Ecological studies of ectomycorrhizal fungi: an analysis of survey methods
17
REVIEW Ecological studies of ectomycorrhizal fungi: an analysis of survey methods Beáta B. Tóth & Zoltan Barta Received: 20 April 2010 / Accepted: 22 July 2010 # Kevin D. Hyde 2010 Abstract In this paper, by reviewing ecological studies of ectomycorrhizal fungi where both fruiting bodies and mycorrhizal root tips were simultaneously surveyed, we investigate whether the diversity data obtained by the two methods leads to similar conclusions about the underlying ecological processes of interest. Despite discrepancies in identifying species, we found that both survey methods identified similar responses by ectomycorrhizal fungal communities to experimental manipulations, successional changes and environmental disturbances (exceptions are short-term or low-level disturbances). By analysing the results of the reviewed studies, we found a positive relationship to exist between fungal species richness and (i) the host plant age and (ii) the number of putative host plant species, independently of the applied survey method. Of the methodological variables, only the number of soil samples (for the below-ground approach) and the duration of the study (for the above-ground approach) have a significant effect on the EMF species richness, with species richness increasing with both. Our investigation also shows that in 73% of the reviewed studies (27 out of 37) a greater species richness was found by fruiting body surveys than by methods based on sampling of the root tips. Based on these findings, we argue for the continuation of fruiting body surveys in order to gain rapid and still valuable information on ecosystems over a wide spatial and temporal range and strongly recommend their use in long-term ecosystem monitoring projects. Keywords Fungal diversity . Ecosystem processes . Monitoring . Sampling methods . EMF community . Above-ground and below-ground responses . Bioindication Introduction Ecosystem change caused by human activities is one of the pivotal issues in ecological research (Staddon et al. 2002). Ectomycorrhizal (EM) fungi are potentially excellent indicators of the effects of these activities due to the large number of species, their specialised life style, and their important ecological function. Mycorrhizal fungi mediate the interaction between plants and the soil and have important roles in nutrient cycling and the development of soil structure (Read et al. 2004). Thus, studies of ectomy- corrhizal fungal (EMF) communities can reveal the direct and indirect (e.g. via the host plant or the soil microbial community) impacts of an environmental factor on the EMF community itself and also on the ecosystem in which it occurs (Staddon et al. 2002). EMF community structure is investigated often and has become an important topic in ecological research (van der Heijden et al. 1998; Copley 2000; Heckman et al. 2001; Högberg et al. 2001; Stinson et al. 2006). Until recently, the applied methodologies have been based on all developmental stages of EM fungi. These stages include (i) the spore-producing epigeous Electronic supplementary material The online version of this article (doi:10.1007/s13225-010-0052-2) contains supplementary material, which is available to authorized users. B. B. Tóth Department of Ecology, University of Debrecen, Debrecen, Egyetem tér 1, 4032, Hungary Z. Barta Department of Evolutionary Zoology, University of Debrecen, Debrecen, Egyetem tér 1, 4032, Hungary e-mail: [email protected] B. B. Tóth (*) Debrecen, Fejedelem u. 19/b. 2/3, 4032, Hungary e-mail: [email protected] Fungal Diversity DOI 10.1007/s13225-010-0052-2
-
Upload
independent -
Category
Documents
-
view
6 -
download
0
Transcript of Ecological studies of ectomycorrhizal fungi: an analysis of survey methods

REVIEW
Ecological studies of ectomycorrhizal fungi:an analysis of survey methods
Beáta B. Tóth & Zoltan Barta
Received: 20 April 2010 /Accepted: 22 July 2010# Kevin D. Hyde 2010
Abstract In this paper, by reviewing ecological studies ofectomycorrhizal fungi where both fruiting bodies andmycorrhizal root tips were simultaneously surveyed, weinvestigate whether the diversity data obtained by the twomethods leads to similar conclusions about the underlyingecological processes of interest. Despite discrepancies inidentifying species, we found that both survey methodsidentified similar responses by ectomycorrhizal fungalcommunities to experimental manipulations, successionalchanges and environmental disturbances (exceptions areshort-term or low-level disturbances). By analysing theresults of the reviewed studies, we found a positiverelationship to exist between fungal species richness and(i) the host plant age and (ii) the number of putative hostplant species, independently of the applied survey method.Of the methodological variables, only the number of soilsamples (for the below-ground approach) and the durationof the study (for the above-ground approach) have asignificant effect on the EMF species richness, with speciesrichness increasing with both. Our investigation also shows
that in 73% of the reviewed studies (27 out of 37) a greaterspecies richness was found by fruiting body surveys thanby methods based on sampling of the root tips. Based onthese findings, we argue for the continuation of fruitingbody surveys in order to gain rapid and still valuableinformation on ecosystems over a wide spatial and temporalrange and strongly recommend their use in long-termecosystem monitoring projects.
Keywords Fungal diversity . Ecosystem processes .
Monitoring . Sampling methods . EMF community .
Above-ground and below-ground responses . Bioindication
Introduction
Ecosystem change caused by human activities is one of thepivotal issues in ecological research (Staddon et al. 2002).Ectomycorrhizal (EM) fungi are potentially excellentindicators of the effects of these activities due to the largenumber of species, their specialised life style, and theirimportant ecological function. Mycorrhizal fungi mediatethe interaction between plants and the soil and haveimportant roles in nutrient cycling and the development ofsoil structure (Read et al. 2004). Thus, studies of ectomy-corrhizal fungal (EMF) communities can reveal the directand indirect (e.g. via the host plant or the soil microbialcommunity) impacts of an environmental factor on theEMF community itself and also on the ecosystem in whichit occurs (Staddon et al. 2002). EMF community structureis investigated often and has become an important topic inecological research (van der Heijden et al. 1998; Copley2000; Heckman et al. 2001; Högberg et al. 2001; Stinsonet al. 2006). Until recently, the applied methodologies havebeen based on all developmental stages of EM fungi.These stages include (i) the spore-producing epigeous
Electronic supplementary material The online version of this article(doi:10.1007/s13225-010-0052-2) contains supplementary material,which is available to authorized users.
B. B. TóthDepartment of Ecology, University of Debrecen,Debrecen, Egyetem tér 1,4032, Hungary
Z. BartaDepartment of Evolutionary Zoology, University of Debrecen,Debrecen, Egyetem tér 1,4032, Hungarye-mail: [email protected]
B. B. Tóth (*)Debrecen, Fejedelem u. 19/b. 2/3,4032, Hungarye-mail: [email protected]
Fungal DiversityDOI 10.1007/s13225-010-0052-2

(above-ground) or hypogeous (underground) fruiting bodies(the sporocarps); (ii) the mycorrhizal stage, which is thesubstrate-exchanging interface on the fine root system ofthe plant hosts and (iii) the mycelium, which is responsiblefor exploring the soil for nutrients and water. This balancedapproach has, however, recently been abandoned due to theadvent of molecular biology-based fungal identificationmethods. Nowadays, as a result, ecological studies of fungalcommunities focus almost exclusively on the mycorrhizalstage. One of the main reasons for this shift inmethodology is the fact that in the same habitat theresults of sporocarp surveys can differ considerably fromthe results obtained by underground sampling of EMFcommunities (Gardes and Bruns 1996). While molecularmethods are fully accepted, sporocarp surveys are ofteninterpreted as representing only an unpredictable sub-sample of the whole underground community, yieldinghard-to-interpret data (Dahlberg et al. 1997; Gehring et al.1998; Horton and Bruns 2001; Anderson and Cairney2007; Lilleskov and Parrent 2007). This widespread beliefhas led to a decline in the number of studies using fruitingbody surveys. However, other studies show that all threeof the above methods (sporocarp, root tip, and myceliumsampling) used for investigating the EMF communityhave their own limitations and benefits (Buscot et al.2000; Horton 2002; Allen et al. 2003; Schmidt and Lodge2005; Koide et al. 2005; Avis et al. 2006; Dickie andFitzJohn 2007), so it is not so surprising that they canprovide strikingly different results (e.g., Peintner et al.2007). As a consequence, it is very difficult to get acomplete picture of the EMF community from eitherabove- or below-ground approaches alone.
While detailed biodiversity information on EMF com-munities has its value, a more important question concernswhat this information can tell us about the functioning ofthe ecosystems in which they occur. Therefore, it wouldseem worthwhile to assess whether or not the data obtainedby the different methods lead to similar conclusions aboutthe underlying ecological processes of interest than con-centrating on the exact details of species composition. Tofacilitate the investigation of this problem, we review thosestudies in which both the above-ground (fruiting bodies)and below-ground (i.e. mycorrhizas on the plant rootsystem) survey methods were simultaneously applied tostudy EMF communities. In addition, we discuss theadvantages and disadvantages of the methods applied toEMF community research.
Comparison of studies of the EMF community
By using several search engines and our own database ofarticles, we found 34 studies in which EMF communities
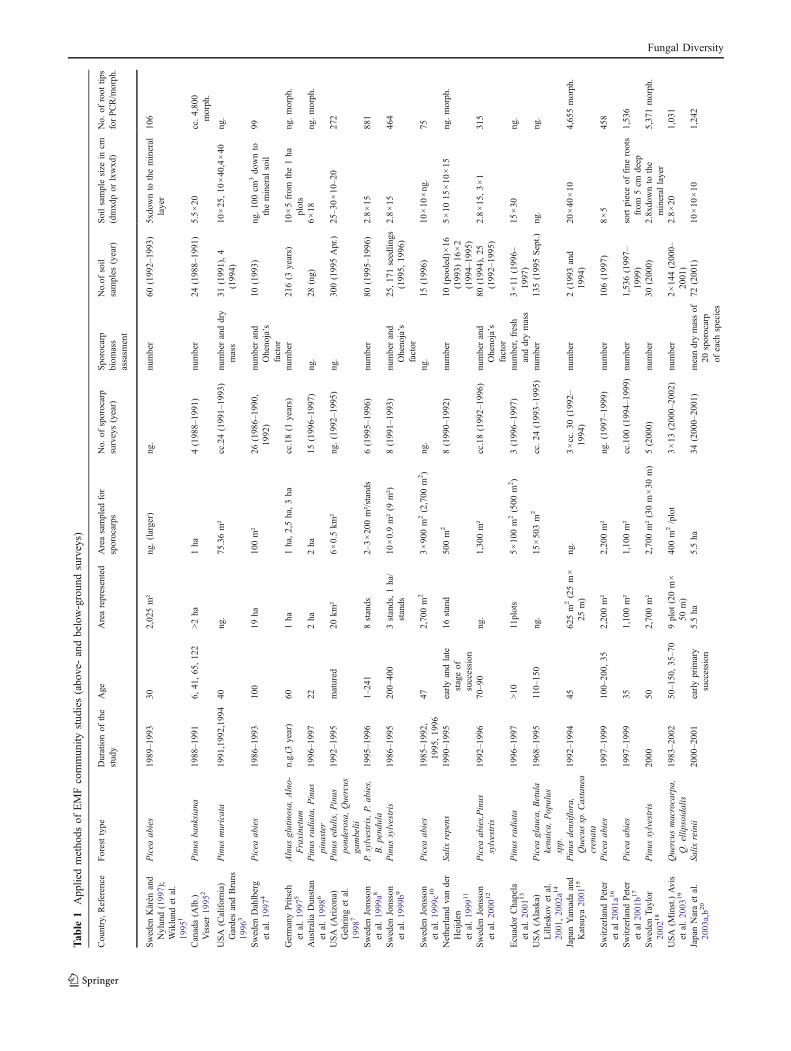
were investigated by using both above-ground and below-ground sampling simultaneously (Tables 1 and 2, andTable Suppl.1). Both the goals of these studies and theirmethodologies vary greatly (Table 1, Suppl.1). We were,however, able to classify the studies into two maincategories: studies in the first category simultaneouslysampled both the above-ground and below-ground aspectsof an EMF community in a given habitat in order tocompare their compositions and so to assess the efficiencyof different methods, while the second category containsstudies which collected above- and below-ground EMFcommunity data to investigate how they changed inresponse to varying environmental factors or to determinetheir suitability as an indicator for environmental change.
Studies on EMF community composition
When the purpose of the studies was merely to determinethe structure (species richness, abundances, composition,diversity or distribution) of the above-ground and below-ground aspects of EMF communities, the two differentapproaches usually found different community structures(Table 2 and Table Suppl.1; Gardes and Bruns 1996;Dahlberg et al. 1997; Pritsch et al. 1997; Dunstan et al.1998; Jonsson et al. 1999b; van der Heijden et al. 1999;Yamada and Katsuya 2001; Taylor 2002; Avis et al. 2003;Valentine et al. 2004; Richard et al. 2004; Fujimura et al.2005; Chen et al. 2007; Riviere et al. 2007; Smith et al.2007b; Nieto and Carbone 2009; Palmer et al. 2009).However, the opposite (i.e., finding similar structures) alsooccurs. For instance, Nara et al. (2003a, b) found that thespecies composition of the underground EMF communitycorresponded closely with that of the sporocarp community inan early primary volcanic desert on Mont Fuji. Similaritiesin above and below-ground sampling results were alsofound in some well-studied taxa, such as Paxillus involutus(Laiho 1970), Suillus grevillei (Zhou et al. 2001), Hebelomacylindrosporum (Guidot et al. 2002), Russula species (Aviset al. 2003; Matsuda and Hijii 2004; Palmer et al. 2009),Suillus pictus (Hirose et al. 2004; Kikuchi and Futai 2003),Pisolithus microcarpus (Ducousso et al. 2004), Tylosporafibrillosa (Carfrae et al. 2006), Tricholoma matsutake(Lian et al. 2006) and four hypogeous genera (Luoma et al.1997 cf: Valentine et al. 2004). These studies have foundconsiderable overlap between the spatial distribution and thebiomass of genets of sporocarps and those of mycelium ormycorrhizas on the fine roots on the same site.
Studies of EMF diversity vs. environmental variables
Despite our rapidly-increasing knowledge of EMF commu-nity ecology, we still need to learn more about therelationship between fruiting bodies and underground
Fungal Diversity

mycorrhizas at a given site in order to gain a better insightof EMF community functioning. To advance our under-standing it would be important to investigate whether thesampling of the different parts of the fungal individuals(mycorrhizas vs. sporocarps) can identify the same under-lying ecological processes occurring in the ecosystem. Theaccumulation of multiple datasets from around the world(albeit mainly from the northern hemisphere) has enabledus to address this question. In the following sections, webriefly review articles investigating the correlation betweenEMF diversity and environmental variables.
Nitrogen surplus
From the results of field investigations where nitrogen (N)was experimentally supplied or it heavily polluted theexperimental sites (N is the main limiting factor for plantsin many soil habitats), we can conclude that the time frameused to investigate changes in EMF community maybe asignificant factor. Short-term studies found that the additionof surplus nitrogen does not affect the species richness orunderground diversity of EMF communities, whereassporocarp surveys show that the diversity of the EMFcommunity was drastically reduced (Kårén and Nylund1997; Jonsson et al. 2000). Interestingly, Peter et al.(2001a) reported the same for the first year of N addition,but after 2 years of further N supply significant changeswere observed. The abundance of species that form largesporocarps (cap diameter about 5–10 cm) decreased on thefine roots in the underground community while theabundance of species with no or resupinate sporocarpsincreased. In a similar, but long-term experiment, Lilleskovet al. (2001, 2002a) demonstrated that species richnessbased on both sporocarp surveys and sampling of the fineroots decreased along an increasing anthropogenic Ndeposition gradient. They also reported that, compared tothe relatively rapid decline of sporocarp abundance anddiversity in response to surplus N, the response of theunderground community is slower. In a field studyconducted in Minnesota (US), Avis et al. (2003) measuredthe diversity, structure, and composition of EMF commu-nities in a 16 year N-addition (fertilization) field experi-ment. Total sporocarp species richness was reduced bymore than 50% in the fertilization treatments and theevenness and diversity also decreased. In addition, theyfound that different species responded differently to thetreatment and so the composition of the above-ground EMFcommunity differed across the fertilization treatments. Thebelow-ground response was similar at the scale of plots ofland, but it vanished at smaller spatial scales (Avis et al.2003). Lilleskov et al. (2002b) also noted that EMF taxacan differ in response to N deposition. A similar result wasfound by Carfrae et al. (2006), who demonstrated that after
a 3-year nitrogen, sulphur and acidity treatment, Ndeposition suppressed the appearance of EM fungi,producing larger sporocarps in young plantations (Carfraeet al. 2006). There were generally fewer sporocarps andlower EMF sporocarp diversity under the N treatment plots,while the number of mycorhizal root tips was greatest. Incontrast, species richness and diversity were also the lowestin these plots. Kårén and Nylund (1997) and Wiklund et al.(1995) found the opposite; thus the biomass of the fineroots and the number of mycorrhizal root tips were halvedfollowing fertilization with both N and sulphur, while theEMF species richness and diversity on the roots were notchanged. They reported a 50% reduction in sporocarpnumber and species richness of mycorrhizal species duringthe N fertilization experiment. To summarise the results ofthe above fertilisation studies, we can conclude that theabove-ground response of the EMF community to Nsurplus is detectable sooner than is the case for below-ground changes.
Chronosequence studies
Despite the rather general finding that the data obtainedfor EMF species compositions derived by sporocarp andfine root sampling overlap only slightly, in the followingchronosequence studies the same relationship betweenage and the EMF community structure emerges indepen-dently of the applied methods (sporocarp or mycorrhizalsampling). For instance, Peter et al. (2001b) showed thatsites of different spatial structure and stand age (35, 100–200 years old) can be differentiated by either samplingmethod. Peter et al. (2001b) argued that the differinghistories of the sites can be a possible explanation for thesefindings. Similarly, Visser (1995) pointed out that bothfruiting body and root tip assessments revealed a distinctsequence of mycorrhizal fungi related to stand age afterregeneration following wildfire disturbance (6, 41, 65122 years ago). It was possible to categorize them intoearly-stage, multi-stage and late-stage fungi (Visser 1995).Another group of researchers have demonstrated, both bysporocarp survey and root tip sampling, a progressiveincrease in species richness of mycobionts along chronose-quences of Sitka spruce forests (6, 12, 30, 40 years),although the number of species encountered was low at allages (Palfner et al. 2005). Gebhardt et al. (2007) attemptedto characterize the diversity and succession of EMFsporocarps and root tip morphotypes of red oak growingon forest reclamation sites. Both methods showed thateach site (5, 21, 33, 43, and 46 years old) exhibited stand-specific EMF communities with low similarity to otherstands. The total number of EM species obtained by eithersporocarp survey or by sampling the root system was thehighest in the 46 year-old undisturbed stand. On the other
Fungal Diversity
Tab
le1
App
liedmetho
dsof
EMFcommun
itystud
ies(abo
ve-andbelow-groun
dsurveys)
Country,Reference
Foresttype
Durationof
the
study
Age
Arearepresented
Areasampled
for
sporocarps
No.
ofsporocarp
surveys(year)
Sporocarp
biom
ass
assasm
ent
No.of
soil
samples
(year)
Soilsamplesize
incm
(dmxdpor
lxwxd)
No.
ofroot
tips
forPCR/m
orph.
Sweden
Kårén
and
Nylund(1997);
Wiklund
etal.
1995
1
Picea
abies
1989–1
993
302,025m²
ng.(larger)
ng.
number
60(1992–
1993)
5xdownto
themineral
layer
106
Canada(A
lb.)
Visser1995
2Pinus
banksiana
1988–1
991
6,41,65,122
>2ha
1ha
4(1988–
1991)
number
24(1988–
1991)
5.5×20
cc.4,800
morph.
USA
(California)
GardesandBruns
1996
3
Pinus
muricata
1991,1992,1994
40ng.
75.36m²
cc.24(1991–
1993)
numberanddry
mass
31(1991),4
(1994)
10×25,10
×40,4×40
ng.
Sweden
Dahlberg
etal.1997
4Picea
abies
1986–1
993
100
19ha
100m²
26(1986–
1990,
1992)
numberand
Ohenoja’s
factor
10(1993)
ng.100cm
3downto
themineral
soil
99
GermanyPritsch
etal.1997
5Alnus
glutinosa,
Alno-
Fraxinetum
n.g.(3
year)
601ha
1ha,2,5ha,3ha
cc.18(1
years)
number
216(3
years)
10×5from
the1ha
plots
ng.morph.
Australia
Dunstan
etal.1998
6Pinus
radiata,
Pinus
pinaster
1996–1
997
222ha
2ha
15(1996–
1997)
ng.
28(ng)
6×18
ng.morph.
USA
(Arizona)
Gehring
etal.
1998
7
Pinus
edulis,Pinus
ponderosa,
Quercus
gambelii
1992–1
995
matured
20km
²6×0.5km
²ng.(1992–1995)
ng.
300(1995Apr.)
25–30×10–2
0272
Sweden
Jonsson
etal.1999a8
P.sylvestris,P.
abies,
B.pendula
1995–1
996
1–241
8stands
2–3×200m²/stands
6(1995–
1996)
number
80(1995–
1996)
2.8×15
881
Sweden
Jonsson
etal.1999b9
Pinus
sylvestris
1986–1
995
200–400
3stands,1ha/
stands
10×0.9m²(9
m²)
8(1991–
1993)
numberand
Ohenoja’s
factor
25,171seedlin
gs(1995,
1996)
2.8×15
464
Sweden
Jonsson
etal.1999c1
0Picea
abies
1985–1
992,
1995,1996
472,700m
23×900m
2(2,700
m2)
ng.
ng.
15(1996)
10×10
×ng.
75
Netherlandvander
Heijden
etal.1999
11
Salix
repens
1990–1
995
earlyandlate
stageof
succession
16stand
500m
28(1990–
1992)
number
10(pooled)×16
(1993)
16×2
(1994–
1995)
5×10
15×10
×15
ng.morph.
Sweden
Jonsson
etal.2000
12
Picea
abies,Pinus
sylvestris
1992–1
996
70–9
0ng.
1,300m²
cc.18(1992–
1996)
numberand
Ohenoja’s
factor
80(1994),25
(1992–
1995)
2.8×15,3×1
315
Ecuador
Chapela
etal.2001
13
Pinus
radiata
1996–1
997
>10
11plots
5×100m
2(500
m2)
3(1996–
1997)
number,fresh
anddrymass
3×11
(1996–
1997)
15×30
ng.
USA
(Alaska)
Lilleskovet
al.
2001
,2002a1
4
Picea
glauca,Betula
kenaica,
Populus
spp.
1968–1
995
110–
150
ng.
15×503m
2cc.24
(1993–
1995)
number
135(1995Sept.)
ng.
ng.
JapanYam
adaand
Katsuya
2001
15
Pinus
densiflora,
Quecussp.C
astanea
crenata
1992–1
994
45625m
2(25m×
25m)
ng.
3×cc.30
(1992–
1994)
number
2(1993and
1994)
20×40
×10
4,655morph.
Switzerland
Peter
etal
2001a1
6Picea
abies
1997–1
999
100–200,
352,200m²
2,200m²
ng.(1997–1999)
number
106(1997)
8×5
458
Switzerland
Peter
etal
2001b1
7Picea
abies
1997–1
999
351,100m²
1,100m²
cc.100
(1994–
1999)
number
1,536(1997–
1999)
sortpieceof
fine
roots
from
5cm
deep
1,536
Sweden
Taylor
2002
18
Pinus
sylvestris
2000
502,700m²
2,700m²(30m×30
m)
5(2000)
number
30(2000)
2.8xdownto
the
mineral
layer
5,371morph.
USA
(Minst.)Avis
etal.2003
19
Quercus
macrocarpa,
Q.ellip
soidalis
1983–2
002
50–1
50,35–7
09plot
(20m×
50m)
400m
2/plot
3×13
(2000–
2002)
number
2×144(2000–
2001)
2.8×20
1,031
JapanNaraet
al.
2003a,b2
0Salix
reinii
2000–2
001
earlyprim
ary
succession
5.5ha
5.5ha
34(2000–
2001)
meandrymassof
20sporocarp
ofeach
species
72(2001)
10×10
×10
1,242
Fungal Diversity

Tab
le1
(con
tinued)
Country,Reference
Foresttype
Durationof
the
study
Age
Arearepresented
Areasampled
for
sporocarps
No.
ofsporocarp
surveys(year)
Sporocarp
biom
ass
assasm
ent
No.of
soil
samples
(year)
Soilsamplesize
incm
(dmxdpor
lxwxd)
No.
ofroot
tips
forPCR/m
orph.
JapanHiroseet
al.
2004
21
Pinus
pentaphylla
var.
himekom
atsu
2000
–2002
520
×24
mand6×
16m
20m×24
mng.(2000–
2002)
number
anddry
mass
35(2002)
5×15
242
USA
(Sth.Oreg.)
Valentin
eet
al.
2004
22
Quecusgarryana
2000
–2002
n.g.
58ha
ng.
20(2001–
2002)
number
19seedlin
gs160
soilcore
(2000–
2001)
2.8×25
700
French(Corsica)
Richard
etal.
2004,2005
23
Quercus
ilex,
Arbutus
unedo
1999
–2002
1,2–10,170
15ha
6,400m
2(160
m×40
m)
3×26
(1999–
2002)
number
2×30
seedlin
gs/
saplings;230
soilcores
10×10
×20
558
USA
(Oregon)
Fujim
uraet
al.
2005
24
Pinus
ponderosa
1998
100–200
cc.4
0ha
24plots
24×240m
transect
1(1998June)
number
32(1998June)
5×15
cc.91
UK
(England)
Palfner
etal.
2005
25
Picea
sitchensis
2000
–2001
6,12,30,40
500ha
ng.
ng.(2001)
number
40cores+25
seedlin
gs(2000–
2001)
4.5×12
morph.118,000
UK
(Scottland)
Carfrae
etal.
2006
26
Picea
sitchensis
1999
131.5ha
(20plots)
1.5ha
cc.9(1999july–
sept)
ng.
80(1999August)
5.2×10
ng.(m
orph.)
China
(South)Chen
etal.2007
27
Eucalyptussp.
ng.
1–7
155×50
ha155×100m
22(2
years)
number
155×5(1tim
e)Deepness:10
–30cm
(cc.500g)
ng.(m
orph.)
GermanyGebhardt
etal.2007
28
Quercus
rubra
2002
–2003
5,21,33,43,46
100,000ha
5×720m
2cc.24(2002–
2003)
ng.
160cores+32
seedlin
gs(2002June–
2003May)
5×15,10
×15
490
USA
(California)
Peayet
al.2007
29
Pinus
muricata
2005
–2006
10500ha
6,330m
210
min/
occasion
11(2005–2006)
numberand
Program
Estim
ateS
114(2005)
2.5×30.5
570
Guinea(W
est)
Riviere
etal.
2007
30
Caesalpiniaceae,
Phylla
nthaceae
ng.
nativ
erainforest
ng.
3×20
m4(4
years)
ng.
4(4
years)
ng.(undersporocarps
andotherplaces)
100
USA
(Calf.)Smith
etal.2007b3
1Quercus
douglasii
2000
–2005
cc.50
1,024m
2(32×
32m)
12.56ha
(cc.
200m
radius)
cc.50(2000–
2005)
number
59+35
(2003–
2004)
11.5×8.5
9,400
CzehRepublic
Peter
etal.2008
32
Picea
abies
1999
–2000
matured
75ha
3×25
ha1(2000)
number
3×100,
3×75
(2000)
Deepness:5cm
,4.5×30
236
Spain
Nieto
and
Carbone
2009
33
Pinus
pinaster
2007
–2008
5ng.
700m
2cc.38(2007
Okt.–2008
June)
number
45saplings
(2007)
deepness
10–2
0cm
107(18,463
root
tips)
USA
(Wisconsin)
Palmer
etal.
2009
34
Castaneadentata
2001
–2005
cc.100
cc.38ha
cc.38ha
cc.32(2001,
2003–
2005)
number
cc.45(2005)
25×25
×25
233
ng.no
tgiven,
Oheno
ja’s
factor
Oheno
ja’s
species-specific
conv
ersion
factor
forestim
atingfung
albiom
ass(O
heno
jaet
al.19
93),
morph
.mycorrhizas
onroot
tipwereidentifiedusing
morph
olog
ical
traitson
ly,nu
mbers
insuperscript(1–3
4)markreferences
used
inTable
2
Fungal Diversity

Table 2 Survey results of EMF community studies (above- and below-ground surveys)
Root tips survey results Sporocarp survey results
The most abundant species Number of speciesor RFLP orsequence type
No. of explicitidentified species
Number ofspecies
The most abundant species
Tylospora fibrillosa, Piceirhizabicolorata1
21 9 64 Lactarius necator, L. rufus, L.theiogalus, Boletus edulis
Suillus brevipes2 12 7 15 Inocybe spp, Suillus brevipes
Suillus brevipes, Russula spp., S.tomentosus2
20 13 34 Cortinarius spp., Bankera Juligineo-alba,Russula spp.
Russula spp.,Suillus brevipes,Cortinarius spp.2
25 14 41 Suillus tomentosus, Cortinarius spp.,Russula spp.
Russula spp., Micelium radicisatrovirens Melin, Tricholoma spp.2
27 14 34 Suillus tomentosus, Cortinarius spp.,Russula spp.
Russula amoenolens, Tomentella sub-lilacina, Russula brevipes, R.xerampelina, A. franchetii3
20 9 10 Suillus pungens, Amanita franchetii,Russula xerampelina
Piloderma croceum, Cenococcumgeophilum, Tylospora fibrillosa,Russula decolorans4
25 12 48 Cortinarius malachius, C. paleaceus, C.traganus, C.brunneus,
Naucoria sp., Lactarius sp., Paxillusrubicundulus, Alnirhiza sp.5
16 (1 plot) 8 28 (from 3plots)
Naucoria striatula, Cortinarius bibulus
Thelephora terrestris, ‘Bcb’ type,Hebeloma crustuliniforme6
6 4 9 Rhizopogon roseolus, R. vulgaris,Hebeloma crustuliniforme, Suillusgranulatus
RFLP type 10,12,3, Tricholoma terreum,Lactarius deliciosus7
51 7 22 (13) Tricholoma terreum, Lactariusdeliciosus
RFLP-taxon X1, Cenococcumgeophilum, Suillus variegatus,Cortinarius group1.8
135 11 66 Suillus variegatus, Cortinarius obtususs.1, C. semisanguineus
RFLP-taxon 1, Suillus variegatus,Piceirhiza bicolorata, Cortinariusgroups9
43 RFLP, 20morph.
14 62 Lactarius rufus, Suillus variegatus,Cortinarius traganus, Russulapaludosa
Thelephora terrestris, Tylopilus felleus,Tylospora fibrillosa10
16 9 28 Hygrophorus olivaceoalbus, Russulaochroleuca, Paxillus involutus,Hebeloma fragilipes, Lactariustheiogalus
Hebeloma sp., Inocybe sp., ITE5,Laccaria sp.,11
15 7(genus) 78 Hebeloma leucosarx, H. pusillum,Laccaria laccata, Paxillus involutus
Cenococcum geophilum (20%),Phialocephala fortinii. Pilodermacroceum12
52 10 111 Cortinarius obtusus, Cantharellustubaeformis
Suillus luteus, Thelephora terrestris,Rhizopogon vulgaris13
3 3 3 Suillus luteus, Thelephora terrestris,Rhizopogon vulgaris
Piloderma byssinum, Amphinemabyssoides, Cortinarius subgenustelamonia14
30 12 144 Tricholoma inamoenum, Cortinariusidahoensis complex, C. brunneus,Boletus subtomentosus var,subtomentosus, Lactarius rufus,Russula abietina
Lactarius theiogalus, Paxillusinvolutus14
9 7 14 Lactarius theiogalus, Laccaria bicolor,L. laccata, Paxillus involutus,Hygrophorus olivaceoalbus, Lactariusolivaceo-umbrinus, Russula betularum
Morphotype 51, 28, 6, 15, 54, 35,Cenococcum geophylum, Russulasp.1.15
28 6 40 Coltricia cinnamomea, Inocybe sp. (sec.Depauperatae), Inocybe umbratica,Russula spp.
Tylospora fibrillosa, T. asterophora,Cenococcum geophilum, RFLP48,RFLP2, RFLP3, RFLP5016
79 RFLP, 36morph.
28 128 Cortinarius brunneus, Russulaochroleuca, Russula laricina
Fungal Diversity

Table 2 (continued)
Root tips survey results Sporocarp survey results
The most abundant species Number of speciesor RFLP orsequence type
No. of explicitidentified species
Number ofspecies
The most abundant species
RFLP 1 (Thelephoraceae), Tylosporaasterophora, Russula laricina, RFLP2–4, Hygrophorus pustulatus17
68 17 25 (23) Russula laricina, Clavulina cristata,Hygrophorus pustulatus, Amanita aff.submembranacea. Inocybe grammata
ng.18 37 19(species orgenus)
56 Cortinarius sp. (42.3%)11
Coenococcum geophylum, Cortinariussubg. telamonia, Russula aff.amoenolens, Tomentella sp.19
72 38 59 Lactarius camphoratus, R. aff.amoenolens, L. laccata, Inocybe sp.,Boletus nobilissimus, Hydnumzonatum, Lyophyllum cf. decastes
Laccaria laccata, Inocybe lacera, L.amethystina, L. murina, Sclerodermabovista20
21 12 23 Laccaria laccata, Hebelomamesophaeum, Scleroderma bovista, L.amethystina, L. murina
Suillus pictus, Cenococcum geophilum21 ng. ng. 17 Suillus pictus, Strobilomyces confusus,Lactarius chrysorrheus, Tylopiluscastaneiceps
Cenococcum geophylum, Tuber sp.22 39 7 >100 Inocybe geophylla, Russula spp., Boletussatanas
Cenococcum geophylum, Russuladecipiens, R. acrifolia, Inocybe spp.,Thelephoraceae, Sebacinaceae23
140 46 166 Laccaria laccata, Inocybe tigrina,Lactarius chrysorrheus
Wilcoxina rehmii, Geopora cooperi24 6 2 10 (genus) Tricharina, Anthracobia, Morchella,Peziza
Tylospora fibrillosa, Lactarius rufus,“Piceirhiza sulfo-incrustata”(notidentified), Russula emetica,Hymenoscyphus ericae, Dermocybecrocea 25
13 11 8 Russula emetica, Lactarius rufus,Dermocybe crocea, Russulaochroleuca
Lactarius rufus, Cortinarius spp.Tylospora fibrillosa,26
7 ng. 6 Tylospora fibrillosa, Lactarius rufus,Inocybe spp., Laccaria spp.
Scleroderma sp., Laccaria sp.,Cenococcum sp.27
7 1 15 Scleroderma cepa, Pisolithus sp2, S.polyrhizum, S. citrinum, Laccarialaccata, Russula aeruginea
Cenococcum geophilum, Boletusaestivalis, Tricholoma muricatum,Tuber spec. 01, Laccariaamethystina28
61 17 10 Scleroderma citrinum, Boletus edulis,Amanita muscaria
ng.29 28 12 36 (genus) 19(species)
Suillus pungens, Russula occidentalis
Russulaceae, Amanitaceae, boletoids30 55 ng. 119 Russulaceae, Amanitaceae, boletoids,Sclerodermataceae
Thelephoraceae, Pyronemataceae,Cortinariaceae31
92 42 108 Tomentella, Russula, Inocybe
Tylospora fibrillosa, Russula emetica,Tylospora asterophora, Thelephoraterrestris32
40 (15, 20, 30) 24 45 (5,27, 33) Clavulina cristata, Russula emetica,Cortinarius flexipes, Cortinarius sp.,Lactarius rufus
Tomentella sublilacina, Thelephoraterrestris, Russula drimeia, Suillusbovinus, Paxillus involutus33
17 9 9 Suillus bovinus, Paxillus involutus,Thelephora terrestris, Xerocomusbadius, Scleroderma verrucosum
Russula pectinatoides, Pezizales,Thelephoraceae, Sebacinaceae,Scleroderma areolatum34
46 28 99 Russulaceae, Boletales, Cortinariaceae,Tricholomataceae, Amanitaceae,Pezizales
Numbers in superscript (1–34) identify references in Table 1
ng. not given
Fungal Diversity

hand, Richard et al. (2004, 2005) found that the age ofQuercus ilex did not strongly shape the EMF diversity andcomposition below the ground. However this study wasnot conducted in stands of different ages, but in a single170-year old stand with seedlings and older saplings.Accordingly, the sporocarp survey method was not appli-cable here because, as a result of the large coverage of themycelium, it could not provide accurate and locallyinformation about specific hosts. The results of fruitingbody surveys have shown that species richness decreases asthe number of layers of vegetation increases; unfortunately,this phenomenon was not investigated by the below-groundsurvey (Richard et al. 2004, 2005). Sporocarp inventoryalso indicated preferential fruiting of some fungal speciesnear either Q. ilex or Arbutus unedo, and the below-groundsampling also found that the two EM hosts shared few EMspecies (only 12.9% of the taxa were shared, Richard et al.2004). In a field study conducted in the Netherlands, above-and below-ground EMF association of Salix repenscommunities was investigated in relation to soil chemistryin a succession of dune ecosystems (van der Heijden et al.1999). The study demonstrated that both the above- andbelow-ground fungal community data support the classifi-cation of the 16 field sites into four habitat categoriesderived by soil chemistry attributes (pH and moisture).These habitat categories are best interpreted as successionalstages of this dune ecosystem. These successional studiesindicate that when sufficient time is available for EMFcommunities to adapt to changing environments, bothmethods can draw the same conclusions.
Studies with other abiotic factors
It has also been investigated whether the EMF communitiesrespond to abiotic environmental conditions other thanincreased N level, such as soil type, moisture level ornutrients, a question that can be closely related to theinvestigation of succession. In a study carried out in severalPinyon pine forests, sporocarp censuses and EMF root tippatterns showed the same relationship with the nutrient andthe moisture level (Gehring et al. 1998). The EMF speciesrichness was not correlated with measures of ecosystemproductivity. The investigated two soil types had similarnumbers of EMF species but their composition wasdifferent. In a Swedish study, the EMF community structurein spruce stands treated for more than 10 years withdifferent levels of dolomite lime were compared (Jonssonet al. 1999c). Despite the differences in fungal taxa foundabove- and below-ground, tests between treatments usingeither fruiting bodies or root tip sampling data revealed asimilar shift in community structure. In another study,Jonsson et al. (1999a) found that low-intensity wildfire did
not affect the average number of species per stand asdetermined by sporocarp surveys. Similarly, no significantdifferences were found between the number of restrictionfragment length polymorphism (RFLP)-taxa on the fineroot system in the controls (insulated stands) and on thestands exposed to fire. The underground EMF communitywas, however, less evenly distributed in the burnt standsthan in the controls. To the contrary, Fujimura et al. (2005)found that several months after a low-intensity fire, fivegenera (Anthracobia, Morchella, Peziza, Scutellinia andTricharina) of post-fire Pezizales were observed by fruitingbody survey, while no root tips colonized by any speciesof post-fire Pezizales fruiting at the site were found. Thissuggests that fungi may switch from mutualism in stableforests to saprotrophism after a disturbance, or couldindicate a methodological inefficiency of the root tipsampling procedure. Future studies are needed to clarifythis. In a field study by Chapela et al. (2001) conducted innew plantations of pines in paramo grasslands in Ecuador,the effects of the introduction of exotic P. radiata pines andtheir accompanying EM fungi were examined. They foundan extreme reduction in the number of species in the EMFcommunity. Only three species (Suillus luteus, Thelephoraterrestris and Rhizopogon vulgaris) were found in anestablished plantation. This reduction in species was notlimited to estimates based on fruiting bodies but was alsoconfirmed using DNA identification methods on EM root-tips. In a field investigation in the Czech Republic, Peteret al. (2008) obtained information about the EMF commu-nity in a heavily-damaged spruce forest and assessedwhether missing EMF partners could contribute to theobserved lack of regeneration. The EM species richness onthe roots of adult trees was significantly lower in theheavily-damaged site than in the other two sites. Thefruiting body survey found an even more drastic decline inEMF species richness.
Studies with biotic factors
Several studies have examined how habitat size andisolation affect the richness of EM fungi. Peay et al.(2007) found that island size had a strong effect on EMassemblage structure. Total species richness increased sig-nificantly with island area, independently of the approachused. Distance from the closest EMF colonist alone was apoor predictor of species richness, having a negativecorrelation with species number only on the largest islands.Durall et al. (1999) examined the effects of small forestgaps and partial cutting on EM mushroom diversity andbiomass in order to provide suggestions for forest manage-ment on both optimal timber and edible mushroom harvest-ing. They found that sporocarp species richness along 100 m
Fungal Diversity

long transects decreased as gap area increased. In 1995, thegap area threshold (the gap area at which species richnessdecreased substantially) was estimated to be between 214 and950 m2, whereas in 1996 it was between 629 and 950 m2.EM richness on seedling root tips also decreased slightlywith increasing distance from the edge of the intact forest.The maximum richness was found to be 7 m or less from theforest edge for both tree species investigated.
Why is the overlap between the species compositionyielded by the above-and below-ground surveysso small?
In the following section we consider several reasons thatcan cause a discrepancy between the two types of surveys.
Sporadic fruiting, different sexual-asexual matingbehaviour
A frequently mentioned weakness of sporocarp surveys isthe sporadic, unpredictable fruiting of a particular species.Because of this stochasticity, many species might be missedin a fruiting body survey (Gehring et al. 1998). Moleculardata indicate that some EMF species do not sporulate veryoften, because the importance of sporulation for propaga-tion maybe much less than has been previously assumed(Sanders 2004) or sporulation might depend upon environ-mental conditions. Studies have revealed that sporocarpproduction is strongly affected by prevailing weatherconditions, so many researchers suggest at least 5–10 yearsof study are needed to get useful information about thecommunity (Hering 1966; Arnolds 1988). This seems toolong for most ecological studies and might be avoidable orreduced by a well-designed sampling procedure (e.g., Feest1999). On the other hand, if we were able to follow thisirregular pattern of fruiting, it might be a good indicator ofecosystem activity. Changing weather conditions are not theonly contributors to sporadic fruiting. For example, Gardesand Bruns (1996) did not record large changes in speciesdiversity among three fruiting seasons even though theannual average of rainfall varied substantially over the sameseasons. Peter et al. (2001b), during a 3 year study, obtainedsimilar results: the 10 most abundant species did not changefor the duration of the study, despite considerable variationsin weather. Gehring et al. (1998) suggested that sporocarpsurveys are unlikely to be informative in arid areas wherefruiting is infrequent and potentially biased towards only afew species; however, this is dependent on the goal of thestudy. For example, if one is seeking the most active EMFspecies of the habitat, sporulating data can provide veryuseful information. Furthermore, one can reduce or elimi-
nate the effect of unpredictable weather conditions on thesporadic fruiting of the fungi. A possible way is to usesaprobic community data as a control. Many studies havefound no changes in the saprobic community structureduring experiments where the disturbance was applieddirectly to the immediate environment of EM fungi (e.g.,Peter et al. 2001a). On the other hand, weather conditionscan instantly affect both types of fungal community(Wiklund et al. 1995). Thus, following the change inproportion of sporocarps of mycorrhizal species comparedto those of saprobic species in the fungal community couldreveal changes in the relevant EM environment at an earlystage. In addition to the weather, the production ofsporocarps by EM fungi has also been closely linked tothe supply of photosynthate to the root systems (Högberget al. 2001), which is strongly dependent on, and henceindicative of, the host plant’s condition. It also seems that inunfavourable conditions, for many EMF species giving upfruiting (i.e. trading-off reproduction for survival) is one ofthe first steps in rearranging their resource allocationstrategy (e.g., Last et al. 1979; Kuikka et al. 2003), andthis can cause an immediate shift in the communityassembly as assessed by sporocarp survey. Consequently,despite its unpredictable nature, a sporocarp communitysurvey can give extra information not only about theattributes of the fungal communities but also about theunderlying functional processes of the ecosystem.
To identify the key environmental factors affecting thespecies richness of the EMF communities, we analysed theresults of the reviewed studies by non-parametric statisticaltests (Spearman rank correlation, Kruskal-Walis test andWilcoxon paired rank test). As expected, there was a strongpositive significant relationship between the host plant ageand (i) the sporocarp species richness (Spearman rankcorrelation, rS=0.63, p=<0.001, n=36) and (ii) the mycor-rhizal species richness on the roots (rS=0.52, p=0.001,n=35), respectively. In addition, studies found significantlymore fungal symbionts by sporocarp survey from forestswhich have more than one putative host plant speciescompared to forests with one putative host (Wilcoxon ranksum test, W=74.5, p=0.018, n=38) and the same trend alsoappears for the underground mycorrhizal species richness(W=91, p=0.087, n=37). This suggests that EMF speciesrichness might correlate with host plant diversity, which canindicate a strong relationship between the two trophiclevels. Nonetheless, forest type (deciduous, pine or mixed)has no influence on the EMF species richness either above-or below-ground (Kruskal-Wallis test, χ2=3.72, df=2,p=0.156; χ2=2.61, df=2, p=0.272). It should be empha-sized that results from the different methodologicalapproaches found similar relationships between the exam-ined environmental variables.
Fungal Diversity

Survey methodologies and sampling efforts
The most abundant EMF species recorded by the twosampling methods often differ. However, as Table 1 shows,most studies (17 out of 32) estimate only the sporocarpbiomass from their number, which is not the best indicatorof biomass (Tóth and Feest 2007). Where the biomass wasmeasured more directly (only 4 studies) by weighing thegathered and dried fungal fruiting bodies, the overlap werelarger between the above- and below-ground surveymethods (Hirose et al. 2004; Chapela et al. 2001; Naraet al. 2003a, b; Gardes and Bruns 1996). A furtherdiscrepancy between the two sampling procedures can becaused by the fact that in most studies there are significantdifferences between the sampling effort for the two typesof survey. Often, a short period of sampling is consideredto be enough to provide a valid estimate of the EMFcommunity on the root system. Sporocarp samplings lastedfor 3.054 years on average (SD=1.77, n=37) in thereviewed studies, whereas sampling of the root tips wassignificantly shorter (1.97 years on average, SD=1.18,N=36, Wilcoxon paired rank sum test,W=919, p=0.004,),and is often done only once (e.g., Dahlberg et al. 1997;Jonsson et al. 1999c; Taylor 2002; Fujimura et al. 2005;Chen et al. 2007). Koide et al. (2007) revealed thattemporal partitioning can occur among the species ofEM fungi in a community and because of this seasonalitymany species can be missed by the short and infrequentsampling of the root tips. Sometimes, the two differentsampling surveys were carried out in different years (e.g.,van der Heijden et al. 1999; Valentine et al. 2004) or noteven on the same plots (e.g. Dahlberg et al. 1997; Table 1).These sampling inconsistencies can also contribute to thedifferences in the results. Additionally, Taylor (2002)demonstrated that species with a low abundance in themycorrhizal community of the root system will usually beomitted from the sample because of the very patchy andstochastic occurrence of these species; hence, the resultscould be highly influenced by sample size. The number ofsoil samples taken range between 2 and 1,536, with anaverage of 156.6 (SD=278.6, n=37) per study (Table 1).This is significantly higher than the number of sporocarpsurveys (mean is 22.75, SD=25.4, n=32, range 1–100;Wilcoxon paired rank sum test W=188.5, p<0.001). Soildepth can also significantly influence the observed speciescomposition and species richness (Fransson et al. 2000;Rosling et al. 2003; Hirose et al. 2004). In the reviewedstudies, the maximum depth of the samples varied between1 cm and 40 cm (mean depth is 17.63 cm, SD=8.18, n=30);moreover, it is often varied, even during the same study(e.g., Gardes and Bruns 1996; van der Heijden et al. 1999;Jonsson et al. 2000; Table 1). Rosling et al. (2003)demonstrated that the organic layer is most intensively
exploited by the fine roots, but considerable numbers ofmycorrhizal roots occur in the mineral horizon (deeperregion) as well, and different types of fungi occupy differentparts of a soil profile. This could contribute to the mismatchbetween the results obtained by below-ground sampling andsporocarp survey.
By analysing the results of the reviewed studies(Spearman rank correlation), we found that among themethodological variables (sample depth, number of soilsample, duration of the study, sample volume and numberof root tips collected for PCR), only the number of the soilsamples had a significant effect on the EMF speciesrichness found on the fine roots in the samples (rS=0.40,p=0.014, n=36). This means that studies taking more soilsamples have found significantly higher species richness onthe fine roots, while the other variables had no significanteffect on the underground EMF species number. Inaddition, in the case of sporocarp surveys, the duration ofthe study had a significant positive effect on the sporocarpspecies richness (rS=0.41, p=0.011, n=37), while the numberof surveys or the size of the sampled area had no considerableeffect on the observed sporocarp species richness.
Numerous unidentified RFLP type
Another reason for the different results could be thenumerous unidentified RFLP types found when analysingthe root tip samples. Currently, the major problem with themolecular ITS-RFLP approach when used alone is thatthe number of unidentified types typically remains high(on average 55.8%, SD=21.5%, n=36, Table 2). This highlevel of inefficiency is caused by (i) the limited number and(ii) the narrow phylogenetic coverage of the named internaltranscribed spacer (ITS) DNA sequences available onGenBank, (iii) the size estimates for fragments varyconsiderably and (iv) significant intraspecific variationexists across large geographical scales (Kårén et al. 1997).Many recent studies (Kårén et al. 1997; Buscot et al. 2000;Sanders 2004) have noted that without knowing the trueextent of the genetic variation within an individual, amongindividuals of the same species and among differentspecies, it is very difficult to know exactly what thesequence diversity in a sample actually means. Smith et al.(2007a) examined intraspecific and intra-sporocarp ITSvariation by DNA sequencing from sporocarps and pooledroots from 68 species of EM fungi collected at a single sitein a Quercus woodland. They detected significant ITSvariation within 27 species, roughly 40% of the taxaexamined. Although intraspecific ITS variation was gener-ally low (0.16–2.85%, mean=0.74%), it was widespreadwithin this fungal community. Aanen et al. (2000, cf. Buscotet al. 2000), also pointed out that in the case of Hebelomamesophaeum, it was the differences between the homolo-
Fungal Diversity

gous chromosomes in the two nuclei of the dikaryotichyphae which caused most of the sequence variation. Recentpublications have warned of misleading sequence informationcontained within GenBank, and hence, increased potential formisidentifying unknown species using BLAST searches(Douglas et al. 2005). It is also estimated that c. 70% of thetaxonomic diversity of the fungal herbarium collections isnot yet represented in GenBank (Brock et al. 2009). Theseweaknesses will probably be minimised or eliminated in thenear future. Our investigations revealed that more recentstudies found a higher number of explicitly identified species(rS=0.35, p=0.046, n=32) and also there was a trend ofobtaining higher species richness (rS=0.31, p=0.079, n=33)for below-ground sampling, while there was no correlationbetween species richness and the date of the study for above-ground samplings (rS=0.06, p=0.738, n=32). These findingsmight indicate that the applied root tip sampling methods arecontinually improving. Currently, however, most EMFcommunity studies of the fine root system still need tosimultaneously carry out fruiting body surveys to obtainspecies names. Horton (2002) stated that species richness ishigher when analysing root tip data than when analysingsporocarp data. However, in the reviewed papers, asporocarp survey appears to be a more accurate assessmentof species richness, since investigations indicate thatestimates of the number of symbionts appear to be muchhigher when based on observations of fruiting bodies than ofmycorrhizae (sporocarp species richness median = 35,mycorrhizal species richness median = 27 , n=37, Wilcoxonpaired rank sum test, W=164.5, p=0.008) and also yieldedmore explicitly identified species than root tip sampling(explicitly identified mycorhizal species richness on rootsmedian = 11, n=35, Wilcoxon paired rank sum test, W =8.5, p<0.001). We found that in 73% of the reviewed studies(27 out of 37) a greater species richness was found fromfruiting body samples than by methods based on samplingthe root tips (Table 2). It should be mentioned that in manycases the identification of species based on fruiting bodymorphology is far from straightforward, especially in the so-called problematic genera such as Cortinarius, Inocybe andRussula, whose identification at species level require highlytrained experts.
Species with inconspicuous sporocarp
Another cause of the difference in results obtained by thedifferent sampling methods could be the colonisation of alarge proportion of the root system by species withoutconspicuous sporocarps or with underground sporocarps(23–41%, Jonsson et al. 2000; 51.1%, Smith et al. 2007b).More than the half of the reviewed papers (56.25% or18 out of 32, for 6 not applicable, Table 2) found thatspecies with no or inconspicuous sporocarps were dominant
on the fine roots. Cenococcum geophilum, an asexually-reproducing species, is a representative of this group.Around 30% of the studies found that C. geophilum wasamong the three most abundant below-ground species(Table 2). The reason for this could be that this species haseasily distinguishable mycorrhizal morphological traits, butit is hard to distinguish their condition (dead or alive), and italso has a wide eological and geographical distribution(Douhan and Rizzo 2005). Obviously, species with incon-spicuous sporocarps will be easily missed by above-groundsporocarp surveys, especially as most EMF communitystudies based on fruiting body surveys do not collectresupinate (inconspicuous) and hypogeous (underground)sporocarps. More careful studies indicate that this can be aserious problem. A study (Köljalg et al. 2000) of EMFcommunities in Swedish boreal forests demonstrated that theproportion of tomentelloid fungi (taxa with resupinatesporocarps) in the underground EM community exceeded1–8%. Therefore this taxon has considerable importance inEMF communities in boreal forests. In a more recent study,due to exhaustive sporocarp collecting methods, Smith et al.(2007b) found that besides the many species that formepigeous sporocarps (55.1%), 26.8% of the collected speciesproduced hypogeous sporocarps and 18.5% of the speciesproduced resupinate sporocarps. This means that nearly halfof the collected species (44.9%) had inconspicuous fruitingbodies, which could have been easily overlooked during aless careful survey. Because they had surveyed not only theconspicuous epigeous sporocarps, the level of correspon-dence between fruiting bodies and EMF root surveysshifted from c. 20% to c. 45%.
Ectomycorrhizal or saprotrophic?
Several studies revealed that many fungal species haveunsettled trophic status, i.e. EM fungi can occupy a largeportion of the biotrophy (parasitic)–saprotrophy continuum(e.g., Lilleskov et al. 2002b; Koide et al. 2008). Some EMfungi can utilize cellulose and other complex carbonsources to a limited extent and genes for lignicolytic activitiesappear to be widespread in EM fungi (Chen et al. 2001).Truffles seem to move along differential nutritional strategies(saprotrophic, endophytic and symbiotic) depending on theenvironmental phase of their life cycle (Murat et al. 2005).Fujimura et al. (2005) proposed a similar suggestion forthe case of post-fire Pezizales fungi (see above). However,Taylor and Alexander (2005) concluded that there is nounequivocal evidence that any ECM fungus can complete itslife cycles in the absence of a host. Furthermore, Hibbettet al. (2000) suggested that mycorrhizae are highly variable,evolutionarily dynamic, associations and it is not clear thatthe families of macrofungi, as currently envisaged, represententirely natural groupings. Contemporary isotope studies
Fungal Diversity

examining the natural abundance of stable isotope ratiosof δ15N and δ13C have revealed that families such asTricholomataceae and Cortinariaceae contain large numbersof saprotrophs as well as EM taxa (Taylor et al. 2003;Trudell et al. 2004). Many genera known as EM are notmonophyletic, and therefore scaling up from species togenus level introduces errors. Rinaldi et al. (2008) emphasisethat although numerous genera have been proposed as beingEM, but in a number of studies evidence for the hypothe-sized EM habit is lacking. Care must thus be used whencompiling list of EM and saprotrophic fungi in community-level studies on the basis of published information only. Thedoubtfulness of the trophic status (actual and species level)of the sampled specimen can also contribute to thediscrepancy between the results of the different surveymethods.
Cryptic species
Species concepts have been discussed by many authors (e.g.,Taylor et al. 2000) and there are several prevalent speciesconcepts that are currently in use in fungal systematics.These are the morphological species (species with distinctmorphological characters), phylogenetic species (genetic andevolutionary distinctiveness represented by each terminaltaxon in phylogenetic trees) and Operational TaxonomicUnit (OTU, based on 99% sequence similarity) (Taylor et al.2000). Among the higher fungi, many reproductivelyisolated cryptic species exist that are morphologicallydifficult to distinguish owing to a lack of taxonomicallyuseful morphological characters (Sato and Murakami 2008).This feature has already been demonstrated even within themost commonly known taxa (e.g., Amanita muscaria (Gemlet al. 2006); Cenococcum geophilum (Douhan and Rizzo2005)) and can result in the recording of several species inthe root tip sampling instead of one. To detect crypticspecies, one needs a very accurate sequence analysis; usingonly RFLP typing is not enough (Sato and Murakami 2008).However, this discrepancy can be avoided or minimised byanalysing the sequences not only of the EM on the root tips,but of the fruiting bodies as well.
Discussion
The aim of this paper was to elucidate how different resultsare obtained by the different sampling methods used forinvestigating EMF communities and how this phenomenoncan affect the findings of ecological investigations. Thereview of studies simultaneously using different surveymethods revealed that at present, EMF community researchis an eclectic assemblage of different methodologicalapproaches and research perspectives that make the
generalisation of their results difficult and could potentiallylead to incorrect conclusions about ecosystem processesand the applied methods (Dahlberg et al. 1997; Gehringet al. 1998; Horton and Bruns 2001; Anderson and Cairney2007; Lilleskov and Parrent 2007). We found that commu-nity studies of EM fungi can find contradictory results indetermining EMF community composition at a site dependingon the applied methods. So bending an one time assessedEMF diversity to a certain functionality not a reliable way tohelp to describe ecosystem processes. However, despite thediscrepancies in community composition findings, our mostvital result is that the majority of the studies that applied bothabove- and below-ground sampling methods to investigatechanges in the habitats detected a similar relationship betweenenvironmental variables and the fungal community by eithermethod (Table Suppl.1). This means that sporocarp dataprovided the same general conclusions as root tip data aboutchanges in the EMF community; this shows the validity ofthe application of both survey methods in fungal ecologicalstudies. Exceptions to this are those short-term studies whereapparently the mycorrhiza have not had enough time toresponse to the disturbance (e.g., fertilisation, defoliation,girdling experiments). This highlights the importance of thetime frame used to assess changes in the fungal community.
Response speed of EMF communities
It has been demonstrated previously that changes in theenvironment could cause a rapid decline in sporocarpproduction. For example, Högberg et al. (2001) investigatedthe response in sporocarp production after the flow ofphotosynthates from foliage to roots was terminated bygirdling trees at chest height. Two months after theinitiation of early girdling (in spring) the sporocarps hadbeen virtually eliminated by the girdling procedure. InAugust they observed a more rapid response of 2–3 days.Similarly, in the study by Last et al. (1979) a decline ofsporocarp number was profound after the defoliation oftrees, whereas the mycorrhizal level of the fine root systemhad not changed. They found that sporocarp productionceased almost immediately (within 2 days) after defoliation.During the investigation, they surveyed sporocarps ofmycorrhizal fungi newly-produced within the differentperiods of observation. Trees, common hosts of mycorrhiza,seem to respond within hours/days to, for example, elevatedlevels of CO2, initiating the response of the undergroundsymbionts. As EM fungi are heavily dependent on current ofassimilates (as been shown in both laboratory and fieldexperiments: Söderström and Read 1987; Lamhamedi et al.1994; Högberg et al. 2001) physiological responses by EMfungi to changes in carbon supply are therefore likely to takeplace shortly after the plant responses. Shifts in communitycomposition, however, may take longer to be noticeable
Fungal Diversity

(Fransson et al. 2001). It has been shown that considerablechanges in the functional activity (e.g., modified enzymeactivity profiles [François and Garbaye 2009], changes in theactivity of fruiting body formation [Last et al. 1979]) of theEM fungi occur early on , but these are undetectable by roottip sampling, making it difficult to detect the early effects ofa disturbance. But if the disturbance is long-lasting or strongenough, the EMF community composition will slowlychange. The delayed response at the mycorrhizal root level,however, raises the question of which environmentalvariable affects the mycorrhiza. Studies have already dem-onstrated the dynamic nature of the EMF community bothabove- and below-ground even in the absence of large-scaledisturbances (Izzo et al. 2005). Thus, preliminary knowledgeabout the characteristic setting of the EMF communitystructure is required in order to detect environmental changes.After a baseline survey (we recommend one or two seasons),monitoring of fruiting body production could provide a veryearly signal to detect unfavourable processes due to the highsensitivity of sporocarp formation (Last et al. 1979; Högberget al. 2001). Therefore, sporocarp community surveys canprovide extra information not only about the attributes offungal communities but also about the underlying functionalprocesses of their ecosystems. In addition, a thorough fungalsporocarp survey, including EM and saprobic species, canalso provide new insights by introducing the possibility ofevaluating the relative contributions of symbiotic andsaprobic components of the micoflora. Following the changesin this ratio could reveal disturbances more precisely in therelevant ectomycorrhizal environment at an early stage.
Key environmental factors and methodological constraints
The main objective of ectomycorrhizal ecological studies isto identify key environmental factors affecting the speciesrichness and diversity of EMF communities. We analysedthe results of papers examining mycorhizal communities bysporocarp and root tip inventory, looking for any trends. Wefound a significant and strong positive relationship betweenfungal species richness and (i) the host plant age and (ii) thenumber of putative host plant species, independently of theapplied survey methods. This suggests that EMF speciesrichness might correlate with host plant diversity, which canindicate a strong relationship between the two trophiclevels. This is a concordance with van der Heijden et al.(1998) result, as they have demonstrated that mycorrhizalfungal diversity determines plant biodiversity. Of themethodological variables, only the number of soil samples(for the below-ground approach) and the duration of thestudy (for the above-ground approach) had a significanteffect on the EMF species richness, both correlatingpositively with it. These results support Taylor’s (2002)finding that the survey results of EMF species richness
found on root tips could be strongly influenced by thesample size. In the case of sporocarp surveys, we canassume that environmental factors will be more variableduring long-term studies, because the time frame is wider,and more species meet their environmental demand forfruiting body formation. Species differ in their environmentalsensitivity and increasing number of fruiting species mightindicate the strong influence of environmental variability as afactor in the sporocarp formation of EMF community.
Despite the high environmental sensitivity of sporocarpproduction, our investigation shows that in 73% of thereviewed studies (27 out of 37) greater species richness wasfound by fruiting body surveys than by methods based onsampling of the root tips. ITS-RFLP and/or sequencingallow for efficient diagnostics of genetic groups (speciesdelimitations) and are good at estimating species richness,although diversity data without species names are lessuseful, especially when one can connect functionallydistinctive features to the species, such as species withnumerous, short-lived (1–2 yr.) small genets such asHebeloma cylindrosporum, Laccaria amethystina, Amanitafranchetii and Russula cremoricolor or species with few,long-lived, relatively large genets (e.g., Suillus ssp. andCortinarius ssp. (Redecker et al. 2001)). There is also highvariation between fungal species in the benefits theyprovide to their hosts (Morgan et al. 2005). Knowledge ofexplicit species names also opens up new possibilities toinvestigate EMF communities, such as analysis of theconstitution and liaisons of the phylogenetic diversity of thecommunity (e.g., Hibbett et al. 2007; Riviere et al. 2007)and broadens our knowledge of the evolutionary processesthat form EMF communities (Faith 1992; Vamosy et al.2009). Based on these findings, we argue for the continu-ation of fruiting body surveys in order to gain rapid and stillvaluable information on ecosystems over a wide spatial andtemporal range; in addition, we strongly recommend theiruse in long-term ecosystem monitoring projects.
It is important to emphasise that by sampling the above-ground fungal community it is possible to obtain anaccurate picture of ectomycorrhizal communities and detectchanges, providing valuable information for forest biodi-versity and conservation or sylvicultural managementwithout excessive effort and cost. Epigeous sporocarps aremuch easier and cheaper to sample and identify thanmycorrhizas (training an individual to identify most EMFspecies can actually be costly and time consuming, butfortunately in many regions numerous people already dothis), therefore it is useful to know that they are goodindicators of the potential activity of fungal communities.As it is difficult to gain information about the physiologicalprocesses and functionality of EM fungi in the field, itseems unwise to neglect fruiting bodies. The identificationprocess maybe accelerated by using purpose-built computer
Fungal Diversity

programs, for example the MatchMaker: Mushrooms of thePacific Northwest (Gibson and Gibson 2008). These newtools have received less attention, although they provide astrikingly different identification method compared tobooks using dichotomous keys. Collectors, or data obtainedfrom public markets can also provide useful informationabout spatial and temporal changes in the macrofungalcommunity both locally and at larger scales. In contrast, themolecular approach can be beyond the reach of manyresearchers because of the expensive equipment, supplies,and training. But once a laboratory is established, themethod can be applied to all taxa across regions.
The benefits of combining above- and below-groundmethods
Our limited information about how ecological variablesinfluence the investment between sexual and asexualreproduction of different EMF species also suggests a needfor studies that address this question. It would be useful todefine environmental and inherent factors that influence themating and sporulating processes in the field and givemeaning to the observed EMF community structures. Acombination of the methods (sporocarp survey and root tip/mycelium sampling) is the only way to demonstrate whichfungi are reproducing in a particular environment, asopposed to which fungi are present but cannot reproduce(sexually). The differences between the results of theabove- and below-ground surveys (if genuine and not dueto a methodological bias) could expand our knowledgeabout the population dynamic strategy of the species.Genets of many EM fungi are relatively small in size(Redecker et al. 2001), and in some EMF species, rapidgenet turnover is apparent (Guidot et al. 2004). Thisstrongly indicates the importance of spores (fruiting bodies)for the development and maintenance of EMF populationsbecause in that case spore-mediated regeneration is the onlyway to produce new genets. Studies have also shown thathabitat fragmentation and isolation affect the EMF richnessand assemblage structure (Peay et al. 2007). This indicatesthat at least some members of the EMF community maybedirectly limited by restricted dispersal ability and speciesvary the investment between dispersal forms (fruiting bodyformation/asexual propagulums). In a study by Peay et al.(2007) those species that occurred widely and colonizedeven small islands tended to be those that invested the mostin dispersal structures relatively to vegetative structures.
Conclusions and perspectives
We conclude that the integration of sporocarp and molec-ular analyses of EMF communities is important in order to
document more completely the community assemblage andto reveal mechanisms (evolutionary and ecological) whichare significant in structuring these communities. To monitorenvironmental changes, the detection of variations in theecosystem must be prompt. In response to the global declineof biodiversity, policy-makers require a rigorous, relevant,and comprehensive suite of biodiversity indicators whichhelps them track changes over time, assess the impacts ofpolicy and management responses, and to identify prioritiesfor action (Walpole et al. 2009). Monitoring sporocarpproduction may seem outdated, but it has proved to be anexcellent and rapid indicator of the changes in ecosystemsand readily applicable in many locations over wide areas.Thus, we strongly recommend applying this method in long-term ecosystem monitoring projects. This would allow us toexpand our limited information, which is currently obtainedmostly by a few research groups from several coniferousforests in the northern hemisphere. Finally, a real but noteasily measurable disadvantage of neglecting sporocarpsurveys is that researchers spend less time in the field andso have fewer observations of fungi in their naturalenvironment; thus, despite the many advantages of “peepingin to the black box” (Horton and Bruns 2001), there is agrowing gap between living fungi and us.
Acknowledgement We would like to thank Steven L. Stephensonand Tamás Székely,jr. for the corrections they made to the manuscript.We also grateful to Alan Feest for useful discussions.
References
Aanen DK, Kuyper TW, Boekhout T, Hoekstra RF (2000) Phylogeneticrelationships in the genus Hebeloma based on ITS1 and 2sequences, with special emphasis on the Hebeloma crustuliniformecomplex. Mycologia 92(2):269–281
Allen MF, Swenson W, Querejeta JI, Egerton-Warburton LM,Treseder KK (2003) Ecology of mycorrhizae: a conceptualframework for complex interactions among plants and fungi.Annu Rev Phytopathol 41:271–303
Anderson IC, Cairney JWG (2007) Ectomycorrhizal fungi: exploringthe mycelial frontier. FEMS Microbiol Rev 31:388–406
Arnolds E (1988) Dynamics of macrofungi in two moist heathlands inDrenthe, The Nederlands. Acta Bot Ned 37:291–305
Avis PG, McLaughlin DJ, Dentinger BC, Reich PB (2003) Long termincrease in nitrogen supply alters above- and below-groundectomycorrhizal communities and increases the dominance ofRussula spp. in temperate oak savanna. New Phytol 160:239–253
Avis PG, Dickie IA, Mueller G (2006) A “dirty” business: testing thelimitations of TRFLP analysis of soil fungi. Mol Ecol 15:873–882
Brock PM, Döring H, Bidartondo MI (2009) How to know unknownfungi: the role of a herbarium. New Phytol 181:719–724
Buscot F, Munch JC, Charcosset JY, Gardes M, Nehls U, Hampp R(2000) Recent advances in exploring physiology and biodiversityof ectomycorrhizas highlight the functioning of these symbiosesin ecosystems. FEMS Microbiol Rev 24:601–614
Carfrae JA, Skene KR, Sheppard LJ, Ingleby K, Crossley A (2006)Effects of nitrogen with and without acidified sulphur on an
Fungal Diversity

ectomycorrhizal community in Sitka spruce (Picea sitchensisBong. Carr) forest. Environ Pollut 141:131–138
Chapela IH, Osher LJ, Horton TR, Henn MR (2001) Ectomycorrhizalfungi introduced with exotic pine plantations induce soil carbondepletion. Soil Biol Biochem 33:1733–1740
ChenDM, Taylor AFS, Bruke RM, Cairney JWG (2001) Identification ofgenes for lignin peroxidases and manganese peroxidases inectomycorrhizal fugi. New Phytol 152:151–158
Chen YL, Liu S, Dell B (2007) Mycorrhizal status of Eucalyptusplantation in south China and implication for management.Mycorrhiza 17:527–535
Copley J (2000) Ecology goes underground. Nature 406:452–454Dahlberg A, Jonsson L, Nylund J (1997) Species diversity and
distribution of a biomass above and below ground amongectomycorrhizal fungi in an old-growth Norway spruce forest insouth Sweden. Can J Bot 75:1323–1335
Dickie IA, FitzJohn RG (2007) Using terminal restriction fragmentlength polymorphism (T-RFLP) to identify mycorrhizal fungi: amethods review. Mycorrhiza 17:259–270
Douglas RB, Parker VT, Cullings KW (2005) Belowground ectomy-corrhizal community structure of mature lodgepole pine andmixed conifer stands in Yellowstone National Park. For EcolManage 208:303–317
Douhan GW, Rizzo GM (2005) Phylogenetic divergence in a localpopulation of the ectomycorrhizal fungus Cenococcum geo-philum. New Phytol 166:263–271
Ducousso M, Galiana A, Chaix G, Prin Y (2004) Relative infectivityof two Pisolithus spp. strains inoculated to the nitrogen-fixinglegume tree Acacia crassicarpa A. Cunn. ex Benth. in a fieldexperiment in Madagascar. Eur J Soil Biol 40:105–111
Dunstan WA, Dell B, Malajczuk N (1998) The diversity ofectomycorrhizal fungi associated with introduced Pinus spp. inthe Southern Hemisphere, with particular reference to WesternAustralia. Mycorrhiza 8:71–79
Durall DM, Jones MD,Wright EF, Kroeger P, Coates KD (1999) Speciesrichness of ectomycorrhizal fungi in cutblocs of different size in theInterior Cedar-Hemlock forest of northwestern British Columbia:sporocarp and ectomycorrhizae. Can J For Res 29:1322–1332
Faith D (1992) Conservation evaluation and phylogenetic diversity.Biol Conserv 61:1–10
Feest A (1999) A practical methodology for surveying the macro-fungus flora (Agarics, Boletes and Gasteromycetes) of a site forconservation. J Pract Ecol Conserv 3:23–32
François R, Garbaye J (2009) Does forest liming impact the enzymaticprofiles of ectomycorrhizal communities through specializedfungal symbionts? Mycorrhiza 19(7):493–500
Fransson PMA, Taylor AFS, Finlay RD (2000) Effects of optimalfertilization on belowground ectomicorrhizal community struc-ture in Norway spruce forest. Tree Physiol 20:599–606
Fransson PMA, Taylor AFS, Finlay RD (2001) Elevated atmosphericCO2 alters root symbiont community structure in forest trees.New Phytol 152:431–442
Fujimura KE, Smith JE, Horton TR, Weber NS, Spatafora JW (2005)Pezizalean mycorrhizas and sporocarps in ponderosa pine(Pinus ponderosa) after prescribed fires in eastern Oregon,USA. Mycorrhiza 15:79–86
Gardes M, Bruns TD (1996) Community structure of ectomycorrhizalfungi in a Pinus muricata forest: above- and below-groundviews. Can J Bot 74:1572–1583
Gebhardt S, Neubert K, Wöllecke J, Münzenberger B, Hüttl RF (2007)Ectomycorrhiza communities of red oak (Quercus rubra L.) ofdifferent age in the Lusatian lignite mining district, East Germany.Mycorrhiza 17:279–290
Gehring CA, Theimer TC,WhithamTG, Keim P (1998) Ectomycorrhizalfungal community structure of Pinyon pines growing in twoenvironmental extremes. Ecology 79(5):1562–1572
Geml J, Laursen GA, O’Neil K, Nusbaum HC, Taylor DL (2006)Beringian origins and cryptic speciation events in the fly agaric(Amanita muscaria). Mol Ecol 15:225–239
Gibson I, Gibson E (2008) MatchMaker: mushrooms of the PacificNorthwest. http://forestry-dev.org/cgi-bin/matchmaker/MatchMaker.asp. Accessed 07/06/2010
Guidot A, Debaud J-C, Marmeisse R (2002) Spatial distribution of thebelow-ground mycelia of an ectomycorrhizal fungus inferredfrom specific quantification of its DNA in soil samples. FEMSMicrobiol Ecol 42:477–486
Guidot A, Debaud JC, Effosse A, Marmeisse R (2004) Below-grounddistribution and persistence of an ectomycorrhizal fungus. NewPhytol 161:539–547
Heckman DS, Geiser DM, Eidell BR, Stauffer RL, Kardos NL (2001)Molecular evidence for the early colonization of land by fungiand plants. Science 293:1129–1133
Hering TF (1966) The terricolous higer fungi of four Lake Districtwoodlands. Trans Br Mycol Soc 49(3):369–383
Hibbett DS, Gilbert L-B, Donoghue MJ (2000) Evolutionaryinstability of ectomycorrhizal symbioses in basidiomycetes.Nature 407:506–508
Hibbett DS, Binder M, Bischoff JF, Blackwell M, Cannon PF (2007)A higher-level phylogenetic classification of the fungi. MycolRes 111:509–547
Hirose D, Kikuchi J, Kanzaki N, Futai K (2004) Genet distribution ofsporocarps and ectomycorrhizas of Suillus pictus in a Japanesewhite pine plantation. New Phytol 164:527–541
Högberg P, Nordgren A, Buschmann N, Taylor AFS, Elbald A,Högberg MN, Nyberg G, Ottosson-Löfvenius M, Read DJ (2001)Large-scale forest girdling experiment demonstrates that currentphotosynthesis drives soil respiration. Nature 411:789–792
Horton TR (2002) Molecular approaches to ectomycorrhizal diversitystudies: variation in ITS at a local scale. Plant Soil 244:29–39
Horton TR, Bruns TD (2001) The molecular revolution in ectomycor-rhizal ecology: peeking into the black-box. Mol Ecol 10:1855–1871
Izzo AD, Agbowo J, Bruns TD (2005) Detection of plot-level changesin ectomycorrhizal communities across years in an old-growthmixed-conifer forest. New Phytol 166(2):619–630
Jonsson L, Dahlberg A, Nilsson M-C, Zackrisson O, Kårén O (1999a)Ectomycorrhizal fungal communities in late-successional Swedishboreal forest, and their composition following wildfire. Mol Ecol8:205–215
Jonsson L, Dahlberg A, Nilsson M-C, Kårén O, Zackrisson O (1999b)Continuity of ectomycorrhizal fungi in self-regenerating borealPinus sylvestris forests studied by comparing mycobiont diver-sity on seedlings and matured trees. New Phytol 142:151–162
Jonsson T, Kokalj S, Finlay R, Erland S (1999c) Ectmycorrhizalcommunity structure in a limed forest. Mycol Res 103:501–508
Jonsson L, Dahlberg A, Brandrud T (2000) Spatiotemporal distribu-tion of an ectomycorrhizal community in an oligotrophicSwedish Picea abies forest subjected to experimental nitrogenaddition: above- and below-ground views. For Ecol Manage132:143–156
Kårén O, Nylund J-E (1997) Effect of ammonium sulphate on thecommunity structure and biomass of ectomycorrhizal fungi in aNorway spruce stand in southwester Sweden. Can J Bot75:1628–1642
Kårén O, Högberg MN, Dahlberg A, Jonsson L, Nylund J-E (1997)Inter- and intraspecific variation in the ITS region of rDNA ofectomycorrhizal fungi in Fennoscandia as detected by endonu-clease analysis. New Phytol 136:313–325
Kikuchi J, Futai K (2003) Spatial distribution of sporocarps andbiomass of ectomycorrhizas of Suillus pictus in a Korean pine(Pinus koraiensis) stand. J For Res 8:17–25
Koide RT, Xu B, Sharda J (2005) Contrasting below-ground views ofan ectomycorrhizal fungal community. New Phytol 166:251–262
Fungal Diversity

Koide RT, Shumway DL, Xu B, Sharda JN (2007) On temporalpartitioning of a community of ectomycorrhizal fungi. NewPhytol 174:420–429
Koide RT, Sharda JN, Herr JR, Malcolm GM (2008) Ectomycorrhizalfungi and the biotrophy–saprotrophy continuum. New Phytol 178(2):230–233
Köljalg U, Dahlberg A, Taylor AFS, Larsson E, Hallenberg N,Stenlid-Larsson K-H, Fransson PM, Kårén O, Jonsson L (2000)Diversity and abundance of resupinate thelephoroid fungi asectomycorrhizal symbionts in Swedish boreal forests. Mol Ecol9:1985–1996
Kuikka K, Härmä E, Markkola AM, Rautio P, Roitto M, Saikkonen K,Ahonen-Jonnarth U, Finlay R, Tuomi J (2003) Severe defoliationof Scots pine reduces reproductive investment by ectomycor-rhizal symbionts. Ecol 84:2051–2061
Laiho O (1970) Paxillus involutus as a mycorrhizal symbiont on foresttrees. Acta for Fenn 106:1–73
Lamhamedi MS, Godbout C, Fortin JA (1994) Dependence ofLaccaria bicolor basidiome development on current photosyn-thesis of Pinus strobus seedlings. Can J For Res 14:412–415
Last FT, Pelham J, Mason PA, Ingleby K (1979) Influence of leaveson sporophore production by fungi forming sheathing mycorrhizaswith Betula spp. Nature 280:168–169
Lian C, Narimatsu M, Nara K, Hogetsu T (2006) Tricholomamatsutake in a natural Pinus densiflora forest: correspondencebetween above- and below-ground genets, association withmultiple host trees and alteration of existing ectomycorrhizalcommunities. New Phytol 171:825–836
Lilleskov EA, Parrent JL (2007) Can we develop general predictivemodels of mycorrhizal fungal community-environment relation-ships? New Phytol 174:250–256
Lilleskov EA, Fahey TJ, Lovett GM (2001) Ectomycorrhizal fungalaboveground community change over an atmospheric nitrogendeposition gradient. Ecol Appl 11:397–410
Lilleskov EA, Fahey TJ, Horton TR, Lovett GR (2002a) Belowgroundectomycorrhizal fungal community change over a nitrogendeposition gradient in Alaska. Ecology 83(1):104–115
Lilleskov EA, Hobbie EA, Fahey TJ (2002b) Ectomycorrhizal fungaltaxa differing in response to nitrogen deposition also differ inpure culture organic nitrogen use and natural abundance ofnitrogen isotopes. New Phytol 154:219–231
Luoma DL, Eberhart JL, Amaranthus MP (1997) Biodiversity ofectomycorrhizal types from southwest Oregon. In Conservationand management of native plants and fungi. Proceedings of anOregon conference on Conservation and Management of NativeVascular Plants, Bryophytes, and Fungi, Corvallis, Ore., 15–17November 1995. Edited by T.N Kaye, A. Liston, R.M. Love, D. L.Luoma, R. J. Meinke and M.V. Wilson. Native plant Society ofOregon, Corvalis, Ore. pp. 249–253
Matsuda Y, Hijii N (2004) Ectomycorrhizal fungal communities in anAbies firma forest, with special reference to ectomycorrhizalassociations between seedlings and mature trees. Can J Bot82:822–829
Morgan JAV, Bending GD, White PJ (2005) Biological cost andbenefits to plant-microbe interactions in the rhizosphere. J ExpBot 56:1729–1739
Murat C, Vizzini A, Bonfante P, Mello A (2005) Morphological andmolecular typing of the below-ground community in a naturalTuber magnatum truffle-ground. FEMS Microbiol Lett 245:307–313
Nara K, Nakaya H, Hogetsu T (2003a) Ectomycorrhizal sporocarpsuccession and production during early primary succession onMont Fuji. New Phytol 158:193–206
Nara K, Nakaya H, Wu B, Zhou Z, Hogetsu T (2003b) Undergroundprimary succession of ectomycorrhizal fungi in a volcanic desserton Mont Fuji. New Phytol 159:743–756
Nieto MP, Carbone SS (2009) Characterization of juvenile maritimepine (Pinus pinaster Ait.) ectomycorrhizal fungal communityusing morphotyping, direct sequencing and fruitbodies sampling.Mycorrhiza 19:91–98
Ohenoja E, Tuokkola P, Pohjola L (1993) Mean weights anddry weight percentages of the fruit bodies of some largerfungi. Department Botany, Univ. Oulu, Kasvitieteen LaitoksenMonisteita 51
Palfner G, Casanova-Katny MA, Read DJ (2005) The mycorrhizalcommunity in a forest chronosequence of Sitka spruce [Piceasitchensis (Bong.) Carr.] in Northern England. Mycorrhiza15:571–579
Palmer JM, Lindner DL, Volk TJ (2009) Ectomycorhizal character-isation of an American chestnut (Castanea dentata)-dominatedcommunity in Western Wisconsin. Mycorrhiza 19:27–36
Peay KG, Bruns TD, Kennedy PG, Bergemann SE, Garbelotto M(2007) A strong species-area relationship for eukaryotic soilmicrobes: island size matters for ectomycorrhizal fungi. Ecol Lett10:470–480
Peintner U, Iotti M, Klotz P, Bonuso E, Zambonelli A (2007) Soilfungal communities in a Castanaea sativa (chestnut) forestproducing large quantities of Boletus edulis sensu lato (porcini):where is the mycelium of porcini? Environ Microbiol 9:880–889
Peter M, Ayer F, Egli S (2001a) Nitrogen addition in a Norway sprucestand altered macromycetes sporocarp production and below-ground ectomycorrhizal species composition. New Phytol149:311–325
Peter M, Ayer F, Egli S, Honegger R (2001b) Above and below-groundcommunity of ectomycorrhizal fungi in three Norway spruce (Piceaabies) stands in Switzerland. Can J Bot 79:1134–1151
Peter M, Ayer F, Cudlín P, Egli S (2008) Belowground ectomycorrhizalcommunities in three Norway spruce stands with different degreesof decline in the Czech Republic. Mycorrhiza 18:157–169
Pritsch K, Boyle H, Munch JC, Buscot F (1997) Characterization andidentification of black alder ectomycorrhizas by PCR/RFLPanalyses of the rDNA internal transcribed spacer (ITS). NewPhytol 137:357–369
Read DJ, Leake JR, Perez-Moreno J (2004) Mycorrhizal fungi asdrives of ecosystem processes in heathland and boreal forestbiomes. Can J Bot 82:1243–1263
Redecker D, Szaro TM, Bowman RJ, Bruns TD (2001) Small genetsof Lactarius xanthogalactus, Russula cremoricolor and Amanitafranchetii in late-stage ectomycorrhizal successions. Mol Ecol10:1025–1034
Richard F, Moreau P-A, Selosse M-A, Gardes M (2004) Diversity andfruiting patterns of ectomycorrhizal and saprobic fungi in an old-growth Mediterranean forest dominated by Quercus ilex L. Can JBot 82:1711–1729
Richard F, Millot S, Gardes M, Selosse MA (2005) Diversity andspecificity of ectomycorrhizal fungi retrieved from an old-growthMediterranean forest dominated by Quercus ilex. New Phytol166:1011–1023
Rinaldi AC, Comandini O, Kuyper TW (2008) Ectomycorrhizalfungal diversity: separating the wheat from the chaff. FungalDivers 33:1–45
Riviere T, Diedhiou AG, Diabate M, Senthilarasu G, Natarajan K,Verbeken A, Buyck B, Dreyfus B, Bena G, Ba AM (2007)Genetic diversity of ectomycorrhizal Basidiomycetes fromAfrican and Indian tropical rain forests. Mycorrhiza 17:415–428
Rosling A, Landeweert R, Lindahl BD, Larson K-H, Kuyper TW,Taylor AFS, Finlay RD (2003) Vertical distribution of ectomy-corrhizal fungal taxa in a podzol soil profile. New Phytol159:775–783
Sanders IR (2004) Plant and arbuscular mycorrhizal fungal diversity–are we looking at the relevant levels of diversity and are we usingthe right techniches? New Phytol 164:415–418
Fungal Diversity

Sato H,Murakami N (2008) Reproductive isolation among cryptic speciesin the ectomycorrhizal genus Strobilomyces: population-level CAPSmarker-based genetic analysis. Mol Phylogenet Evol 48:326–334
Schmidt JP, Lodge DJ (2005) Classical methods and modern analysisfor studying fungal diversity. In: Dighton J, White JF, Oudemans P(eds) The fungal community: its organisation and role in theecosystem, 3rd edn. CRC Press, New York, pp 193–214
Smith ME, Douhan GW, Rizzo DM (2007a) Intra-specific and intra-sporocarp ITS variation of ectomycorrhizal fungi as assessed byrDNA sequencing of sporocarps and pooled ectomycorrhizalroots from a Quercus woodland. Mycorrhiza 18:15–22
Smith ME, Douhan GW, Rizzo DM (2007b) Ectomycorrhizalcommunity structure in a xeric Quercus woodland based onrDNA sequence analysis of sporocarps and pooled roots. NewPhytol 174:847–863
Söderström B, Read DJ (1987) Respiratory activity of intact andexcised ectomycorrhizal mycelial systems growing in unsterilisedsoil. Soil Biol Biochem 19:231–236
Staddon PL, Heinemeyer A, Fitter AH (2002) Mycorrhizas and globalenvironmental change: research at different scales. Plant Soil244:253–261
Stinson KA, Campbell SA, Powell JR, Wolfe BE, Callaway RM,Thelen GC, Hallett SG, Prati D, Klironomos JN (2006) Invasiveplant suppresses the growth of native tree seedlings by disruptingbelowground mutualisms. PLoS Biology 4(5):e140
Taylor AFS (2002) Fungal diversity in ectomycorrhizal communities:sampling effort and species detection. Plant Soil 244:19–28
Taylor AFS, Alexander I (2005) The ectomycorrhizal symbiosys: lifein the real world. Mycologist 19:102–112
Taylor JW, Jacobson DJ, Kroken S, Kasuga T, Geiser DM, HibbettDS, Fisher MC (2000) Phylogenetic species recognition andspecies concepts in fungi. Fungal Genet Biol 31:21–32
Taylor AFS, Fransson PM, Högberg P, Högberg MN, Plamboeck AH(2003) Species level patterns in 13C and 15N abundance ofectomycorrhizal and saprotrophic fungal sporocarps. New Phytol159:757–774
Tóth BB, Feest A (2007) A simple method to assess macrofungalsporocarp biomass for investigating ecological change. Can J Bot85:652–658
Trudell AS, Rygiewicz PT, Edmonds RL (2004) Patterns of nitrogenand carbon stable isotope ratios in macrofungi, plants and soils intwo old-growth conifer forests. New Phytol 164:317–335
Valentine LL, Fiedler TL, Hart AN, Petersen CA, Berninghausen HK,Southworth D (2004) Diversity of ectomycorrhizas associatedwith Quercus garryana in southern Oregon. Can J Bot 82:123–135
Vamosy SM, Heard SB, Vamosy JC, Webb CO (2009) Emergingpatterns in the comparative analysis of phylogenetic communitystructure. Mol Ecol 18:572–592
van der Heijden MGA, Klironomos JN, Ursic M, Moutoglis P,Streitwolf-Engel R, Boller T, Wieken A, Sanders IR (1998)Mycorrhizal fungal diversity determines plant biodiversity,ecosystem variability and productivity. Nature 396:69–72
van der Heijden EW, de Vries FW, Kuyper T (1999) Mycorrhizalassociations of Salix repens L. communities in succession ofdune ecosystems. I. Above-ground and below-ground views ofectomycorrhizal fungi in relation to soil chemistry. Can J Bot77:1821–1832
Visser S (1995) Ectomycorrhizal fungal succession in jack pine standsfollowing wildfire. New Phytol 129:389–401
Walpole M, Almond REA, Besançon Ch et al (2009) Trackingprogress toward the 2010 biodiversity target and beyond. Science325:1503–1504
Wiklund K, Nilsson L-O, Jacobson S (1995) Effect of irrigation,fertilization, and artificial drought on basidioma production in aNorway spruce stand. Can J Bot 73:200–208
Yamada A, Katsuya K (2001) The disparity between the number ofectomycorrhizal fungi and those producing fruit bodies in a Pinusdensiflora stand. Mycol Res 105:957–965
Zhou ZH, Miwa M, Matsuda Y (2001) Spatial distribution of thesubterranean mycelia and ectomycorrhizae of Suillus grevilleigenets. J Plant Res 114:179–185
Fungal Diversity