A Classification of Tasmanian Estuaries and Assessment of ...
Please cite this article in press as: Cabral, H.N., et al., Ecological quality assessment of transitional waters based on fish assemblages in
Portuguese estuaries: The Estuarine Fish Assessment Index (EFAI). Ecol. Indicat. (2011), doi:10.1016/j.ecolind.2011.08.005
ARTICLE IN PRESSG ModelECOIND-952; No. of Pages 10
Ecological Indicators xxx (2011) xxx–xxx
Contents lists available at ScienceDirect
Ecological Indicators
jo ur nal homep age: www.elsev ier .com/ locate /eco l ind
Ecological quality assessment of transitional waters based on fish assemblages in
Portuguese estuaries: The Estuarine Fish Assessment Index (EFAI)
H.N. Cabrala,∗, V.F. Fonsecaa, R. Gamitoa, C.I. Gonc alvesa, J.L. Costaa, K. Erzinib, J. Gonc alvesb,J. Martinsb, L. Leiteb, J.P. Andradeb, S. Ramosc, A. Bordaloc,d, E. Amorimc, J.M. Netoe, J.C. Marquese,J.E. Rebelo f, C. Silva f, N. Castroa, P.R. Almeidag, I. Domingosa, L.S. Gordoa, M.J. Costaa
a Centro de Oceanografia, Faculdade de Ciências da Universidade de Lisboa, Campo Grande, 1749-016 Lisbon, Portugalb Universidade do Algarve, Centro de Ciências Marinhas, CCMAR, P-8005139 Faro, Portugalc Centro Interdisciplinar Investigac ão Marinha & Ambiental C, P-4050123 Oporto, Portugald Univ Porto, Institute Biomedical Science, Lab. Hydrobiology, P-4099003 Oporto, Portugale Institute of Marine Research, Faculty of Sciences and Technology, University of Coimbra, 3004-517 Coimbra, Portugalf Universidade de Aveiro, Departamento de Biologia, P-3800 Aveiro, Portugalg Universidade de Évora, Departamento de Biologia, P-7004516 Evora, Portugal
a r t i c l e i n f o
Keywords:
Water ecological quality
Fish assemblages
Multi-metric indices
Estuaries
Transitional waters
Water Framework Directive
Fish-based indices
a b s t r a c t
The assessment of water quality has changed markedly worldwide over the last years, especially in Europe
due to the implementation of the Water Framework Directive. Fish was considered a key-element in this
context and several fish-based multi-metric indices have been proposed. In this study, we propose a multi-
metric index, the Estuarine Fish Assessment Index (EFAI), developed for Portuguese estuaries, designed
for the overall assessment of transitional waters, which could also be applied at the water body level
within an estuary. The EFAI integrates seven metrics: species richness, percentage of marine migrants,
number of species and abundance of estuarine resident species, number of species and abundance of
piscivorous species, status of diadromous species, status of introduced species and status of disturbance
sensitive species. Fish sampling surveys were conducted in 2006, 2009 and 2010, using beam trawl,
in 13 estuarine systems along the Portuguese coast. Most of the metrics presented a high variability
among the transitional systems surveyed. According to the EFAI values, Portuguese estuaries presented
a “Good” water quality status (except the Douro in a particular year). The assessments in different years
were generally concordant, with a few exceptions. The relationship between the EFAI and the Anthro-
pogenic Pressure Index (API) was not significant, but a negative and significant correlation was registered
between the EFAI and the expert judgement pressure index, at both estuary and water body level. The
ordination analysis performed to evaluate similarities among North-East Atlantic Geographical Intercal-
ibration Group (NEAGIG) fish-based indices put in evidence four main groups: the French index, since it
is substantially different from all the other indices (uses only four metrics based on densities); indices
from Ireland, United Kingdom and Spain (Astúrias and Cantábria); the Dutch and German indices; and
the indices of Belgium, Portugal and Spain (Basque country). The need for detailed studies, including
comparative approaches, on several aspects of these assessment tools, especially in what regards their
response to anthropogenic pressures was stressed.
© 2011 Elsevier Ltd. All rights reserved.
1. Introduction
Water quality assessment includes not only physical and chem-
ical parameters, but also biological elements. A wide variety of
bioindicators have been used, mainly to ensure that water qual-
ity assessment includes components that affect human health, as
∗ Corresponding author. Tel.: +351 217500826; fax: +351 217500207.
E-mail address: [email protected] (H.N. Cabral).
well as goods and services provided by aquatic systems to mankind
(e.g. Deegan et al., 1997; Borja et al., 2008).
In response to the increasing degradation of aquatic systems
observed worldwide (Costanza et al., 1998; Beaumont et al., 2007;
Halpern et al., 2007), several programmes have been developed
and implemented at the international, national and regional lev-
els, providing a framework for the protection and/or restoration of
aquatic systems and ensuring that human activities are carried out
in a sustainable manner. Several examples are the Oceans Policy in
Australia, the Oceans Act and the Clean Water Act in Canada and in
the USA, the Water Framework Directive (WFD) and the European
1470-160X/$ – see front matter © 2011 Elsevier Ltd. All rights reserved.
doi:10.1016/j.ecolind.2011.08.005
Please cite this article in press as: Cabral, H.N., et al., Ecological quality assessment of transitional waters based on fish assemblages in
Portuguese estuaries: The Estuarine Fish Assessment Index (EFAI). Ecol. Indicat. (2011), doi:10.1016/j.ecolind.2011.08.005
ARTICLE IN PRESSG ModelECOIND-952; No. of Pages 10
2 H.N. Cabral et al. / Ecological Indicators xxx (2011) xxx–xxx
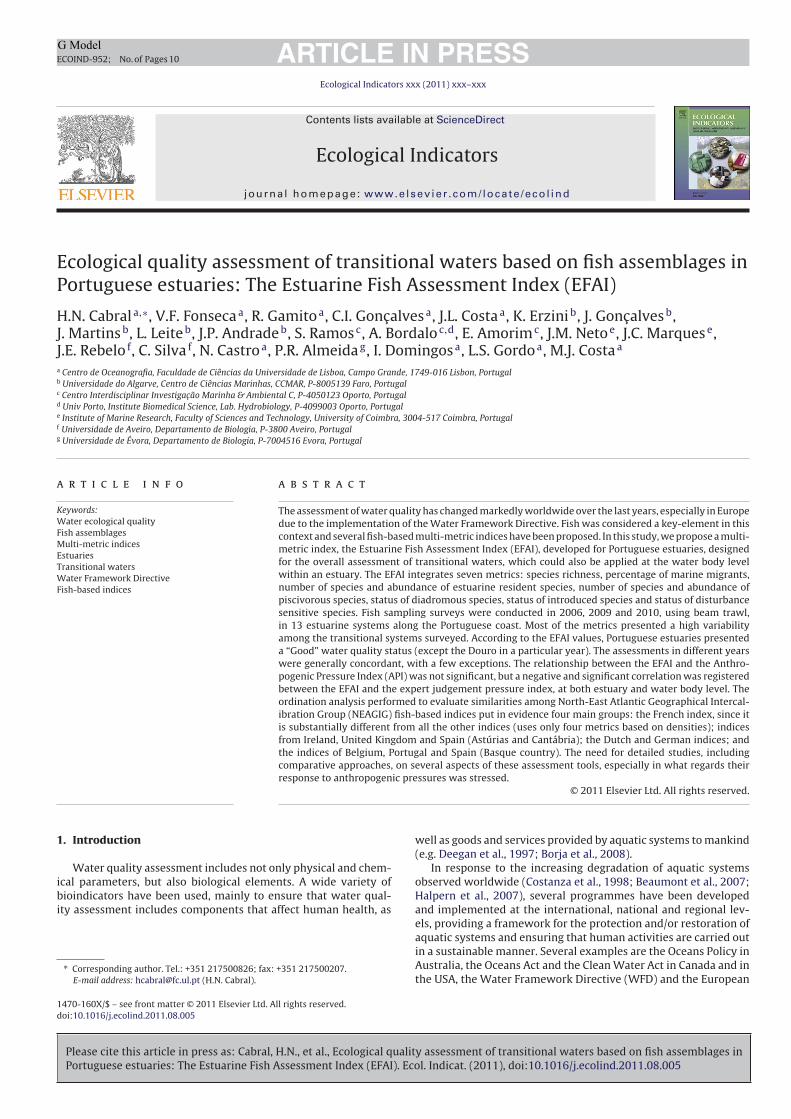
Fig. 1. Estuarine systems sampled along the Portuguese coast.
Marine Strategy Directive in Europe, the National Water Act in
South Africa, among others (see Borja et al., 2008, for a review).
In Europe, the WFD (Directive 2000/60/EC) sets the main goal
of achieving a good ecological status in all European water bod-
ies by 2015, including freshwater, transitional waters (estuaries)
and coastal waters. According to this Directive, member states
should assess water quality based on several physical and chemical
variables, but also using some biological key-elements, i.e. phy-
toplankton, macrophytes and phytobenthos, benthic invertebrates
and fish (Borja, 2005).
Although the use of fish as indicators of water quality is not
particularly recent, the development of fish-based multi-metric
indices has only occurred in the last 2 or 3 decades (Karr, 1981;
Breine et al., 2010). The value of fish fauna as a biological qual-
ity element relies on key aspects of their biology and ecology,
namely their wide dispersion in the aquatic environments, diver-
sity of functional guilds, their major ecological role in food webs,
their relatively long life-span which accounts for long-term effects,
and their value for mankind, particularly as a food resource (e.g.
Whitfield and Elliott, 2002; Van Der Oost et al., 2003; Harrison
and Whitfield, 2004). Nevertheless, some disadvantages of using
fish as indicators should also be considered, in particular their
high mobility, their high tolerance to contaminants and physi-
cal degradation of habitats, the selective nature of the sampling
gears required and the need for large sampling efforts. Also, fish
are subject to strong resource exploitation regimes and represent
generally higher trophic levels (e.g. Whitfield and Elliott, 2002;
Harrison and Whitfield, 2004). However, most of these disadvan-
tages, which can also be recognised for other taxonomic groups,
namely benthic invertebrates (e.g. Karr et al., 1986; Whitfield and
Elliott, 2002), are out-weighed by the advantages (Harrison and
Whitfield, 2004).
Several estuarine fish based-indices have been developed over
the last two decades (Ramm, 1988; Cooper et al., 1994; Deegan
et al., 1997; Quinn et al., 1999; Paul, 2003; Borja et al., 2004;
Harrison and Whitfield, 2004; Breine et al., 2007, 2010; Coates
Please cite this article in press as: Cabral, H.N., et al., Ecological quality assessment of transitional waters based on fish assemblages in
Portuguese estuaries: The Estuarine Fish Assessment Index (EFAI). Ecol. Indicat. (2011), doi:10.1016/j.ecolind.2011.08.005
ARTICLE IN PRESSG ModelECOIND-952; No. of Pages 10
H.N. Cabral et al. / Ecological Indicators xxx (2011) xxx–xxx 3
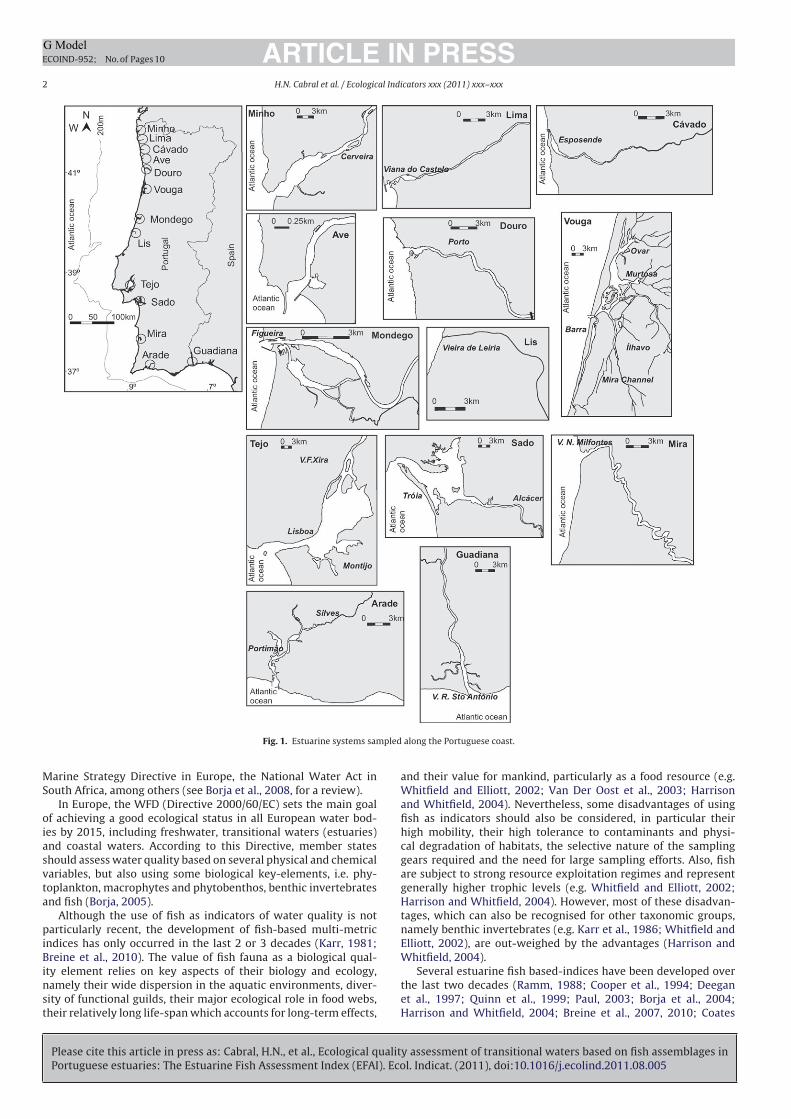
Table 1Main geomorphologic and hydrologic characteristics of the estuarine systems surveyed along the Portuguese coast.
Estuaries Total area
(km2)
River flow
(m3 s−1)
Mean
depth (m)
Residence
time (days)
Entrance
width (m)
Intertidal
area (%)
Latitude Number of
water bodies
Minho 24.5 300 3 2 1246 9 41◦52′39.32′′N 5
Lima 11.3 62 2 1–7 647 <1 41◦41′38.82′′N 3
Cávado 4.3 66 2 <2 87 <1 41◦30′44.72′′N 2
Ave 1.7 32 4 <2 283 <1 41◦20′48.32′′N 1
Douro 7.3 450 4 2 219 11 41◦08′21.08′′N 3
Vouga 120.8 40 2 17 437 64.0 40◦40′11.72′′N 5
Mondego 8.6 79 2 3 264 64 40◦06′56.12′′N 4
Lis 0.4 8 1 <1 41 <10 39◦52′53.84′′N 1
Tejo 367.5 300 5 25 4909 40 38◦52′44.62′′N 4
Sado 212.4 40 6 30 1740 44 38◦24′33.54′′N 6
Mira 4.7 3 4 15 519 42 37◦42′22.45′′N 3
Arade 8.7 50 6 1 220 25 37◦09′23.55′′N 2
Guadiana 37.5 80 3 12 1720 24 37◦16′30.67′′N 4
et al., 2007; Delpech et al., 2010) and some have been applied in
the assessment and monitoring programmes of the WFD. Most
of European Union (EU) member-states deal with several prob-
lems regarding these assessments, especially those related with
the selection of metrics for the indices, the estimation of ecolog-
ical quality ratios (based on reference conditions), the setting of
boundaries between the different ecological quality status, and also
the interpretation of ecological quality ratios and their relationship
with different types and magnitudes of human pressure. Another
major challenge is the intercalibration process, which aims to stan-
dardize the ecological quality status results obtained with different
indices and using different sampling methodologies for common
estuarine systems. Due to the strict agenda for respecting mile-
stones imposed by the implementation of WFD, research on these
methodological aspects has been scarce. Although some contribu-
tions have been published recently (e.g. Uriarte and Borja, 2009;
Delpech et al., 2010) it is expected that more studies address these
aspects and that assessment tools may suffer some changes in the
future.
The WFD establishes guidelines for the use of biological ele-
ments in the assessment of ecological water quality. In the case
of fish fauna, assessment tools should include taxonomic com-
position, abundance, disturbance sensitive species and indicator
species, but the ambiguity of these guidelines led to the develop-
ment of a wide diversity of indices.
In this paper, we propose an index developed for Portuguese
estuaries, designed for the overall assessment of transitional waters
and with the possibility of also being used at the level of water bod-
ies within an estuary, as required by the WFD. A comparison with
other indices proposed by several European member-states was
established, highlighting the difficulties inherent to the intercali-
bration process.
2. Materials and methods
2.1. Fish sampling surveys
Fish was sampled in 13 estuaries along the Portuguese coast
(Fig. 1 and Table 1), following a sampling protocol established for
the implementation of the WFD. This protocol has several require-
ments proposed by the national water agency (INAG), concerning
its simplicity and low cost, but was based on the analysis of pre-
vious data available for the majority of Portuguese estuaries. In
this previous work, the effect of sampling size (number of hauls) in
the metrics was analysed and boundaries of water quality classes,
defined later, had the sampling effort into account. Estuaries were
divided in water bodies (varying from 1 to 6 per estuary). In each
water body, 3–5 hauls (according to water body area; 3 hauls were
performed only in very small water bodies, where trawled area was
almost overlaped among hauls) were performed during the night at
ebb tide, using a 2 m beam-trawl with a tickler chain and a stretched
mesh size of 5 mm at the cod end. Most of Portuguese estuaries
present a high water transparency, especially in lower areas, and
thus the night period allowed to reduce fish avoidance to the net by
visual recognition (differences between day and night hauls were
analysed in previous surveys and results taking into account for
the selection of the best sampling period). Hauls were performed
at a constant speed for a distance of ca. 300 m, monitored by a GPS.
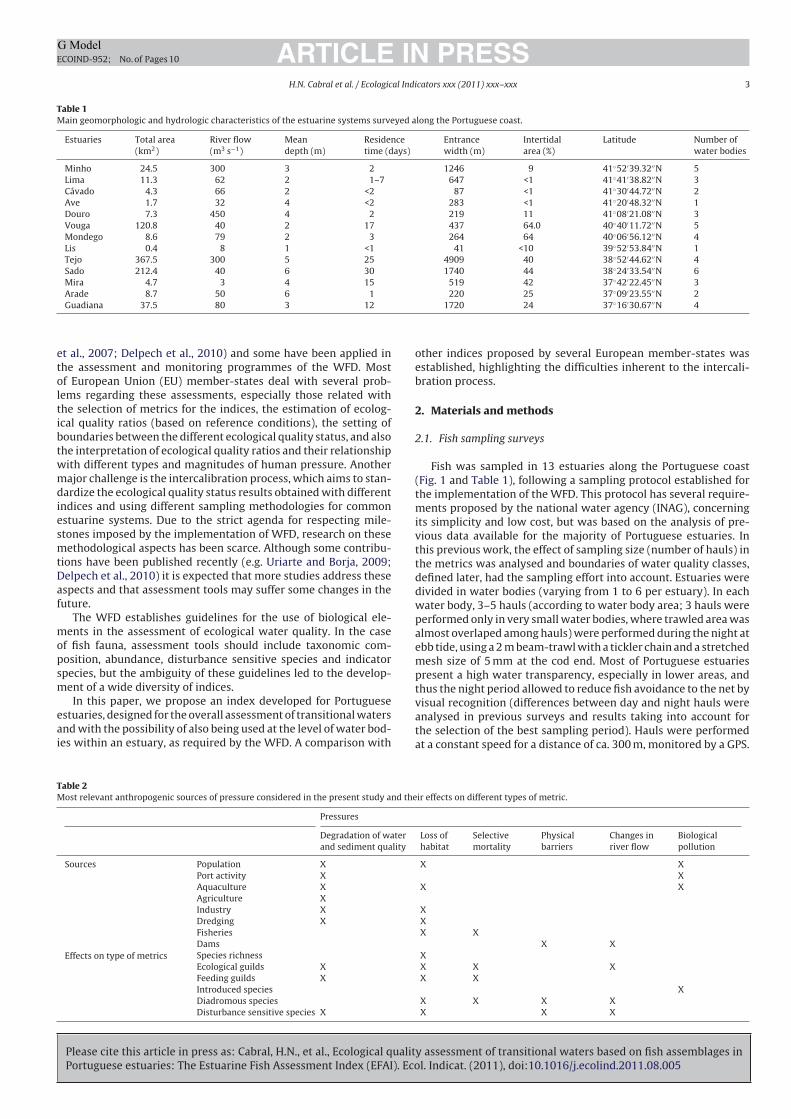
Table 2Most relevant anthropogenic sources of pressure considered in the present study and their effects on different types of metric.
Pressures
Degradation of water
and sediment quality
Loss of
habitat
Selective
mortality
Physical
barriers
Changes in
river flow
Biological
pollution
Sources Population X X X
Port activity X X
Aquaculture X X X
Agriculture X
Industry X X
Dredging X X
Fisheries X X
Dams X X
Effects on type of metrics Species richness X
Ecological guilds X X X X
Feeding guilds X X X
Introduced species X
Diadromous species X X X X
Disturbance sensitive species X X X X
Please cite this article in press as: Cabral, H.N., et al., Ecological quality assessment of transitional waters based on fish assemblages in
Portuguese estuaries: The Estuarine Fish Assessment Index (EFAI). Ecol. Indicat. (2011), doi:10.1016/j.ecolind.2011.08.005
ARTICLE IN PRESSG ModelECOIND-952; No. of Pages 10
4 H.N. Cabral et al. / Ecological Indicators xxx (2011) xxx–xxx
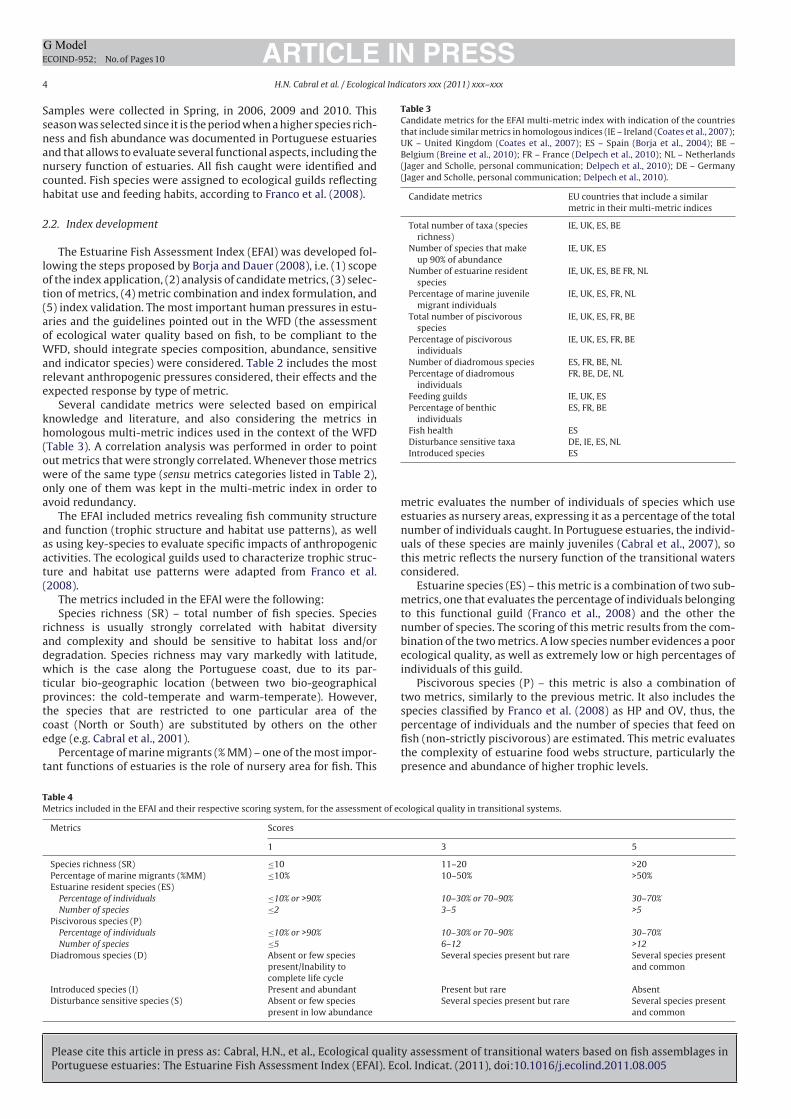
Samples were collected in Spring, in 2006, 2009 and 2010. This
season was selected since it is the period when a higher species rich-
ness and fish abundance was documented in Portuguese estuaries
and that allows to evaluate several functional aspects, including the
nursery function of estuaries. All fish caught were identified and
counted. Fish species were assigned to ecological guilds reflecting
habitat use and feeding habits, according to Franco et al. (2008).
2.2. Index development
The Estuarine Fish Assessment Index (EFAI) was developed fol-
lowing the steps proposed by Borja and Dauer (2008), i.e. (1) scope
of the index application, (2) analysis of candidate metrics, (3) selec-
tion of metrics, (4) metric combination and index formulation, and
(5) index validation. The most important human pressures in estu-
aries and the guidelines pointed out in the WFD (the assessment
of ecological water quality based on fish, to be compliant to the
WFD, should integrate species composition, abundance, sensitive
and indicator species) were considered. Table 2 includes the most
relevant anthropogenic pressures considered, their effects and the
expected response by type of metric.
Several candidate metrics were selected based on empirical
knowledge and literature, and also considering the metrics in
homologous multi-metric indices used in the context of the WFD
(Table 3). A correlation analysis was performed in order to point
out metrics that were strongly correlated. Whenever those metrics
were of the same type (sensu metrics categories listed in Table 2),
only one of them was kept in the multi-metric index in order to
avoid redundancy.
The EFAI included metrics revealing fish community structure
and function (trophic structure and habitat use patterns), as well
as using key-species to evaluate specific impacts of anthropogenic
activities. The ecological guilds used to characterize trophic struc-
ture and habitat use patterns were adapted from Franco et al.
(2008).
The metrics included in the EFAI were the following:
Species richness (SR) – total number of fish species. Species
richness is usually strongly correlated with habitat diversity
and complexity and should be sensitive to habitat loss and/or
degradation. Species richness may vary markedly with latitude,
which is the case along the Portuguese coast, due to its par-
ticular bio-geographic location (between two bio-geographical
provinces: the cold-temperate and warm-temperate). However,
the species that are restricted to one particular area of the
coast (North or South) are substituted by others on the other
edge (e.g. Cabral et al., 2001).
Percentage of marine migrants (% MM) – one of the most impor-
tant functions of estuaries is the role of nursery area for fish. This
Table 3Candidate metrics for the EFAI multi-metric index with indication of the countries
that include similar metrics in homologous indices (IE – Ireland (Coates et al., 2007);
UK – United Kingdom (Coates et al., 2007); ES – Spain (Borja et al., 2004); BE –
Belgium (Breine et al., 2010); FR – France (Delpech et al., 2010); NL – Netherlands
(Jager and Scholle, personal communication; Delpech et al., 2010); DE – Germany
(Jager and Scholle, personal communication; Delpech et al., 2010).
Candidate metrics EU countries that include a similar
metric in their multi-metric indices
Total number of taxa (species
richness)
IE, UK, ES, BE
Number of species that make
up 90% of abundance
IE, UK, ES
Number of estuarine resident
species
IE, UK, ES, BE FR, NL
Percentage of marine juvenile
migrant individuals
IE, UK, ES, FR, NL
Total number of piscivorous
species
IE, UK, ES, FR, BE
Percentage of piscivorous
individuals
IE, UK, ES, FR, BE
Number of diadromous species ES, FR, BE, NL
Percentage of diadromous
individuals
FR, BE, DE, NL
Feeding guilds IE, UK, ES
Percentage of benthic
individuals
ES, FR, BE
Fish health ES
Disturbance sensitive taxa DE, IE, ES, NL
Introduced species ES
metric evaluates the number of individuals of species which use
estuaries as nursery areas, expressing it as a percentage of the total
number of individuals caught. In Portuguese estuaries, the individ-
uals of these species are mainly juveniles (Cabral et al., 2007), so
this metric reflects the nursery function of the transitional waters
considered.
Estuarine species (ES) – this metric is a combination of two sub-
metrics, one that evaluates the percentage of individuals belonging
to this functional guild (Franco et al., 2008) and the other the
number of species. The scoring of this metric results from the com-
bination of the two metrics. A low species number evidences a poor
ecological quality, as well as extremely low or high percentages of
individuals of this guild.
Piscivorous species (P) – this metric is also a combination of
two metrics, similarly to the previous metric. It also includes the
species classified by Franco et al. (2008) as HP and OV, thus, the
percentage of individuals and the number of species that feed on
fish (non-strictly piscivorous) are estimated. This metric evaluates
the complexity of estuarine food webs structure, particularly the
presence and abundance of higher trophic levels.
Table 4Metrics included in the EFAI and their respective scoring system, for the assessment of ecological quality in transitional systems.
Metrics Scores
1 3 5
Species richness (SR) ≤10 11–20 >20
Percentage of marine migrants (%MM) ≤10% 10–50% >50%
Estuarine resident species (ES)
Percentage of individuals ≤10% or >90% 10–30% or 70–90% 30–70%
Number of species ≤2 3–5 >5
Piscivorous species (P)
Percentage of individuals ≤10% or >90% 10–30% or 70–90% 30–70%
Number of species ≤5 6–12 >12
Diadromous species (D) Absent or few species
present/Inability to
complete life cycle
Several species present but rare Several species present
and common
Introduced species (I) Present and abundant Present but rare Absent
Disturbance sensitive species (S) Absent or few species
present in low abundance
Several species present but rare Several species present
and common
Please cite this article in press as: Cabral, H.N., et al., Ecological quality assessment of transitional waters based on fish assemblages in
Portuguese estuaries: The Estuarine Fish Assessment Index (EFAI). Ecol. Indicat. (2011), doi:10.1016/j.ecolind.2011.08.005
ARTICLE IN PRESSG ModelECOIND-952; No. of Pages 10
H.N. Cabral et al. / Ecological Indicators xxx (2011) xxx–xxx 5
Tab
le
5E
FA
I
sco
rin
g
syst
em
for
its
ap
pli
cati
on
at
the
wate
r
bo
dy
(WB
)
lev
el
for
(O)
oli
go
hali
ne, (
M)
meso
hali
ne
an
d
(P)
po
lyh
ali
ne
wate
r
bo
die
s.
Metr
ics
O
M
P
1
3
5
1
3
5
1
3
5
Sp
eci
es
rich
ness
(to
tal
nu
mb
er
of
speci
es)
≤3
4–
8
>8
≤4
5–
10
>1
0
≤5
6–
15
>1
5
Perc
en
tag
e
of
mari
ne
mig
ran
ts
≤10
%
10
–5
0%
>5
0%
≤10
%
10
–5
0%
>5
0%
≤10
%
10
–5
0%
>5
0%
Est
uari
ne
speci
es
Per
cen
tage
of
ind
ivid
uals
≤10
%
or
>9
0%
10
–3
0%
or
70
–9
0%
30
–7
0%
≤10
%
or
>9
0%
10
–3
0%
or
70
–9
0%
30
–7
0%
≤
10
%
or
>9
0%
10
–3
0%
or
70
–9
0%
30
–7
0%
Nu
mb
er
of
spec
ies
≤1
2–
3
>3
≤2
3–
5
>5
Pis
civ
oro
us
speci
es
Per
cen
tage
of
ind
ivid
uals
≤10
%
or
>9
0%
10
–3
0%
or
70
–9
0%
30
–7
0%
≤10
%
or
>9
0%
10
–3
0%
or
70
–9
0%
30
–7
0%
≤10
%
or
>9
0%
10
–3
0%
or
70
–9
0%
30
–7
0%
Nu
mb
er
of
spec
ies
≤1
2
>2
≤1
2–
3
>3
≤2
3–
5
>5
Dia
dro
mo
us
speci
es
Red
uct
ion
in
the
nu
mb
er
of
speci
es/
Inab
ilit
y
to
com
ple
te
the
life
cycl
e
Red
uct
ion
in
the
ab
un
dan
ce
Wit
ho
ut
red
uct
ion
Red
uct
ion
in
the
nu
mb
er
of
speci
es/
Inab
ilit
y
to
com
ple
te
the
life
cycl
e
Red
uct
ion
in
the
ab
un
dan
ce
Wit
ho
ut
red
uct
ion
Red
uct
ion
in
the
nu
mb
er
of
speci
es/
Inab
ilit
y
to
com
ple
te
the
life
cycl
e
Red
uct
ion
in
the
ab
un
dan
ce
Wit
ho
ut
red
uct
ion
Intr
od
uce
d
speci
es
Pre
sen
t
an
d
ab
un
dan
t
Pre
sen
t
bu
t
rare
Ab
sen
t
Pre
sen
t
an
d
ab
un
dan
t
Pre
sen
t
bu
t
rare
Ab
sen
t
Pre
sen
t
an
d
ab
un
dan
t
Pre
sen
t
bu
t
rare
Ab
sen
t
Dis
turb
an
ce
sen
siti
ve
speci
es
Red
uct
ion
in
the
nu
mb
er
of
speci
es
Red
uct
ion
in
the
ab
un
dan
ce
Wit
ho
ut
red
uct
ion
Red
uct
ion
in
the
nu
mb
er
of
speci
es
Red
uct
ion
in
the
ab
un
dan
ce
Wit
ho
ut
red
uct
ion
Diadromous species (D) – diadromous fish are an important
component of fish assemblages in transitional waters, despite using
this environments for a limited period of time, often only during
their migrations towards upstream (anadromous species) or down-
stream (catadromous species) areas. A reduction in the number
of species or in the abundance of diadromous species should be
related mainly to physical barriers in the river basin area or to river
runoff. Since the occurrence of these species is relatively occasional
or rare in estuarine waters, and given the high dependency of sam-
pling gear on reliable abundance estimates, this metric is assessed
based on expert judgement (enquiries to experts).
Introduced species (I) – this metric evaluates if there are sig-
nificant changes in fish assemblages of transitional waters due to
introduced species. The occurrence and high abundance of alien
species strongly affects the structure of indigenous fish assem-
blages. For the same reason as for metric D, this metric will also
be evaluated based on expert judgement.
Disturbance sensitive species (S) – some species that are char-
acteristic of transitional waters are strongly associated to some
particular habitats or conditions. These species may be good indica-
tors of habitat loss or degradation. Among the resident fish species
that occur in Portuguese estuaries, Syngnathidae are sensitive to
both pressures and have been reducing their abundance in some
estuaries (Cabral et al., 2001). As their distribution is often restricted
to particular areas and the effort of the sampling programme devel-
oped for WFD purposes is probably not sufficient to cover the low
abundance of these species, this metric will also be evaluated based
on expert judgement.
This set of metrics reflect the spirit of the WFD compliance
criteria and have also documented responses to anthropogenic
pressures in estuaries (e.g. Karr, 1981; Whitfield & Elliott, 2002).
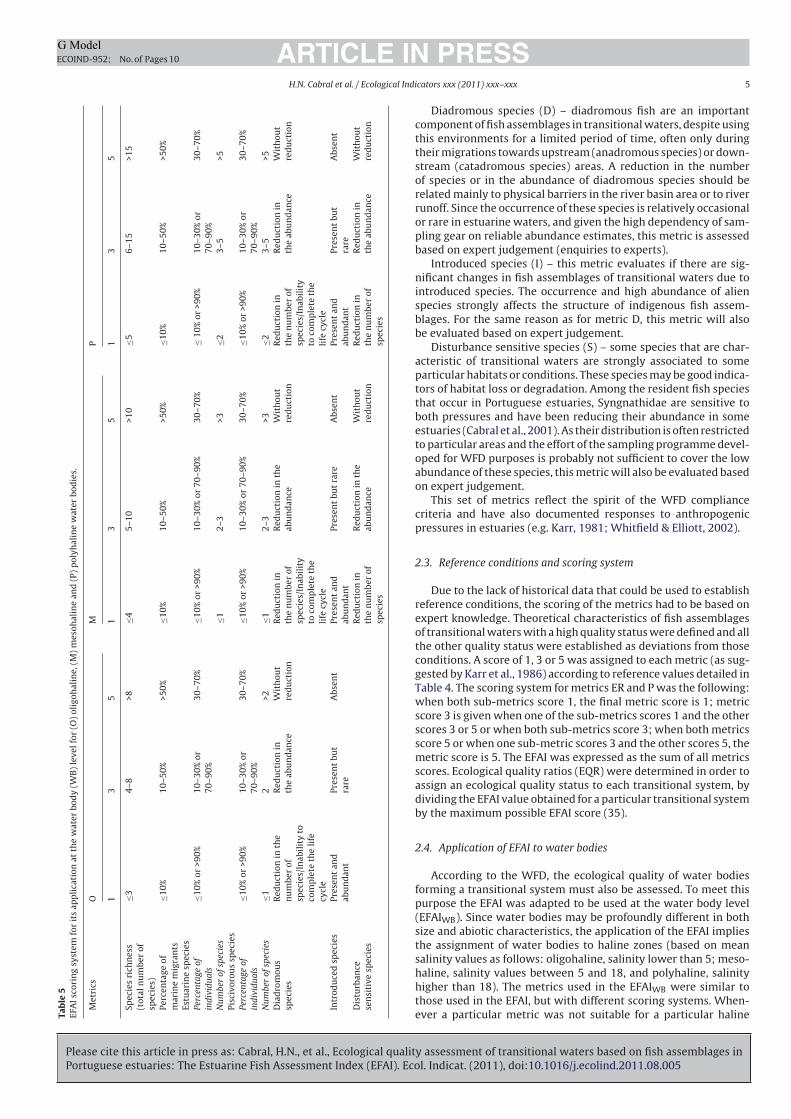
2.3. Reference conditions and scoring system
Due to the lack of historical data that could be used to establish
reference conditions, the scoring of the metrics had to be based on
expert knowledge. Theoretical characteristics of fish assemblages
of transitional waters with a high quality status were defined and all
the other quality status were established as deviations from those
conditions. A score of 1, 3 or 5 was assigned to each metric (as sug-
gested by Karr et al., 1986) according to reference values detailed in
Table 4. The scoring system for metrics ER and P was the following:
when both sub-metrics score 1, the final metric score is 1; metric
score 3 is given when one of the sub-metrics scores 1 and the other
scores 3 or 5 or when both sub-metrics score 3; when both metrics
score 5 or when one sub-metric scores 3 and the other scores 5, the
metric score is 5. The EFAI was expressed as the sum of all metrics
scores. Ecological quality ratios (EQR) were determined in order to
assign an ecological quality status to each transitional system, by
dividing the EFAI value obtained for a particular transitional system
by the maximum possible EFAI score (35).
2.4. Application of EFAI to water bodies
According to the WFD, the ecological quality of water bodies
forming a transitional system must also be assessed. To meet this
purpose the EFAI was adapted to be used at the water body level
(EFAIWB). Since water bodies may be profoundly different in both
size and abiotic characteristics, the application of the EFAI implies
the assignment of water bodies to haline zones (based on mean
salinity values as follows: oligohaline, salinity lower than 5; meso-
haline, salinity values between 5 and 18, and polyhaline, salinity
higher than 18). The metrics used in the EFAIWB were similar to
those used in the EFAI, but with different scoring systems. When-
ever a particular metric was not suitable for a particular haline
Please cite this article in press as: Cabral, H.N., et al., Ecological quality assessment of transitional waters based on fish assemblages in
Portuguese estuaries: The Estuarine Fish Assessment Index (EFAI). Ecol. Indicat. (2011), doi:10.1016/j.ecolind.2011.08.005
ARTICLE IN PRESSG ModelECOIND-952; No. of Pages 10
6 H.N. Cabral et al. / Ecological Indicators xxx (2011) xxx–xxx
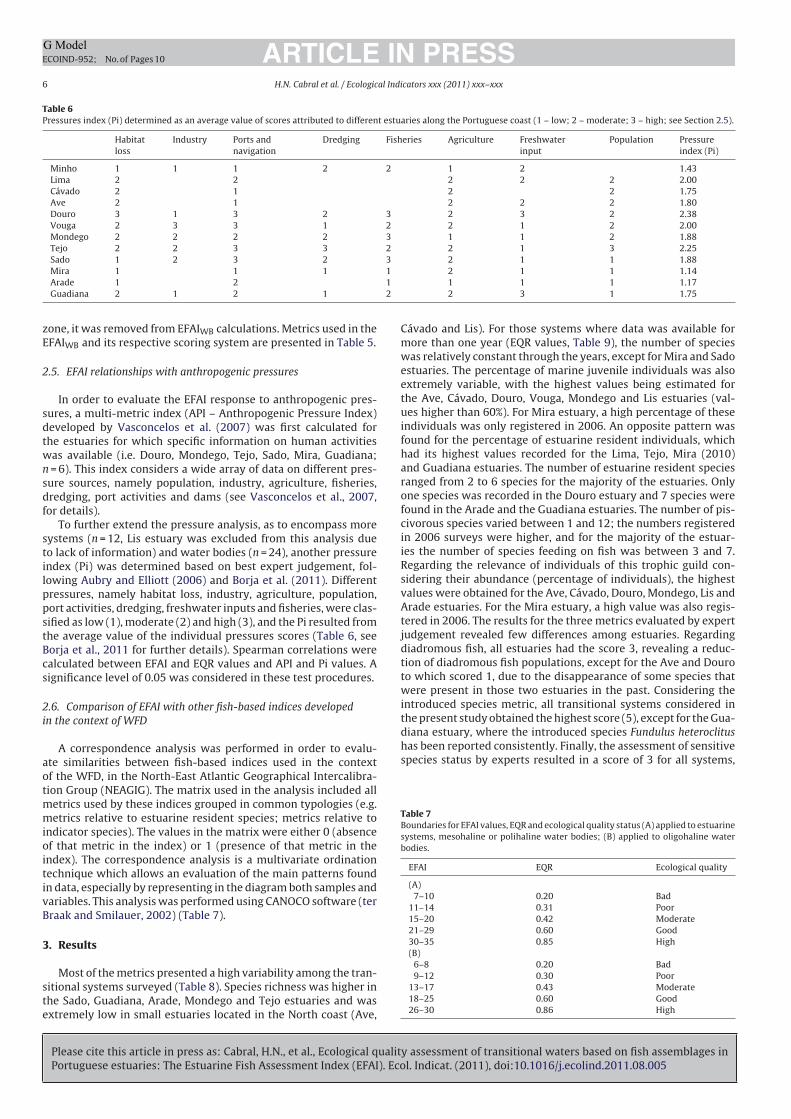
Table 6Pressures index (Pi) determined as an average value of scores attributed to different estuaries along the Portuguese coast (1 – low; 2 – moderate; 3 – high; see Section 2.5).
Habitat
loss
Industry Ports and
navigation
Dredging Fisheries Agriculture Freshwater
input
Population Pressure
index (Pi)
Minho 1 1 1 2 2 1 2 1.43
Lima 2 2 2 2 2 2.00
Cávado 2 1 2 2 1.75
Ave 2 1 2 2 2 1.80
Douro 3 1 3 2 3 2 3 2 2.38
Vouga 2 3 3 1 2 2 1 2 2.00
Mondego 2 2 2 2 3 1 1 2 1.88
Tejo 2 2 3 3 2 2 1 3 2.25
Sado 1 2 3 2 3 2 1 1 1.88
Mira 1 1 1 1 2 1 1 1.14
Arade 1 2 1 1 1 1 1.17
Guadiana 2 1 2 1 2 2 3 1 1.75
zone, it was removed from EFAIWB calculations. Metrics used in the
EFAIWB and its respective scoring system are presented in Table 5.
2.5. EFAI relationships with anthropogenic pressures
In order to evaluate the EFAI response to anthropogenic pres-
sures, a multi-metric index (API – Anthropogenic Pressure Index)
developed by Vasconcelos et al. (2007) was first calculated for
the estuaries for which specific information on human activities
was available (i.e. Douro, Mondego, Tejo, Sado, Mira, Guadiana;
n = 6). This index considers a wide array of data on different pres-
sure sources, namely population, industry, agriculture, fisheries,
dredging, port activities and dams (see Vasconcelos et al., 2007,
for details).
To further extend the pressure analysis, as to encompass more
systems (n = 12, Lis estuary was excluded from this analysis due
to lack of information) and water bodies (n = 24), another pressure
index (Pi) was determined based on best expert judgement, fol-
lowing Aubry and Elliott (2006) and Borja et al. (2011). Different
pressures, namely habitat loss, industry, agriculture, population,
port activities, dredging, freshwater inputs and fisheries, were clas-
sified as low (1), moderate (2) and high (3), and the Pi resulted from
the average value of the individual pressures scores (Table 6, see
Borja et al., 2011 for further details). Spearman correlations were
calculated between EFAI and EQR values and API and Pi values. A
significance level of 0.05 was considered in these test procedures.
2.6. Comparison of EFAI with other fish-based indices developed
in the context of WFD
A correspondence analysis was performed in order to evalu-
ate similarities between fish-based indices used in the context
of the WFD, in the North-East Atlantic Geographical Intercalibra-
tion Group (NEAGIG). The matrix used in the analysis included all
metrics used by these indices grouped in common typologies (e.g.
metrics relative to estuarine resident species; metrics relative to
indicator species). The values in the matrix were either 0 (absence
of that metric in the index) or 1 (presence of that metric in the
index). The correspondence analysis is a multivariate ordination
technique which allows an evaluation of the main patterns found
in data, especially by representing in the diagram both samples and
variables. This analysis was performed using CANOCO software (ter
Braak and Smilauer, 2002) (Table 7).
3. Results
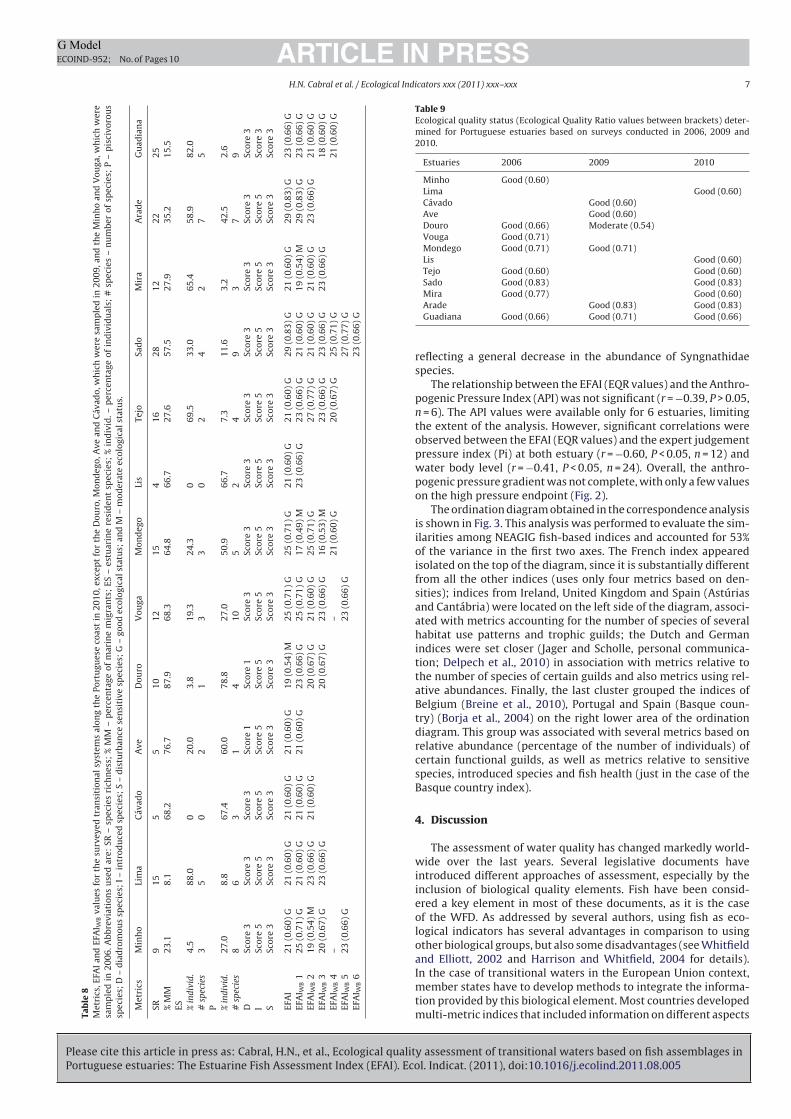
Most of the metrics presented a high variability among the tran-
sitional systems surveyed (Table 8). Species richness was higher in
the Sado, Guadiana, Arade, Mondego and Tejo estuaries and was
extremely low in small estuaries located in the North coast (Ave,
Cávado and Lis). For those systems where data was available for
more than one year (EQR values, Table 9), the number of species
was relatively constant through the years, except for Mira and Sado
estuaries. The percentage of marine juvenile individuals was also
extremely variable, with the highest values being estimated for
the Ave, Cávado, Douro, Vouga, Mondego and Lis estuaries (val-
ues higher than 60%). For Mira estuary, a high percentage of these
individuals was only registered in 2006. An opposite pattern was
found for the percentage of estuarine resident individuals, which
had its highest values recorded for the Lima, Tejo, Mira (2010)
and Guadiana estuaries. The number of estuarine resident species
ranged from 2 to 6 species for the majority of the estuaries. Only
one species was recorded in the Douro estuary and 7 species were
found in the Arade and the Guadiana estuaries. The number of pis-
civorous species varied between 1 and 12; the numbers registered
in 2006 surveys were higher, and for the majority of the estuar-
ies the number of species feeding on fish was between 3 and 7.
Regarding the relevance of individuals of this trophic guild con-
sidering their abundance (percentage of individuals), the highest
values were obtained for the Ave, Cávado, Douro, Mondego, Lis and
Arade estuaries. For the Mira estuary, a high value was also regis-
tered in 2006. The results for the three metrics evaluated by expert
judgement revealed few differences among estuaries. Regarding
diadromous fish, all estuaries had the score 3, revealing a reduc-
tion of diadromous fish populations, except for the Ave and Douro
to which scored 1, due to the disappearance of some species that
were present in those two estuaries in the past. Considering the
introduced species metric, all transitional systems considered in
the present study obtained the highest score (5), except for the Gua-
diana estuary, where the introduced species Fundulus heteroclitus
has been reported consistently. Finally, the assessment of sensitive
species status by experts resulted in a score of 3 for all systems,
Table 7Boundaries for EFAI values, EQR and ecological quality status (A) applied to estuarine
systems, mesohaline or polihaline water bodies; (B) applied to oligohaline water
bodies.
EFAI EQR Ecological quality
(A)
7–10 0.20 Bad
11–14 0.31 Poor
15–20 0.42 Moderate
21–29 0.60 Good
30–35 0.85 High
(B)
6–8 0.20 Bad
9–12 0.30 Poor
13–17 0.43 Moderate
18–25 0.60 Good
26–30 0.86 High
Please cite this article in press as: Cabral, H.N., et al., Ecological quality assessment of transitional waters based on fish assemblages in
Portuguese estuaries: The Estuarine Fish Assessment Index (EFAI). Ecol. Indicat. (2011), doi:10.1016/j.ecolind.2011.08.005
ARTICLE IN PRESSG ModelECOIND-952; No. of Pages 10
H.N. Cabral et al. / Ecological Indicators xxx (2011) xxx–xxx 7Ta
ble
8M
etr
ics,
EFA
I
an
d
EFA
I WB
valu
es
for
the
surv
ey
ed
tran
siti
on
al
syst
em
s
alo
ng
the
Po
rtu
gu
ese
coast
in
20
10
,
ex
cep
t
for
the
Do
uro
,
Mo
nd
eg
o,
Av
e
an
d
Cáv
ad
o,
wh
ich
were
sam
ple
d
in
20
09
,
an
d
the
Min
ho
an
d
Vo
ug
a,
wh
ich
were
sam
ple
d
in
20
06
.
Ab
bre
via
tio
ns
use
d
are
:
SR
–
speci
es
rich
ness
;
%
MM
–
perc
en
tag
e
of
mari
ne
mig
ran
ts;
ES
–
est
uari
ne
resi
den
t
speci
es;
%
ind
ivid
.
–
perc
en
tag
e
of
ind
ivid
uals
;
#
speci
es
–
nu
mb
er
of
speci
es;
P
–
pis
civ
oro
us
speci
es;
D
–d
iad
rom
ou
s
speci
es;
I
–in
tro
du
ced
speci
es;
S
–d
istu
rban
ce
sen
siti
ve
speci
es;
G
–g
oo
d
eco
log
ical
statu
s;
an
d
M
–m
od
era
te
eco
log
ical
statu
s.
Metr
ics
Min
ho
Lim
aC
áv
ad
oA
ve
Do
uro
Vo
ug
aM
on
deg
oLis
Tejo
Sad
oM
ira
Ara
de
Gu
ad
ian
a
SR
9
15
5
5
10
12
15
4
16
28
12
22
25
%
MM
23
.18
.16
8.2
76
.78
7.9
68
.36
4.8
66
.72
7.6
57
.52
7.9
35
.2
15
.5
ES
%
ind
ivid
.4
.58
8.0
02
0.0
3.8
19
.3
24
.3
0
69
.5
33
.0
65
.4
58
.9
82
.0
#
spec
ies
35
02
13
30
24
27
5
P %
ind
ivid
.2
7.0
8.8
67
.46
0.0
78
.82
7.0
50
.96
6.7
7.3
11
.63
.2
42
.5
2.6
#
spec
ies
86
31
41
05
24
93
79
DSco
re
3Sco
re
3Sco
re
3Sco
re
1
Sco
re
1
Sco
re
3
Sco
re
3
Sco
re
3
Sco
re
3
Sco
re
3
Sco
re
3
Sco
re
3
Sco
re
3
ISco
re
5Sco
re
5Sco
re
5Sco
re
5Sco
re
5Sco
re
5Sco
re
5Sco
re
5Sco
re
5Sco
re
5Sco
re
5Sco
re
5Sco
re
3
S
Sco
re
3
Sco
re
3
Sco
re
3
Sco
re
3
Sco
re
3
Sco
re
3
Sco
re
3
Sco
re
3
Sco
re
3
Sco
re
3
Sco
re
3
Sco
re
3
Sco
re
3
EFA
I2
1
(0.6
0)
G2
1
(0.6
0)
G2
1
(0.6
0)
G2
1
(0.6
0)
G1
9
(0.5
4)
M2
5
(0.7
1)
G2
5
(0.7
1)
G2
1
(0.6
0)
G2
1
(0.6
0)
G2
9
(0.8
3)
G2
1
(0.6
0)
G2
9
(0.8
3)
G2
3
(0.6
6)
G
EFA
I WB
1
25
(0.7
1)
G2
1
(0.6
0)
G2
1
(0.6
0)
G2
1
(0.6
0)
G2
3
(0.6
6)
G2
5
(0.7
1)
G
17
(0.4
9)
M
23
(0.6
6)
G
23
(0.6
6)
G
21
(0.6
0)
G
19
(0.5
4)
M
29
(0.8
3)
G
23
(0.6
6)
G
EFA
I WB
2
19
(0.5
4)
M2
3
(0.6
6)
G2
1
(0.6
0)
G2
0
(0.6
7)
G2
1
(0.6
0)
G2
5
(0.7
1)
G2
7
(0.7
7)
G2
1
(0.6
0)
G2
1
(0.6
0)
G2
3
(0.6
6)
G2
1
(0.6
0)
G
EFA
I WB
3
20
(0.6
7)
G2
3
(0.6
6)
G2
0
(0.6
7)
G2
3
(0.6
6)
G1
6
(0.5
3)
M
23
(0.6
6)
G
23
(0.6
6)
G
23
(0.6
6)
G
18
(0.6
0)
G
EFA
I WB
4
––
21
(0.6
0)
G2
0
(0.6
7)
G2
5
(0.7
1)
G2
1
(0.6
0)
G
EFA
I WB
5
23
(0.6
6)
G
23
(0.6
6)
G
27
(0.7
7)
G
EFA
I WB
6
23
(0.6
6)
G
Table 9Ecological quality status (Ecological Quality Ratio values between brackets) deter-
mined for Portuguese estuaries based on surveys conducted in 2006, 2009 and
2010.
Estuaries 2006 2009 2010
Minho Good (0.60)
Lima Good (0.60)
Cávado Good (0.60)
Ave Good (0.60)
Douro Good (0.66) Moderate (0.54)
Vouga Good (0.71)
Mondego Good (0.71) Good (0.71)
Lis Good (0.60)
Tejo Good (0.60) Good (0.60)
Sado Good (0.83) Good (0.83)
Mira Good (0.77) Good (0.60)
Arade Good (0.83) Good (0.83)
Guadiana Good (0.66) Good (0.71) Good (0.66)
reflecting a general decrease in the abundance of Syngnathidae
species.
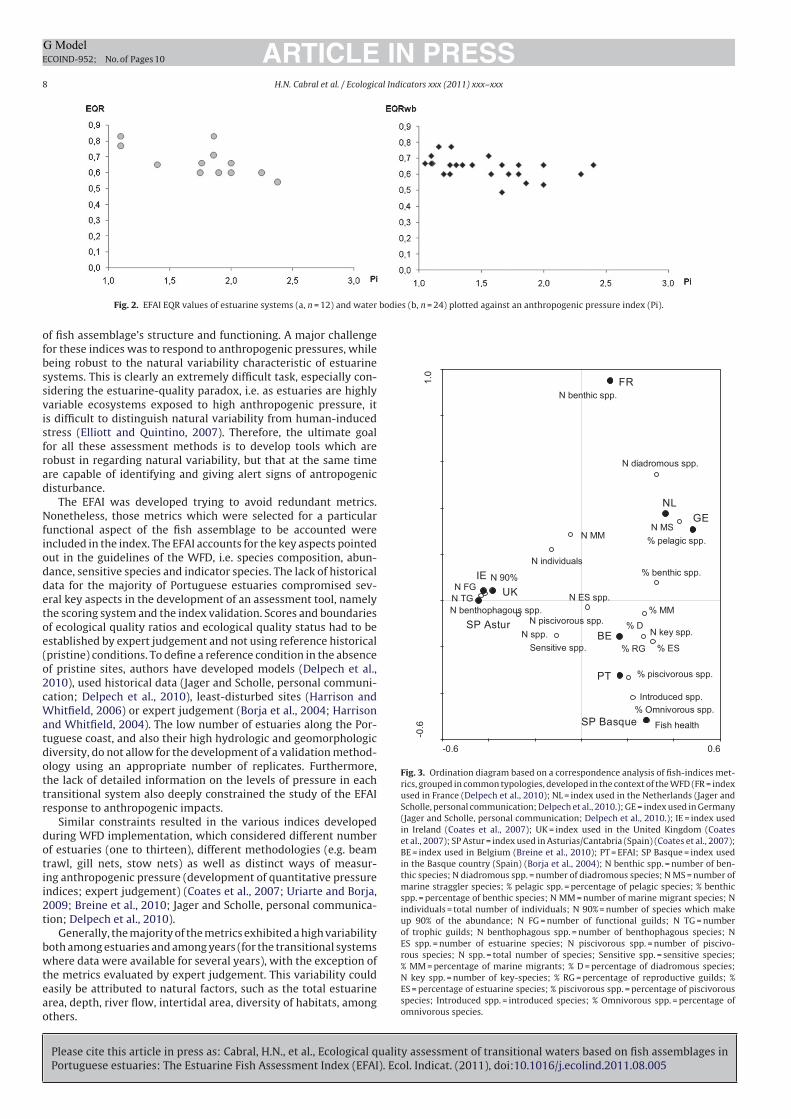
The relationship between the EFAI (EQR values) and the Anthro-
pogenic Pressure Index (API) was not significant (r = −0.39, P > 0.05,
n = 6). The API values were available only for 6 estuaries, limiting
the extent of the analysis. However, significant correlations were
observed between the EFAI (EQR values) and the expert judgement
pressure index (Pi) at both estuary (r = −0.60, P < 0.05, n = 12) and
water body level (r = −0.41, P < 0.05, n = 24). Overall, the anthro-
pogenic pressure gradient was not complete, with only a few values
on the high pressure endpoint (Fig. 2).
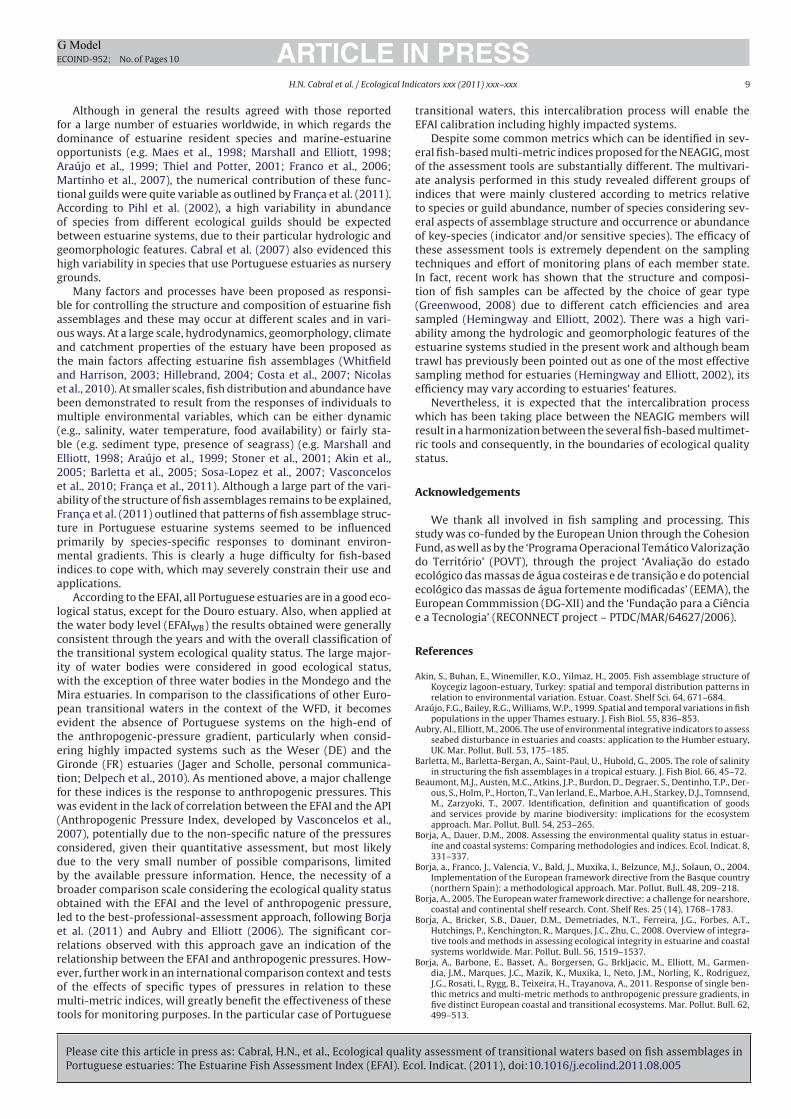
The ordination diagram obtained in the correspondence analysis
is shown in Fig. 3. This analysis was performed to evaluate the sim-
ilarities among NEAGIG fish-based indices and accounted for 53%
of the variance in the first two axes. The French index appeared
isolated on the top of the diagram, since it is substantially different
from all the other indices (uses only four metrics based on den-
sities); indices from Ireland, United Kingdom and Spain (Astúrias
and Cantábria) were located on the left side of the diagram, associ-
ated with metrics accounting for the number of species of several
habitat use patterns and trophic guilds; the Dutch and German
indices were set closer (Jager and Scholle, personal communica-
tion; Delpech et al., 2010) in association with metrics relative to
the number of species of certain guilds and also metrics using rel-
ative abundances. Finally, the last cluster grouped the indices of
Belgium (Breine et al., 2010), Portugal and Spain (Basque coun-
try) (Borja et al., 2004) on the right lower area of the ordination
diagram. This group was associated with several metrics based on
relative abundance (percentage of the number of individuals) of
certain functional guilds, as well as metrics relative to sensitive
species, introduced species and fish health (just in the case of the
Basque country index).
4. Discussion
The assessment of water quality has changed markedly world-
wide over the last years. Several legislative documents have
introduced different approaches of assessment, especially by the
inclusion of biological quality elements. Fish have been consid-
ered a key element in most of these documents, as it is the case
of the WFD. As addressed by several authors, using fish as eco-
logical indicators has several advantages in comparison to using
other biological groups, but also some disadvantages (see Whitfield
and Elliott, 2002 and Harrison and Whitfield, 2004 for details).
In the case of transitional waters in the European Union context,
member states have to develop methods to integrate the informa-
tion provided by this biological element. Most countries developed
multi-metric indices that included information on different aspects
Please cite this article in press as: Cabral, H.N., et al., Ecological quality assessment of transitional waters based on fish assemblages in
Portuguese estuaries: The Estuarine Fish Assessment Index (EFAI). Ecol. Indicat. (2011), doi:10.1016/j.ecolind.2011.08.005
ARTICLE IN PRESSG ModelECOIND-952; No. of Pages 10
8 H.N. Cabral et al. / Ecological Indicators xxx (2011) xxx–xxx
Fig. 2. EFAI EQR values of estuarine systems (a, n = 12) and water bodies (b, n = 24) plotted against an anthropogenic pressure index (Pi).
of fish assemblage’s structure and functioning. A major challenge
for these indices was to respond to anthropogenic pressures, while
being robust to the natural variability characteristic of estuarine
systems. This is clearly an extremely difficult task, especially con-
sidering the estuarine-quality paradox, i.e. as estuaries are highly
variable ecosystems exposed to high anthropogenic pressure, it
is difficult to distinguish natural variability from human-induced
stress (Elliott and Quintino, 2007). Therefore, the ultimate goal
for all these assessment methods is to develop tools which are
robust in regarding natural variability, but that at the same time
are capable of identifying and giving alert signs of antropogenic
disturbance.
The EFAI was developed trying to avoid redundant metrics.
Nonetheless, those metrics which were selected for a particular
functional aspect of the fish assemblage to be accounted were
included in the index. The EFAI accounts for the key aspects pointed
out in the guidelines of the WFD, i.e. species composition, abun-
dance, sensitive species and indicator species. The lack of historical
data for the majority of Portuguese estuaries compromised sev-
eral key aspects in the development of an assessment tool, namely
the scoring system and the index validation. Scores and boundaries
of ecological quality ratios and ecological quality status had to be
established by expert judgement and not using reference historical
(pristine) conditions. To define a reference condition in the absence
of pristine sites, authors have developed models (Delpech et al.,
2010), used historical data (Jager and Scholle, personal communi-
cation; Delpech et al., 2010), least-disturbed sites (Harrison and
Whitfield, 2006) or expert judgement (Borja et al., 2004; Harrison
and Whitfield, 2004). The low number of estuaries along the Por-
tuguese coast, and also their high hydrologic and geomorphologic
diversity, do not allow for the development of a validation method-
ology using an appropriate number of replicates. Furthermore,
the lack of detailed information on the levels of pressure in each
transitional system also deeply constrained the study of the EFAI
response to anthropogenic impacts.
Similar constraints resulted in the various indices developed
during WFD implementation, which considered different number
of estuaries (one to thirteen), different methodologies (e.g. beam
trawl, gill nets, stow nets) as well as distinct ways of measur-
ing anthropogenic pressure (development of quantitative pressure
indices; expert judgement) (Coates et al., 2007; Uriarte and Borja,
2009; Breine et al., 2010; Jager and Scholle, personal communica-
tion; Delpech et al., 2010).
Generally, the majority of the metrics exhibited a high variability
both among estuaries and among years (for the transitional systems
where data were available for several years), with the exception of
the metrics evaluated by expert judgement. This variability could
easily be attributed to natural factors, such as the total estuarine
area, depth, river flow, intertidal area, diversity of habitats, among
others.
-0.6 0.6
-0.6
1.0
N spp.
N ES spp.
N diadromous spp.
N MMN MS
N pisc ivorous spp.N benthophagous spp.
N benthic spp.
N 90%N FG
N TG
N individuals
N key spp.% D
% MM
% ES
% pelagic spp.
% benthic spp.
% piscivorous spp.
% Omnivorous spp.
% RG
Introduced spp.
Sensitive spp.
Fish health
BE
GE
FR
IE
NL
PT
SP Basque
SP Astur
UK
Fig. 3. Ordination diagram based on a correspondence analysis of fish-indices met-
rics, grouped in common typologies, developed in the context of the WFD (FR = index
used in France (Delpech et al., 2010); NL = index used in the Netherlands (Jager and
Scholle, personal communication; Delpech et al., 2010.); GE = index used in Germany
(Jager and Scholle, personal communication; Delpech et al., 2010.); IE = index used
in Ireland (Coates et al., 2007); UK = index used in the United Kingdom (Coates
et al., 2007); SP Astur = index used in Asturias/Cantabria (Spain) (Coates et al., 2007);
BE = index used in Belgium (Breine et al., 2010); PT = EFAI; SP Basque = index used
in the Basque country (Spain) (Borja et al., 2004); N benthic spp. = number of ben-
thic species; N diadromous spp. = number of diadromous species; N MS = number of
marine straggler species; % pelagic spp. = percentage of pelagic species; % benthic
spp. = percentage of benthic species; N MM = number of marine migrant species; N
individuals = total number of individuals; N 90% = number of species which make
up 90% of the abundance; N FG = number of functional guilds; N TG = number
of trophic guilds; N benthophagous spp. = number of benthophagous species; N
ES spp. = number of estuarine species; N piscivorous spp. = number of piscivo-
rous species; N spp. = total number of species; Sensitive spp. = sensitive species;
% MM = percentage of marine migrants; % D = percentage of diadromous species;
N key spp. = number of key-species; % RG = percentage of reproductive guilds; %
ES = percentage of estuarine species; % piscivorous spp. = percentage of piscivorous
species; Introduced spp. = introduced species; % Omnivorous spp. = percentage of
omnivorous species.
Please cite this article in press as: Cabral, H.N., et al., Ecological quality assessment of transitional waters based on fish assemblages in
Portuguese estuaries: The Estuarine Fish Assessment Index (EFAI). Ecol. Indicat. (2011), doi:10.1016/j.ecolind.2011.08.005
ARTICLE IN PRESSG ModelECOIND-952; No. of Pages 10
H.N. Cabral et al. / Ecological Indicators xxx (2011) xxx–xxx 9
Although in general the results agreed with those reported
for a large number of estuaries worldwide, in which regards the
dominance of estuarine resident species and marine-estuarine
opportunists (e.g. Maes et al., 1998; Marshall and Elliott, 1998;
Araújo et al., 1999; Thiel and Potter, 2001; Franco et al., 2006;
Martinho et al., 2007), the numerical contribution of these func-
tional guilds were quite variable as outlined by Franc a et al. (2011).
According to Pihl et al. (2002), a high variability in abundance
of species from different ecological guilds should be expected
between estuarine systems, due to their particular hydrologic and
geomorphologic features. Cabral et al. (2007) also evidenced this
high variability in species that use Portuguese estuaries as nursery
grounds.
Many factors and processes have been proposed as responsi-
ble for controlling the structure and composition of estuarine fish
assemblages and these may occur at different scales and in vari-
ous ways. At a large scale, hydrodynamics, geomorphology, climate
and catchment properties of the estuary have been proposed as
the main factors affecting estuarine fish assemblages (Whitfield
and Harrison, 2003; Hillebrand, 2004; Costa et al., 2007; Nicolas
et al., 2010). At smaller scales, fish distribution and abundance have
been demonstrated to result from the responses of individuals to
multiple environmental variables, which can be either dynamic
(e.g., salinity, water temperature, food availability) or fairly sta-
ble (e.g. sediment type, presence of seagrass) (e.g. Marshall and
Elliott, 1998; Araújo et al., 1999; Stoner et al., 2001; Akin et al.,
2005; Barletta et al., 2005; Sosa-Lopez et al., 2007; Vasconcelos
et al., 2010; Franc a et al., 2011). Although a large part of the vari-
ability of the structure of fish assemblages remains to be explained,
Franc a et al. (2011) outlined that patterns of fish assemblage struc-
ture in Portuguese estuarine systems seemed to be influenced
primarily by species-specific responses to dominant environ-
mental gradients. This is clearly a huge difficulty for fish-based
indices to cope with, which may severely constrain their use and
applications.
According to the EFAI, all Portuguese estuaries are in a good eco-
logical status, except for the Douro estuary. Also, when applied at
the water body level (EFAIWB) the results obtained were generally
consistent through the years and with the overall classification of
the transitional system ecological quality status. The large major-
ity of water bodies were considered in good ecological status,
with the exception of three water bodies in the Mondego and the
Mira estuaries. In comparison to the classifications of other Euro-
pean transitional waters in the context of the WFD, it becomes
evident the absence of Portuguese systems on the high-end of
the anthropogenic-pressure gradient, particularly when consid-
ering highly impacted systems such as the Weser (DE) and the
Gironde (FR) estuaries (Jager and Scholle, personal communica-
tion; Delpech et al., 2010). As mentioned above, a major challenge
for these indices is the response to anthropogenic pressures. This
was evident in the lack of correlation between the EFAI and the API
(Anthropogenic Pressure Index, developed by Vasconcelos et al.,
2007), potentially due to the non-specific nature of the pressures
considered, given their quantitative assessment, but most likely
due to the very small number of possible comparisons, limited
by the available pressure information. Hence, the necessity of a
broader comparison scale considering the ecological quality status
obtained with the EFAI and the level of anthropogenic pressure,
led to the best-professional-assessment approach, following Borja
et al. (2011) and Aubry and Elliott (2006). The significant cor-
relations observed with this approach gave an indication of the
relationship between the EFAI and anthropogenic pressures. How-
ever, further work in an international comparison context and tests
of the effects of specific types of pressures in relation to these
multi-metric indices, will greatly benefit the effectiveness of these
tools for monitoring purposes. In the particular case of Portuguese
transitional waters, this intercalibration process will enable the
EFAI calibration including highly impacted systems.
Despite some common metrics which can be identified in sev-
eral fish-based multi-metric indices proposed for the NEAGIG, most
of the assessment tools are substantially different. The multivari-
ate analysis performed in this study revealed different groups of
indices that were mainly clustered according to metrics relative
to species or guild abundance, number of species considering sev-
eral aspects of assemblage structure and occurrence or abundance
of key-species (indicator and/or sensitive species). The efficacy of
these assessment tools is extremely dependent on the sampling
techniques and effort of monitoring plans of each member state.
In fact, recent work has shown that the structure and composi-
tion of fish samples can be affected by the choice of gear type
(Greenwood, 2008) due to different catch efficiencies and area
sampled (Hemingway and Elliott, 2002). There was a high vari-
ability among the hydrologic and geomorphologic features of the
estuarine systems studied in the present work and although beam
trawl has previously been pointed out as one of the most effective
sampling method for estuaries (Hemingway and Elliott, 2002), its
efficiency may vary according to estuaries’ features.
Nevertheless, it is expected that the intercalibration process
which has been taking place between the NEAGIG members will
result in a harmonization between the several fish-based multimet-
ric tools and consequently, in the boundaries of ecological quality
status.
Acknowledgements
We thank all involved in fish sampling and processing. This
study was co-funded by the European Union through the Cohesion
Fund, as well as by the ‘Programa Operacional Temático Valorizac ão
do Território’ (POVT), through the project ‘Avaliac ão do estado
ecológico das massas de água costeiras e de transic ão e do potencial
ecológico das massas de água fortemente modificadas’ (EEMA), the
European Commmission (DG-XII) and the ‘Fundac ão para a Ciência
e a Tecnologia’ (RECONNECT project – PTDC/MAR/64627/2006).
References
Akin, S., Buhan, E., Winemiller, K.O., Yilmaz, H., 2005. Fish assemblage structure ofKoycegiz lagoon-estuary, Turkey: spatial and temporal distribution patterns inrelation to environmental variation. Estuar. Coast. Shelf Sci. 64, 671–684.
Araújo, F.G., Bailey, R.G., Williams, W.P., 1999. Spatial and temporal variations in fishpopulations in the upper Thames estuary. J. Fish Biol. 55, 836–853.
Aubry, Al., Elliott, M., 2006. The use of environmental integrative indicators to assessseabed disturbance in estuaries and coasts: application to the Humber estuary,UK. Mar. Pollut. Bull. 53, 175–185.
Barletta, M., Barletta-Bergan, A., Saint-Paul, U., Hubold, G., 2005. The role of salinityin structuring the fish assemblages in a tropical estuary. J. Fish Biol. 66, 45–72.
Beaumont, M.J., Austen, M.C., Atkins, J.P., Burdon, D., Degraer, S., Dentinho, T.P., Der-ous, S., Holm, P., Horton, T., Van Ierland, E., Marboe, A.H., Starkey, D.J., Tomnsend,M., Zarzyoki, T., 2007. Identification, definition and quantification of goodsand services provide by marine biodiversity: implications for the ecosystemapproach. Mar. Pollut. Bull. 54, 253–265.
Borja, A., Dauer, D.M., 2008. Assessing the environmental quality status in estuar-ine and coastal systems: Comparing methodologies and indices. Ecol. Indicat. 8,331–337.
Borja, a., Franco, J., Valencia, V., Bald, J., Muxika, I., Belzunce, M.J., Solaun, O., 2004.Implementation of the European framework directive from the Basque country(northern Spain): a methodological approach. Mar. Pollut. Bull. 48, 209–218.
Borja, A., 2005. The European water framework directive: a challenge for nearshore,coastal and continental shelf research. Cont. Shelf Res. 25 (14), 1768–1783.
Borja, A., Bricker, S.B., Dauer, D.M., Demetriades, N.T., Ferreira, J.G., Forbes, A.T.,Hutchings, P., Kenchington, R., Marques, J.C., Zhu, C., 2008. Overview of integra-tive tools and methods in assessing ecological integrity in estuarine and coastalsystems worldwide. Mar. Pollut. Bull. 56, 1519–1537.
Borja, A., Barbone, E., Basset, A., Borgersen, G., Brkljacic, M., Elliott, M., Garmen-dia, J.M., Marques, J.C., Mazik, K., Muxika, I., Neto, J.M., Norling, K., Rodriguez,J.G., Rosati, I., Rygg, B., Teixeira, H., Trayanova, A., 2011. Response of single ben-thic metrics and multi-metric methods to anthropogenic pressure gradients, infive distinct European coastal and transitional ecosystems. Mar. Pollut. Bull. 62,499–513.
Please cite this article in press as: Cabral, H.N., et al., Ecological quality assessment of transitional waters based on fish assemblages in
Portuguese estuaries: The Estuarine Fish Assessment Index (EFAI). Ecol. Indicat. (2011), doi:10.1016/j.ecolind.2011.08.005
ARTICLE IN PRESSG ModelECOIND-952; No. of Pages 10
10 H.N. Cabral et al. / Ecological Indicators xxx (2011) xxx–xxx
Breine, J.J., Maes, J., Quataert, P., Van den Bergh, E., Simoens, I., Van Thuyne, G.,Belpaire, C., 2007. A fish-based assessment tool for the ecological quality of thebrackish Schelde estuary in Flanders (Belgium). Hydrobiologia 575, 141–159.
Breine, J., Quataert, P., Stevens, M., Ollevier, F., Volckaert, F.A.M., 2010. A zone-specific fish-based biotic index as a management tool for the Zeeschelde estuary(Belgium). Mar. Pollut. Bull. 60, 1099–1112.
Cabral, H.N., Costa, M.J., Salgado, J.P., 2001. Does the Tagus estuary fish communityreflect environmental changes? Climate Res. 18, 119–126.
Cabral, H.N., Vasconcelos, R., Vinagre, C., Franc a, S., Fonseca, V., Maia, A., Reis-Santos,P., Lopes, M., Ruano, M., Campos, J., Freitas, V., Santos, P.T., Costa, M.J., 2007.Relative importance of estuarine flatfish nurseries along the Portuguese coast.J. Sea Res. 57, 209–217.
Coates, S., Waugh, A., Anwar, A., Robson, M., 2007. Efficacy of a multi-metric fishindex as an analysis tool for the transitional fish component of the water frame-work directive. Mar. Pollut. Bull. 55, 225–240.
Cooper, J.A.G., Ramm, A.E.L., Harrison, T.D., 1994. The estuarine health index: anew approach to scientific information transfer. Ocean Coast. Manage. 25,103–141.
Costa, M.J., Vasconcelos, R., Costa, J.L., Cabral, H.N., 2007. River flow influence on thefish community of the Tagus estuary (Portugal). Hydrobiologia 587, 113–123.
Costanza, R., Andrade, F., Antunes, P., Van den Belt, M., Boesch, D.F., Boersma, P.D.,Catarino, F., Hanna, S.S., Limburg, K., Low, B., Molitor, M., Pereira, J.G., Rayner, S.,Santos, R., Wilson, J., Young, M., 1998. A Economia Ecológica e a Governac ão Sus-tentável dos Oceanos. In: Constanza, P., Andrade, F. (Eds.), A Economia Ecológicae a Governac ão Sustentável dos Oceanos. FLAD-IMAR-LPN, Portugal, pp. 11–40.
Deegan, L.A., Finn, J.T., Buonaccorsi, J., 1997. Development and validation of an estu-arine biotic integrity index. Estuaries 20 (3), 601–617.
Delpech, C., Courrat, A., Pasquaud, S., Lobry, J., Le Pape, O., Nicolas, D., Boët, P.,Girardin, M., Lepage, M., 2010. Development of a fish-based index to assess theecological quality of transitional waters: the case of French estuaries. Mar. Pollut.Bull. 60 (6), 908–918.
Elliott, M., Quintino, V., 2007. The estuarine quality paradox, environmental home-ostasis and the difficulty of detecting antropogenic stress in naturally stressedareas. Mar. Pollut. Bull. 54, 640–645.
Franc a, S., Costa, M.J., Cabral, H.N., 2011. Inter- and intra-estuarine fish assem-blage variability patterns along the Portuguese coast. Estuar. Coast. Shelf Sci.91, 262–271.
Franco, A., Franzoi, P., Malavasi, S., Federico, R., 2006. Use of shallow water habitatsby fish assemblages in a Mediterranean coastal lagoon. Estuar. Coast. Shelf Sci.66, 67–83.
Franco, A., Franzoi, P., Torricelli, P., 2008. Structure and functioning of Mediterraneanlagoon fish assemblages: a key for identification of water body types. Estuar.Coast. Shelf Sci. 79, 549–558.
Greenwood, M.F.D., 2008. Trawls and cooling-water intakes as estuarine fish sam-pling tools: comparisons of catch composition, trends in relative abundance, andlength selectivity. Estuar. Coast. Shelf Sci. 76, 121–130.
Halpern, B.S., Selkoe, K.A., Micheli, F., Kappel, C.V., 2007. Evaluating and ranking thevulnerability of global marine ecosystems to antropogenic threats. Conserv. Biol.21 (5), 1301–1315.
Harrison, T.D., Whitfield, A.K., 2004. A multi-metric fish index to assess the environ-mental condition of estuaries. J. Fish Biol. 65, 683–710.
Harrison, T.D., Whitfield, A.K., 2006. Applications of a multi-metric fish index toassess the environmental condition of South African estuaries. Estuar. Coast. 29,1108–1120.
Hemingway, K.L., Elliott, M., 2002. Field methods. In: Elliott, M., Hemingway (Eds.),Fishes in Estuaries. Blackwell Science, Iowa.
Hillebrand, H., 2004. Strength, slope and variability of marine latitudinal gradients.Mar. Ecol. Prog. Ser. 273, 251–267.
Karr, J.R., 1981. Assessment of biotic integrity using fish communities. Fisheries 6,21–27.
Karr, J.R., Fausch, K.D., Angermeier, P.L., Yant, P.R., Schlosser, I.J. 1986. Assessmentbiological integrity in running waters: a method and its rationale. Illinois Natu-ral, History Survey Special Publication 5, Champaign, IL, USA.
Maes, J., Van Damme, P.A., Taillieu, A., Ollevier, F., 1998. Fish communities alongan oxygen-poor salinity gradient (Zeeschelde Estuary, Belgium). J. Fish Biol. 52,534–546.
Marshall, S., Elliott, M., 1998. Environmental influences on the fish assemblage ofthe Humber estuary, U.K. Estuar. Coast. Shelf Sci. 46, 175–184.
Martinho, F., Leitão, R., Viegas, I., Neto, J.M., Dolbeth, M., Cabral, H.N., Pardal,M.A., 2007. The influence of an extreme drought event in the fish commu-nity of a southern Europe temperate estuary. Estuar. Coast. Shelf Sci. 75,537–546.
Nicolas, D., Lobry, J.L., Lepage, M., Sautour, B., Le Pape, O., Cabral, H., Uriarte, A.,Boët, P., 2010. Fish under influence: a macroecological analysis of relationsbetween fish species richness and environmental gradients among Europeantidal estuaries. Estuar. Coast. Shelf Sci. 86 (1), 137–147.
Paul, J.F., 2003. Developing and applying an index of environmental integrity for theUS Mid-Atlantic region. J. Environ. Manage. 67, 175–185.
Pihl, L., Cattrijsse, A., Codling, I., Mathieson, S., McLusky, D.S., Roberts, C., 2002.Habitat use by fishes in estuaries and other brackish areas. In: Elliott, M.,Hemingway, K.L. (Eds.), Fishes in Estuaries. Blackwell Science, Oxford, England,pp. 10–53.
Quinn, N.W., Breen, C.M., Whitfield, A.K., Hearne, J.W., 1999. An index for the man-agement of South African estuaries for juvenile fish recruitment from the marineenvironment. Fish. Manage. Ecol. 6, 421–436.
Ramm, A.E.L., 1988. The community degradation index: a new method for assessingthe deterioration of aquatic habitats. Water Res. 22, 293–301.
Sosa-Lopez, A., Mouillot, D., Ramos-Miranda, J., Flores-Hernandez, D., Do Chi, T.,2007. Fish species richness decreases with salinity in tropical coastal lagoons. J.Biogeogr. 34, 52–61.
Stoner, A.W., Manderson, J.P., Pessutti, J.P., 2001. Spatially explicit analysis ofestuarine habitat for juvenile winter flounder: combining generalized addi-tive models and geographic information systems. Mar. Ecol. Prog. Ser. 213,253–271.
ter Braak, C.J.F., Smilauer, P., 2002. CANOCO Reference Manual and CanoDraw forwindows User’s guide: Software for Canonical Community Ordination, Version4.5. Microcomputer Power, Ithaca, New York, USA, 500 pp.
Thiel, R., Potter, I.C., 2001. The ichthyofaunal composition of the Elbe estuary: ananalysis in space and time. Mar. Biol. 138, 603–616.
Uriarte, A., Borja, A., 2009. Assessing fish quality status in transitional waters,within the European water framework directive: setting boundary classesand responding to anthropogenic pressures. Estuar. Coast. Shelf Sci. 82,214–224.
Van Der Oost, R., Beyer, J., Vermeulen, N.P.E., 2003. Fish bioaccumulationand biomarkers risk assessment: a review. Environ. Toxicol. Pharmacol. 13,57–149.
Vasconcelos, R.P., Reis-Santos, P., Fonseca, V., Maia, A., Ruano, M., Franc a, S., Vinagre,C., Costa, M.J., Cabral, H.N., 2007. Assessing anthropogenic pressures on estuarinefish nurseries along the Portuguese coast: a multi-metric index and conceptualapproach. Sci. Total Environ. 274, 199–215.
Vasconcelos, R., Reis-Santos, P., Maia, A., Fonseca, V., Franc a, S., Wouters, N., Costa,M.J., Cabral, H.N., 2010. Nursery use patterns of commercially important marinefish species in estuarine systems along the Portuguese coast. Estuar. Coast. ShelfSci. 86, 613–624.
Whitfield, A.K., Elliott, M., 2002. Fishes as indicators of environmental and ecologicalchanges within estuaries: a review of progress and some suggestions for thefuture. J. Fish Biol. 61, 229–250.
Whitfield, A.K., Harrison, T.D., 2003. River flow and fish abundance in a South Africanestuary. J. Fish Biol. 62, 1467–1472.
Copyright © 2022 FDOKUMEN