Ecolabels and the Greening of the Food Market
212
ECOLABELS AND THE GREENING OF THE FOOD MARKET Proceedings of a Conference Boston, Massachusetts November 7-9, 2002 Gerald J. and Dorothy R. Friedman School of Nutrition Science and Policy Tufts University Boston, MA 02111 (USA)
-
Upload
khangminh22 -
Category
Documents
-
view
0 -
download
0
Transcript of Ecolabels and the Greening of the Food Market

ECOLABELS AND THE GREENING OF THE FOOD MARKET
Proceedings of a Conference Boston, Massachusetts November 7-9, 2002
Gerald J. and Dorothy R. Friedman School of Nutrition Science and Policy Tufts University Boston, MA 02111 (USA)

The Tufts University Friedman School of Nutrition Science and Policy offers a graduate program in Agriculture, Food and Environment. For more information, please contact the Office of Admissions at: Friedman School of Nutrition Science and Policy, Tufts University, 150 Harrison Ave., Boston, MA 02111; 1-617-636-3777; [email protected]; http://nutrition.tufts.edu. Previous conference proceedings: Proceedings volumes are available from two related earlier conferences, Environ-mental Enhancement through Agriculture (held November 1995), and Agricultural Production and Nutrition (held March 1997). For the tables of contents and ordering information, visit: http://nutrition.tufts.edu/conted/past.shtml.
March 2003
ECOLABELS AND THE GREENING OF THE FOOD MARKET
William Lockeretz, editor
Proceedings of a conference held in Boston, Massachusetts, November 7-9, 2002, organized by the Friedman School of Nutrition Science and Policy, Tufts University, and supported by the Economic Research Service and Agricultural Marketing Service of the US Department of Agriculture.

iii
Contents
Preface v
NATIONAL AND INTERNATIONAL POLICIES FOR ORGANIC AND OTHER ECOLABELS
Evolving EU Food Production Policy: Implications for EcolabelingW. Dunne and J.J. O’Connell 1
Certification and Accreditation of Organics in Austria:Implementation, Strengths and Weaknesses
Ika Darnhofer and Christian R. Vogl 11
Going National: Potentials and Pitfalls of Introducing a National Organic Label in GermanyLucia A. Reisch 21
Managing the Confusion over Labels in the Emerging Organic Food Market inBosnia and Herzegovina
Aleksandra Nikolic and Esma Velagic Habul 29
The Organic Label: Does the USDA Definition Conform to Consumer Preferences?David Scott Conner 35
LOCATION-BASED LABELS
Organic and Origin-Labeled Food Products in Europe: Labels for Consumersor from Producers?
Georges Giraud 41
The Commodification of Heritage and Rural Development in Peripheral Regions:Artisanal Cheesemaking in Rural Wales
Tim Jenkins and Nicolas Parrott 51
Local Symbol Systems: Local Food – Local LabelSky McCain and Phil Chandler 63
The Load Less Traveled: Examining the Potential of Using Food Milesand CO2 Emissions in Ecolabels
Rich Pirog and Pat Schuh 69
THE DEVELOPMENT OF SPECIFIC LABELS: RECENT EXPERIENCES
Food Alli ance: Transforming a Regional Success Story into a National NetworkDeborah J. Kane and James F. Ennis 77
Environmentally Friendly Food Production in St. Petersburg, Russia:Consumers’ Awareness and Ecolabeling Scheme Development
Olga Sergienko and Alena Nemudrova 79
The Acceptance and Usefulness of the Term “ Identity-Preserved” (I.P.)in the Sustainable Agriculture Community
Melissa Schafer 91

iv
SOCIAL JUSTICE ISSUES
Linking Producer and Consumer: Rewarding “More Than Purely Price” Valuesin the Marketplace
Cathy Rozel Farnworth 97
Toward Social Justice and Economic Equity in the Food System: A Callfor Social Stewardship Standards in Sustainable and Organic Agriculture
Michael Sligh and Richard Mandelbaum 107
STRATEGIC AND CONCEPTUAL ISSUES
Can Ecolabeling Mitigate Market Failures? An Analysis Applied to Agro-Food ProductsDouadia Bougherara and Gilles Grolleau 111
Giving Credence to Environmental Labeling of Agro-Food Products: Using Searchand Experience Attributes as an Imperfect Indicator of Credibili ty
Gilles Grolleau and Julie A. Caswell 121
Adding Credibili ty Beyond EcolabelsUlrich R. Orth 131
Ecolabeling: What Does Consumer Science Tell Us about which Strategies Work?Mario F. Teisl, Brian Roe and Alan S. Levy 141
CONSUMER RESPONSE TO ECOLABELS
In-Store Demand for Ecolabeled FruitCatherine Durham, Marc McFetridge and Aaron Johnson 151
The Influence of Biased Information on Consumers’ Willi ngness to Payfor Products Labeled as Free of Genetically Modified Ingredients
Tamara VanWechel and Cheryl J. Wachenheim 159
Differential Importance of Ecolabel Criteria to ConsumersLina Gordy 167
ECOLABELS AND AGRICULTURAL PRODUCTION TECHNIQUES
Soil Amendment Quali ty Certification: The Woods End/Rodale Seal ProgramWilliam Brinton and Scott Meyer 177
Why Pesticide Risks Matter and Pose Tough Challenges for Ecolabel ProgramsCharles M. Benbrook 183
Assessment of Environmental Standards for Arable FarmsPhilippe Girardin and Eric Sardet 197

v
Preface
In recent years there has been a proli feration of labels that are intended to convey that foods have beenproduced in an environmentally and socially preferable way. These “ecolabels” variously apply toareas such as consumption of renewable resources; soil , air and water pollution; biodiversity andwildli fe; farm animal welfare; and social justice and equity. Some are bestowed by existingorganizations, others by organizations created just for the purpose. Most are private, but one especiallyimportant one (“organic”) has been regulated by the US Department of Agriculture since 2002 and bythe European Union since the 1990s. Many involve independent third-party certification to enhanceconsumers’ confidence, but others don’ t.
The rationale behind ecolabels is admirable. However, with their rapid growth have come severalimportant questions: How credible are they? Do consumers understand what they do and do not mean,or are they imposing “ information overload” on consumers? Which ones are most successful in gainingconsumers’ confidence and support, and why? How much of a marketing advantage do they give to aproduct in the market? Do they reinforce each other in “greening” the food market, or are they incompetition, with the more valuable and legitimate ones at risk of losing out to the more dubious ones?Can small -volume ecolabeled products survive in today’s food retaili ng environment, which favorslarger suppliers?
Because ecolabels are a rapidly growing part of today’s food market, with different kinds emerging allthe time, it seemed appropriate to bring together all segments of the food production and marketingsector in a conference that would give us a better of idea of where this segment of the market standstoday and what the future holds. The conference was intended to serve three purposes:
• to provide a comprehensive picture of the current state of ecolabels
• to review what we do and do not know about how they affect food marketing, and to identify keyareas where research is needed
• to provide a forum for discussing the controversies that surround ecolabels.
The bulk of the conference consisted of oral presentations and posters submitted in response to a callfor abstracts. Because interesting ecolabel activities are going on in many countries, it was very grati-fying that the call elicited a strong international response, with over a dozen countries representedamong the presenters; almost half the papers in this volume are from outside the US.
Submission of a full paper for inclusion in the proceedings was optional, so that only a portion of theentire program is represented in this volume. (Abstracts of all the presentations, as well as slidepresentations when the speakers chose to use them, may be found on the conference web site:http://nutrition.tufts.edu/conted/ecolabels, under “Detailed Program.”)
The conference organizers are extremely grateful to the US Department of Agriculture’s EconomicResearch Service and Agricultural Marketing Service for generous financial support that made theconference possible.
WILLIAM LOCKERETZ
Friedman School of Nutrition Science and PolicyTufts University


1
Evolving EU Food Production Policy: Implications for Ecolabeling
W. Dunne1 and J.J. O’Connell2
____________________________1Rural Economy Research Centre, Teagasc, 19 Sandymount Avenue, Dublin 4, Ireland. Corresponding author. Email:[email protected]
2Department of Agribusiness and Rural Development, University College Dublin, Belfield, Dublin 4, Ireland. Email:[email protected]
For over four decades, the Common AgriculturalPolicy (CAP) of the European Union has been themajor factor influencing both food supply and pro-duction methods in Western Europe. The economicand policy environment in the EU is now very differ-ent from that which prevailed in earlier decades.Further change is anticipated as the economic, socialand geographic diversity of the EU continues to in-crease through periodic enlargements incorporatingnew Member States. The CAP itself is now under-going a rapid evolution to reflect these changes. Asthis paper demonstrates, these transformations greatlyalter the provenance of food production and the scopefor ecolabeling in the EU.
For most of its existence the primary function of theCAP was to increase food supply, and farmers re-sponded accordingly. Over the last decade the CAPhas been reshaped, its objectives have been broad-ened, and policy has shifted to encourage more eco-friendly farming and food production methods. Thisnoticeable shift in emphasis has provided addedscope for differentiation of food products and the useof ecolabels.
Food Security
When the CAP was conceived and developed in thepost-war period, the primary objective was to in-crease food supply and thereby increase food secu-rity. The main policy instrument used to increasefood supply was high product prices. High prices inturn encouraged scientific advances and the applica-tion of new technology to intensify production. Thispolicy structure gave individual farmers a direct eco-nomic incentive to use this new technology and in-corporate only costs that are directly related to theprofitability and long-term sustainability of produc-tion systems or the need to comply with regulatorystandards. As we discuss later, this is now considered
a rather traditional “productionist” view of farming.Its objective was the optimum consumption of naturalresources to supply food and fiber for consumers atthe lowest cost, with the process largely regulatedthrough the medium of product price.
Farmers, like all members of society, continuouslystrive to increase their income. With the high productprices prevailing during this period, farmers focusedalmost exclusively on their farming activities andfood output as the solution to their income problem.This focus was based on a combination of personalchoice and circumstances, both on-farm and in thewider economy.
Their solutions included the following:
• switching to farm enterprises with higher marginsper hectare
• increasing the intensity of all enterprises
• enlarging the farm by either buying or rentingland.
For many years this policy did maintain and supportfarm incomes and also increased food supply. How-ever, the eventual outcome of the intensification andspecialization in EU agriculture was severe structuralsurpluses of most farm commodities. Because ofstructural surpluses, increasing volumes of the mainfarm products had to be removed from the marketthrough intervention purchases to maintain producerprices. By the late 1980s, intervention purchases ac-counted for a significant proportion of sales.
Throughout this period farmers in the EU were, inessence, in a volume business. By the end of theperiod some farmers were essentially producing forintervention and to meet quality standards for inter-vention purchasing, which significantly impacted onthe prices received by farmers. (Current interventionstandards for cereals, dairy products and beef are

2
summarized in Annex 1.) Further information on howchanges in EU intervention and labeling regulationsfor beef have differentially impacted on cattle pricesin a number of Member States is available in O’Con-nell et al. (1999).
In the process they also were becoming increasinglyisolated from consumers’ demands. In such circum-stances, ecofarming and ecolabeling had only a sec-ondary role.
Further policy complications were developing. Tosustain the internal producer prices, most surplusproduction had to be exported outside the EU (thirdcountries). Eventually, the increasing requirement forexport refunds (subsidies) to promote exports raisedthe budgetary cost of the CAP. Also, the escalatingscale of the exports created severe international tradedifficulties for the EU. By the early 1990s, all thesefactors had combined to precipitate a major revamp-ing of the CAP itself.
Public Costs
The productionist perception of farming takes intoaccount only private costs to the farmer and the pri-vate gains or value that the consumer of the foodultimately derives from the natural resources used toproduce that food. The policy of high product pricesand the unrelenting drive to improve technical andeconomic efficiency in food production in the EU didsolve the food security objective, but it had a numberof indirect impacts and costs.
The intensification of farming activities increasedpressures on li vestock, on the plants used to feedthem, and on the overall biological diversity of theregion where the production occurs. The exploitationof economies of scale has had both direct and indirectimpacts on the environmental landscape, nutrientbalances, and water quality of the region (Baldock etal., 2002). All these changes have significantly af-fected the rural population and society in general,who also consume these public goods to varyingdegrees. Ethical issues also arise about the inputs andproduction techniques used in farming and their pos-sible effects on product safety, animal welfare, andthe environment. Included here are issues such as theuse of recycled animal products, feed additives, hor-mones and growth promoters, as well as livestockhousing conditions.
These negative impacts on the environment, animalwelfare, food safety and even ethical issues are nor-mally referred to as “public costs,” since they do not
directly affect the farmer. These costs accrue to soci-ety as a whole and arise from the deterioration oreven loss of the “public value” placed on these goodsby society. But while food supply remained the pri-mary EU priority, these external costs were under-valued or even ignored. In this policy and marketcontext, ecofriendly farming and ecolabeling essen-tiall y remained non-issues.
Public Goods
The inherent nature of public goods is that they arevery diffuse and their costs and benefits are difficultto quantify. Hence they are difficult to control andregulate. Their value depends on prevailing eco-nomic, social and cultural conditions, and conse-quently varies greatly with the circumstances of theindividual and region. Socio-economic and culturalvalues vary greatly across the EU. They also are con-stantly changing because of the added diversity intro-duced at each enlargement, which incorporates newand more ethnically diverse Member States.
Over the years, various societies have tended to de-fine acceptable standards and practices within aregulatory framework. The framework is usuallydefined in technical terms with advice from a combi-nation of animal, food, public health and environ-mental scientists. The standards may be derived fromexperiments that directly or indirectly measure thebiological response of animals and plants to varyingdegrees of stress. They may measure the probabilityof loss of performance or death of the animal or, inthe more extreme situation, the consumer of the foodproduct. Normally they are focused on the human aseither the consumer or producer, but seldom on thewelfare of the animal or the environment.
The regulation can vary from outright prohibition toestablishing minimum acceptable standards for arange of inputs and management practices. There isextensive and increasing legislation that either pro-hibits or defines the conditions for use of inputs li keland, feeds, feed additives and hormones. A similarsituation exists for management practices such asnutrient balances, stocking densities, housing andtransport conditions, castration and slaughter.
Economic instruments can also be used by the regu-latory authorities to alter the balance between publiccosts and benefits. Taxes or subsidies on either inputsor outputs could significantly affect the optimumintensity of crop and animal production and thereforeaffect the balance between the private and public

3
costs and the overall benefits. Institutional subsidiza-tion of both inputs and outputs is quite common inagriculture, especially for livestock production inmany countries. But public goods generally receive alow priority from policymakers, as the aim is usuallysome mix of protecting farm incomes, increasingfood security, and encouraging exports.
The economic literature contains an increasing num-ber of studies that have attempted to measure publicpreferences in relation to environmental amenities,animal welfare and food safety (Kline and Wichelns,1996; Bennett and Larson, 1996; McInerney, 1996;Henson, 1996). These studies are probably a responseto a growing awareness of public goods and the needto preserve, value, and even “market” them. Thestudies attempt to use a “will ingness to pay” conceptas a measure of the value the individual consumerplaces on the preservation or incremental improve-ment of a specific public good. Further examples ofthese methods are presented in this volume (Conner,2003; VanWechel and Wachenheim, 2003).
The methods used involve revealed and expressedpreference. Revealed preference attempts to derive avalue for non-market goods based upon actualchoices among alternative market goods containingdifferent levels of the desired public good attribute.The expressed preference method, usually contingentvaluation, asks individuals directly about the valuethey place on non-market goods. The findings fromthese studies indicate that there is a great diversity inthe “willingness to pay” for non-market goods. Theseresearch methods need further development beforethey could form the basis for the valuation of publicgoods, especially where a number of public goodissues are involved, as in reversing the public costs ofthe CAP as outlined above.
Private Benefits and Public Costs
As affluence increases, society becomes more awareof the external costs involved, but it also can afford toplace a higher value on public goods like food safety,animal welfare, and environmental and ethical issues.This intensifies the potential conflict between thedegradation of such public goods that are of increas-ing value, and the technical objective of increasingefficiency and productivity in farming and the low-ering of unit costs.
As food surpluses in the EU began to accumulate,this potential confli ct became a reality, and in con-junction with international trade difficulties and
escalating budgetary costs, it was responsible for asignificant change in EU policy in 1992. By the turnof the century, EU food production policy had shiftedto placing a declining value on extra units of foodproduction, but an increasing value on any publicgoods consumed in the production process. The cost-benefit mix had finally progressed to the stage whereit was probable that the sum of the private and publiccosts was greater than the sum of the private andpublic gains. It is scarcely surprising that thisoccurred in an affluent region of the world whereboth the human and the animal population densitiesare relatively high.
CAP Reform
In response to the developing internal and externalmarket situation, a major reform of the CAP wasintroduced for cereals and beef under CommissionerMacSharry in 1992. Official support prices were re-duced by 30% to enable beef to better compete withother meats and to facilitate exports of cereals andmeats to third countries.
To compensate producers for the planned lowerproduct prices for cereals and beef, farmers receiveddirect payments (DPs) or “cheques in the post” tomaintain their incomes. But for supply control pur-poses, these payments were restricted to area-basedquotas for cereals and specific animal-based quotasfor beef. In the 1992 CAP reform, several “accompa-nying measures” were agreed upon and implementedunder the Rural Development program. The mainmeasures provided direct financial aid for:
• land conversion to forestry and alternative enter-prises, including organic farming
• protecting the agricultural environment
• a farm retirement scheme for older farmers.
From an ecofarming perspective, these policy shiftshad several interesting implications. First, the lower-ing of product prices would inevitably shift the opti-mum economic production towards lower levels ofintensity. Second, production was further constrainedby a combination of quotas for products and quotasfor direct payments for specific products. Third, thedirect payments for cattle farmers were and are basedon the possession of certain types of animals ratherthan their performance, and the animals had to be“ farmed” within specified stocking density limits.Fourth, an additional payment was made available formore extensive systems, again defined by a limit on

4
stocking density, and for organic production systems.Fifth, and possibly the most important, the concept of“cross compliance” was introduced whereby the di-rect payments were made conditional on farmingmethods conforming to various other EU measuresand regulations, for example animal welfare andanimal traceability.
The overall i mpact was that the DPs were unlikely tofully compensate the very intensive producers whohave the greatest impact on the degradation of thevalue of public goods. However, when the price andthe DP effects are combined, there was li kely to be anoverall gain in the public cost-benefit balance, but theextent of this is difficult to quantify.
To illustrate the scale of the shift in thinking regard-ing ecofriendly farming that has occurred in Irelandand the EU, we outline here just one example takenfrom a recent report on “Eco-Friendly Farming” pub-li shed by the Irish Department of Agriculture, Foodand Rural Development (DAFRD, 2002). Under theaccompanying measures of the 1992 reform of theCAP,
Member States could implement their own agri-environmental schemes within the discretion al-lowed in the relevant EU legislation. The statedobjectives of the Irish scheme – the Rural Environ-ment Protection Scheme (REPS) which operatedfrom 1994 to 1999 are:
• the establishment of farming practices and pro-duction methods which reflect the need for envi-ronmental conservation and protection;
• the protection of wildlife habitats and endangeredspecies of f lora and fauna; and
• the production of quality food in an environ-mentally friendly manner.
According to this report, “some 46,000 farmers par-ticipated in the first REPS with approximately onethird of agricultural land farmed in accordance withREPS rules.” This was an excellent response bycommercial farmers to a voluntary environmentalscheme, and it clearly shows that farmers willrespond to financial incentives to provide “publicgoods.”
For a number of years, policymakers have alsoencouraged and supported the development oforganic farming at both the EU and individual Mem-ber State level. A critique of the existing certificationand accreditation procedures for organic farming in
Austria is given in this volume by Darnhofer andVogl (2003). Girardin and Sardet (2003, this volume)have also prepared an environmental assessment ofspecifications and schemes in operation for arablefarms in a number of European countries.
Under the more recent Agenda 2000 agreement, theCAP reform was further deepened for beef and cere-als and tentatively extended to include milk. As in1992, this involved lower product prices and in-creases in the value for DPs. Also under the Agenda2000 agreement, the existing less-favored area (LFA)or “headage” payments were decoupled from animalsand linked to land management to prevent environ-mental degradation. The new land-based paymentswere also linked via a minimum stocking densityrequirement to continued use of the land for agricul-tural production, although at a very low level. InFinland, as in Ireland and many other members of theEU, these LFA allowances are considered central inmaintaining viable rural communities in sparselypopulated regions of the EU (Laurila, 2000). How-ever, even as the Agenda 2000 agreement was beingimplemented, additional reform seemed inevitable.
DPs for Public Goods
Adjusting to the reformed CAP structures over thelast decade has provided a major challenge for EUfarmers, input suppliers and output processors. Forbeef, the adjustment process was seriously com-pounded by the continuing fallout from the BSE cri-ses of 1996 and 2000. The eventual consequences ofBSE for farming in the EU are only now beginning toemerge. We believe that this will eventually lead to amuch wider redefinition of acceptable food produc-tion practices and the role of farming in the EU.
EU policymakers in the 21st century are in a uniqueposition in that the DPs are an identified pool ofmoney that could be reoriented to reward farmers forproviding public goods. As a consequence of thereforms to date, the annual value of EU commodity-based direct payments to farmers has rapidly in-creased from a low base to almost 30 billion euro. Anexpenditure this large will ultimately change the wayfarmers undertake their activities. But the transpar-ency of the expenditure is bound to raise questionsabout its current and future function and its value tosociety.
A direct link between the use of DPs and the provi-sion of public goods was proposed by Dunne (1996).This proposal suggested that switching a significant

5
proportion of farm income support from productprices to DPs would provide an ideal opportunity toinfluence private behavior to voluntaril y incorporatethe external costs of public goods into productiontechnology. Under this proposal, the societal value ofthe DPs could be enhanced significantly if the pay-ments were made conditional on supplying publicgoods. This would have the added advantages ofincreasing the economic justification for the largeexpenditure on the DPs themselves, the acceptabili tyof the DPs to EU taxpayers, and the justification forthe DPs under WTO rules.
Dunne (1996) also suggested that decoupling the DPsfrom eligible animals and land would have severaladded benefits. The production costs for cattle farm-ers could then be reduced to reflect the decliningvalue of the carcass, cattle numbers could reflectmarket balance for beef independent of their abilityto collect DPs, and the DPs themselves could be usedto provide a more targeted method of income support.A more generalized form and further refinement ofthis proposal for all land-using farming activities wasdeveloped and published by Dunne and O’Connell(1998; 2000a,b; 2002) and by Dunne et al. (1999).
This integrated proposal for all commodities involvesfull decoupling of the DPs from eligible animals andpartial decoupling from the land. The proposal alsorecognizes the diversity of production conditionswithin the EU by providing for both common EU andoptional national compliance criteria.
For each commodity, the proposal envisaged threetiers of strategic decisions in relation to the overallincome support system. These are:
• the ratio of price to direct payments at the EUand world market interface
• the DP (revenue) allocation mechanism amongMember States within the EU
• the distribution criteria among farmers within theMember States.
In devising this proposal it was assumed that the EUwould have to further reduce border protection andits internal support prices for the next WTO traderound. The value of the DPs could then be increasedto compensate for the price reduction.
This pool of DP revenue could be distributed amongMember States based on the Utilisable AgriculturalArea (UAA) devoted to the individual crop and li ve-stock enterprises. The size of the DP per hectare for
each individual commodity or enterprise would de-pend on the mix of price support and DPs that the EUconsidered desirable to support farm incomes. Anadditional payment, li ke an extensification premiumor a premium for organic production, could be usedto encourage even more extensive production meth-ods and to assist the poorer and more remote regionsof the EU. The revenue accruing to each MemberState would be the product of the mix of land uses(UAA) and the payment rate per hectare for eachcommodity. These “national envelopes” could thenbe disbursed to reflect the diversity of economic,social, and environmental conditions. Alternatively,the revenue distribution among Member States couldbe based on the value of the existing DPs for thecommodities that have already been reformed underthe MacSharry and Agenda 2000 agreements.
The individual Member State could simply distributethe “envelope” on a per hectare basis for each com-modity li ke the “new disadvantaged areas” payment.We suggest that it might be preferable and moreequitable to use a mix of a payment per farmer or perhousehold and a reduced payment per hectare. Thislatter approach would reduce the capitalization ofDPs into assets and would thereby decrease futureproduction costs. This would provide for a strongerpublic good and social dimension to meet localneeds, especially in the poorer regions of the Union.
Compliance Criteria for DPs
The primary DP per hectare at the EU level would bemade conditional on a range of compliance criteriafor the operation of the entire farm. This wouldincorporate public good and consumer values in rela-tion to food safety, traceabili ty, inputs used, produc-tion practices, and impacts on the landscape, environ-ment, and animal welfare. The criteria would be com-mon across the EU and therefore compatible with thesingle market requirements.
In addition to the common EU compliance criteria,further specifications could be implemented byNational governments to address local weaknesses,exploit strengths, and encourage product differentia-tion and competitive marketing strategies, but withinan overall EU single market system. Provided thislatter component was suitably structured it couldprovide financial incentives to reward ecofriendlyand localized food production. With appropriate con-trols and labeling, this localized product could thenbe differentially marketed.

6
A more comprehensive review of the li kely implica-tions of these proposals for farmers, farm structures,administrative requirements, farm inputs, outputs andproduct markets is given in Dunne and O’Connell(2002). From an ecolabeling perspective, a policyframework of this type would clearly facilitatediverse production methods and ecofriendly farming.The resulting products would be very suitable forecolabeling to ensure the maximum economicexploitation of their inherent attributes.
An EU Vision for Agriculture
In policy formation in a modern economy, manyaspects of the production and trade role of agriculturehave to be considered. Apart from changes in productsupport prices and DPs, the EU Agenda 2000 propos-als of 1999 outlined a number of non-price issues inrelation to general competiti veness, the multi -functional nature of EU agriculture, and the CAP.While most of these multi-functional aspects of theCAP were not explicitly incorporated into the finalAgenda 2000 agreement, they will likely shape therole of EU farming in the future.
The following is a summary of the most importantissues affecting the future CAP objectives that werediscussed and outlined in the Agenda 2000 proposalsbut were not explicitly carried through into the agree-ment. These were:
• food safety and product quality, which consum-ers often link to specific production methods orgeographic regions
• animal welfare considerations
• environmental friendliness of production meth-ods
• integration of environmental goals into the CAP
• further developing the role of farmers in themanagement of natural resources and landscapeconservation
• preservation of sustainable farming and socialcohesion
• maintaining a fair standard of living for the agri-cultural community and stability of farm incomes
• creation of complementary or alternative incomeand employment opportunities in rural areas forfarmers and their famili es.
A more complete description and discussion of themulti functional role of farming, including the EUmodel of agriculture and its significance in rural de-velopment, can be obtained elsewhere (Blandford,2001; Cahill , 2001; Harvey, 2001; Latacz-Lohmannand Hodge, 2001; Laurila, 2001; Mahe, 2001; OECD,2001; Tarditi, 2001; Thomson, 2001). A contrastbetween the US and the EU perspective on multi-functionality has been outlined by Freshwater (2002).Daily and Ellison (2002) discuss an even widervision of the role of farming in the economy of natureand in nature conservation.
Mid-Term Review
In July 2002, the EU Commission published a reportentitled a “Mid-Term Review of the Common Agri-cultural Policy.” Against expectations, this reportproposed decoupling direct payments from animalsand a shift to a single income payment per farm forall the relevant land-using enterprises. According tothe proposals:
Farms under this scheme will have complete farmingflexibili ty increasing market orientation, but pay-ments will be conditional on compliance with statu-tory environmental, food safety, and animal healthand welfare standards (Cross compliance). (Com-mission of the European Communities, 2002)
The stated ultimate aim is to include all crop andanimal regimes within this type of framework. Itproposed that farm audits be introduced to ensure thatthe compliance criteria are met. In contrast to thecurrent DP system, this mechanism would also bemuch more compatible with the EU vision of agri-culture and rural areas outlined earlier. The proposalsalso identify funds for financial support for voluntaryschemes, which will i nclude:
encouraging farmers to participate in quali ty assur-ance and certification schemes recognized by Mem-ber States or the EU including geographic indica-tions and designation of origin and organic farming.(Commission of the European Communities, 2002)
Although the future direction of EU agricultural pol-icy is now becoming clearer, several serious opera-tional aspects of the policy have yet to be resolved.Probably the most important in relation to the futureshape of EU farming is the degree to which the DPsare linked to land use and its stewardship versus landownership. The legal texts, published in January2003, further clarify the EU Commissions preferredoptions on the payment mechanism, eligibil ity cri-

7
teria, and the related compliance conditions (Com-mission of the European Communities, 2003). Theselegal texts will then form the basis for negotiationsand may lead to a new agreement for EU agriculturethat will operate for a number of years.
The justification and the compliance criteria for theDPs contained in the Mid-Term Review are verysimilar to the policy framework developed and pub-lished by Dunne and O’Connell (1998; 2000a,b;2002). The major difference between the two propos-als is in the details on how the DPs will be adminis-tered to the farmers. The Commission’s proposalrelies exclusively on an area-based payment on his-torical land use as against our preference for a com-bination of a payment per farmer or per householdand a reduced payment per hectare on current landuse. As noted earlier, we suggested including afarmer/household component to reduce the capitali -zation of DPs into assets, which would otherwiseincrease future production costs. Our proposal wouldalso provide for a stronger public good and socialdimension to meet local needs, especially in thepoorer regions of the Union. Table 1 summarizes thelikely impact of each payment option on the futurestructure of farms, farm enterprises and the generalrural area.
This re-orientation of the DPs has been described byDunne et al. (1999) as “using a [payments] schedulesimilar to the [EU] Farm Retirement Scheme but withREPS type requirements.” Irrespective of the methodused, decoupling of the current DPs would introducea whole new dynamic into the entire EU policy,farming and market interface. As the “center of grav-ity” of mainstream EU agriculture moves closer toecofriendly farming, the contrast between main-stream farming and organic farming is reduced. Thismay narrow the market scope and share for organicproducts, possibly confining it to a type of nichemarket.
The re-orientation of the DPs towards a paymentsystem for public goods wil l affect both the supply ofand demand for food within the EU. This will affectthe overall market balance and the need forsubsidized food exports. Once DPs are decoupledfrom the animals, it is difficult to predict the actualscale of the decline in animal numbers and prices,and the knock-on effects on the farm enterprise mix.But the expenditure on concentrate feed and fertiliz-ers will decrease to reflect these changes.
Preliminary estimates for Ireland suggest that com-pared to 1999, the expenditure reductions on pur-chased feeds and fertili zers could be of the order of20%, valued at approximately 190 and 65 mil lioneuro respectively. This would be the equivalent ofabout one mil lion tonnes of concentrates and about300,000 tonnes of fertilizers (Dunne and O’Connell ,2000b). A more comprehensive discussion of someof the direct and indirect implications of decouplingthe DPs from individual animals is given in Dunneand O’Connell (2002).
Summary
In the past, agricultural policy in the EU was primar-il y driven by the need for a secure food supply andthe objective of sustaining the economic and socialwell -being of farmers. For farmers this was essen-tiall y a volume business, which offered very limitedscope for ecofarming and ecolabeling.
In the affluent EU society of the 21st century, with itsabundance of food, agriculture and food policy willmainly be driven by the economic and social goals ofthis new society. In this society the value placed onan extra unit of food production is declining and pos-sibly negative, but the value placed on any publicgoods consumed in food production is increasing. Asa consequence, the mix of agricultural production andpublic goods that this society is prepared to supportfinancially is changing rapidly.
The level and components of farm incomes in Irelandand the EU in the 21st century will then reflect thesevalue changes. Farm revenue will consist of a mix ofpayments for conventional agricultural commoditiesor products and public goods. The public good pay-ments wil l be conditional on the level and type ofinputs used, farming practices, types of products, andconformance to a societal vision of the role of farm-ing. This wil l affect future production costs, scale ofoperation and the overall configuration of agricultureand rural society.
In comparison with the earlier years of the CAP, thisis a far more fertile territory for ecofriendly farmingpractices, food production and ecolabeling of food.The shift towards ecofriendly farming does, however,reduce the contrast between mainstream farming andorganic farming, which will narrow the market scopeand share for organic products.

8
References
Baldock, David, Janet Dwyer, and Jose M. SumpsiViñas. 2002. Environmental Integration and theCAP. A report to the European Commission, DG,Agriculture, prepared by the Institute for EuropeanEnvironmental Policy.
Bennett, Richard and Douglas Larson. 1996. Contin-gent valuation of the perceived benefits of farmanimal welfare legislation: an exploratory survey.Journal of Agricultural Economics 47(2):224-235.
Blandford, David. 2001. Oceans apart? European andU.S. agricultural policy concerns are converging.EuroChoices (Spring 2001):17-21.
Cahill, Carmel. 2001. The multifunctionality of agri-culture: what does it mean? EuroChoices (Spring2001):36-40.
Commission of the European Communities. 2002.Mid-Term Review of the Common AgriculturalPolicy: Communication from the Commission tothe Council and the European Parliament. Councilof Ministers, Brussels.
Commission of the European Communities. 2003.Proposals for Council Regulations. COM(2003) 23final.
Conner, D.S. 2003. The organic label: Does theUSDA definition conform to consumer prefer-ences? In W. Lockeretz (ed). Ecolabels and theGreening of the Food Market. Proceedings of aConference, November 7-9, 2002. Tufts Univer-sity, Boston, Massachusetts. pp. 35-39.
Daily, G.C., and K. Ellison. 2002. The New Econo-my of Nature: The Quest to Make ConservationProfitable. Island Press, Washington, DC.
DAFRD (Department of Agriculture, Food and RuralDevelopment [Ireland]). 2002. Eco-FriendlyFarming Report, May 2002. P.67169 Gr. 30-011,000 5/02 Brunswick Press Ltd, UK. (6885).
Darnhofer, Ika and Christian R. Vogl. 2003. Certifi-cation and accreditation of organics in Austria: im-plementation, strengths and weaknesses. In W.Lockeretz (ed). Ecolabels and the Greening of theFood Market. Proceedings of a Conference,November 7-9, 2002. Tufts University, Boston,Massachusetts. pp. 11-20.
Dunne, W. 1996. Beef production: performance andprospects. In Proceedings of the Agri-Food Eco-nomics Conference. Teagasc, 19 SandymountAvenue, Dublin 4, Ireland. pp. 3-12.
Dunne, W., and J.J. O’Connell . 1998. Consumer ori-ented direct payments for beef producers. Pre-
sented at EAAE Seminar on Long Term Prospectsfor the Beef Industry, Bercy-Expo, Paris.
Dunne, W., and J.J. O’Connell . 2000a. Public goodissues in direct payments for li vestock producers.In Proceedings of the Fifth International Sympo-sium on Livestock Farming Systems. EAAP Publi -cation No. 97, pp. 134-138.
Dunne, W., and J.J. O’Connell . 2000b. The mainsources and components of farm incomes in the21st century. In Proceedings of the Agri-Food Eco-nomics Conference. Teagasc, 19 SandymountAvenue, Dublin 4, Ireland. pp. 25-39.
Dunne, W., and J.J. O’Connell . 2002. A multicom-modity EU policy framework incorporating publicgood criteria into the direct payment system in ag-riculture. Paper presented at Tenth Congress,European Association of Agricultural Economists(EAAE) on Exploring Diversity in the EuropeanAgri-food System, Zaragoza, Spain.
Dunne, W., E. O’Riordan, and D. Troy. 1999. Fore-sight for the beef industry 2010. In Proceedings ofthe Agri-Food Millennium Conference. Teagasc,19 Sandymount Avenue, Dublin 4, Ireland. pp. 65-71.
Freshwater, D. 2002. A US perspective on multi -functionality. Paper presented at Tenth Congress,European Association of Agricultural Economists(EAAE) on Exploring Diversity in the EuropeanAgri-food System, Zaragoza, Spain.
Girardin, P., and E. Sardet. 2003. Assessment ofenvironmental standards for arable farms. In W.Lockeretz (ed). Ecolabels and the Greening of theFood Market. Proceedings of a Conference,November 7-9, 2002. Tufts University, Boston,Massachusetts. pp. 197-205.
Harvey, David. 2001. How necessary is governmentsupport and regulation of agriculture? EuroChoices(Spring 2001):59.
Henson, Spencer. 1996. Consumer willingness to payfor reductions in the risk of food poisoning in theUK. Journal of Agricultural Economics 47(3):403-420.
Kline, Jeffrey, and Dennis Wichelns. 1996. Measur-ing public preferences for the environmentalamenities provided by farmland. European Reviewof Agricultural Economics 23:421-426.
Latacz-Lohmann, Uwe and Ian Hodge. 2001. Multi-functionality and free trade: conflict or harmony?EuroChoices (Spring 2001):42-46,
Laurila, Ilkka P. 2000. European model of agricul-ture. Research Reports 241. Agricultural Econom-

9
ics Research Institute, PO Box 3, FIN-00411 Hel-sinki, Finland. pp. 59-75.
Mahe, Louis-Pascal. 2001. Can the European modelbe negotiable in the WTO? EuroChoices (Spring2001):10-15.
McInerney, John. 1996. Old economics for new prob-lems: livestock disease. Presidential Address. Jour-nal of Agricultural Economics 47(3):295-314.
O’Connell, J.J., W. Dunne, and U. Shanahan. 1999.An evaluation of changes in the EU interventionsystem and labeling regulations in relation to Irishcattle prices. Working paper No.2. In Developmentof a Strategic Approach for a Single EU Beef Mar-ket. Published by Rural Economy Research Centre,Teagasc, 19 Sandymount Avenue, Dublin 4, Ire-land.
OECD. 2001. Multifunctionality: Towards an Ana-lytical Framework. OECD, Paris.
Tarditi, Secondo. 2001. Farmers and consumers:towards symbiosis? EuroChoices (Spring 2001):23.
Thomson, Kenneth, J. 2001. Agricultural economicsand rural development: marriage or divorce? Jour-nal of Agricultural Economics 52(3):1-10.
VanWechel, Tamara and Cheryl J. Wachenheim.2003. The influence of biased information on con-sumers’ willingness to pay for products labeled asfree of genetically modified ingredients. In W.Lockeretz (ed). Ecolabels and the Greening of theFood Market. Proceedings of a Conference, Nov-ember 7-9, 2002. Tufts University, Boston, Massa-chusetts. pp. 159-166.
Table 1. The impact of the structure of the DP mix on farming and rural areas (Dunne and O’Connell, 2002)
A straight area payment would: A payment with a high farmer/household componentwould:
• Favor the larger farmers
• Encourage restructuring of holdings
• Facilitate the exploitation of economies of scale
• Reduce the unit costs of production
• Be quickly capitalized into land values
• Encourage out-migration of people
• Favor smaller farms
• Transfer almost directly into farmer or householdincome
• Reduce the mobility of land use and ownership
• Increase the likelihood of part-time farming
• Increase the incentive to engage in farmenterprises and production practices that arecompatible with part-time farming

10
Annex 1: Criteria for EU intervention purchasesa
Commonwheat
• A specific weight of 73 kg/hl and a penalty of 0.5 euro per kg below 76 kg/hl
• The ability to pass the EU’s dough machinability test (below 30)
• Moisture content of 14.5%, a discount of 0.2 euro per 0.1% moisture applied between 14%and 14.5%
• A Hagberg falling number of at least 220 seconds including a preparation-agitation time of 60seconds
• A Zelany index of at least 22
• A protein content (dry matter basis) of at least 11.5%. Penalties exist for protein contentbelow 11.5% and a minimum acceptable level of 10.5%
Beef
• Adult bovine animals are categorized on the basis of an EU classification grid of carcassconformation and fat cover (Council Regulation 1208/81)
• Member States are required to report each week the deadweight prices using the EUclassification grid for specific categories for steers, bulls, heifers and cows
• Intervention buying in prices are fixed by the EU Beef Management Committee on the basisof tenders received
• Only beef from male animals is eligible for intervention
• Intervention will be opened if for two consecutive weeks the average market price in aMember State recorded on the basis of the EU carcass classification scale falls below 1,560euro per tonne
• Accepted tenders must be equal to or less than the average market price recorded in aMember State
• Intervention buying-in will close when, during one week, the average market price in aMember State is no longer less than 1,560 euro per tonne
Skimmilkpowder(sprayprocess)
• Intervention does not operate during the winter months
• Minimum protein (dry matter basis) of 35.6% in the non-fat dry matter
• Agencies can purchase powder down to a minimum of 31.4% with the price reduced pro rata
• Product must have been manufactured within 30 days before being offered to intervention
• Payment is made 120 to 140 days after the powder has entered storage
• Further details on quality and packaging are specified in EU regulation 214/2001
Butter
• Made from pasteurized cream, a minimum fat content of 82% and a maximum water contentof 16%
• Payment is made between 45 and 65 days after being taken into store
• Intervention arrangements are specified in Article 6 of EU Regulation 1255/1999
• Procedures for tendering and measuring market prices and quality checks and specificationsare outlined in EU Regulation 2771/1999
aCompiled from information in CAP Monitor, published by Agra Europe (London) Ltd, Tunbridge Wells, UK.
11
Certification and Accreditation of Organics in Austria:Implementation, Strengths and Weaknesses
Ika Darnhofer1 and Christian R. Vogl2
____________________________1Institute of Agricultural Economics, University of Agricultural Sciences Vienna, Peter Jordan Str. 82, A-1190 Vienna,Austria. Corresponding author. Email: [email protected]
2Institute of Organic Farming, University of Agricultural Sciences Vienna, Gregor Mendel Str. 33, A-1180 Vienna, Austria.Email: [email protected]
Over the past few years, policy makers have sup-ported the development of organic farming at theEuropean and national level as a process that contrib-utes to environmentally sound farming practices. InAustria, about 9% of farms are currently under certi-fied organic management, the highest percentage inthe European Union (EU). Several factors have con-tributed to this: the activities of organic farmers’associations; the early inclusion of guidelines fororganic crop production and animal husbandry in theAustrian Codex Alimentarius; government supportthrough direct payments for organic farms during andafter conversion; the early commitment of super-market chains; and the establishment of a privateorganic marketing company (Vogl and Hess, 1999).
Within the EU, the ongoing changes in the CommonAgricultural Policy have shifted farm income supportfrom product price intervention to direct paymentsnot linked to production (Dunne and O’Connell ,2003). However, if direct payments for organicfarming are seen by European governments as a nec-essary tool to reward farmers for the preservation ofpublic goods, they are at the same time the subject ofcritical discussions. As a result, market instrumentsthat support demand, such as labels for organic prod-ucts and the marketing of these products, are gainingimportance. Because organic farming currently is theonly farming approach that is supported by an ex-plicit legal definition and international agreements, ithas an edge over other ecolabels. The defined stan-dards are intended to promote consumer confidenceand prevent an undermining of the market throughfraudulent trading.
Structure of Certification in Austria
EU regulations
With the European Council Regulation (EEC) Nr.
2092/91 and its amendments (henceforth called the“EU Regulation”) the EU has created the regulatoryframework for the organic farming sector in Europe(Lampkin et al., 1999). The EU Regulation identifiesthe production methods that are permitted as well asthose that are prohibited, and lists all the inputs thatmay be used. It also includes processing rules thatmust be satisfied for a product to be labeled“organic.”
The EU Regulation also specifies the inspection andcertification regime that is obligatory for operatorsinvolved in putting organic products on the market. Itrequires that all operators involved in the production,processing, packaging and labeling of organic prod-ucts be officially registered, inspected and certified.Member States must establish an inspection systemoperated either by private certification bodies satis-fying the quality standard EN 45011 (the Europeanversion of ISO Guide 65), or by public certificationauthorities. These certification bodies must besupervised and a system of information exchangebetween the certification bodies and the publicauthorities must be set up to communicate irregulari-ties and infringements found during inspections.Given the differences in conditions and traditionswithin Europe, some issues within the EU Regulationmay be decided at national level.
The EU Regulation, which was passed in June 1991and implemented as of January 1, 1993, is legallybinding in all Member States and must be fulfilled byany imported product. So far, it has been amendedmore than 40 times in an effort to increase thespecificity of the regulations and close loopholes,thus reducing the room for interpretation. One of themajor amendments to date (EEC 1804/99) coversproduction, labeling and inspection of the mostrelevant livestock species (cattle, sheep, goats, horsesand poultry), as the original EU Regulation covered

12
only products of plant origin. The amendment also explicitly excludes genetically modified organisms (GMOs) and products derived from them from organic production.
Organic food products can be imported from non-EU countries when it can be ascertained that the production rules and the inspection measures for organic foods comply with or are equivalent to the EU Regulation. This can be ensured by access to the “List of Third Countries.” To be included in this list, the applicant country must already have enacted organic farming legislation and have a fully functional system of inspection and monitoring. By the end of 2002 the list comprised Argentina, Australia, the Czech Republic, Hungary, Israel, New Zealand, and Switzerland. Exporters from countries not on this list need an import permit. To be granted such a permit, exporters apply for inspection of the operators by an EU-inspection body or an EU-assessed national body (Kilcher et al., 2001).
Implementation in Austria Since 1983 Austria has had a national legal definition of organic farming that covers both plants and live-
stock within Chapter A.8. of the Austrian Codex Alimentarius. In preparation for the accession to the EU in 1995, the EU Regulation was implemented on July 1, 1994. Whenever an amendment of the EU Regulation is published, it replaces the respective Austrian Codex Standards, as was the case when animal production was regulated by the EU in 1999.
The control and certification process for farms, prod-ucts and processors and the accreditation process for certification bodies is characterized by a tripartite approach (Figure 1), where each ministry focuses on a specific agenda. First, the Federal Ministry of Social Security, as the central Competent Authority, implements the EU Regulation and focuses on its main goal of protecting consumers from fraud and producers from unfair competition. Second, the Fed-eral Ministry for Economic Affairs and Labor ensures that inspection and certification activities comply with EN 45011. Third, the Federal Ministry for Agri-culture, Forestry, Environment and Water Manage-ment focuses on environmental conservation. It ad-ministers the Agri-Environment Program of the EU (EEC 2078/92), offering direct payments to certified organic farmers participating in the program.
Figure 1. Overview of bodies involved in control, certification and standards for organic farms and products in Austria.

13
The Ministry of Social Security has a coordinatingrole with regard to the EU Regulation, includinglimited administrative and legislative powers. Actualimplementation is devolved by the Austrian Food Actto the nine State Governors, acting through theirrespective State Food Authorities. A State FoodAuthority issues a provisional approval pendingaccreditation of the certification body. When ac-creditation is achieved, the certification body receivesfinal approval from the state where its head office islocated and further approvals from the other stateswhere it intends to operate and has submitted an ap-plication. In Austria all certification bodies operate inmore than one state. Supervision of the private certi-fication bodies is carried out by each state, with thesupervision of administration and documentationtaking place in the state where the certification bodyhas its head office. There is no cross-supervisionbetween states and the intensity and approach tosupervision differs from state to state (EuropeanCommission, 2001). Supervision only covers thecertification of legal requirements, as private stan-dards are not within the supervisory role of stateauthorities.
The State Food Authorities, as well as the FederalAgencies for the Surveillance of Food Safety, arealso in charge or analyzing food samples for residues,levels of contamination, nitrate content, etc., withintheir food monitoring programs. These programs arenot specific to organic products but may include themin their sampling procedures.
The Subcommittee for Organic Farming of theAustrian Codex Alimentarius Committee, which islocated within the Federal Ministry of Social Secu-rity, plays an important role as it is the forum to dis-cuss rules and criteria on aspects not yet covered bythe EU Regulation. Its bi-monthly meetings areattended by officials from all i nvolved authorities aswell as representatives of all stakeholders (e.g., con-sumers, producers, and retail interest groups). Thewide membership ensures that the decision process istransparent and decisions have broad support. Onceconsensus is reached, the Subcommittee advises thePlenary of the Austrian Codex Alimentarius Com-mittee. This Plenary has the power to decide whichstandards are to be published in the Codex. Thesestandards do not have the status of a law, but are anobjective professional expert statement. The Sub-committee also advises the representatives of theFederal Ministry of Social Security in their negotia-tions on the EU Regulation in Brussels.
An amendment of the EU Regulation (EEC 1935/95),which took effect in 1998, was interpreted in Austriaas requiring certification bodies to be accredited.Therefore the Austrian Accreditation Service, whichis part of the Ministry of Economic Affairs, grantsaccreditation following an assessment of the certifi-cation body’s quality management manual, a two-dayoffice audit, and a one-day witnessed inspection, i.e.,an on-the-spot inspection of an operator. The purposeof accreditation, which is granted for five years, is toconfirm that the certification body has established aquality management system according to EN 45011,as well as qualified staff and the necessary resources.As part of its supervision duties, the AccreditationService audits the certification bodies annually,which can include witnessed inspections or re-inspection of a sample of operators.
Accreditation led to a harmonization of the certifiers’operation procedures, such as the content of contractswith clients, information policy towards clients,education and training of staff and inspectors, sepa-ration between inspection and the certification deci-sion, handling of complaints by organic farmers, anddocumentation requirements (Vogl, 2000).
The Ministry of Agriculture is in charge of imple-menting the Agri-Environment Program (based onEEC 2078/92), which in Austria encompasses 31schemes, including organic farming. Farmers cantake part in the program through a voluntary five-year contract. The program is administered on behalfof the Ministry by Agrarmarkt Austria (AMA), whichalso administers other direct payments to farmerswithin the Common Agricultural Policy. The Techni-cal Inspection Service of AMA controls the properapplication of the schemes, for which farmers receivedirect payments. Within these controls, 5% of farm-ers participating in the scheme “organic farming” willbe inspected each year, with farms selected accordingto a risk assessment system.
A subsidiary of AMA is AMA Marketing, which,among other things, licenses the AMA organic logo,
administers the AMA quality seal (notorganic), and is in charge of ad campaignsin support of Austrian agriculture. TheAMA organic logo exists in two versions:one is colored red, white and black andindicates that the majority of its ingredientsare of Austrian origin. The other is black
and white and indicates that the ingredients originatemainly from foreign countries.
14
There are seven accredited certification bodies oper-ating in Austria, which are either non-profit or for-profit private organizations. Shares are held by pri-vate citizens, by enterprises that work in the inspec-tion business at large, or by organic farmers’ associa-tions. The inspectors visit farms annually and proces-sors several times per year, mostly unannounced.Inspection and certification may be performed by thesame body, but within the body these two steps haveto be administered by two different people (inspector,certifier) in two distinct steps. A certificate is grantedby the certification body only if the inspection reportis complete and plausible, and fulfills all legal re-quirements. Farmers must have such a certificate toreceive direct payments for organic farming and to beallowed to label produce as organic.
Besides the legal regulations, private standards, e.g.those of an organic farmer association or a privatelabel, also are certified. The private standards reflectspecific concerns and interests of the respectivegroup. For example, farmers highly concerned withanimal welfare join an organic farmers’ associationwith regulations on animal keeping, breeding, feed-ing and veterinary medicine that are stricter than theEU Regulation. These farmers and their associationadvertise their approach to organic farming to gain acomparative advantage, for example biodynamicfarmers, organic farmers of certain regions, and cer-tain processors and retailers.
Bio Ernte Austria is the most power-ful organic farmers’ association,with about 50% of all Austrian or-ganic farmers as members. Its stan-dards are stricter than those of theAustrian Codex. As early as the
1960s, the association started to establish an inspec-tion system and to advertise their organic brand.
‘Ja! Natürlich’ is the best known tradelabel in Austria and belongs to thesupermarket chain Rewe (Bil la, Mer-kur). Most of the products of Austrian
origin sold under this label are produced by farmersbelonging to Bio Ernte Austria. All organic farmers
delivering to this and to other labels(e.g. ‘Natur pur’ of Spar) have tofulfill additional requirements that go
beyond the EU Regulation, Austrian Codex standardsand farmer associations’ standards. Conversely, theretailers also are bound by a contract with farmerassociations to purchase organic products fromAustrian farmers first, and foreign products only if
domestic ones are not available.
Appraisal of the Austrian Implementation
Over the four years since accreditation was imple-mented, inspection and certification of organics inAustria have evolved into a highly professional andtransparent system, not least because of the accredi-tation requirement and its accompanying supervision.However, although the first steps for harmonizationof the work of the certification bodies were success-fully implemented, several areas of the certifyingsystem still have potential for improvement. Theseinclude: harmonization of certifiers’ internal guide-lines and procedures for sanctions; improved infor-mation exchange between state and federal authori-ties; and tighter supervision in certain areas.
Harmonization
Although certification bodies do not define their ownset of standards, there can be differences in the inter-pretation of the EU Regulation because of severalimprecisely worded passages, resulting in internalguidelines drafted by the certifiers. These are clearedwith the State Authority, but might not be sharedwith other certification bodies, leading to differencesin interpretation and application of the regulations.However, standardized certification requirementsbased upon harmonized guidelines and sanctions arenecessary, given that the certifiers are in competitionwith each other. This competition can result in apressure to take advantage of the latitude left in theEU Regulation and lead to a customer-friendly inter-pretation and leniency. This is particularly temptingwhen the customer is not a small family farm, but alarge operation or retailer, as inspection fees arebased on the size of the operation. It therefore isimportant that supervision also ensures that the certi-fication bodies are economically independent so as tobe able to exclude a large customer (Vogl, 1998).
Communication
Currently there is limited communication, coordina-tion and data exchange between state and federalauthorities involved in supervising certification bod-ies or analyzing food along the food chain. This notonly inhibits the prompt tracing of irregularities, italso impairs the forwarding of relevant information toconcerned authorities and agencies. An example isthat according to EN 45011 a list of certified productsmust be published, but because of data privacyconcerns, these li sts are not made public in theirentirety in a timely fashion. Another example is that
15
currently each certification body provides the StateAuthority with a confidential l ist of all operators itcertified. The data regarding termination of a certifi-cation contract is thus kept up to date by the StateAuthority, but not publicized or communicated torelevant bodies (e.g., AMA, as farms are only eligiblefor direct payments for organic farming if they have avalid contract with a certifying body). A majorimpediment to the free flow of data are the strictprovisions of data privacy protection; currently thereis no consensus on how they should be interpreted inthe context of organic certification.
Supervision
Two authorities are currently in charge of supervisingcertification bodies: the Accreditation Service and theState Authorities. Based on a supervision plan andusing a specially trained team, the AccreditationService audits certification bodies every year toensure they comply with EN 45011. Although thissupervision focuses primarily on issues of qualitymanagement and documentation, two technical ex-perts for organic farming ensure that quality manage-ment and operation procedures reflect and respect theEU Regulation and Austrian Codex Standards.
Supervision by the State Authorities does not havesuch clearly defined procedures. For example, an EUevaluation mission noted that there were no writtensupervision plans for 2001 (European Commission,2001). Also, the State Authorities barely challenge orassess the quality of the technical work of the certifi-cation bodies, either through evaluation of operators’files or certification decisions or through witnessedinspections or re-inspection of a sample of operators.
However, given several potential conflicts of interestinvolving certification bodies, there is a need for tightsupervision. For example, because some farmers’associations hold shares of certification bodies, therecan be a perception that organic farmers inspectthemselves. This would contradict the requirementthat certification bodies be independent, that is, thatthey cannot be influenced by the interests of farmers,associations, traders, processors or retailers, even ifthese are their customers. Indeed, unless close con-tacts between certifiers and processors or retailers areavoided or supervised, it is conceivable that a poten-tial problem is covered up by quietly withdrawing theproducts from the shelves to avoid negative publicity.These issues currently are partially addressed throughthe supervision by the Accreditation Service, whichincludes procedures to assess the independence of
certification bodies and their employees from farmerassociations, institutions, and dealers in organicproducts or inputs for organic farms (Vogl, 1998).
Regulations
Some of the problems in the certification of organicproducts are due not to flaws in the organization ofaccreditation, certification and supervision, but toloopholes left in the EU Regulations or the methodsof inspection defined there. Indeed, not all organiza-tions involved in the market for organic foods areincluded in the certification system, particularly thetrade, which does not yet fall under the scope of theEU Regulation as long as it does not produce, pack,process or label organic products (The Organic Stan-dard, Nov. 2001, p. 8). Also, the EU Regulation doesnot include specific statements regarding the inspec-tion procedures to be followed with regard to tradeand processing of animal feed (KdK, 2002).
The EU Regulation, acknowledging the possibility ofsupply shortages in the still-developing organic mar-ket, includes the provision that to some extent con-ventional products can be used in feedstuffs untilDecember 2003. This provision creates a gray zonethat can lead to errors and even entice fraudulentbehavior, as recent incidents in Austria have shown(Purkarthofer, 2002)
The methods of inspection stipulated in the EURegulations, such as the requirement that eachoperator be visited once a year, have also been criti-cized. The current system can mean that too muchtime is spent inspecting production that is full y com-pliant, while too little is spent on cases with realproblems (Rundgren, 1999). It might be more effi-cient to visit some operators frequently, but othersonly every 18 months. This could go hand-in-handwith the introduction of a risk-oriented system suchas the HACCP principle (Hazard Analyses CriticalControl Point), that is, points where there is a highprobabili ty that improper inspection may allow orcontribute to a loss of organic integrity (Heinonen,2001).
Another aspect that could be considered is the inter-nal quality management of operators (Rundgren,1999). Indeed, if operators implement regular internalsampling and analysis as well as complete traceabil-ity of products, the burden of inspection costs couldbe reduced. Inspections at enterprises that are certi-fied according to a quality management norm, suchas the ISO family, already offer certification bodies adeeper and more detailed insight into the flow of

16
organic goods through the enterprise. Operatorsmight prefer such cooperation to complete legalregulation (Browne et al., 2000).
However, while including quality management sys-tems at the trader and processor level are a promisingapproach, similar calls at the farm level (Bradley andvan Houten, 2000) do not seem helpful in Austria.Indeed, because most organic farms are family farms,the farmer has limited time and training. Also, thefarmer’s management decisions are highly dependenton unpredictable external factors such as the weatheror market developments, making it unlikely that afarm plan spanning several years and covering bothgeneral management practices as well as plantingpatterns and animal husbandry can be adhered to.Thus, the AMA presently requires crop plans only forthe current year, since these are necessary to calculatevarious direct payments.
Consumers’ and Farmers’ Perspectives
Limits of certification in ensuring consumerconfidence
Because consumers may be buying organic productsfor reasons of health as well as environmental con-cerns, high profile news stories of contaminated orunsafe conventional food increase the demand forthem. It is then crucial to preserve the credibility oforganic labels so as not to undermine consumers’trust in organic products. Certification has a key roleto play in ensuring that incidents similar to thosereported from conventional foods do not occur in theorganic food chain.
At the same time, the limits of certification as a wayto prevent loss of consumer confidence must also beclear. Indeed, several legal provisions made to ac-commodate industry needs and interests in a still -developing market are a potential source of consumerdisillusionment. For example the AMA Marketingorganic logo, in accordance with the EU Regulation,allows up to 5% of selected ingredients to originatefrom conventional production, although the logo canbe perceived as implying 100% organic. Also, if theproduct contains raw ingredients that cannot be pro-duced in Austria, up to 30% of foreign organic ingre-dients can be used, although the logo implies an or-ganic product of Austrian origin. Although theseprovisions are necessary to allow some leeway forprocessors as long as the market cannot ensure acontinuous supply of organic products of the requiredorigin and quality, most consumers are not aware of
them and may feel cheated. In addition, AMAMarketing was heavily criticized by environmentalorganizations and the organic movement for itschoice of advertisements promoting regional andnational labels that could be perceived by consumersas being organic although they are not.
A similar unresolved issue is the fact that the EURegulation stipulates that organic products must beGMO-free. However what “GMO free” means hasnot been clearly defined in many European countries,leaving room for interpretation. In Austria the limitfor “GMO free” is 0.1 % of the total DNA within theframework of “ inevitable contamination,” which isnot the zero-tolerance policy that consumers mightexpect.
Another potential source of consumer insecurity areorganic products revealing traces of prohibitedchemicals. Because organic products are routinelystored next to conventional products, cross contami-nation is bound to occur, as is commingling when thetwo kinds are processed in the same plant.
Besides these issues based on legal tolerance marginsand poor practices by processors and retailers, an-other source of confusion is misleading labeling. TheEU Regulation states that words like “organic,”“ecological,” “biological,” and shortened forms li ke“bio” and “eco” must refer to organic productionmethods; if that is not the case, the matter might behandled as fraud. This also includes all terms thatmight be understood by consumers as similar to theabove mentioned terms, e.g. “controlled,” “ inte-grated” or “natural.” This has led to a significantreduction of misleading and fraudulent advertising onthe Austrian market. Nevertheless, several companiestry to use the positive image of organic farming bydesigning labels positioning their products close tothe organics.
This is especially true for companies with a trade-mark that contain the terms “bio” or “öko” and thatwas registered before January 1, 1995. They can usethis trademark until 2006, although it must be clearlymentioned on the product that it originated from con-ventional farming. However this is not always en-forced (Mergil i, 2002). The likelihood of consumerconfusion is particularly high if the brand sells bothconventional and organic foods with li ttle differencein package design.
Finally, confusing labeling also occurs because sev-eral product groups, such as flowers, wine, textiles,wild fish, and wild animals, are not included in the

17
EU Regulation, so that organic claims can be madewith impunity. As a response, the Austrian CodexAlimentarius Committee started to regulate thesesectors through national standards, as is the case forthe organic production of deer and fish.
Farmers’ need for clar ity
Several farmers’ associations, although appreciatingthe need for inspection and thorough documentationas part of the special status of organic farming, havecriticized the lack of harmonization in the documen-tation requirements and the farm inspection methods.Indeed, the criteria used and the sanctions imposedby the Ministry of Agriculture differ in several pointsfrom those of the Ministry of Social Security. Thedifferences are mainly due to the fact that the Minis-try of Agriculture focuses on environmental protec-tion, whereas the Ministry of Social Security focuseson consumer protection. The situation is worsened bythe poor communication policy of AMA, because theAMA Technical Inspection Service does not have tofollow EN 45011 and keeps its criteria for sanctionsconfidential.
The AMA is thus often perceived by farmers as akind of “black box,” since they do not understand thereasons for the differences in sanctions by AMA andby certification bodies for the same facts (Vogl,1998). It would be advantageous to design oneuniform structure and harmonize the required recordsthat farmers must keep. Inspection procedures oforganic certification and Agri-Environment Programcontrols also could be harmonized. This wouldincrease the efficiency and effectiveness ofinspections and ease farmers’ administrative burden.
The multiple inspection of farms can also be a bur-den. Each organic farm is inspected at least once peryear by a certification body. In addition it may besampled and controlled by AMA or by inspectionservices of brand labels. Finally, it may be sampledfor inspection as part of the supervisory activities ofvarious authorities. Overall it has been estimated thatan organic farm could be inspected up to 11 times ina year (Vogl, 1998). And that does not includeinspections in the framework of regulations that areseparate from organic farming, such as water laws,food safety, hygiene standards, veterinary medicine,and taxes. The possibility of coordinating suchinspections should be investigated.
Insuff icient extension services are also a pressingissue in light of the ongoing updates of the EURegulation as well as the Austrian specifications
within the Agri-Environment Program. Althoughthese updates lead to a sustained improvement ofregulations, they also create a constant source ofuncertainty over whether a specific standard has beenchanged, whether that change has taken effect, andwhether the farmer is risking sanctions. To secureobjectivity, independence, and the quality of deci-sions, EN 45011 mandates that the certification bod-ies cannot be involved in advisory services. The needto inform organic farmers of regulations, standardsand their amendments is thus primarily covered byemployees of the organic farmers’ associations andby the District Authorities for Agriculture. The Dis-trict Authorities especially may have a very variedunderstanding and interest in organic farming,resulting in an uneven level of information madeavailable to farmers.
Discussion and Conclusion
In Austria, the densely woven web of inspection,certification, accreditation and supervision ensuresthat legal and private standards are adhered to. How-ever, it must be recognized that certification is noguarantee in itself and that ultimately its role is toreconfirm that the producers and the processors arekeeping their guarantees (Rundgren, 1999). Certifi-cation is thus no panacea, but only one part of aquality assurance system ensuring the smooth func-tioning of the organic market. This is all the moretrue when considering that certification can only beas good as the standards it is based on. The standards,however, are only compromises between aims andtheir technically and economically sound implemen-tation (Heinonen, 2001). At the same time, it is notpossible to develop standards to cover all situations,nor to standardize the handling of all possible viola-tions (Rundgren, 1999).
The question, then, is how to ensure appropriateinspection and certification while considering thecosts and administration involved. Indeed, consumerswill not continue to pay a premium if the certificationof organic products primarily ends up feeding agrowing bureaucracy and producing excess paper(Baummann, 2001).
The regulations, both at the EU and the Austrianlevel, have so far focused on regulating production atthe farm level. However, most of the publicized ir-regularities have involved organic products after theyleft the farm. The initial focus on the production as-pect can be seen as a response to an image whereorganic farming was primarily made up of family

18
farms engaged in on-farm processing and direct sell -ing. However, this image is being overrun by reality:as the market for organic products grows, industriesand supermarkets get involved and the volume of or-ganic products being transported, stored, and indus-trially processed and retailed grows considerably.
Thus the instruments needed to ensure organic qual-ity have changed; in particular, the need for a cen-tralized database has been voiced (KdK, 2002). Sucha database would combine the piecemeal informationthat is available at various authorities and agencies.The goal is to improve transparency and allow acomprehensive analysis of the flow of organic goods,which could then be traced along the complete foodchain, from farm inputs and production, through trad-ers and storage, to processing and retail. This wouldallow plausibility, product integrity and traceabilityto be checked more easily and would dramaticallyincrease the efficiency of inspections.
To accommodate concerns about privacy of data, theaccess to the database could be restricted to a limitednumber of federal agents. A database alone cannot besufficient to address the issue. It is indispensable tohave dedicated government employees whose objec-tive is not only to analyze the data but also to inquirein cases of suspected irregularities as well as routinetracing of product flows along the food chain. Suchan authority would address the weakest point of thecurrent certification system, namely organic productflows across boundaries: between states, operators,certification bodies, etc.
This authority should be at the federal level, as only agovernment entity has the necessary legal authority toenforce minimum standards (Lohr, 1998) as well asthe independence to ensure objectivity and uniform-ity. Also, volume flow controls are about baselinerequirements, thus there is no need to adjust to re-gional and local circumstances, which could be achallenge to a central authority.
Despite some flaws in overall coordination, the cur-rent system of private certification bodies has provenrobust. Indeed, as found in Sweden (Baummann,2001), a private certification body has advantagesover a state one. First, in Austria most certificationbodies were created by organic farmers’ associationsor organizations rooted in the organic movement.They therefore tend to be committed to the values oforganic farming. This is a benefit compared tocertification by public authorities, who tend to focuson administrative matters rather than the correspon-
dence of values and regulation, as reported fromDenmark (Michelsen, 2001). Second, privatecertifiers in Austria also tend to have employeesresiding in their assigned region. This allows them amore accurate assessment of a specific situation, suchas a drought that reduces seed availability. It alsoallows certifiers to deal with the need to developdifferent solutions to similar problems in differentenvironments, which is an integral part of organicfarming (Michelsen, 2001).
Local roots also ensure certifiers a better level ofinformation through their involvement in both formaland informal communication networks. Thus opera-tor peer-control can play a role in identifyingpotential problems, and not limit control of an organ-ic farm or processor to the yearly visit(s). As long assupervision ensures impartiality of the certifiers,these are valuable features of a certification systemthat aims at doing justice to the needs of organicfarming.
For it must be acknowledged that organic farmingcannot be reduced to checklists, since it is also asocial and ecological movement. Standardized pro-duction method and regulations have difficultiescoping with such a phenomenon (Rundgren, 1997).Thus there is a great need for clarity and simpli fica-tion in our understanding of what organic farmingreally stands for, so that it to stands out as a real pro-duction alternative and not simply as a productionmethod that complies with a set of more or lesstransparent regulations (DARCOF, 2000).
In the present situation, where consumers in increas-ing numbers are concerned about degradation ofstandards, food quality, and so forth, it is easy to askfor strict rules, high standards, and efficient inspec-tion in organic agriculture. But often what consumersexpect is a higher moral standard: just as the organicfarmer should not exploit the soil or the li vestock, so,too, the consumers hope that they are not exploitedwhen buying organically produced food (Kettlitz,2002). Indeed, even if organic growth is based onshort-term concerns about health and food security, italso responds to long-term concerns about our soci-ety, a quest for old and new values, a search for thetruth behind notions such as “natural” (Haest, 2000),and a need for authentic products (Kelterborn, 2000).Therefore if standards, regulations and certificationprocedures betray the core of what organic farmingstands for, it might well also betray the expectation ofconsumers who are searching for an alternative.

19
References
Baummann, P. 2001. Securing against fraud. In Pro-ceedings of the conference “Organic Food andFarming – Towards Partnership and Action inEurope.” The Danish Ministry of Food, Agricul-ture and Fisheries. pp. 98-100. Available on-line:http://www.fvm.dk/kundeupload/konferencer/
organic_ food_farming/index.htmBradley, R., and K. van Houten. 2000. Inclusion of
management systems requirements into organicproduction standards. In T. Alföldi, W. Lockeretz,and U. Niggli (eds). IFOAM 2000 – The WorldGrows Organic. Proceedings of the 13th Interna-tional IFOAM Scientific Conf., 28-31 August2000, Basel. Vdf Hochschulverlag, Zurich. p. 585.
Browne, A.W., P.J.C. Harris, H. Hofny-Colli ns, N.Pasiecznik and R.R. Wallace. 2000. Organic pro-duction and ethical trade: definition, practice andlinks. Food Policy 25:69-89.
DARCOF. 2000. Principles of organic farming. Dis-cussion document prepared for the DARCOF Us-ers Committee. Danish Research Centre forOrganic Farming, Foulum. Available on-line:http://www.foejo.dk
Dunne, W., and J.J. O’Connell . 2003. Evolving EUfood production policy: implications for eco-labeling. In W. Lockeretz (ed). Ecolabels and theGreening of the Food Market. Proceedings of aConference, November 7-9, 2002. Tufts Univer-sity, Boston, Massachusetts. pp. 1-10.
European Commission. 2001. Final report on a mis-sion carried out in Austria from 5 to 9 March 2001in order to evaluate the application of CouncilRegulation (EEC) No 2092/91 to organic farmingin Austria. DG Health and Consumer Protection,Directorate F – Food and Veterinary Office.
Haest, C. 2000. Organic agriculture, a durable trend.In C. Haest and U. Meier (eds). Proceedings of theIFOAM 2nd International Seminar “Organic in theSupermarket,” August 25, 2002, Basel. Availableon-line: http://www.fibl.ch/buehne/archiv/haest-
meier-2000-supermarkt.htmlHeinonen, S. 2001. The role of legislation. In Pro-
ceedings of the conference “Organic Food andFarming - Towards Partnership and Action inEurope.” The Danish Ministry of Food, Agricul-ture and Fisheries. pp. 91-94. Available on-line:http://www.fvm.dk/kundeupload/konferencer/organic_ food_farming/index.htm
KdK. 2002. Positionspapier der Konferenz derKontrollstelle e.V. zum Kontrollsystem und Ver-
fahren nach Verordnung (EWG) Nr. 2092/91 (EG-Öko-VO) (Position paper of the Conference ofControl Bodies on the control system and methodsaccording to EU Regulation 2092/91). Konferenzder Kontrollstellen e.V., Göttingen, Germany.Available on-line: http://www.bioland.de/presse/PositionspapierKdK.pdf
Kelterborn, L. 2000. Positionierung von Bioproduk-ten im Supermarkt (Positioning of organic productsin the supermarket). In C. Haest and U. Meier(eds). Proceedings of the IFOAM 2nd InternationalSeminar “Organic in the Supermarket.” August 25,2002, Basel. Available on-line: http://www.fibl.ch/buehne/archiv/haest-meier-2000-supermarkt.html
Kettlitz, B. 2002. The expectations of European con-sumers. Presentation at the seminar “Labelling andmarketing of organic farming products in the EU:Increasing confusion or more transparency?”organized by the European Institute of PublicAdministration (EIPA), Maastricht, 1-2 July 2002.
Kilcher, L., B. Landau, T. Richter, and O. Schmid.2001. The Organic Market in Switzerland and theEuropean Union. SIPPO (Swiss Import Promo-tion), Zurich, and FiBL (Research Institute ofOrganic Agriculture), Frick, Switzerland.
Lampkin, N., C. Foster, S. Padel, and P. Midmore.1999. The Policy and Regulatory Environment ofOrganic Farming in Europe. Organic Farming inEurope: Economics and Policy, Volume 1.University of Hohenheim, Institut für Landwirt-schaftli che Betriebslehre 410A. Hohenheim, Ger-many.
Lohr, L. 1998. Implications of organic certificationfor market structure and trade. American Journal ofAgricultural Economics 80:1125-1129.
Mergili, S. 2002. Irreführende Etikettierung undPseudo-Bioprodukte (Misleading labeling andpseudo-organic products). Unpublished seminarpaper. Institute of Organic Farming, University ofAgriculture Vienna.
Michelsen, J. 2001. Organic farming in a regulatoryperspective: the Danish case. Sociologia Ruralis41:62-84.
Purkarthofer, F-J. 2002. Fehler und Betrug wurdeaufgedeckt (Mistakes and fraud was disclosed).Ernte – Zeitschrift für Ökologie und Landwirt-schaft 4(02):7.
Rundgren, G. 1997. Accreditation: the key to makingglobal standards work? Paper presented at the 5thIFOAM Trade Conference in Oxford, UK.Available on-line: http://www.grolink.se/studies/
oxford.htm

20
Rundgren, G. 1999. Future perspectives for organiccertification. In D. Foguelman and W. Lockeretz(eds). Organic Agriculture: The Credible Solutionfor the XXIst Century. Proceedings of the 12thInternational IFOAM Scientific Conference,November 15-19, 1998, Mar del Plata, Argentina.IFOAM, Tholey-Theley, Germany. pp. 10-16.Available on-line: http://www.grolink.se/studies/future.htm
Vogl, C. 1998. Zertifizierung und Akkreditierung inder biologischen Landwirtschaft in Österreich(Certification and accreditation in organic farmingin Austria). Report of a research project commis-
sioned by the Accreditation Office of the Ministryof Economic Affairs.
Vogl, C. 2000. Certification and accreditation inorganic farming in Austria. In T. Alföldi, W.Lockeretz, and U. Niggli (eds). IFOAM 2000 –The World Grows Organic. Proceedings of the13th International IFOAM Scientific Conf., 28-31August 2000, Basel. Vdf Hochschulverlag, Zurich.p. 587.
Vogl, C., and J. Hess. 1999. Organic farming inAustria. American Journal of Alternative Agricul-ture 14:137-143.

21
Going National: Potentials and Pitfalls of Introducinga National Organic Label in Germany
Lucia A. Reisch1
____________________________1University of Stuttgart-Hohenheim, Research Group Consumer Theory and Consumer Policy (530a), Faculty of Economicand Social Sciences, Stuttgart, Germany. Email: [email protected]. Member of the Federal Board of ScientificAdvisors for Consumer Policy and Food Policy, Federal Ministry of Consumer Protection, Food, and Agriculture, Berlin.
The Background
Ecolabeling schemes are expected to simultaneouslyprovide incentives for more environmental friendlyproduction methods and the conservation of naturalresources while being an important signaling devicefor consumers interested in ecologically intelligentproducts. From a consumer policy point of view,ecolabels are crucial in empowering consumers toevaluate their options and “vote with their pocket-books.”
From a theoretical perspective, ecolabeling is an im-portant instrument to signal superior ecological qual-ity in markets characterized by credence goods andasymmetrical information. Credence goods arecharacterized by the fact that consumers are not ableto judge significant quali ty dimensions of the good(such as organic food production methods) – neitherthrough search nor via experience (Darby and Karni,1973). Asymmetrical information means that thesellers have more relevant information regarding thequality of a credence good than buyers have (Akerlof,1970). In such “ lemon” markets, buyers use somemarket statistic to judge the quality of prospectivepurchases. There is an incentive for sellers to marketpoor quality merchandise, since the returns for goodquality accrue mainly to the entire group whosestatistic is affected, rather than to the individualseller. As a result there tends to be a reduction in theaverage quality of goods and in the size of the market(Akerlof, 1970). To avoid these effects, reliablesignals of quality have to be actively sent out by thesellers (“signaling” ). Food quality can be portrayedas a “magical hexagon” of the credence char-acteristics food safety, variety of taste, safe origin,ecological regionality, species-appropriate livestockfarming, and high quality ingredients.
Within the EU, labeling of food products is strictlyregulated. Labels are required to be informative in
that they must provide the consumer with useful andcorrect descriptions of the characteristics of the prod-ucts and its production process. To be most useful forthe consumer, this information must be relevant, con-cise, understandable, and credible. In contrast, thereal information environment today is characterizedby a rapid increase in the number of labeling pro-grams offered by individual producers, regions, asso-ciations, and government entities, each with its ownset of criteria and often with no third-party verifica-tion. The widespread consumer confusion triggeredby this information overload over what really quali-fies as “organic” food prompted the German Depart-ment of Consumer Protection, Food, and Agricultureto issue a national label for the production, handling,and processing of organically grown agriculturalproducts in 2001.
Ecolabeling programs usually fall i nto one of thefollowing categories: self-declaration labels by indi-vidual companies; labels established by industryassociations for their members’ products; and labelsestablished by private initiators independent of mar-ket agents, e.g., private or state-run certificationbodies. Increasingly, a fourth category – state-controlled ecolabels issued by a governmental agency– is gaining ground (Golan et al., 2001). Aspects ofecolabeling that usually provoke concern include: thescientific basis of the criteria proposed for the variouslabeling schemes; the attitude of consumers towardsuch schemes in general and in specific (e.g., towardsstore brands); and the potential impact of suchschemes on international trade, especially discrimi-nation within the WTO.
The Political Situation in Germany
By the end of 2000, the BSE crisis had hit the Ger-man meat market harshly and had profoundly dimin-ished consumers’ trust in suppliers’ quality promises,

22
in state-run quality control, and in governmental con-sumer policy. When the Social Democrat-Green gov-ernment finally reacted to reported BSE cases inGermany, the major political goal was to restore con-sumers’ confidence in both markets and politics. Theminister of health and the minister of agriculturewere the first victims: they were dismissed by Chan-cellor Schröder after the scale of the crisis hadbecome obvious. From a consumer policy point ofview, the most important change produced by theBSE crisis was the decision to restructure the formerMinistry of Agriculture and to transform it into aMinistry of Consumer Protection, Food, and Agri-culture (Bundesministerium für Verbraucherschutz,Ernährung und Landwirtschaft, BMVEL).
When the new consumer protection minister RenateKünast gave her inaugural speech in January 2001,she called for a fundamental reorientation in agricul-tural production from a “strategy of quantity” to a“strategy of quality” and maximum transparency.One key instrument to implement this turnaround inagriculture was a government-controlled but volun-tary national food label program. This programwould feature both a common label for organic food(Bio-Siegel) as well as a national label for high qual-ity conventional foods that fulfilled higher qualitystandards than were legally prescribed. The goal ofthe Bio-Siegel was to reduce uncertainty, improvevisibility, and increase the credibilit y of and finallythe purchase of organic food. Some months later, anordinance regarding the new labeling scheme waspassed and a state-controlled national label fororganic food was introduced.
The Market Situation
While some European countries such as Denmark,Austria, and Sweden introduced state-controlled na-tional labels for organic food years ago, Germany is alatecomer. This might come as a surprise, since Ger-many became the first country with a government-sponsored ecolabeling program when it started itsBlue Angel program in 1977, a label that has beenawarded to 4,350 products from different categories.
In spite of this success story, consumers in Germanyhardly make use of ecolabeling information in theirdaily purchases. Until very recently, they were con-fronted with a cornucopia of about 120 differentecolabels for textiles, furniture, services, and food.Surveys regularly find that only a small percentage ofknowledgeable and eco-sensitive consumers knowand make use of the dozen organic food labels issued
and monitored by private certification bodies such asNaturland, Bioland and Demeter. Paying attention tolabeling schemes in decision-making depends mostlyon the belief in considerate buying as a means ofprotecting the environment. Consumers trust labelsissued and controlled by a public or independentauthority more than they do producers’ private envi-ronmental claims (i.e., first party and second partyschemes) (Thøgersen, 2000a).
For products containing GMOs, for instance, there isexperimental evidence that customers do not noticethe labeling at all (Noussair et al., 2002). Yet, asshown in the same study, becoming aware of the factthat a food product contained GMOs had a consider-able impact on consumers’ behavior, which led theauthors to call for a standardized logo. Indeed, a greatmany studies have pointed to the lack of a singlewell -known and reliable ecolabel for organic foodthat can be communicated, recognized, and trusted.
Consumers in Germany in general are highly envi-ronmentally concerned and believe organic agricul-ture to be an environmentally and socially superiorproduction system. Yet consumers act ambivalently.For instance, 80% are against caging of hens, butonly 20% buy free-range eggs; 70% are interested inorganic food and think that it is healthier, and 40%find it tastier, but only 14% buy it regularly. A largemarket research study conducted in December 2001(ZMP, 2002) revealed some aspects that help explainthe gap between buying intentions and actual pur-chases, apart from the well-known attitude-behaviorgap. First, many consumers believe that what theybuy is organic food while in reality it is not; they areconfused by the many labels and logos on the market.Second, the most influential source of informationand influence regarding food purchases is the con-sumers’ peer group – not the family and not informa-tion campaigns or educational programs. Since mostconsumers perceive their peers to have less positiveattitudes towards organic agriculture, their own pur-chase is inhibited by these believes. Here, the imageproblem of organic food takes its toll.
German consumers are used to comparatively lowfood prices and are highly price conscious. Whereasin 1950, 45% of the private consumption budget wasspent for food, in 2001 the figure was only 14%.Based on a model of consumption of organic food,Wier and Smed (2000) predicted that if the relativeorganic price decreased by 20%, consumption wouldgrow considerably. Because of to the recent BSEcrisis, consumers accept price premiums up to 50%
23
for specific food items such as meat. In general, thecost-effectiveness of organic food is accepted if theprice premium does not exceed 20% (ZMP, 2002).
Market research has identified the group of “ infre-quent buyers of organics in supermarkets” as themost promising target group. To date, German con-sumers are reluctant to buy organic food in thesupermarket. Only 26% of organic food items aresold through conventional retail outlets, whereas inDenmark about 90% are sold this way, and in Austriaabout 70%. The bulk is sold in whole food or healthfood stores, which are rather expensive and often noteasily accessible.
The organic market represents 1.8% of the overallfood market, with a yearly turnover of about 2.0 bil-lion euro. Health food retail ing has three typicalorganizational forms: the small corner health foodshop, the specialized health food store, and the healthfood supermarket. While health food supermarketsare still confined to the metropolitan areas, the num-ber of shops and turnover per shop are rapidlyincreasing (Braun, 2000). Whole food supermarketsare planning on a 50% increase of “organic” consum-ers and a 100% increase of turnover by 2005 (to 50euro per person per year).
In spite of its long history (the Demeter label goesback to the 1920s), organic agriculture has gainedprominence only in the past two years, due to bothincreasing political support through the EU andnational governments (“push”) and growing con-sumer interest (“pull” ). The German market for or-ganic food is currently growing at 5% annually;today, 2.1% of German agricultural land is organi-cally farmed – still a low share compared withAustria, Switzerland, France, Sweden, Denmark, andItaly (Michelsen et al., 1999).
The Green minister Künast has set an ambitioustarget: by the year 2010, 20% of all food should beorganically produced (Ministry of Consumer Protec-tion, Food, and Agriculture, 2001). This can beachieved, if at all, only if the consumer group ofirregular buyers of organics in the supermarket canbe won over (Richter et al., 2000). This strategy isbacked by the experience of other countries, e.g.,Austria, where the growing market share for organicproduce is attributed in part to the creation of private,store-backed labels for organic foods in major hyper-market chains (Payer et al., 2000).
Most of the big retail chains in Europe have ambi-tious plans for expanding their organic assortment
over the next few years (Schmid and Richter, 2000).However, the supply of some organic products hasreached its limit and experts predict a serious lack ofsupply in the coming years. Even though the gov-ernmental “push” strategy is accompanied by sys-tematic support of organic farming, expansion plansmight well be halted by natural li mits on the produc-tion of high quali ty organic food because of lowerproductivity in organic farming. The latter is due to aproduction philosophy that accepts natural growthrates and ripening times. This translates into forms ofextensive livestock farming without the use ofpharmaceutical growth promoters and into longerripening times of produce without artificial li ghtingand chemical fertili zer regimes.
Earlier Experiences – Avoidable Pitfalls
Shortly before the current state-initiated ecolabelprogram was launched, producers and certificationbodies had tried to introduce a voluntary nationaleco-food label. After almost a decade of debatebetween the different private certification bodies andthe German Agricultural Marketing Board (CMA)(the marketing association of conventional farmers)the first national ecolabel for food, the Ökoprüf-zeichen (ÖPZ), was launched in 2000. A major moti-vation was to support the sale of organic food in con-ventional retail outlets, mostly supermarkets.
The ÖPZ was meant to bring together the dozenexisting ecolabels in way that would appeal to super-markets as potential outlets. The scheme was organ-ized as a collaboration of the nine major organicfarming associations (organized in the Association ofOrganic Farming Organizations, AGÖL), represent-ing 71% of organic farmers, and the CMA. Theowner of the logo was the Öko-Prüfzeichen GmbH, acompany owned by AGÖL and CMA. Certificationand signing of the contracts with operators was dele-gated to members of AGÖL. The license fee amount-ed to 0.2% of the product price (Huber, 2000b).
However, while hopes for the common label werehigh, the project turned out to be flop. Even beforethe planned communication campaign took off, con-flicts among members escalated and the project wasstopped. Lessons to be learnt from this unsuccessfulattempt can be summarized as follows (Reisch,2001):
• Get all stakeholders in the same boat before youstart to row: the feed industry, organic and con-ventional farmer lobby groups, the food industry

24
and retailers, consumer organizations, environ-mental and animal rights organizations, certifica-tion bodies, and policy-makers must be partnersfrom the outset. If one stakeholder dominates,sooner or later others will l eave. In Germany,Demeter and Bioland, representing 60% ofAGÖL members, left the agreement midwaybecause standards were seen as “diluted” and notserving everyone’s interests.
• Buy locally - label globally: One reason for thefailure of the German national label was that itwas confined to German products. To increaseacceptance and knowledge and to facilitate inter-national trade with organic products it shouldhave included at least European products; the“world” trade of agro-products is mostly (65%)within Europe. An international label would bestserve today’s global trade and would support theharmonization of standards and insure the qualityof organic food. As part of the EU-Regulation2092/91, a European label for organic food wasintroduced in February 2000 (Huber, 2000a). Thelabel can be used without certification fees; 95%of the product contents have to be of organic ori-gin. Even though the label is hardly known byconsumers and producers, it should have beenincorporated in the strategy.
• Keep certification non-profit: Private for-profitcertification bodies might dilute the certificationprocess and endanger the credibility of the label.
• Be aware of consumers: If standards are too low,consumers are lulled into a false sense of secu-rity. Consumer organizations will certainly pointto that and the important target group of well -informed consumers can easily be lost.
• Do not make the fox guard the chicken coop: Thelabel should not be handled by the farmers’ asso-ciations; they will make decisions in their mem-bers’ interests.
• Do not stint on advertising and communication:A national label represents a market innovation.Its introduction has to be supported with a rea-sonable budget for communication campaigns tobreak through the noise barrier of other (in-store)product information. The size of the budgetshould correspond to an average budget neededfor the introduction of a new product (i.e., 15milli on euro instead of the 2.5 mil lion euro actu-ally allocated). 70% of German consumers valuehealth claims as “ important,” 20% as “very im-
portant.” Hence, successful motives in communi-cation strategies promoting organic food are – inthis order – pleasure and taste, health, and qualityof life, whereas environmental concern is a moti-vation that is confined to a small group of activ-ists (ZMP, 2002).
• Serve different consumer demands for differentqualities: Bioland and Demeter, the largest andthe oldest organic farming associations, arepleading for a two-level labeling scheme: the EUlabel should be used to signal basic organic qual-ity as defined by EU guidelines, while the exist-ing German ecolabels should be used as trade-marks to signal higher organic quality and toposition organic products as premium goods.
The New National Eco-Food Label
As mentioned above, a new national eco-food label,the Bio-Siegel (Figure 1), was launched only one yearlater. The initiators had obviously learned somelessons from the failure of the ÖPZ and could avoidseveral pitfalls. First, the label was developed andsupported by a large alliance of the food industry,organic farming associations, the farmers’ union, andpoliticians. This process was facilitated by theimmense public pressure after the BSE crisis hadpeaked and by the organic farming policy that wasvigorously pushed by the new Green minister.
Figure 1. The new German eco-food label.
Second, the criteria for the ecolabel are geared to thecurrent provisions of the EC Ecolabeling Regulationand relate to the basic guidelines of the InternationalFederation of Organic Agricultural Movements(IFOAM), a respected umbrella organization that rep-resents about 700 associations from 100 countries.Hence, a relatively high standard is assured.
The EC Ecolabeling Regulation lays down in detailthe methods and materials that are permitted in

25
organic food production. Organic farms keep preciserecords of their processes and products as well as ofthe distribution channels. The goal is to be able totrace any product from the store back to the producer(“ transparent production” ). Inspection bodies author-ized by the states inspect these farms at least once ayear, often twice. The Bio-Siegel is the only label inGermany protected by criminal law.
After less than one year, more than 8.000 food prod-ucts from 588 companies carry the ecolabel. Thissuccess is also due to the smartly designed and gen-erously financed communication campaign thatlaunched the label in the market (for examples seewww.bio-siegel.de).
Finally, to serve different consumer demands fordifferent qualities, the ministry has decided on alabeling solution with two voluntary state-controllednational labels: one for products of organic farming(complying with the EU guidelines for organicfarming) and one for products of high quality con-ventional farming (i.e., feeding without prophylacticantibiotics and animal meal, no GMOs, species-appropriate livestock husbandry).
Potentials and Limits
From the perspective of a sustainable consumptionpolicy (OECD, 2001; Reisch and Scherhorn, 1999),well -introduced ecolabels are seen as instruments topromote sustainable consumption decisions. In thecase of the new Bio-Siegel one can see a seriouspotential to
• increase transparency and credibility of supply,since it is established by an initiator who is inde-pendent of producers, distributors, and sellers(“ third party scheme”)
• provide information on the production and con-sumption chain, and link products to their pro-duction process (life-cycle assessment, chain ofcustody), which meets consumers’ “ right to beinformed”
• increase awareness of personal risks and socialcosts (external effects)
• provide consumers with the opportunity to ex-press their ecological concerns through their pur-chasing behavior and market mechanism (“ rightto be heard”)
• highlight sustainable product alternatives through“cross-labeling” with social labels (e.g., the
Transfair seal; see Meier, 2000) (“ right tochoose”)
• have indirect macro effects on the sustainabilityof the food supply, raising environmental andsocial standards in the production process and themarket.
Last but not least, voluntary ecolabels are an attrac-tive instrument for both environmental and consumerpolicy since voluntary schemes do not conflict withWTO and Technical Barriers to Trade free tradepolicies.
Still , one should not overestimate the overall envi-ronmental effect of labeling. First, organic food pro-duction stil l represents only a marginal portion ofagricultural production; second, it is difficult to makea general statement about the superiority of organicproduction versus other agricultural techniques(Jungbluth and Frischknecht, 2000).
Conclusions
Research reveals that among other factors such asstrong consumer demand, a high degree of support bythe food industry, a high fraction of sales throughconventional supermarkets, and price premiums notexceeding 50%, the labeling and promotion oforganic food is seen as important factors for thegrowth of a national organic food market (Michelsenet al., 1999; Hamm and Michelsen, 2000). At thesame time, proper education of consumers aboutecolabels depends most of all on increasing theprevalence of ecolabeled products in the shops(Nilsson et al., 1999). Hence, once the market hasbeen developed and a trustworthy standard symbol-ized by a well -known label is established, a positivereinforcement process might take place, furtherstrengthening the organic food market.
In countries where there is no generic label for or-ganic products or where such a label is not known tolarge parts of the population, consumers haveproblems in distinguishing organic food from otherfood, so that the full potential demand for organicproducts cannot develop (Hamm and Michelsen,2000, p. 510). If the mistakes listed above areavoided, the Bio-Siegel is a win-win game for con-sumers: directly via improved individual consump-tion decisions (better quality, less time) and indirectlyvia an average quality increase in the market from theincreased market share of organic food and stimu-lated competition.

26
The new label with a government-mandated certifi-cation process behind it can be expected to be effec-tive in reducing transaction costs between farmersand food manufacturers and in facilitating consumerdecisionmaking. The two-standard label programresponds to an information gap in the market place,allowing preferences and purchases to be moreclosely matched while recognizing that consumerpreferences and quality expectations vary. If the tra-ditional AGÖL labels are still valid and provided onthe packaging, no information is lost.
To summarize: Ecolabeling may not be the best toolfor promoting environmental change in general –other governmental tools such as bans, quotas, oreco-taxes may be more effective. However, it is stil l agood second-best policy when it is difficult toachieve political and regulatory consensus (Golan etal., 2001). Of utmost importance seem to be theviews of the public and poli tical support of organicfarming, which in Germany have only recentlychanged from skeptical distance to active support.
References
Akerlof, G.A. 1970. The market for “ lemons” :Quality uncertainty and the market mechanism.Quarterly Journal of Economics 84: 488-500.
Braun, K. 2000. The retail trade in ecological food-stuffs in the Federal Republic of Germany at thebeginning of the third mil lennium. In T. Alföldi,W. Lockeretz, and U. Niggli (eds). IFOAM 2000:The World Grows Organic. Proceedings of the 13th
International IFOAM Scientific Conference, Aug-ust 2000, Basel. Vdf Hochschulverlag, Zurich. p.506.
Darby, M.R., and E. Karni. 1973. Free competitionand the optimal amount of fraud. Journal of Lawand Economics 16:67-88.
Golan, E., F. Kuchler, and L. Mitchell. 2001. Eco-nomics of food labelling. Journal of ConsumerPolicy 24:117-184.
Hamm, U., and J. Michelsen. 2000. Analysis of theorganic food market in Europe. In T. Alföldi, W.Lockeretz, and U. Niggli (eds). IFOAM 2000: TheWorld Grows Organic. Proceedings of the 13th
International IFOAM Scientific Conference,August 2000, Basel. Vdf Hochschulverlag, Zurich.pp. 507-510.
Huber, B. 2000a. An European-wide logo overview.In T. Alföldi, W. Lockeretz, and U. Niggli (eds).IFOAM 2000: The World Grows Organic.Proceedings of the 13th International IFOAM
Scientific Conference, August 2000, Basel. VdfHochschulverlag, Zurich. p. 541.
Huber, B. 2000b. Öko-Prüfzeichen - a new Germanseal. In T. Alföldi, W. Lockeretz, and U. Niggli(eds). IFOAM 2000: The World Grows Organic.Proceedings of the 13th International IFOAMScientific Conference, August 2000, Basel. VdfHochschulverlag, Zurich. p. 552.
Jungbluth, N., and R. Frischknecht. 2000. Method-ologies for the evaluation of the environmental im-pacts from food consumption. Paper for the OECDEnvironment Directorate, Programme on Sustain-able Consumption, October 2000.
Meier, T. 2000. In T. Alföldi, W. Lockeretz, and U.Niggli (eds). IFOAM 2000: The World GrowsOrganic. Proceedings of the 13th InternationalIFOAM Scientific Conference, August 2000,Basel. Vdf Hochschulverlag, Zurich. p. 563.
Michelsen, J., U. Hamm, E. Wynen, and E. Roth.1999. The European market for organic products:Growth and development. Organic Farming inEurope: Economics and Policy, Vol. 7. Universityof Hohenheim, Stuttgart, Germany.
Ministry of Consumer Protection, Food and Agricul-ture. 2001. Inaugural speech, 8th February 2001.German Bundestag, Berlin.
Noussair, C., S. Robin, and B. Ruffieux. 2002. Doconsumers not care about biotech foods or do theyjust not read the labels? Economics Letters 75:47-53.
OECD (Environmental Directorate, EnvironmentPolicy Committee, Working Party on NationalEnvironmental Policy). 2001. Household food con-sumption: Trends, environmental impacts and pol-icy responses. Sustainable consumption: Sectorcase study series. OECD, Paris.
Payer, H., P. Burger, and S. Lorek. 2000. The envi-ronmental impact of household consumption inAustria: National case study to the OECD Pro-gramme on Sustainable Consumption (OECDInternal Working Paper, Nov. 2000).
Reisch, L.A. 2001. Eco-labeling and sustainable con-sumption in Europe: Lessons to be learned fromthe introduction of a national label for organicfood. Consumer Interest Annual 47:1-6.
Reisch, L.A., and G. Scherhorn. 1999. Sustainableconsumption. In S. B. Dahiya (ed). The CurrentState of Economic Science, Vol. 2. SpellboundPubl., Rohtak. pp. 657-690.
Richter, T., O. Schmid, B. Freyer, D. Halpin, and R.Vetter. 2000. Organic consumer in supermarkets -new consumer group with different buying be-

27
haviour and demands! In T. Alföldi, W. Lockeretz,and U. Niggli (eds). IFOAM 2000: The WorldGrows Organic. Proceedings of the 13th Inter-national IFOAM Scientific Conference, August2000, Basel. Vdf Hochschulverlag, Zurich. pp.542-545.
Schmid, O., and T. Richter. 2000. Marketing meas-ures for selling organic food in European retailchains: key factors of success. In T. Alföldi, W.Lockeretz, and U. Niggli (eds). IFOAM 2000: TheWorld Grows Organic. Proceedings of the 13th
International IFOAM Scientific Conference,August 2000, Basel. Vdf Hochschulverlag, Zurich.p. 506.
Thøgersen, J. 2000a. Psychological determinants ofpaying attention to ecolabels in purchase decisions:model development and multinational validation.Journal of Consumer Policy 23:285-313.
Thøgersen, J. 2000b. Promoting green consumerbehavior with eco-labels. Presentation at the Na-
tional Academy of Sciences/National ResearchCouncil, Workshop on Education, Information, andVoluntary Measures in Environmental Protection,November 29-30, 2000, Washington DC. Unpub-lished manuscript.
Wier, M., and S. Smed. 2000. Modeling consumptionof organic foods. In T. Alföldi, W. Lockeretz, andU. Niggli (eds). IFOAM 2000: The World GrowsOrganic. Proceedings of the 13th InternationalIFOAM Scientific Conference, August 2000,Basel. Vdf Hochschulverlag, Zurich. p. 550.
ZMP Zentrale Markt- und Preisberichtstelle GmbH,Bonn und CMA Centrale Marketing-Gesellschaftder deutschen Agrarwirtschaft (eds). 2002. Wieviel Bio wollen die Deutschen? Das Marktpoten-zial für Produkte aus dem kontrolliert ökologischenLandbau. (How much “organic” do Germanswant? The market potential for products fromorganic farming). CMA, Bonn.


29
Managing the Confusion over Labels in the EmergingOrganic Food Market in Bosnia and Herzegovina
Aleksandra Nikolic1 and Esma Velagic Habul2
____________________________1Department of Agricultural Economics, Faculty of Agriculture, University of Sarajevo, Sarajevo, Bosnia and Herzegovina.Corresponding author. Email: [email protected]
2Bosnian Environmental Technologies Association, BETA, Sarajevo, Bosnia and Herzegovina
Post-war Bosnia and Herzegovina (B&H), an un-stable, natural resource-based economy, is facing thechallenges of development, alleviating poverty anddealing with returning refugees. It is obvious thatneither the national government nor the representa-tives of the international community have a well-defined vision for responding to these challenges.Therefore, many options are being promoted as “ themost suitable solution” or “ the magic answer.”Among these, organic agriculture is becoming veryattractive for projects financed by different programsof the international community (Stability Pact, refu-gee returnee programs, poverty alleviation, etc.). Themain stakeholders in B&H society are very positiveand enthusiastic regarding organic agriculture as adevelopment tool. This attitude is built upon the mar-ket signals coming from the EU and some neighbor-ing countries.
B&H farmers have been familiarized with the ideathat a successful economic survival strategy is “ totarget production to specific value-added markets and… change their product from a faceless, low valueitem to a differentiated product that carries its iden-tity all the way to a consumer who sees special valuein it and is willing to pay more for it” (Granatstein,2001). The B&H government and the internationaldevelopment organizations have recognized the sig-nals from the EU spreading the message that “ thegrowing demand for quality food could be used tosustain the traditional way of life and landscape ofEurope’s marginal farming areas and reduce the needfor public subsidies to keep those marginal areasgoing” (Gilg and Battershil l, 1998). At the same timethere are many signals from the EU and CEE marketspointing out the intensive growth of organic con-sumption and production as well as the change inconsumers’ preferences and attitudes regarding thelevel of food safety and quali ty (Klonsky, 2000).
These signals, which have been recognized by themain actors of B&H society, describe the develop-ment state of the foreign markets. This could be usedas a starting point to raise a commitment to organicagriculture as a developmental option for B&H’srural communities. But to support an entrepreneurialspirit that will induce an effective and long-termdevelopment of the organic sector, it is necessary todefine the potentials and characteristics of the B&Horganic market. The research presented here can beseen as a useful contribution in this context, provid-ing insight into the B&H organic market that couldbe used for crafting an appropriate marketing strat-egy. Therefore, the objectives of this paper are: 1) tounderscore the confusion over ecolabels in theemerging organic food market in B&H as the mainconstraint for its efficient development; and 2) topoint out the roots of B&H consumers’ misconcep-tion of organic labels as a first step in resolving theconfusion.
Research Methods
The marketing study was a part of the project “ Inte-grated rural development in the Stolac region,”implemented by Malteser Hilfsdientst e.V. in coop-eration with CEFA (Italy), the farmers’ cooperativeAgroplod (Stolac) and the Bosnian EnvironmentalTechnologies Association (Sarajevo), and funded bythe German Ministry BMZ. In accordance with theproject proposal and available resources, an explora-tory marketing study was implemented. In general, anexploratory marketing study is an appropriate methodfor clarifying and defining the nature of the problems.
The sample consisted of 400 respondents in the threeB&H regions Sarajevo, Mostar, and Medjugorje.Keeping in mind the EU market experience suggest-ing that “market actors in the form of general foodretailing chains or processing companies are keen to

30
develop the organic food market, because they realizethat there is growing consumers demand for organicfood and they are convinced that their efforts toincrease the supply of organic products will i mprovetheir competitiveness” (Hamm et al., 2002, p. 1), thesample was divided into two major consumer groups:1) individual consumers; and 2) major market actors,such as supermarkets, caterers, restaurants, and smallneighborhood food shops.
Two different types of questionnaires were developedand administered by a team of young researchers.Data were collected by personal interviews.
Research Results
The detailed presentation and explanation of the mar-keting study’s findings are beyond the scope of thispaper. Therefore, only the findings relevant to thefocus and objectives of this paper will be presentedbriefly.
From the study findings it is obvious that most con-sumers (about 90%) are optimistic and enthusiasticregarding the future success of the organic market inB&H. The typical organic customer is female,between 25 and 55 years old, with a secondary schooleducation, with children, and with a monthly budgetper family member of 200 to 350 Konvertible Marks(US$100 to $170).
It is obvious that B&H consumers (both groups) per-ceive organic foods as high quality foods that areworth higher prices (acceptable premium level is 10to 30% for both groups). The main reason for buyingorganics is health (85%). For the market actors themain motives for including organic foods in theirofferings are to satisfy all consumers and to profile itsbusiness in this area (31% and 21% respectively).These findings suggest a promising future for theorganic producers and a willingness on the part of themarket actors to take an active part in development ofthe organic market in B&H.
But the findings also point to some obstacles toincreasing the demand for organic products, such asconsumers’ lack of information, poor understandingof the organic food concept and confusion regardingorganic labeling. The same market obstacles havebeen identified in the Italian organic market by Pinot(2001). The information asymmetry is one of themain obstacles preventing high-quality products fromcommanding higher prices. The poor information andunderstanding of the organic food concept decreasebuyers’ wil lingness to pay premium prices (Loader
and Hobbs, 1999). The research findings that point toinformation asymmetry and consumer confusion areas follows:
• Most consumers defined organic food as “ foodproduced without chemicals” or as “ traditional,healthy food” . No consumer stated that it wasfood with higher quality assured through third-party certification. This indicates both poorunderstanding of the organic food concept andconsumers’ inexperience with voluntary certifi-cation schemes assuring quality in ways that gobeyond the material specifications of the product.
• Most individual consumers (80%) reported thatin their opinion, organic and health foods werethe same products with different names.
• In spite of consumers’ understanding that higherfood quality must be paid for and assured, con-sumers are not familiar with the voluntary systemof organic quality assurance and labeling. Mostindividual consumers stated that the producer orgovernment must insure the higher quality offood (see Figure 1). This leads to the conclusionthat the consumer defines quality in terms of theproduct specifications. The B&H consumers arenot famili ar with a value-laden quality concept,which is the heart of the whole organic foodconcept.
• The fact that only 20% of the market actors whoreported organic trade offer foods with the offi-cial organic label highlights their extremely poorknowledge and misconception about the organicfood concept and organic quality.
24%
35%
24%
14%
3%
0 5 10 15 20 25 30 35
Governement
Producer
NGO with IS Oaccreditation
Univers ity
Other
Figure 1. Consumers’ opinions regarding who shouldinsure organic quality (Nikolic, 2002).

31
• The fact that 50% of the market actors whoreported organic trade pointed to the B&H proc-essing industry as the main supplier of organicfood once again confirms their confusion. InB&H there was no certified processing capacityat the time of the research. This means that mar-ket actors are mixing up organic products with“natural” , “ low-input” or even “whole grain” and“macrobiotic” products, contributing to marketinformation asymmetry.
• The evident asymmetry regarding information isin line with the reported level of willingness topay premium prices (Figure 2). Only 57% of themarket actors are willing to pay premium prices.
57%20%
23%
Yes No Do not know
Figure 2. Market actors’ will ingness to pay premiumprice for organic products (Nikolic, 2002).
The research findings suggest that B&H consumerscare about food quality and recognize organic food ashigh quality food that could be beneficial to theirhealth. They are also aware that the high quality mustbe paid for and assured. But the quality concept andits assurance based on trust and voluntary labelingschemes obviously are not understood by B&H con-sumers (both groups). Research by Baker (1998)found that certification, as a food product attributethat drives consumers’ purchases, was scored low inimportance (10%). Baker (1998) also suggests that“ food markets have not yet developed the right prod-uct that is properly priced, adequately promoted andconveniently available to most consumers.” Thismeans that informational asymmetry is a commonproblem for all products with a value-laden qualityconcept, especially in emerging markets such as theorganic market in B&H.
All entrepreneurs who are eager to start an organicbusiness must answer the major question: Can myorganic product satisfy the needs of B&H consumers
regarding price, promotion strategy and convenience?It is not the aim of the paper to provide the fullanswer. The focus is on part of that question: Can theorganic label communicate the value-laden qualityconcept in the B&H food market in order to providepremium prices?
The answer suggested by the research findings is thatit can, but the marketing strategy for such productsmust include measures to mitigate the negativeimpacts of consumers’ poor understanding of organicfood quality as communicated by organic labels. Inorder to resolve the proven confusion regarding theorganic label we must determine its origin.
Origin of Confusion over the Organic Label
The organic food market, li ke any other market, is “asocially structured institution infused by culturalnorms and meaning” (Hinrich, 2000). The “heart” oforganic agriculture is the value-laden concept of foodquality and its voluntary and market-driven qualityassurance system, corresponding to consumers’beliefs, ethical values and li festyle. Therefore thesocio-cultural context in which the organic market isemerging has a high impact on the effectiveness oforganic labels in communicating a concept of foodquality that is based not only on product specifica-tion, but also on the socio-economic context withinwhich the product is produced (Ilbery and Kneafsey,2000). Some characteristics of the B&H socio-cultural context tailor customers’ attitude towardsorganic food products.
For 50 years B&H was a socialist country in whichthe state played a significant role in economic life.Issues of food quality and safety were strictly definedby the law and guaranteed by the state. At that timethe concept of quality focused only on the materialside of the product, which was described on the labelas the product specification. The relatively lownumber of food scandals was taken as an indicationthat the food quality assurance scheme was effective.Present consumers’ understanding that quality is rep-resented only by the products’ specifications, thematerial aspect of the products, has been formed bythe former quality assurance scheme, stipulated bylaw. No other food quality assurance systems wereoffered. Therefore, the food quality system relying ona voluntary labeling scheme communicating social orvalue-laden aspects of products is totally new forB&H consumers. That is why organic labels as “avoluntary and market-driven practice of providinginformation to consumers about production proc-

32
esses’ and products’ impact on environment” (Groteand Volkgenannt, 2002) were not known or utilized.
As a result it is not clear what organic labels implyregarding food quality. That means that B&H con-sumers are not familiar with the concept that definesquality in terms of the production process or socio-cultural context within which the products are pro-duced. Therefore, the organic label of a third partythat assures organic quality is not enough to establishtrust in the marketplace. This is the main reason forconsumers’ confusion regarding organic food. Themarketing strategy must take into account consum-ers’ understanding of quality and must select propertools to provide critical information needed to explainand tailor consumers’ new food quality perceptions.
Second, the power of the mechanisms that allow con-sumers to rule the market and determine who will besuccessful and who will fail is not full y recognized inB&H. This is also one of the consequences of thepost-war, transitional socio-cultural environment.The market mechanisms (supply and demand) sup-ported by the value-laden concept of quality and vol-untary labeling make it possible for consumers toaffect the production processes or norms imple-mented by food businesses. This enables green con-sumers to strongly influence businesses’ environ-mental performance and the process of “ industrygreening” (Allen and Kovach, 2000).
Still , because of the socialist history and state controlover the economy, B&H consumers are not aware oftheir market power. It is not clearly recognized thatbusiness success depends on how the market votes –the number of consumers’ purchases and their com-mitment to the producers. This is an important part ofthe puzzle of consumers’ misconception of organicfood, which could be a very serious obstacle to thegrowth of the organic market. Therefore, any com-munication strategy aiming to resolve consumers’confusion must send a clear message that consumersare able to affect production processes and have aresponsibility to “vote” for the business that success-fully addresses all the issues that are the most impor-tant to them, such as health, animal welfare, the envi-ronment, and safety.
The third aspect of consumers’ misconception oforganic food is the evident information asymmetry inthe marketplace. This is caused by producers’ poorgrasp of marketing skills that are necessary to intro-duce new products in niche markets such as theorganic market in B&H. The research findings indi-cate that the producers are not using the power of
direct marketing. The concept of direct marketing –“shopping with a human face” (Adam et al., 1999) –could be a powerful tool to spread information aboutthe new products – organic foods – and the newvalue-laden concept of food quali ty. Direct marketingrelies on social interaction and therefore is an excel-lent way to link the two aspects of food quality –material and social.
Conclusions
It is obvious that organic agriculture is becoming anattractive business area offering many possibilitiesfor B&H entrepreneurs. The findings of this ex-ploratory market study suggest that the organic mar-ket could be successfully developed, thereby provid-ing reasonable premium prices for producers. Butthere are some important limitations to its growth thatmust be taken into account. The most importantlimitation is consumers’ misconceptions and confu-sion, which are decreasing the ability of the organiclabel to communicate its specific value-laden qualityconcept and to establish trust as a key mechanism oforganic agriculture.
The main reasons for this are found in the specificsocio-cultural context in B&H that have tailored con-sumers’ understanding of quality as a simple productspecification. The two aspects of organic food qual-ity, the material and the social, are not linked in con-sumers’ perception of quality, making organic labelsmeaningless. On the other hand, B&H consumers arenot aware of their power in the market. The conceptof “market voting” that defines business success isnot recognized. Also, information about the neworganic products and the new value-laden concept arenot being spread efficiently within the B&H foodmarket. This all contributes to informationalasymmetry that could be the main reason for theorganic market’s failure.
The marketing strategy must be crafted in the waythat solves the problem of information asymmetry.The solution must start with understanding the speci-ficity of the socio-cultural context of the B&Horganic market. The priority of any marketing strat-egy must be to explain the new, voluntary qualityassurance system, its benefits and its differencescompared to the old materialistic understanding ofquality. It must be supported by information explain-ing consumers’ great power to insure success for abusiness that successfully addresses health or otherissues important to them. Direct marketing could be apowerful tool in eliminating consumers’ misconcep-

33
tions about organic food labels. The influence of newtechnology must be taken into account: “ In particular,the advent of interactive digital television and explo-sive expansion of the Internet will allow consumersand farmers to be much more linked” (Gill andBattershill , 1998).
ReferencesAdam, Katherine, Radhika Balasubrahmanyam and
Holly Born. 1999. Direct marketing, Businessmanagement series. ATTRA. www.attra.ncat.org
Allen, Patricia, and M. Kovach. 2000. The capitalis-tic composition of organic: potential of the marketin fulfill ing the premise of organic market.Agriculture and Human Values 17:221-223.
Baker, A.G., 1998. Strategic implication of consum-ers food safety preferences. International Food andManagement Review 1(4):451-463.
Gill , A., and M. Battershill . 1998. Quality farm foodin Europe: a possible alternative to the industrial-ized food market and current agrienvironmentalpolicies: lessons from France. Food Policy 23(1):25-40.
Granatstein, D. 2001 Alternative markets for fruit:organic and IFP. Center for Sustaining Agriculture
and Natural Resources, Washington StateUniversity, Wenatchee. organic.tfrec.wsu.edu/OrganicIFP/MarketingIndex.html
Grote, U., and U. Volkgenannt. 2002. Eco-labeling inagriculture. High-level Pan-European Conferenceon Agriculture and Biodiversity, Paris.www.nature.coe.int/CONF_AGRI_2002
Hamm, U., F. Gronefeld, and D. Halpin. 2002.Analysis of the European market for organic food.School of Management and Business, Universityof Wales, Aberystwyth, UK.
Hinrich, Clare. 2000. Embeddedness and local foodsystems: notes on two types of direct agriculturalmarkets. Journal of Rural Studies 16:295-303.
Ilbery, B., and Moya Kneafsey. 2000. Producersconstruction of quality in regional speciality foodproduction: a case study from southwest England.Journal of Rural Studies 16:217-230.
Klonsky, Karen. 2000. Forces impacting the produc-tion of organic foods. Agriculture and HumanValues 17:233-243.
Loader, R., and J.E. Hobbs. 1999. Strategic responseto food safety legislation, Food Policy 24:685-706
Nikolic, Aleksandra. 2002. Prospects of the B&Horganic market. BETA, Sarajevo.


35
The Organic Label: Does the USDA Definition Conform to Consumer Preferences?
David Scott Conner1
____________________________1Department of Applied Economics and Management, Cornell University, Ithaca NY 14853. Email: dsc17@cornell .edu
The organic label is perhaps the most prominent ex-ample of an ecolabel. Organic food, being acredence good (Darby and Karni, 1973), requiresthird-party verification. Prior to 2002, this functionwas performed by a series of independent agencies,each with a potentiall y different definition of whatorganic means. Lohr (1998) argues that a universalset of standards decreases transaction costs andfacilitates commerce in organic food. The USDA’sNational Organic Program’s (NOP) Final Rule hascreated this unified standard, detailing a list of inputsand practices permitted under organic productionand processing. Since October 2002, all food labeledorganic has had to conform to the Rule.
The initial Draft Rule, released in 1997, was widelycriticized by consumer and producer groups as toolenient. These groups were particularly vocal in theiropposition to the inclusion of what became knownas the “Big 3” : genetically modified organisms(GMOs), biosolids, and irradiation. Use of the Big 3is prohibited under the Final Rule.
The goals of the organic label – to provideinformation to decrease transaction costs (time andeffort to discover how it was produced) and tofacilitate commerce – are best accomplished whenthe label’s meaning is well understood by consumersand reflects their preferences.
This paper reports on the findings of a survey andexperimental auction, targeted at current consumersof organic food in Ithaca, NY. The major questionaddressed was: do consumers get what they want orexpect from organic food? Specifically, does theFinal Rule, with its list of acceptable and bannedpractices, conform to consumers’ preferences forwhat should be allowed? Does the label addressconsumers’ stated reasons for buying organic? Doconsumers really understand the label’s meaning?Implications for public policy and private firmstrategy will be discussed.
Methods
A survey of current consumers of organic food wasconducted in Ithaca, NY, in fall 2000. Questionsfocused on reasons for buying organic, preferencesfor what should and should not be included in thedefinition of organic, and wil lingness to pay (WTP)to have or avoid the Big 3 in organic food. Anexperimental English (second price) auction (seeDavis and Holt, 1993) in February 2002 attempted tovalidate the WTP figures by measuring them byanother method. The two methods complement eachother: surveys collect data from a larger sample andallow for a broader array of questions (attitudes,etc.). Auctions impose a budget constraint and realtradeoffs not present in hypothetical surveyquestions.
The survey was administered to a group of currentconsumers of organic food in Ithaca, NY. (The firstquestion of the survey asked respondents if they cur-rently buy organic food. If they said no, the surveywas discarded.) Ithaca is a town known for itsknowledge and activism in food issues. The surveyswere completed at the two locations where organicfood is most prominently sold: the local farmers’market and cooperative “health food” market. Themajor supermarket in the area with a significantorganic produce section declined to participate.Historically, most organic food has been bought inhealth food stores, not in supermarkets (Reicks et al.,1997). There are a large number of organic growerswho sell at the farmers’ market, so patrons at thesetwo locations are likely to consist of typicalconsumers of organic food in Ithaca.
The target population of this research is current con-sumers of organic food. The problem is that thedemographic and socio-economic traits of this popu-lation are unknown. No claims can be made that thesample represents the general populations of Ithaca,of New York State or of the nation as a whole. How-
36
ever, the fact that Ithaca has a thriving organic mar-ket (located primarily at these two locations) makesthe survey respondents an interesting study group forthis issue. These people actively seek out organicfood by shopping at these markets, suggesting theybelong to the market segment The Hartman Group(1996) calls “True Naturals,” the “core purchasers”of organic food.
The surveys were administered over several sessionsin fall 2000, before the Final Rule was published.The farmers’ market operates on Saturdays andSundays; because of space constraints, the board ofdirectors granted permission to collect data only onSundays. Data were collected on September 30 andOctober 7, 2000. The surveying sessions at thecooperative market were conducted on several daysand times to reach people with a variety of shoppinghabits. Only people who currently buy organic foodwere included.
The surveys had three main components:
1. a section on attitudes and shopping habits,including why they buy organic and what theybelieve ought to be included in the definition oforganic
2. a Contingent Valuation (CV) component meas-uring their WTP to have or avoid each of the Big3 included in the definition
3. demographic traits, such as age, gender, educa-tion and income.
A total of 123 (80%) out of 154 surveys were usable.Surveys were rejected if they did not give a numberin the WTP section (they stated “more” or wrote anangry essay on why it should not cost more). Tworespondents’ surveys were discarded when they re-sponded to the first question by stating they did notbuy organic food, resulting in a 79% response rate ifthese two people are included. It was not practical tocount how many people passed by, choosing not tofill out a survey: a response rate on this basis isimpossible.
The CV portion elicited open-ended responses to thethree WTP questions. The baseline was a food itemthat they normally buy organic and that costs $1. Itis certified organic, but by a (hypothetical) agencythat allows the use of GMOs, biosolids, andirradiation, respectively. Respondents were askedhow much they would pay for a bag of the sameitem, identical in appearance, nutrition, freshness,etc., but that is certified by an agency that does not
allow the use of each of the Big 3, singly. The threeWTP questions were in an open-ended format thattends to produce less biased estimates than thosefrom dichotomous choice questions (Balistreri et al.,2001).
The experimental English (second price) auction wasconducted on a different group of organic consumers(recruited via posters and email announcements) inthe Economics Experiment Lab at Cornell Univer-sity. The English auction was chosen because of itssimplicity and demand-revealing properties (Davisand Holt, 1993). Participants were given an allot-ment of $20, from which they paid for any item theywon in the auction. The unspent portion was theirsto keep and also served as an incentive to participate.
WTP was determined by auctioning two items: abaseline item, a bag of organic blue corn chips thatmakes no claims about its GMO content; and a bagof organic blue corn chips with a seal stating it isGMO-free. The original packages of the chips werejust as described to the participants; they wereshown a blown-up image of the actual GM-freelabel. (Note: “GM-free” or “GMO-free”, in thispaper, implies that no GM ingredients were used inproduction. The actual label used in the auction says“No GM Ingredients.” Pollen drift makes the literalclaim of GM-free a different matter.) The chips wereremoved from the original packaging and placed inidentical plastic bags so that the participants werenot influenced by brand recognition, logos, or otherpackaging features. Items were auctioned in randomorder and in three rounds to control for order andwealth effects.
Participants were also given an exit survey, askingfor demographic information closely matching the2000 survey, and a question gauging their under-standing of organic labels. They were asked whethereach of several practices is allowed under the defini-tion of organic. The intent of this question was to seeif they were aware that GMOs are not allowed inorganic production. The other components in thequestion (including, e.g., manure from non-organicfarms, botanical pesticides and mined rock powders)were included because asking only about GMOswould have put too much attention on that compo-nent and possibly biased the responses.
Results
Survey respondents broadly agree with the FinalRule on what should or should not be allowed in

37
organic production and processing. When asked ifeach of the Big 3 ought to be allowed, 85, 80 and76% said that GMOs, biosolids and irradiation,respectively should not be allowed; the othersreplied that it should be allowed, or had no opinion,or didn’ t know. Similarly, 63, 80, 95 and 76% saythat manure from non-organic farms, antibiotics,growth regulators and confinement of animals,respectively, should not be allowed. All these prac-tices (except manure from non-organic farms) arebanned by the Final Rule.
The respondents were are willing to pay to avoid theBig 3 in organic foods. The mean and median premi-ums they said they would pay for GMO-free organicfood were $0.75 and $.50. For biosolid-free, themean was $0.78 and the median $0.50; for irradia-tion-free, the mean was $0.75 and the median $0.50.
The auction also demonstrates a WTP to avoidGMOs in organic food. The bids (both for the thirdround, and the average bids over all three rounds) forthe (GMO-free) labeled and non-labeled chips weresignificantly different at the 95% confidence level;consumers bid more for the labeled chips. The meandifference for both the third round and averageround was $0.40. Expressed as a percent premium(and excluding one extreme outlier observation),consumers would pay an average of 95% more in thethird round and 15% more in the average round.
Data from the surveys and experiment point to a lackof understanding of exactly what consumers are get-ting from organic food. Only 53% of auction partici-pants knew that GMOs are prohibited in organic pro-duction. Furthermore, some organic corn chip manu-facturers have placed “GMO-free” labels on theirpackages along with the organic label, despite thefact that the “GMO-free” information is redundant.They clearly believe that the cost of this redundantlabel is justified by the increased sales it brings. Per-haps the GMO-free label provides a psychologicalincentive to buy the product among consumers whoalready understand the organic label’s meaning, asone auction participant mentioned after the experi-ment.
The survey shows another area in which consumersmay not fully understand the label’s meaning. TheFinal Rule fails to provide a means of expressing inthe marketplace certain values associated with or-ganic agriculture. When asked why they buyorganic, respondents commonly stated reasons suchas concern about pesticide residues, theenvironment, and farm worker safety. Buying
organic certainly contributes positively to theseissues. However many respondents also mentionedreasons such as support for sustainable agricultureand local food systems, and opposition to the“corporate” food system. The label, which is basedon a list of permitted practices, does not necessaril yfacilitate purchases reflecting these values.
Conclusions and Implications
If the purpose of the organic label is strictly to li stpractices that are or are not permissible, the FinalRule is broadly in accord with these consumers’preferences. These results suggest that none of thepractices banned in the Final Rule (especially theBig 3) ought to be reinstated.
However, consumer misunderstanding of the label’smeaning points to a need for better communication ifthe label is to function optimally. With all the effortand resources devoted to the NOP, it is importantthat the label receive the necessary institutionalsupport if the current market and policy environmentfails to provide consumers with the correctinformation. The label could state the informationitself, or refer to consumer-friendly web pages, tollfree numbers, etc. Fees from grower certificationcould be used to fund advertisements that promoteorganic, explain its benefits and clarify the label’smeaning. Otherwise, firms themselves may placeadditional explanations of the label’s meaning andthe benefits of organic on their package, as manynow do.
Firms can use consumer aversion to the Big 3 as apromotional tool. Both the survey and auction indi-cate that consumers wil l pay to avoid GMOs. In asense, consumers are getting this GMO-free trait“ free” when buying organic food, even though theyare willing to pay extra for it. Promotions shouldhighlight the GMO, biosolid and irradiation-freetraits and emphasize that buying organic is the bestway to avoid the Big 3.
The mismatch between the label’s meaning and con-sumers’ use of it as a means to express sustainableagriculture values in the marketplace is more trou-blesome. Organic does not necessaril y mean sustain-able. Sustainable agriculture aims to address both theecological and social problems associated with mod-ern industriali zed agriculture. But the organic labelprovides, at best, information on the environmentalimpacts at the production site. It does nothing toaddress issues such as pollution from transportingfood over great distances, let alone social justice

38
issues. (See Pirog and Schuh [2003] and Sligh andMandelbaum [2003], both in this volume, forproposals regarding labels that respectively reflectthese two issues.) Furthermore, with the entry intothe organic market (and acquisition of once smallindependent organic firms) by large agri-businesscorporations, it is clear that buying organic does notnecessarily imply supporting small family farms or alocal sustainable food system, as many surveyedconsumers stated.
One option is to incorporate social and broader envi-ronmental values into organic certification require-ments (an idea advocated by many in the organicmovement), although they would be difficult toquantify and implement. The USDA organicprogram is probably not the best way to accomplishthis, especially in light of the difficulties involved indeveloping the current standard.
The USDA label could be a “floor” (rather thanbeing both a floor and ceiling, as is the currentpolicy), with individual certifying agencies requiringadherence to these higher standards. Thedisadvantage of this approach is that it would undothe goal of a unified definition of organic that was alarge motivation for the NOP in the first place.
Many activists argue that another word is needed,one that incorporates the list of allowed practicesalong with the values associated with the origins ofthe organic movement. Such a new word couldaddress the broader issues not covered by USDAorganic, but would have to start from scratch to gainthe public recognition, prestige and understandingcurrently enjoyed by the word organic.
Qualifying firms could take greater advantage of ex-isting labels and programs, such as local, Fair Trade,“green,” etc. Activist, consumer and producergroups should cooperate to promote products withthese labels.
In general, steps are needed to allow consumers toaccess information that allows them to make pur-chasing decisions that reflect their values and use themarketplace to shape the world as consumers as wellas citizens. Both the public and private sectors havekey roles to play in this endeavor.
Limitations of the Research and FutureDirections
The sampling for the survey and experimental auc-tion was non-random and restricted to a single
region. No claims can be made that the samples ofparticipants in the survey or auction arerepresentative of organic consumers in general.However, the lack of understanding of the label’smeaning and function by these people suggests thatfurther study on larger random samples is needed todetermine if this problem is widespread.
It is also not clear to what extent the premiumsexpressed in the survey and auction for small pur-chases will carry over to larger expenditures. A 40%or 75% premium on a $1 or $20 purchase is verydifferent from that size premium on one’s entire gro-cery bill .
Also unknown is the effect that the publicity sur-rounding the full implementation of the NOP wil lhave on consumer understanding of the label. Post-tests would shed light on this question.
In a larger sense, more research is needed to deter-mine how voluntary labeling like the organic andother ecolabels can best provide information forconsumers to express their values in themarketplace, and whether other policy interventionsmight be needed. “Knowing where your food comesfrom” is a growing issue in consumer food demand.The organic label and other ecolabels wil l playincreasingly important roles in the future.
References
Balistreri, E., G. McCleeland, G. Poe, and W.Schulze. 2001. Can hypothetical questions revealtrue values? A laboratory comparison of dichoto-mous choice and open-ended contingent valueswith auction values. Environmental and ResourceEconomics 18:275-292.
Darby, M., and Karni, E. 1973. Free competition andthe optimal amount of fraud. Journal of Law andEconomics 16(1): 67-88
Davis, D., and C. Holt. 1993. Experimental Eco-nomics. Princeton University Press, Princeton, NJ.
Hartman Group. 1996. The Hartman Report. Foodand the Environment: A Consumers’ Perspective,Phase I. Prepared for The Food Alliance by TheHartman Group, Bellevue, Washington.
Lohr, L. 1998. Welfare effects of eco-label prolifera-tion: too much of a good thing? Presented at theFAMC Conference on New Approaches to Con-sumer Welfare, Alexandria, Virginia, Jan. 1999.
Pirog, R., and P. Schuh. 2003. The load lesstraveled: Examining the potential of using foodmiles and CO2 emissions in ecolabels. In W.

39
Lockeretz (ed). Ecolabels and the Greening of theFood Market. Proceedings of a Conference,November 7-9, 2002. Tufts University, Boston,Massachusetts. pp. 69-76.
Reicks, M., P. Splett, and A. Fishman. 1997. Shelflabeling of organic foods: effects of customer per-ceptions and sales. Working paper 97-03. RetailFood Industry Center, University of Minnesota.
Sligh, M., and R. Mandelbaum. 2003. Toward socialjustice and economic equity in the food system: acall for social stewardship standards in sustainableand organic agriculture. In W. Lockeretz (ed).Ecolabels and the Greening of the Food Market.Proceedings of a Conference, November 7-9,2002. Tufts University, Boston, Massachusetts.pp. 107-110.


41
Organic and Or igin-Labeled Food Products in Europe:Labels for Consumers or from Producers?
Georges Giraud1
____________________________1Research Unit Food Products Typicali ty, ENITA of Clermont-Ferrand, 63370 Lempdes, France. Email: [email protected]
Consumers’ fears, triggered by food scares and tech-nological developments such as GMOs, have beentranslated into serious concern about food safety,ever-increasing demands for quality assurance, andmore information about product origin. Moreover,public awareness of the irreversible damage done tothe environment by practices that lead to soil andwater pollution, the depletion of natural resourcesand the destruction of delicate ecosystems has led tocalls for a more responsible attitude towards ournatural heritage. Against this background, extensiveagriculture such as organic farming and on-farmprocessing, once seen merely as a fringe interestserving a niche market, has come to the fore as anagricultural approach that not only can produce safefoods with a distinctive native character, but also isenvironmentally friendly.
Organically produced foods and foods typical of aregion have always commanded a higher price thanconventional products. This has previously hinderedthe expansion of these two sectors, which are stillconsidered niche markets. Now, however, one seesmore consumers declaring a positive will ingness topay higher prices in return for guarantees relating tofood safety and quality. Organically produced foodsonce were difficult to obtain other than in specializedoutlets and local markets, but now are much morereadily available on the shelves of the major super-market chains across Europe. Nowadays we can alsofind private-brand origin-labeled or organic foodproducts in most supermarkets. The transition fromscarcity to ready availability seems very quick.
This paper focuses on the place of these kinds ofproducts within European food consumption. Itexamines in turn the market share of food labels, con-sumers’ perceptions of such products, and their pur-chasing behavior in different sales channels. It con-cludes with consideration of the methodology of con-sumer surveys to improve our knowledge of foodconsumers’ actual behavior.
Food Labels in Europe
Quali ty products and European food labels
There is an enormous range of branded foodsthroughout Europe. However, when a productacquires a reputation that spreads beyond nationalborders, it can find itself in competition with productsthat pass themselves off as the genuine article andtake the same name. This unfair competition not onlydiscourages producers but also misleads consumers.That is why the European Union has created labelsknown as PDO (Protected Designation of Origin) andPGI (Protected Geographical Indication) to promoteand protect traditional food products (Table 1). Thesedirectives (2081/92 and 2082/92) complement thedirective on organic farming (2092/91).
The factors contributing to the birth of these newlabels are well known. The European Community hasdeveloped such systems for several reasons:
• to encourage diverse agricultural production
• to protect product names from misuse and imita-tion
• to help consumers by giving them informationabout the products’ specific characteristics.
It is easy for the consumer to perceive the taste,smell , appearance and consistency of food, butwholesomeness and safety are often difficult or im-possible to identify. Food labels are used as qualitycues. Consumer responses throughout Europe varywith region, but seem to be generally congruent.
Food labels’ share of European consumption
PDO-PGI food products’ market share is not wellknown, but most estimates put it at about 7-9% ofoverall food consumption in Europe. Bertozzi (1995)gives a partial indication for the cheese market. Onerare exhaustive database is built on the number ofPDO-PGI labels by country and product category. Inthe organic food market, variations are seen among

42
different estimates because of the rapid increase peryear, as shown in Table 2.
Data from the most recent European sources give thespecific features of how both PDO-PGI and organicfood products are distributed within the EU, as indi-cated in Table 3. Three clusters of countries appear:
• Denmark, Austria, Sweden, Finland and Ger-many have a high and rapidly increasing marketshare for organic food products. These countriesalso have very few PDO-PGI food products.
• France, Italy, Portugal, Spain and Greece arehigh in PDO-PGI products but have a low marketshare for organic products.
• The third group, the United Kingdom, the Neth-erlands, Belgium, Luxembourg and Ireland, arelow in both organic market share and the numberof PDO-PGI products (see Figure 1).
Perception of Labeled Food Products
When one focuses on consumers’ perception of typi-cal food products within Europe, no single Europeanconsumer of such products can be found. Rather, onefinds a splendid mosaic with a great diversity of con-sumer responses. The results are obviously differentamong countries, but also seem to differ according tothe kind of survey. Within the scope of consumersurveys we have to take into account the differencesbetween declarative surveys, focus-group surveys,and scanned data panels.
Food label recall
In face-to-face interviews, we have to keep in mindthat responses depend on how consumers control thevocabulary and their own memory. For instance,unaided recall of food labels in France varies withage, as shown in Figure 2. It is interesting that tenyears ago the label Appellation d’Origine Contrôléewas in second place, and the Organic Farming labelwas lower. Nowadays, all surveys rank the unaidedor aided recall of Organic Farming second.
Focusing on recognition of organic labels, Hamm etal. (2002) present interesting estimates from four ofthe fifteen EU countries (Table 4). It seems difficultto obtain such data: percentages are often rounded, asthey are estimates rather than measurements. Becauseof the administrative means by which conversionsupport grants are distributed to farmers, it seemseasier to obtain data on organic farming acreage. Arecent map drawn at the regional level for Europe is
shown in Offermann and Nieberg (2002).
A more recent regional survey that we did shows thesame rank among the main labels and a great declinefrom national to European versions of the same labels(see Table 5). AOC is known by 57.2% of respon-dents, while PDO is known by only 7.2%; the Frenchversion of the Organic Farming label is known by61.4% of respondents, while the European one isknown by only 17.6%. The regional label of the re-gion where the survey was done (Auvergne) obvi-ously is well known.
The rate of aided recall of the label called TraditionTerroir is remarkable. Among the 375 respondents,18.4% said they knew this label. The fact is that itdoes not exist. It was designed (without registeredtrademark) specifically for this survey to control forrespondents’ tendency to answer positively. Theaided recall of Tradition Terroir is a measure ofdocility during face-to-face interviews. Every spe-cialist in surveys will confirm that anybody will an-swer anything about any purpose so long as the inter-viewer smiles appealingly to the interviewee.
Consumer scanned data panel response to foodlabels
The usual consumer surveys can only measure verbalresponses to questionnaires. They sometimes meas-ure attitudes, but very often miss behavior. Even insensory analysis we have an experimental contextthat may introduce some measurement problems, andwe need many tests to obtain significant results.
This is the main reason that the protocol called “con-sumer scanned data panel” was developed and im-plemented to measure actual behavior and to compareit with verbal and hedonic responses. For the samepanelists, measurements of attitude and behavior donot agree. This is a general result in food behaviorbecause attitude is cogniti vely managed while be-havior is affect-oriented (Köster, 1996). This is obvi-ously true for organic and origin-labeled products,which carry more social status and are more likely tobe a form of ostentation in social l ife.
The results of the scanned data panel are very inter-esting regarding the comparison of actual purchases,hedonic preference and verbal responses of each pan-elist regarding his or her own purchasing behavior. Inour French study, 13.2% of the panelists actually pur-chase origin-labeled food products frequently; 31.6%preferred these products in sensory blind tests, but59.2% declared a positive attitude towards them. On

43
Consumer Scanned Data Panel
Using private credit cards set up by supermarkets, thebar code of a product can be linked to the customercard at the cash register. It thus is possible to identifywho buys what, when, how, and how much. Based onthe principle of single source data, this kind of sur-vey is called a consumer scanned data panel. Weused such a survey in France with a broader protocolincluding sensory preference, declared attitude andactual purchase by the same consumers (Giraud et al.,2000). The study aimed at analyzing the purchasingbehavior of consumers regarding Origin Labeledfood products compared with commercial brands orthe distributors’ own label. The survey (supported bythe French Government Food National Board)focused on Camembert cheese and dry pork sausage;no organic versions of these products were present insupermarkets during the study.
the other side, 75.0% of the panelists did not buy anyorigin labeled food products during the past the yearand 46.1% rejected these products in blind tests, butonly 1.3% expressed a negative attitude towards themduring face-to-face interviews, as shown in Table 6.
Consumer responses are more often negative in ac-tual behavior but become favorable when declared,whereas the sensory responses are more balanced.Consumers’ verbal responses seem to be stronglylinked to the social image carried by brand status.
Consumers’ Purchasing Behavior forOrganic and Origin-Labeled Food Products
Studies of organic consumers usually characterizethem as affluent, well educated and concerned abouthealth and product quality (Richter et al., 2000).Similar features are found for consumers of PDO-PGI food products (Giraud et al., 2001). All studiespoint out that food scares such as BSE, E. coli con-tamination and pesticide poisonings, as well as con-cerns over GMOs, have stimulated interest in organicand origin-labeled foods.
Environmental protection seems to be the secondmost important concern, although not new (Huang,1996). However, the ITC (1999) notes inconsisten-cies in several countries between the poli tical viewsof self-described environmentalists and their shop-ping habits. Most cross-cultural studies indicate thatGerman consumers can be considered as the mostgreen-oriented and discriminating with respect toorganic credentials (Lohr, 2001), whereas southern
Europeans seem more enthusiastic towards everyproposed item about organic farming but cannot dis-criminate clearly among them (Sirieix and Schaer,2000).
The high green commitment level of some consumersresults in a relatively small base of consumers inter-ested in organic and origin-labeled food products.The distinction between regular and occasional con-sumers is commonly used to describe the drivingforces and barriers in this market (Michelsen et al.,1999). Consumers can choose among different saleschannels: supermarkets; bakers/butchers; specialty,organic, fair trade or dietetic food shops; and directsales (farmers markets and weekly markets). Regularorganic consumers seem oriented towards specialtyshops and direct sales, and consider these short retailchannels as a convenient guarantee of the products’authenticity, whereas occasional consumers are moreoriented towards supermarkets (Richter et al., 2000).
The dilemma between dedicated short channels butsmall market share versus the supermarkets’ broadpotential but less involved consumers has beenpointed out in several summaries and well -documented studies on organic food consumption(Sylvander, 2000; Lohr, 2001; Hamm et al., 2002).Unfortunately, similar studies about origin-labeledfood products are lacking. According to Lohr (2001),the analysis of the raw data used by Hamm et al.(2002) confirms that the future of organic foodproducts significantly involves developing sales insupermarkets (Figure 3).
Another understanding of this phenomenon lies indistinguishing between conviction stores, which ad-dress green-oriented consumers’ demands, and con-venience stores, which offer organic and origin-labeled products to current shoppers (Pontier, 1997).Bakers, butchers, specialty food shops, delicatessens,farmers markets and weekly markets belong to thecategory of conviction stores. Supermarkets arelarger than convenience stores but belong to the con-venience category regarding retail distribution of or-ganic and origin-labeled products. With this distinc-tion, we can explain how conviction stores offer des-tination products while convenience stores offer in-terception products, both organic and origin-labeled.
Looked at this way, it is not certain that occasionalconsumers can become regular ones. Daily shopperscannot transform themselves into mili tant consumers.The former are more price sensitive and li kely to seekorganic and origin-labeled products in supermarkets,while the latter are more health-conscious and a bit

44
reluctant to frequent supermarkets (Richter et al.,2000).
This perspective seems to be discouraging for farmerand retail premium prices. It means that studiesmeasuring willingness to pay cannot supportmarketing assessments of organic and origin-labeledfood products (Govindasamy and Italia, 1999; Corsiand Novelli, 2002). Willingness to pay is measuredby means of declarative surveys whose interpretationcould be limited by the shortcomings of verbalresponses, as highlighted above.
The main threat to price premiums for organic andorigin-labeled food products is that supermarkets aremore resistant to charging high prices than arespecialty stores (Lohr, 2001). When cross-tabulatingdata from Hamm et al. (2002) we find a significantnegative correlation between proportion of organicfood sales in supermarkets and the index of organicfood premium price in Europe (Figure 4). (The indexof organic food premium prices is the number oforganic products with a retail price more than 20%above the weighted EU average price, divided by thenumber of products with a retail price no more than20% above the weighted EU average price.)
Premium prices do not seem possible in massmarketing distribution, although a substantially high-er price is necessary for a high quality food product.Despite their low involvement in political concernsrelating to consumption, most consumers (and mostfarmers too) can easily understand that an organic ororigin-labeled food product cannot be everythingthey want it to be at once:
• a nutritious, safe and ecological product
• an organic food with a perfect appearance
• tasty, with unanimous acceptability
• available everywhere, ready-to-use and fresh
• with all these attributes supplied at a low price!
Marketing food products is a hard challenge. Itshould not discourage those who are involved indeveloping organic farming. Marketing organic ororigin-labeled food products cannot give both a goodrate of return and a high turnover. The future oforganic and origin-labeled food products appearspositive with the regular and occasional consumers’complementary demands. Rooted in regular consum-ers’ purchases, this market should find its potentialincrease in the occasional consumer.
Conclusion
For a consumer who is frequently being uprooted andis stressed by his/her urban environment, the emo-tional content of where one’s food is produced isgreater than ever. With a longing for one’s home, theconsumer becomes an identity seeker. Origin andorganic labels respond to this need to identify lostroots or the memory of happy holidays in a rural area.Because of their historical and cultural content, originand organic labels give a meaning to taste. Theyprovide both a means for busy people li ving in largeurban areas to re-energize themselves and a means ofidentifying with the area of production.
More generally, the demand for origin and organiclabels is to be found somewhere between lifestylehabits and changes. The reference to tradition makesmodernity tolerable. The future of origin and organiclabels is supported, strangely enough, by the deve-lopment of novel food products such as fat- or sugar-free foods, restructured meat, alcohol-free wine, andGMOs. The arrival of high tech food products shouldalso result in a demand for compensatory products,and thereby favor organic and origin-labeled foods.
There is a complementarity between high tech prod-ucts and foods with origin and organic labels. Con-sumers are looking for safety and taste. They couldbalance their food habits by purchasing both kinds ofproducts. The consumer’s shopping basket containsboth novel and typical foods. With organic and ori-gin-labeled foods, the consumer seeks to be reassuredby products with a distinctive native character. Withnovel foods, he or she is looking for ready-to-eatmeals of controlled, healthful composition.
Farmers tend to be exclusive (entirely organic orentirely conventional, not both). It is not at all clearthat this pattern will continue in consumers’ behaviorwith respect to food. The consumers’ approachtowards organic and origin-labeled food productsdiffers from producers’ . Producers, and most re-searchers too, are focusing on origin or organic labelwith territorial veracity (Tregear, 2000). Consumersare focusing on origin or organic labels with confi-dence in mind.
Strict rules and high standards for obtaining an or-ganic or origin label obviously are necessary. But thatis far from consumers’ perception. We are thinkingabout organic or origin-labeled food products whileconsumers mainly are eating them. Consumers givean affective response towards food, not a cognitiveone. This is definitely a chance for the organic or

45
origin-labeled market.
From a methodological standpoint, we have to im-prove consumer surveys to avoid declarative bias inface-to-face interviews and because food sensoryperception can not be easily expressed with astandardized lexicon (Köster, 1996). Dealing with theconsumer as a whole does not allow us to focus onlyon the stomach or the purse. We have to take intoaccount contradictions, discrepancies and diversitythat affect consumer behavior with respect to food.This is a difficult but exciting challenge. We canexpect that the consumer scanned data panel protocolwill help us meet it.
References
Bertozzi, L. 1995. Designation of origin: quality andspecification. Food Quality and Preference 6:143-147.
Corsi, A., and S. Novelli. 2002. Consumers’ willing-ness to pay a price for organic beef meat. Paperpresented at Tenth Congress, European Associa-tion of Agricultural Economists (EAAE) onExploring Diversity in the European Agri-foodSystem, Zaragoza, Spain.
Giraud, G., L. Sirieix, and A. Lebecque. 2000. Con-sumers’ purchase behavior towards typical foods inmass marketing: The case of PDO camembert fromNormandy. In B. Sylvander, D. Barjolle, and S.Arfini (eds). Proceedings of the 67th Seminar ofEuropean Association of Agricultural Economists,INRA-ESR Ed., Le Mans, France, 17-1:117-125.
Giraud, G., C. Amblard, L. Trognon, and J.P.Bousset. 2001. Scanned data panel as new comput-erised technology to investigate consumer behaviortowards food products. In 5th Symposium of Inter-national Association of Agri-food Economics,Bologna, Italy, September.
Govindasamy, R., and J. Italia. 1999. Predicting will-ingness-to-pay a premium for organically grownfresh produce. Journal of Food DistributionResearch 30:44-53.
Hamm, U., F. Gronefeld, D. Halpin, N. Kristensen,T. Nielsen, M. Bruselius-Jensen, P. Scheperlen-Bøgh, M. Beckie, C. Foster, P. Midmore, and S.Padel. 2002. The organic food market and mar-keting initiatives in Europe: a preliminary analysis(OMIaRD). QLK5-2000-01124. Institute of RuralStudies, University of Wales, UK.
Huang, C. 1996. Consumer preferences and attitudestowards organically grown produce. EuropeanReview of Agricultural Economics 23:331-342.
International Trade Center (ITC). 1999. Organic foodand beverages: world supply and major Europeanmarkets. ITC/UNCTAD/WTO, Geneva.
Köster, E.P. 1996. The Consumer? The Quality? InAgoral 96, Lavoisier Tec and Doc, Paris. pp. 9-19.
Lohr, L. 2001. Factors affecting international demandand trade in organic food products. In Changingstructure of global food consumption and trade.Economic Research Service, USDA. pp. 67-79.
Michelsen, J., U. Hamm, E. Wynen, and E. Roth.1999. The European market for organic products:growth and development. Organic farming inEurope: Economics and Policy. Vol. 7. Universityof Hohenheim, Stuttgart, Germany.
Offermann, F., and H. Nieberg. 2002. Does organicfarming have a future in Europe? EuroChoices 2:12-17.
Pontier, S. 1997. Consommation biologique et fré-quentation des points de vente. (Organic con-sumption and shopping). In Colloque SFERGrande Distribution Alimentaire. INRA Montpel-lier 107: 377-395.
Richter, T., O. Schmid, B. Freyer, D. Halpin, and R.Vetter. 2000. Organic consumer in supermarkets,new consumer group with different buying behav-ior and demands. In T. Alföldi, W. Lockeretz, andU. Niggli (eds). IFOAM 2000: The World GrowsOrganic. Proceedings of the 13th InternationalIFOAM Scientific Conference, August 28-31,2000, Basel. Vdf Hochschulverlag, Zurich. pp.542-545.
Sirieix, L., and B. Schaer. 2000. Consumers’ attitudestowards organic and regional foods. In B.Sylvander, D. Barjolle, and S. Arfini (eds). Pro-ceedings of the 67th Seminar of European Associa-tion of Agricultural Economists, INRA-ESR Ed.,Le Mans, France, 17-1: 425-428.
Sylvander, B. 2000. Les tendances de consommationdes produits biologiques en France et en Europe.(Trends of organic food products consumption inFrance and Europe). In G. Allard, C. David, and J.Henning (eds). L’agriculture biologique face à sondéveloppement: Les enjeux futurs. INRA ed.,Paris. pp. 193-212.
Tregear, A. 2000. The activities and experiences ofspeciali ty regional food producers in NorthernEngland: a qualitative study. In B. Sylvander, D.Barjolle, and S. Arfini (eds). Proceedings of the67th Seminar of European Association of Agricul-tural Economists, INRA-ESR Ed., Le Mans,France, 17-1:359-367.

46
Table 1. Different European food quality labels.a
A Protected Designation of Origin (PDO) covers the term used to describefoodstuffs that are produced, processed and prepared in a given geographicalarea using recognized know-how. Example: Italian cheese Pecorino Toscano.On the left, the French version of this label.
In the case of the Protected Geographical Indication (PGI) the provenancemust occur in at least one of the stages of production, processing orpreparation. Furthermore, the product can benefit from a good reputation.Example: French dry-cured ham Bayonne. On the left, the German version ofthis label.A food product with the Organic Farming label contains at least 95%organically produced ingredients; the product complies with the rules of theofficial inspection scheme; the product has come directly from the producer ina sealed package; the product bears the name of the producer and the name orcode of the inspection body. On the left, the British version of this label.
aSource: europa.eu.int/comm:agriculture/qual/
Table 2. Increasing organic market share of European food consumption (%).a
Organic market share Au Ge Dk Fr It Swe UK Swi
1998 2.0 1.2 2.5 0.4 0.5 1.8 0.4 2.0
2000 2.9 1.5 4.5 0.6 0.7 1.6 0.9 1.9aSources: Michelsen et al. (1999); Hamm et al. (2002).
Table 3. Indicators of food labels’ market share in European consumption.a
Number of PDO-PGI labels Au Be Ge Dk Fr Fi Gr It Ir Lu NL Por Sp Swe UK TotalCheese 6 1 4 2 41 19 30 1 4 12 16 1 11 148Meat based products 2 2 4 4 25 1 1 14 9 62Fresh meat 3 48 2 1 19 7 5 85Sea products 1 1 1 1 1 5Eggs, honey 4 1 1 9 1 1 17Oil , fat, olive oil 1 1 1 6 23 25 1 5 9 72Table olives 3 10 2 1 16Fruits, vegetables, wheat 3 2 1 16 1 19 29 1 18 21 1 112Bread, cakes, biscuits 4 1 1 2 1 3 12Total (excepted drinks) 12 4 19 3 124 1 74 115 3 5 5 78 66 1 19 529Organic market share in 2000 2.9 0.6 1.5 4.5 0.6 1.6 0.1 0.7 0.1 0.6 0.9 0.4 0.1 1.6 0.9aSources: Hamm et al. (2002) and http://europa.eu.int/comm:agriculture/qual/en/pgi_01en.htm

47
Table 4. Consumers’ organic label recognition.a
Country and label % of consumersrecognizing label
% of labeledorganic products
Austria (Austria Bio-Zeichen) 10 80
Denmark (StatskontrolleretØkologisk)
100 80
Finland (Rising Sun Label) 80 85
France (AB Agriculture Biologique) 41 No dataaSource Hamm et al. (2002).
Table 5. Food labels aided recall in France (%, n = 375).a
Do you know the following food labels?
Appellationd’OrigineContrôlée
57.2%Protected
Designation ofOrigin
7.2%
Label Rouge 80.6%Protected
GeographicalIndication
2.9%
Organic Farming 61.4% Organic Farming 17.6%
Mountain FoodProduct
42.0%TraditionalSpeciality
Guaranteed2.9%
Fair Trade 9.8%Produced in
Savoie21.1%
Tradition Terroir 18.4%Produced inAuvergne
74.4%
aSource: regional survey made in Auvergne by the author and his students, June 2002.
Table 6. Variation of consumer panel responses according to the kind of measurement.a
Kind of measurement
Level of responseRecorded purchases over
one yearHedonic preference in blind
testVerbally declared
attitude
Highly positive frequent: 13.2% preferred: 31.6% positive: 59.2%
Highly negative none: 75.0% rejected: 46.1% negative: 1.3%aSource: Giraud et al. (2001). Camembert PDO cheese consumption, n= 123 respondents, France.

48
Figure 1. Market share of organic or PDO-PGI food products within the European Union.aar Pearson: -0.404
Cross-tabulated data from Hamm et al. (2002) and europa.eu.int/comm:agriculture/qual/en/pgi_01en.htm.
Figure 2. Unaided recall of food labels in France. aSource: CREDOC – INC France 2001.
10%
20%
30%
40%
50%
60%
18-24Age 25-34 35-44 45-54 55-64 65-74 75 +
Label Rouge
Organic Farming
AOC

49
Figure 3. Relationship between organic market share and organic foods sold in supermarkets in EU.a
ar Pearson: 0.685 (p=0.01)
Source: author’s own calculation using data from Hamm et al. (2002). Missing data from Spain and Portugal.
Figure 4. Relationship between organic food premium price and organic food sales in supermarkets in EU.a
ar Pearson: -0.669 (p=0.05)
Source: author’s own calculation on data from Hamm et al. (2002). Missing data from Spain and Portugal.


51
The Commodification of Heritage and Rural Development inPeripheral Regions: Artisanal Cheesemaking in Rural Wales
Tim Jenkins1 and Nicholas Parrott2
____________________________1Institute of Rural Studies, University of Wales, Aberystwyth, UK. Corresponding author. Email: [email protected] of Rural Sociology, Wageningen Agricultural University, The Netherlands.
The imperatives of rural development in high in-come countries have changed significantly in recentyears in response to what many have characterizedas the exhaustion of the modernization project (vander Ploeg et al., 2000) and the impact of postmodernconcerns (Jenkins, 2000) in rural areas. The demiseof modernization is reflected in the economicdecline of agriculture and the persistent unevennessof regional development performance, while post-modern issues are reflected in societal concern overthe natural environment, food safety, the quality oflife, and the provision of other public goods.Europe’s peripheral rural regions are particularlyaffected by the failures of the modernization para-digm of rural development. They are often highlydependent on primary production and particularlyexposed to external competitive forces in the in-creasingly global and liberalized agri-food economy,facing falling commodity prices, lower levels of sub-sidization, falling incomes, and pressures todiversify their economies.
At the same time, however, rural regions face newopportunities in the form of increasingly discerningconsumer demand. Today’s consumers are espe-cially concerned about food-related health issues(Nygård and Storstad, 1998; Shaw, 1999), adven-turous in their tastes (Warde, 1997), interested inregional identities and products that resonate withsuch identities (Cook and Crang, 1998), and inclinedto construct personal identities through their con-sumption patterns (Bell and Valentine, 1997). Nichemarkets associated with such trends, such as organicand specialty foods, are among the few growthsectors in the food industry (OECD, 1995), and thecompanies involved in the production and distri-bution of such foods are recognized as making agrowing contribution to the rural economy (DTZPieda Consulting, 1999).
The combination of these threats and opportunitiesfacing rural regions suggests the need for a shift
from the “ logic of productivism” towards a “logic ofquality” (Allaire and Sylvander, 1996) that will re-construct the eroded economic, social, cultural andenvironmental base of rural areas and take them“beyond modernization” (van der Ploeg and vanDijk, 1995). Peripheral rural regions are well posi-tioned to make this shift. Often, they have not beenfully integrated into intensive agro-industrial foodproduction systems and have maintained relativelytraditional patterns of farming and local attributesthat allow them to retain unique identities and to berelatively well positioned for entry into the post-Fordist era (van der Ploeg and Renting, 2000). Inparticular, they have the potential to market theirproducts with desirable environmental, social andcultural characteristics that tap into the requirementsof health- and identity-conscious consumers.
Against this background, in this paper we take apractical example of the commodification of ruralheritage – namely, the small but symbolically sig-nificant artisanal cheesemaking sector in rural Wales– and contextualize it within recent rural de-velopment thinking. In so doing, we uncover variousparadoxes that are not always apparent in theliterature, and suggest some of the constraints thatneed to be overcome if the new conceptualization ofrural development is to be successful in practice.First, we outline some characteristics of the artisanalfarmhouse cheesemaking sector in Wales. With thesector in mind, we then use a Porterian framework(Porter, 1990; Jenkins and Parrott, 1997) to clarifysome important issues in recent rural developmentthinking, and we outline some of the theoretical andpractical aspects of the commodification of heritage.Finally, we draw some conclusions.
Artisanal Cheesemaking in Rural Wales
In many respects, rural Wales is a classic example ofa geographically peripheral and economically mar-ginal region in what is largely a progressive,

52
outward-looking and globalized national economy.Traditionally, Wales has been highly dependent,both economically and culturally, on agriculture, butthere is increasing policy recognition that agriculturealone is now unable to secure viable and stable ruraleconomic and social development in the face ofgeneral trends that include the loss of traditionalfarming, manufacturing and craft employment, theeffects of globalization and trade liberalization, andthe centralization of services. In addition, Walesretains a unique historical, cultural and linguisticheritage, largely embedded in rural areas, that is alsothreatened by economic decline.
The long tradition of farmhouse cheesemaking in theUK was decimated during and immediately afterWorld War II, largely by government decree follow-ing the 1947 Agriculture Act. At a time when ruralpolicy was essentially dominated by the “logic ofproductivism” or, more cynically, by a conspiracybetween politicians and big business to commercial-ize the countryside (Moore-Colyer, 2001), such old-fashioned small -scale activities were seen as baduses of resources and labor (HCSCA, 2000) and adisruptive influence on the modernization agenda towhich agriculture was subjected (Bertozzi, 1995). InWales, farmhouse cheesemaking had completelydisappeared by the 1970s, when a few individuals,largely working in isolation and unsupported byofficial development efforts, began to revitalize it.
Today, there are some thirty producers in Wales,mostly in the dairying areas of the southwest.1 Mostare well -established, and almost all are micro-businesses. They come from two distinct types ofbackground. Around two-thirds are in-migrants,mainly “ refugees from modernity” (Featherstone,1991) seeking an improved lifestyle in a peacefuland attractive part of Britain. The remaining one-third are traditional small -scale dairy farmers seek-ing to diversify their business activities in order tomaintain the viability of their farms in the face of thesevere economic pressures facing the dairy sector.Both groups have similar motivations: they tend tobe “income sufficers” rather than maximizers, andmany resist expansion on the grounds that it wouldchange their way of life and the nature of theirproducts. All are self-starters and self-taughtinnovators exhibiting considerable entrepreneurship.
____________________________1Much of the detail in this paragraph is taken fromJenkins et al. (1998).
The combined direct economic significance of arti-sanal cheesemaking makes very limited con-tributions to Welsh employment or income. Yet, thesector is coming to be seen and promoted as one ofsymbolic importance, producing “ flagship” productsthat incorporate product quali ty, local tradition, localraw materials, and local retention of added value andthat, most importantly, contribute to the image anddistinctiveness of rural Wales. Typically, producersuse rural and Welsh imagery in their marketing,echoing the French notions of pays and terroir, inwhich place and product are intimately linkedthrough the unique characteristics of a locale or pro-duction method (Buchin et al., 1999).
Rural Development Thinking
Given the clear failure of productivist logic to pro-mote sustained development in peripheral regionssuch as rural Wales, academic and policy thinkingabout rural development has shown significantchange in recent years. For forty years followingWorld War II, it was largely concerned with struc-tures, economies of scale, functions, dependence,standard models, specialization, transferability ofpractices, uniform exogenous interventions, and anormative concern for rationality and efficiency –manifested in uni-sectoral concerns and a subsidizedagriculture. Current rural development thinkingplaces greater emphasis on actors, processes, econo-mies of scope (Saccomandi, 1998), strategy, differ-entiation, locality, heterogeneous endogenous capa-cities, and a positive concern for societal expecta-tions and interests – manifested in integrated policiesand multi -sectoral approaches (Saraceno, 1994;Marsden, 1999).
Among other things, this shift has brought an inter-est in esthetics as much as rationality (Urry, 1995)and has resulted in culture being seen as an intrinsicdimension of the socio-economy rather than as sim-ply a contextual variable (Lagendijk and Kramsch,2000). Importantly, the earlier reliance on the broaddeterminism of economic forces to explain andinfluence rural development has been undermined infavor of a multi -dimensional focus that embracesmore particular institutional and political processes,the agency of communities, networks andassociation (Ray, 1999; Bristow, 2000; Murdoch,2000). Space is increasingly viewed as a positiveattribute rather than as a constraint to be overcome,difference is perceived as a potential asset ratherthan as a deviation from the optimal, and recognition

53
is given to the importance of symbolism in con-sumption and in the creation of identity.
The increased emphasis on the importance of thelocal in a global context arises in part from two fail -ures on the part of Ricardian and neo-classical tradetheory: failure to explain the real nature ofinteraction and engagement between the local andthe global, and failure to produce persuasive reasonswhy some spatial entities are more competitive thanothers (Porter, 1990). Traditionally, localities havetended to be seen, in economic terms, as passive(dis-)beneficiaries of wider systems, with littlepotential actively to influence their circumstanceswithin such systems.
Porterian competitive advantage theory, by contrast,stresses the creation and mobili zation of nationallyor regionally embedded resources in a way that canincrease productivity and competitiveness, a con-ceptual leap of clear potential interest to economi-cally marginal and geographically peripheral ruralregions (Jenkins and Parrott, 1997). While, forPorter, competitive advantage tends to be seen interms of innovation and effectiveness in deployingfactors of production, his insight that competitivestrategies need to move beyond factor cost advan-tages and therefore beyond policies based on alteringfactor costs is instructive for such regions, as is theimportance of his concepts of resource hierarchies1
and resource specificities2.
These considerations suggest that the most valuableresources in regional development terms are thosethat are relatively unique, immobile, innovative andembedded in specific socio-cultural settings, and thatdifferentiation on the basis of such resources is po-tentiall y a powerful competitive instrument for spe-cific regions. Resources are here seen in broadterms, encompassing not only given and createdphysical and human assets, including knowledge,skill s and organization, but also what have been
____________________________1Taking a hierarchical view, resources range from “basic”to “advanced.” Basic resources are those, such as naturalresources, that are passively inherited; while advancedresources, such as infrastructure or heritage, requireinnovative investment or creation.
2Taking a specificity-based view, resources range from“general” to “specialized.” General resources, such asgenerally available technologies, are potentially availableto all regions; while specialized resources, such asculture or imagery, are region-specific and difficult toemulate.
termed the locally rooted “competencies” (Lawson,1999), the local capabilities and the “creative im-pulses” (Salais and Storper, 1992) that are highlyintangible but that are important in enabling the useof assets and association to achieve practical devel-opmental performance. As the Welsh cheesemakingexample shows, there is evidence that some actorswithin localities are, in fact, responding to global-ization by pursuing economic activities that areexplicitly based on local resources, that involve asearch for local specificity, and that represent anattempt to (re)valorize place in a “culture economy”approach to rural development (Ray, 1998). Suchapproaches reveal a localized agency that engagesreflexively with the extra-local, not only in cognitiveand normative ways (Habermas, 1984), but alsoesthetically (Urry, 1995) at the level of feeling,image and symbol.
The recognition of esthetic reflexivity is important inshowing that the commodification of culture leads tothe production of “symbolic” as well as “ real”goods. Artisanally produced Welsh cheeses, forexample, are not substitutable for, or comparablewith, bulk cheeses manufactured under industrialprocesses, since the former contain connotations andimagery that resonate with producers, consumersand societal expectations alike in a way that“placeless” products do not. Analysis of the cultureeconomy necessarily involves the study of suchsymbolic forms in relation to the specific contextsand processes by which they are produced andconsumed (Thompson, 1990).
Porter (1990) also pointed out that competitiveadvantage involves the entire value system of theproduction-marketing-consumption process, an in-sight also attributable to Appadurai (1984), forwhom values and meaning become inscribed inproducts throughout the whole length of their eco-nomic trajectory. Symbolic criteria are thus funda-mental to commodity exchange and value, and suchcriteria are generated and maintained by the activeinvolvement of all in the marketing chain. This pointis well recognized by Welsh artisanal cheesemakers,who unanimously seek to maintain close involve-ment along the entire length of the supply chain,from a personal acquaintance with their suppliers, toan intimate involvement in production by which theymaintain quali ty control, to discernment over thenature of the marketing channels that they utilize todetermine that their products flow to discerning con-sumers.

54
Various results derive from this. First, innovation (acentral concept in the analysis of Porterian competi-tive advantage) goes well beyond the relatively sim-ple realms of technology and organization to encom-pass more complex notions of meaning and valoriza-tion. Innovation is socially and culturallyconstructed by actors whose motivations are shapedby macro- as well as micro-processes that are morethan economic. In the case of Welsh artisanalcheesemaking, for example, innovation is intimatelyconnected with the motivational psychologies ofboth producers and consumers as well as the simpledesire to exploit niche markets.
Second, as the “messages” contained in Welsh arti-sanal cheese production show, economic practicesare as much about creating meaning as about ex-change. As Lagendijk and Kramsch (2000) expressit, such practices are to be understood as symbolic-interpretative processes with important political,social and cultural dimensions. Third, commoditieshave a “social l ife” (Appadurai, 1984) whereby acomplex array of assumptions, conflicts and rela-tionships define their legitimization, and they areturned into symbols within specific historical, cul-tural and spatial contexts, a process molded by bothexternal and internal forces. Artisanal cheeses, forexample, even though almost exclusively “ re-inventions of tradition” (Hobsbawm and Ranger,1983) and often created by non-local in-migrantartisans, tend to draw upon tradition, locality andWelshness for their inspiration and presentation, aswell as being harmonized with wider associative andrelational forces, such as environmentalism andconcerns for quality, which are culturally andsocially determined.
The view that localities possess endogenous agencyhas encouraged some to seek cultural explanationsfor economic development processes. Hence, evo-lutionary economists stress the importance of socialconventions (Nelson and Winter, 1982); others relateeconomic outcomes to societal or civic charac-teristics assumed to result from the historical accu-mulation of social capital (Putnam, 1993); stillothers seek to disentangle the complex interaction ofeconomic performance and its cultural context asrevealed in people’s attitudes and values (Inglehart,1997). All effectively focus on “untraded inter-dependencies” (Storper, 1995), the networks of val-ues and understandings through which economicactors are clearly connected but which are outsidethe purview of most economic analysis. A region or
locality becomes a “nexus of untraded interdepend-encies” (ibid.), in which linkages may be strongerthan purely economic ties between actors and maylead to innovations that result in competitiveadvantage for their localities. Culture and economythus become “mutually constitutive and enabling”(Kramsch, 2000).
Many of these points are well i llustrated by the arti-sanal cheesemaking case. Producers’ innovative be-havior is manifested in products, markets, marketlinkages and technological patterns essentiallydifferent from those presupposed by the moderni-zation paradigm applied to agriculture. The rela-tionship between producers and consumers is re-defined in terms of traceabili ty and feedback, againfeatures conspicuously lacking in modernist agri-culture. New networks are created, largely in theform of shorter food supply-chains that reduce theanonymity of producers and capture a higher pro-portion of added value. Locality becomes importantand enshrined in both production and consumptionpatterns. The importance of the farm household isresurrected as a basis for determining personal andsocial identity, economic strategies and networkrelations. Rural resources are reconfigured as theybecome increasingly redundant in modernist agri-culture. Synergies are created in the form of inter-connections and cohesion among activities, sectorsand actors, as cheesemaking contributes to regionalidentity and image, which then has the potential forpositive impacts on other products, services andpublic goods produced in the region.
In short, the fabrics created by the activities of thecheesemaking sector deviate significantly from theproductivist logic of the modernization paradigm(van der Ploeg et al., 2000). They result in a productthat makes profitable use of an “oversupplied” prod-uct (i.e., milk); they use artisanal (rather than indus-trial and scale-oriented) labor and production proc-esses; they link micro-businesses with (often inter-national) markets that reflect societal expectations;and they encourage endogenous solutions and entre-preneurship based on renewed uses of ecological,cultural and social capital.
Underlying the focus on endogenous agency, how-ever, are two implicit assumptions that the Welshartisanal cheesemaking example suggests may not beas clear-cut as most theorists imply. The first con-cerns the existence of a purposive and socially awareorientation on the part of economic actors, mostoften manifest in profit-maximizing behavior and in

55
various forms of association and cooperation. Yet,the artisanal cheese sector is highly atomistic and inmany ways fails to conform to the conventionalrationalities of economics and marketing. Producersoften work in isolation, and many care little fordeveloping their businesses beyond the small scalenecessary for an adequate income. Moreover, manyare motivated simply by a love of their craft and byachieving a satisfactory standard of living in a con-genial rural environment, and most are too heavilyinvolved in the production process to have the timeor inclination to take full advantage of “untradedinterdependencies” or to become concerned aboutthe wider competitive advantage of their locality.Local actors, therefore, engage strategically, but notnecessarily rationally (in the pure economic sense),in the wider economy and in global markets. To theextent that similar behavior occurs in other sectors,differential patterns of regional development are tobe expected over time and space, since reflexiveengagement with the extra-regional varies, and asthe engagement of local actors with the broadereconomy is motivated by a broader range ofconcerns than economic optimality or eveneconomic purpose.
The second implicit assumption of much of the theo-rizing about endogenous agency concerns the dy-namics of indigenousness and innovation. Manytheorists (e.g., van der Ploeg et al., 2000; van derPloeg and Renting, 2000) assume that farmers arenecessarily central to the rural development process,given their access to resources and their embedded-ness within existing rural networks. Yet in Wales,more than 5,000 farms have ceased milk productionin the last 20 years for economic reasons (NAfW,1999), and very few have chosen cheesemaking orany similar food-related value-adding activity as adiversification strategy. There is considerable policyawareness that a farming culture characterized bythe traditional successional regime of inheritancefrom father to eldest son, modernist labor patterns,regulated and highly disarticulated markets in whichproducers rarely have contact with final consumers,and a high degree of dependence on public subsidycombine to constrain the emergence of an innovativeand entrepreneurial agricultural sector that can suc-cessfully challenge the processes currently con-tributing to economic decline and threatening theviability of farming.
By contrast, the majority of artisanal cheese produc-ers in Wales are in-migrants to a region once noted
for its economic decline and depopulation. Almostby definition in-migrants are in a region that has itsown strong indigenous culture and language, and arenot connected into the networks of values and un-derstandings that link the indigenous population.Nor are they the natural inheritors of the region’shistorically accumulated social capital. Despite this,they appear to be more able to “ reconfigure” localresources, traditions and imagery in ways that suc-cessfully communicate with both local and distantcustomers.
This raises important policy questions about thedynamics of indigenousness, in-migration and theprocesses of innovation for peripheral regions. InWales, much has long been made of the negativeeffects of high levels of in-migration into the heart-lands of Welsh language and culture (Day, 1989;Griffiths, 1992) and of the consequent need tostimulate indigenous entrepreneurship. The exampleof the artisanal cheesemaking sector appears to con-tradict many of the premises underlying such views,and suggests that in-migrants may have a key role toplay in fostering and re-interpreting local culturaltraditions. Because of their awareness of, and empa-thy with, the values and aspirations of people li vingoutside Wales, in-migrants are often well-placed torecognize the potential for revalorizing tangible andintangible local resources in the light of externalmarket demands. Inevitably, however, the role of in-migrants in the resource-valorization process givesrise to questions of “authenticity” and “ownership”of local cultural traditions.
Heritage and Its Commodification
A specific practical example of new forms of ruraleconomic development thinking is provided by thecreation and subsequent commodification of culturalheritage1. Heritage creation is the enlistment of the“spoils of history” for present purposes (Lowenthal,1997) or, more specifically, the contemporary use ofthe past as a resource (Graham et al., 2000). Theprocess of heritage creation is purposeful in political,social, cultural, psychological and economic senses.
____________________________1Some have regretted such commodification as “vulgarculturalism,” no better than “vulgar materialism,” thatallows esthetic values to crowd out more importantmoral-politi cal ones (Sayer, 1997). Such arguments,however, seem to have littl e popular or politi calresonance in the globalized market economy of the post-Fordist late capitalist era, in which everything appearscommodifiable (Brett, 1996).

56
It can be used to erect and justify particular powerand privilege structures (Lumley, 1988), be impor-tant in the creation of identity and a sense of com-munity, be used to validate the progressiveness ofthe present and sanction contemporary policies bystressing continuity and unbroken value systems,and be commodified both culturally and economi-cally.
Hence, the creation of heritage is a symbolic,socially constructed, representational process, andcontrol over this process determines what is actuallyselected and identified as heritage out of the manypossible constructions of the past. Given thispolitical dimension, and since meanings are asfundamental to heritage as artifacts, heritage creationis interpretative and esthetic rather than a rationalsearch for the authentically “ real,” designed to“ invest the contingent with a material, represen-tational and symbolic iconography of permanency”(Harvey, 1996).
Heritage involves intangible values, customs, mean-ings and symbols as much as tangible objects,monuments and other material artifacts. Heritagecreation is, in practice, a highly flexible process:recent socio-cultural trends have made for the inclu-sion of vernacular and everyday artifacts and mean-ings as well as those of social and historical elites,and the use of the more recent past as well as theremoter historical past (Lowenthal, 1997). In fact,much heritage is forged, fabricated, invented or will -fully contrived (ibid), and reflects an imagined,Utopian or corrupted past rather than an actual one.Artisanal cheesemaking in Wales, for example, re-invents and reconstructs a defunct tradition rejectedby modernization, intimates in its advertising the useof supposedly vernacular recipes, and rejects mod-ernist genericism by employing regional imageryand the distinctiveness of locality to differentiate itsproducts. The lack of a verifiable long-standing his-torical lineage or of a genuine authenticity is morethan compensated by the image, quality, meaningand symbol encapsulated as “messages” within theproducts.
Heritage is often bound to specific places, and suchspatial linkages are perhaps most fully and subtlyexploited in France, where concepts of territorialidentity have traditionally been strong and where thereputation of local and regional artisanal food speci-alties is legendary. Braudel (1988) sees France as apatchwork of separate communities rooted in distin-guishable pays that are the products of interaction
between humanity and its environment over time.Such territorial identities are layered, with paysoverlaid with communes, départements, régions andless official spatial entities.
Such layering shows the fluidity of place as a con-struct, the potential diversity of its constructions, andthe potential conflicts that can arise from its use inheritage. Such conflicts surface in attempts to im-prove the marketing of artisanal cheeses in Wales,with individual producers often hostile to any sug-gestion that they should subsume their own uniquelocal products within a wider regional cheese brand-ing initiative, even though such regional brandingmight increase the market visibility, product rangeand marketed turnover of Welsh cheeses. These con-siderations also show the importance of scale inheritage creation and use. While national-level heri-tage has often been the predominant use of the pastas a current poli tical resource, recent trends inregional and local development suggest that heritagealso is a powerful instrument in shaping distinctiveregional and local identities for use both in externalpromotion of localities and in the forging of theirinternal cohesion (cf. Ray, 1998). Its power lies inthe fact that all places have or can create a “heritage”that encapsulates symbolic associations and that isrelatively easily differentiable as a competitiveinstrument (Barham, 2002). Interscalar relationsbetween layers of territorial identity can be complex,with local levels conflicting with, undermined by, orsupported by higher levels.
The commodification of heritage can be conceptu-alized as an interpretative process of converting a setof resources into marketable products (Tunbridgeand Ashworth, 1996), an example of the resurrectionand reconfiguration of resources emphasized incurrent rural development thinking. The heritageresource base is a complex and imaginative mixtureof historical and ahistorical events, people, artifacts,mythologies and associations, often linkedhistorically and symbolically to specific localities.These resources are further interpreted, selected,shaped, assembled, combined and integrated, and theresultant “heritage” can then be associated with aproduct that combines a physical presence withintangible attributes that happen to resonate withpotential consumers at a particular point in time. Thecommodification process is one of interpretativeconstruction in conformity with current re-quirements, and suggests that a wide variety ofproducts can be produced and a wide variety ofmarkets can be served from the same resource base.

57
A particular heritage resource may, for example, beused as a representation of culture, a symbol of iden-tity, an inducement to tourism, an instrument forattracting inward investment, and a marketing assetfor local producers. The symbolic importance and“ flagship” nature of Welsh cheesemaking ill ustratesthe multiply used and multiply consumed nature ofheritage as a commodity, a multiplicity limited onlyby marketing’s inventiveness with product differen-tiation, pricing strategies and market segmentation(Jenkins and Parrott, 1997).
Just as the focus of current rural development think-ing is no longer confined to agriculture, nor even torural areas in a strict geographical sense, so heritagehas an applicabil ity that transcends convenient sec-toral boundaries. The plurality of uses to which heri-tage is put and the profusion of messages that it pro-vides to a range of markets ensure contestation anddissonance, as different actors contest the meaningsinvoked (Tunbridge and Ashworth, 1996). Contesta-tion can lead to conflicts of values, to social/culturalexclusion, and to practical problems such as those ofestablishing property rights. The artisanal cheese-makers’ image of Wales as traditional, rural and suf-fused with local values, for example, may resonatewell with the image of Wales promoted by thoseconcerned with tourism, but it is contested by othersconcerned with attracting inward investment, whoprefer to present Wales as dynamic, forward-lookingand ready to play a full part in the global economy.Such conflicts are in practice reconcilable in the arti-sanal cheesemaking sector, where producers succeedin combining traditional values with market-orientation and entrepreneurship, but they becomeharder to avoid when “scaling up” to a Welsh imagethat finds universal acceptance and support.
Various approaches to the evaluation of the eco-nomic commodification aspects of heritage can bedistinguished (cf. Graham et al., 2000). One is to seeheritage as a fortuitous endowment that can becommercially exploited for economic benefit atminimal cost. Under this approach, economic func-tions are accommodated by particular localities asthe past is traded for current income andemployment; heritage-based commerce is thus oftenseen as a free-riding activity; and the “consumption”of heritage becomes essentially parasitical in that itadds nothing to, and may actually damage, theheritage “resource.”
Another approach is to see the commodification ofheritage as an activating process in which the entre-
preneurial recognition of potential commercial bene-fits leads to the active creation of tradable commodi-ties from previously untraded resources. Under thisapproach, heritage-based commercial activity in-volves a positive concern for resource conservationand maintenance, place imagery, marketing and con-sumer demand.
A third approach is to view heritage more creatively,recognizing that it is not in fixed supply and that itscommodification for contemporary purposes iseffectively unlimited. Under this approach, heritagebecomes an intrinsic part of the economic system, itssustainability as a productive resource assumes evengreater importance, the identification of market seg-ments becomes vital to creative heritage commodifi-cation, and the inter-sectoral balance of multipleheritage-based commercial activities also becomesimportant, as does the reconciliation of potentialconfli ct, contestation and dissonance.
To date, on the limited scale on which it is currentlypracticed, Welsh artisanal cheesemaking is best seenas of the second, activating, kind. It can further beargued that for heritage to become a significantinstrument for rural development, the third, creative,kind of commodification is required, involving notonly small groups of individualistic entrepreneurs,but also wider inputs from institutions, communitiesand developmental organizations.
The difference can be illustrated by considering theregulatory regime under which artisanal cheese-makers in Wales operate. Almost all use unpasteur-ized raw milk, another example of the reconfigura-tion of a resource which, though rejected under themodernist model of agriculture, they see as a majorkey to cheese quali ty1. However, this has broughtmany producers into conflict with regulatoryauthorities for whom, following modernist logic,industrial modes of production and hygiene are thenorm. Pressure for banning the use of raw milkcomes from various sources, including the WTO(Refabert, 1997) and bodies such as the UK Instituteof Food Hygiene and Technology, which maintainthat it poses a public health risk (Kupiec and Revell ,1998). Many food safety officers appear to supportthis view, giving rise to “bias and suspicion” againstunpasteurized cheese and a culture that regards smallfood producers as an inherent threat to public health(HCSCA, 2000). For many artisanal cheesemakers,
____________________________1The gold prize at the British Cheese Awards has onlyever been won by unpasteurized cheeses.

58
therefore, and indeed for their customers, the regu-latory environment is over-zealous and even hostilebecause of the gap in perception as to what consti-tutes an acceptable level of risk and, by the sametoken, what constitutes “quality” in the context ofthe production of “ traditional” foods for nichemarkets.
This raises important questions about the coherenceand direction of food policy and institutional in-volvement, where the aim is to meet consumers’requirements for quality, identity and other post-modern attributes in a market economy. On the onehand, recognizing the need to progress beyond mod-ernization in rural development, small -scale entre-preneurship is actively promoted by regional devel-opment agencies keen to develop regional imageryand association, by rural SMEs (small and medium-sized enterprises), and by a portfolio of identifiablelocal products that can be competitive in a marketeconomy. On the other hand, regulators seek stan-dardization of procedures along the lines of anindustrial model that continues the technological andregulationist trajectories developed in accordancewith the predominantly productivist ethic of muchpost-war food production – a model now overlaid bya quest for “ risk-free” food production in response toincreasingly stringent food hygiene requirements.
The perception of artisanal cheesemakers as entre-preneurs in a hostile environment is also reflected intheir marketing relationships. Not only does artisanalcheesemaking sit uneasily alongside the productivistethic, but also alongside the marketing and distribu-tion networks associated with the modernist foodproduction and marketing system. The markets forspecialty cheeses are growing (Mintel Intelligence,1997) while the number of independent retail outletsis declining, forcing producers to develop increas-ingly innovative and direct supply chains in order tomaintain market access and retain added value. Nev-ertheless, such innovation faces constraints: inWales, high transport costs are a major issue, as isthe relative lack of a cooperative ethos among oftenhighly individualistic producers reluctant to engagein the full creation of enabling networks envisagedby much rural development theory (Murdoch, 2000).
From a marketing perspective, however, perhaps themost interesting issue concerns marketing strategies.Artisanal cheesemaking in Wales has emerged at atime when food retailing, under the logic of the mod-ernist paradigm, has become highly consolidated andcentralized. Five major supermarket chains now
account for over 70% of UK food spending (Bell,1999), and the evolution of centralized sourcing anddistribution networks favors nationwide rather thanregional sourcing policies. Both trends constrain themarket opportunities available to artisanal cheese-makers through conventional channels, forcing manyinto a range of alternative marketing strategies.Many deliberately shun the retail chains onideological grounds, since such outlets personify themass-marketing approach they wish to avoid, andtheir avoidance illustrates both their desire to escapethe modernist treadmill and the point that values andmeanings become inscribed in products throughouttheir economic trajectory. Other producers, morepractically, simply cannot accept the unequal rela-tionship implied by contracts between large retailersand individual small producers.
The alternative marketing strategies, aside from tap-ping into local sales bases that are often in decline,usually involve the exploitation of niche markets.For Welsh cheesemakers, these include the foodhalls of London’s top department stores, as well asdelicatessens and other specialty shops in the UKand overseas, and the mail -order business.1 Otherproducers have established themselves as touristattractions, where visitors can watch the cheese-making process and buy on the premises. In allcases, the objectives are to obtain premium productprices, to create new market networks and producttraceabili ty, and to retain locally as much of theadded value as possible. Avoidance of mass mar-keting by small producers enables them to maintainan image of exclusivity and product identifiability,retain control over their production processes andhence their product quality, and develop the morepersonal commercial linkages that discerning con-sumers increasingly value.
The rejection of modernist logic, especially as mani-fested in highly specialized agriculture, specializedlabor processes (Marsden et al., 1993), externalizedtasks (van Dijk and van der Ploeg, 1995), and stan-dardized products and marketing arrangements, hasseverely complicated the economic analysis of ruraldevelopment. To the extent that artisanal cheesesrepresent the symbols, values and meanings associ-ated with Welsh heritage, the difficulties includedefining the nature of the resources involved; identi-
____________________________1Internet-based sales offer an as yet virtually untappedpotential for cheesemakers to expand their autonomy andabili ty to merchandise on their own terms.

59
fying all the components of the total product, theirvaluation, and how the product should be supplied,priced and marketed; and assessing the complexnature and motivation of demand, consumption andconsumers. Further, analyzing investment in theheritage component of cheeses is complicated by theexternalities involved; by the characteristics of heri-tage as a public good; by the long time period overwhich its benefits can be discounted; by the multi -faceted motivation of artisanal product consumers;and by the fact that artisanal cheeses satisfy con-sumer demand not only for direct user value, butalso for less tangible values, including option, exis-tence and bequest values.
Some of these difficulties can be illustrated by afocus on the “consumption” of heritage products.Although simply subsumed under “demand” byeconomists, such consumption is clearly a complexpsychological process. Essentially, heritage provideshumanity with a collective rootedness in the face ofan unstable present and uncertain future. Such root-edness bonds individuals vertically with ancestorsand horizontally within communities, and it providesthem with an identity and allegiances that are vali -dated by time and tradition.
Rootedness has a particular resonance with the rural,providing reassurance of changelessness (or at leastcontinuity) and time-honored verities.1 The attrac-tion of heritage is also anti-modernist in that, analo-gously with religion, it exalts faith and moral zealover rational mental endeavor (Lowenthal, 1996),and it is post-modernist in that it satisfies higher-order consumer demands (albeit often vague ones)for self-expression, product and environmental qual-ity, and sustainabil ity. It reflects popular concernabout increasing social isolation, popular feelings ofdislocation and exclusion from control over increas-ingly powerful technological and market forces, andnostalgia for processes supposedly in place beforefood became mass produced. Just as heritage is theresult of construction and interpretation at the pro-ducer level, so at the consumer level “authenticity”is derived from consumer knowledge and experi-ence, and the success of heritage products derivesfrom the extent to which they resonate with con-
____________________________1Hence the extent of public concern over the nature andpace of change in rural areas, and the traditionalfondness of conservative politi cians for rural values(Bramwell , 1989).
sumers’ interpretation and expectations of the pastand their desire for escapism, fantasy and educationas well as the immediate pleasures of consumption.
Concluding Note
We have examined artisanal cheesemaking in Walesas an example of the heritage commodification proc-ess. Such commodification can be conceptualized asthe dynamic and purposeful construction of localizedsocio-cultural identities through interaction andengagement with extra-local processes. From theperspective of a peripheral region, the intentionaland purposeful shaping of the past for contemporaryends represents a safe, differentiable and cost-effective competitive instrument. In this paper, wehave examined four general issues. The first two –the re-invention of tradition by cheesemakers andtheir innovative behavior – relate to the internaldynamics of a sector that has succeeded indeveloping marketable products that defy modernproductivist logic but acquire value through theirappeal to tradition, regional specificity andexclusivity. The success of the sector, at least on itsown terms, has in turn led us to question a numberof a priori assumptions about rural development, therole of farmers in this process, and the need forassociative capacity for the successful developmentof rural development initiatives.
The other two issues we have examined – the natureof the regulatory regime within which cheesemakersoperate and their marketing innovativeness – relateto the interplay between local actors and broaderregulatory and commercial forces. Artisanal cheese-makers in Wales have successfully managed toexploit niches within marketing structures and tonegotiate sufficient space within the regulatoryframework to permit their survival. Yet both theregulatory and marketing environments are capableof rapid evolution and continue to have the potentialto present insurmountable constraints to the survivaland development of minority enterprises.
A fundamental set of question remains that cannotbe answered solely on the basis of theory orempirical single sector studies such as ours. Can anumber of limited sectors such as artisanal cheese-making, which add value to local resources, collec-tively add up to a revitalization of peripheral ruralregions and provide a way out of the impasse createdby the modernist project in agriculture? Or are suchsectors destined to remain niche-bound and, whileinspirational beyond their marginal economic impor-

60
tance, irrevocably constrained by the institutionaland commercial structures and interests that themodernist project has created? In order to answersuch questions, rural development theory needs tofocus more explicitly on the technological, marketand institutional conditions required if endogenousinitiatives are to generate wider economic, social,cultural and environmental progress in peripheralregions.
References
Allaire, G., and B. Sylvander. 1997. Quali té spéci-fique et système d’ innovation territoriale. (Qualityand territorial innovation.) Cahiers d’Economie etSociologie Rurales 4:30-59.
Appadurai, A. (ed). 1984. The Social Life of Things.Cambridge University Press, Cambridge.
Barham, E. 2002. Ecolabeling and the crucial com-ponent of place. Paper presented at theConference on Ecolabels and the Greening of theFood Market, Boston, Massachusetts, November7-9, 2002.
Bell , D., and G. Valentine. 1997. Consuming Geog-raphies: We Are Where We Eat. Routledge, Lon-don.
Bell , R. 1999. British food retailing: a comparativeanalysis. European Regional Review 30-35.
Bertozzi, L. 1995. Designation of origin: quality andspecification. Food Quality and Preference 6(3):143-148.
Bramwell , A. 1989. Ecology in the 20th Century: aHistory. Yale University Press, New Haven.
Braudel, F. 1988. The Identity of France. Vol.1:History and Environment. Collins, London.
Brett, D. 1996. The Construction of Heritage. CorkUniversity Press, Cork.
Bristow, G. 2000. Structure, strategy and space:issues of progressing integrated rural developmentin Wales. European Urban and Regional Studies7(1):19-33.
Buchin, S., J. B. Coulon, P. Pradel, I. Verdier and C.Viallon. 1999. Relationships between theelements of “ terroir” and the sensory charac-teristics of the PDO cheeses: the example of thefeeding of animals. Paper presented at the 67thEuropean Agricultural Economists AssociationSeminar, Le Mans.
Cook, I., and P. Crang. 1998. Biographies andgeographies; consumers’ understandings of theorigins of foods. British Food Journal 100(3):162-167.
Day, G. 1989. A milli on on the move? Populationchange and rural Wales. Contemporary Wales 3:137-160.
Dijk, G. van and J. van den Ploeg. 1995. Is thereanything beyond modernisation? In G. van Dijkand J. van den Ploeg (eds). Beyond Modernisa-tion: the Impact of Endogenous Rural Develop-ment. van Gorcum, Assen, The Netherlands.
DTZ Pieda Consulting. 1999. UK Specialty Foodand Drink Sector. Report to Food From Britainand MAFF.
Featherstone, M. 1991. Consumer Culture and Post-modernism. Sage, London.
Graham, B., G. Ashworth and J. Tunbridge. 2000. AGeography of Heritage. Arnold, London.
Griffiths, D. 1992. The Political consequences ofmigration in Wales. Contemporary Wales 5:65-80.
Habermas, J. 1984. Theorie des kommunikativenHandelns. (The Theory of Communicative Ac-tion) Heinemann, London.
Harvey, D. 1996. Justice, Nature and the Geographyof Difference. Blackwell , Oxford.
Hobsbawn, E., and T. Ranger (eds). 1983. TheInvention of Tradition. Cambridge UniversityPress, Cambridge.
House of Commons Select Committee on Agri-culture (HCSCA). 2000. The Marketing of Milk.HMSMO, London.
Inglehart, R. 1997. Modernisation and Postmoderni-sation: Cultural, Economic and Political Changein 43 Societies. Princeton University Press,Princeton, NJ.
Jenkins, T.N. 2000. Putting postmodernity into prac-tice: endogenous development and the role of tra-ditional cultures in the rural development of mar-ginal regions. Ecological Economics 34:301-314.
Jenkins, T., and N. Parrott. 1997. Marketing in theContext of Quality Products and Services in theLagging Regions of the European Union. RIPPLEWorking Paper, 4.
Jenkins, T., N. Parrott, G. Hughes, A.-M. Sherwood,H. Lloyd, P. Leat, J. Branagan, F. Williams and S.Petrie. 1998. Producer Survey Results andAnalysis: United Kingdom. RIPPLE WorkingPaper, 8.
Kramsch, O. (forthcoming). Reconceptualising eco-nomic reflexivity as a cultural politics: the case ofbook publishing in Catalonia, Spain.
Kupiec, B., and B. Revell. 1998. Specialty and arti-sanal cheeses today: the product and the con-sumer. British Food Journal 5:236-243.

61
Lagendijk, A., and O. Kramsch. 2000. Reconceptu-alising the new regionalism: from a managerial toan anthropologically inflected cultural turn? Paperpresented at CURE-3 Conference, Leeuwarden.
Lawson, C. 1999. Towards a competence theory ofthe region. Cambridge Journal of Economics23(2):151-166.
Lowenthal, D. 1997. The Heritage Crusade and theSpoils of History. Viking, London.
Lumley, R. (ed). 1988. The Museum Time Machine.Routledge, London.
Marsden, T. 1993. Constructing the Countryside.UCL Press, London.
Marsden, T. 1999. Rural futures: the consumptioncountryside and its regulation. Sociologia Ruralis39(4):501-520.
Mintel Intelligence. 1997. Cheese. Mintel Publica-tions, London.
Moore-Colyer, R. (forthcoming). A Voice Clamour-ing in the Wilderness: H.J. Massingham and RuralEngland.
Murdoch, J. 2000. Networks – a new paradigm ofrural development? Journal of Rural Studies16:407-419.
National Assembly for Wales (NAfW). 1999. Farm-ing for the Future: a Consultation Document.NAfW, Cardiff .
Nelson, R., and S. Winter. 1982. An EvolutionaryTheory of Economic Change. Harvard UniversityPress, Cambridge, Massachusetts.
Nygård, J., and R. Storstad. 1998. Deglobalisation offood markets? Consumer perceptions of safe food:the case of Norway. Sociologia Ruralis 38(1):35-53.
OECD. 1995. Niche Markets as a Rural Develop-ment Strategy. OECD, Paris.
Porter, M. 1990. The Competitive Advantage ofNations. MacMillan, London.
Putnam, R. 1993. Making Democracy Work. Prince-ton University Press, Princeton, NJ.
Ray, C. 1998. Culture, intellectual property andterritorial rural development. Sociologia Ruralis38 (1):3-20.
Ray, C. 1999. Towards a meta-framework of endo-genous development: repertoires, paths, demo-cracy and rights. Sociologia Ruralis 39(4):521-537.
Refabert, M. 1997. Codex Alimentarius.Saccomandi, V. 1998. Agricultural Market Econom-
ics. van Gorcum, Assen, The Netherlands.Salais, R., and M. Storper. 1992. The four worlds of
contemporary production. Cambridge Journal ofEconomics 16:169-193.
Saraceno, E. 1994. Recent trends in rural develop-ment and its conceptualisation. Journal of RuralStudies 10(4):321-330.
Sayer, A. 1997. The dialectic of culture and econ-omy. In R. Lee and J. Wills (eds). Geographies ofEconomies. Arnold, London.
Shaw, A. 1999. What are “ they” doing to our food?Public concerns about food in the UK. Sociologi-cal Research Online 4(3).
Storper, M. 1995. The resurgence of regionaleconomies ten years later: the region as a nexus ofuntraded interdependencies. European Urban andRegional Studies 2(3):191-221.
Thompson, J. 1990. Ideology and Modern Culture.Polity Press, Cambridge, UK.
Tunbridge, J., and G. Ashworth. 1996. DissonantHeritage. Wiley, Chichester.
Urry, J. 1995. Consuming Places. Routledge, Lon-don.
van der Ploeg, J.D. 2000. Rural development: frompractices and policies towards theory. SociologiaRuralis 40(4):391-408.
van der Ploeg, J.D., and G. van Dijk. 1995. BeyondModernization: The Impact of Endogenous RuralDevelopment. van Gorcum, Assen, The Nether-lands
van der Ploeg, J.D., and H. Renting. 2000. Impactand potential: a comparative review of Europeanrural development practices. Sociologia Ruralis40(4): 529-543.
Warde, A. 1997. Consumption, Food and Taste.Sage, London.


63
Local Symbol Systems: Local Food – Local Label
Sky McCain1 and Phil Chandler2
____________________________1Secretary, Wholesome Food Association, Ball Cottage, East Ball Hill , Devon, EX39 6BU UK. Corresponding author.Email: [email protected]
2Managing Director, Wholesome Food Association, 1 Barton Cottages, Dartington Hall , Totnes, TQ9 6ED UK. Email:[email protected]
Once upon a time, if you wanted your customers toknow that the vegetables you were selling in themarket were organically grown, all you had to do wasmake a sign and prop it up on your stall . If you didthat in the UK today, you might be breaking the law.Unless, of course, you had forked out a lot of moneyfor the right to use an organic symbol. This paperexamines the whole issue of organic certificationschemes and describes an alternative for small pro-ducers - the local symbol system.
What is a Symbol?
In 1991, a regulatory system of control of organicproducts emerged in Europe from what was then theEEC. To protect consumers and producers from sub-standard products, the new EEC regulations made itillegal to describe food as “organic” unless the pro-ducer had signed up with one of several competinggovernment-sanctioned certification agencies. Eachagency issues a “symbol” that indicates that theproduct was produced/grown according to a set ofstandards issued by each country but containingminimum provisions controlled and applied through-out the present day EU. In addition to the expectedorganic growing methods, organic standards requiredetailed records and an on-site inspection at leastonce a year. In October, 2002, the USDA imple-mented a similar model.
These broad area, bureaucratic systems of certifica-tion are well-intentioned and ostensibly provide theconsumer with quality assurance. However, closerexamination of this Pan European/national symbolsystem reveals some worrying problems. We nowexamine three major ones.
Problems with the Certification System
The tyranny of distance
The organic standards support unlimited import/
export of organic produce. This means that an expen-sive system of inspection and regulation must beenforced to police imports. Domestic growers have ahard time competing with cheap imports of items thatcan be grown more easily and cheaply somewhereelse, and vast amounts of fuel are used in transportinggoods between states and countries, which is bad forthe environment.
In 1996, for instance, Britain imported more than114,000 metric tons of milk. (Norberg-Hodge et al.,2000, p. 11). Was this because British farmers did notproduce enough milk for the nation’s consumers? No,because the UK exported about the same amount ofmilk that year, 119,000 tons.
For the most part, this excessive transport benefitsonly a few large-scale agribusinesses and speculators,who take advantage of government subsidies, ex-change rate swings and price differentials to shiftfoods from country to country in search of the highestprofits.
To them that have....
The cost of organic certification in the UK hasincreased from £120+VAT in 1997 to £405+VAT in2002 (Soil Association Certification Limited, Bristol,UK, private communication, December 11, 2002).Many smallholders simply cannot afford it. Thisincrease did not occur during a period of high infla-tion, nor has the standards document changed signifi-cantly. What did happen during this period was anincreased consumer demand for organic products, anincreasing organic premium, and the elimination of aprice break for certification at the small end of themarket. The costs of the symbol are borne througheconomies of scale that favor large-scale businesses.
It is almost impossible to start small and grow intoprofitability faced with the usual costs such as liabil-ity insurance, organic inputs, and a long waitingperiod. For example, although one may enter the

64
certification cycle at any month of the year; if thatyear’s growing materials, seeds, compost, and fertil-izers were not obtained from a certified supplier, thenthat growing season cannot be included in the waitingperiod.
An applicant in the UK must plan to apply for theprogram months in advance of the growing season sothat the regulations may be obtained, the land in-spected, and the application approved. Then – andonly if all materials are certified – that growingseason can be counted as the first monitored year.The products from that year cannot be sold either as“organic” or as “ in conversion,” although the fullcomplement of fees was required. The product fromthe second year that fees were paid may be sold as“ in conversion,” but not as “organic.” Thus, the ap-plicant has paid two full years’ f ees, nearly £1,000($1,600) at the lowest rate (the rate is dependent onsize), without benefit of an organic premium. Pro-vided all regulations were rigidly adhered to and allapprovals granted, the third year’s product can thenbe sold under the organic symbol.
Against the Tide
Although interest in local food is growing, locatingproducers will ing and able to compete with super-markets is almost impossible.
Tony Mannetta does not worry about having enoughcustomers at the hugely popular farmers’ market inUnion Square in Manhattan, or at most of the 27other markets scattered across the city that he over-sees for the Greenmarket program. What he doesworry about is having enough farmers for all ofthem. So later this summer he plans to head for thefields in Orange, Ulster and Dutchess Counties, toknock on barn doors in an effort to meet thedemands of the markets in operation and a dozenmore that the program wants to open. ‘We are run-ning out of farmers,” he said. “Could we use at least50 more farmers in the next five years? Absolutely”
It is getting to be a common problem. As peoplegrow ever more picky about their vine-ripenedtomatoes, and cities and towns from the HudsonValley to the San Francisco Bay area search forways to keep their residents happy, it seems that justabout everyone without a farmers’ market is anglingfor one in their town. And many are finding thatthere are simply not enough farmers to go around(Hu, 2002).
In 1964, I was able to purchase all my meat, cheeseand vegetables from the local farmers’ market or
shops. Today the five largest supermarkets in Eng-land control around 70% of the retail food market.(Moreton, 2000, p. 1)
Gorelick (1998, p. 9) comments: “The growth of verylarge businesses has been at least in part at theexpense of the very small…. In England a superstorethat opened in 1989 cost the nearest town center 70%of its trade within four years; at least ten other townsin the vicinity also lost business.”
Government Regulations Especially HarmSmall Business
Gorelick (1998, p. 47) states, “The cost of complyingwith mounting layers of regulations often becomes soonerous that it can represent a barrier to entry for allbut the largest and most capitalized companies.”Moreover,
when the regulations imposed because of hazards ofmass-produced foods are applied to small-scale pro-ducers, it can be financially ruinous for them – eventhough their products are often far safer, and are soldin face-to face transactions unseparated by layers ofcorporate anonymity. Because of European Com-mission food-processing regulations, for instance,countless small-scale cheese producers – whose tra-ditional varieties have for centuries been made inhome kitchens or cheese rooms attached to barns –have been forced to give up their livelihoods ratherthan meet the exorbitant costs of installi ng stainlesssteel kitchens, tile floors, industrial pasteurizers, andother requirements for marketing according to ECrules (Gorelick, 1998, p. 48).
Paperwork can be a nightmare
Imagine a grower selling vegetables at a busy farm-ers’ market held accountable for every carrot, potatoand onion; how much, how many, at what price,when, and where.
“ I downloaded the forms for Kentucky last week,”Alison said, “and after careful consideration over theweekend, have decided that it would impact ourbottom line by at least $4,000, including over 100hours of record keeping. That’s 100 hours we cer-tainly do not have.” Alison said that for a diversifiedfarm with dozens of different products, keeping pro-duction, harvest, yield and sales data for each wouldbe just too cumbersome (Bycznski, 2002, p. 2)
Small communities (local food sector) simply do notoffer the volume of demand for organic products thatcan justify the start-up costs involved.

65
One size fits all
The minimum organic standards cover the whole EU.They apply equally to an artichoke grower on thecoast of Spain, an olive producer in Italy, and a sheepfarmer in the Welsh hills. Thus, by their very nature,they completely eliminate provisions for regionaldiversity, such as the differences in soil, weather,economic health, transport options and social mores.Certifying agencies do have some leeway in en-forcement by way of derogations. For instance, inMay 2001 UKROFS, (the agency that oversees theapplication of EU standards by the British certifyingbodies), lifted the percentage of non-organic cattlefeed allowed to 49% because of the outbreak of footand mouth disease. However, the procedure for ob-taining such exemptions is cumbersome, and involveseven more time and paperwork.
So, how can these problems be overcome? Let’s sup-pose that decisions now made in Brussels, London, orWashington, DC could all be safely made at a locallevel. How would this work?
Overarching Principles – Local Standards
What if the national body simply supplied a generalset of clearly defined principles that could then beinterpreted at the local level with reference to localconditions? Eliot Coleman (2002) writes: “ I also be-lieve national certification bureaucracies are only ne-cessary when food is grown by strangers in far awayplaces rather than by neighbors whom you know.”
Local groups are in a far better position to interpretprinciples according to their own, specific, local con-ditions than a remote, centralized body can possiblybe. A very appropriate motto is “ think globally, actlocally.”
Replacing bureaucracy with trust andcooperation
The maintenance of an inspection team with theassociated recordkeeping is a very expensive over-head. Extensive recordkeeping for animals is alreadyrequired by government agencies, thus organic certi-fication results in duplication. What if we replacedthis by a system of simple trust that relied on thebasic goodness of human nature? After all , noinspection system is 100% secure, for if people aredetermined to cheat, they will find a way. Even ifyour farm is inspected, for the other 364 days, com-pliance with the standards must be based on trust,anyway.
The great majority of people who can be bothered togrow vegetables or tend animals on a small scale arehighly motivated and committed to the benefits oforganic methods. Once they have made a public dec-laration to this effect, they are unlikely to risk ex-posing themselves to criticism from their peers andneighbors by reneging on it. The very fact that one’scustomers li ve nearby, may pass by on the street orturn up for a visit at odd times during the year, en-genders a community spirit of cooperation rather thanexploitation. It is far easier to cheat when there is alot of money involved or the people involved areforeign and faceless. Local groups can provide ap-propriate training materials on how to implementlocal standards, create peer review systems to protectthe integrity of their symbol that safeguard the repu-tation of the group, and ensure that each membersigns an enforceable contract that specifies compli -ance directives.
Not a replacement
The local symbol systems model is not intended toreplace existing organic certification schemes, but toco-exist with them. As long as the demand for or-ganic food exceeds supply, customers will continueto demand imports. Strict certification agencies arenecessary in order to ensure quality and standardsequivalency.
Community-based minimum standards for local pro-duction and retaili ng would likely vary from place toplace, influenced by local conditions and communityvalues. Community peer pressure would ensurecompliance with agreed upon standards much moreeffectively than current national or statewide sys-tems, which are largely anonymous and rely uponexpensive enforcement mechanisms. Local regula-tion would allow more flexibility, encourage moreaccountabili ty, and would dramatically reduce thecost of both monitoring and compliance. (Norberg-Hodge et al., 2000, p. 41)
Attributes of Local Symbol Systems
People-based, not paper-based
A local symbol system is a network of local groups,all following one set of overarching principles butinterpreting them to suit local conditions.
Trusting, not bureaucratic
Each local group relies on mutual trust rather thansubmitting to policing by a national body imposingbureaucratic rules and regulations. This is perfectlypossible in local communities, where no one is
66
anonymous. Producers sign a pledge detailing theirgrowing methods, and the pledge is available forinspection by customers. Furthermore, an “opengate” policy enables customers to visit and inspectthe places where their food is grown. Peer reviewsystems protect the integrity of the symbol.
Local, and ecofr iendly
Trade is confined within the local area. The size of a“ local” area is variable, according to the bioregion.Some groups have defined it as within a fifty mileradius. By trading locally, transport costs and fuel useare dramatically reduced.
Communal
Local symbol schemes are whole-community based.Customers as well as producers are involved in run-ning the local groups and are encouraged to visitproduction areas, help with planting, bring their chil -dren, etc. Social activities enhance the cohesion oflocal groups by adding to the enjoyment.
In the Western world, agriculture has become in-creasingly divorced from the lives of ordinary people.UK farmers are leaving the land at the rate of about20,000 per year, yet at the same time, a growingnumber of people are operating sustainably managedsmallholdings and small -scale farms with the aim ofsupplying quality food to their local communities.We believe that they hold the key to the regenerationof our agricultural system and that they deserve oursupport and encouragement
Local symbol – national logo
The advantage of having one national logo is self-evident. Customers would be confused by a prolif-eration of different logos all over the country. (Oneof the big advantages of organizations like the SoilAssociation in the UK is that their logos arerecognized everywhere). However, if all local groupsare adhering to the same set of principles for foodproduction and using the same logo, then anywhereyou see that logo you know the product is of thesame, high standard. Furthermore, you know thatwherever you are, the food is locally produced andnot flown or trucked in from hundreds or thousandsof miles away.
Organic food has moved from the margins into themainstream not because shoppers had a Damasceneconversion en masse, but because they lost faith inwhat men in white coats and men in black suits saidwas good for them. They didn’ t get religion; they gotscared. The response of the supermarkets to this shift
in the nation’s buying habits has been to import or-ganic food from countries where it is relatively cheapto produce, either because of government subsidies inmost of the rest of Europe, or the availability ofcheap labor in Africa and elsewhere. About 80% oforganic produce sold in the UK is not grown there.Not only are conversion grants there less generousthan elsewhere in the EU and ongoing subsidies non-existent, but certification fees of around £500 perannum represent an additional tax on the grower justto allow them to use the “organic” label.
The Wholesome Food Association: The FirstLocal Symbol System Implementation
The first UK local symbol system – The WholesomeFood Association – was launched in Devon, in Sep-tember 1999. The WFA is a low-cost, grassroots al-ternative to official organic certification that imple-ments all the attributes listed above. It consists of asupport organization composed of producer and con-sumer members who come together in local groups tomarket locally produced, clean, wholesome food. It isbased on a system of peer review and pledges to up-hold a set of agreed-upon principles for food produc-tion. Since its inception, the WFA has sproutedgroups in England, Scotland, Wales and the US.
Platform of trust
The WFA is based on a platform of trust – thetrust that still exists in community where people stillcare enough to “do the right thing” by each other.This kind of trust is impossible in a global marketwhere goods from unknown origins are thrust intoforeign supermarkets onto foreign shelves, replacinglocal products because of “ free trade” edicts enforcedby blackmail . Trust is acceptable among people whotrade at local markets. The WFA has a tripod of sup-port for the platform of trust.
• We strongly encourage the formation of localgroups. The local group consists of both sup-porting consumers and producers who competewith the supermarkets, not with each other. Op-portunities for cooperation and mutual benefitsare limited only by the imagination of the groupmembers. We advise a yearly “open house”where group members as well as the public visitthe premises.
• We insist on our “open gate” policy whereby thecustomer or any interested party can make an ap-pointment to visit the production/growing area.More and more people are taking a closer look at

67
where their food comes from.
• Each producer signs a pledge to uphold our WFA“Principles” prominently displayed at the point ofsale. Thus, the customer can evaluate the pro-duction criteria.
WFA Principles
WFA Principles follow guidelines that are funda-mental to wholesome and authentic food. “Authentic”is the word suggested by the well-known author ofgardening books, Eliot Coleman. For example, weprohibit the use of synthetic chemicals in sprays,powders, and fertilizers. GMOs in any amounts arestrictly forbidden. No animal growth hormones areallowed, and growing methods that enrich the soil arerequired. We feel that food should be treated as anintegral part of life and community, rather thanmerely a commodity for profit. The foundation onwhich our three-legged platform rests is the insis-tence that food be local and authentic.
References
Bycznski, L. 2002. Growers seek alternative label.Growing For Market 11(5):1.
Coleman, E. 2002. Beyond organic. Mother EarthNews 189:73.
Gorelick, S. 1998. Small is beautiful, big is subsi-dized. How our taxes contribute to social and envi-ronmental breakdown. International Society forEcology and Culture.
Hu, W. 2002. Farmers in short supply at farmer’smarkets. Metropolitan Desk, New York Times,July 20, Section A, p.1, col. 2.
Moreton, C., and E. Lindley. 2000. Exposed: thegreat organic rip-off . Independent Newspaper, UK.February 6. http://www.independent.co.uk/story.jsp?story=1617.
Norberg-Hodge, H., T. Merrifield, and S. Gorelick.2000. Bringing the Food Economy Home. Interna-tional Society for Ecology and Culture.


69
The Load Less Traveled: Examining the Potential ofUsing Food Miles and CO2 Emissions in Ecolabels
Rich Pirog1 and Pat Schuh2
____________________________1Leopold Center for Sustainable Agriculture, Iowa State University, Ames, IA 50011. Corresponding author. Email:[email protected]
2Iowa State University (student majoring in Agricultural Systems Technology), Ames, IA 50011
Food Miles and Weighted Average SourceDistance (WASD)
Food miles are the distance food travels from whereit is grown to where it is ultimately purchased or con-sumed by the end-user. A Weighted Average SourceDistance (WASD) is used to calculate a single dis-tance figure that combines information on the dis-tances from production to point of sale and theamount of food product transported (Carlsson-Kanyama, 1997). The formula for the WASD is:
Σ (m(k) x d(k))
WASD = —————— Σ m(k)
where:
k = different locations of the production origin m = amount consumed from each location of
production origin, and d = distances from the locations of production origin to the point of consumption.
Calculating Food Miles from FoodDistribution Data
The U.S. Department of Agriculture’s AgriculturalMarketing Service 1998 arrival data for produce wereused to calculate a WASD for 30 different fresh pro-duce items arriving by truck at the Chicago TerminalMarket from across the continental United States andMexico (Table 1). Only pumpkins and mushroomstraveled less than 500 miles to reach the Chicagomarket, while six fruits and vegetables (broccoli,cauliflower, table grapes, green peas, spinach, andlettuce) traveled more than 2,000 miles. In a recentstudy of Iowa local food system projects, the WASDfor conventionally sourced meat and produce was 34times greater than the distance for the same fooditems sourced locally (Pirog et al., 2001).
Using Food Miles in Promoting Local FoodSystems
The concept of a food mile is appealing to use topromote local food systems for two reasons: 1) Mostconsumers understand the concept within the contextof their own travel experience; 2) Information neededto estimate food miles for fresh foods such as pro-duce is available.
Figures 1 and 2 provide examples of how the conceptof food miles can be shared with consumers to pro-mote locally grown foods.
Comparing Fuel Use and CO2 Emissions forDifferent Food Transport Systems
The burning of fossil fuels releases carbon dioxide(CO2) and other gases known as greenhouse gasesthat absorb heat and li kely contribute to an increasein global warming. Would there be transportationfuel savings and a reduction in CO2 emissions if morefood were produced and distributed in local and re-gional food systems? A recent study strove to answerthis question by calculating fuel use and CO2 emis-sions to transport 10% of the estimated total Iowa percapita consumption of 28 fresh produce items forthree different food systems (Pirog et al., 2001). Anumber of assumptions regarding production origin,distance traveled, load capacity, and fuel economywere used to make the calculations. The goal was foreach of the three systems to transport 10% by weightof the estimated Iowa consumption of these produceitems from farm to point of sale.
The conventional system represented an integratedretail/wholesale buying system where nationalsources supply Iowa with produce using large semi-trailer trucks. The Iowa-based regional system in-volved a scenario modeled after an existing Iowa-based distribution infrastructure. In this scenario, acooperating network of Iowa farmers would supply

70
produce to Iowa retailers and wholesalers using largesemitrailer and midsize trucks. The local systemfeatured farmers who market directly to consumersthrough community supported agriculture (CSA)enterprises and farmers markets, or through institu-tional markets such as restaurants, hospitals, and
conference centers. This system used small lighttrucks. See Figure 3 for a schematic representation ofthese three systems. The conventional system used 4to 17 times more fuel and released 5 to 17 times moreCO2 than the Iowa-based regional and local systems,depending on the system and truck type used.
Table 1. Weighted average source distancea (WASD) estimations for produce arriving by truck at the ChicagoTerminal Market – 1998.
Fresh produce type
Distance by truck –Continental U.S.
onlya (miles)
Number ofstates supplying
% total or iginating fromMexico
(percent)Apples 1,555 8 0
Asparagus 1,671 5 37Beans 766 11 10
Blueberries 675 6 0Broccoli 2,095 3 3Cabbage 754 17 < 1Carrots 1,774 6 3
Cauliflower 2,118 3 2Celery 1,788 4 3
Sweet Corn 813 16 7Cucumbers 731 17 36
Eggplant 861 8 36Grapes (table) 2,143 1 7
Greens 889 11 2Lettuce (iceberg) 2,040 7 0
Lettuce (Romaine) 2,055 6 0Mushrooms 381 4 0
Onions (Dry) 1,675 15 10Peaches 1,674 8 2
Pears 1,997 4 0Peas (green) 2,102 1 30
Peppers (bell ) 1,261 12 27Potatoes (table) 1,239 14 0
Pumpkins 233 5 0Spinach 2,086 6 < 1Squash 781 12 43
Strawberries 1,944 2 15Sweet Potatoes 1,093 4 0
Tomatoes 1,369 18 34Watermelons 791 14 2
aThe weighted average source distance is a single distance figure that combines information on distances from productionsource to consumption or purchase endpoint. For these calculations, USDA Agricultural Marketing Service arrival data for1998 were used to identify production origin (state). Production origin distances to Chicago were estimated by using a citylocated in the center of each state as the production origin, and then calculating a one-way road distance to Chicago usingthe Internet site Mapquest (mapquest.com). The estimates do not include distance from the Chicago Terminal Market topoint of retail sale. Source: Leopold Center for Sustainable Agriculture.

71
Combining Information on Food Miles andCO2 Emissions into an Ecolabel
Consumers may be able to understand the concept ofa food mile as it relates to food distribution, but themode of transportation must be taken into accountbefore assuming that fuel use and CO2 emissions willbe lower for food that is transported for shorter ratherthan longer distances. Water is the most energy-efficient mode to transport food or other goods, fol-lowed by rail , truck, and airplane (Pimentel andPimentel, 1996).
We propose ecolabel information that takes into ac-count both food miles and CO2 emissions to provideconsumers with a relative indicator of the transport-related environmental impact of their purchases. Weestimated fuel used and CO2 emitted for a set of freshproduce examples that would provide a range of dis-tances traveled and transportation modes to reach aDes Moines, Iowa supermarket. Those examplesinclude:
• Apples grown in Iowa and transported by truck(60 miles)
• Apples grown in Washington State and trans-ported by truck (1,722 miles)
• Potatoes grown in Idaho and transported by truck(1,246 miles)
• Potatoes grown in North Dakota and transportedby truck (558 miles)
• Table grapes grown in Cali fornia and transportedby truck (1,887 miles)
• Table grapes grown in Chile, transported by shipto California, and by truck to Iowa (7,268 miles)
• Pineapples grown in Costa Rica, transported byship to Florida, and by truck to Iowa (2,677miles)
• Pineapples grown in Hawaii, transported byplane to California, and by truck to Iowa (4,234miles)
Other researchers in Great Britain and Japan havecalculated CO2 emissions for produce transportedlocally, nationally, and internationally (Jones, 2001;Woodward et. al., 2002; Taniguchi and Hasegawa,2002). We used the distance the item traveled, con-verted information on the energy needed to movegoods for each mode of transport (air, water, truck) tofuel equivalents, used higher heating values (the en-
ergy released per mass of fuel burned) for each modeof transport, and chemical equations for combustionof each fuel to solve for the amount of CO2 produced.Our results are at best rough approximations, as wedid not take into account the fuel efficiency of a spe-cific type of truck, plane or ship for each transportsystem, nor did we estimate total load capacity forthe trucks, planes, and ships used in transport.
A comparison of the eight examples can be found inFigure 4. The Iowa-grown apples had the lowest fuelusage and CO2 emissions, followed by the NorthDakota potatoes. Hawaiian pineapples flown to Cali -fornia and trucked to Iowa burned 250 times morefuel and released 260 times more CO2 per pound ofproduce transported than did the Iowa-grown apples.Although the Costa Rican pineapples traveled furtherthan the California table grapes, the pineapples usedless fuel and emitted less CO2 because of the higherefficiency of water-based transport compared withtrucks. Approximately 45% of the distance traveledby the Costa Rican pineapples was by water.
We used information on distance traveled and CO2
emissions from our eight examples to design a simpleecolabel that would inform consumers of:
• Source (state, country) of the produce item
• Mode(s) of transportation
• Miles traveled (food miles)
• Relative environmental impact due to transport(based on CO2 emissions).
We used the CO2 emission information to develop asimple Transport Environmental Impact (TEI) rank-ing with the following range, ranking, and colorscheme:
1. Less than 1 pound CO2 released per pound ofproduct transported - Low (green)
2. 1 to 2 pounds CO2 released per pound of producttransported - Moderate (yellow)
3. From 2 to 10 pounds CO2 released per pound ofproduct transported - High (orange)
4. More than 10 pounds CO2 released per pound ofproduct transported – Very High (red)
Rationale for the Color Scheme
We chose green for the color of our Low rankingbecause a typical American consumer associates thecolor green with “go” (as in a traffic light) and as a

72
color that is good for the environment. The color redwas used for the opposite ranking of Very Highbecause consumers associate the color with “stop” (asin a traffic light) and with hot or dangerous. Figs. 5through 8 illustrate several of our ecolabels (exam-ples are in black and white). We used symbols toillustrate mode of transportation, and the metaphor ofan automotive temperature gauge to exemplify theTEI rankings from Low to Very High.
Discussion
The TEI ranking is based only on the eight examplesand does not reflect an evaluation of miles traveled,fuel used, and CO2 released for a comprehensive listof food products covering all four modes of trans-portation. The range, ranking, and color schemechosen reflect a possible approach to be used, but arenot meant to be employed as a research-based set ofstandards. Also, this ranking does not cover otherenvironmental impacts incurred, such as the produc-tion of the food, storage (refrigeration), or transportfrom store to home.
Our sample ecolabels are a first step to communicat-ing information to consumers about the source andthe transport environmental impact of their purchase.Although food transported in local and regional foodsystems will li kely travel shorter distances and havelower CO2 emissions than in conventional systems,one cannot assume that local and regional systemswill have lower CO2 emissions when consideringproduction, storage, and distribution of the food.
Life Cycle Assessment (LCA) should be used to as-sess fuel use and CO2 emissions generated for foodproducts from farm production through consumerpurchase and use. LCA is a method for performing anintegral analysis of the environmental impacts ofproducts in a “cradle to grave” fashion (Centre ofEnvironmental Science, 1996; ISO, 1997). CO2
equivalents per kg of tomato were compared over a20-year period for tomatoes grown in Denmark, theNetherlands, Sweden, and other countries (Carlsson-Kanyama, 1998), with Sweden being the end con-sumption point. Spanish tomatoes had lower CO2
equivalents than those produced in Denmark, theNetherlands, and Sweden, even though the transpor-tation distance to Sweden was longest for the Spanishtomatoes. The reason is that the Spanish tomatoeswere raised in open ground while the greenhouse-raised Swedish, Dutch, and Danish tomatoes expen-ded more fossil fuel energy in crop production.
Future Directions
Future research will be conducted to evaluate the TEIranking system using a more comprehensive sampleof food products across the four transport modes.Investigations will be made into the use of LCA todevelop ecolabels for several food products. Focusgroups will be conducted to gauge consumer andretailer/distributor interest in the ecolabels. Investiga-tions also will be made to determine if such ecolabelscould be used in promoting local foods at farmersmarkets, on-farm stands, and other venues.
References
Carlsson-Kanyama, Annika. 1997. Weighted aver-age source points and distances for consumptionorigin-tools for environmental impact analysis.Ecological Economics 23(1997): 15-23.
Carlsson-Kanyama, Annika. 1998. Food consumptionpatterns and their influence on climate change.Ambio 27(7): 528-34.
Centre of Environmental Science. 1996. Applicationof LCA to Agricultural Products. Leiden Univer-sity. CML Report 130. Translated by Nigel Harle.
International Organisation for Standardisation (ISO).1997. Environmental Management – Life CycleAssessment: Principles and Framework.International Standard ISO 14040.
Jones, Andrew. 2001. Eating Oil: Food Supply in aChanging Climate. SUSTAIN – The Alliance forBetter Food and Farming. London, UK.
Pimentel, D., and M. Pimentel. 1996. Food, Energy,and Society. Colorado University Press, Niwot.
Pirog, R., T. Van Pelt, K. Enshayan, and E. Cook.2001. Food, fuel and freeways: An Iowa perspec-tive on how far food travels, fuel usage, and green-house gas emissions. Leopold Center for Sustain-able Agriculture, Ames, Iowa.
Taniguchi, Y., and H. Hasegawa. 2002. CO2 Emis-sions from transportation of fresh vegetables:Comparison of local, national, and internationalmarkets. Proceedings of the 14th IFOAM OrganicWorld Congress, Victoria, Canada.
Woodward, L., B.D. Pearce, V. Hird and A. Jones.2002. Food and fuel: The environmental impact ofincreasing “ food miles” of organic food. Pro-ceedings of the 14th IFOAM Organic World Con-gress, Victoria, Canada.

73
Figure 1. Average distance by truck to Chicago Terminal Market (Continental U.S. only)(Source: Leopold Center for Sustainable Agriculture.)
Figure 2. Using food miles in promoting local foods.

74
Figure 3. Environmental impact of food transportation. (Source: Leopold Center for Sustainable Agriculture)
Figure 4. Comparison of fuel usage and CO2 emissions to transport selected produce itemsto Des Moines, Iowa, supermarket. (Source: Leopold Center for Sustainable Agriculture)

75
Figure 5. Apple ecolabel.
Figure 6. Potato ecolabel.
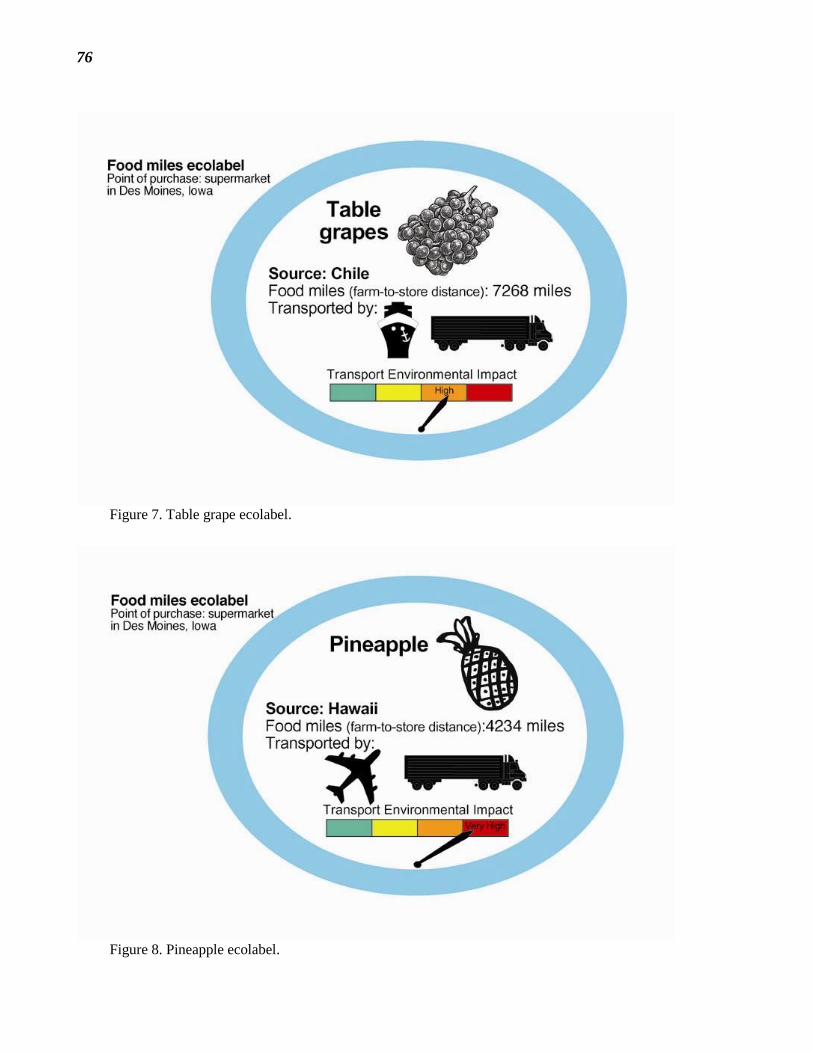
76
Figure 7. Table grape ecolabel.
Figure 8. Pineapple ecolabel.

77
Food Alliance: Transforming a Regional Success Storyinto a National Network
Deborah J. Kane1 and James F. Ennis2
____________________________1Executive Director, Food Alli ance, 1829 NE Alberta, Suite 5, Portland, OR 97211. Corresponding author. Email:dkane@thefoodalli ance.org
2Program Director, Food Alli ance – Midwest Office, 400 Selby Ave., Blair Arcade West, Suite Y, St. Paul, MN 55102.Email: jim@thefoodalli ance.org.
Food Alliance
Food Alliance, a non-profit organization with opera-tions based in Portland, Oregon, and St. Paul, Minne-sota, is dedicated to promoting expanded use of sus-tainable agriculture practices through market-basedincentives. Food Alliance operates an ecolabel pro-gram encouraging environmentally and sociallyresponsible food production.
Farmers and ranchers who meet our strict eligibilityrequirements in the areas of pest and disease man-agement, soil and water conservation, safe and fairworking conditions, and wildlife habitat conservationearn the right to market their products with our eco-label: Food Alliance certified.
In just a few years, Food Alliance has grown from aseedling alliance to an organization recognized re-gionally and nationally for an innovative farmevaluation and approval program. We have enjoyedearly success in promoting the program with farmers,shoppers and retailers alike.
Measuring Success
• Impact: Working with both fresh and processedfoods, Food Alliance is one of the largest andmost diverse agricultural ecolabels in the UnitedStates. Over 200 varieties of fruits and vegeta-bles, as well as li vestock, dairy, wine, and wheat,are Food Alliance certified.
• Participation: There are currently Food Alliancecertified farms and ranches in eight states: Flor-ida, Iowa, Wisconsin, Minnesota, Oregon, Wash-ington, California and Hawaii . Food Alliance cer-tified producers total just under 200, with 1.57milli on acres in production.
• Access: Food Alliance certified products are cur-rently available wherever people shop. FromCostco in Hawaii to Fred Meyer stores up anddown the West Coast, conservative estimates in-dicate that Food Alliance certified products aresold in retail establishments in nearly 20 states.In addition, Food Alliance certified products aresold in countless outlets such as farmers’ mar-kets, farm stands, specialty markets and on-line.
• New markets: Food Alliance has fine-tuned thepractice of developing innovative partnershipsthat expand market access for producers as wellas consumers, including contracts with foodservice outlets (Portland State University) andproduct development with artisanal food produc-ers (Grand Central Baking).
• Consumers: Interest in Food Alliance certifiedproducts and acceptance of the Food Allianceseal are on the rise. As a result of sophisticatedmarketing and promotional campaigns, consumerawareness of the Food Alliance program peakedat 24% in the Northwest in 2001.
• Exposure: Food Alliance has received 12 mil lionmedia impressions in a single year, includingcoverage from National Public Radio, The WallStreet Journal, The New York Times Magazine,The Oregonian, and numerous local and nationaltrade publications.
• Support: Food All iance has consistently at-tracted support from over two dozen national andregional foundations and government agencies.In addition, a growing membership and donorroster have helped diversify Food Alliance’srevenue base.
78
• Bottom line: Participating farmers report newmarkets, price premiums, and sales volume in-creases as a result of new marketing opportuni-ties created by Food Alliance. Retailers reportstrong sales of Food Alliance products, with overhalf of those surveyed experiencing increases inproduce sales.
Creating a National Network
The seeds of a national Food Alliance program wereplanted in 2000 with the establishment of a Midwestaffiliate, based in St. Paul, Minnesota.
An 18-month test partnership in the Midwest was ourfirst attempt at replicating the Food Alliance model inother regions. As a direct result of the partnership, theMidwest Office was able to:
• create efficiencies, thus minimizing start-up timeand costs. Less than four months after signing amemorandum of understanding with the FoodAll iance, the Midwest Office was able to launcha retail campaign.
• offer a much broader array of Food Alliance cer-tified products and expand seasonal availabilitypreviously limited by the Midwest growingseason and crop selection. Not only can Midwestretailers offer Food Alliance certified apples fromWisconsin or corn from Iowa, they can accesscertified products such as Oregon pears, Wash-ington cherries, or Walla Walla sweet onions –sustainably certified items not traditionally avail-able to consumers in these markets. Conversely,Food Alliance certified products from the Mid-west can more easily find their way to markets onthe West Coast through the growing network ofFood Alliance retail and distribution partners.
• start further up the learning curve, avoiding pit-falls and lessons already learned by Northwestcounterparts. There was no need to “start fromscratch” in developing programs, materials andother operational components.
• gain immediate credibility by highlighting thesuccessful Northwest model; this was especiallyeffective in addressing regional concerns aboutprogram implementation.
In January 2002 the relationship with the MidwestOff ice was formalized, moving beyond test to fullimplementation. The most significant consequence ofthis has been the creation of a national infrastructureand hiring of staff to support regional programmingand additional regional affil iates.
The benefits of consolidating specific functions with-in a national office are clear. With a national staffproviding program development, consumer research,planning, and evaluation services to regional pro-grams, regional affiliates can focus on programimplementation, recruitment and region-specific op-portunities. The primary services the national officeprovides regional affiliates are:
• establishing and maintaining third-party verifi-able standards for agricultural producers andprocessors, including administration of ourhighly regarded Stewardship Council.
• developing promotional strategies and materialsfor the Food Alliance certified label at thenational, regional and local levels.
• overseeing promotional campaigns for FoodAlliance certified products at the national,regional and local levels.
• building and maintaining a national alliance ofregional partners.
• maximizing media opportunities and exposure onboth the regional and national level.
With operations in the Northwest and Midwest firmlyestablished, Food Alliance is now ready to launch athird regional affil iate. Earth Pledge Foundation,based in New York, will host Food Alliance’s North-east Office starting in January 2003.

79
Environmentally Fr iendly Food Production in St. Petersburg, Russia:Consumers’ Awareness and Ecolabeling Scheme Development
Olga Sergienko1 and Alena Nemudrova1
____________________________1Department of Environmental Protection, St. Petersburg State University of Refrigeration and Food Technology, St.Petersburg, Russia, 191002. O. Sergienko also is an expert with the St. Petersburg Ecological Union. Correspondingauthor is O. Sergienko ([email protected]).
At present the food industry is among the most dy-namic branches of the Russian economy, providingvarious products for people’s daily consumption.Starting new production does not necessarily meanthat new energy- and resource-conserving technolo-gies are going to be used. Therefore, energy and re-source savings are becoming crucial. Also, specialemphasis should be given to safety and especially theenvironmental aspect of food, as its hygienic cleanli-ness directly affects the health of consumers. Usuallyunder the term “safety” we understand the absence oftoxins, carcinogens, and other negative influences onhumans, assuming consumption does not exceednormal daily amounts.
The concept of environmental safety is wider andcovers not only conventional food safety, but also thesafety of the raw materials used in production, theenvironmental impact of production itself, and thestorage and utili zation of wastes. To confirm that acompany is concerned about its consumers, the qual-ity of its products and the environment, it can launcha voluntary ecolabeling process in addition to thecertification that is mandatory for food products.
Special rules concerning voluntary environmentallabel schemes are already established in many coun-tries, such as the German Blue Angel, the NordicWhite Swan, the US Green Seal, and the ecolabel ofthe European Union, the Euroflower. The specialmark “Life Leaf” was recently introduced in St.Petersburg, Russia (Figure 1), and an ecolabelingscheme and rules were developed. The ecolabelingproject was launched in the city by a non-governmental organization, the St. Petersburg Eco-logical Union.
We present a brief description of the Union and otherorganizations involved in the ecolabeling project, aswell as their roles in developing the ecolabelingmethodology and scheme that prove that this product-
oriented environmental strategy is suitable forvalidation and certification by third parties.
Within this scheme, environmental criteria were de-veloped for evaluating the environmental quality ofmeat products, from “ less discharges of toxic andpolluting substances into water, soil and air” to spe-cial sanitary hygienic requirements for the productionprocess, the chemicals used, and sustainable farming.Currently the project is aiming to develop ecologicalquality criteria for baked goods and bottled drinkingwater.
The successful implementation of an ecolabelingproject depends not only on the readiness of produc-ers to be rewarded by the ecoseal, but also on con-sumers’ interest in and awareness of environmentallysafe products. Research on consumers’ preferencesshowed that poor environmental consciousness couldslow the greening process of the food industry.
Although the ecolabeling process in St. Petersburg isat the beginning stage, its developers hope it will becontinued in the future.
Figure 1. The St. Petersburg Ecolabel “The LifeLeaf”

80
Development of the Ecolabel Project in St.Petersburg
The Russian market only now is about to realize thepotential of environmentally friendly products. Untilrecently there were no schemes for analyzing whetherproducts were “green” or not. A national system ofecolabeling was introduced in 1999, based on ISO14041 requirements. However, it was abandonedbecause of lack of interest and support on the part ofindustry and the public. Only in 2001 did this systembegin operating again, when the St. Petersburg Eco-logical Union, with the support of the St. PetersburgChamber of Commerce and Industry and the cityadministration, initiated a project to develop an eco-labeling scheme for food products. For the first timein the history of environmentally safe production, the“Life Leaf” ecolabel was introduced and officiall yregistered as a trademark. Ecolabeling aims at estab-li shing a public ecolabeling system as a procedurethat can ensure that the special symbol is rewardedonly to environmentally friendly products and goods.
Rationale for the ecolabeling project
Food and processing industries based in St. Peters-burg are steadily increasing. In 2001, their contribu-tion to the industrial output of the city reached 40%.The most significant sectors of the St. Petersburgagricultural industry complex (AIC) are beer andalcohol-free beverages (32%), tobacco (11%), bakedgoods (10.5%), fats and oils (8%), dairy (8%), andflour and cereals (6%). In 2001, the city’s AIC outputincreased by 15% compared with 2000, nearly twicethe average increase in Russia (8%). The AIC in-cludes 86 large and medium-size companies thatcover 23 branches of industry. About 25% of thefood products come from small business. (Shirokov,2002), and the number of small and medium-sizecompanies is increasing rapidly. However, the newproduction facilities do not necessaril y use new envi-ronmentally friendly technologies.
The city has continued cooperation with the Lenin-grad Oblast (Region) under an existing bilateralagreement. According to recently published data, theLeningrad Oblast sent 100% of its dairy and eggproduction to St. Petersburg, 70% of its poultry, 60%of its vegetables, and 30% of its potatoes. The retailmarket in 2001 was steady and sound, without anydramatic fluctuations. The domestic share of totalfood sales was 80%, and the local contribution insome sectors exceeded 50% (Petrov, 2002) Theextent of market saturation with some commodities
approached 100%, which may soon lead to sharpcompetition.
All arguments point to giving special emphasis to thequality of food produced, and the city governmentpays special attention to issues associated withenvironmental quality, which has become a keynoteof the consumer market. Both consumers and pro-ducers face the challenge of the quality of food,especially regarding its environmental safety.
Though it may seem paradoxical, growing interest inenvironmental quality is a sign of economic well -being because it is in the developed countries thatpeople pay attention to what they eat, drink, breatheand use. The founders of the St. Petersburg Ecologi-cal Union consider that environmentally friendlybusiness could become a present-day reality, sincethe psychology of modern Russian consumers haschanged in recent years. Now they are ready to buyeven more expensive goods and foods in lower quan-tities but of better quality, more healthful and safe.Therefore, besides educational activities, the Unionformulated its new challenge – to unite all the effortsand to link consumers’ preferences with producers’readiness to satisfy them. (Gordyshevsky, 2002a).
Objectives of the program
Ecolabeling should comply with ISO 14024 require-ments. One can get the label only by voluntarilysubmitting one’s environmental and quality perform-ance to a comprehensive evaluation. The procedureshould be transparent and open to the public (Gor-dyshevsky, 2002b).
The objectives of the project are the same as thosealready established in different countries:
• providing for the product’s safety at all stages ofits life cycle
• suspension or stoppage of sales of products thatdo not fulfill the established environmental re-quirements
• help in selling goods with the best environmentalcharacteristics
• evaluation of production waste from the point ofview of its environmental safety and possibilitiesfor further utili zation.
There is another important feature that distinguishesthe St. Petersburg project: the products’ safety isconsidered in terms of both consumer health andenvironmental safety.

81
The following steps should be undertaken in theframework of the project:
• selecting a product category that responds tosuggestions from industry, environmentalists,consumers, and other interested parties
• assessing the environmental impacts of productsin the product category by li fe-cycle analysis(LCA)
• setting criteria and thresholds for awarding theecolabel
• reviewing the product category and criteria.
Principal model for the organization of the eco-labeling project: the St. Petersburg EcologicalUnion and its role
The organization of a coordination system cannot beisolated from a discussion about how similar func-tions are organized at the European or even at theglobal level. It might be a bad strategy to develop toostrong regional organizations at the federal level,when most companies want their products to be certi-fied for a more global market. Certainly, a nationalbody is needed. However, it is better to develop andoperate a system with approval of validating institu-tions at the local level, where more knowledge aboutcapacity, experience and companies’ images exist inconsulting companies.
Since 1991, the St. Petersburg Ecological Union hasoperated as a non-governmental organization. It wasorganized primarily as a union of environmental co-operatives, and in 2000 it became a not-for-profit andnon-governmental organization. At first the Unionwas occupied mainly with information and educa-tional activities. The next step was drafting and ap-proving the “Ecology and Human Beings Program,”aimed primarily at enhancing ecological culturethrough practical solution of specific tasks. Withinthat project the Union started working with compa-nies oriented towards environmentally safe business,and it continues to look for ecologically orientedcompanies.
At the moment, in collaboration with the city admini-stration and with the support of the St. PetersburgChamber of Commerce and Industry, the Union isworking on introducing the “Life Leaf” ecologicallabel. The Union’s role and functions within theproject can be described as:
• ecolabeling program founder
• registration
• li cense submission and confirmation
• information and marketing.
The general principles in issuing a license to thecompanies are illustrated in Figures 2 and 3. By anal-ogy with the procedures used in the certification ofenvironmental management systems or environmen-tal laboratories, the general principles in certificationare as following:
1. The company issues a declaration and announcesthe product or product group that is supposed tobe awarded the ecolabel (Figure 2).
2. The Union seeks an expert or organization thathas relevant expertise and can develop a meth-odology for the ecolabeling.
3. The Advisory Board confirms the draft method-ology if there are no amendments needed and allthe parties have approved it. The Board consistsof representatives of the city administration andits committee on natural resources, environ-mental protection and provision for ecologicalsafety, as well as the St. Petersburg Chamber ofCommerce and Industry and representatives oforganizations involved, well -known academics,and experts.
4. When the methodology is available, the consult-ant is accredited to perform an evaluation of theproduction chain through a complete or partialLCA, and guarantees that the LCA meets the re-quirements or criteria li sted in the methodology(Figure 3). This procedure is similar to that of anaccredited laboratory that carries out chemicalanalyses and guarantees that the analyses weredone according to specific standards.
Independent validation, i.e., the quality assuranceprocedure, is important in order to achieve high reli-ability of the environmental labeling scheme. ISOrequirements include certification and accreditationas optional possibilities.
Accreditation and certification may be components inthe quality assurance procedure of an environmentallabeling project at the later stages, since in St. Peters-burg there currently are no national accreditationorganizations able to control certification processesin accordance with the ISO 14024 standard. There-fore, the certification of a Type III environmentaldeclaration remains an option to increase the credi-bility of the ecolabeling scheme. A Type I eco-

82
labeling program is currently being considered: avoluntary procedure undertaken by an independentthird party that leads to the issuing of license con-firming the organization or company’s right to put anecolabel on its products or packaging. (See Bougher-ara and Grolleau [2003] in this volume for an expla-nation of Types I, II and III ecolabels.}
An example of an environmental labeling schemedevelopment from St. Petersburg, including a de-scription of the roles of the different parties involved,is presented at Figure 3. The figure illustrates threedifferent levels for the organization of the eco-labeling project:
1. the technical level: the Technical Board providestechnical conclusions about compliance of thedeclared product with the methodology.
2. the public level: agreement on acceptance by theinterested parties is issued by the AdvisoryBoard; interested parties include customers, us-ers, relevant producers, branch organizations,authorities, etc.
3. the li censing level: awarding of the license to thecompany; periodic review of the company;reconfirmation every three years of the com-pany’s right to ecolabel its products; reviewing ofmethodologies by the same institution.
St. Petersburg State University of Refrigerationand Food Technology and its role
St. Petersburg State University of Refrigeration andFood Technology plays the role of the methodologydeveloper for food products. It was founded in 1931,and since then has become a leading institution in thefield of food technology and engineering. Every yearthe university trains 5000 students in the followingareas: heat and power engineering and energy eff i-ciency; machinery and equipment; automation; foodtechnology; biotechnology; microbiology; economicsand business; industrial ecology; cryogenic machin-ery; air conditioning; and life support systems. TheUniversity consists of 32 departments and 6 faculties.The full -time faculty members and staff number 353;over 80% of the academics have advanced degreesand ranks, and more than 40 fellows areacademicians, corresponding members or academicconsultants of the International Academy of Refriger-ation, the International Academy of Higher Educa-tion, the Engineering Academy or other scientificorganizations.
Major topics of scientific research of the Universityare:
• intensification and optimization of processes, cy-cles and elements of equipment, aimed at energyand resource conservation in machinery and unitsof refrigerating, cryogenic and air conditioningsystems
• thermodynamic, physical, mechanical and chemi-cal properties of ecologically safe working sub-stances and materials
• intensification of processes and technologicalequipment for agricultural and food enterprisesand environmentally friendly food production
• processes and technologies of water desalination,concentration and purification of technologicalproducts in the food industry and agribusiness;cleaning and utilization of effluent and wastes
• social, political, economic and environmentalproblems of northwest Russia.
To increase the degree of independence, the devel-opment of ecolabeling methodology should be doneby one organization or person and verification byanother certified (or accredited) organization or per-son. Therefore, independent institutions such as envi-ronmental auditors and accredited environmentallaboratories are needed. The accredited laboratoriesand certified experts from the St. Petersburg Cham-ber of Commerce and Industry take part in the eco-labeling project. Thus, the third party verification byan institution approved by the program developer willbe realized.
Proposed Guiding Principles and ImportantMethodological Aspects of the EcolabelingProject for Food Products
The general principles or requirements of the ISOstandards should be followed as far as possible in theecolabeling program. These standards guarantee thatthe same basic principles have been followed in theperformance of the LCA for all product groups andservice types, even though the standards allow certainflexibility, such as in the definition of systemboundaries.
The work to prepare ecolabeling methodology for aproduct or service requires cooperation among manu-facturers, importers and representatives of industry,branch organizations and other stakeholders. It is

83
important that the work be coordinated at the citylevel to ensure a broad consensus in the relevantbusiness sectors as well as to ensure objectivity,credibil ity and comparability of the methodologydeveloped for certified products.
An important part of the ecolabeling procedure isdata verification. The data requirement is provided bythe methodology.
The leading principles for the ecolabeling project areas following:
• The methods used should be scientifically andtechnically valid.
• The data used should be appropriate and reason-able in relation to the goal of the study.
• The interpretations should reflect the limitationidentified and the goal of the study.
The development of the methodology must be seen inlight of the overall goal of a product-oriented envi-ronmental strategy: to strengthen competition amongdifferent producers based on eco-eff iciency. Thisgoal can be achieved by improving the access to sup-pliers’ environmental data.
The criteria of ecolabeling must be based on esti-mates of the environmental impact at all stages of theproduct’s life cycle. Careful study of life cycle stagespermits us to define criteria for environmentally dan-gerous factors. If the quality of the goods correspondsto the established criteria, then the goods may carryan ecolabel.
The proposed elements of the scheme include:
• control of actual material flow, record-keeping,etc. at the production site.
• control and selection of data
• control and fulfillment of the general require-ments of ecolabeling methodology.
Requirements for creating ecolabelingmethodology for different product groups
Specific parts in a methodology for certified productsmay differ when comparing two products or serviceseven within the same product group. Therefore, itmay be necessary to prepare different methodologiesfrom case to case. The term “product group” has beenused to clarify that the requirements concern a groupof products, not just a specific product.
Within the scheme, the experts from the St. Peters-burg State University of Refrigeration and FoodTechnology began to elaborate the ecolabeling meth-odology for meat, baked goods and bottled drinkingwater. Thirteen environmental criteria were devel-oped for evaluation of the environmental quality ofmeat products, from “ less discharges of toxic andpolluting substances into water, soil and air” to spe-cial sanitary requirements, to the production process,use of chemicals and sustainable farming.
The first experience with the method at a St. Peters-burg meat processing plant involved the company’sself-declaration to be awarded the ecolabel. The listof criteria for meat products and assessment of the ofthe company’s compliance are shown in Table 1. Thevalue of every criterion was determined on the basisof national standard requirements for conventionalfood product quality and environmental quality andsafety. The overall score was calculated by multi -plying the values of the listed criteria. To be awardedthe ecolabel, the overall score should be as high aspossible, and no less than 0.6. Despite the high con-ventional product quality, this producer could notguarantee the ecological quali ty of the product andtherefore was not awarded an ecolabel. This exampledemonstrates that strict definition of ecolabeling cri-teria imposes technical li mitations on a companyeven though it is strong with regard to conventionalproduction criteria.
Consumers’ Awareness and EcolabelingScheme Development
The successful implementation of an ecolabelingproject depends not only on the readiness of produc-ers to be rewarded with the ecolabel but also on con-sumers’ interest in and awareness of environmentallysafe products. Manufacture of ecologically safe prod-ucts demands additional expenses for preventive ac-tions and certification. As a result the price of“green” food can be considerably higher. Therefore,at the stage of production planning it is advisable tocarry out preliminary marketing research: analyzingthe market for ecologically safe products and study-ing consumers’ preferences and their readiness to payhigher prices for additional ecological quality.
Studying consumers’ att itudes towardsenvironmentally safe baked goods
A pilot investigation of consumers’ attitudes towardsenvironmentally safe baked goods was undertaken as

84
Table 1. Criteria for the ecolabeling of meat products,and values assigned in one example.
Criterion Identification
Value
Quality of raw material C1 1Usage of nonfood waste C2 1Production waste C3 1Used chemical substances C4 0.8Conditions of production C5 1Emissions into the atmosphere C6 0.8Fresh water consumption C7 1Wastewater cleanup system C8 0.97Energy use C9 0.88Quality of end products C10 1Packing C11 1Sanitary and hygienicmeasures of the enterprise
C12 1
Environmental informationand education of the personnel
C13 0.75
Overall Score C0 0.41
part of the ecolabeling project. The research methodwas based on a public opinion survey. The study hadseveral aims: to determine how the maximum pricesconsumers were willing to pay for environmentallysafe products was correlated with their family in-come, sex, and age; to evaluate consumers’ under-standing of the term “ecological quality” for prod-ucts; and to learn consumers’ preferences regardinginformation sources related to environmentally safeproducts.
The study was intended to test the following hy-potheses:
• The segment of the population most prepared topay more for environmentally safe products ispeople with high incomes, mainly middle-agedwomen with higher education.
• Consumers are not sufficiently ready for an in-crease in the price of ecolabeled products.
• Consumers do not know what the “ecologicalsafety” of a product means, and associate it onlywith a product’s quality and safety regardinghealth, i.e., with conventional food safety.
The data were collected using a specially preparedquestionnaire. Visitors at a St. Petersburg supermar-ket and students at St. Petersburg State University ofRefrigeration and Food Technology were chosen as
respondents. Data from a sample of 150 people wereused; therefore the research should be considered as apilot study whose conclusions are only rough.
Results of the survey
The respondents’ social-demographic characteristicsare shown in Table 2. The relationship between thelevel of family income and readiness to purchaseecolabeled baked goods is shown in Figure 4.
The most active group of buyers – women up to 28years old – are prepared to buy environmentally safebread if its price is 5% higher than conventionalbread, whereas men of the same age category arewil ling to pay much more under the same conditions(Figure 5).
For the largest group respondents (45%) the highestacceptable increase in the price of ecolabeled prod-ucts is 5%, compared with about 12% prepared topurchase such products only if their prices do notincrease (Table 3). There also is a segment of buyers(7% of all respondents) prepared to buy these prod-ucts at any price. A total of 88% of respondents areprepared to pay at least 5% more for ecolabeled breadand other baked goods, in some cases considerablymore: the 7% most environmentally concerned saidthey are prepared to buy such products at any prices.
The respondents were asked to choose from a list ofcharacteristics the ones that in their opinion charac-terize ecologically safe production. The answers in-cluded both traditional quality characteristics andenvironmental ones. As seen in Table 4, two envi-ronmental aspects were not taken into account by atleast half the participants: whether the packaging isbiodegradable and whether harmful substances wereformed during production. More than 50% of therespondents in each age group selected “safe forhealth” and “no toxic materials used in manufacture.”Besides environmental quality characteristics, theyalso frequently mentioned characteristics related totraditional concepts of quality.
The research also aimed at revealing the best com-munication tools for “green” marketing. Respondentswere asked to select their preferences from the mostwidespread sources of information:
• A special label on the package
• Advertising in the shop
• Mass media (newspapers, magazines, radio, TV)
• Poster advertising (e.g., on transport, highways).

85
Table 2. Social-demographic characteristics ofrespondents.
Characteristic Respondents(%)
1. Sex Female Male
6238
2. Age Less than 28 28-40 over 40
61.612.825.6
3. Family Income, RUR/month Below 5,000 5,000 to 7,000 7,000 to 10,000 10,000 to 15,000 15,000 to 20,000 above 20,000
29.423.521.214.14.77.1
4. Level of Education Secondary school Professional education Higher education
17.716.565.8
Table 3. Consumers’ acceptance of a price increasefor ecolabeled baked goods.
Acceptable price increase % of sample
None 12 5% 38 10% 22 20% 21 Any 7
The most informative sources for consumers of bakedgoods are a special label on the package (noted by40% of respondents) and poster advertising (14%)(Table 5).
Summarizing the survey results, we conclude that:
• Respondents are not informed enough on ecol-ogically safe production. They do not distinguishnotions of environmental and conventional foodquality. The predominance of the health andsafety aspects seems clear.
• To attract consumer’s attention to and demandfor ecolabeled food requires raising the level ofconsumers’ knowledge about ecological quality.
A large-scale advertising and educational effortand special labels on packages are needed.
• The majority of respondents are not prepared toaccept a price increase of more than 5% for envi-ronmental quality of food products, and a signifi-cant portion refuses to pay any higher price.
• Of women up to age 40, the largest group, re-gardless of income, agree to a price increase ofonly 5%, although they are the most active andinformed segment of consumers. Therefore, thefirst hypothesis was not confirmed.
• 81% of consumers consider the acceptable priceincrease to be between 5% and 20%; only 7% areinterested in purchasing “green” bakery productsregardless of price, while price is the overridingconsideration for 12%.
Conclusions
The objective of environmental labeling is to permitconsumers to choose those goods that impose theleast harm on the natural environment. It also is in-tended to stimulate producers to make environmen-tally safe products. Ecolabels could be considered away to gain a “green advantage” in the market ifthere is a demand for such products among the con-sumers. Therefore, relevant educational programs for
Table 4. Respondents associating various character-istics with the notion “Environmental Quality of aProduct.”
Characteristic Respondents(%)
1. Environmental QualityNo harmful substances formed during manufacture
43.8
Safe for health 60.7No toxic materials used in manufacture
58.4
Grain comes from environ- mentally clean areas
58.4
Biodegradable packaging 38.2 2. Conventional QualityBeneficial for health 51.7High quality flour and water used 48.3Does not contain preservatives and artificial additives
51.7
Does not contain genetically modified products
34.8
Tastier than other kinds 16.9
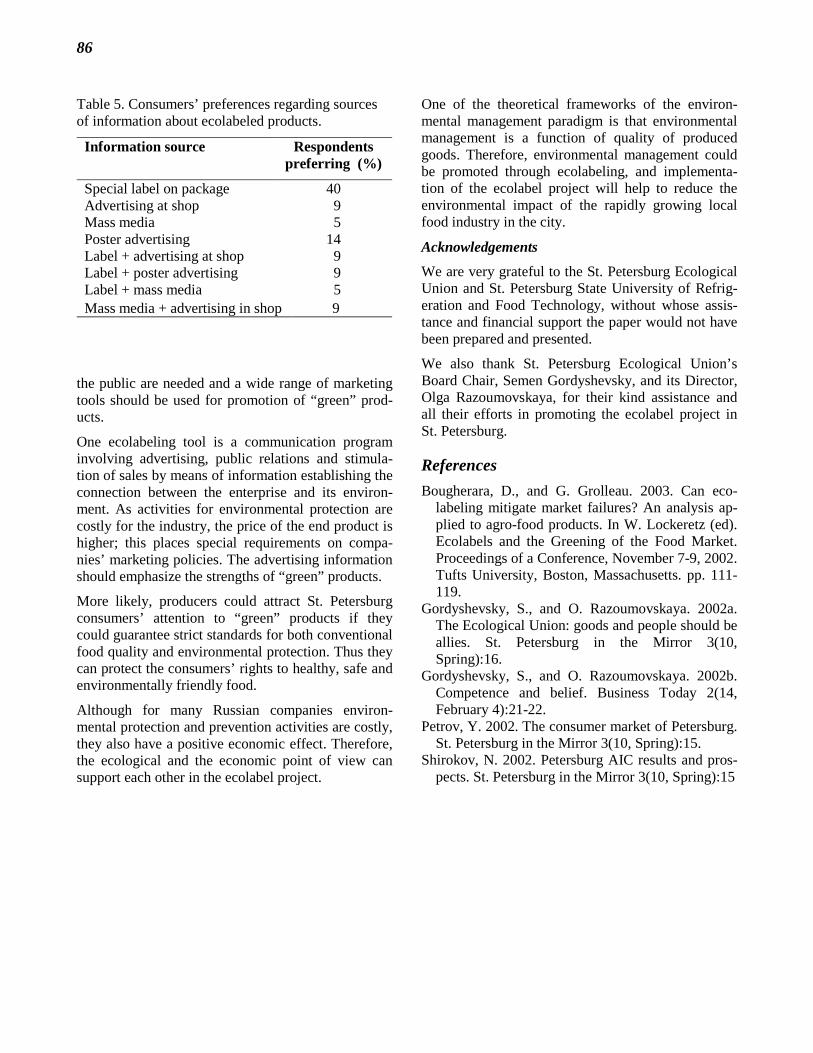
86
Table 5. Consumers’ preferences regarding sourcesof information about ecolabeled products.
Information source Respondentspreferring (%)
Special label on package 40Advertising at shop 9Mass media 5Poster advertising 14Label + advertising at shop 9Label + poster advertising 9Label + mass media 5Mass media + advertising in shop 9
the public are needed and a wide range of marketingtools should be used for promotion of “green” prod-ucts.
One ecolabeling tool is a communication programinvolving advertising, public relations and stimula-tion of sales by means of information establishing theconnection between the enterprise and its environ-ment. As activities for environmental protection arecostly for the industry, the price of the end product ishigher; this places special requirements on compa-nies’ marketing policies. The advertising informationshould emphasize the strengths of “green” products.
More likely, producers could attract St. Petersburgconsumers’ attention to “green” products if theycould guarantee strict standards for both conventionalfood quality and environmental protection. Thus theycan protect the consumers’ rights to healthy, safe andenvironmentally friendly food.
Although for many Russian companies environ-mental protection and prevention activities are costly,they also have a positive economic effect. Therefore,the ecological and the economic point of view cansupport each other in the ecolabel project.
One of the theoretical frameworks of the environ-mental management paradigm is that environmentalmanagement is a function of quality of producedgoods. Therefore, environmental management couldbe promoted through ecolabeling, and implementa-tion of the ecolabel project will help to reduce theenvironmental impact of the rapidly growing localfood industry in the city.
Acknowledgements
We are very grateful to the St. Petersburg EcologicalUnion and St. Petersburg State University of Refrig-eration and Food Technology, without whose assis-tance and financial support the paper would not havebeen prepared and presented.
We also thank St. Petersburg Ecological Union’sBoard Chair, Semen Gordyshevsky, and its Director,Olga Razoumovskaya, for their kind assistance andall their efforts in promoting the ecolabel project inSt. Petersburg.
References
Bougherara, D., and G. Grolleau. 2003. Can eco-labeling mitigate market failures? An analysis ap-plied to agro-food products. In W. Lockeretz (ed).Ecolabels and the Greening of the Food Market.Proceedings of a Conference, November 7-9, 2002.Tufts University, Boston, Massachusetts. pp. 111-119.
Gordyshevsky, S., and O. Razoumovskaya. 2002a.The Ecological Union: goods and people should beallies. St. Petersburg in the Mirror 3(10,Spring):16.
Gordyshevsky, S., and O. Razoumovskaya. 2002b.Competence and belief. Business Today 2(14,February 4):21-22.
Petrov, Y. 2002. The consumer market of Petersburg.St. Petersburg in the Mirror 3(10, Spring):15.
Shirokov, N. 2002. Petersburg AIC results and pros-pects. St. Petersburg in the Mirror 3(10, Spring):15

87
Yes No
Figure 2. The roles of organizations involved in the development of the methdology (program) for certificationof products to be marked by an ecolabel.
Declaration
St. PetersburgEcological Union
Technical assignment
MethodologyDeveloper
Draftmethodology
Advisory Board
Anyamendments
needed?
Enterprise
Methodology

88
No Yes
Yes No
Figure 3. The roles of organizations involved in the procedure of ecolabeling.
St. PetersburgEcological Union
Methodology
Technical Board
Environ-mentalauditors
Accreditedlaboratories
MethodologyDevelopers
Compliance withthe methodology
Conclusion underissuing the license
TechnicalConclusion about
Compliance
Advisory Board
Rejection orreconsideration
Rejection orredevelopment
Agreement onacceptance by
interestedparties?
Hearing of interestedparties
Positive resolution

89
Figure 4. Relationship between level of family income and readiness to buy more expensive ecolabeled bakerygoods.
Figure 5. Relationship between sex-age characteristics and readiness for a price increase.
0
1 0
2 0
3 0
4 0
5 0
6 0
7 0
u p to5 00 0
u p to7 00 0
u p to1 00 0 0
u p to1 50 0 0
u p to2 00 0 0
abov e
th e pr i cew i l l n otch an ge
th e pr i cew i l li n cr eas eon 5 %th e pr i cew i l li n cr eas eon 1 0 %th e pr i cew i l li n cr eas eon 2 0 %
0
10
20
30
40
50
60
til l age of 28year s oldwomen
28-40 year s oldwomen
older then 40year s oldwomen
til l age of 28year s old
men
28-40 year s oldmen
older then 40year s old
men
the pr ice wil l not change the pr ice wil l incr ease on 5%the pr ice wil l incr ease on 10% the pr ice wil l incr ease on 20%


91
The Acceptance and Usefulness of the Term “ Identity-Preserved” (I .P.)in the Sustainable Agr iculture Community
Melissa Schafer1
____________________________1Department of Rural Sociology, Iowa State University, Ames, IA 50011. Email: [email protected]
“ Identity Preservation” of grains is seen by the agri-cultural industry as the way of the future because ofadvances in agricultural production, processing,communication and marketing (Association of Offi-cial Seed Certifying Agencies, 1991; Narigon et al.,1991). The agricultural industry sees identity preser-vation as a way of meeting its customers’ demandsfor specific end traits of grain. Farmers are signingcontracts with agricultural corporations to growidentity-preserved grains because of the premiumvalue they are offered for maintaining or preservingthe “ identity” or pureness of the crops at the farmlevel. Farmers also see identity preservation as anopportunity for diversifying or specializing theircrops. Identity preservation of grains may allow bothfarmers and corporations to “market the farm” whilealso “ farming the market” through the use of e-commerce. Because of the increase in the use of theInternet by farmers and corporations, it is now easierthan ever before for buyers to find specific suppliers.Although the terms “ Identity Preservation” and “ I.P.”are famil iar to agricultural corporations and farmers,why is it that most consumers have never heard of theterm? Also, why is it that the sustainable agriculturecommunity has not adopted the use of this term fortheir food products more widely?
This paper will discuss what the term “ Identity Pres-ervation” or “ I.P.” means, who is using it, who bene-fits from it now, and who could in the future. It willalso discuss the drawbacks of using the term “ I.P.” tomarket natural foods or sustainable agricultural prod-ucts. Currently, identity-preserved food products arebeing sold, but few have the term “ I.P.” on theirlabel. This paper will provide examples of productsthat use the term “ I.P.” on their labels, as well asthose that are identity-preserved, but not labeled assuch. This paper concludes that the sustainable agri-culture community would be best served by identitypreservation if it took a stand regarding whether itwants to use the term or wants to reject it altogether.Since the term is predominantly used by agriculturalcorporations that are not interested in sustainableagriculture, it might be in the sustainable agriculturecommunity’s best interest to chose not to use the
term, so that consumers do not get confused aboutwhich products are grown using sustainable practicesand which are not. The sustainable agriculture com-munity could then market its own label with a differ-ent term, but that still fulfills the concept of identitypreservation. This new label could be used in con-junction with other ecolabels, such as one for inte-grated pest management. One suggestion of a termthat could be so used is “Quality Assured,” (Q.A.) or“Quality Assured System,” (Q.A.S.).
Identity Preservation ( I.P.): The Term andthe Concept
“ Identity-preserved” grains are also called output traitgrains, specialty, high value, premium or niche mar-ket grains. There is no universally accepted definitionof “ I.P.” The term is primarily used by agriculturalcorporations and farmers to signify that a qualityassurance program exists for the particular grain. Thepremium value that is earned from identity preserva-tion is achieved through the successful fulfillment ofone or more of these functions: demonstration ofreliability of a product stream; meeting labeling re-quirements; maintenance of identity such as organicor non-genetically modified; and the control or cap-ture of a value-added trait. Identity-preserved grainsoften are produced with a specific end use in mind,such as for human food, a specific kind of animalfeed, or for cosmetics, pharmaceuticals, or industrialuse. The value-added traits can either by physical,such as the size or color of the seed or hilum, orchemical, such as having a specific desirable contentof protein, oil or sugar. The primary market for iden-tity-preserved grains currently is large food process-ing companies that would like to use the new I.P.specialty oils because of features such as stability andfunctionality. Most identity-preserved grains cur-rently being marketed are simply different varietiesof federally subsidized commodities, particularlycorn, soybeans, and wheat. Identity preservation isnecessary for these specialty crops to keep themseparate from the commodity varieties that do notearn a premium.

92
Economic theory would predict that specialty itemssuch as identity-preserved grains are only “special”when they are produced and sold in small amounts.Therefore, if any of the current identity-preservedgrains were to be produced and sold in large enoughamounts, they would no longer earn a premium, be-cause competition leads to lower prices. According toeconomic theory, for a premium value to be obtained,new types of identity-preserved crops will continu-ally need to be marketed, since eventually the currentones may become commonplace. In the future, thesecrops may not simply be different varieties of thecurrent subsidized commodity grains. Instead theymay be more exotic types of grains. In such a case,then farmers would be able to add these new crops totheir rotations, resulting in a more sustainable agri-cultural system at the farm level. If there is enoughdemand for sustainable agriculture so that it isadopted to a large extent, then eventually it, too, willbecome commonplace. This is the ultimate goal ofthe supporters of sustainable agriculture. But even ifmost food is produced using sustainable practices,there would always be room for improvement. Therewill always be products that are “more sustainable”than the previous ones, and therefore there willalways be a premium for these “new and improved”products.
A perfect example of the lifespan of an identity-preserved grain is high oil corn, one of the first iden-tity-preserved grains to be grown under contract byfarmers. High oil corn became so widely grown thatit is hardly a specialty crop anymore, but nonethelessit is stil l identity-preserved, because it is stored sepa-rately from No. 2 yellow dent corn, the standardcommodity grade. High oil corn is an example of aspecialty crop that followed the law of decliningprofits, because so much is now produced that it nolonger earns any significant premium. However,there currently is much more demand for identity-preserved grains than there is supply (Krawczyk,1999). Examples of identity-preserved grains forhuman consumption are non-genetically modifiedcorn and soybeans, tofu soybeans, blue corn, andwhite wheat (Freiberg, 1991a,b). The process of iden-tity preservation will also be a requirement for allgenetically modified pharmaceutical grains(Meagher, 1999; Schuff, 2002). Currently there aretest plots in the U.S. growing genetically alteredpharmaceutical corn, tobacco, barley, rice and sugar-cane (APHIS, 2002).
Identity preservation of grains requires a systematicchange involving the entire supply chain. Identity
preservation is a quali ty assurance system that re-quires full traceability and transparency in the wholesystem. Documentation and auditing is done to en-sure that the product is not contaminated at any level.The system starts either at the level of the seed com-pany with the purity of the seed genetics or at thefarm level, but is maintained all the way throughtransportation, storage, processing, to the shelf or tothe end user. (This process is described in detail byBullock et al., 2001.)
The term “ I.P.,” meaning the “Identity Preservation”of a specific output trait in grains, is commonly usedby the agricultural industry, but it is not familiar toconsumers. Currently the sustainable agriculturecommunity as a whole has not embraced the term,and it remains to be seen whether it ever will, or ifthe term will primarily still be used by agriculturalcorporations and farmers. The low level of accep-tance of the term by the sustainable agriculture com-munity may be due to the ambiguity of the term re-garding whether I.P. grains are raised using sustain-able practices.
The concept of “ identity-preserved,” but not the term,is already being endorsed by the sustainable agricul-ture community as a market opportunity for familyfarmers to achieve a higher value for their products.Examples of products that use this concept areorganic, hormone free, and free range. “ Identity Pres-ervation” is a broad, umbrella-li ke term, meaning itoverlaps with terms such as organic. Organic can bethought of as fitting under the I.P. umbrella.
The Benefits of Identity Preservation
The sustainable agriculture community includes allthe individuals and groups that are interested in sus-tainable agriculture, such as consumers, farmers,natural food companies, and sustainable agricultureorganizations. Everyone should benefit from sustain-able agriculture! Commodity-based agriculture iscriticized for benefiting agricultural corporations andnot the farmers or consumers. Another criticism ofcommodity agriculture made by the sustainable agri-culture community is that because of the increase inmechanization and large corporate farming, there hasbeen a homogenization of farming practices. As a re-sult, the individual knowledge each farmer possessesabout his land and how to grow best on it is beingdevalued and even lost. The industriali zation of farm-ing has been criticized because of the resultingdeskilling of farmers. Now many farmers are notmuch more than appendages of the machines they

93
use, without any special knowledge of their land.Identity preservation of grains is a possible avenuefor family farmers to get off the technology and pro-duction treadmill t hat leads to the ever-increasingexpansion of farms and expensive technology. In-stead of following the “get larger or get out” motto,farmers can instead focus on identity-preserved cropsthat demand less land because of their premiumprices. Thus, identity preservation is a way for familyfarmers to stay in farming and to prevent the deskill -ing of farmers.
Identity preservation of grains has the potential toprovide family farmers with a more equitable returnfor their production and to provide corporations andconsumers with greater knowledge and trust of thequality of their product. Identity preservation is also away to convert to a more sustainable form of agri-culture, since many of the I.P grains are organic andnon-genetically modified. In addition, identity pres-ervation makes it possible for family farmers to con-vert to the use of sustainable agricultural practices byadding crops to their current rotations. Currentlythere is little incentive for many farmers to growcrops that are not subsidized by the government.However, since identity-preserved crops earn a pre-mium, farmers may chose to diversify their croprotations with identity-preserved crops that are notcurrently subsidized, such as oats. Increasing thenumber of crops in the rotation benefits the soil andprevents disease outbreaks; therefore, it is one ofmany sustainable agricultural practices.
The Term “ I .P.” on Food Labels
Currently there are very few food products that con-sumers can find easily on supermarket shelves thatuse the term “ I.P.” on their labels. However otherproducts are being sold that fulfill the concept of“ identity-preserved” even if they do not use the termon their labels.
The natural foods brand GeniSoy uses the term I.P.on its food products’ labels. GeniSoy was one of thefirst companies to market its products as identity-preserved nationally at major grocery store chainsand natural food stores. GeniSoy makes various typesof soy protein products, such as soy protein shakepowders, soy protein bars, soy nuts, and soy cakes,which are similar to the more common rice cakes.Although GeniSoy uses the term “ I.P.” to market itsproducts, not all the labels define the term or explainwhy it is important to the consumer. GeniSoy’s pro-tein shake is the only one that defines the term I.P.
The protein shake powder comes in a canister, and onboth the front and the back sides the term “ I.P.” isused. On the front there is a symbol representing aseal that states “ IPP Certified Non-GMO Soy-beansTM” , and on the back there is a smaller versionof the same seal (Figure 1).
Figure 1: GeniSoy Protein Shake Powder label.
In addition, on the GeniSoy Protein Shake Powderlabel, the first ingredient is listed as: “ IP SUPROBrand Isolated Soy Protein.” The GeniSoy Soy Nuts!also have the same type of I.P. seal as the proteinshakes, but the text is as follows: “Certified IPPIdentity Preservation ProgramTM” and the first ingre-dient in the list is stated simply as “ IP Soybeans.”The soy protein bars do not have the I.P. seal, mostli kely because of the smaller size of the packaging,but they also include the term “ I.P.” in their list ofingredients.
The natural foods chain Whole Foods also sells a soyprotein powder that competes with GeniSoy’s prod-uct. The container is identical in size to GeniSoy’s,and also uses the term “ I.P.” On the front it has thefollowing phrase above the title of the product: “Cer-tified IPP Non-GMO” and the first ingredient underthe li st of ingredients is: “ IPP SUPROR NON-GMOsoy protein isolate.” However, there is no descriptionon the Whole Foods soy protein shake package ex-plaining what the term “ I.P.P.” means. Nowhere onthe package does it even state the full name “IdentityPreserved Program” as on the GeniSoy packages.
Instead, the Whole Food package emphasizes severaltimes that the product is “NON-GMO” and uses theterm “Non-GMO” as part of the name of product.Under the directions it states: “Blend one heapingscoop … of NON-GMO Soy Protein Powder mix.”Under the nutritional claim it states that “each serv-ing of NON-GMO Soy Protein Powder provides 24grams of soy protein.” Clearly, Whole Foods is notemphasizing the fact that its product is identity-preserved, but instead that it is non-genetically modi-fied. This makes sense, given that most consumers do

94
not know what the term “ I.P.” means. In contrast,consumers who would buy this product are likely tobe aware of what genetically modified foods are andthus might want to buy a product that is non-genetically modified.
The term “ Identity preservation” as such does not sayanything about whether a product is or is not geneti-cally modified. It simply is a quality assurance pro-gram. The products mentioned above are examples ofhow the term “ I.P.” can be used on food products forconsumers, but in these particular cases only con-veyed that the products were non-genetically modi-fied. Some members of the sustainable agriculturecommunity could argue that these products are onlymoderately following sustainable agriculture prac-tices, since they are not certified organic. However,they are non-genetically modified, and so are a stepin the direction of sustainable agriculture.
Identity-Preserved Food Products with NoI .P. LabelAll certified organic products are identity-preserved,but currently no organic products are labeled as “ I.P.Organic.” Organic products are identity-preservedbecause they are channeled into a separate productstream from non-organic products. This channelingstarts at the farm level and continues throughout thetransportation and processing stages, until the productfinally reaches its end user or the market shelf. Tolabel organic products as “ I.P. Organic” would beredundant, because the term “organic” already im-plies separation, traceability and purity. Even thoughorganic products do not use the term I.P. on theirlabels, there are some products that market theirproducts using the identity-preserved concept. Onesuch product is EdenSoy’s Organic Soymilk. On theback of the package it states: “Meticulous trackingand audited records guarantee the purity of this foodfrom the farm to your table.” This explanation isidentical to the type of explanation found on theGeniSoy package that explained what the IdentityPreserved Program meant for its soy protein shake.
Low saturated fat soy oil is another product that isidentity-preserved, but not labeled as such. CurrentlyHy-Vee, a Midwest grocery store chain, sells LowSaturated Fat Soy Oil under its private label calledGrand Selections. Nowhere on the package does itsay anything about the product being identity-preserved. The label looks essentially li ke any othercooking oil package except for the statement that itonly contains one gram of saturated fat per serving,
but it has no other health claims. From simply read-ing the label no customer would ever know the his-tory of the development of this special oil. It receiveda lot of press coverage because its supply chain wasviewed as a model for university-industry partner-ships in new food product innovation and marketing.King (2000) uses the development of LoSatSoyTM oilas a case study on how to develop a value-added sup-ply chain. Iowa State University developedLoSatSoy, the variety of soybean that the oil is madefrom. The Pioneer Hi-Bred seed company has a non-exclusive license for developing and marketing high-yielding varieties. Farmers sign contracts with ele-vators that will purchase the identity-preserved prod-ucts. The soybeans are then sent to the crusher, theoil then is sent to the refinery, and finally the refinersells the oil to a distributor. The distributor sells thelow saturated fat oil to normal supermarkets chainssuch as Hy-Vee. There is nothing about this productthat makes it a sustainable agriculture product, otherthan it is most likely being grown by some familyfarmers; the agricultural practices to grow the soy-beans are no different from those of commodity soy-beans.
Disadvantages of Using the Term “ I .P.”
Although the future is bound to require identity pres-ervation of grains, there are problems with the reli-ability of the current identity preservation systemsand the current use of the term “ I.P.” Although thereare many benefits to identity preservation, it wouldbe misleading to use the term “ I.P.” synonymouslywith sustainable agriculture. Even though identity-preserved grains can be grown using sustainable agri-cultural practices, not all of them are. High oil corn isan example of an identity-preserved grains that dif-fers from commodity corn only in its higher oil con-tent. The production practices as are used to producehigh oil corn are the same as those used to producecommodity corn, including chemical pesticides, fer-tili zers and monoculture. Thus, the production ofidentity-preserved grains may involve practices thatare not sustainable. Also, some identity-preservedgrains may use genetically modified seed, whichmost sustainable agriculture groups oppose.
Even more extreme, not only are some identity-preserved crops genetically modified for the purposeof ease in production and processing, but they mayeven be genetically modified to produce pharmaceu-tical compounds. When crops such as corn and soy-beans are genetically engineered to contain pharma-

95
ceutical compounds, it is called “pharming.” This isstrongly opposed by sustainable agriculture groupsbecause of the risk of genetic contamination of foodcrops and other plants.
Major failures in the grain separation system haveoccurred in recent years. This has sparked interest inidentity preservation systems for grains. The firstmajor contamination occurred when StarLink corncontaminated corn for human consumption in 2000.Again in November, 2002, “volunteer” corn grownfor pharmaceutical use contaminated commodity soy-beans grown in the same field. This resulted from justone plant of genetically modified pharmaceuticalcorn being ground up in the combine when thesoybeans were harvested, which meant that 500,000bushels of soybeans had to be quarantined (Brasher,2002). Even though the USDA was monitoring theidentity preservation process, this major mistake stilloccurred, resulting in members of the agriculturalindustry arguing that pharmaceutical crops should begrown far away from food crops to prevent anycontamination (Brasher, 2002). The sustainableagriculture community demands even stronger re-strictions on these products – outright banning ofgenetically modified pharmaceutical crops.
Another drawback to using the term I.P. is that al-though it is possible to use more than one label onfood products, it might confuse consumers if thereare multiple labeling systems on the same product.The term I.P. also overlaps with some existing labelterms that also have traceability requirements. Onesuch example is the organic label. Examples of otherecolabels that could be combined with the term I.P.are integrated pest management (I.P.M.) and bio-dynamic. However, the term “ I.P.I.P.M.,” standingfor identity-preserved integrated pest management,may be too long for marketing purposes. One poten-tial problem with the term I.P. is that it might not be“catchy” enough for marketing purposes and thatpeople may not remember what the abbreviationstands for. In the agricultural industry itself and inother industries using patents, “ I.P.” also means“ Intellectual Property.” In the computer industry“ I.P.” means Internet Protocol. Although there is nolikely reason to confuse an acronym used in the con-text of computers with those for food, it is possiblethat since “Intellectual Property” is often used inreference to genetically modified foods, this couldconfuse consumers.
There are also some significant barriers at the farmlevel preventing the adoption of identity-preserved
grains by farmers. The tolerances for genetic con-tamination of I.P. crops by other crops are very diffi-cult to meet because they are set so low. The farmjournal Successful Farming discussed the difficultiesof meeting these tolerances and how they are leadingfarmers to become frustrated and lose interest(Holmberg, 2001). It is especially difficult to havelow levels of contamination in I.P. corn crops be-cause corn is an open pollinated crop and pollen driftfrom neighboring fields can easily contaminate I.P.corn. There is also a risk of contamination when thesame combine is used to harvest I.P. crops and non-I.P. crops. It is very difficult to clean a combine thor-oughly and it is too expensive for most farmers toown more than one.
Conclusion
Identity-preserved crops are seen by the agriculturalindustry as the next generation of crops, because theyfulfill end users’ and consumers’ demand moreclosely than does the current commodity grain sys-tem. The sustainable agriculture community as awhole needs to become more aware of the meaningand the use of the term I.P. Then the sustainable agri-culture community needs to take a stand and decideeither to adopt the term “ I.P.” into its their currentlabeling systems or to reject it. The primary reasonfor rejecting the term is that it originated with agri-cultural corporations that are not interested in sus-tainable agricultural practices; the sustainable agri-culture community does not want to use a term thatdoes not fit with its values.
However, this does not mean that the concept ofidentity preservation is flawed. Even if products em-body the concept of identity preservation, they do notall need to be labeled as such. Since there are somany types of identity-preserved products, it mightbe in the sustainable agriculture community’s bestinterest to create a label that is based on the conceptbut uses a different term to distinguish the productsof sustainable agriculture. It is essential, though, thatthe sustainable agricultural community publicize thedifferences between the new label and the original“ I.P.” term used by agricultural corporations so thatconsumers are aware that the new term is only usedfor products that are both identity-preserved andsustainable. Therefore, the new term should never beallowed to be used for products that fall under the do-main of the agricultural industry’s term “ I.P.” such asnon-food products, products for industrial or feedpurposes, and genetically modified food.

96
References
Animal and Plant Health Inspection Service. 2002.Field testing of organisms that produce productsintended for pharmaceuticals. APHIS, USDA,Riverdale, Maryland. http://www.aphis.usda.gov/ppq/biotech/pdf/pharm-2002.pdf viewed December16, 2002.
Association of Official Seed Certifying Agencies.1991. Identity Preserved Crops Roundtable Dis-cussion on Challenges and Opportunities: MeetingProceedings. Rosemont, Illi nois.
Brasher, Philip. 2002. Biotech firm under fire haslink to Iowa: the company accused in a Nebraskacase paid to burn Iowa corn that may have beencontaminated. Des Moines Register. 14 November.http://desmoinesregister.com/business/stories/c4789013/19735220.html viewed January 3, 2003.
Bullock, D.S., M. Desquilbet, and E.I. Nitsi. 2001.The economics of non-GMO segregation and iden-tity preservation. http://www.ace.uiuc.edu/faculty/bullock/foodpol_1.pdf viewed December 16, 2002.
Freiberg, B. 1991a. AgriPro’s views on the opportu-nities of value-added crops. Seed Industry 42(9):4-5.
Freiberg, B. 1991b. Kansas value-added wheat pro-gram looks promising. Seed Industry 42(3):6, 22.
Holmberg, M. 2001. I-P Crops: Mission ImPossible.Successful Farming Online. February. http://www.agriculture.com/sfonline/sf/2001/mid-february/0103mission_ImPossible.html viewed December20, 2001.
King, R.P. 2000. Supply chain design for identitypreserved agricultural products. http://www.sls.wau.nlmi/Activities/Papers/000211_3.pdf viewedDecember 14, 2002.
Krawczyk, T. 1999. An unfulfilled promise.INFORM International News on Fats, Oils andRelated Materials 10(6):552-61.
Meagher, L.R. 1999. The third dimension of nu-traceuticals: adding value through innovative agri-culture. Journal of Nutraceuticals, Functional andMedical Foods 2(1):5-14.
Narigon, E., K. Cutler, and R. McChane. 1991. Iden-tity Preserved, Value-Added Crops: Survey andResource Directory. Freiberg Publ. Co., CedarFalls, Iowa.
Schuff, Sally. 2002. Plant-made pharmaceuticalsoffer medical promise. Feedstuffs 74(35):12, 22.
97
Linking Producer and Consumer:Rewarding “More Than Purely Pr ice” Values in the Marketplace
Cathy Rozel Farnworth1
____________________________1Dept. of Rural Development Studies, University of Agricultural Sciences, Sweden. Email: cathyfarnworth@hotmail .com
While social labels necessaril y need to be simple inorder to appeal to busy yet concerned consumers,they also need to articulate some kind of truth. Thiscan be established by linking them directly to theproducer’s well -being via a quality of life index, andsecond, by deciphering the ethical standpoints ofconsumers and then working with them to provide alabel consistent with such views. This will enableconsumers to act in the real world in line with theirethical reasoning. The focus throughout this paper ison social labels attached to organic produce. The con-text is that of northern consumers purchasing goodsfrom the global South.
The paper is divided into six parts. The first intro-duces the main themes. The second discusses alter-native ways of arriving at satisfactory social stan-dards. The paper then moves from general discussionto my on-going research in Madagascar andGermany. The research approach adopted is pre-sented briefly in part three while the research itselfand its implications are discussed in parts four andfive. The final section seeks to draw the variousstrands together.
Part One: Linking Social Labels and SocialStandards
Social labeling is a means of providing consumerswith information on the well -being of the producerby including these details as part of the packaging, orvia other channels of communication such as theInternet. It is not quite the same as fair trade labeling,which is marketed to the consumer as a means ofensuring that a “fair price” is paid to the producersfor their goods. Although fair prices also form part ofsocial labeling, “more than purely price” values (i.e.,nonfinancial and nonmarket) are given explicitweight in social labeling initiatives. Browne et al.(2000, p. 70) concur that fair trade labeling is not richenough as a concept and suggest that ethical trading(with which social labeling may be aligned) embracesthe idea of sustainable resource management as wellas fair trade agreements and safe working conditions.Clearly, though, the boundaries can be blurred in
practice: some “fair trade” organizations specificallychoose to work with democratically run cooperativesand may apply other ethical criteria. Equal Exchange(www.equalexchange.com), the USA’s first fair tradetea and coffee company, is an example. However thechief focus remains upon financial fairness.
A social label must be simple to appeal to the con-sumer, yet behind it will l ie a world of deep com-plexity. Its sole aim must be to enable consumers toact in line with their ethical reasoning. Yet to achievethis means establishing transparency all along thefood chain, ensuring accountability, and most pro-foundly, providing the certainty that consumers,through their purchases, indeed are helping the pro-ducers create the world they seek – or, at the least,not actively harming the producers’ ability to do so.
There are further complexities to be consideredregarding social labels, in particular that they repre-sent one party to another party. In this they differfrom other popular contemporary efforts to relinkproducer and consumer, such as farmers’ markets, inwhich different parties to the partnership can meetand talk.
In the case under consideration, in which the produc-ers li ve in the global South and the consumers in theglobal North, direct personal contact clearly is notfeasible. Social labels are therefore artifacts designedfor consumer consumption. This is significant interms of the balance of power it implies: actualdecision-making power rests with the consumer onthe basis of information given about the producer.This point raises complex and difficult questions ofrepresentation, only one of which can be discussed inthis paper. This aspect, that of verification of claims,is discussed in the next section.
Part Two: Overview of Social Standards inOrganic Agriculture
Social labels must draw upon verifiable social stan-dards for their legitimacy. To date, however, no com-pulsory procedures exist to verify whether socialstandards have been met in the organic production

98
process, although some groups, such as RAFI (RuralAdvancement Foundation International), IFOAM(International Federation of Organic AgricultureMovements) and the UK-based Soil Association, arenow seeking ways to meet this deficit.1 A few privateinitiatives exist; for instance Rapunzel, a German fairtrade food company, has set up a scheme entitled“Hand-in-Hand.” 2 Such independently realized ap-proaches can usefully inform efforts to bring socialcertification into the mainstream of organic agri-culture.
Yet there is a potential mess in the making. The kindof farming envisaged by the actors who devised cur-rently prevailing organic certification procedures isviewed by many farmers, particularly those in theglobal South, to be irrelevant to local conditions and,in essence, an imposition (Harris et al., 2001). Par-ticularly from smallholders and some NGOs, the callis for bottom-up organic certification procedures thatembrace locali ty, yet can be agreed to be part of theorganic vision by a wide range of stakeholders.
Although compulsory social certification proceduresremain to be framed and adopted by the mainstreamorganic world, the risk is high that such procedureswill similarly be developed without real participationby producers. As such they may become a burden tosmallholders and plantation workers, rather than rep-resenting a means of not only measuring, but alsoenhancing, well-being.
Devising social standards: how to proceed?
There are two ways to approach this conundrum. Oneway is to raise best practice standards across theboard (such as a nationally applicable minimum wageset by the government for agricultural wage laborers).Such nationally adopted standards would necessaril yhave to met by all players.3
____________________________1Sligh and Mandelbaum (2003) describe RAFI’s ongoingefforts with others on social stewardship standards insustainable and organic agriculture. For more details onthe other initiatives visit www.ifoam.org and www.soilassociation.org
2www.rapunzel.de (currently in German, site in English tobe made available soon). Contact Rapunzel directly fordetails of “Hand in Hand” by using the contacts link ontheir website.
3It is worth considering best practice with respect to prod-uct quali ty in order to draw useful comparative data.National/international standards: in the European Union,“maximum permitted pesticide residues” in food are noweffectively at zero for most active ingredients. Voluntary
A second way is to certify best practice; here twostrategies might be identified. One is to appeal towell -established internationally recognized standards,for example regarding codes of labor practice,4 or todevelop codes in situations where these do not al-ready exist: IFOAM is in the process of developingcodes of conduct for organic traders, for example.For the purposes of discussion, let us call these “hardstandards.”
The other strategy to enable best practice to be re-warded demands recourse not to external standards,but to those defined and set by the producer commu-nity itself. This is the approach discussed at length inthis paper, since it raises several issues and takes thedebate around certification into new ground.Standards derived from such a strategy can be called“soft.” Table 1 compares the two strategies.
Devising social standards: the “ soft standards”approach
The soft standards approach does not exclude thehard standards approach, but rather should be under-stood as complementing it. However, it differs inimportant and substantive ways because of its quali -tatively different emphases in terms of content andprocess:
• The focus is on recognizing and supporting whatlocal people value; there is an explicit recogni-tion of the value of otherness/diversity. This isimportant because the fear is very real that anundue focus on “standardization” (via organicand social certification) in the organic world mayunwittingly contribute to the erosion of localknowledge, local understandings of well-being,and those things precious to particular people andcommunities. In other words, the negative ratherthan the positive trends of globalization may bestrengthened through the application of stan-dardized measures.
schemes: Benbrook (2003, this volume) contends thatpesticide residues in the US pose “ tough challenges” forecolabeling programs.
4There is an array of such codes that share commonground, for instance ICFTU/ITS Basic Code of LabourPractice; the Social Accountability International SA 8000Code; the Base Code adopted by the Ethical TradingInitiative and the Model Code of Labour Practices for theApparel Industry adopted by the Clean Clothes Cam-paign.

99
• Such soft standards are rooted in the “felt andexperienced world” of the producer, and this isthe basis of their legitimacy.1
• Although financial fairness might emerge as asignificant quality of life issue, the soft standardsapproach provides a vehicle to enable other“more than purely money” values to emergeeasily, given the shift in focus.
• Not only the content but also the process ofderiving soft standards is very different from thatof hard standards. The producers themselves areinvolved in mapping and capturing their values,and they work to set the standards to which theyaspire. The mechanism of a quality of life indexis suitable, given that quality of life indexes arein widespread use and can be simple to use.
The involvement of other stakeholders at particularstages of the process is important (though carefulattention needs to be paid to the constellation ofpower with respect to forming and taking decisions atany one time). Such involvement is required becausethe active participation of particular stakeholders willbe necessary for certain aspects of a local vision to berealized. For example, if plantation workers wantliteracy classes, this can occur only if the manage-ment permits them to have time off , and perhapsarranges for such courses on site. Similarly, if small -holders are concerned about take-up of their produce,then traders will need to consider extending purchaseguarantees.
Two things are important to bear in mind. First, sincechange in local concepts of well -being is certainlycontinual, and aspirations will feature strongly, suchsoft standards will need to be revised from time totime. Second, soft standards can also include tougher,more “objective” standards with regard to particularthresholds, for instance in health, below whichhuman beings cannot be considered as living a “dig-nified life” (as discussed further in part five).
____________________________1The literature on localization is very extensive, and noadequate overview can be provided here. Cooper (1992)urges that we view the environment not as something thata creature or a human is merely in, but something that ithas. That is, it has an intentional relationship to theenvironment. The environment thus forms a “ field ofsignificance” unique to that being. Further, items withinthat environment point to one another, thereby forming anetwork of meanings. It is this kind of uniqueness that weare considering here. Dauncey (1986), Shiva (1992) andNorton (1992) are also worth consulting.
Part Three: Research Approach
Although the theoretical considerations might becomplex, the task itself – that of devising a way tocreate and capture soft standards and then to weavethese into a social label – dare not be difficult.Rather, simplicity is the goal, since a complex ap-proach would not find any takers. The aims of myparticular undertaking are therefore to contribute tothe debate in two ways:
• by developing a “quality of life toolkit” flexibleenough to be used anywhere, specific enough toproduce unique meaning in a particular situation,and yet universal enough for the results to beunderstood and operationalized by other stake-holders, such as large organic retailers sourcingfrom small farmers; such a toolkit should be ableto answer the questions: “Does involvement inproducing certified organic goods bring aboutpositive change in the li ves of women and menproducers? How can we know this?”
• by permitting the findings to flow into workcentering on the development of “quality of life”criteria that can be attached to organic produce inthe form of social labels; since the criteria needto be relevant to consumers as well as producers,consumer values need to be incorporated.
The undertaking faces a number of challenges: rele-vance to the actors/stakeholders involved; the abilityto follow the unexpected while retaining the boundedobjectives of the undertaking, and the acceptance andmanagement of divergence and difference within aframework of coherence.
Furthermore, it is essential to be able to knit the pro-ducers and consumers together through using aniterative methodological framework. Such a frame-work is shown below in Figure 1.
Part Four: Work in Progress in Madagascar
Quality of Life Index: theoretical overview
How can we ascertain quality of life? Over the yearsthere have been many attempts, including measuringgross domestic product, devising genuine progressindicators, a women’s empowerment measure, andthe human development index (see Murray, 1991;Hamilton, 1999; Neumayer, 2000; Kabeer, 2000 forcomments). Work has also been done at the micro-level. Nazarea et al. (1998) aimed to correct thebiases, as they saw it, of most mainstream develop-ment projects in the Philippines by measuring the

100
target population’s internally defined standards,many of which turned out to be quali tative, non-monetary, nonmaterial, and long-term. Gender, ageand ethnicity of the respondents significantly struc-tured the responses.
Eckermann (2000), in a study of the Australian healthsector, discusses the seemingly puzzling discrepan-cies between objective conditions of well -being andsubjective perceptions. Eating disorders, high rates ofsuicide, and drug abuse among people having all theobjective conditions necessary for “good health”point to the reality of people feeling deeply unhappywith the way the world is organized. She concludesthat quality of life indicators need to reflect people’sli ved experience more accurately, which can only beachieved by abandoning universalistic assumptions.These and other studies (see Shepherd, 1995;Farlinger, 1996; Ahluwalia, 1997; Richmond et al.,2000) demonstrate that subjective perceptions ofwell -being sometimes have little to do with theprovision of “objective” conditions of well -being.
However there are two frameworks, the functioningsframework devised by Sen (1985 in Saith andHarriss-White, 1998) and the capabilities frameworkdevised by Nussbaum (2000), that plead the need toassess basic levels of functioning and capabilityaccording to indicators everyone may agree are valid,below which truly human li ving is not possible. Thefunctionings framework argues that it is not posses-sion of a commodity or the utility it provides that is aproxy for well-being, but rather what the person actu-ally succeeds in doing with that commodity and itscharacteristics. Saith and Harris-White (1998) useSen’s framework to discuss three basic functionings:being healthy, being nourished, and being educated.They assert that in developing countries, gender dif-ferentials may exist even at the level of such basicfunctionings. Their assumptions are first, that thesethree functionings are so elementary as to be neces-sary for well-being, and second, that a differential inany one of these functionings is assumed to result ina differential in well -being.
Nussbaum’s capabilities framework is philosophicalin tenor and promotes a cross-cultural normative ac-count of human capabil ities. This approach assertsthat there should be basic constitutional principles re-spected and implemented by all governments. Suchprinciples should focus on human capabil ities, that is,what people are actually able to do and to be, in away informed by an intuitive idea of a li fe that isworthy of the dignity of a human being.
Acknowledging the validity of all these insights madeby researchers seeking to understand and measurewell -being suggests that a quality of life index capa-ble of eliciting subjective perceptions and also levelsof basic functioning and capability could be verypowerful.
Quality of Life Index: fieldwork in Madagascarand indicative findings
In collaboration with three Malagasy researchersfamili ar with participatory and other methods, Iworked at two sites in 2001 on the rainy and fertileeast coast. All work was carried out in Malagasy andtranslated into French. Attention was paid to genderissues throughout, since countless studies show thatwomen and men react to, and shape, situations differ-ently.1 In the field this meant that women and menwere usually interviewed separately on the sametopic in amenable contexts, by a researcher of thesame gender and at convenient times. Later, duringthe analysis and interpretation stages, data remaineddisaggregated by gender.
Research commenced with smallholder organic farm-ers in an isolated region near Brickavill e. They har-vest plantation and wild-sown cinnamon for Phael-flor, a small private Malagasy-owned organic com-pany exporting essential oil s to the USA and Europe.First order distillation of the cinnamon oil takes placelocally, with further refinement in the capital Antana-narivo. This endeavor is supported by the US Agencyfor International Development, since it is seen as away of preserving important forest biodiversity byencouraging economic use of the buffer zone be-tween the forest and farmland. Research continuedwith plantation workers at Plantation MonDésir,which is located close to urban centers and touristresorts. This plantation produces organic oils, spicesand black pepper chiefly for use in European phar-maceutical and charcuterie industries.
The findings did not resolve themselves neatly into aclear pattern. However distinct – sometimes comple-mentary, sometimes contradictory – themes emergedas fieldwork progressed. I have identified the fol-lowing clusters:
____________________________1One such study examines the way women and menentrepreneurs reacted differently to the opportunities pro-vided by cultivating organic crops for export in Uganda.See Kasente et al. (2000).
101
• the ways in which the respondents sought toachieve security in the context of chronic insecu-rity (for instance through land ownership or thepossession of cattle)
• respondents’ interest in upward mobil ity (throughrunning a business, for example)
• a sense of “entitlement” among respondents (e.g.,to basic literacy or affordable health care)
• affirmation of local values by respondents in asituation where such values are seen to beincreasingly under attack due to a generally per-ceived worsening economic macro-climate andthe promotion of entrepreneurial values by gov-ernment and NGOs (respondents resist by pro-moting food self-suff iciency and rejecting wagelabor in favor of personal independence, for ex-ample, even though this restricts cash income)
• methods the respondents used to manage thecomplexity of their lives. For example, both menand women plantation workers found their livesconstrained by “clock time” – de rigeur at theplantation. This seriously limited their ability toaccommodate other polycyclic rhythms govern-ing their existence: the agricultural year, preg-nancy, festivals, cooking, and childcare. Re-search showed that they developed many strate-gies to manage the complexity of their world.
Land and zebu cattle were seen by all as playing acentral role in the achievement of well-being by vir-tue of the economic stabil ity and cultural recognitionthey conferred, yet neither was in reach of the plan-tation workers. The research demonstrated that otherculturally specific concepts of well -being could bediscerned, some of which were highly personalized inexpression, others more clearly structured by vari-ables such as age and gender.
For the Malagasy respondents, well-being clearly wasneither a unitary concept nor an end-state. Rather, itis constantly being achieved, it is in a process ofbecoming. As the situation changes, so do the strate-gies aiming to define and achieve well-being. Thoughlocal concepts of well -being are in flux, they areclosely aligned with the particular circumstancesprevailing in the research areas. The cultural expres-sion of well -being in the local Malagasy culture isintertwined with multiple influences coming fromelsewhere. (For a presentation of the findings,without analysis, see the two working papers [inFrench] by Farnworth et al. (2002a,b), available atwww.lbutv.slu.se/Publ./publications.htm.
Quality of Life Index: next steps
The next step involves developing indicators with therespondents. The outcomes would have to berespected by other stakeholders in the process inorder to enable their realization. Of course a “ realitycheck” would also need to be built in, probably onthe basis of a rights and responsibilities framework.
An interesting way to proceed might be to establishpanels of producers, consumers and traders (and, ifrelevant, plantation owners) to discuss proposals putforward by a producer community to improve qualityof life. Panel members, depending on their functionin a particular process, would then commit to helprealizing particular proposals.1 Indicators would beestablished to enable progress to be measured againstthe baseline data provided by the quality of lifeindex. A time frame would be essential. Details ofthese on-going strategies to improve local quality oflife could appear directly on a social label attached,for instance, to organic coffee (which could berevised annually), or be made available on the Inter-net and updated regularly.
In the Malagasy case, basic literacy was much de-sired by the majority of adult respondents, par-ticularly women, to reduce their fears of being ex-ploited by li terate people and to enable them to helptheir children with homework. They thought thatclasses could be established to enable a certain levelof literacy to be attained.
Indebtedness was another great concern: some ideasamong many suggested by the plantation workers toovercome food and financial shortfall i ncludedrequesting the plantation owners to establish a ricebank, to which they could sell rice in times of plentyand buy back in times of need at the same price;education in chicken rearing2 and a small facility to
____________________________1It is fair to say that societies are differentially fragile andvary in their capacity to assimilate and absorb influencescoming from elsewhere. This is why the issue of powerrelations is so important – who is calling the tune. Thereis a need to have «enabling spaces” in which producerscan formulate and realize their visions, and, in essence,become powerful enough to contend with other forces.
2The survival rate of chicks was only around 15%, yet anadult chicken could be sold for 17,000 to 22,500 FrancsMalagasy (FMG). The daily wage on the plantation was5000 FMG (about US$0.75) for daily workers, 7,500FMG for permanent workers. Thus a chicken representsaround three days work. Women are responsible forraising poultry.

102
enable the processing of litchis and other fruits togive them higher market value. Rather than directlytrying to establish an indicator with respect tochanges in levels of indebtedness, proxy indicatorscould be established, such as level of usage of therice bank or number of chickens successfully raised.
It is clear from this brief list that once standards ofliteracy are raised or levels of indebtedness reduced,new aspirations will arise and new indicators willneed to be developed. In the case of literacy, forexample, some respondents might enjoy reading somuch that they might aspire to a higher level of liter-acy, or some might want to start learning French.
Part Five: Work in Progress in Germany
Social label: theoretical overview
The aim of my intervention in Germany is to use theunderstandings gained through an analysis of theWeltanschauung or worldview of organic consumersand its systemic representation in the world throughtheir agents (e.g., certification bodies and retailers).The intention is to create an idealized system inwhich this worldview is flexed wider to include aproper interest in the well -being of the producers oforganic goods.
This demands reframing the issue at hand by explor-ing the potential for changed understandings. To pro-vide an example: fair trade shoppers do not necessar-il y find environmental concerns important, andorganic consumers do not always share the fair tradeshopper’s concern with farmer well-being (seeBrowne et al. [2000] for a discussion of this point). Insuch a situation, the task of the interventionist, orchange agent, could be to find ways of alteringboundary judgements by enabling stakeholders to re-label the concerns of the “other” as valuable.1 Thistask is enabled by an understanding of ethics.
It is already known that a substantial body of con-sumers take into account “more than purely price”values when shopping. Browne et al. (2000, p. 79), ina UK study, distinguish between different tiers of
____________________________1See the work of Midgley (2000), who provides a model ofwhat happens when different groups of people havedifferent ethics (values in purposive action) relating to thesame issue, and therefore make different boundaryjudgements, resulting in conflict. His book concludes witha series of case studies discussing how changes haveoccurred in boundary judgements leading to newunderstandings of the “other.”
ethical consumers, with “ true” ethical consumersmaking up 2% of the population, and a further 20-30% semi-ethical, who are will ing to pay a modestpremium but do not go out of their way to purchaseethically. However, it is estimated that 80% of thepopulation is willing to be ethical i f no price pre-mium is involved and if no special effort is requiredto shop ethically. The concerns identified by con-sumers in this study include:
• their own and their famili es’ health
• the environment – how food is produced
• animal welfare – humane treatment of animals
• helping people in developing countries – notexploiting the people who produce the food.
Although the Browne study has gone some way to-wards disentangling the threads, to say that consum-ers have ethical concerns has undoubtedly becomesomething of a lazy commonplace. Indeed, “ethical”seems almost to have become synonymous with“good,” with other shoppers by implication “bad”and needing to be rescued. It would seem vital, if weare to better understand the complex world withinwhich all consumers make decisions, that we refineour understanding of the ethical frameworks that con-sumers draw upon. These are most likely not coher-ently bounded frameworks, nor are they necessaril yexplicit to the consumer. However, quite literallysense-making in this muddled situation – disentan-gling the threads with consumers themselves – mighthelp towards the development of a genuinely em-powering social label: empowering in the sense that itwill permit consumers to “act in the real world” inline with the way they ethically perceive the world.
Consumers draw upon a whole range of ethicalframeworks, for example utilitarianism and rights.2
These both have a strong presence in many societies,playing a significant role in informing understandingsof democracy, for instance. Briefly expressed, utili -tarianism considers that the right action in any onesituation is the one that causes the most happiness, orat least minimal unhappiness, to those affected. Itsproponents argue that utilitarianism enables individu-als and their representatives to take moral decisionsin a rational way. In this scenario, the consumer maybe hoping to increase the happiness of, say, childrenin other countries through not purchasing particular
____________________________2The definitions provided here are drawn from WyeCollege/Open University (2000).
103
makes of trainers, or, more positively, through buy-ing a special brand of chocolate.
Rights theories view individuals as moral agents,with duties and obligations to others. By the sametoken, each person has expectations of what othersmay, and may not, do to them (or should/should notdo for them). These constitute their rights. Thus oneperson’s right is another person’s duty. In thisscenario, consumers may view themselves as moralagents with particular duties towards the rights bear-ers, i.e. the producers.
The way another body of consumers lives may beinfused, for example, with Biblical injunction. Hereeach purchase symbolizes solidarity with otherhuman beings seen to be of tremendous intrinsicworth. A further group may be seeking to counterglobal capitalism through selective purchasing fromcooperatives, for example, and still another groupmay simply be interested in sharing the goodness ofthe world equally, not only among members of thepresent generation but also those yet to come.1
Ethical purchasing is thus about the practical appli -cation of considerations of how one should live andhow one should treat others. It involves an examina-tion by the consumer of whom they consider to formpart of the “moral community,” and whether they areconvinced that they can actively influence the well -being of members of that community.2
Ethical purchasing also very much demonstrates thepoint that the “local is created,” and is not merelygeographical in scope. To use Cooper´s (1992) lan-guage (see footnote 1, p. 99), fields of significance donot merely exist, but are actively created. Farmersmarkets or a social label are pertinent cases in point.The latter is indeed a particular expression of thebelief that farmers in Mali are equally the neighbor ofa consumer in Germany as the person li ving nextdoor.
In the real world the patterning of these theories willbe highly complex, and they are unlikely to bepresent in pure form. Rather, an intermingling will
____________________________1Please refer to Kavka (1978) on ´The Futurity Problem”and Howarth´s (1992) thoughts on “ IntergenerationalJustice and the Chain of Obligation.”
2Readings on where to draw the line of the moralcommunity, and who or what is morally considerable (tobe taken into account in its own right in ethicaljudgements) include Leopold (1949), Goodpaster (1978)and Elli ot (1991).
inform behavior. A useful image is that of variousethical standpoints converging to form a spotlightupon a particular issue.
Social label: fieldwork in Germany andindicative findings
A two-step process was devised, starting with aquestionnaire-based survey of organic consumersregarding their willingness to consider producer well -being. This has now been completed. In the next fewmonths a sequence of consumer workshops will dis-cuss the findings of the questionnaires as well as thefindings of the quality of life index. A central aimwill be to puzzle out the reasons for any divergence.Further, participants will be asked to consider whythose views they might hold as citizens do not neces-saril y translate into ethical consumer behavior.
A pilot survey was administered early in 2001 at theworld’s largest organic fair, the Biofach in Nurem-berg.3 Following revision of the questionnaire,research student Lilja Otto surveyed 223 organic con-sumers in Berlin and Braunschweig, both major citiesin central Germany, during the summer of the sameyear. The questionnaire elicited, first, information onthe degree to which consumers make specific choiceswith respect to fair trade items, and, second, theirunderstanding of some components of quality of lifewith respect to the lives of Southern producers. It washypothesized that the respondents already have takenup ethical positions with respect to particular aspectsof quality of life, whereas they might be more openor uncertain regarding other aspects. Components ofquality of life discussed were:
• improvement in the environment
• improvement in income
• improvement in social status of women farmers
• improvement in health status of the community
• improvement in access to education for childrenof producers
• purchase guarantees by retailers.
Detailed discussions with respondents refined ourunderstanding and brought up new themes for con-sideration. Findings were analyzed according to age(under 30, 30-50, over 50) and gender of respondent
____________________________3See www.biofach.de Please contact the author directly ifyou would like a copy of the report on this first consumerstudy.

104
(see Otto, 2002, for overview; contact the author for ashort summary in German). The findings include thefollowing:
• Information on the producer: 72% want to knowmore about producers and 62% would li ke a por-trait/biosketch of the producer on the label.
• Regarding specific elements of well -being, youngpeople find income levels less important than theenvironment, whereas older people reverse thesepriorities.
• People who purchase a great deal of organic pro-duce (more than 66% of total food purchases)consider the status of women to be a crucialquality of life issue, but those whose shoppingbasket contains little organic produce (less than33%) rate women’s status as low priority, andconsider children’s education to be much moreimportant.
• People whose shopping basket contains from33% to 66% organic produce find health to beone of the most significant issues, while the othertwo groups rate health lower.
Discussions revealed important discrepancies withrespect to how consumers view well-being, withsome contending that Western norms, for instancewith respect to education and health, actually worsenthe well -being of producers in the South. Others con-sider that issues of personal freedom, child labor,state redistribution of wealth and global tradinginequalities – to quote from a long list – substantiallyinfluence well -being in the South. It is also clear thatmost organic consumers want, hope and expectorganic stores to pre-select goods for them accordingto social criteria.
Conclusion
Apart from the specific findings, the work to datewith German organic consumers shows that somehave picked up on how quali ty of life might be seendifferently by people in situ and outsiders. On theother hand, some consumers appear to be relatingquality of life concerns to issues they personally findimportant. At the same time, more “objective” con-cerns are also evident, for instance regarding theissue of child labor. This admittedly simple delinea-tion roughly echoes the earlier discussion regardingthe value of incorporating insider and outsider per-ceptions of well -being into a quality of life index.
Furthermore, many organic consumers display a con-sciousness that they have some personal responsibil-ity towards producers, but seek mechanisms to enablethem to meet these duties with ease, via store pre-selection or indeed a social label. We might indeedfairly conclude that “more than purely price” ormoney values do inform the perspectives of both con-sumer and producer. It is therefore timely to devoteattention not only to further conceptualizing suchvalues in theory, but also to mapping, capturing, andbuilding upon them in practice.
References
Ahluwalia, M. 1997. Representing communities: thecase of a community-based watershed managementproject in Rajasthan, India. Institute of Develop-ment Studies Bulletin 28(4):23-36.
Benbrook, C. 2003. Why pesticide risks matter andpose tough challenges for ecolabel programs. InW. Lockeretz (ed). Ecolabels and the Greening ofthe Food Market. Proceedings of a Conference,November 7-9, 2002. Tufts University, Boston,Massachusetts. pp. 183-195.
Browne, A.W., P.J.C. Harris, H. Hofny-Colli ns, N.Pasiecznik and R.R. Wallace. 2000. Organic pro-duction and ethical trade: definition, practice andlinks. Food Policy 25:69-89.
Checkland, P., and S. Holwell. 1998 Action research:its nature and validity. Systemic Practice andAction Research 11(1):9-17.
Cooper, D.E. 1992. The idea of environment. In D.E.Cooper and J.A. Palmer (eds). The Environment inQuestion: Ethics and Global Issues. Routledge,London.
Dauncey, G. 1986. A new local economic order. In P.Ekins (ed). The Living Economy: A New Eco-nomics in the Making. Routledge, London.
Eckermann, L., 2000. Gendering indicators of healthand well-being: Is quality of life gender neutral?Social Indicators Research 52(1):29-54.
Elliot, R. 1991. A Companion to Ethics. Blackwell,London
Farlinger, S. 1996. Quality of life for women. SocialIndicators Research, 39(1):109-119
Farnworth, C.R., and S. Razanabahoaka. 2002a. Uneétude sur le bien-être des ouvriers et ouvrières dansl’agriculture biologique à la Plantation MonDésir àFénerive-Est, Madagascar. Department of RuralDevelopment Studies, Swedish University of Agri-cultural Sciences, Uppsala.
Farnworth, C.R., V.A. Ramaharo, and S. Razanaba-hoaka. 2002b. Une étude sur le bien-être des culti-

105
vateurs dans l’agriculture biologique dans trois vil -lages autor de Brickavil le, Madagascar. Depart-ment of Rural Development Studies, Swedish Uni-versity of Agricultural Sciences, Uppsala.
Goodpaster, K. 1978. On being morally considerable.Journal of Philosophy 75(6):308-325
Hamilton, C. 1999. The genuine progress indicator:methodological developments and results fromAustralia. Ecological Economics 30(1):13-28.
Harris, P.J.C., A.W. Browne, H.R. Barrett, and K.Cadoret. 2001. Facili tating the inclusion of theresource-poor in organic production and trade:opportunities and constraints posed by certifica-tion. Department of International Development,London.
Howarth, R.B. 1992. Intergenerational justice and thechain of obligation. Environmental Values 1(2):133-140.
Kabeer, N. 2000. Resources, agency, achievement:reflections on the measurement of women’s em-powerment. In Power, Resources and Culture in aGender Perspective. Uppsala University, Sweden
Kasente, D., M. Lockwood, J. Vivian, and A.Whitehead. 2000. Gender and the expansion ofnon-traditional agricultural exports in Uganda.UNRISD OP 12, Geneva, Switzerland
Kavka, G. 1978. The futurity problem. In R.I. Sikoraand B. Barry (eds). Obligations to Future Genera-tions. Temple University Press, Philadelphia.
Midgley, G. 2000. Systemic Intervention: Philoso-phy: Methodology and Practice. Kluwer AcademicPublishers, The Netherlands.
Murray C. L. 1991. Development Data Constraintsand the Human Development Index. UNRISD,Geneva.
Nazarea, V., R. Rhoades, E. Bontoyan, and G. Flora.1998. Defining indicators which make sense tolocal people: intra-cultural variation in perceptionsof natural resources. Human Organisation 57(2):159-170.
Neumayer, E. 2000. On the methodology of ISEW,GPI and related measures: some constructive sug-gestions and some doubt on the “threshold”hypothesis. Ecological Economics 34(3):347-361.
Norton, B. 1992. Sustainabili ty, human welfare, andecosystem health. Environmental Values 1(2):97-111.
Nussbaum, M. 2000. Women’s Capabilities andSocial Justice. Prepared as part of UNRISD’s workfor Beijing+5 Review: Gender Justice, Develop-ment and Rights. UNRISD, Geneva.
Otto, L.M. 2002. Solidarity off the Shelf: Germanconsumers’ perceptions of the quality of life ofproducers in the South. Course Paper, Departmentof Rural Development Studies, University of Agri-cultural Sciences, Uppsala, Sweden
Richmond, L., G.C. Filson, C. Paine, W.C. Pfeiffer,and J.R. Taylor. 2000. Non-farm rural Ontario resi-dents’ perceived quality of li fe. Social IndicatorsResearch 50(2):159-186.
Saith, A., and B. Harris-White. 1998. Gender Sensi-tivity of Well -Being Indicators. Discussion Paper95. UNRISD, Geneva.
Shepherd, A. 1995. Participatory environmentalmanagement: contradiction of process, project andbureaucracy in the Himalayan foothill s. PublicAdministration and Development 15(5):465-479.
Shiva, V. 1992. Recovering the real meaning ofsustainability. In D.E. Cooper and J.A. Palmer(eds). The Environment in Question: Ethics andGlobal Issues. Routledge, London.
Sligh, M., and R. Mandelbaum. 2003. Toward socialjustice and economic equity in the food system: acall for social stewardship standards in sustainableand organic agriculture. In W. Lockeretz (ed). Eco-labels and the Greening of the Food Market.Proceedings of a Conference, November 7-9, 2002.Tufts University, Boston, Massachusetts. pp. 107-110.
Wye College. 1997. Cultural Traditions and Envi-ronmental Values. T861. The Open University,London.

106
Table 1. Devising social standards: comparing soft and hard approaches.
Hard Standards Approach Soft Standards Approach Type of Indicators Qualitative and quantitative Qualitative and quantitative Source of Indicators Codes provide indicators Quality of life index provides baseline
data; indicators are derived from these Basis of Legitimacy Nationally and internationally agreed
codes of conduct Local perceptions of well-being; indicators are internally defined
Nature of Comparison Comparisons can be made horizontally, from farm to farm, country to country
Comparisons can only be made internally – within the producer community – across time
Stakeholders Farmers, workers, trade unionists, plantation owners, traders, certifying organizations as well as consumers – these have differential responsibility for the implementation of targets
Farmers, workers, trade unionists, plantation owners, traders, certifying organizations as well as consumers – these have differential responsibility for the implementation of targets
Figure 1. Knitting producers and consumers together: the research approach (adapted from Checkland and
Holwell, 1998).
Real world problem situation
Quality of Life for Organic Farmers
Unknown
Reflection on twith Mal
he findings agasy Participants and
German Consumer Groups
leads to
Researcher
Findings Shared with
Social LabelingStakeholders
(New) Research Themes
enters
Action in the situation
Qualitative Research in Madagascar
Takes part in
enables
107
Toward Social Justice and Economic Equity in the Food System:A Call for Social Stewardship Standards in Sustainable and Organic Agr iculture
Michael Sligh1 and Richard Mandelbaum2
____________________________1Rural Advancement Foundation International USA (RAFI-USA), P.O. Box 640, Pittsboro, NC 27312. Correspondingauthor. Email: [email protected]
2Comité de Apoyo a los Trabajadores Agrícolas (CATA – Farmworker Support Committee), P.O. Box 510, Glassboro NJ08028. Email: richardmandelbaum@hotmail .com
The National and International Contexts forSocial Justice Labels
The success of “ Organic,” and its limitations
The timing is now right to address the issue of socialjustice as it pertains to ecolabels, since with thecoming into force of USDA’s National Organic Stan-dards we have just passed another important mile-stone in the long history of US organic standardsdevelopment. The organic label, the first mainstreammarketplace-identified product of sustainable agri-culture and “ the mother of all US ecolabels,” hasmuch to be proud of:
• double-digit growth for over two decades
• strong consumer confidence
• standardized national and international environ-mental and humane food production and proc-essing guidelines
• verifiable third-party non-governmental and gov-ernmental certification and accreditation systems
• marketplace rewards to farmers
• reduction in toxic pesticide use, which lowersfarmers’ and farmworkers’ occupational healthrisks.
This is progress. We should take pride in the positiveaspects of this achievement. Organic is the newbenchmark to which all other labels will be com-pared. But with this success comes the challenges ofdilution, cooptation, and concentration. This processof institutionalization also helps to focus our attentionon the work that remains. Environmental and humanepractices alone cannot achieve sustainability in ourfood systems. We must have social justice.
There is also concern about how organic, sustainable,fair trade, and other ecolabeling schemes can bestcooperate in expanding the green and just market-place. The Rural Advancement Foundation Interna-tional (RAFI) is attempting to continue this consen-sus-building through the work of the Greener FieldsForum (Sligh, 2002) and its work towards forming anAgricultural Stewardship Council.
Finally, there is concern about how best to ensurethat the early adopters, small farmers, farmworkersand indigenous producers in the global North andSouth can fairly benefit from the growth of both or-ganic and ecolabeling strategies.
Rising public interest in and consumer demandfor a socially just marketplace
The public is increasingly attracted to products pro-duced under socially just conditions. This is evidentin the growing popularity of both fair trade and certi-fied sweatshop-free products. While both these pro-grams have focused mainly on imported goods,chiefly from nations in the global South, the two con-cepts also can and should be focused inward ondomestically produced agricultural products.
European consumers are increasingly demandingsuch products. Although the market is much smallerin the US than in Europe, it is growing. These prod-ucts are primarily tropical goods from the South –coffee, tea, chocolate, and now rice – but the sameprinciples can apply to all commodities.
Current projects in social justice ecolabels
There are an increasing number of initiatives aimedat promoting and developing aspects of social justicein agriculture. The Social Accountability in Sustain-able Agriculture (SASA) project is a collaborationamong the International Federation of Organic Agri-

108
culture Movements (IFOAM), Social AccountabilityInternational (SAI), Fair Trade Labelling Organiza-tions International (FLO), and the Sustainable Agri-culture Network (SAN). Some organic certifiers,such as the Soil Association in England and Certi-Mex in Mexico, have already developed some socialguidelines.
“ A Call for Social Justice” Project
For these reasons several years ago we initiated theproject “A Call for Social Justice in Sustainable andOrganic Agriculture.” The project represents a col-laboration of RAFI, Comité de Apoyo a los Traba-jadores Agrícolas (CATA), the Peacework OrganicFarm CSA of Liz Henderson, and Oscar Mendieta ofla Asociación de Organizaciones de ProductoresEcológicos de Bolivia (AOPEB), a Bolivian organicproducers association primarily representing indige-nous farmers.
Our goals have gone through a collaborative andparticipatory drafting process and a series of forumsto develop a universal baseline for such standardsthat can help define and set the scope for the use of asocial justice label claim. The project’s draft stan-dards have gone through several revisions based on aseries of extensive public comment periods. The stan-dards are currently in their fourth draft (Henderson etal., 2002).
Our goal is to build a model of an alternative foodsystem by creating an economic incentive for socialequity and just working conditions through the estab-li shment of a “social justice” food label. The visionof this alternative food system is one of vibrant smallfamily farms that provide well-being for the farmfamily and dignified work to wage laborers. Thestandards for such a label are based on the two com-plementary principles of economic equity for thefarmer and just working conditions for the farm-worker, resulting in a win/win scenario in which bothworkers and farmers benefit.
We recognize that the development and implementa-tion of such standards will depend on the equal in-volvement of buyers, farmers and farmworkers.Consistent with this vision, our goal is to build andmaintain a mutually respectful and supportive rela-tionship among the various parties (buyers – farmers– farmworkers), rather than an antagonistic one. Weenvision a symbiotic relationship in which despiteoccasional differences and disputes, the farmer,
farmworker, and buyer can live full and rewardinglives. In this scenario, the farmer can count on a fairagreement or contract with at least minimum fairprices, and a well-trained and consistent work force.The worker can count on stable, dignified work andjust treatment. The buyer can rely on getting highquality food products with added value.
The fundamental link needed to support such a pro-gram would be between a supportive public (con-sumers) and those who work the land (farmers andfarmworkers). In general, the standards are intendedto be consistent with and to build on IFOAM princi-ples on Social Justice, and the work of the Interna-tional Labor Organization (ILO).
Farmers’ r ights and buyers’ responsibili ties
The standards outlining farmers’ rights are based onthe principle that all contracts between farmers andbuyers will be fair and equitable.
These standards ensure the following:
• good faith negotiations on any contract with abuyer, with payments to the farmer that cover thecost of production of the farm products plus a fairreturn on the farmer’s investment and a li vingwage for the farmer. Should the buyer not be ableto afford to pay an adequate price, full disclosureof financial records would be required, as well assteady improvement as finances improve.
• freedom of association and the right to collectivebargaining
• fair grievance procedure
• contract specifications such as recapture ofcapital investment, anti-discrimination clauses,prohibition of the termination of contracts with-out just cause, and profit-sharing incentives.
Farmworkers’ r ights
The standards outlining farmworkers’ rights arebased on the principle that all workers have the rightto safe working conditions, just treatment, and faircompensation.
These standards ensure the following:
• adherence to international laws protecting work-ers, including ILO Conventions and UN Charters
• freedom of association and right to collectivebargaining

109
• fair grievance procedures
• li ving wages
• safe and adequate housing
• health and safety protections, including access toadequate medical care and a “ right to know”clause regarding pesticide use, with the expecta-tion that the least toxic alternative is always used.
Interns and apprentices
In addition, there is a short section pertaining to in-terns and apprentices, in recognition of the vital rolethat interns have played in organic and sustainableagriculture. The standards are based on the fact thatinterns are inherently distinct from wage laborers,and therefore have distinct rights and responsibilities.
These standards require:
• a clear, mutually agreed to, written contract lay-ing out the expectations and assuring the in-tern/apprentice that the farmer will provided thedesired teaching
• a fair stipend to cover living expenses.
Indigenous rights
Most of the world’s farmers are indigenous peoples.An ecolabel that makes claims regarding social jus-tice in agriculture needs to address their unique con-cerns. The current draft of the Call for Social Justicestandards includes a section on indigenous peoples’rights; this section, as with the other sections of thedraft, will be revised and reworked in accordancewith public comment.
Implementation and verification
A crucial issue that the project has not yet addressedis verification and implementation. Strong standardsbecome meaningful only when strictly adhered to. Akey issue will be enforcement of contracts, includingboth buyer-farmer contracts and farmer-worker con-tracts. For instance, how will a labeling program en-sure that the farmer or worker in question will be pro-tected from any retaliation? What sort of effectiveand timely conflict-resolution process or grievanceprocedure will be put into place?
Intended outcomes of the project
Our hope is that the project will achieve the follow-ing:
• To positively influence the ongoing discussionsconcerning adoption of social stewardship stan-dards, through the development of specific lan-guage (these standards) that is representative of abroad spectrum of constituencies, as describedabove. We hope that through collaboration andfriendly dialogue, our work can have this positiveimpact on other programs currently in develop-ment, such as the SASA project (IFOAM-SAI-FLO-SAN) and that of the Soil Association. Webelieve that our standards address certain issuesand areas that either have not been addressed, ornot been addressed in as much detail, by some ofthese other efforts, and that we therefore can pro-vide them with valuable and complementaryinsight.
• To encourage existing certifying agencies, in-cluding organic certifiers, to adopt social stew-ardship standards and to use our standards as abaseline. To this end, we have had preliminarydiscussions with several organizations and agen-cies that might be interested in using these stan-dards as a basis for a pilot project. Such a pilot isthe logical next step for this project, as only anon-the-ground trial will provide us with the in-formation needed to improve and clarify thestandards. We invite any certifying agency orother organization that may be interested in con-ducting such a pilot to contact us.
• To encourage organizations or communities thatdo not already have certification programs cur-rently in place to consider the potential value totheir members of implementing such a program,using these standards as a baseline.
Conclusion
At one and the same time we are both heartened byand concerned about the current proliferation of foodlabels. Heartened, because of the tremendous benefitthat labels can bring to achieving environmental andeconomic justice in the agricultural arena. Con-cerned, because comprehensive community-derivedlabels will, and to some degree already do, share themarketplace with labels that are far less stringent andnot necessarily representative of the communitiesthey claim to represent.
With the distribution of these standards we aim toadd our voices to “setting the bar” for such claims:

110
What does it mean when a label makes claims re-garding workplace justice for agricultural workers,respect for the rights of indigenous communities, oreconomic equity for small scale farmers? These arepowerful claims, and they need to be backed up bycomprehensive standards that are adequately imple-mented and verified.
References
Henderson, Elizabeth, Richard Mandelbaum, OscarMendieta, and Michael Sligh. 2002. Toward social
justice and economic equity in the food system: Acall for social stewardship standards in sustainableand organic agriculture. Draft four, August. Un-published. Available from Laura Lauffer, RAFI, [email protected] or (919) 542-6067.
Sligh, Michael. 2002. Greener Fields: signposts forsuccessful ecolabels. Paper presented at the Con-ference on Ecolabels and the Greening of the FoodMarket. Tufts University, Boston, MassachusettsNov. 7-9. Abstract available at: http://nutrition.tufts.edu/conted/ecolabels/program.shtml

111
Can Ecolabeling Mitigate Market Failures?An Analysis Applied to Agro-Food Products
Douadia Bougherara1 and Gilles Grolleau1
____________________________1UMR INRA-ENESAD, Rural Economics and Sociology, 26 Bd Dr Petitjean, BP 87999 21079 Dijon Cedex, France.Corresponding author is D. Bougherara ([email protected])
Because of their economic properties, environmentalcharacteristics embedded in products are frequentlynot provided at an efficient level. The “invisiblehand” of free markets fails to provide them at aPareto optimum, notably because they are publicgoods and credence attributes. In the literature, eco-labeling is frequently proposed as a market-linkedtool addressing the asymmetrical information prob-lem by conveying information to consumers on prod-ucts’ environmental impacts. However, ecolabels alsoface two other problems capable of disrupting themarket mechanism: the limited abilities of consumersto process increasing flows of information, and thepublic nature of environmental characteristics. Ourcontribution extends the analysis by considering theecolabel as a way to simultaneously overcome infor-mation asymmetry, informational overload, and pub-lic goods problems.
The first section of our paper shows how environ-mental attributes turn out to be a source of marketfailures. Because of their credence properties, envi-ronmental attributes may lead to adverse selection.Adding complex environmental information on prod-ucts may exacerbate informational overload. Thepublic goods properties of environmental character-istics may entail problems of free riding and assur-ance. These obstacles can partially explain whydeclared will ingness to pay does not necessaril y cor-respond to effective purchases. In the second section,we analyze how market failures may be mitigated byemphasizing private benefits, providing accurate andcredible information, adding attributes verifiable byconsumers and used as proxies for credence attrib-utes, and designing the ecolabel as a cognitive sup-port for consumers. In the third section, we provide aqualitative study of several existing ecolabels onagro-food products to stress how to a greater or lesserdegree they succeed in simultaneously attenuatingthese several sources of market failures.
Environmental Attributes of Agro-foodProducts: A Source of Market Failures
Eco-labeling can provide the missing market infor-mation about production process attributes and beused as a mechanism revealing consumer valuationof environmental attributes of agricultural com-modities (Moon et al., 2002, p. 88).
Ecolabeling is frequently considered as a way toovercome the market failure resulting from asymmet-rical information between the producer and the con-sumer. But this view seems restrictive, because mar-keting of ecofriendly agro-food products generatesother market failures that also determine the successof ecolabeling schemes.
Asymmetrical information between producersand consumers
Environmental characteristics of agro-food productscorrespond notably to impacts of farming and proc-essing practices in environmental areas such as water,soil, air, and biodiversity, which are dissociated fromproduct consumption. These environmental attributesfrequently are credence goods according to thetypology of Nelson (1970) and Darby and Karni(1973). The economics of information classifiesgoods or attributes into three categories. For searchattributes, consumers can get the information onquality before purchase just by inspecting the prod-uct. For experience attributes, consumers get theinformation only after purchase. Credence attributes,in contrast, cannot be accurately evaluated even afterpurchase or consumption. In most cases, credenceattributes are well known by the producers, but arehidden from consumers. Frequently the most cost-effective way is to give credence to a third-partyassessment, e.g., an ecoseal of approval that consti-tutes a proxy, instead of having to get information bymore direct means. Credence costs are the costs of

112
getting the proxy, which allows consumers to givecredence to the seller’s promise.
This informational asymmetry leads to adverse selec-tion. Adverse selection corresponds to hidden infor-mation, e.g., the environmental characteristics arealready determined, but producers can cheat by pro-viding false information (Akerlof, 1970). If consum-ers are unable to check environmental characteristics,fraudulent sellers can market bad products with agreen image. Fraudulent sellers want to capture thepremium that consumers are willing to pay for envi-ronmental attributes. But purchasers anticipate sell-ers’ temptation to cheat and then reduce their will -ingness to pay for environmental friendly products.Ultimately, this situation can lead to the eliminationof true ecofriendly products.
Informational overload as a source of marketfailure
Informational asymmetry corresponds to an unequalpartition of information between two agents that al-lows the better-informed agent, typically the seller, toprofit from his advantage, whereas informationaloverload arises because of limited cognitive abilitiesof agents. Even in a world characterized by symmet-rical information, agents can be overwhelmed byincreasing flows of information, and their attentionbecomes the scarcest resource. H. Simon, quoted byVarian (1995), stresses the need for a switch from an“economy of information” to an “economy of atten-tion” :
What information consumes is rather obvious: itconsumes the attention of its recipients. Hence awealth of information creates a poverty of attention,and a need to allocate that attention eff icientlyamong the overabundance of information sourcesthat might consume it.
This situation requires more than solving an asym-metrical information situation, that is, providing ac-curate and credible information. In a first approach,competition for consumers’ attention arises in a richinformational context, because the label i tself pro-vides too much information or because of competi-tion between several sources capable of capturingconsumers’ attention, such as other labels or the storeenvironment. New information and communicationtechnologies reinforce this situation by providing“huge amounts of information, but most seekers ofinformation face constraints that are tight enough forthem to rely mainly on sources with an establishedreputation for credibility” (Andersson, 2002, p. 716).
For example, In a well -documented study on differ-ent kinds of ecolabels, Wynne (1994) shows thatenvironmental “ report cards” establish symmetricalbut useless information because of informationoverload and technical inabili ty of consumers to pro-cess it. (An example of an environmental report cardis Green Cross in the US, which provides a detailedgraphical information about performance and envi-ronmental impacts of the product, based on a cradle-to-grave study of the product, without value judge-ment. The report card resembles a nutritional labeland aims at allowing the purchaser to compare theenvironmental burden of one product relative toanother.)
Environmental characteristics of agro-foodproducts are public goods
The environmental improvement (or degradation)generated by the environmental characteristics ofecofriendly (conventional) products frequently hasproperties of public goods. Indeed, the consumptionof such attributes by an individual A does not reducethe quantity available for another individual B (non-rivalry), and when these characteristics are produced,it is almost impossible to prevent someone from con-suming them (nonexcludability). These two featuresimply that the purchase of ecofriendly products doesnot guarantee to the purchasers an exclusive utilityfrom the environmental improvements generated bytheir purchases. Frequently, it is not feasible to ex-clude those who do not consume ecofriendly prod-ucts, such as those produced without degrading airquality, from the benefits generated by environmen-tally conscious purchasers. Moreover, environmentalbenefits may be intangible. Environmental impactsare often global, and consumer verification of theimpacts is impossible, for example the state of theozone layer. Other environmental characteristicsbecome tangible only after a long time, longer than atypical consumer’s life expectancy, for example theexhaustion of natural resources.
Moreover, individual consumers frequently cannotevaluate the real benefits of their contribution.Consequently, public goods lead to a misallocation ofscarce resources because the decision-making processdoes not take into account all the costs. However, werecognize that some environmental characteristicscan provide private benefits, such as lessconsumption of energy during the consumptionphase, longer durability, less packaging, and lowerpesticides residues in food products.
113
In the following sections, we consider environmentalcharacteristics that have public properties. The pri-vate production of these environmental characteris-tics can generate two distinct problems:
The free riding problem: Since the good is availableto everybody, the free riders consume it without pro-viding a contribution corresponding to their con-sumption. This problem is well documented, and thepresumption of neoclassical economics is that thepublic good will be under-provided by private anddecentralized markets.
The assurance problem: In this case, the agent doesnot contribute to the production of a public goodbecause he believes that the good will not be pro-duced anyway. Indeed, the production of certainpublic goods requires a minimum contribution. Ifthese contributions are insuff icient, the good will notbe produced and the individual will think he hassquandered his contribution, corresponding to the“sucker” payoff (Schmidtz, 1991). For example, aconsumer can renounce purchasing an ecofriendlyagro-food product that preserves ground water be-cause he is convinced that his sole contribution is tooweak to induce a perceptible environmental improve-ment in ground water quality. Consumers are willingto contribute if they are convinced that an adequatethreshold of contributions will be reached. Note thatthe free riding situation arises because of opportunis-tic behavior, while the assurance problem does notpresuppose that agents are self-interested.
There are then three sources of market failure. Be-tween consumers and sellers, there is a two-sidedinformational asymmetry. Consumers face a multi-sided situation because of the free riding behaviorand the assurance problem among themselves. Lastly,an informational overload can lead to the need toallocate consumers’ attention.
How Could Ecolabeling Contribute toMitigating Market Failures?
Ecolabeling was originally proposed as a voluntarymarket-linked tool for addressing market failuresresulting from environmental characteristics of prod-ucts. But at the same time ecolabels need to mitigatethe other causes of market failures previously identi-fied, namely the problems generated by public goodand informational overload. To overcome these barri-ers, we propose to design ecolabels as a mix of solu-tions to each of the previous market failures. Weselect some solutions that are frequently cited in the
theoretical and empirical literature.
Providing accurate and credible information bythird party certification
It is well known that producers suffer from a credi-bility deficit about the environmental information oftheir products. To solve the adverse selection andcognitive problems generated by credence attributes,participation of credible third parties is generallynecessary to manage three things: 1) the definition ofan ecofriendly food product, i.e., the criteria allowinguse of the ecolabel; 2) the monitoring of previouslydefined criteria to check product conformity with thespecifications according to a previously elaboratedprocedure; and 3) the efficient signaling of anecofriendly product (Grolleau and BenAbid, 2001).An efficient signal allows consumers to distinguishtrue ecofriendly products from conventional ones(and possibly to rank them by levels of ecofriend-liness) at a non-prohibitive cost, i.e., to get a separat-ing equilibrium. Indeed, in some circumstances, thetransaction costs can be excessive and swallow upconsumers’ willingness to pay a premium, which intheir decision-making was intended to cover theecofriendly product’s higher production costs.Generally, this signal is a third-party certified eco-label (Caswell and Modjuszka, 1996).
Designing the ecolabel as a cognitive support forconsumers
In an environment overloaded with information, thesuccess of an ecolabel depends on its ability to cap-ture the consumer’s attention rather than only pro-viding factual, correct and complete information un-processable by consumers (Grolleau and Ben Abid,2001). This cognitive support can be “markers andknowledge summaries” capable of capturing the con-sumer’s attention without requiring excessive trans-action costs (Valceschini, 2000). Barzel (1982)argues that people wil l use proxies “because thealternative is more costly.” Doussan (1998) providesanecdotal evidence that a direct measurement of envi-ronmental impacts of farming can require excessivetransaction costs. Indeed, a direct measurement ofenvironmental characteristics can require a “sworninspector monitoring continuously the farmer in eachfield, with all technical means capable of verifyingspecific environmental data” (Doussan, 1998).Instead of spending excessive money in direct meas-urement, the consumer searches for a cognitive sup-port, such as an ecoseal of approval, that synthesizesthe previous conditions.
114
Understanding the limited abilities of consumers canhelp ecolabel designers realize that the success ofecolabeling requires both capturing attention andproviding an informational summary. Some empiricalstudies argue that effectiveness of capturing the con-sumer’s attention depends more on the reputation andstatus of the third party than on a precise knowledgeof the methods of its intervention. For example, theuse of names and logos of well-known environmentalassociations such as WWF and Green Peace increasesthe visibility as well as credibility of green claims(Leubuscher et al., 1998).
Reducing free riding by emphasizing privatebenefits
In the real world, it seems that people may contributeto public goods at levels that exceed the predictionsof the neoclassical theory (charity, donations, etc).Several explanations have been provided, such as the“warm glow” concept, that is, the increased utilityfrom the act of giving rather than receiving(Andreoni, 1990), or the “Veblen effect,” for whichconsumption may be conspicuous, thereby having astatus value (Leibenstein, 1950). A solution to theassurance problem is “assurance contracts,” definedas contractual agreements that contribute to a collec-tive good project (Schmidtz, 1991). These contractsguarantee to all parties that their contributions willnot be wasted, for example by money-back guaran-tees, if the collective good is financially under-supported.
A solution to the public good problems is to add andemphasize private benefits, such as health or taste, tothe collective benefits of preserving the environment(Grolleau and Caswell , 2003), as some environmentallabels for green food products already do. This asso-ciation between environmental attributes of goodsand private ones can come from labeling, but mayalso already exist in the consumer’s mind. Intuitively,we understand that low-chemical production (fertiliz-ers and pesticides) may result in low pesticide resi-dues in food, although it is not scientifically sup-ported. For example, the purchase of organic prod-ucts seems more motivated by self-benefits, that is,safer products, rather than public environmentalbenefits, which constitute a secondary driver. Byassociating private benefits with public ones, ecolabeldesigners can reduce free riding and the assuranceproblem by creating excludability. The marketswitches to a quasi-conventional one with privategoods, where environmental attributes are providedas additional public benefits. The purchase driver
remains conventional private benefits, and environ-mental attributes are bundled in the product. Peopleare willing to purchase ecofriendly products not onlyfor themselves, but also because they primarily enjoythe private attributes resulting from environmentallyfriendly production. For example, Moon et al. (2002,p. 96) show that “ respondents who are more con-cerned about food safety associated with vegetablesare more likely to be willing to pay a premium for theenvironmental attributes of agricultural products.”
Many consumers expect that food products from anecofriendly process will taste better than conven-tional products. According to several experimentalstudies (Deliza et al., 1999; Johansson et al., 1999),provision of information about environmental im-pacts of farming methods influences the quality per-ceived by consumers. For example, a perceived bettertaste allows consumers to mitigate the free riding andassurance situations by emphasizing private benefits,to attenuate information asymmetry because consum-ers infer, or at least do not invalidate, the achieve-ment of an ecofriendly process, and to reduce infor-mation overload by focusing consumers’ attention ona conventional dimension of food quality.
Marketers and designers of ecolabels will try simul-taneously to switch from focusing mainly on publicattributes to emphasizing private ones, and from cre-dence attributes to proxies perceived as search orexperience attributes by consumers. Examples ofthese strategies are provided in the following section,where we show how several ecolabels attempt to takeinto account these potential sources of market fail-ures.
How Do Existing Ecolabels Alleviate theProblems of Supplying EnvironmentalCharacteristics?
We proposed to design ecolabels that mitigate theproblems analyzed in the previous sections. Existingecolabels have often focused on ways to overcomesome of the following problems: asymmetrical infor-mation, informational overload, and public goodproblems. Some ecolabels help alleviate one prob-lem, while others simultaneously mitigate two orthree. The International Standard Organization (ISO)distinguishes three types of ecolabels according to thepresence or absence of third party verification and thetype of characteristics certified (Table 1). We followthis classification to analyze how each type of eco-label can mitigate market failures.

115
Type I ecolabeling
In the late 1970s, several countries and groups ofcountries set up ecolabeling programs (Type I eco-labels, Table 2) aiming both at encouraging the sup-ply of ecofriendly products as well as enabling con-sumers to express their preferences for these prod-ucts. Thus, they were first designed to mitigate theinformational asymmetry. A logo identifies productsthat are less harmful for the environment than otherproducts in the same category. Type I ecolabels helpto mitigate the informational asymmetry through themechanism of third party certification. For consum-ers, credence attributes become search attributesthrough the use of credible third parties (Caswell andModjuszka, 1996). Moreover, the use of logos asinformational summaries as well as means to capturethe consumer’s attention may aid in mitigating theinformational overload problem. However, problemsrelated to the public properties of environmentalcharacteristics remain.
Type II ecolabeling
For Type II ecolabeling, we applied our analysis toagro-food products in France. Indeed, the French sealof approval NF Environnement and the EuropeanEcolabel exclude food products (Bougherara et al.,forthcoming). France constitutes a favorable field forthe development of self-declared ecolabeling (TypeII ). We did a survey and collected ecolabels on agro-food products in 2001-2002 in several representativeFrench stores. We qualitatively analyzed how theyhelp mitigate the three problems we identified(Tables 3 and 4). Our sample is too small to draw anyaccurate quantitative analysis, so the percentagesgiven are only indicative.
The analysis shows that Type II ecolabels of foodproducts especially add health or taste to environ-mental attributes to overcome the public goods prob-lem (through added private attributes) and the infor-mational asymmetry problem (through added searchattributes). This may be specific to food products forwhich the link between the two kinds of attributesoften is already in the consumer’s mind. A confusion,sustained by marketers’ efforts, exists between theimpact of the product and its production process onthe environment on one hand, and on the other theimpact of the environment on the food products, e.g.,safety attributes. For example, on certain mineralwater it is claimed that “ the spring … benefits from anatural preserved environment.” That this watercomes from a preserved environment says nothing
about the environmental performances of the pro-ducer. Rather, it refers to the absence of contamina-tion of water by the production site. It is well knownthat environmental claims are frequently spurious andgenerate confusion among consumers’ between a“preserved area” and an environmentally friendlyprocess of production. Many claims are narrowlyfocused and respond more to safety concerns than toenvironmental ones (Leubuscher et al., 1998).
Other mechanisms enabling consumers to trust eco-labels appear through the analyzed ecolabels. Indeed,most of the products are branded. Brands may trans-fer their reputation to the environmental attributes,making them more credible. Moreover, some eco-labels refer to sponsors. Organizations such as WWFor ONF (French National Forest Agency) can rein-force the credibility of the seller’s claims.
Type III ecolabeling
The third party certification in Type III ecolabelshelps mitigate informational asymmetry, but the con-sumer is left with the task of processing the informa-tion provided with each product to determine whichis least harmful for the environment. Besides, infor-mation overload can occur, depending on the quantityof environmental data given and the other informa-tion sources, such as other labels and the store envi-ronment. Ecolabels can cover a large spectrum be-tween two extremes. At one end, they might be con-cerned with only one environmental area or one stepof the production process, while at the other end withthe entire life cycle. Comparing products accordingto one variable might be easy. However, comparingproducts across many variables and making a trade-off among them may be a time-consuming and de-manding effort requiring expert abilities. Wynne(1994, p. 95) claims that
Simply making information available to consumersin no way assures that they will process it. One mustdistinguish between “ information provision” and“ information impact” , because there is no one to onerelationship between information provided and theimpact, if any, of this information on the recipient.
The goal of Scientific Card Certification in creatingthe Environmental Report Card was to reestablishconsumer sovereignty by leaving to consumers theright to fully compare products themselves. Thetransaction costs it raises may be much higher thanthe expected benefits. Thus, Type III ecolabels maybe more suited for certain categories of products forwhich purchase frequency is rather low and for which
116
consumers take time to choose, such as durable goodslike cars or washing machines (Alli son and Carter,2000). Type II I ecolabels may be less suited for agro-food products.
Concluding Remarks
An important implication of our analysis of ecolabelsuccess is to design ecolabels as providers of mixedsolutions to the several market failures. Indeed, themarket failures caused by environmental characteris-tics create an extra social cost for society, and eco-labels try to attenuate this situation. But a carefulanalysis seems necessary to be sure that the attemptto mitigate these failures is not more costly than themarket failures themselves. Indeed, in some cases wemay just waste money shifting from a market failureto an ecolabel failure. Consumers’ willingness to paya premium may be wasted in high transaction costsrather than used to improve environmental quality. Ina new institutional framework, the use of ecolabels asan alternative to another policy tool is efficient if thecost of designing and implementing ecolabeling poli -cies is lower than both the cost of the other solutionsto mitigate market failures and its expected benefits.Other factors should also be taken into account, suchas rights to use environmental claims, anti-deceptionlaws, level of enforcement, credible sanctions thatinfluence the level of transaction costs, and the effi-ciency of ecolabeling.
References
Akerlof, G., 1970. The market for lemons: qualityuncertainty and market mechanism. QuarterlyJournal of Economics 84:488-500.
All ison, C., and A. Carter. 2000. Study on DifferentTypes of Environmental Labelling (ISO Type IIand III Labels): Proposal for an EnvironmentalLabelling Strategy. Environmental Resource Man-agement, Study for the DG Environment, EuropeanCommission.
Andersson, F. 2002. Pooling reputation. InternationalJournal of Industrial Organization 20:715-730.
Andreoni, J. 1990. Impure altruism and donations topublic goods: A theory of warm-glow giving?Economic Journal 100: 464-477.
Barzel, Y. 1982. Measurement costs and the organi-zation of markets. Journal of Law and Economics25(1):27-48.
Bougherara, D., G. Grolleau, and L. Thiébaut. Forth-coming. Mise en perspective et discussion de
l’exclusion des produits agro-alimentaires du dis-positif d’écolabelli sation. Economie Rurale.
Caswell, J.A., and E.M. Modjuszka. 1996. Usinginformational labelling to influence the market forquality in food products. American Journal ofAgricultural Economics 78:1248-1253.
Darby, M.R., and E. Karni. 1973. Free competitionand the optimal amount of fraud. Journal of Lawand Economics 16:67-88.
Deliza R., A. Rosenthal, D. Hedderley, H.D. MacFie,and L.J. Frewer. 1999. The importance of brand,product information and manufacturing process inthe development of novel environmentally friendlyvegetable oils. Journal of International Food andAgribusiness Marketing 10(3):67-77.
Doussan, I. 1998. La production négociée du droitdes pollutions agricoles (The negotiated rule mak-ing of agricultural environmental laws). In J. Clamand G. Martin (eds). Les transformations de larégulation juridique. Coll. RED&S à la Maison desSciences de l’Homme de Paris, LGDJ, Paris. pp.137-149.
EPA. 1998. Environmental Labeling Issues, Policiesand Practices Worldwide. Report for the PollutionPrevention Division, US Environmental ProtectionAgency.
Grolleau, G., and S. BenAbid. 2001. Fair trading inmarkets for credence goods: An analysis applied toagri-food products. Intereconomics - Review ofEuropean Economic Policy 36(4):208-214.
Grolleau, G., and J.A. Caswell . 2003. Givingcredence to environmental labeling of agro-foodproducts: using search and experience attributes asan imperfect indicator of credibility. In W.Lockeretz (ed). Ecolabels and the Greening of theFood Market. Proceedings of a Conference,November 7-9, 2002. Tufts University, Boston,Massachusetts. pp. 121-130.
Johansson, L., Å. Haglund, L. Berglund, P. Lea, andJ.E. Risvik. 1999. Preference for tomatoes, af-fected by sensory attributes and information aboutgrowth conditions. Food Quality and Preference10(4-5):289-298.
Leibenstein, H. 1950. Bandwagon, snob, and Vebleneffects in the theory of consumers’ demand. Quar-terly Journal of Economics 64:183-207.
Leubuscher, S., W. Hager, C. Wattiez, J. Mombrù,and E. Liaska. 1998. Study on Verification andControl of Environmental Product Claims. FinalReport by Prospect C&S for DG Health and Con-sumer Protection.

117
Moon, W., W.J. Florkowski, B. Brückner, and I.Schonhof. 2002. Willingness to pay for environ-mental practices: Implications for eco-labeling,Land Economics 78(1):88-102.
Nelson, P. 1970. Information and consumer behav-iour. Journal of Political Economy 78:311-329.
Schmidtz, D. 1991. The Limits of Government. AnEssay on the Public Goods Argument. WestviewPress.
Valceschini, E. 2000. La Dénomination d’Originecomme signal de qualité crédible. Revue d’Econo-mie Régionale et Urbaine 3:489-500.
Varian, H.R. 1995. The information economy. Scien-tific American 201 (September):200-201.
Wynne, R.D. 1994. The emperor’s new ecologos? acritical review of the Scientific Certification Sys-tem’s environmental report cards and the GreenSeal certification mark programs. Virginia Envi-ronmental Law Journal 14:51-149.
Table 1. A classification of ecolabels (ISO 14020, 1998).
Type of ecolabel Definition by the ISOType I: Environmental labelingprogram
Voluntary, multiple-criteria-based third party program thatawards a license which authorizes the use of environmentallabels on products indicating overall environmental preferabilityof a product within a particular product category based on lifecycle considerations.
Type II: Self-declared environ-mental claims
Environmental claim that is made, without independent third-party certification, by manufacturers, importers, distributors,retailers or anyone else likely to benefit from such a claim.
Type II I: Environmental declaration Quantified environmental data of a product under pre-setcategories of parameters set by a qualified third party.
Table 2. Some Type I ecolabels (EPA, 1998).
Name Year Location Governmental or Non-Governmental
Number ofProduct
CategoriesBlue Angel 1977 Germany Governmental 88
Nordic Swan 1989 Denmark, Finland, Iceland,Norway, Sweden
Governmental 42
Green Seal 1989 USA Private Non-ProfitAssociation
88
European Ecolabel 1992 European Community Governmental 11
NF Environnement 1992 France Governmental 6
118
Table 3. Type II ecolabels on agro-food products in some French stores.
Product name Product type
1 Bonduelle Salad2 Jordans Cereals3 Mac Cain French fries4 Coopérative
NangicaPotatoes
5 Mas de Nans Wheat6 Trilégumes Potatoes7 Fermiers de Loué Turkey8 Gerblé Biscuits9 Casino Fresh vegetables10 Carrefour Fresh vegetables, Meat11 Auchan Fresh vegetables, Meat12 Cora Fresh vegetables, Meat13 5ème Saison Salad14 Les Crudettes Salad15 Florette Salad16 Candia Milk17 Thonon Mineral water18 Saupiquet Tuna19 Paul Bread20 La Mie Câline Bread21 Point Chaud Bread22 Bret’s Chips23 Peyronnet Salad24 Nactalia Milk25 Milka Alp action Chocolate

119
Table 4. How Type II ecolabels are designed to mitigate market failures.
Type of market failures and mechanisms attenuating them
Public goods problem Informational asymmetry Informationaloverload
ProductAdding private
benefitsAdding experience
attributesThird partycertification Logo
1 X2 X X X X3 X X4 X X5 X X6 X X7 X8 X X X9 X X X X10 X X X X11 X X X X12 X X X X13 X X X14 X X X15 X X X16 X17 X18 X19 X X X20 X X2122232425 X
15 products out of 25 15 products out of 25 8 products out of 25 13 products out of25
(60%) (60%) (32%) (52%)


121
Giving Credence to Environmental Labeling of Agro-Food Products:Using Search and Experience Attributes as an Imperfect Indicator of Credibility
Gilles Grolleau1 and Julie A. Caswell2
____________________________1UMR INRA-ENESAD, Rural Economics and Sociology, 26 Bd Dr Petitjean, BP 87999 21079 Dijon Cedex, France.2Department of Resource Economics, University of Massachusetts, Amherst, MA 01003. Corresponding author. Email:[email protected]
Some consumers derive util ity from buying and usingproducts produced under specific processes, such asenvironmentally friendly practices. Means of verify-ing the use of these practices are frequently necessaryin order for markets to function efficiently and with-out fraud. This is because the consumer usually can-not evaluate whether ecologically sound practiceswere used to produce a product, neither before norafter its purchase and use.
Analysis of ecolabeling has focused to a large extenton the operation of markets for environmental attrib-utes without adequately addressing the total foodproduct. Our analysis differs in that it treats eco-friendliness as a component of a product’s overallquality rather than as a stand-alone attribute. Weexplore the extent to which the credibility of envi-ronmental claims can be supported by a product’sother quality attributes. If consumers perceive a cor-relation between the process attribute and other prod-uct attributes that they can evaluate, the quality levelsof such supporting attributes can be a substitute fordirect verification of environmental attributes, or acomplement to it. Thus, verifiable attributes that canbe inspected before purchase or evaluated after usecan be indicators of the credibility of the processclaim, without strictly proving its truthfulness.
We argue that the credibility of an environmentalclaim that signals that a product is eco-friendly canbe damaged by a failure to provide adequate levels ofother verifiable attributes. We suggest that the marketsuccess of environmentally friendly agro-food prod-ucts requires a mix of environmental and other verifi-able attributes that together signal credibility.
An Overall Model of Quality Perception andQuality Assurance
Consumers’ perception of quality is influenced by theproduct’s intrinsic attributes as well as by extrinsicindicators and cues provided by the seller of the
product. Intrinsic attributes relate to a broad array ofattributes, including food safety, nutrition, conven-ience, composition, and process attributes such aseco-friendliness. As shown in Figure 1, the informa-tion environment for different intrinsic attributes maybe search, experience, or credence in nature. In otherwords, the consumer can learn about the quality levelprior to purchase (search) or after purchase and use(experience). For some attributes, the consumer can-not verify the quality level (credence). Extrinsic indi-cators, such as certification or labeling, and cues,such as brand name, packaging, or price, conveysearch information to the consumer since they areavailable before purchase. The consumer’s percep-tion of quality is a blend formed by information fromthese multiple sources.
Solutions to Informational ProblemsGenerated by Search, Experience, andCredence Attributes
Although consumers’ perceptions are a blend ofinformation, the analysis of problems related to theirability to accurately judge information frequentlytakes an attribute-by-attribute approach to evaluatingand correcting such problems. For search attributes,for example, “ the consumer’s problem of determiningquality is confined to that of inspecting the goodsbefore purchase” (Lancaster, 1996, p. 159). Accord-ing to the seminal work of Stigler (1961), consumerswill gather information up to the point where the costof doing so exceeds the value of further information.Competition in markets wil l encourage companies toprovide search information, at least for desirableproduct attributes. If this mechanism is strongenough, the market will be self-regulating and littleexternal intervention will be required. However, evenwith search attributes, governments or private certifi-ers may play a role in influencing the range of searchinformation available or in making it easier for con-

122
sumers to use, thus lowering their cost of acquiringinformation.
Problems of adverse selection and moral hazard canoccur where important product attributes are experi-ence or credence in nature. An adverse selectionsituation arises when consumers cannot detect a fixedattribute of the product before purchase, while thisinformation is available to sellers (i.e., information isasymmetric). Adverse selection could occur, forexample, where some producers provide false label-ing about environmental attributes and underlyingproduction practices, causing consumers to choseproducts that do not in fact have the attributes theywant. A moral hazard situation arises, on the otherhand, when the producer is tempted to not carry outall the practices necessary to achieve a certain qualitylevel because the consumer cannot or finds it difficultto check whether the actions have been taken. In bothcases, the market will not full y reward high qualityproducers or adequately punish low quality produc-ers.
While moral hazard is a real issue in environmentalcertification, it may be mitigated to some extent bythe need for producers to make significant initialinvestments in knowledge, skills, materials, and timeto become certified. We focus here on the consumerend of the market, where adverse selection, of thetype first analyzed by Akerlof (1970), remains a sig-nificant problem.
Several mechanisms can mitigate adverse selectiongenerated by experience goods; governmental inter-vention may be required in some circumstances. Theoperation of firm reputation can ensure market effi-ciency. For example, in the case developed byBagwell and Riordan (1991), if consumers enter themarket sequentially, then informed consumers couldshare information about experience characteristicswith those who are not yet informed. In addition,consumers repeatedly purchase agro-food products,giving them the opportunity to sanction a fraudulentseller by choosing another seller for their next pur-chases. The credibili ty of this threat depends on thelikelihood of future interaction between seller andpurchaser (Nelson, 1970; Klein and Leffler, 1981).Eff icient quality signaling through use of extrinsicindicators and cues such as seals of approval, label-ing, warranties (e.g., “Your Satisfaction Guaranteedor a Full Refund”), and advertising (Kirmani andRao, 2000) also can mitigate adverse selection linkedto experience attributes.
For experience attributes, government intervention tocorrect market problems frequently is limited(Leland, 1979), for example to setting minimumquality standards or enforcing anti-deception laws.However, if the probability of future interactionbetween the seller and buyer is very low, as in pur-chase of a used car, the threat of earning a bad repu-tation is not credible enough to affect the seller’sbehavior. For example, to correct this type of situa-tion French laws require a third-party intervention todisclose the true quality (i.e., the mandatory“Contrôle Technique”) before sale of a used car.However, setting minimum standards can lead toanticompetitive effects (Scarpa, 1998).
Credence attributes, such as environmental friendli-ness, pose more problems in markets because the costof defining, measuring, and verifying them can behigh, along with the temptation to cheat. A potentialremedy to the measurement problem is to use a proxyor a signal. For example, because safety output maybe too costly to measure (e.g., the absence of pesti-cides residues), it may be more cost effective tomeasure management practices (e.g., organic farm-ing) instead of the final product characteristics.Barzel (1982) argues that the proxy is presumablyused because the alternative is more costly. At theend of the agro-food chain, consumers can search forthe organic label, which is a signal for the proxy, andthereby avoid excessive transaction costs (e.g., costsof finding and evaluating products). Of course, theproxy and signal may convey information about mul-tiple attributes.
Caswell et al. (2002) argue that both firms and con-sumers use extrinsic indicators and cues to determinethe quality of product attributes. Consumers will usethe cues readily available to them, such as eco-sealsof approval, logos of well -known environmentalassociations, price, and brand name. For companiesin the supply chain, the range of indicators and cuesthat are available and efficient to use is larger thanfor the consumer. For quality assurance, Caswell etal. (2002, p. 57) state that
firms are likely to examine the level of quali tymanagement systems adopted by their suppliers,look at supplier records, and check whether thesupplier is certified by a third-party to adhere tospecific quali ty standards. For example, HACCPadoption or ISO 9000 certification are strong signalsto buyers that the supplier closely monitors productquali ty and will be able to deliver the agreed-uponquali ty. Additionally, establishment of extrinsic indi-

123
cators and cues makes it easier to verify whenquali ty standards have been met.
Similarly, examination of environmental systems andcertification such as ISO 14001 are used within thesupply chain to verify environmental quality.
Insuring the credible operation of markets for cre-dence attributes may require external intervention toallow consumers to choose products that correspondto their preferences, and honest producers to crediblysignal their products. Research on the economics ofinformation by Macho-Stadtler and Perez-Castrillo(2001) suggests sufficient conditions for a market forcredence attributes to function effectively (or, in theeconomist’s technical term, for a separating equilib-rium to exist). An effectively functioning marketwould allow eco-friendly producers to label theirproducts at a nonprohibitive cost. To do so they maysupport the cost of an ecoseal of approval to signalmore effectively the environmental quality of theirproducts. Of course, the cost of acquiring the ecosealhas to be lower than the expected profit from havingit. On the other hand, the ecoseal must be prohibi-tively priced for conventional producers in order toprevent them from cheating and free riding on theenvironmentally friendly producers. If it is not, con-sumers will face the same adverse selection problembecause they will not be able to distinguish the trulyeco-friendly products.
Stated more formally, the conditions for a well func-tioning market are the following:
• Eco-friendly producers can acquire the eco-sealat a lower cost than conventional producers.
• The expected profit with an eco-seal is greaterthan the cost of acquiring the seal for eco-friendly producers.
• The expected profit with an eco-seal is less thanthe cost of acquiring the seal for conventionalproducers.
If successful in designing and supporting the costs ofsignaling through a labeling program, eco-friendlyproducers transform the market for consumers fromone of adverse selection due to asymmetric informa-tion (i.e., producers know the real quality but con-sumers do not) to one of successful selection by con-sumers through the provision of reliable, symmetricinformation.
The market improving mechanisms discussed above(information sharing, repeated purchases, and sig-naling) are generally inefficient because their effec-
tiveness depends on the consumer’s ability to detect acheat after the purchase. In the case of credenceattributes, consumers cannot verify the quality butcan only deduce it from the cues they receive oncredence quality. They “believe” or “give credence”to the signals without being able directly to test orverify the credence quality itself. To avoid a marketfailure, consumers often need government or a credi-ble third party. According to Caswell and Modjuszka(1996, p. 1251), “quality signaling may still be usedbut requires a reputable certification agent whomconsumers can trust.” Governmental intervention orcredible third party intervention can mitigate marketfailure and guarantee fair-trading. However, suchintervention will be efficient only if its costs arelower than those of alternatives capable of correctingthe market failure and lower than benefits expectedfrom the intervention.
Even though information about credence characteris-tics may be disclosed, consumers may have difficultyin processing it because of time constraints or a lackof specific skills. Government or third party inter-vention can be considered to be a partial delegationby consumers of their power to define quality prior toits monitoring and signaling to the consumer. Suchintervention is intended to generate consumer trustand influence purchase choices. Its effectivenessdepends on the following factors (Grolleau andBenAbid, 2001):
• How quality is defined. For example, the claim“GMO free” supposes a previous definition of aGMO product itself, the choice of a detectionthreshold, and the precision of the measurementat different levels into the agro-food chain (e.g.,what are the labeling requirements for milk froma cow fed with GMO products?). Frequently,public authorities directly or indirectly define theterms in order to avoid a proliferation of criteria(see, for example, Caswell , 2000).
• How quality is monitored. For example, crediblemonitoring can require an appeal to an inde-pendent expert, who checks the product’s con-formity with specifications according to a previ-ously defined procedure (the certificationsystem).
• How quality is signaled. Quality signalingrequires more than solving the asymmetricalinformation problem (i.e., providing accurate andcredible information to consumers). Suchsignaling also requires cognitive support. This

124
support may be provided, for example, throughmarkers and knowledge summaries, or certifi-cates capable of capturing consumers’ attentionin a context of informational overload withoutrequiring excessive transaction costs. In brief,ecolabel design matters.
The third point is particularly important for thelabeling of the process attributes of agro-food prod-ucts. Simon (quoted in Varian, 1995, p. 200) recog-nizes that
what information consumes is rather obvious: Itconsumes the attention of its recipients. Hence awealth of information creates a poverty of attention,and a need to allocate that attention eff icientlyamong the overabundance of information sourcesthat might consume it.
Some empirical studies argue the effectiveness ofconsumers delegating quality definition and moni-toring depends more on the reputation and status ofthe government or third party than on a preciseknowledge of the methods of its intervention(Steenkamp, 1989; Leubuscher et al., 1998). In addi-tion, ecolabel design matters because of informationproblems. For example, Wynne (1994) shows thatenvironmental report cards (graphical presentation ofenvironmental performances without value judg-ments) establish symmetrical but useless informationfor consumers who lack expertise to process them.Well-designed ecolabels can serve as cognitive sup-ports that economize on the attention of consumersand on transaction costs (Valceschini, 1999; Wynne,1994). Cognitive support means that the informationis conveyed in simple statements that are easy to readand easily understandable without being too time-consuming or requiring high technical abilities.
Overall , more or less external intervention in marketsis likely to be necessary depending on whether keyattributes of the product are search, experience, orcredence in nature. In most cases, market mecha-nisms can be self-enforcing for both search and expe-rience attributes, while credence attributes willfrequently require an increased level of externalintervention in order for markets to function effec-tively.
Using Search and Experience Attributes asIndicators of Credence Attributes
Products are bundles of attributes, and in real marketsinformation on some of these attributes may serve asindicators of the quality of others. Similarly, extrinsic
indicators and cues can be used to provide signalsabout the level of intrinsic quality attributes. Tomarket their products more effectively and to avoidhigh measurement and signaling costs, producersmay use the level of and information on search andexperience attributes, which consumers can verify, toreinforce signaling about the quality level of credenceattributes. For example, consumers are generallyunable to measure intrinsic process attributes such asthe impact of production practices on animal welfareor the environment, but may make inferences aboutthese attributes from extrinsic quality indicators andcues such as eco-seals of approval or brand names.
For example, Doussan (1998) notes that the directmeasurement of the environmental impacts of farm-ing can require excessive transaction costs because ofthe need to use a sworn inspector who monitors eachfield using all technical means available to verifyquality data. Especially at the consumer end of thesupply chain, such an investment is prohibitive andconsumers must use an array of information to givecredence to claims about process quality. These in-clude labels that represent testing efforts by otherparties in the supply chain as well as inspection andverification of the other quality attributes of theproduct.
In practice, most certification systems tend to beoriented toward one-dimension of quality, such asquality control (e.g., ISO 9001), environmentalsoundness (e.g., ISO 14001), or safety (e.g., HACCPand the future ISO 18000). Of course, product qualityis frequently multidimensional, and firms or consum-ers search for optimal tradeoffs among differentattributes. In a multi -attribute/multi-signal atmo-sphere, certification systems interact and can re-inforce or attenuate each other’s effects.
The precise dividing line between experts in differentfields is admittedly fuzzy at the consumer level, par-ticularly for credence attributes. For example, fairtrade certification can reinforce the credibility of anenvironmental certification. Many fair trade labels,such as Max Havelaar, include environmental re-quirements and vice versa because final consumers indeveloped countries are sensitive to a range of issuesregarding methods and conditions of production(Zadek et al., 1999). From another perspective, theco-existence of several certification systems tends toincrease the consumers’ transaction costs in acquiringand processing information, making it more difficultto capture their attention. As a result there has beensome evolution away from one-dimensional to multi -
125
dimensional certification systems, such as integratedquality-environment-safety systems. Such systemsfacilitate simplified signals to consumers that synthe-size several attributes, allowing for lower transactioncosts. The success of these consolidated systems inconveying specific information about particular qual-ity attributes needs further evaluation. However, theprecision of specific information may be less impor-tant than the overall quality perception delivered toconsumers.
We particularly focus on how the quality levels ofsearch and experience attributes and information onthem influence the consumer’s evaluation of thecredibil ity of an ecoseal signals the credence attributeof environmental friendliness. Figure 2 presents asimpli fied sequence for this interaction:
1. The producer signals the credence attribute ofenvironmental friendliness through use of aneco-seal of approval. The level of this cre-dence attribute is essentially a promise madeby the producer that is unverifiable by con-sumers.
2. Consumers form expectations on the levels ofrelated search (e.g., less packaging) and expe-rience (e.g., better taste) attributes, which willbe associated with the eco-seal. Consumersmay also form expectations about extrinsicindicators (e.g., other types of certification)and cues (e.g., higher price, higher qualitybrand name).
3. Consumers assess by inspecting the product orbuying and using it whether their expectationsabout the product’s search and experienceattributes are met.
4. Consumers are either satisfied with or disap-pointed in the degree to which the quality ofthe search and experience attributes corre-sponds to their expectations.
5. If satisfied, consumers will give more credenceto the truthfulness of the producers’ signalregarding the credence attribute of environ-mental friendliness (positive feedback). If dis-appointed, consumers will be suspicious ofthe truthfulness of the producers’ signal re-garding environmental quality (negative feed-back).
The key link in the above sequence is the second,which links expectations and eventual productevaluation across quality attributes. These expecta-
tions may not be scientifically proven and objective;they frequently correspond to subjective beliefs. Theyare well documented in several empirical studies. Forexample, Søndergaard (1999) surveyed consumers ofecological fish in Spain, Germany, and Denmark. Shefound that among the most important reasons forpurchasing ecological food were that these productswere believed to be of higher quality, tastier, andhealthier than conventional food products. Similarly,CEC (1999) found that the interest of Canadian,Mexican, and American consumers in shade-growncoffee was most influenced by the perception thatthis type of coffee is superior in taste and quality.
The interaction of information on the different typesof attributes will i nfluence the subsequent purchasingdecisions of consumers. Note that the credibility ofthe claim about the credence attribute is reinforced orundermined without the consumer directly assessingits veracity. While these related search and experi-ence attributes might be imperfect (perhaps very im-perfect) indicators of the credibility of the credencesignal, consumers will use them to form their overallquality perceptions. This suggests that certifyingagencies, producers, and marketers must be cognizantof the multi -dimensional quality of the products theyseek to sell.
When consumers make repeated purchases over time,they can use inferences across attributes, cues, andindicators to evaluate attributes that they cannot ver-ify. Doing so reduces the consumer’s information andtransaction costs by serving as a substitute for anexpensive process of gathering and processing com-plex information, or acquiring costly informationfrom disinterested third parties. A common inferenceby consumers regards the extrinsic cue of price.Many consumers distrust environmental claims onlow priced products because they perceive a disso-nance between a low price and an environmentalpromise. This is the case even though, objectively, itis sometimes possible to produce ecological productsat lower costs than conventional ones.
Defining a Credibility Area for Eco-FriendlyAgro-Food Products
Defining a credibility area for eco-friendly agro-foodproducts depends on how the different attributes of aproduct are differentiated in a particular country oramong particular market segments. Differentiationcan be vertical, where if products were offered at thesame price, all consumers would rank different qual-ity levels in the same way. For example, pesticide

126
residues in apples would presumably be verticallydifferentiated because all consumers would preferlower levels (Caswell et al., 2002). Other attributesmight be horizontally differentiated, where, again atthe same price, some consumers would prefer onequality level and others would prefer other levels. Forexample, apple varieties are usually horizontally dif-ferentiated.
The level of a product’s environmental soundness orenvironmental stewardship may be vertically differ-entiated, although perhaps only weakly among someconsumers. Other attributes may be vertically orhorizontally differentiated and how they are differen-tiated is li kely to vary, particularly among countries.
Lancaster (1979) extended economic modeling ofproduct quality to define these dimensions of differ-entiation within a group of goods. According to him,an increase or decrease in the absolute quantities ofall characteristics per unit of the good corresponds tovertical product differentiation. A relative increase ordecrease in the quantities of characteristics corre-sponds to horizontal differentiation.
Our conceptual definition of an eco-friendly productcorresponds to a conventional product with additionalenvironmental attributes. It can be considered to bevertically differentiated according to Lancaster’sperspective. This environmental attribute can interactwith several other dimensions of product quality.These interactions can be objective or perceived. Forexample, an increase in certain environmental char-acteristics may have a negative effect on other quali -ties, such as taste or color. In other cases, the inter-action is just perceived by the consumer.
Ecolabels themselves correspond to different bundlesof environmental criteria, selected according to thejudgment of governments, certifiers, or producersthat can diverge from the individual preferences ofmarket participants. As observers have noted, green-ness is a confusingly multidimensional concept.Indeed, environmental friendliness may rarely be thedominant driver in consumers’ product choices, butinstead be an additional secondary consideration. Inthis case, environmentally friendly products are hori-zontally differentiated. Moreover, as noted above,product differentiation is frequently defined accord-ing to a specific group, and the classification can varyamong different subpopulations within a given coun-try at a specific time. In several ecolabeling pro-grams, producers maintain or improve conventionalproperties while at the same time providing environ-mental attributes.
Using these concepts of differentiation, in Figure 3we define a simplified two-dimensional attributespace for agro-food products. The vertical axisindicates the level of environmental characteristics,while the horizontal axis indicates the level ofconventional attributes (e.g., taste, food safety,appearance).
In the characteristic space at time t, eco-friendly foodproducts must have environmental characteristicswith a minimum level Ae. At the same time, to becredible, eco-friendly food products should havequality levels for conventional attributes at least ashigh as Ac. This Ac threshold corresponds to thelevels of related search and experience attributesexpected of eco-friendly products by consumers. Aproduct with high levels of conventional qualityattributes may not meet the Ae standard for environ-mental friendliness. The credibility area for environ-mental friendly food products is the shaded spacewhere (x, y) ∃ (Ac, Ae). From a conceptual point ofview, all the products in this area could be success-fully labeled as eco-friendly.
An ecolabeling program involves continuously up-dating the product attribute criteria. At (t+1), thethresholds Ac and Ae can correspond to new con-sumer requirements. For example, consumer re-quirements for taste and food safety are thought to becontinually increasing. The thresholds for environ-mental soundness may shift as well , so that the credi-ble area will be revised regularly.
Indeed, the market success of eco-friendly agro-foodproducts is closely linked to their position in thecredibil ity area. This takes into account not onlyenvironmental attributes but also conventional attrib-utes and, notably, related search and experienceattributes (Grolleau, 2000). In a context where con-sumers have limited processing time and abilities, thecredibil ity of environmental labeling is linked to thetransaction environment. This transaction contextincludes characteristics of the eco-seal itself but alsoother search and experience attributes of the product,such as its packaging and ambience. Ambience, as iswell documented in the marketing literature, can in-clude several diverse variables, such as brand reputa-tion and store design. Consumer perceptions of thesevariables can work together to mitigate or reinforceinformational asymmetry and overload.
The provision of conventional and environmentalattributes can be analyzed as an implicit contractbetween producers and consumers. A high level ofconventional attributes detectable by consumers

127
before or after the purchase can support the credibil -ity of environmental claims by mitigating two distinctsources of market failure. First, these high levels willsupport the credibility of the credence claims re-garding environmental attributes. Second, an expec-tation of high conventional quality can attenuate thepotential for free riding (i.e., fraud) linked to mostenvironmental attributes. Indeed, most environmentalattributes are public goods and associating privatewith public benefits allows the alleviation of freeriding.
Conclusions
Our central point is that the credibili ty of ecolabelsamong consumers is influenced by the accompanyingsearch and experience attributes of the labeled prod-uct. Consumers form expectations about the levels ofsearch and experience attributes based on the pres-ence of an ecolabel. Their subsequent evaluation ofthese attributes then influences the credibility of theenvironmental claim and their interest in repeat pur-chase of the product based on its environmentalsoundness.
Environmental differentiation of food products re-quires that levels of related search and experienceattributes be taken into account. Honest environ-mental differentiation can fail i f it does not considerthe multi-dimensional character of quality perception.An important further step is to identify which attrib-utes are most likely to reinforce the credibility ofenvironmental claims in different market segments.While private and public authorities can define andenforce standards for ecolabeling, only products withthe right array of accompanying quality attributes arelikely to be fully credible and successful in themarket.
References
Akerlof, G. 1970. The market for lemons: quality,uncertainty and the market mechanism. QuarterlyJournal of Economics 222:488-500.
Bagwell , K., and M. Riordan. 1991. High and de-clining prices signaling product quality. AmericanEconomic Review 81:224-239.
Barzel, Y. 1982. Measurement cost and the organiza-tion of markets. Journal of Law and Economics5:27-48.
Caswell, J.A., and E.M. Modjuszka. 1996. Using in-formational labeling to influence the market forquality in food products. American Journal ofAgricultural Economics 78:1248-1253.
Caswell, J.A. 2000. Labeling policy for GMOs: toeach his own? AgBioForum. Published by Illi noisMissouri Biotechnology Alli ance 3 (1/Winter).http://www.agbioforum.org/
Caswell, J.A., C.M. Noelke, and E.M. Modjuszka.2002. Unifying two frameworks for analyzingquality and quality assurance for food products. InB. Krissoff, M. Bohman, and J.A. Caswell (eds).Global Food Trade and Consumer Demand forQuality. Kluwer Academic/Plenum Publishers,New York. pp. 43-61.
CEC. North American Commission for Environ-mental Cooperation. 1999. Measuring consumerinterest is Mexican shade-grown coffee: Anassessment of the Canadian, Mexican, and USmarkets. October. http://www.cec.org/files/pdf/ECONOMY/shade-e_EN.pdf
Doussan, I. 1998, La production négociée du droitdes pollutions agricoles (The negotiated rule mak-ing of agricultural environmental laws). In J. Clamand G. Martin (eds). Les transformations de larégulation juridique. Coll. RED&S à la Maison desSciences de l’Homme de Paris, LGDJ, Paris. pp.137-149.
Grolleau, G. 2000. L’écoproduit agro-alimentaire: dela compréhension des concepts à la complexité dela réalité (The ecofriendly food product: Toward acomprehensive approach). Annales de l’Ecole desMines, Responsabilité et Environnement 18:27-44.
Grolleau, G., and S. BenAbid. 2001. Fair trading inmarkets for credence goods - an analysis applied toagri-food products. Intereconomics - Review ofEuropean Economic Policy 36(4):208-214.
Kirmani, A., and A.R. Rao. 2000. No pain, no gain: acritical review of the literature on signalingunobservable product quality. Journal of Marketing64:66-79.
Klein, B., and K. Leffler. 1981. The role of marketforces in assuring contractual performance. Journalof Political Economy 81:615-641.
Lancaster, K. 1979. Variety, Equity, and Efficiency.Columbia University Press, New York.
Lancaster, K. 1996. Information and product differ-entiation. In K. Lancaster (ed). Trade, Markets andWelfare. Edward Elgar, Cheltenham. pp. 156-168.
Leland, H. 1979. Quacks, lemons and licensing: atheory of minimum quality standards. Journal ofPolitical Economy 87:1328-1346.
Leubuscher, S., W. Hager, C. Wattiez, J. Mombrù,and E. Liaska. 1998. Study on verification andcontrol of environmental product claims. Finalreport by Prospect C&S for DG Health and Con-
128
sumer Protection.Macho-Stadtler, I., and J.D. Perez-Castrillo. 2001. An
introduction to the economics of information.Oxford University Press, Oxford.
Nelson, P. 1970. Information and consumer behavior.Journal of Political Economy 78:311-329.
Scarpa, C. 1999. Anti-competitive effects of mini-mum quality standards: The role of self-regulation.Paper presented at the Round Table on “The Anti-Competiti ve Impact of Regulation” , EuropeanUniversity Institute, Fiesole, 10-11 September.
Søndergaard, H.A. 1999. Consumer attitudes towardssustainable fishing and ecological fish. MAPPNewsletter 8:5-6. www.mapp.asb.dk/WPpdf/Newsletters/newsletter08.pdf
Steenkamp, J.-B., and E.M. 1989. Product Quality:An Investigation into the Concept and How it isPerceived by Consumers. Van Grouch, Assen/Maastricht, The Netherlands.
Stigler, G.J. 1961. The economics of information.The Journal of Political Economy 69:13-225.
Valceschini, E. 1999. Les signaux de qualité crédi-bles sur les marchés agro-alimentaires: certifica-tions officielles et marques. (Credible quality sig-nals in food markets: governmental certificationsand brands). In Actes du colloque. SFER SignesOff iciels de Qualité et Développement Agricole,Clermont-Ferrand 14-15 avril 1999:147-166.
Varian H.R. 1995. The information economy. Scien-tific American.(September):200-201.
Wynne, R.D. 1994. The emperor’s new eco-logos? Acritical review of the Scientific CertificationSystem’s environmental report card and the GreenSeal certification mark programs. Virginia Envi-ronmental Law Journal 14:51-149.
Zadek, S., S. Lingayah, and M. Fortater. 1998. Sociallabels: Tools for ethical trade. Final Report,Brussels, New Economics Foundation, EuropeanCommission DG 5.
Intrinsic SearchAttributes
IntrinsicExperienceAttributes
IntrinsicCredenceAttributes
ExpectedQuali ty
Perceived Quali ty
Extrinsic SearchIndicators/Cues
MarketingEfforts
Prior Experience; Level of Education; Perceived Quality Risk;Quali ty-Consciousness; Usage Goals; Other Personal andSituational Factors
Figure 1. A unified model of quality perception and quality assurance (Caswell et al., 2002).

129
Figure 2: Impact of search and experience attributes on the credibility of signaling for credence attributes.
Environmental Attributes
Credibility Area for Eco-Friendly Products
Ae
Inferior Quality Superior Quality
0 Ac Conventional Attributes
Figure 3. Credibility area of eco-friendly products in the attribute space.
(1) Produ cers s ignal credenceatt ributes (e.g. ecoseals of
approval)
(2) Consumers form expectations from thesignals of related search (e.g. color) and
experience att ributes (e.g. taste, tenderness)
(3) Consumers assess the relatedsearch and experience att ributes
(4) The quality of the relatedsearch and experience
att ributes correspond s toconsumers’ expectations
(4) The quality of the relatedsearch and experience att ributes
does not correspon d toconsumers’ expectations
(5) Consumers are satisfiedand g ive more credence to the
produ cers’ signal
(5) Consumers are disappo intedand are now suspicious of the
produ cers’ signal
Positive feedback Negative feedback


131
Adding Credibility Beyond Ecolabels
Ulrich R. Orth1
____________________________1Agribusiness and Food Marketing, College of Business, Bexell Hall 330, Oregon State University, Corvalli s, OR 97331.Email: [email protected]
Ecolabels are quality signals that serve as easily rec-ognizable cues for consumers by communicating theproduct attribute “environmentally friendly produc-tion.” The intended audience includes consumerswhose purchase behavior is greatly influenced bysocial-altruistic, biospheric or egoistic motivation(Uyeki and Holland, 2000). With no analytical meansavailable to unambiguously discriminate between or-ganically and conventionally grown produce, buyertrust and supplier credibility become key issues in thepurchase process. Attempts to create trustworthy andcredible ecolabels are numerous, ranging from third-party certification marks that are awarded only after athorough and sophisticated review process, to flashyimitations with little justification.
From a consumer behavioral perspective, “environ-mentally friendly” production can be further classi-fied as a trust as well as a search attribute. Searchattributes are usually accessible prior to purchase andare employed by consumers to identify relevant of-fers (evoked set). Trust attributes cannot be evaluatedat all by consumers, or only at high costs (Darby andKarni, 1973). Moreover, environmentally friendlyproduction is an intrinsic product attribute (Olson andJacoby, 1973), again not readily available for con-sumer evaluation. An ample body of research demon-strates that consumers in this case employ extrinsiccues, such as labels, brand names, and store names, todecide regarding intrinsic attributes (Rao andMonroe, 1989).
In many retail environments, products are displayedand chosen without personal contact. Here, ecolabelsare the major extrinsic cue available to environmen-tally conscious customers. However, large quantitiesof ecoproducts are bought in environments character-ized by frequent buyer-seller interactions, such assupermarket service counters, farmers’ markets, spe-cialty stores, or product demonstration stands.
This paper deals with the interaction between thosecommunicators and consumers in the context of eco-labeled products. Personal characteristics of commu-nicators affect how recipients perceive their credibil -
ity and consequently the credibili ty of the promo-tional message (Wilson and Sherrell , 1993). Physicalattractiveness is considered to be among the mostimportant personal characteristics (Kelman, 1961;Patzer, 1985; Reingen and Kernan, 1994; DeShieldset al., 1995). Abundant research evidence in adver-tising, sales promotion, and social psychology atteststo the potential effects of employing attractive ratherthan unattractive spokespersons and models (e.g.,Baker and Churchill, 1977; Reid and Soley, 1983;Bloch and Richins, 1992; DeShields et al., 1995;Onodera and Miura, 1998).
Despite a number of studies contributing to a betterunderstanding of the question, nothing has beenfound on how communicator attractiveness works inconjunction with environmentally friendly products(Chaiken, 1979; Caballero and Solomon, 1984;Caballero et al., 1989). No systematic examinationcould be found that looks at the conditions forpositive and potential negative effects of attractivecommunicators: Should less attractive models beemployed in cases of a high product classinvolvement? May competent communicators beattractive, or does that impair their perceivedcompetence?
Consequently, this contribution examines how theattractiveness of communicators affects recipientsattitudes for an ecolabeled product. Both direct andmediating effects are considered. The empirical studyalso investigates conditions that may affect the influ-ence of attractiveness.
Literature Review
Trustworthiness, competence, and physical attrac-tiveness are considered major characteristics of aninforming individual (communicator) for efficientlygenerating and shaping attitudes of an informed indi-vidual (recipient) (Janis and Hovland, 1959). Nostudy could be found that examines this issue withregard to organic products. Theoretically, communi-cator attractiveness can affect recipients’ attitudesdirectly as well as indirectly.

132
Direct effects of attractiveness
A direct positive effect of an attractive communicatoron consumer attitudes is supported by variousstreams of research. Recipients seek to be more in-volved with attractive communicators. In those cases,the physical attractiveness either represents a stimu-lus that increases recipients’ attention (Kahle andHomer, 1985) or motivates a recipient to maintaincloser contact to this person (Berscheid and Walster,1974).
Another stream of research interprets the effect as anattempt on behalf of the recipients to identify them-selves with attractive communicators (Kelman,1961). During this process, recipients strive for areward by imitating role models. The respective re-ward usually is an improved self-perception. Imitat-ing the demonstrated behavior (here: product choice)provides the recipient with the comfortable feeling ofbecoming similar to the attractive communicator(Zinkhan and Hong, 1991).
A third line of thought is based on the affect transfermodel and the dual mediation hypothesis (Mac-Kenzie et al., 1986). It assumes that positive feelingsgenerated while watching an attractive model arebeing transferred to the promoted object, resulting inpositive attitudes toward this object (i.e. ecolabeledproduct). Accordingly, hypothesis H1 for this studyis: communicator attractiveness has a positive directeffect on recipients’ attitudes toward ecolabeledproducts.
Mediated effects
In addition to the previous considerations, communi-cators’ attractiveness might affect recipients’ atti-tudes indirectly by affecting their perceived trust-worthiness and competence. This is suggested by thebeauty-is-good stereotype (Dion et al., 1972; Eagly etal., 1991): Attractive communicators are believed tohave more positive characteristics than unattractiveones, a thought that is supported by halo and learningeffects as well as dissonance theory. Halo effectsexist when a global evaluation is based on easilyavailable characteristics; this global evaluation thenaffects the future evaluation of attributes (Shapiro,1982; Huber and McCann, 1982). Recipients developa superficial image of a person based on his or herattractiveness that then affects the perception of othercharacteristics like competence and trustworthiness(Baker and Churchill , 1977). Dissonance theorypostulates that incongruent perceptions generate anuncomfortable situation that the recipient strives to
resolve (Maheswaran and Chaiken, 1991). Hence,attractive communicators are expected to send posi-tive messages and to have positive characteristics.
Furthermore, learning effects may explain mediatingeffects (Greenwald, 1968). People observe that at-tractive individuals frequently are more appreciatedand treated more friendly (Patzer, 1985; Reingen andKernan, 1994). They appear to be better liked, andthey are assumed to be more sociable, independentand exciting, more successful in business, with ahappier family life and a higher status (Brigham,1980), while less attractive people are assumed to bedeviant and are often stigmatized (Jones et al., 1978;Unger et al., 1982). As a consequence, the audienceassociates attractive individuals with positive attrib-utes (Solomon et al., 1992). This leads to hypothesisH2: Attractive communicators are perceived as morecompetent and trustworthy than unattractive ones:attractiveness affects attitudes toward ecolabeledproducts indirectly.
Conditioning variables
A number of studies suggests that the attractivenessof a communicator does not affect the attitudes of arecipient equally under all circumstances. Conditionsfor the effects of attractiveness include product cate-gory involvement and the gender of the communica-tor.
A widespread assumption is that compared with ahigh-involvement situation, attitudes are more easilyaffected under low-involvement conditions by pleas-ant but otherwise minor stimuli (Assael, 1984;Papavassil iou, 1989; Maheswaran and Chaiken,1991; Lord et al., 1995). The physical attractivenessof a communicator could be considered a stimulusthat is not necessaril y relevant for the promoted ob-ject. The logical conclusion would be to employ at-tractive models under low-involvement conditionsonly and not in high-involvement situations. Empiri-cal studies for consumer products (Reingen andKernan, 1994), however, found strong effects ofcommunicator attractiveness on recipients attitudesin low as well as in high involvement situations. Ac-cordingly, hypothesis H3 is: The effect of communi-cator attractiveness on recipients attitudes does notdepend on the product class involvement.
Some researchers point out that attractiveness is moreimportant when communicator and receiver are ofdifferent genders (Baker and Churchill, 1977; Dion,1981). According to the affect-transfer model and thedual-mediation hypothesis, an attractive promoter

133
would be a special stimulus that pleases the recipientand increases his or her willingness to interact. Onthe other hand, this would be contradictory to theearlier mentioned motivation to imitate. Empiricalstudies also have yielded inconsistent results: Bakerand Churchill (1977) found that attractive communi-cators affect the attitudes of significant others morefor “ romantic” products such as eau de toilette thanfor “everyday” products such as coffee. They con-cluded that a “pleasing” effect was involved. How-ever, follow-on research yielded contradictory find-ings (Chaiken, 1979; Caballero and Pride, 1984;Caballero and Solomon, 1984; Caballero et al.,1989). This leads to hypothesis H4: Gender is notrelevant to the effect of a communicator’s attractive-ness.
Summarizing previous fundamental and empiricalresearch on the effects of attractive communicators, itcan be stated that:
• Direct effects can be explained by a willingness-to-interact, by attempts of the recipient to identifywith the communicator, by the affect-transfermodel, and by the dual-mediation hypothesis.
• Mediating (indirect) effects that work throughcompetence and trustworthiness are theoreticallyfounded on beauty-is-good stereotypes, halo ef-fects, dissonance theory, and learning.
• The validity of those findings appears not to belimited by the level of involvement, and gender.
Figure 1 provides an overview of variables and link-ages.
Figure 1. Study variables and their expected linkages.
Attractiveness Trustworthiness Competence
Consumer Attitudes
toward the presentation (AAD) toward the product (AB)
Level of involvement
Gender
Method
Design and procedure
These hypotheses were tested for an organic applejuice. Competence and trustworthiness of communi-cators appear to be key factors since organic juice hasattributes that can be experienced (e.g., taste) andothers that simply have to be trusted by the consum-ers (organic method of fruit and juice production assignaled by ecolabels). Hence, competent and trust-worthy communicators could reduce respective un-certainties and doubts.
The empirical study employed eight communicatorsthat had been screened for differences in physical at-tractiveness, competence, and trustworthiness. Whilethe communicators were selected for some reason-able famil iarity with the product (professionally or byprivate use) they were not celebrities or famil iar tothe audience, so that potentiall y distorting effects offamili arity and esteem were avoided (Ohanian,1991). Different cover stories anchored on professionand age (grandmother, fashion model, professionalathlete, children nurse, student, juice producer, pro-motion professional) were designed to manipulatecompetence and trustworthiness and had been se-lected after a pre-test. To exclude as many potentialeffects of personal style as possible, all communica-tors introduced the product with a standardized text.Each group of respondents evaluated only one pre-senter under the guise of a new product test.
Sample
Respondents were 186 students between 19 and 26years (balanced gender ratio, median age: 22 years).This narrow segment has been selected to excludeadditional potentiall y distorting factors. The productpresentations took place in a realistic setting (super-market product demonstration).
Measures
Following established procedures, perceived compe-tence, trustworthiness and attractiveness were meas-ured on a 7-point bipolar scale (Ohanian, 1991) usinga pre-tested questionnaire. The corresponding itemswere assigned to common factors by principal com-ponent analysis with oblique-angled rotation (KMO =.880, explained variance = .613). Eigenvalues greaterthan 1.0 were used as a cutoff criterion to identifythree factors labeled competence (competent, experi-enced, educated, intelligent), trustworthiness (trust-worthy, honest, sincere, frank, selfish, open, reliable),and attractiveness (attractive, beautiful, likable, inter-

134
esting, pleasing, appealing). Positive correlationsamong the factors confirm expected linkages.
Two independent variables were employed to meas-ure promotion effects: recipients’ attitudes toward thepresentation and toward the promoted product(Brown and Stayman, 1992). Both constructs weremeasured through five items on a 7-point bipolarscale (Holbrook and Batra, 1987). Again, the itemswere assigned to common factors by factor analysiswith oblique-angled rotation (KMO = .902, explainedpercentage of variance = .773). Analysis of thestatements indicates that both variables correlatequite strongly. This suggests an AAD effect: individu-als develop an attitude toward communication media(AAD) that in turn affects their attitude toward theproduct (AB) (MacKenzie et al., 1986; Homer, 1990).Regression analysis with AB as the dependent andAAD as the independent variable yielded a significanteffect (R² = .400; F = 121.86; p < .001). Hence, theresults of this study are consistent with those of pre-vious studies (Homer, 1990). Accordingly, only theAAD variable has been further considered in theanalysis.
Another objective of the study was to investigateproduct class involvement as a potential condition foreffects of attractiveness. Measurement of this vari-able was conducted according to Zaichkowsky(1985). From suitable items that she identified, threewere selected and adapted. The statements were: 1) Iprefer a particular apple juice; 2) I am very interestedin information about different apple juices; and 3)there are many differences between apple juices.Cronbach´s α was .607, the eigenvalue 1.640, and thefactor loadings .791, .787, and .629. Although thosequality parameters are sufficient, it is acknowledgedthat the employed measures are not without prob-lems. However, since further applications only re-quire a categorization in two groups (high and lowinvolvement), the scale has been accepted.
For each construct (competence, trustworthiness,attractiveness, attitudes, involvement), mean valueshave been computed based on the associated itemsfor further use in the analysis.
Results
Effects of competence and trustworthiness
An adequate model for the interaction of the mediat-ing variables (competence and trustworthiness) andthe dependent variable (attitudes) needed to be identi-fied before mediating effects of attractiveness couldbe examined.
If one were to assume a linear-additive relationshipbetween attitudes as the dependent variable andtrustworthiness and competence as independent vari-ables (further referred to as model A), data analysiscould be performed employing a causal model (e.g.,Lisrel). However, this reference model contradictsmechanisms derived earlier during the li terature re-view. There it was assumed that trustworthinessshould be considered the moderating variable foreffects of competence (here: model B). Applyingeither model would have serious consequences forthe examination of direct and mediating effects ofattractiveness on attitudes. Hence, it appears appro-priate first to examine the interrelations betweencompetence, trustworthiness and attitudes beforefurther hypotheses can be tested. This has been doneby examining three alternative models: Models A andB were supplemented by an alternative model C thatconsiders competence the mediating variable (Baronand Kenny, 1986).
To identify the most probable constellation, a seriesof regression analyses was conducted. The mediatingvariables in models B and C were each split intothree dummy variables. Since the models have differ-ent degrees of freedom, the most appropriate modelcan be identified considering (high) R²adj and (low)Akaike Information Criterion (AIC, Akaike, 1987).The following regression equations have been ex-amined:
Model A:
Y = ß0 + ß1C + ß2T
Model B:
Y = ß0 + ß1CTlow + ß2CTmedium + ß3CTHigh + ß4T
Model C:
Y = ß0 + ß1CTlow + ß2CTmedium + ß3CTHigh + ß4C
with
Y = Attitudes C = Competence (metric) T = Trustworthiness (metric) Clow = 1 if competence is low, 0 else Cmedium= 1 if competence is medium, 0 else Chigh = 1 if competence is high, 0 else Tlow = 1 if trustworthiness is low, 0 else Tmedium = 1 if trustworthiness is medium, 0 else Thigh = 1 if trustworthiness is high, 0 else.
The results for the model evaluations are li sted inTable 1. Considering R²adj and AIC, model B,which was derived from the li terature review,

135
proves to be the best: in addition to the significanteffect of trustworthiness, the magnitudes of theparameters for the interaction effects appear to bein the right order (∃1=.358 < ∃2=.441 < ∃3=.448).Hence, model B has been selected for the analysisof the mediating effect of attractiveness.
Effects of Attractiveness
Direct and mediating effects of attractiveness wereevaluated by performing three regression analyses.Subjects of the evaluation are: 1) the effect of theindependent variable (attractiveness) on the mediator(competence and trustworthiness); 2) the effect of theindependent variable on the dependent variable (atti-tude); and 3) the effects of the independent variableand the mediator on the dependent variable:
Model 1: (a) C = ß0 + ß1A; (b) T = ß0 + ß1A
Model 2: Y = ß0 + ß1A
Model 3: Y = ß0 + ß1A + ß2CTlow + ß3CTmedium +
ß4CThigh + ß5T
The direct effect of the independent variable becomesapparent when models 2 and 3 are compared. A me-diating effect of the independent variable could bestated if its effect were smaller in regression model 3.The regression analyses results are listed in Table 2.
The results indicate that model 3, which contains theindependent variable (attractiveness) as well as bothmediating variables (competence and trustworthi-ness), is superior to model B (see Table 3), whichcontains only the mediating variables: AIC decreasesfrom -57.26 (model B) to -71.90 (model 3) and R²adj
increases from .507 to .552. Moreover, the parameterfor the effect of attractiveness in model 3 (.372) ishighly significant. These findings strongly supportthe postulated direct effect. Analysis of model 1shows evidence for the positive effect of attractive-ness on the mediating variables. A further compari-son of the results for models 2 and 3 confirms themediating effect of attractiveness descriptively byconsidering the respective parameters of the regres-sion equation (model 2: .783 > model 3: .372). Thisconfirms hypotheses H1 and H2.
Conditions for effects
Hypothesis H3 asserts that involvement with theproduct class does not influence the effect of attrac-tiveness on attitudes. To evaluate this hypothesis,models 1 through 3 have been computed separately
for two groups of individuals that differ in their in-volvement. Using the median, the total number of184 cases has been split evenly into one group withlow product class involvement and one group withhigh product class involvement. Table 3 gives theparameters by involvement.
The results are very similar for the two groups. How-ever, R² is consistently lower for individuals dis-playing a relatively low involvement than for thesecond group. A simple explanation could be that lessinvolved individuals devoted less attention to an-swering the questionnaire. Product class involvementdid not influence the effect of attractiveness on re-cipients’ attitudes, confirming hypothesis H3.
Hypothesis H4, finally, asserts that gender has noeffect on how the communicator’s attractiveness af-fects recipients attitudes. The results of a simplebivariate ANOVA with the promotion effect (atti-tude) as dependent and communicator gender andattractiveness (dichotomized on the median) as in-dependent variables contradict this hypothesis.
As expected, attractiveness has a significant maineffect (F=96.46, p<0.001), but so does gender(F=3.43). The interaction effect between attractive-ness and gender is not significant (F=0.7). R² is .349,a remarkable value for an ANOVA model that in-cludes an independent variable with a significantlyreduced variance (the attractiveness has been di-chotomized). These results suggest that female com-municators affect attitudes more, which supportshypothesis H4.
Conclusions
A key objective of this study was to identify whethercommunicator attractiveness can reinforce credibilityand trustworthiness of ecolabels. There is evidencefrom this study for positive direct as well as indirecteffects. The logical conclusion is that marketingmanagers responsible for organic product promotionshould not only choose communicators for their per-ceived competence and trustworthiness, but also tryto employ highly attractive individuals. The assump-tion that in cases of high product class involvementthe effect of attractive communicators is weaker thanwith low involvement has been rejected. Notwith-standing the product class involvement, attractivecommunicators should be employed to favorablyinfluence recipients attitudes. Considering that inmost famili es it is still the mother who chooses andprepares food, the finding that female communicators

136
were more effective in promoting the product applejuice is not surprising.
Further questions arise as to what are determinants ofperceived attractiveness, trustworthiness and compe-tence. Identification of how details like clothing, hairstyle, and cosmetics contribute to the perceived at-tractiveness of individuals (Englis et al., 1994) allowsmarketing communication practitioners to adequately“design” communicators for maximum effects.
An additional area for future research lies in investi-gating how attractiveness affects not only attitudes inthe first stage but preferences and product choice infurther stages. While the examination of respectivemechanisms clearly is more difficult, retailers alreadyhave expressed a great interest in establishing a linkbetween communicator characteristics and sales.
Finally, this study did not compare alternatives forpromoting organic products. Examining differentmeans of adding credibility, such as third-party certi-fication marks, endorsers, or ecolabels, will signifi-cantly contribute to more efficient and persuasivecommunication of environmentally friendly produc-tion.
References
Assael, H. 1984. Consumer behavior and marketingaction. 2nd edition. Kent Publishing, Boston.
Akaike, H. 1987. Likelihood of a model and infor-mation criteria. Journal of Econometrics 16:3-14.
Baker, M.J., and G.A. Churchill. 1977. The impact ofphysically attractive models on advertising evalua-tions. Journal of Marketing Research 14:538-555.
Baron, R.M., and D.A. Kenny 1986. The moderator-mediator variable distinction in social psychologi-cal research: conceptual, strategic, and statisticalconsiderations. Journal of Personality and AppliedPsychology 51:1173-1182.
Berscheid, E., and E. Walster. 1974. Physical attrac-tiveness. In L. Berkowitz (ed). Advances in Ex-perimental Social Psychology 7:157-215.
Bloch, P.H., and M.L. Richins. 1992. You look“mahvelous” : the pursuit of beauty and the mar-keting concept. Psychology and Marketing 9:3-15.
Brigham, J.C. 1980. Limiting conditions of the“physical attractiveness stereotype”: attributionsabout divorce. Journal of Research in Personality14:365-375.
Brown, S.P., and D.M. Stayman. 1992. Antecedentsand consequences of attitude toward the ad: a
meta-analysis. Journal of Consumer Research 19:34-51.
Caballero, M.J., and W.M. Pride. 1984. Selectedeffects of salesperson sex and attractiveness in di-rect mail advertisements. Journal of Marketing48:94-100.
Caballero, M.J., and P.J. Solomon. 1984. Effects ofmodel attractiveness on sales response. Journal ofAdvertising 13:17-23.
Caballero, M.J., J.R. Lumpkin, and C.S. Madden.1989. Using physical attractiveness as an adver-tising tool: an empirical test of the attraction phe-nomenon. Journal of Advertising Research 29:16-22.
Chaiken, S. 1979. Communicator physical attractive-ness and persuasion. Journal of Personality andSocial Psychology 37:1387-1397.
Darby, M.R., and E. Karni. 1973. Free competitionand the optimal amount of fraud. Journal of Lawand Economics 16:67-88.
DeShields, O.W., A. Kara, and E. Kaynak. 1995.Source effects in purchase decisions: the impact ofphysical attractiveness and accent of salesperson.International Journal of Research in Marketing13:89-101.
Dion, K.K. 1981. Physical attractiveness, sex rolesand heterosexual attraction. In M. Cook (ed). TheBases of Human Sexual Attraction. AcademicPress, London; New York. pp. 3-22.
Dion, K.K., E. Berscheid, and E. Walster. 1972.What is beautiful is good. Journal of Personalityand Social Psychology 24:285-290.
Eagly, A.H., A.D. Ashmore, M.G. Makhijani, andL.C. Longo. 1991. What is beautiful is good, but ...- a meta-analytic review of research on the physi-cal attractiveness stereotype. Psychology Bulletin110:109-128.
Englis, B.G., M.R. Solomon, and R.D. Ashmore.1994. Beauty before the eyes of beholders: thecultural encoding of beauty types in magazine ad-vertising and music television. Journal of Adver-tising 23:49-63.
Greenwald, A.G. 1968. Cognitive learning, cogniti veresponses to persuasion and attitude change. InA.G. Greenwald, T.C. Brock, and T.M. Ostrom(eds). Psychological Foundations of Attitudes.Academic Press, New York, NY. pp. 147-170,
Holbrook, M.B., and R. Batra. 1987. Assessing therole of emotions as mediators of consumer re-sponses to advertising. Journal of Consumer Re-search 14:404-420.

137
Homer, P.M. 1990. The mediating role of attitudetoward the ad: some additional evidence. Journalof Marketing Research 27:78-86.
Huber, J., and J. McCann. 1982. The impact of infer-ential beliefs on product evaluations. Journal ofMarketing Research 19:324-333.
Janis, I.L., and C.I. Hovland. 1959. Personali ty andPersuasibility. Yale University Press, New Haven.
Jones, W.R., R. Hannson, and A.L. Philips. 1978.Physical attractiveness and judgements of psycho-therapy. Journal of Social Psychology 105:79-84.
Kahle, L.R., and P.M. Homer. 1985. Physical attrac-tiveness of the celebrity endorser: a social adaptionperspective. Journal of Consumer Research 11:954-961.
Kelman, H.C. 1961. Processes of opinion change.Public Opinion Quarterly 25:57-78.
Lord, K.R., M.-S. Lee, and P.L. Sauer. 1995. Thecombined influence hypothesis: central andperipheral antecedents of attitude toward the ad.Journal of Advertising 24(1):73-85.
MacKenzie, S.B., R.J. Lutz, and G.E. Belch. 1986.The role of attitude toward the ad as a mediator ofadvertising effectiveness: a test of competing ex-planations. Journal of Marketing Research 23:130-143.
Maheswaran, D., and S. Chaiken. 1991. Promotingsystematic processing in low-motivation settings:effect of incongruent information on processingand judgement. Journal of Personality and SocialPsychology 61:13-25.
Ohanian, R. 1991. The impact of celebrity spokes-persons’ perceived image on consumers’ intentionof purchase. Journal of Advertising Research31:46-54.
Olson, J.C., and J. Jacoby. 1973. Cue utilization inthe quality perception process. In M. Venkatesan(ed). Proceedings of the 3rd Annual Conference ofthe Association for Consumer Research, Chicago.pp. 167-179.
Onodera, T., and M. Miura. 1998. Interactive effectsof physical attractiveness in advertisements. Psy-chological Reports 82:1403-1410.
Papavassil iou, N.K. 1989. The involvement model inadvertising consumer products abroad. Journal ofEuropean Marketing 23(1):16-30.
Patzer, G.L. 1985. The Physical Attractiveness Phe-nomena. Plenum Press, New York, N.Y.
Rao, A.R., and K.B. Monroe. 1989. The effect ofprice, brand name, and store name on buyers’ per-ceptions of product quality: an integrative review.Journal of Marketing Research 26:351-357.
Reid, L.N., and L.C. Soley. 1983. Decorative modelsand the readership of magazine ads. Journal of Ad-vertising Research 23(2):27-32.
Reingen, P.H., and J.B. Kernan. 1994. Social percep-tions and interpersonal influence: some conse-quences of the physical attractiveness stereotype ina personal selling setting. Journal of ConsumerPsychology 2:25-38.
Shapiro, C. 1982. Consumer information, productquality, and seller reputation. Bell Journal of Eco-nomics 13:20-35.
Solomon, M.R., R.D. Ashmore, and L.C. Longo.1992. The beauty match-up hypothesis: congru-ence between types of beauty and product imagesin advertising. Journal of Advertising 21(4):23-34.
Unger, R.K., M. Hildebrand, and T. Madare. 1982.Physical attractiveness and assumptions about so-cial deviance: some sex-by-sex comparisons. Per-sonali ty and Social Psychology Bulletin 8:293-301.
Uyeki, E.S., and L.J. Holland. 2000. Diffusion ofpro-environment attitudes? American BehavioralScientist 43:646-662.
Wilson, E.J., and D.L. Sherrell. 1993. Source effectsin communication and persuasion research: a metaanalysis of effect size. Journal of the Academy ofMarketing Science 21:101-112
Zaichkowsky, J.L. 1985. Measuring the involvementconstruct. Journal of Consumer Research 12:341-352.
Zinkhan, G.M., and J.W. Hong. 1991. Self conceptand advertising effectiveness: a conceptual modelof congruency, conspicuousness, and responsemode. In R.H. Holman and M.R. Solomon (eds).Advances in Consumer Research 18:348-354.
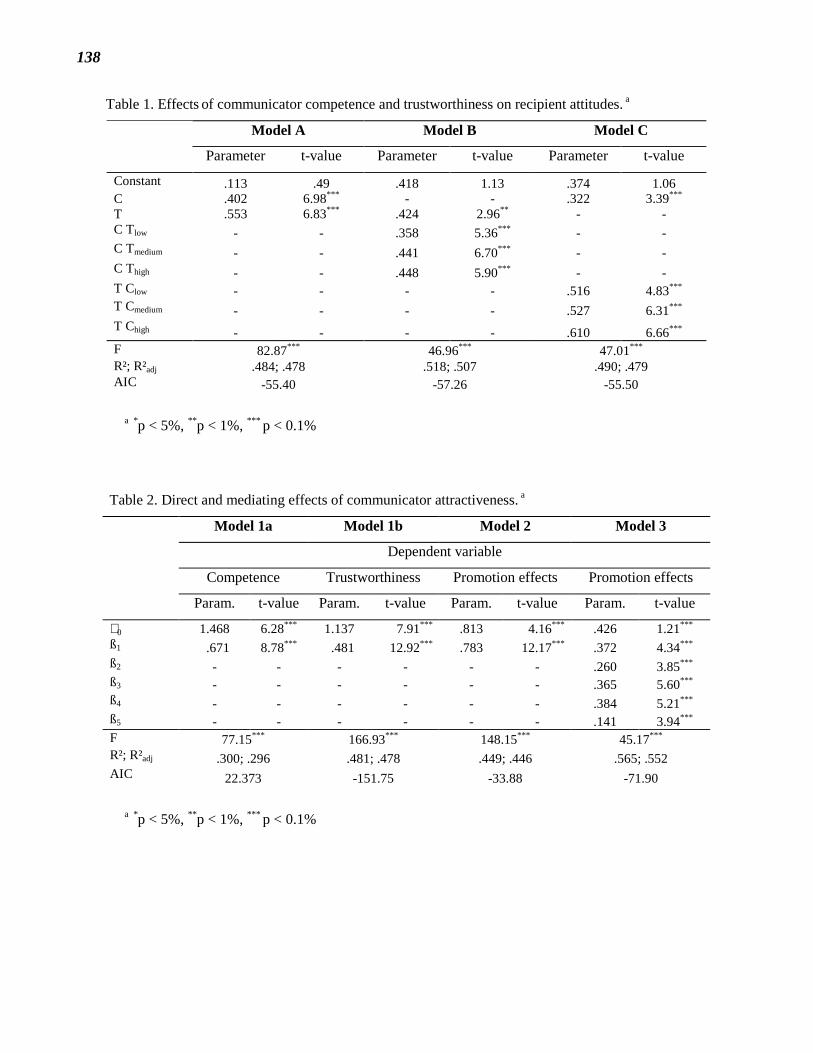
138
Table 1. Effects of communicator competence and trustworthiness on recipient attitudes. a
Model A Model B Model C
Parameter t-value Parameter t-value Parameter t-value
Constant .113 .49 .418 1.13 .374 1.06C .402 6.98*** - - .322 3.39***
T .553 6.83*** .424 2.96** - -C Tlow - - .358 5.36*** - -C Tmedium - - .441 6.70*** - -C Thigh - - .448 5.90*** - -T Clow - - - - .516 4.83***
T Cmedium - - - - .527 6.31***
T Chigh - - - - .610 6.66***
F 82.87*** 46.96*** 47.01***
R²; R²adj .484; .478 .518; .507 .490; .479AIC -55.40 -57.26 -55.50
a *p < 5%, ** p < 1%, *** p < 0.1%
Table 2. Direct and mediating effects of communicator attractiveness. a
Model 1a Model 1b Model 2 Model 3
Dependent variable
Competence Trustworthiness Promotion effects Promotion effects
Param. t-value Param. t-value Param. t-value Param. t-value
∃0 1.468 6.28*** 1.137 7.91*** .813 4.16*** .426 1.21***
ß1 .671 8.78*** .481 12.92*** .783 12.17*** .372 4.34***
ß2 - - - - - - .260 3.85***
ß3 - - - - - - .365 5.60***
ß4 - - - - - - .384 5.21***
ß5 - - - - - - .141 3.94***
F 77.15*** 166.93*** 148.15*** 45.17***
R²; R²adj .300; .296 .481; .478 .449; .446 .565; .552AIC 22.373 -151.75 -33.88 -71.90
a *p < 5%, ** p < 1%, *** p < 0.1%

139
Table 3. Direct and mediating effects of attractiveness for high and low product class involvement.a
Model 1a Model 1b Model 2 Model 3
Dependent variable
Competence Trustworthiness Attitude Attitude
Product class involvement
Low High Low High Low High Low High
∃0 1.610*** 1.251*** 1.120*** 1.243*** .875*** .786*** .338* .520*
ß1 .605*** .778*** .641*** .530*** .776*** .775*** .319** .419***
ß2 - - - - - - .292*** .232**
ß3 - - - - - - .405*** .330***
ß4 - - - - - - .407*** .363***
ß5 - - - - - - .199* .081*
R² .275*** .334*** .331*** .388*** .428*** .449 .548*** .566***
a *p < 5%, ** p < 1%, *** p < 0.1%


141
Ecolabeling: What Does Consumer ScienceTell Us about which Strategies Work?
Mario F. Teisl1, Brian Roe2 and Alan S. Levy3
____________________________1Department of Resource Economics and Policy, University of Maine, Orono, ME 04469. Corresponding author. Email:[email protected]
2Department of Agricultural, Environmental and Development Economics, The Ohio State University, Columbus, OH.3Consumer Studies Branch, U.S. Food and Drug Administration, Washington, DC.
The environmental characteristics of products havebecome increasingly important to consumers(USEPA, 1994). Firms have responded by placinginformation on products that highlight the product’senvironmental attributes and by introducing new orredesigned “green” products (USEPA, 1991). Gov-ernments and nongovernmental organizations havealso responded by organizing, implementing, andverifying environmental labeling programs (hereafter,ecolabeling) that cover thousands of products in morethan 20 countries (USEPA, 1993).
One function of ecolabeling is to improve the flow ofinformation to consumers (Mitra and Lynch, 1995),who in turn change their information search or prod-uct purchase behaviors. These changes may lead tochanges in producer behaviors (see Moorman, 2001for a list of studies looking at firms’ responses tochanges in information policies). Importantly, to altermarkets, not all consumers need to be affected by theinformation program; only a subset of consumersneed to respond to affect producers’ behavior(Moorman, 1998).
When it is effective, labeling may allow for the cor-rection of market failures in product production. Themarket failure here is that consumers with prefer-ences for (or against) specific production outputs lackthe information to reward (or punish) a productmanufacturer through their market decisions (seeHaener and Luckert, 1998 for a nice presentation ofthis issue). Firms that are better able to take advan-tage of the labeling programs will be rewarded with acomparative price or market share advantage(Mitnick 1981; Moorman and Slotegraaf, 1999).
The widespread use of ecolabels suggests that theyare perceived as an effective method of altering con-sumer behavior. However, few studies have at-tempted to identify the effectiveness of alternative
ecolabeling programs (Thogerson, 2000). Market-based research investigating other types of labels(e.g., nutrition labels) has demonstrated that labelingcan change market behavior. The apparent effective-ness of these other labeling programs may not beapplicable to ecolabeling because non-ecolabels pro-vide information about the use characteristics of theproduct, whereas ecolabels differentiate productswith respect to non-use characteristics.
Even if consumers prefer products indicating thatthey were produced in a more environmentally be-nign manner, several communication issues maydelay or derail the potential benefits of an ecolabel.Because the promise of improved production prac-tices is impossible for most consumers to verify, thesuccess of ecolabeling uniquely hinges on companiesbeing able to credibly communicate to the consumerthat production practices have been altered. We pres-ent results from several experimental data sets thatshed some light on how ecolabels can be made moreeffective.
Literature Review
Several attributes seem to affect the impact of infor-mation policies: compulsoriness, explicitness, andstandardization (Teisl and Roe, 1998).
Compulsoriness denotes the degree to which allfirms are required to provide product information. Atone extreme, labeling restrictions are mandatory – allfirms must display certain pieces of information. Atthe other extreme, labeling restrictions are voluntary;most environmental labeling programs fall into thevoluntary category.
Voluntary information disclosure policies often yieldan information environment in which consumers lackdata concerning key product attributes. As a result,
142
attention has been devoted to the process by whichconsumers infer a value for missing information orthe process by which missing information affectschoice (see Lee and Olshavsky, 1997, for a recentreview of this literature). This research suggests thatconsumers look at equivalent attributes from otherbrands (Ross and Creyer, 1992; Jacard and Wood,1988), or other attributes of the same product (John-son and Levin, 1985; Ford and Smith, 1987). Otherssuggest that consumers may not infer missing valuesat all , but merely pay less attention to a product withmissing information (Simmons and Lynch, 1991).
Explicitness denotes the degree of detail presented toconsumers. For this paper we define two types oflabels that are differentiated by the level of informa-tion detail. Ecoseals, such as seals of approval issuedby certification programs, communicate little detailconcerning attribute values. Only consumers who areintimately famil iar with the certification agency andits standards understand the full meaning of the sym-bol. At the other extreme are disclosure labels thatprovide the most detailed information. Information isdisclosed about several product attributes, such asnutrition labels on food, and the disclosure typicallyinvolves continuous or categorical information abouteach element, such as grams of fat, or high/medium/low risk. Disclosure labels are generallyconsidered the most objective of the label categories,while ecoseals are often considered the most norma-tive.
Consumer scientists have long understood that moreinformation is not always better because of the possi-bility of information overload (Scammon, 1977) andof distraction from more authoritative informationsources (Roe et al., 1999). A recent contribution inthis area (Bei and Widdows, 1999) explores howdisclosure of simple (summary ratings) versus com-plex (attribute-level ratings) information differen-tiall y affects consumers with different levels of expe-rience and involvement in the product decision-making. They find that both simple and more detailedinformation improved respondents’ efficiency, butrespondents with previous knowledge of the productcategory benefit more from the more complex infor-mation.
The third major component of labeling policies isstandardization: the degree to which information isrequired to appear in a format that is uniform acrossproducts. At one extreme, a labeling policy can re-quire a specific format, where the firm has no discre-tion over the presentation. For example, warning
labels typically have wording, font size, font typefaceand message location prescribed by regulation. Alter-natively, the content of the information may be re-gulated but the firm has some discretion over how theinformation is presented. Studies suggest that stan-dardized displays provide the largest benefit to con-sumers (Schkade and Kleinmuntz, 1994) becausethey increase the number of products or attributesconsidered during choice, allowing for more accuratechoice decisions (Coupey, 1994; Winneg et al.,1998).
In the experiments analyzed in this paper we contrastsimple information disclosure, in the context of eco-seals, and complex information disclosure in thecontext of detailed price and environmental informa-tion panels. Both types of information currently ap-pear in the consumer goods marketplace; the preva-lence, content and use of each type of disclosure isoften the subject of public discussion and govern-mental regulation.
Approach
Two data sets are examined in this paper; one wascollected during 1997 as part of a project studyinglabeling alternatives for deregulated electricity sup-pliers. This survey was administered as an in-personinterview to a sample of 1,000 respondents inter-cepted at malls in eight U.S. cities (for more detailsee Winneg et al., 1998). The second data set wascollected during 2000 to help develop environmentallabeling strategies for forest products. This surveywas administered by mail to 3,254 pre-recruited USadult residents, of whom 1,948 responded, a 60%response rate (for more detail see O’Brien, 2001).
In both surveys, respondents viewed different envi-ronmental labels and were asked to perform a seriesof experiments (Experiments I and II are from thefirst survey, and Experiments III and IV are from thesecond). These experiments were designed to meas-ure the performance characteristics of the differentlabeling strategies. Various statistical techniques(ANOVA, multivariate regression) were used in thedata analysis. (For more information contact the firstauthor.)
Experiment I
We tested how marketing materials, ecoseals andlabeling affect respondents’ perceptions of and un-certainty about product attributes and purchase inten-tions. Respondents were required first to rate a singleelectricity supplier on price, environmental impact

143
and purchase li kelihood after reading marketing bul-let points. After rating the products, the respondentswere then shown the product’s accompanying label.After viewing the label, respondents were asked thesame sequence of rating questions. Respondent un-certainty is measured by the inability to provide arating; that is, whether the respondent answers“Don’ t Know” to a ratings question.
The bullet points and labeling regimes were experi-mentally manipulated; participants saw marketingbullets that emphasized either the environmentalbenefits of the product or the product’s low price.Under some treatments they also saw an ecoseal.Respondents saw a label with information on either:1) price, fuel mix (the fuels used to generate theelectricity; e.g., coal, solar, and nuclear), and emis-sions; 2) fuel mix and emissions; 3) fuel mix; or 4)emissions.
Experiment II
We tested the impact that information has on con-sumers’ ability to correctly identify product attributesand on their perception of whether they had enoughinformation. We also estimated the market share im-pacts of the various labeling regimes.
Respondents were shown mock brochures represent-ing three competing electricity products (A, B, andC). Each brochure contained marketing and labelinformation that was experimentally manipulated.After viewing the products, they were asked whichproduct they were most and least likely to buy, whichwas the cheapest, which the most environmentallyfriendly, and whether they felt they had enough in-formation to make an informed decision.
We manipulated three key elements of the productinformation: 1) the strength of marketing bulletpoints; 2) the explicitness of label information (sevendifferent levels: no disclosure, disclosure of an eco-seal, or detailed labeling of either: price; fuel mix;emissions; fuel mix and emissions; or price, fuel mixand emissions; and 3) the compulsoriness of the dis-closure regimes (three possible levels: no disclosure;some products disclose information – voluntary; orall products disclose information – compulsory).
All respondents viewed brochures with four market-ing points. The marketing points were stronger inwording for some groups while other groups sawmarketing points that mainly involved puffery. Prod-uct A is the product with the lowest price, the highestair emissions, and the greatest proportion of fuel fromfossil fuels. Product B has the highest renewable
energy sources and is mid-range in price and airemissions. Product C is the cleanest in air emissions,highest in price, and mid-range in fossil fuel use.
Experiment III
We tested whether adding more detailed environ-mental information or altering the organization certi-fying the environmental information affects respon-dents’ perceptions of the label or product. Respon-dents were presented with a single environmentallylabeled generic wood product. After viewing the la-bel, they were asked to: 1) rate the credibility of thelabel; 2) rate the environmental friendliness of theproduct; 3) rate their level of satisfaction with theamount of information presented; and 4) rate thelikelihood that they would buy the product if theprice and quality were the same as the brand of woodproducts they currently purchase.
The labels varied by explicitness, with four possiblelevels of information: 1) an ecoseal logo; 2) an eco-seal with contact information (phone number andwebsite); 3) an ecoseal with contact information anda summary score; or 4) an ecoseal with contact in-formation, summary score and a detailed table listingthe five components of the environmental summaryscore. The scores also were manipulated.
The labels also differed by the organization certifyingthe environmental information. The organizationsincluded the US Environmental Protection Agency(EPA), the Forest Stewardship Council (FSC), andthe Sierra Club (SC).
Experiment IV
We tested if environmental labeling affects respon-dents’ choices of wood products and if there are sig-nificant differences between: less explicit ecosealapproaches versus more detailed environmental dis-closure; compulsory versus voluntary labeling; andstandardized versus nonstandardized labeling.
Respondents were asked to picture themselves in astore looking to purchase a generic wood product,and finding three different brands of the product: A,B and C. The price and environmental attributes forthe three products were such that C was the cheapestand least environmentally sound product, B was themost expensive and most environmentally soundproduct, and A was mid-range for both attributes.The price of the product was always disclosed, butthe disclosure of environmental information was ex-perimentally manipulated. Respondents were askedto assume that the quality of the three brands was

144
identical except for the attributes disclosed above.After viewing the products, respondents were askedwhich product they would buy.
We manipulated three key elements of the productinformation:
• the explicitness of the information disclosure;three levels: no disclosure; an ecoseal with con-tact information; or an ecoseal with contact in-formation, a summary score and a detailed tablelisting the five components of the environmentalsummary score
• the compulsoriness of the disclosure could as-sume three levels: no environmental disclosure;products A and B disclose environmental infor-mation (voluntary); or all three disclose environ-mental information (mandatory)
• the standardization in the organizations used tocertify the environmental information: either thesame certifier across labels; or different certifiersacross labels.
Results
Experiment I
Effect of marketing on perceptions and intentions.The results indicate that products marketed as lowerin price are seen as more damaging to the environ-ment than those marketed as better for the environ-ment. People seeing environmentally marketed prod-ucts are more li kely to buy those products than prod-ucts with price marketing. This indicates that the typeof marketing seen by the respondent influences per-ceptions of the product and the intention to buy.
Adding an environmental seal to a product marketedas low price did have a positive effect on the per-ceived environmental quality of the product, althoughthe environmental rating was lower than productsexhibiting environmental marketing only. Adding anenvironmental seal to products exhibiting price mar-keting increased the li kelihood to buy. In fact, theeffect is strong enough to make products exhibitinglow price marketing and an environmental seal to beviewed similarly to products exhibiting environ-mental marketing alone.
Effect of marketing on uncertainty. The results indi-cate that marketing affects individuals’ uncertaintyabout eco-attributes. Those viewing ecomarketing areless uncertain about the environmental quality ofelectricity. Adding an ecoseal to price marketingdecreases uncertainty about the environmental quality
of electricity. However, the effect is less than that ofenvironmental marketing alone. However, with re-spect to the intention to buy question, there is nodifference between price and environmental market-ing, or the presence of an ecoseal.
The results indicate that labeling can affect respon-dent uncertainty and that marketing can influence theeffect of labeling. In general, ecolabeling followingprice marketing does not affect an individual’s priceuncertainty. However, fuel mix labeling followinglow-price marketing actually increases an individ-ual’s price uncertainty.
Individuals viewing environmental labels after low-price marketing are less uncertain about the environ-mental quality of electricity. Ecolabels provide nosignificant effect when viewed after environmentalmarketing. Finally, with respect to the intention tobuy question, adding a price label to an environmen-tally marketed product significantly reduces the indi-vidual’s uncertainty about their intent to purchase.Environmental labels have no effect on intent to buy.
Experiment II
Correct ranking of eco-attributes. One potentialmeasure of the effectiveness of an information dis-closure policy is if consumers can adequately rankcompeting products by key attributes. Such rankingscan be an important input into the consumer choiceprocess (Lee and Geistfeld, 1998). Respondents’ability to correctly identify an environmentallyfriendly product was only marginally improved byproviding ecoseals or fuel mix information. Compul-sory disclosure of both fuel mix and emissions sig-nificantly improved performance, while such dis-closure of emissions had no effect.
Hence it appears that if correct ranking of productson the basis of environmental attributes is the keyaim, only compulsory disclosure of environmentalinformation would achieve it.
Stated satisfaction with the level of information. Ingeneral, respondents are more likely to be satisfiedwith full, compulsory disclosure than nearly anyother disclosure policy. Even though the objectiveperformance of respondents under the compulsory,full disclosure policy is not always significantly bet-ter than voluntary or no disclosure policies, respon-dents generally reported greater satisfaction with thefull disclosure policy.
Market share impact. In terms of firm-level strate-gies, the firm marketing product A experiences great-

145
est market shares when price is directly comparablevia detailed disclosure, though this is less essentialwhen the marketing points are strongly worded. Ap-parently price is such an important attribute that astrategy of avoiding the disclosure of A’s relativelyweak environmental record would not be rewarded.This may be a manifestation of Johnson and Levin’s(1985) observation that disclosure of only a product’sbest attributes (e.g., price) may induce an inferenceabout missing information (e.g., environment) that ismore damaging than direct, credible revelation of thenegative attribute. In other words, it may be better forthe firm to confess its negative attributes becauseconsumers may draw their own conclusions about themissing data that are more damning than the actualdata.
The results also suggest that the firm marketingproduct A should avoid the compulsory disclosure ofonly environmental information. In such cases marketshare shifts quickly to firm B, particularly if fuel mixis disclosed, or to firm C if emissions are disclosed.This conclusion might be altered, however, if therewere multiple firms with weaker environmental rec-ords that intended to base marketing on price attrib-utes. In such a case, compulsory disclosure of stan-dardized pricing information may lead to cutthroatprice competition. Drawing on standard argumentsfrom the economics of imperfect competition, wemight conclude that firms in such a situation wouldrather try to establish some type of nonprice productdifferentiation so that prices above marginal cost canbe sustained and profits enhanced.
The strategic implication for the firm marketing thehighest-priced product C is simple: avoid compulsoryprice disclosure and focus on environmental attrib-utes. From a state of no disclosure in a market ofsimilar products, a policy of compulsory disclosureof all i nformation would erode product C’s marketshare, while compulsory disclosure of only environ-mental attributes would typically increase its marketshare. No doubt this result will be sensitive to therelative price of C and consumers’ willingness to payfor environmental attributes. If products are distinct,disclosure is less likely to affect market share, thoughproduct C might benefit if only B and C discloseinformation.
Hence full, compulsory disclosure of all informationdoes not appear to harm a firm’s market share if itholds a unique and distinct advantage with respect toprice. A firm with a high-priced product and a strongenvironmental record would likely prefer regimes
with compulsory disclosure of standardized environ-mental information and no mention of price informa-tion, while a medium-priced, environmentally soundfirm’s market share seems relatively robust to disclo-sure policy but may benefit from disclosure thatfocuses on environmental attributes.
Experiment III
Credibility. Altering the amount of information onthe label significantly altered the credibility of thelabel. In all cases, adding contact information to theseal significantly increased the credibility rating.
Adding summary score information decreased thelabels’ credibility, even when the environmentalscores are high. Seemingly, adding the summaryscore increased the respondents’ level of skepticismabout the overall information. This type of responsehas been observed in other contexts; simpli fied, posi-tive information can negatively affect consumer per-ceptions (Levy et al., 1996; Teisl et al., 1999). Simi-larly, it may be that respondents here distrust thepresentation of quantitative information that is ac-companied by only vague information on how thatquantitative information was derived.
In general, adding the table of environmental scoresincreased the labels’ credibility. In all cases the mostdetailed label is seen as more credible than the simpleecoseals. However, in two of the three cases the mostdetailed label is not significantly more credible thanthe ecoseal with contact information. Thus there maybe little credibility benefit in providing more detailedinformation (over the ecoseal with contact informa-tion).
There are significant differences in the credibilityscores across certification organizations for the sim-ple ecoseal. In general, the SC label is seen as themost credible and the FSC label as the least credible.This effect may be due to differences in respondents’famili arity with the organizations; psychology re-search indicates that the credibility of an informationsource is greatly influenced by a person’s famili aritywith the source (Brown et al., 2002). In addition,studies indicate that consumer uncertainty about cer-tifiers reduces ecolabel credibility (Thogerson, 2000).Importantly, there are no differences in credibilityacross certifiers for the case of an ecoseal with con-tact information. Thus, it seems that any differencesin credibility due to this famil iarity effect can be ef-fectively mitigated by the presence of contact infor-mation.

146
Eco-ratings. Adding contact information to the eco-seal increased the perceived ‘ecofriendliness’ of theproduct; however, this effect was significant only forthe FSC case. Adding relatively low summary scoressignificantly decreased the perceived “ecofriendli-ness.” In all cases, adding the table of environmentalscores significantly altered respondents’ ratings ofthe products in the correct direction from the sum-mary score situation. That is, respondents viewing atable of higher (lower) environmental scores cor-rectly provided a relatively higher (lower) environ-mental rating.
One goal of economic and consumer science researchis to understand how consumers evaluate productswhen faced with incomplete or imperfect informa-tion. In this experiment, the ecoseal with contact in-formation does not provide any explicit environ-mental score. However, we presume that respondentsform some a priori expectation of what the ecosealmeans regarding such a score. Analyzing significantdifferences in respondents’ reactions between theecoseal case and the cases where environmentalscores are provided indicates that respondentsviewing only an ecoseal expect that the ecosealedproduct has obtained a score centered in the mid-eighties.
When only looking at an ecoseal, respondents viewthe SC-certified product as the best environmentallyand the EPA-certified product as the worst. Note thatthis is different from the famili arity effect found ear-lier, where EPA was rated relatively high in credibil -ity. It appears that respondents view EPA as a credi-ble source of information, but may not view theagency as necessarily ensuring the most environ-mentally sound product. In the results for ecosealwith contact information, the EPA-certified productwas still viewed as the least ecofriendly, but the othercertifiers were seen as equivalent. Adding the contactinformation mitigated the differences across the othercertifiers observed under the ecoseal baseline case. Ingeneral, when summary scores or more detailed ta-bles are displayed, respondents are able to correctlyuse the more detailed information to rank products bytheir environmental profiles.
Satisfaction with information. Adding contact in-formation to the ecoseal increased satisfaction withthe level of information. In general, summary scoresdid not alter satisfaction. However, in all cases, add-ing the table of environmental scores increased satis-faction. When we compare the most detailed labelswith all the alternative information treatments, we
find that respondents were most satisfied with themost detailed labels, irrespective of certifier.
Respondents viewing only ecoseals were most satis-fied with the information provided by the SC. This isinteresting, given that the actual amount of in-formation on the ecoseals was the same. When con-tact information is added, respondents were leastsatisfied with the EPA label and most satisfied withthe SC label. In general, when summary or tablescores are displayed, the respondents were most satis-fied with the SC labels and products displaying high-er scores.
Likelihood-to-buy. In general, adding contact infor-mation to the ecoseal did not increase the likelihood-to-buy, whereas adding low summary scores de-creased it. In all cases, adding the table of environ-mental scores significantly altered the respondents’li kelihood-to-buy from the summary score situation.Products with relatively low (high) scores had lower(higher) likelihood-to-buy ratings compared to thesummary score case.
There are significant differences in respondents’ en-vironmental perceptions of the product across certifi-cation organizations for the simple ecoseal treatment,for the summary score treatment, and for the detailedtable of scores treatment. However, there are no dif-ferences across certifiers for the ecoseal with contactinformation treatment. Again, comparing the ecosealwith contact information treatment against the simpleecoseal treatment seems to indicate that adding con-tact information mitigates any initial differences inrespondents’ ratings of products.
In general, when summary scores or more detailedtables are displayed, then products that display higherenvironmental scores, or are certified by the SC, aremore li kely to be bought. For the more detailed la-bels, the likelihood-to-buy decision seems to reflect ajoint effect of the label’s perceived credibility and theperceived environmental rating. For example, exceptfor the SC label, the li kelihood-to-buy score gener-ally reflects the environmental ranking of the prod-ucts. With the SC label, the li kelihood-to-buy score ishigher, even though the EPA labeled product actuallydisplayed a higher environmental score; this reactionmay reflect the relatively higher perceived credibil ityof the SC label.
One should not necessaril y interpret the relativelylow ratings of the EPA labels as implying that re-spondents generally disli ke or disapprove of all gov-ernment-sponsored certification schemes. In another

147
section of the survey we found that certification pro-grams sponsored by federal agencies were preferredover alternative organizations (e.g., industry or non-governmental). However, we also found that mostrespondents who favored a federal approach pre-ferred that the U.S. Forest Service administer thecertification scheme rather than the EPA.
Experiment IV
In all but one case we find that presenting environ-mental information to respondents significantly af-fects their choice of product. When no environmentalinformation is presented (i.e., only prices are given)then most respondents choose the low-price product.Except for the case when Products A and B both ex-hibit an FSC ecoseal, presenting environmental in-formation reduces respondent choice of the low-price, least environmentally friendly product. Theabove comparisons also indicate that the effect of anecoseal may be contingent upon the certifying or-ganization. The EPA and SC ecoseals had an impacton choice, whereas the FSC ecoseal did not. Thismay be due to the EPA and Sierra Club being eithermore famili ar to respondents or seen as more credi-ble.
When we compare the voluntary standard ecosealtreatments with the equivalent non-standard treat-ments we find that having standard certifiers in-creases the purchases of Product A but does not alterpurchases of Product B. However, having nonstan-dard certifiers increased the choice of Product B.Apparently, when respondents view multiple prod-ucts bearing a common environmental seal and dif-ferent prices, they assume that the environmentalcharacteristics of the products are similar, and are notwil ling to pay a price differential between the twocertified products. However, when respondents viewa similar situation with competing environmentalseals they assume that the environmental characteris-tics of the higher priced product are better, and atleast some of them are willing to pay the higher price.When we make a similar comparison among moredetailed label treatments, we do not find a similarresult. The increased level of detail cancels any dif-ferential impact between standard and nonstandardcertifier.
This impact of increased detail is also evident incomparisons within the voluntary standard and non-standard treatments but across level of detail. That is,detail i s less important with nonstandardized certifi-ers but important when certifiers are standardized.
Increased label detail allows for greater differentia-tion in product choice. More detailed labels assistconsumers better than simple ecoseals; the ecosealformat simply did not allow identification of the mostenvironmentally benign product except when certifi-ers and prices are different and positively correlated.
When we compare similar voluntary and compulsorylabel treatments we find that the move from volun-tary to compulsory labeling did not significantly alterchoice. Apparently, respondents were able to cor-rectly infer that the lack of environmental informa-tion provided on Product C was a signal that thisproduct performed relatively poorly on this charac-teristic.
Market implications. In terms of firm-level strate-gies, the firm marketing product A, the mid-priced,mid-environmental product, experiences greatestmarket share when the environmental characteristicsof the product are disclosed only through a standard-ized ecoseal. Under this regime Product A can bedifferentiated from Product C, the low-price, leastenvironmentally benign product, but not differenti-ated from Product B, the high-price, most environ-mentally benign product. A medium-priced, envi-ronmentally sound firm’s market share seems tobenefit from environmental labeling as long as thedisclosure is standardized and relatively less explicit.
In contrast, the firm marketing product B experiencesgreatest market share when the environmental char-acteristics of the product are directly comparable viadetailed disclosure. Apparently the environmentalcharacteristics of the product are important enoughthat a strategy of disclosing B’s relatively strong en-vironmental record would be rewarded. A high-priced firm with a strong environmental record wouldlikely prefer regimes with detailed disclosure of stan-dardized environmental information. At a minimum,they would advocate the development of nonstan-dardized ecoseals.
Finally, the firm marketing product C experiencesgreatest market share when the environmental char-acteristics of the product are not disclosed at all. Thestrategic implication for the firm marketing the low-priced product is simple: avoid compulsory environ-mental disclosure and focus solely on price. Movingfrom a state of no disclosure to any policy of envi-ronmental disclosure erodes product C’s marketshare. Again, this result will be sensitive to the rela-tive price of the products and consumers’ willingnessto pay for environmental attributes.
148
Conclusions
In debates surrounding certain ecolabeling programs,some have argued that the lack of consumer responseto these products may indicate that consumers don’ treally care about, or at least are not willing to paymore for, such products. Although this explanationmay be valid, it is not necessaril y true. One alterna-tive explanation is that consumers do care about andare willing to pay for more environmentally benignproducts, but the current state of labeling these prod-ucts is slowing the development of this market. Re-search in other markets has indicated that well -designed health (Teisl et al., 2001) and environmental(Teisl et al., 2002) labeling can significantly alterconsumer and producer behavior.
The results described here suggest that US consumersdo value the environmental benefits of more envi-ronmentally benign products. Thus, consumer-drivenpurchases could potentially support an ecolabeledmarket. However, the results also suggest that thecurrent state of some ecolabeling, where firms can(voluntarily) label their products with simple ecosealsfrom a variety of organizations, may not be the mosteffective method of communicating the environ-mental attributes of products to consumers. Partiesinterested in the long-run success of these programsneed to consider altering current labeling approaches.
The results indicate that labels that display detailedinformation about environmental attributes would bemore beneficial for consumers (and environmentallysensitive forest product manufacturers) than simpleecoseal policies. Among the labeling approachesstudied here, ecoseals are the least credible, provideindividuals with the lowest level of satisfaction, andin general do not give consumers an adequate basisfor product differentiation. However, we also findevidence that seemingly marginal changes (e.g.,adding contact information) can significantly im-prove the performance of simple ecoseals across sev-eral different measures (e.g., credibili ty). In general,ecoseals did not affect individuals’ perceptions northeir choice of products.
An alternative approach to providing more detail onlabels is for certifiers to administer an informationalcampaign to educate consumers as to the goals andmeans of the certification program. Currently, manyrespondents are not famil iar with ecolabeled productsand are unfamil iar with some of the certifying or-ganizations. An informational campaign can increasethe number of people familiar with the organization
(Thogersen, 2000), thus increasing the credibility of asimpler label. The campaign may also increaseAmericans’ desire to put a specific organization incharge of product ecolabeling programs.
Our results also suggest that some voluntary labelingregimes can yield benefits similar to compulsorydisclosure, but we failed to consider scenarios inwhich the voluntary disclosure of information by afirm did not perfectly correlate with the actual envi-ronmental profiles of the products. Hence, we do notknow how consumers would fare under voluntarylabeling programs in the presence of vague marketingclaims. It is unlikely that individual firms or certifierswould ever find it privately beneficial to organize anddisplay product information in a standardized formatthat would also benefit consumers. One might envi-sion a broad set of consumer reactions to missingdisclosure data in the presence of vague and contra-dictory marketing claims; this would be an excellentavenue of future research.
Although we failed to consider alternative scenarios,it is reasonable to assume that voluntary labelingschemes may not perform as well as mandatory la-beling schemes when products display vague or mis-leading marketing claims. In fact, because they donot provide an objective basis for comparisons, theuse of seals-of-approval and voluntary labelingschemes may encourage such claims. The use ofmisleading environmental claims is not trivial; ap-proximately half of environmental advertising ismisleading or deceptive (Kangun et al., 1991). Man-datory, detailed environmental labeling may helprestrict the seller’s ability to make these claims.
Regarding firm-level impacts of disclosure, we findthat a lack of ecolabeling will generally benefit thelow-price firm. Firms with sounder environmentalrecords (and higher prices) generally gain marketshare when labeling offers more detailed environ-mental data. We do note that market-share dynamicsof disclosure policies will be very sensitive to thenumber of firms in the market and the relativestrengths of each firm (see Roe and Sheldon for anexploration of f irm dynamics after the introduction oflabeling).
In total, the results suggest that policies that requirecompulsory display of detailed information aboutprice and environmental attributes would be morebeneficial for consumers than simple ecoseal disclo-sure policies and than most voluntary regimes. How-ever, one should also be mindful of the hypothetical
149
nature of the experiments. First, using survey ap-proaches may have allowed respondents to evaluatethe labels more fully, and with potentially fewer dis-tractions, than they would in an actual purchase set-ting (see Russell and Clark, 1999, for an overview ofinstances when ecolabels may be less effective in amarket setting). Second, externally validated experi-ments indicate that when respondents do not face areal budget constraint they are not as sensitive toprice differences as they are in real markets.
References
Bei, L.T., and R. Widdows. 1999. Product knowledgeand product involvement as moderators of the ef-fects of information on purchase decisions: a casestudy using the perfect information frontier ap-proach. Journal of Consumer Affairs 33(1):165-186.
Brown, A.S., L.A. Brown, and S.L Zoccoli . 2002.Repetition-based credibility enhancement of un-famili ar faces. American Journal of Psychology115(2):199-209.
Coupey, E. 1994. Restructuring: constructive proc-essing of information displays in consumer choice.Journal of Consumer Research 21(1):83-99.
Ford, G.T., and R.A. Smith. 1987. Inferential beliefsin consumer evaluations: an assessment of alterna-tive processing strategies. Journal of ConsumerResearch 14:363-371.
Haener, M.K., and M.K. Luckert. 1998. Forest certi-fication: economic issues and welfare implications.Canadian Public Policy 24(Special Supplement2):583-594.
Jaccard, J., and G. Wood. 1988. The effects of in-complete information on the formation of attitudestoward behavioral alternatives. Journal of Person-ality and Social Psychology 54:580-591.
Johnson, R.D., and I.P. Levin. 1985. More than meetsthe eye: the effects of missing information on pur-chasing evaluation. Journal of Consumer Research12:169-177.
Kangun, N., L. Carlson, and S.J. Grove. 1991. Envi-ronmental advertising claims: a preliminary inves-tigation. Journal of Public Policy and Marketing10(2):45-58.
Lee, J., and L.V. Geistfeld. 1998. Enhancing con-sumer choice: are we making appropriate recom-mendations? Journal of Consumer Affairs 32(2):227-251.
Lee, D.H., and R.W. Olshavsky. 1997. Consumers’use of alternative information sources in inference
generation: a replication study. Journal of BusinessResearch 39(3):257-269.
Levy, A.S., B.M. Derby, and B. Roe. 1996. HealthClaims Quantitative Study. Briefing presented tothe International Food Information Council , USFood and Drug Administration, Washington DC,October 8.
Mitnick, Barry M. 1981. The strategic uses of regu-lation and deregulation. Business Horizons 24(2):71-83.
Mitra, A., and J.G. Lynch, Jr. 1995. Toward a recon-ciliation of market power and information theoriesof advertising effects on price elasticity. Journal ofConsumer Research 21:644-659.
Moorman, C. 1998. The market-level impacts of in-formation: competitive responses and consumerdynamics. Journal of Marketing Research 34:82-98.
Moorman, C. 2001. Firm responses to consumer in-formation policy. In P.N. Bloom and G.T. Gund-lach (eds). Handbook of Marketing and Society.Sage Publications London.
Moorman, C., and R.J. Slotegraaf. 1999. The contin-gency value of complementary capabilities inproduct development. Journal of Marketing Re-search 36(May):239-257.
O’Brien, K.A. 2001. Factors affecting consumervaluation of environmentally labeled forest prod-ucts. Masters thesis, Department of Resource Eco-nomics and Policy, University of Maine, Orono.
Roe, B., and I.M. Sheldon. 2002. The impacts oflabeling on trade in goods that may be verticallydifferentiated according to quality. In M. Bohman,J. Caswell , and B. Krissoff (eds). Global FoodTrade and Consumer Demand for Quality.Kluwer/Plenum Academic Press.
Roe, B., A.S. Levy, and B.M. Derby. 1999. The im-pact of health claims on consumer search andproduct evaluation outcomes: results from FDAexperimental data. Journal of Public Policy andManagement 18:89-105.
Ross, W., and E.H. Creyer. 1992. Making inferencesabout missing information: the effects of existinginformation. Journal of Consumer Research 19:14-25.
Russell , C.S., and C.D. Clark. 1999. the potentialeffectiveness of the provision of consumer infor-mation on product environmental characteristics asa regulatory tool. SØM Meeting, Fredricksdahl,Denmark, November 21-23.
Scammon, D.L. 1977. Information load and consum-ers. Journal of Consumer Research 4 (December):

150
148-155.Schkade, D.A., and D.N. Kleinmuntz. 1994. Infor-
mation displays and choice processes: differentialeffects of organization, form, and sequence. Or-ganizational Behavior and Human Decision Proc-esses 57(3):319-337.
Simmons, C.J., and J.G. Lynch Jr. 1991. Inferenceeffects without inference making? Effects of miss-ing information on discounting and use of pre-sented information. Journal of Consumer Research17(March):477-491.
Teisl, M.F., and B. Roe. 1998. The economics oflabeling: an overview of issues for health and envi-ronmental disclosure. Agricultural and ResourceEconomics Review 27 (2):140-150.
Teisl, M.F., B. Roe, and A.S. Levy. 1999. Eco-certification: why it may not be a “ field ofdreams.” American Journal of Agricultural Eco-nomics 81(5):1066-1071.
Teisl, M.F., N.E. Bockstael, and A.S. Levy. 2001.Measuring the welfare effects of nutrition infor-mation. American Journal of Agricultural Econ-omics 83(1):133-149.
Teisl, M.F., B. Roe, and R.L. Hicks. 2002. Can eco-labels tune a market? Evidence from dolphin-safelabeling. Journal of Environmental Economics andManagement 43:339-359
Thogersen, J. 2000. Promoting green consumer be-havior with eco-labels. Workshop on Education,Information and Voluntary Measures in Environ-mental Protection. National Academy of Sciences–National Research Council . Washington, DC, No-vember 29-30.
US Environmental Protection Agency. 1991. As-sessing the Environmental Consumer Market.
US Environmental Protection Agency. 1993. StatusReport on the Use of Environmental LabelsWorldwide.
US Environmental Protection Agency. 1994. Deter-minants of Effectiveness for Environmental Certi-fication and Labeling Programs.
Winneg, K., M.J. Herrmann, A.S. Levy, and B. Roe.1998. Label testing: results of mall -intercept study.Consumer Information Disclosure Series, The Reg-ulatory Assistance Project, Gardiner, Maine.

151
In-Store Demand for Ecolabeled Fruit
Catherine Durham1, Marc McFetridge1 and Aaron Johnson1
____________________________1Food Innovation Center Experiment Station, Oregon State University, 1207 NW Naito Parkway, Portland, OR 97209.Corresponding author is C. Durham ([email protected]).
Almost every study of consumer response to eco-labeling has been based on surveys or purchasing ex-periments. While such studies frequently indicate thatsome consumers would select ecolabeled productsover a standard product and that they might be will-ing to pay more for it, to date there has been only oneanalysis of regular store sales (Teisl et al., 2002). Theobjective of this study is to analyze regular in-storepurchasing behavior for an established ecolabelingprogram to see if an ecolabel has shifted (increased)demand for the ecolabeled products in the store.
The study sample consists of four stores of a single,regional food retailer that has promoted a specificthird-party ecolabel in their fresh produce depart-ment. Thus, this study examines ecolabeling impactsamong a population that has had the opportunity tolearn about the ecolabeling program through infor-mation displayed at the stores. For this reason, theconsumers there may be as well informed as anyrandom set of consumers. Unlike previous researchbased on new or even hypothetical programs, theanalysis is based on actual demand within an operat-ing market. A year of weekly sales information for agroup of related fresh fruits was collected. Informa-tion collected includes prices and quantities, as wellas promotion, display, and ecolabeling information.
An econometric analysis was undertaken to examinethe impacts of this ecolabel on demand for apples.This paper presents the results for the impact of theecolabel on specific apple varieties offered in thissample of stores. This information is important forboth retailers and producers in determining strategiesfor advancing the goals of the certifying organiza-tions and those that support those goals, includingconsumers interested in eco-friendly products whowill benefit from being able to accurately identifytheir preferred produce selection.
Literature
A few studies have examined the overall i mpact ofecolabeling certification, considering label confusion(Lohr, 1998), market inefficiencies (Swallow and
Sedjo, 2000) and benefits. These studies derive re-sults based on various assumptions about the effec-tiveness of the ecolabel in selling products. A numberof studies have examined which consumers will pur-chase products with ecolabels based on survey results(Govindasamy and Italia, 1998; Nimon and Beghin,1999; Gumpper, 2000; Loureiro et al., 2001). Whilesuch studies frequently indicate that consumers mayprefer ecolabeled to standard products, and in somecases are willing to pay more for them, there is onlyone study of actual store sales that evaluates whetherthese programs can be effective in raising demand(Teisl et al., 2002). As the authors of other studiesrecognize, “a stated preference approach may resultin upwardly biased estimates of consumer willing-ness-to-pay” (Johnston et al., 2001).
The recent study by Teisl et al. (2002) that usedregular sales data examined the impact of thedolphin-safe label on tuna and found that the imple-mentation of the label increased market share forcanned tuna from substitutes of other canned fish andsandwich meats and fresh fish. However the analysisof the impact of the label was limited by the nearsimultaneous adoption of the label by all majorcanned tuna brands. While interesting, a more exten-sive look at store sales of ecolabeled products is stillnecessary, in particular for product categories withcompetition between like products with and withoutthe ecolabel.
Louriero et al. (2001) provide a particularly relevantanalysis for the research reported here, as they exam-ined the same ecolabel during an in-store survey de-signed to elicit consumers’ preferences among con-ventional, ecolabeled, and organic apples. They useda multinomial logit model to examine the choiceamong the three labels based upon demographiccharacteristics and consumers’ attitudes regardingenvironmental issues. In effect equalizing the priceamong offerings, they examined the nonprice factorsthat influenced customers to purchase the ecolabeledproduct or the organic product rather than the stan-dard product. Survey questions were designed to

152
elicit preferences for food safety vs. appearance andthe environment vs. jobs. The choice of organic pro-duce increased with income, having a child in thehousehold, relative importance of the environment,and food safety concerns, while family size increasedthe choice of standard apples. Ecolabeled applesshared the direction of impacts with organic productsonly for the environment and family size, though theeffect was weaker for both. In addition, the respon-dents rated the ecolabeled product’s quality as high-est, and the quality rating of the respondents was asignificant factor in eliciting a choice of the eco-labeled apple.
Their evidence indicates that given equal price andquality, most of the respondents would have chosenthe organic apple over the ecolabeled one. As re-spondents moved towards the environmental end ofthe environment vs. jobs continuum, organic productswere preferred over ecolabeled products and eco-labeled products were preferred over standard prod-ucts. The authors concluded that The Food Allianceecolabel is an intermediate choice between organicand regular apples. However, as part of the study, theresearchers provided a paragraph of information de-scribing The Food Alliance, arguably influencing therespondent’s subsequent behavior with respect toproduce purchases.
However, further information is necessary to deter-mine the place of the ecolabel in the market. There isa large chasm between stated preferences and actualpurchases. The consumer must not only prefer theattributes of the ecolabel, they must also recognizethat the ecolabel represents those attributes, theymust know how to identify and locate it in the mar-ket, and the ecolabeled product they find must besold at a price compatible with their degree of prefer-ence for it and the prices of substitutes. If all thoseconditions are met, they wil l buy it. The analysisreported here focuses on the final achievement ofecolabel marketing by examining the label’s impacton in-store demand, without directly considering allthe steps necessary in between. However, our obser-vation of the environment in which the labeled prod-ucts are being sold, and the results of a companionanalysis (Johnson et al., 2002), will be used to shedlight on the gap between a label’s existence and itsmarket impact.
In summary, realizing the benefits of ecolabels re-quires appreciation and recognition, relative prefer-ence, and purchasing activity. The objective of thestudy reported here is to analyze the final activity of
regular in-store purchasing with an operating eco-labeling program to see if it has accomplished allthree of these stages. It is not, however, a compre-hensive treatment of all three of the steps.
Ecolabels in the United States
The earliest ecolabeled products in the United Stateswere certified organic fruits and vegetables. The or-ganizations behind these first ecolabels were non-governmental: the earliest may have been an organicprogram begun in California in 1973. Organic pro-grams were initiated in Oregon and Vermont in theearly 1980s. The State of Washington was one ofearliest governmental organizations to certify organicproducts, starting in 1988. The Consumers Union hasdeveloped a set of Web pages reviewing ecolabels,which recently li sted 88 different ecolabels (Con-sumers Union, 2002). Thirty-seven of these are fororganic products and seven others are for sustainableagriculture. Of these, two are targeted at tropical ag-riculture. Two were developed in the Pacific North-west. The most recently developed is Salmon Safe,which certifies agricultural producers whose practicesprotect streams and wetlands. The other Northwest-based program is the label analyzed by this study.
The Label
The Food All iance (TFA) organization was formed in1994 with the help of a Kellogg Foundation grant. Anon-profit organization was formed in 1997 to im-plement the program. The group promotes “sustain-able agriculture,” which they define as a system thatemphasizes protecting and enhancing natural re-sources, using alternatives to pesticides, and caringfor the health and well being of farm workers andrural communities. Producers are evaluated in threeprimary areas:
• pest and disease management
• soil and water conservation
• human resource development.
There are now two TFA regional groups. The North-west TFA has 60 approved producers, two proces-sors, 30 retail store partners, four wholesale distribu-tion partners, and one restaurant (The Food Alliance,2002). A number of the producers are vertically inte-grated into processing, for example, two are wineries.Some of the Northwest TFA’s approved producersare located outside of the Northwest; they include aFlorida and a California citrus grower and a Hawai-

153
ian banana producer. A recent expansion of the TFAprogram into the Midwest now has 12 retail partnersin Minnesota, as well as 55 approved producers.
Data and Model
Data used in this study was collected at four stores inthe metropolitan area of Portland, Oregon over a one-year period. Two of the stores were near the city inmiddle to upper-middle-income suburban neighbor-hoods, and two in middle to lower-income areas, oneof which was near the metropolitan fringe. At the endof 2001 all these stores displayed overhead FoodAll iance banners in various numbers, and all soldproducts with Food Alliance stickers for varyingamounts of time over the course of the year. Theamount of point-of-purchase signage alerting thebuyers about which products were TFA approvedvaried from only the small sticker on the fruit,through displays of either a small seal approximately3x5 inches, a similar but larger seal approximately6x10 inches, or a poster approximately 8x11 inches.Seals were either attached to price signage or dangledin front of or behind the fruit. For various reasons theamount of background signage (the overhead bannersand posters) declined or was gradually eliminatedover the course of the year in all but one store.
Analyzing demand for fruit at a disaggregated level isa difficult process. The produce choices available tocustomers at the retail store level are vast, and mod-eling the demand for these products is complicatedby variation in availability and quality. As an exam-ple of this difficulty, based on the PLUs (codes usedby almost all food stores to track produce sales) ob-served in printouts, each of the stores in our sampleoffered between one and five types of fresh Galaseach week. The possibilities include two sizes of theregular Galas, two known as Royal Galas (thoughmarketed simply as Gala by these stores), and onethat might come in a 5-pound bag. One of the Galachoices could also have been organic, either in bulkor in a bag. Thus, 7 different PLUs for Gala wereobserved during the course of the year.
Issues are further complicated by the somewhat looseuse of PLUs by the stores. A typical situation is thatwhile the two PLUs for regular Gala apples refer to asmaller and larger apple, when only one is availableeither code might be keyed at the store register, andoften a display bin contains both kinds though theseare displayed for sale at a single price per pound. It isclear that under these circumstances, stores try toassign the same price for each PLU of that variety.
Some errors were observed in this regard, as weresome discrepancies between signage and the priceregistered in the computer. The data was carefullyexamined and corrected to be consistent with theretail signage and display observations recorded onweekly trips to each location.
Because of our research goals, the demand analysisundertaken is at an unusually disaggregated level.While typical practice in measuring demand even fora particular fruit might be to aggregate all fruits ofthat variety and take a weighted average price, thatwould not allow examination of the impact of a spe-cific label on one of them.
The varying availabil ity of the closest alternatives ofthe same variety and the closely related productsmakes choice for consumers a many-faceted and con-stantly changing one, and the estimation processcomplicated. Because of this complexity, at presentour analysis is limited to a subset of those choices –bulk apples – split into the three leading apple varie-ties by sales in the subject market (Fuji , Gala, RedDelicious), and all other bulk apples.
By careful examination of the data it was found thatthe bulk PLUs observed in a particular variety couldbe aggregated into one or two categories, for exampleonly one Fuji bulk apple category was displayed inany store in any week. Both small and large Gala andRed Delicious apples frequently were available atdifferent prices in the same store. Because only thelarge fruit PLU was used for the ecolabeled products,and because the larger fruit was more frequently of-fered, it formed our base category for each variety.The method for incorporating the availability of asmall alternative, also for bagged alternatives, is dis-cussed later.
A system of demand equations is used to estimate therelationships between quantities and prices, eco-labeling, other promotional factors, and market con-ditions. Clearly, there are substitutes in fruit choiceamong the many types of apples as well as betweenapples and other fruits; however, at this stage theanalysis has focused on bulk apples. For modelingpurposes, bulk apples are treated as a subset of fruitchoices among which consumers allocate their appleexpenditures. In addition to own and substituteprices, factors generally assumed by retailers to im-pact the quantity of a particular apple variety de-manded at retail are display size, advertisement inweekly flyers, condition, and size.
Individual equations are estimated for the three lead-

154
ing varieties sold in the market: Fuji , Gala, and RedDelicious. All other bulk apples are aggregated and aweighted average price for them is calculated forinclusion as an explanatory factor. In addition, pro-motional variables are calculated for the rest of thebulk apples as factors promoting the sale of thoseapples as opposed to those of all other apples in thesystem.
Availability of the same variety in a bag is includedas a 0-1 dichotomous variable, as is the availability ofa second size in the same variety. These two vari-ables only appear in their own variety equation; theimplicit assumption is that they only offset purchasesof the same variety.
Promotional factors influencing choice other than theecolabel are total display size and advertising. Totaldisplay space is entered as 100s of square inches ofspace allowed for the fruit (shelf space). This numberincludes the amount of extra space in bins in the pro-duce area and in outside display areas when theyoccurred. Advertising was a dichotomous variableand represented whether the variety appeared in theweekly circular advertising supplement in the market;this is the same in all of the stores.
Finally there is the variable for the ecolabel informa-tion. The variable reported, though not the only onetested, was an index based on the level of ecolabelinformation: 0 is for no information (this should befruit that is not produced under the ecolabel); 1 is forthe sticker on the fruit only; 2 is for a Food Allianceseal about 3x4 inches placed either behind or dan-gling in front of the fruit; 3 is for a descriptive FoodAll iance poster (8x11 inches) directly behind thefruit. The design of this index implies that each ofthese pieces of information increases the identifica-tion of the product by consumers (the implicit as-sumption is that the larger the display size, the morenoticeable it is). However, any combination of thesethree signals could occur and could impact demand inother ways, so other variations on how informationidentifying ecolabeled product can impact demandwere also examined. These variations included indi-vidual dichotomous variables for each of these threedisplay levels, a dichotomous variable for the stickerand another index for the two types of signage.
The linear approximate almost ideal demand system(LA/AIDS) model is used to estimate bulk apple de-mand. The AIDS (Deaton and Muellbauer, 1980)model is derived from a model of consumers’ mini-mizing cost relative to their purchasing desires andgenerally meets the desired theoretical properties for
demand. In the linear approximation of the AIDSmodel, a Stone Index is used to formulate the expen-diture component.
Results
From the perspective of demand estimation the esti-mation results are quite satisfactory. The R2 for theLA/AIDs model is 0.80, indicating that the modelexplains a large part of the variation in bulk applemarket share. More basic analysis with individualestimation of demand equations in a double log for-mulation using the SUR (seemingly unrelated regres-sion) technique is similarly successful.
The parameters estimated in the version of theLA/AIDS model used for this analysis directly meas-ure the impact of the explanatory variables on theshare of that variety in the sales in the bulk applegroup. The results from the model are given in Table1. Prices are entered in natural logs as explanatoryvariables and the relationship between quantity andprice is calculated as a function of the parametersestimated in the system. These relationships are re-ported as elasticities at the bottom of Table 1.
The elasticity represents the percentage change inquantity demanded for a one percent change in aprice. Own price elasticities are fairly elastic withrespect to own price, ranging from -2.35 for Galas to-0.98 for Red Delicious. Quantity demanded is lesselastic with respect to cross prices, the highest is 0.64for the impact of a 1% increase in the price of Galason the demand for Red Delicious apples. Symmetrywas not imposed on the cross price parameters, giventhat the demand group was limited to bulk apples.
Display space, as expected, has a consistently posi-tive impact on share or quantity demanded; morespace draws more attention to the product. Adver-tisement seems to be a weaker though positive factor.It appears to be most significant in the Gala equation,where the circular was most often announcing a sub-stantial price savings. Availability of direct alterna-tives to a product are negative if significant, as ex-pected. These results are strongest for the availabilityof small Red Delicious apples with its availabilitydecreasing the sales share of large Red Deliciousapples by 4% (average share of Red Delicious was14%). This larger impact may be due to the regularavailability of small Red Delicious apples in most ofthe stores, which is not as common for Gala. Theregular availability of small Red Delicious applesmay create an expectation on the part of consumersleading them to search for the small Red Delicious

155
alternative; therefore it is more likely to have an im-pact. Availability of a small Fuji alternative was notincluded in the model because small and large alter-natives almost never occurred.
Seasonality was tested in early versions of the model,but lost its explanatory power when display size in-formation was added. Since stores increase and de-crease display size for fruit according to season, itscapture of seasonal effects is not surprising.
Quality measures were developed during the courseof this study but did not cover a sufficient period oftime to be included in this analysis. Further work isneeded on quality elements such as size and fruit con-dition. Quality may be particularly important for un-derstanding consumers’ acceptance of ecolabeledproducts.
None of the variations in how the ecolabel informa-tion was included in the model was found to cause asignificant effect on the sales share of the individualapple variety. While this contrasts with positive per-ceptions by at least some consumers regarding thecharacteristics of this ecolabel, at some level i t ap-pears that these perceptions fail to translate into in-creased demand.
Results from the accompanying study (Johnson et al.,2002) and Loureiro et al. (2001) indicate that while acertain portion of the public does consider thesecharacteristics as desirable, this desirability is notbeing translated into purchasing activity at present.Johnson et al. (2002) reported that approximately25% of their survey respondents were aware of TheFood Alliance, and an even smaller portion recog-nized which products were actually certified. Withoutthat recognition consumers will not be able to prefer-entially select these products even if they prefer tosupport them. Even with this recognition, shoppinghabits may not be such that consumers are seekingout these products.
An important promotional factor may be responsiblefor the lack of consumer response: the extensive useby the stores in our study group of decorative photo-graphic banners depicting the ecolabels mission.These banners show pictures of farmers and farmworkers in the field, and make general statementsabout goals of the group. Other banners just show theseal itself. These banners may confuse consumersabout which products are Food Alliance approved.This implication is supported by the survey results ofJohnson et al. (2002).
On the other hand these banners and the overalladoption of the program by the store may increaseconsumer loyalty to that store and their produce sales,but not provide a direct demand incentive that couldbe realized individually, or statistically discerned, forthe specific fruit that has the ecolabel certification.(While use of these banners did change over time insome of the stores, there was not sufficient variationover time to examine whether this is occurring. Avery large number of stores with varying quantity andplacement of presentations and periods of time overwhich those impacts could be measured would benecessary.) The success of a number of new foodstores with environmentally friendly promotion givessome support to the possibility that a store’s salescould be improved because it supports eco-friendlyproducts.
The remaining variables in the model, dichotomousvariables for the stores, allow unaccounted differ-ences in buying and selling behavior at the stores tobe accounted for. These differences may include thepreferences of the shoppers that frequent them, or thevariety of fruit alternatives available. It is evident thatshoppers in some of these stores are buying higherpercentages of Gala or Fuji apples in comparison toRed Delicious.
Conclusions
This analysis examines the impact of an ecolabel oncurrent, in-store purchases over a limited period oftime and store type. Though the features of retailproduce sales make analysis difficult, the overallmodel successfully explains a large part of the varia-tion in sales share for individual apple varieties. Amajor finding of the study is that the estimated modelindicated the ecolabel under consideration had noimpact on demand for individual bulk apples. Itseems unlikely, though certainly not impossible, thatadditional data from the same source will show thatthe ecolabel actually has a measurable, direct impactunder current operating circumstances. However, anumber of circumstances may be responsible for thisoutcome at present.
It took many years for the concept of organic to im-pact a sizable portion of consumers, and many con-sumers still misunderstand what organic means. Eco-labels may take an extended period of availability toachieve an observable impact. In addition, ecolabelssuch as this one have multiple objectives, and thismay render it more difficult for consumers to under-stand. It is a sustainable agriculture label, and in-

156
cludes both production practices and the well -beingof the labor force and agricultural communities, butthe sustainability concept cannot be considered to bebroadly or well understood by the public at this time.
Two principal factors are believed to be responsiblefor the lack of impact on demand for specific varie-ties. The first is limited understanding and knowledgeregarding the label. The second is the confusing mes-sage portrayed in the stores. The Johnson et al.(2002) companion study reported that a limited num-ber of consumers have heard of the ecolabel, andeven fewer truly understand it.
Therefore, further consumer education and “brand”management might be all that is needed for the eco-label to have a positive impact on demand. The certi-fying organizations for ecolabels should examinealternative promotional approaches. To do this typeof research, one will need to develop in-store signageexperiments in combination with the promotionalactivities to help establish the program. By looking atsignage and promotional activities simultaneously,one can obtain a better understanding of whether andhow an ecolabel can affect retail demand for theproducts.
In summation, there are three principal ways in whichvalue can be obtained for participants. The first twoways are by improving total store sales for the retailerand increasing market access for the producers. Thelast is increased demand for the labeled product. Thisstudy only addresses the latter; it did not discover animpact on product demand. As discussed, a numberof market factors may have been responsible for thisoutcome.
However, an ecolabel will be more successful inachieving its objectives if demand for individualecolabeled products is increased. Thus, an importantfuture activity for ecolabeling is the evaluation of theeffect of current promotions on actual demand andthe testing of new promotional activities.
References
Consumers Union. 2002. The Consumers UnionGuide to Ecolabels. http://www.eco-label.org/home.cfm, viewed October 18, 2002.
Deaton, A.S., and J. Muellbauer. 1980. An almostideal demand system. American Economic Review70:312-326.
Govindasamy, R., and J. Italia. 1998. A willingness-to-purchase comparison of integrated pest man-agement and conventional produce. Agribusiness14:403-414.
Gumpper, M.R. 2000. Do consumers respond toecolabels? Evidence from a market experimentusing contingent valuation. Pennsylvania Eco-nomic Review 9:14-32.
Johnson, A.J., C.A. Durham, D.O. Andrade, andM.V. McFetridge. 2002. Recognition of eco-labeled products in retail environments. Posterpresentation at the Conference on Ecolabels andthe Greening of the Food Market, November 7-9,2002, Tufts University, Boston, Massachusetts.Abstract available at http://nutrition.tufts.edu/conted/ecolabels/program.shtml
Johnston, R.J., C.R. Wessells, H. Donath, and F.Asche. 2001. Measuring consumer preferences forecolabeled seafood: An international comparison.Journal of Agricultural and Resource Economics26:20-39.
Lohr, L. 1998. Welfare effects of eco-label prolifera-tion: Too much of a good thing? Department ofAgricultural and Applied Economics, University ofGeorgia, Faculty Series 98-22.
Loureiro, M.L., J.J. McCluskey, and R.C. Mittel-hammer. 2001. Assessing consumer preferencesfor organic, eco-labeled, and regular apples. Jour-nal of Agricultural and Resource Economics 26:404-416.
Nimon, W., and J. Beghin. 1999. Ecolabels and in-ternational trade in the textile and apparel market.American Journal of Agricultural Economics 81:1078-1083.
Swallow, S.K., and R.A. Sedjo. 2000. Eco-labelingconsequences in general equilibrium: A graphicalassessment. Land Economics 76:28-36.
Teisl, M.F., B. Roe, and R.L. Hicks. 2002. Can eco-labels tune a market? Evidence from dolphin-safelabeling. Journal of Environmental Economics andManagement 43:339-359.
The Food All iance. 2002. The Food Alliance home-page and linked pages. http://www.thefoodalliance.org/index.html, viewed October 18, 2002.

157
Table 1. LA/AIDS model of retail apple demand.
System R² = 0.80 N=140
Gala Fuji Red DeliciousAverage Sales Share
of Bulk Apples0.098 0.302 0.143
Variables
EstimatedParameters
t-valueEstimatedParameters
t-valueEstimatedParameters
t-value
Intercept 0.1573 6.19 0.214 5.42 0.2256 11.91
Price of Gala (natural log) -0.1434 -5.24 0.080 1.97 0.0797 3.91
Price of Fuji (natural log) 0.0504 1.84 -0.054 -1.27 0.0121 0.57
Price of Red Del. (natural log) -0.0239 -0.61 0.095 1.52 -0.0413 -1.32
Weighted Av. Price O. Bulk 0.1003 2.29 0.125 1.87 0.0421 1.24
Small Alternative Availabili ty 0.0119 0.60 -0.0425 -3.26
Apple Bag Availabili ty -0.0204 -1.65 0.020 1.04 -0.0075 -0.72
Eco-label Index Gala -0.0104 -1.23 0.013 0.98 0.0107 1.57
Eco-label Index Fuji -0.0047 -0.50 -0.004 -0.24 -0.0005 -0.07
Eco-label Index Red Del. -0.0006 -0.06 0.010 0.55 -0.0116 -1.32
Eco-label Index Other Apples -0.0031 -0.27 0.025 1.33 -0.0133 -1.38
Ad (weekly circular) for Gala 0.1184 4.34 0.012 0.28 -0.0547 -2.51
Ad (weekly circular) Fuji 0.0192 1.18 0.022 0.87 -0.0254 -1.96
Ad (weekly circular) Red Del. -0.0318 -1.95 0.017 0.69 0.0272 2.15
Ad (weekly circular) Other -0.0060 -0.68 0.005 0.35 -0.0001 -0.01
Total Display Area Gala 0.0026 2.84 -0.001 -1.02 0.0012 1.69
Total Display Area Fuji 0.0006 1.14 0.001 1.46 0.0006 1.62
Total Display Area Red Del 0.0004 0.30 0.000 0.16 0.0023 2.46
Total Display Area for Other -0.0010 -3.05 0.000 -0.71 -0.0009 -3.47
Store 1 0.0468 1.94 0.056 1.69 -0.0185 -1.13
Store 2 0.0581 3.06 0.027 0.88 -0.0538 -3.31
Store 3 0.0185 0.80 0.101 2.85 -0.0732 -3.92
Stone Index -0.0500 -0.81 -0.264 -2.72 -0.0374 -0.76
System R² = 0.80 N=140
Price Elasticities (%Change in Quantity Demanded for a 1% Change in Price )
Gala -2.35 0.47 0.64
Fuji 0.62 -0.98 0.16
Red Delicious -0.14 0.52 -1.21
Expenditure Elasticities 0.49 -0.84 0.74


159
The Influence of Biased Information on Consumers’ Wil lingness to Pay forProducts Labeled as Free of Genetically Modified Ingredients1
Tamara VanWechel2 and Cheryl J. Wachenheim3
____________________________1This research was funded by the Agricultural Experiment Station at North Dakota State University and the United StatesDepartment of Agriculture.
2Upper Great Plains Transportation Institute, North Dakota State University.3Department of Agribusiness and Applied Economics, Box 5636, North Dakota State University, Fargo, ND 58105.Corresponding author. Email: [email protected].
As application of genetic modification in crop varie-ties grows and expands in scope, participants fromthroughout the marketing channel face new opportu-nities and challenges associated with the develop-ment, use, and handling of the resultant products.They must evaluate the potential benefits, costs, andassociated risks as part of their strategic decision-making process. For example, growers are faced withdecisions about whether to grow genetically modified(GM) crops. Biotechnology companies must makeinvestment decisions including research, commer-cialization, and marketing of GM technologies, or-ganisms, and products. Food manufacturers mustconsider use of commodities produced with biotech-nology and determine labeling and promotionalstrategies for the resulting food products. Consumershave new choices associated with food and otherproducts produced with biotechnology. These andother stakeholders will benefit from informationabout consumer acceptance of biotechnology andfactors influencing it. This information will facilitatedecision-making and reduce associated risks.
Acceptance by consumers and participants at eachstep in the marketing channel is paramount to thecommercial success of products including GM ingre-dients or developed using biotechnology. However,there is little information available about the willing-ness of consumers to purchase GM food products(Lusk et al., 2001b). In part, this is because consum-ers are not well informed about biotechnology (RoperStarch Worldwide, Inc., 2000; Rousu et al., 2002a),and in part because available market research is lim-ited. Hallman et al. (2002) surveyed 1,203 US resi-dents in spring 2001. They found that Americans arenot well informed about technologies used in agri-culture and the food industry, including biotechnol-ogy. Nearly 60% either did not believe or were not
sure whether GM products were available in grocerystores. Perhaps in part as a result, they tended not tohold strong beliefs regarding the role of biotechnol-ogy in food production.
One of the most discussed topics in the biotechnol-ogy debate is how its adoption will affect the envi-ronment. Hallman et al. (2002) found that a strongmajority of Americans were concerned about the en-vironmental effects of biotechnology. This concern islikely to have resulted in part from the number,strength, and activities of environmental interestgroups such as Green Peace and Friends of the Earth(Rousu et al., 2002b). There is some evidence thatthese groups have been more effective in presentingtheir message than those providing information aboutthe positive or neutral effects of biotechnology.Huffman et al. (2002a) found that consumers whoidentified themselves as more informed about bio-technology were more likely to be unwilling to payfor GM products.
The purpose of this paper is to assess whether will-ingness to pay for food products can be motivated bythe bias of information available about the environ-mental effects of the technology used in producingtheir ingredients. Specifically considered is how in-formation provided about the influence of biotech-nology on the environment affects willingness to paya premium for food products labeled with a guaranteethey are free of GM ingredients.
Assessment of Consumer Demand
Literature addressing issues related to biotechnology,including production and use of GM crops in the USand elsewhere, its associated ethical, environmental,and safety concerns, and regulatory options, includ-ing labeling, overshadows that devoted to the as-

160
sessment of consumer willingness to pay for foodproducts made with or including GM components.The latter is discussed here in some detail. (SeeUzogara, 2000, and Persley and Siedow, 1999, fordetailed considerations of other aforementionedissues.)
In the current study, revealed preference is used toassess willingness to pay using an experimental auc-tion. Experimental auctions have the potential to pro-vide more reliable measures of willingness to paythan hypothetical surveys (Lusk et al., 1999). Thebenefits of experimental auctions are described insome detail in Fox et al. (1998). They have been usedin a number of studies to estimate consumer demandfor new food items, such as those introduced in thecurrent study (Fox, 1995; Hayes et al., 1995; Buzbyet al., 1998; Fox et al., 1998; Lusk et al., 2001a,b;Rousu et al., 2002a; Huffman et al., 2002b).
An initial effort to assess revealed consumer willing-ness to pay for a product guaranteed to be producedwithout biotechnology was reported by Fox et al.(1994). A Vickrey sealed-bid, second price auctionwas used to estimate consumer will ingness to pay toreplace milk from cows receiving bovine somato-tropin (BST) with that from cows not receiving BST.The Vickrey second price auction has been used fre-quently in valuation experiments (Lusk et al., 2001a).In this auction variant, the highest bidder purchasesthe product at the second highest bid price. Averagebids to exchange a glass of milk were positive, butmost, particularly in two of three metropolitan areas,were either zero or exceeded $1, supporting the exis-tence of market segments for BST-free milk. Provid-ing factual information to participants about BSTcoincided with lower variance in average bid betweenrounds.
Melton et al. (1996) used a second-price, ascendingbid auction to determine preferences for pork chopswith multiple quality characteristics among primaryshoppers of households that consumed meat. Attrib-utes discerned from viewing the fresh product werepoorly correlated with those discerned from photo-graphs, and they tended to contradict the rankings byparticipants after taste testing. This finding suggeststhat an initial purchase based on observable attributesmay not be repeated if it does not correspond witheating experience.
Lusk et al. (2001b) used an experimental auction toestimate consumer willingness to pay for a higherlevel of steak tenderness. Rather than conducting theexperiment in a laboratory setting with recruited, paid
participants, they used a sample of consumers alreadyshopping in a retail grocery store. The authors notethat this helped target the population of interest (e.g.,meat consumers), and helped avoid sample selectionbias. It also served to address the concern noted byBuzby et al. (1998) of bid inflation resulting fromgiving participants money to participate. Becauseconsumers participated as individuals, the methodsused in other experimental auctions discussed herecould not be employed. A method was adopted whereparticipants paid to upgrade to their preferred steak iftheir bid exceeded a pre-determined “market price.”
The results emphasize that consumer preference doesnot necessarily translate into willingness to pay. Al-though consumers could readily distinguish betweenlevels of tenderness in a blind taste test and 69% pre-ferred the more tender steak, only 36% were willingto pay for it. The authors offered two potential expla-nations. First, consumers may lack confidence that alabeled steak will hold the same attributes as thesame-labeled steak they previously tasted. Second,shoppers may not actually be the intended consumersof the product they are purchasing. As such they maynot be buying based on their own preferences. In asecond treatment, steaks were descriptively labeled as“guaranteed tender” and “probably tough.” Descrip-tive labeling increased preference for the more tendersteak (84%), and the percentage of consumers willingto pay for it (51%).
Using first and second price auctions, Lusk et al.(2001a) assessed how much students endowed with abag of corn chips containing GM ingredients werewil ling to pay to switch to non-GM corn chips. Allstudents were from Midwestern towns and enrolled inan agriculture major, and most came from farms. Notsurprisingly, given the nature of the population, stu-dents had little objection to GM foods and expresseda strong willingness to consume them. As demon-strated elsewhere, there was evidence of a marketsegment that valued the non-GM guarantee.
Huffman et al. (2002b) used a random nth price ex-perimental auction to assess wil lingness to pay forproducts under both voluntary (standard label versusnon-GM label) and mandatory (standard label versusGM label) labeling scenarios. Participants submittedbids, which were ranked from high to low. A randomnumber (n) was selected, and the product was sold atthe nth price to each of the n–1 highest bidders. Forexample, if the number 5 was randomly drawn, thetop 4 bidders would each purchase the product at thefifth highest price. A strong criticism of the Vickrey

161
second-price auction is that it fails to disclose thecomplete demand curve for the auctioned item amongparticipants. The random nth-price auction correctsfor this problem because it attracts sincere bids frombidders who might be off the margin. Sincerity ofbids results from a participant’s inability to use amarket-clearing price as a marker, and the equal op-portunity among participants to purchase the good.
Participants in two Midwestern cities bid on threeproducts. Products were selected to represent prod-ucts that are highly processed (tortilla chips), refinedand distilled (vegetable oil), and fresh (potatoes). Sixgroups bid on products with a label indicating onlythe name of the product, and on those also noting“This product is made without genetic engineering.”Four groups bid on products with the plain label andthose with labels indicating “This product is madewith genetic engineering” . Participants bid on eitherthe GM (or implied GM) or non-GM products in eachround (i.e., bids by individuals for GM and non-GMproducts did not occur simultaneously). Round se-quence was randomized, and only one round wasbinding so as to prevent reduction of bid prices asparticipants moved along their individual demandcurve. Prior to bidding, participants were providedone-page information summaries. Information pro-vided was biased positively, biased negatively, orverifiable (unbiased).
Participants bid more for products presumed non-GM. No demographic characteristics appeared toaffect the discount for the GM-perceived products.The hypothesis that average bids for GM food prod-ucts are not different, regardless of whether a volun-tary or mandatory labeling strategy is used, could notbe rejected. For the GM labeled treatments (manda-tory labeling scenario), bid order influenced bid price(Rousu et al., 2002a). Participants bidding on prod-ucts with the GM label in the first round paid asmaller premium for products with a standard labelthan those who bid on products with a standard labelfirst. Those who perceived themselves at least some-what informed about GM bid far less for GM foods,suggesting their prior-received information wasweighted by a negative bias.
Huffman et al. (2002a) used data from the fourgroups tested under the mandatory labeling scenarioto evaluate the influence of information on the prob-ability a consumer will be “out of the market” forGM food products. Consumers who reported alwaysreading labels for an initial purchase of a food itemand those reporting they were at least somewhat in-
formed about GM foods were more li kely to offer azero bid for the GM product.
Rousu et al. (2002b) evaluated consumer acceptanceof non-GM foods with tolerance levels of 0, 1, and5%. Consumers bid less for foods with a GM toler-ance, but the difference between bids for 1 and 5%tolerance products was not statistically significant.The products and experimental design followed theone detailed in Huffman et al. (2002b).
Methods and Procedures
A random nth-price experimental auction was used toelicit and estimate the influence of information biason consumers’ willingness to pay for foods with astandard NutriFacts label compared with foods alsolabeled with a non-GM guarantee. The methodsclosely paralleled those described in Huffman et al.(2002b) and Rousu et al. (2002a). Key differencesinclude the composition of the participant population,type and form of products, product labeling, scope ofinformation provided to participants and the timing ofits introduction, and simultaneous (versus sequential)bidding on non-GM and presumed GM products.
A convenience sample of 112 students from NorthDakota State University was recruited to participatein the auction. Students were recruited through large-section anthropology, sociology, and communicationclasses. Approximately 33 students participated ateach of three different time periods over a period oftwo days. A fourth auction was conducted in a col-lege of agriculture service course with 17 students aweek later to increase sample size. Monetary com-pensation of $15 was provided to encourage partici-pation, but its distribution before required purchase(s)also served to eliminate any budgetary constraint.
At each time period, students were randomly as-signed one of three treatments defined by the infor-mation they would receive about the environmentalimpact of biotechnology. Each participant received apacket including a pre-auction survey, detailed in-structions, information about biotechnology, and apost-auction survey. Moderators reviewed step-by-step instructions orally with participants throughoutthe auction. Practice rounds were conducted to ensurethat participants understood the auction process.
The auction consisted of two rounds. In the firstround, participants bid on two varieties of each ofthree food products: individually wrapped muffinsand chocolate chip cookies, and bags of potato chips.These products were selected to meet two key crite-
162
ria. First, they include ingredients that are commonlyproduced in North Dakota and for which GM varie-ties exist (e.g., wheat) or already have been commer-cialized (e.g., corn, oil seeds, potatoes). Second, con-sumers universally purchase them, regardless ofdemographic characteristics. Individual serving, con-venience-sized products were used to appeal to col-lege students in the school environment. Participantsbid discretely on two variations of each of the threeproducts; one with a standard Nutrifacts label, andone also with a label indicating “This product doesnot contain genetically modified ingredients” (Figure1). The two versions of each product were offeredsimultaneously to each participant. Labeling productscontaining GM ingredients was rejected as a strategyfor the current study. The current US labeling policyregarding biotechnology is voluntary. Huffman et al.(2002b) demonstrate that when consumers can accu-rately read market signals (i.e., can interpret infor-mation identically whether from voluntary or man-datory labeling strategies), a voluntary labeling pol-icy provides higher welfare. Furthermore, in light ofpublic ignorance of biotechnology and the extent ofadverse controversy, it is unlikely that firms wouldvoluntarily adopt a strategy of labeling foods as con-taining GM ingredients.1
After the first round of bidding, participants wereprovided with and instructed to read one-page sheetswith biased information (positive or negative) aboutthe effects of biotechnology on the environment, orgeneral information about North Dakota agriculture.The environmental impact information was not iden-tified as biased. Under each impact statement therewere from one to five supporting statements.Positive-biased impact statements included the fol-lowing:
• fewer, less toxic pesticides used by farmers whogrow genetically modified crops
• yield gains
• soil and water conservation
____________________________1An innovative strategy for firms, and the industry ingeneral, should they one day be required to label productsthat contain GM ingredients and perhaps even otherwise,is to increase general consumer acceptance by makingclaims regarding their inclusion an expected and custom-ary practice. This could increase consumers’ comfortlevel by making the GM product label one they expect tosee on products they consume.
• potential for less energy and air emissions due tomore efficiency in product transport.
Negative-biased impact statements included the fol-lowing:
• increased use of certain herbicides
• lower yields
• increased tolerance in certain insects
• genes could move to wild species, creating weeds
• harm to nontargeted species.
A second round of bidding followed. Participants hadbeen informed as part of their initial instructions thatonly one of the two rounds would be binding; that is,that they would actually need to purchase the prod-ucts from winning bids in only one of the two rounds.Otherwise, participants with a winning bid in the firstround may bid less for the same product(s) in thesecond round.
Results
Respondent profiles
The majors of the 112 participants were concentratedin the social sciences, with 30% in sociology and26% in the humanities; 14% reported a major withinthe College of Agriculture. Other majors includedpsychology, computer science, natural resourcesmanagement, business, and the hard sciences. Thepopulation was nearly evenly split by gender, withmales comprising 51%, and females 49%. Most wereCaucasian (93%), single (82%), had no children(88%), and lived with at least one other person(75%). Almost three-fourths (72%) reported beingemployed; a majority earned an annual income ofeither less than $5,000 (25%) or between $5,000 and$10,000 (32%). A large majority (83%) grew up inthe Lutheran or Catholic faith, and 30% grew up on afarm. Just over one-third of participants (38.5%) wereoriginally from a large city (between 10,000 and100,000 inhabitants). Just over 51% percent wereevenly split between rural towns (less than 1,000) andsmall cities (between 1,000 and 9,999). Ten percentwere from Minneapolis or St. Paul or their suburbs.
Both pre- and post-auction surveys included ques-tions regarding the knowledge, behavior and attitudesof participants. Although they did not reveal evidencesuggesting they are active environmentalists, overallthey expressed a general concern about the environ-ment. Nearly 60% said they used recycled products

163
always or frequently, although only 45% reportedrecycling always or frequently. Over two-thirds ofparticipants agreed that more action needs to be takento preserve the environment. A much lower percent-age agreed that man has upset nature’s balance (29%)or that pesticides are poisonous and should be pro-hibited (17%). The former seems to contrast withHallman et al. (2002, p. 28), who reported that 90%of Americans surveyed felt that “ the balance of na-ture can be easily disrupted by humans.”
Participants reported on their knowledge about andperceptions of GM foods. They were asked how wellinformed they were regarding GM foods. The aver-age response was 5.7, where 1 = extremely well in-formed and 8 = not informed at all. This concurs withthe results of Hallman et al. (2002), who found thatAmericans in general freely admit to being relativelyuninformed about biotechnology. Hallman et al.(2002) reported that only 41% believed that theywere adequately informed. In the current study,nearly two-thirds of participants said they were onlysomewhat informed or not informed at all . Only 11%considered themselves well informed or extremelywell i nformed. When asked how much of the foodthey consume is genetically modified, the overallaverage was approximately half. Overall, respondentsbelieved there are substitutes for GM food products.Three-quarters thought there were substitutes alwaysor frequently. Only 5% reported there were neversubstitutes. Most participants perceived there to beonly a moderate (38%) or low (46%) level of risk orno risk (5%) associated with consuming GM foods.
Finally, participants were asked about their use offood product labels. Participants self reporting thatthey read nutritional labels “always” , “ frequently” ,“occasionally” , and “never” were nearly evenly splitover the range of responses (uniform distribution).This is consistent with results reported by Hallman etal. (2002). Although 90% of the Americans they sur-veyed thought GM food should be labeled as such,only 53% reported that they would look at food labelsfor this information and only 45% expressed a will -ingness to pay more for non-GM foods.
Willingness to pay
There was an overall difference between mean bidsfor the non-GM and presumed GM version of eachproduct. The average bids for the non-GM versionsof potato chips, the cookie and the muff in were re-spectively 8.6, 6.7, and 11.0% higher than for theirpresumed GM counterparts. In the first round, prior
to information distribution, mean bids were differentfor the non-GM and presumed GM version of thecookie and the muff in. The bid differential for potatochips was only marginally significant. In the secondround of bidding (after participants not in the controlgroup had been provided biased information aboutbiotechnology), average bids for the non-GM versionof each product were again higher. However, therewas not a significant difference in average bid for thetwo versions of cookie, and the difference betweenbids for potato chips was again only marginally sig-nificant.
The bid differential between the non-GM and pre-sumed GM products decreased between rounds foreach product. The change in the differential wassmall i n value, but the percentage change was sub-stantial, ranging from 25% for the muff in to 52% forthe cookie. Surprisingly, the source of the change indifferential between rounds was not consistent acrossproducts. Bids for both the non-GM and GM versionsof potato chips decreased from the first to the secondround. The bid decline was greater for the non-GMversion. In contrast, bids for both versions of themuff in and cookie products increased betweenrounds. For each product, the bid increase wasgreater for the GM version.
A univariate analysis of covariance was used to testwhether information about the impact of biotechnol-ogy on the environment had an effect on the differ-ential in willingness to pay for GM versus non-GMproducts. The null hypothesis is that no treatmenteffect exists. The covariance model takes the form:
Dij = E + Tij + ∃(xij - x..) + εij
where:
Dij = Percentage differential between bids(non-GM minus standard product,round two).
E = Overall effect Tij = Treatment effect (information bias) ∃ (xij - x..) = Independent covariate: percentage
differential between bids (round one) εij = Error term
The subscripts i and j represent the product and thetreatment (information bias); x denotes the bid.
The null hypothesis is rejected (p = .004). The leastsquares mean bid differential (non-GM minus pre-sumed GM product) in the second round of biddingwas 9.8% for participants in the control group (those

164
reading general information about North Dakotaagriculture). The differential was higher for thosereceiving negatively biased information (13.9%), butthe difference from the control was not significant.This result concurs with that of Huffman et al.(2002a) that prior held information regarding bio-technology or GM foods may be negatively biased.The least squares mean for participants in the groupreading positively biased information was -4.84%Providing information to participants on the pur-ported positive impacts of biotechnology on the envi-ronment resulted in the average participant payingmore for the product presumed to include GM ingre-dients. Least squares means testing (Bonferroni) wasused to adjust for the covariate effect in comparingmean differences. The average percentage differencein round two among those receiving the positivelybiased information was statistically different from theaverage among those receiving no (p = .042) andnegatively biased (p = .005) information.
Conclusions
The effect of information regarding environmentalimpacts of GM crops on willingness to pay for GMfood products was consistent with expectations. In-formation about the positive effects of GM crops onthe environment resulted in increased bids for stan-dard label (presumed GM) products over those identi-fied as non-GM. Negative information increased theamount by which participants were willing to paymore for products with a non-GM guarantee. Theresults also support the belief that consumers do readlabels, at least in an experimental setting and whenthe information is constrained to a standard Nutri-Facts label and a statement regarding the GM com-ponents of the product. Participants were instructedto evaluate the products, but were not specificallytold to read the labels. Because products offered wereidentical except for the label, only participants whoactually carefully viewed the labels would have dif-ferentiated between the products.
Overall, the results indicate that students are con-cerned about the environment and how it is affectedby the use of biotechnology, and that they value non-GM labeled products. Also, willingness to pay can beinfluenced by information provided. While caution isadvised about applying the results of this study to amore general population, to a different or broaderlocale, or to GM food products in general, the resultsare useful. College students in the Northern Plainsrepresent a market segment similar to that which
might be found at colleges and universities through-out much of the United States. The results support theidea that providing environmental impact informa-tion, particularly to this market segment, could be abeneficial strategy for agribusiness firms. Because amajority of retail food items in the United States docontain GM ingredients, should those against bio-technology continue informational campaigns, a pri-ority for the industry should be to ensure that con-sumers understand the impact of GM crop productionand feel safe consuming the resulting food products.
Directions for Future Research
Two important characteristics of this research thatmay limit its applicability include the homogeneity ofthe participant population as compared to the moregeneral market, and the nature and scope of theinformation provided to participants (treatment).Regarding the former, the nature of the participatingpopulation not only inherently limits direct applica-tion of the results to a wider population, but alsoresulted in consideration of only immediately con-sumable food products (i.e., individual-size amounts).There is no basis for believing that willingness to payfor non-GM refreshments is representative of thewillingness to pay for other non-GM food products,such as those more likely to be consumed at home.
Regarding the nature and scope of information limi-tation, the environmental impact information pro-vided to participants was designed to be both visuallyattractive and credible. Nonetheless, it was limited toa one-page scientific summary. This format wouldunlikely be the choice of a firm or organization withthe objective of influencing consumer acceptance ofbiotechnology. More likely they would consider moreengaging means, such as radio, television or printmedia, well-designed pamphlets, and presentationsaimed at specific target markets. It is also expectedthat firms offering a retail food product that does notcontain GM ingredients would use more creativemeans to promote this on the product packaging,including the label, in contrast to the simple labelstatement used in the current study.
As the use of methods in experimental economicsgrows, it is anticipated that future research will bedesigned to overcome these limitations, at least inpart. Applying the methods employed to test willing-ness to pay for different products would widen thescope of findings for the region (e.g., foods used toprepare meals, or foods designed to appeal to health-conscious consumers). Creative labeling may change

165
the price premium that people are willing to pay fornon-GM products, and changing how the informationwas presented may change consumer attitudes aboutand preferences for products based on their GMcomposition. For example, using a television ormagazine advertisement as a means to convey infor-mation about biotechnology could be more influentialand alluring to a greater fraction of the population. Iffinancially and geographically feasible, engaging amore diverse population to participate in a futurestudy would be helpful. Results then could be gener-alized more easily over the entire population.
ReferencesBuzby, J.C., J.A. Fox, R.C. Ready, and S.R. Crutch-
field. 1998. Measuring consumer benefits of foodsafety risk reductions. Journal of Agricultural andApplied Economics 30:69-82.
Fox, J.A. 1995. Determinants of consumer accept-ability of bovine somatotropin. Review of Agri-cultural Economics 17:51-62.
Fox, J.A., J.B. Kliebenstein, D.J. Hayes, and J.F.Shogren. 1994. Consumer acceptability of milkfrom cows treated with bovine somatotropin. Jour-nal of Dairy Science 77:703-707.
Fox, J.A., J.F. Shogren, D.J. Hayes, and J.B.Kliebenstein. 1998. CVM-X: Calibrating contin-gent values with experimental auction markets.American Journal of Agricultural Economics80:455-465.
Hallman, W.K., A.O. Adelaja, B.J. Schilling, and J.T.Lang. 2002. Public Perceptions of GeneticallyModified Foods: Americans Know Not What TheyEat. Pub. No. PR-0302-001. Food Policy Institute.
Hayes, D.J., J.F. Shogren, S.U. Shin, and J.B. Klie-benstein. 1995. Valuing food safety in experimen-tal auction markets. American Journal AgriculturalEconomics 77:40-53.
Huffman, W.E., J.F. Shogren, A. Tegene, and M.Rousu. 2002a. Negative information and resistanceto adoption of new technology: the case of geneti-cally modified food. Manuscript. Department ofEconomics, Iowa State University, Ames.
Huffman, W.E., J.F. Shogren, A. Tegene, and M.Rousu. 2002b. Should the United States initiate amandatory labeling policy for genetically modifiedfoods? Manuscript. Department of Economics,Iowa State University, Ames.
Lusk, J.L., J.A. Fox, and C.L. McIlvain. 1999. Con-sumer acceptance of irradiated meat. Food Tech-nology 53:56-59.
Lusk, J.L., M.S. Danield, D.R. Mark, and C.L. Lusk.2001a. Alternative calibration and auction in-stitutions for predicting consumer willingness topay for nongenetically modified corn chips.Journal of Agricultural and Resource Economics26:40-57.
Lusk, J.L., J.A. Fox, T.C. Schroeder, J. Mintert, andM. Koohmaraie. 2001b. In-store valuation of steaktenderness. American Journal of Agricultural Eco-nomics 83:539-550.
Melton, B.E., W.E. Huffman, J.F. Shogren, and J.A.Fox. 1996. Consumer preferences for fresh fooditems with multiple quality attributes: evidencefrom an experimental auction of pork chops.American Journal of Agricultural Economics 78:916-923.
Persley, G.J., and J.N. Siedow. 1999. Applications ofbiotechnology to crops: benefits and risks. Councilfor Agricultural Science and Technology 12:1-8.
Roper Starch Worldwide, Inc. 2000. Consumer andFarmer Opinions about Food and Agriculture.Philip Morris Management Co.
Rousu, M., W.E. Huffman, J.F. Shogren, and A.Tegene. 2002a. The value of verifiable informationin a controversial market: evidence from lab auc-tions of genetically modified foods. Staff WorkingPaper. Department of Economics Series, Paper #3.Iowa State University, Ames.
Rousu, M., W.E. Huffman, J.F. Shogren, and A.Tegene. 2002b. Are U.S. consumers tolerant ofGM foods? Manuscript. Department of Economics,Iowa State University, Ames.
Uzogara, S.G. 2000. The impact of genetic modifica-tion of human foods in the 21st century: a review.Biotechnology Advances 18:179-206.

166
Figure 1. Example of product labels.
Nutrition Facts:
Serving Size: one ounce (28 g., approximately 17 chips)Calories 150 % Daily ValueTotal Fat 9g 14%Cholesterol 0mg 0%Sodium 160mg 7%Total Carbohydrate 15g 5%Protein 2g
Ingredients: selected potatoes, corn oil, sunflower oil, and/or canolaoil, and salt.
**This product does not contain GM ingredients.
Nutrition Facts:
Serving Size: one ounce (28 g., approximately 17 chips)Calories 150 % Daily ValueTotal Fat 9g 14%Cholesterol 0mg 0%Sodium 160mg 7%Total Carbohydrate 15g 5%Protein 2g
Ingredients: selected potatoes, corn oil, sunflower oil, and/or canolaoil, and salt.

167
Differential Importance of Ecolabel Criteria to Consumers
Lina Gordy1
____________________________1Institute for Agriculture and Trade Policy, 2105 First Avenue South, Minneapolis, MN 55404. Email: l [email protected]
Problem Statement
Present consumption patterns are not sustainable on aglobal level. Therefore, curtailment of the use ofnatural resources in human societies is necessary(Ryan, 1995). Proper ecolabeling could potentiallyreduce environmental impacts of consumption, butwithout consumer interest, these programs aredoomed to fail (EPA, 1993a, 1994).
Labeling is an educational tool that also helps con-sumers identify environmentally preferable products(EPA, 1993a). However, in addition to choosing la-beling solely to address environmental impacts, it isalso necessary to focus the labels to address what isimportant to consumers. When choosing what prod-ucts should be awarded a label it is important to de-cide what issues should be addressed. Labeling pro-grams select these issues and use criteria to determinethe performance for the chosen products and to shapethe focus of the label. For example, the Environ-mental Protection Agency’s Energy Star sets stan-dards for energy eff iciency, and the Food Alliance’sstamp of approval focuses on sustainable agriculture(Kane and Ennis, 2003).
Attitude is the consumer’s li king, endorsement orpreference for product attributes. It summarizes thecriteria that consumers use to make decisions regard-ing what products to buy (Kinnear and Taylor, 1996).Attitude is an important aspect of purchasing deci-sions that can be used to predict shopping behavior(Fishbein and Ajzen, 1975). Therefore, it is importantfor both the food industry and ecolabelers to deter-mine consumers’ attitudes to find out what criteriathey want. Research is needed to determine if andhow information about products’ environmental im-pact corresponds to what consumers want (Palm andWindahl, 1998).
In the research reported here, the importance of eco-label criteria to respondents was measured using awritten questionnaire administered to 340 adults. Thepurpose was to establish a framework within whichdifferential importance of ecolabel criteria could bedetermined. Consequently, this study tested the dif-
ferential importance of a set of thirteen criteria forecolabels on products to consumers.
The first objective was to determine the differentialimportance of information regarding thirteen selectedecolabel criteria. The second objective was to meas-ure the relation of social structural variables (age,gender, ethnicity, formal education, and householdincome and composition) to the importance of eco-label criteria to consumers. This study aimed to testthe hypotheses:
H1: Consumers differentiall y endorse criteria forecolabels; and
H2: Socio-demographic factors affect the importanceof information on criteria for ecolabels to consumers.
Research regarding ecolabels may help guide futureenvironmental labeling efforts to change consumerand producer attitudes and behavior, thus reducingthe environmental burdens of consumption. Con-sumer demands for ecolabeled products have in-creased, but consumer attitudes toward label criteriahave not been established in prior research (EPA,1993a; Arda, 1995). The findings from this and suc-ceeding studies may be used for establishing labelsthat are successful regarding consumers’ confidencein and endorsement of them. This study found thatthese patterns exist, and that some consumers findcertain ecolabel criteria more important than others.The primary purpose of this study was to provideinsight into the socio-demographic triggers to criteriaendorsement, and to develop a framework for testingthese. The study should therefore be considered apilot effort for exploring the use of this methodology.
Background
The ecosystem of the Earth is finite and non-expanding. With a growing population, the bounda-ries to the ecosystem are limiting (Daly, 1998). Theneed to slow population growth has been recognizedfor a long time (e.g., Malthus, 1798), but not untilquite recently has the need to limit consumption beenacknowledged (Daly, 1998).
168
Ecolabels are intended to provide consumers withinformation and assessments not otherwise apparent,to guide them in making purchasing decisions basedon the environmental impacts of products. Ecolabelsalso serve as consumer protection tools by providingenvironmental information not readily available ornot supplied by the marketer (EPA, 1993a).
Ecolabels generally have three objectives:
• to prevent misleading environmental advertising
• to raise awareness and to encourage consumers tobase purchasing decisions to a greater extent onenvironmental attributes by providing necessaryinformation
• to provide market-based incentives for manufac-turers to lessen the environmental impacts oftheir products and production processes (EPA,1993a).
The main purpose of ecolabels is to alleviate the en-vironmental burdens of human consumption, thusslowing the depletion of the natural environment(EPA, 1994).
Environmental Certification Programs (ECPs) arethird-party, positive or neutral ecolabeling programsthat strive to make credible, unbiased, and independ-ent judgments about environmental product attrib-utes. As voluntary programs, ECPs are positive sell -ing arguments or neutral disclosures of environ-mental impacts (EPA, 1993a).
ECPs include three types of certification: 1) Seal-of-approval; 2) Report card; and 3) Single-attribute cer-tification (EPA, 1993a). Most existing national andinternational ECPs are seal-of-approval programs.These ecolabels generally assess products based on alifecycle assessment (LCA) or an abbreviated LCA(EPA, 1993a).
ECPs are intended to convey information about mul-tiple environmental attributes of products (EPA,1993a). Several ECPs continuously raise the stan-dards to promote environmental improvements, andto ensure that only a few products on the market meetthe certification requirements (EPA, 1993a). Positiveproduct labeling programs provide manufacturerswith a market-based incentive to create products withenvironmental or social benefits. Often operated by aneutral third-party, these labeling programs set crite-ria and standards, and award a seal-of-approval foruse in advertising (EPA, 1994).
Criteria for ecolabels
ECPs base the selection of products on a specific setof criteria for assessment. The criteria are developedfor each product category, after which products in thesame category are judged against the same set ofcriteria. The foremost difference among existingECPs is how product categories and criteria aredefined (EPA, 1994). Criteria-setting is typicallyconcerned mainly with environmental policy goals,consumer awareness of environmental issues, andeconomic effects on industry, but determination ofcriteria for seals-of-approval must be based on a life-cycle review of product category.
The decision-making groups sometimes have repre-sentatives from major stakeholder groups such asenvironmental and consumer groups, government,and business and trade representatives. External tech-nical advice is commonly sought from the govern-ment or standard-setting organizations. Criteria aresometimes based on LCAs in which potentiall y sig-nificant environmental impacts are identified. Criterialevels (i.e., standards) are established to reduce theimpacts considered most significant, and to addressthe environmental impacts of the specific productcategories. The standards for an ECP are usuallyelevated to provide incentives for continuous im-provement (EPA, 1994).
Ecolabeling programs are developing around theworld, yet they are increasingly being criticized byindustry. The criticism has mainly been focused onthe policy level and on the abuse of ecolabels as pro-tectionist trade barriers. Ambiguity as to the devel-opment of criteria and standards has also been identi-fied as a concern (Salzman, 1997; EPA 1994).
Most existing ecolabeling programs (e.g., Green Seal,USA; Environmental Choice, Canada; Bra Mil jöval,Sweden; The White Swan, Nordic countries) do notincorporate consumer acceptance of label criteria,which could influence their success in the market(EPA, 1994). However, a public or internal review isusually conducted that incorporates the opinions of areview group. After principal environmental impactshave been determined, standards are set to addressthese impacts. The standards are set sufficiently highthat only a few products on the market can meetthem, in order to encourage increased product per-formance. After the criteria have been chosen, a re-view is conducted to increase public acceptance ofthe label (EPA, 1993a). However, exceptions mayexist in labeling programs not reviewed for this re-search.

169
Because of the lack of existing research on the topic,a set of criteria, plausibly part of existing ecolabels,was developed for the purpose of testing in thisresearch. The criteria were consistent with twoframeworks, Life Cycle Assessment (LCA) and TheNatural Step (TNS). LCA is frequently used for thepurpose of ecolabeling (EPA, 1992). TNS is moreunconventional but is increasingly being accepted asa framework for sustainable development (Nattrassand Altomare, 1999). For the purpose of testing,these criteria provided bases for criteria selection.
Criteria were extracted from existing programs andgrouped according to impact categories associatedwith TNS and LCA. Both the LCA and TNS frame-works endorse sustainability, not only environment-related issues. These frameworks were chosen in thisstudy as bases for criteria development to facilitate amore broad-based sustainability label. Endorsementof sustainability criteria was tested in this study byusing a questionnaire to determine the importance ofthese criteria to consumers. Ecolabeling efforts havecome about because of increased consumer demandfor this type of information. Thus, criteria selectionought to be based on the importance of the criteria toconsumers in order to sustain consumer interest inecolabels.
Efforts to reduce the environmental impact of indus-trial activities have long been focused on production;the immediate impact of consumption and consumerlifestyles has been considered a less significantproblem. Uusitalo (1986) identified two reasons forthis: consumers perceive themselves as being de-pendent on the producers and the consumption alter-natives, and consumers feel powerless in influencingdecisions regarding industrial activity. In addition,very lit tle knowledge concerning the role of consum-ers in environmental implications is available orwidespread. The significance of consumer decisionsis perceived to be less than that of macrolevel factorssuch as the rapid industrial, economic and populationgrowth (Uusitalo, 1986). Despite this, new ap-proaches to creating sustainable production and con-sumption processes require redirection of the think-ing of all actors in the market. Thus, the role of con-sumer attitudes cannot be neglected.
Consumer attitude
Consumer attitude is the subject’s enduring percep-tional, knowledge-based, evaluative, and action-ori-ented processes regarding a product or its attributes(Kinnear and Taylor, 1996). Attitude measurement
may be used to evaluate the effectiveness of a mar-keting program, or could serve as support in devel-oping these (EPA, 1993a). Measuring consumers’attitudes is central to many marketing situations;attitudinal data are usually the basis for market seg-mentation strategies. Determining the attitudes ofdifferent market segments towards a product or prod-uct attributes may also be essential for targeting con-sumer education.
This study is concerned with the importance thatconsumers attach to different environmental attrib-utes associated with a product label, in this studyreferred to as ecolabel criteria. Attitude is expressedby the consumer as liking, endorsement of, or prefer-ence for a product or its attributes. Attitude is an im-portant aspect of purchasing decisions and consumerpreference for a product (Kinnear and Taylor, 1996).A relationship exists between consumer attitudes andbehavior, which may make it possible to predict con-sumer endorsement of a product based on attitudes(Fishbein and Ajzen, 1975). Similarly, attitudesshould be plausible indicators of endorsement ofenvironmental attributes of a product. Different prod-uct attributes have different importance to consumers(Hawkins et al., 2001). The consumer’s overall atti-tude towards a product is determined by the per-ceived performance of the product with regard toeach attribute and the importance attached to each.On this basis, it is essential to provide informationabout product attributes because they play an integralrole in attitude formation.
Influence of social variables on consumerattitudes
It has been emphasized that the findings of studiesabout the relationship between socio-demographic aswell as other variables and environmentally con-scious consumption should be used in targeting ef-forts of education related to the impacts of consumerdecisions on the environment (Balderjahn, 1988). Inthe neoclassical view, patterns of consumption areassumed to originate from socio-demographic vari-ables such as household income and composition(Schor, 1999). From a social science perspective,socio-economic class is also a predictor of consump-tion patterns; consumers with similar backgroundexpress similar consumption patterns. These simi-larities are present also in situations when no func-tional needs and considerations apply (Schor, 1999).
The Consumer Labeling Initiative, CLI, is a descrip-tive survey study performed by the EPA in whichconsumer preferences for format of ecolabels were

170
examined (EPA, 2000). Socio-demographic factors(age, gender, and presence of children in the house-hold) have been used in previous studies to investi-gate whether significant differences exist amongvarious groups of interviewees, such as education andincome groups (EPA, 2000; Berger, 1997). In theCLI, it was determined that presence of children inthe household was significant for whether consumersread the label. In this study, it is hypothesized thatenvironmentally concerned consumers are younger,better educated, with a higher income than the aver-age consumer, and more often female with youngchildren in the household.
These socio-demographic variables have been studiedin other contexts concerning consumer attitudes(Balderjahn, 1988; Nesmith and Wright, 1997; EPA,2000). Balderjahn hypothesized that consumers be-longing to the upper social class (highly educatedwith higher incomes) generally are more ecologicallyconcerned in their shopping behavior than other con-sumers. However, socio-demographic variables wereshown to have little effect on ecologically responsibleshopping behavior, except education, which had arelatively high predictive power but was notstatistically significant. Male consumers generallywere almost twice as concerned about the envi-ronment as female consumers if they also expressed apositive attitude towards environmentally consciousliving.
By contrast, Nesmith and Wright (1997) determinedthat women are more ecologically responsible shop-pers than men. Thus, Nesmith and Wright’s resultscontradict those of Balderjahn (1988). This could bedue in part to the difference in geographical location(Balderjahn in Germany, Nesmith and Wright inCanada), as well as difference in time (1988, 1997).
In general, however, social structural variables havenot been shown to be reliable predictors of ecologi-cally responsible shopping behavior (Uusitalo, 1986;Balderjahn, 1988; EPA, 1994; 2000). However, thesevariables have not been tested as predictors ofecolabel criteria endorsement. Additionally, Balder-jahn (1988) suggested testing in different geographi-cal locations. In this study, variables previously de-termined to be unsuccessful as predictors of ecologi-cally responsible shopping behavior were incorpo-rated to determine if socio-demographic variablesmay be used to predict ecologically responsibleshopping behavior as expressed by ecolabel en-dorsement in the United States.
Methods
A descriptive survey was used in this study to deter-mine consumer endorsement of ecolabel criteria. Thismethod has been used to examine consumer en-dorsement of different aspects of ecolabels (EPA,2000), as well as for testing other aspects of ecologi-cally responsible shopping attitudes (Balderjahn,1988). The first hypothesis (H1) in this research pre-dicted that consumers differentiall y endorse eco-labels. Some criteria were included because they arecurrently used in existing ecolabels. Additionally, thecriteria were chosen to fit under the impact categoriesderived from the two frameworks utili zed in thisstudy: TNS and LCA. Product categories tested inthis research were chosen according to previous re-search (Palm and Windahl, 1998; EPA, 2000).
Socio-demographic variables have been tested, butgenerally showed to not be reliable predictors ofecologically responsible shopping behavior (Uusitalo,1986; Balderjahn, 1988; EPA, 1993a; 1994; 2000;Berger, 1997). However, socio-demographic vari-ables have not been tested as predictors of ecologi-cally responsible shopping behavior expressedthrough ecolabel criteria endorsement. For this rea-son, socio-demographic variables were tested in thisresearch to predict ecologically responsible shoppingbehavior as expressed by ecolabel endorsement in theUnited States. Therefore, the second hypothesis (H2)predicted that socio-demographic variables affect theimportance of ecolabel criteria to consumers. Socio-demographic variables included age, gender, ethnic-ity, formal education, and household income andcomposition. Ecolabel endorsement is assumed to bean indicator of ecologically responsible shoppingbehavior, although it is recognized that this may notbe true in all cases. However, all other predictors ofecologically responsible shopping behavior fall out-side the realm of this research.
Sample location and population
The research was conducted in Muncie, Indiana.Muncie has long been used to study consumer atti-tudes. What came to be known as the Middletownstudies were initiated in 1924, and since then, Munciehas become one of the most studied communities inthe United States (Hoover, 1990). Muncie was firstchosen by accident, but was later chosen for furtherstudies due to its high number of native-born WhiteAmericans. It was thought to be “as representative aspossible of contemporary America, and… at the sametime compact and homogenous enough to be man-

171
ageable” (Hoover, 1990, p. 5). Additionally, Munciewas at the time not dominated by one industry, norconnected to a university. The first Middletownstudies produced a work that because of its detail andliterary style is regarded as one of the most signifi-cant books in recent American history: Middletown inTransition: A Study in Cultural Conflicts (Lynd andLynd, 1937). Because of the great detail in which thestudies were conducted, Muncie has since frequentlybeen chosen for marketing and attitudinal studies.
The population of interest for this study includesadults at least 16 years old who visited the Bureau ofMotor Vehicles (License Branch) on South MadisonStreet in Muncie, Indiana, during the survey period(July 16-23, 2001). The respondents selected repre-sented an appropriate sample population using lim-ited time, as well as adequate demographic and socio-economic representation, because nearly the entirepopulation of Muncie must visit one of the LicenseBranches in order to renew driver’s licenses, registertheir vehicles, and register to vote. Only one centralLicense Branch is present in Muncie. However, onesmaller branch is located north of Muncie, exclusionof which may contribute to a slight unrepresentative-ness of the sample. However, this study only seeks totest a methodology for further research.
Procedure
Importance of ecolabel criteria to respondents wasmeasured through a questionnaire distributed by thePrincipal Investigator to respondents as they enteredthe License Branch. Data were collected on six con-secutive business days from 9:00 AM to 5:00 PM.After the questionnaires were completed, they werecollected and numbered in order of collection. A totalof 340 respondents completed the questionnaire. Nocount of respondents declining to participate in thesurvey was made. Of the 340 respondents, 179 (53%)completed all questions. Unmarked questions werelabeled “no data,” and the remainder of the questionswas used in the analysis.
Two different parts of the survey instrument weredistinguished. In the first part, respondents wereasked to judge the importance of ecolabel criteria infive product categories: Food, Clothing, HouseholdChemicals, Electrical Appliances, and Packaging.The second part elicited responses concerning socio-demographic variables of the respondents (age, gen-der, ethnicity, formal education, combined householdincome, and age of children in the household). Inthese questions, several categories were provided,
and if the answer did not fit in any of the choices, therespondent selected “other” . The socio-demographicquestions were measured categorical and quali tativedata.
Respondents completed the first part of the question-naire by indicating the best response from three pos-sible categories: “ Information important for me tohave on a label” , “ Information unimportant for me tohave on a label” , or “ I don’ t know”. For some of thesocio-demographics variables, a range of responsechoices was provided. For example, there were sevenpossible answers for level of education, from lessthan high school through PhD/professional. Cate-gorical data were used for the socio-demographicvariables age, gender, ethnicity, education, income,and household composition.
Statistical treatment
Chi-square tests were used to test the following rela-tionships:
• endorsement of the presented set of ecolabel cri-teria in the five product categories versus respon-dent’s gender
• endorsement of ecolabel criteria versus presenceof children in respondent’s household
• endorsement of ecolabel criteria versus respon-dent’s self-declared environmentalism.
Analysis of variance was used to determine variationof consumer endorsement of ecolabel criteria withrespect to the respondent’s age, ethnicity, income,education, and self-declared political orientation.
Results
The criteria tested in this study were provided ashypothetical criteria for a hypothetical ecolabel, how-ever plausible. The criteria tested in this researchwere:
• presence of toxins in product
• presence of artificial substances in product
• atmospheric effects from manufacturing
• transportation distance of product
• resources consumed in manufacturing
• waste generation as a result of manufacturing
• use of nonrenewable resources in product
• amount of energy consumed in manufacturing

172
• water pollution as a result of manufacturing
• geographical origin of product
• geographical origin of raw material for product
• product locally produced
• child labor in manufacturing.
Respondents differentially endorsed the presentedcriteria. Five criteria were util ized in all product cate-gories (child labor, water pollution, atmospheric ef-fects, waste generation, and energy consumption). Ofthese five, child labor was the most frequently en-dorsed criterion. This criterion is related to the socialwelfare impact category as associated with the TNSand LCA frameworks, and may indicate that socialwelfare issues are considered important to many re-spondents. The other four criteria are related to envi-ronmental health.
Existing ecolabeling schemes do not incorporate con-sumer endorsement of criteria. Rather, ecolabelingschemes choose criteria according to perceived envi-ronmental impacts of specific product categories. Todetermine consumer preferences for one or morecriteria may be helpful in the development andreformulation of ecolabeling schemes. Consideringconsumer demands constitutes the basis for success-ful marketing activity.
Regarding all tested criteria (some of which were notutili zed in all product categories), the followingstatements can be made. Based on their levels of en-dorsement relative to other criteria, energy consump-tion and transportation distance were unimportant torespondents. Resource consumption and non-renew-able resource consumption were also generally unim-portant to respondents, as well as the criteria locallyproduced and waste generation, which were some-what more frequently endorsed. Water pollution andatmospheric effects were somewhat important torespondents, while presence of toxins, child labor,and principal material were important to consumersin all product categories when present.
These results may indicate that consumers in thissample population are not aware of the interconnec-tion between certain criteria, such as transportationdistance and energy consumption with locally pro-duced and atmospheric effects. They may also indi-cate that respondents are not frequently exposed tosuch concepts or thinking. However, respondentsmay simply not care about the impacts of the con-
sumer products they purchase. These causes and re-lationships need further investigation.
Social variables
In other research, environmental attitudes wereshown to differ across a number of socio-demo-graphic variables. It could be argued, then, that atti-tudes held by people will i nfluence their shoppingbehavior. Therefore, in this study, it was expectedthat a relationship would be found between the socialvariables and endorsement of ecolabel criteria. Sev-eral statistically significant relationships were found(Table 1).
Age was recoded to determine differences betweenyounger and older respondents’ endorsement of eco-label criteria. Respondents in the age category 40+generally seemed to endorse ecolabel criteria morethan younger respondents. However, no statisticallysignificant difference was noted between youngerand older respondents in ecolabel criteria endorse-ment.
In this study, women expressed a higher endorsementof ecolabel criteria than men. African-American re-spondents expressed a statistically significantlyhigher ecolabel criteria endorsement than WhiteAmerican/Non-Hispanic respondents for the productcategories food and household chemicals.
Table 1. Interactions between respondent character-istics and ecolabel criteria endorsement.
Interaction Significance
Age * criteria endorsement NSGender * criteria endorsement
Food 0.033 Household chemicals 0.030 Electrical appliances 0.034 Packaging 0.000Ethnicity * criteria endorsement Food 0.001 Household chemicals 0.003Education * criteria endorsement NSIncome * criteria endorsement Electrical appliances 0.042 Packaging 0.018Children * criteria endorsement NSNS = Not Significant

173
No statistically significant differences were foundbetween education groups and ecolabel criteria en-dorsement. However, a statistically significant differ-ence was found between the <$10,000 income groupand the $70,000-$89,999 group for the product cate-gories electrical appliances and packaging, with thelowest income group expressing the highest ecolabelcriteria endorsement. In addition, the lowest incomegroup tended to have a higher endorsement of eco-label criteria for the clothing category. Except for thehighest income group, all other income groups fol-lowed the same pattern: the lowest income grouprepresented the highest endorsement of ecolabel cri-teria, after which ecolabel criteria endorsement be-comes lower as the respondent’s reported incomeincreases. However, this relationship is not statisti-cally significant for income groups other than thelowest and the second highest. No statistically sig-nificant difference was found between respondentswith children present in the household and thosewithout children present in the household, for anyproduct category (see Table 1 for statistical signifi-cance).
Differential Importance of Ecolabel Criteriato Consumers
The purpose of this study was to test a method fordetermining the importance of ecolabel criteria toconsumers. Two main objectives of the study were toexamine the differential endorsement of ecolabelcriteria, and to examine socio-demographic variablesas predictors of differential endorsement of ecolabelcriteria. This study was thus intended to provide in-sights as to consumer attitudes towards ecolabels sothat standards for policies regarding ecolabels may bedeveloped in order to decrease the environmentalimpacts of consumption.
It is recommended that ecolabeling schemes take intoconsideration the differential importance that con-sumers place on ecolabel criteria. For example, com-prehensive studies examining consumer preferencesin ecolabels and the importance they place on differ-ent criteria are needed, so that this information couldbe incorporated when into setting criteria for eco-labels. Based on the reported research, more compre-hensive studies utilizing a more extensive set of crite-ria and product categories could be conducted, po-tentiall y also in different geographical and politicalsettings. Particularly, it may be beneficial to incorpo-rate aspects of sustainability other than environ-mental criteria, because social welfare and equity
issues were found to be potentiall y the most impor-tant aspects of sustainability for the respondents inthis research. This may have several benefits. Pri-marily, a label incorporating social welfare criteriamay be more appealing to consumers than a strictlyenvironmental label.
It may be generalized that overall, respondents in thestudy desired information about environmental im-pacts of the products they purchase. The populationsampled was from Muncie, Indiana, which may beconsidered fairly socio-demographically representa-tive of the broader American public. Thus, it can beextrapolated that American consumers in general arelikely to desire environmental information in theform of labels. However, the country has subpopula-tions that differ socio-demographically from thesample. Different communities may require differen-tial targeting of ecolabeling and environmental edu-cation efforts. Already, some groups are socio-demographically responsive to green marketing. Ifecolabels are developed only to meet their needs ordesires, the benefits of ecolabeling may not reach allsocio-demographic groups of American society.
In pursuit of the goals of ecolabeling, ecolabelsshould be available to all consumers, and not deemeda luxury, in order to guide real environmental im-provements. Ecolabeling is a rapidly growing greenmarketing activity with considerable potential to al-leviate the environmental impacts of consumption. Amain objective of ecolabeling is to raise awarenessabout potential environmental impacts caused byproducts. By providing information regarding envi-ronmental attributes in the form of ecolabels, envi-ronmental attributes may be incorporated in con-sumer decision-making. Hence, public awareness canbe increased about the environmental impact of con-sumption. In order to make real environmental im-provements, marketers and policymakers must striveto convey the message that in an effort to decreasethe environmental burdens of consumption, individ-ual efforts matter.
For future research, it may be beneficial to utili zeseveral sampling locations and then compare theresults in different cultural and social settings. Alarger sample size and extended sampling time mayalso be beneficial to increase the opportunities tomake generalized conclusions about the broaderAmerican public. This study should be considered apilot project for developing a framework withinwhich criteria importance can be tested. It is sug-gested that other criteria, product categories and

174
sample populations be used in future research, tomore accurately capture the attitudes of the averageAmerican consumer. Ecolabel endorsement is as-sumed to be an indicator of ecologically responsibleshopping behavior. However, all other predictors ofecologically responsible shopping behavior fall out-side the realm of this research. Therefore, it is sug-gested that other predictors of ecologically responsi-ble shopping behavior be tested in future research.
There is a clear lack of literature relative to socio-demographic influences on ecolabel criteria en-dorsement. Socio-economic and demographic differ-ences have been discussed briefly in previous litera-ture relative to environmental attitudes and environ-mentally concerned shopping behavior. However, nostudies have been conducted regarding this aspect ofecolabeling. Future research is needed to explore therelationship between gender, ethnicity, householdincome, and respondent education and ecolabel crite-ria importance to consumers. Since ethnicity, income,and education are still closely related in America,determining the relationships between them and eco-label criteria endorsement may be worthwhile forecolabel development purposes. Studying the rela-tionships between ecolabel criteria importance andsocial structural variables further may provide insightregarding the complex patterns of consumer behav-ior.
References
Arda, M. 1995. The competitiveness of natural prod-ucts with environmental advantages and develop-ing countries. In Green Goods. Kretsloppsdelega-tionen, Rapport 1995:5, pp. 21-25.
Balderjahn, I. 1988. Personality variables and envi-ronmental attitudes as predictors of ecologicallyresponsible consumption patterns. Journal of Busi-ness Research 17.
Berger, I. 1997. The demographics of recycling andthe structure of environmental behavior. Environ-ment and Behavior 29(4):515-531.
Daly, H. 1998. Consumption: The Economics ofValue Added and the Ethics of Value Distributed.In L. Westra and P. Werhane (eds). The Businessof Consumption – Environmental Ethics and theGlobal Economy. Rowman and Littlefield Publish-ers, Inc., Lanham, Maryland.
Environmental Protection Agency. 1992. Status Re-port on the Use of Environmental Labels World-wide. Office of Pollution Prevention and Toxics.Washington, DC.
Environmental Protection Agency. 1993a. Evaluationof Environmental Marketing Terms in the UnitedStates. EPA 1992. Washington, DC.
Environmental Protection Agency. 1993b. The Useof Life Cycle Assessment in Environmental La-beling. EPA 742-R-93-003. Off ice of PollutionPrevention and Toxics, Washington, DC.
Environmental Protection Agency. 1994. Determi-nants of Effectiveness of Environmental Certifica-tion and Labeling Programs. Off ice of PollutionPrevention and Toxics, Washington, DC.
Environmental Protection Agency. 2000. ConsumerLabeling Initiative (CLI). Phase I report. EPA700-R-96-001. Off ice of Pollution Prevention andToxics, Washington, DC.
Fishbein, M., and I. Ajzen. 1975. Belief, Attitude,Intention and Behavior. Addison-Wesley Publish-ing Company, Inc., Reading, Massachusetts.
Hawkins, D., R. Best, and K. Coney. 2001. Con-sumer Behavior – Building Marketing Strategy.Irwin/McGraw-Hill . New York, NY.
Hoover, D. 1990. Middletown Revisited. Ball StateUniversity, Muncie, Indiana.
Kane, D.J., and J.F. Ennis. 2003. The Food Alliance:transforming a regional success story into a na-tional network. In W. Lockeretz (ed). Ecolabelsand the Greening of the Food Market. Proceedingsof a Conference, November 7-9, 2002. Tufts Uni-versity, Boston, Massachusetts. pp. 77-78.
Kinnear, T., and J. Taylor. 1996. Marketing Research– An Applied Approach. 5th ed.
Lynd, R., and H. Lynd. 1937. Middletown in Transi-tion: A Study in Cultural Confli cts. Harcourt,Brace and Co., New York, NY.
Malthus, T. 1798. An Essay on the Principle ofPopulation; or, A View of its Past and PresentEffects on Human Happiness. 7th ed. A. Kelley1971. New York, NY.
Nattrass, B., and M. Altomare. 1999. The NaturalStep for Business – Wealth, Ecology and the Evo-lutionary Corporation. New Society Publishers,Gabriola Island, BC, Canada.
Nesmith, C., and P. Wright. 1995. Gender, resources,and environmental management. In B. Mitchell(ed). Resource and Environmental Management inCanada: Addressing Conflict and Uncertainty. Ox-ford University Press, Toronto.
Palm, L., and S. Windahl. 1998. How Swedish con-sumers interpret and use environmental informa-tion – a study of quantitative environmental prod-uct declarations. Konsumentverket, Rapport1998:28. Stockholm, Sweden.

175
Ryan, C. 1995. Green goods: shaping an ‘ industrialecology’ . In Green Goods. Kretsloppsdelegationen,Rapport 1995:5, pp. 74-88.
Sætrang, Ø. 1995. Environmental challenges regard-ing production and consumption patterns. In GreenGoods. Kretsloppsdelegationen, Rapport 1995:5,pp. 16-20.
Salzman, J. 1997. Informing the green consumer –the debate over the use and abuse of environmental
labels. Journal of Industrial Ecology 1(2)Schor, J. 1999. What’s wrong with consumer soci-
ety? Competitive spending and the “new consum-erism”. In R. Rosenblatt (ed). Consuming Desires– Consumption, Culture, and the Pursuit of Happi-ness. Island Press, Washington, DC.
Uusitalo, L. 1986. Environmental Impacts of Con-sumption Patterns. St. Martin’s Press, New York.


177
Soil Amendment Quality Certification:The Woods End/Rodale Seal Program
William Brinton1 and Scott Meyer2
____________________________1Woods End Research Laboratory, Mt Vernon ME 04352. Corresponding author. Email: [email protected] Gardening Magazine, Emmaus PA. Email: [email protected]
The presence and use within farming of soil amend-ments derived from recycled plant and animals resi-dues and waste products has exploded in world mar-kets during the past 10 years. It is estimated that inAmerica alone, 7 million tons of composted wastesare used in farming (Hogg et al., 2002). A similarquantity is estimated for continental Europe. Many ofthese composts are used in organic farming. How-ever, of these products, only some are regularlytested regarding mandatory state standards pertainingto hygienic and site-regulatory requirements. Com-posts are generally viewed as benign; few are exam-ined as to content, and still fewer for efficacy rele-vant to specific plant-growth or soil-improving po-tentials. In Europe the Eco-Label seal program ex-amines general composition as a soil -conditioner(Hogg et al., 2002). In Germany, the organizationBundesgütegemeinschaftkompost (BGK) awards aseal based principally on achieving low heavy metalcontent plus meeting hygienic limits (Hogg et al.,2002). In the US, a compost industry-group, USComposting Council, awards a testing seal of assur-ance based on evidence of laboratory testing alone(USCC, 2002).
This paper reports a new voluntary quality seal pro-gram for composts, RSAP, that sets standards withinspecific horticultural end-use types (Rodale, 2002).
Compost as a Unique Product
Recycled compost products are of a partly unknownnature (from the consumer standpoint) regarding bothderivation and quality of performance (Brinton andMeyer, 2002). Laboratory survey work to date withcomposted products indicates widely varying indicesof performance and types of ingredients (Brinton etal., 1996; Long, 1998; CWMI, 2002). Furthermore,with recent reports of the presence of herbicide resi-dues clopyralid and picloram in composts (Brinton,2002), a sharper focus on environmental quality hasbecome evident, while horticultural performanceremains essentially unrecognized in standards. Previ-
ously, we reported widely varying indices of per-formance for composts of potting-mix quality andpeat-compost mixtures (Brinton and Tresemer, 1996).
During composting breakdown, some stabili zationoccurs, whereby the product achieves a state of “ma-turity” generally accepted as beneficial to plants.However, the presence of incomplete breakdownproducts from natural decay, including ammonia andvolatile organic acids (Brinton, 1999), may result incompost being odorous and performing poorly, orbeing phytotoxic.
Significant breakdown of natural and xenobioticcompounds does occur in composting (Brinton andEvans, 1999; Rynk, 1999). However, the length oftime that is required varies, depending on severalfactors. A pertinent requirement in evaluating thepresence of any natural or synthetic chemical resi-dues is to examine the relative completeness of thedecay cycle. A young compost, by reason of beingfresh or immature, may be expected to contain someresidues. On the other hand, a properly matured com-post may be expected to contain little or no objec-tionable residues. Presently, there are no mandatorystandards for compost. The Washington Departmentof Transportation requires a Solvita maturity test tobe performed before the product is used in specifiedprojects (WADOT, 1997). The California Depart-ment of Transportation has employed a similar sys-tem (Caltrans, 2001). Recently, to encourage morechecking of compost maturity, the compost divisionof the California Integrated Waste ManagementBoard has updated the Caltrans test requirement as aflowchart, and has proposed to work with the newMaturity Index (CCQC, 2001) to monitor more com-posts (M. Leon, California Integrated Waste Man-agement Board, personal communication). A recentevaluation of the maturity index approach revealedthat it correlates positively with observed plant per-formance (UC Davis, 2002).
Taking account of these facts and considering theultimate use of composts for professional organic
178
horticulture suggest that performance of the productshould be an important driving factor for ecologicalmarketing, and that reasonable safety thresholds mustbe established for low-level contamination, includingchemicals and fine plastic particles.
The Need for a New Seal of Quality
Phase I: A laboratory survey of commercial, naturalsoil amendments was developed in fall 1998. Sam-ples of readily available, bagged commercial com-posts from across the US were tested, with the testdata then compared with information provided by thecompost producer related to the use of the material(Long, 1999). Subsequently, in 2001, we obtainedsamples of commercial compost products within aregion of intensive composting. Samples were spli tand riffled from commercial bags, and analyzed forcomposition, and tested for plant growth perform-ance.
Phase II. We surveyed composters across the US todetermine mixtures, quantities and qualities of re-cycled products (Brinton, 2002). Approximately 3milli on m3 of compost were accounted for in oursurvey. This data supplied feedback about the natureof compost ingredients and the concerns of producersin achieving end-product quality.
Plant growth tests were performed by mixing freshmedia with limed peat-moss based on the “dilution-to-standard-conductivity” (DSC) procedure (USDAand USCC, 2002). Two types of plant tests were em-ployed. One uses garden cress (Lepidium sativum),which is sensitive to maturity but not to clopyralid orpicloram. The other uses field peas (Pisum sativum)and red clover (Trifolium repens) to assess the pres-ence of auxinic herbicides generally. Clover is ap-proximately three times more sensitive than peas(Brinton, 2002). Subsamples of each compost samplewere shipped to an environmental laboratory forGC/MS analysis for base- and acid-extractable or-ganic contaminants.
Results
In our Phase I analytical survey, 51% of the commer-cial bagged composts were described on the label asof a leaf-yard-waste nature, and a similar number(49%) specified manure in the name. 75% listed spe-cific ingredients, but several listed possible ingredi-ents, suggesting that a generic bag label was beingused. There were no biosolids (sewage sludge) com-posts indicated. There were 16 companies repre-
sented on the label of the 39 composts tested, indi-cating that many companies offered multiple prod-ucts. Only four companies gave web sites for com-pany information and only five gave phone numbersfor product information. All compost products thathad labels provided multiple use guidelines rangingfrom mulch to seedling-starter mixes, supporting thegeneral belief in the “cure-all ” nature of composts.
Composted commercial products’ coefficient ofvariation in total carbon, salt (conductivity), and C:Nratio was 58, 97 and 63%, respectively. The pH var-ied from less than 5.0 to 8.8. Only 18% of commer-cial products listed N-P-K contents, which varied by46, 31 and 25%, respectively. The decompositionindex of the products varied from “ fresh, raw com-post” to “ full y mature” using the Solvita index(USDA and USCC, 2002). The cress test calibratedto a standard peat-lime mixture (=100%) ranged from11 to 120%, with a mean of 47% in the first surveyand 46% in the second. Key test traits, including pHand salt level, correlated very poorly with to recom-mended application rates for soil. Of the compoststested, the mismatch of recommended rates to testtraits suggests to us that compost marketing in the USis seen primarily as a disposal route for recycled ma-terials. This underscores the caveat emptor principlefor composts and natural soil amendments.
RSAP: A Quality Seal for Composts
End use and test groups
The Rodale/Woods End Seal divides compost prod-ucts into six categories based on their primary usewithin horticultural-agricultural systems. Each usegroup is then linked to a set of primary analyticaltraits (Table 1). Within these analytical traits, a rank-order scoring technique is applied.
Definitions of market types
A use-group is also a market group, and this meansthe best or highest or most appropriate use of a com-post product, as determined by a technical standardcomprising an analytical profile. Closer definitionsand primary concepts of these uses are described inTable 2. This also links to “Allowed Use,” which setsforth suggested label types and application rateranges, also applying to the label-use accuracy. Thistable becomes the driving force for all classificationand testing.
Scoring and ranking
Laboratory test results form an analytical profile.
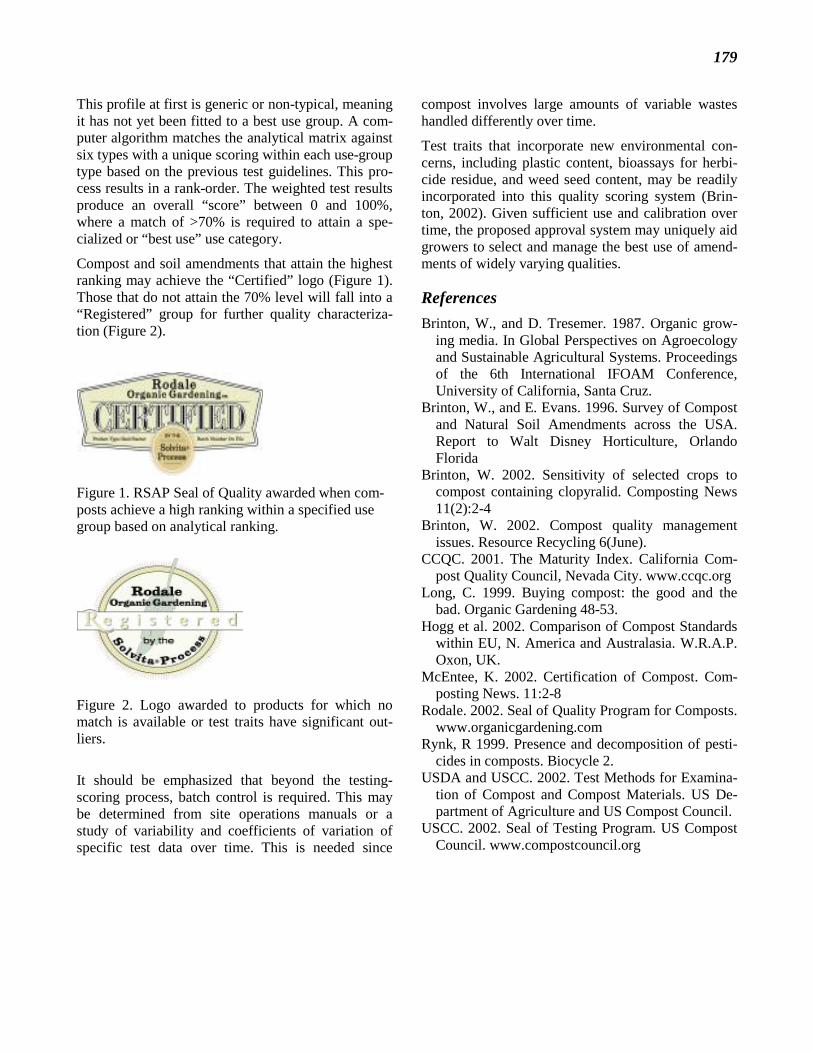
179
This profile at first is generic or non-typical, meaningit has not yet been fitted to a best use group. A com-puter algorithm matches the analytical matrix againstsix types with a unique scoring within each use-grouptype based on the previous test guidelines. This pro-cess results in a rank-order. The weighted test resultsproduce an overall “score” between 0 and 100%,where a match of >70% is required to attain a spe-cialized or “best use” use category.
Compost and soil amendments that attain the highestranking may achieve the “Certified” logo (Figure 1).Those that do not attain the 70% level will fall into a“Registered” group for further quality characteriza-tion (Figure 2).
Figure 1. RSAP Seal of Quality awarded when com-posts achieve a high ranking within a specified usegroup based on analytical ranking.
Figure 2. Logo awarded to products for which nomatch is available or test traits have significant out-liers.
It should be emphasized that beyond the testing-scoring process, batch control is required. This maybe determined from site operations manuals or astudy of variability and coefficients of variation ofspecific test data over time. This is needed since
compost involves large amounts of variable wasteshandled differently over time.
Test traits that incorporate new environmental con-cerns, including plastic content, bioassays for herbi-cide residue, and weed seed content, may be readilyincorporated into this quality scoring system (Brin-ton, 2002). Given sufficient use and calibration overtime, the proposed approval system may uniquely aidgrowers to select and manage the best use of amend-ments of widely varying qualities.
References
Brinton, W., and D. Tresemer. 1987. Organic grow-ing media. In Global Perspectives on Agroecologyand Sustainable Agricultural Systems. Proceedingsof the 6th International IFOAM Conference,University of California, Santa Cruz.
Brinton, W., and E. Evans. 1996. Survey of Compostand Natural Soil Amendments across the USA.Report to Walt Disney Horticulture, OrlandoFlorida
Brinton, W. 2002. Sensitivity of selected crops tocompost containing clopyralid. Composting News11(2):2-4
Brinton, W. 2002. Compost quality managementissues. Resource Recycling 6(June).
CCQC. 2001. The Maturity Index. Cali fornia Com-post Quality Council , Nevada City. www.ccqc.org
Long, C. 1999. Buying compost: the good and thebad. Organic Gardening 48-53.
Hogg et al. 2002. Comparison of Compost Standardswithin EU, N. America and Australasia. W.R.A.P.Oxon, UK.
McEntee, K. 2002. Certification of Compost. Com-posting News. 11:2-8
Rodale. 2002. Seal of Quality Program for Composts.www.organicgardening.com
Rynk, R 1999. Presence and decomposition of pesti-cides in composts. Biocycle 2.
USDA and USCC. 2002. Test Methods for Examina-tion of Compost and Compost Materials. US De-partment of Agriculture and US Compost Council.
USCC. 2002. Seal of Testing Program. US CompostCouncil. www.compostcouncil.org

180
Table 1. RSAP end-use groups and associated primary analytical traits assigned the greatest weighting forranking of quality.
Analytical Determinants
Compost End-Use Category
pH MaturityIndex
OrganicMatter
Salts andSoluble Ions
Mineralsand Metals
BulkDensity
PlantGrowth
Seed Starter √ √ √ √ √ √ √
Container Mix √ √ √ √ √ √ √
Garden Compost √ √ √ √ √ √
Topsoil Blend √ √ √ √
Mulch √ √
Natural Fertilizer √ √ √

181
Table 2. RSAP end-use groups descriptors.
Quality SealEnd-UseCategory
Allowed Use Unique Properties
SuggestedApplication Rate
Seed Starter
General plant substrate forstarting seedlings in shallowcontainers for generalgardening and latertransplanting.
Loose texture, high airvolume and water-holdingcapacity, mature organicmatter, low salinity, lowNH4, high available N,moderate nutrient releasepotential.
Generally used atrates of 25-100% ofblend.
Container Mix
Medium to large containersfor growing out, nurserystock, house plants andornamentals.
High air volume and waterholding capacity, matureorganic matter, low salinity,low NH4, moderate tocoarse texture, moderatenutrient release potential.
Generally used atrates of 50-100% ofblend.
Garden Compost
All -purpose garden use andin greenhouse beds,incorporation into soil orcontainer media at moderateto high application ratestypical of soil building.
Medium organic matter,moderate to medium-highavailable nutrients andnutrient release potential,mature organic matter,medium to medium-highsalinity; low C:N ratio, lowNH4:NO3 ratio.
Generally used atrates of 25- 250 kgper 10m².
Topsoil Blend
Topsoil replacement, directseeding, lawn-care, soilrepair and garden raisedbeds. High to very highapplication rates or coverage.
Simulates rich nativetopsoil , low to moderateorganic matter, medium tohigh density, low C:N ratio,low salinity, stable, lowNH4:NO3 ratio.
Generally used for filland soil replacementup to 100%.
Mulch
A coarse blend for surfaceapplication only, undershrubs and for general non-growth purposes; 1-8” thicksurface application for weedcontrol, gradual nutrientrelease, and surface organicmatter improvement.
High organic matter,moderate to high C:N ratio,low to very low salinity andsoluble nutrients, lowNH4:NO3 ratio.
Generally used forcover layers up to100%.
Natural Fertilizer
A high nutrient product bestsuited to be used sparingly toadd nutrients to soil .
Moist to very dry,spreadable, low dust, passespathogen tests, highavailable nutrients and rapidnutrient release potential.
Generally used atrates of 2-35 kg per10 m².


183
Why Pesticide Risks Matter andPose Tough Challenges for Ecolabel Programs
Charles M. Benbrook1
____________________________1Benbrook Consulting Services, 5085 Upper Pack River Road, Sandpoint, ID 83864. Consultant to the WWF/WPVGA/UWcollaboration. Email: benbrook@hil lnet.com
Why Consumers Remain Focused onPesticides in Food
Between two-thirds and three-quarters of consumersvoice strong or very strong concerns over pesticideresidues in food. A market research firm recentlysummarized findings from a May 2002 series offocus group sessions on ecolabeled potatoes with thecomment: “Consumers certainly want to do what’s‘good for the environment.’ Even more importantly,however, they want to do what’s ‘good for mybody’ ” (Houlihan, 2002).
Consumers remain concerned over pesticide residuesin food for good reason. New scientific informationstrongly reinforces concern on both sides of the riskequation – pesticide exposure and toxicity. Manypeople are now aware that pregnant woman, infants,children, and the health-compromised are more vul-nerable to pesticide-related health problems and thatUS regulatory science and policy in the past failed totake this biological reality into account, or did so in acursory way.
What does “ far more vulnerable” mean in this con-text? US Environmental Protection Agency (EPA)risk assessments often show that vulnerable popu-lations face 100-fold to 1,000-fold higher risks thando healthy adults (Office of Pesticide Programs,2002).
Exposure
Through the 1970s and until the late 1990s, EPAbased its pesticide risk assessments on exposures tohealthy adults. The Food Quality Protection Act(FQPA), passed in 1996, directed the EPA to conducta reassessment of all food uses of pesticides, takinginto account the heightened susceptibility of infantsand children, the elderly, and other vulnerable popu-lation groups.
Infants consume more food per kilogram of body-weight than adults and a much less varied diet. As a
result, exposure to a pesticide from consumption of agiven food is greater per kilogram of infant/childbody weight compared to adults (National ResearchCouncil, 1993).
In the early 1990s relatively little was known aboutthe frequency or levels of pesticides in food as actu-ally eaten. Then-existing government data on resi-dues had been collected as part of tolerance enforce-ment programs and represented residues at the farmgate, prior to washing, shipping, storage, marketing,and preparation. Relatively insensitive analyticalmethods were employed.
To improve the accuracy of pesticide dietary riskassessments, Congress funded the USDA’s PesticideData Program (PDP) beginning in 1991. By design,this program focuses on the foods consumed mostheavily by children, and the food is tested, to theextent possible, “as eaten” (Agricultural MarketingService, 2002). That is, banana or orange samples aretested without the peel; processed foods are tested asthey come out of a can, jar or freezer bag.
Almost 10 years of PDP testing has greatly enhancedunderstanding of pesticide residues in key segmentsof the US food supply. In a given year’s results, sam-ples of a particular food include domestic productionand imports roughly proportional to their respectiveshare of overall consumption. Also, market claimsassociated with a given food item, such as “organic,”“ IPM-grown,” “ no detectable residues” or “pesticidefree,” are recorded and appear in PDP recordsroughly in proportion to their occurrence in retailmarket channels (Baker et al., 2002). As a result,PDP results make it possible to compare the pesticiderisks in domestic versus imported foods, as well as tocompare the frequency and levels of residues bymarket claim (Groth et al., 2000).
There is good news and bad news in the PDP results.Some major food groups – dairy, meat, and poultryproducts – contain relatively few detectable pesti-

184
cides and contribute very modestly at the nationallevel to dietary exposure and risk. Relatively fewpesticides are routinely present in food at levels thatpose significant risks, to the extent contemporary riskassessment science and toxicological data accuratelyreflect real-world risks. Most high-risk food-chemicalcombinations are known and under active regulatoryreview.
The bad news is that six years after passage of theFQPA, key children’s foods still contain worrisomepesticide residues (Consumers Union, 2001). PDPdata document the foods most likely to contain resi-dues of high-risk pesticides: apples, pears, peaches,grapes, green beans, tomatoes, peas, strawberries,spinach, peppers, melons, lettuce, and various juices.The data make it possible for EPA and others to carryout detailed dietary risk assessments, incorporatingthe percentage of samples testing positive, the levelsand distribution of residues found, the presence ofmultiple residues that work through a common modeof biological action, and the relative mammaliantoxicity of pesticides found.
Nearly three-quarters of the fresh fruits and vegeta-bles (F&V) consumed most frequently by children inthe US contain residues, and almost half the PDPF&V samples tested from 1994-1999 contain two ormore residues (Baker et al., 2002). In general, soft-skinned fruit and vegetables tend to contain residuesmore frequently than do foods with thicker skins,shells, or peels.
The pattern of residues in organic foods tested by thePDP differs markedly from the pattern in conven-tional samples, as shown in Table 1. Conventionalfruits are 3.6 times more li kely to contain residuesthan organic fruit samples, and conventional vegeta-bles are 6.8 times more li kely to have one or moredetectable residues.
The Baker et al. paper in Food Additives and Con-taminants is the first peer-reviewed study comparingresidues in organic, ecolabeled, and conventionalfoods. It draws on three data sets: 1994-1999 PDPdata, residue testing by the California Department ofFood and Agriculture, and Consumers Union testingof four foods. Consistent and highly significant dif-ferences were found in each of the three data sets,lending confidence to the statistical results despiteoften small sample sizes of specific organic foodsand ecolabeled produce. As expected, conventionalfoods are more li kely to contain residues than organicfood. The pattern of residues in IPM-grown and “No
Detectable Residue” (NDR) samples was closer toconventional foods than organic.
Table 2 presents comparable results drawing on PDPyear 2000 testing. Conventional samples were 3.2times more li kely to contain residues compared toorganic samples, whereas NDR samples actuallycontained residues more frequently than conventionalproduce. The number of NDR samples in year 2000PDP testing was small, so these results should beinterpreted with caution.
Compared to organic produce, conventional samplescontain residues more frequently and also tend tocontain multiple residues more often, as shown inTable 3. The average positive sample of conventionalproduce tested by PDP in 2000 contained 2.5 resi-dues, whereas positive organic samples contained 1.5on average. Note that imported foods consistentlycontained more residues than domestic samples, re-gardless of market claim.
Table 4 provides further perspective on the frequencyof multiple residues, drawing on two data sets (PDP,1994-1999; Consumers Union, four crops). Averagedacross the two data sets, just under 7% of positiveorganic samples and 54% of positive conventionalsamples contained multiple residues. The averagepositive conventional apple sample contained 3.2pesticide residues, peaches contained 3.1, and celeryand cucumber contained 2.7 (Baker et al., 2002).
The FQPA requires EPA to take dietary, water, resi-dential, and occupational exposures into account inreaching judgments whether cumulative pesticiderisks exceed “ levels of concern.” Detailed pesticideexposure assessments in agricultural communitieshave shown that exposure levels increase duringspray season even among children whose parents arenot occupationally exposed (Koch et al., 2002). In-halation of indoor air accounted for almost 85% ofchlorpyrifos exposure in a study based in Maryland,exposure that should decline as a result of recentregulatory actions (Pang et al., 2002).
Given that almost all Americans consume pesticidesevery day, and also are periodically exposed fromhome, garden, and urban uses of pesticides, it is nowonder that recent biomonitoring studies frequentlyfind residues of pesticides and their metabolites inurine or blood (MacIntosh et al., 1999; Adgate et al.,2001; Mills and Zahm, 2001; Lu et al., 2002). InMarch 2002 the Centers for Disease Control and Pre-vention (CDC) released the most extensive analysisever done of environmental contaminants in blood

185
and urine (CDC, 2001). While lead and tobacco ex-posure markers appear in decline, organophosphate(OP) insecticides and their metabolites were found innearly all urine samples tested.
Toxicity
During fetal development and the first years of life,infants are much less able to detoxify most pesticidesand are uniquely vulnerable to developmental toxins,especially neurotoxins, given that the brain and nerv-ous system continue developing through about age 12(National Research Council, 1993; Cooper et al.,1999; Eskenazi et al., 1999).
Implementation of the FQPA has triggered an explo-sion in toxicological and risk assessment research onthe developmental effects of pesticides, with specialfocus on those capable of impairing either the devel-opment or functioning of the endocrine system. Newtoxicological data have forced downward by one totwo orders of magnitude the allowable levels of ex-posure to dozens of pesticides found in food (Gray etal., 1999; Office of Pesticide Programs, 2002). TheEPA has had to phase out hundreds of food uses ofrelatively high-risk pesticides (mostly OP insecticidesuses) in order to meet the FQPA’s new “ reasonablecertainty of no harm” standard, with hundreds moreto go (Consumers Union, 2001).
In the last decade, compelling new evidence hasemerged on the mechanisms through which pesti-cides can disrupt development at very low doseswhen exposures occur during critical developmentalstages. Literature through early 1999 is summarizedin a special issue of the journal Toxicology and In-dustrial Health (Colborn et al., 1999). Just a fewexamples follow that focus on research publishedsince the 1999 review.
A team of researchers at the University of California-Berkeley School of Public Health found that expo-sures to pesticides during pregnancy significantlyheightened risk of children developing leukemia, andthat the more frequent the exposures, and the earlierin life, the greater the increase in risk (Ma et al.,2002). A team in the Department of PreventiveMedicine, University of Southern Cali fornia, foundthat exposure to pesticides in the home during fetaldevelopment and the early years of life increased therisk of non-Hodgkin’s lymphoma, with odds ratios ashigh as 9.6 for Burkitt lymphoma (Buckley et al.,2000).
A study in Ontario, Canada confirmed that exposuresto pesticides three months prior to conception and
during pregnancy increased the risk of spontaneousabortions (Arbuckle et al., 2001).
Research supported by the French Ministry of En-vironment documented clear linkages between ex-posures to pesticides commonly used in grape vine-yards and long-term adverse cognitive effects (Baldiet al., 2001). Cognitive performance in a group ofchildren living in an upland agricultural region inMexico with substantial pesticide use was comparedto that of a similar cohort in a nearby vil lage. Chil -dren exposed to pesticides had lessened stamina andattention spans, impaired memory and hand-eye co-ordination, and greater difficulty making simple linedrawings (Guillette et al., 1998).
Just-published work on the developmental neuro-toxicity of the most widely used insecticide in theUnited States, chlorpyrifos, showed that this OP tar-gets neural cell replication and differentiation, as wellas the functioning of glial cells (Qiao et al., 2002).The authors conclude that exposures to this OP dur-ing the first few years of life are probably a greaterrisk than during fetal development, although prenatalexposures appear to disrupt the architectural organi-zation of specific regions in the brain and the devel-opment of the fetal li ver.
Anti-androgenic pesticides have been shown to causedemasculinization in several species by blocking thereceptor sites needed for male sexual hormones toperform their normal functions during development(Gray et al., 1999; Baatrup and Junge, 2001).
Why the public remains focused on pesticiderisks
Food exposure to pesticides remains a significant butreadily managed public health problem (ConsumersUnion, 2001). Pesticides in food rarely poison peoplefrom a single acute exposure episode – aldicarb inCalifornia watermelons in the 1980s was a rare ex-ception. Pesticide exposures are also generally notthe sole cause of developmental or degenerative dis-eases. Still, pesticides in food contribute to reproduc-tive, developmental and chronic health problems,birth defects, degenerative neurological diseases, andcancer. Some do so through overt toxicity (i.e., expo-sures trigger a developmental abnormality or growthof cancerous cells). Others do so by impairing thedevelopment or functioning of the immune system,hence increasing the susceptibility of a person to avariety of diseases. The degree to which pesticidescontribute to diseases is not known, which is onereason that regulators impose safety factors in deter-

186
mining dose levels consistent with a “ reasonablecertainty of no harm” standard.
While the FQPA has set the stage for EPA actionstargeting high-dietary-risk pesticide uses, no onefamili ar with the implementation process expectsdecisive or aggressive action in the foreseeable fu-ture. In a detailed assessment of progress through theend of 2000, Consumers Union (CU) gave the EPAan average grade of C- for its FQPA implementationefforts. The highest grade, a B+, was awarded forprogress in reducing residential exposures; the lowestgrade, a D, was triggered by very modest progress inreducing dietary exposures (Consumers Union,2001). An update using CU’s grading system wouldproduce comparable results today because few ac-tions restricting high-risk pesticide uses have beentaken since early 2001.
In the years ahead consumers are li kely to continuereading about newly discovered, sometimes worri-some pesticide risks and the lack of much progress inreducing risks via government action. The moneyspent on organic and ecolabeled foods is li kely togrow appreciably as a result.
Given that pesticide concerns will typically be themajor, or at least among the major factors leading aconsumer to seek out ecolabeled food, the way eco-label programs deal with pesticide use and risks willbe a decisive factor in gaining consumer trust andbrand loyalty. Experience to date with U.S. ecolabelprograms suggests that consumer recognition andtrust is hard to win and easy to lose.
How Current Ecolabels Deal with PesticideRisks
Current food ecolabel programs make two sorts ofclaims regarding pesticide use and risks. One set isbased on food quality outcomes, and typicallyfocuses on the relative presence or absence of resi-dues in products. A second set of claims refers tohow a crop was produced, often not making any di-rect food safety claims. Some ecolabel programsmake both types of claims – for example, food pro-moted as free of pesticides and grown using envi-ronmentally friendly production practices.
Three broad categories of food ecolabels are dis-cussed below: organic; based on a residue claim; andsustainable, or based on an eco-friendly productionsystem. Pesticide use and risks are dealt with inmarkedly different ways across programs falling inthese categories.
The global debate over agricultural biotechnologyhas triggered increasingly rancorous debate on theimpacts of farming systems and technology on pesti-cide use and safety. Often organic farming is cham-pioned by small farm, environmental and consumeradvocates as the low-risk, sustainable alternative tothe planting of GMO seeds, while biotech proponentscharacterize organic systems as unproductive, back-wards, and in any event, just as risky as conventionalsystems. They point to the use in organic farming ofnon-synthetic pesticides and botanicals and the lackof residue testing for these pesticides as evidence thatorganic food is, or may be as risky as conventionalfood.
Organic food
Certified organic food is grown in compliance with ahighly evolved set of standards that include prohibi-tion against the use of most synthetic pesticides, in-cluding all those known to pose even modest levelsof human health risk. Organic farmers may and oftendo apply sulfur, oils, several botanicals, Bacillusthuringiensis (Bt), soaps, certain microbial pesticides,and pheromones.
By volume, the leading pesticides in both organic andconventional agriculture are sulfur, horticultural/pet-roleum distil lates and oils, and copper-based fungi-cides. There are some formulations of these pesti-cides approved for organic production and manyothers available to conventional growers. These pes-ticides are used in similar ways for comparable rea-sons on organic and conventional fruit and vegetablefarms. Sulfur is almost certainly the most commonpesticide residue present on conventional and organicF&Vs, but it is never tested because it is exempt fromthe requirement for a tolerance and poses essentiallyno risk through the diet. Copper also is not testedbecause of tolerance exemptions and the fact thatcopper is an essential nutrient and harmless at thelevels ingested as food residues.
Organic farmers also rely on pheromones, Bacillusthuringiensis insecticides, and products that coatproduce with nontoxic, biodegradable materials thatare often approved as food additives and are exemptfrom the need for a tolerance (e.g., soaps and clays).Residues of these pesticides are rarely tested becausethere are no tolerances to enforce and no basis forfood safety concerns, given how these products areused in production agriculture.
The major botanical pesticides of concern in organicproduction, based on extent of use and toxicity, con-

187
tain pyrethrins as the active ingredient. Pyrethrins aretoxic but degrade rapidly after spraying and hencerarely leave detectable residues. Also, they are ap-plied at very low rates, on the order of one to twoone-hundredths of a pound per acre. Other botanicalsof possible concern include rotenone and sabadilla.The most recent survey of organic farmers carried outby the Organic Farming Research Foundation foundthat only 9% of 1,045 farmers applied botanicalsregularly (mostly pyrethrins and neem), and that 52%never use them, 21% use them rarely, and 18% “onoccasion” (Walz, 1999).
Annual inspections are carried out by organic certi-fiers to assure that only permitted production inputsand practices are used on certified fields. The farmplans submitted by growers to certifiers must spellout the methods used to control pests common in theregion; experienced organic field inspectors have in-depth knowledge of what farmers need to do to avoiddamaging pest losses. When farm plans gloss overcritical pest management challenges, applicants canexpect a series of questions from inspectors duringannual farm visits and a degree of skepticism whencertification decisions are being made. Some certifi-ers periodically test a small percentage of the foodthey certify each year for residues of synthetic pesti-cides; with full i mplementation of the National Or-ganic Program rule, certifiers will li kely test for pesti-cides somewhat more regularly in order to retainaccreditation.
Available data firmly support the conclusion thatbuying organic food is the best way for consumers toreduce exposure to pesticide residues in food, espe-cially residues of higher-risk products (see Tables 1-4and Baker et al., 2002; Younie and Litterick, 2002).Still , organic food is not free of pesticide residues.For example, nearly all samples of fresh organic (andconventional) stone fruit, grapes, tomatoes, and cer-tain other crops contain residues of sulfur or horti-cultural or petroleum oils and about one-quarter oforganic F&Vs test positive for prohibited syntheticpesticides.
It is legitimate to ask why one-quarter of organicF&V samples contain residues of synthetic pesticideswhen presumably no certified organic productionfields are directly sprayed with these materials. Liketransgenic DNA, pesticides are ubiquitous and mo-bile across agricultural landscapes. Most positiveorganic samples contain low levels of pesticideswidely used on nearby conventional fields that mostli kely stem from drift, use of contaminated irrigation
water, soil -bound residues of persistent pesticides, orcross-contamination with post-harvest fungicides instorage facilities (Baker et al., 2002). The small per-centage of samples sold as organic and found to con-tain relatively high levels of residues li kely arisefrom inadvertent mixing of produce, laboratory error,mislabeling, or deliberate fraud.
Those hoping to convince consumers that pesticideresidues in organic food are as risky as those in con-ventional foods are not likely to let these facts get inthe way of their arguments. Expanded residue testingof botanicals and biopesticides would be needed todecisively settle the empirical issues behind this de-bate. But settling this largely artificial controversywould mean less testing of much more significantpesticide dietary risks, a tradeoff thus far rejected bygovernment regulatory and research agencies.
Programs based on residue claims
Some ecolabels are based on claims of “No Detect-able Residues,” and are often called “NDR” pro-grams. The added claim “pesticide free” is sometimesused in advertising and promotional material associ-ated with NDR-certified food.
The best known and most successful NDR programsare run by the Gerber Product Company and Scien-tific Certification Systems (SCS), an Oakland, Cali -fornia based company. The SCS “NutriClean” pro-gram uses an NDR standard of 0.05 ppm, althoughSCS is reportedly moving toward a 0.01 ppm stan-dard (Stan Rhodes, President, Scientific CertificationSystems, private communication, 2002).
Gerber quality control procedures are designed toassure “no detectable pesticides in finished baby foodproduct.” Their program relies on grower contractsand reporting of pesticide use, a “Do Not Use” list,and use of highly sensitive analytical methods at sev-eral stages of the food manufacturing process, withlimits of detection as low as 0.001 ppm and rarelyover 0.01 ppm.
The lower the residue level allowed in an NDR pro-gram, the stronger the food safety claims that can besupported by the program. Lower allowed levels willrequire farmers to make more substantial changes inIPM systems and typically will rule out most mid- tolate-season uses of high-risk pesticides. Lower levelsalso will increase program costs since residue testingwill have to be done with more sophisticated methodsand equipment. In some instances, grower contracts,multi -faceted quality control procedures, and chain-

188
of-custody procedures are necessary to guarantee theabsence of residues above NDR program standards.
NDR programs that make “pesticide free” claims arevulnerable to legal challenges since such claims canbe misleading. This is because the “ free” in “pesti-cide free” actually means “ free of a subset of pesti-cides tested for above a given level of detection at thetime food is consumed.” NDR programs typicallyequate “pesticide free” at the time food is purchasedand consumed with reduced use of pesticides duringthe production season. While seemingly logical, foodthat meets an NDR standard when consumed mightcontain appreciable residues prior to harvest or whensold to consumers, as was clearly the case in 1994-2000 PDP testing (see Tables 3 and 4). Publiclyavailable residue data on NDR and conventional pro-duce suggests that pests on fields meeting an NDRstandard may have been managed in much the sameway as pests in nearby conventional fields growingthe same crop. Greater transparency and better under-standing are needed regarding just what an NDRlabel means in terms of pesticide residues, since someconsumers are looking to ecolabels to provide bothgreater assurances of food safety and lessened envi-ronmental and farmworker risks from pesticide use.
Still , consumers can be confident that NDR-certifiedfood rarely contains residues over 0.05 ppm. Unfor-tunately, it is difficult to make a case that the absenceof residues over 0.05 ppm means that NDR-certifiedfood is largely free of pesticide risk. Azinphos-methyl residues in apples are among the major con-tributors to overall OP dietary risk, yet the mean resi-due level found in PDP testing ranges between 0.03ppm and 0.06 ppm from year-to-year. Methamido-phos in tomatoes is another risk driver, with meanresidues typically in the same range. A majority ofthe 100 food-pesticide combinations ranking higheston Consumers Union’s list of risk-driver pesticideuses involve cases where mean residues are under the0.05 ppm NDR standard (Groth et al., 2000).
The highest-risk pesticide-food combination inEPA’s cumulative OP dietary risk assessment wasdimethoate in grapes; the mean dimethoate residuefound was well below 0.05 ppm. Accordingly, a sig-nificant portion of conventional grape samples testedby the PDP would meet the 0.05 ppm NDR programstandard.
Consumers Union developed a method to calculatetolerance levels for high-risk pesticides that in allli kelihood would meet the FQPA’s “ reasonable cer-
tainty of no harm” standard (Groth et al., 2000). Forthe approximately two-dozen pesticides with acute orchronic Reference Doses at or below 0.0001 mg/kgper day, tolerance levels must be set at 0.01 ppm orlower to fully protect infants and children. (RfDs areregarded as acceptable levels of exposure and arecalculated by applying safety factors between 100and 3,000 to the “No Observable Adverse EffectLevels” found in toxicological experiments.)
EPA has set tolerances at 0.01 ppm for two carefullystudied major risk-driver uses of the OP insecticidechlorpyrifos (apples and grapes) and is li kely to es-tablish tolerances this low or lower for some otherOP-crop uses. Hence, it is clear that the typical 0.05ppm NDR standard is not health-protective for themost toxic pesticides now appearing with someregularity in key children’s foods. To support pesti-cide food safety claims, future ecolabel programs willhave to be at least as strict as federal law. A standardbetween 0.01 ppm and 0.001 ppm wil l be needed andis within reach for sophisticated programs, as demon-strated by the success of the Gerber Products Com-pany in meeting their quality control goal of no de-tectable residues in finished baby food products.
NDR-based programs must confront another problemarising from the uses and residue profiles of some oftoday’s safest biopesticide alternatives. Spinosad,kaolin clay, and harpin proteins are examples ofbiopesticides with attractive environmental and tox-icity profiles. These biopesticides already are or soonwill be approved for organic production. Use of theseproducts though will routinely result in residuesabove 0.05 ppm. In such cases, the application of anNDR standard divorced from actual risks couldemerge as a barrier to progress toward reduced-riskpest management systems.
Eco-friendly farming system claims
A third category of ecolabels is based on a wide vari-ety of combinations of claims regarding the use ofeco-friendly production systems and practices, some-times coupled with assurances that certain high-riskpractices and inputs are not used. Some ecolabel pro-gram goals and claims are expansive, even compre-hensive, encompassing pesticide use and risks, ero-sion control and sedimentation, water quality, ripar-ian area management, preservation of wildlifehabitat, and worker safety and quality of life issues.The Food All iance is a well -known example of a“ full-service” program.

189
Other programs are more focused and narrow interms of the crops and regions covered and the typesof environmental issues addressed. The PacificNorthwest’s Salmon Safe program is an example of anarrowly focused program that strives to achieve asingle, well -defined outcome of broad interest topeople in the region.
In general, the more focused an ecolabel program, theeasier it is to establish credible, meaningful and veri-fiable goals. It requires considerable work to definegoals, establish risk indicators, set standards, andspecify how progress will be measured and verified.Unfortunately, all these steps must be completed insequence by each environmental, grower, commod-ity, or consumer group wanting to establish a credibleecolabel program. Experience suggests that the singlemost important ingredient is a good working relation-ship among people and constituencies that sharecommon goals. People skills and mutual respectgreatly enhance the odds that partnership-driven ac-tivities will be successful and sustainable.
Ecolabel programs based on production systems typi-cally focus on adoption of conservation and biologi-cally based farming systems. Biointensive, preven-tion-based IPM is typically a prerequisite for programparticipants and is often a major program focus. Ac-cordingly, programs strive to identify core biointen-sive IPM practices and a way to establish certifica-tion standards linked to the adoption of some portionof identified, proven practices.
In practice, biointensive IPM systems are extraordi-narily complex and dynamic and are difficult to cap-ture in a “check list” of practices. Differences fromone season to the next, or one production region toanother, can dramatically alter pest pressure and theefficacy of various pest management practices, trig-gering the need for changes in IPM systems and pes-ticide use.
The World Wildlife Fund-Wisconsin Potato andVegetable Growers Association-University of Wis-consin (WWF/WPVGA/UW) potato collaborationhas successfully developed a set of biointensive IPMstandards that are now incorporated in the certifica-tion of potatoes labeled as “Healthy Grown.” Ac-complishing this task for a single commodity in adefined geographic area required years of effort and amajor commitment of time by growers, environmen-talists, university researchers, IPM specialists, advi-sory committee members, consultants, and the state’spotato industry trade association.
While overly simplistic “check-li st” IPM should beavoided by ecolabel programs, there are some basicprinciples that ecolabel programs should featureprominently in IPM program standards and require-ments:
• Proven phytosanitary practices should be man-datory, as must resistance management practices.
• If farmers find it necessary to intensify pesticideuse because of growing pest pressure, theyshould also diversify and intensify adoption of arange of preventive practices.
• Steps should be taken to identify where pestpopulations first emerge, so that aggressive,early-season actions can be taken to slow popu-lation growth and spread.
• Active steps should be taken to avoid harm tobeneficial arthropods, and to the extent possible,populations of beneficials should be encouragedthrough management of f ield borders and pesti-cide selection and use patterns.
• The tracking of pesticide use and risks should beincorporated in some way into ecolabel pro-grams, especially if any claims are made relatedto pesticide risks.
The requirement for adoption of biointensive IPMpractices can serve as a vehicle to inform farmers ofthe system changes they are expected to make. Thisserves an educational function and allows farmers toproject what program enrollment will entail and cost,and whether alternative systems and technology willwork acceptably well i n their farming system.
Credible Pesticide Risk Claims in EcolabelPrograms
Most ecolabel programs attract clients and consumersby pledging to reduce pesticide risks. The organicclaim is the cleanest and most rigorous – no syntheticpesticide use is allowed. This basic feature and ad-vantage of organic farming is backed up by a sophis-ticated set of production standards, a science-basedmaterials review process, annual inspections, andoccasional residue testing. No other food ecolabelprogram can match the organic label in terms of thescope of pesticide risk-related claims that can be le-gitimately made and defended.
One of the simplest and best ways for a non-organicecolabel program to make strong and defensible pes-ticide risk-related claims is to issue “Do Not Use” or

190
“Use With Restrictions” li sts of pesticides. If a “DoNot Use” list contains most of the high-risk pesti-cides used on conventional farms producing a givencrop in a given region, farmers meeting the standardsalmost certainly wil l reduce the adverse impacts ofpesticides. Setting up and administering such a pro-gram is relatively simple and inexpensive, especiallycompared to programs based on residue testing orenvironmental performance standards, li ke adoptionof sufficiently “green” or biointensive IPM systems.
Hybrid ecolabel programs combine “Do Not Use”lists with requirements for the adoption of provenprevention-based biointensive IPM practices. The“Do Not Use” lists are often needed to gain consumerand environmental community confidence that theprogram is achieving meaningful changes.
“Do Not Use” lists can be remarkably effective inchanging pesticides use patterns, as demonstrated bythe WWF/WPVGA/UW biointensive IPM potatocollaboration. In 1996, this program identified 12high-risk pesticides used in potato production andplaced them on a “Do Not Use” list that is now partof the standards governing production and labeling of“Healthy Grown” potatoes. Table 5 presents basicdata on the use of these 12 pesticides in Wisconsinpotato production in 1992, 1995, 1998, and 2001.
Across the whole Wisconsin potato industry, the 12high-risk pesticides accounted for 14% to 16% oftotal use by weight prior to the beginning of the col-laboration in 1996. Two years later, in 1998, theirshare had dropped to 4.1%, and in 2001 declinedfurther to just 2.1%.
A key goal of the Wisconsin collaboration is reduc-ing not just the amount applied, but also the overallpublic health and environmental consequences ofpesticide use in potato production (Lynch et al.,2000). To track risks, not just the amount applied, thecollaboration developed a toxicity index that encom-passes acute and chronic mammalian risks, ecologicalrisks (birds, fish, small aquatic invertebrates), andimpacts on bees and beneficial organisms.
The index is used to calculate “toxicity units,” anindicator of relative pesticide risk potential that isdriven by amount applied and the inherent toxicity ofpesticides (Benbrook et al., 2002). In 1992, the 12high-risk pesticides used in Wisconsin potato pro-duction accounted for 32% of total toxicity units;most of the balance was associated with use of fungi-cides needed to control the serious outbreak of late
blight that hit major potato production regions in theearly 1990s.
Two years into the Wisconsin program, growers hadon average reduced toxicity units associated with the12 pesticides to just 9.5% of total toxicity units, andreduced them further to 1.4% in 2001, the first year“Healthy Grown” potatoes were certified in Wiscon-sin.
In 2001 there were only 53 fields of potatoes certifiedin Wisconsin as “Healthy Grown,” covering some4,800 acres, or about 6% of the state’s total potatoarea, yet most growers in and out of the programadhered to the “Do Not Use” lists for most of theirland, as evident in the huge drop in the amount of“Do Not Use” pesticides applied between 1998 and2001. The ability of ecolabel programs to change pestmanagement behavior across a whole industry isencouraging and provides strong justification forcontinuing public and private sector investment inecolabel programs and IPM partnerships.
Essential ingredients for credible claims
The six essential ingredients of credible pesticide-related ecolabel claims can now be described.
1. There must be logical basis – a process or ana-lytical method – to identify the pesticide risksthat the program is striving to reduce. Organismsat risk and the nature of the possible adverse im-pacts following exposures need to be specified.This process/method must be grounded in ac-cepted risk assessment concepts, models anddata, and must ultimately make sense to consum-ers and attract their attention and money. Riskswill change over time and ecolabel programsmust have the flexibility to continuously targetthe most significant risks.
2. Target risks must be quantifiable at the field orfarm level in some sort of baseline from whichreductions in risk can be calculated. Typically,the easiest and most defensible baseline is aver-age pesticide use and risks on land managed bynearby conventional growers not in the program.The data to establish such baselines for majorcrops in the US are often readily available at thecrop-state level.
3. Credible risk indicators must be established thatcan serve as a proxy for the real-world risks thatan ecolabel program is striving to reduce (im-pacts on birds, farmworker poisonings, OP die-

191
tary exposure risk, or a combination of multiplerisks).
4. Standards must set forth acceptable levels of riskstemming from pesticide applications on a givenfield enrolled in an ecolabel program. The stan-dards can be based on actual direct measures ofrisk – poisoning episodes, residues in food, birdkill s – or on indicators of risk, such as aggregatepesticide toxicity units per acre.
5. Compliance with standards must be independ-ently verified by a third party that is granted ac-cess to information needed to assess actual field-level performance relative to stated standards andrequirements.
6. All aspects of the program must be transparentand accessible to growers, consumer and envi-ronmental organizations, interested members ofthe public, the farm community, and regulators.
Program standards can be simplistic and easy to en-force or complicated and challenging to implement.Programs should take into account both the volumeof pesticides applied and pesticide toxicity in order toavoid the pitfall of risk-trading, where a prohibitionagainst the use of one set of high-risk pesticides sim-ply triggers a shift to other products, some of whichmay turn out to be worse than those on the initial “DoNot Use” list.
Several Integrated Fruit Production (IFP) programs inEurope, and a few in the US, use a “Red/Yellow/Green” list approach in defining acceptable pesticideuses. In these programs, relative risk judgments aremade regarding the environmental impacts of anacre-treatment with a given pesticide. Per acre risksare compared to the risks from use of alternativeproducts; the riskiest products are placed on a “Red –Do Not Use” list; the least riskiest go on a “Green –Unrestricted Use” list; all others land on the “Yellow– Use Only When Needed and with the FollowingPrecautions” list.
The IFP “Red/Yellow/Green” approach is designedto provide farmers access to some pesticides that canpose significant risks under some circumstances, butcan be used safely with the proper attention to detailand safety precautions. The public health and envi-ronmental benefits of an IFP-based ecolabel restlargely on how and to what extent credible risk indi-cators drive the delineation of the three lists. MostIFP programs to date are not transparent in terms of
the criteria and data used to place various pesticideson the Red/Yellow/Green li sts. Also, they do notlimit the number of applications that can be madewith “Yellow” and “Green” pesticides.
Shortcomings in most contemporary IFP programsreflect how IFP programs have been carried out todate, rather than inherent flaws in the IFP approach.It would be a simple matter to place caps on themaximum number of “Yellow” and “Green” pesti-cide applications that may be made per season; thedelineation of lists could be grounded in rankings ofindicators of risk per acre.
There are many ways that ecolabel programs cancapture the interactions between pest managementsystems and pesticide use and risks. Those that es-tablish meaningful goals for reduction in risk andcredible risk indicators to monitor progress will havethe best chance to win the confidence of consumers.
Critical future challenges loom for ecolabel pro-grams. Those active in Cali fornia and Florida mustfind ways to deal with the consequences of the phase-out of methyl bromide. Use of soil fumigants in gen-eral deserves more attention by ecolabel programs;for this reason, the soil fumigation policy developedby the Protected Harvest board is a welcome devel-opment. All programs, including organic certifica-tion, will have to deal more effectively with post-harvest pest management and pesticide use. Impactsand applications of biotechnology pose a number ofchallenges.
Ways must be found to accommodate – and com-municate to consumers about – the wide range oftoxicity in the pesticides that are applied. Some re-cently registered and emerging biopesticides clearlyare far safer than the conventional products they canhelp replace, but pose new challenges, from residuesin food to resistance management.
Better ways are needed to empirically capture thelinkages between progress toward biointensive IPMand reduced reliance on high-risk pesticides. Pestcomplexes and pest pressure are highly variable anddynamic across time and space, and farmers mustadapt quickly and decisively in many circumstances.Ecolabel program standards and guidelines need toanticipate the need for system changes and find waysto permit and reward innovation that moves growerstoward biointensive IPM.
192
References
Agricultural Marketing Service. 2002. Pesticide DataProgram Annual Summary Calendar Year 2000.United States Department of Agriculture, Wash-ington, D.C.
Adgate, J.L., D.B. Barr, C.A. Clayton, L.E. Eberly,N.C.G. Freeman, P.L. Lioy, L.L. Needham, E.D.Pellizzari, J.L. Quackenboss, A. Roy, and K.Sexton. 2001. Measurement of children’s exposureto pesticides: analysis of urinary metabolite levelsin a probability-based sample. EnvironmentalHealth Perspectives 109(6):583-590.
Arbuckle, T.E., Z. Lin, and L.S. Mery. 2001. Anexploratory analysis of the effect of pesticide ex-posure on the risk of spontaneous abortion in anOntario farm population. Environmental HealthPerspectives 109(8):851-858.
Baatrup, E., and M. Junge. 2002. Antiandrogenicpesticides disrupt sexual characteristics in the adultmale guppy (Poecilia reticulata). EnvironmentalHealth Perspectives 109(10): 1063-1070.
Baker, B., C.M. Benbrook, E. Groth, and K.L.Benbrook. 2002. Pesticide residues in conven-tional, integrated pest management (IPM)-grownand organic foods: insights from three US datasets. Food Additives and Contaminants 19(5):427-446.
Baldi, I., L. Fill eul, B. Mohammed-Brahim, C.Fabriguole, J.F. Dartigues, S. Schwall , J.P. Drevet,R. Salamon, and P. Brochard. 2001. Neurophysicaleffects of long-term exposure to pesticides: resultsfrom the French phytoner study. EnvironmentalHealth Perspectives 109(8):839-844.
Benbrook, C.M., D.L. Sexson, J.A. Wyman, W.R.Stevenson, S. Lynch, J. Wallendal, S. Diercks, R.Van Haren, and C.A. Granadino. 2002. Developinga pesticide risk assessment tool to monitor progressin reducing reliance on high-risk pesticides.American Journal of Potato Research 79:183-199.
Buckley, J.D., A.T. Meadows, M.E. Kadin, M.M. LeBeau, S. Siegel, and L.L. Robinson. 2000. Pesti-cide exposures in children with non-Hodgkin lym-phoma. Cancer 89(11):2315-2321.
Centers for Disease Control and Prevention. 2001.National Report on Human Exposure to Environ-mental Chemicals. Atlanta, Georgia.
Cooper, R.L., J.M. Goodman, and T.E. Stoker. 1999.Neuroendocrine and reproductive effects of con-temporary-use pesticides. Toxicology and Indus-trial Health 15(1-2):26-36.
Consumers Union. 2001. A Report Card for the EPA:Successes and Failures in Implementing the Food
Quality Protection Act. Consumers Union of theUnited States, Inc., Yonkers, NY. www.ecologic-ipm.com/ ReportCard_final.pdf
Eskenazi, B., A. Bradman, and R. Castorina. 1999.Exposures of children to organophosphate pesti-cides and their potential adverse health effects.Environmental Health Perspectives 109 (Supple-ment 3):409-419.
Gray, L.G., J. Ostby, E. Monosson, and W.R. Kelce.1999. Environmental antiandrogens: low doses ofthe fungicide vinclozolin alter sexual differentia-tion of the male rat. Toxicology and IndustrialHealth 15(1-2):48-65.
Groth, E., C.M. Benbrook, and K.L. Benbrook. 2000.Update – Pesticide Residues in Children’s Food.Consumers Union of the United States, Inc.,Yonkers, NY. www.ecologic-ipm.com/PDP/
Update_Childrens_Foods.pdfGuillette, E.A., M.M. Meza, M.G. Aquilar, A.D.
Sotto, and I.E. Garcia. 1998. An anthropologicalapproach to the evaluation of preschool childrenexposed to pesticides in Mexico. EnvironmentalHealth Perspectives 106(6):347-353.
Houlihan, T. 2002. Common’Tater interview withTim Huberty. The Badger Common’Tater 54(9):8-9. September.
Koch, D., L. Chensheng, J. Fisker-Andersen, L.Jolley, and R.A. Fenske. 2002. Temporal associa-tion of children’s pesticide exposure and agricul-tural spraying: report of a longitudinal biologicalmonitoring study. Environmental Health Perspec-tives 110(8):829-833.
Lu, C., D.E. Knutson, J. Fisker-Andersen, and R.A.Fenske. 2001. Biological monitoring survey oforganophosphorous pesticide exposure among pre-school children in the Seattle metropolitan area.Environmental Health Perspectives 109(3):299-303.
Lynch, S., D. Sexson, C. Benbrook, M. Carter, J.Wyman, P. Nowak, J. Barzen, S. Diercks, and J.Wallendal. 2000. Working out the bugs. Choices(Third Quarter):28-32.
Ma, X., P.A. Buffler, R.B. Gunier, G. Dahl, M.T.Smith, K. Reinier, and P. Reynolds. 2002. Criticalwindows of exposure to household pesticides andrisk of childhood leukemia. Environmental HealthPerspectives 110(9):955-960.
MacIntosh, D.L., L.L. Needham, K.A. Hammer-strom, and P.B. Ryan. 1999. A longitudinal investi-gation of selected pesticide metaboli tes in urine.Journal of Exposure Analysis and EnvironmentalEpidemiology 9(5):494-501.

193
Mills, P.K., and S.H. Zahm. 2001. Organophosphatepesticide residues in urine of farmworkers andtheir children in Fresno County, California. Ameri-can Journal of Industrial Medicine 40(5): 571-577.
National Research Council . 1993. Pesticides in theDiets of Infants and Children. National AcademyPress, Washington, DC.
Off ice of Pesticide Programs. 2002. Pesticide Reregi-stration – Chemical Status. US EnvironmentalProtection Agency, Washington, DC.
www.epa.gov/pesticides/reregistration/status.htmViewed October 10, 2002.
Pang, Y., D.L. MacIntosh, D.E. Camann, and P.B.Ryan. 2002. Analysis of aggregate exposure to
chlorpyrifos in the NHEXAS-Maryland investiga-tion. Environmental Health Perspectives 100(3):235-240.
Qiao, D., F.J. Seidler, S. Padilla, and T.A. Slotkin.2002. Developmental neurotoxicity of chlorpyri-fos: What is the vulnerable period? EnvironmentalHealth Perspectives 110(11):1097-1103.
Walz, E. 1999. Final Results of the Third BiennialNational Organic Farmers’ Survey. Organic Farm-ing Research Foundation. Santa Cruz, Cali fornia.
Younie, D., and A. Litterick. 2002. Crop protectionin organic farming. Pesticide Outlook, Royal Soci-ety of Chemistry 13(4):158-161.
Table 1. Frequency of pesticide residues in fresh fruits and vegetables by market claim; PesticideData Program, 1994-1999a.
Organic No Market Claim
Number ofSamples
Number ofPositives
PercentPositive
Number ofSamples
Number ofPositives
PercentPositive
Eight Fruits 30 7 23% 12,612 10,287 82%
Twelve Vegetables 97 9 9% 13,959 8,465 61%
All Fresh Foods 127 16 13% 26,571 18,752 71%aResidues of long-banned organochlorine insecticides and their metabolites are not included.
Source: Data from Table 2 in Baker et. al., 2002.

194
Table 2. Organic, pesticide free and NDR samples in 2000 testing carried out by USDA’s Pesticide DataProgram (PDP).
Number of Samples Number of Positives Percent PositiveMarketClaim Domestic Import Total Domestic Import Total Domestic Import Total
Conventional 6,780 2,014 8,794 4,314 1,563 5,877 64% 78% 67%Organic 39 9 48 7 3 10 18% 33% 21%NDR 5 3 8 4 3 7 80% 100% 88%All MarketClaims 6,824 2,026 8,850 4,325 1,569 5,894 63% 77% 67%
Number of Samples Number of Positives Percent PositiveDomestic Import Total Domestic Import Total Domestic Import Total
Organic Fruits and VegetablesCantaloupe 6 1 7 0 1 1 0% 100% 14%Carrot 3 1 4 2 0 2 67% 0% 50%Green bean 2 2 4 1 0 1 50% 0% 25%Lettuce 5 0 5 0 0 0 0% - 0%Orange 9 0 9 1 0 1 11% - 11%Strawberry 4 0 4 0 0 0 0% - 0%Bell pepper 4 2 6 2 0 2 50% 0% 33%All other 6 3 9 1 2 3 17% 67% 33%All Organic 39 9 48 7 3 1 18% 33% 21%
Number of Samples Number of Positives Percent PositiveDomestic Import Total Domestic Import Total Domestic Import Total
Conventional Fruits and VegetablesApple 180 4 184 141 4 145 78% 100% 79%Cantaloupe 186 214 400 74 158 232 40% 74% 58%Carrot 163 16 179 137 9 146 84% 56% 82%Cherry 275 0 275 259 0 259 94% - 94%Cucumber 392 337 729 262 305 567 67% 91% 78%Grape 393 339 732 220 287 507 56% 85% 69%Green bean 581 113 694 395 82 477 68% 73% 69%Lettuce 720 12 732 265 8 273 37% 67% 37%Nectarine 341 2 343 335 2 337 98% 100% 98%Orange 701 22 732 569 20 589 80% 91% 80%Peach,composite
273 260 533 249 252 501 91% 97% 94%
Peach, single 272 259 531 248 247 495 91% 95% 93%Pear, canned 354 8 362 22 1 23 6% 13% 6%Pineapple 149 215 364 4 16 20 3% 7% 5%Potato 364 4 368 257 1 258 71% 25% 70%Strawberry 493 20 513 451 19 470 91% 95% 92%Strawberry,frozen
36 1 37 29 1 30 81% 100% 81%
Bell pepper 538 187 725 357 151 508 66% 81% 70%Tomato,canned
360 1 361 40 0 40 11% 0% 11%
All Conven-tional 6,780 2,014 8,794 4,314 1,563 5,877 64% 78% 67%

195
Table 3. Number of residues found in 2000 PDP testing by type of claim and source of produce.
Number of Unique ResiduesFound
Average Number of Residues perPositive SampleMarket Claim
Domestic Imported Total Domestic Imported TotalConventional 9,559 4,903 14,462 2.2 3.1 2.5Organic 7 8 15 1.0 2.7 1.5NDR (“Pesticide Free” &“No Pesticides Detected”) 6 17 23 1.5 5.7 3.3
Source: Benbrook Consulting Services, derived from the results of year 2000 Pesticide Data Program testing(AMS, 2002)
Table 4. Occurrence of multiple residues by market claim in PDP and Consumers Union data set.
Organic Sampleswith MultipleResidues
IPM/NDR Sampleswith MultipleResidues
No Market ClaimSamples with MultipleResidues
Number Percent Number Percent Number PercentPDP 1994-1999 (20 Crops) 9 7.1% 46 24% 12,102 45.5%Consumers Union (4 crops) 4 6% 20 44% 42 62%
Average of Two Data sets 6.5% 34% 53.6%
Note: Residues of long-banned organochlorine insecticides and their metabolites are not includedSource: Data from Table 5 in Baker et. al. (2002)
Table 5. Trends in the application and toxicity units associated with twelve “do not use” pesticides inWisconsin potato production (see notes).
1992 1995 1998 2001Pounds Applied 96,000 180,000 49,414 8,000Pounds Applied as a Percent of Total H/I/FApplications 16% 14% 4.1% 0.66%
Toxicity Units (in mil lions) 37.6 55.7 15.7 2.1Toxicity Units as a Percent of Total H/I/FToxicity Units 32% 28% 9.5% 1.4%
“Do Not Use” list compiled by the WWF-WPVGA-UW Potato IPM Collaboration (aldicarb, azinphos-methyl,disulfoton, methamidophos, carbofuran, carbaryl, oxamyl, endosulfan, phorate, diazinon, permethrin andparaquat).H/I/F – Herbicides, Insecticides and Fungicides.Use data from the USDA’s National Agricultural Statistics Services – Agricultural Chemical Usage Surveys.


197
Assessment of Environmental Standards for Arable Farms
Philippe Girardin1 and Eric Sardet1
____________________________1INRA Agriculture Durable UMR Nancy-Colmar, BP 507, 68021 Colmar, Cedex, France. Corresponding author is Ph.Girardin ([email protected])
Ecolabeling: A Societal Requirement
To respond to society’s demand for a more sustain-able agriculture (better stewardship of the environ-ment, animal welfare, better integration into the localfabric), the mass market, some professional organi-zations, and even producer groups have proposedguidelines or standards for how farmers manage theirfarming systems. Facing this proliferation of guide-lines, the consumer is confused. Which is the mostsustainable? What are the impacts of the differenttypes of agriculture (integrated, sustainable, low in-put, organic, etc.)? How can one rate them?
To answer this question, we propose a method forcomparing standards for arable farming systems. As afirst step, only the environmental impacts were takeninto account, but not health or social impacts. Themethod provides an outline of a “reference” standard.
Analysis of the Standards
We analyzed eight sets of standards proposed forEuropean farmers. According to their historical originor their aim, they are variously called “standards” ,“ reference guide”, “charter, “contract” , “commit-ment” , “base”, etc. (Hereafter, these all wil l be called“standards.”) They are:
• the European standards for organic agriculture(OA) (Le Guillou and Scharpé, 2000)
• the standards of the International Organization ofBiological Control (IOBC) (Böller et al., 1997)
• the Swiss guide for Integrated Production (IP)(Ofag, 1999)
• the basis for agriculture “raisonnée” (FrenchMinistry of Agriculture, 2002)
• the charter of Farre (Forum de l’Agriculture Rai-sonnée Respectueuse de l’Environnement)(Farre, 1999)
• the contract of CTE 68 (Contrat Territorial d’Ex-ploitation) (Préfecture du Haut-Rhin, 2000)
• “engagement Irtac” (Institut de RecherchesTechnologiques Agro-alimentaires des Céréales)(Irtac, 1999)
• the system of reference Quali’Terre (Quali’Terre,2000).
These standards sometimes include external control,but sometimes only involve self-assessment. Thestudy was carried out only for standards for arablefarming systems, and does not cover viticulture,arboriculture, mixed farms, dairy farms or vegetablefarming.
The method for analyzing the environmental impactsof each standard was developed in two steps:
1. Evaluation matrix
The first step is to develop a double entry table(shown in Table 1 with values entered for the specificcase of Organic Agriculture):
• The rows correspond to the six components ofenvironmental impact (expanded to 10 rows bybreaking some down into subcomponents) re-garding which all the technical actions mentionedin the standards were assessed: ground and sur-face water; air; soil ; biodiversity; nonrenewableresources; and landscape.
• The 27 columns are formed from the total of 210technical actions found in the eight standards.The actions corresponding only to the regulatoryprocess (such as keeping pesticides in a specialroom) were not taken into account. Those 210technical actions were grouped into 27 technicaloperations and then into 8 technical functions(fertilization, pesticide management, water man-agement, rotation, cropping plan, soil cover, non-
198
productive elements, and mechanical operations).For example. the technical function “pesticidemanagement” includes six technical operations:storage of pesticides; handling and use; rinsingand disposal of containers; sprayer management;choice of pesticides; and biological control.These encompass the 48 separate technical ac-tions found in one or another of the eight stan-dards.
When the technical operation has no impact on theenvironmental component being considered, the cor-responding box in the matrix is shaded (for example,splitting of N-fertilizer application has no impact onthe landscape).
2. Rating of technical actions
Each technical action receives a rating score. Exam-ples are presented in Table 2 for pesticide manage-ment. The score for each of the six technical opera-tions (e.g., “choice of pesticides” ) is calculated bysumming the scores of the technical actions goinginto that technical operation. In using the sum, it isassumed there is a compensation among the differenttechnical actions. To get a clearer picture, the valuesfor the technical operations are represented in theevaluation matrix with pictograms corresponding tofour classes (✗ = no prescription, or a prescriptiondealing only with regulatory aspects; Λ = technicaloperation with a low effect on the environment; Κ =technical operation with a medium effect on the envi-ronment; ϑ = technical operation with a high envi-ronmental effect).
An evaluation matrix with those pictograms was setup for each of the eight standards. Table 1 has al-ready given an example for the European standardson organic agriculture. In this first step of evaluation,the rating of a given technical operation is the samefor all environmental components. With a more pre-cise evaluation of the technical actions, it is possibleto differentiate the impact for each environmentalcomponent.
Comparison of Standards
Simple comparison
The simplest way to compare the standards is tocount the number of pictograms that represent eachof the four classes. Such a presentation (Figure 1)shows that respectively 53 and 58% of the technicalactions included in the IP (18 of 34) and OA (18 of31) standards have a high impact on the environment.
At the other end, the Farre and Quali’Terre standardsmention more technical actions (respectively 46 and45), but very few of these have a high environmentalimpact (respectively 13 and 27%). However, this typeof comparison does not take into account the relativeimportance of the technical operations, all of whichget the same weight. To avoid this shortcoming, thestandards also were compared using the multicriteriaanalysis method ELECTRE III (Shärlig, 1990).
Multicriteria analysis
The ELECTRE II I method needs a reduced (<10)number of criteria. The information included in theeight evaluation matrices must be aggregated. Thisaggregation was done in two steps. First, the infor-mation in each of the eight rows of the matrix wascondensed into a single row by aggregating the in-formation within each column. Then, the 27 columnswere condensed into 8 columns corresponding to the8 technical functions (Table 3). To do so, each of the27 criteria was weighted by agro-environmental ex-perts using Simos’s method (1990). One set of theseweighting factors is presented in Table 4. It was usedfor the remaining calculations.
ELECTRE III was used for a first comparison of theeight standards for their impacts on groundwater(Table 5A). Only the criteria that affect water qualitywere used in the calculation (pesticides, N-fertilizerand irrigation management). A second ranking wasdone taking into account the impacts on all the envi-ronmental components (Table 5B) using ELECTREIII and four other methods of global aggregation. Thefirst is the weighted mean. In the second method,called “dictatorial” , the criterion with the highestweight is used for the first ranking, the second crite-rion is then used to break ties, and so forth. In thethird method, called “hierarchical” , any standard thatdoes not obtain at least the value Κ for the most im-portant criterion is set aside. Then, any standards thatdo not obtain at least that value for the second mostimportant criterion are set aside, and so forth. In thefourth method, called “democratic,” the standardswere compared pairwise by two for the eight techni-cal functions. One standard was judged better thanthe other if it is higher for at least 50% of the criteria.Those criteria must also correspond to more than50% of the total weight.
Results
The results of the ranking show the environmental rele-vance of organic agriculture and integrated production(Swiss IP and IOBC) (Morris and Winter, 1999). While

199
the other standards have some positive aspects, theyclearly are insuff icient to improve environmental qual-ity in arable lands.
The OA standards imposes fewer constraints than theothers, but, they have a stronger positive impact on theenvironment. Nevertheless, some improvements can beproposed, such as quantitative management of N fertili -zation; irrigation management; and soil cover. Someparts of the IP standards could be included in OA, sincemost parts of the different standards are complementary.Continuing development of the standards is necessary tokeep consumers’ confidence.
Apart some specific points like storage of pesticides, thestandards of French “ raisonnée” agriculture, which areclose to the English or German “ integrated” agriculture(Bonny, 1997), have a very weak positive impact on theenvironment. Most of the items mentioned in thosestandards correspond only to the regulatory aspect orare only optional. This kind of standard is intended tobe met by 80% of all farmers. In contrast, the most re-strictive standards, such as IP or OA, are accepted byonly a few percent of farmers.
The environmental impacts presented here are onlypotential impacts. Very likely, the farmers’ practices gobeyond what they need to do according to the standardsthey agree to follow. This is particularly true in organicagriculture, where farmers are obliged to use rotations,cover crops, and other beneficial techniques even if thatis not explicitly stated in the standards (Bourdais, 1998).
Taking into account the complementary nature of theeight standards analyzed here, it is possible to set up a“reference” standard for which the most environmen-tally positive technical action was selected. For exam-ple, for the management of hedges, the IP standard wasincluded, whereas split ting the N fertili zer applicationwas taken from “ raisonnée” agriculture. Even if it is notthe best way to avoid nitrate pollution, it is the bestamong the actual standards. No standard has a satisfac-tory requirement regarding field size management orsoil organic matter content. The agronomic and eco-nomical feasibility of such a “reference” standard muststill be demonstrated.
Two improvements in this method for comparing stan-dards for agriculture can be investigated. First, the envi-ronmental impact could be differentiated according tothe environmental components. For instance, the impactof soil cover could be considered more important forerosion and runoff than for soil biological activity. Thesecond improvement concerns the use of weightingfactors for the different environmental components. TheSimos’s method could also be used for the environ-mental criteria. In this case there will be three kinds of
expertise involved in the comparison. The first expertisecorresponds to the decision rules for each technicalaction (Table 2); the second is used to weight the tech-nical operations; the third is used to weight the factorsfor the environmental components.
Conclusion
The proposed method allows us to do four things: 1)to clarify the standards for users; 2) to rank themaccording to one or all the environmental compo-nents; 3) to improve the current standards; and 4) tohelp in writing new standards.
However, to answer the societal requirements, it willbe important to enlarge the method by includinghealth, social and ethical aspects in order to assessnot only the environmental impacts but also the over-all sustainability of agricultural practices (Féret andDouguet, 2001). This assessment could be mademore reliable by using three indices (social, environ-mental and health), which could rate the type of man-agement and later all the food products. The methodpresented in this paper could be used to developedthe environmental index.
References
Böller, F., C. Malavolta, and E. Jörg. 1997. Direc-tives pour la Production Intégrée en grandes cul-tures. Bulletin Oilb/Srop 20:21-39.
Bonny, S. 1997. L’agriculture raisonnée, l’agricultureintégrée et Farre. Nature Sciences Sociétés 5:64-71
Bourdais, J.L. 1998. Agrobiologie et environnement– Une comparaison des systèmes de productionagrobiologiques et conventionnels en Aquitaine surla base d’ indicateurs. Fcca-Cemagref, Bordeaux.
Farre. 1999. Socle commun de l’agriculture raisonnéerespectueuse de l’Environnement. Farre, BoulogneBil lancourt, France.
Féret, S., and J.M. Douguet. 2001. Agriculture dura-ble et agriculture raisonnée, quels principes etquelles pratiques pour la soutenabilité du dévelop-pement en agriculture? Nature Sciences Société 9:58-64.
Irtac. 1999. Production raisonnée des céréales àpaille. Institut de recherche technologique alimen-taire des céréales, Paris.
Le Guillou, G., and A. Scharpé. 2000. L’agriculturebiologique – Guide sur la réglementation com-munautaire. Opoce (Office des Publications Offi-cielles des Communautés Européennes), Luxem-bourg.

200
Ministère de l’agriculture. 2002. Le référentiel del’agriculture raisonnée. Paris.
Morris, C., and M. Winter. 1999. Integrated farmingsystems: the third way for European agriculture?Land Use Policy 16:193-205.
Ofag. Prestations écologiques requises: règles tech-niques. Srva, Lausanne.
Préfecture du Haut-Rhin. 2000. Arrêté préfectoralconcernant les CTE type du Haut-Rhin. Préfecture68.
Quali’Terre. 2000. Référentiel régional de quali fica-tion des exploitations agricoles. Quali’Terre, Arras.
Shärlig, A. 1990. Décider sur plusieurs critères.Presses polytechniques et universitaires romandes,Lausanne.
Simos, J. 1990. Evaluer l’ impact sur l’environ-nement, une approche originale par l’analyse mul-ticritères et la négociation. Presses polytechniqueset universitaires romandes, Lausanne.
Figure 1. Environmental quality implications of four standards for arable farming systems.
18
18
12
6
11
4
5
8
5
9
28
32
56
59
45
44
0 20 40 60 80 100
Swiss P.I.
O.A.
Quali' terre
FARRE
Spe
cific
atio
ns
Number of evaluation modules
High effect Medium effect Low effect No recommendation

Tab
le 1
. Eva
luat
ion
mat
rix fo
r the
env
ironm
enta
l im
pact
s of a
gric
ultu
ral t
echn
ique
s for
Org
anic
Agr
icul
ture
TECH
NICA
L O
PERA
TIO
NSPE
STIC
IDES
FERT
ILIZ
ATIO
NM
ECHA
NIZA
-TI
ON
ROTATION
CRO
PPIN
GPL
AN
SOIL COVERING
Non Productive Elements
WAT
ERUS
EPE
STIC
IDES
Nitro
gen
P & K
Mineralamendments
Organic matter
Trace elements
MEC
HANI
ZA-
TIO
N
ROTATION
CRO
PPIN
GPL
AN
SOIL COVERING
Non Productive Elements
WAT
ERUS
EStorage
Handling
Rinsing/disposalSprayer
Choice ofpesticidesBiological
controlAgenda
Dose
Splitting
Intercrops
Storage
Spreading
Type
P & K
Mineralamendments
Organic matter
Trace elements
Maintenance
Choice oftools
Anti-erosivetechniques
ROTATION
Field size
Cropdiversity
SOIL COVERING
Non Productive Elements
Quantity
Management
ENVIRONMENTALCOMPONENTSWATER
surfa
ce ûûûû☺☺û
☺û
#ûûûûû
ENVIRONMENTALCOMPONENTSWATER
grou
nd ûûû
☺☺ûûû#☺û☺
ûû
ENVIRONMENTALCOMPONENTSSOIL
Qua
ntity
☺#
ûûûû
ENVIRONMENTALCOMPONENTSSOILs
truct
ure
û#
ENVIRONMENTALCOMPONENTSSOIL
Chem
ical
qual
ity☺#û
$
ENVIRONMENTALCOMPONENTSSOIL Bi
olog
ical
qual
ity.
☺☺
#
û
ENVIRONMENTALCOMPONENTS
AIR
☺☺û☺
ENVIRONMENTALCOMPONENTS LAND
SCAP
E☺
$
ENVIRONMENTALCOMPONENTS B IO
DIVE
RSIT
Y ☺☺
#û
$$
ENVIRONMENTALCOMPONENTS Non
Rene
w.Re
ssou
rces
☺#
201
ûûûûû
û
û
û
û
û
ûûûûûû
û
û
û û
#û
ûûû
ûûûûû

202
Table 2. Example of decision rules to qualify environmental impact of pesticide management.
PESTICIDE MANAGEMENT ✘Storage a
❏ The floor of the room is covered with concrete + 6
❏ Room that does not freeze + 1 ❏ Room locked, well-ventilated 0 ❏ Room with pesticide cabinet, or, on the floor, a duckboard isolating the pesticides from the soil, or, a reserve of absorbent material in case of leakage or spillage, and, a water reserve or an extinguisher close to the room.
+ 2
❏ Room with an extinguisher or nearby water source + 0.5
❏ Unusable pesticides stored in a specific room and not kept for too a long time + 0.5
❏ Fuels kept separate from flammable materials + 0.5
❏ Establish and maintain a register of pesticides kept in stock + 0.5 ❏ Tools used specifically for preparation of the spray mixture stored in the pesticide room + 0.5
✘Handling and use ❏ Filling site : % if a filling site is mentioned % if safety standards are mentioned
or ❏ Filling of the sprayer tank : % no pesticide spill (brackets, intermediate tank, return-flow valves) % no direct pumping into ground or surface water % Prepare mixer in a room with no risk of spilling into a body of water or a groundwater
recharge area
+ 0.5 + 4 + 1 + 1.5 + 0.5
❏ Field location relative to the water resource: no spraying less than 10 m from a watercourse + 3 ❏ Calculate accurately the minimum volume of mixture for each treated area + 1 ❏ Remember to use personal protection (notwithstanding common sense and the regulations) 0 ❏ Take into account the information given by the extension services and agrometeorological information
+ 0.5
❏ Subscribe to a technical advisory service not linked to a pesticide marketing organization + 1 ✘Rinsing/disposal ❏ (a) Provide a water reserve on the sprayer or in the field and spray the rinse water on the field + 3 ❏ (b) Cans and packages : 3 systematic rinses, pour the rinsing water into the sprayer, make a hole in the cans and keep in a special room before disposal or recycling
+ 3
❏ (c) Be involved in the collection operation or put cans, packages and outdated pesticides in a waste collection site where toxic wastes are collected
+ 3
❏ If (a) + (b) or (a) + (c) + 8 ✘Sprayer ❏ Sprayer checked by accredited service at least every three years + 2
❏ Self-check of sprayer once a year according to the directions of use + 2 ❏ Before each spraying, be sure sprayer is in good working order (filter, gauge, valves, nozzle) + 3 ❏ Water reserve on the sprayer for the user + 1 ❏ Brush/”handblower” in the tractor to clean the nozzles + 1 ❏ Choice of nozzles: prefer air injection nozzles and recoil nozzles (bigger drops, less drift) + 3

203
Table 2, continued
✘Choice of pesticides
❏ No pesticide use (Organic farming standards) +10 ❏ Systematic selection of pesticide treatment based on tolerance thresholds
or ❏ Recommendations for each crop with (a) prohibition of at least one type of treatment (insecticide, fungicide, growth regulator, herbicide....) (b) limitation on number of sprayings ❏ if (a) or (b)
+ 4 + 4 + 2
❏ Application rate: systematic reduction, at least 20% + 2
❏ No atrazine (until July 2003; afterwards: forbidden by regulations) + 2
❏ Choice of pesticides according to their toxicity (impacts on health/beneficials/biodiversity) according to a positive list in the standards
+ 4
❏ Take into account field risks (drainage, slope) in pesticide choice according to mobility and persistence % with an accepted diagnostic method % if no complementary information
+ 4 + 1
❏ Control of resistance through the successive or simultaneous use of active ingredients from different chemical classes
+ 2
❏ Have valid (less than 3 years old) instructions (ingredient, recommended dose, spectrum of activity...)
+ 0.5
✘Alternative methods ❏ Implementation of preventive pest control: % if no complementary information % if general approaches ( hoeing, flame weeding, biological control...) % systematic choice of biological, biotechnical, physical and agronomic means when they are
efficient
+ 1 + 2 + 5
❏ Choice of varieties according to their tolerance or resistance + 3 ❏ Recording of crop health, and interpretation from technical reports + 2 ❏ Weeding at the scale of crop rotation and according to soil management + 1
a The points obtained for each technical operation ( ✘) are summed, and the pictogram (see Table 3) is assigned according to the following rule: [sum] ≤3 = # ; 3 < [sum] <7 = $ ; [sum] ≥7 = ☺

204
Table 3. Evaluation matrix of the environmental impacts of technical functions for eight standards.
Pe
stic
ides
Fe
rtili
zatio
n
N
on-p
rodu
ctiv
e el
emen
ts
C
ropp
ing
plan
R
otat
ion
Ir
riga
tion
So
il co
ver
M
echa
niza
tion
French raisonnée # # # ' ' # ' ' CTE 68 # ' $ ' ' ' $ # OA ☺ # ' $ # ' ' ' FARRE $ # # ' ' # ' ' IRTAC $ # ' # # $ ' ' IOBC $ ' $ # ☺ $ # $ Quali’terre # # # # # # ' # Swiss IP $ ' ☺ # ☺ ' ☺ '
Table 4. Weighing factors of an agronomist expert obtained by Simos’s methoda (1990).
Fertilization
Mechani-zation
Crop-ping Plan
Irri-gation
Pesticides
Nitrogen
Stor
age
Han
dlin
g/
utili
zatio
n R
insi
ng/
disp
osal
Sp
aray
er
Cho
ice
of
pest
icid
es
Bio
logi
cal
cont
rol
Age
nda
Dos
e
Split
ting
Inte
rcro
ps
Stor
age
Spre
adin
g
Typ
e P &
K
Min
eral
am
endm
ents
O
rgan
ic m
atte
r
Trac
e el
emen
ts
Mai
nten
ance
Cho
ice
of to
ols
Ant
i-ero
sion
te
chni
ques
R
otat
ion
Fied
size
Cro
p di
vers
ity
Soil
Cov
er
Non
prod
uctiv
e el
emen
ts
Qua
ntity
Man
agem
ent
.06 .28 .19 .21 .02 .13 .11
.03
.11
.08
.18
.37
.24 .47
.13
.05
.21
.13
.50
.43
.07
.50
.50
.25 .75
.20
.19
. 01
.12
.15
.07
.16
.11
aThe expert is given cards, on each of which is written the name of one criterion, and is asked to rank them in increasing order according to the impact of the criterion on an environmental component. He can put cards in the same position if he judges the impacts are similar, and he can insert white cards within the set of the “criteria” cards to increase the distance between criteria. Then, the ranks are transformed into weighting factors. A group of experts gets an agreement on the ranks they obtained.

205
Table 5. Ranking of the standards according to the impact on water [A] or the total environmental impact [B] ofthe agricultural practices they recommend.
[A] Impact on surface and groundwater.
AggregationMethod Standards
Swiss IP OA IOBC IRTAC CTE68 FARRE French Raisonnée Quali’terre
ELECTRE II I 3 1 2 4 5 5 7 7
[B] Impact on all the environmental components (water, air, soil, biodiversity, non-renewable resources,landscape)
Aggregationmethod
Standards
Swiss IP OA IOBC IRTAC CTE 68 FARRE French Raisonnée Quali’terre
Weighted mean 1 2 3 4 5 6 7 7
“Dictatorship” 2 1 3 4 6 5 7 7
“Hierarchy” 1 4 2 3 6 4 7 7
“Democracy” 1 3 2 3 3 3 3 3
ELECTRE II I 1 3 2 4 4 6 7 7