la vente sauvage : un mode de distribution defiant le ... - CEJA
Upload
khangminh22Category
view
1download
0
HAL Id: hal-03529383https://hal.archives-ouvertes.fr/hal-03529383
Submitted on 17 Jan 2022
HAL is a multi-disciplinary open accessarchive for the deposit and dissemination of sci-entific research documents, whether they are pub-lished or not. The documents may come fromteaching and research institutions in France orabroad, or from public or private research centers.
L’archive ouverte pluridisciplinaire HAL, estdestinée au dépôt et à la diffusion de documentsscientifiques de niveau recherche, publiés ou non,émanant des établissements d’enseignement et derecherche français ou étrangers, des laboratoirespublics ou privés.
Éco-éthologie des canidés sauvage : Session 1J.L. Mulder
To cite this version:J.L. Mulder. Éco-éthologie des canidés sauvage : Session 1. Revue d’Ecologie, Terre et Vie, Sociéténationale de protection de la nature, 1985, 40 (2), pp.133-191. �hal-03529383�

SESSION 1 ÉCO-ÉTHOLOGIE DES CANIDÉS SAUVAGES
SPATIAL ORGANIZATION, MOVEMENTS AND DISPERSALIN A DUTCH RED FOX (VULPES VULPES) POPULATION
SOME PRELIMINARY RESULTS
J.L. MULDER *
Geographically the Red fox habitat in the Netherlands is divided into two main areas, separated by an at least 60 km wide zone of unsuitable lowland. The eastern and southern parts of the Netherlands have sandy soils, and the Fox populations here are continuons with those in Germany or Belgium. The other Fox inhabited area is the coastal dune area along the North Sea. Sixteen years ago foxes were found here for the first time. They were probably introduced by man. By now they have spread over the wh ole are a (approx. 3 x 1 00 km) and seem to have reached fairly stable densities.
The new ecological situation led to sorne concern about the impact of the . Fox on bird and game populations. This was the main motivation for the
Waterworks of the Province of North Rolland, in charge of the management of the North Rolland Dune Reserve, to start a research project on Fox ecology in 1 979 . Although there is no regular Fox control in the area, a number of foxes is lost each year due to poaching. Foxes feed primarily on the ubiquitous rabbits.
During the project, in which many students took part, a total of 56 foxes were radio-collared and followed for periods of up to 3 .5 years. Fixes were made from a car, as often as circumstances permitted, usually every 5 to 20 minutes.
SPA TIAL ORGANIZA TION
The most striking aspect of the spatial organization is its stability. The majority of the adult foxes lives in small groups of 1 male and 1 or 2, maybe sometimes 3 females, like in the studies of Macdonald ( 1 980), Niewold (1 980) and von Schantz ( 1 98 1 ). These groups occupy terri tories of 1 05 to 200 ha each, of which the position in the field remains roughly the same throughout the years (Fig. 1 ) , while in the meantime ail the occupants may have been replaced by others.
(1 will use " home range " here as the more general word, for any arearegularly used for any period by a particular Fox; the more specifie word
* Present adress : P .W.N., Van Oldenbarneveldweg 40, 1901 KC Castricum, TheNetherlands.
Rev. Eco/. (Terre Vie), vol . 40, 1 985

1982
Figure 1 . - Location of 5 group territories during 3 consecutive years. The number of radio-collared adult foxes is indicated. The rectangular lines form a 1 km grid as in ali
other figures. The coastline is to the left .
.. territory " is used if this area is rather large, and stable for a longer period, and if there are indications that more than one Fox is involved.)
During spring and early summer boundary zones between territories (i .e . the areas visited by foxes of adjoining groups) are narrow and stable . In latc summer and autumn the territorial boundaries are somewhat Jess respected, and the foxes are sometimes visiting parts of the neighbouring territories. In winter territoriality increases again ; it is however not uncommon to find a male in January far outside his own territory, probably attracted by a female in oestrus.
In one instance, two groups merged into each other in summer, following the accidentai death of a female in the first, and the probable death of a male in the other. This newly formed group occupied the area of the former two territories. However the former configuration and number of territories were restored in l ate winter ; the newly formed group restricted its activities to the original territory of the male, so the result was a complete shift of territory by the two females . Their former territory was occupied by a new group of at least two first year animais.
Besides the resident territorial foxes there is a small number of individuals, mostly one year old males, living temporarily in very restricted home ranges in or near the boundary zones of the group territories (see below, and Niewold, 1 980). In autumn and winter there is a further number of foxes, the young of the l ast l itter, mostly males again, roaming everywhere, trying to find a place to live (see Dispersal patterns) .
CHARACTERISTIC MOVEMENTS WITHIN THE HOME RANGE
Generalizations about the movement patterns of foxes within their home range inevitably lead to simplification. However the vast amount of data gathered over the last four years has provided sorne understanding of certain characteristic movement patterns of foxes in different social situations. Since the rabbits are abundant and fairly evenly distributed, the influence of food distribution on movement patterns is estimated to be slight.
Territorial males usually visit ali boundary areas of their territory each night, most of them in a rather erratical way (Fig. 2 A), but a few make a very predictable circuit every night (Fig. 2 B) .
-· 1 34

1 1 1
' '
' '
-----
c
-.,
1 1
1 1 1
D
Figure 2. - Characteristic movements of different foxes within their territory during one complete night of activity. A and B : territorial males . C : a female with cubs. D : a
younger female without cubs.
The most important female of a group, the one with a l itter, usually is active in ali parts of her territory each night, but does not visit the boundaries to the same extent as the male does (Fig. 2 C) . Other females of a group tend to use only part of their territory per night (Fig. 2 D) .
. .
. . "' ·.
:·:;.;·· . ··"" :' •:s. •
.. . ...
A B
Figure 3. - Ali radio-fixes of a non territorial male during 19.5 hours of activity in December 1982 (A), and 10.5 hours in April and June 1983 (B) . The stippled area is
the boundary zone between two group territories.
- 135 -

Non-territorial foxes, living more or less in between the group territories, may restrict their movements to areas of 20 to 40 ha (Fig. 3) . From time totime they may make short trips to other places, up to 3 km away, until an opportunity arises to join a territorial group.
Figure 4 shows the movements of the third female of the same group asshown in figs. 2 B-D, during late spring of her second year. She seemed to be banished to a corner of the territory, and sometimes made trips along the boundàries of other territories. After the death in July of a female in the territoryupper left in figure 4, she moved in and became a territorial female.
Figure 4. - Twenty-five hours of activity in June of a non-territorial female in her second year. Boundary zones between group territories are stippled. A : territory where
she was born. B : territory of the group she eventually joined.
DISPERSAL PATTERNS
From mid August to December the majority of the surviving young of the year leaves the territory of birth. Of a total of 34 young (earmarked and radiocollared foxes combined) of which the whereabouts were known at least till halfway their second year, 22 had dispersed to another place, 1 .5 to 35 km away. All 1 9 males left, and 4 of the 1 5 females. The other 11 femalesstayed in their original group. This difference between males and females isconsistent with the results of tagging studies, for instance those of Jensen (1 973), Storm et al. (1 976 ) and Englund ( 1980) .
The radio-collared young foxes showed a variety of dispersal patterns.
- 1 3 6 -

Five types of dispersal patterns have been discerned so far : examples are shown in figure 5 .
- A sudden dispersal i s shown in figure 5 A. A young male made several " exploratory " trips south of his territory of birth, often following the borders of the dune area, always returning in the same night. From one day to the
··
..
2,J�· ...5lkm r··· .•.
til' A
·. ··. :·;. .... . ·· ·····�.
··.
.. ·· ...... ::.::: -
2
B c
·.
··· ... , .
..
..
.. . . . ... �.
2 ·:· �'-®1 ···· ... �3 !
.. ···· ....
. · ......
.
.
. . .
::
.
::
:-
D
•, ·· .
.. :·· . . .
.
.... ····�. 3 :
��: �, .. ··
· ...
.. ··
····· ...... :::.::-
E Figure 5. - Examples of five different dispersal patterns of young foxes in their first winter and later. The coastline (to the left) and the borders of the dune area are shown.
The natal territory has been numbered 1, and later home ranges 2, 3 and 4.
next he occupied a territory 7 km to the north, respecting the very same boundaries as the former occupant, a radio-collared territorial male which had been shot by a poacher in the week preceding the arrivai of this young male.
- Sorne male foxes established a new home range soon after their first explorations, but kept returning, sometimes every other day, to their original territory for periods of up to two months before staying permanently in their new one (Fig. 5 B).
- A rather common pattern was dispersal via one or more temporary home ranges. From these temporary home ranges the Fox kept making exploratory trips, often progressively further and partly along routes taken earlier (Fig. 5 C), untill a definite territory was established.
- Sorne young foxes gradually restricted their movements to a small part of their original territory, or established (without rouch exploratory behavior) a tiny home range not far away (see above). The male Fox of figure 3 and figure 5 D lived that way for fifteen months, before he took over the adjoining territory.
- The fifth dispersal pattern we observed only once (Fig. 5 E) . Over a period of 1 0 weeks a female Fox gradually extended her activities into a neighbouring territory. In the end she stayed there for 8 months, most probably as a subordinate to another female. In her second winter she moved to still another adjoining territory.
- 1 37 -
We have studied dispersal within a rather l arge area of suitable Fox habitat. In a case like this the pattern of dispersal will generally be determined by the " social circumstances " which the exploring Fox meets . Sorne young foxes however do not display much exploratory behavior, and seem to prefer to wait for an opportunity to establish a territory in the immediate surroundings of their birth place . In this case the local ecological conditions obviously permit them to survive, sometimes for long periods, in a restricted home range .
SUMMARY
Sorne aspects of the ecology and social behaviour of a Fox population l iving in a Dutch coastal dune area are described. Most adults l ive in small groups, each of them occupying a stable terri tory of 1 05 to 200 ha. Severa] characteristic patterns of daily movements are described for territorial foxes, and for young foxes inhabiting small home ranges in between group territories . Finally five patterns of dispersal of young foxes in their first winter and thereafter are distinguished.
RESUME
Quelques aspects d'une population vulpine habitant les dunes néerlandaises de la Mer du Nord sont décrits . La plupart des renards adultes v;vent en petits groupes, chaque groupe occupant un territoire stable de 1 05 à 200 ha. Plusieurs types caractéristiques de mouvements quotidiens ont été décrits concernant les renards territoriaux et les jeunes renards vivant sur de petits domaines situés parmi les territoires de groupe. Finalement cinq types de dispersion de jeunes renards pendant leur premier hiver et la période suivante sont décrits .
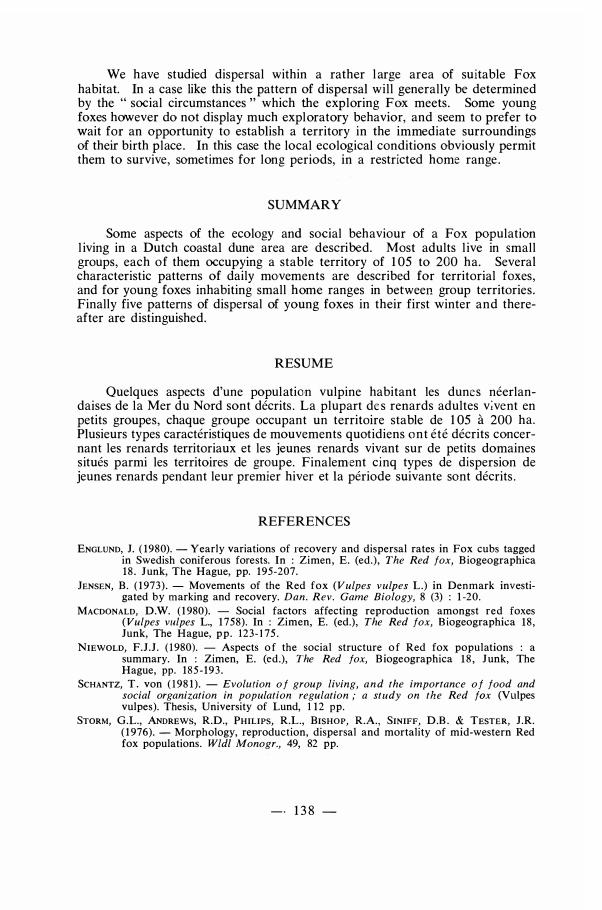
REFERENCES
ENGLUND, J. ( 1 980). - Yearly variations of recovery and dispersal rates in Fox cubs tagged in Swedish coniferous forests. In : Zimen, E. (ed.) , The Red fox, Biogeographica 1 8 . Junk, The Hague, pp. 1 95-207.
JENSEN, B. ( 1 973) . - Movements of the Red fox (Vulpes vulpes L.) in Denmark investigated by marking and recovery. Dan. Rev. Game Bio/ogy, 8 (3) : 1 -20.
MACDONALD, D.W. ( 1 980). - Social factors affecting reproduction amongst red foxes (Vulpes vulpes L., 1 758) . In : Zimen, E. (ed.), The Red fox, Biogeographica 18 , Junk, The Hague, pp . 123 - 1 75 .
NIEWOLD, F.J .J . ( 1 980). - Aspects o f the social structure o f Red fox populations : a summary. In : Zimen, E. (ed.), The Red fox, Biogeographica 1 8 , Junk, The Hague, pp. 1 85 - 193 .
SCHANTZ, T . von ( 1 98 1 ) . - Evolution of group living, and the importance of food and social organization in population regulation ; a study on the Red fox (Vulpes vulpes). Thesis, University of Lund, 1 1 2 pp.
STORM, G.L., ANDREWS, R.D., PHILIPS, R.L., BISHOP, R.A., SINIFF, D.B. & TESTER, J.R. ( 1 976). - Morphology, reproduction, dispersal and mortality of mid-western Red fox populations. Wldl Monogr., 49, 82 pp.
- · 1 3 8 -
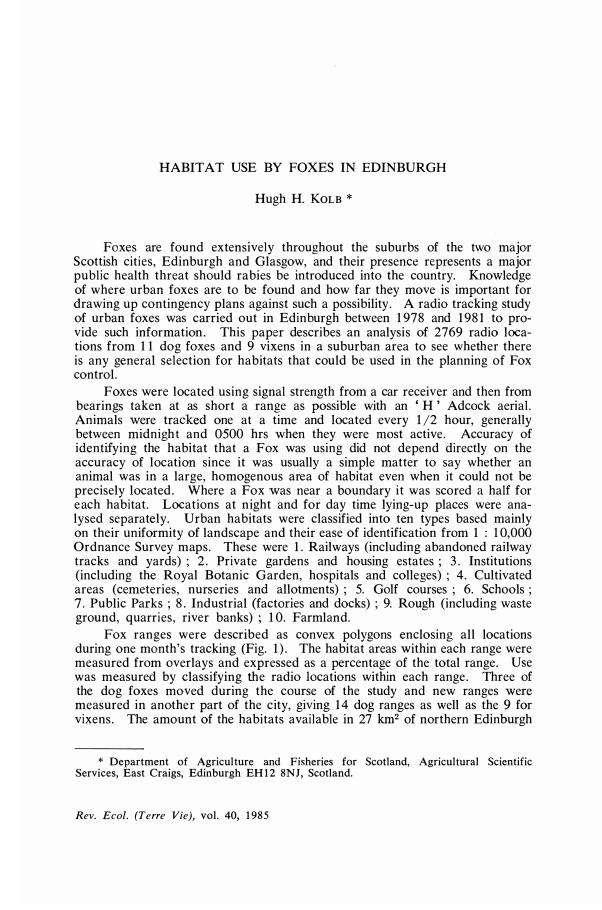
HABIT AT USE BY FOXES IN EDINBURGH
Hugh H. KoLB *
Foxes are found extensively throughout the suburbs of the two major Scottish cities, Edinburgh and Glasgow, and their presence represents a major public health threat should rabies be introduced into the country. Knowledge of where urban foxes are to be found and how far they move is important for drawing up contingency plans against such a possibility . A radio tracking study of urban foxes was carried out in Edinburgh between 1 978 and 1 98 1 to provide such information . This paper describes an analysis of 2769 radio locations from 1 1 dog foxes and 9 vixens in a suburban area to see whether there is any general selection for habitats that could be used in the planning of Fox control .
Foxes were located using signal strength from a car receiver and then from bearings taken at as short a range as possible with an ' H ' Adcock aerial . Animais were traoked one at a time and located every 1 /2 hour, generally between midnight and 0500 hrs when they were most active . Accuracy of identifying the habitat that a Fox was using did not depend directly on the accuracy of location since it was usually a simple matter to say whether an animal was in a large, homogenous area of habitat even when it could not be precisely located . Where a Fox was near a boundary it was scored a half for e ach habitat . Locations at night and for day time lying-up places were analysed separately. Urban habitats were classified into ten types based mainly on the ir uniformity of landscape and their ease of identification from 1 : 1 0,000 Ordnance Survey maps . These were 1 . Railways (including abandoned railway tracks and yards) ; 2 . Private gardens and housing estates ; 3 . Institutions (including the Royal Botanic Garden, hospitals and colleges) ; 4. Cultivated areas (cemeteries, nurseries and allotments) ; 5. Golf courses ; 6. Schools ; 7. Public Parks ; 8 . Industrial (factories and docks) ; 9. Rough (including wasteground, quarries, river banks) ; 1 0. Farmland.
Fox ranges were described as convex polygons enclosing ali locations during one month's tracking (Fig. 1 ) . The habitat areas within each range were measured from overlays and expressed as a percentage of the total range. Use was measured by classifying the radio locations within each range . Three of the dog foxes moved during the course of the study and new ranges were measured in another part of the city, giving 1 4 dog ranges as weil as the 9 for vixens . The amount of the habitats available in 27 km2 of northern Edinburgh
* Department of Agriculture and Fisheries for Scotland, Agricultural ScientificServices, East Craigs, Edinburgh EH 1 2 8NJ, Scotland.
Rev. Eco[. (Terre Vie), vol. 40, 1 985

• .
. .. , •. .
._;, .· .
. ..
. .
Figure 1. - Summer ranges of two one year old dog foxes in different parts of Edinburgh. The habitats are numbered as in the main text. The scale is given by the lines of the
Ordnance Survey 1 km grid. '0 : Locations at night. 0 : Daytime lying-up places.
was also measured by classifying habitat every 100 rn along the easting and northing lines of the 1 km O.S. grid. General comparisons between use andavailability, and the behaviour of the foxes were made using Spearman rank correlation coefficients (r.) on the summarised data.
Selection was measured by the difference between the percentage of times an animal was found in a habitat and the percentage area of that habitat within the range. Significance of selection was estimated by using the Kruskal-Wallis test on the sets of differences between percentage habitat available and used.
More than three quarters of the observations were accounted for by five habitats (Table 1). In decreasing importance these are : gardens, institutions,waste ground, cultivated areas and golf courses. There is sorne variation in where the two sexes were to be found, and where foxes were during the day and night. Dog foxes included railway lines in their top five habitats and were much more likely to be found on waste ground, whereas vixens were also to be found in public parks. Public parks also featured much more in the night time activity of the foxes whereas waste ground and cultivated areas were utilised more during the day.
Habitat use can be broken down into several components. How much isuse just a reflection of the habitat available in each foxes range ? How representative are the ranges of habitat in northern Edinburgh ? How much active
- 140 -
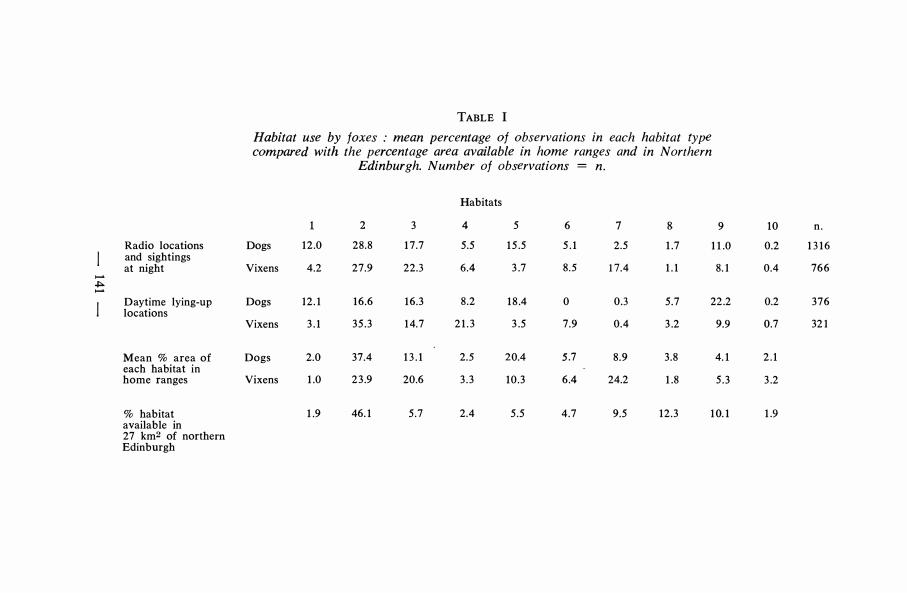
TABLE 1 Habitat use by faxes : mean percentage of observations in each habitat type compa.red with the percenta.ge area available in home ranges and in Northern
Edinburgh. Number of observations = n.
Habitats
2 3 4 5 6 7 8 9 10 n .
Radio locations Dogs 12 .0 28.8 1 7 .7 5.5 1 5 .5 5 . 1 2.5 1 .7 1 1 .0 0.2 1 3 1 6 and sightings at night Vixens 4.2 27.9 22.3 6.4 3 .7 8 .5 17.4 1 . 1 8.1 0.4 766
..... .j::. .....
Daytime lying-up Dogs 12 . 1 16.6 16.3 8 .2 1 8 .4 0 0.3 5 .7 22.2 0.2 376 locations
Vixens 3 . 1 35 . 3 1 4.7 2 1 . 3 3 .5 7.9 0.4 3 .2 9.9 0.7 321
Mean % area of Dogs 2.0 37.4 1 3 . 1 2.5 20.4 5.7 8 .9 3 .8 4. 1 2 . 1 each habitat in home ranges Vixens 1 .0 2 3 .9 20.6 3 . 3 10 .3 6.4 24.2 1 .8 5 .3 3 .2
% habitat 1 .9 46. 1 5 .7 2.4 5 .5 4 .7 9.5 12 .3 1 0. 1 1 .9 available in 27 km2 of northern Edinburgh

selection of urban habitats is being shawn by foxes ? The first two questionsare only really relevant to Edinburgh and cities that resemble it closely. The last will tell us something about urban Fox behaviour in general.
At night habitat use and availability within each range were significantly correlated (Dogs, r. = 0.59 , p 0.05; Vixens, r. = 0.77, p 0.01 ) . This i s not so for day time lying up places (Dogs, r. = 0 . 39 , ns ; Vixens, r. = 0.25 , ns) . The ranges studied were representative of the northern part of the city for dogs(r. = 0.65, p 0.05) but not for vixens (r. = 0.49, ns) . Significant selection forhabitats was being shown by bath sexes during the day and night (Fig. 2),
Nlght Railways
Gard ens
Institutions
Cultlvated
Golf courses
Sc ho ols
Public parks
lndustrlal
Rough
Farmland � -20 0 +20 -20 0 +20
% Selection
Figure 2. - Habitat selection by urban foxes in Edinburgh. Day ; daytimes lying-up places ; Night ; radio locations. The bars represent the mean difference between the percentage of locations in a habitat and the percentage of habitat available in the ranges.
although it was stronger during tte day. In decreasing arder of importance, dog foxes were selecting for railway lines, waste ground, cultivated areas, institutions, and industrial areas (the last featuring only during the day) . Vixens, by contrast, were selecting railway lines, cultivated areas, gardens, waste ground, schools and institutions at night, but cultivated areas, waste ground railway lines, industrial areas and schools during the day. Selection at night was correlated for the sexes (r. = 0 .72 , p 0.05), but not during the day (r. = 0.44 ,ns). Dog foxes were actively choosing railway lines, waste ground and institutions to lie-up in, whereas vixens were much more likely to be found in gardens and cultivated areas. Selection was significant for bath sexes (Dogs -day : H = 29 .4, p 0.01 . Dogs - night : H = 24.4, p 0.05 . Vixens - day : H = 25.9, p 0.01 . Vixens - night : H = 1 9 .5, p 0.01 ) .
The adaptability and mobility of faxes means that i t can be difficult to generalise about sorne aspects of their behaviour. Foxes can be found in most
-· 1 42-

parts of Edinburgh and breed within a kilometer of the city centre . To a large extent their use of habitat is a reflection of the types available. The features of the micro-habitat that the foxes are using, presumably food, cover and Jack of disturbance, can be found in varying degrees in most places. However urban Fox densities are not uniform and habitats are not used solely in proportion to their availability. This is more true of where foxes lie-up during the day. Dur:ng the night they are free to use a larger range of habitats .
From the point of view of rabies control several points arise from these observations :
1 . - There is a distinct selection for railway lines, particularly by dog foxes, and especially in a reas th at are heavily built up (Fig. 1 ) .
2 . - Dog faxes were found in almost equal frequencies in gardens, the grounds of institutions, golf courses and rough ground, ali areas that provide a large amount of surface cover .
3 . - Vixens showed a distinct selection for gardens, which i s consistent with the fact that the majority of breeding earths in cities are under garden sheds and outhouses (Harris, 1 977), whereas dog faxes were avoiding such places .
While most of the vixens studied were breeding residents, the dog foxes, most of which were young, were probably part of a mobile non-territorial population (Kolb, 1 984) . Therefore Fox control that concentrated on gardens would temporarily reduce the breeding population . However rabies is likely to be carried out of an area by young dog foxes and these are mostly to be found on or near railway lines and in areas of thick cover.
SUMMARY
Use of habitat by urban foxes was compared with its availability within their ranges. G reater selection was shown for day time lying-up places than fm night locations . The greatest selection was for railway lines by dog foxes. Dog foxes avoided private gardens whereas vixens selected for them.
RESUME
On a mis en rapport l'utilisation et la disponibilité de l'habitat dans les domaines de renards urbains . On remarque une plus grande préférence pour les l ieux de repos diurnes que pour les localisations nocturnes. Le choix le plus net est celui des mâles pour les voies de chemin de fer. Les mâles évitent les jardins privés alors que les femelles les préfèrent.
REFERENCES
HARRIS, S. (1977) . - Distribution, habitat utilisation and age structure of a surburban Fox (Vulpes vulpes) population. Mammal Rev., 7 : 25-39.
KOLB, H.H. ( 1 9 84) . - Factors affecting the movements of dog foxes in Edinburgh.J. appl. Eco/., 2 1 : 161- 173 .
-· 1 43 -·


CAN THE INCREASE OF FOX DENSITY EXPLAIN
THE DECREASE IN LYNX NUMBERS AT DONANA ?
J .R. RAu *, J .F. BEL TRAN * and M. DELIBES *
The number of red foxes (Vulpes vulpes) bas increased dramatically over the last few years in the Dofi.ana National Park (S.W. Spain) whereas a noticeable decrease in the numbers of lynx (Lynx pardina) bas apparently taken place during the same period . The Spanish authorities and private organizations concerned with nature conservation related both phenomena, and called for measures to control Fox numbers . In order to determine whether competitive pressures might have affected the already endangered Lynx population we will attempt here to use the data available on Fox and Lynx abondance and food habits to provide a preliminary answer to the questions raised, pending further research.
STUDY AREA
The study was carried out at the Dofi.ana Biological Reserve, an area of 68 km2 within the Dofi.ana National Park, located on the right bank of the mouth of the Guadalquivir River (approx. 37° N, 6° 30' W) . Two main ecosystems can be recognised : a dense Mediterranean scrubland of Halimium sp . , Erica spp . , etc . , and a marsh, usually flooded from November to June and covered by Scirpus spp. (for a detailed description of the area see Valverde, 1 95 8 ; Allier et al., 1 974). The climate is mesomediterranean, with humid and mild winters and dry and hot summers .
METHODS
We have collected information on Lynx ecology since 1 973 and studied the diet of foxes throughout 1 982 . However, a simultaneous comparative study of the ecology of both species only began at the end of 1 98 3 .
The criteria t o estimate Fox density were : a) the frequency o f visits to scent stations (where Cronk's bobcat urine was employed as attractant) and b) a faecal sample census derived from the absolute number of faecal samplescollected monthly on representative plots randomly distributed over the study area (technique developed by Rau et al. in prep .) . Lynx abondance was extra-
* Estaci6n Biol6gica de Dofiana, CSIC, 4 1 0 1 3 Sevil la (Spain).
Rev. Eco/. (Terre Vie), vol. 40, 1 985 2

polated from captures (only livetraps were used in order to prevent injuries to these animais) , as weil as from radio-tracking locations .
Modified data from Delibes ( 1 980), who analysed 1 53 7 droppings, were used in order to ascertain the food habits of Lynx on a monthly basis, while the analysis by Beltnin and Delibes (unpubl.) of 487 droppings collected in the Dofiana scrubland from January to December 1 98 2 supplied information on Fox diet . In arder to compare the feeding habits of adult foxes and of their pups we collected their respective droppings in May 1 984 .
Information on habitat use is derived from dropping abondance, number of dens, locations by radio-tracking and field observations.
RESULTS
1 . - A bundance
According to the estimation of Rau et al. (in prep. ) , Fox numbers range from a mean of 1.15 individuals/km2 in spring to 1 .92 individuals/km2 in winter (Tab. I) ; the annual mean density reaches 1 . 3 7 foxes/km2, which is a rather high figure for continental Europe (see Zimen, 1 980). Estimates of seasonal density are in moderate agreement with the recorded rates of visits to_scent stations (Table I), in spite of the high variability of the winter sample .
Autumn
Win ter
Spring
Summer
TABLE I
Estimation of Fox density by means of faecal sample censuses and scent-station tines (means and two standard errors) .
Estim. Ind./ 10 km2 % visits
1 3 .4 ± 3 .5 1 0.82 ± 1 .09
1 9.2 ± 1 .6 6 . 1 8 ± 4.68
1 1 .5 :±: 2.0 1 .80 ± 0.62
14.4 ± 1.7 14.89 ± 3 . 9 1
However, more precise data are needed in order to test the reliability of both methods. On the basis of the figures derived from trapping and intensive radiotracking, we estimate Lynx density at Dofiana to range from 0 . 1 0 to 0. 1 8 individuals/km2.
2. - Food habits
The striking differences between the diet of both species of carnivores are obvious in figure 1 : While the Lynx behaves as a food specialist, preying mostly on rabbits (at !east 60 % of its prey) , the Fox is much more eclectic in its food habits, its diet ranging from rabbits and invertebrates to berries. Aside from rabbits, Lynx feeds on birds (mainly ducks) , sorne young ungulates and small mammals (the " Other vertebrates " of figure 1 ) . The diet of the Fox includes rabbits, a few birds (mainly Passerines) , sorne small mammals, reptiles and carrion (" Other vertebrates ") , many larval stages and imagos of
- 1 46 -

F O X
J F M A M J J A S 0 N D
50
LYNX
Fruits and berries
lnvertebrates
Other vertebrates B irds
Rabb its
Other verte brates Birds
Rabbits
Figure 1 . - Annual diet variation of foxes and lynxes in Dofiana. Data are percentages of aU food categories.
Coleoptera, together with sorne Orthoptera, scorpions and a few earthworms (" Inverterbates ") and blackberries (Rubus ulmifolius), pine kernels (Pinus pinea) and berries of Corema album and Juniperus phoenica (" Fruits and berries ") .
The overlap between the diets of Fox and Lynx is small, although rabbits are the main vertebrate prey of both species, mainly during the breeding period. The diet of adult and pup foxes in May 1984 is represented in figure 2, where one can notice that the pups feed much more on mammals (mainly rabbits) than the adults do, the latter concentrating mainly on beetles and berries . These differences would appear more important if the criterion of biomass consumed was considered, instead of the frequency of prey items occurrence.
3 . - Habitat use In the study area we distinguish a " border zone " (BZ) and a " scrubland
zone " (SZ). The first one includes the ecotone between marshes and scrubland, which is precisely the area harbouring the highest concentrations of rab-
-· 147 -

60
ADULTS PUPS
30 0 30
Mise.
Fruits
lnvert.
Reptiles
Birds
Mammals
60
Figure 2. - Comparative diet of Fox pups and adult foxes in May 1 984. Data are percentages of ail food categories.
bits and other potential prey. Taking into account the average size of the Lynx home range, a band 3 km wide on the eastern limit of the Reserve was chosen as BZ (including approximately 33 % of marsh, 3 3 % of ecotone and 3 3 % of scrubland) . SZ was represented as a strip of land, about 8 km wide, connected to the western si de of the former.
More than 90 % of severa! thousands radio-locations of the seven Lynx captured in the Reserve were in the BZ area. Also, the number of Lynx droppings/km along firebreak transects averages four times higher on BZ than on SZ (0. 3 8 and 0. 1 0 respectively) . Conversely, foxes seem to be about two and half times more abundant on SZ than on BZ (3 .05 and 1 .20 droppings/km respectively) , ail of the occupied dens of this species being found in SZ. Moreover, circumstantial evidence (tracks, direct observations) confirms this apparent habitat segregation between Fox and Lynx, whereas Delibes unpublished data for the period 1 973-1 976 suggest that Lynx were then much more abundant ·on SZ, when foxes were rare .
DISCUSSION
The most popular (but rather naïve) interpretation of foxes and lynxes ·opposite population trends at Dofiana correlates these trends and interpretsthe present situation as a displacement of lynxes by an " invasion " of foxes . Such an idea could seem farfetched to Central and Northern European naturalists, but we must remember that the Spanish Lynx is only half the weight of the European Lynx. While this hypothesis fails to explain why such an invasion did not occur before, considering the long history of sympatry of both species in the area it appears, from the data presented in this paper, that Lynx and Fox use different resources . However, the present day partitioning of resources can be viewed as due to a lack of actual competition, as weil as an end-result of competition itself (Sale, 1 974) . On the other hand, in a stable system, it would be expected that the larger and more efficient predator, in this case the Lynx, would displace the smaller and more opportunistic predator, the Fox, as it seems to have been the case in the past. Therefore, we should look
-· 1 48 -

for an alternative explanation, the appearance of a new disruptive factor operating in the area since the end of the seventies.
In connection with this, an hypothesis could be put forward : up to now, Lynx controlled Fox numbers by interference competition (we know sorne cases of foxes killed by the Lynx) , and were themselves controlled by Rabbit availability (in other species of the genus no young survive at low prey density - Brand et al. , 1 976 - and in our study area no young apparently survived the autumn of 1 982) . Thus, a persisting low density of rabbits could induce a decrease in the number of Lynx (especially in the areas where they were already scarce, i .e . scrubland) , and favour the build up of a growing Fox population. A further recolonization of the scrubland by Lynx could later be made difficult because of the competition with a number of foxes much higher than bef ore .
Sorne other factors can also be put forward to explain both the drop in Rabbit numbers (i .e . the severe drought which took place between 1 979 and 1 98 3 ; a new outbreak of myxomatosis ; the absence of scrub management,etc . ) , and the ability of foxes to quickly invade the " emptied " areas (i .e. increased human disturbances in the reserve ; increased availability of carrion due to the drought, etc.) . Sorne alternative hypotheses can also be put forward : the Lynx numbers could decrease as a consequence of increased poaching, or of a greater probability of being killed by cars . However, these hypotheses require further research to be proved or falsified. In any case, high Fox numbers seem to be more a consequence than a cause of the present low density of the Lynx population . Presently we feel that the control of foxes would probably not have any noticeable effect on the Lynx population.
As we are attending a Canid Symposium, we will close our comments by an example where two Canid species were also involved. lt is weil known that the smaller and more opportunistic Coyote (Canis latrans) replaced the bigger and more specialised Wolf (Ca:nis lupus) in most of North America during the past century. Such a change had certainly nothing to do with interspecific competition, but was caused by increased environmental disturbances due to human activities, as weil as to deliberate Wolf eradication in many areas . We hope that the future of the Spanish lynx in Dofiana will be brighter.
ACKNOWLEDGEMENTS
We are grateful to F. Alvarez, B. Arrizabalaga, J. Boixo, J . Castroviejo, A. Catalan, E. Collado, L. Fisher, R. Laffitte and 1. Mateos for tbeir assistance in this work.
SUMMARY
Sorne preliminary data are presented on the abundance, food habits and habitat use of Lynx and Fox in Dofiana. The methods used were : scent-stations !ines and faecal sample censues (Fox), radio tracking (Lynx) and faecal counts and analysis of droppings (both species) . Foxes outnumber Lynx at Dofiana, but the latter use the edge of the marshes (the most productive habitat in the area) , more than foxes do. Food data reveal little dietary overlap : Lynx are food specialists (preying mainly on rabbits) , whereas foxes are generalists . Common use of rabbits as prey during the Fox breeding season could indicate
- 1 49 -

exploitative competition. Further data are however needed for a better understanding of this interaction . The increase in Fox numbers probably fol!c Ned the decline of the Lynx population.
RESUME
Nous présentons des résultats préliminaires sur l'abondance, l'alimentation et l'utilisation de l'habitat par le Renard et le Lynx à Dofiana. Les méthodes employées sont : comptage des stations de marquage olfactif et recensements des excréments pour les renards, radio-pistage pour les lynx et analyse des excréments pour les deux espèces. Les renards sont actuellement plus abondants que les lynx, mais ces dernie.rs utilisent plus souvent le bord des marais, c'est-à-dire les plus riches biotopes. L'analyse de la nourriture montre que le chevauchement des régimes est faible : le Lynx est un spécialiste des lapins, tandis que Je Renard est un généraliste . La prédation commune des lapins pendant l'élevage des jeunes peut laisser supposer une compétition interspécifique. On a besoin de plus de données pour comprendre les interactions entre Lynx et Renard, mais on peut imaginer que si ce dernier est abondant c'est surtout parce que le premier est devenu rare .
REFERENCES
ALLIER, C., ÛONZALEZ BERNALDEZ, F. & RAMIREZ, DIAZ, L. ( 1 974). - Mapa eco/6gico de la Reserva Biol6gica de Doiiana. CSIC, Sevil la.
BRAND, C.J . , KEITH, L.B. & FISCHER, C.A. (1 976). - Lynx responses to changing Snowshoe hare densities in Central Alberta. J. Wildl. Manage., 40 : 4 1 6-428 .
DELIBES, M. ( 1 980) . - Feeding ecology of the Spanish lynx in the Coto Dafiana. Acta theriologica, 25 : 309-324.
SALE, P.F. ( 1 974) . - Overlap in resource use and interspecific competition. Oecologia, 17 : 245-256.
VALVERDE, J.A. ( 1958). - An ecological sketch of the Coto Dofiana. British Birds, 5 1 : 1 -23 .
ZIMEN, E. (Ed.) ( 1980) . - The Red Fox. B iogeographica 1 8, Junk, The Hague.
- 1 50 -

THE IMPACT OF HUMAN ACTIVITIES ON THE FOOD HABITS OF RED FOX AND WOLF IN OLD CASTILLE, SPAIN
S. REIG, L. DE LA CuESTA and F. PALACIOS *
Although the Red fox (Vulpes vulpes) and the Wolf (Canis lupus) differ in ecology and behaviour, the data of Castroviejo et al. ( 1 975) and many other authors on the feeding ecology of these Canids reveal sorne similarities between the two species, such as an almost complete absence of prey selection and the use of human refuse, game and domestic animais as food. This dependence on the human environment is detrimental to the economy of rural communities and also represents a health hazard, because bü·th animais are rabies transmitters (mainly the Fox) .
Based on these premises, the present study attempts to estimate the amount of use of man-modified environments, as well as the influence of different types of land use on the food habits of these two wild Canids. Ali the data presented here proceed from our own investigations on the diet of these species in Spain, soon to be published.
STUD Y AREA
In order to evaluate the response of the two wild Canids to different environmental conditions, we selected two areas representing different habitats and categories of land use . The A zone, located in Sierra de la Demanda, Cordillera Cantabrica and Montes de Leon, is a mountainous area that, according to Rivas-Martinez ( 1 98 1 ), corresponds to an euro-siberian environment, with an human population density of 65 inhabitants per square kilometre, mainly dedicated to livestock breeding. The B zone, located in the Upper Meseta of the Duero River, is a large plain, classified by Rivas-Martinez ( 1 98 1 ) as a supramediterranean environment, with a lower human density (30 inhab./km2) mainly dedicated to agriculture .
MA TER/AL A ND METHODS
In the A zone, we have analysed the gut contents of 84 red foxes and 55 wolves, while in the B zone, 260 and 63 gut contents were respectively examined. The specimens were collected between 1 979 and 1 983 , and
* Unidad de Zoologia Aplicada, « El Encin », Carretera de Barcelona, km 37, Alcalade Henares (Madrid), Spain.
Rev. Ecol. (Terre Vie), vol, 40, 1985

although they were gathered at different times of the year, no seasonal grouping was made due to the reduced number of Wolf carcasses examined.
The contents of each stomach and intestine were analysed according to traditional methods and each prey item was identified to the lowest possible taxon. To evaluate contents, biomass values or number of individual specimens of each kind of prey were not taken into consideration ; we concentrated instead on the criteria of presence/absence, in arder to obtain more qualitative information on the food habits. Then, the diet was classified by the habits and environmental characteristics of the food items, without regard to their nutritional value.
These food items were considered as indicators of specifie human activities, so once the list of food items was completed, we attempted to relate the presence of each prey item to the kind of human activity which conditioned its presence. The result was the following list of biological indicators : a) Indicators of agricultural activities : Coturnix coturnix, A lectoris rufa, fam.
Alaudidae, Microtus arva.lis, Pitimys sp. , Lagomorphs, Calliptamus, Fam. Acrididae, Melolontha, cultivated fruits .
b ) Indicators of livestock breeding : Capra hircus, Ovis aries, Typhoeus,Geotrupes.
c) Indicators of human refuse and associated fauna found around humansettlements : birds included in d and e, mammals included in d and e ,Mus sp. , domestic animais, cultivated fruits and garbage .
d) Indicators of industrial activities involved with breeding livestook : Coturnixcoturnix, poultry, Ovis aries, Sus domestica.
e) Indicators of hunting activities : Coturnix coturnix, A lectoris rufa, fam.Corvidae, Lagomorphs, " big game " .
f) No direct indication of human influence : amphibians, reptiles, small birds,small mammals, most of the insects, wild fruit, " big " and " small " game.
As a possible source of error, it is important to underline the fact that in most cases more than one kind of human activity can influence the presence of a same food item. For example, sheep remains found in a gut content could weil be due to different causes. On the one band, they could quite likely come from a flock of sheep, and therefore indicate livestock breeding activity ; but they could also have been ingested in a slaughter bouse, and thus indicate an industrial environment. Finally, they could also come from a garbage dump in a rural area and reflect the presence of the species near rural settlements. The paucity of data on the trophic behaviour of our two Canids prevents any exact evaluation of the actual importance of different human activities . Therefore, in such cases, we allocated the same value to each of the possible environments contributing to the same food item, while recognizing that in sorne cases activities associated with human settlements are overestimated.
The next step was to establish a trophic matrix (gut contents = columns ; human activities = rows) , where food items were substituted by the corresponding human activity value. The Simpson index (À = � p2;, Ruiz and Jover,1 9 8 1 ) was applied to the matrix to estimate the degree of dominance of the different activities for each gut content and, adding ali of them, to calculate the relative dominance for the whole sample. Actual values were expressed in percentages for comparison. The results obtained were compared by 2 x 2 contingency tables .
- 1 52 -

RESULTS AND DISCUSSION
As evidenced by figure 1 , the anthropogenic component of the diet is important in the Wolf, amounting to 86 % in the A zone and to 85 % in theB zone. This is probably a consequence of the large biomass of food required, following the disappearance of large wild mammals ; this situation bas forced the Wolf to avail itself of domestic mammals whose capture is also easier. The Fox's habits seem to be Jess dependent upon the anthropogenic component, which represents only 4 7 % of its diet in the A zone and 48 % in the B zone.
A z o n e
N I , 5 3
R E D F O X W O L F
B z o n e
N I , 5 2
Figure 1 . - Percentage values for each category of food items associated with human activities. HS : human waste material and associated fauna found around human settlements ; A : agricultural activities ; L : livestock breeding activities ; 1 : industrial activities ;
NI : absence of direct human influence.
This coïncides with the Fox's more generalist dietary habits, that included a large amount of small birds, amphibians, reptiles, small mammals, insects and wild fruits, which were not considered to be directly human-related. Nevertheless, since the mortality caused by traffic killing increases the availability of sorne of these prey items, an undetermined proportion of this category of food is influenced by human activities.
1 53 -

No significant differences in results between zones A and B are apparent in spite of their different habitats and types of land use. The values obtained were : x2 = 0.66 (0 .5 > P > 0.25) for the Fox and x2 = 5 .62 (0.025 > P > O.Ol )for the Wolf. However, the importance of game and livestock for the Wolf is greater in the A zone, where livestock and big game are more common. Undoubtedly, if the data had been expressed as amounts of biomass, the differences would have been more important, because of the size of these preys .
On the other band, the fact that more than 50 % of the total amount of human-related food in both species cornes from human waste and associated fauna in rural populations accounts for the apparent independence of food habits with respect to habitat and land use.
Finally, another factor affecting these results lies in the characteristics of the sample, which consisted mainly of isolated specimens that were pooled together, ignoring information on local habitat characteristics which sometimes differ strikingly from those of the area as a whole. Thus the opportunistic behaviour of both species was not taken into consideration. Although the studies of Sargeant ( 1 972) and Eberhardt et al ( 1 982) on red foxes, and thoseof Guitian et al. (1 979) and Mech (1 966) on wolves, show how specializedland use can induce abnormal prey-item availability, it also favours selection of these prey. In this case the alteration of food habits in response to land use is obvious.
SUMMARY
An attempt is made to describe the role of anthropogenic factors on the food habits of the Red fox (Vulpes vulpes) and the Wolf (Canis lupus) . Two zones differing in habitats and types of land use were chosen in North..:Western Spain. A total of 444 and 1 1 8 gut contents, from foxes and wolves respectively, was collected. Presence/absence data were obtained and a possible relationship between categories of human activities and food items was looiked for by establishing a trophic matrix (gut contents = columns, human activities = rows) to which the Simpson index was applied . The results showed differences between the species in the amount of anthropogenic food, 86 % and 85 % in the Wolf, and 47 % and 48 % in the Fox, for the A and B zones respectively. However, comparing both zones, no significant differences were obtained, suggesting that the main human activity affecting food habits is that brought about by the presence of human settlements ; waste, garbage and associated fauna represent more than 50 % of the total amount of anthropogenic food in both species.
RESUME
L'étude analyse le rôle des activités humaines dans le déterminisme du comportement alimentaire du Renard roux (Vulpes vulpes) et du Loup (Canislupus) en Espagne. On a choisi dans le nord-ouest du pays deux zones dont leshabitats et l'utilisation du terrain sont différentes. 444 et 1 1 8 contenus digestifs de renards et de loups ont été examinés . Les données de présence/absence desproies sont confrontées aux types d'activités humaines dans une matrice (contenus digestifs = colonnes ; activités humaines = lignes) sur laquelle l'index de
- 1 54 -

Simpson a été calculé . Les résultats révèlent des différences interspécifiques ; la proportion d'aliments associés aux activités humaines est de 86 % et 85 % chez le Loup et de 4 7 et 48 % chez le Renard, respectivement pour les zones A et B. Toutefois une comparaison entre les deux zones, pour chaque espèce, montre que l 'activité humaine principale qui affecte les comportements alimentaires est celle qui résulte de la présence des populations rurales (déchets et faune associée) se traduisant par plus de 50 % du total des aliments qui sont d'origine anthropique .
REFERENCES
CASTROVIEJO, J . , PALACIOS, F., ÜARZON, J. y CUESTA, L. ( 1 975). - Sobre )a alimentacion de los canidos ibericos. Trans. Xllth Congr. Game Biol., Lisboa.
EBERHARDT, L., HANSON. W., BENGSTON, J., GARROT, R. and HANSON, E. ( 1 982). - Arctic fox home range characteristics in an oil-development area. /. Wildl. Managt., 46 : 1 8 3 - 1 90.
GITIAN, J . , DE CASTRO, A., BAs, S. y SANCHEZ, J .L. ( 1 979). - Nota sobre la dieta del Lobo (Canis lupus) en Galicia. Trabajos Composte/anos de Biologia, 8 : 95- 104.
MECH, L.D. ( 1 966) . - The wolves of Isle Royale. U.S. Dep. Interior. Fauna of the National Parks, Ser., 7 : 2 1 0 pp.
RrvAs-MARTINEZ, S. ( 1 9 8 1 ) . - Les étages bioclimatiques de la végétation de la Péninsule Ibérique. Act. III Congr. Optima. Anales Jard. Bot. Madrid, 37 : 25 1 -268.
Rurz, X. y JovER, L.L. ( 1 98 1 ) . - Sobre la alimentacion otofial de la Garcilla bueyera (Bulbucus ibis) en el Delta del Ebro, Tarragona (Espafia) . Pub/. Dept. Zoo/., Universidad de Barcelona, 6 : 52-72.
SARGEANT, A. ( 1 972). - Red fox spatial characteristics in relation to waterfowl predation. J. Wildl. Managt., 36 : 225-236.
- 1 55 -


THE EXPANSION MECHANISM OF THE WOLF (CANIS LUPUS)
IN NORTHERN EUROPE
ERKKI PULLIAINEN *
The whole territory of Finland once belonged to the core range of the nominate form of the Wolf (Canis lupus lupus L. 1 758) . This was still the s ituation around 1 880, when efforts to exterminate the species from the country were intensified (review in Pulliainen, 1 984 b) . This goal was achieved to the extent that it had disappeared from the southern, western and central regions by 1 890, and by 1 900 bred only in the eastern and northern parts of the country {Palmén, 1 9 1 3) . Since that time the wolves occuring i n Finland have formed the western edge of the eastern European Wolf population. Due to cultural and political differences, the two Wolf populations have developed in contrasting ways, the eastern population increasing and the western decreasing (Pulliainen, 1 965, 1 980� . The eastern frontier of Finland forms i n this sense a n interèsting observation line running north-south. The purpose of the present paper is to provide records on the expansion mechanism of the Wolf as it appears on the both sides of this frontier.
METHODS
Since 1 968 , the Finnish Border Patrol Establishment has recorded every border crossing by wolves observed on its daily patrols . These data, for the years 1 968- 1 9 8 3 , will be complemented here with earlier information published by the author in 1 965 . The methods used in Soviet Karelia are described by Danilov et al. ( 1 978) . Pulliainen ( 1 982 a) shows that the crossing data can be used to follow relative changes in the movements of wolves, but the numbers of crossings are not indicative of the exact numbers of animais involved, as one individual may cross frontier severa! times in the same year.
RESULTS
The main results obtained are as follows
( 1 ) Finland received its first post-war immigration (expansion) of wolves from Soviet Karelia ( = Karelian ASSR) between 1 959 and 1 963 , 1 96 1 beingthe peak year (Pulliainen, 1 965) . These wolves appeared in Finnish Northern
* Department of Zoology, University of Oulu, and Varrio Subarctic Research Station,University of Helsinki, Linnanmaa, 90570 Oulu 57, Finland.
Rev. Eco/. (Terre Vie), vol . 40, 1985

Karelia, where they were killed. The edge of the expanding population consisted of migrating males. Once breeding females came to inhabit the frontier region, a widening of the area used by each family could be followed during the course of the summer (Pulliainen, 1 965) .
The Kuhmo-Suomussalmi district of Finland received wolves from the central part of Soviet Karelia, where an increase was recorded from 1 96 1 to 1 965, and then a sharp decrease (Danilov et al. , 1 978) . These immigrating wolves were also killed. Numbers of wolves were relatively low in Soviet Karelia (Danilov et al. , 1 978), and especially in the adjacent Finnish territory in the late 1 960 s (Pulliainen, 1 974) .
(2) In 1 9 7 1 - 1 976 an increase was recorded in the Wolf populations of the southern, central and northern parts of Soviet Karelia, the highest density being reached in the southern part (Danilov et al. , 1 978) . These authors emphasize the threefold increase in the Karelian Wolf population from the years 1 966-1 969 (0.2 tracks/ 1 0 km) to 1 973-1 976 (0. 7 tracks/ 1 0 km) . The highest densities were recorded in the areas adjacent to Finnish Northern Karelia and Kuhmo, and in the south eastern corner (Figure 1 , Danilov et al. , 1 978) .
Of the 4656 crossings of the frontier by wolves recorded by the Finnish Border Patrol Establishment in the years 1 968- 1 979, 4640 took place in the frontier between Finland and the U.S .S .R. , 1 4 on the Norwegian border and two on the Swedish border. There are no corresponding records for the two latter borders in 1 980- 1 983 , when 1 6 1 5 crossings took place on the Soviet Border. There was a steep increase in the total number of crossings from 1 974 to 1 977 and a subsequent decrease to 1 9 8 1 , with an increase again to 1 98 3 . Figure 2 shows that this increase in the activity o f wolves mainly concerned Kuhmo (area 5) and Northern Karelia (areas 6-7) , also being reflected to sorne extent north and south of these areas. The first peak, the subsequent decrease and the new increase are especially clear in areas 6 and 7. Wolves have wandered out of areas 5-1 1 by specifie migration routes (Figure 1 , see Pulliainen, 1 965, 1 982 a) to reach various parts of the southern half of Finland .
DISC USSION
The Soviet Karelian Wolf population has always been under hunting pressure. A bounty system is used to encourage their killing, and ail possible means (from poison to steel traps and helicopters) cao be used. According to Dr. P. Danilov (pers. comm.) the population varied between 600 and 780 in1 975-1 983 , and the number of kilts (official statistics) between 1 00 and 1 50. The latter figure is enough - according to Danilov - to reduce the population, since other mortality factors also exist.
Our interest naturally concerns the factors (extrinsic or intrinsic) which control the size of this Wolf population, and in particular the behaviour of a saturated Wolf population, a stage which the Soviet Karelian population reached during the early 1 970 s (see Pulliainen, 1 980, 1 982 a) .
The abundance of wolves in Sov;et Karelia since the Second World Waris in many respects a consequence of human impact. An intensive programme of clear-felling was commenced in the vast areas of coniferous forest in the late 1 940 s, and the conifers were replaced with deciduous trees which provid� d
- 1 5 8 -

2 00 k m
Figure 1 . - The main migration routes of wolves i n Finland, numbers of crossings of observation l ines by wolves, and Wolf density in the Karelian ASSR in winter (according to Danilov et al., 1 978 ; abbreviations 1 = 0. 1 9 or less, 2 = 0.20 - 0.29, 3 = 0.30 - 0.39,
4 = 0.40 - 0.49 and 5 = 0.50 or more tracks/ 10 km of observation line).
food for Moose populations (A lces alces) , enabling them to increase markedly (Danilov et al. , 1 978) . After the war, Finland relinquished large areas of Karelia to U.S.S.R. and most of this land remained neglected. Fields and meadows returned to forest and again provided very suitable environments for Masse and other game (Pulliainen, 1 965). There were also plenty of Reindeer (Rangifer tarandus) available in the northem half of Soviet Karelia (Danilov et al. , 1 978).
- · 1 59 - ·

Thus, there was an abundance of food for wolves, which could use the forest roads when moving from one place to another.
In an improved food and movement situation the number of potential Wolf territories probably increased, and these were presumably also occupied. The changes recorded in the activity of wolves on the frontier in Finnish Northern Karelia and Kuhmo (Fig. 2) suggest that the wolves do not leave their familiar area, i .e . their territories, without good reason (for familiar area theory, see Pulliainen, 1 984 a). One good reason could be that the pack tends to become too big.
600
- � � �
� �
·� ' --' ~ 8
� �
,gj f4 3 6 9
.., 337 :z � ... )> z 4 0
12?21 � 10
1 1
Figure 2 . - Numbers of crossings of various parts o f the Fenno-Soviet border b y wolves recorded by the Finnish Border Patrol Establishment in the years 1 968- 1 9 8 3 (calculated
per 100 km of frontier).
It is significant that the saturated Soviet Karelian Wolf population (about 5-7 wolves/ 1000 km2, see Pulliainen, 1 980) seems to be increasing still further,i.e. there seems to be no self-regulation mechanism in the sense described byZimen (1 976). The present author ( 1 980, 1 982 b) has suggested that a higher proportion of females may reproduce in a hunted population than in a non-
- 1 60 -

hunted one if hunting disrupts pack stability by removing previously reproductive individuals . Packard et al. ( 1 983) have found support for this hypothesis and discuss its relevance in practice . They write : " Most wild Wolf packs consist primarily of several pups, a breeding pair, and only one or two biders . Only paclk:s numbering more th an about 1 0 members in mid-win ter would usually contain more than one or two biders of each sex that even potentially could constitute " extra " breeders if an alpha were killed. In the relatively rare larger packs containing more than two potential breeders of each sex, we would expect that even if more than one pair did breed, competition for resources would usually result in domination by one pair. Therefore we would not predict continued reproduction by more than one female in a pack for a long period following disturbance due to hunting. "
Large packs ( 1 0- 1 5 members) are really rare in Finnish territory, but they have occurred in the vicinity of the eastern frontier when the sex ratio of the population has been near 1 : 1 (Pulliainen, 1 965, 1 980, 1 982 a) . On the basis of kill statistics it is evident that at least in sorne cases there have been severa} pups, subadults and adults in the same pack. It is not known, however, which have produced the offspring.
Keith ( 1 983) , reviewing " sustainable harvests " of different Wolf populations, concludes that he would " become concerned about the status of Wolf populations wh ose annual rates of harvest were exceeding 30 % " , whereasMech ( 1 970 : 63-64) had suggested rates of 50 % or more as being required to reduce Wolf populations. Dr P. Danilov's data referred to here and our own observations on the frontier between Finland and the U.S .S .R. seem to support the previous suggestion, since an " official " killing of approx. 20 % (in the presence of other mortality factors) resulted in a slight decrease in the Soviet Karelian Wolf population.
This paper constitutes Report No. 152 from the Varrio Subarctic Research Station of the University of Helsinki.
SUMMARY
The tracks of wolves crossing the frontiers make it possible to study the exchange of population. An increase in the crossings is recorded which is due to an increase in the number of wolves in Soviet Karelia. The culling of populations resulted in a slight decrease of the number of wolves in the Soviet Union.
RESUME
Depuis 1 968 les garde-frontières finlandais notent toutes les traces de loups qui traversent les frontières entre la Suède, la Norvège, l 'U.R.S.S. et la Finlande. De cette façon il est possible d'étudier les mouvements de population de part et d'autre de ces limites . En Carélie soviétique la population de loups est soumise à des actions de contrôle importantes. Néanmoins cette population a augmenté considérablement au milieu des années soixante-dix du fait de l'augmentation des élans, résultant d'une nouvelle gestion forestière . A la même époque, dans la partie centrale de la frontière, les secteurs de Kuhmo et de
- 1 6 1 -
3

Carélie du Nord, le nombre des passages a significativement augmenté . Ceci résulte probablement d'une augmentation de la pression sociale au sein des meutes de Carélie soviétique . Il semble enfin qu'une diminution d'environ 20 % des effectifs de loups en U.R.S.S. a entraîné une légère diminution des populations lupines de Carélie .
REFERENCES
DANILOV, P.l., !VANTER, E.V., BELKIN, V.V. & NIKOLAEVSKII, A.A. ( 1 978) . - lzmeneni 'a cislennosti ohotnicih zverej Karelii po materialam zimnih marsrutnyh ucetov. In : !vanter, E.V. (ed.). Fauna i Ekologi'a Ptic i Mlekopita'uscih Taeznogo SeveroZapada SSSR, Petrozavodsk, 128- 1 59 .
KEITH, L .B . ( 1 983) . - Population dynamics of wolves. Can. Wildl. Serv. Rep. Ser., 45 : 66-77 .
MECH, L.D. ( 1 970). - The Wolf : The Eco/ogy and Behavior of an Endangered Species. xx, 3 84 pp. Garden City, N.Y.
PACKARD, J.M., MECH, L.D. & SEAL, U.S. ( 1 983) . - Social influences on reproduction in wolves. Can. Wildl. Serv. Rep. Ser. , 45 : 78-85 .
PALMÉN, J .A. ( 1 9 1 3) . - Biir, Wolf und Luchs in Finland. Zoo/. Beobachter, 54 (3) : 1 -6 .
PuLLIAINEN, E. ( 1 965). - Studies on the Wolf (Canis lupus L.) in Finland. A nn. Zoo/. Fennici, 2 : 2 1 5-259.
PuLLIAINEN, E. ( 1 974) . - Suomen suurpedot. 263 pp. Helsinki .
PuLLIAINEN, E. ( 1 980) . - The status, structure and behaviour of populations of the wolf (Canis 1. lupus L.) along the Fenno-Soviet border. A nn. Zoo/. Fennici, 17 : 1 07- 1 12 .
PULLIAINEN, E. ( 1 982 a) . - Behavior and structure of an expanding Wolf population in Karelia, Northern Europe. In : Harrington, F.H. & Paquet, P.C. (eds.) . Wolves of the World. Perspectives of Behavior, Eco/ogy, and Conservation, Park Ridge, New Jersey, 1 34- 145.
PuLLIAINEN, E. ( 1 982 b). - Experiences in the protection of the large predators in Finiand. /nt. J. Study A nim. Probl. 3 ( 1 ) : 3 3 -4 1 .
PULLIAINEN, E . ( 1 984 a) . - Use of the home range b y pine martens (Martes martes L.). A cta Zoo/. Fennica, 1 7 1 : 27 1 -274.
PULLIAINEN, E. ( 1 984 b). - Petoja ja ihmisiii. 320 pp. Helsinki.
ZIMEN, E. ( 1 976). - On the regulation of pack size in wolves. Zeitschr. Tierpsychol., 40 : 3 00-3 4 1 .
- 1 62 -

CONNAISSANCE DU CHIEN VIVERRIN EN EUROPE
M.J . DucHENE et M. ARTOIS
Centre national d'Etudes sur la Rage et la Pathologie des Animaux Sauvages, B . P. 9, F - 54220, Malzeville .
Le Chien viverrin (Nyctereutes procyonoides) a été introduit volontairement au cours des années trente dans la partie européenne de l 'U.R.S .S . Depuis 1 93 8 , son aire de répartition s'est étendue vers le centre et le nord de l'Europe. Sa progression semble actuellement arrêtée sur la rive ouest du Rhin (Artois et Duchêne, 1 982) . Dans la zone d'acclimatation, le régime aEmentaire est principalement composé de p:;tits rongeurs et de végétaux. En U.R.S .S . et dans une moindre mesure en Pol ogne, le Chien viverrin se révèle un vecteur actif de la rage : jusqu'au tiers des animaux sauvages ont été reconnus enragés. S i l 'on excepte des données physiologiques et zootechniques obtenues en élevage, en Finlande principalement, la biologie du Chien viverrin est très mal connue en Europe . Nous avons donc demandé au Dr H. Ikeda de présenter une synthèse de nos connaissances sur l'écologie et le comportement de cette espèce au Japon .
SUMMARY
Sin ce 1 93 8 the Raccoon dog has spread from the Soviet Union to West Germany and Norway. The b iology of this opportunistic omnivore and major rabies vector is unfortunately very poorly known in Europe. This is why Dr H. Ikeda has been asked to review what is known of its ecology and behaviour in Japan .
REFERENCE
ARTOIS, M. et DucHENE, M.J. ( 1 982) . - Première identification du Chien viverrin (Nyctereutes procyonoides) en France. Mamma/ia, 46 : 265-267 .
- 1 63 -


REGIME ALIMENTAIRE ET DOMAINE VITAL DU CHIEN VIVERRIN AU JAPON
Hiroshi IKEDA *
Le Chien viverrin (Nyctereutes procyonoides) est un Carnivore de taillemoyenne, commun au Japon, qui vit de façon nocturne en forêt et dans les zones broussailleuses . Plusieurs études concernant son régime alimentaire (Yamaguchi, 1 976 ; Ikeda et al. , 1 979), son domaine vital (Ikeda et al. , 1 979 ; Ikeda, 1 982) et son comportement social (Masui, 1 980 ; Ikeda, 1 982) ont été faites récemment. L'ontogénèse et le comportement reproducteur en captivité ont été rapportés par Okusaki ( 1 979) et Ikeda ( 1 983) . Enfin Ikeda (1 982) et Yamamoto et Hidaka (sous presse) ont étudié le rôle du marquage olfactif par les fécès déposées dans les latrines.
Dans cette brève étude nous décrivons le régime alimentaire et le domaine vital en nous référant aux études effectuées par l'auteur dans l 'Ile de MatuuraJima et à « Ebino Height » (île de Kyushu) , au Sud du Japon.
Régime alimentaire
La composition du régime et sa variation saisonnière ont été déterminées par l 'analyse de 1 82 fécès collectés à Matuura-Jima en 1 977 et 1 978 . Le pourcentage de fréquence d'apparition des aliments est donné dans le tableau I . Le matériel végétal es t surtout constitué de fruits. L'importance et la nature des fruits consommés chaque mois correspond à la saison de fructification de chaque espèce ; on a trouvé de grandes quantités de baies de Myrica rubra en juin, alors qu'en octobre les baies de Stauntonia hexaphylla prédominent. Des insectes, Hémiptères, Coléoptères, Diptères et Orthoptères, sont les principaux animaux terrestres composant le régime . D'autres an;maux terrestres, comme les mammifères, les oiseaux, les myriapodes, les vers de terre, les araignées apparaissent moins souvent. Bien que la densité du Mulot japonais, Apodemus speciosus, soit élevée dans cette île (Doi et Ivamoto, 1 982), les chiens viverrins en ont peu consommé. Murata (comm. pers.) a trouvé pour sa part que les espèces de Microtus constituaient l 'élément principal parmi les micromammifères . Les organismes marins, crabes, poissons, palourdes, varechs, etc . , apparaissent avec une fréquence élevée tout au long de l 'année . Les fruits, les insectes et les organismes marins ont constitué presque toute la nourriture du Chien viverrin au cours du cycle annuel, variant selon leur abondance saison-
* Adresse : Monuments and Sites Division, Agency for Cultural Affairs, Kasumigaseki 3 -2-2, Chidoya-Ku, Tokyo 100 (Japon).
Rev. Eco/. (Terre Vie), vol. 40, 1 9 8 5

TABLEAU 1
Fréquence d'apparition et pourcentage des aliments dans les fécès.
Mars Juin Août Octobre
Végétaux
Tiges, feuilles, etc. 30,9 43 , 1 1 6,0 43 , 1
Fruits 36,4 88,2 48,0 98,0
Animaux terrestres
Insectes 20,0 78,4 92,0 78 ,4
Mammifères 9, 1 2,0 0,0 7,8
Oiseaux 10,9 0,0 8,0 5,9
Autres invertébrés 37,7 3 ,9 24,0 3 1 ,4
Organismes marins
Poissons 60,0 1 3 ,7 20,0 3 1 ,4
Palourdes 69, 1 52,9 24,0 39,2
Crabes 34,5 25,5 72,0 56,9
Autres animaux 40,0 0,0 4,0 3 9,2
Varech 89, 1 0,0 0,0 1 3 ,7
Divers 20,0 5 ,9 8 ,0 29,4
Nombre de 55 5 1 25 5 1 fécès examinées
nière et leur disponibilité. Ikeda et al. ( 1 979) ont également rapporté une grande abondance de ces organismes marins dans le régime analysé dans une autre île . Dans des régions non insulaires, Yamaguchi ( 1 976) et Sasaki (comm. pers.) ont trouvé que les chiens viverrins se nourrissaient essentiellement de graines, de fruits et d'insectes.
Les différents composants de l'alimentation du Chien viverrin sont de taille relativement réduite et sont principalement collectés ou ramassés sur le sol, en forêt et en bord de mer.
Domaine vital
Les dimensions du domaine vital, déterminées par radio-pistage dans les ·deux zones d'étude (île Matuura-Jima et Ebino Height) figurent au tableau Il.A Matuura-Jima les domaines vitaux sont plus réduits que ceux d'Ebino Height {8 à 1 2 et 1 2 à 1 5 ha, respectivement) en raison du confinement. Ikeda et al. ( 1 979) ont observé des domaines vitaux de 1 , 1 4 à 4,3 ha dans l'île de Takashima.
Harestad et Bunnell ( 1 979) ont mis en évidence une relation générale entre la taille du domaine et le poids corporel chez les omnivores : H = 0,059 W0,92 ·où H = surface du domaine vital et W = poids corpmel .
Les valeurs obtenues par radio-pistage sont nettement plus faibles que les estimations calculées avec cette équation (Tableau Il) . Le Chien viverrin occupe <lonc des domaines plus petits que d'autres omnivores .
On a observé d'importants chevauchements des domaines vitaux dans les
- 1 66 -

TABLEAU II
Taille du domaine vital déterminée par radio-pistage et estimation de la tailledu domaine d'après la formule de Harestad et Bunnell (1979).
Taille du Domaine Poids Localité domaine vital
d'étude Individu
vital estimé corporel Période d'observation
(ha) (ha) (kg)
� ad. 1 0,6 87,6 2,8 Août 77 Matuura- 2 � � j . 8,0 49,3 1 ,5 Août 77 - Janvier 78
Jima 3 � � j . 1 2,4 59,8 1 ,9 Janvier - Mars 78
4 9 9 ad. 22,5 90,4 2,9 Mars 79
5 9 9 ad. 24,0 1 1 8 ,8 3 ,9 Mars 79
6 � � ad. 3 9,3 96, 1 3 , 1 Mars 79
7 9 9 ad. 23 ,0 75, 1 2,4 Avril 80 Ebino
8 9 9 ad. 1 2 ,5 67,2 2, 1 Avril 80 Height
9 9 9 ad. 5 1 ,0 69,5 2,2 Avril - Décembre 80
1 0 9 9 ad. 32,5 94, 1 3,0 Avril - Octobre 80 I l 9 <jl ad. 1 4,8 80,6 2,6 Avril 80
12 � � ad. 1 5 ,9 99,8 3,2 Octobre - Décembre 80
îles de Matuura-Jima et Takashima (Ikeda et al. , 1 979) . Cette superposition est moins apparente à Ebino Height.
Pour déterminer un modèle d'utilisation du domaine vital , les domaines vitaux des animaux n° 1 et n° 2 ont été reportés sur un quadrillage ayant une maille de 20 m2• Le temps total passé pendant les périodes d'activité et d'inactivité a été mesuré p our toute la période de pistage (Fig. 1 ). Les quadrats occupés par les animaux peuvent être divisés grossièrement en deux catégories selon la durée totale du temps passé à l'intérieur de chacun .
Figure 1 . - Somme du temps passé (période active et inactive) dans différentes zones du domaine vital à Matuura-j ima. Les animaux nos 1 et 2 ont été suivis en août 1 977.
-· 1 67 -
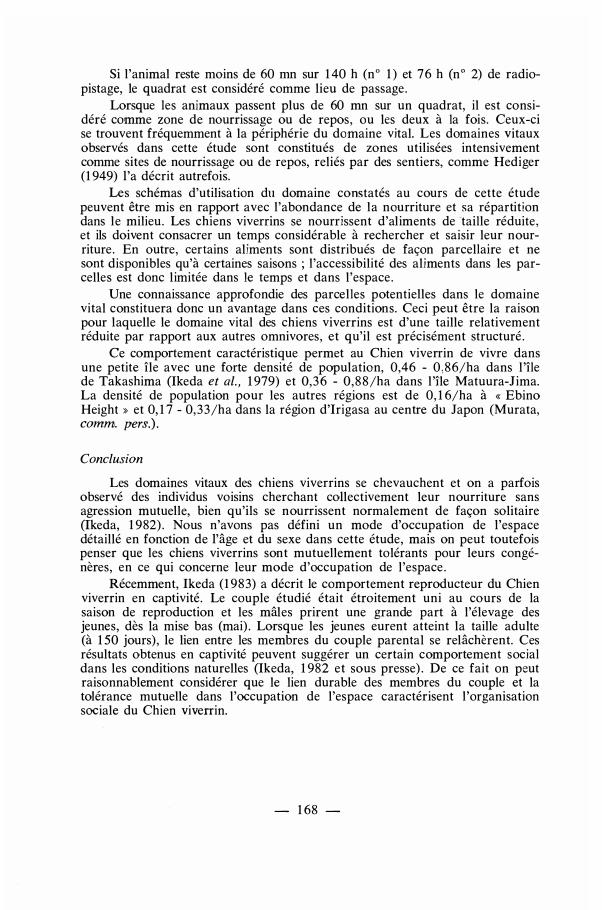
Si l'animal reste moins de 60 mn sur 1 40 h (n° 1 ) et 76 h (n° 2) de radiopistage, le quadrat est considéré comme lieu de passage .
Lorsque les animaux passent plus de 60 mn sur un quadrat, il est considéré comme zone de nourrissage ou de repos, ou les deux à la fois . Ceux-ci se trouvent fréquemment à la périphérie du domaine vital. Les domaines vitaux observés dans cette étude sont constitués de zones utilisées intensivement comme sites de nourrissage ou de repos, reliés par des sentiers, comme Rediger (1 949) l'a décrit autrefois.
Les schémas d'utilisation du domaine constatés au cours de cette étude peuvent être mis en rapport avec l'abondance de la nourriture et sa répartition dans le milieu. Les chiens viverrins se nourrissent d'aliments de taille réduite , et ils doivent consacrer un temps considérable à rechercher et saisir leur nourriture . En outre, certains aliments sont distribués de façon parcellaire et ne sont disponibles qu'à certaines saisons ; l'accessibilité des aliments dans les parcelles est donc limitée dans le temps et dans l'espace .
Une connaissance approfondie des parcelles potentielles dans le domaine vital constituera donc un avantage dans ces conditions. Ceci peut être la raison pour laquelle le domaine vital des chiens viverrins est d'une taille relativement réduite par rapport aux autres omnivores, et qu'il est précisément structuré .
Ce comportement caractéristique permet au Chien viverrin de vivre dans une petite île avec une forte densité de population, 0,46 - 0 ,86/ha dans l 'île de Takashima (Ikeda et al. , 1 979) et 0,3 6 - 0,8 8 /ha dans l 'île Matuura-Jima. La densité de population pour les autres régions est de 0, 1 6/ha à « Ebino Height » et 0, 1 7 - 0, 33/ha dans la région d'lrigasa au centre du Japon (Murata, comm. pers.) .
Conclusion
Les domaines vitaux des chiens viverrins se chevauchent et on a parfois observé des individus voisins cherchant collectivement leur nourriture sans agression mutuelle, bien qu'ils se nourrissent normalement de façon solitaire (Ikeda, 1 982) . Nous n'avons pas défini un mode d'occupation de l'espace détaillé en fonction de l'âge et du sexe dans cette étude, mais on peut toutefois penser que les chiens viverrins sont mutuellement tolérants pour leurs congénères, en ce qui concerne leur mode d'occupation de l'espace .
Récemment, Ikeda (1 983) a décrit le comportement reproducteur du Chien viverrin en captivité . Le couple étudié était étroitement uni au cours de la saison de reproduction et les mâles prirent une grande part à l'élevage des jeunes, dès la mise bas (mai) . Lorsque les jeunes eurent atteint la taille adulte (à 1 50 jours) , le lien entre les membres du couple parental se relâchèrent. Ces résultats obtenus en captivité peuvent suggérer un certain comportement social dans les conditions naturelles (Ikeda, 1 982 et sous presse) . De ce fait on peut raisonnablement considérer que le lien durable des membres du couple et la tolérance mutuelle dans l'occupation de l'espace caractérisent l 'organisation sociale du Chien viverrin.
- 1 68 -

SUMMARY
Japanese raccoon dogs feed on a variety of dietary i tems, ranging from insects and marine organisms to fruits, depending on their seasonal abundance and availability . The home ranges of the raccoon dogs vary from 8 to 5 1 ha, and are smaller than those of other mammalian omnivores of comparable size . Within an home range, foraging and resting areas are connected by a network of paths. Home ranges of neighbouring individuals often overlap each other. The social structure of the Raccoon dog populations is briefly discussed, in connection with the diet and the spacing pattern of the species.
REFERENCES
Doi, T. & twAMOTO, T. ( 1 982) . - Local distribution of two species of Apodemus in Kyushu. Res. Popul. Eco/., 24 : 1 1 0- 1 22.
HARESTAD, A.S. & B uNNELL, F.L. ( 1 979). - Home range and body-weight : a reevaluation. Eco/ogy, 60 : 389-402 .
REDIGER, H. ( 1 949) . - Saugetier-Territorien und ihre Markierung. Bijd. Dierk., 28 : 1 7 2 - 1 84.
IKEDA, H . ( 1 982) . - Unpublished Doctoral Thesis, Kyushu University. IKEDA, H. ( 1 983) . - J. Mamm. Soc. Jap., 9 : 229-236.
IKEDA, H . ( in press) . - Proceedings of the Sino-Japanese Joint Symposium on Mammalogy . IKEDA, H. , EGUCHI, K. & ÜNO, Y. ( 1 979). - Home range utilization of a Raccoon dog
Nyctereutes procyonoides viverrinus Temminck, in a small i slet in western Kyushu. Jap. J. Eco/., 29 : 3 5-48.
MASUI, M. ( 1 9 80) . - Shizen, 35 : 45-5 1 (en japonais) .
ÜKUZAKI, M . ( 1 979) . - J. Kagawa Nutrition College, 1 0 : 99- 1 03 (en japonais avec résumé anglais) .
YAMAGUCHI, Y. ( 1 976). - Bull. Kanagawa Pref. Mus. Nat. Sei., 9 : 73 -76 (en japonais avec résumé anglais) .
YAMAMOTO, 1. & HIDAKA, T. ( 1 984) . - Utilization of latrines in the Raccoon dog Nyctereutes procyonoides. A cta Zoo!. Fenn . , 1 7 1 : 241 -242.
- 1 69 -


BEHA VI OUR OF RABID FOXES
M. ARTOIS and M.F.A. AuBERT *
Although much is known of the ecology and behaviour of foxes, many aspects of the spread and prevalence of rabies in Fox populations are poorly understood. There is a Jack of information on the contact rates between rabid and healthy foxes and little detail on the rate of spread within local populations. Though there is ample documentation of the overt behaviour of rabid foxes there is no information on changes in behaviour of foxes in the field as and when they become rabid. The only way to observe such changes in behaviour with any assurance of success is to inoculate wild free-living foxes with rabies virus and to monitor their subsequent behaviour adequately by appropriate means. This paper reports observations on 3 foxes so treated, together with observations on other radio-tagged foxes which became infected with rabies naturally during a field study of faxes in Lorraine . The main goal of this work was to confirm that rabid faxes do not stray very far from their range, as rabid dogs are reputed to do (W.H.O. , 1 984) .
MA TER/A L AND METHODS
Three foxes which were inoculated with rabics virus were fitted with radio transmitters on the day of inoculation : the virus used for inoculation was extracted from the salivary glands of naturally infected foxes, and the dose was calculated to induce an incubation period of about eighteen days (Andral et al. , 1 982) .
The inoculated foxes were released at their point of capture . Their movements were subsequently observed frequently, but intermittently, to establish their range of movements and rhythms of activity, but when there was evidence of abnormal behaviour in these foxes they were tracked intensively ; for example , one a female, Annonciade, was tracked continuously for six days, except for a gap of only few hours.
Three ether foxes fitted with radio transmitters were radio tracked up to two months but were not inoculated . These became infected naturally and also developed rabies a few days (Nathalie) , one month (Clement) , and two months (Pascaline) later. These were not being tracked intensively as were the inoculated foxes, and less information about their behaviour while rabid is available .
* Ministère de l'Agriculture, Direction de l a Qualité, Services Vétérinaires, CentreNational d'Etudes sur la Rage, B.P. 9, 54220 Malzéville.
Rev. Eco/. (Terre Vie), vol. 40, 1 9 8 5

RESULTS
The three foxes R2 (female), R3 (male) and Annonciade (female) displayed « normal » movement for about two weeks before unusual behaviour was detected. During these short periods it was possible to establish their home ranges and their patterns of spatial and temporal activity. Although it was predicted that onset of clinical symptoms of the disease would occur at 1 8 days, it seems from changes in behaviour that onset was variable at 1 9, 1 6 and12 days. R2 died 23 days after inoculation, R3 20 days and Annonciade 1 8 days. In two cases only, the place of death was known for naturally infected foxes. One, a male, Clément, was shot near a village outside its range ; Nathalie was also found dead outside ber range. The third, Pascaline, exhibited abnormal movements while it was being radio tracked, but radio contact with it was lost after two days and ber body was found about a week after death, again outside its normal range. At one time this animal was Iocated in the cellar of an empty bouse. No confirmatory laboratory diagnosis of rabies was possible with Pascaline because of its state of decomposition.
Figure 1. - Home ranges of the three radio-tracked foxes (the dog Fox Clément (1) , and the vixens Nathalie (2) and Pascaline (3)) and the places, shown by dark urrows,
where they were found dead. The grid square is 1 X 1 km.
Home range Umits and dispersal. - In the case of ali three inoculatedfoxes it was possible to compare the range of movements of the foxes before and after the onset of rabies symptoms. During the abnormal behaviour phase ali three strayed beyond their previous range at many different points for severa!hundred metres, but ali three died on the edges of their ranges.
The naturaly infected Fox, Pascaline, also behaved in this way but later
- 1 72 -

moved away and was found dead outside her range at 2 km. Nathalie was found at 1 . 5 km and Clément at 2.2 km of their core activity area.
Curiously, there was thus sorne apparent differences in the behaviour of the three inoculated foxes compared with the three which were naturally infected in their adherence to their ranges. This was unlikely to be due to any difference in the strain of virus and most l ikely was a chance occurrence.
Use of space. - Radio tracking observations on healthy faxes revealed individual differences in their exploitation of the habitat. In general however, they preferred wooded country in day time and open country at night (Artois et al, in prep . ) .
Erratic and unpredictable movements of the rabid foxes made i t difficult to maintain continuous observations on these faxes as revealed by the low number of radio fixes obtained. Such erratic movement behaviour was characteristic of rabid faxes .
Annonciade, which was observed more closely than the other foxes revealed movements which were purposeful and not random during the « healthy » period, but later the pattern of movements became random and disorientated. Unlike formerly, when there were distinct differences between the use of space in day time and at night, no differences were observed in this respect between day and night after the onsct of rabies (Table I) .
TABLE I
The use of space by A nnonciade before and after the onset of clinical signs of rabies (fixes number per each land-use class) .
Healthy Fox Rabid Fox
Day Night Day Night
Woodland 1 5 1 6 2 8 3 8
Arable land 1 0 43 1 9 3 7
Grassland 0 9
A ctivity rhythms. - A disturbance in the daily rhythm of activity of all foxes was observed when they became rabid. It was characterised by irregular activity and was relatively more intense during the day by comparison with activity during the « healthy » period. This is depicted in figure 2, which presents an aggregation of the Locomotor Activity Index (Bideau et al. , 1 983 ; Aubert et al. , in this issue) , for the four foxes R2, R3 , Annonciade and Pascaline . This is a characteristic sign of onset of the disease .
DISCUSSION
Post-mortem examination of two of the naturally infected faxes found dead, Pascaline and Nathalie, revealed wounds. Pascaline's skull had traces of bites in the frontal sinus region, which were not observed when the Fox was fitted with the radio collar two months previously. The wound to Nathalie was a deep tear in the right forelimb. It is possible that these were the sites of infection in the two foxes.
- 1 73 -

�· \ ,,
HEURE SOLAI RE
HEURE SOLA IRE
® Figure 2. - Cumulative Locomotor Activity Index of the four Foxes (R2, R3, Annonciade and Pascaline) radio-tracked before ( 1 ) and after (2) the onset of clinical signs of rabies.
In a previous article (Andral et al. , 1 982) the disco-very of many subcutaneous traces of bites on vixen R2 were reported. She had remained motionless for 1 2 hours at the boundary of her territory before dying and it was suggestedthat possibly she could have been bitten by a neighbouring Fox. If this were so, healthy foxes would run a high risk of being bitten by a rabid Fox in these circumstances though much would depend upon the state of immobilisation of the rabid Fox towards the terminal stages of the disease when it was no longer able to move freely.
It is only conjecture that these superficial wounds to R2 were inflicted during the terminal 1 2 hours of its life. Thus it is not possible to indicate whether or not the disease is more often transmitted by a healthy Fox deliberately making aggressive contacts with a rabid Fox, or vice versa. Also there is the observation (George et al., 1 980) that only 1 1 % of captive foxes exhibit furious rabies symptoms, but whether or not foxes exhibiting the dumb rabies form in the wild can transmit the disease effectively is not known, nor if effective, how frequently.
The presence of reoently acquired wounds on three of the foxes found dead
- 1 74 -

suggests that transmiSSion is effected by highly aggressive contacts between rabid and healthy foxes, rather than by a more passive transmission. It would be interesting to investigate this aspect in a large sample of foxes submitted for rabies diagnosis (Lloyd, pers. comm.) . The observations reported here reveal changes in activity of foxes when they become rabid, but the number of foxes observed is inadequate to enable generalisations . Also, the peak incidence of rabies in foxes in the early spring (Toma and Andral, 1 977) is probably associated with greater normal agonistic contacts between foxes at the time when the Fox population is in greatest agitation - namely, when young an imais are seeking places to settle during or after dispersal and when competition for space and reproductive partners occurs. This investigation did not cover these aspects which could be of paramount importance to the rate of spread of the disease to rabies-free areas. Radio-tracking is an invaluable tool for studying the movements of animais, but as this study reveals, it has limitations and inadequacies . The ideal combination would be radio tracking and visual observation when intimate animal behaviour patterns need to be unravelled.
SUMMARY
Six foxes fitted with radio transmitters were radio tracked in the field while rabid. The rabid Fox !oses its sense of time and space, but it does not travel far from its home range . Its overall leve! of activity is increased, mostly because of the numerous aimless day-time movements. The presence of recently acquired wounds on sorne foxes suggests that rabies transmission might be effected by highly aggressive contacts . Radio tracking is an invaluable tool for studying movements of rabid animais, but in this case, it has also its limitations, and an ideal strategy would be a combination of radio tracking and visual observation .
RESUME
On a suivi par radio-pistage six renards en liberté alors qu'ils étaient enragés. Le Renard enragé perd son sens de l'espace et du temps, mais ne s'éloigne guère de son domaine d'activité . Le niveau total d'activité augmente, principalement en raison de déplacements diurnes qui semblent n'avoir aucun but. L'existence de blessures récentes sur certains de ces renards pourrait indiquer que le mode de transmission de la rage se produit au cours d'un contact très violent. Si le radio-pistage est un apport essentiel dans l'étude sur le terrain d'individus enragés, son intérêt est limité ; l ' idéal serait de pouvoir combiner l'observation directe à cette technique .
ACKNOWLEDGMENTS
We should like to thank M.M. Stahl, Léger and Barbillon for their contribution to our field work, and M.M. Andral and Blancou for their decisive support. This work was made possible due to the collaboration of Office National de la Chasse and the Entente Interdépartementale de Lutte contre la Rage. We are especially grateiul to Gwynn Lloyd for his constructive criticisms of an early draft of this paper and the rewriting of the english version.
- 1 7 5 -

REFERENCES
ANDRAL, L., ARTOIS, M., AUBERT, M.F.A. et BLANCOU, J. ( 1 982) . - Radio-pistage de renards enragés. Camp. Immun. Microbiol. Infect. Dis., 5 : 1 85-29 1 .
BIDEAU, E., VINCENT, J .P., e t ANGIBAULT, J .M. ( 1 983) . - Occupation d e l 'espace chez le Chevreuil. 1. Cas des mâles. Acta Oecol., Oecol. Applic., 4 : 1 6 3 - 1 84.
GEORGE, J.P. , GEORGE, J . , BLANCOU, J . et AUBERT, M .F.A. ( 1 980). - Description clinique de la rage du Renard. Etude expérimentale. Rev. Méd. Vét., 1 3 1 : 1 5 3 - 1 60.
TOMA, B . and ANDRAL, L. ( 1 977). - Epidemiology of Fox rabies. A dv. Virus Res., 21 : 1 -36 .
WoRLD HEALTH ÜRGANIZATION ( 1 984). - Guide/ines for dog rabies control. Doc. VPH/8 3 .43, Geneva.
- 1 76 -

METHODE D'INTERPRETATION STATISTIQUE DU RYTHME D'ACTIVITE DE CARNIVORES
SUIVIS PAR RADIO-PISTAGE
M. AuBERT * , M. ARTOIS * et P. STAHL * *
Ce travail ( 1 ) s'inscrit dans u n programme visant une meilleure définition des exigences écologiques du Renard roux (Vulpes vulpes) et du Chat forestier (Pelis si/vestris) , avec pour finalité la mise au point de règles de gestion de leurs populations dans le cadre de la prophylaxie sanitaire de la rage et de l 'aménagement cynégétique .
Nous exposons une méthode d'analyse du rythme d'activité des renards et des chats forestiers suivis par radio-pistage . Cette analyse est assurée au Centre National d'Etudes sur la Rage par un ensemble de programmes informatiques de saisie et traitement des données. Ce progiciel qui fera l'objet d'une publication ultérieure ne sera pas ici décrit dans son ensemble .
MA TERIEL ET METHODES
Prise d'information sur le terrain. Celle-ci ayant été décrite par ailleurs (Artois et Aubert, 1 983) , nous rappelons seulement qu'après leur capture les animaux sont équipés de colliers émetteurs et relâchés . Leur localisation est effectuée à l 'aide de différentes antennes, environ tous les quarts d'heure au cours de périodes de vingt-quatre heures, ou approximativement toutes les 4 heures sur des périodes de quatre jours. Ces périodes ne sont pas nécessairement en continuité . De plus, les intervalles de temps séparant chaque localisation sont autant que possible réglés sur l 'amplitude des déplacements observés de l'animal, des déplacements rapides nécessitant des l ocalisations plus fréquentes .
Gestion de l'information au laboratoire. Le stockage et le traitement des données ont été organisés sur micro-ordinateur Apple II et sur Victor S 1 . Le langage utilisé est un Basic (Applesoft ou Microsoft selon le cas) .
L'enregistrement et la mise à jour des fichiers de données ont été conçus sur un mode conversationnel, de manière à dégager au mieux l'opérateur non informaticien des contraintes de cette discipline .
* Ministère d e l 'Agriculture, Direction d e la Qualité, Services Vétérinaires, CentreNational d'Etudes sur la Rage, B .P. 9, F 54220 Malzéville.
** Convention C.N.E.R.-O.N.C.-Académie et Société Lorraines des Sciences-Laboraratoire de Biologie du Comportement de l'Université de Nancy.
( 1 ) Travail effectué dans le cadre d'une convention de recherche avec l'Office National de la Chasse.
Rev. Eco/. (Terre Vie), vol. 40, 1 9 8 5 4

Les données entrées étaient pour un animal donné : le numéro du relevé, ses 'coordonnées géographiques et chronologiques (date, heure) , la régularité du signal, la précision du relevé et le type de végétation fréquenté par l 'animal (lorsqu'un contact visuel pouvait être établi) .
En plus de la constitution des fichiers de données, leur contrôle et leur correction éventuelle, le progiciel assure leur interprétation :
- util isation de l 'espace par l'animal pisté : cartes de présences, trajets, étude des surfaces fréquentées en fonction de leurs caractéristiques phytosociologiques ;
- utilisation du temps : ce dernier point sera le seul exposé.
EVALUA TION DE L'ACTIVITE CIRCA DIENNE MOYENNE : LES PROBLEMES POSES ET LES SOL UTIONS A DOPTEES
1 °) La distance séparant deux localisations consécutives est une sous-estimation biaisée de l'activité locomotrice.
Comme Bideau et coll. ( 1 983) , il importe d'abord de préciser que la méthode de pistage employée ne peut nous renseigner précisément sur l 'activité locomotrice à proprement parler. Nous ne pouvons que mesurer les changements de position de l 'animal sur le terrain d'étude, sans préjuger du cheminement suivi. Nous parlerons donc de la mesure d'un déplacement ou d'un indice d'activité locomotrice, étant bien entendu que cet indice sera toujours une sousestimation de l 'activité locomotrice réelle, sous-estimation d'autant moins biaisée que l'intervalle entre deux relevés sera bref et que la trajectoire de l 'animal suivi sera rectiligne. Malheureusement le biais de cette estimation n'est pas systématique, puisqu'il dépendra lui-même de deux facteurs :
- Le comportement de l'animal pisté : par exemple des déplacements continus et assez rectilignes d'un point de repos à une zone de chasse seront mieux appréciés que des déplacements louvoyants sur cette zone .
- Le rythme des relevés, qui est guidé par la disponibilité des hommes de terrain plus souvent qu'il n'est théoriquement souhaitable .
Pour répondre respectivement à ces contraintes le statisticien doit adopter la démarche suivante :
- Examiner les interprétations chiffrées des déplacements à la lumière d'observations supplémentaires sur le comportement de l 'animal pisté .
- Définir le délai-seuil entre deux relevés au-delà duquel un changement de localisation de l'animal ne permet pas la déduction d'un trajet linéaire quelque peu vraisemblable.
Un tel délai ne pouvant être fixé a priori, c'est l 'opérateur qui sera amené à le préciser à l'écran. L'expérimentateur garde ainsi la possibilité d'étudier de manière pragmatique la stabilité du tracé des spectogrammes d'activité, en fonction des contraintes qu'il peut imposer au tri d'une même série de données .
2°) Comment à partir de sondages effectués à rythme irrégulier pendant quelques jours, établir un diagramme qui rende compte de l'activité mcryenne circadienne pour cette période ? La manipulation de données discontinues prises à intervalles variables
exige une grande prudence . La figure 1 b schématise les deux types d'écueils
- 1 7 8 -

® O h
j o u r
6 7
j o u r j + 1 l 1 : '
�
®
8 h
D
©
1 2 3 4 5
l � ' ! � 1 1 1 ' ' 1
l.-.....: '
8 9 10 1 1
! ! l � 1 1
1 ' ' ' 1 -
r e l ev é n ' 1 n " 2
B h 1 1 9 h - - - - ..1 1 -- - - -D
dépl acement g é o g ra ph i qu e
(! � 9 h B h
D �
re l e vé n · n · 2
--- - _ _ a.�-. h--+--t--11--li--: lt--t--t-+-1*:'-+_..J�� - - -1 1 ' ' 1-.·----�
D
6 0 m n 2 0 m n
24 h
9 h
Figure 1 . - a) Mesure discontinue et arythmique des changements de localisation de l'animal radio-pisté. Des intervalles de temps trop longs entre les localisations 2 et 3, 5 et 6, 7 et 8 n'autorisent pas la prise en compte de déplacements apparents de l'animal. L'arythmicité des temps de localisation pose le problème d'une méthode permettant de déduire le profil des déplacements moyens journaliers. b) Deux méthodes non admissibles pour l'estimation de l'activité locomotrice. c) Solution adoptée : le découpage des intervalles entre observations selon une échelle prédéfinie. Les heures sont arrondies au plus près de ces graduations : celles-ci étant en dixième d'heure, l'imprécision de la mesure du temps introduite par cette méthode est toujours inférieure à 3 minutes. Les calculs de sommes et de moyennes, peuvent alors être effectués sur chacune des 240 périodes de
6 minutes qui composent la journée.

qui doivent être évités. Supposons que l'on mesure un déplacement (d) entre deux relevés consécutifs séparés de 20 minutes : ne disposant que de ces deux relevés pour J'heure entière, on peut être tenté d'extrapoler à celle-ci Je déplacement observé = d X 60/20. Ceci signifierait que l'animal se serait déplacé pendant 40 minutes où aucune observation n'a été faite , à la même vitesse que pendant les 20 minutes d'observation. Il serait tout aussi arbitraire de réduire Je déplacement horaire au déplacement mesuré pendant ces 20 minutes, sous Je seul prétexte que celles-ci sont incluses dans l'heure . Ceci signifierait qu� J'animal ne se serait déplacé qu'au moment où on a cherché à le localiser.
La solution proposée ici consiste à admettre les conventions simplificatrices suivantes :
a) Entre deux localisations chronologiquement très proches (6 minutes)1e déplacement est considéré constant et uniforme .
b) Le nycthémère étant divisé en périodes de 6 minutes le s déplacementsobservés pendant ces périodes sont sommés .
Les déplacements observés ayant été effectués à des moments qui ne coïncident pas nécessairement avec ce découpage, il est nécessaire de recadrer ceux-ci : lorsque la période de déplacement recouvre partiellement une période de 6 minutes, l'extrapolation au reste de cette pér "ode n'est effectuée que dans Je cas où la fraction de la période non couverte n'excède pas 3 minutes . Dans le cas contraire, cette mesure n'est pas prise en compte . Ce procédé équivautpratiquement à centrer les données sur une échelle de 6 minutes, sans que cela entraîne ni perte d'information appréciable , ni surévaluation ou sous-évaluation systématiques des déplacements effe ctués (Figure 1 c) .
RESULTA TS
Le logiciel assure trois sorties graphiques : en fonction de chacune des240 périodes de 6 minutes qui composent un jour, sont représentés : la moy::nne des déplacements (effectués pendant 6 minutes), le nombre de déplacements mesurés, l'écart-type de ceux-ci (Fig. 2) .
Plusieurs données résument encore l 'analyse : Je déplacement moyen ·circadien, divisé lui-même en déplacement nocturne et déplacement diurne .
La qualité de l 'échantillonnage est mesurée :
- Par Je pourcentage du nombre de périodes de 6 minutes pour lesquel les une mesure au moins a été effectuée, rapportée au nombre de périodes de {) minutes nocturnes ou diurnes ; ces pourcentag( s wnt appelés, selon le cas,·couverture diurne ou couverture nocturne .
- Par la moyenne et la variance du n ombre d'observations par pér:ode ·de 6 minutes.
Il est ainsi possible de comparer l 'activité du même individu à différentes périodes de l'année, ou en fonction de son état physiologique ou sanitaire (Figure 3) .
Enfin, l e programme rend possible l 'étude des déplacements cumulés de plusieurs individus afin de rechercher les modèles d'utilisation du temps propres à un sexe ou à une espèce donnée .
1 80 -

IJ Pi: l W.• � u T
\ , , � u " 1� ... r
... "
.. z
u .. >
"
r , .. 1
r " a u ...
I l
a
b
IŒURE SOLA! RE
c
HEURE SOIJH RE
Figure 2 . - Indice d'activité locomotrice : a) Rythme circadien. b) Nombre de mesures effectuées par période de 6 mn. c) Ecart-type de ces mesures. Ces données sont le cumul des observations effectuées sur trois renards non enragés, confirmant les résultats individuels non présentés ici . Les déplacements sont d'amplitude plus grande pendant la nuit, avec un minimum relatif de 24 heures à 2 heures. JI apparaît que c'est surtout la nuit que l'effort de pistage a été porté, alors que le jour, un petit nombre de suivis a été tout à fait suffisant, comme l'indiquent les écarts-types très faibles calculés . Enfin le caractère exceptionnel de certains grands déplacements est signalé par l'importance des écarts-types
correspondants.
DISCUSSION
La méthodologie adoptée pose plusieurs questions. La tai lle de cet exposé nous limitera à n'en discuter que deux.
En ce qui concêrne l'évaluation du déplacement entre deux localisations, il est évident que le choix de la ligne droite est le plus simple. Reddingius et coll. ( 1 983 ) proposent un modèle séduisant déduit de l'observation du déplavement d'un Diptère sur une surface plane à quadrillage virtue l . Ils démon-
- 1 8 1 -

iiEIJRE SOI.IH RF.
\1 \ if � J8 � ��w li r
HFlJRE SOLAI RE
Figure 3 . - Spectrogramme d'activité du même Renard en période saine (a) , et après entrée en phase clinique de rage (b) . Pour interpréter ces graphiques il convient de prendre garde à la différence d'échelle des vitesses (mètres/0, 1 heure). Avant la maladie, le déplacement moyen circadien était de 9 790 mètres, soit un déplacement moyen horaire de 592 mètres « la nuit » (de 17 h à 9 h), et de 39 mètres « le j our » (de 9 à 17 h). Caractérisant l'installation de la phase clinique on mesure respectivement : 10 1 1 9 mètres/ 24 heures, 1 80 mètreslh la nuit, et 303 mètres!h le jour. Les déplacements sont donc peu augmentés. L'activité qui était quasi exclusivement crépusculaire et nocturne, est répartie de manière imprévisible pendant la totalité du cycle circadien, avec une légère dominante
diurne.
trent que le choix de cette grille ne peut être laissé au hasard et devait être guidé par la fréquence des changements de direction de l'animal . On mesure donc les recherches éthologiques qui restent à entreprendre avant de pouvoir appliquer de tels modèles aux déplacements des Carnivores .
Le deuxième point à discuter concerne la méthodologie de la prise d'information . Celle-ci nous interdisait l'utilisation des méthodes mises au point par Deat et coll. ( 1 980) , pour l ' interprétation de données continues obtenuesavec un matériel lourd. En l'absence de ces moyens, la démarche générale était d'opter pour une prise d'information discontinue à intervalles réguliers . Cet intervalle était réglé à la fois sur l'appréciation globale des déplacements de l 'animal suivi, et sur des impératifs matériels . Hall et Newsom ( 1 978) ont ainsi localisé des lynx toutes les deux heures, Andelt et Gibson ( 1 979), des coyotes toutes les heures, Bideau et coll. ( 1 983) , des chevreuils toutes les 20 minutes. Cette manière de procéder permettait un calcul simple des indices d'activité . Nous proposons une méthode de détermination des spectrogrammes d'activité à partir de données discontinues sans rythme déterminé a priori qui permet de mieux suivre l'activité réelle de l 'animal : rapprochant les relevés lorsque l 'animal est très mobile, les espaçant dans le cas contraire. D'où pour un moindre investissement, une meilleure appréciation des variations chronologiques et spatiales des déplacements réels.
RESUME
Les auteurs exposent une méthode d'estimation de l 'activité locomotrice circadienne moyenne à partir d'un ensemble de relevés de radio-pistage effectués de manière discontinue, et à des intervalles de temps irréguliers pendant
- 1 82 -

plusieurs jours . Cette méthode permet de concentrer l'effort du suivi aux moments où l'animal pisté est le plus mobile.
Des diagrammes d'activité obtenus par ordinateur à partir du suivi de renards enragés et non enragés sont donnés.
SUMMARY
The authors describe a method for estimating the circadian acttvtty of radio-tagged animais when fixes are taken during several days at irregular time intervals . This allows a more intensive tracking during periods of intense activity of the tracked animais . Examples of activity diagrams are given. They were obtained by computing data from non rabid and rabid faxes .
REFERENCES
ANDELT, W.F. & ÜIPSON, P.S. ( 1 979) . - Home range activity and daily movements of coyotes. J. Wildl. Manage. , 43 : 944-95 1 .
ARTOIS, M. & AuBERT, M.F.A. ( 1 983 ) . - Problèmes posés par l e traitement des données du radio-pistage du Renard et du Chat forestier. Soc. Fr. Etude Comp. Anim., Bull. /nt., 1 9 8 3 , ( 1 ) : 63-68 .
13JDEAU, E. , VINCENT, J .P. , QUERE, J .P. et ANGIBAULT, J .M. ( 1 983) . - Occupation de l 'espace chez le Chevreuil. 1. Cas des mâles. Acta Oecol., Oecol. Appl., 4 : 1 6 3 - 1 84.
DEAT, A., MAUGET, C., MAUGET, R. , MAUREL, D. & SEMPERE, A. ( 1 980). - The automatie, continuous and fixed radiotracking system of the Chizé forest : theoretical and practical analysis, pp. 43 9-45 1 . In A handbook on biotelemetry and radiotracking, C.J. Amlaner and D.W. Macdonald (Eds), Pergamon Press, Oxford, 804 pp.
HALL, H.T. and NEWSOM, J .D. ( 1 978) . - Summer home ranges and movements of bobcats in bottomland hardwoods of southern Louisiana. Proc. Ann. Conf. Southeast Assac. Fish Wildl. Agencies, 30, 2 1 pp.
REDDINGIUS, J., SCHILSTRA, A.J. & THOMAS, G. ( 1 983) . - The grid method in estimating the path Iength of a moving animal . J. Anim. Eco/. , 52 : 1 99-208.
- 1 83 -


ECO-ETHOLOGIE DES CANIDES SAUVAGES
RESUMES DES PANNEAUX MURAUX
ECOLOGY AND BEHA VIOUR OF WILD CANIDS
SUMMARIES OF POSTERS
REGIME ALIMENT AIRE CHEZ LE RENARD ROUX (V ULPES VULPES L.)
ET RESSOURCES ALIMENT AIRES DANS UNE V ALLEE DES ALPES SUISSES
Simon CAPT Centrale Suisse de la Rage, Microbiologie Vétérinaire,
Université de Berne, Suisse
Le contenu de 3 3 3 estomacs de renards provenant des Alpes suisses a été analysé . Tous les animaux étaient âgés de plus de 4 mois lors de l'analyse . La catégorie de nourriture la plus importante était constituée par les déchets de cuisine ·et de viande présents dans environ 60 % des estomacs . Les rongeurs étaient décelés dans environ 1 5 % , et les fruits cultivés dans environ 30 % des estomacs.
Nous constatons l'importance primordiale des déchets ou autres matières produites par l'homme en tant que ressources alimentaires dans la rég;on mentionnée. Il a également été constaté que les ressources alimentaires ne sont pas réparties équitablement sur toute la surface étudiée, les fonds de vallée représentant la zone la plus variée en ressources, tandis qu'en altitude les possibilités d'obtenir de la nourriture sont plus restreintes. Cette situation doit certainement influencer l 'organisation spatiale et sociale du Renard de cette région .
URBAN FOX POPULATION IN OSLO
H. CHRISTENSEN University of Oslo, Zoological lnstitute, Postbox 1 050, Blindern, Oslo 3
In 1 984, a survey of the public's reports of faxes ( Vulpes vulpes) wascarried out in Oslo. The investigation was advertised regularly through newspapers, radio, television and posters in the display windows of various banks .
The telephone reports received from the public have been recorded by us on special questionnaires formulated by British researchers, but adjusted fnr Oslo. The police service , the park and sports service and the Society for Animal Protection in Oslo have ali received these questionnaires, and interviews with taxi-drivers are currently in progress . The preliminary results presented
- 1 85 -

fore st
2 C o a s t . r ive r . bro o k
3 U n u s ed l a n d
4 L a r g e . woo d e d g a rden
5 Pu bl i c b ui l d i n g s l schoo l s , ho s p i t a l s , s port sground s )
6 R a i l w ny l i n e s
7 C h u rc h y a rd s 1 p a r k s
8 ln d u s t r y
9 P l a c e for rub b i s h ac c u m u l a t i o n
The numbers above refer to the four histograms.
here are based exclusively on 400 public reports from the period 1 98 3 - 1 984. Seventeen Fox dens have been recorded within the built-up area.
Oslo is both the Capital city and a county of Norway. Its surface area is 426.3 km2 including a 1 25 km2 built-up area. The remaining 2/3 of the totalarea is classified as agricultural/forestry /recreational area. The human population (1 982) is 1 ,454,823 inhabitants .
- 1 86 -

ASPECTS OF FOOD ECOLOGY OF SOME AUSTRIAN RED FOX POPULATIONS (VULPES VULPES)
AND POSSIBLE CONSEQUENCES FOR THE SPREAD OF RABIES
Franz SucHENTRUNK
Institut für Wildbiologie und Jagdwirtschaft, Universitiit für Bodenkultur, Colloredogasse I2 , A l / 80 Wien
The diet of 42 1 red foxes coming from six different ecological regions of Austria has been investigated by stomach and gut analysis. In areas with high proportions of arable land the foxes feed upon a great variety of food sources ; these populations are not controled by food shortage and there are but a few cases of rabies . In alpine regions the diet of foxes is not as varied as in agricultural areas, and Roe deer (Capreolus capreolus) and eventually Chamois(Rupicapra rupicapra) carcasses make up a large part of the die t of foxes, especially in winter time . Such carcasses, which can attract severa! foxes each, are l ikely to enhance intraspecific aggression and rabies transmission. It is argued that the high winter m ortality of Roe deer and Chamois in the alpine zone contribute to the maintenance of a high population density of foxes and to the spread of rabies in areas where the control of Fox numbers by hunting is difficult to carry out .
REFERENCE
SUCHENTRUNK, F. ( 1 984). - Zur Nahrungsokologie und korperlichen Kondition osterreichischer Rotfuchs-Populationen (Vulpes vulpes L.). Dissertation, Universitiit Wien, 1 20 pp.
ETUDE DES PO PULA TI ONS DE CERTAINS CANIDES SAUVAGES OU ERRANTS
A L'OCCASION DU TIR DE NUIT
O. ROBOLY
Entente Interdépartementale de Lutte contre la Rage, B .P. 43, F - 54220 Malzéville
Depuis 1 978 , la France utilise, après l'Australie et la Suisse, le tir de nuit des renards pour limiter leurs populations.
Ce tir se pratique à l 'aide d'une carabine équipée d'une lunette, à partir d'un véhicule muni d'un phare orientable . Après chaque sortie, les responsables établissent une fiche de « tir de nuit et de comptage » dont les données permettent de déterminer directement le nombre d'animaux vus, tirés et tués par 1 0 km éclairés (Indice kilométrique d'abondance sur 1 0 km, IKA 1 0) et d'approcher indirectement un indice de leur densité au km2•
- 1 87 -

Près de 20 départements utilisent à l 'heure actuelle cette méthode . Cela permet à l'Entente Interdépartementale de Lutte contre la Rage , avec un programme mis au point au Centre National d'Etudes sur la Rage, de déterminer dans un premier temps les indices kilométriques d'abondance des renards, chats errants ou harets et chiens vus par nuit. Ces IKA 1 0 sont également calculés pour tous les autres animaux sauvages dénombrés (lièvres, cerfs, chevreuils , rapaces nocturnes, etc . ) .
Outre les avantages directs inhérents à cette méthode (sélectivité , comptages, prélèvements biologiques, réduction du cheptel reproducteur vulpin ct non pas des renardeaux), les résultats traités par informatique devraient permettre d'établir prochainement une cartographie indiquant le nombre de renards vus et le nombre de cas de rage par canton .
L'application de cette méthode à l a prophylaxie de la rage canine est également étudiée dans certains pays d'Afrique.
REFERENCE
ROBOLY, O. ( 1 982). - Application du tir de nuit des renards à la prophylaxie de la rage. Comparative Jmmunology Microbiology and infectious Diseases, 5, ( 1 , 2, 3) . Conférence internationale 0 M S - C N E R.
- 1 8 8 -

ECO-ETHOLOGIE DES CANIDES SAUVAGES
RESUMES DES DISCUSSIONS
ECOLOGY AND BEHA VIOUR OF WILD CANIDS
SUMMARIES OF THE DISCUSSIONS
1 . - RESUME DES DISCUSSIONS
Le principal aspect évoqué concernait la méthodologie des études écolog:ques et éthologiques des Canidés sauvages ou errants . Des précisions ont été, en particulier, demandées sur quatre points principaux :
- la quantification du régime alimentaire (expression en termes de pourcentage de fréquence ou pourcentage du volume des contenus intestinaux) ;
- la quantification des déplacements et de l'occupation de l'espace èn général (évaluation des zones fréquentées) ;
- la quantification des densités des populations ;
- les notions de territoire et de sédentarité .
Il a été demandé aux auteurs d'apporter plus de précisions sur ces aspects de leur exposé et de donner des évaluations chiffrées. Les réponses ont montré toutes les difficultés de cette entreprise .
Néanmoins il est apparu important de bien indiquer les méthodes choisies, aussi bien pour le recueil des données sur le terrain que pour le traitement de celles-ci. Le choix parmi les différentes possibilités doit être explicité. Il deviendra ainsi possible d'établir des comparaisons .
2 . - RESUME DES PRINCIP ALES CONCLUSIONS
1 . - Le contraste entre la sédentarité et les déplacements à plus ou moins grande distance est particulièrement frappant chez les Canidés.
2 . - On peut rechercher trois causes principales à la motivation de ces comportements .
a) L'émigration peut résulter de la pression démographique. Celle-ci estsouvent à mettre en rapport avec l 'augmentation de la proie principale dans l 'aire d'origine . Cette dernière est parfois une conséquence directe ou indirecte de l 'influence de l 'Homme (modifications du traitement forestier favorisant l'Elan et donc le Loup, par exemple) .
b) La pression sociale peut exercer « une force centrifuge » sur certainsindividus conduisant ceux-ci à e ntreprendre des déplacements plus ou moins importants. C'est le cas des mâles « subadultes » devenant itinérants, ou celui des renards entreprenant à l 'automne des déplacements de grande amplitude pour rechercher un nouveau partenaire sexuel.
c) Enfin des perturbations du comportement d'occupation de l'espacepeuvent être induites par des causes pathologiques (la rage en est un bon·exemple) ou l'application de mesures de limitation des populations (dans lebut d'une prophylaxie sanitaire) .
- 1 89 -

3 . - Les liens de parenté dans la composition sociale d'un groupe de Canidés n'ont pas été évoqués . Il semble néanmoins qu'une préférence s'établisse dans la composition d'un groupe entre les parents et leur descendance . Toutefois ces liens sont très difficiles à mettre en évidence chez les Canidéssauvages (le marquage génétique pourrait constituer une méthode d'approche de cette question, mais à l 'heure actuelle les difficultés pratiques et techniques ne sont pas résolues) .
4. - L'influence humaine (directe et/ou indirecte) semble déterminantedans l'évolution démographique récente des Canidés sauvages (et d'autres Carnivores) . Cette influence s'exerce de façon particulièrement évidente dans les zones urbaines et péri-urbaines, mais aussi de façon plus insidieuse dans les zones « non urbanisées ». Des exemples particulièrement frappants en sont donnés par le Loup (Espagne, Finlande) et le Renard.
5. - La complexité des inter-relations entre Carnivores (super-prédation, compétition) doit être soulignée . L'approche synécologique de ces problèmes est extrêmement complexe. Elle nécessite des études longitudinales longues et coûteuses, seules capables d'apporter des éléments concrets pour la gestion de ces populations. Les rapports Lynx-Renard au Coto Dofiana, les rapports RenardLoup-Chien viverrin en Europe du Nord et les rapports Loup-Chien-(Renard) en zone méditerranéenne constituent les exemples les plus caractéristiques de cette complexité.
6. - L'attention des autorités est attirée sur la généralisation (banalisation) de la présence de certains Canidés sauvages (et autres Carnivores) en zones urbanisées . L'importance de leurs relations avec les populations et les animaux domestiques (notamment sous l'aspect sanitaire) ne doit être ni exagérée ni sous-estimée. Le problème d'une possible hybridation entre espèces sauvages et espèces domestiques doit aussi être pris en considération .
* * *
1 . - SUMMING UP OF THE DISCUSSIONS
The main point raised concerned the methodology of ecological and behavioural studies on wild or ferai Canids. More precise informations were requested, in particular, on :
- the quantification of the diet (expressed in terms of frequency of occurrence, or volume of intestinal contents percentage) ;
- the quantification of movements and space use, in general (evaluation of home ranges) ;
- the quantification of population densities ; - the concepts of territory and sedentary period . The authors have been asked to bette r document these aspects of their
presentations and to provide quantitative data . The answers have shown the great difficulty of doing so.
Nevertheless, it appeared that it was very important to clearly indicate what methods were chosen for collecting the data, as well as for processing them. The choice amongst the various possibilities has to be explicit. Then it will be possible to make comparisons.
1 90 -

2 . - S UMMING UP OF THE MAIN CONCL USIONS
1 . - The contrast between sedentary periods and long-range movements among wild Canids is particularly striking.
2. - The initiation of such long-range movements can be due to threecategories of factors :
a) Emigration can be the result of an increase of the demographie pressure, which can often be related to increase of the main prey in the area oforigin . This is sometimes the consequence of the direct or indirect influence of man (change in the forest management policies favouring Moose, and therefore Wolf, for example) .
b) The social pressure can exert a " centrifugai force " on sorne individualsIeading them to undertake short-range or long-range movements . Such is the case for " subadult " male foxes becoming itinerant, and for others undertaking long-range movements in autumn in search of a new partner.
c) Finally, disturbances in the use of space can be induced by pathologicalcauses (rabies is a good example) , or by the application of population culling measures (for public health purposes) .
3 . - Kin-relationships within the social groupings of our wild european Canids have not been mentioned by the various speakers . Nevertheless, it seems that sorne preferential bonds do exist between parents and their kins . However, it is very difficult to demonstrate such social bonds among wild Canids (genetic markers could help, but practical and technical difficulties have first to be overcome) .
4. - Human influences (direct and/or indirect) appear to be a major factor leading to demographie changes among wild Canids (and other Carnivores) . Such influences are particularly obvious in urban and sub-urban areas, but do operate also in agricultural areas. Wolves (Spain, Finland) , and even foxes, provide particularly striking examples .
5 . - The complexity of inter-relations between Carnivores (super-predation, competition) must be emphasized. The synecological approach to these problems is very complex. It requires expensive long term studies, which are the only way to provide a concrete basis for the management of these populations. The relationships between Lynx and Fox in the Coto Dofiana, those between Fox, Wolf and Raccoon dog in northern Europe, and the relationships between Wolf, Dog and Fox in the Mediterranean area, are good examples of this complexity .
6 . - The authorities' attention is drawn on the fact that the existence of wild Canids (and other Carnivores) in urbanized areas has now become commonplace . The importance of their relationships with the human population and domestic animais (especially in the public health field) should neither be exaggerated nor under-estimated. The problem of a possible hybridization between wild and domestic species should also be considered.
- 1 9 1 -
Copyright © 2022 FDOKUMEN


![10 11 Session HR Session Seri Management[1]](https://static.fdokumen.com/doc/165x107/6314ba61fc260b71020fb0ee/10-11-session-hr-session-seri-management1.jpg)