Eating Behaviour among University Students - MDPI
13
nutrients Article Eating Behaviour among University Students: Relationships with Age, Socioeconomic Status, Physical Activity, Body Mass Index, Waist-to-Height Ratio and Social Desirability Joanna Kowalkowska 1, * and Rui Poínhos 2 Citation: Kowalkowska, J.; Poínhos, R. Eating Behaviour among University Students: Relationships with Age, Socioeconomic Status, Physical Activity, Body Mass Index, Waist-to-Height Ratio and Social Desirability. Nutrients 2021, 13, 3622. https://doi.org/10.3390/nu13103622 Academic Editor: David J. Mela Received: 9 August 2021 Accepted: 13 October 2021 Published: 16 October 2021 Publisher’s Note: MDPI stays neutral with regard to jurisdictional claims in published maps and institutional affil- iations. Copyright: © 2021 by the authors. Licensee MDPI, Basel, Switzerland. This article is an open access article distributed under the terms and conditions of the Creative Commons Attribution (CC BY) license (https:// creativecommons.org/licenses/by/ 4.0/). 1 Department of Human Nutrition, Faculty of Food Sciences, University of Warmia and Mazury in Olsztyn, Sloneczna 45F, 10-718 Olsztyn, Poland 2 Faculty of Nutrition and Food Sciences, University of Porto, Rua do Campo Alegre, 823, 4150-180 Porto, Portugal; [email protected] * Correspondence: [email protected]; Tel.: +48-89-524-5517 Abstract: Eating behaviour is of particular interest for research focusing on body weight status. However, little is known about the relationships of certain factors, especially social desirability, with self-reported eating behaviour such as cognitive restraint, uncontrolled eating, and emotional eating among young adult males and females. This study aimed to evaluate the relationships between eating behaviour and age, socioeconomic status (SES), physical activity (PA), body mass index (BMI), waist-to-height ratio (WHtR), and social desirability among university students. A cross-sectional study was conducted among 353 university students (59.2% females). Eating behaviour was assessed using the 13-item Three-Factor Eating Questionnaire (TFEQ-13). SES and PA were determined using self-reporting, and the Marlowe–Crowne Social Desirability Scale assessed social desirability. BMI and WHtR were calculated based on measured parameters. Associations between self-reported eating behaviour and other variables were assessed using Pearson’s correlation coefficient and multivariate general linear models. Cognitive restraint was positively correlated with BMI and WHtR in both males (r = 0.174, P = 0.036 and r = 0.194, P = 0.020, respectively) and females (r = 0.239, P < 0.001 and r = 0.165, P = 0.017, respectively), and emotional eating was positively correlated with BMI among females (r = 0.184, P = 0.008). Social desirability was negatively correlated with uncontrolled eating (r = -0.287, P < 0.001) and emotional eating (r = -0.301, P < 0.001) among females. There were no significant correlations between eating behaviour and age or socioeconomic status (P > 0.05). Multivariate analysis showed that, among males, PA had a main effect on emotional eating (ηp 2 = 0.044, F = 6.276, P = 0.013). Among females, cognitive restraint was positively associated with PA (ηp 2 = 0.034, F = 7.127, P = 0.008) and BMI (ηp 2 = 0.038, F = 7.959, P = 0.005), and emotional eating with BMI (ηp 2 = 0.032, F = 6.638, P = 0.011). Social desirability had the highest main effect on eating behaviour among females, being negatively associated with uncontrolled eating (ηp 2 = 0.077, F = 16.754, P < 0.001) and emotional eating (ηp 2 = 0.082, F = 18.046, P < 0.001). This study showed that PA, BMI, WHtR, and social desirability were associated with self-reported eating behaviour among university students. Social desirability bias should be considered when evaluating uncontrolled eating and emotional eating among females. Keywords: dietary restraint; uncontrolled eating; emotional eating; social desirability; body mass index; waist-to-height ratio; obesity; young adults 1. Introduction The prevalence of obesity almost tripled between 1975 and 2016 in the world [1]. In 2016, 39% of adults were overweight, and 13% were obese. The main cause of excessive body weight is an energy imbalance resulting from an increase in energy-dense food consumption and physical inactivity [1]. Eating behaviour dimensions are of particular interest in research focusing on the overweight [2,3]. Nutrients 2021, 13, 3622. https://doi.org/10.3390/nu13103622 https://www.mdpi.com/journal/nutrients
-
Upload
khangminh22 -
Category
Documents
-
view
3 -
download
0
Transcript of Eating Behaviour among University Students - MDPI

nutrients
Article
Eating Behaviour among University Students: Relationshipswith Age, Socioeconomic Status, Physical Activity, Body MassIndex, Waist-to-Height Ratio and Social Desirability
Joanna Kowalkowska 1,* and Rui Poínhos 2
�����������������
Citation: Kowalkowska, J.; Poínhos,
R. Eating Behaviour among
University Students: Relationships
with Age, Socioeconomic Status,
Physical Activity, Body Mass Index,
Waist-to-Height Ratio and Social
Desirability. Nutrients 2021, 13, 3622.
https://doi.org/10.3390/nu13103622
Academic Editor: David J. Mela
Received: 9 August 2021
Accepted: 13 October 2021
Published: 16 October 2021
Publisher’s Note: MDPI stays neutral
with regard to jurisdictional claims in
published maps and institutional affil-
iations.
Copyright: © 2021 by the authors.
Licensee MDPI, Basel, Switzerland.
This article is an open access article
distributed under the terms and
conditions of the Creative Commons
Attribution (CC BY) license (https://
creativecommons.org/licenses/by/
4.0/).
1 Department of Human Nutrition, Faculty of Food Sciences, University of Warmia and Mazury in Olsztyn,Słoneczna 45F, 10-718 Olsztyn, Poland
2 Faculty of Nutrition and Food Sciences, University of Porto, Rua do Campo Alegre, 823,4150-180 Porto, Portugal; [email protected]
* Correspondence: [email protected]; Tel.: +48-89-524-5517
Abstract: Eating behaviour is of particular interest for research focusing on body weight status.However, little is known about the relationships of certain factors, especially social desirability, withself-reported eating behaviour such as cognitive restraint, uncontrolled eating, and emotional eatingamong young adult males and females. This study aimed to evaluate the relationships betweeneating behaviour and age, socioeconomic status (SES), physical activity (PA), body mass index (BMI),waist-to-height ratio (WHtR), and social desirability among university students. A cross-sectionalstudy was conducted among 353 university students (59.2% females). Eating behaviour was assessedusing the 13-item Three-Factor Eating Questionnaire (TFEQ-13). SES and PA were determined usingself-reporting, and the Marlowe–Crowne Social Desirability Scale assessed social desirability. BMIand WHtR were calculated based on measured parameters. Associations between self-reportedeating behaviour and other variables were assessed using Pearson’s correlation coefficient andmultivariate general linear models. Cognitive restraint was positively correlated with BMI andWHtR in both males (r = 0.174, P = 0.036 and r = 0.194, P = 0.020, respectively) and females (r = 0.239,P < 0.001 and r = 0.165, P = 0.017, respectively), and emotional eating was positively correlatedwith BMI among females (r = 0.184, P = 0.008). Social desirability was negatively correlated withuncontrolled eating (r = −0.287, P < 0.001) and emotional eating (r = −0.301, P < 0.001) among females.There were no significant correlations between eating behaviour and age or socioeconomic status(P > 0.05). Multivariate analysis showed that, among males, PA had a main effect on emotional eating(ηp2 = 0.044, F = 6.276, P = 0.013). Among females, cognitive restraint was positively associated withPA (ηp2 = 0.034, F = 7.127, P = 0.008) and BMI (ηp2 = 0.038, F = 7.959, P = 0.005), and emotionaleating with BMI (ηp2 = 0.032, F = 6.638, P = 0.011). Social desirability had the highest main effect oneating behaviour among females, being negatively associated with uncontrolled eating (ηp2 = 0.077,F = 16.754, P < 0.001) and emotional eating (ηp2 = 0.082, F = 18.046, P < 0.001). This study showed thatPA, BMI, WHtR, and social desirability were associated with self-reported eating behaviour amonguniversity students. Social desirability bias should be considered when evaluating uncontrolledeating and emotional eating among females.
Keywords: dietary restraint; uncontrolled eating; emotional eating; social desirability; body massindex; waist-to-height ratio; obesity; young adults
1. Introduction
The prevalence of obesity almost tripled between 1975 and 2016 in the world [1]. In2016, 39% of adults were overweight, and 13% were obese. The main cause of excessivebody weight is an energy imbalance resulting from an increase in energy-dense foodconsumption and physical inactivity [1]. Eating behaviour dimensions are of particularinterest in research focusing on the overweight [2,3].
Nutrients 2021, 13, 3622. https://doi.org/10.3390/nu13103622 https://www.mdpi.com/journal/nutrients
Nutrients 2021, 13, 3622 2 of 13
Cognitive restraint (also referred to as dietary restraint) refers to strategies aimingto limit food consumption to maintain or reduce body weight [2]. However, it has alsobeen associated with weight gain [4,5], as it can lead to increased hunger and appetite,resulting in an intense feeling of deprivation and the possible abandonment of dietaryrestrictions [5]. Restrained eaters may have problems with eating regulation, which canresult in vulnerability to emotional eating and binge eating [4]. Uncontrolled eating andemotional eating are eating behaviour dimensions related to hunger and disinhibition [6].Disinhibition refers to a tendency towards excessive eating, with usually hedonic foodchoices (i.e., energy-dense food, high in sugars and fat), potentially leading to poorer dietquality, obesity, and vulnerability to eating disorders [2]. Uncontrolled eating refers tothe consumption of large amounts of food in response to food palatability, hunger, andsocial cues [2], while emotional eating refers to food consumption in response to stressor negative emotions, as physiological signals associated with emotions may be confusedwith hunger [5].
Eating behaviour is a complex construct influenced by a range of factors, including sex,age, body weight status, and psychological, social, economic, and lifestyle factors [3,7–14].Previous studies conducted in European countries showed that levels of the eating behaviourdimensions differed by sex [15,16] and age [9,17]. Some studies showed that obesogenicbehaviours (e.g., less healthy eating patterns, uncontrolled eating, lower physical activity)were more prevalent among people with lower socioeconomic status (SES) [7,10], but alsothat the association between SES and obesity risk was partly mediated by uncontrolled eatingand eating at night [10]. Although cognitive restraint and emotional eating were higheramong people with obesity, they were not significantly related to SES [10]. Regular physicalactivity (PA) can help to alleviate negative emotions [18] and improve appetite control [19],thus preventing overeating. PA can also compensate for excessive energy intake, therebyhelping in weight loss or maintenance [19].
The assessment of eating behaviour and related factors based on self-report tools canbe biased by social desirability [20], i.e., the tendency to avoid criticism and report moresocially acceptable answers [21]. Social desirability bias may result in overestimation ofhealthy behaviours (or desirable traits) and underestimation of undesirable ones [22,23],and should therefore be considered [20]. Knowing the effect of social desirability on self-reported eating behaviour and its associations with other factors can be useful in improvingthe accuracy of dietary assessment and developing effective strategies to prevent eatingand weight disorders.
Young adults starting independent life are particularly vulnerable to developingunhealthy eating behaviour, which can lead to eating disorders and/or becoming over-weight. Some studies have explored the associations between such eating behaviourand several factors, including age [9,11,17], SES [9,10], PA [8,17], body mass index (BMI)and/or body weight status [3,9,11,24–26], and social desirability [16,27] among adults;however, very few have been conducted in Poland [25,26]. Some of the studies only in-cluded females [3,17,25,26]. Moreover, the relationships between some of the variableswere inconsistent across studies. The discrepancies concerned, for example, the direction ofthe association between eating behaviour dimensions and SES [9,10] and between cognitiverestraint and BMI, which may be population-dependent [9,10,24].
Therefore, the aims of the present study were to evaluate the association betweeneating behaviour dimensions (cognitive restraint, uncontrolled eating, emotional eating)among university students, their relationships with a range of factors (i.e., age, SES, PA,BMI, waist-to-height ratio (WHtR)), and to study the effect of social desirability on self-reported eating behaviour and on its relationships with the studied factors.

Nutrients 2021, 13, 3622 3 of 13
2. Materials and Methods2.1. Participants
This cross-sectional study was conducted in a convenience sample of Polish universitystudents. Students attending the University of Warmia and Mazury (Olsztyn, Poland) fromdifferent faculties and years of study were invited, in the university facilities, to participatein the study. The inclusion criterion was an age between 19 and 26 years. From a total of365 participants, 12 were excluded due to the incompleteness of self-reported data. Thus,data from 353 students (59.2% females) were analysed.
2.2. Procedure
The study was conducted according to the guidelines of the Declaration of Helsinkiand approved by the Bioethics Committee of the Faculty of Medical Sciences, University ofWarmia and Mazury in Olsztyn on 17 June 2010 (resolution no. 20/2010); this approvalwas obtained for a period from 2010 to 2020 for a larger survey which was divided intoseveral work packages. Data collection for the current study was conducted in the years2014–2016 and continued in 2019 to obtain a larger sample size to perform the analysis formales and females separately. Potential participants were informed about the aims, scope,and organization of the study. Written informed consent was obtained from all partici-pants. Respondents completed a paper-and-pencil self-administered questionnaire. For thecurrent study, sections regarding eating behaviour, social desirability, sociodemographics,and lifestyle were considered. Anthropometric measurements were carried out by well-trained researchers at the university, according to the international guidelines [28,29]. Therespondents’ height, weight, and waist circumference (WC) were measured using mobilestadiometers (SECA), digital scales (Tanita), and measuring tapes (SECA), respectively.Respondents were measured without shoes and in light clothing. Corrections for bodyweight and WC were applied (0.5 to 1.0 kg or cm, respectively).
2.3. Measures
Eating behaviour was assessed using the Three-Factor Eating Questionnaire. Theoriginal version of the TFEQ was developed by Stunkard and Messick [30] and contained51 items. The Polish version used in this study comprises 13 items (TFEQ-13) [31], and wasdeveloped based on the shorter, revised 18-item TFEQ developed by Karlsson et al. [6].Twelve items were statements with four possible answers, indicating the degree of agree-ment with the statement and scored as follows: definitely yes (3 points), rather yes (2),rather not (1), or definitely not (0) [31]. The thirteenth item had an 8-point response scale,where 1 means ‘I never restrain from eating’ and 8 means ‘I always restrain from eating’and was scored as follows: 1 or 2 (0 points), 3 or 4 (1), 5 or 6 (2), and 7 or 8 (3). TheTFEQ-13 included three subscales: cognitive restraint (5 items; total score range: 0 to 15points), uncontrolled eating (5 items; 0 to 15 points), and emotional eating (3 items; 0to 9 points). The psychometric properties of the TFEQ-13 were evaluated among Polishteenagers and the variance explained by each of the three subscales was 28.9%, 19.2%, and8.8%, respectively [31]. In the present study, good internal consistency was demonstratedfor the TFEQ-13 subscales (Cronbach’s alpha was 0.803, 0.751, and 0.804, respectively).
The socioeconomic status index (SESI) was created based on four categorical variables:mother’s education (three categories: primary/lower secondary, upper secondary, higher),father’s education (three categories: the same as for the mother’s education), family eco-nomic situation (three categories: below average, average, above average), and household’seconomic situation (five categories: poor, modest, average, good, very good). Numericalvalues were assigned to each category in ascending order, e.g., mother’s education withthree response categories: primary/lower secondary (1 point), upper secondary (2 points),higher (3 points). All variables were then standardized. SESI was calculated as the sum ofthe four standardized variables [7]. A holistic approach to determining the socioeconomicstatus of respondents (in one measure) was used in other studies [32–34], and the four-itemSESI was previously used in a representative sample of 13–21-year-old Polish females [7].

Nutrients 2021, 13, 3622 4 of 13
In the present study, Cronbach’s alpha for SESI was 0.611. The SESI range in the studysample was from −10.25 to 6.49. SES index categories were based on a tertile distribution:low (35.1% of the sample), medium (30.9%), and high (34.0%). Details regarding the distri-butions of the SESI and its components in the total sample and by sex groups are shown inTable S1.
PA was assessed using questions regarding usual PA at work and/or school (“Howwould you describe your physical activity at work or at school?”) and PA at leisure time(“How would you describe your physical activity during your time off?”) [35]. Eachquestion included three response categories (low, moderate, high). For each responsecategory, a brief description with the amount of activity and examples of activities wasgiven. Total PA was determined by a combination of certain categories of both questions,according to the categorization described elsewhere [35,36]. For example, total PA wasconsidered ‘low’ when (i) low PA was reported by a respondent in both questions or(ii) low PA was reported in one of the questions, and moderate PA was reported in theother one. The reproducibility of the PA questions and total PA was previously assessedamong adolescents and adults (15 to 65 years) [36]. Respondents were assigned to one ofthree categories of total PA: low (53.8% of the sample), moderate (42.8%), or high (3.4%).Due to the small number of participants with high PA, the ‘moderate’ and ‘high’ categories(46.2%) were combined for further analysis. Details regarding the distributions of PA atwork/school, PA at leisure time, and the total PA in the total sample and within sex groupsare shown in Table S1, and the participants’ characteristics by sex and PA subgroups areshown in Table S2.
BMI as a measure of general adiposity [28] and WHtR as a measure of abdominaladiposity [37] were calculated based on measured height (cm), weight (kg) and WC (cm).BMI (kg/m2) was calculated as the body weight divided by the square of body height(in meters) [28]. WHtR was calculated as WC divided by the body height [37]. Thedistributions of BMI and WHtR as categorical variables in the total sample and within sexgroups are shown in Table S1.
Social desirability was evaluated using the Marlowe–Crowne Social DesirabilityScale [21]. The scale contains 33 statements regarding personal attitudes and traits, withdichotomic answers (true/false), and with one point scored for answers corresponding tosocial desirability. The social desirability score was calculated as the sum of all items (range:0 to 33). English to Polish translation (by two independent translators) and back-translationof the scale were performed. Cronbach’s alpha for this scale was 0.722. The test–retestreproducibility of the Polish version of the scale was assessed in the study sample (n = 353),showing a very good reproducibility of the social desirability score (r = 0.849, P < 0.001). Afactor analysis was also performed in the study sample, and the scree-plot method showedthat the scale presented a unifactorial structure (data not shown).
2.4. Statistical Analysis
Normality was tested using skewness and kurtosis. Since positive skewness wasobserved for WHtR, this variable was included in further analyses after logarithmic trans-formation. Descriptive statistics consisted of means and standard deviations (sd) for contin-uous variables and frequencies (n, %) for categorical variables. Means were compared usingan independent sample t-test, and proportions were compared using chi2 or Fisher’s exacttest. Since previous studies demonstrated sex differences in eating behaviour [9,15,16],further analyses were performed for males and females separately. Pearson’s correlationcoefficient was used to measure the association between eating behaviour dimensions,age, SESI, BMI, WHtR, and social desirability. Partial correlations (controlled for socialdesirability) between eating behaviour dimensions and the other variables were also cal-culated. The effects of the studied characteristics on eating behaviour dimensions wereassessed using multivariate general linear models (GLM), with effect sizes being measuredwith partial eta-squared (ηp2). All independent and dependent variables included in the

Nutrients 2021, 13, 3622 5 of 13
multivariate GLM were continuous, except for one independent variable—the total PA(with two categories) [38].
The study sample size was tested using the post-hoc power analysis, based on meanscores obtained for eating behaviour among males and females. The statistical powerwas, on average, 83%, and ranged from 65% for uncontrolled eating to 93% for cognitiverestraint. Overall, the post-hoc power was adequate (above 80%).
All analyses were performed using PS IMAGO PRO 6.0 (Predictive Solutions, Cracow,Poland) and IBM SPSS Statistics for Windows, version 26.0 (IBM Corp., Armonk, NY, USA).P values < 0.05 were considered statistically significant.
3. Results
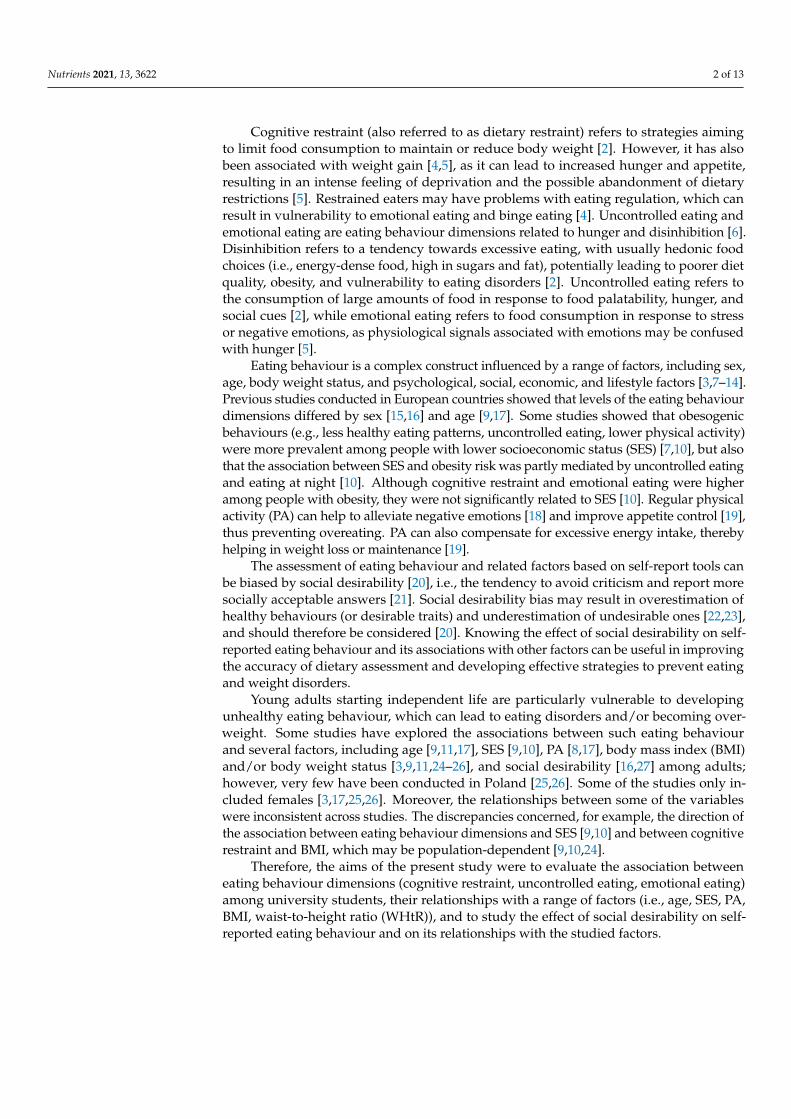
Table 1 presents the characterization of participants regarding age, SESI, PA, BMI,WHtR, social desirability, and the TFEQ-13 subscales. All studied characteristics signifi-cantly differ between sexes, except for the social desirability. Age, SESI, BMI, and WHtRwere higher among males. Moderate/high PA was found in 55.6% of males and 39.7% of fe-males. Females scored higher on cognitive restraint and emotional eating, while males hadhigher uncontrolled eating. The characteristics of participants with low or moderate/highPA are available in Table S2. Similar sex differences in age, BMI, WHtR, and the TFEQ-13subscales were found in both PA subgroups, except for emotional eating among adultswith low PA and uncontrolled eating among those with moderate/high PA.
The distribution of sociodemographic characteristics, physical activity, and bodyweight status in the total sample and by sex groups is shown in Table S1. Most of thesample had normal weight assessed with BMI (54.2% of males, 76.6% of females), andabdominal obesity was identified in 22.9% of males and 8.6% of females.
Table 2 presents the correlations between eating behaviour dimensions, age, SES, BMI,WHtR, and social desirability among males and females. Regarding eating behaviour, inboth sexes, the strongest correlations were found between emotional eating and uncon-trolled eating. Emotional eating was positively correlated with cognitive restraint onlyamong males. In both sexes, there was no significant correlation between eating behaviourand age or SES. BMI and WHtR were positively correlated with cognitive restraint in bothsexes and BMI was positively correlated with emotional eating among females. Socialdesirability was associated with eating behaviour only among females, with negativecorrelations with uncontrolled eating and emotional eating. Partial correlations (controlledfor social desirability) between eating behaviour dimensions and the other variables areshown in Table S3. These correlations did not differ significantly from those reported inTable 2 (p > 0.05 for all the comparisons), showing no significant effect of social desirabilityon the associations.
Table 3 presents the effects of age, SES, PA, BMI, WHtR, and social desirability oneating behaviour. In the male subsample, only emotional eating was significantly explainedby the independent variables, with low PA being related to higher emotional eating.Despite not being significant overall, WHtR was positively associated with emotionaleating. Among females, all eating behaviour dimensions were significantly explained.Significant main effects were presented by PA, BMI, and social desirability. Participantswith low PA had lower cognitive restraint, while higher BMI was associated with highercognitive restraint and emotional eating. Higher social desirability was associated withlower uncontrolled eating and emotional eating. The parameter estimates for all significanteffects have the same sign as the corresponding Pearson’s correlations. It is worth notingthat the determination coefficients for each of the eating behaviour dimensions were higherfor females than males, and in both subsamples they were higher for emotional eating.
Nutrients 2021, 13, 3622 6 of 13
Table 1. Participant characteristics.
Total Sample Males Females P Value
Total sample, n (%) 353 (100.0) 144 (40.8) 209 (59.2)Age (years), mean ± sd 21.3 ± 1.4 21.7 ± 1.6 21.0 ± 1.2 <0.001
SESI, mean ± sd 0.01 ± 2.71 0.37 ± 3.04 −0.24 ± 2.43 0.046Physical activity, n (%) 0.005
low 190 (53.8) 64 (44.4) 126 (60.3)moderate/high 163 (46.2) 80 (55.6) 83 (39.7)
BMI (kg/m2), mean ± sd 23.1 ± 3.9 24.9 ± 3.8 21.9 ± 3.5 <0.001WHtR, mean ± sd 0.44 ± 0.06 0.47 ± 0.06 0.42 ± 0.05 <0.001
Social desirability, mean ± sd 15.5 ± 4.9 15.6 ± 4.4 15.4 ± 5.2 0.589TFEQ-13 subscales, mean ± sd
cognitive restraint 5.9 ± 3.3 5.2 ± 3.1 6.4 ± 3.4 0.001uncontrolled eating 6.1 ± 3.1 6.6 ± 3.3 5.8 ± 2.9 0.011
emotional eating 2.8 ± 2.1 2.4 ± 1.9 3.1 ± 2.1 0.002
sd, standard deviation; SESI, socioeconomic status index, as a sum of four standardized variables (mother’s education, father’s education, family economic situation, household’s economic situation); BMI, bodymass index; WHtR, waist-to-height ratio; TFEQ-13, 13-item Three-Factor Eating Questionnaire; P, significance level of the t-test for comparison between sexes.
Table 2. Correlations between eating behaviour dimensions, age, SESI, BMI, WHtR, and social desirability among males (n = 144) and females (n = 209).
CognitiveRestraint
UncontrolledEating
EmotionalEating Age (Years) SESI BMI (kg/m2) WHtR Social
Desirability
r (P) r (P) r (P) r (P) r (P) r (P) r (P) r (P)
Cognitive restraint −0.061 (0.467) 0.192 (0.021) 0.084 (0.317) 0.089 (0.286) 0.174 (0.036) 0.194 (0.020) 0.085 (0.312)Uncontrolled eating −0.097 (0.160) 0.428 (<0.001) 0.088 (0.295) −0.080 (0.339) 0.133 (0.111) 0.125 (0.137) −0.102 (0.224)
Emotional eating 0.112 (0.107) 0.601 (<0.001) 0.160 (0.055) −0.101 (0.227) 0.052 (0.537) 0.155 (0.064) −0.129 (0.124)Age (years) 0.020 (0.768) −0.134 (0.054) −0.135 (0.051) 0.067 (0.428) 0.329 (<0.001) 0.318 (<0.001) −0.033 (0.697)
SESI −0.023 (0.745) −0.029 (0.679) 0.063 (0.365) −0.120 (0.084) 0.057 (0.500) −0.021 (0.799) 0.196 (0.018)BMI (kg/m2) 0.239 (<0.001) 0.074 (0.285) 0.184 (0.008) 0.047 (0.496) −0.049 (0.480) 0.843 (<0.001) 0.009 (0.915)
WHtR 0.165 (0.017) 0.027 (0.697) 0.087 (0.209) 0.115 (0.098) −0.073 (0.292) 0.858 (<0.001) 0.047 (0.573)Social desirability −0.049 (0.482) −0.287 (<0.001) −0.301 (<0.001) 0.024 (0.728) 0.057 (0.410) −0.051 (0.460) 0.002 (0.977)
Correlations for males are presented above the main diagonal, while correlations for females are presented below the main diagonal; r, Pearson’s correlation coefficient; SESI, socioeconomic status index; BMI,body mass index; WHtR, waist-to-height ratio.

Nutrients 2021, 13, 3622 7 of 13
Table 3. Effects of age, SESI, physical activity, BMI, WHtR, and social desirability on eating behaviour dimensions among males and females.
Multivariate TestsTests of between-Subjects Effects
Cognitive Restraint (CR) Uncontrolled Eating (UE) Emotional Eating (EE)
F P ηp2 β F P ηp2 β F P ηp2 β F P ηp2
Males (n = 144)Corrected model - - - - 1.337 0.245 0.055 - 1.302 0.260 0.054 - 3.314 0.004 0.127
Age (years) 0.990 0.400 0.022 0.037 0.046 0.831 0.000 0.104 0.331 0.566 0.002 0.175 2.966 0.087 0.021SESI 0.629 0.598 0.014 0.081 0.835 0.362 0.006 −0.077 0.688 0.408 0.005 −0.039 0.556 0.457 0.004
Physical activity * 2.791 0.043 0.058 −0.457 0.745 0.390 0.005 0.908 2.650 0.106 0.019 0.784 6.276 0.013 0.044BMI (kg/m2) 2.154 0.096 0.046 0.012 0.009 0.924 0.000 0.093 0.466 0.496 0.003 −0.144 3.500 0.064 0.025
WHtR 1.860 0.139 0.040 11.217 1.359 0.246 0.010 −0.012 0.000 0.999 0.000 12.013 4.457 0.037 0.032Social desirability 0.793 0.500 0.017 0.038 0.386 0.536 0.003 −0.055 0.712 0.400 0.005 −0.045 1.548 0.216 0.011Females (n = 209)Corrected model - - - - 3.587 0.002 0.096 - 3.918 0.001 0.104 - 6.027 <0.001 0.152
Age (years) 1.437 0.233 0.021 0.066 0.117 0.733 0.001 −0.307 3.606 0.059 0.018 −0.208 3.078 0.081 0.015SESI 1.008 0.390 0.015 −0.028 0.092 0.763 0.000 −0.033 0.169 0.682 0.001 0.062 1.146 0.286 0.006
Physical activity * 2.914 0.035 0.042 −1.267 7.127 0.008 0.034 −0.077 0.037 0.848 0.000 0.131 0.198 0.657 0.001BMI (kg/m2) 4.526 0.004 0.064 0.356 7.959 0.005 0.038 0.093 0.769 0.382 0.004 0.201 6.638 0.011 0.032
WHtR 0.905 0.439 0.013 −8.641 0.831 0.363 0.004 −3.367 0.177 0.674 0.001 −8.290 1.995 0.159 0.010Social desirability 7.737 <0.001 0.104 −0.037 0.717 0.398 0.004 −0.151 16.754 <0.001 0.077 −0.115 18.046 <0.001 0.082
* physical activity in two categories: low, moderate/high (as reference group); P, significance level; ηp2, partial eta-squared; β, standardized regression coefficient for parameter estimates; SESI, socioeconomicstatus index; BMI, body mass index; WHtR, waist-to-height ratio. Determination coefficients (R2) for eating behaviour dimensions among males: 5.5% for CR, 5.4% for UE, 12.7% for EE (adjusted: 1.4%, 1.3%,8.9%, respectively); females: 9.6% for CR, 10.4% for UE, 15.2% for EE (adjusted: 6.9%, 7.8%, 12.7%, respectively).

Nutrients 2021, 13, 3622 8 of 13
4. Discussion
This study aimed to evaluate the associations of eating behaviour dimensions withage, SESI, PA, BMI, WHtR, and social desirability among university students. Basedon the multivariate analysis, a main effect on emotional eating was presented by someof those variables in both sexes, while on cognitive restraint and uncontrolled eatingamong females only. PA, BMI, and social desirability presented a main effect on eatingbehaviour among females, with social desirability having the largest effect. PA was the onlyvariable that presented a main effect on eating behaviour (i.e., emotional eating) amongmales. There was no significant association between eating behaviour and age or SES. Ingeneral, self-reported eating behaviour was better explained regarding emotional eatingand among females.
In the present study, cognitive restraint and emotional eating were higher amongfemales, while uncontrolled eating was higher among males. Although females usuallyhave higher body weight concern and can be more prone to limit food consumption tocontrol their weight, they are also more vulnerable to eating in response to stress andnegative emotions. The results suggest that men seem to be more prone to consuming largeamounts of food, which may be due to food palatability, hunger, and social cues [2]. Similarsex differences in the scores of TFEQ subscales were found among French adolescents andadults, except for the scores of uncontrolled eating in middle-aged adults [15]. Higherscores of emotional eating and cognitive restraint among female students were also found inPortugal [16]. Research carried out among Lebanese and Chilean students also showed thatfemales scored higher on emotional eating [11,39]. On the other hand, a study conductedamong German adults showed that females scored higher on all three eating behaviourdimensions (TFEQ subscales) [9].
According to the current results, emotional eating and uncontrolled eating are pos-itively correlated in both sexes, with a stronger association among females. Cognitiverestraint and emotional eating had a low positive association among males only, and therewere no significant associations between cognitive restraint and uncontrolled eating. Lowerpositive associations between emotional eating and uncontrolled eating were found amongadult women and men in Germany [9], and between emotional eating and binge eatingamong students in Portugal [16]. Somewhat differently than in the present study, theassociation between cognitive restraint and emotional eating was significant but weakin both sexes among German adults [9]. Among Portuguese students, emotional eatingwas positively associated with different types of cognitive restraint: rigid control amongfemales and flexible control among males [16]. Significant, positive associations were foundbetween all TFEQ dimensions in post-menopausal women, with the strongest associationbetween uncontrolled eating and emotional eating [23]. Although cognitive restraint canbe considered both as a cause and a consequence of emotional eating [5], the cross-sectionalstudy design did not allow a causal relationship to be assessed.
Interestingly, no significant association between self-reported eating behaviour andage or SES was found in the present study. This research was conducted among universitystudents, and the participants’ SES characteristics were, to some extent, similar to otherstudies conducted among adolescents and young adults in Poland [7,33,40]. Some otherstudies demonstrated significant associations between some of the eating behaviour dimen-sions and age or SES. Age was positively associated with cognitive restraint and negativelyassociated with both disinhibition and hunger among female students satisfied with theirweight [17]. Similarly, a positive association of age with cognitive restraint and negativeassociations with both uncontrolled eating and emotional eating were found among adultmales and females in Germany [9]. Age was negatively correlated with uncontrolled eatingonly among male students in Lebanon [11]. The associations of SES with the three eatingbehaviour dimensions were positive but weak among adults in Germany [9]. In contrast,among adults in France, uncontrolled eating scores were higher among people with lowerSES, whereas no significant relationships have been found with cognitive restraint or emo-
Nutrients 2021, 13, 3622 9 of 13
tional eating [10]. Given the inconsistency in these findings, future research should includemore objective SES measures and longitudinal studies.
Positive correlations between cognitive restraint and both BMI and WHtR were foundin both sexes, however, multivariate analysis confirmed a positive association betweencognitive restraint and BMI only among females. Similar to the current findings, cognitiverestraint has been positively associated with BMI among adult males and females inGermany [9]. In France, adults with obesity presented higher cognitive restraint [10],however, in Poland, no difference between women with normal weight and those withobesity was found [25]. The direction of the association between cognitive restraint and BMImay be different depending on the population studied: although those associations wereweak, in a clinical sample of adults with obesity, cognitive restraint was inversely associatedwith BMI, while in a web-based survey among US adults, the association was positive [24].Similarly, in the present study, further analysis showed significant positive correlationsbetween cognitive restraint and BMI among non-overweight (BMI < 25 kg/m2) males andfemales, while they were negative (despite non-significant correlations) among overweight(BMI ≥ 25 kg/m2) males and females (data not shown). These findings suggest that adultswith higher BMI demonstrated higher cognitive restraint only within a certain range ofbody weight status. On the other hand, cognitive restraint may have a counterproductiveeffect and lead to weight gain [4,5], since unsuccessful dieters can present high cognitiverestraint and overeating tendencies [5]. Cognitive restraint has been indirectly associatedwith body size through its interaction with disinhibition [3].
The current results showed that emotional eating was positively associated withBMI among females. Among males, emotional eating was positively related to WHtR.Surprisingly, there was no significant association between uncontrolled eating and BMIor WHtR. Other studies have shown that both uncontrolled eating and emotional eatingwere related to BMI and/or body weight status [9–11,25]. BMI was positively associatedwith both uncontrolled eating and emotional eating among female students in Lebanon,while, among males, with emotional eating only [11]. Uncontrolled eating and emotionaleating were higher among French adults with obesity (when compared to those withoutobesity) [10] and among Polish women with obesity (vs. normal weight) [25]. Other studiesshowed that dieting self-efficacy was negatively correlated with uncontrolled eating andemotional eating among Polish females aged 19–22 years [26], and eating self-efficacywith binge eating and emotional eating among Portuguese students (both males andfemales) [16]. Moreover, it was found that uncontrolled eating acts as a mediator in therelationship between SES and BMI among men [9]. Emotional eating did not mediatethe association, but higher emotional eating scores were associated with higher BMI inboth sexes [9]. One study showed that higher scores on both hunger and disinhibitionwere related to greater body weight and size among middle-aged and elderly women [3].Interestingly, females with high disinhibition had higher BMI and WC compared to thosewith low disinhibition levels, irrespective of restraint level [3]. The current findingsshowed that higher emotional eating was associated with higher general adiposity amongfemales and higher abdominal adiposity among males. This can be partly explained byphysiological differences between both sexes—males have a higher tendency to accumulateabdominal visceral fat [41]. In the present study, abdominal obesity was found in abouta 2.7 times higher proportion of males than females. Since PA plays a key role in theenergy balance, the negative association between emotional eating and PA is relevant tothe interpretation of such results.
The current study also found that higher PA was associated with higher cognitiverestraint among females and with lower emotional eating among males, although similarassociations were expected in both sexes. Interestingly, among males, PA was the onlyvariable that presented a main effect on eating behaviour. Only a few studies have exploredthe associations between TFEQ dimensions and PA [8,17]. Similar to the current findings,PA was positively associated with cognitive restraint and negatively with disinhibitionamong female university students dissatisfied with their weight [17]. People with higher
Nutrients 2021, 13, 3622 10 of 13
BMI may restrain food consumption and/or increase PA to reduce body weight. Theinverse association between PA and emotional eating may be explained by the role of PA inalleviating stress and negative emotions [18], and improving appetite control [19], thereforepreventing overeating and weight gain. Another study, conducted among adult males andfemales, showed that emotional eaters with higher PA had lower BMI and consumed morehealthy foods, even though there were no differences in the consumption of unhealthyfoods (sweets, high-fat foods) [8]. Furthermore, self-reported PA may be biased by socialdesirability. In the present study, the social desirability score was higher among femalesreporting moderate/high PA compared to those reporting low PA (p = 0.024; data notshown). Other studies carried out among middle-aged women demonstrated that socialdesirability was associated with PA overreporting [22].
Contrary to expectations, no significant effect of the social desirability was found onthe associations between eating behaviour dimensions and other variables. Nevertheless,social desirability presented a direct effect on some of the self-reported eating behavioursamong females: uncontrolled eating and emotional eating were negatively associated withsocial desirability in both univariate and multivariate analyses. Social desirability had thelargest main effect on eating behaviour, and it was the only factor which significantly ex-plained uncontrolled eating. Among males, the associations with uncontrolled eating andemotional eating were also negative but non-significant. Overall, social desirability seemsto be a potential bias when assessing eating behaviour among females, but not amongmales, or when regarding the relationships of eating behaviour with other characteristics. Itis worth mentioning that there was no difference in mean social desirability scores betweenthe sexes. Similarly, no sex differences were found in social desirability scores amongPortuguese higher education students [16]. A relatively high mean social desirability scorewas found among post-menopausal women, which may be explained by actual positivetraits of females who volunteered for research with a higher respondent burden [23]. Asexpected, females with higher social desirability scored lower on uncontrolled eating andemotional eating, which are eating behaviours considered socially undesirable and may beassociated with feelings of shame or guilt [12]. The current findings are somewhat similarto those obtained among Portuguese students showing that social desirability was not asso-ciated with dietary restraint [16,27], but was negatively associated with external, emotional,and binge eating in both sexes [16]. A review of health-related studies demonstrated thatsocially desirable responding affected findings in almost half of those studies [20]. Onlya few studies have explored the social desirability effect on associations between eatingbehaviour dimensions similar to those analysed in the present study [16,27], showing thatcontrolling for social desirability weakened most of the associations [16].
Strengths and Limitations
Several limitations of this study should be emphasized. Since the study was conductedamong a sufficiently large, but convenience, sample of Polish university students, thefindings may not be generalizable to other population groups and countries. Moreover,since this was a cross-sectional study, it is not possible to directly infer causal relationships.Difficulties in comparing the findings, to some extent, resulted from the different studypopulations (e.g., included females, middle-aged people, or subjects with obesity only)and tools (e.g., different TFEQ versions) applied in prior research. For example, theuncontrolled eating subscale in the TFEQ-R18 [6] included both hunger and disinhibitionitems of the original 51-item TFEQ [30], while the uncontrolled eating subscale in the TFEQ-13 comprised hunger items only [31]. Although this questionnaire was validated andused in other studies, it is a self-reported tool and does not take actual food consumptioninto account.
The strengths of the study include using both univariate and multivariate analysis,allowing for the evaluation of the effect of each variable on eating behaviour adjustedfor confounders, which strengthened the conclusions. Since a social desirability bias mayaffect the results based on self-reported data [20], partial correlations controlled for social
Nutrients 2021, 13, 3622 11 of 13
desirability were calculated and showed no significant effect of social desirability on theassociations between variables. Since some variables can be particularly sensitive to thesocial desirability bias, simple descriptive questions on the economic situation were usedinstead of a direct question about income. Anthropometric parameters were measuredand two indexes reflecting general and abdominal adiposity (BMI and WHtR, respectively)were calculated. Besides using BMI, there were only a few studies on TFEQ dimensions,including other measures of body size such as WC [3,13], hip circumference, and waist–hipratio [3].
The current findings highlight the most important factors that should be consideredwhen assessing dietary restraint, uncontrolled eating, and emotional eating in future re-search, especially socially desirable responding. Besides the several factors included inthe present study, based on the literature, some other factors related to the eating be-haviour dimensions may be considered in future research: body weight satisfaction [17],nutritional knowledge [17], and night sleep duration [13]. To better understand the associa-tions between eating behaviour dimensions and their causal factors, longitudinal researchis needed.
5. Conclusions
The current study showed that PA, BMI, and WHtR were associated with self-reportedeating behaviour among university students. BMI was positively associated with cognitiverestraint and emotional eating among females, while WHtR was positively associated withemotional eating among males. Among males with higher emotional eating, interventionsaiming to prevent them from becoming overweight should focus on increasing PA. Asocial desirability bias was found when assessing self-reported eating behaviour, i.e.,uncontrolled eating and emotional eating among females, but not on the relationships ofeating behaviour dimensions with other characteristics.
Supplementary Materials: The following are available online at https://www.mdpi.com/article/10.3390/nu13103622/s1, Table S1: Distribution of sociodemographic characteristics, physical activity,and body weight status in the total sample and within sex groups, Table S2: Participant characteristicsby sex and physical activity subgroups, Table S3: Partial correlations (controlled for social desirability)between eating behaviour dimensions and age, SESI, BMI and WHtR among males and females.
Author Contributions: J.K. was responsible for the conceptualization and design of the main study,and data collection; J.K. and R.P. were responsible for the design, analysis, and interpretation ofdata for this manuscript; J.K. was responsible for writing the manuscript; R.P. was responsible forrevising the manuscript critically for important intellectual content; J.K. was responsible for fundingacquisition. All authors have read and agreed to the published version of the manuscript.
Funding: This research was funded by the Faculty of Food Sciences, University of Warmia andMazury in Olsztyn (Poland) from sources of the Polish Ministry of Science and Higher Education.The APC was financially supported by the Minister of Education and Science under the programentitled “Regional Initiative of Excellence” for the years 2019–2022, Project No. 010/RID/2018/19,amount of funding 12,000,000 PLN.
Institutional Review Board Statement: The study was conducted according to the guidelines of theDeclaration of Helsinki, and approved by the Bioethics Committee of the Faculty of Medical Sciences,University of Warmia and Mazury in Olsztyn on 17 June 2010 (resolution no. 20/2010).
Informed Consent Statement: Written informed consent was obtained from all subjects involved inthe study.
Data Availability Statement: The data supporting the conclusions of this article will be madeavailable from the corresponding author upon reasonable request.
Acknowledgments: Thanks are expressed to the participants for their contributions to the study andthe university students participating in collecting the data.
Conflicts of Interest: The authors declare no conflict of interest.
Nutrients 2021, 13, 3622 12 of 13
References1. World Health Organization (WHO). Obesity and Overweight. Fact Sheets. 2020. Available online: https://www.who.int/news-
room/fact-sheets/detail/obesity-and-overweight (accessed on 19 May 2021).2. Bryant, E.J.; Rehman, J.; Pepper, L.B.; Walters, E.R. Obesity and Eating Disturbance: The Role of TFEQ Restraint and Disinhibition.
Curr. Obes. Rep. 2019, 8, 363–372. [CrossRef]3. Dykes, J.; Brunner, E.J.; Martikainen, P.T.; Wardle, J. Socioeconomic gradient in body size and obesity among women: The role of
dietary restraint, disinhibition and hunger in the Whitehall II study. Int. J. Obes. Relat. Metab. Disord. 2004, 28, 262–268. [CrossRef]4. Lowe, M.R.; Levine, A.S. Eating motives and the controversy over dieting: Eating less than needed versus less than wanted. Obes.
Res. 2005, 13, 797–806. [CrossRef]5. van Strien, T. Causes of Emotional Eating and Matched Treatment of Obesity. Curr. Diab. Rep. 2018, 18, 35. [CrossRef]6. Karlsson, J.; Persson, L.O.; Sjöström, L.; Sullivan, M. Psychometric properties and factor structure of the Three-Factor Eating
Questionnaire (TFEQ) in obese men and women. Results from the Swedish Obese Subjects (SOS) study. Int. J. Obes. Relat. Metab.Disord. 2000, 24, 1715–1725. [CrossRef]
7. Czarnocinska, J.; Wadolowska, L.; Lonnie, M.; Kowalkowska, J.; Jezewska-Zychowicz, M.; Babicz-Zielinska, E. Regional andsocioeconomic variations in dietary patterns in a representative sample of young polish females: A cross-sectional study(GEBaHealth project). Nutr. J. 2020, 19, 26. [CrossRef]
8. Dohle, S.; Hartmann, C.; Keller, C. Physical activity as a moderator of the association between emotional eating and BMI: Evidencefrom the Swiss Food Panel. Psychol. Health 2014, 29, 1062–1080. [CrossRef] [PubMed]
9. Löffler, A.; Luck, T.; Then, F.S.; Luck-Sikorski, C.; Pabst, A.; Kovacs, P.; Böttcher, Y.; Breitfeld, J.; Tönjes, A.; Horstmann, A.; et al.Effects of psychological eating behaviour domains on the association between socio-economic status and BMI. Public Health Nutr.2017, 20, 2706–2712. [CrossRef] [PubMed]
10. Pigeyre, M.; Rousseaux, J.; Trouiller, P.; Dumont, J.; Goumidi, L.; Bonte, D.; Dumont, M.-P.; Chmielewski, A.; Duhamel, A.;Amouyel, P.; et al. How obesity relates to socio-economic status: Identification of eating behavior mediators. Int. J. Obes. 2016, 40,1794–1801. [CrossRef] [PubMed]
11. Aoun, C.; Nassar, L.; Soumi, S.; El Osta, N.; Papazian, T.; Rabbaa Khabbaz, L. The cognitive, behavioral, and emotional aspectsof eating habits and association with impulsivity, chronotype, anxiety, and depression: A cross-sectional study. Front. Behav.Neurosci. 2019, 13, 204. [CrossRef]
12. Devonport, T.J.; Nicholls, W.; Fullerton, C. A systematic review of the association between emotions and eating behaviour innormal and overweight adult populations. J. Health Psychol. 2019, 24, 3–24. [CrossRef]
13. Konttinen, H.; van Strien, T.; Männistö, S.; Jousilahti, P.; Haukkala, A. Depression, emotional eating and long-term weightchanges: A population-based prospective study. Int. J. Behav. Nutr. Phys. Act. 2019, 16, 28. [CrossRef]
14. Ruddock, H.K.; Brunstrom, J.M.; Vartanian, L.R.; Higgs, S. A systematic review and meta-analysis of the social facilitation ofeating. Am. J. Clin. Nutr. 2019, 110, 842–861. [CrossRef] [PubMed]
15. de Lauzon, B.; Romon, M.; Deschamps, V.; Lafay, L.; Borys, J.M.; Karlsson, J.; Ducimetièrem, P.; Charles, M.A. The Three-FactorEating Questionnaire-R18 is able to distinguish among different eating patterns in a general population. J. Nutr. 2004, 134,2372–2380. [CrossRef] [PubMed]
16. Poínhos, R.; Oliveira, B.M.P.M.; Correia, F. Eating behavior in Portuguese higher education students: The effect of socialdesirability. Nutrition 2015, 31, 310–314. [CrossRef] [PubMed]
17. Bond, M.J.; McDowell, A.J.; Wilkinson, J.Y. The measurement of dietary restraint, disinhibition and hunger: An examinationof the factor structure of the Three Factor Eating Questionnaire (TFEQ). Int. J. Obes. Relat. Metab. Disord. 2001, 25, 900–906.[CrossRef]
18. Bernstein, E.E.; McNally, R.J. Exercise as a buffer against difficulties with emotion regulation: A pathway to emotional wellbeing.Behav. Res. Ther. 2018, 109, 29–36. [CrossRef]
19. Martins, C.; Robertson, M.D.; Morgan, L.M. Effects of exercise and restrained eating behaviour on appetite control. Proc. Nutr.Soc. 2008, 67, 28–41. [CrossRef]
20. Van de Mortel, T.F. Faking it: Social desirability response bias in self-report research. Aust. J. Adv. Nurs. 2008, 25, 40–48.21. Crowne, D.P.; Marlowe, D. A new scale of social desirability independent of psychopathology. J. Consult Psychol. 1960, 24, 349–354.
[CrossRef]22. Adams, S.A.; Matthews, C.E.; Ebbeling, C.B.; Moore, C.G.; Cunningham, J.E.; Fulton, J.; Hebert, J.R. The effect of social desirability
and social approval on self-reports of physical activity. Am. J. Epidemiol. 2005, 161, 389–398. [CrossRef]23. Mossavar-Rahmani, Y.; Tinker, L.F.; Huang, Y.; Neuhouser, M.L.; McCann, S.E.; Seguin, R.A.; Vitolins, M.Z.; Curb, J.D.; Prentice,
R.L. Factors relating to eating style, social desirability, body image and eating meals at home increase the precision of calibrationequations correcting self-report measures of diet using recovery biomarkers: Findings from the Women’s Health Initiative. Nutr.J. 2013, 12, 63. [CrossRef]
24. Cappelleri, J.C.; Bushmakin, A.G.; Gerber, R.A.; Leidy, N.K.; Sexton, C.C.; Lowe, M.R.; Karlsson, J. Psychometric analysis of theThree-Factor Eating Questionnaire-R21: Results from a large diverse sample of obese and non-obese participants. Int. J. Obes.2009, 33, 611–620. [CrossRef]
25. Brytek-Matera, A.; Rogoza, R.; Czepczor-Bernat, K. The Three-Factor Eating Questionnaire-R18 Polish version: Factor structureanalysis among normal weight and obese adult women. Arch. Psychiatry Psychother. 2017, 19, 81–90. [CrossRef]
Nutrients 2021, 13, 3622 13 of 13
26. Obara-Gołebiowska, M. Analysis of the psychological aspects of eating self-regulation and dieting self-efficacy among youngwomen aged 19–22 years. J. Educ. Health Sport. 2016, 6, 543–551.
27. Freitas, D.; Oliveira, B.M.P.M.; Correia, F.; Pinhão, S.; Poínhos, R. Eating behaviour among nutrition students and social desirabilityas a confounder. Appetite 2017, 113, 187–192. [CrossRef] [PubMed]
28. World Health Organization (WHO). Physical status: The use and interpretation of anthropometry. In Report of a WHO ExpertCommittee; Technical Report Series No. 854; World Health Organization: Geneva, Switzerland, 1995; Available online: https://apps.who.int/iris/handle/10665/37003 (accessed on 14 April 2021).
29. Centers for Disease Control and Prevention (CDC). National Health and Nutrition Examination Survey (NHANES). Anthropom-etry Procedures Manual; 2013. Available online: https://www.cdc.gov/nchs/data/nhanes/nhanes_13_14/2013_Anthropometry.pdf (accessed on 14 April 2021).
30. Stunkard, A.J.; Messick, S. The three-factor eating questionnaire to measure dietary restraint, disinhibition and hunger. J.Psychosom Res. 1985, 29, 71–83. [CrossRef]
31. Dzielska, A.; Mazur, J.; Małkowska-Szkutnik, A.; Kołoło, H. Adaptacja polskiej wersji kwestionariusza Three-Factor Eating Ques-tionnaire (TFEQ-13) wsród młodziezy szkolnej w badaniach populacyjnych [Adaptation of the Three-Factor Eating Questionnaire(TFEQ-13) for school-aged adolescents in a population study]. Probl. Hig. Epidemiol. 2009, 90, 362–369.
32. Długosz, A.; Wadołowska, L.; Niedzwiedzka, E.; Długosz, T. Porównanie dwóch wskazników sytuacji społeczno-ekonomicznej iich zastosowania w ocenie zywienia młodziezy [Comparison of two indices of the socioeconomic status and their applications inthe dietary assessment of adolescents]. Handel Wewnetrzny 2013, 4, 37–46.
33. Kowalkowska, J.; Wadolowska, L.; Wuenstel, J.W.; Słowinska, M.A.; Niedzwiedzka, E. Socioeconomic status and overweightprevalence in polish adolescents: The impact of single factors and a complex index of socioeconomic status in respect to age andsex. Iran. J. Public Health. 2014, 43, 913–925.
34. Krusinska, B.; Wadolowska, L.; Biernacki, M.; Slowinska, M.A.; Drozdowski, M. Serum ‘vitamin-mineral’ profiles: Associationswith postmenopausal breast cancer risk including dietary patterns and supplementation. A case-control study. Nutrients 2019, 11,2244. [CrossRef] [PubMed]
35. Wadolowska, L.; Stasiewicz, B. The manual for developing of nutritional data from the KomPAN® questionnaire. In KomPAN®
Dietary Habits and Nutrition Beliefs Questionnaire and the Manual for Developing of Nutritional Data, 2nd ed.; Gawecki, J., Ed.;Committee of Human Nutrition, Polish Academy of Sciences: Olsztyn, Poland, 2020; pp. 35–56. Available online: https://knozc.pan.pl/index.php?option=com_content&view=article&id=137:dietary-habits-and-nutrition-beliefs-questionnaire-and-the-manual-for-developing-of-nutritional-data-kompan-english-version-2nd-edition&catid=36&Itemid=129&lang=pl(accessed on 14 April 2021).
36. Kowalkowska, J.; Wadolowska, L.; Czarnocinska, J.; Czlapka-Matyasik, M.; Galinski, G.; Jezewska-Zychowicz, M.; Bronkowska,M.; Dlugosz, A.; Loboda, D.; Wyka, J. Reproducibility of a Questionnaire for Dietary Habits, Lifestyle and Nutrition KnowledgeAssessment (KomPAN) in Polish Adolescents and Adults. Nutrients 2018, 10, 1845. [CrossRef] [PubMed]
37. Ashwell, M.; Gunn, P.; Gibson, S. Waist-to-height ratio is a better screening tool than waist circumference and BMI for adultcardiometabolic risk factors: Systematic review and meta-analysis. Obes. Rev. 2012, 13, 275–286. [CrossRef] [PubMed]
38. Field, A. Discovering Statistics Using SPSS, 3rd ed.; Sage Publications: London, UK, 2009.39. Valladares, M.; Durán, E.; Matheus, A.; Durán-Agüero, S.; Obregón, A.M.; Ramírez-Tagle, R. Association between Eating Behavior
and Academic Performance in University Students. J. Am. Coll. Nutr. 2016, 35, 699–703. [CrossRef] [PubMed]40. Lonnie, M.; Wadolowska, L.; Bandurska-Stankiewicz, E. Dietary-lifestyle patterns associated with adiposity and metabolic
abnormalities in adult men under 40 years old: A cross-sectional study (MeDiSH project). Nutrients 2020, 12, 751. [CrossRef]41. Nauli, A.M.; Matin, S. Why do men accumulate abdominal visceral fat? Front. Physiol. 2019, 10, 1486. [CrossRef]


![ES[S]PRIT – an Internet-based programme for the prevention and early intervention of eating disorders in college students](https://static.fdokumen.com/doc/165x107/631c013c93f371de19013afa/essprit-an-internet-based-programme-for-the-prevention-and-early-intervention.jpg)