Earned value
41
-
Upload
independent -
Category
Documents
-
view
1 -
download
0
Transcript of Earned value


ن
Percent Complete Fields in Primavera P6
Page 1 www.PMarchy.com
.Percent Complete Fields in Primavera P6
by Nader Khorrami Rad, PMP
Release 1.1, 2012
Check www.PMarchy.com for newer versions of this free ebook and to find other PM resources.

ن
Percent Complete Fields in Primavera P6
Page 2 www.PMarchy.com
Copyright © 2012 Nader Khorrami Rad
All rights reserved. This material may be freely copied
and distributed, in part or as a whole, subject to
inclusion of the Author’s name and web address
(en.khorramirad.info).
While all attempts have been made to verify
information provided in this publication, the Author
assumes no responsibility for errors or contrary
interpretation of the subject matter herein.
The author has tried to be as objective as possible but
might have been influenced by his personal
experiences and preferred practices.
ن
Percent Complete Fields in Primavera P6
Page 3 www.PMarchy.com
Table of Content
Table of Content .............................................................................................................................................. 3
Introduction ...................................................................................................................................................... 4
Main Diagram .................................................................................................................................................. 6
A Quick Review of the Whole Structure .......................................................................................................... 7
A Quick Review of the Actual Progress ................................................................................................... 8
A Quick Review of the Planned Progress ..............................................................................................10
A Quick Review of the Earned Value Analysis ......................................................................................10
The Structure of the Planned Progress .........................................................................................................18
The Structure of the Actual Progress ............................................................................................................24
The Activity % Complete ........................................................................................................................24
The Duration % Complete .....................................................................................................................26
The Units % Complete ...........................................................................................................................27
The Physical % Complete ......................................................................................................................27
The Performance % Complete ..............................................................................................................31
Option 1: Based on Activity % Complete, without the Resource Curves 32
Option 2: Based on Activity % Complete, with Resource Curves 33
Options 4, 5 and 6: Based on Actual Dates 36
Option 3: Based on WBS Milestones 38
Summary .......................................................................................................................................................40

ن
Percent Complete Fields in Primavera P6
Page 4 www.PMarchy.com
Introduction
Anyone who has used Primavera P6 before might have at least some minor problems understanding the way different
percent complete fields are calculated and related to each other. This software supports many different kinds of percent
completes and many different kinds of relationships between them in order to cover all of your needs. In this book, the
whole structure of the percent complete fields will be discussed, and I hope that you find the answer to all of your related
questions.
You need to know many other things to be able to prepare a professional plan (e.g. the synchronization of duration, units
and cost) that are not discussed here.
You may also find some other percent complete fields that are not discussed here because they do not play any role in the
main structure of the progress measurement and are used for other purposes.
In the next few pages, you will be presented with a detailed diagram of the percent complete fields. This diagram shows all
the relationships needed to understand the system. The diagram might seem complicated in the first place, but I’m sure
that you will better understand and find it easy when you go through the book. I strongly recommend you to check the
diagram while reading the text.
The diagram is divided into two columns and six rows to group the fields and make it easier to understand. The left column
shows the fields needed to measure actual progress, and the right column shows the fields needed to measure planned
progress. Each row shows a different level of the plan: Project, WBS Elements, Activities, Steps, Assignments and
Expenses. Some fields are duplicated among multiple rows because they are calculated differently for each of them;

ن
Percent Complete Fields in Primavera P6
Page 5 www.PMarchy.com
Performance % Complete is one of them. If you check the diagram now, you will find out that some instances of the fields
are missing; for example, Units % Complete is calculated for both Activities and WBS Elements, but it is not presented in
WBS Elements row because it is better to avoid it and use other fields for WBS Elements.
You might be able to skip many of the settings and steps that I’ve provided here and still be able to produce the necessary
information; keep in mind, however, that these kind of shortcuts are not feasible in long-term, and I recommend you to
avoid them.
The last thing I need to explain is the way percentages calculations are shown in this book. Suppose we have a 1000 day
long project and we are now in day 300. What percentage of the planned duration is passed? You may easily answer
30%. But how would you show that? It is common to show the calculation as follows:
The Answer = Actual Duration / Planned Duration * 100 = 300 / 1000 * 100 = 30%
(This is a sample formula and it is not applicable to Primavera P6)
This book presents this kind of calculations as follows:
The Answer = Actual Duration / Planned Duration = 300 / 1000 = 30%
(This is a sample formula and it is not applicable to Primavera P6)
The reason behind this presentation is that 30% is the same value as 0.3, not the same as 30 with a “%” symbol. Think of
30% as a different display format for 0.3.

ن
Percent Complete Fields in Primavera P6
Page 6 www.PMarchy.com
Main Diagram
WB
SA
ctiv
ity
Step
Ass
ign
men
tsP
roje
ctEx
pen
ses
Planned ValuesActual/Earned Values
Steps % Complete
Manually Entered
Physical % Complete
Units % Complete
Duration % Complete%
CompleteType
Activity % Complete
Custom % Complete
50 / 50
0 / 100
WBS Milestones
SettingA
SettingB
Schedule % CompletePV
Schedule % Complete
PV
Cost profile
Performance % CompleteEV
Performance % Complete
EV
OD, RD
AS, AF
SettingB
AU, RU
Performance % CompleteEV
Curvessetting
Cost profile
Cost profile
DD, BL
Schedule % CompletePV
AU, RU
AU, RU

ن
Percent Complete Fields in Primavera P6
Page 7 www.PMarchy.com
A Quick Review of the Whole Structure
There are lots of percent complete fields in Primavera P6, and they are utilized in different ways in order to give you two
important outputs: the actual and the planned progress.
Planned progress is presented by the Schedule % Complete and actual progress is presented by the Performance %
Complete. You can think of these two fields as the final products and the other fields as tools needed for these products.
Eng-Amr
Highlight
Eng-Amr
Highlight
Eng-Amr
Highlight

ن
Percent Complete Fields in Primavera P6
Page 8 www.PMarchy.com
A Quick Review of the Actual Progress
The Actual Progress is presented by the Performance % Complete. Many other percent completes and settings are
involved in this calculation; the simplified structure is as follows:
Duration % Complete
Units % Complete
Physical % Complete
Activity % Complete
WBS Milestones
0 / 100
50 / 50
Custom % Complete
Performance % Complete
Steps % Complete
Manual Values
This field is calculated in one of the five ways. Four of them are used for milestone progresses, and the other one for
continuous progress. In continuous progress, it will be possible to have any number between zero and 100, but in
milestone progress you will only have some predefined values available. You should be careful not to confuse progress
Eng-Amr
Highlight
Eng-Amr
Highlight
Eng-Amr
Highlight

ن
Percent Complete Fields in Primavera P6
Page 9 www.PMarchy.com
milestones with schedule milestones. Schedule milestones are important events in time, which are items of the plan
alongside the activities.
The only way of having continuous progress is to link the Performance % Complete to the Activity % Complete. The latter
field itself is equal to one of the three percent completes available for each activity: Duration % Complete,
Units % Complete, and Physical % Complete. You will have two options for Physical % Complete; you can either enter the
values manually or use Activity Steps to calculate them.
The previous diagram is oversimplified; you may find the complete version in the main diagram of the book.
The performance measurement and Earned Value Analysis are usually linked to each other and the same happens in
Primavera P6. Earned Value fields are the key to understand percent complete fields. Many percent complete fields are
linked by them or interpreted by them. Two essential values in EVM are Planned Value (PV) and Earned Value (EV). PV
shows the planned progress in terms of monetary units, and Schedule % Complete is its other presentation form, in terms
of percentage. Actual progress is presented by EV in terms of monetary value, and by Performance % Complete in terms
of percentage.
As a result of all the links and relations between percent complete fields and EVM fields, we need to have an overview of
the Earned Value Analysis before starting the main subject. But first, let's have a quick review of the planned progress.
Eng-Amr
Highlight
Eng-Amr
Highlight
Eng-Amr
Highlight
Eng-Amr
Highlight

ن
Percent Complete Fields in Primavera P6
Page 10 www.PMarchy.com
A Quick Review of the Planned Progress
You can see in the main diagram that the structure of the planned progress is much simpler than the actual progress. It
doesn’t involve many fields and it doesn’t have any settings. The only thing that causes a little confusion is that the
Schedule % Complete is calculated differently for Activities and for WBS Elements.
A Quick Review of the Earned Value Analysis
You need to estimate and enter all the Activity costs in order to be able to have EVM calculations. These costs work as
weight factors for many roll-ups, which use weighted average to calculate the aggregated values. For example:
Name Planned Cost Planned Progress Actual Progress
Sample WBS Element 400$ {=100$+300$} 31% {=(50%*100$+25%*300$)/400$} 21% {=(40%*100$+15%*300$)/400$}
Sample Activity 1 100$ 50% 40%
Sample Activity 2 300$ 25% 15%
The planned cost of the WBS Element is equal to the sum of the underlying Activities, which in this case is 400$.

ن
Percent Complete Fields in Primavera P6
Page 11 www.PMarchy.com
Planned and actual progress of the WBS Element is a weighted average of the underlying Activities’ progress. We use
weighted averages, because all the Activities do not have the same importance. If you use a simple average, you will have
the same amount of aggregated progress for a little Activity and a large one; for example you can finish a 100$ Activity
instead of a 3000$ Activity and the total progress would be the same, which is not acceptable. That is why we use
weighted averages, and it is generally accepted to use planned cost as the weight factor.
When you start entering the actual data in your plan, many values change according to the data. In order to have a fixed
picture of the initial plan and compare the current plan with it, you should use a concept named Baseline. What we use as
weight factors is the baseline cost, not the costs in the current plan. So, here we will update the previous table with the
new title:
Name Baseline Cost Planned Progress Actual Progress
Sample WBS Element 400$ {=100$+300$} 31% {=(50%*100$+25%*300$)/400$} 21% {=(40%*100$+15%*300$)/400$}
Sample Activity 1 100$ 50% 40%
Sample Activity 2 300$ 25% 15%
Eng-Amr
Highlight

ن
Percent Complete Fields in Primavera P6
Page 12 www.PMarchy.com
If you were supposed to do the math in Excel, you would probably use an intermediate value to simplify the calculations:
Name Baseline
Cost Intermediate value Planned Progress Actual Progress
Sample WBS Element 400$ 125$ {=50$+75$} 31% {=125$/400$} 21% {=(40%*100$+15%*300$)/400$}
Sample Activity 1 100$ 50$ {=50%*100$} 50% 40%
Sample Activity 2 300$ 75$ {=25%*300$} 25% 15%
This intermediate value is equal to Planned Progress multiplied by Baseline Cost and shows how much of the baseline
cost should be spent so far. The sum of these values show the amount of money we should have spent for the WBS
Element, and its Planned Progress is calculated by dividing this amount to the Baseline Cost of the WBS Element. In this
case, we should have spent 125$ of the total budgeted 400$, which means 31% Planned Progress. This calculation is
another form of the previous weighted average, and they have no difference at all.
This intermediate value is called Planned Value, or PV for short. Primavera P6 calls it Planned Value Cost. PV is also
called BCWS in some resources, which stands for Budgeted Cost of Work Scheduled.
The title is updated in the next table.

ن
Percent Complete Fields in Primavera P6
Page 13 www.PMarchy.com
Name Baseline
Cost PV Planned Progress Actual Progress
Sample WBS Element 400$ 125$ {=50$+75$} 31% {=125$/400$} 21% {=(40%*100$+15%*300$)/400$}
Sample Activity 1 100$ 50$ {=50%*100$} 50% 40%
Sample Activity 2 300$ 75$ {=25%*300$} 25% 15%
So, we should have spent 125$ until now. Suppose that our actual cost is 150$. Are we ahead of the plan?
Let’s see the next table. AC stands for Actual Cost.
Name Baseline
Cost AC PV
Planned
Progress Actual Progress
Sample WBS Element 400$ 150$ {=80$+70$} 125$ 31% 21% {=(40%*100$+15%*300$)/400$}
Sample Activity 1 100$ 80$ 50$ 50% 40%
Sample Activity 2 300$ 70$ 75$ 25% 15%

ن
Percent Complete Fields in Primavera P6
Page 14 www.PMarchy.com
The AC column shows the actual costs of Activities and the WBS Element. It is possible to spend more money than initially
planned, but don’t progress as much. That is why Actual Cost is not used to measure actual progress; instead of that,
another concept called Earned Value will be used. EV acts as another intermediate value, like PV. The following table
shows how the EV helps us calculate the Actual Progress. EV is sometimes called BCWP, which stands for Budgeted
Cost of Work Performed.
Name Baseline
Cost AC PV
Planned
Progress EV Actual Progress
Sample WBS Element 400$ 150$ 125$ 31% 85$ {=40$+45$} 21% {=85$/400$}
Sample Activity 1 100$ 80$ 50$ 50% 40$ {=40%*100$} 40%
Sample Activity 2 300$ 70$ 75$ 25% 45$ {=15%*300$} 15%
Sample Activity 1 has 40% actual progress and its Baseline Cost is 100$; as a result, we expect it to cost 40$ until now, or
in better words, its performed work is equal to 40$ of the whole budgeted cost. This value is the Earned Value of this
Activity to date. We sould have spent 40$ for this progress, but our actual cost was 80$, which means that we are over-
budget in this area.
The EV of the WBS Element is equal to the sum of the EVs of its Activities, which is 85$. Our actual progress for this WBS
Element is equal to 85$ and we can compare it with PV, which is 125$; this means that our actual progress is less than the
planned progress.
Eng-Amr
Highlight
Eng-Amr
Highlight
Eng-Amr
Highlight

ن
Percent Complete Fields in Primavera P6
Page 15 www.PMarchy.com
Our current situation in this project is as follows:
EV: 85$ PV: 125$ AC: 150$ BAC: 400$
BAC stands for Budget At Completion and is the same as Baseline Cost.
Now we can calculate many different EVM outputs.
The first thing is to compare the appropriate cost we should have spent to the actual cost we’ve spent. This will be called
CPI, which stands for Cost Performance Index.
CPI = EV / AC = 85$ / 150$ = 57%
(Standard formula)
What we’ve earned so far is equal to 57% of the money we’ve spent. That is not good enough. If we don’t improve this, we
will finish the project with an actual cost that is much more than our budget. CPI of 100% shows that the cost we’ve spent
for the actual works performed is equal to what we’ve planned before.
We can also calculate the Cost Variation (CV) as follows:
CV = EV – AC = 85$ - 150$ = -65$
(Standard formula)
This means that we are 65$ over budget so far.
ن
Percent Complete Fields in Primavera P6
Page 16 www.PMarchy.com
CPI and CV show the cost performance. We can calculate schedule performance with similar indicators. The first one
would be the ratio of the actual progress to the planned progress, which is called Schedule Performance Index (SPI):
SPI = EV / PV = 85$ / 125$ = 68%
(Standard formula)
Our actual progress is equal to 68% of the planned progress and we are behind schedule.
The Schedule Variance (SV) would be:
SV = EV – PV = 85$ - 125$ = -40$
(Standard formula)
This means that we are 40$ behind the schedule (SV), even though we are 65$ over budget (CV).
The most important thing is that we never compare PV and AC directly; comparisons are between EV and other factors.
SPI, SV, CPI and CP are important indicators, but you don’t need to know them in this book; what you need here is the
concept of PV and EV.
EV is the actual progress in monetary units. It is usually not easy to understand progress in terms of monetary values, and
percentages work better. In our sample, Earned Value is 85$. We’ve actualized 85$ of the total 400$, so:
Performance % Complete = EV / BAC = 85$ / 400$ = 21%
(Standard formula, also applicable in Primavera P6)

ن
Percent Complete Fields in Primavera P6
Page 17 www.PMarchy.com
The percentage presentation of EV is usually called Performance % Complete. The percentage form of planned progress
is sometimes called Schedule % Complete and is calculated as follows:
Schedule % Complete = PV / BAC = 125$ / 400$ = 31%
(Standard formula, not always applicable in Primavera P6)
These two formulas are used in many resources. In Primavera P6, these two formulas are always true for WBS Elements,
but you cannot expect Activities to follow them. The Schedule % Complete of Activities would not follow the standard
formula if you have any resource or expense curves other than uniform. The Performance % Complete of Activities does
not follow the standard formula if Activity has a non-uniform Expense.
Besides the exceptions mentioned above, you can always be sure about the Performance % Complete and Schedule %
Complete of the WBS Elements; they always follow the standard formulas.

ن
Percent Complete Fields in Primavera P6
Page 18 www.PMarchy.com
The Structure of the Planned Progress
You will learn the whole structure and process of planned progresses in this section. This structure is really simple.
Planned Progress is reported by Schedule % Complete in Activities and WBS Emelents rows. First let’s take a look at
Schedule % Complete of Activities. The following figure shows the way this field is calculated for each Activity. Yellow bars
show the baseline dates, the blue bars show the current dates, and the red line shows the Data Date.
Schedule % Complete = 100%
Schedule % Complete = a / b
Schedule % Complete = 0%
As you can see, this field is calculated by Data Date and baseline dates; the current schedule has no effect on it.
Schedule % Complete shows that what percentage of the baseline time has passed. When Data Date is before
Baseline Start, the Schedule % Complete is 0%; when it is after the Baseline Finish, the value whould be 100%; in other
a
b

ن
Percent Complete Fields in Primavera P6
Page 19 www.PMarchy.com
cases, it whould be the ratio of the passed baseline time to the baseline duration. This ratio is usually shown by the
following formula:
Schedule % Complete = ( [Data Date] – [Basline Start] ) / ( [Baseline Finish] – [Baseline Start] )
(P6 formula for Activities | Not applicable to the WBS Elements)
This formula is not used for WBS Elements. Actually, the Schedule % Complete of Activities is not used in any other
calculation in this process.
The standard formula is:
Schedule % Complete = PV / BAC
(Standard formula)
P6 does not follow this formula for Activities. The following figure shows this scenario:
Schedule % Complete = 50%
PV = 75$ + 75$ = 150$
PV / BAC = 150$ / 300$ = 50%
Schedule % Complete = 50%
PV = 160$ + 80$ = 240$
PV / BAC = 240$ / 300$ = 80%
160$ 80$
40$ 75$ 75$ 75$ 75$ 20$

ن
Percent Complete Fields in Primavera P6
Page 20 www.PMarchy.com
This figure shows a four day Activity with two different baseline costs; the right one has a uniform baseline cost of 75$ per
day and the left one has a non-uniform baseline cost. The Data Date is shown by the red line and is placed on the second
day; as a result, Schedule % Complete would be 50% in both cases.
PV in the right case is 150$ and it is 240$ in the left case. The standard formula of PV / BAC for the right case is 50%,
which is equal to the Schedule % Complete; but this standard value in the left case is 80%, which is not equal to its
Schedule % Complete.
The PV of the WBS Element is equal to the sum of the PVs of its underlying Activities. When the PV is calculated for the
WBS Element, its Schedule % Complete will be calculated by the standard formula:
Schedule % Complete = PV / BAC
(P6 formula for WBS Elements)

ن
Percent Complete Fields in Primavera P6
Page 21 www.PMarchy.com
The following table shows the sample project. Data Date is the second day and both Activities start on the first day and
finish on forth day in Baseline.
Name BAC PV
Schedule %
Complete Cost Curve
Sample WBS Element 400$
Sample Activity 1 100$ {=20$+30$+50$} 50$
Sample Assignment for Activity 1 20$ - Uniform, 5$ per day
Sample Assignment for Activity 1 30$ - All in the start of the Activity
Sample Expense for Activity 1 50$ - 20$ in first day, 10$ in each of
the other days
Sample Activity 2 300$ {=100$+200$} 50%
Sample Assignment for Activity 2 100$ - All in the start of the Activity
Sample Expense for Activity 2 200$ - Uniform, 50$ per day
Schedule % Complete for both acticities would be 50% (2days/4days).

ن
Percent Complete Fields in Primavera P6
Page 22 www.PMarchy.com
This table shows the calculations needed for Schedule % Complete of WBS Elements:
Name BAC PV
Schedule %
Complete Cost Curve
Sample WBS Element 400$ 270$ {=70$+200$} 68% {=270$/400$}
Sample Activity 1 100$ {=20$+30$+50$} 70$ {=10$+30$+30$} 50$
Sample Assignment for Activity 1 20$ 10$ {=5$*2} - Uniform, 5$ per day
Sample Assignment for Activity 1 30$ 30$ - All in the start of the Activity
Sample Expense for Activity 1 50$ 30$ {=20$+10$} - 20$ in first day, 10$ in each of
the other days
Sample Activity 2 300$ {=100$+200$} 200$ {=100$+100$} 50%
Sample Assignment for Activity 2 100$ 100$ - All in the start of the Activity
Sample Expense for Activity 2 200$ 100$ {=50$*2) - Uniform, 50$ per day
This WBS Element has two Activities, both with a Schedule % Complete of 50%, but the Schedule % Complete of the
WBS Element is equal to 68%.

ن
Percent Complete Fields in Primavera P6
Page 23 www.PMarchy.com
To summarize, Schedule % Complete is calculated based on these inputs:
For Activities:
o Data Date
o Baseline Dates
For WBS Elements:
o Baseline cost curves of all the assignments and expenses of the underlying Activities
o Data Date
o BAC
This kind of question is common among planners:
“I have a plan. Its Activities have logical Schedule % Completes, but the value of the
Schedule % Complete of all the WBS Elements are zero; why?”
And the answer is simple: Schedule % Complete of the WBS Elements depends on costs, and they would remain zero if
you don’t have costs in your plan.

ن
Percent Complete Fields in Primavera P6
Page 24 www.PMarchy.com
The Structure of the Actual Progress
The structure of the actual progress in Primavera P6 is flexible yet complicated. This complication is designed to cover all
the different needs you may have.
We will start discussing this subject; please follow the main diagram all the way.
The Activity % Complete
Actual data is entered in plan in every control point. These data change many values and the Activity % Complete is one
of them. Different Activities need different kinds of calculations; for example, if you have a 10m long wall and 2m is
constructed, progress would usually be measured as 20%. This was a sample of the continuous progress. Some other
Activities are better with milestones of progress; for example, if you have an outsourced engineering Activity, you might
consider two progress milestones of 70% for the issue of the drawing and 30% for its acceptance. In this case, you will
only have three progress values for this activity: 0%, 70%, and 100%.
Each Activity has three different kinds of percent completes:
Duration % Complete
Units % Complete
Physical % Complete

ن
Percent Complete Fields in Primavera P6
Page 25 www.PMarchy.com
Each of these three fields has its own values, and you will tell the software which one it should use as the
Activity % Complete for each Activity. This setting is not global because you might not be able to use only one of them for
a whole plan.
The setting mentioned above is the % Complete Type field of Activities. The following table shows a sample:
Name Duration
% Complete
Units
% Complete
Physical
% Complete % Complete Type
Activity
% Complete
Sample WBS Element Some value Some value No value No value No value
Sample Activity 1 20% 30% 40% Duration 20%
Sample Activity 2 25% 35% 45% Units 35%
Sample Activity 3 29% 39% 49% Physical 49%
Activity % Complete is just a duplication; You can easily set the % Complete Type of all the Activities and forget about it;
you will always use Activity % Complete instead of the three percent completes.
We will discuss the calculation of these three percent completes in the next sections.

ن
Percent Complete Fields in Primavera P6
Page 26 www.PMarchy.com
The Duration % Complete
You may expect Duration % Complete to use a formula similar to the following:
[Actual Duration] / [Planned Duration] (Sample formula; not used in Primavera P6)
But Primavera uses another formula:
Duration % Complete = ( [Original Duration] – [Remaining Duration] ) / [Original Duration]
(P6 formula for Activities)
If the Remaining Duration is bigger than Original Duration, the result would be a negative value, but the
Duration % Complete would be zero.
Suppose we have an Activity, originally planned to be 10 days. It has been 20 days since the actual start and we believe
that it needs 9 more days to complete. How much is the Duration % Complete? The answer is:
Duration % Complete = (10 – 9 ) / 10 = 10%
(sample calculation in Primavera P6)
If you expect it to be the ratio of the Actual Duration to the current planned duration, the result would be 69%. If you need
to use the latter formula (for any reason), one solution is to make a Global Change to calculate it and put it in Physical %
Complete and set % Complete Type to Physical.

ن
Percent Complete Fields in Primavera P6
Page 27 www.PMarchy.com
The Units % Complete
When you add Assignments and Expenses to Activities, the budgeted units will be calculated; when you add actual units,
the combination of planned and actual units will make the Units % Complete through this simple and intuitive formula:
Units % Complete = [Actual Units] / ( [Actual Units] + [Remaining Units] )
(Primavera P6 formula for Activities)
This field shows what percent of the work of the Activity is done so far and is the most common percent complete type.
The Physical % Complete
Units % Complete and Duration % Complete is not appropriate for some Activities; in this case, you can use
Physical % Complete. The value of this field shapes in one of these ways:
By manually entered values
By Activity Steps
Manually entered values are determined by expert judgment or by parameters external to the schedule. Steps are
predefined progress milestones.

ن
Percent Complete Fields in Primavera P6
Page 28 www.PMarchy.com
If you want to use Activity Steps for Physical % Complete, you should activate the “Activity percent complete based on
activity steps” option in Calculation tab of the Projects page.
This setting is global, meaning that you cannot change it for individual Activities; you either use Steps for the whole
Activities or not. But don’t worry, if you activate this option and some of your Activities do not have any Steps, you can still
enter their Physical % Completes manually. If the option is active and the Activity has Steps, you cannot enter values in
Physical % Complete field; Primavera P6 will calculate it for you based on the Activity Steps.

ن
Percent Complete Fields in Primavera P6
Page 29 www.PMarchy.com
Activity Steps are defined in Steps tab of the Activity Details pane. Each Step has a weight and a % Complete; the
Physical % Complete of the Activity would be the weighted average of the Steps.
Step Progress
(0% or 100%)
Step Progress
(0% to 100%)
Relative
Weight
Weight
In scale of 100

ن
Percent Complete Fields in Primavera P6
Page 30 www.PMarchy.com
The following table shows a sample:
Name Step Weight Step % Complete Physical % Complete
Sample WBS Element - - No value
Sample Activity 1 - - 75% {=25%*100%+25%*0%+50%*100%}
Sample Activity Step 1.1 25% 100% {manually entered} -
Sample Activity Step 1.2 25% 0% -
Sample Activity Step 1.3 50% 100% {manually entered} -
Sample Activity 2 - - 20% {=20%*100%+80%*0%}
Sample Activity Step 2.1 20% 100% {manually entered} -
Sample Activity Step 2.2 80% 0% -

ن
Percent Complete Fields in Primavera P6
Page 31 www.PMarchy.com
The Performance % Complete
We’ve discussed the Activity % Complete so far. This field shows the progress of the Activities but is not used for
WBS Elements. Actual progress is reported by the Performance % Complete, both for the Activities and WBS Elements.
Performance % Complete of the Activities under the same WBS Element is calculated by one of these six options:
1. By Activity % Complete and without resource curves
2. By Activity % Complete and with resource curves
3. By WBS Milestones
4. By 0/100 method
5. By 50/50 method
6. By x/(100-x) custom method
(1) and (2) are continuous and the rest of them are milestone progresses. (1) and (2) are depended on the Activity
progress, (3) is completely independent from the Activity progress, and the rest of them are only influenced by Actual Start
and Actual Finish of the Activities.
As you can see, lots of options are provided. We will discuss them in the coming sections.
The method of Performance % Complete calculation is set in WBS level, meaning that all the Activities under a single
WBS Element use the same technique. In order to choose the method, go to Earned Value tab of the WBS Details pane in
WBS page.

ن
Percent Complete Fields in Primavera P6
Page 32 www.PMarchy.com
Available options are shown in the left. We will discuss each option in the coming sections.
Option 1: Based on Activity % Complete, without the Resource Curves
The first option for Performance % Complete calculates it based on Activity % Complete and without resource curves. In
order to use this method for a single WBS Element, go to WBS page, select the WBS Element, and then turn the Activity
Percent Complete option on and the Use Resource Curves / Future Period Buckets off. These two options are in the
Earned Value tab of the WBS Details pane.
In this case, the following process follows:
1. Performance % Complete of the Activities would be equal to their Activity % Complete.
2. The EV of the Activities would be calculated based on EV = BAC * Performance % Complete formula.

ن
Percent Complete Fields in Primavera P6
Page 33 www.PMarchy.com
3. The EV of the WBS Element would be equal to the sum of its underlying Activities EVs.
4. Performance % Complete of the WBS Element would be calculated by EV / BAC formula.
The following table shows a sample calculation:
Name BAC Activity
% Complete
Performance
% Complete EV
Sample WBS Element 800${=100$+300$+400$} No value 30% {=240$/800$} 240$ {=50$+90$+100$}
Sample Activity 1 100$ 50% 50% 50$ {=50%*100$}
Sample Activity 2 300$ 30% 30% 90$ {=30%*300$}
Sample Activity 3 400$ 25% 25% 100$ {=25%*400$}
Option 2: Based on Activity % Complete, with Resource Curves
Activity % Complete is based on one of the three percent completes: Duration % Complete, Units % Complete or
Physical % Complete. It is only Units % Complete that is based on resource curves. In this option,
Performance % Complete would be equal to Units % Complete in order to use resource curves.
ن
Percent Complete Fields in Primavera P6
Page 34 www.PMarchy.com
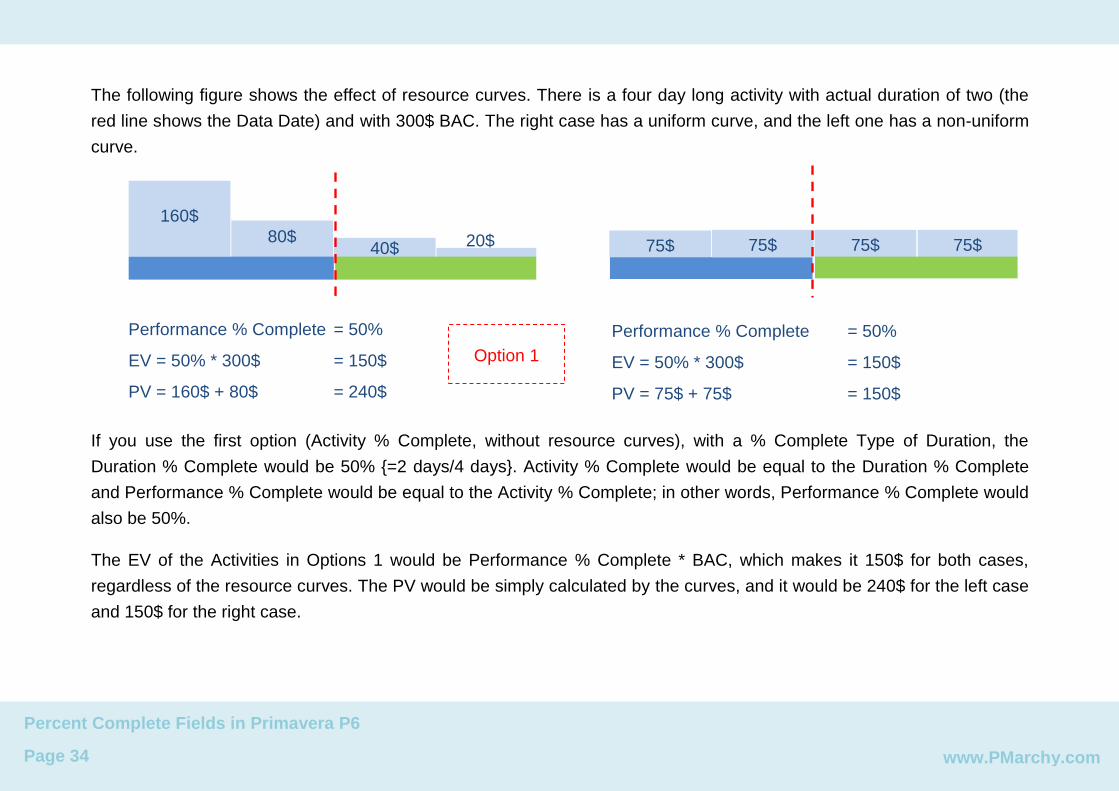
The following figure shows the effect of resource curves. There is a four day long activity with actual duration of two (the
red line shows the Data Date) and with 300$ BAC. The right case has a uniform curve, and the left one has a non-uniform
curve.
Performance % Complete = 50%
EV = 50% * 300$ = 150$
PV = 75$ + 75$ = 150$
Performance % Complete = 50%
EV = 50% * 300$ = 150$
PV = 160$ + 80$ = 240$
If you use the first option (Activity % Complete, without resource curves), with a % Complete Type of Duration, the
Duration % Complete would be 50% {=2 days/4 days}. Activity % Complete would be equal to the Duration % Complete
and Performance % Complete would be equal to the Activity % Complete; in other words, Performance % Complete would
also be 50%.
The EV of the Activities in Options 1 would be Performance % Complete * BAC, which makes it 150$ for both cases,
regardless of the resource curves. The PV would be simply calculated by the curves, and it would be 240$ for the left case
and 150$ for the right case.
160$
80$ 40$ 75$ 75$ 75$ 75$ 20$
Option 1

ن
Percent Complete Fields in Primavera P6
Page 35 www.PMarchy.com
In this scenario, we are working according to the plan and we expect EV to be equal to the PV. In the left case, EV is less
than PV, showing that we are behind schedule; but are we?
In cases like this, we can use resource curves to overcome the problem. The following figure shows the new calculations.
EV = 75$ + 75$ = 150$
PV = 75$ + 75$ = 150$
Performance % Complete = 150$/300$ = 50%
EV = 160$ + 80$ = 240$
PV = 160$ + 80$ = 240$
Performance % Complete = 240$/300$ = 80%
160$
80$ 40$ 75$ 75$ 75$ 75$ 20$
Option 2

ن
Percent Complete Fields in Primavera P6
Page 36 www.PMarchy.com
The following table shows a sample calculation:
Name BAC Activity
% Complete
Units
% Complete
Performance
% Complete EV
Sample WBS Element 800${=100$+300$+400$} No value Some value 32% {=255$/800$} 255$ {=40$+135$+80$}
Sample Activity 1 100$ 50% 40% 40% 40$ {=40%*100$}
Sample Activity 2 300$ 30% 45% 45% 135$ {=45%*300$}
Sample Activity 3 400$ 25% 20% 20% 80$ {=20%*400$}
You will get the same result if you use the first option (Activity % Complete without resource curves) and the
% Complete Type of Units.
Options 4, 5 and 6: Based on Actual Dates
Options 4 through 6 are the 0/100, 50/50 and the Custom % Complete options in the Earned Value tab of the WBS Details
pane. All three of them use a template of x/(100-x), in which x is zero in option 4, 50 in option 5 and is customizable in
option 6. When you activate the Actual Start of the Activity, its Performance % Complete would be equal to x and it
remains x until you activate the Actual Finish of the Activity; it will then become 100.

ن
Percent Complete Fields in Primavera P6
Page 37 www.PMarchy.com
When you use any of these options, the only possible Performance % Complete values for each Activity would be zero,
x%, and 100%.
When Performance % Complete of Activities are set, their EV is calculated by Performance % Complete * BAC formula.
The EV of the WBS Element would be the sum of the underlying EVs (as usual) and its Performance % Complete would
be calculated by the EV / BAC formula.

ن
Percent Complete Fields in Primavera P6
Page 38 www.PMarchy.com
The following table shows the sample calculation based on a customized 20/80 method:
Name BAC Actually
Started
Actually
Finished
Performance
% Complete EV
Sample WBS Element 800$ 20% {=160$/800$} 160$ {=100$+60$+0$}
Sample Activity 1 100$ 100% 100$ {=100%*100$}
Sample Activity 2 300$ - 20% 60$ {=20%*300$}
Sample Activity 3 400$ - - 0% 0$ {=0%*400$}
Option 3: Based on WBS Milestones
The Performance % Complete in other methods is based on Activities status, but this method is completely independent of
the Activities. In this case, a customized number of progress milestones are defined for the WBS Element and progress
will be calculated based on them. These progress milestones work like Activity Steps.
Performance % Complete of the WBS Element will always be equal to the % Complete of its progress milestones. The
Performance % Complete of all the underlying Activities will be equal to that. The EV of the Activities and the WBS
Milestone will be calculated by Performance % Complete * BAC formula.

ن
Percent Complete Fields in Primavera P6
Page 39 www.PMarchy.com
This kind of calculation is used when Activities are not a good measure of the progress of the WBS Element.
The following table shows a sample calculation:
Name BAC
WBS
Milestone
Weight
WBS
Milestone
Completed
Performance
% Complete EV
Sample WBS Element 800${=100$+300$+400$} 75% {=(1+2)/(1+1+2)} 600$ {=75%*800$}
Sample WBS milestone 1 1
Sample WBS milestone 2 1 -
Sample WBS milestone 3 2
Sample Activity 1 100$ 75% 75$ {=75%*100$}
Sample Activity 2 300$ 75% 225$ {=75%*300$}
Sample Activity 3 400$ 75% 300$ {=75%*400$}
You may have not-started Activities with actual progress in this case!

ن
Percent Complete Fields in Primavera P6
Page 40 www.PMarchy.com
Summary
As you saw, the structure of planned progress is different from actual progress. In some methods, actual and planned
progress does not match and you will have some false variants reported, which is not appropriate. This is why some other
professional software has more flexible options and methods for planned progress.
Some elements, like Activity Steps, change your actual progress, but do not change the planned progress. You can
always avoid this by decomposing the work, instead of using Steps. In general, you can use either of these two:
1. A complicated actual progress method with a simple WBS and Activity list structure
2. A simple actual progress method with a complicated WBS and Activity list structure
The problem with (1) is that actual and planned values do not match. However, (2) does not have this problem, but the
number of activities would increase dramatically. For example, instead of having a single Activity with 4 Steps, you can
define one work package (WBS Element) with 4 Activities underneath and use a simple Units % Complete or even
Duration % Complete instead of Step based Physical % Complete.