Early necrosis and apoptosis of Schwann cells transplanted into the injured rat spinal cord
13
Early necrosis and apoptosis of Schwann cells transplanted into the injured rat spinal cord Caitlin E. Hill, 1 Andres Hurtado, 1,2 Bas Blits, 1 Ben A. Bahr, 3 Patrick M. Wood, 1 , 4 Mary Bartlett Bunge 1,4,5 and Martin Oudega 1,2,4 1 The Miami Project to Cure Paralysis, University of Miami Miller School of Medicine, Miami, FL 33136, USA 2 The International Center for Spinal Cord Injury, Kennedy Krieger Institute and the Department of Neurology, Johns Hopkins University School of Medicine, Baltimore, MA 21205, USA 3 Department of Pharmaceutical Sciences, Neuroscience Program, University of Connecticut, Storrs, CT 06269, USA 4 Department of Neurological Surgery, University of Miami Miller School of Medicine, Miami, FL 33136, USA 5 Department of Anatomy and Cell Biology, University of Miami Miller School of Medicine, Miami, FL 33136, USA Keywords: calpain, caspase, cell death, contusion, fodrin breakdown product, spinal cord injury Abstract Poor survival of cells transplanted into the CNS is a widespread problem and limits their therapeutic potential. Whereas substantial loss of transplanted cells has been described, the extent of acute cell loss has not been quantified previously. To assess the extent and temporal profile of transplanted cell death, and the contributions of necrosis and apoptosis to this cell death following spinal cord injury, different concentrations of Schwann cells (SCs), lentivirally transduced to express green fluorescent protein (GFP), were transplanted into a 1-week-old moderate contusion of the adult rat thoracic spinal cord. In all cases, transplanted cells were present from 10 min to 28 days. There was a 78% reduction in SC number within the first week, with no significant decrease thereafter. Real- time polymerase chain reaction showed a similar 80% reduction in GFP-DNA within the first week, confirming that the decrease in SC number was due to death rather than decreased GFP transgene expression. Cells undergoing necrosis and apoptosis were identified using antibodies against the calpain-mediated fodrin breakdown product and activated caspase 3, respectively, as well as ultrastructurally. Six times more SCs died during the first week after transplantation by necrosis than apoptosis, with the majority of cell death occurring within the first 24 h. The early death of transplanted SCs indicates that factors present, even 1 week after a moderate contusion, are capable of inducing substantial transplanted cell death. Intervention by strategies that limit necrosis and ⁄ or apoptosis should be considered for enhancing acute survival of transplanted cells. Introduction Cell transplantation for repair of the CNS has been explored with variable success. Transplanted cells may replace lost cells after disease, such as Parkinson’s (Bjorklund, 2005), amyotrophic lateral sclerosis (Nirmalananthan & Greensmith, 2005) and multiple sclerosis (Blakemore & Franklin, 2000), and after traumatic brain (Watson et al., 2003) and spinal cord injury (SCI; Takami et al., 2002), where they also may serve as a substrate for regenerating axons. Importantly, genetic modification of transplanted cells could be utilized for gene therapy to enhance morphological and functional restoration (Watson et al., 2003; Girard et al., 2005; Klein et al., 2005). The therapeutic efficacy of this approach depends greatly on the survival of the transplanted cells. Survival of transplanted cells is compromised in various models of CNS injury. An example is a rat model of Parkinson’s disease where only a few percent of nigral dopamine neurons injected into the striatum survive the first week (Mahalik et al., 1994; Barker et al., 1996; Emgard et al., 1999). Similarly, Schwann cells (SCs) survive poorly within a moderately contused spinal cord environment (Hill et al., 2006). A 7-day delay in transplantation improves their survival, but the majority of SCs still die soon after grafting (Hill et al., 2006). SCs injected into a 1-week-old moderate contusion promote axon regeneration into the transplant and improve hindlimb locomotion (Takami et al., 2002). This modest improvement in neurological outcome, however, may be restricted by the demonstrated poor survival of the transplanted SCs. It is clear that death of cells transplanted into the injured CNS is a widespread occurrence that can limit their restorative potential. Transplanted cells die by necrosis and apoptosis. Necrosis, char- acterized by cell swelling, loss of membrane integrity and ensuing release of intracellular contents, can be induced by mechanical strain, decreased oxygen and nutrient levels, and elevated levels of toxic agents such as oxidants, acids and intracellular ions (Syntichaki & Tavernarakis, 2003). All of these may occur during the evolution of an injury in the CNS (Hall & Springer, 2004), resulting in activation of cell signaling pathways (Golstein & Kroemer, 2007) and, in due course, may result in calpain-induced collapse of the cytoskeleton (Ray & Banik, 2003). Apoptosis is genetically programmed, energy- dependent, cell death characterized by cell shrinkage, cytoplasmic blebbing, chromatin condensation and DNA fragmentation. Apoptosis can be initiated by intrinsic or extrinsic activation of calcium- independent, cystine proteases (caspases; Eldadah & Faden, 2000; Correspondence: Dr C.E. Hill, as above. E-mail: [email protected] Received 20 March 2007, revised 13 July 2007, accepted 17 July 2007 European Journal of Neuroscience, Vol. 26, pp. 1433–1445, 2007 doi:10.1111/j.1460-9568.2007.05771.x ª The Authors (2007). Journal Compilation ª Federation of European Neuroscience Societies and Blackwell Publishing Ltd
-
Upload
independent -
Category
Documents
-
view
3 -
download
0
Transcript of Early necrosis and apoptosis of Schwann cells transplanted into the injured rat spinal cord

Early necrosis and apoptosis of Schwann cells transplantedinto the injured rat spinal cord
Caitlin E. Hill,1 Andres Hurtado,1,2 Bas Blits,1 Ben A. Bahr,3 Patrick M. Wood,1,4 Mary Bartlett Bunge1,4,5
and Martin Oudega1,2,4
1The Miami Project to Cure Paralysis, University of Miami Miller School of Medicine, Miami, FL 33136, USA2The International Center for Spinal Cord Injury, Kennedy Krieger Institute and the Department of Neurology, Johns HopkinsUniversity School of Medicine, Baltimore, MA 21205, USA3Department of Pharmaceutical Sciences, Neuroscience Program, University of Connecticut, Storrs, CT 06269, USA4Department of Neurological Surgery, University of Miami Miller School of Medicine, Miami, FL 33136, USA5Department of Anatomy and Cell Biology, University of Miami Miller School of Medicine, Miami, FL 33136, USA
Keywords: calpain, caspase, cell death, contusion, fodrin breakdown product, spinal cord injury
Abstract
Poor survival of cells transplanted into the CNS is a widespread problem and limits their therapeutic potential. Whereas substantialloss of transplanted cells has been described, the extent of acute cell loss has not been quantified previously. To assess the extentand temporal profile of transplanted cell death, and the contributions of necrosis and apoptosis to this cell death following spinal cordinjury, different concentrations of Schwann cells (SCs), lentivirally transduced to express green fluorescent protein (GFP), weretransplanted into a 1-week-old moderate contusion of the adult rat thoracic spinal cord. In all cases, transplanted cells were presentfrom 10 min to 28 days. There was a 78% reduction in SC number within the first week, with no significant decrease thereafter. Real-time polymerase chain reaction showed a similar 80% reduction in GFP-DNA within the first week, confirming that the decrease in SCnumber was due to death rather than decreased GFP transgene expression. Cells undergoing necrosis and apoptosis were identifiedusing antibodies against the calpain-mediated fodrin breakdown product and activated caspase 3, respectively, as well asultrastructurally. Six times more SCs died during the first week after transplantation by necrosis than apoptosis, with the majority ofcell death occurring within the first 24 h. The early death of transplanted SCs indicates that factors present, even 1 week after amoderate contusion, are capable of inducing substantial transplanted cell death. Intervention by strategies that limit necrosis and ⁄ orapoptosis should be considered for enhancing acute survival of transplanted cells.
Introduction
Cell transplantation for repair of the CNS has been explored withvariable success. Transplanted cells may replace lost cells afterdisease, such as Parkinson’s (Bjorklund, 2005), amyotrophic lateralsclerosis (Nirmalananthan & Greensmith, 2005) and multiple sclerosis(Blakemore & Franklin, 2000), and after traumatic brain (Watsonet al., 2003) and spinal cord injury (SCI; Takami et al., 2002), wherethey also may serve as a substrate for regenerating axons. Importantly,genetic modification of transplanted cells could be utilized for genetherapy to enhance morphological and functional restoration (Watsonet al., 2003; Girard et al., 2005; Klein et al., 2005). The therapeuticefficacy of this approach depends greatly on the survival of thetransplanted cells.
Survival of transplanted cells is compromised in various models ofCNS injury. An example is a rat model of Parkinson’s disease whereonly a few percent of nigral dopamine neurons injected into thestriatum survive the first week (Mahalik et al., 1994; Barker et al.,1996; Emgard et al., 1999). Similarly, Schwann cells (SCs) survivepoorly within a moderately contused spinal cord environment (Hill
et al., 2006). A 7-day delay in transplantation improves their survival,but the majority of SCs still die soon after grafting (Hill et al., 2006).SCs injected into a 1-week-old moderate contusion promote axonregeneration into the transplant and improve hindlimb locomotion(Takami et al., 2002). This modest improvement in neurologicaloutcome, however, may be restricted by the demonstrated poorsurvival of the transplanted SCs. It is clear that death of cellstransplanted into the injured CNS is a widespread occurrence that canlimit their restorative potential.Transplanted cells die by necrosis and apoptosis. Necrosis, char-
acterized by cell swelling, loss of membrane integrity and ensuingrelease of intracellular contents, can be induced by mechanical strain,decreased oxygen and nutrient levels, and elevated levels of toxicagents such as oxidants, acids and intracellular ions (Syntichaki &Tavernarakis, 2003). All of these may occur during the evolution of aninjury in the CNS (Hall & Springer, 2004), resulting in activation ofcell signaling pathways (Golstein & Kroemer, 2007) and, in duecourse, may result in calpain-induced collapse of the cytoskeleton(Ray & Banik, 2003). Apoptosis is genetically programmed, energy-dependent, cell death characterized by cell shrinkage, cytoplasmicblebbing, chromatin condensation and DNA fragmentation. Apoptosiscan be initiated by intrinsic or extrinsic activation of calcium-independent, cystine proteases (caspases; Eldadah & Faden, 2000;
Correspondence: Dr C.E. Hill, as above.E-mail: [email protected]
Received 20 March 2007, revised 13 July 2007, accepted 17 July 2007
European Journal of Neuroscience, Vol. 26, pp. 1433–1445, 2007 doi:10.1111/j.1460-9568.2007.05771.x
ª The Authors (2007). Journal Compilation ª Federation of European Neuroscience Societies and Blackwell Publishing Ltd

Springer, 2002). Both necrosis and apoptosis affect the fate of graftedcells (Mahalik et al., 1994; Emgard et al., 2003; Bakshi et al., 2005).Here we transplanted SCs into a 1-week moderate contusion of the
adult rat thoracic spinal cord, to examine the extent and temporalprofile of cell death following transplantation, and the contributions ofnecrosis and apoptosis in this death. This study is the first to quantifythe time course of transplant death in a large number of cases earlyafter injury using two separate techniques (histology and molecularbiology) and genetically identifiable transplanted cells. We show thattransplanted SCs die primarily within the first 24 h after implantation,by necrosis, and that the 22% of SCs that survive the first week stablyintegrate into the injury site and persist. By determining the timecourse and mechanism by which transplanted cells die, our results willfacilitate the design of interventions aimed at increasing survival oftransplanted cells within the injured CNS to optimize their support ofaxonal repair.
Materials and methods
Isolation and transduction of SCs
SCs were isolated from sciatic nerves of adult female Fischer 344 rats(Harlan Sprague–Dawley, Indianapolis, IN, USA) and killed with anoverdose of ketamine (60 mg ⁄ kg), xylazine (12 mg ⁄ kg) and acepro-mazine (2 mg ⁄ kg) followed by cervical dislocation. Briefly, afterremoval of the epineurium, the nerves were cut into 3-mm-longsegments that were placed into 60-mm plastic culture dishes andcovered with D10 medium [Dulbecco’s modified Eagle’s medium(DMEM); Gibco, Carlsbad, CA, USA, containing 10% fetal bovineserum; Hyclone, Logan, UT, USA]. The segments were transferred tonew dishes weekly and the medium was refreshed biweekly. After2 weeks, the explants were treated with dispase (Roche, Indianapolis,IN, USA) and collagenase (Worthington, Lakewood, NJ, USA),dissociated and, after centrifugation (1500 g at 4 �C), resuspended inD10 medium with the SC mitogens, pituitary extract (20 lg ⁄ mL;Biomedical Technologies, Stoughton, MA, USA), forskolin (2 lm;Sigma, St Louis, MO, USA) and heregulin (2.5 nm; Genentech, SanFrancisco, CA, USA). The cells were then plated onto poly-l-lysine(Sigma)-coated culture dishes, given fresh medium biweekly and,when confluent, replated at 1 ⁄ 4 confluent density into new dishes.Early on, the cells were treated with Thy-1 and rabbit complement(MP Biomedicals, Solon, OH, USA) to eliminate remaining fibro-blasts. The resulting SC cultures were > 95% pure based on p75immunostaining.At early passage, SCs were transduced overnight with a lentiviral
vector encoding green fluorescent protein (GFP; Naldini et al., 1996) ata multiplicity of infection of 30. The production of the lentiviral vectorswas previously described in detail (Blits et al., 2005). GFP expres-sion was controlled by the cytomegalovirus promoter and enhancedwith the woodchuck post-transcriptional regulatory element (Loebet al., 1999). The transduction efficiency in the SC cultures was > 99%.
Collection of SCs for transplantation
Just prior to transplantation, SCs were collected by trypsinization(0.05% trypsin; Invitrogen, Carlsbad, CA, USA; 0.05% EDTA for5 min), and their total number determined. Then SCs were suspendedin DMEM-F12 (Invitrogen) at a concentration of 2 · 106 ⁄ 5 lL andkept on ice until injection into the contused spinal cord (see below).Lower concentrations of SCs were obtained by serial dilution. Asample of SCs was stained with trypan blue at the start and finish oftransplant sessions to determine the viability of the cells. Samples of
SCs (four samples per concentration, two independent experiments)were also stained with trypan blue following passage of SCs throughthe pulled glass pipette to determine the effect of the transplantprocedure on survival and actual number of cells injected. For twocases, cells were lysed by heating to 55 �C for 10 min followed bythree successive series of freezing and thawing.
Surgery and SC transplantation
A total of 151 female Fischer rats (160–180 g) were included in thisstudy; 139 were used for histological analysis, three were used forultrastructural analysis and nine were used for quantitative real-timepolymerase chain reaction (PCR; see Tables 1 and 2). Rats wereanesthetized with 1–2% halothane in oxygen. A laminectomy wasperformed at vertebral level T9 to expose the dura at the T10 spinalcord level. A moderate contusion was then induced using theMASCIS ⁄ NYU impactor by dropping a 10-g weight 12.5 mm ontothe exposed dura. The injury site was closed in anatomical layers. Therats received buprenorphine (0.01 mg ⁄ kg; s.c.) for the first 2 days toreduce pain, and gentamycin (0.05 mg ⁄ kg; s.c.) daily for the firstweek to prevent infections.Seven days after the contusion injury, the rats were re-anesthetized
with 30 mg ⁄ kg ketamine, 6 mg ⁄ kg xylazine and 1 mg ⁄ kg acepro-mazine, the laminectomy site was re-exposed and 5 lL of DMEM-F12 with GFP-expressing SCs (at different concentrations, see below)were injected into the injury epicenter at a rate of 1 lL ⁄ min, using a
Table 1. Numbers of animals at each time point for each concentration oftransplanted cells utilized for survival and volume analyses
Method of analysis andintended number of cells
Animals at each time after transplantation (n)
10 min 6 h 7 days 28 days
Histology250 000 6 6 7 6500 000 5 6 6 (4) 61 000 000 6 6 8 72 000 000 5 4 6 (4) 7
Medium injection (0 cells) 4 4 4 4
Real-time PCR1 000 000 6 3
Number of animals included in the analysis of the number and percentage ofsurviving SCs. The numbers in parentheses are the numbers of animals forthose groups included for volume and density analysis. PCR, polymerase chainreaction.
Table 2. Number of animals at each time point and cell concentrationanalysed for necrotic and apoptotic cells
Method of analysis andintended number of cells
Animals at each time after transplantation (n)
10 min 6 h 24 h 3 days 7 days
FBDP500 000 3 5 5 5 42 000 000 5 2 5 5 2
Activated caspase 3500 000 5 6 5 5 72 000 000 5 6 5 6 7
Number of animals included in the analysis of necrotic (FBDP+) and apoptotic(activated caspase 3+ with condensed, fragmented nuclei) cells. FBDP, fodrinbreakdown product.
1434 C.E. Hill et al.
ª The Authors (2007). Journal Compilation ª Federation of European Neuroscience Societies and Blackwell Publishing LtdEuropean Journal of Neuroscience, 26, 1433–1445

Hamilton syringe attached to a pulled glass capillary tube (tipdiameter, 150 lm). Following injection, the needle was left in placefor an additional 2 min and then slowly retracted. The rats received2 · 106, 1 · 106, 5 · 105 or 2.5 · 105 SCs in 5 lL (Tables 1 and 2).To determine if GFP from dead cells persisted at 6 h, two rats received1 · 106 lysed SCs. The injury site was closed in anatomical layers,and buprenorphine and gentamycin were administered intramuscularlyas above. The bladders were manually expressed twice daily untilreflex urination returned. Animals were provided with food and waterad libitum. The rats were housed according to the National Institute ofHealth and the United States Department of Agriculture guidelines.The Institutional Animal Care and Use Committee of the University ofMiami approved all animal procedures.
Tissue processing
Histology
Animals were terminally anesthetized with ketamine (60 mg ⁄ kg)xylazine (12 mg ⁄ kg) and acepromazine (2 mg ⁄ kg) and transcardiallyperfused at 10 min, 6 h, 24 h, 3 days, 7 days and 28 days after cellinjection (Tables 1 and 2) with heparinized saline (0.9% NaCl)followed by 4% paraformaldehyde in phosphate buffer (PB; 0.1 m,pH 7.4). The spinal cords were removed and postfixed overnight inthe same fixative, and then cryoprotected in 30% sucrose inphosphate-buffered saline (PBS; 0.1 m, pH 7.4). A 15-mm segmentof spinal cord centered on the injury ⁄ transplant site was removed,frozen and stored at )80 �C. Horizontal tissue sections, 20 lm thick,were cut on a cryostat, collected in series onto sub-X slides and storedat )20 �C until stained. From each tissue block, four series werecollected with sections separated by 80 lm.
Electron microscopy
Three spinal cords, two with 1 · 106 GFP SCs and one with 1 · 106
lysed GFP SCs, were processed for electron microscopy, and analysedultrastructurally for the presence of apoptotic and necrotic SCs 6 hafter transplantation. Animals were perfused, as above, and postfixedfor 3 days in 4% paraformaldehyde. The injury ⁄ transplant site wasthen cut into 250-lm blocks that were postfixed overnight in 2%glutaraldehyde in 0.1 m PB, further fixed with 1% osmium tetroxidein 0.1 m PB overnight, washed with 0.15 m PB and run through agraded series of cold ethanol. The tissue was then rinsed withpropylene oxide (PO) for 2–5 min, and incubated overnight with a1 : 1 mixture of PO and Epon ⁄ Araldite (E ⁄ A) with DMP-30overnight at room temperature. The following day, the E ⁄ A wasreplaced with fresh E ⁄ A, and tissue blocks were placed in a vacuumdesiccator for 3–5 h for further penetration. The blocks were thenplaced in embedding molds and the plastic was allowed to cure at64 �C overnight. To detect apoptotic and necrotic cells ultrastructur-ally, plastic sections containing the transplanted cells were cut andstained with toluidine blue. Ultra-thin sections (80–120 nm) werecollected onto 150-mesh copper grids, stained with uranyl acetate andlead citrate, and examined and photographed using a Philips CM-10electron microscope. Pellets of SCs collected after trypsinizationand embedded in plastic were also examined to better understandthe ultrastructural morphology of SCs prior to integration andmyelination.
Quantitative real-time PCR
Quantitative real-time PCR was performed to detect the inserted GFP-DNA to confirm that the loss of labeled cells observed histologically
was not due to downregulation of the transgene product expressionafter transplantation. Rats were killed 10 min (n ¼ 6) or 7 days(n ¼ 3) after transplantation of 1 · 106 SCs, and a 5-mm segmentcontaining the injury ⁄ transplant site was removed, rapidly frozen andstored at )80 �C until DNA isolation. DNA from spinal cord tissue orcultured cells (for a standard curve) was collected using the QIAampDNA Mini Kit according to the manufacturer’s instructions (QIAGENSciences, Valencia, CA, USA), and measured using a NanoDrop ND-1000A spectrophotometer (NanoDrop Technologies, Wilmington, DE,USA).Each lentivirally transduced SC was found to yield approximately
3.3 pg DNA. A standard curve consisting of nine data points wasgenerated using the DNA equivalent to 10 000, 5000, 2500, 1250,625, 313, 156, 78, 39 SCs. Because the standard curve reactionscontained variable proportions of GFP-SCs and wild-type spinal cordcells, each sample was adjusted to contain a total amount of 100 ngDNA using DNA extracted from wild-type Fischer 344 rat spinalcords. No-template controls also were generated.Real-time PCR reaction tubes contained 10 lL of sample DNA
(10 ng ⁄ lL) and 15 lL mastermix (total, 25 lL). The mastermixcontained 8 lL H2O, 2.5 lL 10 · buffer, 0.75 lL 50 mm MgCl2,0.5 lL 10 mm deoxyribonucleotides, 0.25 lL Taq polymerase (Invi-trogen), 2 lL 2.5 · SyBr Green (Molecular Probes, Eugene, OR,USA), 0.5 lL (100 nm) 5¢GAACGGCATCAAGGTGAACT3¢ (for-ward primer) and 0.5 lL (100 nm) 5¢TGGGTGCTCAGG-TAGTGGTT3¢ (reverse primer). Each sample was run four separatetimes in triplicate using a real-time PCR machine (Corbett ResearchRotor-gene 3000 with Rotor-gene v.6.0 software, Mortlake, NSW,Australia). Each dilution point of the standard curve and no-templatecontrols were run in triplicate.Samples were kept at 95 �C for 10 min to denature the double-
stranded genomic DNA prior to conducting the following 45 cycles(each step 20 s): denaturing (95 �C), annealing (58 �C), extension(72 �C) with third segment acquisition of fluorescence (cycling Adata) and fourth segment acquisition of fluorescence at 89 �C (cyclingB data). A melt curve was conducted by raising the temperature from72 �C (above the Tm for non-specific products but below that for thespecific product) to 99 �C at 1 �C ⁄ s, acquiring fluorescence at eachstep, holding for 15 s on the first step and 5 s thereafter. Melt curveanalysis revealed a single PCR product, which was confirmed on a 2%agarose gel. Then, following dynamic tube normalization andautomatic threshold detection, CT values were obtained. Linearregression showed high correlation between the amount of inputDNA and corresponding CT values (r2 > 0.99). The M-value wasestimated as )3.792; the B-value was 32.731. The reaction efficiencywas 0.84. The amount of GFP-DNA in each unknown sample wasestimated by running a standard curve sample in triplicate with eachrun, and then normalizing the data by applying mean CT values foreach sample to the standard curve. This allowed for the calculation ofthe number of GFP-positive (GFP+) SCs in 100 ng of DNA isolatedfrom the spinal cords.
Immunohistochemistry
Spinal cord sections were stained with antibodies against the affinity-purified calpain-mediated amino terminal fodrin fragment (FBDPN;rabbit, 1 : 150; Bahr et al., 1995), activated caspase 3 (rabbit purifiedmonoclonal, 1 : 150; BD Biosciences, San Jose, CA, USA) or p75(IgG 192; mouse monoclonal supernatant) to identify necrotic SCs,apoptotic SCs and endogenous SCs, respectively. For staining, seriesof sections were thawed and rinsed with PBS, blocked with 5%
Transplanted cell death after SCI 1435
ª The Authors (2007). Journal Compilation ª Federation of European Neuroscience Societies and Blackwell Publishing LtdEuropean Journal of Neuroscience, 26, 1433–1445

normal goat serum and 0.1% Tween-20 in PBS for 1 h, and thenincubated with the primary antibody in PBS with 5% normal goatserum and 0.1% Tween-20 overnight at 4 �C. Next, the sections werewashed with PBS and incubated for 2 hours at room temperature withthe secondary antibodies, goat-anti-mouse IgG-594 (1 : 200) or goat-anti-rabbit IgG 594 (1 : 200; Molecular Probes) and Hoechst 344(1 : 500). The sections were then washed with PBS, air dried andstored at 4 �C. To confirm the specificity of staining, primary orsecondary antibodies were omitted from some sections; also, cordsinjected with either medium or lysed cells were stained. Just beforeexamination, sections were coverslipped with Vectamount fluorescentmounting medium (Vector Laboratories, Burlingame, CA, USA) andsealed with nail polish.
Quantification of SC survival and transplant volume
Stereoinvestigator (MicroBrightField, Williston, VT, USA) was used toquantify transplant volume, the total number and density of GFP+ SCs,and the number of necrotic (GFP+ ⁄ FBDP+) and apoptotic (GFP+ ⁄ acti-vated caspase 3+ ⁄ condensed, fragmented nuclei-positive) transplantedSCs. We first used Stereoinvestigator to determine the volume occupiedby the transplanted SCs and by the endogenous SCs (p75+, but GFP-negative) in a total of 109 injured ⁄ transplanted spinal cords using theCavaleiri function. The injury site was outlined at 2.5 · in every eighthspinal cord section (every other section in a series). The outlined regionwas then overlaid with a grid of 200 · 200 lm and, at 10 ·magnification, GFP+ and ⁄ or p75+ cells were marked. From theseoutlines, we were able to calculate total lesion volume by summing themeasured outlined areas · 8 sections · 20 lm for each case. Thepercentage of lesion occupied by p75 was determined for each case[(p75 volume ⁄ lesion volume) * 100].To determine the number of surviving transplanted SCs, the
transplant containing GFP+ cells was first outlined at 2.5 · magnifi-cation in every eighth tissue section. Next, a grid of 150 · 400 lmwas placed over this area, and each GFP+ cell with an identifiablenucleus was counted using the optical fractionator function at 63 ·magnification (sampling box: 20 · 20 lm). From these numbers, thetotal number of GFP+ cells per rat was determined (n ¼ 113). Thepercentage of surviving SCs was calculated for each of the cellconcentrations, at each time point investigated, using the formula [%cell survival ¼ (number of GFP+ cells counted ⁄ mean number ofGFP+ cells at 10 min) * 100]. The density of GFP+ SCs within thetransplant (n ¼ 109) was calculated using the formula [density ofcells ¼ cell count ⁄ transplant volume].To obtain the number of transplanted SCs undergoing necrosis or
apoptosis, the transplant was outlined and overlaid with a grid of100 · 200 lm. Then, in every eighth tissue section from two separateseries, GFP+ cells that were also positive for either FBDP or activatedcaspase 3 were counted using the optical fractionator function at 63 ·magnification (sampling box: 50 · 50 lm). The GFP+ ⁄ caspase 3+
cells were counted only if a condensed, fragmented (Hoechst 344-labeled) nucleus was present. To determine the number of necrotic orapoptotic cells per rat, 41 injured ⁄ transplanted spinal cords wereanalysed for necrosis and 57 injured ⁄ transplanted spinal cords wereanalysed for apoptosis (see Table 2 for number of animals included ineach group). The percentages at any given time were calculated usingthe formula [percentage of FBDP+ or active caspase 3+ cells ¼ (num-ber of FBDP+ or active caspase 3+ cells ⁄ mean number of GFP+ cellsat 10 min) * 100]. The total percentage of cells undergoing necrosisand apoptosis represents the sum of the mean percentage of cells ateach time point.
Statistical analysis
Two-way anovas followed by Dunnett’s post hoc tests were used tocompare lesion volume, transplant volume, p75 staining volume, theabsolute numbers and percentages of surviving cells, and the densityof SCs within the transplant across time and concentration. One-wayanovas followed by Dunnett’s post hoc tests were used to test fordifferences between groups within a given time or concentration.Significance was assigned at P £ 0.05. A one-way anova followedby a Scheffe’s post hoc test was used to compare the percentagedecrease in cell survival from 10 min between 7 and 28 days. Thenon-parametric Kruskal–Wallis test was used to assess the number oftransplanted cells undergoing either necrosis or apoptosis. All data areexpressed as mean ± SEM.
Results
Minimal effect of transplant procedure on SC viability
To assess the damage to cells caused by the transplant procedure, SCviability at the start and end of the transplantation sessions and afterpassage of the SCs through the pulled glass injection needle wasdetermined using trypan blue staining. The average SC viability was98.8 ± 0.2% (n ¼ 10) at the beginning and 90.3 ± 1.3% (n ¼ 20) atthe end of the transplantation session. SC viability following passagethrough the pulled glass injection needle was 90.5 ± 0.7% (n ¼ 33).Passing increasing concentrations of SCs through the glass needle didnot alter SC viability (F3,29 ¼ 1.27, P ¼ 0.31). The mean number ofdead SCs after passage through the pipette was 9.6 ± 1.4%,10.8 ± 1.8%, 9.9 ± 1.1% and 7.3 ± 1.0% for 2.5 · 105, 5.0 · 105,1.0 · 106 and 2 · 106 SCs in 5 lL of medium, respectively. Theeffect of our transplantation procedure (collection and injection) on theSC viability in vivo was at most a decrease of 9.4%.
Lower number of transplanted SCs than projected
Because the purpose of this study was to accurately assess SCsurvival, it was important to precisely establish the number of cellstransplanted; to do this the actual number of SCs present after passagethrough the pulled glass injection needle was quantified. Theprocedure for cell transplantation was followed, but instead ofinjecting the cells into the spinal cord they were collected in anEppendorf tube. The actual average number of SCs that passedthrough the glass needle was 56.5 ± 2.8% of the intended number ofSCs (Table 3). To eliminate this error from the calculation ofpercentage of surviving SCs, the actual number of cells presentimmediately after injury (10 min post-transplantation), instead of theintended number of cells, was used as the baseline value (100%).
Table 3. Number of cells actually passed through the injection pipette
Intended numberof cells
Actual numberof cells
Actual as percentageof intended number
250 000 125 351 ± 11 218 54.0 ± 6.2500 000 300 556 ± 31 380 61.1 ± 4.7
1 000 000 611 250 ± 46 977 60.1 ± 6.32 000 000 1079 688 ± 124 420 50.1 ± 4.5
Data represent the number of cells quantified using a hemocytometer followingpassage through the injection pipette and collection into an Eppendorf tube,mean ± SEM.
1436 C.E. Hill et al.
ª The Authors (2007). Journal Compilation ª Federation of European Neuroscience Societies and Blackwell Publishing LtdEuropean Journal of Neuroscience, 26, 1433–1445

Identification of SCs and their integration into host tissue
In all rats, the SC transplant could be easily recognized because theSCs were lentivirally transduced to express GFP. Morphologicalanalysis revealed changes in the appearance of the transplants overtime (Fig. 1) as they integrated into the injury site. At 10 min (Fig. 1E)and 6 h (Fig. 1F) after transplantation, SCs within the lesion site werespherical in shape. SCs with a bipolar shape, a sign of integration intothe host tissue, were found in the transplant margins at 24 h andthroughout the transplant at all time points at 3 days and beyond(Fig. 1G and H show 7-day and 28-day time points).
p75 immunocytochemistry, in conjunction with GFP expression,was used to identify transplanted (p75+ ⁄ GFP+) SCs (Fig. 2A and B)and endogenous (p75+ ⁄ GFP–) SCs (Fig. 2C) at the injury site. In allcases, including those receiving injection of medium alone,substantial p75 staining was present that was not associated withtransplanted GFP+ SCs and which persisted throughout the 28-daysurvival [Fig. 2D: transplanted SCs (in green) and endogenous SCs(in red)].
The volume occupied by endogenous SCs within the contusedspinal cord segment following medium or SC injection was measured
using Stereoinvestigator. Seven days after injury a large volume ofendogenous SCs was present within the injury site (Fig. 2E).Endogenous p75+ SCs occupied 18.7 ± 1.8% of the lesion volumein control cases 10 min after receiving a medium injection, andpersisted at this level at 28 days (23.1 ± 2.3%). The volume andpercentage of lesion occupied by endogenous SCs was not altered bythe transplantation of SCs 7 days after injury (volume: F14,4 ¼ 0.437,P ¼ 0.78; percentage of lesion: F19,4 ¼ 0.659, P ¼ 0.62); it wassimilar to the medium-injected control group for all tested concentra-tions (Fig. 2E). Across all groups there was a significant reduction inp75 volume with time, F14,2 ¼ 5.80, P £ 0.005 (Fig. 2E); with thep75 volume at 28 days being significantly reduced compared withthe p75 volume at 6 h (Dunnett’s, P £ 0.001). Despite a significantdecrease in p75 volume between 6 h and 28 days, the percentage oflesion occupied by p75+ SCs remained similar between transplant andcontrol animals across time (F19,3 ¼ 1.895, P ¼ 0.14), with p75+
endogenous SCs filling 23.1 ± 2.3% of the lesion at 28 days in thecontrol and 21.6 ± 1.6% after transplantation. The reduction in p75volume between 6 h and 28 days coincided with a 42.2% decrease inlesion volume and a significant decrease in lesion volume over time(F19,3 ¼ 19.491, P £ 0.001; Fig. 2F). Together this suggests that host
Fig. 1. Histological analysis of transplanted SCs over time. Ten minutes (A, E) and 6 h (B, F) after transplantation SCs remained spherical; by 7 days (C, G) SCshad extended processes and appeared bipolar. At 28 days (D, H) SCs remained bipolar and were aligned within the transplant. Scale bars: 100 lm (A–D); 10 lm(E–H).
Transplanted cell death after SCI 1437
ª The Authors (2007). Journal Compilation ª Federation of European Neuroscience Societies and Blackwell Publishing LtdEuropean Journal of Neuroscience, 26, 1433–1445

SC invasion occurred mainly during the first week after the contusioninjury prior to SC transplantation, and that delayed transplantation ofSCs does not enhance the ingress of endogenous SCs.
Decrease in SC transplant volume with time
Injection of different concentrations of SCs within a 5-lL volumeproduced transplant volumes that differed relative to the number ofcells transplanted (Fig. 3A). Injection of 2.5 · 105 or 5 · 105 cellsresulted in significantly smaller transplant volumes than injections of1 · 106 or 2 · 106 cells (see ++ in Fig. 3A). Regardless of the numberof cells transplanted, the transplant volumes were significantly reducedat 7 and 28 days after transplantation when compared with thevolumes at 10 min post-transplantation (Fig. 3A). The average volumereduction from 10 min was 58.8 ± 3.7% (n ¼ 23) at 7 days, and73.9 ± 2.5% (n ¼ 27) at 28 days post-transplantation across allexperimental conditions.
Early SC death after transplantation
The number of SCs present in the contusion site post-transplantationwas quantified histologically for the four different SC concentrations,and the effect of these concentrations on SC survival over time wasdetermined. Irrespective of cell concentration, the number of SCswithin the transplant was stable for the first 6 h, before decreasingwithin the first 7 days post-transplantation (Fig. 3B). In all groups, thenumber of SCs quantified 7 and 28 days post-transplantation wassignificantly reduced compared with the number at 10 min (Fig. 3B,time: F15,3 ¼ 58.31, P £ 0.001). The reduction in cell numberbetween 10 min and 28 days (85.2 ± 1.9%) was not significantlydifferent (P ¼ 0.89) from that between 10 min and 7 days(78.0 ± 1.8%); indicating that most cells died within the first weekof transplantation.Figure 3C shows the percentage of surviving SCs with time for all
four concentrations studied. Because only 57.5% of cells intended tobe injected actually passed through the needle when tested in vitro, themean number of cells quantified 10 min post-transplant was used tocalculate the percentage of cells surviving over time to preventoverestimating cell death. Whereas reducing the concentration oftransplanted SCs resulted in fewer cells within the transplant (Fig. 3B:cell number: F15,3 ¼ 39.46, P £ 0.001), it had no effect on thepercentage of surviving SCs (Fig. 3C: cell number: F15,3 ¼ 0.27,P £ 0.8). Similar to the absolute number of SCs quantified, there wasa significant reduction in the percentage of SCs surviving at 7 and28 days compared with 10 min post-transplantation regardless of thenumber of cells initially transplanted (F15,3 ¼ 45.84, P £ 0.001). Thisindicates that the percentage of SCs that die after transplantation intothe injured spinal cord was not affected by the initial number of SCstransplanted. The number of transplanted SCs present in the contusion
Fig. 2. Transplanted green fluorescent protein (GFP)+ SCs represent only aproportion of the p75+ staining within the contused cord segment. Host p75+
cells invaded the segment prior to transplantation at 7 days post-injury. Delayedtransplantation did not increase the volume of p75+ ⁄ GFP SC domains. Onemonth after delayed transplantation, both transplanted GFP+ ⁄ p75+ SCs (A, B)and endogenous p75+ ⁄ GFP– SCs (C) can be observed within the lesion. Manyp75+ SCs were present within the lesion following control injections ofmedium, as indicated by p75 volume (E). Transplantation of GFP+ SCsincreased the total volume of p75 immunostaining, but did not significantlyincrease the volume of p75 staining not associated with transplanted SCs.Instead there was a significant reduction in p75 staining over time (two-wayanova, time: F14,2 ¼ 5.80, P < 0.005, Dunnett’s post hoc). Transplantation ofSCs did not alter the size of the lesion. Across all groups there was a significantreduction in lesion volume over time (two-way anova, time: F19,3 ¼ 19.491,P < 0.001). *P < 0.01, significant reduction within the groups compared with6 h (E) and 10 min (F). Inset in (D) shows schematic outline of injury siteand transplant. GFP: green; p75: red. Scale bars: 10 lm (A–C); 100 lm (E).
1438 C.E. Hill et al.
ª The Authors (2007). Journal Compilation ª Federation of European Neuroscience Societies and Blackwell Publishing LtdEuropean Journal of Neuroscience, 26, 1433–1445

at 7 and 28 days post-transplantation were not significantly different.In total, 18.5 ± 1.4% of cells survived 7 days and beyond, with22 ± 1.8% (n ¼ 27) surviving at 7 days and 14.8 ± 1.9% (n ¼ 25)surviving at 28 days.
Corresponding to the decrease in cell number and transplantvolume, the density (cells ⁄ mm3) of SCs within the transplant site(Fig. 3D) was reduced 7 and 28 days post-transplantation,(F15,30 ¼ 44.03, P £ 0.001). Whereas the number of SCs graftedinitially affected the density of cells within the transplant(F15,3 ¼ 16.12, P £ 0.001), by 28 days the density of cells wassimilar in all transplants (F3,21 ¼ 2.10, P ¼ 0.13).
Confirmation of SC death by quantitative real-time PCR
To eliminate the possibility that the reduction in counted transplantedSCs was due to downregulation of the GFP transgene, quantitativereal-time PCR was performed using primers designed for the insertedGFP-DNA. The amount of GFP-DNA found in each sample was usedto calculate the number of GFP+ SCs per 100 ng DNA. At 10 minpost-transplantation, we found 926 ± 406 cells per 100 ng DNA(n ¼ 6) in the contused cord and, at 7 days, 190 ± 113 cells per100 ng DNA (n ¼ 3). This was a 79.5% reduction in GFP-DNAbetween 10 min and 7 days post-grafting, indicating that the decreasein GFP protein resulted from fewer cells rather than a decrease intranscription and ⁄ or translation of the transgene in the surviving cells.
Death by both necrosis and apoptosis after transplantation
To determine the mechanisms by which SCs transplanted into themoderately contused spinal cord died during the first week post-transplantation, GFP+ SCs were qualitatively and quantitativelyexamined for necrosis and apoptosis using electron microscopy andimmunohistochemistry, respectively. Six hours after injection, swollentransplanted SCs were observed that had lost their membrane integrityand demonstrated lysosomal leakage and clumpy, ill-defined aggre-gation of chromatin (Fig. 4F and G). These are all ultrastructuralcharacteristics of SC necrosis (Berciano et al., 1999). Other SCs werefound that had compact, dense chromatin, intact lysosomes andshrunken cell bodies, some of which contained membrane blebbingwithout a loss of membrane integrity. These are all ultrastructuralcharacteristics of apoptosis (Fig. 4H–K). Included in Fig. 4 areelectron micrographs of cells pelleted following trypsinization(Fig. 4C and D), healthy SCs (Fig. 4E) and images of a 6-h transplantin a toluidine blue-stained plastic section (Fig. 4A and B). Forquantification, necrotic SCs were detected using an antibody against a
Fig. 3. Quantification of Schwann cell (SC) survival and the effect oftransplant cell number. The transplant volume (A), number of SCs (B) andpercentage of surviving SCs (C) were significantly reduced at 7 and 28 days,but not at 6 h after transplantation, for all cell concentrations tested.(A) Reducing the number of cells transplanted to 500 000 or 250 000, butnot 1 million, resulted in significantly smaller transplant volumes comparedwith volumes for transplants of 2 million cells (two-way anova, cell number:F15,3 ¼ 13.25, P < 0.001; time: F15,3 ¼ 32.80, P < 0.001, Dunnett’s post hoc).(B) Reducing the initial number of transplanted cells to 250 000 or500 000 cells resulted in significantly fewer green fluorescent protein (GFP)+
cells within spinal cords. (C) Reducing the initial number of transplanted cellsdid not improve the percentage of surviving GFP+ SCs (two-way anova, cellnumber: F15,3 ¼ 39.5, P < 0.001; time: F15,3 ¼ 59.3, P < 0.001, Dunnett’spost hoc). (D) At 28 days the density of cells within the transplants is similaracross all groups. At earlier time points the number of cells initiallytransplanted influences the density of cells within the transplant. Over timethe density of cells within the transplant decreases (two-way anova, time:F15,3 ¼ 44.0, P < 0.001, Dunnett’s post hoc). *P < 0.01; **P < 0.001,significance within the group compared with mean values at 10 min;++P < 0.001, significance between groups compared with transplants of2 million cells.
Transplanted cell death after SCI 1439
ª The Authors (2007). Journal Compilation ª Federation of European Neuroscience Societies and Blackwell Publishing LtdEuropean Journal of Neuroscience, 26, 1433–1445

1440 C.E. Hill et al.
ª The Authors (2007). Journal Compilation ª Federation of European Neuroscience Societies and Blackwell Publishing LtdEuropean Journal of Neuroscience, 26, 1433–1445

FBDP specific to calpain degradation (Bahr et al., 1995; Emgard et al.,2003; Bakshi et al., 2005). The use of this antibody allows themonitoring of pathogenic calpain activation in cells as indicated bycytoskeletal damage. Activated calpain cleavage of the FBDP has beenused to identify neurons vulnerable to excitotoxic cell death (Bahret al., 2002), and is a sensitive indicator of neuropathogenesis (Bahret al., 1995, 2002; Karanian et al., 2005; Zhu et al., 2005). ApoptoticSCs were detected using an antibody against activated caspase 3 inconjunction with the presence of condensed, fragmented nuclei.
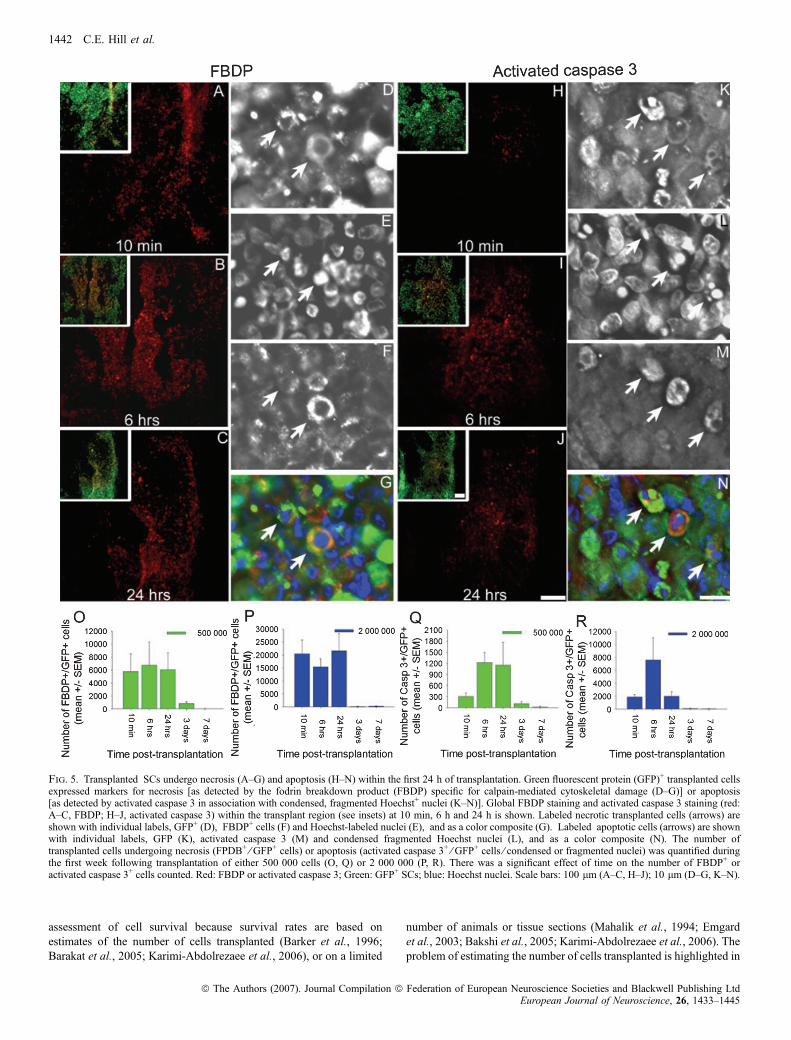
GFP+ necrotic SCs were found within the transplant at 10 min(Fig. 5A), 6 h (Fig. 5B) and 24 h (Fig. 5C) after transplantation.Examples of these SCs are depicted in Fig. 5D–G. With an initial cellconcentration of either 5 · 105 SCs ⁄ 5 lL (Fig. 5O) or 2 · 106
SCs ⁄ 5 lL (Fig. 5P), the numbers of necrotic transplanted SCs weresimilar at 10 min, 6 h and 24 h after grafting. Not surprisingly, with2 · 106 SCs ⁄ 5 lL the total number of necrotic SCs was higher thanwith 5 · 105 SCs ⁄ 5 lL (Fig. 5L vs K). The percentage of necroticcells, however, was similar; a total of 9.3% (n ¼ 21) and 8.8%(n ¼ 22) of the transplanted SCs were necrotic after injection of5 · 105 SCs ⁄ 5 lL and 2 · 106 SCs ⁄ 5 lL, respectively. Very fewnecrotic SCs were observed beyond the 24-h time point (Fig. 5O andP). There was a significant effect of time on the number of necrotic,GFP+ SCs [5 · 105 cells: v2(4, N ¼ 22) ¼ 12.53, P £ 0.01;2 · 106 cells: v2(4, N ¼ 19) ¼ 11.24, P £ 0.005].
Apoptotic transplanted SCs were observed at 10 min (Fig. 5H), 6 h(Fig. 5I) and 24 h (Fig. 5J) post-transplantation. Both transplanted(Fig. 5K–N) and host spinal cord cells were observed undergoingapoptosis. Few apoptotic SCs were present at the 10-min time point intransplants of either 5 · 105 SC ⁄ 5 lL (Fig. 5Q) or 2 · 106 SCs ⁄ 5 lL(Fig. 5R). With both concentrations, the total number of apoptoticcells considerably increased at the 6-h time point, but the number ofapoptotic SCs was still much lower than the respective number ofnecrotic SCs at the same time after transplantation (Fig. 5O vs Q andFig. 5P vs R). With 5 · 105 SCs ⁄ 5 lL, the number of apoptotic SCsin the transplant remained elevated at 24-h post-transplantation anddecreased rapidly thereafter (Fig. 5Q). With 2 · 106 SCs ⁄ 5 lL, thenumber rapidly decreased after the 6-h time point and remained lowthereafter (Fig. 5R). A total of 1.4% (n ¼ 21) and 1.1% (n ¼ 22) oftransplanted SCs were observed undergoing apoptosis in transplants of5 · 105 SCs ⁄ 5 lL and 2 · 106 SCs ⁄ 5 lL, respectively. There was asignificant effect of time on the number of apoptotic GFP+ SCs[5 · 105 cells: v2(4, N ¼ 28) ¼ 19.53, P £ 0.001; 2 · 106 cells:v2(4, N ¼ 29) ¼ 21.84, P £ 0.001]. Our data indicated that apoptosiswas more prolonged with 5 · 105 SCs ⁄ 5 lL compared with 2 · 106
SCs.
Discussion
SCs expressing GFP were transplanted into the spinal cord moderatelycontused 1 week earlier, and their survival and mechanisms of deathwere investigated using accurate quantitative histological and molec-ular biology techniques. Whereas grafted SCs integrated well within
the contused spinal cord by 7 days, only 22% of the transplanted SCssurvived the first week, and this percentage did not change signifi-cantly over the next 3 weeks. The percent decrease in transplanted SCnumber was independent of the number of cells injected and of the SCdensity within the transplant. During the first 24 h post-transplanta-tion, over six times more transplanted cells died by necrosis thanapoptosis. This study provides a clear picture of the acute loss of cellstransplanted into the contused spinal cord, and is a starting point forthe development of strategies to enhance the survival of transplantedcells, an important and often under-recognized problem facing cellularreplacement therapy for CNS injury and disease.Although others have attempted to quantify cell survival following
transplantation (Mahalik et al., 1994; Barker et al., 1996; Emgardet al., 1999; Bakshi et al., 2005; Barakat et al., 2005; Karimi-Abdolrezaee et al., 2006), this is the first study to quantify early cellloss following transplantation in a large number of cases using areliable and persistent genetic cellular label to assess both the numberof surviving cells and the mechanisms by which they die at early timepoints. Another novel aspect of this study was the use of real-timePCR to quantify the decrease in GFP-DNA. This technique showed adecrease in GFP-DNAwithin the transplanted spinal segment of 80%,thereby confirming that the decrease in SC number was due to deathrather than downregulation of the GFP transgene expression.Using this contusion ⁄ transplantation paradigm as well as other
models, previous studies have demonstrated the presence of SCswithin the lesion at varying times after grafting (Martin et al., 1996;Takami et al., 2002), but their number and origin could not beaccurately evaluated due to the lack of a stable cellular label (forexample, complete transection: Xu et al., 1995, 1997; Oudega et al.,1997; partial transection: Bamber et al., 1999; Iannotti et al., 2003;Hsu & Xu, 2005). Hill et al. (2006), employing this contusion model,found that few immediately transplanted SCs expressing humanplacental alkaline phosphatase survived beyond 2 weeks, and that a 7-day delay in transplantation improved cell survival. Barakat et al.(2005) used the same injury model, but grafted GFP-expressing SCs at2 months post-injury and showed substantial cell loss in the chroniccontusion injury. The present study confirms the cell loss observed inthe two earlier studies, and adds to them by quantifying both the timecourse of the acute SC loss and the underlying mechanisms oftransplanted cell death.There have been many studies on the loss of other cell types
following transplantation into the injured spinal cord or brain (Barkeret al., 1996; Emgard et al., 1999, 2003; Marsala et al., 2004; Bakshiet al., 2005; Karimi-Abdolrezaee et al., 2006). For example, in theischemic rat spinal cord, 1–2% of neural precursors survive at3 months post-grafting (Marsala et al., 2004). Between 2 and 15%of embryonic neurons survive within the injured striatum at 1 weekpost-transplantation (Barker et al., 1996; Emgard et al., 1999).Approximately 4% of neural precursor cells survive at 24 h aftertransplantation into the brain following a lateral fluid percussion injury(Bakshi et al., 2005). Whereas all these studies indicate failure oftransplanted cells to survive, it has been difficult to obtain a precise
Fig. 4. Ultrastructure of transplanted SCs. An overview of the injured spinal cord containing patches of SCs following electron microscopy processing (A).Apoptotic (arrows), necrotic (arrowheads) and healthy (asterisks) SCs are evident within the transplant site (B). At the ultrastructural level, following trypsinizationand collection, SCs are rounded and contain autophagic vacuoles in the cytoplasm, while the plasma membrane remains intact (C, D). The nuclei appear healthy witha thin layer of heterochromatin along the nuclear envelope. Six hours after transplantation, healthy-appearing SCs contain an elongated nucleus, intact mitochondriaand few autophagic vesicles, and exhibit an intact plasma membrane (E). SCs undergoing necrosis are swollen, and have extensive, large autophagic vacuoles (F, G).Plasma membranes are disrupted (boxed area in F). Within the nucleus more heterochromatin is observed (F, G). SCs with characteristics of early and late apoptosisare observed (H–K). (H) A small cell with extensive membrane blebbing, but without a pyknotic nucleus. (I–K) Three apoptotic cells with condensed, fragmentednuclei and dense cytoplasm. All EM images of transplanted cells were taken at 2600 · from a single thin section adjacent to the toluidine blue-stained section shownin (A). Scale bar: 10 lm (B).
Transplanted cell death after SCI 1441
ª The Authors (2007). Journal Compilation ª Federation of European Neuroscience Societies and Blackwell Publishing LtdEuropean Journal of Neuroscience, 26, 1433–1445
assessment of cell survival because survival rates are based onestimates of the number of cells transplanted (Barker et al., 1996;Barakat et al., 2005; Karimi-Abdolrezaee et al., 2006), or on a limited
number of animals or tissue sections (Mahalik et al., 1994; Emgardet al., 2003; Bakshi et al., 2005; Karimi-Abdolrezaee et al., 2006). Theproblem of estimating the number of cells transplanted is highlighted in
Fig. 5. Transplanted SCs undergo necrosis (A–G) and apoptosis (H–N) within the first 24 h of transplantation. Green fluorescent protein (GFP)+ transplanted cellsexpressed markers for necrosis [as detected by the fodrin breakdown product (FBDP) specific for calpain-mediated cytoskeletal damage (D–G)] or apoptosis[as detected by activated caspase 3 in association with condensed, fragmented Hoechst+ nuclei (K–N)]. Global FBDP staining and activated caspase 3 staining (red:A–C, FBDP; H–J, activated caspase 3) within the transplant region (see insets) at 10 min, 6 h and 24 h is shown. Labeled necrotic transplanted cells (arrows) areshown with individual labels, GFP+ (D), FBDP+ cells (F) and Hoechst-labeled nuclei (E), and as a color composite (G). Labeled apoptotic cells (arrows) are shownwith individual labels, GFP (K), activated caspase 3 (M) and condensed fragmented Hoechst nuclei (L), and as a color composite (N). The number oftransplanted cells undergoing necrosis (FPDB+ ⁄ GFP+ cells) or apoptosis (activated caspase 3+ ⁄ GFP+ cells ⁄ condensed or fragmented nuclei) was quantified duringthe first week following transplantation of either 500 000 cells (O, Q) or 2 000 000 (P, R). There was a significant effect of time on the number of FBDP+ oractivated caspase 3+ cells counted. Red: FBDP or activated caspase 3; Green: GFP+ SCs; blue: Hoechst nuclei. Scale bars: 100 lm (A–C, H–J); 10 lm (D–G, K–N).
1442 C.E. Hill et al.
ª The Authors (2007). Journal Compilation ª Federation of European Neuroscience Societies and Blackwell Publishing LtdEuropean Journal of Neuroscience, 26, 1433–1445

the current study where the actual number of cells injected was reducedby as much as 50% following passage of the cells through the injectionpipette (Table 3). Moreover, few studies have examined the survival ofcells within the first few hours to days after transplantation. So far, themost comprehensive analyses of transplanted cell survival have beenachieved using dopaminergic neurons transplanted into a rat Parkin-son’s model (Mahalik et al., 1994; Barker et al., 1996; Emgard et al.,1999, 2003), but these studies have been limited by the lack oftyrosine hydroxylase (TH) expression within the first few days oftransplantation, making early quantification of cell loss difficult.
By using GFP+ SCs with immunohistochemistry, we were able toidentify SCs undergoing necrosis and apoptosis early after transplan-tation. Nine percent of all transplanted GFP+ SCs within the contusionwere positive for the FBDP, produced specifically following calpaincleavage, and used as a marker for necrosis (Emgard et al., 2003;Bakshi et al., 2005). In contrast, 1.5% of SCs were positive forapoptosis (as detected by activated caspase 3 in conjunction withcondensed, fragmented nuclei). Six times more SCs died by necrosisthan apoptosis following transplantation. Whereas both necrotic andapoptotic cells were quantifiable by our techniques, these numbersrepresent only a snapshot of cell death over time and do not representthe total number of transplanted cells dying by either mechanism. Ourresults are in agreement with those of Emgard et al. (2003), whografted TH-positive embryonic neurons into the rat striatum, andfound about 64% necrotic TH+ cells at 90 min and about 24%apoptotic TH+ cells at 1-day post-grafting. Although the relativecontribution of necrosis is not as pronounced as in our study, their datashow that necrosis plays a major role in early death of cellstransplanted into the CNS. Other studies identified apoptosis as themajor contributor to death of grafted cells. Bakshi et al. (2005) foundthat significantly more neural progenitors grafted into the rat cortexafter a lateral percussion fluid injury died due to apoptosis thannecrosis during the first week post-transplantation.
CNS injuries and diseases share common degradative mechanisms;however, substantial differences in expression of inflammatorymediators over time and between injury models exist (Kobori et al.,2002; Aimone et al., 2004; Lu et al., 2004; Velardo et al., 2004; Milleret al., 2005). In general, the difference in the relative contribution ofnecrosis and apoptosis to the death of grafted cells among studieslikely reflects: differences in the graft site environment and timing oftransplantation; differential vulnerability to necrosis-inducing factorsand ⁄ or the propensity for apoptosis in embryonic dopaminergicneurons (Emgard et al., 2003), neural precursors (Bakshi et al., 2005)and SCs (present study); and differences in the degree of underesti-mation of transplant necrosis because of the difficulty in reliablyidentifying transplanted cells and the failure to examine cells withinthe first hours to days after transplantation.
The substantial necrotic cell death observed following delayedtransplantation indicates that, whereas delaying SC transplantation canimprove transplant survival (Martin et al., 1996; Hill et al., 2006), toxicfactors persist in the subacute injury site. Some known inducers of SCdeath in vitro (Nagano et al., 2001; Conti et al., 2002; Boyle et al.,2005) are, in fact, present within the subacute injury site, includingelevated levels of lipid peroxidase, cytokines and chemokines (Hall &Springer, 2004; Velardo et al., 2004). Further examination of how theseand other factors present after SCI induce cell death and affect SCsurvival is needed, as targeting the triggers of cell death rather thanblocking intracellular signaling pathways appears to be more effectivein enhancing cell survival (Sortwell, 2003).
In our paradigm, apoptotic SCs were mainly present within the first24 h, diminishing thereafter. This is slightly earlier than previouslyreported following transplantation of other cell types into the injured
CNS in which apoptosis of transplanted cells was observed as early as90 min but was mainly elevated between 1 and 10 days (Mahaliket al., 1994; Emgard et al., 2003; Bakshi et al., 2005). SCs canundergo apoptosis in response to substrate detachment (anoikis; Kodaet al., 2006; J. Fortun, personal communication), and removal ofserum and mitogens (Delaney et al., 1999; C. Hill, personalobservations). The early apoptosis of SCs suggests that apoptosismay have been initiated prior to transplantation (although apoptoticprofiles were not readily observed in pelleted cells processed forelectron microscopy). By targeting anoikis and ⁄ or supplementing thetransplant medium with serum and mitogens, it may be possible toreduce the acute SC apoptosis.In the current study, GFP+ cells were identified as apoptotic by
activated caspase 3 staining in association with condensed fragmentednuclei, and as necrotic by intense staining for the FBDP specificallycleaved by calpain. The stringency of the criteria for quantificationresulted in a conservative measurement of cell death of transplantedcells by measuring the two ends of the apoptosis–necrosis continuum.Further studies are needed to determine if any of the transplanted cellsexperience both calpain and caspase 3 activation. Given the growingevidence that apoptosis and necrosis represent two ends of acontinuum of cell death (Portera-Cailliau et al., 1997; Zeiss, 2003),it is possible that a single cell can have both caspase and calpainactivity. Further supporting this possibility is the known activation ofcaspase 3 subsequent to calpain activation following certain neuro-logical insults that occur as part of the proposed pathway of‘pathological apoptosis’ (Blomgren et al., 2001). In the current study,we observed a small population (< 15%) of cells that were caspase 3+
but did not contain condensed fragmented nuclei, and a largerpopulation of GFP+ cells that were weakly FBDP+. Although thesecells were not included in our quantification, they may represent cellscloser to the middle of the continuum.Our study revealed endogenous GFP– ⁄ p75+ SCs in the transplant
site. This confirms numerous previous observations on the ingress ofhost SCs (Blakemore, 1975; Raine, 1976; Harrison & Pollard, 1984;Beattie et al., 1997; Bruce et al., 2000; reviewed in Bunge & Wood,2006). Despite this host SC migration, it is important to betterunderstand and improve survival of transplanted cells in the injuredspinal cord. First, grafted cells are intended to replace cells and ⁄ or fillinjury areas, and serve as a physical substrate for regenerating axons.With poor survival of the transplanted cells, cells will not be replacedand axons will not have the support necessary to grow across theinjury site. Secondly, cells undergoing necrosis liberate their intracel-lular contents, which may exacerbate tissue damage and obscurepotential therapeutic benefits. Thirdly, ethical and technical challengesprevail in obtaining sufficient cells for human transplantation; fewercells will be needed if better survival is achieved. Lastly, usingtransplanted cells for gene therapy is proving to be a strong candidatefor CNS repair (Grill et al., 1997; Watson et al., 2003; Girard et al.,2005; Klein et al., 2005). For best efficacy of this approach (forexample, optimization of growth factor release from transplantedgrowth factor-transduced SCs), it will be key to know their survivalrate once transplanted. The result reported here clearly delineates thetime course and mechanism of cell death following transplantation,and highlights the need to develop strategies to enhance survival ofgrafted cells in order to optimize their potential for repair after SCI.
Acknowledgements
We gratefully acknowledge the assistance of Larissa Riveron and YelenaPressman (tissue isolation and culturing), Nisha Ali and Yasmina Abajas (tissueprocessing), Scott Raffa (tissue processing and caspase 3 quantification), and
Transplanted cell death after SCI 1443
ª The Authors (2007). Journal Compilation ª Federation of European Neuroscience Societies and Blackwell Publishing LtdEuropean Journal of Neuroscience, 26, 1433–1445

Dr Beata Frydel and Bridgette Shaw (confocal microscopy and Stereoinves-tigator� assistance). We thank Enrique P. Lopez and The Miami Project AnimalCore for contusion injuries and animal care, The Miami Project Viral VectorCore for generation and production of viral vectors, and Margaret Bates, RaisaPuzis and Anna Gomez for tissue processing for electron microscopy andassistance in ultrastructural analysis. This research was sponsored by theInternational Spinal Research Trust, NINDS 09923 and 38665, the MiamiProject to Cure Paralysis, the Lois Pope LIFE fellowship program (C.E.H.), andthe Helen Wilshire Walsh fund. M.B.B. is the Christine E. Lynn DistinguishedProfessor of Neuroscience.
Abbreviations
DMEM, Dulbecco’s modified Eagle’s medium; E ⁄ A, Epon ⁄ Araldite; FBDP,fodrin breakdown product; GFP, green fluorescent protein; PB, phosphatebuffer; PBS, phosphate-buffered saline; PCR, polymerase chain reaction; PO,propylene oxide; SC, Schwann cell; SCI, spinal cord injury; TH, tyrosinehydroxylase.
References
Aimone, J.B., Leasure, J.L., Perreau, V.M. & Thallmair, M. (2004) Spatial andtemporal gene expression profiling of the contused rat spinal cord. Exp.Neurol., 189, 204–221.
Bahr, B.A., Bendiske, J., Brown, Q.B., Munirathinam, S., Caba, E., Rudin, M.,Urwyler, S., Sauter, A. & Rogers, G. (2002) Survival signaling and selectiveneuroprotection through glutamatergic transmission. Exp. Neurol., 174,37–47.
Bahr, B.A., Tiriveedhi, S., Park, G.Y. & Lynch, G. (1995) Induction of calpain-mediated spectrin fragments by pathogenic treatments in long-term hippo-campal slices. J. Pharmacol. Exp. Ther., 273, 902–908.
Bakshi, A., Keck, C.A., Koshkin, V.S., LeBold, D.G., Siman, R., Snyder, E.Y.& McIntosh, T.K. (2005) Caspase-mediated cell death predominatesfollowing engraftment of neural progenitor cells into traumatically injuredrat brain. Brain Res., 1065, 8–19.
Bamber, N.I., Li, H., Aebischer, P. & Xu, X.M. (1999) Fetal spinal cord tissuein mini-guidance channels promotes longitudinal axonal growth aftergrafting into hemisected adult rat spinal cords. Neural Plast., 6, 103–121.
Barakat, D.J., Gaglani, S.M., Neravetla, S.R., Sanchez, A.R., Andrade, C.M.,Pressman, Y., Puzis, R., Garg, M.S., Bunge, M.B. & Pearse, D.D. (2005)Survival, integration, and axon growth support of glia transplanted into thechronically contused spinal cord. Cell Transplant., 14, 225–240.
Barker, R.A., Dunnett, S.B., Faissner, A. & Fawcett, J.W. (1996) The timecourse of loss of dopaminergic neurons and the gliotic reaction surroundinggrafts of embryonic mesencephalon to the striatum. Exp. Neurol., 141,79–93.
Beattie, M.S., Bresnahan, J.C., Komon, J., Tovar, C.A., Van Meter, M.,Anderson, D.K., Faden, A.I., Hsu, C.Y., Noble, L.J., Salzman, S. & Young,W. (1997) Endogenous repair after spinal cord contusion injuries in the rat.Exp. Neurol., 148, 453–463.
Berciano, M.T., Fernandez, R., Pena, E., Calle, E., Villagra, N.T. & Lafarga, M.(1999) Necrosis of Schwann cells during tellurium-induced primarydemyelination: DNA fragmentation, reorganization of splicing machinery,and formation of intranuclear rods of actin. J. Neuropathol. Exp. Neurol., 12,1234–1243.
Bjorklund, A. (2005) Cell therapy for Parkinson’s disease: problems andprospects. Novartis Found. Symp., 265, 174–186.
Blakemore, W.F. (1975) Remyelination by Schwann cells of axons demyeli-nated by intraspinal injection of 6-aminonicotinamide in the rat.J. Neurocytol., 4, 745–757.
Blakemore, W.F. & Franklin, R.J. (2000) Transplantation options fortherapeutic central nervous system remyelination. Cell Transplant., 9, 289–294.
Blits, B., Kitay, B.M., Farahvar, A., Caperton, C.V., Dietrich, W.D. & Bunge,M.B. (2005) Lentiviral vector-mediated transduction of neural progenitorcells before implantation into injured spinal cord and brain to detect theirmigration, deliver neurotrophic factors and repair tissue. Restor. Neurol.Neurosci., 23, 313–324.
Blomgren, K., Zhu, C., Wang, X., Karlsson, J.-O., Andersson, A.-L., Bahr,B.A., Mallard, C. & Hagberg, H. (2001) Synergistic activation of caspase 3by m-calpain after neonatal hypoxia-ischemia – a mechanism of ‘patholog-ical apoptosis’? J. Biol. Chem., 276, 10191–10198.
Boyle, K., Azari, M.F., Cheema, S.S. & Petratos, S. (2005) TNFalpha mediatesSchwann cell death by upregulating p75NTR expression without sustainedactivation of NFkappaB. Neurobiol. Dis., 20, 412–427.
Bruce, J.H., Norenberg, M.D., Kraydieh, S., Puckett, W., Marcillo, A. &Dietrich, D. (2000) Schwannosis: role of gliosis and proteoglycan in humanspinal cord injury. J. Neurotrauma, 17, 781–788.
Bunge, M.B. & Wood, P.M. (2006) Transplantation of Schwann cells andolfactory ensheathing cells to promote regeneration in the CNS. In Selzer,M.E., Clarke, S., Cohen, L.G., Duncan, P.W. & Gage, F.H. (Eds), Textbook ofNeural Repair and Rehabilitation. Cambridge University Press, Cambridge,pp. 513–531.
Conti, G., De Pol, A., Scarpini, E., Vaccina, F., De Riz, M., Baron, P., Tiriticco,M. & Scarlato, G. (2002) Interleukin-1 beta and interferon-gamma induceproliferation and apoptosis in cultured Schwann cells. J. Neuroimmunol.,124, 29–35.
Delaney, C.L., Cheng, H.L. & Feldman, E.L. (1999) Insulin-like growth factor-I prevents caspase-mediated apoptosis in Schwann cells. J. Neurobiol., 41,540–548.
Eldadah, B.A. & Faden, A.I. (2000) Caspase pathways, neuronal apoptosis, andCNS injury. J. Neurotrauma, 17, 811–829.
Emgard, M., Hallin, U., Karlsson, J., Bahr, B.A., Brundin, P. & Blomgren, K.(2003) Both apoptosis and necrosis occur early after intracerebral grafting ofventral mesencephalic tissue: a role for protease activation. J. Neurochem.,86, 1223–1232.
Emgard, M., Karlsson, J., Hansson, O. & Brundin, P. (1999) Patterns of celldeath and dopaminergic neuron survival in intrastriatal nigral grafts. Exp.Neurol., 160, 279–288.
Girard, C., Bemelmans, A.P., Dufour, N., Mallet, J., Bachelin, C., Nait-Oumesmar, B., Baron-Van Evercooren, A. & Lachapelle, F. (2005) Grafts ofbrain-derived neurotrophic factor and neurotrophin 3-transduced primateSchwann cells lead to functional recovery of the demyelinated mouse spinalcord. J. Neurosci., 25, 7924–7933.
Golstein, P. & Kroemer, G. (2007) Cell death by necrosis: towards a moleculardefinition. Trends Biochem. Sci., 32, 37–43.
Grill, R., Murai, K., Blesch, A., Gage, F.H. & Tuszynski, M.H. (1997)Cellular delivery of neurotrophin-3 promotes corticospinal axonal growthand partial functional recovery after spinal cord injury. J. Neurosci., 17,5560–5572.
Hall, E.D. & Springer, J.E. (2004) Neuroprotection and acute spinal cordinjury: a reappraisal. NeuroRx, 1, 80–100.
Harrison, B.M. & Pollard, J.D. (1984) Pattern of Schwann cell remyelination ina spinal cord lesion. Neurosci. Lett., 52, 275–280.
Hill, C.E., Moon, L.D., Wood, P.M. & Bunge, M.B. (2006) Labeled Schwanncell transplantation: cell loss, host Schwann cell replacement, and strategiesto enhance survival. Glia, 53, 338–343.
Hsu, J.Y. & Xu, X.M. (2005) Early profiles of axonal growth and astroglialresponse after spinal cord hemisection and implantation of Schwann cell-seeded guidance channels in adult rats. J. Neurosci. Res., 82, 472–483.
Iannotti, C., Li, H., Yan, P., Lu, X., Wirthlin, L. & Xu, X.M. (2003) Glial cellline-derived neurotrophic factor-enriched bridging transplants promotepropriospinal axonal regeneration and enhance myelination after spinal cordinjury. Exp. Neurol., 183, 379–393.
Karanian, D.A., Brown, Q.B., Makriyannis, A., Kosten, T.A. & Bahr, B.A.(2005) Dual modulation of endocannabinoid transport and fatty acid amidehydrolase protects against excitotoxicity. J. Neurosci., 25, 7813–7820.
Karimi-Abdolrezaee, S., Eftekharpour, E., Wang, J., Morshead, C.M. &Fehlings, M.G. (2006) Delayed transplantation of adult neural precursor cellspromotes remyelination and functional neurological recovery after spinalcord injury. J. Neurosci., 26, 3377–3389.
Klein, S.M., Behrstock, S., McHugh, J., Hoffmann, K., Wallace, K., Suzuki,M., Aebischer, P. & Svendsen, C.N. (2005) GDNF delivery using humanneural progenitor cells in a rat model of ALS. Hum. Gene Ther., 16, 509–521.
Kobori, N., Clifton, G.L. & Dash, P. (2002) Altered expression of novel genesin the cerebral cortex following experimental brain injury. Brain Res. Mol.Brain Res., 104, 148–158.
Koda, M., Someya, Y., Kadota, R., Mannoji, C., Miyashita, T., Murata, A. &Yamazaki, M. (2006) BDNF suppresses anoikis of Schwann cell. Neurosci.Res., 55, S218.
Loeb, J.E., Cordier, W.S., Harris, M.E., Weitzman, M.D. & Hope, T.J. (1999)Enhanced expression of transgenes from adeno-associated virus vectors withthe woodchuck hepatitis virus posttranscriptional regulatory element:implications for gene therapy. Hum. Gene Ther., 10, 2295–2305.
Lu, X.C., Williams, A.J., Yao, C., Berti, R., Hartings, J.A., Whipple, R., Vahey,M.T., Polavarapu, R.G., Woller, K.L., Tortella, F.C. & Dave, J.R. (2004)
1444 C.E. Hill et al.
ª The Authors (2007). Journal Compilation ª Federation of European Neuroscience Societies and Blackwell Publishing LtdEuropean Journal of Neuroscience, 26, 1433–1445

Microarray analysis of acute and delayed gene expression profile in rats afterfocal ischemic brain injury and reperfusion. J. Neurosci. Res., 77, 843–857.
Mahalik, T.J., Hahn, W.E., Clayton, G.H. & Owens, G.P. (1994) Programmedcell death in developing grafts of fetal substantia nigra. Exp. Neurol., 129,27–36.
Marsala, M., Kakinohana, O., Yaksh, T.L., Tomori, Z., Marsala, S. & Cizkova,D. (2004) Spinal implantation of hNT neurons and neuronal precursors: graftsurvival and functional effects in rats with ischemic spastic paraplegia. Eur.J. Neurosci., 20, 2401–2414.
Martin, D., Robe, P., Franzen, R., Delree, P., Schoenen, J., Stevenaert, A. &Moonen, G. (1996) Effects of Schwann cell transplantation in a contusionmodel of rat spinal cord injury. J. Neurosci. Res., 45, 588–597.
Miller, R.M., Chen, L.L., Kiser, G.L., Giesler, T.L., Kaysser-Kranich, T.M.,Palaniappan, C. & Federoff, H.J. (2005) Temporal evolution of mouse striatalgene expression following MPTP injury. Neurobiol. Aging, 26, 765–775.
Nagano, S., Takeda, M., Ma, L. & Soliven, B. (2001) Cytokine-induced celldeath in immortalized Schwann cells: roles of nitric oxide and cyclic AMP.J. Neurochem., 77, 1486–1495.
Naldini, L., Blomer, U., Gage, F.H., Trono, D. & Verma, I.M. (1996) Efficienttransfer, integration, and sustained long-term expression of the transgene inadult rat brains injected with a lentiviral vector. Proc. Natl Acad. Sci. USA,93, 11382–11388.
Nirmalananthan, N. & Greensmith, L. (2005) Amyotrophic lateral sclerosis:recent advances and future therapies. Curr. Opin. Neurol., 18, 712–719.
Oudega, M., Xu, X.M., Guenard, V., Kleitman, N. & Bunge, M.B. (1997) Acombination of insulin-like growth factor-I and platelet-derived growthfactor enhances myelination but diminishes axonal regeneration intoSchwann cell grafts in the adult rat spinal cord. Glia, 19, 247–258.
Portera-Cailliau, C., Price, D.L. & Martin, L.J. (1997) Excitotoxic neuronaldeath in the immature brain is an apoptosis-necrosis morphologicalcontinuum. J. Comp. Neurol., 378, 70–87.
Raine, C.S. (1976) On the occurrence of Schwann cells within the normalcentral nervous system. J. Neurocytol., 5, 371–380.
Ray, S.K. & Banik, N.L. (2003) Calpain and its involvement in thepathophysiology of CNS injuries and diseases: therapeutic potential of
calpain inhibitors for prevention of neurodegeneration. Curr. Drug TargetsCNS Neurol. Disord., 2, 173–189.
Sortwell, C.E. (2003) Strategies for the augmentation of grafted dopamineneuron survival. Front. Biosci., 8, s522–s532.
Springer, J.E. (2002) Apoptotic cell death following traumatic injury to thecentral nervous system. J. Biochem. Mol. Biol., 35, 94–105.
Syntichaki, P. & Tavernarakis, N. (2003) The biochemistry of neuronalnecrosis: rogue biology? Nat. Rev. Neurosci., 4, 672–684.
Takami, T., Oudega, M., Bates, M.L., Wood, P.M., Kleitman, N. & Bunge,M.B. (2002) Schwann cell but not olfactory ensheathing glia transplantsimprove hindlimb locomotor performance in the moderately contused adultrat thoracic spinal cord. J. Neurosci., 22, 6670–6681.
Velardo, M.J., Burger, C., Williams, P.R., Baker, H.V., Lopez, M.C., Mareci,T.H., White, T.E., Muzyczka, N. & Reier, P.J. (2004) Patterns of geneexpression reveal a temporally orchestrated wound healing response in theinjured spinal cord. J. Neurosci., 24, 8562–8576.
Watson, D.J., Longhi, L., Lee, E.B., Fulp, C.T., Fujimoto, S., Royo, N.C.,Passini, M.A., Trojanowski, J.Q., Lee, V.M., McIntosh, T.K. & Wolfe, J.H.(2003) Genetically modified NT2N human neuronal cells mediate long-termgene expression as CNS grafts in vivo and improve functional cognitiveoutcome following experimental traumatic brain injury. J. Neuropathol. Exp.Neurol., 62, 368–380.
Xu, X.M., Chen, A., Guenard, V., Kleitman, N. & Bunge, M.B. (1997)Bridging Schwann cell transplants promote axonal regeneration from boththe rostral and caudal stumps of transected adult rat spinal cord.J. Neurocytol., 26, 1–16.
Xu, X.M., Guenard, V., Kleitman, N. & Bunge, M.B. (1995) Axonalregeneration into Schwann cell-seeded guidance channels grafted intotransected adult rat spinal cord. J. Comp. Neurol., 351, 145–160.
Zeiss, C.J. (2003) The apoptosis-necrosis continuum; insights from geneticallyaltered mice. Vet. Pathol., 40, 481–495.
Zhu, C., Wang, X., Xu, F., Bahr, B.A., Shibata, M., Uchiyama, Y., Hagberg, H.& Blomgren, K. (2005) The influence of age on apoptotic and othermechanisms of cell death after cerebral hypoxia-ischemia. Cell. Death.Differ., 12, 162–176.
Transplanted cell death after SCI 1445
ª The Authors (2007). Journal Compilation ª Federation of European Neuroscience Societies and Blackwell Publishing LtdEuropean Journal of Neuroscience, 26, 1433–1445