e)1986 Stephen L. Loy
288
e)1986 Stephen L. Loy
-
Upload
khangminh22 -
Category
Documents
-
view
3 -
download
0
Transcript of e)1986 Stephen L. Loy

e)1986 Stephen L. Loy

AN EXPERIMENTAL INVESTIGATION OF A GRAPHICAL
PROBLEM-STRUCTURING AID AND NOMINAL GROUP
TECHNIQUE FOR GROUP DECISION
SUPPORT SYSTEMS
by
STEPHEN L. LOY, B.S., M.B.A.
A DISSERTATION
IN
BUSINESS ADMINISTRATION
Submitted to the Graduate Faculty of Texas Tech University in Partial Fulfillment of the Requirements for
the Degree of
DOCTOR OF PHILOSOPHY
Approved
May, 1986

AN EXPERIMENTAL INVESTIGATION OF A GRAPHICAL
PROBLEM-STRUCTURING AID AND NOMINAL GROUP
TECHNIQUE FOR GROUP DECISION
SUPPORT SYSTEMS
by
STEPHEN L. LOY, B.S., M.B.A.
A DISSERTATION
IN
BUSINESS ADMINISTRATION
Submitted to the Graduate Faculty of Texas Tech University in Partial Fulfillment of the Requirements for
the Degree of
DOCTOR OF PHILOSOPHY
Approved
rperson of the ^Cpnittee
"A
ijL u I /Jt .,L >VA,i>
Accepted
Dear#of the Graduate School
May, 1986
mi C^€p* r^^ ACKNOWLEDGEMENTS
I vish to express my gratitude to those vho helped in
the making of this dissertation. I am indebted to the
members of my committee for their guidance and support.
Special thanks go to my committee chairman. Dr. James F.
Courtney, who vaa especially supportive and helpful. I
greatly appreciate the efforts of Dr. William E. Pracht,
who provided the structual modeling software and the
inspiration for this dissertation.
I wish to acknowledge the assistance of Dr. Jerry Hunt
and Dr. Ram Baliga. Their help in obtaining subjects for
my study was instrumental to the success of this project.
Others within the College of Business Administration who
helped in many different but significant ways include: Mr.
Bob Rhoades, Director of Administrative Services; Ms. Cindy
Brennan, Copy Shop Supervisor; fellow doctoral students
Darrell Eubanks, David Paradice, and Larry C. Meile.
I thank Dr. George Huber, Dr. A. Ramaprasad, and Mr.
Ed Szewczak for their willingness to share their work with
me.
I am deeply grateful to my parents, Mabel and Lewis E.
Loy; my brother. Dr. L. David Loy; and my sister. Dr. Sally
Loy Warder, for their moral support which provided me with
the incentive to persevere toward this goal.
ii

Finally, my most special appreciation goes to my wife,
Marianna Heins-Loy, whose assistance, encouragement, and
love made the completion of this dissertation a reality.
iii
TABLE OF CONTENTS
ACKNOWLEDGEMENTS ii LIST OF TABLES vii LIST OF FIGURES viii
CHAPTER
I. INTRODUCTION AND BACKGROUND 1
Development of Decision-making Technology.... 1 Problem Statement 11 Purpose of the Research and Research Method.. 14 Summary and Organization of the Dissertation. 17
II. LITERATURE REVIEW 19
Introduction 19 Group Decision Making 19 Computer-generated Graphics. . 23 Computer-based Group Decision
Support Systems 26 Perceptronics Group Decision Aid 26 Executive Mind Support 28 Cooperative Group Decision Support
System < CGDSS) 30 Group Decision-making Techniques 31
Interacting Groups. . 32 Classical Brainstorming 34 Battelle-Buildmappen-Brainwriting 36 Brainwriting Pool 37 Pin-Card 38 Gallery Method 40 Nominal Group Technique 41 Kepner-Tregoe Method 44
Problem Reduction Strategies 46 Model Building Approaches 48
Simulation 48 Structural Modeling 49 Cognitive Happing 51 Influence Diagrams 56 Maps of Causality 57 Strategic Data Base Group Design 57 Predecision Support System 59 Graphical Interactive Structural
Modeling Option < GISMO) 61 Summary 63
iv

III. THE RESEARCH MODEL 65
Introduction 65 Model Presentation 68
Decision Support System 68 Individual Information Processor 71 Small Group Problem Solving. . 73 Organizational Information Processor 73 Computer Information Processor 77 Decision Tasks 79
Research Model To Be Tested 88 Problem Complexity 89 Capabilities and Experiences 91 Environment 91 Problem-structuring Processes. 92
Objectives of the Study 92 Research Questions Studied 96 Research Hypotheses 105 Summary 107
IV. DESCRIPTION OF THE METHODOLOGY 108
Introduction 108 The Research Design Ill
Experimental Design 112 Research Strategy 114 Research Variables. 123 Research Controls 125 Experimental Controls 126 Information System Characteristics 130
Data Analysis 132 Decision Performance 132 Group Problem Understanding 135
Limitations of the Study 136 Summary 140
V. RESEARCH RESULTS 142 Introduction 142 Decision Performance Results 145 Problem Understanding Results 153 Additional Findings 158 Summary of Results 160
VI. DISCUSSION AND CONCLUSIONS 161
Introduction 161 Practical Implications and Contributions 162 Theoretical Implications and
Contributions 165

Informal Observations 168 Suggestions for Future Research 170 Summary , 173
BIBLIOGRAPHY 174
APPENDICES
A. GRAPHICAL INTERACTIVE STRUCTURAL MODELING INSTRUCTIONS 185
B. EXAMPLE OF A STRUCTURAL MODEL SUBJECTS CAN CREATE 192
C. BUSINESS MANAGEMENT LABORATORY PARTICIPANT
INSTRUCTIONS 194
D. BML/SLIM PRE-EXPERIMENT QUIZ 195
E. BML/SLIM POST-EXPERIMENT QUESTIONNAIRE 199
F. SUBJECT AGREEMENT TO CONFIDENTIALITY 209
G. BACKGROUND QUESTIONNAIRE 210
H. DESCRIPTION OF THE SLIM INFORMATION
SYSTEM 218
I. GROUP MEETING INSTRUCTIONS 229
J. KNOWLEDGE SCALE ANALYSIS 235 K. MANOVA RESULTS FOR DECISION
PERFORMANCE MODEL 236 L. BML DECISION SETS FOR GAME ADMINISTRATOR AND
EXPERIMENTAL UNITS 242
M. DATA USED IN ANALYSES 268
vi

LIST OF TABLES
2.1. Decision Strategies for Reducing Complexity
in Problem Diagnosis and Formulation 47
2.2. Sample Output of Predecision Recommendations... 61
2.3. Sample Output of Predecision
Recommendations 61
4. 1. Time Schedule of the Experiment 122
5. 1. Individual Difference Variables 144
5. 2. Wilk's Lambda Tests of Model Effects 151
5.3. Regression Results for Problem Domain Understanding Model 157
vii

LIST OF FIGURES
GDSS Front-End Features 9
The Basic Research Design. . 16
A Structural Model of Structural Modeling 50
Example of a Cognitive Map 52
Example of a Map of Causality 58
Conceptual Model of the Research 69
Structure of a Decision Support System 70
Newell and Simon Model of Human Information
Processing. 71
Components of Computer-based DSS 78
Information Formation 80
Decision Production System Model 82
Factors Affecting Problem Formulation 86
The Research Model Tested 90
Detailed Model of the Research Variables Ill
The Research Design 113
Hardware/Software Configuration of
Problem Structuring System 131 5.1. Average Net Income for the Four Treatment
Combinations and Factor Levels at the End
of the Game 147
5. 2. Average Net Incomes 148
5. 3. Beginning of Game Problem Understanding 154
5.4. Problem Understanding at Game's End 155
5. 5 Pre-test/Post-test Change in BML/SLIM
Knowledge 159 viii
1 .
1 .
2 .
2 .
2 .
3 .
3 .
3 .
3 .
3 .
3 .
3 .
3 .
4 .
4 .
4 .
1 .
2 .
1 .
2
3 .
1 .
2 .
3 .
4 .
5 .
6 .
7 .
a.
1 .
2 .
3 .

CHAPTER I
INTRODUCTION AND BACKGROUND
Development of Decision-making Technology
Since the development of the electronic digital
computer, computer technology has been applied to an ever-
expanding variety of problems. First generation computers
were used to solve large mathematical problems and logic
operations which were too difficult and time-consuming for
the human mind to solve. The business problems which were
first addressed by computers were the highly structured
tasks of payroll and billing CMandell, 1979].
The second generation of computers brought business
organization into the electronic data processing (EDP) era.
These EDP systems were designed to handle the repetitious
and time-consuming tasks of the business firm, such as
batch processing of payroll, invoicing, personnel records,
and inventory files.
During the third generation of computers, technology
was directed toward the less structured control problems of
middle management, such as inventory control and scheduling
of labor and materials. These management information
systems (MIS) were designed to provide management reports
on business operations and conditions. Initially, MIS

provided only regularly scheduled management reports. The
development of database systems and database management
systems made a large body of data and information easily
and readily available to managers on an ad hoc basis.
The fourth generation of computer technology has
further expanded applications into the less structured
problems faced by the strategic level of organizations.
Typical applications which have been developed include
mathematical modeling and simulation capabilities. These
applications are designed to aid higher-level organiza
tional decision makers. These decision support systems
(DSS) are intended to enhance the effectiveness of
organizations by providing the individual decision maker
with easy-to-use tools to aid in the solution of semi-
structured problems CKeen and Scott Morton, 1978].
Keen and Scott Morton C1978] suggested that DSS were
developed in response to the increasingly complex and
unpredictable environment organizations faced in the 1970s.
They CKeen and Scott Morton, 1978, p. 1] characterized DSS
as being intended to:
(1) support managers in their decision processes in semistructured tasks,
(2) support, rather than replace, managerial Judgment, and
(3) improve the effectiveness of decision making rather than its efficiency.
Sprague and Carlson C1980, p.2] classified DSS on the
basis of their characteristics. They described those
characteristics as follows.
(1) They tend to be aimed at the less structured, underspecified problems that upper management face.
(2) They attempt to combine the use of methods or analytical techniques with traditional data access and retrieval functions.
(3) They focus specifically on features which make them easy to use by managers in an interactive mode.
(4) They emphasize flexibility and adaptability to accommodate changes in the environment and the decision-making approach of the user.
More recently, attention has been directed to the
development of DSS for decision-making groups, because of
the importance and pervasiveness of groups in strategic
decision making in organizations. Strategic or policy
decisions have the least structure of all organizational
decision types CMintzberg, et al.. , 1976; Mintzberg, 1979],
and are characterized by novelty, complexity, and open-
endedness. Typically, such decisions are the result of
group interaction and group consensus CSteiner and Miner,
1982].
A fundamental requirement of a group decision support
system (GDSS) is that it should provide interactive support
for the basic problem-solving and decision-making tasks of
decision groups. Tasks that need support are those related

to problem identification, problem formulation, alternative
solution generation, and choice. The GDSS should provide
easily evoked and communicable models for group members,
and provide a means or procedure for conducting the group
activities. To do this, we must understand how groups go
about making strategic decisions.
Groups facing strategic decisions usually begin with
little understanding of the decision situation they face,
and only a vague idea of what the solution might be and how
it will be evaluated when it is developed CMintzberg, et
al. , 1976]. The group may start out making random trials
or, more likely, by choosing actions based on a very
rudimentary map of causality CHall, 1984]. As under
standing and experience are gained, that knowledge is
retained in the organization's "knowledge base." The
retention process is used to admit the relationships, thus
selected, to the organization's storehouse of knowledge.
It may reject or edit relationships selected to fit the
existing set of retained knowledge or modify the existing
set and adopt its converse. The relationships represented
and retained in the maps are then available for retention
in the organization's map of causality and hence may
influence future decisions CHall, 1984].
A key stage of the strategic decision process is
problem diagnosis CMintzberg, et. al. . 1976]. The diagnosis

stage is often the most frequently overlooked activity of
the decision-making process. In this phase, decision
makers attempt to comprehend the problem and to determine
cause-effect relationships of the decision situation
CMintzberg, et. al. 1976]. Problem comprehension involves
the activities related to problem recognition, determin
ation of cause-effect relationships, and the development of
models. These models are simplified replications of
reality which identify the main components and indicate how
they are related COxenfeldt, et. al.. , 1978]. The model
development activities give the decision maker direction
and understanding which is needed before the phases of
alternative generation and choice can take place. There
fore, model development must be performed well for the
correct problem to be solved.
Ackoff C197d, p. 13] states the idea as follows:
In dealing with a problematic situation, a decision maker must develop a concept--a representation or a model--of it. He attempts to solve the problem as he. conceives it. Thus if his conception is wrong, the solution to the problem as conceived may not solve the problem as it exists. A common example is a formulation of a problem that leads to the suppression of symptoms rather than the removal of the cause of a deficiency that creates the problem. Because of such errors of conceptualization, it has often been observed that we more frequently fail to face the right problem than fail to solve the problem we face.

The ability to conceptualize the problem domain can be
limited or enhanced by the technology a decision maker
uses. Ackoff C1978] argues that "...our searches for
solutions tend to be restricted by the dimensionality of
our mental images" (p. 78), and, therefore, "Our concep
tions of what can be done in problematic situations are
often limited by constraints attributed to technology" (p.
71). Technology to aid decision making, therefore, should
aid the decision makers in developing better mental models
because, as Ackoff C1978, p. 78] puts it, "Increasing the
number of dimensions in which we think about problems can
often reveal new and more effective solutions." These
dimensions of a problem determine the problem domain or
problem environment. Our ability to solve problems depends
critically on how well we conceptualize the causal con
nections between events CAckoff 1978].
Computer-generated graphic displays are considered
effective decision aids which expand the conceptual domains
of decision makers CScott Morton, 1971; DeSanctis, 1964;
Pracht, 1984, 1985], as well as an effective medium of
communication. Two categories of computer-generated
graphics can be classified as data summarization graphics
and model building graphics. Data summarization graphics
include data reduction displays such as bar graphs, pie
charts, histograms, etc. Research on the usefulness of

this type of graphic display has focused on issues such as
tables-versus-graphics and CRT-versus-hardcopy CDeSanctis,
1984]. Other studies have compared information present
ation modes CDickson, Senn, and Cherveny,1977; Lucas and
Nielsen, 1980; Jarvenpaa, Dickson, and DeSanctis, 1984;
Dunikoski, 1984; DeSanctis, 1984].
Model building graphics is concerned with the visual
representation of the structure inherent or perceived by
the decision maker in a problem domain. The structural
model illustrates the structures of the relationships among
the elements of the problem domain CPracht, 1984, 1985].
Tools, both computer-based and noncomputer-based, have
been developed to enhance group decision-making and model-
building effectiveness. A set of such tools has been
defined as a group decision support system (GDSS)
CHumphreys and McFadden, 1980; Gray, 1981; Steeb and
Johnston, 1981; Kull, 1982; Huber, 1982, 1984; Wagner,
1983; Bui and Jarke, 1984; Wedley and Field, 1984]. The
GDSS is intended to in-crease the effectiveness of decision
groups by facilitating the interactive sharing and use of
information among group members, and between the group and
the computer system.
Generally, a GDSS includes software to evaluate group
opinions and procedures to structure group interaction with
the Nominal Group Technique or the Delphi Technique for

8
supporting the generation of alternative solutions and the
alternative choice. Huber C1984, p. 196] observed that:
...one system provides the capability for a group to identify and analyze the multiattrib-ute utility functions of its members. Yet another provides the capability for a group to obtain its members' strengths of feeling about the importance of different organizational goals and the performance of organizational units with regard to these goals and to use the resulting values in an organizational analysis algorithm.
GDSS are considered a subset of DSS CAdelman, 1984].
The distinguishing characteristics of a GDSS are: (1) the
structured interaction between individual decision makers,
and (2) individual terminals linked together so that
aggregate models can be displayed on a large, public
screen. Office automation technology is employed to
enhance communication between group members. The remaining
GDSS technology is the same as individual DSS technology.
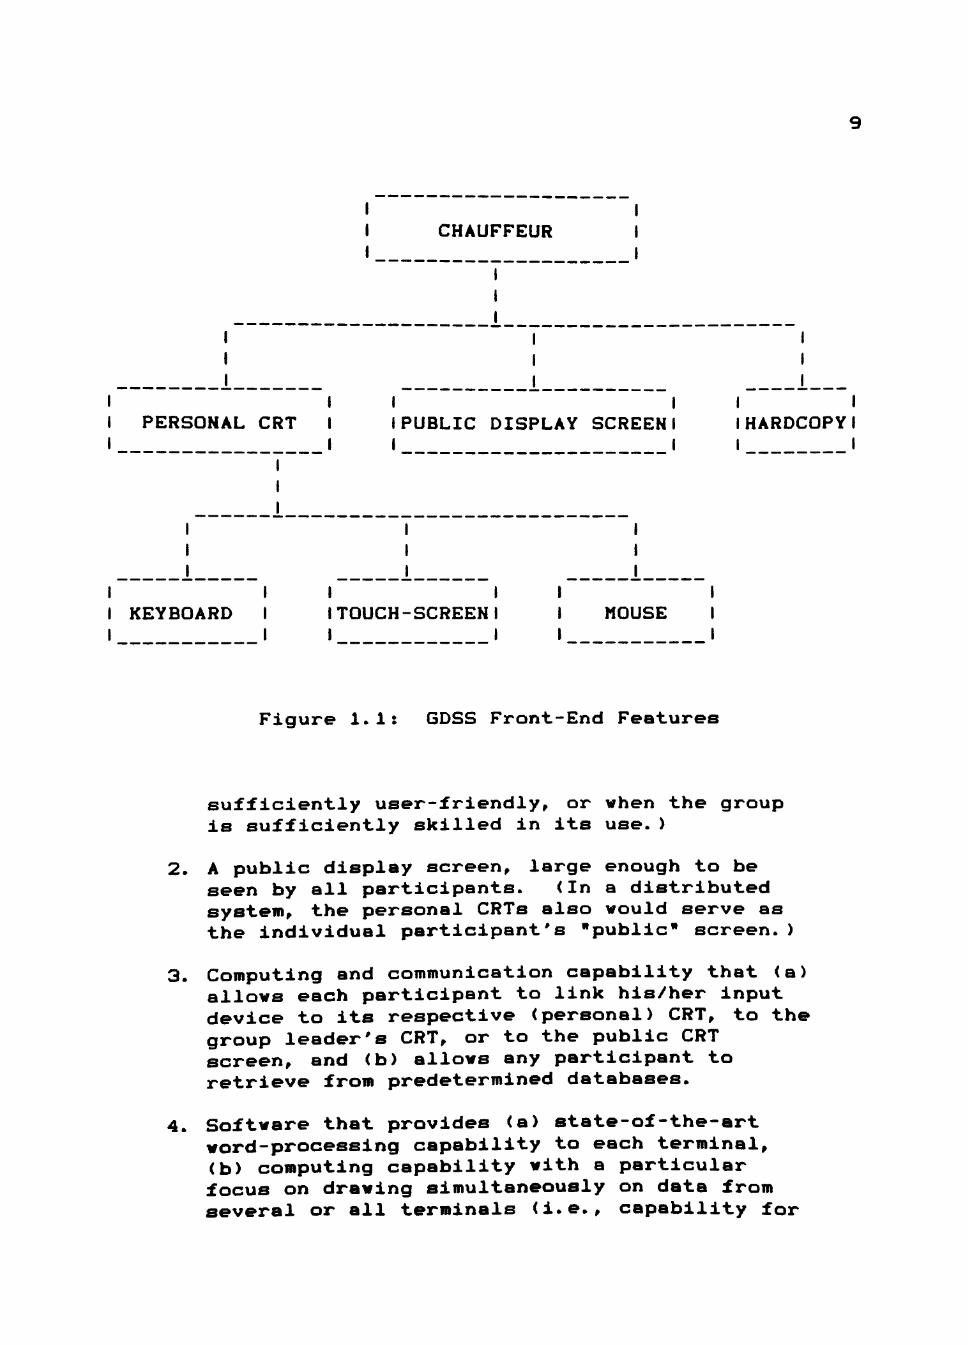
Figure 1.1 illustrates Huber's C1982, p. 98]
description of a GDSS in which a GDSS is a computer-
based decision support system with the following features:
1. A personal CRT and input device for each participant, i.e., for each group member, the chauffeur, and the communication aide who keys in the inputs for those who prefer to use verbal or handwritten media when entering information into the system. (A chauffeur is the system operator who serves as an intermediary between the group and the GDSS software. The chauffeur receives verbal directives from the group leader or chairperson and translates them into GDSS commands. The chauffeur is not required when the GDSS is
CHAUFFEUR
I PERSONAL CRT I
I
I I I PUBLIC DISPLAY SCREEN I I I
I I IHARDCOPYI I I
I
I
I I KEYBOARD I
I
I I I TOUCH-SCREEN I i I
MOUSE
Figure 1.1: GDSS Front-End Features
sufficiently user-friendly, or when the group is sufficiently skilled in its use. )
A public display screen, large enough to be seen by all participants. (In a distributed system, the personal CRTs also would serve as the individual participant's "public" screen.)
Computing and communication capability that (a) allows each participant to link his/her input device to its respective (personal) CRT, to the group leader's CRT, or to the public CRT screen, and (b) allows any participant to retrieve from predetermined databases.
Software that provides (a) state-of-the-art word-processing capability to each terminal, (b) computing capability with a particular focus on drawing simultaneously on data from several or all terminals (i.e., capability for
10
constructing and altering worksheets, bar graphs, decision trees, etc.), and (d) anonymity when eliciting information from the individual participants when this is desired.
GDSS are not yet common in organizations, nor is there
a large base of research and literature on them. Most
definitions of GDSS are based upon descriptions of GDSS
components. Typically, the GDSS is described as consisting
of "a set of software, hardware, and language components
and procedures that support a group of people engaged in a
decision-related meeting" CHuber, 1984, p. 195]. Bui and
Jarke C1984, p. 103] describe a GDSS in terms of the
functions it performs:
From the point of view of the group, the group DSS assures three main functions: (i) automatic selection of appropriate group decision-technique(s), unless the group overrides this procedure, (ii) computation and explanation of a group decision, and (iii) suggestions for a discussion of individual differences or for a redefinition of the problem if attempts to reach a consensus fail.
From these descriptions it can be said that a GDSS has
as its major components: (1) a DSS, (2) some sort of
process-oriented, group decision-making methods to
structure group member interaction, and (3) a conferencing
system that supports group communication. Based on these
descriptions a GDSS is defined as a DSS which is intended
to support efficient and effective group decision making

11
through the combined use of computer hardware, software,
and some group decision-making procedure.
A GDSS should provide support for handling the five
main types of problems encountered in the group decision
making process CBales and Strodtbeck, 1951]:
1. Problem of Orientation: The decision makers often ignore or are uncertain about some of the relevant facts. They seek information, orientation, or confirmation.
2. Problem of Evaluation: The decision makers--because of personalities, cognitive differences, and the nature of the problem--have different values and interests. They need a framework to analyze the problem and express their wishes and feelings.
3. Problem of Control: Each decision maker within the group may end up with a different decision outcome. They seek exchanges of points of view and directions to reach consensus.
4. Problem of Tension Management: The frequencies of both negative and positive reactions tend to increase during the group decision-making process. The group seeks to improve understanding, increase compliance, reduce tension, and avoid member withdrawal.
5. Problem of Integration: The group seeks consensus during the group problem-solving process and collective endorsement of the final agreement.
Problem Statement
Despite the recognition that strategic decision making
is typically a group process, existing computer-based DSS
are designed to assist only the individual decision maker.
Moreover, DSS research has focused on individual decision

12
making and ignored group decision making. GDSS technology
is relatively new, and the environments they are designed
to serve are more complex than those of the DSS. The GDSS
should not only provide the same decision-making aids as
the DSS, but should structure group procedures to support
group processes as well CHuber, 1984].
There are a small number of GDSS currently available
CGray, 1981; Steeb and Johnston, 1981; Huber, 1982, 1984;
Kull, 1982; Wagner, 1983; Bui and Jarke, 1984; Wedley and
Field, 1984], but these offer support for only a small
subset of decision-group tasks related to alternative
generation and choice phases of decision making. None
provide a graphical problem-structuring aid to support
group problem-formulation activities.
Of the GDSS and GDSS prototypes which have been
developed, very little is known about their ability to
fulfill the objectives of enhancing decision-group
efficiency and group decision-making effectiveness. At
this writing, there is a dearth of published reports about
controlled studies of the impact of GDSS on group decision
making performance. In the most recent published report of
a GDSS development, Bui and Jarke C1984, p. 110] state that
"...empirical studies will be required to test (the system)
once the system has reached a sufficient degree of
maturity." Other GDSS, such as Executive Mind Support

13
CKull, 1982; Grey, 1983], have not been subjected to
controlled studies.
Huber C1984, p. 196] views the current state of GDSS
research thus: "The useful domain and overall effective
ness of these GDSS (currently available) are yet to be
determined, but what evidence exists suggests that even
today's GDSS contribute to decision group effectiveness."
In one such study, Steeb and Johnston C1981] reported
that GDSS-aided groups considered more problem attributes,
generated more alternative solutions, exhibited more
completeness in problem understanding, and exhibited more
satisfaction and confidence with their group's decisions
than non GDSS-aided groups in a structured problem
environment.
In addition to the problem of having little formal
testing of current GDSS, no framework exists to test a GDSS
for determining (1) what components a GDSS should contain,
(2) the effectiveness of various components in different
systems, or (3) the effectiveness of the GDSS to achieve
its primary objective of enhancing the effectiveness of
group decision making.
As previously stated, current GDSS do not provide
support for the model building or structural modeling
activities for group decision making. A structural
modeling system has been developed which has shown promise

14
in providing effective support for individual strategic
decision makers. The system developed by Pracht C1984] is
called the Graphical Interactive Structural Modeling Option
(GISMO). GISMO has been studied using individual decision
makers and was found to improve individual problem domain
understanding. But, research as to whether GISMO has
similar effects on group decision-making performance and
problem understanding had not been conducted.
Purpose of the Research and Research Method
The purpose of this study was to investigate the
effects of GISMO on group decision-making performance and
problem-domain understanding in an ill-structured problem
environment. Also investigated in the study were the
effects of GISMO with the Nominal Group Technique process.
This study addressed one of the limitations cited in the
Pracht C1984, p. 91] study: "the use of individual
decision makers rather than groups." This limitation
restricted the external validity of Pracht's findings.
The study used students to play the Business
Management Laboratory (BML) CJensen and Cherrington, 1977]
simulation game. The subjects also had access to the BML
companion decision support package SLIM (Simulation
Laboratory for Information Management) CCourtney and

15
Jensen, 1961]. BML/SLIM management simulation and decision
support packages CCourtney, DeSanctis, and Kasper, 1983]
were used to provide a semistructured problem environment.
This use of BML provided a problem environment in which the
information system characteristics could be varied in order
to determine how changes impact decision outcomes. Also,
the use of BML as a laboratory tool made replication of the
study possible.
A structured problem is one which has relatively few
elements and simple element relationships. An ill-
structured problem, on the other hand, has many elements,
and the nature of the cause-effect relationships and the
strength of the relationships among them are not easily
identified and understood. A semistructured problem has
some parts which are structurable and some which are not.
The choice of a semistructured problem was appropriate for
this study in that the structural modeling system (i.e.,
GISMO) was being studied for its suitability as a GDSS
component.
The research design, illustrated in Figure 1.2, has
two factors. The first factor is called the problem
structuring tool (TOOL). This factor has two treatments,
which are based upon the- tool a group used to aid its
decision making. One set of groups used GISMO in the study
and the other set did not (NONGISMO). The second factor is
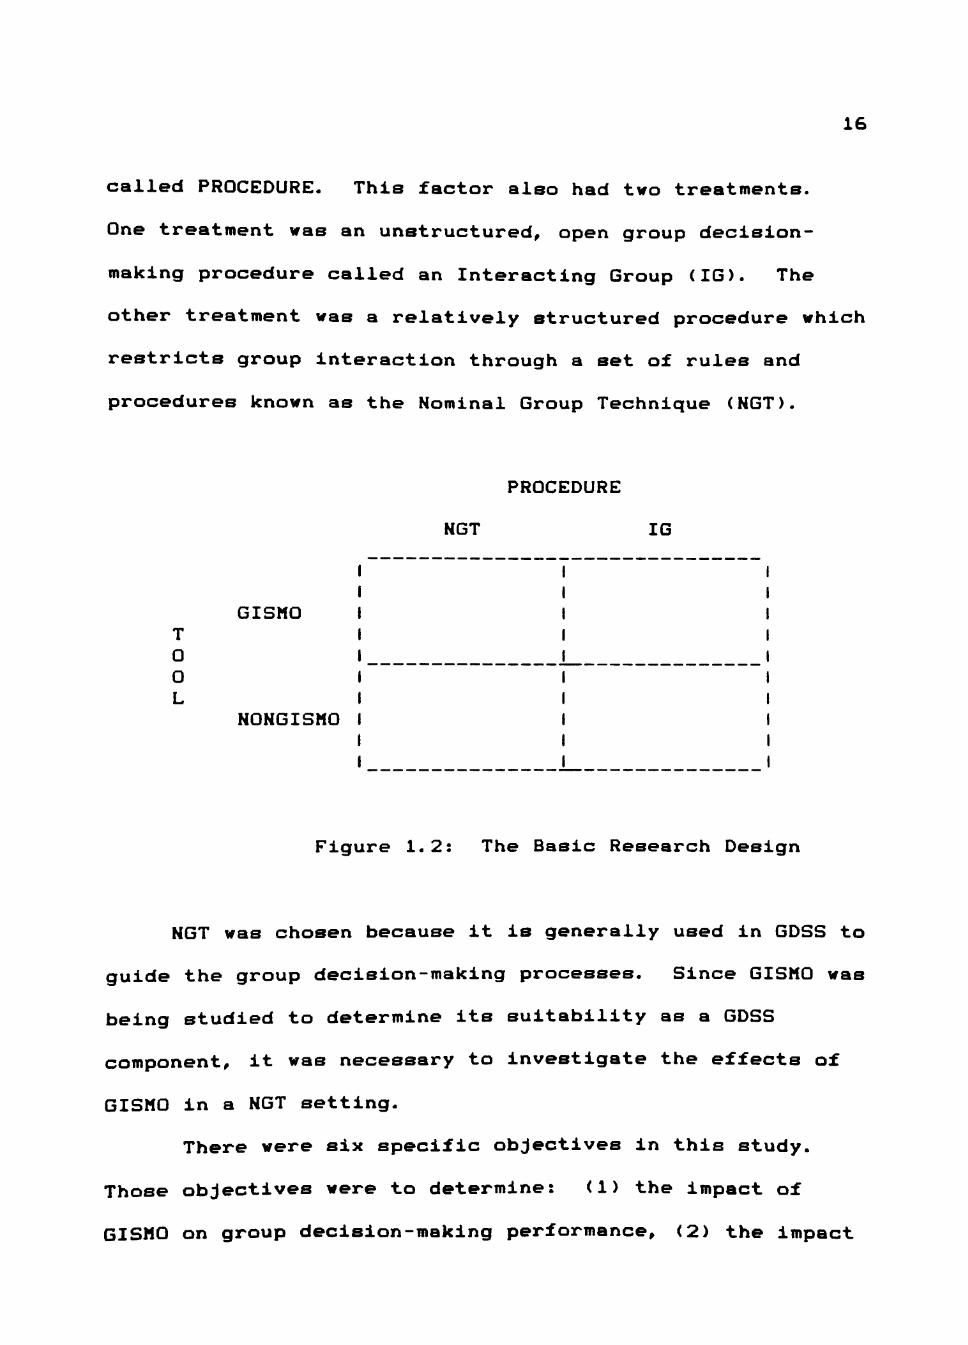
16
called PROCEDURE. This factor also had two treatments.
One treatment was an unstructured, open group decision
making procedure called an Interacting Group (IG). The
other treatment was a relatively structured procedure which
restricts group interaction through a set of rules and
procedures known as the Nominal Group Technique (NGT).
T O O L
GISMO
NONGISMO
PROCEDURE
NGT IG
Figure 1.2: The Basic Research Design
NGT was chosen because it is generally used in GDSS to
guide the group decision-making processes. Since GISMO was
being studied to determine its suitability as a GDSS
component, it was necessary to investigate the effects of
GISMO in a NGT setting.
There were six specific objectives in this study.
Those objectives were to determine: (1) the impact of
GISMO on group decision-making performance, (2) the impact
17
of GISMO on group decision-environment understanding,
(3) the impact of NGT on group decision-making performance,
(4) the impact of NGT on group decision-environment under
standing, (5) whether there is an interaction effect bet
ween GISMO use and NGT use on group decision performance,
and (6) whether there is an interaction effect between
GISMO use and NGT use on group decision-environment under
standing.
Summary and Organization of the Dissertation
The dissertation is presented in six chapters. The
first has provided a preview of the research and why this
research was undertaken. The second chapter will discuss
the conceptual foundations of GDSS, group decision-making
techniques, problem-solving strategies, and model building
approaches. The third chapter will consider some of the
factors affecting group decision-making effectiveness. The
theoretical model which underlies this research is also
presented in the third chapter. The fourth chapter will
present the research methodology in detail. Discussions of
the experimental design, data analysis, and other experi
mental issues are discussed, also. The results of the
study are reported in the fifth chapter. The final chapter
vill discuss the practical and theoretical implications of

18
this study, and put forth several suggestions for future
research studies.

CHAPTER II
LITERATURE REVIEW
Introduction
The first section of this chapter discusses why
strategic decision-making groups need support in performing
their decision-making tasks. The second section presents
some GDSS which have been developed to aid in strategic
decision making. The third section discusses a number of
procedural techniques which have been devised to increase
group decision-making effectiveness. The fourth section of
this chapter presents several model building approaches
which have been used to enhance model construction and
human problem understanding.
Group Decision Making
Numerous techniques, strategies, and technologies to
improve the effectiveness of decision groups have been
developed CDelbecq, et. al.. 1971, 1975; Van de Ven and
Delbecq, 1974; McLean and Shephard, 1976; MacCrimmon and
Taylor, 1976; King and Rodriguez, 1978; Herbert and Yost,
1979; Humphreys and McFadden, 1980; Lendaris, 1980;
Nadler, 1981; Steeb and Johnston, 1981; Volkema, 1983;
Wagner, 1983; Bui and Jarke, 1984; Szewczak, 1984; Wedley
and Field, 1984; White, 1984; Ramaprasad and Poon, 1983,
19

20
1985]. Structuring participant interaction, complexity
reduction, simulation, structural modeling, influence
diagrams, and cognitive mapping are Just a few examples of
these techniques.
Strategic or policy decisions have the least structure
of all organizational decision types CMintzberg, et. al.,
1976; Mintzberg, 1979], and are characterized by novelty,
complexity, and open-endedness. Such decisions typically
are the result of group interaction and group consensus
CSteiner and Miner, 1982]. Because of the importance and
pervasiveness of group decision making in organizations,
more attention is being directed toward providing computer
aids to increase group decision-making effectiveness.
A three-stage model of strategic decision making was
constructed by Mintzberg, et. al. C1976]. The stages were
problem diagnosis, alternative generation, and choice. The
key stage in that model is the problem diagnosis stage. In
it, the decision makers attempt to comprehend the problem
and to determine cause-effect relationships of the decision
situation CMintzberg, et. al.> 1976]. Problem comprehension
involves the activities related to problem recognition and
determination of cause-effect relationships. These
activities involve the development of a model to represent
the structure of the cause-effect relationships perceived
in the problem domain.

21
These initial steps give the decision maker direction
and understanding which is needed before the phases of
alternative generation and choice can take place. There
fore, these initial steps must be performed well for the
correct problem to be solved.
Groups facing strategic decisions usually begin with
little understanding of the decision situation they face,
and only a vague idea of what the solution might be and how
it will be evaluated when it is developed CMintzberg, et
al. . 1976]. The group may start out making random trials
or, more likely, by choosing actions based on a very rudi
mentary map of causality CHall, 1984]. As understanding
and experience are gained, that knowledge is retained in
the organization's "knowledge base." The retention process
is used to admit the relationships, thus selected, to the
organization's storehouse of knowledge. It may reject or
edit that which is selected to fit the existing set of
retained knowledge or modify the existing set and adopt its
converse. The relationships represented and retained in
the maps are then available for retention in the
organization's map of causality and hence may influence
future decisions CHall, 1984].
The pattern of search is simpieminded and proceeds on
the basis of elementary models of causality until driven to
more complex ones. "The pattern of search also proceeds in

22
ever widening circles from solutions suggested by the
symptoms, to solutions that worked for this problem before,
to solutions that absorb the slack of excess resources in
the system. This pattern of search is biased by the
particular local expertise of the unit undertaking the
search and usually commences among the variables within the
control of the problem solvers" CHall, 1981, p. 114].
Rados C1972] observed that when several alternative
solutions are readily available a more exhaustive search is
made for the best solution. If alternatives are not
available, the first satisfactory solution that arises is
chosen CHall, 1981].
Ackoff C197a, p. 13] states the idea as follows:
In dealing with a problematic situation, a decision maker must develop a concept--a representation or a model--of it. He attempts to solve the problem as he. conceives it. Thus if his conception is wrong, the solution to the problem as conceived may not solve the problem as it exists. A common example is a formulation of a problem that leads to the suppression of symptoms rather than the removal of the cause of a deficiency that creates the problem. Because of such errors of conceptualization, it has often been observed that we more frequently fail to face the right problem than fail to solve the problem we face.
The ability to conceptualize the problem domain can be
limited or enhanced by the technology a decision maker
uses. Ackoff C197a, p. 78] argues that "...our searches
for solutions tend to be restricted by the dimensionality

23
of our mental images" and, therefore, "Our conceptions of
what can be done in problematic situations are often
limited by constraints attributed to technology" CAckoff,
1978, p. 71). Technology to aid decision making, there
fore, should aid the decision makers in developing better
mental models because, "Increasing the number of dimensions
in which we think about problems can often reveal new and
more effective solutions" CAckoff, 1978, p. 78]. The
dimensions of a problem determine the problem domain or
problem environment. The ability to solve problems depends
critically on how well the causal connections between
events are conceptualized CAckoff, 1978].
The_ effectiveness of group decision making can be
enhanced through the use of computer-based and noncomputer-
based tools and procedures. Computer graphics and GDSS are
examples of such tools and procedures CHumphreys and
McFadden, 1980; Gray, 1981; Steeb and Johnston, 1981;
Huber, 1982, 1984; Kull, 1982; Wagner, 1983; Bui and Jarke,
1984; Wedley and Field, 1984]. Computer graphics are
discussed in the next section and followed by a section on
GDSS.
Computer-generated Graphics
Computer-generated graphic displays have been
considered an effective way to expand the conceptual

24
domains of decision makers CScott Morton, 1971; DeSanctis,
1984; Pracht, 1984, 1985; Pracht and Courtney, 1985].
Expansion of the decision maker's conceptual domain also is
a primary objective of DSS. Graphics not only can expand
conceptual horizons, but also are an effective medium of
communication.
Computer graphics have been mentioned by researchers
for their effectiveness as decision aids since the early
1970's CScott Morton, 1971], and since that time many
studies have been conducted to compare information
presentation modes CSenn and Dickson, 1974; Benbasat and
Taylor, 1978; Lucas and Nielsen, 1980; DeSanctis, 1984;
Dunikoski, 1984]. Most of these studies have been
concerned with comparing the effectiveness of tabular
displays of information to graphic displays.
Computer-generated graphics can be used to provide a
pictorial summary of data, or to depict a system of re
lationships (i.e., a model). Data summarization graphics
include such displays as bar graphs, pie charts, histo
grams, etc. Research on the usefulness of this type of
graphic display has focused on issues such as tables-
versus-graphics and CRT-versus-hardcopy CDeSanctis, 1984].
The second use of graphics involves the visual
representation of relationships among variables, rather
than summarization of data CPracht, 1984, 1985]. The

25
structural modeling system developed by Pracht C1984]
provides the capability to interactively develop, modify,
and display structural models on a computer terminal
screen. Other techniques have been developed which allow
the interactive entry of the relationships CBui and Jarke,
1984; Ramaprasad and Poon, 1983, 1985]- However, these
systems do not permit the interactive development,
modification, and display of the models (i.e., directed
graphs). They operate in batch mode rather than inter
actively, and provide either word descriptions or tables to
represent the structure of a complex issue or system, or a
printed model.
The primary advantage of the system developed by
Pracht C1984] is that the user's knowledge (current and
past) about a problem domain can be easily, visually and
interactively organized as a set of elements (variables) in
a hierarchical or network model. The models can be inter
actively rearranged or changed by the user at any time.
These abilities allow the user to store the model and to
use it as a "knowledge base" for future use CPracht, 1984,
1985; Pracht and Courtney, 1985].
In the next section of this chapter, an overview of
some of the computer-based systems which have been designed
to improve group decision-making effectiveness is presented,

26
Computer-based Group Decision Support Systems
Several prototype computer-based systems to aid
decision-making groups have been developed and reported in
the literature in the last few years CSteeb and Johnston,
1981; Huber, 1982, 1984; Kull, 1982; Wagner, 1983; Bui and
Jarke, 1984]. Discussions of three of the most promising
GDSS are presented in this section.
Perceptronics Group Decision Aid
trposes of the Perceptronics Group Decision Aid V The pu]
(PGDA) CSteeb and Johnston, 1981] are: (1) to guide the
group decision-making process by selective elicitation^of a
decision tree which incorporates value and probability
inputs from all group members, and (2) to identify con
flicts in value Judgments, and to initiate discussions
through use of multi-attribute utility analysis^ij The PGDA
features include a simple individual data entry terminal
for each group member, a large screen (7 ft. color video
display) for feedback of computer-generated information,
and a specially trained system operator (chauffeur) who
facilitates group interaction CSteeb and Johnston, 1981].
2) U The PGDA system was tested by comparing ten, three-
person decision groups. Five used the group decision
aiding system and the other five followed an unstructured
interaction procedure. ) The groups were compared on the
27
bases of "...decision analytic measures, participation
measures, decision quality measures, and satisfaction
measures" CSteeb and Johnston, 1981, p. 549]. The decision
analytic measures included the number of problem attributes
considered, and the number of actions and events generated
by the group. Individual participation was evaluated by a
tally of the number of actions, events, and attributes
contributed by each member.
^ ( The decision quality measure was based on the Judg
mental evaluation of a panel of experts who ranked the
solutions generated by each group on: (1) decision content
(comprehensiveness), (2) decision breadth, (3) decision
feasibility, and (4) decision detail (number of actions and
events in the recommended course of action ). (
The satisfaction measures were satisfaction with:
(1) information flow among the group members, (2) the num
ber of alternative solutions generated by the group,
(3) the degree of problem understanding, (4) the level of
co-operation among group members (facilitation of consensus
agreements), and (5) the group's decisions (sufficiency of
group problem analysis) CSteeb and Johnston, 1981, pp. 550-
551].
^ r^ The results indicate that PGDA groups exhibit more
completeness of the decision-making process and higher
levels of satisfaction and confidence with the group's

28
decisions. Also, the PGDA groups considered more problem
attributes, generated more potential actions and events,
and exhibited "...superiority both in decision content and
decision breadth compared to the unaided groups" CSteeb and
Johnston, 1981, p. 549].
The groups in the PGDA study were instructed to arrive
at a consensus decision within a three-hour period. A
comparison of the groups on how they spent their time has
shown that CSteeb and Johnston, 1981, p. 5501
The average nonaided group spent approximately 91 percent of its time generating actions and events and exchanging information, and less than nine percent of its time on quantitative Judgmental activities. All five of the nonaided groups followed this pattern. The average (PGDA) aided group, on the other hand, spent as much time in value and probability estimation (28 percent) as in action and event generation (26 percent). Attribute listing and weighting constituted 18 percent of the aided group's time, and conflict resolution procedures accounted for another 18 percent. Again, all of the aided groups spent the majority of their time making systematic quantitative evaluations while the unaided groups tended to follow a scenario of dividing early into factions, each supporting a given course of action. The factions would then attempt to buttress their position by qualitatively enumerating all available favorable evidence.
Executive Mind Support
Executive Mind Support is the name of a GDSS developed
by Execucom Systems Corporation. This GDSS was described
in articles by Huber C1982], Kull C1982], and Wagner
C19a3]. Mind Support is a combination of the DSS generator
29
(Interactive Financial Planning System) and another DSS
generator (Hindsight). Mind Support contains the features
of CWagner, 1983, p. 152]:
English-like syntax, nonprocedural model construction, easy incorporation of powerful mathematical procedures into a model structure, Monte Carlo and optimized solutions, interrogation of models by "What-If" analysis and other useful procedures, consolidations, graphic outputs, and a host of other capabilities.
Hindsight is a DSS generator which CWagner, 1983,
p. 153]:
. . . automates common meeting-oriented procedures such as voting, ranking and rating and subgroup selection of alternatives, quantitative estimation and free-form opinion registration. Issues phrased by a moderator at one terminal are responded to by each participant via his touch screen, or by typing in the case of narrative response. The system presents graphical tabulations of the results, which may be on an anonymous basis.
Another report on Hindsight CKull, 1982, p. 74] stated
that:
Hindsight offers a planning language that allows users with minimum programming skills to build computer models. It's not likely that a group would interrupt a meeting to construct one, however. More likely, the organization would have standard models written into the system before the session. ^
y--^ ( T h e r e are no published studies of controlled testing
of Executive Mind Support or Hindsight. Reports of the
effectiveness and usefulness of this GDSS have been based
on personal observations of decision makers in simulated
30
decision environments. Kull C1982] found that most users
felt the system helped bring out individual viewpoints, but
,n
u
felt a loss of traditional group interaction, KJ
Cooperative Group Decision Support System (CGDSS)
CT- f \ " ^ CGDSS is a GDSS prototype which integrates a
conventional DSS model component, two computerized process-
oriented group decision methods, i.e., the Delphi method
and the Nominal Group Technique, and a simple computerized
conferencing system that supports group communication CBui
and Jarke, 1984]. The main feature of this system,
Electra, is the incorporation of a multiple criteria
decision method "...as a vehicle to expand the DSS
framework to organizational group decision making" CBui and
Jarke, 1984, p. 101].
The function of the CGDSS is to provide the individual
group member with an individual DSS to support personal
decision making, and to provide "...negotiation advisory
support for assisting the individual in negotiating with
other decision makers of the group" CBui and Jarke, 1984,
p. 103].
The multiple criteria decision component provides
support to the decision maker and decision group primarily
in the alternative solution generation and choice phases of
decision making. There is no indication that the CGDSS has

31
components for providing support in the problem identifi
cation and problem evaluation phases of decision making.
Thus far, observations of the CGDSS in applied situations
have indicated that the system has CBui and Jarke, 1984, p.
110]:
...the ability to (1) support geographically dispersed decision makers, (2) enhance equality of participation in the group discussion, (3) allow time to mediate on discussion topics, and (4) facilitate technical information exchange.
But these abilities have not been empirically tested in
controlled studies.
I Group Decision-making Technigues
Attempts to find ways to increase group decision
making effectiveness have relied on the development of
techniques to structure or control personal and communi
cation interactions among the group members. These
techniques are process-oriented approaches which control
the processes in which member ideas and opinions are
expressed, developed, and adopted. A summary of several
of the techniques is presented in this section?) But first,
a definition of what constitutes a decision-making group
needs to be established.
What is a group? "A group consists of two or more
people interacting for the purpose of accomplishing some

32
goal" CHarold, 1979]. Work effectiveness is a measure of
how well the group carries out the task to which it was
assigned or which it has assigned to itself CHarold, 1979,
p. 96]. Group effectiveness can be measured through the
determination of (1) how well the group meets or exceeds
acceptable levels of quantity and quality, (2) whether the
group experience satisfies rather than frustrates the
personal needs of members, and (3) whether the group
experience maintains or enhances members' ability to work
together on subsequent tasks CHarold, 1979, p. 96].
Hare C1982, p. 20] states that, for a collection of
individuals to be considered a group.
...the group must have a set of values to give meaning to its activities, a set of norms that specify the role relationships between the group members, some form of leadership to carry out specific tasks, and some means of providing resources that are needed to reach the group's goals.
Interacting Groups
An interacting group (IG) is a conventional discussion
group in which members can interact throughout the
decision-making process. It is like a committee that
discusses a problem in an attempt to reach a consensus.
The IG format is generally an unstructured, free-flowing
meeting, with minimal direction by the leader other than
the presentation of the issues to the group CDelbecq, et.
al.. , 1975].

33
The IG format, for fact-finding problems, contains a
number of process characteristics which inhibit decision
making performance. Some of those process characteristics
are CDelbecq, et. al . , 1975, pp. 31-33]:
1. Because interacting group meetings are unstructured, high variability in member and leader behavior occurs from group to group.
2. Discussion tends to fall into a rut, with group members focusing on a single train of thought for extended periods, and with relatively few ideas generated.
3. The absence of an opportunity to think through independent ideas results in a tendency for ideas to be expressed as generalizations.
4. Search behavior is reactive and characterized by short periods of focus on the problems, tendencies for task avoidance, tangential discussions, and high efforts in establishing social relationships and generating social knowledge.
5. High-status, expressive, or strong personality-type individuals tend to dominate in search, evaluation, and choice of group product.
6. Meetings tend to conclude with a perceived lack of closure, low feelings of accomplishment, and low interest in future phases of problem solving.
The interacting group process can provide some
motivational benefits, however. IG may be effective in:
(1) increasing group motivation and cohesion, (2) in
creasing a sense of group consensus, and (3) increasing the
feeling that each alternative solution has been carefully
reviewed CDelbecq, et. al. . 1975].
34
Numerous structured problem-solving techniques and
approaches have been devised with the objective of
eliminating the negative process characteristics of IG and,
thereby, increasing individual and group problem-solving
and decision-making effectiveness. Van Gundy C1981]
presents an excellent review of a large number of these
group problem-solving techniques, as well as techniques
designed to enhance individual performance.
A list of some other group problem-solving techniques
is presented below. This list is not exhaustive. The
items marked with an asterisk are some of the more well-
known and more widely-used techniques. A brief discussion
of these specific techniques follows the list.
IDEA GENERATING TECHNIQUES FOR GROUPS
* Battelle-BuiIdmappen-Brainwriting » Brainwriting Pool * Classical Brainstorming
Force-Fit Game * Gallery Method Gordon/Little Method 6-3-5
* Pin-Card Semantic Intuition Stimulus Analysis Trigger Method Visual Synectic Wildest Idea
Classical Brainstorming
Developed in the late 1930's COsbourn, 1963], brain
storming is one of the most widely known and used methods
35
for idea generation. Brainstorming is based on two funda
mental principles: (1) deferred Judgment, and (2) quantity
breeds quality.
Deferred Judgment means that an idea is not Judged as
to its worth, importance, practicality, etc., when it is
expressed (i.e.. Judgment is deferred until a later stage).
The purpose of deferring Judgment is to encourage group
members to feel free in generating ideas.
The second principle is based upon the belief that the
larger the number of ideas generated, the greater the
possibility that one of them will provide a solution for
the problem and that the best solution to the problem will
be uncovered.
Four basic rules govern a brainstorming session:
1. Criticism of an idea is ruled out.
2. Freewheeling is welcomed.
3. Quantity of ideas is wanted.
4. Combining and improving ideas of others is sought. «
r
A brainstorming group consists of group members, a
leader, and an optional associate leader. The assignment
of people to groups should not be based on random
selection, because unfamiliarity among group members tends
to inhibit freewheeling behavior CVan Gundy, 1981].

36
Not all problems are suitable for brainstorming
sessions. Brainstorming was designed to find ideas, not to
Judge existing ideas. A brainstorming problem should have
many different possible solutions. The problem should be
stated in specific terms so that specific ideas can be
developed. Complex problems should be avoided or broken
into separate parts. A brainstorming session should be
conducted to deal with each part.
There has not been enough research to conclusively
determine how and under what conditions brainstorming works
best CVan Gundy, 1981]. The major weakness of brain
storming is that its usefulness is limited to relatively
simple problems, because with complex problems the number
of ideas becomes too numerous to manage effectively.
Battelle-BuiIdmappen-Brainwriting
The Battelle-Buildmappen-Brainwriting (BBB) method was
developed by researchers at the Battelle Institute in
Frankfurt, Germany. The BBB approach begins with classical
brainstorming, followed by idea stimulation from a picture
portfolio (the buildmappen) and ends with a second round of
idea generation using the basic brainstorming method. Six
steps are involved in using the BBB method CWarfield,
Geschka, and Hamilton, 1975]:
1. A problem is read to a group numbering five to eight persons.

37
2. The group verbally brainstorms to develop known or trivial solutions to the problem.
3. Each group member is given a folder containing eight to ten pictures that are unrelated to the problem.
4. Each person writes down any new ideas or modifications of the old ideas suggested by the pictures.
5. The solutions of each group member are read to the entire group.
6. The group discusses the ideas with the goal of developing additional variations.
A major advantage of the BBB method is that the
individual writing of ideas stimulated by the pictures can
help overcome the personal inhibitions often found in face-
to-face idea generation sessions. Ideas are generated by
individual free-association, by stimulation of others'
ideas, and by stimulation from the pictures.
Brainwriting Pool
Brainwriting pool (BP) also is a variation of
classical brainstorming. The primary difference is that
the stimulation of new ideas or improvements upon old ideas
is derived from the written, rather than verbalized, ideas
of others. The absence of verbal interaction is designed
into the method so as to prevent negative consequences
which often accompany group discussions and to add a
greater sense of anonymity [Van Gundy, 1981]. But
spontaneity of ideas may be lost because of the lack of

38
verbal interaction. Six steps are involved in using this
method:
1. Five to eight persons are seated around a table.
2. A group leader presents a problem to the group.
3. The participants silently write down their ideas on a sheet of paper.
4. As soon as an individual has listed four ideas, the sheet is placed in the middle of the table (the pool) and exchanged for another sheet. (An optional procedure is to create a pool from ideas which have been previously developed. The pool would be ready-made and the initial listing of four ideas would not be needed.)
5. The participants then continue to add new ideas to the sheets taken from the pool, exchanging one sheet for a new one whenever stimulation is needed.
6. After 30 to 40 minutes, the process is terminated and the idea sheets are collected for later evaluation.
The BBB method is more likely to produce higher
quality and more diverse ideas than other brainstorming
variations--especially Method 6-3-5 CWarfield, et. al..
1975].
Pin-Card
Pin-Card is another variation of brainwriting devel
oped by the Battelle Institute. The procedure requires
group members to write their ideas on different-colored

39
cards and to pin them on a board for group examination.
This approach involves nine steps CVan Gundy, 1981, pp.
115-116]:
A problem statement is written on a chalkboard or a pinboard which is visible to a group of five to seven persons.
The group discusses the problem statement to make sure that all group members clearly understand it.
Stacks of colored cards are distributed among the group members, with each member receiving a different-colored stack.
8,
The group members silently write down one idea on each card and pass it to the person on their immediate right.
When group members need stimulation for generating additional ideas, they pick up a card passed on from the person on their left, write down any new ideas stimulated by it, and pass the new-idea card on to the person on their right. (The stimulation card may be either retained or passed on at the same time.)
After 20 to 30 minutes of this activity, a group moderator announces that the idea-generation period is over.
The group members collect the cards on their right and begin pinning them on a large pinboard. The cards usually are sorted into idea categories, using title cards as headings for the different columns.
The group members read over all of the cards and, if necessary, move some cards to different categories and eliminate duplications.
The group moderator points to each card and asks for comments or questions to help clarify idea meanings. Because the ideas are color-coded, the originator of a particular idea can

40
be easily determined and, if necessary, questions asked of this individual.
The Pin-Card approach possesses many of the same
advantages of brainwriting: it reduces anxiety for persons
who have trouble verbalizing ideas in group situations, and
a larger quantity of ideas can be generated than in most
brainstorming procedures. Two major problems can occur
when using the Pin-Card method. First, bottlenecks often
develop when a group member receives more cards than he
passes on and, second, the group members may feel a great
deal of time pressure to generate as many ideas as possible
CVan Gundy, 1981].
Gallery Method
The Gallery method, another technique developed by the
Battelle Institute, reverses the Pin-Card technique
procedures. The steps for this technique are CVan Gundy,
1981]:
1. Sheets of flip-chart paper are pinned to the walls of a room.
2. A problem statement is written on a location visible to a small group (five to seven persons).
3. The group discusses the problem statement to make sure that all group members clearly understand it.
4. The group members silently write down ideas on the sheets of paper (flip chart sheets).

41
5. After 20-30 minutes of writing, a break is taken and the participants are given 15 minutes to walk around, look at the other idea sheets, and take notes.
6. A second round of silent writing is conducted in which the group is instructed to generate new ideas or make improvements on the ideas of others.
7. After the terminal round is completed, the group examines the ideas and selects those deserving further attention or implementation.
The distinctive feature of the Gallery Method is that
group members are permitted to move about during the break
period (incubation period). A disadvantage is that
people's movements may distract others.
Nominal Group Technigue
Techniques also have been developed which combine two
or more problem-solving stages and, in most cases,
emphasize the process aspects of problem solving. The
Delphi method and the Nominal Group Technique (NGT) are the
two most notable, and they include two problem-solving
stages (generation and selection of ideas). Delphi and NGT
are unique in their emphasis upon both the task and group
process aspects of problem solving. Another technique, the
Kepner-Tregoe method, also is especially helpful for
analyzing problems, and evaluating and selecting ideas CVan
Gundy, 1981].

42
NGT has been found to be more effective than brain
storming in terms of the quantity of ideas generated and
quality of decisions made CDelbecq and Van de Ven, 1971;
Van de Ven and Delbecq, 1974]. For these reasons NGT has
been regarded as a major component of GDSS CHuber, 1982,
1984; Wagner, 1982].
NGT was developed in 1968 by Delbecq and Van de Ven
C1971], and was designed to attain six objectives:
1. increase creative productivity of groups,
2. facilitate group decision making,
3. stimulate generation of critical ideas,
4. give guidance in the aggregation of individual Judgments,
5. save human effort and energy, and
6. promote participant satisfaction with group decisions.
The essential characteristics of NGT are:
1. silent generation of ideas by writing,
2. round-robin feedback from group members to record each idea in a terse phrase on a flip chart,
3. discussion of each recorded idea for clarification and evaluation, and
4. individual voting on priority of ideas with the group decision being mathematically derived through rank-ordering or rating.
NGT was designed to be used by small decision groups
in Judgmental (e.g., strategic) decision-making when there

43
is a lack of agreement or an incomplete state of knowledge
concerning either the nature of the problem or the
components which must be included in a successful solution.
As a result, heterogeneous group members must pool the
Judgments to invent or discover a satisfactory course of
action CDelbecq, et. al. . 1975].
NGT has been found to have advantages over interacting
groups (i.e., classical brainstorming groups) in solving
ill-structured problems because it CDelbecq, et. al. ,
1975]:
1. assures different processes for each phase of independent idea generation,
2. provides structured feedback and increases attention given to each idea,
3. balances participation among group members, and
4. incorporates mathematical voting techniques in the aggregation of group Judgment.
In a study investigating the applicability of NGT to a
structured problem, "NGT and interacting consensus groups
were compared on the criteria of decision quality,
utilization of best resource, and improvement in quality
over average-member decision quality" CHerbert and Yost,
1979, p. 358]. It was concluded that "...(the) nominal-
group format was found to be superior to the interactive-
group format in decision quality when a structured problem
was used..." CHerbert and Yost, 1979, p. 366]. Also, "The

44
increment between group decision quality and the best
individual decision was greater in the NGT condition; in
fact, an average negative utilization of best resource was
noted in the interacting group condition, indicating that
the average interacting group decision was poorer than the
average best individual decision" CHerbert and Yost, 1979,
p. 367].
The research finding presented above leads to the
contention that the use of NGT as part of a GDSS would be
beneficial. Indeed, NGT is commonly used as the procedural
component of most GDSS which have been developed CSteeb and
Johnston, 1981; Wagner, 1983; Bui and Jarke, 1984; Huber,
1984].
Kepner-Tregoe Method
The Kepner-Tregoe (K-T) method was developed as an
approach for managers to use in analyzing problems and
making decisions. The K-T approach was designed "...to
provide an efficient, orderly method for showing managers:
what to do, when to do it, and what information to use and
how to use it" CVan Gundy, 1981, p. 257]. K-T consists of
two phases: problem analysis and decision making. The
problem analysis phase is designed to guide the process of
finding a problem cause, while the decision-making phase is
designed to assist the decision maker in taking action.

45
The problem analysis phase has seven stages:
1. Identify problem areas by comparing actual performance with desired performance.
2. Examine problem areas, establish priorities, and select a problem.
3. Determine the precise nature of the problem by describing its identity, location, time, and extent. Describe what is not included in the problem.
4. Examine the problem specifications to identify those characteristics which distinguish what the problem is from what it is not.
5. Examine the problem domain to determine relevant changes that could have caused the problem,
6. Using the relevant changes identified, deduce possible causes of the problem.
7. Test the possible causes of the problem by determining the extent to which they explain what is and is not characteristic of the problem.
The decision-making phase also has seven stages:
1. Establish the specific objectives to be accomplished in terms of expected results and available resources.
2. Classify the objectives in order of importance by listing "must" and "want" requirements.
3. Develop alternative courses of action.
4. Compare each alternative against the "musts" and "wants" developed for the objectives.
5. Make a tentative decision by selecting the best alternative.
6. Evaluate any possible adverse consequences of the alternative selected.

46
7. Carefully plan implementation of the decision by establishing procedures to eliminate or minimize adverse consequences. Follow up on the decision to make sure that the specified actions are carried out.
The major strength of the K-T method is its emphasis
upon a systematic procedure for analyzing problems and
making decisions. It can help prevent premature
development of conclusions about problem causes, ensure
that alternatives are not generated until objectives have
been established, and provide a screen for efficiently
filtering alternative courses of action CVan Gundy, 1981,
pp. 266-267]. Therefore, K-T "...has the potential to
increase the quality of the problem analysis and decision
making cycles" CVan Gundy, 1981, p. 269] and may lead to
greater subordinate commitment in implementing decisions.
K-T was designed primarily to help decision makers
identify a problem cause and select from among already-
identified alternatives CVan Gundy, 1981, p. 267).
Therefore, K-T is not suitable for solving ill-structured
problems because it assumes that there can be only one
cause of a problem, and limited number of known possible
solutions to the problem.
Problem Reduction Strategies
Four decision strategies for reducing complexity in
problem diagnosis and formulation were identified by

47
MacCrimmon and Taylor C1976]: (1) determining the boun
daries of a problem, (2) examining changes in the decision
environment (or decision maker) which may have precipitated
the problem, (3) factoring complex problems into subprob-
lems, and (4) focusing on the controllable components of a
decision situation. A table of strategies for complexity
reduction (using categories suggested by MacCrimmon and
Taylor C1976]) is presented in Table 2.1 and a discussion
of these strategies is given in Volkema C19a3].
Table 2.1: Decision Strategies for Reducing Complexity in Problem Diagnosis and Formulation (Source: Volkema, 1983, p. 643)
Determining Problem Boundaries Explicit Boundary Clarification (Kepner & Tregoe, 1965) Function Expansion (Nadler, 1967) Assumptional Analysis (Mitroff, et. al. . 1979)
Examining Changes Focusing on Changes
Factoring Into Subproblems Means-ends Analysis Morphological Analysis Attribute Listing Input-output Analysis
(Kepner and Tregoe, 1965)
(Newell, et aJ . , 1960) (Hall, 1962) (Rickards, 1975) (Hall, 1962)
Focusing on the Controllable Components Working Forward,
Working Backward (Feldman & Kanter, 1965; Polya, 1973)
Planning Process (Bourne, et. aJL. , 1971) Mixed Scanning (Etzioni, 1967) Selective Focusing (Shull, et. al . , 1970)

48
Model Building Approaches
Two modeling techniques to represent complex systems
have evolved from General Systems Theory. Both techniques,
dynamic modeling and structural modeling, have been used as
methods for problem understanding and problem formulation
CForrester, 1968, 1971; McLean and Shephard, 1976; McLean,
1977; Lendaris, 1980]. Both techniques use models as
devices to represent the information about a system for the
purpose of studying the system CGordon, 1978]. The task of
building a model involves: (1) the establishment of the
model structure to define the system boundaries and to
identify the variables, attributes, and activities of the
system; and (2) supplying data which provide the attribute
values and define the relationships of the system's
activities.
Simulation
The objective of simulation, or dynamic modeling, is
to derive and forecast the expected behavior of a system by
using complex mathematical techniques [McLean and Shepherd,
1976], Lendaris [1980, p. 807] describes simulation as
concentrating on the determination of the "...exact numer
ical or statistical properties of the system being mod
eled. " The most notable examples of the dynamic modeling
technique are the dynamic world models of Forrester [1971],
and Meadovs, ejL al.. [19723. These models were intended to

49
show the changes which would take place in the world system
over time.
The simulation approach has been criticized for
focusing too much attention on the modeling of mathematical
behavior, and failing to place sufficient attention on the
problem identification and specification in terms of a
structure which adequately represents a complex system
[McLean and Shepherd, 1976]. The structural modeling
approach is suggested as a technique to avoid the defi
ciencies of dynamic simulation modeling.
Structural Modeling
Structural modeling (SM) is less concerned with
prediction than is simulation modeling. SM is more
concerned with the "...qualitative structural aspects
(i.e., problem definition and formulation) than exact
numerical or statistical properties of the system being
modeled" [Lendaris, 1980, p. 807]. SM tools use graphics
and words to represent the structure of a complex system or
problem. Knowledge about the problem domain is represented
as a set of elements (variables) and their relationships
CFigure 2.1]. The SM process generally involves participa
tion by more than one person, and is applicable in situa
tions where the participants are working collectively on a
problem which is defined in terms of a system (i.e., ele
ments, interconnections, etc. ).

5 0
"So. e \
cn c -H
H 01
13 0
E
H 00
s 3 -M
u 3 (4
•M
cn 'H 0
H (U
T3 0
£
H (0 ^ 3
*J U 3 t i
-M
cn <
^^ <J3 .H 0]
«
a %
o CO (J> .H
^ 10
•H (H
dO
*a c di
J
• « 01 0 u 3 Q
cn
U 3
51
The structural modeling process starts with certain
system-related data, ideas, skills, and/or knowledge
residing in the various group members. The process ends
with enhanced knowledge of a problem CMcLean and Shephard,
1976] and understanding of the system by the participants,
individually and collectively CLendaris, 19803. This is
accomplished because SM "...compels open discussion of the
crucial relationships relating to understanding...the
structure of the system" CMcLean and Shepherd, 1976, p 51].
Excellent surveys of SM, SM tools, and SM research are
given in Lendaris C1980], Pracht C1984, 19853, and
Pracht and Courtney C19a4, 1985].
Cognitive Mapping
The cognitive mapping approach uses one basic type of
relationship, the causal relationship. Concepts (or
variables) are represented as points and the causal links
between points are represented as arrows. The map (Figure
2.2) is a representation of all the cause-effect relation
ships which the decision maker perceives in a problem
structure. The cognitive mapping approach is designed to
capture the structure of the causal assertions of a person
with respect to a particular problem domain, and to
generate the consequences that follow from the structure.
5 2
Illustrative Cognitive Map Concepts 1 and 2 are policy concepts.
Concepts 3 througti 9 are cognitive concepts. Concepts 10 and 11 are affective (value) concepts.
FIGURE A4-2.
Valency Matrix and Associated Row and Column Sums for the Cognitive Map in Figure A4-1
1 2 3 4 3 6 7 8 9
10 11
Column abs. sums
1
0 0 0 0 0 0 0 0 0 0 0
0
2
0 0 0 0 0 0 0 0 0 0 0
0
3
0 0 0 0 0 0 0 0 0 0 0
0
4
1 0 1 0 0 0 0 0 0 0 0
2
5
0 0
- 1 I 0 0 0 0 0 0 0
2
6
0 0 0 0 1 0 0 0 0 0 0
1
7
0 0 0 0 0 0 0 0 0 0 0
0
8
0 0 0 0 0 0 1 0 0 0 0
1
9
0 - 1
0 0 1 0 0
- 1 0 0 0
3
10
0 0 0 0 0 1 0 0 0 0 0
1
11
0 0 0 0 0 0 0 0
- 1 0 0
1
Row abs. sums
1 1 2 1 2 1 I 1 1 0 0
1»
1
Figure 2.2: Example of a Cognitive Map (Source: Axelrod, 1980, p. 350)

53
Axelrod C1976, p. 5] argues that:
The real power of this approach appears when a cognitive map is pictured in graph form; it is then relatively easy to see how each of the concepts and causal relationships relate to each other, and to see the overall structure of the whole set of portrayed assertions.
The ability to solve problems depends on how well the
causal connections between events are conceptualized. The
conceptualization is important because the decision maker
attempts to solve the problem based on how he has conceived
it. If the problem conception is wrong, the decision maker
will fail to solve the right problem. As Ackoff C1978,
p. 13] states "...we more frequently fail to face the right
problem than fail to solve the problem we face."
The objectives of the cognitive mapping approach are:
(1) to make certain types of problem evaluation easier,
(2) to expand the range of complexity that a reasonably
skilled person could handle, and (3) to promote the devel
opment of new ways of thinking that would be logical exten
sions of the existing methods CAxelrod, 1976]. When a cog
nitive map accurately represents the concepts and beliefs
of a decision maker, that person CAxelrod, 1976, p. 56]
. ..should rationally make predictions, decisions, and explanations that correspond to the predictions, decisions, and explanations generated from the model. For this reason, the cognitive mapping approach has potential as an aid to decision makers who may know what they believe, but who are not always able to make correct deductions

54
from the full complexity of their many interrelated beliefs.
The relationships between points in a cognitive map
may also be given signs (•, - ) , and weights (e.g., -1 or 1
or 3). These cognitive maps are called "signed digraphs"
and "weighted digraphs," respectively. The relationships
defined in these two types of digraphs are linear, and the
signs and weights represent the slope of the linear
function. A third type of digraph is the "functional
digraph" in which the relationships are defined by
nonlinear functions placed on the arrows. The simulation
models developed by Forrester C1971] are examples of
functional digraphs.
The creation of a signed digraph involves three basic
steps: (1) listing a collection of variables (points)
thought relevant to the problem, (2) drawing arrows from
variable X to variable Y if a change in X leads to a change
in Y, and (3) placing a sign (• or -) on the arrow to ref
lect whether the change in X leads to a positive or nega
tive change in Y. The process of performing these steps
has the effect of clarifying the structure of the problem
domain and its complexity for the user [Axelrod, 1976 3.
The use of cognitive mapping has been adapted for
group decision-making situations to aggregate individual
beliefs for unstructured problem solving [Roberts and

55
Brown, 1974 3. The group cognitive mapping process uses a
mechanical (i.e., highly structured) process to aggregate
the group beliefs, rather than using a consensus
(interacting group) approach. Studies have shown that the
mechanical approach results in the development of more
accurate cognitive maps in comparison to "spontaneous"
cognitive maps generated by interacting groups [Roberts and
Brown, 19743. A description of both the mechanical and
spontaneous process should explain why this occurs.
The mechanical procedure is based on the Delphi
Technique. It is performed in three rounds of activities.
In round one, the members individually list as many
variables as they can think of which might be relevant to
the problem. These separate lists are then aggregated. In
round two, the aggregate list is reduced to only a few of
the most significant variables. The members may follow
either a ranking procedure or a Likert-scale rating
procedure to reduce the list. Both approaches have been
found to yield comparable results CRoberts, in. Axelrod,
1976].
In round three, the arrows and signs are assigned to
the map. The procedure for determining the arrows and
signs requires each group member to indicate for each
ordered pair of distinct variables in the reduced list, the
sign (*, -, 0) and strength of the relationship. The

56
individual decisions are then aggregated to create the
group map. The act of systematically considering all
pairwise relationships is intended to significantly
diminish the possibility that important effects and
feedback loops are not omitted CRoberts, in. Axelrod, 1976 3.
The spontaneous approach is an unstructured process in
which the group determines which variables to include in
the cognitive map on the basis of consensus. As a result,
the maps tend to contain many variables and causal
assertions. Spontaneous maps seldom contain feedback loops
or cycles.
Influence Diagrams
Influence diagrams have been used as a technique for
aiding group discussion and decision making CRamaprasad and
Poon, 1983, 19853. A problem decomposition technique
called "Mapping and Interpreting Influence Diagrams" (MIND)
has been proposed as a technique which "...can be used to
elicit influence diagrams for large, complex business
policy and planning problems, to map the diagrams, and to
encode...information in the diagrams" [Ramaprasad and Poon,
1983, p. 13. MIND elicits the influence diagrams "...in a
series of small, logical, meaningful, cognitively manage
able steps" CRamaprasad and Poon, 1983, p. 23. The MIND
technique involves five phases: (1) specifying the frame
work into "cognitively manageable chunks," (2) specifying
57
all relevant elements of the problem, (3) specifying
pairwise relationships between elements (organizational and
environmental) of the problem, (4) specifying the strengths
of relationships between elements, and (5) mapping the
influence diagram by encoding all data (i.e., elements),
relationships between data, and strengths of relationships
between data in the form of a matrix. The output of MIND
is in the form of tables giving the first-order and second-
order effects CRamaprasad and Poon, 1983 3.
Maps of Causality
The study of causality maps or mental models evolved
from cognitive mapping research. Causality maps (Figure
2.3) are created to represent the relationships among
significant external and internal variables that describe
an organization's environment. The relationships among the
variables in the causal maps are used as "...assumptions
for constructing the budget and as a diagnosing framework
for problem solving. The planning, perceiving and
interpreting frameworks are supplied by the structure of
the causality maps retained in the organization's memory"
[Hall, 1981, p. 1313.
gtrateoic Data Base Group Design
A research effort presently is being conducted by
Szetrczak [1985 3 to investigate the effectiveness of the

5 8
•S M
EM
OR
Y
z
NIZ
AT
IO
<
TH
E O
R
o
f i"
IZA
FIO
N
Z < o a£ O
^ — 0 " r & > ^ ^ •£ r a c X 3 0 I ' f*
X ^ £ -o J :
/ r ''
>
—J
^ ^ < a. oc (J
•S 5 t- ^ > F ^ - I 0 -J "^ H 2 U ^ O
Long
-run
i
ST
RU
CT
UR
t O
F C
AU
SA
LI
OR
ILN
TA
IIC
(I
DL
OL
OG
Y,
bfc
Llf
cfS
)
PR
OC
ED
UR
E
RE
DU
CIN
G r
•0 r~ 00 3 . . Q Q
«« •0
ii »• >. — 2 c - 0
2 - = Q = 5 5 w ^ ? "^ H ^ *
• i; « E ^ * « ? ;?
3 c 0 Q • >•
i\ ^ \ ^ r'~' < X ^ ^ ° • 5
* P :- ^ ^ '/I •S h cr - ^ 1 _i 5 u > ^ -i : M <• < ••XI UJ < 1 >
? n 2 ; ; z 3 £ ^ : ^ o
Sho
rt-r
u
VA
LU
ES
( R
EL
AT
IO
SIG
N 0
1 1
RE
LA
TK
i
LIS
TO
I S
P
OL
ICIE
S
INS
TIT
UT
P
RIO
KII
II
AS
PIR
All
^" ~ 1 -*^ • y iv->
c r; c 3 / ci
1 : V ^ 5 i * • c -• \ 111
• . c - u
! : \ a ^ 1 •. *. < 1 2 i \ \ ^ \ \. •• •.
? ? " ' \ \ \ ^ - i I \ • •• \ \ n ^- ^ ^ _ = •.
1/1
l / > l / l
UJ ( J 0 Of a.
g z UJ
z < z 0 1—
- J - J y l
u
i / l U
H
^ 0
— >/> & > - • ; ; ! Q
Z (- Z (J Z ui 1/1 -^ 1/1 -< 'yi — UJ < UI 0 UI - i 0 !^ U a. 0 <
AD
MIT
CH
AN
M
AP
S o
r C
AL
AD
MIT
CH
AN
S
UL
CE
SS
rUL
AD
Mir
CH
AN
i IN
ST
ITU
TIO
N
t — u •M
^ < Q '^ UJ z 0 u. 5E < ^ c —
uo _ r--J u "> . ^ u < " -D I J LU > < 0 ac C U LO l/l < Z
=^ ^ 0^ « =«: <
r- . r— _ ^ V
^ < :£ ^ £ I i 0 -J 0 _ l 0 s j -J LJ 'oJ Q U Z ^ se. Qi a. ai 3
— fN m U U U
A
. 1 1 \ • 0 ~ "^ - _ ae 0 . , J — • . 1 . -
ofi-^ » - r J ^ ^ c w w i — , • | « f c _
==^ ' : \ ' \ i i ^ p - •••• T-== ^ ^ - \ V V : <
^ c \ "^ •* " * •
Q Z \ ,
-. ^ \ . C o .
< > ) > ^ ^ ^ 0 ^ « ^ *
2 2 / „ ^ N. ' t r \ » = ^ ^
y _ i , _ - ~ c 2 c < / 2 £ < ^ i : • ^ - o _ _ < ^ ^ ~ C ^ — ~ *- 2 ? ^ — w
A 1 • 1 LU
i-n • "
0
0
— Z
u < z UJ
3
*— yi
J f 2 a _i < 3 a y) _ i a: 0 ^ a. < a: U r-X — J j
r> ^ =i 0 ^ ^j 9 0 a: z UI a u. J y i ^ 0 0 -J ^ z . - ^ ^ 3 i ; r < 0 u a: u 2 i — -^ ^ -T a 33 23 2
^ * - o r * i ^ j ; ; 3 ^ ( « ^ > ^ y
c ^ !r _ ^ 3 C 0 O c
' / I _J UI
z > 1/1 _J
0 ^ 2 Z
: : ac 0 ^ 5: :^ 0 1/1 0 < < -
0 . y l 2
32 < 2 > < UJ H-t - < 1/) _ l
0 < '-J 0 at J
-T 1 0
'V .
A - * 0 "^
! !^ Q i -^ C - * D
2 * 2 <
- t
>. -P -H H CO oa 3 CO
u M 0
a flO £
CO
'H 0 01
H
a E CO X
u
• ^
^ CO (P ^
« H H CO X
«« 01 u u 3 0 UI >^
n
01 u 3 0>

59
strategic data base (SDB) group design. SDB is a technique
for assessing the current organizational environment and
determining the most significant information items related
to strategic decision-making [King and Cleland, 1977; Grant
and King, 1982 3. SDBs are "...concise statements of the
most significant strategic items related to various
clientele and/or environments which affect the organi
zation's strategic choices" [King and Cleland, 1977, p.
59 3. Ideas about strategic alternatives are developed as a
result of compiling the SDBs. The list is compiled through
the efforts of a task force which represents diverse
interests within the firm. This research effort uses an
unstructured decision situation and the classical brain
storming group format. Included among the dependent vari
ables measured are: (1) information evaluation, (2) number
of ideas generated, (3) quality of the SDB, (4) perceived
confidence in the SDB, (5) perceived satisfaction with the
design process, (6) perceived implementability of the SDB,
and (7) time for the process [Szewczak, 1984 3.
Predecision Support System
The Predecision Support System <PSS) is a Specific DSS
(SDSS) that acts as a traffic controller within a general
DSS generator [Wedley and Field, 1984 3. The primary
purpose of the PSS is to aid the manager "...at the design

60
stage of the decision-making process. It is utilized
before alternatives are generated, before information is
gathered, and before a participatory group meets" [Wedley
and Field, 1984, p. 7013. PSS uses a model which a
combination of the Vroom-Yetton [1973 3 decision style model
and the Stumpf, Zand, and Freedman [1979 3 decision method
and membership model.
The resulting model is a normative model to recommend
a decision style, a decision method, and decision member
ship for a decision-making situation. The model employs
the Vroom-Yetton [19733 continuum of decision styles from
Autocratic <A1 and A2> to Cooperative (CI and C2) to Group
(Gl and G2). The decision styles vary according to the
degree of structure used to gather and process information.
Individual interactions (II) involve face-to-face discus
sions on a one-to-one basis. Interacting groups (IG),
nominal groups (NG), and Delphi groups (DG) are three
procedures for allowing the relevant people to provide
information necessary for the decision.
Decision membership refers to the predominant
composition of a decision-making group. The decision
making group may be composed of experts (EX), co-workers
(CW), and representatives (RE).
The PSS asks ten situational questions for the manager
to answer [Wedley and Field, 1984, p. 7013.
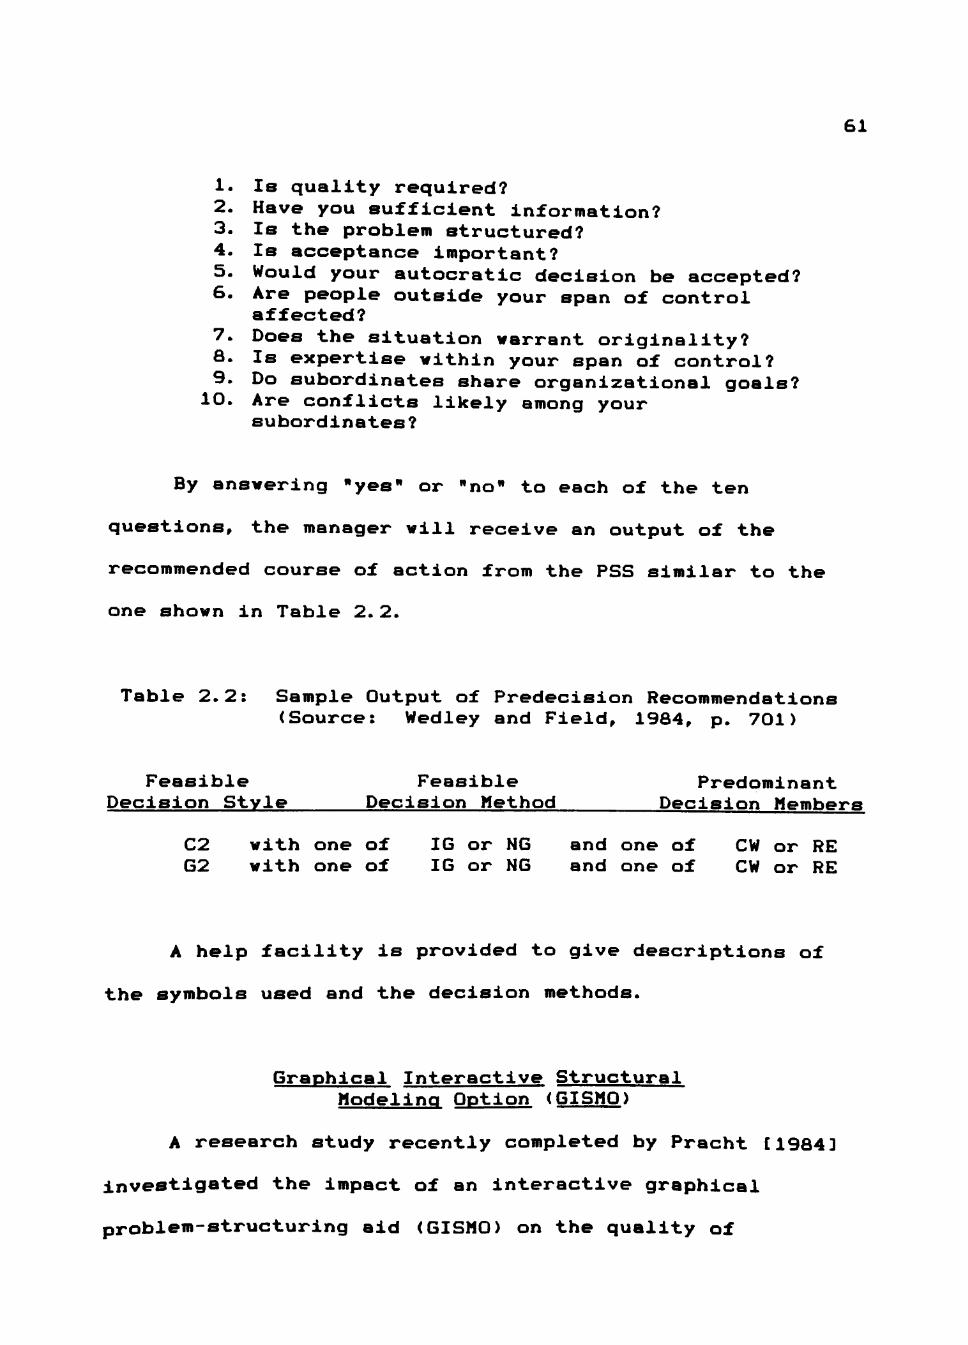
61
1. Is quality required? 2. Have you sufficient information? 3. Is the problem structured? 4. Is acceptance important? 5. Would your autocratic decision be accepted? 6. Are people outside your span of control
affected? 7. Does the situation warrant originality? 8. Is expertise within your span of control? 9. Do subordinates share organizational goals?
10. Are conflicts likely among your subordinates?
By answering "yes" or "no" to each of the ten
questions, the manager will receive an output of the
recommended course of action from the PSS similar to the
one shown in Table 2.2.
Table 2.2: Sample Output of Predecision Recommendations (Source: Wedley and Field, 1984, p. 701)
Feasible Feasible Predominant Decision Style Decision Method Decision Members
C2 with one of IG or NG and one of CW or RE G2 with one of IG or NG and one of CW or RE
A help facility is provided to give descriptions of
the symbols used and the decision methods.
Graphical Interactive Structural Modeling Option (GISMO)
A research study recently completed by Pracht [1984 3
investigated the impact of an interactive graphical
problem-structuring aid (GISMO) on the quality of

62
individual decision-making performance and understanding of
decision environment. Pracht and Courtney [1984, p. 2 3
reported that there were "... statistically significant
interactive effects between cognitive style, use of the SM
(structural modeling) tool (GISMO), and understanding of
the decision-making environment." They also concluded that
the graphics package significantly improved performance for
subjects with a field-independent (analytic) cognitive
style, but subjects with a field-dependent (heuristic)
cognitive style were not significantly helped.
GISMO is an extension of a computerized structuring
tool (SPIN) developed by McLean and Sheperd [1976 3. The
extensions, provided by Pracht [1984 3, include the addition
of a menu-driven user interface, a set of interactive
digraph routines, digraph design and modification pro
cedures, and an on-line help facility [Pracht and Courtney,
1984, 1985 3. These extensions enhance the man/machine
interaction characteristic of DSS. The interactive
structural model generation, together with interactive
graphics review and editing capabilities provides the user
with a unique "hands-on" model-building tool. GISMO allows
users to create, save, retrieve, edit, and delete struc
tural models.
GISMO aids the user in creating maps of causality
which depict the cause-effect relationships among variables

63
in a problem domain. The user interface utilities make it
easy for users to specify: (1) relevant elements of the
problem, (2) pairwise relationships between problem
elements, and (3) the strengths of the relationships. The
map or digraph is then created by GISMO from the table
specified by the user. A sample of a GISMO digraph and
interactive table are shown in Appendix B.
Summary
In this chapter a brief review of the major research
efforts and publications related to computer-based group
decision-making techniques, problem-solving strategies, and
computer-based modeling and problem-structuring aids was
presented. These various areas of research are related in
that GDSS technology attempts to combine DSS technology,
structured group decision-making methods, and structured
problem-solving approaches to create a system intended to
enhance the efficiency and effectiveness of small decision
groups.
In general, much research has been conducted sepa
rately in each of the areas mentioned above. However,
there have been few controlled studies testing the effec
tiveness of GDSS or their components. For example, it is
generally accepted that NGT and Delphi approaches are
appropriate for a GDSS, but the assumption has not been

64
tested in different problem environments. Also, current
GDSS primarily focus on providing support for the alter
native generation and choice phases of problem solving, and
ignore the problem evaluation phase.
In the next chapter, the theoretical models of human
decision making which underlie the research study are
discussed, as well as the research model which was tested
in the study. The propositions based on the research model
and the formal hypotheses tested are presented in Chapter
III.

CHAPTER III
THE RESEARCH MODEL
Introduction
The literature review in the preceding chapter
suggests several conclusions. First, the field of DSS is
evolving from providing support for individual decision
makers to providing support for decision-making groups.
This is a natural development in that: (1) the "...concept
of Decision Support has evolved from two main areas of
research: the theoretical studies of organizational
decisionmaking...and the technical work on interactive
computer systems" [Keen and Scott Morton, 1978, p. vii3,
and (2) the DSS should provide support for semistructured
and unstructured decisions [Sprague and Carlson, 1982 3
which are usually the domain of group decision-making
[Steiner and Miner, 19823. Alter [19803 found that DSS
improve managerial effectiveness by:
1. Improving personal efficiency by allowing a manager to perform a task in a different way that uses less time or less effort.
2. Expediting problem solving by providing faster turnaround, newer insights, better consistency and greater accuracy.
3. Facilitating interpersonal communication both with specific individuals and across organizational boundaries. *
65

66
4. Fostering learning or training.
5. Improving overall control.
Second, the development of computer-based DSS to
support group decision-making activities is still in the
embryonic stage. The GDSS prototypes discussed in the
preceding chapter illustrate the immaturity of these
systems. The primary objective of the GDSS prototypes is
to enhance group decision-making effectiveness. However,
few of these prototypes have been subjected to systematic,
controlled empirical testing. Consequently, the effective
ness of these systems has not been determined. Related to
this problem is the absence of adequate coverage in the
literature concerning the design and research issues of
GDSS. Certainly, there is a need for empirical studies and
the development of GDSS research issues.
A theory of GDSS can be inferred from a review of
Group Decision Support System literature. The theory of
GDSS is a combination of DSS theory and group decision
making process theory. At the foundation of DSS theory is
belief that decision-making effectiveness of human decision
makers is influenced by the quality of the human-to-
computer interaction in the man/machine system. The
foundation of group decision-making process theory is based
on the belief that group decision-making effectiveness is

67
influenced by the quality of the human-to-human
interactions.
The GDSS theory is based on the belief that by
blending DSS technology and appropriate group decision
making process techniques, the resulting increase in group
decision-making effectiveness will be greater than the sum
of their individual effects. While this assumption is the
basis for all GDSS presented in the literature, no report
of formal testing of this assumption have appeared. More
significantly, there have been no reports of testing
whether these GDSS enhance group decision-making effective
ness.
This research study builds on the research performed
by Pracht [1984 3 in that the same software, gaming
simulation, and comparable conceptual models are used. The
conceptual model used is the man/machine system model. The
primary difference between this study and the Pracht [1984 3
study is that the focus of the research is on the effect of
the graphical structural modeling aid (GISMO) on small
groups. Thus, the man/machine system model is modified so
that the "man" component includes both the individual user
and the small decision-making group.
In this chapter a conceptual model based on a
man/machine system is developed. Following the model
presentation, the research propositions are discussed, and

68
the empirically tested research hypotheses are presented.
The methodological design and procedures followed in the
research experiment are discussed in Chapter IV.
Model Presentation
The fundamental man/machine conceptual model for the
research is illustrated in Figure 3.1. The boundary lines
are shown as broken lines to emphasize the permeable nature
of the boundaries.
The integrated man/machine system is shown as
operating within an organizational and political environ
ment, which in turn exists within some external environ
ment. The man/machine system components and their
interactions are discussed in the following sections.
Decision Support System
The Decision Support System component is composed of
two subsystems: the human information processor system and
the computer information processor system. These sub
systems work together to solve organizational problems and
to make organizational decisions. The primary role of the
computer component is to assist the human processors in
assimilating information in the problem definition, and
alternative generation and testing phases of problem-
solving, thereby promoting more effective decisions.

69
EXTERNAL ENVIRONMENT
ORGANIZATIONAL AND POLITICAL ENVIRONMENT
DECISION SUPPORT I SYSTEMS I
l<
I >l DECISION I TASKS
(HUMAN< >COMPUTER)I
DECISION OUTPUT
MAN/MACHINE SYSTEM
Figure 3.1 Conceptual Model of the Research (Source: Pracht, 1984)
Bonczek, et. al. [19813 view the human-based and
computer-based DSS as generically consisting of a Language
System (LS), a Knowledge System (KS), and a Problem
Processing System (PPS) (Figure 3.2). For the human-based
DSS, the PPS resides in the mental skills of the user. In
the computer-based DSS, the PPS is the software which

70
processes a user's request for information and extracts
that information from a pool of knowledge about the problem
domain.
I I I I I I I I I
USER < >LANGUAGE< >INTERFACE< >KNOWLEDGE A I I I I LS PPS T~ ~" KS I I
Figure 3.2: Structure of a Decision Support System (Source: Bonczek, et. al. , 1981)
Human information processing (HIP) is based on the
view that humans have an input mechanism, an output
mechanism for interpretation and making choices, internal
processes for filtering and other analysis efforts
associated with information, and memories for long-term and
short-term storage of information [Sage, 19813. These
functions are equally applicable to both individual and
group decision makers. Empirical work on decision-making
processes can be placed into three categories: (1) the
cognitive aspects of decision making of individuals, (2)
the social aspects of group decision making, and (3) organ
izational decision making in field settings [Beyer, 19813.

71
Individual Information Processor
Newell and Simon [1972 3 present a formal model of
human information processing for research in artificial
intelligence. The model (Figure 3.3) is a conceptual model
and does not exactly depict human processes. It is only
intended to represent the major processes involved in HIP
and relationships among these processes.
I---I
I Receptors I I(eye, ear, i
>I nose) I - >|
Environment I I
I Processor I > I (brain) i I I
K - - -1 E f f e c t o r s I I ( p h y s i c a l , i I spoken, I I wr i t t en ) I
- _ _ > l <
Memory
~~iTM (brain)
~~LTM (brain)
ex terna l memory
(notes )
F i g u r e 3 . 3 : N e w e l l and S imon Model o f Human I n f o r m a t i o n P r o c e s s i n g ( S o u r c e : S i m o n and N e w e l l , 1 9 7 2 )
Human m e n t a l p r o c e s s e s h a v e b e e n f o u n d t o b e r e l a t e d
t o s u c h p h y s i o l o g i c a l and p s y c h o l o g i c a l f a c t o r s a s :
( 1 ) l e f t - s i d e / r i g h t - s i d e b r a i n f u n c t i o n s ; ( 2 ) c o g n i t i v e
a b i l i t i e s , and ( 3 ) memory and i n f o r m a t i o n o v e r l o a d [ R o b e y
a n d T a g g e r t , 1 9 8 2 3.

72
In DSS research the models of individual information
processing have focused on personal cognitive abilities,
cognitive style, individual demographic differences,
personality traits, and problem-solving and information-
processing behavior of users. Experience has shown that
successful design and implementation strategies for
building a DSS are seen as contingent on these factors
[Robey and Taggert, 1982 3.
The human mind is constrained by inherent properties
which, as Newell and Simon [1972, p. 1463 have indicated,
"...impose strong constraints on the ways in which the
system can seek solutions to problems in larger problem
spaces."
Among these constraints are: (1) the human mind
operates serially in one-process-at-a-time fashion, rather
than in parallel fashion; and (2) the inputs and outputs of
the serial processes are held in a small short-term memory
with a storage capacity of only a few symbols. There is
access to an essentially infinite long-term memory, but the
time required to store a symbol in that memory is longer.
These properties--serial processing, small short-term
memory, infinite long-term memory with fast retrieval but
slow storage--lead human decision makers to attempt to
choose solutions which satisfy primary goals, but which are
not necessarily optimal.
73
Small Group Problem Solving
Research on group problem solving reveals that the
group has both advantages and disadvantages over individual
problem solving [Maier, 19673. Among the advantages are:
(1) greater sum total of knowledge and information,
(2) greater number of approaches to a problem, and (3) bet
ter comprehension of the decision.
Other factors may negatively influence the quality of
group decision making. Among those factors are: (1) so
cial pressures for conformity, (2) valence of solutions
which leads to premature closure on a solution, (3) indi
vidual persuasive abilities or stubborn persistence, and
(4) the desire to win arguments rather than finding the
best solution.
Some factors can be negative or positive influences
depending on the structure of the group, skills of the
leader, and problem-solving tools used by the group. Among
these factors are: (1) disagreement, (2) conflicting in
terests versus mutual interests, (3) risk taking, (4) time
requirements, and (5) who changes opinions (i.e., the
person(s) with the most constructive viewpoints or those
with the least constructive viewpoints.
n-rqanizational Information Processor
Numerous decision frameworks have appeared in the
Organization Behavior literature to describe organizational

74
decision-making processes. The following frameworks
represent some well-known models. These models expand
individual information processing models by including
interpersonal and organizational behavior in problem
solving and decision making. Beyer [19813 classified
decision-making process models as being: (1) those that
model the stages of strategic decision making, and
(2) those that identify dimensions along which the stages
of decision making may vary. The Simon decision-making
model and various decision production models are examples
of the first class of models. The Rational Actor,
Bureaucratic, Muddling Through, and Garbage Can models are
examples of the second class of models.
The Rational Actor model, one of the earliest models,
is based on the microeconomic assumption that the individ
ual decision maker is perfectly and economically rational.
The central assumption of this model is that the decision
maker is fully aware of his choices and preferences (i.e,
utilities functions), which permits him to rank all the
possible decision outcomes according to preference. With
this knowledge the decision maker is able to choose that
alternative which will maximize his well-being [Cyert,
Simon, and Trow, 19563. In the case of business decisions,
the criterion for ranking decision outcomes is assumed to
be profit maximization.

75
The highly normative Rational Actor model focuses on
the logic of optimal choice by an individual decision maker
rather than decision-making groups. As a result it has
been criticized as being overly idealistic and neglectful
of human cognitive limitations [Keen and Scott Morton,
19783. Simon [19693 concluded that, in the real world,
decision makers are not objectively rational, because
humans do not possess the cognitive capabilities to find
optimal solutions to all problems. Therefore, the human
decision maker can only try to satisfy, not maximize, his
primary objectives.
The Bureaucratic model views strategic decision making
as a process of incrementalism, or "Muddling Through."
This model is an extension of the intendedly rational
approach of the Rational Actor model. However, it differs
from the rational model in that it recognizes the function
of political bargaining processes and does not regard
decision making as the driving force of the organization.
In this model, organizational decision making is not a
neat, predictable, or controllable process, but is a
process in which company, divisional, and personal goals
interact to determine the decision making actions.
The Muddling Through model [Lindblom, 19593 rejects
both the rational and satisficing models. According to
Lindblom [19593, rational decision making is not possible

76
because the required information needed to make rational
decisions is not available or is too costly to obtain.
And, if all the information were available to the decision
maker, the strategic problem itself would be too complex
for the human to understand and process. Thus, decision
making becomes a process of making "safe" incremental deci
sions rather than making comprehensive, optimal decisions.
In the Organizational Process model [Cyert and March,
1963 3, the organization is viewed as being comprised of
both formal and informal communication channels in which
coalitions exist with their own priorities, goals, and
focus of attention. Organizational decisions are based on
bargaining among the coalitions and the factoring of large-
scale problems into small subproblems.
The factoring process leads to a functional division
of the organization structure, where each subdivision
processes information pertinent to its own programs and
procedures. The function of the organization's information
system is to integrate these subdivisions. Mintzberg
[1979, p. 703 explained the value of the computer-based DSS
in this model as: "...its role in integrating subunits...
to create a joint plan rather than bargaining over their
independent, often incompatible subpians."
In a more recent model, the Garbage Can Model [Cohen,
et al. , 19723, organizational decision making is viewed as

77
occurring in "organized anarchies" which are characterized
by three properties:
Property 1: Ill-defined preferences. The organization operates on the basis of a variety of inconsistent and ill-defined preferences. The organization is a loose collection of ideas rather than a coherent structure which discovers preferences through action more than it acts on the basis of known preferences.
Property 2: Unclear technology. The organization operates on the basis of simple trial-and-error procedures, the residual of learning from the accidents of past experiences and pragmatic inventions of necessity. In spite of these faults, the organization manages to survive and possibly grow.
Property 3: Fluid participation. Participants vary in the amount of time and effort they devote to different domains, and involvement varies from one time to another. As a result the boundaries of the organization are uncertain and changing, and the audiences and decision makers for any particular kind of choice change capriciously.
Although these properties do not necessarily explain
the full behavior of organizations, they "...are character
istic of any organization in part--part of the time"
[Cohen, et, aJL-» 1972, p. 13.
Computer Information Processor
The compute!—based DSS components are shown in Figure
3.4 as: the user, the dialogue management system (DGMS),
the problem processing system (PPS), the data base (DB),
data base management system (DBMS), the knowledge base

78
DATA BASE
KNOWLEDGE BASE
DBMS KBMS MBMS
MODEL I BASE i
PROBLEM PROCESSING SYSTEM
DIALOGUE MANAGEMENT SYSTEM
I USER
Figure 3.4: Components of Computer-based DSS (Source: Pracht, 1984)
(KS), the knowledge base management system (KBMS), the
model base (MB), and the model base management system
(MBMS). The DSS consists of a complex set of software
which links the user, data base, model base, and knowledge
base.
The user may be either an individual or a group. The
user interacts with the DSS through the dialogue or

79
language system, and creates a model of the problem he/she
is trying to solve with the aid of the DBMS, KBMS, and
MBMS. The components of the GDSS are similar to those of
the DSS, except for the extensions to the Dialogue Manage
ment System to accommodate group interaction processes
discussed in Chapter I and Chapter II.
Decision Tasks
Many models have been developed to represent the tasks
involved in the decision-making process. One common theme
among these models is that data are received by way of a
scanning process. These data are then selectively
converted into a suitable form of information that can be
consumed by the problem solver. This information serves as
the basis for decision making. The information is formed
in the mind of the problem solver as an outcome of
comparisons between the problem and the data. Figure 3.5
illustrates three fundamental components of this process.
One of the best-known models is Simon's decision
making process model. Simon [19603 breaks the decision
making process into three phases: intelligence, design,
and choice. The intelligence phase involves searching the
environment for conditions calling for a decision. The
initial step of intelligence is problem recognition or
problem finding. Data are detected and collected from the
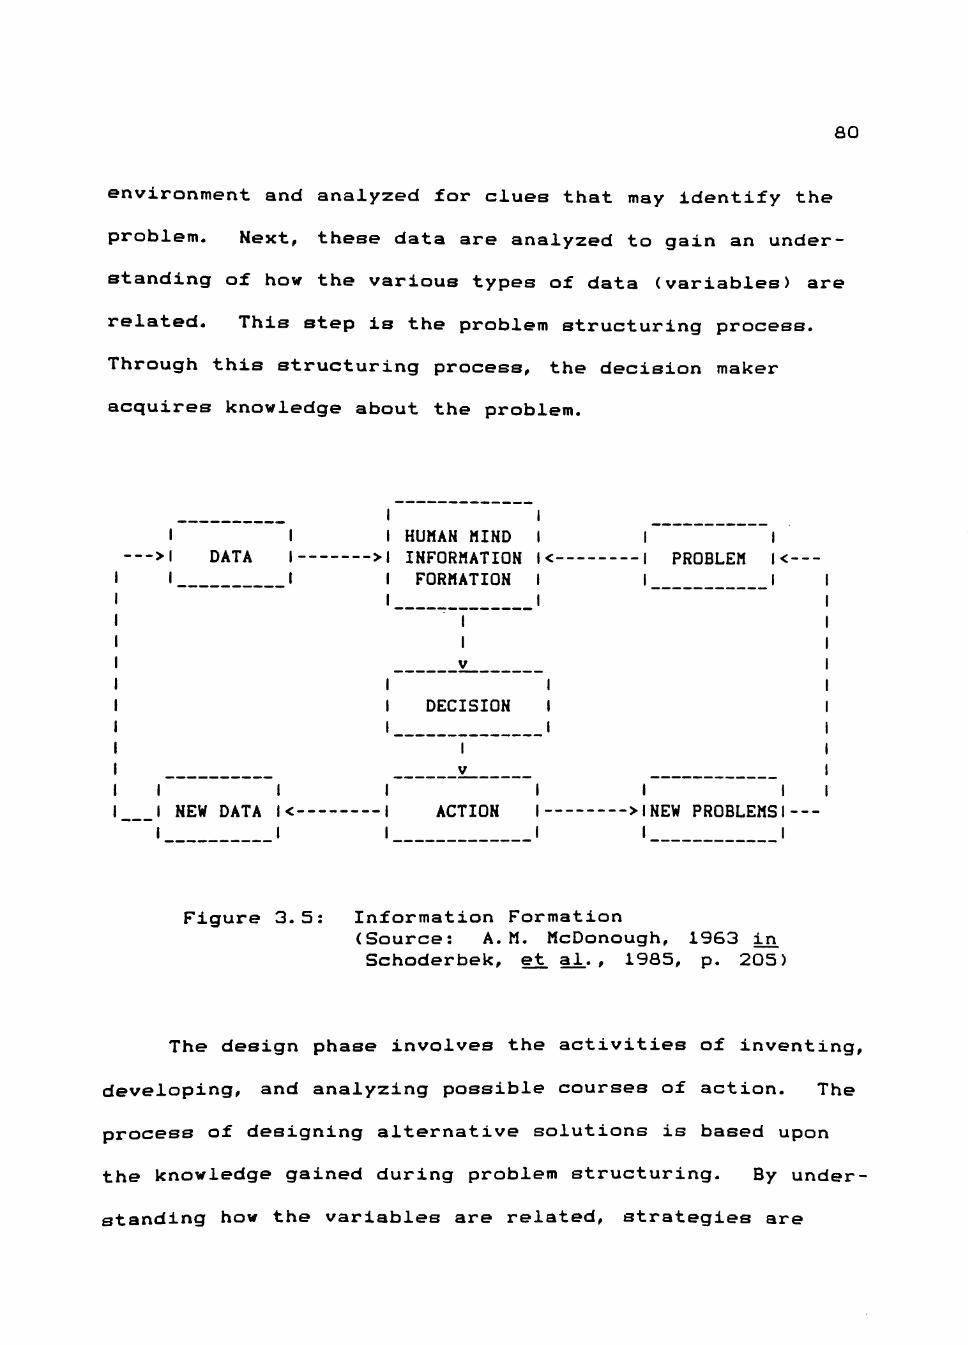
80
environment and analyzed for clues that may identify the
problem. Next, these data are analyzed to gain an under
standing of how the various types of data (variables) are
related. This step is the problem structuring process.
Through this structuring process, the decision maker
acquires knowledge about the problem.
I I •> I DATA I
I
I I I NEW DATA l<-I I
HUMAN MIND INFORMATION FORMATION
___
I DECISION I I I
I ACTION I
PROBLEM l<---
I I •>INEW PROBLEMS I I I
Figure 3.5: Information Formation (Source: A.M. McDonough, 1963 in_ Schoderbek, et. aJ . , 1985, p. 205)
The design phase involves the activities of inventing,
developing, and analyzing possible courses of action. The
process of designing alternative solutions is based upon
the knowledge gained during problem structuring. By under-
itanding how the variables are related, strategies are
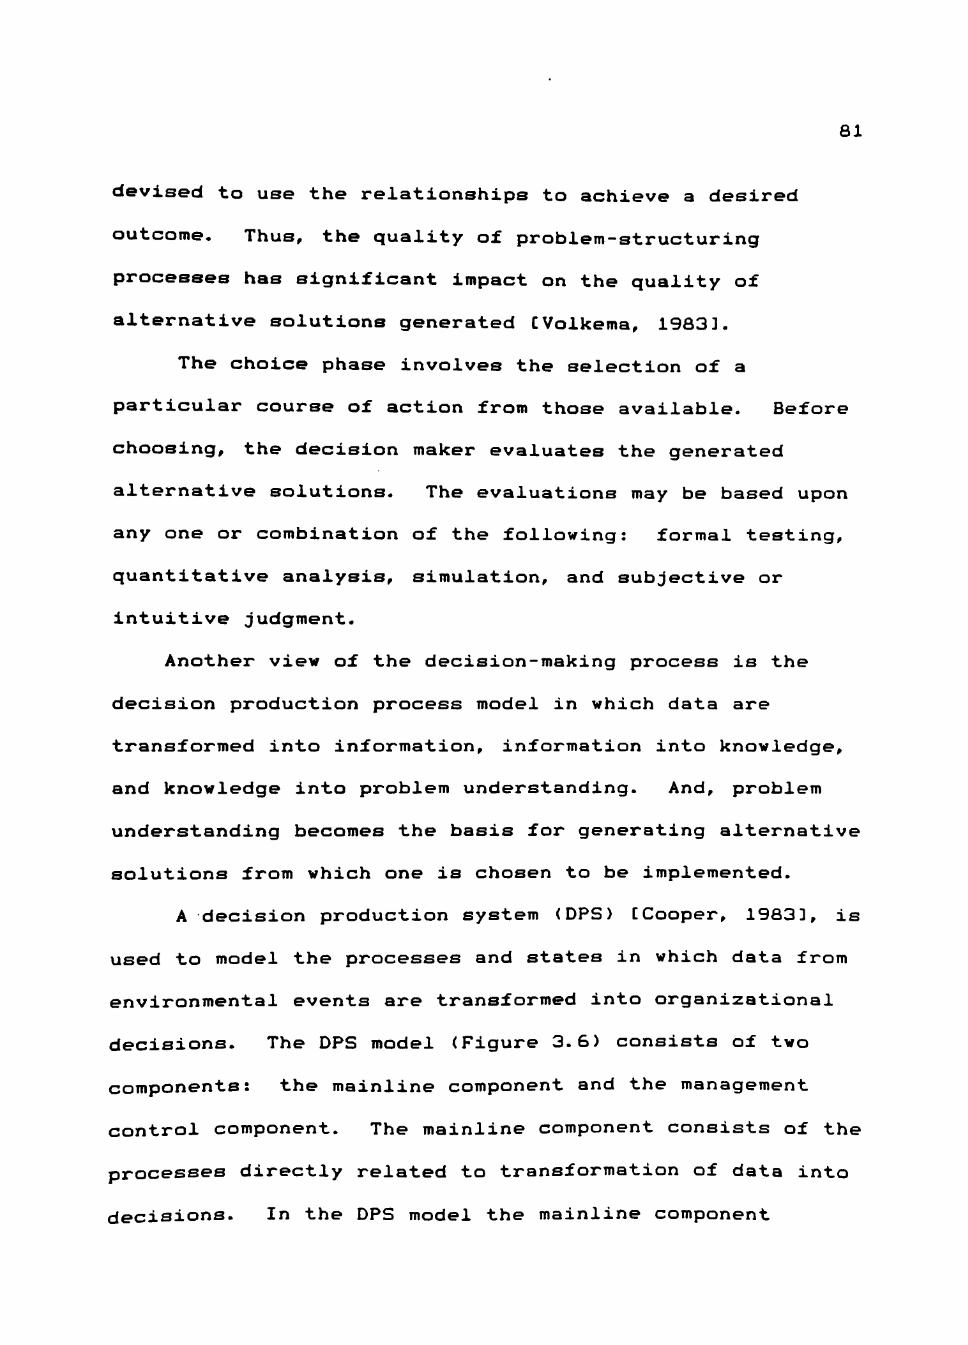
81
devised to use the relationships to achieve a desired
outcome. Thus, the quality of problem-structuring
processes has significant impact on the quality of
alternative solutions generated [Volkema, 19833.
The choice phase involves the selection of a
particular course of action from those available. Before
choosing, the decision maker evaluates the generated
alternative solutions. The evaluations may be based upon
any one or combination of the following: formal testing,
quantitative analysis, simulation, and subjective or
intuitive judgment.
Another view of the decision-making process is the
decision production process model in which data are
transformed into information, information into knowledge,
and knowledge into problem understanding. And, problem
understanding becomes the basis for generating alternative
solutions from which one is chosen to be implemented.
A decision production system (DPS) [Cooper, 19833, is
used to model the processes and states in which data from
environmental events are transformed into organizational
decisions. The DPS model (Figure 3.6) consists of two
components: the mainline component and the management
control component. The mainline component consists of the
processes directly related to transformation of data into
decisions. In the DPS model the mainline component

82
processes are: detection and selection, assimilation,
problem structuring, and alternative generation and choice.
The output of these processes are intermediate states which
result in the final state--the decision. The management
control component is comprised of the directing and
organizing roles within which the mainline tasks must
operate. Although not shown in the Cooper model [1983 3,
feedback loops between process blocks and processing states
are assumed to exist.
E N V I I I I I IflLTERNATIVEl R IDETECTIONIINTERMV.! IKNOWLEDGE1 PROBLEM I PROBLEM I GENERATION I DECISION 0—)EXTERfWL—) I 9HD I ) IflSSIMILflTIONI ) I STRUCTURING I )l AND I ) N DATA ISELECTIONI DATA I I I ISTRUCTUREI CHOICE I M I I I I E N ManagoKnt Control: Probla Triggering, Resource Coordinating and Goal Provision T( —
Figure 3.6: Decision Production System Model (adapted from Cooper, 1983)
External data, which reflect environmental events or
conditions, enter the production system through the
detection and selection processes of the organization. The
function of the detection and selection processes are to
identify and capture relevant external data in the
organization's data base.

83
Assimilation of internal data involves manipulation
and interpretation, resulting in an updating of knowledge.
Knowledge, both individual and organizational, becomes the
input for the problem-structuring process. In the problem-
structuring process the applicable portions of knowledge
are identified and organized into mental and/or physical
models of the problem structure. This problem structure
becomes the foundation for generating alternative
solutions. The generated solutions are tested, discussed,
and modified before one is chosen for implementation.
The decision includes implementing the decision, and
evaluating the implementation processes which were not
shown in the Cooper [1983 3 model. The decision outcomes
eventually become environmental events which may re-enter
the DPS in succeeding rounds.
The ease or difficulty with which the decision maker
is able to perform the decision-making processes in the DPS
model is affected by the degree of structure or complexity
in the problem domain. Simon [I960, pp. 5-63 classified
decisions as being programmed or nonprogrammed decisions
based on the following distinctions:
Decisions are programmed to the extent that they are repetitive and routine, to the extent that a definite procedure has been worked out for handling them so that they don't have to be treated de. novo each time they occur. Decisions are nonprogrammed to the extent that they are novel, unstructured, and consequential.

84
There is no cut-and-dried method for handling the problem because it hasn't arisen before, or because its precise nature and structure are elusive or complex, or because it is so important that it deserves a custom-tailored treatment.
In an organizational setting, the executive is the
manager of decision-making resources. The executive's task
is to see that decisions of the right kind are (1) made in
the most efficient manner, (2) not over designed, and
(3) not excessively costly [Oxenfeldt, et. al . , 19783. He
assigns tasks to production lines, and generally sets
special instructions where required. Ordinarily, the
executive keeps a staff of specialists and consultants in
data gathering, data interpretation, report writing, and
production of creative ideas [Oxenfeldt, et. al.. , 19783.
Therefore, the output of this production line is decisions
from a carefully engineered cooperative process.
The decision-production (or act-of-decision) models
are criticized as being too rationalistic and cognitive in
perspective for strategic decision making in that (1) they
are strongly linked to the omniscient, rational manager who
is in most cases assisted by a professional "techno-
structure," and (2) they represent exclusively managerial
problem solving and do not include the role of organiza
tional problem-solving processes [Haselhoff, 1976 3.
A model which incorporates such organizational
factors as: (1) organizational values and norms.
85
(2) managerial skills and knowledge, (3) structural
relationships of the organization, (4) problem-solving
process relationships (i.e., problem recognition, problem
analysis, decision making, communication, motivation), and
(5) problem-solving technology, is illustrated in Figure
3.7. Four factors are shown as influencing problem for
mulation: (1) the complexities of the problem, (2) the
capabilities of the planner or designer, (3) the environ
ment in which the planning or designing occurs, and (4) the
formulation process used by the planner or designer [Lewin,
1951; Hinton, 1968 3.
Problem complexity can be defined as structured,
semistructured, and ill-structured. Simon [I960, 19693
identified problem complexity as being determined by:
(1) the number of elements (variables) in the system, and
(2) the degree and nature of interactions among the ele
ments (variables). A structured problem has relatively few
elements and simple relationships. An ill-structured
problem generally has many elements, but more importantly
the direction of the cause-effect, linearity, and strength
of the relationships are not easily identified or under
stood.
The capability and experience construct of the
decision maker has several facets. Such factors as
decision-making style, cognitive abilities, educational

8 6
background, work experience, and computer experience have
been found to be significant intervening variables which
can affect decision-making performance in DSS-related
research [DeSanctis, 1982; Kasper, 1983; Pracht, 1984 3.
Also training can significantly influence decision-making
performance [DeSanctis, 1982; Kapser, 1983 3.
PROBLEM COMPLEXITY
I I I CAPABILITIES I I AND I I EXPERIENCES I I I
i i i ENVIRONMENT I I I
I I PROBLEM-I STRUCTURING I PROCESS
I I ->i PROBLEM i I STRUCTURE I i I
I
Figure 3.7: Factors Affecting Problem Formulation
Environmental factors include organizational values
and norms, and structural relationships within the organi
zation and decision-making group. Also included are time

87
constraints, work load, and support from colleagues
[Volkema, 1983 3.
The problem-structuring process relationships involve
both categories of process relationships and technology.
These two are combined because of the impact problem-
solving technology has on problem-solving processes. The
process relationships involve the following stages of
problem-solving: problem recognition, problem analysis,
decision making, communication, motivation, implementation,
and post-implementation follow-up. Problem-solving
technology includes all of the systems and procedures
related to environmental surveillance and forecasting,
planning, delegation, participation, control, management
science, and computer applications [Tabatoni and Jarniou,
1976 3. The interdependence of these factors greatly
impacts the problem-solving activities and problem
formulation strategies of individual decision makers and
decision-making groups.
From the previous discussions it can be concluded that
strategic problem-solving in most organizations is not the
sole activity of one manager. The combined efforts of
executive managers, specialists, consultants, and tech
nology (i.e., the "technostructure") to perform the tasks
are characteristic of strategic problem-solving and
decision-making. With this in mind, the following research

88
model has been developed to incorporate these factors. The
basic research premise of this model is that the decision
making quality of a problem-solving group is positively
related to the use of the interactive problem-structuring
tool (GISMO), and the decision-making structure of the
group.
It is believed that GISMO affects group decision
making quality and problem-domain understanding by:
(1) allowing groups to perform problem-solving tasks in a
way that uses less time and less effort, (2) expediting
problem solving by providing faster turnaround, newer
insights, better consistency and greater accuracy,
(3) facilitating interpersonal communication within the
group, and (4) fostering learning. While it was beyond the
scope of this research to study these specific impacts,
these are the ways in which it is thought that GISMO will
affect group decision making. Suggestions for future re
search efforts in these areas are presented in Chapter VI.
Research Model To Be Tested
The research study was designed to: (1) investigate
the impact of a graphical problem-structuring aid on the
decision-making performance of small decision groups,
(2) investigate the interaction effects between use of the
problem-structuring aid and two commonly-used group
89
problem-solving approaches, and (3) relate the quality of
group problem domain understanding to group performance.
The following research model (Figure 3.8) is an adaptation
of Figure 3.7 in that it is modified to model the relation
ships of specific interest in the research study. The
model incorporates the four categories of factors which
affect problem perception and formulation (Figure 3.7).
Problem Complexity
Problem complexity in the study was based on Simon's
[1964 3 description of problem structure. A structured
problem is one which has relatively few elements and simple
element relationships. An ill-structured problem has many
elements and the nature of the cause-effect relationships,
and the strength of the relationships among them are not
easily identified and understood. A semistructured problem
has some parts which are structurable and some which are
not. In this study, all decision groups faced the same
problem environment in terms of complexity, elements, and
element relationships. The problem environment was
provided by the business simulation game used in the study.
A more complete discussion of the game setting is provided
in Chapter IV.
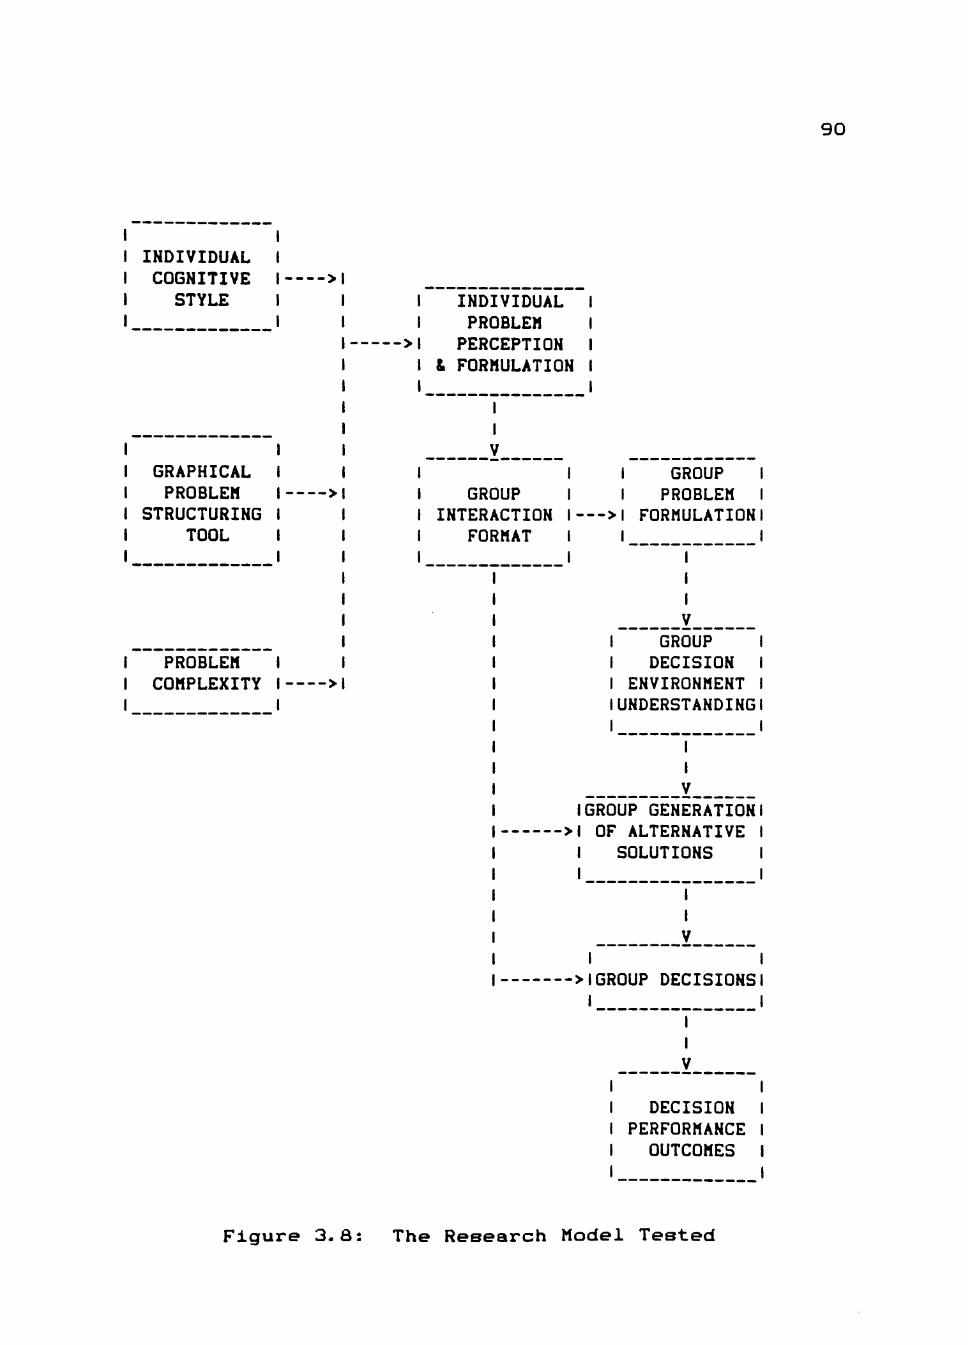
90
1 INDIVIDUAL 1 COGNITIVE 1 STYLE
1 GRAPHICAL 1 PROBLEM 1 STRUCTURING 1 TOOL
i PROBLEM 1 COMPLEXITY 1
1 >
1 >
1 1 > 1
1 INDIVIDUAL 1 PROBLEM
>l PERCEPTION 1 & FORMULATION
1 1 V
1 GROUP 1 1 INTERACTION 1-1 FORMAT 1
1 1 1 >| 1 1 1 1
1 3
1 GROUP 1 1 PROBLEM 1
--->! FORMULATION! ! !
1 1 1 V
1 GROUP ! 1 DECISION ! ! ENVIRONMENT ! !UNDERSTANDING! ! 1
1 1 V
GROUP GENERATION! OF ALTERNATIVE ! SOLUTIONS !
1 1 1 V
1 i HGROUP DECISIONS! 1 1
1 !
V ! !
1 DECISION 1 1 PERFORMANCE ! ! OUTCOMES 1 ! !
Figure 3.8: The Research Model Tested

91
Capabilities and Experiences
The individual cognitive style of the subjects,
although measured, is not a main research variable in the
study. Cognitive style is considered a moderating factor
which may influence a subject's problem-structuring
abilities, and the decision-making activities of groups.
Each member of a decision group enters the group
situation with his/her own set of perceptual abilities and
biases. In the group setting, these abilities and biases
may be affected by the group processes.
Environment
The structure of the group processes and interpersonal
communication affects the quality of problem formulation
activities and, therefore, has significant relationships
with the quality of group problem understanding and
decision performance in an unstructured problem environ
ment. The model implies that group decision performance
quality is associated with the structure of group processes
in the problem-solving and decision-making activities, and
the level of individual and group understanding of the
structure of the problem domain. Group activities can be
thought of as a continuum ranging from highly-structured to
highly-unstructured. The degree of structure in the group
situation can have significant impact on what individual
perceptions and knowledge are expressed and considered by

92
the group. Therefore, the structure of the group process
can have significant impact on the quality of group problem
formulation and the decision-making process. Increased
understanding of the cause-effect relationships among the
significant variables of the problem leads to the group
generating and choosing better solutions.
Problem-structuring Processes
The research model breaks the problem-structuring
processes into (1) group processes, and (2) technological
or computer-aided processes. It implies that the
technology employed, prior individual problem-structuring
perceptions, and the problem-solving approach followed by
the group, are significant factors affecting problem-domain
understanding and decision-making performance.
Objectives of the Study
The purpose of GISMO is to provide decision makers
with an easy-to-use tool to construct cognitive maps or
conceptual models of a problem domain. The objectives of
GISMO are: (1) to improve the model-building efficiency of
individuals and groups, (2) to provide an easy-to-use
medium for storing, re-trieving, modifying, and displaying
models, (3) to act as a medium for sharing ideas and
focusing group attention, (4) to increase decision-maker

93
knowledge of a problem domain, and (5) to enhance decision
outcomes.
It is believed that GISMO achieves these objectives by
expanding the conceptual dimensions of mental model
building. Mintzberg, et al, [19763, and Ackoff [19783
argue that the key stage of strategic decision making is
the one where the decision maker(s) attempts to determine
the cause-effect relationships in the problem domain.
Ackoff [1978, p. 783 goes on to argue that "Increasing the
number of dimensions in which we think about problems can
often reveal new and more effective solutions. " And that
"Our conceptions of what can be done in problematic
situations are often limited by constraints attributed to
technology" [Ackoff, 1978, p. 713.
GISMO is believed to be a technological tool which can
add new dimensions for thinking about problems [Pracht,
1985; Pracht and Courtney, 19853. Those dimensions are
related to the visual and interactive model-building
environment which GISMO provides to decision makers for
formulating causal models (Appendices A and B). GISMO can
fulfill a knowledge base role by supporting the human
mental processes [Newell and Simon, 1972 3 associated with
memory.
The general objectives of the study were to see
whether GISMO achieves its primary objectives of improving
94
decision-maker problem knowledge and decision-maker
decision performance in a semistructured problem
environment. Also, to investigate whether the impact of
GISMO is different in an unstructured and a structured
group setting.
A behavioral laboratory experiment was conducted to
measure the effects of GISMO on group decision-making
performance and problem-domain understanding, and to
investigate the relationship between the effects of GISMO
and group structure. This study was conducted to address
one of the limitations cited in the Pracht [1984 3 study of
GISMO. That limitation was "...the use of individual
decision makers rather than groups" [Pracht, 1984, p. 913
which restricted the external validity of Pracht's
findings.
The senior business students were assigned to groups
to play the Business Management Laboratory (BML) [Jensen
and Cherrington, 19773 simulation game. The subjects also
had access to the BML companion decision support package
SLIM (Simulation Laboratory for Information Management)
[Courtney and Jensen, 19813. BML/SLIM management
simulation and decision support packages [Courtney,
DeSanctis, and Kasper, 19833 were used to provide a
semistructured problem environment. This use of BML
provided a problem environment in which the information
95
system characteristics could be varied to determine how
changes impact decision outcomes. Also, BML has been used
in several MIS/DSS laboratory experiments [DeSanctis, 1982;
Kasper, 1983; Pracht, 19843 so that there is a continuity
of research efforts in this area, and a basis for building
on previous research and comparing results.
A semistructured problem environment was appropriate
for this study to simulate a strategic problem setting.
Although it is acknowledged that by strict definition a
strategic problem is more ill-structured than semi-
structured, a compromise had to be made between external
validity and internal validity of the experiment.
Internal validity would have required that the problem
setting faced by the subjects be simple and unambiguous,
(i.e., a structured) problem. External validity would have
required the laboratory problem to replicate a real-world
strategic problem setting. But, in doing so, many of the
experimental controls would be lost.
The research design, which was illustrated in Figure
1. 2, has two factors. The first factor is called the prob
lem structuring tool (TOOL). This factor has two treat
ments which are based upon the tool a group used to aid
their decision-making. One set of groups used GISMO in the
study, and the other set (NONGISMO) did not. The second
factor is called PROCEDURE. This factor also had two

96
treatments. One treatment was an unstructured, open group
decision-making procedure called an Interacting Group (IG).
The other treatment was a relatively structured procedure
which restricts group interaction through a set of rules
and procedures known as the Nominal Group Technique (NGT).
NGT was chosen because it is generally accepted that
this procedure should be part of a GDSS. And, since GISMO
was being studied to determine its suitability as a GDSS
component, it was necessary to determine whether NGT and
GISMO are compatible.
Six specific objectives guided this study. Those
objectives were to determine: (1) the impact of GISMO on
group decision-making performance, (2) the impact of GISMO
on group problem understanding, (3) the impact of NGT on
group decision-making performance, (4) the impact of NGT on
group problem understanding, (5) whether there is an
interaction effect between GISMO use and NGT use on group
decision performance, and (6) whether there is an
interaction effect between GISMO use and NGT use on group
problem understanding.
Research Questions Studied
Several research questions are indicated by the
research model shown in Figure 3. 8. The research questions
of this study were concerned with the impact of GISMO on

97
group decision performance and level of problem under
standing. The following questions were put forth to direct
the study toward determining the suitability of a problem-
structuring tool, such as GISMO, in group strategic
decision making. A second set of objectives was concerned
with the investigation of the impact of GISMO in an
unstructured, informal group setting (IG), and in a
structured, formalized group setting (NGT).
1. Does GISMO use lead to better group decision
performance?
GISMO decision groups were expected to exhibit better
decision performance as a result of being able to more
easily construct and communicate their ideas about the
structure of the problem domain. Structural models have
long been used as a medium to illustrate ideas about the
elements and relationships of some phenomenon. They are
used to illustrate the elements and relationships of a
problem-space, for ease of communication and clarity of
ideas, and as intellectual tools to assist in the thought
processes of problem-solving. Therefore, with a relatively
easy-to-use tool for creating structural models, these
groups will be more productive in developing an understand
ing and knowledge of the problems they must solve. As a
result of this increase in understanding, the GISMO groups

98
are expected to exhibit both better problem-structure
understanding and better decision performance.
The basis for these expectations extend from the
visual and interactive nature of GISMO. GISMO, which is
based on the structural modeling approach, provides a
systematic method for humans to translate their mental
representations of a complex problem into a visual
structure to represent the problem. In a group setting the
models also provide a medium enhancing interpersonal
communication and focusing group attention.
A structure is defined as a system or model that is
composed of interrelated parts. The most convenient
methods for representing a model are: (1) an interaction
matrix, and (2) a directed graph (digraph). An interaction
matrix method is more suitable for structural manipulation,
and the directed graph method is better for communicating
models to others because of its similarity to causal loop
diagrams [McLean, 19773. An example of an interaction
matrix which is manipulated by GISMO users is illustrated
in Appendix B.
The directed graph model presents variables of a
complex problem as nodes with the functional relationships
between the variables represented by arrows (directed
links). Examples of directed graphs which can be easily
constructed with GISMO are illustrated in Appendix A.

99
Structural modeling (SM) is a process generally
involving participation by more than one person. It
applies in cases where the participants are working
collectively on a problem, and the problem is defined in
terms of a system of elements, relationships, etc. The SM
process starts with certain system-related data, ideas,
skills, and/or knowledge residing in the various partici
pants, and ends with an enhanced understanding of the
system (i.e., problem structure) by the participants,
individually and collectively [Lendaris, 19803. The
enhancement of problem understanding occurs because SM
compels open discussion of the crucial relationships in the
structure of the problem [McLean and Shepherd, 1976 3.
For these reasons, it is posited that the groups which
use GISMO will develop a better understanding of the rela
tionships in the problem structure of the BML game. As a
result, they will exhibit better decision-making perfor
mance than the groups which do not have access to GISMO.
These improvements will be the result of: (1) more atten
tion being placed on the problem formulation and structur
ing phases of decision making because of the ease of devel
oping and modifying the structural models, (2) improved
ability of group members to easily and accurately communi
cate their individual ideas to other members, and (3) abil
ity to share, combine, and develop ideas with others.

100
The propositions were analyzed using BML game
performance indicators (i.e., net income for each decision
period and retained earnings at the end of the game) to
compare the decision performance of the groups, and tests
of subject knowledge of the BML game variables and pair-
wise relationships between the variables.
2. Does NGT use lead to better group decision performance?
As previously stated, NGT was chosen as a treatment in
this study because: (1) NGT has been found to enhance
group decision-making quality when a group is faced with
instructured problems, and (2) NGT is commonly implemented
in GDSS to structure the group decision-making activities
under the belief that NGT is an essential component of a
GDSS. Therefore, it is necessary to investigate the impact
of GISMO in an NGT setting.
The groups were subdivided into two categories--NGT
and IG--to provide a basis for comparing a structured group
setting to an unstructured group setting. For the NGT
groups, interactions among the group members were
controlled by the NGT procedures. The nominal groups
followed a mechanical procedure of listing the problems
faced by the firms, ranking the problems in order of
importance, and selecting the problems to be addressed.
Each group member created a possible solution, then these

101
solutions were ranked by the group, and the top-ranked
solution was implemented. The procedure is called
mechanical because the process is prescribed and group
decisions are based on rank voting rather than consensus.
The interacting groups followed a procedure in which
members personally interacted throughout the decision
making process. IG is similar to a committee in that
members engage in discussions in an attempt to reach a
consensus on group decisions concerning problems, solu
tions, choice, and implementation. This procedure has been
referred to as spontaneous because the group discussions
and decisions do not follow a well-defined structure
[Axelrod, 1976 3.
Delbecq and Van de Ven [19713 assert that nominal
groups are useful only in generating ideas and that
interacting groups are more effective in evaluating and
making decisions. However, Herbert and Yost [19793 found
that nominal groups were superior to interacting groups in
decision quality with a structured problem. Whether this
finding can be generalized to unstructured problems is not
known. It was hoped that a comparison of the decision
performance of both nominal groups and interacting groups
in an unstructured problem situation would shed some light
on this question.
102
3. Does GISMO use lead to better group understanding
of the decision environment?
A fundamental objective of GISMO is to help subjects
develop an understanding of the structure inherent in the
decision environment. Therefore, subjects using GISMO were
expected to feel that the decision environment is more
well-structured relative to the perceptions of NONGISMO
subjects. These questions were answered through use of the
questionnaire in Appendix E which asks the subjects to rate
the structure of the environment for the decisions their
groups made.
Each group member was asked to list factors which
determined the various decisions made by his/her group and
to rate the importance of each factor. Because the
researchers can control the factors via game parameters,
the correct answers to such questions are known, providing
a basis for comparing the decision groups. Scores on the
questionnaire were used as a measure to compare the groups
on the decision environment variable.
To derive a group measure of problem environment
understanding, the scores of the group members were
averaged. It was proposed that group decision performance
is directly related to the quality of the group's problem
environment understanding. Because a fundamental purpose
of GISMO is to improve interpersonal communication and

103
knowledge of the problem domain, the better performing
groups should have had higher mean scores and smaller
variations in individual scores.
4. Does NGT use lead to better group understanding
of the decision environment?
The same instrument was used to measure this
proposition as in proposition 3. This proposition is based
on the finding of Delbecq and Van de Ven [1971] that
nominal- and Delphi-group formats are more effective than
the interacting group format in the quantity of ideas
generated in an unstructured problem situation. NGT was
developed as a technique "...useful for situations where
individual judgment must be tapped and combined to arrive
at decisions which cannot be calculated by one person"
[Delbecq, et. al.. , 1975, p. 43. "The central element of
this situation is the lack of agreement or incomplete state
of knowledge concerning either the nature of the problem or
the components which must be included in a successful
solution. As a result, heterogeneous group members must
pool their judgments or discover a satisfactory course of
action" [Delbecq, et^ al.« f 1975, p. 5 ] .
In most studies that have compared NGT to interacting
groups, the total and mean number of unique ideas generated
by a group and the quality of the ideas generated has been
used as evidence for indicating differences in decision

104
quality [Delbecq and Van de Ven, 1971; Herbert and Yost,
19793. However, in this study evidence of decision quality
would be indicated by the economic well-being (i.e.,
profitability) of a group's simulated company. The number
of alternative solutions a group generates is not of
interest in this study.
Better decision environment understanding was expected
because the primary purposes of NGT are to: (1) increase
problem-mindedness, (2) depersonalize ideas, (3) improve
effective communication and sharing of ideas, and (4) en
courage equitable participation within the group [Delbecq
et al. , 1975 3.
The following propositions are concerned with the
relationship between the problem-structuring aid (GISMO)
and the group problem-solving procedure. The questions are
concerned with the presence of joint or combined effects of
GISMO and the group procedure.
5(a). Do groups that use GISMO and NGT exhibit better
decision performance than groups that do not use
GISMO but do use NGT?
5(b). Do groups that use GISMO and NGT exhibit better
group decision performance than groups that use
GISMO and IG?

105
6(a). Do groups that use GISMO and NGT exhibit better
decision environment understanding than groups that
do not use GISMO but do use NGT?
6(b). Do groups that use GISMO and NGT exhibit better
problem environment understanding than groups that
use GISMO and IG?
Research Hypotheses
The formal research hypotheses tested in the research
study are presented in this section. The results from the
testing of these hypotheses should allow the experimenter
to make some conclusions about the separate and combined
effects of GISMO and NGT. The hypotheses are stated in the
conventional null form.
Hypothesis I: Groups using GISMO will not exhibit a higher
level of decision performance than groups not using GISMO.
Hypothesis II: Groups using Nominal Group Technique (NGT)
will not exhibit a higher level of decision performance
than the Interacting Groups (IG).
Hypothesis III(a): The IG groups using GISMO will not
exhibit a higher level of decision performance than IG
groups not using GISMO.
Hypothesis Ill(b): The NGT groups using GISMO will not
exhibit a higher level of decision performance than NGT
groups not using GISMO.
106
Hypothesis III(c): GISMO groups using NGT will not exhibit
a higher level of decision performance than GISMO groups
using the IG procedure.
Hypothesis Ill(d): NONGISMO groups using NGT will not
exhibit a higher level of decision performance than
NONGISMO-IG groups.
Hypothesis Ill(e): GISMO-IG groups will not exhibit a
higher level of decision performance than NONGISMO-NGT
groups.
Hypothesis Ill(f): GISMO-NGT groups will not exhibit a
higher level of decision performance than NONGISMO-IG
groups.
Hypothesis IV: Groups using GISMO will not exhibit a
higher level of problem understanding than groups not using
GISMO.
Hypothesis V: Groups using the Nominal Group Technique
(NGT) will not exhibit a higher level of problem
understanding than the Interacting Groups (IG).
Hypothesis VI(a) : The IG groups using GISMO will not
exhibit a higher level of problem understanding than IG
groups not using GISMO.
Uypat.heB±B VI (b) : The NGT groups using GISMO will not
exhibit a higher level of problem understanding than NGT
groups not using GISMO.

107
Hypothesis VI(c): GISMO groups using NGT will not exhibit
a higher level of problem understanding than GISMO groups
using the IG procedure.
Hypothesis VI(d): NONGISMO groups using NGT will not
exhibit a higher level of problem understanding than
NONGISMO-IG groups.
Hypothesis VI(e): GISMO-IG groups will not exhibit a
higher level of problem understanding than NONGISMO-NGT
groups.
Hypothesis VI(f): GISMO-NGT groups will not exhibit a
higher level of problem understanding than NONGISMO-IG
groups.
Summary
In this chapter the theoretical model underlying the
research study was presented. The research propositions
(or questions) investigated were presented with a brief
discussion as to why these questions are important and how
the questions were tested in the study. The formal
hypotheses when tested will indicate answers to the
propositions presented in this chapter.
A detailed discussion of the experimental design and
methodological procedures followed in the study is
presented in Chapter IV.

CHAPTER IV
DESCRIPTION OF THE METHODOLOGY
Introduction
Van Horn [19733 identified four methods of conducting
research in the MIS/DSS area: (1) case studies, (2) field
studies, (3) field tests, and (4) laboratory studies. Case
studies involve the creation of broad and detailed narra
tive descriptions of organizations with the intent of
capturing much of the complexity of the research problem.
Experimental design and/or controls are not employed in
case studies. Field studies study of one or more real-
world organizations within an experimental design
framework, but without experimental control. Large amounts
of data are collected for use in attempts to isolate the
effects of the independent variables. Field tests study of
one or more real-world organizations within an experimental
design framework. The researcher attempts to control or
change some aspect of the system being studied in order to
explain the impact of selected independent variables on the
response measure. Four approaches fall into the category
of laboratory studies: simulation, small group, man-
machine, and prototype experiments. Simulation and
prototype experiments involve the development of computer-
models of organizations and information systems. These
108
109
models are used to study the impact of certain information
system variables on the organizations. Small group (or
human factor) experiments are designed to explore human
behavior problems in a man-machine system. Man-machine
experiment experiments explicitly focus on factors
involving the interface between the system and the human
decision maker to develop a more meaningful understanding
of how people interact with machine-based systems.
This research study was a man-machine experiment
performed in a laboratory setting. The experiment used an
artificial decision-making environment to create a semi-
structured problem for the experimental units (i.e., the
decision-making groups). The laboratory setting enabled
the control of the nature of the information system
utilized by the groups. Consequently, the information
systems characteristics were varied in order to determine
how the changes affected the response variables. This
control was a major advantage in this research. Another
advantage stemmed from the use of human decision makers.
These feature were used to overcome some of the validity
problems that arise from the other research approaches
[Dickson, et. al.. , 1977 3.
Specifically, with the laboratory experiment it was
possible to ensure that all groups faced the same problem
environment both in terms of problem complexity and in

no
actions (decisions) made by the competing firms. These
features are significant because they provided a bases on
which the groups could be compared.
The groups went through four weeks of training to
learn their experimental tasks before the actual experiment
began. Data analysis consisted of: (1) a multivariate
analysis of variance of the decision outcomes (i.e., net
income) for each of the six decision periods in the game,
and (2) a generalized linear model analysis of problem
environment understanding of the groups at the end of the
experiment. In order to establish a multi-dimensional
scale of group problem understanding, the various measures
(indicants) of problem understanding were subjected to
factor analysis, reliability analysis, and construct
validity analysis. A detailed model of the variables
considered in the study is given in Figure 4. 1. A detailed
description of these variables is given in the second
section of this chapter.
The remainder of this chapter is divided into four
sections. Each section presents the primary topics related
to the research methodology.
1. Research Design a. the experimental design b. the research strategy
2. Research Variables 3. Research Controls 4. Data Analysis

Ill
PRIMARY RESEARCH VARIABLES
Modeling Tool • GISMO » NO GISMO
Group Decision-making Procedure • Nominal Group Technique • Interacting Group
V
RESPONSE VARIABLES Decision Performance
• Net Income Problem Understanding
• Post-experiment tests • Post-experiment models
A I !
!
NUISANCE VARIABLES Individual/Group Cognitive Style Group Size, Beginning knowledge
Figure 4.1: Detailed Model of the Research Variables
The Research Design
The purpose of the experiment was to evaluate the
effects of two factors (problem-structuring TOOL and group
decision-making PROCEDURE) on group decision performance
and group problem understanding. Both factors had two

112
treatment levels. The two treatment levels of TOOL were
GISMO use and no GISMO use (NONGISMO). The two treatment
levels of PROCEDURE were Nominal Group Technique (NGT) and
Interacting Group (IG). The decision-making groups were
the experimental units in the study. The experimental
subjects were senior Business Administration students
enrolled in two different sections of an Administrative
Policies course. Both sections were taught by the same
professor. For control purposes, students in each section
were randomly assigned to groups. A summary of these
procedures is given later in the Research Controls section.
The basic research model of the study says that in a semi-
structured problem setting small group decision performance
is a function of: TOOL, PROCEDURE, the cognitive style
level of the group, the interaction effects between TOOL
and PROCEDURE, and the number of members in a group (SIZE).
Experimental Design
There were two experimental factors being investigated
in the study: (1) the problem-structuring aid used by a
group (TOOL); and (2) the group problem-solving procedure
used by a group (PROCEDURE). The TOOL factor had two
levels: (1) the GISMO groups used the problem-structuring
aid in the experiment, (2) the NONGISMO groups which did
not have access to the problem-structuring aid. The

113
PROCEDURE factor also had two levels: (1) the NGT groups,
and (2) the IG groups. The design was unbalanced in that
there was an unequal number of groups in the factor levels
combinations.
The experimental design was a 2 x 2 factorial
experiment (Figure 4.2). The experimental design includes
two experimental factors that were under the control of the
experimenter. The design is said to have completely
crossed treatments which produces four treatment combin
ations. The design allows for the test of three general
hypotheses: (1) that the means of the factor levels (i.e.,
GISMO and NONGISMO) of TOOL are equal, (2) that the means
of the factor levels (i.e., NGT and IG) of PROCEDURE are
equal, and (3) that the joint or interaction effect of TOOL
and PROCEDURE is equal to zero for all combinations of
PROCEDURE
NGT IG
T O O L
GISMO
NONGISMO
Figure 4.2: The Research Design

114
factor levels. For this study, the two factors are said to
interact if the differences in the mean response under the
levels of one factor are different at two levels of the
other factor.
Research Strategy
Sixteen decision-making groups played the Business
Management Laboratory (BML) management game [Jensen and
Cherrington, 1977 3 and also had access to its companion DSS
- the Systems Laboratory for Information Management (SLIM)
[Courtney and Jensen, 19813. The groups assumed the role
of the strategic decision makers for a simulated company in
the game [Appendix C3. Each group performed the role of
the executive management of a firm in a four firm industry.
All groups competed against the same three "phantom" firms
in same industry. It is important to note that the groups
did not directly compete against each other. The decisions
of a group had no on affect the firms of the other groups
in the experiment. Each group operated independently
within its own industry. This was done to ensure
comparability of results among the experimental units.
Each group made three practice and six game decisions
in the experiment. Group decision performance was measured
by the net income of the firm managed by the groups in each
Qf the six game periods. These results were used to

115
compare the decision performance of the groups. At the end
of the game, each subject was required to construct a
structural model of his/her concept of the BML relation
ships, and to complete a post-experiment questionnaire
(Appendix E). These instruments were used as the bases for
determining group problem understanding of the problem
environment.
The BML/SLIM package has been used in several DSS
laboratory studies [DeSanctis, 1982; Kasper, 1983; Pracht,
1984 3. The use of a common system provides for research
continuity, comparability, and replicability [Courtney,
DeSanctis, and Kasper, 1983 3. The sets of decisions made
by the BML game administrator and the experimental units,
and the data used for analysis in this study are given in
Appendix L and Appendix M, respectively.
The BML game, at its maximum, involves a two-product/
two-market area situation which requires players (either,
individuals or groups) to make 56 decisions per decision
round [Courtney, et al.. , 1983 3. These decisions involve
marketing, production, financial, general administrative,
and limited personnel functions. The decisions vary from
well-structured to semistructured to illstructured. The
BML game administrator may limit the game to a two-product/
one-market area problem, a one-product/two-market area
problem, or a one-product/one-market area problem. For the

116
simplest situation (i.e., the one-product/one-market area)
the game players are required to make about sixteen deci
sions per period. The one-product/one-market area problem
was chosen for this experiment because it provided a
sufficiently complex problem setting which would challenge
the groups, but was not so complex that the experimental
tasks were excessively difficult.
It has been argued that the internal validity of a
laboratory experiment can be damaged by requiring the
subjects to perform tasks which are overly complicated and
unrelated. Therefore, it is best to have tasks which are
easy for the subjects to understand and perform [Jenkins,
1982; Jarvenpaa, et. al. . 1984 3. However, in this study,
the use of overly simple tasks would have created a very
structured problem environment for the experiment. Thereby,
reducing the external validity of the experiment. A
semistructured problem setting was justified in this
experiment because the primary research objective was to
determine the effects of GISMO and NGT in ill-structured
problem solving.
Experimental Units and Procedures
The experimental units for this study were small
decision-making groups. The subjects in the experiment
were college seniors enrolled in two different sections of

117
an Administrative Policy course. Both sections were taught
by the same instructor and classes were held on Tuesday and
Thursday. During the experiment, the groups met in the
laboratory during regular class time on Thursday. The
groups were also required to meet in the laboratory at an
arranged time on Monday or Tuesday. Thus, each group met
twice a week for 45 minutes, and followed the required
group meeting guidelines shown in Appendix I.
The assignment of subjects to experimental units
(i.e., groups) was done by drawing names from a box. The
assignment of treatment levels to experimental units was
not truly random, however. The design is what Kerlinger
[19733 called a compromise experiment group-control group
design. The compromise comes about because, it was not
possible to make a truly random assignment of treatments to
experimental units. Students who were enrolled in one
section of the Administrative Policy course formed one
level for the TOOL treatment and those in a different
section formed the other level of the TOOL treatment. The
experimental treatment TOOL was in effect randomly assigned
and there was no reason to expect any systematic
differences between the two sections. In effect the TOOL
treatment was assigned to the groups non-systematically
through the registration process. In addition, the design
affords an adequate degree of experimental control by

118
having the sections of nearly equal size that: (1) met in
the same same room, (2) met on the same days, (3) were
taught the same material (except for the structuring aid
and Nominal Group Technique), (4) were taught by the same
instructor, and (5) were assigned separate meetings times
and/or met in isolated rooms where they could be monitored
and prevented from mixing the four treatment groups.
The assignment of groups to a PROCEDURE level was done
by randomly assigning four groups the NGT level and the
other remaining groups to the IG level. This procedure
divided each section into nearly an equal number of groups.
The result these assignments was the creation of four
GISMO/NGT, five GISMO/IG, four NONGISMO/NGT, and three
NONGISMO/IG groups. Twelve of the sixteen groups consisted
of four members, the remaining four groups had three
members each. The effects of differences in group size
were considered in the data analysis.
At the first meeting, all subjects were asked to sign
a non-disclosure statement (see Appendix F), agreeing not
to divulge information about the study or their activities
in the study until was completed. This non-disclosure
statement has been used in previous studies with consider
able success [DeSanctis, 1982; Kasper, 1983; Pracht, 19843.
Since participation in the study was a requirement of
the Administrative Policy course, the subjects received

119
course credit for participating in the study. The amount
of course credit for each subject was based upon attendance
at group meetings, use of the computer tools and peer
evaluations. The subjects were expected to come to the
sessions prepared to contribute in a meaningful and
knowledgeable manner. This required all subjects to access
the SLIM data base and to use it to gain knowledge and
understanding. Course credit was significantly reduced
for subjects who missed meetings, did not use the computer
tools (i.e., GISMO and SLIM), or failed to actively
participate in the group meetings. Subjects who showed
these symptoms were counseled when these problems became
evident.
Attendance requirements do not ensure that subjects
will come to the group meetings prepared or that the groups
will be motivated to perform diligently. Therefore, bonus
points were offered as an incentive. Each member in the
top-ranked groups, as measured by net income in each of the
six decision periods, received a 1% bonus. At the end of
the game, the top ranked groups, as measured by the
accumulated net income (retained earnings) received a 2%
bonus. The second placed groups received a 1% bonus.
These incentives seemed to effectively motivate the groups
to perform competitively and provided a goal which seemed
lead to group cohesion and enthusiasm.

120
The groups were not told how many decision periods the
game would run, so that end-of-game strategies could be
avoided. Also, the subjects were told that the last
decision set would be run several times so that those
decisions could run their full effect. No evidence of end-
of-game strategies was found.
An eight quarter historical base was used to create a
two-hundred-fifty item data base. The list of items
available in the data base is shown in Appendix H. The
individual decisions for the "phantom" firms were developed
using a range of strategies similar to the one used by
DeSanctis [19823, Kasper, [19833, and Pracht [19843. One
firm followed a strategy based on low price, low quality,
and high production volume. Another firm followed a middle
of the road strategy, and the third firm followed a high
price, high quality, low production volume strategy
(Appendix L).
Throughout the game the groups were able to retrieve
data from the SLIM data base to support their decisions.
As the game progressed, decisions were specified for the
phantom firms so that they consistently pursued their
respective strategies.
The groups were introduced to BML and SLIM in the
first two weeks of the study, and were given instruction in
how to use the computer terminals. The GISMO groups were

121
introduced to GISMO and the graphics terminals in the third
and fourth weeks of training. The graphics terminals were
also available for practice use at times other than the
group meetings. The fifth through eight weeks were devoted
to playing the BML game using the DSS and the structural
modeling software. Also, on two occasions, during these
weeks, all subjects were required to turn in models of how
they perceived the BML problem environment. The last day
of the study was used to administer the post-experiment
questionnaire and collecting the structural .models created
by the subjects.
Time Schedule
The schedule of the major study events is given in
Table 4.1. In the first week of the study, subjects were
introduced to BML/SLIM, and the GEFT and background
questionnaires administered. Individual subjects were
assigned to temporary groups until the class enrollment
stabilized after the class drop date, which was extended an
extra week past the originally scheduled date. These
temporary groups made one trial BML decision. These groups
made an initial decision at the end of the first week and
received the results the following week.
At the end of the second week, the subjects were
assigned to groups and given further instruction in

122
BHL/SLIM. The GISMO groups were given additional instruction
with GISMO also. The subjects were assigned to four-member
decision groups on the basis of an random drawing of names.
Since the enrollment in the afternoon section was twenty-
six, two groups were formed with only three members. There
were fourteen four-member groups at the start of game play.
One of the four-member groups had a member who quit
attending class, and another group had a member disquali
fied after the first decision round of the game when it was
learned that the member had had previous exposure to BML.
Table 4.1: Time Schedule of the Experiment
Experiment Schedule
Date Activity
Preliminary Testing Subject Training (Wk. 1) Subject Training (Wk. 2) Subject Training (Wk. 3) Spring Break Subject Training (Wk. 4) Game Play (Wk. 5) Game Play (Wk. 6) Game Play (Wk. 7) Game Play (Wk. 8) Post-experiment testing
During the third and four weeks of the study, the
groups made two more practice BML decisions. The actual
play of the BML game started March 25 and continued for
four weeks during which time each group made six sets of
F e b . F e b . F e b . Mar. Mar. Mar. Mar. A p r . Apr . A p r . A p r .
1 4 1 8 2 5
4 9 - 1 7
1 8 2 5
1 8
1 5 2 3

123
decisions. The BML/SLIM Post-Experiment questionnaire and
a post-experiment interview were administered at the end of
the experiment.
Research Variables
Independent Variables
The research design was made up of two treatment
factors: TOOL and PROCEDURE, and each factor had two
treatment levels: (1) GISMO and NONGISMO, and (2) NGT and
IG. In addition to the experimental factors, several
nuisance variables were considered in the study. Nuisance
variables are defined as known or suspected undesired
sources of variation in an experiment that may affect the
dependent or response variables [Kirk, 19823. The nuisance
variables considered in this experiment were: (1) cognitive
style, problem complexity, decision environment, and
certain demographic characteristics of the subjects. A
discussion of these is presented following the presentation
of the research variables.
Dependent Variables
Two dependent variables were used in the study. One
dependent variable was used to measure group decision
making performance, and the other was used to measure group
problem understanding. Group decision performance was
measured by the net income of the firm controlled by each

124
group at the end of each decision period. Net income was
represented the difference between the total revenue minus
total expenses for a firm in a decision period (i.e., one
quarter of the BML game).
The second dependent variable (group problem
understanding) was measured at the end of the experiment.
The level of group problem understanding was computed by
totaling the problem understanding scores for the members
in a group and dividing the total by the number of group
member.
A multidimensional approach was used to measure
problem understanding. The four parts, (2 ,3, 12, and
BML/SLIM Quiz), of the Post-experiment Questionnaire were
designed to measure problem understanding. The scores on
these four parts were used as four indicants in the problem
understanding scale. A fifth indicant was measured as the
number of relationships identified in the post-experiment
structural models submitted by the subjects.
The reason for using a multidimensional approach to
measure dependent variable was to obtain a broader and more
reliable measurement of the problem understanding
construct. This is possible because the indicants measure
different dimensions of problem understanding. Common
factor analysis, reliability analysis, and construct
validity analysis (Appendix J) were used to develop a scale

125
which could be construed to be a measure of group problem
understanding [Zeller and Carmines, 1980 3.
Research Controls
The purpose of research controls is to prevent or
control the contamination of the experiment by intervening
factors. Contamination is an ever-present problem in
behavioral studies and perfect control is not possible.
However, it is necessary for the experimenter to attempt to
control the known and suspected nuisances variables. The
controls can be implemented through the research design and
experimental controls. Three experimental controls and one
statistical control can be used to control nuisance
variables [Kirk, 19823. One approach is to hold the
nuisance variable constant for all experimental units, or
make sure all experimental units are the same on the
nuisance characteristic. A second approach is one that is
used in conjunction with the first, that is to assign
subjects randomly to experimental treatments. Then, the
known, as well as suspected, sources of variation or bias
are distributed over the entire experiment and thus do not
affect one or a limited number of treatment levels. A
third approach is to include the variable as a factor in
the experimental design. The fourth approach is to control

126
the influence of nuisance variables with analysis of
covariance procedure [Kirk, 19823.
Experimental Controls
The nuisance variables which are known or suspected to
influence the response variables (i.e., group performance
and problem understanding) were related to: (1) differ
ences in innate perceptual (cognitive) style among the
groups, (2) differences in the demographic characteristics,
work experience, managerial experience, computer experience
and business simulation game experience among the groups,
and (3) differences in group size. The following subsec
tions present discussions concerning why these variables
were considered and how each of these nuisances were
handled in the experiment.
Cognitive Style
A number of studies of have determined that cognitive
style differences affect group decision making processes
[Witkin, et. al.. , 1971; Witkin and Goodenough, 1977; White,
1984 3, BML game performance [DeSantis, 1982; Kasper, 1983 3,
and the impact of GISMO [Pracht, 1984 3. Cognitive style
has been widely studied in MIS/DSS research [McKenney and
Keen, 1974; Dickson, Senn, and Cherveny, 1977; Bariff and
Lusk, 1978; Benbasat and Taylor, 1978; Zmud, 1979;
DeSanctis 1982; Kasper, 1983; Pracht, 1984; White, 19843

127
and a great deal of debate has been conducted concerning
the value of considering individual cognitive styles as an
independent research variable [Keen and Bronsema, 1981;
Huber, 1983; Robey, 19833. However, this experiment was
not concerned with cognitive style as an independent
research variable, but did recognize that it was likely to
be significant nuisance variable affecting the dependent
variables—group decision performance and group problem
understanding.
Two instruments have been commonly used in MIS/DSS
research to measure individual cognitive style: (1) the
Group Embedded Figures Test (GEFT), and (2) the Meyers-
Briggs Type Indicator (MBTI). The GEFT measures the abil
ity of a person to find figures hidden within a larger
figure. Witkin contends that the ability to identify the
embedded figures is related to a person's problem solving
approaches and interpersonal relationships [Witkin, et. al. .
19713. The MBTI measures a person's: (1) perceptions of
objects along a sensing versus intuition scale, and
(2) evaluation of objects along a thinking versus feeling
scale. The perception scale is viewed as an information-
gathering function [White, 19843. Sensing individuals
utilize a structured approach to making decisions by
reducing the problem to a core of underlying causal
relationships and then to choose the optimal alternative

128
solution. Intuitive individuals emphasize common sense,
intuition, and unquantified feelings of future developments
when selecting alternatives to solve problems.
The GEFT was chosen to measure cognitive style because
the Pracht [1984 3 study found the GEFT scores were related
to individual BML game performance. Field-independent
(high-analytic) subjects using GISMO exhibited better
decision-making performance and higher levels of decision
environment understanding than the field-dependent (low-
analytic) subjects. Witkin, et^ al. [19713 have shown that
field-independent individuals have more analytic and
structuring abilities compared to field-dependent types.
The experimental evidence published so far on individual
differences, as measured by the GEFT, indicates that field-
independents (high analytics) out perform field-dependents
(low analytics) in ill-structured problem-solving and
decision-making tasks [Benbasat and Dexter, 1979; Lusk,
1979; Pracht, 1984 3. Additionally, the GEFT also has been
used extensively in cognitive research and has a large
empirical base [Witkin, et. al.. , 1971; Witkin and
Goodenough, 1977 3.
Demographic Characteristics and Experience
The demographic characteristics of the subjects were
measured and used to evaluate the equivalence of the groups

129
on variables which have been found or suspected to bias
this type of experiment. Table 4.1 summarizes the test of
differences among the groups. As can be seen the only
significant difference among the treatment groups between
the NGT and IG groups. Further investigation of the
effects of age indicated no significant influence on the
responses variables.
Before the study began, the subjects filled out the
questionnaire on personal background and experience.
Previous studies [DeSanctis, 1982; Kasper, 19833 have
indicated that subjects with extensive computer and/or
managerial experience may bias study results. Since
subjects with relevant experience in business decision
making, BML/SLIM experience, and extensive computer
experience could possibly contaminate the results, these
subjects were identified and excluded from the experiment
as active participants. These students were used as
laboratory assistants,or given other course assignments.
Differences in Group Size
As was previously discussed, two of the sixteen groups
had only three group members assigned to them. Both of
these groups were in the NONGISMO/IG treatment combination.
Two other groups lost a group member after the group
assignments were made. One of these groups (GISMO/IG) had
a member disqualified from the experiment after it was

130
learn he had had prior experience with a business
simulation game. The other group (NONGISMO/NGT) had a
member quit the course. It has been reported that there
are no differences in BML game performance and game
understanding between three-member and four-member groups
[Wolfe and Chacko, 19833. But it was still suspected that
the differences in group size might have an undesirable
impact on the dependent variables. Therefore, the effects
of group size differences was investigated. The results of
the investigation are reported in the next chapter.
Information System Characteristics
The terminals used in the study were two Hewlett-
Packard 2623A graphics terminals with built-in printers.
The terminals were linked to a VAX-11/780 mainframe via two
telephone lines, as shown in Figure 4. 3. Two 1200 baud
modems were used to transmit the signals. The terminals
were located in the Management Research Laboratory.
All subjects had individual accounts on the VAX-11/780
so they could access the SLIM data base. The subjects used
the VT-100 terminals in the VAX User Area for the SLIM
access. As a control measure, a system logon file, which
checked the userid, was used so that each subject could
only access the packages which he/she was assigned. No
Qther operations were possible with those user accounts.

131
Therefore, the NONGISMO subjects would be directly logged
into SLIM when they logged on, and logged off the system
when the SLIM program was terminated. The GISMO subjects
were given the option of SLIM or GISMO when they logged on.
I I I USER/GROUP I I !
T !
!
I I I I GRAPHICS TERMINAL! >IHARDCOPY PRINTER I I I
!
I !
1_ ! ~ ~~ i I MODEM ! ! I
!
!
I 1
! "" I I V A X - 1 1 / 7 8 0 I ! i
T !
!
J. I " ' I I GISMO ! ! !
Figure 4.3: Hardware/Software Configuration of Problem Structuring System

132
Data Analysis
The objective of the research experiment was to
determine the main effects of the experimental factors
(predictors) on net income in the BML game and problem-
environment understanding (responses) of the experimental
units (i.e., groups). The factorial design permits the use
of regression analysis, analysis of variance, and analysis
of covariance to examine the nature of relationships
between the response means of the treatment combinations
and the independent variables. Both approaches are nearly
equivalent when the independent variables are treated
qualitatively [Kirk, 19823.
The generalized linear model is used to model the
primary variables, nuisance variables, and suspected
interactions can be used to test the research questions
concerning the dependent variables, decision performance,
and group problem understanding. The SAS GLM procedure with
the Manova option was used to fit the generalized linear
model for decision performance model, and GLM was used to
fit the problem understand model.
Decision Performance
Each of the sixteen decision groups generated six net
income responses. These responses were treated as a
response vector in a multivariate analysis of covariance.

133
Two important nuisance variables were expected to
affect decision performance: the differences in group
cognitive style, and the differences in group size.
Statistical control of those effects was desired. Analysis
of covariance is a statistical control which enables the
experimenter to remove potential sources of bias from the
experiment, biases that are difficult or impossible to
eliminate by experimental control [Kirk, 19823. Through the
analysis of covariance, the dependent variable can be
adjusted so that the effects of uncontrolled sources of
variations is removed before the test of significance is
applied. Thus, permitting the estimation of the factor
parameters and the testing of the research hypotheses.
The generalized linear model is used to describe the
theoretical model which is the basis for testing the
hypotheses related to the effects of TOOL and PROCEDURE on
decision performance. The full multivariate analysis of
covariance model representing the factor effects and
covariates is shown below. The covariates in the model are
C(k) for group size, and D(l) for group GEFT average.
Y(i,j,k)= u * A<i) * B(j) * AB(i,j) * C(k) ^ D(l) ••• e(i, j,k, 1)
where:
Y(i,j,k,l) = is the observation vector for the dependent variable, net income, for experimental unit (1) assigned to treatment combination (i,j) of group size (k).

134
i = O, 1 (NONGISMO = O, GISMO = 1)
j » O, 1 (IG = O, NGT = 1)
k = O, 1 (SIZE 4 = 0 , SIZE 3 = 1 )
1 - 1,..., 16 (observation group)
u = overall level mean response vector
A(i) = estimated treatment (TOOL) effect
B(j) = estimated treatment (PROCEDURE) effect
AB(i,j) = estimated interaction effect between TOOL and PROCEDURE
C(k) = blocked effect for group SIZE
D(l) = random blocked effect of group cognitive style
e(i, j,k, 1) = the error term.
The interaction term AB(i,j) included in the
model to test for differences in GISMO effect for NGT and
IG groups. A test for interaction is required in this
study because the Interaction hypotheses are an important
part of this study, and the experimental design. The
subhypotheses of Hypothesis III are used to analyze the
factor effects, if a significant interaction effect is
present. The analysis of factor effects can be done by
performing a multiple comparison test to determine the
nature of the interaction. If no significant interaction
is found, then there is no basis to reject Hypothesis III,
or to perform the analysis of factor effects for the
subhypothesi

135
Group Problem Understanding
The general linear model describing the theoretical
model which is the basis of the research of problem
understanding is as follows:
Y(i,j,k,l) = u • A(i) -*• B(j) * AB(i,j) • C(k) • D(l) • F(l) 1- e(i, j,k,l)
where:
y(i,j,k,l) = is the response of subject 1 for the dependent variable, problem understanding, in factor combination (i,j) of group size (k).
i = O, 1 (NONGISMO = O; GISMO = 1)
j = O, 1 (IG = O; NGT = 1)
k = O, 1 (SIZE 4 = 0 ; SIZE 3 = 1 )
1 = 1,..., 60
u = overall-level mean response
A(i) = fixed effect of the TOOL factor
B(j) = fixed effect of the PROCEDURE factor
AB(i,j) = fixed interaction effect between TOOL and PROCEDURE
C(k) = blocked fixed effect for group size
D(l) = random blocked effect for individual cognitive style
F(l) = blocked effect for individual pre-experiment knowledge
e(i,j,k) = the error term.
The problem understanding measurement was taken at the
individual level, rather than the group level, since group

136
members were not allowed to confer while filling out the
post-experiment questionnaire (Appendix E). Thus, the
problem understanding scores represent individual knowledge
instead of group or pooled knowledge. Through the GLM pro
cedure a test of the mean scores of the subjects the four
factor combinations is possible, therefore the comparison
of problem understanding is based on the factor levels.
The analysis of covariance model is used to remove the
effects of individual cognitive style, group size, and
differences in problem understanding levels at the
beginning of the experiment.
The interaction term, AB(i,j), is included to test for
the joint effects of the experimental factors. A non
significant interaction will mean that Hypothesis VI and
its subhypotheses cannot be rejected.
Limitations of the Study
The limitations of the study are related to the
following issues:
1. the use of student subjects,
2. the artificial nature of the decision-making environment,
3. the restricted nature of the problem-structuring tool, and
4. the possibility of contamination.

137
The consequence of these limitations is that it may
not be completely accurate to generalize the the findings
of the experiment to the population of strategic decision
making groups in real organizations. The use of student
surrogates for managers in business games is a continuing,
unresolved issue. Some studies indicate that students and
managers respond similarly in many circumstances [Khera
and Benson, 1970; Chorba and New, 1980 3, while other
studies indicate that students respond quite differently
than managers [Lucas and Nielsen, 1980 3. In a recent study
[Jenkins, 1982 3, it was indicated that "managers, as
opposed to students, tend to be biased subjects" [Jenkins,
1982, p. 103.
The use of student subjects in the experiment seems
justified in that the purpose of the study is to investi
gate the effects of using problem-structuring tools and
group problem-solving approaches for groups in a new or
changing decision-making environment.
The inability to control all the factors which affect
the dynamics of the group behavior is a significant
limitation. Complete control of those factors would
guarantee that the groups strictly followed the NGT pro
cedures. However, in human behavioral research complete
control is not feasible. However, attempts to control
those factors which have been determined to be important in

138
influencing group decision making were provided through the
experimental design and experimental procedures of the
study.
The problem of artificiality of the business gaming
decision environment is the result of the tradeoff which
has been made between experimental control and realism. A
laboratory experiment permits a high level of control of
the independent variables (e.g., problem complexity,
decision environment, and cognitive style composition of
the groups). A field study using actual business managers,
while involving a more realistic environment, would permit
very little experimental control. For fundamental research
(as opposed to applied research) the relationships and
interactions among the important variables are the factors
which were studied. In order to isolate these relation
ships and interactions, the experiment was conducted in a
controlled laboratory environment. Although, the study
does not replicate the strategic decision-making activities
of managers in a real corporate setting, it does simulate
the important processes of strategic decision making which
would be difficult to examine and compare across decision
makers in a real-world setting.
The problem-structuring tool used in the study, is
based on an extended version of SPIN [McLean, et. al.. , 1976,
1976a3 approach. It is only one kind of structural

139
modeling technique, therefore the results from this study
are not completely generalizable to all structural modeling
procedures. The problem-structuring tool used in the study
is a prototype system and does not contain all of the
state-of-the-art features that would be contained in a
commercial system.
Also, the results are not generalizable to all GDSS
because some of the important components and procedures of
many current GDSS are either not tested nor included in the
system used in the experiment. Among the GDSS features
which were not included in this study are: (1) a computex—
based voting procedure, (2) a public screen to display
group member models, and (3) sufficient number of graphics
terminals to permit group members to interact electron
ically as they would in a real GDSS session. Regardless of
these limitations the essence of a GDSS environment was
created through the use of the GISMO models in the group
meetings.
It was, however, necessary for the investigator to be
closely involved in the training and monitoring of the
groups during the experiment. Without proper controls
contamination of the groups could occur. To reduce the
problem of contamination, the study was conducted in the
the Management Research Laboratory in the College of
Business Administration at Texas Tech University. The

140
laboratory can be partitioned into 6 separate rooms. The
laboratory is also equipped with a control room with one
way mirrors and an intercom system. In this way, it was
possible to unobtrusively observe the groups during
performance of their activities to ensure that proper
meeting procedures were followed by the groups.
Summary
In this chapter the research procedures, methodo
logies, data analysis, laboratory procedures, experimental
design, subject characteristics, control mechanisms, study
time table, hardware and software considerations, and study
limitations were discussed.
Briefly recapping the research design, each group made
six sets of game decisions, giving six sets of performance
results. At the end of the game, another dependent
variable (problem understanding) was measured as the
average of the group members' scores on the related
knowledge tests of the BML Post-Experiment Questionnaire
and the number of edges in the structural models turned in
by each subject representing his/her perception of the
relationships in the BML game.
The groups met in the Management Research Laboratory
to conduct the group meetings twice a week during the
experiment. All groups went through four weeks of training

141
during which time they were given instruction covering BML
and SLIM. The groups that used GISMO were given instruc
tion in its use. The NGT groups learned about the proce
dure and were instructed in its use. During the training
period all groups made three trial decisions. The last two
decisions were made using the respective tools and group
procedures the group was assigned.
In the next chapter a discussion of the results
derived from the research experiment are presented. The
discussion of the theoretical and practical implications,
and the conclusions drawn from the study is presented in
Chapter VI.
CHAPTER V
RESEARCH RESULTS
Introduction
The hypotheses developed in Chapter III were tested
using data gathered in the study according to the
methodology described in Chapter IV. The statistical
techniques presented in Chapter IV were used to test the
research hypotheses. The results of those tests and the
interpretation of the results are presented in this
chapter. Briefly, the contention of the research is that
group decision performance and problem-environment undez—
standing are influenced by both the decision support tools
and the decision-making procedures used by a decision
making group. The study also contends that there is an
interaction or joint effect between the TOOL and the group
PROCEDURE factors.
Before testing the hypotheses, a set of preliminary
analyses was performed to assess the degree of equivalence
of the groups on the nuisance variables suspected to affect
group decision-making performance and problem-environment
understanding. Among these variables were cognitive style,
work and computer experience, and age of the subjects. As
discussed in Chapter IV, differences among groups that can
not be controlled by the experimental design can be
142

143
statistically controlled through the analysis of covariance
procedure.
The only significant difference (p > t = .04) found
among the groups was age (Table 5.1). However, there was no
evidence from further analysis that the age difference
affected the study results. The ages of the IG subjects
ranged from 20 to 24 years while the ages of NGT subjects
ranged from 21 to 25 years.
Data used to test the hypotheses came from the
following sources:
1. the pre-experiment questionnaire,
2. the pre-experiment BML/SLIM quiz,
3. the Group Embedded Figures Test(GEFT),
4. the Post-experiment BML/SLIM questionnaire,
5. the BML game results, and
6. the structural models created by the subjects at the end of the experiment.
The actual statistical analyses were performed using
the SAS and SPSS packages on an IBM 3033 computer. The
generalized linear models developed in Chapter IV provided
the basis for the analyses of group decision performance
and group problem understanding. The general findings of
the study indicate support for the contention that GISMO
use is related to higher group decision performance and
problem understanding. Results of the tests of the

144
Table 5.1: Individual Difference Variables
GEFT
GISMO NONGISMO NGT IG
Means
13.6 12.6 12.3 13.9
Work Experience (Mos. GISMO NONGISMO NGT IG
Supervisory GISMO NONGISMO NGT IG
Computer Exp GISMO NONGISMO NGT IG
23.2 21.9 22.1 23.1
N
35 25 27 33
)
35 25 27 33
Experience (Moa.) 18.3 19.0 19.2 18.1
lerience -13.2 13.4 14.0 12.8
Computer Experience -GISMO NONGISMO NGT IG
Age GISMO NONGISMO NGT IG
16.8 16.6 16.2 17.1
21.9 21.9 22.2 21.7
35 25 27 33
SD
3.69 4.58 3.47 4.42
22.0 12.7 20.1 17.7
11.2 11.4 12.2 10.7
Work Related 35 25 27 33
Acadenic 35 25 27 33
35 25 27 33
7.01 5.84 7.22 6.00
Related 5.50 4.88 4.72 5.68
0.97 1.17 1.12 0.92
I
0.90
1.57
0.28
0.21
-0.24
-0.37
-0.12
-0.73
0.09
0.66
0.23
-2.10
di
58
58
56.2
58
58
58
58
58
58
58
58
58
P>T
0.37
0.12
0.78
0.84
0.81
0.71
0.90
0.47
0.92
0.51
0.82
0.04»
research hypotheses are presented in the remainder of this
chapter. Test procedures and results for the decision
performance hypotheses are presented in the next section,
followed by test procedures and results for the problem
145
understanding hypotheses. The implications of these
results and suggestions for future research based on these
results are presented in Chapter VI.
Decision Performance Results
The experimental design was a 2 X 2 factorial design.
This type of design allowed testing of three general
hypotheses: (1) the test that the effects of the two
levels of the TOOL factor are equal, (2) the test that the
effects of the two levels of the PROCEDURE factor are
equal, and (3) the test that the joint or interaction
effect between the TOOL factor and the PROCEDURE factor is
zero. The data analysis used the Multiple Analysis of
Covariance (MANOCOVA) statistical technique. MANOCOVA can
be used to simultaneously study the effects of multiple
independent (treatment) variables on two or more dependent
variables. It is used when some of the independent
variables are nonmetric, and to remove the effects of
uncontrolled (nuisance) independent variables on the
dependent variables. Both nonmetric and metric independent
variables are handled in MANOCOVA. The test statistic used
in the analysis is Wilk's Lambda or the likelihood ratio.
Wilk's Lambda is used to test for significant differences
between the levels of the main effects, the interaction
effects, and the nuisance effects on net income.

146
The primary research contention that the use of the
problem-structuring aid has a positive effect on group
decision performance is supported by the results of the
experiment. And, no significant interaction (p > F = 0.39)
between the TOOL factor and the PROCEDURE factor was found.
Therefore, Hypothesis III, nor its subhypotheses, cannot be
rejected on the basis of the data collected in this study.
Group cognitive style was not significantly related to
group decision performance (p > F = 0.347). In the Pracht
study [19843, individual GEFT was related to individual
decision-making performance. But, there is no strong
evidence that this effect applies to the group setting.
The finding that GISMO is related to better group decision
performance is not consistent with the findings of Pracht
[1984 3. This difference may stem from (1) the group
effects being strong than the individual difference
effects, and (2) the longer training period for the
subjects in this study. In the Pracht study subjects were
given one week of training in the use of SLIM, the BML
game, and GISMO. In this study, subjects had four weeks to
learn these skills.
Average net incomes at the game's end are presented in
Figure 5.1. As can be seen, the mean of the GISMO group is
higher than the NONGISMO group mean, and the IG group mean
is higher than the NGT group mean.

147
NGT IG
GISMO
NONGISMO
N = 24 Mean = -14975
N := 18 Mean = -43479
N = 42 Mean = -27191
N = 30 Mean = -2524
N= 24 Mean = -36248
N = 54 Mean = -17512
N = 54 Mean = -8058
N = 42 Mean -39347
Figure 5.1: Average Net Income for the Four Treatment Combinations and Factor Levels at the End of the Game
Figure 5.2 shows the average net incomes of the four
treatment combinations for each of the six decision periods
in the experiment. As can be seen from the graph, net
income of the GISMO groups generally was higher than that
of the NONGISMO groups. And, net income of the IG groups
generally was higher than that of the NGT groups.
Because the normality assumption necessary for ANOVA
procedures was not met, the raw values for decision
performance were converted to ranked values and subsequent
analysis was performed on these ranked scores.

148
Average Net Income ($000)
30
20
10
0
-10
-20
-30
-40
-50
-60
-70
-80
— G I S / I G
— G I S / N G T
— N O G / I G
N O G / N G T
/
/
y \y
I
1 I 2
! 3
I 4
I
6
Decision Period
Figure 5.2: Average Net Incomes (GIS/IG = GISMO/NGT; GIS/IG = GISMO/IG; NOG/NGT = NONGISMO/NGT; NOG/IG = NONGISMO/IG)
149
As previously stated, one set of hypotheses in this
study dealt with joint effects of the problem-structuring
aid and the decision-making procedure used by the groups.
The first step in testing for the main effects is to
determine whether the two experimental factors (TOOL and
PROCEDURE) interact. The generalized linear model shown
below was used to make this test.
Y(i,j,k,l)= u ^ A(i) * B(j) * AB(i,j) * C(k) * D(l) • e(i,j,k,1)
where:
Y(i,j,k,l) = is the observation vector for the dependent variable, net income, for experimental unit (1) assigned to treatment combin-ation (i,j) of group size (k).
i = O, 1 (NONGISMO = O, GISMO = 1)
J = O, 1 (IG = O, NGT = 1)
k = O, 1 (SIZE 4 = 0 , SIZE 3 = 1 )
1 = 1 , . . . , 16 (group number)
u = overall level mean response vector
A = estimated treatment (TOOL) effect
B = estimated treatment (PROCEDURE) effect
AB = estimated interaction effect between TOOL and PROCEDURE
C = blocked effect for group size
D = random blocked effect for group cognitive style average
e(i,j»k,l) = the error term.

150
The term AB(i,j) is the interaction for the TOOL and
PROCEDURE factors. The MANOCOVA model was chosen to test
the main effects and interaction effects of the experi
mental factors. Significant changes were found between the
models with and without GEFTAVG and group SIZE as
covariates. Consequently, the covariate model was chosen.
The GEFTAVG was not found to be signifcantly related to
decision performance (p > F = 0.347), while SIZE was
significant in the model (p > F = 0.016). The fit of the
MANOCOVA model:
Y(i,j,k,l)= u * A(i) ->• B(j) -*• AB(i,j) * C(k) * D(l)
gave the results shown in Appendix K and in Table 5.2. The
Wilk's statistics are reported in Table 5.2.
The test of interaction between the main factors
indicates no significant interaction between the TOOL and
PROCEDURE factors (p > F = 0.391). A level of significance
of 0.05 would require F(6,5) = 3.40. Since F = O. 51 <
3. 40, the conclusion is that AB = O, and no interaction
effects are present.
The MANOCOVA results also show that SIZE was a
significant variable explaining the variation in net income
(F = 6.15 > 3.40). And GEFTAVG was not significant (F =
0,65 < 3.40) at a level of significance of 0.05.

151
Table 5.2: Wilk's Lambda Tests of Model Effects
MANOVA Test Criteria for the Hypothesis of: No Overall TOOL Effect
Wilk's L = O.1903 F(6, 5) = 3.54 Prob > F = 0.047
No Overall PROCEDURE Effect Wilk's L = 0.4117 F(6, 5) = 1.19 Prob > F = 0.216
No Overall TOOL»PROCEDURE Interaction Effect Wilk's L = 0.6200 F(6, 5) = 0.51 Prob > F = 0.391
No Overall SIZE Effect Wilk's L = O.1194 F(6, 5) = 6.15 Prob > F = 0.016
No Overall GEFTAVG Effect Wilk's L = O.5618 F(6, 5) = 0.65 Prob > F = 0.347
The test of the hypotheses concerning the effects of
the experimental factors are presented in the following
text. These hypotheses are stated in the conventional null
form and require one-tail tests of significance. A level
of significance of 0.05 and F(6,5) = 3.40 are used to make
these tests.
Hypothesis I: Groups using GISMO will not exhibit a
higher level of decision performance than groups not using
GISMO.
HO: A = O HI: A > O
The MANOCOVA results shown in Table 5.2 indicate that
GISMO use does significantly contribute to the variation of
152
the dependent variable (p > F = 0.047). A level of
significance of O.05 would require a F = 3.40. Since
F(6, 5) = 3.40 < 3.54, the conclusion is that A > 0, that
is, the use of GISMO is related to higher levels of group
decision performance regardless of the group decision
making procedure. In order to detect changes in group
performance over time. Univariate F tests on decision
performance were conducted for each of the six decision
periods (see Appendix K). Significant differences among
the GISMO and NONGISMO groups were observed in the first,
second, third, and fifth trials.
Hypothesis II: Groups using Nominal Group Technique
(NGT) will not exhibit a higher level of decision perform
ance than the Interacting Groups (IG).
HO: B = O HI: B > O
For the PROCEDURE factor, differences in the level
effects cannot be substantiated by the results. Since F =
1.19 < 3.40, the conclusion that B = O cannot be rejected
at a level of significance of 0.05. Thus, there is no
significant difference in the effects between NGT and IG.
The general conclusion of the fit of the generalized
linear model for the dependent variable representing group
decision performance is that the use of the problem-
structuring aid did significantly improve the decision
153
performance of the groups which used GISMO. Secondly, the
use of NGT resulted in no significant difference in
decision performance compared with that of the IG decision
performance. Thirdly, no evidence of significant inter
action (p > F = .391) between the use of GISMO and group
decision-making procedure was found. Therefore, the
conclusion is that the effects of GISMO were independent of
the decision-making procedure.
In the next section, the results of the data analysis
and test of the hypotheses concerning group problem under
standing are presented.
Problem Understanding Results
Five indicants of problem-understanding were used to
create a general measure of problem understanding: parts
2, 3, 12, the BML/SLIM Quiz of the Post-Experiment
Questionnaire (Appendix E ) ; and the end-of-game structural
models turned in by the subjects. The results of these
measurements indicate that GISMO use was significantly (p >
t = 0.045) related to a higher level of problem under
standing. Again, no evidence of significant (p > t = 0.79)
interaction between the TOOL factor and the PROCEDURE
factor was found.
A study of the pre-experiment measurement of BML/SLIM
knowledge (Appendix D) indicated that the NONGISMO subjects

154
had more knowledge of BML/SLIM at the end of the training
period than the GISMO subjects. The relative differences
in knowledge among the treatment combinations are shown in
Figure 5.3. These differences in beginning knowledge were
removed from the main effects by including the pre-
experiment scores as a covariate in the generalized linear
model. The differences in pre-experiment knowledge may be
attributed to the number of tasks which the GISMO groups
had to learn during the training phase. The GISMO subjects
had to learn GISMO as well as BML/SLIM, while the NONGISMO
groups were able to concentrate on BML/SLIM.
The pre-experiment test results reported in Figure 5.3
show that a significant difference (p > !tl = .02) between
NGT
GISMO I N = 16 I Mean = 29.16 I
NONGISMO I N = 11 ! Mean = 43. 14 I I
IG
I ! N = 17 ! Mean = 27. 15
N = 11 Mean = 22.04
N = 27 Mean = 34.85
N = 31 Mean = 24.84
N = 33 Mean = 28. 12
N = 25 Mean = 31.32
Figure 5.3: Beginning of Game Problem Understandin(

155
the means of NGT and IG groups. A significant difference
also existed between the NONGISMO/NGT and NONGISMO/IG
groups (t = -4.00, p > t = .0008). A third significant
difference exists between GISMO/NGT and NONGISMO/NGT groups
(t = -2.74, p > t =.025).
At the end of the game, there was evidence that the
GISMO groups had surpassed the NONGISMO groups in knowledge
of the BML game. The mean knowledge scores for all treat
ment combinations and factor levels are given in Figure
5.4.
NGT IG
!
GISMO I N = 14 ! Mean = 218.60
!
NONGISMO I N = 11 ! Mean = 206.81
N = 17 Mean = 221.71
N = 11 Mean = 205.83
N = 31 Mean = 220.31
N = 22 Mean = 206.32
N = 25 Mean = 213.41
N = 28 Mean = 215.47
Figure 5.4: Problem Understanding at Game's End
As can be seen in Figure 5.4, the GISMO groups had a
higher mean score on the knowledge measurement than the
NONGISMO groups. But there was only a small difference in
the means of the NGT and IG groups. The analysis of

156
covariance procedure was used for the generalized linear
model. The fit of the following response function yielded
the results shown in Table 5. 3.
Y(i,j,k) = u ^ A(i) ••- B(j) * AB(i,j) * C(k) * D(l) * F(l) * e(i, j, k, 1)
where:
Y(i,j,k,l) = is the response of subject 1 in group size k for the dependent variable, problem understanding, in factor combination (i,j) of group size (k).
i = O, 1 (NONGISMO = O; GISMO = 1)
j = O, 1 (IG = O; NGT = 1)
k = O, 1 (SIZE 4 = 0 ; SIZE 3 = 1 )
1 = 1,..., 60
u = overall-level mean response
A(i) = fixed effect of the TOOL factor
B(j) = fixed effect of the PROCEDURE factor
AB(i,j) = fixed interaction effect between TOOL and PROCEDURE
C(k) = random fixed effect for group size
D(l) = random blocked effect for individual cognitive style
F(l) = blocked effect for individual pre-experiment knowledge
e(i,j»k) = the error term.
The analysis of covariance model was used to remove the
•ffects of individual cognitive style, group size, and

157
differences in problem understanding levels at the
beginning of the experiment. The results from the fit of
the models are shown in Table 5.3.
Table 5.3: Regression Results for Problem Domain Understanding Model
Regression Coefficients
Regression Coefficients
GRAND MEAN TOOL PROCEDURE TOOL^PROCEDURE PREKNOWLEDGE GEFT SIZE
Estimated Req.
172. 23. 3.
-4. 1. 0.
-13.
Coef.
98 47 62 90 72 59 69
Estimated Std.
31. 13. 14. 18. 0. 1.
12.
Dev.
99 40 95 36 99 23 46
t
5. 1. 0. -0. 1. 0. -1.
41 75 24 27 74 48 10
P >
0. 0. 0. 0. 0. 0. 0.
Itl
01 04* 40 40 04» 32 14
The test for the interaction term on the response
variable indicated no significant (p > t = 0.79) inter
action was present between the two main factors. A level
of significance of 0.05 requires a t statistic of !tl >
1. 66. Since the t statistic of the coefficient AB is t =
24 < 1-66, the hypothesis that AB = O cannot be rejected.
Therefore, Hypothesis VI, and its subhypotheses, cannot be
rejected on the basis of these data. Thus, the following
discussion will address only the tests of Hypothesis IV and
Hypothesis V, which are concerned with the main effects of
the generalized linear model.
158
Hypothesis IV: Groups using GISMO will not exhibit a
higher level of problem understanding than groups not using
GISMO.
HO: A = O HI: A > O
The results for the test of main effects of the TOOL
indicate that the difference in the use of GISMO is signi
ficantly (p > t = 0.045) related to problem understanding.
A level of significance of O.05 requires a t statistic
greater than 1.66 (!t! > 1.66). Since t = 1.75 > 1.66, the
conclusion is that A > O and, therefore Hypothesis IV can
be rejected.
Hypothesis V: Groups using the Nominal Group
Technique (NGT) will not exhibit a higher level of problem
understanding than the Interacting Groups (IG).
HO: B = O HI: B > O
This hypothesis cannot be rejected. A level of
significance of 0.05 requires a Itl > 1.66. Since t = 0.24
< 1.66, the conclusion is that 8 = 0 , i.e., there was no
difference in problem understanding between NGT and IG
groups at the end of the game.
Additional Findings
An interesting finding came from the analysis of the
rate of change in BML/SLIM knowledge of the groups from the

159
b e g i n n i n g t o t h e end o f t h e e x p e r i m e n t . At t h e b e g i n n i n g
t h e NONGISMO g r o u p s seemed t o have a b e t t e r k n o w l e d g e o f
t h e BML game t h a n t h e GISMO g r o u p s ( F i g u r e 5 . 3 ) . But, a t
t h e end o f t h e game t h e GISMO g r o u p s e x h i b i t e d b e t t e r
k n o w l e d g e ( F i g u r e 5 . 5 ) .
NGT
GISMO
NONGISMO
N = 16 Mean = 1 . 2 5
N = 11 Mean = - 0 . 5 5
N = 27 Mean = 0 . 5 2
IG
N = 17 Mean = 0 . 6 5
N = 14 Mean = - 0 . 7 1
N = 31 Mean = 0.03
N = 33 Mean = 0.94
N = 25 Mean = -0 . 64
F i g u r e 5 . 5 : P r e - t e s t / P o s t - t e s t Change i n BML/SLIM Knowledge
The test of mean differences between pre-experiment
and post-experiment knowledge of BML relationships
indicates the rate of change in knowledge was greater for
the GISMO groups. One of the difficulties in using
decision performance as a measure of effectiveness of a
problem-structuring aid is that the effects tend to be
long-term rather than short-term [Chorba and New, 1980;
Kasper, 1983; Volkema, 1983; Pracht, 19843. But, in this

160
study, the longer training period conducted prior to the
start of the actual experience seemed to have overcome this
difficulty.
Summary of Results
The results of the hypotheses testing indicate that
the use of GISMO was related to better group performance in
the BML game. And, the effects of the use of GISMO are
independent of the decision-making procedure used by the
groups. Also, the use of the graphical problem-structuring
aid is associated with better understanding of the problem
environment. Group members using the graphics aid
identified more relationships than members of the non-aided
groups.
In the next chapter discussions of the meaning of
these results, and the theoretical and practical implica
tions of the results are presented.

CHAPTER VI
DISCUSSION AND CONCLUSIONS
Introduction
This chapter presents a recapitulation of the
research results, as well as a discussion of the
theoretical and practical contributions and implications of
the research. The implications and contributions of the
study are related to the technical and behavioral aspects
of the research. The technical aspects involve the
"transfer of technology," and the study of the effect of
that technology in a group decision-making setting. A
computer-assisted structural modeling technique from the
field of systems engineering was extended by the addition
of interactive capabilities and integrated into a DSS by
Pracht, [1984 3. The purpose of this integration was to
provide a DSS with capabilities to support the problem-
structuring phase of decision making. Pracht [1984 3
studied the behavioral effects of this system on individual
decision making. This research extended the use of this
system to small decision groups.
The behavioral aspect of this study was the investi
gation of the impact of GISMO on group decision-making
performance and group problem understanding in a simulated
GDSS setting. A secondary behavioral aspect of this study
161

162
was the investigation of interaction effects between GISMO
use and the Nominal Group Technique.
A controlled laboratory experiment employing a gaming
simulator, the Business Management Laboratory (BML),
provided a semistructured problem environment to explore
the validity of the variables and relationships posited in
the research model (Figure 3.8). The theoretical implica
tions of this model emanate from the development and
partial validation of a conceptual model of the man/machine
system to support group decision making. The unique
feature of this model is its focus on the problem formula
tion phase of group decision making.
The results of the research lead to three general
conclusions: (1) the use of GISMO was related to better
group decision performance, (2) the use of GISMO was
related to better group problem understanding, and (3) the
effects of GISMO were similar for both NGT and IG
procedures. The practical significance of these findings
are discussed in the following sections.
Practical Implications and Contributions
The practical implications of this research stem from
the finding that GISMO use is related to better group
decision performance and problem understanding or know
ledge. These findings support the contention that GISMO

163
can provide useful and effective support to decision-making
groups. Therefore, this kind of aid should be considered
for inclusion in GDSS.
GISMO provides effective support for groups during the
problem formulation phase of decision making, which current
GDSS do not support. Current GDSS concentrate on
supporting groups during the alternative generation and
choice phases of strategic decision making. The inclusion
of a graphical problem-structuring aid in these GDSS would
create a decision support system for all phases of
strategic decision making.
Another practical contribution of this research is the
use of GISMO in a group decision making context. Origi
nally, GISMO was tested with individual decision makers
with mixed results. The reasons given for these results
were the short training period prior to the start of the
experiment, and the short duration of the game, which
prevented the increase in knowledge to translate into
measurable improvements in decision performance [Pracht,
1984 3. A contribution of this study was the evidence that,
with a longer training period and a longer experiment,
significant changes in decision performance can be
detected.
The results of this study seem to imply that the scope
of GISMO could be extended to support problem-structuring

164
activities of groups with members in separate geographic
locations. The use of the aid in conjunction with an
electronic communications system and distributed processing
systems may make effective distributed group decision
making possible. The ability to accurately communicate and
share mental models would be a valuable tool for organiza
tional decision makers. The ability to collectively build
and modify models over time and distance would be of value
to most organizations.
It is speculated that GISMO may be a useful tool for
the building of a knowledge base for an artificial intel
ligence (Al) system. The perceived environment of an
organization could be modeled by managers, staff members,
and other "experts" and used as a blueprint for an Al
system. The use of GISMO for this purpose has not been
attempted at this time. However, it does seem to be a
promising application.
In relation to knowledge bases, GISMO models could be
used to teach managers about the environment in which the
organization operates. Knowledge base models that repre
sent the collective knowledge of an organization's
perception of cause-effect relationships in an organiza-
•tion's problem domain could be valuable diagnostic and
management aid. With these models management could have a
clearer understanding of how they perceive the organization

165
and its environment at one moment in time or how these
perceptions have changed over time. The use of causal
mapping has been suggested before [Hall, 19843, but GISMO
provides a means to easily construct these maps.
The problem-structuring aid may make possible
computer-based support of decision-making approaches beyond
the strictly "rational" or "technical" perspectives
currently supported by DSS and GDSS. As stated in Chapter
III, strategic decision making in most organizations is an
adaptable and flexible procedure in which human intuition
and politics are important factors. Problem-structuring
aids are a potential vehicle for graphically portraying
political issues that may strongly influence the decision
making process [Axelrod, 1976; Hall, 19843.
Theoretical Implications and Contributions
Theoretical contributions of the research are related
to the development and testing of a GDSS conceptual model:
(1) the validation of major components of the model, and
(2) the inclusion of small group processes in the
man/machine system model [components of the model, i.e.,
the IG/NGT group component not significant, discuss this
morel. The model is used to explain certain human
behavioral aspects of a man/machine decision support system
to assist decision groups. An issue which previously had

166
not been raised in regard to GDSS is the relationship
between the technology and group decision-making processes.
Generally, the GDSS literature has assumed that technology
and the group decision-making process work in a synergistic
fashion to create an effect which is greater than the sum
of the individual effects. This research has questioned
this assumption and tested its validity in a controlled
experiment.
A theoretical model of GDSS and a methodology for
conducting GDSS research were developed for this study.
This model development was necessary to provide a basis for
a systematic investigation of GISMO and NGT impacts. The
model provides two variables which could be used to measure
these impacts--decision performance and problem
understanding. This model can provide a foundation for
further GDSS research in the areas of GDSS development,
operation, use, and impact of GDSS in an organizational
setting, and the study of problem-structuring aids to
enhance group decision-making quality. Before GDSS can be
of real benefit it must be tested and its impact measured.
One assumption of the theoretical model (Figure 3.8)
which was not validiated was the assumption that the
structuredness of the group decision-making process is
related to group decision performance and problem
understanding. The failure to validate this part of the
167
model may be related to one or more of the following
factors.
One factor may be the effects of GISMO itself. It was
observed that the GISMO groups used the structural models
to focus and structure the group discussions and decision
making. This type of strucuture may have accomplished the
same objectives that NGT was design to accomplish. There
fore, the results of GISMO and NGT are very similar.
Another factor could be the dislike of the NGT proce
dure by the groups which used it. A tendency for the NGT
groups to drift away from the NGT procedure to less struc
tured group interaction was observed. A strong adherence
to the NGT process may have given different results.
The failure to validate the entire model may be due to
the relatively small sample size in the experiment. The
small sample size lead to low degrees of freedom for the
statistical analyses, and insufficient power to reject the
false null hypotheses.
Lastly, the results of this study seem to suggest
that the use of GISMO in problem formulation is sufficient,
and that NGT use provides no additional benefits. This
speculation on the relative strengths of the effects of
GISMO and NGT needs to be further investigated.
A great deal of research has been directed toward the
study of computer graphics. Nearly all of these efforts

168
have conceived graphics as a data summarization aid, which
can pictorially represent data in the form of charts and
graphs. But, research into the use of computer graphics as
aids to represent knowledge and ideas, and to build models
seldom has been considered. This use of computer graphics
may prove to be powerful aids in computer-based decision
support systems. It is hoped that this research will draw
interest into further research in this area.
This research has contributed to the knowledge of the
impact of GISMO on problem understanding. The results
confirm those of Pracht [1984 3 in that GISMO use was
related to better problem understanding. But, unlike that
study, GISMO also was related to better decision
performance. However, no determination of whether better
knowledge lead to better decisions, or better decisions
lead to better knowledge through a feedback loop, can be
made. It is hoped this research will raise some interest
in that issue as well.
Informal Observations
Several informal observations were made during the
experiment which warrant discussion and future investiga
tion. These observations were concerned with individual
subject reactions and comments, and group processes.
Subject reactions are those expressed by the subjects about

169
the study and the experimental tasks they were required to
perform. The group process observations are concerned with
group behaviors noted in the various groups.
In general, most of the NGT group members expressed a
dislike of the NGT procedure. These subjects expressed
that the procedure restricted the group interaction and,
therefore, hampered group performance. They felt their BML
game performance would have been better without the NGT
restrictions. The GISMO groups expressed that opinions
that they had too much to learn during the training period.
Trying to learn BML, SLIM, and GISMO seemed to be a burden
for them. The GISMO/NGT groups expressed that learning the
NGT procedures hampered their performance, also. However,
the study results do indicate that the GISMO groups tended
to make better BML decisions than the NONGISMO groups.
Other observations were related to differences in the
amount of time the GISMO and NONGISMO groups took in making
group decisions. Generally, the NONGISMO groups took more
time to make their decisions. Since all groups were
limited to 45 minutes for making decisions, the GISMO
groups typically were finished before the time limit,
whereas, the NONGISMO groups were rushing to complete the
decisions when time expired.
It also was observed that during the NONGISMO meeting
more ideas were presented and discussed in comparison to
170
the GISMO meetings. However, the discussion of these ideas
tended to be shorter and less focused than those of the
GISMO groups. When an idea was presented, the discussion
of the idea was not explained and examined in as much depth
or attention. In the GISMO groups fewer ideas were pre
sented but each idea was given more attention. The GISMO
models were used to communicate ideas and to focus group
discussion. Thus, the attention and discussion on those
ideas were greater and less time was to spent in fruitless
arguments and misunderstandings.
These observations suggest that future research should
investigate the number of ideas presented and considered,
the length of time each ideas is the focus of attention,
and the length of time to make decisions. These results
may provide valuable insights as to why GISMO seems to
enhance group decision performance and the relationships
bet-ween GISMO effects and group interaction process
effects.
Suggestions for Future Research
Because of software limitations, the limited number of
graphics terminals, subjects using GISMO in this study did
not have access to GISMO during group meetings: members
had to use GISMO outside the group and bring their models
to the meetings. Nonetheless, the results justify future

171
studies of a larger scope. Future research efforts should
have terminals available for each group member to use
during the group meetings as well as outside the meetings.
Software that permit members to interact electronically to
collectively create and modify a single model should be
used also. This setting would provide a more realistic
group decision-making setting.
Another suggestion for future research involves the
comparison of the effects of GISMO in face-to-face meetings
and meetings where the members are physically separated.
The purpose of such research would be to investigate the
ability of the graphics aid in transmitting knowledge and
ideas in distributed groups which interact electronically.
Conducting meetings through electronic media is becoming
more commonplace in today's organizations. It is expected
that decision making will follow this pattern, too.
This research has compared only two group decision
making methods. Whether GISMO will have similar impacts
when used in conjunction with other group decision-making
methods discussed in Chapter II should be studied. One
method which may be worthy of study is the Kepner-Tregoe
method. The scope of the Kepner-Tregoe method may be
expanded when used with GISMO.
This study used student subjects, which raises the
issue of external validity of the results. It is suggested
172
that future studies use real business managers to determine
applicability of the results of this study to real
organizational decision makers. Such a study could use
GISMO as a training tool for these managers.
Another direction future research might take is in the
study of the effects of GISMO on group processes. Such a
study could focus on the effects of the aid on group
communication, the number of ideas generated and considered
by groups, length of time groups take to make decisions,
group cohesion, etc.
One observation made in this study was that the GISMO
groups took less time to make their decisions. These
groups seemed to focus their discussions on a small set of
issues and discussed these issues in more depth. The
NONGISMO groups, on the other hand, tended to raise more
issues but the discussion tended to be brief and
incomplete. The improvement in decision making for the
GISMO groups may have resulted from differences in the way
member ideas were communicated and through the ability to
store their mental models for later use and modification.
Future studies should be directed toward developing
techniques to use GISMO to support and enhance group
communication and learning.

173
Summary
This research investigation involved two widely
diverse fields: computer-based DSS and group decision
making. This research is the first such formal
investigation conducted to study the relationship between a
computer-based problem-structuring aid and group problem-
solving in a GDSS environment. The study is timely in that
it has raised many fundamental questions about GDSS
technology, research, and theory. The results have
provided some valuable insights into the roles and
potentials of problem-structuring aids, such as GISMO, as
components of Group Decision Support Systems.

BIBLIOGRAPHY
Ackoff, R. The Art of Problem Solving. New York, NY: John Wiley & Sons, Inc., 1978.
Adelman, L. "Real-time Computer Support for Decision Analysis in a Group Setting: Another Class of Decision Support Systems." Interfaces, vol. 14, no. 2, March-April 1985, pp. 75-83.
Axelrod, R. Structure of Decision: The Cognitive Maps of Political Elites. Princeton University Press: Princeton, NJ, 1976.
Bales, R.F. and F.L. Strodtbeck. "Phases in Group Problem Solving." Journal of Abnormal and Social Psychology, vol. 46, 1951, pp. 485-495.
Bariff, M.L. and E.J. Lusk. "Cognitive and Personality Tests for the Design of Management Information Systems." Management Science, vol. 23, no. 8, April 1977, pp. 820-829.
Benbasat, I, and A.S. Dexter. "Value and Events Approaches to to Accounting: An Experimental Evaluation." Accounting Review, vol. 54, October 1979, pp. 735-749.
Benbasat, I. and R.N. Taylor. "The Impact of Cognitive Styles on Information System Design." MIS Quarterly. vol. 3, no. 2, June 1978, pp. 43-54.
Beyer, J.M. "Ideologies, Values, and Decision Making in Organizations," in Handbook of Organizational Design Volume 2: Remodeling Organizations and Their Environments. P.C. Nystrom, and W.H. Starbuck, (eds.). New York, NY: Oxford University Press, 1981, pp. 166-202.
Bonczek, R.H., C.W. Holsapple, and A. B. Whinston. Foundations of Decision Support Systems. New York, NY: Academic Press, Inc., 1981.
Bui, T. and M. Jarke. "A DSS for Cooperative Multiple Criteria Group Decision Making." Proceedings of the Fifth International Conference on Information Systems. November 28-30, 1984, Tucson, AZ, pp. 101-113.
174

175
Carlson, E. D. , B. F. Grace, and J. A. Sutton. "Case Studies of End User Requirements for Interactive Problem-Solving Systems." MIS Quarterly, vol. 2, March 1977, pp. 51-63.
Chorba, R.W. and J.L. New. "Information Support for Decision Maker Learning in a Competitive Environment: An Empirical Study." Decision Sciences, vol. 11, no. 4, 1980, pp. 603-615.
Cohen, M.D., J.G. March, and J.P. Olsen. "A Garbage Can Model of Organizational Choice." Administrative Science Quarterly, vol. 17, 1972, pp. 1-25.
Cooper, R.B., "Decision Production - A Step Toward a Theory of Managerial Information Requirements." Proceedings of the Fourth International Conference on Information Systems. December 15-17, 1983, Houston, TX, pp. 251-267.
Courtney, J.F. and R.L. Jensen. "SLIM: A Management Simulation for Teaching MIS and DSS." Interface: The Computer Education Quarterly, vol. 2, 1980, pp. 58-66.
Courtney, J.F. and R.L. Jensen. SLIM Users Manual. Dallas, TX: Business Publication, Inc., 1981.
Courtney, J.F., G. DeSanctis, and G.M. Kasper. "Continuity in MIS/DSS Laboratory Research: The Case for a Common Gaming Simulator. " Decision Sciences, vol. 14. , no. 3, 1983, pp. 419-439.
Cyert, R. M. and J.G. March. A. Behavioral Theory of the Firm. Englewood Cliffs, NJ: Prentice-Hall, 1963.
Cyert, R.M., H.A. Simon, and D.B. Trow. "Observation of a Business Decision." Journal of Business. 1956, pp. 237-248.
Delbecq, A.L. and A.H. Van de Ven. "A Group Process Model for Problem Identification and Program Planning." The Journal of Applied Behavioral Science, vol. 7, no. 4, 1971, pp. 466-492.
Delbecq, A.L., A.H. Van de Ven, and D.H. Gustafson. Group Technigues for Program Planning: A Guide to Nominal Group and Delphi Processes. Glenview, IL: Scott, Foresman and Company, 1975.

176
DeSanctis, G.R. "An Examination of an Expectancy Theory Model of Decision Support System Use." Unpublished DBA dissertation: Texas Tech University, 1982.
DeSanctis, G.R. "Computer Graphics as Decision Aids: Directions for Research." Decision Sciences, vol. 15, no. 4, December 1964, pp.463-487.
Dickson, G.W., J.A. Senn, and N.L. Cherveny. "Research in Management Information Systems: The Minnesota Experiments." Management Science, vol. 23, no. 9, May 1977, pp. 913-923.
Dunikoski, R.H. "Alternative Report Format Effects of a Decision Support System." Unpublished DBA dissertation: Texas Tech University, 1984.
Forrester, J.W. Principles of Systems. Cambridge, MA: Wright-Allen, 1968.
Forrester, J.W. World Dynamics. Cambridge, MA: Wright-Allen, 1971.
Gordon, G. System Simulation (2nd ed.), Engelwood Cliffs, NJ: Prentice-Hall, 1978.
Grant, J.H. and W.R. King. The Logic of Strategic Planning. New York, NY: Little, Brown and Company, 1982.
Gray, P. "The SMU Decision Room Project." Proceedings of the First International Conference on Information Systems, Atlanta, GA, June 1981.
Gray, P. "Initial Observations from the Decision Room Project." Proceedings of the Third International Conference on Information Systems, Boston, MA, June 1983.
Hall, R.I. "Decisionmaking in Complex Organizations." The Functioning of Complex Organizations. England, Negandhi, and Wilpert, (eds.). Cambridge, MA: Oelgeschlager, Gunn & Hain, Publications, Inc., 1981, pp. 111-144.
Hallf R.I. "The Natural Logic of Management Policy Making." Management Science, vol. 30, no. 8, August 1984, pp. 905-927.
177
Hare, A. P. Creativity in Small Groups. Beverley Hills, CA: Sage Publications, 1982.
Harold, D. "The Effectiveness of Work Groups, " in Organizational Behavior. Steven Kerr (ed. ). Columbus, OH: Grid Publishing Company, 1979, pp. 95-118.
Haselhoff, F. "A New Paradigm for the Study of Organizational Goals," in From Strategic Planning to Strategic Management. Ansoff, H. I., R. L. Declerck, and R. L. Hayes (eds.). London: John Wiley & Sons, 1976, pp. 15-28.
Herbert, T.T. and E.B. Yost. "A Comparison of Decision Quality Under Nominal and Interacting Consensus Group Formats: The Case of the Structured Problem." Decision Sciences, vol. 10, 1979, pp. 358-370.
Hinton, B.L. "A Model for the Study of Creative Problem Solving. " J., o^ Creative Behavior, vol. 2, no. 2, 1968, pp. 133-142.
Huber, G. P. "Group Decision Support Systems as Aids in the Use of Structured Group Management Techniques." Transactions of the Second International Conference on Information Systems. San Francisco, CA, June 1982.
Huber, G.P. "Cognitive Style as a Basis for MIS and DSS Designs: Much Ado About Nothing." Management Science, vol. 29, no. 5, May 1983, pp. 567-579.
Huber, G.P. "Issues in the Design of Group Decision Support Systems." MIS Quarterly, vol. 8, no. 3, Sept. 1984, pp. 195-204.
Humphreys, P. and W. McFadden. "Experiences With MAUD: Aiding Decision Structuring Versus Bootstrapping the Decision Maker." Acta Psvchologica. vol. 45, 1980, pp. 51-89.
Jarvenpaa, S.L, G.W. Dickson, and G.R. DeSanctis. "Methodological Issues in Experimental IS Research: Experiences and Recommendations." MIS Quarterly (forthcoming).
Jenkins, A.M. "A Program of Research for Investigating Management Information Systems." Internal report, Indiana University, 1982.

178
Jensen, R.L. and D. Cherrington. BML Participant's Manual. Dallas, TX: Business Publication, Inc., 1977.
Kasper, G.M. "A Conceptual Model and Empirical Analysis of Decision Support Use." Ph.D dissertation: State University of New York at Buffalo, 1983.
Keen, P.G.W. and M.S. Scott Morton. Decision Support Systems: An. Organizational Perspective. Reading, MA: Addison-Wesley, 1978.
Keen, P.G.W. and G.S. Bronsema. "Cognitive Styles Research: A Perspective for Integration, " in Proceedings of the Second International Conference on Information Systems. Cambridge, MA., December 1981.
King, W.R. and J.I. Rodriguez. "Evaluating Management Information Systems." MIS Quarterly, vol. 2, no. 3, 1978, pp. 43-51.
Kirk, R. E. Experimental Design: Procedures for the Behavioral Sciences. Belmont, CA: Wadsworth, Inc., 1982.
Kull, D.J. "Group Decisions: Can Computers Help?" Computer Decisions. May 1982, pp. 70-84 and 160.
Lendaris, G.G. "Structural Modeling - A Tutorial Guide." Proceedings lEEE-SMCS Internatl. Conf. Cybernetics and Society. 1980, vol. 10, pp. 807-840.
Lewin, K. Field Theory and Social Science. New York, NY: Harper and Brothers, 1951.
Lindblom, C.E. "The Science of Muddling Through." Public Administration Review, vol. 19, Spring 1959, pp. 155-169.
Lucas, H.C. and N.R. Nielsen. "The Impact of the Mode of Information Presentation on Learning and Performance." Management Science, vol. 26, 1980, pp. 982-993.
Lusk, E. "A Test of Differential Performance Peaking for a Disassembled Task." Journal of Accounting Research. Spring 1979, pp. 286-294.
MacCrimmon, K.R. and R.N. Taylor. "Decision Making and Problem Solving,• in Handbook of Industrial and Qroanizational Psychology. M.D. Dunnette (ed.). Chicago, IL: Rand McNally, 1976, pp. 1397-1453.

179
Maier, N.R.F. "Assets and Liabilities in Group Problem Solving: The Need for an Integrative Function." Psychological Review, vol. 74, no. 4, July 1967, pp. 239-249.
Mandell, S. L. Computers Data Processing Concepts and Applications with BASIC. St. Paul, MN: West Publishing Company, 1979.
McKenney, J.L. and P.G.W. Keen. "How Managers' Minds Work." Harvard Business Review, vol. 52, no. 3, May/June 1974, pp. 79-90.
McLean, J.M. and P. Shepherd. "The Importance of Model Structure." Futures, vol. 8, February 1976, pp. 40-51.
McLean, J.M. "Getting the Problem Right-A Role for Structural Modeling," in Futures Research: New Directions. H.A. Linstone and W.H. Simmonds (eds.) Reading, MA: Addison-Wesley, 1977, pp. 144-157.
Meadows, D.H., D.L. Meadows, J. Randers, and W.W. Behrens III. The Limits To Growth: A, Report for the Club of Rome's Project On the Predicament of Mankind. New York, NY: Universe Books, 1972.
Mintzberg, H., D. Raisinghani, and A. Theoret. "The Structure of 'Unstructured' Decision Processes." Administrative Science Quarterly, vol. 21, 1976, pp. 246-275.
Mintzberg, H. The Structuring of Organizations. Englewood Cliffs, NJ: Prentice-Hall, Inc., 1979.
Nadler, D.A. The Planning and Design Approach. New York, NY: John Wiley & Sons, 1981.
Neter, J. and W. Wasserman. Applied Linear Statistical Models. Homewood, IL: Richard D. Irwin, 1974.
Newell, A. and H.A. Simon. Human Problem Solving. Englewood Cliffs, NJ: Prentice-Hall, 1972.
Osbourn, A.F. Applied Imagination (3rd ed. ). New York, NY: Scribner's, 1963.

180
Oxenfeldt, A.R., D.W. Miller, and R.A. Dickinson. A Basic Approach to. Executive Decision Making. New York, NY: AMACOM, 1978.
Pracht, W.E. "An Experimental Investigation of a Graphical Interactive Problem Structuring Tool for Decision Support Systems." DBA dissertation, Texas Tech University, 1984.
Pracht, W.E. "GISMO: A Visual Problem Structuring and Knowledge Organization Tool." IEEE Transactions of Systems. Man, and Cybernetics, forthcoming, 1985.
Pracht, W.E. and J.F. Courtney. "Effects of Computer Graphics Assisted Problem Structuring." Working paper WEP841, Texas Tech University, 1984.
Pracht, W.E. and J.F. Courtney. "A Visual Interface for Capturing Mental Models in Model Management Systems." Hawaii International Conference on Systems Sciences, 1985.
Rados, D. L. "Selection and Evaluation of Alternatives in Repetitive Decision Making." Administrative Science Quarterly, vol. 17, June 1972, pp. 196-206.
Ramaprasad, A. and E. Poon. "A Computerized Interactive Technique for Mapping Influence Diagrams (MIND)." Strategic Management Journal, vol. 6, no. 4, 1985, pp. 377-392.
Roberts, F.S., and T.A.Brown. "Signed Digraphs and the Energy Crisis." American Mathematical Monthly. vol. 82, no. 6, 1975, pp. 577-594.
Roberts, F.S. "The Questionnaire Method," in Structure of Decision: The Cognitive Maps of Political Elites. R. Axelrod (ed). Princeton, NJ: Princeton University Press, 1976.
Robey, D. and W. Taggert. "Human Information Processing and Decision Support Systems." MIS Quarterly, vol. 6, no. 2, 1982, pp. 61-73.
Robey, D. "Cognitive Style and DSS Design: A Comment on Huber's Paper." Management Science, vol. 29, no. 5, May 1983, pp. 580-582.

181
Sage, A.P. "Behavioral and Organizational Considerations in the Design of Information Systems and Processes for Planning and Decision Support." IEEE Transactions on Systems. Man, and Cybernetics. vol. SMC-11, no. 9, September 1981, pp. 640-678.
Schoderbek, P. P. , C. G. Schoderbek, and A. G. Kefalas. Management Systems: Conceptual Considerations (3rd ed. ) . Piano, TX: Business Publications, 1985.
Scott Morton, M.S. Management Decision Systems: Computer Based Support for Decision Making. Cambridge, MA,: Harvard University, Division of Research, 1971.
Senn, J. A. and G.W. Dickson. "Information System Structure and Purchasing Decision Effectiveness." Journal of Purchasing, vol. 10, August 1974, pp. 52-64.
Simon, H.A. Administrative Behavior (2nd ed. ). Englewood Cliffs, NJ: The Free Press, 1957.
Simon, H.A. The New Science of Management Decision. New York, NY: Harper and Brothers, 1960.
Simon, H.A. "The Architecture of Complexity." General Systems Yearbook, vol. 10, 1964, pp. 63-76.
Simon, H.A. The Science of the Artificial. Cambridge, MA: M. I.T. Press, 1969.
Simon, H.A. and A. Newell. "Human Problem Solving: The State of the Theory in 1970." American Psychologist, vol. 26, no. 2, February 1971, pp. 145-159.
Sprague, R.H. and E.D. Carlson. Building Effective Decision Support Systems. Englewood Cliffs, NJ: Prentice-Hall, 1982.
Steeb, R. and S.C. Johnston. "A Computer-Based Interactive System for Group Decision Making." IEEE Transactions on Systems. Man, and Cybernetics, vol. SMC-11, no. 8, August 1981, pp. 544-552.
Steiner, G and J. Miner. Management Policy and Strategy (2nd ed.). New York, NY: MacMillan Publishing Company, 1982.
182
Stumpf, S.A., R.D. Freedman, and D.E. Zand. "Judgmental Decisions: A Study of Interactions Among Group Membership, Group Functioning, and the Decision Situation." Academy of Management Journal, vol. 22, 1979, pp. 765-782.
Stumpf, S.A., D. E. Zand, and R.D. Freedman. "Designing Groups for Judgmental Decisions." Academy of Management Review, vol. 4, 1979, pp. 589-600.
Szewczak, E.J. An. Empirical Evaluation of the Effectiveness of the Strategic Data Base Group Design Process. A Proposal for Dissertation Research. Graduate School of Business, University of Pittsburgh, May 1984.
Tabatoni, P. and P. Jarniou. "The Dynamics of Norms in Strategic Management," in From Strategic Planning to Strategic Management. Ansoff, H.I., R.L. Declerck, and R.L. Hayes (eds.). London: John Wiley and Sons, 1976, pp. 29-38.
Taylor, R.N. and I. Benbasat. "A Critique of Cognitive Styles Theory and Research." Proceedings of. the First International Conference on Information Systems. Philadelphia, PA, 1980, pp. 82-90.
Van de Ven, A.H. and A.L. Delbecq. "The Effectiveness of Nominal, Delphi and Interacting Group Decision Making Processes." Academy of Management Journal, vol. 17, no. 4, 1974, pp. 605-621.
Van Gundy, A.B. Technigues of Structured Problem Solving. New York, NY: Von Nostrand Reinhold Company, 1981.
Van Gundy, A.B. Managing Group Creativity: A. Modular Approach to Problem Solving. New York, NY: American Management Association, 1984.
Van Horn, R.L. "Empirical Studies of Management Information Systems." Data Base, vol. 5, 1973, pp. 172-180.
Volkema, R.J. "Problem Formulation in Planning and Design." Management Science, vol. 29, no. 6, June 1983, pp. 639-652.

183
Vroom, V.H. and P.W. Yetton. Leadership and Decision Making. Pittsburgh, PA: University of Pittsburgh Press, 1973.
Wagner, G.R. "Beyond Theory Z With DSS." Proceedings of the Third International Conference on Information Systems. Boston, MA, 1983, pp. 149-155.
Warfield, J.N. "An Assault On Complexity." Battelle Memorial Institute, Columbus, OH, Battelle Monograph No.3, 1973.
Warfield, J.N. "Structuring Complex Systems." Battelle Memorial Institute, Columbus, OH, Battelle Monograph No. 4., 1974.
Warfield, J. N. , H. Geschka, and R. Hamilton. Methods of. Idea Management. Columbus, OH: Academy of Contemporary Problems, 1975.
Wedley, W.C. and R.H.G. Field. "A Predecision Support System." Academy of Management Review, vol. 9, no. 4, 1984, pp. 696-703.
White, K.B. "MIS Project Team: An Investigation of Cognitive Style Implications." MIS Quarterly, vol. 8, no. 2, June 1984, pp. 95-101.
Winer, B.J. Statistical Principles in Experimental Design (2nd ed.). New York, NY: McGraw-Hill, 1971.
Witkin, H.A., P.K. Oltman, E. Raskin, and S.A. Karp. Manual for the Embedded Figures Test. Palo Alto, CA: Consulting Psychologists Press, 1971.
Witkin, W.A. and D.R. Goodenough. "Field Dependence and Interpersonal Behavior." Psychological Bulletin, vol. 84, 1977, pp. 661-689.
Witkin, W.A. Cognitive Styles in. Personal and Cultural Adaptation. Heinz Werner Lecture Series #11, Clarke University Press, 1978.
Wolfe, J.T. and T.I. Chacko. "Team Size Effects on Business Game Performance and Decision Making Behaviors." Decision Sciences, vol. 14, no.1, 1983, pp. 121-133.

184
Zeller, R.A. and E.G. Carmines. Measurement in the Social Sciences: The Link Between Theory and Data. Cambridge, ENG: Cambridge University Press, 1980.
Zmud, R.W. "On the Validity of the Analytic-Heuristic Instrument in 'The Minnesota Experiments'." Management Science, vol. 24, no. 10, June 1978, pp. 1088-1092.

APPENDIX A
GRAPHICAL INTERACTIVE STRUCTURAL MODELING INSTRUCTIONS
I. INTRODUCTION
In addition to the mamagement information system called SLIM, you have been provided with a tool to assist you in understanding and describing your rather complex decision making environment. This tool is based on a technique called Structural Modeling, amd is useful for describing the qualitative features or "geography" of complex systems.
The structural modeling process is essentially one of identifying the elements important in the system under consideration; and developing a representation of the system defined by these elements and relationships. Structural models are, in essence, diagrams consisting of collections of system elements (nodes) and relationships between elements (connections between nodes).
You may use a structural modeling system called GISMO to interactively construct geographic representations of a marketing model, or a plant and production model, or a model of the "total system"., etc.
II. THE GRAPHICAL INTERACTIVE STRUCTURAL MODELING OPTION (GISMO)
GISMO is a software system (set of computer programs) that allows you to design, construct, and save structural models on the computer. It is interesting to note that these models are sometimes referred to as "cognitive maps" since they are representations of an individual's mental model of a system or field of study. Usually it is best to start with a few elements and allow the "cognitive map" to grow as your concept and understanding of the system grows.
GISMO is a menu-driven system that is relatively easy to learn and to use. The following instructions and example will help you get started with interactive structural modeling. The structural modeling procedure menu shown below provides the functions necessary to work with up to five different structural models.
III. CREATING A NEW STRUCTURAL MODEL
In order to create a new structural model it is necessary to define the elements, relations, and relation strengths. Instructions for entering and editing this information using an interactive table are given below.
185

186
C E G I S D
SM Procedure Menu
Create New SM's Edit/Review Existing SM's Digraph Utilities List Index of SM's Save a SM Delete a SM
Type the letter Type M to return to MAIN MENU
A. Identifying the Elements
The elements to be included in the structural model are entered through the use of an interactive table. This table will appear whenever you choose the "Create a New SM" from the SM Procedure Menu. Eight character element names are entered into the table by the following sequence:
1. Position the cursor behind the next available space in the table (or the element name you wish to replace);
2. Press the "DEL" key;
3. Type in the element Name; and
4. Hit return.
For Cursor Positioning, please note the following key functions
<CTRL> U = Moves up one row
<CTRL> D = Moves down one row
<CTRL> R = Moves right one column
<CTRL> L = Moves left one column

187
An example of a sinple five-element systen would be as follows:
ELEMENT NUMBER
1
2
3
4
5
6
7
•
ELEMENT NAME
COS
REVENUE
SALES
SREPS
PRICE
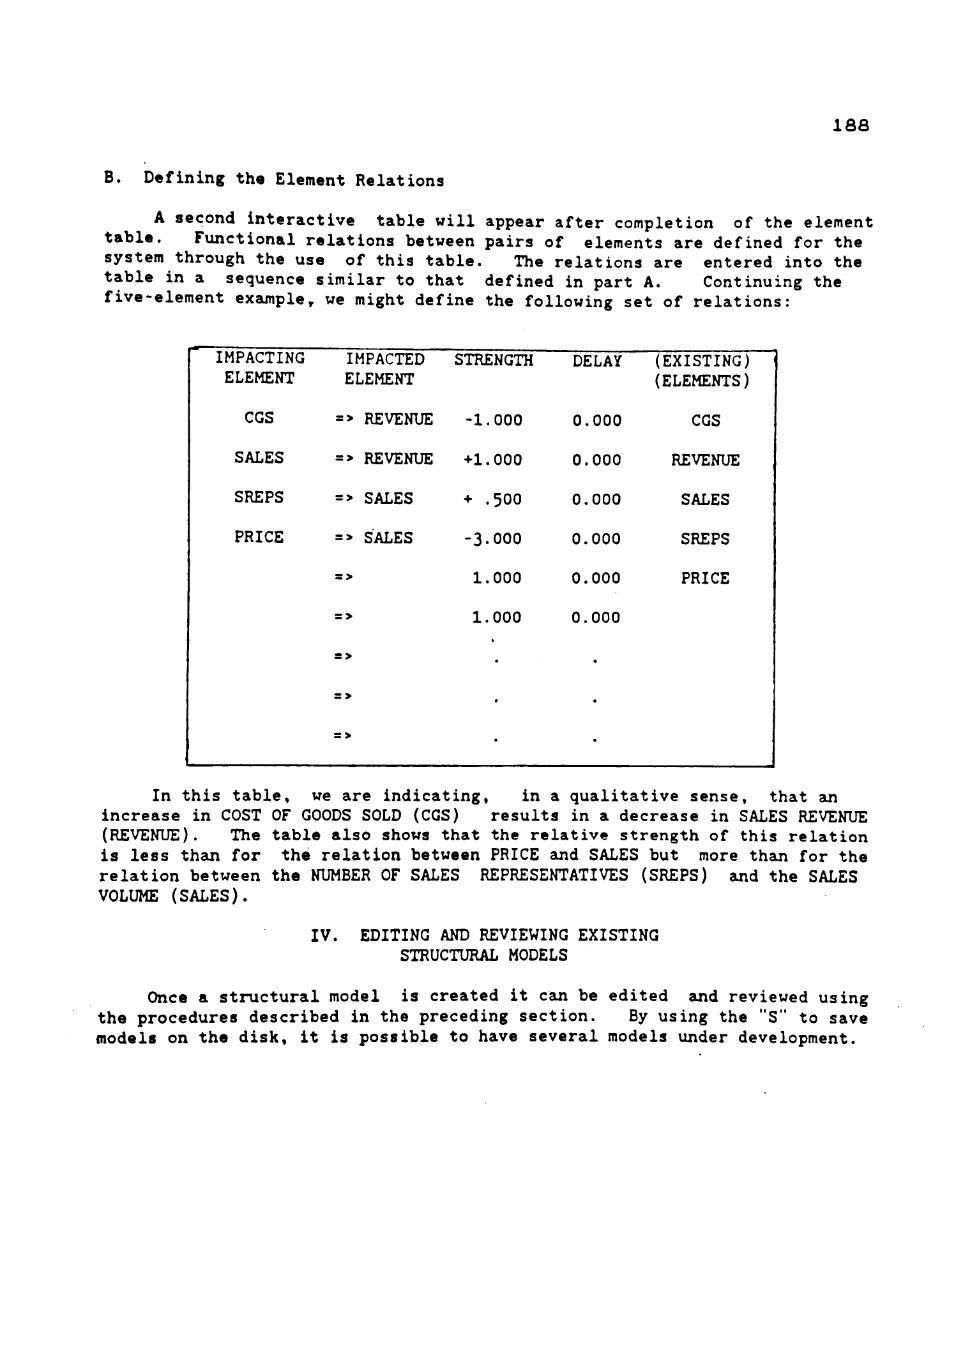
188
B. Defining the Element Relations
A second interactive table will appear after completion of the element table. Functional relations between pairs of elements are defined for the system through the use of this table. The relations are entered into the table in a sequence similar to that defined in part A. Continuing the five-element example, we might define the following set of relations:
IMPACTING ELEMENT
CGS
SALES
SREPS
PRICE
IMPACTED ELEMENT
=> REVENUE
=> REVENUE
=> SALES
=> SALES
s>
= >
= >
= >
= >
STRENGTH
-1.000
•H.OOO
+ .500
-3.000
1.000
1.000
•
•
DELAY
0.000
0.000
0.000
0.000
0.000
0.000
•
•
•
(EXISTING) (ELEMENTS)
CGS
REVENUE
SALES
SREPS
PRICE
In this table, we are indicating, in a qualitative sense, that an increase in COST OF GOODS SOLD (CGS) results in a decrease in SALES REVENUE (REVENUE). The table also shows that the relative strength of this relation is less than for the relation between PRICE and SALES but more than for the relation between the NUMBER OF SALES REPRESENTATIVES (SREPS) and the SALES VOLUME (SALES).
IV. EDITING AND REVIEWING EXISTING STRUCTURAL MODELS
Once a structural model is created it can be edited and reviewed using the procedures described in the preceding section. By using the "S" to save models on the disk, it is possible to have several models under development.

189
V. DIGRAPH UTILITIES
One of the greatest benefits resulting from the construction of a structural model is that it not only helps to conceptualize the components of a complex system, but also enables individuals to visualize how these components interrelate. This picture of the system is called a digraph (from "directed graph"). The Digraph Utilities Menu and the associated fxinctions are described below.
DIGRAPH UTILITIES MENU
C = Create New Digraph
E = Edit/Review Existing Digraph
I = Print the Digraph Edit Instructions
L = Check the Element Relation Lines
Type the Letter Type "M" to Return to MAIN MENU
A. Creating a New Digraph
After defining the elements and relations, GISMO now will assist in the construction of a digraph. Recall that in a digraph, the elements are represented as nodes, the relations between elements as lines, and the direction of the relations by the arrows.
The first step in digraph generation, the positioning of the elements, is done automatically. When this step is completed, GISMO will assist the user in constructing the lines representing relations between nodes. In this process a "B" will be plotted at the "beginning" element and an "E" at the "ending" element. The user constructs the line between these elements (representing the relation) in the following sequence of steps:
1.
2.
3.
Position the cursor at the desired position on the element marked with the "B". The arrows on the 10-key pad located on the right hand side of the keyboard are used for cursor positioning;
Move the cursor in a straight line to either a comer or the end element. Press a "C" if at a comer and an "E" if at the end element.
Repeat steps 1 and 2 until all relations are completed, these steps is shown in the following diagram.
The result of

190
PRICE
SREPS
V '
SALES
/ V
— ^ REVENUE < CGS
B. Edit/Review Existing Digraph
Once the digraph has been generated, the user may now edit and review an existing digraph as many times as desired. Maiiy users prefer to define only a three-element or four-element model with the interactive table described in step III., then complete the model with the digraph editing utilities described below. Please note that the element table is automatically changed to reflect changes in the digraph but the reverse is not true. (i.e. if new elements amd relations are added to the tables, then a new digraph must be created.)
1. Construct a line representing a relation between elements (e.g. "X" ==> "Y"): a. Position the cursor at element "X";
Press the letter "B"; Move cursor in a straight line; Press "C" if at a comer, or;
b. c. d. e. Press "E" if at element "Y"
2. Delete/Reposition an element relation: a. Position cursor at element "X"' b. Press "D" k "B"; c. Move cursor to element "Y"; d. Press "D" k "E"; and
191
e. If repositioning the relation, perform step 1.
3. Add an element: a. Position the cursor at the desired location; b. Press "A"; c. Type in the element name; and d. Indicate the relations for the element using
step 1.
U. Move an element: a.. Position cursor on the element; b. Press and "M"; c. Position the cursor to desired position; d. Press "P"; and e. Reposition all relations using
steps 1. and 2. Note: It may be easier to reposition the element before constructing
the lines representing the relations or to delete the relation first.
3> Delete an element: a. Position cursor on the element and b. Press "D" k "N". Note: all the relations connected to the element will also be deleted
6. Hit "ESC" to re-plot the Digraph.
C. Check the Element Relations Lines
Sometimes in the process of editing the digraph a relation is forgotten. This check will cycle through all relations, plotting a series of "B"'s auid "E"'s to allow verification (and changing if necessary) for all existing relations.
APPENDIX B
EXAMPLE OF A STRUCTURAL MODEL SUBJECTS CAN CREATE
SALREP
COMMSN
0.8
SALES
A~ 1.6
RAWMAT
LABOR
FINGDS
1.2 > y
N , 0.4 COGS
/ 0.8
-2.0 N
>
±. -> REV
ADVTSG
FACTOR
\' 1.6 k/R
/\ 0.5
192

193
<CTRL>U=UP <CTRL>D=D0WN <CTRL>R=RIGHT HIT "DEL" TO ENTER VALUES HIT "ESC" TO EXIT
<CTRL>L=LEFT
IMPACTING ELEMENT
SALREP COMMSN RAWMAT LABOR FINGDS ADVTSG FACTOR A/R COGS SALES
=>
=>
=>
=>
=>
=>
=>
=>
=>
=>
=>
IMPACTED ELEMENT
SALES SALES COGS COGS COGS A/R A/R REV REV REV
STRENGTH
0.750 1.600 0.400 1.200 0.800 1.600
-0.500 1.000
•2.000 3.000 1.000
DELAY
0.000 0.000 0.000 0.000 0.000 0.000 0.000 0.000 0.000 0.000 0.000
(EXISTING) (ELEMENTS)
SALREP COMMSN RAWMAT LABOR FINGDS ADVTSG ADVTSG A/R COGS SALES REV
SALREP
COMMSN
RAWMAT
LABOR
FINGDS
~]/ 0.8
SALES
t 1.^
1.2 0.4 -2.0
$ COGS
7^^~0
^ REV
ADVTSG
FAriOR r rM* 1 «-"»
>!/ 1.6 A/R
/ 0.5
7 F — r

APPENDIX C
BUSINESS MANAGEMENT LABORATORY PARTICIPANT INSTRUCTIONS
You have been promoted to the Strategic Decision Making Board of firm four. To help you with your new responsibilities, the firm has developed a management information system. This system will provide access to a large data base containing information on the performance of your firm and competing firms. Following the Board's decisions at the end of each quarter, this data base will be updated. You may use this system to provide you with information on which to base your decisions. The procedure for using this system, known as SLIM, is outlined in the SLIM User's Manual.
As a Board member of firm four, your objectives are to gain a thorough understanding of the environment in which your firm is operating and to maximize the long-run profitability of the firm's stockholders. Your performance will be evaluated on: (1) your group's understanding of the decision-making environment (i.e., how the key elements interact), and (2) the value of the corporation's stock at the end of your term on the Board. Therefore, in addition to operations, you also will be required to hand in a "description" which identifies the essential variables of your firm's operating environment and indicates the relationships among these variables.
Note that SLIM must be used to input your quarterly decisions. The SLIM information system may be used to help you make these decisions. SLIM also may be used to output quarterly financial statements (Income Statement and Balance Sheet). However, this as well as any other use of SLIM is entirely up to you.
Each of you will be assigned to a group which will comprise the Strategic Decision Making Board of your firm. The Business Management Laboratory Participant's Manual describes the game and its operation.
194

APPENDIX D
BML/SLIM PRE-EXPERIMENT QUIZ
Narae: Group # : _ _ .
VAX A c c t . # D a t e :
BML/SLIM QUIZ
S e l e c t t h e bes t answer t o each of the fo l lowing q u e s t i o n s :
1. Consuaer deaand in the s t a i n l e s s s t e e l f la tware industry i s soaewhat s e a s o n a l .
a) True b) False
2. As a Manager for your fira^ the price which you set for your product is:
a) The retail price b) The wholesale price c) The producers' price d) b or c
3. If your firn has back orders which nust be filled in the current quarter, what selling price is attached to these orders?
a) The current quarter's price b) The price that prevailed at the tine of the order c) The current quarter's price or the price at order tiae,
whichever is lower d) The current quarter's price or the price at order tiae,
whichever is higher
4. The sales voluae as reported in the BHL/SLIH data base for any quarter refers to:
a) New sales for that quarter b) New sales plus back orders c) New sales plus back orders plus lost sales
195

196
5. Which of the following is not true regarding the puchase of raw aaterlals?
a) If insufficient raw aaterlals have been ordered, aaterlals will be autoaatlcally purchased froa a distributor
b) It takes two weeks to order and obtain raw aaterlals froa a distributor
c) If aaterlals are purchased froa a distributor, the fira is charged the Spot Market Price which is not known (by you) in advance
d) Raw aaterlals purchased for storage in your inventory are obtained at the Futures Price as reported in the BHL/SLIH data base for the previous quarter
e) Raw aaterlals purchased for storage in inventory are available at the beginning of the period in which they are ordered
6. To avoid reduced production capacity due to natural depreciation, your fira can spend aoney on
a) Halntenance b) Engineering studies c) Each of the above
7. Which of the following is not true concerning special loans?
a) These occur autoaatlcally if the fira is short of cash b) The loan rate is at least 12X quarterly c) The loan assures that the fira has a ainiaua cash balance of
$10,000 d) It is the only financing aethod available to the fira
8. Suppose you wanted to find out the net earnings for Fira 2 in the 3rd quarter of 1976 <4th quarter of the BHL gaae). How would you request this inforaation froa the SLIH systea?
9. Every SLIH query aust end with what syabol?
10. Write a set of coaaands which would tell SLIH to calculate the "quick ratio* (accounts receivable divided by accounts payable plus special loans) of the current quarter for your fira and print the result on the screen.
11. Write a set of coaaands which would tell SLIH to coapute the unit aanufacturlng cost of the current quarter for your fira and print the result on the screen.

197
KNOWLEDGE TEST
Name: Decision round
VAX Acct. # Date:
The matrix printed below shows a number of BML/SLIM variables in its rows and columns. Please think of how the row variable and the column variable, which correspond with each empty cell, relate to each other in the BML game. Then describe this relationship by means of the following codes:
TYPE CODE MEANING
Direction + Increase in row variable results in increase in column variable
Increase in row variable results in decrease in column variable
Row variable provides bound on increase in column variable
Row variable provides bound on decrease in column variable
No relationship
Not sure
B(+)
B(-)
Empty
?
S
W
D
I
Strength S Strong effect
Weak effect
Lag D Delayed effect
Immediate effect
If you think there is a relationship between two variables, then write one code from each category in the corresponding empty cell. For example, if an increase in one variable (row) results in a decrease in another variable (column), and this effect is strong and immediate, then write in the corresponding matrix cell (separated by commas): -,S,I. While evaluating the relationship between two variables, assume that everything else remains constant. Also, remember that the matrix asks for the relationship between variables as this exists in the BML game, not for the way you relate these variables as a manager/decision maker.

198
TPC PC BO+SV
PRICE
ADV
PVFS
MAIN
PSE
APPENDIX E
BML/SLIM POST-EXPERIMENT QUESTIONNAIRE
NAME Group Number_ Section
The following questionnaire attempts to determine your understanding of and reactions to the Business Management Laboratory decision-making environment.
1. Rate the degree of confidence you had in the accuracy of each of the following decisions, prior to receiving the results of those decisions.
not at all little somewhat highly confident confidence neutral confident confident
Marketing Decision
Product Price
Number of Sales Representatives
Advertising
Commission
Quality Control
2
2
2
2
2
3
3
3
3
3
4
4
4
4
4
5
5
5
5
5
Plant and Production Decisions
Raw Materials Ordered 1
Production Levels 1
Maintenance Cost 1
Plant Capacity Expansion 1
2
2
2
2
3
3
3
3
4
4
4
4
5
5
5
5
Finance and Administration Decisions
Bonds 1
Short Term Loans 1
Shares of Stock Sold 1
Short Term Investment 1
2
2
2
2
199
3
3
3
3
4
4
4
4
5
5
5
5

200
PRIC Product Price
CSS% Second Shift Change %
ADV Advertising Budget
MAIN Maintenance Budget
SREP Number of Sales Representatives
RMO Raw Materials Orders
COM Sales Commission
QC Quality Control Budget
STIN Short-term Investment
PVFS Production Volume First Shift
PVSS Production Volume Second Shift
COGS Cost of Goods Sold
BL Bottom-line (Net Income)
RSB Total Research Budget
STL Short-term Loan
DIVD Dividends
MS Market Share
SP Stock Price
EI Economic Indicator
BBI Bull-Bear Index
SV Sales Volume
BO Back-orders
PRAW Price of Raw Materials
PV
PC
TPC
Production Volume
Production Capacity-lst shift
SEXP Sales Expenses
Total Production Costs
ENG Engineering Budget

201
In this question, you are to indicate relationships between factors or elements of the BML game. Put a "•" in the blank if you think that both variables change in the same direction, a "-" if they change in opposite directions, and a "0" if they have no relationship at all.
(example) ADV
EI
ENG
PRAW
MS
QC
SV
ADV
SREP
BO
COM
PV
PC
PRIC
PRIC
QC
SV
MS -h
SV
TPC
MS
SV
MS
MS
EI
ADV
MS
SV
SV
EI
COGS
BL
COGS
BO
SV
SV
SV
SV
ADV
SREP
COM
SEXP
PV
PV
COGS
PRAW
MAIN
ENG
PC
PC
RSB
PV
ADV
RMO
BL
BL
SEXP
SEXP
BL
BO
RMO
BL
COGS
PC
BL
PV
COGS
SV

202
3. In this question, you are to indicate factors and relationships among factors involved in your decisions (not factors in the BML game). Assume that your firm is operating at maximum capacity, but has been losing sales due to stockouts and has been having excessive backorders. One solution strategy involves factors affecting marketing aspects (Part A); a different solution strategy involves production capacity expansion (Part B). For Part A assume you have chosen a strategy involving marketing aspects, and list the marketing factors you consider important, along with the reasons for choosing these factors.
A. Marketing Strategy (Price, etc.)
Factors Reasons
1. Average Price Compare price with indus. ave,
2.
4.
5,
6.
7,
For Part B, assume you have chosen to expand your plant, and list the factors you consider important, along with the reason for choosing these factors.
B. Plant Capacity Expansion Strategy
Factors Reasons
1.
2.
3.
4.
203
Please circle the number which is most indicative of your opinion concerning BML/SLIM and GISMO.
4. Utilization of SLIM has enabled me to make better decisions.
5. Overall, I would say that the BML game presented a structured decision-making environment.
6. Utilization of GISMO helped me to better visualize how the factors in the BML game interrelated.
Strongly Disagree
Strongly Agree
8.
More time and training in the use of SLIM would have enabled me to make better use of the system.
More time and training in the use of GISMO would have enabled me to make better use of the system.
9. Are there changes or additions to SLIM which you think would be desirable? Please be specific and constructive.
10. Are there changes and additions to GISMO which you think would be
desirable?

204
11. Assume that structured decisions are those for which we can specify algorithms or unambiguous rules for solution and unstructured decisions are those that contain a high degree of uncertainty and may be novel or unique, and that semi-structured decisions are somewhat in between. With these definitions in mind, rate whether you think the BML game is structured (S), unstructured (U), or semi-structured (SS).
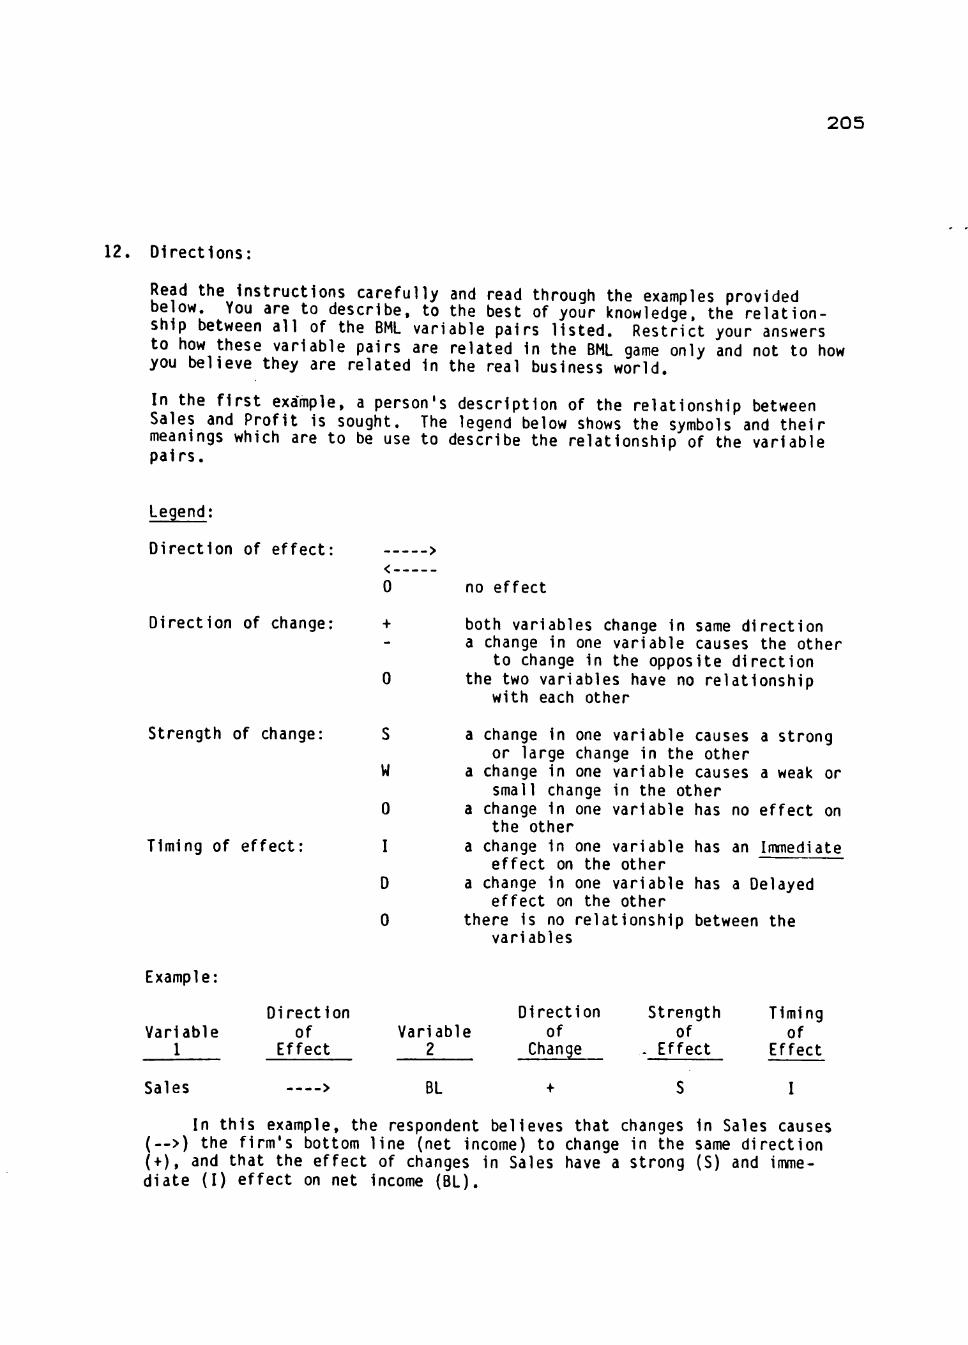
2 0 5
12. Directions:
Read the instructions carefully and read through the examples provided below. You are to describe, to the best of your knowledge, the relationship between all of the BML variable pairs listed. Restrict your answers to how these variable pairs are related in the BML game only and not to how you believe they are related in the real business world.
In the first example, a person's description of the relationship between Sales and Profit is sought. The legend below shows the symbols and their meanings which are to be use to describe the relationship of the variable pairs.
Legend:
Direct ion of e f fec t :
0
- - >
no effect
Direction of change;
0
both variables change in same direction a change in one variable causes the other
to change In the opposite direction the two variables have no relationship
with each other
Strength of change:
Timing of effect:
S
W
0
I
D
0
a change In or large
a change in small cha
a change in the other
a change in effect on
a change In effect on
there is no variables
one variable causes a strong change in the other one variable causes a weak or nge in the other one variable has no effect on
one variable has an Immediate the other
one variable has a Delayed the other
relationship between the
Example:
Variable 1
Direction of
Effect Variable
2
Direction of
Change
Strength of
. Effect
Timing of
Effect
Sales BL I
In this example, the respondent believes that changes in Sales causes (-->) the firm's bottom line (net income) to change in the same direction (+), and that the effect of changes In Sales have a strong (S) and immediate (I) effect on net Income (BL).
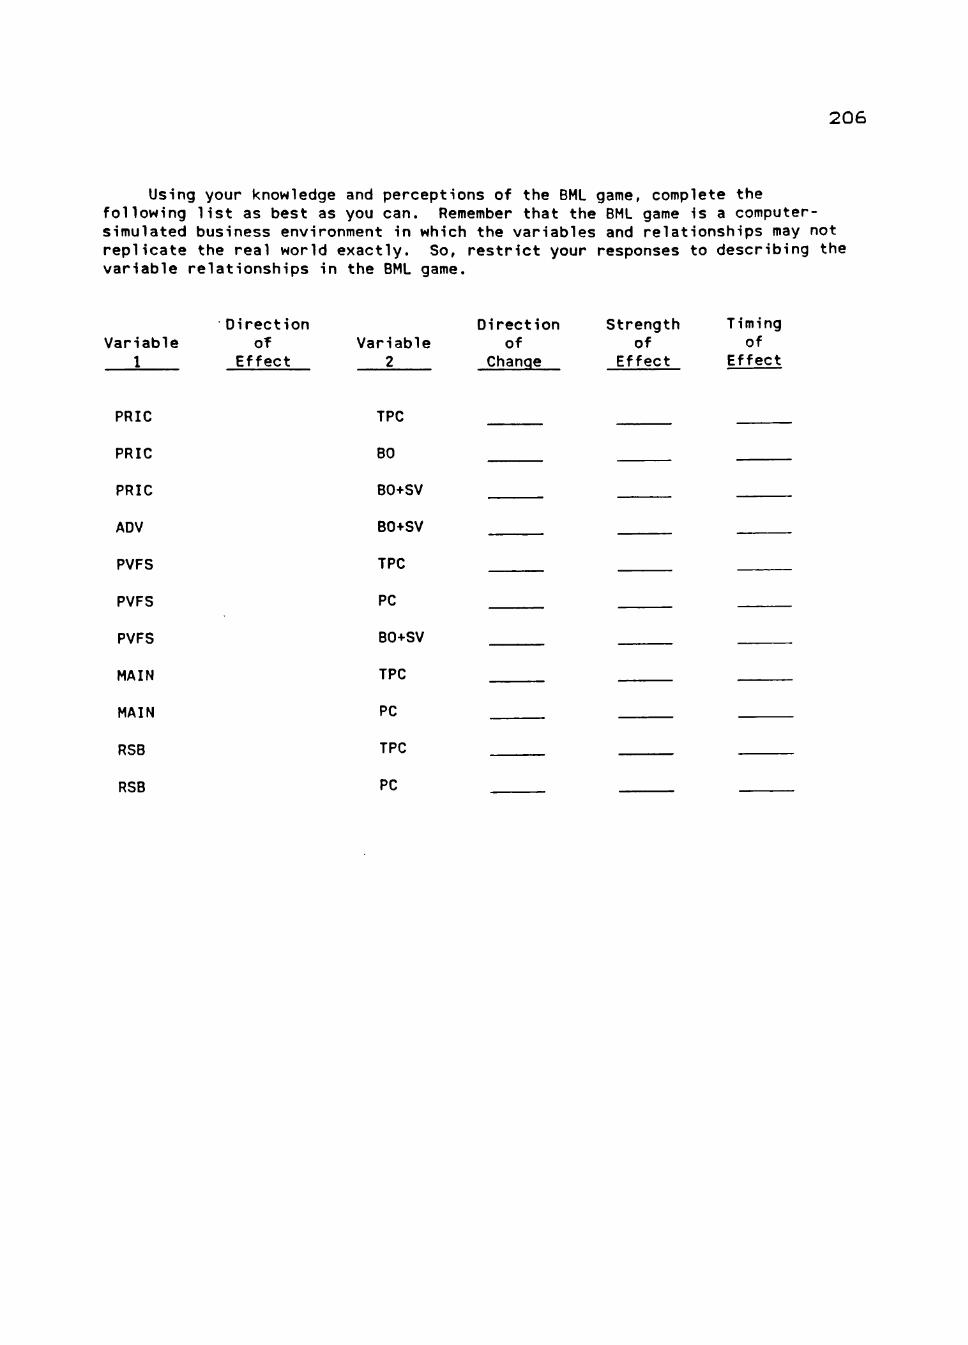
206
Using your knowledge and perceptions of the BML game, complete the following list as best as you can. Remember that the BML game is a computer-simulated business environment in which the variables and relationships may not replicate the real world exactly. So, restrict your responses to describing the variable relationships in the BML game.
Variable 1
PRIC
PRIC
PRIC
ADV
PVFS
PVFS
PVFS
MAIN
MAIN
RSB
RSB
Direction oT
Effect Variable
2
TPC
BO
BO+SV
BO+SV
TPC
PC
BO+SV
TPC
PC
TPC
PC
Direction of
Change
Strength of
Effect
Timing of
Effect

207
Name: Group #
VAX Acct. # Date:
BML/SLIH QUIZ
Select the best ansver to each of the folloving questions:
1. Consuner deaand in the stainless steel flatvare industry is sonevhat seasonal.
a) True b) False
2. As a aanager for your fira, the price vhich you set for your product is:
a) The retail price b) The wholesale price c) The producers' price d) b or c
3. If your fira has back orders which aust be filled in the current quarter, what selling price is attached to these orders?
a) The current quarter's price b) The price that prevailed at the tiae of the order c) The current quarter's price or the price at order tiae,
whichever is lower d) The current quarter's price or the price at order tiae,
whichever is higher
4. The sales voluae as reported in the BML/SLIM data base for any quarter refers to:
a) New sales for that quarter b) New sales plus back orders c) New sales plus back orders plus lost sales
5. Which of the following is not true regarding the purchase of raw aaterlals?
a) If insufficient raw aaterlals have been ordered, aaterlals will be autoaatlcally purchased froa a distributor
b) It takes two weeks to order and obtain raw aaterlals froa a distributor

208
c) If aaterlals are purchased froa a distributor, the fira is charged the Spot Market Price which is not known (by you) in advance
d) Raw aaterlals purchased for storage in your inventory are obtained at the Futures Price as reported in the BML/SLIM data base for the previous quarter
e) Raw aaterlals purchased for storage in inventory are available at the beginning of the period in which they are ordered
6. To avoid reduced production capacity due to natural depreciation, your fira can spend aoney on
a) Maintenance b) Engineering studies c) Each of the above
7. Which of the following is not true concerning special loans?
a) These occur autoaatlcally if the fira is short of cash b) The loan rate is at least 12X quarterly c) The loan assures that the fira has a ainiaua cash balance of
$10,000 d) It is the only financing aethod available to the fira
8. Suppose you wanted to find out the net earnings for Fira 2 in the 3rd quarter of 1976 (4th quarter of the BHL gaae). How would you request this inforaation froa the SLIH systea?
9. Every SLIH query aust end with what syabol?
10. Write a set of coaaands which would tell SLIH to calculate the *quick ratio" (accounts receivable divided by accounts payable plus special loans) of the current quarter for your fira and print the result on the screen.
11. Write a set of coaaands which would tell SLIH to coapute the unit aanufacturlng cost of the current quarter for your fira and print the result on the screen.

APPENDIX F
SUBJECT AGREEMENT TO CONFIDENTIALITY
I understand that it is in the best interest of scientific inquiry not to discuss with my fellow students, now or during the next month, any aspect of the experiment in which I am participating. I fully realize that such discussion may lead to possible distortions of the data and may in effect cause the entire experiment to be abandoned.
Signature
Date
209

APPENDIX G
BACKGROUND QUESTIONNAIRE
Najne:
Permanent Mailing Address
Phone:
Age:
Sex:
Current Year of Study: Sophomore
Junior
Senior
Highest Degree Obtained to Date:
High School Diploma
B.B.A., B.S., or B.A.
M.B.A., M.S., or M.A.
Other (Specify)
If working toward a degree state
Degree:
Major Field ^
210

211
1. The following questions pertain to your employment history. Please ANSWER ALL THE QUESTIONS in this section.
A. Have you been employed as a manager on a full-time, year-around basis?(Check One)
Yes No
If yes, how many years of full-time, year-around management experience do you have?
Years
B. Have you been employed in a non-management position on a full-time year-around basis? (Check One)
Yes No
If yes, how many years of experience do you have in this type of employment?
Years
C. Have you been employed as a manager on a part-time basis (including summer employment)? (Check One)
Yes No
If yes, how many months of part-time management experience do you have?
Months
D. Have you been employed in a non-management position on a part-time basis (Including summer employment)? (Check One)
Yes No
If yes, how many months of experience do you have in this type of employment?
Months

212
The following questions pertain to your management experiences. Please indicate your response by circling the number which most closely corresponds to your work experience in each of the situations. If you have no experience in any one of these areas, please circle the NO EXPERIENCE category.
A. How much experience do you have in REVIEWING AND/ OR EVALUATING a subordinate's work?
Work Experience:
No Moderate Extensive Experience Experience Experience
B. How much experience do you have in SCHEDULING WORK?
Work Experience:
1 2 3 4 5 6 7
No Moderate Extensive Experience Experience Experience
C. How much experience do you have in SETTING PERFORMANCE GOALS FOR SUBORDINATES?
Work Experience:
1 2 3 4 5 6 7
No Moderate Extensive Experience Experience Experience
D. How much experience do you have in DIRECTING OR SUPERVISING SUBORDINATES?
Work Experience:
1 2 3 4 5 6 7
No Moderate Extensive Experience Experience Experience

213
E. How much experience do you have in RESOLVING EMPLOYEE COMPLAINTS OR GRIEVANCES?
Work Experience:
No Moderate Extensive Experience Experience Experience
F. How much experience do you have INTEGRATING THE PLANS OF SEVERAL DEPARTMENTS?
Work Experience:
1 2 3 4 5 6 7
No Moderate Extensive Experience Experience Experience
G. How much experience do you have FORECASTING FUTURE DEPARTMENTAL NEEDS (Personnel, Finance, etc.)?
Work Experience:
1 2 3 4 5 6 7
No Moderate Extensive Experience Experience Experience
H. How much experience do you have EVALUATING EMPLOYEE PERFORMANCE AND RECOMMENDING PERSONNEL ACTIONS (Hires, Promotions, Transfers, Demotions, and terminations)?
Work Experience:
1 2 3 4 5 6 7
No Moderate Extensive Experience Experience Experience

214
I. How much experience do you have RECOMMENDING WAGE AND SALARY ACTIONS FOR SUBORDINATES?
Work Experience:
No Moderate Extensive Experience Experience Experience
J. How much experience do you have ASSIGNING SUBORDINATES TO SPECIFIC TASKS?
Work Experience:
1 2 3 4 5 6 7
No Moderate Extensive Experience Experience Experience
The following questions pertain to your experience with computers and their application to business problems. On the scale labeled "Work Experience", circle the number which most closely corresponds to your relevant employment experience. On the scale labeled "Academic Experience", circle the number which most closely corresponds to your relevant educational experience.
A. How much experience do you have GENERATING COMPUTER REPORTS?
Work Experience:
I 2 3 4 5 6 7
No Moderate Extensive Experience Experience Experience
Academic Experience:
1 __2 3 4 5 6 7
No Moderate Extensive Experience Experience Experience

215
B. How much experience do you have WRITING COMPUTER PROGRAMS?
Work Experience:
No Moderate Extensive
Experience Experience Experience
Academic Experience:
1 2 3 4 5 6 7 No Moderate Extensive Experience Experience Experience
C. How much experience do you have WORKING WITH HARD-COPY (PAPER) COMPUTER TERMINALS?
Work Experience:
1 2 3 4 5 6 7
No Moderate Extensive
Experience Experience Experience
Academic Experience:
I 2 3 4 5 6 7
No Moderate Extensive Experience Experience Experience
D. How much experience do you have WORKING WITH VIDEO DISPLAY COMPUTER TERMINALS?
Work Experience:
1 2 3 4 5 6 7
No Moderate Extensive Experience Experience Experience
Academic Experience:
1 2 3 4 5 6 7
No Moderate Extensive Experience Experience Experience

216
E. How much experience do you have WORKING WITH COMPUTER STORAGE DEVICES (e.g. Disk, Tape)
Work Experience:
No Moderate Extensive
Experience Experience Experience
Academic Experience:
1 2 3 4 5 6 7
No Moderate Extensive Experience Experience Experience
F. How much experience do you have USING "CANNED" COMPUTER PACKAGES SUCH AS SPSS, BMDP,MINITAB?
Work Experience:
1 2 3 4 5 6 7
No Moderate Extensive
Experience Experience Experience
Academic Experience:
1 2 3 4 5 6 7
No Moderate Extensive Experience Experience Experience
G. How much experience do you have OPERATING COMPUTER SYSTEMS OR PROGRAMS?
Work Experience:
1 2 3 4 5 6 7
No Moderate Extensive
Experience Experience Experience
Academic Experience:
1 2 3 4 5 6 7
No Moderate Extensive
217
Experience Experience Experience
H. How much experience do you have in PLAYING A BUSINESS SIMULATION GAME such as IMAGINIT OR BML/SLIM?
Work Experience:
No Experience
Moderate Experience
Extensive Experience
Academic Experience:
No Experience
Moderate Experience
Extensive Experience
APPENDIX H
DESCRIPTION OF THE SLIM INFORMATION SYSTEM
The System Laboratory for Information Management (SLIM) consists of a dynaunic data base and data dictionary, a simple query language and query processor, and a module for data base administration. The administration module includes features for managing passwords and for data base encryption if additional security is desired.
The SLIM data base contains 126 items for each round of play (simulating a calendar quarter). New data are automatically added to the data base by BML as it processes student decision input and generates results. Therefore, after the administrator obtains the students' input and runs BML, students may retrieve the new data from the SLIM data base by using the query language.
One firm has access to some data about other firms. This is data that is essentially "public" in the real world, but goes beyond what is in standard BML reports. For example, in actuality one firm could always know another's price and SLIM allows sharing of such data. However, some data, such as factored accounts receivable, is strictly private and only the owning firm has access to it. Access to some data is delayed to simulate information that is released in annual reports. Also, when data about a competing firm is retrieved, an error term is added to simulate discrepancies in reporting, data collection, etc*
The SLIM Query Language
Two types of interactive processing are discussed: ad hoc queries and predefined or "canned" queries with interactive capability and limited modeling capability. Figure 1 illustrates some ad hoc queries just to give a feel for the language. More detailed examples are discussed subsequently.
After the user has logged into SLIM he/she is ready to enter commands. The first query (what the user enters follows the ". . .") retrieves the current value of the Bull-Bear stock market index (BBI). The second command (using the abbreviated form of print) retrieves the number of sales reps from firm 1, area 1, quarter 8. The third retrieval uses the LIST command which outputs format in a tabular fashion. Items retrieved are the Bull-Bear index. Economic Index (EI), and the user firm's stock price (SP) for all quarters (Ql-*). The fourth command (after one typographical error) uses the MAX function to retrieve the firm's maximum stock price. Notice that the dialogue is "user-friendly" and the error message helps locate the
218

219
source of the problem. Other functions are MIN, SUM, AVERAGE, and LOG. The fifth command computes this firm's quick ration and the sixth command (on the smae line) prints the quick ratio.
'As part of the standard decision-making process, students usually come up with some queries that they wish to use during each round of play. A procedure has been devised to avoid typing such queries each time. This process consists of putting the queries onto a command file and instructing SLIM to read and execute commands from this "batch" file. Another command (TERMINAL) can be embedded in the batch file to switch control back to conversational modeling capability allowing use of "what is" type queries.
The use of predefined command files and a simple model is illustrated next. In this exaimple the student wants to know how much cash will be available from three sources: current sales and backorders (approximately 60% collected in cash), accounts receivable (100% collected), and cash-on-hand. Backorders are filled at the lower of current price or price at time of order.
The command file is listed in Figure 2. The file (which is created by the student--not the instructor) has been set up so that the user can interactively define variables (as opposed to data base items) Y(l) through Y(4) to be changes in price and variables Z(l) through Z(4) to be changes in sales volume. The manner in which this is done is explained later. The first four lines of the command file define variables X(l) through X(4) to be the new trial prices (current prices plus the changes). Trial sales volumes (X(5) though X(8)) are calculated on lines 5 through 8. Finally, revenue from sales and backorders is computed on lines 9-12. Notice how the MIN function is used to select the appropriate price on backorders.
The REMARK command is then used to augement the standard headings of the LIST command which is used to output results. Finally, total sales revenue, cash from sales revenue, accounts receivable and cash-on-hand are printed at line 17 and control returns to the terminal at line 18.
In the sample terminal session using this command file (Figure 3), the user first assumes no change in price or sales volume. SLIM automatically sets all variables to zero initially, so after logging in the user immediately types in BATCH; and SLIM begins executing commands from the user-prepared batch file. The first output the user gets corresponds to the assumption of no change in price or sales volume. The user can then play "What if..." games by redefining price changes and/or sales volume changes using the COMPUTE command. The user must then REWIND the file and enter BATCH again. In the exsimple, the user raises the price on product 1 in area 1 by $2.00 and lowers sales
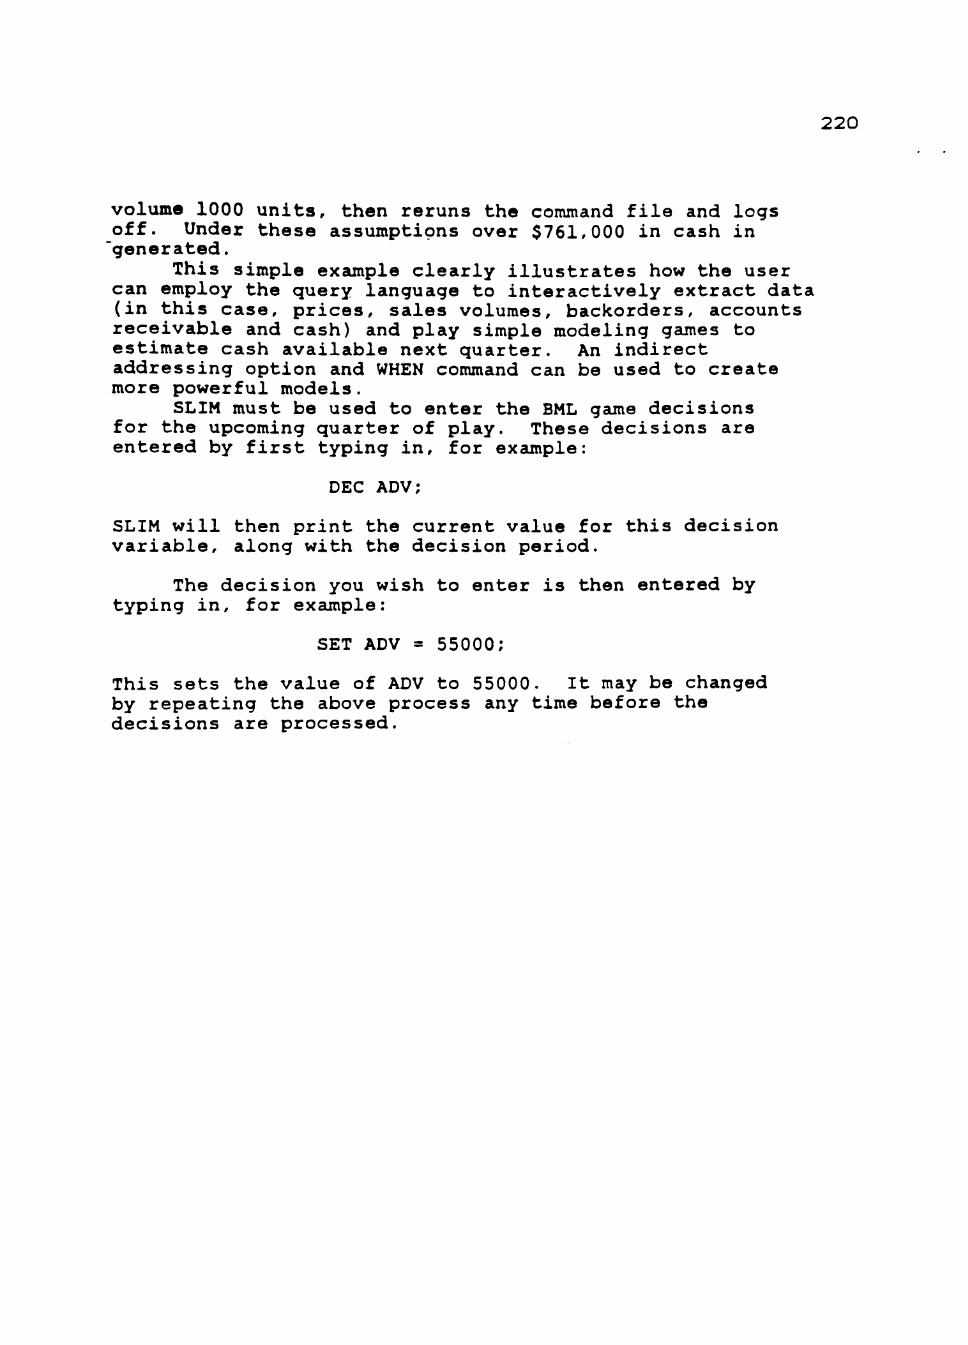
220
volume 1000 units, then reruns the command file and logs off. Under these assumptions over $761,000 in cash in 'generated.
This simple example clearly illustrates how the user can employ the query language to interactively extract data (in this case, prices, sales volumes, backorders, accounts receivable and cash) and play simple modeling games to estimate cash available next quarter. An indirect addressing option and WHEN command can be used to create more powerful models.
SLIM must be used to enter the BML game decisions for the upcoming quarter of play. These decisions are entered by first typing in, for example:
DEC ADV;
SLIM will then print the current value for this decision variable, along with the decision period.
The decision you wish to enter is then entered by typing in, for example:
SET ADV = 55000;
This sets the value of ADV to 55000. It may be changed by repeating the above process any time before the decisions are processed.

221
The command:
DEC;
will list the current values for all BML decisions sample of this decision matrix is shown below.
I I I
I I I
I I I
I I I
PRIC
0.00
not used
MAIN
0.00
FVBO (CHANGE)
0.00
I I I
I I I
I I I
I I I
ADV
55000
not used
RMO
0.00
SOFF (CHANGE)
0.00
I I I
I I I
I I I
I I I
SREP
0.00
PVFS
0.00
IPC (CHANGE)
0.00
DIVD
0.00
I I I
I I I
I I I
I I I
COM
0.
PVSS
0.
STIN
0.
not used
0.
,00
00
00
00
I I I
I I I
I I I
I I I
QC
0.00
css%
0.00
STL
0.00
not used 0.00
I I I
I I I
I I I
I I I
A complete list of the BML decisions are shown in Figure 4
•Adapted from DeSanctis(1982) and Kasper (1983)

222
FIGURE 1
Sample Ad Hoc Queries
* * * * * * * * * * * * * * * * * * * * * * * * * * * * *
* *
* W E L C O M E T O * * *
* S L I M * * *
* THE SYSTEM LABORATORY FOR * * INFORMATION MANAGEMENT * * * * * * * * * * * * * * * * * * * * * * * * * * * * * *
WHAT IS YOUR USER NUMBER? ?2 PASSWORD? XXXXXXXXX PRINT BBI BBI (Q8) = 119.44 PRI SREPS (Fl) SREPS (F1,Q8,A1) = 11.00 LIST SP (Ql-*)/BBI(Ql-*),EI(Q-*)
SP F2
1.6478 1.5231 1.4595 1.5150 1.5657 1.9370 1.9579 2.7970 PRINT MAX (SP(Q1=
BBI
111.16 112.00 112.78 114.25 116.76 121.44 120.44 119.44
= * ) ) * * * * * * ERROR IN SUBSCRIPT * * * * * * IF YOU NEED HELP, TYPE IN "HELP SUB";
. . . PRINT MAX (SP(Q1-*)) MAX = 2.7970 . . . LET 2z(AR±^ASH±STI) /_ (STL+SPL+AP) PRINT Q; Q = 2.8519 . . . END
L O G G E D O F F O F S L I M
EI
105.25 106.25 107.00 107.80 108.50 109.10 110.00 112.12

223
FIGURE 2
Sample SLIM Batch File
1 . 2. 3. 4. 5. 6. 7. 8. 9. 10. 11. 12. 13. 14. 15. 16. 17. 18.
LET LET LET LET LET LET LET LET LET LET LET LET
X ( X ( X ( X 1 X ( X ( X ( X ( X ( X i X ( X <
REMARK REMARK LIST PI REMARK LET R = TERMIN;
: i ) = [2) = [3) = [4) = [5) = ;6) = :7) = [8) = :9) = :io) : i i ) : i 2 ) X IS X IS
ilCE R IS = SUM L;
PRICE (P1,A1) + Y(l) PRICE (P2,A1) + Y(2) PRICE (P1,A2) + Y(3) PRICE (P2,A2) + Y(4) SV (P2,A1) + Z(l); SV (P1,A1) + Z(2); SV (P1,A2) + Z(3); SV (P2,A2) + Z(4); X(1)*X(5)+B0(P1,A1)*MIN(PRICE(P1,A1),X(1)); = X(2)*X(6)+B0(P2,A1)*MIN(PRICE(P2,A1),X(2)) = X(3)8X(7)+B0(P1,A2)*MIN(PRICE(P2,A2),X(3)) = X(4)*X(8)+B0(P2,A2)*MIN(PRICE(P2,A2),X(4)) PRICE CHANGE AND Z IS SALES VOL CHANGE SALES REVENUE (Al-2,Pl-2),Y(1-4),SV(A1-2,P1-2),Z(1-4),X(9-12) CASH FROM SALES. SUM IS TOTAL CASH AVAILABLE (X(9-12)) * .60; PRI R, AR, CASH;
FIGURE 3
Saunple SLIM What- i f E x e r c i s e
. BATCH; X IS PRICE CHANGE AND Z X IS SALES REVENUE
IS SALES VOL CHANGE
PRICE
42.50 11.00 44.00 12.00
Y
0.000 0.000 0.000 0.000
SV F2,Q8
9070.00 6833.00 5547.00 2254.00
Z
0.000 0.000 0.000 0.000
X
385475.00 75163.00 344068.00 27048.00
R IS CASH FROM SALES, SUM IS TOTAL CASH AVAILABLE R = 439052.40 AR(F2,Q8) = 291151.64 CASH(F2,Q8) = 46931.90 SUM = 777135.95
LET Y(l)=2.0 LET Z(l)= -1000; REWIND; BATCH;
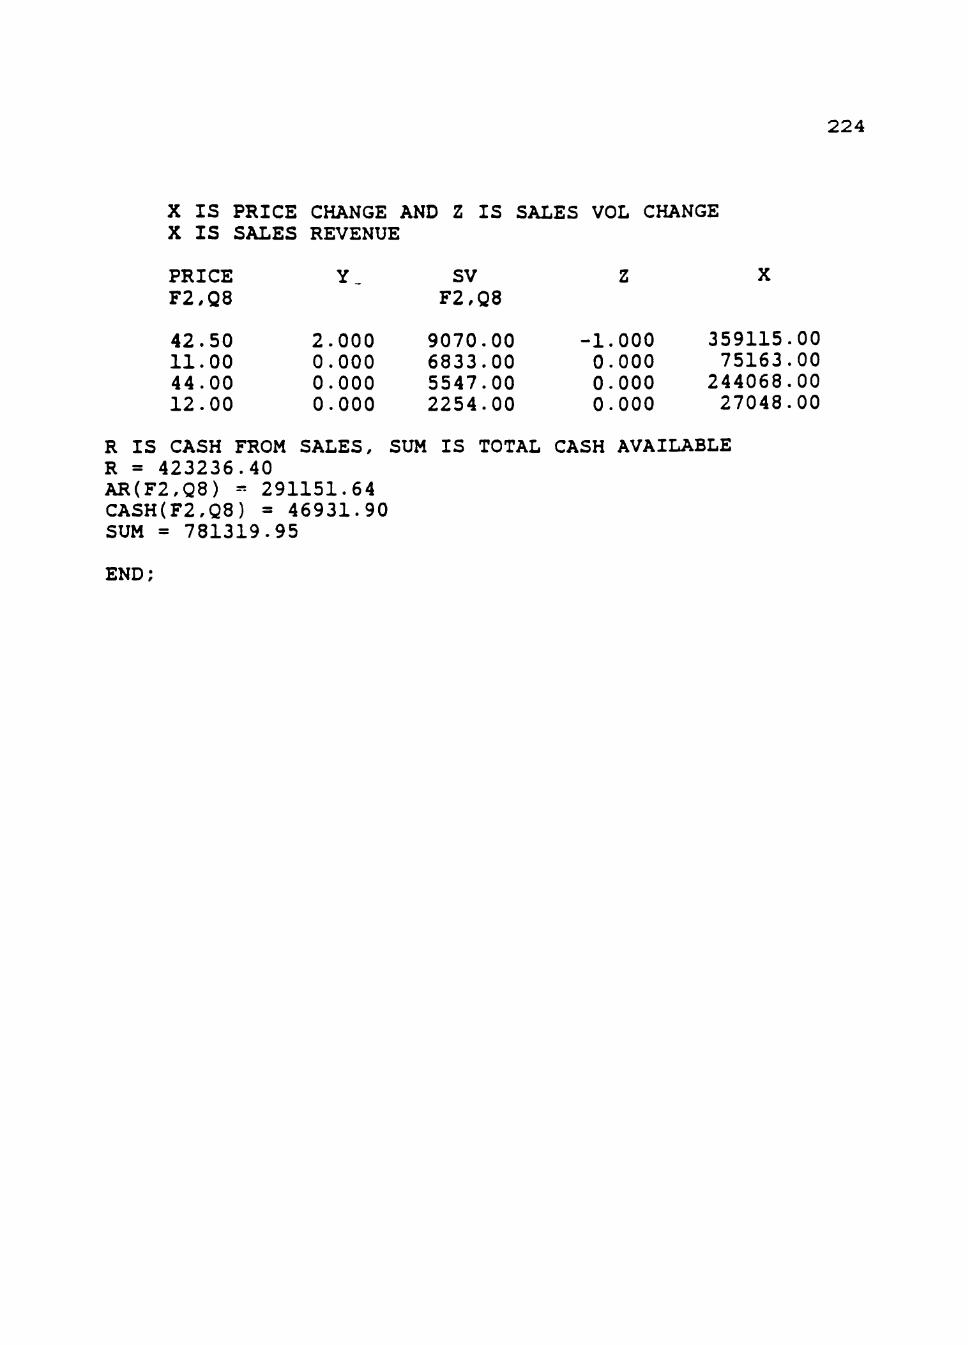
224
X IS PRICE CHANGE AND Z IS SALES VOL CHANGE X IS SALES REVENUE
PRICE F2,Q8
42.50 11.00 44.00 12.00
Y_
2.000 0.000 0.000 0.000
SV F2,Q8
9070.00 6833.00 5547.00 2254.00
Z
-1.000 0.000 0.000 0.000
X
359115, 75163,
244068. 27048.
.00
.00
.00
.00
R IS CASH FROM SALES, SUM IS TOTAL CASH AVAILABLE R = 423236.40 AR(F2,Q8) - 291151.64 CASH(F2,Q8) = 46931.90 SUM = 781319.95
END;

225
Figure 4
BML Decision Directory
DECISION
ADV
COM
DESCRIPTION
YOUR FIRM'S ADVERTISING BUDGET FOR THE UPCOMING QUARTER.
SALES REPRESENTATIVES PER PRODUCT COMMISSION RATE.
CSS% CHANGE IN THE PERCENTAGE OF SECOND SHIFT CAPACITY.
DIVD
FVBO
COMMON STOCK DIVIDEND DECLARED FOR THE UPCOMING QUARTER.
CHANGE IN THE FACE VALUE OF BONDS. A NEGATIVE ENTRY INDICATES THE CALL OF THAT DOLLAR AMOUNT OF OUTSTANDING BONDS.
IPC INCREASE IN THE PRODUCTION CAPACITY IN LABOR HOURS. THIS REQUIRES TWO QUARTERS TO BECOME AVAILABLE FOR USE.
MAIN MAINTENANCE EXPENSE FOR THE UPCOMING BML QUARTER.
PRIC YOUR FIRM'S PRODUCT SELLING PRICE FOR THE UPCOMING QUARTER.
PVFS
PVSS
QC
RMO
PRODUCTION VOLUME FIRST SHIFT FOR THE UPCOMING QUARTER.
PRODUCTION VOLUME SECOND SHIFT FOR THE UPCOMING QUARTER.
TOTAL QUALITY CONTROL BUDGET FOR THE UPCOMING QUARTER.
TOTAL RAW MATERIALS YOU WISH TO ORDER. THESE MATERIALS ARE NOT AVAILABLE FOR THE UPCOMING QUARTER. THEY ARE FOR THE QUARTER THAT FOLLOWS.
SOFF THE NUMBER OF COMMON STOCK SHARES OFFERED (+) OR PURCHASED FOR THE TREASURY.

226
SREP THE TOTAL NUMBER OF SALES REPRESENTATIVES YOU WANT FOR THE UPCOMING QUARTER.
STIN THE CASH AMOUNT YOU WISH TO PLACE IN SHORT TERM INVESTMENT FOR ANY QUARTER.
STL THE AMOUNT OF SHORT-TERM FUNDS YOU WISH TO FOR THE UPCOMING QUARTER.

227
Figure 5
SLIM Data D i c t i o n a r y
DATA'ITEM '
Environmental
BBI Bull-Bear Index (stock market) BLRT Current Period Bill Rate EI Current Economic Indicator EINQ Economic Indicator Forecast, Next Quarter's EINY Economic Indicator Forecast, Next Year's FUT Current Period Futures Quotation (raw material
price quotes) LFUT Last Quarter's Future Price PRAW Current Period Spot Quotation (raw material's
spot market price) QTR The current quarter YEAR The current year
Finance and Administration
AC Administrative Costs AP Accounts Payable AR Accounts Receivable BOUT Outstanding Bonds CASH Cash Assets COGS Cost of Goods Sold CR Credit Rating DIVD Dividends Declared, current period FC Fixed Costs FVBO Change in Face Value of Bonds (sale or call) IE Interest Expense ME Miscellaneous Expenses NET Net Earnings OE Owners Equity PIC Paid-in Capital ROA Return on Total Assets SALE Sales Revenue SOFF Number of Shares Stock Offered (+) or
Purchased for Treasury(-) SOUT Number of Shares Stock Outstanding SP Stock Price, last closing SPL Outstanding Special Loans SSP Stock Sales Price, new issue SSR Stock Sales Receipts, new issue STIN Short Term (90 day) Investment, amount STII Short Term Investment Income STIR Short Term Investment, rate

228
STL Short Term Loan STLO Short Term Loans Outstanding "TAX Tax Liability
UBD Unamortized Bond Discount
Marketing and Sales
ADV Advertising Budget BO Backorders COM Sales Commission LS Lost Sales due to Stock out MS Market Share PRIC Price QC Quality Control Budget SALR Salary for Sales Representatives SC Total Sales Compensation, current SREP Number of Sales Representatives SV Sales Volume, units Plant and Production CE Capital Expenditures, current CPC Change in Production Capacity CSS% Change in the Percentage of Second Shift
Capacity Available for use. DEPR Depreciation Charge FGI Finished Goods Inventory FGUG Finished Goods Unit Cost ICC Inventory Carrying Charges MAIN Plant Maintenance Expenditures MEF Maintenance Expenditure Factor (equal to 1
proper maintenance, greater than 1 undermaintained) PC Plant Capacity in Labor Hours. PLAN Book Value of Plant PUMC Per Unit Manufacturing Cost PVFS Production Volume, First Shift PVSS Production Volume, Second Shift RMI Raw Material Inventory RMO Raw Material Orders RMUC Raw Material Unit Cost SSI Second Shift Production Currently Available
as a Percentage of First Shift Capacity TPC Total Production Costs

APPENDIX I
GROUP MEETING INSTRUCTIONS
Description of thie NGT Meetings (with GISMO)
The following are descriptions of the tasks for your group. Each BML decision round requires your group to conduct two sessions: the problem-structuring session and the decision-making session.
Everyone is expected to come to the sessions prepared to contribute in a meaningful and knowledgeable manner. This will require everyone to use the SLIM data base system to gain knowledge and understanding of their company and industry. Each group member needs to be familiar with the position of his group's firm prior to the group meetings.
A. Problem-structuring Session
1. Prior to the session, each member creates his model of the problem structure using GISMO, and generates a digraph of the model.
2. Each member presents a model to the group in round-robin fashion. Group members may only ask for clarifications of models, but may not criticize the models.
3. After initial presentation, the models may be modified.
4. Each model is again presented without explanation.
5. A confidential ranking of the models is performed. The model with the highest ranking is selected as the group's problem-structure model.
6. A group model is created using GISMO and copies of the model are distributed to all members.
7. Each group member, working alone, then creates possible solutions for the BML decision round to be presented at the next meeting. The solutions should be based on the model the group has selected.
B. Decsion-making Session
1. Each member silently creates a possible solution.
229

230
Description of the NGT Meetings (with GISMO), cont.
2. Each member presents his solution in round-robin order with clarifications made when necessary.
3. Individual solutions can be made after presentation.
4. Individual solutions are again presented without comments.
5. The solutions are confidentially ranked. The solution with the top ranking becomes the group's choice.
6. The chosen solution is implemented by f i l l ing out the BML decision sheet.

231
Description of the IG Meetings (with GISMO)
The fol lowing are descriptions of the tasks for your group. Each BML decision round requires your group to conduct two sessions: the problem-structuring session and the decision-making session.
Everyone is expected to come to the sessions prepared to cont r i bu te in a meaningful and knowledgeable manner. This w i l l require everyone to use the SLIM data base system to gain knowledge and understanding of the i r company and industry. Each group member needs to be fami l ia r with the posit ion of his group's f i rm pr ior to the group meetings.
A. Problem-structuring Session
1 . Open discussion of variable relat ionships.
2. Members present GISMO models which are to be used to explain and c l a r i f y the i r viewpoints.
3. Using GISMO, a group model is created through consensus agreement of the relat ionships.
4. Copies of the group model are d is t r ibuted to members.
5. Each member is to use that model for further decision-making a c t i v i t i e s .
B. Decision-making Session
1 . Members present and discuss the i r suggested solut ions.
2. A consensus is reached on a solution to implement.
3. The group works together to f i l l out a BML decision sheet.

232
Description of the NGT Meetings
The fol lowing are descriptions of the tasks for your group. Each BML decision round requires your group to conduct two sessions: the problem-structuring session and the decision-making session.
Everyone is expected to come to the sessions prepared to cont r i bu te in a meaningful and knowledgeable manner. This w i l l require everyone to use the SLIM data base system to gain knowledge and understanding of the i r company and industry. Each group member needs to be fami l ia r with the posit ion of his group's f i rm prior to the group meetings.
A. Problem-structuring Session
1 . Si lent generation of variable relat ionship l i s t .
2. Round-robin presentation of l i s t with explanations and c l a r i f ica t ions permitted.
3. Si lent modif ication of l i s t s .
4. Confidential ranking of l i s t s with highest-ranked l i s t chosen to have ordered pairs assigned signs and weights.
5. Each member assigns signs and weights to the ordered pai rs .
6. This l i s t is presented to the group for explanation and c l a r i f i c a t i o n .
7. Modif ications to signed and weighted l i s t are permitted.
8. The l i s t s are conf ident ia l ly ranked with highest-ranked l i s t chosen as the group model for generation of a l ternat ive so lu t ions.
9. Copies of the l i s t are made and dist r ibuted to the group members.
B. Decision-making Session
1 . Si lent generation of solut ions.
2. Round-robin presentation of solutions with explanations and c l a r i f i c a t i o n s .
3. Individual modif ication of solut ions.

233
Description of the NfVr Mppt^y^g^^ cont.
' • S ^ ^ " / o ; i . p ^ ? 2 ^ : S t V L " ^ " * ^ ° " ^ "''' ' ' ' 9 ^ - ' - " ^ ^ ^ solution
5. Solution is implemented by f i l l i n g out the BML decision sheet.

234
Description of the IG Meetings
The fol lowing are descriptions of the tasks for your group. Each BML decision round requires your group to conduct two sessions: the problem-structuring session and the decision-making session.
Everyone is expected to come to the sessions prepared to cont r i bu te in a meaningful and knowledgeable manner. This w i l l require everyone to use the SLIM data base system to gain knowledge and understanding of the i r company and industry. Each group member needs to be fami l ia r with the posit ion of his group's f i rm prior to the group meetings.
A. Problem-structuring Session
1. Discussion of relevant relationships.
2. Consensus agreements of the relationships are made and listed,
3. Copies of the list are distributed and members are instructed to generate solutions based on the list.
B. Decision-making Session
1 . Open discussion of each member's solut ions.
2. A consensus solution is derived.
3. The solut ion is implemented by f i l l i n g out the BML decision sheet.
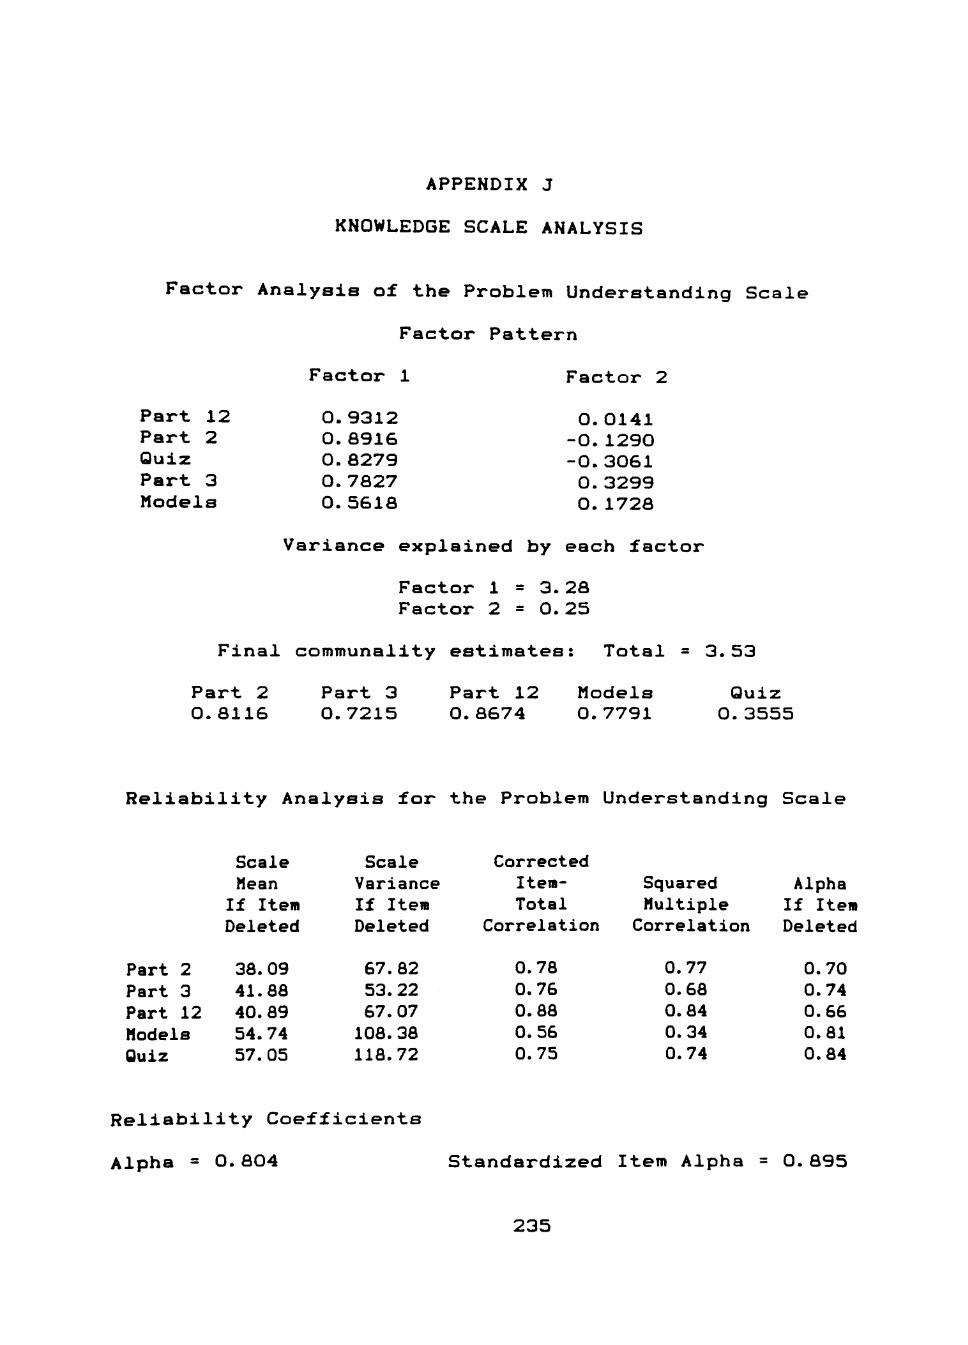
APPENDIX J
KNOWLEDGE SCALE ANALYSIS
Factor Analysis of the Problem Understanding Scale
Factor Pattern
Factor 1 Factor 2
Part 12 Part 2 Quiz Part 3 Models
0.9312 0. 8916 0.8279 O. 7827 0.5618
0.0141 -0.1290 -0.3061 0.3299 0.1728
Variance explained by each factor
Factor 1 = 3.28 Factor 2 = 0.25
Final communality estimates: Total = 3.53
Part 2 0.8116
Part 3 0.7215
Part 12 0.8674
Models 0.7791
Quiz 0.3555
Reliability Analysis for the Problem Understanding Scale
Part 2 Part 3 Part 12 Models Quiz
Scale Mean If Item Deleted
38.09 41.88 40.89 54.74 57.05
Scale Variance If Item Deleted
67.82 53.22 67.07 108.38 118.72
Corrected Item-Total
Correlation
0.78 0.76 0.88 0.56 0.75
Squared Multiple Correlation
0.77 0.68 0.84 0.34 0.74
Alpha If Item Deleted
0.70 0.74 0.66 0.81 0.84
Reliability Coefficients
Alpha = 0.804 Standardized Item Alpha = 0. 895
235

APPENDIX K
MANOVA RESULTS FOR DECISION PERFORMANCE MODEL
Dependent variable Yl:
Regression Coefficients
Regression Coefficients
Intercept Tool Procedure Tool» Procedure Size GEFTAVG
Estimated Rea. Coef.
2.58 4.68 -1.65 -1.89 -5.60 0.69
Estimated Std. Dev.
8.28 3.43 3.36 4.44 2.87 0.58
t Ratio
0.31 1.36 -0.49 -0.43 -1.95 1.19
P > Itl
0.38 0.10*» 0.31 0.34 0.04 • 0.13
Analysis of Variance
Source DF MEAN SQUARE F VALUE P > F R-SOUARE
Model Error
5 10
30.59 18.71
1.64 0.12 0.45
Analysis of Variance Detail
SOURCE
TOOL PROCEDURE TOGL#PROCEDURE SIZE GEFT
DF Type I SS
18.35 1.42 0.81
105.96 26.40
F
0.98 0.08 0.04 5.66 1.41
P > F
0.17 0.39 0.42 0.02 0.23
Type III SS
44.90 22.46 3.38 71.47 26.40
F
2.40 1.20 0.18 3.82 1.41
P > F*
0.07»» 0.15 0.34 0.04* 0.23
•*• o n e - t a i l probabi l i t i e s • s i g n i f i c a n t at a = 0.05
«• s i g n i f i c a n t at a 0.10
236

237
Dependent v a r i a b l e Y2:
R e g r e s s i o n C o e f f i c i e n t s
Regression Coefficients
Intercept Tool Procedure Tool•Procedure Size GEFTAVG
Estimated Rea. Coef.
5.35 2.99 -4.64 1.51 -6.34 0.64
Estimated Std. Dev.
7.52 3.12 3.05 4.04 2.61 0.53
t for HO: Parameter=
0.71 0.96 -1.52 0.37 -2.43 1.21
=0 P > l t l •
0.25 0.18 o.oa«« 0.36 0.02» 0. 13»
A n a l y s i s o f V a r i a n c e
Source DF MEAH SQUARE F VALUE P > F R-SQUARE
Model Error
5 10
3 7 . 1 2 15.44
2.40 0.06 0.55
A n a l y s i s of Variance D e t a i l
SOURCE
TOOL PROCEDURE TGGL^PROCEDURE SIZE GEFT
DF Type I SS
18.35 10.29 5.81
128.45 22.68
F
1.19 0.67 0.38 8.32 1.47
P > F
0.15 0.22 0.28 0.01 0.13
Type III SS
45.30 50.45 2.16 91.34 22.68
F
2.93 3.27 0.14 5.91 1.47
P > F*
0.06«* 0.05» 0.36 0.02* 0.13
• one-tai l probabilities • significant at a = 0.05
•• significant at a = 0.10
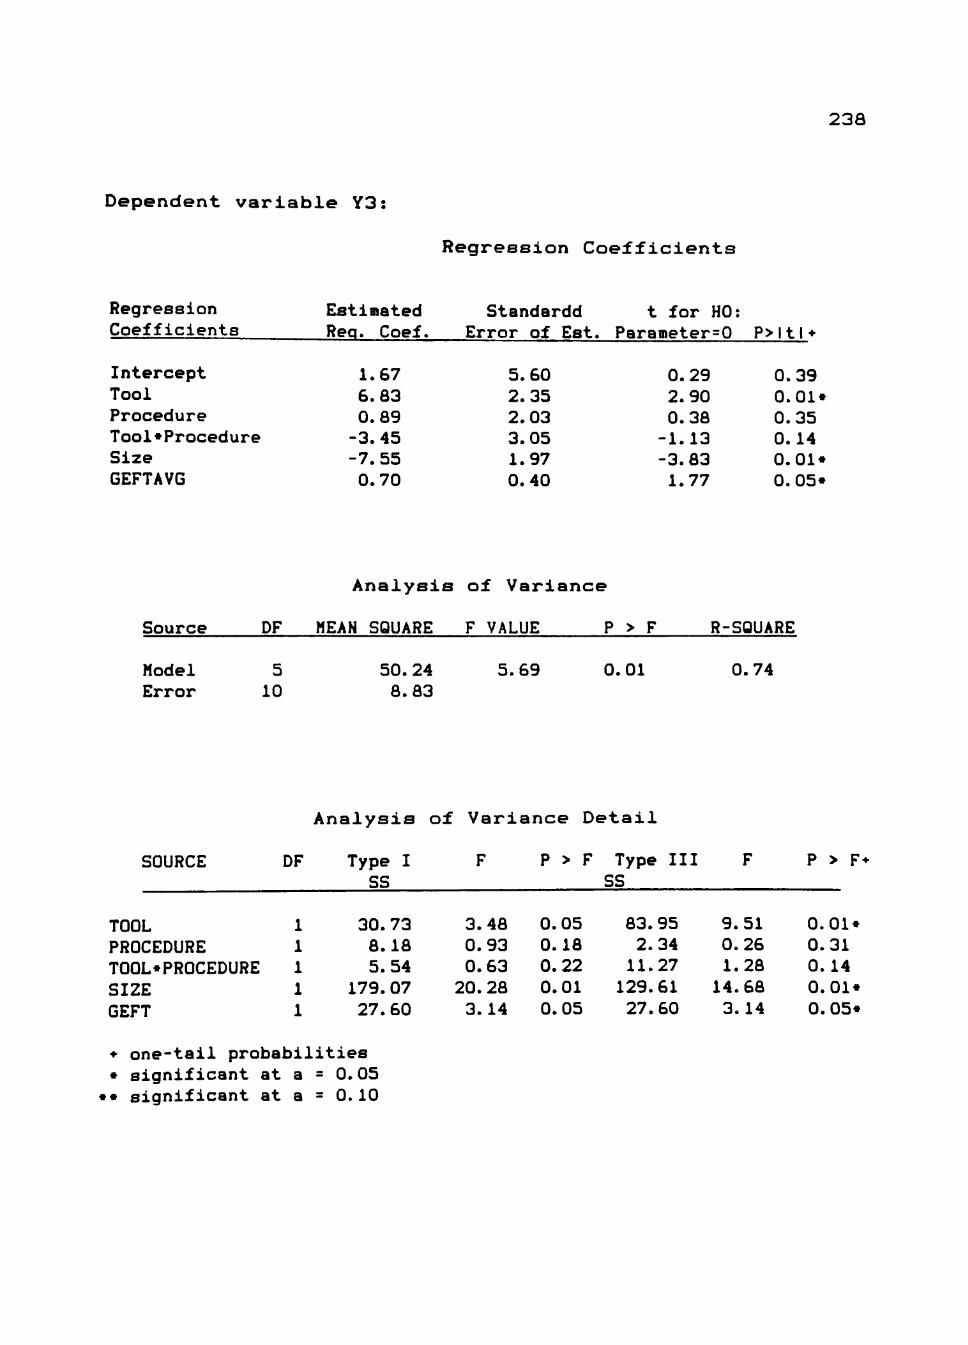
238
Dependent variable Y3:
Regression Coefficients
Regression Coefficients
Intercept Tool Procedure Tool•Procedure Size GEFTAVG
Estimated Rea. Coef.
1.67 6.83 0.89 -3.45 -7.55 0.70
Standardd Error of
5.60 2.35 2.03 3.05 1.97 0.40
Est. t for HO:
Parameter=0
0.29 2.90 0.38 -1.13 -3.83 1.77
P>ltl*
0.39 0.01* 0.35 0.14 0.01* 0.05«
Analysis of Variance
Source DF MEAH SQUARE F VALUE P > F R-SQUARE
Model Error
5 10
50.24 8.83
5.69 0.01 0.74
Analysis of Variance Detail
SOURCE
TOOL PROCEDURE TGGL«PRGCEDURE SIZE GEFT
DF Type I SS
30.73 8.18 5.54
179.07 27.60
F
3.48 0.93 0.63 20.28 3.14
P > F
0.05 0.16 0.22 0.01 0.05
Type III SS
83.95 2.34 11.27 129.61 27.60
F
9.51 0.26 1.28 14.68 3.14
P > F
O.Ol* 0.31 0.14 0.01* 0.05«
• one-tail probabilities • significant at a = 0.05 •• significant at a = 0.10

239
Dependent variable Y4:
Regression Coefficients
Regression Coefficients
Intercept Tool Procedure Tool*Procedure Size GEFTAVG
Estimated Rea. Coef.
-3.02 0.92 -0.63 0.29 -1.92 0.97
Standard Error of
9.54 3.95 3.87 5.12 3.30 0.67
Est. t for
Parameter
-0.32 0.23 -0.16 0.06 -0.58 1.45
HO: =0 P>ltl*
0.38 0.41 0.44 0.48 0.29» 0.09**
Analysis of Variance
Source DF MEAN SQUARE F VALUE P > F R-SQUARE
Model Error
5 10
18.33 24.84
0.74 0.32 0.27
A n a l y s i s of Variance D e t a i l
SOURCE
TOOL PROCEDURE TGGL*PRGCEDURE SIZE GEFT
DF Type I SS
3.11 7.84 2.08 26.16 52.44
F
0.13 0.32 0.08 1.05 2.11
P > F
0.37 0.29 0.39 0.16 0.09
Type III SS
3.70 0.76 0.08 8.38 52.44
F
0.15 0.03 0.00 0.34 2.11
P > F*
0.35 0.43 0.48 0.29 0.09«»
• one-tail probabilities • significant at a = 0.05 •• significant at a = .10

240
Dependent variable Y5:
Regression Coefficients
Regression Coefficients
Intercept Tool Procedure Tool*Procedure Size GEFTAVG
Estimated Rea. Coef.
-4.85 5.86 4.24 -5.13 -2.78 0.87
Estimated Std. Dev.
8.11 3.36 3.29 4.35 2.81 0.57
t for HO: Parameter=0
-0.60 1.74 1.29 -1.18 -0.99 1.53
P>ltl+
0.28 0.06»» 0.11 0.13 0.17 0.08»*
Analysis of Variance
Source DF MEAN SQUARE F VALUE P > F R-SQUARE
Model Error
5 10
32.07 17.96
1.79 0.10 0.47
Analysis of Variance Detail
SOURCE
TOOL PROCEDURE TGGL»PROCEDURE SIZE GEFT
DF Type I SS
22.92 40.66 15.87 38.94 41.96
F
1.28 2.26 0.88 2.71 2.34
P > F
0.14 0.08 0.18 0.09 0.08
Type III SS
34.85 9.37 24.97 17.53 41.96
F
1.94 0.52 1.39 0.98 2.34
P > F*
0.10»» 0.24 0.13 0.17 0.08*»
• one-tail probabilities • significant at a = 0.05 •• significant at a 0.10
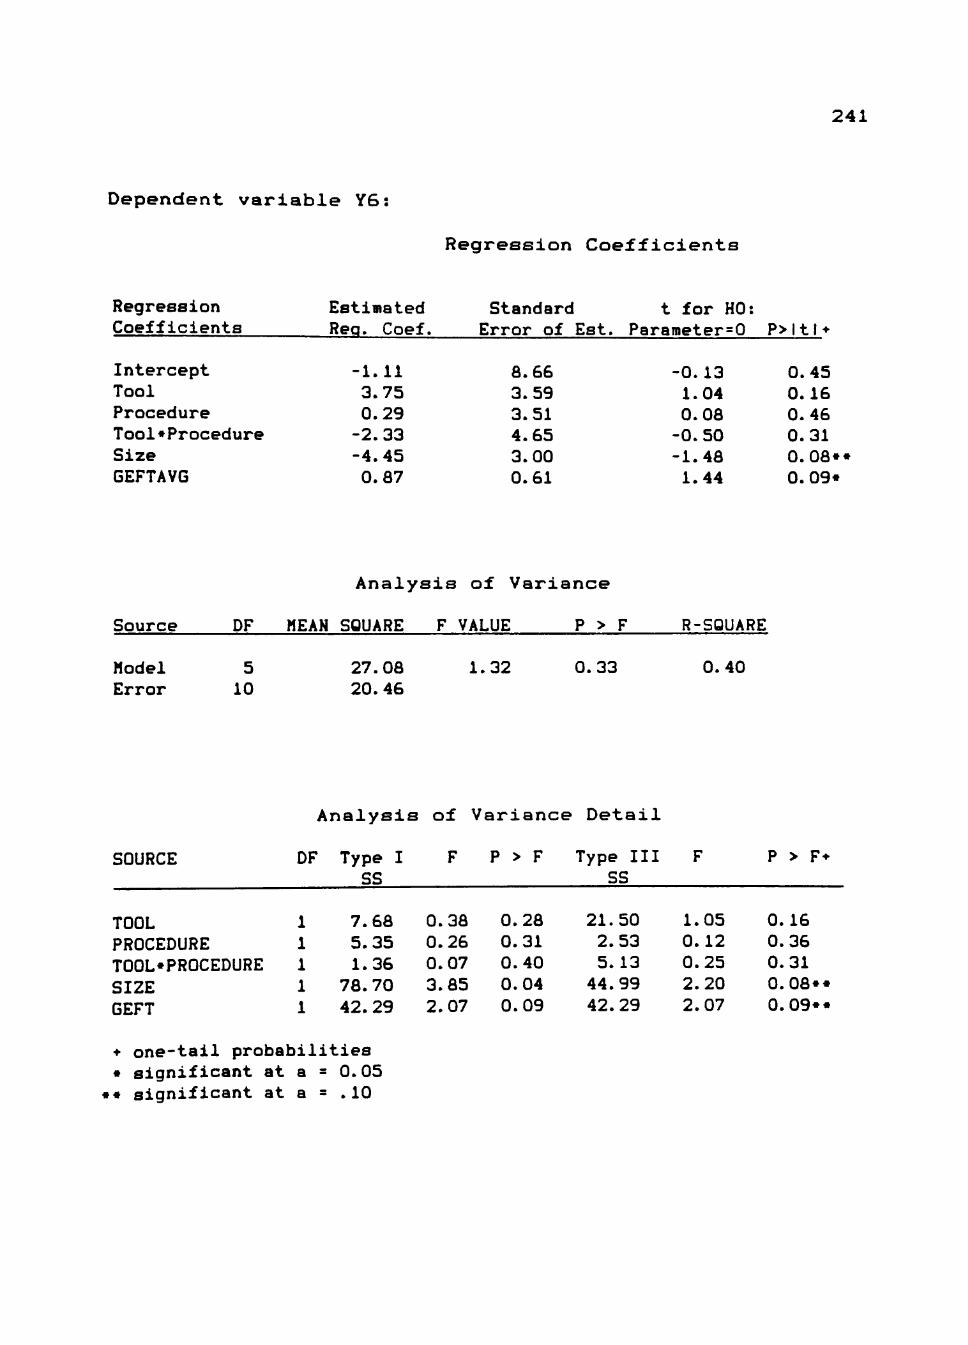
241
Dependent variable Y6:
Regression Coefficients
Regression Coefficients
Intercept Tool Procedure Tool'Procedure Size GEFTAVG
Estimated Rea. Coef.
-1.11 3.75 0.29 -2.33 -4.45 0.87
Standa Error o
8.66 3.59 3.51 4.65 3.00 0.61
t for HO: 'ameter=0 P>ItI•
0.13 1.04 0.08 0.50 1.48 1.44
0.45 0.16 0.46 0.31 0.08»» 0.09«
Analysis of Variance
Source DF MEAN SQUARE F VALUE P > F R-SQUARE
Model Error
5 10
27.08 20.46
1.32 0.33 0.40
Analysis of Variance Detail
SOURCE DF Type I F P > F Type III SS SS
P > F*
TOOL J PROCEDURE J TGGL»PROCEDURE J SIZE J GEFT J
L 7.68 L 5.35 L 1.36 L 78.70 L 42.29
0.38 0.26 0.07 3.85 2.07
0.28 0.31 0.40 0.04 0.09
21.50 2.53 5.13 44.99 42.29
1.05 0.12 0.25 2.20 2.07
0.16 0.36 0.31 0.08»» 0.09»«
• one-tail probabilities • significant at a = 0.05
•« significant at a = .10
APPENDIX L
BML DECISION SETS FOR GAME ADMINISTRATOR AND EXPERIMENTAL UNITS
1. Decision Sets for Database Creation
1
44
5000
0 8000
0 0 0 44
5000
0 8000
0 0 0 44
5000
0 8000
0 0 0 44
5000
0 8000
0 0 0
-1 44
5000
0 8000
0 0 0 44
5000
0
0 0 0 0 0 0 0 0 0 0 0 0 0 0 0 0 0 0 0 0 0 0 0 0 0 0 0 0
0 0 0 0 0 0 0 0 0 0
9 1.0 0
900 300 0 0 10 0 0
900 300 0 0 10 0 0
900 300 0 0 10 0 0
900 300 0 0
9 0 0
900 300 0 0 10 0 0
0 0
1000
0 0 0 0 0 0 0 0 0 0 0 0 0 0 0 0 0 0 0 0 0 0 0 0 0
0 0
1000
0 0 0 0 0 0 0
0 0 0 0 0 0 0 0 0 0 0 0 0 0 0 0 0 0 0 0 0 0 0 0 0 0 0 0
0 0 0 0 0 0 0 0 0 0
0 0 0 0 0 0 0 0 0 0 0 0 0 0 0 0 0 0 0 0 0 0 0 0 0 0 0 0
0 0 0 0 0 0 0 0 0 0
0 0 0 0 0 0 0 0 0 0 0 0 0 0 0 0 0 0 0 0 0 0 0 0 0 0 0 0
0 0 0 0 0 0 0 0 0 0
1 2 811
1 Z 812 1 2 813 1 2 814
1 2 815
1 2 816 1 2 817
2 2 811
2 2 812 2 2 813
2 2 814
2 2 815
2 2 816
2 2 817
3 2 811
3 2 812
3 2 813
3 2 814
3 2 815
3 2 816
3 2 817
4 2 811
4 2 812 4 2 813
4 2 814
4 2 815
4 2 816
4 2 817
1 3 811
1 3 812
1 3 813
1 3 814
1 3 815
1 3 816
1 3 817
2 3 811
2 3 812
2 3 813
242
243
8000
0 0 0
k L 44
5000 0
8000 0 0 0
L L 44
5000 0
8000 0 0 0
1 44
5000
0 8000
0 0 A 0
44 5000
0 8000
0 0 0
44 5000
0 8000
0 0 0
44 5000
0 8000
0 A
0 A 0
0
0 0 0 0 0 0 0 0 A 0 0 0 0
0 0 0 0 0
0 0 0 0 0 0 0 0 0 0 0 0 0 0 0 0 0 0 0 0 0 0 0 0 0 0 0 0
900 300
0 0
10 0 0
900 300
0 0
10 0
0 900 300
0 0
9 0 0
900 300
0 0
10 0 0
900 300
0 0
10 0 0
900 300
0 0
10 0 0
900 0 0 0
0 0 0 0 0 0
1000 0 0 0 0 0 0
0 0 0 0 0
0 0
1000 0 0 0 0 0 0 0 0 0 0 0 0 0
1000 0 0 0 0 0 0 0 0 0 0 0
0 0 0 0 0 0 0 0 0 0 0 0 0 0 0 0 0 0
0 0 0 0 0 0 0 0 0 0 0 0 0 0 0 0 0 0 0 0 0 0 0 0 0 0 0 0
0 0 0 0 0 0 0 0 0 0 0 0 0 0 0 0 0 0
0 0 0 0 0 0 0 0 0 0 0 0 0 0 0 0 0 0 0 0 0 0 0 0 0 0 0 0
0 0 0 0 0 0 0 0 0 0 0 0 0 0 0 0 0 0
0 0 0 0 0 0 0 0 0 0 0 0 0 0 0 0 0 0 0 0 0 0 0 0 0 0 0 0
2 3 814 2 3 815 2 3 816 2 3 817 3 3 611 3 3 812 3 3 813 3 3 814 3 3 815 3 3 816 3 3 817 4 3 811 4 3 812 4 3 813 4 3 814 4 3 815 4 3 816 4 3 817
1 4 811 1 4 812 1 4 813 1 4 814 1 4 815 1 4 816 1 4 817 2 4 811 2 4 812 2 4 813 2 4 814 2 4 815 2 4 816 2 4 817 3 4 811 3 4 812 3 4 813 3 4 814 3 4 815 3 4 816 3 4 817 4 4 811 4 4 812 4 4 813 4 4 814 4 4 815 4 4 816 4 4 817

244
-1
-1 48
5000
0 6000
0 0 0 48
5000 A
0 6000
0 0 0 48
5000
0 6000
0 0 0 48
5000
0 6000
0 0 0
48 5000
0 6000
0 0 0 48
5000
0 6000
0 0 0 48
5000
0 6000
0
0 0 0 0 0 0 0 0 0 0 0 0 0 0 0 0 0 0 0 0 0 0 0 0 0 0 0 0
0 0 0 0 0 0 0 0 0 0 0 0 0 0 0 0 0 0 0
9 0 0
1500
500 0 0 10 0 0
1500
500 0 0 10 0 0
1500
500 0 0 10 0 0
1500
500 0 0
9 0 0
1500
500 0 0 10 0 0
1500
500 0 0 10 0 0
1500
500
0 0
1000
0 0 0 0 0 0 0 0 0 0 0 0 0
1000
0 0 0 0 0 0 0 0 0 0 0
0 0
1000
0 0 0 0 0 0 0 0 0 0 0 0 0
1000
0 0
0 0 0 0 0 0 0 0 0 0 0 0 0 0 0 0 0 0 0 0 0 0 0 0 0 0 0 0
0 0 0 0 0 0 0 0 0 0 0 0 0 0 0 0 0 0 0
0 0 0 0 0 0 0 0 0 0 0 0 0 0 0 0 0 0 0 0 0 0 0 0 0 0 0 0
0 0 0 0 0 0 0 0 0 0 0 0 0 0 0 0 0 0 0
0 0 0 0 0 0 0 0 0 0 0 0 0 0 0 0 0 0 0 0 0 0 0 0 0 0 0 0
0 0 0 0 0 0 0 0 0 0 0 0 0 0 0 0 0 0 0
1 1 821
1 1 822
1 1 823 1 1 824
1 1 825
1 1 826
1 1 827
2 1 821
2 1 822
2 1 823
2 1 824
2 1 825 2 1 826
2 1 827
3 1 621 3 1 822
3 1 823
3 1 624 3 1 825
3 1 826
3 1 827
4 1 821
4 1 822 4 1 823 4 1 824
4 1 825
4 1 626
4 1 827
1 2 821 1 2 822
1 2 823
1 2 824
1 2 825
1 2 826 1 2 827
2 2 821
2 2 822
2 2 823
2 2 624
2 2 825
2 2 826
2 2 827
3 2 821
3 2 822
3 2 823
3 2 624
3 2 825

245
-1
-1
0 0 48
5000
0 6000
0 0 0
48 5000
0 6000
0 0 0 48
5000
0 6000
0 0 0 48
5000
0 6000
0 0 0 48
5000
0 6000
0 0 0
48 5000
0 6000
0 0 0 48
5000
0 0 0 0 0 0 0 0 0
0 0 0 0 0 0 0 0 0 0 0 0 0 0 0 0 0 0 0 0 0 0 0 0 0 0 0 0
0 0 0 0 0 0 0 0 0
0 0 10 0 0
1500
500 0 0
9 0 0
1500
500 0 0 10 0 0
1500
500 0 0 10 0 0
1500 500 0 0 10 0 0
1500
500 0 0
9 0 0
1500
500 0 0 10 0
0 0 0 0 0 0 0 0 0
0 0
1000
0 0 0 0 0 0 0 0 0 0 0 0 0
1000
0 0 0 0 0 0 0 0 0 0 0
0 0
1000
0 0 0 0 0 0
0 0 0 0 0 0 0 0 0
0 0 0 0 0 0 0 0 0 0 0 0 0 0 0 0 0 0 0 0 0 0 0 0 0 0 0 0
0 0 0 0 0 0 0 0 0
0 0 0 0 0 0 0 0 0
0 0 0 0 0 0 0 0 0 0 0 0 0 0 0 0 0 0 0 0 0 0 0 0 0 0 0 0
0 0 0 0 0 0 0 0 0
0 0 0 0 0 0 0 0 0
0 0 0 0 0 0 0 0 0 0 0 0 0 0 0 0 0 0 0 0 0 0 0 0 0 0 0 0
0 0 0 0 0 0 0 0 0
3 2 826
3 2 827
4 2 821
4 2 822
4 2 823 4 2 824
4 2 825
4 2 826
4 2 827
1 3 821
1 3 822 1 3 823 1 3 824
1 3 825
1 3 826 1 3 827 2 3 821
2 3 822 2 3 823
2 3 624
2 3 825 2 3 826 2 3 827
3 3 821
3 3 822
3 3 623 3 3 824
3 3 825
3 3 826
3 3 827
4 3 821
4 3 822
4 3 823 4 3 824
4 3 825
4 3 626 4 3 827
1 4 821
1 4 822
1 4 823
1 4 824
1 4 825
1 4 826
1 4 827
2 4 821
2 4 622
246
-1
0 6000
0
0
0
48
5000
0
6000
0
0
0
48
5000
0
6000
0
0
0
45
5000
0
6000
0
0
0
48
5000
0
6000
0
0
0
48
5000
0
6000
0
0
0
48
5000
0
6000
0
0
0
0
0
0
0
0
0
0
0
0
0
0
0
0
0
0
0
0
0
0
0
0
0
0
0
0
0
0
0
0
0
0
0
0
0
0
0
0
0
0
0
0
0
0
0
0
0
0
0 1500
500 0 0 10 0 0
1500
500 0 0 10 0 0
1500
500 0 0
9 0 0
1500
500 0 0 10 0 0
1500
500 0 0 10 0 0
1500
500 0 0 10 0 0
1500
500 0 0
0 0 0 0 0 0 0
1000
0 0 0 0 0 0 0 0 0 0 0
0 0
1000 0 0 0 0 0 0 0 0 0 0 0 0 0
1000
0 0 0 0 0 0 0 0 0 0 0
0
0
0
0
0
0
0
0
0
0
0
0
0
0
0
0
0
0
0
0
0
0
0
0
0
0
0
0
0
0
0
0
0
0
0
0
0
0
0
0
0
0
0
0
0
0
0
0
0
0
0
0
0
0
0
0
0
0
0
0
0
0
0
0
0
0
0
0
0
0
0
0
0
0
0
0
0
0
0
0
0
0
0
0
0
0
0
0
0
0
0
0
0
0
0 0 0 0 0 0 0 0 0 0 0 0 0 0 0 0 0 0 0
0 0 0 0 0 0 0 0 0 0 0 0 0 0 0 0 0 0 0 0 0 0 0 0 0 0 0 0
2 4 823
2 4 824
2 4 825
2 4 826 2 4 827
3 4 821
3 4 822
3 4 623
3 4 824
3 4 825
3 4 826
3 4 827
4 4 821
4 4 822
4 4 823
4 4 824
4 4 825 4 4 826 4 4 827
1 1 831
1 1 832
1 1 833 1 1 834
1 1 835
1 1 836
1 1 837
2 1 831
2 1 832
2 1 833 2 1 834
2 1 835
a 1 836
2 1 837
3 1 831
3 1 832
3 1 833
3 1 834
3 1 835
3 1 836
3 1 837
4 1 831
4 1 832
4 1 833
4 1 834
4 1 835
4 1 836 4 1 837

2. Administrator's Game Decision Sets
247
-1 44.75
6000
0 10000
3000
215000
0 52.75
31100
0 6500
3000
237000
0 SB. 50
30000
0 6000
0 150000
0
• 1
46.99
29000
0 6500
3750
5750
0 52.75
31100
0 4500
4500
30000
0 58.50
30000
0 5000
5000
40000
0 1 1
46.99 31000
0 0 0 0 0
106000
0 0 0 0 0 0
114000
0 0 0 0 0 0
70000
0
0 0 0 0 0
2750
0 0 0 0 0 0
15000
0 0 0 0 0 0
20000
0
0 0
10 L2S
0 4500
6000
100000
0 9
L2S 0
3300 4997
110000
200000
7 4 0
2000
2000
112000
100000
10 0
.80 4000
16000
130000
-100000
9 0
.60 3500
15000
76940
0 7 0 0
1800
5500
0 0
11 0
0 0
1000
2000
0 0 0 0 0
1000
1000
0 0 0 0 0
3000
0 0 0 0
1 0
1000
2000
0 0 0 0 0
1000
1000
0 0 0 0 0 0
5000
1000
0 0
1 0
0 0 0 0 0 0 0 0 0 0 0 0 0 0 0 0 0 0 0 0 0
0 0 0 0 0 0
1000000
0 0 0 0 0 0 0 0 0 0 0 0 0 0
0 0
0 0 0 0 0 0 0 0 0 0 0 0 0 0 0 0 0 0 0 0 0
0 0 0 0 0 0 0 0 0 0 0 0 0 0 0 0 0 0 0
150000
0
0 0
0 0 0 0 0 0 3 0 0 0 0 0 0 0 0 0 0 0 0 0 0
0 0 0 0 0 0 0 0 0 0 0 0 0 0 0 0 0 0 0 0 0
0 0
1 2 831
1 2 832
1 2 833
1 2 834
1 2 835
1 2 836
21 2 837 2 2 831
2 2 832
2 2 833 2 2 834
2 2 835 2 2 836
12 2 837
3 2 831
3 2 832
3 2 833 3 2 834
3 2 835
3 2 836 3 2 837
1 3 831
1 3 832
1 3 833 1 3 834
1 3 835
1 3 836
51 3 837
2 3 631 2 3 832
2 3 833
2 3 834
2 3 835
2 3 836 22 3 837
3 3 831
3 3 832
3 3 633
3 3834
3 3 835
3 3 836
3 3 837
1 4 831
1 4 832
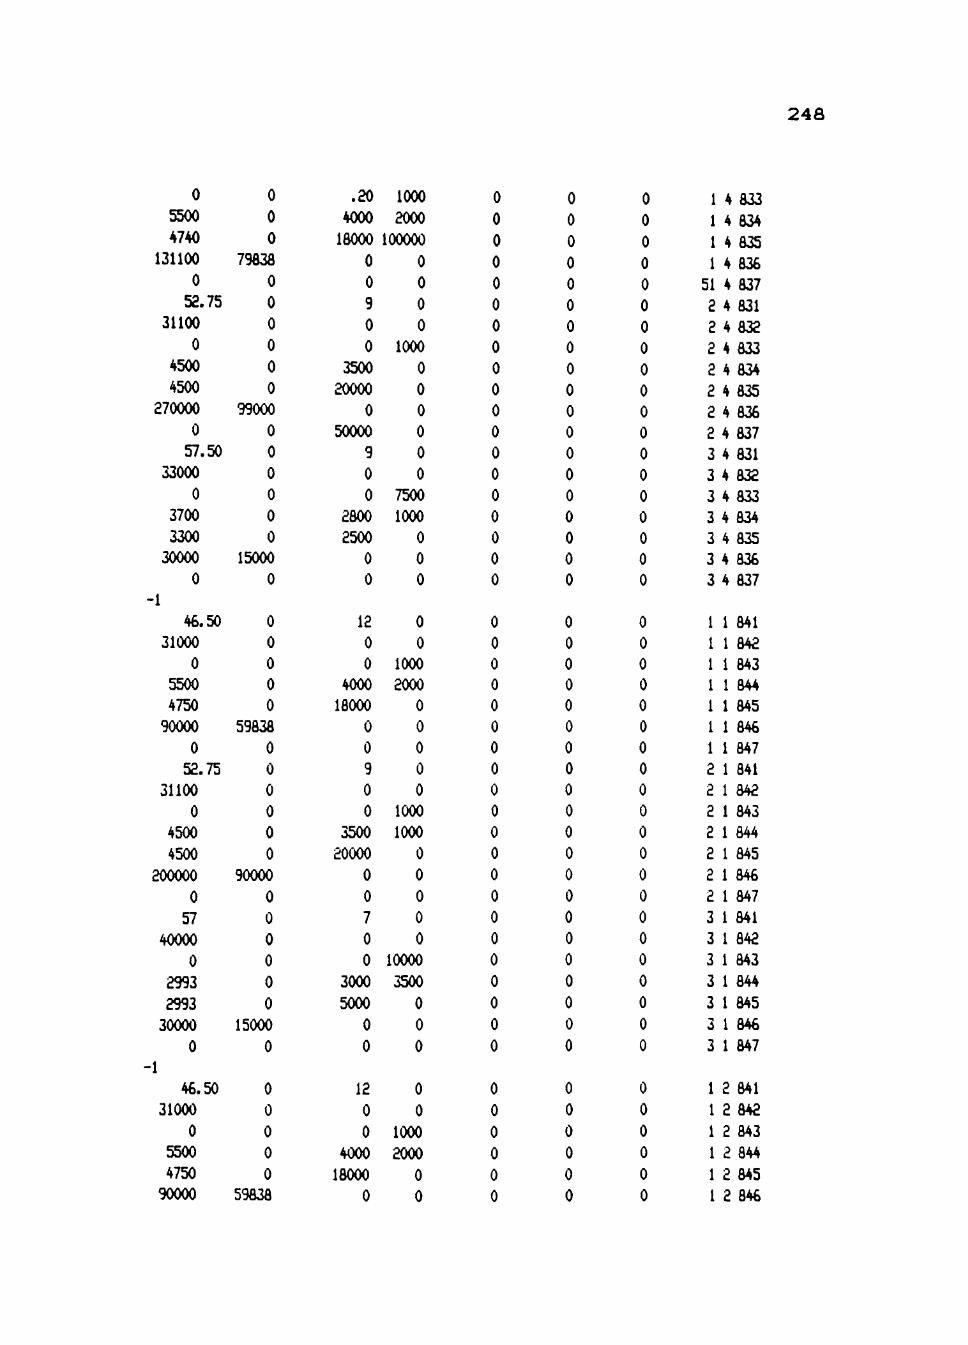
248
0 5500
4740
131100
0 52.75
31100
0 4500
4500
270000
0 57.50
33000
0 3700
3300
30000
0
-1
46.50
31000
0 5500 4750
90000
0 52.75
31100
0 4500
4500
200000
0 57
40000
0 2993
2993
30000
0
1
46.50 31000
0 5500
4750
90000
0 0 0
79838
0 0 0 0 0 0
99000
0 0 0 0 0 0
15000
0
0 0 0 0 0
59838
0 0 0 0 0 0
90000
0 0 0 0 0 0
15000
0
0 0 0 0 0
59838
.20 4000
1000
2000
16000 lOOOOO
0 0 9 0 0
3500
20000
0 50000
9 0 0
2800
2500 0 0
12 0 0
4000 18000
0 0 9 0 0
3500
20000
0 0 7 0 0
3000
5000
0 0
12 0 0
4000
18000
0
0 0 0 0
1000
0 0 0 0 0 0
7500
1000
0 0 0
0 0
1000
2000 0 0 0 0 0
1000
1000
0 0 0 0 0
10000
3500
0 0 0
0 0
1000
2000
0 0
0 0 0 0 0 0 0 0 0 0 0 0 0 0 0 0 0 0 0
0 0 0 0 0 0 0 0 0 0 0 0 0 0 0 0 0 0 0 0 0
0 0 0 0 0 0
0 0 0 0 0 0 0 0 0 0 0 0 0 0 0 0 0 0 0
0 0 0 0 0 0 0 0 0 0 0 0 0 0 0 0 0 0 0 0 0
0 0 0 0 0 0
0 0 0 0 0 0 0 0 0 0 0 0 0 0 0 0 0 0 0
0 0 0 0 0 0 0 0 0 0 0 0 0 0 0 0 0 0 0 0 0
0 0 0 0 0 0
1 4 833
1 4 834
1 4 835
1 4 836
51 4 837
2 4 831
2 4 832
2 4 833
2 4 834
2 4 835
2 4 836 2 4 637
3 4 831
3 4 832
3 4 833 3 4 634
3 4 835
3 4 836 3 4 837
1 1 841
1 1 842 1 1 643 1 1 844
1 1 845
1 1 846 1 1 847
2 1 841
2 1 842
2 1 843 2 1 844
2 1 845
2 1 846
2 1 847
3 1 841
3 1 842
3 1 843
3 1 844
3 1 845
3 1 846
3 1 847
1 2 841
1 2 842
1 2 843
1 2 844
1 2 645
1 2 846

249
0 52.75
31100 0
i.P/VA
4500 4500
200000 0
58.50 40000
A
0 2993 2993
30000
0 -1
47.50
31000
0 5500 4750
90100
0 52.75
21100
0 4500 4500
200000
0 58.50
40000
0 3600 3600
30000
0
0 0 0
0 0 0
90000 A 0 0 0 0 0 0
15000
0
0 0 0 0 0
59838
0 0 0 0 0 0
90000
0 0 0 0 0 0
15000
0
0 9 0
0 3500
20000 0
0 7 0 0
3000 6000
0 0
12 0 0
4000 8000
0 0 9 0 0
3500 20000
0 0 7 0 0 1
2500 8000 2500
-50000
0 0 0
1000 1000
0 0
0 0 0
10000 0 0 0 0
0 0
1000 2000
0 0 0 0 0
1000 1000
0 0 0 0 0
12000 0 0 0 0
0 0 0 0 0 0 0 0 0 0 0 0 0 0 0
0 0 0 0 0 0 0 0 0 0 0 0 0 0 0 0 0 0 0 0 0
0 0 0 0 0 0 0 0 0 0 0 0 0 0 0
0 0 0 0 0 0 0 0 0 0 0 0 0 0 0 0 0 0 0
-10000 0
0 0 0 0 0 0 0 0 0 0 0 0 0 0 0
0 0 0 0 0 0 0 0 0 0 0 0 0 0 0 0 0 0 0 0 0
1 2 847 2 2 841 2 2 842 2 2 843 2 2 844 2 2 845 2 2 846 2 2 847 3 2 841 3 2 842 3 2 843 3 2 644 3 2 845 3 2 846 3 2 847
1 3 841 1 3 842 1 3 843 1 3 844 1 3 845 1 3 846 1 3 847 2 3 841 2 3 842 2 3 843 2 3 844 2 3 845 2 3 846 2 3 847 3 3 841 3 3 842 3 3 843 3 3 844 3 3 845 3 3 846 3 3 847

250
3. Decisions of the Experimental Groups
(a) GISMO/NGT Group 1 decisions
-1 55
7500 A
0 7000
3000
5000
0 -1
57 10000
0 8000
3000 5500
0 -1
52 7500
0 2000
0 0 0
-1
52 10000
0 8000
3000
6000
0 -1 *
53.95 10000
0 8000
4000
5500
0 1
52 7500
0
0 0 0 0 0
5000
0
0 0 0 0 0
5500
0
0 0 0 0 0 0 0
0 0 0 0 0
6000
0
0 0 0 0 0
5500
0
0 0 0
10 5 0
2800
1200
99000
10000
10 0 0
620 2120
99000
0
10 0 0
360 1110
0 99798
10 0 0
620 2120
200000
0
10 0
.50 515 1770
0 0
8 1
.10
0 1000
0 0 0 0 0
1 0
500 400 0 0 0
0 0
300 200 0 0 0
0 0
500 300 0 0 0
0 0
1500
900 0 0 0
0 0
1500
0 0 0 0 0 0 0
0 0 0 0 0 0 0
0 0 0 0 0 0 0
0 0 0 0 0 0 0
0 0 0 0 0 0 0
0 0 0
0 0 0 0 0 0 0
0 0 0 0 0 0 0
0 0 0 0 0 0
250000
0 0 0 0 0 0 0
0 0 0 0 0 0 0
0 0 0
4 2 831
4 2 832
4 2 833
4 2 834
4 2 835
4 2 836
4 2 837
4 3 831
4 3 832
4 3 833 4 3 834
4 3 835
4 3 836 4 3 837
4 4 831 4 4 832
4 4 833 4 4 834
4 4 835
4 4 836 4 4 837
4 1 841
4 1 842
4 1 843
4 1 844
4 1 845
4 1 846
4 1 847
4 2 841
4 2 842
4 2 843
4 2 844
4 2 845
4 2 846
4 2 847
4 3 841
4 3 842
4 3 843
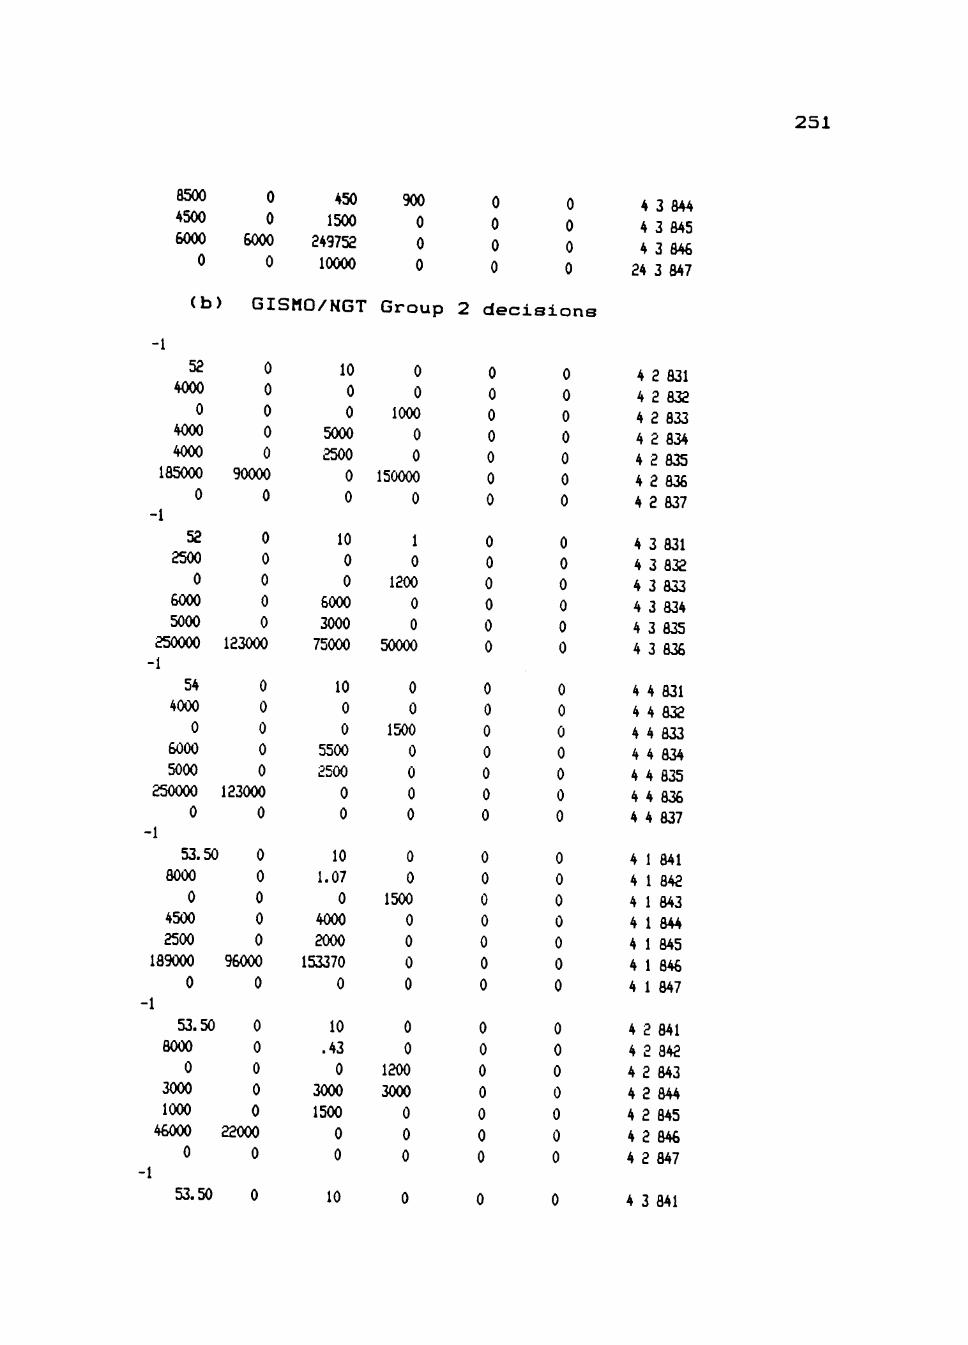
251
8500
4500
6000
0
0 0
6000
0
450 1500
249752
10000
900 0 0 0
0 0 0 0
0 0 0 0
4 3 844
4 3 845
4 3 846
24 3 847
<b) G I S M O / N G T G r o u p 2 decision.
-1
52
4000
0
4000
4000
185000
0
-1
52
2500
0
6000
5000
250000
-1
54
4000
0
6000
5000
250000
0
-1
53.50
8000
0
4500
2500
189000
0
-1
53.50
8000
0
3000
1000
46000
0
-1
53.50
0
0
0
0
0
90000
0
0
0
0
0
0
123000
0
0
0
0
0
123000
0
0
0
0
0
0
96000
0
0
0
0
0
0
22000
0
10
0
0
5000
2500
0
0
10 0 0
6000
3000
75000
10
0
0
5500
2500
0
0
10
1.07
0
4000
2000
153370
0
10
.43
0
3000
1500
0
0
10
0
0
1000
0
0
150000
0
1 0
1200 0 0
50000
0
0
1500
0
0
0
0
0
0
1500
0
0
0
0
0
0
1200
3000
0
0
0
0
0
0
0
0
0
0
0 0 0 0 0 0
0
0
0
0
0
0
0
0
0
0
0
0
0
0
0
0
0
0
0
0
0
0
0
0
0
0
0
0
0 0 0 0 0 0
0
0
0
0
0
0
0
0
0
0
0
0
0
0
0
0
0
0
0
0
0
4 2 831 4 2 832 4 2 833 4 2 834 4 2 835 4 2 836 4 2 837
4 3 831 4 3 832 4 3 833 4 3 834 4 3 835 4 3 836
4 4 831
4 4 832
4 4 833
4 4 834
4 4 835
4 4 836
4 4 837
4 1 841
4 1 842
4 1 843
4 1 844
4 1 845
4 1 846
4 1 847
4
4
4
4
4
4
4
2 841
2 842
843
844
845
846
847
4 3 841
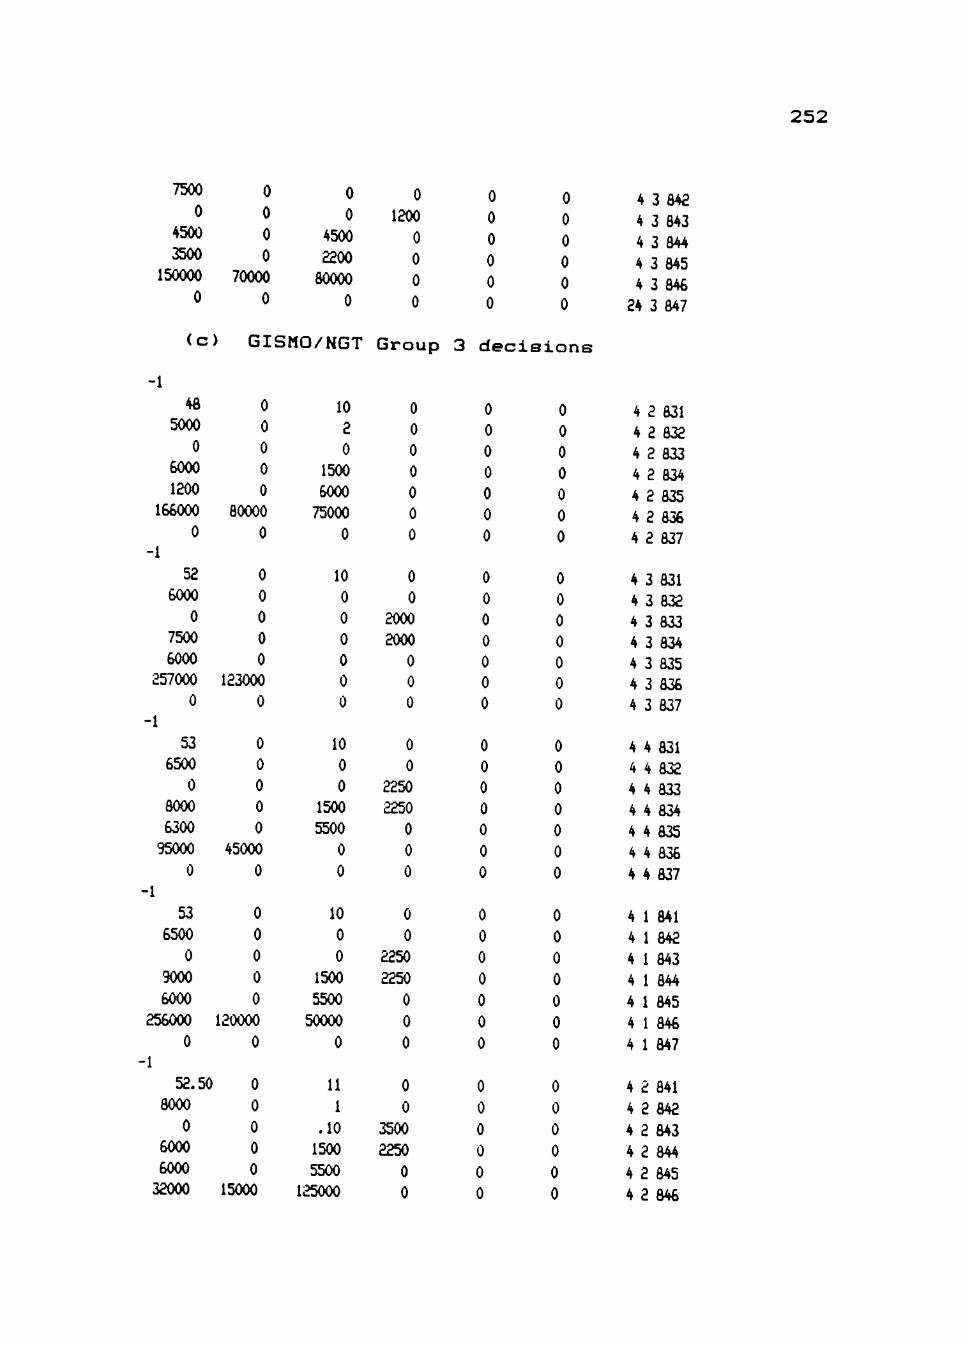
7500
0 4500
3500 150000
0
0
0 0 0
70000
0
0 0
4500
2200
80000
0
0 1200
0 0 0 0
0 0 0 0 0 0
0 0 0 0 0 0
4 3 842 4 3 843
4 3 844
4 3 845
4 3 846
24 3 847
(c) GISMO/NGT Group 3 decisions
252
-1 48
5000
0 6000
1200 166000
0 -1
52 6000
0 7500
6000
257000 0
-1 *
53 6500
0 8000
6300
95000
0 -1
* 53
6500
0 9000
6000
256000
0 -1 1
52.50 8000
0 6000
6000 32000
0 0 0 0 0
80000
0
0 0 0 0 0
123000
0
0 0 0 0 0
45000
0
0 0 0 0 0
120000
0
0 0 0 0 0
15000
10 2 0
1500
6000
75000
0
10 0 0 0 0 0 0
10 0 0
1500
5500
0 0
10 0 0
1500
5500
50000
0
11 1
.10 1500
5500 125000
0 0 0 0 0 0 0
0 0
2000
2000
0 0 0
0 0
2250
2250
0 0 0
0 0
2250
2250
0 0 0
0 0
3500
2250
0 0
0 0 0 0 0 0 0
0 0 0 0 0 0 0
0 0 0 0 0 0 0
0 0 0 0 0 0 0
0 0 0 0 0 0
0 0 0 0 0 0 0
0 0 0 0 0 0 0
0 0 0 0 0 0 0
0 0 0 0 0 0 0
0 0 0 0 0 0
4 2 831
4 2 832
4 2 833
4 2 834
4 2 835
4 2 836 4 2 837
4 3 831
4 3 832 4 3 833 4 3 834
4 3 835 4 3 836 4 3 837
4 4 831
4 4 832
4 4 833
4 4 834
4 4 835 4 4 836
4 4 837
4 1 841
4 1 842
4 1 843
4 1 844
4 1 845
4 1 846
4 1 847
4 2 841
4 2 842
4 2 843
4 2 844
4 2 845
4 2 846
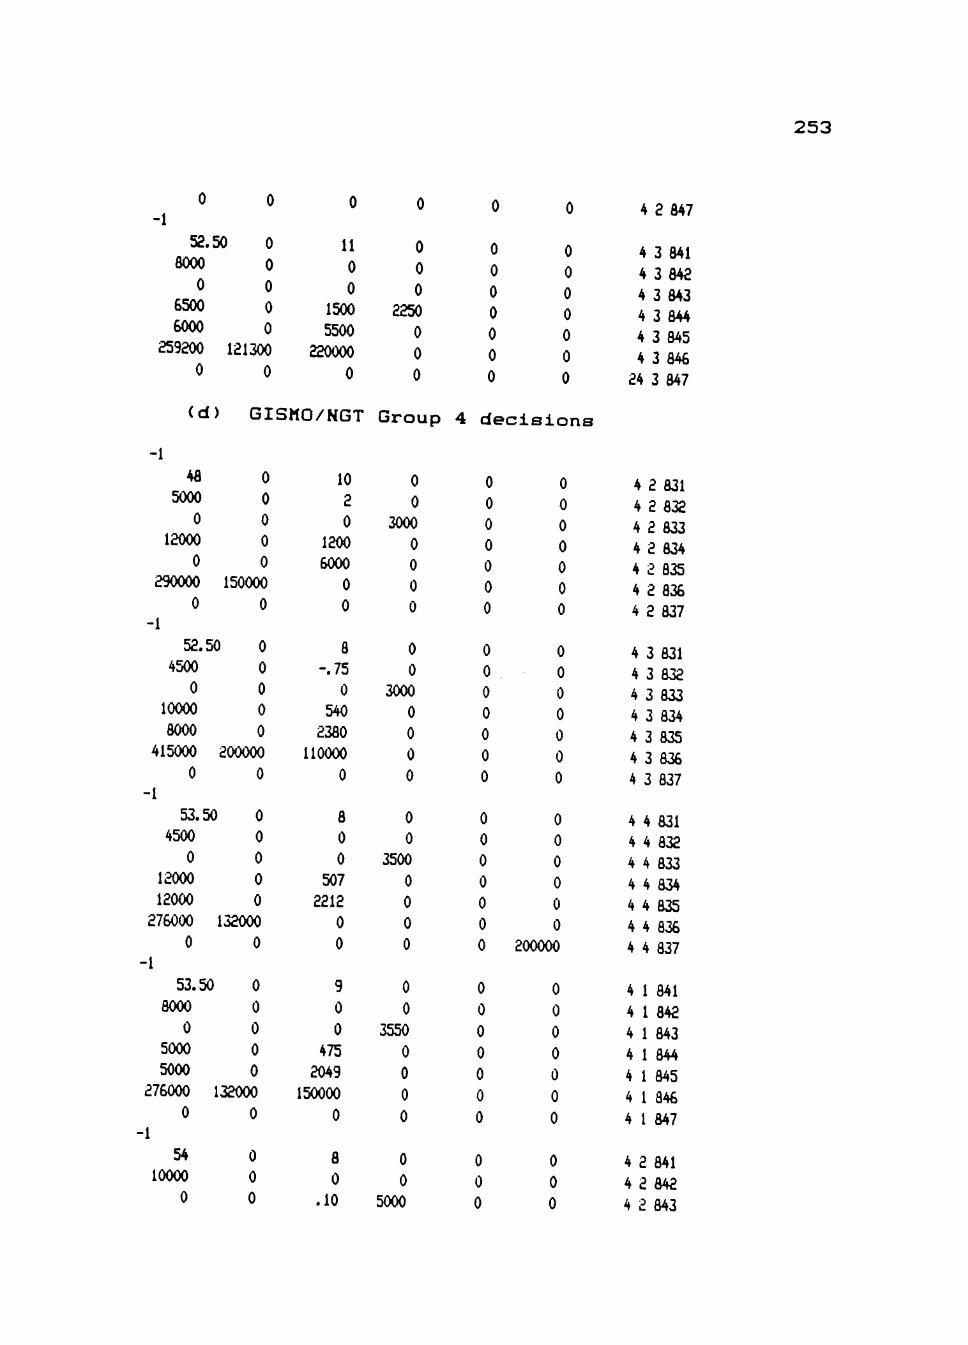
253
-1 52.50
8000
0 6500
6000
259200
0
0 0 0 0 0
121300
0
11 0 0
1500
5500
220000
0
0 0 0
2250
0 0 0
0
0
0
0
0
0
0
(d) GISMO/NGT Group 4 decisions
4 2 847
0 0 0 0 0 0 0
4 3 841
4 3 842
4 3 843 4 3 844
4 3 845
4 3 846
24 3 847
-1 48
5000
0 12000
0 290000
0 -1
0 0 0 0 0
150000
0
52.50 0
4500
0 10000
8000
415000
0 -1
0 0 0 0
200000
0
53.50 0
4500
0 12000
12000
276000
0 -1
53.50
8000
0 5000
5000
276000
0 -1
54 10000
0
0 0 0 0
132000
0
1 0
0 0 0 0
132000
0
0 0 0
10 2 0
1200 6000
0 0
8 -.75
0 540
2380
110000
0
8 0 0
507 2212
0 0
9 0 0
475 2049
150000
0
8 0
.10
0 0
3000
0 0 0 0
0 0
3000
0 0 0 0
0 0
3500
0 0 0 0
0 0
3550
0 0 0 0
0 0
5000
0 0 0 0 0 0 0
0 0 0 0 0 0 0
0 0 0 0 0 0 0
0 0 0 0 0 0 0
0 0 0
0 0 0 0 0 0 0
0 0 0 0 0 0 0
0 0 0 0 0 0
200000
0 0 0 0 0 0 0
0 0 0
4 2 831
4 2 832
4 2 833 4 2 834 4 2 835
4 2 836 4 2 837
4 3 831
4 3 832
4 3 833 4 3 834
4 3 835
4 3 836 4 3 837
4 4 831
4 4 832
4 4 833
4 4 834
4 4 835
4 4 836 4 4 837
4 1 841
4 1 842
4 1 843
4 1 844
4 1 845
4 1 846
4 1 847
4 2 841
4 2 842
4 2 843

254
2000
1000 30000
A
0 -1
54 8000
0 4000
4000 92000
0
(e
-1 49
5000
0 9000
1500 158000
0 -1
52 3000
0 9000
3600 140000
0 -1
52 15000
0 4400
400 0 0
-1
48.99 12000
0 1000
100 0 0
0
0 25000
0
0 0 0 0 0
44000
0
500 2000
0
0
9 1.25
.20 414 1749
80000
0
) GISMO/IG
0
0 0 0 0
19800
0
0 0 0 0 0
20000
0
0 0 0 0 0 0 0
0 0 0 0 0 0 0
8 0 0 0
1440
50000
0
8 0 0 0
2000 99337
0
8 0 0 0
2000
0 125000
7 1 0 0
2000
35000
0
0 0 0 0
0 0
5000
0 0 0 0
Group
0 -500
0 0 0 0 0
0 0 0 0 0 0 0
0 0 0 0 0 0 0
0 -500
3000
0 0 0 0
0 0 0 0
0 0 0 0 0 0 0
0 0 0 0
0 0 0 0 0 0 0
1 decisions
0 0 0 0 0 0 0
0 0 0 0 0 0 0
0 0 0 0 0 0 0
0 0 0 0 0 0 0
0 0 0 0 0 0 0
0 0 0 0 0 0 0
0 0 0 0 0 0 0
0 0 0 0 0 0 0
4 2 844
4 2 845
4 2 846
4 2 847
4 3 841
4 3 842
4 3 843 4 3 844
4 3 8 5
4 3 846 24 3 847
4 2 831
4 2 832
4 2 833
4 2 834
4 2 835
4 2 836 4 2 837
4 3 831
4 3 832
4 3 833 4 3 834
4 3 835
4 3 836 4 3 837
4 4 831
4 4 832
4 4 833 4 4 834
4 4 835
4 4 836
4 4 837
4 1 841
4 1 842
4 1 843
4 1 844
4 1 845
4 1 846
4 1 847

255
-1 48.95
12000 A
0 7500
750 186100
0
-1
51.99
10000
0 10000
10000
184000
0
0
0
0 0 0
89000
0
0 0 0 0 0
88000
0
7
0
0 0
2000
150000
0
5 0 0 0
2000
0 0
0
0
3000
0 0 0 0
0 0
3000
0 0 0 0
0
0
0 0 0 0 0
0 0 0 0 0 0 0
0
0
0 0 0 0 0
0 0 0 0 0 0 0
4 2 841
4 2 842
4 2 843
4 2 844
4 2 845
4 2 846
4 2 847
4 3 841
4 3 842
4 3 843 4 3 844
4 3 845
4 3 846
4 3 847
(f) GISMO/IG Group 2 decisions
-1 52
6000
0 4500
1500
160000
0 -1
55 6000
0 3500
2500
100000
0 -1
55 6000
0 3000
3000
80000
0 •1
56 11000
0 3000
0 0 0 0 0
75200
0
0 0 0 0 0
50000
0
0 0 0 0 0
40000
0
0 0 0 0
10 0
.50 2500
5000
105000
0
9 .25 0
3500
5000
0 0
9 0 0
3500
5000
100000
0
9 .08 0
3500
0 0
2000 0 0
50000
0
0 0
3000
0 0 0 0
0 0
3000
0 0
25000
0
0 50
4000
0
0 0 0 0 0 0 0
0 0 0 0 0 0 0
0 0 0 0 0 0 0
0 0 0 0
0 0 0 0 0 0 0
0 0 0 0 0 0 0
0 0 0 0 0 0 0
0 0 0 0
4 2 831 4 2 832
4 2 833 4 2 834
4 2 835
4 2 836
4 2 837
4 3 831
4 3 832
4 3 833 4 3 834
4 3 835
4 3 836
4 3 837
4 4 831
4 4 832
4 4 833
4 4 834
4 4 835
4 4 836
4 4 837
4 1 841
4 1 842
4 1 843
4 1 844

256
3000
70000
0 -1
50 22000
0 3500
2500
60000
0 -1
53 22000
0 3000 3000 60000
0
0 35000
0
0 0 0 0 0
30000
0
0 0 0 0 0
30000
0
5000
0 0
9 0 0
3500
2500
50000
0
9 0 0
5000
3500 50000
0
0 0 0
0 0
2000
0 0 0 0
0 0
2000
0 0 0 0
0 0 0
0 0 0 0 0 0 0
0 0 0 0 0 0 0
0 0 0
0 0 0 0 0 0 0
0 0 0 0 0 0 0
4 1 845
4 1 846
4 1 847
4 2 841
4 2 842
4 2 843
4 2 844
4 2 845
4 2 846
4 2 847
4 3 841
4 3 842
4 3 843 4 3 844
4 3 845
4 3 846 4 3 847
(g) GISMO/IG Group 3 decisions
-1 49
5000
0 10000
0 69920
0 -1
57 5000
0 5000
5000
230000
0
-1
56
4000
0 4500
3500
23000
0
0 0 0 0 0
46500
0
0 0 0 0 0
110000
0
0 0 0 0 0
11000
0
10 2 0
5000
0 100000
0
8 0 0
5000
0 0 0
8 .20 0
5000
0 100000
0
1 -1000
1000
0 0 0 0
0 0
1000
0 0 0 0
0 -400
1000
3000
0 0 0
0 0 0 0 0 0 0
0 0 0 0 0 0 0
0 0 0 0 0 0 0
0 0 0 0 0 0
200000
0 0 0 0 0 0 0
0 0 0 0 0 0 0
4 2 831
4 2 832
4 2 833
4 2 834
4 2 835
4 2 836 4 2 837
4 3 831
4 3 832
4 3 833
4 3 834
4 3 835
4 3 836
4 3 837
4 4 831
4 4 832
4 4 833
4 4 834
4 4 835
4 4 836
4 4 837

257
-1 56
5000
0 4000
0 92000
0 -1
56 5000
0 4000
0 69000
0 •1
56 5000
0 4500
3500 184000
0
0
0 0 0 0
44000
0
0 0 0 0 0
33000
0
0 0 0 0 0
88000
0
9 1.80
0 4000
4000
0 0
9 0 0
5000
2000
100000
0
9 0 0
5000
2000
0 0
0 -600
1000
2000 0 0 0
1 0
2000
2000
50000
0 0
0 0
2000
2000
150000
0 0
0 0 0 0 0 0 0
0 0 0 0 0 0 0
0 0 0 0 0 0 0
0 0 0 0 0 0 0
0 0 0 0 0 0 0
0 0 0 0 0 0 0
4 1 841
4 1 842
4 1 843
4 1 844 4 1 845 4 1 846
4 1 847
4 2 841
4 2 842
4 2 843 4 2 844
4 2 845
4 2 846 4 2 847
4 3 841
4 3 842
4 3 843
4 3 844 4 3 845
4 3 846 4 3 847
<h) GISMO/IG Group 4 decisions
-1 48
8000
0 6000
4000
23000
0 -1
50 12000
0 8000
8000
184000
40000 -1
51.50
12000
0 8000
0 0 0 0 0
110000
0
0 0 0 0 0
88000
20000
0 0 0 0
10 0 0
1800
5500
112982
0
10 0 0
2880
8880
300000
0
10 0 0
2880
0 0
3500
0 0
150000
0
0 0
5000
0 0
120000
0
0 0
5000
0
0 0 0 0 0 0 0
0 0 0 0 0 0 0
0 0 0 0
0 0 0 0 0 0 0
0 0 0 0 0 0 0
0 0 0 0
4 2 831 4 2 832 4 2 833
4 2 834
4 2 835
4 2 836 4 2 837
4 3 831
4 3 832
4 3 833
4 3 834
4 3 835
4 3 836 4 3 837
4 4 831
4 4 832
4 4 833
4 4 834

258
8000
71000
0 -1
50 15000
0 6000 4000
35600
0 -1
50 20000
0 6000 4000 46750
0 -1
50 23000
0 6000 4000
36000
0
0 34000
0
0 0 0 0 0
17050
0
0 0 0 0 0
23050
0
0 0 0 0 0
17000
0
8880
0 160121
10 0 0
1800
5500
198321
0
10 0 0
800 5500
350000
0
10 0 0
2200 4500
350000
0
(i) GISMO/IG
-1 48
5000
0 8000
0 235000
0
-1
49.99
12000
0 8000
8000
40000
0
0 0 0 0 0
112000
0
0 0 0 0 0
20000
0
10 0 0
500 750
50000
0
9 0
.70 1000
1500
0 175000
0 0 0
0 0
3500
0 0 0 0
0 0
3500
0 0 0 0
0 0
3500 0 0 0 0
Group
0 0
1000
0 0 0 0
0 0
1000
0 0
150000
0
0 0 0
0 0 0 0 0 0 0
0 0 0 0 0 0 0
0 0 0 0 0 0 0
5 deci
0 0 0 0 0 0 0
0 0 0 0 0 0 0
0 0 0
0 0 0 0 0 0 0
0 0 0 0 0 0 0
0 0 0 0 0 0 0
sions
0 0 0 0 0 0 0
0 0 0 0 0 0 0
4 4 835
4 4 836
4 4 837
4 1 841 4 1 842
4 1 843
4 1 844
4 1 845
4 1 846
4 1 847
4 2 841
4 2 842
4 2 843 4 2 844
4 2 845 4 2 846 4 2 847
4 3 841
4 3 842 4 3 843 4 3 844
4 3 845 4 3 8^
4 3 847
4 2 831
4 2 832
4 2 833 4 2 834 4 2 835
4 2 836
4 2 837
4 3 831
4 3 832
4 3 833
4 3 834
4 3 835
4 3 836
4 3 837

2 5 9
-1
52.99
6000
0
9300
9300
404000
0
-1
51.99
25000
0
6000
3300
40000
0
-1
51.99 40000
0
4000 2000
0
0 -1
53.99
40000
0
8000
2000
145000
0
0
0
0
0
0
198000
0
0
0
0
0
0
20000
0
0 0 0 0 0 0 0
0
0
0
0
0
60000
0
8
.53
.30
3000
3000
100000
50000
8
0
-.50
3000
3000
0
0
9
.47
-.30
1500
1500
0
0
9
0
0
3000
1500
150000
0
0
0
1000
0
0
0
0
1
0
3000
5000
0
0
0
0 0
3000 5000
0 0 0
0
0
3000
5000
0
0
0
0
0
0
0
0
0
0
0
0
0
0
0
0
0
0 0 0 0 0 0 0
0
0
0
0
0
0
0
0
0
0
0
0
0
0
0
0
0
0
0
0
0
0 0 0 0 0 0 0
0
0
0
0
0
0
0
4 4 631
4 4 832
4 4 833
4 4 834
4 4 835
4 4 836
8* 4 837
4 1 Ml 4 1 842 4 1 843 4 1 844 4 1 845 4 1 846 44 1 847
4 2 841 4 2 842 4 2 843 4 2 844 4 2 845 4 2 846 44 2 847
4 3 841
4 3 842
4 3 843
4 3 844
4 3 845
4 3 846
44 3 847
(j) NONGISMO/NGT Group 1 decisions
-1 45
5000
0 5000
6000 275000
0 1
52
5000
0 5000
0 0 0 0 0
132000
0
0 0 0 0
9 2
.80 2000
2000
80000
100000
8 0
.20 2000
0 0
1000
0 0 0 0
0 0
1000
0
0
0
0
0
0
0
0
0
0
0
0
0
0
0
0
0
0
0
0
0
0
0
4 2 831
832
833
2 834
835
836
837
4 3 831
4 3 832
4 3 833
4 3 834

260
6000
275000
0 -1
56 6000
0 5000
7000 253000
0 -1
48 6000
0 3000
0 0 0
-1
53 6000
0 5000 6000
92000
0 -1
55 20000
0 3000
1500
132100
0
0 132000
0
0 0 0 0 0
121000
0
0 0 0 0 0 0 0
0 0 0 0 0
44000
0
0 0 0 0 0
62700
0
2000
80000
0
8 0 0
2000
3000
0 0
7 0
-1.0
2000
0 0 0
7 0
.90 2000 2000
103000
0
7 0
-.70
2000
1000
0 0
0 95000
0
0 0
1000
0 0 0 0
0 0
1000
0 0 0 0
0 0
1000 0 0 0 0
0 0
1000
3000
0 0 0
0 0 0
0 0 0 0 0 0 0
0 0 0 0 0 0 0
0 0 0 0 0 0 0
0 0 0 0 0 0 0
0 0 0
0 0 0 0 0 0 0
0 0 0 0 0 0 0
0 0 0 0 0 0 0
0 0 0 0 0 0 0
4 3 835
4 3 836
4 3 837
4 4 831
4 4 832
4 4 833 4 4 834
4 4 835
4 4 836
4 4 837
4 1 841
4 1 842
4 1 843
4 1 844 4 1 845 4 1 846
4 1 847
4 2 841
4 2 842 4 2 843 4 2 844 4 2 845
4 2 846 4 2 847
4 3 841
4 3 842 4 3 843
4 3 844
4 3 845
4 3 846 4 3 847
(k) NONGISMO/NGT Group 2 decisions
-1 48
5000
0 9000
0 207000
0
0 0 0 0 0
99000
0
10 0 0 0 0
67661
100000
0 0 0 0 0 0 0
0 0 0 0 0 0 0
0 0 0 0 0 0 0
4 2 831
4 2 832
4 2 833
4 2 834
4 2 835
4 2 836
4 2 837
261
-1 60
10000 A
0 5000
A
0 115000
0 -1
57 15000
0 6000
0 46000
0 -1
49.50
30000
0 5500
0 126500
0 -1
52.50
30000
0 6000 3000
207000
0 -1
52.50
40000
0 9000
5000
0 0 0 0 0
55000
0
0 0 0 0 0
22000
0
0 0 0 0 0
60500
0
0 0 0 0 0
99000
0
0 0 0 0 0
322000 154000
0
(1)
-1 48
5000
0 9000
0
9 3 0 0 0
40872
50000
9 0 0
3630
4620
0 100000
9 0 0
3025 4538
0 0
9 0
1.0 4950
7425 0 0
9 0
.10 7700
11550
0 0
0 0 0 0 0 0 0
0 0
5000
0 0 0 0
0 0
3250
1000
0 0 0
0 0
3000
3000
0 0 0
0 0
3000
1000
0 0 0
NONGISMO/NGT Group
0 0 0 0
10 0 0
1500
0 0 0 0
0 0 0 0 0 0 0
0 0 0 0 0 0 0
0 0 0 0 0 0 0
0 0 0 0 0 0 0
0 0 0 0 0 0 0
3
0 0 0 0
0 0 0 0 0 0 0
0 0 0 0 0 0 0
0 0 0 0 0 0 0
0 0 0 0 0 0 0
0 0 0 0 0 0 0
4 3 831
4 3 832
4 3 833 4 3 834
4 3 835
4 3 836
4 3 837
4 4 831
4 4 832
4 4 833 4 4 834
4 4 835
4 4 836
4 4 837
4 1 841
4 1 842
4 1 843 4 1 844
4 1 845
4 1 846 4 1 847
4 2 841
4 2 842
4 2 843 4 2 844 4 2 845
4 2 846
4 2 847
4 3 841
4 3 842
4 3 843 4 3 844
4 3 845
4 3 846
4 3 847
decisions
0 0 0 0
4 2 831
4 2 832
4 2 833
4 2 834

262
2500
315000
0 -1
49 5000
0 10000
4000 322000
0 -1
50 5000
0 15000 5000
460000
0 -1
52 5000
0 13000
10000
414000
0 -1
20000
0 10000
4000
46000
0
-1
52.50
30000
0 6500
6500 299000
0
0 148500
0
0 0 0 0 0
154000
0
0 0 0 0 0
220000
0
0 0 0 0 0
198000
0
I 0
0 0 0 0
22000
0
0 0 0 0 0
143000
0
6000
0 0
10 1 0
1000
1000
0 0
10 1 0
1250 1250
200000
0
10 0 0
1255 1250
0 0
10 0 0
1250
1250
100000
0
9 0 0
1500
1500
200000
0
0 0 0
0 0
5000
0 0 0 0
0 0
5000
0 0 0 0
0 0
5000
0 0 0 0
0 0
5000
0 0 0 0
0 0
5000
0 0 0 0
0 0 0
0 0 0 0 0 0 0
0 0 0 0 0 0 0
0 0 0 0 0 0 0
0 0 0 0 0 0 0
0 0 0 0 0 0 0
0 0 0
0 0 0 0 0 0 0
0 0 0 0 0 0 0
0 0 0 0 0 0 0
0 0 0 0 0 0 0
0 0 0 0 0 0 0
4 2 835
4 2 836
4 2 837
4 3 831
4 3 832
4 3 833
4 3 834
4 3 835
4 3 836 4 3 837
4 4 831
4 4 832
4 4 833 4 4 834
4 4 835 4 4 836 4 4 837
4 1 841
4 1 842 4 1 843
4 1 844
4 1 845
4 1 846
4 1 847
4 2 841
4 2 842
4 2 843 4 2 844
4 2 845
4 2 846 4 2 847
4 3 841
4 3 842
4 3 843
4 3 844
4 3 845
4 3 846
4 3 847
263
(m;
-1 48
10000
0 7000 18000
35000
0 -1
55 30000
0 15000 10000
10000
0 -1
55 15000
0 5390
0 10000
0 -1
50 20000
0 5390
0 10000
0 -1
50 25000
0 5365
5000
12000
0 • 1
X
51.50
2000
0 5150 10000
> NUN
0 0 0 0 0
25500
0
0 0 0 0 0
25000
0
0 0 0 0 0
15000
0
0 0 0 0 0
15000
0
0 0 0 0 0
17000
0
0 0 0 0 0
UiSMO/
10 0 0
2000
6000
0 0
10 0 0
5000
0 188457
0
10 1 0
5000
4000
0 0
10 0 0
1005
1000
0 0
8 1 0
1000
1000
40000
0
8 1
1.0 1000
1000
IG Group
0 0
10000
20000
0 4750
0
0 0
15000
20000
0 0 0
0 0
10000
15000 0 0 0
0 0
5000
10000
0 0 0
0 0
5000
2000
0 0 0
0 0
8000
1000
0
1
0 0 0 0 0 0 0
0 0 0 0 0 0 0
0 0 0 0 0 0 0
0 0 0 0 0 0 0
0 0 0 0 0 0 0
0 0 0 0 0
decisi
0 0 0 0 0 0 0
0 0 0 0 0 0 0
0 0 0 0 0 0 0
0 0 0 0 0 0 0
0 0 0 0 0 0 0
0 0 0 0 0
ons
4 2 831
4 2 832
4 2 833
4 2 834
4 2 835
4 2 836
4 2 837
4 3 831
4 3 832 4 3 833
4 3 834
4 3 835 4 3 836
4 3 837
4 4 831 4 4 832
4 4 833 4 4 834 4 4 835
4 4 836
4 4 837
4 1 841
4 1 842 4 1 843
4 1 844 4 1 845
4 1 846
4 1 847
4 2 841
4 2 842
4 2 843
4 2 844
4 2 845
4 2 846
4 2 847
4 3 841
4 3 842
4 3 843
4 3 844
4 3 845

264
12000
0
(n
-1 48
5000
0 9000
0 500000
0 -1
46 5000
0 9000 7000
500000
0 -1
46 8000
0 9000
5000
560000
0 -1 1
48
7000
0 9000
5000
200000
0
-1
50
15000
0 9000
0 150000
0
17000
0 300000
0
) NONGISMO/IG
0 0 0 0 0
250000
0
0 0 0 0 0
250000
0
0 0 0 0 0
295000
0
0 0 0 0 0
100000
0
0 0 0 0 0
75000
0
10 0 0
3750
3750 22587
5000
10 .23 0
3750 3750
44386 36850
10 0 0
2500
2500
0 0
10 0 0
2500
2500
16395
0
10 -1.0
0 0
GroL
0 0 0 0 0 0 0
0 0 0 0 0 0 0
0 0 0 0 0 0 0
0 0 0 0 0 0 0
0 0
0 1000
2000
2000
0 0
0 0 0 0
0 0
ip 2
0 0 0 0 0 0
5000
0 0 0 0 0 0
5000
0 0 0 0 0 0
2500
0 0 0 0 0 0 0
0 0 0 0 0 0 0
0 0
decisions
0 0 0 0 0 0 0
0 0 0 0 0 0 0
0 0 0 0 0 0 0
0 0 0 0 0 0 0
0 0 0 0 0 0 0
4 3 846
54 3 847
4 2 831
4 2 832
4 2 833
4 2 834
4 2 835 4 2 836 4 2 837
4 3 831 4 3 832
4 3 833 4 3 834
4 3 835 4 3 836
4 3 837
4 4 831 4 4 832 4 4 833
4 4 834
4 4 835
4 4 836 4 4 837
4 1 841
4 1 842
4 1 843
4 1 844
4 1 845
4 1 846
4 1 847
4 2 841
4 2 842
4 2 843
4 2 844
4 2 845
4 2 846
4 2 847

265
-1 52
20000
0 9000
0 200000
0
(o
-1 48
10000
0 5000 5000
240000
0 -1
0 0 0 0 0
100000
0
10 0 0
2000
2000
63615
0
0 0
2000
0 0 0 0
0 0 0 0 0 0 0
) NONGISMO/IG Group 3
0 0 0 0 0
115000
0
52.50 0 10000
0 6250 6250
289500
100000 -1
55 10000
0 5000
5417
410909
50000
-1
52
30000
0 6250
6250 289500
0 -1
52 40000
0 8300
0 0 0 0
14500
100000
0 0 0 0 0
175000
100000
0 0 0 0 0
86500
0
0 0 0 0
10 1.0 0
1850
5500 45174
172902
11 0 0
2250
6900
0 0
11 0 0
2250
6900
115000
0
11 0 0
2250
6900
0 0
11 0 0
3000
0 0
7500
1000
0 0 0
0 0
10000
1000 0 0 0
0 0
10000
1000
150000
0 0
0 0
10000
2000
200000
0 0
0 0
12000
2000
0 0 0 0 0 0 0
0 0 0 0 0 0
500000
0 0 0 0 0 0
2500
0 0 0 0 0 0 0
0 0 0 0
0 0 0 0 0 0 0
decisi
0 0 0 0 0 0 0
0 0 0 0 0 0 0
0 0 0 0 0 0 0
0 0 0 0 0 0 0
0 0 0 0
4 3 841
4 3 842
4 3 843
4 3 844 4 3 845
4 3 846
4 3 847
ons
4 2 831
4 2 832
4 2 833
4 2 834 4 2 835
4 2 836 4 2 837
4 3 831
4 3 832
4 3 833 4 3 834
4 3 835
4 3 836 4 3 837
4 4 831
4 4 832 4 4 833 4 4 834
4 4 835
4 4 836 4 4 837
4 1 841
4 1 842
4 1 843
4 1 844
4 1 845
4 1 846
24 1 847
4 2 841
4 2 842 4 2 843
4 2 844
266
8300 441109
0 •1
52 47500
0 10000
10000
460000
0
0 210000
0
0 0 0 0 0
220000
0
9200
125000
0
12 0 0
3600
11100
110000
0
0 0 0
0 0
14500
2000
100000
0 0
<p) NONGISMO/IG Group
-1 50
6000
0 6000
3000
73416
0 -1
52 6000
0 8000
5600
110651
200000 -1
52 10000
0 8000 8000
130264
215000
-1
53
10000
0 5000
5417
171300
0
0 0 0 0 0
48729
0
0 0 0 0 0
72590 230000
0 0 0 0 0
86630
215000
0 0 0 0 0
113400
0
10 1.0 0
811 3573
0 0
11 0 0
1583
6937
50000
0
12 .25 0
1800 8442
150000
200000
12 0 0
1989
6862
150000
0
2 0
2000
0 0 0 0
0 0
3000
0 0
10000
0
0 0
3000
0 0 0 0
0 0
4000
0 0 0 0
0 0 0
0 0 0 0 0 0 0
4
0 0 0 0 0 0 0
0 0 0 0 0 0 0
0 0 0 0 0 0 0
0 0 0 0 0 0 0
0 0 0
0 0 0 0 0 0 0
decisions
0 0 0 0 0 0 0
0 0 0 0 0 0 0
0 0 0 0 0 0 0
0 0 0 0 0 0 0
4 2 845
4 2 846
54 2 847
4 3 841
4 3 842
4 3 843
4 3 844
14 3 845
4 3 846 54 3 847
4 2 831 4 2 832
4 2 833 4 2 834
4 2 835
4 2 836 4 2 837
4 3 831
4 3 832
4 3 833
4 3 834
4 3 835
4 3 836 4 3 837
4 4 831
4 4 832 4 4 833
4 4 834
4 4 835 4 4 836
4 4 837
4 1 841
4 1 842
4 1 843
4 1 844
4 1 845
4 1 846
4 1 847

267
-1 53
11000
0
9500
9500
154586
0 -1
54
25000
0
9500
4750
115901
0
0
0
0
0
0
1010%
0
0
0
0
0
0 75786
0
12
0
0
2147
10627
0
0
12
.75 0
1932
8606
100000
0
0
0
4000
0
0
0
0
0
-500
4000
0
0 0 0
0 0 0 0 0 0 0
0 0 0 0 0 0 0
0 0 0 0 0 0 0
0 0 0 0 0 0 0
4 2 841
4 2 842
4 2 843
4 2 844
4 2 845
4 2 846
4 2 847
4 3 841
4 3 842
4 3 843 4 3 844
4 3 845
4 3 846 4 3 847

CO
<a a
a -H U OJ 01 O J I O J U
a.
APPENDIX M
DATA USED IN ANALYSES
a ro iXi <c r i r ) ^ ro - I u") CJ ro rJ n ^ ro f i T rJ *r ^ ro r-j ci
cs ro i3C i3 T - i . r H . H ^ ^ ^ T H ^ ^ ^ ^ ^ ^ r < ) ^ ^ ^ f ^ ^ ^
c ro <! <i: cJ <r r-j ro CJ <T C n r i -r ^ C4 - • ro ci a ^ ro »-< -^
c ; r o < i 3 T H r o r j f H < r T - i , - i r O ' - ' r j < r - r H ^ r o » - < > o ^ r O ' - i - . - i
c! Ci ~i Ci Ci -o UT »-• --r -r-i ^ T-( ^ CJ C4 ro TH ro ^ <r T-t i-H ^
o r i H-i TH T-t o ^ ^ r i .-« ^ TH T-i CJ T-i -r-t TH r-4 1-1 rJ TH i-« ^
a r-j X r-j ,-• LT ,-1 -r-t r-4 r-i T-« .-• ,-( r J i-H r-i ^ ro ,-• i-H T-i TH ^
o CJ o »-< •r-i »o ui t-» TH iH ^ TH T-i •--I 1-1 T-i ,-( r-i T-i i-« CJ T-* 1-1
CJ CJ LJ_ I H * H r.1 I H 1-1 1-1 1-1 1-1 1-1 ^ r-i x^ I H ^ r-j ,-H TH r 4 '-^ 1-1
c j c j u j i - i < r O i - t i r H , H T - t ^ i - i , - < i - i T - i « T < r r j ^ T - i T - 4 ' r H ^
C5 CJ iZi ro ro rv <r »-• ^ Ci 1-1 *-• 1-1 ro 04 ro Ci r ci ro ci ^ cj
Ci Ci CJ '-I iH i \ ro ^ Ci ••-< iH iH T-« Ci 1-4 CJ 11 Ci -rH Ci 1-1 iH 1-1
o c i i X i T - t T - i r v - T T - i r o r o i - i i - i — ( i - i N O ' - " i - » c i c i - ^ r o » - < T - i
Ci Ci <r ro «r IV iH 1-1 Ci '-I 1-1 '-I T-i Ci CJ ro 1-1 T CJ ro TH .1 ,-(
o ^ iTj Ci ro o LiT ^ o m CJ «r Ci MD o UT ro CJ ro o o o CO o Ci iH 1-1 -q- Ci Ci r«T o ro TH , - I CJ
O - H C i - . , H . . . ^ ^ ^ ^ ^ i - , , H ^ C i ^ ^ ^ . ^ C i - < - H - « i H
O ' - ' u c i r o o o D o o o o o o o o o o o o o o r o o o
C3 *-< CJ Ti iH CM '-t Ci Ci Ci Ci Ci Ci Ci Ci Ci Ci Ci Ci Ci Ci T-\ Ci Ci
C ' - ' i X i C i O O O C i O i i O O O O T O O O O b T O O O O
CJ *-• i l . 1-i CJ Ci Ci TM Ci T^ Ci Ci Ci Oi »-< Ci Ci Ci Ci iH Ci Ci Ci Ci
0 < I C i o o c i o o o o o o o o o o o o o o o o o
cs <i: 1-t c-i CI -^ c\ Ci Ci Ci Ci ci ci ci cj CJ ci c i ci ci ci ci cj
^ i z ^ - c j s r u i - a H - c j c j u z t - z u z ^ - u z _ J t - i l : : : C J ^ - ' C . l - i ^ U : i : C J C . l U i - < x : » - ' 0 > - ' j < : : O u J
2i<x~iOLe: i i . L i _ : c < r u - < r x : < i : z : < i < r < E u . 2 : L i _ i i u . 2 : ^ i o
< i<E<c«x<x<r<r<i<r 'T<r<i<3:<i :< i<r<r<i<i : C n i X i i X i i X i i X i i Z i A i X i P C i O C i ^ i X i i X i A i X i | X i i X i A i X t | X t
•»J| i T i U i c D C c r u t u j i X i i X i O ^ i X i t Z i i X i C C i i X i a j c c i A i X i i X i i X i a j i Z i i X i i r i c r i i X i C Qi U r > l = l U J C D , - l i H i - < i - | i 1 , H i - < T H T H _ t < r i H . r - l i H ^ , - l T - . ^ i - l ^
> - L L 1 « I U C : r o r o r o r o r o r o n r o r o r o r o r o r o r o r o r o r o r o r o r o
c n u j x i : u . x r i : 2 : 3 : L L . u - u . L i _ u _ j : n : u . x : i j _ 2 : i : u _ u .
CI »-i ro Ci Ci T-t CJ Ci ro Ci UT Ci »-• -^ ro ro .-• ro T-i ^ <r CD UJ Ci Ci Ci CJ Ci Ci Ci Ci Ci Ci Ci Ci Ci Ci Ci Ci Ci C\ Ci Ci
»-t CJ 1-1 TH T-i 1-t 1-1 Ci Ci Ci Ci ro ro r"! ro -T <r <r <r UT u i ii"2 UT
o o Q c n T - ( C i r o < r L - ! - o r ^ G O O o ^ r j r o < T ! j T > o r v C D O O ^ ^ ^ ^ T - ( i - l - , - ( i - » i H T H C i
268

269
3 : <r 2 : <r CD UJ i i :
I - o h- <r « j
O O f - i O O O O O O O O O O O O O O O O O
U") UT O O O UT O O b1 UT U* O O UT O LiT O O O U") r\ Ci o UT o Ci uT o r^ r^ d o UT c i o r^ o o UT r^ ro ^ o CJ o »-« Ci o ro CO iH ij-! Ci o uT ro o u") rv ro
C4 o uT u i o>. rv uT T-i o b i oc ro o ro o -o o c^ CD r^ Ci <T <r a ^ o T m <T a a m a T ci m a <r ci ro
H - O i - C J O ^ I u i X
J— O H- 3 i; :: UI X
bT UT O O O UT O O U'J bT b") O O U"l O U"5 O O O b l
r s Ci o UI o Ci uT o r-. r ci o un cJ o r o o bi rx
ro o o CJ o '-• CJ o ro 00 T-H bi c^ -o bT ro o m r . ro
Ci ro ro ro uT ro <r Ci " ro ro ci <r ci r^ Ci ui ci Ci
o pN. ci Ci «T ro C M (N. rs T-4 b'l o 00 Ch CD CN <r i" -c u") Ci ro <r Ci «r <i <T - <r CJ CJ UI TH ro ,-I - r cj <J" CJ ro
u X CJ o 2: <c u
2; O J— UJ X a.
UJ X CJ O 2: 3 ':<::
2: CD I- UJ x: u_
2: 3 2: 2: CD K- z:
CD UJ Li_ »—
CJ ro X <r
Ci r i X 3
C3 ro CD •'X
czj ro CD 3
C3 ro u. <i
C5 ro U. 3
CJ ro UJ <r
cr ro UJ 3
CZJ ro iZ( ^i
cr ro i:zi 3
C3 ro u <r
C5 ro u 3
O |3J CO
375
1 - t
<i
1 - 1
000
1 - t
• 0
• 375
Ci
0
1 - t
,250
1 - 1
<r
500
i H
0^
\n
500
T - l
Ci
• 250
Ci
0
CJ
• 000
»H
<r
625
1 - 1
0
1 - 1
375
ro
<r
m
1 - 1
ro
t-i
Ci
,000
1 - t
<r
\n c-i >o
1 - 1
ro
i H
625
T - l
<r
,000
Ci
0
1-1 ,000
CJ
^
375
i H
0
T - t
000
T - t
<r
uo CJ
C i
0
1 - t
• 250
C i
«r
375
T - l
r
1 - 1
750
T - l
•<r
,500
CJ
00
1 - 1
,000
1 - 1
^
0
Ci
T - l
0
Ci
000
T H
^
,125
Ci
<r
1-1
• 500
CJ
<r
500
1 - 1
b-J
CJ
00
0*
T H
«r
• 750
CJ
ro
r-i
• 625
T
<r
00
0
i H
CN
1 - 1
,000
i H
*r
• 375
CJ
b l
1-1
.125
ro
0
,375
1 - t
0
T - l
• 375
1 - 1
<r
U"! r^ ro
T - l
1 -1
^
.000
1 - 1
<r
<j ro CO o ro T-l b") r^ LO CN rv CO o ui >o 00 CJ ro T-t ro Ci 1-t »-t 1-4 uo Ci Ci ro CN ro IH ^ T- 1-1 cJ
PN bO o^ u") ro 'O >o CO uo T-t ro o 00 o o <r ui ci uo
ro Ci ro Ci n ci ro CJ CJ T-H ro I H
T-< C ! T-l bO T-* CJ ro TH CJ lH T-l T-l
T-l ^ T-H r o 1-1 CJ
1-1 > 0 T-t < r T-l T-l
CJ
iH ro Ci Ci CJ ro 1-1 1-1 1-1 ro iH ro 1-1 CJ CJ ' - I T-I ro c i TH
T H T - i c i ' - ' b o » - « r o r o T H r o i - t i - i i H r O T H O i - i < r c i ' - i
TM 1-t Ci ro Ci uo ro TH ,-1 -"T «r ro Ci Ci 1-t <r 1-t ro c i -<
1-t 1-t Ci »-• b i T-l ro T-t T-l <r T T-l TH •T T-l fv. T-( <r Ci i-i
Ci ro T-t Ci Ci '- ' T-l ro T-l ro 1-t Ci TH ro c i c i ^-i cJ I H CJ
^ T - t l - t T - l u ' ) T - t T - t r O l - l < r i - l T - l l - l * T T H U ' ) T - l C i T - l l - l
iH CJ ro <T UT <J iV 00 CN O T-l CJ ro <r L.T <I i\ CO CN o _, ^ T-l 1-1 TH TH T-l T-l 1-1 1-1 Ci
270
c r o u 3 T i r o i - i ^ i - i . T r H ^ T - t ; , - ) i - i ^ T H r x ^ ^ r r ^ b o ^ c j
cs ro II I <E "«r ro ro cJ ro <r «T ^ ro ^ <T CJ -q- ""T ro CJ b") ro CJ CJ
C 3 r O a j 3 T - l C J l - l l H , - | T H l - t T H T - t T - t < r i - < T H T H l - | T - | , - | T - t , - | , - l
C5 ro < ! •«i CJ Ci 1-1 cJ CJ <r Ci ro ro T-< r-i Ci <r ro TH Ci T cJ c i '-•
C3 r o <n 3 T-t CJ ^ T-l ^ ^ T H T H T-l T-l T-l C i T-t T-. ^ T-l C i UT ^ CJ
C23 CJ ~3 T-t CJ b i • ^ i H r o < i r o 1-t T-l 1-t 1-1 f x C i vo i i 1-t < r 1-1 uo
C 5 C J » - « 1 - | l - l T H T H l - t T l - ^ l 1 l - | l - l , H T - t , - t l - l C J ' - < T H l - l l - l C J
C J c j x T - i i H , - t i - t T - i i - i r O ' - < i - t i - i r o T - t < r i j o r o T - i T - i C j T - i r o
C5 Ci CD 1-1 TH iH T-l T-t 1-t T-l ro T-t 1-1 1-1 1-1 bn Ci Ci T-t -rH Ci 1-1 ro
C 3 C i U _ i _ 4 l - t T H l - l T H l - l T H l - l , - | T - l l - | T - i y - ) T - l C j T - l T - t l - l , - l T - l
C3 Ci UJ iH T-l ro T-l iH 1-t ij-j ro T-l Ci TH 1-t uo Ci -c Ci TH c-i TH ro
Ci Ci l a 1-1 T-t • r T-« 1-1 cJ NO '-I 1-1 i-i iH T-l vQ «r u~! Ci T-t <r T-l u")
c s c i u T H i - i ^ i H T - t T - t r o T - t T - i T - t , - i i - i < r c i r o T - i i - i r O i - i T - i
C5 Ci iXt 1-1 Ci ro T-l T-l T-l lsl T-* ^ '-t ro T-H b l UT bO Ci iH bO 1-1 Ci
C 2 c i < i T - i i - i c i T - « ' - « T - i r O T H , - i T - i ^ i - i - « r r o b O ' - ' i - t < r T - t r o
n o o ^ bO ^ o <r bO ^ o o CN <i o ro CJ <r uT uo a -^ a Ci TH ro ro Ci 1-1 CJ c i T-* T-I ro \n a o T-I c i ro ^
C J - t i Z i T H , _ ^ ^ T - i , - i ^ i - i , - i , - i i i c i - H T - i i - i C 4 - ^ - i ' - < ^ ' - i
C S T - I C J C J o o o o o o r - i o o o r o o o o o o o ' O O ' O
C2 TH CJ *-• CJ CJ CJ CJ CJ CJ 1-1 Ci Ci Ci .-I Ci Ci CJ CJ CJ Ci T-< Ci T-l
csT-tiXiC^J o o o o o o o o o ' - ' o o o o c j ^ r o o o o
C5 T-« III T-« Ci CJ CJ CJ CJ Ci c-i Ci a TH CJ CJ CJ CJ TH 1-t CJ CJ CJ CJ
C 3 < i c j o o o o o o o o o o o o o o o o o o o o
C5 <r '-f CJ CJ Ci CJ CJ CJ CJ Ci CJ Ci Ci CJ Ci CJ CJ CJ Ci CJ Ci Ci
c j i - z c J z i i r c j i r u c J z u i r H - c j z u c j z H -2 : < i : " ^ o c c : c j i i i » - t C J » - i t - " c j » - ' c j c j i - i c j i - i ^ c _ j » - i ( _ j c j i - i C D
< i : 3 : u . < i u . u . < r u . < r < i u . < i : u - : c < r i j _ < r < r u . 5 i <r<i<r<c-a<r<i<i<r-^<x<c<!:<r<r<r<x<i<r<r
uJCDCt iuJUJ o j i ^ i X i i X i A i X i C C i i X i a j t ^ i X i i X i i Z i i X i a j i i ^ i X i i X i i X i i X i i X i k X i c ^ M i ^ i X i i X t a j A i X i t X i c r i A a j i X i i X i i X i c C i i X i i X i i X i
> - u J < r L c : r o r o r o r o r o r o r o r o r o r o r o r o r o r o r o r o r o r o r o r o
c n u j x i : . - C 2 : z : i : 2 : c : c c u _ 3 : L i _ u . u . i i u . : c u . x : 2 :
TH cJ ro T-l ro »-• CJ «-• ro CJ 1-1 CJ 1-1 ro 1-1 <r c j CJ CJ CJ «2: CD UJ CJ CJ CJ CJ CJ CJ CJ CJ CJ CJ CJ Ci CJ OJ CJ Ci C4 Ci OJ CJ
>-* d T-i > c - < i M 3 r N r N r ^ r \ c o o o o o c o c N c h C N O ^ o o o O ' - '
iH OJ ro <r u i ^ r^ CO c^ o T-t CJ ro ^ UT o r^ CD CN o o iZi cn CJ CJ OJ cJ CJ CJ CJ OJ CJ ro ro ro ro ro ro ro ro ro ro <r

271
•^ <Z "Z <L (3 Ui cn
I - o t - •a: _J
o o o o o o o o o o o o o o o o o o o o
UO bO to O b"J O O O O UT O O O O O UI O U"5 O bO CJ fv cJ o r^ uo \n m o CJ uo UT o o o r^ o r uo CJ >o ro vo bO 00 r^ cJ fv o T-l Ci cJ o bo b"J ro o 00 fv '-•
ro r^ ro T-l OJ ro o Ci ro uo T-l ro c^ rv. c 4 ro ro o ro ro ro uo b") ro b") <r ro ro o CO «r CJ ro ci OJ *T O m *T
»— O H - U C D ^ Z u i X
2: CD »— UJ ii: u_
2: o 2: 2: CD - 2:
CD Ui UL K-
C2 ro X <r
a ro X 3
CS ro CD <r
C3 ro CD 3
c:; ro u . «i
Ci ro u . 3
C5 ro UI <i
CJ ro UI 3
CJ ro iZi <r
cs ro 1=1 3
C3 ro CJ <i
o 1X1 cn
bO UO UT O bT O O O O b"i O O O O O b") O liO O U") OJ fv CJ O rv bO bO UO O Ci LO L"i O O O r^ O IV LO Ci >o ro NO bo 00 IV Ci r^ o - Ci OJ o uo bO ro o 00 rv 1-t
• r"
5:
u
z:
UJ
<L
X
3
X
u
u.
•:t^
ro
0 ro
uo CJ o CJ
0
T-l
0 0 0
<r
ro bO
bO r-H
ro OJ
OJ
1-4
0 0 0
ro
0 bO
0 0 0
OJ
OJ
CJ
uo OJ •0
Ci
CN
ro
0 0 bO
1-t
0
1-1
0 0 0
Oi
r J
ro
bO rs 00
T-t
0
1-t
0 0 0
bO
CO <3-
bO c-i 0
ro
ro
1-1
uo CJ 1-t
ro
IV ro
0 uO Ci
OJ
«r
ro 0 0 0
ro
0-Ci
0 bO r CJ
0
1-1
0 0 0
ro
0 ro
0 0 0
Oi
0
1-1
0 0 0
*T
1-1
-0
m r CO
1-1
T-l
T-l
0 uo Oi
«r
r IV
bO CJ 1-t
Ci
«r
1-1
bO Ci i H
ro
0 ^
uo OJ <1
1-1
0
1-1
bO CJ 0
bO
<T Oi
0 0 0
^
0
T
0 0 0
0
T-t
ro T-l
0 0 0
ro
rv
OJ
0 0 uo
ro
c 1—1
0 bO OJ
OJ
CN
ro 0 UT CI
CJ
T-l
Ci
uo r ro T H
ro
1-1
0 0 0
uo
OD ro
bO Oi 0
Ci
0
1-t
bO r ro
< •
Oi ~o
in CJ 0
T-t
00
OJ
0 uo Ci
CJ
1-1
bO
\n rj >o 1-t
0
1-t
bO CJ T-t
ro
0 <r
0 0 L"3
1 — t
00
CJ
bO CJ •0
1-1 CJ 1-1
<r - <r
00 ro ro T-t ro ro
^ > 00 C J T-i
a T-t
rv ro
CJ Ci
r^ CO
Ci CJ
CN <r ro b'j
*r <r
ro Oi C J 1-t
r o 1-t 1-1
<r <r <r
CN bO CN c^
CJ r-'i
<T CN
bo rv 1-1 CJ
^ CN
00 CO ro TH
o o r ^ c o c o b o c o c o c o r o u o r ^ ^ i v o ^ r T - i ^ D c o o J r v c D
, H i - t O J T - l , - l < r ^ T H , H i - ^ - ^ T - l T ^ i - ( T - , T - l T H T - l , r H T W
T - | T - t C J T - t T - | T - l T - t T - l T H l - l l - | T - H _ l l - l T - | l - l l - t l - l l - l , - l
T ro cJ T-" T-* '-t Ci ro cJ •-< ^ CJ «T "3- ro i-t c j cJ oj cJ
T H CJ 1-1 T-« T H 1-1 T-l T-t T-t CJ «T c J 1-1 r o CJ T-l CJ CJ 1-1 1-1
T H OJ 1-t t-t T H •<r 1-1 r o 1-1 T-t 1-1 T-t ij-j CJ T-t i H T H 1-t 1-1 1-1
^ C - J T - t T - l i - ^ 1 - I ^ ^ T - | T H ^ ^ T - . O J T H ^ C J - t T - l ^
*r OJ 1-1 T-l Oi ^ Ci ro c i c i T T-I bO T-I ro TH CJ —• CJ ^
^ ^ ^ T - t T - | T - l i - | T - 4 i - l C i - r r ' - l i - t ^ ' r H i - I C i > O C i T - t
«r ro ro Ci ro <r ro <r ro r*") 1-t CJ <r bo ro OJ ro CJ CJ CJ
T H r o b O T H i - i < r i H T - i T - i u o T H < T i - i r v c j T - i > o b O T - i ' T
T-l ro ro CJ Ci <r ro T-I ,H cj 1-1 CJ uo *?" ro -^ ro -t 1-1 c i
1-1 CJ ro <r LO >o rv CD o o 1-1 Ci ro <r uo o iv 03 CN o CJ OJ OJ CJ CJ CJ CJ CJ CJ ro ro ro ro ro ro ro ro ro ro *T
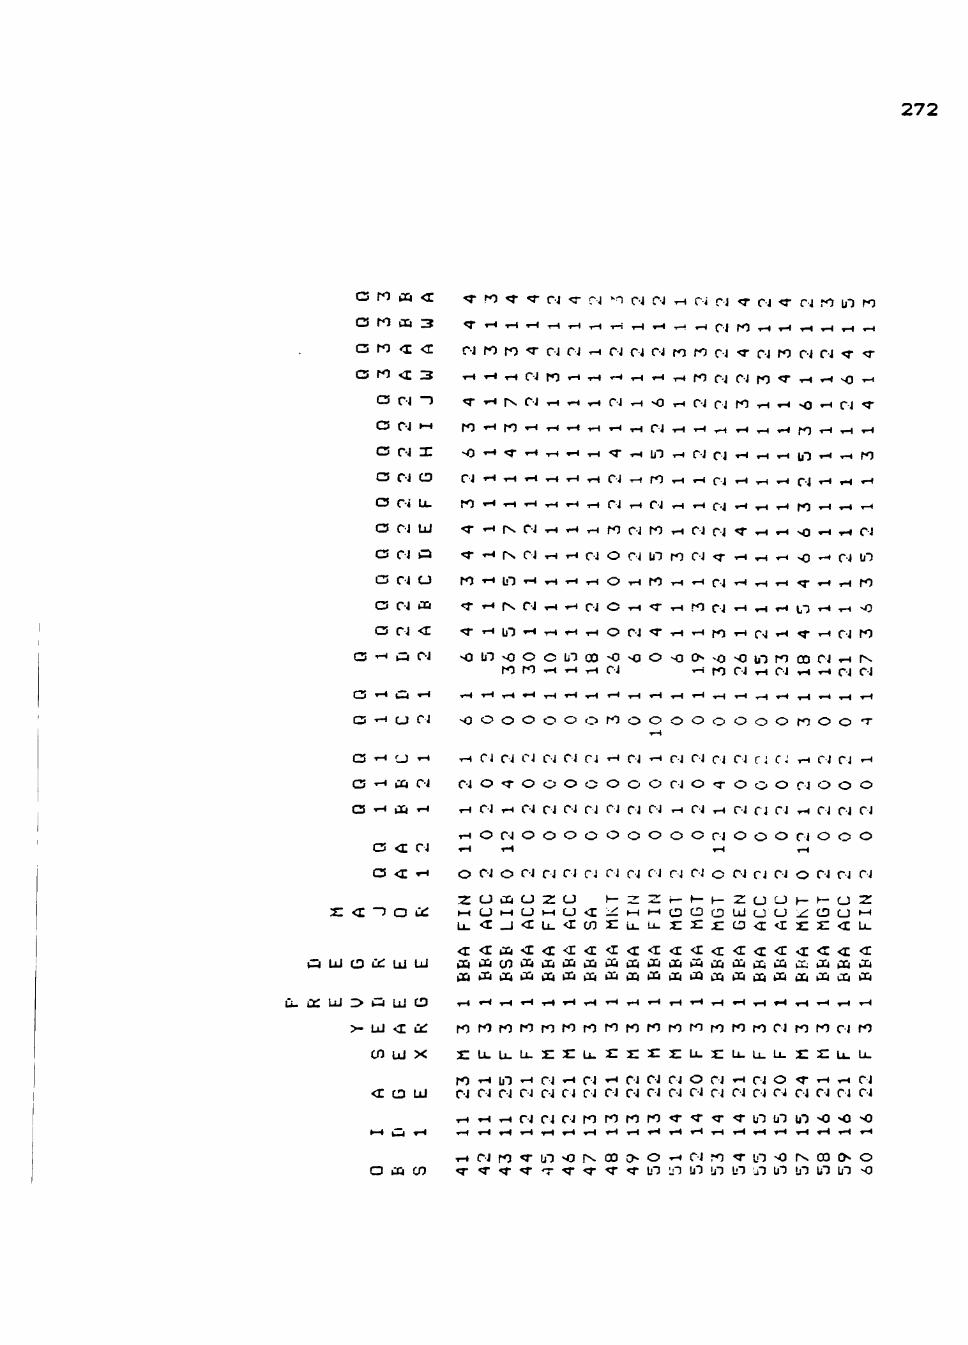
272
C5 ro i3Cj <r - r ro «r OJ <5- CJ ^0 o j OJ OJ CJ <T a -o- c j ro bO ro
C 5 r O | I l 3 < T T - " T H l - l T - t T H T - | T H l - | l - t T - . , - l C J r O l - l l - t T H T W l - l l - l
a to <L <r. OJ ro ro T OJ OJ TH CJ CJ OJ ro ro CJ -T OJ ro OJ OJ T -q-
C j r o < c 3 T H i - « T - i C J r o » - i T - i T - t i H i - i T - t r o o i C i r o < r r H i - i v O i - t
C3 OJ ~) <r TH rv Oi i-< Ti Oi o 1-1 Oi Ci ro TH TH 3 iH ci
a c j « r o T - i r o ^ T - i ^ i H T . i T H O i ^ T - . ^ ^ ^ ^ f O T - . T H ^
C5 OJ X O T-l 1 T-t T-l 1-1 1-1 <T TH bO 1-t Ci CJ TH TH 1-1 UO »-• T-l ro
C3 CJ O CJ t-l T-l iH iH OJ ro ,-H rH CJ TH CJ T-l TH
CJ OJ u_ ro TH 1^ TW TM 1-1 ,-, CJ 1-1 CJ iM 1-1 CJ T^ 1-1 1-1 ro t-l T-l 1-t
C5 OJ u •«r T-t r\ OJ TM TH iH ro OJ ro TH OJ CJ ^ -^ vO ^ TH CJ
C5 CJ Q «r T-l pN CJ T-t T-l OJ o cJ bO ro cJ <r TH T-l 1-t «o T-l OJ bO
C5 0 J U r o T i b " ) T - t i H ^ T H O i - i r o T H ^ c j T H , H i - i > « r ' - " T H r o
a OJ ixi <T »-• IV CJ 1-t 1-1 CJ o 1-1 <r T-t ro CJ T-l TH T-< LO T-t 1-t vo
C3 CJ <x «r TH bO T-l T-l 1-1 iH o OJ <r 1-t T-l ro 1-t Cvi TH <r t-t cJ ro
CZS' - ' i - iOJ M 3 b 0 O O O U 0 C D < I ^ O s 3 C N - 0 ' > 0 U 0 r 0 0 0 C J i - i r v
ro ro ,-< ^ 1-H CJ T-H ro CJ iH CJ TH T-l c j OJ
C 3 T - I C 4 T - I T - I T H I - , , - 1 T - I T H ^ T ^ I - 1 ^ T M ^ T H T ^ ^ T - I ^ ^ T H I - I
C i T - t ( j c j o o o o o o o r o o o o o o o o o r o o o T
1-1
C3 1-1 CJ T-l T-l CJ CJ CJ Oi Ci Ci T-t Ci T-t Ci CJ Ci Ci rj C 1-1 Ci Ci T-i
a -^ cu Ci OJ O <T O O O O O O O CJ O O O O CJ o o o CJ t-f »xj t-l ^ Ci 1-1 OJ CJ CJ CJ CJ CJ OJ 1-1 CJ 1-1 OJ CJ CJ TH CJ OJ CJ
TH O CJ O O O O O O O O O CJ O O O CJ o o o
C3 <r CJ 1-1 1-t 1-1 T-l
C3 <E T-l O Ci O OJ CJ CJ CJ OJ CJ f J CJ Oi O OJ CJ CJ O CJ OJ CJ
z o i x i o z i u i - 2 : 2 : r - H - ( - 2 : u c J h - t - a 2 : :sz <L ~i CD ij^ i - i O i - t c j » - i c j < r : : ^ t - i ' - » c D C D c D U J u c j : z : c D c j » - i
L i . < r _ j < r u - < r c n 5 : u . u - x : 2 : £ : c 3 < x < r 2 : 2 : < r u _ < x < r t X i - ^ < r < i < x < i < r < i < r < r < r < r < i < E « a : < r < r < i
i=iUJcDiJc:uJUJ iXiAcniXiaj iXiaj iXi iXi iXiaja i iXj iXiai j iXia^tZi iXi iXi iXiiXiiXiiXiAiXiiXiiXiajiXiajaaiXiiXiAiXiiXiiXiiXiiXi
0 C : U J I > I = I U J C D , _ < 1 - l i - | T - l T - | l H , - l T - l T - l . - l , - | l - l T - | T H l H l - l r - | - H , - | T H
> - u j < r u t : r o r o r o r o r o r o r o r o r o r o r o r o r o r o r o c J r o r o c j r o
c n u j x i : u . u . L L . i : : c u . i : i : : c x : u . j : u . u . L i . j : 2 : u . L i -
ro T-t bO t-l CJ T-« CJ T-< Ci CJ CJ o CJ TH CJ o <r T-l TH CJ <r CD u OJ CJ OJ CJ OJ cJ CJ CJ CJ CJ OJ OJ CJ OJ CJ CJ CJ CJ CJ OJ
1-1 iH ^ CJ CJ CJ ro ro ro ro «r <r rr <r bO bO uo >o o
T-4 OJ ro <r bO <» r 00 > o 1-1 c J ro <r bo o r CD c^ o o uo CO «r <r ^ T - r <r <r LO Lio bO bo bO JO bO uo uo bo o

273
31 < i 2 : -a: CD u Lc:
(— 0 » — C J O Z l L d X
I— O I— 3 J^ UJ X
u X CJ Ci 3: <E u
i : a »- UJ X u-
UJ X CJ O i : 3 .:^
2 : CD h- UI :t: LU
2 : o 2 : 2 : o h- :c
CD UJ U_ H-
C3 ro X <c
cs ro X 3
£2 ro CD <r
G5 ro CD 3
C3 ro u . <i
cs ro u . 3
cs ro UJ «x
(3 r"") LJ 3
cs ro t i i t i
C3 ro iZi 3
Ci ro CJ <r
cs ro o 3
o iXi cn
T H O O O O O O O O ^ O O O O O O I - I O O O
O O LO bO O uo O uo O bO O O uo bO O 1:0 bO UO bO O o UO CJ Ci o OJ bo fv bO Ci bO o Ci r^ o Ci i v r« Oi o o Ci o T-l o <i rv ro Ci T-t Ci o o ro bO T-l 00 ro vc o
o o r o < r c D c N r o t o < i r o O ' < T T - i c o r o c i U O o o < r — i C N <r OJ rv uo ro ro ro '«r CJ ro c i uo - o uo <r uo •'r ro <i ^
O O bO bO O uo O uo O bO O O LO UO O UO uO UO uO o O UO Ci Ci O Ci LO !V L-j Ci UO O Ci fv O CJ rx rs c^ o o CJ o T-l o MD r, ro cj '-• CJ o - D ro bo T-I co r*") VQ o
«r ro «T UO tr ro Ci ro CJ ro CJ UO OJ «r ro UO CJ ro «O «5-
«r o o ro LO o ro ro 1-1 r^ Ci o >o CN CN o M3 TH oo UO <r c-j rs UO ro ro ro a a oj -o <T ro uo «r ro to -
O O bO UO O UO o UO O O O O bO UO bO bO UO UO O O o UO r^ CJ LO Ci LO rv bo uo uo o iv r^ rv CJ r-> r^ UO O o Ci CO T-t rv ~o r-, ro CJ r^ Oi uo ro ro ro o co CD ci o
Oi cJ CJ ro 1-1 OJ 1-t OJ T-l T-4 T-l CJ iH cJ T-l cJ iH 1-1 ro ro
rx o rv <r o o CJ - ro IV CJ o CJ UO T-t o <r o ro •>
r O T - ^ T - r l i H T - l T - l - ^ i - t r O i H i - I O J T H r H T - t ^ r T - l i - H C J
0 0 0 0 0 0 0 0 0 UO 0 0 0 0 bO 0 0 0 b O O O O b O O b O O O O O r ^ O O b O O C J O O O r x O
o o fv o CJ o o o o ro o UO CJ o T-t bo o UO ro o
CJ t-l iH OJ CJ ' ^ TH T-t T-i T-t 1-1 CJ iH CJ CJ OJ 1-1 1-f ro t-l
o o < J " « r ^ « T ' ^ < T < J ' ^ r o < r < r < r ' ^ < r < T - o < T < r r ^
o 00 OJ ro ro CO 1-1 CN CN ro o CJ OJ o 00 o cJ bO «r o 1-1 <r ro 1-t T-l CJ CJ TH CJ <r CJ TH CJ CJ T-I CJ ro
CJ CN c^ ro OJ CO ro 00 CJ rv <r UO CN ^ UO r^ o CO 00 •<i
ro OJ ^ ro CJ <T cJ ro .-t OJ i-t <r TH CJ 1-1 ro cJ CJ UO ro
ro T-l cJ CJ ro T-t T-l 1-1 1-t CJ t-l ^ 1-1 CJ CJ <r T-I CJ UO ^
T-l tH 1-1 1-t CJ T-l CJ CJ TH TH TH T-t iH iH CJ TH T-l T-l iH TH
T - 4 i H , - i O J r o T H i _ i i - i T - i t - i i H i - t T H t - i r o t - i i - t T - i < r t - t
1-t ro CJ <r OJ t-l CJ C J T-I C J I H T-I i-t C J TH <r
1-1 1-1 bO CJ ro TH 1-1 TH T-l TH 1-1 cJ 1-1 CJ cJ * r
CJ cJ <T <r iH <r cJ ro 1-1 CJ 1-1 <r iH ro T-l <r
rOTHCjroT-iT-iTHT-iT-irOt-i<rr-iro«r^
04 ro <r ^ CJ <T CJ ro T-l CJ TH «r CJ CJ TH 1-1
c j i - t i - t r o r o t - ' T - t T H T - i i - t i - i < r i H C J t - i T - t
TH OJ ro <r bO o ^- 00 CN o 1-1 Ci ro <r uO o •«r <3" T -^ <r «r T •T •«r bO UO jo L.0 UO UO UO
Oi
i H
ro
1-1
Oi
1-1
IV bO
CJ
T H
Oi
Ci
CJ
ro
00 UO
CJ
ro
<i
0
OJ
1-1
0^ LO
«T
T H
<T
i H
<r
1-t
0
>o
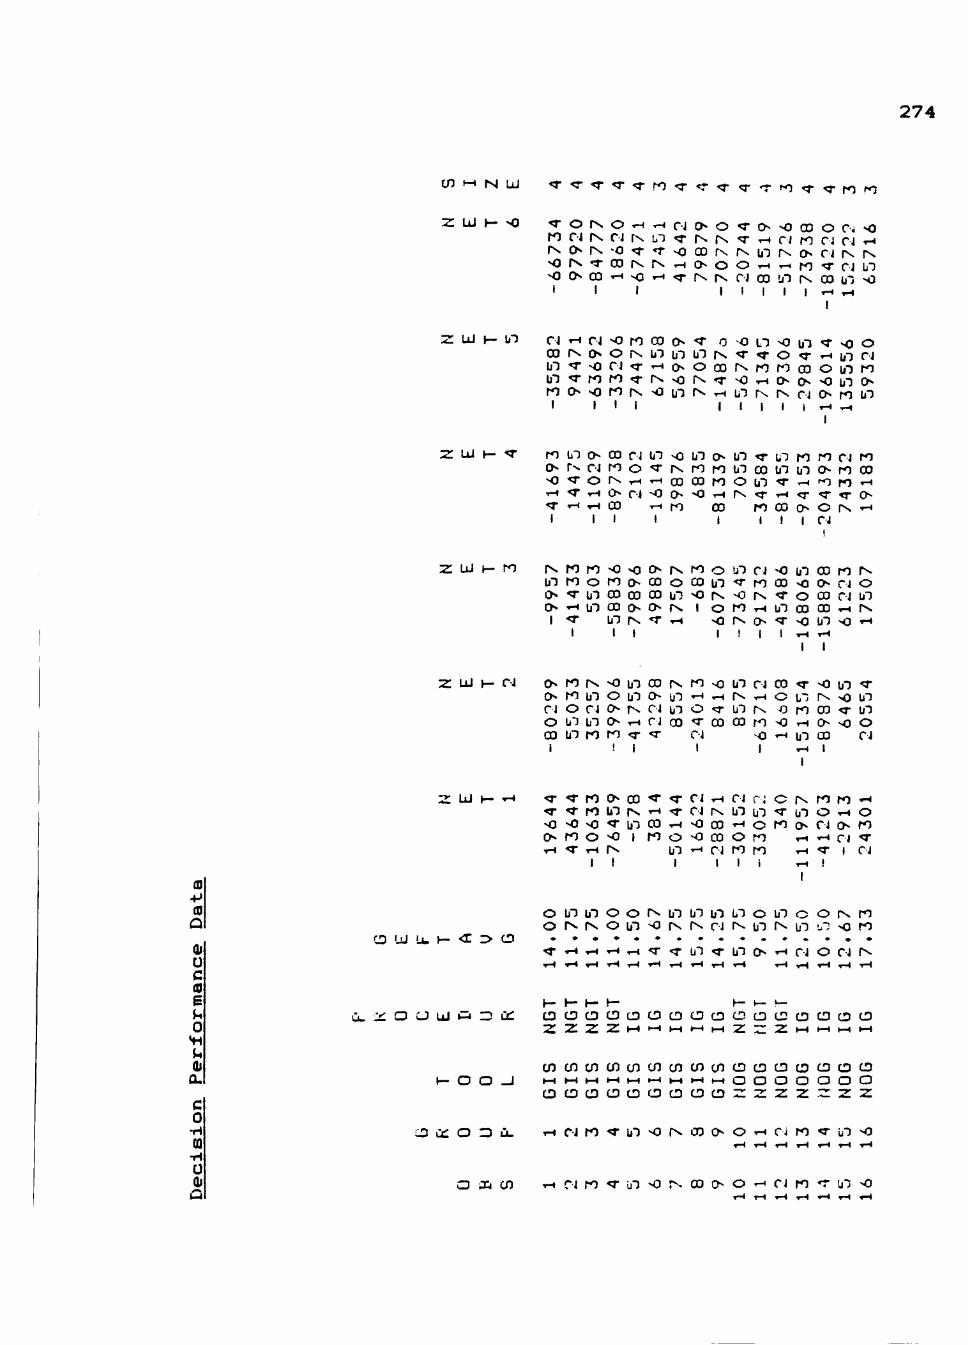
274
cn i-H rsi UJ
2: u »- >o
« r < r < r < T < r r o « T < r < r ^ ' T i O ' r ' < r r o
•<r o rv ro OJ IV
Ch rv
O- CD
rv
I I
O iH T- CJ OJ rv LO T 'O «T «r <i 00 f\ r>. TH 1-1 NQ 1-1 •^
I
O IV
PN.
O <T CN >0 00 O Ci *0 fv ^ T-l Ci ro Ci cJ t-l
CO fN r\ UO r^ CN CJ IV r^ CN o o T-t T-l ro -^ CJ UO
rv C J 00 UO | \ CD bO sD I I i I I 1-1 iH
2 : LJJ I— UO CJ TH CJ o ro 00 cs <r o CO rv o o pN bo bo bo rv bO •«r vQ CJ <r T-l CN UO <r ro ro «r rN >o ro ch NQ ro rs >o bo I I I I II
-0 LO >o •^ -"T O
o 00 rv ro ro rv r r o r v T-l UO rv
I
CN rv I
UO
00 CN Ci
t
^ -c o t-t bO CJ o UO ro >C bO CN CN ro bO
2 : LU I— ^ !> 00 C J UO vO bO CN ro UO o. rv CJ ro o NO <r o rv ^ 1-1 < r T-l CN CJ - o 0^ ' O < r t - l T-l CO i I I I
T-t r o
UO «r UO ro ro c j ro rv ro ro UO CO bO UO CN ro CO o o o o r o O b O ' T T M ' o r o t - i
T H r v i T T - i < r < r « r c N CD ro CO cN o rv 1-1 I I I I CJ
U l — ro r v r o r o > o » o o r v r o o u o c j " C b O O O r o r v b o r o o r o c N O O o c o b O < r r o o o < i C N c j o i > ^ b O O O c o c o u o ^ r v < i r v c ^ » H b O 0 0 o ^ C N r v I o r o T - i i < r b o r v < r T - i > o f v c N
I t 1 I I I
<r o CO c J UO bo 00 00 1-1 rv <T >o bO >o T-t I 1-1 T-l
I I
z UJ I- OJ CN ro rv <i bo CO rv ro vo bo c J CO <r o bO ^
2: UI H- T-«
(0
CO Q
OJ U c (0 B u 0 VI u dl a.
c 0 -H QQ •H 0 Oi
a
CD U U. >- <! O- CD
v; CD CJ u 1=1 Z! O:
CN OJ 0 CO 1
<r <r <i CN i H
0 0
<r
ro 0 UO bO
T <r ^ ro <r
bO rv T-l
bO CJ bO ro
ro ro <i 0 r-l 1
UO rv 1-1
0 CN CN ro !
CN UO <r 0 rv 1
0 0
T-t
bO rv T-l
1
CO IV UO 1
0 bO
1-t
CN CJ CJ <r
<• 1-1
00 ro
rv 0
<r
UO UO 00
«T TT 1-1
0 UO 1
bO rv <r
1-1
0 ^ OJ 1
CJ CJ 0 0 1-1
bO r». UO
1-1
T CO
i H
rv CO CO Oi 1
UO OJ
<T
rv UO 00
CJ UO 1-1
0 ro 1
UO rv UO
1-1
rv ro 0 1
Ci UO 0 ro ro i
0 UO
0^
0 0 >0 T-l
0 T ro
bO rv T-t
UO ro TH
-15
rv bO CN 1-1
TH
1-1
1
0 UO
OJ
r CO CN 00 1
ro 0 CJ 1-t
j
0 i,-i
0
>0 «T 0
ro 1-t
0 a 1
rv >o CJ
UO UO 0 CJ
1-t
0 ro <r CJ
ro ro rv
H - H - »— h - t— t— t—
CDCDCDCDCDCDCDCDCDCDCDCDOCDCDCD 2 : 2 : 2 : 2 : i - i t - « i - H i - i i - H 2 : 2 : 2 : t - i > - t H - i > - t
c n c n c n c n c n c n c n c n c n c D C D C D c D C D c D C D 1 — i i - t H H t — i > - i H - i i — i H - i H - i O O O O O O O O C D C D C D C D C D C D C D 0 2 : 2 : 2 : 2 : 2 : 2 : 2 :
h - 0 0 _ i I — l l - t H H t — 1 > - | H - I
•3 ce: o "ID Lt- i - i O J r o ^ b O o r v C D C N O T H C i r o < r u O > o
o iXi cn 1-1 CJ ro <r uO •<) rv CO CN o T-t Ci ro T UO >o

275
cn >-cn a o u o u o u o - < r c N G o o o o D O D > O T - < o o ^ ^ * r r o r v b o r v r o r o ^ c » « r o > o c o < i r v > o f v
' ^ t - l T H
05 >-CO u _l
cn
o o c N U O u o ' < r u o r O r - i O > o ^ > 0 " < r r o o o r o u o « r u o b o o o o c J - « r r o r ^ . ^ - < 3 ' ^ ' - I t H ,_! T-l
00 >o
r>j i-i D Ci _i
0^
*>• ro t-t rv •«r bO bO ro TH <i <r -rr <r Ci UO <r ro >o "T ro cJ UO bO CJ ^ bO <3" «r ^ rv
ro -J iXi
OJ - J
iXi
' c J c^ rv o TH rv ijT rv vo c>i ^ >o >o OJ CO ro CN Oi <r o. ro «r tH o tH (N.
OJ ro o «T rv rv -^ bO TH 00 c j r v v o ^ o r v r v r r r v v o b o u o rv
ro CD 00 CO ro UO ch- o ro CJ o ^o CJ o <r o t r -o UO UO UO <i rv rv o <i rv >o UO rv rv bO rv r>v
o o o o o o o o o o o o o o o o o o o o o o o o o o o o o o C J | V O C O T - < r C N v O O O i > > r v b O ' < r > O C N t T b O < r O > > > O C D U O C D b O U O O O O U O < l ~ < 3
T-l
(0 -M (0 Q
o c -H T3 c (0 +J 01 u 0) c D E Hi H i3 0 0.
TH O OJ O >O O CO CO VO O O O CJ O CJ CD NO CJ -O CJ <r CD CJ O CJ 00 <r O rv O 00 _l • TC < r T H C J r v c o o O i H < r « r c D T H C D b o o T - i T H T - t i H C D O L ' 0 * 5 * i H O « r r v ' < r « T o A c o r v U O r v < i c o c D < i 0 3 o o < i r v > o u o o o > o r v > o r v b o o o b o o o r v c o r v i v r v o o c o
H-LL.
UJ CD
cc: Zl VH UJ O O
_ j o c
cn
o
b O b o r v c N r o > o ^ o u O i H O O r o o c o o o T b O C J b o c o r v o o c o u o o o c o r v o o r o
C D C D C D C D C D C D C D O C D C D C D C D C D C D C D O C D C D C D O C D C D C D C D C D C D C D C D C D C D 2 : 2 : 2 : 2 : 2 : 2 : 2 : 2 : 2 : z 2 : 2 : 2 : 2 : 2 : z • - » ^ H . H H - l » H ^ _ • H H ^ ^ - t H ^ » H H H t H • - ,
c n c n c n c n c n c n c n c n c n c n c o c n c n c n c n c n c n c n c n c n c o c n c o i n c n c n c n c n c n c n
C D C D C D C D C D C D C D C D C D C D C D C D C D C D C D C D C D C D C D C D C D C D C D O C D O C D C D C D C D
HH iH T-t iH TH CJ CJ c J c J ro ro ro ro <r «r <r «r bO UO UO bO o >o o rv rv r>» rv 00 00 CD
T H C i r o « r u o > o r v c D C N O r - i c j r o « r b o - o r v o o c N O t H C i r o < r b O o r v c o o ^ o TH tH 1-1 1-t T-l TH TH iH iH T-l Ci OJ CJ CJ CJ OJ CJ c-J CJ CJ ro

2 7 6
cn >-cn i-i 0^ o Cc:
rv CO m rv «T ro ro >o ro -q- ro o- UO rv Ci o- CJ CJ UO ^ UO •«r •'T UO
cn
cn UJ _ J <E cn
a 3 > 0 ' H r v u o u o - < » r o o o o u o ^ o ^ b O T b o < i v o > o > o > C Q o r v > o < i u o C N r o b O ( v
hsl
a _j
UO 5r bO SD bo UO >o bo <r bO -T ro c J OJ OJ >O *r ro T OJ «r ro ro OJ rv UO bO -O «r
ro _j
c-i _ J
0 0 bO 0 0 0 0 0 0 0 0 0 0 0 0 0 0 0 0 0 0 0 0 0 0 0 0 0 0 0 o ^ c ^ c J o o u o T H ^ v o * r c N c N r o o C N C J ' ^ b o c o o o c N c ^ o r v ^ O T - l 1 - l ^ v r o c • i o r v i H « r b O o o O i H r v c i O o o < r O r o C N t o r v i \ o r v - < r T H i H o o T H O - r o >oroooborocorvuorvrv>ONOuobO<ivo*7"<iNONO>orobObOOorvrvuorvNO
0 0 0 0 00 tH O O
o o o o o o o o o o o o o o o o o o o o o o o o o o c J b O - O v o i v o o - ^ * r r o b O O O b o < r o o < r c D b O r v < r r o o o ^ r v < r ^ < r
i H
1-1 < i « r > o o o < i > o C ' J o o o J C D < i O o O " ^ - « r o c j C J < r c D o < i " « r o o < i c o o j o o
:c r o o » r v o r v r v i H C D C O i H O T - t C D ' « r < 3 ' < r c o r v i H O ' < r c o r v o o o r v O T - i < T < r iXi C N r v r v c D r v r v r v > 0 " O r v c D > o o < i r v r v O Q o r v o o N o r v b o c o r v c D r v o o c D
u. Ui CD
bO >o •<J «r TH 00 -"O OJ rv o 00 o OJ 00 ro CJ ro 00 CJ rs UO CN <r <r UO rv o ^ 00 00
cn XI l-J
o o cn
CDCDCDCDCDCDCDCDCDcDCDCDCDcDCDcDCDCDiDCD^DCDCDCDCDCDCDcDCDO ^ H ^ _ t • - l l - l l - t 2 : 2 : 2 : 2 : z 2 : 2 : 2 : 2 : 2 : 2 : ' - t t - l ^ | - H l - l • H » H H - l t H ^ - , , - l ^ - , ^ - l » _ l
o o
CncncncncncDCDCDCDCDCDCDCDCDCDOCDCDCDCDCDCDCDCDCDCDOCDCI^O • - i » - t O O O O O C D o O O O o O O O O O O O O O O O O C D O 0 0 2 : 2 : 2 : 2 : 2 : 2 : 2 : 2 : 2 : 2 : 2 : 2 : 2 : 2 : 2 : 2 : 2 : 2 : 2 : 2 : 2 : 2 : 2 : 2 : 2 : 0 0 0
cu oocNChCNCSOOOOTHiHTHTHCiOJCj ro ro ro ro<r« r< r< ruObOUO>o>o>o
CO iXt o *H Oi ro tr UO >o rv 00 CN o tH Ci ro <r UO o rv CD CN o ^ Ci ro <r UO >o rv CO c> o
ro ro ro ro ri ro ro ro ro <r <r r -T <r "T <r <r «r UO UO jO UO UO UO UO UO UO UO -o


![Stephen Briggs [Compatibility Mode]](https://static.fdokumen.com/doc/165x107/6324c3005c2c3bbfa802dd10/stephen-briggs-compatibility-mode.jpg)