
E-Service Quality from Attributes to Outcomes - MDPI
21
Journal of Open Innovation: Technology, Market, and Complexity Article E-Service Quality from Attributes to Outcomes: The Similarity and Difference between Digital and Hybrid Services Natalia Vatolkina 1, *, Elena Gorbashko 2 , Nadezhda Kamynina 3 and Olga Fedotkina 4 1 Department of Management, Bauman Moscow State Technical University (National Research University), 105005 Moscow, Russia 2 Department of Project and Quality Management, Saint Petersburg State University of Economics, 191023 St. Petersburg, Russia; [email protected] 3 Department of Land Law and State Registration of Real Estate, Moscow State University of Geodesy and Cartography, 105064 Moscow, Russia; [email protected] 4 Department of Data Analysis and Machine Learning, Financial University under the Government of the Russian Federation, 125167 Moscow, Russia; [email protected] * Correspondence: [email protected] or [email protected] Received: 8 October 2020; Accepted: 11 November 2020; Published: 12 November 2020 Abstract: Our research goal is to offer an e-service quality model based on experience and multidimensional quality and compare its applicability for e-services to find differences and similarities in consumer perceptions and behavioral intentions. Additionally, we seek to compare attributes that compose quality dimensions for hybrid and digital e-services. The study was based on an online survey conducted in July–September 2019 among citizens and foreign residents in the Russian Federation. Respondents had to answer questions concerning a specific e-service brand to capture real consumer behavior. The data of 365 questionnaires were analyzed using the Spearman correlation to determine the relationship between the model components. Customer experience is a valid outcome variable in the e-service model that strongly influences customer satisfaction and repurchase intentions. The model proved to be equally valid for hybrid and digital e-services. The key differences between digital and hybrid e-services lie within the distribution of e-service attributes between quality dimensions. Ease of use and perceived usefulness are the most essential attributes that have a direct influence on customer satisfaction. The findings show the necessity of best practices diffused between different types of e-services and present an opportunity to widely spread research findings between different e-service sectors. Keywords: e-service; e-service quality; customer experience 1. Introduction The service sector contributes to the key macroeconomic indicators of the world economy development, produces the largest share of global GDP, leads in the total employment rate, and creates sustainable opportunities for equality and social wellbeing. Currently, the growth of the service sector is driven by digital transformation, the growing penetration rate of Internet and mobile technologies, the emergence of new business models, and the increasing attractiveness of the sharing economy [1–4]. It has led to dramatic changes in service production systems [5] and consumer behavior [6] and the emergence and fast development of electronic services. Electronic service is a general term that refers to services rendered through information technologies via the Internet [7–10]. E-services involve a broad range of activities that use the Internet as a distribution channel (e.g., e-tailing, e-banking, e-travel) and newly emerged digital services. There is no commonly agreed definition of digital service, and authors J. Open Innov. Technol. Mark. Complex. 2020, 6, 143; doi:10.3390/joitmc6040143 www.mdpi.com/journal/joitmc
-
Upload
khangminh22 -
Category
Documents
-
view
3 -
download
0
Transcript of E-Service Quality from Attributes to Outcomes - MDPI

Journal of Open Innovation:
Technology, Market, and Complexity
Article
E-Service Quality from Attributes to Outcomes:The Similarity and Difference between Digital andHybrid Services
Natalia Vatolkina 1,*, Elena Gorbashko 2, Nadezhda Kamynina 3 and Olga Fedotkina 4
1 Department of Management, Bauman Moscow State Technical University (National Research University),105005 Moscow, Russia
2 Department of Project and Quality Management, Saint Petersburg State University of Economics,191023 St. Petersburg, Russia; [email protected]
3 Department of Land Law and State Registration of Real Estate, Moscow State University of Geodesy andCartography, 105064 Moscow, Russia; [email protected]
4 Department of Data Analysis and Machine Learning, Financial University under the Government of theRussian Federation, 125167 Moscow, Russia; [email protected]
* Correspondence: [email protected] or [email protected]
Received: 8 October 2020; Accepted: 11 November 2020; Published: 12 November 2020�����������������
Abstract: Our research goal is to offer an e-service quality model based on experience andmultidimensional quality and compare its applicability for e-services to find differences and similaritiesin consumer perceptions and behavioral intentions. Additionally, we seek to compare attributesthat compose quality dimensions for hybrid and digital e-services. The study was based on anonline survey conducted in July–September 2019 among citizens and foreign residents in the RussianFederation. Respondents had to answer questions concerning a specific e-service brand to capture realconsumer behavior. The data of 365 questionnaires were analyzed using the Spearman correlationto determine the relationship between the model components. Customer experience is a validoutcome variable in the e-service model that strongly influences customer satisfaction and repurchaseintentions. The model proved to be equally valid for hybrid and digital e-services. The key differencesbetween digital and hybrid e-services lie within the distribution of e-service attributes between qualitydimensions. Ease of use and perceived usefulness are the most essential attributes that have a directinfluence on customer satisfaction. The findings show the necessity of best practices diffused betweendifferent types of e-services and present an opportunity to widely spread research findings betweendifferent e-service sectors.
Keywords: e-service; e-service quality; customer experience
1. Introduction
The service sector contributes to the key macroeconomic indicators of the world economydevelopment, produces the largest share of global GDP, leads in the total employment rate, and createssustainable opportunities for equality and social wellbeing. Currently, the growth of the service sectoris driven by digital transformation, the growing penetration rate of Internet and mobile technologies,the emergence of new business models, and the increasing attractiveness of the sharing economy [1–4].It has led to dramatic changes in service production systems [5] and consumer behavior [6] and theemergence and fast development of electronic services. Electronic service is a general term that refers toservices rendered through information technologies via the Internet [7–10]. E-services involve a broadrange of activities that use the Internet as a distribution channel (e.g., e-tailing, e-banking, e-travel) andnewly emerged digital services. There is no commonly agreed definition of digital service, and authors
J. Open Innov. Technol. Mark. Complex. 2020, 6, 143; doi:10.3390/joitmc6040143 www.mdpi.com/journal/joitmc

J. Open Innov. Technol. Mark. Complex. 2020, 6, 143 2 of 21
refer to digital interaction through Internet Protocol [11], digital technologies [12], and digital data,a combination of digital technologies and physical products [13]. In general, digital services include aset of actions to create, search, collect, store, process, provide, and distribute information and productsin digital form, performed through the use of information technologies via the Internet upon therequest of consumers. To distinguish between different types of services, we propose to use the term“hybrid services” to generalize e-services based on traditional activities when only a limited number ofprocesses is offered online and the service result is delivered offline. Thus, e-services can be dividedinto two groups—hybrid services and digital services.
The difference in development dynamics between digital and hybrid services can be illustratedwith data from the e-services market of the Russian Federation, which, in 2019, accounted for almost5% of the national GDP, its growth rate being over 280% in comparison to 2015. Hybrid services(e-finance and e-commerce sectors) comprise 88.7% of the total e-service market. The fastest growingsectors are e-tailing, e-banking, and e-travel. Three digital services sectors (marketing and advertising,infrastructure and communication, and media and entertainment) make up only 4.5% of the totale-services market. The e-services market is mostly consumer-oriented, and the B2B e-services shareis 2.7% of the market volume [14], although at least 27% of Russian enterprises use cloud services.However, only penetration rate and audience size enable the evaluation of the development of sometypes of e-services. For example, e-government services in the Russian Federation have the highestpenetration rate of 74.8% of the total population aged between 15 and 72 years, which is very close tothe penetration rate of the Internet (87.3%) in 2019 [15,16].
The high growth rate and ease of access make it attractive for companies, fuel competition, and raisethe importance of research into e-services quality, which is the source of the open innovation practicesin the e-service market as it generates the information necessary for corporate and user innovation,customer involvement, and knowledge exchange between internal and external innovations [17].
Since information quality and digital technologies create the customer value of e-services,it is necessary to integrate information management and quality management concepts and tools.Digitalization changes the nature of e-service quality when a complex configuration of traditionaland new “digital” service properties is formed. It stimulates multiple research efforts to buildan e-service quality model that explains the relationships between e-service attributes and quality,customer satisfaction and consumer behavior, acceptance, and intentions for use. As stated in theWorld Economic Forum Report, the phenomenon of “digital consumption”, cross-sectoral diffusion ofcustomer expectations, and the concepts of “solution economy” and “experience economy” shift thefocus from the consumer properties of services to their ability to generate benefits for the consumer,solve the consumer’s problems, and offer cognitive and emotional experience—not only in theconsumer market, but also in B2B interaction [6]. Research into the e-service quality focuses eitheron the general e-service or on the specific type of e-service, such as e-travel, e-tailing, or the digitalplatform. No comparison study of e-service quality models for different types of services has beenconducted, so the following question remains unanswered—does the general phenomenon of e-serviceexist, when applied to quality, experience and satisfaction, or are there significant differences betweenhybrid and digital services? Hybrid services are supported by offline service delivery, clear regulationrules, and robust business models. They appeal to well-established consumer needs and offer bothonline and offline expertise. Digital services deliver value and experience online, offer inadequateconsumer rights protection, and satisfy intangible needs with intangible quality properties. This meansthat experience perceptions of quality attributes may significantly vary for hybrid and digital services.Comparison between e-service quality models applied to hybrid and digital e-services could prove ordisprove the knowledge and best practices flow between providers of different e-services, allowing usto understand if common quality regulations are applicable for all types of e-services.
Our research is targeted at comparing the performance of the general e-service quality model basedon the concept of experience-based multidimensional quality for hybrid and digital e-services in orderto find differences and similarities in consumer perceptions and behavioral intentions. The main tasks

J. Open Innov. Technol. Mark. Complex. 2020, 6, 143 3 of 21
of this research are to show approaches to e-service quality, adoption, and continuation models througha literature review and choose a model for the study, to choose the dimensions of e-service quality andassign quality attributes to each dimension, and to test the chosen e-service quality model for digitaland hybrid e-service quality by a survey among e-service customers located in different regions of theRussian Federation, including Russian citizens and foreigners residing in Russia. The novelty of thesurvey design is that it allows for assessing real consumer behavior with a specific e-service brandrather than measuring consumer perceptions of abstract e-services in general.
The paper is structured as follows:Section 2 (Literature Review) provides a brief description of the recent research into technology
acceptance models and e-service quality models and substantiates the integrated e-service qualitymodel based on customer experience and multidimensional e-service quality. The section contains thedescription of e-service quality dimensions and e-service attributes related to each dimension. Finally,the section provides the research hypotheses.
Section 3 (Methodology and Hypothesis Development) provides details about the design andimplementation of the survey.
Section 4 (Results) presents the results of the study. It starts with the short statistical test ofdifferences between hybrid and digital e-services based on the Student t-test and Fisher test. Further,it contains a detailed analysis of the correlation between the components of the model for e-services ingeneral and specifically for hybrid and digital e-services.
Section 5 (Discussion) focuses on the explanation of the role of customer experience in theintegrated e-service model and its relationship with customer satisfaction and e-service qualitydimensions. The section contains a discussion of the relationship between e-service attributes andquality dimensions, which brings unexpected findings and highlights the significant differencesbetween hybrid and digital e-services. The section ends with the revisited e-service model that wasproposed in the literature review section and improved distribution of attributes between qualitydimensions for e-services in general and digital and hybrid e-services in particular.
Section 6 (Conclusions) highlights the key findings of the study and presents some limitationsand recommendations for future research as well.
Section 7 (Managerial Implications) and Section 8 (Practical/Social Implications) show the possibleusefulness of the study findings for e-service providers when managing e-service quality and generalbenefits of the study for open innovation practices and quality of life.
Finally, Section 9 describes limitations and future research opportunities.The major originality of the study is in the attempt to compare the performance of the e-service
quality model regarding e-services in general and hybrid and digital e-services based on the design ofthe conducted survey.
2. Literature Review
Two traditional areas of research (technology acceptance models and service quality modelsand theories) influence recent advancements in e-service quality modeling. Service qualitymodels conceptualize quality attributes and outcome variables—customer expectations, satisfaction,repurchase intentions, and word of mouth—while technology acceptance models search for qualityattributes and other factors that influence customer behavior—decisions to adopt an e-service and tocontinue using it.
Based on the ideas of diffusion of innovation (DOI) [18], behavioral theories of reasonableactions (TRA), and planned behavior (TPB) [19], technology acceptance models are focused ontechnology attributes and other factors that affect the user’s decision to adopt a technology.Initially, DOI introduced six technology attributes that influence the technology adoption decision:relative advantage, compatibility with the pre-existing system, complexity or difficulty to learn,testability, potential for reinvention, and observed effects [18]. The Task Technology Fit (TTF) modelstressed the importance of the technology compliance with the user’s tasks to increase the likelihood

J. Open Innov. Technol. Mark. Complex. 2020, 6, 143 4 of 21
of its use [20]. Subsequent theories of the technology acceptance model specified this technologyattribute as “perceived usefulness” and complimented it with “perceived ease of use” derived fromthe DOI model. In [21], ease of use is defined as the ability of a customer to find information or enacta transaction with the least amount of effort. The TAM [22], TAM 2 [23], TAM3 [24], UTAUT [25],and UTAUT [26] models tried to distinguish between technology attributes and the hierarchy of social,personal, technical, environmental, and organizational factors that influence the decision to use thetechnology. The national cultural characteristics of consumers are the factors which most recentlygained attention [27]. The UTAUT2 theory confirmed that the same technology attributes explain theadoption of e-services [26].
Thus, we can conclude that technology acceptance models are able to answer a question thatis not traditionally considered in quality management—which e-service attributes are important forthe consumer when making a decision about using a service? Such attributes can be called “startingquality”, when the consumer has no experience of using the service and decisions are based onlyon expectations.
To explain how a consumer makes a decision to continue using information technology or aninformation system, the following models were offered—the Information Systems ContinuanceIntention Model (ISCI) and the Information System Success Theory (ISS) rooted in theExpectation-Confirmation Theory (ECT). These theories assume that satisfied users will continue touse the product or service, and dissatisfied users will stop using it [28]. The ISCI model assumes thatthe user’s intention to continue using the information system depends on three factors: satisfaction,meeting expectations, and perceived usefulness derived from technology acceptance models. The ISStheory goes further and incorporates ideas of service quality, when system quality, information quality,and quality of services influence together the user’s satisfaction and intentions for use, which bringsnet benefits to a customer [29].
Along with the ISCI and ISS models, numerous e-service acceptance and continuation modelshave appeared in the last ten years which investigate the relationship between e-service attributes,e-service quality, customer satisfaction, acceptance, and repurchase intentions, although the correlationbetween them varies in different models. The weak point of such models is that e-service attributesare usually disintegrated and may affect every outcome variable or even be influenced by them.For example, the E-Service Acceptance Model (ETAM) demonstrates a three-step consequence ofe-service attribute influence on customer satisfaction and quality, while both of them influence customerintention to use e-services [30]. The ETAM’s significant omission is that quality and satisfaction areconcepts of the same level affected by different e-service attributes, like ease of use, learning, content,support, trust, or design. As suggested in [31], perceived usefulness has a statistically significanteffect on the intention to use online platform services, and satisfaction has been found to have apositive effect on the ease of use, as it breaks casual relations between service quality and customersatisfaction. New interpretations of technology acceptance models are offered in [32,33], where thedecision of adoption is made towards the specific e-service function, like volunteer recruitment forNGO in Twitter [32] or communication of e-Word of Mouth in Tripadvisor [33].
Technology acceptance and continuation models overlook the customer’s active role in e-servicecreation, although several models include mediating factors like attitude toward internet purchase,which bridges customer satisfaction and internet purchase intention [34].
Contrarily, e-service quality models are based on the shared understanding of the relationshipbetween e-service quality and outcome variables such as customer satisfaction, repurchase intentions,and word of mouth [10,35,36] (Figure 1).
J. Open Innov. Technol. Mark. Complex. 2020, 6, x FOR PEER REVIEW 4 of 22
transaction with the least amount of effort. The TAM [22], TAM 2 [23], TAM3 [24], UTAUT [25], and
UTAUT [26] models tried to distinguish between technology attributes and the hierarchy of social,
personal, technical, environmental, and organizational factors that influence the decision to use the
technology. The national cultural characteristics of consumers are the factors which most recently
gained attention [27]. The UTAUT2 theory confirmed that the same technology attributes explain the
adoption of e-services [26].
Thus, we can conclude that technology acceptance models are able to answer a question that is
not traditionally considered in quality management—which e-service attributes are important for the
consumer when making a decision about using a service? Such attributes can be called “starting
quality”, when the consumer has no experience of using the service and decisions are based only on
expectations.
To explain how a consumer makes a decision to continue using information technology or an
information system, the following models were offered—the Information Systems Continuance
Intention Model (ISCI) and the Information System Success Theory (ISS) rooted in the Expectation-
Confirmation Theory (ECT). These theories assume that satisfied users will continue to use the
product or service, and dissatisfied users will stop using it [28]. The ISCI model assumes that the
user’s intention to continue using the information system depends on three factors: satisfaction,
meeting expectations, and perceived usefulness derived from technology acceptance models. The ISS
theory goes further and incorporates ideas of service quality, when system quality, information
quality, and quality of services influence together the user’s satisfaction and intentions for use, which
brings net benefits to a customer [29].
Along with the ISCI and ISS models, numerous e-service acceptance and continuation models
have appeared in the last ten years which investigate the relationship between e-service attributes, e-
service quality, customer satisfaction, acceptance, and repurchase intentions, although the correlation
between them varies in different models. The weak point of such models is that e-service attributes
are usually disintegrated and may affect every outcome variable or even be influenced by them. For
example, the E-Service Acceptance Model (ETAM) demonstrates a three-step consequence of e-
service attribute influence on customer satisfaction and quality, while both of them influence
customer intention to use e-services [30]. The ETAM’s significant omission is that quality and
satisfaction are concepts of the same level affected by different e-service attributes, like ease of use,
learning, content, support, trust, or design. As suggested in [31], perceived usefulness has a
statistically significant effect on the intention to use online platform services, and satisfaction has
been found to have a positive effect on the ease of use, as it breaks casual relations between service
quality and customer satisfaction. New interpretations of technology acceptance models are offered
in [32,33], where the decision of adoption is made towards the specific e-service function, like
volunteer recruitment for NGO in Twitter [32] or communication of e-Word of Mouth in Tripadvisor
[33].
Technology acceptance and continuation models overlook the customer’s active role in e-service
creation, although several models include mediating factors like attitude toward internet purchase,
which bridges customer satisfaction and internet purchase intention [34].
Contrarily, e-service quality models are based on the shared understanding of the relationship
between e-service quality and outcome variables such as customer satisfaction, repurchase
intentions, and word of mouth [10,35,36] (Figure 1).
Figure 1. Conceptualization of e-service quality [36].
The means-end chain theory is an important theoretical background for e-service models [37–
Figure 1. Conceptualization of e-service quality [36].

J. Open Innov. Technol. Mark. Complex. 2020, 6, 143 5 of 21
The means-end chain theory is an important theoretical background for e-service models [37–40]explaining how customers evaluate experiences—from quality attributes to quality dimensions.It means that in order to explain how a customer makes the decision to continue use an e-service(repurchase intention), we should follow the linear relationship presented in Figure 1.
Limitations of technology acceptance and e-service models are rooted in their technological natureand we should apply service-dominant logic [41] as a general concept when explaining e-servicecustomer behavior. E-service is a result of value co-creation by the provider and consumer, and thuse-service should be seen as a specific customer experience that creates e-service quality and generatescustomer satisfaction and intention to continue using the service. Customer experience in e-serviceshas been studied as a factor of repurchase intentions [42], firm’s competitiveness [43], and wordof mouth [44], but not in correlation with customer satisfaction and e-service quality. At the sametime, the emergence of customer experience of using e-services could explain the transition betweencustomer decision to accept e-services and customer decision to continue to use e-services. It leadsto the concept of “experienced” quality, whereby customer perceptions of quality are based on realexperience and thus experience influences repurchase intentions through satisfaction. In our view,the combination of e-service quality and technology acceptance models with the concept of customerexperience may offer a better understanding of customer behavior, from the decision to adopt ane-service to the decision to continue using this service, with a mediating role of customer experience,e-service quality, and customer satisfaction. Such a combination is also based on the idea of the servicejourney [45].
A relevant model was offered by Vatolkina in [46] but we refined it based on the literature review.Firstly, we deleted expected security from the e-service attributes that influence the decision to adoptan e-service because it has not gained sufficient theoretical substantiation. For example, the studyof Himanshu Raval and Viral Bhatt, 2020 [47] showed that security and online shopping platformsatisfaction have a weak correlation. In [27], we also find that a survey held among Chinese customersshowed that perceived privacy surprisingly did not impact the “likelihood to purchase online”.Secondly, based on the literature review [10,21,34–36,48–57], we added the dimension of quality ofsupport (Figure 2) to complement the dimensions of quality of e-service results, quality of e-serviceprocess, quality of e-service system, and quality of e-service information. The dimension “qualityof support” is aligned with the E-RecS-Qual model [57] and reflects the system of e-service recoverythat is not the part of the value created by the e-service but influences both customer perceptions ofe-service quality and customer experience.
J. Open Innov. Technol. Mark. Complex. 2020, 6, x FOR PEER REVIEW 5 of 22
40] explaining how customers evaluate experiences—from quality attributes to quality dimensions.
It means that in order to explain how a customer makes the decision to continue use an e-service
(repurchase intention), we should follow the linear relationship presented in Figure 1.
Limitations of technology acceptance and e-service models are rooted in their technological
nature and we should apply service-dominant logic [41] as a general concept when explaining e-
service customer behavior. E-service is a result of value co-creation by the provider and consumer,
and thus e-service should be seen as a specific customer experience that creates e-service quality and
generates customer satisfaction and intention to continue using the service. Customer experience in
e-services has been studied as a factor of repurchase intentions [42], firm’s competitiveness [43], and
word of mouth [44], but not in correlation with customer satisfaction and e-service quality. At the
same time, the emergence of customer experience of using e-services could explain the transition
between customer decision to accept e-services and customer decision to continue to use e-services.
It leads to the concept of “experienced” quality, whereby customer perceptions of quality are based
on real experience and thus experience influences repurchase intentions through satisfaction. In our
view, the combination of e-service quality and technology acceptance models with the concept of
customer experience may offer a better understanding of customer behavior, from the decision to
adopt an e-service to the decision to continue using this service, with a mediating role of customer
experience, e-service quality, and customer satisfaction. Such a combination is also based on the idea
of the service journey [45].
A relevant model was offered by Vatolkina in [46] but we refined it based on the literature
review. Firstly, we deleted expected security from the e-service attributes that influence the decision
to adopt an e-service because it has not gained sufficient theoretical substantiation. For example, the
study of Himanshu Raval and Viral Bhatt, 2020 [47] showed that security and online shopping
platform satisfaction have a weak correlation. In [27], we also find that a survey held among Chinese
customers showed that perceived privacy surprisingly did not impact the “likelihood to purchase
online”. Secondly, based on the literature review [10,21,34–36,48–57], we added the dimension of
quality of support (Figure 2) to complement the dimensions of quality of e-service results, quality of
e-service process, quality of e-service system, and quality of e-service information. The dimension
“quality of support” is aligned with the E-RecS-Qual model [57] and reflects the system of e-service
recovery that is not the part of the value created by the e-service but influences both customer
perceptions of e-service quality and customer experience.
Figure 2. Integrated e-service adoption–continuance quality model.
The integrated e-service adoption–continuance quality model shows that e-service quality
influences the consumer experience, which affects consumer satisfaction, leading in turn to the
consumer’s intention to continue using the service. Low satisfaction results in a refusal to use the
service in the future. Considering the diversity of e-services, the following question arises: is the
model applicable for all types of e-services?
Figure 2. Integrated e-service adoption–continuance quality model.
The integrated e-service adoption–continuance quality model shows that e-service qualityinfluences the consumer experience, which affects consumer satisfaction, leading in turn to theconsumer’s intention to continue using the service. Low satisfaction results in a refusal to use the

J. Open Innov. Technol. Mark. Complex. 2020, 6, 143 6 of 21
service in the future. Considering the diversity of e-services, the following question arises: is the modelapplicable for all types of e-services?
3. Methodology and Hypothesis Development
The literature review revealed that the majority of the e-service quality, e-service acceptance,and continuation models are constructed either for general e-services (like E-S-QUAL) or for specifichybrid e-services (e-tailing, e-library, e-travel) or even for websites (like W-S-QUAL). Just a few studieswere conducted for digital e-services like platforms and social media [31,50,51,54]. No comparisonbetween two types of e-services have been conducted to prove that relationships between customerexperience, quality, satisfaction, and intention for use are similar for hybrid and digital e-services aswell as to prove that e-quality dimensions are similar for digital and hybrid e-services.
Therefore, we devised the following research hypotheses.
Hypothesis 1 (H1). The relationship between customer experience, quality, satisfaction, and intention foruse is similar for both major types of e-services—hybrid and digital services—and could be described with anintegrated e-service adoption–continuance quality model.
Hypothesis 2 (H2). The e-service quality dimensions and attributes are similar for two major types ofe-services—hybrid services and digital services.
To design the study, we started with the selection of e-service quality attributes corresponding tothe five e-service quality dimensions of the model. Based on the study of a systematic review andspecific research papers on general e-service quality and website quality models, as well as specificresearch on e-tailing, social platforms, and e-travel quality models [10,21,34–36,48–58], we concludedthat every dimension is composed of several e-service attributes (Table 1).
Table 1. E-service quality dimensions and attributes.
E-Service Quality Dimensions E-Service Attributes
Quality of e-service result
FunctionalityPersonalization
ReliabilityAbility to save time
Quality of e-service processEase of use
SecurityAccessibility
Quality of e-service system Website or app structure and navigationWebsite or app design
Quality of e-service information Quality of website or app contentUsefulness of information
Quality of e-service customer support Timeliness of e-service customer support
To test the relationships between the components of the integrated e-service adoption–continuancequality model, a structured questionnaire for an online survey was developed because the questionnaireis a very flexible data collection tool [59]. The survey was designed using a Likert scale from 1 to 5,where 1 = strongly disagree, 2 = disagree, 3 = neutral, 4 = agree, 5 = strongly agree. Each questionaimed to assess the perception of one of the components of the model. The questionnaire items,their correlation with model components, and descriptions of the quality components are presented inTable 2.

J. Open Innov. Technol. Mark. Complex. 2020, 6, 143 7 of 21
Table 2. Correspondence between questionnaire items and model components.
Model Component Code Questionnaire Items Description of ModelComponent
Customer experience EXC1 The overall experience of using thee-service is positive
Experience reflects feelingsand knowledge customergains through interaction
with e-service componentsoffered by the e-service
provider [60]
E-service acceptance ADP1 I have frequently used e-service duringthe last six months
Decision to start usinge-service based on
expectations of certaine-service usefulness and ease
of use
Intention to continueusing e-service INT1 I plan to use e-service in the next few
monthsCustomer readiness to
continue using e-service
Customer satisfaction SAT1 I am satisfied with the quality of thee-service
Level of conformancebetween service quality and
customer expectations
Quality ofe-service result
RES1 The e-service provides me with what Iwant or require
Degree to which e-serviceresults meets customer needs
to achieve specific goal
RES2 I think that the e-service is reliable
RES3 The e-service can be adapted to meetmy needs
RES4 The e-service helps me to save time
RES5 I’m satisfied with the quality of thee-service result
Quality ofe-service process
PROC1 The e-service is easy to use
Degree to which e-serviceco-creation process meets
customer needs andexpectations
PROC2 I feel that my personal and financialinformation I use for the e-service is safe
PROC3 I always can get access to the e-servicewhen I need it
PROC4 I’m satisfied with the process of usingthe e-service
Quality ofe-service information
INF1 The e-service website content is of highquality
Degree to which informationprovided by e-service
provider meets customerneeds to achieve specific
goals when using thee-service
INF2 The e-service allows me to find thenecessary information
INF3 I’m satisfied with the quality ofinformation e-service provides
Quality of e-servicesystem
SYS1 The e-service website has a clearstructure
Degree to which e-servicewebsite or app design andstructure meets customerneeds to achieve specific
goals when using thee-service
SYS2 I like how the e-service website or applooks like
SYS3 I’m satisfied with the quality of thee-service technical level
Quality of e-servicecustomer support
SUP1 The quality of customer support is high Degree to which e-servicecustomer support meets
customer needs to use thee-service effectively
SUP2 The e-service is quick to answerquestions about the support
SUP3 I’m satisfied with the quality ofcustomer support
Intention to refuse usingthe service REF1 I’m going to refuse to use e-service in
the next several monthsCustomer readiness to refuse
to use e-service
A specific feature of the questionnaire design is that respondents had to answer questions about aspecific e-service brand. Previous studies used questions about any abstract e-service [30,34,49,56] or

J. Open Innov. Technol. Mark. Complex. 2020, 6, 143 8 of 21
abstract e-service of a specific type [27,31,41,43,47,61], so the respondents had to imagine what theirdecisions or perceptions could be in general. Several studies investigate consumer behavior in relationto specific e-service platforms—like volunteer acceptance of the Twitter platform based on the TAMmodel [32] or developing and measuring the importance of e-service quality dimensions and attributesfor Facebook’s users [51,54].
We expected that our survey design would capture real consumer behavior. In the survey,we offered 20 different options, including international brands popular in Russia, like Booking,AliExpress, Instagram, Youtube, Facebook, Badoo, Qiwi, WhatsApp, and Google as well asstrong Russian brands like Wildberries, Yandex, YandexTaxi, YandexDrive, Ivi, Ozon, Avito,and SberbankOnline. Respondents could choose any other e-service brand, so Discord, Afisha,Apteka, Gosuslugi, DeliveryClub, and Steam appeared in the results of the survey.
The questionnaire was created in Google form and invitations to participate in the survey weredistributed via the largest Russian social digital platform, “Vkontakte”, at random. The preface tothe questionnaire included the purpose of the study, rules of using the Likert scale, and a disclaimerstating that the survey was anonymous.
We collected 365 completed questionnaires from the respondents in the period between July andSeptember 2019. An analysis showed that 350 respondents were residents of 38 Russian cities and15 were international students from Ukraine, Turkmenistan, Thailand, Iraq, Germany, Georgia, andNorthern Cyprus who currently lived in Russia.
Table 3 gives the respondents’ profile. The majority of respondents (68.8%) represent two agegroups, from 18 to 24 years and from 25 to 34 years old, where the latter had the highest e-servicepenetration rate. Among the respondents, 66.3% used e-services daily, including 26% of respondentswho used e-services several times a day. Only 7.1% of respondents rarely used e-services (several timesor once a year).
Table 3. Participants’ profile in the final survey.
Item Frequency Share, %
GenderMale 144 39.5
Female 221 60.5
Age18 or Under 14 3.8
18–24 86 23.625–34 165 45.235–44 80 21.945–54 15 4.155–69 5 1.4
The frequency of using an e-serviceMore than once a day 95 26
Daily 147 40.3Weekly 59 16.2
Monthly 38 10.4More than once a year 24 6.6
Once a year or less 2 0.5
The survey demonstrated that 43.7% of the respondents chose digital services, and 55.3% preferredhybrid services. YouTube was the digital e-service with the largest audience in the study (18.1% ofrespondents chose it in the survey). Yandex Taxi (the Russian largest online taxi-aggregator) andWildberries (the largest online retailer in Russia) were ranked second and third, with 12.1% and 9.6%of the respondents’ choice, respectively. In general, the industry coverage of the selected e-servicesapplied to most of their types (entertainment and media, online retail, online travel, electronic payment

J. Open Innov. Technol. Mark. Complex. 2020, 6, 143 9 of 21
services, transport services, food delivery, event ticket booking, online video, online music and books,social networks, financial services, etc.). This is why the survey results can be applied to the B2Ce-services market in Russia in general.
Since the size of the general sample was not set, and it was also impossible to control the chanceof re-passing the survey because it was held online, a simple random sampling formula was used forthe calculation:
n =t2·v·(1− v)
∆2 (1)
t: the acceptable confidence level is 0.95. At this confidence level, the normalized deviation was1.96. The total sample of 365 people included 211 and 154 respondents preferring hybrid and digitale-services, respectively. Therefore, the variance equaled v·(1 − v) = (211/365)·(154/365) = 0.2439. Hence,sampling error was 5%.
∆ =
√t2·v·(1− v)
n=
√1.962·0.2439
365= 0.051
4. Results
4.1. Analysis of the Survey Results
To compare the average values of the chosen response options for hybrid and digital e-services,the Student t-test was selected with p = 0.05. To compare the variance of the response choice valuesfor hybrid and digital e-services, the Fisher test was applied with p = 0.95. Table 4 gives the generalsurvey results, indicating the average values, standard deviation, Student t-test, and Fisher testvalues. We identified eight key variables, confirming at least one hypothesis and revealing statisticallysignificant differences between hybrid and digital e-services.
Table 4. Results of the survey.
Code Question Mean Std.Deviation
StudentTest
FisherTest
EXC1 The overall experience of using the e-service is positive 4.515 0.76 0.15 0.01ADP1 I have frequently used e-service during the last six months 4.32 1.027 0.16 0.90INT1 I plan to use e-service in the next few months 4.504 0.89 0.38 0.81SAT1 I am satisfied with the quality of the e-service 4.367 0.8 0.32 0.99RES1 The e-service provides me with what I want or require 4.378 0.86 0.14 0.51RES2 I think that the e-service is reliable 4.230 0.95 0.17 0.94RES3 The e-service can be adapted to meet my needs 4.186 0.97 0.27 0.85RES4 The e-service helps me to save time 4.378 1.09 0.00 0.00
PROC1 The e-service is easy to use 4.636 0.76 0.06 0.00
INF1 The e-service website content is of high quality 4.384 0.83 0.23 0.08INF2 The e-service allows me to find the necessary information 4.427 0.81 0.15 0.56SYS1 The e-service website has a clear structure 4.45 0.87 0.03 0.02SYS2 I like how the e-service website or app looks like 4.35 0.81 0.08 0.45
PROC2 I feel that my personal and financial information I use for thee-service is safe 3.74 1.13 0.23 0.79
SUP1 The quality of customer support is high 4.17 0.92 0.23 0.24SUP2 The e-service is quick to answer questions about the support 3.98 1.0 0.00 0.01
PROC3 I always can get access to the e-service when I need it 4.443 0.92 0.01 0.00RES5 I’m satisfied with the quality of the e-service result 4.197 0.75 0.47 0.51SYS3 I’m satisfied with the quality of the e-service technical level 4.386 0.85 0.28 0.40INF3 I’m satisfied with the quality of information e-service provides 4.4 0.86 0.09 0.50
PROC4 I’m satisfied with the process of using the e-service 4.373 0.88 0.01 0.00SUP3 I’m satisfied with the quality of customer support 4.172 0.82 0.02 0.00REF1 I’m going to refuse to use e-service in the next several months 1.909 1.4 0.02 0.03
J. Open Innov. Technol. Mark. Complex. 2020, 6, 143 10 of 21
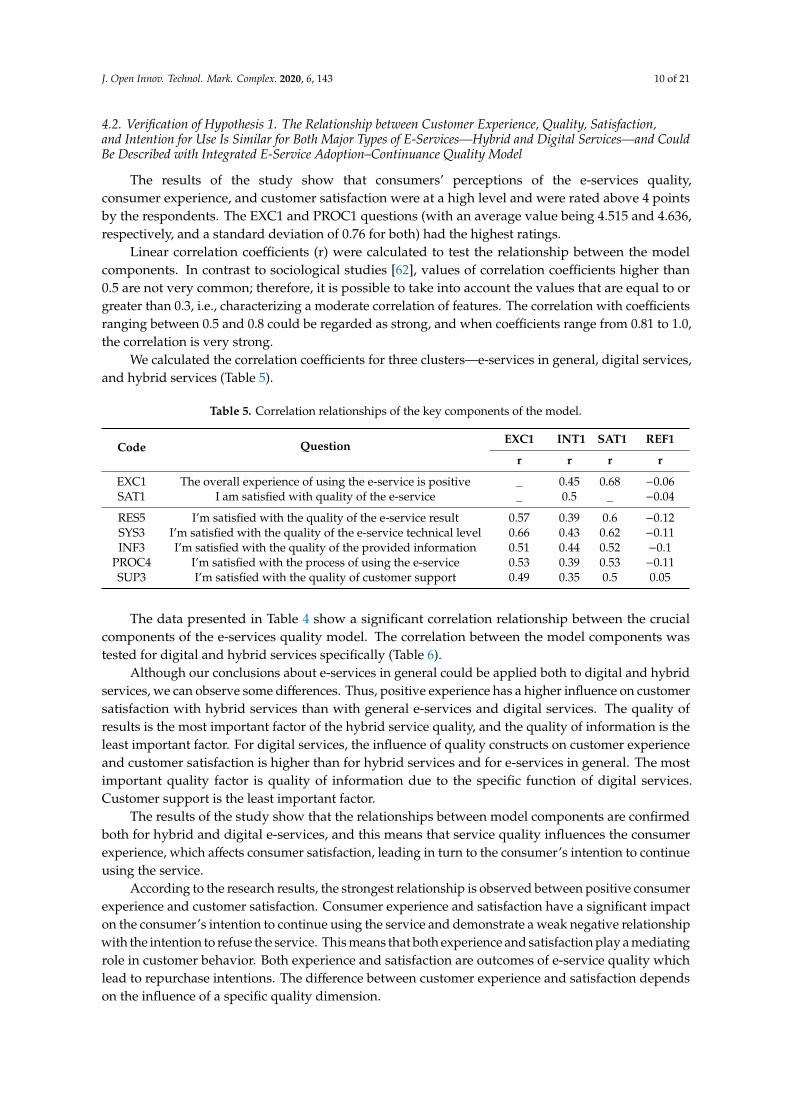
4.2. Verification of Hypothesis 1. The Relationship between Customer Experience, Quality, Satisfaction,and Intention for Use Is Similar for Both Major Types of E-Services—Hybrid and Digital Services—and CouldBe Described with Integrated E-Service Adoption–Continuance Quality Model
The results of the study show that consumers’ perceptions of the e-services quality,consumer experience, and customer satisfaction were at a high level and were rated above 4 pointsby the respondents. The EXC1 and PROC1 questions (with an average value being 4.515 and 4.636,respectively, and a standard deviation of 0.76 for both) had the highest ratings.
Linear correlation coefficients (r) were calculated to test the relationship between the modelcomponents. In contrast to sociological studies [62], values of correlation coefficients higher than0.5 are not very common; therefore, it is possible to take into account the values that are equal to orgreater than 0.3, i.e., characterizing a moderate correlation of features. The correlation with coefficientsranging between 0.5 and 0.8 could be regarded as strong, and when coefficients range from 0.81 to 1.0,the correlation is very strong.
We calculated the correlation coefficients for three clusters—e-services in general, digital services,and hybrid services (Table 5).
Table 5. Correlation relationships of the key components of the model.
Code Question EXC1 INT1 SAT1 REF1
r r r r
EXC1 The overall experience of using the e-service is positive _ 0.45 0.68 −0.06SAT1 I am satisfied with quality of the e-service _ 0.5 _ −0.04
RES5 I’m satisfied with the quality of the e-service result 0.57 0.39 0.6 −0.12SYS3 I’m satisfied with the quality of the e-service technical level 0.66 0.43 0.62 −0.11INF3 I’m satisfied with the quality of the provided information 0.51 0.44 0.52 −0.1
PROC4 I’m satisfied with the process of using the e-service 0.53 0.39 0.53 −0.11SUP3 I’m satisfied with the quality of customer support 0.49 0.35 0.5 0.05
The data presented in Table 4 show a significant correlation relationship between the crucialcomponents of the e-services quality model. The correlation between the model components wastested for digital and hybrid services specifically (Table 6).
Although our conclusions about e-services in general could be applied both to digital and hybridservices, we can observe some differences. Thus, positive experience has a higher influence on customersatisfaction with hybrid services than with general e-services and digital services. The quality ofresults is the most important factor of the hybrid service quality, and the quality of information is theleast important factor. For digital services, the influence of quality constructs on customer experienceand customer satisfaction is higher than for hybrid services and for e-services in general. The mostimportant quality factor is quality of information due to the specific function of digital services.Customer support is the least important factor.
The results of the study show that the relationships between model components are confirmedboth for hybrid and digital e-services, and this means that service quality influences the consumerexperience, which affects consumer satisfaction, leading in turn to the consumer’s intention to continueusing the service.
According to the research results, the strongest relationship is observed between positive consumerexperience and customer satisfaction. Consumer experience and satisfaction have a significant impacton the consumer’s intention to continue using the service and demonstrate a weak negative relationshipwith the intention to refuse the service. This means that both experience and satisfaction play a mediatingrole in customer behavior. Both experience and satisfaction are outcomes of e-service quality whichlead to repurchase intentions. The difference between customer experience and satisfaction dependson the influence of a specific quality dimension.

J. Open Innov. Technol. Mark. Complex. 2020, 6, 143 11 of 21
Table 6. Correlation and regression relationships of the crucial components of the model for the digitaland hybrid services.
Code Question EXC1 INT1 SAT1 REF1
r r r r
Correlation Coefficients for the Digital E-Services
EXC1 The overall experience of using the e-service is positive _ 0.49 0.67 −0.07SAT1 I am satisfied with the quality of the e-service 0.67 0.42 _ −0.04RES5 I’m satisfied with the quality of the e-service result 0.6 0.33 0.6 −0.06SYS3 I’m satisfied with the quality of the e-service technical level 0.64 0.41 0.65 −0.08INF3 I’m satisfied with the quality of the provided information 0.65 0.47 0.61 −0.04
PROC4 I’m satisfied with the process of using the e-service 0.59 0.39 0.57 −0.11SUP3 I’m satisfied with the quality of customer support 0.52 0.34 0.48 0.11
Correlation Coefficients for the Hybrid E-Services
EXC1 The overall experience of using the e-service is positive _ 0.42 0.7 −0.04SAT1 I am satisfied with the quality of the e-service 0.7 0.46 _ −0.04RES5 I’m satisfied with the quality of the e-service result 0.55 0.45 0.59 −0.17SYS3 I’m satisfied with the quality of the e-service technical level 0.55 0.45 0.59 −0.13INF3 I’m satisfied with the quality of the provided information 0.38 0.44 0.45 −0.13
PROC4 I’m satisfied with the process of using the e-service 0.45 0.41 0.52 −0.08SUP3 I’m satisfied with the quality of customer support 0.47 0.38 0.54 0.03
Thus, customer experience was proven to be an outcome variable of the e-service quality model,as it shows a significant correlation with customer satisfaction and e-service quality dimensions bothfor hybrid and digital e-services. It complements previous studies where outcome variables involvedsatisfaction, repurchase intentions, and word of mouth [36]. This is an important contribution of ourstudy, since it enables us to shift the focus from the technological to the interactive nature of e-services.It is proven also by the differences which we can observe. Thus, positive experience has a strongerinfluence on customer satisfaction with hybrid services than with e-services in general and digitalservices. In our opinion, this is the consequence of the more interactive nature of hybrid e-services asthey involve delivering customer value offline with interpersonal interactions.
Thus, the quality of e-services has a greater influence on customer satisfaction, while consumerexperience is influenced by the quality of e-service technical level, quality of e-service process,and quality of customer support. This shows that customer satisfaction is a function-driven conceptand emerges through a comparison of customer needs and e-service results. This correlates withprevious studies where fulfillment/reliability was the strongest factor affecting satisfaction [10].The added value of our findings is that other quality dimensions assessed in our study also showed thatthe e-service consumer experience concept reflects the customer’s active participation in the e-servicevalue co-creation process and thus depends on the quality of service delivery process, customer support,and technical level.
4.3. Verification of Hypothesis 2. The E-Service Quality Dimensions and Attributes Are Similar for Two MajorTypes of E-Services—Hybrid Services and Digital Services
The survey tested the relationship between e-service attributes and e-service quality dimensions(Table 7).

J. Open Innov. Technol. Mark. Complex. 2020, 6, 143 12 of 21
Table 7. Relationship of e-service quality dimensions with e-service attributes.
CodeSAT1 RES5 SYS3 INF3 PROC4 SUP3
r r r r r r
RES1 0.7 0.57 0.58 0.52 0.54 0.48RES2 0.56 0.5 0.58 0.54 0.53 0.51RES3 0.48 0.44 0.51 0.49 0.52 0.47
PROC1 0.59 0.53 0.6 0.53 0.59 0.5INF1 0.56 0.54 0.58 0.54 0.52 0.52INF2 0.49 0.52 0.56 0.54 0.55 0.43
PROC2 0.35 0.33 0.37 0.37 0.38 0.4SYS1 0.48 0.55 0.55 0.52 0.57 0.51SYS2 0.48 0.51 0.55 0.5 0.5 0.51SUP1 0.5 0.51 0.5 0.51 0.5 0.63SUP2 0.4 0.47 0.45 0.46 0.4 0.6
PROC3 0.46 0.52 0.62 0.53 0.59 0.52RES4 0.26 0.32 0.27 0.44 0.38 0.37
The results of the study show that only two e-service attributes have a strong influence on customersatisfaction—usefulness and ease of use. Other e-service properties show a strong influence on qualitydimensions, proving the multistage nature of the e-service model. The perception of the e-serviceattributes appears in the process of e-service value co-creation and emergence of customer experience(Table 8).
Table 8. Relationship between quality attributes of digital and hybrid e-services.
CodeSAT1 RES5 SYS3 INF3 PROC4 SUP3
r r r r r r
Correlation Coefficients for the Digital E-Services
RES1 0.68 0.59 0.6 0.62 0.61 0.42RES2 0.53 0.51 0.6 0.58 0.58 0.5RES3 0.51 0.46 0.55 0.53 0.52 0.45
PROC1 0.63 0.57 0.66 0.68 0.6 0.53INF1 0.55 0.49 0.54 0.63 0.54 0.5INF2 0.5 0.5 0.58 0.63 0.65 0.4
PROC2 0.32 0.3 0.31 0.4 0.37 0.34SYS1 0.5 0.52 0.61 0.5 0.5 0.44SYS2 0.59 0.6 0.58 0.57 0.53 0.51SUP1 0.49 0.43 0.47 0.52 0.46 0.58SUP2 0.32 0.42 0.39 0.42 0.38 0.55
PROC3 0.47 0.57 0.63 0.58 0.59 0.44RES4 0.23 0.29 0.22 0.39 0.28 0.36
Correlation Coefficients for the Hybrid E-Services
RES1 0.72 0.57 0.57 0.43 0.46 0.54RES2 0.59 0.5 0.57 0.51 0.48 0.53RES3 0.44 0.4 0.46 0.45 0.51 0.5
PROC1 0.56 0.48 0.53 0.39 0.54 0.45INF1 0.57 0.57 0.61 0.45 0.5 0.53INF2 0.46 0.53 0.55 0.47 0.45 0.45
PROC2 0.38 0.37 0.4 0.34 0.4 0.47SYS1 0.47 0.49 0.56 0.53 0.59 0.58SYS2 0.4 0.45 0.51 0.43 0.47 0.5SUP1 0.5 0.56 0.53 0.5 0.55 0.68SUP2 0.49 0.54 0.51 0.49 0.57 0.66
PROC3 0.46 0.48 0.6 0.47 0.57 0.59RES4 0.37 0.43 0.37 0.53 0.47 0.33

J. Open Innov. Technol. Mark. Complex. 2020, 6, 143 13 of 21
Our study verified the multidimensional structure of e-service quality according to means-endchain theory and multiple previous studies [1,7,10,35,36,39] and allowed us to verify the validity ofthe following quality dimensions for both hybrid and digital e-services: quality of e-service results,quality of e-service process, quality of e-service information, quality of e-service system, and qualityof e-service customer support. This approach to quality dimensions is based on the ideas of theEdvardsson B. [48], ISCI model [29], and E-RecS-Qual model [57] and assumes that the e-service qualitydimension should be conceptualized as a specific component of the service and quality attributesspecify each of these components. This differs from the multiple studies [1,7,10,35,36,39] where qualitydimensions are represented by quality attributes, and this confuses both customers and managerswhen conceptualizing e-service quality.
5. Discussion
5.1. Integrated E-Service Adoption–Continuance Quality Model
According to our findings, e-service quality dimensions show a moderate impact on the consumerintention to continue using a service, which confirms the means-end chain theory, when a customerstarts with a judgment of specific attributes and progresses to perception or more abstract concepts likequality, experience, and satisfaction.
An interesting finding that still places means-end chain theory under question is that e-serviceusefulness and ease of use have a strong impact directly on customer satisfaction. This reminds usabout technology acceptance models and shows that e-service usefulness and ease of use are themost significant attributes not only at the stage of e-service acceptance but also at the stage of usingthe service. Other consumer attributes require aggregation in quality dimensions in order to have acumulative impact on customer satisfaction and the decision to continue using the service. Our findingsallowed us to revisit the model (Figure 3).
J. Open Innov. Technol. Mark. Complex. 2020, 6, x FOR PEER REVIEW 14 of 22
where quality dimensions are represented by quality attributes, and this confuses both customers
and managers when conceptualizing e-service quality.
5. Discussion
5.1. Integrated E-Service Adoption–Continuance Quality Model
According to our findings, e-service quality dimensions show a moderate impact on the
consumer intention to continue using a service, which confirms the means-end chain theory, when a
customer starts with a judgment of specific attributes and progresses to perception or more abstract
concepts like quality, experience, and satisfaction.
An interesting finding that still places means-end chain theory under question is that e-service
usefulness and ease of use have a strong impact directly on customer satisfaction. This reminds us
about technology acceptance models and shows that e-service usefulness and ease of use are the most
significant attributes not only at the stage of e-service acceptance but also at the stage of using the
service. Other consumer attributes require aggregation in quality dimensions in order to have a
cumulative impact on customer satisfaction and the decision to continue using the service. Our
findings allowed us to revisit the model (Figure 3).
Figure 3. The revisited integrated e-service adoption–continuance quality model.
The important added value of the study is that the relationship between e-service quality
dimensions and e-service attributes shows the significant differences for the hybrid and digital e-
services. As we stated above, perceived usefulness (RES1) has the most decisive impact on customer
satisfaction both for digital and hybrid services. For digital e-services, it has a stronger correlation
with process quality than with result quality. This may be because most of the digital services are
process-oriented, whereby the customer receives benefits during the process of e-service delivery.
For digital e-services, process quality and system quality are the most consistent quality dimensions.
Thus, the accessibility and reliability of the e-service are perceived as a part of the system quality
dimensions. Ease of use has a strong correlation with two dimensions—information quality and
process quality. For hybrid services, the most crucial quality dimension is the quality of the results,
while quality of information is the least important factor. This is determined by the differences in
function of information. For digital services, information is the primary service outcome determining
the usefulness of the service. At the same time, for hybrid services, system quality is also important
because it has a strong correlation with six e-service attributes. Information quality and process
quality are less important for hybrid e-services because they are result-oriented, and the service
delivery process is entirely associated with the use of websites or mobile applications. Interestingly,
security for all types of services shows a moderate correlation with the quality of customer support,
which means that security is perceived as a function of the support or help from the service provider.
Figure 3. The revisited integrated e-service adoption–continuance quality model.
The important added value of the study is that the relationship between e-service qualitydimensions and e-service attributes shows the significant differences for the hybrid and digitale-services. As we stated above, perceived usefulness (RES1) has the most decisive impact on customersatisfaction both for digital and hybrid services. For digital e-services, it has a stronger correlationwith process quality than with result quality. This may be because most of the digital services areprocess-oriented, whereby the customer receives benefits during the process of e-service delivery.For digital e-services, process quality and system quality are the most consistent quality dimensions.Thus, the accessibility and reliability of the e-service are perceived as a part of the system qualitydimensions. Ease of use has a strong correlation with two dimensions—information quality andprocess quality. For hybrid services, the most crucial quality dimension is the quality of the results,

J. Open Innov. Technol. Mark. Complex. 2020, 6, 143 14 of 21
while quality of information is the least important factor. This is determined by the differences infunction of information. For digital services, information is the primary service outcome determiningthe usefulness of the service. At the same time, for hybrid services, system quality is also importantbecause it has a strong correlation with six e-service attributes. Information quality and process qualityare less important for hybrid e-services because they are result-oriented, and the service deliveryprocess is entirely associated with the use of websites or mobile applications. Interestingly, security forall types of services shows a moderate correlation with the quality of customer support, which meansthat security is perceived as a function of the support or help from the service provider.
The analysis shows that perceived security and the ability of the service to save the consumer’stime have the lowest impact on perceived quality and, in our opinion, this requires further research.Similar results can be observed in some other studies. For example, as shown in [47], security and onlineshopping platform satisfaction have a weak correlation, while ease of use, reliability and responsiveness,assurance, and attractiveness have a significant impact on online shopping customer satisfaction.It is also confirmed in [27] that perceived privacy surprisingly did not impact the “likelihood topurchase online”. As a contrast, the results of the study on the adoption of e-government servicesmade in the United Arab Emirates underline strong positive relations between consumer perceptionsof confidentiality and trust and e-government services adoption [61].
5.2. E-Service Quality Dimensions and Consumer Attributes
We suppose that security is an independent attribute that influences the decision to adopt ane-service and intentions to continue using the e-service. However, it does not influence the e-servicequality perception and customer satisfaction level. In our opinion, according to the Kano Model [63],security should be considered as a basic attribute (“must be”) that does not affect customer satisfactionbut leads to customer dissatisfaction if not present. This means that even if customers perceive thatthe security of an e-service is high, it has no influence on their intentions to adopt an e-service orcontinue using it. On the contrary, if the perceived security is low, it will negatively influence thedecision and decrease the value of the e-service quality. Hence, the relationship between perceivede-service security and consumer behavior requires further study. As for the perception of time in thecontext of using e-services, we can assume that consumers take this benefit for granted (also as a basicproperty, according to the Kano Model), which means that there is no impact on quality perceptionand satisfaction level.
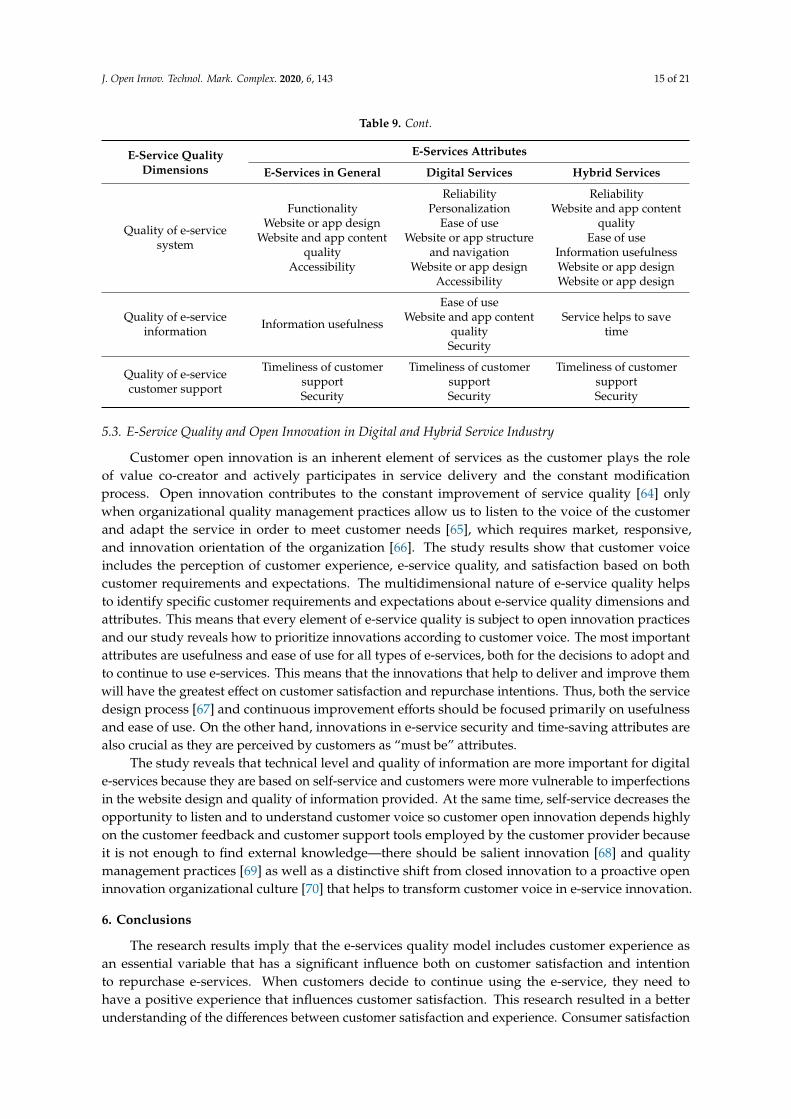
We present a new relationship between quality dimensions and consumer attributes according toour findings (Table 9).
Table 9. Revised e-service quality dimensions and consumer attributes.
E-Service QualityDimensions
E-Services Attributes
E-Services in General Digital Services Hybrid Services
Quality of e-serviceresult Functionality
Quality of e-serviceprocess
PersonalizationReliabilityEase of use
Website or app structureand navigation
FunctionalityEase of use
Information usefulness
Website or app structureand navigation
J. Open Innov. Technol. Mark. Complex. 2020, 6, 143 15 of 21
Table 9. Cont.
E-Service QualityDimensions
E-Services Attributes
E-Services in General Digital Services Hybrid Services
Quality of e-servicesystem
FunctionalityWebsite or app design
Website and app contentquality
Accessibility
ReliabilityPersonalization
Ease of useWebsite or app structure
and navigationWebsite or app design
Accessibility
ReliabilityWebsite and app content
qualityEase of use
Information usefulnessWebsite or app designWebsite or app design
Quality of e-serviceinformation Information usefulness
Ease of useWebsite and app content
qualitySecurity
Service helps to savetime
Quality of e-servicecustomer support
Timeliness of customersupportSecurity
Timeliness of customersupportSecurity
Timeliness of customersupportSecurity
5.3. E-Service Quality and Open Innovation in Digital and Hybrid Service Industry
Customer open innovation is an inherent element of services as the customer plays the roleof value co-creator and actively participates in service delivery and the constant modificationprocess. Open innovation contributes to the constant improvement of service quality [64] onlywhen organizational quality management practices allow us to listen to the voice of the customerand adapt the service in order to meet customer needs [65], which requires market, responsive,and innovation orientation of the organization [66]. The study results show that customer voiceincludes the perception of customer experience, e-service quality, and satisfaction based on bothcustomer requirements and expectations. The multidimensional nature of e-service quality helpsto identify specific customer requirements and expectations about e-service quality dimensions andattributes. This means that every element of e-service quality is subject to open innovation practicesand our study reveals how to prioritize innovations according to customer voice. The most importantattributes are usefulness and ease of use for all types of e-services, both for the decisions to adopt andto continue to use e-services. This means that the innovations that help to deliver and improve themwill have the greatest effect on customer satisfaction and repurchase intentions. Thus, both the servicedesign process [67] and continuous improvement efforts should be focused primarily on usefulnessand ease of use. On the other hand, innovations in e-service security and time-saving attributes arealso crucial as they are perceived by customers as “must be” attributes.
The study reveals that technical level and quality of information are more important for digitale-services because they are based on self-service and customers were more vulnerable to imperfectionsin the website design and quality of information provided. At the same time, self-service decreases theopportunity to listen and to understand customer voice so customer open innovation depends highlyon the customer feedback and customer support tools employed by the customer provider becauseit is not enough to find external knowledge—there should be salient innovation [68] and qualitymanagement practices [69] as well as a distinctive shift from closed innovation to a proactive openinnovation organizational culture [70] that helps to transform customer voice in e-service innovation.
6. Conclusions
The research results imply that the e-services quality model includes customer experience asan essential variable that has a significant influence both on customer satisfaction and intentionto repurchase e-services. When customers decide to continue using the e-service, they need tohave a positive experience that influences customer satisfaction. This research resulted in a betterunderstanding of the differences between customer satisfaction and experience. Consumer satisfaction
J. Open Innov. Technol. Mark. Complex. 2020, 6, 143 16 of 21
is strongly influenced by the usefulness and ease of use, while consumer experience is influenced bythe quality of e-service technical level, quality of e-service process, and quality of customer support.This confirms that both customer experience and satisfaction should be embedded in e-service qualitymodels to illustrate different angles of customer perceptions and behavior. It bridges the gap betweencustomer loyalty management, which is seen mostly as a marketing function, and quality management,which is seen mostly as an operational function.
The hypothesis about the similar relationship between customer experience, quality, satisfaction,and intention was confirmed for hybrid and digital e-services, as well as the multidimensional natureof e-service quality, including the customer support quality, system quality, information quality,e-service process quality, and quality of e-service results. This supports the idea of common theoreticalapproaches to quality management for all types of e-services regardless of the combination of onlineand offline strategies and experiences. Future research should stimulate the diffusion of best practicesbetween different types of e-services and provide the opportunity to spread research findings betweendifferent e-service sectors widely.
The major difference between hybrid and digital e-services was found in the relationship betweenattributes and quality dimensions because of the different focus in value generation—process-orientedfor digital services and result-oriented for hybrid services.
An unexpected finding is that two e-service attributes (perceived usefulness and perceived easeof use) have a significant direct influence on customer satisfaction. Other attributes show an indirectrelationship with satisfaction through quality components. Therefore, research results develop ideas oftechnology acceptance models and prove that perceived usefulness and perceived ease of use shouldbe the focus of managers at all stages of the consumer lifecycle—from the decision to adopt an e-serviceto the cyclical decision to continue using it.
Another unexpected finding is that security and ability to save time show a weak correlationwith e-service quality and customer satisfaction. We should treat them as essential e-service attributesaccording to the Kano Model, when they influence dissatisfaction, if not present, but do not influencesatisfaction, if present.
The combination of technology acceptance models, e-service models, and the customer experienceconcept enables us to explain customer behavior, when initial customer expectations are focused ontwo e-service attributes—functionality and ease of use—but after the consumer has experience ofusing the e-service, his or her expectations undergo a transformation, and he or she perceives e-servicequality through a wider number of e-service attributes combined in five e-service quality dimensions:e-service result quality, e-service system quality, e-service process quality, information quality, andcustomer support quality. The adoption decision is based only on expectations, and the intentionto continue using the e-service is based on the transformation of customer experience into customersatisfaction mediated by the e-service quality and customer experience.
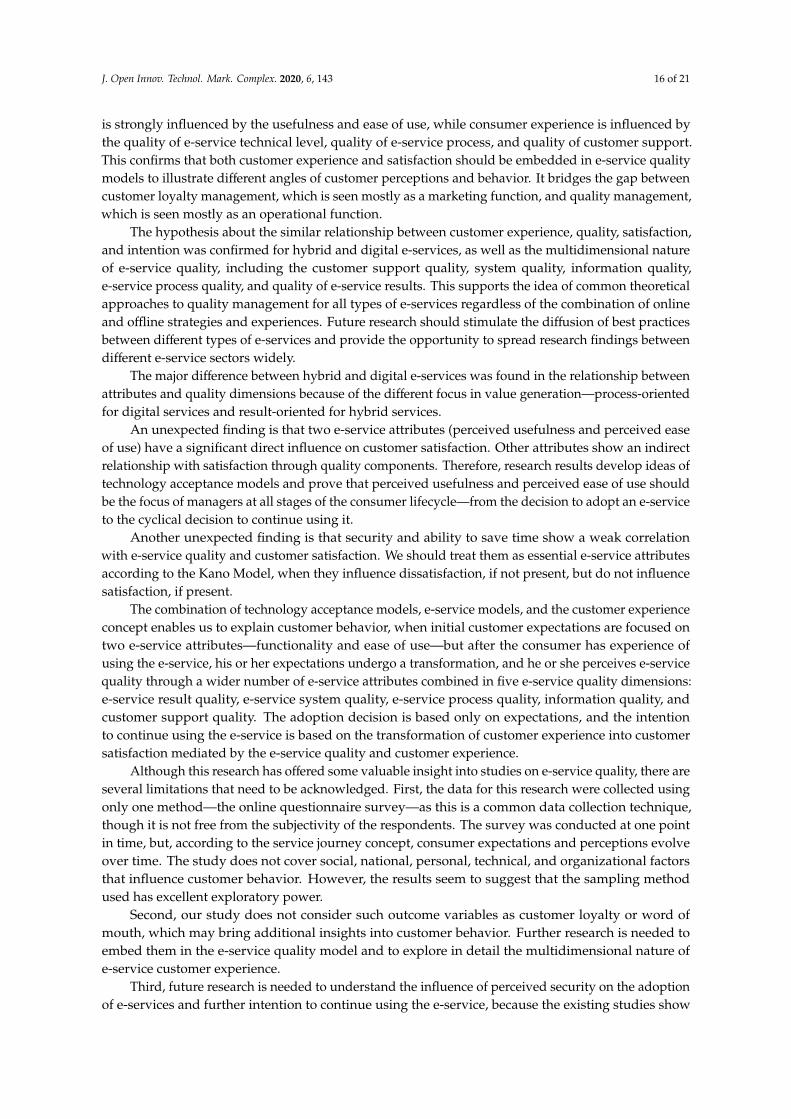
Although this research has offered some valuable insight into studies on e-service quality, there areseveral limitations that need to be acknowledged. First, the data for this research were collected usingonly one method—the online questionnaire survey—as this is a common data collection technique,though it is not free from the subjectivity of the respondents. The survey was conducted at one pointin time, but, according to the service journey concept, consumer expectations and perceptions evolveover time. The study does not cover social, national, personal, technical, and organizational factorsthat influence customer behavior. However, the results seem to suggest that the sampling methodused has excellent exploratory power.
Second, our study does not consider such outcome variables as customer loyalty or word ofmouth, which may bring additional insights into customer behavior. Further research is needed toembed them in the e-service quality model and to explore in detail the multidimensional nature ofe-service customer experience.
Third, future research is needed to understand the influence of perceived security on the adoptionof e-services and further intention to continue using the e-service, because the existing studies show
J. Open Innov. Technol. Mark. Complex. 2020, 6, 143 17 of 21
contradictory results in terms of the relationship between security, e-service quality perception,and customer satisfaction.
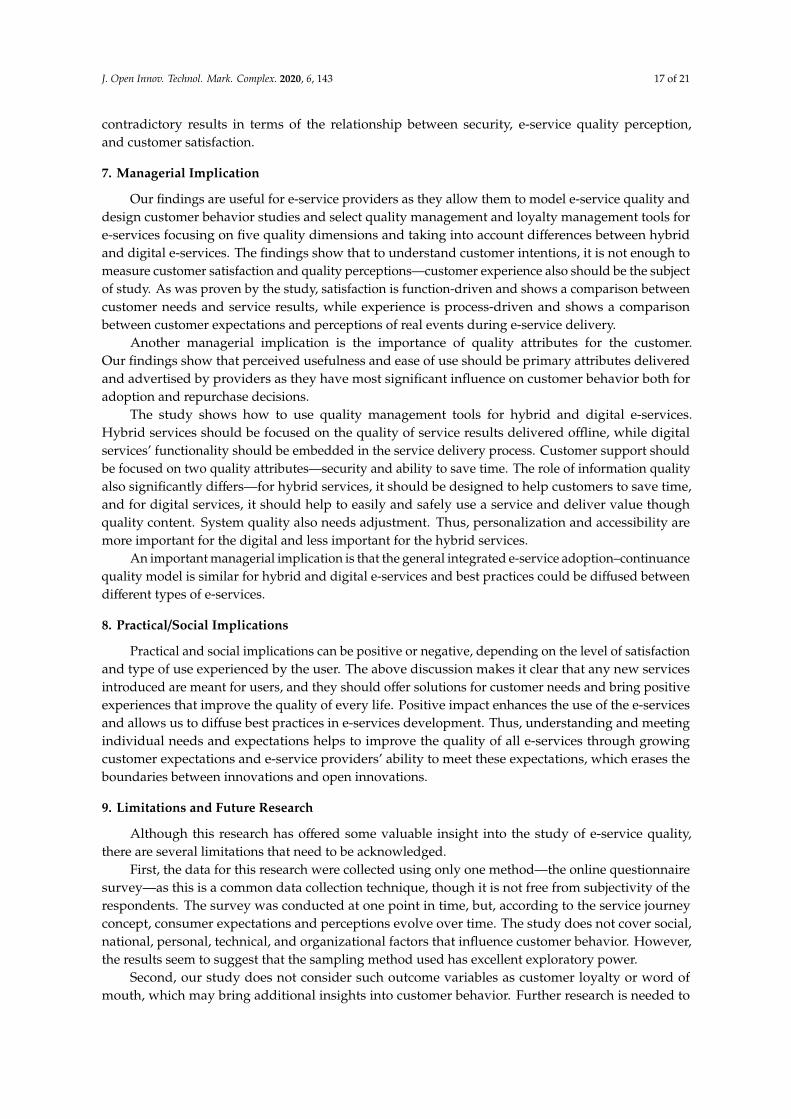
7. Managerial Implication
Our findings are useful for e-service providers as they allow them to model e-service quality anddesign customer behavior studies and select quality management and loyalty management tools fore-services focusing on five quality dimensions and taking into account differences between hybridand digital e-services. The findings show that to understand customer intentions, it is not enough tomeasure customer satisfaction and quality perceptions—customer experience also should be the subjectof study. As was proven by the study, satisfaction is function-driven and shows a comparison betweencustomer needs and service results, while experience is process-driven and shows a comparisonbetween customer expectations and perceptions of real events during e-service delivery.
Another managerial implication is the importance of quality attributes for the customer.Our findings show that perceived usefulness and ease of use should be primary attributes deliveredand advertised by providers as they have most significant influence on customer behavior both foradoption and repurchase decisions.
The study shows how to use quality management tools for hybrid and digital e-services.Hybrid services should be focused on the quality of service results delivered offline, while digitalservices’ functionality should be embedded in the service delivery process. Customer support shouldbe focused on two quality attributes—security and ability to save time. The role of information qualityalso significantly differs—for hybrid services, it should be designed to help customers to save time,and for digital services, it should help to easily and safely use a service and deliver value thoughquality content. System quality also needs adjustment. Thus, personalization and accessibility aremore important for the digital and less important for the hybrid services.
An important managerial implication is that the general integrated e-service adoption–continuancequality model is similar for hybrid and digital e-services and best practices could be diffused betweendifferent types of e-services.
8. Practical/Social Implications
Practical and social implications can be positive or negative, depending on the level of satisfactionand type of use experienced by the user. The above discussion makes it clear that any new servicesintroduced are meant for users, and they should offer solutions for customer needs and bring positiveexperiences that improve the quality of every life. Positive impact enhances the use of the e-servicesand allows us to diffuse best practices in e-services development. Thus, understanding and meetingindividual needs and expectations helps to improve the quality of all e-services through growingcustomer expectations and e-service providers’ ability to meet these expectations, which erases theboundaries between innovations and open innovations.
9. Limitations and Future Research
Although this research has offered some valuable insight into the study of e-service quality,there are several limitations that need to be acknowledged.
First, the data for this research were collected using only one method—the online questionnairesurvey—as this is a common data collection technique, though it is not free from subjectivity of therespondents. The survey was conducted at one point in time, but, according to the service journeyconcept, consumer expectations and perceptions evolve over time. The study does not cover social,national, personal, technical, and organizational factors that influence customer behavior. However,the results seem to suggest that the sampling method used has excellent exploratory power.
Second, our study does not consider such outcome variables as customer loyalty or word ofmouth, which may bring additional insights into customer behavior. Further research is needed to

J. Open Innov. Technol. Mark. Complex. 2020, 6, 143 18 of 21
embed them in the e-service quality model and to explore in detail the multidimensional nature ofe-service customer experience.
Third, future research is needed to understand the influence of perceived security on the adoptionof e-services and further intention to continue using the e-service, because the existing studies showcontradictory results in terms of the relationship between security, e-service quality perception,and customer satisfaction.
Author Contributions: Conceptualization, N.V. and E.G.; Data curation, N.V., N.K. and O.F.; Formal analysis,N.V., N.K. and O.F.; Investigation, N.V. and N.K.; Methodology, N.V.; Resources, N.V. and O.F.; Visualization, O.F.;Writing—original draft, N.V. and O.F.; Writing—review and editing, E.G. and N.K. All authors have read andagreed to the published version of the manuscript.
Funding: This research was funded by RFBR, project number 20-010-00571 “The Impact of Digital Transformationon Improving the Quality and Innovation of Services”.
Conflicts of Interest: The authors declare no conflict of interest.
References
1. Li, H.; Suomi, R. Dimensions of E-service Quality: An Alternative Model. In Proceedings of the 2ndInternational Conference on Future Generation Communication and Networking Symposia, Sanya, China,13–15 December 2008; IEEE Computer Society: Washington, DC, USA, 2008; Volume 1, pp. 29–35. [CrossRef]
2. Tishina, E.A.; Rezantseva, E.Y.; Reut, D.V. The concept of digital transformation of the society. In Proceedingsof the 10th International Conference “Management of Large-Scale System Development”, MLSD, Moscow,Russia, 2–4 October 2017; IEEE: New York, NY, USA, 2017; pp. 1–5. [CrossRef]
3. Zuev, D.; Kalistratov, A.; Zuev, A. Machine Learning in IT Service Management. Procedia Comput. Sci. 2018,145, 675–679. [CrossRef]
4. Abdullaev, F.O.; Khamraev, K.I.; Arzuova, S.A.; Abdukayumov, A.N. Digital transformation of marketinstitutions. J. Southwest Jiaotong Univ. 2019, 54. [CrossRef]
5. Shaytura, S.V.; Minitaeva, A.M.; Ordov, K.V.; Shaparenko, V.V. Virtual enterprises in a spatial economy. Int. J.Recent Technol. Eng. 2019, 7, 719–724.
6. World Economic Forum White Paper Digital Transformation of Industries: Digital Enterprise. 2016.Available online: http://reports.weforum.org/digital-transformation/wp-content/blogs.dir/94/mp/files/pages/files/digital-enterprise-narrative-final-january-2016.pdf (accessed on 9 September 2020).
7. Rowley, J. An analysis of the e-service literature: Towards a research agenda. Internet Res. 2006, 16, 339–359.[CrossRef]
8. Zeithaml, V.; Bitner, M.J. Services Marketing. Integrating Customer Focus across the Firm, 3rd ed.; McGraw-Hill:New York, NY, USA, 2003.
9. Järvinen, R.; Lehtinen, U. Service Characteristics in Transition: Influence of Transition from TraditionalHealth Services to e-Health Services in Service Characteristics. Int. J. E Serv. Mob. Appl. 2015, 7, 1–16.[CrossRef]
10. Kim, J.; Lennon, S.J. Descriptive Content Analysis on E-Service Research. Int. J. Serv. Sci. Manag. Eng. Technol.2017, 8, 18–31. [CrossRef]
11. Plaksin, S.; Abdrakhmanova, G.; Kovaleva, G. Approaches to Defining and Measuring Russia’s InternetEconomy. Foresight STI Gov. 2017, 11, 55–65. [CrossRef]
12. Ruutu, S.; Casey, T.; Kotovirta, V. Development and competition of digital service platforms: A systemdynamics approach. Technol. Forecast. Soc. Chang. 2017, 117, 119–130. [CrossRef]
13. Barrett, M.; Davidson, E.; Prabhu, J.; Vargo, S.L. Service innovation in the digital age: Key contributions andfuture directions. MIS Q. 2015, 39, 135–154. [CrossRef]
14. Russian Association of Electronic Commerce. RUNET Today 2019. Main Analytical Report. Available online:http://a.raec.ru (accessed on 12 August 2020).
15. Abrakhmanova, G.I.; Vishnevsky, K.O.; Gokhberg, L.M.; Demyanova, A.V.; Dranev, Y.Y.; Diachenko, E.L.;Kovaleva, G.G.; Kontsemir, M.N.; Kuznetsova, I.A.; Ratay, T.V.; et al. Indicators of Digital Economy 2019:Statistical Review; Higher School of Economics (National Research University) Press: Moscow, Russia, 2019.
J. Open Innov. Technol. Mark. Complex. 2020, 6, 143 19 of 21
16. Abrakhmanova, G.I.; Vishnevsky, K.O.; Gokhberg, L.M.; Demyanova, A.V.; Kevesch, M.M.; Kovaleva, G.G.;Kontsemir, M.N.; Kuznetsova, I.A.; Ozerova, O.K.; Polyakova, V.V.; et al. Digital Economy 2020: Short StatisticalReview; Higher School of Economics (National Research University) Press: Moscow, Russia, 2020.
17. Chesbrough, H. Open Innovation: A New Paradigm for Understanding Industrial Innovation. In OpenInnovation: Researching a New Paradigm; Chesbrough, H., Vanhaverbeke, W., West, J., Eds.; Oxford UniversityPress: Oxford, UK, 2006; pp. 1–12.
18. Rogers, E. Diffusion of Innovation, 5th ed.; Free Press: New York, NY, USA, 2003.Available online: http://www.simonandschuster.com/books/Diffusion-of-Innovations-5th-Edition/Everett-M-Rogers/9780743222099 (accessed on 10 September 2020).
19. Ajzen, I. The Theory of Planned Behavior. Organ. Behav. Hum. Decis. Process. 1991, 50, 179–211. [CrossRef]20. Goodhue, D.L.; Thompson, R.L. Task Technology Fit and Individual Performance. MIS Q. 1995, 19, 213–236.
[CrossRef]21. Collier, J.E.; Bienstock, C.C. Measuring Service Quality in E-Retailing. J. Serv. Res. 2006, 8, 260. [CrossRef]22. Davis, F.D. Perceived Usefulness, Perceived Ease of Use, and User Acceptance of Information Technology.
MIS Q. 1989, 13, 319–340. [CrossRef]23. Venkatesh, V.; Davis, F.D. A Theoretical Extension of the Technology Acceptance Model: Four Longitudinal
Field Studies. Manag. Sci. 2000, 46, 169–332. [CrossRef]24. Venkatesh, V.; Bala, H. Technology Acceptance Model 3 and a Research Agenda on Interventions. Decis. Sci.
2008, 39, 273–315. [CrossRef]25. Venkatesh, V.; Thong, J.Y.L.; Xu, X. Unified Theory of Acceptance and Use of Technology: A Synthesis and
Road Ahead. J. Assoc. Inf. Syst. 2016, 17, 328–376. [CrossRef]26. Chang, A. UTAUT and UTAUT 2: A review and agenda for future research. J. Win. 2012, 13, 106–114.
[CrossRef]27. Mummalaneni, V.; Meng, J.G.; Elliott, K.M. Consumer Technology Readiness and E-Service Quality in
E-Tailing: What is the Impact on Predicting Online Purchasing? J. Internet Commer. 2016, 15, 311–331.[CrossRef]
28. Oliver, R.L. A Cognitive Model of the Antecedents and Consequences of Satisfaction Decisions. J. Mark. Res.1980, 17, 460–469. [CrossRef]
29. Petter, S.; DeLone, W.; McLean, E. Measuring Information System Success: Models, Dimensions, Measures,and Interrelationships. Eur. J. Inf. Syst. 2008, 17, 236–263. [CrossRef]
30. Taherdoost, H. Development of an Adoption Model to Assess User Acceptance of E-Service Technology:E-Service Technology Acceptance Model. Behav. Inf. Technol. 2018, 37, 173–197. [CrossRef]
31. Kim, J. Platform Adoption Factors in the Internet Industry. Sustainability 2018, 10, 3185. [CrossRef]32. Saura, J.R.; Palos-Sanchez, P.; Velicia-Martin, F. What Drives Volunteers to Accept a Digital Platform That
Supports NGO Projects? Front. Psychol. 2020, 11, 429. [CrossRef] [PubMed]33. Reyes-Menendez, A.; Saura, J.R.; Martinez-Navalon, J.G. The Impact of e-WOM on Hotels Management
Reputation: Exploring Tripadvisor Review Credibility with the ELM Model. IEEE Access 2019, 7, 68868–68877.[CrossRef]
34. Zarei, G.; Asgarnezhad Nuri, B.; Noroozi, N. The effect of Internet service quality on consumers’ purchasebehavior: The role of satisfaction, attitude, and purchase intention. J. Internet Commer. 2019, 18, 197–220.[CrossRef]
35. Ladhari, R. Developing e-service quality scales: A literature review. J. Retail. Consum. Serv. 2010, 17, 464–477.[CrossRef]
36. Blut, M.; Chowdhry, N.; Mittal, V.; Brock, C. E-Service Quality: A Meta-Analytic Review. J. Retail. 2015, 91,679–700. [CrossRef]
37. Gardial, S.; Clemons, D.; Woodruff, R.; Schumann, D.; Burns, M. Comparing Consumers’ Recall of Prepurchaseand Postpurchase Product Evaluation Experiences. J. Consum. Res. 1994, 20, 548–560. [CrossRef]
38. Johnson, M.D. Consumer Choice Strategies for Comparing Noncomparable Alternatives. J. Consum. Res.1984, 11, 741–753. [CrossRef]
39. Jung, Y.; Kang, H. User Goals in Social Virtual Worlds: A Means-End Chain Approach. Comput. Hum. Behav.2010, 26, 218–225. [CrossRef]
40. Zeithaml, V.A. Consumer Perceptions of Price, Quality, and Value: A Means-End Model and Synthesis ofEvidence. J. Mark. 1988, 52, 2–22. [CrossRef]

J. Open Innov. Technol. Mark. Complex. 2020, 6, 143 20 of 21
41. Blut, M. E-Service Quality: Development of a Hierarchical Model. J. Retail. 2016, 92, 500–517. [CrossRef]42. Akaka, M.A.; Vargo, S.L.; Schau, H.J. The context of experience. J. Serv. Manag. 2015, 26, 206–223. [CrossRef]43. Pekovic, S.; Rolland, S. Recipes for achieving customer loyalty: A qualitative comparative analysis of the
dimensions of customer experience. J. Retail. Consum. Serv. 2020, 56, 102171. [CrossRef]44. Ameen, N.; Tarhini, A.; Reppel, A.; Anand, A. Customer Experiences in the age of Artificial Intelligence.
Comput. Hum. Behav. 2021, 114, 106548. [CrossRef]45. Tyrvainen, O.; Karjaluoto, H.; Saarijarvi, H. Personalization and hedonic motivation in creating customer
experiences and loyalty in omnichannel retail. J. Retail. Consum. Serv. 2020, 57, 102233. [CrossRef]46. Mohanty, R.P.; Lakhe, R.R. TQM in the Service Sector; Jaico Publishing House: Mumbai, India, 2008.47. Raval, H.; Bhatt, V. A study on customers’ perceptions towards E service quality dimensions and their
satisfaction of online shopping platforms. Mukt Shabd J. 2020, IX, 3984–3997.48. Edvardsson, B. Service Quality Improvement. Manag. Serv. Qual. 1998, 8, 142–149. [CrossRef]49. Ahmad, A.; Rahman, O.; Khan, M.N. Consumer’s Perception of Website Service Quality: An Empirical Study.
J. Internet Commer. 2016, 15, 125–141. [CrossRef]50. Shatnawi, T. Development of an Integrated Conceptual Framework for Electronic Hedonic Service Quality
(e-HSQ): An Exploratory Study. J. Internet Commer. 2019, 18, 395–427. [CrossRef]51. Hossain, M.A.; Kim, M. Does Multidimensional Service Quality Generate Sustainable Use Intention for
Facebook? Sustainability 2018, 10, 2283. [CrossRef]52. Zemblyte, J. The Instrument for Evaluating E-Service Quality. Procedia Soc. Behav. Sci. 2015, 213, 81–86.
[CrossRef]53. Ho, C.; Lee, Y. The development of an e-travel service quality scale. Tour. Manag. 2007, 28, 1434–1449.
[CrossRef]54. Zeglat, D.; Tedmori, S. Assessing the Importance of E-SQ Dimensions and Attributes: Perspective of
Facebook’s Users. Int. Bus. Res. 2014, 7, 83–97. [CrossRef]55. Lestarini, D.; Surendro, K. Designing Kano-Based E-Service Quality Model to Improve User Satisfaction.
In Proceedings of the 2nd International Conference on Information Technology, Information Systems andElectrical Engineering (ICITISEE), Yogyakarta, Indonesia, 1–3 November 2017; pp. 147–152.
56. Fassnacht, M.; Koese, I. Quality of electronic services: Conceptualizing and testing a hierarchical model.J. Serv. Res. 2006, 9, 19–31. [CrossRef]
57. Parasuraman, A.; Zeithaml, V.A.; Malhotra, A. E-S-QUAL—A multiple-item scale for assessing electronicservice quality. J. Serv. Res. 2005, 7, 213–233. [CrossRef]
58. ISO/IEC TS 25011 Information Technology—Systems and Software Quality Requirements and Evaluation(SQuaRE)—Service Quality Models. Available online: https://www.iso.org/standard/35735.html (accessed on11 November 2020).
59. Vatolkina, N. The transformation quality model of e-services: A theoretical rationale. Vestn. Plekhanov Russ.Univ. Econ. 2019, 2, 93–107. [CrossRef]
60. Gupta, S.; Vajic, M. The Contextual and Dialectical Nature of Experiences in New Service Development;Fitzsimmons, J., Fitzsimmons, M., Eds.; Sage: Thousand Oaks, CA, USA, 1999; pp. 33–51.
61. Rodrigues, G.; Sarabdeen, J.; Balasubramanian, S. Factors that Influence Consumer Adoption of E-governmentServices in the UAE: A UTAUT Model Perspective. J. Internet Commer. 2016, 15, 18–39. [CrossRef]
62. Andreeva, M.M.; Volkov, V.R. Correlation analysis in sociological research. Bull. Kazan Technol. Univ. 2013,16, 271–274. Available online: https://cyberleninka.ru/article/n/korrelyatsionnyy-analiz-v-sotsiologicheskih-issledovaniyah (accessed on 10 September 2020).
63. Juznik Rotar, L.; Kozar, M. The Use of the Kano Model to Enhance Customer Satisfaction. Organizacija 2017,50, 339–351. [CrossRef]
64. Rashid, M.; Ur, H.; Nurunnabi, M.; Rahman, M.; Masud, M.; Kaium, A. Exploring the Relationship betweenCustomer Loyalty and Financial Performance of Banks: Customer Open Innovation Perspective. J. OpenInnov. Technol. Mark. Complex. 2020, 6, 108. [CrossRef]
65. Krajcsák, Z. Implementing Open Innovation Using Quality Management Systems: The Role of OrganizationalCommitment and Customer Loyalty. J. Open Innov. Technol. Mark. Complex. 2019, 5, 90. [CrossRef]
66. Ergün, H.S.; Kuscu, Z.K. Innovation Orientation, Market Orientation and e-Loyalty: Evidence from Turkishe-Commerce Customers. Procedia Soc. Behav. Sci. 2013, 99, 509–516. [CrossRef]

J. Open Innov. Technol. Mark. Complex. 2020, 6, 143 21 of 21
67. Nam, K.W.; Kim, B.Y.; Carnie, B.W. Carnie Service Open Innovation; Design Elements for the Food andBeverage Service Business. J. Open Innov. Technol. Mark. Complex. 2018, 4, 53. [CrossRef]
68. Salge, T.O.; Bohné, T.M.; Farchi, T.; Piening, E.P. Harnessing the value of open innovation: The moderatingrole of innovation management. Int. J. Innov. Manag. 2012, 16, 1–26. [CrossRef]
69. Yusr, M.M. Innovation capability and its role in enhancing the relationship between TQM practices andinnovation performance. J. Open Innov. Technol. Mark. Complex. 2016, 2, 1–15. [CrossRef]
70. Kratzer, J.; Meissner, D.; Roudb, V. Open innovation and company culture: Internal openness makes thedifference. Technol. Forecast. Soc. Chang. 2017, 119, 128–138. [CrossRef]
Publisher’s Note: MDPI stays neutral with regard to jurisdictional claims in published maps and institutionalaffiliations.
© 2020 by the authors. Licensee MDPI, Basel, Switzerland. This article is an open accessarticle distributed under the terms and conditions of the Creative Commons Attribution(CC BY) license (http://creativecommons.org/licenses/by/4.0/).