E-logbook Technology Development in South Africa
22
173 Reflections on the State of Research and Technology in South Africa’s Marine and Maritime Sectors Chapter 9 E-logbook Technology Development in South Africa Amos Barkai and Philippe Lallemand 1. Introduction One of the main hindrances to integrated knowledge management between fishers, managers and scientists is the lack of, and an inability to capture reliable and suitable fishing data. The problem has a number of aspects, not all of which are technical. In many countries around the world, a culture of protecting catch data and disinformation is common among fishers, fishing companies and even official government offices. Significant education is needed to change these mentalities. Although the more industrialised fisheries in South Africa seem well equipped to supply accurate data, there is still a gap between the industry’s data collection and its dissemination to the management authorities. Furthermore, the management of the less industrialised sectors of the South African fishing industry has been struggling with a cumbersome data collection system that has been providing inaccurate and untimely data for years. Consequently, there is a significant lack of reliable data to describe fishing operations (catches, duration, gear, locations and relevant environmental conditions), which has been a serious obstacle for advancements in fisheries management, not only in South Africa, but around the world (Barkai and Bergh, 2005). Another problem that is endemic to imperfect data collection is the ensuing poor quality of historical data found in many fisheries. For example, not all factors related to catch per unit effort (CPUE) data, a key index of trends in resource abundance, have been systematically and/or properly recorded. Consequently, this data is absent from most statistical analyses and resource abundance modelling exercises. Unfortunately, this missing data is often crucial for sound management advice and decisions. This is a global phenomenon and South Africa is certainly no exception. For scientists, unreliable data leads to weak and incomplete stock assessment models and management programmes. For industry, the lack of a comprehensive data collection system significantly reduces its fishing efficiency, since past performance cannot be analysed effectively. As a result, poor management decisions based on unreliable analyses are sometimes made, potentially causing substantial cost and risk to marine resources and the fishing industry (Barkai et al., 2008). Although there has been a greater awareness of the importance of collecting timely and accurate fishing data among South African scientists and fisheries managers in recent years, there is still some confusion about the data need and how exactly to collect and store it. It is common for skippers to record scientific data on one form, for shore managers to use another for commercial purposes and for skippers to keep separate fishing logbooks. This data is then transferred to different computer systems or complex spreadsheets. Sometimes, it is left in paper format in large, inaccessible books and files. There is degradation in the quality of data because of the multistage process of transcription from handwritten logbook sheets to paper forms and then to electronic databases (Barkai and Bergh, 2005). A key step in addressing this issue is unifying all parties with regard to data collection and management. Electronic logbook (e-logbook) systems can bridge the data gaps between fishers, managers and scientists. Moreover, when designed with adaptability and flexibility in mind, such systems can be an effective and useful tool for all marine-related stakeholder
Transcript of E-logbook Technology Development in South Africa

173
Reflections on the State of Research and Technology in South Africa’s Marine and Maritime Sectors
Chapter 9 E-logbook Technology Development in South Africa
Amos Barkai and Philippe Lallemand
1. IntroductionOne of the main hindrances to integrated knowledge management between fishers, managers and scientists is the lack of, and an inability to capture reliable and suitable fishing data. The problem has a number of aspects, not all of which are technical. In many countries around the world, a culture of protecting catch data and disinformation is common among fishers, fishing companies and even official government offices. Significant education is needed to change these mentalities. Although the more industrialised fisheries in South Africa seem well equipped to supply accurate data, there is still a gap between the industry’s data collection and its dissemination to the management authorities. Furthermore, the management of the less industrialised sectors of the South African fishing industry has been struggling with a cumbersome data collection system that has been providing inaccurate and untimely data for years. Consequently, there is a significant lack of reliable data to describe fishing operations (catches, duration, gear, locations and relevant environmental conditions), which has been a serious obstacle for advancements in fisheries management, not only in South Africa, but around the world (Barkai and Bergh, 2005).
Another problem that is endemic to imperfect data collection is the ensuing poor quality of historical data found in many fisheries. For example, not all factors related to catch per unit effort (CPUE) data, a key index of trends in resource abundance, have been systematically and/or properly recorded. Consequently, this data is absent from most statistical analyses and resource abundance modelling exercises. Unfortunately, this missing data is often crucial for sound management advice and decisions. This is a global phenomenon and South Africa is certainly no exception. For scientists, unreliable data leads to weak and incomplete stock assessment models and management programmes. For industry, the lack of a comprehensive data collection system significantly reduces its fishing efficiency, since past performance cannot be analysed effectively. As a result, poor management decisions based on unreliable analyses are sometimes made, potentially causing substantial cost and risk to marine resources and the fishing industry (Barkai et al., 2008).
Although there has been a greater awareness of the importance of collecting timely and accurate fishing data among South African scientists and fisheries managers in recent years, there is still some confusion about the data need and how exactly to collect and store it. It is common for skippers to record scientific data on one form, for shore managers to use another for commercial purposes and for skippers to keep separate fishing logbooks. This data is then transferred to different computer systems or complex spreadsheets. Sometimes, it is left in paper format in large, inaccessible books and files. There is degradation in the quality of data because of the multistage process of transcription from handwritten logbook sheets to paper forms and then to electronic databases (Barkai and Bergh, 2005).
A key step in addressing this issue is unifying all parties with regard to data collection and management. Electronic logbook (e-logbook) systems can bridge the data gaps between fishers, managers and scientists. Moreover, when designed with adaptability and flexibility in mind, such systems can be an effective and useful tool for all marine-related stakeholder

174
Part 3 Current Research and Technology Advances in the Marine Sciences
groups, from the fishers themselves to commercial managers, government agencies and scientists. In fact, e-logbook systems have already been widely implemented and have proven to be an effective data collection tool in fisheries around the world, from Africa to Australasia, North America and Europe.
2. The South African experience with the collection and management of fisheries data
The South African fishing industry is a mature industry that, like most fisheries around the industrialised world, is managed to ensure the sustainable use of fisheries as a resource. Law mandates the Department of Agriculture, Forestry and Fisheries (DAFF) to ensure that this resource is not overexploited (Republic of South Africa, 1998). Any overexploitation of the country’s marine resources would not only affect the larger players (such as established fishing companies) and the small-scale subsistence fishers, but the entire South African population.
DAFF relies on scientific advice to manage the fisheries. The quality and accuracy of data used by fisheries scientists is therefore crucial if it is expected to produce accurate information and sound advice.
The transformation of the fishing industry is a constitutional and legislative imperative. The primary vehicle for the promotion of the transformation of the South African fishing industry is the Marine Living Resources Act, Act No 18 of 1998 (MLRA). Another important purpose of the MLRA is to provide for the orderly exploitation of marine living resources, and to exercise control over marine living resources in a fair and equitable manner to the benefit of the citizens of South Africa (Republic of South Africa, 1998).
2.1 Fisheries management responsibilities
The mandate regarding fisheries matters used to reside with the Department of Environmental Affairs and Tourism (DEAT), which became the Department of Environmental Affairs (DEA) in 2009. In April 2010, most of DEA’s functions were transferred to DAFF.
Now DAFF, through its Fisheries Management Branch (FMB), is the regulatory authority responsible for managing marine and coastal activities such as the following:
• The allocation and management of fishing rights• The regulation of recreational fishing• The management of South Africa’s marine protected areas• The protection and monitoring of South Africa’s coastal and estuarine resources• Researching fish stocks and providing advice on the status of fish stock
However, the FMB has not been fully integrated into DAFF. DEA still manages issues related to marine protected areas (MPAs), which has led to the former being fragmented when executing its mandate.
The process comprises the following directorates that make up the FMB:
• The Directorate: Aquaculture and Economic Development (AED) ensures aquaculture growth and fisheries economic development for sustainable livelihoods by providing public support and an integrated platform for the management of aquaculture.
• The Directorate: Fisheries Research and Development (FRD) ensures the promotion of the sustainable development of fisheries resources and ecosystems by conducting and supporting appropriate research.

175
Reflections on the State of Research and Technology in South Africa’s Marine and Maritime Sectors
• The Directorate: Marine Resources Management (MRM) ensures the sustainable utilisation of, as well as equitable and orderly access to marine living resources through improved management and regulation.
• The Directorate: Monitoring, Control and Surveillance (MCS) ensures the promotion and protection of the sustainable use of marine living resources by intensifying enforcement and compliance.
The FMB employs scientists and technicians who conduct research on more than 200 fish species each year. This data is used to advise the Minister of Agriculture, Forestry and Fisheries and help the FMB to determine the number of fish that may be harvested in each of the 20 commercial fisheries. The FMB relies on the Operational Management Procedures (OMP) database and uses it to manage the major marine fisheries.
The OMP approach is based on the precautionary principle, and derives the total allowable catch (TAC).
2.2 Fishing permit conditions
In South Africa, commercial fishing permit conditions define the rules and regulations pertinent to the fishing activity for which the permit has been issued.
There are 28 fishing permit conditions to be met when fishing commercially in South Africa. Some of these permits are sector-specific, depending on the species, area and/or method used (see Table 1).
Each permit condition highlights the various requirements pertaining to the fishing activity for which the permit is to be issued. Under various sections, depending on the permit type, fishers are required to submit catch statistics in a catch return logbook and/or data on landed catch in a landing declaration sheet.
Moreover, for each fishing permit listed in Table 1, fishers are informed under the permit conditions that if their fishing vessel is longer than 6 m, it must be fitted with a functioning Vessel Monitoring System (VMS) approved by DAFF.
Since most vessels are already required by law to be equipped with an onboard VMS, it potentially creates an opportunity to enable the integration of an onboard electronic reporting system.
2.3 Fisheries data collection
MRM is responsible for managing the fisheries, allocating fishing rights and setting up permit conditions and regulations. These permit conditions and regulations include exemptions, the allocation of fishing quotas and the maintenance of the rightsholder register. MRM also controls, manages and processes the information collected from all the fisheries. This ranges from socio-economic information to catch effort and landing data.
Currently, there are three main sources of fishing data available to MRM and FRD. The first two are collected systematically and the last one is only collected sporadically:
• Commercial capture fisheries data collection through a vessel logbook: The catch effort and landing data collection is currently initiated and maintained by the FMB through its mandatory logbook programme.

176
Part 3 Current Research and Technology Advances in the Marine Sciences
• Scientific data collection through vessel surveys: Programmes run by scientific groups, such as the Marine Resource Assessment and Management Group (MARAM) from the Department of Mathematics and Applied Mathematics at the University of Cape Town, require scientific survey data collected by DAFF.
• Commercial fisheries data collection through observer programmes: Periodically, DAFF also runs ad-hoc observer programmes to gather specific commercial fisheries data to inform management and/or as part of a requirement for a certification process, such as the Marine Stewardship Council (MSC) certification for hake fishery. In compliance with MSC standards, the hake fishing industry has funded an independent observer programme for several years. The programme is run by Capricorn Fisheries Monitoring cc based in Cape Town, which was previously contracted by DAFF.
MCS manages the VMS (see Figure 1), as well as the patrols and inspections of vessels at sea. MCS also manages some 215 fishery control officers (FCOs), who collectively cover some 3 500 km of coastline. There is one FCO for approximately every 17 km. The FCOs are distributed around five major areas grouped into 40 clusters (see Figure 2).
Figure 1: The Vessel Monitoring System of DAFF’s Directorate: Monitoring, Control and Surveillance (based on DAFF 2012a).

177
Reflections on the State of Research and Technology in South Africa’s Marine and Maritime Sectors
Figure 2: Coverage of DAFF’s Directorate: Monitoring, Control and Surveillance, and the geographic distribution of fishery control officers (based on DAFF, 2012a).
MCS’s key compliance responsibilities include land-based patrol and inspections that monitor 22 consumptive commercial fishing sectors, fish processing establishments (FPEs), landing places and restaurants. It manages an estimated 250 000 recreational fishers, 800 subsistence fishers and 916 interim relief applicants. It also monitors exports and imports of fish at points of entry and exit.
DAFF has been focusing on its restructuring within a new ministry and has also been actively involved in the formulation and implementation of the new Policy for the Small-scale Fisheries Sector in South Africa. All of this was achieved to the detriment of its core function of fisheries management (DAFF, 2012b).
The responsibilities of MRM’s operational fisheries/marine resources units include the following:
• Management of fisheries• Allocation of fishing rights• Permit conditions• Permits/exemptions (for example, section 18 and section 81 of the MLRA, imports and
exports)• Rights registers• Transfer of rights• Administration• Constitution and management of sector working groups• Stakeholder liaison

178
Part 3 Current Research and Technology Advances in the Marine Sciences
• Scientific liaison• Compliance liaison• Fishing effort and vessel changes• Recreational fisheries: cross-cutting in a number of sectors• FPEs: cross-cutting in a number of sectors
Two directorates manage the functions above:
The Directorate: Offshore and High Seas Fisheries Management (OHSFM) is in charge of the following two units:
• The Demersal Fisheries Management Unit, which includes the following fisheries:- Hake deep-sea trawling- Hake/sole inshore trawling- Hake longline fishing- Hake handline fishing- Horse mackerel fishing- Demersal shark fishing
• The Pelagics and High Seas Fisheries Management Unit, which includes the following fisheries:- Small pelagics (pilchard and anchovy) fishing- Tuna pole fishing- Large pelagics (tuna and swordfish) fishing- Patagonian toothfish fishing
The Directorate: Inshore Fisheries Management (IFM) is in charge of the following units:
• The Line and Net Fisheries Management Unit, which includes the following fisheries:- Traditional line fishing- Squid fishing- Net fishing (beach seine/trek net and gillnetting)- KwaZulu-Natal beach seine fishing
• The Small Invertebrates and Seaweed Management Unit, which includes the following fisheries:- Abalone- Oysters- Seaweed- White mussels- Bait organisms/small invertebrates
• The Large Crustaceans Management Unit, which includes the following fisheries:- West Coast rock lobster (offshore)- West Coast rock lobster (nearshore)- South Coast rock lobster (SCRL) fishery- KwaZulu-Natal deep-sea prawn trawling
2.4 Current South African logbook system, issues and limitations
The South African fisheries data collection system was first developed with scientific imperatives in mind. Early on, scientists at government agencies managed the collection and maintenance of the databases. While the scientists continuously improved the system,
179
Reflections on the State of Research and Technology in South Africa’s Marine and Maritime Sectors
compliance and enforcement managers saw an opportunity to use the data originally collected for scientific research to meet their requirements and fulfil their purposes.
With the refinement of the South African fishing regulations, accountability, compliance and enforcement needed to be monitored. Very quickly, the compliance and enforcement authorities took custody of the commercial fisheries catch-and-effort database, and government scientists lost most of the control of the database system they had created. Recently, DAFF updated its ageing Sybase database system by developing an alternative data collection system called the Multi-axial Simulation Table (MAST), which is based on Oracle database architecture. However, the newly developed MAST system was found to be harder to implement in all fisheries than previously thought. Today, parallel to the MAST system, a live Sybase database system is still being used for several fisheries, including demersal fisheries.
Only compliance and enforcement agencies have read-and-write access to the database, while scientists only have access to a ‘dumped’ version of the database, which they can consult for their research. There seems to be a substantial delay (up to two years) between the time the data is submitted by the fishers and the time this data is made available to the scientists. Table 2 shows the data submission schedule requirements for each fishing permit. Depending on the fishing permit, the delay between the discharge following the fishing activity and the data submission can vary from the same day to a month later. The paper logbook is then submitted to the DAFF office where it is processed. Due to the variability between the current data collection systems and the number of steps required, it is hard to estimate the delays between the time DAFF receives the form and the time it is entered into the system. Moreover, depending on the fishing permit, a landing summary must be submitted between 24 hours of discharge and seven months after landing the fish.
This is a good example of an instance where onboard e-logbook systems would dramatically reduce the processing time of the data submitted during and after fishing trips, while increasing the quality and integrity of the information collected at sea. Moreover, such systems would ensure consistency across the collected data, as free-format data entry is limited and data recording is typically done via predefined look-up lists and validation rules that limit the likelihood of recording invalid data. Furthermore, the illegible entries that occur in paper-based logbooks, as well as the errors inherent in the paper-based logbook process where the data is first recorded on paper and then re-entered into a database from the paper logbook, are avoided.
With an e-logbook system, decisions can be made in real time. Faster transmission of information from sea to shore allows for timely responses. As a result, decisions made on a regulatory, managerial, commercial or environmental basis are relevant to what is actually happening at sea. Backlogged, non-electronic reporting, such as that currently implemented in South Africa, means that any event at sea is sometimes only registered onshore up to several weeks after it has occurred. Responding to month-old information, particularly in an ever-dynamic ocean environment, is senseless. Faster transmission will have a substantially more positive effect on, for example, quota management, conservation and even commercial decision-making.
The shoreside reception and centralisation of data also represents a challenge for management authorities. The task of standardising the entire corpus of data so that it is useable for scientific and management purposes is considerable, and is ongoing.

180
Part 3 Current Research and Technology Advances in the Marine Sciences
Currently, the SCRL fishery is the only fishery in South Africa that has adopted an e-logbook system solution on all its vessels, although more companies in other fisheries are starting to use such systems for their day-to-day operations. An example of such a company is Sea Harvest (Pty) Ltd., which is in the hake-trawling industry.
3. An e-logbook solution for South Africa
3.1 Benefits of e-logbook technology
An obvious response to the lack of reliable and/or timely data is to use modern information technology (e-logbooks) in the management of living marine resources. Bringing accurate and user-friendly data-logging tools to fishers could potentially transform the entire fishing fleet and the fishing community into the largest group of surveyors in the marine environment. The calibre of data produced through e-logbooks has the potential to benefit all sectors of the fishing industry, from the fishers themselves (fleet deployment and productivity dashboard) to seafood consumers (tracking of fish from catch to end-user), scientists (resource modelling and stock assessment), resource managers (drafting regulations) and government enforcement officials (monitoring and compliance activities). In addition, the international shift towards a greater emphasis on output control measures, such as TACs, requires the implementation of sophisticated catch monitoring tools to allow for a near-real-time auditing of catch versus TAC. (Barkai, 2004; Barkai, 2007; Barkai et al., 2009; Barkai et al., 2010; Barkai et al., 2012).
3.2 The South African experience with e-logbook technology
Olrac SPS, a South African-based company, was one of the first to offer an e-logbook solution to commercial fisheries. During the last 15 years, the company has developed a sophisticated electronic data-recording and reporting system. This system, which was recently re-branded as the Olrac Electronic Logbook Software Solution, was driven by Olrac’s consulting experience of the problems that arise when data management is inadequate for scientific research. Today, the main goal of the Olrac software system is to offer a paperless alternative to the present paper-based fisheries data-collection and reporting systems (Barkai, 2004; Barkai, 2007; Barkai et al., 2009; Barkai et al., 2010; Barkai et al., 2012). To this day, Olrac is the only comprehensive commercial e-logbook solution implemented in South Africa. It can be found on every SCRL fishing vessel (Barkai and Flanagan, 2014) and trawlers targeting hake for Sea Harvest (Pty) Ltd., one of the largest South African fishing companies.
Furthermore, the system is now certified by the local authorities for use in the UK and Australia. It is also used in The Netherlands and the USA. Olrac SPS has consulted to the Australian Fisheries Management Authority (AFMA), as well as the Department for Environment, Food and Rural Affairs (DEFRA) in the UK, and the National Oceanic and Atmospheric Administration (NOAA) in the USA with regard to the development of a standardised data format for the centralisation of fisheries data shoreside.
Data that was initially developed for data logging and data management for use in e-logbook technology in the commercial fishing industry has now evolved to provide a complete solution for the collection, management and reporting of other vessel-based activities, such as commercial and recreational fishing trips, oceanographic surveys, marine inspections, cargo and service trips, and surveillance missions.

181
Reflections on the State of Research and Technology in South Africa’s Marine and Maritime Sectors
Ultimately, e-logbook technology should be integrated to include two basic components to cater for the entire data flow, from at-sea collection to the generation and dissemination of reports (see Figure 3).
An onboard data-collection component is a stand-alone data-gathering tool installed on the vessel’s computer (desktop, laptop or tablet).
A second shore-based component can be a secured web application (in the internet ‘cloud’) with the main function to receive, store and disseminate nominal data and summary reports coming from the vessels or, if necessary, other third-party data-logging systems. Such a system should also allow for the direct entry of data via an internet interface in cases where the use of an onboard data-logger is not practical (due to the cost or unsuitable working environment). With the shore or ‘cloud’ system, the entire fleet of vessels can be managed. It can include a vessel registry, a full quota management system and an elaborate administrative component that allows the user to customise the system to satisfy his or her needs.
Fishing Management Authorities (FMA)
Acknowledgement (success/failure)
SATCOM
Olra
c-D
DL
First sales
Vessels
VMS
Web services
Web servicer
DDM web portal
Validation
XML schema
Olrac Dynamic Data Manager
(DDM)
Database serverFMA DB DDM
Other permitted data recipients
GPS
XML
XML
Validate data
XML
Fig ure 3: Example of the general structure of the data-collection and management system.
3.3 Onboard data-logger
3.3.1 Basic functionality
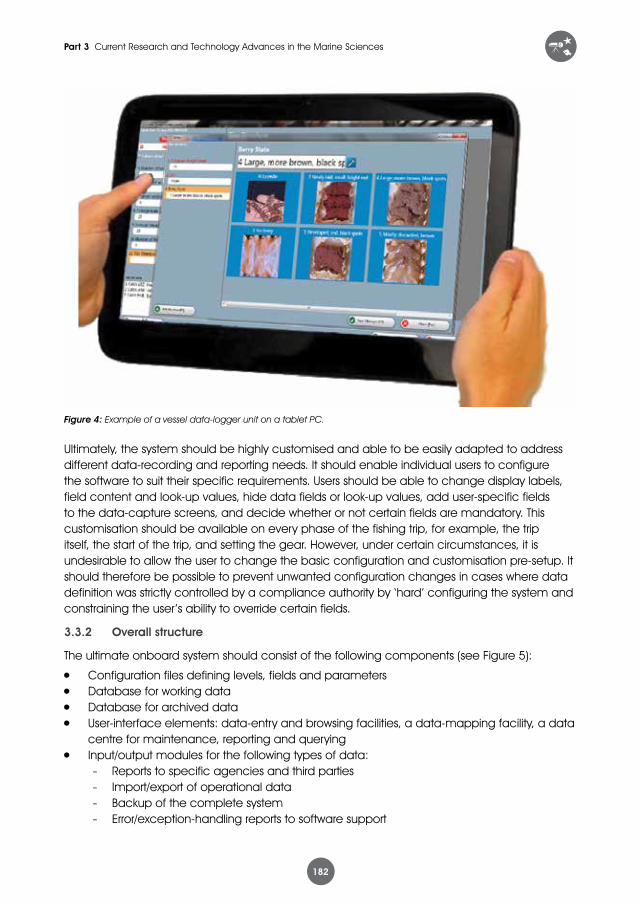
With the advance of technology, today’s data-logger can make the most of touch-screen capability to capture data in real time and/or after the fishing activity has taken place (see Figure 4). The user can collect any type of data in any form. This includes images, video clips, numerical and alphanumeric fields, free-text comments, date, time and location. Such systems allow data to be inserted from guiding images (infographs) to guide it through complex data-entry needs. Each mode of data entry has its own unique data-entry interface, specifically designed for the type of data recorded.
182
Part 3 Current Research and Technology Advances in the Marine Sciences
Figure 4: Example of a vessel data-logger unit on a tablet PC.
Ultimately, the system should be highly customised and able to be easily adapted to address different data-recording and reporting needs. It should enable individual users to configure the software to suit their specific requirements. Users should be able to change display labels, field content and look-up values, hide data fields or look-up values, add user-specific fields to the data-capture screens, and decide whether or not certain fields are mandatory. This customisation should be available on every phase of the fishing trip, for example, the trip itself, the start of the trip, and setting the gear. However, under certain circumstances, it is undesirable to allow the user to change the basic configuration and customisation pre-setup. It should therefore be possible to prevent unwanted configuration changes in cases where data definition was strictly controlled by a compliance authority by ‘hard’ configuring the system and constraining the user’s ability to override certain fields.
3.3.2 Overall structure
The ultimate onboard system should consist of the following components (see Figure 5):
• Configuration files defining levels, fields and parameters• Database for working data• Database for archived data• User-interface elements: data-entry and browsing facilities, a data-mapping facility, a data
centre for maintenance, reporting and querying• Input/output modules for the following types of data:
- Reports to specific agencies and third parties- Import/export of operational data- Backup of the complete system- Error/exception-handling reports to software support

183
Reflections on the State of Research and Technology in South Africa’s Marine and Maritime Sectors
Data entry
Mail reporter
Data browser
Data centre
Mapper
Explorer
GPS logger
ArchiveWorking
storeConfiguration settings
Use
r co
nfig
ura
tion
Data baseTransmission
IP, SMTO, MAPI, Satellite, Physical media
Reports
(to agencies, e
tc.)
Error/exception
Backup
Import/export (to other units)
Figure 5: Example of the basic structure of an onboard system.
To be fully practical, the onboard system should make extensive use of drop-down lists whenever possible. The use of drop-down lists to enter data helps to maintain data integrity, thus minimising typos and saving time. However, users can add new fields and values if necessary.
A flexible onboard e-logbook system should also be easily configured to fit the ‘taste’ and needs of different users of the same basic configuration. For example, the user could decide which fields should be visible, compulsory and remembered from previous entries. The user could also decide which data fields should be visible in which phase of the vessel operation (see Figure 6). Examples are ‘trip start’, ‘trip end’ and, within a trip activity, ‘start’ and ‘end’. The system should also allow users to set upper and lower limits for any numerical field to reduce the chance of typos.
Another feature of an intelligent versatile e-logbook system is its ability to be dynamically configured to ‘intelligently’ guide the user during its data-logging activities (see Figure 7). The system can then be configured to reflect data-logging actions of vastly different activities. For example, the same basic underlying user interface can have different settings and can be used to collect data for different forms of fishing (trawling, longlining, purse seine, traps, etc.) or other vessel activities (sea ferry, cargo delivery, coastal guard patrols, oceanographic surveys, etc.).
Data collected by the onboard system should be able to generate any type of report in any format (XML, HTML, CSV, PDF, etc.). These reports can be saved and transferred to other databases (such as a shore version, internet or ‘cloud’, or other third-party databases) either directly, using portable storage devices or in real time using the onboard VMS or other onboard satellite communication systems.

184
Part 3 Current Research and Technology Advances in the Marine Sciences
Figure 6: Example of an e-logbook system data editor.
Figure 7: Example of the main dashboard screen.
3.3.3 Device-logger
Ultimately, one should be able to link the onboard system to any number of analogue or digital sensors (transducers). The device-logger’s main function, however, should be to read Global Positioning System (GPS) data and track and plot vessel movements. The device should also track trips, gear setting and hauling. It can fill in the date, time, location and other GPS-related fields if it has access to a GPS unit (see Figure 8). GPS input can come from either a VMS transponder or standard GPS-outputting National Marine Electronics Association (NMEA) strings on a serial or universal serial bus (USB) connection. In fact, in most South African fisheries, vessels of a certain size are required by law to be equipped with a fully functional onboard VMS that would be compatible with such a system.
The device-logger can be a small, ‘lightweight’, stand-alone application that continually runs on the computer hosting the onboard system, even if the main system unit is not operational. The onboard system should communicate with the device-logger via a simple application programming interface (API), allowing all the low-level interfacing with various sensors to be handled exclusively by the device-logger. This also means that only the device-logger application needs to be compatible with new devices, such as new GPS or VMS units.

185
Reflections on the State of Research and Technology in South Africa’s Marine and Maritime Sectors
Figure 8: Example of a GPS reading on a device-logger.
3.4 Shore or internet ‘cloud’-based system
The main functionality of the web-based or shore-based system (master system) is to process and report the data received from vessels describing their fishing operations, catch taken, landings, vessel movements, sales and transhipment, and make that data available to the user via a variety of interfaces. The master system could include a vessel registry, a full quota management system and an elaborate administrative component that would allow the system to be customised to satisfy diverse requirements. Such a master system could easily be tailored to meet any future South African electronic data-reporting requirements.
The shore version could be deployed on a server running the necessary components (for example, ASP.NET and SQL server).
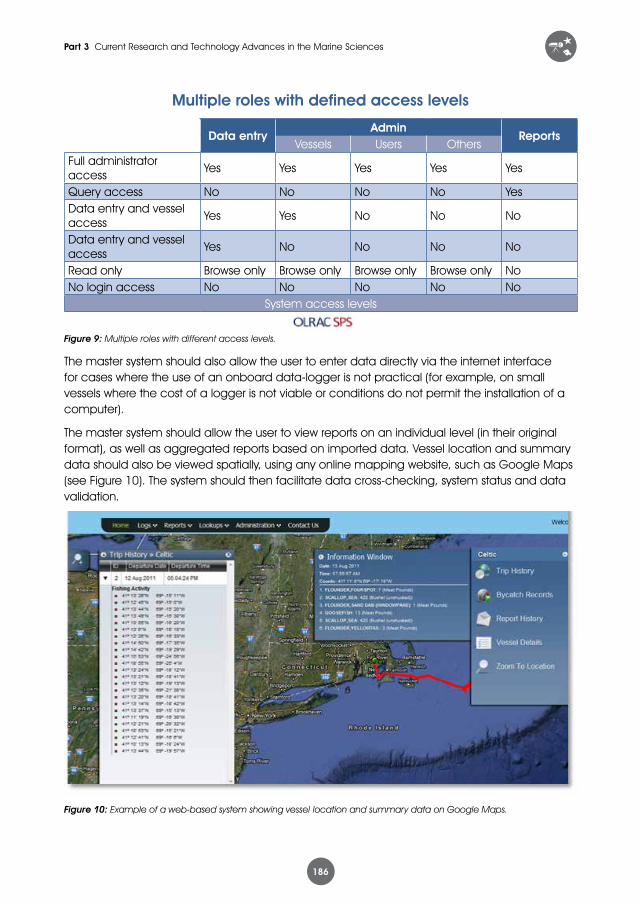
Due to its nature, the web-based interface should be securely controlled and access to the data should be limited according to the role of the user (see Figure 9). Typical user roles include the following:
• Administrator, which allows complete control to add, edit or delete data on the system, as well as to view aggregated data.
• Vessel user, which allows the vessel owner or master to view all data submitted by the vessel.
• Fishing authority, which allows the user to view all data received from the various onboard installations, but not to control system configuration data.
186
Part 3 Current Research and Technology Advances in the Marine Sciences
Multiple roles with defined access levels
Data entryAdmin
ReportsVessels Users Others
Full administrator access
Yes Yes Yes Yes Yes
Query access No No No No YesData entry and vessel access
Yes Yes No No No
Data entry and vessel access
Yes No No No No
Read only Browse only Browse only Browse only Browse only NoNo login access No No No No No
System access levels
Figure 9: Multiple roles with different access levels.
The master system should also allow the user to enter data directly via the internet interface for cases where the use of an onboard data-logger is not practical (for example, on small vessels where the cost of a logger is not viable or conditions do not permit the installation of a computer).
The master system should allow the user to view reports on an individual level (in their original format), as well as aggregated reports based on imported data. Vessel location and summary data should also be viewed spatially, using any online mapping website, such as Google Maps (see Figure 10). The system should then facilitate data cross-checking, system status and data validation.
Figure 10: Example of a web-based system showing vessel location and summary data on Google Maps.

187
Reflections on the State of Research and Technology in South Africa’s Marine and Maritime Sectors
3.5 GIS add-ons
A visual data analysis or Geographic Information System (GIS) module specifically designed to work with the onboard system’s main database could be a useful optional add-on. It should allow the user to analyse subsets of data captured by the onboard system. For example, the system might let the user capture information on trips, sets and catches. A trip has, for example, a departure date, departure port and skipper name fields. Possible set fields include start time, start latitude, start longitude and gear used. Possible catch record fields include species and weight. From a selected set, the user could create subsets of data for a particular analysis or presentation. For example, graphs could be drawn showing CPUE as a function of time, moon phase and current strength. Spatial CPUE density distributions could also be plotted on a map, which could then be filtered for various target species or reflect different environmental conditions. Subsets could be swapped to explore different scenarios and data relationships, for example, CPUE at new moon time compared to CPUE at full moon time. A subset of definitions (the list of classes and fields selected for the subset) could be saved to reinvestigate patterns when updating the data.
With the GIS add-on, it should be possible to simulate, for example, the spatial distribution of CPUE by dividing catch weight by fishing duration.
The table created by such an add-on query engine could be shown on a graph (such as a bar graph or a pie chart) or, as in Figure 11, in a density distribution map (if the data contains longitude/latitude information for each row in the table).
Figure 11: Example of information displayed by a GIS add-on.

188
Part 3 Current Research and Technology Advances in the Marine Sciences
ConclusionOver the past decades, various GIS-based e-logbook systems specifically designed for the commercial fishing industry have been developed around the world with mixed success. Despite many technical and logistical hurdles at first, some systems managed to implement and deploy their technology aboard many vessels around the world. Throughout the years, lessons were learnt and had to be considered before making e-logbook reporting in commercial fishing a global reality. In South Africa, these challenges were met by Olrac SPS during the deployment of the Olrac e-logbook technology onboard trap longline lobster vessels off the South African south coast (Barkai and Flanagan, 2014).
The Olrac e-logbook technology was first installed in 2009 by Ruwekus Fishing (Pty) Ltd., aboard the SCRL fishing vessel, Rigel 4. The decision to install the programme was driven by the need to capture real-time fisheries data in an electronic format that can be exported from the vessel and investigated with ease. With the successful implementation of the software aboard the Rigel 4, all the other fisheries operators that form part of the South Coast Rock Lobster Industry Association (SCRLIA) adopted the e-logbook.
The deployment of the Olrac e-logbook provided many challenges and continues to be a work in progress. With vessels completing voyages that last 30 to 45 days, software ‘bugs’ and shortcomings had to be slowly worked out between trips. This required patience and a good working relationship between the vessel officers, shore management and the Olrac software developers.
The officers on the fishing vessels were at first hesitant to adopt the new technology. However, after being educated on the advantages of such a system, they were convinced. The system is now viewed as a tool rather than a burden. Four years later, Ruwekus Fishing (Pty) Ltd., which pioneered this project, is starting to investigate the data to understand the effect of environmental conditions such as wind, moon phase, current and water temperature on their catch rates. The company also studies the spatial distribution of the southern spiny lobster (Palinurus gilchristi). It will take some time before meaningful results and patterns emerge from the fisheries data, which will directly influence fishing decisions, but the company is making progress. The company hopes that the e-logbook will become a crucial source of information, a sort of ‘Google’ for the SCRL fishery – a search engine of data that answers many relevant, scientific or commercial questions (see Figure 12). As the South African fishing industry slowly moves into the digital age, the Olrac e-logbook has driven Ruwekus Fishing (Pty) Ltd. towards being ‘tech-ready’ for further developments and requirements.
Experience such as this has consistently highlighted the critical role that fisheries statistics and other data related to fishing plays in management and decision-making in South Africa. Where the available data is lacking or has not been properly recorded, various suboptimal decisions have been made. The new data system (MAST), which has been installed at DAFF, has, it would appear, compromised the integrity of the data available for fisheries management. At the moment, in South Africa, fisheries data from the commercial sector is recorded in paper format and digitised later. In some instances, scientists have been forced to de-archive original paper records and embark on a process of re-digitisating the data, a very costly, time-consuming and error-prone task. Furthermore, the lack of consistency with regard to units has rendered years of work obsolete. There can be a substantial time lag between an event and the ability to act on it in an informed manner with all the data available. Shortening this time lag will create additional

189
Reflections on the State of Research and Technology in South Africa’s Marine and Maritime Sectors
management options for many South African fisheries. One obvious option for achieving this is to digitally collect data at sea in near real time through the development of an integrated e-logbook system for the various South African fisheries.
For those vessels that cannot use electronic recording tools such as laptops, tablets and mobile phones due to various limitations such as the size of the boat, paper logbooks may still be used. The logbook information can then be captured in an onshore e-logbook system via digital forms set up to match the structure and format of the paper logbook (to ease data entry). This e-logbook system has validation to limit data capture errors. Fishers can also telephone their trip details to a call centre, which will directly capture the details into the onshore digital facilities.
A number of fishing nations are leading or have already led the implementation of e-logbook systems at sea. In the European Union (EU), this approach has been legislated and member countries have responded to this legislation in a variety of ways. In Australia and New Zealand, as well as the USA, similar initiatives are underway.
Figure 12: Example of data generated by e-logbook technology and used for spatial distribution analysis in the SCRL industry.

190
Part 3 Current Research and Technology Advances in the Marine Sciences
ReferencesBarkai, A. 2004. “An electronic fishery data management system: a demonstration of a
unique, wheelhouse, software solution for the collection, management and utilization of commercial fishing data.” In: Nishida, T., Lailola, P. and Hollingworth, C. (eds) GIS/spatial analyses in fishery and aquatic sciences, 2:559–606. Saitama: Fishery-Aquatic GIS Research Group.
Barkai, A. 2007. “OLFISH electronic logbook: bridging the gap between fisher, manager and scientist through cohesive data-logging”. In: Proceedings of the ICES Annual Science Conference, 17–21 September, Helsinki.
Barkai, A. and Bergh, M. 2005. “Use and abuse of data in fishery management.” In: Shotton, R. (ed) Deep Sea 2003: Conference on the governance and management of deep-sea fisheries. Part 1:274–292, 1–5 December 2003, Queenstown: Chief Publishing Management Service Information Division, FAO.
Barkai, A. and Flanagan, K. 2014. “The Olrac Electronic Fisheries Data Management System, case study: the South African South Coast deepwater lobster fishery (Palinurus gilchristi)”. In: Proceedings of the 10th International Conference and Workshop on Lobster Biology and Management, 18–23 May, Cancun, Mexico: ICES Journal of Marine Science.
Barkai, A., Geggus, K., Felaar, F., Dantie, Z., Hayes, A. and Glago, D. 2008. “Environmental and fisheries data management, access, and integration”. In: Proceedings of the ICES Annual Science Conference, 17–21 September 2007, Helsinki.
Barkai, A., Geggus, K., Felaar, F., Dantie, Z., Hayes, A. and Glago, D. 2009. “OLFISH dynamic data logger: a complete solution for the recording, reporting, and transmission of commercial fishing data”. In: Proceedings of the ICES Annual Science Conference, 22–26 September 2008, Halifax.
Barkai, A., Felaar, F., Geggus, K., Dantie, Z. and Hayes, A. 2010. “OLFISH – a complete, paperless solution for the collection, management and dissemination of marine data.” In: Diodato, N. (ed) Satellite Communications, pp. 203–238. Rijeka: Sciyo.
Barkai, A., Meredith, G., Felaar, F., Dantie, Z. and De Buys, D. 2012. The advent of electronic logbook technology – reducing cost and risk to both marine resources and the fishing industry. International Journal of Agricultural, Biosystems Science and Engineering, 6(7): 889–896.
Department of Agriculture, Forestry and Fisheries (DAFF) 2012a. Maritime Control and Surveillance (MCS) Operations.
Department of Agriculture, Forestry and Fisheries (DAFF) 2012b. Portfolio committee presentation on the integration of the branch: fisheries management into the DAFF, 28 August, Pretoria: Department of Agriculture, Forestry and Fisheries.
Republic of South Africa 1998. Marine Living Resources Act, 1998. South Africa, Government Gazette 395(18930). URL: http://www.gov.za/documents/download.php?f=70675. Accessed 27 March 2014.

191
Reflections on the State of Research and Technology in South Africa’s Marine and Maritime Sectors
TablesTable 1: List of fishing permit conditions in South Africa
Permit condition Main species Method
Abalone fishery Abalone Air-assisted diving
Pelagic fishery (mainly anchovy and pilchard ) Anchovy Purse seine nets
Hake deep-sea trawl fishery Hake Deep-sea trawl
Hake handline fishery Hake Handline
Hake longline (south coast inshore) fishery Hake Longline
Hake longline (south coast offshore) fishery Hake Longline
Hake longline (west coast) fishery Hake Longline
Hake, sole, horse mackerel and demersal shark fishery
Hake Trawl, longline or handline
Hake/horse mackerel midwater trawl fishery Hake Midwater trawl
Hake/sole inshore trawl fishery Hake Inshore trawl
Traditional linefish fishery (Zone A) Linefish Line methods
Traditional linefish fishery (Zone B) Linefish Line methods
Traditional linefish fishery (Zone C) Linefish Line methods
SCRL fishery Lobster Traps
West Coast rock lobster (nearshore) fishery Lobster Ring/hoop nets
West Coast rock lobster (offshore) fishery Lobster Traps
KwaZulu-Natal commercial oyster fishery Oyster Hand gathering
Southern Cape commercial oyster fishery Oyster Hand gathering
Patagonian toothfish fishery Prince Edward Islands (South African EEZ)
Patagonian toothfish
Deep-sea longline
Pelagic fishery (pilchard/sardine) Pilchard/sardine Purse seine nets
KwaZulu-Natal prawn trawl fishery Prawn Deep-sea trawl
Commercial seaweed fishery Seaweed Hand gathering
Demersal shark longline Shark Longline
Squid commercial fishery Squid Squid jig
Swordfish longline fishery Swordfish Deep-sea longline
Tuna longline fishery Tuna Deep-sea longline
Tuna pole fishery Tuna Pole
Commercial white mussel fishery White mussel Hand gathering

192
Part 3 Current Research and Technology Advances in the Marine Sciences
Table 2: Catch and landings current reporting requirements from fishing permit conditions for selected South African commercial fisheries
Catch reporting requirement Landing reporting requirement
Form to be submitted
Submission schedule
Form to be submitted
Submission schedule
Hake handline fishery
Commercial linefish catch return (blue book)
As soon as catch is landed
Landing declaration sheet
Before the 15th of the month
Tuna longline fishery
Catch return book
By the 15th of each month
Excel spreadsheet with trip summaries to be emailed
Within two weeks after discharge
Tuna pole fisheryCatch return book
By the 15th of each month
Landing declaration form as per Annexure 4 of the tuna pole permit conditions
As soon as possible after each trip
Updated on an electronic monthly summary in Excel as per Annexure 5 of the tuna pole permit conditions
By the 15th of every month
Pelagic fishery (anchovy)
Pelagic catch report (skipper form)
At the end of the trip before offloading
Landing declaration OM/EN 26/7/3
Weekly summaries of catches
Pelagic fishery (pilchard/sardine)
Pelagic catch report (skipper form)
At the end of the trip before offloading
Landing declaration OM/EN 26/7/3
Weekly summaries of catches
Traditional linefish fishery (Zone A, Zone B and Zone C)
Commercial linefish catch return (blue book)
By the 15th of each month
Catch and landing information on the same form (see catch reporting requirements)
Squid fisherySquid jigging catch book
The last day of the month with respect to the previous month
Electronic summary of landings
By the end of the month following the end of the six-month period (1 January to 30 June and 1 July to 31 December)

193
Reflections on the State of Research and Technology in South Africa’s Marine and Maritime Sectors
Catch reporting requirement Landing reporting requirement
Form to be submitted
Submission schedule
Form to be submitted
Submission schedule
Hake, sole, horse mackerel and demersal shark fishery
Catch-effort data in the fishing logbook (catch discharge sheet)
Sector-specific (in section C of permit condition)
Electronic summary of landings
By the end of the month following the end of the six-month period (1 January to 30 June and 1 July to 31 December)
Hake longline (south coast inshore) fishery
Longline daily logsheet (HK/LL 1)
Within 30 days of the date of landing
Landing declaration sheet (HK/LL 2)
On receipt of fish and/or fish product if processed and weighed within 24 hours of discharge
Hake longline (south coast offshore) fisheryHake longline (west coast) fishery Hake deep-sea trawl fishery
Trawl fishing log (catch discharge sheet)
Before discharg-ing is completed and submitted the last day of the month fol-lowing the month the catch was discharged
Goods received
On receipt of fish and/or fish product if processed and weighed within 24 hours of discharge
Hake, horse mackerel midwater trawl fisheryHake/sole inshore trawl fishery
Abalone fishery
Abalone/ perlemoen catch statistic forms
On landing Permit holder provides copy of landing slips to a nominated FPE
On landing
West Coast rock lobster (nearshore) fishery
West Coast rock lobster landing form (OM/EN 26/12/2)
On landing, once all rock lobsters have been weighed
Catch and landing information on the same form (see catch reporting requirements)
West Coast rock lobster (offshore) fishery
West Coast rock lobster landing form (OM/EN 26/12/3)
On landing once all rock lobsters have been weighed
Catch and landing information on the same form (see catch reporting requirements)
SCRL fishery
V1/3/5/2/1 S daily catch rate – SCRL
Recorded on a daily basis and submitted on landing
Catch and landing information on the same form (see catch reporting requirements)

194
Part 3 Current Research and Technology Advances in the Marine Sciences
Catch reporting requirement Landing reporting requirement
Form to be submitted
Submission schedule
Form to be submitted
Submission schedule
KwaZulu-Natal prawn trawl fishery
Drag book OM/EN 26/6/15 and landing books OM/EN 26/6/13 and 26/6/14
Submitted on a monthly basis
Landing report OM/EN 26/7/3
Recorded on completion of the offloading process
Patagonian toothfish fishery Prince Edward Islands South African EEZ)
CCAMLR five-day catch-effort report (ref. 23-01)
Every 5 days
Catch and landing information on the same form (see catch reporting requirements)
CCAMLR monthly fine-scale catch-effort data reporting (ref. 23-04)
Monthly
CCAMLR monthly fine-scale biological data reporting (ref. 23-04)
Monthly
Demersal shark longline fishery
Longline daily logsheet (HK/LL 1)
By the 15th of the following month in which the landings were made
Swordfish longlineDaily catch return book
By the 15th of the following month in which the landings were made
Beach seine net fishery
Commercial catch returns for drift and beach seine nets
Before the end of each month in respect of the previous month fished