DYNAMO-HIA--a Dynamic Modeling tool for generic Health Impact Assessments
11
DYNAMO-HIA–A Dynamic Modeling Tool for Generic Health Impact Assessments Stefan K. Lhachimi 1,2 *, Wilma J. Nusselder 1 , Henriette A. Smit 3 , Pieter van Baal 4,5 , Paolo Baili 6 , Kathleen Bennett 7 , Esteve Ferna ´ ndez 8,9,10 , Margarete C. Kulik 1,11 , Tim Lobstein 12 , Joceline Pomerleau 13 , Johan P. Mackenbach 1 , Hendriek C. Boshuizen 2,13 1 Department of Public Health, Erasmus MC, University Medical Center Rotterdam, Rotterdam, The Netherlands, 2 Department of Statistics and Mathematical Modeling, National Institute for Public Health and the Environment (RIVM), Bilthoven, The Netherlands, 3 Julius Center for Health Sciences and Primary Care, University Medical Center Utrecht, Utrecht, The Netherlands, 4 iBMG/iMTA, Erasmus University Rotterdam, Rotterdam, The Netherlands, 5 Expertise Centre for Methodology and Information Services, National Institute for Public Health and the Environment (RIVM), Bilthoven, The Netherlands, 6 Fondazione IRCCS ‘‘Istituto Nazionale dei Tumori’’, Descriptive Studies and Health Planning Unit, Milan, Italy, 7 Department of Pharmacology & Therapeutics, Trinity Centre for Health Sciences, St James’s Hospital, Dublin, Ireland, 8 Tobacco Control Unit, Cancer Control and Prevention Programme, Institut Catala ` d’Oncologia-ICO, L’Hospitalet de Llobregat, Barcelona, Spain, 9 Cancer Control and Prevention Group, Institut d’Investigacio ´ Biome `dica de Bellvitge-IDIBELL, L’Hospitalet de Llobregat, Barcelona, Spain, 10 Department of Clinical Sciences, School of Medicine, Universitat de Barcelona, L’Hospitalet del Llobregat, Barcelona, Spain, 11 Center for Prevention and Health Services Research, National Institute for Public Health and the Environment (RIVM), Bilthoven, The Netherlands, 12 Director of Policy and Programmes,IASO - the International Association for the Study of Obesity IOTF - the International Obesity TaskForce, London, United Kingdom, 13 Department of Biometrics, Wageningen University, Wageningen, The Netherlands Abstract Background: Currently, no standard tool is publicly available that allows researchers or policy-makers to quantify the impact of policies using epidemiological evidence within the causal framework of Health Impact Assessment (HIA). A standard tool should comply with three technical criteria (real-life population, dynamic projection, explicit risk-factor states) and three usability criteria (modest data requirements, rich model output, generally accessible) to be useful in the applied setting of HIA. With DYNAMO-HIA (Dynamic Modeling for Health Impact Assessment), we introduce such a generic software tool specifically designed to facilitate quantification in the assessment of the health impacts of policies. Methods and Results: DYNAMO-HIA quantifies the impact of user-specified risk-factor changes on multiple diseases and in turn on overall population health, comparing one reference scenario with one or more intervention scenarios. The Markov- based modeling approach allows for explicit risk-factor states and simulation of a real-life population. A built-in parameter estimation module ensures that only standard population-level epidemiological evidence is required, i.e. data on incidence, prevalence, relative risks, and mortality. DYNAMO-HIA provides a rich output of summary measures – e.g. life expectancy and disease-free life expectancy – and detailed data – e.g. prevalences and mortality/survival rates – by age, sex, and risk- factor status over time. DYNAMO-HIA is controlled via a graphical user interface and is publicly available from the internet, ensuring general accessibility. We illustrate the use of DYNAMO-HIA with two example applications: a policy causing an overall increase in alcohol consumption and quantifying the disease-burden of smoking. Conclusion: By combining modest data needs with general accessibility and user friendliness within the causal framework of HIA, DYNAMO-HIA is a potential standard tool for health impact assessment based on epidemiologic evidence. Citation: Lhachimi SK, Nusselder WJ, Smit HA, van Baal P, Baili P, et al. (2012) DYNAMO-HIA–A Dynamic Modeling Tool for Generic Health Impact Assessments. PLoS ONE 7(5): e33317. doi:10.1371/journal.pone.0033317 Editor: Nitika Pant Pai, McGill University Health Centre, McGill University, Canada Received October 14, 2011; Accepted February 7, 2012; Published May 10, 2012 Copyright: ß 2012 Lhachimi et al. This is an open-access article distributed under the terms of the Creative Commons Attribution License, which permits unrestricted use, distribution, and reproduction in any medium, provided the original author and source are credited. Funding: The DYNAMO-HIA project was funded by the EU Public Health Programme 2003–2008 of the European Commission’s Directorate General for Health and Consumer Affairs (DG SANCO), with co-financing from the Erasmus Medical Center Rotterdam, the Institute of Public Health and the Environment in the Netherlands, the Catalan Institute of Oncology, the International Obesity task force, the London School for Hygiene and Tropical Medicine, the Haughton Institute in Dublin and the Instituto Tumori in Milan. E. Fernandez was also partly supported by the Thematic Network of Cooperative Research on Cancer (RD06/0020/ 0089) from the Instituto de Salud Carlos III, Government of Spain; and by the Ministry of Universities and Research (2009SGR192), Government of Catalonia. The funders had no role in study design, data collection and analysis, decision to publish, or preparation of the manuscript. Competing Interests: The authors have declared that no competing interests exist. * E-mail: [email protected] Introduction Health Impact Assessment (HIA) is a combination of proce- dures, methods, and tools that judges the effect of (intended) programs, projects, or policies on overall population health and the distributional effects within a population [1]. The rationale behind HIA is that many risk-factors for chronic diseases are affected by policy measures outside the realm of health policy (e.g. transportation, food, or urban planning). Health impact assess- ments have been carried out at all governmental levels (e.g. local [2], regional [3], national [4], and supranational [5]). The number of HIAs is likely to rise due to increased institutional adoption [6] and political will, in particular at EU level [7]. Currently, there is a diversity of approaches to the quantification of policy PLoS ONE | www.plosone.org 1 May 2012 | Volume 7 | Issue 5 | e33317
-
Upload
independent -
Category
Documents
-
view
3 -
download
0
Transcript of DYNAMO-HIA--a Dynamic Modeling tool for generic Health Impact Assessments
DYNAMO-HIA–A Dynamic Modeling Tool for GenericHealth Impact AssessmentsStefan K. Lhachimi1,2*, Wilma J. Nusselder1, Henriette A. Smit3, Pieter van Baal4,5, Paolo Baili6,
Kathleen Bennett7, Esteve Fernandez8,9,10, Margarete C. Kulik1,11, Tim Lobstein12, Joceline Pomerleau13,
Johan P. Mackenbach1, Hendriek C. Boshuizen2,13
1Department of Public Health, Erasmus MC, University Medical Center Rotterdam, Rotterdam, The Netherlands, 2Department of Statistics and Mathematical Modeling,
National Institute for Public Health and the Environment (RIVM), Bilthoven, The Netherlands, 3 Julius Center for Health Sciences and Primary Care, University Medical
Center Utrecht, Utrecht, The Netherlands, 4 iBMG/iMTA, Erasmus University Rotterdam, Rotterdam, The Netherlands, 5 Expertise Centre for Methodology and Information
Services, National Institute for Public Health and the Environment (RIVM), Bilthoven, The Netherlands, 6 Fondazione IRCCS ‘‘Istituto Nazionale dei Tumori’’, Descriptive
Studies and Health Planning Unit, Milan, Italy, 7Department of Pharmacology & Therapeutics, Trinity Centre for Health Sciences, St James’s Hospital, Dublin, Ireland,
8 Tobacco Control Unit, Cancer Control and Prevention Programme, Institut Catala d’Oncologia-ICO, L’Hospitalet de Llobregat, Barcelona, Spain, 9Cancer Control and
Prevention Group, Institut d’Investigacio Biomedica de Bellvitge-IDIBELL, L’Hospitalet de Llobregat, Barcelona, Spain, 10Department of Clinical Sciences, School of
Medicine, Universitat de Barcelona, L’Hospitalet del Llobregat, Barcelona, Spain, 11Center for Prevention and Health Services Research, National Institute for Public Health
and the Environment (RIVM), Bilthoven, The Netherlands, 12Director of Policy and Programmes,IASO - the International Association for the Study of Obesity IOTF - the
International Obesity TaskForce, London, United Kingdom, 13Department of Biometrics, Wageningen University, Wageningen, The Netherlands
Abstract
Background: Currently, no standard tool is publicly available that allows researchers or policy-makers to quantify the impactof policies using epidemiological evidence within the causal framework of Health Impact Assessment (HIA). A standard toolshould comply with three technical criteria (real-life population, dynamic projection, explicit risk-factor states) and threeusability criteria (modest data requirements, rich model output, generally accessible) to be useful in the applied setting ofHIA. With DYNAMO-HIA (Dynamic Modeling for Health Impact Assessment), we introduce such a generic software toolspecifically designed to facilitate quantification in the assessment of the health impacts of policies.
Methods and Results: DYNAMO-HIA quantifies the impact of user-specified risk-factor changes on multiple diseases and inturn on overall population health, comparing one reference scenario with one or more intervention scenarios. The Markov-based modeling approach allows for explicit risk-factor states and simulation of a real-life population. A built-in parameterestimation module ensures that only standard population-level epidemiological evidence is required, i.e. data on incidence,prevalence, relative risks, and mortality. DYNAMO-HIA provides a rich output of summary measures – e.g. life expectancyand disease-free life expectancy – and detailed data – e.g. prevalences and mortality/survival rates – by age, sex, and risk-factor status over time. DYNAMO-HIA is controlled via a graphical user interface and is publicly available from the internet,ensuring general accessibility. We illustrate the use of DYNAMO-HIA with two example applications: a policy causing anoverall increase in alcohol consumption and quantifying the disease-burden of smoking.
Conclusion: By combining modest data needs with general accessibility and user friendliness within the causal frameworkof HIA, DYNAMO-HIA is a potential standard tool for health impact assessment based on epidemiologic evidence.
Citation: Lhachimi SK, Nusselder WJ, Smit HA, van Baal P, Baili P, et al. (2012) DYNAMO-HIA–A Dynamic Modeling Tool for Generic Health ImpactAssessments. PLoS ONE 7(5): e33317. doi:10.1371/journal.pone.0033317
Editor: Nitika Pant Pai, McGill University Health Centre, McGill University, Canada
Received October 14, 2011; Accepted February 7, 2012; Published May 10, 2012
Copyright: � 2012 Lhachimi et al. This is an open-access article distributed under the terms of the Creative Commons Attribution License, which permitsunrestricted use, distribution, and reproduction in any medium, provided the original author and source are credited.
Funding: The DYNAMO-HIA project was funded by the EU Public Health Programme 2003–2008 of the European Commission’s Directorate General for Healthand Consumer Affairs (DG SANCO), with co-financing from the Erasmus Medical Center Rotterdam, the Institute of Public Health and the Environment in theNetherlands, the Catalan Institute of Oncology, the International Obesity task force, the London School for Hygiene and Tropical Medicine, the Haughton Institutein Dublin and the Instituto Tumori in Milan. E. Fernandez was also partly supported by the Thematic Network of Cooperative Research on Cancer (RD06/0020/0089) from the Instituto de Salud Carlos III, Government of Spain; and by the Ministry of Universities and Research (2009SGR192), Government of Catalonia. Thefunders had no role in study design, data collection and analysis, decision to publish, or preparation of the manuscript.
Competing Interests: The authors have declared that no competing interests exist.
* E-mail: [email protected]
Introduction
Health Impact Assessment (HIA) is a combination of proce-
dures, methods, and tools that judges the effect of (intended)
programs, projects, or policies on overall population health and
the distributional effects within a population [1]. The rationale
behind HIA is that many risk-factors for chronic diseases are
affected by policy measures outside the realm of health policy (e.g.
transportation, food, or urban planning). Health impact assess-
ments have been carried out at all governmental levels (e.g. local
[2], regional [3], national [4], and supranational [5]). The number
of HIAs is likely to rise due to increased institutional adoption [6]
and political will, in particular at EU level [7]. Currently, there is
a diversity of approaches to the quantification of policy
PLoS ONE | www.plosone.org 1 May 2012 | Volume 7 | Issue 5 | e33317
interventions [8]. However, for the quantification step in HIA,
a generic modeling tool – i.e. allowing for various and multiple
chronic diseases and arbitrary risk-factors – that takes into account
the standard causal pathway assumed in HIA has been lacking [9].
The standard HIA causal pathway assumes that a policy
intervention leads to a change in risk-factor prevalence which in
turn leads to changes in disease incidence and disease-related
mortality [10]. The two objectives of HIA – to predict future
consequences of implementing different options and to inform
decision makers in choosing between options [11] – address the
technical core of quantification (predict) as well as the context
(inform) in which an HIA takes place. Hence, a potential standard
tool should aim for technical accuracy in the prediction of the
effects of interventions on population health, and yet be effective in
the applied setting of an HIA, where time and resources are
scarce. These objectives were operationalized into six criteria that
a generic model should fulfill to be useful as a standard tool [9].
The first three criteria (real-life population, dynamic projection, and
explicit risk-factor states) ensure that the model structure is sufficiently
accurate in modeling changes in risk-factor exposure over time in
a real-life population in a transparent way. The last three criteria
(modest data requirements, rich model output, and generally accessible) ensure
a wide usability by accounting for the constraints of a decision-
making process.
This article proposes a software – DYNAMO-HIA (DYNamic
MOdeling for Health Impact Assessment) –as a standard tool for
the quantification of user-specified policy interventions within the
HIA-framework.
Materials and Methods
Implementation of Requirements for a Standard ToolWe designed DYNAMO-HIA to satisfy the six criteria that
a generic standard tool for HIA should fulfill. DYNAMO-HIA
models a closed real life population, i.e. stratified by sex and age in
1 year age categories up to the age of 95 without migration
(including the expected number of newborns). The model is
dynamic in 1-year time steps and projects reference and (several)
intervention scenario(s) over time. DYNAMO-HIA has explicit risk-
factor states, i.e. at every time step of the simulation each simulated
individual is classified into a specific risk-factor category. This
ensures an accurate, unbiased estimation and increases the
transparency of the simulation and the resulting output data.
DYNAMO-HIA has a parameter estimation module, mostly
using methods taken from the Chronic Disease Model of Dutch
National Institute for Public Health (RIVM-CDM) [12], reducing
data needs substantially. Incidence and prevalence of a disease are
only needed at the population level, i.e. specified by age and sex
and not by each risk-factor state. The module back-calculates the
risk-factor specific values using the relative risk from each risk-
factors state on diseases. The user can inspect these intermediate
results when desired, thus improving transparency. DYNAMO-
HIA provides rich simulation output available in three forms: (1) raw
output data, allowing detailed analysis by age, sex, and risk-factor
status. This raw data give either the cohort disease life table for
every simulated cohort or the period data for every simulated year;
(2) several dynamic plots, e.g. population pyramids or survival
rates, based on the data that contrast key information between the
reference scenario and the intervention scenario; (3) a range of
summary outcome measures, e.g. cohort-, period-, or disease-free
life expectancy. The graphical user interface allows general
accessibility; no programming or other advanced computing skills
are required.
Model CoreDYNAMO-HIA is a Markov-type model based on a multi-state
model (MSM). The change of the state depends only on current
characteristics, i.e. age, sex, risk-factor status, and health status.
The MSM is implemented as a partial micro-simulation combining
a stochastic micro-simulation to project risk-factor behavior with
a deterministic macro approach for the disease life table [13]. In
the micro-simulation, module large numbers of distinctive risk-
factor biographies are simulated: Given the age and sex-specific
transition probabilities between risk-factor states, the risk-factor
status of each simulated individual is updated in annual increments
(see Fig. 1 for details). In the macro module, a separate disease life
tables is constructed for each risk-factor biographies. These disease
life tables account for competing risks and multiple morbidity [14].
The exact configuration of the disease life tables, i.e. the number
and types of diseases, can be specified by the user (see Fig. 2 for
details). For every risk-factor biography, the probability of disease
incidence and mortality over time is calculated, accounting for the
current age, risk-factor, and disease status (see Fig. 3 for details).
These biography-specific life tables are calculated for each birth-
cohort, i.e. all individuals that are born in the same calendar year.
For example, for a cohort of newborns, risk-factor biographies are
projected and subsequently disease life tables are calculated. Older
cohorts, i.e. those born before the first simulation year, already
have the disease prevalence as specified by the input data, which is
then similarly updated. Population values are obtained by
aggregating the individual biography/diseases life tables: either
across cohorts at a given simulation time point to obtain period
measures or along cohorts to obtain cohort specific measures (see
Fig. 4 for details). The split into a micro and a macro module is
done purely for computational convenience; micro- and macro-
simulations yield the same result when used with the same data
[15,16]. However, time and memory requirements in macro-
simulations rise exponentially when the number of simulated states
increases. In contrast, micro-simulations – unlike customary multi-
state life tables – do not require the a priori specification of all
theoretically possible combinations of diseases/risk-factor states,
but only those states that are actually occupied. However, for
simulating rare events – e.g. lung cancer at young ages – micro-
simulations require the simulation of large numbers of individuals,
offsetting the savings in time and memory requirements.
The epidemiological model uses relative risks by risk-factor
class, i.e. incidences in exposed risk-factor classes are a multiple of
the incidence in non-exposed. The total mortality, i.e. population
level mortality by age and sex, is being decomposed in the
mortality due to the diseases included in the model and other-
cause mortality. This decomposition assumes additive mortality:
the total mortality rate in the population is explained as the sum of
the mortality rate of the included diseases and other-cause
mortality, i.e. mortality from all causes/diseases that are not
explicitly included in the model.
Modeling Policies with DYNAMO-HIAThe goal of HIA is to compare the effect of several policies/
interventions on future population health, keeping the status quo
as the reference scenario. Within DYNAMO-HIA, policies can be
modeled in two ways (both approaches can be applied simulta-
neously and/or targeted at selected parts of the population only).
The first approach is to define a counterfactual risk-factor
prevalence that is assumed to be reached after a successful one-
time, sustained intervention, e.g. a reduction in alcohol consump-
tion caused by a tax increase or a ban on smoking in public. The
approach of defining counterfactual risk-factor prevalences is akin
to epidemiological methods, where total or partial eradication of
DYNAMO-HIA
PLoS ONE | www.plosone.org 2 May 2012 | Volume 7 | Issue 5 | e33317
a risk-factor is quantified. DYNAMO-HIA does this quantification
dynamically, i.e. effects are projected over time. The second
approach is to alter the transition probabilities between different
risk-factor states, i.e. changing the risk-factor behavior of the
population. This approach is closer to the reality of many health
interventions that try to influence life style choices of individuals,
e.g. halving the future number of teenagers that become obese.
The specification of the transition probabilities influences greatly
the future development of the risk-factor prevalence, which is
always debatable. As an option, DYNAMO-HIA provides the use
of net transition probabilities [17]: DYNAMO-HIA estimates
internally the transition probabilities that keep the age-specific
risk-factor prevalence constant, ignoring any future cohort effects.
IllustrationTo illustrate the usability of DYNAMO-HIA, we present two
stylized example applications. The first illustration projects the
consequences of a policy-induced increase in alcohol consumption
and resembles a prospective HIA. The second illustration
quantifies the changes in population health if smoking were to
be eradicated and resembles a burden of disease study. In both
applications, we model the effects of risk-factors on total mortality
and nine diseases (ischemic heart disease, stroke, diabetes, COPD,
breast-, lung, esophageal-, colorectal-, and oral-cancer) and keep
the age-specific risk-factor prevalence constant over time by using
net transition probabilities between risk-factor classes, i.e. ignoring
any future cohort effects. Hence, the difference between the
reference scenarios and the intervention scenarios depends solely
on the different initial risk-factor prevalences. The data sources
and the relative risk used are shown in detail in the supporting
information (see Table S1, Table S2, Table S3, Table S4, and
Table S5).
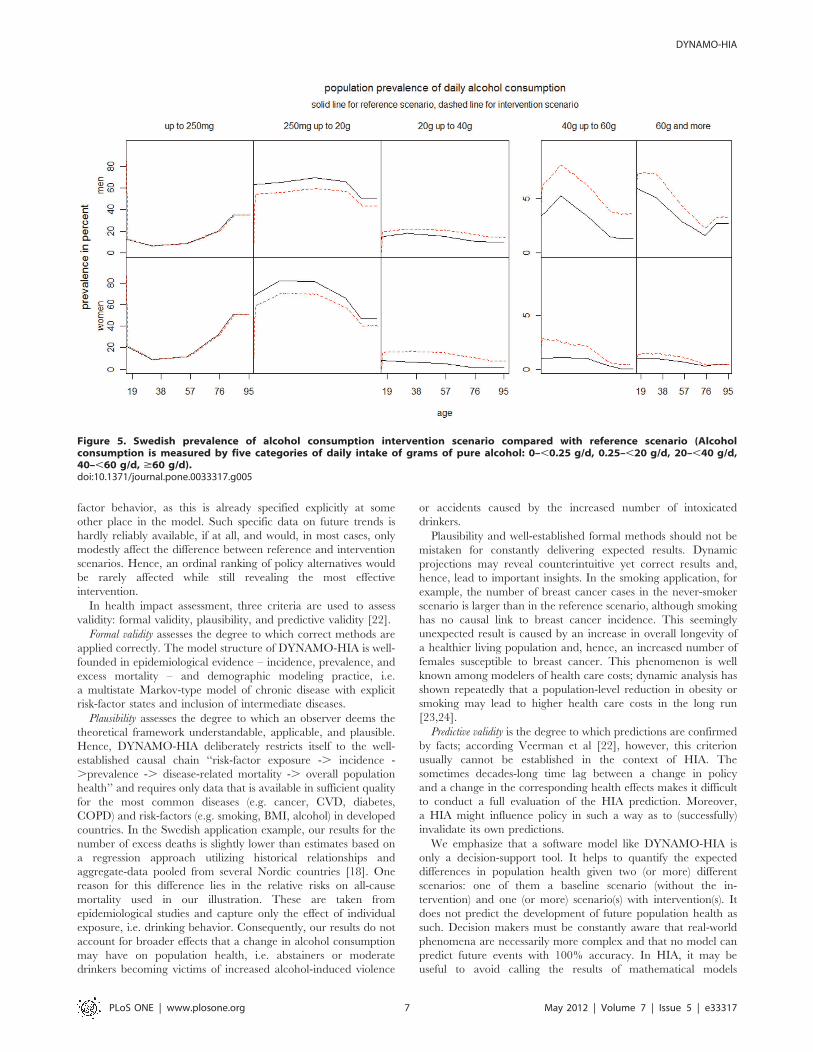
Liberalizing access to alcohol: The swedish case. In
2004, Sweden was forced to lift her its ban on private alcohol
imports [18]. Prospective studies were forecasting an increase in
overall alcohol consumption and consequently a worsening of
a number of alcohol-related harm indicators. In our reference
scenario, we keep the alcohol consumption prevalence observed in
2002 constant during the projection period and assume a one-time
change in the consumption of pure alcohol by 1 L per-capita,
producing a counterfactual risk-factor prevalence for the in-
tervention scenario as seen in Fig. 5. We project both scenarios for
25 years in the future (see Table 1).
The annual excess number of deaths due to increased alcohol
consumption is on average approx. 170 deaths, accruing to some
4,300 additional deaths over the 25 year period. This projected
difference in overall population mortality also reflects all other
effects a risk-factor has on other-cause mortality, accounting for
not included diseases and – more salient in the case of alcohol –
injuries/accidents via the relative risk of a risk-factor on total
mortality. This absolute number is rather small compared to the
overall population of some 9 million; hence, the effect on total life
expectancy and, similarly, the overall difference in disease-free life
expectancies between the reference and the intervention scenario
are negligible.
Alcohol intake has a pronounced effect on a number of the
diseases projected in the model. In projection year 25, the biggest
difference in absolute cases is for diabetes with approx. 6,600 more
cases, followed by stroke with an excess prevalence of approx.
1,700 cases. Ischemic heart disease, the most prevalent of the
included diseases, is overall less affected by the change in alcohol
intake. The population prevalence differs only marginally over the
simulation period, but still accounts for approx. 700 additional
cases; this is partly caused by the beneficial effect of moderate
drinking by some age groups (see Table S3). From the five
included cancers, the increase in breast cancer is the most notable:
in projection year 25, the excess prevalence is approx. 1,800 cases
in the intervention scenario. For the other cancers, the increase in
prevalence cases is relatively minor: for oral cancer approx. 750,
for colorectal cancer approx. 280, and for esophageal cancer
approx. 60 additional cases in the counterfactual scenario. COPD
shows a slight decrease in absolute numbers, although it is not
causally related to alcohol intake. This is due the higher number of
deaths, thus there are less persons alive to contract this disease.
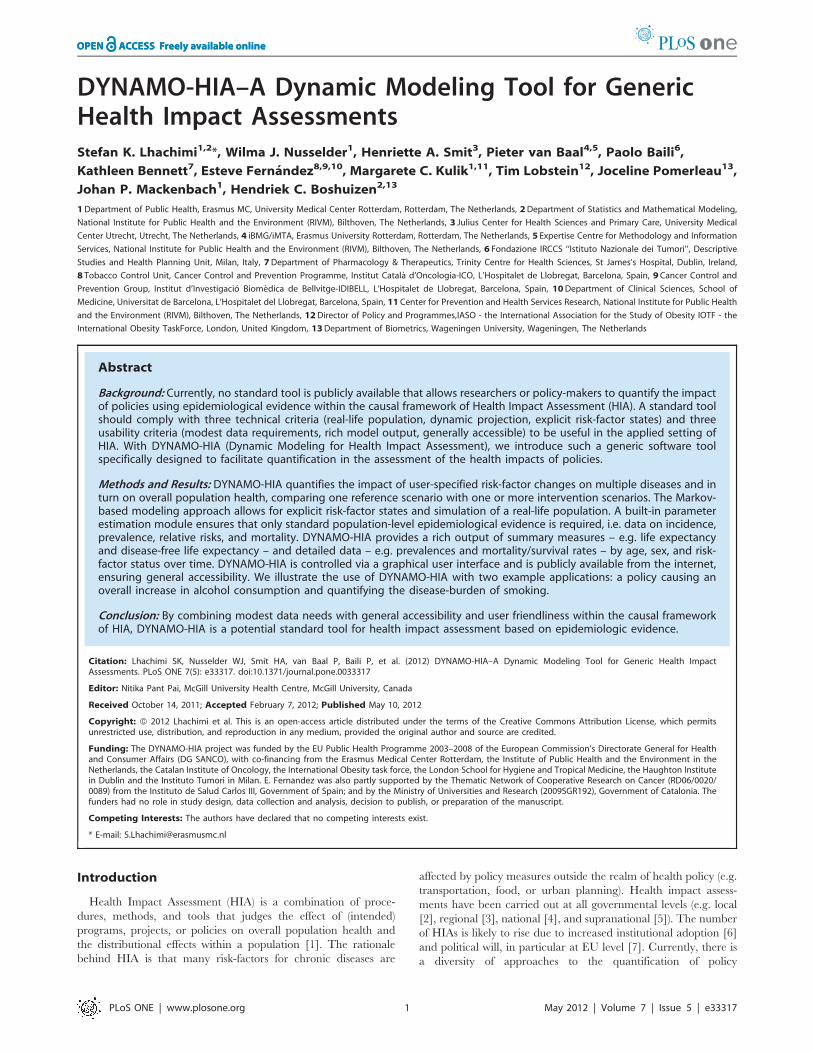
Figure 1. Example of risk-factor biographies for a risk-factor with three categories. DYNAMO-HIA simulates individuals and projects theirrisk-factor biographies. The risk-factor status is being updated in one-year increments, given age- and sex-specific transition probabilities. The age-and sex-specific risk-factor status determines the relative risk of a person to contract a disease or to die. DYNAMO-HIA allows one risk-factor perscenario. This risk-factor can be either categorical (up to ten categories), duration dependent (up to ten categories, of which one is durationdependent, i.e. the risk on disease in this category depends on how long a person is in the category), or a continuous distribution (normal or log-normal, specified by entering mean, standard deviation, and, in the case of the log-normal, skewness).doi:10.1371/journal.pone.0033317.g001
DYNAMO-HIA
PLoS ONE | www.plosone.org 3 May 2012 | Volume 7 | Issue 5 | e33317
Total elimination of smoking: A projection with UK
data. Smoking is a major public health concern. This illustra-
tion quantifies the gain in population health obtainable if an entire
population would consisted of never smokers compared to a real
life population that keeps the currently observed smoking behavior
unchanged. Smoking is measured in three categories (never-,
former-, current-smoker). The data for this illustration are from
the UK and projected 25 years into the future (see Table 1 and
Table 2). In the counterfactual, the whole population consists of
never smokers and no uptake of smoking.
In 25 years, the population of non-smokers is projected to have
approx. 1,510,000 more individuals than a population keeping the
current smoking behavior. This translates into a total life
expectancy of 81.4 years for the counterfactual compared to
79.0 years for the reference scenario. This gain in life expectancy is
substantially larger for men than for women: For men the
difference is more than 3 life years (76.9 in the reference scenario
compared to 80.0 in the intervention scenario) and women 1.8
years (81.0 compared to 82.8). The projected life expectancies
clearly demonstrate that in DYNAMO-HIA no autonomous
trends are assumed, e.g. a secular increase in life expectancy that
one may expect over the next 25 years.
Smoking also has a causal effect on a number of diseases. The
biggest reduction in the modeled diseases is for COPD. In
projection year 25, the average life years lived with COPD is
approx. 0.9 years less in the intervention scenario than in the
reference scenario, more than halving population prevalence from
1.7% to .5%. The next biggest reduction is for IHD, with approx.
half a year less expected life years with this disease; a difference in
prevalence of one percentage point. Similarly, the prevalence of
stroke goes down by approx. 0.4 percentage points (from 2.3% to
1.9%). The three included cancers that are related to smoking are
reduced as well (lung cancer by approx 87,000 cases, esophageal
cancer by approx 38,000, and oral cancer by approx 9,200 cases).
However, other included diseases that are not causally related to
smoking (diabetes, breast-, and colorectal cancer) increase in
prevalence thanks to the larger number of surviving individuals
that are now at risk of contracting those diseases.
Discussion
Within the rapidly developing field of HIA no standard method
on quantification has emerged yet [19], but three approaches
predominate the field: regression based methods, quantitative risk
assessment, and population health models. The regression based
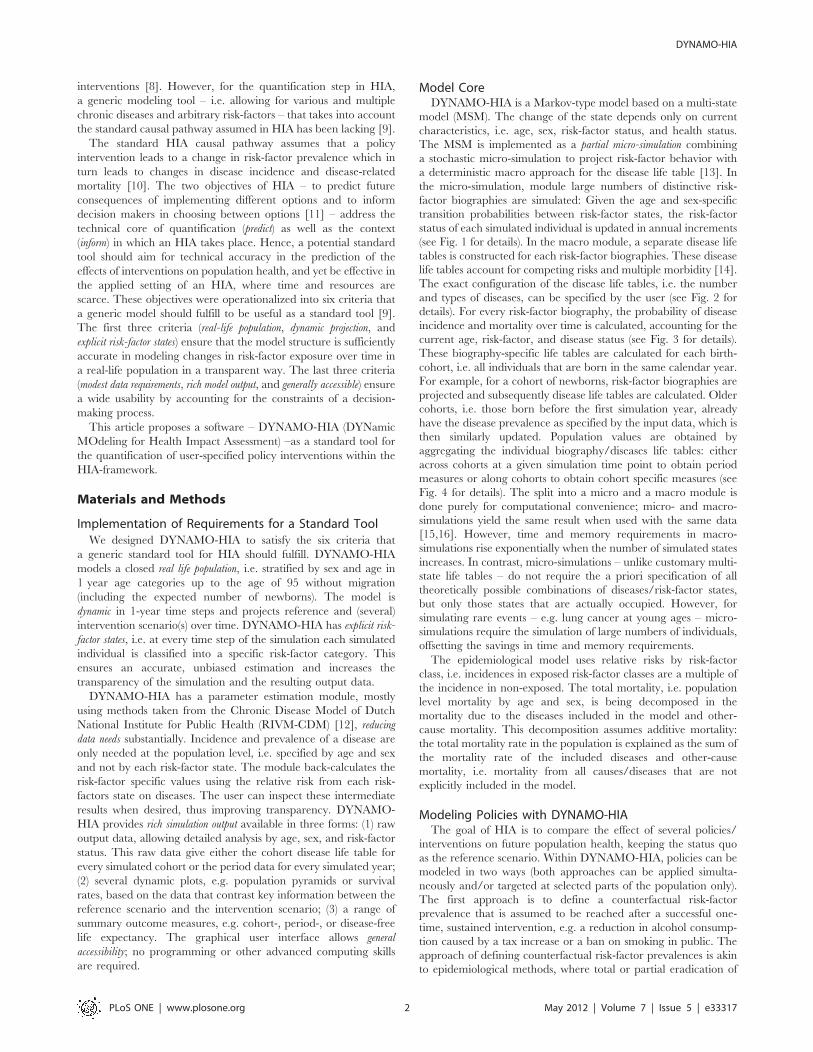
Figure 2. Stylized structure of disease life table. The disease life tables contain disease clusters. Each disease cluster consists of one or morediseases. Within disease clusters, intermediate diseases – that is, a disease that increase the risk of getting another disease – can be specified (e.g.having diabetes increases the risk of getting IHD). All diseases are chronic diseases, i.e. excess mortality depends on age and sex and not on timesince onset of disease. However, acutely fatal and/or cured fraction can be specified for diseases. The disease life table assumes independencebetween disease clusters. The user can freely specify the relative risks from risk-factor to disease, from risk-factor to death, and from intermediatedisease to other diseases.doi:10.1371/journal.pone.0033317.g002
DYNAMO-HIA
PLoS ONE | www.plosone.org 4 May 2012 | Volume 7 | Issue 5 | e33317
methods originated in econometrics and usually estimate the long
term relationship between exposure (e.g. per-capita consumption)
or proxy variables (e.g. tax rate on alcohol) and health outcomes of
interest on an aggregate level, adjusting for further variables as
suggested by (economic) theory. This approach usually takes only
limited notice of underlying epidemiological mechanisms. Quan-
titative risk assessment, originating from (environmental) exposure
assessment of toxic substances, makes explicit use of dose-response
relationships derived through epidemiological studies. These
approaches are usually static, i.e. do not account for changes over
time in real-life populations. Population health models combine
epidemiological evidence and insights on causality to dynamically
quantify the effect of risk-factors on population health.
DYNAMO-HIA fills a gap among the already existing
population health models that are suggested for application in
HIA [9,20]. Compared to existing models, DYNAMO-HIA strikes
a balance between being sufficiently technically accurate and
ensuring wide usability. Technically equal or more complex
models – e.g. POHEM, ARMADA, RIVM-CDM – allow for
greater flexibility in modeling but are not publicly available, and
require highly specialized input data and proficiency in specialized
programming languages (except ARMADA). More accessible
models – e.g. PREVENT, Proportional Multi-state Life Table
(MSLT), GBD – lack dynamic projection capabilities (except
PREVENT and multiple cohort versions of the MSLT [21]) and
do not have explicit risk-factor states. This technical simplification
ignores mortality selection and may lead to biased estimates [9].
DYNAMO-HIA is specially designed to fit within the standard
framework of HIA, synthesizing elements of already well
established modeling approaches. Our approach allows for
a flexible risk-factor configuration (categorical, duration de-
pendent, continuous); generic chronic diseases as specified by the
user (with intermediate diseases, partially fatal diseases, and/or
diseases with a cured fraction); arbitrary specification of– age and
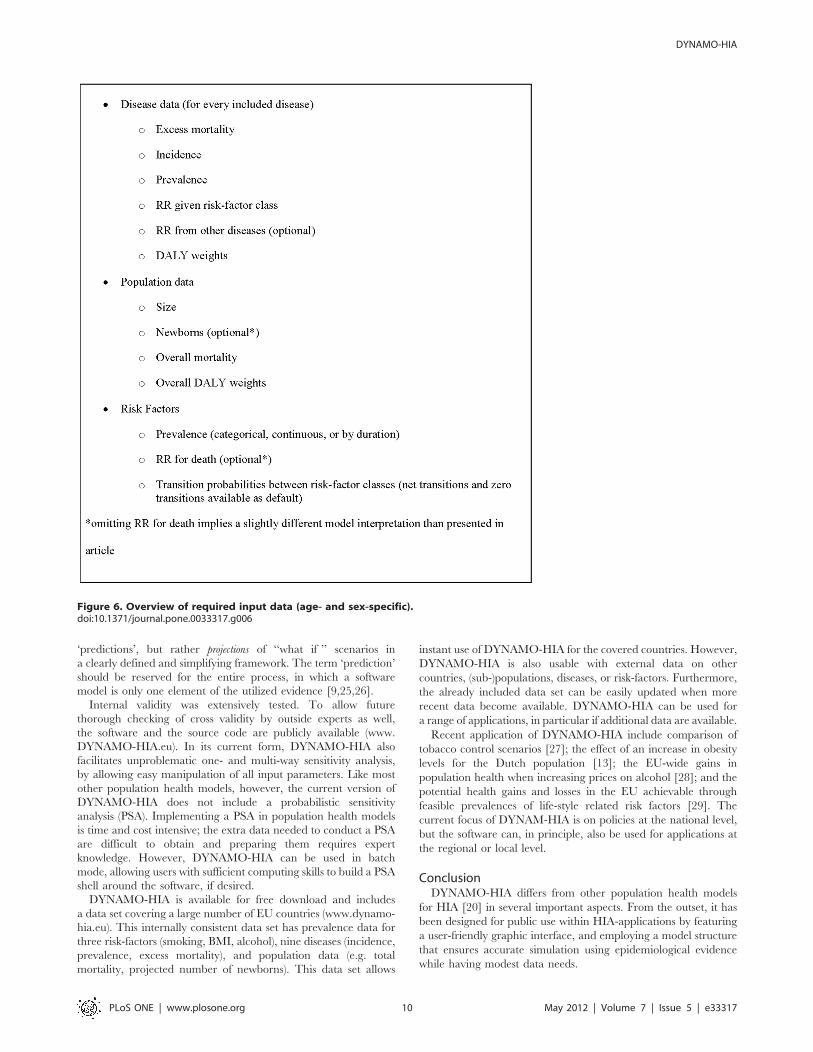
sex-specific – relative risks; and minimal data needs by requiring
only population level data (see Fig. 6). Furthermore, a mouse-
driven graphic user interface allows straightforward handling of
the software, i.e. no knowledge of a programming language is
required. In addition to exporting the existing, partly customiz-
able, graphs into files – e.g. detailed plots of mortality rates or
prevalences of risk-factors or diseases, both over time and age-
specific – most calculated data can be exported for use in
separate software (e.g. Excel). These raw output data allow
further analyses, such as grouping diseases into categories (e.g.
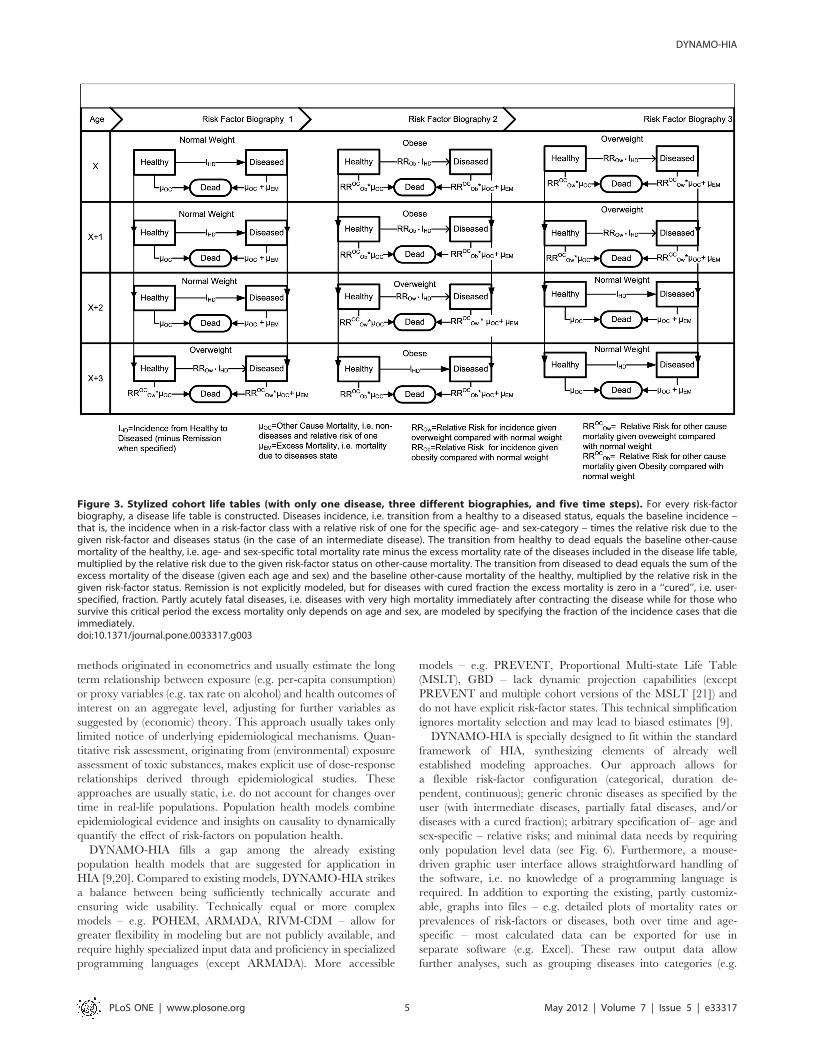
Figure 3. Stylized cohort life tables (with only one disease, three different biographies, and five time steps). For every risk-factorbiography, a disease life table is constructed. Diseases incidence, i.e. transition from a healthy to a diseased status, equals the baseline incidence –that is, the incidence when in a risk-factor class with a relative risk of one for the specific age- and sex-category – times the relative risk due to thegiven risk-factor and diseases status (in the case of an intermediate disease). The transition from healthy to dead equals the baseline other-causemortality of the healthy, i.e. age- and sex-specific total mortality rate minus the excess mortality rate of the diseases included in the disease life table,multiplied by the relative risk due to the given risk-factor status on other-cause mortality. The transition from diseased to dead equals the sum of theexcess mortality of the disease (given each age and sex) and the baseline other-cause mortality of the healthy, multiplied by the relative risk in thegiven risk-factor status. Remission is not explicitly modeled, but for diseases with cured fraction the excess mortality is zero in a ‘‘cured’’, i.e. user-specified, fraction. Partly acutely fatal diseases, i.e. diseases with very high mortality immediately after contracting the disease while for those whosurvive this critical period the excess mortality only depends on age and sex, are modeled by specifying the fraction of the incidence cases that dieimmediately.doi:10.1371/journal.pone.0033317.g003
DYNAMO-HIA
PLoS ONE | www.plosone.org 5 May 2012 | Volume 7 | Issue 5 | e33317

IHD and stroke or all cancers), including costs, or constructing
additional graphs.
DYNAMO-HIA simulates the effect of a single risk-factor on
a population without migration. However, the categorical risk-
factor can be used to partition the population in up to ten
distinctive categories. For example, a population could be
partitioned along a risk-factor – say, non-smokers and smokers –
and socio-economic status – say, with and without college
education – having in total four different groups to assess policies
that are more successful for people with certain socio-economic
status. The possibility of partitioning a population also allows
quantification of the effect of an environmental hazard. In this
case, for example, the population is partitioned according to their
proximity to the hazard source – say, noise exposure or air
pollution due to a new airport – with 5% of the total population
living less than 5 km from the hazard source, 5% to 10% living less
than 10 km and so on. This requires, of course, sufficient insight
into which part of the population is affected and knowledge of the
relative risks of the modeled exposure on the included diseases and
total mortality.
A category may also represent a combination of known risk-
factors: For example, smoking status and BMI – smoking/non-
smoking and normal weight/overweight/obese – could be
modeled by partitioning the population into six distinctive risk-
factor categories. However, this would require knowledge about
the relative risk of the combined risk-factor class – say, relative risk
of being obese and a smoker on the included diseases and total
mortality.
The overall performance of a model crucially depends on the
quality of the input data. In particular for dynamic models, the
epidemiological data has to be mutually consistent, otherwise
projected changes in the prevalences might be caused by
mismatching data and not by the changes in the risk-factors. A
limitation is that an autonomous trend in the rates, e.g. annual
reduction in overall mortality or disease incidence, cannot be
specified. Autonomous trends are often observed for past time
periods and caused by a number of factors; chief among them
improved curative interventions and changed risk-factor behav-
ior. In a risk-factor based model, however, the specification of
a future autonomous trend must be net of any underlying risk-
Figure 4. Schematic overview of the dimension of a multi-cohort, multistate-life table. Each plane is a distinct cohort with varying startingages for cohorts already existing at the starting year of the simulation and starting age zero for cohorts born during the simulation run. The cohort lifetables, consisting of the set of individual risk-factor biographies, follow every already existing birth cohort until the cohort reaches 105 years of age. Inaddition, every year of the simulation a cohort of newborns is created and – after simulating individual risk-factor biographies for them – is followedthrough the appropriate disease life tables as well. This allows collecting health data for each cohort according to their risk-factor status (longitudinal)or the health status of the population by age, sex, and risk-factor status by each year of the simulation (cross-sectional).doi:10.1371/journal.pone.0033317.g004
DYNAMO-HIA
PLoS ONE | www.plosone.org 6 May 2012 | Volume 7 | Issue 5 | e33317
factor behavior, as this is already specified explicitly at some
other place in the model. Such specific data on future trends is
hardly reliably available, if at all, and would, in most cases, only
modestly affect the difference between reference and intervention
scenarios. Hence, an ordinal ranking of policy alternatives would
be rarely affected while still revealing the most effective
intervention.
In health impact assessment, three criteria are used to assess
validity: formal validity, plausibility, and predictive validity [22].
Formal validity assesses the degree to which correct methods are
applied correctly. The model structure of DYNAMO-HIA is well-
founded in epidemiological evidence – incidence, prevalence, and
excess mortality – and demographic modeling practice, i.e.
a multistate Markov-type model of chronic disease with explicit
risk-factor states and inclusion of intermediate diseases.
Plausibility assesses the degree to which an observer deems the
theoretical framework understandable, applicable, and plausible.
Hence, DYNAMO-HIA deliberately restricts itself to the well-
established causal chain ‘‘risk-factor exposure -. incidence -
.prevalence -. disease-related mortality -. overall population
health’’ and requires only data that is available in sufficient quality
for the most common diseases (e.g. cancer, CVD, diabetes,
COPD) and risk-factors (e.g. smoking, BMI, alcohol) in developed
countries. In the Swedish application example, our results for the
number of excess deaths is slightly lower than estimates based on
a regression approach utilizing historical relationships and
aggregate-data pooled from several Nordic countries [18]. One
reason for this difference lies in the relative risks on all-cause
mortality used in our illustration. These are taken from
epidemiological studies and capture only the effect of individual
exposure, i.e. drinking behavior. Consequently, our results do not
account for broader effects that a change in alcohol consumption
may have on population health, i.e. abstainers or moderate
drinkers becoming victims of increased alcohol-induced violence
or accidents caused by the increased number of intoxicated
drinkers.
Plausibility and well-established formal methods should not be
mistaken for constantly delivering expected results. Dynamic
projections may reveal counterintuitive yet correct results and,
hence, lead to important insights. In the smoking application, for
example, the number of breast cancer cases in the never-smoker
scenario is larger than in the reference scenario, although smoking
has no causal link to breast cancer incidence. This seemingly
unexpected result is caused by an increase in overall longevity of
a healthier living population and, hence, an increased number of
females susceptible to breast cancer. This phenomenon is well
known among modelers of health care costs; dynamic analysis has
shown repeatedly that a population-level reduction in obesity or
smoking may lead to higher health care costs in the long run
[23,24].
Predictive validity is the degree to which predictions are confirmed
by facts; according Veerman et al [22], however, this criterion
usually cannot be established in the context of HIA. The
sometimes decades-long time lag between a change in policy
and a change in the corresponding health effects makes it difficult
to conduct a full evaluation of the HIA prediction. Moreover,
a HIA might influence policy in such a way as to (successfully)
invalidate its own predictions.
We emphasize that a software model like DYNAMO-HIA is
only a decision-support tool. It helps to quantify the expected
differences in population health given two (or more) different
scenarios: one of them a baseline scenario (without the in-
tervention) and one (or more) scenario(s) with intervention(s). It
does not predict the development of future population health as
such. Decision makers must be constantly aware that real-world
phenomena are necessarily more complex and that no model can
predict future events with 100% accuracy. In HIA, it may be
useful to avoid calling the results of mathematical models
Figure 5. Swedish prevalence of alcohol consumption intervention scenario compared with reference scenario (Alcoholconsumption is measured by five categories of daily intake of grams of pure alcohol: 0–,0.25 g/d, 0.25–,20 g/d, 20–,40 g/d,40–,60 g/d, $60 g/d).doi:10.1371/journal.pone.0033317.g005
DYNAMO-HIA
PLoS ONE | www.plosone.org 7 May 2012 | Volume 7 | Issue 5 | e33317

Table
1.Numberofdiseasecasesan
dpopulationprevalence
(inpercent)forexample
applications.
SwedishAlcoholExample
UK
SmokingExample
Reference
Sce
nario
InterventionSce
nario(1
Lincrease
perca
pitaalcohol
consu
mption)
Reference
Sce
nario
InterventionSce
nario(A
llare
never
smokers)
year
numbers
%.
numbers
%year
Numbers
%numbers
%
IHD
1354,747
3.9%
354,747
3.9%
12,183,447
3.6%
2,183,447
3.6%
25428,727
4.7%
428,026
4.6%
25
2,666,917
4.4%
2,144,465
3.5%
Stroke
1150,271
1.7%
150,271
1.7%
11,002,594
1.7%
1,002,594
1.7%
25192,924
2.1%
194,616
2.1%
25
1,374,698
2.3%
1,156,176
1.9%
Diabetes
1368,787
4.1%
368,787
4.1%
11,559,679
2.6%
1,559,679
2.6%
25385,216
4.2%
391,793
4.3%
25
1,850,392
3.1%
1,999,847
3.2%
Lung
14,613
0.1%
4,613
0.1%
182,082
0.1%
82,082
0.1%
Cancer
255,753
0.1%
5,750
0.1%
25
107,393
0.2%
20,334
0.0%
Oral
19,377
0.1%
9,377
0.1%
155,804
0.1%
55,804
0.1%
Cancer
2511,738
0.1%
12,495
0.1%
25
70,949
0.1%
33,013
0.1%
Esophageal
1971
0.0%
971
0.0%
111,231
0.0%
11,231
0.0%
Cancer
251,241
0.0%
1,300
0.0%
25
14,535
0.0%
5,324
0.0%
Colorectal
136,415
0.4%
36,415
0.4%
1248,380
0.4%
248,380
0.4%
Cancer
25
47,775
0.5%
48,062
0.5%
25
329,116
0.5%
370,596
0.6%
Breast
190,444
1.0%
90,444
1.0%
1543,738
0.9%
543,738
0.9%
Cancer
25
108,854
1.2%
110,661
1.2%
25
670,013
1.1%
705,919
1.1%
COPD
1105,052
1.2%
105,052
1.2%
1525,247
0.9%
525,247
0.9%
25
131,118
1.4%
130,850
1.4%
25
1,016,422
1.7%
278,194
0.4%
Withatleast
1918,921
10.2%
918,921
10.2%
15,148,112
8.6%
5,148,112
8.6%
onedisease
25
1,081,720
11.7%
1,088,547
11.8%
25
6,726,107
11.1%
5,792,303
9.4%
Size
of
19,002,148
9,002,148
159,987,010
59,987,010
totalpopulation
259,210,437
9,206,131
25
60,416,567
61,929,848
Fordata
sources
seeTable
S1,Table
S2,Table
S3,Table
S4,Table
S5.
doi:10.1371/journal.pone.0033317.t001
DYNAMO-HIA
PLoS ONE | www.plosone.org 8 May 2012 | Volume 7 | Issue 5 | e33317
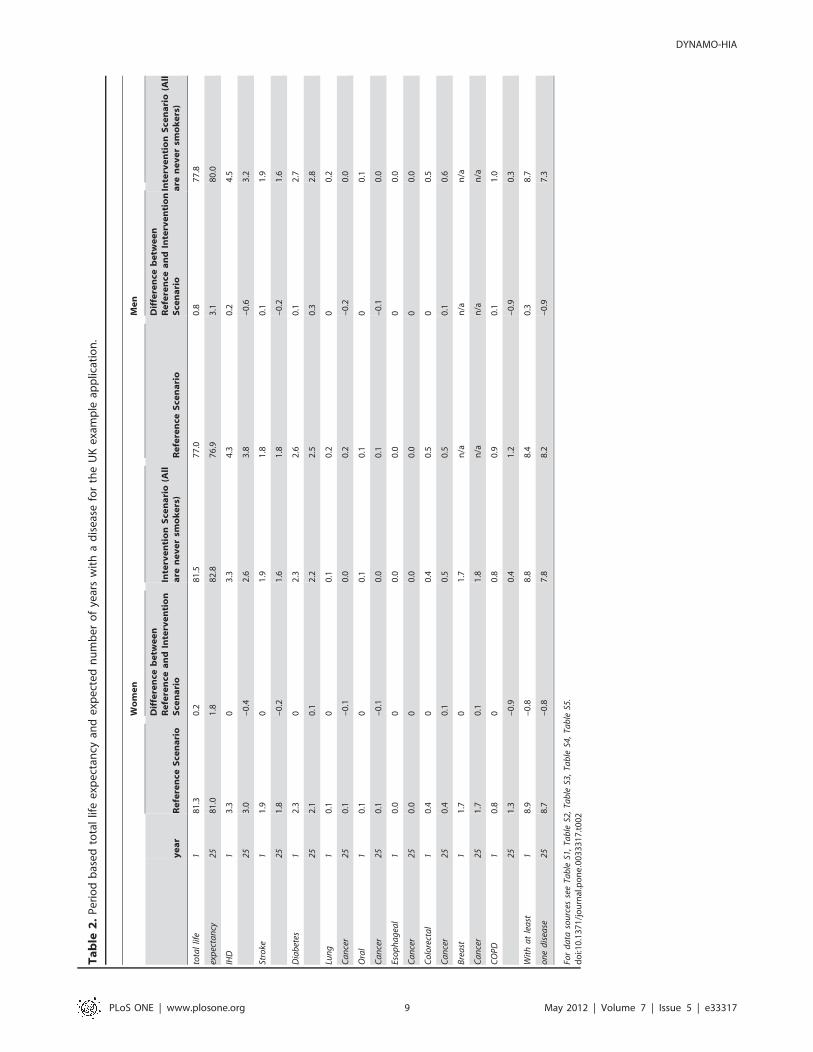
Table
2.Periodbasedtotallifeexp
ectan
cyan
dexp
ectednumberofyearswithadiseasefortheUKexample
application.
Women
Men
year
Reference
Sce
nario
Difference
betw
een
Reference
andIntervention
Sce
nario
InterventionSce
nario(A
llare
neversm
okers)
Reference
Sce
nario
Difference
betw
een
Reference
andIntervention
Sce
nario
InterventionSce
nario(A
llare
neversm
okers)
totallife
181.3
0.2
81.5
77.0
0.8
77.8
expectancy
2581.0
1.8
82.8
76.9
3.1
80.0
IHD
13.3
03.3
4.3
0.2
4.5
253.0
–0.4
2.6
3.8
–0.6
3.2
Stroke
11.9
01.9
1.8
0.1
1.9
251.8
–0.2
1.6
1.8
–0.2
1.6
Diabetes
12.3
02.3
2.6
0.1
2.7
252.1
0.1
2.2
2.5
0.3
2.8
Lung
10.1
00.1
0.2
00.2
Cancer
250.1
–0.1
0.0
0.2
–0.2
0.0
Oral
10.1
00.1
0.1
00.1
Cancer
250.1
–0.1
0.0
0.1
–0.1
0.0
Esophageal
10.0
00.0
0.0
00.0
Cancer
250.0
00.0
0.0
00.0
Colorectal
10.4
00.4
0.5
00.5
Cancer
250.4
0.1
0.5
0.5
0.1
0.6
Breast
11.7
01.7
n/a
n/a
n/a
Cancer
251.7
0.1
1.8
n/a
n/a
n/a
COPD
10.8
00.8
0.9
0.1
1.0
251.3
–0.9
0.4
1.2
–0.9
0.3
Withatleast
18.9
–0.8
8.8
8.4
0.3
8.7
onedisease
258.7
–0.8
7.8
8.2
–0.9
7.3
Fordata
sources
seeTable
S1,Table
S2,Table
S3,Table
S4,Table
S5.
doi:10.1371/journal.pone.0033317.t002
DYNAMO-HIA
PLoS ONE | www.plosone.org 9 May 2012 | Volume 7 | Issue 5 | e33317
‘predictions’, but rather projections of ‘‘what if ’’ scenarios in
a clearly defined and simplifying framework. The term ‘prediction’
should be reserved for the entire process, in which a software
model is only one element of the utilized evidence [9,25,26].
Internal validity was extensively tested. To allow future
thorough checking of cross validity by outside experts as well,
the software and the source code are publicly available (www.
DYNAMO-HIA.eu). In its current form, DYNAMO-HIA also
facilitates unproblematic one- and multi-way sensitivity analysis,
by allowing easy manipulation of all input parameters. Like most
other population health models, however, the current version of
DYNAMO-HIA does not include a probabilistic sensitivity
analysis (PSA). Implementing a PSA in population health models
is time and cost intensive; the extra data needed to conduct a PSA
are difficult to obtain and preparing them requires expert
knowledge. However, DYNAMO-HIA can be used in batch
mode, allowing users with sufficient computing skills to build a PSA
shell around the software, if desired.
DYNAMO-HIA is available for free download and includes
a data set covering a large number of EU countries (www.dynamo-
hia.eu). This internally consistent data set has prevalence data for
three risk-factors (smoking, BMI, alcohol), nine diseases (incidence,
prevalence, excess mortality), and population data (e.g. total
mortality, projected number of newborns). This data set allows
instant use of DYNAMO-HIA for the covered countries. However,
DYNAMO-HIA is also usable with external data on other
countries, (sub-)populations, diseases, or risk-factors. Furthermore,
the already included data set can be easily updated when more
recent data become available. DYNAMO-HIA can be used for
a range of applications, in particular if additional data are available.
Recent application of DYNAMO-HIA include comparison of
tobacco control scenarios [27]; the effect of an increase in obesity
levels for the Dutch population [13]; the EU-wide gains in
population health when increasing prices on alcohol [28]; and the
potential health gains and losses in the EU achievable through
feasible prevalences of life-style related risk factors [29]. The
current focus of DYNAM-HIA is on policies at the national level,
but the software can, in principle, also be used for applications at
the regional or local level.
ConclusionDYNAMO-HIA differs from other population health models
for HIA [20] in several important aspects. From the outset, it has
been designed for public use within HIA-applications by featuring
a user-friendly graphic interface, and employing a model structure
that ensures accurate simulation using epidemiological evidence
while having modest data needs.
Figure 6. Overview of required input data (age- and sex-specific).doi:10.1371/journal.pone.0033317.g006
DYNAMO-HIA
PLoS ONE | www.plosone.org 10 May 2012 | Volume 7 | Issue 5 | e33317
Supporting Information
Table S1 Overview of data sources for disease data used in the
example applications.
(DOCX)
Table S2 Overview of data sources for risk factors used in the
example applications.
(DOCX)
Table S3 Overview of relative risks from alcohol to diseases and
total mortality used in the example applications (below the age of
15 all relative risks are set 1).
(DOCX)
Table S4 Overview of relative risks from smoking to diseases
and total mortality used in the example applications (below the age
of 35 all relative risks are set to 1).
(DOCX)
Table S5 Overview of relative risks from diabetes to IHD and
stroke used in the example applications.
(DOCX)
Author Contributions
Conceived and designed the experiments: SKL WJN HS PvB JPM HCB.
Analyzed the data: SKL. Wrote the paper: SKL. Collected and validated
data on all respective diseases and/or risk factors: PB KB EF MCK TL JP.
References
1. European Centre for Health Policy (1999) Health impact assessment: main
concepts and suggested approach. Gothenburg consensus paper. Brussels: WHO
Regional Office for Europe.
2. Cole BL, Shimkhada R, Morgenstern H, Kominski G, Fielding JE, et al. (2005)
Projected health impact of the Los Angeles City living wage ordinance.
J Epidemiol Community Health 59: 645–650.
3. Fehr R, Mekel O, Lacombe M, Wolf U (2003) Towards health impact
assessment of drinking-water privatization – the example of waterborne
carcinogens in North Rhine-Westphalia. Bull World Health Organ 81: 408–414.
4. McPherson K, Marsh T, Brown J (2007) Tackeling obesities: Future choices -
Modelling future trends in obesity and the impact on health. In: Office for S, ed.
Foresight Obesity Project 2nd ed. London.
5. Abrahams D, Haigh F, Pennington A (2004) A health impact assessment of the
European employment strategy across the European Union. Liverpool.
6. Wismar M, Blau J, Ernst K, Elliott E, Golby A, et al. (2007) Implementation and
institutionalizing HIA in Europe. In: Wismar M, Blau J, Ernst K, Figueras J, eds.
The Effectiveness of Health Impact Assessment Scope and limitations of
supporting decision-making in Europe: WHO. pp 57–78.
7. Salay R, Lincoln P (2008) Health impact assessments in the European Union.
Lancet 372: 860–861.
8. Veerman JL (2007) Quantitative Health Impact Assessment. Rotterdam: EUR.
192 p p.
9. Lhachimi SK, Nusselder WJ, Boshuizen HC, Mackenbach JP (2010) No
Standard Tool for Quantification in Health Impact Assessment: A review.
Am J Prev Med 38: 78–84.
10. Cole BL, Fielding JE (2007) Health impact assessment: A tool to help policy
makers understand health beyond health care. Annual Review of Public Health
28: 393–412.
11. Kemm J (2007) What is HIA and why might it be useful? In: Wismar M, Blau J,
Ernst K, Figueras J, eds. The Effectiveness of Health Impact Assessment Scope
and limitations of supporting decision-making in Europe: WHO. pp 3–13.
12. Hoogenveen RT, van Baal PHM, Boshuizen HC (2009) Chronic disease
projections in heterogeneous ageing populations: approximating multi-state
models of joint distributions by modelling marginal distributions. Math Med
Biol.
13. Boshuizen HC, Lhachimi SK, Baal P, Hoogenveen RT, Smit HA, et al. (2012)
The DYNAMO-HIA model: An efficient implementation of a risk factor/
chronic disease Markov model for use in health impact assessment. (accepted for
publication).
14. Barendregt JJ, van Oortmarssen GJ, van Hout Ben A, van den Bosch JM,
Bonneux L (1998) Coping with multiple morbidity in a life table. Math PopulStud 7: 29–49.
15. van Imhoff E, Post W (1998) Microsimulation Methods for PopulationProjection. Population: An English Selection 10: 97–138.
16. Karnon J (2003) Alternative decision modelling techniques for the evaluation of
health care technologies: Markov processes versus discrete event simulation.Health Econ 12: 837–848.
17. Kassteele J, Hoogenveen RT, Engelfriet PM, Baal PH, Boshuizen HC (2012)Estimating net transition probabilities from cross-sectional data with application
to risk factors in chronic disease modeling. Stat Med 31: 533–543.
18. Holder H, Andreasson S, Norstrom T, Osterberg E, Rossow I (2005) Estimatesof Harm Associated with Changes in Swedish Alcohol Policy. Stockholm:
National Institute of Public Health.19. Mindell JS, Boltong A, Forde I (2008) A review of health impact assessment
frameworks. Public Health 122: 1177–1187.20. Bronnum-Hansen H (2009) Quantitative health impact assessment modelling.
Scand J Public Health 37: 447–449.
21. Cobiac LJ, Vos T, Barendregt JJ (2009) Cost-Effectiveness of Interventions toPromote Physical Activity: A Modelling Study. PLoS Med 6: e1000110.
22. Veerman JL, Mackenbach JP, Barendregt JJ (2007) Validity of predictions inhealth impact assessment. J Epidemiol Community Health 61: 362–366.
23. van Baal PHM, Polder JJ, Wit GA, Hoogenveen RT, Feenstra TL, et al. (2008)
Lifetime Medical Costs of Obesity: Prevention No Cure for Increasing HealthExpenditure. PLoS Medicine 5: e29 EP.
24. Barendregt JJ, Bonneux L, van der Maas PJ (1997) The Health Care Costs ofSmoking. New England Journal of Medicine 337: 1052–1057.
25. Massad E, Burattini MN, Lopez LF, Coutinho FAB (2005) Forecasting versus
projection models in epidemiology: The case of the SARS epidemics. MedicalHypotheses 65: 17–22.
26. Bray D, Storch H (2009) Prediction or Projection? Science Communication 30:534–543.
27. Kulik MC, Nusselder WJ, Boshuizen HC, Lhachimi SK, Fernandez E, et al.(2012) Comparison of Tobacco Control Scenarios: Quantifying Estimates of
Long-Term Health Impact Using the DYNAMO-HIA Modeling Tool. PLoS
ONE 7: e32363.28. Lhachimi SK, Cole K, Nusselder WJ, McKee M (2011) Health impacts of
increasing the EU-wide excise duty on alcohol: A dynamic projection. Seville,Spain.
29. Lhachimi SK (2010) Potential public health gains in Europe (Poster presented at
EUPHA 2010). The European Journal of Public Health 20: 211.
DYNAMO-HIA
PLoS ONE | www.plosone.org 11 May 2012 | Volume 7 | Issue 5 | e33317