Dynamics of the Third Wave of COVID-19 from the Perspective ...
11
Citation: Klosiewicz, T.; Szkudlarek, W.; W˛ eglewska, M.; Konieczka, P.; Zalewski, R.; Podlewski, R.; Sowi ´ nska, A.; Pu´ slecki, M. Dynamics of the Third Wave of COVID-19 from the Perspective of the Emergency Department in a Large Regional Hospital—Single Center Observational Study. Healthcare 2022, 10, 18. https://doi.org/10.3390/ healthcare10010018 Academic Editor: André van Zundert Received: 25 October 2021 Accepted: 20 December 2021 Published: 23 December 2021 Publisher’s Note: MDPI stays neutral with regard to jurisdictional claims in published maps and institutional affil- iations. Copyright: © 2021 by the authors. Licensee MDPI, Basel, Switzerland. This article is an open access article distributed under the terms and conditions of the Creative Commons Attribution (CC BY) license (https:// creativecommons.org/licenses/by/ 4.0/). healthcare Article Dynamics of the Third Wave of COVID-19 from the Perspective of the Emergency Department in a Large Regional Hospital—Single Center Observational Study Tomasz Klosiewicz 1, * , Weronika Szkudlarek 2 , Magdalena W˛ eglewska 2 , Patryk Konieczka 3 , Radoslaw Zalewski 1 , Roland Podlewski 1 , Anna Sowi ´ nska 4 and Mateusz Pu´ slecki 1,5 1 Department of Medical Rescue, Faculty of Health Sciences, Poznan University of Medical Sciences, 60-608 Poznan, Poland; [email protected] (R.Z.); [email protected] (R.P.); [email protected] (M.P.) 2 Students’ Scientific Circle of Emergency Medicine, Department of Medical Rescue, Faculty of Health Sciences, Poznan University of Medical Sciences, 60-608 Poznan, Poland; [email protected] (W.S.); [email protected] (M.W.) 3 Department of Emergency Medicine, Faculty of Health Sciences, Poznan University of Medical Sciences, 60-608 Poznan, Poland; [email protected] 4 Department of Computer Science and Statistics, Poznan University of Medical Sciences, 60-608 Poznan, Poland; [email protected] 5 Department of Cardiac Surgery and Transplantology, Medical Faculty, Poznan University of Medical Sciences, 61-848 Poznan, Poland * Correspondence: [email protected]; Tel.: +48-668956969 Abstract: Background: The outbreak of the Coronavirus Disease 2019 (COVID-19) pandemic has caused many significant social and economic changes. The consecutive waves of the epidemic in various countries have had dissimilar courses depending on the methods used to combat it. The aim of this study was to determine the dynamics of the third wave of COVID-19 from the perspective of emergency departments (ED). Methods: This was a retrospective review of medical records from ED. The authors have identified the most frequent symptoms. Prognostic factors have been chosen— prognostic scales, length of stay (LOS)—and a number of resources required have been calculated. Results: As the time passed, there were fewer patients and they presented mild symptoms. A statistically significant difference was observed in the median of blood oxygenation measurement (p = 0.00009), CRP level (p = 0.0016), and admission rate. Patients admitted to the hospital required more resources at ED. LOS was shorter in patients discharged home (p < 0.0001). Conclusions: The blood oxygen saturation (SPO2) and CPR levels can be helpful in decision-making regarding medical treatment. The fast-track for patients in good clinical condition may shorten the duration of stay in ED, and reduce the number of required resources. Keywords: COVID-19; pandemic; emergency department; decision making process; fast-track 1. Introduction The rapid spread of coronavirus was noticed in December 2019 in China. The disease mainly causes acute aspiratory failure. The World Health Organization (WHO) used the name of Coronavirus Disease 2019 (COVID-19) to identify the virus that quickly spread all over the world, which, in turn, caused WHO to announce the pandemic [1,2]. Patients infected with COVID-19 present a wide range of clinical conditions: an asymptomatic infection, a mild course of infection, or a severe viral pneumonia leading to acute respi- ratory failure followed by death [3]. Emergency departments (ED) are often the place of the first contact between a patient and a medical professional. These are places where not only patients with COVID-19, but also those with other medical problems are attended to without prior appointment. Diagnostics and therapies of varying degrees of complexity are performed. This makes the work in an ED a major organizational challenge; it requires the Healthcare 2022, 10, 18. https://doi.org/10.3390/healthcare10010018 https://www.mdpi.com/journal/healthcare
-
Upload
khangminh22 -
Category
Documents
-
view
4 -
download
0
Transcript of Dynamics of the Third Wave of COVID-19 from the Perspective ...
�����������������
Citation: Kłosiewicz, T.; Szkudlarek,
W.; Weglewska, M.; Konieczka, P.;
Zalewski, R.; Podlewski, R.;
Sowinska, A.; Puslecki, M. Dynamics
of the Third Wave of COVID-19 from
the Perspective of the Emergency
Department in a Large Regional
Hospital—Single Center
Observational Study. Healthcare 2022,
10, 18. https://doi.org/10.3390/
healthcare10010018
Academic Editor: André van Zundert
Received: 25 October 2021
Accepted: 20 December 2021
Published: 23 December 2021
Publisher’s Note: MDPI stays neutral
with regard to jurisdictional claims in
published maps and institutional affil-
iations.
Copyright: © 2021 by the authors.
Licensee MDPI, Basel, Switzerland.
This article is an open access article
distributed under the terms and
conditions of the Creative Commons
Attribution (CC BY) license (https://
creativecommons.org/licenses/by/
4.0/).
healthcare
Article
Dynamics of the Third Wave of COVID-19 from the Perspectiveof the Emergency Department in a Large RegionalHospital—Single Center Observational Study
Tomasz Kłosiewicz 1,* , Weronika Szkudlarek 2, Magdalena Weglewska 2, Patryk Konieczka 3 ,Radosław Zalewski 1 , Roland Podlewski 1, Anna Sowinska 4 and Mateusz Puslecki 1,5
1 Department of Medical Rescue, Faculty of Health Sciences, Poznan University of Medical Sciences,60-608 Poznan, Poland; [email protected] (R.Z.); [email protected] (R.P.);[email protected] (M.P.)
2 Students’ Scientific Circle of Emergency Medicine, Department of Medical Rescue, Faculty of Health Sciences,Poznan University of Medical Sciences, 60-608 Poznan, Poland; [email protected] (W.S.);[email protected] (M.W.)
3 Department of Emergency Medicine, Faculty of Health Sciences, Poznan University of Medical Sciences,60-608 Poznan, Poland; [email protected]
4 Department of Computer Science and Statistics, Poznan University of Medical Sciences,60-608 Poznan, Poland; [email protected]
5 Department of Cardiac Surgery and Transplantology, Medical Faculty, Poznan University of Medical Sciences,61-848 Poznan, Poland
* Correspondence: [email protected]; Tel.: +48-668956969
Abstract: Background: The outbreak of the Coronavirus Disease 2019 (COVID-19) pandemic hascaused many significant social and economic changes. The consecutive waves of the epidemic invarious countries have had dissimilar courses depending on the methods used to combat it. The aimof this study was to determine the dynamics of the third wave of COVID-19 from the perspectiveof emergency departments (ED). Methods: This was a retrospective review of medical records fromED. The authors have identified the most frequent symptoms. Prognostic factors have been chosen—prognostic scales, length of stay (LOS)—and a number of resources required have been calculated.Results: As the time passed, there were fewer patients and they presented mild symptoms. Astatistically significant difference was observed in the median of blood oxygenation measurement(p = 0.00009), CRP level (p = 0.0016), and admission rate. Patients admitted to the hospital requiredmore resources at ED. LOS was shorter in patients discharged home (p < 0.0001). Conclusions: Theblood oxygen saturation (SPO2) and CPR levels can be helpful in decision-making regarding medicaltreatment. The fast-track for patients in good clinical condition may shorten the duration of stay inED, and reduce the number of required resources.
Keywords: COVID-19; pandemic; emergency department; decision making process; fast-track
1. Introduction
The rapid spread of coronavirus was noticed in December 2019 in China. The diseasemainly causes acute aspiratory failure. The World Health Organization (WHO) used thename of Coronavirus Disease 2019 (COVID-19) to identify the virus that quickly spreadall over the world, which, in turn, caused WHO to announce the pandemic [1,2]. Patientsinfected with COVID-19 present a wide range of clinical conditions: an asymptomaticinfection, a mild course of infection, or a severe viral pneumonia leading to acute respi-ratory failure followed by death [3]. Emergency departments (ED) are often the place ofthe first contact between a patient and a medical professional. These are places where notonly patients with COVID-19, but also those with other medical problems are attended towithout prior appointment. Diagnostics and therapies of varying degrees of complexity areperformed. This makes the work in an ED a major organizational challenge; it requires the
Healthcare 2022, 10, 18. https://doi.org/10.3390/healthcare10010018 https://www.mdpi.com/journal/healthcare
Healthcare 2022, 10, 18 2 of 11
appropriate allocation of human and material resources. In this COVID-19 era, frontlinemedical staff in ED are facing even more new challenges to diagnose and treat patients.The ongoing COVID-19 pandemic has had a huge, devastating impact on healthcare orga-nizations. It has also affected the increased mortality of non-COVID-19-related illnesses [4].ED should focus on early recognition, immediate isolation, as well as appropriate infectionprevention with care taken to optimize supportive care. This refers not only to patientswith suspected COVID-19, but also to doctors and nurses working at the ED units, as theyare at a significant risk of accidental infection. Appropriate infection prevention should bestrict, and include all PPE instructions. [5]. With the presence of well-known overcrowdingproblems and limited resources, forecasting patient influx for ED care is a key solution tomaintaining fluent work conditions. This overcrowding is manifested mainly by a pro-longed waiting time and length of stay [6,7]. The ability to perform smooth reorganizationbetween periods with different inflows of COVID-19 patients may be important, especiallyfor facilities with a small number of beds within ED, and limited staff.
The objective of this study was to determine the course of the third wave of COVID-19based on observations of symptoms, severity, and workload in the perspective of the ED inorder to better understand and, hopefully, predict the impact of future pandemic waves on thehealthcare system. It also aimed at determining if a dynamic increase in COVID-19 incidencerate coincides with a drop of severity of the patients’ symptoms severity on presentation.
2. Materials and Methods2.1. Study Design
The study was designed as a retrospective review of medical records. The study wasperformed in ED at Hipolit Cegielski Medical Center, Poznan, Poland. Records from thehospital information system were used. The data were prepared by authorized profession-als to ensure the protection of personal information. According to local regulations, thisstudy did not meet the criteria of a medical experiment, and the approval of the BioethicsCommittee was not required.
2.2. Study Protocol
The subjects of interest were individuals diagnosed with COVID-19 (according toICD-10 classification U07.1). All patients with this diagnosis were included in the group.Individuals younger than 18 years old, and those admitted due to trauma were excluded,as the occurrence of trauma could not be related to COVID-19 in any direct way.
2.3. Emergency Department
This department was dedicated to adults only. Nevertheless, if a pediatric patient camein, physical examination was performed by a physician and, if necessary, the patient wastransported to a children’s hospital. The department was staffed with emergency medicinespecialists and residents. The Manchester Triage System was used to select priorities ofadmission and treatment. The system was not modified or adapted for COVID-19. At thetriage point, a paramedic measured critical vitals: heart rate (HR), respiratory rate (RR),non-invasive blood pressure (NIBP), hemoglobin oxygen saturation (SpO2), Glasgow ComaScale (GCS), temperature. If a patient presented any signs of infection, Abbott’s antigentest (Abbott Rapid Diagnostic Jena GmbH, Jena, Germany), which detects viral proteins inthe nasopharynx, was used. The test was performed by experienced and trained nurses,or paramedics working in the ED. In case of an unclear result or high clinical suspicionof infection with a negative antigen test, the RT-PCR method was used as appropriate todetect viral mRNA. The result was entered into a nationwide registry. A patient with apositive test result was referred to the isolation area. Based on the examination in triage,a further pathway for the patient was determined. Those in a good condition who didnot require oxygen therapy were referred to the waiting room in the isolation area. Thoserequiring oxygen therapy were directed to the observation room in the isolation area. Therewere incidents where a COVID-19 patient was referred from triage to the examination area
Healthcare 2022, 10, 18 3 of 11
without a test. This was a group of patients who did not present symptoms of COVID-19infection. In this case, the test was performed on a physician’s order. The patient wasimmediately transferred to the isolation area, and appropriate disinfection procedures wereimplemented. All personnel were required to wear personal protective equipment (glovesand surgical mask) and maintain social distance whenever possible. Personnel working inthe infectious area were equipped with safety goggles, a FFP3 respirator mask, and a fullprotective suit complying with the European standard EN 14126.
2.4. Selection of Variables
Based on the review performed by Grant et al. [8], the most common symptomswere defined. These were further divided into four groups: systemic (fever, myalgia,fatigue, near fever), respiratory (dyspnea, cough, chest pain), gastrointestinal (abdominalpain, diarrhea, nausea/vomiting, anosmia/ageusia), ear–nose–throat (sore throat, vertigo,rhinitis). Other symptoms were also reported in the analyzed records, but their frequencywas sporadic, and they were not included in further analyses.
Prognostic factors were defined based on the review of Izcovich et al. [9]. Their identifi-cation indicates the severity of the disease. Among these proposed by Izcovich, the authorsselected the level of WBC (white blood cells), PLT (platelet count), CREA (creatinine inserum), and CRP (C-reactive protein). Other biochemical tests were discarded because theywere not run on every patient. Parameters such as D-dimers, LDH (lactate dehydrogenase),or liver enzymes were evaluated only in reasonable cases.
Two prognostic scales were also calculated based on the selected parameters:Quick Sequential Organ Failure Assessment Score for Sepsis (qSOFA), which identifies
high-risk patients for in-hospital mortality with suspected infection outside the intensivecare unit (ICU). This scale includes mental status, RR, and systolic blood pressure.
Quick COVID-19 Severity Index (qCSI). This scale is to stratify the risk of critical illnessat 24 h, defined by oxygen requirement (>10 L/min by low-flow device, high-flow device,non-invasive, or invasive ventilation) or death. This scale includes RR, SpO2, and oxygenflow rate.
Resources were defined as laboratory tests (blood, urine); electrocardiogram; radio-graphs; computed tomography; point of care ultrasound; intravenous fluids; intravenous,intramuscular, or nebulized medications; simple procedure (urinary catheter, oxygensupplementation). Complex procedures, such as endotracheal intubation, procedural anal-gosedation, blood transfusion, and mechanical ventilation, were counted as two resources.
Length of stay (LOS) was defined as the time from when a patient was admitted by aphysician until the time of the discharge or admission to a ward. The time when patientshad been waiting for admission after triage was not calculated.
2.5. Statistical Analysis
First, the quantitative variables were checked for normality with the use of the Shapiro–Wilk W test. As none of the analyzed parameters met the criteria of a normal distribution,they were presented as median (interquartile range). The categorical variables were ex-pressed as the numbers (n) with percentages (%). For statistical analysis, Kruskall–Wallisand Mann–Whitney tests were used as appropriate. Spearman’s correlation rank was usedto assess a correlation between variables. A p-value less than 0.05 was considered significant.The analysis was performed using the Statistica 12 software (Tibco Inc., Tulsa, OK, USA).
3. Results3.1. Study Group
During the study period, a total number of 862 patients diagnosed with COVID-19were admitted to our department. In this group, five patients were excluded due to thelack of data, and four due to an age <18 years. Among them, there was also a group of75 patients admitted directly to the department of COVID-19 treatment, whose presence inthe ED was caused only by the need to register in the hospital information system. These
Healthcare 2022, 10, 18 4 of 11
individuals were not examined by a physician, but only passed through the ED. Finally,778 cases were included in the analysis.
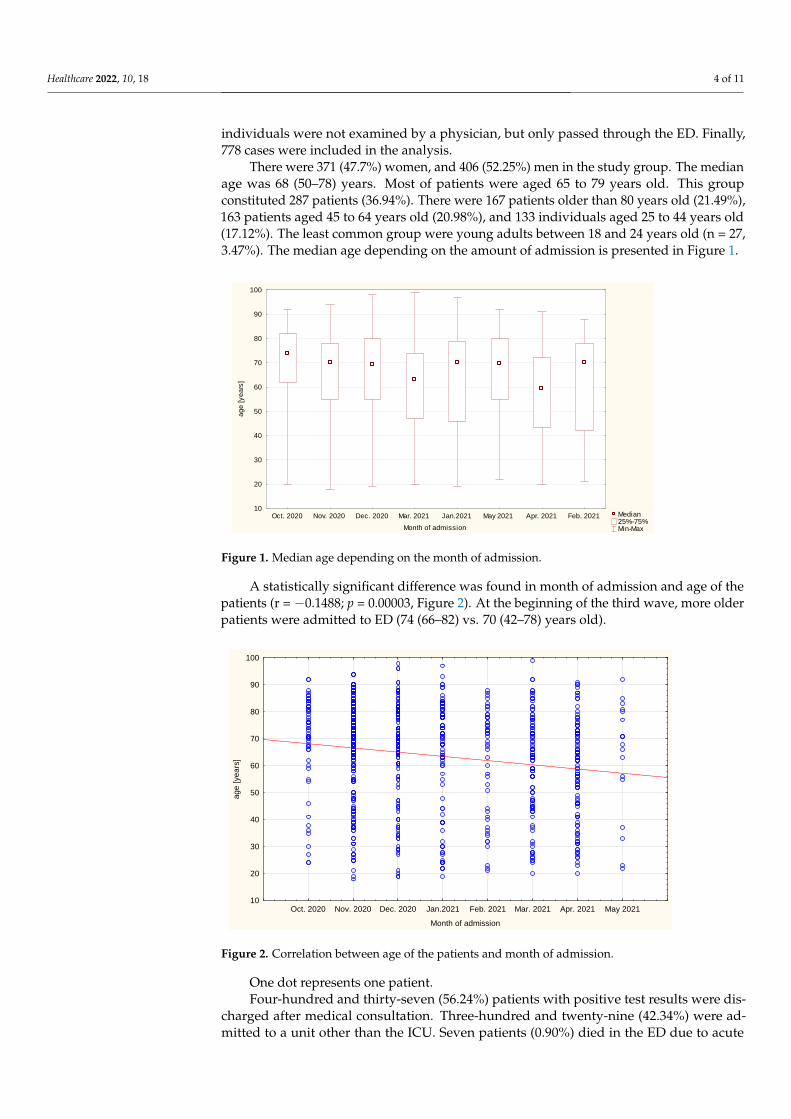
There were 371 (47.7%) women, and 406 (52.25%) men in the study group. The medianage was 68 (50–78) years. Most of patients were aged 65 to 79 years old. This groupconstituted 287 patients (36.94%). There were 167 patients older than 80 years old (21.49%),163 patients aged 45 to 64 years old (20.98%), and 133 individuals aged 25 to 44 years old(17.12%). The least common group were young adults between 18 and 24 years old (n = 27,3.47%). The median age depending on the amount of admission is presented in Figure 1.
Healthcare 2022, 10, x 4 of 12
rank was used to assess a correlation between variables. A p-value less than 0.05 was con-
sidered significant. The analysis was performed using the Statistica 12 software (Tibco
Inc., Tulsa, OK, USA).
3. Results
3.1. Study Group
During the study period, a total number of 862 patients diagnosed with COVID-19
were admitted to our department. In this group, five patients were excluded due to the
lack of data, and four due to an age <18 years. Among them, there was also a group of 75
patients admitted directly to the department of COVID-19 treatment, whose presence in
the ED was caused only by the need to register in the hospital information system. These
individuals were not examined by a physician, but only passed through the ED. Finally,
778 cases were included in the analysis.
There were 371 (47.7%) women, and 406 (52.25%) men in the study group. The me-
dian age was 68 (50–78) years. Most of patients were aged 65 to 79 years old. This group
constituted 287 patients (36.94%). There were 167 patients older than 80 years old
(21.49%), 163 patients aged 45 to 64 years old (20.98%), and 133 individuals aged 25 to 44
years old (17.12%). The least common group were young adults between 18 and 24 years
old (n = 27, 3.47%). The median age depending on the amount of admission is presented
in Figure 1.
Figure 1. Median age depending on the month of admission.
A statistically significant difference was found in month of admission and age of the
patients (r = −0.1488; p = 0.00003, Figure 2). At the beginning of the third wave, more older
patients were admitted to ED (74 (66–82) vs. 70 (42–78) years old).
One dot represents one patient.
Median 25%-75% Min-Max
Oct. 2020 Nov. 2020 Dec. 2020 Mar. 2021 Jan.2021 May 2021 Apr. 2021 Feb. 2021
Month of admission
10
20
30
40
50
60
70
80
90
100
ag
e [
ye
ars
]
Figure 1. Median age depending on the month of admission.
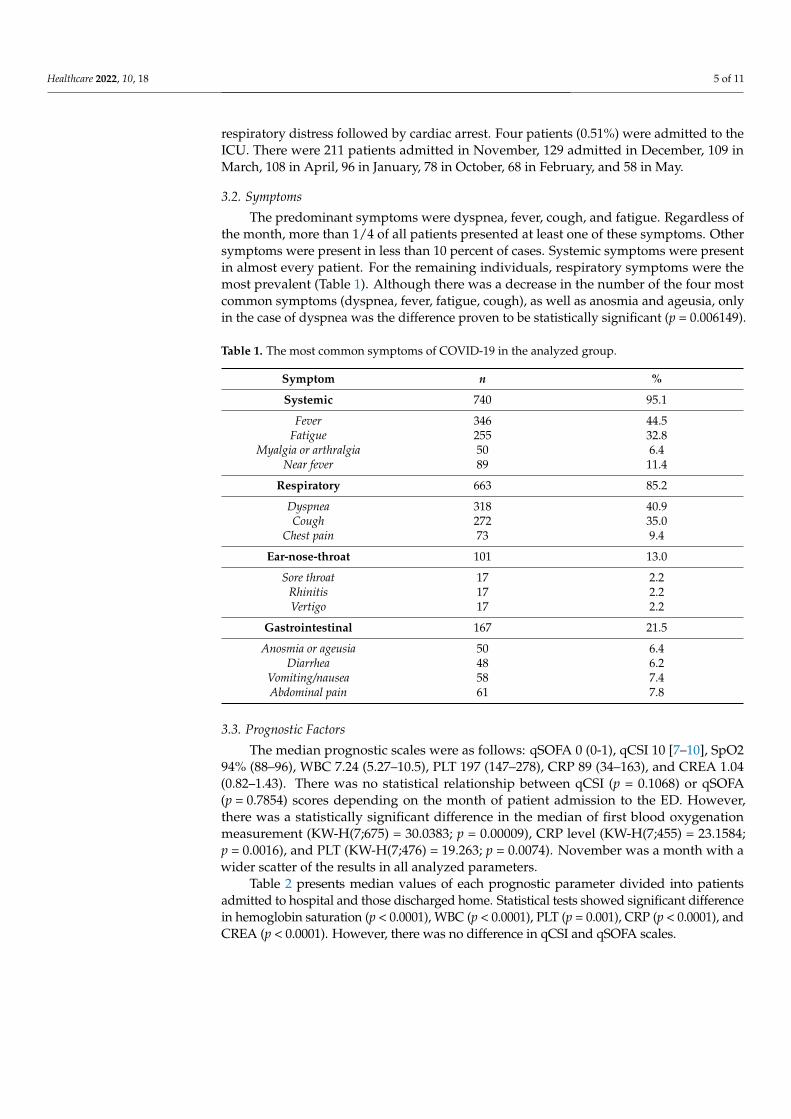
A statistically significant difference was found in month of admission and age of thepatients (r = −0.1488; p = 0.00003, Figure 2). At the beginning of the third wave, more olderpatients were admitted to ED (74 (66–82) vs. 70 (42–78) years old).
Healthcare 2022, 10, x 5 of 12
Oct. 2020 Nov. 2020 Dec. 2020 Jan.2021 Feb. 2021 Mar. 2021 Apr. 2021 May 2021
Month of admission
10
20
30
40
50
60
70
80
90
100
ag
e [
ye
ars
]
Figure 2.Correlation between age of the patients and month of admission.
Four-hundred and thirty-seven (56.24%) patients with positive test results were dis-
charged after medical consultation. Three-hundred and twenty-nine (42.34%) were admit-
ted to a unit other than the ICU. Seven patients (0.90%) died in the ED due to acute res-
piratory distress followed by cardiac arrest. Four patients (0.51%) were admitted to the
ICU. There were 211 patients admitted in November, 129 admitted in December, 109 in
March, 108 in April, 96 in January, 78 in October, 68 in February, and 58 in May.
3.2. Symptoms
The predominant symptoms were dyspnea, fever, cough, and fatigue. Regardless of
the month, more than 1/4 of all patients presented at least one of these symptoms. Other
symptoms were present in less than 10 percent of cases. Systemic symptoms were present
in almost every patient. For the remaining individuals, respiratory symptoms were the
most prevalent (Table 1). Although there was a decrease in the number of the four most
common symptoms (dyspnea, fever, fatigue, cough), as well as anosmia and ageusia, only
in the case of dyspnea was the difference proven to be statistically significant (p =
0.006149).
Table 1. The most common symptoms of COVID-19 in the analyzed group.
Symptom n %
Systemic 740 95.1
Fever 346 44.5
Fatigue 255 32.8
Myalgia or arthralgia 50 6.4
Near fever 89 11.4
Respiratory 663 85.2
Dyspnea 318 40.9
Cough 272 35.0
Chest pain 73 9.4
Ear-nose-throat 101 13.0
Sore throat 17 2.2
Rhinitis 17 2.2
Vertigo 17 2.2
Gastrointestinal 167 21.5
Figure 2. Correlation between age of the patients and month of admission.
One dot represents one patient.Four-hundred and thirty-seven (56.24%) patients with positive test results were dis-
charged after medical consultation. Three-hundred and twenty-nine (42.34%) were ad-mitted to a unit other than the ICU. Seven patients (0.90%) died in the ED due to acute
Healthcare 2022, 10, 18 5 of 11
respiratory distress followed by cardiac arrest. Four patients (0.51%) were admitted to theICU. There were 211 patients admitted in November, 129 admitted in December, 109 inMarch, 108 in April, 96 in January, 78 in October, 68 in February, and 58 in May.
3.2. Symptoms
The predominant symptoms were dyspnea, fever, cough, and fatigue. Regardless ofthe month, more than 1/4 of all patients presented at least one of these symptoms. Othersymptoms were present in less than 10 percent of cases. Systemic symptoms were presentin almost every patient. For the remaining individuals, respiratory symptoms were themost prevalent (Table 1). Although there was a decrease in the number of the four mostcommon symptoms (dyspnea, fever, fatigue, cough), as well as anosmia and ageusia, onlyin the case of dyspnea was the difference proven to be statistically significant (p = 0.006149).
Table 1. The most common symptoms of COVID-19 in the analyzed group.
Symptom n %
Systemic 740 95.1
Fever 346 44.5Fatigue 255 32.8
Myalgia or arthralgia 50 6.4Near fever 89 11.4
Respiratory 663 85.2
Dyspnea 318 40.9Cough 272 35.0
Chest pain 73 9.4
Ear-nose-throat 101 13.0
Sore throat 17 2.2Rhinitis 17 2.2Vertigo 17 2.2
Gastrointestinal 167 21.5
Anosmia or ageusia 50 6.4Diarrhea 48 6.2
Vomiting/nausea 58 7.4Abdominal pain 61 7.8
3.3. Prognostic Factors
The median prognostic scales were as follows: qSOFA 0 (0-1), qCSI 10 [7–10], SpO294% (88–96), WBC 7.24 (5.27–10.5), PLT 197 (147–278), CRP 89 (34–163), and CREA 1.04(0.82–1.43). There was no statistical relationship between qCSI (p = 0.1068) or qSOFA(p = 0.7854) scores depending on the month of patient admission to the ED. However,there was a statistically significant difference in the median of first blood oxygenationmeasurement (KW-H(7;675) = 30.0383; p = 0.00009), CRP level (KW-H(7;455) = 23.1584;p = 0.0016), and PLT (KW-H(7;476) = 19.263; p = 0.0074). November was a month with awider scatter of the results in all analyzed parameters.
Table 2 presents median values of each prognostic parameter divided into patientsadmitted to hospital and those discharged home. Statistical tests showed significant differencein hemoglobin saturation (p < 0.0001), WBC (p < 0.0001), PLT (p = 0.001), CRP (p < 0.0001), andCREA (p < 0.0001). However, there was no difference in qCSI and qSOFA scales.
Healthcare 2022, 10, 18 6 of 11
Table 2. Prognostic factors in patients admitted to hospital and discharged home.
Admission Discharged
Parameter Median IOR Median IOR p-Value
qSOFA 0 0–1 0 0–0 0.7854qCSI 10 44,476 7 7–10 0.1068WBC 8.32 6.10–11.30 6.23 4.77–8.60 0.000000PLT 217 154–287 183 141–244 0.001139CRP 121 65–194 51 15–103 0.000000
CREA 1.20 0.85–1.82 0.95 0.78–1.18 0.000001SpO2 89 82–94 95 93–97 0.000000
Abbreviations: qSOFA—Quick Sepsis Related Organ Failure Assessment; qCSI—Quick COVID-19 SeverityIndex; WBC—white blood cells; PLT—platelet count; CRP—C-reactive protein; CREA—creatinine in serum;SpO2—hemoglobin oxygen saturation; IQR—interquartile range.
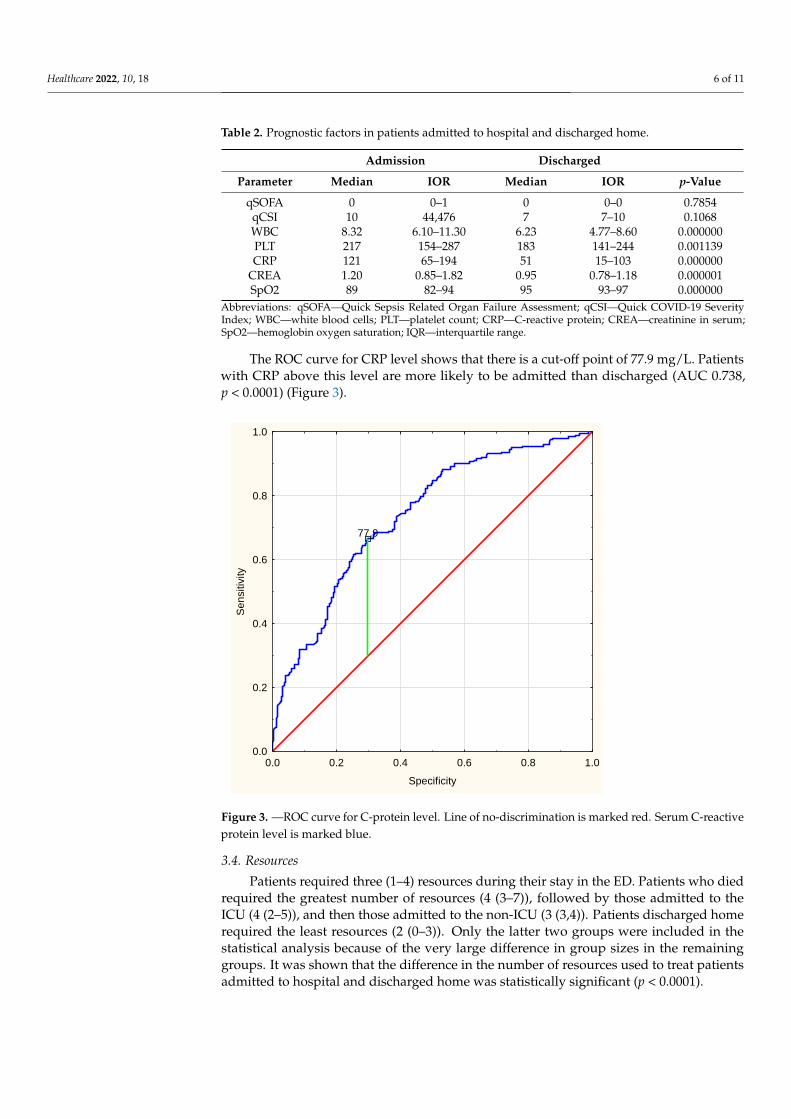
The ROC curve for CRP level shows that there is a cut-off point of 77.9 mg/L. Patientswith CRP above this level are more likely to be admitted than discharged (AUC 0.738,p < 0.0001) (Figure 3).
Healthcare 2022, 10, x 7 of 12
77,9
0.0 0.2 0.4 0.6 0.8 1.0
Specificity
0.0
0.2
0.4
0.6
0.8
1.0
Se
nsitiv
ity
Figure 3. —ROC curve for C-protein level. Line of no-discrimination is marked red. Serum C-reac-
tive protein level is marked blue.
3.4. Resources
Patients required three (1–4) resources during their stay in the ED. Patients who died
required the greatest number of resources (4 (3–7)), followed by those admitted to the ICU
(4 (2–5)), and then those admitted to the non-ICU (3 (3,4)). Patients discharged home re-
quired the least resources (2 (0–3)). Only the latter two groups were included in the statis-
tical analysis because of the very large difference in group sizes in the remaining groups.
It was shown that the difference in the number of resources used to treat patients admitted
to hospital and discharged home was statistically significant (p < 0.0001).
3.5. Length of Stay
The median LOS in the ED was 134 min (47–251). The shortest length of stay was 2
min, whereas the longest lasted 3063 min. This parameter varied between groups. The
lowest median LOS was in the group of those discharged home (89 min (10–1470). This
was followed by those admitted to the intensive care unit (140 min (37–532)), followed by
those admitted to non-ICU ward (183 min (362–3063)). The highest median length of stay
concerned deceased patients—293 min 965–867). In the analysis of statistical significance
of differences in LOS, the groups of deceased patients and patients admitted to the inten-
sive care unit were excluded due to a very small size of these groups, as in previous sta-
tistics. The analysis showed statistically significant differences in length of stay between
the groups of patients discharged home and those admitted to the hospital (p < 0.0001,
Figure 4).
Figure 3. —ROC curve for C-protein level. Line of no-discrimination is marked red. Serum C-reactiveprotein level is marked blue.
3.4. Resources
Patients required three (1–4) resources during their stay in the ED. Patients who diedrequired the greatest number of resources (4 (3–7)), followed by those admitted to theICU (4 (2–5)), and then those admitted to the non-ICU (3 (3,4)). Patients discharged homerequired the least resources (2 (0–3)). Only the latter two groups were included in thestatistical analysis because of the very large difference in group sizes in the remaininggroups. It was shown that the difference in the number of resources used to treat patientsadmitted to hospital and discharged home was statistically significant (p < 0.0001).
Healthcare 2022, 10, 18 7 of 11
3.5. Length of Stay
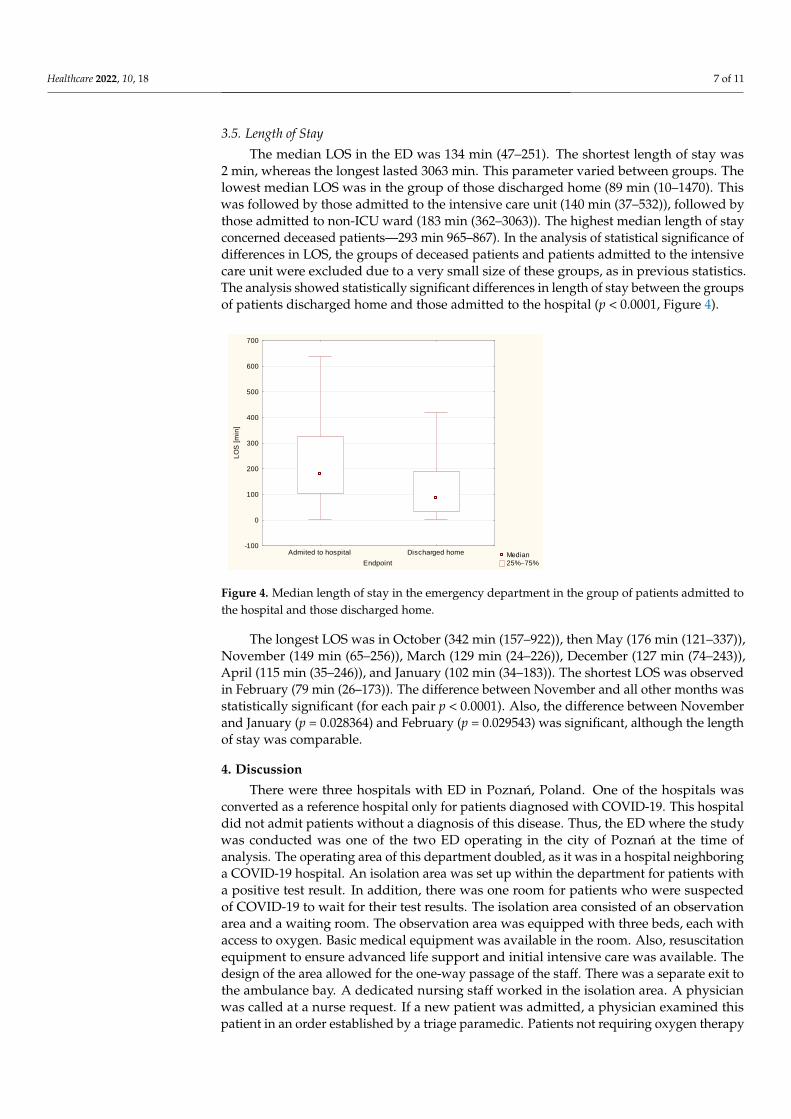
The median LOS in the ED was 134 min (47–251). The shortest length of stay was2 min, whereas the longest lasted 3063 min. This parameter varied between groups. Thelowest median LOS was in the group of those discharged home (89 min (10–1470). Thiswas followed by those admitted to the intensive care unit (140 min (37–532)), followed bythose admitted to non-ICU ward (183 min (362–3063)). The highest median length of stayconcerned deceased patients—293 min 965–867). In the analysis of statistical significance ofdifferences in LOS, the groups of deceased patients and patients admitted to the intensivecare unit were excluded due to a very small size of these groups, as in previous statistics.The analysis showed statistically significant differences in length of stay between the groupsof patients discharged home and those admitted to the hospital (p < 0.0001, Figure 4).
Healthcare 2022, 10, x 8 of 12
Median
25%75%
Admited to hospital Discharged home
Endpoint
-100
0
100
200
300
400
500
600
700
LO
S [
min
]
Figure 4. Median length of stay in the emergency department in the group of patients admitted to
the hospital and those discharged home.
The longest LOS was in October (342 min (157–922)), then May (176 min (121–337)),
November (149 min (65–256)), March (129 min (24–226)), December (127 min (74–243)),
April (115 min (35–246)), and January (102 min (34–183)). The shortest LOS was observed
in February (79 min (26–173)). The difference between November and all other months
was statistically significant (for each pair p < 0.0001). Also, the difference between Novem-
ber and January (p = 0.028364) and February (p = 0.029543) was significant, although the
length of stay was comparable.
4. Discussion
There were three hospitals with ED in Poznań, Poland. One of the hospitals was con-
verted as a reference hospital only for patients diagnosed with COVID-19. This hospital
did not admit patients without a diagnosis of this disease. Thus, the ED where the study
was conducted was one of the two ED operating in the city of Poznań at the time of anal-
ysis. The operating area of this department doubled, as it was in a hospital neighboring a
COVID-19 hospital. An isolation area was set up within the department for patients with
a positive test result. In addition, there was one room for patients who were suspected of
COVID-19 to wait for their test results. The isolation area consisted of an observation area
and a waiting room. The observation area was equipped with three beds, each with access
to oxygen. Basic medical equipment was available in the room. Also, resuscitation equip-
ment to ensure advanced life support and initial intensive care was available. The design
of the area allowed for the one-way passage of the staff. There was a separate exit to the
ambulance bay. A dedicated nursing staff worked in the isolation area. A physician was
called at a nurse request. If a new patient was admitted, a physician examined this patient
in an order established by a triage paramedic. Patients not requiring oxygen therapy were
examined by a physician. Then, a consultation was provided, and the patient was dis-
charged home or referred to the observation area for further diagnosis or treatment. With
longer LOS, the chance of cross-infection increases, and the health workers working in ED
will be at risk. Therefore, activities should be made to shorten the LOS for patients with
signs and symptoms of respiratory tract infection. The efficacy and legitimacy of a fast-
track for minor medial cases were previously proven by other authors [10–12]. This ap-
proach can significantly reduce the length of stay in the ED. However, this approach re-
quires a robust patient selection procedure based on the evidence-based medicine. The
use of predictive scales, ideally based on parameters or markers measured in the ED, with-
out the need for laboratory or radiodiagnostic involvement could be an important com-
ponent of the fast-track for COVID-19 patients presenting to the ED.
About 80% of COVID-19 patients have mild or moderate disease, whereas approxi-
mately 15% of patients develop severe disease that requires oxygen support, and 5% have
Figure 4. Median length of stay in the emergency department in the group of patients admitted tothe hospital and those discharged home.
The longest LOS was in October (342 min (157–922)), then May (176 min (121–337)),November (149 min (65–256)), March (129 min (24–226)), December (127 min (74–243)),April (115 min (35–246)), and January (102 min (34–183)). The shortest LOS was observedin February (79 min (26–173)). The difference between November and all other months wasstatistically significant (for each pair p < 0.0001). Also, the difference between Novemberand January (p = 0.028364) and February (p = 0.029543) was significant, although the lengthof stay was comparable.
4. Discussion
There were three hospitals with ED in Poznan, Poland. One of the hospitals wasconverted as a reference hospital only for patients diagnosed with COVID-19. This hospitaldid not admit patients without a diagnosis of this disease. Thus, the ED where the studywas conducted was one of the two ED operating in the city of Poznan at the time ofanalysis. The operating area of this department doubled, as it was in a hospital neighboringa COVID-19 hospital. An isolation area was set up within the department for patients witha positive test result. In addition, there was one room for patients who were suspectedof COVID-19 to wait for their test results. The isolation area consisted of an observationarea and a waiting room. The observation area was equipped with three beds, each withaccess to oxygen. Basic medical equipment was available in the room. Also, resuscitationequipment to ensure advanced life support and initial intensive care was available. Thedesign of the area allowed for the one-way passage of the staff. There was a separate exit tothe ambulance bay. A dedicated nursing staff worked in the isolation area. A physicianwas called at a nurse request. If a new patient was admitted, a physician examined thispatient in an order established by a triage paramedic. Patients not requiring oxygen therapy
Healthcare 2022, 10, 18 8 of 11
were examined by a physician. Then, a consultation was provided, and the patient wasdischarged home or referred to the observation area for further diagnosis or treatment.With longer LOS, the chance of cross-infection increases, and the health workers working inED will be at risk. Therefore, activities should be made to shorten the LOS for patients withsigns and symptoms of respiratory tract infection. The efficacy and legitimacy of a fast-trackfor minor medial cases were previously proven by other authors [10–12]. This approachcan significantly reduce the length of stay in the ED. However, this approach requiresa robust patient selection procedure based on the evidence-based medicine. The use ofpredictive scales, ideally based on parameters or markers measured in the ED, without theneed for laboratory or radiodiagnostic involvement could be an important component ofthe fast-track for COVID-19 patients presenting to the ED.
About 80% of COVID-19 patients have mild or moderate disease, whereas approxi-mately 15% of patients develop severe disease that requires oxygen support, and 5% havecritical disease with complications such as respiratory failure or severe sepsis [13]. Theprimary goal of an ED is to triage patients whose current or developing symptoms maylead to deterioration. The role of an emergency physician is to vigilantly observe symptoms.Biochemical parameters or basic vital signs may be helpful in making decisions regardingdischarge home or admission to a hospital. Treatment of patients with COVID-19 is difficult.This is primarily because of the dynamics of the disease itself. In a patient presenting to theED, a physician looks mainly for symptoms of respiratory failure during the examination.On this basis, a decision is made whether to treat the patient in the hospital or at home.Hensgens suggested that ED screening protocols should include non-specific complaints,particularly in older patients, to improve early identification and proper segregation [14].
Over the past year, new scales and ratios were developed to support decision-making,and assess the risk of severe exacerbation [15]. However, these are not tools on the basis ofwhich a patient can be safely discharged home. In the conditions studied, neither qSOFA norqCSI were a useful tool to estimate further decision. Other authors also suggest that thesescales do not have proper efficacy to predict death, ICU admission, and disease severityof COVID-19 [16]. In our analysis, a different level of selected biochemical parameters inpatients admitted to hospital and those discharged home has been presented. Nevertheless,it should be noted that the median results of WBC, PLT, as well as CREA, although theyvaried in both groups, remained within normal ranges. Therefore, it seems that their routineevaluation is not necessary. Thus, two parameters seem to be important: CRP and SpO2.CRP values were almost three times different in both groups. The level of plasma CRP ispositively correlated to the severity of COVID-19 pneumonia lung lesions. CRP testingmay be useful as an earlier indicator for severe illness, and may help physicians to stratifypatients for intensive care unit transfer [17,18]. CRP level was also positively correlatedwith the diameter of lung lesion. Moreover, CRP concentration higher than 32.5 mg/Lshowed high rates of sensitivity to detect patients at risk for respiratory failure [19]. Higherlevels at presentation might indicate impending clinical deterioration and the need formechanical ventilation [20]. Our results suggest that patients with CRP level > 77.9 mg/Lwere more likely to be admitted to hospital. Therefore, we suggest to pay special attentionto this group of patients when considering further decisions. Akhavan et al. [21] reportedsimilar values of oxygen saturation in admitted and discharged patients (89% vs. 96%).The authors concluded, however, that this parameter may be helpful in assessing theneed of oxygen supplementation. It is less useful for identifying which patients maydeteriorate clinically in the days after ED discharge, requiring subsequent hospitalization.In the presented study, these two were the parameters that showed the greatest differenceswhen comparing November to other months. Blood saturation is a better predictor ofdeterioration in COVID-19. This is related to the “silent hypoxia” phenomenon [22,23]. Thepatient does not experience dyspnea for a long time, despite the developing destructiveprocess in the lungs. The parameters we analyzed in the study are also the basis of thePANDEMYC scale. This interesting tool was proposed and validated by Torres-Macho andcolleagues [24]. In their wide-ranging and pioneering investigation, the authors estimated
Healthcare 2022, 10, 18 9 of 11
mortality risk based on the basic parameters of blood count, CRP, creatinine, saturation,sodium, age, and smoking status. Their approach supports our results on the significanceof CRP and saturation in the decision-making process. In the future, it would be interestingto define a cut-off point for hospital admission. In this way, the PANDEMYC scale could bea real support for ED physicians.
Interestingly, in the last months of the pandemic, the number of patients complainingof dyspnea, cough, fever, or anosmia decreased. It is likely that patients were presentingto the hospital earlier than in previous months. This may be the result of a greater publicawareness of the symptoms, or the fear of getting sick. Patient outcomes are worse whenthe second and higher stages of the disease occur.
Understanding the trend of patient flow in an emergency department is importantto ensure the best possible management. According to the results presented in this study,patients’ length of stay in the ED was the longest in October. In the authors’ opinion, thereason for this was the overall large increase in the number of cases, and the general over-load of the system. There were logistical problems regarding the ability to transport andadmit patients to COVID-19-dedicated hospitals. As a result, patients waited a long time tobe transferred to another hospital or to COVID-19 treatment units. Patients admitted tothe hospital usually required three or four resources, more than those discharged home.Staff efficiency was further limited by the need for increased epidemiological rules andprotective equipment. It should be noted that in December, a field hospital was establishedat the Poznan International Fair. This facility received many patients, relieving the previ-ously overloaded wards. Such hospitals allow effective treatment of patients who do notrequire advanced therapies. At the same time, they concentrate all resources necessary forCOVID-19 treatment in one place [25].
The authors are aware of limitations of this paper. The number of individuals in thestudy group was relatively small. There are differences in group sizes between months.There is, therefore, a risk of statistical error. This is due to the characteristics of this waveof infections, and the fluctuating variability in the number of cases. The results are basedon data from a single hospital. There was no prepared form based on which physiciansperformed the anamnesis and further diagnosis. Moreover, the hospital admission policiesmay differ, and, thus, the results cannot be generalized to other hospitals or the generalpopulation. Also, further treatment was physician-dependent. Therefore, the analyzedgroup cannot be a national representative. The results may be different in other cities. Manypatients had comorbidities. These may have affected the results of particular laboratorytests. In this situation, it would be beneficial to divide patients using the Charlson Comor-bidity Index. This scale predicts 10-year survival in patients with multiple comorbidities.However, in this study, we did not analyze chronic diseases. In addition, in many cases,working in isolation, and overcrowding made it difficult to keep detailed records, whichwere often completed in the destination ward.
5. Conclusions
The largest number of patients with COVID-19 symptoms were admitted to ED atthe beginning of the third wave (October 2020–May 2021). As time progressed, patientspresenting with milder symptoms were observed. ED should be prepared for an increasedinflux of patients at the beginning of the wave. This is the period that may require re-organization of the workplace to the greatest extent. It is worth considering a fast-trackfor patients in a good clinical condition to reduce the length of stay in the ED, the risk ofaccidental infection in healthcare providers, and the number of resources required. CRPlevels greater than 77.9 mg/L may be helpful in the decision-making process. Being on thethreshold of the fourth wave of the COVID-19 pandemic, taking into account the changingprofile of patients and preventive vaccinations, further studies are necessary to determinethe decision predictors.
Healthcare 2022, 10, 18 10 of 11
Author Contributions: Conceptualization, T.K. and M.P.; methodology, T.K. and M.P.; software,P.K. and A.S.; validation, P.K.; formal analysis, T.K., W.S., A.S. and M.W.; investigation, T.K., W.S.and M.W.; resources, P.K. and T.K.; data curation, W.S., M.W., R.P. and R.Z.; writing—all authors,writing—review and editing, T.K., M.P., R.P. and A.S.; visualization, R.Z.; supervision, T.K. and M.P.;All authors have read and agreed to the published version of the manuscript.
Funding: This research received no external funding.
Institutional Review Board Statement: This study did not involve humans or animals.
Informed Consent Statement: Not applicable.
Data Availability Statement: Data are available from the corresponding author on reasonable request.
Acknowledgments: The authors would like to acknowledge all the staff of our Emergency Department.
Conflicts of Interest: The authors declare no conflict of interest.
References1. Lenzen, M.; Li, M.; Malik, A.; Pomponi, F.; Sun, Y.-Y.; Wiedmann, T.; Faturay, F.; Fry, J.; Gallego, B.; Geschke, A.; et al. Global
socio-economic losses and environmental gains from the Coronavirus pandemic. PLoS ONE 2020, 15, e0235654. [CrossRef][PubMed]
2. World Health Organization. Report of the WHO-China Joint Mission on Coronavirus Disease 2019 (COVID-19); World HealthOrganization: Geneva, Switzerland, 2020.
3. Bilgin, S.; Kurtkulagi, O.; Kahveci, G.B.; Duman, T.T.; Tel, B.M.A. Millennium pandemic: A review of coronavirus disease(COVID-19). Exp. Biomed. Res. 2020, 3, 117–125. [CrossRef]
4. Mulholland, R.H.; Wood, R.; Stagg, H.R.; Fischbacher, C.; Villacampa, J.; Simpson, C.R.; Vasileiou, E.; McCowan, C.; Stock,S.J.; Docherty, A.B.; et al. Impact of COVID-19 on accident and emergency attendances and emergency and planned hospitaladmissions in Scotland: An interrupted time-series analysis. J. R. Soc. Med. 2020, 113, 444–453. [CrossRef] [PubMed]
5. Garcia-Castrillo, L.; Petrino, R.; Leach, R.; Dodt, C.; Behringer, W.; Khoury, A.; Sabbe, M. European Society for EmergencyMedicine position paper on emergency medical systems’ response to COVID-19. Eur. J. Emerg. Med. 2020, 27, 174–177. [CrossRef][PubMed]
6. Kadri, F.; Harrou, F.; Chaabane, S.; Tahon, C. Time Series Modelling and Forecasting of Emergency Department Overcrowding.J. Med. Syst. 2014, 38, 358–365. [CrossRef] [PubMed]
7. Boyle, J.; Jessup, M.; Crilly, J.; Green, D.; Lind, J.; Wallis, M.; Miller, P.; Fitzgerald, G. Predicting emergency department admissions.Emerg. Med. J. 2011, 29, 358–365. [CrossRef]
8. Grant, M.C.; Geoghegan, L.; Arbyn, M.; Mohammed, Z.; McGuinness, L.; Clarke, E.L.; Wade, R.G. The prevalence of symptoms in24,410 adults infected by the novel coronavirus (SARS-CoV-2; COVID-19): A systematic review and meta-analysis of 148 studiesfrom 9 countries. PLoS ONE 2020, 15, e0234765. [CrossRef]
9. Izcovich, A.; Ragusa, M.A.; Tortosa, F.; Marzio, M.A.L.; Agnoletti, C.; Bengolea, A.; Ceirano, A.; Espinosa, F.; Saavedra, E.;Sanguine, V.; et al. Prognostic factors for severity and mortality in patients infected with COVID-19: A systematic review.PLoS ONE 2020, 15, e0241955. [CrossRef]
10. Chrusciel, J.; Fontaine, X.; Devillard, A.; Cordonnier, A.; Kanagaratnam, L.; Laplanche, D.; Sanchez, S. Impact of the implementa-tion of a fast-track on emergency department length of stay and quality of care indicators in the Champagne-Ardenne region: Abefore–after study. BMJ Open 2019, 9, e026200. [CrossRef]
11. Chen, T.; Fuertes, R.; Sáez, O.; Villegas, V.; Soto, B.; Calle, F.; Cardona, C.; Mora, C.; Cañadas, J.; Tong, Y.; et al. Efficacy ofa fast-track pathway for managing uncomplicated renal or ureteral colic in a hospital emergency department: The STONErandomized clinical trial of Sonography and Testing of a Nephrolithiasis Episode. Emergencias 2021, 33, 23–28.
12. O’Donnell, C.; Molitch-Hou, E.; James, K.; Leong, T.; Perry, M.; Wood, D.; Masud, T.; Thomas, B.; Ross, M.A.; Franks, N. Fast trackdialysis: Improving emergency department and hospital throughput for patients requiring hemodialysis. Am. J. Emerg. Med.2021, 45, 92–99. [CrossRef] [PubMed]
13. World Health Organization. COVID-19 Strategic Preparedness and Response Plan; World Health Organization: Geneva, Switzerland, 2021.14. Hensgens, K.R.; van Rensen, I.H.; Lekx, A.W.; van Osch, F.H.; Knarren, L.H.; Wyers, C.E.; Bergh, J.P.V.D.; Barten, D.G. Sort and
Sieve: Pre-Triage Screening of Patients with Suspected COVID-19 in the Emergency Department. Int. J. Environ. Res. Public Health2021, 18, 9271. [CrossRef]
15. Bradley, P.; Frost, F.; Tharmaratnam, K.; Wootton, D.G. Utility of established prognostic scores in COVID-19 hospital admissions:Multicentre prospective evaluation of CURB-65, NEWS2 and qSOFA. BMJ Open Respir. Res. 2020, 7, e000729. [CrossRef] [PubMed]
16. Saberian, P.; Tavakoli, N.; Hasani-Sharamin, P.; Modabber, M.; Jamshididana, M.; Baratloo, A. Accuracy of the pre-hospital triagetools (qSOFA, NEWS, and PRESEP) in predicting probable COVID-19 patients’ outcomes transferred by Emergency MedicalServices. Casp. J. Intern. Med. 2020, 11, 536–543.
17. Chen, W.; Zheng, K.; Liu, S.; Yan, Z.; Xu, C.; Qiao, Z. Plasma CRP level is positively associated with the severity of COVID-19.Ann. Clin. Microbiol. Antimicrob. 2020, 19, 18. [CrossRef]
Healthcare 2022, 10, 18 11 of 11
18. Wang, L. C-reactive protein levels in the early stage of COVID-19. Méd. Mal. Infect. 2020, 50, 332–334. [CrossRef] [PubMed]19. Herold, T.; Jurinovic, V.; Arnreich, C.; Lipworth, B.J.; Hellmuth, J.C.; von Bergwelt-Baildon, M.; Klein, M.; Weinberger, T. Elevated
levels of IL-6 and CRP predict the need for mechanical ventilation in COVID-19. J. Allergy Clin. Immunol. 2020, 146, 128–136.e4.[CrossRef]
20. Ullah, W.; Thalambedu, N.; Haq, S.; Saeed, R.; Khanal, S.; Tariq, S.; Roomi, S.; Madara, J.; Boigon, M.; Haas, D.C.; et al.Predictability of CRP and D-Dimer levels for in-hospital outcomes and mortality of COVID-19. J. Community Hosp. Intern. Med.Perspect. 2020, 10, 402–408. [CrossRef] [PubMed]
21. Akhavan, A.R.; Habboushe, J.P.; Gulati, R.; Iheagwara, O.; Watterson, J.; Thomas, S.; Swartz, J.L.; Koziatek, C.A.; Lee, D.C. RiskStratification of COVID-19 Patients Using Ambulatory Oxygen Saturation in the Emergency Department. West. J. Emerg. Med.2020, 21, 5–14. [CrossRef]
22. Rahman, A.; Tabassum, T.; Araf, Y.; Al Nahid, A.; Ullah, A.; Hosen, M.J. Silent hypoxia in COVID-19: Pathomechanism andpossible management strategy. Mol. Biol. Rep. 2021, 48, 3863–3869. [CrossRef]
23. Bickler, P.E.; Feiner, J.R.; Lipnick, M.S.; McKleroy, W. “Silent” Presentation of Hypoxemia and Cardiorespiratory Compensation inCOVID-19. Anesthesiology 2021, 134, 262–269. [CrossRef] [PubMed]
24. Torres-Macho, J.; Ryan, P.; Valencia, J.; Pérez-Butragueño, M.; Jiménez, E.; Fontán-Vela, M.; Izquierdo-García, E.; Fernandez-Jimenez, I.; Álvaro-Alonso, E.; Lazaro, A.; et al. The PANDEMYC Score. An Easily Applicable and Interpretable Model forPredicting Mortality Associated With COVID-19. J. Clin. Med. 2020, 9, 3066. [CrossRef] [PubMed]
25. Szarpak, L.; Pruc, M.; Nadolny, K.; Smereka, J.; Ladny, J.R. Role of a field hospital in COVID-19 pandemic. Disaster Emerg. Med. J.2020, 5, 221–223. [CrossRef]