Dynamics of seedling banks in beech forest: results of a 10-year study on germination, growth and...
14
Dynamics of seedling banks in beech forest: results of a 10-year study on germination, growth and survival Jerzy Szwagrzyk, Janusz Szewczyk * , Jan Bodziarczyk Department of Forest Botany and Nature Conservation, Agricultural University, Al. 29 Listopada 46, 31-425 Cracow, Poland Received 4 November 1998; received in revised form 4 August 1999; accepted 20 December 1999 Abstract The dynamics of a seedling bank was studied in four plots located in the Krynica Experimental Forest, southern Poland. Each sample plot was divided into eight sectors, in which germinants and seedlings were mapped, measured, and labelled; their survival was checked twice a year between 1989 and 1996. Maps of relative light intensities on the forest floor in sample plots were produced on the basis of measurements conducted in June and August 1991. During the entire period of study, European beech (Fagus sylvatica L.) made up over 96% of germinants and seedlings. Numbers of beech germinants varied strongly (from 0 to 1178) among plots and years. Each year of abundant germination was followed by one or two years of scarce germination, and there was an increasing trend in the number of germinants in three plots between 1989 and 1996. Seedling emergence was almost independent of relative light intensity and first-season survival was positively, but weakly correlated with it. Long-term survival of seedlings was low and strongly related to relative illumination. Results of analyses of spatial patterns in seedlings suggested that some microsites were more conducive than others to germination and early survival of seedlings. Survival among taller germinants was greater than among shorter ones. A true seedling bank was observed only in two plots, where relative light intensities were 9 and 15% of full sunlight. In a plot with relative light intensity of 4%, the seedling bank was unstable and in the least illuminated plot (<3% of full sunlight) no seedling bank was formed. Results indicate that, even in a strongly shade-tolerant species like beech, formation of a seedling bank requires the occurrence of canopy openings in the close proximity. # 2001 Elsevier Science B.V. All rights reserved. Keywords: Fagus sylvatica; Natural regeneration; Seedling demography; Shade tolerance; Western Carpathians 1. Introduction Natural regeneration in temperate forests, domi- nated by shade-tolerant tree species, has been thor- oughly studied for many decades, especially in Central Europe (Burschel et al., 1992; Korpel, 1995; Madsen and Larsen, 1997), North America (Woods, 1984; Canham, 1989; Houle, 1994; Boerner and Brinkman, 1996) and Japan (Nakashizuka, 1988; Washitani and Tang, 1991; Peters et al., 1992). However, the mechan- isms involved in natural regeneration are still poorly understood, because the whole process is usually prolonged and complex (Streng et al., 1989; Peterken, 1996; Gray and Spies, 1996). When a tree stand reaches the understorey re-initiation phase (Oliver and Larson, 1990), seedlings start to appear on the forest floor; however, this does not necessarily mean that they will eventually form the next generation of Forest Ecology and Management 141 (2001) 237–250 * Corresponding author. Tel.: 48-12-4119044. E-mail address: [email protected] (J. Szewczyk). 0378-1127/01/$ – see front matter # 2001 Elsevier Science B.V. All rights reserved. PII:S0378-1127(00)00332-7
-
Upload
independent -
Category
Documents
-
view
1 -
download
0
Transcript of Dynamics of seedling banks in beech forest: results of a 10-year study on germination, growth and...
Dynamics of seedling banks in beech forest: results of a10-year study on germination, growth and survival
Jerzy Szwagrzyk, Janusz Szewczyk*, Jan BodziarczykDepartment of Forest Botany and Nature Conservation, Agricultural University,
Al. 29 Listopada 46, 31-425 Cracow, Poland
Received 4 November 1998; received in revised form 4 August 1999; accepted 20 December 1999
Abstract
The dynamics of a seedling bank was studied in four plots located in the Krynica Experimental Forest, southern Poland.
Each sample plot was divided into eight sectors, in which germinants and seedlings were mapped, measured, and labelled;
their survival was checked twice a year between 1989 and 1996. Maps of relative light intensities on the forest ¯oor in sample
plots were produced on the basis of measurements conducted in June and August 1991. During the entire period of study,
European beech (Fagus sylvatica L.) made up over 96% of germinants and seedlings. Numbers of beech germinants varied
strongly (from 0 to 1178) among plots and years. Each year of abundant germination was followed by one or two years of
scarce germination, and there was an increasing trend in the number of germinants in three plots between 1989 and 1996.
Seedling emergence was almost independent of relative light intensity and ®rst-season survival was positively, but weakly
correlated with it. Long-term survival of seedlings was low and strongly related to relative illumination. Results of analyses of
spatial patterns in seedlings suggested that some microsites were more conducive than others to germination and early survival
of seedlings. Survival among taller germinants was greater than among shorter ones. A true seedling bank was observed only
in two plots, where relative light intensities were 9 and 15% of full sunlight. In a plot with relative light intensity of 4%, the
seedling bank was unstable and in the least illuminated plot (<3% of full sunlight) no seedling bank was formed. Results
indicate that, even in a strongly shade-tolerant species like beech, formation of a seedling bank requires the occurrence of
canopy openings in the close proximity. # 2001 Elsevier Science B.V. All rights reserved.
Keywords: Fagus sylvatica; Natural regeneration; Seedling demography; Shade tolerance; Western Carpathians
1. Introduction
Natural regeneration in temperate forests, domi-
nated by shade-tolerant tree species, has been thor-
oughly studied for many decades, especially in Central
Europe (Burschel et al., 1992; Korpel, 1995; Madsen
and Larsen, 1997), North America (Woods, 1984;
Canham, 1989; Houle, 1994; Boerner and Brinkman,
1996) and Japan (Nakashizuka, 1988; Washitani and
Tang, 1991; Peters et al., 1992). However, the mechan-
isms involved in natural regeneration are still poorly
understood, because the whole process is usually
prolonged and complex (Streng et al., 1989; Peterken,
1996; Gray and Spies, 1996). When a tree stand
reaches the understorey re-initiation phase (Oliver
and Larson, 1990), seedlings start to appear on the
forest ¯oor; however, this does not necessarily mean
that they will eventually form the next generation of
Forest Ecology and Management 141 (2001) 237±250
* Corresponding author. Tel.: �48-12-4119044.
E-mail address: [email protected] (J. Szewczyk).
0378-1127/01/$ ± see front matter # 2001 Elsevier Science B.V. All rights reserved.
PII: S 0 3 7 8 - 1 1 2 7 ( 0 0 ) 0 0 3 3 2 - 7
canopy trees (Madsen and Larsen, 1997). Mortality
among germinants is high (Harper, 1977; Nakashi-
zuka, 1988; Boerner and Brinkman, 1996; Ida and
Nakagoshi, 1996) and the growth rates of seedlings
can be extremely low (Davis, 1991; Madsen and
Larsen, 1997). The changeability in sapling growth
rates (due to the emergence and closure of canopy
gaps) makes the species composition and structure of
the next generation of canopy trees dif®cult to predict
(Runkle and Yetter, 1987; Canham, 1989; Streng et al.,
1989; Gray and Spies, 1996).
This problem is specially pronounced in situations
where several shade-tolerant tree species share domi-
nance in a given forest type (Klinka et al., 1992; Latham,
1992; Takyu and Ohsawa, 1997). In such a case, dom-
inance can easily change from one species to another
between two consecutive generations (Lertzman, 1992;
Szewczyk and Szwagrzyk, 1996); this phenomenon is
frequently referred to as `reciprocal replacement' of tree
species (Woods, 1984). However, the mechanisms
behind that phenomenon are still unclear.
The important role of a seedling bank in natural
regeneration of forests has been stressed by many
authors (Oliver and Larson, 1990; Klinka et al.,
1992; Peterken, 1996). Some other authors have
shown the signi®cant role played by sprout banks
(Hara, 1987; Ohkubo et al., 1996) in that process.
With the creation of canopy gaps, seedlings waiting
under the canopy in the form of a seedling bank are
likely to respond with more vigorous growth (Can-
ham, 1989; Oliver and Larson, 1990), usually after a
period of acclimation to the changed light environ-
ment (Tucker et al., 1987). The fact that they do not
need to start as germinants give them an initial com-
petitive advantage over tree species which do not form
seedling banks (Shugart, 1984). Unfortunately, quan-
titative data concerning the processes of establishment
and persistence of a seedling bank are scarce.
The main goal of this research was to examine the
processes of formation of a seedling bank in a forest
dominated by shade-tolerant tree species. To follow
the fate of many individual seedlings for a number of
years, we restricted our study to four plots represent-
ing various stages of stand development within a forest
tract which was almost homogeneous in respect to
topography, elevation and species composition of tree
stands. The study extended over 11 years. The speci®c
questions asked by us were: how big is the spatial and
temporal variation in numbers of seedlings and their
survivorship? How are the density of seedlings and
their survival related to relative light intensities? Do
the seedlings appear more frequently in some places
than in the others, and how is that related to their
survival in those places? What is the age structure of a
seedling bank? Although the duration of our research
was less than the average length of time spent by
suppressed seedlings under forest canopy (Morin and
Laprisse, 1997), compared to other studies it seems
long enough to obtain some valuable information
about the dynamics of the seedling bank.
2. Study area
The study was conducted in the Jaworzyna Kry-
nicka range, the highest part of the Krynica Experi-
ment forest in the north-western Carpathians
(498170N, 208580E). The area is covered with exten-
sively managed stands of European beech Fagus
sylvatica L. and silver ®r Abies alba Mill., with an
admixture of Norway spruce Picea abies (L.) Karst.
and rowan Sorbus aucuparia L. Although these stands
have been subjected to various kinds of silvicultural
treatment, they do regenerate naturally, and some parts
of the forest still display old-growth characteristics.
Four research plots were established in the upper
part of the Czarny Potok catchment; their elevation
ranged from 960 to 1025 m. Aspect ranged from E
through NE to N, and maximum slope inclination
varied between 8 and 118. Three plots (A, B and C)
were located in old, extensively managed beech and
mixed beech-®r-spruce stands; the fourth site (D) was
situated in a mature (around 80-years old) stand.
Species composition, number of trees, basal area
and maximum tree heights (all calculated on the basis
of measurements conducted in, 1986) are given in
Table 1. Between 1986 and 1996, no timber cutting
took place. A few ®rs, beeches and one rowan were
snapped by wind during that decade, but none of them
were closer than 10 m to the study plots.
3. Methods
3.1. Field measurements
Four circular plots, 6 m in diameter, were estab-
lished in 1986: the plots had been chosen from a
238 J. Szwagrzyk et al. / Forest Ecology and Management 141 (2001) 237±250
regular 100 m�100 m grid covering a larger part of
the Krynica Experiment Forest (Szwagrzyk, 1990). In
July 1986, all seedlings within the circular plot were
mapped and measured; measurements were repeated
in June 1987, except that plot B was omitted from
measurements in 1987. Each seedling was located
using a theodolite and measuring tape. Heights of
seedlings were measured to the nearest 1.0 cm. Height
increments in seedlings which had survived more than
one growing season were measured to the nearest
0.1 cm. In total, our study spanned 11 years, but no
data were collected in 1988.
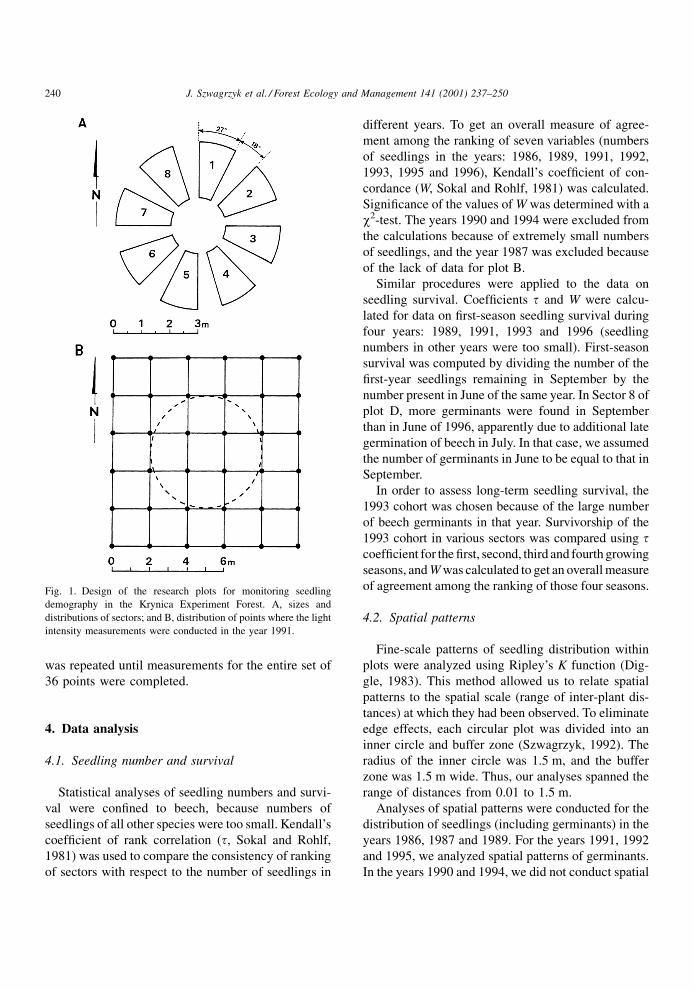
In June 1989, each circular plot was divided into
sectors (see Fig. 1) to avoid the potential in¯uence of
trampling on seedling emergence and survival. Seed-
lings in wide sectors (without trampling) were
mapped, measured, and given plastic labels with
numbers. Seedlings in narrow sectors (trampled ones)
were also mapped and measured, but not labelled. For
the labelled seedlings, censuses were repeated in
September to determine their survival.
In years 1991±1992 as well as measurements con-
ducted in June and September, two censuses of seed-
ling survival were conducted in July and August in
addition to the ones done in June and September. In
years 1993±1996, the number of censuses was again
reduced to two per year.
In 1991, a series of measurements of light intensity
on the forest ¯oor was conducted using a set of ®ve
light-meters calibrated in Lux. Measurements were
repeated twice: on 20 June, soon after beech leaf
development, and on 21 August, between 11 a.m.
and 2 p.m. June 20 was a bright sunny day with some
clouds, so the light intensity in the open varied; 20
August was an overcast day, with very little variation
in light intensity in the open. In each permanent plot,
the light intensity was measured at 36 points distrib-
uted regularly at the intersections of a 2 m�2 m grid,
covering the circular plot and its immediate environs
(Fig. 1). Light intensity was measured simultaneously
at four points randomly selected from the grid and at
one place in the open (a clearing at a forest road). The
series of light measurements at each point consisted of
15 measurements at 5-s intervals. After completing the
series at a set of four points, light meters were moved
to the next set of four points and the whole procedure
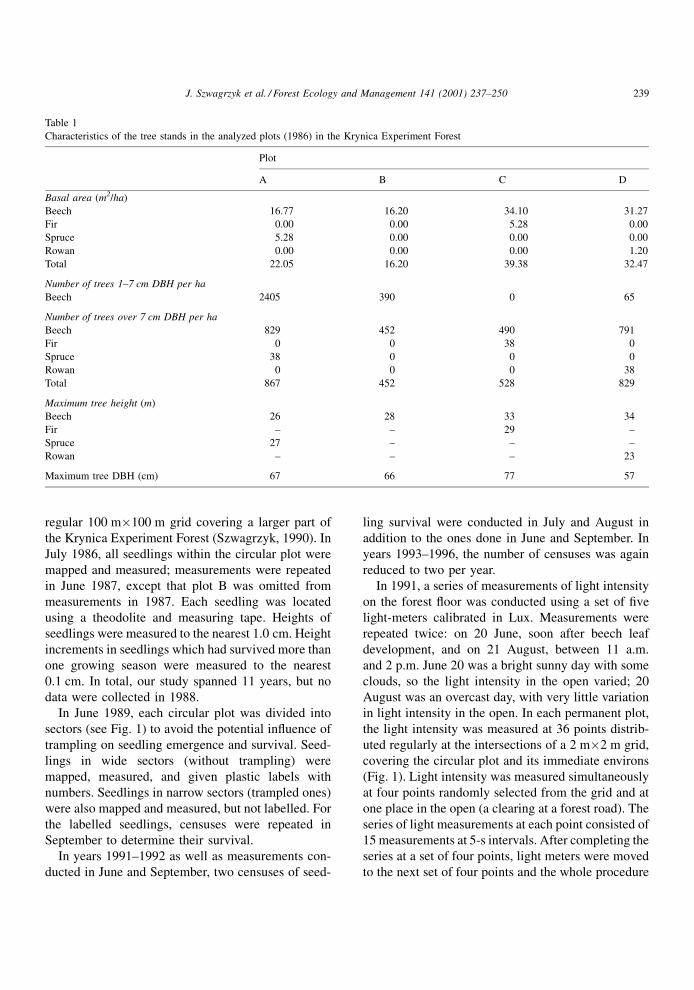
Table 1
Characteristics of the tree stands in the analyzed plots (1986) in the Krynica Experiment Forest
Plot
A B C D
Basal area (m2/ha)
Beech 16.77 16.20 34.10 31.27
Fir 0.00 0.00 5.28 0.00
Spruce 5.28 0.00 0.00 0.00
Rowan 0.00 0.00 0.00 1.20
Total 22.05 16.20 39.38 32.47
Number of trees 1±7 cm DBH per ha
Beech 2405 390 0 65
Number of trees over 7 cm DBH per ha
Beech 829 452 490 791
Fir 0 0 38 0
Spruce 38 0 0 0
Rowan 0 0 0 38
Total 867 452 528 829
Maximum tree height (m)
Beech 26 28 33 34
Fir ± ± 29 ±
Spruce 27 ± ± ±
Rowan ± ± ± 23
Maximum tree DBH (cm) 67 66 77 57
J. Szwagrzyk et al. / Forest Ecology and Management 141 (2001) 237±250 239
was repeated until measurements for the entire set of
36 points were completed.
4. Data analysis
4.1. Seedling number and survival
Statistical analyses of seedling numbers and survi-
val were con®ned to beech, because numbers of
seedlings of all other species were too small. Kendall's
coef®cient of rank correlation (t, Sokal and Rohlf,
1981) was used to compare the consistency of ranking
of sectors with respect to the number of seedlings in
different years. To get an overall measure of agree-
ment among the ranking of seven variables (numbers
of seedlings in the years: 1986, 1989, 1991, 1992,
1993, 1995 and 1996), Kendall's coef®cient of con-
cordance (W, Sokal and Rohlf, 1981) was calculated.
Signi®cance of the values of W was determined with a
w2-test. The years 1990 and 1994 were excluded from
the calculations because of extremely small numbers
of seedlings, and the year 1987 was excluded because
of the lack of data for plot B.
Similar procedures were applied to the data on
seedling survival. Coef®cients t and W were calcu-
lated for data on ®rst-season seedling survival during
four years: 1989, 1991, 1993 and 1996 (seedling
numbers in other years were too small). First-season
survival was computed by dividing the number of the
®rst-year seedlings remaining in September by the
number present in June of the same year. In Sector 8 of
plot D, more germinants were found in September
than in June of 1996, apparently due to additional late
germination of beech in July. In that case, we assumed
the number of germinants in June to be equal to that in
September.
In order to assess long-term seedling survival, the
1993 cohort was chosen because of the large number
of beech germinants in that year. Survivorship of the
1993 cohort in various sectors was compared using tcoef®cient for the ®rst, second, third and fourth growing
seasons, and W was calculated to get an overall measure
of agreement among the ranking of those four seasons.
4.2. Spatial patterns
Fine-scale patterns of seedling distribution within
plots were analyzed using Ripley's K function (Dig-
gle, 1983). This method allowed us to relate spatial
patterns to the spatial scale (range of inter-plant dis-
tances) at which they had been observed. To eliminate
edge effects, each circular plot was divided into an
inner circle and buffer zone (Szwagrzyk, 1992). The
radius of the inner circle was 1.5 m, and the buffer
zone was 1.5 m wide. Thus, our analyses spanned the
range of distances from 0.01 to 1.5 m.
Analyses of spatial patterns were conducted for the
distribution of seedlings (including germinants) in the
years 1986, 1987 and 1989. For the years 1991, 1992
and 1995, we analyzed spatial patterns of germinants.
In the years 1990 and 1994, we did not conduct spatial
Fig. 1. Design of the research plots for monitoring seedling
demography in the Krynica Experiment Forest. A, sizes and
distributions of sectors; and B, distribution of points where the light
intensity measurements were conducted in the year 1991.
240 J. Szwagrzyk et al. / Forest Ecology and Management 141 (2001) 237±250
analyses, because numbers of germinants were too
small. In 1993, we did not conduct spatial analysis,
because of the lack of data on exact distribution of
germinants; the number of germinants in that year was
extremely large, so we only counted them. Mapping,
measurements and labelling of surviving individuals
was done in 1994.
In years when seedlings were abundant, we also
conducted separate analyses of spatial pattern for
beech seedlings and germinants. In cases when seed-
lings of the other species were numerous enough, we
carried out separate analyses for those species.
Bivariate Ripley's K analysis (Diggle, 1983) was
employed to analyze spatial relationships between
beech seedlings and seedlings of other species (only
when the number of seedlings of the other species
exceeded 10 per plot) and to analyze relationships
between the distributions of seedlings in different
years. The latter analysis was made for all seedlings
(including germinants) in 1987 and 1989. In all other
combinations of years (1987±1991, 1987±1992,
1989±1991, 1989±1992, 1991±1992), analyses were
conducted only for germinants, so the results repre-
sented mainly spatial relationships between cohorts.
4.3. Calculating relative light intensities
The absolute light intensity recorded at each point
beneath the forest canopy was divided by the light
intensity recorded at the same time in the open to
obtain relative light intensity. The mean relative light
intensity was calculated for each point as an average
from values ascertained for 20 June and for 21 August.
On the basis of data from 36 regularly distributed
points per plot, contour maps of relative light intensity
were produced for each 10 m �10 m square using
linear interpolation. The map of sectors was then
superimposed upon each of the contour maps of
relative light intensity, and the mean relative light
intensities for each sector were determined as
weighted averages of relative light intensities as read
from the map.
4.4. Relationship between seedling number and
relative light intensity
The simple coef®cient of correlation was employed
to determine the relationship between light intensity
and seedling number or seedling survival. Light inten-
sity was represented by average values for sectors
calculated for the growing season 1991. Seedling
survival was de®ned in two different ways: as an
average ®rst-season survival for all cohorts in a given
sector, and as four-year survival of the 1993 cohort in a
given sector. The relationship between those two
estimators of seedling survival was examined using
t coef®cient.
5. Results
5.1. Numbers of beech germinants
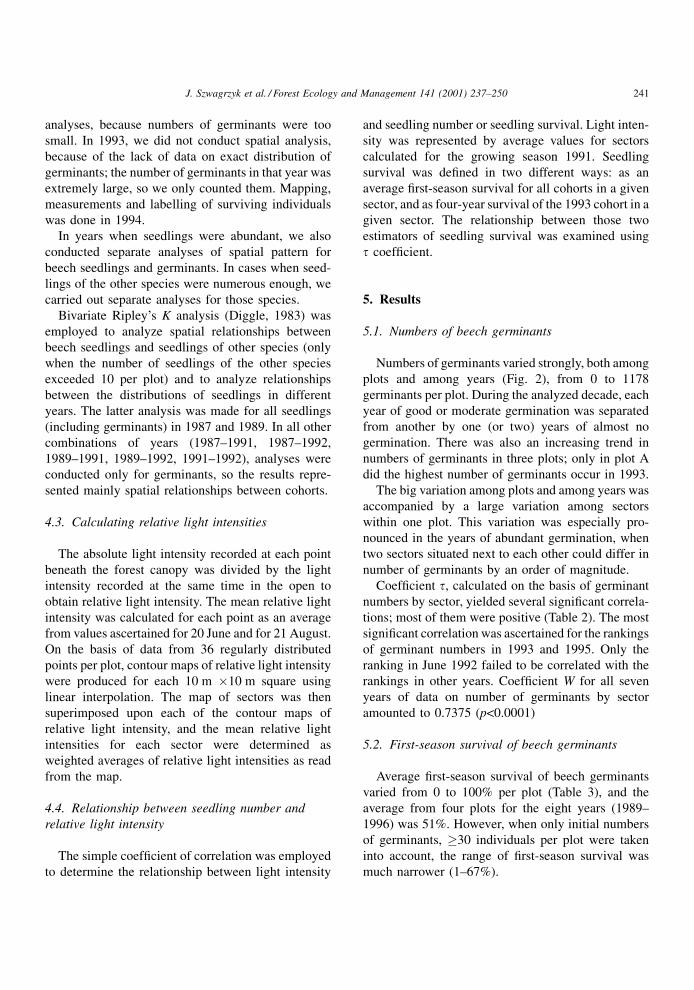
Numbers of germinants varied strongly, both among
plots and among years (Fig. 2), from 0 to 1178
germinants per plot. During the analyzed decade, each
year of good or moderate germination was separated
from another by one (or two) years of almost no
germination. There was also an increasing trend in
numbers of germinants in three plots; only in plot A
did the highest number of germinants occur in 1993.
The big variation among plots and among years was
accompanied by a large variation among sectors
within one plot. This variation was especially pro-
nounced in the years of abundant germination, when
two sectors situated next to each other could differ in
number of germinants by an order of magnitude.
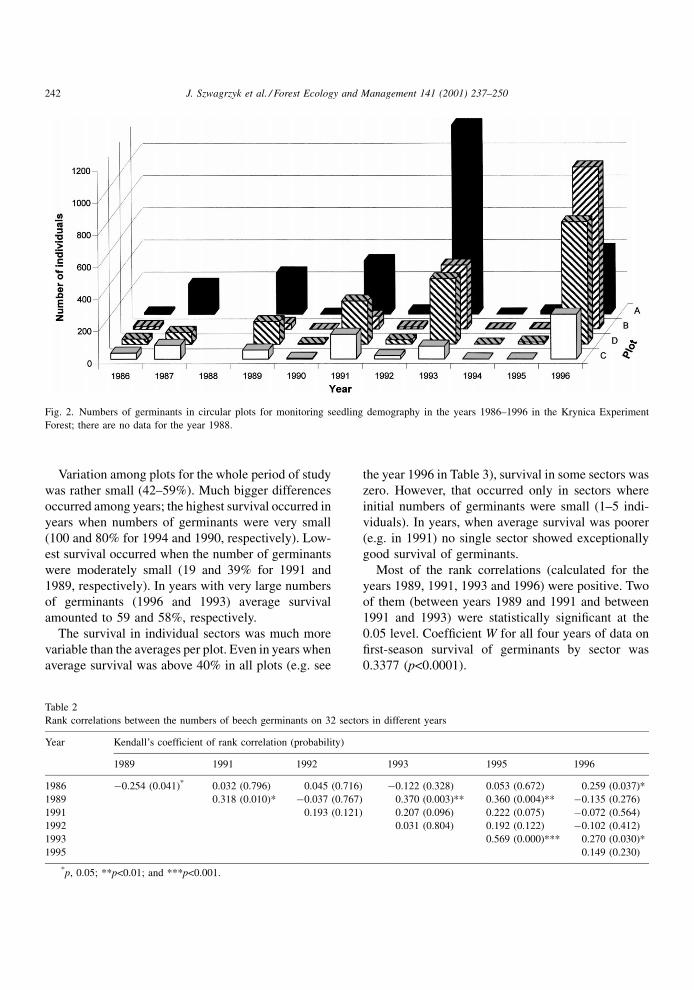
Coef®cient t, calculated on the basis of germinant
numbers by sector, yielded several signi®cant correla-
tions; most of them were positive (Table 2). The most
signi®cant correlation was ascertained for the rankings
of germinant numbers in 1993 and 1995. Only the
ranking in June 1992 failed to be correlated with the
rankings in other years. Coef®cient W for all seven
years of data on number of germinants by sector
amounted to 0.7375 (p<0.0001)
5.2. First-season survival of beech germinants
Average ®rst-season survival of beech germinants
varied from 0 to 100% per plot (Table 3), and the
average from four plots for the eight years (1989±
1996) was 51%. However, when only initial numbers
of germinants, �30 individuals per plot were taken
into account, the range of ®rst-season survival was
much narrower (1±67%).
J. Szwagrzyk et al. / Forest Ecology and Management 141 (2001) 237±250 241
Variation among plots for the whole period of study
was rather small (42±59%). Much bigger differences
occurred among years; the highest survival occurred in
years when numbers of germinants were very small
(100 and 80% for 1994 and 1990, respectively). Low-
est survival occurred when the number of germinants
were moderately small (19 and 39% for 1991 and
1989, respectively). In years with very large numbers
of germinants (1996 and 1993) average survival
amounted to 59 and 58%, respectively.
The survival in individual sectors was much more
variable than the averages per plot. Even in years when
average survival was above 40% in all plots (e.g. see
the year 1996 in Table 3), survival in some sectors was
zero. However, that occurred only in sectors where
initial numbers of germinants were small (1±5 indi-
viduals). In years, when average survival was poorer
(e.g. in 1991) no single sector showed exceptionally
good survival of germinants.
Most of the rank correlations (calculated for the
years 1989, 1991, 1993 and 1996) were positive. Two
of them (between years 1989 and 1991 and between
1991 and 1993) were statistically signi®cant at the
0.05 level. Coef®cient W for all four years of data on
®rst-season survival of germinants by sector was
0.3377 (p<0.0001).
Fig. 2. Numbers of germinants in circular plots for monitoring seedling demography in the years 1986±1996 in the Krynica Experiment
Forest; there are no data for the year 1988.
Table 2
Rank correlations between the numbers of beech germinants on 32 sectors in different years
Year Kendall's coefficient of rank correlation (probability)
1989 1991 1992 1993 1995 1996
1986 ÿ0.254 (0.041)* 0.032 (0.796) 0.045 (0.716) ÿ0.122 (0.328) 0.053 (0.672) 0.259 (0.037)*
1989 0.318 (0.010)* ÿ0.037 (0.767) 0.370 (0.003)** 0.360 (0.004)** ÿ0.135 (0.276)
1991 0.193 (0.121) 0.207 (0.096) 0.222 (0.075) ÿ0.072 (0.564)
1992 0.031 (0.804) 0.192 (0.122) ÿ0.102 (0.412)
1993 0.569 (0.000)*** 0.270 (0.030)*
1995 0.149 (0.230)
*p, 0.05; **p<0.01; and ***p<0.001.
242 J. Szwagrzyk et al. / Forest Ecology and Management 141 (2001) 237±250
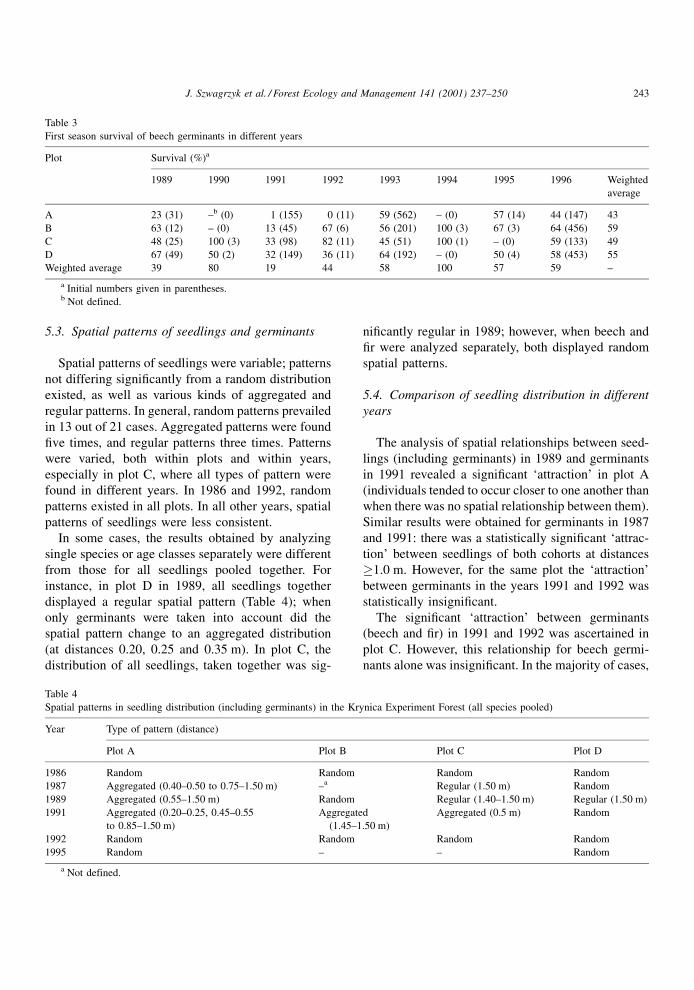
5.3. Spatial patterns of seedlings and germinants
Spatial patterns of seedlings were variable; patterns
not differing signi®cantly from a random distribution
existed, as well as various kinds of aggregated and
regular patterns. In general, random patterns prevailed
in 13 out of 21 cases. Aggregated patterns were found
®ve times, and regular patterns three times. Patterns
were varied, both within plots and within years,
especially in plot C, where all types of pattern were
found in different years. In 1986 and 1992, random
patterns existed in all plots. In all other years, spatial
patterns of seedlings were less consistent.
In some cases, the results obtained by analyzing
single species or age classes separately were different
from those for all seedlings pooled together. For
instance, in plot D in 1989, all seedlings together
displayed a regular spatial pattern (Table 4); when
only germinants were taken into account did the
spatial pattern change to an aggregated distribution
(at distances 0.20, 0.25 and 0.35 m). In plot C, the
distribution of all seedlings, taken together was sig-
ni®cantly regular in 1989; however, when beech and
®r were analyzed separately, both displayed random
spatial patterns.
5.4. Comparison of seedling distribution in different
years
The analysis of spatial relationships between seed-
lings (including germinants) in 1989 and germinants
in 1991 revealed a signi®cant `attraction' in plot A
(individuals tended to occur closer to one another than
when there was no spatial relationship between them).
Similar results were obtained for germinants in 1987
and 1991: there was a statistically signi®cant `attrac-
tion' between seedlings of both cohorts at distances
�1.0 m. However, for the same plot the `attraction'
between germinants in the years 1991 and 1992 was
statistically insigni®cant.
The signi®cant `attraction' between germinants
(beech and ®r) in 1991 and 1992 was ascertained in
plot C. However, this relationship for beech germi-
nants alone was insigni®cant. In the majority of cases,
Table 3
First season survival of beech germinants in different years
Plot Survival (%)a
1989 1990 1991 1992 1993 1994 1995 1996 Weighted
average
A 23 (31) ±b (0) 1 (155) 0 (11) 59 (562) ± (0) 57 (14) 44 (147) 43
B 63 (12) ± (0) 13 (45) 67 (6) 56 (201) 100 (3) 67 (3) 64 (456) 59
C 48 (25) 100 (3) 33 (98) 82 (11) 45 (51) 100 (1) ± (0) 59 (133) 49
D 67 (49) 50 (2) 32 (149) 36 (11) 64 (192) ± (0) 50 (4) 58 (453) 55
Weighted average 39 80 19 44 58 100 57 59 ±
a Initial numbers given in parentheses.b Not defined.
Table 4
Spatial patterns in seedling distribution (including germinants) in the Krynica Experiment Forest (all species pooled)
Year Type of pattern (distance)
Plot A Plot B Plot C Plot D
1986 Random Random Random Random
1987 Aggregated (0.40±0.50 to 0.75±1.50 m) ±a Regular (1.50 m) Random
1989 Aggregated (0.55±1.50 m) Random Regular (1.40±1.50 m) Regular (1.50 m)
1991 Aggregated (0.20±0.25, 0.45±0.55
to 0.85±1.50 m)
Aggregated
(1.45±1.50 m)
Aggregated (0.5 m) Random
1992 Random Random Random Random
1995 Random ± ± Random
a Not defined.
J. Szwagrzyk et al. / Forest Ecology and Management 141 (2001) 237±250 243
seedlings and germinants in different years were dis-
tributed independently of one another. This indepen-
dence was especially pronounced when comparing the
distribution of seedlings in 1989 with the distribution
of germinants from the 1992 cohort; no signi®cant
spatial relationships were found.
5.5. Correlation between incident light and beech
seedling number and survival
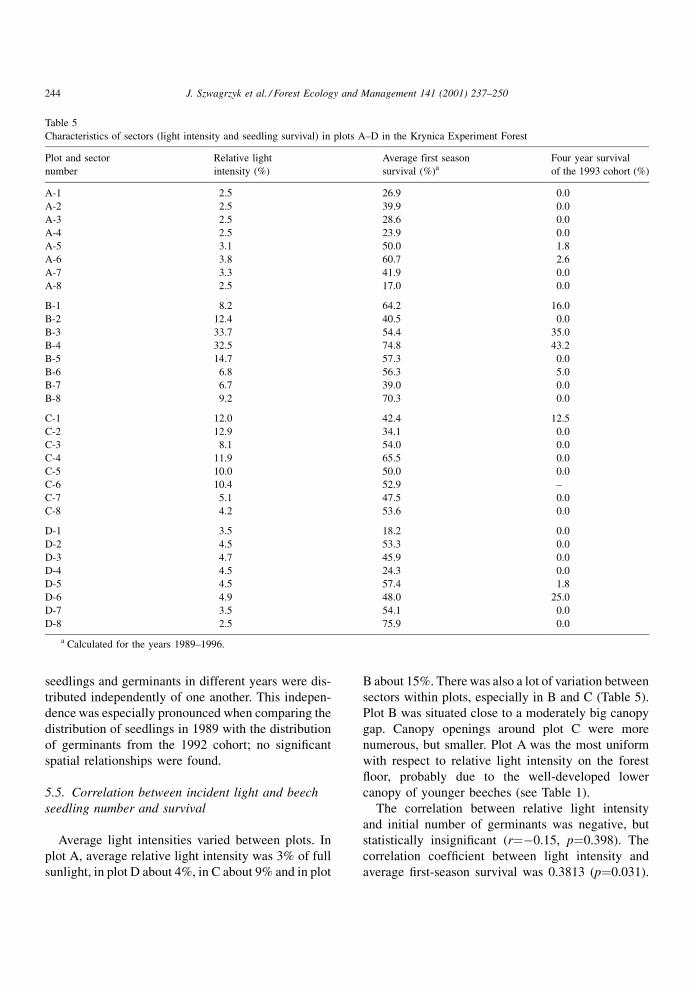
Average light intensities varied between plots. In
plot A, average relative light intensity was 3% of full
sunlight, in plot D about 4%, in C about 9% and in plot
B about 15%. There was also a lot of variation between
sectors within plots, especially in B and C (Table 5).
Plot B was situated close to a moderately big canopy
gap. Canopy openings around plot C were more
numerous, but smaller. Plot A was the most uniform
with respect to relative light intensity on the forest
¯oor, probably due to the well-developed lower
canopy of younger beeches (see Table 1).
The correlation between relative light intensity
and initial number of germinants was negative, but
statistically insigni®cant (r�ÿ0.15, p�0.398). The
correlation coef®cient between light intensity and
average ®rst-season survival was 0.3813 (p�0.031).
Table 5
Characteristics of sectors (light intensity and seedling survival) in plots A±D in the Krynica Experiment Forest
Plot and sector
number
Relative light
intensity (%)
Average first season
survival (%)a
Four year survival
of the 1993 cohort (%)
A-1 2.5 26.9 0.0
A-2 2.5 39.9 0.0
A-3 2.5 28.6 0.0
A-4 2.5 23.9 0.0
A-5 3.1 50.0 1.8
A-6 3.8 60.7 2.6
A-7 3.3 41.9 0.0
A-8 2.5 17.0 0.0
B-1 8.2 64.2 16.0
B-2 12.4 40.5 0.0
B-3 33.7 54.4 35.0
B-4 32.5 74.8 43.2
B-5 14.7 57.3 0.0
B-6 6.8 56.3 5.0
B-7 6.7 39.0 0.0
B-8 9.2 70.3 0.0
C-1 12.0 42.4 12.5
C-2 12.9 34.1 0.0
C-3 8.1 54.0 0.0
C-4 11.9 65.5 0.0
C-5 10.0 50.0 0.0
C-6 10.4 52.9 ±
C-7 5.1 47.5 0.0
C-8 4.2 53.6 0.0
D-1 3.5 18.2 0.0
D-2 4.5 53.3 0.0
D-3 4.7 45.9 0.0
D-4 4.5 24.3 0.0
D-5 4.5 57.4 1.8
D-6 4.9 48.0 25.0
D-7 3.5 54.1 0.0
D-8 2.5 75.9 0.0
a Calculated for the years 1989±1996.
244 J. Szwagrzyk et al. / Forest Ecology and Management 141 (2001) 237±250
Correlation between light intensity and four-year sur-
vival of the 1993 cohort was 0.7159 (p<0.0001). The
relationship between average ®rst-season survival and
four-year survival of the 1993 cohort was statistically
signi®cant (t�0.3345, p<0.0001).
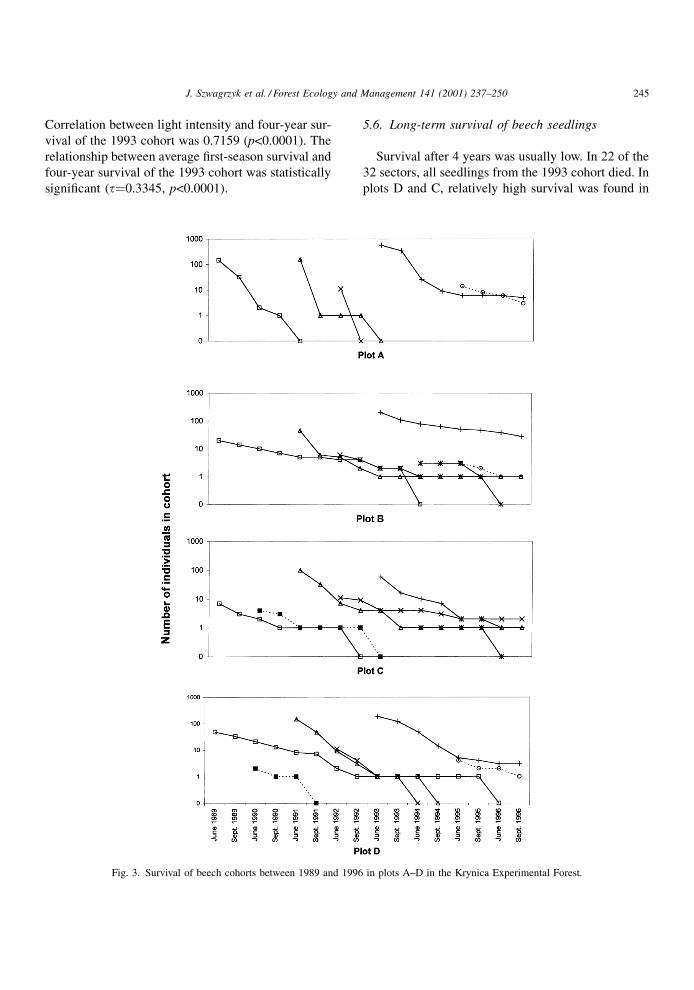
5.6. Long-term survival of beech seedlings
Survival after 4 years was usually low. In 22 of the
32 sectors, all seedlings from the 1993 cohort died. In
plots D and C, relatively high survival was found in
Fig. 3. Survival of beech cohorts between 1989 and 1996 in plots A±D in the Krynica Experimental Forest.
J. Szwagrzyk et al. / Forest Ecology and Management 141 (2001) 237±250 245
sectors where the initial number of germinants was
low (<10 individuals). However, in plot B, high sur-
vival occurred in sectors where initial numbers of
germinants had been over 20.
Plot A was characterized by a very rapid decline in
numbers of surviving seedlings (Fig. 3). In contrast,
mortality in plot B was more gradual, and more
seedlings survived for more than 2 growing seasons.
Survival curves for plots C and D were similar Ð
mortality rates were moderate, and ®nal numbers of
survivors very low (Fig. 3). However, there were
essential differences in survival between the latter
plots. Initial numbers of germinants in plot D were
usually higher; thus, mortality was in fact more rapid
in plot D than in plot C.
Coef®cient t was calculated for four-year survival
of the 1993 cohort. All rank correlations were positive
and signi®cant. Three (between 1993 and 1994, 1995
and 1996) at the 0.05 level, and three (1994±1995,
1994±1996 and 1995±1996) at the 0.001 level. Coef-
®cient W for the whole set of four-year survival data of
the 1993 cohort was 0.78333 (p<0.0001).
5.7. Growth rates of beech seedlings which survived
more than 3 years
In plots A and D, growth rates of all seedlings,
including those which had survived more than 3 years,
were very small. During the study, none of the seed-
lings surviving for more than 3 years had achieved a
height of 10 cm, and annual height increment was in
the 0.1±0.5 cm range. In plot D, all seedlings died
before the fall of 1996 (Fig. 3). In plot A, a few
seedlings from the 1993 cohort survived until fall 1996
(Fig. 3), despite their very poor growth rates.
Among the seedlings established after 1989 in plot
C, the survival and growth rates were slightly greater.
One seedling was almost 23 cm tall in its ®fth year of
growth, and in plot B one seedling was even 35 cm tall
in its sixth year of growth. However, other seedlings in
plot B grew poorly and died within ®ve years.
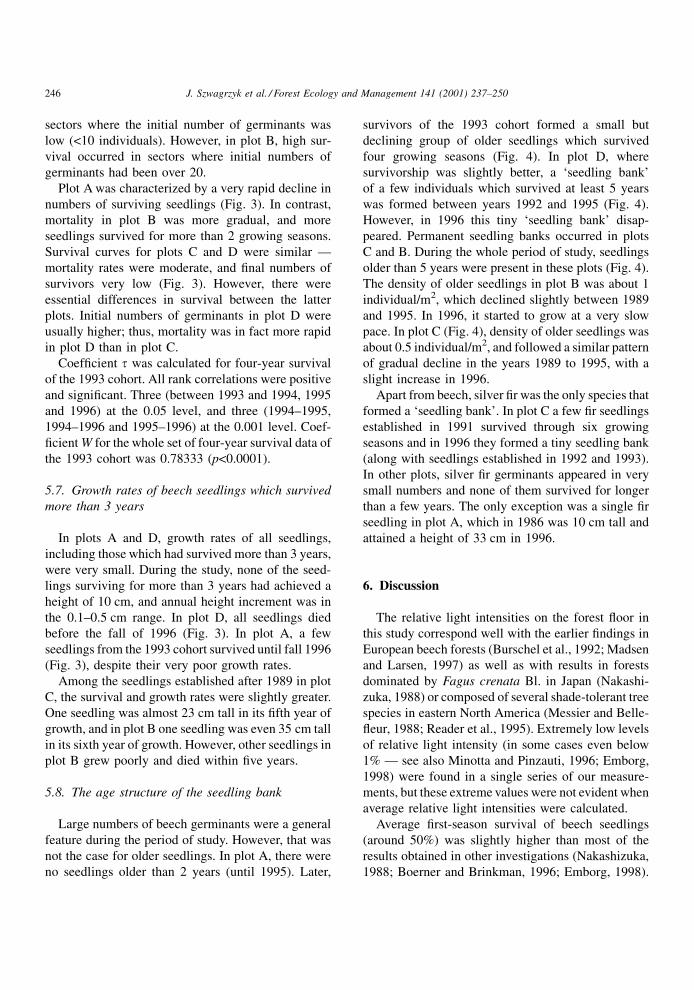
5.8. The age structure of the seedling bank
Large numbers of beech germinants were a general
feature during the period of study. However, that was
not the case for older seedlings. In plot A, there were
no seedlings older than 2 years (until 1995). Later,
survivors of the 1993 cohort formed a small but
declining group of older seedlings which survived
four growing seasons (Fig. 4). In plot D, where
survivorship was slightly better, a `seedling bank'
of a few individuals which survived at least 5 years
was formed between years 1992 and 1995 (Fig. 4).
However, in 1996 this tiny `seedling bank' disap-
peared. Permanent seedling banks occurred in plots
C and B. During the whole period of study, seedlings
older than 5 years were present in these plots (Fig. 4).
The density of older seedlings in plot B was about 1
individual/m2, which declined slightly between 1989
and 1995. In 1996, it started to grow at a very slow
pace. In plot C (Fig. 4), density of older seedlings was
about 0.5 individual/m2, and followed a similar pattern
of gradual decline in the years 1989 to 1995, with a
slight increase in 1996.
Apart from beech, silver ®r was the only species that
formed a `seedling bank'. In plot C a few ®r seedlings
established in 1991 survived through six growing
seasons and in 1996 they formed a tiny seedling bank
(along with seedlings established in 1992 and 1993).
In other plots, silver ®r germinants appeared in very
small numbers and none of them survived for longer
than a few years. The only exception was a single ®r
seedling in plot A, which in 1986 was 10 cm tall and
attained a height of 33 cm in 1996.
6. Discussion
The relative light intensities on the forest ¯oor in
this study correspond well with the earlier ®ndings in
European beech forests (Burschel et al., 1992; Madsen
and Larsen, 1997) as well as with results in forests
dominated by Fagus crenata Bl. in Japan (Nakashi-
zuka, 1988) or composed of several shade-tolerant tree
species in eastern North America (Messier and Belle-
¯eur, 1988; Reader et al., 1995). Extremely low levels
of relative light intensity (in some cases even below
1% Ð see also Minotta and Pinzauti, 1996; Emborg,
1998) were found in a single series of our measure-
ments, but these extreme values were not evident when
average relative light intensities were calculated.
Average ®rst-season survival of beech seedlings
(around 50%) was slightly higher than most of the
results obtained in other investigations (Nakashizuka,
1988; Boerner and Brinkman, 1996; Emborg, 1998).
246 J. Szwagrzyk et al. / Forest Ecology and Management 141 (2001) 237±250
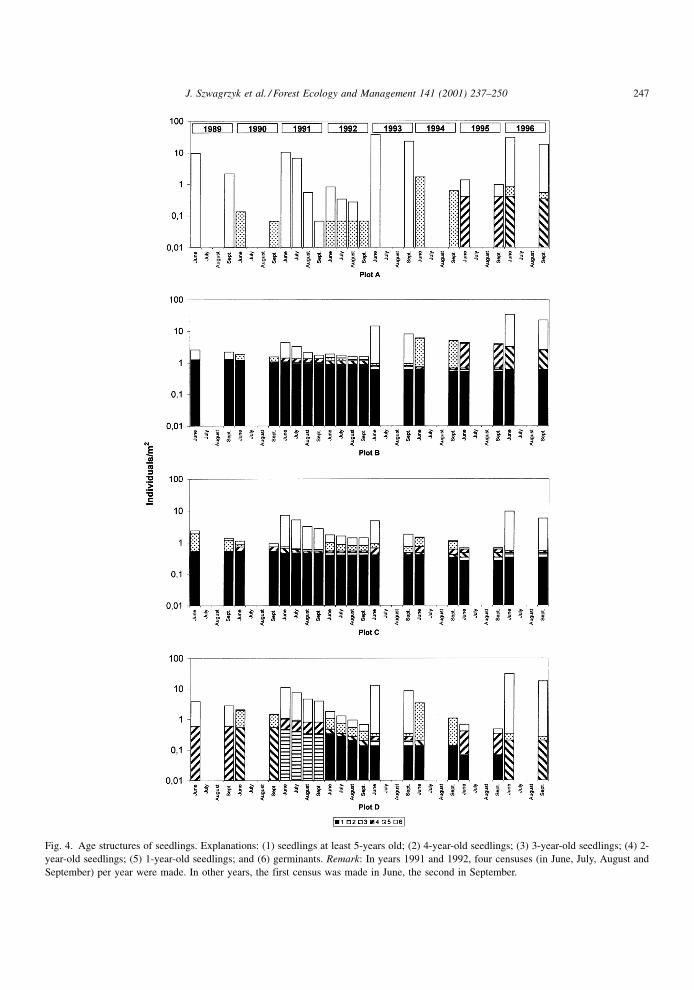
Fig. 4. Age structures of seedlings. Explanations: (1) seedlings at least 5-years old; (2) 4-year-old seedlings; (3) 3-year-old seedlings; (4) 2-
year-old seedlings; (5) 1-year-old seedlings; and (6) germinants. Remark: In years 1991 and 1992, four censuses (in June, July, August and
September) per year were made. In other years, the first census was made in June, the second in September.
J. Szwagrzyk et al. / Forest Ecology and Management 141 (2001) 237±250 247
However, it is within the range of survival found in the
study by Streng et al. (1989) for numerous species
with various regeneration strategies. Even in sectors
with the lowest light intensities, average ®rst-season
survival was >10% and agreed with earlier ®ndings
that relative light intensities below 1% of full sunlight
permit ®rst-season survival of seedlings of large-
seeded species (Welander and Ottosson, 1998). Thus,
like in Chen (1997), the ®rst-season survival was not a
good estimator of the likely formation of a seedling
bank.
Although we did not record the proximate causes of
®rst-season beech seedling mortality, damping-off as a
result of fungal pathogen activity (Nakashizuka, 1988;
Burschel et al., 1992) can play an important role
during the growing season. Mortality in winter, espe-
cially in species with small germinants, like spruce,
rowan and silver ®r, may have been caused by detri-
mental effects of beech litter (Facelli and Pickett,
1991). Herbivory did not seem to be a signi®cant
factor in seedling mortality, although saplings, espe-
cially of rowan and silver ®r, were heavily browsed by
deer in the locality.
Out of more than 6000 beech seedlings observed in
the course of the study, only two grew taller than
20 cm and both were situated in plots with a partly
open canopy. Thus, the fraction of seedlings which
could eventually enter the sapling class is very small.
Our results also indicate that, in places with no large
openings in the canopy, there is little chance of
germinants attaining sapling size irrespective of
how many seedlings exist on the forest ¯oor and
how many survive the ®rst growing season.
As long-term survival of seedlings of all tree species
is generally low (even in plots with relatively high
light intensities), the occurrence of numerous germi-
nants is a prerequisite for the formation of a seedling
bank (Burschel et al., 1992; Reader et al., 1995).
Species composition of germinants almost perfectly
re¯ects species composition of the overstorey and the
spatial limitation of seedling recruitment (Ribbens
et al., 1994) probably plays an important role in this
community. Because shade-tolerant species domi-
nated the overstorey, they also dominated the seed
rain and contributed numerous germinants to the pool.
Species of smaller stature (like rowan) or light-
demanding species which do not occur in the immedi-
ate vicinity (like goat willow) are marginalized
because of their small number of germinants, probably
re¯ecting the scarcity of seed rain.
The role of the microsite mosaic in shaping the
`seedling bank' can be evaluated indirectly on the
basis of results from the spatial analyses. In general,
there are places where numbers of germinants were
high and others where they were low, and ranking was
quite consistent among many years, as shown by the
results of the test of concordance. On the other hand,
aggregated spatial patterns and mutual `attraction'
between germinants in consecutive years are not a
rule, and they did not occur in some plots (plot D).
Thus, the role of microsites for the formation of a
seedling bank seems only locally important.
The results of our study suggest that shade-toler-
ance of seedlings is not a guarantee of their success in
tree stands dominated by shade-tolerant tree species,
which cast very deep shade (Messier and Belle¯eur,
1988; Ribbens et al., 1994; Emborg, 1998). In the plot
where relative light intensity was lowest (plot A), no
seedling bank formed. In plot D, where relative light
intensity was around 4%, the seedling bank was
unstable, appearing and disappearing within few
years. Permanent seedling banks formed only in plots
where relative light intensities were much higher (9
and 15%) due to the occurrence of canopy gaps in
close proximity. Thus, contrary to some widespread
opinions (Shugart, 1984), canopy openings are also
essential for the regeneration of shade-tolerant spe-
cies. This fact is often overlooked in short-term studies
in which the occurrence of numerous seedlings on the
forest ¯oor is considered proof that natural regenera-
tion is actually taking place (Emborg, 1998). In fact,
very often it is only a `ephemeral' pulse of regenera-
tion with virtually no chance of ever attaining the
sapling stage.
The conclusion of this work is that it is impossible
to fully comprehend the dynamics of seedling banks
on the basis of short-term studies. Therefore, long-
term demographic studies on tree seedlings (Streng
et al., 1989; Houle, 1994) are necessary for under-
standing the processes of natural forest regeneration.
Acknowledgements
We would like to express our grateful thanks to
Anna Gazda and to Wieslaw Klimek for their
248 J. Szwagrzyk et al. / Forest Ecology and Management 141 (2001) 237±250
assistance in the ®eld. Douglas A. Maguire (Oregon
State University) and an anonymous referee provided
useful comments on the manuscript. This work was
supported by the research grant 6 P205 009 07
funded by the Committee of Scienti®c Research
(KBN).
References
Boerner, R.E.J., Brinkman, J.A., 1996. Ten years of seedling
establishment and mortality in an Ohio deciduous forest
complex. Bull. Torrey Bot. Club 123 (4), 309±317.
Burschel, P., El, Kateb, H., Mosandl, R., 1992. Experiments in
mixed mountain forests in Bavaria. in: Kelty, M.J., Larson,
B.C., Oliver, C.D. (Eds.), The Ecology and Silviculture of
Mixed-Species Forests). Kluwer Academic, Dordrecht, pp. 183±
216.
Canham, C.D., 1989. Different responses to gaps among shade-
tolerant tree species. Ecology 70, 548±550.
Chen, H.Y.H., 1997. Interspecific responses of planted seedlings to
light availability in interior British Columbia: survival, growth,
allometric patterns, and specific leaf area. Can. J. For. Res. 27,
1383±1393.
Davis, W.C., 1991. The role of advance growth in regeneration of
red spruce and balsam fir in the East-Central Maine. In:
Simpson, C.M. (Ed.), Proceedings of the Conference on Natural
Regeneration Management. Forestry Canada Ð Maritime
Region, Fredericton, pp. 157±168.
Diggle, P.J., 1983. The Statistical Analysis of Spatial Point
Patterns. Academic Press, London, 148 pp.
Emborg, J., 1998. Understorey light conditions and regeneration
with respect to the structural dynamics of a near-natural
temperate deciduous forest in Denmark. For. Ecol. Manage.
106, 83±95.
Facelli, J.M., Pickett, S.T.A., 1991. Plant litter: its dynamics
and effects on plant community structure. Bot. Rev. 57, 1±32.
Gray, A.N., Spies, T.A., 1996. Gap size, within-gap position and
canopy structure effects on conifer seedling establishment. J.
Ecol. 84, 635±645.
Hara, M., 1987. Analysis of seedling banks of a climax beech
forest: ecological importance of seedling sprouts. Vegetatio 71,
67±74.
Harper, J.L., 1977. Population Biology of Plants. Academic Press,
London, 892 pp.
Houle, G., 1994. Spatiotemporal patterns in the components of
regeneration of four sympatric tree species Ð Acer rubrum,
Betula alleghaniensis and Fagus grandifolia. J. Ecol. 82, 39±
53.
Ida, H., Nakagoshi, N., 1996. Gnawing damage by rodents to the
seedlings of Fagus crenata and Quercus mongolica var.
grosserata in a temperate Sasa grassland±deciduous forest
series in southwestern Japan. Ecol. Res. 11, 97±103.
Klinka, K., Wang, Q., Kayahara, G.J., Carter, R.E., Blackwell,
B.A., 1992. Light-growth response relationships in Pacific
silver fir (Abies amabilis) and subalpine fir (Abies lasiocarpa).
Can. J. Bot. 70, 1919±1930.
Korpel, S., 1995. Die Urwaelder der Westkarpaten. Gustav Fisher
Verlag, Stuttgart, 310 pp.
Latham, R.E., 1992. Co-occurring tree species change rank in
seedling performance with resources varied experimentally.
Ecology 73, 2129±2144.
Lertzman, K.P., 1992. Patterns of gap-phase replacement in a
subalpine, old-growth forest. Ecology 73, 657±669.
Madsen, P., Larsen, J.B., 1997. Natural regeneration of beech
(Fagus sylvatica L.) with respect to canopy density, soil
moisture and soil carbon content. For. Ecol. Manage. 97, 95±
105.
Messier, C., Bellefleur, P., 1988. Light quantity and quality on the
forest floor of pioneer and climax stages in a birch±beech±
sugar maple stand. Can. J. For. Res. 18, 615±622.
Minotta, G., Pinzauti, S., 1996. Effects of light and soil fertility on
growth, leaf chlorophyll content and nutrient use efficiency of
beech (Fagus sylvatica L.) seedlings. For. Ecol. Manage. 86,
61±71.
Morin, H., Laprisse, D., 1997. Seedling bank dynamics in boreal
balsam fir forests. Can. J. For. Res. 27, 1442±1451.
Nakashizuka, T., 1988. Regeneration of beech (Fagus crenata)
after the simultaneous death of undergrowing dwarf bamboo
(Sasa kurilensis). Ecol. Res. 3, 21±35.
Ohkubo, T., Tanimoto, T., Peters, R., 1996. Response of Japanese
beech (Fagus japonica Maxim.) sprouts to canopy gaps.
Vegetatio 124, 1±8.
Oliver, C.D., Larson, B.C., 1990. Forest Stand Dynamics.
McGraw±Hill, New York, 467 pp.
Peterken, G.F., 1996. Natural Woodland. Cambridge University
Press, Cambridge, 522 pp.
Peters, R., Nakashizuka, T., Ohkubo, T., 1992. Regeneration and
development in beech-dwarf bamboo forest in Japan. For. Ecol.
Manage. 55, 35±50.
Reader, R.J., Bonser, S.P., Duralia, T.E., Bricker, B.D., 1995.
Interspecific variation in tree seedling establishment in
canopy gaps in relation to tree density. J. Veg. Sci. 6,
609±614.
Ribbens, E., Silander, J.A., Pacala, S.W., 1994. Seedling recruit-
ment in forests: calibrating models to predict patterns of tree
seedling dispersion. Ecology 75, 1794±1806.
Runkle, J.R., Yetter, T.C., 1987. Treefalls revisited: gap dynamics
in the southern Appalachians. Ecology 68, 417±424.
Shugart, H.H., 1984. Forest Dynamics. Springer, New York, 278
pp.
Sokal, R.R., Rohlf, J.F., 1981. Biometry. W. H. Freeman, New
York, 859 pp.
Streng, D.R., Glitzenstein, J.S., Harcombe, P.A., 1989. Woody
Seedling Dynamics in an East Texas floodplain Forest. Ecol.
Monogr. 59, pp. 177±204.
Szewczyk, J., Szwagrzyk, J., 1996. Tree regeneration on
rotten wood and on soil in old-growth stand. Vegetatio 122,
37±46.
Szwagrzyk, J., 1990. Natural regeneration of forest related to the
spatial structure of trees: A study of two forest communities in
Western Carpathians, southern Poland. Vegetatio 89, 11±22.
J. Szwagrzyk et al. / Forest Ecology and Management 141 (2001) 237±250 249

Szwagrzyk, J., 1992. Small-scale spatial patterns of trees in a
mixed Pinus sylvestris±Fagus sylvatica forest. For. Ecol.
Manage. 51, 301±315.
Takyu, M., Ohsawa, M., 1997. Distribution and regeneration
strategies of major canopy dominants in species-rich subtropi-
cal/warm temperate rainforests in south-western Japan. Ecol.
Res. 12, 139±151.
Tucker, G.F., Hinckley, T.M., Leverenz, J., Jiang, S., 1987.
Adjustment of foliar morphology in the acclimation of
understory Pacific silver fir following clearcutting. For. Ecol.
Manage. 21, 249±268.
Washitani, I., Tang, Y., 1991. Microsite variation in light
availability and seedling growth of Quercus serrata in
a temperate pine forest. Ecol. Res. 6, 305±
316.
Welander, N.T., Ottosson, B., 1998. The influence of shading
on growth and morphology in seedlings of Quercus robur L.
and Fagus sylvatica L. For. Ecol. Manage. 107, 117±
126.
Woods, K.D., 1984. Patterns of tree replacement: canopy effects on
understory pattern in hemlock-northern hardwood forests.
Vegetatio 56, 87±107.
250 J. Szwagrzyk et al. / Forest Ecology and Management 141 (2001) 237±250