DYNAMIC SIMULATION MODEL OF COMMON POOL RESOURCE COOPERATION EXPERIMENTS
35
WORKING PAPERS IN SYSTEM DYNAMICS WPSD 5/03 ISSN 1503-4860 Dynamic Simulation Model of Common Pool Resource Cooperation Experiments by Daniel Castillo and Ali Kerem Saysel Structure Behaviour Rate Constant Level Structure Behaviour Rate Constant Level The System Dynamics Group Department of Information Science University of Bergen, Norway Postbox 7800, N-5020 Bergen, Norway
-
Upload
independent -
Category
Documents
-
view
0 -
download
0
Transcript of DYNAMIC SIMULATION MODEL OF COMMON POOL RESOURCE COOPERATION EXPERIMENTS
WORKING PAPERS IN SYSTEM DYNAMICS
WPSD 5/03 ISSN 1503-4860
Dynamic Simulation Model of Common Pool Resource Cooperation Experiments
by
Daniel Castillo and Ali Kerem Saysel
Structure
Behaviour
Rate
Constant
Level
Structure
Behaviour
Rate
Constant
Level
The System Dynamics Group Department of Information Science
University of Bergen, Norway Postbox 7800, N-5020 Bergen, Norway
DYNAMIC SIMULATION MODEL OF COMMON
POOL RESOURCE COOPERATION EXPERIMENTS Daniel Castillo
School of Environmental and Rural Studies, Pontificia Universidad Javeriana, Trans 4#
42-00, Bogota, Colombia.
Ali Kerem Saysel
Department of Information Science, System Dynamics Group, University of Bergen,
P.B. 7800, 5020 Norway.
ABSTRACT
We investigate the decision rules adopted by individuals in local communities, whose
livelihoods depend on common pool resource stocks and who face the cooperation
dilemma in their everyday life. For this purpose, field experiments are modeled and the
model structure and output are confronted with experimental data and with the relevant
theory of collective action proposed by Ostrom (1998). The field experiments analyze
the cooperative action among coastal communities in Providence Island (Colombian
Caribbean Sea). The simulation model is built according to the principles and methods
of System Dynamics. The model formalizes the feedback causality among reputation,
trust and reciprocity as suggested by Ostrom (1998). Moreover, based on the payoff
structure used in the experiments, it considers other behavioral factors such as
temptation to free ride, profit maximization, and awareness of the individuals in
feedback perspective. Depending on the initial conditions and parameter values, model
behavior replicates major patterns of the experimental data. It reveals path dependent
characteristic to the initial trust of the individuals in the group. The variables and
decision rules built into the model structure provide the basis for a dialogue between the
theories of collective action and future experimental designs to test and improve such
theories.
Keywords: Common pool resources; Cooperation; Field experiment; System Dynamics;
Modeling decision-making.
1
I. INTRODUCTION
According to the “tragedy of the commons” hypothesis suggested by Gordon (1954)
and Hardin (1968), as a rational being, user of a common pool resource tries to
maximize her/his own benefits by increasing individual resource extraction. If every
actor follows the same rationale, the resource will eventually be overexploited or
depleted and will not be able to generate any social benefit in the long term. This
problem represents a cooperation dilemma among common pool resource’s (CPR) users
where everyone has to extract less and “sacrifice” from their individual short-term
benefits in order to improve the social benefits in the long term. Many renewable
natural resources, the fisheries, pastures, forestry, groundwater, and others such as
biodiversity, the atmospheric ozone and the global atmosphere are common pool
resources. The conservation and governance of these resources face the same challenge,
the cooperation dilemma. Local and rural communities whose economic livelihood and
social development depends strongly on any common resource are also strongly trapped
in this dilemma. These types of users usually have to cope with environmental policies
that intend to conserve the resources on one hand and with their own livelihood needs
on the other.
Traditionally, the proposed solutions to overcome the commons problem have focused
on external regulations for extraction and ownership rights (Ostrom, 1990). Those
policies have been designed based on the complete rational actor paradigm of
neoclassical economic theory (Gintis, 2000). However, during the last 10 years’
research in CPR management and collective action, alternative explanations have been
developed to overcome commons problems. Field studies and evidence from all around
the world have shown that the “tragedy of the commons” is not unavoidable and people
can efficiently cooperate and build institutions to govern common resources. Data from
laboratory experiments, which employ game theory and experimental economic
approaches, also supported this fact. Such developments have revaluated conventional
perspectives in CPR management such as the state intervention and individual property
rights, as well as the rational self-interested actor of traditional economics (Ostrom,
1990 and 1998).
2
For example, in Colombia, a mega-diverse country with 10% of the world’s biodiversity
(Franco, 1999), environmental management has been decentralized since the late 1980s.
Colombia’s indigenous population of 700,000 (less than 2% of the total population) has
been granted control by Colombia’s Constitution of nearly one fourth of the country’s
land mass. After Earth Summit in Rio de Janeiro in 1992, Colombian government began
to build an institutional framework for sustainable development policies by creating the
national environmental system (SINA, Sistema Nacional Ambiental) in 1993. SINA
was organized according to a decentralized schema, which consists of local
environmental agencies, whose purpose is to regulate and monitor the natural resources
at local levels. However, in Latin America the decentralization process has faced serious
difficulties due to the history of almost two centuries of strong centralized policy
making which has created a culture of direct dependence on the government. Currently,
local and rural communities under common property regimes manage a high percentage
of the biodiversity. Institutions have been set up to promote direct participation of local
communities in resource management but the policy instruments have not had much
effect on the behavior of the local resource users. On the other hand, the efficiency of
state interventions is limited and they do neither guarantee citizen participation nor the
desired sustainable use of the resources (Cardenas, 2002).
To design efficient environmental institutions which facilitate the decentralized
governance of CPRs, individual incentives being faced by the local communities must
be understood (Cardenas, 2002). To understand the institutional failures, which create
social inefficiencies and overexploitation of natural renewable resources, a micro level
analysis of various incentives and social behavior is particularly important. With this
respect, the experimental methods in CPR research have gained considerable popularity
since Ostrom et al., 1994 and became a substantial instrument in policy analysis. On the
other hand, formal simulation models of decision-making in CPR situations based on
multi-agent systems are also emerging as a method, which can assist the experimental
studies (for example Deadman, 1999; Jager and Janssen, 2002). Both the laboratory
experiments and formal simulation models can be useful in testing the theories of
collective action and can improve the scientific policy proposals in the long term. In this
paper, we present a dynamic feedback model (System Dynamics model) of field
experiments in the Old Providence Island of Colombian Caribbean Sea, which builds on
3
Ostrom’s “behavioral theory of collective action” (Ostrom, 1998). Next, we provide a
brief background on the behavioral theory of collective action, the experiments and on
modeling decision making. Then we’ll introduce the formal simulation model. After
that, the discussion on model validity and model behavior analysis will follow. We
conclude with a discussion on future work.
II. BACKGROUND
Important amount of fieldwork have led to the development of a “second-generation
model of rationality”, which identifies “the attributes of human behavior that should be
included in future formal models” such as reputation, trust and reciprocity (Ostrom,
1998). According to Ostrom (1998), “the individual attributes that are particularly
important in explaining behavior in social dilemmas include the expectations
individuals have about other’s behavior (trust), the norms individuals learn from
socialization and life’s experiences (reciprocity), and the identities individuals create
that project their intentions and norms (reputation)”.
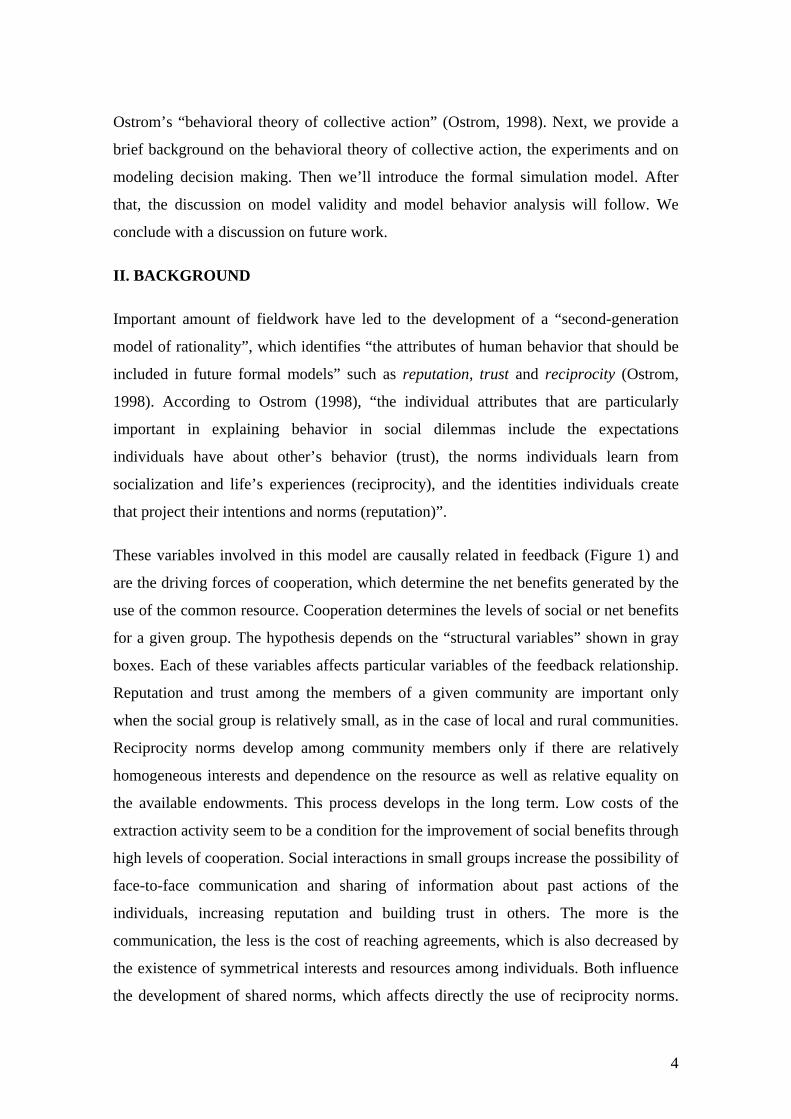
These variables involved in this model are causally related in feedback (Figure 1) and
are the driving forces of cooperation, which determine the net benefits generated by the
use of the common resource. Cooperation determines the levels of social or net benefits
for a given group. The hypothesis depends on the “structural variables” shown in gray
boxes. Each of these variables affects particular variables of the feedback relationship.
Reputation and trust among the members of a given community are important only
when the social group is relatively small, as in the case of local and rural communities.
Reciprocity norms develop among community members only if there are relatively
homogeneous interests and dependence on the resource as well as relative equality on
the available endowments. This process develops in the long term. Low costs of the
extraction activity seem to be a condition for the improvement of social benefits through
high levels of cooperation. Social interactions in small groups increase the possibility of
face-to-face communication and sharing of information about past actions of the
individuals, increasing reputation and building trust in others. The more is the
communication, the less is the cost of reaching agreements, which is also decreased by
the existence of symmetrical interests and resources among individuals. Both influence
the development of shared norms, which affects directly the use of reciprocity norms.
4
The community analyzed in this research satisfies the conditions required by these gray
boxes.
Figure1. Structural variables affecting reputation, trust and reciprocity (adopted from Ostrom, 1998)
According to the predictions of this theory, social groups with these characteristics have
high potential to escape from the resource depletion trap. Case studies show that, the
most successful communities have self-developed their own rules for the use of
common resources. When external regulations have been implemented, they tend to
undermine social structures supporting the local institutions.
Ostrom et al., (1994), Ostrom (1998, 2000), Cardenas et al., (2000), Cardenas (2000a)
and Lopez (2001) among others have reported important CPR experiments. These
results confirm the importance of self-organization and identify communication among
individuals as a key factor in reaching agreements and developing rules for the use of
the resource. When subjects do not face restrictions and cannot communicate with each
other, their decisions tend to be neither pure Nash strategies nor efficient choices, but
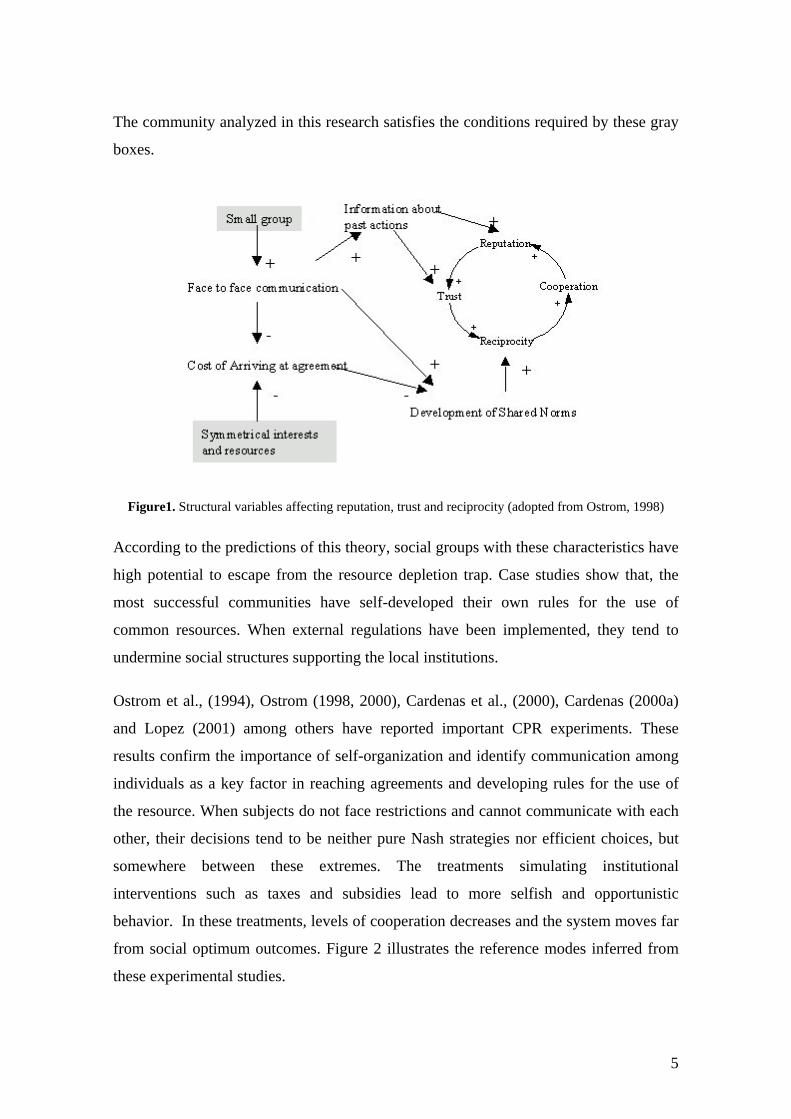
somewhere between these extremes. The treatments simulating institutional
interventions such as taxes and subsidies lead to more selfish and opportunistic
behavior. In these treatments, levels of cooperation decreases and the system moves far
from social optimum outcomes. Figure 2 illustrates the reference modes inferred from
these experimental studies.
5
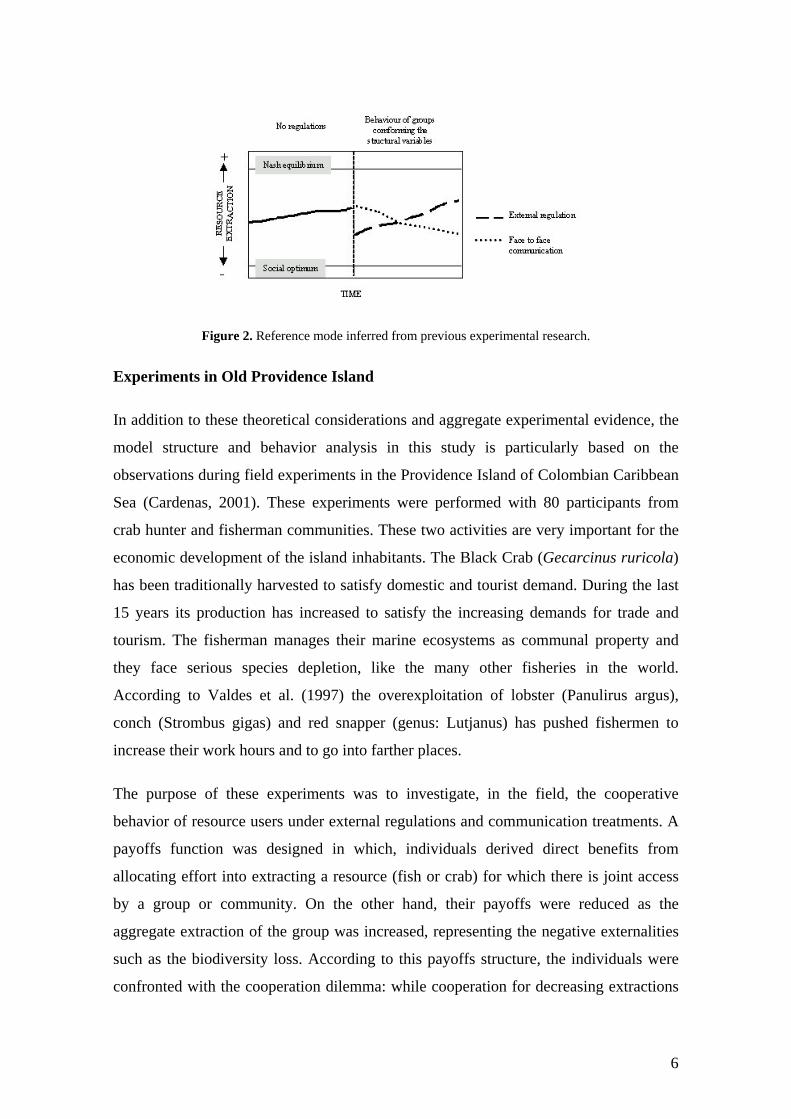
Figure 2. Reference mode inferred from previous experimental research.
Experiments in Old Providence Island
In addition to these theoretical considerations and aggregate experimental evidence, the
model structure and behavior analysis in this study is particularly based on the
observations during field experiments in the Providence Island of Colombian Caribbean
Sea (Cardenas, 2001). These experiments were performed with 80 participants from
crab hunter and fisherman communities. These two activities are very important for the
economic development of the island inhabitants. The Black Crab (Gecarcinus ruricola)
has been traditionally harvested to satisfy domestic and tourist demand. During the last
15 years its production has increased to satisfy the increasing demands for trade and
tourism. The fisherman manages their marine ecosystems as communal property and
they face serious species depletion, like the many other fisheries in the world.
According to Valdes et al. (1997) the overexploitation of lobster (Panulirus argus),
conch (Strombus gigas) and red snapper (genus: Lutjanus) has pushed fishermen to
increase their work hours and to go into farther places.
The purpose of these experiments was to investigate, in the field, the cooperative
behavior of resource users under external regulations and communication treatments. A
payoffs function was designed in which, individuals derived direct benefits from
allocating effort into extracting a resource (fish or crab) for which there is joint access
by a group or community. On the other hand, their payoffs were reduced as the
aggregate extraction of the group was increased, representing the negative externalities
such as the biodiversity loss. According to this payoffs structure, the individuals were
confronted with the cooperation dilemma: while cooperation for decreasing extractions
6
increased the social benefits, any individual could free ride to increase her own efforts
and own income. The payoffs function is calibrated by Cardenas (2000) and the
formulation is shown by Equation 1.
(1) tTotalEfforEffortEffort ×−××+×−× 2085205.260 2
The parameter values 5 and 8 stand for the number of players and for the Nash strategy
(in effort units) respectively. A unit of effort means the time spent in the extractive
activity, which can be represented in hours, days, months or years.
Figure 3 illustrates the possible benefits an individual can derive, based on this payoffs
function. There are two extreme possibilities from an individual player’s perspective:
when the total effort of the 4 others is at its minimum level 4, the individual can derive
benefits between 758 $ (Colombian Pesos) to 880 $ depending on 8 alternative
extraction units for that round (this is illustrated by the 8 points on the upper inverse
parabolic curve). The other extreme is when the 4 others extract at their maximum level
in total, 32 (effort units). Then the individual can derive benefits between 198 $ and
320$, represented with the lower inverse parabolic curve. The space between these two
extremes depicts all possible alternative benefits for the individual depending on the
total group effort. According to this payoffs function, even if an individual doesn’t put
any efforts (plays 0 effort units) he still gets benefits due to environmental services from
biodiversity. However, according to the rules of the experiment, efforts have to be
between 1 and 8.
Figure 3. Individual payoffs with respect to individual and group efforts
7
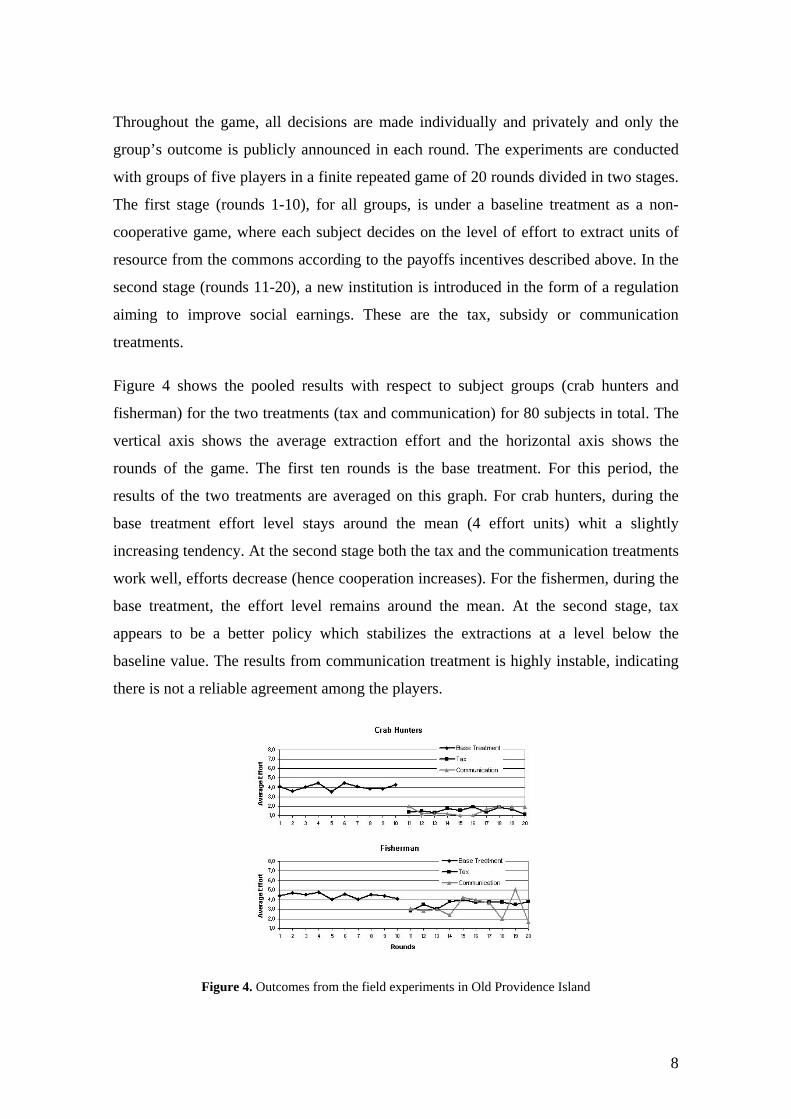
Throughout the game, all decisions are made individually and privately and only the
group’s outcome is publicly announced in each round. The experiments are conducted
with groups of five players in a finite repeated game of 20 rounds divided in two stages.
The first stage (rounds 1-10), for all groups, is under a baseline treatment as a non-
cooperative game, where each subject decides on the level of effort to extract units of
resource from the commons according to the payoffs incentives described above. In the
second stage (rounds 11-20), a new institution is introduced in the form of a regulation
aiming to improve social earnings. These are the tax, subsidy or communication
treatments.
Figure 4 shows the pooled results with respect to subject groups (crab hunters and
fisherman) for the two treatments (tax and communication) for 80 subjects in total. The
vertical axis shows the average extraction effort and the horizontal axis shows the
rounds of the game. The first ten rounds is the base treatment. For this period, the
results of the two treatments are averaged on this graph. For crab hunters, during the
base treatment effort level stays around the mean (4 effort units) whit a slightly
increasing tendency. At the second stage both the tax and the communication treatments
work well, efforts decrease (hence cooperation increases). For the fishermen, during the
base treatment, the effort level remains around the mean. At the second stage, tax
appears to be a better policy which stabilizes the extractions at a level below the
baseline value. The results from communication treatment is highly instable, indicating
there is not a reliable agreement among the players.
Figure 4. Outcomes from the field experiments in Old Providence Island
8
Dynamic modeling of decision making
Computer models are emerging as an important complement of extensive field studies
and economic laboratory experiments in CPR problems. Jager and Janssen (2002) and
Deadman (1999) have both used agent based modeling approach to link common pool
resource laboratory experiments with computer models. Though their studies intend to
represent the structure of the experiments reported in Ostrom et al. (1994) and discuss
the model behavior with respect to these experimental results, they don’t benefit from
the “behavioral theory of collective action” (Ostrom 1998) as the conceptual
framework. Deadman (1999) studies the relationship between individual behavior and
group level performance by providing the agents with a return maximizing strategy with
several possible options to achieve their goals. The main objective is to explore the
possibility of testing theories of individual action and group behavior through computer
simulations. The model behaves similar to the group level performance in laboratory
experiments, which is characterized by an oscillating pattern due to over investment in
the CPR and a subsequent fall in extraction. The author claims this behavior fit as the
bases for the verification of the model. Jager and Janssen (2002) use psychological
theory of human decision making, which considers basic needs and uncertainty as the
driving factors of decisions as opposed to the traditional “rational actor” assumption.
Their original objective is to explain the individual’s behavior in real experiments as
originating from heterogeneity in Social Value Orientations (SVO’s) of the participants
using the “consumat” approach, a multi-agent simulation method from social
psychology. Their model is not able to explain individual patterns of the real
experiments. On the other hand, they claim, the statistical fit between simulation data
and real experiments observations are not “sufficient proof that the simulation model
captures the most relevant dynamics that guide the behavior of the subjects in the
Ostrom et al (1994) experiments.” (Jager and Janssen, 2002). They call for the necessity
of more empirical data. They identify different needs which are important in decision-
making, their relative importance, decision maker’s Social Value Orientations, cognitive
processes subjects use, personality characteristics and the relevant time horizon people
use to make a decision. The authors conclude, testing all these factors in experimental
settings is a very complex task, therefore the usefulness of simulation models is to
9
provide a practical tool to “test beforehand the relevance of factors and develop
hypotheses concerning the effects of varying these factors” (Jager and Janssen, 2002).
The modeling approach of the present study is based on the principles and methods of
System Dynamics (Forrester 1961; Sterman 2000). System Dynamics is particularly
useful in formalizing feedback processes governing the dynamics of socio economic
systems. In addition to the representation of physical and institutional structures of the
systems, it provides methods for formulating decision rules which represent the
behavior of the agents within those systems (Sterman 2000, p. 515). Decision makers
may be represented as individuals or as aggregations of decision-making individuals or
groups. In these continuous dynamic formulations, the decision makers’ rationality can
be limited by separating the actual and available information to the agents, by
considering expectations on the future states of the system and by taking into account
several other cognitive limitations. Time delay formulations have an essential role in
representing these processes. The model structure consists of feedbacks, time delays and
nonlinearities, which create dynamic behavior patterns over time.
In this particular case, the existence of feedback processes among the variables such as
reputation, trust, and reciprocity and the others like temptation to free ride through the
rounds of the experiments; the existence of time delays in building variables such as
reputation and trust; and existence of non linear relationships among the factors such as
trust and reciprocity (illustrated in Figure 8) makes system dynamics to be an
appropriate approach for modeling the experiments. Finally, many variables that need to
be considered in this analysis are “soft variables”, which lack units but are identified
within appropriate scales, like trust, for example. The model building practice in system
dynamics supports these requirements. Provided that the sensitivity of model behavior
is tested with respect to the uncertainty in “soft variables”, inclusion of behavioral
factors in formal simulation is strongly encouraged. According to Forrester (1961, p.
57), to omit such variables is equivalent to saying that they have zero effect – probably
the only value that is known to be wrong. Moreover, there are opportunities for
statistical estimation of soft variables. As long as the model structure satisfies the
conditions for structural validity and there exists reliable data from extensive field
studies, statistical estimation of soft variables are also possible (Sterman 2000, p. 868).
10
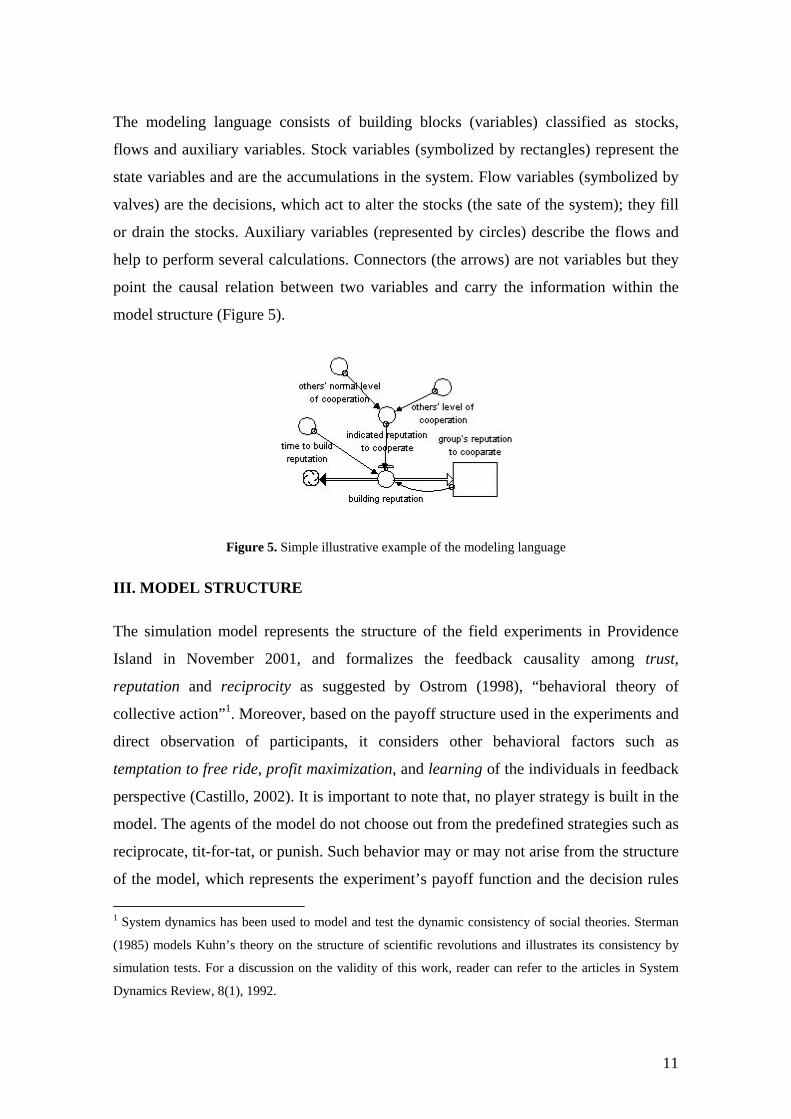
The modeling language consists of building blocks (variables) classified as stocks,
flows and auxiliary variables. Stock variables (symbolized by rectangles) represent the
state variables and are the accumulations in the system. Flow variables (symbolized by
valves) are the decisions, which act to alter the stocks (the sate of the system); they fill
or drain the stocks. Auxiliary variables (represented by circles) describe the flows and
help to perform several calculations. Connectors (the arrows) are not variables but they
point the causal relation between two variables and carry the information within the
model structure (Figure 5).
Figure 5. Simple illustrative example of the modeling language
III. MODEL STRUCTURE
The simulation model represents the structure of the field experiments in Providence
Island in November 2001, and formalizes the feedback causality among trust,
reputation and reciprocity as suggested by Ostrom (1998), “behavioral theory of
collective action”1. Moreover, based on the payoff structure used in the experiments and
direct observation of participants, it considers other behavioral factors such as
temptation to free ride, profit maximization, and learning of the individuals in feedback
perspective (Castillo, 2002). It is important to note that, no player strategy is built in the
model. The agents of the model do not choose out from the predefined strategies such as
reciprocate, tit-for-tat, or punish. Such behavior may or may not arise from the structure
of the model, which represents the experiment’s payoff function and the decision rules
1 System dynamics has been used to model and test the dynamic consistency of social theories. Sterman
(1985) models Kuhn’s theory on the structure of scientific revolutions and illustrates its consistency by
simulation tests. For a discussion on the validity of this work, reader can refer to the articles in System
Dynamics Review, 8(1), 1992.
11
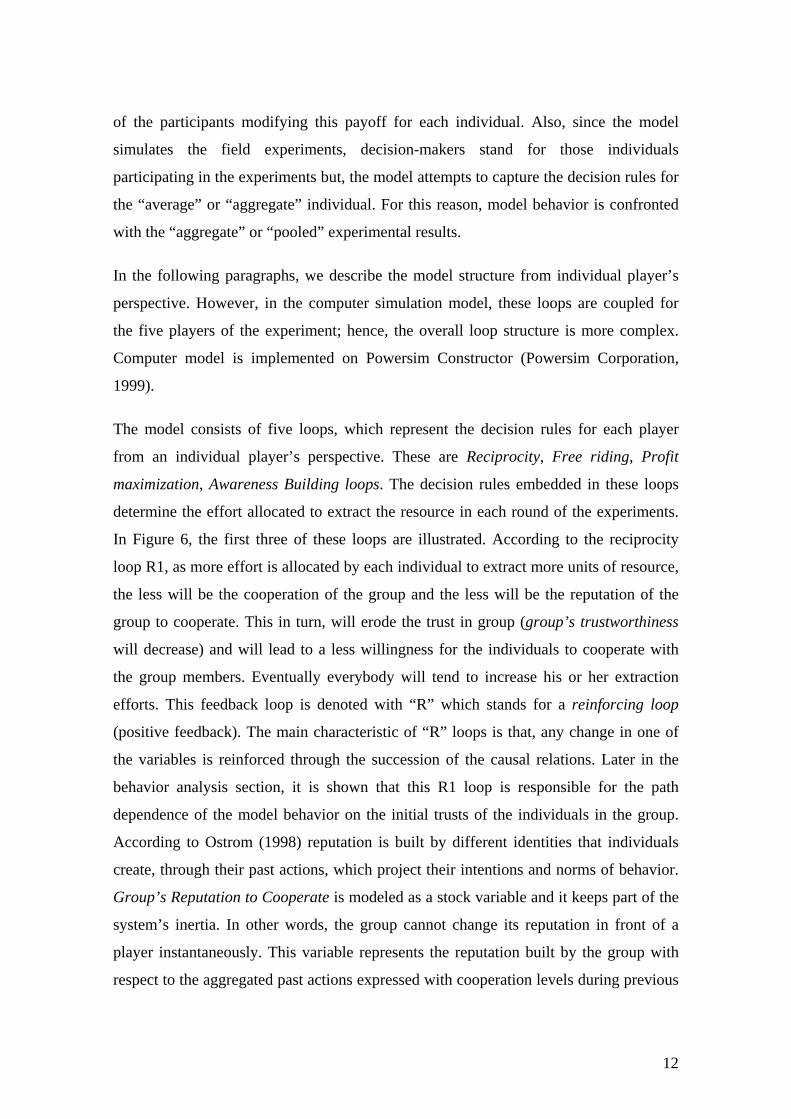
of the participants modifying this payoff for each individual. Also, since the model
simulates the field experiments, decision-makers stand for those individuals
participating in the experiments but, the model attempts to capture the decision rules for
the “average” or “aggregate” individual. For this reason, model behavior is confronted
with the “aggregate” or “pooled” experimental results.
In the following paragraphs, we describe the model structure from individual player’s
perspective. However, in the computer simulation model, these loops are coupled for
the five players of the experiment; hence, the overall loop structure is more complex.
Computer model is implemented on Powersim Constructor (Powersim Corporation,
1999).
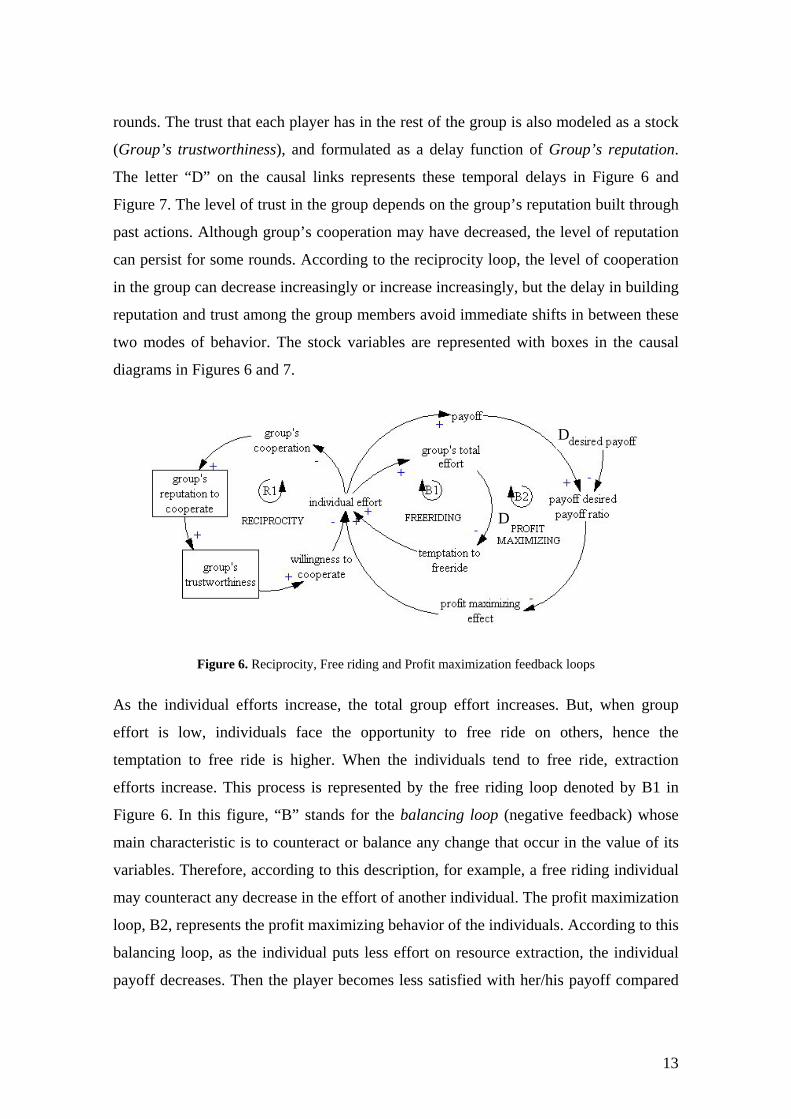
The model consists of five loops, which represent the decision rules for each player
from an individual player’s perspective. These are Reciprocity, Free riding, Profit
maximization, Awareness Building loops. The decision rules embedded in these loops
determine the effort allocated to extract the resource in each round of the experiments.
In Figure 6, the first three of these loops are illustrated. According to the reciprocity
loop R1, as more effort is allocated by each individual to extract more units of resource,
the less will be the cooperation of the group and the less will be the reputation of the
group to cooperate. This in turn, will erode the trust in group (group’s trustworthiness
will decrease) and will lead to a less willingness for the individuals to cooperate with
the group members. Eventually everybody will tend to increase his or her extraction
efforts. This feedback loop is denoted with “R” which stands for a reinforcing loop
(positive feedback). The main characteristic of “R” loops is that, any change in one of
the variables is reinforced through the succession of the causal relations. Later in the
behavior analysis section, it is shown that this R1 loop is responsible for the path
dependence of the model behavior on the initial trusts of the individuals in the group.
According to Ostrom (1998) reputation is built by different identities that individuals
create, through their past actions, which project their intentions and norms of behavior.
Group’s Reputation to Cooperate is modeled as a stock variable and it keeps part of the
system’s inertia. In other words, the group cannot change its reputation in front of a
player instantaneously. This variable represents the reputation built by the group with
respect to the aggregated past actions expressed with cooperation levels during previous
12
rounds. The trust that each player has in the rest of the group is also modeled as a stock
(Group’s trustworthiness), and formulated as a delay function of Group’s reputation.
The letter “D” on the causal links represents these temporal delays in Figure 6 and
Figure 7. The level of trust in the group depends on the group’s reputation built through
past actions. Although group’s cooperation may have decreased, the level of reputation
can persist for some rounds. According to the reciprocity loop, the level of cooperation
in the group can decrease increasingly or increase increasingly, but the delay in building
reputation and trust among the group members avoid immediate shifts in between these
two modes of behavior. The stock variables are represented with boxes in the causal
diagrams in Figures 6 and 7.
D
D
Figure 6. Reciprocity, Free riding and Profit maximization feedback loops
As the individual efforts increase, the total group effort increases. But, when group
effort is low, individuals face the opportunity to free ride on others, hence the
temptation to free ride is higher. When the individuals tend to free ride, extraction
efforts increase. This process is represented by the free riding loop denoted by B1 in
Figure 6. In this figure, “B” stands for the balancing loop (negative feedback) whose
main characteristic is to counteract or balance any change that occur in the value of its
variables. Therefore, according to this description, for example, a free riding individual
may counteract any decrease in the effort of another individual. The profit maximization
loop, B2, represents the profit maximizing behavior of the individuals. According to this
balancing loop, as the individual puts less effort on resource extraction, the individual
payoff decreases. Then the player becomes less satisfied with her/his payoff compared
13
to the maximum that she/he can receive and tends to increase her/his efforts for
extraction through the variable, profit maximization effect.
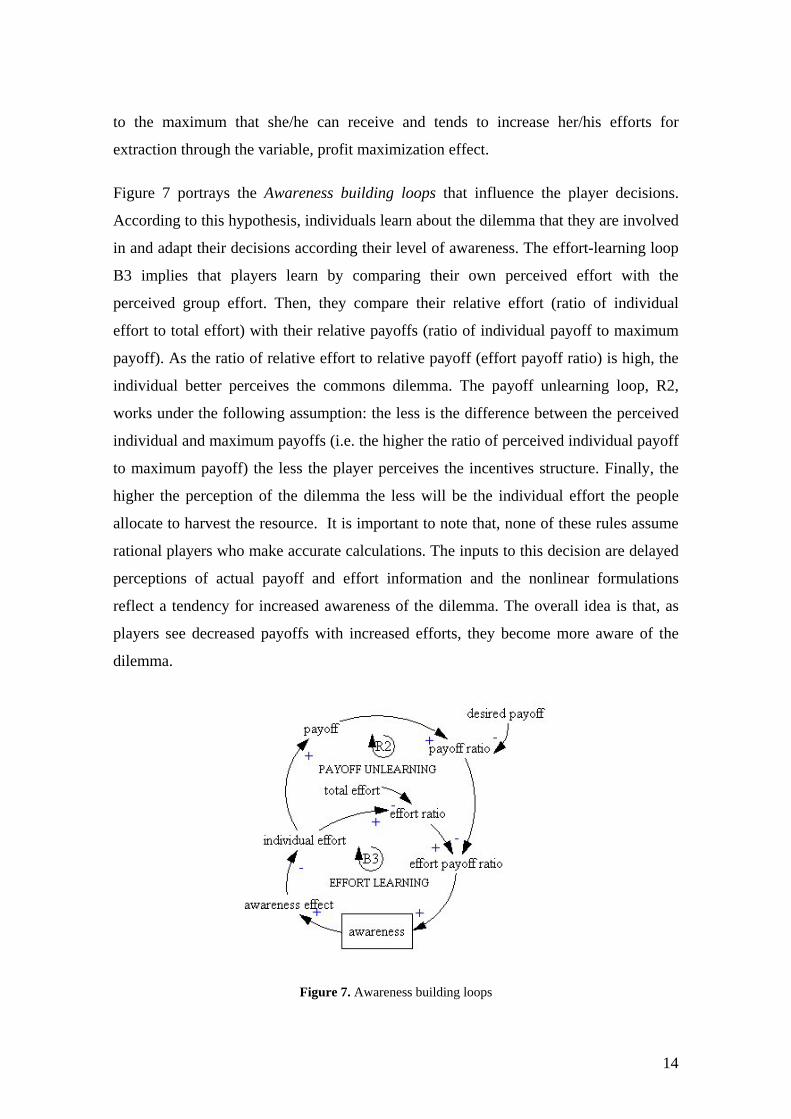
Figure 7 portrays the Awareness building loops that influence the player decisions.
According to this hypothesis, individuals learn about the dilemma that they are involved
in and adapt their decisions according their level of awareness. The effort-learning loop
B3 implies that players learn by comparing their own perceived effort with the
perceived group effort. Then, they compare their relative effort (ratio of individual
effort to total effort) with their relative payoffs (ratio of individual payoff to maximum
payoff). As the ratio of relative effort to relative payoff (effort payoff ratio) is high, the
individual better perceives the commons dilemma. The payoff unlearning loop, R2,
works under the following assumption: the less is the difference between the perceived
individual and maximum payoffs (i.e. the higher the ratio of perceived individual payoff
to maximum payoff) the less the player perceives the incentives structure. Finally, the
higher the perception of the dilemma the less will be the individual effort the people
allocate to harvest the resource. It is important to note that, none of these rules assume
rational players who make accurate calculations. The inputs to this decision are delayed
perceptions of actual payoff and effort information and the nonlinear formulations
reflect a tendency for increased awareness of the dilemma. The overall idea is that, as
players see decreased payoffs with increased efforts, they become more aware of the
dilemma.
Figure 7. Awareness building loops
14
The payoff function in the model is identical to that used in the experiments (Equation
1) whose formulation is generic to the games with group externalities. In the model, the
effort of an individual is formulated by Equation 2.
(2) IndividualEffort=ReferenceEffort×WillingnessToCooperate× TemptationToFree
ride×ProfitMaximizingEffect/AwarenessOfDilemmaEffect/RiskPerceptionEffect
The entire variables are nonlinear functions, except the model constant Reference
Effort. The Reference Effort for each player represents one of the culturally learned
social behavior norms for this type of social dilemmas. This parameter is set at 4 effort-
units assuming an intermediate norm between a complete selfish decision (8 effort
units) and a full cooperative one (1 effort unit). Therefore, the model adjusts individual
efforts around this reference value, based on the weights of the factors involved in the
effort formulation.
The effects of reciprocity, temptation to free ride and profit maximization, awareness
and risk perception on effort decisions are formulated by several nonlinear functions.
The following paragraphs provide a closer look at these formulations.
Willingness to Cooperate
The level of trust of each player in the rest of the group (group’s trustworthiness) affects
the effort decision for each round. This effect represents the reciprocity norms a player
has. In this sense, the effect has been called willingness to cooperate. The nonlinear
relationship between group’s trustworthiness and willingness to cooperate is shown in
Figure 8. According to this formulation, when group’s trustworthiness is high, the
player reciprocates to the group with her/his next decision, by decreasing his extraction
effort. As group’s trustworthiness decreases, player’s willingness to reciprocate tends to
decrease. At very low levels of trust, player reciprocates by increasing his extractions.
As trust approaches its minimum and maximum levels, the reciprocity of the player
saturates at certain levels.
15
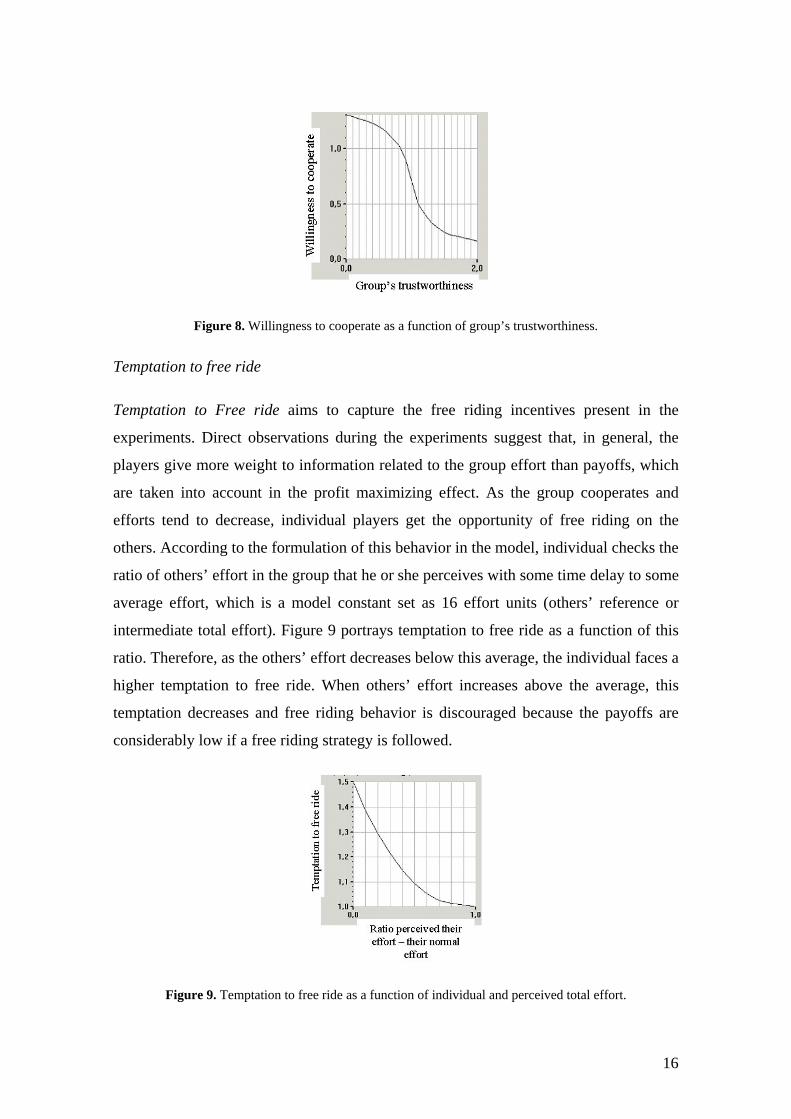
Figure 8. Willingness to cooperate as a function of group’s trustworthiness.
Temptation to free ride
Temptation to Free ride aims to capture the free riding incentives present in the
experiments. Direct observations during the experiments suggest that, in general, the
players give more weight to information related to the group effort than payoffs, which
are taken into account in the profit maximizing effect. As the group cooperates and
efforts tend to decrease, individual players get the opportunity of free riding on the
others. According to the formulation of this behavior in the model, individual checks the
ratio of others’ effort in the group that he or she perceives with some time delay to some
average effort, which is a model constant set as 16 effort units (others’ reference or
intermediate total effort). Figure 9 portrays temptation to free ride as a function of this
ratio. Therefore, as the others’ effort decreases below this average, the individual faces a
higher temptation to free ride. When others’ effort increases above the average, this
temptation decreases and free riding behavior is discouraged because the payoffs are
considerably low if a free riding strategy is followed.
Figure 9. Temptation to free ride as a function of individual and perceived total effort.
16
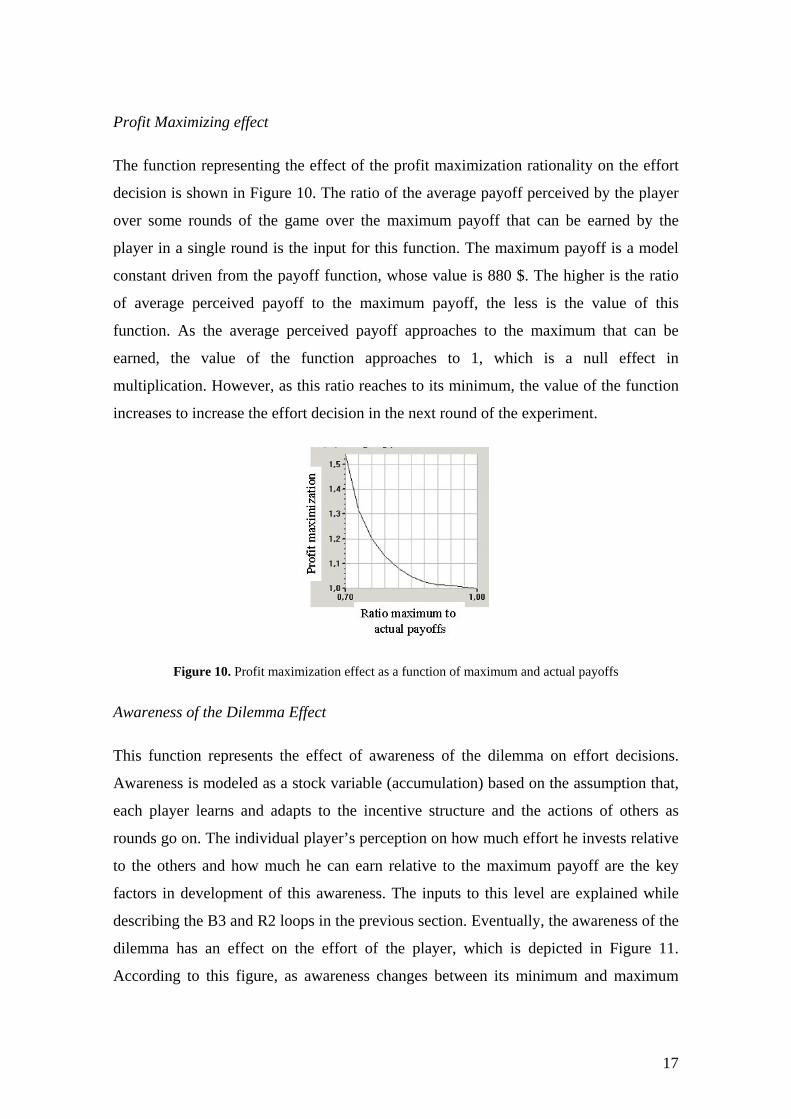
Profit Maximizing effect
The function representing the effect of the profit maximization rationality on the effort
decision is shown in Figure 10. The ratio of the average payoff perceived by the player
over some rounds of the game over the maximum payoff that can be earned by the
player in a single round is the input for this function. The maximum payoff is a model
constant driven from the payoff function, whose value is 880 $. The higher is the ratio
of average perceived payoff to the maximum payoff, the less is the value of this
function. As the average perceived payoff approaches to the maximum that can be
earned, the value of the function approaches to 1, which is a null effect in
multiplication. However, as this ratio reaches to its minimum, the value of the function
increases to increase the effort decision in the next round of the experiment.
Figure 10. Profit maximization effect as a function of maximum and actual payoffs
Awareness of the Dilemma Effect
This function represents the effect of awareness of the dilemma on effort decisions.
Awareness is modeled as a stock variable (accumulation) based on the assumption that,
each player learns and adapts to the incentive structure and the actions of others as
rounds go on. The individual player’s perception on how much effort he invests relative
to the others and how much he can earn relative to the maximum payoff are the key
factors in development of this awareness. The inputs to this level are explained while
describing the B3 and R2 loops in the previous section. Eventually, the awareness of the
dilemma has an effect on the effort of the player, which is depicted in Figure 11.
According to this figure, as awareness changes between its minimum and maximum
17
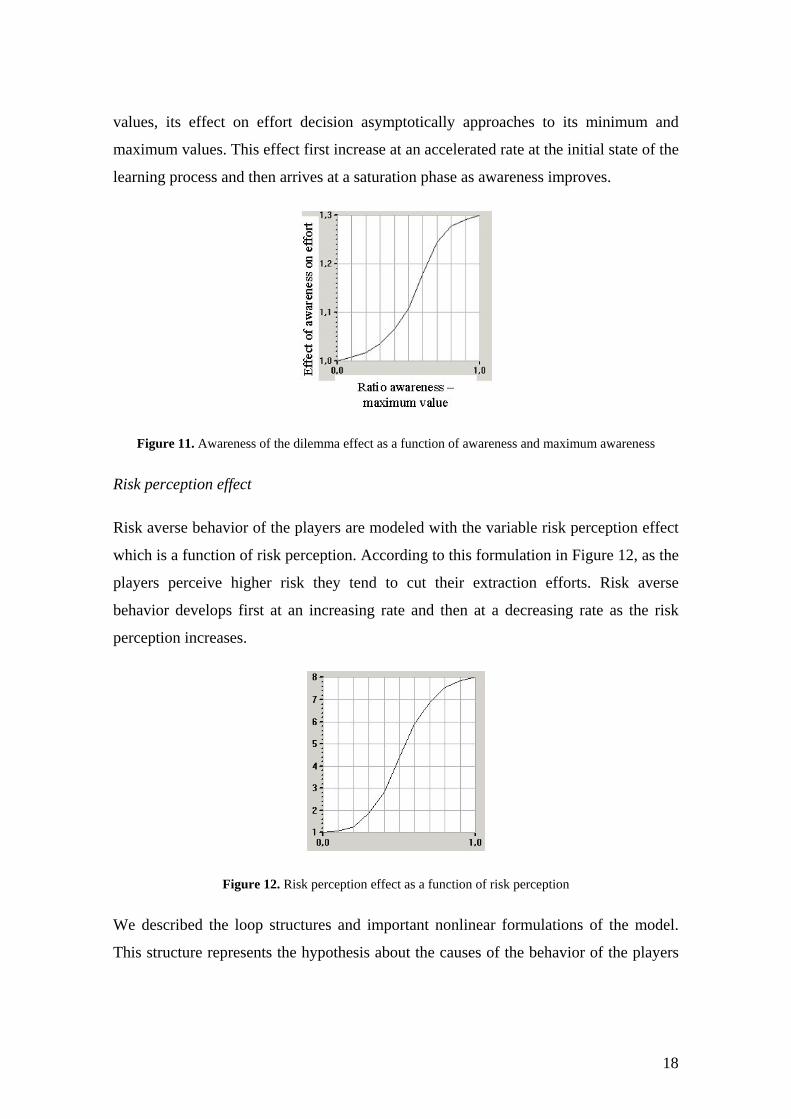
values, its effect on effort decision asymptotically approaches to its minimum and
maximum values. This effect first increase at an accelerated rate at the initial state of the
learning process and then arrives at a saturation phase as awareness improves.
Figure 11. Awareness of the dilemma effect as a function of awareness and maximum awareness
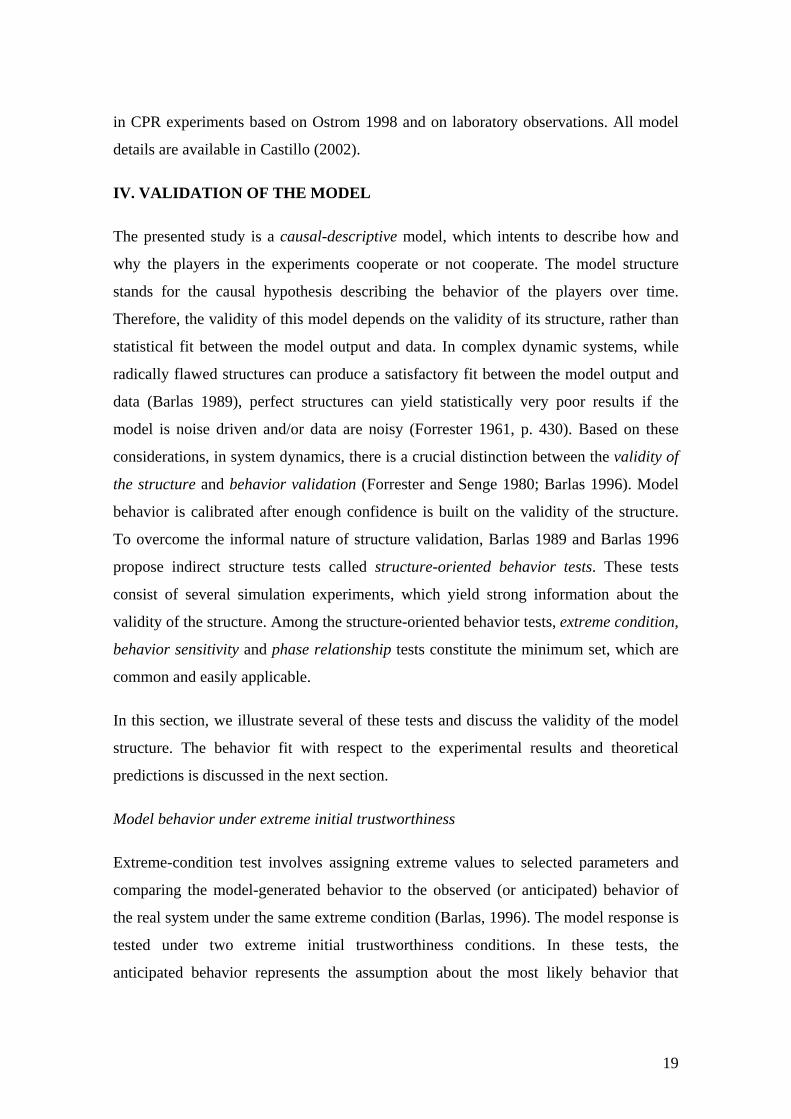
Risk perception effect
Risk averse behavior of the players are modeled with the variable risk perception effect
which is a function of risk perception. According to this formulation in Figure 12, as the
players perceive higher risk they tend to cut their extraction efforts. Risk averse
behavior develops first at an increasing rate and then at a decreasing rate as the risk
perception increases.
Figure 12. Risk perception effect as a function of risk perception
We described the loop structures and important nonlinear formulations of the model.
This structure represents the hypothesis about the causes of the behavior of the players
18
in CPR experiments based on Ostrom 1998 and on laboratory observations. All model
details are available in Castillo (2002).
IV. VALIDATION OF THE MODEL
The presented study is a causal-descriptive model, which intents to describe how and
why the players in the experiments cooperate or not cooperate. The model structure
stands for the causal hypothesis describing the behavior of the players over time.
Therefore, the validity of this model depends on the validity of its structure, rather than
statistical fit between the model output and data. In complex dynamic systems, while
radically flawed structures can produce a satisfactory fit between the model output and
data (Barlas 1989), perfect structures can yield statistically very poor results if the
model is noise driven and/or data are noisy (Forrester 1961, p. 430). Based on these
considerations, in system dynamics, there is a crucial distinction between the validity of
the structure and behavior validation (Forrester and Senge 1980; Barlas 1996). Model
behavior is calibrated after enough confidence is built on the validity of the structure.
To overcome the informal nature of structure validation, Barlas 1989 and Barlas 1996
propose indirect structure tests called structure-oriented behavior tests. These tests
consist of several simulation experiments, which yield strong information about the
validity of the structure. Among the structure-oriented behavior tests, extreme condition,
behavior sensitivity and phase relationship tests constitute the minimum set, which are
common and easily applicable.
In this section, we illustrate several of these tests and discuss the validity of the model
structure. The behavior fit with respect to the experimental results and theoretical
predictions is discussed in the next section.
Model behavior under extreme initial trustworthiness
Extreme-condition test involves assigning extreme values to selected parameters and
comparing the model-generated behavior to the observed (or anticipated) behavior of
the real system under the same extreme condition (Barlas, 1996). The model response is
tested under two extreme initial trustworthiness conditions. In these tests, the
anticipated behavior represents the assumption about the most likely behavior that
19
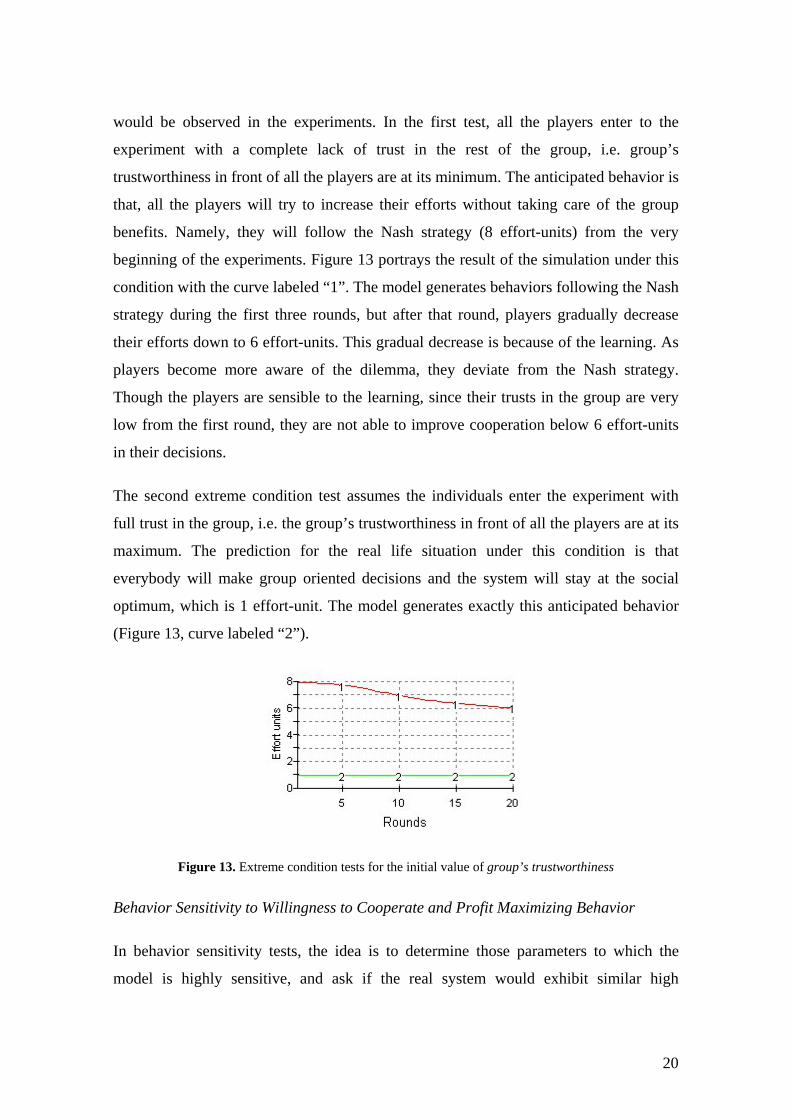
would be observed in the experiments. In the first test, all the players enter to the
experiment with a complete lack of trust in the rest of the group, i.e. group’s
trustworthiness in front of all the players are at its minimum. The anticipated behavior is
that, all the players will try to increase their efforts without taking care of the group
benefits. Namely, they will follow the Nash strategy (8 effort-units) from the very
beginning of the experiments. Figure 13 portrays the result of the simulation under this
condition with the curve labeled “1”. The model generates behaviors following the Nash
strategy during the first three rounds, but after that round, players gradually decrease
their efforts down to 6 effort-units. This gradual decrease is because of the learning. As
players become more aware of the dilemma, they deviate from the Nash strategy.
Though the players are sensible to the learning, since their trusts in the group are very
low from the first round, they are not able to improve cooperation below 6 effort-units
in their decisions.
The second extreme condition test assumes the individuals enter the experiment with
full trust in the group, i.e. the group’s trustworthiness in front of all the players are at its
maximum. The prediction for the real life situation under this condition is that
everybody will make group oriented decisions and the system will stay at the social
optimum, which is 1 effort-unit. The model generates exactly this anticipated behavior
(Figure 13, curve labeled “2”).
Figure 13. Extreme condition tests for the initial value of group’s trustworthiness
Behavior Sensitivity to Willingness to Cooperate and Profit Maximizing Behavior
In behavior sensitivity tests, the idea is to determine those parameters to which the
model is highly sensitive, and ask if the real system would exhibit similar high
20
sensitivity to the corresponding parameters (Barlas 1996). Here two illustrative
examples are given for behavior sensitivity tests: sensitivity to willingness to cooperate
and sensitivity to profit maximizing behavior.
Willingness to cooperate represents the reciprocity norms of each player as a response
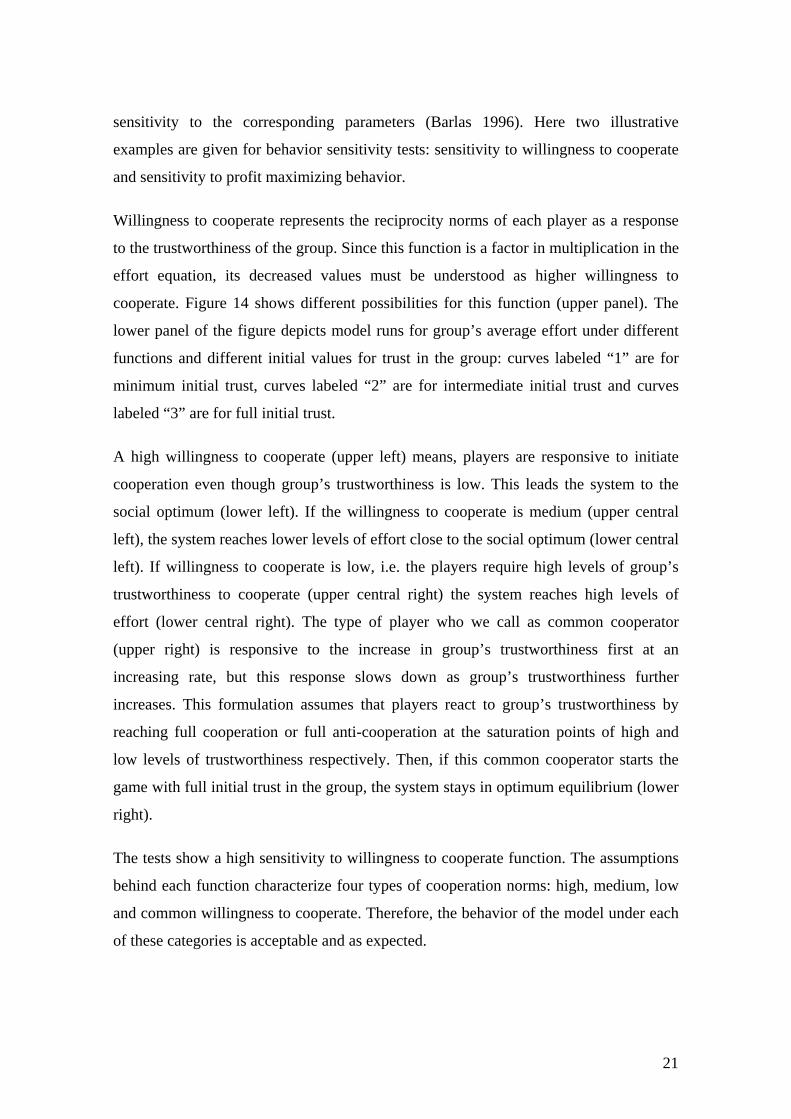
to the trustworthiness of the group. Since this function is a factor in multiplication in the
effort equation, its decreased values must be understood as higher willingness to
cooperate. Figure 14 shows different possibilities for this function (upper panel). The
lower panel of the figure depicts model runs for group’s average effort under different
functions and different initial values for trust in the group: curves labeled “1” are for
minimum initial trust, curves labeled “2” are for intermediate initial trust and curves
labeled “3” are for full initial trust.
A high willingness to cooperate (upper left) means, players are responsive to initiate
cooperation even though group’s trustworthiness is low. This leads the system to the
social optimum (lower left). If the willingness to cooperate is medium (upper central
left), the system reaches lower levels of effort close to the social optimum (lower central
left). If willingness to cooperate is low, i.e. the players require high levels of group’s
trustworthiness to cooperate (upper central right) the system reaches high levels of
effort (lower central right). The type of player who we call as common cooperator
(upper right) is responsive to the increase in group’s trustworthiness first at an
increasing rate, but this response slows down as group’s trustworthiness further
increases. This formulation assumes that players react to group’s trustworthiness by
reaching full cooperation or full anti-cooperation at the saturation points of high and
low levels of trustworthiness respectively. Then, if this common cooperator starts the
game with full initial trust in the group, the system stays in optimum equilibrium (lower
right).
The tests show a high sensitivity to willingness to cooperate function. The assumptions
behind each function characterize four types of cooperation norms: high, medium, low
and common willingness to cooperate. Therefore, the behavior of the model under each
of these categories is acceptable and as expected.
21
Rounds
Effo
rt un
its
5 10 15 20012345678 1
2 3 1 2 3 1 2 3 1
Rounds
Effo
rt un
its
5 10 15 20012345678 1
2
3
1
23
1
2 3
1
2
Rounds
Effo
rt un
its
5 10 15 20012345678
1
2 31
2 3 1 2 3 1
Input: Trust in them Input: Trust in them Input: Trust in them Input: Trust in them
WILLINGNESS TO COOPERATEWILLINGNESS TO COOPERATEWILLINGNESS TO COOPERATEWILLINGNESS TO COOPERATECOMMON LOWMEDIUM HIGH
Rounds
Effo
rt un
its
5 10 15 2012345678
0
1
2
31
2
3 1
2
3 1
2
Rounds
Effo
rt un
its
5 10 15 20012345678 1
2 3 1 2 3 1 2 3 1
Rounds
Effo
rt un
its
5 10 15 20012345678 1
2
3
1
23
1
2 3
1
2
Rounds
Effo
rt un
its
5 10 15 20012345678
1
2 31
2 3 1 2 3 1
Input: Trust in them Input: Trust in them Input: Trust in them Input: Trust in them
WILLINGNESS TO COOPERATEWILLINGNESS TO COOPERATEWILLINGNESS TO COOPERATEWILLINGNESS TO COOPERATECOMMON LOWMEDIUM HIGH
Rounds
Effo
rt un
its
5 10 15 2012345678
0
1
2
31
2
3 1
2
3 1
2
Input: Group’s trustworthiness Input: Group’s trustworthiness Input: Group’s trustworthiness Input: Group’s trustworthiness
Rounds
Effo
rt un
its
5 10 15 20012345678 1
2 3 1 2 3 1 2 3 1
Rounds
Effo
rt un
its
5 10 15 20012345678 1
2
3
1
23
1
2 3
1
2
Rounds
Effo
rt un
its
5 10 15 20012345678
1
2 31
2 3 1 2 3 1
Input: Trust in them Input: Trust in them Input: Trust in them Input: Trust in them
WILLINGNESS TO COOPERATEWILLINGNESS TO COOPERATEWILLINGNESS TO COOPERATEWILLINGNESS TO COOPERATECOMMON LOWMEDIUM HIGH
Rounds
Effo
rt un
its
5 10 15 2012345678
0
1
2
31
2
3 1
2
3 1
2
Rounds
Effo
rt un
its
5 10 15 20012345678 1
2 3 1 2 3 1 2 3 1
Rounds
Effo
rt un
its
5 10 15 20012345678 1
2
3
1
23
1
2 3
1
2
Rounds
Effo
rt un
its
5 10 15 20012345678
1
2 31
2 3 1 2 3 1
Input: Trust in them Input: Trust in them Input: Trust in them Input: Trust in them
WILLINGNESS TO COOPERATEWILLINGNESS TO COOPERATEWILLINGNESS TO COOPERATEWILLINGNESS TO COOPERATECOMMON LOWMEDIUM HIGH
Rounds
Effo
rt un
its
5 10 15 2012345678
0
1
2
31
2
3 1
2
3 1
2
Input: Group’s trustworthiness Input: Group’s trustworthiness Input: Group’s trustworthiness Input: Group’s trustworthiness
Figure 14. Sensitivity analysis of willingness to cooperate function
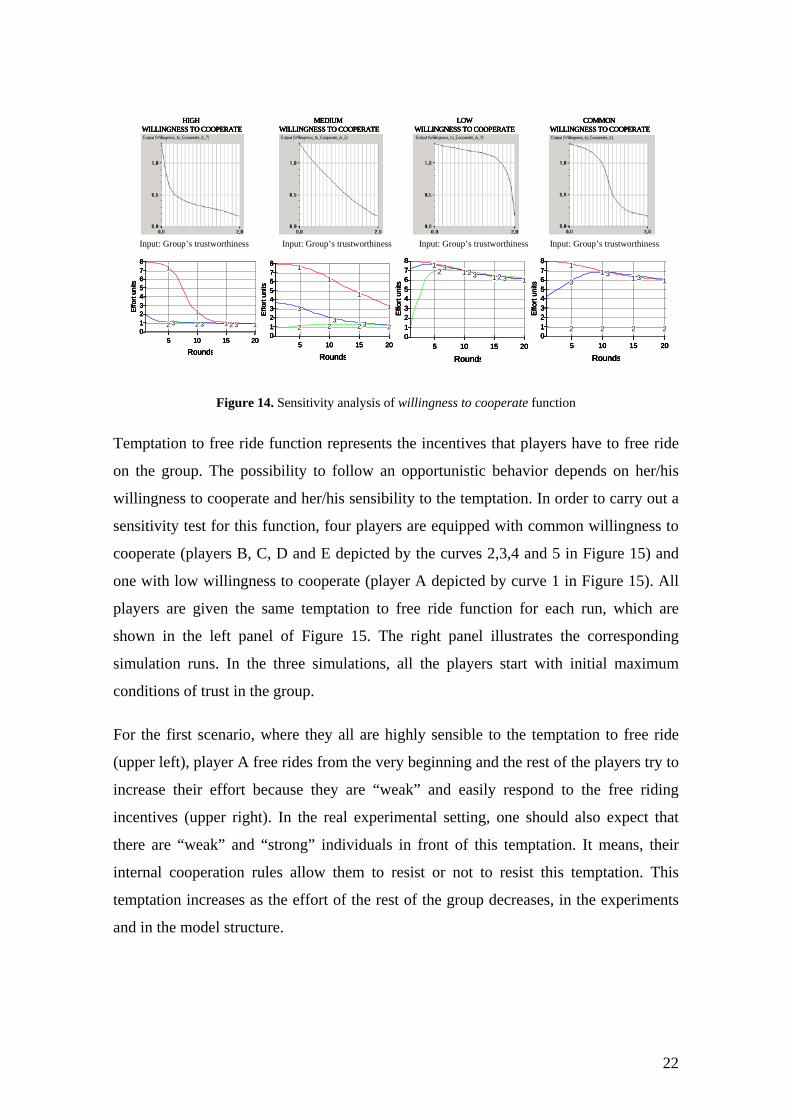
Temptation to free ride function represents the incentives that players have to free ride
on the group. The possibility to follow an opportunistic behavior depends on her/his
willingness to cooperate and her/his sensibility to the temptation. In order to carry out a
sensitivity test for this function, four players are equipped with common willingness to
cooperate (players B, C, D and E depicted by the curves 2,3,4 and 5 in Figure 15) and
one with low willingness to cooperate (player A depicted by curve 1 in Figure 15). All
players are given the same temptation to free ride function for each run, which are
shown in the left panel of Figure 15. The right panel illustrates the corresponding
simulation runs. In the three simulations, all the players start with initial maximum
conditions of trust in the group.
For the first scenario, where they all are highly sensible to the temptation to free ride
(upper left), player A free rides from the very beginning and the rest of the players try to
increase their effort because they are “weak” and easily respond to the free riding
incentives (upper right). In the real experimental setting, one should also expect that
there are “weak” and “strong” individuals in front of this temptation. It means, their
internal cooperation rules allow them to resist or not to resist this temptation. This
temptation increases as the effort of the rest of the group decreases, in the experiments
and in the model structure.
22
The two lower panels portray two different possibilities of this function and their
corresponding runs. The behavior patterns are the same but the maximum effort units
reached by the free riding player are different. The model shows sensitivity to
temptation to free ride, which is coherent with the assumed behavior of the players in
the experiments according to our hypothesis.
Rounds
Effo
rt un
its
A1B2C3D4E5
5 10 15 20012345678
1
2 3 4 5
1
2 3 4 5
1
2 3 4 5
1
2
Input: Ratio their effort-normal effort
Rounds
Effo
rt un
its
A1B2C3D4E5
5 10 15 20012345678
1
2 3 4 5
1
2 3 4 5
1
2 3 4 5
1
2
Input: Ratio their effort-normal effort
Rounds
Effo
rt un
its
A1
B2
C3
D4
E5
5 10 15 20012345678
1
2 3 4 5
1
2 3 4 5
1
2 3 4 5
1
2
Input: Ratio their effort-normal effort
Rounds
Effo
rt un
its
A1B2C3D4E5
5 10 15 20012345678
1
2 3 4 5
1
2 3 4 5
1
2 3 4 5
1
2
Input: Ratio their effort-normal effort
Rounds
Effo
rt un
its
A1B2C3D4E5
5 10 15 20012345678
1
2 3 4 5
1
2 3 4 5
1
2 3 4 5
1
2
Input: Ratio their effort-normal effortInput: Ratio their effort-normal effort
Rounds
Effo
rt un
its
A1B2C3D4E5
5 10 15 20012345678
1
2 3 4 5
1
2 3 4 5
1
2 3 4 5
1
2
Input: Ratio their effort-normal effort Rounds
Effo
rt un
its
A1B2C3D4E5
5 10 15 20012345678
1
2 3 4 5
1
2 3 4 5
1
2 3 4 5
1
2
Input: Ratio their effort-normal effortInput: Ratio their effort-normal effort
Rounds
Effo
rt un
its
A1
B2
C3
D4
E5
5 10 15 20012345678
1
2 3 4 5
1
2 3 4 5
1
2 3 4 5
1
2
Input: Ratio their effort-normal effort
Rounds
Effo
rt un
its
A1
B2
C3
D4
E5
5 10 15 20012345678
1
2 3 4 5
1
2 3 4 5
1
2 3 4 5
1
2
Input: Ratio their effort-normal effortInput: Ratio their effort-normal effort
Figure 15. Sensitivity analysis of temptation to free ride function
Phase relationships between effort, group’s reputation and group’s trustworthiness
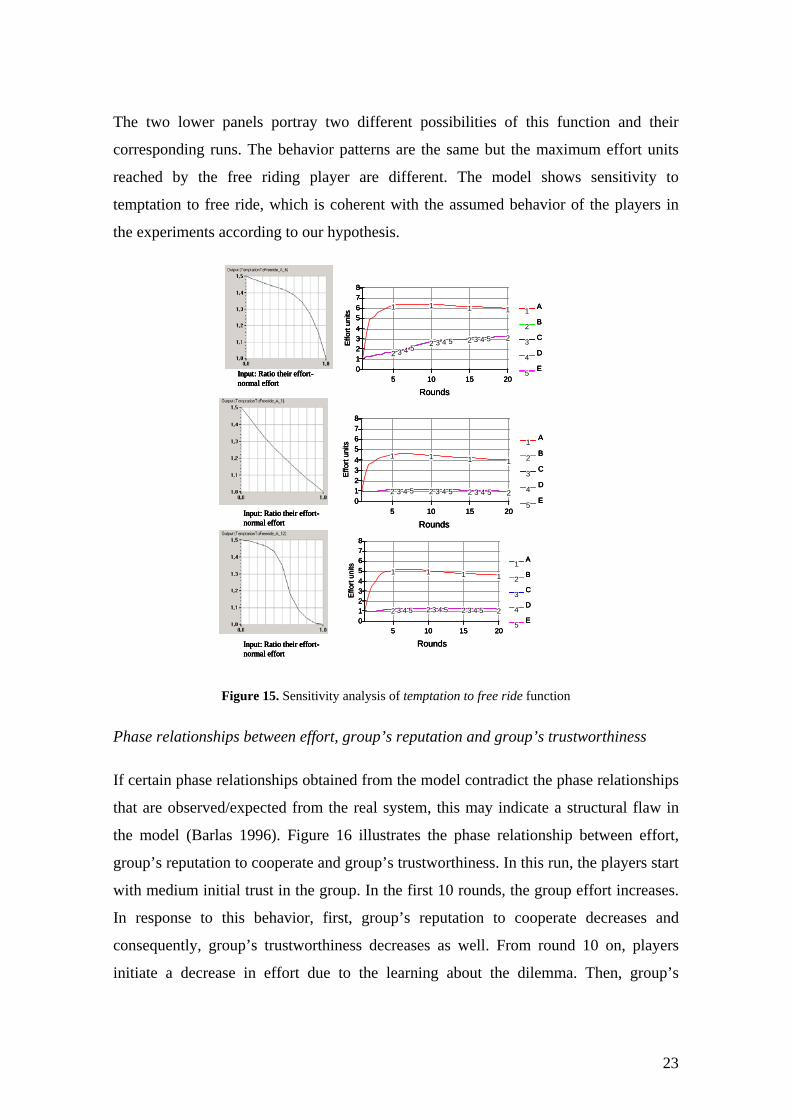
If certain phase relationships obtained from the model contradict the phase relationships
that are observed/expected from the real system, this may indicate a structural flaw in
the model (Barlas 1996). Figure 16 illustrates the phase relationship between effort,
group’s reputation to cooperate and group’s trustworthiness. In this run, the players start
with medium initial trust in the group. In the first 10 rounds, the group effort increases.
In response to this behavior, first, group’s reputation to cooperate decreases and
consequently, group’s trustworthiness decreases as well. From round 10 on, players
initiate a decrease in effort due to the learning about the dilemma. Then, group’s
23
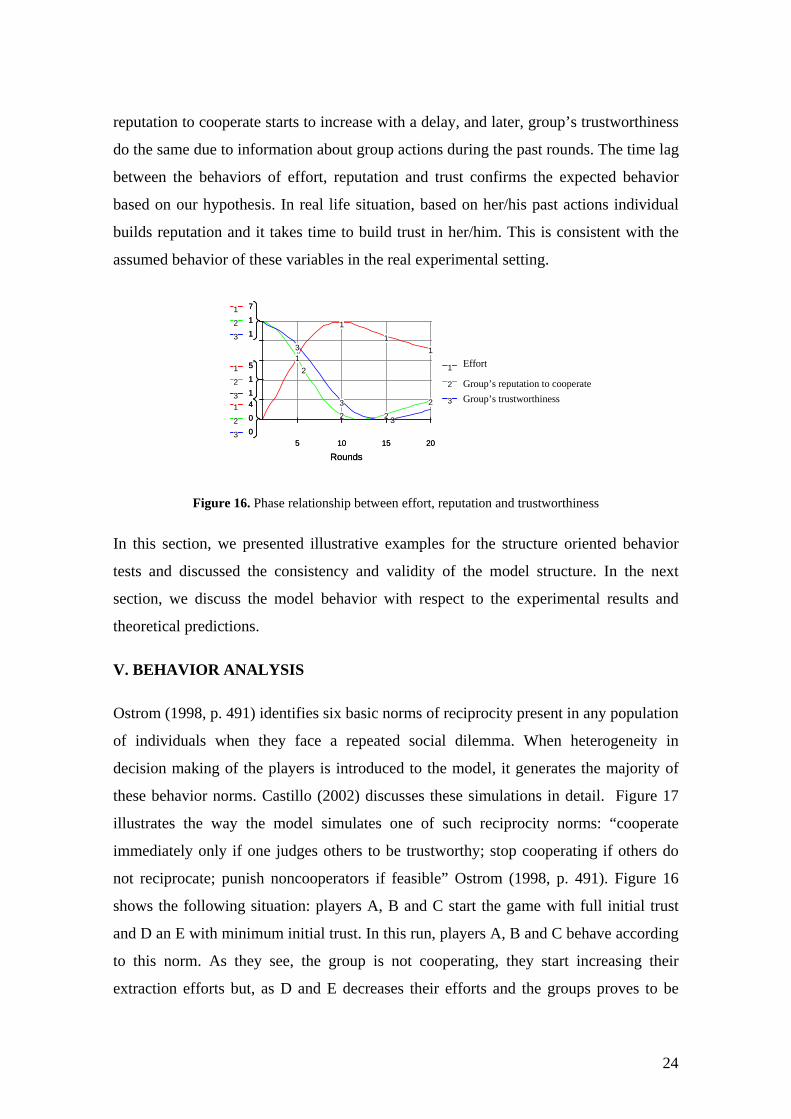
reputation to cooperate starts to increase with a delay, and later, group’s trustworthiness
do the same due to information about group actions during the past rounds. The time lag
between the behaviors of effort, reputation and trust confirms the expected behavior
based on our hypothesis. In real life situation, based on her/his past actions individual
builds reputation and it takes time to build trust in her/him. This is consistent with the
assumed behavior of these variables in the real experimental setting.
Rounds
Effort1Reputation to Cooperate2Trust in them3
5 10 15 20
1
2
4
3
0
0
1
2
5
3
1
1
1
2
7
3
1
1
12
3
1
23
1
2 3
1
2 Group’s trustworthiness Group’s reputation to cooperate
Effort
Rounds
Effort1Reputation to Cooperate2Trust in them3
5 10 15 20
1
2
4
3
0
0
1
2
5
3
1
1
1
2
7
3
1
1
12
3
1
23
1
2 3
1
2 Group’s trustworthiness Group’s reputation to cooperate
Effort
Figure 16. Phase relationship between effort, reputation and trustworthiness
In this section, we presented illustrative examples for the structure oriented behavior
tests and discussed the consistency and validity of the model structure. In the next
section, we discuss the model behavior with respect to the experimental results and
theoretical predictions.
V. BEHAVIOR ANALYSIS
Ostrom (1998, p. 491) identifies six basic norms of reciprocity present in any population
of individuals when they face a repeated social dilemma. When heterogeneity in
decision making of the players is introduced to the model, it generates the majority of
these behavior norms. Castillo (2002) discusses these simulations in detail. Figure 17
illustrates the way the model simulates one of such reciprocity norms: “cooperate
immediately only if one judges others to be trustworthy; stop cooperating if others do
not reciprocate; punish noncooperators if feasible” Ostrom (1998, p. 491). Figure 16
shows the following situation: players A, B and C start the game with full initial trust
and D an E with minimum initial trust. In this run, players A, B and C behave according
to this norm. As they see, the group is not cooperating, they start increasing their
extraction efforts but, as D and E decreases their efforts and the groups proves to be
24
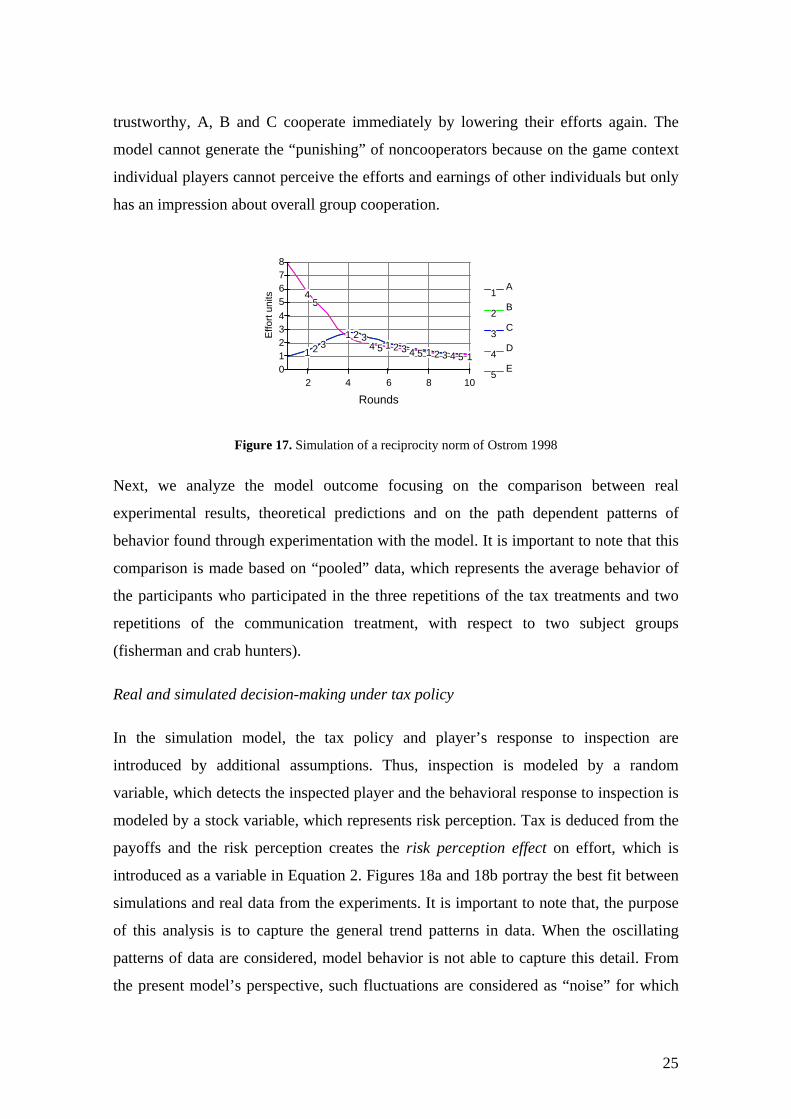
trustworthy, A, B and C cooperate immediately by lowering their efforts again. The
model cannot generate the “punishing” of noncooperators because on the game context
individual players cannot perceive the efforts and earnings of other individuals but only
has an impression about overall group cooperation.
Rounds
Effo
rt un
its
A1B2C3D4E5
2 4 6 8 10012345678
1 2 3
45
1 2 34 5 1 2 3 4 5 1 2 3 4 5 1
Figure 17. Simulation of a reciprocity norm of Ostrom 1998
Next, we analyze the model outcome focusing on the comparison between real
experimental results, theoretical predictions and on the path dependent patterns of
behavior found through experimentation with the model. It is important to note that this
comparison is made based on “pooled” data, which represents the average behavior of
the participants who participated in the three repetitions of the tax treatments and two
repetitions of the communication treatment, with respect to two subject groups
(fisherman and crab hunters).
Real and simulated decision-making under tax policy
In the simulation model, the tax policy and player’s response to inspection are
introduced by additional assumptions. Thus, inspection is modeled by a random
variable, which detects the inspected player and the behavioral response to inspection is
modeled by a stock variable, which represents risk perception. Tax is deduced from the
payoffs and the risk perception creates the risk perception effect on effort, which is
introduced as a variable in Equation 2. Figures 18a and 18b portray the best fit between
simulations and real data from the experiments. It is important to note that, the purpose
of this analysis is to capture the general trend patterns in data. When the oscillating
patterns of data are considered, model behavior is not able to capture this detail. From
the present model’s perspective, such fluctuations are considered as “noise” for which
25
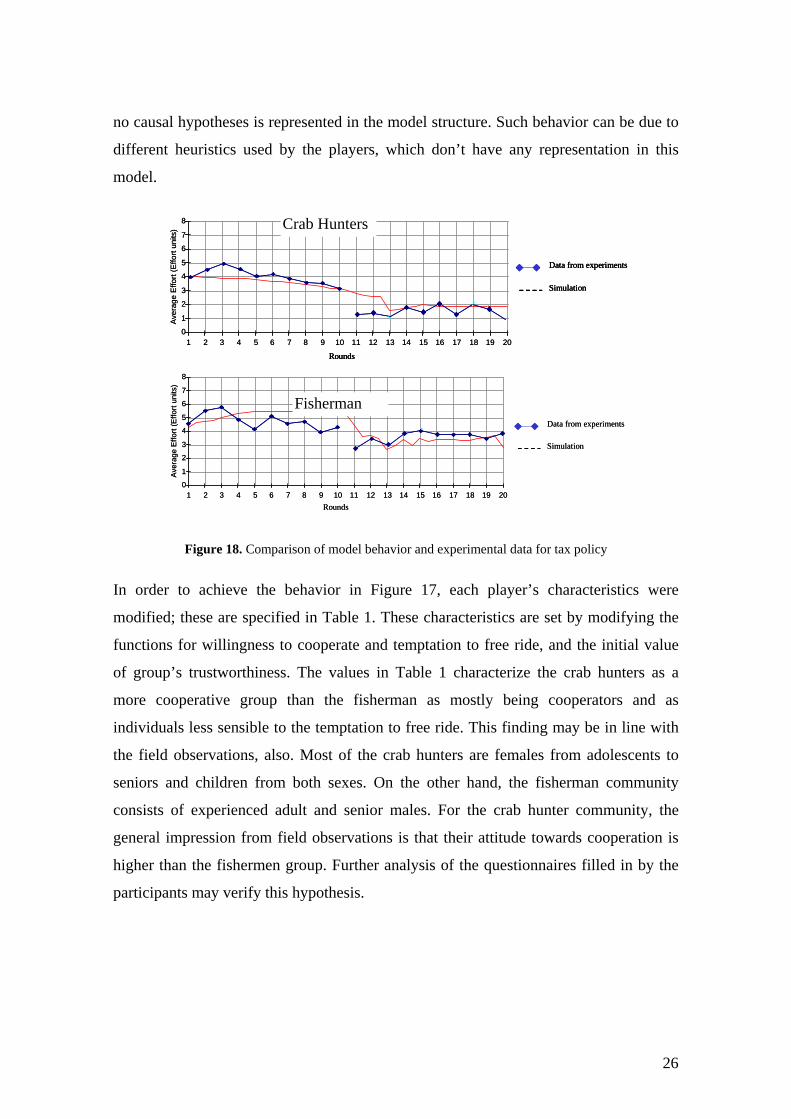
no causal hypotheses is represented in the model structure. Such behavior can be due to
different heuristics used by the players, which don’t have any representation in this
model. Av
erag
e Ef
fort
(Effo
rt un
its)
1 2 3 4 5 6 7 8 9 10 11 12 13 14 15 16 17 18 19 200
1
2
3
4
5
6
7
8
Simulation
Data from experiments
Rounds
Aver
age
Effo
rt (E
ffort
units
)
1 2 3 4 5 6 7 8 9 10 11 12 13 14 15 16 17 18 19 200
1
2
3
4
5
6
7
8
Simulation
Data from experiments
Rounds
Simulation
Data from experiments
Rounds
Ave
rage
Effo
rt (E
ffort
units
)
1 2 3 4 5 6 7 8 9 10 11 12 13 14 15 16 17 18 19 200
1
2
3
4
5
6
7
8
Rounds
Simulation
Data from experiments
Ave
rage
Effo
rt (E
ffort
units
)
1 2 3 4 5 6 7 8 9 10 11 12 13 14 15 16 17 18 19 200
1
2
3
4
5
6
7
8
Rounds
Simulation
Data from experiments
Crab Hunters
Fisherman
Figure 18. Comparison of model behavior and experimental data for tax policy
In order to achieve the behavior in Figure 17, each player’s characteristics were
modified; these are specified in Table 1. These characteristics are set by modifying the
functions for willingness to cooperate and temptation to free ride, and the initial value
of group’s trustworthiness. The values in Table 1 characterize the crab hunters as a
more cooperative group than the fisherman as mostly being cooperators and as
individuals less sensible to the temptation to free ride. This finding may be in line with
the field observations, also. Most of the crab hunters are females from adolescents to
seniors and children from both sexes. On the other hand, the fisherman community
consists of experienced adult and senior males. For the crab hunter community, the
general impression from field observations is that their attitude towards cooperation is
higher than the fishermen group. Further analysis of the questionnaires filled in by the
participants may verify this hypothesis.
26
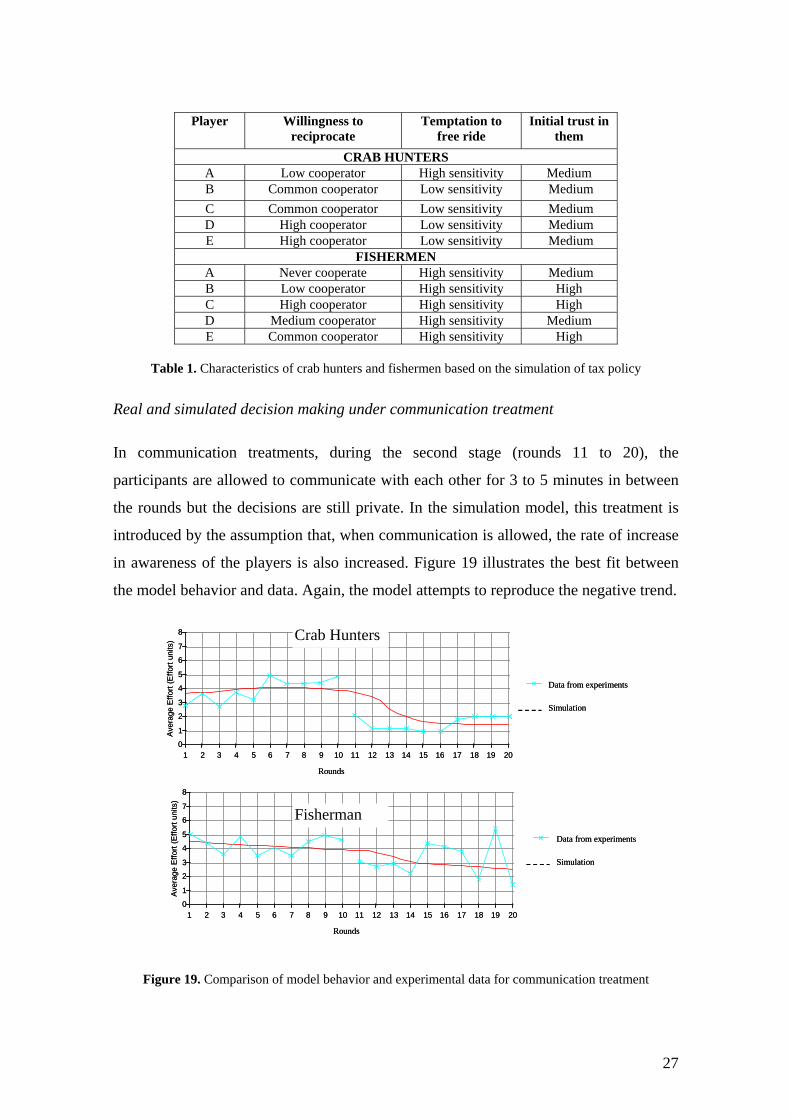
Player Willingness to reciprocate
Temptation to free ride
Initial trust in them
CRAB HUNTERS A Low cooperator High sensitivity Medium B Common cooperator Low sensitivity Medium C Common cooperator Low sensitivity Medium D High cooperator Low sensitivity Medium E High cooperator Low sensitivity Medium
FISHERMEN A Never cooperate High sensitivity Medium B Low cooperator High sensitivity High C High cooperator High sensitivity High D Medium cooperator High sensitivity Medium E Common cooperator High sensitivity High
Table 1. Characteristics of crab hunters and fishermen based on the simulation of tax policy
Real and simulated decision making under communication treatment
In communication treatments, during the second stage (rounds 11 to 20), the
participants are allowed to communicate with each other for 3 to 5 minutes in between
the rounds but the decisions are still private. In the simulation model, this treatment is
introduced by the assumption that, when communication is allowed, the rate of increase
in awareness of the players is also increased. Figure 19 illustrates the best fit between
the model behavior and data. Again, the model attempts to reproduce the negative trend.
Rounds
Simulation
Data from experiments
Ave
rage
Effo
rt (E
ffort
units
)
1 2 3 4 5 6 7 8 9 10 11 12 13 14 15 16 17 18 19 200
1
2
3
4
5
6
7
8
Rounds
Simulation
Data from experiments
Ave
rage
Effo
rt (E
ffort
units
)
1 2 3 4 5 6 7 8 9 10 11 12 13 14 15 16 17 18 19 200
1
2
3
4
5
6
7
8
Simulation
Data from experiments
Rounds
Ave
rage
Effo
rt (E
ffort
units
)
1 2 3 4 5 6 7 8 9 10 11 12 13 14 15 16 17 18 19 200
1
2
3
4
5
6
7
8
Simulation
Data from experiments
Rounds
Ave
rage
Effo
rt (E
ffort
units
)
1 2 3 4 5 6 7 8 9 10 11 12 13 14 15 16 17 18 19 200
1
2
3
4
5
6
7
8
Crab Hunters
Fisherman
Figure 19. Comparison of model behavior and experimental data for communication treatment
27
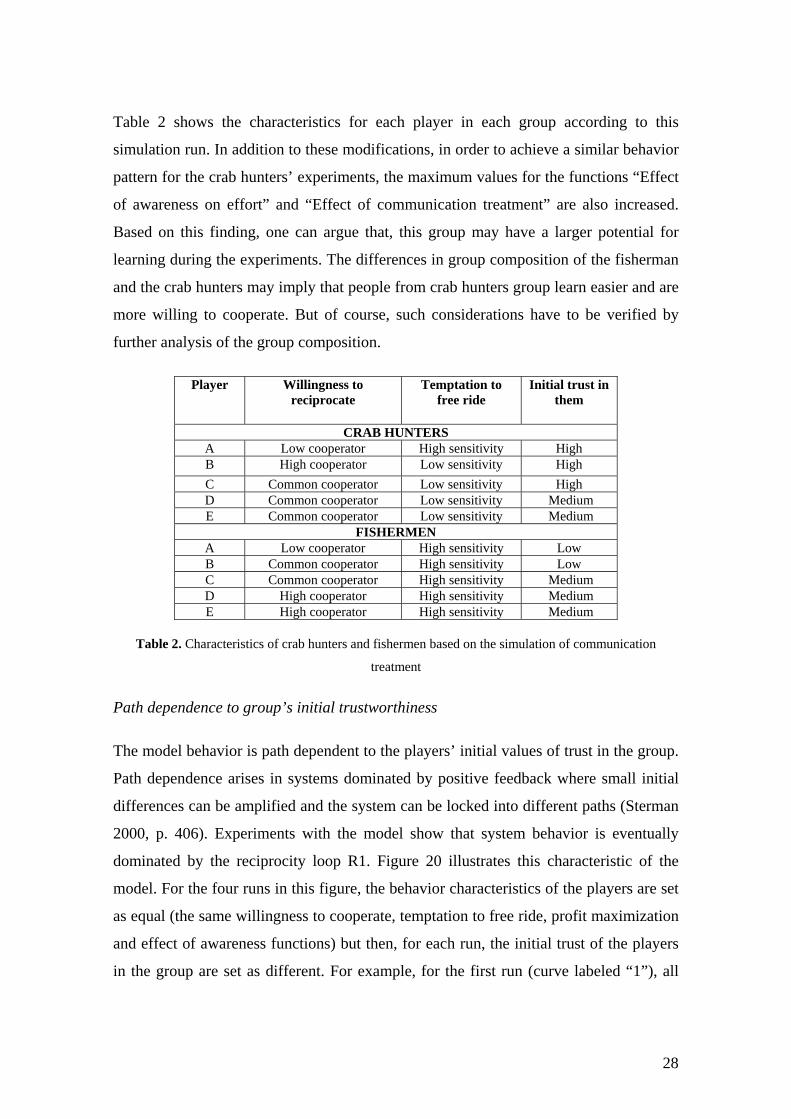
Table 2 shows the characteristics for each player in each group according to this
simulation run. In addition to these modifications, in order to achieve a similar behavior
pattern for the crab hunters’ experiments, the maximum values for the functions “Effect
of awareness on effort” and “Effect of communication treatment” are also increased.
Based on this finding, one can argue that, this group may have a larger potential for
learning during the experiments. The differences in group composition of the fisherman
and the crab hunters may imply that people from crab hunters group learn easier and are
more willing to cooperate. But of course, such considerations have to be verified by
further analysis of the group composition.
Player Willingness to reciprocate
Temptation to free ride
Initial trust in them
CRAB HUNTERS A Low cooperator High sensitivity High B High cooperator Low sensitivity High C Common cooperator Low sensitivity High D Common cooperator Low sensitivity Medium E Common cooperator Low sensitivity Medium
FISHERMEN A Low cooperator High sensitivity Low B Common cooperator High sensitivity Low C Common cooperator High sensitivity Medium D High cooperator High sensitivity Medium E High cooperator High sensitivity Medium
Table 2. Characteristics of crab hunters and fishermen based on the simulation of communication
treatment
Path dependence to group’s initial trustworthiness
The model behavior is path dependent to the players’ initial values of trust in the group.
Path dependence arises in systems dominated by positive feedback where small initial
differences can be amplified and the system can be locked into different paths (Sterman
2000, p. 406). Experiments with the model show that system behavior is eventually
dominated by the reciprocity loop R1. Figure 20 illustrates this characteristic of the
model. For the four runs in this figure, the behavior characteristics of the players are set
as equal (the same willingness to cooperate, temptation to free ride, profit maximization
and effect of awareness functions) but then, for each run, the initial trust of the players
in the group are set as different. For example, for the first run (curve labeled “1”), all
28
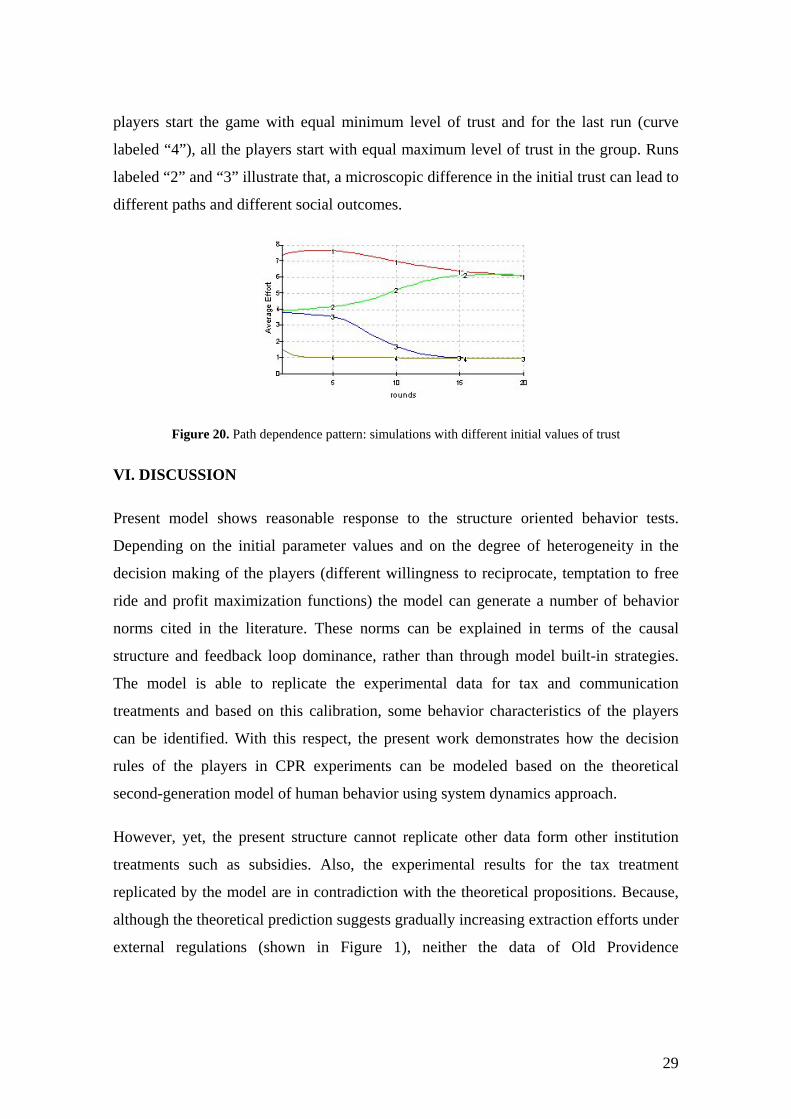
players start the game with equal minimum level of trust and for the last run (curve
labeled “4”), all the players start with equal maximum level of trust in the group. Runs
labeled “2” and “3” illustrate that, a microscopic difference in the initial trust can lead to
different paths and different social outcomes.
Figure 20. Path dependence pattern: simulations with different initial values of trust
VI. DISCUSSION
Present model shows reasonable response to the structure oriented behavior tests.
Depending on the initial parameter values and on the degree of heterogeneity in the
decision making of the players (different willingness to reciprocate, temptation to free
ride and profit maximization functions) the model can generate a number of behavior
norms cited in the literature. These norms can be explained in terms of the causal
structure and feedback loop dominance, rather than through model built-in strategies.
The model is able to replicate the experimental data for tax and communication
treatments and based on this calibration, some behavior characteristics of the players
can be identified. With this respect, the present work demonstrates how the decision
rules of the players in CPR experiments can be modeled based on the theoretical
second-generation model of human behavior using system dynamics approach.
However, yet, the present structure cannot replicate other data form other institution
treatments such as subsidies. Also, the experimental results for the tax treatment
replicated by the model are in contradiction with the theoretical propositions. Because,
although the theoretical prediction suggests gradually increasing extraction efforts under
external regulations (shown in Figure 1), neither the data of Old Providence
29
Experiments nor the present model structure confirms this. In fact, this discrepancy calls
for future research both in experimental and modeling perspectives.
According to the hypothesis arising from model behavior analysis, the crab hunters are
a more cooperative group than the fishermen. This is a result obtained by the values of
the functions fitting the model behavior to the experimental outcomes. Verification of
this hypothesis by field survey analysis can further increase the confidence in model
structure. This investigation may yield important information about the relation between
real life cooperation attitudes and decisions in the experiments. Path dependence of
model behavior with respect to trust can be relevant outcome which points to the
importance of trust in resource management in local communities. A practical
implication would be to design environmental policies, which empower the social
relationships and facilitate building trust among the community members.
In more general terms, modeling can be used as a tool to determine the relevant factors
in decision making in common pool resource management. Relevant factors identified
by model analysis can guide experimental designs. For example, the insights generated
through the modeling process concerning the learning process, information available to
the players, free riding and profit maximizing incentives are all potential hypothesis to
be tested by experiments. Collaboration between experiments and models can be
powerful in testing the relevance of factors in decision-making and in improving the
knowledge on social behavior. While modeling can be used to identify new problems
and generate hypothesis about the causes of observed or desired behavior, which helps
new experimental designs, new experimental evidence can help improving the model
structures as well. Figure 21 is a simple illustration of this idea. The experiments loop
represents how knowledge is generated through experimental research. Based on the
current knowledge on social behavior, problems are identified, the hypotheses about the
problems are tested by experiments and the knowledge is improved by the analysis and
reasoning on data. The formal models loop illustrates how modeling can be useful in
improving knowledge. New hypotheses can be tested by new model structures and
insights from model analyses can contribute to the knowledge.
30
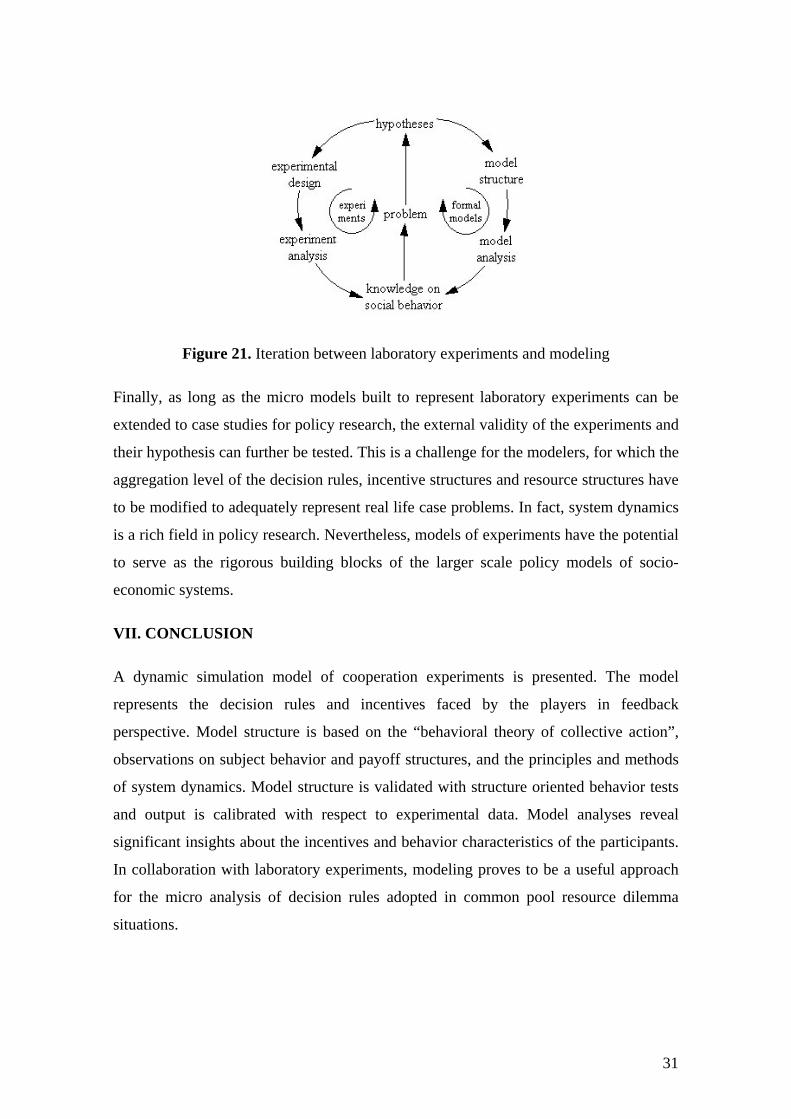
Figure 21. Iteration between laboratory experiments and modeling
Finally, as long as the micro models built to represent laboratory experiments can be
extended to case studies for policy research, the external validity of the experiments and
their hypothesis can further be tested. This is a challenge for the modelers, for which the
aggregation level of the decision rules, incentive structures and resource structures have
to be modified to adequately represent real life case problems. In fact, system dynamics
is a rich field in policy research. Nevertheless, models of experiments have the potential
to serve as the rigorous building blocks of the larger scale policy models of socio-
economic systems.
VII. CONCLUSION
A dynamic simulation model of cooperation experiments is presented. The model
represents the decision rules and incentives faced by the players in feedback
perspective. Model structure is based on the “behavioral theory of collective action”,
observations on subject behavior and payoff structures, and the principles and methods
of system dynamics. Model structure is validated with structure oriented behavior tests
and output is calibrated with respect to experimental data. Model analyses reveal
significant insights about the incentives and behavior characteristics of the participants.
In collaboration with laboratory experiments, modeling proves to be a useful approach
for the micro analysis of decision rules adopted in common pool resource dilemma
situations.
31
ACKNOWLEDGEMENTS
We want to acknowledge to Lånekassen of Norway for the economic support for this
research through a two years scholarship for one of the authors, and to the Center for
Development Studies at the University of Bergen for financial support for fieldwork.
Thanks to Juan Camilo Cardenas, at the School of Environmental and Rural Studies at
Javeriana University in Colombia, who offered the academic, logistic and economic
support the field work in Colombia. In Old Providence Island, very special thanks to
Jennifer Bowie and Jaime Valderrama for their enthusiastic help and expert logistics for
the field work. And to fishermen and crab hunters who participated in the experiments
and workshops many thanks for sharing with us a part of their knowledge.
REFERENCES
Barlas, Y., 1989. Tests of model behavior that can detect structural flaws: demonstration
with simulation experiments. In: P. M. Milling and E. O. K. Zahn (Editors), Computer
Based Management of Complex Systems, Springer-Verlag, Germany, pp. 246-254.
Barlas, Y., 1996. Formal aspects of model validity and validation in system dynamics.
System Dynamics Review, 12 (3): 183-210.
Castillo, D., 2002. Simulating Common Pool Resource Field Experiments: A
Behavioral Model of Collective Action. M. Phil. Thesis, Department of Information
Science, University of Bergen, Norway.
Cárdenas, J. C., 2000a. Observing People in the Field Lab: Learning through Field
Experiments about Cooperation in Communities using Biodiversity Resources.
Research and Writing Competition Proposal, The John D. and Catherine T. MacArthur
Foundation.
Cárdenas, J. C., 2000b. Rural Institutions, Poverty and Cooperation: Learning from
Experiments and Conjoint Analysis in the Field. Doctoral Dissertation, Department of
Resource Economics, University of Massachusetts Amherst, Amherst.
32
Cárdenas J. C., 2002. Building, Monitoring and Sustaining Cooperation and Collective
Action in Local Environmental Management. Research proposal, Facultad de Estudios
Rurales y Ambientales, Universidad Javeriana, Bogota, Colombia.
Cárdenas, J. C., Stranlund, J. K. and Willis, C. E., 2000. Local environmental control
and institutional crowding-out. World Development, 28 (10): 1719-1733.
Deadman, P. J., 1999. Modelling individual behaviour and group performance in an
intelligent agent-based simulation of the tragedy of the commons. Journal of
Environmental Management, 56: 159-172.
Forrester, J. W. and Senge, P., 1980. Tests for building confidence in system dynamics
models. In: Legasto, A., J. W. Forrester, and J. Lyneis (Editors), TIMS Studies in
Managements Sciences, 14, North Holland, New York, pp. 209-228.
Forrester, J. W., 1961. Industrial Dynamics. Productivity Press, Cambridge, MA.
Franco, A. M., 1999. Hacia la conservacion de las especies amenazadas de Colombia.
Biosintesis. Boletin # 11, Instituto de Investigacion De Recursos Biologicos Alexander
Von Humboldt, Bogota, Colombia.
Gintis, H., 2000. Beyond homo economicus: evidence from experimental economics.
Ecological Economics, 35: 311-322.
Gordon, H. S., 1954. The economic theory of a common property resource: the Fishery.
J. Political Economy, 62: 124-142.
Hardin, G., 1968. The tragedy of the commons. Science, 162: 1243–1248.
Jager, W. and Janssen, M. A., 2002. Using artificial agents to understand laboratory
experiments of common-pool resources with real agents. In: Janssen, M.A. (Editor),
Complexity and Ecosystem Management: The Theory and Practice of Multi-agent
Systems, Edward Elgar Publishers, Cheltenham UK/Northampton, MA, USA, pp. 75-
102.
33
López, M. C., 2001. Comunicación para la cooperación en el medio rural: Un análisis
desde la economía experimental. Graduation Thesis, Universidad Javeriana, Bogota,
Colombia.
Ostrom, E., 1990. Governing the Commons: The Evolution of Institutions for Collective
Action. Cambridge University Press, Cambridge, New York, 280 pp.
Ostrom, E., 1998. A behavioral approach to the rational choice theory of collective
action. American Political Science Review, 92 (1): 1-22.
Ostrom, E., 2000. Collective action and the evolution of social norms. Journal of
Economic Perspectives, 14 (3): 137-158.
Ostrom, E., Gardner, R. and Walker, J., 1994. Rules, Games and Common-Pool
Resources. University of Michigan Press, Ann Arbor, 369 pp.
Powersim Corporation, 1999. Powersim Constructor. Powersim Corporation Inc., PB
3961, Dreggen, Bergen, Norway.
Sterman, J. D., 1985. The growth of knowledge: testing a theory of scientific
revolutions with a formal model. Technological Forecasting and Social Change, 28: 93-
122.
Sterman, J. D. (2000) Business dynamics: Systems thinking and modelling for a
complex world. McGraw-Hill.
Valdes, C., Cardenas, F., Devia, C., 1997. Paisajes culturales y sistemas de produccion
en las islas de Providencia y Santa Catalina (Colombia). Ambiente y Desarrollo,
Instituto de Estudios para el Desarrollo, IDEADE, Ano 4, 6 and 7.
34