Dynamic Capabilities and Pain Points in the Icelandic Energy ...
107
Lokaverkefni til MS–gráðu í stjórnun og stefnumótun Dynamic Capabilities and Pain Points in the Icelandic Energy Sector Oddur Sturluson Febrúar 2016
-
Upload
khangminh22 -
Category
Documents
-
view
1 -
download
0
Transcript of Dynamic Capabilities and Pain Points in the Icelandic Energy ...

Lokaverkefni til MS–gráðu í stjórnun og stefnumótun
Dynamic Capabilities and Pain Points in the Icelandic Energy Sector
Oddur Sturluson
Febrúar 2016

Dynamic Capabilities and Pain Points
in the Icelandic Energy Sector
Oddur Sturluson
Lokaverkefni til MS-‐gráðu í stjórnun og stefnumótun
Leiðbeinandi: Gunnar Óskarsson
Viðskiptafræðideild
Félagsvísindasvið Háskóla Íslands
Febrúar, 2016

Dynamic Capabilities and Pain Points in the Icelandic Energy Sector.
Ritgerð þessi er 30 eininga lokaverkefni til MS prófs við
Viðskiptafræðideild, Félagsvísindasvið Háskóla Íslands.
© 2016 Oddur Sturluson
Ritgerðina má ekki afrita nema með leyfi höfundar.
Prentun: Háskólaprent
Reykjavík, 2016

Table of Contents
I. Introduction ......................................................................................................... 1 Need for the research .................................................................................................... 2 Research problem ......................................................................................................... 5 Nominal definitions ....................................................................................................... 7 Context ........................................................................................................................ 11 Environmental analysis ................................................................................................. 15
Porter’s five forces analysis ............................................................................................ 16 Consumer market analysis ............................................................................................. 21 PESTEL analysis ............................................................................................................... 22
Analysis of the Internal environment ............................................................................ 26 The value chain .............................................................................................................. 26 VRIO analysis .................................................................................................................. 31 SWOT matrix .................................................................................................................. 32
II. THEORY ............................................................................................................ 36 Theoretical foundations ............................................................................................... 36 Literature ..................................................................................................................... 41 Model ........................................................................................................................... 44
III. METHODS ........................................................................................................ 46 Design .......................................................................................................................... 48 Sample ......................................................................................................................... 49 Measurement ............................................................................................................... 53 Analysis ........................................................................................................................ 59 Validity ......................................................................................................................... 60 Assumptions ................................................................................................................. 61
IV: FINDINGS ......................................................................................................... 63 Brief overview .............................................................................................................. 63 Results ......................................................................................................................... 63 Descriptive analysis ...................................................................................................... 77 Validity/reliabilit .......................................................................................................... 78
V. DISCUSSION ...................................................................................................... 81
VI. CONCLUSION ................................................................................................... 84 Summary ...................................................................................................................... 84 Conclusions .................................................................................................................. 86 Implications .................................................................................................................. 86
Table of figures:
PICTURE 1: BARNEY'S CONCEPTUAL MODEL (PICTURE FROM NEWBERT, 2007) ILLUSTRATES THE DIFFERENCE BETWEEN RESOURCES THAT RESULT IN COMPETITIVE ADVANTAGE AND SUSTAINED COMPETITIVE ADVANTAGE. ........................................................................................ 8
PICTURE 2: ANALOGY BETWEEN BEHAVIORAL AND GRAMMATICAL ENTITIES (GERSICK, C. J. G. & J. R. HACKMAN, 1990). THE ANALOGY BETWEEN BEHAVIORAL AND GRAMMATICAL ENTITIES SERVES AS AN EXAMPLE OF HOW ROUTINES FUNCTION .......................................................................... 10
PICTURE 3: PORTER'S FIVE FORCES ........................................................................................................ 17 PICTURE 4: PESTEL ANALYSIS (MCGEE ET AL., 2010) .............................................................................. 23 PICTURE 5: AN EXAMPLE OF CULTURAL INSENSITIVITY. ........................................................................ 25 PICTURE 6: PORTER'S VALUE CHAIN (MCGEE ET AL., 2010). .................................................................. 27 PICTURE 7: SUPPLY CHAIN (FELLER ET AL., 2006). .................................................................................. 30 PICTURE 8: VRIO ANALYSIS (BARNEY & HESTERLY, 2011) ...................................................................... 32 PICTURE 9: SWOT MATRIX (GRIFFIN, 2008) ........................................................................................... 34
QUESTION 1: .......................................................................................................................................... 65 QUESTION 2: .......................................................................................................................................... 66 QUESTION 3: .......................................................................................................................................... 66 QUESTION 4: .......................................................................................................................................... 67 QUESTION 5: .......................................................................................................................................... 67 QUESTION 6: .......................................................................................................................................... 68 QUESTION 7: .......................................................................................................................................... 68 QUESTION 8: .......................................................................................................................................... 69 QUESTION 9: .......................................................................................................................................... 70 QUESTION 10: ........................................................................................................................................ 70 QUESTION 11: ........................................................................................................................................ 71 QUESTION 12: ........................................................................................................................................ 71 QUESTION 13: ........................................................................................................................................ 72 QUESTION 14: ........................................................................................................................................ 72 QUESTION 15: ........................................................................................................................................ 73 QUESTION 16: ........................................................................................................................................ 73 QUESTION 17: ........................................................................................................................................ 74 QUESTION 18: ........................................................................................................................................ 74 QUESTION 19: ........................................................................................................................................ 75 QUESTION 20: ........................................................................................................................................ 75 QUESTION 21: ........................................................................................................................................ 76 QUESTION 22: ........................................................................................................................................ 76 QUESTION 23: ........................................................................................................................................ 77 QUESTION 24: ........................................................................................................................................ 77 QUESTION 25: ........................................................................................................................................ 78 QUESTION 26: ........................................................................................................................................ 78
1
I. Introduction
“Success breeds complacency. Complacency breeds failure. Only the paranoid
survive.” – Andy Grove (Isaacson, W. (2014). The Innovators. Pg. 196, Simon &
Schuster: New York.)
The core topic of strategic management as a field of study is how firms achieve and
maintain competitive advantage. The concept of dynamic capabilities, which draws
from the resource-‐based view, organizational learning, contingency theory and
evolutionary economics for its theoretical foundation, is one of the most influential
paradigms in this field. Capabilities can influence a firm’s performance on many
levels and can be used to change short-‐term competitive positions into long-‐term
competitive advantages. Dynamic capabilities offer managers a way to change their
firm’s competencies, knowledge systems and culture to adapt to a dynamic
environment, ensuring organizational survival.
In this thesis the theoretical and practical benefits of dynamic capabilities will
be explored in relation to the Icelandic energy sector. In the first chapter, we explain
the goals and value of my study, as well as providing background information about
the Icelandic energy sector and performing basic internal and external strategic
analyses such as VRIO and PESTEL. In the second chapter, we review the theoretical
foundations of dynamic capability research and the process model to be used in this
study. It begins with a literature review of dynamic capabilities that touches on
several theoretical streams: Contingency theory, innovation management and
theory of the firm, to name a few. The scope of the study and theory behind the
process model are also discussed in this section.
The research methods, design and data analysis are examined in the third
chapter. The goal of this research is to clarify the Icelandic energy sector’s pain
points from the dynamic capabilities view (DCV) by conducting a questionnaire
based survey study on the experiences and opinions of individuals currently
employed in the Icelandic energy sector. An analysis of the results will be used to
suggest further avenues of research based on survey data collected from a sample of

2
Icelandic firms functioning in the energy sector. Managers and other staff working
for energy production firms, or engineering, consulting or service firms that operate
in the energy sector were invited to take part in the study via e-‐mail.
The fourth chapter discusses the research findings, perform a statistical
analysis, provide suggestions for validity tests and improvements for future use. The
next chapter turns to a discussion of the implications of the research and analysis. In
this section the analysis will be more descriptive than statistical. Finally, we review
the conclusions and limitations of the paper with suggestions for future research.
Need for the research
The field of strategic management is relatively young, having been known as
business policy until 1979 (Nag, Hambrick, & Chen, 2007), when Schendel and Hofer
(1979) renamed it with a new emphasis on the concept of strategy. Since then
scholars have analysed, debated and proposed numerous avenues of research within
the field of strategic management. Nevertheless the field’s scope of study is still
widely considered ambiguous (Nag et al., 2007).
In their search for a broadly accepted definition of strategic management
Nag, Hambrick and Chen considered explicit definitions given by several influential
scholars over the years (Nag et al., 2007). One of the most recent, and applicable to
recent academic trends in the field is the definition given by Bowman, Singh &
Thomas (2002) in the Handbook of Strategy and Management: “The strategic
management field can be conceptualized as one centred on problems relating to the
creation and sustainability of competitive advantage, or the pursuit of rents” (Pg.
45). While this is definition is certainly appropriate it is broad and reflects the open-‐
ended nature of strategic management as a field of study. Nag et al. (2007) also
drew attention to the importance of resources and assessments of inner and outer
environments, as did Thomas, Hunger and Rangarajan (2008).
The field’s ambiguity does not diminish its scientific value. The renowned
philosopher of science, Thomas Kuhn said that scientific communities don’t need

3
unifying paradigms to justify or confirm their existence (1962). What they truly need
is a shared identity. Owing to its theoretical underpinnings in economics and the
social/behavioural sciences, strategic management research can encompass a large
array of different perspectives, one of which is dynamic capabilities. Dynamic
capabilities are not a fully developed scientific theory per se (Helfat & Peteraf, 2009).
The term has been in use for less than 30 years, and it has only been roughly 20
years since Teece and Pisano (1994) seminally used the concept “dynamic
capabilities” as we know it today in their work. It is therefore neither surprising nor
discouraging that a theory of something as complex as dynamic capabilities should
still be fairly conceptual and formative. Vigorous empirical analysis of subjects
relevant to this phenomenon is a key factor towards the development of a viable
theory.
Countless scholars have studied innovation but two of the most influential in
modern academia are Oskar R. Lange (1943) and Joseph Schumpeter (1912, 1942).
Schumpeter, famous for his “gales of creative destruction” and his later view that
capitalism would lead to monopolies and the suffocation of innovation and
entrepreneurialism defined innovation as “the setting up of a new product function”
(p. 87). Lange’s definition was a change in product functions “which make it possible
for the firm to increase the discounted value of the maximum effective profit
obtainable under given market conditions”. Put simply this means that innovation is
a value-‐creating manifestation of an idea or invention. It should be emphasized that
it is not enough to simply create something. For this manifestation to truly be
considered innovative, its production has to be cost efficient. It could achieve that
goal by lowering production costs or creating new value chains for example.
Innovation can be either evolutionary (continuous) or revolutionary
(disruptive). The former is an innovation that incrementally improves an existent
technology or capacity whereas the latter is completely new and can often render
existent technology obsolete (Yu & Hang, 2009). Innovation usually involves risk,
especially in dynamic markets where innovation is constant and disruptive, such as
the software or digital media industries. Innovative firms are trailblazers and it’s

4
usually impossible to know with certainty whether the trail will lead to hidden
treasures or off a proverbial cliff. In spite of such uncertainty, studies show that
there is a positive correlation between a firm’s capacity for innovation and its
performance (Hitt, Ricart i Costa and Nixon, 1998; Raffa & Zollo, 1998; Ireland and
Hitt, 1999). Such a capacity facilitates growth and profits and makes a firm more
adaptive to external changes.
With improvements in communications and technology, the speed of market
change has accelerated. With a firm, factual understanding of the relationship
between dynamic capabilities and innovation, managers have a foundation for
adapting to internal and external changes. The most concrete method for gathering
hard facts about the possibilities and limits of capabilities is quantitative research.
That’s why research such as this is relevant to both academics in management fields
as well as firm managers.
To evaluate the effect of dynamic capabilities on innovation it is vital to
consider what positive or negative effects such capabilities might have. The use of
dynamic capabilities can cause an increase in production and revenues or a decrease
in costs, benefitting firm performance (Teece, Pisano & Shuen, 1997; Teece, 2007;
Drnevich & Kriauciunas, 2010). However, capabilities also require cultivation and
management. Resources spent on the fostering of dynamic capabilities are resources
that could otherwise be spent on ordinary or managerial capabilities (Helfat et al,
2007; O’Reilly & Tushman, 2008; Drnevich & Kriauciunas, 2010).
While there is significant data to indicate that dynamic capabilities positively
influence firm performance (Yeoh and Roth, 1999; Baum, Locke and Smith, 2001;
Lee, Lee and Pennings, 2001; Danneels, 2002; Makkonen, Pohjola, Olkkonen and
Koponen, 2013; Wilden, 2013; Yung-‐Chul, 2013; Wang, Senaratne and Rafiq, 2015),
there is also a considerable amount of data that supports the ecological position that
most firms are in fact inert and unable to adapt. Change occurs instead through an
“evolutionary process of variation-‐selection-‐retention” (O’Reilly & Tushman, 2008, p.
186). If the assumption that most companies are incapable of adaptation were true
it would mean that strategic management was redundant and that owners and
5
managers should focus on extracting residual value before allowing their firms to
fail. Clearly this serves as an important caveat to the desirability of pursuing dynamic
capabilities. Should management waste precious resources, causing negative
externalities and increasing industry costs simply to struggle against the inevitable?
While some scholars such as Dew, Goldfarb and Sarasvathy (2006) consider
strategic management “futile in the face of environmental disruptions” there is a
wealth of studies that conclude that dynamic capabilities are important factors in
enhancing profitability and competitive advantage (Yeoh and Roth, 1999; Baum,
Locke and Smith, 2001; Lee, Lee and Pennings, 2001; Danneels, 2002; Makkonen,
Pohjola, Olkkonen and Koponen, 2013; Wilder, 2013; Yung-‐Chul, 2013; Wang,
Senaratne and Rafiq, 2015). It would seem that while organizations do generally
become more inert and less adaptable as they grow older others are able to adapt.
Dynamic capabilities are in fact at the root of what differentiates those firms that
can overcome their inertia and escape path dependencies from those that are
doomed to fail. Since it is management’s function to keep firms alive and preferably
profitable it would be counterintuitive to encourage managers to “cannibalize” a
firms resources. Strategic management must offer ways to ensure continued
survival. The underlying position that management should strive for competitive
advantage, against all odds undoubtedly influences the tone and assumptions of this
type of research.
Research problem
Before making specific decisions about what form would be optimal for a
quantitative study of dynamic capabilities and innovation it’s necessary to properly
define and isolate these concepts to avoid tautology. Dynamic capabilities are the
processes by which firm managers ‘integrate, build, and reconfigure internal and
external competencies to address rapidly changing environments’ (Teece et al.,
1997: 516). It should be clear that capabilities are related to, but separate from
resources and core competencies.

6
It is also necessary to take market dynamism into account. Dynamic
capabilities have different attributes in moderately dynamic or high-‐velocity
markets. In moderately dynamic markets, they resemble traditional organizational
routines. This means that they are stable, predictable processes that emphasize
analysis and variation. In high-‐velocity markets however, they are experiential,
unstable, adaptive but unpredictable and the evolutionary emphasis is on selection.
This difference not only alters the way dynamic capabilities are formed but how they
should be used to achieve competitive advantage
As stated earlier the focus of this thesis is not primarily the relationship
between dynamic capabilities and firm performance. The focus of this study is on
how dynamic capabilities relate to the paint points of a dynamic and innovative
market e.g. the Icelandic energy sector. Whether dynamic capabilities improve
energy firm performance is beyond the scope of this particular thesis. Studies on the
relationship between innovation and firm performance will be briefly discussed in
chapter II. The main focus of this thesis however, will remain on the research
question:
What sort of dynamic capabilities are common in Icelandic energy firms
and what can they tell us about industry pain points?
Research in the field of dynamic capabilities often incorporates themes of
innovation and entrepreneurship. Clearly innovation is highly valuable, not only in
gaining competitive advantage in existing markets, but in creating entirely new
markets. This is important since dynamic capabilities do not only enable firms to
react to market changes, but to cause market changes as well. Managers seeking to
increase in-‐firm innovation need to know how dynamic capabilities interact with
innovation and which capabilities result in the greatest innovative capacity.
To be clear, this study’s separation of a firm’s innovation from its
performance is not pleonastic. While innovation plays an important role in
dynamic capabilities, which in turn can serve as a catalyst for competitive
advantage, innovation is not always necessary or beneficial for a firm’s

7
performance. Ambidexterity, the capacity to simultaneously exploit existing
assets and explore new possibilities is key in achieving and sustaining
competitive advantage. If exploration comes at the cost of exploitation it can
spell financial ruin, as has been the case with many research-‐intensive tech
companies, who have been unable to recap the high cost of R&D. Achieving a
balance between these two factors means tying together two radically
different organizational alignments. On the one hand successful exploitation
necessitates a quick and efficient strategy based on incremental and
continuous innovation. On the other hand a successful strategy for exploration
would have to be flexible and potentially disruptive (O’Reilly & Tushman,
2008). If a firm attempts to excel at both without the right balance it runs the
risk of being good at neither.
Nominal definitions
Before delving into the theoretical foundations of this research, certain key concepts
and terms should be defined or clarified. The first and perhaps most important
concept to be familiar with is capabilities. Capabilities are the organizational skills,
competences and processes necessary to successfully utilize a firm’s strategic
resources. Capabilities are to organizations what skills are to individual employees:
the aptitudes needed to accomplish tasks and improve their strategic position. The
main focus of this thesis is dynamic capabilities, a firm’s ability to respond to and
create environmental change (Teece, 2007), and how such capabilities affect
innovation.
To keep the framework within which dynamic capabilities are researched
from being vague or tautological it is important to make a clear distinction between
dynamic capabilities, resources and routines (Eisenhardt & Martin, 2000). Dynamic
capabilities as defined by Teece, Pisano and Shuen (1997: 516) are “the firms ability
to integrate, build and reconfigure internal and external competences to address to
rapidly changing environments”. Teece later described dynamic capabilities as “…the
particular (nonimitability) capacity business enterprises possess to shape, reshape,
8
configure and reconfigure assets so as to respond to changing technologies and
markets and escape the zero-‐profit condition” (Teece, 2009: 87). While seemingly
insignificant, Teece’s emphasis on escaping the zero-‐profit condition in his later
definition not only reflects a more established theoretical foundation for the
importance of dynamic capabilities in establishing and maintaining competitive
advantage, but also a subtle reference to the problem of success traps.
Resources are firm-‐specific, inimitable assets such as trade secrets or tacit
knowledge (Teece et al., 1997; Armstrong & Shimizu, 2007). The value of specific
resources depends on the context in which they are used, due to differing effects on
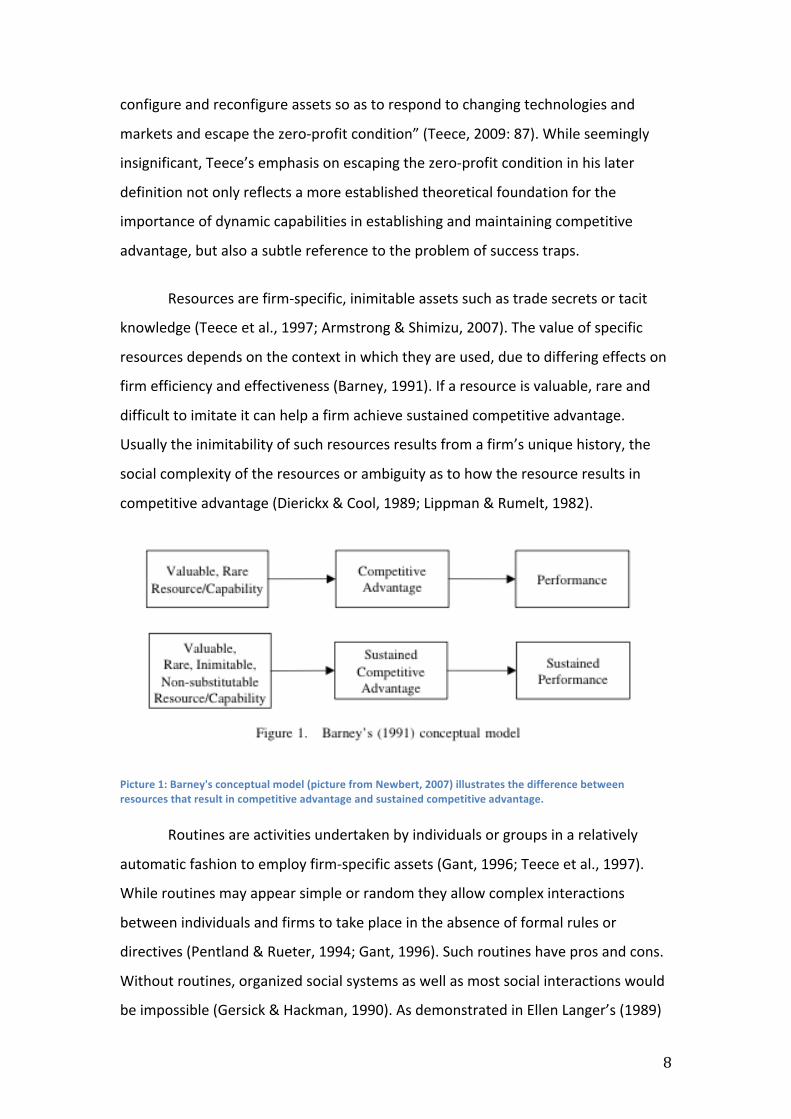
firm efficiency and effectiveness (Barney, 1991). If a resource is valuable, rare and
difficult to imitate it can help a firm achieve sustained competitive advantage.
Usually the inimitability of such resources results from a firm’s unique history, the
social complexity of the resources or ambiguity as to how the resource results in
competitive advantage (Dierickx & Cool, 1989; Lippman & Rumelt, 1982).
Picture 1: Barney's conceptual model (picture from Newbert, 2007) illustrates the difference between resources that result in competitive advantage and sustained competitive advantage.
Routines are activities undertaken by individuals or groups in a relatively
automatic fashion to employ firm-‐specific assets (Gant, 1996; Teece et al., 1997).
While routines may appear simple or random they allow complex interactions
between individuals and firms to take place in the absence of formal rules or
directives (Pentland & Rueter, 1994; Gant, 1996). Such routines have pros and cons.
Without routines, organized social systems as well as most social interactions would
be impossible (Gersick & Hackman, 1990). As demonstrated in Ellen Langer’s (1989)

9
influential work on mindful and mindless cognitive processing however, some
routines are dysfunctional and survive purely out of habit rather than gain. Some
behavioural routines can be so socially engrained that they persist despite being
unpopular amongst those they affect (Gersick & Hackman, 1990).
Put simply, a firm’s resources (often referred to as firm-‐specific assets) are
valuable assets that the firm owns or has access to. Capabilities on the other hand
are activities the firm can use to gain and protect its resources. For example, if an
engineering firm were studied, engineering experience would qualify as a firm
specific asset. An example of a routine would be new employee orientation and a
dynamic capability would be the firm’s ability to hire new engineers or fire
redundant staff to adapt to current market trends.

10
For an empirical study of dynamic capabilities to be valid the relevant
capabilities must be clearly defined as a set of specific processes. Most identifiable
dynamic capabilities can be found in one of the following four categories (Eisenhardt
& Martin, 2000):
• Resource integration: e.g. product development routines.
• Resource reconfiguration: routines for copying, transferring and recombining
resources, tacit knowledge in particular.
• Resource gain: knowledge-‐creation, alliance and acquisition routines
designed to bring new resources into the firm.
• Resource release: jettison routines to remove redundant resources.
It is important to keep in mind that dynamic capabilities are an extension and
improvement of the resource-‐based view. The RBV has been criticised for being
unspecific and glossing over the reconfiguration and building of resources in dynamic
Picture 2: Analogy between Behavioral and Grammatical Entities (Gersick, C. J. G. & J. R. Hackman, 1990). The analogy between behavioral and grammatical entities serves as an example of how routines function.

11
markets. After all many resources, especially knowledge-‐based and tacit resources
are inimitable and take a long time to develop (Eisenhardt & Martin, 2000). To
accurately explain why certain firms are better at adapting to sudden and substantial
changes in the market it is important to take instability into account (Priem and
Butler, 2000).
Context
The simple definition of dynamic capabilities belies how complex the concept can
become in realistic market situations. After all, to quantitatively measure
competitive advantage and firm performance over time might require different
criteria depending on the relevant industry’s characteristics. Market dynamism plays
an integral role when it comes to correctly analysing capabilities and routines after
all (Eisenhardt and Martin, 2000). In stable and moderately dynamic markets
capabilities are similar to routines but in highly dynamic markets the difference
between them is more pronounced. It could be argued that the need for quantitative
research is greater in highly dynamic sectors, to make up for a lack of experience in
that sector. More stable sectors are often older, less uncertain and more established
so that participants and investors have had time to gain experiential and tacit
knowledge about how the sector functions.
Major environmental shifts are becoming increasingly common in todays
market (Wiggins and Ruefli, 2005). To successfully manage a firm in this
hypercompetitive market, managers must be able to achieve competitive advantage
by adapting to external changes. In highly dynamic markets, where innovation is
frequent and often unpredictable, the current resources held by a firm might not be
enough to maintain its competitive advantage. A firm’s ability to adapt to and exploit
innovations and market changes are a better indicator of whether or not a firm will
thrive in such a market. Dynamic capabilities also give managers a more pliant
managerial measurement than traditional tools such as VRIO or the value chain. As
Warren (2002) pointed out in his book Competitive Strategy Dynamics, the static
nature of such measurement tools can cause reinforcing feedback, where the in-‐ or
12
outflow of resources drives a further in-‐ or outflow of that same resource. For
example, actions to save costs might not have an immediate effect on the firm’s
ability to function but might curtail investment and resource building, eventually
leading to collapse. Sustained competitive advantage, which is the primary goal of
strategic management might require expenditure in the short term but can save a
firm from the zero-‐profit trap of highly competitive industries in the long term.
Iceland is a sparsely populated island with approximately 320,000
inhabitants, roughly 200,000 of which live in the greater Reykjavík area. The island
itself is about 103,000 square kilometers. 10% of the country is covered in glaciers
and much of the interior is mountains and highlands, devoid of settlements and
people (Askja Energy Partners (a), 2015). Iceland is also located on top of the Mid-‐
Atlantic Ridge between the North American and Eurasian tectonic plates, resulting in
some volcanic and seismic activity. Life expectancy is high, infant mortality is low and
the country is considered one of the most developed and wealthy nations in the
world. Iceland has a free market economy and is a member of the European Free
Trade Association (EFTA) and the European Economic Area (EEA). Although the
country formally applied for EU membership in 2009, political opposition has at least
temporarily suspended the application (Ministry for Foreign Affairs, 2015).
Renewable energy constitutes almost all of Icelandic energy production, with
71% of generated electricity coming from hydropower and 29% from geothermal
energy sources. A small amount of electricity is generated by wind power and fossil
fuels but it is so small that many sources simply omit to mention it (National Energy
Authority, 2015). Hydropower and geothermal energy also account for about 85% of
Icelandic energy consumption (Statistics Iceland, 2015). Electricity prices in Iceland
are also substantially lower than in most other OECD countries. Iceland is the world’s
largest electricity generator per capita at approximately 55,000 kWh annually (17
TWh total) with considerable potential for increased production, not only in hydro-‐
and geothermal power but also in wind and maritime power (Askja Energy Partners
(b), 2015). The majority of Icelandic energy is sold to energy intensive industries such
as the aluminum industry. This creates a steady flow of foreign currency into the

13
Icelandic economy, which has proved especially valuable in the wake of currency
depreciation caused by the collapse of the banking system in 2008. Icelandic energy
exports may increase in the near future if plans to build a submarine electrical cable
between Iceland and the United Kingdom pan out. Iceland imports almost all fuels
used for transport and shipping. The recently initiated search for hydrocarbons on
the Icelandic continental shelf could change that as well as the larger formation of
Icelandic energy production, if it proves successful.
The state has a considerable presence in the Icelandic energy sector. The
largest energy company is the state-‐owned Landsvirkjun, which produces about 75%
of all Icelandic electricity and manages more than 96% of the country’s hydropower
production. Lansdvirkjun also owns a 65% share in the Icelandic Transmission System
Operator (Landsnet). Landsvirkjun does not sell directly to households, selling
primarily to industry or public utilities (Askja Energy Partners (c), 2015).
Orkuveita Reykjavíkur (OR) is another of Iceland’s main energy firms and
services the greater Reykjavík area. A 93.5% share is owned by the city of Reykjavík
with the rest split amongst a few adjacent municipalities. It not only produces energy
but is also the largest local provider of electricity and heating to end-‐users. It also
distributes hot and cold water as well as operating a sewage system for Reykjavík
and several adjacent municipalities. Many of the countries energy consumers
purchase their electricity and heating from OR due to the large proportion of the
Icelandic population living in the capital. Their largest single customer is the Norðurál
aluminum smelter (Askja Energy Partners (c), 2015).
The third of the three largest energy-‐producing companies is HS Orka.
Formerly a state-‐owned company, HS Orka’s majority shareholder is the Canadian
energy company Alterra Power. In addition to these three firms there are a number
of smaller energy producers, almost all owned by the Icelandic state and/or Icelandic
municipalities. These include HS Veitur, Norðurorka, Orka Náttúrunnar, Orkubú
Vestfjarda, Orkuveita Húsavíkur, Metanorka and Rarik. There are also numerous
engineering, service and consulting firms that work with the energy-‐producing firms
and constitute part of the Icelandic energy sector as a whole (Askja Energy Partners

14
(c), 2015).
With rising global energy consumption and increased public interest in
renewable energy, the Icelandic energy sector has numerous potential avenues for
growth. To increase exports would necessitate an increase in national energy
production as well as investment in more sophisticated transmission and distribution
systems, for example submarine cables to countries such as Greenland, Canada or
the UK. Increased exports also depend on competitiveness on an international scale.
A firm with suboptimal management may thrive within the constraints of the tariffs
and miscellaneous protections granted to nationalized industries but to compete
internationally it must have a competitive advantage.
The international renewable energy market is a dynamic field with high
learning rates, rapid cost decreases and the constant specter of political
intervention. To achieve sustained competitive advantage in a dynamic market such
as this, firms must have dynamic capabilities that exceed those of their competitors.
It is with this in mind that the decision was made to complete a study of dynamic
capabilities and innovation in the Icelandic energy sector. In the next chapter we will
review the relevant literature on dynamic capabilities, the resource based view and
other schools of thought that influence and guide the methodology of this research.
To properly analyse Icelandic energy firms we reach for the usual Strategic
Management approach of splitting our analysis into two parts: organizational and
environment (also referred to as inner and outer context) (Rasche, 2007). This
approach allows us to separate circumstantial issues from organizational or practical
issues. A certain strategy might work well in one environment but not in another and
vice-‐versa after all, and to allow managers to securely make strategic decisions it is
necessary for them to know both what characterizes their environment and what
strategies are (or aren’t) likely to succeed in such an environment. This is one of the
most fundamental tenants of the pursuit of competitive advantage, which is the
main goal of strategic planning (McGee et al., 2010).

15
Basing decisions on observations of past events serves to create a cultural
“common sense” awareness of what common pitfalls and hazards to avoid but is a
flawed method. Perspectives on the past are often biased, inaccurate or incomplete.
It is this uncertainty that results in the difference between intended and realized
strategy (McGee et al., 2010). Intended strategy fits the traditional concept of
strategy as a plan or prediction. Such strategies represent management’s
assumptions about the future and their goals, based on their current and past
resource base as well as analyses of environmental factors. Such strategies often
don’t go according to plan or change as time progresses. There are many possible
explanations for why such plans go astray and being able to deviate from a strategy
to accommodate unforeseen opportunities or threats, both in the inner and outer
context, should not be seen as a bad thing.
Until now we have only discussed the DCV and RBV which both focus on the
organization itself, unlike the market-‐based view (Klug, 2006) in which the outer
environment is the point of focus. In the next section, we will examine the outer
environment with a special emphasis on dynamism in the energy sector.
Environmental analysis
Before performing an environmental analysis we must begin by defining the relevant
environment. There are numerous criteria for what could be considered the relevant
environment. The environmental factors are any external factors that influence
management decisions. Factors such as these can include government, consumers,
competition, suppliers, lobbyists as well as scientific and technological advances.
Managers need to be acutely aware of external factors and the effect they might
have on their firms to respond appropriately to competitive forces and achieve
competitive advantage. In this chapter we discuss the external environment, using
strategic methods and tools.
Industry analysis
16
An industry analysis is an assessment of a certain industry or market, used by firms
to map threats and opportunities stemming from the development of the industry.
Profit margins vary between industries due to differences in their structures (Porter
(a), 1998). A firm’s performance will therefore be significantly influenced by its
position in an industry and how that industry is structured. Is the industry
monopolistic or in perfect competition? Where does the firm fit in? Can the firm
specialize in such a way as to have an advantage in certain sectors of the industry?
Can the firm compete in terms of price or quality? To answer these questions and
more, we’ll use Porter’s (1998) five forces analysis.
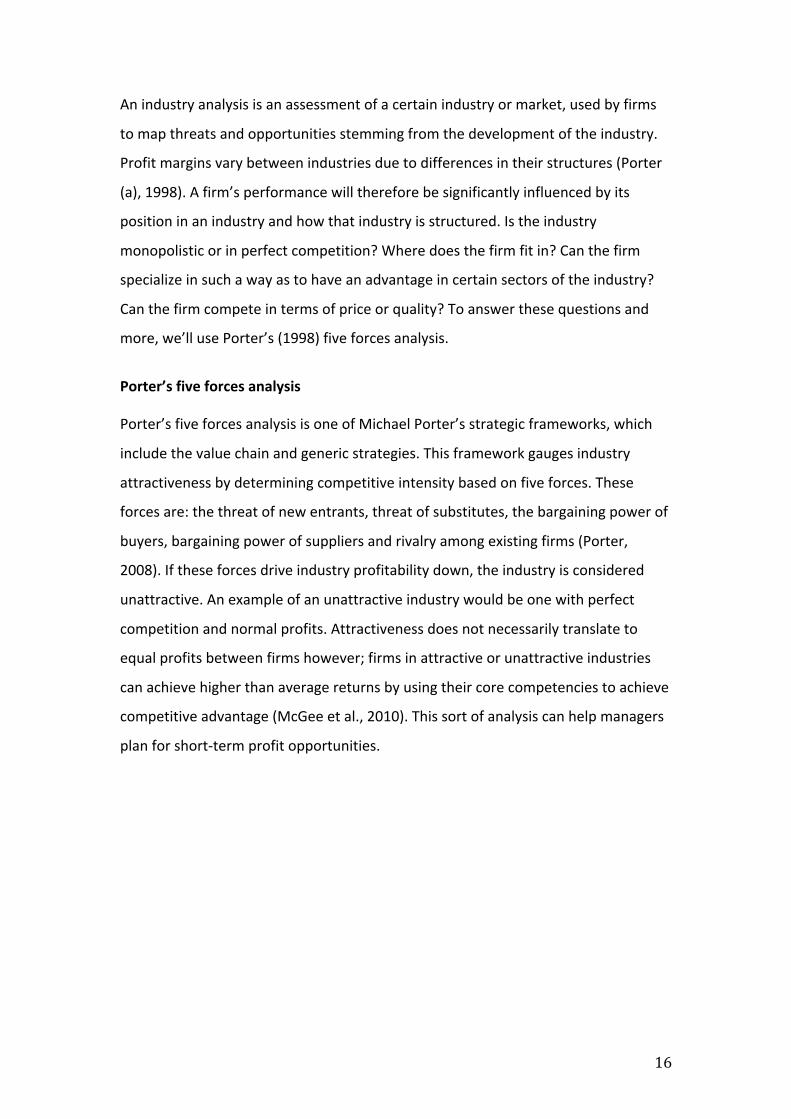
Porter’s five forces analysis
Porter’s five forces analysis is one of Michael Porter’s strategic frameworks, which
include the value chain and generic strategies. This framework gauges industry
attractiveness by determining competitive intensity based on five forces. These
forces are: the threat of new entrants, threat of substitutes, the bargaining power of
buyers, bargaining power of suppliers and rivalry among existing firms (Porter,
2008). If these forces drive industry profitability down, the industry is considered
unattractive. An example of an unattractive industry would be one with perfect
competition and normal profits. Attractiveness does not necessarily translate to
equal profits between firms however; firms in attractive or unattractive industries
can achieve higher than average returns by using their core competencies to achieve
competitive advantage (McGee et al., 2010). This sort of analysis can help managers
plan for short-‐term profit opportunities.

17
New entrants often bring a new approach, new ideas and innovation, disrupting the
status quo and forcing incumbent firms to reorganize their business models and
strategies (Porter (b), 1998). There are certain barriers that keep new entrants at bay
however. These entry barriers fall into seven categories (Porter, 2008):
1. Supply-‐side economies of scale: firms that produce in large volumes achieve
greater economies due to decreasing marginal costs of production. Fixed
costs are spread over a larger number of units and larger firms often have
more negotiating power. Supply-‐side economies of scale mean that potential
entrants either have to take a substantial risk by entering the industry on a
Rivalry among existing
competitors
Threat of new
entrants
Threat of substitutes
Bargaining power of buyers
Bargaining power of suppliers
Threat of new entry: • Time and cost of
entry • Specialist
knowledge • Economies of
scale • Cost advantages • Technology
Competitive rivalry: • Number of
competitors • Quality
differences • Other
differences • Switching costs • Customer
Buyer power: • Number of
Customers • Size of each
order • Differences
between competitors
• Price sensitivity • Ability to
Supplier power: • Number of
suppliers • Size of suppliers • Uniqueness of
service • Your ability to
substitute • Cost of changing
Picture 3: Porter's Five Forces (Porter (a), 1998)

18
large scale or compete with incumbent firms on worse terms (Porter, 2008).
This barrier is highly relevant in Iceland, where new and smaller energy firms
have to compete with large state run firms with deep pockets.
2. Demand-‐side benefits of scale: Also known as network effects, benefits of
scale affect customer’s willingness to trade with a firm based on how large
the firm is. Larger and better-‐known firms are either considered more
reliable when it comes to supplying crucial products or customers see value
in belonging to a large network of consumers. The best way for a new entrant
to overcome this barrier is to differentiate itself from incumbent firms and
specialize to address different customer concerns than their competitors.
3. Customer switching costs: Once a buyer has become accustomed to
purchasing from a certain supplier, switching has explicit and hidden costs.
Staff must be retrained, new data gathered and new systems put in place. If
the cost of switching to a new supplier outweighs the benefits new entrants
will find it difficult to gain clients.
4. Capital requirements: this barrier is one of the most straightforward. Entry
into an industry requires capital investment. Although the amount of
investement may differ between industries, there is always a need for
facilities, inventories, marketing and other such things. The lower the need
for financial resources, the less of a barrier this is. Also worth keeping in mind
is that if expected returns are high, capital requirements present less of a
problem because investors will be more willing to finance the firm.
5. Incumbency advantages independent of size: incumbents may have certain
advantages that new entrants can’t easily replicate, even with a large amount
of financial resources. These advantages can include accumulated
experience, brand recognition, professional networks, proprietary technology
and a host of other advantages not available to new entrants (Porter (b),
1998).
6. Unequal access to distribution channels: New entrants are usually at a
disadvantage when it comes to distributing their goods and services.
Incumbents have easier access to distributors, retailers and wholesalers for a
number of reasons; established networks and reputation and exclusive

19
partnerships among others. If access to distribution is enough of a barrier, it
might prove easiest for new firms to create entirely new distribution
channels
7. Restrictive government policy: governmental policy decisions regarding
important subjects such as foreign investment can directly influence the
attractiveness of an industry. Governments can impose licensing
requirements or restrictions, which hinder new entrants but they can also
make entry easier by lowering tariffs or fees (Clegg, Carter, Kornberger og
Schweitzer, 2011). Governments also indirectly support entry by funding
research centers and subsidizing education for example, lowering the cost of
entry for new firms.
Although all seven barriers are relevant in the context of the Icelandic energy sector,
the first and seventh are especially noteworthy. Not only do large, pre-‐existing firms
dominate the market, but the government also keeps the industry under its thumb.
The Icelandic public is highly critical of big industry, especially foreign owned firms
seeking to make headway in the Icelandic market.
The power of suppliers
Suppliers, when in a strong position, can lower over-‐all industry profitability by
charging higher prices, lowering quality and service standards or shifting costs to
industry participants (Porter, 2008). Firms can become over-‐reliant on suppliers with
whom they’ve done business and formed a relationship due to switching costs.
There are several reasons suppliers can become more powerful compared to their
buyers. If suppliers offer an unsubstitutable product, if they offer differentiated
products, if they do not receive a large portion of their revenues from the industry in
question and so forth.
The power of buyers
In a nutshell, the power of buyers is the opposite of the power of suppliers. Buyers
can lower industry profitability by demanding lower prices, higher quality and

20
service standards and manipulating industry participants into competition. If the
demand for goods is elastic the buyers are in a stronger position and can make more
demands towards the industry participants. If there are few buyers, low switching
costs or the goods are easily substituted, buyers can threaten to look elsewhere.
The threat of substitutes
Substitutes are products that perform the same or a similar function as a different
product and can replace that product. Substitutes can pose a risk to industry
participants if they can achieve similar quality at a lower price. A well-‐executed
substitute should be able to affect the profitability of its competitor product. If the
competitor is unable to convince buyers that their product is superior or worth the
higher price, its profitability will decrease. Substitutes are not always directly related
to their competitor products and changes in different industries might unexpectedly
create substitutes, such as with plastic materials that became good enough to
substitute steel in automobile manufacturing. There is no real substitute for
electricity of course and while one could argue that different forms of production
represent a substitute, such as choosing to use solar generated electricity rather
than geothermally generated electricity for example, the low price for electricity in
Iceland means that there is less need for alternative modes of production.
Rivalry among existing competitors
Highly competitive rivalry, especially price competition, can decrease industry
attractiveness by transferring profits from the industry to buyers and in some cases
by skewing economic signals. Rivalry can take on many forms, for example
advertising campaigns, product introductions and price discounting. If sufficiently
rigorous, competition of this nature can raise costs. Porter (a) (1998) said that it was
the intensity and the basis on which industry participants compete that dictates the
degree to which rivalry will affect profitability. Rivalry is intense if there are many
participants and they are homogenous in terms of size and power, if the industry is
growing slowly or exit barriers are high. Exit barriers are the opposite of entry
barriers and exist when for practical, legal or emotional reasons management feels

21
obliged to remain in a particular business even though profitability may be low (or
even negative) (Porter (b), 1998).
The basis of competition, whether companies compete in terms of price,
service, convenience, advertising or something else and whether companies
compete on the same basis also affects profitability. As mentioned earlier, price
competition is especially detrimental to profits, as it spurs retaliation and trains
customers to ignore other features and focus solely on price (Porter, 2008). Rivalry
between firms serving different customer segments, with different needs and wants,
can prove much more profitable and beneficial for the growth of the industry as a
whole.
Consumer market analysis
Consumer analysis can be used in a number of ways to help firms develop marketing
strategies. Understanding what consumers think and how they feel, whether on an
individual or group level can help management identify their target market and set
marketing objectives. Consumer research should be continuous so as to allow the
firm to adapt and improve its strategy. Target marketing is one form of consumer
analysis. It has three major steps: segmentation, targeting and positioning.
First bases for segmenting the market are identified and profiled. When
segmenting a market there are numerous factors that determine how segments are
chosen. Segments are based on the needs and desires of potential buyers, their
geographical locations, their purchase history and their fiscal status amongst other
things (Weinstein, 2004). Secondly the attractiveness of those segments is measured
through research methods such as focus groups and appropriate segments chosen.
Finally, a marketing mix is developed to appeal to that market segment and the firm
positions itself to implement their marketing campaign. Knowing the relevant
segment is important to be able to effectively market to consumer tastes (Kotler,
Armstrong, Wong og Saunders, 2008). Geographic location has historically been the
most important factor in deciding market segments for Icelandic energy firms with
the exception of the Orka Náttúrunnar (ON Power) which markets itself as a
22
environmentally conscious energy firm, offering fast-‐charging stations for electric
cars and experimenting with CO2 and H2S emission reduction.
Targeted marketing helps managers decide whom they should be marketing
to by measuring the potential for profit in different segments. Is the segment
growing, stagnant or shrinking? Is there untapped potential in this segment? Does
our firm conform to the demands of this segment? There are many questions
managers need to consider before embarking on an expensive marketing campaign.
Once a sufficiently attractive segment has been chosen a firm has to dedicate itself
to a marketing strategy aimed at that segment. Succesful strategies often have three
common features: the point of parity, the point of difference and image (Kotler et
al., 2008).
The point of parity refers to features that the product has in common with
competitor products whereas points of difference are the opposite. While managers
often emphasise advertising the point of difference, the point of parity offers buyers
some context. Say for example that Coca-‐Cola wanted to convince Pepsi drinkers to
start drinking their titular soft drink instead. Obviously offering Pepsi drinkers
something completely different might not resonate with them. After all, they like
Pepsi. In such a situation it would be more effective to market Coca-‐Cola as being
“like” Pepsi only better somehow. The third feature, image, plays an important role
in this stage of the marketing campaign. Using a marketing mix of advertising,
packaging, presentation, price, service and location firms can selectively aim for their
intended segment. That is precisely what ON Power has done in recent years, most
likely in a bid to appeal to the urban sensibilities of Reykjavík inhabitants, which is
their main service area.
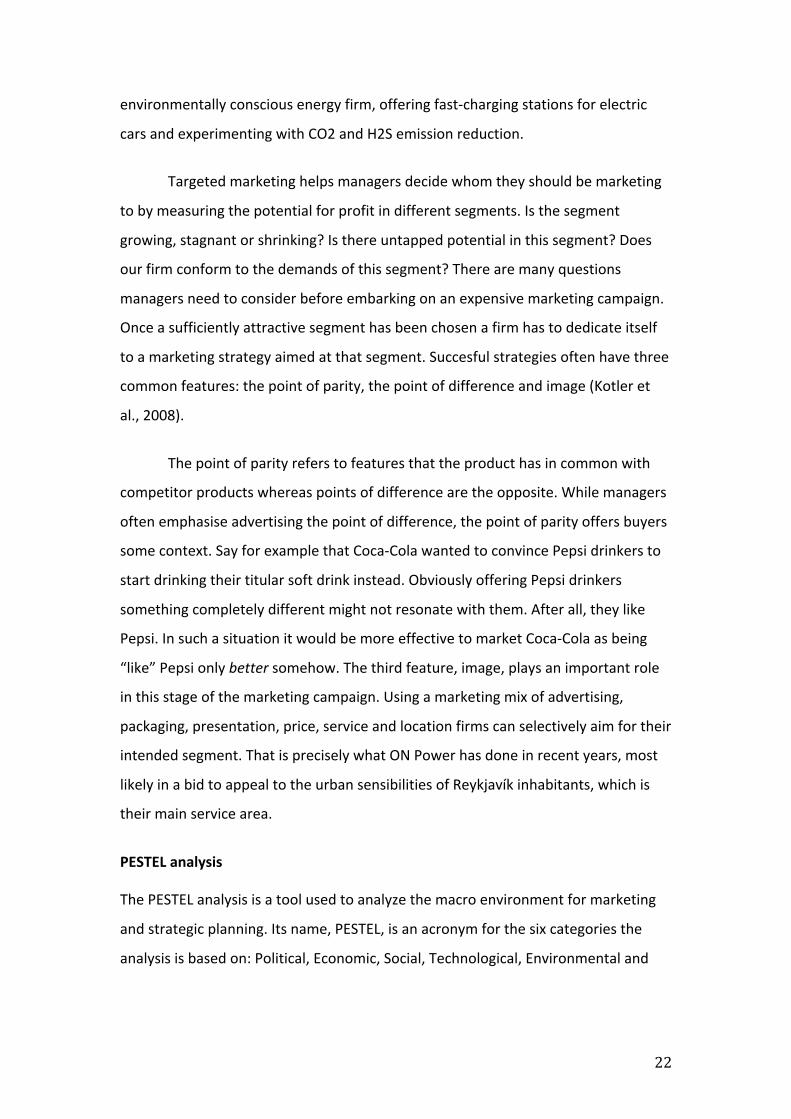
PESTEL analysis
The PESTEL analysis is a tool used to analyze the macro environment for marketing
and strategic planning. Its name, PESTEL, is an acronym for the six categories the
analysis is based on: Political, Economic, Social, Technological, Environmental and

23
Legal factors (Witcher and Chau, 2010). These six categories are examined to create
a holistic view of external factors influencing the industry’s future.
Political factors
Politics and government policy play an important part in the viability of business
ventures and have become increasingly important to businesses with the rise of
globalization. Firms need to be aware of the threats and opportunities in the political
environment before entering a new market and even when deciding whether to stay
in an established one. Political decisions such as tax policies, trade regulations, trade
agreements and political stability have a significant impact on the economy (Clegg et
al., 2011).
Legal
Political
Economic
Social
Technology
Environment
Picture 4: PESTEL analysis (McGee et al., 2010)
24
Economic factors
Economic factors refer to macroeconomic factors such as currency valuation,
interest rates, inflation and growth. Macroeconomics and politics are highly
connected factors due to the influence political leaders can have on central banks,
public image and other things which influence currency value, the state of education
and the workforce and expectations for the future (Hitt, Ireland and Hoskisson,
2009). What economic factors are considered desirable depend largely on the needs
of the firm seeking entry. High wages may make for a more expensive workforce but
they also mean that the populace has more money to spend on goods and services.
Social factors
Not to be overlooked, social conventions and structures must be handled tactfully to
avoid public-‐relations disasters. Different beliefs, cultures, languages and histories
create a metaphorical minefield of potential problems. Social development and
status also affects the types of products needed (Hitt et al, 2009). If you were to
compare an urban environment with a rural one for example, you might find very
different consumption habits due to what sort of consumption is considered socially
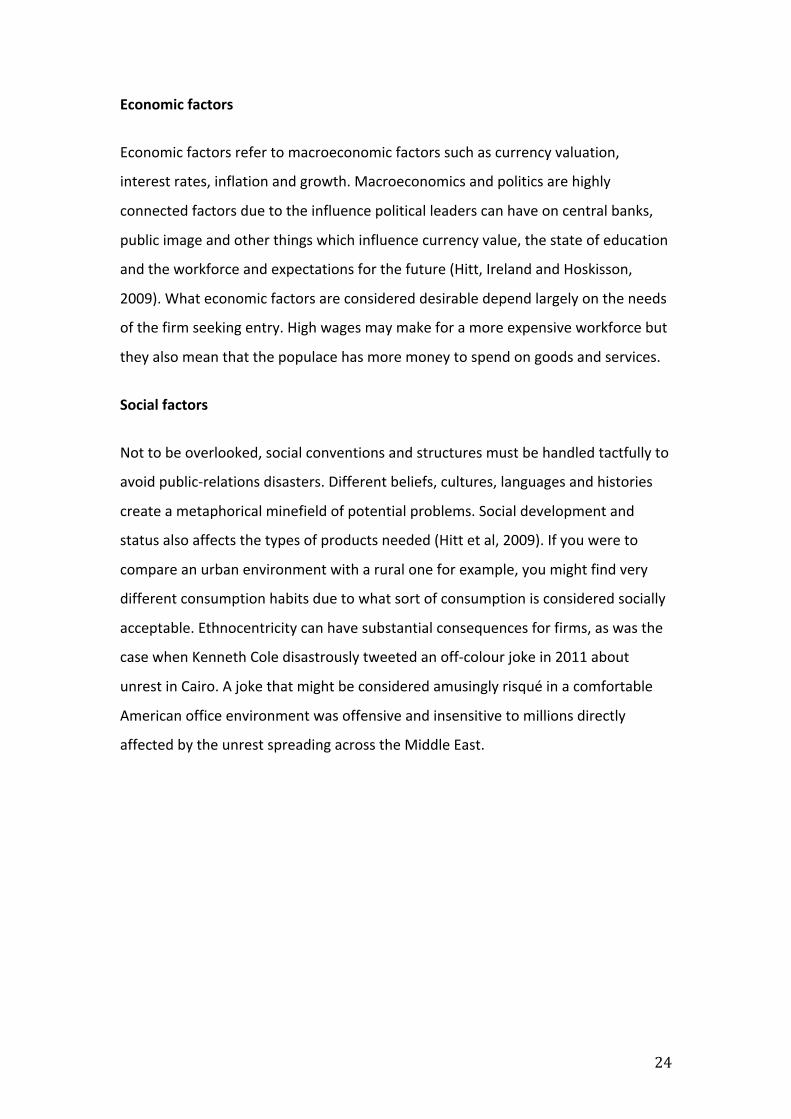
acceptable. Ethnocentricity can have substantial consequences for firms, as was the
case when Kenneth Cole disastrously tweeted an off-‐colour joke in 2011 about
unrest in Cairo. A joke that might be considered amusingly risqué in a comfortable
American office environment was offensive and insensitive to millions directly
affected by the unrest spreading across the Middle East.
25
Picture 5: An example of cultural insensitivity.
Technological factors
Technological innovation can (and frequently does) cause rapid change in markets by
reducing costs, increasing efficiency and ease distribution (Clegg et al, 2011). There’s
a wealth of recent examples of technological innovation disrupting preexisting
markets: the internet, e-‐mail, the smart phone are all very recent but have
completely changed the business world. New technology can do more than disrupt
markets however; it can also keep an existing product or service from becoming
obsolete
Environmental factors
Environmental factors are increasingly important due to public concern over climate
change and environmental protection. Governments are under pressure to address
pollution with new laws, regulations and fees. This change in public opinion might
also entail a change in consumption habits; sustainability and waste reduction don’t
exactly go hand in hand with unbridled consumerism.
Legal factors
26
Like economic factors, legal factors are also closely tied to political factors, due to
government’s role in making laws but are more specifically about existing
regulations such as employment or health and safety regulations. Being aware of
legal factors is essential to avoiding unnecessary legal costs and complications, which
can impede firm performance (Clegg et al, 2011). It is quite common for countries to
have laws regarding foreign ownership of real estate or foreign-‐based businesses for
example, which might affect the feasibility of the firms business plan.
Analysis of the Internal environment
Analysis of the internal environment is mainly about examining the resources and
capabilities a firm has or can easily access. This includes knowing the firms resources,
how they can be employed and how they can help the firm achieve competitive
advantage. Knowing a firms strengths and weaknesses are vital to be able to decide
which external factors are necessary for success. In this chapter we discuss some
analytical tools that managers can use to analyze their inner environment as well as
their core competencies, corporate values and goals.
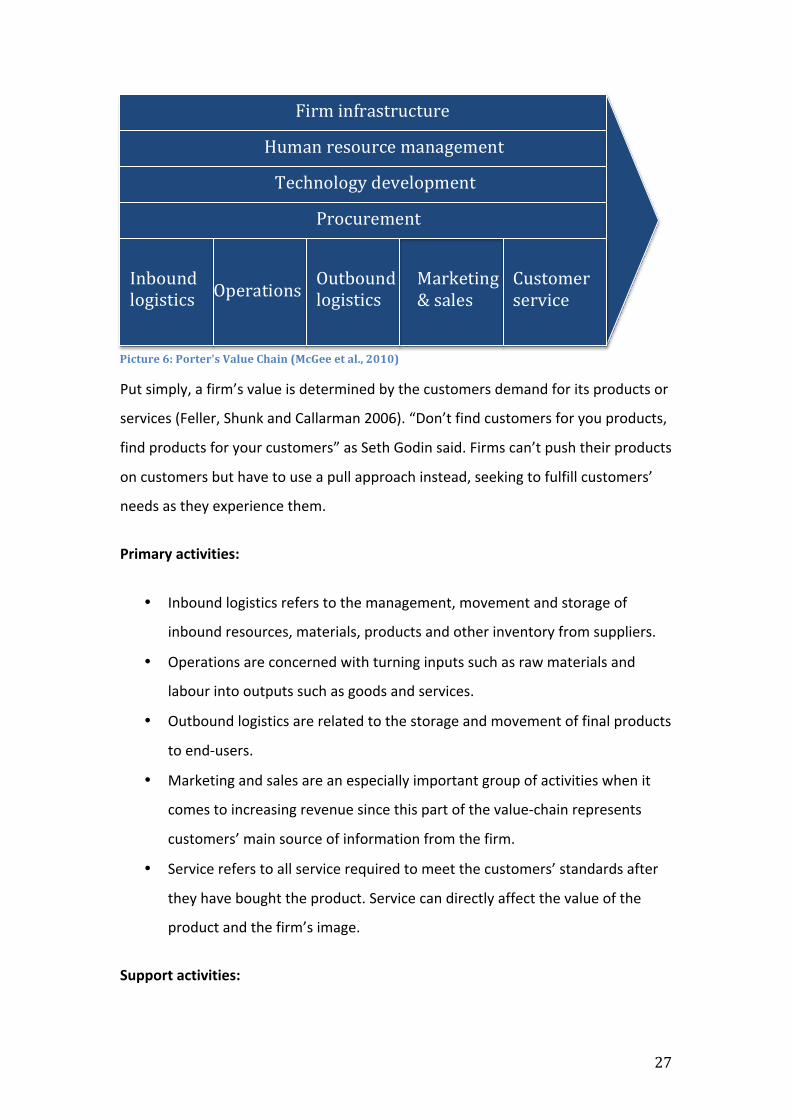
The value chain
The value chain is an analytical tool used to determine and clarify how a business
unit produces value and where its profits come from. It is a financially oriented
method where the firm’s activities are put forward as a chain. In it, the unit’s
activities are put into two categories: primary and support activities. The primary
activities are inbound logistics, operations, outbound logistics, marketing and sales
and service. The support activities are procurement, human resource management,
technological development and infrastructure (Johnson et al., 2011). The value chain
not only gives managers a clear idea of where to look to lower costs and increase
value-‐formation but what it is that their customers value most in their product
(McGee et al., 2010).
27
Put simply, a firm’s value is determined by the customers demand for its products or
services (Feller, Shunk and Callarman 2006). “Don’t find customers for you products,
find products for your customers” as Seth Godin said. Firms can’t push their products
on customers but have to use a pull approach instead, seeking to fulfill customers’
needs as they experience them.
Primary activities:
• Inbound logistics refers to the management, movement and storage of
inbound resources, materials, products and other inventory from suppliers.
• Operations are concerned with turning inputs such as raw materials and
labour into outputs such as goods and services.
• Outbound logistics are related to the storage and movement of final products
to end-‐users.
• Marketing and sales are an especially important group of activities when it
comes to increasing revenue since this part of the value-‐chain represents
customers’ main source of information from the firm.
• Service refers to all service required to meet the customers’ standards after
they have bought the product. Service can directly affect the value of the
product and the firm’s image.
Support activities:
Firm infrastructure
Human resource management
Technology development
Procurement
Inbound logistics Operations Marketing
& sales
Outbound logistics
Customer service
Picture 6: Porter's Value Chain (McGee et al., 2010)
28
• Firm infrastructure refers to clerical tasks necessary for production such as
accounting, legal, quality assurance and strategic management.
• Human resource management includes all activities pertaining to staff:
recruitment, training, dismissal, compensation et cetera.
• Technological development refers to the technology, equipment, hardware,
software and technical knowledge used in transforming inputs into outputs.
• Procurement is all acquisition of goods and services from external sources.
All these activities are interconnected and offer managers opportunities to
reduce costs and increase revenue. Each block of the chain can have three
subactivities that affect value formation: direct activities, indirect activities and
quality assurance. Direct subactivities create value by themselves. Sales and
marketing are examples of direct activities. Indirect activities create value by
making direct activities run smoothly, like management and record-‐keeping.
Quality assurance ensures that the activities meet the standards and demands
required. If we think of marketing as a direct activity, proofreading
advertisements would be an example of quality assurance (McGee et al., 2010).
The value chain offers some insight into the very reason the firm exists, what
need they are fulfilling. There are certain risks to overemphasizing the value
chain however. Focusing too much on cost minimization might not only make
future investments and growth impossible but might even make it impossible to
maintain current quality standards and services.
The value chain doesn’t take people, products, capacity or customers into
account and can distort the goal of running a business by causing inappropriate
attention to eliminating costs. There are after all, some costs that cannot be
avoided if one wants to successfully run a company; staff salaries, maintenance,
marketing and product development, amonst many other examples.
The value chain analysis for assessing competitive advantage
When performing a value chain analysis with the goal of assessing competitive
advantage there are a few things that must be kept in mind (McGee et al, 2010).

29
• Each element in the value chain must be defined within context of
competitive advantage.
• The cost and importance of activities haave to be evaluated in each element
to calculate the total cost.
• The cost of elements should be compared and the most expensive ones
identified. It can be useful to compare the costs to those of competitors.
• Costly activities should be identified. Minimizing cost there will prove most
beneficial to the firm.
• The relationship between elements and activities should be clarified and
known to management.
• Management has to be on the lookout for opportunities to decrease cost,
especially in high cost activities.
When the flow of goods and service is managed within value chain, we refer to it as
supply chain management.
Supply chain management
Supply chain management is the management and arrangement of upstream and
downstream product flows between suppliers, the firm and buyers. It is a cross-‐
functional approach that includes the movement of input (raw material, labour, et
cetera) and output resources (finished goods) from start to finish. With increased
globalization and the advent of hypercompetitive markets these functions have
more commonly been outsourced to specialized firms that can more efficiently and
effectively complete the task. Supply chain management was developed as a way to
Transportation Procurement Central
manufacturing Distribution, assembly & repair
Sales, marketing & customer service
Customers
Suppliers
Demand signal
Product flow
Picture 7: Supply chain (Feller et al., 2006)
30
improve trust and cooperation between an increasing number of supply chain
partners
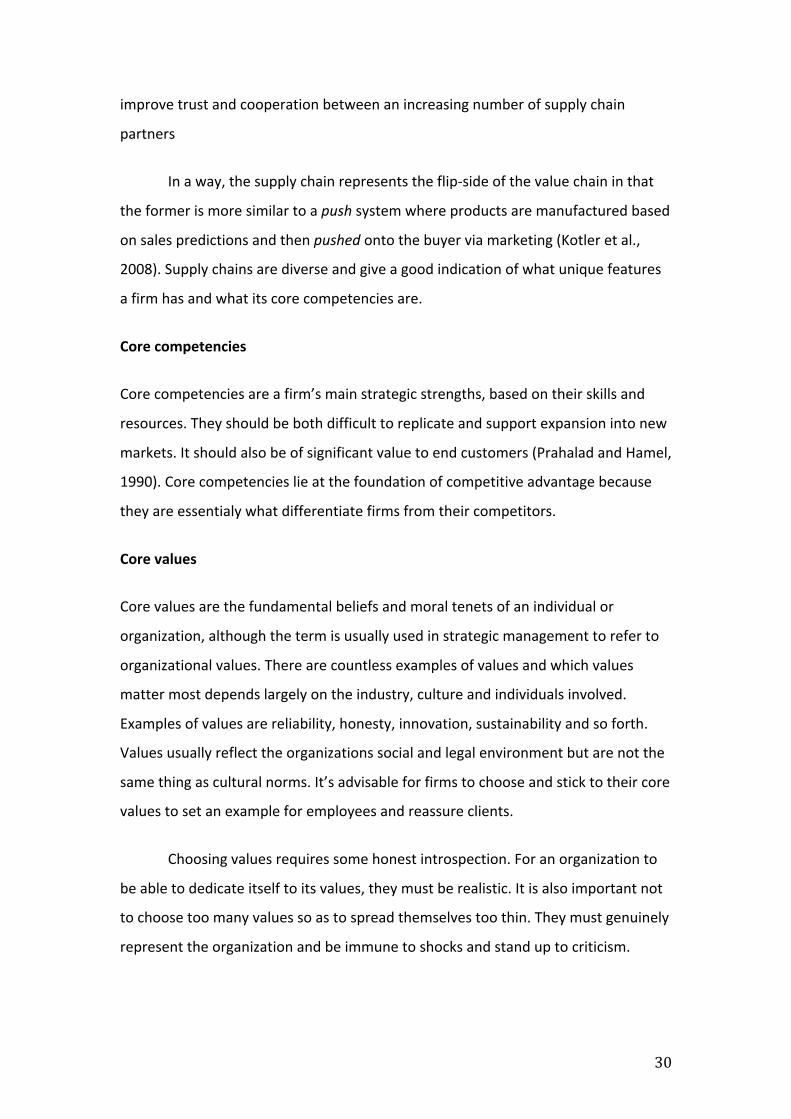
In a way, the supply chain represents the flip-‐side of the value chain in that
the former is more similar to a push system where products are manufactured based
on sales predictions and then pushed onto the buyer via marketing (Kotler et al.,
2008). Supply chains are diverse and give a good indication of what unique features
a firm has and what its core competencies are.
Core competencies
Core competencies are a firm’s main strategic strengths, based on their skills and
resources. They should be both difficult to replicate and support expansion into new
markets. It should also be of significant value to end customers (Prahalad and Hamel,
1990). Core competencies lie at the foundation of competitive advantage because
they are essentialy what differentiate firms from their competitors.
Core values
Core values are the fundamental beliefs and moral tenets of an individual or
organization, although the term is usually used in strategic management to refer to
organizational values. There are countless examples of values and which values
matter most depends largely on the industry, culture and individuals involved.
Examples of values are reliability, honesty, innovation, sustainability and so forth.
Values usually reflect the organizations social and legal environment but are not the
same thing as cultural norms. It’s advisable for firms to choose and stick to their core
values to set an example for employees and reassure clients.
Choosing values requires some honest introspection. For an organization to
be able to dedicate itself to its values, they must be realistic. It is also important not
to choose too many values so as to spread themselves too thin. They must genuinely
represent the organization and be immune to shocks and stand up to criticism.

31
VRIO analysis
The VRIO framework is another form of internal analysis based on four factors:
value, rarity, imitability and organization. Tangible and intangible resources and skills
are examined with the goal of finding new avenues for reaching competitive
advantage. Tangible resources are physical things like tools and machinery while
intangible resources are things that have no physical presence but can still be owned
by the company such as brand reputation and property rights (Barney and Hesterly,
2011). The four factors mentioned above can be thought of as questions whose
answers make it easier for organizations realize potential opportunities to compete
more effectively.
• Value: “Is the firm able to exploit an opportunity or neutralize an external
threat with the resource/capability?” Value is created by the resources the
firm has that increase the customer’s utility (Barney, 1991). Low value is a
bad sign for firms, making it difficult to make plans and investments for
growth. Companies without valuable resources are ill equipped to compete
(Barney og Hesterly, 2011).
• Rarity: “Is control of the resource/capability in the hands of a relative few?”
Rarity refers to resources that can only be acquired by one or few firms. If a
resource is not rare, it leads to competitive parity. It is therefore important
that firms are aware of how rare these resources are and whether or not they
can be used as a point of difference (Teece, Pisano and Shuen, 1997).
• Imitability: “Is it difficult to imitate, and will there be significant cost
disadvantage to a firm trying to obtain, develop, or duplicate the
resource/capability?” Imitability is necessary to turn temporary competitive
advantage into sustained competitive advantage. Even if a firm has a rare
resource it must be inimitable or else competitors will quickly imitate or
substitute for that resource.
• Organization: “Is the firm organized, ready, and able to exploit the
resource/capability? Is the firm organized to capture value?” The answer to
this question hinges on the previous answers. Organization includes
32
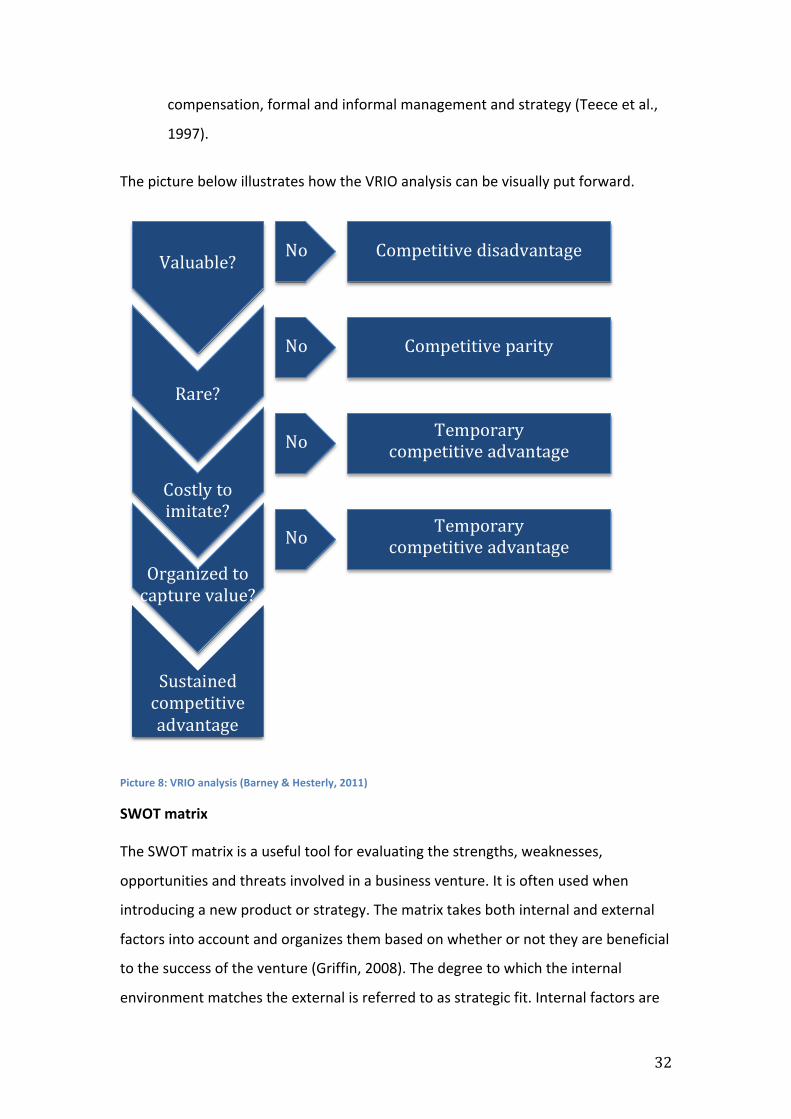
compensation, formal and informal management and strategy (Teece et al.,
1997).
The picture below illustrates how the VRIO analysis can be visually put forward.
Picture 8: VRIO analysis (Barney & Hesterly, 2011)
SWOT matrix
The SWOT matrix is a useful tool for evaluating the strengths, weaknesses,
opportunities and threats involved in a business venture. It is often used when
introducing a new product or strategy. The matrix takes both internal and external
factors into account and organizes them based on whether or not they are beneficial
to the success of the venture (Griffin, 2008). The degree to which the internal
environment matches the external is referred to as strategic fit. Internal factors are
No
No
No
No
Competitive disadvantage
Competitive parity
Temporary competitive advantage
Temporary competitive advantage
Valuable?
Rare?
Costly to imitate?
Organized to capture value?
Sustained competitive advantage

33
the strengths and weaknesses of the venture and can include the qualities of the
product itself, the location, marketing, personnel and so on. The external
environment offers opportunities and threats in the form of macroeconomic and
technological changes, cultural factors, competition and legislation. It is important
to note that with different goals and contexts the same factors can be either
beneficial or detrimental to the success of a product or strategy (Humphrey, 2005).
Strengths
A business venture’s strengths are internal factors that have a positive effect on the
success and profitability of said venture. Furthermore, strengths should increase
competitive advantage. Firm strengths can be either tangible or intangible resources
such as equipment, clientele, distribution networks, patents, management, IT and so
forth. Identifying strengths depends on manager’s insight and judgement as to which
factors are beneficial, which are not and what strengths they can attempt to gain.
Weaknesses
Strengths (S) Weaknesses (W)
Opportunities (O)
Threats (T)
Internal factors
External factors
SO Strategies -‐ Use strengths to take advantage of opportunities.
WO Strategies -‐ Beat weaknesses to take advantage of opportunities
ST Strategies -‐ Use strengths to avoid threats.
WT Strategies -‐ Minimize weaknesses and avoid threats.
Picture 9: SWOT matrix (Griffin, 2008)

34
Just as important as being aware of a firm’s strengths is identifying and addressing
it’s weaknesses. Examples of weaknesses could be a bad location, poor promotional
work or inexperience in a certain field. There are countless potential weaknesses and
managers should not shy away from being honest about what could potentially be a
weakness. It is important to be able to judge whether a venture has any chance of
success before resources are poured into attempting it.
Opportunities
Opportunities are external factors that have a beneficial effect on the profitability of
the firm or venture. These opportunities include not only macroeconomic factors
such as altered consumer tastes or greater cash flow but also small scale
opportunities presented by suppliers and competitors such as if a competitor were
to be involved in a scandal.
Threats
Threats are negative external factors such as a supplier raising prices or a competitor
lowering prices. Although the SWOT matrix is often used to predict strengths,
weaknesses, opportunities and threats to new ventures or firms, established
products and firms are also susceptible to unforeseen threats such as tax hikes or
distribution issues.
Strategic planning
When an organization has enough information and data regarding all relevant
internal and external factors it can begin the process of defining its strategy and
allocating resources to implement this strategy. Strategic planning is similar but
separate from strategic thinking. The former is more systemic and formalized
whereas the latter is more creative and flexible. Strategies can be formed on either
the business-‐level or the corporate-‐level. Business strategies regard the way a
company creates, maintains and uses its competitive advantage, while corporate
strategy regards how to diversify and merge with other businesses. Corporate
strategy is therefore only relevant to larger corporations since small businesses only

35
have one strategic decision make on the corporate-‐level: which industry to enter
(McGee o.fl., 2010).
A successful strategy requires efficiency, realism and clarity. Wishful thinking can be
fatal for managers and staff hoping to make the most of the firm’s resources. But it is
also imperative that the firm’s goals and organization are clear to managers and staff
alike. No wind is favourable if you don’t know where you’re sailing.

36
II. THEORY
Theoretical foundations
At its core, the DCV is closely related to innovation and entrepreneurship. Stevenson
and Amabile defined entrepreneurship as “the pursuit of opportunity beyond the
resources you currently control” (1999). Based on this definition, entrepreneurship is
not only for enterprising individuals with nothing but an idea and bootstraps by
which to pull themselves up, but also for organizations and firms seeking to survive
intense competition. Corporate innovation is often written off as an oxymoronic
buzzword, seen by critics as trying to have the best of both worlds: the steadiness
and stability of a large corporation combined with the creativity and exponential
growth of startups. But while the management of established corporations and
startups will never be exactly the same and there might be some truth to the claim
that those who espouse corporate innovation are simply trying to have their cake
and eat it too, there is plenty of proof that corporations can innovate. Just not the
same way startups do.
That’s because not every innovation has to be a revolutionary new
technology or groundbreaking discovery. In a manner of speaking, innovation
doesn’t even have to be new. That is to say, the technology behind it doesn’t have to
be new. As Rogers and Shoemaker (1972) put it:
It matters little, as far as human behaviour is concerned whether or not
an idea is “objectively” new as measured by the lapse of time since its
first use or discovery… if the idea seems new and different to the
individual, it is an innovation.
We can take some of the most emblematic examples of innovation and
entrepreneurship in the past decade as examples. The technology underlying
Facebook, Twitter and Uber was not new – but the way this technology was
combined and consumed was. This is referred to as cultural entrepreneurship. This
type of innovation can be small, incremental and more realistically attainable for

37
larger (and hence slower) corporations. But for that to happen, the firm must
purposefully pursue a course of innovation management.
In a way, innovation management mirrors Coase’s (1937) theory that
transaction costs are the cause of firm-‐formation. Good innovation management
lowers the cost of using or retaining specific resources, for example inventions and
innovations that bring factors of production together by lessening spatial
distribution such as e-‐mail or social network sites. While initially positive the
advantage of such innovation can later be diminished by what Kogut and Zander
referred to as “the paradox that creativity works by rules of exclusions” (1996: p.
515). Put simply, path-‐dependence can lead to sub-‐optimal circumstances where
firms are bound by existing thought processes. Due to this a firm can follow “best
procedure” and still be unprofitable.
Again, one of the key foundations of successful strategy is a clear goal. Basing
innovation management on the DCV requires that we determine what purpose
dynamic capabilities have – why are they important and what do we stand to gain by
investigating them? Our conclusion will likely depend on the definition we’ve chosen
to lean on. Are dynamic capabilities meant to make firms more adaptable to rapidly
changing environments (Teece, 1997) or to instigate changes in the market
(Eisenhardt and Martin, 2000)?
It has been mentioned before that the DCV is an extension of the RBV and
that they share many of their theoretical underpinnings. It would be a mistake
however to ignore the differences between the two. While the RBV assumes
Ricardian rents, the DCV assumes Schumpeterian rents. Ricardian rents occur when
similar goods or resources are of different quality and yield. Schumpeterian rents
occur in the time between an innovation is introduced and it becomes widely
disseminated. As an illustrative example, consider two energy firms that both
produce electricity from geothermal sources. Let’s assume that the quality of their
services and products are identical. If one of the companies is situated in a highly
active geothermal area and the other is not, that company can produce at a lower
cost, and create more rent. That’s an example of Ricardian rent. But lets say that one
38
of the firms invents a new method of extracting geothermal energy which greatly
decreases the cost of production and gives the inventing firm a competitive
advantage until eventually, the other company manages to catch on to what the
inventor firm is doing and does the same. Schumpeterian rent is the surplus profit
the inventor firm achieves during their temporary competitive advantage.
While the Ricardian position views rents as market inefficiencies that remain
despite equilibrium, the Schumpeterian perspective places a greater emphasis on
the role of the entrepreneur and temporary imbalances created by innovation.
Schumpeter’s routinely cited idea of “creative destruction” captures the essence of
his theories quite aptly. Economies gravitate towards stagnant equilibrium and it is
the role of the entrepreneur to instigate change and make old modes of production
obsolete.
Whereas the RBV is primarily concerned with a firm’s resources, the DCV
pays more attention to the processes and path-‐dependencies that cause the
formation of a firm’s resource base. The former is focused on resource
substitutability while the latter is focused on inimitability. Helfat et al. (2007) refer to
these differences by the biology-‐based terms technical versus evolutionary fitness.
These terms are quite suitable in describing the difference between the two
perspectives albeit in a slightly heavy-‐handed way. Proponents of the DCV criticized
the static nature of the RBV and just as it is not necessarily the strongest, fastest or
most intelligent species that passes on it’s genetic material, the largest, richest and
most famous companies do not always survive. What truly sets survivors apart then,
is adaptability.
Simply drifting with the current, without any course or strategy is also a
recipe for disaster. A firm does not become innovative by chasing every
technological or management trend that comes along, nor is it likely to achieve
structural success. How can managers decide what risks to take and what to avoid? If
there were any simple answer to that question, it would result in an entirely
different economy than the one we know. What we know is vital however is being
capable of organizational learning and avoiding common observational biases that

39
impede innovation, such as the certainty effect (Kahneman and Lovallo, 1993) which
causes risk aversion.
Being prepared for every eventuality is neither possible nor practical for most
firms, so what is the optimal way for management to organize their firms? According
to the contingency theory there is no best way to organize a corporation, lead a
company or make decisions. Instead, the optimal course of action is contingent upon
the internal and external situation. While this might sound like management is just
supposed to “wing it” what it really means is that relation and task-‐oriented
behaviour has to be taken into account and a fit between that behaviour and the
resources and power structure of the organization has to be found at the beginning.
This brings us back to the RBV.
To understand the philosophical and practical assumptions which form the
foundation of the resource-‐based view, contingency theory and innovation
management the theory of the firm should be considered (Knight, 1921; Coase,
1937; Cyert and March, 1963; Williamson, 1975; Nelson and Winter, 1982; Grant,
1996). The term theory of the firm may be a bit misleading, seeing as how there is no
single, universally accepted theory, but rather several non-‐exclusive theories about
what purpose firms serve. Knight’s theory was that firms existed as a sort of risk
preference conduit, allocating risk in such a way as to meet different individual
needs (1921). That way, risk-‐seeking entrepreneurs could employ the skills of risk-‐
averse professionals.
Later management scholars considered Knight’s theory insufficient and
expanded on it (Grant, 1996). Coase (1937) and Williamson (1975) emphasised the
relative efficiency of contract-‐based, hierarchical organizations. Others sought to
further integrate economics and organizational studies into the theory of the firm
(Cyert and March, 1963; Nelson and Winter, 1982), resulting in the behavioural and
evolutionary theories of the firm. While the resource-‐based view of the firm is “less a
theory of firm structure and behaviour as an attempt to explain and predict why
some firms are able to establish positions of sustainable competitive advantage”
(Grant, 1996: p. 110), all of these approaches have influenced it.

40
While the DCV has become the most prominent branch of RBV research,
there are two other categories commonly used (Armstrong & Shimizu, 2007): The
Schumpeterian view and the hypercompetition view that sustained competitive
advantage is actually a series of competitive advantages over time. There are also
three major paradigms in addition to dynamic capabilities (Teece, Pisano and Shuen,
1997). On the one hand there are two that emphasize exploitation of market power:
the competitive forces approach (Porter, 1980) and the strategic-‐conflict approach
(Shapiro, 1989). On the other hand there are those that emphasize efficiency: the
resource-‐based perspective (Penrose, 1959; Rumelt, 1984) and the DCV. These
research categories and paradigms will not be discussed in much detail in this thesis
to avoid confusing the issue, but there is a wealth of interesting literature on the
subject.
Dutta, Narasimhan and Rajiv (2005) put forth an interesting view of
capabilities as “the efficiency with which a firm uses the inputs available to it (i.e., its
resources, such as R&D expenditure), and converts them into whatever output(s) it
desires (i.e., its objectives, such as developing innovative technologies)”. This view
encapsulates the connection between the DCV, innovation management and
contingency theory. In nutshell, the three are connected because they all deal with
the unquantifiable factors that decide competitive advantage. Efficiency is a poorly
quantifiable concept, much like capabilities. It is specifically because they are
difficult to measure and observe that they are inimitable and provide competitive
advantage (Schumpeter, 1942; Penrose, 1959; Nelson & Winter, 1982; Prahalad &
Hamel, 1990).
Because of this difficulty and despite growing interest, dynamic capabilities
are underrepresented in quantitative research (Newbert, 2007). If capabilities and
core competences are more significant in explaining competitive advantage than
resources it might seem strange that they have received comparably little empirical
attention. This is likely in part due to the difficulty of measuring capabilities and
competitive advantage. A firm’s dynamic capabilities are largely moulded by its
history and path dependency. Despite knowledge management’s attempts to codify

41
tacit knowledge most learning is still local (Teece, Pisano and Shuen, 1997). A “one
size fits all” approach to organizational routines and competences is misguided in
diverse and dynamic environments where technology and circumstances are
constantly changing.
Literature
As mentioned in the introduction, the dynamic capabilities view has garnered
substantial interest since it appeared in Teece, Pisano and Shuen’s (1997) influential
“Dynamic Capabilities and Strategic Management”. That interest has spread beyond
the field of strategic management and into other management fields such as
entrepreneurship and business administration (Barreto, 2010). The fast growth of
research, reviews and literature on the subject has presented us with a wide range
of perspectives, interpretations and criticisms. Several distinct definitions have been
put forward, and while this thesis follows Teece’s (2009) definition of dynamic
capabilities as inimitable capacities to shape, reshape, configure and reconfigure
assets so as to respond to changing technologies and markets, a closer look at other
definitions can provide deeper understanding of the direction in which researchers
have taken dynamic capability research.
Teece and Pisano (1994) initially introduced the concept in 1994 in an article
in Industrial and Corporate Change but it was not until 1997 when Teece et al. (1997)
published their famous article in Strategic Management Journal that the dynamic
capabilities view of strategic management was developed as we recognise it today.
Their vision of the DCV was an extension of the RBV, designed to rectify its static
view of competitive advantage. DCs were not a resource but rather, an ability to
utilise internal and external competences to achieve sustained competitive
advantage in rapidly changing environments. These abilities were usually tacit and
could not easily be bought or traded and were assumed to be path-‐dependent and
heterogeneous across firms. As well as the RBV, Teece et al. (1997) were heavily
influenced by entrepreneurial and evolutionary economics (Schumpeter, 1934;
Schumpeter, 1947; Nelson & Winter, 1982), as can be seen in their emphasis on

42
evolutionary paths, organizational learning and reconfiguration. Following the
publication of their influential article, more researchers dedicated their attention to
the DCV as a key element of study. Numerous articles were published in prestigious
academic journals such as Strategic Management Journal, Academy of Management
Journal, Journal of Management and more, spanning not only strategic
management, but several other business administration fields as well (Barreto,
2010).
The definitions given for DCs and the DCV in the following years varied
slightly, with some emphasizing the RBV and others leaning more heavily on
evolutionary economics. An example of this difference is that while Teece et al.
(1997) described DCs as abilities or capacities, some others emphasised their
repeatability, viewing them as more similar to routines or processes (Eisenhardt &
Martin, 2000; Zollo & Winter, 2002; Helfat et al., 2007). The former view echoes the
RBV concept of competencies (Stalk et al., 1992) and the latter is based on
organizational learning which is a view often employed in evolutionary economics
(Nelson & Winter, 1982). Other than that the most important points for debate are
how DCs are affected by environmental dynamism, how they should be
characterised and what results they can be expected to have on firm performance.
While Teece et al. (1997) clearly emphasise the importance of external
changes, there has been some disagreement as to how relevant environmental
dynamism is to the DCV. Some, such as Zollo and Winter (2002) consider
environmental dynamism to be almost irrelevant. This might sound somewhat
confusing at first with regards to the DCV’s criticism of RBV as static but they
consider the dynamism of the capabilities themselves as paramount to the theory,
differentiating dynamic from ordinary capabilities (Winter, 2003) or substantive
capabilities (Zahra et al., 2006). Other types of capabilities have been suggested such
as the capability to develop opportunities and avoid threats (Teece, 2007) but since
these capabilities are typically considered dynamic capabilities, they will not be
specifically taken into account here.

43
What lessons are there to be gleaned from the path dependencies of
successfully adaptive firms? This is where evolutionary economics and
environmental dynamism come back into play. Repetition, reflection and articulation
are the learning mechanisms, which equip firms with the necessary experience to
thrive (Eisenhardt and Martin, 2000; Zollo and Winter, 2002; Zahra et al., 2006).
Learning mechanisms such as these can be either tacit or explicit. Tacit would be
through discussions and peer-‐to-‐peer observation whereas explicit learning would
be through codified knowledge such as manuals or routine specifications. In a
moderately dynamic environment variation is the key to survival whereas selection
more relevant in high-‐velocity environments (Eisenhardt and Martin, 2000).
Likewise, learning from experience is more important to older firms than startups.
Another thing that makes dynamic capabilities harder to measure is the lack
of heterogeneity between firms (Eisenhardt and Martin, 2000) and the lack of a clear
relationship between DCs and performance. Most influential writers on the subject
of dynamic capabilities seem to assume a positive relationship between DCs and firm
performance (Zollo and Winter, 2002, Teece, 2007). There are those however who
approach the question of DCs positive outcome with more caution. Eisenhardt and
Martin (2000) consider DCs to be contributive, but not directly responsible for
improved firm performance. Not only is it problematic to ascertain what positive
affect dynamic capabilities might have but what affect they might have in general.
Two firms with identical capabilities might end up with completely different resource
bases depending on their circumstances after all. There is also the question of the
trade-‐off – by cultivating and employing dynamic capabilities managers neglect
other possibilities (Winter, 2003).
Unsurprisingly the large body of work dedicated to the DCV and the
popularity of the concept has received a good deal of criticism. This criticism is worth
examining. Some argue that the concept is tautological or poorly defined
(Williamson, 1999) whereas others argue that the theory is not universally applicable
(Winter, 2003; Newbert, 2007). Much of the criticism seems to stem from a lack of
clarity regarding the conceptualization, procedures and scope that have hitherto

44
been used to research the DCV. Helfat and Peteraf (2009) deftly answered criticisms
that dynamic capabilities lack a clear scientific theory. DCV is a young and evolving
theoretical standpoint. For it to evolve into a viable scientific theory, great care must
be taken to properly define concepts properly.
Model
When deciding what process to use in the execution of this research a plethora of
options was available. Originally the plan was to delve into Schumpeterian theory,
researching Kondratiev waves and how they could be used in management
decisions. Structural equation modelling, a statistical technique for testing and
estimating causal relationships using a combination of statistical data and qualitative
causal assumptions (Pearl, 2000) seemed to be the next way to go. In the end it was
decided to keep it simple and use survey analysis to pinpoint industry pain points.
This was decided after preliminary research indicated that the target population was
too small to be able to form a statistically viable control group for the dependent
variable.
By surveying individuals employed in the Icelandic energy sector on dynamic
capabilities as business processes, we could ascertain what capabilities are lacking
and therefore, where improvements are needed. Business processes are actions that
firms engage in to accomplish some objective. Thus, business processes can be
thought of as the routines or activities that a firm develops in order to get something
done (Nelson and Winter, 1982; Porter, 1991). Examples of business processes
include the process for acquiring supplies and other raw materials, the process of
producing products or services, the process of delivering products or services to
customers, and the process of providing after sales service (Porter, 1985). (Ray, Jay
and Muhanna, 2004).
This study relies on the exceptional work of scholars who inspect a basic
question that continues to pester DC researchers: How can something as fluid and
constantly changing as dynamic capabilities be quantitatively measured in a
consistent and replicable way? Although this line of inquiry might initially seem more
45
(or even exclusively) relevant in an academic context, being able to reliably quantify
dynamic capabilities is increasingly important to managers who are expected to
simultaneously develop and deploy their DCs (Ambrosini and Bowman, 2009).
Dynamic capabilities cannot be purchased or attained in the same way that other
assets can (Teece, 1997) and being able to accurately gauge what capabilities are
and what they do can save managers vast amounts of time and resources spent
developing the wrong capabilities.
While this research is not on how to measure capabilities, it is grounded on
an analysis of quantitative information received through a questionnaire that was
sent to all Icelandic energy firms as well as service and engineering firms with
connections to energy firms. Orignially, all management staff was invited to take
part, with a total of between 300-‐400 potential participants. The study benefitted
from the assistance and good faith of several agents in upper management that
granted us a greater level of access than we would have otherwise received.
Nonetheless, this proved inadequate and the criteria was later broadened to include
all staff in these firms to increase the number of participants.
There are a number of limitations and delimitations in this research. Of
course time and budget are the biggest constraints, as well as lack of prior
experience. There is also the small size of the target population, the fairly broad
parameters that were necessary to find a sufficiently large population and the lack of
a control group. These limits are partly inherent in the design of the research and
outside of the researchers control but some of the blame undoubtably lies with the
author.

46
III. METHODS
Quantitative research is a type of empirical investigation, focusing on observable and
verifiable observation rather than theory or logic. It’s called quantitative (as opposed
to qualitative) because its findings are expressed numerically, usually through
statistics or other mathematics. While qualitative research attempts to gain broad
insight and form hypotheses about phenomena, quantitative research is used with
the goal of reaching an unbiased result that is applicable to larger populations. To
that end, a researcher will study a subset of the population called a data sample,
manipulating key variables to observe and explain how those variable affect the
subject. Quantitative research has three main tenets:
• Observation and explanation
• Data collection
• Analysis
Observation and explanation is where research begins. The explanation to an
observation can be put forth in the form of a question or hypothesis, which has to be
proved or disproved. Numerical data is then gathered and statistically analysed with
the goal of reaching a verifiable and generalizable conclusion.
The four most basic type of quantitative research are: survey, correlational,
causal-‐comparative and experimental. This study is a survey study. Survey studies
use polls, questionnaires and interviews to study behavior and attitudes. They can be
conducted with one sample or used to compare several samples. When conducting a
survey study it is important that sampling is conducted in such a manner as to
properly reflect the population. While this is often done through simple random
sampling, such as when the goal of the survey is to measure public opinion,
surveying completely at random would not work in this case. A stratified random
sample method was used instead: the sample was originally a group of managers,
chosen at random from the larger population of all managers working for firms in
the Icelandic energy sector. It was later broadened to encompass all employees
working for firms in the Icelandic energy sector.

47
Not only sampling but also the method by which the survey is conducted can
influence the outcome of the study if done improperly. There are a number of ways
that surveys can be conducted but for this study it was conducted through the
website SmartSurvey, which employs a mix of e-‐mail contact and self-‐administration,
and direct polling. The former method offers participants more control and greater
anonymity. Unfortunately, it also means that participants are more likely not to
finish the survey or ignore it. Therefore, direct polling was performed in many cases
if the participant approved.
As mentioned in the second chapter quantitative research has been lacking in
the subfield of dynamic capabilities. Newbert (2007) suggested that this might be
due to the “relative ease of measuring resources as compared to capabilities and
core competencies” and added that “compared to resources, measuring capabilities
and core competencies often necessitates a greater need for primary data collection
techniques and often introduces a greater potential for slippage and respondent bias
(Newbert, 2007).” This research has two main goals, the first of which is to examine
ordinary and dynamic capabilities in the Icelandic energy sector and what they tell us
about the industries pain points. To achieve that the survey data will be analysed in
the context of general data on industry performance, environmental dynamism and
heterogeneous capabilities. The second goal is to assess the viability of quantatitive
methods that have been used elsewhere to study dynamic capabilities in the
Icelandic energy sector. There are therefore three main questions that lead the
development and conduct of the survey:
1. What difficulties face a researcher attempting to perform quantitative
research on the Icelandic energy sector?
2. Research in which sectors could be used as a model or foundation for
research in the Icelandic energy sector?
3. Do the findings fit our expectations based on theory and in comparison with
the findings of the model research?

48
Design
Survey research is often used because it is inexpensive and simple. It has become
widely used in market research and is especially useful for assessing opinions and
trends but must be designed carefully to avoid biased results. Managers have an
incentive to manipulate the information to portray themselves in a more positive
light, but misinterpreting the data can lead to disastrous strategic planning. How
then do we avoid designing a biased and inaccurate survey? While it is impossible to
create a perfectly accurate survey, due in part to the fluid nature of opinions and
trends as well as financial and time constraints, there are steps we can take to make
the survey as accurate as possible.
Self-‐criticism and reflection are vital to achieving an accurate survey. The
goals of the survey must be clear and concise. Too broad or too narrow and the
survey will be flawed. The sample must be chosen in such a way as to ensure
accuracy and representation. While it is one of the researchers goals to gather data
from as broad a base as possible, not all respondents are relevant to the study. If the
survey were about political opinion or ethics, anybodies opinion would be valid, but
in studies such as this, which are specifically about the opinions of employees in the
energy sector it would be fruitless to survey a larger cross section of the wider
population In this study the sample is chosen at random from the entire population
of energy sector employees in Iceland. This was possible due to the small size of the
Icelandic energy sector. In conversation with instructor Gunnar Óskarsson, a sample
size of roughly 100 respondents was mentioned as a good reference quantity to
produce significant results. The total population of people working in management
positions within the energy sector as defined in this study was roughly 350. I
attempted but was unsuccessful in acquiring enough participants from this
population, and so broadened the parameters to encompass all staff employed with
firms in the energy sector, which roughly quadrupled the number of potential
participants. Enough responses were secured, albeit barely. It was challenging and
required three attempts and the help of insiders in the sector. The challenges faced
will be discussed in more detail in the fifth chapter: Discussion.

49
When choosing how to reach people it’s important to consider the goal of
the research and the nature of the sample. While face-‐to-‐face surveying is accurate
it is also time consuming and can feel embarrassing to participants worried about
privacy and the security of their responses. Sending e-‐mails and allowing the
participants to self-‐administer the survey allows them greater privacy but
unfortunately people are less likely to participate without some form of incentive.
Convincing people to participate was one of the biggest challenges faced in doing
this research. Without any incentive to encourage people to take the time to fill out
the survey and considerable concerns about the security and anonymity of the data
gathered, gathering the required number of responses was more time consuming
than had been planned.
The survey was kept as short and clear as possible to avoid confusion. Rating
questions were used rather than multiple choice questions due to the dynamic
nature of the subject matter. While it is slightly more difficult to analyze the results
gleaned from multiple-‐choice questions and the risk of bias is greater, they are more
open-‐ended and allow for extreme views. Mixing up and randomizing the questions
was not considered necessary because the nature of the research did not need to be
disguised from the participant. It was considered more important that the questions
and subject matter be clear to the participant. Finally, the responses were
numerically coded and tested.
Sample
Before sampling the target population must be identified. The population is a
complete group of people or objects that share some defining common
characteristic established by the researcher. Usually, the target population is not the
same as the accessible population. The former is the entire group whereas the latter
is the portion of the population the researcher has access to. In large studies the
difference between the target and accessible populations can be considerable but
due to the small size of the target population in this study (employees in the
Icelandic energy sector), the entire target population was accessible. Since the goal

50
was to find a sample of roughly 100 participants the choice was made to invite the as
much of the total population to participate in the hopes of gathering enough data to
be statistically relevant.
Fortunately for the purposes of this study, information on Icelandic energy
firms and their management is readily available online, as well as from the
Directorate of Internal Revenue. The following e-‐mail was sent to all Icelandic energy
firms, as well as engineering and service firms that had worked with or for energy
firms:
Kæri viðtakandi, Tilgangur þessa tölvupósts er að bjóða fyrirtækinu þínu þátttöku í nafnlausri rannsókn um aðföng fyrirtækja. Þátttaka í rannsókninni er opið öllum þeim sem sinna stjórnunarstörfum hjá fyrirtækjum sem starfa í orkugeiranum auk verkfræði- og þjónustufyrirtækja sem hafa starfað með orkufyrirtækjum. Rannsóknin er unnin af Oddi Sturlusyni B.A. undir leiðsögn Gunnars Óskarssonar Ph.D. og gildir til M.Sc. gráðu í Stjórnun og Stefnumótun. Ekki er hægt að rekja svör til einstakra fyrirtækja og algjör nafnleynd þátttakenda verður gætt. Vinsamlegast smelltu á hlekkinn til að taka þátt: https://www.esurveycreator.com…
Allar athugasemdir og spurningar má senda á netfangið
The e-‐mail was only sent out in Icelandic but for the sake of the reader I will include
this English translation of that e-‐mail:
Dear recipient,
The purpose of this e-‐mail is to invite your company to participate in an
anonymous survey about company resources. Anybody who serves a
managerial role for a company that is active in the energy sector, as well as
for engineering and service companies which work with energy firms is
welcome to participate.

51
The study is developed and conducted by Oddur Sturluson B.A. under the
supervision of Gunnar Óskarsson Ph.D. and will be used as the foundation of
a thesis for a M.Sc. degree in Strategic Management.
Answers can’t be traced to individual companies and participation is
completely anonymous. Please click the link to participate. http….
All comments and questions can be sent to [email protected].
In the following week, 24 individuals participated in the survey. The week after that,
only 3 participated. It was at this point that I first realized that convincing enough
people to participate would be a more difficult task than I had imagined and indeed
the most difficult part of the entire process. After two weeks and 27 responses I sent
another e-‐mail to reiterate the invitation:
Kæri viðtakandi, fyrir rúmlega tveimur vikum síðan var fyrirtækinu þínu boðið að taka þátt í nafnlausri rannsókn um aðföng fyrirtækja. Við viljum þakka þeim sem hafa tekið þátt en jafnframt hvetja þá sem eiga það eftir að taka þátt áður en lokað verður fyrir þáttöku þann 20. mars næstkomandi. Þátttaka í rannsókninni er opið öllum þeim sem sinna stjórnunarstörfum hjá fyrirtækjum sem starfa í orkugeiranum auk verkfræði- og þjónustufyrirtækja sem hafa starfað með orkufyrirtækjum. Vinsamlegast athugið að þetta gildir um alla sem sinna stjórnunarstörfum, óháð deild eða sérfræðisvið. Rannsóknin er unnin af Oddi Sturlusyni B.A. undir leiðsögn Gunnars Óskarssonar Ph.D. og gildir til M.Sc. gráðu í Stjórnun og Stefnumótun. Ekki er hægt að rekja svör til einstakra fyrirtækja og algjör nafnleynd þátttakenda verður gætt. Vinsamlegast smelltu á hlekkinn til að taka þátt: https://www.esurveycreator.com…
Allar athugasemdir og spurningar má senda á netfangið
Here is the English translation of that e-‐mail:
Dear recipient,

52
Approximately two weeks ago your company was invited to participate in an
anonymous survey about company resources. We would like to thank those
that have already participated and encourage those who have not to do so
before the survey is closed march 20th, 2015. Anybody who serves a
managerial role for a company that is active in the energy sector, as well as
for engineering and service companies which work with energy firms is
welcome to participate. Please note that this includes all managers,
regardless of department or field.
The study is developed and conducted by Oddur Sturluson B.A. under the
supervision of Gunnar Óskarsson Ph.D. and will be used as the foundation of
a thesis for a M.Sc. degree in Strategic Management.
Answers can’t be traced to individual companies and participation is
completely anonymous. Please click the link to participate. http….
All comments and questions can be sent to [email protected].
Following the second email, 11 more people participated and I had a total of 38
participants by the time I had planned on closing the survey, still well below the
approximately 100 responses I needed. At this point I decided that a more “hands
on” approach was needed and contacted several managers with whom I had been in
contact for previous school projects and asked for their help in gathering
participants. Three of them expressed lack of interest or time but the rest were of
great assistance and in the next two months the total and final number of
participants rose to 93. While slightly below the goal, it was sufficient for the
purposes of thes study. The challenges faced in gathering enough responses and
how that challenge was overcome will be discussed in more detail in chapter 5.
As a general rule, samples should be as large as possible to improve how well
they represent the population and to avoid sampling error. While the sample used in
this study is fairly small compared to the samples used in many studies conducted on
larger populations, it represents a larger portion of the target population than would

53
usually be the case abroad and is sufficiently higher than the minimum of 30
participants needed for the use of the central limit theorem. There are also only
three variables, which decreases the need for a large sample.
Measurement
When assessing the validity and reliability of a quantitative study it is important to
be aware of the errors and biases to which the researcher might be susceptible.
There are two main types of errors: Type I and II. A Type I error is when the
researcher mistakenly rejects a true null hypothesis and accepts a false alternative
hypothesis. A Type II error is when the researcher accepts a false null hypothesis and
rejects a true alternative hypothesis. The probability that either a Type I or II error
will occur is referred to as alpha or beta respectively. Alpha is established by the
researcher prior to analysis and is represented as a percentage. An alpha of .05 for
example means that there is a 5% chance of mistakenly rejecting a true null
hypothesis. The probability of rejecting the null hypothesis and reaching a
statistically significant result on the other hand is 1 minus beta or power.
At first performing a power analysis was considered to estimate the
likelihood of committing a Type II error, or to rely on the standard values of .05 for
alpha and .8 for beta. The point of a power analysis is to measure the effect of the
independent variable on the dependent variable. To perform a power analysis would
have meant to estimate the population effect size, gamma, based upon a t-‐test of
the difference between the mean of the data with the mean of the data from the
research the method was based on. While this was initially thought to be a good idea
a colleague pointed out that despite the similarities between the subjects of these
studies and the subject of this study, certain variables were vastly different and
could warp the conclusion. We then pivoted from the original research subject to
this one.
The survey used Likert scale questions, which contained 5 options. One end
was labeled “Strongly Disagree” while the other was marked “Strongly agree” with
the middle option representing a neutral response. The first section of the survey
54
asked respondents about their opinions on energy sector innovation and the role it
plays in their firm’s success and the second section asked respondents about basic
and measurable types of capabilities.
Drnevich and Kriauciunas’s (2010) study on the contribution of ordinary and
dynamic capabilities on relative firm performance was the inspiration and
foundation for this research. They theorized and tested the contributions of
capabilities on firm performance, considering the conditions under which ordinary
and dynamic capabilities increased firm performance amongst a sample of Chilean
firms. They did so, not only by examing the contributions of the capabilities
themselves but also by examing the effects of environmental dynamism and
capability heterogeneity. They found that a dynamic environment decreased the
positive effects of ordinary capabilities while increasing the positive effects of
dynamic capabilities to firm performance. The same was true of capability
heterogeneity.
Building on the conclusion that dynamic capabilities positively affect firms in
dynamic environments and with heterogeneous capabilities I immediately became
interested in how this might affect the Icelandic energy sector, which is both
dynamic and heterogeneous, but quite small on an international scale. A survey was
developed based on the survey method they had used, which used three
independent variables four main categories of dynamic capabilities. The first section
of the survey was originally intended to categorize respondents into three categories
depending on their position towards innovation and their opinion of how innovation
affects their firm. The categories were “managers interested in innovation”,
“managers neutral towards innovation” and “managers disinterested in innovation”.
These categories were also supposed to function as the independent variables that
the study would hinge on. The general hypothesis was that managers who are
interested in innovation would work for firms with greater dynamic capabilities,
either because their interest in innovation increases the odds that their firm
supports innovation or because they work in an innovative environment. We
therefore expected managers who belong to the “interested” category to score their

55
firm’s dynamic capabilities higher than the other two categories. After broadening
the target population this section had to be reconsidered however, since it would
most likely skew the results, making them less representative.
Section two depends on the four basic and tangible types of dynamic
capabilities that are used as a measure of the firm’s dynamic capabilities. These are
product development routines, knowledge management routines, acquisition
routines, and exit routines. This study does not specifically address the questions of
life-‐cycle stage theory in the same way that Capaldo et al. (2003) did in their study of
dynamic capabilities in small software firms. According to the life-‐cycle stage theory,
a firm’s life cycle can be segmented into separate and steady stages separated by
changes in the firm’s internal or external environments. Examples of events that
could cause stage changes might be the beginning or end of a cooperative
partnership with another firm or the termination of a key employee. These events
and the stages between them are usually identified by analysing data and interviews
with the firm’s management. The reason life cycles were not specifically addressed is
because the study is not longitudinal and so data is only gathered during one stage.
This is not to say that the information would not be of some value in a longer and
more expensive study but that for the purposes of this study it is unnecessary.
The researcher informally inteviewed several individuals working in the energy
sector to gain some practical insight into what questions should be asked to gain a
relevant working knowledge of the sector. Their feedback was also sought regarding
the survey and some of the wording was altered based on their feedback to ensure
clarity. After that a mass e-‐mail was sent out to all energy firms as well as
engineering and service firms working in the energy sector, inviting them to
participate in the study. After participation, participants were asked to comment on
their opinion of the survey in the hopes of gaining further insight into the data.
Participants answered the survey anonymously on the website e-‐Survey. The original
Icelandic version of the survey is included in the appendix but the English translation
is shown here:

56
I: Independent variables: Statements regarding innovation within the firm and its
impact on performance. These statements will be included in the general survey in
the form of a 5-‐item scale (where 1= strongly disagree and 5= strongly agree).
A. I consider myself well informed about energy sector innovation.
B. Innovation played an important role in the firm’s performance in the last 5
years.
C. Innovation will continue to play an important role in the firm’s performance
in upcoming years.
I (continued): The following are 3-‐item multiple-‐choice questions.
D. Do you think energy production will increase, remain the same or decrease in
the next decade?
E. Do you think energy consumption will increase, remain the same or decrease
in the next decade?
F. Do you think the rate of energy sector innovation will increase, remain the
same or decrease in the next decade?
II: Dependent variables: These are 5-‐item scales measuring the responses to the
following statements concerning firm specific dynamic capabilities (where 1 =
strongly disagree and 5 = strongly agree).
The questions in the following section are about product development routines.
Product development routines refer to the process firms need to undergo to bring
a new product or service to market. This includes concept work, product design
and market research. Please answer on a scale of 1 to 5 how much you agree or
disagree with the following statements if 1 = strongly disagree and 5 = strongly
agree.
A. Product development routines.
a. The firm has an effective product development system.
b. There is a common understanding of how product development can
improve firm performance.

57
c. There is open communication and teamwork between those
responsible for product development.
d. There is coordination between internal departments to develop
products.
e. The firm’s policies and procedures make product development easy.
The questions in the following section are about knowledge management routines.
Knowledge management routines refer to the definition, recording and
development of knowledge employees have as well incentives for employees to
share and gain knowledge. Please answer on a scale of 1 to 5 how much you agree
or disagree with the following statements if 1 = strongly disagree and 5 = strongly
agree.
B. Knowledge-‐management routines.
a. The firm has an effective knowledge-‐management system.
b. There is a common understanding of how knowledge-‐management
can improve firm performance.
c. There is open communication and teamwork between those
responsible for knowledge-‐management.
d. There is coordination between internal departments to manage and
disseminate knowledge.
e. The firm’s policies and procedures make knowledge-‐management
easy.
The questions in the following section are about acquisition routines. Acquisition
routines refer to the acquisition of all resources that a firm or organization needs
for operations, production or services, whether it be funds, property, labour,
knowledge, technology, materials or other merchandise. Please answer on a scale
of 1 to 5 how much you agree or disagree with the following statements if 1 =
strongly disagree and 5 = strongly agree.
C. Acquisition routines.
a. The firm has an effective resource acquisition system.

58
b. There is a common understanding of how resource acquisition can
improve firm performance.
c. There is open communication and teamwork between those
responsible for knowledge acquisition.
d. There is coordination between internal departments to acquire and
deploy resources.
e. The firm’s policies and procedures make resource acquisition easy.
The questions in the following section are about exit routines. Exit routines refer to
jettison of all obsolete resources. Please answer on a scale of 1 to 5 how much you
agree or disagree with the following statements if 1 = strongly disagree and 5 =
strongly agree.
D. Exit routines.
a. The firm has an effective resource jettison system.
b. There is a common understanding of how the jettison of obsolete
resources can improve firm performance.
c. There is open communication and teamwork between those
responsible for the jettison of obsolete resources.
d. There is coordination between internal departments to jettison
obsolete resources.
e. The firm’s policies and procedures make the jettison of obsolete
resources easy.
As mentioned earlier the second section of the survey is divided into four categories
based on basic and observable dynamic capabilities. The categories are product
development routines, knowledge management routines, acquisition routines, and
exit routines. A high score in these categories indicates a high level of dynamic
capabilities and vice versa. A generally poor grade in one or more of these categories
could indicate what needs to be addressed for the Icelandic energy industry to
become more competitive on an international scale.

59
Analysis
In this section we’ll list the way the answers are quantified and explain what sort of
results we expected. The possible scores are listed below.
I: Independent variables:
A. 1-‐5
B. 1-‐5
C. 1-‐5
D. 1-‐3
E. 1-‐3
F. 1-‐3
Possible total: 24
II: Dependent variables:
G. 0-‐24
H. 0-‐24
I. 0-‐24
J. 0-‐24
Possible total: 96
The original idea was for participants to be divided into three categories based on
their responses in the first section. Participants could therefore fall in the “managers
interested in innovation”, “managers disinterested in innovation” or “managers
neutral about innovation” category. The probability of falling in any category was
equal but since it is to be expected that a large portion of managers would be found
around the mean, the curve was expected to be normal. The opinions of managers
who are slightly interested or disinterested would really have been of slightly less
importance to us in this version of the study than the opinions of those managers
that represent the extremes of being very interested or disinterested. We expected
to find that managers in the “interested” category score higher in the second section

60
than those in the other two categories and that those in the “disinterested” category
score lower than the rest.
Validity
There are several factors that require consideration when ensuring that a survey
returns valid and reliable results. The way the questions are ordered, worded,
formatted and structured can all affect the participants experience of the survey and
indeed whether they choose to participate at all. Validity is the accuracy of the data
we gather while reliability is the consistency of data we gather using this method.
There are a few different types of validity that are used to measure the accuracy of
different aspects of the study. Most surveys have the appearance of validity or face
validity but what might seem like legitimate questions or design on the surface
might not stand up to serious scrutiny. A good survey should have content, internal,
and external validity.
Content validity means that the questions reflect the subject accurately, by
not excluding important issues or giving undue weight to unimportant issues. If we
were to ignore the effect of environmental dynamism on the contribution of
capabilities for example, we might assume that our results were applicable to less
dynamic industries. Internal validity means that we can reasonably expect the
questions to explain the subject. In other words this means that the questions
should be formatted with the goal of finding a relationship between the
independent and dependent variables in mind. External validity means that our
results can be generalized to the target population. This form of validity is closely
connected to sample representativeness and requires that the sample be statistically
similar to the population. Qualitative research can improve the validity of surveys by
imbuing the researcher with a deeper understanding of the subject and the cultural
concerns of his target population.
Reliability is related to internal consistency and the consistency of our results.
This refers both to the consistency of our respondents’ answers, even when the
wording and design of our questions is changed aswell as the degree to which
61
different questions measure the same element. There are several ways to test for
reliability, including but not limited to split sample comparisons or Cronbach’s Alpha.
Validity and reliability do not always go hand in hand and even an invalid study can
be reliable if it is repeatedly wrong in the same way.
Assumptions
Assumptions are things that are accepted as true withouth having been proved. They
are essential and it would be impossible to conduct research without them.
Assumptions can be simple, like that people will tend to act in their own best
interest or that participants will be honest when they respond to the researchers
questions. While it is not necessary to prove ones assumptions, they must be
justified. It is not enough simply to state ones assumptions. For example, a
researcher could justify his assumption that participants will be honest by ensuring
his participants’ anonymity and security, giving them no reason to answer
dishonestly. It can also help to allow participants to comment and ask questions
about the survey to assure them that the results will faithfully reflect their answers
and not be taken out of context.
The assumptions we use in quantitative research are not the same as the
ones used in qualitative or mixed research. The most important assumptions of
quantitative research are that it takes an objective stance to trying to answer or
understand questions or phenomena – the subjective state of the research topic or
of the researcher are not addressed. It is supposed to be unbiased and free of
values. It is positivist and deductive, stemming from hypotheses and leading to
observations. The results of properly done quantative research in social fields are
considered to be generalizable in different social situations and the positivistic
scientific method is considered the cornerstone of reaching the correct conclusions.
In short, the assumptions used in quantitative research are based on the idea that
people, experiences, phenomena and reality are independent of personal experience
and objectively measurable. If something is not measurable it is ignored.

62
These assumptions permeate the quantitative method with strengths and
weaknesses. Due to the vast amount of published research on which researchers can
base their studies and stringent rules and guidelines quantitative research is
consistent and can be easily compared to other research on the subject. Since the
researcher is less visible criticism is more likely to be focused on the research itself
rather than critics’ opinion of the researcher. The researchers objectivity also
decreases the effect he or she has on the subject being studied, although some
scholars have cast doubt on the degree to which this is true. Further more,
quantitative research can be conducted fairly quickly and returns a solid answer
rather than an interpretation or opinion on the subject.
These strengths have a flip side however: stringent rules and guidelines can
also mean that researchers interpret data so that it is consistent with prior research
rather than take the risk of their research being discounted. It is a common criticism
by proponents of qualitative research methods that the results of quantitative social
research do not fit with the experience of those involved in the subject. While
quantitative data can seem consolingly precise and clear cut, the reality of a
situation might belie a simple explanation. Despite the different assumptions used in
different research paradigms there is much to be learned from the different
approaches, given that they are properly used and interpreted.
Another thing the researcher has to be aware of and address are weaknesses
in the study called limitations that are beyond the researchers control. These can be
time, money, or the scope of preexisting data on the subject. Delimitations are limits
to the scope of the study that are in the researchers control. These can be the goals
of the research, the research method and the variables. All reseach has limitations
and delimitations; indeed the very act of choosing a specific research subject
represents delimitation since it excludes all other subjects. The delimitations
elucidate the criteria participants must fulfill and what population I can generalize
the results to. For example, the results of this study are generalizable to managers
(1), who currently work for firms active in the energy sector (2) in Iceland (3).

63
IV: FINDINGS
Brief overview
What sort of dynamic capabilities are common in Icelandic energy firms
and what can they tell us about industry pain points?
This is the research question that lies at the heart of this study. It is a humble
contribution to the research on the contribution of dynamic capabilities to
innovation and of dynamic capabilities and innovation to firm performance but
worth exploring. With that goal in mind I performed the aforementioned survey with
the hope of shedding some light on the subject.
In a nutshell, the results of the survey are concurrent with other research on
the subject and in line with my expectations. There are of course a number of other
related questions that are left unanswered however. Do managers feel the same as
other employees? Do their firms actually have more dynamic capabilities or are they
simply more likely to identify them due to their interest in innovation? These
questions and more will be addressed in the next chapter: Discussion.
For now I will restrain myself to discussing the data itself. To recap, the four
categories of dynamic capabalities used were product development, knowledge
management, acquisition and exit routines. It’s interesting that some categories
were generally rated higher than others across the board. Unfortunately data to
compare the Icelandic energy sector to other countries’ energy sectors was
unavailable. I am therefore unable to speculate whether this characterizes the
energy industry as a whole or is a culturally specific phenomenon.
Results
The first 6 questions, regarding innovation within the firm and its impact on firm
performance were split into two categories. The first three were 5-‐item scales where

64
1 = strongly disagree and 5 = strongly agree. The next three after that were 3-‐item
multiple-‐choice questions where the options were: Increase, Remain the same and
Decrease. These first six questions represented the independent variable of the
study, where respondents would be categorized according to their knowledge of,
and interest in, innovation. In response to the first statement “I consider myself well
informed about energy sector innovation”, 17 disagreed or strongly disagreed, 24
were neutral and 52 agreed or strongly agreed. Seeing as how the respondents work
in the energy sector, it is not particularly surprising that they would consider
themselves well informed about innovation in that sector, especially if they compare
their knowledge of the subject to that of people uninvolved in the sector. There is
also the chance that the respondents are overestimating their knowledge, although
it is difficult to surmise what effect such psychological factors might have on
participant responses. All things considered, a predominantly positive response such
as this one indicates that the chosen target population is suitable for the subject
being discussed.
Question 1: (1:9, 2:8, 3:24, 4:34, 5:18)
The next two questions hint at an interesting foundation for further research I had
not anticipated. While 44 agreed or strongly agreed that innovation had played an
important role in their firm’s performance in the last 5 years, 60 agreed or strongly

65
agreed with the statement that innovation will continue to play an important role in
the firm’s performance in upcoming years.
Question 2: (1:9, 2:16, 3:24, 4:35, 5:9)
This seeming discrepancy raises the question: what has changed? If people do not
think innovation has been important in the past, why do they expect it to be
important in the future? Has their been some external development recently that
could explain this view?
Question 3: (1:17, 2:8, 3:8, 4:56, 5:4)

66
The responses to the next three questions show an overwhelming view that energy
production, consumption and innovation will increase in the future. It is safe to
assume that many of those respondents who think that production or consumption
will decrease think that innovation will trend towards greater utility and efficiency in
the energy sector. I say this since it is unlikely that a growing population will need
less energy or be easily convinced to decrease their consumption, meaning that
energy will have to be more efficiently distributed and utilized.
Question 4: (1:8, 2:4, 3:81)
Question 5: (1:9, 2:16, 3:68)

67
Question 6: (1:2, 2:13, 3:78)
The following 20 questions were split into 4 sections: product development routines,
knowledge management routines, acquisition routines and exit routines. These are
all 5-‐item scales measuring the responses to statements made regarding dynamic
capabilities where 1 = strongly disagree and 5 = strongly agree. These 4 sections
represent the dependent variables used in my analysis. Questions seven to eleven
were about the process firms need to undergo to bring a new product or service to
market, called product development routines.
Question 7: (1:13, 2:17, 3:24, 4:34, 5:5)

68
Product development routines include concept work, product design and market
research. When looking at the responses regarding product development routines,
the firms in question seem to be doing alright. There are more who agree with the
statements than disagree with the statements but there is also a significant amount
that responded neutrally.
Question 8: (1:10, 2:22, 3:22, 4:33, 5:6)
The statement that received the most neutral responses was number 9: “There is
open communication and teamwork between those responsible for product
development.” 34 people responded neutrally while 21 disagreed or strongly
disagreed and 38 agreed or strongly agreed. The responses in the product
development section seem to be rather normally distributed, with few respondents
answering strongly one way or the other.

69
Question 9: (1:2, 2:19, 3:34, 4:36, 5:2)
The next question: “There is coordination between internal departments to develop
products.” received a majority of positive responses. This is interesting because
question 9 and 10 are quite similar. How can internal departments coordinate to
develop products if there isn’t open communication and teamwork between those
responsible for product development? There would seem to be some ambiguity
regarding the degree to which managers control coordination between
departments.
Question 10: (1:1, 2:19, 3:26, 4:45, 5:2)

70
Question 11: (1:0, 2:25, 3:32, 4:35, 5:1)
Questions twelve to sixteen were about knowledge-‐management routines.
Knowledge-‐management routines refer to the definition, recording and
development of knowledge employees have as well incentives for employees to
share and gain knowledge. Interestingly, 55 respondents disagreed with the
statement that the firm they work for has an effective knowledge-‐management
system and 6 strongly disagreed.
Question 12: (1:6, 2:55, 3:13, 4:17, 5:2)
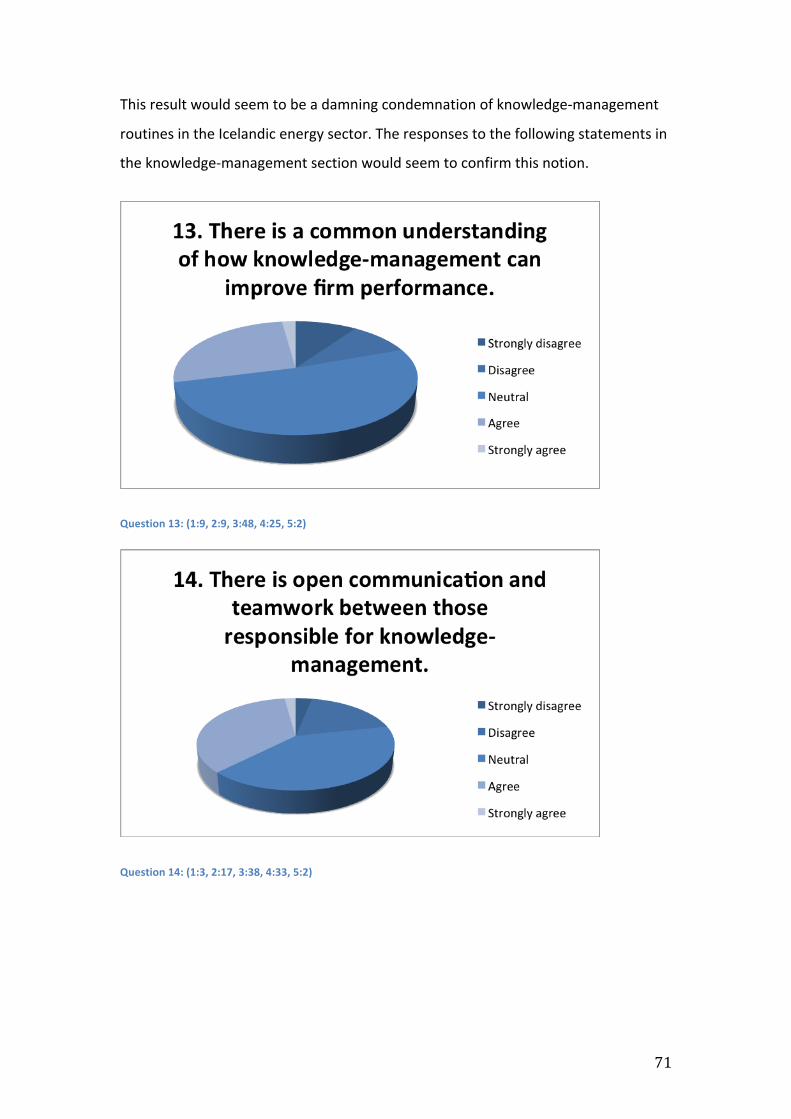
71
This result would seem to be a damning condemnation of knowledge-‐management
routines in the Icelandic energy sector. The responses to the following statements in
the knowledge-‐management section would seem to confirm this notion.
Question 13: (1:9, 2:9, 3:48, 4:25, 5:2)
Question 14: (1:3, 2:17, 3:38, 4:33, 5:2)

72
Question 15: (1:4, 2:25, 3:37, 4:25, 5:2)
The majority of respondents in all 5 questions respond neutrally or in disagreement.
This indicates that participants consider their firm’s knowledge-‐management
systems subpar.
Question 16: (1:9, 2:16, 3:41, 4:26, 5:1)
Questions seventeen to twenty-‐one are about acquisition routines. Acquisition
routines refer to the acquisition of all resources that a firm or organization needs for
operations, production or services, whether it be funds, property, labour,
knowledge, technology, materials or other merchandise.

73
Question 17: (1:11, 2:9, 3:26, 4:37, 5:10)
The responses in this section were largely positive. It was only in question 18: “There
is a common understanding of how resource acquisition can improve firm
performance,” that positive responses were not the majority.
Question 18: (1:3, 2:26, 3:25, 4:28, 5:10)

74
Question 19: (1:2, 2:26, 3:13, 4:51, 5:1)
Question 20: (1:1, 2:23, 3:17, 4:47, 5:4)

75
Question 21: (1:1, 2:25, 3:11, 4:54, 5:2)
Questions twenty-‐two to twenty-‐six are about exit routines. Exit routines refer to the
jettison of all obsolete resources.
Question 22: (1:10, 2:9, 3:46, 4:27, 5:1)
The responses to these questions were similar to the responses in the knowledge-‐
management section, which is to say largely neutral or negative.

76
Question 23: (1:8, 2:28, 3:36, 4:12, 5:9)
Question 24: (1:8, 2:9, 3:54, 4:19, 5:3)

77
Question 25: (1:8, 2:27, 3:40, 4:15, 5:3)
Question 26: (1:9, 2:17, 3:47, 4:19, 5:1)
Neutral responses, while not explicitly negative, can be viewed as a certain failure on
the part of the firms in question. If employees are unfamiliar with the subject, we
can assume that management is not placing much emphasis on it.
Descriptive analysis
The data is interesting although when analysed in context with existing research on
the energy industry and the Icelandic market, not especially surprising. The Icelandic

78
energy sector is small and dynamic, with an emphasis on technological skill and an
interest in innovation. The luke-‐warm responses to questions about knowledge
management seem to echo prior research about the lack of consistent and explicit
knowledge management in Icelandic firms. Likewise, resource jettison is difficult in a
market with many financially significant long-‐term investments. The inclusion of staff
in addition to managers may also mean that many of the recipients are unfamiliar
with their firm’s resource jettison routines.
Validity/reliability
To perform a validity and reliability analysis of the results would require more time
and resources than are available, but we can judge what sort of analysis would be
suitable from the methods used in this study. As mentioned earlier, reliability is the
degree of stability exhibited when a measurement is repeated under identical
conditions. Validity on the other hand is how well a survey measures what its
intended subject. The unstable nature of the subject being studied creates a certain
lack of reliability. People’s opinions frequently change and don’t necessarily reflect
real, objective changes in the industry. To assess the reliability of the study, there
are three types of analysis that could be performed: a test-‐retest analysis, alternate-‐
form analysis and internal consistency analysis.
The test-‐retest analysis is the most commonly used reliability test in survey
research and is performed by asking the same respondents to take the same survey
twice at different times to check how stable their responses are. The results are
quantified with a correlation coefficient (r). If an observer gathers data,
intraobserver reliability can be gauged by having the same observer make two
separate recordings. The stability problem mentioned in the last paragraph can be
countered by retesting the survey shortly later. Opinions are more likely to change
over a long period of time. It is important to avoid overusing this method though, or
else the practice effect, which occurs when individuals become familiar with the
survey answer based on their memory of the last answer rather than their sincere
response, inflating the reliability estimate.

79
Another commonly used test is the alternate form analysis, in which
questions measuring the same things are worded or ordered differently. The
researcher must be careful to change the questions slightly so that they are similar
but not identical. It is important that the question still clearly refer to the same
subject. One can also avoid altering the wording of the question by changing the
order or wording of the response options without changing their meaning. This
compels participants to read the response options carefully and genuinely consider
their answer. Whichever method is chosen, it is imperative to have the two forms
equivalent and with the same degree of difficulty, otherwise the attributes being
measured will not be the same. The alternate-‐form analysis can be performed at the
same time or at separate points in time. When performed at the same time the
sample can be split in half and the halves compared. If the sample is large enough,
you can split it into more forms.
The third form of analysis is the internal consistency analysis, which is applied
to multiple items that measure the same concept. This form of analysis uses
Cronbach’s coefficient alpha to measure how well different items measure different
attributes of the same variable. Internal consistency reliability is not the most
relevant form for this particular study.
In addition to the reliability analyses, it would be prudent to perform validity
measures to check how well the survey measures the subject is was supposed to
measure. Technically speaking there are four types of validity, although face validity
is not universally considered a real measure of validity. Face validity refers to how
valid the survey appears at a glance, even to people without prior knowledge or
training in that field. Content validity is another qualitative measure of validity
although reviewers familiar with the subject at hand measure this one. In a nutshell,
content validity means that the survey includes (and excludes) everything it should.
A more quantitative form is of criterion validity, which measures how well the
research model or instrument used compares to other models or instruments. The
most difficult and valuable form is construct validity. This measures how accurately
the research model or instrument measures the subject. If several differing research

80
methods all had a high degree of construct validity they would return similar results
about the same subject. This is the most work-‐intensive measurement, since it
requires different approaches performed by multiple researchers on the same
subject, which must not be confused with similar subjects.

81
V. DISCUSSION
The findings of this study seem to indicate that knowledge management and
resource jettison routines need improvement in the Icelandic energy sector. The
findings can be interpreted in a number of ways however, which are not mutually
exclusive. Participants could have a skewed opinion of what routines are working
well based on their own departments, the results may apply to firms in other
comparably dynamic sectors, the results may not be bound to the Icelandic energy
sector and so on.
All of these possible interpretations provide intriguing possibilities for further
research. If we rely solely on existing literature on the DCV however, it would seem
that the staff’s capabilities likely have more influence on the corporate culture than
the other way around. In their critique of the importance of dynamic capabilities,
Eisenhardt and Martin (2000) concluded that resource configurations are more
important than dynamic capabilities in deciding long-‐term competitive advantage. If
this is the case it would mean that the configuration of individual level skills and
interest in innovation are more important to the success of the firm than the firm
level capabilities to alter those configurations.
This scope of this study is of course, much too small to be able to declare with any
certainty whether individual level skills or firm level capabilities come first in this
proverbial “chicken or the egg” scenario. In fact, due to the pivot from researching
only managers to researching all staff in any capacity, the study became less about
management and more about corporate culture. This pivot was unavoidable, due to
the difficulty of producing a statistically viable sample from such a small population
as managers in the Icelandic energy sector. In hindsight, the best way to perform a
quantitative study of such a small population would be to perform a longitudinal
study. Time and resource constraints make such a study beyond the reach of an
M.Sc. student but would return the most reliable results.
If we consider the results in the context of DCV criticisms however, we can
see some interesting implications from the results of this study. Let us first consider

82
capabilities and how they are developed or learned. Capabilities can be gained or
lost and the current level of capability can be changed by new inflows or outflows of
capabilities. Inflows and outflows and organizational learning are affected by the
current configuration of resources and capabilities, both at an individual and at a
firm level. While interpreting the data it struck me that the main resource, human
resources, was underrepresented in the questionnaire. No questions were about the
recruitment and selection of new human resources, which should be seen as an
immensely important capability.
Knowledge management was another section that could have been done
differently. The difference between tacit and explicit knowledge, as well as the
unspoken and varying assumptions made by respondents make such a rudimentary
inspection of knowledge management routines superficial. After all, it tells us
nothing of what kind of knowledge is relevant or how respondents define
knowledge. Firms also don’t really seek to make all tacit knowledge or behaviour
explicit or codified, even if they could. Corporate culture and the way knowledge is
transferred in the work place is a highly social phenomenon and often difficult to put
into words. Besides the difficulty of codifying tacit knowledge, there is also a degree
of risk involved. Some procedures, systems and behavior are suitable for codification
and stringent implementation, but some preexisting knowledge or procedures can
be flawed, outdated or detrimental. Once they are made explicit however it can
prove difficult to get rid of them, since they become part of “how things are done
around here”.
There is also the issue of anonymity in a market where one firm is by far the largest.
While anonymity is considered important to reach an unbiased solution as well as for
the protection of the privacy of the participants, it also means that there is no way of
knowing whether one or more firms are overrepresented. This should not be a
problem due to the randomization of respondents, but it would have been
preferable for the researcher to have some way to be able to tell what firms were
being discussed without jeopardizing the respondent’s anonymity.

83
By far the most interesting result of this study was the neutral response that the
sections on knowledge management and resource jettison received. This neutrality
can be interpreted as a lack of familiarity with the subject and the routines
employed by the firm, or indeed that the lack of familiarity stems from the lack of
any formal routines. It has been noted in earlier research that knowledge
management is widely lacking in Icelandic firms and so a general lack of
understanding in that field is not entirely surprising, what is surprising is the lack of
familiarity with jettison routines, which are the flip side of acquisition routines. This
could indicate that the emphasis within the firm is so firmly placed on resource
acquisition that getting rid of obsolete resources is not even given a second thought.
This brings to mind an anecdote about the recent redecoration of Gamla Bíó, the
oldest theatre in Iceland. Those who had purchased it wanted to redecorate the
interior, and so without giving it a second though ripped out the old furnishings and
threw them out into trash containers to be taken away. Designers, woodworkers and
many others saw the famous old chairs and furniture and immediately jumped at the
opportunity to own these beautiful and historical furnishings which would have
otherwise have ended up in a landfill. The new owners hadn’t even given it a second
thought that these old but still functional resources could be of any value.

84
VI. CONCLUSION
Summary
In the introduction of my thesis I discussed the need for this sort of research, what
problem it is that I hoped to illuminate and discussed the theoretical and practical
context of my research. In the chapter Theory I reviewed the relevant literature,
layed out the scope of the study and justified my choice of research model. In the
chapter after that, Methods, I went into further details about the research model
and how it was employed, as well as how I planned to test for validity and what
methodological assumptions I made. In Findings I discussed the data gathered during
the implementation of the research method. I go into how I would test for validity
and test the hypotheses. I then discuss the application of the research method and
provide a short descriptive analysis in the next chapter, Discussion. In this final
chapter, I will discuss my thoughts now that I have completed the study, what
implications the findings have and what I would do differently if I were to repeat the
study, as well as offering several suggestions for further research on the subject.
The topic of this study has changed considerably since I wrote the first
research plan, both in reaction to external challenges as well as the development of
my own knowledge on the subject matter. At first my goal was to contribute to the
quantitative research needed to illuminate the dynamic capability view. My
impetuousness caught up with me and the further I proceeded with my research the
more my limitations and the limitations of my study due to time and resource
constraints became clear. Originally, my goals were to improve the position of
academic research in the field of strategic management, especially in the subfield of
dynamic capabilities and to improve managerial decision making in the Icelandic
energy sector. Unsurprisingly, these rather ambitious goals took on more specific
and attainable forms in the months to come.
While strategic management does have limitations, it is nonetheless a
valuable tool for firms to position themselves to be able to react quickly and

85
appropriately to unforeseen external factors. This is especially true when pursuing
long term competitive advantage in a dynamic environment, such as the energy
sector. Dynamic capabailities and innovation are intrinsically linked concepts and the
main goal of this study was to gain further insight into the relationship between
them. I decided to perform a quantitative study due to the perceived need for more
quantatitive research in the field of strategic management. In hindsight, I think that
the Icelandic energy sector requires further qualitative research, due to cultural
factors that differentiate the Icelandic energy sector from the global and American
sectors on which most of the relevant literature is based. Any further quantitative
research would in my opinion be most productive if it used a longitudinal format and
received in-‐depth access to numerical data from the subject firms – something that
was beyond my reach and the humble scope of my research. The primary goal of this
research was to test whether this form of quantitative study could be used on a
small population. Judging from my experience, this method is insufficient for the
needs of any researcher hoping to reap meaningful quantitative data from such a
small sample. Different methods are needed.
There are a number of interesting possibilities that could not be confirmed or
denied with the data collected. This is not to say that the data is of no value but that
the format originally intended to categorize the respondents into groups of
“uninterested”, “neither uninterested or interested” or “interested” was insufficient
to account for the overwhelmingly “interested” response the study received in the
first section. This is indicative of the fundamental shortcomings of the method in this
environemt but is also likely due to two errors on my part: the name of the study
given and its explanation may have been more likely to attract respondents
interested in or positive towards innovation. The first section should also have been
more thorough and randomized, so as to check internal validity. The nature of the
population also changed midway through the study, which no doubt influenced the
responses I received. When it became clear to me that of the roughly 350 individuals
who perform a managerial role in the Icelandic energy sector, less than 40 would be
willing to answer I realised that I needed to cast a wider net. I then resent my
invitation to include all staff of firms that produce, distribute or sell energy and the
86
engineering and service companies that work with them. While this gave me a much
larger target population and made it much easier for me to receive the roughly 100
responses I had hoped for, I worry that the study’s relevance and accuracy suffered
as a result.
Conclusions
The responses to our questionnaire lead us to a few important conclusions, albeit
not the ones we were looking for. Knowledge management and resource jettison
systems can be seen as lacking in this field, although product development routines
and resource acquisition are relatively strong. This gives the impression that the
Icelandic energy sector is in general more preoccupied with rapid growth than with
rapid adaptability. This is also reflected in the overwhelmingly optimistic responses
gathered that energy consumption, production and innovation were likely to
increase in the future. It is also reflected in media coverage and public statements by
Icelandic energy firms, who continuously announce new projects and plans for
further expansion. In a way it makes sense – Iceland has grown and become
increasingly modern, industrial and hungry for energy. The Icelandic energy sector
emphasizes rapid growth at the expense of adaptability because things only seem to
be able to go up from here. What’s particularly interesting however is that few of
the respondents seem to consider that an increase in energy sector innovation
would result in less consumption, and less need for expanded operations. Instead,
the goal seems to be to expand operations abroad to justify further growth.
Implications
As I’ve mentioned a few times before in this essay, the method I used could have
been better suited to the environment, but another limitation I now realize affected
the validity of my study is the ambiguity surrounding what methods are to be used in
dynamic capability research and indeed what constitutes a dynamic capability. I
would therefore first and foremost advise that further qualitative research is
performed on the subject of dynamic capabilities in the Icelandic energy, as a

87
foundation on which to decide which quantitative research methods and
experiments would be most suitable in the future. Due to the small size of the target
population, an in-‐depth longitudinal study, taking place over a span of a few years
would in my opinion be the most likely to return reliable and important results. All
four categories of dynamic capabilities studied in this thesis: product development,
knowledge management, resource acquisition and resource jettison offer important
avenues of research for future studies. The original goal of findind industry wide pain
points gives way to studying the relationship between individual level skills and firm
level capabilities – is it the capable organization that picks and creates skilled staff or
is it the skilled staff that pick and create a capable organization – is also a very
exciting and important subject, although it might be unhandy for such a small
statistical population.
88
Bibliography
Askja Energy Partners (a). (2015). Iceland in a Nutshell [internet portal]. Retrieved
from http://askjaenergy.org/iceland-‐introduction/iceland-‐in-‐a-‐nutshell/
Askja Energy Partners (b). (2015). Energy Data [internet portal]. Retrieved from
http://askjaenergy.org/iceland-‐introduction/energy-‐data/
Askja Energy Partners (c). (2015). The Energy Sector [internet portal]. Retrieved
from http://askjaenergy.org/iceland-‐introduction/iceland-‐energy-‐sector/
Armstrong, C. E. and Shimizu, K. (2007). A Review of Approaches to Empirical
Research on the Resource-‐Based View of the Firm. Journal of Management,
33(6): 959-‐986.
Barney, J. B. (1991). Firm Resources and Sustained Competitive Advantage. Journal
of Management, 17(1): 99-‐120.
Barney, J. B. and Hesterly, W. S. (2011). Strategic Management and Competitive
Advantage. Pearson: Boston.
Barreto, I. (2010). Dynamic Capabilities: A Review of Past Research and an Agenda
for the Future. Journal of Management, 36(1): 256-‐280.
Baum, J. R., Locke, E. A. and Smith, K. G. (2001). A multi-‐dimensional model of
venture growth. Academy of Management Journal, 44: 292-‐303.
Baumol, W. J. (1968). Entrepreneurship in Economic Theory. The American Economic
Review, 58(2): 64-‐71.
Bowman, E. H., Singh, H. and Thomas, H. (2002). The Domain of Strategic
Management: History and Evolution. In Handbook of Strategy and
Management, Pettigrew, A., Thomas, H. and Whittington, R. (eds.): 31-‐51.
Sage: London.

89
Brown, T., Davidsson, P. and Wiklund, J. (2001). An Operationalization of Stevenson’s
Conceptualization of Entrepreneurship as Opportunity-‐based Firm Behavior.
Strategic Management Journal, 22(10): 953-‐968.
Clegg, S., Carter, C., Kornberger, M. and Schweitzer, J. (2011). Strategy: Theory and
Practice. Sage Publications: London.
Coase, R. H. (1937). The Nature of the Firm, Economica, 4: 386-‐405.
Cyert, R. M. and J. G. March (1963). A Behavioural Theory of the Firm. New Jersey:
Prentice-‐Hall.
Danneels, E. (2002). The Dynamics of Product Innovation and Firm Competences.
Strategic Management Journal, 23: 1095-‐1121.
Dierickx, I. and Cool, K. (1989). Asset Stock Accumulation and Sustainability of
Competitive Advantage. Management Science, 35(12): 1504-‐1511.
Drnevich, P. L. and Kriauciunas, A. P. (2010). Clarifying the Conditions and Limits of
the Contributions of Ordinary and Dynamic Capabilities to Relative Firm
Performance. Strategic Management Journal, 32(3): 254-‐279.
Dutta, S., Narasimhan, O. and Rajiv, S. (2005). Conceptualizing and Measuring
Capabilities: Methodology and Empirical Application. Strategic Management
Journal, 26: 277-‐285.
Eisenhardt, K. M. and Martin, J. A. (2000). Dynamic Capabilities: What are they?
Strategic Management Journal, 21: 1105-‐1121.
Gersick, C. J. G. and Hackman, J. R. (1990). Habitual Routines in Task-‐Performing
Groups. Organizational Behaviour and Human Decision Processes, 47: 65-‐97.
Grant RM. 1996. Toward a Knowledge-‐Based Theory of the Firm. Strategic
Management Journal, Summer Special Issue 17: 109–122.

90
Griffin, A. (2008). New Strategies for Reputation Management: Gaining Control of
Issues, Crises and Corporate Social Responsibility. Kogan Page Limited:
London.
Helfat, C., Finkelstein, S., Mitchell, W., Peteraf, M., Singh, H., Teece, D. and Winter, S.
(2007). Dynamic Capabilities: Understanding Strategic Change in
Organizations. Malden: Blackwell.
Helfat, C. E. and Peteraf, M. A. (2009). Understanding Dynamic Capabilities: Progress
Along a Developmental Path. Strategic Management Journal, 7(1): 91-‐102.
Hitt, M.A., Ireland, R. D. and Hoskisson, R. E. (2009): Strategic Management:
Concepts, Competitiveness and Globalization. Cengage Learning Business
Press: Stanford.
Hitt, M. A., Ireland, R. D., Camp, S. M. & Sexton, D. L. (2001). Guest Editor’s
Introduction to the Special Issue. Strategic Entrepreneurship: Entrepreneurial
Strategies for Wealth Creation. Strategic Management Journal, 22: 479-‐491.
Hitt, M. A., Ricart i Costa, J. E. and Nixon, R. D. (1998). The New Frontier. In M. A.
Hitt, J. E. Ricart i Costa and R. D. Nixon (eds.) Managing Strategically in an
Interconnected World. Chichester: Wiley; 1-‐12.
Ireland, R. D. and Hitt, M. A. (1999). Achieving and Maintaining Strategic
Competitiveness in the 21st Century: The Role of Strategic Leadership.
Academy of Management Executive, 13(1): 43-‐57.
Kahneman, D. and Lovallo, D. (1993). Timid Choices and Bold Forecasts: A Cognitive
Perspective on Risk Taking. Management Science, 39(1): 17-‐31.
Knight, F. H. (1921). Risk, Uncertainty, and Profit. Hart, Schaffner & Marx: New York.
Kogut B. and Zander, U. (1996). What Firms do? Coordination, Identity, and Learning.
Organization Science 7(5): 502–518.
91
Kotler, P., Armstrong, G., Wong, V. & Saunders, J. (2008). Principles of Marketing.
Pearson Education International: London.
Kuhn , T. (1962). The Structure of Scientific Revolutions. University of Chicago Press:
Chicago.
Lange, O. R. (1943). A Note on Innovations. The Review of Economics and Statistics,
25(1): 19-‐25.
Langer, E. J. (1989) Minding Matters: The Mindlessness/Mindfulness Theory of
Cognitive Activity. In L. Berkowitz (Ed.) Advances in Experimental Social
Psychology. New York: Academic Press.
Lee, C., Lee, K. and Pennings, J. M. (2001). Internal Capabilities, External Networks
and Performance: A Study on Technology-‐based Ventures. Strategic
Management Journal, 22(6-‐7): 615-‐640.
Lippman, S. A. and Rumelt, D. P. (1982). Uncertain Imitability: An Analysis of
Interfirm Differences in Efficiency Under Competition. The Bell Journal of
Economics, 13(2): 418-‐438.
Machlup, F. (1967). Theories of the Firm: Marginalist, Behavioural, Managerial.
American Economic Review, 57: 201-‐220.
Makkonen, H., Phjola, M., Olkkonen, R. and Koponen, A. (2013). Dynamic capabilities
and firm performance in a financial crisis. Journal of Business Research,
67:2707-‐2719.
McGee, J., Thomas, H. and Wilson, D. C. (2010). Strategy: Analysis and Practice, 2nd
edition. Mcgraw-‐Hill: New York City.
Ministry for Foreign Affairs (2015). Skýrsla Gunnars Braga Sveinssonar
utanríkisráðherra um utanríkis-‐ og alþjóðamál (Lögð fyrir Alþingi á 144.
Löggjafarþingi 2014-‐2015). Reykjavík: Ministry for Foreign Affairs.
92
Nag, R., Hambrick, D. C. and Chen, M. (2007). What is Strategic Management, Really?
Inductive Derivation of a Consensus Definition of the Field. Strategic
Management Journal, 28: 935-‐955
National Energy Authority. (2015). Energy Statistics in Iceland 2014. Reykjavík:
National Energy Authority.
Nelson, R. and Winter, S. (1982). An Evolutionary Theory of Economic Change.
Belknap: Cambridge.
Newbert, S. L. (2007). Empirical Research on the Resource-‐Based View of the Firm:
An Assessment and Suggestions for Future Research. Strategic Management
Journal, 28, 121-‐146.
Nonaka, I. & Takeuchi, H. (1995). The Knowledge-‐Creating Company: How Japanese
Companies Create the Dynamics of Innovation. Oxford University Press: New
York City.
O’Reilly, C. A. & Tushman, M. L. (2008). Ambidexterity as a Dynamic Capability:
Resolving the Innovator’s Dilemma. Research in Organizational Behavior, 28:
185-‐206.
Pearl, Judea (2000). Causality: Models, Reasoning and Inference. Cambridge
University Press.
Pearl, Judea (2000). Causality: Models, Reasoning and Inference. Cambridge
University Press.
Penrose, E. (1959). The Theory of the Growth of the Firm. Oxford University Press:
New York City.
Pentland, B. T. and H. Rueter (1994). Organizational Routines as Grammars of Action.
Administrative Science Quarterly, 39: 484-‐510.

93
Porter (a), M. (1998). Competitive Advantage: Creating and Sustaining Superior
Performance. Free Press: New York.
Porter (b), M. (1998). Competitive Strategy: Techniques for Analyzing Industries and
Competitors.: Free Press: New York.
Porter, M. (2008). On Competition: Updated and Expanded Edition. Harvard Business
Review Press.
Priem, R. L. and Butler, J. E. (2000). Is the Resource-‐Based “view” a Useful
Perspective for Strategic Management Research? Academy of Management
Review, 26(1): 22-‐40.
Raffa, M. and Zollo, G. (1998). Economia del Software, Napoli: ESI.
Rasche, A. (2007). The Paradoxical Foundation of Strategic Management. Physica-‐
Verlag: Heidelberg.
Ray, G., Jay, B., and Muhanna, W.A. (2004). Capabilities, Business Processes, and
Competitive Advantage: Choosing the Dependent Variable in Empirical Tests
of the Resource-‐Based View. Strategic Management Journal, 25: 23-‐37.
Richardson, G. B. (1960). Information and Investment: A Study in the Working of the
Competitive Economy. Oxford University Press: Oxford.
Rogers, E. M. and Shoemaker F. (1972). Communication of Innovations. The Free
Press: New York.
Rugman, A. M. and Verbeke, A. (2002). Edith Penrose’s Contribution to the
Resource-‐Based View of Strategic Management. Strategic Management
Journal, 23: 769-‐780.
Schendel, D. and Hofer, C. W. (1979). Strategic Management: A New View of
Business Policy and Planning. Little Brown: Boston.

94
Schumpeter, J. A. (1934). The Theory of Economic Development. Transaction
Publishers: London.
Schumpeter, J. A. (1947). The Creative Response in Economic History. Journal of
Economic History, 7: 149-‐159.
Stalk G., Evans, P. and Shulman, L. E. (1992). Competing on Capabilities: The New
Rules of Corporate Strategy. Harvard Business Review, 70(2): 57-‐69.
Statistics Iceland. (2015). Manufacturing and Energy Statistics [Data file]. Retrieved
from http://www.statice.is/Statistics/Manufacturing-‐and-‐energy/Energy
Stevenson, H. and Amabile, T. (1990). Entrepreneurial Management: In Pursuit of
Opportunity. In T. McCraw and J. Cruikshanks (Eds.), the Intellectual Venture
Capitalist: John H. McArthur and the Work of the Harvard Business School,
1980-‐1995 (pp. 133-‐162). Harvard Business School Press: Boston.
Teece, D. J., Pisano, G. and Shuen, A. (1997). Dynamic Capabilities and Strategic
Management. Strategic Management Journal, 18(7): 509-‐533.
Teece, D. J. (2007). Explicating Dynamic Capabilities: The Nature and
Microfoundations of (Sustainable) Enterprise Performance. Strategic
Management Journal, 28(13): 13919-‐1350.
Teece, D. J. (2009). Dynamic Capabilities and Strategic Management. Oxford
University Press: New York City.
Wang, C. L., Senaratne, C. and Rafiq, M. (2015). Success Traps, Dynamic Capabilities
and Firm Performance. British Journal of Management, 26: 26-‐44.
Warren, K. (2002). Competitive Strategy Dynamics. John Wiley & Sons: Chichester.
Weinstein, A. (2004). Handbook of Market Segmentation: Strategic Targeting for
Business and Technology Firms. The Haworth Press: London.

95
Wheelen, T. L. and Hunger, J. (2008). Concepts in Strategic Management and
Business Policy. Prentice Hall: New Jersey.
Wilden, R., Gudergan, S. P., Nielsen, B. B. and Lings, I. (2013). Dynamic Capabilities
and Performance: Strategy, Structure and Environment. Long Rage Planning,
46: 72-‐96.
Witcher, B. J. and Chau, V. S. (2010). Strategic Management: Principles and Practice.
Cengage Learning Business Press: Stanford.
Williamson, O. E. (1975). Markets and Hierarchies. Prentice-‐Hall: New Jersey.
Winter, S. G. (1986). ‘The Research Program of the Behavioural Theory of the Firm:
Orthodox Critique and Evolutionary Perspective’. In B. Gilad and S. Kaish
(eds.). Handbook of Behavioural Economics, Vol. A. JAI Press, Greenwich: 151-‐
188.
Yeoh, P. L. and Roth, K. (1999). A Resource-‐based view of the Firm. Strategic
Management Journal, 20(7): 637-‐653.
Yu, D. and Hang, C. C. (2009). A Reflective Review of Disruptive Innovation Theory.
International Journal of Management Reviews, 12(4): 435-‐452.
Yung-‐Chul, K. (2013). Learning Orientation, Dynamic Capabilities and Performance in
Korean High-‐tech Ventures. Advances in Management, 6: 54-‐61.
Zollo, M. and Winter, S. G. (2002). Deliberate Learning and the Evolution of Dynamic
Capabilities. Organization Science, 13(2): 339-‐351.

96
Appendix.
Spurningalisti vegna rannsóknar á aðföngum fyrirtækja
Síða 1
Eftirfarandi er rannsókn til M.Sc. gráðu í Stjórnun og Stefnumótun og er ætluð fólki sem sinnir stjórnunarstörfum hjá fyrirtækjum semstarfa í orkugeiranum auk verkfræði- og þjónustufyrirtækja sem hafa starfað með orkufyrirtækjum.
Þátttaka er nafnlaus til að tryggja nafnleynd þáttakenda.
Rannsóknin er unnin af Oddi Sturlusyni undir leiðsögn Gunnars Óskarssonar Ph.D..
Öllum athugunum og spurningum má senda á netfangið [email protected].
Síða 2
Vinsamlegast svaraðu á bilinu 1 til 5 hversu ósammála eða sammála eftirfarandi staðhæfingum þú ert, þar sem 1 =mjög ósammála og 5 = mjög sammála.
Ég tel mig vel upplýsta/nn um nýsköpun í orkugeiranum.
1
2
3
4
5
Nýsköpun hefur gegnt veigamiklu hlutverki í afkomu fyrirtækisins sem ég starfa hjá á síðustu 5 árum (1 = mjögósammála - 5 = mjög sammála).
1
2
3
4
5
Nýsköpun mun áfram gegna veigamiklu hlutverki í afkomu fyrirtækisins á komandi árum (1 = mjög ósammála - 5 = mjögsammála).
1
2
3
4
5
Síða 3
Vinsamlegast veldu það svar sem þú telur endurspegla þína skoðun á eftirfarandi spurningum.
Heldurðu að orkuframleiðsla eigi eftir að aukast, standa í stað eða minnka næsta áratuginn?
Aukast.
Standa í stað.
Minnka.

97
Heldurðu að almenn orkuneysla og orkunotkun eigi eftir að aukast, standa í stað eða minnka næsta áratuginn?
Aukast.
Standa í stað.
Minnka.
Heldurðu að nýsköpun í orkugeiranum eigi eftir að aukast, standa í stað eða minnka næsta áratuginn?
Aukast.
Standa í stað.
Minnka.
Síða 4
Eftirfarandi spurningar eru um vöruþróun. Með vöruþróun er átt við það ferli sem þarf að ganga í gegnum til að ný varaeða þjónusta komist á markað, til dæmis hugmyndamótun, vöruhönnun og markaðsrannsóknir. Vinsamlegast svarið ábilinu 1 til 5 hversu ósammála eða sammála eftirfarandi staðhæfingum þú ert þar sem 1 = mjög ósammála og 5 = mjögsammála.
Fyrirtækið býr yfir árangursríku vöruþróunarkerfi.
1
2
3
4
5
Starfslið fyrirtækisins gerir sér í heildina grein fyrir þeim áhrifum sem vöruþróun getur haft á afkomu fyrirtækisins (1 =mjög ósammála - 5 = mjög sammála).
1
2
3
4
5
Opin samskipti og samvinna ríkir meðal þeirra sem bera ábyrgð á vöruþróun (1 = mjög ósammála - 5 = mjög sammála).
1
2
3
4
5
Mismunandi deildir innan fyrirtækisins vinna saman til að þróa vörur (1 = mjög ósammála - 5 = mjög sammála).
1
2
3
4
5

98
Stefnur og aðferðir fyrirtækisins auðvelda vöruþróun (1 = mjög ósammála - 5 = mjög sammála).
1
2
3
4
5
Síða 5
Eftirfarandi spurningar eru um þekkingarstjórnun. Með þekkingarstjórnun er átt við hverskonar skilgreiningu,skrásetningu og uppbyggingu á þekkingu starfsmanna í fyrirtækinu auk hvatningu til starfsfólks að deila og afla nýrriþekkingu. Vinsamlegast svarið á bilinu 1 til 5 hversu ósammála eða sammála eftirfarandi staðhæfingum þú ert þar sem1 = mjög ósammála og 5 = mjög sammála.
Fyrirtækið býr yfir árangursríku þekkingarstjórnunarkerfi.
1
2
3
4
5
Starfslið fyrirtækisins gerir sér í heildina grein fyrir þeim áhrifum sem þekkingarstjórnun getur haft á afkomufyrirtækisins (1 = mjög ósammála - 5 = mjög sammála).
1
2
3
4
5
Opin samskipti og hópvinna ríkir meðal þeirra sem bera ábyrgð á þekkingarstjórnun (1 = mjög ósammála - 5 = mjögsammála).
1
2
3
4
5
Mismunandi deildir innan fyrirtækisins vinna saman til að stjórna og miðla þekkingu (1 = mjög ósammála - 5 = mjögsammála).
1
2
3
4
5

99
Stefnur og aðferðir fyrirtækisins auðvelda þekkingarstjórnun (1 = mjög ósammála - 5 = mjög sammála).
1
2
3
4
5
Síða 6
Eftirfarandi spurningar eru um öflun aðfanga. Aðföng eru allt það sem fyrirtæki eða stofnun þarf til eigin rekstrar,framleiðslu eða þjónustu,hvort heldur fjármunir, húsnæði, vinnuframlag, þekking, tæki, efni eða annar varningur. Vinsamlegast svarið á bilinu 1 til5 hversu sammála eða ósammála eftirfarandi staðhæfingum þú ert þar sem 1 = mjög ósammála og 5 = mjög sammála.
Fyrirtækið býr yfir árangursríku kerfi til að afla aðfanga.
1
2
3
4
5
Starfslið fyrirtækisins gerir sér í heildina grein fyrir þeim áhrifum sem öflun aðfanga getur haft á afkomu fyrirtækisins (1= mjög ósammála - 5 = mjög sammála).
1
2
3
4
5
Opin samskipti og samvinna ríkir meðal þeirra sem bera ábyrgð á öflun aðfanga (1 = mjög ósammála - 5 = mjögsammála).
1
2
3
4
5
Mismunandi deildir innan fyrirtækisins vinna saman að öflun og nýtingu aðfanga (1 = mjög ósammála - 5 = mjögsammála).
1
2
3
4
5

100
Stefnur og aðferðir fyrirtækisins auðvelda öflun aðfanga (1 = mjög ósammála - 5 = mjög sammála).
1
2
3
4
5
Síða 7
Eftirfarandi spurningar eru um losun úreldra aðfanga. Vinsamlegast svarið á bilinu 1 til 5 hversu ósammála eða sammálaeftirfarandi staðhæfingum þú ert þar sem 1 = mjög ósammála og 5 = mjög sammála.
Fyrirtækið býr yfir árangursríku kerfi til að losa úreld aðföng.
1
2
3
4
5
Starfslið fyrirtækisins gerir sér í heildina grein fyrir þeim áhrifum sem losun úreldra aðfanga getur haft á afkomufyrirtækisins ((1 = mjög ósammála - 5 = mjög sammála).
1
2
3
4
5
Opin samskipti og hópvinna ríkir meðal þeirra sem bera ábyrgð á losun úreldra aðfanga (1 = mjög ósammála - 5 = mjögsammála).
1
2
3
4
5
Mismunandi deildir innan fyrirtækisins vinna saman til að losa úreld aðföng (1 = mjög ósammála - 5 = mjög sammála).
1
2
3
4
5

101
Stefnur og aðferðir fyrirtækisins auðvelda losun úreldra aðfanga (1 = mjög ósammála - 5 = mjög sammála).
1
2
3
4
5
» Redirection to final page of eSurvey Creator (change)

102
Question: 1 2 3 4 5 6 7 8 9 10
Strongly disagree 9 9 17 X X X 13 10 2 1
Disagree 8 16 8 X X X 17 22 19 19
Neutral 24 24 8 X X X 24 22 34 26
Agree 34 35 56 X X X 34 33 36 45
Strongly agree 18 9 4 X X X 5 6 2 2
Question: 11 12 13 14 15 16 17 18 19 20
Strongly disagree 0 6 9 3 4 9 11 3 2 1
Disagree 25 55 9 17 25 16 9 26 26 23
Neutral 32 13 48 38 37 41 26 25 13 17
Agree 35 17 25 33 25 26 37 28 51 47
Strongly agree 1 2 2 2 2 1 10 10 1 4
Question: 21 22 23 24 25 26
Strongly disagree 1 10 8 8 8 9
Disagree 25 9 28 9 27 17
Neutral 11 46 36 54 40 47
Agree 54 27 12 19 15 19
Strongly agree 2 1 9 3 3 1
Question: 4 5 6 Increase 81 68 78 Remain the same 4 16 13 Decrease 8 9 2


![Íslenskur orðaforði íslenskra grunnskólanema sem eiga annað móðurmál en íslensku [Icelandic vocabulary among Icelandic second language learners]](https://static.fdokumen.com/doc/165x107/6344d24938eecfb33a064409/islenskur-ordafordi-islenskra-grunnskolanema-sem-eiga-annad-modurmal-en.jpg)