Durham E-Theses - Coastal land use in the Maltese islands
417
• • •
-
Upload
khangminh22 -
Category
Documents
-
view
6 -
download
0
Transcript of Durham E-Theses - Coastal land use in the Maltese islands
Durham E-Theses
Coastal land use in the Maltese islands: a description
and appraisal
Schembri, John Andrew
How to cite:
Schembri, John Andrew (2003) Coastal land use in the Maltese islands: a description and appraisal,Durham theses, Durham University. Available at Durham E-Theses Online: http://etheses.dur.ac.uk/4417/
Use policy
The full-text may be used and/or reproduced, and given to third parties in any format or medium, without prior permission orcharge, for personal research or study, educational, or not-for-pro�t purposes provided that:
• a full bibliographic reference is made to the original source
• a link is made to the metadata record in Durham E-Theses
• the full-text is not changed in any way
The full-text must not be sold in any format or medium without the formal permission of the copyright holders.
Please consult the full Durham E-Theses policy for further details.
Academic Support O�ce, Durham University, University O�ce, Old Elvet, Durham DH1 3HPe-mail: [email protected] Tel: +44 0191 334 6107
http://etheses.dur.ac.uk
Coastal land use in the Maltese Islands: a description and appraisal
John Andrew Schembri
A copyright of this thesis rests with the author. No quotation from it should be published without his prior written consent and information derived from it should be acknowledged.
A thesis submitted in fulfillment of the requirements for the degree of Doctor of Philosophy of the University of Durham
August2003
~ ~ JAN zoo~
Abstract
The area of the Maltese Islands is 316 km2 , and with an official coastal length of 180 km
possess a high ratio of coastal length to area. The physical properties of the coast include a
highly indented and largely accessible coastline having a low sloping profile, on the north, east
and south-east littoral of Malta, presenting inlets, bays and deep harbours. Most of the
recreational, industrial and coastal residential areas are situated around these areas together with
a wide range of fortifications and military defensive structures built as part of the coastal
defensive network of Malta over the last five centuries. In contrast, the other parts of the coast,
including Gozo, consists of a largely inaccessible coastline made up of cliffs and boulder scree
slopes with the few indentations marking sandy beaches. These areas have a high aesthetic
quality.
The rapid pace of development over last half-century has witnessed an economic transformation
from an economy based on British military spending to one based on the development of coastal
areas for marine-related services, tourism and residential and second-home development.
Coastal land use conflicts have intensified with economic development and as people have
sought to make a more use of the coast. This thesis is concerned with the evaluation of the
coastal land use in the Maltese Islands.
A historical overview of the coast is first presented, then a methodology for the mappmg,
surveying and estimation of the land uses along the coastal zone of the Maltese Islands is
developed. This is based on a number of coastal field surveys that the author participated in
between 1989 and 1998. The coastal zone was divided into sixteen segments and mapping is
covered by sixteen land uses. The main results were that coastal development was centred in
areas where a high natural coastal indentation and good physical accessibility of the coast were
present, these, in tum, gave rise to land use conflict. In addition, civil engineering works and
modifications such as rock-cutting, jetties, breakwaters and, in densely populated areas,
promenades, intensified land use conflict. A notable difference in the type of coastal
development processes to the north (tourism) and south (industry) of the Great Fault is evident.
The thesis also includes the part played by the Malta Environment and Planning Authority in
influencing coastal land uses, the main land use modifications proposed in the European Union
accession talks and a brief assessment of the land use situation in selected localities in 2003.
II

Preface and acknowledgments
This thesis is intended to provide an overall view of the coast of the Maltese Islands
with land use being the key term used throughout. The coast is a dynamic
environment, susceptible to change from physical conditions such as meteorological
circumstances, ocean processes and physical factors of geology and geomorphology
prevailing at the land/sea interface. Human-induced situations arising from high
population densities include also the need to accommodate housing, recreational sites,
economic development and communications and maintain the extant agricultural
fabric. In addition, the existence of archaeological and historical sites and the presence
of a number of fragile ecosystems such as salt marshes, sand dunes and sand beaches,
present a challenge to all coastal managers and planners. The mosaic of land uses
along the Maltese littoral calls for a detailed appraisal.
This thesis is the result of the author's interest and participation in a number of coastal
surveys in the Maltese Islands, together with the experience gained in conducting
coastal field sessions for university students from Malta, Durham, Keele, Cardiff and
Canterbury.
My work on the coast started with the encouragement I received from Professor
Gerald H. Blake and Professor Ewan W. Anderson and Dr. Peter J. Atkins of the
University of Durham who advised me to take on the coast as a theme for research.
Practical experience soon followed with a number of coastal surveys and field
exercises for students plus the production of a number of papers mainly for
conferences and local publications.
The thesis is organized into three main parts. Chapters I to V provide the general
setting to the Maltese coast, giving a historical overview, the necessary
epistemological support and methodological backing of the field mapping exercise.
Chapters VI and VII provide the descriptive element of the coast, based on the land
uses mapped. Chapter VIII and IX contain the appraisal aspect of the thesis where
through the application of a statistical method the evaluation of the coastal land uses
with respect to the overall topographical pattern of the coast is examined.
iii

As illustrative material accompanying the text, maps, diagrams and plates are used
throughout. A progression from the general overall image of the Maltese Islands as
presented in Chapters I and II by means of small scale maps to figures showing details
at larger scales as the description and analysis unfolded in Chapters VI to VIII. The
selection of the maps and photographs was dictated by two facets: the first one was to
satisfy the need to show as wide a range as possible of coastal environments and
secondly to illustrate a number of coastal land use issues. The result was that most of
the coastal segments are represented. Most of the plates presented were photographed
by the author in May 2001 during the final compilation of the thesis document.
Further illustrative material was taken from reproducing old photographs of coastal
sites. Mainly taken during the last part of the 191h century and placed within the
context of Chapter IV they help the reader to assess the extent of coastal development
over a century.
A fairly large number of tables accompany the text, with most of the tables being the
result of field and cartometric measurements. All the tables are derived from
Appendix 1 that gives a comprehensive view of the distribution of the 16 land uses
along the coast of the Maltese Islands. Subdivided into 16 coastal segments and these
in turn are further subdivided into 136 coastal units, they provide a quantifiable data
as to the properties of the Maltese coastline. All tables, maps and plates are placed in
the main section of the thesis and generally follow in the page immediately where they
are first mentioned.
The sources of information for the thesis were derived from journals and books and
technical publications whose main theme was coastal management, the libraries at the
Planning Authority, the Malta Maritime Authority, the Tourism Authority and the
Statistics Authority stocked valuable information where technical documents
pertaining t coastal issues were concerned. The National Library of Malta at Valletta,
the Melitensia Reading Room of the University of Malta and the British Library
Lending Division at Boston Spa stocked excellent secondary source information.
Secondary literature included newspaper articles, Local Councils' and Parish Church
Publications. To all the librarians concerned a special word ofthanks is due.
iv

The research and writing for this thesis was done cocurrently with lecturing full-time
and helping to set up the Geography Programme at the University of Malta. As a
result my grateful thanks go to a number of students who helped me at various stages
in the realization of this work, especially in drawing a number of maps and in
formatting tables: Maria Attard, Mariella Busuttil, Kurt Bonnici, Odette Magri and
Josianne Vassallo. Academics at the university who encouraged me throughout were
my mentor, former Rector and Chairman of the Mediterranean Institute Rev. Professor
Peter Serracino-Inglott, the present Rector Professor Roger Ellul-Micallef, the pro
Rector Professor Charles J. Farrugia and Professor Patrick J. Schembri (no relation)
of the Department of Biology and Professor Dominic Fenech of the Department of
History. Thanks are also due to Professor Anton Buhagiar and Mr. Sandro Lanfranco
for assistance with the statistics. However this thesis would never have got off the
ground were it not for the efforts put in during my earlier education by my parents
Maria and the late Salvino Schembri, the patience endured by my wife, Marlene and
our son Peter Paul, for being around while I selfishly followed the academic paths.
v

Table of Contents Abstract ii Preface and acknowledgments m Table of Contents vi List of Tables xi List of Figures xvi List of Plates xviii List of Appendices xix Chapter 1 Introduction Chapter 2 Background to the Mediterranean and the Maltese Islands 14 Chapter 3 Coastal management and coastal land use in perspective 44 Chapter 4 The history of coastal land use in Malta 62 Chapter 5 Mapping and surveying the coast of Malta 96 Chapter 6 Coastal land uses: description and discussion 144 Chapter 7 A discussion of the coastal segments 259 Chapter 8 An assessment ofthe coastal land use distribution 309 Chapter 9 Conclusion 342 Appendices 3 55 References 3 77
Chapter 1 Introduction 1.1 Introduction 1 1.2 Chapter Format 10 1.3 Aims and Objectives of the study 12 1.4 Conclusion 13
Chapter 2 Background to the Mediterranean and the Maltese Islands 2.1 Introduction: The Mediterranean setting 14 2.1.1 The Mediterranean Coastline 19 2.1.2 The Mediterranean Action Plan 21 2.1.3 Mediterranean Islands 22 2.2 The Maltese Islands: Location, size and selected physical features 24 2.3 The Geology and Geomorphology of the coast 30 2.3 .1 Geology 31 2.3.2 Geomorphology 36 2.4 Conclusion 43
Chapter 3 Coastal management and coastal land use in perspective 3.1 Introduction 44 3.2 Land 45 3.3 Land use 47 3.4 Coastal land uses 52 3.5 Surveying and scale 53 3.6 Coastal management 55 3.7 Methodology of analysis 57 3.8 Integrated Coastal Zone Management 59 3.9 Conclusion 61
vi

Chapter 4 The history of Coastal Land Use in Malta
4.1 Introduction 62 4.1.1 Previous studies on land use 62 4.1.2 The history of coastal land use 63 4.2 The influence of the political history on coastal land use 64 4.2.1 Prehistory to Medieval period 65 4.2.2 The period of the Knights of St. John 66 4.2.3 The British Period 67 4.2.4 The post-Independence period and the Structure Plan 74 4.3 The historical demography of coastal settlements 82 4.4 Physical changes to the Harbours 85 4.5 Conclusion 95
Chapter 5 Mapping and surveying the coast of Malta 5.1 Introduction 96 5.2 Identifying a coastal zone 97 5.3 Establishing the study matrix for this thesis 103 5.4 The coastal "urban" areas 1 06 5.5 The coastal "rural" areas 107 5.6 Establishing coastal segments 109 5.7 Establishing the length ofthe coastline 112 5.8 Mapping scales 115 5. 9 Cartographic materials used 116 5.10 Geology maps 125 5.11 Pedology maps 125 5.12 The selection process of the land use categories and the mapping key 126 5.12.1 Preliminary observations, winter 1988 126 5.12.2 The pilot study, Spring 1989 126 5.12.3 The Coastal Zone Survey, summer 1989 132 5.12.4 The 1998 coastal survey 138 5.13 Cartometric method 13 9 5.14 Data reduction 140 5.15 Conclusion 143
Chapter 6 A discussion of coastal land use 6.1 Introduction 144 6.2 A synoptic analysis of coastal land uses: areal measurements 145 6.3 Coastal urban land uses 152 6.4 Coastal rural land uses 155 6.5 Presentation of each section 158 6.6 Recreational Areas 161 6.6.1 Introduction 161 6.6.2 Background Information 162 6.6.3 Justification for study 165 6.6.4 Definitions and criteria used for field identification 165
(a) Tourism 166 (b) Maritime Recreational Areas 167
6.6.5 Presentation of data 170
vii

6.6.6 6.6.7 6.7 6.7.1 6.7.2 6.7.3 6.7.4
6.7.5
Discussion and analysis 171 Conclusion 174 Residential Areas, Roads, and Historic Sites 174 Introduction 174 Background information 175 Justification for study 175 Definitions and criteria used for field identification (a) Residential areas 176 (b) Public utilities 176 (c) Historic sites 176 Presentation of data 1 79
6. 7.6 Discussion and analysis 180 6.7.7 Conclusion 184
176
6.8 Extractive Industries and Maritime Industrial Development Areas 184 6.8.1 Introduction 184 6.8.2 Background Information 185 6.8.3 Justification for study 188 6.8.4 Definitions and criteria used in field identification 189
(a) Maritime-related industrial activities 190 (b) Extractive Industries 190
6.8.5 Presentation of Data 192 6.8.6 Discussion and Analysis 193 6.8. 7 Conclusion 199 6.9 Depositional Environments 200 6.9.1 Introduction 200 6.9.2 Background information 200 6.9.3 Justification for study 201 6.9.4 Definitions and criteria used for field identification 203 6.9.5 Discussion and analysis 203 6.9.6 Presentation of Data 205 6.9.7 Conclusion 207 6.1 0 Afforested areas 207 6.1 0.1 Introduction 207 6.1 0.2 Background information 214 6.1 0.3 Justification for study 208 6.1 0.4 Definition and criteria used for field identification 209 6.1 0.5 Discussion and analysis 209 6.1 0.6 Presentation of results 210 6.10.7 Conclusion 215 6.11 Arable Land 217 6.11.1 Introduction 217 6.11.2 Background Information 217 6.11.3 Justification for study 218 6.11.4 Definitions and criteria used for field identifying features 219 6.11.5 Discussion and analysis 221 6.11.6 Presentation of Data 223 6.11.6.1 The main coastal agricultural regions 226
(a) the "rdum" areas on the western part of Malta 226 (b) the Lowland Areas 231
viii

(c) the South of Malta 233 (d) Gozo and Comino 233
6.11. 7 Conclusion 234 6.12 Undeveloped Land 235 6.12.1 Introduction 235 6.12.2 Background Information 235 6.12.3 Justification for study 239 6.12.4 Definitions and criteria used for field identification 239
(a) Low sloping unvegetated rock areas 240 (b) Coastal rock platform 242 (c) Steep rock faces and cliffs (garigue vegetation) 243 (d) Boulder scree areas (Rupestral Vegetation) 243
6.12.5 Discussion and analysis 244 6.12.6 Presentation of Data 245 6.12.7 Conclusion 247 6.13 Dilapidated areas 248 6.13.1 Introduction 248 6.13 .2 Background information 249 6.13 .3 Justification for study 249 6.13 .4 Definitions and criteria used for field identification 249 6.13 .5 Presentation of data 251 6.13.6 Discussion and analysis 252 6.13.7 Conclusion 255 6.14 General conclusion: sea and ocean uses and concrete areas 25 5
Chapter 7 A discussion of the coastal segments 7.1 Introduction 259 7.2 Segment I 259 7.2.1 Physical attributes 259 7.2.2 Land uses 260 7.3 Segment II 262 7.3.1 Physical attributes 262 7.3 .2 Land uses 264 7.4 Segment III 267 7.4.1 Physical attributes 267 7.4.2 Land uses 268 7.5 Segment IV 270 7.5 .1 Physical attributes 270 7.5.2 Land uses 271 7.6 Segment V 275 7.6.1 Physical attributes 275 7.6.2 Land uses 275 7. 7 Segment VI 281 7.7.1 Physical attributes 281 7.7.2 Land uses 281 7.8 Segment VII 282 7.8.1 Physical attributes 282 7.8.2 Land uses 283 7.9 Segment VIII 284
ix

7.8.1 Physical attributes 284 7.8.2 Land uses 284 7.10 Segment IX 290 7.10.1 Physical attributes 290 7.10.2. Land uses 290 7.11 Segment X 292 7 .11.1 Physical attributes 292 7 .11.2. Land uses 292 7.12 Segment XI 293 7.12.1 Physical attributes 293 7.12.2. Land uses 294 7.13 Segment XII 2 96 7.13 .1 Physical attributes 2 96 7.13.2. Land uses 297 7.14 Gozo298 7.14.1 Introduction 298 7.14.2. Segment XIII 299 7.14.3 Physical attributes 299 7.14.4 Land uses 299 7.15 Segment XIV 3 00 7.15.1 Physical attributes 300 7.15.2. Land uses 300 7.16 Segment XV 30I 7. I 6.1 Physical attributes 30 I 7.16.2. Land uses 30I 7.17 Segment XVI 303 7.17. I Physical attributes 303 7.17.2. Land uses 303 7. I 8 Conclusion 304
Chapter 8 An assessment of the coastal land use distribution 8.1 Introduction 309 8.2 Presentation of results in histogram format 309 8.3 Selected physical features of the coast 321 8. 3.1 Coastal indentation 3 21 8.3.2 Accessibility 324 8.4 Coastal land use conflict 324 8.4.1 Coastal geomorphology as a component in land use conflict 334 8.5 Conclusion 339
Chapter 9 Conclusion 9. I Introduction 342 9.2 The frameworks 343 9.3 Spatial subdivisions 345 9.4 The four key findings of the thesis 347 9.4 Conclusion 351
X

List of Tables
Table 1.1 Key land-use results from Coastal Zone Survey, 1989 4
Table 1.2 List of themes discussed at the Coastal Zone Management Conference, September 1996 I 0
Table 2.1 Mediterranean Sea: regional subdivisions 16
Table 2.2 Selected data for Mediterranean countries 22
Table 2.3 Area of selected Mediterranean islands and archipelagos 23
Table 2.4 Mediterranean Sea: distances of selected ports from Malta 26
Table 2.5 Selected dimensions for the Maltese Islands 26
Table 2.6 Selected criteria for the smallest maritime states 27
Table 2. 7 Selected criteria for the ten largest states 27
Table 2.8 Main categories of land use for Malta and Gozo 29
Table 2.9 Selected geoliogical data of the Maltese Islands 32
Table 2.10 Maltese Islands, Coastal Geology: Percentage Distribution of coastal rock type ofthe Maltese Islands, Malta, Gozo and Comino 36
Table 2.10 Main geological strata of the Maltese Islands: selected data, depth in metres below surface 3 7
Table 2.11 Maltese Islands, Coastal Geomorphology: Percentage distribution of coastal rock features of the Maltese Islands, Malta, Gozo and Comino 39
Table 3.1 Micro states/territories and their population density 46
Table 3.2 Indicators of land uses and land covers 49
Table 3.3 Selected land use categories, South Africa 54
Table 3.4 Selected land use categories, Puerto Rico 54
Table 3.5 Selection ofland use categories, Portugal 54
Table 3.6 Selection ofland use categories, San Francisco estuary, USA 54
Table 3.7 Integrated Coastal Zone Management chronological development 61
xi

Table 4.1 The main occupiers of the Maltese Islands, showing the period and principal architectural expression 64
Table 4.2 Sequence of main reports on physical planning of the islands 78
Table 4.3 Population Changes in the Inner Harbour and Outer Harbour regions, 1931 - 1995 83
Table 4.4 Changes to the population of the Inner Harbour localities subdivided by main geographic area 83
Table 4.5 Population changes in five coastal localities in Malta, 1931-1995 84
Table 4.6 Main historical events in the Mediterranean and Malta and the physical changes to the Harbours during the British military presence in Malta 87
Table 4.6 (cont.) Main historical events in the Mediterranean and Malta and the physical changes to the Harbours during the British military presence in Malta 88
Table 5.1 Coastal Zone Boundary delimitation for selected States 101
Table 5.2 Coastal Zone Boundary delimitation for selected states in the U S A 1 02
Table 5.3 Main criteria used to identify the coastal segments 111
Table 5.4 Coastal length for the Maltese Islands at a scale of 1 : 25,000 and various selected transects 115
Table 5.5 British Directorate of Overseas Surveys Series M 8910, 1971, Survey Sheets: Scale 1: 2500 used in Coastal Surveys 117
Table 5.6 Selected data for coastal units 122
Table 5. 7 Cartometric adjustments to coastal survey sheet series 124
Table 5.8 Land use categories identified in the Pilot Survey 135
Table 5.9: Land Use Categories identified in the summer 1989 survey 136
Table 5.10: Main details from 1:2500 scale maps for Malta and Gozo 137
Table 5.11: Main land use categories, sub-categories and principle features and utilities used in the identification of the land uses, with respective symbols 141
Table 5.12 Table 5.12: Scheme showing grouping ofland uses 142
Table 6.1 Maltese Islands: Areal distribution of coastal land uses (ha) 148
XII

Table 6.2 Maltese Islands: Percentage distribution of main land uses for Malta, Gozo and Comino by rank order 148
Table 6.3 Maltese Islands: Percentage distribution of each land use category for Malta, Gozo and Comino by rank order 148
Table 6.4 Percentage distribution of coastal land-use categories for the Maltese Islands, Malta, Gozo and Comino classified by "urban" and "rural" categories 151
Table 6.5 Distribution in hectares of the main coastal land use categories in the Maltese Islands 153
Table 6.6 Percentage distribution of the main coastal land use categories in the Maltese Islands 154
Table 6. 7: Area of selected land use categories in Segments I to VIII as a percentage of the total area in each category 15 5
Table 6.8: Area of selected land use categories m Segments IX to XVI as a percentage of the total area in each category 15 5
Table 6.9: Percentages distribution of arable and developed land use categories for "urban" segments 156
Table 6.10: Percentage area of selected rural land use categories in the Maltese Islands 157
Table 6.11: Cumulative percentage distribution of "urban" land uses in Segments IX to XVI and "rural" land uses in Segments I to VIII 158
Table 6.12: List of eight main sections in this chapter 160
Table 6.13: RECREATIONAL AREAS. Land use distribution for Malta, Gozo, Comino and the Maltese Islands 170
Table 6.14: Spatial distribution of Recreational Areas in Segment II 172
Table 6.15: RESIDENTIAL AREAS, ROADS AND HISTORIC SITES. Land use distribution for Malta, Gozo, Comino and the Maltese Islands 179
Table 6.16: EXTRACTIVE INDUSTRIES and MARINE INDUSTRIAL AREAS (MIAs). Land use distribution for Malta, Gozo, Comino, and the Maltese Islands 192
Table 6.17: Salt panning sites presented by site (segment), number of clusters and the approximate area of each cluster 194
xiii

Table. 6.18: Basic spatial dimensions of Marsamxett Harbour, Grand Harbour, and Marsaxlokk Bay 198
Table 6.19: Beaches in the Maltese Islands: location, users and type of beach 202
Table 6.20: AREAS WITH DEPOSITIONAL ENVIRONMENTS. Land use distribution for Malta, Gozo, Comino and the Maltese Islands 205
Table 6.21: AFFORESTED AREAS Land use distribution for Malta, Gozo, Comino and the Maltese Islands 21 0
Table 6.22 Location of afforestation projects in Malta 211
Table 6.23 Distribution of coastal afforestation projects in Segment II 211
Table 6.24: Afforestation projects in the localities surrounding the Main Harbours ofMalta 213
Table 6.25: Location and length of afforestation areas in the Maltese Islands 216
Table 6.26: ARABLE LAND. Land use distribution for Malta, Gozo, Comino and the Maltese Islands 223
Table 6.27: Coastal flora as a percentage of total flora for each category in the Maltese Islands 239
Table 6.28: UNDEVELOPED AREAS. Land use distribution for Malta, Gozo, Comino and the Maltese Islands 245
Table 6.29: DILAPIDATED AREAS. Comino and the Maltese Islands 251
Land use distribution for Malta, Gozo,
Table 7.1: Selected data for all coastal segments 258
Table 7.2: Main compass orientation for selected parts ofthe main bays and inlets in Segment II presented in contiguous sequence 260
Table 7.3 Main compass orientation of the bays in segment XI 265
Table 7.4 Selected synoptic data for coastal unit in Segment II 265
Table 7.5 Selected synoptic data for coastal unit in Segment III 268
Table 7.6 Selected synoptic data for coastal unit in Segment IV 271
Table 7. 7 Selected synoptic data for coastal unit in Segment V (Marsamxett Harbour) 277
xiv
Table 7.8 Selected synoptic data for coastal unit in Segment V (Grand Harbour) 277
Table 7.9 Selected synoptic data for coastal unit in Segment VI 281
Table 7.1 0 Selected synoptic data for coastal unit in Segment VII 283
Table 7.11 Selected synoptic data for coastal unit in Segment VIII 285
Table 7.12 Selected synoptic data for coastal unit in Segment IX 291
Table 7.13 Selected synoptic data for coastal unit in Segment X 293
Table 7.14 Main compass orientation of bays in Segment XI 294
Table 7.15 Selected synoptic data for coastal unit in Segment XI 295
Table 7.16 Selected synoptic data for coastal unit in Segment XIII 299
Table 7.17 Selected synoptic data for coastal unit in Segment XIV 301
Table 7.18 Selected synoptic data for coastal unit in Segment XV 302
Table 7.19 Selected synoptic data for coastal unit in Segment XVI 303
Table 8.1: Synoptic table summarizing the results of Figures 8.1-8.16 319
Table 8.2: Selected estimated dimensions for the Maltese Islands, Malta, Gozo, Comino and the sixteen segments 327
Table 8.3: Interpretation of Figure 8.17: similarity between land uses based on percentage values 330
Table 8.4 Interpretation of Figure 8.19: similarity between segments based on percentage values 332
Table 8.5: Clustering of segments with main land uses and physical properties 333
Table 8.6: Coastal segments: land use index, type and accessibility of coast 334
Table 8.7: Coastal segments I-XVI: conflicting land uses 335
Table 8.8 Percentage distribution of land uses in selected areas in all segments in Malta 337
Table8.9 Distribution of selected coastal geomorphological propertiesand coastal land uses for selected segments and localities 338
Table 8.10 Percentage distribution of selected categories m asssessmg coastal accessibility indices 340
XV

List of Figures
Figure 1.1: Malta Coastal Zone Survey, 1989 - list of participants 3
Figure 1.2: Malta: Coastal Zone Variables 1 5
Figure 1.3: Gozo and Comino: Coastal Zone Variables 1 5
Figure 1.4: Malta: Coastal Zone Variables 2 6
Figure 1.5: Gozo and Comino: Coastal Zone Variables 2 6
Figure 1.6: Malta: Coastal Zone Variables 3 7
Figure 1.7: Gozo and Comino: Coastal Zone Variables 3 7
Figure 2.1: The Mediterranean: island setting and principle ports 16
Figure 2.2: Geology ofthe Maltese Islands 33
Figure 2.3: Geomorphology of Malta 37
Figure 2.4: Geomorphology of Gozo 38
Figure 2.5: Maltese Islands- Fault systems 41
Figure 2.6: Malta: Steepness of slope 42
Figure 4.1 : Distribution of villages existing before 1419 70
Figure 4.2: The spread of settlement in Malta - 1824 70
Figure 4.3: The spread of settlement in Malta - 1895 71
Figure 4.4: The spread of settlement in Malta - 1957 71
Figure 4.5: The spread of settlement in Malta- 1995 72
Figure 4.6: Land use in the Maltese Islands, 1960s 73
Figure 5.1: Maltese Islands: area covered by Local Councils' administrative boundaries that are contiguous with the coast 105
Figure 5.2: Malta: extent of land seen from the sea 105
Figure 5.3: Subdivision of Coastal Segments 110
xvi

Figure 5.4: Location of Ordnance Survey sheets used 119
Figure 5 .5a: Coastal sites and localities l20a Key l20b
Figure 5.6 Malta, Bahar ic-Caghaq: Representation of land uses by symbols, hashing and lettering 129
Figure 5.7: Malta, Birzebbugia: Representation ofland uses by colour coding 130
Figure 5.8: Malta, Rdum Dikkiena: Representation of land uses by morphology, crop pattern and hydrology 131
Figure 6.1: Sliema: Typical plan view of urban coastal area 168
Figure 6.2: Comino: Typical plan view of recreational development in rural area 169
Figure 6.3: Recreational Areas 173
Figure 6.4: Residential Areas 181
Figure 6.5: Industrial Areas 191
Figure 6.6: Utilization of shore platform for salt panning sites marked in grids 195
Figure 6.7: Grand Harbour, Rinella Bay: Tank Cleaning Farm adjacent to fortifications 196
Figure 6.8a: Grand Harbour, Dockyard Creek: ship-repairing docks, historical fortifications and residential areas in close proximity 197
Figure 6.8b: Depositional environments 206
Figure 6.9: Afforestation areas 212
Figure 6.10: Arable land 225
Figure 6.11: Malta, West coast: pocket arable land with stream in scree slopes 227
Figure 6.12: Gozo, arable land 228
Figure 6.13: Malta, West coast: arable land 230
Figure 6.14: Comino: undeveloped coastline in remote coastal rural areas showing a predominantly "garigue" environment 237
Figure 6.15: Gozo, San Bias Bay: Land use pattern typical of scree slope(rdum) areas with garigue plateau and pockets of arable land in valley leading to small inlet with beach 238
xvii

Figure 6.16: Undeveloped Areas 246
Figure 6.17: Gozo, North coast: site of illegal dumping area on foreshore near historic tower and afforested area 253
Figure 6.18: Dilapidated Areas 254
Figure 6.19: Distribution of concrete platforms 256
Figure 8.1: Distribution of land uses in Segment I 311
Figure 8.2: Distribution of land uses in Segment II 311
Figure 8.3: Distribution of land uses in Segment III 312
Figure 8.4: Distribution of land uses in Segment IV 312
Figure 8.5: Distribution of land uses in Segment V 313
Figure 8.6: Distribution ofland uses in Segment VI 313
Figure 8. 7: Distribution of land uses in Segment VII 314
Figure 8.8: Distribution of land uses in Segment VIII 314
Figure 8.9: Distribution of land uses in Segment IX 315
Figure 8.10: Distribution of land uses in Segment X 315
Figure 8.11: Distribution of land uses in Segment XI 316
Figure 8.12: Distribution of land uses in Segment XII 316
Figure 8.13: Distribution of land uses in Segment XIII 317
Figure 8.14: Distribution of land uses in Segment XIV 317
Figure 8.15: Distribution of land uses in Segment XV 318
Figure 8.16: Distribution of land uses in Segment XVI 318
Figure 8.17: Bray-Curtis Similarity Index for the coastal land uses 329
Figure 8.18: Bray-Curtis Similarity Index for the coastal segments 331
XVlll

List of Plates
Plate 4.1: Malta, Marsamxett Harbour 89
Plate 4.2: Malta, Marsamxett Harbour 89
Plate 4.3: Malta, Valletta, Grand Harbour 90
Plate 4.4: Malta, Valletta, Grand Harbour 90
Plate 4.5: Malta, Tower Road, Sliema 92
Plate 4.6: Malta, Tower Road, Sliema 92
Plate 4.7: Balluta Bay 93
Plate 4.8: Balluta Bay 93
Plate 4.9: Gozo, Marsalfom 94
Plate 4.10: Gozo, Marsalfom 94
Plate 6.1 a: Malta, St. George's Bay, Paceville 164
Plate 6.1 b: Malta, St. Julian's and the Hilton project 164
Plate 6.2: Malta, Valletta fortifications 177
Plate 6.3: Malta, limits ofWied iz-Zurrieq 178
Plate 6.4: Malta, Birzebbugia 20 I
Plate 6.5: Gozo, Mgarr ix-Xini 204
Plate 6.6: Malta, Ghajn Tuffieha Bay 215
Plate 6.7: Malta: Delimara Power Station site 222
Plate 6.8: Malta: south east Malta 241
Plate 7.1: North Malta, Dahlet ix-Xmajjar 263
Plate 7.2: Malta: St Julian's Bay 274
Plate 7.3: Malta, Grand Harbour, Marsa 279
Plates 7.4 a and b: Malta, Cottonera, Birgu (Vittoriosa) 280a and 280b
Plate 7.5: Malta, Birzebbugia, St. George's Bay 286
XIX

Plate 7.6: Malta, Birzebbugia, St. George's Bay 287
List of Appendices
Appendix I: Distribution of coastal land uses 355
Appendix 2: Coastal terrestrial indicator vegetation 360
Appendix 3: Coastal maritime indicator veg~tation 361
Appendix 4: Publications on the coast as listed in Ulrich's Periodicals' Directory 362
Appendix 5: Classification Key 364
Appendix 6: List of Government Notices, Legal Notices, Regulations, Codes and Acts pertaining to the Maltese coasts 366
Appendix 7: A century of legislation pertaining to coastal matters in Malta, 1880-1990: list oflaws, government_notices, legal notices and regulations 367
Appendix 8:Existing structure plan policies relevant to the coastal zone368
References 3 77
XX

Chapter 1: Introduction and background
1.1 Introduction
The start of research for this thesis coincided with the requirement by the Government
of Malta for a coastal survey as a key element in the Structure Plan for Malta. This
Plan fonned part of the Government's wish to rationalize the use and administration
of the country's physical resources with the 1989 Coastal Survey being the first of its
kind for Malta, and to distinguish the coast as a separate entity from the rest of the
Island. The author was involved in the organization of this survey. Figure 1.1 gives
the names and the main functions of the people involved in the survey. The survey
was a joint collaboration between the Town Planning Department of the Ministry of
Works of the Government of Malta, the University of Durham and the University of
Malta. Professor E. W. Anderson from Durham University was the person
commissioned by the Government of Malta to lead the team of thirty people. He had
extensive experience in conducting similar surveys in the Middle East and
Mediterranean and his leadership, technical and academic background were crucial in
the successful completion of the project.
The outputs included a detailed report (Coastal Zone Survey of the Maltese Islands,
Anderson and Schembri, 1989), one hundred land use maps (scale - 1 :2500) and four
other maps identifying sites of ecological importance. The land use maps remain the
basis for the Planning Authority's decision-making process in the coastal area. This
thesis also presents an analysis of the land uses in the coastal zone, and particularly
illuminates those locations where conflicts occur. The study was divided into a
number of stages.
In the initial stage a pilot survey was carried out by Professor Anderson and the
present author in April 1989 to identify two sets of criteria upon which the coastal
survey was to be based. These criteria were: the identification of the land use
categories that were most representative of the coast- essentially these were the land
uses that occurred most frequently along the littoral; and, the location of the landward
boundary of the coastal zone - essentially drawing a line, largely parallel to the
shoreline, up to the extent where the mapping of the land uses was to take place. This

pilot survey was done on three selected sites, each one having different envirorunental
properties from the other two. However, all three sites were collectively representative
of the local coastal area.
The second stage was the coastal land use survey itself. By using the mapping key
developed during the pilot survey, the whole coast of the Maltese Islands was mapped
from the shoreline to an inland extent that in general varied from 1 00 to 200 metres.
This spatial limit depended on a number of variables that are explained below. The
results obtained were presented in a format identifying the percentage of the littoral
that was occupied by each one of the 13 criteria. The results are shown in Table 1.1
and are presented in two sets: one for Malta, and one for Gozo and Camino together.
A paper was produced as a result of the survey (Anderson and Schembri, 1990). This
included six maps that are reproduced in Figures 1.2-1. 7, three for Malta and three for
Gozo. These highlight the main coastal land uses for the Islands.
For the purposes of this thesis a third stage was necessary. This stage included further
studies. These were based on the experience gained on the first survey and employing
the same landward boundary to delimit the coastal zone. The results of these
additional studies form the basis of this thesis with the main exercise focusing on 16
land use categories that represented the area from the shoreline to the backshore zone
as delineated for the 1989 survey. The results were presented by the author in areal
format. In addition I subdivided the littoral length of the Maltese Islands into 16
segments. The results are presented in Appendix l.These constitute the basis of the
main text of the thesis.
A fourth exercise involved a number of cartometric measurements. These
measurements were done to assess three main variables. The first variable concerned
the estimation of the different land uses along the coastal zone, with the results
forming the basis of the land use data and the subsequent statistical interpretation that
formed the major analytical part of the thesis. The second and third variables dealt
with the physical aspects of the coastal zone.
2

SURVEY TEAM
Or E wan Anderson Direclor
Mr John Schembri De Ge~ald Blake lewis Anderson Richard Frosl Nadia lanzon Ruth Mallia Mary Muscat Cli~e Schofield Enoch lonna Be end a T ucnbull
MINISTRY
Me Godwin Cassar Mr Vict01 Ellul Mr Con~ad Thake
ECOLOGY
Or Patrick Schembri Me Edwin lanlcanco Francis Mallia Maciello Spiteri Anlonella Vassallo
ARCHAEOLOGY
Anthony Pace Geucge Said
PLANNING
Stephen Farrugia Valerio Schembri
N
l-0 km 5
Figure 1.1: Malta Coastal Zone Survey, 1989
Source: Anderson, E.W. and Schembri, P.J. (1989)
University of Durham, England University of Malta
Malta i University Services
Ministry lor the Development ot the Infrastructure, Town Planning Division
- Tourism dominated coastal zone

Table 1.1 Key land use results from Coastal Zone Survey, 1989. (Figures shown are linear measures expressed as a percentage of the total coastal length of either Malta or Gozo and Comino) *
Categories Malta Gozo and Comino
I. Coastal zone obscured 30.5 7.5 by development
2. Lowland coastline 30.5 16 (unobscured by develoJ>ment)
3. Coastline accessible 50 26 4. Tourism dominated 35 19
coastline 5. Coastline dominated by 8 4.5
industry 6. Coastline frontage with 16.5 4.5
maritime activities 7. Coastal zone agriculture 23 57
muse II 16 abandoned 12 41
8. Coastal zone vegetation 9 8.5 _{green all year)
9. Coastal zone dominated 3 1.5 by pollution (oil and Dumping)
10. Coastline of 0 2.5 international scientific (Inland sea and imgortance Dwejra Bay)
11. Coastline of national 6 6 Scientific importance
12. Coastline of 5 2.5 international importance (recommended)
13. Coastline of national 13.5 14 importance (Fortification in Grand (Inland sea and Dwejra (recommended) and Marsamxett harbours)
Sources: Anderson and Schembn, J.A. (1990); Anderson and Schembn, P.J.( 1989) * As linear measurements overlap figures do not add to I 00 per cent
Bay)
4

Figure 1.2 Malta: Coastal Zone Variables 1 Source: Anderson and Schembri, (1990)
0
Suggested future d Building limit
D Development Issues
• Development blackspots
TT77T Tourism dominated coastal zone
~ Shoreline inaccessible
-- Shoreline accessible
T'll"'"''"lrRdum
"''"'Bare cliff
........... Low rock coastline
Figure 1.3 Gozo and Comino: Coastal Zone Variablesl Source: Anderson and Schembri, (1990)
TT77T Tourism dominated co:astnl :zone
- Shoreline inaccessible
-- Shoreline accessible
YTTTT'Rdum
....... Bare cUff
·· · .. " .... Low rock coastline
···:= .. ~"· .... t:
0 7
• 1 Suggested future =1 Building limit
D Development Issues
• De•·elopment blackspots
N
t 0 2
5

Figure 1.4 Malta: Coastal Zone Variables 2 Source: Ander3on and Schembri, ( 1990)
·-in .agricultural use
Agriculture abandoned
Industry
Maritime activity
S Saltpans
0 ""'
Figure 1.5 Gozo and Comino: Coastal Zone Variables 2 Source: Anderson and Schembri, (1990)
In agricultural use
Agriculture abandoned
IDD:ZI:I Industry
Maritime activity
S Saltpans
Q Quarry
N
t 2
6

Figure 1.6 Malta: Coastal Zone Variables 3 Source: Anderson and Schembri, (I 990)
N
t p
0 5
---
Figure 1.7 Gozo and Comino: Coastal Zone Variables 3 Source: Anderson and Schembri, ( 1990)
---
..
p I>
Coastal zone of lntemationallmporblnce
Coastal zone of notional Imporblnce
Coutal zone of national scientific Importance
Beacb, predominantly sand
• ,.• Vegetation
P Pollution
0
·-~
Coutal zone of lntemntionallmportaru:e
COilS tal zone of notional Importance
Coastal zone of national scientific imporblnce
Beacb, predominantly sand
H
t 2
0.~~ -~
7

The results were mainly used to complement the land use results and showed the
percentage distribution of the rock type (geology) and rock form (geomorphology) of
the coastal zone. The need to perform this function was due to the fact that the scale of
coastal development and the spatial distribution of a number of coastal land uses are
partly the result of the geology and the geomorphology of the coast. Although other
key issues, such as marine flooding, are also a function of the physical character of a
shoreline (Arthurton, 1996), it was the impact of the land uses in the coastal zone that
is the central focus of this thesis.
A fifth exercise was to search, evaluate and read secondary sources. These sources
were crucial in supporting the field material gathered. The two broad areas that the
literature was based on were land use and coastal management. In addition, land use
material was generally taken from sources dealing with the coast and not from
literature on land use per se. Publications dealing with coastal management featured
prominently in the literature consulted. In addition, a further assessment of selected
areas along the coast was made between April and May 2003. Primarily these
included the coastal urban areas, especially locations where development and changes
to the coastline were made, and a couple of coastal rural sites. Reference to these is to
be found in Chapter 7 and the utilization of local press cuttings in substantiating the
arguments local debate were found helpful.
Managing coastal land use is particularly critical at this time in Malta's history
because the pressures on land are great. With a small area and the second highest
population density of any nation state (http://www.fao.org), land is a scarce resource.
Coastal land, in particular, is under pressure because the largest and fastest growing
sector of Malta's economy is the tourist industry. Tourism developments are highly
concentrated in coastal areas and today receive over a million international visitors
annually.
The ways in which land is used represent a confluence between possibilities and
restraints in both the physical and human environment. This dissertation presents the
"stage" of physical geography and the human "play" that has been acted on it to
produce the current patterns of land use. However "the play" influences "the stage"
8

and turns the whole system into a dynamic area. The coast was portrayed through the
1989 survey and the report and maps that followed. This thesis elaborates on this
report through a survey of the coast undertaken in 1998 and by representing the land
uses spatially in hectares and analyzing the subsequent results. In addition, the human
use of Malta's coast is summarized, its current use assessed, and the possibilities for
the future are proposed. Since my interest in this topic and my research began, a
national Planning Authority has been established in Malta. The Town Planning
Department was organized into a Planning Authority in 1992, and ten years later, in
March 2002 amalgamated with the Department of the Environment and referred to as
the Malta Environment and Planning Authority (MEP A). In this thesis the reference to
these institutions follows this chronological order.
Some regulations are now being enforced with respect to land use, and local plans are
being drawn up to guide future development. A local conference (April, 1996)
entitled "Towards an Integrated Coastal Zone Management Strategy for the Maltese
Islands" indicated the felt need for managing the coastal zone. Another conference
held in November, 1997 raised a wide range of issues for discussion some of these are
presented in Table 1.2. This dissertation combines two strands of geographic thought
- coastal zone management and land use planning - whilst providing a method for
mapping and evaluating coastal land use.
Although in other contexts coastal zone management entails a broad range of issues
such as dune protection, ground water salinization, mangrove protection, hurricane
and other hazard management, in Malta the primary problems and challenges are
those of competing and conflicting uses and over-development of the coastal land.
Other problems in the coastal area include the pollution of marine waters, problems
generated by sea use management, especially in highly accessible near-shore areas
within enclosed bays, and also the protection of archaeological and historical sites
within the coastal zone. The focus of this study is on land use, as the problems
associated with the coastal area, whether those found on land, or in the water, but
mainly due to activities happening on land.
9

Table 1.2 Selected list of themes discussed at the Coastal Zone Management Conference, November, 1997.
The Coastal Environment, its Exploitation, Management and Protection
Integrated Coastal Zone Management
The Value of Coastal Resources
Climate Change, Sea Level Rise & Extreme Events
Physical Processes
Science and Management
Case Studies in Coastal Zone Management
Recreation and Tourism
Modeling
Geomorphology
Regulation and Control
Shoreline Management
Management of the Coast of Mediterranean states
Sedimentology
Human Exploitation of Coastal Resources
Environmental Agencies
International Initiatives and Partnerships
Remote Sensing Mapping and GIS
Exploitation and Management of Biotic Resources
Networking, Education and Public Participation
Funding and Management of Coastal Zone Management
Monitoring
Pollution and Water Quality
The Management of Coastal Resources Source: Ozhan, E. ed (1997) Medcoast '97, Qawra, Malta.
1.2 Chapter format
This thesis is presented in a chapter format with Chapter I introducing the thesis
through the platform upon which the coastal land use study of the Maltese Islands
unfolds: the need for a rational plan in the utilization of coastal resources, the
commissioning of the Coastal Zone Survey with the involvement of the author, and
the coastal land use survey that formed the basis of this thesis.
The focus of Chapter 2 is on placing the Maltese Islands within their geographical
context by giving a description of the Mediterranean environment and its islands, and
10

the background of the coastal zone of the Maltese Islands, presented in a number of
relevant sections. These sections outline the main geographical properties, emphasize
selected coastal properties that are of importance to the thesis, such as the geology and
the geomorphology of the coast, and include the cartometric data gathered that
pertains to these physical properties.
Following the introductory sections, the thesis then proceeds to examme the
epistemology and meaning of coastal land use study in Chapter 3. The central
argument here is a review of the literature concentrating on a series of key words that
were important in the thesis. As this thesis is essentially about land use within coastal
management, terms such as land, land use, and coastal management are explained so
as to bring out the raison d'etre of coastal management, the meaning of land use, and
the philosophy behind the need for proper management of coastal land use. The
expenence gained with similar exercises elsewhere, and the identification of key
themes in forming the central part of all literature searches, were valuable in
compiling this chapter.
As this thesis is essentially concerned with the impact of humans on the local coastal
land use environment, Chapter 4 presents a brief overview of the history of the
Islands. To keep in line with the theme of the thesis, the human use and development
of the coast is given due importance including the part played by MEPA in the
development of the coast in Malta.
The fieldwork aspect of the thesis is then brought into focus with Chapter 5, where the
selection process in the choice of the base key used together with the criteria
employed in the selection of the land use categories, are the main themes. The map of
the Maltese Islands with the location of a number of place names is an additional
feature in this chapter. This map helped to establish the anthropogenic influence on
the coast by showing the names assigned to coastal features and localities and also
helps to identifY the various localities mentioned in the thesis. A discussion on the
criteria used for delimiting the terrestrial area of the coast follows, as it is important to
present at the initial phase of the thesis, the choice of the "stage". The final sections of
this chapter deal with the method of data reduction where the data gathered was
II

compressed into "legible" proportions and the reasons for dealing first with eight and
then with 16 land use categories is explained.
Chapter 6 is the product of the field studies done to evaluate the state of coastal land
use. The study quantifies the various land uses in hectares and simplifies the
discussion on the coastal land use situation by means of the division of the littoral
length into a number of coastal segments. The chapter concentrates on treating the
sixteen main coastal land uses as spatially distributed on the Maltese Islands' coast.
In Chapter 7 the main focus is on the description of the land uses as they occurred on
each segment. Two sections are devoted to each segment. In the introductory part one
finds the general physical features of the segment such as aspect, geology and overall
geomorphology whilst in the second part land uses and the recent problems resulting
from development are examined. In addition, the final part of the Chapter includes the
selected assessments done between April and May 2003.
Further analysis of the land use situation is developed in Chapter 8, where the data is
analyzed employing a number of histograms. The relationship between the coastal
land uses, coastal geomorphology and the geology of each segment is examined in the
light of the degree of accessibility of the coast and the existing land use conflict.
The final chapter outlines the main contributions of the thesis and proposes a number
of options for rational land use management, especially where land use conflicts
occur. The role of the planning process in Malta is also assessed.
1.3 Aims and Objectives of the study
The concern shown for the state of the Maltese coastal environment has been
documented through the publication of the proceedings of a conference held under the
auspices of Europa Nostra in 1960. In this publication the rapid and haphazard
development of the coastal area as a way of meeting the needs of the tourist industry
was the prime motive behind the philanthropic organisation that convened the meeting
(Agius Muscat, 1968). Din !-Art Helwa, (trans: "This sweet Land") is a National
12
association for safeguarding the historic, artistic and natural heritage of Malta and
Gozo. Founded in 1965, it is an independent, non-political body, the local sponsor of
the event. The society has recently been given trust of a 1 ih century watch tower.
The aims of my study are to:
(a) Map the coastal land uses exploring the least number of categories for a quick
assessment of the coastal terrestrial resources;
(b) IdentifY the inland extent of the coastal zone so that future planning and
management of the coast can have a spatial focus;
(c) Develop a methodology for combining the physical and human related elements
that make up the coastal zone;
(d) Develop a methodology for classifYing the coastal areas into a series of categories
by grouping the coastal areas having similar physical and anthropogenic features;
(e) IdentifY areas were land use conflicts are occurring;
(f) Evaluate the extent to which the geology and the geomorphology of the coast, as
important physical attributes, condition coastal development;
(g) Predict the sites where future coastal development should be directed.
1.4 Conclusion
My involvement in the 1989 Survey was the inspiration for this thesis. In what follows
I will try to develop an approach that will be relevant to the coastal land use issues
that are so important in Malta. The thesis may be described as applied geography and
in chapters two to nine we will see that there is a wide range of methodological and
theoretical literature that is relevant. I hope that my work will be of interest and of
value to the various coastal stakeholders and planning authorities.
13

Chapter 2: Background to the Mediterranean and the Maltese Islands
2.1 Introduction: The Mediterranean setting
Literature on the geography of the Mediterranean can be divided into three broad
classes. In the first category, descriptions of the Region are given in a systematic
manner where the various physical components of the lands and the sea surrounding
them are treated from the aspects of the geology, tectonic, bathymetry, climate, natural
vegetation, soils and flora and fauna. The human components of the population,
history, economy, trade and tourism are normally found in the second part of the
books (Branigan and Jarrett, 1975; Robinson, 1970). The second type of sources treat
the Mediterranean from the environment and society point of view, where after a brief
account of the physical conditions of the Region the human aspect is developed at
length (King, R., De Mas, P. and Beck, J.M., 2001; King, R., Proudfoot, L. and Smith,
B., 1997). The third type consists ofthe classical volumes (Braudel, F., 1975; Horden,
P. and Purcell, N., 2000). Braudel (1975) is influenced by the events of long duration
such as the mountains, climates and the desert and portrays these as giving the
Mediterranean its overall uniformity in the 161h century. Islands are also described as
mini-continents having a rhythm of their own. Horden and Purcell (2000), in treating
the Mediterranean from antiquity to the medieval period, emphasize the existence of
communities within micro-ecological environments. It was these sources that were of
assistance in writing this section on the Mediterranean.
The Mediterranean Sea (Figure 2.1) has an area of about 2.9 million km2 and is 3600
km in length from the Straits of Gibraltar in the west to the Lebanese shores in the
east. The comparative north - south distance between the continents of Africa and
Asia is about 1600 km if measured from the Gulf of Sirte to the North Adriatic. The
main physical features of the Sea are the two main basins, each of which is divided
into a number of seas. Table 2.1 gives the regional subdivisions for the Mediterranean,
showing the areal extent of the various constituent seas that make up the larger
Mediterranean. The western basin is clearly more compact than the comparatively
large areas of the Central and Ionian basins. This is mentioned here so as to emphasize
both the isolation of the Maltese Islands from the Eastern Mediterranean and their
proximity to the more compact Western Basin, and thus partly account for the mainly
14

I MOROCCO ______ ';- (
---- '
---- International boundary
··----·-·-··-.. ·-· Non-demarcated I disputed boundary
- _____ ... - ., /
------{_.------····· -------.... --- ALGERIA \)
-~ \
0
-~ I -~ )
-~ \ -~
-~ '---
LIBYA EGYPT
-~ >--..._ ./'• .\ / / -.....-- ---.... --... L--------------'· ~ / ------400km
----- I I / ·---.... . ·--- ~-
Figure 2.1 The Mediterranean: island setting and principal ports Sources: Espenshade eta/ (1990);King eta/ (1997)
Key to Mediterranean ports
I Catania 2 Tripoli
3 Tunis 4 Palermo 5 Naoles 6 Dunes 7 Ah!iers 8 Genoa 9 Marseilles 10 Barcelona 11 Riieka 12 Trieste 13 Piraeus 14 Alexandria 15 Port Said 16 Gibraltar
.....

European influences on the cultural development of the islands. This situation may
have added to the strategic value of the islands, especially at times when
communications by sea were slower and wind-powered. Other important physical
features are the fold mountains that encircle the western basin and most of the
northeastern basin; a desert to the south east; five main peninsulas that provide the
irregular coastline, and a large number of islands that are mainly located along the
northern coast.
Table 2.1 Mediterranean Sea: regional subdivisions
Region Name of Sea Approx. area 1000 km2
I Alboran 68 II North-West 287 III South-West 264 IV Tyrrehenian 231 v Adriatic 133 VI Ionian 151 VII Central 583 VIII Aegean 143 IX North Levantine 177 X South Levantine 500
Total western 850 basin (I-IV)
Total eastern 1687 basin (V-X)
Total 2537 Mediterranean
Source: Kuwabaro, 1984
The coastal configuration and bathymetry of the Mediterranean are an important
feature in its water circulation and upwelling patterns. A number of Straits constrict
the various subsidiary basins and impede the flow of large volumes of water but
increase the speed of water flow. This latter feature, together with the substantial
depth of some of the basins, provide the necessary flushing of the waters and are
important features of the circulatory patterns of the Atlantic waters that enter through
the Strait of Gibraltar and take a century to circulate back through.
Descriptions of the Mediterranean physical environment normally give the impression
that the sea and lands surrounding it possess uniform patterns of climate, temperatures
16

and sea salinity. However regional differences at all scales are evident. The water
circulation pattern is such that the salinity of the Mediterranean waters on entering the
Straits of Gibraltar is around 36%o. Due to the high degree of insolation and both local
and other winds, salinity increases as the waters circulate along the south
Mediterranean coast raising salinity levels to around 38-39% along the eastern
seaboard. This high salinity is compensated for by waters flowing into the
Mediterranean from the Black sea (salinity 20%o) and with fresh waters from rivers
and precipitation. Water flows out of the Mediterranean again mainly through the
Straits of Gibraltar as a bottom, denser layer.
Differences in the overall climate that affect the coastal areas is also evident
depending on the air masses that influence the Mediterranean in general. Overall, four
air masses condition the Mediterranean environment throughout the year. The
Continental Tropical Air Mass originates from the African continent and is associated
with a dry, warm atmosphere. It is responsible for giving the climate the long-term
stability associated with the Mediterranean mostly during the summer months and
aiding navigation with calm seas and clear skies. However, the passage of this dry air
mass over the Mediterranean waters increases the humidity levels on the islands and
the northern shores over which it passes, giving the notorious hot and humid summer
environment. The attraction of the Mediterranean as a touristic area is mainly due to
the stable climatic conditions afforded by this air mass in addition most naval battles
were fought when these conditions prevailed. The Maritime Tropical Air Mass has
similar characteristics but since its origins lie in the mid-Atlantic Ocean it already
contains a substantial amount of humidity before it reaches the Mediterranean area. It
is this air mass, which, when coming into contact with the Maritime Polar (wet) and
Continental Polar (dry) air masses from the North Atlantic Ocean and Northern
Europe respectively, produce what is known as the Mediterranean Front. This gives
the Mediterranean most of its precipitation, the bulk of its unstable weather conditions
in the autumn and winter, the main source of river water flow in addition to snow melt
in higher mountainous levels, and stormy seas that hinder navigation by small sea
craft but are crucial in the water circulation and oxygenation systems.
17

Local winds, rainfall regimes, insolation, humidity and cloud cover are all features
that are conditioned by the prevailing air masses that do not originate on the
Mediterranean. However they determine the socio-economic pattern of the
Mediterranean lands and their populations. Most coastal activities are also greatly
influenced by the rhythm of the seasons especially with the prevailing local winds,
bathymetric features of the basins, coastal configuration and indentation and
geomorphological properties. Most of the physical features of the Mediterranean
coasts are due to the processes that shaped the Mediterranean over millions of years.
The salient events are the plate tectonic movements that shrunk the Tethys Sea into
the Mediterranean, the changes to the sea levels due to the drying up (desiccation) and
subsequent filling up of the Mediterranean, the changes to coastlines and associated
hinterlands during the Ice Ages and the pattern of land emergence and subsidence
generally as a result of local tectonic effects. These conditions created a heavily
indented coastline with a large number of islands. In addition, the geological nature of
the Mediterranean lands, with an overall soft lithological base, permits rapid erosion
by marine, terrestrial and atmospheric waters to influence and shape the local coastal
geomorphology.
Effectively the human response to these physical properties of the coasts and their
associated hinterlands was one where the Mediterranean attracted a series of peoples
some of which developed into key civilizations that later influenced global cultures.
Basically two sets of cultures were prominent: those associated with the riverine
environment ( eg. Egyptian) where the annual flooding of the rivers on to the
surrounding flat land provided water and nutrients for crops, and those civilizations
that were associated with the coast ( eg. Phoenician) whose main source of income
was trade through the maritime connections and sea-faring. Mountain civilizations
( eg. Berber) played a minor part in the coastal affairs of the Mediterranean. Thus one
can put forward the idea that the human modification to the coasts has been around for
about ten millennia with various degrees of intensity depending on the population
density of the location and on the particular use to which an area is put to. Whatever
the origin and duration of the Mediterranean civilizations, the scenario is one where a
rich cultural heritage has been left and is now part of the contemporary coastal
management process.
18

Further issues influencing the coastal management process in the Mediterranean lands
are the problems generated by population increase and coastal urban development, the
development of industries especially those associated with maritime trade and traffic,
and the growing importance of tourism and recreation in the economies of the states
concerned. All these factors have transformed the land uses in the Mediterranean to an
extent that concern for the overall environment of the region has been around for the
last decade. In fact, two particular publications provide a succinct analysis of the
situation. Allen (2000) quoting Grove and Rackham (1998), provides four illustrative
models of land use change that can be applicable to most of the northern
Mediterranean presenting the situation in four time-frames: BC, AD 50, AD 1770, and
AD 1990. The main modifications to the Mediterranean environment were associated
with food production. These included the introduction of terraced and irrigated
agriculture to the sea levels since the pre-historic period, drainage of wetlands for
providing more arable land, the construction of dams, the decline of the forest cover,
and the introduction of new plant species since Roman times. Industrialization
brought about changes to the transport systems through trains and automobiles and the
influence of industrial activity in the abandonment of agriculture and later in the last
century the influx of tourists and the associated land use changes along the coast.
Change to the sea level since pre-historic times is one of the main physical
modifications to the coastal environment.
2.1.1 The Mediterranean Coastline
The total length of the Mediterranean coastline is 46,000 km with the northern shores
comprising 85 per cent. This is due to the highly indented coastline to the north of the
basin and the presence of a large number of islands. In addition, only about 40 per
cent of the coast is accessible, thus causing a concentration of most human activities.
With a coastal urban population expected to reach about 200 million in 2025 and the
concentration of tourism, industry, hydrocarbon ports, refineries and thermal power
plants located mostly along the accessible areas, then the problems of the
Mediterranean coastal zones will escalate if no precautions are taken to decrease the
effects of these problems (The Blue Plan, 1989). Table 2.2 has selected data for
Mediterranean countries where the large North African states (Egypt, Libya and
Algeria) have a relatively smaller coastline than the smaller (in overall area) of North
19

Meditenanean (European) states. In addition, the two Mediterranean island states
(Cyprus and Malta) have a coastline which is as long as some other smaller
Mediterranean states such as Albania, Syria and Lebanon. Other points shown in
Table 2.2 demonstrate that from the predicted population estimates a substantial
increase in the coastal populations of all North African states is envisaged whilst
European states on the Meditenanean watershed can exhibit a marginal increase or
even a decline (Italy and Greece). These demographic situations are similar to the
overall scenarios of the demographic patterns for Meditenanean states (King, R., De
Mas, and Beck, J.M., 2001).
Table 2.2 Selected data for Mediterranean countries
Countries Population Population in in Mediterranean
millions watershed in millions
~pain 38.5 13.9 France 54.6 5.5 Italy 57.8 42.2
ex-Yugoslavia 23.2 2.3 Albania 3.0 3.0 Greece 9.9 8.9 Turkey 49.3 9.9 Syria 10.5 1.2
Lebanon 2.6 2.6 Israel 4.2 2.6 Egyl'_t 46.9 16.4 Libya 3.6 2.3
Tunisia 7.1 5.0 Algeria 21.7 11.5
Morocco 21.9 3.3 Cyprus 0.7 0.7 Malta 0.4 0.4
Sources: The Blue Plan (1989) Branigan and Jarrett (1975)
Total area Estimated length Range of predicted km2 of Mediterranean population in
coastline Mediterranean km watershed for 2025 in
millions 551 200 2 600 17.9-20.0 543 965 I 700 5.9-7.9 324 000 8 000 39.2-46.2 255 800 6 100 5.4-3.9 28 863 200 n.a. 133 022 I 500 8.5-10.7 770 246 5 200 15.6-24.2 185 200 200 n. a. II 175 200 n.a. 20 800 200 3.4-5.3
I 003 000 900 28.9-36.0 2 105 000 I 700 7.6-10.2 164 150 I 300 7.9-10.4
2 224 000 1200 17.6-27.7 458 730 500 5.9-6.8
9290 800 0.8-0.9 316 200 0.4-0.45
In addition, the depletion of fish and other marine food stocks and the problems
associated with sea-level changes can only increase the pressure on the coastal
environments. Viles and Spencer (1995) cite the concentration of the tourism industry
around sandy beaches that has increased the problems along the Meditenanean coast.
The change to the natural supply of beach material has drastically changed the coastal
environments where the construction of dams in the hinterland has decreased the
supply of sediment sources and the artificial accretion of beaches to generate more
20

recreational space and drastically increased the coastal problems. In addition, the
construction of ports and marinas with their associated engineering works limit the
circulation of water in bays and increase eutrophication, the rapid growth of algae that
take up most of the dissolved oxygen, deplete the biological capacity ofthe waters and
drastically increased the coastal problems.
2.1.2 The Mediterranean Action Plan
As a result of the United Nations Conference on the Human Environment in
Stockholm in 1972 the United Nations Environment Programme (UNEP) was set up.
Awareness of the increasing deterioration of the Mediterranean coastal environment,
the increasing population in the coastal states and the pollution caused by industries
and tourism, a number of Mediterranean countries proposed the setting up of the
Mediterranean Action Plan (MAP) under the auspices of UNEP entitled "The Blue
Plan". The main objectives of the Plan were: to develop a series of legally binding
treaties to be signed by the governments of Mediterranean countries; the creation of a
pollution and research monitoring network; and, a socio-economic programme that
would reconcile development priorities with a healthy Mediterranean environment.
The Blue Plan ( 1989) presented an overall view of the situation in the Mediterranean
concerning the demographic and economic scenarios, selected physical (forest, soil
and water) environments, and the importance of the coastline and the sea in the
development of the lands bordering the Basin. Most of the data presented covers up to
1985 but different scenarios are postulated for the period 2000-2025. The overall
conclusion is one where the increase in the populations for the southern
Mediterranean states together with the increasing tempo of industrialization in the
northern states will put further pressure on the physical and human resources of the
region. Attention focused on a number of problems, mainly the control of urbanization
through better guidelines on coastal development, enforcement of legislation to
decrease the disposal of industrial waste through rivers, and the development of
educational programmes to increase awareness and information on the environment
and broaden employment opportunities. These initiatives will then pave the way for
the separate national programmes to participate in a concerted Mediterranean-wide
effort.
21

2.1.3 Mediterranean Islands
Mediterranean islands present a special geographical context in that their location in a
sea renowned for its long historical traditions and human settlement patterns have put
them in closer contact with the continental land masses that their counterparts in the
Atlantic or Pacific Oceans. As a result the problems generated by Mediterranean
states regarding pollution, dumping of industrial waste, pressures produced by tourism
development that spill over to islands form the mainland, and the passage of maritime
traffic places them within easy reach of the environmental problems of larger land
masses.
Islands in the Mediterranean can be grouped into two, depending on their size: large
islands such as Sardinia, Corsica, Crete, Sicily and Cyprus and Euboea, and the small
islands such as those on the Aegean and Adriatic, the Italian Islands, the Balearic
Islands and the Maltese Islands (cfFigure 2.1). Table 2.3 gives the area for a number
of Mediterranean islands, besides the differences in size the fact that only two are
sovereign states shows that Mediterranean states have always displayed a need to
control the islands nearer to their mainland. The two exceptions of Cyprus and Malta
were colonies of Britain, a non-Mediterranean state but a Mediterranean maritime and
military power by all means up to the mid-201h century. The problems faced by many
Mediterranean lands in their economic development are greater in islands due to a
number of factors. Distance from the mainland makes communications by sea and
possibly by air as the only options and these can be interrupted during inclement
weather conditions. The depletion of aquifers, through overuse and contamination by
nutrients, and the generally thin soils put agricultural practice at a disadvantage when
compared to northern arable land practices in Europe. Population changes affect
islands when the economic conditions deteriorate but also when the population
densities become high for an insufficient resource base.
22

Table 2.3: Area of selected Mediterranean islands and archipelagos
Islands and archipelagos Area Sovereign kml State
Balearic Islands 5,014 Spain Corsica 8,618 France Sardinia 23,813 Italy
Aegean Islands 25,610 Greece Crete 8,261 Greece
Euboea 3,655 Greece Corfu 592 Greece
Rhodes 1,398 Greece Sicily_ 25,460 Italy
Maltese Islands 316 Sovereign state Cyprus 9,251 Sovereign state
Elba 223 Italy_ Djerba 510 Tunisia
Source: http://users.erols.com
Although island populations are also affected by adverse international political
situations, when generally an exodus to the nearest mainland occurs and the
demographic profile generally ages, leaving sparse human resources behind, the
situation in Malta is opposite to this general trend. It was during world wars and
political tension in the Mediterranean that the islands enjoyed economic progress
especially when their geographical position was strategically important. As a result
emigration during these periods was minimal and employment opportunities high.
During other periods it was the state with large public works that kick-started the
economy. Cases in point in Malta are the building of the breakwater at the Grand
Harbour entrance in 1900s, road construction in the 1950s, the residential and
industrial building boom in the 1960s, the new airport runway in the 1970s, and the
Container Terminal in the 1970s and its extensions in the 1980s together with the
Power Station. Throughout the last forty years heavy investment on hotels and
recreational establishments ran parallel to the above industrial and infrastructural
works. It is clear that these construction works have taken their toll on the islands'
coastal resources and apparently the trend for the immediate future includes the
further development of the coastal environment.
The importance of the development of the tourist industry in the Mediterranean over
the last five decades has spilled over to the islands and this has benefited in changing
23

the economic base of many of them and provided alternative sources of employment
opportunities to the islanders and other people on seasonal employment from the
mainland. However some of the land use problems associated with the mainland
coastal urban centres are also to be found on islands especially when the islands in
question have unique features that are marketable to the tourist industry. Two
examples are the volcanic islands of Stromboli and Capri off the Italian coast. Elba,
off the Tuscan coast of Italy, with a population of about 30,000 and an influx of two
million visitors annually, has problems with safeguarding its historical heritage and
keeping up its image of an up-market tourist destination.
Nicholls ( 1998) outlines a number of factors that are relevant to coastal management
in islands given that islands are different from mainlands and also from larger islands.
A small land mass means that important natural resources are limited in supply, a high
dependency on international trade is crucial to economic viability, the natural storage
capacity of water is limited to the extent of the small land mass, public administration
generally takes up a substantial amount of the annual budget. Micallef ( 1997) provides
guidelines for the sustainable development of small islands and proposes that since
these small land masses are extremely fragile in their economic performance because
of a small natural resource base, problems with communications, a poor agricultural
output, and economic investment relying mainly on developing tourism, makes the
continued assistance of their mainland administrators of vital importance.
2.2 The Maltese Islands: Location, size and selected physical features
The selected study area of this thesis is the Maltese Islands, which are located in the
central Mediterranean about 93 km due south of Sicily and 290 km east of Tunis.
Figure 2.2 gives the location of the islands within the Mediterranean. The islands lie at
the exact centre of the Mediterranean with a 19 degree distance from either end of the
Mediterranean, and a longitudinal distance from both the eastern and the western ends
at 7 and 9 degrees respectively from the northern and southern limits of the
Mediterranean shores. This geographical location throws light on and partially
accounts for the socio-economic and cultural influences experienced by the islands.
As a result of the central location, the islands were occupied by successive military
powers that were dominant or influential in Mediterranean affairs. This long series of
24

political occupants left their mark on coastal land uses and conditioned the strong
economic and cultural links with Europe, with which 80 per cent of trade is still done
and where 90 per cent of tourist visitors originate. Semitic links with North Africa are
seen in the language (Mifsud Bonnici, 1960; Serracino Inglott, 1981) and place names
(Wettinger, 2000; Schembri 2001 ).
The relative location of the Islands, i.e., their location in relation to the adjacent lands
and seas, is another factor that may have contributed to the present pattern of coastal
land use and is therefore worth mentioning. This highlights the importance of the
maritime dimension of the Maltese Islands in the Mediterranean. Two tables give an
indication of this situation. Table 2.1 presented details on the regional subdivision of
the Mediterranean into a number of constituent Seas that make up the larger
Mediterranean. Table 2.4 lists the distances of the important ports from Malta and
from this the proximity to ports in the Western Mediterranean basin is evident ( cf
Figure 2.1 ). The relative isolation of the Islands can also be examined from the
position of the other central Mediterranean islands, Pantalleria, Linosa, Lampedusa
and Lampione that make up the Pelagic group of islands. These have very small
populations and were never considered as possessing viable socio-cultural links with
Malta except for the provision of wood in the 161h century.
Having an area of approximately 320 km2, the archipelago consists of three main
islands Malta (245 km\ Gozo (68 km2) and Comino (6 km2
), together with a number
of other smaller islands and rocks. Table 2.5 gives the relevant dimensions. Their total
length is about 45 km, trending north-west to south-east. The islands lie on the
submarine ridge that divides the Mediterranean into two halves and have an area of
69 000 km2 as Exclusive Economic Zone. Like all other small island states the
Maltese Islands possess a small area per kilometre of coastline (Table 2.6) whilst
larger states (Table 2.7), mainly continental land masses, have a far larger land mass
for the same coastal length. This means that small islands depend relatively more on
their coastal resources than larger states. In addition, Table 3.1 gives the population
densities for selected small states and territories.
25

Table 2.4 Mediterranean Sea: distances of selected seaports from Malta
Seaport* Km Catania 110 Tripoli 195 Tunis 222 Palenno 231 Naples 325 Dunes 400 Algiers 572 Genoa 580
Marseilles 635 Barcelona 666
Rijeka 686 Trieste 730 Piraeus 517
Alexandria 822 Port Said 937 Gibraltar 996
.. Source: Malta Mant1me Authonty ( 1989) *Location of ports is in Figure 2.1
Table 2.5 Selected dimensions for the Maltese Islands
Area Length (km) Width (km) trending trending
NWtoSE SWtoNE
Malta 246 km2 27.3 14.5
Gozo 67 kmL 14.5 7.2
Comino 6 km2 2.75 2.25
Cominotto 9.9ha 450m 225m St. Paul's 0.02 ha lOOm 200m Islands Manoel Island included 1.25 Km 0.45 Km
within area of Malta
Filfla 2.0 ha 400m 250m
Fungus Rock 0.7 ha Gebla tal- 0.4 ha Haifa Source: Adapted from Azzopardi A. ( 1995).
Nautical miles 203 361 411 428 602 741 1065 1074 1176 1233 1270 1352 1057 1522 1735 1789
Shoreline (km)
136.8
45
7.5
2.8
Comments
Main island with administrative Capital situated 8 km to NW of Malta 2 km to NW Malta 1 km to SE of Gozo near Comino North of St. Paul's Bay within Marsamxett Harbour; land bridge 3 km off S. Malta coast; Nature Reserve Gozo Gozo
26

Table 2.6 Selected criteria for the smallest maritime states
State Area Coastal Length km2
1 Monaco 1.5 2 Macao 15 3 Maldives 298 4 Gibraltar 6 5 Bermuda 54 6 Gilbert lsi. 684 7 Seychelles 404 8 Nauru 21 9 Tuvalu 26 10 Wallis & Futuna 207 11 Antigua 280 12 Cook Islands 240 13 St.Kitts, Nevis Ariguilla 389 14 MALTA 313 15 Tonga 997 16 Grenada 344 17 Singapore 583 18 Bahrain 596 19 St. Lucia 616 20 Barbados 430 21 St. Vincent 389 22 Sao Tome & Principe 964 23 Dominica 790 All states are Islands except Monaco, Sao Tome and Gibraltar. Source: Dahl ( 1991)
Table 2. 7 Selected criteria for the ten largest states
State Area Rank Coastal Length km2 km
Ex-USSR 22,274,000 1 46,670 Canada 9,971,000 2 90,908 China 9,600,000 3 14,500 USA 9,363,396 4 19,924 Brazil 8,521,000 5 7,491 Australia 7,692,000 6 25,760
India 3,136,500 7 7,000 Argentina 2,771,300 8 4,989
Sudan 2,504,530 9 853
Algeria 2,460,500 10 1,183
Source: Dahl (1991)
Km 4
40 644 12 103
1143 491 24 26 129 153 120 193 140 419 121 193 161 158 97 84
209 148
Rank
3 1
10 7
15 5
17 22 82 69
Area/Length km2/km
0.4 0.4 0.5 0.5 0.5 0.6 0.8 0.9 1.0 1.6 1.8 2.0 3.0
2.2 2.4 2.8 3.0 3.7 3.9 4.4 4.6 4.6 5.3
Area/Length km2/km
477 110 662 469
1,137 299 448 555
2,936 2,079
The Maltese Islands, a sovereign state within the British Commonwealth (Cremona,
(1994), have a population of 382,525 (National Statistics Office, 2002) making them
27

one of the most densely populated nations of the world (United Nations Demographic
Yearbook, 2001 ). About one-third of this population lives in localities that are
immediately contiguous to the coast (Central Office of Statistics, 1996; Schembri and
Bonavia, 1998). In addition, 1.2 million tourists visit the Islands every year (National
Statistics Office, 2001a). These visitors put pressure on the infrastructure and coastal
resources, as most of the recreational establishments are located on the coast ( eg.
National Tourism Organization, 1995; Lockhart, 1997a). The Maltese Islands are no
exception to the general trend that the coastal areas of many countries have increased
in importance with economic development. Marine-related industries and services are
located mainly in the protected areas of a coast, notably in harbours, and also occupy
extensive physical space along the coastal fringe (Schembri, 1993).
These scenarios cause a degree of conflict of land uses along the coastal margin,
especially in areas where there is a high degree of accessibility mainly brought about
by a low sloping land profile. Thus the coastal area can be reached easily either from
the landward or from the seaward side or from both. The intensity of land use can also
be influenced by the general shape of the coast, i.e., whether the littoral is embayed
(having a harbour or bay) or rectilinear in outline. Other factors that influence coastal
land use are the degree of slope of the land towards the shoreline, and the geology and
geomorphology of the coastal margin. Recent coastal land use development has also
been superimposed on an architecturally-rich historical environment, mainly the
military architecture of a succession of occupiers (Hughes, 1993; Spiteri, 1989;
Spiteri, 1999), and also on ecologically-sensitive areas that grew out of the
interactions within the natural environment. The latter include salt marshes, sand
dunes and beaches (Schembri and Sultana, 1989).
Within the milieu of a fast pace of coastal development, efforts at introducing a degree
of planned development have been attempted. A summary of these efforts is shown in
Table 4.2 in Chapter 4, where the studies and reports commissioned by successive
Maltese Government administrations are listed and reviewed in chronological order.
These start in the immediate post Word War II period (Harrison and Hubbard , 1945)
for the Harbour areas and end with the legislation that introduced the Malta Structure
Plan in 1992. Since then a number of local plans have been published: the
28

Marsaxlokk Bay Local Plan (Planning Authority, 1995); the Grand Harbour Local
Plan, (Planning Authority, 1997a; Malta Environment and Planning Authority,
2002a); the North West Local Plan - consultation draft (Planning Authority, 200 I); the
North Harbours Local Plan - consultation draft (Planning Authority, 2000b); the
Gozo-Comino Local Plan - consultation draft (Malta Environment and Planning
Authority, 2002b); the Malta South Local Plan - Report of Survey (Malta
Environment and Planning Authority, 2002c ). All these deal in part with coastal land
use.
In the meantime, the Ministry of Tourism under the auspices of the World Tourism
Organization has prepared a master plan for Tourism as a guide for the upgrading of
the industry (Horwarth and Horwarth, 1990). Allied to these activities, the ship
repairing industry, the development of the Cottonera waterfront, the extension of the
Cruise Liner Terminal in Grand Harbour, the proposed development ofManoel Island
and Tigne, and the development of the container terminal at Marsaxlokk Bay, together
provide other facets of coastal land use.
Up to 1989 the only land use data available for the Maltese Islands was that dealing
with the extent of urban areas. These data indicated an urban sprawl growing from
5.5 per cent ofthe surface area ofMalta in 1955 to 16.5 per cent in 1985 (Cilia, 1995).
However, in 1990 it was estimated that the island of Malta alone had 28 per cent of its
surface used for urban, industrial, touristic and airport facilities (Duca and Zammit,
1989). Table 2.8 gives the most recent data collated (National Statistics Office,
2001 b).
Table 2.8 Main categories of land use for Malta and Gozo
Land use kml Per cent A riculturalland 107.19 34.90
L and under forest and wooded land 13.37 4.23
B 73.38 21.97 1.60 0.50
Dry o en land 114.57 38.40 Total 310.11 100
Source : National Statistics Office, 200 I, 3.
29

;_':-_
Fortunately for the Maltese Islands, the mapping of the land (and waters) has been
reproduced fairly regularly by the British Directorate of Overseas Surveys and recently
by the French Geographical Bureau (see chapter 5). Thus reliable base-line
cartographic representation of the land surface is readily available in Ordnance Survey
sheets. These sheets give the topographic outline at 25-foot contour intervals, identify
the main geomorphological features such as cliffs and steep slopes, indicate the names
of the localities, and show all built-up areas. Further details in this regard are provided
in Chapter 5. The land-use mapping for this thesis was done on these sheets, with the
features mentioned providing a guide to site location and on-site assessment of land
use variations. As a result of the cartographic representation of the land surface and
features on these sheets, the mapping of the land uses by the author was facilitated.
Mapping is influenced by the choice of the mapping scale, the time span available for
the mapping exercise itself, and the area to be mapped. So as to minimize these
problems I identified and delimited the mapping area, basing my selection on the
experience on the 1989 survey work and the numerous tasks assigned to students on
coastal field projects. As a first exercise towards this end, a number of studies were
consulted so as to justify the method used in delineating the coastal zone ( cf. Tables
2.12 and 2.13). In addition, these geographic limits influenced the categories of
coastal land uses that were to be mapped and then fitted to the needs of this study.
Essentially, the main sources tapped for this were Coastal Management studies. An
additional exercise involved the subdivision of the coastal zone into a number of
segments.
2.3 The Geology and Geomorphology of the coast
In general, the natural features of the land influence land use. Crofts (1973) identified
topography as being the main element that conditions land use. The scheme developed
by Crofts and reproduced in Gardner and Dackombie ( 1983) associates various land
uses to the degree of slope of the land. In general, gentle slopes are associated with
urban and industrial development and also with agriculture. Steeper slopes tend to
inhibit development options. Slopes are conditioned by the geological condition of the
terrain, the tectonic system influencing the area, and the meteorological situation
(Selby, 1993; Waugh, 2000). In coastal areas and especially along the nearshore and
backshore areas, slopes are also affected in the very long term (millions of years) by
30

water run-off from the land and by marine conditions such as storm and tidal wave
action. The end result, relating the geology (the type of rock) to the slope of the
terrain, produces distinct geomorphological features such as cliffs, screes, and
beaches. This section provides a brief overview of the geology and the
geomorphology of the coast of the Maltese Islands to furnish the necessary
background for the coastal land use study.
2.3.1 Geology
The geology of the Maltese Islands is made up of a succession of marine sediments
deposited during the Oligo - Miocene period (ca. 60 million years ago). The
succession is based on a temporal scale, and we can estimate the approximate period
and time of deposition. Two main studies have been consulted, namely, Zammit
Maempel (1977), to guide on the lithological aspect ofthe strata, (see Table 2.9); and
Alexander (1988), to provide a spatial context for the occurrence of the type of rock
(Figure 2.2). However, for the purposes of this thesis the discussion on the geological
aspect will focus on the spatial extent of the various strata as each Member outcrops
along the littoral.
The main cartometric exercise relevant to this section of the thesis was taken from a
Geological Survey of the Maltese Islands published by Ordnance Survey (British
Petroleum Exploration Company Limited, 1957 - scale 1 :31 ,680) and the Geological
Map of the Maltese Islands (Oil Exploration Directorate, 1992 - scale 1 :25,000)
published by the Government of Malta. One of the main results of this exercise was
the compilation of the raw data presented in Tables 2.10 and 2.11. These tables give
the percentage distribution of the different types of rock and the percentage
occurrence of the coastal geomorphological properties for the Maltese Islands as a
whole, and for the separate islands that make up the archipelago, i.e., Malta, Gozo,
and Camino. The data were compiled whilst measuring the coastal length of the
Maltese Islands from the 1 :2,500 scale maps at 25 m (1 em) length transects and
denoting as accurately as possible the rock type and the coastal features. The length of
coast for each separate rock type (geology) and each geomorphological property were
entered in a table against the respective Ordnance Survey (O.S.) sheet number. The
figures presented in Tables 2.10 and 2.11 are the percentage value for each column of
31

figures from the total for the Maltese Islands and form a synopsis of the data gathered.
Each table gives the percentage distribution of rock type for each individual island and
for the whole archipelago. As it was felt necessary to provide a diagram with giving
the distribution of rock type over the whole island so as to present the distribution for
the whole of the islands Figure 2.2 was provided. However the data in Table 2.10
appertains to the situation along the coast.
The type of rock that forms the coastal margin ts basic to coastal management
practices. The disposition of an area for development is in part dependent on the rock
type. Thus the different islands, though possessing similar geological strata, have
notable differences in the percentage composition of each littoral facies and outcrop.
Table 2.10 compares the three main islands and also gives figures for the whole
archipelago. The Globigerina limestone formation is shown in its three main
subdivisions. The importance of this lies in the friable nature of the Upper and
Middle Globigerina limestone formations that may not encourage development where
they outcrop, although the Power Station foundations at Delimara were built on these
rock types. Table 2.10 also identifies alluvium and sand percentage distributions to
demonstrate the limited amount of these types of beaches on the local littoral. A
number of significant points emerge that throw light on the general properties of the
coast and at the same time highlight the physical differences between the separate
islands.
Table 2.9 Selected geological data of the Maltese Islands
Upper Coralline Greensand Globigerina Lower Coralline Limestone /Blue Clay Limestone Limestone
Maximum thickness 160 70 25-200 140 below surface
Percentage surface area 22.6 12.3 44.5 20.6 Outcropping (Malta) 1
Percentage of Coastal 16.4 9.4 35.1 36.0 Length 2
Main Geomorph- low sloping beach/ rdum/talus low sloping plunging cliff, ological Features rocklrdum rock/shore platform shore platform
Main source: Zamrnit-Maempel (1977) 1 Estimated by we1ght of paper, descnbed above
2 Measured on I :25,000 scale maps at 25m intercept intervals. The remainder 3.1 per cent is covered by beaches and other coastal deposits.
32

1 ~ Son Lt()(IOfdo 3fds
OOii Oomol<h ....
lliillJ) Tot 1CtMO e~s
em """" .... 112!8---~ (j;:"of L.ctj:!'P 8~
~
i ~ ~ ;)
~ ~
g) ~: ~4\COU 8f6
crn~·...,a· ll<o:cW w:.:wtc a• Q«<o--•-·1 i EJ G:'\c_!n J.Ac:!cf' .t.ll~bc:r
§.§GRE.~"'() FORMATION
D !LI.E: CLAY & Qt..OO!GER!NA LI'-ESiOI'o't roRJ-MTIQN$
~ II Mofo Mc:AtoC:t
~ Xl t ncll MIU'Oc:t
~ AUOfd ~l'llb(t
o~,.,.tmbn }~~ u ~~ ~
Figure 2.2 Geology of the Maltese blands
Snurcc: Alexander (1988)
MAI.TA
~
M:!'n a 0 ' e-.... a ) . '
0 ~un
"""''• '? . > 0 ,, 2 , ,_.,
GOlO
,
~~ COM!NO ·~-
' N
~/ I
~

Due to the absence of any data referring to the spatial extent of the different rock
outcrops, an easy and quick method was devised to determine the surface area of the
different rock outcrops. Essentially, a photocopy of the geological maps of Malta and
Gozo was weighed on a Sartorius Analytical Balance. The different rock outcrops of
each separate island were cut out with a pair of scissors and weighed on the same
balance. As the whole area of Malta is 245 km2 and that for Gozo is 67 km2, the
relative proportions, represented by the different pieces and shapes of paper, for the
islands was calculated. The results are given in Table 2.1 0. Although the method was
rather crude, it was faster than estimating areas by superimposing a transparent sheet
with metric scale and grid squares. In addition, the accuracy demanded from such an
exercise was in estimating relative proportions and not in calculating precise data.
These figures show that 70 per cent of the coastal littoral of the archipelago consists of
two types of rock Lower Coralline Limestone (LCL) and Globigerina Limestone
formations. The former occurs at 30 per cent of the Malta coast and 61.8 per cent of
the Gozitan littoral. Globigerina Limestone outcrops at 42.5 per cent of Malta
coastline and only less than 20 per cent for Gozo. Extreme values show that the
whole Comino coastline is composed of UCL and the almost two-thirds of the
Gozitan coast has LCL outcropping. Of significance is that all of the strata are
represented in Malta and Gozo with the exception of Middle Globigerina for Gozo,
and of the 12 values falling between 10 and 20 percentage points, two in the 20-30 per
cent range and one at 61.8 per cent is the highest after the UCL for Comino. In all,
this shows a varied coastline geology that indicates a variety of landscapes which in
turn have encouraged different types of land uses and led to a number of coastal
management practices.
A number of factors account for the importance of coastal geology to the study of
coastal land use and consequently has implications for coastal management. The areas
with intensive coastal development in the Maltese Islands are areas were harbours and
creeks are present. These coastal geomorphic landscape features are the result of
erosion of the soft lithological structure that the Globigerina Limestone is made of. A
process that spanned millions of years produced features classified as rias (Strahler
and Strahler, 1984) with the excellent natural inlets that have been used by humans as
zones for trade and commerce by successive occupiers of the Islands all of whom
34

leaving their imprint on the landscape. This is in sharp contrast to the situation in
Gozo where the coastline shows a marked absence of notable inlets due to the absence
of the soft Globigerina Limestone along most parts of the coast resulting in a limited
economy based on the development of creeks and harbours.
Other coastal areas, having a different geology, have developed diverse landforms and
encouraged different land use patterns. The combination of the geological nature of
the Maltese Islands, composed mainly of sedimentary deposits of marine origin, and
the prevailing tectonic activity, give a varied structure to the coastline. Lower
Coralline Limestone formations present steep cliffs in areas where the land was
tectonically uplifted, and a low lying coastline in zones of land subsidence. In
general, the coastal margin formed is rather linear with few inlets. Globigerina
Limestone formation has a highly erodable lithological structure that produced large
scale coastal indentations and a shore platform that skirts the areas with high cliffs; a
low sloping coastline being an additional feature in some localities. Malta's harbour
network is the end product of these processes. Clay, being unconsolidated material,
exhibits unique properties. It produces spectacular concave cliffs and slopes where it
outcrops alone, and boulder fields where Upper Coralline Limestone plateaux are to
be found above it. The latter becomes unstable as a result of the wetting of the clay.
Large blocks being dislodged from the cliff face fall on to the slopes below creating
boulder scree zones. The scenery here is spectacular with the coastline having an
irregular shape from the large boulder spread at sea level. The major fault zone that
produced the Great Fault in Malta and isolated Comino was also responsible for the
formation of a number of bays to the north. This process produced a succession of
ridges and valleys; the latter formed due to the collapse of sections of the ridges as a
result of faulting. The sea drowned part of the valleys and formed bays and inlets.
Land use along the coastal margin is partly the result of the physical processes
outlined above. In areas where the low sloping rock prevails and access to the coast is
high, development has taken place. The opposite is true for areas with high cliffs and
boulder scree slopes. In addition, development has been attracted to areas where bays,
creeks and inlets are located.
35

Table 2.10 Maltese Islands, Coastal Geology: Percentage Distribution of Coastal Rock Type of the Maltese Islands, Malta, Gozo and Comino.
Category Maltese Islands Malta Gozo Comino
Alluvium 0.9 1.3 - -Sand 2.2 1.9 2.6 0.2 Upper Coralline 16.4 15.3 1.5 99.8 Limestone Greensand/ Blue Clay 9.4 8.6 14.2 -Upper Globigerina 8.4 6.0 17.8 -Limestone Middle Globigerina 7.7 10.7 - -Limestone Lower Globigerina 19.0 25.8 2.1 -Limestone Lower Coralline 36.0 30.4 61.8 -Limestone Source: Author's calculatton presented m synoptic form complied from I :2500 scale sheets measured from using I em divider width.
2.3.2 Geomorphology
A number of classifications of the Geomorphology of the coastline of the Maltese
Islands have been attempted with Paskoff and Sanlaville (1978), reproduced in Figure
2.3 for Malta and Figure 2.4 for Gozo, and Ellenberg (1983) for Gozo. However, no
quantification regarding the predominant features was produced. As a general
observation, the coast of the Islands can be simply classified as upland or lowland,
with the former predominant in the southern and western coast reaching a maximum
height of 253 metres above sea-level. The rest of the coast, can be classified as
lowland, at an altitude of not more than 75 metres. For Gozo practically the whole
coastline is an upland one with only a few exceptions.
The distribution of the geomorphological features of the Maltese Islands is examined
in Table 2.11. In general, a large part of the littoral is accessible, with almost 50 per
cent of the coast made up of low sloping rock or reclaimed land. The latter essentially
consists of coastal areas that have been covered with concrete to accommodate
marine-related industries or to enhance coastal facilities such as jetties, promenades
36

I j;::::::IZ ll "' l 9
EffiA' I ···" 2 10 1-1 11'1
MALTE
Figure 2.3 Geomorphology of Malta
Source: Paskoff and Sanlawille (1978) Legend
Quaternary continental deposits 2 Upper Coralline Limestone 3 Globigerina Limestone 4 Tectonic faults: (a) fault plane
(b) fracture 5 Clay slopes 6 Beach 7 Low rocky coast 8 Rdum- Coastal scree slopes 9 Cliffs I 0 High cliffs II Slickenside 12 Underground karstic formations: (a) sinkholes
13 Water drainage division 14 High coast 15 Highest altitude
16 Built-up area
(b) underground watercourse
3 II
1'?/51 ~ 91 4 12
I:Jl 1 ......... I 5 13
171 ~I 6 14
I 7 1 21) I 7 15
~~-8 16
37

GOZO
' I ~W(JA A
3 KM
Figure 2.4 Geomorphology of Gozo
Source: Paskoff and Sanlawille (1987)
Legend
1. Quaternary continenqal deposits 2. Upper Coralline Limestone 3. Globigerina Limesto._e 4. Tectonic faults: (a) fault plane .
(b) fracture 5. Clay slopes 6. Beach 7. Low rocky coast 8. Rdum - Coastal scree slopes 9. Cliffs 10. High Cliffs 11. Slickenside 12. Underground karstic formations: (a) sinkholes
(b) underground watercourse 13. Water drainage division 14. High coast 15. Highest altitude 16. Built-up area
1:::::::17 I I 9
EEHA' I 2 10
1-111\l 3 1!
1:?~: Ql 4 12
IJ60 1 .. ·······1 5 13
l/1 s~ I 6 14
1~""'1~3 1 7 15
III!"B 8 16
38

and slipways, although only a small percentage of this is evident on Gozo. The
boulder scree areas, steep rock faces and cliffs constitute the inaccessible half of the
littoral. However, Gozo has two-thirds of its coast made up of these features whilst
Malta has 40 per cent. Sand is found only in small proportions, a matter of not
inconsiderable inconvenience for the tourist industry.
Table 2.11 Maltese Islands, Coastal Geomorphology: Percentage distribution of coastal rock features of the Maltese Islands, Malta, Gozo and Comino.
Maltese Islands Malta Gozo Comino Mud 0.5 0.7 - -Sand 2.2 2.1 2.9 1.6 Boulder Screes 18.3 18.4 20.2 7.8 Low Sloping Rock 36.7 37.3 30.6 60.6 Steep Rock Face 3.7 3.2 3.9 10.1 Cliff 25.2 20.3 41.4 19.7 Reclaimed Land 13.2 18.0 1.0 -
Source: Author's calculation presented m synoptic form compiled from I :2500 scale sheets measured from using lcm divider width.
The combination of the geological nature of the Maltese Islands, composed mainly of
sedimentary deposits of marine origin, and the prevailing tectonic activity, give a
varied structure to the local coastline. This combination of the main geological and
geomorphological features can be examined spatially on the map produced by Paskoff
and Sanlaville ( 1978). The maps indicate that the occurrence of Lower Coralline
Limestone formations present either steep cliffs where land has been tectonically
uplifted or a low-lying coastline in zones of land subsidence. In both cases the coastal
margin formed is rather linear, with few inlets. In areas where the Globigerina
Limestone formation is present a highly erodible lithological structure has developed
into large-scale coastal indentations. In the latter cases there is either a shore platform
that skirts the areas where there are high cliffs. In other localities a low sloping
coastline prevails. In both cases the areas have been intensively developed.
Another coastal feature is the boulder fields and screes. These are the result of the
unconsolidated clays becoming unstable when wet and destabilise the capping Upper
Coralline plateau above, dislodging large blocks on to the lower slopes and creating
boulder scree areas. Where the boulder screes reach the sea, the coastline is largely
39

inaccessible, has an irregular shape and is generally not amenable to development.
This landscape pattern is prevalent along the coastal margin of western Malta and
north eastern Gozo, although a number of sand beaches and beach pockets are to be
found along parts of the boulder screes. The combination of these geomorphic features
provided an aesthetically pleasing coastal environment.
The importance that this author attaches to the geology and geomorphology of the
coast in relation to the land use can be gauged from the Figures 2.5 and 2.6 where the
steepness of slope and the system of faults on Malta are shown. Thus these figures
provide an indication on the coastal geology and the coastal geomorphology. These
figures formed part of a poster session (Schembri and Magri, 1996) and a short
communication on ongoing research at Littoral '96: Partnership in Coastal zone
Management, a conference held at Portsmouth, England.
40

N
4-
.------.-.. PRE$UMl0 FAVt.rS
0 Z l km
Figure 2.5 Maltese Islands - Fault Systems
Source: Alexander (1988)
SntCUUAI.. +--11\A(A
ANTIC!.. IN AI.,. AREA --~
Tht Gnol F'oull ('('tC:(Ofb 1JM1)o E.HE·WSW, r$owt!tl'wv<f 90· 100\'1. 10 H, vb~ lotnqtn ''):m.
41

Malta Steepness of Slope
Figure 2.6 Malta Steepness of Slope
Source: Bowen-Jones eta/ (1960)
J $ I Main stmctllral scarps
j ~; :;: J Main built up areas
0 Slope less tl>an 5%(1120)
[I] SlopeofS'Y.-15%(1/20-In)
• Slope of 15%-40% (ln-112.S)

2.4 Conclusion It is therefore apparent that the Maltese Islands whilst having most of the physical
characteristics that appertain to the Mediterranean environment and have been subject
to cultural influences from adjacent Mediterranean shores they have characteristics
that make them unique within the wider Mediterranean world and the closer island
community characteristics evident for small Mediterranean islands. In addition, the
Maltese Islands, together with Cyprus in the Mediterranean, are a sovereign state, but
having a very high population density, makes their overall political and socio
economic situation in a different league to other islands. In fact, this chapter served to
illustrate these traits and in Chapter 4 the characteristic that the islands were ruled by
the Knights of St. John, a European-based military and religious society and by Britain
give further weight to the fact that the islands cultural characteristics are not purely
Mediterranean. These factors are now part of the socio-physical fabric of the islands
and manifest themselves in all strata of land use planning. However, to bring back the
argument of coastal zone management and coastal land use, the next chapter will
focus on the meaning of these terms and the need for both coastal management and
the rational use of coastal land.
43

Chapter 3 Coastal management and coastal/and use in perspective
3.1 Introduction
This chapter will focus primarily on the two main themes that form the basis of this
thesis: coastal land use and coastal management. The focus will be to provide an
epistemological background to the central themes of the thesis. This background will
involve an explanation of the meaning of the main themes, the development of the
disciplines of land use and coastal zone management, and the evaluation of the
contemporary need for the two disciplines, especially within the context of the local
situation. Finally the focus will be on the contemporary theories that emerged from
these two strands of inquiry.
As a result of the overlap of land use and coastal management in this thesis, another
two areas of interest have emerged: coastal land use and integrated coastal zone
management, with land use and coastal land use bracketed within the same paradigm
and coastal management and integrated coastal zone management within another.
Studies on land use in general have predated those on coastal land use, with the
former having a larger physical area and being broader in scope, normally
encompassing the larger coastal hinterland and beyond. Coastal land use studies, on
the other hand, have a more limited area, and, in general, are limited to matters that
are affected by marine influences. A similar situation exists between coastal
management and integrated coastal zone management, with the former pre-dating the
latter but being narrower in scope and situation. The distinction between the two will
be explained below. As a result of this, a number of strands of thought emerge in this
thesis, all of which are commented upon.
As explained above, the data gathered for this thesis is the result of two coastal land
use surveys, together with a number of cartometric measurements. Following these
studies, other themes and fields of study arose and this author developed additional
interests, sought the meaning of various terms and felt the need to seek the necessary
epistemological background particular to these themes. Two particular areas came into
focus. The first is Fractal Studies: the variation of coastal length with changing scale
of map. This theme has already been referred to in Chapter 2, where the variation in
the length of the coast was examined with respect to the change in map scale. The
44
second theme was the use of simple statistical methods normally employed to
examine the relationship between variables as tools for coastal management. These
themes have been mentioned according to the order in which each one appeared to me
to be important in the development of this thesis. However, the list below presents
these themes in a specific sequence that follows a progression, from the basic notion
of land availability to the ultimate concept of integrated coastal zone management. In
the opinion of the author, this progression is the logical development of the whole
study as developed in this thesis. The main essence of the thesis is that aspects of
these themes have been drawn upon by the author to provide a methodology for the
study of coastal land use as a basis for coastal zone management.
Therefore, in summary, the main themes on which this thesis is built are:
• land
• land use
• coastal land uses
• surveying and scale
• methodology of analysis
• coastal zone management
• integrated coastal zone management.
An epistemological background to each theme will be given following the sequence
established above. Simultaneously, the literature consulted will be also reviewed.
3.2 Land
The first element to be discussed is the primary base on which this thesis is focused:
land. Land constitutes about 30 per cent of the surface of the earth, and is
• essential to the sustenance of life (Clark, 1995, 651 ),
• with a limited carrying capacity (Yunlong,1990,337),
• basic to all aspects of development (Okpala, 1992,92).
45
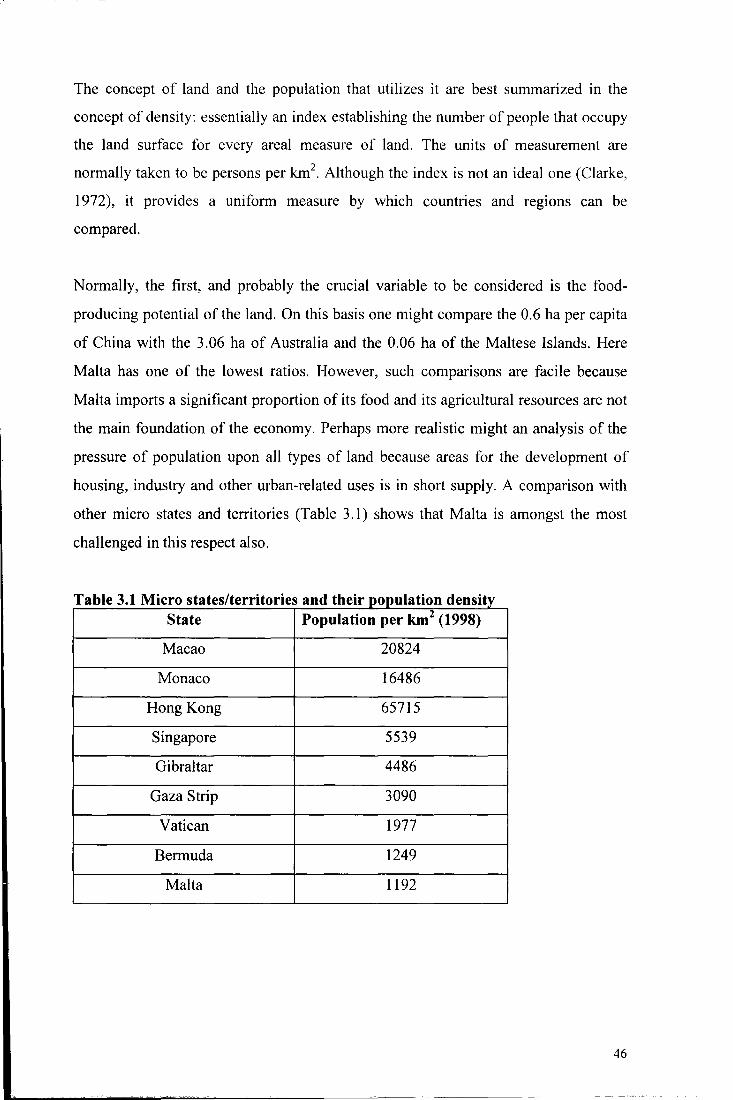
The concept of land and the population that utilizes it are best summarized in the
concept of density: essentially an index establishing the number of people that occupy
the land surface for every areal measure of land. The units of measurement are
normally taken to be persons per km2. Although the index is not an ideal one (Clarke,
1972), it provides a uniform measure by which countries and regions can be
compared.
Normally, the first, and probably the crucial variable to be considered is the food
producing potential of the land. On this basis one might compare the 0.6 ha per capita
of China with the 3.06 ha of Australia and the 0.06 ha of the Maltese Islands. Here
Malta has one of the lowest ratios. However, such comparisons are facile because
Malta imports a significant proportion of its food and its agricultural resources are not
the main foundation of the economy. Perhaps more realistic might an analysis of the
pressure of population upon all types of land because areas for the development of
housing, industry and other urban-related uses is in short supply. A comparison with
other micro states and territories (Table 3.1) shows that Malta is amongst the most
challenged in this respect also.
Table 3.1 Micro states/territories and their po_l!_ulation density State Population per km2 (1998)
Macao 20824
Monaco 16486
Hong Kong 65715
Singapore 5539
Gibraltar 4486
Gaza Strip 3090
Vatican 1977
Bermuda 1249
Malta 1192
46

3.3 Land use
Closely linked to the notions of land are those of the utilization of the land surface:
land use. Land is effectively fixed in supply taking up about 29 per cent of earth's
land surface (Best, 1981 ), but the use to which it can be put is flexible. The first basic
estimate of the use of the 149 million km2 area of the terrestrial part of the world,
excluding the 14m km2 which is permanently covered by ice, is the subdivision into
four main uses: 11.3 per cent - arable land; 25.3 per cent - grassland; 31.2 per cent -
forest; and 32.2 per cent- other uses.
Land use deals essentially with the spatial aspects of all people's activities on land and
the way in which the land surface is adapted, or could be adapted, to serve human
needs (Clarke, 1996). The main human uses can be classified as either intensive
(services, roads, industries) or extensive (agriculture) (Healey and Ilbery, 1990).
Conventionally, four major uses are defined: agriculture, forest and woodland, urban
land, and miscellaneous.
The concern on the capacity of the earth to contain all the human-generated needs has
led to debates that developed into the 'environmental revolution' of the 1960s and
1970s (Owens, 1992). Meadows et a! (1972) cited the Club of Rome's seminal
publication Limits to Growth as the watershed that threw light on the matter and
further citing sources that pinned the reason for the depletion of the earth's resource
base on the 'loss' of land to economic development.
Further groupings of land parcels are identified: land units and land systems being two
important categories. A land unit has a simple form and usually occurs on a single
rock type or superficial deposit. Land units are often recognized on the basis of their
geomorphology. A land unit may be composed of two or more separate elements.
Land systems comprise a number of land units. They on the other hand can be defined
as subdivisions of a region into areas having within them common physical attributes
which are different to those of adjacent areas. Any one land system normally has a
recurring pattern of topography, soils and vegetation reflecting the underlying rocks
(geology), erosional processes (geomorphology) and the climate under which these
processes operate. A land unit, the detailed component of a land system, is
47

particularly useful in evaluating land for agricultural and engineering purposes and in
devising problem-oriented classifications. The resultant land-systems maps are easily
interpreted, and both rapid and economic to produce (Cooke and Doornkamp, 1974).
Best ( 1981) defines land use as that which deals essentially with the spatial aspects of
all the activities of man on land and the way in which the land surface is adapted, or
could be adapted to serve human needs. Van Duivenbooden et a! (1996, 143) define
land use as "the human activities that are directly related to the land, make use of its
resources or have an impact on it." Whilst both definitions concentrate on the
utilization of the land, Best focuses on the adaptation of the land surface, and van
Duivenbooden et al (1996) mention the impact of man on the same surface, and
further adds that land use is made up of three interacting aspects. The first is the
biophysical land use aspect, and refers to "the human interference in the functioning
of a given agro-ecosystem"; the second aspect is termed land use purpose, and refers
to "the socio-economic use that people make of the land"; the third aspect is termed
land use circumstance and combines the first two aspects as it describes "the socio
economic and biophysical environment in which a particular type of land use is
applied." The latter concept of impact is probably the contemporary philosophy
behind two main authors' theories of the state of the world, namely, Simmons (1996)
and Goudie (1997).
In addition, a further projection of the land use concept is one that introduces the idea
of land cover. This puts forward the idea that, whilst land use identifies parcels of
land according to the use which people make of them, land cover identifies parcels of
land according to what is actually covering the land surface (Badruddin and Hamilton,
1996). Land cover denotes physical features, both natural and human-made that
occupy and cover the surface. Land use is the activity associated with a parcel of
land. Although the problem in the local context of a land-use survey may not be
significant, as the land cover associated with the Maltese environment does not have
the wooded canopy normally linked to "wetter" and "greener" locations, uses of
buildings within the urban environment could pose problems of interpretation.
However, as the mapping done by the author for this thesis was based upon a good
48

practical knowledge of the prevailing coastal urban architecture and this problem was
resolved.
Another problem that links land-use studies with Satellite Imagery and Remote
Sensing, as applications of modem technology, is the fact that notwithstanding their
efficiency they do not interpret land uses but only distinguish land cover. In fact in
many Remote Sensing applications and analyses, land use and land cover are used
interchangeably (Badruddin and Herrington, 1996), which for the purposes of this
thesis is unacceptable. Badruddin and Herrington (1996) claim that land-use maps
prepared from land cover images can generate misleading results.
In an attempt to solve this problem over, Thibault (1999) provides two lists, one of
land use and another of land cover, and helps in distinguishing between the two.
These are shown in Table 3.2. As an example, educational land uses (identified as
No.3 in the list) are associated with 'building' in the land cover list (identified with
the lower case 'h'). However, he further elaborates his argument by introducing the
concept of land print, in addition to that of land cover, to fine-tune the factor that is
present on the land surface. Essentially this method associates the type of land use to
its particular extension on the land in its immediate vicinity. Thus a school
(educational, No.3) has 'building' as its land cover but lawn, 'e', as its land print.
Table 3.2 Indicators of land uses and land covers
Types of land uses Types of land cover I land print 1 agricultural. a. woods 2 commercial b. trees 3 educational c. shrubs 4 recreational d. pasture 5 residential e. lawn 6 transportation f. till 7 industrial g. bare ground 8 idle h. building 9 unknown 1. paved
J. railroad k. miscellaneous
Source: Thibault ( 1999)
49

For the purposes of this thesis, it is the land use concept that has been applied.
Effectively the main epistemological difference between the survey of 1989 and that
of 1998 is that the greater mapping detail of the first survey included the concepts of
land use, land cover and land print without distinguishing particularly between each
one of them, whilst the second smvey classified land by the type of uses to which it is
put.
As the identification, analysis and classification of land use is the main
epistemological basis of this thesis, a brief history of its systematic analysis during the
twentieth century is timely at this stage. The need for baseline information had long
been felt, especially as data on the resomce potential of the earth was needed. The
seminal land use surveys by Stamp (1948) paved the way to further studies elsewhere,
especially in the lands of the British Empire. Of particular note here is the land use
survey performed by the University of Durham's Department of Geography in the
1950s, probably influenced by Stamp's work, where teams of mappers surveyed the
whole area of Malta and Gozo focusing on agricultural land use (Bowen-Jones, H.,
Dewdney, J and Fisher W.B., 1960). This also included studies on the geology, soils,
mban areas and demography, seminal papers in their own right. It is important to
mention at this point that further land use surveys in Britain were conducted by
Coleman ( 1961) and Walford ( 1997) both of which employed the systematic mapping
of surface features of the whole territory. In fact, the data presented for this thesis
groups the results of a systematic mapping of the coastal zone of the Maltese Islands.
Local studies on land use emphasized the changing pattern of the utilization of the
land surface as a result of urbanization and development. Six significant sources can
be cited. The first is the local seminal text on the geography of Malta (Bowen-Jones
et.al., 1960) which was the result of a five-year land use survey of the Maltese Islands.
Charlton and Beeley (1993) examined land use change in a number of sites as an
update of the Bowen-Jones (1961) eta! study. Their main concern focused on the
depletion of arable land in Malta as a result of mbanization. Schembri and Lanfranco
(1993) showed the depletion of natural habitats for flora and fauna on the Maltese
Islands including the change in the land use patterns as affected by deforestation,
afforestation and land reclamation. Mallia (2000) draws a land use picture for the tum
50

of the millennium by noting the population changes since 1948, up by 15 per cent
compared to the 400 per cent increase in the built-up area. In addition, he identifies
industry, commerce, quarrying and tourism as the main contributors to land use
change in Malta. Cilia ( 1995) reviewed the growth of the built-up area throughout the
20th century. The values for Malta were 4.1 per cent in 1910 increasing to 18.1 per cent
in 1995 and an estimate of 21.7 per cent for 2010. The comparable figures for Gozo
are 1.6, 7.3 and 8.7 per cent respectively. Details on quarry, agricultural and landfill
areas are also given. Schembri and Bonnici (2000) review the changing pattern of
population growth and settlement as key factors that conditioned the change in the
land use patterns. In fact from the data examined it was concluded that it is the coastal
localities that have experienced the highest rate of land use change.
The second strand of thought is the local contemporary land use issue where a three
pronged debate is developing. One debate in Malta has focused on vintners requesting
the release of more land for the development of vineyards in the light of growing
competition from European wine producers. The argument here is one that cites the
accession of Malta into the European Union and the subsequent removal of
government protection. Local vintners expect more competition in the local market
from foreign wine producers; and the local wine industry would also find it difficult to
make an impact on the European market as the volume of produce will not be large
enough.
Secondly, housing needs for a growing population is an issue being debated in Malta.
With a limited area of land available and the needs of tourism and industry still
unsatisfied, land for housing is scarce. High-rise buildings provide part of the answer.
However, most local councils are against high-rise buildings as it changes the
traditional architectural cultural fabric of low-rise development.
Thirdly, the re-use of the existing land seems to be the most plausible answer to urban
and rural land use problems (The Times [of Malta] 16 September 1999). Within the
urban environment the re-use of old buildings in the village core areas may be
gathering momentum, and in rural areas the rehabilitation of abandoned fields can be
an answer towards increasing the agricultural potential of the islands.
51

These arguments provide scope for yet another aspect in the vast ancillary terminology
associated with land use, that of land user. Whithby and Ollerenshaw ( 1986) use the
term to differentiate between identifying the uses to which land is being put by means
of a land use survey and interviewing the actual users of the land to identify the
amount of produce. Cadastral surveys are a case in point and have a history that pre
dates that of land use studies. In fact, the original Domesday Book in Britain dates to
1086 (Upshall, 1992).
The introductory part of this thesis (Section 1.1) highlighted the need for the rational
management of land use in the Maltese Islands especially in view of the limited
spatial resources available. In fact Schembri (2000) presents the problem posed by
increasing population density in the Islands on the land available as being the nation's
main environmental concern at the start of the new milletmium.
3.4 Coastal land uses
The local debate regarding coastal land use is one that centres around the provision of
touristic and recreational areas. The major projects range from the provision of better
facilities for the ferry service between Gozo and Malta at Cirkewwa in the north of
Malta; the building of the Hilton Hotel and associated yacht marina at St. Julian's
Bay; the development of Manoel Island and the Tigne Peninsula in Marsamxett
Harbour; the extension of the cruise liner terminal; and the development of the
Cottonera waterfront in Grand Harbour. The local debate is about changing the
present land use pattern through land reclamation as is the case for the Grand Harbour
projects; constructing high-rise buildings as with the Hilton project; and the
encroaching of the land area on the nearshore zones and affecting scuba-diving sites,
as at Cirkewwa. These problems are typical of the urban littoral frontier (Hudson,
1996) and the surveys conducted in the last decade of the last century show the
growing importance of the coast as an investment potential.
As the focus of this thesis is on the coast, it is the land uses that prevail along the
coast that are of interest to the author. Essentially these land uses are determined by
activities normally associated with the coast. The identification of the coastal land use
52

indicators as presented for this thesis was the result a number of studies, surveys and
secondary sources. These can be summarized into: a pilot study, the 1989 survey, a
number of coastal land use exercises developed for undergraduate courses, and a
review of technical and academic literature on coastal zone management. It was only
after these were completed then that the land use indicators used for the 1998 survey
were identified. A full account ofthis procedure is given in Chapter 5.
In order to decipher the epistemology in the selection of coastal land use indicators by
different coastal surveyors, a number of land use categories that were used in surveys
to map the coast of a number of countries (South Africa, Puerto Rico and Portugal)
are shown in Tables 3.3 - 3.6. The distinctive element that emerges is that there is a
general inconsistency in the indicators used. The first difference noted is that one
survey uses indicators for both the land and foreshore area (South Africa) whilst the
other (Puerto Rico) uses indicators for the land area only, and the San Francisco
classification develops mainly the human element of the whole land use concept. In
addition the indicators for South Africa can overlap on one another, making field
identification problematic and difficult to interpret the results.
3.5 Surveying and scale
The similar need for the rational use of land led to the already-mentioned pioneering
Land Utilization Survey of Great Britain in the 1930s by L.D. Stamp which was
followed by a major report in 1946 " The land of Britain and how it is used." This
was followed by a second major survey in 1960. Although land-use surveys entail
the investigation of the land surface and the cartographic representation of the land
use, they are largely descriptive exercises (Johnston eta!, 1994) with the emphasis of
Stamp's work being on the "use and misuse of land in Great Britain" (Johnston eta!,
1994, 316). A third Land Utilization Survey was held in 1996 (Walford, 1997).
Although the level of detail mapped had increased since the 1654 -1658 Down Survey
of Ireland and the Tithe Surveys of Great Britain of the 191h century, a number of
problems were apparent throughout; even as the method and technology for field
mapping and representation improved with the introduction of Satellite Imagery,
Remote Sensing and Geographic Information Systems applications. Whithby and
53

Table 3.3 Selected land use categories, South Africa.
I. Conservation areas; 2. Low Intensity Use areas; 3. High intensity boating; 4. Multi-purpose Boating; 5. Commercial and recreational Harbours; 6. Industrial waterfronts; and 7. Commercial naval channels. Source: Olsen and Seavey (I 990)
Table 3.4 Selected land use categories, Puerto Rico
I. cropped land; 2. pasture and harvested forage; 3. forest brush; 4. non-productive land; 5. rural public community service land; 6. land used for quarrying or mining; 7. urban and manufacturing; and 8. miscellaneous. Source: Ma11in and James (1993)
Table 3.5 Selected land use categories, Portugal
I. rocks 2. beaches 3. wetlands 4. shrublands 5. agricultural areas 6. foreseted areas 7. urban areas 8. golf courses 9. camping sites I 0. docking areas I1. beach parking areas 12. stone quarries 13. estuaries Source: Andersen et a!. (1996)
Table 3.6 Selected land use categories, San Francisco estuary, USA
1. residential 2. commercial I light industrial 3. heavy industrial 4. intensive agriculture 5. rural Source: Me Creary (1992)
54

Ollerenshaw ( 1986, 1 0) give three examples as being common problems for most
surveys:
(a) the consistency of interpretation of land use by surveyors;
(b) the different definitions for land cover and land use; and
(c) the difficulty in interpreting urban land uses from the external form of buildings.
In order to place this issue of mapping problems into the perspective of this thesis, the
concern for maintaining consistent land-use interpretation throughout is explained in
Section 5.4. Basically this involved adhering to the mapping key developed for the
1989 coastal land use survey of Malta that was used by all mappers, and also keeping
in line with the new categories established for the 1998 survey. The level of
generalization was higher for the 1998 survey as a number of land uses identified in
the 1989 survey occupied small patches of land and could therefore be grouped
together or included within a major land-use category without disrupting the main
scope of the survey. This situation is elaborated upon in Chapter 5. In addition, the
decade that separated the two surveys gave ample time for the author to develop the
required number of land use categories sufficient to include the whole coastal littoral.
3.6 Coastal management
Although the main focus of this thesis is coastal land use, a large part of the literature
cited deals with coastal management. This was due to the fact that coastal land use
issues were mostly found in sources that dealt with coastal management per se.
Following the definitions of the coastal zone, that were used to assist in the
identification of the geographic limits of the local coastal zone especially its landward
boundary, presented above in Section 2.5, a clarification of the terms of reference of
coastal management is timely at this stage. A fairly broad spectrum of opinions
emerges.
In fact, the term coastal management can lead to a number of interpretations. It can
be broadly interpreted to mean:
55

• "a type of public activity or intervention that is applied to the coastal and marine
environment and its resources" (Klarin and Hershman, 1990, 144 );
• "involving concerns related to economic development, land use and port
development, and fisheries management, as well as coastal resource protection"
(Dean, 1979, 287);
• "including multiple goals, involving the preservation and development of coastal
resources, some of which can be conflicting" (Owens, 1992, 144 );
• land and sea managed as one unit (Amir, 1984);
• the voluntary sector played a key role in placing coastal management centre-stage
(Ballinger, 1999,511 ).
Carter ( 1988) acknowledges that coastal management has been around ever smce
humans tried to use the resources of the sea and adjacent coasts, however it is only
recently that the management of the coastal areas has been given a scientific approach.
These definitions show that coastal management encompasses a wide spectrum of
issues and therefore that the definitions linked to it are broad in scope. Two reasons
can be identified for the relatively large number of definitions of coastal management.
First, the term and the terminology associated has been around for about 25 years.
This has generated a large amount of literature, provided innumerable jobs, and
originated academic and technical courses to train the Coastal Manager. In the wake
of all these scenarios, coastal management has developed its own epistemology
(theory of the method of knowledge). Second, coastal management involves a broad
number of traditional disciplines such as the pure sciences, social sciences, and the
humanities. In fact, meetings on coastal management have a broad brief involving
physical, human, economic and social scientists as well as planners, managers and
politicians. Therefore the study of coastal management can be considered to fit in
fairly well within the terms of reference of geographers, whose discipline spans the
physical and social sciences. Appendix 4 gives the range of publications.
Sorensen ( 1997) provides a brief review of the development of the term coastal
management and also gives an explanation of each of the words that make up the term
56

"integrated coastal management" (ICM). As a theme for international conferences,
Coastal Zone Management (CZM) presents a large number of issues and subjects,
Table 1.2 has some examples. In addition to the above aspects, CZM also relates to
the terrestrial, marine, aquatic and atmospheric domains.
Mitchell (1986) identifies coastal management with a system in that the needs to
manage coastal resources are essentially based on a pattern that has been developed in
the United States and used all over the world. This system runs from the gathering of
information (baseline studies) to the enactment and enforcement of laws that help to
safeguard the coastal resources. However, an interpretive tool is needed for the
analysis of the coastal land use results gathered, that can be effective for coastal
management purposes.
3. 7 Methodology of analysis
A statistical tool that facilitates the automatic identification of groups of clusters of
observations in a data set is cluster analysis (Sokal, and Rohlf, 1995). Holt (1998)
identifies cluster analysis as an effective statistical tool to group variations in a data
set. Lipshitz and Ravel ( 1998) use a method of multivariate analysis to examine socio
economic differences among localities that make up "large" geographic units. The
outcome of the study encouraged the formulation of varying regional development
policies to areas having different socio-econmic bases. This policy was used in
preference to a "homogenous" policy applied across the board irrespective of the
cultural condition of the locality. Ravichandran, et al (1996) used this method naming
it the "ecoregional concept," in which the regional approach was used for the
management of environmental resources. The authors identified 23 features including
geological, geomorphological, morphometric and land use for 63 micro-basins in
Tamiraparani Basin in Southern India in an attempt to describe water quality patterns.
As this study aims to group coastal regions (segments) that have similar land use
patterns and at the same time set out to establish a heirarchy of coastal areas based on
the prevailing type of land use the cluster analysis method is preferred. In addition, as
the method uses the regional approach by examining whole areas irrespective of their
land use fabric, the analytical procedure advocated by a number of authors working in
coastal management in the Mediterranean and Middle Eastern areas was found
57

suitable. In fact, the use of cluster analysis in the interpretation of data is widely
recognised as a tool for effective coastal management.
The reasons for utilizing the method are given below:
Mokiri eta/ (1996, 172)
(a) "analyse the conflicts in coastal uses ;
(b) to explore the potential for development of the different parts of the island;
(c) to examine the effects of multivariate procedures and multiple criteria analysis as
integrated tools in coastal management;
(d) to assist the development of guidelines for future planning and decision-making in
the area".
Legakis, et al (1993,144)
(a) "local authorities, developers and planners can use this methodology as part of a
formal evaluation procedure to (i) assess the environmental quality of an area by
summerising the main elements of the natural environment (ii) can help solve
problems caused by lack of background knowledge in various elements of the
natural environment
(b) can help solve problems caused by inexistance of communication between
planners and ecologists;
(c) can help solve the problem of an indifferent and hostile attitude of authorities and
local people towards nature by providing quick and hard evidence of the ecological
value of an area;
(d) this methodology can be used to determine the level of human disturbance that can
be sustained by a coastal area."
Price (1990,3):
(a) "knowledge where particular coastal resources overlap with resources uses or
impacts;
(b) provides an approximation of where the main conflicts and possible threats to
natural resources occur along the shoreline;
(c) identification of areas in greatest need of control and regulation;
(d) areas where future development could occur with minimal environmental
disruption".
58

Price (1989) "for management purposes, a synoptic picture of coastal conflicts can be
particularly useful. This can be obtained by identifying areas in which concentrations
of key resources overlap with concentrations of major resource uses/impacts".
Simeoni, et a!., (1996, 314)
"Classification is important for coastal management strategies, to reduce, but not
eliminate the need for monitoring activities".
3.8 Integrated Coastal Zone Management
The literature surveyed brought up a number of definitions pertaining to Integrated
Coastal Zone Management (ICZM) and Table 3. 7 has its chronological development.
Although searching for an ideal definition is an ambitious undertaking, it can be taken
to mean an approach at integrating policy and planning into a balanced programme
that meets the needs of the physical and cultural resources of the coastal zone (Klarin
and Hershmann, 1990). Jorge (1997) maintains that ICZM is essentially a
government-driven process that links four main elements: private sector forces, public
resources, Non-Governmental Organisations' actions, and local communities. In fact
a number of researchers in ICZM emphasize that it is the central administration of the
area being managed that should be given the leading role in the administration of an
ICZM policy. Kawabe (1998) suggests that for the "alleviation of friction" between
different administrative bodies concerned with coastal management implementation
of an ICZM policy under a single authority would help in decreasing friction. In
Central America, Windervoxel (1999) identified that the ICZM version termed as the
"alliance for sustainable development" is backed by the ministerial and political level
and includes a large number of political agreements. Windervoxel ( 1999) cites three
reasons for the involvement of the central administration in such matters: gaps in the
data that provides the information, a restricted technical and financial capacity, and
strong sectoralism. However, the main issue that emerged from the literature surveyed
is that notwithstanding the involvement of the government in assisting in the
implementation of ICZM it is the bottom/up approach and not the top/down approach
that succeeds in the end (Aston, 1999). The author cited the example of small islands
as a primary case where this notion (bottom/up) has been successful. The small size
of a number of Pacific Islands, the close association between the coast and the
59

remaining terrestrial area together with the strong involvement of the community in
the management of coastal ecosystems have made ICZM the ideal tool for managing
coastal resources (Aston, 1999).
Community involvement in ICZM is an issue that has been tackled by a number of
authors and an acronym CB-CMR (Community-Based Coastal Resource
Management) was coined. Van Mulekon (1999) describes it as "localised co
management systems wherein small-scale fisherfolk take up a dominant role in
fisheries management in the Philippines". Lowry et al (1999) state that CB-CMR is
being introduced in Sri Lanka "as a political strategy to respond to conditions of
poverty and unsustainable resource use practices." In N E Tanzania the programme
provides training in a wide range of skills aided by facilitation by government
workers through technical advice (Makoloveka and Shurcliff, 1997). The continuous
failure of contemporary management techniques has encouraged managers to accept
the development of "inter-generational equity" by which a lifetime of experiences and
knowledge is used as a basis to propose changes for the next generation of
stakeholders to uphold (Veitayaki, 1997). In the Bay Islands of Honduras, Luttinger
( 1997) proposes the notion that due to increasing tourism the conflicts between the
economic and environmental processes have increased. Thus "building consensus and
reserve organisation "can help solve future conflicting issues that may threaten the
community based marine conservation initiatives. Citing a final example taken from
the Philippines, Rivera and Newkirk ( 1997) maintain that the poverty driven over
exploitation of coastal resources has decreased from Mindanao to Luzon due to
community-based coastal resources management projects. These include bio-physical,
social, economic and legal scenarios.
Although most of the examples mentioned above deal with the marine environment in
developing countries, and essentially involve rural communities, the situation in the
United Kingdom is not very different. Edwards et al (1997) mention the fact that rural
communities are more participatory than urban communities when it comes to
introduce an element of community participation.
60

Table 3. 7 Integrated Coastal Zone Management chronological development
1992 Rio declaration on environment and development, Agenda 21 and Chapter 17 on the Protection of the Oceans
1992 UNCED (United Nations Conference on Environment and Development) Convention on Biodiversity
1992 OECD (Organisation for Economic Cooperation and Development) recommends ICZM
1993 UNCED Convention on Climate Change
1993 Noordevijk guidelines for ICZM 1996 Coastal zone Canada Conference on cooperation in the coastal zone Adapted from Lawrence ( 1997)
3.9 Conclusion This chapter reviewed the meaning of a number of key terms that were seen to be
crucial to this thesis. The identification of the terms came about during the course of
the research, when besides the literature consulted on coastal management (Bowker's
R.R. Seriels Bibliography Department, 2000; Appendix 4), so as obtain a general view
of coastal matters and problems, other issues emerged, notably land use and integrated
coastal management. The key terms were then put in a conceptual order, with the
concept of 'land' first, as it is the basis of all the discussion of the thesis, and the
concept of 'integrated coastal management' the last, as it is the most complicated of
the terms used in this thesis. The discussion of each main term or phrase occupies a
separate section in this chapter.
The other relevant secondary literature consulted is reviewed in the sections where the
particular coastal land use is discussed. This method was used throughout the thesis.
An example of this method can be seen in, for example, Chapter 5, where secondary
literature for different coastal land use identification keys is reviewed. Literature
reviews for aspects of each main coastal land use category are seen in the relevant
sections in Chapter 6. In addition, the literature cited also tapped the general economic
situation of the Maltese Islands pertaining to that particular land use under discussion.
The development of the local coast through the last four centuries was thought to be
of an important influence in the contemporary situation and, as a result, the following
chapter deals with the issue and also uses general historical texts to present the
background.
61

Chapter 4 The history of coastal/and use in Malta.
4.1 Introduction
To put coastal land use in perspective, two factors need highlighting. The first is that
the contemporary land use situation is a function of historical developments and
therefore a brief overview of the history of the islands has to be presented. Secondly,
the land uses along the littoral are influenced by the land uses in the hinterland. Thus,
although this work examines land use along the littoral fringe to a distance inland ( cf.
Chapter I), land uses further inland, up to the whole spatial extent of the islands, must
also be mentioned.
4.1.1 Previous studies on land use
Studies on land use for the Maltese Islands have largely concentrated on descriptive
accounts focused primarily on agricultural activity, residential buildings and industrial
development. Duca and Zammit (1989) were the first to attempt to relate all elements
within a spatially coherent whole when they outlined the areal distribution of the main
land uses of the individual islands and for the archipelago as a whole. However five
sources do give a detailed account of the geography of the islands with an indication
of a land use history. Bowen-Jones, et a! (1960), Bruce (1965), Ransley (1985),
Blouet (1992) and Azzopardi (1995) all treat the geography of Malta in sufficient
detail that a pattern and process account of land use is possible. Further data can be
derived from the maps and charts for the Maltese Islands, notably those produced in
1895 (Vassallo et a!), British Petroleum Exploration Company Limited (1957), Public
Works Department (1983a, 1983b, 1983c), and Planning Authority (1996). Further
studies on land use per se were done by Charlton and Beeley (1987) as part of a
review to the land use situation done for their Doctoral theses with Durham University
in the 1950s. Cilia ( 1995) reviewed the land use situation in the light of population
growth and its projections and the land areas, identified for urban expansion, within
each of the local council boundaries and produced a spatial estimate of the land uses.
Mallia (2000) outlined the present land use situation linking it to energy use and the
production of solid and liquid waste. Schembri and Lanfranco (1993) deal with the
encroachment of the urban land on the local natural environment.
62

For the purposes of this present account, a senes of four maps (Figures 4.1-4.4)
showing the extent and development of the built-up areas for the past century are
presented to help the discussion. As the residential category is one of the highest land
users of the Islands, population data is important, as it gives an idea of the need for
expanding residential space to accommodate changing demographic demands. Further
details in this regard are provided by the results of the decennial census-taking
introduced by the British in 1842 which gives the necessary information. Schembri,
J.A. (2000) provides a detailed account of the population changes over the last century.
Successive Abstracts of Statistics, Demographic Abstracts and Censuses of Agriculture
and Fisheries also provide supplementary data.
4.1.2 The history of coastal land use
The core matter of this section is to review the history of coastal land use from a
chronological perspective, identifying the main land use elements left by former
occupiers of the islands. Other reasons for the inclusion of a historical account of
coastal land uses are:
a) the historical heritage of the Islands dates back 7000 years, with some of the surviving
artefacts located in the coastal areas; contemporary land uses and development sites
overlap or have even displaced this historical heritage. In some cases land uses are
conditioned by the presence of historical remains;
b) the history of the coastal defensive network is part and parcel of the military, political
and strategic situation of the Islands and is a reflection of the broader Mediterranean
and global geo-political situation. It is also important for an understanding of the
coastal character, as defensive works are part ofthe architectural heritage; and
c) the coastal historical heritage is a particular form of land use that occupies a limited
amount of land sites but its presence adds chronological and temporal depth to the
coastal uses. The establishment of historical heritage paths has in fact been the subject
of a seminar organized by the Tourism Authority on the 251h June 2001.
63

4.2 The influence of the political history on coastal land use
The history of coastal land use in the Maltese Islands can be linked to the history of
occupation by successive powers. Table 4.1 highlights this chronological sequence,
giving also the main residential form and urban land uses. The list is not exclusive to
the coast but a part of the heritage listed is located on the coast. The strategic
geographical location of the Islands in the central Mediterranean, occupying a 45 km
stretch in the Sicilian Channel, made them attractive for domination. In fact a
succession of occupying peoples has been documented through literary references,
archaeological finds, some extant land uses and personal accounts (the first of which
dates to 1536 (Vella, 1980).
Table 4.1 Main occupiers of the Maltese Islands, showing . d d I h't t I . per10 an prmc1pa arc 1 ec ura expressiOn
Occupier Period Main architectural expression and
predominant land use Neolithic 5000 - 2000 BC menhir, dolmen,
megaliths Megalithic 3750- 1800 BC megaliths, rock cut tombs Phoenician 800- 480BC tombs Carthaginian 480- 218 BC tombs Roman 218- 395 AD houses, mosaic floors,
baths, rock-cut chambers, catacombs
Byzantine 395- 870AD hypogea Arabic 870- 1090AD small nucleated villages
with serpentine streets, flat-roofed squat houses
Norman 1090- 1194 AD Norman houses Sicilian and other a large number of small Europeans 1184- 1530 AD villages and hamlets built
along Arabic tradition Knights of St. John 1530 - 1798 AD urban development around
Grand and Marsamxett Harbours; growth of villages
French 1798- 1800 AD war situation British 1800- 1964 AD urban development along
eastern coastal areas Independence 1964- explosive urban growth in
rural areas; tourism Source: Compiled from Blouet 8 ( 1992) & Azzopardi (1995)
64

4.2.1 Prehistory to Medieval period
The coastal areas of the Maltese Islands, as identified in this thesis, have a limited
share of the archaeological heritage. However, the overseas links with Sicily, evident
from the obsidian and other sherds (i.e. not found in the geology of Malta), show that
the coast played an important part in the development of the Islands and can be
identified with putting them within the archaeological map of the Central
Mediterranean. Thus Renfrew's (1973) identification of six clusters of chiefdoms
(groups of settlements) does include parts of coastal areas that were under the
influence of separate clans. He lists agriculture as being the main land use, attributing
to it 70 per cent of the land surface. He estimated a population of approximately
11,000 (ca. 4000 BC) living offthe staple foodstuffs of wheat and barley, bovines and
pigs. This largely agrarian diet was supplemented by a diet of fish and shellfish,
putting the coastal resources into perspective.
The transition from archaeological (temple buildings) to the pre-knights period shown
above (Table 4.1) saw the occupation of the Islands by Mediterranean and European
powers notably by the Romans and Muslims. However, the coastal areas remained
extremely vulnerable to both organized invasion and haphazard incursions. With the
former, the islands served merely as an outpost commanding a strategic waterway and
as a pawn in the Punic Wars with Carthage. The Muslims had a long-lasting effect on
the culture with the introduction of the Semitic language, still predominant today, a
serpentine street pattern radiating from a central core, and irrigated terraced
agriculture. A cubic form of squat one-storey high buildings was the main type of
residential housing enforced - this was probably the first planning scheme used in the
history of the Islands. The introduction of field terracing provided more space for
growing food and allowed for a population estimate of 21,000 by the year AD 991
(Bowen-Jones et.al., 1960). The coastal heritage left by the Muslims is to be found in
the coastal place names (Wettinger, 2000) where the lexicography used is still extant.
The effect of the water supply on settlement and development was great especially
along the coast. Figure 4.1 shows the limited area of settlement north of the Great
Fault and along the coastal perimeter. The main reason for this was that the coastal
areas were not considered safe enough for habitation due to frequent pirate raids that
65

disembarked parties in search of water. In part, these raids were brought about by the
availability of water sources along the northern coastal periphery of Malta. Thus
settlements were essentially clustered south of the Victoria Lines fault and forced the
population to live within a narrow topographic range and a limited economic
spectrum. From archaeological evidence it has emerged that these settlements were
essentially rural; a few exceptions were however in evidence notably the Borg-in
Nadur site at Birzebbugia.
During the medieval period attempts at watching over the marine approaches to the
Islands have been identified by Wettinger, (1979) with the organisation of coastal
roster watches by the military set-up of the time (dejma), although the coastal areas
still remained extremely vulnerable to both organized invasion and haphazard
incursions. The gentle topography of the eastern Malta coast and the deep coastal
creeks on the south and western side and in Gozo had a large bearing on this inland
settlement pattern.
The result is that settlements in Malta follow two broad patterns, neither of which had
an influence along the coast: first, one that is dependent on a permanent supply of
water for agriculture (this produces crops all year round) and the other that develops
solely on rain-fed crops, here the range of food being limited. The results of this on
the settlement pattern were the following: (a) villages utilising the permanent supply
of water grew faster and accommodated larger populations, eg, Mosta, Birkirkara,
Qormi, Zebbug and Siggiewi. These are distributed between the Victoria Lines Fault
and mid-way between a line drawn from the harbour to the Southern coast; and (b)
villages living off fodder crops and other activities not associated with agriculture.
These are located further south and east of their northern counterparts, and had smaller
populations. None of these settlements in these the two categories are located on the
coast.
4.2.2 The period of the Knights of St. John
The general picture of the settlement pattern of the Islands vis-a-vis the coast is one
that highlights the fact that, prior to the 161h Century, settlement was largely away
from the coast. The Knights changed the settlement pattern of Malta by establishing
66

themselves around the Grand Harbour and moving the administrative capital of the
island from an inland location (Mdina) to a coastal one (Vittoriosa and later, Valletta).
The building of a large number of coastal defences, especially around Grand Harbour,
and also the building of Valletta itself and its subsequent elevation to being the
capital and administrative city, made the harbour region an attractive area for
residential purposes. This situation was also partly due to the establishment of the
harbour as the main locus of shipbuilding and repair. The Knights also changed the
spatial distribution of the traditional land uses of the islands, introduced new land use
elements within the coastal area and in the hinterland, prominent among which were
country houses, hunting lodges, aqueducts and fortifications, and, above all, laid the
pattern for the present-day residential harbour conurbation. Thus from an island
looking inwards and drawing its living from the limited space available, Malta sought
to optimise its maritime character by utilising the resources provided by its ports and
harbours. It was this political situation that started the development of the coast. In
contrast, Gozo retained the medieval land use vestiges well into the 20th century.
Maritime activity in Malta has a long history and it took on a new dimension with the
arrival of the Knights of St. John to Malta and the building of Valletta and the
fortifications around Grand Harbour. This new security helped to start changing the
geographical location of population settlement, from the spread around the inland
areas to a movement towards the harbour zone. This depleted the population of a
number of villages and caused the abandonment of some Wettinger (1979) Figure
4.5). It also changed job prospects from those of a totally agriculturally oriented
economy incresingly to jobs associated with coastal and port activities. The erection of
a number of coastal defensive structures all around the coast of the Islands, especially
in areas that were considered vulnerable (watch towers, forts, defensive walls,
redoubts and batteries), further enhanced the security of the island. The strategic
location of Malta, together with the availability of secure all-weather and deep water
ports, turned the island into a centre for trade in the Mediterranean.
4.2.3 The British Period
The British era is important because it concentrated development along the coastal
littoral in areas other than the Harbour region. The land use changes occurring during
67

the British period were influenced by advances in warfare technology spanning the
160 year period. The political fluctuations in the world stage at large and in the
Mediterranean in particular added further importance to the strategic value of the
Islands. Table 4.6 shows the main events in chronological order of the British rule.
The table highlights the international and local political situation, the demographic
and economic situation in Malta, and also shows some land use changes occurring
around the Harbour littoral as a result of the political and social changes occurring
during the period. The tabular format of presentation seeks to link the various
political and cultural factors to land use. Four main elements connected with the coast
can be identified:
a) the initial land use intensification of the sites occupied by the Knights around
Grand Harbour with building and excavation so as to construct the docks needed
for ship repair;
b) the enhancement of a number of coastal fortifications with increased wall
buttressing;
c) the construction of a number of large forts along the great fault of the Victoria
Lines, which were part of the defensive network that was set up by the end of the
19th century to form a second line of defence should the coastal defenses fail at
the northern end of Malta;
d) the construction of residential units for British forces personnel, the majority of
whom did not reside in the capital city but were accommodated in areas
specifically built for this purpose. These were spread along coastal areas north of
Marsamxett Harbour and in the southern part of Malta around Hal-Far and
Kalafrana, both of which are located on the coast.
The British also occupied a number of other sites. A map (Figure 4.6) showing such
sites is reproduced from Nehring (1966). It gives a compact picture of the land uses
for the islands in presenting areas that were used for military purposes by the British.
Most of these zones had a coastal area that was partly sheltered from rough sea swell.
The utilization of the coast for maritime purposes to patrol the internal waters saw
military bases established at Kalafrana, Rinella and Marsaxlokk, whilst areas in Grand
Harbour were reserved for British Naval ships (Harrison and Hubbard, 1945). In
addition, the dockyard was the British Admirality ship repair station for the
68

Mediterranean. This situation influenced residential land use development in a
number of ways, especially in the coastal areas. The series of Figures (4.1 to 4.6)
illustrate the main patterns listed below:
a) new areas around Marsamxett Harbour, in line with British forces housing for
services personnel, were developed;
b) along Pieta' to St. Julian's seafront for the middle and upper classes moving away
from the crowded Grand Harbour region;
c) housing for a newly emerging working class concentrated on providing domestic
help for resident British families occupied the area at the back of the coastal
houses along the Sliema seafront; and
d) the housing and married quarters for the British services, such as Tigne with its
complex of Barracks, and the areas ofPembroke, St. George's and St. Andrew's;
e) military establishments at:
• Kalafrana and Marsaxlokk, within the more protected parts of the South Eastern
bay, these were associated with sea planes and a sea rescue squad;
• Mgarr, where a large slipway for launching small torpedo ships was constructed;
• Grand Harbour, where the military dockyard was the main repair base for the
British Fleet;
• Marsamxett Harbour, having a number of shoreline facilities for the mooring of
ships;
• Pembroke, with their associated firing ranges;
f) residential establishments at:
• Kalafrana;
• St. George's Bay (limits of St. Julians), Tigne' and Sliema .
69

Fi ure 4.1: Distribution of villa
'· ,5· \
c;-1 \.
\ • •
Source: We/linger, G. (I 975) in Lu//re/1, A. T Medieval Malta: studies Malta before the Knights.
Figure 4.2: The spread of settlement in Malta -1824
.. • • *'.., ,_ _,.
~· _, .,. "" • ,
--...
... • ... .II ~
,
Source: Bowen-Jones et. a/. ( 196 I)
70

Figure 4.3: The spread of settlement in Malta -1895
• . ... •
Source: Bowen-Jones et.al. (1961)
. .. ....
Fi ore 4.4: The s read of settlement in Malta -1957
Source: Bowen-Jones et.al. (1961)
71

Figure 4.5: The spread ofsettlement in Malta -1995 Source: Planning Authority (pers.comm.)
72

GO Z 0
'"
~ Buih·Up i\tus
Ill MilitAry Arc~
ffil[!] bldustri Ill Ar~:a.t Siopo lqt ,.,._
D !loy F ormina
~ ltriptcd Arc>s . . h-.wl VU.. and Troc Crops
0 Bomol...ond •
I ':: I -l'rinap<ll -
Figure 4.6 Land use in the Maltese Islands, 1960
Source: Nehring (1966)
73

In addition, the mam inland establishments were a number of airfields at Luqa,
Ta'Qali and Hal Far with their operating facilities in Nissan huts and other buildings.
The post-1945 period witnessed the need for economic diversification away from
dependency on the presence of British Forces with the establishment of a new
economic order based on manufacturing industry and tourism. This paved the way for
a number of land use changes some of which affected the coastal zone. Prominent
among these were:
a) the loss of agricultural land to industry and the urban sprawl, including some land
on the coast;
b) the establishment of a number of industrial estates within the suburban region to
cater for the increase in the light industrial base, one of which, at Rinella, is
located near the coast;
c) the expansion of tourism. This was initially concentrated around the Sliema - St.
Julians area, only to expand to the northern areas of St. Paul's Bay - Bugibba -
Qawra and Mellieha later. Coastal land use was greatly affected by this, as a
number of recreational establishments also occupied part of the foreshore;
d) the urban residential sprawl affected the littoral with second home ownership by
Maltese, most of this development occurred near the coast, and
e) the industrial intensification of Marsaxlokk Bay put further pressure on coastal
land resources in the south.
4.2.4 The post-Independence period and the Structure Plan
The post-independence period saw an intensification of land use in a number of areas.
Inland land uses changed predominantly from an agricultural to a residential one, and,
the Harbours' hinterland witnessed the sub-urban sprawl adjacent to areas devoted to
light industries. Along the coastal margin the touristic and recreational aspects
developed at a fast pace, with the construction of tourist accommodation, such as,
hotels, holiday flats and second homes for the Maltese. In the harbours the
intensification of the maritime and industrial base put increased pressure on the
limited land available.
74

The situation as shown in the above table focused attention to some extent on
planning. This gradually emerged after I 945, partly as a result of the infrastructural
damage caused by the Second World War. Table 4.5 highlights the principal efforts
made to address this problem. It shows the flow, at intermittent speeds, of legislation
and studies aimed at making efficient use of space. The period spans the last two
decades of British rule and the three decades since Independence. At times, planning
legislation efforts ran right across the local party political spectrum, with sharp
dividing lines in 1964, 1981 and 1987, all years marking notable changes, with
independence in 1964 and general elections in 1981 and 1987. However, throughout
this half-century a number of issues emerged:
(a) the preparation of a national physical plan (1990);
(b) the setting up of a Planning Authority ( 1992);
(c) the formulation of a National Tourist Plan and the setting up of a Tourism
Authority ( 1999);
(d) the building regulations reviewed and enforced (2000) and
(e) the merging of the Environmental Protection Department and the Planning
Authority into the Malta Environment and Planning Authority (MEPA).
In addition, the Structure Plan for the Maltese Islands was published in 1990, it has
three major goals:
a) "to encourage further social and economic development and to ensure as far as possible that sufficient land and support infrastructure are available to accommodate it;
b) to use land and buildings efficiently and consequently to channel urban development areas, particularly through rehabilitation and upgrading of the existing fabric and infrastructure thus constraining further inroads into underdeveloped land, and generally resulting in higher density development than at present; and
c) To radically improve the quality of all aspects of the urban and rural environment" Source: The Sunday Times [ofMalta] 20 November 1994
75

Essentially the Plan encompasses eleven policy sectors aimed at managmg
development:
a) settlement patterns;
b) tourism and recreation;
c) transport;
d) conservation and public utilities;
e) land and property management;
f) minerals;
g) built environment;
h) housing;
i) social and community facilities;
j) commerce and industry;
k) agricultural, horticulture and fisheries;
All eleven sectors are present at varying scales within the coastal area and we may
argue that a land use inventory of the coastal zone is a basic requirement for the
identification of coastal properties, with a view to managing them efficiently as set out
in the Structure plan. In 1989 a Coastal Land Use Survey was commissioned by the
Planning Services Division to serve as a basis for examining the existing use of the
stock available and to make recommendations for future development potentials. In
addition this coastal survey was to identify areas that could tolerate further
development and areas where development would be detrimental to the natural
environment. This was the first survey in which the coast was mapped, examined and
studied for its land use properties in the Maltese Islands.
Evolving planning policies were also noted throughout this period. These were the
result of change in environmental awareness that was essentially influenced by NGOs
who lobbied the political establishment to incorporate the need for Environmental
Impact Assessments prior to major projects. In fact the first EIA ever to be
commissioned Malta was at Delimara prior to the building of the Power Station
(Government of Malta, 1988a; Government of Malta, 1988b; Government of Malta,
1988c). The introduction of Local Councils in 1992 established the boundaries for
each of the 68 Local Councils. This brought for some localities, that were not
traditionally associated with the coast, stretches of coastline for which they were
responsible under their jurisdiction. A case in point is the inland locality of Naxxar
76

having Bahar ic-Caghaq in its territorial limits. Local Council legislation also
influenced policy in that all local structural needs of any size had an administrative
and legally-binding voice. Notable changes made to the littoral areas in all coastal
localities are the upgrading of areas especially the paving of promenades and increase
in street furniture. In addition, the marine servicing areas, with the mooring of boats
and the on-shore servicing areas, became more organized with zones earmarked for
sea craft of different sizes. Changes in policy are also noted in the demarcation of
swimming zones to render selected bay and inlets safe from moving seacraft (The
Times [of Malta] 14 June 2003, 14) and the regular testing of sea water for monitoring
safety swimming standards.
Changes to planning policies greatly affected the coastal urban areas with various
measures intended to safeguard the aesthetic environment. These include the
classification of each building within one of four categories depending on the state of
repair and the architectural, historic or archaeological value. Some of these sites are
also 'scheduled' and under no circumstances can they be modified without stringent
planning permission. Heights of buildings are also controlled with only the areas
where intensive tourist development takes place such as the Sliema/St. Julians and the
Qawra/ Bugibba seafronts can buildings be taller than seven stories. This legislation
follows the aesthetic problems generated from the permission granted in the 1960s for
a 13-storey Preluna Hotel in Sliema. However, following the building of the Hilton
multi-storey complex in St. Julians where this planning procedure was flouted,
entrepreneurs are still pressing for multi-storey developments especially in the Qawra
area
77

T bl 4 2 S a e equence o h . I I mam reports on puys1ca p1annmg o f h . I d t e 1s an s. Year Source Comments
1945 Harrison and Hubbard Suggested the setting up of the Town Planning commission and the drafting of a comprehensive Town Planning Ordinance.
1947 White Paper: Proposed draft regulations for a comprehensive building code as the need was felt for the revision of building development laws.
1959 Windyer Morris: "Building Proposals to expedite the processing of applications for building permits and for
regulations and Land Use the drafting of new building regulations incorporating new techniques for modem
Planning" buildings. Recommended establishment of Planning Authority as no land use policy and no attempt had been made to carry out planning surveys since 1945 thus Morris recommended:
• identification of areas for urban development sufficient for ten years growth
• a comprehensive Town and Country Planning Law
• preparation of an Outline Plan for the Maltese Islands, the setting up of the Lands Department and the Lands registration system.
1964 ltalconsult, UNDP funded Prepared a) a National Physical Plan b) a Tourism Master Plan Suggested the establishment of a central physical Planning Authority.
1965 Draft consolidated Act All existing building legislation put forward
1967-1970 Sieczkowski An outline physical development plan was prepared but never implemented.
1969 Town and Country Planning Act Enacted after two years' debate but never brought into force
Town and Country Planning
1981 Act struck off the statute book
1983 Building Development uraged urban development as it provided for the establishment of BOAs outside
rdaries of former schemes results inunprecedant sprawl of development into Areas Act tryside and merging of settlements (BOAs)
1987 Planning Services Division essentially this was the reactivation of the planning function within the Works (PSD) established Department of the Ministry for the Development and Infrastructure
1988 Building Permits this set out (Temporary Provisions) Act a) the framework for preparing the Structure Plan
b) reintroducing the Planning schemes as a legal document c) tightening up enforcement procedures
proposed the setting up of the Planning Authority
1988 Horworth and Horwort Tourism Master Plan
1989-1990 Colin Buchanan and Inception Report for Structure Plan Partners and General Report of survey summary based on 17 detailed technical reports and a number of
Progetti SpA key studies of which the Coastal Land Use Survey was one
1992 Structure Plan approved by Parliament
Establishment of the Planning Authority.
Sources: Personal commumcat1on, Plannmg Authonty The Sunday Times [ofMalta]20 November 1994; The Sunday Times [ofMalta]27 November 1994.
78

Communication with the public is maintained by the publication of lists of sites
proposed for development. These lists are published in newspapers and on-site notices
are also put up. The public can witness the workings of the decision-making
committee by attending the meetings and also making verbal presentations during the
committee's deliberations.
The lists mentioned above present, in a nutshell, the efforts of the local authorities to
plan for a more efficient use of local resources. The effects of these on coastal
management have been the Planning Authority's work in the publication of local
plans. Three such plans have been published to date. These are the Grand Harbour
Local Plan, Marsaxlokk Bay Local Plan and North West Local Plan. Four other plans
are in the draft stage: North Harbours Local Plan, Central Malta Local Plan, South
Malta Local Plan, and Gozo and Comino Local Plan. In each of these, coastal matters
featured prominently especially through the landscape quality assessment. This took
into consideration land use, traffic and environmental resources. As a result of these
exercises the coastal cliffs have been scheduled, with the limits identified on maps. In
future no development can take place in these areas. Coastal cliffs and scree slope
areas account for about ten per cent of Malta's surface area. In the scheduling process,
information relating to the historical heritage, architectural, ecological, agricultural,
archaeological and marine conservation qualities is collected and the landscape quality
then assessed. The Planning Authority processes about 8000 applications every year.
The structure plan is not meant to be a static exercise but has to be reviewed to take
into consideration socio-economic changes. However, an important aspect is the
setting up of a monitoring programme, not only to keep an eye on any changes made
to the landscape, but also to examine how the Plan's policies themselves are affecting
the same landscape.
It was the enactment by the Malta Parliament of the Development Planning Act that
the Planning Authority was set up in 1992. The main function of the Authority is to
promote and control development through set guidelines, as published in a number of
policies and plans, and also through consultations with Government departments,
79

Non-Governmental Organizations and stakeholders. The establishment of the local
councils in 1994 added a further institutionalized stakeholder.
The policies to be followed are established in the Structure Plan, and they serve as a
guide towards controlling development in Malta. Their main aim is to balance
development with environmental requirements. In addition to the policies, two types
of more detailed development plans are put forward: Local Plans and Subject Plans. A
Local Plan is essentially site-specific and deals with areas that require attention due to
problems in managing the environment of the area brought about as a result of a rapid
rate of development. A Subject Plan deals with policies as stipulated in the Structure
Plan with a more detailed approach. Public consultation is a key feature in the
formulation of the Local and Subject Plans.
Seven sets of policies relevant to the coastal zone are presented within the Structure
Plan. Each set presented here is indicated by a code with upper case letters with
further details found in the Appendix.
(a) Coastal Zone Management (CZM) Policies: CZM 1-3. This includes the setting
up of an adequately staffed Coastal Management Unit, the formulation of a Subject
Plan for Coastal Zone Management to incorporate areas identified for conservation as
well as recreational and areas adequate for development.
(b)Tourism (TOU) Policy: TOU 15. The definition of a comprehensive policy for
the coast formulated in consultation with government departments and agencies is the
main element in this policy section. It involves the assessment of the different
ecosystems pertaining to the coastal zone, the enforcement of policies and the
identification of permissible coastal uses.
( c ) Natural and cultural resources: Rural Conservation (RCO) Policies: RCO
10,11,16-24, 34, 36-38; Recreation (REC) Policy: REC 9; Marine Concervation
(MCO): Policies MC01-13; Archaeology (ARC): Policy ARC 4. Detailed policies
consider the conservation of natural features such as springs, dunes, marshlands and
coastal cliffs and areas having natural vegetation. In addition, the control of any type
of development, together with the prohibition of camping, removal of dune binding
vegetation and activities that increase soil erosion. The cultural features of a whole
territory of a number of listed sites especially the Dwejra/Qawra area in Gozo, islands
80

and rocks, and typical coastal habitats, including sand dunes and sandy beaches. In
addition, the designation of 14 sites as Marine Conservation Areas, Areas of
Ecological Importance (AEis) and Sites of Scientific Importance (SSis) has been
undertaken.
(d) Yachting and shipping development. Tourism (TOU) Policy 13; Inter Island
Transport (liT): Policies liT 1, 2, 4; Industry (IND): Policies IND 5,15; Public
Transport (PTR): Policy PTR 5. The purpose of these policies is to determine the
advisability and feasibility for various types of harbours, moorings and facilities for
yachts and other boats together with the identification of sites for these activities. An
important development is to enhance the ferry terminals and the elimination of
monopolies with the introduction of new ventures for the Malta-Gozo connections.
(e) Development. Settlements (SET): Policies SET 11, 12; Built Environment
(BEN): Policy BEN 5: These policies are set to prohibit urban development outside
existing and committed built up areas. These include the development of residential
units, commercial outlets, offices and factories together with any ancillary land uses
such as car parks.
(f) Illegal development. Recreation (REC): Policies REC 10-12; CZM 3, TOU 5.
In this type of development a number of policy-sets are present. These include holiday
villages, which are to conform to Stmcture Plan policies, caravan sites, some of which
are to be demolished, and public access to the coastline and at the top of cliffs is to be
secured. This can be done by the state through the acquisition of land, demolition of
illegal encroachments along the shoreline and the establishment of detours where
these are not possible.
(g) Fisheries and aquaculture. Agriculture, Horticulture and Fisheries (AHF):
Policies AHF 1, 13-16. Mineral exploitation. Policy IND16; Minerals (MIN):
Policies MIN 5, 6. These policies are meant to put marine uses in line with Stmcture
Plan policies especially those concerning the enhancement of shoreline facilities for
the berthing of fishing craft. The policies concerning the mineral exploitation envisage
the guarantees that offshore activities will not interfere with navigation and should
also safeguard the natural environment.
The scheduling process is a further instmment that assists the Planning Authority to
achieve its objectives. This Process restricts the demolition, extension or alteration of
81

"buildings, structures and remains of geological, palaeontological, archaeological,
architectural, historical, antiquarian or artistic importance are designated as scheduled
property that is to be conserved. In addition, areas of natural beauty, ecological or
scientific value are also to be protected."
4.3 The historical demography of coastal settlements
The demographic situation in Malta as a whole has been one of a constant increase of
the population. However, the coastal localities have experienced a variety of different
demographic situations. The localities adjacent to the Grand Harbour have a decline,
especially the walled towns of Valletta, Floriana, Cospicua, Senglea and Vittoriosa,
whilst those to the north and south of the island saw their populations increase. The
former trend was due to the decline in the services offered by the marine-related
industries ( eg. the decline of the dockyard as a ship-repairing facility for the British
fleet) in the Grand Harbour. Taking the Grand Harbour littoral alone, the situation is
dramatic. Whereas in 1842 almost half of the Maltese population lived within the
fortified precincts of the five walled towns mentioned above, by 1985 this had reduced
to only 8 per cent and to 6.4 per cent in 1995. Contributory factors were the spread of
industrialization beyond the Harbour area, good accessible roads leading to Outer
Harbour work places, more efficient public transportation, increased car ownership,
substandard housing in the densely populated inner city areas, and the availability of
land elsewhere on the island. In the immediate post-war situation unemployment was
high and job prospects were low. Emigration was the considered to be the main
demographic and economic safety valve, thus further decreasing the Grand Harbour
population.
Along the Marsamxett littoral the situation was slightly different, with an increase in
the population of Sliema in the immediate post-war period, and up to 1967 for Msida.
Otherwise both major localities saw their population dwindling and are today
experiencing the aging of the remaining population. The figures for their populations
are given in Tables 4.3 and 4.4. Using the terminology employed for the demographic
census, the localities that are contiguous with the coast are called the "Inner Harbour
Region" and their adjacent localities towards the hinterland the "Outer Harbour
82

Region". These show that a general trend of a decrease in the Inner Harbour
population ran in conjunction with an increase in the Outer Harbour localities.
Table 4.3 Population Changes in the Inner Harbour and Outer Harbour re~10ns, 1931 1995 -Region 1931 1948 1957 1967 1985 1995
Inner Harbour 109296 120958 126114 118372 101963 87997
Outer Harbour 42456 64774 69480 74567 98610 112262
.. Source: Central Office of Statistics ( 1996)
Table 4.4 Changes to the population of the Inner Harbour 1 r r bd · · d d b h · OCa I leS SU lVI e ry mam geograp1 1c area
Locality 1931 1995 Sceberras Peninsula Valletta 22779 7184 Floriana 6241 2647
Cotton era and Grand Harbour Area Vittoriosa 6573 3011 Cospicua 12163 5961 Senglea 7683 3454 Kalkara 1899 2800 Marsa 7867 5285 Marsamxett Harbour Area Pieta', Msida, Ta' Xbiex 6334 12911 Gzira 6295 (1948) 7858 Sliema 18880 12768
Other Localities Hamrun 11580 11142 Paola 7297 9370 Santa Lucia - 3606
Source: Central Office of Statistics (1996)
Table 4.3 gives an indication of the trend for 1931 to 1995, with the Inner Harbour
Region losing one-third of its population from a peak of 126,114 in 1957 and the
Outer Harbour Region almost doubling its population to 112,262 in the same period.
Details for the individual localities in the Inner Harbour are given in Table 4.4. These
indicate marked decreases for the Grand Harbour, with populations for the coastal
83

walled towns of Floriana, Vittoriosa, Cospicua and Senglea showing on average a 50
per cent reduction (1931 - 1995) and Valletta, the administrative capital of Malta,
losing two-thirds of its population. Of the other localities, the region of Sliema alone
made significant losses. The other localities all experienced increases except Hamrun.
In addition to the factors cited above this movement inland was also influenced by the
availability of land away from the coastal areas in the Outer Harbour region for
building purposes and the abandonment of agricultural land as farmers either
emigrated or obtained jobs linked to the new manufacturing industries. The latter also
affected some coastal localities ( cf. Chapter 6). Some displacement to inland localities
of the population of the Harbour areas was due to the bombing by German and Italian
airforces during the Second World War. A large number of the people did not return
to the Harbour areas after the war for a range of reasons: houses that were bombed
out; emigration, mainly to Australia; and alternative pennanent accommodation in the
inland localities.
The other harbour regions on the Marsamxett side have on the other hand increased in
population but, examined separately, Sliema has experienced a decline, with growth
registered mainly for a period in Gzira.
The population growth of the other localities situated at Marsaxlokk Bay, namely
Birzebbugia and Marsaxlokk, the northern areas of Mellieha and the locality of
Marsascala lying on the eastern coast St. Paul's Bay, have had a somewhat different
demographic pattern with the population development of the two localities as shown
in the Table 4.5 below. A general trend of population increase is evident.
Table 4.5 Population changes in five coastal localities in Malta, 1931-1995.
Locality 1931 1948 1957 1967 1985 1995
Birzebbuga 1724 5339 5297 4876 5668 7295
Marsaxlokk 829 1431 1469 1462 2405 2865
Marsascala - - 888 876 1936 4792
Mellieha 3198 4549 4290 4279 4525 6220
St.Paul's Bay 1779 3440 3040 2788 4465 7332
Source: Central Office of Stattst1cs ( 1996)
84

It is immediately apparent that not only has the Birzebbugia population grown but that
the 1931-1948 threefold increase reflects the result of the Shell fuel installation and
the job prospects revolving around the British Services personnel at nearby Kalafrana.
Furthermore, the prosperity generated as a result of this encouraged more people to
move into Birzebbugia. This, together with the post war movement of population for
the reasons mentioned above also resulted in Birzebbugia having an increased
settlement rate, far greater than the other coastal localities on the Harbour conurbation.
Not listed in the census were the British services personnel and their families whose
presence generated income and jobs for the locals. The close proximity of the two
large villages of Zejtun and Zurrieq also helped to attract new residents to the seaside
resort. In fact, the percentage increases in the populations of Birzebbugia and
Marsaxlokk, over the 20th century, were the largest ones recorded for all the localities
in the South East region (Schembri and Bonnici, 2000).
4.4 Physical changes to the Harbours From a naval arsenal for the Knights, the Grand Harbour was transformed during the
British period (1800-1964) into a dockyard for the repair of British Naval Ships and a
safe anchorage for the British Mediterranean Fleet. The economy of the Maltese
Islands was, throughout the century that followed the Crimean War, linked to the
fortunes of war and peace in Europe and elsewhere, depending on the British
involvement in foreign or Empire affairs. Table 4.6 presents a synoptic account, in
chronological order, of the main political events that affected the Mediterranean and
Malta over two centuries. The physical changes made to Malta harbours were partly as
a result of the same events. The naval needs of war normally brought about economic
prosperity, whilst the opposite was true in times of peace. The years immediately
following war were particularly harsh.
The transformation of the harbours to accommodate the needs of industry, servicing
and at the same time cater for the outdoor recreation of the residents entailed
extensive works, primarily of an engineering nature. These included the dredging of
the sea bottom to attain the required depth for the berthing of ships; the construction
of wharves for loading/unloading industrial and commercial goods and as working
areas for marine-oriented industry and industrial services; the building of boundary
85
walls to shelter and enclose industrial areas; the construction of jetties and
breakwaters where heavy sea currents make working conditions hazardous; the
provision of promenades for recreation in this densely populated environment; and,
finally, the creation of space for pleasure boat facilities. These developments
transformed the littoral of Grand Harbour and Marsamxett Harbour. Plates 4.1- 4.4,
with explanatory captions, show selected changes to sites in Grand Harbour.
Following the end of the Second World War it seemed that the economic fortunes of
Malta and Gozo had to depend on either industrialization through the attraction of
foreign investment to the islands, or by using the safety valve of emigration so as to
deplete the workforce and a potential explosion of the population. Birth rates were
still very high, especially in the Grand Harbour area. One way of diversifying the
economy was to turn the dockyard into a commercial enterprise. This came about
partly as the global presence of British forces was to be run down.
It is thus apparent that the industrialization of the Maltese Islands hinged on the viable
development of the coastal areas, with the Malta Dockyard in the forefront of these
new initiatives. Throughout most of the post-war period the commercial viability of
the Malta Drydocks (as they later were to be called) was always in question, yet it was
nonetheless by far the largest single employer on the islands and also the major
foreign exchange earner. Economically speaking, the light industrial and the artisan
side of the economy helped to maintain a steady flow of jobs available outside the
Drydocks complex and also to offset the debt-ridden side ofheavy industry.
86

Table 4.6 Main historical events in the Mediterranean and Malta and the physical changes to the Harbours during the British military presence in Malta.
Year Situation in the British Mediterranean Malta Situation Mediterranean Policy
1800-1814 Napoleonic Wars Blockade of Malta ended in 1800-1840 British content Commercial blockade 1800. Britain secures to adapt to the Order's
central Mediterranean military installations island
1814 Treaty of Amiens Malta's strategic position in centre of the Mediterranean
valued ~Britain 1827 Battle at Navarino Britain competes with 1840 - Malta redeveloped
UK, France, Russia against France for influence in the militarily on a vast scale: a Turkey and Egypt Mediterranean place on a seaway which
Britain and France compete served a great part of the for influence in the world
Mediterranean 1830 French seizure of Algiers Britain and France compete Malta becomes an
for influence in Western important base from which Mediterranean ships sailed into many
spheres of influence 1839-1852 French Mediterranean Aden taken as precaution Malta garrison improved
ambitions through Egypt 1848 First Drydock built P~ulation 1842: 113,000
1853-1856 Crimean War General Increase in Malta forward supply and Mediterranean trade refit station for British
forces in Crimea 1858 Railway from Alexandria to Building of Malta railway
Suez linking the Innermost parts of Grand Mediterranean to Red Sea Harbour used for building
of commercial vessels. Introduction oftram-
propelled vessels - coal-bunkering facilities for Royal Navy ships and
private vessels Dock No I built
1869 Suez Canal opened
1878 Cyprus leased from Egypt - Headquarters for the Mediteranean fleet-Harbours im_l)l'oved
1882 Other Mediterranean ports Egypt taken - new static defences Algiers, Gibraltar Port constructed
Said. Invented - Harbour - barracks and military works hospitals
1871 2nd Dock built 1892 3rd Dock built
Employment at Dockyard: I 0,000
Po_!J_ulation 1891: 165,000 1899 start for 2 more docks
- Harbour side workshops and refit facilities
Table 4.6 Continued
87

Year Situation in the British Mediterranean Malta Situation Mediterranean Policy
1900-1913 German interests in the British fleet strengthened Breakwaters at Grand Mediterranean Harbour built.
Population 190 I: 184,000 1911:212,000
1914-1918 First World War Briish and French fleets used Economic boom. Malta used Grand Harbour as hospitalization centre.
1919-1938 Inter war period Britain responded to italian Improvement in the Maltese Italy invades Abbyssinia Fascists interest education system. Malta's
(Ethiopia) economic performance depended on the political
problems in the Mediterranean
1939-1945 Second World War Aim to keep Malta in bid to Dockyard workshops moved defect Germans in North into crevices excavated Africa. works 1943 Italian fleet surrenders in Malta Harbours Malta plays part in invasions of Italy.
1948-1963 Post-war period British military presence Emigration used as a safety 'Cold War' starts diluted due to NATO and US valve for economic slump.
Sixth Fleet involvement Start of tourism as an alternative source of
employment. British military presence decreased after the
Suez Crisis ( 1956) Population 1948: 200,000
1964 Intensification of Cold war USSR interests Malta granted independence between USA and USSR from Britain
1965-1978 Arab/Israeli conflicts Closure of Suez Canal (1969-1975)
1979 British forces leave Malta
1980-2000 Problems in Middle East and Further intensification of Balkans tourist industry with
Harbours' infrastructure accommodating yacht
marinas and a cruise liner terminal
Population 1995: 378,000 ..
Sources: Adapted from Blouet ( 1992); author's additions for last row
88

Source: Bonnici, J. and Cassar, C. (1989)
Plates 4.1 and 4.2 Malta, Valletta, Marsamxett Harbour: The effects of the development of road transport and the introduction of waterpolo as a summer sport are portrayed in these plates. The ferry service started in 1882 and serviced the Harbour crossing from Valletta to Sliema, Msida and St. Julians, a number of British military personnel also used the service. The development of the road network around the harbours, the introduction of the Malta ·Railway and Malta Tramways (1887-1932) and the use of private transport spelt the demise of the ferries. They have been reintroduced in the late 20th century as part of a tourist attraction and in an attempt to decrease the traffic flow into Valletta. The waterpolo pitch was built in the 1970s and was one of a series of similar facilities constructed around the coast of Malta.
89

Source: Bonnici, J, and Cassar, C. (1989)
Plates 4.3 and 4.4 Malta, Valletta, Grand Harbour: The bastions and other fortifications built during the presence of the Knights of St. John (1530-1798) in Malta were also affected by changes. Although outright demolition of entire curtain walls and bastions to accommodate wider entrances to the city from the hinterland and develop the shiprepairing yard (19th century) and a hotel (20th century) were two major changes made to the littoral of the Harbour and the surrounding area, the overall character of the Valletta fortifications has been largely retained. The pinto Stores in the foreground and the bastions are still almost intact whilst a 17th century building has been retained, converted into a hotel in the 19th century and still in operation.
90

This situation led to different scales of development in the Harbours. Whilst Grand
Harbour followed its historical pattern of marine-oriented works and facilities for
ships and tankers, and saw this industrial vocation augmented by cargo berthing
facilities, grain storage silos, cruise liner depots, coal and oil storage facilities,
Marsamxett harbour on the other side of Sceberras peninsula remained rather
dormant, awaiting, and later receiving, touristic and retail trading development.
However the area that attracted touristic development was the Sliema and St.Julians
area (identified as Segment IV in this thesis) area where a large number of recreational
accommodation were built over a short span of time. Plates 4.5 - 4.8 demonstrate the
changes made to the littoral land use pattern over a few decades. Some areas in Gozo
were also affected by coastal urban development with changes to the most popular
summer resort locality of Marsalforn shown in Plates 4.9 and 4.1 0. From a quiet, out
of-the-way summer residential and fishing hamlet it has been transformed into the
tourist hub of Gozo.
On the other side of the island to the south east, Marsaxlokk Bay lingered on in its
dual functions of a fishing village locality and a summer residential area. With the
location of a fuel storage depot at Birzebbugia ( 1916), the initial stages of an
industrial base in this south-eastern Bay were started. This was followed by North
Atlantic Treaty Organisation oil, Esso and Liquified Petroleum Gas storage facilities.
During the last decade a new projects for a container terminal, further oil storage
facilities and the siting of a new power station have completely transformed the Bay
into an industrial zone (Schembri, 2002). Further discussion of these issues is made in
Chapter 6, where land uses are examined in greater detail.
The coast of Malta can be divided into three levels of development that occurred
throughout the 201h century. The first is the area around the Harbours, where the two
sets of maps show that the amount of development in the hinterland was substantial.
The coastal margin therefore is occupied by older buildings that give a "coastal
heritage" look to the coastal zone area under discussion in this thesis. The Grand
Harbour area is the best example whilst parts of St. Paul's Bay, Salina Bay,
Birzebbugia and Marsaxlokk also show elements of coastal development in the mid-
1930s. The second type of coastal development occurred where the built-up area along
91

Source: Bonnici and Cassar (1989)
Plates 4.5 and 4.6 Malta, Sliema, Tower Road: Typical contemporary changes to the coastal zone setting can be seen around a 1 ih century tower with the late 1 91
h century terraced houses have been replaced by a 201
h century hotel and flats for residential development. In addition, the road has been widened covering parts of the rocky foreshore and developing the promenade. The tower is used as a restaurant.
92

-- -····-·- ---- ............, __ . ___ ____
Source: Bonnici, J. and Cassar, C. (1989)
Plates 4,7 and 4.8 Malta, Balluta Bay: Recent changes to the foreshore are evident in the sequence of plates with only the house on the edge of the promontory still standing, otherwise the area has changed considerably. The villas in the background have been replaced by flats. The site was also used for the bathing of horses and thus restricted the use by people for swimming.
93

.,.;o-'-:::::='::'::_,;:"- .:::.. _,;.. __ -::-:: _ _;:::-·--.--. ··---· -- ,-_ -.--~''"'~...--
Source: Bonnici, J. and Cassar, C. (1989)
Plates 4.9 and 4.10 Gozo, Marsalforn: Prominent summer resorts in Gozo have also been affected by changes. The waterfront terraced .. houses have been developed into flats and further encroachment on to the hinterland areas is evident over the span of a century. The loss of agricultural land and depletion of the natural resource base of the coastal zone was the direct result of these changes. Note the character of the sea craft (dghajsa) moored behind the jetty and used as passenger ferries within the bay and the sailing boat (luzzu tal-latim) used as a passenger and cargo ferry between Malta and Gozo.
94

the coast (termed ribbon development in urban theory; Carter, 1981) is seen to have
occurred after the 1930s and before the 1990s. Areas such as Xghajra, Marsascala,
and parts of St. Paul's Bay are good examples. The third type of coast within this
classification includes the areas where hardly any development has taken place. As a
general comment in this regard the areas near to the harbours have land uses that span
this century or more, other areas depend largely on the degree of access to the coastal
zone.
4.5 Conclusion
It is apparent from the above that the development of the coast of the Maltese Islands
was partly due to the fact that the Islands were for the last four centuries dominated by
strong military powers. These made the necessary changes to the coast to meet their
needs and ambitions. The result of these factors was that the coast of Malta has a
large number of historical buildings. These are today masked by the recent structures
built in connection with the development of tourism and coastal industries. The range
of coastal land uses that have engulfed or replaced historical heritage remains range
from the demolition of entire bastions in the Harbour region to Bronze Age cart tracks
in Birzebbugia. In addition, the development of the Sliema promenade saw the
replacement houses built in the late 19th and early 20th century by modern flats. The
situation has produced a coast that has a number of competing land uses. The mapping
of these land uses is of importance, especially in the areas where coastal land use
competition is evident. However, a good mapping technique has to be developed
prior to any analysis of the land use situation is undertaken. This is the main theme of
the next chapter.
95

Chapter 5 Mapping and surveying the coast of Malta
5.1 Introduction
This chapter examines the methodology used in mapping coastal land uses. It will
review the salient points that emerged from the 1989 survey and incorporated into the
methodology used for the 1998 survey such as the identification of the coastal zone
boundary in establishing part of the study matrix for this thesis, and the basis for the
development of the land use mapping. As the coastal area has a number of interrelated
activities, land use data have become increasingly important in overcoming the
problems posed by man/land relationships. This situation is put forward by Ketchum
(1972) who listed six main influences by people on the coast. These were: residential
and recreational; industrial and commercial; waste disposal; agriculture, aquaculture
and fishing; nature reserves; and, military and strategic. Although Carter (1988)
admits that these categories provide only a broad view of the human uses of the coast,
they are a good preliminary tool for studying the coast.
Furthermore, the function or the role played by a parcel of land is not always
discernible (Ellis, 1978). With the importance of protecting the coastal zone from
haphazard development, by far the best method in drawing an inventory of coastal
resources is in surveying as many of the variables as possible. This eliminates the
problems associated with technical difficulties in interpreting the land use data
obtained from aerial photographs or remote sensing techniques. For example, aerial
photographs showing quarrying sites can be mis-interpreted as being sites in the initial
stage of building development. In addition, the short coastal length of the Maltese
Islands permits the precise identification of most of the coastal features in a relatively
short time. Thus for the present research it was decided that the best way to identify
the different types of land uses along the coast was in the physical surveying of the
area through personal visual experience.
The focus in this chapter is on the methodology used in identifying and representing
land uses. The material is presented in a way that shows the successive mapping
stages, through to the final end-product. Throughout the various stages in which the
field studies were conducted, a number of problems were tackled with the result that a
systematic methodology for evaluating coastal land use could be made. As this was
96

the first local exercise wholly done for coastal areas, the mapping technique evolved
over a number of sessions into "the" method to be used for drawing an inventory of
coastal resources. Essentially this method is explained in a series of techniques in this
chapter from section 5.2 to section 5.16. These sections can be grouped into five steps.
Sections 5.2 to 5.7 identify the study matrix of the thesis incorporating the
delimitation of the coastal zone, definition of the coastal urban and rural areas, the
establishment of the coastal segments and the length of the coast. Sections 5.8 to 5.11
provide information on the cartographic materials used giving details on the ranges of
maps utilized in the compilation of the data. Sections 5.12 and 5.13 provide details
regarding the development of the main mapping key that was used in the land use
survey for this thesis with Table 5.11 as the principal factor. Section 5.14 gives details
on the mapping teams used along the coast and sections 5.15 and 5.16 combine the
techniques used in estimated the land use areas and bringing figures down to
manageable proportion.
5.2 Identifying a coastal zone
The limits of any spatial unit are normally determined by the boundary lines enclosing
it. For sovereign states this line is generally known as a border. Contiguous states
have common borders. A boundary can either have a geopolitical meaning similar to
that for a border or it can also mean the line or zone of separation between different
units, the units having different geographical properties such as land and sea,
mountain and plain. In other cases a boundary can be less evident in being
represented by a vegetation line (salt-tolerant plants are sometimes used to identify
coastal regions from other areas) such as those observed by botanists. Psychological
or imaginary boundaries dividing areas by ethnic groups are also common. A zone is
an area enclosed by a number of boundaries.
Definitions of coastal zones are an important element in planning and management as
the extent of its geographic area conditions administrative systems and influences
policies and decision-making processes. In fact, coastal zone delimitation is
characterized by both physical and human factors and both take the shoreline as the
starting point. An important physical factor is the state and level of tides with the
Mean High Water Mark indicating the landward extent of the zone, although storm
97
surge, influences of salt spray and the catchment area of the land boundary whose
water run-off leads to the ocean are the various continental limits to the coastal zone
generally cited (Kay and Alder, 1999). Notwithstanding these criteria influences that
are beyond the outer limits of the zone can have a significant bearing on the coastal
zone no matter how wide or narrow is its geographical space. Beatly, Brower and
Schwab (1994) cite non-point-source water pollution as a typical example where
industrial affluent dumped into the watershed well within the continental landmass is
pollutes the coast. This factor is also a clear example of the situation in the
Mediterranean.
One of the important facets of coastal geography is in the boundary subdivisions of
the coastal area from other adjacent areas, producing an area that is referred to in this
thesis as the coastal zone. Various definitions of the coastal zone are reviewed later
but essentially this area is one that extends on either side of the shoreline: one
boundary located on the seaward extension, the other on the landward part. The
landward boundary forms a crucial element in framing the study matrix for this thesis.
The example of the New Jersey Coastal Management Programme (State of New
Jersey, Department of Environmental Protection 1980, 18) mentions the idea of a
landward boundary that defines "the general geographic scope of the programme" as
being one of three coastal management pedestals. The term 'geographic' here implies
the area enclosed within the boundaries that falls under the jurisdiction of the
Programme. The Oregon Coastal Management Programme states that the Land
Conservation and Development Commission may recommend to the Legislature
geographic areas to be designated as areas of critical statewide concern (State of
Oregon Department of Land Conservation and Development, 1986). These two
examples present the further ends of the geographic spectrum within the coastal
management paradigm: one as an initial requisite to management, the other at the tail
end of a coastal management exercise.
At this stage there is a need to identify spatial limits that include within them the main
coastal activities. This implies delimiting a boundary on the landward side as a
starting point for identifying the coastal zone from the rest of the landmass. The first
factor to be considered here is the land/sea interface known also as the shoreline.
98

Strictly, this is 'the water's edge' (Bird, 1984, 1 ), the dividing line where the land is
separated from the sea. The shoreline is here taken as coinciding with the high tide
mark. Being a land-use exercise, this study is concerned with the different land uses
occurring from the shoreline to a distance inland. A discussion of the choice of
distances inland is the main theme of this section. Delimitation, in this case, is
important and a number of sources were consulted in this regard. These included the
Coastal Zone Management Act passed by the US Congress in 1972, the physical
criteria used in delimiting this area by a number of sovereign states, selected states in
the US and a number of islands. Tables 5.1 and 5.2 present these criteria. They
include details taken from a broad spectrum of sources such as scientific papers,
coastal zone activities brochures and personal communications. The sources are cited
within the table itself.
The coastal zone in the 1972 law passed by the US Congress is defined as:
" The term 'coastal zone' means the coastal waters (including the lands therein and thereunder) and the adjacent shorelands (including the waters therein and thereunder), strongly influenced by each other and in proximity to the shorelines of the several coastal states, and includes islands, transitional and intertidal areas, salt marshes, wetlands, and beaches. The zone extends, in Great Lakes waters, to the international boundary between the United States and Canada and, in other areas, seaward to the outer limit of the United States territorial sea. The zone extends inland from the shorelines only to the extent necessary to control shorelands, the uses of which have direct and significant impact on the coastal waters. Excluded from the coastal zone are lands the use of which is by law subject solely to the discretion of, or which is held in trust by, the Federal Government, its officers or agents." Source: Ellis 1978,125
This definition was considered in identifying the physical extent of the coastal zone
area for Malta. In addition, a number of sources relevant to delimitation in a number
of countries were used and, although the criteria cited are self-explanatory, it is
appropriate to comment on a few selected points. Sovereign states, defined as "states
having absolute, unlimited power, and the right to make decisions, and accordingly to
act" (Clark, 1995, 586), Brachya (1983) indicated that coastal zone boundaries can be
based on either dominant natural landscape characteristics such as geology,
topography and vegetation or the dominant land use, prominent among which are
built-up areas and agriculture.
99

Problems in the delimitation of a coastal zone can be seen through the spatial limits of
the bands which have been suggested for the coastal zone of Israel as follows:
beach/foreshore 0 - 100 metres, immediate hinterland 10 - 200 metres, further
hinterland 100 - 500 metres, (Brachya, 1983 ). These dimensions indicate that an
overlap of boundaries is possible. The littoral length was also subdivided into a
number of units lengthwise (Brachya, 1983). On the other hand, Amir (1984) has
defined the coastal zone of Israel as being the narrow belt lying between the fertile
lands of the plains and the sea and including all the elements of the natural system.
Hong, S-Y ( 1991) suggests for China a landward boundary using the existing
administrative subdivisions such as cities and towns adjacent to coastal waters. In the
case of the thirty-one coastal states of the continental US, it has been suggested that a
50-mile zone behind coastlines be called the 'Coastal Zone' (Edwards et al, 1997).
However, this dimension has varied for a number of states as shown in Table 5.1. For
the Italian peninsula, the zone was delimited by a belt running parallel to the coastline
that includes the areas that are functionally interrelated with the marine zone.
Although the width of this zone does not need to be uniform (Consiglio Nazzionale
delle Ricerche ( 1985), a maximum limit of 5 km inland for Italy was suggested for the
whole peninsula. Special areas that are often included within coastal zones are
marshes and other coastal wet land habitats (Morgan, 1989). The importance of
delimitation is highlighted by the fact that the coast is often a separate planning unit
with its own specific problems (Public Works Department, 1990).
The difficulty in establishing a definite limit as to where the coastal zone ends on the
landward side can be noted from a number of publications pertaining to different
states, territories and islands of the USA. A postal survey addressed to central
authorities running a CZM programme was conducted for the purposes of this thesis
requesting information on the criteria used to delimit the landward coastal boundary.
The replies to the questions varied significantly and helped in the compilation of
Table 5.2.
100

T bl 51 C a e oasta one oun ary e 1m1tat10n or se ec e IZ B d d I' . I t d S tates Country Criteria for Land and Water Boundaries
Australia I 00 m at least, or, extending 3 km inland or to the inner margin of recent estuarine sediments and coastal dunes where these extend more than 3 km inland. Source: Cullen, 1982, 184.
China Using the existing administrative subdivisions such as cities and towns adjacent to coastal waters. Source: Hong, S -Y, 1991, 393.
Israel Up to 500 m inland divided into: beach, 0 - I 00 m; immediate hinterland, I 0 - 200 m; further hinterland, 100-200 m. Source: Brachya, 1983, 512.
Sources: in table with relevant countries
Of importance to this thesis are the delimitations for islands in that the criteria
established vary from encompassing the whole island (e.g. Guam, 549 km2) to the
limits established by different county councils (e.g. in Hawaii). Delimitation of the
extent of the coastal zone can be useful for management purposes and may be
necessary for administrative and legislative processes In general, coastal zone
delimitations as shown in Tables 5.1 and 5.2 above, follow primarily political areas,
with the zone's extent conditioned by the inland extent of counties that front the
water's edge (e.g. Connecticut, Delaware, Florida, Maine and Maryland). Other
delimitations use the degree of salt content in the water, such as in estuarine
conditions (e.g. California), salt marshes and wetlands (e.g Alabama). In some cases
more than one criterion was used such as for California, Connecticut and
Massachusetts where multiple "tiers" were identified for denoting the coastal zone
boundary. Effectively the boundary is, in general, influenced by the inland extent of
the counties fronting the sea, and, in areas where sensitive ecosystems prevail, such as
coastal wetlands and estuaries, an inland limit is taken that includes most of the
particular ecosystem. Within these parameters the inland limit of the coastal zone
boundary varies significantly for different states.
101

T bl 52 C a e t I Z oas a one B oun d ary d r ·t r e IIDI a 100 t d t t or se ec e sa esm th USA e State Dimensional Limits
Alabama All coastal waters and adjacent shorelines within the lOth contour (the tenth line from a series of lines denoting heights above sea-level, the contours are spaced at 25-foot intervals). This includes transitional and intertidal areas, salt marshes, and wetlands as well as coastal island beaches located within the limit of the US territorial sea.
American Samoa All of the land masses (except excluded federal Lands), the territorial waters, and submerged lands within the 3 mile limit.
California CCA defines 'CZ' - the territorial sea, all off- shore islands and to extend inland generally IOOC yards from the sea's mean high tide line. In significant coastal estuarine, habitat, and recreational areas, the CZ extends inland to the first major ridgeline paralleling the sea or 5 miles from the MHTL of the sea, which ever is less, and in developed urban areas the CZ general!\ extends inland less than 1000 yards. The jurisdiction of the San Francisco Bay Conservation and Development Commission includes generally all areas of the Bay subject to tidal action and the first 100 feet of the shoreline.
Connecticut Two tiered: Primary near shore tier:
• seaward side by the limit of the State's jurisdiction in Long Island Sound .
• landward side is bounded by a continuos line delineated by a I 000' linear setback measured from the inland boundary of State regulated tidal wetlands, or the continuous interior contou elevation of the I 00-year frequency coastal storm - whichever is farthest inland. Secondary inland tier: includes all areas, except those in the primary tiers, within the inland boundary of the 36 coasta municipalities.
Delaware The entire State, due to proximity of nearly all lands in the State to coastal waters.
Florida The entire State, except that Federal consistency will only be applicable in coastal counties.
Maine From territorial sea landward to the incorporated limits of all coastal towns and unorganised territories, 13 7 coastal towns and to unorganised townships.
Maryland From its 3-mile jurisdiction in the Atlantic Ocean to the inland boundaries of the countie bordering the Atlantic Ocean, Chesapeake Bay and Potomac River to the District of Columbia.
Massachusetts "Coastal frontage" - that the position of the land bordering the ocean to the point where the ocea1 waters are restricted to a closure of 300 feet by opposing banks; or in the case of large riven mouths, where water !lows under a bridge carrying a state road.
Mississippi From territorial sea landward to include all areas within the three coastal counties.
Northern Mariana Islands Islands of Saipan, Tinian, Rota. and all the remaining land and water areas of the Commonwealth.
Oregon The territorial sea, extends from Pacific shoreline inland to the crest of the Coastal Mountain Range. This excludes Umpqua, Rouge and Columbia River basins that penetrate the coastal mountaim but originate in the Cascades or interior lands.
Washington All State's shorelines and associated wetlands, including, at a minimun, all upland area 200' fromHWM; Non - SMA area within the 15 coastal counties which front on saltwater. SMA - all marine water areas of the State, to streams with a mean annual !low of 20 feet per se( or more, and to lakes larger than 20 acres. Applies also to adjacent land areas extending landwarc 200' from HWM and to all marshes, bogs, swamps, tloodways, river deltas and lloodplain associated with water bodies subject to the Act.
Source: personal communications from Coastal Management admmtstratwns ofvanous States.
102

5.3 Establishing the study matrix for this thesis Attempts to classify the Maltese coast in a number of segments/areas to introduce an
element of sectoralisation in coastal uses have been made mainly on the basis of rock
type (Bigeni, 1982, for Gozo ), nature and shape of rock (Camilleri, 1977), coastal uses
for walking and bathing (Torpiano, 1975), physical and man-made factors and
predominantly touristic attractiveness (Farrugia, 1989).
In a publication by Din !-Art Helwa edited by Agius Muscat (1968) two authors made
attempts at classifying parts of the coast. Lanfranco' s classification was based on the
predominant features of rock, soil and the dependent flora and fauna. Aguis Muscat
himself based his classification on the geological strata that make up the island; Lower
Coralline Limestone and Globigerina Limestone were treated separately but he only
grouped together the three uppermost layers of Upper Coralline Limestone, Blue Clay
and Greensand.
Haslam et a! ( 1977) treat the coast from the floristic point of view and divide the
coastal length into four categories: Coralline cliffs, sloping rocky shore, soil or clay
slope, sandy bay and saltmarsh. The flora living on each separate substrate was given
as a percentage of the total flora of the islands.
A few scientific publications have concentrated on geomorphological observations of
the coasts of the Maltese Islands. These were discussed in detail by Paskoff and
Sanlaville (1978), who maintained that the coastline is closely controlled by the
geological structure and the limestone solution features, in that different rates of
erosion of rocks produce different coastal features. Mechanical and chemical
processes account for the configuration of the low limestone coasts, whilst the
highland coasts are associated with mechanical and chemical processes. The authors
have also produced a map of the Islands dividing the coast into fourteen
geomorphological/topographical categories.
Effectively Paskoff and Sanlaville (1978) used both the geology as the base for their
study and, through observation along the coastal margin, they interpreted the coastal
features. Of the fourteen categories, five dealt with lithology. These were quaternary
103

continental deposits, Upper Coralline Limestone, Globigerina Limestone, Clay slopes
and beaches. These dealt with the effects of tectonic factors, namely faults,
slickenslide and scree slopes (rdumijiet); four with topography, namely, low rocky
coast, cliffs, high cliffs and high coast; and, two are associated with freshwater
movement, namely, underground and karstic formations and the water drainage
division. Another two factors shown were the highest altitudes and the built-up areas.
Their cartographic representation along the coast is shown in Figures 2.3 and 2.4.
A Maltese coastal zone delimitation has never been seriously attempted. However for
the purposes of this thesis, and more specifically for the development of the present
argument, its spatial extent is inferred and quantified through a number of published
sources. One of the most plausible estimates can be taken from the delimitation ofthe
demographic census localities in the 1995 Census of Population and Housing Central
Office of Statistics (1996). This publication, adapted for the purposes of this thesis,
shows the spatial boundary limits of the demographic localities without considering
the physical properties of the land. The map constructed is reproduced in Figure 5 .1.
It incorporates 63 per cent of the area of Malta, 92 per cent of Gozo and the whole of
Comino. Another attempt at demarcating the coastal area was done by identifying the
limits to which the land can be in view from the sea; a limit of about 20 per cent has
been calculated. Figure 5.2 shows the results of this exercise as an increasing number
of tourist brochures are advertising Malta's potential as viewed from the sea and an
increasing number of tourist trips are organized around a ferry tour of the island.
However, for the present study the criteria that have been used are the following. As
physical parameters that essentially delimit the rural areas the identifying features that
were used were key breaks of slope and the inland limit of Inula Crithmoides (Golden
Samphire), a salt-tolerant plant that grows also under the influence of sea spray. The
indicators used for the coastal urban areas were anthropogenic factors, such as tourist
establishments, port and harbour works, coastal fortifications and residential areas. It
was the distance from the water's edge to the fa<;ade of these establishments that
incorporated the study matrix. The following sections elaborate on the criteria
mentioned.
104

Figure 5.1 Area covered by Local Councils' administrative boundaries that are contiguous with
the coast. Source: Based on Census 1995 and developed by author.
THE HAL TESE ISLANDS ADHIN!STRATfVE BOUNDARIES
AND COASTAL AREA DEMARCATION
Figure 5.2 Malta: Extent of land seen from the sea Source: Camilleri (1977)
MALTA : COASTAL HINTERLAND
km
administrative bmmdaties contiguous with the coast
km
D . area of hinterland visible from sea level

5.4 The coastal "rural" areas
In identifying a practical boundary for the coastal "rural" areas the extent to which the
first break of slope occurs was the prime consideration. In the absence of a notable
'break of slope' the limits of halophytic (salt tolerant) vegetation was considered. Sea
spray conditions plant growth with halophytic vegetation growing up to limits
influenced by these conditions, these being roughly parallel to the coast. Inula
crithmoides (Golden Sapphire) is one of the best local indicators in that it marks the
zone of sea spray influence inland. In many cases the limits of the "vegetation line"
coincided with the limits of the first break of slope inland. However, where the Jnula
Crithmoides did not coincide with the first break of slope then the "topographic
boundary" was drawn along the contour that marked the first break of slope from the
shoreline. In general these areas were undeveloped areas and at times marked with
rough terrain.
Although not used to demarcate the study matrix of this thesis other types of
vegetation were taken into account: terrestrial coastal vegetation and maritime coastal
vegetation. Essentially these were used to help in identifying selected land uses and it
is felt proper to mention them here. Haslam et a/ (1977) gave a detailed account of the
flora of the Maltese Islands they distinguished two broad types: the Perennials, that
occur in habitats which are tolerable for land plants throughout the year, and the
Annuals, which can only grow in places temporarily tolerable such as rocky shores,
close enough to the sea to receive storm floods in winter. The study, besides including
all the terrestrial flowering plants, also describes briefly the main maritime
communities. For the purposes of this study the main emphasis lay on the latter.
Appendices 2 and 3 list the most important vegetation with the species in Appendix 2
the most important of the two as they represent five terrestrial flowering plants. The
table in Appendix 2, besides giving the scientific nomenclature, the English and
Maltese names, gives also the main characteristics of each species together with the
substrate properties (the main terrestrial habitat on which each plant lives is also
given. Essentially the short list provides a spectrum of species that live on a variety of
landscapes that are representative of the coast: sand dunes, estuarine conditions, deep
soil, and moist rocky places. All the species are basically tolerant of salt spray.
106

Although all five species listed in Appendix 2 helped in delineating the landward
boundary of the coastal zone as they all thrive in salt-tolerant conditions, two species
were of particular importance in this part of the exercise. Inula crithmoides was
practically used throughout, its inland limit being a function of a moist, rocky
substrate. Theoretically this indicates that the plant should thrive all round the coast;
and in practice this was confirmed. The two other species, Phragmites Australis
were associated with areas that are either near to sandy beaches or where fresh water
flows into the sea via the mouth of a valley. However all species are coastal zone
markers because in the absence of other marker vegetation they help in the delineation
of valleys within the sea-spray limit having a higher salt content in the soil.
The s1x mam maritime spec1es investigated are listed in Appendix 3. Their
distribution along the coast was indicative of the presence or absence of pollutants.
They were not used to demarcate the coastal zone but with a visual assessment of the
type and spatial coverage on the sea bottom near the shore, an idea of the type and
extent of pollution could be gained. Furthermore, the type of sea bottom prevalent in a
bay was also indicated by the presence or otherwise of Posidonia oceanica banquettes
along the shore. Strong sea currents and storm wave action combine to scrape the
Posidonia oceanica from the sea bottom and deposit it on a beach or rocky shore.
5.5 The coastal "urban" areas
Delimiting the coastal zone in built-up areas has posed a major problem for the
present survey. As vegetation and geomorphological factors could rarely be
considered, a cultural parameter has been introduced. This problem was encountered
mainly along the eastern lowland coastline in the part of the coast where recreational
and industrial activity takes place. As the predominant location of these activities is
along the shoreline, the first line of buildings along the littoral was taken as the
primary marking point. This was also justified by the fact that it is the facade of these
buildings as seen from the seaward side which provides the main aesthetic qualities
for the built-up area along the coast.
The inland extent ofthe activity areas was also considered. This was governed mainly
by a number of land uses: tourism-related, industry-relate residential and historic sites.
107

In the first type the tourism-related activity although most commercial establishments
were located along the littoral, usually facing the sea, a number of shops and services
were found further inland, normally a short distance (about 50m) from the seafront.
These were considered to be within the coastal zone. The industry-related enterprises
along the shore occupied a more inland location than the tourism - related ones. The
main exception is the drydocks in the Grand Harbour where the inland spatial
incursion was limited by the historic fortifications. Otherwise, for the Marsaxlokk
container terminal, the whole industrial complex was included. In areas where
residential zones predominated it was the distance between the shoreline and the
building fa9ade that was considered.
An interesting feature that linked the 'physical' markers with the anthropogenic ones
occurred in some urban areas, with Inula Crithmoides found in patches at the foot of
the buildings facing the sea. Thus the limit of the first facade of the first buildings
lining the waterfront can be justified also using physical criteria and an "urban facade
boundary" confirmed. These cultural factors were justified with the previous botanical
criteria in that the main coastal zone vegetation marker, Inula crithmoides" a
halophytic plant used in the first survey as an indicator of the coastal zone boundary,
either did not have the ideal terrain in which to grow or the buildings on the facade
precluded the necessary bioclimate for it to grow further inland. Furthermore there
are instances in the Grand Harbour where the plant was seen to grow within crevices
high upon the edge of the fortifications or even on the upper edges of dilapidated
buildings. Thus even in the built-up areas the presence of Inula crithmoides was used
to help in justifying the inland limit of the urban zone.
These physical criteria produced a line that, in general, ran parallel to the shoreline.
Mapping was confined to this area only; this extended from the shoreline to the
landward margin. For the purposes of data collection, establishing the land use
inventory and analyzing the physical geographical factors which influence the land
use, the boundary delimitation had to be a definite line.
108

5.6 Establishing coastal segments
To facilitate discussion, another type of boundary had to be introduced in the study.
This entailed the division of the littoral margin of each separate island into a number
of segments, following mainly large scale physical geographical and morphological
criteria (Brachya, 1983). Essentially this was done to divide the littoral into a number
of segments so that discussion can be easier and management policies explained
better. In addition, the main analytical factor of this thesis lies in the grouping
together of coastal areas having more or less the same cultural and/or physical
properties. Figure 5.3 proposes that these subdivisions should be the end of one
coastal unit and the beginning of another. Effectively the idea to identify segments
resulted from consultation of various manuals on coastal management, such as Clark
( 1995) and Ellis ( 1978), the need to portray that the coast is essentially one that can be
sectoralised through physical parameters and to present a regional dimension for the
local coast irrespective of the boundaries established through Local Council criteria,
Electoral Divisions or Parish Boundaries.
A number of criteria were considered to identify the segments that permitted the
division of the littoral. Each segment had roughly homogeneous physical properties
and fairly uniform anthropogenic influences. These were:
• compass orientation - the general direction that the part of the coast is facing;
• geology - the type of rock; slope angle at the land/water interface;
• large scale geomorphology, such as low sloping coastline, cliff face;
• slope angle; and,
• cultural features, mainly the predominant cultural development, e.g.
industrial, touristic, agricultural or residential.
Table 5.3 shows the criteria used for demarcating different zones. Although cultural
features can be left out of this exercise, and the segments be identified solely within
the four physical criteria mentioned, their influence in determining the limits of the
segments was minimal, as each one of the four physical parameters were, in turn,
considered before the cultural criterion.
109

l . j. I I
loa
Figure 5.3 Subdivision of Coastal Segments
KEY
}'}£ I"ALTESE ISUNDS : COASTAL ZOHAUTY
Segment I: Cirkewwa Point to il-Ponta ta' L-Ahra.x Segment ll: ll-Ponta ta' 1-Ahrax to il-Ponta. ta' 1-Ghallis Segment ill: ll-Ponta ta' 1-Ghallis to il-Ponta ta' Dragunara Segment N: ll~Ponta ta' Dragunara to il-Ponta ta' Dragut Segment V: ll-Ponta ta' Dragut to il-Ponta ta' Ricasoli Segment VI: ll-Ponta ta' .Ricasoli to il-Ponta taz- Zonqor Segment VTI: ll-Ponta taz-Zonqor to il-Gzira Segment VTII: ll-Gzira to 11-Ponta ta' Delimara Segment IX: ll-Ponta ta' Delimara to il-Ponta ta' Benghisa Segment X: li-Ponta ta' Benghisa to Ras ir-Raheb Segment XI: Ras ir-Raheb to Cirkewwa Point Segment XII: Comino Segment XTII: 11-Ponta ta' San Dimitri to il-Ponta ta' Reqqa Segment XIV: ll-Ponta ta' Reqqa to Ras il-Qala Segment XV: Ras il-Qala to Ras il-Bajda Segment XVI: Ras il-Bajda to il-Ponta ta' San Dimitri

Thus, to summarize, two sets of boundaries are proposed: the first running parallel to
the shoreline, enclosing the area that was mapped and investigated in this thesis;
another boundary, drawn with reference to the 1:25,000 scale maps published by the
Oil Exploration Directorate ( 1992) for Geology and that published by the Works
Department ( 1984a, 1984b, 1984c) for the large scale geomorphology, that divided the
coastal perimeter into a number of segments. Other spatial units will be utilised. In
general these are:
• The Maltese Islands: referring to the archipelago as a whole political entity;
• The separate islands of Malta, Gozo and Comino; and
• A 16 segment subdivision for the Maltese Islands mentioned below in Table 5.3.
Table 5.3 Main criteria used to identify the coastal segments
Segment Compass Geology Large Scale Slope Angle Cultural Orientation Geomorphology Features
I * * embayed zone
II * embayed zone
III * * linear coastline *
IV * * emba}'ed zone *
v * * embayed zone *
VI * linear coastline *
VII * * embayed zone
VIII * * embayed zone *
IX * * linear coastline *
X * * linear coastline *
XI * * embayed zone *
XII * island
XIII * * linear coastline *
XIV * * embayed zone *
XV * linear coastline
XVI * linear coastline * indicates presence of the feature shown Source: developed by author from cartometric exercises
Ill

5. 7 Establishing the length of the coastline
During the preliminary literature search and initial field exercises, the issue of coastal
length was not a prominent factor. A number of reasons account for this. Coastal
length has traditionally been a static dimension, which at best should be quoted
together with other spatial dimensions, such as areal extent, of the state or country in
question. The example of Malta is a case in point. In fact, the length of the coast of
the Maltese Islands is quoted in official publications as 183 km, notwithstanding the
changes affecting the littoral with the construction of jetties, breakwaters and other
civil engineering structures. Even in publications pertaining to the European Union,
where each state's spatial dimensions are given annually, and in which changes noted
to the surface area of the states making up the Union are noted (Commission of the
European Communities, Com. 92, 23 final Vol. III, 16), the littoral figures are not
included. It is therefore not surprising that local figures for the littoral have remained
unchanged for over 30 years (e.g. National Statistics Office, 2002).
In literature searches for this work, and especially sources pertaining to regional and
country case studies, the issue of coastal length never arose beyond the empirical
values. Most journals, articles and even books found in this bibliography do not
assign much importance to this issue. However, through the personal communications
sought from North American coastal agencies regarding the delimitation of the
landward boundary of the coastal zone ( cf. previous section), the need to know the
precise length of a coast comes up, especially in technical literature.
Since this study focuses on a small island, the issue of the precise quantification of the
coastal length is important. Larger states have a larger land area to coast ratio ( cf.
Tables 2.6 and 2. 7) and therefore the coast may not exert an impact on larger states as
important as it does on smaller states (Blake, 1984). The issue of coastal length
emerged during the literature search where scientific papers appearing in the context
of specialized studies on the coastal perimeter of Britain (Mandelbrot, 1967) and
Australia (Galloway and Bahr, 1979) paved the way for an investigation into the local
scene.
112

The importance of the issue of coastal length to coastal land use and coastal
management will be dealt with here. Justification for examining coastal length within
a land use exercise can be seen through a number of factors:
(a) By changes to land use types as the indentation changes along the coastal
perimeter, with a higher indentation the more intense would be the land use; as
natural protection from bad maritime weather conditions is given to coastal areas,
with the result that sheltered areas tend to cluster dense populations and a range of
land uses. A discussion on this issue is given in Chapter 8;
(b) The high land area to coastal length ratio (cf. Table 2.6); and
(c) A series of factors mentioned in the next chapter, such as, the high population
density of the island, the sovereign state status of the archipelago and the recent
quick pace of economic development that have put great pressures on coastal
resources.
In part, this emphasis and linkage of coastal length to coastal management emerged as
a result of the mapping exercise described later in sections 5.12-5.14. The issue of
conflicting uses in heavily indented bays and inlets along the eastern coast of Malta
gradually emerged and detailed observation followed.
Drawing from the theories proposed by Maling (1988) that the coastal length is a
function of both the scale of map measured and the width of transects, a number of
coastal lengths for the Islands at a variety of scales were drawn up. The study has a
number of practical factors that aid in the management process, especially for areas
that are heavily indented. Essentially it is the knowledge that, in whichever way the
local coastline is measured the traditional length officially recognized is wrong. The
areas that are prone to heavy land use pressures are the areas that need to be measured
most accurately as they are the most indented. To begin with, the islands forming the
Maltese archipelago are presented in a hierarchical order of both spatial and littoral
dimensions starting with Malta through Gozo to Comino and the smaller rocks of
Cominotto, Selmunette, Fungus Rock, and Filfla. Since this is a thesis dealing with
the coast, it was felt that the actual length of coastline of the Maltese Islands must not
be taken as read in secondary sources. Rather the need was felt to measure the coastal
length using the same scale sheets as that used for the estimation of the land uses.
113

Deciding on the particular coastal length to be quoted in this work was the next
cartometric exercise to be performed. A range of maps at various scales from 1 :2,500
to 1 :31,000 were used and consulted in the process of the compilation of this thesis.
However, as the main land use mapping and measurements were done on the I :2,500
scale sheets, it was thought appropriate to perform coastal length measurements using
the same level of detail, ensuring a degree of uniformity.
At this stage the issue of the coastal length can be taken further to investigate a
number of other factors. Coastal length measurements are tied to two main criteria,
namely, the scale of the map used and the apparatus used for performing the actual
measurement. The equipment and methodology for the latter are reviewed in detail by
Maling ( 1988). Two main pieces of equipment were used in this instance, the
opisometer and a pair of dividers. The former is a reliable piece of equipment for
measuring the linear parts of the coastline. However, the apparatus was not as efficient
for measuring in detail lengths of the indented portions of coast. Although the use of
the opisometer gave very quick results, their reliability is questionable.
The pair of dividers, on the other hand, afforded greater accuracy especially in treating
lengths of the indented and fragmented parts of the coast where boulder screes were
prevalent. They gave scope to experiment with map scales and transect width. The
latter factor opened up a new facet in the concept of fractals as developed by
Mandelbrot (1967) and Galloway and Bahr (1979). It became immediately apparent
that this issue has never been applied to the local scene and that the traditional
dimensions given never mention map scale and/or transect width. To elaborate on this
issue a cartometric exercise was performed. This involved calculating the length of
coast as measured from the 1:25,000 scale maps using various transects, the results of
which are shown in Table 5.4. A range of values was obtained, and the smaller
transect the longer the coastal length turned out to be.
114

Table 5.4 Coastal length for the Maltese Islands at a scale of 1: 25,000 and various selected transects
Transect Malta Malta Malta Gozo Malta & Comino Length East West km km Gozo km Metres km km km
500 68.630 54.195 122.825 38.310 161.135 7.340
400 71.890 54.680 126.570 38.510 165.080 7.450
300 75.250 57.150 132.400 39.700 172.100 7.100
200 78.400 57.320 135.720 42.390 178.110 8.560
100 84.400 64.645 149.045 42.500 191.545 8.975
Source: Author's calculations
5.8 Mapping scales
Maltese Islands
km 168.475
172.530
180.200
186.670
200.520
Owens (1992) defines scale as the degree of generalization of a landscape. Scale is
controlled by two essential factors: the dimensions of the area that is to be studied and
the level of accuracy that is required; as scale increases, the level of generalization
decreases. Listed below is what is considered to be a spectrum of scales (Robinson et.
al., 1983) relevant to land use mapping: rV!c-tL
1. large scale 1 : 1 x 1 06 or )e~ - ~ VI/I '' [ 1 ~ ! n l ,_.
11. medium scale 1 : 1 X 1 05 to 1 : 1 X 1 06
iii. small scale 1 : 50,000 to 1 : 1x 10⁵ ~ L~'JJ<- JL<A~
Perotte ( 1986) claimed that many coastal managers want mapping at 1:10,000 scale,
while for Owens (1992) a scale of 1:5,000 institutes detailed mapping. It is therefore
important to note that the local mapping of the Maltese coast at 1:2,500 was an
exercise in detailed mapping.
Studies aimed specifically at coastal zone mapping are few and the number does not
reflect the importance which this subject warrants. Ellis (1978), Owens (1992) and
Perotte (1986) attempted to collate and investigate such mapping. Their studies were
intended to be either primers to provide general information and guidance or
115

overviews to be used as a starting point for coastal zone mapping. Their major
concern was to try and initiate some form of uniformity in the thematic mapping of
the coasts. The major problem stemmed from the wide spatial variability of the coastal
character. Planners and managers need information that combines as many variables
as possible in a small number of maps. Hence the diligent selection and compilation
of a reliable base map should be the first goal. Small scales limit detailed studies and
diminish the levels of detail. For small areas large scales are required. Coastal
managers need a low level of generalization and hence large scale maps are the vital
working tools.
Mapping the coastal area is essentially an exercise in identifying natural and cultural
features. For the purposes of this thesis mapping basically entailed depicting land use.
Ellis (1978) defines land use as comprising two components:- land use and land
cover; land use being activity related, i.e., the way in which a parcel of land or water is
used, whilst land cover refers to vegetation or artificial structures on the land. In the
case of the Maltese Islands, the problem of land cover hardly emerged, as vegetation
is generally sparse and artificial structures, where a cover or canopy is found, are
restricted to shipbuilding facilities in the Grand Harbour or boat shelters which form a
part of marine recreational facilities. Otherwise, all coastal land uses mapped were not
covered up. The topographic details shown on the survey sheets were valuable in
linking the topography to the land use elements being mapped, especially in
undeveloped areas.
5.9 Cartographic materials used
Maps and sheets of the Maltese Islands are available at a number of scales. The
British Government's Overseas Development Administration (Directorate of Overseas
Surveys - DOS) produced and updated maps of Malta on a regular basis throughout
the 201h century up to 1974. From these the most detailed maps available are the
M891 0 series at a scale of I :2,500, published between 1971 and 1974, by which Malta
is covered in 154 sheets. Gozo is covered in 42 sheets by a set published between
1964 and 1968, and Comino in two sheets which were published in 1963. Of these,
1 00 sheets covered the coastal zone area and were therefore used in the Coastal
Surveys. Table 5.5 presents the lists pertaining to Malta subdivided by Segment.
116

Table 5.5 British Directorate of Overseas Surveys Series M 8910, 1971, Survey Sheets: Scale 1: 2500 used in Coastal Surveys
Segntentl: 3882,4082,4083,4283/4284.
Segntent II: 428114282, 4081 (part of), 4280/4281, 4080 (part of), 4480, 4481 (part of), 4680, 4680, 4479, 4478, 4678, 4879/5029, 4879, 4677, 4678, 4878,4879/5079 (part of).
Segntent III: 4878, 4879/5079 (part of), 5078, 5077, 5277, 5476 (part of).
Segntent IV: 5476 (part of), 5275, 5475, 5474/5476 (part of), 5474/5674 (part of), 5673 (part of).
Segntent V: 5473, 5474/5674 (part of), 5673 (part of), 5673 (part of), 5672, 5472, 5471, 5470, 5671, 5672 (part of).
Segntent VI: 5872, 5871, 6070/6071, 6069 (part of).
Segntent VII: 6069 (part of), 6068 (part of), 6068 (part of), 6067, 6066, 6065, 6064.
Segntent VIII: 6065, 5964 (part of), 5964 (part of), 5865, 5866, 5665, 5664/5864, 5863 (part of), 5863 (part of), 5665,
SegmentiX: 5762,5562,5463,5263,5064,5065,4864,4665,4666,4466(partof),
Segment X: 4466 (part of), 4467, 4468, 4268/4267, 4269, 4069, 4070, 4071, 4072, 3872, 3873.
Segment XI: 3874/4074, 3875, 4073, 4075, 4076, 4077, 3877/3878 (part of), 3877/3878 (part of), 4078, 4079, 4080 (part of), 4081 (part of), 3881/3860, 3883/3882,
Segment XII Comino
Segment XIII: 2692 (part of), 2893, 3093,
Segment XIV: 3292/3293 (part of), 3491/3492 (part of), 3691, 3690/3890, 3689, 3889.
Segment XV: 3888/4088, 3887/4087, 3887/4887 (part of), 3887/4887 (part of), 3687, 3686, 3486, 3286/3285, 3086, 2886/2887 (part of), 2886/2887 (part of), 2888,
Segment XVI: 2688, 2689, 2690, 2691 and 2692 (part of). Source: compiled by author from the series ofO.S. sheets.
"part of" means that only a part of the sheet was used in a particular segment, it usually follows that the next (adjacent) segment used the remaining part of the same sheet, hence another "part of'.
117

The term 'part of indicates that only part of (a section) of that sheet was used in the
compilation of the sequence O.S. sheets that make up a segment. The parts were
necessary as the O.S. sheets do not distinguish between one segment and another. As a
result, some O.S. sheets had to be sectioned into different parts, this occurred mainly
in those sheets that were located at the separation of two contiguous segments. These
'parts' were identified with the segment in which they appertained to. Therefore the
same sheet number would appear more than once in different segments signifying that
one sheet had more than one section of it falling in different segments. Figure 5.4
shows the distribution of the sheets along the coast. In addition, the coastal place
names that occurred along the coast were identified from the 1:25,000 maps of Malta
and Gozo and from the 1:2,500 survey sheets. These were compiled into Figure 5.5
and a key developed and shown on the reverse side of the same page. Combined
together the Figure and Table provide a guide to sites and locations along the coast
used in this thesis. In all 352 sites are identified.
The subdivision of the coast into 136 coastal units is an additional cartometric feature
that has been introduced for this thesis. A number of units make up a segment. These
units are primarily determined by the O.S. sequence of sheets as they appear along the
coast, and secondly their size is determined by the area of land that each unit is
represented on each sheet. However a number of minor adjustments were made to the
size and extent of some units. Essentially this issue emerged during the compilation of
the sequence of 0. S. sheets for presentation in Appendix 1 and also in preparing the
working document in Chapter 7 and sections of Chapter 8. Two tables were complied
to elaborate on this issue. Table 5.6 lists the number of units present in each segment.
Some segments are represented by a large number of units because they either have a
- long coastline ( eg: rectilinear: Segments IX, X, XIV; em bayed: Segments II, XI) and
therefore consist of a large number of O.S. sheets. In the other segments where there
are also a large number of units the reason is that there are sections of coast from
opposite sides of the same narrow creek or bay represented on the same O.S. sheet and
these sections are identified as separate units and listed in contiguous format as they
appear on the coast. This sequence emerges in Chapter 7 and in Appendix 1.
118

-a
Figure 5. 4 Map of the Maltese Islands showing location of O.S. sheets
Source: Compiled by author

0 %
"i 0
a .., ~ ·-
~ ....
£3 -·--= c.J .s -= = = I. ..,
0 ~ .c - -·- :s-..,
Ill -0
= ;.., - ,Q WI
] = 0 ·-u c. 0
e Vl 0 "' ll'i u ~ u r.
-~ :I 00 :I ·- 0 ~ til
I20a

t-.J 0 CT
Sources: compiled by author from- , British Directorate of Overseas Surveys Series l\1 8910 (1971) Worl>s Department (1984 a); Worl•s Department (1984 b); Worlls Department ( 1984 c).
I. l1onla taC-( irkewwa 46. Qalel Ma1ku 91. Ghar i,f.J>uhhnn I](,, II·Tnmticra 1nl·lhic•1 2. lr-lhmla Ia' Wicd Musa 47. Qrcjlen ruinl 92.Ji-lellieqa I H. b·Xircr I. Ramla laf.Jiir 48. llahar ic·Callha~ lla~ 9.1. 1.-llsicn 1.\8. 11cuf!hisn l1uint
•1. Ramla lni-Qunin 49.11·1lhlla 1-lln'dn 1H. 7.111111"' ruinl 1.\'1. St c icnrsc·s Unl 5. 11-llojja In' I·Annicr SO. 11-rm,ht lh ic:t a 9S. (ihar ix-Xa111n l·lll. l'•cnr lin~ 6. lhmla tal- Turri ~I. St Gcur •e's IJav %. Mn1sascala lin~ 1•11. \Victl i"·X~'I'la 7. l>ahlel ix·Xmaiiar S2. Dr~unara ('uinl 'l7. Xirer ic·C'crna 1·12. ( ih:u yinhnua 8. Pm11a IR' 1-Ahra.x S.l. 11-Qalicl I ?B. ll·l'unla Ia' Jlarul 14.1. (i1Hu ju-Nn(!hni! '}. lhlum 1-Ahmar ~~. S11inula l'niul '1'1. II·Mil•fubn 14-1. If. 1\.111111 IU. lhlum lai-Mudnnua SS. Sl Julian's llay IIIII. II·Cii.i1a 1-U. lihou lloe~an
II. IJahkl i•·Xilcp .Ill. llallulallay 101. Mi~nuna l'uinl l•llo.lllalil·l'llr
11. II·Ma~hal ~7. Sl Julian·> llal 11!2. S1 'f'hum:IS llay 1-17. I ·1\llal ''j 1. lt.huu if.IJmar 5K. Slicnm l'uinl III.I.II·Mm"nr I·IH. Jl.liu;,-1 S1o:nk
H. ll·l'arson '-'J. Hhnt iLI·Ilml lll.I.I1LUll:& la(-Ciria;nl 1-I'J. Wi'""\1/nuhl."f 15. Ta'l·lm,!ln•uatl bO. 11-IJ:aii'lll;t' (ihou itl- IU~. J•unln ht' faua iJ. -~~11. illllajln
lhnl ,._.~ .. u~•~ II>. Ghar ll••1rat I• I. Dra~ull'uint llllo .. Xu1b iHiha~iu ~,;o-,.,,h:u
17. ll·ll•ii• lul·Mctlicha 62. Sli<111a ('reck 1117. Taht ii·M••1i<l I H. f..,\,hlu 18. Ghajn 7cjluna 6). l.aznrcllu \reck 1118. l'<•ntalal·llurJa l~:l. 1.-Cih&m·cira 1?. 1\as il-Griche ·, M. Msilla C1<ek 111'1. ll·h•tlic~ha IHI:bk<>lji 20. 1.-lm'•ichah (o5. l'ieli ('r«k I Ill. llur1a I·Khira 155. Wicd M:nthnl 21. lllnlal-llaola 66. Marsalll.'lt!ll llarhmu Ill. Ru il·fcnck 1511. I. l>knllla' Snjjclla. 12. Gicjjer Sthuuucll 67. 11-l'ussa 112. 1\as il-fenek IS7. (ih;u il·'l'ouni~ 21. Htlum il·llil:s (oR. Sl F.hun l'ninl I "· lluf111 7.-f~hira 15K. 'In· Melba
H. 1\as il-t.li~nuua 69. 11-McuoJa (IDI·IIrakenl 114. lh~ ii·Qnla 15'1. 11·11·~·· i
2.1. II·Qala tai-Mislra 70. Mal>a C'1cck 115. Kalanka 1•1-Qali lhU. \\'iccll)icl!u
' 26. Rdum ltxawu 71. lhs Jlaniir ll6.1'clc1'S ru.,f (Kalanka 1<>1. h Xuojjck hii·Tumbclll
27. Oahlcl il-fcknma 71. l'rend1 C'1eck 117. 'rumhclll'uinl 1C1'2. T;t" Xmtlu 28 Rwl'IWU rltinl 73. l>ockyaul Creek 118. Kalanka l'uu.la 11>.1. llllmi\ Ia' Wic.l
holija 29. ll·lhjja lal·l'walcs 14. Kalkara Creek 119. Gh:11 llclla IM. Wietll'ulija .10. Rdu111 SIUJ>flin 1S. 1\inclla Creek (llit:hi 120. l'u~la lai·Tawwalija 16S. II·Ka111a' Wicol l'ulija
llal) 11. Tai·K•IIII' 76. Ricasoli l'oinl 12f.II.Qalai·TawwRiiia lfil•. II·Minkba H. Gha'n Rasul 77. \'lied Ghanuni«l 122. ronla lai·Gidicn 1117. 11-ll:ojlra .13. Ghar Ia I· Vci:Cja 78. II·Kalanka lal·l'•l•iiicl IHII-Knlaukalai-Gitlien 1!18. Wietf if.fla>Sli>R H. Ghajn ClhuTur 79. Tar-1\Dmel 124. l>climan l'oinl llo?. Ochcl Mat 111 •h H. 1\dnmlai·Mahmq 80. 'rohl il·l•iebja 12S. Tatllic~hn Ia'
l>climar'a 1711. 11-lhcjro
.16. Qala Ia' I·Ghaiiellin 81. Ta' T•lk 126. ManaxluH flay 171.1.·hmiex H. Rdnmi-Ab'ad 82. Tan-Nisa 127. Ras ic-Cagh••l 172. lol·l>:ohlo 18. h.-Xta'la Ia' Uu'•ibba 83. T•I·Q•s•isin 128. Tahl ii·Tnm<icra I H. II·T•i•ijo 39. lx·Xlala lni-Qawra 84. Ras if.(,cbcl 129.1\uii·Tri•J 17-1. Wic.lllallll 40. 11-l'onta lal.Qawra 8~. lllal•l·llajda I JO. Qiiljlcn lluint 11S. ll·llnojja (lllue
tiwlln) 41. h:-Xtajta tai-Qowta 86. 11-<iulr lnl-lllala f. Ill. 11-l;ussn 11(•. \Victl l:i-J.urrictJ
Oajda •12. Ic-C ens 111-Gebcl 87. IOrrl-1\b'ad 1.12. 11-l'ollla 1-Kbin 171. I\ as il-llojja•la ~3. l'u11 llm·Marrad 88. 1>-Swali Ill. Tad-l>cbbra 17R. I ihar h-Xa~hru
(Sulina ll•rl 44. Ghallis ruinl 89. 11-Gulfla' Xuxella 134. 11-Tnmi:iet• 179. Ta' llcuicAD
(jcww~uijll
U. Ghalli. flocks 90. Sola Ruck (1.-i>kullt:o' IH.II-IIuh•a 180. Tnf.(ia\l'wija
·-~· --- -·- -----·--·-· ?i~J~. ---·---· .. - ------ -------·-
IBI.Il<nb il·ll•flhal 226. ll·M••i:• 2l. Gha'nll•rrani 67. 'fa' 1-lkbiex 182.1\as il.lfannija 227.1hlnmlai-Vii!••ju H. Rdum Ia' Sckkck 68. Ghar lima 18.1. ln·Hdlicl 228. 11-lllala 25. ll·G••Idum 69. Ta' cuC IM.f..lfsnn 229. Ras ir·l!ahch 26. lldmulla' Sekkck 70. Tal-llajl I R.I. llah1 ii-Turnl 230. l'umm ir·Rih Unl 27. lnlumlni-Marin 71.1c-Cnus IRI•.II-Mii<JIIh 2.11. 1\as il-1\ahch 28. 1\duni lar·ltamln 12. 11-l'aqmn I R7. lih:u lluixa 2J2. i'incjna ll•l 29. lldumta• Vcmfla 73. ll·l'innur IRS. II·M••fhln•l 2)J. II·Qnssaba .10. lrdum ii·Khir H. \'lied Jl.la•iena 18?. lias llnniir 2 H. Ohujn l'urlicha llnr .II. Son II las liar 7S. ll·Tm!l>a lai-Kiicb I9U. Tn' Uwicuu1 H.l. llanolalai·Mi><JmJa .liR M is Ira 1\m:h 76. \Vie<llai·Killicnja
!<iol<lcn Burl 77. Wicd Snn Gur~ i•Jt. Cih;u l.nt•~i 2.11>. 1\ohuu Majcsn (II· .12. Tu' Ciha.in l.cmhuha
Mniicl tni·Mujcsnl ' I 1J.!. Tu·;- Uwi\!UUI H7. ll:ls if.\Vnh• -·
.\.\. ( ihain IJcrln 7K. ll·lhnha ('J,l, II;&~! a S·SC\\liO 21R. 1\olmu Majcsa J.l lr~lum Som 1:ilcp 7'1. llajjoda PJ·I. 11id• 1-tibl."al ... ·n 2.1'1. II< hun iol-lldli .'5. Dnhkt (~•tw\ IIU. Ta"·Xcm.,
I''·"· h-~XmJCiil 2411. ll·l'rajjcl lh tihall,,.,r Hi. hl·lhlwra HI. S:m:ap
1%. I> Si~s 1.-Ahjml 241. lla> in·Nie•f• .17. C)alal'uiul H2. ii-Knu110 197.f.,.x, .. 1," 242. li:-C'mnnija .18. Ta' llu <ihnss R.I. lias il·lhjtla 1'18. Ia Xwicki 243. ?ichcl huloork .1'1. Tol· Mello 8~. Xlcudi IJay -~r illlamiern 244. lhlmu il·!,lanuuich 40. lichcltaf.lfalra 85. 11-Tkikcn
2110. <ih:u ii-Tu1lija 24S. Oam111ieh l'uiul 41. li.?.ilka 86. Ghar la' Santa Kulatiu 21li.Mi~udllnm 2ol6. lhlum ii·Qawwi •12. Tal-lllala 87. cbcl lien Gor~ 21!2. II Kullnna 247. Ta' <)assisu (llolnml 4.1. ll·lln•ii• BB. Wardija rninl
201. Jt,lum lluui.:'l" I 248. t ·irLtwwa (l'antLiisc ·1·1. Tai·Gioa'"n 89. hi-Dcjj:"l Bay)
21l·l. lhlum niHicna I. San Uimitri rui111 •l>.llumlutt ir-Rummitn 90. llwejra llay
- II a~ 211~. lhlum 111• Oi,lcm 2. TDI·Il•J! . 46. lloubal,!~i<'ni ltudc. 91. l'ungus Ruck (II·Gclol
lai-Gcneral 2UC.. ll·lh•lhal·ll:rjda l. JicHa l'uinl 4 7. Ta • llumharin 92. ()wejra ruinl
2111. ll•hnula' lih:11 llinijn ~.Ghar ix-Xih 48. llahla lai;.('awl I. 11-Uajja Ia' San Nikla" 20M. Cih:or llini.iu S.l•inu l1oint ~9. 11-Gclocllac·Cawl (lac· 2. 11-llajja u' Sanla Ma1i:
Cawl lloeksl 209. lltlum n .... 1irn 6. furllit l1oinl SO. Ghar MiukR ). li·lcr7ic•t• 2 Ul. llthun f)uu Nazju 7. b·X1iek 51 .ll·lllatal·lhojda 4. 11-llncjja
211. 1\tlnm ID' f.fflrar 8. ls-Si~~~~ S2. lhmla ht.i-ZcwwieL a S. 11-ronla l·hqicqa 212. Tu'li'licn 9. Ghar ir-1\ih H. Mgau llarhuur 6. If. ala lai-Mazt 213. Tal Oowwija 10. RKS ii:-Calla 54. Skull Ia' Ghasarar 7. llein ii-Kmiemcn 21~. Rthuulal·l aws II. Ghar ii·Qamh 55. Mcllicha l'oinl B. Conuninollu 21 ~. IJ.()aws 12. 1\as ii·Konnit S6. Xaiii·Ahmor I. 11-ll•.ii• Ia' San Nikl••'
211o. b·XII<Jiihi ll. Ghur il-l hlejtla ~ 7. Qala lni·Mikhnl 2.JI.flajja Ia' Santa Mari 217. Jhs id-Uaw\VOID 14. Nn&h•~ ii·IIBhBI sa. lhs il-ll<~hi 3. li-l.crii«]• 218. Mi ·,,. l'c1ha IS. ltc, 1 o l'oinl ~9. Ferre ltuck 4. 11-llnejja 219. Ta·llnuumul 16. Xineni llul 60. M \arr h ·X ini llay S. 11-ronla 1-lrqi«l• 220. 'l'al·l'crli 17. Qulla 1-llnj<ID 61. ll·l't\UID Ia' 1-lsktmdlu 6. 11-Qala lai-Mau.
221. Cihnr lJ••s••n IR.(JhRjjar llny €12. lla&ra IJ·Scwtla 7. llcjn il-K micmcn ,. 222. Mi~ro l'coha 19. ruuta to' Santa Moria 63. ~IJiarr ix·Xini 11:1}' B. Cominonu 22.1.11-Minn 20. Manalrurn llay 64. 11-Kauk•• Ia' Mgarr ix·
Xini 224. lhlniiiiRS·S:ug 21. Ghar Qaw<fl• 6S. l'a' llolugna
22S. I>·Sikka (l:oi·F•ajna) 22. lldumlas-Surgu 66. Ras in·Ncwwicla
-· - ,_ . ---- ------·--·-· ------------- -· . -·-----·----·

This situation is apparent in all three Harbours in Segments V and VIII and in areas
where the bays and inlets were very narrow, such as St. Julian's Bay and Balluta
(Segment IV). As the sequence of the coastal segments is a continuous one in that the
end of a segment touches the beginning of the next one, so the sequence of coastal
units forming each segment had to follow the same pattern. This subdivision was
essentially a cartometric exercise where each coastal unit is presented as contiguous
with the one preceding it and with the one following it irrespective of in which O.S.
sheet the coastal unit was located. This problem would not have emerged had the
level of the discussion stopped at Chapter 6, but with the requirements of the thesis
and the felt need for detailed appraisal, the subdivision was thought to be ideal for the
development of sections of Chapters 7 and 8.
To clarify this matter it entailed representing the O.S. sheet sequence in Appendix 1 as
a series of four-digit figures some of which are duplicated. Table 5.6 gives a number
of details pertaining to the coastal units in each segment. Adjacent units can have
similar characteristics. In establishing the coastal units, the O.S. sequence was rigidly
followed in areas where the coast shows rectilinear properties but in embayed zones
this practice had to be occasionally modified. Table 5. 7 presents these minor
modifications and the criteria used in applying the changes. Essentially the need for
this subdivision emerged only in the later part of this thesis. The identification
numbers (1 to 136) of the coastal units with the O.S. numbering can be seen in the
first two columns of Appendix 1. In addition, this numerical order for the
identification of the coastal units was found convenient in the discussion in Chapter 8.
Malta is covered in 112 coastal units, Gozo in 23 and Comino retained as one unit.
Further detail is provided in Table 8.6 where data for the separate bays, harbours and
inlets together with stretches of rectilinear coast are given. This table was found useful
in comparing the general land use patterns between embayed and rectilinear parts of
the coast.
The islands were also covered by three I :25,000 sheets published in 1984. These maps
are titled 'Malta East', 'Malta West' and a third covers 'Gozo' (Works Department,
1984a; 1984b; I984c).The maps at 1: 25,000 were used to plot out my logistic
strategy and the field mapping progress, and also to transfer data gathered from the
121

larger scale maps. All of these editions were prepared by air photography in August
1968 by Hunting Surveys Ltd. with additional information supplied by the Office of
the Public Works Department in Malta. Printing was done for the DOS by the
Ordnance Survey. The choice of these maps was dictated by the level of detail
presented in the maps. The 1968 series was superior to many of the versions published
later. Further data was obtained from another set of 1: 2,500 sheets labeled as sketch
Table 5.6 Selected data for coastal units Segment Coastal Unit Number of Per cent of
identification Coastal total number digits Units in segment of units
I 1-4 4 2.9 II 5-20 16 11.8 III 21-27 7 5.2 IV 28-36 7 6.6 v 37-56 20 14.7 VI 57-62 6 4.4 VII 63-68 6 4.4 VIII 69-77 9 6.6 IX 78-87 10 7.4 X 88-99 12 8.8 XI 100-112 13 9.6 XII 113 1 0.7 XIII 114-116 3 2.2 XIV 117-122 6 4.4 XV 123-131 9 6.6 XVI 132-136 5 3.7
Source: Compiled by author from Appendix I
maps. These sketch maps highlight mainly the urban areas and also give street names,
the extent of built-up areas, and also new road constructions and communication
network changes. These maps are continuously being updated by the Drawing Office
of the Department of Public Works and are readily available. These sketch maps were
consulted throughout the survey, especially in areas where substantial changes were
affected to the coastal area.
A key feature of the 1 :2,500 scale sheets are the numbered lines along the horizontal
and vertical axes showing northings and eastings. These were useful in estimating
areas and measuring distances. Every sheet is overlain by a grid pattern of faint lines
122

and each square corresponds to 10,000 m2 (1 hectare) in area. The numbered grids
were also used in fitting together adjacent quadrangles to form large continuous maps
ofthe coastal areas.
The sheets also show geomorphological features such as steep slopes and cliffs.
Contour intervals, at 2.5 metres, are represented in light brown and accentuated every
10 metres in a thicker and bolder maroon. These geomorphological features were ideal
in correlating the type of land use to the slope of the coastal zone terrain, in fact the
details presented on these sheets were of great help in identifying land uses in
undeveloped areas. In addition, other coastal geomorphological details are represented
accurately with boulder debris on scree slopes differentiated by size, position and
shape. Coastal configuration is outlined precisely and this, together with large rocks,
can be used for exact orientation in the field. A conversion table for metric to non
metric scale is included in the right hand margin. Other details of importance were
found on the left hand corner of every map. These include the latitudinal and
longitudinal degrees, seconds and minutes; buildings according to roof outline; and
field boundaries were very accurately reproduced. The latter helped greatly in
orientation in unbuilt areas. Representation ends at the shoreline.
The choice of maps for the field survey was conditioned by a number of factors that
were in turn controlled by the cartographic options available. The features required to
map out land uses accurately were well represented on the map: a clear shoreline
margin, accurate contour identification and precise geomorphological representation
were the main attributes; and field boundaries aided further the mapping exercise.
Sheets with scales of 1 :25,000 and 1: 2,500 scales were used. For the actual field
mapping, the 1:2,500 scale maps were used with a second set used to transfer the
detailed representation of the land uses. The 1 :25,000 were used to compile, group
and synthesize the detailed survey results. As the sheets used were dated, having been
produced about 15 to 20 years previously, new built-up areas and any changes to the
coastline from the construction of jetties, promenades to main rock falls or changes to
sand beaches were marked to the base map.
123

T bl 57 C t t . d' a e .. ar orne nc a t I us men s to coas a survey s h t ee senes Coastal Coastal Ordnance Locality Criteria used Segments Units Sheet Survey
Number II 5 4283, Mellieha Bay same orientation facing south
4282,4281 II 6 4081 Mellieha Bay same survey sheet covering the narrow XI 109 4081 Dahlet ii-Pra.ijiet neck of north Malta with bays facing
opposing directions II 7 4080 Mellieha Bay same survey sheet covering the narrow XI 109 4080 Dahlet ii-Prajjiet neck of north Malta with bays facing
opposing directions II 9 4480,4680 Selmunette to include St. Paul's islands in same
coastal unit II, III 16,19,20 4878 Coast Road three separate units on same sheet which
are not contiguous, separated with other units to obtain contiguity
III 22,23 5078 Qalet Marku to isolate Qalet Marku peninsula Ill 26 5276 Dragonara survey sheet shows boundary between
peninsula segments IV 29 5276 St. George's Bay inner part of St. George's Bay
IV 28,31 5476 St. George's Bay parts of same sheet used for different units due to embayment of coast, separated with other units to obtain contiguity
IV 33,35 5474 St. Julian's Bay parts of same sheet used for different units due to embayment of coast, separated with other units to obtain contiguity
v 36-42 various sheets Marsamxett twenty units were identified, and the Harbour. two harbours were separated. Details of
43-55 various sheets Grand Harbour the sheets and coastal units are in Appendix I
VI 57,58 5872 Ricasoli two units on same sheet to separate the Xaghajra two localities
VI, VII 62,63 6069 Zon_qor Point sheet falls at change of segments VII, VIII 67,70 6065 11-Kalanka tat- two sites in opposing orientation and
Tumbrell and ta' different segments 1-Inginier
VII, VIII 68,69 6064 Delimara Point same sheet at intersection of two segments, and drastic change in orientation
VIII 71,73 5865 Marsaxlokk Bay parts of same sheet used for different units due to embayment of coast, separated with one other unit to obtain contiguity
VIII 76 5864, 5664 Container included in same unit Terminal and Pretty Bay
IX 79 5662, 5462 a very small area in 5662 included with 5462
X 101 3874,4074 Fomm ir-Rih a very small area in 3874 included with 4074
XI 102 4075, 3875 Gnejna Bay peninsula and bay included in same unit for Bay
XI 105 3877,3878 Ras il-Wahx whole peninsula included in same unit XII 113 3886, 4086 Comino whole island included in same unit XIV 118 3482,3491 Marsalforn Bay only change to Gozo coast, to include
bay in one unit Source: Complied by author dunng cartometnc estimates and from field expenence
124

Areas where competing land uses were located over a small geographic space were
initially field mapped at I: I ,250 or even at I: 675 scale. However the presentation of
the results was done at the I: 2,500, I: 25,000 scale and, for a general overview
picture where a map of the island of Malta fitted into an A3 size paper, the scale used
was of the order of about 1: 120,000. Synoptic maps produced are shown in their
relevant sections in the next chapter.
5.10 Geology maps
Other maps and charts were used to complement the mam survey sheets. For
geological information the map of the Geological Survey of the Maltese Islands
produced by the British Petroleum Company Limited in 1954 at a scale of 1: 31,680
and the Geological Map of the Maltese Islands (Oil Exploration Directorate, 1992) at
a scale of 1:25,000 suited the purposes well. The representation of the main rock
types together with the precise position of discontinuities were of great help, even in
areas where many different outcrops occurred in a limited area.
5.11 Pedology maps
Pedological information was important to the extent that soils washed down to the
coastal area could be identified. However field reference to the Soil Map of Malta
and Gozo, published by the Directorate of Overseas Surveys in 1960 and printed by
the Ordnance Survey at a scale of 1: 31,680, was the only source that could be used.
Reference to the soil type was only included in marginal field notes and did not
feature in the report of survey or in this work. However Quaternary soil deposits
found at three coastal locations in Malta were identified from the Geological map
published in 1992 by the Oil Exploration Division.
5.12 The selection process of the land use categories and the mapping key
The spatial aim of this thesis has always been the appraisal of the whole littoral of the
Maltese Islands. However, a number of studies were conducted over the study period
with three main purposes in mind: (i) for the identification of the categories that
would ultimately have to be the representatives of the land uses in the surveys; (ii) to
develop a mapping symbolization key; and (iii) for experience to be gained in
125

interpreting visually the coastal landscape. For the first purpose cited above the
number of land uses that the author settled for were 16 that were used for the 1998
survey. However, for the purposes of this thesis, the sections that follow review the
different surveys done to fine-tune these 16 land use categories. Therefore the chapter
sections include the land uses identified for the pilot survey (Section 5.12.2 and Table
5 .8), the land uses utilized for the 1989 summer survey (Section 5 .12.3 and Tables 5. 9
and 5.10), and the land uses deployed for this thesis (Section 5.12.4 and Table 5.11).
The different number of land uses employed to map the coast reflect the on-going
experimentation that was underway throughout this period.
5.12.1 Preliminary observations, winter 1988
The preliminary observations during the winter of 1988 took the form of coastal walks
along the eastern Malta coastline as this was rather more accessible than other areas
due to its low sloping nature. The cartographic results produced by the author from
these initial exercises consisted of field sketches that mainly identified shoreline
features using a broad brush approach with land use categories kept to a minimum.
For example, no differentiation was made to separate the various elements making up
the land that remained undeveloped. Human impact was mainly differentiated on the
basis of the cultural uses (industrial, recreational, residential and historical) and
undeveloped areas (agricultural and areas left in their natural state). An attempt was
also made to define the extent inland to which mapping should take place. However a
simple key to symbolize the land uses was also developed towards the end of the
winter period as a result of the experience gained in looking at the coast. This key is
shown in Appendix 5. The main problem with the symbols shown rested with the
mapping scale and detail to which the land uses and other features were to be
represented. For small scales and detailed identification of coastal features the key
was confusing, as was to be realized later with the mapping at Bahar-ic-Caghaq
(Figure 5.6). However, it was a healthy exercise in that the mapping scale was put into
better perspective and confidence in the identification of most coastal features was
gained. The number of land use categories utilized was not quantified.
126

5.12.2 The pilot study, Spring 1989
The second attempt at evaluating the coastal land use features was completed in the
spring of 1989 where three days were devoted to mapping three different coastal
environments. This exercise was done by Professor Ewan Anderson and myself
primarily to organise sites, materials and mapping prior to the pilot study itself
especially as the latter would involve a substantial amount of organization. Briefing a
small team of mappers for the Coastal Zone Survey later on in the summer also
required an element of experience to be passed on.
The cartographic results of the Pilot Survey are shown illustrated in Figures 5.6, 5. 7
and 5.8. The sites mapped were:
I. Bahar ic-Caghaq area: selected so as to link with the work done a few months
previously during the winter of 1988;
II. Pretty Bay, Birzebbugia: selected due to personal experience and the knowledge
that as the area was slowly being influenced by the industrialization of a container
terminal. Continuous monitoring of this site was planned to be a regular feature.
III. Rdum ta Gidem: selected due to its lack of accessibility: this presented a land use
facet with agriculture and slope screes being the main categories ;
In addition to the land use, cartographic interpretation of three different sites was
reproduced using different symbolization, including colour differentiation. Thus for
Figure 5.6 of the Bahar-ic-Caghaq area, letter symbols formed the basis of the land
use identification. However this method was very detailed, identifying very small
patches of land use as small as 25m2• The system can be applied successfully to a
small area, however it would not be advisable to map the whole coast of the Maltese
Islands using this method. The clutter of symbols dotting the littoral is not aesthetic in
the cartographic sense and can also be confusing. In addition, it is impossible to
synthesize the material from the 1:2,500 to the 1:25,000 scale. The end result of this
was that a different set of symbols were developed to help in the identification and
symbolization of small parcels of land uses that were clustered into small areas. This
system is reproduced in Appendix 5.
127

Figure 5.7 for the Birzebbugia area was an exercise in differentiating land uses by
colour. Here again costs for producing the whole coast of the Maltese Islands by this
method was inhibiting. However, the end result was one that produced a very neat
map and in all probability was crucial in the award of the contract for the Coastal
Land Use Survey. The Department of Geography at the University of Durham was of
valuable assistance in producing the final maps.
In the Rdurn ta Gidem area a method of map overlays was proposed. In Figure 5.8 the
results of the overlayed maps are reproduced as one figure. This method had a basic
aim of including a number of physical features on which the anthropogenic (human
induced) ones were superimposed. Again, as with Figure 5.6, this method was good
for small areas, but the costs of producing the overlayed cartography for the whole
coastline would have been very expensive to produce and the expertise was not
available locally.
The three areas mapped covered most of the land use elements of the coast and as only
one method had to be used for the field mapping exercise of the Coastal Land Use
Survey the pilot study was the basis used in the discussions that helped evolve the
mapping system. Although the aim of the Pilot Survey was to produce detailed maps
of the main variables for about 1 0 per cent of the coastline of Malta, it was more an
exercise in testing the methodology and the identification of any mapping problems.
The main approach was by observation, collection of material and discussion.
Orientation and slope angles were measured by field compass and clinometer. The
main element that emerged from this brief was that a number of land use categories
and a number of sub-categories were proposed. In general, a fairly good idea of the
nature of the coast was obtained.
Although the survey did not cover the full extent of the coast, more categories were
added to the ones observed on the three sites, partly on the basis of the Winter Survey
and on the further experience gained. These are listed in Table 5.8 and include ten
main land use categories, having in total 46 attributes. The attributes were essentially
the land use features that make up the coastal resources in the ten main categories
listed. The main categories were spatially larger in area than the sub-categories.
128

........ N 00
Qala Ta' Bahar Area
~ 't!- Zl
Figure 5.3 Bahar ic-Cagb.aq
Source: Anderson and Schembri, J.A (1989)
Boundary ol coastal zone
Predomlnanlly domestic
~ Predomlnanlly tourism
i; ~.:;: i' l1j
}>};rf!: Pollution (mainly litter & dumping)
l~\tf,4tr~ Beach
J;:O:~;\,"'-:;
[§;\~ Seaweed accumulallons
o o o Area ol outstanding aclenllllc Interest • • • Area of outstanding natural beauty
Ma)or halophyte boundary
• Soli deposits
Vegetation M Mllllary
... " Ml Mllllary fortifications .., .. Herbaceous * II RG Globlgerlna Ls.
9Q~ 9 0 Trees RLCL Lower Coralline Ls.
,...,.... K Concrete Shrubs " ......
Zc Cobbles
~ Industrial sallpans =-=--= Zl Boulders
CAP Car park Zp Pebbles
Cb Commercial bar 5. - Slope angles
Uolghl In mo '' 01
l<j<! &o o 100 2yo 300 •oo Mohu • ' • I • I '•"' ~ I I j I I I I I i I '• I I I
100 0 200 •oo eoo 800 1000 1200 fool

Il-8aJJa ta' San Gar;
Boundary of coastal zone
Predominantly domestic
Predominantly tourism
Industrial
D Transition zone
Predominantly agricultural
100 50 0 100 200 300 400 metres
Figure 5.•7 Malta, Biri:ebbuga: representation of land uses by colour coding
Source: Anderson and Schembri, .J.A (1989)
D ~ ~
Predominantly vegetated wasteland
Pollution
Rocks
D Sand
Seaweed accumulations
Areas of outstanding natural beauty
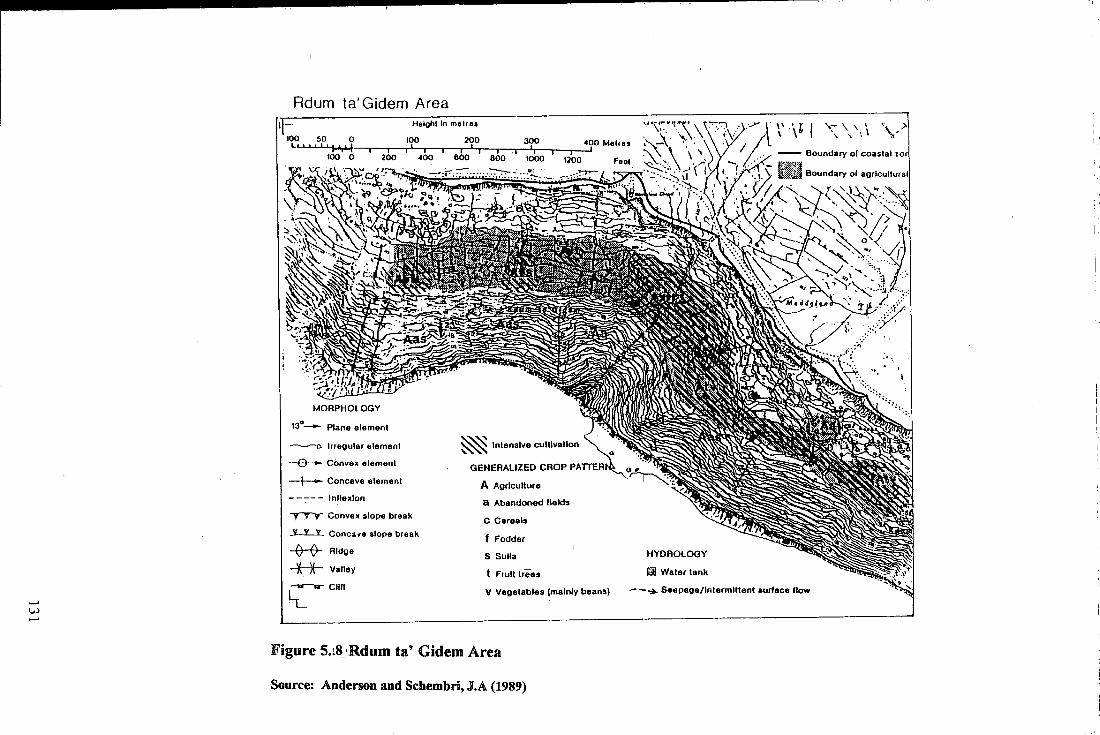
,_. w ,_.
A dum ta' Gidem Area Height In metros
tOO 50 o tOO 200 300 400 Metres l •• I I I I I• .,. I I I I 1 I I I I I I .I •• I I I
100 0 200 400 600 600 1000 1200
13°- Plane element
------c. Irregular element
-e-- Convex element
-t-<:- Concave element
.---:--- lnllexlon
TTY Convex slope break
.3--LI. Conca•e slope break
~Ridge
~Valley
-..-..- Cllll
~
~ Intensive culllvallon
GENERALIZED CROP PA
A Agriculture
a Abandoned fields
C Cereals
f Fodder
5 Sulla
t Frulltrees
V Vegetables (mainly beans)
Figure 5.~8_,Rdum ta' Gidem Area
Source: Anderson and Scbembri, J.A (1989)
HYDROLOGY
OJ Water tank
.- -;. 586page/lnlerm1Henl surface llow
,_\"··'I ... , '\ !
'I
I,
, I
I:

5.12.3 The Coastal Zone Survey, summer 1989
The end result of the spring survey was that a brief was compiled to be distributed to
the participants of the summer land use survey. The list of participants is detailed in
Figure 1.1 and included the Director of the Survey, Professor (then Dr.) Ewan
Anderson, myself, Professor (then Dr.) Gerald Blake, eight University students, four
from Malta and four from Durham, essentially these eleven geographers formed the
mapping team. Professor (then Dr.) Patrick Schembri and Edwin Lanfranco as
consultants from the University of Malta and a number of administrative assistants
from the Town Planning Department (as the Malta Environment and Planning
Authority was known then). Further changes were made to the main key to be used for
the Coastal Zone Survey of the summer of 1989. In all eight main land use categories
and 28 sub-categories were provided in the brief. These are summarized in Table 5.9.
As the list of categories was shortened, an overlap of land uses emerged. In these
cases the predominant use was selected. The criteria used in identification of the land
uses is reviewed in this chapter but the main cartographic identifying features were
hatching and colour-coding (Table 5.1 0).
Site selection for the summer 1989 survey posed no problems as the whole littoral
length of the Islands was to be mapped. However, the extent to be mapped inland was
a feature that emerged in the follow-up discussions to the pilot survey. In section 1.3
of the thesis this issue is discussed but the emerging problem was that the whole
littoral would not have a standard fixed cut-off line that is distance-related from the
coast but a line that winds its way along physical or anthropogenic features. This line
in general is one that is parallel to the shoreline. This situation is similar to studies
carried out in a number of countries and shown in Tables 5.1 and 5.2. As a result, the
main output was the production of 1 00 colour-coded maps ( cf. Section 1.1) at a scale
of 1:2,500, now held by the Planning Authority. Table 5.10 gives the list of categories
the identifying features for each category and the colour coding used in the final
mapping that was presented. In addition, twelve synoptic charts were also produced.
These were drawn at a scale of 1:25,000, six representing Malta and six showing
Gozo. These dealt with tourism, accessibility, vegetation, pollution, industry,
economic and historical features.
132

Mapping and identifying coastal features is an exercise that calls for effective
cartographic representation. The major land use categories that include within them
all of the coastal elements have to be properly distinguished from one another. Colour
was therefore important in presenting the data effectively. Besides enhancing the
display, colour adds visual interest, increases contrast and may evoke a stimulus or
response in the map reader (Robinson et. al, 1984). As the maps drawn are later to be
used by coastal planners and managers, attention was paid to create combinations that
did not mislead the data interpretation, make unnecessary contrasts or highlight
unimportant features. Thus it was thought to be important to create a continuous
graphic communication between the cartographer and map reader by enhancing visual
interest. As each land use category utilized one specific colour it was important to first
identify the aesthetic reactions aroused by different colours, reactions which connote
concepts (Robinson et. al, 1984). For example vegetation was coloured green and
maritime functions in blue. The hues employed in demarcating one category from
another tallied with the Robinson eta! ( 1984, 163) classification as follows:
• Red for tourism - being an important dimension in coastal development all
tourists facilities have to be marked as important;
• blue for maritime functions - conventional use;
• green for vegetated areas - conventional use;
• yellow - paucity of vegetation - shore;
• orange- openland;
• brown - agriculture;
• black - pollution;
• mauve - services;
• purple - industry
• purple with dot pattern - historical.
Furthermore, domestic buildings were left uncoloured as the thin black lines marking
them did not in any way interfere with the colours used. In addition, to broaden the
colour spectrum the colours described above were also enhanced with a line or dot
pattern to represent each of the 26 land use elements individually. These details are
given in Tables 5.9 and 5.10.
133

An exercise of these dimensions, mapping land use on a scale of I: 2,500 covering an
area of about 19 km2, could not have been performed single-handed for a number of
reasons. A "snapshot" of the coastal situation was needed as a good base for the study
per se and to provide a strong basis for future updates; and, the time span for
mapping had to be short and the survey performed during the peak-use season. The
reason is that a number of mobile kiosks and other features associated with the
swimming season occupy the coast. A summer survey was also necessary as it is
during this season that a high degree of use was made of the coast and it was
important to assess as many coastal land use variables as possible. In addition, the
involvement of Geography student groups from Durham and Malta Universities
constrained the survey period to the summer vacation. Geography undergraduates
from Durham had to be made familiar with the local environment. This was
facilitated by the Durham Geography Department's 15-day field class in Malta the
previous April.
On the other hand, the preliminary development of methodology can be performed
either singly or in a team of two. The latter brings out on-site discussions and is
probably the most important component in the exercise. Only the main land use
exercise of 1989 utilized more than two people at the same time.
The main problems that emerged as a result of the successive mapping stages was that
a uniform mapping key and symbols were not developed, consequently land use
measurement and interpretation suffered. Therefore this lack of uniformity was ironed
out with the production of three maps for Malta and three for Gozo and Comino
giving a synoptic view of coastal land uses. These are shown in Chapter I. They were
used to produce a paper to mark the completion of the survey and to highlight the
problems faced at the coast in Malta (Anderson and Schembri, 1990).
134

Table 5.8 Land use categories identified in the Pilot Survey
1. Residential 6. Sea-based TransQort permanent boathouses temporary hangers
slipways 2. Commercial Services boatways
retail marinas office jetty hotel port mobile kiosk bar 7. Communications and utilities
electrical power 3. Industrial broadcasting
light water supply heavy sewage pipeline under construction extractive 8. Recreational
swtmmmg 4. Land-based transQortation fishing
car parks entertainment roads boating promenades hunting bus terminus trapping bus stop camping sites
clubs 5. Institutional
religious 9. SQecial interest educational historical entertainment scenic military ecological
agricultural
10. Undeveloped land bare rock scree slopes shore platforms
Source: compiled from results of 1989 Pilot Survey
135

Table 5.9 Land Use Categories identified in the summer 1989 survey
RECREATION 1. Tourist buildings 2. Transient tourism 3. Areas of tourist use 4. Boathouses 5. Maritime activities 6. Services/Recreation
VEGETATION 1. Vegetation
LAND UNDER DEVELOPMENT 1. Urban wasteland 2. Transitional land 3. New construction 4. Dumping: building rubble 5. Dumping: domestic 6. Oil pollution
RESIDENTIAL 1. Domestic buildings 2. Retail/Commercial: non-tourist 3. Military/Historical/ Archaeological
UNDEVELOPED AREAS 1. Unvegetated coastal rock 2. Coastal rock platform 3. Open land : garrigue -
steppe maritime vegetation 4. Open land : rupestral -
rdum vegetation
AGRICULTURE 1. Land in use 2. Land abandoned
INDUSTRY 1. Industry: primary 2. Industry: secondary and tertiary
OTHER USES I. Beach: sand/silt 2. Beach: shingle 3. Widien 4. Soil deposits
Source: Compiled by E. W. Anderson and author from 1989 Pilot survey and for use in the main 1989 survey
136

T bl 5 10 M . d t 'I f a e . : am e a1 s rom 1 2 500 . ' sea e maps ~ M It or a a an dG ozo Land Use Catee:ories ldentifvine: Factors Colour Code Tourism Tourist buildings (hotels, guest houses, bars, cafe, multi-use Red
building with a tourist component) - striped pattern; transient tourism (caravan and camping sites) - dot pattern; areas of tourist use (car parks) - coloured in
Maritime Functions Boathouses (buildings with large predominant front doors Blue and usually no windows - striped pattern Maritime activities (jetties, slipways, harbours and boat houses)- no particular pattern, colour enhancement of straight coastline
Vegetated Areas Vegetated patches oflandscape significance (trees, shrubs Green or plants of similar size which remain green throughout the year)- striped pattern
Accessible Shore Beach: sand/silt- coloured in Yellow Beach: shingle- dot pattern Unvegetated coastal rock - line pattern Coastal rock platform- cross-form pattern
Open Land Natural landscape: Orange Garrigue: steppe maritime vegetation - dot pattern Rupestral Rdum vegetation (depending upon soil and shelter) - double dot pattern Valleys- arrow in direction of water flow Man-made landscape: Urban wasteland- striped pattern Transitional land - coloured in
Agriculture currently in use- striped pattern Brown abandoned - dot pattern soil deposits -coloured in
Pollution rubble dumping - dot pattern Black domestic dumping - striped pattern new constructions - dot and line pattern oil pollution - coloured in seaweed banquettes - striped pattern (angular)
Services retail and commercial - striped pattern Mauve recreation - coloured in
Industry primary (quarries, salt pansO - striped pattern Purple secondary (manufacturing, ship repair)- cross form pattern
Historical Historical (military, historical or archaeological) Purple with dot placed in some category as they occur in apparently small pattern discreet areas except in Grand Harbour, but distinguished on the maps - dot pattern
Domestic Domestic buildings were left unimproved on the base maps unimproved Source: developed by author based on mapping results of the 1989 Coastal Zone Survey
137

5.12.4 The 1998 coastal survey
The 1998 mapping for this thesis involved using a monochrome copy of the 1989
mapping as a guide during the survey and modifying the mapping using the 16 land
use categories but retaining the same coastal zone boundary. The land use mapping
was done with a charcoal pencil using the lower case lettering (a-p) throughout (refer
to Table 5.11 ). The main changes observed were in the urban coastal areas. The
introduction of the dilapidated areas category helped to smooth out problems in
distinguishing between transitional, waste land and new building construction.
Recreational areas were also grouped into two instead of six categories as tourist
buildings, the services associated with the tourism industry and recreational areas
having maritime activities are all generally found near one another serving the same
needs of recreation, thus separate identification was not needed. The identification of
the land uses in the undeveloped areas category was greatly helped with the contour
pattern on the O.S. sheets with the density and spacing between the contour lines
being an indicative factor and the geomorphological representation of cliffs and scree
slopes indicated in the key to the O.S. sheets. A dense contour pattern generally
identified abandoned agricultural land as some slopes were rather steep to retain soil,
and in other cases field sizes were generally very small to permit a viable harvest, the
introduction of machinery and the transport of products to the market. All the changes
made were primarily done to cut down on the number of land uses that were mapped
separately and whose final linear dimensions in the 1989 survey were rather small and
had little bearing on the overall results. In addition, representing minute features on
the synoptic maps in this thesis would have been impossible. Effectively the changes
made provided a smoother representation of the land uses both cartographically and in
the data presented in the tables. However, one main change was that the land use
results obtained were represented in a spatial format (hectares) rather than in linear
units and attention was paid to avoid giving figures with overlapping land uses and
probably mislead the reader of this thesis, as is evident from Table 1.1.
\ In addition, a modified key with different symbols and changes to the land use
variables was developed for the 1998 Coastal Land Use Survey. This is shown in
Table 5.11. Thus, problems of uniformity in interpretation of the coastal land uses
were eliminated and a new set of measurements was developed. However it must be
138

stressed that, were it not for the experience gained in the successive mapping
exercises and surveys, the final result would not have been so succinct. In the final
presentation of the results in this thesis, and including the changes affected as a result
of the land use changes, the land use categories were kept to a maximum of sixteen
for the sake of an efficient presentation of the discussion. These are summarized in
Table 5.11 and include the cartographic key to the symbols given and which form the
basis of the discussion in the next section.
In addition, between April and May 2003, an assessment of changes to selected
coastal localities was made by the author. These included mainly changes to the
coastal urban areas made since the 1998 survey and took into consideration the
proposals made by the MEP A in the various Draft Local Plans for Public
Consultation, Reports of Survey and Local Plans. Various issues from the Times [of
Malta] helped to identify particular sites where changes were occurring or proposals
for development were being made, and in some cases also provided a literary source
to substantiate field observations. The results of these changes are developed in the
conclusion to Chapter 7.
5.13 Cartometric method
Cartometry, has been defined by the International Cartographic Association as the
measurement and calculation of numerical values from maps. Maling (1988) identifies
measurements of distance, area, direction, and counting the numbers of objects shown
on maps as the four basic kinds of techniques in cartometry. Although a number of
sophisticated methods for the actual estimation of areas are available, the method
proposed by Sauvain (1990) was used for the purposes of this thesis, using a
transparent copy of millimetric graph paper where 1 em = 10 divisions and 1 cm2 = 100
divisions, superimposed on the 1 :2,500 scale maps where each cm2 (1 00 divisions)
represented 625m2 one small square (lmm2) equalled 6.25m2
• The method used in
estimating the land use for each of the 16 categories on every sheet was by adding up
the results of a, b and c below:
a) the number of complete centimetre squares under the transparent grid;
b) the number of complete millimetric squares;
c) the number of incomplete small (m) squares to the nearest 0.75, 0.50 or 0.25.
139

The results were entered into a matrix denoting the sixteen land use categories on the
horizontal line and sheet numbers on the vertical line. Thus the complete quantitative
land use situation was identified. The values were then converted into hectares. Each
value represented the cumulative total for that particular land use found on one coastal
unit on one O.S. sheet. In addition, cumulative totals for each land use in each
segment and the total area of all the land uses in each unit are also given, together
with the cumulative value of the total area of coastal zone for each segment. All the
results are shown in Appendix 1.
5.14 Data reduction
The data gathered from the field was calculated in square metres, resulting in an
unwieldy data base. So as to achieve an efficient discussion, the data gathered from
the field was modified by a process known as "data reduction". This consists of a
number of steps to compact the data and, in the first place, make it easier to be
followed. In fact, data reduction is one of the preliminary methods suggested by
Ehenberg (1982) and O'Brien (1992) as a method to be followed prior to analysis.
Essentially this involved two stages:
(a) the 1 00 survey sheets were organized into 16 coastal segments; and
(b) the area for each land use category was converted into hectares ( cf. Appendix 1)
This data reduction gave the opportunity to reduce the data further through successive
stages and provide areal measurements for compacting the 16 land use categories into
eight and successively into data for each island (Malta, Gozo and Comino separately)
and finally into data representing the Maltese Islands as a whole group. In fact the
discussion in the next chapter follows the results obtained through the data reduction
method where the data is examined through a sequence of spatial scales starting from
that of the Maltese Islands, then tackling each island separately before the analysis of
each segment.
140
~------------------------------------------------~---------------------------

Table 5.11 Main land use categories, sub-categories and principal features and utilities used in the identification ofthe land uses, with respective symbols. 1998 coastal survey
Symbol Main category land Symbol Sub-category land uses Principal features and utilities used to identify the main and sub-category land uses (Upper uses (lower case) case)
A Recreational areas a tourism hotels, holiday flats, beach concessions, catering establishments
b marine servicing areas jetties, breakwaters, slipways, boathouses, ferry and cruise liner facilities, yacht marinas, boat parking facilities
B Residential areas, c residential areas buildings for residential use
roads and historical d public utilities (Roads, roads, promenades (walkways), pedestrian zones, pavements, vehicle parking facilities and other sites promenades) infrastructure facilities evident at ground level
e historical sites notably coastal defences (towers, forts, bastions, batteries, redoubts, pill boxes), sites with archaeological remains and buildings of historical importance
c Extractive and f extractive Industries reverse osmosis plants, salt producing areas.
industrial areas g industrial areas marine servicing industries, power stations, fuel storage and distribution depots
D Depositional h depositional environments sand beaches, sand dunes, salt marshes, fresh water springs, areas of ecological importance. environments
E Afforestation areas i afforested areas trees and vegetation planted by men
F Arable land j agriculture areas: in use agricultural areas under cultivation or identified as temporarily fallow
k agricultural areas: abandoned agricultural areas abandoned
G Undeveloped land I shore platforms predominantly Globigerina limestone shoreline with smooth surface, unvegetated
m low sloping rock predominantly Coralline limestone shoreline with pitted surface, sparse garigue vegetation
n cliffs and steep slopes steep rock faces and cliffs
0 scree slope areas 'rdum' boulder fields, rupestral vegetation
H Dilapidated areas p dilapidated areas rubbish dumps, spoil from building industry, on-going infrastructure works, unused urban areas
Source: Compiled by author
141
I
I

In order to interpret the different number of land uses identified for each survey (Pilot,
1989 and 1998) and group the information present in Tables 5.9 and 5.11, Table 5.12
was compiled. This shows how the number of land uses was rationalized so as to
simplify mapping and interpretation. Thus, the recreational areas in the third column
represents tourism and marine servicing areas in column two and the six land uses in
column 1 i.e., tourist buildings, transient tourism, areas of tourist use, boathouses,
maritime activity and services/recreation. The same process applies for the other rows.
Table 5.12: Scheme showing grouping of land uses
Land Use Categories (28) Land use categories (16) identified in identified in the summer 1989 1998 Survey (cf. Table 5.11 Columns survey (cf. Table 5.9) used in 2 and 3) Section 5.12.3 only Used in Sections 6.3 to 6.15 Tourist buildings Tourism (a)
. Transient t()_)JD~I!I Areas of tourist use Boathouses Maritime activity Marine servicing areas (b) Services/recreation Domestic buildings Residential areas (c) Retail/commercial Public utilities (d) Military/historical/archaeologic Historical sites (e) a! Industrial areas: Light Extractive industries (f) Heavy Industrial areas (g) Under construction Extractive Beach: sand/silt Beach: shingle Widien Depositional Environments (h) Soil deposits
Vegetation Afforested areas (i)
Agriculture: land in use Agriculture: land in use U) Agriculture: land abandoned Agriculture: land abandoned (k) Unvegetated coastal rock Shore platform (I) Coastal rock platform Low sloping rock (m) Open Iand;garrigue, steppe Cliffs and steep slopes (n) maritime vegetation Open land: rupestral rdum Scree slopes (rdum) (o) vegetation Urban wasteland Transitional land New constructions Dumping;building material Dilapidated areas (p) Dumping:domestic Oil pollution Source: compiled by author from Tables 5.9 and 5.11
Key (a) indicates lower-case land use symbol (A) indicates upper-case land use symbol
Synoptic grouping of the land uses into eight land use categories. Used in Section 6.2 only_
Recreational areas (A)
Residential areas, roads and historical sites (B)
Extractive and industrial areas (C)
Depositional Environments (D)
Afforested areas (E)
Arable Land (F)
Undeveloped land (G)
Dilapidated areas (H)
142
5.16 Conclusion
The methodological and cartographic techniques employed and the refinements made
to the mapping key over successive exercises were the result of experience gained
over a number of years of teaching at the University of Malta, conducting field
sessions for local and foreign students (students from the University of Durham
included), and coastal field sessions to the International Ocean Institute's Coastal
Zone Management Programme. All of the above gave me extensive experience on the
terrestrial side of the coastal zone of the Maltese Islands. Thus mapping and the
necessary cartometric measurements could be performed with a fair degree of
accuracy. The discussion that follows in Chapter 6 is the result of extensive field
studies, detailed mapping, accurate cartographic representation and precise
cartometric measurements. These led to the values presented being based completely
on raw data. The new set of calculations was based on the areal unit of the hectare,
and each land use category was identified separately from the rest with no over
lapping between land uses. Again, measurements were made to suit the researcher and
the needs of this thesis.
143

Chapter 6 Coastal/and uses: description and discussion
6.1 Introduction
The data reduction exercise described in the previous chapter enables the presentation
of the data in this chapter in increasing detail both for the land uses (categories), and
locations (segments). The reason behind this method puts a strong base for the
discussion and analysis and does justice to the detailed surveying, mapping and
cartometric measurements made. This method of analysis first gives an overview of
the coastal land use distribution in the Maltese Islands as a complete archipelago, to
give a general view of the archipelago, secondly to show the differences in the coastal
land use between the separate islands from the aspect of each individual island,
namely, Malta, Gozo, and Comino separately, and finally land use is examined for
each of the 16 segments individually so as to provide a strong base for the discussion
and analysis and to do justice to the detailed surveying, mapping and cartometric
measurements made. This ensures that the coastal land use in the Maltese Islands is
examined in detail. In addition Appendix 1 shows the further subdivision of each
segment into a number of coastal units, adding to the detail of the coastal land uses.
The 16 segments are divided into 136 coastal units, these are discussed in Chapter 7.
The coast of the Maltese Islands features on 100 of the 172 Ordnance Survey sheets
that make up the whole archipelago: 73 for Malta, 23 for Gozo and two for Comino.
The data as presented in the thesis, follows the sequence of the segments as given by
the sheets in the Ordnance Survey series.
In this thesis on land use in the coastal zone of the Maltese Islands the discussion and
analysis are based on the data gathered from the field, with the main data-base
presented in hectares. Elaboration of this data is given as a ratio in the form of
percentage values where particular land uses need to be put into the perspective of a
wider geographical setting. Thus most of the data is presented consistently in the
same format throughout this chapter and it is made up of two sets: the raw values in
hectares, and the corresponding ratios in percentages. Two main elements are
represented: the quantitative, which is the raw data as presented in hectares and,
secondly, the qualitative, which is represented by the different land use categories.
There are three broad sections in this chapter:
144

(a) introduction to the Maltese Islands, where a general view of the coastal land uses
is provided;
(b) description and discussion of each land use category as distributed in the Segments
making up the coastal zone. There are nine sections in this part of the chapter, with
each of the first eight sections consisting of seven parts each. The particular land
use is described in the first four parts along the following lines: introduction,
background information, justification of the study, and the fourth part providing
definitions of the particular land-use category. The final three parts in each section
provides a framework for discussion of the raw land use data in the ensuing
pattern: presentation of the data, discussion and analysis and the conclusion. The
final (ninth) section is concerned with presenting a conclusion and also to provide a
platform for further analysis in the subsequent chapters; and
(c) synoptic map is presented with each section. Each map of the Maltese Islands
includes the land uses pertaining to each section. The localities for each map can be
identified from Figure 5.5 and its accompanying key found on the back part of the
same page.
Discussion starts with an examination of three tables that subdivide the coastal area
into eight main land uses. The data presented in this chapter is the result of data
reduction methods explained in Section 5 .14.
6.2 A synoptic analysis of coastal land uses: areal measurements
The data presented in this chapter is the result of three exercises: field surveying,
mapping, and cartometric measurements and the data reduction techniques used. The
methodology for compiling this data has been described in Chapter 5. A synoptic view
of the land uses of the coastal zone is presented to give the distribution of the eight
main land use categories as found on Malta, Gozo and Comino separately (Table
5.11). This data is summarized in Tables 6.1, 6.2 and 6.3. These tables give the
distribution of the eight main land-use categories that are the main focus of this
chapter. A consistent format is presented for each table. The main 8x4 matrix,
representing the eight main land use categories on the vertical axis and the separate
islands of Malta, Gozo and Comino and data for the Maltese Islands as a whole are
represented on the horizontal axis. Each table is therefore made up of 32 cells. Table
145

6.1 is the main table giving the raw data for each major land use category for each
island separately and for the Maltese Islands as a whole. The data in the two other
Tables 6.2 and 6.3 represent ratios to the raw data of Table 6.1 and give the ratios for
each land use as represented in each separate island and for the Maltese Islands.
The coastal zone of the Maltese Islands, as defined for the purposes of this thesis, is
approximately 18.5 km2; this includes 14.5 km2 for Malta, 3.5 km2 for Gozo and the
rest for Comino (Table 6.1 ). The uneven division in the coastal zone area between the
three islands of Malta, Gozo and Comino with 78.6, 18.9 and 2.5 per cent respectively
is immediately apparent. Malta has the largest coastal zone dimensions for a number
of reasons:
(a) it is the largest island of the archipelago;
(b) it has the longest coastline of the three islands;
(c) the indentation of the coastline on the east and south of the island gives it a high
proportion of coastal margin to land area when compared to the other two islands; and
(d) the low sloping topography along a substantial part of the Malta coastline gives it a
wide coastal zone boundary ( cf. section 2.3 .1 ).
The largest of these values is for the undeveloped areas, with almost 40 per cent ofthe
whole littoral area. This, together with arable land, constitutes two-thirds of the whole
coastal area. Within each individual island the highest ratio for one particular land use
is given by the undeveloped areas category for Comino with 83.6 per cent. Gozo has
almost one-half of its coastal zone identified under this category and almost 87 per
cent of its coastal zone grouped between the arable and the undeveloped land
categories together. Malta has more than one-half of its coastal zone identified under
these land uses. For Malta residential and recreational areas make up most of the
remaining land uses, with 291.2 ha, or 15.7 per cent of the area under study. Almost
20 per cent of the Malta coastal zone is occupied by recreational and residential land
uses.
The three values for the recreational areas, residential areas and industry, are clustered
at around 150 ha of area each for Malta (around 10 per cent for each category), whilst
for Gozo the figures are smaller, ranging from 10.2-3.5 ha (0.5 to 0.1 per cent),
146

indicating that Gozo's coastal zone is less "urban" than that of Malta. For the coastal
zone of Comino the fact that the recreational area consists only of a hotel is reflected
in the high proportion of 14.4 per cent for this land use category. In addition, the
coastal zone boundary for Comino is more evenly distributed around the coastal
margin than for Malta and Gozo mainly because of the absence of significant indented
coastal areas, giving a generally rectilinear coastline and a coastal zone boundary
running parallel along the shoreline. In addition, the marked absence of significant
terraced agricultural areas and valleys help to maintain a rather uniformly narrow
coastal zone. In fact Table 8.2 has details pertaining to the mean width of the coastal
zone for each segment. Those segments that possess scree slopes and agricultural
areas (Segments X and XIV) or a low sloping profile (Segment III) have wide coastal
zones, whilst the opposite situation exists for segments where cliffs are present
(Segments IX and XIII). Furthennore, the lack of marked coastal indentations presents
a coastline that is not amenable to development due to the absence of sheltered areas.
The smallness of the island and the relative isolation from the other parts of the
archipelago may also be significant contributors to this land-use pattern.
It should be noted that the coastal zone boundary, although being in general
essentially a line running parallel to the shoreline, does not give uniform areal
dimensions for all segments. This is due to a number of factors explained in sections
5.2 - 5.6 and Table 5.3 in the previous chapter where the study matrix of this thesis
was put forward through the criteria used in establishing a coastal zone. These criteria
considered the extent of halophytic vegetation, whether the area was urban or rural,
and the overall physical properties of the coast. Therefore each segment has different
coastal zone dimensions and Table 8.2 gives details for each segment.
The highest values are for those land uses having undeveloped land and arable land. In
fact, the Maltese Islands possess 65.8 per cent of these land uses along their littoral,
Malta has 60 per cent of its coastal zone area occupied by arable and undeveloped
land, Gozo 87.9 per cent and Comino 83.8 per cent. Of the other land use categories
the residential and recreational land uses are the locations where intensive human
interaction and impact prevail, and in general, referred to in this thesis as the coastal
147

Table 6.1 Maltese Islands: Areal distribution of coastal land uses (ha)
Land Use Malta Gozo Comino
Recreational Areas 140.4 3.9 6.5 Residential Areas 150.8 3.5 0.6 Industrial Areas 139.3 10.2 -Areas with depositional 9.5 3.0 * environments Afforested Areas 66.0 19,9 0.2 Arable Land 350.9 133.2 0.1 Undeveloped areas 523.9 175.1 37.7 Dilapidated areas 78.2 2.0 -Total 1459.0 350.8 45.1 Source: Estimated by author from Appendix 1 *Area< 0.1 ha
Table 6.2 Maltese Islands: Percentage distribution of main land uses for Malta, Gozo and Comino. Data given for each separate island by rank order
Land Use Maltese Malta Gozo Islands
Recreational Areas 8.1 9.6 1.1 Residential Areas (B 8.4 10.3 1.0 Dila idated Areas (H) 4.3 5.4 0.6 Industrial Areas ( C ) 8.1 9.6 2.9 Areas with de ositional environments (D) 0.7 0.6 0.8 Afforested Areas E) 4.6 4.5 5.7 Arable Land F 26.1 24.1 38.0 Undevelo ed Areas (G) 39.7 35.9 49.9 Total 100 100 100 Source: Estimated by author from Table 6.1 Upper case lettering denotes key symbol for the land use as presented in Table 5.11 *Area< 0.1 ha
Maltese Islands
150.8 154.9 149.5 12.5
86.1 484.2 736.7 80.2
1854.9
Comino
14.4 1.3
* 0.5 0.2
83.6 100
Table 6.3 Maltese Islands: Percentage distribution of each land use category for Malta, Gozo and Comino by rank order.
Land Use
Recreational Areas Residential Areas Dila idated Areas Industrial Areas Areas with de ositional environments Afforested Areas Arable Land Undevelo ed Areas Source: Estimated from Table 6.1 * Area < 0.1 per cent
Malta
93.1 97.4 97.5 93.2 76.0 76.7 72.4 71.1
Gozo Comino Total
2.6 4.4 100 2.2 0.4 100 2.5 100 6.8 100
24.0 * 100 23.1 0.2 100 27.5 0.1 100 23.8 5.1 100
148

urban areas. Table 6.2 shows that Malta, having 29.9 per cent of its coast devoted to
these activities, is by far the leading island of the archipelago in this respect. Gozo at
2.1 per cent is well behind. The case of Comino at 15.7 is due to the fact that the only
hotel on the island occupies a substantial part of its coastal zone. For the dilapidated
type of land use, the total area of 80.2 ha (Table 6.1) represents 4.3 per cent of the
coastal zone for all the islands.(Table 6.2).
Other general considerations noted include the following:
(a) Within the whole complex of the archipelago, 8.4 per cent of coastal land use
is taken up by residential areas. The difference between the three islands is
manifested here with about 97.4 per cent of this land use category found on
Malta (Table 6.3).
(b) the remaining areas within the urban complex present a similar situation with
over 90 per cent of these located on Malta.
However, the distribution ofthe areas that are associated with the paved (covered with
an artificial surface) areas is much smaller for Gozo and Comino than they are for
Malta.
Differences are also to be found in the land uses identifying the smaller values:
depositional environments, afforested areas and dilapidated areas. These represent a
total of 9.6 per cent (Table 6.2) of the coastal zone for the Maltese Islands. Spatially
this amounts to 178.8 ha, of which 86 percent is found on Malta. The main reasons for
this are that more sand beaches are located on Malta, and more afforested areas are to
be found on the larger island along the coast. In addition, data for dilapidated areas is
very high for Malta and accounts for 97.5 per cent (Table 6.3) of the values given for
the Maltese Islands as a whole. The higher population density, and the concentration
of development and infrastructural works occurring on Malta make the larger island
more prone to accumulating unwanted and discarded building material and rubbish
dumps. In addition, there are more pockets of unbuilt areas in urban zones in Malta
than on Gozo and they are larger in size.
149

This part of the discussion can be elaborated upon with the help of Table 6.3 and
section 6.4 that follows. Both sets of data help in the assessment of selected
proportional values between Malta and Gozo. The areal ratios between Malta and
Gozo/Comino are 78:22, meaning that for every 78 km2 area for Malta, Gozo and
Comino have 22 km2, the ratios for coastal length are 73:27 (cf. Table 8.2), and those
for the coastal zone area are 79:21 (Table 8.2). From Table 6.3 it is apparent that only
the ratios dealing with coastal rural environment conform to the ratios for the Maltese
Islands as a whole whereas the ratios for the coastal urban environment are heavily
represented for Malta. The range of values here is 97.4 - 93.1 for Malta and 7.0 - 2.2
for Gozo and Comino together. However, the unique nature of Comino is apparent
with its 14.4 per cent devoted to recreational land use and 83.6 per cent (Table 6.2) of
undeveloped land. The reason for this is that the only hotel on Comino occupies a
substantial part of the coastal zone.
The data presented and discussed have provided an insight into the coastal land use
fabric of the Maltese Islands, showed up the main differences between the coastal land
use set-up of the separate islands of the Maltese archipelago and helped to identify the
land uses that generally appertain to the urban and rural fabric. Thus the terms "urban"
and "rural" will be used throughout the thesis to indicate both land uses and
geographic locations, whether the spatial unit being discussed is the coastal segment
or the coastal unit.
In order to conclude this section it is important to show that these observations
indicate that a simple classification of coastal land uses can be used to subdivide the
coastal zone into three main sections. First are the land uses associated with the
coastal urban core areas, this would include most residential (A) and recreational land
uses (B). Industrial areas (C) are also included in this category as in Malta most are
located within the urban zones, such as at Grand Harbour and Marsaxlokk Bay.
Dilapidated areas (H) are also included with this category as most of them are found
within the urban sprawl. Secondly, areas with arable land (F) and undeveloped areas
(G) can be considered as having a rural character and very different from the urban
areas, in fact they constitute part of the rural environment. Thirdly, the remaining two
land use categories of afforested areas (E) and depositional environments (D) lie
150

between the urban-rural spectrum both by their genetic nature and location placed at
the interface of the two to act as buffers and also at times lie on the periphery of both
urban and rural coastal environments. In addition, the important nature and high utility
value of both afforestation areas (practically all planted by humans to embellish the
coastal environment) and sandy beaches which although limited in size and extent
(only 2 per cent of the coast has sandy beaches) form the backbone of the tourist
industry in Malta. In fact the sandy beach at Birzebbugia (Segment VIII) lies within
the urban environment and the beaches at Ghajn Tuffieha, and Golden Bay (Segment
XI) are to be found in the rural environment. Table 6.4 gives the percentage value for
each island and for the Maltese Islands. The high percentage of coastal urban land
uses for Malta is evident from the Table. The analysis that follows will examine the
land uses extant over sectors of the coastline to identify the land use fabric of the
different segments that make up the coastal zone of the Maltese Islands.
Table 6.4 Percentage distribution of coastal land-use categories for the Maltese Islands, Malta, Gozo and Comino classified by "urban" and "rural" categories.
Land uses Maltese Malta Gozo Comino Islands
ABCH 28.9 34.9 5.6 15.7 Urban DE 5.3 5.1 6.5 0.5 Others FG 65.8 60.0 87.9 83.8 Rural
Total 100 100 100 100 Total
Source: Estimated by author from Table 6.2
The discussion that follows focuses on the 16 category land use classification (Table
5.11) and utilizes the two main matrices presented as Tables 6.5 and 6.6. A 256-cell
matrix is given for each table. Table 6.5 gives the distribution for each separate land
use for each segment. Thus the 15.8 ha for cell Ia is the area covered by recreational
activities in segment I. On the other hand, from Table 6.6 this figure represents 12.78
per cent for the recreational land use category for Segment I as a ratio for the Maltese
Islands (Segments I to XVI) for this category, it is shown in cell Ia in Table 6.6.
Ideally the Tables should be read along the vertical axis if the need is to assess the
land use categories along the coast, and read across the horizontal axis if the need is to
assess the distribution of the land uses within particular coastal segments.
151

6.3 Coastal urban land uses
As discussed above, the distribution of the coastal land uses along the littoral is
unevenly distributed between the main islands because land uses associated with the
urban fabric are most strongly represented on Malta's littoral. Land uses associated
with the rural fabric (agriculture and undeveloped areas) are characteristic of the
Gozitan littoral and some parts of the Malta coast. Tables 6.5 and 6.6 provide further
evidence for this and help to identify better the distribution of these land uses along
the coast. Within the urban fabric identified above, coastal segments I to V provide
about three-quarters of the area devoted to coastal urban activities, the only exception
being the area in cell VIII g, where the industrial zone of Marsaxlokk Bay is located,
together with a high proportion of the residential areas for the whole coastal littoral.
This data shows that within Malta the industrial areas are highly represented within
the urban zones. The major maritime industrial areas of Grand Harbour and
Marsaxlokk Bay together with their associated residential areas account for these high
urban land uses.
Segments II, III, IV and V all show a high value for recreational land uses, with the
'urban' categories. Segment Ill is represented by four isolated recreational
establishments in an otherwise rural environment (one hotel, one marine recreational
park and boathouses and a holiday complex). In addition, from the data presented,
coastal industrial land uses (g) have a highly selective location, being represented in
only four contiguous segments, V to VIII. The extent of the urban fabric in the coastal
zone can also be assessed from the values given for the land uses a to g (as given in
Table 5.11) and from Segments I to VIII as provided in Table 6. 7. This table shows
the percentage value of the land uses that make up the separate "urban" land uses in
Segments I to VIII. Thus 87.21 per cent of all the recreational areas in the Maltese
Islands are found in segments I to VIII. The same applies for the other categories
represented in the table.
All values are high with the exception for salt production sites ('f), which account for
the extractive industries, all of which are located in coastal rural areas. Examples are
Reverse Osmosis plants and salt panning activities, which both require siting away
from urban areas. Dilapidated areas also have a strong coastal urban orientation in that
152
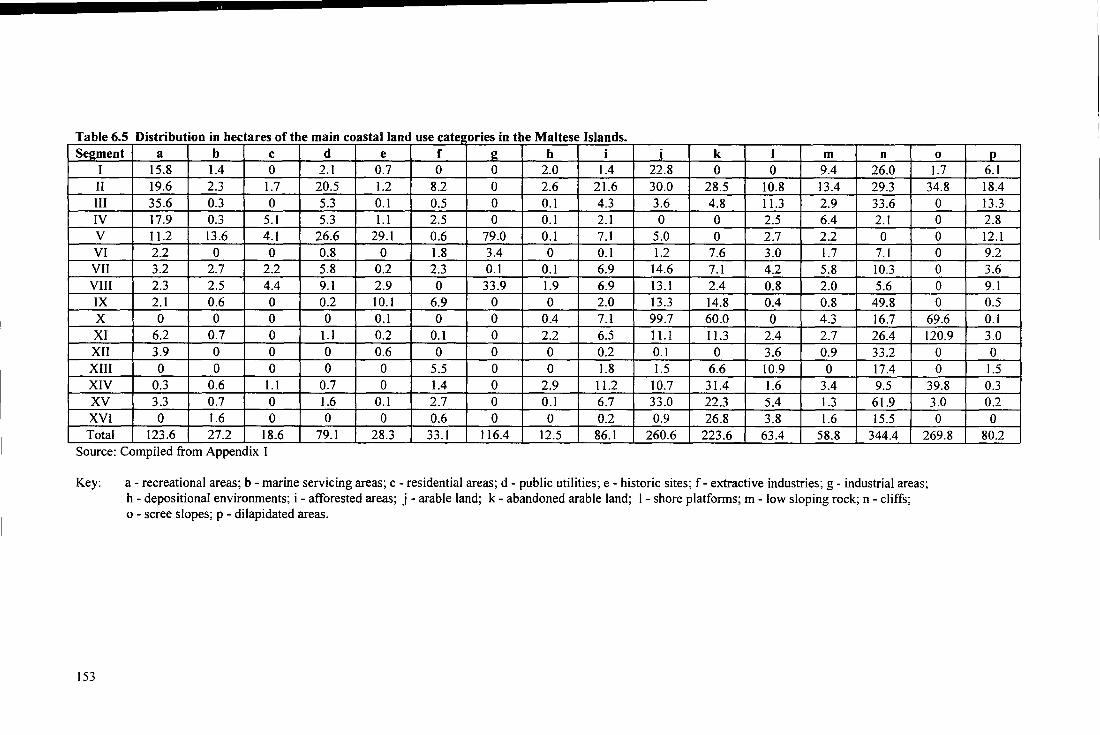
Table 6.5 Distribution in h fth I land use categ or · · ·he Mal Island Se_gment a b c d e f z h i j k I m n 0
I 15.8 1.4 0 2.1 0.7 0 0 2.0 1.4 22.8 0 0 9.4 26.0 1.7 II 19.6 2.3 1.7 20.5 1.2 8.2 0 2.6 21.6 30.0 28.5 10.8 13.4 29.3 34.8 III 35.6 0.3 0 5.3 0.1 0.5 0 0.1 4.3 3.6 4.8 11.3 2.9 33.6 0 IV 17.9 0.3 5.1 5.3 1.1 2.5 0 0.1 2.1 0 0 2.5 6.4 2.1 0 v 11.2 13.6 4.1 26.6 29.1 0.6 79.0 0.1 7.1 5.0 0 2.7 2.2 0 0 VI 2.2 0 0 0.8 0 1.8 3.4 0 0.1 1.2 7.6 3.0 1.7 7.1 0 VII 3.2 2.7 2.2 5.8 0.2 2.3 0.1 0.1 6.9 14.6 7.1 4.2 5.8 10.3 0 VIII 2.3 2.5 4.4 9.1 2.9 0 33.9 1.9 6.9 13.1 2.4 0.8 2.0 5.6 0 IX 2.1 0.6 0 0.2 10.1 6.9 0 0 2.0 13.3 14.8 0.4 0.8 49.8 0 X 0 0 0 0 0.1 0 0 0.4 7.1 99.7 60.0 0 4.3 16.7 69.6 XI 6.2 0.7 0 1.1 0.2 0.1 0 2.2 6.5 11.1 11.3 2.4 2.7 26.4 120.9 XII 3.9 0 0 0 0.6 0 0 0 0.2 0.1 0 3.6 0.9 33.2 0 XIII 0 0 0 0 0 5.5 0 0 1.8 1.5 6.6 10.9 0 17.4 0 XIV 0.3 0.6 1.1 0.7 0 1.4 0 2.9 11.2 10.7 31.4 1.6 3.4 9.5 39.8 XV 3.3 0.7 0 1.6 0.1 2.7 0 0.1 6.7 33.0 22.3 5.4 1.3 61.9 3.0 XVI 0 1.6 0 0 0 0.6 0 0 0.2 0.9 26.8 3.8 1.6 15.5 0 Total 123.6 27.2 18.6 79.1 28.3 33.1 116.4 12.5 86.1 260.6 223.6 63.4 58.8 344.4 269.8
~-
Source: Compiled from Appendix 1
Key: a- recreational areas; b -marine servicing areas; c - residential areas; d - public utilities; e - historic sites; f- extractive industries; g- industrial areas; h - depositional environments; i - afforested areas; j - arable land; k - abandoned arable land; I - shore platforms; m - low sloping rock; n - cliffs; o - scree slopes; p - dilapidated areas.
!53
p 6.1 18.4 13.3 2.8 12.1 9.2 3.6 9.1 0.5 0.1 3.0 0
1.5 0.3 0.2 0
80.2

ble 6.6 P •ercenta~ e distrib ·· fth - ---- - -- h - - - --- I --------
Segment a b c d e f g h i .i k I m n 0
I 12.78 5.15 0 2.65 1.22 0 0 16.00 1.63 8.75 0 0 15.99 7.55 0.63 II 15.86 8.46 9.14 25.92 20.98 24.77 0 20.80 25.09 1 1.51 12.75 17.03 22.79 8.51 12.90 III 28.80 l.IO 0 6.70 0.17 1.51 0 0.80 4.99 1.38 2.15 17.82 4.93 9.76 0 IV 14.48 1.10 27.42 6.70 1.92 7.55 0 0.80 2.44 0 0 3.94 10.88 0.61 0 v 9.06 49.63 22.04 33.63 50.87 1.81 67.87 0.80 8.25 1.92 0 4.26 3.74 0 0 VI 1.78 0 0 1.01 0 5.44 2.92 0 0.12 0.46 3.40 4.73 2.89 2.06 0 VII 2.59 9.93 11.83 7.33 0.35 6.95 0.09 0.80 8.01 5.60 3.18 6.62 9.86 2.99 0 VIII 1.86 9.19 23.66 11.50 5.07 0 29.12 15.20 8.01 5.03 1.07 1.26 3.40 1.63 0 IX 1.70 2.21 0 0.25 17.66 20.85 0 0 2.32 5.10 6.62 0.63 1.36 14.46 0 X 0 0 0 0 0.17 0 0 3.20 8.25 38.26 26.83 0 7.31 4.85 25.80 XI 5.02 2.57 0 1.39 0.35 0.30 0 17.60 7.55 4.26 5.05 3.79 4.59 7.67 44.81 XII 3.16 0 0 0 1.05 0 0 0 0.23 0.04 0 5.68 1.53 9.64 0 XIII 0 0 0 0 0 16.62 0 0 2.09 0.58 2.95 17.19 0 5.05 0 XIV 0.24 2.21 5.91 0.88 0 4.23 0 23.20 13.01 4.ll 14.04 2.52 5.78 2.76 14.75 XV 2.67 2.57 0 2.02 0.17 8.16 0 0.80 7.78 12.66 9.97 8.52 2.21 17.97 l.l1 XVI 0 5.88 0 0 0 1.81 0 0 0.23 0.35 11.99 5.99 2.72 4.50 0 Total 100 100 100 100 100 100 100 100 100 100_ L_ 100 - L_ IO_Q 100 100 100
-
Source: Compiled from Appendix I
Key: a- recreational areas; b - marine servicing areas; c - residential areas; d - public utilities; e - historic sites; f- extractive industries; g- industrial areas; h - depositional environments; i - afforested areas; j - arable land; k - abandoned arable land; I - shore platforms; m - low sloping rock; n - cliffs; o- scree slopes; p- dilapidated areas.
154
p 7.61
22.94 16.58 3.49 I
15.09 11.47 4.49 i
11.35 I 0.62 0.12 3.74
0 1.87 0.37 0.25
0 I
100 ' -

they account for 93.02 percent within the "urban" segments, although a closer
examination of the localities where they occur show that road construction makes a
fairly large contribution.
Table 6.7: Area of selected urban land use categories in Segments I to VIII as a ercenta e of the total area in each cate o
mbol Per cent Main urban land uses a 87.21 Recreation areas b 84.56 Marine facilities c 94.09 Residential areas d 95.44 Roads e 80.58 Historic sites f 48.03 Salt roduction sites
100.00 Industrial areas 93.02 Dila idated areas
Source: Estimated from Table 6.6
6.4 Coastal rural land uses
The rural land use indicators mainly consist oftwo types: arable land and undeveloped
areas. Arable land exhibits areas where agriculture is practiced or was the main land
use activity until the land in question was abandoned. Undeveloped areas consist
mainly of one of four main geomorphological features: shore platforms, low sloping
rock, cliffs and steep slopes, and scree slopes. The land uses designated as "rural" in
the coastal segments IX to XVI are presented for these segments in Table 6.8. All
values are above three-quarters of the total land uses for each segment, with the value
for Malta (Segments IX, X and XI) having a higher mean at 88.3 per cent than those
for Gozo (Segments XIII to XVI) at 86.5. Further examination of the raw data
presented shows arable land identified with land uses (j and k) constituting the larger
Table 6.8: Area of selected land use categories in Segments IX to XVI as a percentage of the total area in each category
Segment Arable Undeveloped Total Segment Arable Undeveloped Total Land Areas Per cent Land Areas Per cent
IX 27.7 50.6 78.3 XIII 17.9 62.5 80.4
X 61.9 35.1 97.0 XIV 36.6 47.2 83.8
XI 11.3 78.3 89.6 XV 38.9 47.6 86.5
XII 0.2 88.7 88.9 XVI 54.3 41.0 95.3
Source: Estimated from Table 6.5
155
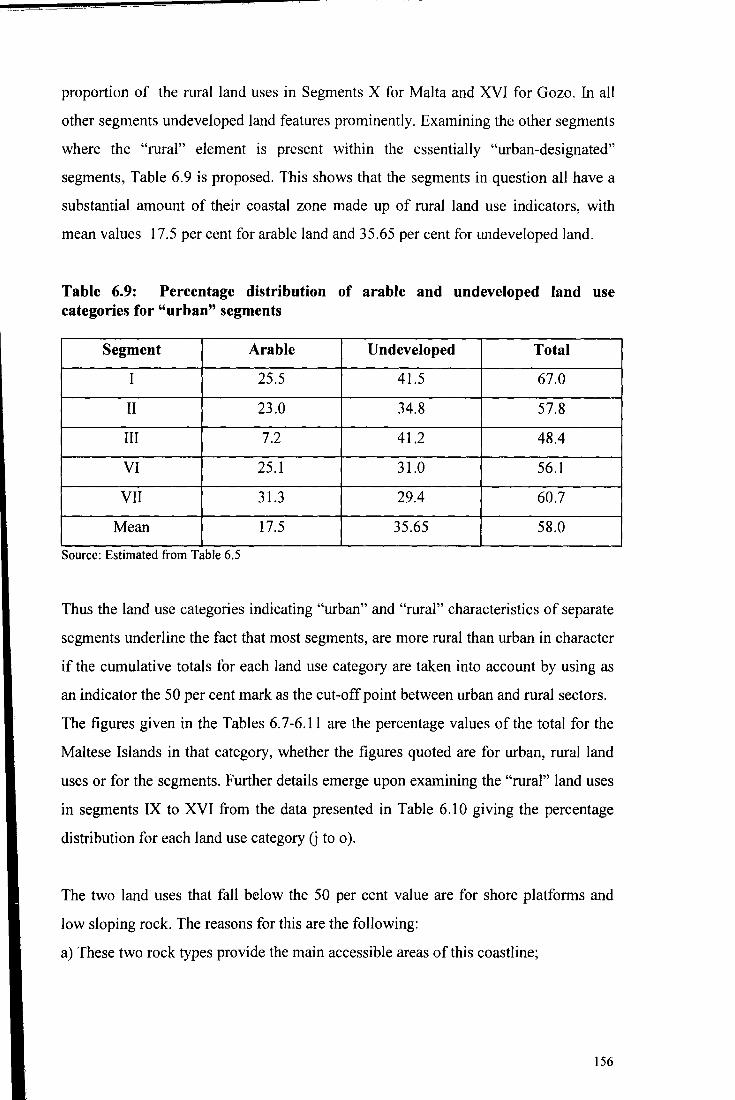
proportion of the rural land uses in Segments X for Malta and XVI for Gozo. In all
other segments undeveloped land features prominently. Examining the other segments
where the "mral" element is present within the essentially "urban-designated"
segments, Table 6.9 is proposed. This shows that the segments in question all have a
substantial amount of their coastal zone made up of rural land use indicators, with
mean values 17.5 per cent for arable land and 35.65 per cent for undeveloped land.
Table 6.9: Percentage distribution of arable and undeveloped land use categories for "urban" segments
Segment Arable Undeveloped Total
I 25.5 41.5 67.0
II 23.0 34.8 57.8
III 7.2 41.2 48.4
VI 25.1 31.0 56.1
VII 31.3 29.4 60.7
Mean 17.5 35.65 58.0
Source: Estimated from Table 6.5
Thus the land use categories indicating "urban" and "mral" characteristics of separate
segments underline the fact that most segments, are more rural than urban in character
if the cumulative totals for each land use category are taken into account by using as
an indicator the 50 per cent mark as the cut-off point between urban and rural sectors.
The figures given in the Tables 6. 7-6.11 are the percentage values of the total for the
Maltese Islands in that category, whether the figures quoted are for urban, rural land
uses or for the segments. Further details emerge upon examining the "mral" land uses
in segments IX to XVI from the data presented in Table 6.10 giving the percentage
distribution for each land use category G to o ).
The two land uses that fall below the 50 per cent value are for shore platforms and
low sloping rock. The reasons for this are the following:
a) These two rock types provide the main accessible areas ofthis coastline;
156

b) They are prevalent in zones where the "urban" character of the coastal zone is
prominent. The high values linked to the other four land use types ('j ', 'k', 'n' and 'o')
are due to the fact that the land uses are in themselves indicators of a rural coastal
environment.
Table 6.10: Area of selected rural land use categories in Segments IX to XVI as a percentage of the total area in each category
Land use Symbol Per cent arable: in use j 65.36
arable: abandoned k 77.45 shore platforms 1 44.32 low slop rock m 25.50
Cliff n 66.90 Scree slopes 0 86.47
Source: Estimated from Table 6.6
Examining the "urban" land use category values in the matrices provided in Tables
6.5 and 6.6, the figures tend to be rather low for the urban land use categories column
in Table 6.11 when compared to the data examined above for both the predominantly
"urban" areas and "rural" areas. Table 6.11 gives percentage data for the segments
whose land uses were not discussed above in Tables 6.7-6.10. Keeping to the "urban"
and "rural" labels discussed above, Segments IX to XVI show a consistently small
percentage value for the urban land uses whilst segments I to VIII do not exhibit the
same consistency in values. The reasons that only segments IV, V and VIII show a
predominant urban character are because the industrial base for segments V and VIII
is very highly represented, and segment IV is almost completely made up of urban
land uses. For segments II, Ill, VI and VII a more even spread of urban and rural
characteristics is prevalent.
It can therefore be concluded that the segments that possess a predominant urban
industrial land use typology are IV, V and VIII. Segments VII, IX, X and XI have a
predominantly rural environment, while segments I, II, III and VI have a
predominance of rural land uses but also some marked urban activities. A discussion
using Appendix I would reveal the exact details within each segment. In addition, a
more even spread of urban and rural land uses is seen in segments II, Ill, VI and VII.
Thus, notwithstanding the urban/rural classification label placed on selected land use
157

categories and the identification of some segments according to this method,
variations occur. These will form part of the basis of the following sections.
Table 6.11: Cumulative percentage distribution of"urban" land uses in segments IX to XVI and "rural" land uses in Segments I to VIII
Segment 'Urban' land uses Segment 'Rural' land (a, b, c, d, e, f, g, p) uses
(i ,k,l,m,n,o) IX 20.0 I 67.0
X 0.2 II 57.8
XI 5.9 III 48.4
XII 10.5 IV 22.9
XIII 15.5 v 5.1
XIV 3.9 VI 56.1
XV 2.1 VII 60.7
XVI 4.3 VIII 24.7
Source: Estimated from Table 6.5
6.5 Presentation of each section Following the processes of data collection and of data reduction (Chapter 5), the main
focus of this chapter is to describe and analyse the land use data. Eight sections
follow (6.6-6.13), each representing a group of coastal land use categories and deals
with each group separately. All sections, with the exception of depositional
environments, afforested areas and dilapidated areas, group a number of land uses.
The breakdown and identification of the land use categories follows that given in
Chapter 5, in Table 5.11 and is used throughout this thesis. Table 6.19 gives the list of
sections with their respective title and the land uses that fall within each section.
Each section is analysed, following a sequence as follows:
(a) Introduction to the main land use category by presenting the land use study matrix;
(b) Background information pertaining to the land-use under discussion, including all
of the sub-categories as they have developed over the years and as affecting the
Maltese islands' land use in general;
(c) Justification for study gives the reasons for including the particular land use in the
discussion and as a consequence outlines the importance of the particular land-use
category to the thesis;
!58

(d) Definition of the land use categories to be discussed follows the definitions as
presented in Olsen and Seavy (1990), the Coastal zone survey report for 1989, and
as finally developed for this thesis and presented in Table 5.11;
(e) Presentation of the coastal land use data for the particular coastal land-use category
as given for each of the 16 coastal segments and as sub-totals for Malta, Gozo and
Comino and the Maltese Islands. The tables are presented in two main data sets:
areal, in hectares, and as ratios (percentages);
(f) Discussion and analysis of the data presented in the main Table and in the synoptic
map provided; and
(g) Conclusion.
The figures presented and the discussion that follows are m hectares (ha) and
percentages. This is done for a number of reasons:
a) As a quantity, one hectare is large enough at 1 0,000m2, that cartometric errors are
minimized whilst at the same time the hectare within the scale of the Maltese
Islands' littoral is a fairly small area. This affords good comparability between
different land uses, knowing that the total area under investigation is about 19,000
ha;and
b) As figures are presented to one decimal point, this brings down the minimum area
for discussion to the I ,000m2 level, approximately 32m x 32m. This makes up a
fairly small area on the 1 :2,500 scale map and a minute one on the 1 :25,000 scale.
As an attempt at using the appropriate level of precision for the description of
coastal land use, a range of scales is used between one hectare and one-tenth of a
hectare. This is broad enough to accommodate land use variations even within
areas that possess a variety of land uses in a small area.
In addition, any element of subjectivity or any human error in the estimation of areas
and in presenting the figures was smoothed out and corrected by the fact that all
measurements were done initially in square metres, on a scale of 1 :2,500, and later
converted into hectares. Thus all the figures present a fair element of cartometric
precision. However, when appropriate, and when areas are rather small, measurements
are given in m2 in the discussion.
!59

The discussion centres around the tables presented with each section. Each deals with
the land use categories as listed in Table 5 .11. The order of discussion used is one
where the "urban" land use categories are placed first in the table and are also the first
to be discussed. "Rural" land uses are then discussed, followed by the dilapidated
areas at the end. This last category has been left to the end as it largely represents the
areas that were undergoing change at the time of the survey and the general
conclusion of the chapter deals especially with change. Although the prevalence of
the elements that make up this land-use category are linked more with the "urban"
land uses than with any other, as it is made up of elements that are essentially
associated with areas where dumping of building material, industrial and domestic
waste prevail.
In order to highlight the association between coastal land uses and demonstrate the
distribution of coastal functions two types of maps have been included with each
section. The first type shows the distribution along the coast of the Maltese Islands of
the land uses being discussed in each particular section and Table 6.12 gives the list of
sections which are to be followed in this chapter based on broad land use categories
(eg. Figure 6.3). The second type of map shows details pertaining to land uses in a
section of the coast (eg. Figure 6.1) The latter generally serves to pinpoint a recurring
example that is found in various parts of the coast and the key identifying the land
uses is common throughout the chapter and found with Figure 6.19.
Table 6.12 List of the eight main sections in this chapter
Section 6.6- Recreational Areas: tourism, marine servicing areas
Section 6. 7 - Residential Areas: residential areas, public utilities, roads
Section 6.8 -Extractive Industry and Industrial Areas: extractive industries, industrial areas
Section 6.9- Depositional environments
Section 6.10 - Afforested Areas
Section 6.11 -Arable Land: agriculture areas in use , abandoned agricultural land
Section 6.12- Undeveloped Areas: shore platforms, low sloping rock, cliffs and steep slopes, scree slope areas (rdum)
Section 6.13 - Dilapidated areas Source: developed from Table 5.11
160

The first three categories to be discussed form the basis for the urban and economic
environments. These are made up of recreational areas, residential areas and industrial
areas. These areas collectively make up the "urban" land use categories. The second
set of four categories is mainly linked to the natural environment. These are the areas
that are not built upon and do not have the urban qualities such as buildings and other
engineering structures as for the urban land uses. These include areas with depositonal
environments, afforested areas, arable land and undeveloped areas. These are
essentially land uses that provide the "rural" base to the coast. A final category is the
dilapidated land uses.
Further details regarding the definition of each land use category are given with the
relevant section in this chapter. However, one point needs clarification. Although the
land uses under discussion have been broadly labeled as "urban" and "rural" types,
there are instances where these are found in close proximity to one another. An area
may also be traditionally associated with the urban environment but also has land uses
associated with the "rural" category. In part these situations reflect two factors: the
marked variations in the patchwork of coastal land uses that make up the local littoral,
and the detailed mapping that was done in the field.
6.6 Recreational Areas
6.6.1 Introduction The land uses that form the coastal urban fabric have been separated into two
categories largely incorporating two main coastal urban uses: recreational areas
reviewed in this section of this thesis and residential areas presented in section 6.7.
These are tackled together with their associated infrastructural facilities of marine
servicing areas for the recreational areas land use category, and roads and public
utilities for the residential areas category. Historic sites have been arbitrarily included
with the latter. This separation of the urban land uses into two main sections was
necessarily due to the presence and importance that the tourist sector (represented by
the recreational area) has on the economy in general and on the coastal fabric in
particular, that it warranted a separate treatment.
Recreational areas along the coast, for the purposes of this thesis, are closely linked to
tourism and the shoreline services that cater for boating facilities. They form part of
161

the coastal urban environment as most hotels and catering establishments are located
within the densely built-up areas of the coast. The elements that identified this land
use category are given in Table 5.11 .
6.6.2 Background Information
As an economic activity, tourism has experienced continuous growth over the last 40
years. Data compiled according to tourist arrivals shows a steady increase of visiting
tourists from 12,583 in 1959 to 1,215,713 in 2000 (National Statistics Office, 2001a)
with the estimated financial values of Lm 765,000 to Lm 270 million in the same
period. The workforce in full and part-time employment in tourism including those
employed in the hotels and restaurants increased from 505 to 12,004 (National
Statistics Office, 2001c) of which 9033 are in full-time employment (Employment and
Training Corporation, 2002). The increase in the number of hotels was from 25 to 133
and the number of beds including all types of accommodation including guest houses,
hostels, tourist villages, aparthotels, self catering establishment and hotels increased
from 1218 in 1959 to 46,432 in 1998 (Mangion and Vella, 2000). Cruise passengers
also increased from 8399 in 1959 to 144,064 in 1998. Tourism's contribution to the
economy taking the multiplier effect into consideration is estimated to be around Lm
255 million and about 19 per cent of the GDP (National Statistics Office, 2001 b)
which is proportional to 27 per cent of Government income (Mangion and Vella,
2000). Although part-time employment in the sector is significant and moonlighting
rampant it is estimated that employment in the sector is equivalent to 17 per cent of
the national full-time compliment (Mangion and Vella, 2000). In addition, a
considerable part of the construction industry is geared to service the tourist sector in
the building of new establishments, the upkeep of the older tourist venues and sites
used for recreational purposes and other associated activities. Estimated projections at
an increase of 5 per cent as a result of further coastal development are envisaged.
Increases in tourist arrivals have been registered throughout the last 3 decades from
I 00,000 in the 1960s (Schembri and Magri, 1995) to about 1.2 million in I 998
National Statistics Office, 2001 b). The use of land for this industry has also increased
substantially and large parts of the coastal areas are dotted with hotels and restaurants.
In fact, according to estimates calculated by the author from a brochure published by
162

the Ministry of Tourism (National Tourism Organization, 1995) about two-thirds of
the hotel and catering establishments in the Maltese Islands are located on the coast.
The spatial distribution of this land use category is seen from Figure 1.1 and a general
prevalence of tourist activity along the north-east Malta coast is apparent. Further
details of the spatial distribution of recreational areas are presented in Table 6.13.
Plates 6.1(a) and (b) show the development of a popular tourist resort in Malta.
Tourism in Malta has generated a substantial amount of literature. The main initial
focus of many papers generally start by giving a brief overview of the development of
tourism in Malta as a main fulcrum in the changing economic base of the islands,
however with a heavy dependence on the British tourist market. Lockhart and Ashton
( 1991) used the results of a survey conducted in the late 1980s on tourist
accommodation and concluded that the temporal distribution of visitors was
dominated by the prevalence of "the package-holiday" (p.28). The few sandy beaches,
lack of attention to the upkeep of roads and the general bad state of the environment,
especially in summer in the tourist congested areas, were the main complaints aired by
the respondents. Notwithstanding the generally negative view that the new buildings
disrupted the old architectural style, the coast was spared from the "continuous ribbon
development" (p.31 ). Lockhart ( 1997 a) proposed that only with the introduction of
environmental legislation and the enforcement of a land use structure plan, was it
possible to control haphazard coastal development and curtail the use of scenic sites
by bird trappers and hunters. The efforts by successive administrations to increase the
bed capacity and diversify from the British dependence together with the impact of
high seasonality (summer) of domestic tourism were the central themes in Lockhart
( 1997b ). The author concluded that the emergence of long-haul tourist destinations
was also affecting tourism in Malta as it was in other Mediterranean destinations.
Ioannides and Holcomb (200 1) maintain that although high-income tourists are the
ideal niche to attract, they generally cost more to cater for and have greater
environmental awareness. The latter is definitely not in Malta's favour. In addition,
the authors doubt whether promoting eco-tourism is wise on Malta's part as there are
few "unspoiled" areas left and the place is littered with plastic containers, household
refuse and debris from the building industry. Both Lockhart (1997) and Ioannides and
Holcomb (2001) compare Malta and Cyprus. Common trends include their location in
163

Plate 6.1a Malta, StGeorge's Bay Paceville: Contemporary coastal resort development on north side of bay facing 19th century boathouses. The afforestation setting in the foreground is the open space of another tourist resort developed on a fertile vaUey floor. Source: The author
Plate 6.1 b Malta, St. Julian's Bay: the Hilton project in the background and a landscaped public garden in the foreground. Source: The author

the Mediterranean, common historical links with Britain and the attraction of a high
number of British tourists. The emphasis on cultural tourism, increase in five-star
accommodation and the failure of the two islands' administrations to combine tourism
strategies with the development of a strong economic base and sound land use strategy
are parallel aspects of the general tourism plans and pitfalls of both islands (Ioannides
and Holcomb, 2001 ). Lockhart (1997 a) cites the failure to enforce planning
regulations and sustainable forms of tourism have little attention in both islands'
planning processes, the dependence on a few markets and the strong hand of politics
in shaping policy are also detrimental factors.
6.6.3 Justification for study
Land used for the recreational purposes mentioned above is one of the main features
of the coast of the Maltese Islands. This is partly due to the development of coastal
tourism and the maritime-oriented recreational activities. A number of coastal areas
have been developed into areas with hotels, guest houses, restaurants and commercial
outlets servicing this recreational industry. As a consequence, land speculation is high
and infrastructure activities have complemented this development with the
construction of promenades, slipways, jetties and marinas. Many of these areas
coincide with high population concentrations and have therefore become nodal areas
used as major activity centres accommodating multiple activities and as a result
generating a high economic value.
6.6.4 Definitions and criteria used for field identification
Two variables have been identified as making up the land use category of recreation:
(a) areas with facilities for tourism, identified with attributes such as hotels, holiday
flats, beach concessions, and catering establishments; and
(b) marine facilities, identified with attributes such as jetties, breakwaters, slipways
ferry and cruise liner facilities, yacht marinas, boat-parking facilities, boathouses,
and caravan and camping sites.
Two sources for defining the categories are utilized. One is taken from a coastal zone
management manual (Olsen and Seavy, 1990) and the second is from the actual land
use field mapping exercises. The first definition is reproduced in full:
165

"Recreational boating facilities include marinas, launching ramps, residential boating facilities, recreational wharves, piers and slips, floats or floating docks, and recreational mooring areas.
1. Marina: any dock, pier, wharf, float, floating business, or combination of such facilities that service five or more recreational boats as a commercial enterprise or in association with a club.
2. Launching ramp: a man-made or natural facility used for the launching and retrieval of boats.
3. Residential boating facility: a dock, pier, wharf, or float, or combination of such facilities, contiguous to a private residence, condominium, cooperative or other home owners' association properties that may accommodate up to four boats.
4. Recreational mooring area: any designated area managed by a commercial enterprise, a club, city, or town where five or more recreational craft are kept at moorings"
Source: Olsen and Seavey 1990, 71
Recreational land use along the coastal zone was classified into two broad elements.
These are described separately.
(a) Tourism
This was by far the major element. Table 5.11 gives the elements associated with this
land use and includes tourist buildings such as hotels, guest houses, bars, cafes and
multi-use buildings with a tourist component. Further related elements of other
amenities such as car parks linked to particular hotels were also included in this
category. Essentially, in mapping the features associated with these recreational
establishments, elements that formed part of the residential land use category were
integrated with them. These therefore called for a degree of attention in the mapping
of the urban landscape, as there were problems in the identification of some of the
buildings used for holiday flats as separate from the residential ones. Figure 6.1 shows
the integration of recreational areas along Sliema promenade, in this case restaurants
and hotels within the residential environment. Two historical sites are also identified,
in perspective these are dwarfed by the contemporary building development. In coastal
rural areas, zones used for recreational purposes normally stood out clearly and no
similar problems were encountered regarding identification. Figure 6.2 shows a
typical example taken from Comino and identifies the site of a secluded beach with
associated hotel amid undeveloped surroundings. In general these areas catered for the
international tourist market. The presence of caravans along the coast, which
166

collectively may sometimes constitute a camping site, were also noted and included
with this land use category, even though their physical presence was limited solely to
the summer months. However, the final section of this chapter deals with areas where
multiple uses occur, and caravan sites are one of these areas. The key to the detailed
land use maps similar to those found in Figures 6.1 and 6.2 is to be found on the flap
with the Figure on page 253.
(b) Marine Servicing Areas
These included infrastructural elements that enhanced both the aesthetic and the
functional value of areas where many activities were taking place. Table 5.11 gives
the elements that constituted this land use variable. These variables are generally
located in areas where there is a high degree of accessibility between land and sea.
Although the spatial extent of these areas is normally small, they are generally noted
for the high degree of activity associated with recreational activities and a
concentration of retail outlets. Engineering works such as jetties and breakwaters
form part of this land use variable. The main purposes of three of these amenities are
the following:
• concrete platforms which normally help to improve sea/shore accessibility;
• slipways, which have a good physical access from the roads and enhance boat
access between land and sea ; and
• jetties, normally used to protect the coastal environment from sea swell and which
also increase the serviceable area of sea/shore.
Boathouses are also included with these variables as they constitute an amenity that
caters for recreational purposes. Essentially boathouses are one-roomed garage-type
buildings whose function is mainly for the provision of shelter for one boat. Most of
these rooms are permanent structures. They are usually located in sheltered coastal
areas that lack the facilities normally associated with storm protective structures such
as breakwaters. The distance to the nearest habitable area is normally substantial,
hence the purpose of these boathouses. In effect, many boathouses in Malta actually
serve as summer residences for whole families. Many are equipped as summer
houses, with electricity, water and sanitary facilities. Nonetheless buildings with large
prominent front doors and without windows can be considered as boathouses. In the
167

Figure 6.1 Sliema: Typical plan view of urban coastal area with recreational establishments in residential zone and road parallel to shoreline. A historical tower (H) marks the strategic importance of the site in coastal defence network of pre-19th Century Malta

C UUtiO
SOm -'· il..------ --c-·-~ '.. f /. f'-..1"'· /1 .. t.-
' ;/// ,)
1;/ l J / /' ,.,....~->'
/'~ ~ //"'1,.:.> .•
!~_;:---...,
\(.~~~~--~ ,./ ,_j// .. :;> / • • • •
/~ // ,...- // .. ( / . . (' -~· /"" -· ..
1.....-..r'_./- /
~ I 1---:-'1 _ / '·, fll I 1-1 I K V \ ·-"/ // rv "" / ' ' ..... / / .. ,/ . ./
/
.. /'
' "' /~ ' ~· ~·· ......... ~ I /-J I ~ ,\ / .,
)
J ,/ .. 17/ .. ,
/ ~- / ./ .r ,. .
.. ) (_~(/ .. ·- '? ~.;;
~-, ;(!·-· ~: .· .. 1 t '"-~''''''51"" j .. ""'~~-·
H.__ I ./ ~
~
Figure 6.2 Comino: typical plan view of recreational development land in ruraR area wnth hotel development near sand! lb>each

6.6.5 Presentation of data
Table 6.13: RECREATIONAL AREAS. Land use distribution for Malta, Gozo, Comino and the Maltese Islands.
Hectares
Segments Tourism Marine Total Tourism Servicing Areas
I 15.8 1.4 17.2 10.5 II 19.6 2.3 21.9 13.0 III 35.6 0.3 35.9 23.6 IV 17.9 0.3 18.2 9.5 v 11.2 13.5 24.7 7.4 VI 2.2 - 2.2 1.5 VII 3.2 2.7 5.9 2.1 VIII 2.3 2.5 4.8 1.5 IX 2.1 0.6 2.7 1.4 X - - - -XI 6.2 0.7 6.9 4.1 TM 116.1 24.3 140.4 74.6
XII 3.9 - 3.9 2.6 TC 3.9 - 3.9 2.6
XIII - - - -XIV 0.3 0.6 0.9 0.2 XV 3.3 0.7 4.0 2.9 XVI - 1.6 1.6 -TG 3.6 2.9 6.5 3.1
GT 123.6 27.2 150.8 80.3 Source: Estimated by author from field data and cartometnc measurements
Key I to XVI- coastal segments (rows) TM- Total of values for Malta TC - Total value for Comino TG - Total of values for Gozo GT - Total of values for the Maltese Islands
Per cent
Marine Total Servicing Areas
0.9 9.1 1.5 12.5 0.2 19.0 0.2 12.4 9.0 15.2 - 11.6
1.8 4.3 1.7 4.8 0.3 1.4 - -
0.5 3.6 16.1 93.9
- 2.1 - 2.1
- -0.4 1.1 0.5 2.1 1.1 0.8 2.0 4.0
18.1 100
170
Grand Harbour and some other areas boathouse ownership is perceived as being an
honourable part of a family's inheritance. The legal status of some boathouses has
been contested for some time, leading the Planning Authority to enforce the
demolition of parts of what became a shanty town along the north coast of Malta.
Residents protested as the action deprived them of a second home just before summer,
and disrupted the vacation community spirit in the area (The Times (of Malta] 6
August, 2001 ).
6.6.6 Discussion and analysis
Table 6.13 presents the land use elements for the recreational areas category. Its
spatial extent for the Maltese Islands is 150.8 ha, about 8 per cent of the total area for
the coastal zone. A synoptic map for their occurrence along the coast of the Maltese
Islands is shown in Figure 6.3. The emphasis attached to this economic activity in the
different islands is seen from the fact that 90 per cent of it is located on the Malta
coast, with the rest on Gozo and Comino. Along the Malta littoral the distribution is
heavily biased towards the northern and northeastern shoreline, where a high
concentration of recreational land uses is apparent along Segments I to V; these
account for 117.9 ha or 78 per cent of the total for the Maltese Islands.
Further concentration of recreational land uses is evident, with just over one-half
clustered in segments II and V. This indicates that the concentration of recreational
activities is grouped along selected areas of the coast. A low sloping accessible
coastline is partly the reason for this concentration. In a number of cases the land use
category is not present along all parts of the littoral in segment V, with the
concentration of recreational activities located along the Marsamxett Harbour littoral.
A number of reasons account for this:
• the harbour's littoral is highly accessible along most of its length;
• the high concentration of population living around the littoral;
• the area has extensive yacht marina development;
• the various marinas are linked by a pedestrian promenade that follows the coastal
margin along most of its length; and
• the touristic development along the littoral further encourages the development of
marine recreational areas.
171

The other major concentration is for Segment II from Ahrax Point to Ghallis Point.
Recreational development occurs mainly in the bays and inlets and evidence is absent
along the rectilinear parts of the coast. This area includes Mellieha Bay, St. Paul's Bay
and Salini Bay (Segment II). Table 6.14 gives the spatial distribution of the
recreational activities in this segment.
Table 6.14 Spatial distribution of Recreational Areas in Segment II
Locality Area (ha)
Ponta ta' 1-Ahrax to Rdum tal-Madonna 0.4 Mellieha Bay 8.5
Mgiebah 5.3 St. Paul's Bay 5.9
Salini Bi!Y_ 4.3 Total 24.4
Source: author's fieldwork and cartometnc measurements
In Segment V the area under the recreational land use is 15.9 ha along Marsamxett
Harbour and 8.8 ha for the Grand Harbour area. Whilst for the Marsamxett Harbour
recreational areas are located along most of its 10 km land/sea periphery, for the
Grand Harbour area recreational areas are found mostly along part of the
Valletta/Floriana coastline and at the inner areas of Ricasoli Bay, Senglea Creek and
French Creek. The contribution of the other east coast segments, i.e., VI to VIII, that
include the Marsascala area to Benghisa, constitutes about one-tenth of the total
recreational activity. This is mainly due to the summer vacation resorts of Marsascala
(Segment VII) and Birzebbugia (Segment VIII). These resorts attract mainly locals
from the southern and south eastern parts of Malta. In the south western region areas
of maritime recreational value are confined to the sand beaches from Ras ir-Raheb to
Qammieh (Segment XI) and to the rocky creek of Wied iz-Zurrieq and Ghar Lapsi
(Segment IX). Ghar Lapsi and Migra Ferha (Segment X) are essentially vantage
viewing points on the southern cliff edge about one hundred metres above sea level.
Segments X and XIII are noted for the absence for any recreational infrastructure.
These areas make up the stretches from Wied iz-Zurrieq to Ras ir-Raheb for Segment
X in Malta and the north east coast of Gozo. High cliffs are the main physical feature
of these areas, with direct access to and from the coast being rather difficult.
172

6.6. 7 Conclusion
Although recreational areas are widely spread along the littoral of the Maltese Islands,
a link with the low sloping accessible areas is evident together with areas where a high
concentration of population lives. The following section reinforces this argument by
reviewing the residential areas.
6. 7 Residential Areas, Roads, and Historic Sites
6.7.1 Introduction
The grouping of these three land-use variables into one category was due to the fact
that they are all related to the urban fabric. Residential areas in themselves constitute
a considerable area of the urban fabric, especially when they are present in clusters.
The definition of an urban area varies considerably from one country to. For the
Maltese Islands it is a locality that constitutes a population of more than 2000
inhabitants (cf. United Nations Department of Economic and Social Affairs (2001)).
Although roads are present even in rural areas, the large proportion of the road
network is found mainly in the urban areas. In addition, most coastal areas have a
road along a large part of the littoral, generally located between the foreshore and the
backshore area, irrespective of whether these areas are urban or rural in character.
Figure 6.1 shows an example of a coastal urban area, with the coastal road located
between the foreshore area and the built-up hinterland. In fact, only three coastal
Segments, IX, XIII, and XVI do not respect this model and do not have a coastal road
skirting the whole length of their littoral.
Historic sites are mainly found in areas that are highly accessible from the sea. The
very purpose of many of these sites along the coast was for defense and therefore they
are today found in areas where many coastal activities are concentrated. In addition,
many of these sites have become part of the built environment with the expansion of
the urban area next to them. Historical sites are being influenced by the three major
land use categories reviewed in this chapter, namely, residential areas, recreational
areas and industrial areas. Figures 4.2 - 4.5 (in Chapter 4) show this process for the
built-up areas for the 19th and 20th centuries.
174

N a 0 2 4 8 8km
Figure 6.3
creational areas
Legend
Coastal Zone Boundary
• Touristic areas
Marine recreational areas
Source: Developed by author from field surveys

This section deals with the residential areas as a main land-use category. Together
with the recreational areas reviewed in the previous section, these areas form the bulk
of the urban environment along the coast. Three land use categories are presented in
this section: residential areas, the areas occupied by roads and historical sites.
6.7.2 Background information
Residential areas form the bulk of the urban land uses in the Maltese Islands in that
their spatial extent has increased from 5.5 per cent of the surface area of the Maltese
Islands in 1955 to 16.5 per cent in 1990 (Cilia, 1995). In essence, this increase has
reflected the socio-economic changes of the country and also the population increase
to 367,000 in 1994 (Central Office of Statistics, 1996). The local debate regarding the
provision of residential areas centres on two facets: land surface occupied and housing
affordability (Chamber of Architects and Civil Engineers, 1999). Housing
affordability to lower income groups is made possible with state help in Malta with
the provision of residences at subsidized rents (Lockhart, 1987). However none of
these residential units are located within the coastal zone boundary of this thesis.
The salient features of the historical background to the Maltese Islands was presented
in Chapter 4, however only a relatively small part of the coast is covered with
historical artifacts, notwithstanding the strategic importance of the fortifications in
the coastal defense.
The road network is a more prominent feature. In fact, 1500 krn of roads cover the
land surface of the islands, of which 99 per cent are bitmac surfaced (Central Office of
Statistics, 1999). This puts the Islands as the leading country in the world, with 4. 7 krn
length of road surface per krn2 of area. In addition, the historical development of the
road network saw an increase of 100 per cent from 800 km in the 1930s to the present
figure (Central Office of Statistics, 1999).
6.7.3 Justification for study
Including residential areas, roads and historic sites these land use categories within the
study is partly justified by the built-up areas being used as indicators to mark the
coastal zone limits by taking house facades facing the sea (section 1.3.). In most cases
175

m urban areas these facades had roads in front of them and in many cases the
historical sites identified were located within the urban built-up areas.
6.7.4 Definitions and criteria used for field identification
(a) Residential areas
These areas can be defined as comprising terraced houses, flats and villas. In general,
a ribbon-type distribution prevails (Carter, 1995) along the coast. Identification was
simple and mapping was rather straightforward as the residential areas were left in
their original hue on the map, and new additions were drawn in. Data regarding the
areas occupied by each category were then estimated.
(b) Public utilities
Road construction and upkeep can also be viewed with this land use category in that
the coastal accessibility for residential and other purposes is conditioned by the
presence or otherwise of roads. Easily identifiable in plan and on site, roads were
probably the easiest of all the land uses to map and to quantify spatially as their
columnar features when seen in plan on the maps helped the areal measurements.
(c) Historic sites
Historic sites have been included with this land use category as they are essentially
sites that in many cases form a continuous unit with the urban fabric. These comprise
a rather wide range of fortifications, varying in scale from the massive defensive walls
and bastions of the Harbours (Plate 6.2) to the coastal watch towers. Archaeological
sites located in the coastal zone are also included within this category. A problem was,
however, posed for areal quantification in that coastal watch towers, redoubts and
batteries have very small areas, normally less that 0.1 ha each, but a greater
significance in the coastal land use fabric. The isolated and relatively remote situation
of some historical artifacts also draws vandal attention (Plate 6.3). When giving land
use values for complete segments, it was the cumulative measurements of each land
use category that was finally shown, because some historical buildings are not large
enough even when their individual cumulative areas are summed. As a result, an
asterisk is placed in the cell in Table 6.22 where this situation occurs.
176

Plate 6.2 Malta Valletta: Fortifications enclose the peninsula, with typical high urban density, that separates Marsamxett Harbour from Grand Harbour to the north and south respectively. Source: Undated promotional material, Malta Tourism Authority.

Herman Grech
Plate 6.3 Malta, limits of Wied iz-Zurrieq: Vandalism on 171h century coastal watchtower built as part of the defence of the coastal rural areas. Source: The Times [of Malta] 15 August 2001
12J

6.7.5 Presentation of data
Table 6.15 RESIDENTIAL AREAS, ROADS AND HISTIORIC SITES. Land use distribution for Malta, Gozo, Comino and the Maltese Islands.
Hectares
Segment residential public historical Total Resid areas utilities sites ential
areas I - 2.1 0.7 2.8 -II 1.7 20.5 120 34.2 1.1 III - 5.3 0.1 5.9 -IV 5.1 5.3 1.1 11.5 3.3 v 4.1 26.6 29.1 59.8 2.6 VI - 0.8 * 0.8 -VII 2.2 5.8 0.2 8.2 1.4 VIII 4.4 9.1 2.9 16.4 2.8 IX - 0.2 10.1 10.3 -X - - 0.1 0.1 -XI - 1.1 0.2 1.3 -
TM 17.5 76.8 56.5 150.8 11.3
XII - - 0.6 0.6 -TC - - 0.6 0.6 -
XIII - - - - -XIV 1.1 0.7 - 1.8 0.7 XV - 1.6 0.1 1.7 -XVI - - - - -TG 1.1 2.3 1.1 3.5 0.7
GT 18.6 79.1 28.3 154.9 7.0 Source: Estimated by author from field data and cartometnc measurements
Key I to XVI- coastal segments (rows) TM- Total of values for Malta TC - Total value for Comino TG - Total of values for Gozo GT - Total of values for the Maltese Islands * - less than 0.1 ha
Per cent
public historical utilities sites
1.4 0.5 13.2 7.7 3.4 0.1 3.4 0.7 17.2 18.8 0.5 -3.8 0.1 5.9 1.9 0.1 6.5 - 0.1
0.7 0.1 49.7 36.5
- 0.4 - 0.4
- -0.5 0.1 1.0 -- -
1.5 0.1
51.2 36.9
179
Total
1.9 22.0 3.5 7.4 38.6 0.5 5.3 10.6 6.6 0.1 0.8 97.3
0.4 0.4
-1.2 1.1 -
2.3
100

6.7.6 Discussion and analysis
The main factor that distinguishes this land use category is the fact that, out of the
total area of 154.9 ha, about one-half is taken up by roads. There are many reasons for
this:
• roads parallel to the coastline are to be found along most of the littoral length of
the coast;
• in urban or built-up areas the road is the main line of communication between the
coastal zone and its hinterland;
• essentially it is areas that have a good accessibility along their littoral that have
had roads constructed all along their coastal perimeter.
The apparently limited area (18.6 ha) occupied by the residential areas land use
category is conditioned by the coastal zone limit extending only up to the first line of
buildings and therefore the full extent of the residential areas is not included in the
figures. The distribution of residential areas is best examined from the figures
presented in Table 6.22, with the main concentration of these land uses being in the
urban coastal areas. Figure 6.4 shows the distribution of the land uses under
discussion in this section. The highest figures are for segments IV, V and VII, the
continuous belt from St. Julians (Segment IV) to Kalkara (Segment V) in the Harbour
areas and around Marsaxlokk Bay (Segment VIII). For the other areas of the coast
smaller values occur in segments VI, with the cluster of houses at Xghajra, and
Marsalfom in Gozo in Segment XV.
As the limit of the coastal zone for urban areas extends only to the line of first
buildings the area occupied by roads along the urban coastal areas is high with over
three-quarters of the area forming the bulk for this category. Practically all coastal
segments are represented, with the exception of segments I, VII and XI. All segments
in Gozo are sparsely represented due to the fact that access roads from the hinterland
to the coastal areas are not parallel to the coast but perpendicular to it. This is
basically due to topography, with access roads running along valley bottoms to the
shoreline as a solitary line of communication. The V -shaped valley system in north
west Malta and in Gozo precludes a coastal road network.
180

N
A 0 2 4 8 8km
Figure 6.4
R idential areas
Legend
Coastal Zone Boundary
• Residential
~ Roads
• Historical sites
Source: Developed by author from field surveys
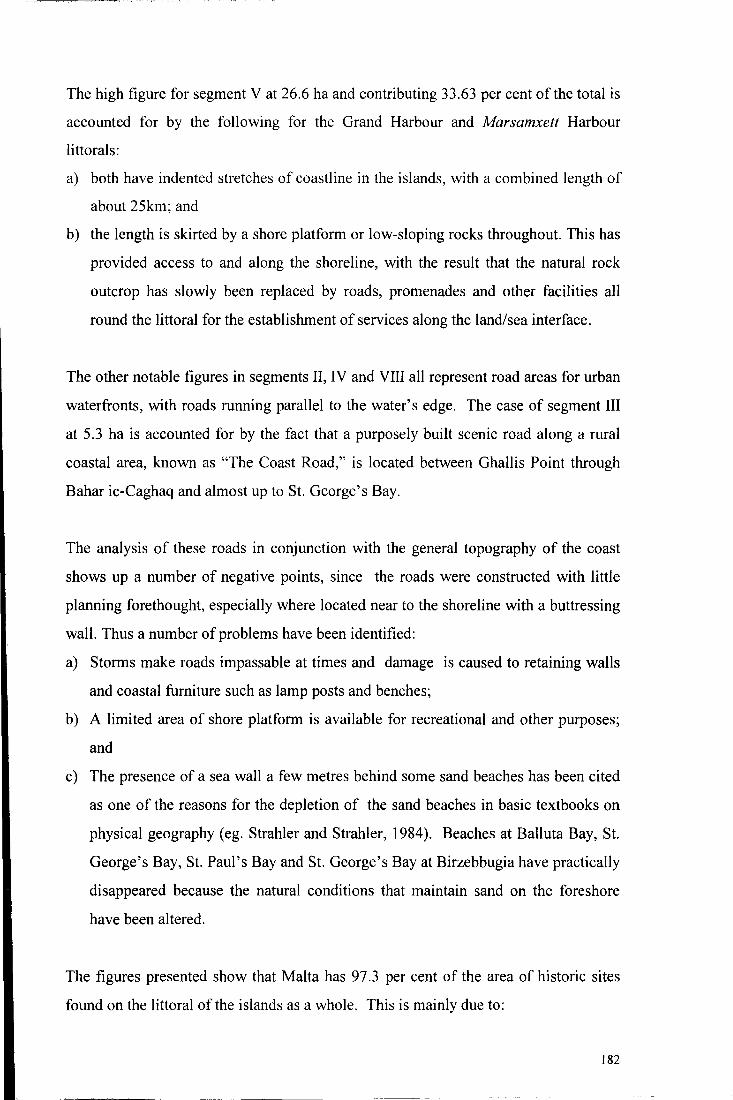
The high figure for segment Vat 26.6 ha and contributing 33.63 per cent of the total is
accounted for by the following for the Grand Harbour and Marsamxett Harbour
littorals:
a) both have indented stretches of coastline in the islands, with a combined length of
about 25km; and
b) the length is skirted by a shore platform or low-sloping rocks throughout. This has
provided access to and along the shoreline, with the result that the natural rock
outcrop has slowly been replaced by roads, promenades and other facilities all
round the littoral for the establishment of services along the land/sea interface.
The other notable figures in segments II, IV and VIII all represent road areas for urban
waterfronts, with roads running parallel to the water's edge. The case of segment III
at 5.3 ha is accounted for by the fact that a purposely built scenic road along a rural
coastal area, known as "The Coast Road," is located between Ghallis Point through
Bahar ic-Caghaq and almost up to St. George's Bay.
The analysis of these roads in conjunction with the general topography of the coast
shows up a number of negative points, since the roads were constructed with little
planning forethought, especially where located near to the shoreline with a buttressing
wall. Thus a number of problems have been identified:
a) Storms make roads impassable at times and damage is caused to retaining walls
and coastal furniture such as lamp posts and benches;
b) A limited area of shore platform is available for recreational and other purposes;
and
c) The presence of a sea wall a few metres behind some sand beaches has been cited
as one of the reasons for the depletion of the sand beaches in basic textbooks on
physical geography ( eg. Strahler and Strahler, 1984). Beaches at Ball uta Bay, St.
George's Bay, St. Paul's Bay and St. George's Bay at Birzebbugia have practically
disappeared because the natural conditions that maintain sand on the foreshore
have been altered.
The figures presented show that Malta has 97.3 per cent of the area of historic sites
found on the littoral of the islands as a whole. This is mainly due to:
182

a) the extensive network of fortifications in the Grand Harbour area; and,
b) the fact that the long accessible coastline of Malta needed defensive works that
could deter any invaders. As shown in Chapter 4 these fortifications were
developed mainly by the Knights and later the British.
The figures presented show a total area of 58.3 ha of monuments, of which one-half is
located around the Grand Harbour. The high priority of coastal defence is
demonstrated by their presence along most of the littoral. Only in areas where the sea
to land accessibility is low are coastal fortifications not represented. However, small
watch towers built by the Knights and pill boxes built by the British in the defense of
the islands during the Second World War are not quantified because the area they
cover is very small.
The data in Table 6.15 indicate a 2.9 ha for segment VIII, and lO.lha for segment IX.
This represents the fortresses built by the British in response to improvements in the
technology of warfare. In all two cases the forts were built in areas highly
inaccessible from the sea at Delimara and Benghisa (both in Segment V). In addition,
a number of Knights' fortifications were upgraded by the British and in a few cases
their spatial extent increased, such as at Fort St. Lucian at Marsaxlokk Bay (Segment
VIII). The British also superimposed a number of pill boxes on top of Knights'
fortifications around the Grand Harbour area (Segment V), although these additions
did not influence the spatial extent of the fortifications. As a general trend, coastal
fortifications built by the Knights' protected mainly the highly accessible areas, whilst
the British built theirs in areas where sea/land accessibility was poor.
The coastal defensive historical sites have a unique spatial distribution that largely
repeats itself in most of the inlets and larger bases along the coast of Malta. Their
distribution in the l61h and 1 ih centuries followed a pattern of having watch towers at
the outer precincts of peninsulas enclosing bays and fortifications with fire power at
the inner areas of the same bay. The latter included redoubts, batteries and also the
occasional fougasse, a circular man-made hole in the rock that when filled with
explosives and sharpnel is ignited on the approach of the enemy (Hughes, 1993 ). In
areas where accessibility was difficult, the system of watch towers was the only means
183

of defensive works utilized as at the coastal area from Wied iz-Zurrieq to Marfa
(Segments IX to XI) on the western coast of Malta. In areas where the littoral zone
was mainly one with a predominantly linear coastal pattern and few inlets of note, but
also highly accessible from the seaward side, entrenchments and low defensive walls
were constructed such as along the north Malta coast between Marfa and il-Ponta ta'
l-Ahrax. During the British period the geography of coastal defences was concentrated
on the building of large forts such as at Delimara, Benghisa, Madliena and San
Leonardo. In the Second World War in addition to the pill boxes, rows of barbed wire
and iron stakes screened the whole coastal littoral.
6.7.7 Conclusion
The general impression given of the first two land-use categories is one where the
urban element is highly represented. This is seen from the fact that, in the subsequent
sections dealing with the other land-use categories, the urban land uses are not
prominent. However, the next land use to be discussed is the industrial areas, where
again the coastal urban fabric is the focal point of the discussion.
6.8 Extractive Industries and Maritime Industrial Development Areas (Industry)
6.8.1 Introduction
In an attempt to limit the number of major land use categories and to help in the
process of data reduction (cf. Section 5.14), all "industrial" activities that were
within the coastal zone boundary were grouped together. However, two main types of
industrial activities have been identified:
(a) the extractive group: salt-panning, quarrying and reverse osmosis (R.O.) plants;
and
(b) the maritime-related serv1cmg industries located exclusively within Grand
Harbour and Marsaxlokk Bay group: Malta Drydocks, the Tank Cleaning Farm; the
Power Stations in both sites; the Grain Silo Storage facilities; the Container
Terminal; all fuel storage depots.
However, some distinctions can be made within the "extractive" group. The location
of salt panning areas and the Reverse Osmosis (R.O.) plants are totally dependent on
proximity to the sea, whilst stone quarrying is just an extension of an inland activity
184

and a number of sites just happen to be on the and within the Coastal Zone
boundaries. The distribution of these land use categories in this segment is shown in
Figure 6.5.
6.8.2 Background Information The industrialisation of the Maltese islands has experienced a marked increase in
tempo in the last thirty years. The gainfully occupied population amounts to 137,387,
38.3 per cent of the population with a Gross National product per head of Lm 3092 in
1998 - an increase from Lm2112 in 1991 (Central Office of Statistics, 1993). Only 4
per cent of the working population is engaged in the construction industry, with only
1.4 per cent of workers employed directly in quarrying (National Statistics Office,
2002). The efficiency of new machinery and advances in the technology of building
equipment has permitted a decrease in the employment of workers in quarries from
618 in 1965 (Balm, 1996) to 318 in 1997 (Central Office of Statistics, 1999). The
emphasis of industrialization has been has been predominantly two-fold: first, on light
industry based mainly inland around the harbour conurbation manufacturing textiles,
footwear and electronic components accounting for 43.3 per cent of the work force in
about 2600 establishments (National Statistics Office, 2001c), and, secondly, on
heavy and servicing industry based on the coast especially in Grand Harbour and
lately also in Marsaxlokk Bay. As for the primary industry, the extractive industries
of salt production, desalination and quarrying are the main components. Together with
tourism, industrialization has been one of Malta's main foci for economic
development.
The mam economic efforts have centred around shifting an economy based on
servicing the British military base to one of economic sustainability based on a strong
infrastructure and on the twin pillars of tourism and industrial output. The latter can
be conveniently divided into the light industrial sector that produces textiles, leather
and microchip components and the heavy industrial sector that is concerned with ship
servicing and repairing. Whilst the former has a relatively recent history, spanning the
last 40 years, the latter has its origins dating to the Knights of St. John, when the area
around Grand Harbour was turned into a ship building and repairing port. This
tradition was retained by the British, who maintained the harbour as the main base of
185

their Mediterranean Fleet. The post-independence period saw the addition of further
developments along the harbour littoral. These were mainly concentrated on the
provision of cruise liner and yacht marina facilities. The most recent issue to emerge
in the coastal zone development of the Grand Harbour concerns the changes to the
waterfront of the Cottonera littoral, as a result of a project for the rehabilitation of the
area. In this project part of the Drydocks will be turned into a yacht marina-hotel
artisanal workshop facility. The project was first proposed by the present author in
November 1993 at a workshop (Schembri and Borg, 1997). In their review the
conveners of the workshop and authors of the proceedings (Fsadni, C. and Selwyn T.,
1997) commented that here "a future is imagined in which tourism acts as a catalyst
that can anchor the local population to its ancestral links and at the same time earn
them a living" and they labelled this plan as "enlightened intervention in the Maltese
walled cities" (page 1 0).
The land uses extant in the coastal zone of the Harbours are partly a reflection of this
development spanning centuries of effort. The industrial base of Malta is spread
further inland and includes a manufacturing sector made up of 1632 establishments
and employing about 28,000 persons. These include 12 industrial estates, 11 of which
are in Malta (National Statistics Office, 2002), and all located beyond the coastal zone
delimitation used for this thesis. As for the building of the infrastructure necessary for
this economic diversification, the primary products of stone and spall were obtained as
a result of the development of the extractive industry. These quarries of open-cast
extraction of natural rock are mainly located inland but are represented on the coast by
a small number of derelict sites.
Reverse Osmosis (R.O.) Plants are used to convert sea water into potable water. The
first Plant was introduced to Malta in 1982 at Ghar Lapsi on the south coast of Malta
(Segment IX). Since then four other plants have been set up. These are located at
Cirkewwa (North coast), Pembroke (East coast), Marsa (Grand Harbour) and Tigne
(Marsamxett Harbour). Plans are in hand to commission another plant on the South
east coast. The main idea behind these Plants is to combat water shortage for
domestic, industrial and other needs associated with tourism and other forms of
recreation. The production of water from these Reverse Osmosis plants is in the
186

region of 112 million m3 per year (1999/2000 estimates by the National Statistics
Office (2002)). These are added to the water extracted from underground sources,
which is 19.2 million m3 per year, in addition to 0.4 million m3 of distilled water from
the Marsa plant per year (National Statistics Office, 2002). The latter is used mainly
for the Power Station augmented by R.O. Plant water production to a total of about
185,000 m3 per day. In addition the storage capacity of all surface reservoirs totals 0.5
million m3• Reverse Osmosis (R.O.) plants have been the modern answer to combat
water shortage in the island of Malta. As with land use type, they have been included
within the extractive elements in that they make full use of drawing sea water and
converting it into potable water, pumping out residue water with a higher salt content.
The locations of the five R.O. plants near the shoreline fall within the coastal zone
boundaries of this study. The construction of each consists of a pipe network that
leads to a filtering station. In essence it is the station itself that takes up the space and
not the pipe networks leading to and from the sea. For security purposes each RO
plant has controlled access and is fenced off, thus demarcating precisely the land use
limits and helping to identify easily the area occupied.
Another facet of water production in the Islands deals with the production of water for
irrigation. A Sewage Treatment Plant situated at Sant Antnin limits of Marsascala
(Segment VII) has increased its production capacity from 3 72 million litres in 1984 to
1562 million litres in 1993. This plant produces second class water which is used to
irrigate fields in the south east of Malta (Malta National Report, 2002), and the
agricultural production of this region has been enhanced. The problem of water
shortage is rather acute during the summer and the R.O. Plants have provided a
practical answer to the water shortage problems in Malta.
Quarrying is another important economic activity, not only as it yields one of the few
natural resources of the Maltese Islands, i.e. stone for building purposes, but also
because it provides employment for around 845 persons in 70 establishments and an
associated 6429 persons in the construction industry (National Statistics Office,
2001 b).
187

6.8.3 Justification for study
Each type of land use has its own justifiable reasons for inclusion in the land use
study. Salt panning is largely compatible with the environment, having a low-profile,
though a fairly long littoral spread on the low sloping Lower Globigerina
promontories along the eastern seaboard of Malta and on the northern and southern
shores of Gozo. Salt-pans are one-metre square rectangular I 0-cm deep pools etched
into the rock surface. The Globigerina rock surface is the only rock type in Malta and
Gozo that possesses the "soft" lithological qualities permitting the construction of
these pools. Sea water placed in the pools evaporates, leaving salt sediment to be
harvested. Three harvests are produced between May and October. However, the
presence of these pools precludes alternative or overlapping land uses, especially
during the spring and summer harvesting season when trespassing is unwelcome.
The extensive and highly commercialised industry at Salini Bay is also included
within this land use sub-category, although the salt manufacturing network is much
larger. The method of production utilizes the shallow, narrow and sheltered inlet of
Salini Bay and the trapping of sea water in the inner recesses of the bay by means of a
system of dykes facilitates the production of the salt through evaporation. Access on
to the working surface is made by a system of fixed wooden pontoons.
The benefits of the presence of R.O. plants at Cirkewwa, Ghar Lapsi and Pembroke
are debateable. The first two are located in areas where they interfere with the
generally low profile of the coast. At Pembroke the noise generated by the plant is
inconvenient to the residents. The RO at Tigne is less conspicuous both within the
built aesthetic form and its audibility from nearby built-up areas. The remaining
structure at Marsa will be considered separately along with the whole Grand Harbour
industrial complex.
In justifying the inclusion of quarrying within the coastal extractive industries one
may cite a number of points regarding the four locations investigated, two in Malta
and two in Gozo. Quarries are the most striking feature in a "reworked" landscape in
the Maltese Islands (Balm, 1996). The Maltese attachment to stone has been around
since prehistoric times and the numerous archaeological sites with large Megalithic
188

temples bear witness to "sacred island" status. The military fortifications surrounding
Grand Harbour and other sites (Hughes, 1993), and the large Baroque churches in all
towns and villages bear witness that the Maltese have used local stone for all
buildings from residential and worship purposes to the needs for defence of the
territory. Although the use of local quarried stone decreased by 50 per cent between
1988 and 1993 and the use of the concrete block and cement increased at the same
time, the pressure on extending the quanies is great. Although quarrying is an
essentially inland function that utilizes the Globigerina and Upper and Lower
Coralline Limestone, there are four cases where it is located within the coastal zone.
In all cases the quanies also break through the coastline. Aesthetically it is probably
the most negative of all coastal industrial activities. The management of quarries, and
their proper utilization, is a challenge that needs to be taken up seriously.
6.8.4 Definitions and criteria used in field identification
Citing the sources used previously for the other land-use categories for definitions
pertaining to this section, a problem arises with defining those structures that protect
and service shoreline facilities, as the same structures are also classified under the
recreational areas category. So as to eliminate the problem, the same definition will be
used for both recreational and industrial servicing facilities. A distinction will be
made according to the type of sea-use associated with the littoral area under
discussion. The definition is reproduced in full.
1. "Shorelines protection facilities include breakwaters, groynns, bulkheads, jetties, and other structures, the purpose or effect of which is to control, or prevent, the erosion of coastal features.
2. Riprap is a foundation or sustaining wall of stones placed together without mortar. 3. A revetment is a structure built to armour a sloping shoreline face composed of
one or more layers of stone or concrete rip-rap. A revetment blankets, and generally conforms to, the contours of a coastal feature.
4. A groin is a structure built of rock, steel, timber, or concrete that extends from a beach into tidal waters and is used to entrap sand; groins are generally perpendicular to the shoreline's coastal trend.
5. Breakwaters and jetties are fixed or floating structures that protect a shore, harbour, anchorage, or basin by intercepting waves.
6. A bulkhead is a structure or partition built to retain or prevent sliding of the land and protect the inland area against damage from waves.
7. A seawall is a massive bulkhead with a vertical, curved, or stepped face designed to withstand the direct onslaught of ocean waves (Olsen and Seavey, 1990, 84).
189

(a) Maritime-related industrial activities.
The areas have specific functions:
a) shipbuilding;
b) ship repairing;
c) grain silo site;
d) tank cleaning farm;
e) power stations;
f) container terminal; and
g) hydrocarbon strategic facilities.
Identification is straightforward. These areas, besides having the industrial equipment
that identifies each one, have a littoral made up of concrete platforms, jetties,
wharves, slipways, servicing rooms, offices and other buildings associated with their
functioning. The only mapping I used for these was in the identification of their limits
and boundaries.
(b) Extractive Industries
Extractive Industries are ofthree kinds:
(a) those associated with quarrying where open pit systems are used to exploit the
natural resource of Upper and Lower Coralline and Globigerina Limestone for
building purposes and also for the construction of roads, coastal land reclamation,
and the production of concrete;
(b) those associated with the utilisation of the sea water for the production of potable
water through Reverse Osmosis (RO) plants; and
(c) those associated with salt production (Plate 6.4, p20 1 ).
190

N
A 0 2 4 8 8km
Figure 6.5
lndu trial areas
Legend
Coastal Zone Boundary
• Industrial areas
Extractive Industries
D Salt pans
• Quarrying
Source: Developed by author from field surveys

6.8.5 Presentation of Data
Table 6.16: EXTRACTIVE INDUSTRIES and MARINE INDUSTRIAL AREAS (MIAs). Land use distribution for Malta, Gozo, Comino, and the Maltese Islands.
Hectares extractive industrial Total extractive industries areas industries
I <0.1 - <0.1 < 0.1 II 8.2 - 8.2 5.3 III 0.5 - 0.5 0.3 IV 2.5 - 2.5 1.6 v 0.6 79.0 79.0 0.4 VI 1.8 3.4 5.2 1.2 VII 2.3 0.1 2.4 1.4 VIII <0.1 33.9 33.9 < 0.1 IX 6.9 - 6.9 4.4 X - - - -XI 0.1 - 0.8 < 0.1
TM 22.8 116.4 139.2 14.6
XII - - - -TC - - - -
XIII 5.5 - 5.2 3.5 XIV 1.4 - 1.4 0.9 XV 2.7 - 2.7 1.7 XVI 0.6 - 0.6 0.4 TG 10.2 - 10.2 6.5
GT 33.0 - 144.4 22.1 Source: Estimated by author from field data and cartometric measurements
Key I to XVI -coastal segments (rows) TM- Total of values for Malta TC - Total value for Camino TG - Total of values for Gozo GT - Total of values for the Maltese Islands
Per cent industrial Total
areas - < 0.1 - 5.3 - 0.3 - 1.6
54.9 55.3 2.2 3.4
< 0.1 1.4 21.7 21.7
- 4.4 - -- < 0.1
78.8 93.4
- -- -
- 3.5 - 0.9 - 1.7 - 0.4 - 6.5
78.8 100
192

6.8.6 Discussion and Analysis
Table 6.16 gives an indication of the spatial spread of the Extractive Industry and
Maritime Industrial Areas, and Figure 6.5 indicates their location along the littoral.
The main consideration seen from this table is that, whilst the areas occupied by the
extractive industry are spread around the whole littoral of the archipelago, those in the
secondary and tertiary categories are a highly localised. In fact, the latter are found in
Segments V and VIII and more specifically in the Grand Harbour and Marsaxlokk
Bay. Further intensification of these land uses is evident, as only the inner recesses of
Grand Harbour are occupied by marine industrial areas. Out of a total of 144.4 ha,
93.4 per cent are located on Malta, with 77 per cent of these belonging to the maritime
industrial services located around the two zones of Grand Harbour and Marsaxlokk
Bay. The Gozo coast only has a salt-panning industry. The greater length of indented
coastline along the coast of Malta gives more scope for the location of marine
industrial facilities as protection from the sea swell is guaranteed more.
The location of R.O Plants near the coast is influenced by a number of factors. The
most important are the following:
(a) in areas where accessibility to the shoreline is good;
(b) in areas with high population concentrations, the plants at Pembroke and Tigne'
were specifically located to service the water shortage problem in a residential and
touristic area, whilst the R.O at Cirkewwa services northern Malta;
(c) an appreciable distance from built-up areas is desirable due to noise problems
generated by the R.O. operating plant, although the plants at Tigne and Pembroke
do not respect this norm; and
(d) proximity to shoreline areas where longshore drift currents ensure a clean supply
of sea water. The supply of sea water to the Plant at Marsa is of inferior quality,
however, and the saline water emitted has been partly responsible for upsetting the
ecological balance in the inner recesses of the Grand Harbour.
193

Table 6.17 highlights three factors associated with salt panning:
(a) the comparatively large areas in Segment II including 6.5 ha in Salini Bay, which
is the largest area in Malta devoted to this activity;
(b) there are 5.4 ha of salt pans in Segment XII in Gozo ; and
(c) salt panning activity is almost evenly spread along the east coast of Malta, with
salt pans present on almost all segments. Malta has a large accessible Globigerina
shore area but the comparatively accessible Globigerina area for Gozo is more
limited ( cf Chapter I). The people of both islands utilize most possible sites for
this extractive industry. A typical land use distribution is shown in Figure 6.6
where salt panning activity occurs on all possible sites along on the foreshore of
the south-east coast of Malta where good access from the land is prevalent.
Table 6.17 Salt panning sites presented by site (segment), number of clusters and the approximate area of each cluster.
Segment Number of Area in hectares of each groups of salt group
pans II 2 1.8; 6.5 III 2 0.3; 0.2 VI 2 0.4; 1.4 VII 5 0.3; 0.4; 0.6; 0.2; 0.8 XII 1 5.4 XIV 3 0.3; 0.4; 0.7 XV 3 0.5; 1.0; 1.1 XVI 1 0.6
Source: Estimated by author
Table 6.18 shows that an index (F) of serviceable coast per spatial unit of area can be
deduced for each of the three Harbours. This indicates the extent of the immediate
hinterland of each harbour, especially the industrially-related structures whose
location is dependent on maritime proximity. These are specific structures such as the
Tank Cleaning Farm at Rinella Bay in Grand Harbour, shown in plan in Figure 6. 7.
The diagram also serves to show the proximity of the historical fortifications and
residential areas in these parts of Grand Harbour. Additional structures are Malta
Drydocks the Grain Silo, the Marsa Power Station, Malta Shipbuilding in Grand
Harbour; Oil Services in Marsamxett Harbour; and in Marsaxlokk Harbour the
Delimara Power Station, Oil and gas storage facilities around the bay and the Freeport
Terminals.
194

.,., "C ·c C)()
= ·-"C Q,l
..:.1: -«! e .,., Q,l -";j C)()
= ·-= = = c. --; .,.,
~J -~ e -~ .... = -c. Q,l -Q .c rJ:J '-Q
= Q ·-.... = .!:! -·-.... ~ \C ..c Q,l -= C)()
~

Figure 6.7 Grand Harbour, Rinella Bay: Tank Cleaning Farm adjacent to fortifications and beach

l I !
I i
I i
H
\ \
Figure 6.8 Grand Harbour, Dockyard Creek: ship repairing docks, historical fortifications and residential areas in close proximity

Table 6.18 Basic spatial dimensions of Marsamxett Harbour, Grand Harbour, and Marsaxlokk Bay
Location Marsamxett Harbour Grand Harbour Marsaxlokk Bay
Dimension
A Coastal length 10.461 km 15.555 km 10.728 km
B Terrestrial coastal zone area 0.57 km2 1.29 km2 0.85 km2
c Percentage area with primary industry 4.4 0.4 -
D Percentage area with - 66.2% 39.9% secondary/tertiary industry E Maritime (water) area 1.390 km2 2.198 km2 4.856 km2
F NB 0.054 km2/km 0.083 km2/km 0.079 km2/km Source: Author's calculatiOns
Interest in the development of the harbours in Malta can be seen from the various
studies commissioned. In 1968, studies (Government of Malta, Ministry for Public
Buildings and Works, 1968) were commissioned for the development of Marsamxett
Harbour through a London-based firm, G. Maunsell and partners. In 1991, studies for
the construction of a breakwater at the entrance of Marsamxett Harbour (Malta
Development Corporation, 1991) involved a number of U.K. consultants: All ott and
Lomax, Manchester; Halcrow and Partners, Swindon; Hydraulics Research,
Wellingford. All the reports commissioned mentioned the importance of conserving
the historic heritage of the Harbour, that any development should be sympathetic with
the surrounding environment and that the transportation links with the immediate
hinterland of the harbour should also be considered. In 1997, plans for the
development of the existing sea terminal at Grand Harbour (Viset Consortium, 1997),
were provided for the Valletta International Sea Terminal. The scale of the
development proposals are such as to include within the Terminal a conference centre,
amphitheatre facilities, restaurants, family recreational areas besides the improvement
normally associated with the flow of sea ferry passengers.
The complete absence of any maritime industrial activity from Kullana to Ahrax Point
is due to the fact that the geological nature of the rock strata does not permit coastal
quarrying or salt-panning activity, whilst the topographic nature of the terrain makes
198

the western coast very inaccessible. Furthermore, this zone is probably the most
aesthetically pleasing natural/semi-natural of environments, where only a limited
amount of touristic development has been allowed. The desalination plant at
Cirkewwa does not fall within the coastal zone boundary line, although the effects of
landscaping had a positive aesthetic effect. The other area where no industrial activity
is recorded is St. George's to Dragut Point, where touristic and recreational activity is
heavily predominant.
The Ghallis to St. George's and Benghisa to Kullana areas have extractive industry
along only part of coastal zone. The first has an extensive network of salt pans at
Bahar ic-Caghaq, spanning an area of about 0.5 ha the second has the only two
quarries located near the coast to have broken completely through the cliff line. These
cover an area of about 6.9 ha. The three other remaining zones have by far the highest
concentration of industrial activity, with 83.7 per cent of all the industrial activity in
Malta concentrated along a coastal length of 36.7 km for the harbours.
6.8. 7 Conclusion
In all probability the topographic nature of all three harbours helped to fashion their
present-day use. These features include:
a) a heavily indented coastline providing a long land/sea interface;
b) a narrow mouth decreasing the length of unexposed coast, especially for Grand
Harbour and Marsamxett;
c) a deep incision inland into the land mass;
d) a deep bathymetry;
e) a minimum of siltation, as the hinterland and catchment areas are not extensive,
given the smallness ofthe island;
f) a significant height of the backing cliffline for Grand Harbour, affording
protection from landward winds;
g) a shore platform skirting all three harbours that gives a great accessibility from the
sea to the land;
h) a large population living in close proximity to the harbours;
i) a rock structure made of Globigerina limestone that can be quarried to extend the
serviceable land area.
199

6.9 Depositional Environments
6.9.1 Introduction
The 'depositional environments' land use category groups the land uses associated
with the deposition of sediments along the shoreline and within the coastal zone. The
range of sediments includes mainly the sand beaches, but other elements, such as
sediments of terrestrial origin deposited along the coastline as a result of flow of
rainwater, are also included. Soil deposits and mud flows, typical of valley-mouth
environments, located within the coastal zone at the backshore area of beaches, are
cases in point. The depositional environments category forms the only "soft" part of
the coast of the Maltese Islands. All the other land-use categories deal with the "hard"
elements of rock and concrete.
6.9.2 Background information
Sand beaches are arguably the most threatened part of the local coastal environment.
There are many reasons for this. Most of the sand beaches have been sites where
intensive coastal development has taken place, resulting first in the removal of the
sand dune system at the backshore area, and then in the depletion of the foreshore
beach area. The latter was partly due to the hard structures constructed along the
littoral in the form of shoreline promenades and concrete structures for boating
facilities. Essentially the problems associated with the local coastal environment are
partly due to the presence of sand beaches in highly developed areas. As hardly any
local literature is available to build up a secondary source base, primary source
material derived from field investigation has been utilised in this thesis and also from
a study for the Coastal Environment Research Programme (1991) by Professor Ewan
Anderson and the author. This study examined the profile and sediment composition
of the beaches of Malta. Table 6.19 refers to the beaches survey compiled during this
survey all the sites are listed where swimming is suggested by the popular tourist
brochures. These can be classified into three categories: sandy beaches, pocket
beaches, and rock beaches. The locations are represented in Figure 6.8b. The
prevalence of sites in the north and west parts of Malta and northern part of Gozo is
clearly evident.
200

Soil deposits occurred only in selected coastal localities in Malta: Cirkewwa (segment
I) ; St. Thomas Bay (Segment VII); Marsaxlokk Bay (Segment Vlll); and Ghar Lapsi
(Segment IX). These Quaternary deposits fo rmed during the last 1 00,000 years are
essentially soi ls deposited from a terrestrial source, mainly from water flow during a
previously wetter period . The change in the climatic pattern that gave a drier
environment dried up these soi l deposits, with time consolidating the deposits into the
present formations. The samples extant have survived later marine transgressions
(encroachment of the sea) into the landmass.
6.9.3 Justification for study
The area occupied by deposition is the smallest land-use category. However, it forms
the focal point for most recreational activity concentrated around sandy beaches, with
a number of recreational establishments and facilities for the mooring and launching
of sea-craft. Land use competition occurs around these zones. As a consequence,
these are considered as areas where the greatest ecological problems are encountered.
In fact, Plate 6.5 shows a group of volunteers attempting to restore a beach to its
former condition after fine Coralline aggregate was dumped on the sand by a building
contractor prior to concreting over the beach.
Plate 6.4 Malta, Birzebbugia: Typical pattern of salt pans on foreshore with the Container Terminal in background. Source: The Author

Table 6.19: Beaches in the Maltese Islands : location, users and type of beach
Locality Foreign and local users Predominantly local users Beach
Malta Paradise Bay - - s Cirkewwa - - S,R Cirkewwa to Ahrax Point - - S, R, (4s)
Mellieha Bay - - S, R (3s) lmgiebah ( -) - s Blata 1-Bajda - R Mistra - - S, R St. Paul's Bay - - R, s Bugibba - - R Qawra - - R Salina - - R Qalet Marku - - R, s Bahar ic-Caghaq - - R, s St. George's Bay_ - - S,r Dragonara Point to Msida - - R Valletta - R, s Xgh11jra - R Marsascala - R St. Thomas Bay - S, R Hofra 1-Kbira - s Hofra iz-Zghira - s Peter's Pool - - R 11-Qala it-Tawwalija - R 11-Kalanka tai-Patriiiet - R Marsaxlokk day-trippers • s St. George's Bay - S,R Birzebbugia - S, R Wied iz-Zurrieq day-trippers - R Ghar Lapsi - R Migra Ferha - - R Gnejna Bay - - s Ghajn Tuffieha - - s (2) 11-Prajjiet (Anchor Bay) - - s
Gozo Xwieni Bay - R Qbaiiar - s Marsalfom - - s Rami a - - s San Bias - - s Dahlet Qorrot - s Hondoq ir-Rummien - s Barbaganni Rock - R Mgarr - - S,R Xatt 1-Ahmar - - S,R Mgarr ix-Xini - - S,R Xlendi - - S,R Dwejra - - R
Comino St. Nicholas Bay - - S,R St. Mary's Bay - - S,R Blue Lagoon - - R Source: Comptled by author from tounst broucheurs and field survey.
Key: R - rocky; S - sand; s - pocket; 4s - number of pocket beaches; - indicates presence of beach users; blank space indicates lack of beach users.
202

6.9.4 Definitions and criteria used for field identification
Widien (valleys) also formed part of this land-use category and the main indicator
used to delimit the area was Phragmites Australis (Great Reed). The topographic and
natural water drainage is in part controlled by the presence of valleys into which rain
water flows from the catchment area to the seas. Widien are characterized by a
significant break of slope formed due to faulting or a Horst and Graben type of
landscape, and always ending up roughly perpendicular to the coast. The reeds are
normally found either in areas where fresh water meets the coastal, more saline, water
at the tail-end of a wied, or where a perennial stream is found as a result of the
puncturing of the Upper Coralline formation at the junction with the Blue Clay
formation. In theory, as all widien courses drain into the sea, this type of vegetation is
to be found all around the islands. But urban, touristic and industrial developments,
together with the construction of road networks, running through part of the valley
bottom, have decreased the presence of the reeds and their associated environment.
Agricultural activity along parts of the coast has also depleted their presence by
uprooting them to create space for crop production. In addition, in coastal urban areas
or areas where road construction runs through valleys, reeds have also been depleted.
6.9.5 Discussion and analysis
Table 6.20 presents the percentage distribution of the depositional environments
category and Figure 6.8 indicates their distribution. The data shows that three-quarters
of this land-use category are found on Malta. More than one-third of the depositional
environments are located in Segments I and II. Two other significant features are
worth mentioning: first, the sand beaches in Segment XI in western Malta, and
Segment XIV in northern Gozo. The coastal geomorphological conditions prevalent
in these areas are made up of promontories with scree taluses of Upper Coralline
Limestone boulders. Wave action erodes the rock scree into small particles that
eventually are deposited as sand in the inner recesses of the Bays (Schembri and
Magri, 1996).The second significant feature is the 1.9 ha of sand at Marsaxlokk Bay
(Segment V). Three main sand beaches occur here, all of which are the result of the
artificial replenishment of smaller beaches. These occurred in 1988 for the beach at
203
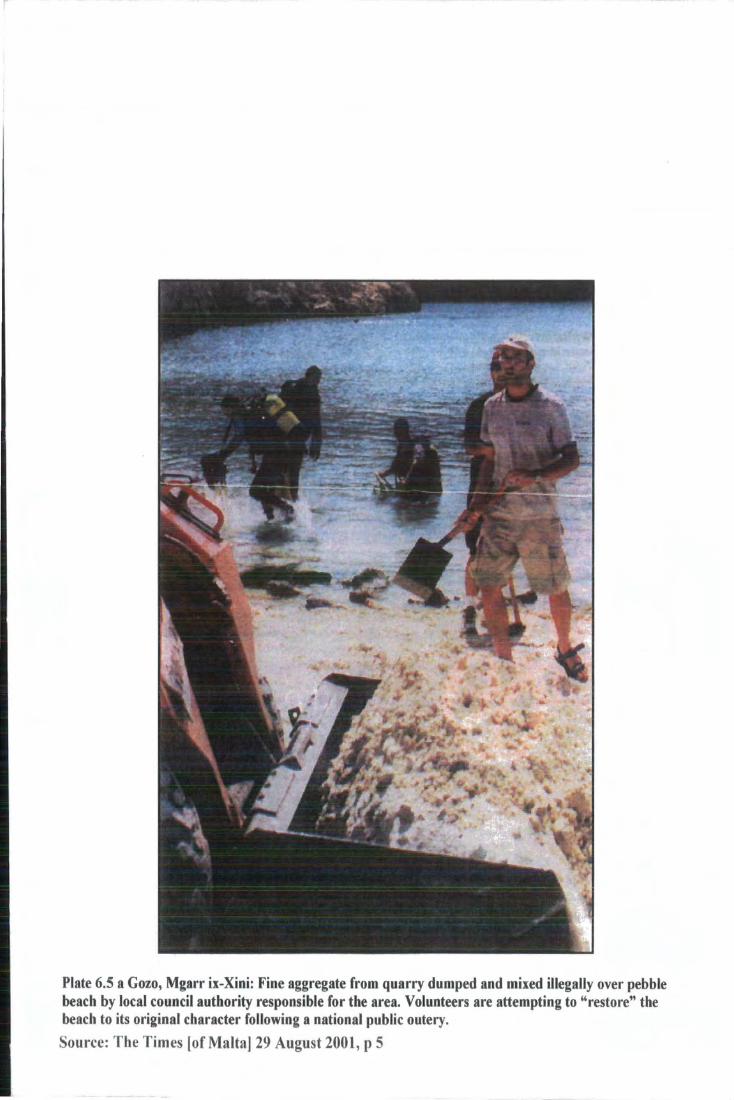
Plate 6.5 a Gozo, Mgarr ix-Xini: Fine aggregate from quarry dumped and mixed illegally over pebble beach by local council authority responsible for the area. Volunteers are attempting to "restore" the beach to its original character following a national public outery.
Source: The Times (ofMalta]29 August 2001, p 5

6.9.6 Presentation of Data
Table 6.20: AREAS WITH DEPOSITIONAL ENVIRONMENTS. Land use distribution for Malta, Gozo, Comino and the Maltese Islands.
Hectares Per cent
Segment Areas with Total Areas with depotional depotional
environment environment I 2.0 2.0 16.0 II 2.6 2.6 20.8 III 0.1 0.1 0.8 IV 0.1 0.1 0.8 v 0.1 0.1 0.8 VI - - -VII 0.1 0.1 0.8 VIII 1.9 1.9 15.2 IX - - -X 0.4 0.4 3.2 XI 2.2 2.2 17.6 TM 9.5 9.5 76.0
XII < 0.1 0.1 <0.1 TC < 0.1 0.1 <0.1
XIII - - -XIV 2.9 2.9 23.2 XV 0.1 0.1 0.8 XVI - - -TO 3.0 3.0 24.0
GT 12.5 12.5 100 Source: Estunated by author from field data and cartometnc measurements
Key I to XVI- coastal segments (rows) TM- Total of values for Malta TC - Total value for Comino TG - Total of values for Gozo GT - Total of values for the Maltese Islands
Total
16.0 20.8 0.8 0.8 0.8 -
0.8 15.2
-3.2 17.6 76.0
<0.1 <0.1
-23.2 0.8 -
24.0
100
205

N
A 0 2 4 • 8km
Figure 6.8 b
Depo itional Environments
Legend
Coastal Zone Boundary
• Depositional Environments
Source: Developed by author from field surveys

Marsaxlokk, material being obtained from the dredging activity in the building of the
Power Station; in 1989 for the beach at Pretty Bay in Birzebbugia, using dredged sand
from the Container Terminal site (Borg and Schembri, 1995); and in 1998 the beach at
St. George's Bay was replenished from the sand at Pretty Bay.
6.9. 7 Conclusion
The main concluding comment regarding this land-use category is the fact that
depositional environments have an ecological, environmental, economic, and aesthetic
value far greater than their size suggests. As a management option, the modem
strategy is one where beach replenishment and construction seems to be the popular
practice. However, this is being done without creating or encouraging the
development of the associated environments linked to beach management. Two main
management factors are evident here: the development of nodal areas where sand
beaches occur, and the depletion and nourishment of beaches.
6.10 Afforested areas
6.10.1 Introduction
Afforested areas, although small in size, enhance the aesthetic qualities of the larger
areas surrounding them, making their proper management crucial. They have been
placed alone and also in the middle of the main matrix, where all the land use data is
shown. The following points are important with regard to afforested areas:
(a) they are not associated with either the urban or the rural coastal environments;
(b) the plants used are generally prone to changes, both as a result to changes in the
physical conditions, such as storms, and also due to human-induced environmental
conditions, such as gas emission from vehicles;
(c) the concluding remarks to this thesis place an emphasis on the coastal
afforestation projects as a way to improve the environmental quality of the coast,
both in the urban and in the rural localities, and to bridge the gap in the aesthetic
qualities between the rural and urban coastal environments.
This section focuses on afforestation projects have been used to enhance the aesthetic
environment. Figure 6.9 shows their distribution.
207
---- -----

6.10.2 Background information
The occupation of the Maltese Islands for the last seven millennia has depleted the
natural vegetation cover of the islands. The obvious way of addressing this is to plant
new trees and bushes. In fact, a number of reports commissioned by the Department of
Agriculture contain details regarding the beneficial returns from afforestation projects.
Enhancing the general look of the environment, and the provision of shaded areas in
otherwise sun-baked zones, are two of the reasons mentioned. As a result, successive
local administrations and local councils have embarked upon such projects.
Afforestation projects in Malta were initiated by foreigners: the Knights who planted
the largest woodland at Wied il-Luq (Buskett) and the British in embellishing their
military establishments, locals reserving the practice with cypress for cemeteries
(Borg, 1998). Borg (1998) estimates that since 1957, when the truly local effort at
afforestation started to be implemented, the tree cover area increased from 0.5 per cent
in the mid-1960s to 1.5 per cent to date, of the total land area. Another estimate put
the afforested and wooded areas in Malta at 1.21 per cent (Centro Studi Ricerche,
1976). Although most of the afforestation projects involved land cover of the inland
areas some are found within the coastal zone boundary, the most apparent ones are
listed in Table 6.21. Success at further tree planting efforts depends on a number of
factors such as the choice of suitable sites and establishing good humus-retaining soils
(Borg, 1997).
6.10.3 Justification for study
Two problems associated with these plantations are, first, the semi-arid climate
prevailing, which is unfavourable to many species, and, second, the generally barren
coastal areas of the Islands, which together put increasing pressure on the preservation
and up-keep of all afforestation efforts. In addition, we may identify several problems
which follow afforestation:
(a) Vandalism, ranging from the uprooting of the young saplings immediately after
planting;
(b) Heavy rain that softens the soil;
(c) Chopping of the mature trees;
(d) Trees knocked down by vehicles, especially in areas where trees line main roads;
208

(e) Illegally dumping of domestic waste. Plants having a number of shoots and
branches growing from soil level are more prone to this type of illegal rubbish
dumping than plants that grow from a single stem or branch. In addition, being
wind-breakers themselves, the plants also trap flying debris, increasing the risk of
rubbish accumulation.
6.10.4 Definition and criteria used for field identification
Tree planting in Malta is termed "afforestation" especially when this involves the
planting of clusters of trees or in single file normally where they are scarce. Tree
planting in public areas in Malta can take a number of forms:
a) planting in a single file, with trees spaced about 3 m apart in rows along either the
periphery of roads, on pedestrian walkways (pavements) or in the boundary
between the edge of a road and a field. On paved or concrete footpaths the ground
is broken up at the intervals where planting is to take place;
b) in clusters along rural slopes and ridges. These areas can be rather extensive, as at
Delimara Peninsula (5 ha). The object of such an exercise was to cover as much
area of barren ground as possible and to decrease the rate of water run-off from
steep slope;
c) in groups, to enhance some of the recreational areas, notably children's play
grounds, public gardens and urban coastal promenades such as Marsascala, Sliema
and Birzebbugia. Plate 6.6 shows an example of these afforestation initiatives
associated with coastal areas.
6.10.5 Discussion and analysis
As a number of afforestation projects consisted also of lines of trees planted along the
peripheries of roads, the discussion in this section will examine the land-use
dimensions from the linear aspect as well as from the areal perspective. In addition,
Figure 6.9 should help in the identification of their location along the coast.
209

6.10.6 Presentation of results
Table 6.21: AFFORESTED AREAS Land use distribution for Malta, Gozo, Comino and the Maltese Islands.
Hectares Per cent
Segment Area Total Area (per Total (hectares) (hectares) cent) cent)
I 1.4 1.4 1.63 1.63 II 21.6 21.6 25.09 25.09 III 4.3 4.3 4.99 4.99 IV 2.1 2.1 2.44 2.44 v 7.1 7.1 8.25 8.25 VI 0.1 0.1 0.12 0.12 VII 6.9 6.9 8.01 8.01 VIII 6.9 6.9 8.01 8.01 IX 2.0 2.0 2.32 2.32 X 7.1 7.1 8.25 8.25 XI 6.5 6.5 7.55 7.55
TM 66.0 66.0 76.66 76.66
XII 0.2 0.2 0.23 0.23 TC 0.2 0.2 0.23 0.23
XIII 1.8 1.8 2.09 2.09 XIV 11.2 11.2 13.01 13.01 XV 6.7 6.7 7.78 7.78 XVI 0.2 0.2 0.23 0.23 TG 19.9 19.9 23.11 23.11
GT 86.1 86.1 100 100 Source: Estimated by author from field data and cartometric measurements
Key I to XVI- coastal segments (rows) TM- Total of values for Malta TC - Total value for Comino TG - Total of values for Gozo GT -Total of values for the Maltese Islands
(per
210

(a) Spatial dimensions
From a total area of 0.86 km2 identified as coastal afforestation, 0.66 krn2 pertain to
the island of Malta, 32 per cent of which is located from Dahlet ix-Xilep to Ghallis
Tower, and 22 percent from Fomrn ir-Rih to Cirkewwa along the western coast. The
remaining half is distributed equally between Segments III, IV and VI. Details of
these pockets of afforestation are given in Table 6.22.
Table 6.22 Location of afforestation projects in Malta
Location area (ha) Sheet number
Mellieha to Mgiebah 10.8 4281, 4080,4280/4281, 4480,/4481
Delimara Peninsula 6.3 5964 and part of 5865
Pwales 4.6 4478
Bahar ic-Caghaq 4.5 5077,5078,5079
South coast 2.1 4467 (Migra Ferha)
F omm ir-Rih to 6.3 3872,3873,3874,3875, Cirkewwa 4976,3877,3878,4079,
3880,3881,3882,3883. Source: Esttmates based on field data and cartometnc measurements
Other pockets of significant dimensions include the western coastal areas from Fomm
ir-Rih to Cirkewwa (Segment I) totalling 6.3 ha. The data shown in Table 6.21 gives
86.1 ha as the total area of afforestation for the Maltese Islands, one-quarter of which
is located in Segment II as shown in Table 6.23.
Table 6.23 Distribution of coastal afforestation projects located in Segment II
Location Area (ha) Mellieha Bay 8.8
Mgiebah 3.0 St. Paul's Bay 5.4
Salini Bay 4.4 Total 20.0
Source: Estimates based on field data and cartometric measurements
211

N
A 0 2 4 8 8km
Figure 6.9
Affore tation areas
Legend
Coastal Zone Boundary
• Afforestation areas
Source: Developed by author from field surveys

The high figure for this segment is accounted for partly by the afforestation projects
undertaken by successive administrations, which saw the 'greening' of garrigue areas
in the north of Malta. The reasons for this policy included the need to embellish the
area (for example the 1.25 ha in segment I), and to cover up as much garrigue as
possible on the ridges. Tree planting in segment V is also notable. Being an area
where residential, historical and industrial areas prevail around the Grand Harbour,
aesthetic motives were prominent here. Table 6.23 presents the spatial extent of these
areas with the proximity ofthe locality.
Twenty per cent of this value of 6.36 ha is located around the Grand Harbour and 80
per cent around Marsamxett Harbour. The industrialisation and lack of littoral space
around the Grand Harbour contributes to its small percentage value. The area around
the Marsamxett littoral is clearly marked, with large coastal urban spaces where public
gardens are located. In other areas, the clusters in Segment III mark projects around
the Ghallis Tower on the coast road near Bahar ic-Caghaq; and the 5.5 ha in segment
X further enhances the aesthetic quality of arguably the prime local rural coastal area.
Table 6.24: Afforestation projects in the localities surrounding the main Harbours of Malta
Grand Harbour Area (ha) Marsamxett Harbour Area (ha) Floriana 0.06 Floriana 0.04 Mars a 0.12 Pi eta 1.75
Senglea 0.12 Manoel Island 1.43 Vittoriosa 0.12 Msida 1.56 Ricasoli 0.12 Valletta 0.04
Total 1.54 Total 4.82 Source: Author's estimates based on field data
(b) Linear dimensions
The distribution of the coastal "afforested" areas in the Maltese Islands is shown in
Table 6.25. In all, 13 km of coastline have some form of afforestation, which
represents about 7.1 per cent of the coastal length, of which 11 km are found in Malta
(approximately equivalent to 8.1 per cent of the coastal length). For Gozo the 2 km
represent 4.34 per cent of the coast.
213
The location of the afforested areas is heavily skewed to the northern shores, with a
2.5 km long stretch of tamarisk and acacia plants growing along the coast road from
Bahar ic-Caghaq to Salina Bay (Segment Ill). This includes the areas on Qalet Marku
peninsula and Ghallis Tower precincts. Further north, from Qawra point to St. Paul's
Bay, a 1.6 km of coast has five sites that have been planted with perennial trees
(Segment II). Ghar il-Fekruna, a small inlet with a cave just north of St. Paul's Bay,
and one of the most aesthetically pleasing areas in the whole of Malta, has been
planted with acacia to complement the carob trees ( Ceratonia siliqua) on the seaward
side of the slope (Schembri and Magri,1996). In Mellieha Bay, the Ghadira nature
reserve complex has also been further vegetated with a 1 km length of afforestation
along the shore facing Mellieha (Segment II). In the northern bays, only Ahrax Point
(Segment I) has been embellished in this way. Of the sandy beaches to the north west
(Segment X), Ghajn Tuffieha Bay and Golden Bay have four pockets of plantations,
amounting to a total length of 750 metres in length, covering most of their area in
plants. The management of Ghajn Tuffieha Bay has been entrusted to the Gaia
Foundation (a local environmental group) and the number of trees planted has
increased. Further south Segments IX and X), along the cliff/rdum areas the only
notable additions to the natural vegetations are at Migra Ferha, Wied iz-Zurrieq and
Ghar Hasan. On the south side of the island, around Marsaxlokk Bay (Segment VIII),
the largest plantation is at Delimara Point with approximately 100 sq. m (93.7 sq. m),
which covers practically the whole peninsula and also the small rocky bays of St.
Peter Pool and il-Hofra iz-Zghira. Other afforested pockets in the south are at St.
George's Bay (Birzebbugia), around Fort St. Lucian and at St. Thomas' Bay.
In Gozo afforestation is practically non-existent along the high cliffed areas to the
south, north and east, with the exception of the areas around Xlendi Bay. The Mgarr
harbour area, San Blas, ir-Ramla and Marsalforn (Segment XIV) have been afforested.
In Comino there are patches around St. Mary's Bay and San Niklaus Bay.
These efforts aesthetically to embellish the coast of the Maltese Islands seem to follow
four broad criteria:
214

a) to enhance the aesthetic value of tourist dominated areas, as is evident along the
northern shores and the afforestation along the south coast of Migra Ferha,
Wied iz-Zurrieq and Ghar Hasan.;
b) to provide public gardens and linear tree plantations along mam road
thoroughfares in the coastal urban areas such as Ta'Xbiex, Msida and St.
George's Bay;
c) to improve the aesthetic quality near beaches, both sandy and rocky. The
Delimara peninsula is an exception, as it does not fall in any of the three
categories mentioned above; and
d) to provide an ameliorated micro-climate, especially in summer.
6.10.7 Conclusion
This land-use category has been isolated from all the others, as a number of years are
needed for the aesthetic qualities to be observed and appreciated. This makes its
management practices different, due to its fragile nature, the cultural risks involved
( cf. above), and because the plants have an importance far greater than their size
suggests. In addition, their aesthetic quality and appearance is highly compatible with
the agricultural environment that will be described next.
Plate 6.6 Malta, Ghajn Tuffieha Bay: Afforestation programmes evident on clay slopes on foreground and natural vegetation on similar in background. Source: Undated promotional material, Malta Tourism Authority.

Table 6.25: Location and length of afforestation areas in the Maltese Islands
Malta Linear Categories Length (m)
(approximate) Beaches Gardens Other
Delimara 1250 -Tumbrel! Point 250 - -
Peter's Pool 200 - -Hofra iz-Zghira (ii-Qali) pocket -
Xorb 1-Ghagin pocket -11-Munxar (1/o) pocket -St. Thomas Bay 200 -Rinella Creek pocket -
(Excelsior Hotel site) pocket -Piela' to Msida 1250 - -
Msida 50 -Ta' Xbiex garden -
Manoel Island -Hilton Hotel -
Bahar ic-Caghaq (2) 300 -Qalet Marku (2) 250 -
Ghallis (2) ]2500 -Salina Bay (3) -
Qawra 500 -
St. Paul's Bay (5) 1000 -Ghadira (3) 1000 - -Ahrax Point pocket -
11-Pra.ijiet pocket -Golden Bay ]750 -
Ghajn Tuffieha Bay (2) -Migra Ferha 500 -
Wied iz-Zurrieq garden -Ghar Hasan 250 -
Total 10,250
Gozo
Mgarr (2) 500 -San Bias 200 -
lr-Ramla (2) 300 -Marsalfom (2) 400 -
Xwieni Bay pocket (50m) -Ghar ii-Qamh 250 -
Xlendi 250 -Total 1950
Source :author's estimates from field surveys and cartometric measurements
216

6.11 Arable Land
6.11.1 Introduction
The two land use categories that follow deal with the rural aspect of the coastal zone.
Arable land and undeveloped areas together constitute about two thirds of the coastal
zone. In addition, the aesthetic value of these land uses is high, as the dense
development associated with the coastal urban land use categories is generally
lacking. The land use category to be examined in this section is arable land and a
distinction will be made between land which is currently cultivated and land which is
lying fallow. The main reason for this is to try and identify these coastal areas that are
prone to land abandonment and others that are actively producing crops. The
distribution is shown in Figure 6.1 0.
6.11.2 Background Information
Agriculture is one of the main traditional economic sectors of the Maltese Islands.
However, in recent times a number of constraints have limited this activity to a
peripheral one with the decrease of agricultural land being a major problem. In I957,
138.6 km2 of land was devoted to all forms of agriculture. In I983 the total
agricultural area was 93.3 km2 or 29.I per cent of the surface area of the Maltese
Islands, with arable land making up 88.4 per cent. Arable land is classified into three
categories, namely, irrigated, dry and waste (National Statistics Office, 2002). In this
thesis just over a quarter of the coastal zone in the Maltese Islands is classified as
arable. Of this 72.4 per cent is found in Malta and 27 .I per cent in Gozo and Camino
(Table 6.3). As a linear measurement, 23 per cent of the coast of Malta is identified
with agriculture and 57 per cent in Gozo and Camino (Anderson and Schembri, P.J.,
I989). In the I998 survey the areas representing agriculture were estimated to cover
an area of 350 ha in Malta and 133 ha in Gozo and small patches in Camino, in all
totalling approximately 500ha.
Although 40 per cent of the surface area of the Maltese Islands is cultivable there are
problems. For instance, 65 per cent of the fields are less than I hectare in area, and 80
per cent are less than 2 ha. Another problem is that the number of full-time farmers
has declined from 59I6 in I975 to 2966 in I992 and to 2I29 in 1998 (National
Statistics Office, 2002). In a way this is compensated for by an increase in part-time
217
activity, amounting to 12,774 persons. These part-time farmers maintain productivity
by the application of modem agricultural methods, higher quality seeds, more
irrigation water, and intensive farming using drip irrigation systems and appropriate
mechanized tools. These factors also account for the increase in food production. In
fact, data for Gozo alone showed a 23 per cent increase in food production in one year
(The Times [of Malta] 9 October 1995) with the wholesale value of agricultural
products sold through organized markets was worth Lm 1.54 million in 1999. At the
same time 10 per cent of Malta's imports are for food, valued to about Lm 100 million
(Central Office of Statistics, 2000). The third problem is land tenure, as only 5 per
cent of the arable land belongs to the farmer, the rest remaining with absentee
landlords and the Government. In 1992 the Roman Catholic church, which
traditionally did not give much of its land for non-agricultural purposes, passed on its
property to the Government in return for educational subsidies. Future options for the
development of agriculture could be influenced by a measure of land reform to
allocate unused land to farmers. A fourth problem is the depletion of agricultural land
by the extension of the urban areas to accommodate the increasing population and the
needs of industry and tourism, together with the over-extension of a number of
quarries. Although successive administrations have invested money for the
revitalization of this primary economic activity, the problems of lack of water, poor
soil, small parcels of land or small fields have taken their toll on the agricultural
output of the islands, with the result that a fifth problem of the abandonment of arable
land has emerged.
6.11.3 Justification for study
The justifications for including arable land and agriculture in a study of coastal land
use is that a good portion of the coastal zone is made up of arable land and most of
the developments associated with the urban land uses are in fact areas where
agriculture was formerly practiced. Coastal zone agriculture has never been identified
in these Islands as a separate entity from the rest of the local agricultural land and it is
through this exercise that agriculture along the littoral has been brought into focus. In
addition, the element of abandoned arable land is given importance, as it is mainly this
type of land use that is first earmarked for development, especially as about half of the
arable land along the littoral has largely been abandoned. Although the problems of
218

agriculture along the coast are not very different from those for agriculture found
inland, the importance of coastal land being used for agriculture is that it enhances the
aesthetic qualities of the zone. Even abandoned land, which in this thesis is also
classified as arable, because of its potential in crop production, has its own aesthetic
qualities. Furthermore, bird-trapping sites, concentrated largely all around the littoral,
make extensive use of abandoned agricultural land. The recent public awareness of
the negative impacts of bird-trapping and hunting also calls for a detailed appraisal of
abandoned coastal agricultural land.
In addition, as about half of the land along the littoral is largely abandoned, it turned
out to be necessary to identify and map it precisely. With industrial, residential and
touristic investment projects maintaining momentum, the replacement of abandoned
agricultural land with built-up structures can be a real threat anywhere along the coast,
especially within areas that have been included in building schemes. In addition, as
most of the coastal agricultural holdings are formed of small pockets of shallow soil,
they can never provide a full-time job. The survey can thus identify areas where the
building over and development of arable land has a greater chance to occur. As a field
by field survey of the Maltese Islands was last done between 1955 and 1958 by a
group of Durham geographers (Bowen-Jones et al, 1960), the time was now ripe for a
review of at least a part of the original survey.
6.11.4 Definitions and criteria used for field identifying features
Arable land is land that can be worked by plough or spade. The broader definition of
agriculture is an activity "concerned with the growing of crops and the rearing of
livestock, however some restrict the term to the growing of crops alone" (Small and
Witherick, 2001, 5). In fact, in this thesis standing or evidence of cropping were the
main criteria used to identify arable land. Evidence of cropping was taken when fields
had an overall absence of dried weed stumps from previous years, the rubble walls
were still in place through most of the field perimeter and no evidence of exposure of
the bedrock was evident.
Mapping agricultural land use was difficult in that it presented itself in a number of
formats in different locations: as a very productive unit in valley-mouth bottoms just
219

behind coastal inlets with sandy beaches, typical of the northern parts of Malta and
Gozo; as a dry-land agriculture type along the eastern and south-eastern rocky coasts
of Malta and southern Gozo; and as small fragmented patches but highly fertile zones
in scree slope areas in both islands. In all cases physical field sizes tend to be small
because the scree slope areas and valley bottoms and sides of valleys near the littoral
tend to blend with a rugged and steep topography. This encourages field terracing,
presenting a patchwork of small, elongated field patterns. The demarcation of fields is
achieved by rubble walls, another characteristic form of the arable rural landscape.
These are built for a number of purposes: as protection against soil erosion and
gullying; as a wind protection; and as the best way of increasing the amount of flat,
arable, ploughable land available on steep slopes.
For the identification of the abandoned arable land, a number of criteria were
established to determine this type of land use as it tended to camouflage and blend
with areas of bare rocky outcrops that had to be mapped and classified with the areas
of undeveloped land that form the next section in this chapter. In this regard, the areas
that posed the most problems were the gently sloping zones on Malta's east coast and
the rugged western rdum areas with the small field pockets located between large
Upper Coralline boulders strewn on the lower geological strata.
The state of the rubble walls was the main criterion used in identifYing whether land
was in use or abandoned. Built primarily to enhance and increase the area of arable
land where the topographic slope does not permit active agriculture, rubble walls
break a slope into a number of flat fields. Built from the prevailing geological stratum,
they are also a reflection of the local geological rock type. Terraced agriculture is
possible only if these buttressed walls are properly maintained. Varying in height
from one-half metre for clayey soil areas, to two metres, where wind protection and
privacy are sought, they tend to crumble and fall when the sun-baked soil becomes
loose that is used to bind together the patchwork of stone boulders and cobbles with
smaller splinters of rock fragments. Abandoned fields are indicated by degraded
rubble walls and exposed soil and regolith faces. This was taken as the primary
220

criterion m identifying land abandonment. In extreme cases of long-term
abandonment, the exposed rock face had a smoothed rock surface (Plate 6. 7).
Crop cultivation was another indication that helped in the classificaction of coastal
agricultural land. At times it was difficult to identify whether an area was cultivated
or not as the main surveys took place in the summer months, however the state of the
rubble walls, the presence of bare rock exposure and the density and thickness of the
dried weeds gave a good idea whether a field was cultivated or not even though a
winter visit was not conducted. Conversely it was easy to identify coastal summer
agricultural produce in rdum areas due to the presence of reservoirs. The presence of
fodder crops also denoted agricultural activity. These areas were mainly identified
through the presence of sulla which is conspicuous by its crimson flowers at the end
of a stalk. The cultivated variety had a longer stalk than the self-seeding type. The
former type of sulla denoting agricultural land which is in use, the latter denoting
abandoned agricultural land. Sulla was observed in any of three conditions. The first
was where a crop was still not harvested and reached a height of about I metre,
indicating a cultivated field; the second type was where the crop was harvested and
only had a 15 em woody stump remaining above the soil; and the third condition
occurred where short 20-30 em high plants persisted, indicating an abandoned field.
In general, patches of rocky outcrops and a slope in excess of 15 degrees also
indicated field abandonment.
6.11.5 Discussion and analysis
Although 26.1 per cent of land in the Coastal Zone is classified as arable for the
purposes of this thesis (Table 6.1 ), this represents only 6.4 per cent of all the
agricultural land in the Maltese Islands, with almost one-half of this land use category
abandoned. The Tables presented with this section give the distribution of agriculture
along the coastal area and Figure 6.10 shows the distribution. The following
characteristics are evident:
221

Plate 6.7 Malta, Delimara Power Station site: abandoned arable land and dilapidated area with building spoil dumping in rural coastal area. Source : The author

6.11.6 Presentation of Data
Table 6.26: ARABLE LAND. Land use distribution for Malta, Gozo, Comino and the Maltese Islands.
Hectares
Segment land in abandoned Total land in use use land
I 22.8 - 22.8 4.7 II 30.0 28.5 58.5 6.2 III 3.6 4.8 8.4 0.7 IV - - - -v 5.0 - 5.0 1.0 VI 1.2 7.6 8.8 0.2 VII 14.6 7.1 21.7 3.0 VIII 13.1 2.4 15.5 2.7 IX 13.3 14.8 28.1 2.7 X 99.7 60.0 159.7 20.6 XI 11.1 11.3 22.4 2.3
TM 214.4 136.5 350.9 44.1
XII 0.1 - 0.1 0.1 TC 0.1 - 0.1 0.1
XIII 1.5 6.6 8.1 0.3 XIV 10.7 31.4 42.1 2.2 XV 33.0 22.3 55.3 6.8 XVI 0.9 26.8 27.7 0.2 TG 46.1 87.1 133.3 9.5
GT 260.6 223.6 484.2 53.7 Source: Esttmated by author from field data and cartometnc measurements
Key I to XVI- coastal segments (rows) TM- Total of values for Malta TC - Total value for Comino TG - Total of values for Gozo GT - Total of values for the Maltese Islands
Per cent
abandoned Total land
- 4.7 5.9 12.1 1.0 1.7
- -- 1.0
1.6 1.8 1.5 4.5 0.5 3.2 3.1 5.8 12.4 33.0 2.3 4.6
28.3 72.4
- 0.1 - 0.1
1.4 1.7 6.5 8.7 4.6 11.4 5.5 5.7 18.0 27.5
46.3 100
223

(a) Three-quarters of all the arable land (cultivated land which is in use together with
land which is abandoned) are found on Malta the rest on Gozo and Comino; this data
shows that the arable land is found almost in the same proportions in the coastal zone
as in the rest of the respective islands (cf. Chapter 1) for area (68:32 per cent) and
coastal length (76:24 per cent).
(b) Almost one-half of the distribution on Malta is concentrated in segment X.
(c) Segment II has the second highest figure for Malta.
(d) Gozo is well represented in that coastal segments XV and XIV are, respectively,
third and fourth on the list for the whole of the Islands.
Agricultural activity is present all around the coast of Malta, with a limited presence
only in the area from Pembroke (Segment III) to the Harbour areas (Segment V). The
highest concentration is found in the rdum areas from Fomm ir-Rih to Ghar Lapsi on
the southern cliffed coast (Segment X). These areas (Figure 6.1 0) have a regular
supply of water from perennial springs and are sheltered from northern and easterly
winds by the high cliffs and from the southern and western winds by Upper Coralline
boulders. The geomorphological set-up of these areas, with a height above sea-level
of about 50 metres and a sloping profile that accommodates substantial agriculture,
also contributes to different conditions found on the plateau above or in other parts of
the coastal zone. The other areas in Malta where active agriculture is extant are
located in the north-eastern coastal areas that form part of the Salini Bay, Burmarrad
and Ghadira agricultural areas (Segment II).
Arable land abandonment in Malta is mainly apparent in the regions which lack
perennial water. This condition is also seen in Gozo, where coastal agricultural land
abandonment is most evident in the south western, west and north-western region
from Xlendi to Marsalforn. (Segments XIV to XVI). Although data referring to land
owned or cultivated by emigrants from Gozo is impossible to obtain, the high rates of
emigration in the 1950s and 1960s coincided with a decrease of cultivated land during
the same period. The land taken up by quarrying has also caused the loss of land for
agriculture in Gozo.
224

Figure 6.10
Arable land
Legend
• • Coastal Zone B oundary
Land in current use
Land abandoned
Source: Developed fto fi 1
by author m e d surveys

In Malta, as a linear measure, agriculture occurs in less than a quarter of the coastal
zone, but is far more in evidence in Gozo and Comino. As a proportion of the total
coastline of Malta, fields abandoned constitute I2 per cent and fields in use II per
cent. (I989 survey results). For Gozo and Comino, the percentages were respectively
41 and I6.
Another issue pertaining to agricultural land is abandonment, examples are shown in
plan in Figures 6.I1 and 6.I2. In Malta almost 40 per cent of this land in the coastal
zone is abandoned, whilst for Gozo and Comino the figure is 65.5 per cent. These
figures represent about ten per cent of the coastal zone for Malta and 25.2 per cent of
the Coastal area for Gozo and Comino. For the Maltese Islands as a whole,
abandoned agricultural land is equivalent to 15.0 per cent of the coastal zone.
Agricultural land in use amounts to 12.6 per cent of Malta's Coastal Zone and 3I per
cent of Gozo's Coastal Zone.
6.11.6.1 The main coastal agricultural regions
Four regions can be separately identified in the coastal zone:
(a) the rdum areas on the western part of Malta;
(b) the lowland areas on the north-eastern seaboard;
(c) the south of Malta; and
(d) Gozo and Comino
(a) The rdum (scree slopes) areas on the western part of Malta
This part of the coast is one of the most fertile on the island. Agriculture is intensive,
with summer fruit trees adding on to the usual variety of tomatoes, vines and
vegetables. The presence of perennial springs, issuing from fissures between the Blue
Clay outcropping beneath the capping Upper Coralline formation, ensures a reliable
supply of water, even during the summer months. Irrigation channels distribute this
water in the fields. Sulfa grows in areas where the water supply is inconsistent or the
network of water channels does not reach.
226

• •
•
•
.. . • • • •
SOm
Figure 6.11 Malta, West coast: pocket arable land with stream in scree slopes

"e
= .! ~ -,Q
f ~
~J .. Q s c
N ...-I
~ ~ ~ = ~ ·-r..

The sectoral subdivision being used in this work is reproduced for agriculture in Table
6.26. This shows the predominance of agricultural activity in the rdum areas, where
almost two-thirds of the coastal area from Il-Kullana to Ras ir-Raheb (Segment XI) is
devoted to agriculture. This area accounts for 40 per cent of the coastal zone
agriculture in Malta. Although land abandonment is common in this sector, the area
represents the longest continuous stretch of coast devoted to agriculture ( eg. Figure
6.13). The success of agricultural activity in this area is mainly due to the availability
of water from perennial springs, with a further contribution from the Mtahleb area,
which provides the catchment area for three valleys: Wied Ghar Ilma, Wied ir-Rum
and Wied Migra Ferha (SegmentX). An eight kilometre stretch of agricultural activity
is present along the coastal zone, sheltered by the south western Upper Coralline
Limestone plateaux and located above the Lower Coralline cliffs that plunge from
150m at Rdum Dikkiena and Rdum Dun Nazju to 75m at the coastal edge of the
Mtahleb area to Ras ir-Raheb (Segment XI). Agricultural activity increases in Mtahleb
and the Rdum tas-Sarg (Segment XI) vicinity as the terrain assumes gentler slope, thus
necessitating less frequent rubble wall terracing, with the result that individual fields
are larger in size.
Product-wise this area can be divided into two: the first part from Rdum Dikkiena to
Rdum Dun Nazju where animal fodder, and cash crops are the main products, whilst
in the second part, from Mtahleb to Rdum tas-Sarg, kitchen garden products,
tomatoes, legumes and also fruit trees are prevalent (Segment XI).
As mentioned earlier, land abandonment is also evident in this otherwise highly
productive agricultural environment. This land is located towards the northernmost
and southernmost parts of this sector, especially towards the cliff edges, where the
terrain rises at 15-20 degrees. This slope encourages the abandonment of land due to:
(a) the small land parcels brought about by intensive field terracing; (b) the difficulty
in using agricultural machinery; and (c) the problems associated with bringing up the
produce. The lack of use has meant damage to rubble walls, followed by soil erosion
229

"0 c .!!
G,j
::c CIIS a. = .w ""' CIIS Q u -""' G,j
~ = -
~] -; ~ ~ ..... ..c G,j a. = 1:)1) .... ~

and gullying, and in some cases exposure of the bare rock. Some of these abandoned
areas are strewn with self-seeding sulla, which although smaller in size than the
cultivated variety, is used to supplement animal fodder. Other areas in Malta where
coastal agriculture is successful are found just further south of ii-Kullana at ix-Xwieki
limits of Gebel Ciantar (Segment X), where the agricultural environment resembles
that of the Kullana to Ras ir-Raheb area. A one kilometre belt of fertile agricultural
land about 200 metres wide, together with five pockets totalling 6.4 ha at Wied Fulija,
Fomm ir-Rih, Ghajn Tuffieha, Rdum il-Qammieh and Paradise Bay (all in Segment
XI), make up the southern and western half of the island.
Abandonment of agricultural land (Table 6.26) is especially evident from Ras il-Wahx
to Rdum il-Qammieh, (Segment XI) where a 1 km stretch around Qammieh Point
peninsula has been taken over by bird-trapping enthusiasts. The remaining area
within this 40 km length of southern and western coast of Malta is also noted for
apparently never having been cultivated. Certain factors account for this: (a) the
distance from the nearest settlements of Manikata, Mgarr, Dingli on the northern part
and Qrendi, Zurrieq (Nigret and Bubaqra), and Benghisa on the southern part; (b) the
lack of accessibility along the rdum areas; (c) lack of perennial water springs in the
southern half from Ghar La psi to Benghisa (Segment IX); (d) the effects of the former
aerodrome at Hal Far. Topographically speaking, the southern half of this stretch of
coast is mainly flat and the plateau is punctured by a number of widien. Its watershed
is independent from the rest of the island, giving a very small flood catchment area
that does not help to maintain a regular supply of water. Agriculture in these areas is
unaffected by urban sprawl.
(b) The Lowland Areas
Coastal agriculture in these parts exploited the northern fertile areas formed by
alluvium deposited by ancient water courses that flowed throught the valleys in a
wetter, pluvial period about 10,000 years ago. Agriculture is still very active, using a
regular supply of water pumped up from the shallow sea-level aquifer by windmills.
The flat nature of th~ terrain precludes the need for high boundary walls.
231

The other coastal area where successful agriculture takes place, and land abandonment
is minimal, is along the northern part of Malta from Cirkewwa to Ahrax (Segment I).
Representing 4. 7 per cent of the coastal zone arable land for Malta, this area has a
thriving agricultural activity due largely to the availability of water in perched
aquifers, where the Blue Clay acts as an aquiclude below the exposed Upper Coralline
Limestone. Wind driven water pumps bring water to the surface and characterize the
aesthetic environment of the northern coast.
Along the north-eastern coast, from Ahrax point to Ghallis (Segment III), agriculture
is mainly found along the perimeters of Mellieha, St.Paul's, Mistra and Salini Bays
(Segment II). Much of the soil here has been formed from alluvium deposited during
the Holocene. The presence of shallow sea-level aquifers, resulting from the land
subidence that formed the Horst and Graben topography in the areas to the north of
the Great Fault, ensures a reliable supply of water throughout the year. The flat terrain
facilitates the use of agricultural machinery and field sizes are large enough to
mitigate against the partitioning resulting from Maltese inheritance procedures, when
the patrimony is divided up equally between all surviving offspring.
Abandoned agriculture is mainly found in this area along the Tal-Blata promontory.
Distance from the nearest settlement, together with development prospects and a lack
of regular water supply have caused land abandonment in this area. Of the remaining
areas in Malta, from Ghallis to Benghisa (Segments IV, V, VI, VII and VIII), only
12.2 per cent of coastal zone has agriculture. The lack of a regular water supply, the
tourist, industrial and urban developments, have depleted the number of full-time
farmers and caused widespread land abandonment, have led to a situation where only
about 35 ha of agricultural land in use is found in pockets at Bahar ic-Caghaq
(Segment III), Ricasoli (SegmentVI), StThomas Bay, Hofra 1-Kbira u Hofra z-Zghira
(all in Segment VII), Marsaxlokk and il-Ponta 1-Kbira (Segment VIII), on either side
of Fort St. Lucian. Abandoned land occurs in stretches, the longest being one of 4
km, from Ricasoli to Zonqor Point at Marsascala and on the outer side of Delimara
peninsula.
232

(c) The South of Malta
Agriculture in this part of the Island has suffered greatly from the lack of water
supply, with the area from Ricasoli to Marsascala (Segment VI) having very little
agricultural activity. The only areas where sizeable pockets of activity were noted
were in the Hofra z-Zghira and Hofra 1-Kbira precincts. There are two main reasons
for this:
i) the rock stratum here is chiefly made up of Upper Globigerina Limestone, with a
layer of clay underneath that gives a soil rich in clay. Thus water is retained within
the soil for longer periods;
ii) most ofthe agriculture is practised along the sides ofwidien and valley bottoms;
iii) alluvium carried down enhances soil fertility.
The main result of the agricultural abandonment in these areas is bird-trapping and
hunting. They have the advantage of facing south east and east, are topographically
elevated at 100 m above sea level, and are situated about 2 km away from of the main
urban residences and major road communication networks. A sewage treatment plant
in the limits of Marsascala has been constructed to stop land abandonment by the
provision of water for irrigation. But this method has not succeeded in promoting
agriculture in that irrigation has not yet reached the coastal areas mentioned. The plant
is only operating at half capacity and all the local farmers still consider farming as a
part-time activity. Unfortunately, with the increase in land given over to industrial and
ancillary activities in the South of Malta, potentially fertile agricultural land may
never realise its potential.
(d) Gozo and Comino
Agriculture in the two smaller islands has also suffered the same fate as the island of
Malta. Land abandonment has been further accenuated with a sharp decrease in full
time agricultural labour. Alternative employment in Malta and elsewhere has been the
main reason, even though Gozo is well-watered, with the presence of perennial
springs. In fact it is only in these areas where Blue Clay slopes are found that coastal
agriculture has thrived in two areas, one to the north east and the other to the south of
the Island. In all the other areas, from Xlendi (Segment XV) Marsalforn (Segment
XIV), land abandonment is evident. At least a I 0 km stretch can be identified.
233
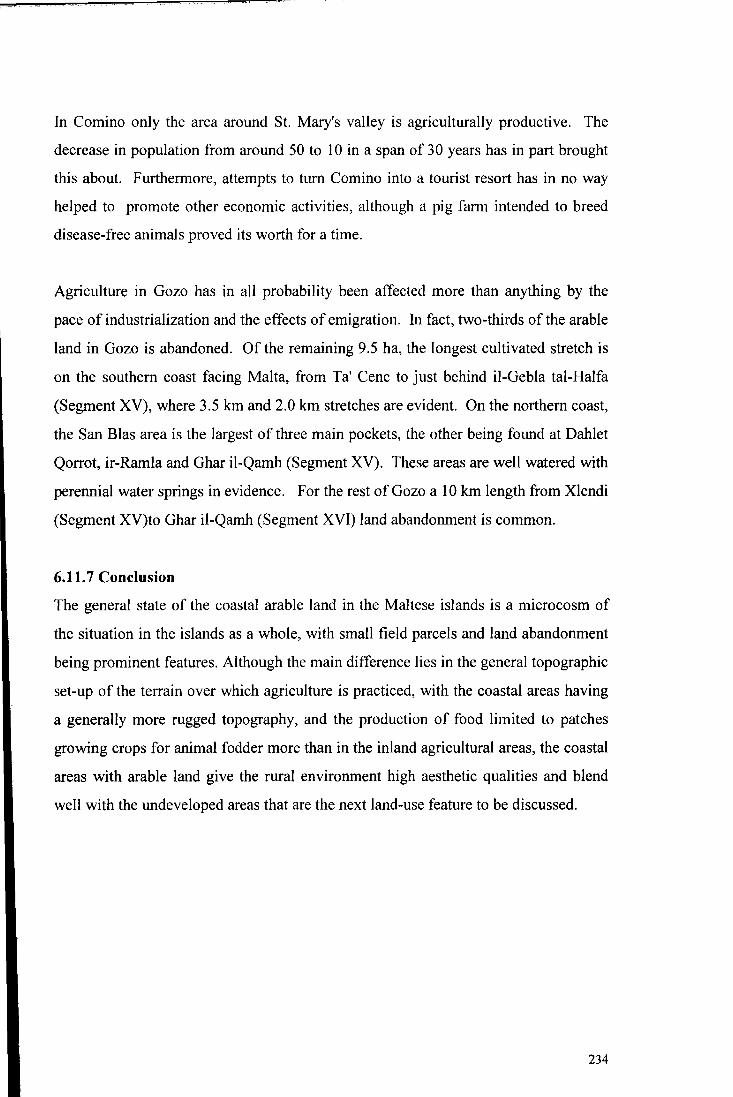
In Comino only the area around St. Mary's valley is agriculturally productive. The
decrease in population from around 50 to 10 in a span of 30 years has in part brought
this about. Furthermore, attempts to turn Comino into a tourist resort has in no way
helped to promote other economic activities, although a pig farm intended to breed
disease-free animals proved its worth for a time.
Agriculture in Gozo has in all probability been affected more than anything by the
pace of industrialization and the effects of emigration. In fact, two-thirds of the arable
land in Gozo is abandoned. Of the remaining 9.5 ha, the longest cultivated stretch is
on the southern coast facing Malta, from Ta' Cenc to just behind il-Gebla tal-Haifa
(Segment XV), where 3.5 km and 2.0 km stretches are evident. On the northern coast,
the San Bias area is the largest of three main pockets, the other being found at Dahlet
Qorrot, ir-Ramla and Ghar il-Qamh (Segment XV). These areas are well watered with
perennial water springs in evidence. For the rest ofGozo a 10 km length from Xlendi
(Segment XV)to Ghar il-Qamh (Segment XVI) land abandonment is common.
6.11.7 Conclusion
The general state of the coastal arable land in the Maltese islands is a microcosm of
the situation in the islands as a whole, with small field parcels and land abandonment
being prominent features. Although the main difference lies in the general topographic
set-up of the terrain over which agriculture is practiced, with the coastal areas having
a generally more rugged topography, and the production of food limited to patches
growing crops for animal fodder more than in the inland agricultural areas, the coastal
areas with arable land give the rural environment high aesthetic qualities and blend
well with the undeveloped areas that are the next land-use feature to be discussed.
234

6.12 Undeveloped Land
6.12.1 Introduction
With the high population density and the intense pace of development in the coastal
zone, together with the presence of areas devoted to agriculture, the areas that are as
yet undeveloped are limited in the Maltese environment. However, there has been less
pressure in the north of Malta and Gozo for two reasons: first the tendency for
residential and recreational areas to cluster together in accessible zones and, second,
the grouping of marine-related industries in the southern coastal areas. In general
these are located in areas away from the coastal urban zones. The purpose of this
section is to review the location of these zones. In addition, the differentiation of this
land use category into four separate land uses has helped in identifying the land use
type which in this section is more prone to attract development.
6.12.2 Background Information
Natural vegetation (not planted by humans) was an important component in the
coastal land use studies. It was used in the 1989 survey and retained in the 1998
survey as one of the identifying factors in demarcating the landward limit of the
coastal zone ( cf Chapter 1 ). In this section vegetation will be used as an indicator to
distinguish between two of the four land uses grouped under the undeveloped land
category, namely garrigue or steppe maritime vegetation, these are demonstrated in
Figure 6.14, and rupestral or rdum vegetation, shown in Figure 6.15. The latter
normally has pockets of arable land, whilst the former is devoid of any agricultural
activity as soil erosion is widespread in this type of environment. The other two
categories are distinguished by the absence of any vegetation and generally identified
by the type of rock prevailing.
Natural vegetation in the Maltese Islands is typical of a Mediterranean type of climate
where the semi-arid environment, the shallow and humus-deficient soil, coupled with
the effects of humans, have together conditioned the natural vegetation of the Islands
to the maquis, garrigue and steppe plants. Studies on the Mediterranean and Maltese
vegetation have a long history but citing the most significant accounts in Tomaselli
(1977) for the Mediterranean and Haslam and Royle (1968), Haslam, Wolsey and Sell
235

( 1977 for Malta. In Duca and Zammit ( 1989) for the Maltese Islands, one can decipher
the number of halophytic (salt-tolerant) species that are significant along the coastal
margin and for distinguishing the major vegetation biomes prevalent. In addition, a
pictorial guide (Sultana and Falzon, 1995) was a great aid in identification.
Another main indicator to distinguish the main features in this section were
landforms. Although through experience the four categories mentioned here are easily
distinguished the literature backing the observations was important. Textbooks that
review coastal landforms formed the basis for the studies (Strahler and Strahler, 1984;
Waugh, 2000), specialist sources dealing with specific features such as shore
platforms (Sunamura, 1972; Trenhaile, 1987) and for the local situation (Buttigieg,
Vassallo and Schembri, 1997). The literature dealing with the scree slopes include
works by Alison (1998), and for the local situation Schembri and Magri (1996)
provide the background. Using the case study of Gozo, Ellenberg (1983) reviews the
coastal geomorphology of the Gozitan coast. The author identified four main types,
with garrigue and steppe vegetation prevalent on the western, northern and north
eastern coast; maquis on the western rdum areas; cliffside vegetation along the
southern margin; and the rest identified as maritime maquis. The latter is typical of
areas along the eastern sea board where human impact is the greatest. Cultivated
areas shown as a separate category are found within rdum and valley bottom areas.
The lack of natural vegetation along the coast of the Maltese Islands is further
aggravated by a saline microclimate. Thus only salt-tolerant vegetation can thrive.
Haslam et. al. ( 1977) estimated that only 14 per cent of total floristic species occur
along the coast. The breakdown is given as follows in Table 6.27.
236

Figure 6.14 Comino: undeveloped coastline in remote coastal rural areas showing a predominantly "garigue" environment.
/. ( .
J. . .
. .
. .
.. ..
. .
. . .
·.·{P.
. . .
. . I" . /
..
SOm
Figure 6.15 Gozo, ,San Bias: Land use pattern typical of scree slope (rdum) areas with garigue plateau and pockets of arable land in valley leading to small inlet with beach

Table 6.27: Coastal flora as a percentage of total flora for each category of geomorphic feature in the Maltese Islands.
Geomorphic feature Per cent of Total Flora*
Sloping rock_y shores 5.0 Coralline cliffs 1.8
Clay or soil slopes 1.7 Sandy bays 3.6
Salt marshes 1.7 In sea water 0.3
*Only 12 per cent of the above have a totally terrestrial substatum
Source: Haslam et. al., 1977
6.12.3 Justification for study
A study of undeveloped land is justified for a number of reasons, prominent among
which are the following:
(a) it provides the open spaces needed for recreational purposes;
(b) many consider it as aesthetically acceptable;
(c) it provides a natural habitat for a number of flora and fauna;
(d) it blends well with the agricultural environment, presenting relatively large tracts
of open countryside and enhancing coastal scenery; and
(e) parts of it have high value investment potential and are therefore very prone to
development.
6.12.4 Definitions and criteria used for field identification
Undeveloped land can be defined as that which has as yet not accommodated any type
of major human modification such as urbanization or changes to the littoral by the
construction of breakwaters or other major land reclamation projects. For the purposes
of this thesis, undeveloped land (Plate 6.8) can be identified through a number of
factors:
(a) the predominant geomorphological features are still, to a large extent, the result of
physical processes, and have not yet been built over;
(b) where present, a natural vegetative cover prevails; and
(c) cultural features are largely absent.
239

In addition the definition used by Olsen and Seavey (1990) confirms the interpretation
given to the undeveloped parts of the coast definition used for the land use categories
in this thesis. In fact "bedrock ledge", "boulder-strewn areas" and "rock pools" are
clearly important markers in interpreting the land uses in this category. The scenic
value of these areas is also confirmed.
" Rocky shores include naturally occurring shorelines composed of bedrock ledge or boulder-strewn areas, extending from below mean low water to above the mean high water mark. These areas frequently contain tide pools. Many rocky shores are well recognized for their scenic value. Rocky shores are often important tourist attractions, and are used for surf casting and skin diving by increasing numbers of people." (Olsen and Seavey, 1990, 61).
Four elements make up this land use category. Two of the elements are distinguished
by the geological and geomorphological properties, namely the Unvegetated Coastal
Rock and Coastal Rock Platforms, the other two elements are distinguished primarily
by the type of vegetation growth and secondarily by the rock type, namely, Steppe
Maritime Vegetation, associated with steep rocks and cliffs, and Rdum Rupestral
Vegetation, associated with scree slopes. A short description of the four main
categories follows.
(a) Low sloping unvegetated rock areas
This type of rock is low-lying, predominantly composed of Upper or Lower Coralline
limestone formation. The generally exposed nature of the rock is due to its low
profile, making areas near the shoreline vulnerable to storm surges, sea spray and tidal
changes. Although the formation is highly pitted (containing numerous small circular
holes of about 2 ems in diameter) the adverse marine conditions decrease the soil
trapping facilities associated with this type of formation further inland, and limit the
growth of vegetation. The main environmental threat to these areas comes from
attempts to cover the surface of these areas in concrete to make them easier to walk
on. Vegetated coastal rock is predominantly made up ofUpper Corollaine Limestone
240

Plate 6.8 Malta, South East coast: Typical Globigerina Limestone cliff. Source: The Times [of Malta], Property and Construction Supplement 13 May 2001, pill.

or Lower Corollaine Limestone. The general topographic conditions are rather
similar, with low sloping areas of around 2° - 5°. However, the pitted nature of the
geological properties of these outcrops places these surfaces on a different frequency
to those mentioned.
These include:
• the growth of vegetation due to trapping of soil and other particles washed down
from the hinterland;
• trapping of water in pools; and
• a lack of physical accessibility over the rock surface itself (Segment 1).
The latter condition regulates human use along the littoral where the pitted surface is
present. This rock provides particles for sand and sandy beach formation by erosion.
The bays and inlets along the northern shore of Malta are a case in point. Thus access
to these coastal stretches is restricted to the sandy pockets whereas, in areas where the
smoother Globigerina Limestone prevails, human use extends over most of the
littoral.
(b) Coastal rock platform
This is usually of Globigerina Limestone. It normally has a smooth, easily erodable
surface. Such areas are ideal for all types of maritime activity, especially if they are
located within bays, as they present an accessible and smooth coastline. Such areas
within bays are highly in demand (Buttigieg, M., Vassallo M. and Schembri, J.A.
1997).
Various scientific terms have been used to distinguish these areas from other coastal
geomorphological units. Shore platform, wave-cut platforms are the most commonly
used terms (Sunamura, 1972; Trenhaile, 1987). Although students of these
environments limit themselves to examining these features when they are present in
large spans, the local limited coastal environmental area does not allow for such
spaces. Within the parameters of this land use exercise, shore platforms have been
divided into types depending on the presence or otherwise of vegetation. Essentially
this division distinguishes broadly the following.
242

Unvegetated coastal rock is predominatly made up of Globigerina Limestone, and is
located very near to the sea surge zone that precludes any vegetation growth.
Normally it has a smoothened surface; is occasionally backed by a low cliff line or
steep rock face; and is practically all accessible. These physical factors result in
making these areas highly prone to development, especially where there is an element
of shelter from sea swell in the inner recesses of bays, or where jetties afford physical
protection. In fact they are considered as an extension of the areas where marine
recreational activities occur; the latter were developed partly as a result of a previous
low sloping unvegetated rock sites. Practically all areas on the eastern Malta
coastlines (Segments II, IV, V and VIII), where marine reacreational activities occur,
have these coastal physical geographical properties. As a management option for these
areas more use should be made of those properties to trap soil and water. A project for
the planting of salt-tolerent maquis vegetation especially on the areas nearer the
coastal roads could be embarked upon. A few instances of these do exist, two notable
ones being at Qalet Marku area and Mgarr Harbour in Gozo (Segment XIV).
(c) Steep rock faces and cliffs (garrigue vegetation)
This unit is normally of a Coralline Limestone formation. Its highly pitted nature
enables the trapping of small amounts of soil; the distance from the shoreline
decreases the effects of storm waters; and the lack of protection from the wind
produces stunted vegetation growth. On cliff sides, vegetation growth is conditioned
by the height reached by storm waters. The height above sea level varies from 25-
150m on average. The cultural use of these areas is for bird-trapping and hunting
during the open season. The cliffs also provide good vantage sight-seeing areas,
Dingli Cliffs in Malta and Ta' Cenc in Gozo are typical examples.
(d) Boulder scree areas (Rupestral Vegetation)
This unit is identified by the presence of Upper Coralline Limestone boulders that
have fallen over the other geological formations (as a result of the erosion of the
underlying Blue Clay/Greensand immediately underneath it). The end result is the
presence of Upper Coralline boulders forming talus on the slopes below. In addition,
the boulders that do not reach the far end of the slope or lie at the bottom of the cliff
edge within a flat area, provide an excellent source of natural shelter for plants and
243

produce conditions of humidity and temperature for their immediate environment.
This coupled to the presence of soil formed from the eroding Upper Coralline cliffs,
and the supply of water through natural seepage brought about by the Blue
Clay/Upper Coralline Limestone junctions, provides rdum areas with a distinctive
type of vegetation called rupestral or cliff-side vegetation. These physical conditions
were the main identifying factors for this type of land use.
Out of a total coastal zone area about 38 per cent are devoted to this category; of this,
80 per cent are garrigue and rupestral type areas, whilst unvegetated coastal rock, at
7.5 per cent and coastal rock platform at 10.5 per cent, make up the other two
categories. Thus undeveloped open land comprises more than one-third of the coastal
zone area.
6.12.5 Discussion and analysis
The data for the spatial distribution of this area is shown in Table 6.28, following the
coastal divisions into segments used in the previous sections. Figure 6.16 gives the
distribution on a map of the Maltese Islands. Coastal undeveloped areas are limited
along the south eastern and eastern coastal areas, whilst the segments that make up the
northern segment of Malta i.e. I, II and XI make up one-half of the undeveloped areas
of Malta. The other significant contribution in this sphere is that of segment IX with
7.0 per cent. Examining the various details presented, land classifiable under the low
land coastline type is only 16.5 per cent of all the coastal area under examination,
whilst the remainder is associated with steep slopes, cliffs and scree slopes.
Only zone II has all the four variables represented, even though the two variables
associated with low lying land are very limited in extent. Rdum areas make the most
impact for their limited distribution. Segment IX has the least variability, with
practically all the area occupied by garrigue vegetation, whilst segment V, (Harbour
areas) is notable for the absence of garrigue areas. All the other zones have a
distribution of the three most common rock configurations.
244

6.12.6 Presentation of Data
Table 6.28: UNDEVELOPED AREAS. Land use distribution for Malta, Gozo, Comino and the Maltese Islands.
Hectares
Shore Low Cliffs Scree Total Shore plat- sloping and slopes plat-
forms Rock steep forms slopes
I - 9.4 26.0 1.7 34.2 -II 10.8 13.4 29.3 34.8 94.0 1.5 III 11.3 2.9 33.6 - 47.7 1.5 IV 2.5 6.4 2.1 - 10.4 0.3 v 2.7 2.2 - - 4.5 0.4 VI 3.0 1.7 7.1 - 11.7 0.4 VII 4.2 5.8 10.3 - 20.3 0.6 VIII 0.8 2.0 5.6 - 8.2 0.1 IX 0.4 0.8 49.8 - 51.0 0.1 X - 4.3 16.71 69.6 90.6 -XI 2.4 2.7 26.4 120.9 150.9 0.3
TM 37.5 50.7 205.8 229.5 523.5 5.1
XII 3.6 0.9 33.2 - 37.7 0.5 TC 3.6 0.9 33.2 - 37.7 0.5
XIII 10.9 - 17.4 - 28.3 1.5 XIV 1.6 3.4 9.5 39.8 54.3 0.2 XV 5.4 1.3 61.9 3.0 71.6 0.7 XVI 3.8 1.6 15.5 - 20.9 0.5 TG 21.7 6.3 104.3 42.8 175.1 2.9
GT 63.4. 58.8 344.4 269.8 736.1 8.6 Source: Estimated by author from field data and cartometnc measurements
Key I to XVI- coastal segments (rows) TM- Total of values for Malta TC - Total value for Comino TG - Total of values for Gozo GT - Total of values for the Maltese Islands
Per cent
Low Cliffs Scree sloping and slopes Rock steep
slop_es 1.2 3.3 0.1 1.8 4.5 5.0 0.4 4.6 -0.9 0.3 -0.2 - -0.2 0.9 -0.8 1.4 -0.3 0.7 -0.1 6.8 -0.6 2.0 9.7 0.4 3.4 16.4 6.9 27.9 31.2
0.1 4.5 -0.1 4.5 -
- 2.4 -0.5 1.3 5.4 0.2 8.4 0.4 0.2 2.1 -0.9 14.2 5.8
7.9 46.6 37.0
245
Total
4.6 12.8 6.5 1.5 0.6 1.5 2.8 1.1 7.0 12.3 20.5 71.1
5.1 5.1
3.9 7.4 9.7 2.8 23.8
100

N
A
Figure 6.16
Und veloped areas
Legend
_ Coastal Zone Boundary
lnacce ible areas
• Scree slopes
• Cliffs and Steep rock
Accessible areas 0 Shore platforms, low
sloping rocks, reclaimed areas and beaches
Source: Developed by author from field surveys

The intensive cultural use in all the segments except IX and XI, indicates that
undeveloped areas make up between one-half and three-quarters for the segments in
the southern and north western areas. Segment X has intensive agricultural activity
and thus the natural regions are understandably depleted, even though agriculture
blends well with the natural environment. In fact segments IX, X and XI have almost
their whole coastal zone taken up by agriculture and the undeveloped areas put
together. Including the agricultural element together with undeveloped areas, it is
apparent that, for segments II, III, VI and VII, half the area is occupied by the
undeveloped areas and arable land elements. Segments VIII and IV have
approximately one-quarter of their area devoted to these two land use categories. The
reason is that relatively large areas in these segments reflect the urban land uses, i.e.,
the residential, recreational and industrial activities. The last two segments, namely I
and V, possess the smallest ratios of 0.6 per cent and 4.4 per cent for these land use
categories, respectively, the latter reflecting the urban and industrial character of the
Harbour regions.
6.12.7 Conclusion
The main conclusion regarding this land-use category is that the major physical
division of the island of Malta by the Great Fault is immediately apparent, with the
areas to the north exhibiting 84 per cent of rupestral rdum type of land use. The nature
of the terrain determines the degree of accessibility or otherwise of the coastal areas.
In general, cliffs and scree slope areas, with the associated rugged topography,
generally preclude development. Low sloping shorelines and shore platforms, if
located in areas that are in embayed zones, attract development due in part to the
accessibility afforded by the low sloping profile. In fact, in this land use exercise, the
areas that have uses other than the ones examined in this section all have a good
degree of accessibility. The exception to this rule lies in the dilapidated areas category
where access and topography do not necessarily condition dilapidation. This will be
discussed in the final section.
247
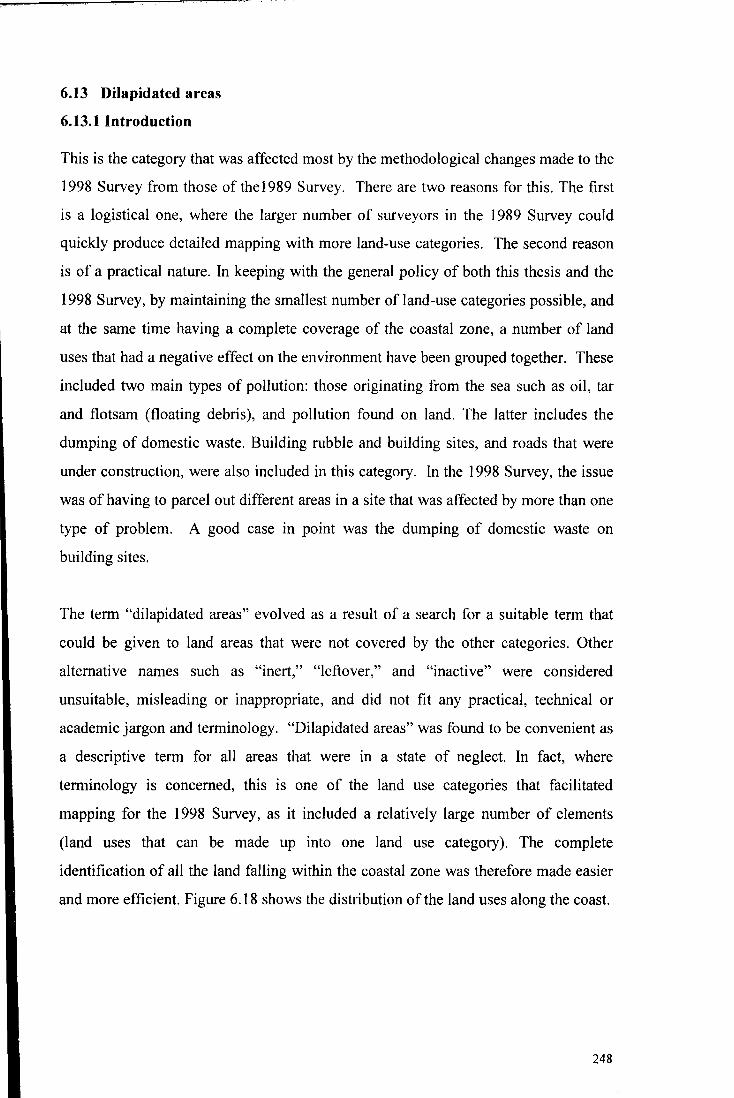
6.13 Dilapidated areas
6.13.1 Introduction
This is the category that was affected most by the methodological changes made to the
1998 Survey from those of the 1989 Survey. There are two reasons for this. The first
is a logistical one, where the larger number of surveyors in the 1989 Survey could
quickly produce detailed mapping with more land-use categories. The second reason
is of a practical nature. In keeping with the general policy of both this thesis and the
1998 Survey, by maintaining the smallest number of land-use categories possible, and
at the same time having a complete coverage of the coastal zone, a number of land
uses that had a negative effect on the environment have been grouped together. These
included two main types of pollution: those originating from the sea such as oil, tar
and flotsam (floating debris), and pollution found on land. The latter includes the
dumping of domestic waste. Building rubble and building sites, and roads that were
under construction, were also included in this category. In the 1998 Survey, the issue
was of having to parcel out different areas in a site that was affected by more than one
type of problem. A good case in point was the dumping of domestic waste on
building sites.
The term "dilapidated areas" evolved as a result of a search for a suitable term that
could be given to land areas that were not covered by the other categories. Other
alternative names such as "inert," "leftover," and "inactive" were considered
unsuitable, misleading or inappropriate, and did not fit any practical, technical or
academic jargon and terminology. "Dilapidated areas" was found to be convenient as
a descriptive term for all areas that were in a state of neglect. In fact, where
terminology is concerned, this is one of the land use categories that facilitated
mapping for the 1998 Survey, as it included a relatively large number of elements
(land uses that can be made up into one land use category). The complete
identification of all the land falling within the coastal zone was therefore made easier
and more efficient. Figure 6.18 shows the distribution of the land uses along the coast.
248

6.13.2 Background information
The high population density and the rapid increase in the socio-economic
development of the island has put a great pressure on the disposal of solid waste.
Data for 2000 has that 1.2 million tons of construction rubble, representing 85 per cent
of all waste, was dumped at Maghtab (National Statistics Office, 2002). The effect of
this on the general environment is noticeable in all areas. Investment in the
recreational market, with the building of hotels and other places of entertainment, the
need to provide residential housing, and the development of coastal industrial
maritime areas, condition parts of the coastal zone into sites of permanent
development. As this thesis examines the spatial distribution of land-use along the
coastal area, the dilapidated areas land use category is directly associated with the
building industry. These building sites generate a number of problems:
• sites are normally surrounded by an area of spoil and of building material debris;
• access roads are partially blocked with debris and building machinery;
• new infrastructure facilities for drainage, water and electricity and new roads have
to be provided, increasing the area of spoil around sites.
6.13.3 Justification for study
In justifying the inclusion of this land use category here, one can cite a number of
factors:
• the negative environmental quality ofthe areas affected by this type of problem;
• the effective change in land use into land for domestic waste; and
• the change of low sloping shore platforms from recreational localities to hazardous
zones due to tar deposition along the littoral.
6.13.4 Definitions and criteria used for field identification
Six elements are associated with this land use category, four linked with the building
industry, with the other two being domestic waste and tar. Our definition of the
dilapidated areas will encompass the following land use type that impinge negatively
on the aesthetic environment these include those associated with the with the building
industry as stated in Chapter 5:
249

(a) Urban wasteland. These areas are generally found in urban zones and include all
pockets of land lying within the built-up area. They were usually found between
separate house block units. This temporary use varied from make-shift car and/or
boat parks to areas where illegal dumping of domestic refuse occurred. Spatially
speaking they afforded open spaces in ribbon-type built-up areas;
(b) Transitional land. These areas are associated with arable land that has been either
abandoned or is in the process of being developed. Normally these are areas that
are adjacent to sites being developed for residential, recreational or industrial needs
but are now derelict and earmarked for development. Essentially they were areas
that were used for agriculture. Whilst urban wasteland is identified as being
surrounded by residential housing, these areas are earmarked for immediate
development;
(c) Recent additions and new constructions. These pertain to the building sprawl and
are essentially an addition to the network of residential areas;
(d) Dumps of building material. Associated largely with the building industry this
land use category is easily identified. Two types of sites are normally identified:
dumps of building material in areas officially recognised for such purposes, and in
areas were it is illegal to follow such practices, (Figure 6.17).
(e) Domestic waste. This includes household refuse and refuse from catering
establishments dumped illegally along the littoral. The most favoured sites are
afforested; and
(f)Tar. Grouped within this land use category, but essentially of a maritime origin, tar
constitutes the end result of oil dumping in the open water which finally reaches the
shoreline. It has been placed within this category for the sake of convenience; it
constitutes only 1.2 per cent of the whole land utilities (1989 Survey).
250

6.13.5 Presentation of data
Table 6.29: DILAPIDATED AREAS. Land use distribution for Malta, Gozo, Comino and the Maltese Islands.
Hectares Per cent Area (ha) Total Per cent
Segment I 6.1 6.1 7.6 II 18.4 18.4 22.9 III 13.3 13.3 16.6 IV 2.8 2.8 3.5 v 12.1 12.1 15.1 VI 9.2 9.2 11.5 VII 3.6 3.6 4.5 VIII 9.1 9.1 11.4 IX 0.5 0.5 0.6 X 0.1 0.1 0.1 XI 3.0 3.0 3.7
TM 78.2 78.2 97.3
XII - - -TC - - -
XIII 1.5 1.5 1.8 XIV 0.3 0.3 0.4 XV 0.2 0.2 0.3 XVI - - -TG 2.0 2.0 2.5
GT 80.2 80.2 100 Source: Estimated by author from field data and cartometric measurements
Key I to XVI- coastal segments (rows) TM - Total of values for Malta TC - Total value for Comino TG - Total of values for Gozo GT - Total of values for the Maltese Islands
Total
7.6 22.9 16.6 3.5 15.1 11.5 4.5 11.4 0.6 0.1 3.7
97.3
--
1.8 0.4 0.3 -
2.5
100
251

6.13.6 Discussion and analysis
A number of features are apparent from the data in Table 6.29:
a) the dilapidated areas category is found along the eastern coast of Malta, all
segments (I-XI) are represented;
b) the areas where intensive touristic development is taking place have a high
percentage of this land-use category with new building construction;
• Segment IV- St. Julian's Bay and St. George's Bay;
• Segment VI - St. Thomas's Bay; and
• Segment VII - Marsascala Bay.
• In Gozo the areas around Xlendi (Segment XV) and Marsalforn Bays (Segment
XIV) are the best examples.
The Freeport terminal at Marsaxlokk Bay in Segment VIII and the Grand Harbour
area in Segment V are linked to industrial development. Segments along the south
and western coast of Malta (Segments IX to XI) possess less dilapidated areas and
are normally affected by the deposition of tar.
The Table 6.29 and Figure 6.18 presented with this section highlight a number of
issues:
(a) a concentration of abusive land uses practices on the eastern coast of Malta
(Segments I to VIII);
(b) the predominance of the urban wasteland category, accounting for one-half of the
total;
(c) areas that feature dumping of building material do not coincide with the urban
wasteland areas, showing that dumped material is transported to selected sites away
from the traditional urban areas;
(d) 80 per cent of the urban wasteland category is located in segments II, III and V;
and
(e) 50 per cent ofthe area with dumped material is located in segment II.
252

Key to land uses
rtl
~ Recreational areas C1J '-ro
CTI ~ Residential areas c: a. E 0 ~ Public utilities
~ Historical sites
II Extractive industries
~ Industrial areas
~ []] = Depositional environments ,_ . Col
~
~ .E Afforested areas .:: ,_ .E H+H Agricultural areas: in use .~
,_ = [[[ill ~ Agricultural areas: abandoned Col ,_ e
D "' Shore platform Col ,_ ...:: = c:J 0 Low sloping rock ;j ,_
B .. -~ Steep rock face/cliff e ~ ~ Scree slopes
~ ~ Dilapidated areas '-e
EJ ~ Direction of stream ·;:;;
"' ~ = 0 Shoreline '"' .c
0 ~ z Coastal zone boundary 0 N
c3 ri ,_ r- .. --~E ... "' ... ~
~~ ·- '-~ =

N
A 0 2 4 • 8km
Figure 6.18
Dilapidated areas
Legend
Coastal Zone Boundary
• Dilapidated areas
Source: Developed by author from field surveys

6.13. 7 Conclusion
This final category has put into perspective the problems in managing land use, in that
the dilapidated areas whether located in urban or in rural areas depreciate the coastal
zone, besides affecting negatively the aesthetic environment. Essentially the debris
accumulated and located in the urban areas mainly consists of refuse material
originating from household and restaurant leftovers, whilst the dilapidated areas in
the rural surroundings mainly consist of dumped vehicles in inaccessible areas with
scree slope and cliffs and tar patches in rural accessible areas. Areas where building
development is taking place and consequently fall within this category are generally
confined to the coastal urban areas. The end result of this is that there is a difference
between the types of dilapidation, depending on the prevailing activities occurring in
the area where dilapidation has been identified.
6.14 General conclusion: sea and ocean uses and concrete areas
A coastal zone management plan generally envisages a plan for sea uses together with
that for land uses. Although this thesis is mainly concerned with land uses, the uses
made ofthe area of internal waters has also to be taken into consideration. However,
this will be done on a qualitative basis in that presenting the data for sea uses at the
same dimensions and scale as for land uses would upset the rigour established in the
thesis, and sea uses of the internal waters are generally conditioned by the physical
fabric ofthe shore and land-based coastal activities.
One of the best indicators that promote an idea as to the linkage of sea uses to land
uses is the presence of concrete platforms. These are constructed along the shoreline
and are generally used to enhance the efficiency of the land/sea interface. Their
presence along the shoreline is demonstrated through the dimensions given in Table
2.11 where 13.2 per cent of the coast is estimated as having a concrete face, the large
proportion constructed along the Malta littoral. Figure 6.19 shows the distribution of
concrete platforms along the littoral of the Maltese Islands. Three factors emerge:
(a) concrete platforms are generally located in areas where a large number ofland uses
occur, such as marine servicing areas and industrial areas, and also residential
areas;
255

p
Er====:==r:r===:E::::~· =r=c--: o 2 4 G 8km
Figure 6.19
Concrete platforms
Legend
Coastal Zone Boundary
ill Concrete platforms
Key to main sea uses
B- mooring of recreational boats
F- mooring of fishing vessels
I -marine-based industry
P - passenger ferry terminal
S- swimming
Y- yacht marinas
I
i I
Source: Developed by author 1 from field surveys I
i l
-------------------------------------------~ ·------

(b) the accessibility of the area is generally high, with a low sloping rock face or shore
platform being the main geomorphological feature;
(c) em bayed areas possess more of their coastline with a concrete face than rectilinear
areas.
Thus coastal segments IV, V, and VIII, which are the urban/industrial segments, have
the greatest length of their shoreline lined with concrete. Segments I, II and VII have a
similar concrete face only in parts of their littoral, generally in the inner recesses of
Bays. The other segments have a notable absence of concrete faces and very little land
claim.
Sea uses along the coast of the Maltese Islands reflect two main issues. First is the
degree of accessibility of the coast from the landward side. Coastal areas that have a
low degree of slope are normally accessible with the result that the adjacent waters are
intensively used. Secondly the shoreline is generally concreted over to enhance
accessibility and accommodate ancillary uses such as jetties and boat slipways. In
many areas breakwaters have also enhanced the efficiency of the shoreline and
associated internal waters by providing all-weather zones and increasing the servicing
area around a bay especially when the breakwater edge that faces the bay is only a few
centimetres above the water line. In addition, the dredging of parts of the sea bottom
in bays and harbours permits the servicing of vessels with a deep draught.
Figure 6.19 shows the areas that are concreted over and the predominant sea uses
adjacent to the shoreline. These sea uses are distributed among six categories. Their
distribution is conditioned by the degree of slope of the shoreline and the general
indentation of the coast: the greater the indentation and the lower the slope the more
intensive is the use of the coast ( cf. Chapter 3 ). Another consideration that has
emerged is that with the exception of the distribution of industrial activities in Grand
Harbour most of the large scale coastal activities and projects whether of an industrial
or recreational nature are occurring at the outer reaches of bays and inlets or in areas
having a rectilinear coastline. This issue will be tackled in the concluding chapters of
this thesis, however the focus of the next chapter will remain on a detailed description
and analysis of each segment of the coast.
257

Chapter 7 A discussion of the coastal segments
7.1 Introduction
In the preceding chapter the discussion centred around coastal land use as seen from
the aspect of the whole littoral area for each separate island. The main distinction that
was made was between land uses that had either a predominant urban or rural
character and that will be retained. The argument now focuses on examining the land
uses for each segment (I to XVI). Table 7.1 demonstrates the varied dimensions of
the segments. These include variations in coastal zone area, littoral length and mean
coastal zone width.
T bl 7 1 S I t d d t ~ II a e . : e ec e a a ora t I t coas a se2men s Area (ha) Length Mean
Segment (km) coastal zone width (m)
I 89.4 7.4 120.8 II 253.7 23.8 106.6 III 115.7 8.0 144.6 IV 48.2 7.7 62.6 v 193.3 25.6 75.5 VI 38.1 6.3 60.5 VII 69.1 13.8 50.1 VIII 96.9 10.8 89.7 IX 101.5 17.3 58.7 X 258.0 12.5 206.4 XI 194.8 21.6 90.2
Mean: 124.5 14.1 96.9 Malta XII 42.5 8.1 52.5
Camino XIII 45.2 5.5 82.2 XIV 114.9 13.1 87.7 XV 142.3 20.9 68.1 XVI 51.0 9.6 53.1
Mean: 88.4 12.3 72.8 Gozo
Mean: all 115.9 13.3 88.1 Islands
Source: Compiled by author from cartometric measurements
258

7.2 Segment I
7.2.1 Physical Attributes
The Segment stretches from Cirkewwa Point to 1-Ponta ta' 1-Ahrax is 7.4 km in length
and has one of the shortest lengths of Segments for the Maltese Islands, amounting to
3.5 per cent of the total coastline. The total area of the coastal zone is 89.6 ha and the
average width of the coastal zone is 120.8 metres. The orientation towards the north
and northwest in addition to the low, sloping profile influenced the author to identify
this segment separately from the other adjacent ones, i.e., Segments II and XI,
conditioning the size. However, the Segment has a large number of land uses when
compared to other coastal segments. Eleven land uses were identified with coastal
units 2 and 4 having the highest number.
The general orientation of the area faces North, however since the coastline has an
embayed form parts of the six bays face in different directions:_ir-Ramla ta' Wied
Musa has sides facing NE and the opposite shoreline NNW, at ir-Ramla tal-Bir the
sides face NE and WNW, ir-Ramla tal Qortin (NNE and WNW), Armier Bay (E and
NNW), ir-Ramla tat-Torri having a general orientation to the NW with one side ofthe
littoral facing NE the opposite side SW; and the last inlet, and the only one not to have
any sand, is at_Dahlet ix-Xmajjar_with sides facing NE and W.
The segment consists of a low sloping rock profile with the main outcropping
geological formation being Upper Coralline Limestone. Quaternary continental
deposits are also evident. The geological formation of this littoral is made up of Upper
Coralline Limestone and forms part of Marfa Ridge. Horst and Graben formations that
characterize the part of Malta to the North of the Great Fault, consisting of ridges
(Horst) and valleys (Graben), manifest themselves in an embayed littoral environment.
The Coastal zone in Segment I facing the South Comino Channel is in fact part of the
Horst formation still above sea level. The Channel is the submerged part of the
Graben.
259

7 .2.2 Land uses
Using the data in Appendix 1, and examining the values for this segment, i.e., the area
in hectares for every land use in each coastal unit and the percentage values for each
land use category, it was possible to construct Table 7.2. This Table also provides
synoptic information. This segment is dominated by recreational areas (a) arable land
(j) steep rock faces (n); and low sloping rock profile. Depositional environments (h)
and afforested areas (i) also are present. The highest figure in the matrix is for steep
rock faces for coastal unit 4 with 4 7.21 per cent of the values for all the land uses
represented in the sheet. Five land uses are not represented: residential areas (c),
industrial areas (f and g), abandoned agricultural land (k) and shore platforms (1).
Table 7.2: Selected synoptic data for coastal units in Segment I
Coastal unit Number of Per cent: land uses Per cent: area land uses out ofmax.16 of segment
1 5 31.25 7.7 2 11 68.75 33.1 3 8 50.00 15.1 4 9 56.25 44.1
Source: Estimated by author from land use data
The overall scenario for this segment is one that is dominated by recreational land
uses set in a rural environment. One-fifth of the area consists of an active agricultural
sector with a good natural water supply from the shallow aquifers, producing a variety
of crops at all seasons, and substantial parts of an undeveloped shoreline with sandy
beaches. The low sloping profile of the terrain indicated by the 9.4 ha of low sloping
rock provides good access within the coastal zone and accounts for the presence of
agriculture as an important economic activity. In addition, the presence of agricultural
land near the littoral indicates that the area has not been affected by urban and
recreational development, as in other parts of Malta. Almost 30 per cent of the land
uses mapped are also indicated by steep rock, with three-quarters of this for the whole
segment found along the eastern perimeter of the segment. The area is in general rural
in character as the urban and industrial land indictors are represented only through the
land uses devoted to recreation: coastal units 2 and 3 providing more than two-thirds
of this capacity for the whole segment. The presence of hotels in these areas accounts
for this. Of particular interest are two land uses depositional (h) environments and
260

dilapidated areas (p). The presence of five sandy beaches mentioned above along the
littoral account for this situation. The high incidence of dilapidated areas (p) is all due
to two factors - building debris as a result of public works along the coast and hotel
restructuring. The endemic problem of dumping of domestic waste also accounts for
part ofthis land use category.
Three main development initiatives occurred along this segment. The increase in the
capacity of the Ramla Bay Hotel and its associated facilities such as sporting and
recreational facilities necessitated the tapping of more water resources from adjacent
boreholes and took some areas of fertile agricultural land from its hinterland. The
extension of the Gozo Ferry Terminal changed the overall rural fabric of the northern
most tip of Malta in that facilities included the widening of the road network, a larger
area devoted to ancillary passenger services, and the extension of the breakwater and
ferry berthing facilities hampered the bathing and scuba-diving facilities in the vicinity
(The Times [of Malta] 13 May 2003, p 6). The third development evolved into a hot
political issue when a number of boathouses, built without the necessary permits
adjacent to 17th century fortified walls constructed as part of the defence of the north
Malta coast, were demolished by the Armed Forces of Malta on instructions by the
MEP A. In all probability this was one of the first highly publicized incidents where
enforcement of the building regulations was seen to be occurring.
Potentially the area has high aesthetic qualities with five small sandy beaches along
the length of the littoral and a low sloping garrigue shoreline. However passage over
part of the foreshore is impeded as it is fenced across part of the beach which is leased
to the hotel. In addition, the presence of substantial quantities of rubbish left over by
campers and other users, especially within the afforested parts of this area, and the
illegal dumping of domestic and construction waste generated in urban areas, spoil the
overall environment (Plate 7.1). In fact, the area around the old watch tower has been
leased to a private entrepreneur to develop a camping site for commercial purposes
also with a view at controlling litter dumping.
It is the highly accessible nature of the whole segment, its rural character, its relative
distance from the urban areas of Malta, the clean beaches facing the Comino Channel
261

that make the area a popular destination for swtmmers, campers and also of
developers. In fact the MEP A, in its local plan for the North of Malta, has referred to
this zone as a high quality area, and its management to focus on the identification of
camping sites, the maintenance of the historic walls and tower and the upkeep of the
environs of the Gozo Ferry Terminal. In addition, the problem with the proliferation
of boathouses (one-roomed cubicles used as summer residences) in the area has
prompted the MEP A to issue guidelines regarding their location, cleanliness and legal
status (The Times [of Malta} 25 November 2002, 48).
7.3 Segment II
7.3.1 Physical attributes
The limits of Segment II commence at il-Ponta ta' 1-Ahrax limits of Mellieha to
Ghallis Point. The need to group together all the north eastern Bays in Malta was the
main reason for this segment to be the second largest one for the Islands. With a
coastal length of 23.8 km, an area of 253.7 ha, and an average coastal zone average
width of 106.8 m is the fourth widest for the Islands. The localities that feature
prominently in this Segment are Ghadira, St. Paul's Bay, Bugibba, Qawra and Salina
Bay. These skirt Mellieha Bay, St. Paul's Bay and Salina Bay. St. Paul's Islands are
located in this Segment.
The general aspect of the Segment is to the northeast, however, the sides of the Bays
are oriented differently and Table 7.3 has been compiled to show varying orientations
of the sides of the each bay.
262

Plate 7.1 North Malta, Dahlet ix- Xmajjar: Dumping of domestic debris and unused household appliances in coastal rural area identified as the first official campsite. Source: The Times 2nd June 2001

7.3.2 Land uses
Just over one-third of the cells presented in this Segment and seen in Appendix
denote no type of land use, with coastal units 10, 16 and 18 having the least
variability, with few land uses shown (Table 7.4). Coastal unit 10 represents St.
Paul's Islands, and unit 18 Salina Bay. The remaining coastal units have a fair spread
of both urban and rural related land uses. With the recreational land use category (a),
arable land (j) and (k) and land uses (m), (n) and (o) for coastal units 14, 15 and 16 are
highly represented. Dilapidated areas in this Segment feature prominently in urban
areas in most other parts of Malta.
The main geological features of the Segment can be divided into two: the area from il
Ponta ta' 1-Ahrax to St. Paul's Bay features scree slope landscapes (rdum) with
Globigerina Limestone shore platforms at intermittent distances. The second part
features a low rock coastline of Lower Coralline Limestone. The Horst and Graben
formations mentioned in Segments I and XI are also evident in this Segment; the bays
are in themselves the end result of this process.
Most of the land use categories identified for this thesis are represented in this
segment, with the exception of the industrial land uses. The fact that a high proportion
of the land uses mapped appertain to the rural environment indicates the overall
setting of the segment. However the 19.6 ha of recreational areas and the 20.5 ha of
public utilities indicate that the area has a substantial part of it devoted to urban
development. In addition the 2.3 ha of marine servicing areas located for most of the
urban littoral length show that the servicing of marine related activities occur along
substantial parts of the coastal area. One outstanding feature of the land use scenario
are the afforested areas. At 21.6 ha it is one of the highest for any segment because the
area and length of the segment itself is rather high and a number of areas within the
segment have been afforested in an effort to improve the aesthetic quality of the
environment. In addition, some of the undeveloped areas possess zones that have a
supply of good soil and natural water sources that encourage growth of indigenous
trees and maintain the health of afforestation areas. Prominent among these are the
Ghadira area behind the sandy beach at Mellieha Bay and is-Simar at St.Paul's Bay.
264
Table 7.3 Main compass orientation of selected parts of the main bays and inlets in Segment II presented in contiguous sequence
Name of Bay Locations Compass orientation Mellieha Bay Dahlet ix-Xilep to Ghar SE
Baqrat NE Ghadira Bay NW Ghadira Bay to Ras il-Griebeg
Llo Selmun Mgiebah to Ras il-Mignuna Nto E Mistra Bay MistraBay SE
Sides of Bay SW;NE St. Paul's Bay Rdum Rxawn to Pwales SE
Pwales Beach NE Pwales Beach to Tal- NW Ghazzelin NE Tal-Ghazzelin NW Rdum 1-Abjad/Bugibba to Qawra Point
Salina Bay Qawra Point to Salt Pans E Salt Pans NE Salt Pans to Ghallis Point NW
Source: Compiled by author from I :25,000 scale map of the Maltese Islands
Table 7.4 Selected synoptic data for coastal units in Segment II
Coastal Unit Number of Per cent: land uses Per cent: area of land uses out of max.16 segment
5 5 31.25 6.0 6 9 56.25 11.5 7 7 43.80 6.6 8 8 50.00 7.6 9 IO 62.50 I9.2 IO 2 12.50 2.4 II IO 62.50 5.0 I2 I1 68.75 8.9 I3 8 50.00 7.5 I4 7 43.80 5.5 I5 10 62.50 4.2 I6 3 I8.75 0.9 I7 5 3I.25 3.7 I8 3 I8.75 0.7 I9 8 50.00 6.6 20 5 31.25 3.7
Source: Estimated by author from land use data
265
Another important land use feature is the depositional environment category where the
2.6 ha appertain almost to one beach at Ghadira which is by far the most popular
beach in Malta and also the largest. However a number of pocket beaches are present
along most of the littoral of the segment one of which at St. Paul's Bay is heavily
degraded due to the concrete structures placed along the shoreline that modified wave
impact and refraction in the bay depleting the sand supply. The beach was further
degraded by sewage overflows into the sea.
The four land use categories identified for the undeveloped part of the coast show that
the segment is highly represented in all of them. The aesthetic qualities of the area are
a feature that should be given the required attention. In fact, one particular zone within
this segment, 11-Fekruna, has recently been in the news. The area possesses a secluded
pocket beach backed by a steep afforested clay slope. The local council, in monitoring
new development boundaries proposed by the MEP A, realized that it had included it
within the new development areas. Representations to the press had the Authority
acknowledge its mistake. However, the area forms part of the larger Xemxija zone in
St. Paul's Bay and which is a highly desirable area for up-market local and tourist
accommodation. Only the scheduling (no development permits to be issued) of this
and similar zones by the MEP A can stop this.
The coastal zones of Segments I and II fall within MEPA's North West Local Plan
area and as such their coastline, with the exception of the urban areas of Xemxija,
Mellieha, Qawra and Bugibba, has been designated as an Opportunity Development
Zone (ODZ). This means that future development can only be considered if the
application consists of coastal related activities and its proposed location does not fall
within the scheduled areas (Planning Authority, 2001,1 06). In fact the go-ahead has
been given for the establishment of a marine park at Qawra Point as part of the efforts
to increase to the 80,000 tourists who visit Malta through the local diving associations
(The Times [of Malta] 8 July 2002, p 5).
A number of planning issues for the St. Paul's/Bugibba/Qawra area have been
compiled by MEPA. These are: conflicting land uses due to high pressure for
residential development, increase in population density, partly due to height of
266

buildings and the conversion of one and two storey premises into high-rise apartment
blocks with poor quality building design and increase in traffic congestion. In
addition, the need to increase public amenities that include the building of a new
school, a regional sports complex and a new regional bus and coach transport station
put further pressure on the locality (Planning Authority, 2001). In order to minimize
the pressure on the coast a series of land use strategies have been proposed by MEP A.
These include location of tourist accommodation away from the rural areas to zones
within the urban area, zoning urban areas into Residential Priority Areas and
Entertainment Priority Areas in addition to the re-routing of through traffic. The latter
is a very sensitive issue especially in bottleneck areas along Xemxija Hill and Ghadira
Bay. Further measures include the protection of historic zones by the designation of an
Urban Conservation Area and the scheduling of environmentally sensitive areas to
guard the natural environment, and ensure public access to the foreshore by restricting
the development of boathouses and beach rooms. In addition, the Ghadira Nature
located at the landward side of Ghadira Bay is a protected bird sanctuary and is visited
by 10,000 people every year, 38 per cent ofwhich are school children (The Times [of
Malta] January 6 2003 pp 20-21).
7.4 Segment III
7.4.1 Physical attributes
This Segment starts at Ghallis Point and finishes at Dragonara point. It is 8 km long
and, like Segment I, is one of the shortest segments, occupying only 3.8 per cent of the
whole littoral. The rectilinear nature of the coast, the almost uniform aspect through
most of its length, and the low-sloping profile throughout, have influenced the
boundaries of the segment, as its littoral is very different from the em bayed features of
the segments on either side of it.
The predominantly rectilinear nature of the coast is characterized with a marked lack
of notable indentations and this has produced a coastline that is highly exposed to
winds from the north east, compromising the variety of land uses and making the
extensive use of this part of the littoral hazardous. The predominant orientation of the
littoral of this segment is to the NE, however the orientation of Qalet Marku Bay is to
the NNW and Bahar ic-Caghaq Bay is to the NNE.
267

The main geological outcrop consists of Lower Coralline Limestone that presents a
pitted surface on exposure, making the rock surface difficult to walk on. Thus,
although access to the littoral should be good, in that the degree of slope does not
exceed three degrees, this geomorphological condition curtails access to the shoreline.
7 .4.2 Land uses
After examining the coastal units for their coastal land use variability, in Appendix 1 a
112-cell matrix is shown for this segment, with 70 cells being unrepresented,
approximately 62 per cent of the total. Residential areas (c), scree slope areas ( o) , and
industrial areas are unrepresented, whilst historic sites (e), depositional environments
(h) and arable land are all limited to only one particular unit. The natural features of
this segment comprise almost one-half of the coastal zone area mapped with shore
platforms (I) and low sloping shoreline (m) constituting 30 per cent, the remainder
being made up of steep rocks. Depositional environments feature as land use category
(i) and their distribution is conditioned by the presence of peninsulas of Qalet Marku
and Qreiten Point. In fact, these features occupy only the most relatively indented part
of the littoral of this segment from Ghallis point to Bahar ic-Caghaq. The remainder
of this littoral is occupied with steep rock faces and deep waters and less indentation
along the coast is evident. Table 7.5 gives a synopsis of the data for this segment
found in Appendix 1.
Table 7.5: Selected synoptic data for coastal units in Segment III
Coastal unit Number of Per cent: land Per cent: area of land uses uses out of segment
max.16 21 7 43.8 9.3 22 7 43.8 7.0 23 4 25.0 8.0 24 11 68.8 16.5 25 3 18.8 11.7 26 5 31.3 45.2 27 5 18.8 2.3
Source: Estimated by author from land use data
The table gives the number of land uses present in each coastal unit, with unit 24
having the highest variability, with 11 out of the 16 land uses monitored. Variability
268

decreases on either side of the Qalet Marku peninsula. Two main features contribute
to the land uses in the segment. The first is the coast road running parallel to the
shoreline almost the whole length of the segment, the second is the Maghtab rubbish
dump that has grown from the hinterland area onto a very visible location near the
coast road. Although the presence of the landfill maintained the rural character of this
segment pockets of recreational development are evident. The land uses that are
prevalent along this littoral are those associated with the recreational environment,
notable among these are boathouses, a hotel, a caravan site and a "fun park" where
family water sports and other activities are organized. These land uses are
concentrated along the low sloping part of the coastal segment whilst along the cliff
side areas development is farther away into the hinterland.
The nearby presence of the main refuse dump of Malta at Maghtab in the limits of
Bahar ic-Caghaq can be seen from part of this segment, although it is not within the
coastal zone boundaries used for this thesis, the landfill is highly visible from the
coast, water seepage affects the sea water quality in its vicinity, strong winds carry
flying debris towards the coast and its presence has conditioned development along
this part of the littoral. The Maghtab landfill remains the major environmental sore of
the island and following the publication of the Solid Waste Management Strategy for
the Maltese Islands in 200 1 it was estimated that Lm 70 million are needed to close it
down. A number of proposals were put forward in the Strategy as part of the measures
to deal with the problems of disposing of 1.5 million tons of solid waste annually. The
measures included the closing down of the site by 2004 and the landscaping of the
whole site to enhance the rural character of the area (Government of Malta, 2001).
The dump is already posing health hazards to the population in the vicinity, is an
eyesore from wherever it is visible and ruins the high aesthetic qualities of the
environment. Its further increment may pose a great physical hazard to motorists
should it spill over in wet weather conditions. In addition, seepage of liquid material
into the sea has also been reported (The Times [of Malta] 23 November 2002, 6), as is
the smell of burning rubbish with the emission of noxious fumes and wind-blown
litter. This dump has featured as the centre of the debate for a number of years in that
it is considered as being the country's main environmental problem and a typical
269

example of a small island with no response to its waste disposal problem. A recent
proposal involves the dumping most of the debris in the "landfill" into the sea creating
either an artificial island, or combining the reclaimed land with a breakwater to
protect the area from the strong northeast storms, jetties to service a number of boats
and yachts, and a promenade for coastal walks.
In addition to the land reclamation the idea was put forward to excavate part of the
existing littoral to add on to the additional services. An area with up-market
residences and a hotel also have been proposed. Depositional environments feature as
land use category (i) and their distribution is conditioned by the presence of the
peninsulas of Qalet Marku and Qreiten Point. In fact, these features occupy only the
most relatively indented part of the littoral of this segment from Ghallis point to Bahar
ic-Caghaq. The remainder of this littoral is occupied with steep rock faces and deep
waters and less indentation along the coast is evident.
7.5 Segment IV
7.5.1 Physical attributes
Segment IV stretches from the peninsula at St. George's Tower to Dragut Point at the
entrance to Marsamxett Harbour. Most of the coastline is accessible from the
landward side and is highly urbanized. The average width of the coastal zone is 62.6
m, making it the narrowest zone in any Segment in the Maltese Islands.
The general orientation of the segment is to the NE, however the Segment can be
divided into two. One part has embayed features with three main inlets, StGeorge's
Bay, 11-Qaliet, St. Julians's Bay and Balluta Bay, the other having a predominantly
rectilinear coastline up to St. Elmo Point. The sides of the bays are oriented in
different directions to the general aspect of the Segment. The sides of StGeorge's
Bay face SE and NW respectively, and for St. Julian's BayS and N. Balluta Bay has
two main inlets, one facing NNE and the other NNW, with the first having sides
facing to the E and NW and the second having a concave shape with an orientation
from N to WNW. The rectilinear parts of the coast also faces NE. The main
subdivision of the two sectors is dependent on the physical attributes of the area,
where a fault running in a perpendicular direction to the coast at St. Julian's Point was
270

partly responsible for the Lower Coralline Limestone formation g1vmg way to
Globigerina Limestone. Shore platforms and a low sloping coastline are characteristic
geomorphological features prevalent along the whole littoral.
7.5.2 Land Uses
The matrix presented gives an indication of the land uses extant in segment IV, with a
low range of values for the land uses for every unit. The highest value is seen for
coastal unit 36, with 68.75 per cent representing 11 out of a maximum of 16 land uses.
All the other units have a land-use representation of less than eight of the 16 land-use
categories. There are two main reasons for this: the fragmentation of the coastal zone
of this Segment into 9 units gives a small area for each unit, restricting the space for a
variety of land uses; secondly, the area is highly urbanized, having very few land-use
categories associated with the "rural" environment, thus limiting the variety of land
uses.
Table 7.6: Selected synoptic data for coastal units in Segment IV
Coastal unit Number of Per cent: land uses Per cent: area of land uses out od max. 16 segment
28 5 31.25 10.2 29 3 18.75 3.9 30 8 50.00 11.0 31 4 25.00 8.1 32 6 37.50 24.3 33 4 25.00 5.2 34 6 37.50 15.5 35 6 37.50 12.9 36 11 68.75 8.9
Source: Estimated by author from land use data
Examining the land uses through the details given in Appendix 1 and the data in Table
7.5, a high proportion of the segment is identified as urban. Land uses associated with
the urban environment (a-d) form the greater proportion for each coastal unit. In
addition, data for land use p, denoting dilapidated areas, are also significant, with
Plate 7.2 highlighting one of the problems of dilapidation. The limited development
along units 35 and 36 is seen from the data for steep rock (m) at 40 per cent in cell 35,
and 28 per cent for cell 34, indicating areas with a low rock coastline.
271
This segment has one of the highest proportions of urban land uses along the littoral
of the Maltese Islands. The main reason for this is that the area already had a high
residential urban character, forming part of the post-1950 urban growth away from the
main harbours' conurbation. In addition, the 1960s building boom was partly
concentrated in this zone where these areas were marketed by property developers as a
viable investment. Building took the form of flats geared to attract foreign buyers and
the overall business attitude was more akin to property speculation than to develop a
truly local product. In addition the building style was imported from northern Europe
with little consideration to local climatic conditions or aesthetic quality and resembled
long lines of pigeonhole blocks. The post 1980s mass tourism impact on Malta
affected this area greatly in that a number of hotels were built in the St. Julian's
locality and the 1990s craze for the recreational value of Paceville put further pressure
on the residential urban environment of the area turning the zone into a mecca for
night revelers. In conjunction to these developments the coastal area has also been
affected. Most hotels and guest houses are located along the shoreline together with a
large number of restaurants. A number of old houses have been demolished to make
way for blocks of flats and the few older residences left have been turned into
restaurants. Clear examples of this situation can be seen along the Sliema seafront
where properties are marketed at Lm 150,000 - 200,000 for each flat. These values are
six to eight times the prices asked for similar properties for other coastallocalites (The
Sunday Times [of Malta]10 November 2002). The shoreline has also been greatly
modified in that a strip of reclaimed land along most of the coastal perimeter has been
added to allow for the provision of commercial shoreline concessions on the water's
edge.
Although the situation does not seem to be as congested in the Sliema area, in that the
road skirting the waterfront is wider, a 20-metre shore platform and a 6-metre cliff
and a 2-metre wide pavement separates the buildings from the shoreline, the area is
none-the-less as attractive to property developers and entrepreneurs. In addition, the
Sliema coast consists of a rectilinear coastline fronting the open sea whilst the St.
Julian's front lies within a bay enclosed by a breakwater. The problems associated
with the dilapidated areas are essentially the result of the perennial construction going
on the localities, dumping of restaurant and household rubbish in unbuilt zones and
272

parking lots and the tar washed on the rocks from the illegal flushing of oil from all
types and sizes of sea craft.
Among the important proposals that the Structure Plan for the Maltese Islands puts
forward for this segment are the following: to secure public access to the whole
coastline by bringing the littoral into public ownership and resisting the demands for
shoreline and beach concessions by private developers. These include requests for
jetties, private beaches, pathways, swimming pools and waterpolo pitches (Planning
Authority, 2002b). Unfortunately part of the only stretch of undeveloped coast at
Pembroke has been converted into a football pitch only a few meters away from the
shoreline. Requests at promoting sites for beach replenishments must be subject to a
satisfactory Environmental Impact Assessment. Although a third of the tourist
accommodation capacity for Malta is located in this area, 68 hotels and 14 tourist
villages, the Structure Plan envisages that 4000 additional tourist beds will be required
by the end of the Structure Plan period in 20 I 0. However, this total has already been
exceeded especially with the addition of more hotels in the Paceville area (Planning
Authority, 2002b) putting further land use pressure on coastal resources. However the
most important issue concerning land use problems in this segment are the problems
generated by the development of the tourist and recreational capacities on the
residential areas. Although policies for the regulation of commercial establishments in
residential areas are in place and stringent rules are applied regarding the location of
bars and restaurants adjacent to residential areas, noise and general nuisance prevail
just the same. In addition, problems with a lack of parking facilities affect residents
just the same.
273

Plate 7.2 Malta: St. Julian's Bay: problems of dilapidation in urban areas spill over to the near shore waters with sewage and liquid overflows in bathing zones. Source: The Times 14th August 2001

7.6 Segment V
7.6.1 Physical attributes
The Segment includes the two main Harbours in Malta and the combined length of
25.6 km is the longest for all segments. The segment commences at Dragut Point and
ends at Ricasoli Point. The two harbours have been included together due to the
generally similar physical features they possess and their difference of physical
properties from the adjacent segments.
The area is highly embayed and characterized by a series of peninsulas and creeks.
These inlets have developed as a result of faulting and the erosional quality of the
Globigerina Limestone formation that has developed into a ria system of ridges and
valleys in a previously pluvial environment. The tilting of the Islands to the East
caused marine invasion into the valleys and formed the Harbours and a series of
creeks.
The general orientation of the Harbours is to the north east. The all-weather nature of
the creeks at Grand Harbour can be gauged from the general pattern of the main
orientation, with each creek having a general NW -NNW trend, whilst the Harbour
itself faces NE, a 75-90 degree change in direction. The situation at Marsamxett
Harbour is fairly similar, with an orientation for the creeks ranging from SE to NW
with the Harbour opening also to the NE. It is this degree of shelter from the
prevailing NE winds that has given the local Harbours their high economic status. In
fact for Grand Harbour, out of a total coastal length of 15.6 km, 64.0 per cent is
occupied by wharves and promenades, whilst for Marsamxett Harbour, with a total
length of 10.5 km, 54.8 per cent of the littoral is paved and occupied by promenades.
7.6.2 Land Uses
The lack of land use variability in the Harbours is gauged from the section on segment
V in Appendix 1, with most of Marsamxett Harbour's coastal units exhibiting a
greater variability than those around Grand Harbour. In fact the farther out towards the
mouth of the Harbour that a coastal unit is located, the greater is its land use
variability. This is seen in coastal units 37 to 43 for Marsamxett Harbour (Table 7.7)
and coastal units 55 and 56 for the Grand Harbour (Table 7.8). Coastal industrial land
275

uses (g) are extremely site selective and occupy an area of around 90 per cent or over
for the particular coastal unit which they form (eg. Coastal units 46, 49, 50 and 51)
the Power Station at Marsa is included with this category (Plate 7.3). The recreational
and residential land use categories are also manifested more in the coastal units
pertaining to Marsamxett Harbour and to Grand Harbour. The dilapidated areas (p)
which normally accompany the urban residential areas and recreational zones, at least
as far this research is concerned, are also present in the form of metal scrap-yards.
The mam distinguishing feature between the two Harbours, which is reflected in
section 6.8, is that Grand Harbour caters for both industrial development (Malta Dry
docks) and recreational facilities (boating, Cruise Liner Terminal), whilst Marsamxett
Harbour has developed exclusively around recreational activities especially tourist
accommodation and yacht marina development. For Grand Harbour these two main
economic activities are located adjacent to one another, with the areas nearer to the
Harbour mouth catering mainly for recreational activities. The activities at the far end
of the harbour are more concerned with industrial activities.
The lack of land use variability in the Harbours is gauged from the section on segment
V in Appendix I, with most of Marsamxett Harbour's coastal zone exhibiting a
greater variability than those around Grand Harbour. Coastal industrial land uses (g)
are extremely site selective with the Power Station at Marsa bracketed with this
category (Plate 7.3). The recreational and residential land use categories are evident
along the coast of Marsamxett Harbour than that of Grand Harbour. The dilapidated
areas (p) which normally accompany the urban residential areas and recreational
zones, at least as far this research is concerned, are also present in the form of metal
scrap-yards.
This segment exhibits properties that are typical of coastal industrial areas and the
site-selective land uses are the result of a long historical legacy attached to Grand
Harbour by way of maritime services and to Marsamxett Harbour by way of the
touristic and yacht marina services that have developed in the last thirty years. The
new developments of Manoel Island and Tigne Point in Marsamxett Harbour and the
276

Table 7.7: Selected synoptic data for coastal units in Segment V (Marsamxett Harbour)
Coastal Number of Per cent: Per cent: Unit land uses land uses area of
out of max. part 16 segment*
37 6 37.5 1.6 38 6 37.5 2.9 39 6 37.5 3.9 40 8 50.0 9.0 41 7 43.7 7.4 42 6 37.5 4.6 43 7 43.7 4.8 44 4 25.0 1.1 45 6 37.5 2.6 46 5 31.2 19.9
Source: Estimated by author from land use data *total for this column is 57.8 per cent the remainder is found in Table 7.8
Table 7.8: Selected synoptic data for coastal units in Segment V (Grand Harbour)
Coastal Number of Per cent: Per cent: Unit land uses land uses area of
out of max. part of 16 segment*
47 1 6.3 0.6 48 1 6.3 0.5 49 5 31.2 12.8 50 2 12.5 4.7 51 3 18.8 5.2 52 5 31.2 0.8 53 4 25.0 4.1 54 4 25.0 2.4 55 5 31.2 1.3 56 6 37.5 9.8
Source: Estimated by author from land use data *total for this column is 42.2 per cent the remainder is found in table 7.7
277

changes to the Cottonera littoral in Grand Harbour with the rehabilitation of parts of
the waterfront which are in progress (Plate 7.4) constitute other focal points in the
development of the whole local littoral.
The Grand Harbour Local Plan (Planning Authority, 1997a) considers that the
centuries-old industrial and urban developments in this area, together with the
consequent high population density, are the main reasons for the land-use problems. In
fact, the deterioration of the urban fabric, the inefficient use of space for commercial
and industrial activities, the poor maintenance of the historic buildings together with
the increasing pollution of the area are the greatest problems. In general, the Plan
envisages a number of policies that affect the coastal zone area. Among these are the
following: good accessibility to the waterfront along most of the non-industrial
perimeter; restoration and care of the bastions, fortifications and historical artifacts; an
efficient land use system for the Drydocks and the camouflage from land of the large
industrial workshops either by covering them with a large "Nissan hut" type of shelter,
but this would not be compatible with the overall aesthetic environment of the
fortifications, or provide a trellis with creepers along the road hiding the workshops
from view and at the same time landscaping the street. In fact proposals for the latter
have been put forward through the local council (pers. comm. MEP A official). Other
suggestions include the establishment of regular ferry links to other parts of the
Harbour and the efficient connections to the hinterland; addition to the existing
afforestation projects; upgrading of the Cottonera and Marsamxett waterfronts by
enhancing a multiplicity of uses such as recreational and commercial establishments;
the strategic siting of small enterprise workshops; and, the overall enhancement of the
touristic potential of the area with the development of the Cruise Liner Terminal and
the Cottonera Waterfront Project as the flagships of the Harbour.
The main problems associated with the physical and human fabric of the localities
surrounding the Grand Harbour have been identified as follows:
• Decline and ageing of the local population coupled to a substantial number of
abandoned houses;
278

• deterioration of the architectural fabric including historical sites and residential
zones with pockets of poor quality housing reminiscent of slum areas;
• Lack of adequate community facilities and open spaces;
• Inefficient use of industrial land;
• The land use conflicts generated with industrialization, port activity,
residential zones and touristic development.
The Plan envisages the following main proposals to address these problems:
• Reversing population decline and regeneration of urban areas and
rehabilitation of historic zones;
• Reducing the impact of industry on residential areas and historic zones;
• Encouraging tourism especially in the Three Cities;
• Streamlining port function; and
• Assisting non-coastal dependent industry through the supply of sites away
from the littoral;
Effectively the changes to the littoral land uses were substantial in order to
accommodate the above proposals. The Cottonera Waterfront Project has transformed
the coast of the southern part of the Grand Harbour with the upgrading of the coastal
areas; tourism to the Three Cities has generated an increase in economic activity; and
the upgrading of the Cruise Liner Terminal at Valletta promises to enhance the liners'
Malta stopover in the central Mediterranean (Planning Authority, 1997). Proposals to
develop Sliema Creek and Pi eta Creek for yachting by increasing the number of berths
in Marsamxett Harbour must be considered in the light of existing facilities, and the
increasing demand for these facilities (Planning Authority, 2000b).
279

Plate 7.3 Malta, Marsa Power Station within the dense urban environment Source: Pers. Comm. Department of Information.
280a

Source: Undated promotional material, Malta Tourism Authority.
Source: The Author
Plates 7.4 a and b Malta, Cottonera, Birgu (Vittoriosa): The ship repairing facilities are being replaced with a yacht mal'ina, a casino, a hotel and the upgrading of the waterfront.
280b

7.7 Segment VI
7.7.1 Physical attributes
The limits of Segment VI start at Ricasoli Point and end at Zonqor Point just before
Marsascala Bay. The small coastal locality of Xghajra is included in this segment.
The coastal length of this segment is 6.3 km. With a coastal zone area of 38.1 ha it
gives an average coastal zone width of 60.5 metres. From Table 7.1 it can be seen
that this segment is the smallest in all the dimensions presented in the table. The
overall orientation of the segment is to the NE and, with a rectilinear coastline
throughout, there are no substantial changes of aspect through most of the littoral area.
The main physical features of the area are the two main geological formations, of
Lower Coralline Limestone and Globigerina Limestone that outcrop at the coastal
margin, and the rectilinear nature of the shoreline. The lack of any embayment
features has probably increased the isolation of this segment and accounts for the
limited land use variability of this segment.
7. 7.2 Land uses
The distribution of land uses in this segment is one that respects the coastal rural
environment. However, the dilapidated areas (p) are prominent, due to dumping of
domestic refuse and building of a road along the littoral. Land use for extractive
industries is mainly comprised of salt panning on the Globigerina Limestone
foreshore. Rinella Movie Park and the coastal locality of Xghajra constitute the
recreational land uses (a) in this segment.
Table 7.9: Selected synoptic data for coastal units in Segment VI
Coastal Unit Number of Per cent: land Per cent: land uses uses out of area of
max.16 segment 57 2 12.5 8.9 58 5 31.3 23.6 59 8 50.0 28.9 60 4 25.0 3.9 61 3 18.8 25.8 62 4 25.0 8.9
Source: Estimated by author from land use data
The lack of development in this segment is mainly due to the sewage outfall at the
Wied Ghammieq near Xghajra. In addition, the lack of embayment features, and in
281

general the high amount of dilapidated areas, have militated against further use of this
stretch of coast. The exposed nature of the coast, coupled to the proximity of Grand
Harbour, has necessitated the building of defensive structures. The presence of a
series of coastal towers built by the Knights, and a line of pill boxes in the defence of
the Second World War against the Italians and Germans, have given a distinctive
character to the area. These fortifications could be enhanced and included within a
coastal heritage trail including the San Leonardo Fort. This proposal can be
implemented with the collaboration of two heritage associations, Din !-Art Helwa and
Fondazzjoni Wirt Artna. An additional walk around the Rinella Movie Park would be
an interesting addition. The recent emphasis of investment in the film-making industry
includes the possible extension of the facilities to include more parts of the foreshore.
However the random dumping of refuse along most of this littoral places it high on
the list of dilapidated areas and strong enforcement procedures must be put into place
before any Heritage trail proposals are implemented.
7.8 Segment VII 7.8.1 Physical attributes
Marsascala Bay and the littoral up to the Delimara Point make up this Segment. The
main dimensions pertaining to this segment are given in Table 7.1. Within the list of
segments presented this zone is the third smallest ofthe littoral, having an area of69.1
ha and a coastal length of 13.3 km. This segment has the narrowest coastal zone width
for the whole of the Maltese Islands. Although this segment can be considered to form
part of the east Malta coast, a minor difference to the preceding segments II to V in
the general orientation is evident, as it tends towards the SE at Delimara. However,
the orientation of the sides ofMarsascala Bay are to the NE and S respectively.
Two mam geological formations characterize this segment: Lower Coralline
Limestone is the main outcrop at Marsascala Bay, with the Globigerina Limestone
formation prevailing for the remaining part. The three strata that make up the
Globigerina Limestone formations play an important part in both the geo
morphological set up of the Segment and the associated land uses. The coastal
configuration of the Segment from St. Thomas's Bay to Delimara Point is mainly due
to the high degree of erosion of the upper and middle strata of Globigerina Limestone
282

with a series of small inlets separated by prominent but short peninsulas. The presence
of salt panning activity as an extractive industry is mainly due to the presence of the
third rock layer as seen from the surface, namely the Lower Globigerina limestone
formation on most of the peninsulas. In fact, the main reason for the presence of the
promontories is that the Lower Globigerina Limestone has a lower rate of erosion than
the other two strata.
7.8.2 Land Uses
The distribution of the land use types along this segment reflects the degree of
recreational development along this area of the coast, with coastal units 63, 64 and 65
and 66 having urban oriented land uses, whilst units 67 and 68 have rural oriented
land uses. The general issue that comes out of the coastal land uses of this segment is
that it is typical of the coastal development in Malta, as seen in the past centuries.
Coastal fortifications along the littoral reflect the military defensive needs of the last
four centuries up to 1945; salt panning sites show the need for small scale economic
enterprises are still needed; boat houses and small one storey houses provide for the
summer recreation needs of low-wage earners and some are still a remnant of the
coastal residences of the past century; recreational and residential development at
Marsascala show modern tourist needs.
Table 7.10: Selected synoptic data for coastal units in Segment VII
Coastal unit Number of land Per cent: land uses Per cent: area of uses out ofmax.16 segment
63 12 75.0 20.5 64 11 68.8 10.3 65 7 43.8 19.5 66 8 50.0 15.1 67 7 43.8 16.1 68 5 31.3 18.5
Source: Estimated by author from land use data
The distribution of the land use types along this segment reflects the degree of
recreational development along this area of the coast, with the coast along Marsascala
having urban oriented land uses and the remainder have rural oriented land uses. The
general issue that comes out of the coastal land uses of this segment is that it is typical
283

of the coastal development in Malta. Coastal fortifications along the littoral reflect the
military defensive needs of the last four centuries up to 1945; salt panning sites show
the need for small scale economic enterprises; boat houses and small one storey
houses provide for the summer recreation needs of low-wage earners, and some of
these are stiii a remnant of the coastal residences of the past century; however the
recreational and residential development at Marsascala show the modem tourist and
recreational needs.
This segment is the typical situation of the recreational development of the rural area
of the coastal zone. The proximity to the main urban centre of Malta and the high
degree of accessibility of the shoreline both from land and the sea have turned
attention to Marsascala Bay. However, the intense urbanization of segment IV is stiii
not evident at Marsascala even though it is a rapidly expanding locality.
7.9 Segment VIII
7.9.1 Physical attributes
The area of Marsaxlokk Bay constitutes this segment. Oriented to the south east, it has
a coastal length of 10.8 km and a coastal zone area of 96.9 ha, giving an average
coastal zone width of 89.7m. The Bay consists of a number of inlets, with Pretty Bay
and St. George's Bay separated by the St. Lucian Peninsula from Marsaxlokk village
Bay. The orientation to the south east, coupled to the wide mouth of the Bay, have
conditioned the construction of a number of jetties and breakwaters with the purpose
of turning the Bay as much as possible into an all-weather area. As the south east
winds blow an average of 15 per cent of the days with storms during the winter, the
recreational and later economic necessities were facilitated by the civil engineering
works. The geological formation predominant in the area is Globigerina Limestone.
This was partly responsible for the formation of the indented coastline, which,
together with erosion by flowing water from terrestrial origins and the subsidence of
the land, brought about a marine transgression forming the present coastal
configuration.
7.9.4 Land uses The coastal land use variability of the Bay is evident from the Table 7.11, where the
extreme ends of the Bay in units 69 and 77 show only 3 land uses each. Land use
284

variability increases in the other segments that represent the inner parts of the Bay.
The higher variability for unit 75 is due to the presence of industrial areas at St.
George's Bay with associated problems of oil seepage (Plate 7.5) and physical
encroachment on archaeological remains (Plate 7.6).
Table 7.11: Selected synoptic data for coastal units in Segment VIII
Coastal Unit Number of land Per cent: land uses Per cent: area of uses out ofmax.16 segment
69 3 18.8 6.5 70 6 37.5 4.7 71 5 31.3 2.7 72 9 56.3 12.5 73 9 56.3 7.5 74 9 56.3 7.9 75 11 68.8 13.7 76 10 62.5 18.1 77 3 18.8 26.3
Source: Estimated by author from land use data
The land uses present along the littoral demonstrate that the Bay has both urban and
rural land uses. A case in point is Delimara Peninsula which has only three main types
of land uses associated with the natural environment, and another is Benghisa
Peninsula with three types associated with industrial zones. The other units are typical
of the coastal urban environment with residential, recreational and historical land
uses. The end result is mainly due to the large expanse of the Bay being the broadest
in Malta and the development of the littoral for industrial purposes throughout this
century. Thus the rural element evident in some units is in fact a result of a lack of
attention for this area in past centuries and the limited degree of accessibility for parts
of the littoral. However, the removal of the Fuel Installation Depots from St. George's
Bay within the next decade should pave the way for an opportunity to upgrade the area
for an aesthetically-pleasant residential development.
285

Plate 7.5 Malta, Birzebbugia, St. George's Bay: Managing hazards in coastal urban environments: warning signals prohibiting bathing due to oil seepage from Installation Depot. Note the Container Terminal in the background and the typical seafront upgrading by local council in foreground with paved promenade and street lighting, waist-high railings to counter hazard of two metre drop to shore platform. Steps provide access to foreshore. Source: The Author

Plate 7.6 Birzebbuga, St. George's Bay: Road development and Local Council's upgrading ofthe promenade are seen threatening with physical encroachment on archaeological heritage of Bronze age silos on shore platform. Source: The Author

The publication of the Marsaxlokk Bay Local Plan includes a number of
recommendations that assist in developing a rational land use policy for the coast, the
urban fabric, the rural hinterland, and to minimize the conflicts that the industrial
potential of the area presents. These include:
(a) Relocation of the March 31 51 Fuel Installation Depot and the Liquefied Gas
Installation to a site in the Freeport area. These measures would provide space for the
extension of urban development as the presence of the Depots within the urban zones
is creating a series of environmental problems.
(b) Designation of Urban Conservation Areas, Opportunity Areas and Design Priority
Areas are aimed at improving the quality of the urban fabric. These are applicable
mostly to the seafront and incorporate restrictions to the building heights along the
coast, recommendations regarding the architectural style of house facades especially
the newer developments where blocks of flats replace old houses and designs of shop
and commercial premises and restaurant fronts have to satisfy specific aesthetic
criteria.
(c) Waterfront improvement is to be attended to by embellishing the coast road
through the improvement of the existing road surface, the construction of a wide
promenade with accompanying street furniture such as benches, lampposts, and waist
high railings all along the seafront.
(d) The overall 'greening' of the coastal environment. Afforestation programmes aim
to cover whole areas with trees and shrubs as in the case of the north-facing area of
Delimara Peninsula and around St Lucian Tower. Tree planting programmes,
designated to enhance the littoral length of the Bay, normally involve the planting of
trees in single files on the pavement or promenade skirting the coast.
(e) Attention to the historical and archaeological heritage is to be attended through a
number of measures. Development of a heritage footpath linking points of tourist
attraction to a number of pre-historic and military fortification sites such as towers,
redoubts, and defensive walls. Attention towards the upkeep of all the military
fortifications to be encouraged. Already a number of sites are used for commercial
purposes, these include Fort St. Lucian and Pinto Battery however others are in a poor
state of repair and urgent action is called for.
(f) Improvements to the existing road network have also been proposed. As a central
policy measure these include the already established roads leading to the Power
288

Station site and the Freeport Terminal to decrease heavy traffic from the urban core
areas and the coast.
(g) Attention to the 'soft' parts of the coast such as beaches has also been undertaken
with the embellishment of the Pretty Bay beach that turned a large area of sand into a
multi-recreational zone with a children's playground, a small football/basketball pitch
and the addition of street furniture. The local councils have stepped up their efforts to
upgrade the area by widening the promenade, embellishing the pedestrian walkways,
increasing the street furniture and improving the facilities for the mooring and
servicing of boats. The replenishment of the small beach in 1989, improvement to the
existing parking facilities and the increase in the recreational facilities on the beach
are intended to enhance and promote the general appearance of the area.
The land uses present along the littoral demonstrate that the Bay has areas that are
found in either end of the coastal land use spectrum used for this study, i.e. urban on
one hand and rural on the other. A case in point is Delimara Peninsula which has only
3 main types of land uses associated with the natural environment, and another is
Benghisa Peninsula with 3 types associated with industrial zones. The other units are
typical of the coastal urban environment. The end result is mainly due to the large
expanse of the Bay, the widest and broadest, and the development of the littoral for
industrial purposes throughout this century. Thus the rural element evident in some
units is in fact a result of a lack of attention for this area in past centuries and the
limited degree of accessibility for parts of the littoral. However, the removal of the
Fuel Installation Depots from St. George's Bay within the next decade should pave the
way for an opportunity to upgrade the area for an aesthetically-pleasant residential
development.
289

7.10 Segment IX
7.10.1 Physical features
The coastal area of this segment is 101.5 ha and stretches from Benghisa Point toIl
Kullana. The average width of the coastal zone here is 58.7 metres. The general
orientation of the coast is towards the South but ranges from the South East at
Benghisa to the South West at il-Kullana, an approximate change of 45°. Steep slopes
and cliffs cover most of the coastal margin with a number of inlets linked to faulting.
Wied ix-Xaqqa and Wied Iz-Zurrieq are narrow faulted features in the cliff face. A
series of caves mark the cliff I water interface: with Blue Grotto, Il-Hnejja, Ghar ix
Xaghra, Ghar Lapsi and Ghar it-Torkija being the most prominent, and Ghar Hasan at
about 50m above sea level. Promotories are also evident. The main geological
formation is Lower Coralline Limestone with Globigerina Limestone stretching at
either end of the segment. A downthrown formation of Upper Coralline Limestone
from Ras il-Harnrija to Ix-Xoqqa is evident
7.10.2 Land use
The lack of variability in the land use distribution in this segment is evident from
Table 7.11 where only one coastal unit is represented by half of the land uses used in
this survey. Wied iz-Zurrieq is located in this unit. Out of a total of 160 coastal cells,
only 43 are represented (26.9 percent).
The rural character of the segment is evident from the lack of land uses associated
with recreation. These are concentrated at Wied iz-Zurrieq and Ghar Lapsi. However,
the land uses associated with the extractive industries (f) are represented for coastal
units 78 and 80, these being two quarries that have broken through the cliff-line.
Coastal unit 86 (cell 86f) has a 4.6 ha area occupied by a Reverse Osmosis plant. With
regards to the "rural" land uses G too), these are well-represented, with (6 X 10) 21
out of 60 cells in Coastal units 78, 86 and 87 having less than one-half of their coastal
land use in land uses other than steep slopes and cliffs. The 6.3 ha of land mapped on
sheet 4864 was steep slopes and cliffs, the only coastal cell to have only one land use
in all of the coastal survey. Arable land takes up a quarter of all the land use for the
segment, with the highest concentration in Coastal units 86 and 87 the equivalent of
with 86.8 per cent for the whole segment.
290

Table 7.12: Selected synoptic data for coastal units in Segment IX
Coastal unit Number of land Percent: land uses Per cent: area of uses out of max. 16 segment
78 5 31.3 14.3 79 3 18.8 1.0 80 5 31.3 5.0 81 3 18.8 4.5 82 2 12.5 0.4 83 8 18.8 20.3 84 1 6.3 6.2 85 6 37.5 8.9 86 7 43.8 23.4 87 3 18.8 15.8
Source: Estimated by author from land use data
The rural character of the segment is evident from the lack of land uses associated
with recreation. These are concentrated along the small coastal hamlets of Wied iz
Zurrieq and Ghar Lapsi. However, the land uses associated with the extractive
industries (f) are represented by two quarries that have broken through the cliff-line
and a 4.6 ha area occupied by a Reverse Osmosis plant. The "rural" land uses (j too),
are well-represented with arable land, steep slopes and cliffs.
This segment marks a sharp break in the coastal land use sequence observed so far. Its
proximity to the preceding segment of Marsaxlokk Bay is not reflected in a similarity
of land use. The hinterland that does not fall within the coastal zone identified for this
thesis is developing into an industrial base, with a large number of factories. The flat
nature of the platform here facilitated the building of an airfield and Nissan huts, part
of the military bulwark in the defence of Malta and the central Mediterranean in
World War II. There is an abrupt change in the topography from low sloping shoreline
of Segment VIII to one with cliffs and steep slopes for this segment. There is also a
change in the general geomorphological nature of the coast, with a rectilinear
shoreline as opposed to the embayed coast of Marsaxlokk Bay. However, the land
uses seen towards the end of this segment are similar to those found in Segment X that
follows.
291

7.11 Segment X
7.11.1 Physical attributes Stretching from Il-Kullana to Ras Ir-Raheb for a length of 12.5km, the area mapped is
approximately 258.0 ha, representing an average coastal width of 206 m. This
considerable width is mainly due to the break of slope being located at the farthest
inland distance of any Segment, as the indicator for the landward limit, the halophytic
plant Inula crithmoides, grows on the edge of the cliff scarp that backs the scree. The
area of coastal zone for this segment represents 73 per cent for that for the whole of
Gozo. The orientation of this segment is from the SWat 11-Kullana toW in Wied Ras
ir-Raheb, a 45° change in orientation.
The Maghlaq Fault affecting the western part of Malta was responsible for the
uplifting of the Island, and gave the topographic scale to this segment. In addition, the
terraced slopes are the result of the capping of Upper Coralline Limestone slumping
over the unstable wet Blue Clay beneath, giving boulder scree slopes. These main
features are found within the coastal zone of this segment: a cliff with a sheer drop
into the ocean or skirted by a narrow shore platform; a scree slope area with
agriculture as the main economic activity; and, thirdly, an Upper Coralline Limestone
cliff between the slope and the fourth feature, a plateau. The limit of the Inula
chrithmoides at a few metres beyond the cliff line marks the extent of the coastal
zone.
7.11.2 Land uses
Land use distribution in this segment is completely dominated by "rural" categories.
For all units except for units 95 and 99, land uses are clustered between i and o. This
situation is reflected in the data given in Table 7.13, where the highest value is only a
maximum of six land uses out of 16 represented in the coastal units 89 and 95. In
addition, nine different land uses are apparent in the whole segment.
Five land uses are represented throughout the segment. These are afforested areas (i),
arable land (j and k), cliffs and steep slopes (m), and scree slopes (o). A low rocky
shoreline (m) is only apparent in three instances, in units 88, 89, 98 and 99.
292

Table 7.13: Selected synoptic data for coastal units in Segment X
Coastal units Number of Per cent: land Per cent: area land uses uses out of of segment
max.16 88 6 37.5 5.9 89 6 37.5 14.7 90 4 25.0 1.6 91 3 18.8 0.2 92 4 25.0 15.3 93 5 31.3 5.0 94 2 12.5 4.7 95 6 37.5 13.8 96 4 25.0 13.9 97 5 31.3 10.0 98 4 25.0 6.1 99 5 31.3 8.8
Source: Estimated by author from land use data
The uniformity in the land use pattern throughout the whole profile of this segment is
due to two factors: geological and geomorphological properties that have given scope
to terraced cliff-side agriculture; and the lack of human accessibility which has helped
to retain the rural features of the area. This segment has pleasant aesthetic
environmental qualities. In the North West Local Plan (Planning Authority, 2001) it is
proposed to maintain the aesthetic quality of the segment by ensuring that at least
footpath communication to the beaches is properly maintained by removing any
structures that impede access at Ghajn Tuffieha, and Anchor Bay. The situation at
Gnejna Bay and Ramla Bay is somewhat different in that vehicular access and parking
facilities are to be improved together with the embellishment of the roads that lead
form the nearest villages to the bays. This involves an afforestation and tree planting
programme.
7.12 Segment XI
7 .12.1 Physical attributes
This is the last stretch of coast to be reviewed for Malta. The segment stretches from
Ras ir-Raheb to Cirkewwa Point and has a coastal length of 21.6 km, with an area of
194.8 km2. The average width of the segment is 90.2 metres, which is very near to the
mean width for the Malta Segments at 96.9metres. This high percentage shows that a
293

lack of land use variability is evident. The general orientation of the segment is to the
northwest. However, there is a marked change in orientation along the littoral from
Ras ir-Raheb, which is oriented to the west, to Cirkewwa Point which is oriented to
the north. As the segment is mainly made up of an indented coastline, the bays
present different and varying degrees of orientation. Table 7.14 shows these.
Table 7.14: Main compass orientation of the bays in Segment XI
Bay Orientation Fomm ir-Rih Bay NtoSW
Gnejna Bay NtoSW Ghajn Tuffieha NtoW
Golden Ba_y_ WtoSW Anchor Bay N to S Paradise Bay Nto S
Source: Compiled by author from I :25,000 scale map of the Maltese Islands
The general physical features of the area are composed of cliffs and scree slopes, with
the bays made up of sandy beaches. The Faults normal to the coast have encouraged
features common to the Horst and Graben landscape, with the bays featuring as the
submerged parts of these formations. Practically all of the different types of geological
features of the Islands are found along this segment, with the capping Upper Coralline
Limestone formation presenting spectacular landscape scenery of scree slopes over the
Blue Clay formation. The basal formation is normally Globigerina Limestone but
some areas with Lower Coralline Limestone are also present. The general lack of
development in this segment is mainly due to the inaccessible terrain that this
landscape presents. In addition, the dense faulting prevalent makes the area prone to
landslides, especially after intense precipitation.
7.12.2 Land uses
Twelve coastal units are identified with this segment. The land uses identified along
this segment are essentially related to the rural fabric, with a prevalence of scree slope
areas and cliffs. The urban-related land uses are all clustered with the land uses
associated with the recreational activities and clearly represented in four of the coastal
units. These are occupied with hotels and boathouses.
294

Table 7.15: Selected synoptic data for coastal units in Segment XI
Coastal unit Number of Per cent: land uses Per cent: area land uses outofmax.16 of segment
100 4 25.0 1.1 101 7 43.7 11.1 102 9 56.3 17.8 103 10 62.5 11.6 104 9 56.3 6.8 105 5 31.1 10.1 106 5 31.1 9.0 107 9 56.3 4.9 108 7 43.7 4.5 109 3 18.7 0.2 110 4 25.0 3.1 111 6 37.5 14.6 112 8 50.0 5.2
Source: Estimated by author from land use data
The main determining factors for the development of the land uses in this segment
are, first, the relative isolation of the segment from the main Maltese urban network;
second the lack of accessibility from the sea to the land; and third the fact that there is
an absence of a coastal road that runs parallel to the shoreline. As a consequence, the
linear type of development is lacking, leaving a healthy aesthetic natural environment
with development concentrated in selected pockets. The land use pattern of this
segment is rather similar to the one found on Gozo.
An interesting factor is that the North West Local Plan covers substantial areas of
coastal segments I, II, X and XI. As a result the segments have a number of common
attributes, the notable factors being the overall rural character of the environment with
coastal agriculture, sandy beaches, cliffs and scree slopes and therefore land use
problems are evident throughout.
The MEP A identified a number of key factors that are the main pillars of its strategy
for these areas especially as a number of sandy beaches notably at Ghajn Tuffieha,
Gnejna and Golden Sands are considered as fragile environments. The main policy is
to protect the natural environment of the area by the conservation of coastal habitats,
rehabilitation of public access and enhancing the landscape value by implementing a
295
Management Plan of the under the auspices of the GAIA Foundation for Ghajn
Tuffieha. This is in line with the scheduling of areas with landscape value for the
benefit of users and also to protect sensitive zones from human influences and to
safeguard the physical environment. In fact vehicular access is controlled and
allocated only to parking areas above the bays, restoration of historical buildings, and
the protection of agricultural land. Beaches are to be afforded special attention in that
the number of kiosks on the sand is to be controlled and no sand can be moved away.
However the aesthetic quality of the area attracts new developments and permission
has been granted for a new hotel to replace an older one built in the 1970s. The
developers claim that the project will be compatible with the environment and the
plans include the embellishment of the area and are the result of the excellent
cooperation between the developers and MEPA (The Times [of Malta] 3 April 2003,
4). The owners of the hotel already operate another four hotels and tourist complexes
in Malta.
7.13 Segment XII
7.13.1 Physical attributes
This segment deals with Comino. As with the other segments, the demarcation of the
coastal zone of this island followed the criteria established in Chapter 1. As there are
few indentations along the coast of Comino, the coastal zone boundary is largely a
line running parallel to the coast that gives a coastal zone area of 42.5 ha and a coastal
length of 8.1 km. This data produces a coastal zone width of about 52.5 metres,
making it the second smallest coastal zone width for the Maltese Islands.
As the whole island has been included in one coastal unit, all of the compass
directions are present along the Comino coast, however the two main bays that are an
important feature in the development of tourism on the island, and which basically
provide the only built-up area in the coastal zone of this segment, face to the north.
Probably the main contributory factor in this regard is that Comino provides a degree
of shelter for the coastal zone of the north of Malta.
The main characteristic of the physical features of Comino is its uniformity in the
geology with a predominance of the Upper Coralline Limestone formation together
296

with associated landforms. The latter provide a scenic value to the coastal zone, with
caves, stacks and rock windows on the western side of the island. Probably the main
contributory factor in this regard is that Camino provides a degree of shelter for the
coastal zone of the north of Malta.
7.13.2 Land uses
The land uses that feature in this segment have already been discussed elsewhere in
Chapter 1 in the context of a comparison between the islands that make up the
archipelago. They are also presented in the appendix as a separate group of data.
However, comparing them to the other segments, the similarity with the land uses
extant in Segments IX and XIII is evident with regards to the area of the coastal zone
that is undeveloped and the similarity to the situation in segment X, with a limited
amount of land devoted to recreational development. The main difference, however,
with the other segments emerges in the amount of land identified as arable. The lack
of natural water resources along the coast and the lack of a permanent population and
the rugged terrain are not conducive to the development of agriculture.
The physical isolation of Camino, the limited accessibility from the sea through most
of its shoreline, and the absence of a sizeable population, place the island in a
disadvantaged position with respect to the other two islands. However the aesthetic
qualities of the island together with the cluster of rocks to the south west of the island
provide a marketable value in excess of its size especially in tourism development
such as ecotourism.
The Local Plan for Camino (Malta Environment and Planning Authority, 2002b)
proposes a number of measures whose aim is to safeguard its landscape value and
protect the natural habitats and protect it from urban related development. Among
these are the following:
• Designating it as a Nature reserve;
• Its formal scheduling as an Area of Ecological Importance and as a Site of
Scientific importance;
297

• The entire island together with its associated minor islets shall be afforded
the same level of protection as scheduled property;
• Confirm its status as a Rural Conservation Area; and
• Development initiatives are to be limited solely to those aspects where
infrastructural needs for communication between Malta and Gozo are
necessary.
Meanwhile the MEP A has set up a Steering Committee for Comino (The Sunday
Times [of Malta] 21 July 2002) to oversee environmental management concerns on
Comino. The committee is to formulate and implement a management plan aimed to
identify ecological, archaeological and recreational assets in order to strike a balance
between land and sea use (The Times [of Malta] 13 November 2002). Positive
elements regarding the safeguard of the aesthetic qualities of the island stem from the
fact that MEP A have removed an illegal concrete structure at Kemmunett, one of the
islets off Comino (The Times [of Malta] 13 November 2002. pp30-31). This was
apparently built by a prominent Maltese company that organizes round island cruises
to assist the lighting of its passengers on the islet.
7.14 Gozo
7.14.1 Introduction
The Segments that follow appertain to Gozo. MEP A recognized that Gozo is
'significantly different from Malta especially in housing, tourism, industry, transport
(including double insularity problems), tourism and recreation' (MEP A, 2002 b, 2).
Development guidelines for Gozo follow an overall strategy whereby caution has to
be exercised due to the limited land available, and the unique cultural and natural
characteristics of the island that make it a desirable place 'to visit and inhabit'
(MEPA, 2002 b, 2). In addition, development projects need to be compatible with
planning policy, the surrounding environment and nearby activities, be efficient on
land use, and create wealth and employment opportunities.
298

7.14.2 Segment XIII
7.14.3 Physical attributes
The general orientation of this segment, stretching from San Dimitri Point to Xweini
Bay, is almost uniform to the north. The rectilinear nature of the coast, having an
average width of 82.2 m and an area of 45.2 ha, presents few changes in the overall
compass direction. However the bay at Xwieni has sides facing east and west
respectively. The geology of the coastline is made up of a Lower Corolline Limestone
that presents as a steep rock face and cliff for most of the littoral, up to Reqqa Point.
The remaining part of the coastline is made up of low-sloping Globigerina Limestone
where salt pans have been dug into the rock surface.
7.14.4 Land uses
The land uses are clustered around the "rural" categories and the physical uniformity
of the Segment can be deduced from the presence of land uses (1), the shore platforms,
and n (steep rock and cliffs), throughout the zone for this segment. The land uses
associated with human modification of the natural environment are also uniform
throughout the 5.5km length of the segment with arable land, most of which is
abandoned, being prominent, and dilapidated areas associated with an illegal refuse tip
that is developing underneath the cliffside and over the shore platform.
Table 7.16: Selected synoptic data for coastal units in Segment XIII
Coastal unit Number of Per cent: land uses Per cent: area land uses out of max. 16 ofse2ment
114 3 18.8 9.7 115 6 37.6 33.0 116 6 37.6 57.3
Source: Estimated by author from land use data
This segment bears the marks of an area that is rural in character. The location at the
northernmost tip of Gozo is one factor. However the presence of extensive amounts of
accumulated rubbish, a land use that is largely associated with urban areas in this
thesis, shows the need for an organized coastal zone management strategy.
299

7.15 Segment XIV
7.15.1 Physical attributes
Extending from Reqqa Point to Qala Point, this segment is long, because of the need
to group together all of the main bays located on the north of Gozo and second,
because of the notable change in orientation that marks out different segments in the
thesis comes only after an appreciable length of coast. With a coastal length of 13.1
km making it the second longest segment for Gozo and an area of 114.9 ha producing
an average width of 87.7 m. The orientation of the coastal zone of this segment
changes direction from north to east, with further changes noted at the main bays to
the north coastline. Reqqa Bay and sides oriented to the south east and north west,
Marsalfom Bay and ir-Ramla to the NNW and NNE.
The physical features found on this segment of coast are varied and can in fact be
placed into two sections. In Section one from Reqqa Point to Dahlet Qorrot, the
geology is dominated by clay scree slopes, having five bays Xweini Bay, Il-Qbajjar,
Ir-Ramla, Marsalfom Bay and San Bias Bay as marked indentations along the coast.
The second part has a shore platform of Middle Globigerina limestone that skirts most
of the shoreline and is associated with rectilinear properties of the coast, largely
consisting of lower Coralline Limestone with a low sloping rock profile.
7.15.2 Land uses
Six coastal units are identified in Table 7.17, giving a breakdown of the number of
land uses for each unit and the percentage area of each unit. Although, in general, the
greater the area of coastal units, the more varied is the land use spectrum that a unit
possesses, this does not apply to this segment, as coastal unit 117 is the third largest in
area in land use variability as it possesses the largest number of land uses in the
segment - 12. The coastal unit that includes Marsalfom Bay with its tourist and
residential development, accounts for the high variability in this coastal unit. The area
of Dahlet Qorrot and coastal quarry in unit 122 provides the variation in the land uses
for this unit when compared to units 118 to 121.
300

Table 7.17: Selected synoptic data for coastal units in Segment XIV
Coastal unit Number of land Per cent: land Per cent: area of uses uses out of max. segment
16 117 12 75.0 18.1 118 7 43.8 25.9 119 3 18.8 11.5 120 4 25.0 30.5 121 1 6.3 0.1 122 8 50.0 13.9
Source: Estunated by author from land use data
The differences in the land use concentration along this segment are particularly
evident in the coastal units that have a degree of protection by the building of jetties
and breakwaters and the attraction of recreational activities. Especially in Marsalfom
Bay with its tourist and residential development. In addition, the area at Dahlet Qorrot
and a coastal quarry provide further variation in the land uses. However attempts at
"rehabilitating" this unused quarry met with stiff opposition from the local population
in the vicinity and the local council of Qala under whose political jurisdiction the
coastal locality appertains. In fact a referendum on the issue was conducted by the
local council and a huge majority voted against the proposal.
7.16 Segment XV 7.16.1 Physical attributes The segment stretches from Qala Point to Wardija Point, with a total length of 20.9
km. The coastal zone area is 142.3 ha, giving a coastal zone width of about 68m. The
weather conditions affecting the Comino Channels are important in the Ferry crossing
schedules between the Islands. Thus the orientation of the segments is important.
This segment has a general orientation due South towards the Comino Channel.
However at Xlendi the orientation changes to the South West.
7.16.2 Land use Table 7.18 shows the degree of land use variability along the segment and with each
coastal unit. The variability is greater from Qala Point to Mgarr Harbour, with more
than one-half of the land use categories represented in the unit. Coastal unit 130, that
includes Xlendi Bay, also has the same degree of variability.
301

Table 7.18: Selected synoptic data for coastal units in Segment XV
Coastal unit Number of Per cent: land uses Per cent: area of land uses out of max. 16 segment
123 9 56.3 14.8 124 8 50.0 10.9 125 10 62.5 8.5 126 8 50.0 15.5 127 2 12.5 6.4 128 3 18.8 23.0 129 3 18.8 5.3 130 9 56.3 10.4 131 4 25.0 5.2
Source: Estimated by author from land use data
The consistent feature of the segment is cliffs almost one-half of all land use
categories of the segment and arable land representing most of the remaining land
uses. However the low sloping rock (m) and shore platform (1) are present in about 5
per cent of the area. Notable indentations occur at Mgarr Harbour, Mgarr ix-Xini and
Xlendi Bay. The geology of the sector is varied, with all of the main geological strata
featuring at some stage.The variability is greater from Qala Point to Mgarr Harbour,
with more than one-half of the land use categories represented. Xlendi Bay also has
the same degree of variability. This segment, like most of Gozo, is a clear example
rural littoral development in that the recreational aspect emerges along areas where
there are indentations of the coast.
This segment, like most of Gozo, is a clear example rural littoral development in that
the recreational aspect emerges along areas where there are indentations of the coast.
A case in point involved the Qala Creek Project. This proposal put forward by Gozo
Prestige Holidays incorporated a five-star hotel and a yacht marina with port facilities
and a tourist village utilizing the site of a coastal unused quarry at a cost of Lm 41
million and was expected to take 4 years to complete (The Times [of Malta] 28
August 2002, 4). In addition, the developers insisted that public access to the beach at
Hondoq ir-Rummien will be enhanced and not restricted contrary to what the local
fear (The Sunday Times [of Malta]: Classified Property Pages 10 November 2002, 1).
However in a landmark example for environmental management in the Maltese
Islands, the population refused to endorse the development following a referendum
organized by the local council at Qala (The Times [ofMalta] 2 November 2002, 11).
302

7.17 Segment XVI
7.17.1 Physical attributes
This Segment completes the coastal zone of the Maltese Islands. It is rural in
character and located at the far north western ends of the Islands. The length of this
segment is 9.6 km with an area of 51.0 ha, representing a coastal zone width of
approximately 53m. The segment stretches from Wardija Point to San Dimitri Point.
The rectilinear nature of the coastline conditions a regular orientation towards the
West, with the exception of the inlet at Dwejra where orientations of the sides of the
bay are towards the north and south. About 41 percent of the coastal zone area is taken
up mainly by cliffs and to a lesser extent by shore platforms and low sloping rock. The
main geological feature is the Lower Coralline Limestone formation that outcrops
along most of the littoral. The most notable indentation is at Dwejra Bay, designated
as a Site of International Scientific Importance because of its unique
geomorphological features that include an arch and endemic vegetation that grows on
a stack.
7.17.2 Land uses
Table 7.19 shows the lack of variability in the land use of the segment, with coastal
unit 134 having the highest number of the land use categories. This area is the Dwejra
Bay region and land use b is represented by a series of boathouses. They mark the
difference between this coastal unit and the other four in this segment. A notable
feature is that most arable land is abandoned.
Table 7.19: Selected synoptic data for coastal units in Segment XVI
Coastal unit Number of land Per cent: land use Per cent: area uses out of max. 16 ofseg_ment
132 3 18.8 22.2 133 2 12.5 16.1 134 6 37.5 27.1 135 2 12.5 16.2 136 4 25.0 18.4
Source: Estimated by author from land use data
The overall lack of variability in the land use of the segment is evident, however, the
land use at Dwejra Bay is represented by a series of boathouses within the rich natural
environment. A notable feature is that most arable land is abandoned. The land uses
303

extant in this segment are a manifestation of its geographical position. The
furthermost tip of Gozo is not an area ideal for development. Thus its rural nature has
been left untouched by development. The land uses extant in this segment are a
manifestation of its geographical position. The furthermost tip of Gozo is not an area
ideal for development. Thus its rural nature has been left untouched by development.
7.18 Conclusion
The MEP A in its Draft Gozo and Comino Local Plan outlined the main needs for the
island. Three overall policies were proposed. The first concerns access to the
foreshore with the public having 'free and unhindered' rights (MEPA, 2002b, 110),
however this must not be interpreted as a right to improve access. The second
concerns the coastal Viewshed Protection Zone. This provision concerns the built-up
areas where no lateral extension to the built footprints and no vertical increase to the
building heights are to be undertaken without authorization. Thirdly, the coastal areas
that have an ecological, natural, or landscape value are to be safeguarded by the
appropriate legislation. This includes the need for EIAs where modifications to
existing beaches are requested and the prohibition of creating new beaches where
none existed before.
The land uses along the Gozitan coasts are predominantly associated with the rural
environment with pockets of recreational land uses. The most prominent of these are
at Mgarr, site of the Malta-Gozo Ferry terminal, and Xlendi (both sites in Segment
XV) a fishing village community transformed into a tourist area and Marsalforn
(Segment XIV) a seaside resort with recent haphazard development of flats holiday
homes and hotels similar to some areas in Malta. However one major point of concern
for the future development of the predominantly rural Gozitan coast are the Malta
Hilton-type projects proposed for two sites at Mgarr ix-Xini and Qala (both sites in
Segment XV). The two proposals envisage the quarrying of rock along the waterfront
to create a shoreline that accommodates yachts by cutting through a substantial part of
the hinterland. The case at Mgarr ix-Xini is to widen a natural inlet whilst the case
with the Qala seafront is to use and modify the site of a derelict and abandoned coastal
quarry. As both sites lie on an exposed part of the coast breakwaters are needed to
create safe anchorage. These types of proposals, if implemented, will alter the scenic
304

coast of Gozo in a substantial manner, reduce the natural aesthetic qualities of Mgarr
ix-Xini, and encourage similar developments in the future.
A number ofmodifications were observed in an assessment of the local littoral carried
out between April and May 2003. The principal aesthetic modification concerns the
embellishment of the promenades practically in all localities. This consists of
• resurfacing of the pavements using a combination of coloured tiles, with the
end result consisting of a mosaic of red grey and green hues;
• planting of trees, bushes and flowers;
• embellishment of roundabouts with water fountains and monuments;
• increase in street furniture such as benches, decorative lampposts and railings;
• introduction of litter bins that blend with the overall hue of the surroundings;
• surfacing of the coast roads;
• increase in traffic control measures such as the introduction of more traffic
signs, one-way streets, and traffic calming measures;
These improvements were undertaken by the local councils of Mellieha (Segment I),
St. Paul's Bay, Bugibba, and Qawra (all in Segment II); the whole stretch from St
Julian's to Sliema (Segment IV) and around all the localities of Marsamxett Harbour
and Grand Harbour (Segment V), Marsascala, (Segment VII), the localities in
Marsaxlokk Bay: Birzebbugia and Marsaxlokk (Segment VIII) and Wied iz-Zurrieq
and Ghar Lapsi (Segments IX and X).
Another aesthetic modification involved the increase in the number of flats along the
littoral where practically all areas are undergoing progressive change. Two storey
houses are being demolished and replaced by six and seven storey buildings in
addition to building over with same structures over coastal vacant land. All the
localities mentioned above are undergoing this process and in some parts of Malta the
process is complete.
The identification of Swimming Zones is another maJor improvement m the
management of the local littoral. These are off-limit areas for speed boats, jet skis and
high speed watercraft. The idea is to make the inshore zones safe for swimming.
Eighteen bays have been marked with yellow and red coloured buoys at 50 metre
305

intervals and patrol craft monitor infringements. The Bays included are the following:
Mellieha Bay, Imgiebah Bay, two sites in St Paul's Bay (Segment II); Birzebbugia
(Segment VIII); Ghajn Tuffieha Bay and Golden Sands (Segment XI); in Camino
(Segment XII) two bays San Niklaw Bay and Santa Maria Bay together with Blue
Lagoon; in Gozo Qbajjar Bay, Marsalforn Bay, Ramla 1-Hamra Bay, San Bias Bay
(Segment IV) Hondoq ir Rummien (Segment XV) and Xlendi Bay (Segment XVI)
(The Times [of Malta] June 14 2003,14).
Segment I falls within the North West Local Plan (Planning Authority, 2001) with the
main change being to the stock of boathouses along the Armier Bay area. Some of the
illegal structures have been demolished but access to the shoreline is hampered in
some areas. In addition, the Solemar Hotel has extended its previous limits and
encroached on good arable land and is siphoning potable water from the local water
table depleting the resource available to farmers.
In Segment II the main elements noted were the extension of seafront area with flats
as noted above however the principal change is the increase in the number of
restaurants and recreational establishments together with the competition for space
between sites used for aquaculture and sailing routes preferred by windsurfers.
Changes to Segments III and IV have already been noted with the extension of the
Maghtab rubbish dump and the Hilton Project. However the dump is to be closed
down by the date of European Union accession (1st May 2004) and replaced by an
engineered landfill behind Ghallis Tower (Segment III). Meanwhile two landfill sites
have been earmarked as a temporary replacement both on the cliffed part of the coast
in Segment IX. This issue has prompted the expected debate in the local press (The
Times [of Malta] July 10 2003a, p4-5; The Times [of Malta] July 11 2003b, p5).
In Segment IV the further intensification of developments with blocks of flats and
recreational establishments has gone apace increasing the population density of the
area and intensifying traffic problems and congestion.
The major projects that have been initiated since both involve sites in are Segment V.
The Cottonera Waterfront Rehabilitation Project where besides the embellishment to
306

the littoral mentioned above, Dock No 1 built in 1868 has been decommissioned and
removed, the buildings that accommodated workshops are being refurbished and is to
be used as a bank premises, a new yacht marina is being developed, a casino opened
and new flats and a hotel are in the process of construction. (Planning Authority,
1997b ). This development has also spilt over to other areas in the region where
upgrading of street furniture, house facades and attention to the more historical
remains, such as chapels street and comer niches and fortifications, is being attended
to. With regards to the other major development the Manoel Island and Tigne Point
project remains the principal feature of Marsamxett Harbour (Planning Authority,
1992). Although work on the Manoel Island part has not yet started the first phase of
the Tigne point development is underway and the area is being marketed as up-market
zone with flats and recreational, business and commercial outlets. However there still
remains the problem with the site of the former Excelsior Hotel left incomplete along
the littoral between the Valletta bastions although in 1992 a three-year time span for
completion was given. Another major development along the Grand Harbour littoral is
the extension to the Valletta Cruise Passenger Terminal (Planning Authority, 1998)
sited under the bastions; work on this project is to commence shortly.
Segments VI, VII and VIII constitute the remaining segments on the east and south
east coasts of Malta. The major changes to the coast besides the embellishment
projects mentioned above all involved conflict of uses between the location of
industrial activities, the supply of fuels to the various hydrocarbon installations, the
disposal of liquid waste and fish farming activities. A number of these issues were
mentioned in the relevant sections in Chapter 6 especially in section 7.9.4 dealing
with Marsaxlokk Bay but although the Local Plan was the first one of the series of
Plans to be published one of the major requirements to tum Delimara peninsula into a
nature reserve has not been implemented. However the relocation of the fuel
installation depots at St. George's Bay (Segment VIII) may soon be implemented as a
result of Malta's entry into the European Union and the restrictions to the height of
building facing the sea is also being observed.
The remaining segments in Malta (IX, X and XI) occupy the whole south west and
western littoral and are broadly classified under the "rural" category. Cliffs, scree
307

slopes, sandy beaches and arable land constitute the principal land uses. Very few
changes have been monitored over the past years however the footpath pattern in
some areas, notably at Rdum Dikkiena, has been obstructed with bird-trapping hides,
limiting access to the area (Schembri and Magri, 2003). Arguably the most important
management provision made since has been the scheduling of the coastal areas and no
development of any kind can be permitted. However, as mentioned above, the sites for
the temporary landfills fall within the boundaries of these segments and therefore one
expects that their negative impact will follow suit. In addition, the replacement of an
old hotel with new development mentioned in section 7.12 also falls within the
boundaries of segment XI. At the time of writing the area consists of one whole rubble
mound and is highly visible from the nearby surroundings.
The major change affected to Gozo was in the changes made to the ferry terminal at
Mgarr (Segment XV) where car parking and ferry berthing provisions are being
extended and enhanced. This has been the result of increasing traffic between the two
islands and in line with the MEPA aims to upgrade the harbour. Xlendi valley,and
Mgarr ix-Xini are the only two Gozitan sites to be scheduled, the latter done hastily
due to an environmental infringement by a quarry owner ( cf. Plate 6.5). Other
provisions still waiting for the MEP A stamp are the listing of the Dwejra area
(Segment XVI) as a World Heritage Site, which is under treat from encroachment of
nearby quarry extensions, and the new pipeline for sewage disposal at sea further out
than the existing outlet after the building of a sewage treatment plant also at Mgarr ix
Xini.
The main overall coastal issue is therefore one that requires continuous vigilance by
the MEP A both in urban areas, where development proposals threaten the
intensification of activities, and in rural areas where proposals for recreational land
uses threaten to turn "rural" parts of the coast into urban zones. Although the
development of industrial zones seems to be confined to two particular areas in
Segments V and VIII the landfill issue has now emerged as the main threat to the
coast with indecision as to its siting.
308

Chapter 8 An assessment of the coastal/and use distribution
8.1 Introduction
The discussion of the two previous chapters dealt with a description and analysis of
the land uses in the coastal zone of the Maltese Islands. The argument was based on
the field data captured, and involved the distribution of 16 coastal land use categories
in the coastal zone. In Chapter 6 the analysis was based on the land use categories as
distributed along the whole littoral of the coast. In Chapter 7 the analysis focused on
the land uses in each coastal segment. In this chapter further analysis will be made.
Three main purposes are identified. The first purpose is to present a series of
histograms, one for each segment, so as to compare the 16 coastal segments with one
another (Section 8.2). The second purpose is to examine the physical properties of the
coast as they condition land use (Section 8.3). The third purpose is to assess the
degree of compatibility or conflict between the coastal segments themselves and
between the coastal land uses within particular segments (Section 8.4). Finally, in the
conclusion, the degree to which particular segments are prone to development is
examined, based on the physical geographical criteria (Section 8.5). The data
examined consists of a number of cartometric measurements provided by two major
categories: the 16 land uses as distributed in each of the 16 coastal segments, and a
number of measurements pertaining to various physical properties of the coast such as
cliffs, shore platforms and scree slopes.
8.2 Presentation of results in histogram format
A series of histograms based on the land uses in each segment are presented in Figures
8.1-8.16. The idea is to put in simple format the land uses prevalent in each segment.
Each figure shows the distribution of the land uses in one segment. The key to the
land uses for all Figures is given at the bottom for Table 8.1. A number of
considerations are apparent that show that not all the segments have the same land use
properties and therefore a degree of variability of the coast can be gauged. Further
general considerations appertain to the size of the segments themselves: a large
segment generally has either a long coastal length (Segments V, VIII and XV) or a
wide coastal zone (Segment III) or both, such as the case with Segment X. A wide
range of land uses per segment is evident from Table 8.1 with two segments having the
309

maximum 16 land uses and Segment XIII has only seven land uses. In general the
segments that lie within the coastal urban areas have more land uses than the ones in
the rural category.
Examining the histograms one finds two main categories. In the first category are the
histograms that represent segments where the area covered by a few land uses is far
superior to the remaining land uses represented in the same segment, and these are
therefore termed 'dominant'. These include Segment I with recreational areas, arable
land in use and cliffs as the dominant land uses, whilst the land occupied by public
utilities, historical sites, low sloping rock, scree slopes and dilapidated areas is
represented by smaller areas. In Segment II arable land, both that which is still in use
and that which is abandoned, cliffs and scree slopes are the dominant land uses. In
Segment III recreational areas and cliffs are dominant; Segment IV shows that
recreational areas dominates the coastal zone; Segments V and VIII are dominated by
industrial areas whilst the 'rural' land uses dominate the remaining segments in Malta.
These include Segment IX dominated by cliffs, Segment X with arable land, both
those that are in use and those that are abandoned, together with scree slopes being the
dominant land use, and Segment XI dominated by scree slopes. The Segments that
represent Comino and Gozo demonstrate that the arable land uses, both those are in
use and those that are abandoned, together with cliffs and scree slopes are consistently
shown to be the dominant land uses throughout.
The second type of Segments are those where the distribution of the land uses lies
within a low range of values, in general those that have a small coastal zone area, such
as Segments IV, VI and VII. However, where only one land use is highly dominant in
one of these segments it dwarfs the other land uses in that Segment. Segments V and
VIII are clear examples with industrial areas dominating all other land uses.
310

Figure 8.1 Distribution of land uses in Segment I
c
30
25
! 10 <( 5
0
Segment I
~
.' .. ' :~
'• ~
~ n n ..... n o
abc de f gh
Land uses
I""
~·
i k
Figure 8.2 Distribution of land uses in Segment D
Segment II
40
35 II) 30 I!
i 25 .c 20 -.5 15 -
! 10 -<( :--
5 - - -
0 liilll!l ~ 11 _0_
a b c d e f g h i j k
Lands uses
Key to land uses
' '
... ll
i•·
~ • [•I-r:l R F.'·
m n o p
1- r--
F ,_ [!' , -
:-- - ~ t-
I m n 0 p
a- recreational areas; b- marine servicing areas; c- residential areas; d- public utilities; e- historic sites; f- industrial areas; g- extractive industries; h - depositional environments; i - afforested areas; j- arable land ; k- abandoned arable land; I- shore platforms; m- low sloping rock; n- cliffs; o- scree slopes; p- dilapidated areas.

Figure 8.3 Distaibution of land uses in Segment ill
Segment Ill
40
35+D~--~~~~~----~~~--~--~--~---4
Ill 30 +Mil--------------------------! 1 25~------------------~--~ ~ 20 +a~----------~------------------~----~ c
15 +M~------------------------------~-----4 ! 10 +a~----~~~----------~--~----,.----5+ti~----,.r-~------~=-----~
0 +-~-.--~,_--~,-.-~~
a b c d e f g h k m n o p
Land uses
Figure 8.4 Disbibution of land uses in Segment IV
Segment IV
20 T------~--~~~----~-=~==~~~-=~--~
18 Ill 16
j ~~ ~ 10 ·= 8 -f--llt----'-,-------.:;_;:_..;,;___..::... ____ --::------'--'-=-.:._:__ __ _.;.':---"'=--4 e 6 +1'·3'l--":-7""-----=,......,.,=-,...,.....:=---,.,..-7-=-=-':;~~7-f - - l---=-~=o-~ ct 4
2~r---~1•1--'-,-~b~----~~----~-
0 +-~-.~~~~~~--~~----~~~~--~~
a b c d e g h k m n o p
Land uses

Figure 8.5 Distribution of land uses in Segment V
SegmentV
90 .---~~~~~~~~~~~~,-~~~~·~~,~~
80+-------~~----~~~--~--=-~------~
w 70+---------------~--------------------~
I 60+---------------~--------------------~ I so +--------------.c .5 40 +---------------
~ 30 <t 20~--
10 0
a b c d e f g h
Land uses
k
Figure 8.6 Distribution of land uses in Segment VI
Segment VI
m n o p
10 ~--~--~--~~--~=-~~--~--~--~--~
9+--------------------------------------8+-------------------------------------
! 7+-------------------------.r----i 6 -t----------------llt---
.c 5+-------------------------.r-----
.5 4 +-------------------------111-------lll---::-~ 3+-~--~~~----~~~~~~r~-=~~=-~ <t 2 -HBI--"--=::=....._::::__.::._:_--==-I:il-----::--'-':':--_;:__,----r;.<!--f.+-::='"----l~.,:.:c:-~H
1 0+-~-T~~~~~~----~~~~--~~~~
a , b c de f g h k m n o p
Land uses

Figure 8. 7 Distribution of land uses in Segment Vll
Segment VII
1 6 ~~~==~~~~~~~~~
14 +-~=-~~==~~~~--~ ~-------------4
! 12 +---------------------~H-------~~--~
j10 r---------------.c 8 +---------------------.5 6 +----------------------~l--lld--lliil------.-.-! 4 ~ +-------~~~--~~~-r -~w-~~~-~~--~
2
0
abc de fgh
Land uses
k
Figure 8.8 Distribution ofland uses in Segment VITI
Segment VIII
40
35
! 30 1 25 ~ 20 c
15 ! 10 ~
5
0 abcde fgh k
Land uses
m n o p
m n o p

Figure 8.9 Distribution of land uses in Segment IX
60
50
e ~ 40
.c 30 c
f 20
<C 10
0
Segment IX
''!. .. ,
" r-
iJB r-
c=;J __11111_ ~- !.'
a b c d e f g h k
Land uses
Figure 8.10 Distribution of land uses in Segment X
Segment X
120
100 1:1
en ! 80 t
60 .c .5
I ' ~ CIS 40 _.._ r---!
..,, 'i u
<C 20 ~ t ,
,.. r---
0 _0
a b c d e f g h i j k
Land uses
1 -~
'-
~· l'l
m n o p
- -'•'
31 -=. ·"~ -~ '!,£ ,,:<:
~ -~ ~ n
-"-
I m n 0 p

Figure 8.11 Distribution of land uses in Segment XI
Segment XI
140
120+-------~------~----~----------~~~ Ill e 100 +---------------------------------~.r-~
i 80 ~--------------------.t:. c 60 +----------------------------------
e 40 +---------------------------------~~r-~ c(
20 +-------~~----------~--------~ r~ ·~--~
0 +-~~~--~~~~~~~~~~~~~
a b c d e g h k I m n o p
Land uses
Figure 8.12 Distribution of land uses in Segment Xll
Segment XII
35
30 Ill e 25
i 20 .t:. c 15 t!J
10 ! c(
5
0 a b c d e g h k m n 0 p
Land uses

Figure 8.13 Distribution of land uses in Segment Xill
20 18
Ul 16
i ~~ .1:. 10 c 8
" ! 6 ~ 4
2 0
Segment XIII
-- -'•· j
i--
r:1 n a b c d e f g h
Land uses
-
I':"
b
I'IJ
t-
~-·
k
Figure 8.14 Distribution of land uses in Segment XIV
45 40
~ 35 ~ 30
i 25 .1:. .5 20
e 15 ~ 10
Segment XIV
"
.• '• .,
.-~
'~i;'..r'~~ •• ~~ :r~ .. ~-·~~-~ ·--
~
fj'
-
,; ' I""'
Ill
m n o p
~·
i!''
~ l-t !\'
-[ -~-,
-,_
-'~··~
t-- -5 0 ....... r-1 n 1":'1 D
a b c d e g h k m n o p
Land uses

Figure 8.15 Distribution of land uses in Segment XV
Segment XV
70
60 Ill !50
i 40 ..c .5 30
~ 20 <(
10
0 a b c d e g h k m n 0 p
Land uses
Figure 8.16 Distribution of land uses in Segment XVI
Segment XVI
30 ~~~~----~--------~~~--~~~~~--.
25+-----~------~----------~~------~~ Ill
~ W+------------------------c~----------~ ..c 15r---~~~~-------fl~~~~~ c
~ 10
<( 5 -t----'-:':=---"-'-~7:-:...;--:::-=-:::.:.::..,;"-'-----'-~~ 1--'-::':----:':-'------'4 r-------~
a b c d e f g h k m n o p
Land uses

To facilitate interpretation a synoptic table has been provided (Table 8.1 ). This
represents the information given in the above mentioned figures in matrix form. For
ease of reference two keys are presented: a key that divides the land uses of each
segment into three main types:
(a) the land uses that are highly represented in each segment, and are therefore
dominant (highly conspicuous by their presence) in the particular segment where it is
located, these are indicated in bold lettering (eg. a);
(b) the remaining land uses denoted by an asterisk (*); and
(c) the land uses that are not represented in the segment (-).
The second key denotes the land uses.
Table 8.1 Synoptic table summarizing the results of Figures 8.1 - 8.16 --
Segment No. of a b c d e f g h i j k I m land uses
I 9 a * - * * - - - - j - - * II 16 a * * * * * - * * .i k * * III 10 a * - - - - - * * * * * * IV 12 a * * * * * - * * - - * * v 12 * * * * * * g * * * * * -VI 10 * - - * - * * - * * * * * VII 16 * * * * * * * * * j * * * VIII 14 * * * * * - g * * * * * * IX 12 * * - * * * - - * * * * * X 9 - - - - * - - * * .i k - * XI 14 * * - * * * - * * * * * * XII 7 * - - - * - - - * * * * -XIII 7 - - - - - * - - * - * * -XIV 14 * * * * - * - * * * k * * XV 14 * * - * * * - * * j * * * XVI 8 - * - - - * - - * * k * *
Source: Compiled by author from Figures 8.1-8.16
Key to symbols in matrix
Bold lower case lettering indicates dominant land uses within the segment
n
n n n
* -* * * n
* * n n
* n
*
asterisk "* " indicates the presence of that particular land use, but is not considered dominant (-) does not indicate the presence of that particular land use
Key to land uses
0
* 0
----* --0
0
--0
* -
a - recreational areas; b - marine servicing areas; c - residential areas; d - public utilities; e - historic sites; f- extractive industries g - industrial areas; h - depositional environments; i - afforested areas; j - arable land; k - abandoned arable land; I - shore platforms; m - low sloping rock; n - cliffs; o - scree slopes; p - dilapidated areas.
319
p
* * * * * p
* * * * * -* * * -

The general comments regarding this part of the analysis promotes the idea that cliffs
are a highly represented land use, featuring in 13 out of 16 segments, and dominant in
seven out of the 16 segments i.e. in Segments I, II, III and IX in Malta, Camino
(Segment XII) and XIII and XV in Gozo. In the remaining segments it is the
recreational areas in Segments I, II, III and IV and the industrial land uses in segments
V and VIII that are mostly evident. In addition, it is this latter group of segments that
are the most accessible both from land and sea because of the presence of shore
platforms and low sloping rock profile in addition to the concrete platforms lining
parts of the foreshore. In addition, the fortifications lining the Grand Harbour littoral
have masked the natural cliffs that preceded them and adjacent to which they were
built; the result is that, in this exercise, it is the historical land use (represented by
fortifications) that emerges and not the cliffs. Arable land is present in the "rural"
parts of the coast, whilst for segments VI and XVI it is the abandoned arable land that
is the dominant land use category. For all the other segments, the presence of a large
number of land uses increases the potential for land use conflict to occur especially
where:
• a large number of land uses are represented in the segment, especially if these are
clustered over a small area such as in the coastal urban zones in the inner parts of
bays; this issue is tackled in section 8.4 below;
• dilapidated areas are present, especially if these are concerned with building sites
or dumping of domestic waste; this problem is increased when this land use
category coincides with the intensive development areas associated with the tourist
areas;
• one highly dominant land use in a segment is accompanied by a number of other
land uses that are normally clustered together, especially if these land uses are
grouped into a small area;
• within a segment it is the proximity to one another of the urban, rural, industrial
and dilapidated land uses that can lead to conflicts. In fact land use conflict is the
issue to be tackled in section 8.4.
320

8.3 Selected physical features of the coast Further analysis on this part of the basic dimensions of the coast of the Maltese
Islands has yielded more data which is shown in Table 8.2. This table groups the
coastal length, the average width of the coastal zone for each segment, the distribution
of land uses and the percentage of the coast that has natural access and an index
showing the indentation ratio. The data is given for each Segment, for each separate
island and for the Maltese Islands.
8.3.1 Coastal indentation The factor of indentation mentioned above yields a number of other studies. One such
investigation is the indentation ratio for the Islands. Essentially, the degree of
indentation, for the purposes of this thesis, refers to the extent or degree to which a
particular area around the coastal margin departs from the linear or straight line
format. The latter is a line drawn along the perimeter of each island at a parallel
distance from the coast but not touching the actual shoreline. For the purposes of this
thesis this is called the circumnavigable length.
The importance of this element for this thesis lies in the fact that the greater the
indentation of the coastline, the greater is the propensity of that particular part of coast
to have a range of activities. The indented parts of the coast provide a greater land/sea
servicing interface and a better shelter from adverse maritime conditions such as
storms. These areas generally attracted settlement for millennia and therefore possess
more historical and archaeological remains and today they attract a higher degree of
urban and economic development. As a consequence, land use conflicts are more
prone to occur in the highly indented parts of the coast than in the less indented or in
the rectilinear stretches. Providing the planner with an index such as the one presented
in this thesis is a direct step to predicting future sites that could be earmarked for
development.
321

Table 8.2 Selected estimated dimensions for the Maltese Islands, Malta, Gozo, Comino and the sixteen segments.
Segment Coastal Circum- Coastal Average Land Land Natural length navigable zone width of uses uses access
km length area coastal a-m n-p %of km km2 zone in %of %of segment
metres segment segment
I 7.4 5.2 0.8 120.8 54.2 45.8 81.2 II 23.8 6.5 2.4 106.6 63.7 36.3 68.5 III 8.0 6.2 0.8 144.6 64.4 35.6 99.3 IV 7.7 3.2 0.5 62.6 75.3 24.7 97.8 v 25.6 10.5 1.9 75.5 100 0 100 VI 6.3 5.7 0.5 60.5 64.8 35.2 85.2 VII 13.8 5.6 0.7 50.1 76.5 23.5 65.3
VIII 10.8 1.6 0.9 89.7 92.2 7.8 85.9 IX 17.3 13.6 0.9 58.7 31.6 68.4 24.4 X 12.5 5.0 2.6 206.4 12.1 87.9 6.0 XI 21.6 9.6 2.1 90.2 13.2 86.8 28.0
Total Malta 154.97 63.2 14.1 Mean Mean Meah Mean 96.9 58.9 41.1 67.4
XII 8.1 0.4 52.5 21.7 78.3 62.0 (Comino)
XIII 5.5 4.2 0.4 82.2 51.2 48.8 17.3 XIV 13.1 10.5 1.2 87.7 32.0 68.0 51.1 XV 20.9 12.5 1.4 68.1 25.2 74.8 35.3 XVI 9.6 5.0 0.5 53.1 33.5 66.5 28.8
Total Gozo 49.28 32.2 3.5 Mean Mean Mean Mean 72.8 35.5 66.3 33.1
Maltese 212.35 18.0 Mean Mean Mean Islands 88.1 50.2 49.2
Source: Author's measurements wtth I em= 25m length on 1:2500 map scale.
Examining the littoral for coastal indentations or rectilinear features shows both
properties evident in the Maltese Islands. Marked indentation occurs along the eastern
Malta littoral, and the rectilinear features of the Western Malta, Comino and Gozitan
(Segments XII to XVI) coastal margins are highly evident. In general, coastal areas
having ports, harbours and bays are indented, penetrating inland into the land mass.
Areas not possessing these features are termed as having rectilinear properties.
Different characteristics of the Malta coastline emerge from Table 8.2. There are
1 03.4 km of coastal length from Cirkewwa (Segment I) to Benghisa Point (Segment
VIII), passing through the indented northern and eastern parts of the coast, which is
322
Ratio of circum-
navigable to coastal
length 1:
1.42 3.66 1.29 2.41
24.38 1.11 2.47
6.75 1.28 2.51 2.25 Mean 1:4.5
1.07
1.30 1.25 1.67 1.93 Mean 1.53

twice as much as the 51.5 km of the rectilinear southern and western coasts. The
circumnavigable data amount to 35.0 km and 28.2 km respectively, giving an
indentation ratio of 1:2.9 for the heavily indented part of the coast and 1:1.8 for the
remaining part of the coast. Comparing the above figures with those for Gozo, which
has 43.7 km of circumnavigable coastal length and 78.5 km of actual coastal length,
an indentation ratio of 1: 1.8 is calculated. This value is similar to that of the south
and western Malta margin. Further details show that 84.6 per cent of the whole
Eastern littoral of Malta (Segments II-VIII) is taken up by the indented parts of the
coastline, whereas only three areas can be identified as possessing an element of
linearity in this eastern part of the coastal margin. The latter are represented by
Segments III, VI and a short stretch in Segment II, from il-Ponta ta' L-Ahrax to Dahlet
ix-Xilep.
A further detail that arose out of this cartometric exercise is the heavy indentation of a
number of Segments. Essentially, a simple scale was established where the separate
segments were classified into three broad categories of indentation: high, middle or
low. The ratio was calculated between the dimensions of circumnavigable length and
coastal length with the shorter circumnavigable length always having a ratio of one.
Grand Harbour and Marsamxett Harbour making up Segment V, the bays to the North
East of Malta in Segment II and Marsaxlokk Bay represented by Segment VIII are the
most prominent in this respect. The coastal margin to the north of il-Kullana on the
Western coast of Malta up to Cirkewwa, that includes Segments X and XI with the
sandy beaches of Gnejna, GhajnTuffieha and Golden Bay and the area between
Marsascala Bay and Delimara in Segment VII, present a moderate form of indentation.
The remaining segments, having a ratio less than 1: 2.00, possess a low degree of
indentation.
The similarity noted between various portions of the coast will emerge again when the
land use data gathered is investigated, but for management purposes the coastal
dimensions presented can help the planner in at least two ways: the first is in the
identification of areas that have 'similar' properties, the second, is at predicting
coastal margins that can be earmarked for development, depending on the degree of
indentation of the coast. Since such areas are prone to land use conflicts, development
323

briefs must be prepared with a degree of caution. This exercise not only helps to
quantify the degree of indentation or otherwise of the coast of the Maltese Islands but
also helps to highlight an important coastal geomorphological feature - indentation.
Coastal inlets, of all physical dimensions and properties of width, length, and depth
have many attributes, some of which have been mentioned above, but they also
enhance the mooring of boats, as they present a better shelter from strong winds and
sea swell conditions. Cultural development is normally associated with these inlets
and in Malta they form a substantial part of the coastline. The data presented in this
chapter will form the basis for the concluding remarks for the thesis.
8.3.2 Accessibilty
Table 8.2 also shows the influence of accessibility on coastal land use for the separate
segments. The figures give the land uses normally associated with high accessibility
(a-m), these include the urban and industrial land uses (a-g), the land uses denoting
areas with unconsolidated material (i) and the areas where shore platforms and a low
sloping rock profile prevails (1 and m). The remaining land uses (n-p) are presented in
the adjacent column. These combine the inaccessible parts of the coast and dilapidated
areas. Additionally, the percentage values for the accessible parts of the shoreline are
provided as a value for each segment based on the coastal geomorphology of the area
and shown in the penultimate column as 'natural access.' This combines the values for
shore platforms, low sloping rock and reclaimed parts of the coast. The final column
presents the ratio of the circumnavigable length (column 2) to the coastal length
(column 1 ), this gives the degree of indentation of each coastal segment. An element
of consistency is apparent in the values given: generally segments where a high degree
of natural access is evident have a high value for land uses associated with good access
(a-m), especially for Segments 1-VIII.
8.4 Coastal land use conflict
Price (1989, 11) maintains that land use conflict occurs where "major areas of
concentrated resources overlap with heavy use impacts." Carter (1988, 2) identifies
"the disruption by Man of the natural coastal system". Viles and Spencer (1995, 17)
propose a two-pronged classification to group coastal problems. First they put forward
problems that arise out of "natural stresses" and secondly pose those problems that
324
arise due to a significant human input. The latter depend also on the type of human
interference and is also scale-dependent. Clark (1995), in suggesting the need for
integrated planning of coastal areas, cites the fact that it is the competition and conflict
that occurs among a variety of land uses such as "residential, tourist, commercial,
industrial, transportation, recreational and agricultural activities" competing within
limited space that causes conflict in coastal areas, especially if competition occurs in a
limited space. Within the local context Borg ( 1995) places a number of indicators as
demonstrating conflict along the Maltese littoral. These are, the competition for space
on land and sea surface, the degradation and eradication of land habitats and benthic
(sea bottom) habitats and the degradation of water quality from effluents.
Placing the above quotations within the context of this thesis, and using the case of the
Maltese Islands with its high population density and multiple uses taking place in the
coastal zone, land use conflict can be considered as a pressing issue. However, the
type of conflict varies with the predominant land use prevailing. Within this context,
and as mentioned above, especially throughout Chapter VI, three types of conflicts can
be proposed, based on the three broad land uses. First there are those conflicts
occurring in the coastal rural areas, i.e., those areas where the dominant land use type
consists of cliffs, scree slopes and agriculture. Second there are those conflicts in the
coastal urban areas, i.e., the land uses associated with the recreational, residential and
industrial activities. Third there are those on the rural/urban fringe, i.e., afforestation
areas. Considering the series of explanations as to what constitutes conflict ( cf. Price
(1989), Carter (1988), Viles and Spencer (1995), and Clark (1995)), and using the data
obtained for the coastal land use spectrum, as developed in this thesis for the Maltese
Islands, a simple classification based on correlation analysis. Before tackling land use
conflict per se it is helpful to examine the extent to which land uses, on the one hand,
and segments on the other possess similarity based on the results obtained in this
thesis. This can be done through correlation analysis.
Correlation analysis is a technique used to establish the degree of correspondence
between two or more geographical patterns. Robinson (1998, 80) states that this
method of investigating interrelationships was utilized first by Rose (1936) and then by
Weaver (1943) who as agricultural economists related agricultural production to
325

physical variables through correlation methods. They were followed by McCarty
(1953) and McCarty et a! (1956) who utilized correlation analysis as the principal
statistical tool in "his attempt at explaining the location of phenomena by looking at
the spatial distribution of different variables" (Robinson, 1998, 80). The method
employed here falls under the paradigm of cluster analysis where the correlation
matrix depicts similarities between observations "which in geographical terms can be
places" (Robinson, 1998, 146) or as in this thesis can also be land uses. Cluster
analysis is shown as a branching structure or dendogram. These "branches" are
representations of the degree of similarity between observations and also give the
numerical value (usually a percentage) at which two or more of the observations
possess similar properties, generally the higher the value the higher is the similarity
between the observations. In addition, the correlation matrices possess the facility of
grouping observations that have occurred within a relatively small numerical range.
Dendograms are interpreted in the following manner. First the mutually highly
correlated pairs of observations are identified. These pairs are then grouped with each
of the unattached observations separately until, at the end of the grouping procedure,
all the observations are combined into one group (White, 1984). The method used in
this chapter first identified the three broad clusters (A, B and C) under which the land
uses appertained to, secondly, the most compatible land uses were paired and finally
the linkage is established between the remaining land uses individually and the
previous groups. The result is shown in Table 8.3 with the Key at the bottom of the
table helpful in explaining the pairing system used.
One such method is the Bray-Curtis Index. Essentially it is a data transformation
method that is generally applied to make inferences beyond the purely empirical values
presented. These indices allow the measurement of (a) the degree to which populations
are distributed differently and (b) the degree to which one population is segregated
from the rest of the population (http:// www.sru.edu/depts/artsci/ges/urban). Indices of
dissimilarity provide the researcher with a comprehensible figure between 0 and 100 in
cases where percentage values are used. The nearer to a 100 that a pair of values is
bracketed the greater is their similarity. On the other hand the nearer to 0 the more
dissimilar they are found to be. (http:lhistory.wise.edu/archdeacon/404tja/diss.html).
These indices are also employed as "locational indices in comparing the distribution of
326

two different categories of persons or things" (http://www. latech.edu/tech/liberal
arts/geography/courses/440/44exer4.html, pI). A list of dissimilarity measures is to be
found in the web site entitled Bray-Curtis Index presented as a dissimilarity measure
(http://biover.bio.ub.es/vegana/resources/help/ginkgo/DataOperations.html) with the
for distances between quantitative data. The index is ideal as it performs well in
situations where there are a low number of categories, as in the case of this thesis
where 16 land use categories and 16 segments were being analysed.
In these cases use of the data collected is made and attempts to examme the
relationships of the variables made develops into a series of dendograms. As most
methods in spatial statistics, the index was utilised by biologists to examine / (! t f
similarities oetween different categories. In fact, ~lfal and Rolf (1975, 1995) present --x:Jf:--ct ',
two substantial volumes on statistics for biologists and although the Bray-Curtis index
does not feature in the volumes other similar methods are presented in the texts that
give similar results. The Index employed here was in fact suggested to the author by a
biologist. As a practical example the index for land uses using Figure 8.17 presents
land uses a and d as the most similar with a similarity of index of 62 per cent. These
are followed by land use p where the similarity between it and an amalgamation of a
and d shows a similarity of 58 per cent. This procedure was repeated for 15 steps
taking each land use category in tum and working the similarity between it and an
amalgamation of all the previous land uses. The procedure is applied in the same way
for the segments.
Correlation among land uses is shown in Figure 8.17 and Table 8.3 and correlation
between Segments is shown in Figure 8.18 and Table 8.4. These are presented in the
following pages. In the correlation between land uses three groups of clusters are
shown (Table 8.3): Cluster A, encompassing the "urban" land uses, Cluster B, made up
of mainly "rural " land uses whilst Cluster C groups the extractive and industrial areas.
The correlation between land uses in Cluster C and the remaining land uses (Clusters
A and B) is very low. Details to the three groups of land uses are as follows:
Cluster A: recreational areas (a), marine servicing areas (b), residential areas (c),
public utilities (d), historic sites (e), afforested areas (i), depositional environments
(h), low sloping rock (m), dilapidated areas (p ).
327

Cluster B: arable land (j), abandoned agricultural land (k), cliffs (n), and scree
slopes ( o ); shore platforms (1); and
Cluster C: industry (g), extractive industry (f)
As Cluster A has the largest number of land uses it is felt appropriate to deal with this
cluster further and propose that it can be subdivided into four groups of land uses:
• a, d, and p (recreational areas, public utilities and dilapidated areas) essentially
land uses associated with the urban environment;
• b, e and c (marine servicing areas, historical areas and residential areas) land uses
associated with the accessible urban coastal areas; and
• i and m (afforested areas and low sloping rock) essentially land uses associated
with the rural and accessible areas but also located in the urban areas; and
• h (depositional environments) found in both urban and rural areas.
Cluster B groups the rural land uses: arable land (j), abandoned agricultural land (k)
cliffs (n) and scree slopes ( o ), and these cluster together denoting a high degree of
compatibility. They also provide the best aesthetic coastal areas. Shore platforms (l)
are a type of land use that can be considered to fall within the rural category however
their correlation index is nearer to Cluster C. Shore platforms provide the most
accessible part of the coastline and, in general, are located in areas where the rock type
is the Globigerina Limestone formation. In addition, most of the marine servicing
industries are located in these areas and are generally found in coastal embayed areas
on the south and east of the Malta coastline. In the rectilinear areas where Globigerina
Limestone shore platforms are present and exposure to a heavier sea swell than in the
embayed areas is prevalent, salt panning is found. This is classified with the extractive
industries, within the land use classification system developed for the purposes of this
thesis, and this also partly accounts for the shore platforms (1) to correlate at a value
nearer the industrial land uses (g) and extractive industries (f).
328

Figure 8.17 Bray-Curtis Similarity Index for the coastal land uses
Key to land uses
a recreational areas
b marine servicing areas
"
c residential areas
d public utilities
e historic sites
~LJ L--
k f industrial areas
g extractive industries
h depositional environments
0
afforested areas
h arable land
k abandoned arable land c
I.- I shore platforms
b m low sloping rock
'---- .-----e n cliffs
o scree slopes
-,...-- p dilapidated areas
m
..___ a
,...--
d
p
0. 10. 20. 30. 40. 50. 60. 70. 80. 90. 100.

Table 8.3 Interpretation of Figure 8.17: similarity between l d b d I an uses ase on percentage va ues
Similarity between land
Land use symbol* uses: per cent a-d 62 p-(a-d) 58 i-m 50 b-e 47 (b-e)-{(i-m) + [(a-d)+p]} 40 c-{ (b-e)+(i-m)+[(a-d)+p]} 30 h- {c(b-e)+(i-m)+[(a-d-p]} 25 n-k 55 j -(n-k) 50 o-{(n-k)+j} 40 1-{ o(n-k)+j} 30 f-{Cluster A)+ (Cluster B) 20 g_-_{f-(Cluster A)+ (Cluster B_}l 10 Sour~e: dev~loped by author from Fig11re 8.18 - denotes linkage ( ) denotes a pair of land uses
Cluster
A
B
c
[ ] denotes grouping between three land uses: a pair plus one land use category { } denotes a group of more than two land uses + denotes amalgamation of pairs or groups of three or more land uses
*Key to land uses a - recreational areas; b - marine servicing areas; c - residential areas; d - public utilities; e - historic sites; f- extractive industries g - industrial areas; h - depositional environments; i - afforested areas; j- arable land; k- abandoned arable land; I- shore platforms; m - low sloping rock; n - cliffs; o - scree slopes; p - dilapidated areas.
330

Figure 8.18 Bray-Curtis Similarity Index for the coastal segments
segment 4 -
segment 5
segment 8 -
segment 12
,..---
J segment 3
y segm~nt 13
segment 9
segment 15
segment 6
segment 1
segment-2
segment 7
segment 10
segment 11
segment 14
segment 16 ...
20. lO. 40. 50. so. 70. 80. . 90. 100 .

Table 8.4 shows the tabular interpretation of the correlation pertaining to the
Segments. Four groups are identified with Clusters 1 and 3 grouping at the higher
values, these can be classified as the "rural" segments whilst Cluster 4 is identified
with the industrial and urban category of segments. Cluster 2 comprises the segments
that fall within the rural/urban category.
Table 8.4 Interpretation of Figure 8.18: similarity between t b d t I s~men s ase on percen a2e va ues
Similarity Segment No. between
segments: per cent
XI-XIV 75 XVI-(XI-XIV) 66
VII-II 77 I-{VH-II) 58 VI-[I-(VII-II)] 52 IX-XV 82 XIII- (IX-XV) 67 III-[XIII-(IX-XV)] 61 XII-{III-[XIII-(IX-XV)]} 54 V-VIII 52 IV-_(\"_-VIII) 33 Source: developed by author from Figure 8.19 Key: - denotes linkage ( ) denotes a pair of segments
Cluster
1
2
3
4
[ ] denotes grouping between three segments: a pair plus one segment { } denotes a group of more than two segments + denotes amalgamation of pairs or groups of three or more land uses
Figure 8.18 further shows that Clusters 1 and 2 are similar at the 50 per cent level,
Cluster 3 is 48 per cent similar to the combination of Clusters 1 and 2, and Cluster 4 is
only 24 per cent similar to Clusters 1, 2, and 3. This shows that the Segments that
exhibit intensive urban/industrial land uses are highly dissimilar to the remaining
segments.
Throughout this thesis the broad subdivision of the coastal zone was one between
urban and rural land uses and was also a major distinguishing feature. Table 8.5
combines the Segments, the 'main land use type' column and in the third column
geomorphology of the group of segments based on the shape of the coast as
332

represented on maps is provided. The synoptic result gives the main character of the
particular segments and the end result shows that in deep embayed harbours the
major urban and industrial developments have taken place. The identification of
coastal areas that have similar properties is very important as it enables planners and
managers to rationalize on policies.
T bl 8 5 Cl a e . f . h . I d ustermg o segments wit mam an d h . I uses an playsica properties Segments Main land use type Geomorphology IV V VIII Urban, industrial DeeplyEmbayedharbours XII III XIII IX XV Rural Rectilinear coastline VI I II VII rural/urban Embayed coastline XXI XIV XVI Rural Em bayed Source: compiled by author
Table 8.6 establishes an index whereby the number of actual land uses in a coastal
segment was divided by the maximum number of possible land uses (i.e. 16). A high
index value suggests a high number of land uses and therefore offers the possibility of
a high level of land use conflict. In addition, this Table relates the general
geomorphological property of a segment with regards to whether its general features
provide a rectlinear or embayed coast, and also denotes whether a coastal segment has
a generally accessible or inaccessible coastline.
In general, it is the accessible areas that exhibit a varied land use pattern, and, as a
result, more land use conflicts are found in the accessible than in the inaccessible
areas, with the Segments where there are both the accessible and the embayed features
present having even more land use conflict than those segments where inaccessible and
rectilinear areas feature.
333

Table 8.6 Coastal Segments: land use index, type and accessibili~ of coast. Segment Number of Number of land INDEX Rectilinear Em bayed Accessible Inaccessible
land uses uses not coastline coastline coastline coastline represented
I 11 5 0.69 * II 15 1 0.94 III 13 3 0.81 * IV 12 4 0.75
v 13 3 0.81
VI 11 5 0.69 * VII 15 1 0.94 * VIII 14 2 0.88
IX 12 4 0.75 * X 9 7 0.56 * XI 14 2 0.88
XII 7 9 0.43 * XIII 7 9 0.43 * XIV 14 2 0.88
XV 14 2 0.88 -
XVI 8 8 0.50 * Source: Compiled by author from land use data and coastal surveying
* indicates presence of feature
*
* *
*
*
* *
8.4.1 Coastal geomorphology as a component in land use conflict
* * * * * * * * *
* *
Land use conflict is intense where most of these land uses occur over a small area
such as in coastal urban areas where residential areas and marine recreational areas
occur near one another. In the rural areas, it is the extractive industries, especially
quarrying, that cause the most land use conflict. Dilapidated areas cause conflict in
both the rural and the urban areas. Table 8.7 lists the land uses that cause conflict in
all segments. The prevailing pattern shows that Segments I-IX, that make up most of
the coast of Malta with the exception of the stretch along the west coast from Wied iz
Zurrieq to Cirkewwa, exhibit land use conflicts, at least at the scale presented by the
level of the segments.
The analysis is taken a stage further by introducing three additional elements. The first
is the selection of the segments where land use conflict is prevalent by placing the
urban land uses in a hierarchy of 'land use conflicts' (Table 8. 7). The second is the
subdivision of these segments into their component localities (Table 8.8) and thirdly,
the distribution of the main geomorphological shoreline characteristics that appertain
334
* * * *
*

to each part of the coast are provided (Table 8.7). These tables are being proposed in
order to identify with more precision the areas within the segments that are responsible
for the prevailing land use distribution, and also to try and narrow down the areas
within the segments that are in general responsible for land use conflict. Table 8.5
shows that segments II-VIII are the parts of the coast where most land use conflicts
occur. This is because dilapidated areas and industrial areas are present in all of them.
T bl 8 7 C t IS a e . oas a ~ t I XVI mens - fl' f : con IC m_g an d uses Segment Industrial Dilapidated Tourism Marine Residential Public Historial
areas areas recreational areas utilities _{g)_ (p) (a) areas (b) (c) (d)
I * * * II * * * * * III * * * * * IV * * * * * v * * * * * * VI * * VII * * * * * VIII * * * * * * IX * * * * X XI
XIII XIV * * * * * XV XVI
Source: Compiled by author from land use data
Table 8.6 gives the predominant land use categories (urban, rural and industrial)
present in particular segments. The subdivisions within the segments are based on the
coastal areas that, in general, exhibit overall uniform geomorphological features,
notably embayed or rectilinear features within the segment. In general the table shows
that in embayed areas, such as harbours and bays, the urban and industrial land uses
are represented with higher values and, as a result, the chances for land use conflict are
greater. This is seen especially in segments IV, V and VIII. In Table 8.9 Segments II,
VII and VIII have been selected for this test for a number of reasons. Segment II
incorporates both rural and urban coastal areas and, as a result, a high degree of
335
sites (e)
*
* * *
* *
*

differentiation is evident along its littoral. It includes the bays on the north-east coast
of Malta. Segment VIII, which includes the whole of Marsaxlokk Bay, has a varied
land use base with industrial, urban and rural land uses incorporated into it. Segment
VII has a land use set-up part of which includes Marsascala Bay with its urban element
and another part which is predominantly both rectilinear for a long stretch of coast,
and exhibits overall rural characteristics. The reason for proposing this Table with this
particular classification is that, as seen through an examination of the coastal
segments, land use conflict occurs mainly in areas where there is a high degree of
accessibility, thus, identifying these areas with a greater precision is possible and at a
level smaller in size than that given by the data for the coastal segments. In addition,
the land use data is reduced to give selected categories only and thus simplify the
analysis. The Table shows two main subdivisions: (a) the shoreline geomorphology as
measured from the 1 :2500 scale sheets, ( cf. Chapter 5) and (b) the land uses present as
estimated from the field data. The data for each land use and geomorphological
variable for each selected locality is presented as two separate percentage values; one
representing land uses, the other representing geomorphological variables. Only data
for three Segments (II,VII and VIII), those for embayed localities having different
overall land use characteristics and also where the change in coastal character is clearly
apparent along the littoral of the respective segments, has been presented for the
purpose of this exercise. Segment II shows in detail the localities that constitute St.
Paul's Bay, namely, the Mistra area, Pwales, Bugibba, and Qawra. Segment VII gives
the details for the five sections in Segment VII, namely, two areas along the
Marsascala seafront, St. Thomas's Bay, and two areas where development has not yet
occurred: the Tumbrell Point area and part of the Delimara peninsula. In general it is
the coastal units where concrete platforms and land reclamation have been developed
that are the areas where major land use conflicts occur.
336
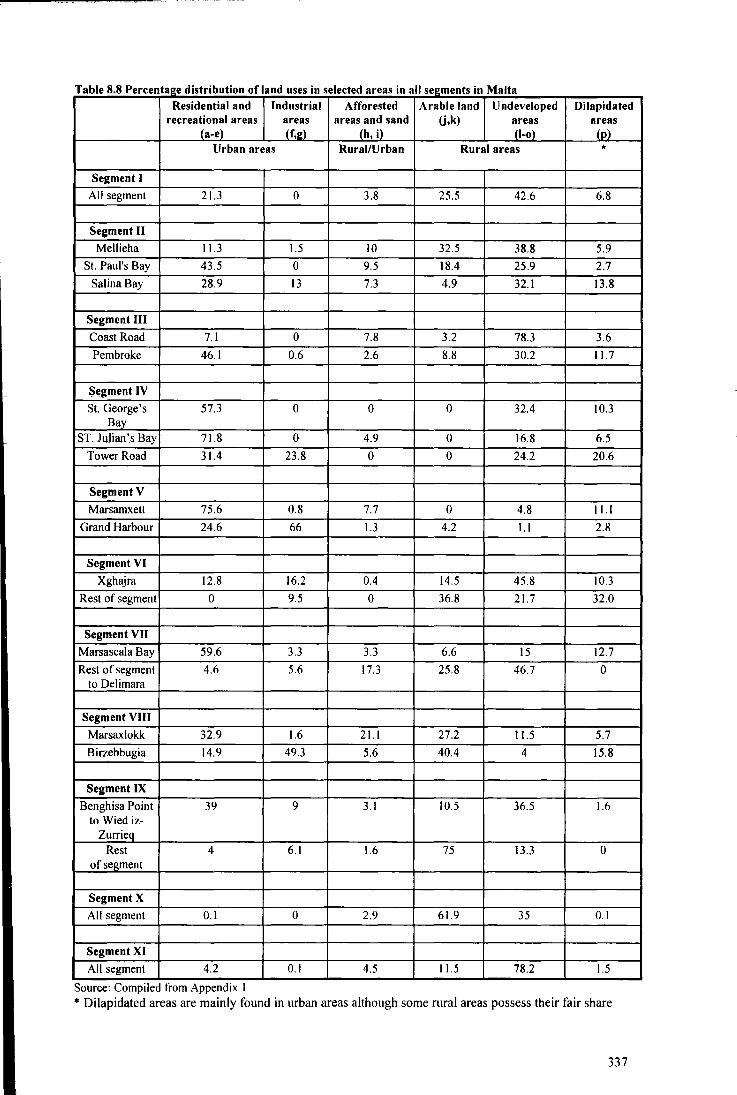
T bl 8 8 P a e ercen a2e d" "b . astn utaon o fl d an uses m se ecte d areas 10 a II . M I segments 10 a ta Residential and Industrial Afforested Arable land Undeveloped Dilapidated
recreational areas areas areas and sand (j,k) areas areas (a-e) (f,g) (h, i) (1-o) (p)
Urban areas Rural/Urban Rural areas *
Segment I
All segment 21.3 0 3.8 25.5 42.6 6.8
Segment II
Mellieha 11.3 1.5 10 32.5 38.8 5.9
St. Paul's Bay 43.5 0 9.5 18.4 25.9 2.7
Salina Bay 28.9 13 7.3 4.9 32.1 13.8
Segment Ill
Coast Road 7.1 0 7.8 3.2 78.3 3.6
Pembroke 46.1 0.6 2.6 8.8 30.2 11.7
Seg!.l!.~tiV
St. George's 57.3 0 0 0 32.4 10.3 BllY_
ST. Julian's Bay 71.8 0 4.9 0 16.8 6.5
Tower Road 31.4 23.8 0 0 24.2 20.6
Segment V
Marsamxett 75.6 0.8 7.7 0 4.8 11.1
Grand Harbour 24.6 66 1.3 4.2 1.1 2.8
Segment VI
Xghajra 12.8 16.2 0.4 14.5 45.8 10.3
Rest of segment 0 9.5 0 36.8 21.7 32.0
Segment VII
Marsascala Bay 59.6 3.3 3.3 6.6 15 12.7
Rest of segment 4.6 5.6 17.3 25.8 46.7 0 to Delimara
Segment VIII
Marsaxlokk 32.9 1.6 21.1 27.2 11.5 5.7
Birzebbugia 14.9 49.3 5.6 40.4 4 15.8
Segment IX
Benghisa Point 39 9 3.1 10.5 36.5 1.6 to Wied iz-
Zurrieq Rest 4 6.1 1.6 75 13.3 0
of segment
Segment X
All segment 0.1 0 2.9 61.9 35 0.1
Segment XI
All segment 4.2 0.1 4.5 11.5 78.2 1.5
Source: Comptled from Appendtx I * Dilapidated areas are mainly found in urban areas although some rural areas possess their fair share
337

Table 8.9: Distribution of selected coastal geomorphological properties and t II d ~ I t d t d I l'f coas a an uses or se ec e segmen san oca I 1es
Segment Sand Scree Low Steep Cliff Reclaimed Urban Industrial Afforestation Arable and O.S. slopes rock rock land land uses Land and land
sheet (a-e) uses unconsolidated U,k) (f & g) material
(h, i) Segment
II 4479 6.4 38.2 39.5 10.6 0 5.3 48.3 0 14.4 0
4478 4.9 13.9 32.8 11.9 1.6 34.8 51.3 0 22.3 24.8
4678 0 0 30.2 11.3 0 58.5 54.9 0 4.3 39.8
4679 0 0 91.3 8.7 0 0 83.7 0 4.9 0
Segment VII
6069 4.4 0 61.4 5.7 0 28.5 83.8 2.5 5.0 5.8
6068 2.2 0 76.6 17.4 0 3.8 64.4 10.0 2.5 17.4
6067 7 0 47.1 23.8 22.1 0 3.8 0 0 91.3
6066 0 0 31.1 7.3 61.6 0 19.2 11.6 0 57.8
6065/64 0 0 77.2 7 15.8 0 0 8.7 55.9 25.7
Segment VIII 6065 0 7.9 78 11.2 2.8 0 59.5 0 0 38.8
5865 0 0 0 5 0 95 82.4 0 0 16.3
5866 0 0 32.2 2.3 0 65.5 56.4 13.6 0 26.3
5865 0 0 49.5 15.5 0 5 35.0 0 3.0 61.0
5865 0 0 60.7 31 0 8.3 42.4 5.4 9.0 41.6
5665 0 0 46.3 0 0 53.7 42.5 45.0 6.5 0
5664/5864 3.7 0 59.3 0 0 36.9 34.5 10.7 20.0 30.3
5863 0 0 74.7 14.7 0 10.5 9.0 43.9 0 35.8
Source: Compiled by author from cartometric measurements
In Tables 8.7 and 8.8 a number of similarities are apparent. The percentage values for
the land uses a-e, that in large part make up the urban area, are high in both Tables,
where Pwales, Bugibba, and Qawra (O.S. 4479 and 4478) are shown in Segment II and
Marsascala (O.S. 6069 and 6068) is shown in Segment VII. Similarly, the same
localities show correspondingly high values for low rock and reclaimed land in the part
of the Table dealing with geomorphological properties. The southern part of the outer
extremity of Marsaxlokk Bay (Segment V), where the Container terminal is located
(O.S. 5865), shows a 100 per cent reclaimed zone. The area has been protected from
338
Unde- Dilapid vel oped -a ted
areas areas
34.4 2.9
1.4 0.2
1.0 0
10.0 1.4
1.5 1.4
3.3 2.4
3.7 1.2
11.4 0
9.4 0.1
1.7 0
1.3 0 2.1 1.6
1.0 0
1.2 0.4
0 6.0
2.6 1.9
0 11.2

strong sea currents and turned into an all weather area and this has encouraged
development. Prior to the construction of the Terminal, 90 per cent of the area was
accessible over a low sloping rock face. The exposed nature of the area, located at
outer extremity of the Bay, did not encourage development save for a seaplane base
constructed by the British in the 1920's and this was only made possible with the
construction of a small jetty and breakwater at Kalafrana (Segment V). It was only
after the construction of civil engineering works that development of such an area
proceeds. In addition, most of the littoral of Marsaxlokk Bay is highly accessible and
very little coastal engineering modifications were ever made prior to the 1960's. The
historical development of the coastal area of the Bay indicates that the inner recesses
were the first parts to be urbanized and industrialized with the provision of oil storage
facilities. These areas provided the safest mooring parts of the whole Bay. It was only
in the later years of the twentieth century, with the construction of shore protection
works, that development could take place in the outer reaches of the Bay.
Another facet that provides evidence for the onset of development is in areas where
sandy beaches occur with the presence of unconsolidated material. In addition, these
are found in the inner recesses of bays and form part of the accessible areas of the
coastal environment. For segments VII and VIII O.S. sheets 6069 and 6068 for
Marsascala (Segment VII), and O.S. sheet 5865 for the sandy bay at Birzebbugia
(Segment VIII), the urban land uses have high values indicating substantial amount
development near areas having unconsolidated material.
8.5 Conclusion
The above discussion focused around the fact that it is the degree of access to a
shoreline that largely determines the intensity of development along a coast. Access,
conditioned by natural factors such as a low sloping rock profile or shore platform,
was the primary factor that influenced the urbanization and industrialization of coastal
areas. Generally these occurred in the inner recesses of bays and inlets. However, with
the use of techniques that helped the construction of civil engineering works such as
breakwaters and jetties, development in areas where normally adverse marine
conditions prevail or access from land difficult. Two cases in point are the
development of the Hilton site at St Julian's bay where the rectilinear coastline was
339

modified into a sinuously embayed feature to accommodate a sheltered yacht marina
and the construction of a coastal road along the cliff perimeter of part of Delimara
together with the removal of part of the backing cliff to accommodate the Power
Station.
Table 8.10 Percentage distribution of selected categories in asssessing coastal accessibility indices
Segment Land uses Accessible shoreline Index of CoastaV a-m Circumnavig_able length
I 54.2 81.2 I:4.20 II 63.7 68.5 I:3.66
III 64.4 99.3 I: 1.29
IV 95.3 97.8 I :2.41
v 100 100 1:24.38 VI 64.8 85.2 1:1.11
VII 76.5 65.3 1:2.47
VIII 92.2 8-5~9 1:6-.75
IX 31.6 24.4 1:1.28
X 12.1 6 1:2.51
XI 13.2 28 1:2.25
XII 21.7 62 1:1.07
XIII 51.2 17.3 1:1.30
XIV 32 51.1 1:1.25
XV 25.2 35.3 I :1.67
XVI 33.5 28.8 I: 1.93
Sources: Adapted from Table 8.2
Table 8.10 was compiled specifically to show the influence of accessibility on coastal
land use for the separate segments. The Table is divided into three columns. The first
column shows the land uses normally associated with high accessibility, such as the
urban and industrial land uses (a-g), the land uses denoting areas with unconsolidated
material (i) and the areas where shore platforms and a low sloping rock profile prevails
(1 and m). These figures represent the percentage value of the land uses (a-m) as a
percentage of the land uses in each segment, in segment I these occupy 54.2 per cent.
The second column gives the percentage values for the accessible parts of the shoreline
as a percentage value for each segment based on the coastal geomorphology of the
area. This includes the total length of shoreline in each segment where the lengths of
shoreline occupied by shore platforms, low sloping rock and unconsolidated material
are added up together. Thus the 81.2 per cent of the coast in segment I is accessible
coastline. The third column presents the degree of indentation of the coastal segment
340

(cf. Table 8.2). A degree of consistency is apparent in the values given: segments
where a high degree of natural access is evident (column 2) and possess em bayed
features (cf Table 8.4) with a strong urban/industrial development have land uses
associated with good access. The opposite is true for segments having a rectilinear
coastline and possess overall "rural" land uses The Segments are essentially grouped
into two sets, the "urban" segments in one group and the "rural" segments in another.
The third column in Table 8.10 shows that segments can be grouped into three
categories. Those having a definitely urban /industrial character segments IV, V and
VIII with a high index value (column 3), embayed features and accessible shoreline. In
the second category there are those segments that have a 50-70 per cent range for
urban land uses together with high values for the accessible shoreline and a high index.
These include segments I, II, Ill and VII. The rural land uses dominate the remaining
segments irrespective of whether they possess em bayed or rectilinear features or have
an accessible coastline. It is probably their distance from the urban/industrial hub of
Malta that led them to have such properties.
It may therefore be proposed that the areas where development will in the future be
earmarked are those areas where the conditions explained in Table 8.8 and Figures 8.1-
8.16 prevail. Thus the areas within the already highly accessible harbours in Malta
could be the likely sites. A good example is the development of Manoel Island located
in Marsamxett Harbour (Segment V). In addition, areas whose accessibility could be
enhanced such as at the Power Station site (Segment VIII) at Delimara and areas where
civil engineering works can transform a rectilinear shoreline into a highly indented
one, such as the Hilton site, and the Cirkewwa-Gozo Ferry Terminal (Segment 1), will
constitute zones where development is possible. In fact, given the facilities and
technology that are available to achieve any type of construction, excavation and
engineering works in relatively short time-spans, and thus overcoming any physical
problems associated with access, any area can be a potential zone for development. It
is therefore the element of legislation and enforcement that can assist in the rational
development of the local coastal zone. This issue will form part of the concluding
chapter.
341

Chapter 9 - Conclusion
9.1 Introduction
The coastal zone is very important for the Maltese Islands. In the first instance, most
of the population lives around the harbour conurbation as the traditional location of
the marine servicing industries. The administrative fulcrum of the country at Valletta
and the older core of the tourist industry are located around Grand Harbour and
Marsamxett Harbour. Some of the newer residential and recreational developments
are also occurring along the coast with the localities of Birzebbugia, Marsaxlokk and
Marsascala in the south, Pembroke, St. Julian's and Paceville in the north east and
Salina Bay, St. Paul's Bay, Bugibba and Qawra in the north being prominent. Gozo
too attracts its fair share of attention. Thirdly, the fast pace of economic development
has been geared towards marine services, ship repair, the container industry and
coastal tourism with the building of hotels and restaurants. Fourthly the development
of second homes along the coast has seen the proliferation of new building blocks of
flats to accommodate summer residents and tourists. Since the establishment of the
Structure Plan for the Maltese Islands there have been tangible efforts to control the
haphazard development in most spheres and along the coast. These efforts can be
monitored through the publication of the Local Plans and Area Plans. In addition, the
introduction of Local Councils in 1992 is today providing tangible evidence in a
number of spheres among which are the infrastructure changes along most coastal
localities with the embellishment and upkeep of promenades, playing fields and the
overall maintenance of the area.
The problems of over-development of the coast of the Maltese Islands have been
identified through the last four decades via four sources. Din l-Art Helwa (Agius
Muscat, 1968) was the first with the publication of the Conference Proceedings held
in Malta. The other three major instances were the 1989 survey and the reports and the
1998 survey conducted especially for this thesis. A 2003 assessment was done by the
author to check on the extent to which the various coastal management proposals by
MEP A were actually done.
Allied to the problems of over development, or the indirect result of it, are the
problems generated due to the small size of the islands. In all probability the high
342

indices related to population density, and the indices developed for this thesis such as
the area of land per kilometre of coast, are the indirect result of the small size of the
islands. However, this adverse situation is partially balanced out by the additions to
the coastal serviceable length through the construction of jetties, breakwaters, and
yacht marina pontoons. These engineering constructions normally mark out areas of
intensive land use such as ports, harbours and bays and also coincide with areas of
intensive land and hinterland development. As a result, these areas provide a greater
marine serviceable area for each unit length of coast. The sites at the Cirkewwa Gozo
Ferry Terminal, the Cottonera Waterfront Project, Manoel Island and Tigne Point
development and the Hilton Project and the yacht marinas are cases in point.
9.2 The frameworks
The thesis can be placed within a number of frameworks: a temporal, a spatial, a
planning and management frame, and finally within a location and future development
framework. The first, the temporal, is dealt with in Chapter 4, where a brief history of
the land use changes spanning the Colonial influence and the post-1964 Independence
period is given. The latter were mainly a result of the changes experienced when
Malta relinquished its socio-economic dependence upon military bases, a 400-year
legacy that stretched to the occupation of Malta by the Knights of St. John and the
British, and strengthened its manufacturing industry and focused on tourism as a
foreign exchange earner.
The second, a spatial frame, is probably the most important and is dealt with in
Chapters 6, 7 and 8 where the distribution of the coastal land uses is examined. In
Chapterj 6 the discussion was first based on identifying the coastal "urban" and the
coastal "rural" areas, then the focus was on a systematic analysis of the sixteen land
uses. In Chapter 7 a regional approach was used and each segment was examined as
separate entity. In Chapter 8 a series of histograms and cartometric measurements
formed the basis of the discussion. The histograms provided a pictorial comparative
assessment of the distribution of the different land uses in each segment whilst the
data developed from the cartometric measurements shows the properties of the
Maltese coast in a different light from the traditional approach of just emphasizing
coastal length. In fact, the data estimated for the geology and the geomorphology of
343

the coast helped to identify the influence that these physical features had on coastal
land use. Further details are provided in Chapter 8, these pertain to the coastal
physical features that were used to identify the contribution of the geomorphological
properties to parts of the coast within selected coastal segments. The exercise showed
the relationship of physical features to the areas of development. In addition, factors
such as shoreline length and the relationship of these with the coastal zone area
produced two indices (Table 8.2: Ratio of circumnavigable length to coastal length;
Table 8.6 number of land uses divided by the maximum number of land uses i.e. 16)
that indicate that the higher the indentation ratiofor the coast the higher is the land use
conflict and therefore sites for future development lie in the coastal areas where few
land uses occur.
The management framework can be divided into three time frames. The first is the
Colonial phase (up to ca 1945). In this phase the needs of the political occupier ofthe
islands determined the type of modification to the coastal character. This was done for
three purposes: for defence from military attack (e.g. fortresses and watch towers); for
defence against sea storms in inclement weather conditions by engineering
constructions (e.g. breakwaters); and for the enhancement of coastal facilities for all
types of sea craft (e.g. pontoons, slipways). The second time frame consisted of the
attempts at coordinating resource use through the commissioning of a number of
reports by non-Maltese experts with coastal issues only indirectly (1945-1989; Table
4.2) involved. This theme is developed in Chapter 4. A third time-frame (post-1992)
occurred with the establishment of the Planning Authority, which was later merged
with the Environment Protection Department to form the MEP A in 2002. This
political decision showed the importance that environmental protection has on
planning and development.
The final framework concerns location and development. If there is one singular
thread that runs throughout these frames, it could be concerned with location. The
areas that attracted attention for development are the highly accessible coastal areas.
In fact, the series of maps developed for this thesis and found mainly in Chapters 2
and 6, and Tables 5.3, 7.1, 8.2 and 8.6 with their associated commentaries highlight
the fact that accessibility, sinuosity of the coast (possessing em bayed or rectilinear
344

features) and coastal engineering works are the three main elements that determine the
extent to which a coastal area is prone to development.
As with all matters dealing with environmental issues, it is the physical/human
interaction that is of central importance. The method proposed (Chapter 5) and used in
this thesis is a simple one: mapping the whole coastal zone area by using a key
composed of sixteen land uses, measuring the area of coverage of each land use,
reducing this data to manageable proportions, and, presenting the results in synoptic
formats as done in Chapters 6 and 8 and detailed in Appendix 1. The main outcome of
this is that scientists on the one hand and other interest groups on the other, can
examine in mutually intelligible and mathematical representation, the viability of the
state of, or the changes made to, a coastal zone. In addition, the mutual influences and
impacts that can occur between the physical and human parameters are also
considered. Thus a management framework can be established to safeguard against
excessive development of a particular area using the method proposed in this thesis:
the 16-key mapping method, the combination of the results into a matrix format and
subsequent analysis, could be a standard procedure by which a base-line study for a
coastal management framework can be proposed.
9.3 Spatial subdivisions
The description and analysis followed in this thesis marked out two sets of major
regional subdivisions: a north-south one based on the position of the Great Fault and
an east-west one based on the different coastal land uses located on either side of
Malta's littoral.
The first set is based on the limits set by the Great Fault (Victoria Lines), with human
influence largely determined by physical boundaries. In the area to the north of the
Great Fault, the geological stratification has produced the surface exposure of four of
the five main local rock types, giving a varied geology ( cf. Figure 2.2). In the southern
area the largely predominant Globigerina formation is practically the only stratum
exposed at the surface. The predominant geomorphological property of the north is the
undulating landscape. This was brought about as a result of the high density faulting
system that produced the Horst and Graben formations characterized by rugged
345

topography and deep incised valley systems these are accompanied by lush natural
vegetation and intermittent streams. In the south an undulating landscape of low relief
is the main physical feature. The resultant coastal property is one where the northern
areas are characterized by limited access both from the sea and from the land, whilst
the south eastern areas possess a higher degree of access.
In the northern area (including Gozo) a low population density prevails and coastal
development is geared principally towards tourism development. Three large bays in
Malta are found here. The southern area has high population density and industrial
development. The three main harbours in Malta are located in this area. The land uses
that predominate in the North are the areas known for high aesthetic qualities:
agriculture, undeveloped areas of rugged topography, high cliffs and scree and clay
slopes. Sand beaches are also a feature of these areas. Land uses in the south are
dominated by residential and industrial development. This situation has prompted the
author to differentiate between the coastal areas that have a predominant "urban" and
those that have a "rural" label throughout the thesis. A marked difference exists
between the areas that have a good accessibility associated with the location of the
southern "urban" areas. In the northern coastal areas the degree of access is limited to
the sandy beach areas, unless otherwise modified by engineering structures.
Effectively, in Malta, coastal segments I, II, III and XI mark out the northern areas
whilst the rest mark the southern areas. This subdivision follows the general
topographic pattern established in Malta with the Great Fault (Victoria Lines)
separating Malta into northern and southern areas.
The second set of observations relate to the spatial division of Malta into an eastern
coastal area with segments II, III, IV, V, VI, VII, and VIII and a western coastal area
with segments IX, X, and XI. The segments on the east side include those segments
that are generally considered to have a predominantly urban character, whilst those on
the west possess more rural characteristics. In the former are located most of the
harbours and bays with practically all residential, touristic and industrial development
occurring along the littoral of this section. This area is marked by a high degree of
access along most of its coastal length. The western area is identified by the coastal
cliff and scree slope areas and a limited degree of access both from the land and from
346

the sea. This land use situation is highly compatible with the situation for the physical
environment where the indentation of the coast and the accessibility of the shore from
the sea on most of the eastern seaboard have influenced land use.
9.4 The four key findings of the thesis
This study can be regarded as a baseline for future reference. Its main findings are:
The use of boundaries to establish the study matrix of the thesis is considered as the
first contribution. There are three boundaries. The first the boundary that is referred to
in the thesis as "the coastal zone boundary" which separates the coastal zone from its
hinterland and runs almost parallel to the shoreline. Developed on the field for the
1989 Survey, confirmed through secondary literature ( cf. Chapter 2), and applied for
the survey used for this thesis. The identification and demarcation on the Ordnance
Survey sheets of this boundary is important for three reasons. First, it is an additional
contribution to the variety of coastal zone boundaries used for a number of states and
regions as listed in Tables 2.9 and 2.1 0. Secondly, the boundary has proved its worth
and the MEPA is still using this boundary as the limits for the Maltese coastal zone;
therefore, a degree of comparability can be attained with future surveys. Thirdly, a
number of small islands have had problems identifying their coastal zone due to the
smallness of the land mass. In fact, the whole extent of the land area of some islands
is considered to be the coastal zone. However, with the identifying features developed
in this thesis it can be shown that small islands can actually have a coastal zone
boundary of their own as much as larger territories.
Another boundary runs perpendicular to the coast and was developed for the purposes
of this thesis and identifies sixteen coastal segments. These are based on selected
large-scale coastal geomorphological properties and the compass orientation of the
particular stretches of coast (refer to Table 5.3. The Maltese coast was thus subdivided
into sixteen terrestrial parcels that helped to develop the analysis for this thesis and
can be used for the practical side of coastal zone management.
The third type of boundary was again one perpendicular to the coast and subdivided
each coastal segment into a number of coastal units. Using the O.S. sheets as a base
347

the coast was divided into 136 coastal units (Appendix 1; Table 5.6) although there
are some exceptions to this general rule as shown in Table 5.7.
The second key finding of this thesis is the identification of the 16 land uses that
together complete the coastal zone. The development of this method evolved over a
number of surveys and coastal mapping exercises spanning a decade. The contribution
of the main use of this method is in the practical nature of the mapping exercise. When
used in conjunction with the Ordnance Survey sheets, the mapping key affords a very
quick mapping procedure. Although the actual field identification of cultural features
has to be performed, the undeveloped coastal areas and areas with arable land conform
greatly with the contour lines and general geomorphological features presented on the
sheets thus facilitating and hastening the mapping pace. The land use classification can
therefore be easily interpreted by a wide range of individuals with different levels of
experience on the field following a short briefing. In addition, the key can be used on
older series of Ordnance Survey sheets to identify former land use distribution, aided
by means of aerial photography and old photographs, and thus examine, in greater
detail than that presented in Chapter 4, the historical development of the coast. Use of
the mapping key in future is guaranteed as long as the general principles of Ordnance
Survey cartography are followed.
As this thesis is essentially a baseline study of the properties of the Maltese coastline
the data captured through simple cartometric methods is the third key contribution. As
explained in Chapter 5 this thesis is an exercise in cartometry as much as it is on
coastal land use. This thesis provides new data for the coast of the Maltese Islands.
These include the physical length of the shoreline, the circumnavigable length, the
percentage distribution of the types of rock (geology) and features (geomorphology),
that are found on the coast, all presented synoptically in Chapter 2, in addition to the
land use data utilized in Chapters 6 and 7. The contribution ofthese cartometric results
to this thesis can be considered from two aspects. The first is that the method is very
simple to use and apply and no expensive equipment is involved. Another theme that
emerged during the cartometric exercises was that the length of coast varied with the
scale of the maps used and the width of the dividers used in taking the measurements.
In addition to the arguments, examples and data presented in Chapters 2 and 5, this
348

issue is of great importance for planning and management purposes in that precise
quantification of the littoral length should be the basic property on which all else
follows. First, because the actual length of the coast as estimated must invariably be
accompanied with the scale of map and the instrument used. Secondly a culture in this
regard should be initiated in that all linear coastal data presented anywhere should at
least conform to this criterion following on the seminal work of Galloway and Bahr
(1979) and Mandebrot (1967). Thirdly, comparative coastal lengths between different
regions can only be done properly if this criterion is applied throughout.
This data is needed by MEP A for a number of reasons first because the coastal land
uses have never been quantified before, secondly, as presented in this thesis, the data is
given at a number of regional scales, and at increasing levels of detail. The sequence
that follows shows the scales at increasing levels of detail: the Maltese Islands, the
three separate islands of Malta, Gozo and Comino, each of the 16 segments and each
of the 136 coastal units as presented in Appendix 1. The data given refers to a snapshot
of the coastal land uses of the Maltese Islands as examined in 1998. Therefore using
the same coastal zone boundary and the same units of measurements one can develop a
sequence of the changes to those that occurred along the coast. It is also possible, after
identifying the changes that occurred in the past, to propose retrospectively the pattern
of changes that occurred over the previous decades. The mapping key that was
developed and the subsequent measurements made conform also to the features
presented on the Ordnance Survey sheets. The data presented for the actual length of
coast is also of significance in that the actual length of functional coast and the
changes made to the littoral can be monitored accurately and future changes quantified.
The third contribution is the development of the mapping key and the maps presented
with this thesis. The key itself developed over a number of sessions (Section 5.12
explains the development of this process) and consists of 16 variables. Two main
attributes can be associated with the key, the first is that it is adapted to map coastal
areas in any environment not only in the local or the Mediterranean contexts as most
features mapped are located anywhere on the coast. Secondly, the key can be modified
according to the scale that needs to be used and as presented in Table 5.11 the mapping
key can be used to monitor land uses at selected detail. It can accommodate three
349

(urban, rural and rural/urban), eight (A to H) or 16 (a to p) land uses. Table 5.12
explains part of this process. The important feature of the key is that it was done with
the use of the Ordnance Survey sheets in mind. This feature decreased substantially the
time used for field mapping in that a number of land use categories are clearly
recognizable features on the sheets themselves. These include the following:
residential areas, shore platforms, low sloping rock, scree slopes and cliffs. In addition
the detailed contours presented (every 2.5 m and accentuated every 10 m) suggest
whether arable land is in use (widely spaced contour lines) or probably abandoned
(crowded contour lines). In addition, this mapping contributes to the rapid-assessment
procedure used for the coastal zone.
The actual maps presented with the thesis are also important contributors. In the first
category I would place the group of synoptic maps that identify each land use category
as distributed in the Maltese Islands, and shown in Chapter 6. In the second category of
importance I would place the more detailed maps showing the land use distribution at
selected sites. Thirdly, another map of significance (Figure 5.5) is that which identifies
the 352 coastal place names. This is the first time that a map of the sort is being
presented locally. Its importance lies in the fact that for planning and management
purposes the identification of the precise locations is of great importance.
The fourth contribution is the method used in the analysis. The physical and human
properties operating in the coastal zone have already been placed on the same scale of
values by being converted into spatial entities (hectares). In this thesis, the same
attributes are being analyzed using histograms and in two cases using the Bray-Curtis
Similarity Index. Through this method the land uses were classified into those that are
compatible with one another and those that are not. The same conditions apply for
segments, with those segments that have a similar land use distribution and those that
have a different distribution. In addition, two physical properties of the coast, geology
and geomorphology, are placed within the context of the land use categories and
spatial relationships are deduced. The overall conclusion that can be drawn is one that
shows that the overall land use pattern followed in the Maltese Islands is one
conditioned by the extent of coastal development.
350

It will be interesting in the context of Malta's membership of the EU to monitor future
change. Present trends, modified in the light of changing political circumstances, may
lead to on the one hand more emphasis on coastal protection for areas of outstanding
natural and scientific interest. These sections of the coast may attract greater
development pressure for a variety of services including heritage/marine tourism such
as Vittoriosa, and from industrialization /utility development such as Marsaxlokk Bay.
Gozo and Comino seem likely to witness lower levels of pressure though recent
discussion of a proposed hotel/marina development for a disused quarry near Qala
Point indicate towards the fact that the smaller islands may not be immune from the
attention of seeing some form of tourism development especially as Malta seems to
offer very few such opportunities. Stringent planning controls will need to be exercised
in the smaller island if there is the political and planning will to limit such
development (cf. Times [ofMalta] June 30 2003).
9.4 Conclusion
Effectively the best guarantee of safeguarding the coastal environment and instilling a
greater awareness towards conserving the historical, cultural and natural assets of the
Maltese Islands is through a sustained educational campaign in schools and the media
and the collaboration of all stakeholders concerned with the coast. The best way
forward would be the involvement of the local communities. The key elements that
need to be addressed for the future management options of the coastal zone in the
Maltese Islands lie in two recent publications: Borg (200 1) and The State of the
Environment Report (2002). Essentially the first highlights identifies issues and
development objectives that need to be addressed over the next 20 years in the light of
the Structure Plan review Borg (200 1) lists a series of proposals for the Planning
Authority to follow regarding the efficient management of the coast (Appendix 8).
These include guidelines for future projects, regulations for the better management of
specialized recreational activities such as underwater diving and bird trapping sites,
land reclamation for agriculture and the siting of aquaculture activities, the smoothing
of rock surfaces by concrete, guidelines for marina development on urban waterfronts,
and the need to conduct the necessary studies prior to any action. A commentary on the
Structure Plan policies that affect the coastal zone is included .. It places emphasis on
nine sectorial issues:
351

Natural resources: the control of development in ecologically sensitive sites and areas designated as scientifically important has been largely successful in Malta with legal protection given to a number of sites. However more protection is called for to Gozitan sites and the marine environment.
Cultural resources: legal protection has been provided to a wide spectrum of historical and archaeological artefacts such as megalithic temples and fortifications but underwater and marine heritage sites still need protection.
Tourism: three main areas of attention include the protection of popular tourist areas from incompatible development, ensuring access to all parts of the coast and the identification of suitable sites for off shore leisure development.
Agriculture: The abandonment of coastal agricultural land intensifies soil erosion and degrades the overall landscape scenery. Measures are called for to encourage cultivation in these areas.
Aquaculture and fisheries: Three suggestions are put forward. The relocation of fish farming cages away from the nearshore areas to offshore sites; the relocation of the fish market; and, the protection from uncompatible development in areas where the fishing fleet is moored and serviced .
Maritime activities: Site-specific proposals for Grand Harbour, Malta Freeport, Cirkewwa and Mgarr harbours were put forward with the emphasis on the need to protect their historical and natural heritage due to development. Offshore bunkering sites still need to be identified.
Mineral extraction: The restoration of coastal quarry sites should be in line with the surrounding environment.
lnfastructure: this relates to the sites where fuel is stored and energy and water produced together with their associated distribution networks. Energy, desalination plants, sewage and waste disposal sites, land reclamation, roads, pipelines and cables.
Other development: the development of residential and industrial units in undeveloped coastal areas should be restricted. Source: Borg (200 I)
352

The State of the Environment Report is essentially environmental reporting intended to
"provide a compilation and evaluation of technically valid information about the state
of the environment" (The State of the Environment Report, 2002, 1 ). The Report
provides the main components that make up the local environment, identifies areas of
pressure and the response measures, assess trends and recommends measures for
improvement. The coast features in a number of sections in the Report with a strong
emphasis on the health and resources of the marine areas. However, in the terrestrial
part of the coast comments on coastal erosion especially along the scree slope margins
(Segments X, XI, XIV in this thesis), loss of material from sandy beaches and
unprofessional attempts in beach reclamation were the main problems physical
problems cited (Birzebbugia, Segment VIII in this thesis). With regards to coastal zone
management and the overall degradation of the coastal environment the reasons given
were the "interests of the various stakeholders" (p 30) and the "independent status" (p
30) of the Maltese Islands. The report suggested that the present sectoral management
approach be substituted with a more organic and inclusive approach.
Land use designations will be affected with the accession of Malta into the European
Union. In addition to the designations affording protection to sites and features of
heritage importance, such as Areas of Ecological Importance, and Sites of Scientific
Importance, Scheduled Property Sites and Nature Reserves, and to the planning
designations that essentially identify areas where development is acceptable,
designations governed by E U legislation will come into force. This implies that land
can become eligible for specific EU grant aid (State of the Environment Report, 2002).
In fact the negotiations concerning Malta's accession to the EU especially the part
dealing with the environment provides for financial assistance regarding the relocation
of the Liquefied Petroleum Gas Bottling Plant from at il-Qajjenza (Segment VIII) to
Benghisa (Segment VIII), the Marsa Power Station (Segment V) to conform to EU
standards regarding emissions, and the Maghtab rubbish dump (Segment III) will have
to close down (Aggornat 144, [email protected], 5 October 2002). In fact, land use
changes in coastal areas will in future be determined by the extent of to which a
particular use needs a coastal environment for its operation and also the extent of the
population density surrounding that particular use (Schembri, 2002). In addition, the
353

MEP A follows a policy of not allowing any new coastal developments that do not
belong to the coastal setting and that can be accommodated inland.
The effective management of the coastal zone continues to be a much discussed
political issue. From the debate that emerged as a result of the siting of the Power
Station in Delimara (Government ofMalta, 1988a, b, c) to the most recent controversy
that emerged with the replacement of the Maghtab dump (Section 7.18 p 306) with two
temporary landfills utilizing disused quarries near to Malta's prized megalithic temples
of Hagar Qim and Mnajdra (Segment X) with an engineered landfill at Ghallis
(Segments II and III). The latter is at a visual distance from one of Malta's main tourist
venues at Qawra (Segment II). The debate has brought in MEPA, the Local Councils
that are directly affected, a number of Non-Governmental Organizations such as
Fondazzjoni Wirt Artna, Din !-Art Helwa (concerned with historical and
archaeological heritage), Nature Trust and the Malta Hotels and Restaurants
Association and all the political parties. It is only once that the small size of the
islands, the high population density and the broad urban spread and the pressures that
these factors exert on the coast that a broad consensus can be reached regarding the
problems of coastal land use with the participation of the community, local councils,
stakeholders and Non-Government Organizations under one Coastal Authority.
354

Appendix t' Oisl.-ibulion of coas\"!1\ lmnl \\:\~
ftheet No. a b c d 0 f g II I ) k I "' n 0 p total sheet I 3882 1 25 0.3 0 0.8 0 0 0 0 0 0 0 0 1.9 0 0 1.4 6.9
·1002 2 54 0.9 0 0.9 03 0 D 0.1 0.1 8.6 0 0 2.5 7 1 0.6 3 1 29.6 4083 3 5.1 0.2 0 0 0.3 0 0 1.9 0 3.8 0 0 1.3 0.3 0 O.G 13.5 4283/4~84 4 2.6 0 0 0.4 0.1 0 0 0 1.3 10.4 0 0 3.7 16.6 1 1 1 39.4 Key to land uses
15.8 1.4 0 2.1 0.7 0 0 2 1.4 22.6 0 0 9.4 26 1.7 G. I . " •·ecrcntiounl ilrc:as
II 420214281 5 0 0 0 0 0 0 0 0 3.1 0 0 0 0.5 2.6 0.4 2.5 15.1 4081 6 4.5 0 0 1 0 0 0 1.4 1.8 5 13.7 0.4 0.4 0 I 1 0 29.3 IJ mnrinc servicing :uc1U 4080 7 3.8 0 0 1.5 0 0 0 0.8 2.8 6 0 0.3 0 1.6 0 0 16.8 4280/4281 8 44 0.7 0 2 0 0 0 0 0.2 0 0 5.1 0 2.4 1. 1 3.3 19.2 c rc.sidential art;•s 4480/4481 9 0 0 0 0 0 2 0 0.1 2.9 4.5 13.6 1.8 0.1 4.9 16.7 2 48 6 4680 10 0 0 0 0 0 0 0 0 0 0 0 0 0.9 0 5.2 0 6.1 cJ public ulilitic.< 4479 11 0.1 0.1 0 0.6 0.9 0 0 0.1 0.4 0 0 O.G 0 4.7 43 0.8 12.6 4478 12 0.2 0.9 0.9 4.5 4 5 0 0 0.2 4.6 53 0 0.9 0.4 0 0 0.2 22.6 c hi$tol'ic sites 4678 13 4 7 0.4 0 2.5 2.5 0 0 0 0.8 73 0 0.6 0.3 0 0 0 19.1 4679 l 14 06 0 0 2.5 3.6 0 0 0 0.4 0 0 0 2.8 3.1 0 0.6 14
f iutluslrin l ,a i'C:t.S 4879/5029 15 1 0.2 0.8 1.2 03 0 0 0 0.5 0 0 1.1 2.3 2.8 0 0.5 10.7 4878 16 0 0 0 0.9 0 0 0 0 0 0 0 0 0.5 0 0 0.7 2.1
g extrnctlvc industries 4678 17 0 0 0 1 0 l.3 0 0 1.6 0.5 0 0 0 0 0 3.7 9.3 4677 18 0 0 0 0.4 0 0 0 0 0.1 1.4 0 0 0 0 0 0 1.9
h dcpo.sltiomtl euviroumcnCS 4878 19 0.3 0 0 1.4 0 J.9 0 0 0.9 0 0.7 0 0.8 4.9 0 3.9 16.8 487915079 20 0 0 0 , 0 0 0 0 1 3 0 0.5 0 4.4 2.3 0 0 9.5
196 2.3 1 7 205 12 82 0 2.6 21.6 30 20 5 10.8 13.4 29.3 34.8 18 4 i "rrorcstcc.J :treas
Ill 4878 21 0 0 0 0.8 0 0 0 0 0.6 0 0.5 0.9 0.4 6.3 0 1 10.7 j :mohlc laud 5078 22 0 0.1 0 1 0 0 0 0 0.2 0 0.4 1.3 1.3 3.6 0 0 8.1 5078 23 0 0 0 0 0.1 0 0 0 1.2 0 0 2.1 0 5.9 0 0 9.3 It ;1bamlonctl an1blc hwd 5077 24 3.6 0.2 0 1.5 0 0.5 0 0.1 2.1 3.6 3.9 0.1 1.2 0 0 2.3 19.1 5277 25 7.3 0 0 0 0 0 0 0 0 0 0 3.6 0 2.1 0 0 13.5 1 shore pl:,tronns 5276 26 24 7 0 0 1.5 0 0 0 0 0 0 0 2.6 0 13.5 0 10 52.3 5476 27 0 0 0 0.5 0 0 0 0 0 0 0 0.5 0 1.7 0 0 2.7 na low sloping roc~\ 35.6 0.3 0 53 0.1 0.5 0 0.1 4.3 3.6 4.8 11.3 2.9 336 0 13.3
IV 5476 28 1.5 0 0 0.5 0 0 0 0 0 0 0 0.5 0 1.7 0 0.7 4.9 n cliffs 5276 29 0.8 0 1 0.1 0 0 0 0 0 0 0 0 0 0 0 0 1.9 5275 30 1.3 0.3 0.5 1.3 0.6 0 0 0.1 0.1 0 0 0 0 0 0 0.9 5.3 o scree slope-s 5476 31 2.1 0 0 0.5 0 0 0 0 0 0 0 0.9 0 0.4 0 0 3.9 5475 32 7.2 0 1,1 0 0.1 0 0 0 1.2 0 0 0 1.0 0 0 0.3 11.7 p clil:opid;otcd :u·c:o> 5474 33 0.5 0 1 0.9 0 0 0 0 0 () 0 0 0 0 0 0.1 2.5

5475 34 4.4 0 0.4 0 0.1 0 0 0 0.1 0 0 0 2.1 0 0 0.4 7.5 5474 35 0.1 0 1.1 1.5 0 0 0 0 0.7 0 0 0 2.5 0 0 0.3 6.2 5673 36 0 0 0 0.5 0.1 2.5 0 0 0 0 0 1.1 0 0 0 0.1 4.3 17.9 0.3 5.1 5.3 1.1 2.5 0 0.1 2.1 0 0 2.5 6.4 2.1 0 2.8 48.2
v 5474 37 1.2 0 0.3 0.5 0 0 0 0 0 0 0 0.2 0 0 0 0.8 3 5474 38 1.2 1.8 0.1 1.4 0 0 0 0 0.4 0 0 0 0 0 0 0.8 5.7 5473 39 0.9 0.6 0.5 2.6 0 0 0 0 1.8 0 0 0 0 0 0 1.1 7.5 5473 40 2.2 3.6 0.2 1.1 2.8 0 0 0 1.4 0 0 1 0 0 0 5.1 17.4 5472 41 1.8 1.5 0 4.5 4.2 0 0 0 1.61 0 0 0 0.3 0 0 0.4 14.3 5473 42 0.3 0 2.5 3.8 1.5 0 0 0 0.4 0 0 0 0.3 0 0 0 8.8 5673 43 0.4 0.4 0.5 0.7 5.7 0 .0 0.1 0 0 0 1.4 0 0 0 0 9.2 5672 44 0.3 0.9 0 0.6 0 0 0 0 0 0 0 0 0.3 0 0 0 2.1 5472 45 1.6 1.2 0 1 .1 0.5 0.6 0 0 0 0 0 0.1 0 0 0 0 5.1 5471 46 0.8 0 0 2.6 0 0 34.6 0 0.1 0 0 0 0 0 0 0.5 38.6 5470 47 0 0 0 1.1 0 0 0 0 0 0 0 0 0 0 0 0 1.1 5471 48 0 0 0 0.9 0 0 0 0 0 0 0 0 0 0 0 0 0.9 5470 49 0.3 0 0 0.1 0 0 24.1 0 0.1 0 0 0 0 0 0 0.3 24.9 5671 50 0 0 0 1.1 0 0 7.9 0 0 0 0 0 0 0 0 0 9 5671 51 0 0 0 1.1 0 0 8.6 0 0 0 0 0 0.3 0 0 0 10 5672 52 0.1 0.5 0 0 0.6 0 0 0 0.1 0 0 0 0.3 0 0 0 1.6 5671 53 0 0 0 2 3.1 0 2.8 0 0.1 0 0 0 0 0 0 0 8 5672 54 0 0.5 0 0.7 2.8 0 0 0 0 0 0 o I o.1 0 0 0 4.7 5672 55 0.1 0.4 0 0.7 0 0 0 0 0.2 0 0 0 0 0 0 1.1 2.5 5672 56 0 2.1 0 0 7.9 0 1 0 0.9 5 0 0 0 0 0 2 18.9 11.2 13.5 4.1 26.6 29.1 0.6 79 0.1 7.1 5 0 2.7 2.2 0 0 12.1 193.3
VI 5872 57 0 0 0 0 0 0 2.8 0 0 0 0 0.6 0 0 0 0 3.4 5872 58 0.5 0 0 0 0 0 0.6 0 0 0 0 0.9 0 2.4 0 4.6 9 5871 59 1.7 0 0 0.8 0 0.4 0 0 0.1 0.8 2.6 0 1.4 0 0 3.2 11 6071 60. 0 0 0 0 0 0 0 0 0 0 0.8 0.2 0 0.4 0 0.1 1.5 6070 61 0 0 0 0 0 0 0 0 0 0 4.2 1.3 0 4.3 0 0 9.8 6069 62 0 0 0 0 0 1.4 0 0 0 0.4 0 0 0.3 0 0 1.3 3.4 2.2 0 0 0.8 0 1.8 3.4 0 0.1 1.2 7.6 3 1.7 7.1 0 9.2 38.1
VII 6069 63 1.6 1.4 1.6 5.4 0.1 0.3 0 0.1 0.5 0.1 0.6 0 1.3 0 0 1.2 14.2 6068 64 1.6 0.4 0.3 0.2 0.1 0.4 0 0 0.1 0 0.7 0 1.1 0.8 0 1.4 7.1 6067 65 0 0.2 0 0.2 0 0 0 0 0 6.9 2.5 1.4 0 1.4 0 0.9 13.5 6066 66 0 0.7 0.3 0 0 0.6 0.1 0 0 3 0 2.8 0.4 2.5 0 0 10.4 6065 67 0 0 0 0 0 0.2 0 0 1.3 1.6 3.3 0 1.4 3.2 0 0.1 11.1

VIII
IX
X
6064.
5964 6065 5865 5866 5865 5855 5665 5664/5864 5863
5"762 5562 5463 5263 5264 5064 4864 4865 4665 4666
4466 4467 4267 4468 4268/4267 4269 4069 4070 4071 4072 3872 3873
68
69 70 71 72 73 74 75 76 77
78 79 BO 81 82 83 84 85 86 87
88 89 90 91 92, 93 94 95 96 97 98 99
0 3.2
0 0 0
1.2 0.1 0.1 0.1 0.8 0
2.3
0 0 0 0 0
1.5 0
0.3 0.3 0
2.1
0 0 0 0 0 0 0 0 0 0 0 0 0
0 0 0 0 0.8 0 2.7 2.2 5.8 0.2 2.3 0.1
0 0.1
5 3 0 6.9 14.6 7.1
0 4.2
0 0 0 0 1.9 0
0.1 0
0.8 0.1 0 0
2.9
0 0 0 5 0.4 0.3 0 0.5 0.2 0
0 0 0.1 0 0 0 0 0 1.3 0 0 0.5 0 1.7 0 0 0 0.1
1.7 1.2 1.6 0.4 0 1.8
0 0.4 0 0 0 0 0 0.2
2.7 0 3.5 0.5 0.1
0 0 0 0
0 0 1.4 0 1.5 0 0.5 2.3 0 0.4 1.3 1.4 0 3 0.1 0.4 2.8 0.2 0 1.9 1.8 0 4.8 1.8 0.8 1.4 0 0 0 0.5 0 22.5 0 0 0 0
13.1 2.4 2.5 4.4 9.1 0 33.9 1.9 6.9 0.8
0 0 0 0 0
0.4 0
0.1 0.1 0
0.6
0 0 0 0 0 0 0 0 0 0 0 0 0
0 0 0 0 0 0 0 0 0 0 0
0 0 0 0 0 0 0 0 0 0 0 0 0
0 10 2 0 0 0 0 0 0.3 0 0 0 0 0 0
0.1 0 0 0 0 0 0 0.1 0
0.1 0 4.6 0 0 0
0.2 10.1 6.9
0 0 0 0 0 0 0 0 0 0 0 0 0
0 0 0 0 0 0 0 0 0 0 0
0.1 0.1
0 0 0 0 0 0 0 0 0 0 0 0 0
0 0 0 0 0 0 0 0 0 0 0
0 0 0 0 0 0 0 0 0 0 0 0 0
0 0 0 0 0 0 0 0 0 0 0
0 0 0 0 0 0 0
0 0 0 0 0.1 0 0 0 0.6 0.2 0.1 0 0.1 2.3 0 0 0 0.1 0 0
0.4 0 1.1 0 0 0 0 0
0.3 0 0 0.4 0.5 3.2 6.9 0 0 7.5 6.7 0 2 13.3 14.8 0.4
0.3 2.1 1.4 0
0.6 7.5 1.1 0.1
1.1 17.3 0.1 3.9 0 0
7.1 6.3 0 0
10.4 4.2 10.6
0.4 1.6 15.8 14 5.2
0 0 0 0 0 0 0 0 0 0 0 0 0
0 0 0 0
0.4 24.7 0.1 13.7 1.8 0 5.6 0 0 9.4
0.4 7.1 99.7 0.4 60
1.6 2.4 5.8 10.3
0 0.3 0 0
0.2 0.5 0 1 0 2
0.6 0.5 0.1 1.8 0.5 0.3 0
1.8 0
5.6
0.2 1.9 0.2 0.7 0 3.9. 0 2.2 0 0.3
0.4 16.6 0 6.3 0 7.8 0 8.3 0 1.8
0.8 49.8
1 0.9 0.6 3.4 0 1.6 0 0.2 0 0 0 1.3 0 1.5 0 3.8 0 0 0 1.1
1.6 0.1 1.1 2.8 4.3 16.7
0 0
0 0 0 0 0 0 0 0 0 0
0 0 0 0 0 0 0 0 0 0 0
0 3.6
0 0 0
1.4 0
0.3 3.5 I
1.4 2.5 9.1
0.4 0 0 0 0
0.1 0 0 0 0
0.5
5.2 0 17.9 0
0 0.3 . 0 10.6 0 3.3 0 0 0 0 0.1
5.8 0 9 0
8.5 0 9 0
69.6 0.1
12.8 69.1
6.3 4.6 2.6 12.1 7.3 7.7 13.3 17.5 25.5 96.9
14.5 1
5.1 4.6 0.4
20.6 6.3 9 24 16
101.5
15.1 37.8 4.1 0.6
39.4 12.8 12.1 35.7 36.1 25.7 15.8 22.8 258

XI 4073 4074/3874 4075/3875 4076 4077 3877/3878 4078 4079 4080 4081 3880 3881 3883
XII XII
XIII 2892
XIV
XV
2893 3093
3932/2293 3491/3492 3691 3690/3870 3689 3889
3887/4087 3689 3686 3486 3888/4088 3286/3285 3086 2887/2886 2888
100 101 102 103 104 105 106 107 108 109 110 111 112
0 0
0.5 2.9
0 0
0.4 0.8 0 0 0
0.6 6.2
0 0
0.4 0
0.1 0.1 0
0.1 0 0 0 0 0
0.7
113 3.9 0
114 115 116
0 0 0 0
0 0 0 0
0 0 0 0 0 0 0 0 0 0 0 0 0 0
0
0 0 0 0
117 118 119 120 121 122
0 0.3 0 0 0 0
0.4 1.1 0 0 0 0 0 0 0 0
0.2 0 0.3 0.6 1.1
123 0 0.1 124 1.2 0 125 0 0.1 126 0 0.2 127 0 0 128 0 0 129 0 0 130 2.1 0.3 131 0 0
0 0 0 0 0 0 0 0 0
0 0
0.8 0.3 0 0 0 0 0 0 0 0 0
1.1
0 0 0 0 0 0 0 0
0.2 0 0 0 0 0 0 0 0 0.1 0 0 0 0 0 0 0 0
0.2 0.1
0 0.6 0
0 0 0 0
0.6 0 0 0 0
0.1 0.7
0 0 0 0
0 0 0 0 0 0 0
0 0.3 5.2 5.5
1.2 0 0 0 0
0.2 1.4
0 0.1 1.7 0.2 0 0 0.5 0 0.2 0.1 0 0.8 0 0 0 0 0 0 0 0 0
0.8 0 0 0 0 0
0 0 0 0 0 0 0 0 0 0 0 0 0 0
0 0 0.1 1.1 0.6 1.4 0.4 1.fil 0.9 0.9 0 0 0 0.5
0.1 0 0 0 0 0 0 0 0 0.9
0. i 0.1 2.2 6.5
0.5 0 0.1 2.4 0.5 0 0.3 4.3 0 3.8 1.2 1.6 0 1.1 0 0 0 0.3
2.5 0.5 0 0 0.1 0.4
0.5 0.3· 0 0 0.1 0
0.3 0.3 0 0.5 1.6 0 0.3 1.3 0
1 '1.1 11.3 2.4
0 1.2 0.3 0 0 2.1 15.3 0.1
0.1 0 26.3 0 0.1 1.1 9.6 0 0 3 5.9 0.1
0.1 1.3 17.9 0 0 3.1 10.9 0
0.1 2.3 5.3 0.8 0 3.1 2 1.9 0 0.1 0.1 0
1.6 3.9 0 0 0.7 3.8 21 0 0 1.4 6.3 0.1
2.7 26A 120.9 3
0 0 0.2 0.1 0 3.6 0.9 33.2 0 0
0 0 0 0
0 0 0 0 0 0 0
0 0 0 0
1.8 0 0 0.7 0 0.8
1.8 1.5
0.4 1.9 0.6 2.5 4.8 1.4 0 0 0 0 2 8.7 0 0 0 0 2.51 0
2.9 11.2 10.7
0.8 1.8 1.4 6.3 4.4 2.8 6.6 10.9
3.6 0 12.3 0 5.3 0 7.3 0 0 0
2.9 1.6 31.4 1.6
0 0.1 0.6 3.8 4 1.9 0 0 2.5 5.4 2.4 1.2 0 0 2.6 2.4 2.3 1.9 0 0 0.1 10.6 0.4 0 0 0 0 0 0.1 0.4 0 0 0 8.4 4.1 0 0 0 0 0.5 3.3 0 0 0 0.9 0.8 1.6 0 0 0 0 1.1 4.1 0
0 0 0 0
2.9 0.4 0.1 0 0 0
3.4
0 5.9 11.5 17.4
3.1 0 0 0 0
6.4 9.5
0 0 0 0
4.7 8.1 7.8 17 0.1 2.1
39.8
0 8.6 0 0 1 1.6
0.6 0 1.4 0.5 9.4 0 0 8.6 0 0 20.3 0 0 3.8 0
0.1 8.'1 () 0.1 2.1 0
0 0.3 1.2 1.5
0.3 0 0 0 0 0
0.3
0 0
0.1 0 0 0 0
0.1 0
2.1 21.6 34.7 22.6 13.2 19.7 17.5 9.6 8.7 0.3 6.1
28.5 10.2
194.8
42.5
4.4 14.9 25.9 45.2
20.8 29.8 13.2 35 0.1 16
114.9
20.9 15.5 12.1 22.1 9.1
32.8 7.6 14.8 7.4

3.3 0.7 0 1.6 0.1 2.7 0 0.1 6.7 33 22.3 5.4 1.3 61.9 3 0.2 142.3
XVI 2688 132 0 0 0 0 0 0 0 0 0 0.9 6.3 ~I 0 4.1 0 0 11.3 2688 133 0 0 0 0 0 0 0 0 0 0 2.7 0 5.5 0 0 8.2 2690 134 0 1.6 0 0 0 0.6 0 0 0 0 6.7 1.6 1.6 1.7 0 0 13.8 2691 135 0 0 0 0 0 0 0 0 0 0 5 0 0 3.3 0 0 8.3 2692 136 0 0 0 0 0 0 0 0 0.2 0 6.1 2.2 0 0.9 0 0 9.4 0 1.6 0 0 0 0.6 0 0 0.2 0.9 26.8 3.8 1.6 15.5 0 0 51

Appendix 2: Coastal terrestrial indicator vegetation
I. Elymus Farctus Mediterranean couch very strong and wiry deep rooted, sand dune stabilizer (=Agropyron junceum) p 459, Plate LIX
2. Phragmites Australis Reed small reed marks areas where saltwater mixes with freshwater, grows in p 478, Plate LXIV Qasbet ir-rih salt- marshes
3. Atriplex halimus Shrubby Orache Large perennial shrub, grows both in wild and cultivated areas thrives in p 28, Plate V Haxixa mielha, deeper soil found also on bastion walls in coastal regions
Bjanca 4. Mesembryanthemum Round-leaved Mesembryanthemum low-growing annual-often takes on a brick-red colouration, grows in
nodiflorum sandy and rocky places p 38 Plate VII Kristallina tal-Blat
5. Inula crithmoides Golden Sapphire small, perennial shrub grows in moist, rocky coastal localities p 323, Plate XLIV Xorbett
- - --
Source: Haslam, S.M., Sell, P. D., and Wolseley, P. A. (1977)
360

Appendix 3: Coastal maritime indicator vegetation
1. Enterornorpha associated with high levels of bright - green 'sp' sewage pollution translucent
tubular thallus
2. Ulva 'sp' associated with high levels of bluish-green sewage pollution bright - leaves with stiff green sheltered places sterns
3. Cystoseira 'sp' in exposed rock habitats - tough texture intolerant of phosphate pollution
4. Acetabularia whitish - intolerant of stiff white stalk Acetabulum sewage pollution
5. Cymodocea like posidonia but in more brick- red Nodosa sheltered conditions - also creeping sterns
more tolerant
6. Posidonia in open well aerated and shaggy bases
I Oceanica unpolluted sea - on muddy bottom I
I
Source: Lanfranco, E (1975) Unpublished mimeo report, pers. comm ..
361

APPENDIX4: Publications on the coast as listed in Ulrich's Periodicals Directo
Name of Publication Year Public Freguencl: Description Circulation Commenced per Year
Coast 1955 -1989 10
Coast (Bay Head) 1984 10 Covers the Jersey shore. Provides informative feature articles on the shore's rich history and lifestyles, as well as what's new in art and science, profiles of personalities, poetry, fiction, photographic essays. Includes up-to-date guides on dining, nightlife, real estate and bed and breakfast inns
Coast & Country 1984 6 Contains-articles on human 75000 and personal issues, the home, money management, health, business, dining wine, leisure, area issues, travel and personalities
Coast Business 1989 6 Covers the business news, people and opportunities on the Mississippi Gulf West
Coast Guard Eng. 1933 4 Aimed at sharing lessons Digest learned and advancing
engineering in the Coast Guard
Coast Marine & Transportation Directory
Coast to Coast 1986 4 Covers issues in national 1000 sport, government actions in sport. Coastal Bend Council of Governments, Box 9909, Corpus Christi; TX 78469
Coast to Coast 8 Coast to Coast Resorts 362,992 Management
Coastal Bend Council 1969 4 Examiner regional planning 1,100 of Governments. Monthly Update
Coastal Cruising US 4 Formerly Carolina Cruising: 25,000 advertising book reviews
Coastal Engineering 1977 6 For engineers working in the field of marine and coastal technology
362

Coastal Engineering : 1958 8 Japan
Coastal Engineering 1952 irregular American Society of Civil Research Council every two Engineers Proceedings years
Coastal Farmer 1981 New Natal Farmer (until 3000 1983)
Coastal Law Memo 1980- 1988
Coastal Management 1973 4 explores the technical, legal, political, social and policy issues surrounding the utilisation of valuable and unique coastal environments and resources. Formly CZM Journal
Coastal Research 1962 every three Science, engineering and years other matters of coastal
interest
Coastal Research Notes
Coastal Zone 1969 every ten specialises in reporting on Management days federal - state relationships in
the U.S. Coastal Zone and EEZ, including information on oil, gas, and mineral activities on the outer continental shelf; also covers technical side of coastal management community development, and certain aspects of tourism
Coastal Zone Management Journal
Coast guard 1946 4 Dept. ofTransport. 15,000 Advertising; book reviews; film reviews; illustrations, statistics. Dept. ofTransport; HM Coast guard;
Coastlines 4 Pacific Stock Exchange (news & activities); the securities industry, trading highlights and related topics
Coastwatch 1970 Formerly: Univ. of N. Carolina. Sea Grant College Newsletter
Bowker's R.R. Serials Bibliography Department (2000)
363

Appendix 5: Classification Key
Symbol Land use Symbol Land use A AGRICULTURE G GARDEN Ac Agriculture: cereals Gpri Garden: Private Av Agriculture: vegetables Gpub Garden: ,public As Agriculture: sulla
H HUNTING B BOATS Ha Hunting: shooting Ba Boat: amature Ht Hunting: traQPjng Bf Boat: fishing Hrto Hunting: reserved area Bg Boat: grounded Bh Boat: hired I INDUSTRY Bm Boat: moored Ih Industry: heavy Bp Boat: park II Industry: light Bt Boat: trailer lsp Industry: salt pans By Boat: yacht
INF INFRASTRUCTURE c COMMERCIAL INFb Infrastructure: broadcasting Cb Commercial:bar INFe Infrastructure: electrical power Ck Commercial: kiosk INFp Infrastructure: pipeline Co Commercial: office JNFs Infrastructure: sewage Cs Commercial: shop INFw Infrastructure: water supply Cst Commercial: tourist shop
J JETTY CA CAR Jb Jetty: breakwater CAa Car: access Js Jetty: Services Cabs Car: bus stop CAp Car: park K CONCRETE CAr Car: route Kfp Concrete: footpath
Kp Concrete: promenade D DIMENSIONS Ks Concrete: steps Da Dimension: altitude Dl Dimension: length L LEISURE On Dimension: number Lbc Leisure: beach concession Dt Dimension: thickness Lc Leisure: club Ow Dimension: width Ls Leisure: sports
E ECOSYSTEM M MILITARY ESTABLISHMENT Eb Ecosystem: beach Mb Military: barbed wire site Ee Ecosystem: ecologically imp Mf Military: fortification Er Ecosystem: erosion Ere Ecosystem: rocky coast N INTEREST Esd Ecosystem: sand dune Na Interest: Aesthetic Esm Ecosystem: salt marsh Ne Interest: Ecological Est Ecosystem: stream Nee Interest: Economic Evm Ecosystem: valley mouth Nh Interest: Historical
No Interest: Other, specify F FISHING Ns Interest: Scenic Fa Fishing: area Nsc Interest: Scientific Fe Fishing: farm Fl Fishing: flora Fp Fishing: point
FA FAULT
364
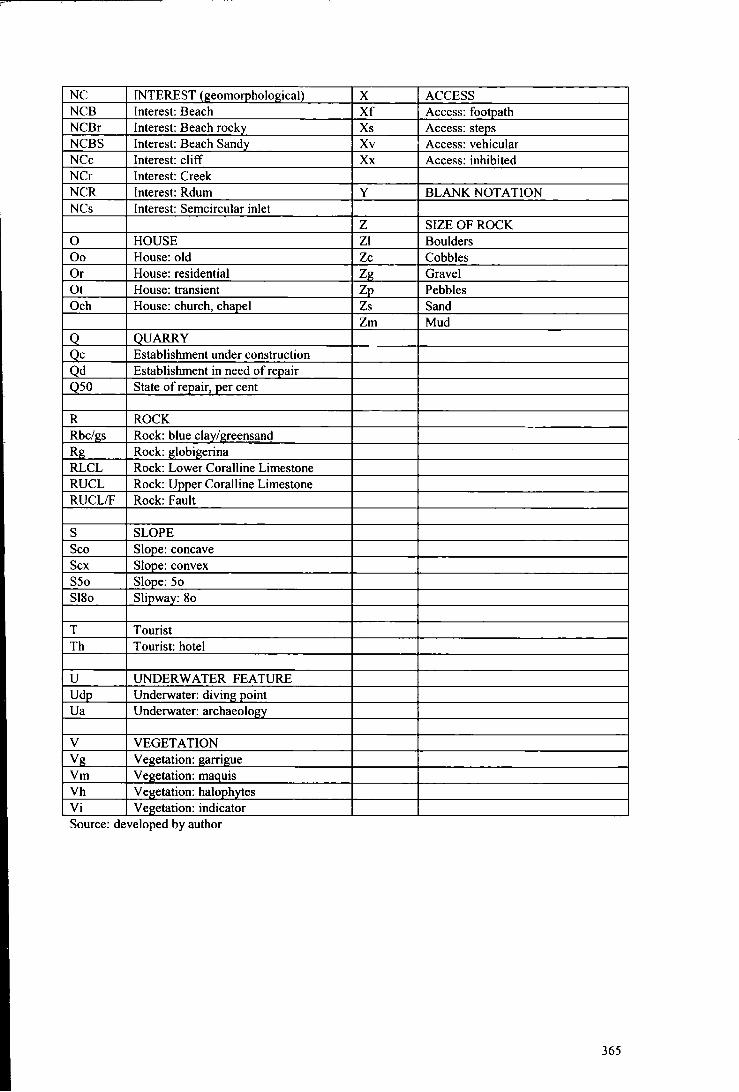
NC INTEREST (geomorphological) X ACCESS NCB Interest: Beach Xf Access: fooqpath NCBr Interest: Beach rocky Xs Access: steps NCBS Interest: Beach Sandy Xv Access: vehicular NCc Interest: cliff Xx Access: inhibited NCr Interest: Creek NCR Interest: Rdum y BLANK NOT A TION NCs Interest: Semcircular inlet
z SIZE OF ROCK 0 HOUSE Zl Boulders Oo House: old Zc Cobbles Or House: residential Zg Gravel Ot House: transient Zp Pebbles Och House: church, chapel Zs Sand
Zm Mud Q QUARRY Qc Establishment under construction Qd Establishment in need of repair
_Q50 State of re_pair, eer cent
R ROCK Rbc/gs Rock: blue clay/greensand Rg Rock: globigerina RLCL Rock: Lower Coralline Limestone RUCL Rock: Upper Coralline Limestone RUCL/F Rock: Fault
s SLOPE Sco Slope: concave Sex Slope: convex S5o Slope: 5o Sl8o Slipway: 8o
T Tourist Th Tourist: hotel
u UNDERWATER FEATURE Udp Underwater: diving point Ua Underwater: archaeology
v VEGETATION Vg Vegetation: garrigue Vm Vegetation: maquis Vh Vegetation: halophytes Vi Vegetation: indicator Source: developed by author
365

Appendix 6: List of Government Notices, Legal notices, Regulations, Codes and Acts pertaining to the Maltese coasts.
- Sand (preservation) Act, 1949 (act. no. XVI of 1949) - Protection of Birds and Wild Rabbits Regns. 1980. LN 68 of 1980 amended by 25 of 1983 - Disembarkation of Animals (Min. Standards) Regulations, 1963. LN of 1963 - Place of Landing ofForeign Animals. GN 9 of 1946 - Disembarkation of Bullocks Directions GN 425 of 1933 - Bathing of Animals Regulations LN 31 of 1960; amended by LN 90 of 1975; 45 of
1977 - Of Boats. Code of Police laws, Part XXII, Sec 243- 304 - Continental Shelf Act, 966 (Act No XXXV of 1966) - OfFishing, Sale ofFish, Fishing Boats. Code of Police Laws, part XXII, Sec 305 -306 - Territorial Waters and Contiguous Zone Act, 1971 (Act. No XXXII of 1971) - of Territorial Waters, Harbours, and Wharves. Code of Police Laws, part XX, Sec 224 -234 - Int. Convention on the Safety of Life at Sea (Ratification) Act, 1981. Act No XXV of 1986 - Continental Shelf (Designation of Area) Order 1971. LN 36 of 1971; 113 of 1974 - Fishing Boats Regulations. GN 212 of 1937 - Merchant vessles on fure or with a damaged hull prohibited to enter any harbour. GN257 of 1938 - Safety of boats used for passenger traffic Regulations GN 104 of 1880 - Sea traffic during petrol handling in certain places Regulations. Gn 340 of 1911; 122 of 1913 - Small craft (speed) Regulations, 1961. LN 26 of 1961 - Speed boats & Water Skiing Regulations, 1985. LN 190of 1985 - Boatsman's Fees Regulations, 1957. GN 572 of 1957 - Boats plying for hire at any landing place in the harbours in Malta, or at Mgarr or
Marsalfom, Gozo. GN 189 of 1894; amended by GN 38 of 1920; Police Notice 15.1 of 1921 - Comino Passenger Service (Time-Table) Regulations, 1973. LN 66 of 1973; amended by LN 39 of 1974 - Gozo Boats Carrying Passengers. GN 239 of 1942 - Malta/Gozo Hydrofoil Boat Passenger Service (Time-Table) Regulations, 1966. LN 26 of 1966; amended by LN 69 of 1966, 68 of 1967 - Mechanically driven boats (Passenger & Cargo) Regulations 1955. GN 704 of 1955;
amended by GN 626 of 1957, LN 116 of 1975 - Steam boats plying for hire or touring lighters in the harbours or bays or between the
islands. GN 230 of 1909 amended by GN 49 of 191 0; vide GN 19 of 1911 - Tariff of fares for steam-boats plying between the Islands GN 507 of 193-7 - Wied iz-Zurrieq Coastal Boats (Tariff offares) Regulations 1979 LN 70 of 1979;
amended by LN 41 of 1981 - Berthing regulations 1975 LN 117 of 1975 - Berthing of Vessels & Boats in Harbours Regulations GN 791 of 1957 - Landing Places for Boats carrying Passenger Regulations GN 380 of 1935 - Mooring of Boats in French Creek GN 130 of 1899 - Berthing (Amendment) regulations, 1986 LN 33 of 1986 - Berthing (Amendment) No 2 regulations , 1986 LN 51 of 1986 - Swimming pools (Control) Regulations 1974 LN 74 of 1974; amended by LN 81 of
1974 - Marine pollution (Prevention & Control) Act, 1977 (Act. No XII of 1977) - Material Discharge Outside Harbours Regulations. GN 24 of 190? - Petroleum ships entry and discharge of petroleum in harbours. GN 397 of 1936;
amended by GN 427 of 1936; 127 & 451 of 1937 - Transfer of Cattle, Animals or Eggs between Malta and Gozo & removal of manure or other filth. GN 402 of 1911; GN 242 & 483 of 1944 - Special Development Areas Act, 1956 (Act No IX of 1956) - Town and Country Planning Schemes. Code of Police Laws, Part I, Sec 1-2 - Town and Country Planning Act 1969 (Act No IX of 1956) - Building Development Areas Regulations, 1983. LN 23 of 1983
366

Appendix 7: A century of legislation pertaining to coastal matters in Malta, 1880-1990: I' fl . I I I . tst o aws, government notices ega not ces and reaulations.
LAW GN LN REG AM 1880 F F 1881 1882 1883 1884 1885 1886 1887 1888 1889 1890 1891 1892 1893 1894 F F 1895 1896 1897 1898 1899 B 1900 1901 1902 [903 1904 1905 p
1906 1907 1908 1909 F F 1910 F F F 1911 F F 1912 1913 F F 1914 1915 1916 1917 1918 1919 1920 F F F 1921 F 1922 1923 1924 1925 1926 1927 1928 1929 1930 1931 1932 1933 F 1934 1935 B 1936 p
1937 1938 1939 1940 1941 1942 F F 1943 1944 p
367

LAW GN LN REG AM
1945 1946 1947 1948 1949 1950 1951 1952 1953 1954 1955 1956 1957 1958 1959 1960 1961 1962 1963 1964 1965 1966 1967 1968 1969 1970 1971 1972 1973 1974 1975 1976 1977 1978 1979 1980 1981 1982 1983 1984 1985 1986 1987 1988 1989 1990
PT
PT
T
TTTT
Law I Act of Parliament Government Notice Legal Notice Regulation Amendment
F
FFF
F F
F F F
F
F
B F p
T
F T
T
TIT
TT TT
T
mBBT
Berthing Fenies Pollution Tourism
Source: Compiled by author from Government Gazette Publications, 1880-1990
F
FFF F
F F
F F F F
m F F
TT F TT
T
m
368

Appendix 8 Existing Structure Plan Policies relevant to the coastal zone
Structure Plan Policies for Coastal Zone Management
POLICY CZM 1: A professionally staffed and adequately resourced coastal zone management unit will be established as a matter of high priority.
POLICY CZM 2: A Subject Plan will be prepared for coastal zone management, to include both conservation of this important resource, and improved facilities for its enjoyment by the public.
POLICY CZM 3: Public access around the coastline immediately adjacent to the sea or at the top of cliffs (including in bays, harbours, and creeks) will be secured. This will include taking shorelands into public ownership, Government acquisition of illegal developments and encroachments, and suitable construction works. In the few cases where this is not practical (for ex_ample where security considerations are paramount), nearby detours will be established. All the coastline will be brought into public ownership within a specified period.
POLICY TOU 15: The Planning Authority in co-operation with the Secretariat for the Environment and other relevant bodies will define a comprehensive policy for the coastal zone. This policy should aim at enabling Government to:
. 1. Assess the different components of the coastal zone considered as a unique ecosystem
2. Identify permissible uses, development criteria, and standards
3. Promote and enforce policies
4. Include the coastal zone as an area requiring mandatory Environmental Impact Assessment procedures
Structure Plan policies on natural and cultural resources
POLICY RCO 10: In identifying and designating Areas of Ecological Importance in Local Plans, one or more of the following habitat types must be present:
1. Permanent springs 2. Saline marshlands 3. Sand dunes 4. Forest remnants 5. Semi natural woodland 6 Natural freshwater pools and transitional coastal wetlands 7 Deep natural caves 8. Coastal cliffs 9. Representative examples of typical Maltese habitats such as garigue, maquis, valley
sides, watercourses, and gently sloping rocky coasts.
368a

POLICY RCO 11: In identifying and designating Sites of Scientific Importance in Local Plans, one or more of the following features must be present:
1. The only known locality in the Maltese Islands where certain endemic and/or non endemic species are found
2. A locality where certain endemic and/or non endemic species with a restricted distribution in the Maltese Islands occur ('restricted distribution' is taken to mean occurrence in five localities or less)
3. The type locality of an endemic species 4. An important bird nesting site or of some other major ornithological interest 5. A locality of special palaeontological interest 6. A lithostratigraphical type section 7. A locality of particular geomorphological interest 8. Some other specific feature of scientific importance not listed above
POLICY RCO 16: No form of permanent construction will be allowed in sandy coastal areas and existing constructions will be removed wherever practicable. The removal of sand from sandy beaches is prohibited, and the extension and creation of sandy beaches for recreational use will be encouraged. Sandy beaches include shallow inshore seabeds. All beach and seabed enhancement will be the subject of Environment Impact Analyses.
POLICY RCO 17: Overnight camping on sandy beaches, and any camping on sand dunes will be prohibited, and access of vehicles to sandy beaches and dune areas will be prevented.
POLICY RCO 18: Without prejudice to any other policy or regulation protecting dune areas, the Planning Authority will actively prevent the removal of sand binding vegetation from such areas.
POLICY RCO 19: The Planning Authority will carry out surveys in order to identify sites where the habitat and/or landscape has degraded. Such surveys will be reviewed every two years.
POLICY RCO 20: Positive action will be taken to rehabilitate identified areas of degraded habitat and landscape, and proposals from Government agencies and non governmental bodies for rehabilitation schemes for these areas, provided that such schemes do not conflict with other policies and/or regulations concerning these areas, will be supported subject to scrutiny and approval by competent experts. POLICY RCO 21: There is a general presumption against development in areas prone to erosion.
POLICY RCO 22: Positive action will be taken to prevent further loss of sandy beaches, sand dunes, coastal clay slopes, soil, and cliff edges.
POLICY RCO 23: Developments connected with the construction of coastal defences, the enlargement of existing beaches, and the creation of new ones will only be allowed following a scientific study by competent persons of their ~hart term and long term environmental, social, and economic impact, and provided that it is clearly demonstrated that there is a real need for such development and that the benefits outweigh any negative impacts.
POLICY RCO 24: Existing regulations concerning excavation and transport of sand and soil will continue.
369

POLICY RCO 34: Without prejudice to any other policy or regulation . protecting the environment of the minor islands of the Maltese archipelago, the Planning Authority will have a general presumption against any new physical development on these islands. The minor islands of the Maltese archipelago are: St. Paul's Islands (Selmunett Islands), Ghallis Rocks, rocks off Xrobb ii-Ghagin, rocks off Delimara Point, Filfla Island, Cominotto, rocks in the Blue Lagoon area, Gebla tal-Haifa, II- Hnejja, Tac-Cawl Rock, Fessej Rock, and Fungus Rock (General's Rock).
POLICY RCO 36: Efforts will be made to declare the Qawra area including the Inland Sea and Dwejra Bay, in Gozo, a Natural World Heritage Site in terms of the Convention Concerning the Protection of the World Cultural and Natural Heritage.
POLICY RCO 37: A management authority for the Qawra National Park will be established. This management authority will formulate detailed management plans which take into consideration the type, location, size, traditional human use and activities, and the presence of features of natural, historical, archaeological, scientific, or aesthetic interest in the Qawra area including the Inland Sea and Dwejra Bay, so that the public may enjoy these features without their suffering any degradation or harm.
POLICY RCO 38: Without prejudice to any other policy or regulation governing the Qawra area including the Inland Sea and Dwejra Bay, Conservation Areas, including Marine Conservation Areas, may be designated within the Qawra National Park, and policies relevant to such designated Conservation Areas are applicable in addition to any applicable to the National Park as a whole.
POLICY REC 9: As from the commencement date of the Structure Plan, no structure other than tents, windbreaks, and shading devices, used by day visitors, will be permitted in coastal areas. All such temporary structures will be demounted and removed by midnight. The owners of all huts and other makeshift (shanty) structures on coastlines or adjacent areas, without building permits, will be served w(th eviction notices, requiring the removal of the structures within a period of three months and the restoration of the land to the satisfaction of the Planning Authority. Any structures remaining on these sites after the expiry of the notices will be demolished and the land restored, at the occupier's expense.
POLICY MCO 1: The following general vicinities are designated as candidates for the status of Marine Conservation Areas. Following further analysis, these and other possible areas will be categorised and given protection accorded to defined categories:
1. Dwejra, Gozo 2. Qbajjar, Gozo 3. Ramla Bay, Gozo 4. Mgarr ix-Xini Bay, Gozo 5. Comino Island 6. Filfla Island 7. Cirkewwa 8. St. Paul's Islands, Mistra Bay 9. Qawra Point
10. StGeorge's Bay vicinity, Paceville 11. Outer Marsamxett Harbour 12. St. Thomas Bay to Delimara Point 13. Blue Grotto to Ghar Lapsi 14. South of Fomm lr-Rih Bay to Ras ii-Wahx.
370

POLICY MCO 2: The Planning Authority will, as far as possible, include marine archaeological sites and structures within the boundaries of Marine Conservation Areas. Access to archaeological sites and wrecks will be strictly regulated.
POLICY MCO 3: A Maritime Geographic Information System will be established, de-signed to integrate data related to coastal zone management and Maltese territorial waters.
POLICY MCO 4: The Planning Authority, in conjunction with the Secretariat for Environment, will conduct an underwater survey of infralittoral ecosystems for the Maltese Islands.
POLICY MCO 5: The Planning Authority will establish a national system of Marine Conservation Areas within the shortest possible time but only after full consultation with interested Government institutions, environment groups, maritime resources users groups, and the general public.
POLICY MCO 6: It will be the policy of the Planning Authority to site, as much as possible, Marine Conservation Areas contiguous with land based Conservation Areas. This will guarantee the protection of the marine zone from any land activities likely to pose threats to the marine environment and vice versa.
POLICY MCO 7: The system of Marine Conservation Areas will include representative areas of all existing marine and coastal ecosystems as outlined in the infralittoral habitat survey.
POLICY MCO 8: Candidate sites for Marine Conservation Areas, which exhibit a wide variety of ecosystems and habitats over a relatively small area, will be accorded preference during the selection process. This will ensure greater ecological stability in the protected area and offer greater scope for a wide variety of activities.
POLICY MCO 9: categories.
All categories of Marine Conservation Area will conform to international
POLICY MCO 10: The Planning Authority will establish a priority list of all Marine Conservation Areas, and rank sites by importance.
POLICY MCO 11: The traditional rights of fishermen to utilise resources is recognised. Wherever jobs may be threatened, fishermen will be given first option for suitable jobs and services related to site protection.
POLICY MCO 12: Marine Conservation Areas that benefit other nations or worldwide interests will be designated, as for example where migrating species pass through or breed in a particular coastal area.
POLICY MCO 13: A management authority for Marine Conservation Areas will be established, and detailed management plans prepared and followed.
POLICY ARC 4: As a matter of priority, the Planning Authority will designate Hagar Qim/Mnajdra and Ggantija as Areas of Archaeological Importance and will collaborate with other agencies to develop them as National Parks.
371

Structure Plan Policies relating to yachting and shipping development
Policy TOU 13: In conjunction with the appropriate agencies the Planning Authority will prepare a Subject Plan including Environmental Impact Assessments to determine the advisability and feasibility of various types of harbours, moorings and facilities for yachts and other boats. Each potential location shall be studied and planned
Policy liT 1: Ferry services between Gozo and the Inner Harbour will be made more frequent and generally improved, including the introduction of fast services. Studies will be undertaken into the advantages and disadvantages of allowing competitive ferry services between mainland Malta and Gozo.
Policy IIT2: Suitable ferry terminal facilities for passengers and freight will be provided in the Inner Harbour area.
Policy liT 4: Ferry terminal facilities providing bad weather alternatives to Cirkewwa will be fully established. Ghadira (Mellieha Bay) is suitable nearby location.
Policy IND 5: The Planning Authority will prepare a Subject Plan aimed at establishing the potential for the longer term relocation of heavy port/industrial uses from Grand Harbour to the Marsaxlokk Bay area. In the interim period, no new industrial uses will be permitted in the vicinity of Grand Harbour.
Policy IND 15:A local plan shall be prepared for Marsaxlokk Bay and the surrounding area. The plan will be based on studies of the long term requirements of all industrial activities related to deep water port uses, including security aspects, safety, and environmental impacts. Major gas installations liable to explosion shall be located away from urban areas, including the removal of existing installations. To assist the early preparation of the local plan, oil companies shall supply particulars of their requirements, including especially requirements in the event that oil is discovered in commercial quantities. The efficient use of the deep water port potential at Marsaxlokk Bay, and the visual quality of new development shall be particular features of the local plan and development permits.
Structure Plan policies relevant to development
POLICY SET 11: No form of urban development will be permitted outside existing and committed built-up areas, and primary development areas as designated in the Structure Plan even where roads and public utilities are available. Permitted forms of non urban development outside such areas are restricted to the categories referred to in Paragraph 7.6.
Paragraph 7.6: The term ·urbanisation' means the creation of new built-up areas containing all or most urban uses: houses, shops, offices, factories, and all the built support facilities which these accumulate. In seeking to prohibit urbanisation of existing non urban areas it is not the intention to prohibit built structures of various kinds which are normal and legitimate
. inclusions in the non urban scene - farmhouses and other genuine agricultural buildings, reservoirs, picnic area toilets and car parks, and control buildings and walls/fences at archaeological and ecological sites. Nevertheless, the provision of such structures must be controlled in order to preserve and enhance the environmental quality of the countryside.
372

POLICY SET 12: Notwithstanding the policy against any form of urbanisation outside areas designated for urban uses in the Structure Plan, the Planning Authority will consider applications for permission to develop which ostensibly infringe Policy SET i i. In any such case the onus will be on the applicant to present evidence as to why the· policy should be infringed, giving reasons why from a planning point of view such proposed use cannot be located in areas designated for development.
POLICY BEN 5: Applications for development permits outside urban areas will be judged against the policies and design guidelines of the Local Plans for Rural Conservation Areas, and in the interim period, to Structure Plan policies and the guidelines contained in the Explanatory Memorandum.
Structure Plan policies on illegal development
· POLICY REC 10: Low cost holiday home villages or other similar developments will not be permitted. Holiday villages will conform to Structure Plan policies.
POLICY REC 11: Sites at White Rocks and Marfa are designated for overnight accommodation of mobile caravans and tents. Each site will have a management and maintenance team. Regulations will be introduced to ensure the best use of sites, and to avoid permanent occupancy of any pitch. Overnight caravans shall only be permitted to occupy designated mobile caravan sites. Permanent residential caravan sites will not be permitted.
POLICY REC 12: The owners of all illegal constructed property sited on Government or other land will be served with eviction notices requiring that the offending structures be demolished and the site restored within a period of one year from the serving of the notices. Any structure remaining on expiry of the notice will be demolished and the site restored at the occupier's expense. No fines will be imposed on illegal occupiers and no compensation will be payable to them.
POLICY CZM 3: Public access around the coastline immediately adjacent to the sea or at the top of cliffs (including in bays, harbours, and creeks) will be secured. This will include taking shorelands into public ownership, Government acquisition of illegal developments and encroachments, and suitable construction works. In the few cases where this is not practical
. (for example where security considerations are paramount), nearby detours will be established. All the coastline will be brought into public ownership within a specified period.
POLICY TOU 5: The Planning Authority will give favourable consideration to the development of tourist accommodation replacing shanty and illegal development between Vendome B.attery and White Tower on the northern coastline of the Marfa peninsula.
373

Structure Plan Policies relating to coastal uses
Fisheries and aquaculture
POLICY AHF 1 :Major improvements in agriculture, horticulture, and fisheries will be · encouraged, so that:
1. The sector assists the overall economy of the country through reduced imports and increased exports
2. Better quality products are available to domestic consumers 3. The countryside land resource is used efficiently and does not become derelict 4. Food supplies are safeguarded in the event of natural, accidental, or deliberate
calamities 5. The countryside is safeguarded for the benefit of future generations
POLICY AHF 13:Government will promote efficiency in agriculture and fisheries through land availability measures, including:
1. Establishing access rights of way for agricultural vehicles and machinery, and improving rural roads and tracks, in a manner which improves the appearance of the countryside
2. Making land available on long leases to secure capital investment in agriculture, including for livestock, forage, and organic farming
3. Introducing measures to encourage the formation of larger more viable farms and farming businesses
4. Identifying sites for the establishment of secure boat storage with maintenance facilities, near to but not on the coastline
POLICY AHF 14:A small fisheries centre and fishing boat berthing facilities will be promoted in the north of mainland Malta, and a deep sea fisheries centre at Marsaxlokk Bay.
POLICY AHF 15: Marine based aquaculture units will be encouraged so as to make best use of land and sea resources. Production units will be located well away from the coast to avoid any significant visual impact. Detailed planning criteria and permit conditions will be developed to ensure suitable safeguards.
POLICY AHF 16: Large land based aquaculture units will be restricted to industrial estates and former quarries, and multi storey structures used where feasible. Small units will be permitted on forms in conformity with Policy AHF 5. All offsite water supply and discharge pipes will be underground, and the reuse of water, other than seawater, is mandatory. Detailed planning criteria and permit conditions will be developed to ensure suitable safeguards.
374

Mineral exploitation
POLICY IND 16: Government will ensure that permissions for offshore operations will include measures for the safety of navigation, safeguards for the natural environment, and satisfactory abandonment measures.
POLICY MIN 5: There will be a presumption against surface mineral working in or near areas of acknowledged interest for ecology, archaeology, and in areas of high quality agricultural land. The extraction of significant amounts of Blue Clay will not be permitted.
POLICY MIN 6: The extension of existing workings and the merging of adjacent workings will be given preference to the development of new mineral workings. In support of any application for new or extended mineral workings, evidence will be required to demonstrate that the existing site has been worked to the maximum practicable depth.
Transport
POLICY PTR 5: The Planning Authority will ensure the provision of transport interchanges between different modes of transport (car, bus, mini bus, taxi, passenger ferry, vehicle ferry, aircraft, rapid transit system, foot) where appropriate.
375

References
Agius Muscat, A. (ed.) (1968) Malta and Europe: the defence of the coast. Malta, Din l-Art Helwa.
Allen, H. D. (2000) Mediterranean ecogeography. Harlow, Prentice Hall.
Alexander, D. (1988) A review of the physical geography of Malta and its significance for tectonic geomorphology. Quaternary Science Review, 7:4-53.
Allison, R. J. and Kimber, 0. G. (1998) Failure mechanisms and rates of change in rock slopes and cliffs. Earth Surface Processes and Landforms, 23:731-750.
Amir, S. (1984) Israel's coastal program: resource protection through management of land use. Coastal Zone Management Journal, 1:189-223.
Anderson, E. W. and Schembri, J.A. (1990) The Maltese Islands: a threatened coastline. In Lockhart D. and Drakakis-Smith, D. (eds) Environmental and economic issues in small island development, Developing Areas Research Group, Monograph No 6. London: The Commonwealth Foundation, pp. 5-24.
Anderson, E.W. and Schembri, P.J. (1989) Coastal zone survey of the Maltese Islands: report. Planning Services Division, Works department, Government of Malta, Beltissebh.
Arthurton, R. S. ( 1996) Awareness of the physical environment - a foundation for coastal decision. In Taussik, J. and Mitchell J. (eds) Partnership in coastal management. Cardigan, Samara Publishing Limited, pp. 1-7.
Aston, J. ( 1999) _Experiences of coastal management in the Pacific Islands. Ocean and Coastal Management 42: 483-501.
Azzopardi, A. ( 1995) A new geography of the Maltese Islands. Malta, Progress Press Co. Ltd.
Bacon, P.R. Deane, C.A. and Putney, A. D. (1988) A workbook of practical exercises in coastal zone management for Tropical islands. London, Commonwealth Service Council.
Badruddin, A and Hamilton, L.P. (1996) Effects on land use data quality in resource analysis. Proceedings of the Annual Conference of the American Society for Photogrammetry and Remote Sensing, November 19-21, Bethseda.
Ballinger, R. (1999) The evolving organizational framework for Integrated Coastal management in England and Wales. Marine Policy, 23: 501-523.
Balm, R. ( 1996) Big holes in a small place. Geography 81: 82-86.
376

Beatley, T. Brower, D. J. and Schwab, A. K. (1994) An introduction to coastal zone management. Washington, Island Press.
Beeley, B.W. and Charlton, W.A. (1994) Maltese patterns of dependence: an historical perspective. Scottish Geographical Magazine, 110: 112-120.
Best, R.H. ( 1981) Land Use and living space. Oxford, Methuen.
Bigeni, V. (1982) Urban and rural environment of Gozo. B.E. & A. Unpublished Dissertation, Faculty of Architecture and Civil Engineering, University of Malta.
Bird, E.C.F. (1984) Coastline changes. Chichester. Wiley.
Blake, G.H. (1984) Mediterranean non-energy resources: scope for cooperation and dangers of conflict. In Luciani, G. (ed) The Mediterranean region, London, Croom Helm, pp 41-74.
Blake, G.H. (1997) Coastal state sovereignty in the Mediterranean sea: the case of Malta. Geojoumal41: 1-8.
Blouet, B. (1992) The story ofMalta. London, Faber and Faber.
Bonavia, M. and Schembri, J.A. (1999) The role of transport in urban environments. In Proceedings for the International Seminar on Atmospheric Pollution, Mgarr. Gozo. Malta, Malta University Press.
Bonnici, J. and Cassar, M. (1989) Malta: then and now. Malta, The authors.
Borg, J. ( 1997) Afforestation strategies in the Mediterranean. Media Centre, Malta.
Borg, J. (1998) Afforestation in Malta: acheivements and disappointments. National Awareness Seminar on desertification and land degradation, organised by the Ministry of Foreign Affairs and the Environment, Foundation oflnternational Studies, Valletta, 3-4 June.
Borg, J. A. and Schembri, P .J. (1995) Preliminary data on bathymetric and temporal changes in the morphology of a Maltese Posidonia oceanica (L.) Delile meadow. Rapport du Congres de la Commission Internazionale pour l 'Exploration Scientifique de laMer Mediterranee, 34:123.
Borg, M. (1995) Coastal Management in Malta: discussion paper. Malta, Planning Authority.
Borg, M. (200 1) Coastal strategy topic paper: draft for public consultation. Malta, Planning Authority.
Bowen-Jones, H., Dewdney, J.C. and Fisher, W.B. (1961) Malta: Background for Development. Durham, University of Durham, Department of Geography, Durham Colleges.
377

Bowker R.R. Serials Bibliography Department (2000) Ulrich's periodicals directory, including irregular series and annuals, 2001. 391
h edition. New Jersey, Bowker's R.R. Database Publicity Group.
Brachya, V. (1983) Coastal management of Israel's Mediterranean strip. Israel Environment Bulletin, 8: 8-11.
Branigan, J.J. and Jarrett, H.R. (1975) The Mediterranean lands. London, Macdonald and Evans.
Braudel, F. (1975) The Mediterranean and the Mediterranean world in the age of Philip II. Fontana/Collins, Glasgow.
British Petroleum Exploration Company Limited ( 1957) Geological Survey of the Maltese Islands Malta and Gozo, scale 1: 31,680. London, Ordnance Survey.
Bruce, M.W. (1965) Malta: A geographical monograph. Valletta, Progress Press Co. Ltd.
Burgess, R.J. ( 1956) A Geography of the Maltese Islands. Malta, A. C. Aquilina.
Buttigieg, M., Vassallo, M. and Schembri, J. A. (1997) Basic geomorphological studies of shore platforms in the Maltese Islands. In Ozhan E. ( ed) Proceedings of the Third International Conference on the Mediterranean Coastal Environment, pp. 79-90.
Camilleri, P. (1977) Planning for Tourism. Unpublished B.E. & A Dissertation, Faculty of Architecture and Civil Engineering, University of Malta.
Carter, H. (1981) The study ofurban geography, 3rd edition. London, Edward Arnold.
Carter, R.W.G. (1988) Coastal environments: an introduction to the physical, ecological and cultural systems of coastlines. London, Academic Press.
Carter, R.W.G. (1995) Coastal environments: an introduction to the physical, ecological and cultural systems of coastlines. 2"d edition. London, Academic Press.
Camhis, M and Coccossis, H. (1982) Coastal management and planning perspectives. Ekistics, 49: 92-97.
Central Office of Statistics (1993) Annual Abstract of Statistics, 1992. Malta, Central Office of Statistics.
Central Office of Statistics (1996) Census of population and housing, Malta 1995: final report. Malta, Central Office of Statistics.
Central Office of Statistics ( 1999) Annual Abstract of Statistics. 1997. Malta, Central Office of Statistics.
378

·~~~- -----------~~~~~~~~·--- --~--
Central Office of Statistics (2000) Annual Abstract of Statistics, 1999. Malta, Central Office of Statistics.
Centro Studi Ricerche (1976) Report on an afforestation plan (greening) for Malta. Catania, Centro Studi Ricerche.
Chamber of Architects and Civil Engineers ( 1999) Housing affordability in Malta. Conference organized by the Chamber of Architects and Civil Engineers in conjunction with the Building Industry Consultative Council, The Coastline Hotel, 41
h
November.
Charlton, W. A. and Beeley, B.W. (1987) Land use change in Malta. Land Use Policy, 4: 96-101.
Charlton, W. A., and Beeley, B.W. (1993) Agriculture, land use and resource transformation in Malta. Tijdsschrift voor Econoische en Sociale Geografie, 84: 325-331.
Cilia, G. (1995) Sustainable development: land use in Malta. Friends of the Earth -Malta. Mimeo report, 32 p.
Clark, J. R. (1995) Coastal zone management handbook. New York, Lewis Publishers.
Clarke, J.l. (1972) Population geography, 2"d edition. Oxford, Pergamon.
Clarke, W .C. ( 1996) The sustainability of sustenance: land and agricultural production in the Third World. In Douglas 1., Huggett, R. and Robinson, M.(eds) Companion encyclopedia of geography: the environment and humankind, London, Routledge, pp 651-676.
Coastal Environment Research Programme ( 1991) Preliminary Report. Coastal Environment Research Programme
Coastal Environment Research Programme (1996) Conference on Towards an integrated strategy for coastal zone management in the Maltese Islands. Qawra, Malta.
Coleman, A. ( 1961) The second land-use survey: progress and prospects. Geographical Journal, 127: 68-186.
Commission of the European Communities (1995) Communication from the Commission to the Council and European parliament on the integrated management of coastal zones. Com (95)511 Final. Commission of the European Communities, Brussels, 31.10.1995.
Consiglio Nazzionale delle Ricerche (1985) Atlante delle sptagge italiane: dimensione, tendenza evolutiva, opere umane. Firenze, Selea.
379

Cooke, R. U. and Doomkamp, J. C. (1974) Geomorphology m environmental management: an introduction. Oxford, Clarendon Press.
Council for the environment ( 1992) A policy for coastal zone management in the Republic of South Africa: Part 2-Guidelines for coastal land use. Pretoria, Academica Publishers.
Cremona, J .J. (1994) The Maltese constitution and constitutional history since 1813. Malta, PEG.
Crofts, R. (1973) Slope categories in environmental management. Unpublished paper, Department of Geography, University College London.
Cullen, P. (1982) Coastal zone management in Australia. Coastal Zone Management Journal, tO: 183-213.
Dahl, A. L. (1991) Island Directory. UNEP [United Nations Environment Progranune] Regional Seas Directories and Bibliographies No.35, Nairobi, UNEP.
Dahl, C. ( 1997) Integrated coastal resources management and community participation in a small island setting. Ocean and Coastal Management, 36: 23-45.
Dean, F. L. (1979) Planning for environmental management: new directions and initiatives. Coastal Zone Management Journal, 5: 285-306.
Department of Information ( 1996) Census of Population and Housing: 1995. Valletta, Department of Information.
Duca, C. and Zammit N. (1989) A phytogeographical study of Malta. Unpublished B.Ed.(Hons) dissertation, Faculty of Education, University of Malta.
Edwards, S.D., Jones, P.J.S. and Nowell, D.E. (1997) Participation in coastal zone management initiatives: a review and analysis of examples from the U.K. Ocean and Coastal Management, 36: 143-165.
Ehenberg, A. S.C. ( 1982) A primer in data reduction. Chichester, Wiley.
Ellenberg, L. (1983) Die Kusten von Gozo. Essener Geogr. Arb. Bd. 6, pp.129-160.
Ellis, M.Y. (ed.)(1978) Coastal Mapping Handbook. Washington,U.S. Department of the Interior and U.S. Department of Commerce.
Employment and Training Corporation (2002) Annual report, 2002. Hal Far, Employment and Training Corporation.
Espenshade, E.B. Jr., Hudson, J.C. and Morrison J.L (1990) Goode's world atlas, 191h
Edition. USA, Rand McNally.
380
Farrugia, S. (1989) Quo Vadis- Coast?. Unpublished B.E. & A Dissertation, Faculty of Architecture and Civil Engineering, University of Malta.
Fsadni, C. and Selwyn, T. (1997) Sustainable tourism in Mediterranean islands and small cities. Malta and Euromed (London), Med Campus.
Galloway, R.W. and Bahr, M.E. (1979) What is the length of the Australian Coast? Australian Geographer, 14: 244-247.
Gardner, V. and Dackombie, R. (1983) Geomorphological field manual. London, George Allen and Unwin Publishers.
Goudie, A. ( ed)( 1997) The human impact reader: readings and case studies. Oxford, Blackwell.
Government of Malta, Ministry for Public Buildings and Works ( 1968) Marsamxett Harbour; report on hydraulic model investigations for proposed harbour development. London, G. Maunsell and partners.
Government of Malta (1988a) Power Station Project, Volume 1: Reports on identification of site. Malta, Government of Malta.
Government of Malta (1988b) Power Station Project, Volume 2: Environmental Impact Assessment of a Power Station on a site at Delimara. Malta, Government of Malta.
Government of Malta ( 1988c) Power Station Project. Volume 3: Comparative illustrations showing blending of new power station within the proposed location. Malta, Government of Malta.
Government of Malta (2001) Solid Waste Management Strategy for the Maltese Islands. Malta, Ministry of the Environment, Government of Malta.
Government of Malta (2002) State of the Environment Report 2002. Malta, Government of Malta. http:/ /www.mha.gov.mt/environment/environment.html
Grove, A.T. and Rackham, 0. (1998) History of Mediterranean land use. In Mairota, P., Thomes, J.B. and Geeson, N. (eds) Atlas of Mediterranean Environments in Europe: the desertification context. Chichester, Wiley.
Harrison, A. St. B. and Hubbard, R.P.S. (1945) Valletta: a report to accompany the outline plan for the region of Valletta and the Three Cities. Malta, Government of Malta.
Haslam, S. and Royle, P.Y. (1968) Buskett and its natural history. Malta, Malta University Press.
Haslam, S.M., Sell, P. D. and Wolseley, P.A. (1977) A Flora ofthe Maltese Islands. Malta, Malta University Press.
381

~~~~~~----~-----~---~----
Healey, M. and Ilbery, B. (1990) Location and Change: perspectives on economic geography. Oxford, Oxford University Press.
Helicon (1992) The Hutchinson Encyclopedia, l01h edition, Upshall,M. ( ed). Oxford,
Helicon.
Holt, G .D. ( 1998) Which methodology? For contractor selection. International Journal ofProject Management, 116: 53-164.
Hong, S-Y. ( 1991) Assesment of coastal zone Issues m the Republic of Korea. Coastal Management, 19: 391-415.
Harden, P. and Purcell, N. (2000) The corrupting sea: a study of Mediterranean history. Blackwell, Oxford.
Horwath and Horwath (UK) Ltd. ( 1990) The Maltese Islands: Tourism Developmet Plan. London, Horwath and Horwath.
Hudson, B. J. (1996) Cities on the shore: the urban littoral frontier. New York, Pinter.
Hughes, Q. (1993) Malta: a guide to the fortifications, Valletta, Said Publications.
Ioannides, D. and Holcomb, B. (2001) Raising the stakes: some implications of upmarket tourism policies in Cyprus and Malta. In Ioannides, D., Apostolopoulos, Y. and Somnez, S.F. ( eds ), Mediterranean islands and sustainable tourism development. Cassell, London., pp. 234-258.
Johnston, R.J., Gregory, D., and Smith, D. (1994) The dictionary of human geography, 3rd edition, Oxford, Blackwell.
Jorge, M.A. ( 1997) Developing capacity for coastal management in the absence of government: a case study in the Dominican Republic. Ocean and Coastal Management, 36:47-72.
Kawabe, M. (1998) To enhance the environmental values of Tokyo Bay - a proposition for Integrated Coastal Zone Management. Ocean and Coastal Management, 41: 19-39.
Kay, R. and Alder, J. (1999) Coastal planning and management. London, E & F.N. SPON.
Ketchum, B.H. (ed) (1972) The water's edge. Boston, MIT Press.
King, R., de Mas, P. and Beck, J. M. (2001) Geography, environment and development in the Mediterranean region. Sussex, Academic Press.
382

King, R., Proudfoot, L. and Smith, B. (1997) The Mediterranean: environment and society. London, Arnold.
King, R.L. and Olson, S. G. (1988) Coastal state capacity for marine resources management. Coastal Management, 16: 305-318.
Klarin, P. and Hershman, M. (1990) Response of coastal zone management programmes to sea level rise in the United States. Coastal Management, 18:143-165.
Kuwabaro, S. (1984) The legal regime of the protection of the Mediterranean against pollution from land-based sources. Dublin, Tycooly International Publishing Limited.
Lanfranco, E. ( 1975) Coastal maritime vegetation. Unpublished mimeo report, 8 p.
Lawrence P.L. (1997) Integrated coastal zone management and the Great Lakes. Land Use Policy, 14:119-136.
Legakis, A., Kollaros, D., Paragamian, K. Trihas, A., Voreadon, C. and Kypriotakis, Z ( 1993) Ecological assessment of the coasts of Crete (Greece). Coastal Management, 21:143-154.
Lipshitz, G. and Ravel, A. (1998) Socio-economic differences among localities: a new method of multi-variate analysis. Regional Studies, 32: 747-757.
Lockhart, D.G. (1987) Public housing initiatives in Malta since 1955. Scottish Geographical Magazine, 103: 33-43.
Lockhart, D.G. (1997) Tourism to Malta and Cyprus. In Lockhart, D.G and DrakakisSmith, D. ( eds) Island tourism - trends and prospects. London, Pinter, pp 152-178.
Lockhart, D.G. (1997a) 'We promise you a warm welcome': tourism to Malta since the 1960s. GeoJournal41: 145-152.
Lockhart, D.G. (1997b) Islands and tourism: an overview. In D.G. Lockhart and Drakakis-Smith D. (eds) Island Tourism: trends and prospects. London and New York, Pinter, pp. 3-20.
Lockhart, D.G. and Ashton, S. (1989) Landscapes of Malta. Gozo and Comino: a countryside guide. London, Sunflower Books.
Lockhart, D.G. and Ashton, S.E. (1991) Tourism in Malta. Scottish Geographical Magazine, 107: 22-32.
Lockhart, D.G. and Mason, K.T. (1989) A social and economic atlas of Malta and Gozo. Keele, University ofKeele, Department of Geography.
Lockhart, D.G., Drakakis-Smith, D. and Schembri, J. (eds) (1993) The development process in small island states. Routledge, London and The Commonwealth Foundation, London and New York.
383

Lowry, K., Pallewatte, N. and Dainis, A.P. ( 1999) Policy-relevant assessment of community coastal management practices in Sri Lanka. Ocean and Coastal Management, 42:717-745.
Luttinger, N. (1997) Community-based coral reef conservation in the Bay Islands of Honduras. Ocean and Coastal Management, 36: 11-22.
Luttrell, A. T. ( 1973) Medieval Malta: studies Malta before the Knights. Malta, Idsea Books.
McCarty, H.H. ( 1953) An approach to a theory of economic geography. Annals of the Association of American Geographers, 43: 183-184.
McCarty, H.H., Hook, J.C., Knos, D.S. (1956) The measurement of association in industrial geography. Department of Geography, State University oflowa, Iowa City.
McCreary, S., Twiss, R., Warren, B, White, C., Huse, S., Gardels, K. and Rogues, D. (1992) Land use change and impacts on the San Francisco estuary: a regional assessment with national policy implications. Coastal Management, 20: 219-253.
Makoloveka, S. and Shurcliff (1977) Coastal management in Tonga, Tanzania: a decentralized community-based approach. Ocean and Coastal Management, 37: 349-358.
Maling, D.H. (1988) Measurements from maps: principles and methods of cartometry. Oxford, Pergamon.
Mallia, E.A. (2000) The environment: prospects for the millennium. In Vella, C.C. (ed) The Maltese islands on the move: mosaic of contributions marking Malta's entry into the 21st century .. Malta, Central Office of Statistics.
Malta Development Corporation ( 1991) Marsamxett Harbour: breakwater study: proposal for feasability study. Manchester, Allott and Lomax.
Malta Environment and Planning Authority (2002a) Grand Harbour Local Plan. Floriana, Malta Environment and Planning Authority.
Malta Environment and Planning Authority (2002b) Gozo and Comino Local Plan. -Draft for public consultation. Floriana, Malta Environment and Planning Authority.
Malta Environment and Planning Authority (2002c) Malta South Local Plan - Report of survey. Floriana,.Malta Environment and Planning Authority.
Malta Maritime Authority (1989) Maritime Malta: marketing brochure. Valletta. Malta Maritime Authority.
384

Malta National Report (2002) Malta National Report, submitted by the Government of Malta to the World Summit on Sustainable Development, Johannesburg. Malta, F ormatek Ltd.
Malta Tourism Organisation ( 1995) Hotels and Restaurants Guide. Valletta, Malta Tourism Organisation.
Mandelbrot, B.B. (1967) How long is the coast of Great Britain? Statistical selfsimilarity and fractional dimension. Science, I 55: 636-638.
Mangion, M.L and Vella, L. (2000) Strategic Plan, 2000-2002. Valletta, Malta Tourism Authority.
Martin, G.J. and James, P.E. (1993) All possible worlds: a history of geographical ideas, 3rd edition, New York, Wiley.
Mather, A.S. (1999) Land use and cover change. Land Use Policy, 16: 143-144.
Meadows, D.H., Meadows, D.L., Randers, J. and Brehens III, W. (1972) The limits to Growth. London, Earth Island.
Micallef, A. ( 1997) Small islands and sustainability: a question of conflicting demands?. In Ozhan E. ( ed) Proceedings of the Third International Conference on the Mediterranean Coastal Environment, pp. 713-723.
Mifsud Bonnici, R. (1960) Dizzjunarju bijo-bibhografiku nazzjonali, Malta, Dipartiment ta' 1-Informazzjoni.
Mitchell, J .K. ( 1986) Coastal management since 1980; the US experienceand its relevance for other countries. In E. Mann Borgese and N. Ginsburg (eds), Ocean Yearbook 6. Chicago, University Chicago Press, pp. 319-345.
Morgan, J.R. (1989) Marine regions: myth or reality. Ocean and Shoreline Management, 12: 1-21.
Moriki, A., Coccossis, H. and Karydis, M. (1996) Multicrieria evaluation in coastal management. Journal ofCoastal Research, 12: 171-178.
Moviment ghall-Ambient-Friends of the Earth, Malta (1997) Towards a sustainable Europe, sustainable Malta: a discussion paper. Malta, Friends of the Earth.
National Tourism Organization (1995) Hotels and Restaurants guide. Valletta, National Tourism Organization.
National Statistics Office (2001a) Touristat 2000. Malta, National Statistics Office.
National Statistics Office (200 1 b) Malta in figures: 2001. Malta, National Statistics Office.
385

National Statistics Office (200lc) Labour Force Survey. Malta, National Statistics Office.
National Statistics Office (2002) Environment Statistics. Malta, National Statistics Office.
Nehring, B. ( 1966) Die Maltesischen inseln. Mimeo report.
Nicholls, K. ( 1998) Management of freshwater, coastal areas and marine resources in the OECS. In Integrated Management of Freshwater, Coastal Areas and Marine Resources in Small Island Developing States. Malta, United Nations Environment Programme I Institute for Islands and Small States.
O'Brein, L. (1992) Introducing quantitative geography: measurement, methods and generalised linear models, London, Routledge.
Oil Exploration Directorate (1992) Geological map of the Maltese Islands, scale 1:25,000. Malta, Office of the Prime Minister.
Okpala, D.C.I., ( 1992) Land survey and parcel identification: data for effective land management. Land Use Policy 9: 92-98.
Olsen, S. and Seavey, G.L. (1990) The State of Rhode Island Coastal Resource Management Programme: as amended. The Coastal Resource Management Centre, Graduate School of Oceanography, Narragansett, University of Rhode Island.
Ordnance Survey (1934) Malta and Gozo, scale 1: 31,680, Geographical Section, General Staff, 3859 Edition 4. London, War Office.
Ordnance Survey (1957) British Petroleum Exploration Company Limited Geological Survey of the Maltese Islands, scale 1 :31680. London, Ordnance Survey.
Owens, D.W. (1992). National goals, state flexibility, and accountability in coastal zone management. Coastal Management, 20: 143-165.
Ozhan, E. (ed.)(1997) Medcoast '97: Proceedings of the Third International Conference on the Mediterranean coastal environment, 2 vols, Medcoast Secretariat, Middle East Technical University, Ankara, 11th -141h November, Qawra, Malta.
Paskoff, R. and Sanlaville, P. ( 1978) Observations geomorphologiques sur les cotes de l'arcipel Maltais. Zeitschrift fur Geomomhologie N.F. 22: 310-328.
Perotte, R. (1986) A review of coastal zone mapping. Cartographica. 23:1-2.
Public Works Department ( 1990) Structure Plan for the Maltese Islands: Inception Report. Floriana, Public Works Department.
Planning Authority ( 1992) Manoel Island - Tigne Point Develoment Brief. Floriana, Planning Authority.
386

Planning Authority ( 1995) Marsaxlokk Bay Local Plan. Floriana, Planning Authority.
Planning Authority ( 1997a) Pjan lokali ghall Port il-Kbir - The Grand Harbour Local Plan: public consultation draft. general policies. Floriana, Planning Authority.
Planning Authority (1997b) Cottonera Waterfront Development Brief. Floriana, Planning Authority.
Planning Authority (1998) Valletta Cruise Passenger Terminal. Floriana, Planning Authority.
Planning Authority (2000a) Malta & Gozo, scale 1:25,000. Floriana, Planning Authority Mapping Unit.
Planning Authority (2000b) North Harbours Local Plan - Draft for public consultation. Planning Authority, Floriana.
Planning Authority (200 I) North West Local Plan - Draft for public consultation. Planning Authority, Floriana.
Price, A.R.G. (I990) Rapid assessment of coastal zone management requirements: a case study from the Arabian Gulf. Ocean and Shoreline Management, I3: I-I9.
Public Works Department (1983a) Malta West, scale 1:25,000. Malta, Public Works Department.
Public Works Department (1983b) Malta East, scale 1:25,000. Malta, Public Works Department.
Public Works Department (1983c) Gozo, scale I :25,000. Malta, Public Works Department.
Ransley, N. (I985) A geography ofthe Maltese Islands, 3rd edition. Malta, Progress Press Co Ltd.
Ravichandran, S., Ramanibai, R. and Pundarikanthan, N.V. (1996) Ecoregions for describing water quality patterns in Tamiraparan Basin, S. India. Journal of Hydrology, 178: 257-276.
Renfrew, C. (1973): Before civilization: the radiocarbon revolution and prehistoric Europe London, Cape.
Rivera, R. and Newkirk, G. (1997) Power from the people: a documentation of nongovernmental organisations' experience on community-based coastal resource management in the Philippines. Ocean and Coastal Management, 36: 73-95.
Robinson, A.H., Sale, R. D. Morrisson, J.L. and Muehrcke, P.C. (1983) Elements of cartography, 51
h edition. New York, Wiley.
387

Robinson, G.M. (1998) Methods and techniques in human geography. Chichester. Wiley.
Robinson, H. (1970) The Mediterranean lands (3rd edition). London, University Tutorial Press.
Rose, J.K. (1936) Com yields and climate in the Com Belt. Geographical Review, 26: 88-102.
Sauvain, P .A. ( 1990) Advanced techniques and statistics. Hulton.
Schembri, J.A., (1993) Coastal Zone of the Maltese Islands: Character and Conservation . Politika, I : 48-62.
Schembri, J.A. (2000) The changing gepgraphy of population and settlement in the Maltese Island~l!l Vella, C.C, (ed) The Maltese islands on the mo:v_e: _mosaic of contributions marking Malta's entry into the 21st century .. Malta, Central Office of Statistics.
Schembri, J. A. (2001) Toponyms of coastal features and their linguistic association along the coast of the Maltese Islands. In Conference on the Geographies of the EuroArab Encounter: past. present and future. 4th -ih October. Valletta, Malta.
Schembri, J.A. (2002) Fuel Ahoy! The geographical impact of the fuel installation depots at St. George's Bay and Birzebbugia. Paper presented at a Conference on Energy and the Environment, Enemalta Corporation, Mediterranean Conference Centre, Valletta, Malta 18th -19th October, 2002.
Schembri, J.A. and Bonavia, M. (1998) Changes in the coastal population of Malta. Paper presented at the International Conference on the Urban Environment in the Mediterranean. Foundation for International studies, Valletta, Malta.
Schembri, J. A. and Bonnici, K. (2000) 11-Geografija ta' Hal Kirkop. In Vella, H.C.R.(ed.) Hal Kirkop inhawi ta'madwaru, pp 150-161.
Schembri, J.A. and Borg, M. ( 1997) Population changes in the walled cities of Malta in Fsadni, C. and Selwyn (eds). In Sustainable tourism in Mediterranean islands and small cities. Med Campus, Malta and Euromed (London), pp114-123.
Schembri, J.A. and Magri, 0 (1995) Littoral land use competition at Xemxija: a touristic area in the Maltese Islands. Occasional Paper Series No.1 0. Valletta Islands and Small States Institute, Foundation for International Studies.
Schembri, J. A. and Magri, 0 (1996) The physical properties and utilization of scree slopes in Malta. Paper presented at the International Conference on Integrating economic and Environmental Planning in islands and Small states. Foundation for International Studies, Valletta.
388

Schembri, J.A. and Magri, 0 (2003) Peripheral agricultural areas in the Maltese Islands. Paper to be presented at the Royal Geographical Society (with the Institute of British Geographers) Annual Conference, London 3 rd -5th September.
Schembri, P.J. and Lanfranco, E. (1993) Development and the natural environment in the Maltese Islands. In Lockhart, D.G., Drakakis-Smith, D. and Schembri, J. (eds) The development process in small island states. London, Routledge, pp.247-266.
Schembri, P.J. and Sultana J. (eds.)(l989) Red data book for the Maltese Islands. Malta, lnterprint.
Schecter, R.N. (1992) Personal Communication. State of Carolina, Department of Environment, Health and Natural Resources, Division of Coastal Management. Shorelands and Coastal Management Programme. Washington, Department of Ecology.
Selby, M.J. ( 1993) Hillslope materials and processes, 2nd edition. Oxford, Oxford University Press.
Serracino Inglott, E. ( 1981) 11-Miklem Malti. Malta. Klabb Kotba Maltin,
Simeoni, U., Calderoni, G. Setti, M., Ciavola, P. and Zamoriola, A. (1996) The coastline of Durres Bay (Albania): geomorphology, sediment dynamics and coastal management issues. In Taussik, J. and Mitchell, J. (eds) Partnership in Coastal Management: Proceedings of the Third International Conference of the European Coastal Association for Science and Technology (Eurocoast), 16th 19th September. Portsmouth, U.K., pp. 309-316.
Simmons, I.G. (1996) Changing the face of the earth: culture, environment. history. 2nd edition, Oxford, Blackwell.
Small, J. and Witherick, M. (2001) A modem dictionary of geography, 4th edition, London, Edward Arnold.
Smith, H. D. (1991) The present and future of coastal zone management in the UK. Land Use Policy, 8: 125-132.
Sokal, R.R. and Rohlf, F .J. ( 197 5) Introduction to biostatistics. London. Freeman.
Sokal, R.R. and Rohlf, F .J. ( 1995) Introduction to bioststistics. London, Freeman.
Sorensen, J. ( 1997) National and international efforts at integrated coastal management,acheivements and lessons. Coastal Management, 25: 3-42.
Spiteri, S.C. ( 1989) The Knights' fortifications: an illustrated guide of the fortifications built by the Knights of St. John in Malta. Malta, The Author.
Spiteri, S.C. (1999) The British fortifications: an illustrated guide to the British fortifications in Malta. Malta, The Author.
389

Stamp L.D. (1948) The land of Britain: its use and misuse. London, Longman
State of New Jersey, Department of Environmental Protection ( 1980) New Jersey Coastal Management Programmme: summary and management system. Division of Coastal Resources, Trenton, New Jersey.
State of Oregon, Department of Land Conservation and Development (1986) Oregon's coastal management program: a citizen's guide. Oregon, Oregon Coastal Management Programme.
Strahler, A.N. and Strahler, A.H. (1984) Elements of physical geography, 3rd edition New York, Wiley.
Sultana, J and Falzon, V. (eds)(1995) Flora u Fawna ta' Malta. Floriana, Dipartiment ghall-Harsien ta' 1-Ambjent.
Sunamura, T. (1972) Geomomhology of rocky coasts. Oxford, Wiley.
The Blue Plan ( 1989) Futures of the Mediterranean Basin (MAPIUNEP)_ Grenon, M. and Batisse, M. eds. Oxford, Oxford University Press,
The Sunday Times [of Malta) 20 November 1994, Putting a planning process in place-1. Valletta, Progress Press Co. Ltd., pp. 40-41.
The Sunday Times [of Malta] 27 November 1994, Putting a planning process in place-11. Valletta, Progress Press Co.Ltd., pp. 42-44.
The Sunday Times [of Malta] 21 July 2002, A steering committee for Comino. Valletta, Progress Press Co. Ltd, p.72.
The Sunday Times [of Malta]: classified property pages 10 November 2002, Telling it like it is. Valletta, Progress Press Co. Ltd, p. 1.
The Times [of Malta] 16 September 1999, We cannot afford to use more land. Valletta. Progress Press Co. Ltd. p 11.
The Times [of Malta] 6 August, 2001, Boathouse owners plan protest action. Valletta, Progress Press Co. Ltd. p 24 .
The Times [of Malta] 8 July 2002, Underwater marine park to be established off Qawra Point. Valletta, Progress Press Co. Ltd, p. 5.
The Times [of Malta] 28 August 2002, Plans to make Qala creek a yachting hub. Valletta, Progress Press Co. Ltd, p. 4.
The Times [of Malta] 2 November 2002, Council to hold referendum on Qala project. Valletta, Progress Press Co. Ltd, p. 11.
390

The Times [of Malta] 13 November 2002, Comino Committee has environmental management in its sights. Valletta, Progress Press Co. Ltd, pp. 30-31.
The Times [of Malta] 23 November 2002, Potentially hazardous materials found at landfills. Valletta, Progress Press Co. Ltd, p. 6.
The Times [of Malta] 25 November 2002, George Pullicino [Parlamentary Secretary for the environment] explains Armier boathouses intention. Valletta, Progress Press Co. Ltd, p. 48.
The Times [of Malta] 6 January, 2003, Ghadira Nature Reserve- refuge from a hectic life. Valletta, Progress Press Co. Ltd, pp. 20-21.
The Times [of Malta] 3 April 2003, New Hotel planned at Golden Sands. Valletta, Progress Press Co. Ltd, p. 4.
The Times [of Malta] 13 May 2003, Cirkewwa diving spoiled by construction dust. Valletta, Progress Press Co. Ltd, p. 6.
The Times [of Malta] 14 June 2003, Swimmers' zones in 18 areas. Valletta, Progress Press Co. Ltd, p. 14.
The Times [of Malta] 30 June 2003, The Hotel Moratorium Saga. Valletta, Progress Press Co. Ltd, p. 11.
The Times [of Malta] July 10 2003, Temporary landfills decision criticized. Valletta, Progress Press Co. Ltd, p. 5.
The Times [of Malta] July 11 2003a, Nationalist MP attacks choice of sites. Progress Press Co. Ltd, pp. 4-5.
The Times [of Malta] July 11 2003b, New landfill 'another national disaster' MHRA [Malta Hotels and Restaurants Association]. Valletta, Progress Press Co. Ltd, p. 5.
Thibault, P.A. (1999) Ground cover patterns near streams for urban land use categories. Landscape and Urban Planning 39:37-45.
Tomaselli, R. (1977) The degradation of the Mediterranean maquis. Ambio 6c: 356-362.
Torpiano V. (1975) Planning for leisure. Unpublished B.E. & A. Dissertation, Faculty of Architecture and Civil Engineering, University of Malta.
Trenhaile, S.A. ( 1987) The geomorphology of rocky coasts. Oxford, Clarendon Press.
United Nations Department of Economic and Social Affairs (200 1) 1999 Demographic Yearbook: fifty-first issue. New York, United Nations.
391

United Nations Environment Programme/ Mediterranean Action Plan (UNEP/MAP) ( 1988) The Blue Plan - Futures of the Mediterranean Basin: executive summery and suggestions for action, 2000-2025. Sophia Antipolis, France Mediterranean Blue Plan Regional Activity Centre.
Upshall, M. ( ed.)( 1992) The Hutchinson Encyclopaedia, 1 01h edition. Oxford,
Helicon.
Vall ega, A. ( 1990) Esistenza, societa, ecosistema: pensiero geografico e questione ambientale. Milano, Murisia.
van Duivenbooden, N., Windmeijer, P.N., Fresco, L.O. and Andriesse, W. (1996) The integrated transect method for land use characterization, with special reference to inland valley agro-ecosystems in West Africa. Landscape and Urban Planning, 34:143-160.
van Mulekon, L (1999) An institutional development process in community based coastal resource management: building the capacity and opportunity for community basedco-management in a small-scale fisheries community. Ocean and Coastal Management, 42: 439-456.
Vassallo, N., Strickland, R. and Trapani, P. (1895) Map of Malta compiled from various documents, scale 6" to 1 mile. Malta, Public Works Department.
Veitayaki, J. (1997) Traditional marine resource management practices used in the Pacific Islands: an agenda for change. Ocean and Coastal Management 37:123-136.
Vella, H.C.R. ( 1980) The earliest description of Malta (Lyons 1536) by Jean Quentin d' Autun. Malta, Interprint.
Vigneaux, M. (1998) Action programme on the Maltese Seashore. Mimeo report for the Ministry of Tourism, Malta.
Vink A.P.A. (1983) Landscape ecology and land use. London, Longman.
Viset Consortium (1997) Valletta International Sea Terminal. Mosta, Malta. Viset Consortium.
Viles, A. and Spencer, T. (1995) Coastal problems: geomorphology. ecology and society at the coast. London, Arnold.
Waite, C. ( 1982) Coastal management in England and Wales. Ekistics, 293: 124-127.
Walford, R. (1997) Land-Use - UK; a survey for the 201h Century. London, The
Geographical Association.
Water Services Corporation (1998) Annual Report. Malta, Water Services Corporation.
392

Waugh, D. (2000) Geography: an integrated approach, Yd edition. Oxford, Oxford University Press.
Weaver, J.C. (1943) Climatic relations of American barley production. Geographical Review, 33:569-588.
Wettinger, G. (1979) The militia roster of watch duties of 1417. Armed Forces of Malta Journal, 32:25-42.
Wettinger, G. (2000) Place-names ofthe Maltese Islands, ca. 1300-1800. Malta, PEG.
Whitby, M., and Ollerenshaw, J., (1986) Land use and the European environment. London, Belhaven Press.
White, P. (1984) The West European city: a social geography. London, Longman.
Works Department (1984a) Gozo. scale 1:25.000. Series M898, Sheet 1, Valletta, Government of Malta.
Works Department ( 1984b) Malta West, scale 1:25,000, Series M898, Sheet 2, Valletta, Government of Malta.
Works Department (l984c) Malta East, scale 1:25,000, Series M898, Sheet 3, Valletta, Government of Malta.
Yunlong, C. (1990) Land use and management in PR China: problems and strategies. Land Use Policy 7:337-351.
Zammit-Maempel, G. (1977) An outline ofMaltese geology. Malta, The author.
Websites
http://biover.bio.ub.es/vegana/resourceslhelp/ginkgo/DataOperations.html
http:/ /users.erols.com
http:/history.wise.edu/archdeacon/./404tja/diss.html
http://www. latech.edu/tech/liberal-arts/ geography/courses/ 440/ 44exer4.html
http:// www.fao.org
http:/ I www .sru.edu/ depts/artsci/ ges/urban
393