Popular Factual Heritage Television and the Contemporary Heritage ...
Upload
khangminh22Category
view
0download
0
Duluth Heritage Preservation Commission Special Meeting
City Council Chambers Monday, March 2, 2020, 12:00 PM (Note Special Date and Time)
Call to Order and Roll Call Resolutions 1. 319 and 323 E. Superior Street Redevelopment Old Business 2. Lisa Luokkala, Assistant Manager, Parks and Recreation: Update on Lincoln Park Project 3. Minnesota Historic Property Record, Background Data Form Continuation Sheet, for Pastoret
Terrace 4. Suggestions on Grant Application for Submitted CLG Grants Due March 6, 2020
A. 2021 Preserve Minnesota and B. Duluth Commercial Historic District Design Guidelines
Communications and Other Business 5. Planning Commission Update 6. Consideration of Minutes – January 13, 2020 7. Correspondence: Lakewalk Trail Extension and Kitchi Gammi Park Trail Project by the City of
Duluth 8. Informational: Twenty-Four Reasons Historic Preservation Is Good for Your Community Adjournment (Next Meetings: Monday April 13 and Monday May 11)

January 13, 2020 Heritage Preservation Commission meeting Page 1 of 2
Heritage Preservation Commission January 13, 2019 Special Meeting Minutes
City Hall – Council Chambers Call to Order and Roll Call President Jessica Fortney called to order the meeting of the Heritage Preservation Commission (HPC) at noon on Monday January 13, 2020. Attending: Stacey DeRoche, Jessica Fortney, Mike Poupore, and Sarah Wisdorf Absent: Ken Buehler Staff Present: Steven Robertson and Cindy Stafford Add item #4 to new business regarding lighting on the Aerial Lift Bridge MOTION/Second: DeRoche/Poupore add item 4 to the agenda
VOTE: (4-0) Approval of Minutes 1. Consideration of Minutes – December 10, 2019
MOTION/Second: Wisdorf/DeRoche approve the minutes VOTE: (4-0)
Unfinished Business 2. Womens Club Final Preservation Plan (PL 17-074, 2400 E. Superior St.)
MOTION/Second: Wisdorf/DeRoche approve the final preservation plan dated 12/2/19
VOTE: (4-0)
3. Pastoret Terrace. CLG Grant Application (PL 18-104, Sec 138) – Steven Robertson gives an overview and notes #3 on the Proposed Suitable Course of Action: Demo Mitigation Activities. Develop design guidelines to continue and advance the preservation of the Duluth Commercial Historic District along East 1st Street between 1st Avenue West and 3rd Avenue East in a manner consistent with the Secretary of the Interior’s Standards for the Treatment of Historic Properties. Robertson confirms the HPC would be willing to hold a special meeting if a vote on the CLG grant is needed. The HPC affirms.
New Business 4. Alex Jackson, the energy Manager for the city of Duluth addressed the HPC. He gave an
overview regarding the proposed lighting on the aerial lift bridge. They propose to replace the 32 existing fixtures with 24 custom color changing LED fixtures mounted in the same location. This will save the city $4,000 per year. No permanent alterations to the bridge will be made. No holes will be drilled. It will decrease the light trespassed to their neighbors. He invites questions. Stacey Deroche asks when the project will be finished. Jackson said as soon as possible. The original timeframe was 2 months during the winter months while shipping is closed. He needs the approval from HPC to move forward. He will then order fixtures and hire an electrical contractor. Robertson noted they are proposing 4,000Kelvin (K) for lighting. Jackson said it won’t be lit at 4,000k, but that volume is needed in order to make the color spectrum. Currently it is about 2,500K,

January 13, 2020 Heritage Preservation Commission meeting Page 2 of 2
and it will look exactly the same. Mike Poupore asked with more fixtures, would it be brighter. Jackson explains the LED are designed for narrow floods which only covers their own area. The lighting won’t be concentrated in one area. Poupore asked if they have consulted with the dark sky group. Jackson affirms. The dark sky group would not like to see the bridge lit at all. Chair Fortney noted from a historic perspective, she doesn’t see a conflict, and there is an important safety component involved. She sees the lighting as a cultural aspect. Chair Fortney thanks Jackson for the information. The HPC unanimously agreed this lighting proposal did not warrant a historic construction permit.
Communication and Other Business 5. Planning Commission Update – Commissioner Sarah Wisdorf gave an overview of
upcoming discussion items at the Planning Commission meeting. Nothing specific pertaining to the HPC, other than 1 small change for a concurrent use permit in Lincoln Park, which will conform to the surrounding neighborhood.
6. HPC Board Member Resignation – Robertson shared the email from Mike Malone date 1-20-2020, he will be moving to Scotland and officially resigned from the HPC.
7. Conference 2021 in Duluth. Will staff support? Robertson will research possibility. Adjournment at 1:05 p.m. Next Meeting Monday, February 10, 2020 Respectfully,
_ Adam Fulton – Deputy Director Department of Planning and Economic Development

MHPR No. SL-DUL-0110
Original or Addendum No.
Historic District Name: Duluth Historic Building District
Minnesota Historic Property Record Background Data Form
Continuation Sheet

Pastoret Terrace
MHPR Number
Prepared by: Debra Kellner
Historic Consultant
2729 S. Lake Ave.
Duluth, MN 55802
(218) 340-8074
January 24, 2020

Pastoret Terrace Page 3 of 37
Acknowledgements
This report was produced in compliance with the Minnesota Historic Property Record Guidelines, Updated June
2009, published by the Minnesota Department of Transportation and the Minnesota Historical Society.
This report was produced in consultation with the Minnesota State Historic Preservation Office and conforms to
the Proposed Suitable Course of Action: Demolition Mitigation Activities.
Special thanks to the Duluth Public Library, the Duluth Building Inspection Department, and Duluth Planning
Department staff for their assistance in search of documents related to the Pastoret Terrace building and the
architect Oliver G. Traphagen.

Pastoret Terrace Page 4 of 37
Table of Contents
Building Description 5
Duluth Early History 10
Historic Context and Significance 11
Current Use 14
Architect – Oliver G. Traphagen 16
List of Buildings 17
Index to Photographs 22
Photo Key 24
Bibliography 35

Pastoret Terrace Page 5 of 37
Building Description
The Pastoret Terrace building is situated on the northwest corner of East First Street and Second Avenue East in
downtown Duluth near the central business district and within the Duluth Commercial Historic District.1 The
Romanesque Revival style building is situated on a bluestone foundation and is comprised of red brick with
narrow mortar joints and stone masonry walls. It was designed as an upscale apartment building featuring two
rowhouses along East First Street and four rowhouses ascending Second Avenue East. A prominent tower
anchors the building at the southeast corner. The townhouses facing East First Street and on Second Avenue
East are congruent in style yet each feature unique design details. Prominent features include the tower, a
series of projecting bays, textured and molded ornamental brickwork, arched windows, and covered entrances.
The existing windows and doors do not appear to be original and/or are destroyed or concealed behind wood.
The L shape footprint features a rear courtyard which in its current state is overgrown with weeds. From the
vantage of the courtyard the definition of each townhouse is portrayed by inlets between each unit. Each inlet
features simple fenestration void of architectural ornamentation.
The First Street façade and a portion of the Second Avenue facade is obscured by an architecturally incompatible
wood shingle addition that was added c. 1924. Like many Victorian rowhouses of the late nineteenth century
the first floor of each unit was raised above the street level and accessed by a formal entry stair at the main
entries, each featuring an enclosed porch. The original rough stone ashlar masonry of the lower level is
obscured or possibly was removed at the time of the c. 1924 remodel and addition.
The two-story southerly facing First Street elevation is asymmetrical design. Each town house unit features an
ornamental façade punctuated with two projecting bays. Each bay features arched windows defined by textured
and ornamental brickwork on the first level below a recessed three-sided bay with rectangular windows. Each
bay is flanked by a covered porch entrance. The entrances appear to have been partially removed and rendered
obsolete at the time the of the c. 1924 addition. A brick stringcourse extends across the second story and
continues around the prominent two-story tower at the corner of the building. The tower features brick arches
above the windows which are positioned on stone sills. The windows openings on this façade are concealed
with plywood. The roofline is composed of two rows of brick at the parapet which reveals exposed wood
substrate.
The asymmetrical easterly facing Second Avenue East elevation is stepped in alignment with the incline of
Second Avenue East and is fashioned in the same manner as the First Street elevation; however, it is less ornate.
While it appears that this façade is composed of two townhouses, early records indicate the building was
designed as a six-unit townhouse. The stepped design features two projecting bays flanked by two covered
entrances. The entry porch elements which support the porch roofs are intact, however, the adjacent railings,
decks, and doors do not appear to be original and are in a state of disrepair. The lower level is mostly obscured
by the c. 1924 addition, the exposed portion features a rusticated foundation with secondary service access
commonly seen in buildings of this style and vintage. A small area of replaced brick is observable at the central
section of the second level. Unlike the 1st Street elevation, the roofline features a cornice along the entire
1 Koop, Michael and Chris Morris, Duluth Historic Commercial District, National Register of Historic Places Multiple Property Documentation Form, Minnesota Historical Society, 2006.

Pastoret Terrace Page 6 of 37
elevation. Some form of white emulsion coating on the roof, parapet interiors and tops of parapets is observed
along this elevation.2
The north facing façade is accessed by the alley between East First Street and East Second Street. This façade is
characterized by a bluestone foundation and is clad with yellow brick. The cornice wraps around a portion of
this façade. Two rows of three windows under brick arches are featured on the westerly section of this façade.
The west façade is viewed from the rear courtyard which reveals the delineation of each townhouse unit. The
inlets between each townhouse features arched window openings resting on stone sills. The bluestone
foundation is prominently visible from this vantage. A tall brick chimney is situated in the interior corner of the
building. The chimney is void of architectural ornamentation is not a prominent feature from the First Street or
Second Avenue East vantage.
The building is in a state of great disrepair. The majority of the windows are boarded up or otherwise obscured.
The window opening that retain glass do not appear to be original to the building.
The interior of the Pastoret Terrace building is not accessible due to safety concerns; thus, a physical description
of the interior space is not included with this report. In 1917, the Duluth architecture firm, LHB conducted an
assessment to document the current physical condition of the building. At this time, an internal inspection was
completed. The interior of the building was reviewed using flashlights due to the lack of intact electrical service.
LHB did not tour the lowest section of the building. Overall, the report concludes that the First Street portion of
the building was subjected to fire on the upper floors. Page 4 of the LHB report includes the following
description of the interior of the building:
“The Pastoret Terrace is constructed with exterior and interior brick masonry bearing walls with
wood floor and roof joists spanning between the masonry walls. The interior brick masonry
walls are dividing walls that separated the original town homes that occupied the building.
Within the original townhomes, between the interior brick walls there are numerous wood
partition walls that break the original units up into many smaller apartments/single room
occupancy units. Some of these wood partition walls may be bearing, but because most of the
plaster ceiling and walls are still in place, we could not confirm this. The overall complex is an L
shape with the southern five sections served by a non-original double load corridor that steps
down at each section change. The most northerly structure does not connect to the internal hall
used by the other units but does share a common masonry wall.”
Fire damage has claimed much of the front of the building along First Street. The interior features tongue and
groove hardwood flooring plaster walls and ceiling with wood wainscot in the hallways. The condition of the
plaster walls is very poor due to moisture and mold where the roof appeared to be leaking. The Second Avenue
townhomes feature elegant wood stairs that are in fair shape and could be salvaged and repaired. Interior doors
are multi-panel wood type. It is not clear from the report if any of the interior doors are original. Nonetheless,
LHB reports that the doors are the corridor are badly burned; many are painted. LHB concludes that while the
interior stairs on the Avenue could be salvaged, the remainder of the building should be gutted to the structural
framing and brick exteriors. Upon review of the LHB report, it appears the interior of the building is beyond
repair and does not retain its architectural integrity.
2 Pastoret Terrace Assessment: Terrace, Kozy Bar, Ballroom, Prepared by: LHB, Inc., 21 W. Superior St., Suite 500, Duluth, MN 55802. LHB Project Number 160202, 17 June 2016.

Pastoret Terrace Page 7 of 37

Pastoret Terrace Page 8 of 37

Pastoret Terrace Page 9 of 37
Source: City of Duluth, Department of Planning and Development (origin unknown).
Sketch indicates the configuration of the building sometime after the c. 1924 remodel.
Pastoret Terrace Page 10 of 37
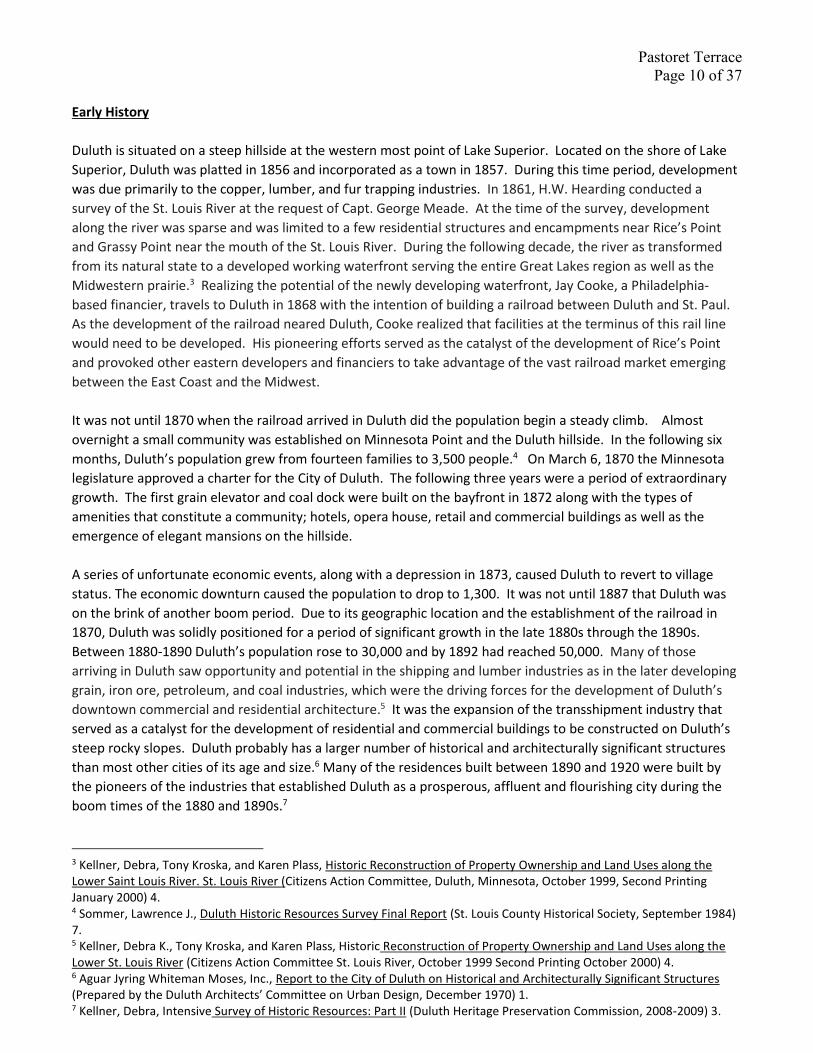
Early History
Duluth is situated on a steep hillside at the western most point of Lake Superior. Located on the shore of Lake
Superior, Duluth was platted in 1856 and incorporated as a town in 1857. During this time period, development
was due primarily to the copper, lumber, and fur trapping industries. In 1861, H.W. Hearding conducted a
survey of the St. Louis River at the request of Capt. George Meade. At the time of the survey, development
along the river was sparse and was limited to a few residential structures and encampments near Rice’s Point
and Grassy Point near the mouth of the St. Louis River. During the following decade, the river as transformed
from its natural state to a developed working waterfront serving the entire Great Lakes region as well as the
Midwestern prairie.3 Realizing the potential of the newly developing waterfront, Jay Cooke, a Philadelphia-
based financier, travels to Duluth in 1868 with the intention of building a railroad between Duluth and St. Paul.
As the development of the railroad neared Duluth, Cooke realized that facilities at the terminus of this rail line
would need to be developed. His pioneering efforts served as the catalyst of the development of Rice’s Point
and provoked other eastern developers and financiers to take advantage of the vast railroad market emerging
between the East Coast and the Midwest.
It was not until 1870 when the railroad arrived in Duluth did the population begin a steady climb. Almost
overnight a small community was established on Minnesota Point and the Duluth hillside. In the following six
months, Duluth’s population grew from fourteen families to 3,500 people.4 On March 6, 1870 the Minnesota
legislature approved a charter for the City of Duluth. The following three years were a period of extraordinary
growth. The first grain elevator and coal dock were built on the bayfront in 1872 along with the types of
amenities that constitute a community; hotels, opera house, retail and commercial buildings as well as the
emergence of elegant mansions on the hillside.
A series of unfortunate economic events, along with a depression in 1873, caused Duluth to revert to village
status. The economic downturn caused the population to drop to 1,300. It was not until 1887 that Duluth was
on the brink of another boom period. Due to its geographic location and the establishment of the railroad in
1870, Duluth was solidly positioned for a period of significant growth in the late 1880s through the 1890s.
Between 1880-1890 Duluth’s population rose to 30,000 and by 1892 had reached 50,000. Many of those
arriving in Duluth saw opportunity and potential in the shipping and lumber industries as in the later developing
grain, iron ore, petroleum, and coal industries, which were the driving forces for the development of Duluth’s
downtown commercial and residential architecture.5 It was the expansion of the transshipment industry that
served as a catalyst for the development of residential and commercial buildings to be constructed on Duluth’s
steep rocky slopes. Duluth probably has a larger number of historical and architecturally significant structures
than most other cities of its age and size.6 Many of the residences built between 1890 and 1920 were built by
the pioneers of the industries that established Duluth as a prosperous, affluent and flourishing city during the
boom times of the 1880 and 1890s.7
3 Kellner, Debra, Tony Kroska, and Karen Plass, Historic Reconstruction of Property Ownership and Land Uses along the Lower Saint Louis River. St. Louis River (Citizens Action Committee, Duluth, Minnesota, October 1999, Second Printing January 2000) 4. 4 Sommer, Lawrence J., Duluth Historic Resources Survey Final Report (St. Louis County Historical Society, September 1984) 7. 5 Kellner, Debra K., Tony Kroska, and Karen Plass, Historic Reconstruction of Property Ownership and Land Uses along the Lower St. Louis River (Citizens Action Committee St. Louis River, October 1999 Second Printing October 2000) 4. 6 Aguar Jyring Whiteman Moses, Inc., Report to the City of Duluth on Historical and Architecturally Significant Structures (Prepared by the Duluth Architects’ Committee on Urban Design, December 1970) 1. 7 Kellner, Debra, Intensive Survey of Historic Resources: Part II (Duluth Heritage Preservation Commission, 2008-2009) 3.

Pastoret Terrace Page 11 of 37
Historic Context and Significance
Pastoret Terrace has undergone significant changes throughout its architectural history. Pastoret Terrace was
designed by Oliver G. Traphagen and constructed in 1886 under contract with Michael Pastoret, a local dry-
goods store owner. Pastoret Terrace was synonymous with elegant upscale living; often referred to as Pastoret
Flats, the building was originally constructed of six town houses and was built for $35,000.00.8 In 1903 Pastoret
Terrace was purchased by Simon S. Altschul and was again sold in 1908 for $40,000.00 to Eustace Realty of
Minneapolis. Designed in the Romanesque Revival style, it is exemplary of many of Traphagen’s ornate designs
found in Duluth.
Image, Duluth Public Library.
Historic photo reveals the pediments and roofline balustrade, domed tower with finial, as well as
the rusticated foundation and original porch entrances.
The Zenith City of the Unsalted Sea: Duluth Historic Contexts Study was prepared in August 1991. Spanning the
time period from the mid 1850’s through the 1940’s, this study describes Duluth’s broadest patterns of
development and describes the Early Settlement Context, Shipping Context, Industry and Commerce Context,
Community Institutions Context, Neighborhood Context, and Recreational Resources Context. The Pastoret
Terrace is considered under the broader “Industry and Commerce Context 1870-1940” for its commercial
influence near the developing waterfront but is more closely associated with the “Neighborhood Context 1880-
1940” which includes the development of Duluth’s early neighborhoods in the central hillside area. Among the
8 Lundy, John, “Before it was the Kozy it was the lap of luxury,” Duluth News Tribune 21 November 2010.
Pastoret Terrace Page 12 of 37
most prestigious of these early neighborhoods was Ashtabula Heights. Located between Second and Sixth
Avenues East and First and Fourth Streets, Ashtabula Heights was host to many of the early upscale residences.
Pastoret Terrace, regarded as one of Duluth’s premiere luxury apartment buildings, was located among many of
Duluth’s finest residences in the fashionable Ashtabula Heights neighborhood.
By the 1890s the Superior Street streetcar line was extended to 22nd Avenue East. Duluth’s business elite soon
followed and in the next twenty years built the large and elegant homes that would later be known as Duluth’s
“Mansion District” which is encompasses the 24-block area between 21st Ave E and 28th Ave. E and between
Superior Street and Third Street. Developers lured the newly affluent to this area by offering free land or
building materials. Ashtabula Heights, once the height of fashion, was slowly losing status as a stylish
neighborhood and seemed destined to accommodate the working class. By 1910, the population of the Twin
Ports was near 120,000 and by 1920, Ashtabula Heights was no longer focus of luxurious living. Many of the
stately mansions were raised or were subdivided into rooming houses for the working class.9
Pastoret Terrace was significantly altered as the use of the building transitioned from upscale townhomes to
more modest apartment dwellings. The most significant change to the exterior of the building occurred c. 1924
when an addition was added to the front of the East First Street elevation. The addition was designed to
accommodate commercial shops, a restaurant, and a tavern. The renovation plans, as stated in “Pastoret
Terrace, built in the eighties, as it will appear when remodeled,” Duluth Herald 7 April 1924:
“the entire front wall of the building is being removed and the entire building is to be held up
with steel beams and supports while a row of stores fronting 1st St. will extend back under the
building.”
The addition obstructs, and according to City of Duluth building permits, raised a portion of the front façade
including the original covered porches and entrances to the First Street apartments. A permit dated 3/12/1924
confirms the transformation from a 6-unit town house to a multi-dwelling apartment building with retail space
in the basement part of the building. The permit application requests that the retail store in the basement part
of building would be extended to property line on 1st street and for a portion of 2nd avenue east. A new
basement entrance with part of front part of present building present basement would be used for retail
purposes and proper stairs would be constructed from living apartments down to sidewalk.
The c. 1924 plans feature an elaborate Moorish style; however, the stylistic components of the street level
elevation were not fully realized.10 It was at this time that the prominent architectural features including the
pediments, balustrade, dome and finial were likely removed. The stone masonry foundation along first street is
likely compromised or possibly fully removed to accommodate the retail space.
A review of the Duluth City Directory 1935-2009 serves to further confirm the transition from the original 6-unit
townhome to a multi-use apartment and commercial structure: In 1935 a single resident was listed at 129 E. 1st
Street; Ignace G. Kozairek. At this date, the building is recognized as the Kennelworth Apartments. By 1940, the
same reference is made to both Ignace Kozairek and Kennelworth Apartments along with the names of twenty-
two residents. Commercial listings now appear: Security Roofing and Siding Company, and Jack A. Wallin Co.
Plumbers and Carlson Motors & Used Cars. The first reference to Kozy Bar is made in 1960, prior to that date,
Koziarek Tavern is listed. At this time, 27 tenants are named. The residential density continued to increase and
9 “Ashtabula Heights,” http://zenithcity.com/archive/duluth-history/ashtabula-heights/ 10 “Pastoret Terrace, Built in Eighties, As it will Appear when Remodeled,” Duluth Herald 17 April 1924.

Pastoret Terrace Page 13 of 37
by 1960, the building included forty apartments; many tenants shared bathrooms. The once fashionable
neighborhood gradually morphed into one of Duluth’s most marginalized neighborhoods. Now predominantly
known as the Kozy, the building earned a notorious reputation for hosting many former Bowery residents and
received and overwhelming number of police calls were received in responses to incidents at the Kozy. By 2005,
the Kozy had fifty apartments mostly occupied by tenants suffering from alcoholism, drug abuse, and mental
illness.11
Image: Duluth Public Library, Clipping File: Duluth Buildings. Duluth Herald 4/2/1924
The prominent feature of the original building, the dome with a large finial positioned atop the
corner tower no longer remains. Other alterations include removal the cornice, wrought iron
balustrades, pediments, as well as the porch entrances and stairs. All of which were likely
removed c. 1924.
11 Passi, Peter, “Neglected Kozy an ‘attractive nuisance’”, Duluth News Tribune 24 April 2019.

Pastoret Terrace Page 14 of 37
Current Use
On November 15, 2010 a fire was started in unit 32 and the Kozy was significantly damaged by smoke and fire.
All thirty residents were displaced and three days later the city condemned the structure for human habitation.
The owner at that time, Eric Ringsred, along with his development partner, former Duluth Planning and
Development Director Mike Conlan, proposed to revive the adjacent Kozy bar and convert the Paul Robeson
Ballroom into a clinic or other neighborhood support service facility. Then Mayor Don Ness had a different
vison for the burned buildings. He was noted to support the conversion of the building into market rate “work
force” apartment building. Ringsred and Conlan disagreed and claimed this approach would not be
economically viable. The majority of City Counselors disagreed and claimed there was too much low-income
property in area, and thus did not support the proposed reuse of the building.12 The building, caught up in
disputes between Ringsred, Conlan, and the city, remained virtually untouched after the fire.
Since the time of the fire, Duluth Police have responded to numerous calls involving trespassing and vandalism
of the building. The boarded-up Pastoret Terrace Building, formerly home to the Kozy Bar, continues to serve as
a beacon for troublemakers, according to testimony by Duluth Police Chief Mike Tusken gave during the trial
which would decide whether the structure and the adjoining Paul Robeson Ballroom should be torn down. By
2016, local police have been called to the property at 125-129 E. First St. 37 times and at least eight of those
calls stemmed from reports that people had broken into the buildings, which continue to attract squatters,
Tusken said.13
The LHB report (2106) documented the physical condition of the building and also served to explore and assess the potential for reuse of the building. LHB concluded the building, based on their condition assessment, could be rehabilitated as the structural integrity was intact. While the exterior masonry was found to be sound, repairs to the exposed parapet, replacement of the roof, tuckpointing and window replacement would be necessary. The interior would require significant rehabilitation and replacement of electrical and mechanical systems. LHB analyzed and compared the potential of rehabilitation and the cost of demolition. Their final recommendation was that the Duluth and/or St. Louis County work with landowners of adjacent vacant parcels in order to develop a large-scale project which would include the rehabilitation of Pastoret Terrace. After the fire the building continued to deteriorate and ultimately was forfeited to the State of Minnesota for payment of St. Louis County property tax. On June 22, 2016, under Resolution 16D-25 RESOLUTION CONDITIONALLY AUTHORIZING ACUQISITION OF PASTORET TRRACE PREOPRTY FROM ST. LOUIS COUNTY FOR $75,000.00 the city of Duluth, under the authority of the Duluth Economic Development Authority (“DEDA”) acquired the tax forfeited property from the State of Minnesota. The purpose was to authorize DEDA to acquire the Pastoret Terrace property thereby eliminating the blight it caused on the East First Street neighborhood, by redeveloping the property in a manner which will result in a project that would be economically viable, would support the redevelopment of the neighborhood, and return it to the tax rolls. Approval of the resolution allowed DEDA to actively seek a developer for the property.14 On November 3, 2016 DEDA issued a Request for Proposals (“RFP”) soliciting proposals for the redevelopment of the property, which included alternatives of historic reuse of the existing structure as well as redevelopment of the Pastoret Terrace and possibly the adjacent Paul Robeson Ballroom. Proposals were to demonstrate sound economic viability and development that would fulfill the redevelopment objectives which included redevelopment of the property including new jobs, new tax base, and a development that would enhance the
12 Passi, Peter, “Ness Changes Stance of Kozy Redevelopment,” Duluth News Tribune 29 May 2013. 13 Passi, Peter, “Neglected Kozy an ‘attractive nuisance’,” Duluth News Tribune 24 April 2019. 14 City of Duluth, Duluth Economic Development Authority, Resolution Conditionally Authorizing Acquisition of Pastoret Terrace Property From St. Louis County for $75,000.00, 22 June 2016.

Pastoret Terrace Page 15 of 37
economic vitality of the HARTS District and serve as a catalyst to further development in the district. Restoration of the existing building was a desirable factor but the economic viability of the project and the benefits to the HARTS District were the paramount goals. The three proposals which were received included: OCH Bookstore, LLC, Pastoret LLC, and Torlakson, Inc. Each of the proposals were considered by a panel consisting of DEDA commissioners and staff, a City Counselor, and members of the Duluth business community. DEDA Board of Commissioners determined none of the proposals were suitable or viable. DEDA was then directed to seek additional proposals for the redevelopment of the property. The previous responders to the original RFP were invited to revise or submit new proposals that better met the redevelopment objectives. The purpose of the resolution was for DEDA to not only reject the proposals but to seek new proposals from existing proposers or from other entities interested in developing the property.15 On November 3, 2016, under Resolution 17D-07 RESOLUTOIN DIRECTING STAFF TO RENEW MAKREKTING EFFORTS RELATED TO THE PASTORET TERRACE PREOPRTY IN LINE WITH DEDA’S NOVEMBER 3, 2016 RFP AND REJCTING PROPOSALS PRVIOUSLY RECEIVED, DEDA formally rejected the initial proposals and sought new proposals for the redevelopment of the property. DEDA pursued additional proposals for the redevelopment of the building. A lack of adequate and viable proposals to redevelop the property caused DEDA to otherwise address the blighted condition of the property by considering the removal of such blight by demolition of the property. DEDA commissioned Wenck Associated to prepare an Environmental Assessment Worksheet (EAW) to assess the impacts of demolition. On June 27, 2019, under Resolution 18D-25 RESOLUTION APPROVING EAW FOR PASTORET TERRACE AND ROBISON BUILDINGS, DEDA approved the EAW for the potential demolition of the Pastoret Terrace building. Subsequently, Judge Eric Hylden ruled in favor of the DEDA proposal to demolish the Paul Robeson Ballroom and Pastoret Terrace buildings. A group of local preservationists named Respect Starts Here, along with Eric Ringsred, appealed this ruling in attempt to save the building from demolition. On January 22, 2020, Judge Hylden, granted a stay of demolition pending the appeal of his earlier ruling in favor of the DEDA plan to demolish the fire ravaged structures. An appeal bond of $50,000.00 is required of the plaintiffs.16 In 2017 it was included on the list of the Duluth Preservation Alliance Ten Most Endangered Properties.17
15 City of Duluth, Duluth Economic Development Authority, Resolution Approving EAW for Pastoret Terrace and Robison Building, Resolution 18D-25, 27 June 2018. 16 Passi, Peter, “Kozy defenders must pay for stay’” Duluth News Tribune 24 January 2020 A3. 17 “Duluth’s Ten Most Endangered Properties,” (A Perfect Day Duluth 14 March 2017, www.perfectdayduluth.com).

Pastoret Terrace Page 16 of 37
Image: Clint Austin / [email protected], April24, 2019
Architect - Oliver G. Traphagen
Oliver G. Traphagen was born in Tarrytown, NY in 1854. When he was a young child, his family moved to Sparta,
Wisconsin and later to St. Paul, Minnesota. He began his career as a carpenter and evolved into an architect
under the guidance of the prominent St. Paul architect, George Wirth. Traphagen and Wirth moved to Duluth
and formed a partnership during the years 1884-1886. In 1886 Wirth returned to his native Germany while
Traphagen continued his architecture practice in Duluth between 1887-1890. During this period thirty-seven of
Traphagen’s designs were constructed in Duluth.
During the significant growth period in the late 1800’s and early 1900’s, Duluth became home to many skilled
craftsmen and architects. At this time, Traphagen and Francis Fitzpatrick, another renowned architect, formed a
partnership which lasted from 1890 to 1896. Together they designed twenty-seven of Duluth’s most important
buildings leading them to be recognized as “Duluth’s representative architects”.18 “Beyond the ordinary, they
designed buildings of unusual vigor and distinctive power and directness”.19 Fitzpatrick left Duluth in 1896 and
Traphagen again continued his practice for two years before leaving for Hawaii for the benefit of his daughter’s
health.
18 Hampton, Rosemary, “Duluth Has Some of the Most Spectacular Buildings in the Midwest,” Hillsider September 2001 (article located in Duluth Public Library clipping files: Building Files). 19 Scott, James, Traphagen & Fitzpatrick: Representative Architects of Duluth. (University of Minnesota, Duluth Minnesota, 1967).
Pastoret Terrace Page 17 of 37
Traphagen practiced in Hawaii for nine years from 1897-1906. Traphagen established himself quickly in Hawaii
and soon after proved to be an important architect. “No other architect of that turbulent period had the impact
on Honolulu as the considerably talented import from Duluth”20 It was said that in the five brief years he was
there, he transformed Hawaii; “Downtown Honolulu was to become further dominated by Traphagen buildings”
He is likely best known in Hawaii for the elaborate design of the Moana Hotel. The first large hotel on Waikiki
Beach, the Moana opened its doors on March 1, 1901 and is said to be “the costliest and most elaborate hotel
building in the Hawaiian Islands”. It was the first large hotel on Waikiki Beach. The five-story hotel included a
roof garden which appears to be the first of its kind in Hawaii.21 Its modern style boasted a telephone and
bathroom in each room. His designs adapted to the Hawaiian climate which vastly different from Duluth,
Minnesota; he effectively translated the Beaux Arts style into wood. During his time there, he designed
approximately 32 buildings, however, most examples of his work are no longer standing.
After his brief period in Hawaii, he moved to San Francisco where he is known to have designed one building.
The bulk of Traphagen’s extant work remains in Duluth in the fashionable east hillside or “mansion district”
among other stately homes designed by Boston, New York, or Chicago architectural firms or by other prominent
Duluth architects; I. Vernon Hill, W. T. Bray, William A. Hunt, Carl Nystrom, Frederick German, and Fredrick
Perkins. While he is best known for his Romanesque Revival style which was prominent on the East Coast and
the Midwest, his designs do not reflect a purist esthetic or strict dedication to an architectural style.
“Traphagen and Fitzpatrick used the Romanesque fashion with such imaginative brilliance that their impact on
Duluth’s architectural figure has lasted well into the mid-twentieth century”.22
Traphagen buildings:23
Buildings by George Wirth and/or Oliver Traphagen 1882-1884
Metropolitan Block 113-119 W. Superior St. 1882
Hotel St. Louis 330 W. Superior St. 1882
Grand Opera House NE Corner 4th Ave W. and Superior St. 1883
Post Office 4th Ave. W. & Superior St. (get address) 1883
Fargussen Bldg. 406-408 W. Superior St. 1883
Portland School 2nd – 3rd St., 9th-10th Ave. 1883
Bell & Eyster Blk 3 W. Superior St. 1883
Haug Bros. Bldg. 15 W. Superior St. 1883
St. Louis County Courthouse 611 E. 2nd 1883
German-American Blk. 209-211 W. Superior St. 1883
St. Luke’s Hospital 323 2nd Ave. E 1884
George & Jessica Spencer
Residence 1003 London Road 1884
Silberstein & Bondi 9-11 W. Superior St. 1884
Miles Bldg. 19 W. Superior St. 1884
Merchants Hotel 202-204 W. Superior St. 1884
20 Mason, Glen E., “Oliver G. Traphagen, FAIA, 1897-1907 In Hawaii,” A.I.A. (article located in the Duluth Public Library clipping files: Biography – Traphagen, Oliver). 21 Ibid. 22 Scott, James, Traphagen & Fitzpatrick “Representative Architects of Duluth”, University of Minnesota, Duluth, MN, 1967 23Buildings by George Wirth, Oliver Traphagen, and Francis Fitzpatrick. Compiled by Maryanne Norton, November 2011. (summary located in Duluth Public Library clipping files: Building Files – Oliver Traphagen).
Pastoret Terrace Page 18 of 37
Williamson Block 125-127 W. Superior St. 1884
Miller Block SE corner Lake Ave. Superior St. 1884
Albert & Stella Seip
Residence 28 W.3rd St. 1884
Costello Block 24 E. Superior St. 1884
George Wirth and Oliver Traphagen 1885-1886
Board of Trade Bldg. 300 W. Superior St. 1885
William and Amelia
Sherwood Res. 1125 E. Superior St. 1885
Fargusson Bldg (2) 402-404 W. Superior 1886
Wirth Building 13. W. Superior St. 1886
Oliver Traphagen, 1886-1890
Oneota School 4420 W. 1st St. 1886
Exchange Building 230 W. Superior St. 1886
Melvin & Ida Forbes
Residence 530 2nd St. 1886
Charles & Edna Arthur
Residence 230 E. 4th St. 1886
Hotel St. Louis addn. 318-324 W. Superior St. 1886
Henry & Alameda Bell
Residence 600 E. 2nd St. 1887
O’Brien & Knowlton Blk 126-132 W. Michigan St. 1887
Buckingham Terrace 18-30 W. 3rd St. 1887
Salter Terrace 301-307 E. 3rd St. 1887
Pastoret Terrace 129-131 E. 1st St. 1887
William & Alice Billson
Residence 1531 E. 1st St. 1887
Duluth National Bank 229-233 W. Superior St. 1887
James & Persis Norton
Residence 1131 E. Superior St. 1887
Odd Fellows Hall 20 N. Lake Ave. 1888
Archibald & Annie McLean
Residence 3 E. 4th St. 1888
Manufacturers Bank 302-304 Central Ave 1888
Traphagen Bldg. 301-303 Central Ave 1888
William & Sarah McGonagle
Residence 129 N. 12th Ave E. 1888
Wells-Stone
Warehouse 239-245 S. 5th Ave. W. 1888
Oppel Block 115-117 E. Superior St. 1888
Pastoret-Stenson 29-33 E. Superior St. 1888
Wieland Block 26 E. Superior St. 1889
Duluth Coffee & Spice 1701-1703 W. Michigan St. 1889
Matthew & Lucy Harrison
Residence 2605 Greysolon Rd. 1889

Pastoret Terrace Page 19 of 37
Marshall-Wells
Warehouse 247-253 S. 5th Ave. W. 1889
St. Louis County Jail 614 E. 3rd St. 1889
Engine House #1 101 E. 3rd St. 1889
Charles & Emilie Hoyt
Residence 1119 E. 1st St. 1889
Johnson Block 323 W. Superior St. 1889
Berkelman Bldg. 119 E. Superior St. 1889
George & Mary Howe
Residence 1421 E. Superior St. 1889
Guilford & Caroline Hartley
Residence 1305 E. Superior St. 1889
W. Duluth Village Hall 531 N. Central 1889
August & Clara Fitger
Residence 629 E 1st. St 1895
Duluth City Jail 126 E. Superior St. 1890
Oliver Traphagen & Francis Fitzpatrick, 1890-1896
Phoenix Building 333 W. Superior St. 1890
Fitger Brewery
Boiler House 600 E. Superior St. 1890
Philadelphia Terrace 1412-1420 E. Superior St. 1890
A.W. Wieland Store 123 W. Superior St. 1890
Hoppmann Building 421 W. Superior St. 1890
Chester Terrace 1212-1228 E. 1st St. 1890
Clinton & Kate Marshall
Residence 325 E. 2nd St. 1890
Alonzo & Julia Whiteman
Residence 2732 London Road 1890
Lester Park Hotel 60th and London Road 1890
Costello Blk (2) 22 E. Superior St. 1891
Lyceum Theater 423-431 W. Superior St. 1891
James Norton rental 1120 E. 1st St. 1891
James Norton rental 1124 E. 1st St. 1891
First Presbyterian 300 E. 2nd St. 1891
Alexander Miles rental 301 W. 4th St. 1891
303 W. 4th St. 1891
305 W. 4th St. 1891
307 W 4th St. 1891
309 W.4th St. 1891
311 W. 4th St. 1891
Residence 1001 E. Superior St. 1891
Incline Pavilion 5th Ave W. & Skyline Pkwy. 1891
Henry & Lizzie Blume
Residence 1419 E. 2nd St. 1891
Duluth Shoe Co. Foot of 6th Ave. W. on slip #1 1891
Selleck Block 631 W. Michigan St. 1891

Pastoret Terrace Page 20 of 37
Charlotte Wells Store 913 – 195 W. Michigan St. 1891
The Hardy School 200 Woodland Ave. 1891
Myron & Mary Bunnell
Residence 1306 E. Superior St. 1892
William & Josephine Magie
Residence 1401 E. Superior St. 1892
Oliver & Amelia Traphagen
Residence 1511 E. Superior St. 1892
Torrey Building 314-316 W. Superior St. 1892
Boyle & Brothers Saloon
Restaurant 319 W. Superior St. 1892
Duluth Street Railway Co. Barn & Repair
Shop 2601-2619 W. Superior St. 1892
Munger Terrace 405 Mesaba Ave. 1892
Townsend & Mayme Hoopes
Residence 2206 Woodland Ave. 1892
Charles & Maude Towne
Residence 2334 Woodland Avenue 1892
Duluth Driving Park N. Side Woodland/Wabasha & Winona 1892
Hamilton & Martha Peyton
Residence 1329 E. Superior St. 1893
The Herald Building 220 W. Superior St. 1893
Mesaba Block 407-409 W. Superior St. 1893
Charles & Louise Schiller
Residence 1420 E. 2nd St. 1893
Stone-Ordean
Warehouse 203-211 S. 5th Ave. W. 1893
St. Louis Hotel 318-324 W. Superior St. 1893
Sagar Drug 225-227 S. 5th Ave. W. 1893
George & Jessica Spencer
Residence 302 16th Ave. E. 1893
Elmer & Lizzie Matter
Residence 314 E. 2nd St. 1894
Crane Ordway Co. 8-10 E. Michigan St. 1894
Board of Trade Building 301 W. 1st St. 1895
Fitger Settling Room 600 E. Superior St. 1896
Superior, Wisconsin buildings (add as appendix B)
Twohy Mercantile 1515 N. 1st St. 1895
St. Paul, Minnesota buildings
P R L Hardenbergh & Company
Building 235-239 E. 8th St. before 1895
Traphagen buildings in Hawaii, 1898-1907
Haleiwa Hotel North Shore, Oahu 1898
C B Reynolds House 1040 Green Street 1898
Pastoret Terrace Page 21 of 37
Green Street 1898
McChesney & Sons
Building 42 Queen Street 1899
Judd Bldg. Corner Fort & Merchants St. 1899
Elite Building Fort Street 1899
Boston Block Fort, near Queen 1899
Sprekels Block/First Bank,
Hilo 30 Kalakaua St., Hilo 1899
Palama Fire House North King Street 1900
McIntyre Bldg. corner King & Fort St. 1900
Kaka’ako Pumping
Station 500 Ala Moana Drive 1900
Moana Hotel 2365 Kalakaua 1901
Mendonca Bldg. Smith & Maumakea 1901
Collins Harness Maker 82-84 S. King St. 1901
George & Helen Carter
Residence corner Liliha & Judd Street 1901
E. O. Hall & Sons
Building corner King & Fort Street 1902
Waity Building 74 S. King St. 1902
Lewers & Cooke
Building King St. between Fort & Alakea 1902
August Drier
Residence Beretania St. 1902
Hackford Building 745 Fort St. 1902
Queen’s Hospital Wing & Physicians
Cottage Ala Moana St. 1903
O’Neil Building corner Fort & King St. 1903
Odd Fellows Hall Fort St. near King 1903
Cooper_Cartwright
Building corner Fort & King 1903
McLean Building Nuuana St. 1904
Immigration Station Ala Moana 1905
Electric Light Plant Nuuana Valley 1905
Crematorium Nuuana Cemetery 1905
Hilo Jail Puahela St., Hilo 1905
State Archives
Building State Capitol Grounds 1906
Punahou President’s
Residence 1601 Punahou 1907
James & Mable Castle
Residence 2933 Kalakaua St. unknown
Oahu Prison 1904

Pastoret Terrace Page 22 of 37
MINNESOTA HISTORIC PROPERTY RECORD
INDEX TO PHOTOGRAPHS
Pastoret Terrace MHPR SL-DUL-0110
127-129 E. 1st Street
Duluth
St. Louis County
Minnesota
Medium format photographs by Jeff Frey, Jeff Frey Photography, September 2019.
SL-DUL-0110-01 Elevation view of façade of Pastoret Terrace building.
Camera facing northwest
SL-DUL-0110-02 Oblique view of Pastoret Terrace building
Camera facing southeast
SL-DUL-0110-03 Elevation view of Pastoret Terrace building, north section of façade
Camera facing southwest
SL-DUL-0110-04 Elevation view of Pastoret Terrace building, east section of façade
Camera facing southwest
SL-DUL-0110-05 Oblique view of Pastoret Terrace building
Camera facing south
SL-DUL-0110-06 Elevation view of Pastoret terrace, center section of facade
Camera facing northeast
SL-DUL-0110-07 Elevation view of Pastoret Terrace, interior corner
Camera facing east
SL-DUL-0110-08 Elevation view of Pastoret Terrace building
Camera facing northeast
Pastoret Terrace Page 23 of 37
SL-DUL-0110-09 Oblique view showing neighborhood context depicting Pastoret Terrace
2nd Ave. E. elevation
Camera facing northwest
SL-DUL-0110-010 Oblique view showing neighborhood context depicting Pastoret Terrace
E. 1st Street elevation
Camera facing southwest
SL-DUL-0110-011 Oblique view showing neighborhood context
Intersection of E. 1st Street and 2nd Ave E.
Camera facing northeast

Pastoret Terrace Page 24 of 37
MINNESOTA HISTORIC PROPERTY RECORD
SEE INDEX TO PHOTOGRAPHS FOR CAPTION
SL-DUL-0110-01
Pastoret Terrace Page 25 of 37
MINNESOTA HISTORIC PROPERTY RECORD
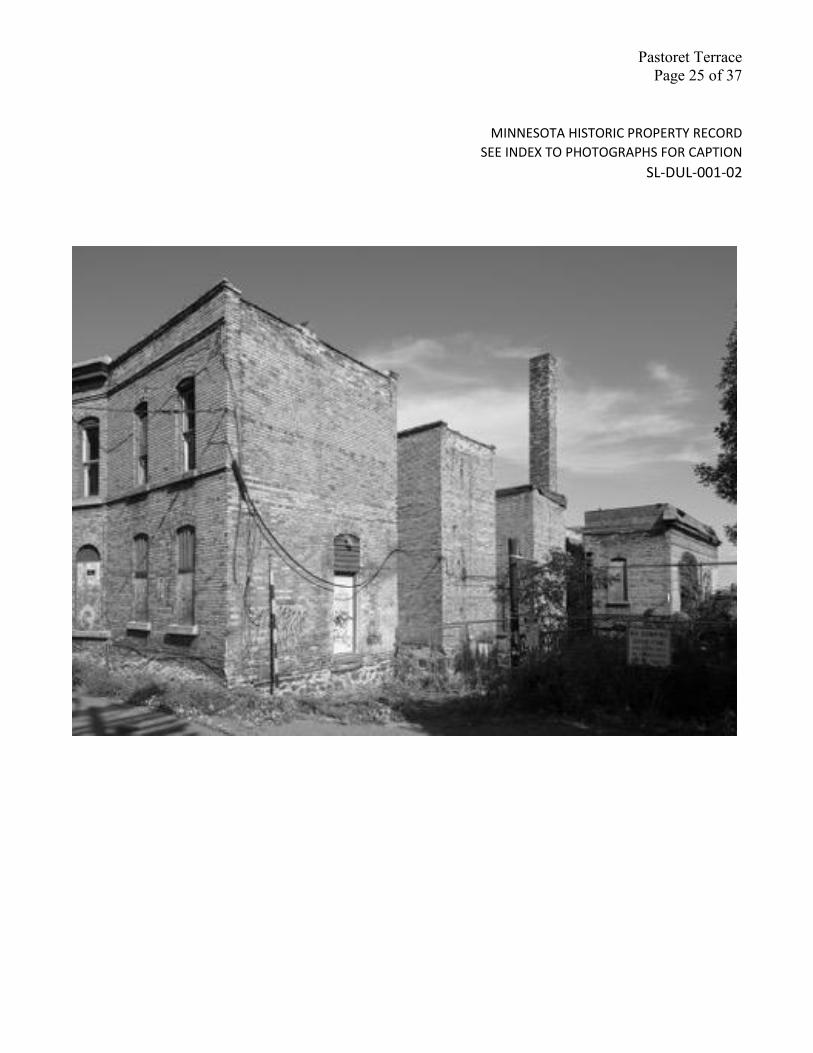
SEE INDEX TO PHOTOGRAPHS FOR CAPTION
SL-DUL-001-02

Pastoret Terrace Page 26 of 37
MINNESOTA HISTORIC PROPERTY RECORD
SEE INDEX TO PHOTOGRAPHS FOR CAPTION
SL-DUL-001-03
Pastoret Terrace Page 27 of 37
MINNESOTA HISTORIC PROPERTY RECORD
SEE INDEX TO PHOTOGRAPHS FOR CAPTION
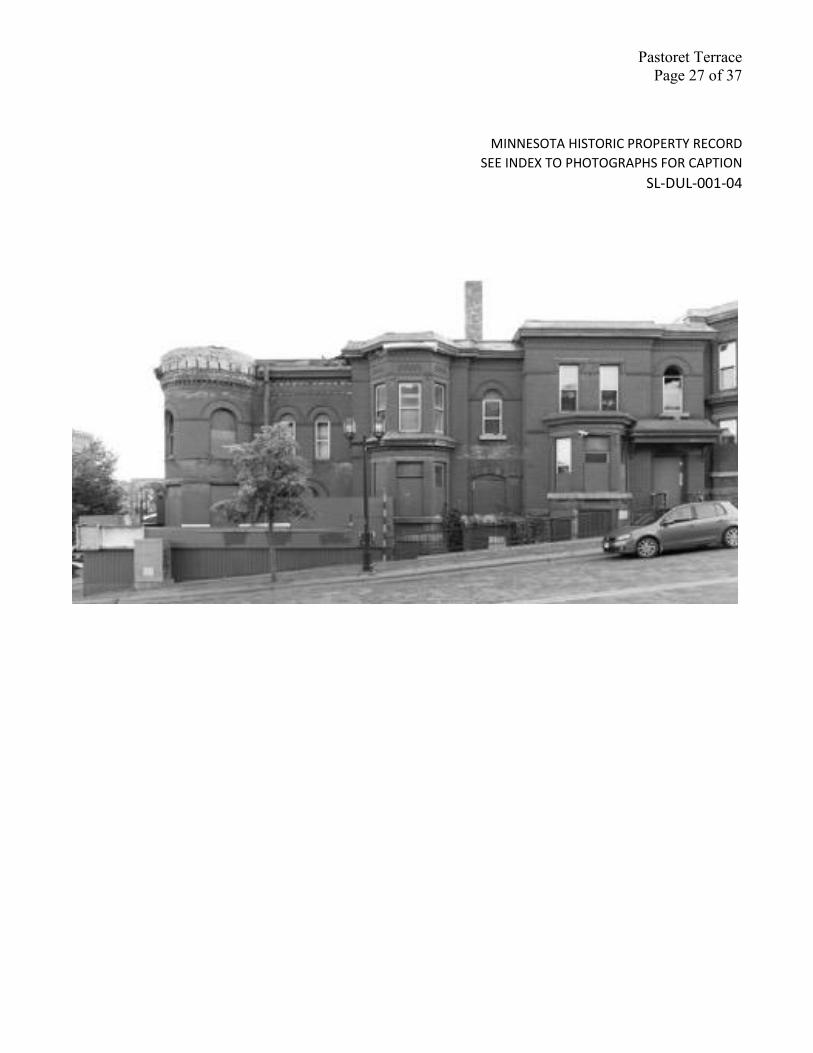
SL-DUL-001-04

Pastoret Terrace Page 28 of 37
MINNESOTA HISTORIC PROPERTY RECORD
SEE INDEX TO PHOTOGRAPHS FOR CAPTION
SL-DUL-001-05

Pastoret Terrace Page 29 of 37
MINNESOTA HISTORIC PROPERTY RECORD
SEE INDEX TO PHOTOGRAPHS FOR CAPTION
SL-DUL-001-06

Pastoret Terrace Page 30 of 37
MINNESOTA HISTORIC PROPERTY RECORD
SEE INDEX TO PHOTOGRAPHS FOR CAPTION
SL-DUL-001-07
Pastoret Terrace Page 31 of 37
MINNESOTA HISTORIC PROPERTY RECORD
SEE INDEX TO PHOTOGRAPHS FOR CAPTION
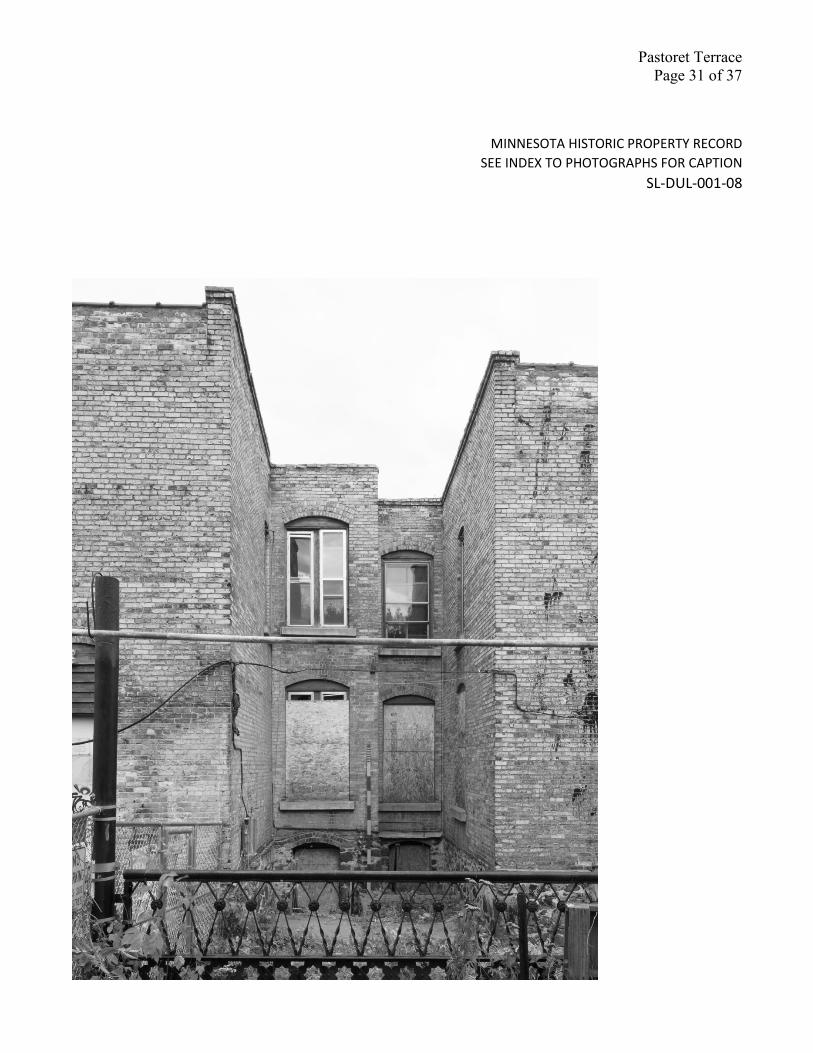
SL-DUL-001-08

Pastoret Terrace Page 32 of 37
MINNESOTA HISTORIC PROPERTY RECORD
SEE INDEX TO PHOTOGRAPHS FOR CAPTION
SL-DUL-001-09

Pastoret Terrace Page 33 of 37
MINNESOTA HISTORIC PROPERTY RECORD
SEE INDEX TO PHOTOGRAPHS FOR CAPTION
SL-DUL-001-10

Pastoret Terrace Page 34 of 37
MINNESOTA HISTORIC PROPERTY RECORD
SEE INDEX TO PHOTOGRAPHS FOR CAPTION
SL-DUL-001-11

Pastoret Terrace Page 35 of 37
Bibliography
Aguar Jyring Whitman Moser, Inc. Report to the City of Duluth on Historical and Architecturally Significant Structures. Prepared by the Duluth Architects’ Committee on Urban Design, December 1970.
“Ashtabula Heights.” http://zenithcity.com/archive/duluth-history/ashtabula-heights/
Buildings by George Wirth, Oliver Traphagen, and Francis Fitzpatrick. Compiled by Maryanne Norton, November 2011. (located in Duluth Public Library clipping files: Building Files – Traphagen, Oliver). “Duluth’s Ten Most Endangered Properties.” A Perfect Day Duluth, 14 March, 2017 www.perfectdayduluth.com. Eubank, Nancy. The Zenith City of the Unsalted Sea: Duluth Historic Context Study. Duluth Heritage
Preservation Commission, August 1991.
C. B. Frank’s Atlas of the City of Duluth, Minnesota, Complete in One Volume by C.B. Frank, County
Surveyor, Duluth. Duluth: G.W. Baist, Map Publisher, 906 Walnut Street, Philadelphia, Penn., 1902.
“Resolution Conditionally Authorizing Acquisition of Pastoret Terrace Property from St. Louis County for
$75,000.00. Resolution 16D-25, 22 June 2016.” City of Duluth, Duluth Economic Development Authority.
“Resolution Directing Staff to Renew Marketing Efforts Related to the Pastoret Terrace Property in line
with DEDA’S November 3, 2016 RFP and Rejecting Proposals Previously Received Resolution 17D-07, 1 March
2017. City of Duluth, Duluth Economic Development Authority.
“Resolution Approving EAW for Pastoret Terrace and Robison Buildings, Resolution 18D-25, 27 June 2018. City
of Duluth, Duluth Economic Development Authority.
Dierckins, Tony and Maryanne C. Norton. Lost Duluth, Landmarks, Industries, Buildings and Homes and
The Neighborhoods in Which They Stood. Duluth, MN: Zenith City Press, 2012.
Farnam, Joan. “Preservationists Compile Book about Traphagen.” Budgeteer News 20 June 1999.
“Haleiwa Hotel Demolished 1952.” North Shore News 21 January 21 1985. (article found in Duluth
Public Library clipping files: Biography, Traphagen, Oliver).
Hammer, Zack. “Rising from the Ashes: Occupy Duluth Winters in the Kozy.” The UMD Statesman 23
February 2012.
Hampton, Rosemary E. “Duluth Has Some of the Most Spectacular Buildings in the Midwest.” Hillsider
September 2011.
Hibbard, Dan and David Franzen. “The View From Diamond Head, Royal Residence to Urban Resort.”
(article found in Duluth Public Library clipping files: Biography, Traphagen, Oliver).
Huddelson, Richard and Carl Ross. By the Ore Docks: A Working Peoples History of Duluth.
Minneapolis: U of Minnesota Press, 2006.

Pastoret Terrace Page 36 of 37
Kellner, Debra. Intensive Survey of Historic Resources in Duluth’s East End Neighborhood: Part II. Duluth
Heritage Preservation Commission, 2008-2009.
Kellner, Debra K, Tony Kroska, and Karen Plass. Historic Reconstruction of Property Ownership and Land Uses along the Lower St. Louis River. Citizens Action Committee St. Louis River, October 1999 Second Printing January 2000.
Koop, Michael and Chris Morris. Duluth Historic Commercial District. National Register of Historic Places
Multiple Property Documentation Form. Minnesota Historical Society, 2006.
Lundgren, Paul. “Paul Robeson in Duluth, 30 January 2014.”
https://www.perfectduluthay.com/2014/01/30/paulrobeson- in-duluth/
Lundy, John. “Before it was the Kozy it was the Lap of Luxury.” Duluth News Tribune 21 November 2010.
Lundy, John. “Kozy Owner: Why the Delay?” Duluth News Tribune 30 December 2010.
Martin, Rachel. “The Kozy was Once a Place of Elegance.” The Senior Reporter June 2006.
Mason, Glen E. “Oliver G. Traphagen, FAIA, 1897-1907 In Hawaii.” AIA (article located in Duluth Public
Library clipping files: Biography – Traphagen, Oliver)
Oliver G Traphagen Walking and Driving Tour. Preserve Minnesota Duluth 16 September 2005
(included in Duluth Public Library clipping files: Duluth Buildings)
Passi, Peter. “Developer, Mayor Disagree on Path Ahead for Kozy Building.” Duluth News Tribune 26
May 2013.
Passi, Peter, “Kozy defenders must pay for stay.’” Duluth News Tribune 24 January 2020 A3.
Passi, Peter. “Neglected Kozy an ‘attractive nuisance’.” Duluth News Tribune 24 April 2019.
Passi, Peter. “Ness Changes Stance of Kozy Redevelopment.” Duluth News Tribune 29 May 2013.
Pastoret Terrace Assessment: Terrace, Kozy Bar, Ballroom. Prepared by: LHB, Inc., 21 W. Superior St.,
Suite 500, Duluth, MN 55802. LHB Project Number 160202, 17 June 2016.
“Pastoret Terrace, Built in Eighties, As it will Appear when Remodeled.” Duluth Herald 17 April 1924.
“Our View, Kozy Countdown, Pastoret Terrace Timeline.” Duluth News Tribune 9 June 2013.
(found in Duluth Public Library clipping files: Biography, Traphagen, Oliver)
Sanborn Fire Insurance Map. 1906
Scott, James. Traphagen & Fitzpatrick “Representative Architects of Duluth. University of Minnesota,
Duluth, Minnesota, 1967

Pastoret Terrace Page 37 of 37
Sommer, Lawrence. Duluth Historic Resources Survey, St. Louis County Historical Society, September
1984.
“The Terrace is one of the Best-Known Pieces of Property in the City.” Duluth News Tribune 13 September 1903.

KITCHI GAMMI PARK TRAIL PHASE I ARCHAEOLOGICAL RECONNAISSANCE SURVEY
ST. LOUIS COUNTY, MINNESOTA
State Project Number (SP): 118-090-024 Federal Project Number: STPF-TA 3920(085)
Authorized and Sponsored by:
Minnesota Department of Transportation Cultural Resources Unit, Mail Stop 620
395 John Ireland Boulevard St. Paul, MN 55155-1800 Renee Barnes (Historian)
City of Duluth
411 West 1st Street Duluth, MN 55802
Patrick Loomis (Project Engineer)
Prepared by:
Merjent, Inc. 1 Main Street SE, Suite 300
Minneapolis, MN 55414 Mike Madson (Principal Investigator, OSA License No.19-050)
December 2019

Kitchi Gammi Park Trail Phase 1 Archaeological Reconnaissance Survey
Page 2
MANAGEMENT SUMMARY The City of Duluth plans to construct a new bike trail and a new vehicle access road through Kitchi
Gammi Park just northeast of the Lester River in Township 50 North, Range 13 West, Section 4, St. Louis
County, Minnesota. The project will comply with M.S. 138 (Field Archaeology Act) and M.S. 307.08
(Private Cemeteries Act) during all Project phases with the assistance of the Minnesota Department of
Transportation Cultural Resources Unit. In addition, the City of Duluth plans to utilize Federal Highway
Administration funds to complete the Trail portion of the Project which requires compliance with
Section 106 of the National Historic Preservation Act, as amended, and implementing regulations found
in 35 CFR 800.
The City of Duluth and the Minnesota Department of Transportation contracted with Merjent, Inc. to
perform a Phase 1 Archaeological Reconnaissance Survey within the project’s Area of Potential Effect,
which measures approximately 7.69 acres. Merjent archaeologist Michael Madson served as Principal
Investigator and performed the field work with Merjent archaeologists Kevin Mieras and Sigmund
Antecki between October 28 and 30, 2019. Merjent performed pedestrian survey within the Area of
Potential Effect and placed 44 shovel probes in areas deemed appropriate by the Principal Investigator
at intervals of no greater than 15 meters. Merjent identified no archaeological resources. The effort to
identify archaeological deposits in the Area of Potential Effect was appropriate to existing conditions.
Merjent recommends that archaeological sites eligible for inclusion on the National Register of Historic
Places are not likely to exist within the Area of Potential Effect and that no additional archaeological
survey is necessary.

Kitchi Gammi Park Trail Phase 1 Archaeological Reconnaissance Survey
Page 3
TABLE OF CONTENTS MANAGEMENT SUMMARY ........................................................................................................................... 2
Table .......................................................................................................................................................... 3
Figures ....................................................................................................................................................... 3
Photographs .............................................................................................................................................. 3
INTRODUCTION ............................................................................................................................................. 4
METHODOLOGY ............................................................................................................................................ 6
LITERATURE SEARCH ..................................................................................................................................... 6
General Land Office Map and Historic Aerial Photograph Review ........................................................... 7
The Lake Superior Shoreline and Project APE Soils ................................................................................ 10
Implications for Archaeological Potential ............................................................................................... 10
RESULTS ...................................................................................................................................................... 10
SUMMARY AND RECOMMENDATIONS ....................................................................................................... 20
REFERENCES CITED ...................................................................................................................................... 21
Table Table 1. Overview of Surveyed Areas by Station
Figures Figure 1. Kitchi Gammi Trail Project, Project Overview, St. Louis County, Minnesota
Figure 2. Kitchi Gammi Trail Project, General Land Office Map, St. Louis County, Minnesota
Figure 3. Kitchi Gammi Trail Project, 1939 Aerial, St. Louis County, Minnesota
Figure 4. Kitchi Gammi Trail Project, Project Area Mapbook, St. Louis County, Minnesota
Photographs Photograph 1. Manicured park area near Bike Trail Station 85+50 and Access Road Station 302+00, in the
vicinity of Shovel Probe B8. View to southwest.
Photograph 2. Wooded stand near Bike Trail Station 88+00 and Access Road Station 304+50, in the
vicinity of Shovel Probe B1. View to southwest.

Kitchi Gammi Park Trail Phase 1 Archaeological Reconnaissance Survey
Page 4
INTRODUCTION Merjent, Inc. (Merjent) was contracted by the City of Duluth (City) and the Minnesota Department of
Transportation (MnDOT) to perform a Phase 1 Archaeological Reconnaissance Survey for a new bike trail
and a new vehicle access road (Project) through Kitchi Gammi Park (Park) just northeast of the Lester
River in Township 50 North, Range 13 West, Section 4, St. Louis County, Minnesota (Figure 1). Currently,
the Duluth Lakewalk terminates at the western edge of the Park. Bikers are required to share the busy
Brighton Beach Road with vehicles through the length of the Park, to meet up with Congdon Blvd, and
then continue along the Congdon Blvd/North Shore Dr route to Two Harbors. This new Kitchi Gammi
Trail (Trail) will utilize portions of the existing Brighton Beach Road as well as portions of the (currently)
adjacent woods and manicured park grounds. The City also plans to remove Brighton Beach Road and to
construct a new access road with terminals at Congdon Blvd (Access Road).
The Project APE for the project was determined as follows. The Trail will measure approximately 4,635
feet/1412 meters long. Merjent assumed a corridor width of 50 feet/15.24 meters, which would
encompass an area of 5.36 acres. The Access Road will measure approximately 3,222 feet/982 meters
long. Again, Merjent assumed a corridor width of 50 feet/15.24 meters, which would encompass and
area of 3.74 acres. Approximately 1.41 acres exist in both the Trail and Access Road corridors; therefore,
the aggregate survey corridor is approximately 7.69 acres. This effectively represents the Project Area of
Potential Effect (Project APE).
Three regulatory conditions exist for the Project. Since the lands that may be utilized for the Project are
owned by the City of Duluth (City), the City must comply with M.S. 138 (Field Archaeology Act) and M.S.
307.08 (Private Cemeteries Act) during all Project phases with the assistance of the MnDOT Cultural
Resources Unit (CRU). In addition, the City plans to utilize Federal Highway Administration (FWHA) funds
to complete the Trail portion of the Project which requires compliance with Section 106 of the National
Historic Preservation Act, as amended, and implementing regulations found in 35 CFR 800.
Merjent archaeologist Michael Madson served as Principal Investigator and performed the field work
with Merjent archaeologists Kevin Mieras and Sigmund Antecki. Merjent applied industry best practices
and adhered to the Secretary of the Interior’s Standards and Guidelines for Archaeology and Historic
Preservation (48 Code of Federal Regulations [“CFR”] 44716), the SHPO Manual for Archaeological
Projects in Minnesota (Anfinson 2005), and OSA’s State Archaeologist’s Manual for Archaeological
Projects in Minnesota (Anfinson 2011). Merjent placed 44 shovel probes within the Project APE and
identified no archaeological resources.

T50R13
T51R13
MinnesotaSD
ND
WI
MI
Canada
0 1,000 2,000
Feet Figure 1Kitchi Gammi Trail Project
Project OverviewSt. Louis County, Minnesota
Date:
(12
/17
/20
19
)
Sour
ce: Z
:\C
lien
ts\M
_P
\MN
_D
OT
\Kitch
i_G
am
mi_
Pa
rk_
Tra
il\F
ield
_D
ata
\Cu
ltu
ral\M
ap
Do
cs\K
GP
T_
Fig
ure
1_
Ove
rvie
w.m
xd
4For Environmental Review Purposes Only
Access Road Corridor
Bike Trail Corridor
Township Boundary

Kitchi Gammi Park Trail Phase 1 Archaeological Reconnaissance Survey
Page 6
METHODOLOGY
The general objective of a Phase 1 archaeological reconnaissance is to identify archaeological resources
within the Project APE that are at least 45 years of age. Archaeological resource types considered for
this investigation included both pre‐contact and historic‐period archaeological sites and earthworks that
could provide information about human occupation. Such sites could be evident in artifacts or features
on or below current ground surfaces. The focus of this investigation was to understand what sites have
been identified in or near the Project APE (archival review), and if any unknown resources could be
positively identified within the Project APE (field reconnaissance). If an archaeological site were to be
identified in the Project APE during field reconnaissance, as much data would be collected to provide a
basic understanding of the site’s eligibility for inclusion on the National Register of Historic Places
(NRHP).
Merjent’s scope of work included two tasks: (1) archival review and (2) field reconnaissance. As noted
below, the archival review included review of records on file at the Minnesota State Historic
Preservation Office (SHPO) and the Minnesota Office of the State Archaeologist (OSA), which house
archaeological site forms, report files, and cultural resource reference materials for the State of
Minnesota.
Field reconnaissance generally consisted of standard Phase I methods as outlined by Anfinson (2005,
2011). Merjent archaeologists Michael Madson, Kevin Mieras, and Sigmund Antecki executed the field
reconnaissance between October 28 and 30, 2019. Archaeologists located the Project APE utilizing
Geographic Information System (GIS) data in conjunction with a Trimble Geo7X series Global Positioning
System (GPS) unit, supplemented with aerial photograph‐based paper maps.
Mr. Madson assessed ground surface visibility to determine the proper survey techniques. In those
areas where ground surface visibility was below 25% and where previous disturbance was not obvious,
Merjent archaeologists placed shovel probes where slopes were less than 20 percent. In such areas
shovel probes were placed at a maximum interval of 15 meters and were generally 30 to 40 centimeters
in diameter and reached depths of 60 centimeters. Soils recovered from shovel probes were screened
through ¼ inch hardware cloth mesh and returned.
Merjent archaeologists photographed areas within the Project APE and recorded ground surface and
subsurface conditions on standard field forms. Field forms, photograph logs, and all archival materials
are on file at Merjent’s office in Minneapolis, Minnesota.
LITERATURE SEARCH Merjent archaeologists conducted an archival review of the Project APE and the surrounding area within
a 1‐mile radius (literature search study area). The Project is within SHPO’s Archaeological Sub‐Region 9n
(Lake Superior North). Sub‐Region 9n is located along the Minnesota shore of Lake Superior running

Kitchi Gammi Park Trail Phase 1 Archaeological Reconnaissance Survey
Page 7
from Duluth to the United State/Canada border just north of Grand Portage. In addition, the Project APE
falls within the HIGH Layer of the Mn Model (Phase 3) Survey Implementation Model.
Mr. Madson conducted the literature search of OSA files on July 1 and December 17, 2019. Mr. Mieras
reviewed SHPO survey report files on July 29 and December 17, 2019. Mr. Madson and Mr. Mieras
reviewed additional archival resources, including 19th century maps and field notes, published by
General Land Office (GLO), and historic aerial photographs.
No previous archaeological survey reports within the literature search study area are on file at SHPO. No
previously identified archaeological sites or earthworks are within one mile of the Project APE. The
nearest terrestrial archaeological site, the Hartley Root Cellar (21SL1102), is 4.5 miles west of the
Project.
General Land Office Map and Historic Aerial Photograph Review
Merjent reviewed 19th‐century GLO maps and notes on file with the Bureau of Land Management (BLM
2019a). The GLO map of Township 50 North, Range 13 West, Section 4 illustrates two examples of a
structure and a clearing, one at each end of the Project APE (Figure 2). The GLO notes describe them
each as “a House and 2 acres [of] clearing,” which were established sometime before June 1857 (the
survey date indicated on the GLO map).
A review of the land patent on file with the BLM (BLM 2019b) for the northern structure and clearing
shows that just over 160 acres were granted to Warren Ford as Bounty Land for his role as a Private in
the Vermont Militia during the War of 1812. Mr. Ford held title to the acreage sometime between
March 3, 1855 (when Bounty Land grants were first made available) and October 5, 1860, when title was
sold to Henry Stowell. The land patent for southern structure and clearing shows that just over 116
acres were granted to Benjamin N. Harrison as Bounty Land for his role as a Private in the Illinois Militia
during the Black Hawk War. Mr. Harrison held title to the acreage sometime between March 3, 1855
and October 5, 1860, when title was sold to Daniel W. Case.
Merjent reviewed aerial photographs taken between 1939 and 1989, on file with the OSA. The 1939
aerial photograph shows the early layout of Kitchi Gammi Park, which was an extension of the nearby
Brighton Beach Tourist Camp (now the location of the Mid‐Continent Ecology Division Laboratory), both
of which were owned and operated by the City (Nelson and Dierckins 2017) (Figure 3). Kitchi Gammi
Park, first constructed in the 1920s, has been maintained ever since. The Park infrastructure, in
particular Brighton Beach Road, has been replaced repeatedly in response to Lake Superior shoreline
erosion, most often associated with storm events. However, the alignment of Brighton Beach Road and
the Park layout has not altered significantly since the 1920s.

T50R13
T51R13
MinnesotaSD
ND
WI
MI
Canada
0 500 1,000
Feet Figure 2Kitchi Gammi Trail Project
General Land Office MapSt. Louis County, Minnesota
Date:
(12
/17
/20
19
)
Sour
ce: Z
:\C
lien
ts\M
_P
\MN
_D
OT
\Kitch
i_G
am
mi_
Pa
rk_
Tra
il\F
ield
_D
ata
\Cu
ltu
ral\M
ap
Do
cs\K
GP
T_
Fig
ure
2_
GL
O.m
xd
4For Environmental Review Purposes Only
Access Road Corridor
Bike Trail Corridor
Township Boundary

MinnesotaSD
ND
WI
MI
Canada
0 200 400
Feet Figure 3Kitchi Gammi Trail Project
1939 AerialSt. Louis County, Minnesota
Date:
(12
/17
/20
19
)
Sour
ce: Z
:\C
lien
ts\M
_P
\MN
_D
OT
\Kitch
i_G
am
mi_
Pa
rk_
Tra
il\F
ield
_D
ata
\Cu
ltu
ral\M
ap
Do
cs\K
GP
T_
Fig
ure
3_
19
39
Ae
ria
l.m
xd
4For Environmental Review Purposes Only
Access Road Corridor
Bike Trail Corridor

Kitchi Gammi Park Trail Phase 1 Archaeological Reconnaissance Survey
Page 10
The Lake Superior Shoreline and Project APE Soils
As noted by Miller (n.d.), the current shoreline along Lake Superior likely took shape around 2,000 years
ago. The rapids of Sault Saint Marie, exposed by the lowering levels of Lake Michigan and Lake Huron,
restricted flow out of Lake Superior and raised the level to its current elevation, approximately 600 feet
above sea level. Miller (n.d.) also noted that the Lake Superior shoreline was possibly upwards of 500
feet above its current level immediately after the recession of the last glaciation as water filled the Lake
Superior basin. Lake levels then gradually fell to a point approximately 250 feet lower than the current
level, before the restriction at Sault Saint Marie.
Soils in the Project APE are generally ascribed to the Barto, stony‐Greysolon‐Rock outcrop complex, with
possible slopes ranging from 0 to 18 percent (NRCS 2019). Merjent Archaeologists expected excavatable
soils to be relatively shallow with depths not likely to exceed 15 inches or 40 centimeters.
Implications for Archaeological Potential
No previous archaeological reconnaissance survey has been documented in the Project APE or the
literature review study area and no previously identified archaeological sites are within the Project APE.
However, a brief review of the development of the Lake Superior shoreline and readily available early
historic‐period maps suggests that that the APE has potential to contain archaeological sites, namely:
Pre‐contact period archaeological sites from the Archaic Period, but more likely from the
Woodland Period (sometime after around 2,000 years before present as the current lake level
stabilized), and;
Mid‐19th (Bounty Land settlement) and 20th century (post World War I development of the Park
and subsequent park use) archaeological sites.
RESULTS The Phase I reconnaissance survey was completed by Merjent archaeologists Michael Madson, Kevin
Mieras, and Sigmund Antecki between October 28 and 30, 2019. A series of 44 shovel probes were
excavated within areas not obviously disturbed or paved (Table 1 and Figure 4). Table 1 shows the field
conditions of the surveyed Trail and Access Road corridors. Each corridor measured 50 feet wide with a
20‐foot centerline offset. As illustrated on Figure 4, overlap along the corridors occurred in some areas.
The aggregate survey area, or the combined total acreage of all survey areas discounting the overlap,
was approximately 7.69 acres. As noted above, this effectively represents the Project APE.
Subsurface visibility within the entire survey area was less than 25 percent, necessitating shovel testing
across a variety of field conditions ranging from open, grassy manicured green spaces (Photograph 1) to
wooded stands of mixed pine and birch with bedrock exposures (Photograph 2).

Kitchi Gammi Park Trail Phase 1 Archaeological Reconnaissance Survey
Page 11
Table 1. Overview of Surveyed Areas by Station
Bike Trail Station (from)
Bike Trail Station (to)
Access Road Station (from)
Access Road Station (to)
Field Conditions Applicable Shovel Probes
76+15 82+00 n/a n/a Existing paved trail Crossing of Brighton Beach Road Sloped and mechanically contoured
n/a
82+00 84+00 n/a n/a Open, manicured green space B11‐B14
84+00 86+00 300+00 302+50 Open, manicured green space B7‐B10
86+00 91+50 302+50 308+00 Sparsely wooded Bedrock at surface
B1‐B6; B22‐B25
91+50 92+50 308+00 309+00 Wetland n/a
92+50 96+00 309+00 313+00 Densely wooded B15‐B21
96+00 101+50 313+00 318+00 Brighton Beach Road ditch/paved roadbed
n/a
101+50 109+00 n/a n/a Open, manicured parkPaved roadways Gravel pads
A1‐A12
n/a n/a 318+00 328+00 Brighton Beach Road ditch/paved roadbed
n/a
109+00 122+52 n/a n/a Brighton Beach Road ditch/paved roadbed
n/a
n/a n/a 328+00 332+24 Densely wooded D1‐D7

")
")
")
")
")
")
")
")
!>
!>T50R13S4
B14
300+00
82+00
81+00
80+00
79+00
78+00
77+00
76+15
0 50 100
Feet Figure 4Kitchi Gammi Trail Project
Project Area MapbookSt. Louis County, Minnesota
Date:
(12
/17
/20
19
)
Sour
ce: Z
:\C
lien
ts\M
_P
\MN
_D
OT
\Kitch
i_G
am
mi_
Pa
rk_
Tra
il\F
ield
_D
ata
\Cu
ltu
ral\M
ap
Do
cs\K
GP
T_
Fig
ure
4_
Ae
ria
lMa
pb
oo
k.m
xd
4For Environmental Review Purposes Only
!!
!!
!
!
!
!!
!
!
!!
!!
!
!
!
!
!
!
7
56
34
12
!> Negative Shovel Test
") Stationing Location
Access Road Corridor
Bike Trail Corridor

")
")
")
")
")
")
")
")
")
")
")
")
")
")
")
")
!>
!>
!>
!>
!>
!>
!>
!>
!>
!>
!>
!>
!>
!>
!>
!>
!>
T50R13S4
B1
B2B3
B4
B5
B6
B7
B8
B9
B10C1
B11
B12
B13
B14
B25306+00
305+00
304+00
303+00
302+00
301+00
300+00
90+00
89+00
88+00
87+00
86+00
85+00
84+00
83+00
82+00
0 50 100
Feet Figure 4Kitchi Gammi Trail Project
Project Area MapbookSt. Louis County, Minnesota
Date:
(12
/17
/20
19
)
Sour
ce: Z
:\C
lien
ts\M
_P
\MN
_D
OT
\Kitch
i_G
am
mi_
Pa
rk_
Tra
il\F
ield
_D
ata
\Cu
ltu
ral\M
ap
Do
cs\K
GP
T_
Fig
ure
4_
Ae
ria
lMa
pb
oo
k.m
xd
4For Environmental Review Purposes Only
!!
!!
!
!
!
!!
!
!
!!
!!
!
!
!
!
!
!
7
56
34
12
!> Negative Shovel Test
") Stationing Location
Access Road Corridor
Bike Trail Corridor

")
")
")
")
")
")
")
")
")
")
")
")
")
")
")
")
")
")!>
!>
!>
!>
!>
!>
!>
!>
!>
!>
!>
!>
!>
!>
!>
T50R13S4
B1
B2B3
B4
B15
B16
B17
B18
B19
B20
B21
B22
B23B24
B25
312+00
311+00
310+00
309+00
308+00
307+00
306+00
305+00
96+00
95+00
94+00
93+00
92+00
91+00
90+00
89+00
88+00
0 50 100
Feet Figure 4Kitchi Gammi Trail Project
Project Area MapbookSt. Louis County, Minnesota
Date:
(12
/17
/20
19
)
Sour
ce: Z
:\C
lien
ts\M
_P
\MN
_D
OT
\Kitch
i_G
am
mi_
Pa
rk_
Tra
il\F
ield
_D
ata
\Cu
ltu
ral\M
ap
Do
cs\K
GP
T_
Fig
ure
4_
Ae
ria
lMa
pb
oo
k.m
xd
4For Environmental Review Purposes Only
!!
!!
!
!
!
!!
!
!
!!
!!
!
!
!
!
!
!
7
56
34
12
!> Negative Shovel Test
") Stationing Location
Access Road Corridor
Bike Trail Corridor

")
")
")
")
")
")
")
")
")
")
")
")
")
")
")
")
")
!>
!>
!>
!>
!>
!>
T50R13S4
A11
A12
B15
B16
B17
320+00
319+00
318+00
317+00
316+00
315+00
314+00
313+00
312+00
102+00
101+00
100+00
99+00
98+00
97+00
96+00
95+00
0 50 100
Feet Figure 4Kitchi Gammi Trail Project
Project Area MapbookSt. Louis County, Minnesota
Date:
(12
/17
/20
19
)
Sour
ce: Z
:\C
lien
ts\M
_P
\MN
_D
OT
\Kitch
i_G
am
mi_
Pa
rk_
Tra
il\F
ield
_D
ata
\Cu
ltu
ral\M
ap
Do
cs\K
GP
T_
Fig
ure
4_
Ae
ria
lMa
pb
oo
k.m
xd
4For Environmental Review Purposes Only
!!
!!
!
!
!
!!
!
!
!!
!!
!
!
!
!
!
!
7
56
34
12
!> Negative Shovel Test
") Stationing Location
Access Road Corridor
Bike Trail Corridor

")
")
")
")
")
")
")
")
")
")
")
")
")
")
")
")
")
!>
!>
!>
!>
!>
!>
!>
!>
!>
!>
!>
!>
T50R13S4
A1
A3
A2
A4
A5
A6
A7
A8
A9
A10
A11
A12
326+00
325+00
324+00
323+00
322+00
321+00
320+00
319+00
110+00
109+00
108+00
107+00
106+00
105+00
104+00
103+00
102+00
0 50 100
Feet Figure 4Kitchi Gammi Trail Project
Project Area MapbookSt. Louis County, Minnesota
Date:
(12
/17
/20
19
)
Sour
ce: Z
:\C
lien
ts\M
_P
\MN
_D
OT
\Kitch
i_G
am
mi_
Pa
rk_
Tra
il\F
ield
_D
ata
\Cu
ltu
ral\M
ap
Do
cs\K
GP
T_
Fig
ure
4_
Ae
ria
lMa
pb
oo
k.m
xd
4For Environmental Review Purposes Only
!!
!!
!
!
!
!!
!
!
!!
!!
!
!
!
!
!
!
7
56
34
12
!> Negative Shovel Test
") Stationing Location
Access Road Corridor
Bike Trail Corridor

")
")
")
")
")
")
")
")
")
")
")
")
")
")
")
")
")
")
!>
!>
!>
!>
!>
!>
!>
!>
!>
T50R13S4
A1
A2
D1
D2
D3
D4
D5D6
D7
332+24332+00
331+00
330+00
329+00
328+00
327+00
326+00
325+00
117+00
116+00
115+00
114+00
113+00
112+00
111+00
110+00
109+00
0 50 100
Feet Figure 4Kitchi Gammi Trail Project
Project Area MapbookSt. Louis County, Minnesota
Date:
(12
/17
/20
19
)
Sour
ce: Z
:\C
lien
ts\M
_P
\MN
_D
OT
\Kitch
i_G
am
mi_
Pa
rk_
Tra
il\F
ield
_D
ata
\Cu
ltu
ral\M
ap
Do
cs\K
GP
T_
Fig
ure
4_
Ae
ria
lMa
pb
oo
k.m
xd
4For Environmental Review Purposes Only
!!
!!
!
!
!
!!
!
!
!!
!!
!
!
!
!
!
!
7
56
34
12
!> Negative Shovel Test
") Stationing Location
Access Road Corridor
Bike Trail Corridor

")
")
")
")
")
")
")
")
T50R13S4
122+52
122+00
121+00
120+00
119+00
118+00
117+00
116+00
0 50 100
Feet Figure 4Kitchi Gammi Trail Project
Project Area MapbookSt. Louis County, Minnesota
Date:
(12
/17
/20
19
)
Sour
ce: Z
:\C
lien
ts\M
_P
\MN
_D
OT
\Kitch
i_G
am
mi_
Pa
rk_
Tra
il\F
ield
_D
ata
\Cu
ltu
ral\M
ap
Do
cs\K
GP
T_
Fig
ure
4_
Ae
ria
lMa
pb
oo
k.m
xd
4For Environmental Review Purposes Only
!!
!!
!
!
!
!!
!
!
!!
!!
!
!
!
!
!
!
7
56
34
12
") Stationing Location
Bike Trail Corridor

Kitchi Gammi Park Trail Phase 1 Archaeological Reconnaissance Survey
Page 19
Photograph 1. Manicured park area near Bike Trail Station 85+50 and Access Road Station 302+00, in the vicinity of Shovel Probe B8. View to southwest.
Photograph 2. Wooded stand near Bike Trail Station 88+00 and Access Road Station 304+50, in the vicinity of Shovel Probe B1. View to southwest.

Kitchi Gammi Park Trail Phase 1 Archaeological Reconnaissance Survey
Page 20
Soils observed throughout the Project APE were consistent with the Barto, stony‐Greysolon‐Rock
outcrop complex, i.e. silty loams overlaying clay with cobble inclusions, often with pooling water visible
at 50 to 60 centimeters below the ground surface (cmbgs). In general, soil profiles consisted of:
a thin silty loam topsoil (0 to 20/25 cmbgs, 10YR 3/2 [very dark grayish brown]), over;
mottled clay (20/25 to 35/40 cmbgs, 5YR 4/4 [reddish brown]), over;
clay (35/40 to 55/60 cmbgs, 5YR 4/6 [yellowish red]).
Modern cultural material examples (including but not limited to a wire fragment and condiment
packets) were observed in the topsoil of excavated shovel probes, particularly within the open,
manicured park grasses of the main recreational area between Bike Trail stations 101+50 and 109+00.
Recovered modern materials were placed in backfilled shovel probes.
Merjent archaeologists observed no pre‐contact or historic‐period cultural materials within the Project
APE.
SUMMARY AND RECOMMENDATIONS Between October 28 and 30, 2019, Merjent conducted a Phase I Archaeological Survey within the
Project APE. No archaeological sites were identified during the field investigations. The effort to identify
archaeological deposits in the APE was appropriate to existing conditions. Merjent recommends that
archaeological sites eligible for inclusion on the NRHP are not likely to exist within the Project APE and
no additional archaeological survey is necessary.
While not reviewed for the purposes of this survey of the Project APE, it should be noted that a scatter
of historic‐period artifacts was noted on the surface approximately 125 feet/38 meters east of Bike Trail
station 118+50. Since the Bike Trail will generally follow the centerline of the existing roadway at this
location, and no vegetation clearing will be necessary (only removal of existing pavement), Merjent
suggested that the historic‐period artifact scatter would not be impacted by construction of the Project.
This historic‐period artifact scatter, possibly related to the location of the Ford/Stowell structure noted
on the GLO, will be noted in a pending document and site form (Madson 2020).
While not expected, in the event archaeological materials are identified during Project construction
activities, such activities should cease in the immediate area, and a professional archaeologist should be
contacted to evaluate the identified materials. In the event of a confirmed archaeological site, steps
should be taken to record and evaluate the site in consultation with MnDOT, the City, the OSA, and the
Minnesota Indian Affairs Council (MIAC) and, if the site is determined by MnDOT to be eligible for
inclusion on the NRHP, to determine and implement any procedures for treatment. Should human
remains be identified, the procedures as outlined in Minnesota Statute Chapter 307, “Private
Cemeteries,” must be followed.

Kitchi Gammi Park Trail Phase 1 Archaeological Reconnaissance Survey
Page 21
REFERENCES CITED Anfinson, Scott 2005 SHPO Manual for Archaeological Projects in Minnesota. Minnesota Historical Society. St. Paul,
Minnesota. 2011 State Archaeologist’s Manual for Archaeological Projects in Minnesota. Office of the State
Archaeologist. St. Paul, Minnesota. Bureau of Land Management 2019a General Land Office Plat and Field Notes. (Website: https://glorecords.blm.gov/default.aspx,
accessed June and December 2019) 2019b 1860s Federal Land Patents. (Website: https://glorecords.blm.gov/default.aspx, accessed June
and December 2019) Madson, Michael 2020 Site form for Site KGP‐H01. Pending submittal in 2020. Miller, Jim n.d. An Introduction to the Geology of the North Shore. (Website:
http://www.lakesuperiorstreams.org/understanding/geology.html, accessed December 2019) Nelson, Nancy S. and Tony Dierckins 2017 Duluth’s Historic Parks: Their First 160 Years. Zenith City Press, Duluth, Minnesota NRCS 2019 Soil Survey of St. Louis County, Duluth Park. (Website: https://websoilsurvey.nrcs.usda.gov/app/,
accessed December 2019)

Minnesota Individual Property Inventory FormPlease refer to the Historic and Architectural Survey Manual before completing this form.
Must use Adobe Acrobat Reader to complete and save this form. Adobe Acrobat Reader can be downloaded at: https://get.adobe.com/reader/?promoid=KLXME
Historic Name:
Inventory No.:
Associated MN Multiple Property Form (Name and Inventory No.):
Other Names:
General Information
New or Updated Form:
Extant:
Location Information
Survey Type:
Township:
USGS 7.5 Quad Name(s):
Total Acres:
Property Identification Number (PIN):
Previous Determinations
Review and Compliance No.:
Agency Proj. No.:
Grant No.:
Subdivision:Block(s):
Lot(s):
Previous Individual Determination:National Register Listed
Within a National Register-Listed District
Contributing Status:
SEF
CEF
Locally Designated
NPS DOE
Not Eligible
QtrQtrQtr:
Previous District Determination:
UTM Coordinates:
Within a Locally Designated District
Contributing Status:
Within a SEF District
Within a CEF District
Street Address:
County:
If Multiple, List All Counties:
City/Twp:
If Multiple, List All Cities/Townships:
Urban:
Within a State Register-Listed District
Contributing Status:
Contributing Status:
Contributing Status:
Range: E/W: Section:
QtrQtr: Qtr:
Township:
QtrQtrQtr:
Range: E/W: Section:
QtrQtr: Qtr:
State Register Listed
District Name:
Datum:
UTM Zone Easting Northing
Page 1 of 3 (July 2019 Form Version)

Minnesota Individual Property Inventory Form
Historic Name:
Inventory No.:
Associated MN Multiple Property Form (Name and Inventory No):
Architect/Builder/Engineer:
Architectural Style:
Architectural Style (if other):
Exterior Material:
Exterior Material (if other):
Associated Properties (Name and Inventory No.):
Function/Use Category:
Function/Use Category (if other):
Function/Use Subcategory (if other):
Function/Use Subcategory:
Other Significant Construction Dates:
Date(s) Constructed:
Number of Resources on the Property:
Buildings: Sites:Structures: Objects:
Property Category:
Classification
Function or Use
Description
Significance
Historic:Function/Use Category:
Function/Use Category (if other):
Function/Use Subcategory (if other):
Function/Use Subcategory:
Current:
Yes No More Research Recommended
More Research Recommended
More Research Recommended
Yes No
Yes No
Provide full Statement of Significance on Continuation Sheet.
Applicable National Register of Historic Places Criteria:
Criterion A: Property is importantly associated with significant events.
Criterion B: Property is associated with the lives of significant persons.
Criterion C: Property has significant architectural characteristics.
Criterion D: Property may yield important information in history/prehistory. More Research RecommendedYes No
Area of Significance: Additional or Other Area(s) of Significance:
Period(s) of Significance:
Date Source(s):
Architect/Builder/Engineer Documentation:
Provide full Narrative Description on Continuation Sheet.
Criteria Considerations? No Yes If yes, describe in Statement of Significance on Continuation Sheet.
Discuss in Statement of Significance on Continuation Sheet.
Page 2 of 3 (July 2019 Form Version)

Minnesota Individual Property Inventory Form
Historic Name:
Inventory No.:
Associated MN Multiple Property Form (Name and Inventory No):
State Historic Preservation Office Comments (SHPO Use Only)
Initials: Date:
Concur Does Not Concur More Information Needed
Comments:
Additional DocumentationFor all properties, the following additional documentation must be submitted with the inventory form. Refer to the Historic and Architectural Survey Manual for guidance.
1. Photographs2. Maps
Preparer's Information and Recommendation
Date Inventory Form Prepared:
Preparer Name and Title:
Bibliography
Organization/Firm (if applicable):
Recommended Individual Evaluation:
Eligible for the National Register Within a National Register-Eligible District
Contributing Status:Not Eligible for the National Register
More Information Needed for Evaluation
Recommended District Evaluation:
Complete Bibliography on Continuation Sheet.
District Inventory Number:
District Name:
Eligible for Local Designation
Not Eligible for Local Designation
More Information Needed for Local Designation
Within a Locally-Eligible District
Contributing Status:
District Inventory Number:
District Name:
Individual Recommendation (NRHP)
More Information NeededDoes Not Concur
Historic District Recommendation (NRHP)
Concur
More Information NeededDoes Not Concur
Contributing/Noncontributing Status Recommendation
Concur
Page 3 of 3 (July 2019 Form Version)

Minnesota Individual Property Historic Name: Brighton Beach Fireplace/Shelter______ Inventory Form – Continuation Sheet Inventory No.: SL-DUL-3132_______________________ Associated MN Multiple Property Form (Name and Inventory No): _____________________________________
1
Narrative Description
The Brighton Beach Fireplace/Shelter (SL-DUL-3132) is located at a popular day-use park on the shore of Lake Superior. The park is signed as Kitchi Gammi Park but still also referred to locally as Brighton Beach (Mayo and Mayo 2018:16). It is situated along one segment of a system of looping drives and pull-offs located on the south side of Brighton Beach Road, which runs south of and parallel to Congdon Boulevard for a distance of approximately 0.8 mile, its west end located approximately 0.2 mile east of the Lester River. The drives are paved, and the pull-offs are gravel-surfaced. Aside from the shelter, park amenities include picnic grounds, an early 1980s-built pavilion, modern playground equipment, and portable toilets.
At the southeast edge of one of the drives, roughly 500 feet southwest of the pavilion, is the Brighton Beach Fireplace/Shelter, referred to by some locals as “Bela’s Castle,” the origin of which is not identified (Photograph 1). Secondary sources agree it was constructed during the federal relief era but do not identify a construction date, and it is not specifically mentioned in the annual Park Department reports (cf. Lewis 2015:4; Mayo and Mayo 2018:16). It was likely built circa 1938 during a WPA project to improve Duluth’s parks (see Statement of Significance). A structure appears in its location in a 1939 aerial photograph, though the resolution is not high enough to confirm its plan.
The Rustic-style shelter is semicircular in plan, with the flush plane adjacent to the drive, and the arc facing Lake Superior. The walls are of random rubble construction using gabbro (“bluestone”). The flush plane features a wide, centered chimney but is otherwise open, which allows for pedestrian entry (Photograph 2). The arced wall contains six, regularly spaced, open windows with stone sills and lintels (Photograph 3). The semi-conical roof is formed of concrete slabs anchored to steel rafters. The interior side of the chimney features an arched fireplace at the base (Photograph 4). Running along the entirety of the interior of the arced wall is a stone bench. The interior window sills are either concrete or have been parge coated.
The fireplace shelter was previously inventoried as an element of the Brighton Beach Tourist Camp (SL-DUL-2328), but the tourist camp was incorrectly located, and it was actually on the north side of Congdon Boulevard, well west of the fireplace shelter (see 2019 inventory form for SL-DUL-2328).
Statement of Significance
After Samuel Snively was elected mayor of Duluth in April of 1921, one of his first proposals was to obtain the land that would become Brighton Beach, and later Kitchi Gammi Park, for incorporation into the city’s park system (The Duluth Herald [Herald] 1921a, 1921b). Snively’s vision, building on the work begun more than three decades earlier by the first president of the Duluth Board of Park Commissioners, William
Minnesota Individual Property Historic Name: Brighton Beach Fireplace/Shelter______ Inventory Form – Continuation Sheet Inventory No.: SL-DUL-3132_______________________ Associated MN Multiple Property Form (Name and Inventory No): _____________________________________
2
K. Rogers, was to construct a scenic parkway system to connect Duluth’s major parks. Whereas Rogers, though, proposed a parkway system running from Miller Creek to the former corporate boundary at 40th Avenue East, Snively promoted a “’combined park and boulevard system’ that included . . . extending and connecting the boulevards from Jay Cooke State Park along the brow of the hill all the way to Lester Park and Brighton Beach” (Nelson and Dierckins 2017:44, 28). He stated, “Our main boulevard passing through all of the parks will be the link connecting the state highway 1 with its easterly and westerly approaches to our city” (quoted in Herald 1922). This boulevard, of course, came to be called the Skyline Parkway.
Citing the importance of retaining public views to water as part of his plan, Snively stated, “Every city should own the beaches that surround it . . . We have failed to get the land west of the Lester river, except for Lakeshore park, but this mistake must not be made to the east of the river. Here the shore line must belong to the city, and now is the time to get it” (Herald 1921a). Approval to purchase the approximately 65-acre, 1.5-mile stretch of shoreline east of the river, referred to as the Brighton Beach tract, initially failed due to a sudden rise in the price requested by the selling party. After the amount was reduced to $46,200 in August of 1921 and a few other requirements addressed, the city council acquiesced and approved the purchase on September 28th. The purchase was made possible by the issuance of bonds payable in 1952 (Herald 1921b, 1921c, 1921d, 1921e, 1921f).
In September of 1938, federal approval was received for $1,500,000 to be used over a two-year period to improve Duluth parks. An article dating to that month in the Herald included the “development of Kitchi Gammi park, on the lakeshore east of the Brighton Beach tourist camp” as one of a group of projects “for which funds have been earmarked and work is either under way or ready to start this week.” Most likely, the construction of the fireplace shelter was part of this development.
The fireplace shelter was evaluated with reference to the registration requirements for social and recreational facilities within the National Register Multiple Property Documentation Form for Federal Relief Construction in Minnesota, 1933-1943 (MPDF). While the overall 1.5 million-dollar parks improvement project under which the shelter was likely constructed may have been particularly important to Duluth, taken individually, the shelter does not meet this registration requirement (3a). It is noted that while the fireplace shelter exhibits fine craftsmanship using indigenous stone, this quality is common to numerous federal relief-era buildings, structures, and objects in the Rustic style throughout the state; the shelter, while attractive, does not stand out as a representative of this style, even when only the regional or local level is considered (3b). It is possible that this fireplace shelter is a relatively unique type of structure for the federal relief era in Minnesota (3c). Rarity alone, however, is not sufficient to bestow significance on a property, and as the shelter does not constitute a particularly important federal relief project; stand out from an architectural or engineering standpoint; or appear to have played an

Minnesota Individual Property Historic Name: Brighton Beach Fireplace/Shelter______ Inventory Form – Continuation Sheet Inventory No.: SL-DUL-3132_______________________ Associated MN Multiple Property Form (Name and Inventory No): _____________________________________
3
identifiably significant role in Duluth’s recreational history, rarity does not play a role in the evaluation of its eligibility for listing in the National Register.
Registration requirement 4 indicates that a building or structure constructed as part of a larger complex, such as a park, parkway, wayside, or zoo, may not be considered eligible unless the original landscape design and spatial and functional relationships remain intact. The fireplace shelter was added to a park created during the 1920s, i.e., prior to the federal relief era, and therefore cannot be said to have been constructed as part of a larger complex with a cohesive design. It therefore does not meet Registration Requirement 4.
Due to a lack of significance, the Brighton Beach Fireplace/Shelter (SL-DUL-3132) is not individually eligible for listing in the National Register.
Kitchi Gammi Park remains eligible as a contributing element to the Skyline Parkway historic district. According to the report titled Skyline Parkway Cultural Resources Inventory, Duluth, St. Louis County, Minnesota (Stark 2011:26), the “lateral [Skyline Parkway historic] district boundaries would extend to the right-of-way of [Congdon] boulevard, and also include the entirety of [Kitchi Gammi] Park and its contributing features.” The Brighton Beach Fireplace/Shelter, although not individually significant, historically contributed to the recreational qualities of Kitchi Gammi Park, and it retains the integrity to convey this contribution. Further, it incorporates native stone in its construction, which is one of the five components identified in the Skyline Parkway Corridor Management Plan (URS Corporation 2003) as defining the character of Skyline Parkway. It is therefore recommended that the fireplace shelter is a contributing feature of Kitchi Gammi Park.

Minnesota Individual Property Historic Name: Brighton Beach Fireplace/Shelter______ Inventory Form – Continuation Sheet Inventory No.: SL-DUL-3132_______________________ Associated MN Multiple Property Form (Name and Inventory No): _____________________________________
4
Bibliography
The Duluth Herald 1921a Park System Plans; Mayor is Ambitious. 18 July. 1921b Brighton Beach Park Site Offered to City for Sum of $46,200. 8 August. 1921c Mayor’s Park Plans Discussed; Further Extensions Sought. 19 July. 1921d Federated Trades Hear of Brighton Beach Purchase Plan. 31 August. 1921e Motions and Resolutions. 29 September. 1921f Council Will Open Bids on Park Bonds. 7 December. 1922 Boulevard Drive and Park System as Mapped Out by Mayor Snively. 18 December.
1938 Park Program Included in U.S. Approval. 26 September.
Duluth Park Department
c. 1928-1964 (various) Annual Report Park Department. Held at the Kathryn A. Martin Library, Archives & Special Collections, Duluth.
Lewis, George
2015: Bela’s Castle. Look at Lakeside Feb/March:4. Mayo, William and Kathryn Mayo
2018 61 Gems on Highway 61: Your Guide to Minnesota’s North Shore. Adventure Publications, Cambridge, MN.
Nelson, Nancy S. and Tony Dierckins
2017 Duluth’s Historic Parks: Their First 160 Years. Zenith City Press, Duluth, MN.

Minnesota Individual Property Historic Name: Brighton Beach Fireplace/Shelter______ Inventory Form – Continuation Sheet Inventory No.: SL-DUL-3132_______________________ Associated MN Multiple Property Form (Name and Inventory No): _____________________________________
5
Maps
Brighton Beach Fireplace/Shelter (SL-DUL-3132)
Modern pavilion

Minnesota Individual Property Historic Name: Brighton Beach Fireplace/Shelter______ Inventory Form – Continuation Sheet Inventory No.: SL-DUL-3132_______________________ Associated MN Multiple Property Form (Name and Inventory No): _____________________________________
6
Photographs
Photograph 1. SL-DUL-3132, October 2019, looking northeast
Photograph 2. SL-DUL-3132, October 2019, looking east

Minnesota Individual Property Historic Name: Brighton Beach Fireplace/Shelter______ Inventory Form – Continuation Sheet Inventory No.: SL-DUL-3132_______________________ Associated MN Multiple Property Form (Name and Inventory No): _____________________________________
7
Photograph 3. SL-DUL-3132, October 2019, looking northwest
Photograph 4. SL-DUL-3132, October 2019, interior view of chimney, looking northwest
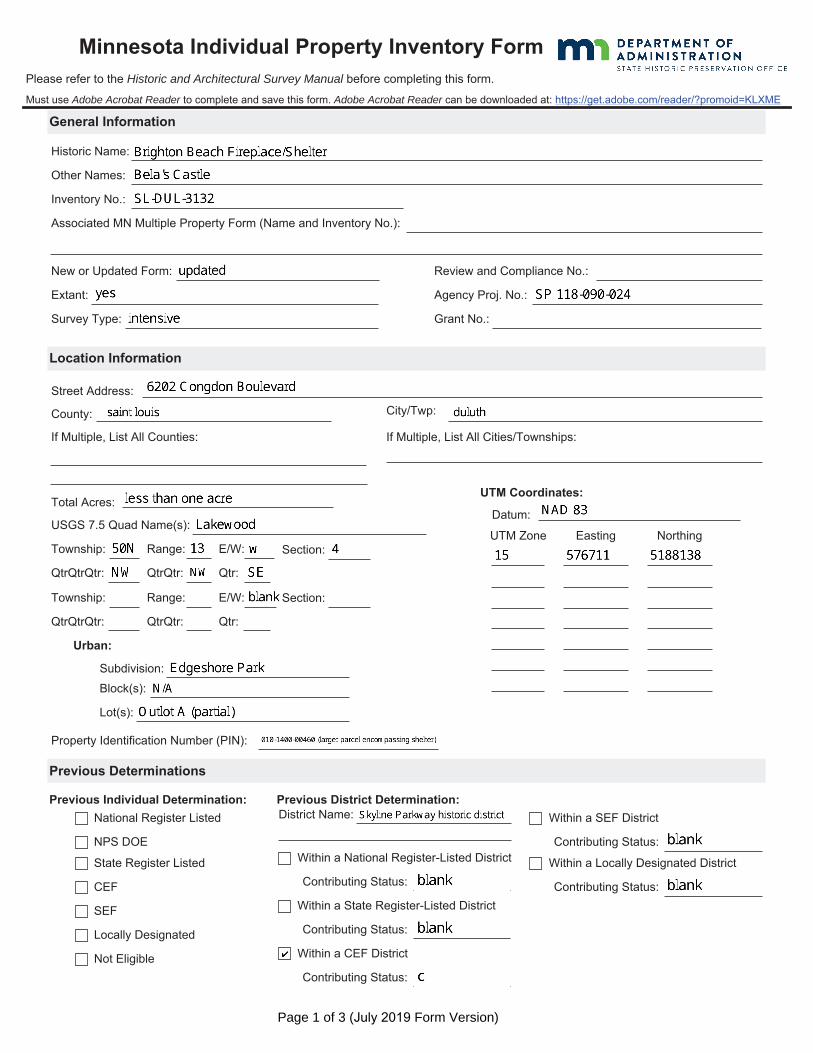
Minnesota Individual Property Inventory FormPlease refer to the Historic and Architectural Survey Manual before completing this form.
Must use Adobe Acrobat Reader to complete and save this form. Adobe Acrobat Reader can be downloaded at: https://get.adobe.com/reader/?promoid=KLXME
Historic Name:
Inventory No.:
Associated MN Multiple Property Form (Name and Inventory No.):
Other Names:
General Information
New or Updated Form:
Extant:
Location Information
Survey Type:
Township:
USGS 7.5 Quad Name(s):
Total Acres:
Property Identification Number (PIN):
Previous Determinations
Review and Compliance No.:
Agency Proj. No.:
Grant No.:
Subdivision:Block(s):
Lot(s):
Previous Individual Determination:National Register Listed
Within a National Register-Listed District
Contributing Status:
SEF
CEF
Locally Designated
NPS DOE
Not Eligible
QtrQtrQtr:
Previous District Determination:
UTM Coordinates:
Within a Locally Designated District
Contributing Status:
Within a SEF District
Within a CEF District
Street Address:
County:
If Multiple, List All Counties:
City/Twp:
If Multiple, List All Cities/Townships:
Urban:
Within a State Register-Listed District
Contributing Status:
Contributing Status:
Contributing Status:
Range: E/W: Section:
QtrQtr: Qtr:
Township:
QtrQtrQtr:
Range: E/W: Section:
QtrQtr: Qtr:
State Register Listed
District Name:
Datum:
UTM Zone Easting Northing
Page 1 of 3 (July 2019 Form Version)

Minnesota Individual Property Inventory Form
Historic Name:
Inventory No.:
Associated MN Multiple Property Form (Name and Inventory No):
Architect/Builder/Engineer:
Architectural Style:
Architectural Style (if other):
Exterior Material:
Exterior Material (if other):
Associated Properties (Name and Inventory No.):
Function/Use Category:
Function/Use Category (if other):
Function/Use Subcategory (if other):
Function/Use Subcategory:
Other Significant Construction Dates:
Date(s) Constructed:
Number of Resources on the Property:
Buildings: Sites:Structures: Objects:
Property Category:
Classification
Function or Use
Description
Significance
Historic:Function/Use Category:
Function/Use Category (if other):
Function/Use Subcategory (if other):
Function/Use Subcategory:
Current:
Yes No More Research Recommended
More Research Recommended
Provide full Statement of Significance on Continuation Sheet.
Applicable National Register of Historic Places Criteria:
Criterion A: Property is associated with significant events.
Criterion B: Property is associated with the lives of significant persons.
Criterion C: Property has significant architectural characteristics. More Research Recommended
Yes No
Yes No
Criterion D: Property may yield important information in history/prehistory. More Research RecommendedYes No
Area of Significance: Additional or Other Area(s) of Significance:
Period(s) of Significance:
Date Source(s):
Architect/Builder/Engineer Documentation:
Provide full Narrative Description on Continuation Sheet.
Criteria Considerations? No Yes If yes, describe in Statement of Significance on Continuation Sheet.
Discuss in Statement of Significance on Continuation Sheet.
Page 2 of 3 (July 2019 Form Version)

Minnesota Individual Property Inventory Form
Historic Name:
Inventory No.:
Associated MN Multiple Property Form (Name and Inventory No):
State Historic Preservation Office Comments (SHPO Use Only)
Initials: Date:
Concur Does Not Concur More Information Needed
Comments:
Additional DocumentationFor all properties, the following additional documentation must be submitted with the inventory form. Refer to the Historic and Architectural Survey Manual for guidance.
1. Photographs2. Maps
Preparer's Information and Recommendation
Date Inventory Form Prepared:
Preparer Name and Title:
Bibliography
Organization/Firm (if applicable):
Recommended Individual Evaluation:
Eligible for the National Register Within a National Register-Eligible District
Contributing Status:Not Eligible for the National Register
More Information Needed for Evaluation
Recommended District Evaluation:
Complete Bibliography on Continuation Sheet.
District Inventory Number:
District Name:
Eligible for Local Designation
Not Eligible for Local Designation
More Information Needed for Local Designation
Within a Locally-Eligible District
Contributing Status:
District Inventory Number:
District Name:
Individual Recommendation (NRHP)
More Information NeededDoes Not Concur
Historic District Recommendation (NRHP)
Concur
More Information NeededDoes Not Concur
Contributing/Noncontributing Status Recommendation
Concur
Page 3 of 3 (July 2019 Form Version)

Minnesota Individual Property Historic Name: Brighton Beach Tourist Camp__________ Inventory Form – Continuation Sheet Inventory No.: SL-DUL-2328________________________ Associated MN Multiple Property Form (Name and Inventory No): _____________________________________
1
Narrative Description
The location of the Brighton Beach Tourist Camp (SL-DUL-2328), when the property was previously inventoried, was incorrect. According to the report titled Skyline Parkway Cultural Resources Inventory, Duluth, St. Louis County, Minnesota (Stark 2011:19):
At S 61st Avenue E is a paved parking area on the south side with a tourist information booth. Just east of this parking area is a pull-out marking the entrance of the Brighton Beach Road, which leads to the Brighton Beach Tourist Camp (SL-DUL-2328), once operated as a tourist camp by the city and now functioning as Kitchi Gami park. The unpaved turnout is delineated by the guard rocks, characteristic of the Skyline Parkway, and includes a modern wood gazebo (SL-DUL-3107) and stone shelter/fireplace (SL-DUL-3107).
The associated inventory form depicts an area larger than the one described, but still on the south side of Congdon Boulevard. The Brighton Beach Tourist Camp was actually located opposite the tourist information booth on the north side of Congdon Boulevard, west of the junction of Congdon Boulevard with Brighton Beach Road, and it does not include the modern wood gazebo or stone shelter/fireplace, which are located well to the east. The tourist camp is evident in an aerial photograph dating to 1939. The site is now fully occupied by the United States Environmental Protection Agency Mid-Continent Ecology Division facility (EPA facility), and the only possible vestige of the camp is a remnant of driveway that now serves as a walkway along the east side of the main buildings (Photographs 1-4).
Because the camp was incorrectly located, current GIS data held by the State Historic Preservation Office and by the Minnesota Department of Transportation for the property, which includes two points and one polygon, is also not correct and will need to be adjusted.
Statement of Significance
After Samuel Snively was elected mayor of Duluth in April of 1921, one of his first proposals was to obtain the land that would become Brighton Beach, and later Kitchi Gammi Park, for incorporation into the city’s park system and the establishment of a tourist camp there (The Duluth Herald [Herald] 1921a, 1921b). Snively’s vision, building on the work begun more than three decades earlier by the first president of the Duluth Board of Park Commissioners, William K. Rogers, was to construct a scenic parkway system to connect Duluth’s major parks. Whereas Rogers, though, proposed a parkway system running from Miller Creek to the former corporate boundary at 40th Avenue East, Snively promoted a “’combined park and boulevard system’ that included . . . extending and connecting the boulevards from Jay Cooke State Park

Minnesota Individual Property Historic Name: Brighton Beach Tourist Camp__________ Inventory Form – Continuation Sheet Inventory No.: SL-DUL-2328________________________ Associated MN Multiple Property Form (Name and Inventory No): _____________________________________
2
along the brow of the hill all the way to Lester Park and Brighton Beach” (Nelson and Dierckins 2017:44, 28). He stated, “Our main boulevard passing through all of the parks will be the link connecting the state highway 1 with its easterly and westerly approaches to our city” (quoted in Herald 1922a). This boulevard, of course, came to be called the Skyline Parkway.
Citing the importance of retaining public views to water as part of his plan, Snively stated, “Every city should own the beaches that surround it . . . We have failed to get the land west of the Lester river, except for Lakeshore park, but this mistake must not be made to the east of the river. Here the shore line must belong to the city, and now is the time to get it” (Herald 1921a). Approval to purchase the approximately 65-acre, 1.5-mile stretch of shoreline east of the river, referred to as the Brighton Beach tract, initially failed due to a sudden rise in the price requested by the selling party. After the amount was reduced to $46,200 in August of 1921 and a few other requirements addressed, the city council acquiesced and approved the purchase on September 28th. The purchase was made possible by the issuance of bonds payable in 1952 (Herald 1921b, 1921c, 1921d, 1921e, 1921f).
In May of 1922, the Herald reported that the city, in cooperation with the Duluth Automobile Club, was preparing not one but three sites to serve as automobile tourist camps, the largest of which, now at 85 acres, was Brighton Beach. The other two were a 28-acre parcel south of Fairmont Park known as Indian Point and a 54-acre parcel north of Chester Park on Fifteenth Avenue East (Herald 1922b). A lack of finances, however, appears to have slowed the process. In June of 1922, an article in the Herald (1922c) apprised readers that due to limited funds and the prioritizing of developing “the westerly extension of the boulevard” and Indian Point, Mayor Snively had earlier in the year requested that the automobile club “take Brighton Beach off the city’s hands and equip it for the accommodations of tourists.” The automobile club, its funds also limited, instead presented to the city council on June 19th a resolution by which the city would equip “Indian Point, Chester Park and Brighton Beach . . . with water, wood fuel, stoves and other accommodations so that Duluth would be attractive to tourists,” and chastised the city for not accomplishing what numerous small towns had already done in Minnesota. Club members, impressing upon the council a sense of urgency due to the imminent seasonal swell of tourist travel, asked that it appropriate the one to two thousand dollars needed to equip the three camps, and were “assured that early action would be taken by the council on the matter.”
How well the council followed through on its assurances in 1922 is unclear with regard to Brighton Beach. Although in that year the Herald made subsequent references to an existing Indian Point Tourist Camp, only one was made to the Lester Park Tourist Camp, the original and short-lived name given to the Brighton Beach camp, and that was only ten days after the resolution was brought to city council. The annual reports of the Duluth Parks Department for the years 1922 through 1927 have been lost, and the annual report of the Duluth City Auditor and City Treasurer for 1922 does not specify parks with

Minnesota Individual Property Historic Name: Brighton Beach Tourist Camp__________ Inventory Form – Continuation Sheet Inventory No.: SL-DUL-2328________________________ Associated MN Multiple Property Form (Name and Inventory No): _____________________________________
3
expenditures as occurred in subsequent years. For 1923, though, these departments reported $2,543.37 incurred for improvements to lands at Brighton Beach (p. 24), and a Duluth Chamber of Commerce Convention and Tourist Bureau brochure dating to 1922-1923 notes “Complete Equipment” for all three of the city’s camps. The following year, the Auditor reported $2,031.51, for unspecified improvements to Brighton Beach generally and $5,741.30 for improvements to the tourist camp specifically (p. 30).
In 1925, Mayor Snively agreed to the recommendation of the Retail Merchants Association and the Duluth Automobile Club to have a “cooking house” constructed at the Brighton Beach and Indian Point tourist camps,
. . . approximately 16 by 30 feet, and [with] a huge lumber camp stove in the center. Inside the building there also will be a large table and running water. The unique part of the construction will be the sides of the buildings which will be so arranged that wooden windows will be let down outward and will form individual tables at which parties of six may be seated. The eaves of the roof extend well beyond the sweep of the windows when let down and, except in driving rain, people may eat at tables in comfort [Herald 1925] [see Photograph 3].
An expenditure of $1,592.23 under the heading of “buildings” for the Brighton Beach Tourist Camp was reported by the City Auditor for the year 1925 (p. 44). Photographs of the camp dating to 1928 show a large, hip-roofed pavilion, which was likely also constructed during the 1923-1925 period. As the annual report of the City of Duluth Park Department (Park Department) for the year 1928 refers to showers at the camp (p. 36), a building for this purpose was probably also part of the initial development, along with a toilet building, mentioned in the 1929 annual report (p. 26). The buildings and tent sites were accessed via a system of irregular looping gravel drives that tied in to a road known today as Brighton Beach Road. The park road ran along the northwest edge of the auto camp and continued approximately 350 feet northeast and 0.3 mile southwest of camp before turning up at both ends to meet what was then Congdon Boulevard but became Trunk Highway 61 in 1926.
The Brighton Beach Tourist Camp added to the proliferation of auto camps in Minnesota, leading the Saturday Evening Post, in 1924, to cite the state specifically as one which had obtained substantial summer tourist business because it was “dotted with free auto camp towns just as it is dotted with 10,000 lakes” (May 1924:89). The author indicated that the camps encouraged motorists to explore areas north of more heavily traveled east-west routes across the country. The following year, however, Duluth could no longer be classified as a free auto camp town, as it began to charge 50 cents per night and car at both the Brighton Beach and Indian Point tourist camps. The combined camps brought in $1,883.50 during the summer tourist season, from June through September, in 1925 (Park Department c. 1928:30).

Minnesota Individual Property Historic Name: Brighton Beach Tourist Camp__________ Inventory Form – Continuation Sheet Inventory No.: SL-DUL-2328________________________ Associated MN Multiple Property Form (Name and Inventory No): _____________________________________
4
Apparently the fee did not serve as much of a deterrent, because over the next three seasons, combined revenue was above $3,000. In the first year for which separate statistics are available, 1927, the Brighton Beach Tourist Camp hosted 9,800 tourists in 4,056 cars, and in 1928, 15,243 tourists in 4,804 cars, nearly double, then triple the number of cars that came to Indian Point in those years. As such, the Park Department (c. 1928:36) reported in 1928 that the Brighton Beach camp “was on a more than self-sustaining basis,” attributing its success to its location on Lake Superior and its recent provision of hot water in the showers, neither of which was a feature of the Indian Point camp. It additionally reported that the combined camps hosted visitors from 35 states and Canada that year. With the bulk of the development at the Brighton Beach Tourist Camp having been completed, improvements were minimal during this period. Improvements were, however, made to the parkland surrounding the camp in 1928, consisting of widening, grading, graveling, and adding corrugated iron culverts to the park road, as well as removing brush and rubbish, which was intruding on vistas and picnic areas. It was noted by the Park Department (c. 1928:30) in its report for that year that Brighton Beach had been “unofficially named Kitchi Gammi Park.”
In 1929, some limited plantings were made around the toilet building, both to screen the building and because the camp area was “denuded of plant growth and its barrenness [made] it unsightly and rather depressing” (Park Department c. 1929:26). That year also witnessed “a slight decrease” (Park Department c. 1929:38) in visitors at Brighton Beach and a corresponding increase at Indian Point, which the Park Department attributed to “the presidential visit in 1928,” though it did not elaborate as to why that would have differentially affected the camps.
Despite the previously mentioned surmise by Belasco (1979:126) that in deference to the hotel and resort industry, no public camp could add cabins, the city of Duluth did just that. In 1930, four log cabins were constructed at the Brighton Beach Tourist Camp, perhaps due to the realization that the drop-off in campers had less to do with Calvin Coolidge than with the national trend toward cabin camps. Five more cabins were added the next year (Park Department c. 1931:14). The cabins were arranged in facing rows, the row of four to the east of the pavilion, and the row of five to the west (see Photograph 3). Construction of the cabins was contracted out, but the City installed wiring and window shades at each, with all costs paid out of the camp’s revenue. Even so, the Park Department (c. 1931:12) lamented in its report for 1931:
The falling off of tourists at the camps is also due to the demand by tourists for cabins. They no longer bring their tents or cots and hundreds were turned away on account of lack of cabin facilities, sometimes forty or fifty in one day. These tourists do not come dressed for, or do they wish to stay at hotels. Should we give them the facilities they want or let them drive on to the next cabin camp?

Minnesota Individual Property Historic Name: Brighton Beach Tourist Camp__________ Inventory Form – Continuation Sheet Inventory No.: SL-DUL-2328________________________ Associated MN Multiple Property Form (Name and Inventory No): _____________________________________
5
Tourist facilities were upgraded through federal relief programs during the latter part of the decade. In 1935, workers with the Emergency Relief Administration made several improvements to the combined tent and cabin camp, including “closing in of the pavilion, rebuilding the caretaker’s house [original construction date unknown], replacement of the equipment stoves, rearrangement and improvements in the toilet building, and the addition of chimneys and stoves to the cottages” (Park Department c. 1935:6). In the spring of 1938, the National Youth Administration (NYA) constructed nine more cabins in the same manner as the original, adding five to the east row and four to the west row (Duluth News-Tribune 1938). The following fall, the NYA began work to extend water, gas, and sewer to all cabins (Park Department c. 1939:12). These improvements, along with the upswing in auto camp patronage encouraged by the Depression, helped the Brighton Beach Tourist Camp to rebound financially, with steady increases occurring between 1934, when revenue amounted to $1,918.50 and 1938, when it amounted to $3,996.90.
During the early 1940s, as would be expected during the war years, patrons of the Brighton Beach Tourist Camp were considerably less, but it continued to operate at a net gain. The camp received a boost in 1944 when the war-induced housing shortage caused several war industry workers to take up residence at the camp “for practically the entire season” (Park Department c. 1944:11). Additionally, some patrons were given a special dispensation of gasoline to accommodate travel to Duluth to seek relief from hay fever.
When the end of World War II allowed multitudes of Americans to take their places behind the wheel, the Brighton Beach camp thrived. With heated cabins and the allowance of trailers, the camp could operate year-round, and revenue peaked at over $10,000 in 1949, creating a profit of over $4,000. In that year, the camp “was filled to capacity every day during the months of June, July and August and during these months more than 50 cars per day were turned away” (Park Department c. 1949:8).
For reasons not laid out by the Parks Department, revenues started to decline in the early 1950s, and in 1953, both the Brighton Beach and Indian Point tourist camps were leased out for operation by private parties, although this arrangement had been occurring at the Indian Point camp since the 1930s. The city received 25 percent of the revenue for cabins, trailers, and tents and 10 percent of the revenue for rented bedding, and an additional 5 percent for total revenue over $9,000, as well as payment for a hotel license. Ultimately, though, the decline must have continued, because circa 1963, the camp was shut down and the buildings and structures removed. At least some cabins and the pavilion roof were relocated for use at various recreational facilities in the city (Park Department c. 1951:9, c. 1956:6; c. 1964:26).
In 1966, the EPA facility was built on the site.

Minnesota Individual Property Historic Name: Brighton Beach Tourist Camp__________ Inventory Form – Continuation Sheet Inventory No.: SL-DUL-2328________________________ Associated MN Multiple Property Form (Name and Inventory No): _____________________________________
6
Bibliography
Belasco, Warren J. 1979 Americans on the Road: From Autocamp to Motel, 1910-1945. The MIT Press, Cambridge, MA.
Duluth Chamber of Commerce, Convention and Tourist Bureau 1922-1923 In and Out of Duluth. Brochure. Available online at https://reflections.mndigital.org/
catalog/nemhc:2796#/image/1?searchText=&viewer=OSD_VIEWER. Duluth City Auditor [and City Treasurer]
c. 1923-1925 Annual Report of the City Auditor [and City Treasurer]. Available online at https://babel.hathitrust.org/cgi/pt?id=uiug.30112110818470&view=1up&seq=273.
The Duluth Herald
1921a Park System Plans; Mayor is Ambitious. 18 July. 1921b Brighton Beach Park Site Offered to City for Sum of $46,200. 8 August. 1921c Mayor’s Park Plans Discussed; Further Extensions Sought. 19 July. 1921d Federated Trades Hear of Brighton Beach Purchase Plan. 31 August. 1921e Motions and Resolutions. 29 September. 1921f Council Will Open Bids on Park Bonds. 7 December. 1922a Boulevard Drive and Park System as Mapped Out by Mayor Snively. 18 December. 1922b City Authorities Getting Parks Ready. 5 May. 1922c City To Do Share for Camp Sites. 20 June.
Duluth News-Tribune
1938 Summer Ahead! City Builds More Tourist Cabins. 13 March. Duluth Park Department
c. 1928-1964 (various) Annual Report Park Department. Held at the Kathryn A. Martin Library, Archives & Special Collections, Duluth.

Minnesota Individual Property Historic Name: Brighton Beach Tourist Camp__________ Inventory Form – Continuation Sheet Inventory No.: SL-DUL-2328________________________ Associated MN Multiple Property Form (Name and Inventory No): _____________________________________
7
Lewis, George 2015: Bela’s Castle. Look at Lakeside Feb/March:4.
May, Earl Chapin
1924 The Argonauts of the Automobile. Saturday Evening Post 197(6):25, 89-90, 92. Mayo, William and Kathryn Mayo
2018 61 Gems on Highway 61: Your Guide to Minnesota’s North Shore. Adventure Publications, Cambridge, MN.
Nelson, Nancy S. and Tony Dierckins
2017 Duluth’s Historic Parks: Their First 160 Years. Zenith City Press, Duluth, MN.
Stark, William E. 2011 Skyline Parkway Cultural Resources Inventory, Duluth, St. Louis County, Minnesota. Stark Preservation
Planning. Submitted to the City of Duluth and the Minnesota Department of Transportation.
Maps
2011 report-described location Brighton Beach Tourist Camp
(SL-DUL-2328)
Brighton Beach Fireplace/Shelter (SL-DUL-3132)
Actual location of the Brighton Beach Tourist Camp
(SL-DUL-2328) 2011 inventory form-mapped
location Brighton Beach Tourist Camp

Minnesota Individual Property Historic Name: Brighton Beach Tourist Camp__________ Inventory Form – Continuation Sheet Inventory No.: SL-DUL-2328________________________ Associated MN Multiple Property Form (Name and Inventory No): _____________________________________
8
Photographs
Photograph 1. 1939 aerial photograph depicting Brighton Beach Tourist Camp
Photograph 2. 2017 aerial photograph depicting EPA facility
Camp
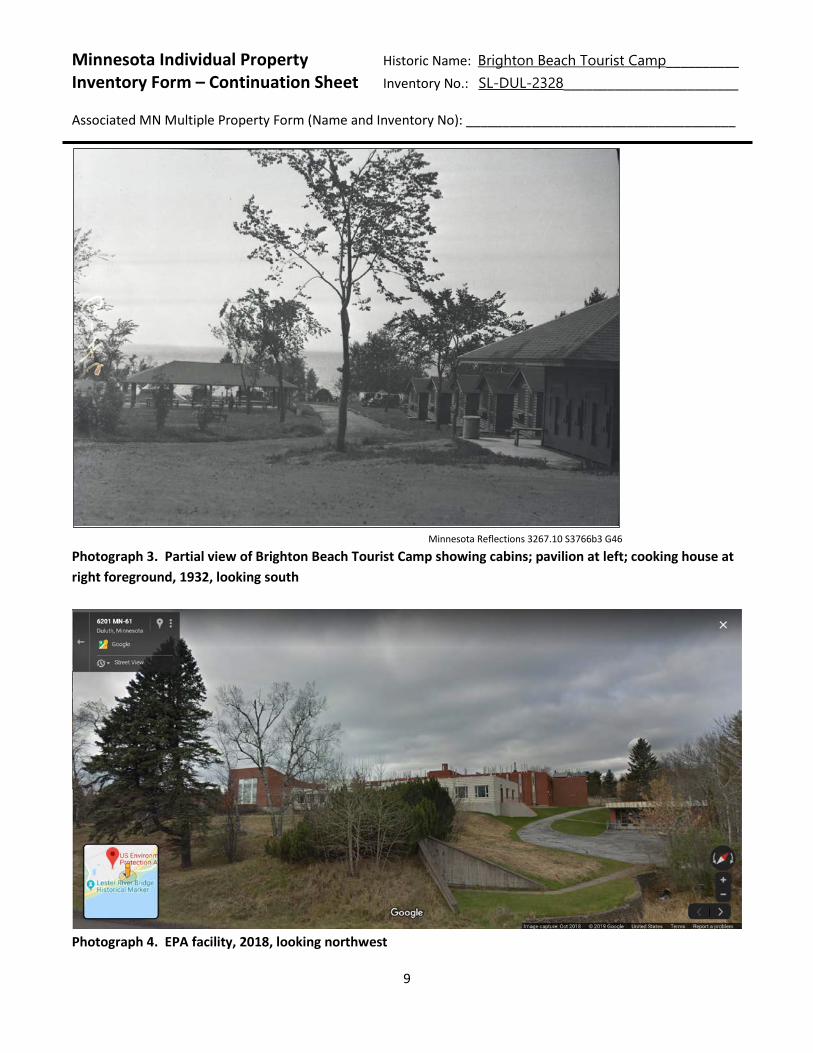
Minnesota Individual Property Historic Name: Brighton Beach Tourist Camp__________ Inventory Form – Continuation Sheet Inventory No.: SL-DUL-2328________________________ Associated MN Multiple Property Form (Name and Inventory No): _____________________________________
9
Minnesota Reflections 3267.10 S3766b3 G46
Photograph 3. Partial view of Brighton Beach Tourist Camp showing cabins; pavilion at left; cooking house at right foreground, 1932, looking south
Photograph 4. EPA facility, 2018, looking northwest

Eleanor Bacso City of Duluth
SHPO Certified Local Government (CLG) Grant FY20 Printed On: 14 February 2020 1
Applicant Information/Project Summary/Budget Information Project Name* Please provide a succinct title for the project.
2021 State Preservation Conference
City Name, Address, and County
City of Duluth 411 West First Street Duluth, MN 55802
Project Staff List principal personnel and their qualifications. You can upload a document with a staff list on it as well.
FY20 CLG Grant Budget Template (Conference).xlsx Steven Robertson, Senior Planner Adam Fulton, Deputy Director Eleanor Bacso, Economic Developer Chris Fleege, Director of Planning and Development
Brief Project Summary Please provide a brief summary of the project.
Host the 2021 State Conference
Amount Requested
$43,350.00
Match Offered Must be at least 40% of total costs. If you are unsure of how much of a match is needed for your project, check your budget template.
$19,150.00
Budget Please download the budget template provided below to save, fill out, and upload

Eleanor Bacso City of Duluth
SHPO Certified Local Government (CLG) Grant FY20 Printed On: 14 February 2020 2
Authorized Representative City's Authorized Representative.
Chris Fleege, Director of Planning & Economic Development
Project Narrative Project Categories Please indicate which one of the following categories your project falls under.
7. Public Education
Project Description Please provide a detailed description of the project.
Explore and expand the preservation needs of our state's local communities and broaden historic preservation efforts to bolster our sense of "place" by producing Heritage Preservation strategies. Using local initiatives to promote Historic Preservation across the state, and capitalizing on these strengths as a catalyst to use preservation as an economic engine that is accessible to more communities and benefiting our region as a whole.
Sugested Tours
-Optional Self guided tours:
A Planned Communities of Riverside and Morgan Park,
B Historic Recreation Areas in Duluth,
C Superior WI and the North Shore,
D Historic Parking Lots (Sites of Former Historic Structures that Were Demolished)
-Guided tours:
A Downtown Duluth and Canal Park,
B Entertainment (West Duluth Theater, Norshor)
C Duluth’s Other Dowtowns (Lincoln Park, West Duluth, London Road)
-Walking Tour of the Lakewalk (Fitgers, Canal Park)
-Evening Event on the Vista; Tour of the Harbor
Individual class sessions will be held at different historic locations within the downtown historic district: Zeitgeist (Zinema or Teatro?), Norshor, Greysolon Ballroom (Moorish room or the Ballroom?). Kick off (or conclusion) session could be at the Historic Depot

Eleanor Bacso City of Duluth
SHPO Certified Local Government (CLG) Grant FY20 Printed On: 14 February 2020 3
Reflection of Goals and Strategies of the Statewide Preservation Plan Please include a discussion of how this project reflects the goals and strategies outlined in the statewide preservation plan.
Renewed interest from our next generations.
Examples of preservation projects. Preserve and protect our historic fabric. Celebrate the entire built environment. Collaboration, education, funding, and advocacy. Identification of our resources. Changing demographics.
Impact on Community Provide a concise statement describing the expected effect of the project on the community’s awareness and understanding of local government in addressing local preservation issues.
This conference will raise awareness at the state and local level of preservation issues in the City of Duluth and State of Minnesota. It will also improve: the economics of historic preservation, the connection of history, housing and healthy communities, Creating long- term value to our communities, and Innovation and repurposing our history.
Community Support Please provide a concise statement summarizing demonstrated community support for this project. Cash match is one measure of community support. Simply Stating that there is community support is NOT a demonstration of support.
How we will these help provide support? City of Duluth (Staff Time) HPC (Volunteer Time)
Duluth Preservation Alliance Local AIA chapter Lake Superior Area Realtors Visitors and Convention Bureau Planning Institute Congress of New Urbanism Mainstreet

Eleanor Bacso City of Duluth
SHPO Certified Local Government (CLG) Grant FY20 Printed On: 14 February 2020 4
The Duluth Preservation Alliance, Heritage Preservation Commission, and broader preservation community will support this grant request both financially and with an in-kind match of volunteer hours to ensure a successful event.
Final Product Provide a concise description of products that will result from the project. You may upload any documentation you think is necessary. The product of the Annual Statewide Historic Preservation Conference will be the increased capacity for conference attendees to preserve cultural heritage and to effectively inform current and future public policies and cultural practices. Through the information and ideas shared during the conference sessions, tours and events, Minnesota's solid foundation of preservation education and activism will be enhanced, leading to increased preservation of places that matter and to the strengthening of connections between historic preservation, economic viability and sustainability. Conference attendees will be able to explore Duluth's wealth of wide-ranging historic resources and learn about their use by an increasingly diverse population. Form start- ups to pop-up shops and co-working locations, Duluth's historic building stock has been successfully utilized by a wide variety of communities. Minnesota is a state rich in diverse, and sometimes challenging, cultural resources. The need to responsibly preserve this important and growing legacy is essential to the state's health and stability. As stewards of these critical resources, conference attendees will be better prepared to encourage historic preservation as an essential tool for revitalization and for the creation of greater understanding among an increasingly diverse population. Conference organizers will seek professional accreditation from the Minnesota Association of Realtors, the Minnesota American Planning Association, and the American Institute of Architects.

Eleanor Bacso City of Duluth
SHPO Certified Local Government (CLG) Grant FY20 Printed On: 14 February 2020 5
File Attachment Summary
Applicant File Uploads • FY20 CLG Grant Budget Template (Conference).xlsx

FY20 CLG Grant
City Name [City Name]
Category Grant Request Cash Match In-Kind/ Volunteer Match Total
DPA Volunteers $ 6,000 $ 6,000
HPC Volunteers $ 3,000 $ 3,000
COD Staff $ 3,200 $ 3,200
NorShor Theatre $ 500 $ 500 $ 1,000
Greysolon Ballroom $ 500 $ 500 $ 1,000
Other Venues $ 500 $ 300 $ 800
Literature $ 1,100 $ 400 $ 400 $ 1,900
Transportation $ 400 $ 400 $ 800
Speakers/Expenses $ 6,000 $ 2,000 $ 2,000 $ 10,000
Vista Cruise $ 750 $ 750 $ 750 $ 2,250
Reception/F&B $ 1,450 $ 1,450 $ 500 $ 3,400
Keynote Speaker $ 6,000 $ 2,000 $ 2,000 $ 10,000 $ - $ - $ -
Total: $ 17,200 $ 7,000 $ 19,150 $ 43,350
Minimum match needed $ 6,880.00
Meets match? Yes
Budget Justification: How were the above figures determined?
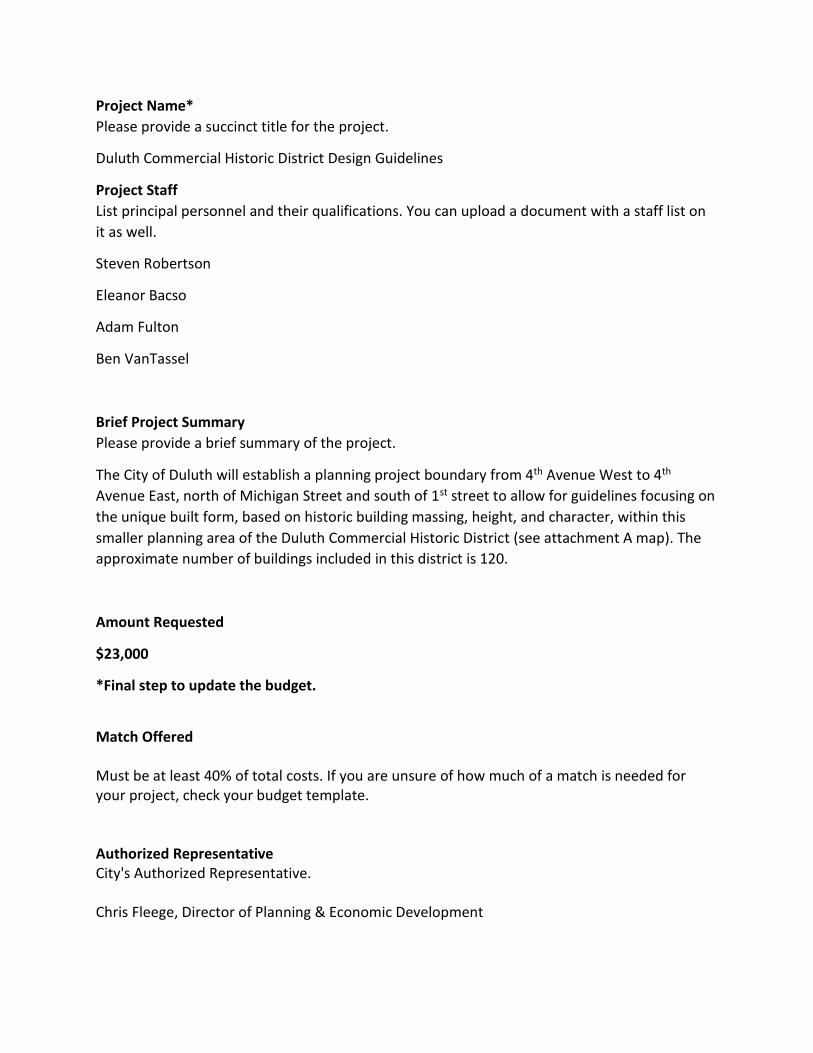
Project Name*
Please provide a succinct title for the project.
Duluth Commercial Historic District Design Guidelines
Project Staff
List principal personnel and their qualifications. You can upload a document with a staff list on
it as well.
Steven Robertson
Eleanor Bacso
Adam Fulton
Ben VanTassel
Brief Project Summary
Please provide a brief summary of the project.
The City of Duluth will establish a planning project boundary from 4th Avenue West to 4th
Avenue East, north of Michigan Street and south of 1st street to allow for guidelines focusing on
the unique built form, based on historic building massing, height, and character, within this
smaller planning area of the Duluth Commercial Historic District (see attachment A map). The
approximate number of buildings included in this district is 120.
Amount Requested
$23,000
*Final step to update the budget.
Match Offered Must be at least 40% of total costs. If you are unsure of how much of a match is needed for your project, check your budget template. Authorized Representative City's Authorized Representative. Chris Fleege, Director of Planning & Economic Development

Project Categories
Please indicate which one of the following categories your project falls under.
Comprehensive Planning
Project Description
Please provide a detailed description of the project.
The City of Duluth plans to contract with a firm specializing in historic preservation planning,
architectural history, or cultural resources management that will, using existing documents,
develop a detailed, cohesive, set of design guidelines. Information from “Creating & Using
Design Guidelines” by the National Park Service will be used to guide the production of the
design guidelines. The contracted firm shall include interdisciplinary expertise in historic
planning and an architectural history. Additional expertise in historic architecture shall be
considered. The contracted individual or firm will be responsible to: Determine the City’s and
HPC’s needs for historic district design guidelines; help coordinate community input by
facilitating public meetings and/or developing survey questions; and compose design
guidelines.
The final design guidelines will be in accordance with the will be The Secretary of the Interior’s
Standards for the Treatment of Historic Properties intended to provide property owners,
contractors and developers assistance as they plan alterations to their historic buildings as well
as to standardize the information used to give guidance to the HPC during decision making.
Substantially conform to a timeline to begin at the end of September 2020, with completion no
later than July 31st, 2021; and handle other activities and services associated with the
development of the guidelines. At least two public presentations by the selected firm will be
required. Once drafted by the City’s consultant, the City will submit the draft design guidelines
to the SHPO and HPC for formal review and comment. Any comments provided by the SHPO
and/or HPC will be considered by the City and will be incorporated, as feasible, into the final
design guidelines. For any comments provided which the City is not able to incorporate, the City
will provide written reasons for not accepting. Draft final design guidelines will be submitted to
the SHPO and HPC for final review and comment. The design guidelines will be considered final
upon written notification by the City, at which time the City will submit final versions of the
design guidelines to the SHPO and HPC. The City will evaluate the guidelines and consider a
resolution to commit the City to accept and incorporate the guidelines into current city
planning procedures once they are finalized. This may include adoption into plans or ordinances
related to development of property in areas covered by the guidelines.

Reflection of Goals and Strategies of the Statewide Preservation Plan
Please include a discussion of how this project reflects the goals and strategies outlined in the
statewide preservation plan.
Through developing design guidelines for along 1st Street bound by 1st Avenue West and 3rd
Avenue East within the Duluth Commercial Historic District, this project meets many goals and
strategies of the statewide preservation plan. The first goal is to preserve and protect the
places that matter. The Duluth Commercial Historic District is an integral piece in keeping
Duluth’s downtown strong. It is imperative that Duluth continues to recognize and highlight the
history of our unique area. One of the ways that we strive to honor the historic significance of
our structures is through developing establishing design guidelines. Through doing this, these
historic buildings can be protected and preserved as long as possible. The economic benefits of
increasing protections in this area are numerous. One of the economic strengths of reuse of
existing buildings is the lower cost. The current costs of new construction are incredibly high
which makes reusing an existing structure more appealing for developers. By using an existing
structure, a developer reignite an underutilized area by investing in a building which can result
in a domino effect; other developers or owners in the area see the success of the reuse of the
building become interested in investing in other existing historic buildings. Developers can also
utilize tax credits that can help with the cost of sustaining and preserving the buildings.
Impact on Community
Provide a concise statement describing the expected effect of the project on the community’s
awareness and understanding of local government in addressing local preservation issues.
Community Support
Please provide a concise statement summarizing demonstrated community support for this
project. Cash match is one measure of community support. Simply Stating that there is
community support is NOT a demonstration of support.
HPC is supporting the project. DEDA is matching- cash match/City is supporting the program.
Mayor? Armory group- support for historic preservation.
Final Product
Provide a concise description of products that will result from the project. You may upload any
documentation you think is necessary.
There will be a change to our zoning code over the historic area. (More protection and
preservation rules). There will be a guide to historic preservation in this area. We will emulate
Mankato’s North Front Street Commercial District Design Guidelines. It will include guidelines

on materials, signage, lighting and new construction guidelines. Also, we intend on issuing a
historic downtown walking guide.

Prepared by
reasonshistoric preservation is good for your community
twenty-four

Contents INTRODUCTION TWENTY REASONS HISTORIC PRESERVATION IS GOOD FOR YOUR COMMUNITY
FOUR ADDITIONAL REASONS (FOR GOOD MEASURE)
COVERAGE OF THE CITY
APPROVAL RATES
CONCLUSION
SOURCES
ACKNOWLEDGEMENTS
1
2
28
29
30
31
31
32
Cover Photo: Dine in the Pines, Courtesy of Ruston Main Street Saratoga Springs, NY
Introduction Historic preservation is good for cities….no, not just good, historic preservation is great for cities. The reasons preservation is great for cities are multiple – aesthetic, symbolic, cultural, social, educational, economic, and others. In recent years these values have been well articulated, notably by Tom Mayes in Why Old Places Matter; Stephanie Meeks in The Past and Future City: How Historic Preservation is Reviving America’s Communities; Historic Preservation and the Livable City by Eric W. Allison and Lauren Peters; The Future of the Past: A Conservation Ethic for Architecture, Urbanism, and Historic Preservation by Steven W. Semes; several books by Roberta Gratz, and others. Each makes a convincing case for the importance of historic preservation in American cities.
But in spite of the strength of their arguments, historic preservation is under attack in many places in the United States. Sometimes those attacks are made by well-meaning community activists, usually arguing with the vignette rather than substantive research, that historic preservation is the cause of gentrification, high rents, and is stopping needed densification.
In other instances, the attack is blatantly industry driven – usually by advocacy groups for real estate developers – who resent not being able to build their skyscrapers wherever they damn well please. But instead of making the candid admission that they just want to make more money, their opposition to historic preservation is couched in seemingly beneficent public policy goals using spurious arguments such as “small business can’t afford to be in historic districts” or “historic preservation is preventing affordable housing” or “we’re losing our competitive position to Singapore” or “if we can’t weaken historic preservation laws, we can’t get the density we need to grow.”
The third prong of the attack comes from the ideological right that argues any limitation on what can be done with my property is unpatriotic, un-American, unconstitutional, and an oppression of my freedoms. These voices are periodically supported by anti-regulatory think tanks such as the Charles Koch Institute. Among the most recent of the latter is an essay in Forbes entitled, “Historic Designations Are Ruining Cities”. That premise is not only wrong, but silly.
What these three groups have in common, besides their antipathy toward historic preservation, is that their evidence is scant to non-existent. At best their “proof” is the anecdote from an isolated example; at worst it is a blatant misrepresentation of reality.
At PlaceEconomics we acknowledge that the aesthetic, symbolic, cultural, etc. values of historic preservation are real, but are difficult if not impossible to quantify. In the long run, those values are more important than the values of historic preservation enumerated and quantified below. But as the great British economist John Maynard Keynes once wrote, “In the long run we are all dead.”
We measure the contributions of historic preservation that can be measured. Over the last five years PlaceEconomics has done analyses of the impacts of historic preservation in nearly a dozen cities of all sizes throughout the United States. From that research we’ve assembled the twenty-four reasons why historic preservation is good for your city.
1

reasonsHistoric rehabilitation means jobs —generally well-paid jobs, particularly for those without advanced formal education. Rehabilitation tends to be more labor intensive than new construction, so work restoring historic buildings has a greater job creating impact per dollar spent than new construction. In Savannah, for example, one million dollars spent on the rehabilitation of a Savannah historic building will generate about 1.2 more jobs and $62,000 more in income for Georgia citizens than the same amount spent on new construction.
In New York City, more than $800 million is invested annually in New York’s historic buildings, creating jobs for 9,000 New Yorkers and providing paychecks of over $500 million each year.
In Pittsburgh, just the projects using the federal historic tax credit have added an average of 500 jobs and $18 million in salaries and wages every year for the past 35 years.
But jobs don’t just come from historic rehabilitation activities. Designated local historic districts are job magnets. In Nashville, while only 3% of jobs are located in historic districts, 11% of all job growth in the city has gone to historic districts. The author of the “Historic Designation is Ruining Cities” wrote, “Today, cities that are thriving are those that offer people plentiful dining, retail, and other entertainment options.” In that he is correct. In Nashville designated historic districts also saw 24% of all job growth in accommodation and food service jobs, playing a key role in the tourism industry. In New York City, while 8% of all jobs are in designated historic districts, 12.7% of all food service and accommodations jobs are there. As anyone in the food
historic preservation is good for your community
twenty-four
St. Augustine, FL
Nashville, TN
1. Jobsservice industry knows, success depends not just on the quality of the food, but the atmosphere and character of the restaurant. That’s why in Rhode Island, 14 of the 25 highest rated restaurants on Yelp are in historic districts. In Raleigh 9 of the top 20 Yelp rated restaurants are in historic districts. It’s not just that cities providing dining are thriving, those restaurants are particularly thriving in designated historic districts.
2

Thirty years ago, the conventional wisdom was that downtowns had been replaced by shopping centers, and if downtowns survived at all it would be exclusively because local government and financial institutions were located there. Of course, that was a prescription for a nine to five, five day a week economic, social, and cultural desert. Thankfully not everyone accepted that premise. In large cities and small towns, the most common and ultimately successful strategy was to identify, protect, reuse, and enhance the historic buildings that differentiated downtown from the mall. For those places wise and farsighted enough to reinvest and redevelop their historic structures rather than raze them, the payoff is clear.
In Indianapolis, while about 11% of downtown is made up of historic districts, they contribute a disproportionate amount of income generation, containing nearly 39,000 jobs, 26% of all of the jobs downtown. In Nashville commercial property values in downtown historic districts increased in value by 425% between 2007 and 2017, compared to the rest of downtown at 236%. Two-thirds of new businesses in downtown Raleigh chose historic and other older buildings for their location. In
2. Downtown Revitalization
Burlington, NC Nashville, TN New Orleans, LA
Saratoga Springs, New York, the downtown Broadway Historic District is the cultural and economic hub of Saratoga Springs where 22% of all jobs in the city are located. In Tybee Island, Georgia (population 3,127) the concentrated efforts towards the Main Street Corridor commercial area creates a fertile environment for small businesses. Nearly 250 net new jobs have been created in the Tybee Island Main Street Corridor alone.
Main Street, is an economic revitalization program based on utilizing each downtown’s historic buildings. There is no more cost-effective program of economic development of any kind in the United States today. Since 1980, Main Street districts in more than 2000 communities have seen cumulative investment of $79 billion, 285,000 buildings rehabilitated, more than 640,000 net new jobs, and nearly 144,000 net new business. Many of these are small towns in rural America. This historic preservation-based program didn’t ruin those towns; in many cases it literally saved them.
3

3. Heritage TourismOften when “economics” and “historic preservation” appear in the same sentence, the reaction is, “Oh, you must mean heritage tourism.” In fact, tourism is just one economic contributor of historic preservation, but it is an important one. Consistent findings in both the US and internationally indicate that heritage visitors stay longer, visit more places, and spend more per day than do tourists with no interest in historic resources.
New York City’s historic sites, places, and landmarks are a major draw for visitors. For domestic tourists who only come to the City for a day, nearly one-third (31.2%) fall into the “heritage visitor” category. The share is even larger for overnight visitors, with 4 in 10 putting a high priority on visiting historic places. While New York’s tourism industry has a huge impact on the City’s overall economy, just the domestic heritage tourism component represents direct spending of more than $8 billion each year. Those expenditures mean jobs – nearly 135,000 jobs a year. Over 98,000 are jobs directly related to the heritage tourism industry and an additional 36,000 indirect and induced jobs are generated by heritage tourism. These heritage tourism jobs result in nearly $6 billion in direct wages to New York City residents and $738 million in local tax revenue. Each heritage visitor in New York City spends on average $83 more during the trip than the non-heritage tourist.
In Pittsburgh 45.6% of overnight visitors and 44.8% of day visitors fall within the definition of heritage tourist. Tourism is a large and growing industry there, but just the heritage portion of that industry is responsible for nearly $812 million annually in expenditures in the Pittsburgh area. What is particularly important about these visitors is that they spend more each day in Pittsburgh as compared to visitors with no interest in historic resources. This difference is the heritage premium. Pittsburgh sees nearly $64 million per year in additional economic activity based on the additional amount heritage visitors spend each day compared to other tourists.
Just the heritage portion of Pittsburgh’s tourism industry is responsible for 12,300 direct jobs and an additional 4,500 indirect jobs. The salary and wages paid to workers meeting the needs of Pittsburgh’s heritage visitors is $310 million per year with another $223 million to indirect and induced jobs.
Brooklyn Bridge
Downtown Nashville
Hotel Adelphi, Saratoga Springs NY
4
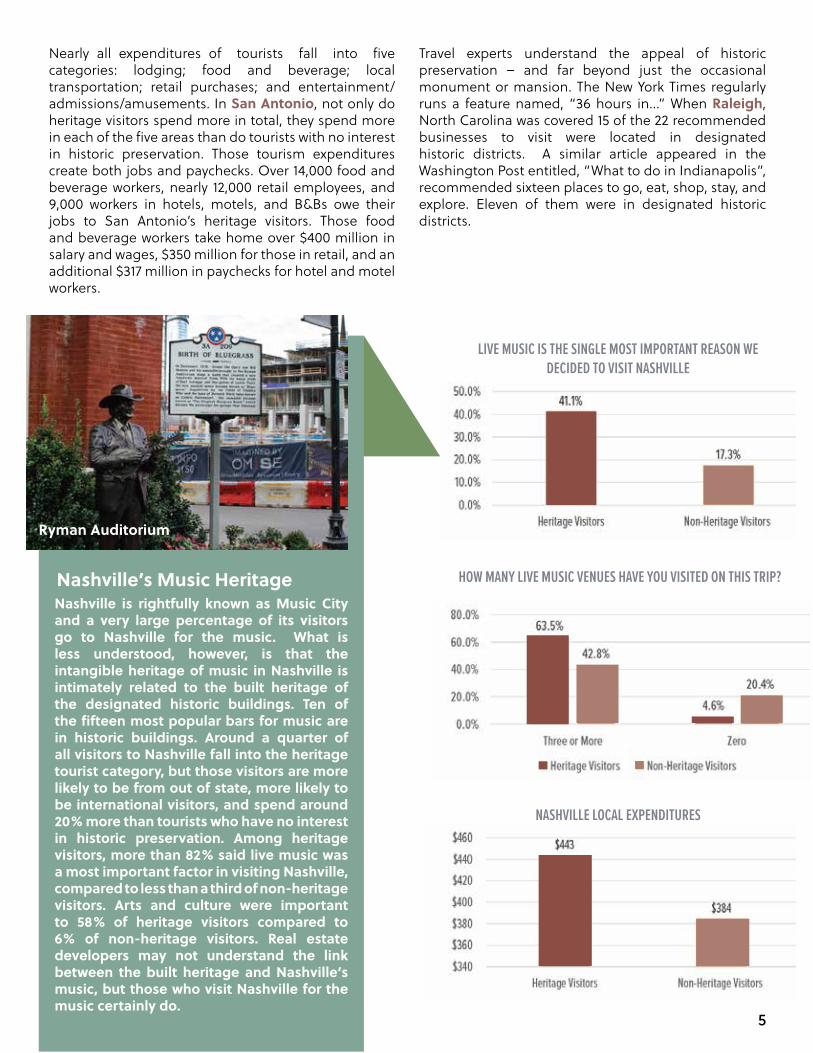
LIVE MUSIC IS THE SINGLE MOST IMPORTANT REASON WE DECIDED TO VISIT NASHVILLE
NASHVILLE LOCAL EXPENDITURES
HOW MANY LIVE MUSIC VENUES HAVE YOU VISITED ON THIS TRIP?
Nearly all expenditures of tourists fall into five categories: lodging; food and beverage; local transportation; retail purchases; and entertainment/admissions/amusements. In San Antonio, not only do heritage visitors spend more in total, they spend more in each of the five areas than do tourists with no interest in historic preservation. Those tourism expenditures create both jobs and paychecks. Over 14,000 food and beverage workers, nearly 12,000 retail employees, and 9,000 workers in hotels, motels, and B&Bs owe their jobs to San Antonio’s heritage visitors. Those food and beverage workers take home over $400 million in salary and wages, $350 million for those in retail, and an additional $317 million in paychecks for hotel and motel workers.
Nashville is rightfully known as Music City and a very large percentage of its visitors go to Nashville for the music. What is less understood, however, is that the intangible heritage of music in Nashville is intimately related to the built heritage of the designated historic buildings. Ten of the fifteen most popular bars for music are in historic buildings. Around a quarter of all visitors to Nashville fall into the heritage tourist category, but those visitors are more likely to be from out of state, more likely to be international visitors, and spend around 20% more than tourists who have no interest in historic preservation. Among heritage visitors, more than 82% said live music was a most important factor in visiting Nashville, compared to less than a third of non-heritage visitors. Arts and culture were important to 58% of heritage visitors compared to 6% of non-heritage visitors. Real estate developers may not understand the link between the built heritage and Nashville’s music, but those who visit Nashville for the music certainly do.
Nashville’s Music Heritage
Travel experts understand the appeal of historic preservation – and far beyond just the occasional monument or mansion. The New York Times regularly runs a feature named, “36 hours in...” When Raleigh, North Carolina was covered 15 of the 22 recommended businesses to visit were located in designated historic districts. A similar article appeared in the Washington Post entitled, “What to do in Indianapolis”, recommended sixteen places to go, eat, shop, stay, and explore. Eleven of them were in designated historic districts.
Ryman Auditorium
5
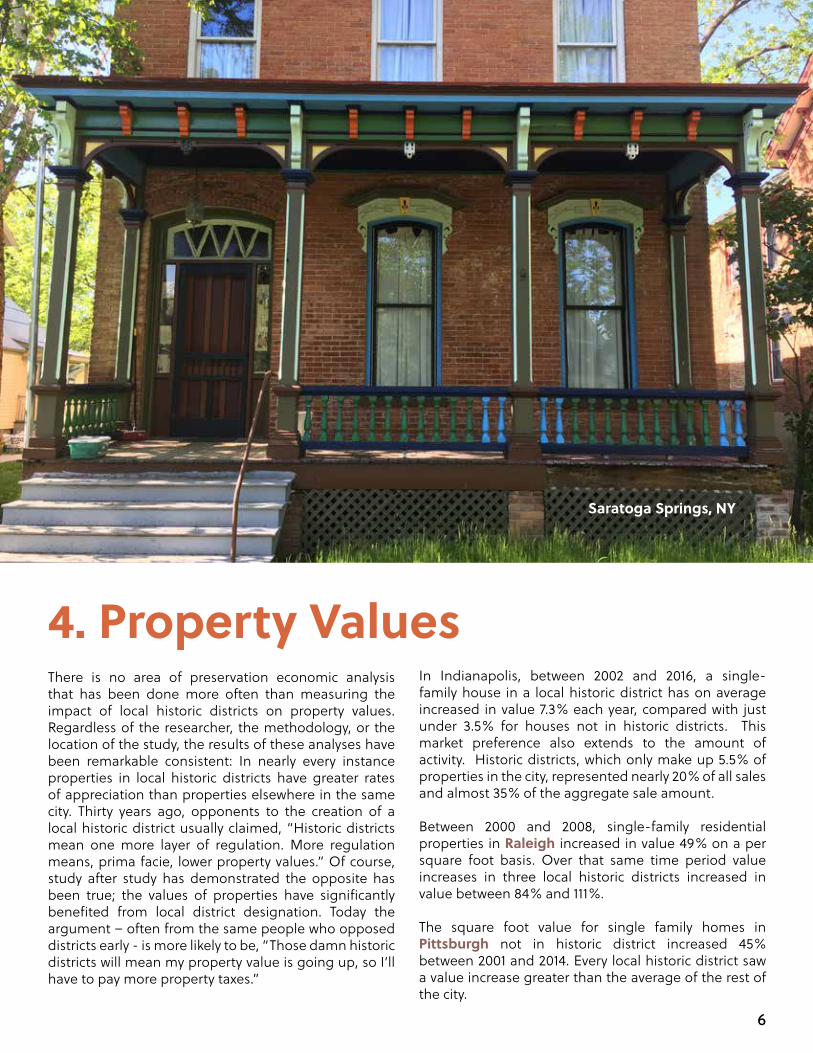
There is no area of preservation economic analysis that has been done more often than measuring the impact of local historic districts on property values. Regardless of the researcher, the methodology, or the location of the study, the results of these analyses have been remarkable consistent: In nearly every instance properties in local historic districts have greater rates of appreciation than properties elsewhere in the same city. Thirty years ago, opponents to the creation of a local historic district usually claimed, “Historic districts mean one more layer of regulation. More regulation means, prima facie, lower property values.” Of course, study after study has demonstrated the opposite has been true; the values of properties have significantly benefited from local district designation. Today the argument – often from the same people who opposed districts early - is more likely to be, “Those damn historic districts will mean my property value is going up, so I’ll have to pay more property taxes.”
4. Property Values
Saratoga Springs, NY
In Indianapolis, between 2002 and 2016, a single-family house in a local historic district has on average increased in value 7.3% each year, compared with just under 3.5% for houses not in historic districts. This market preference also extends to the amount of activity. Historic districts, which only make up 5.5% of properties in the city, represented nearly 20% of all sales and almost 35% of the aggregate sale amount.
Between 2000 and 2008, single-family residential properties in Raleigh increased in value 49% on a per square foot basis. Over that same time period value increases in three local historic districts increased in value between 84% and 111%.
The square foot value for single family homes in Pittsburgh not in historic district increased 45% between 2001 and 2014. Every local historic district saw a value increase greater than the average of the rest of the city.
6

VALUE PER SQUARE FOOT BY AGE IN SARATOGA SPRINGS
$0.00$50.00
$100.00$150.00$200.00$250.00$300.00$350.00
Pre 1900 1900-1925 1926-1950 1951-1975
Value per Square Foot by Age
Historic District Not Historic DistrictNot in Historic Districts
$100$50
$0
$150$200$250$300$350
PROPERTY VALUES BY STYLE (SARATOGA SPRINGS)
$0$200,000$400,000$600,000$800,000
$1,000,000
Victorian
Property Values by Style
Historic District Not in Historic District
$0$200,000$400,000$600,000$800,000
$1,000,000
Victorian
Property Values by Style
Historic District Not in Historic District
Saratoga Springs is fortunate to have a large inventory of older and historic houses, many of which are not located in one of the local historic districts. Some buyers are specifically attracted to these older properties. Comparisons were made for both median and mean by age, by style, by “typical house”, by total value, by value per square foot, and by rate of change in value over time. In every instance, properties in designated local historic districts outperformed comparable properties not within local districts.
It is true that higher values usually mean higher property taxes. And for those with modest resources or living on fixed incomes, that can create difficulties. Often led by preservation advocates, many cities have adopted taxation policies that mitigate those problems. But the reality is this – rising property values resulting in rising taxes may be a cash flow problem, but a wealth enhancement.
Around the United States, the effective property tax rate is typically between 1.5% and 2.5% of the value of the property each year. Thus, a property worth $100,000 would have annual taxes of between $1,500 and $2,500. For example purposes only, assume the market as a whole goes up 3% per year while properties in the historic district go up 4% per year. Next year the non-historic house would have a value increase of $3,000 and increased taxes of between $45 ($3,000 x 1.5%) and $75 ($3,000 x 2.5%) while the historic house would have a value increase of $4,000 and increased taxes of between $60 ($4,000 x 1.5%) and $100 ($4,000 x 2.5%). So here is the effect on the owner of the historic house — she had to pay additional taxes of between $15 and $25 more than her neighbor, the owner of the non-historic house. But the value of her home increased $1,000 more than did her neighbor. She would be hard pressed to find any investment on Wall Street where an additional $15 to $25 in outlay was rewarded with another $1,000 in wealth.
That does not mean that rising property taxes which cause financial difficulties for some owners should not be addressed. But the short-term cash flow problem is offset 40 to 67 times by the increased wealth.
$0.00$50.00
$100.00$150.00$200.00$250.00
Excellent Good Normal
Median Value by Condition
Historic District Not Historic District
MEDIAN VALUE BY CONDITION (SARATOGA SPRINGS)
Not in Historic Districts
$250
$200
$150
$100
$50
$0Excellent NormalGood
7

5. Foreclosure PatternsDecember 2007 marked the beginning of what has come to be known as the Great Recession. Hardest hit in the recession was the real estate market. While the recession was officially designated as having ended in June, 2009, the real estate market in hundreds of cities didn’t recover until three or four years later. In a few markets a decade after the real estate crash, values have still not reached their pre-recession levels.
Economists argue over the causes of the recession, but one thing is not in dispute – millions of Americans lost virtually all of their assets through the foreclosure of their homes. In the 10 years from the beginning of the recession 7.8 million homes were foreclosed on, and millions of additional families faced some type of foreclosure action during that time. Although most markets have recovered, the rate of home ownership in the United States is still five percentage points below its height of more than 69% reached in 2004. But even at the city level, the rate of foreclosure varied greatly from neighborhood to neighborhood. In more than 20 cities we’ve looked at, foreclosure rates in local historic districts were decidedly lower than the rest of the city.
Between 2008 and 2012, the foreclosure actions for single family homes in Indianapolis reached a staggering 26 percent. But those with homes in local historic and conservation districts—while also hit hard by the recession—fared much better with just 6% foreclosure rates.
Florida was especially hard hit in the real estate crash. Every local historic district in Miami-Dade County had a lower foreclosure rate than the 11.2% found in the rest of the county.
In designated historic districts, the foreclosure rate was less than a third of what was experienced in the rest of Pittsburgh.
In San Antonio the rate of foreclosure of single-family houses was less than the citywide average in 10 of the 13 residential historic districts.
For Raleigh single family houses not in historic districts, for every 1000 houses, 100 faced foreclosure over the six-year period, January of 2008 through December of 2013. Local historic districts saw only 28.8 houses per thousand foreclosed upon. Savannah had its share of foreclosures with nearly one house in 8 facing foreclosure in the six-year period between 2008 and 2014. But every historic district in Savannah had lower rates of foreclosure than did the city as a whole. In Nashville, 54 out of every
‐60%
‐40%
‐20%
0%
20%
40%
60%
80%
100%
120%
140%
Change in Up Years (2002‐2006)
Change in Crash Years (2007‐2011)
Change in Recovery Years(2012‐2016)
Value ChangesHistoric Districts vs Rest of Jurisdictions
Historic Districts Rest of Jurisdictions
FORECLOSURE RATE (MIAMI-DADE COUNTY)
4%6%8%
10%12%
0%2%
Historic Districts Rest of County
11%
6%
1000 houses faced a foreclosure action between 2007 and 2018. In Nashville’s historically designated districts the rate was less than half of that at 25.3 houses per thousand. Further, 16% of the foreclosures in historic districts were on new houses built as infill in the neighborhood.
One might prematurely conclude, “well, those historic neighborhoods are all rich, so those people could weather the recession.” Simply not the case. In every one of those cities – Indianapolis, Miami/Dade County, Pittsburgh, San Antonio, Raleigh, Savannah, and Nashville – while there are some wealthy historic neighborhoods, there are also numerous neighborhoods that are the opposite of wealthy. In nearly every one of the less prosperous neighborhoods, the foreclosure rate was still less than the rest of the city.
It isn’t that people who live in historic districts never get fired, or divorced, or run their credit card bills up too high. Rather there is a latent demand for homes in those neighborhoods even in market downturns. As a result, homeowners who find themselves in financial difficulties often find buyers for their homes before they reach the point of foreclosure.
0
10
20
30
40
Local HistoricDistricts
National RegisterDistricts
Rest of Pittsburgh
Foreclosure Rates Per 1000 Houses in PittburghFORECLOSURE RATE PER 1000 HOUSES IN PITTSBURGH
0
10
20
30
40
Local HistoricDistricts
National RegisterDistricts
Rest of Pittsburgh
Foreclosure Rates Per 1000 Houses in Pittburgh
8

6. Strength in Up and Down MarketsRelated to the foreclosure findings is the pattern of value change in both up markets and down markets. As a general pattern, homes in historic districts do better when the market is moving up, fall later and less steeply when markets decline, and begin their value recovery sooner than other neighborhoods.
Between 2000 and 2008 – prior to the recession — single-family residential properties in Raleigh increased in value 49% on a per square foot basis. Over that same time period value increases in three local historic districts increased in value between 84% and 111%. Then the recession began and property sales declined both in historic districts and the city as a whole between 2008 and 2009. But before the recession was declared over the volume of property sales in historic districts began to recover and continued through the end of 2013. Home sales in the rest of the city continued to decline before picking up once that national recession ended. By 2013 the number of sales transactions in historic districts was nearly 10% above the 2008 level, sales in the rest of Raleigh still lagged their 2008 numbers by 10%.
In 2012 the city as a whole recorded a 13% increase in the number of home sales. Raleigh’s local historic districts saw a 68% increase in number of sales between 2011 and 2012.
Between 2007 and 2010, new construction in New York City fell 30% and didn’t recover to pre-recession levels of activity until 2012. Over that same time, activity in historic districts, while suffering a minor one-year decline, maintained a pre-recession level of activity.
An analysis of building permits in Nashville from 2006-2011 shows that historic districts weathered the recession well, accounting for 19% of all permit investment and over 18% of all projects during the recession.
In up years in the real estate market, San Antonio’s local historic districts significantly outperformed the city as a whole. When the recession hit, there was a minor decline in historic district property values, but less severe than in the rest of the city. Then when the recession was finally over, recovery in the residential real estate sector began first in San Antonio’s historic neighborhoods. The 15-year period between 1998 and 2013 covered three real estate cycles – rapid appreciation until 2007, real estate crash, and then market recovery. By 2013 the average square foot price of a single-family home outside of San Antonio’s historic districts was up about 68% from its 1998 value. But San Antonio’s historic districts homes were up 139% over their 1998 values.
This pattern of resilience in real estate recessions isn’t limited to housing values or sales activity. Between 2007 and 2010, new construction in New York City fell 30% and didn’t recover to pre-recession levels of activity until 2012. This collapse in the building industry meant that thousands of New York workers were suddenly without jobs or paychecks. Over that same time, however, activity in historic districts, while suffering a minor one-year decline, maintained a pre-recession level of activity. For rehabilitation work in historic districts, the decline began later, was much less deep, and recovery began sooner as compared to new construction in the City. If activity in New York’s historic districts had declined as much as did new construction, more than 1,600 more New Yorkers would have been on the unemployment line each year between 2008 and 2012. The speculation inherent in new construction left the industry vulnerable to boom and bust, whereas reinvestment and rehabilitation of older buildings acted as a stabilizing force during the economic downturn.
Many cities today are developing “resiliency plans.” But resiliency isn’t limited to recovery after natural disasters. It is also necessary after financial crises. In city after city, it has been the local historic districts that have been the most resilient after a real estate crash.
9

While it’s the companies of the Fortune 500 that get the headlines in the Wall Street Journal, it is small businesses who are the backbone of the American economy. 96% of all businesses employ fewer than 50 people; 89% fewer than 20. These small businesses employ 23 million more workers than do firms of 500 with more people on the payroll. Since the end of the recession, those small businesses have added 30% more jobs than have the big guys. Further, it is small businesses that offer the greatest entrepreneurial opportunity to women and minorities. So an economically dynamic city should be particularly concerned about creating an environment hospitable to small businesses. It is often historic districts that are the location of choice for small businesses.
Historic districts and buildings have a competitive advantage. They contain attractive buildings, spaces, and other attributes desirable to small businesses. Small businesses don’t just provide convenience and local jobs; they are also the source of the commercial vitality of a neighborhood. These businesses value the unique character inherent in historic buildings and often the competitive rents in older structures. While historic districts account for 8% of all private jobs in New York City, these neighborhoods are the place of employment for nearly 10% of the City’s jobs in small firms.
In Saratoga Springs, historic districts house 31% of all jobs at small firms (firms employing fewer than 20 people).
In Savannah, 30% of all jobs are in historic districts, but nearly half (48%) of the businesses that employ fewer than 20 people are located in these areas.
In San Antonio, while historic districts are home to only 4% of all jobs, fully 7% of small firm jobs have chosen to locate there.
Recent analysis of Dun and Bradstreet data show that while only 4.8% of the businesses in Manhattan are owned by minorities or women, 7.2% of businesses in historic districts meet that test. In fact, 12% of all women-owned businesses and 8% of minority owned businesses are located in historic districts.
Small businesses are important to a local economy, and historic districts make a great location for a disproportionate share of small businesses.
7. Small Business
Denham Springs, LA
Little Rock, AR
10

8. Start ups and Young BusinessesIf small businesses are important, start-up and young businesses (less than 3 years old) are even more so. Almost all net new job creation comes from new businesses. Where do those businesses choose to locate? Often in local historic districts.
In Miami-Dade County 4.9% of all jobs are located in historic districts but 5.2% of job growth occurred in those areas. Just over 6% of jobs at start-up firms are located in historic districts. That might not seem significant, but more than one in four jobs at start-up firms were created in historic districts.
In New York City, historic districts are home to 8% of all private jobs, but 10.1% of jobs at start-up firms (in business for less than one year) and 10.9% of all jobs in young firms.
Raleigh, North Carolina is an economically vibrant and growing city. Of the new businesses in downtown Raleigh 46% of them chose a designated historic building to open their operation. Another 22% chose older buildings that were not yet historically designated.
A business’ location is more than an address. Particularly new and small businesses want their physical location to be a reflection of the quality and character of the goods or services sold within. The quality and character a historic building is an appropriate choice for these entrepreneurs.
Three Fold Noodles + Dumpling Co. — Little Rock, AR
11

9. Jobs in Knowledge and Creative Class SectorsRichard Florida may have overstated the case in The Rise of the Creative Class but urbanists, economists, and economic development experts note that the young, well educated, talented workers are essential for a local economy to grow and the city to be vibrant. So where are those knowledge and creative class workers choosing to live and work?
In New York City the three categories within which creative workers are employed are disproportionately represented in New York’s historic districts. While 8% of all jobs are in historic districts, more than 10% of Professional, Scientific, and Technical Services jobs are in historic districts and more than 13% of jobs in the Information field. People can love or hate New York, but no one can argue that it is not one of the most creative cities in the world. And creatives gravitate toward neighborhoods with character. More than 20% of jobs in the Arts, Entertainment, and Recreation sector are located in historic districts in New York City.
Pittsburgh has seen an in-migration of young, educated workers which bodes well for the future of Pittsburgh’s economic growth. But the location of the jobs held by those workers is not random. Pittsburgh’s historic districts capture a disproportionate share. While around 19% of all workers in Pittsburgh hold a bachelors or advanced degree, more than 35% of workers in historic districts have reached that educational attainment. While historic districts contain slightly more than 37% of all jobs, those areas are home to 47% of the jobs in finance and insurance, 58% of the jobs in education and 44% of jobs in the information sector. These knowledge worker jobs are the growth areas in the US economy and are concentrated in historic districts in Pittsburgh.
In San Antonio, historic buildings and historic districts have a long history of incubating the arts. Arts related jobs in San Antonio are generally concentrated within or clustered around historic districts. This is also true of nonprofit organizations generally, 28% of which are located in San Antonio historic districts. While historic districts are home to just 4% of all jobs, there is a greater share of workers in arts and entertainment; information services; education; and professional, scientific, and technical services fields.
Firms employing “knowledge workers” are particularly attracted to historic areas. Although historic districts are home to 31% of all jobs in Savannah, 39% of
professional/scientific/technical services jobs, 57% of art/entertainment/recreation jobs, and 74% of educational services jobs are in historic districts.
New York and Los Angeles will always argue which is the more creative city. Creative class workers show a decided preference for local historic districts in New York and the same can be said for LA. Between 2005-2015 Los Angeles saw a 20% growth rate in arts related jobs, but local historic districts saw a 35% growth rate in arts related jobs.
While workers in the knowledge and creative fields will never be a large percentage of the entire workforce, they have a disproportionate impact on the economic vitality of a city. And employers of those workers are disproportionately choosing to locate in historic districts.
of all Professional, Scientific, and Technical Service Jobs10.4%
of all Private Jobs 8%
of all Information Jobs 13.3% of all Arts, Entertainment, and Recreation Jobs20.3%
In NYC, Historic Districts Contain:
12

10. Millennials and HousingIn 2019 the number of Millennials (those born between 1981 and 1996) in the United States surpassed the number of Baby Boomers. That means for the next generation, that age group will have an outsized impact on how and where cities grow. So a city planning for a prosperous future must consider the needs and preferences of Millennials. Many in this age cohort might not identify themselves as “preservationists” but the qualities they are looking for in cities are the qualities found in historic neighborhoods.
One of the fastest growing cities in the nation is Nashville, a city particularly attractive to Millennials. While that age group makes up 29% of the population in non-historic neighborhoods, they constitute 33% of historic district residents.
New residents in a neighborhood who are renters are from all age groups, but a sizable share are Millennials. In Raleigh, historic districts have seen an influx of new renters in recent years, reflecting increased interest in living in the historic downtown area. Just over 60% of renters moved in since 2005, compared to around 30% of citywide renters.
In Los Angeles, the number of millennial residents in historic districts grew by 9% since 2010, compared to 7% in the rest of the city. Despite making up only 1.8% of the land area, historic districts accounted for 4% of all new millennial residents between 2010 and 2016, meaning these areas punch above their weight in terms of attracting young adults.
A recent survey of the National Trust for Historic Preservation found that 44% of millennials surveyed wanted to live in historic, character rich neighborhoods.National home buying trends back this up. Nationally, despite making up only 34% of homebuyers, millennials account for 59% of all buyers of houses built before 1912 and 43% of buyers of houses built between 1912 and 1960.
Attracting and retaining Millennials needs to be an economic development priority for cities. Whether as renters or homeowners, Millennials have revealed a preference for historic neighborhoods.
Home rehabbed by young family in Helena, AR
Micro Apartments in Columbus, OH
MILLENNIALS AND HISTORIC HOUSES NATIONWIDE
Millennials as Buyers of Houses 1912-1960
Millennials as Buyers of Houses Pre-1960
Millennials as Share of All Home Buyers
of all Private Jobs
13

11. Walkability/BikeabilityIn 2007 Walk Score was released to the public. Since then urban planners, real estate professionals, public health workers, transportation experts, and others have stressed the importance of Walk Score; it has become a basic tool of urban analysis. But most neighborhoods in America are not very walkable. The American Journal of Preventive Medicine noted, “Neighborhoods built a half-century or more ago were designed with ‘walkability’ in mind. And living in them reduces an individual’s risk of becoming overweight or obese.” For multiple reasons people are prioritizing walkability in their choice of where to work and live. The Urban Land Institute reports that 50% of U.S. residents say that walkability is a top priority or a high priority when considering where to live.
What neighborhoods are walkable? Historic neighborhoods.
Nashville is notoriously unwalkable. Walk Score rated Nashville the 48th most walkable large city in the US, with a Walk Score of 28 and a Bike Score of 25. As a city, Nashville falls in the “Car Dependent” category. Yet historic districts are demonstrably more accessible earning a Walk Score of 63 and a Bike Score of 57. Nearly half of the historic districts have a Walk Score over 70, which is considered “very walkable.”
In Pittsburgh, the Walk Score was calculated for every block in every historic district. Then the average scores for historic districts was compared with the city as a whole. The result? As Pittsburgh is a dense city, the overall Walk Score is a very respectable 60. However, the average block within historic districts in Pittsburgh achieves a Walk Score of 75. Historic neighborhoods are more walkable than in most of a quite walkable city.
As with the Walk Score, the Transit Score was calculated for every block in every historic district in Pittsburgh and then compared with the city. The results were the same. While the city of Pittsburgh had a Transit Score of 54, blocks in historic districts averaged a Transit Score of 66. Probably because of the number of hills and steep topography the Bike Score for the City of Pittsburgh is just under 40, while the Bike Score for Pittsburgh’s historic neighborhoods is 63.
Raleigh’s local historic districts represent some of the most walkable parts of the city. While the city of Raleigh has an average Walk Score of 29, meaning that most neighborhoods are car-dependent, Raleigh’s historic districts average a 73 Walk Score.
Savannah, as a whole, rates a score of 41, putting it in the “Car-Dependent” category, while every local historic district scores higher ranging from “Somewhat walkable” to “Walker’s Paradise.”
Competitive cities need to be walkable, and walkability is found in historic neighborhoods.
The Walk Score categories are:
90–100 Walker’s ParadiseDaily errands do not require a car.70–89 Very WalkableMost errands can be accomplished on foot.50–69 Somewhat WalkableSome errands can be accomplished on foot.25–49 Car-DependentMost errands require a car.0–24 Car-DependentAlmost all errands require a car.
Indianapolis, IN (Photo Credit: Raina Regan)
14

Density. The D word. Density has lots of proponents – transportation experts, infrastructure engineers, public works directors, urban planners. The argument goes like this: “We need to have density to efficiently provide public services. Everything from bus systems to school locations to fire protection to waterlines are more efficiently and cost-effectively provided if we have density.” And you know what – they are right. Cities need density. But here’s where the argument falters; density is seen as a synonym of high-rise construction. Wrong. Where is density being provided right now? In historic neighborhoods.
In Miami-Dade County, historic districts are some of the densest areas with population density 5 times the county as a whole and nearly 2 1⁄2 times the average density in the urban areas. Another argument for density is that there is much greater tax generation per acre. True, and in Miami/Dade County the historic districts represent nearly four times the assessed value per acre than the rest of the County.
A common criticism of historic preservation is that it prevents increased density, and critics claim that preservation is in opposition of new developments that would provide needed housing units. This claim is not true in Nashville. First, historic districts only cover 6% of the land area of Nashville, there is plenty of space elsewhere in the city beyond historic neighborhoods. Second, historic districts are disproportionately absorbing Nashville’s population growth. Third, historic districts are on average the densest parts of the city. In fact, these areas are home to 4,828 people per square mile, 1,600 more than residential neighborhoods in the rest of the city. Density is needed in Nashville and historic neighborhoods are providing it.
San Antonio is not a dense city overall, with a population of around 2,900 people per square mile. However, the average density for San Antonio historic districts is 5,369 persons per square mile. Individually almost every historic district has a density higher than the city-wide average.
But what is often missed by both proponents and opponents of density is that people will accept and even appreciate density if it is at a human scale. That’s what Savannah’s historic neighborhoods provide. As a whole Savannah is not a dense city, with just over 1,300 persons per square mile citywide. The local historic districts in Savannah are nearly five times as dense housing over 6,300 people per square mile. Importantly this is density
12. Density at a Human Scale
Fourplex in Los Angeles, CA
Duplex in Los Angeles, CA
0
5000
10000
15000
20000
HPOZ (Historic Districts) Rest Of City
Population Density (Los Angeles)
0
5000
10000
15000
20000
HPOZ (Historic Districts) Rest Of City
Population Density (Los Angeles) POPULATION DENSITY - PEOPLE/SQ MI(LOS ANGELES)
15

at a human scale. These are neighborhoods where people like to walk—not overpowered with 20-story condominiums—but lined with houses built in the close proximity envisioned by General James Edward Oglethorpe.
Even in a low-density city like Los Angeles, the local historic districts are 1 ½ time the average density as other residential neighborhoods.
The powerful and influential Real Estate Board of New York (REBNY) has made the case for weakening protections for local historic districts around four main arguments. 1) The population of New York City is growing. 2) The City is landlocked and so cannot grow outward. 3) Therefore, we have to grow upwards. 4) Historic districts are precluding us from building the skyscrapers that we want to build and the density the City needs. That series of posits seems very reasonable. Who could argue with that?
Preservationists both can and should and here’s why. 1) Less than 5% of the developable lots in the City of New York is under the purview of the Landmarks Preservation Commission. If you can’t figure out how to build your skyscrapers on the other 95% of the land, maybe you’re not smart enough to be in the real estate business. 2) In every one of the five boroughs, the densest residential neighborhoods are the historic districts. 3) The density of the Census Blocks where residential highrises were built in Manhattan between 2000 and 2010, as tall as they are, still have density less than the historic districts in Manhattan. 4) Because of unit size and frequent patterns of low full-time occupancy, the density added by those skyscrapers is much less than their height would suggest.
Yes, New York City needs density, and yes, much of that needs to come from high rise development. But why does that density need to be in the 5% of the land of New York City that is already providing the highest density?
For all the whining from REBNY about the evils of historic districts, those developers certainly aren’t shy about marketing what urban journalist Roberta Gratz calls their “over-the-top luxury towers catering to the foreign oligarchs or providing pied-à-terres to American one-percenters” by stressing their proximity to historic neighborhoods. Allowing them to be built in the middle of New York’s historic districts would be allowing parasite buildings – using the ambiance, quality, and character of the neighborhood as the door mat for their $6,000/square foot luxury phallic symbol.
New York City, NY
New York City, NY
16

13. Environmental ResponsibilityIt was Carl Elefante, immediate past president of the American Institute of Architects, who first coined the phrase, “The greenest building is the one already built.” This connection between the historic built environment and environmental sustainability went unrecognized by most of the environmental movement for decades, culminating in the LEED certification program which awarded more points for a single bike rack than for reusing an entire building. This myopia led to significant recent research by both academics and practitioners including, Stewardship of the Built Environment: Sustainability, Preservation, and Reuse, by Robert A. Young, Building Reuse: Sustainability, Preservation, and the Value of Design by Kathryn Rogers Merlino, Sustainable Heritage, by Amalia Leifeste and Barry L. Stiefel, Sustainable Preservation: Greening Existing Buildings, by Jean Carroon, Green Restorations: Sustainable Building and Historic Homes, by Aaron Lubeck and others. These published works were supplemented by the research of the Preservation Green Lab (now called the Research & Policy Lab of the National Trust). In their first major study, the Preservation Green Lab compared the environmental responsibility between appropriately retrofitting a historic building or building a new green gizmo structure. They found among other things that it takes 10 to 80 years of operating savings of a green gizmo building to recoup the negative climate change impacts of the construction. Almost every building typology in every region of the country demonstrated a better environmental outcome through adaptive reuse than with demolition and new construction.
In Maryland, a study by economic analyst Joseph Cronyn and environmental economist Evans Paull compared the differences in environmental impact of rehabilitating a 50,000 square foot historic industrial building to building a new structure at the edge of town. Among their findings were: a 20%-40% reduction in Vehicle Miles Traveled; reduced travel related CO2 of 92-123 metric tons; retained embodied energy of 55,000 Million BTUs; greenfield land preserved 5.2 acres; less demolition debris in landfill of 2.500 tons; $100,000 value of natural resources saved; and infrastructure investment saved of between $500,000 and $800,000. Between the environmental benefits and the fiscal savings, the Sierra Club and the Tea Party ought to be holding hands in leading the preservation parade. These findings have been confirmed in city level preservation impact studies.
Mayor Bloomberg before he left office wanted to put New York City on a path to be the most environmentally
responsible city on the planet. Good businessman that he is, he decided that step one should be an audit of which buildings were using how much energy today. Contrary to conventional wisdom, in fact the least energy use per square foot was found in buildings constructed more than 70 years ago. For multi-family properties, a structure built since 1980 used nearly 13% more energy per square foot than did an apartment built prior to 1920. While the energy efficiency has improved for buildings constructed over the last 30 years, still an office tower built since 1980 uses 33% more energy per square foot than one built nearly a century ago.
The U.S. Green Building Council recommends that a connected development pattern has at least 140 intersections per square mile. While Nashville’s streets inside the 1963 boundary have an impressive average of 932 intersections per square mile, the historic district streets double that. The impact of shorter blocks, connectivity for transit, and traffic calming benefits are well known with more intersection density.
Apart from energy usage, the amount of waste that goes into landfills when eliminating older and historic buildings is also an important factor when evaluating environmental responsibility. To put these environmental costs in context, when a decision is made to demolish one modestly sized house in a Raleigh historic district, 62.5 tons of waste is generated for the landfill. That’s as much waste as one person would generate in 79.5 years. When the energy cost of razing and hauling to the landfill are added to the embodied energy already within the existing building, the demolition of a modest sized historic home in Raleigh is equivalent to throwing away 15,285 gallons of gasoline.
Nearly every 4th grader in America learns that to be environmentally responsible it’s necessary to reduce, reuse, recycle. The use of historic buildings does all of those things.
Nashville, TN
17

14. Smart GrowthThe closest we have in the United State for a comprehensive sustainable development movement is one known as Smart Growth. And Smart Growth has a specific set of principles. They are:
• Create a range of employment opportunities.• Mix land uses.• Take advantage of compact building design.• Create walkable neighborhoods and a range of
housing opportunities and choices.• Foster distinctive, attractive communities with a
strong sense of place.• Preserve open space, farmland, natural beauty, and
critical environmental areas.• Strengthen and direct development towards
existing communities.• Provide in advance a variety of transportation
choices, urban and social infrastructure based on population projections.
• Make development decisions sustainable, predictable, fair, and cost effective.
• Encourage community and stakeholder collaboration in development decisions.
• Cost effectiveness in decision making.
Historic neighborhoods are the living embodiment of all ten Smart Growth principles. In fact, if a community did nothing but protect its historic neighborhoods, it will have advanced a comprehensive sustainable development agenda.
Commute time has both environmental and quality of life implications. The density and central location of Indianapolis historic districts have implications for the live-work balance. While the average commute in the Indianapolis is 23 minutes, nearly 35% of households in historic districts commute less than 15 minutes. This also affects the quality of life of residents, as more time spent commuting means less time spent with family, exercising, and contributing to the community.
In a 2013 report by the International Downtown Association, Savannah’s Landmark District is considered a “high live-work” downtown with 29% of all workers also residing there. This has positive impacts not just for the worker, but for the environment, traffic congestion, businesses that serve both residents and workers, the municipal budget, and public safety issues. Density, walkability, bikeability, and live-work lifestyle are important in quality of life measurement and that is exactly what Savannah’s historic neighborhoods provide.
San Antonio, TXPhoto Credit: SA Office of Historic Preservation
Nashville, TN
Indianapolis, IN (Photo Credit: Raina Regan)
18

The use of public transit is usually a priority for both sustainability and resilience strategies. In nearly every municipality in Miami-Dade County, residents of local historic districts use public transit to a greater degree than do the rest of the citizens of their community. This translates into environmental savings as households in historic districts drive 2,300 miles less per year. Less miles traveled means less greenhouse gas emissions. 92% of properties in historic districts are within .25 miles of a bus route, compared to 76% in the rest of the city. 29% of residents in historic districts are within .5 miles of a hospital, compared to 10% in the rest of the city. 75% of residents in historic districts live within .5 miles of a public school, compared to 67% in the rest of the city.In Miami/Dade County, 82% of properties in historic districts are located within 1⁄4 mile of a park or greenspace compared to 43% of the rest of the county. The average tree canopy coverage in historic districts is over 20% as compared to just over 12% in the county overall. The historic district tree canopy contributes more than $19 million in economic benefits.
Roughly twice the number of workers commute into Raleigh’s historic districts than workers who live in the districts and commute elsewhere. And nearly 40% of the incoming workers travel less than 10 miles to get to their workplace in the districts, compared to only 33% in the city as a whole. People who live around historic districts are benefiting from their concentration of businesses and jobs as well.
A public commitment to identify, protect and enhance San Antonio’s historic neighborhoods is in and of itself Smart Growth. San Antonio’s historic neighborhoods should serve as the model in how to reach the vision established for environmental sustainability.
San Antonio is known for its cohesive neighborhoods with compelling and unique personalities. Modern linked mass transit, improved infrastructure and a concerted effort to preserve and maintain our historic buildings, parks and open spaces compliment smart growth patterns. The result is a livable and vibrant community that is strongly connected to its past and maintains it small town feel. The Average Transit Score for San Antonio Historic Districts is nearly twice the citywide average.
A neighborhood that adopted the Smart Growth principles should be expected to benefit from a priority on almost everyone’s list – reduced commuting time. That is already happening today in historic neighborhoods in San Antonio. Over a third of historic district residents have commute times of less than 15 minutes. That compares with less than 24% of other San Antonio residents who can make the same claim.
The conclusion for this section is simple: Historic Preservation IS Smart Growth.
Indianapolis, INPhoto Credit: Indiana Landmarks
19

15. Neighborhood Level DiversityIn some places historic districts are seen as exclusively the domain of the rich and white. While throughout the country there are, indeed, some historic districts that are very wealthy, that is far from the norm. Further, at PlaceEconomics, we believe that healthy neighborhoods are those that at the neighborhood level are a reflection of the economic, racial, and ethnic diversity of the entire city. We are further convinced that economic integration at the neighborhood level ought to be a public policy goal. Where are these “mirror of the city” areas? Almost exclusively in local historic districts.
Historic districts help to achieve public policy housing goals by providing housing options for a range of household sizes and incomes, while fostering a balance of neighborhood stability and healthy change. In Raleigh housing units come in a variety of sizes. The vast majority—over 75 percent—are modestly sized, with fewer than 2,500 square feet. A diversity of housing sizes results in a diversity of housing price points for both renters and potential owners. It is this range of price options that leads to economic integration within a neighborhood.
Historic districts ought to provide jobs across the demographic spectrum. When the racial makeup of workers in Pittsburgh as a whole is compared to the racial makeup of workers in historic districts, there is nearly no statistical difference. Historic districts are a virtual mirror of the city at large in terms of the race of those working there. As are the residents in Pittsburgh’s historic residential areas.
While Miami-Dade County as a whole is diverse, the local historic districts are particularly so. While there are differences among individual historic districts, on an aggregate basis the residents who choose to live in the county’s local historic districts are a mirror of the diversity of the county as a whole, in income, in race, and in ethnicity.
In nearly every historic neighborhood in Nashville there are households with very modest earnings living next to households of significant income. This is economic integration and is central to the equity goals of the city. Nashville recognizes that urban vitality is built on diversity, and it has become a basic premise of placemaking that healthy neighborhoods are neither all rich nor all poor. The historic districts in Nashville are home to households at both the bottom and the top of
0% 20% 40% 60% 80% 100%
ROC
HD
Race
White Black Asian Other
100%
Rest of County
0% 20% 40% 60% 80%
RACIAL DIVERSITY (MIAMI-DADE COUNTY)
AsianWhite Black Other
Historic Districts
the economic rungs of the city. In fact, there is almost an even distribution of households in historic districts among lower (36.1%), middle (27.3%), and upper income (36.6%) households.
In San Antonio, at the historic district level, neighborhoods are composed of a great diversity of incomes by household. A few – Cattleman Square and Government Hill - have a higher percentage of households making $25,000 and under, while King William and Monte Vista have a greater share of households making more than $150,000. Most neighborhoods are statistically near the city averages for household in each income category. Even in a perceived wealthy district like King William, the share of households earning under $25,000 is nearly the same as the city overall. And in that district, there are more than two times as many households earning less than $50,000 per year than those making more than $150,000.
San Antonio, TXPhoto Credit: SA Office of Historic Preservation
20

In Saratoga Springs, the eight historic districts are comprised of the most diverse residential populations in the city. In fact, the historic districts are home to a larger share of non-white residents than the rest of the city. While the overall population of Saratoga Springs is 90% white, the city’s historic districts have greater diversity among African American, Asian, and other minority populations. Saratoga Springs historic districts help preserve the existing rental housing stock in town. As a result, many of these renters are able to call local historic districts home. Saratoga Springs’ historic districts also provide a wide variety of housing sizes and models, which is another important aspect of maintaining housing. There are more housing options in historic districts than elsewhere in the city. This enables residents from a wide range of economic levels, household sizes, and age groups to live in Saratoga Springs. In fact, 40% of all apartment properties are located in historic districts —again demonstrating that historic districts, while covering only a small portion of the land area, are dense, productive, efficient and equitable.
While historic districts in Manhattan are overall higher in income and lower in minority populations than the borough as a whole, in many instances the other boroughs demonstrate just the opposite. Likewise, while those households earning more than $150,000 constitute a larger share of the population in historic districts than the borough at large in both Manhattan and Brooklyn, the other boroughs show a different reality. In the Bronx, Queens, and Staten Island, high-income households in historic districts represent virtually the same share of the population as the borough as a whole.
When compared citywide, New York City’s historic districts have a larger share of the White population and a correspondingly smaller share of minority populations than the rest of the City. But, in fact, those overall numbers are skewed by patterns in Manhattan. When looked at on a borough by borough basis, the picture is much different. In the Bronx and Brooklyn, the Black population within historic districts is nearly a mirror image of the Black population in the rest of the borough. In Staten Island, historic districts have a larger share of the Black population than the rest of the borough. This trend continues with Hispanic populations as well. In both Manhattan and Brooklyn, there is a smaller share of Hispanics in historic districts than in the borough as a whole, but in the Bronx, Queens, and Staten Island, there is a higher share of Hispanic New Yorkers living in historic districts than in the rest of the borough.
Neighborhoods ought to be available to a wide spectrum of a city’s population, and more often than not it is the historic districts that are meeting that goal.
88% 90%
2% 2%4% 3%7% 5%
0%10%20%30%40%50%60%70%80%90%
100%
Historic Districts Not in Historic Districts
Chart Title
White Black or African American Asian Other
RACIAL DIVERSITY (SARATOGA SPRINGS)
0%10%20%30%40%50%60%70%
Bronx Brooklyn Manhattan Queens StatenIsland
un der 50k
Historic Districts Rest of Borough
0%
10%
20%
30%
40%
Bronx Brooklyn Manhattan Queens StatenIsland
over 150
Historic Districts Rest of Borough
SHARE OF NYC HOUSEHOLDS WITH INCOME LESS THAN $50,000
SHARE OF NYC HOUSEHOLDS WITH INCOME OVER $150,000
0%
10%
20%
30%
40%
Bronx Brooklyn Manhattan Queens StatenIsland
over 150
Historic Districts Rest of Borough
0%10%20%30%40%50%60%70%
Bronx Brooklyn Manhattan Queens StatenIsland
un der 50k
Historic Districts Rest of Borough
0%10%20%30%40%50%60%70%
Bronx Brooklyn Manhattan Queens StatenIsland
un der 50k
Historic Districts Rest of Borough
0%10%20%30%40%50%60%70%
Bronx Brooklyn Manhattan Queens StatenIsland
un der 50k
Historic Districts Rest of Borough
21
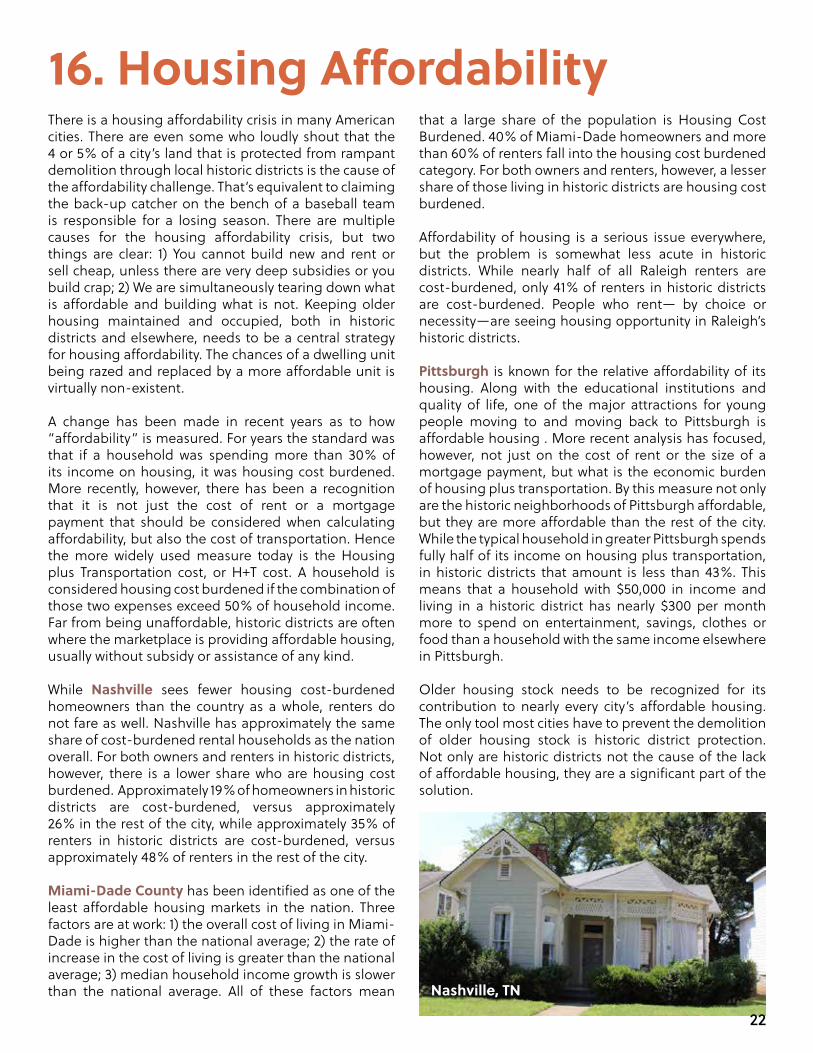
16. Housing AffordabilityThere is a housing affordability crisis in many American cities. There are even some who loudly shout that the 4 or 5% of a city’s land that is protected from rampant demolition through local historic districts is the cause of the affordability challenge. That’s equivalent to claiming the back-up catcher on the bench of a baseball team is responsible for a losing season. There are multiple causes for the housing affordability crisis, but two things are clear: 1) You cannot build new and rent or sell cheap, unless there are very deep subsidies or you build crap; 2) We are simultaneously tearing down what is affordable and building what is not. Keeping older housing maintained and occupied, both in historic districts and elsewhere, needs to be a central strategy for housing affordability. The chances of a dwelling unit being razed and replaced by a more affordable unit is virtually non-existent.
A change has been made in recent years as to how “affordability” is measured. For years the standard was that if a household was spending more than 30% of its income on housing, it was housing cost burdened. More recently, however, there has been a recognition that it is not just the cost of rent or a mortgage payment that should be considered when calculating affordability, but also the cost of transportation. Hence the more widely used measure today is the Housing plus Transportation cost, or H+T cost. A household is considered housing cost burdened if the combination of those two expenses exceed 50% of household income. Far from being unaffordable, historic districts are often where the marketplace is providing affordable housing, usually without subsidy or assistance of any kind.
While Nashville sees fewer housing cost-burdened homeowners than the country as a whole, renters do not fare as well. Nashville has approximately the same share of cost-burdened rental households as the nation overall. For both owners and renters in historic districts, however, there is a lower share who are housing cost burdened. Approximately 19% of homeowners in historic districts are cost-burdened, versus approximately 26% in the rest of the city, while approximately 35% of renters in historic districts are cost-burdened, versus approximately 48% of renters in the rest of the city.
Miami-Dade County has been identified as one of the least affordable housing markets in the nation. Three factors are at work: 1) the overall cost of living in Miami-Dade is higher than the national average; 2) the rate of increase in the cost of living is greater than the national average; 3) median household income growth is slower than the national average. All of these factors mean
that a large share of the population is Housing Cost Burdened. 40% of Miami-Dade homeowners and more than 60% of renters fall into the housing cost burdened category. For both owners and renters, however, a lesser share of those living in historic districts are housing cost burdened.
Affordability of housing is a serious issue everywhere, but the problem is somewhat less acute in historic districts. While nearly half of all Raleigh renters are cost-burdened, only 41% of renters in historic districts are cost-burdened. People who rent— by choice or necessity—are seeing housing opportunity in Raleigh’s historic districts.
Pittsburgh is known for the relative affordability of its housing. Along with the educational institutions and quality of life, one of the major attractions for young people moving to and moving back to Pittsburgh is affordable housing . More recent analysis has focused, however, not just on the cost of rent or the size of a mortgage payment, but what is the economic burden of housing plus transportation. By this measure not only are the historic neighborhoods of Pittsburgh affordable, but they are more affordable than the rest of the city. While the typical household in greater Pittsburgh spends fully half of its income on housing plus transportation, in historic districts that amount is less than 43%. This means that a household with $50,000 in income and living in a historic district has nearly $300 per month more to spend on entertainment, savings, clothes or food than a household with the same income elsewhere in Pittsburgh.
Older housing stock needs to be recognized for its contribution to nearly every city’s affordable housing. The only tool most cities have to prevent the demolition of older housing stock is historic district protection. Not only are historic districts not the cause of the lack of affordable housing, they are a significant part of the solution.
Nashville, TN
22

17. First Place of ReturnMany cities in the United States, primarily in the northeast and Midwest, have been losing population for decades. In recent years, however, some of them have again begun to grow in population. So a question arises – when cities begin to grow after extended periods of population decline, where within the city does that growth take place? The answer – in local historic districts.
Philadelphia, America’s 6th largest city, lost population for half a century. While its population peaked in 1950, Philadelphia shrank by more than 24% by 2000. Then comes the 2010 Census, and the city leadership, local newspapers, and public boosters all celebrated. “We’ve finally turned the corner! We gained population. It wasn’t much, only 8,500 people, but at least we’re growing!” Except they weren’t. The historic districts grew by around 14,000 people; the rest of the city still lost population.
Washington, DC followed the same pattern. After fifty years of population decline, the city grew between 2000 and 2010, but a disproportionate share of that growth took place in Washington’s historic districts. Boston turned the corner earlier. Between 1950 and 1980, the population of Boston declined by nearly 30%. But when population growth began to occur again where it took place wasn’t random. While Boston’s historic districts are home to just under 23% of the population, those neighborhoods accommodated 36% of the city’s growth.
Pittsburgh, like many other legacy cities, has lost population in recent years. Although that process has slowed, there was still a loss of 9% of the city’s population between 2000 and 2010. However, the local historic districts, when aggregated, gained 4% in population.Indianapolis fared better. Although there was a population decline between 1970 to 1980, there has been a slow but steady growth for the last half century. But what is happening now? Between 2000 and 2010, Indianapolis’ Urban Compact Area saw a rapid increase in population, growing an impressive 20% over those ten years. That growth slowed between 2010 and 2015, gaining 3% in the later period. However, growth in historic districts represented 17% of the total growth. Between 2010 and 2015, the local historic districts pulled more than their weight, growing 9% compared to the 2% growth in undesignated areas.
Mayors – if your city has been losing population and you want to attract people back, don’t tear down your historic neighborhoods. That will be the first place of return
Philadelphia, PA
Pittsburgh, PA
23

4%6%8%
10%12%
0%2%
14%
Change in Historic Districts Change in Rest of the County
14%
6%
MIAMI-DADE COUNTY POPULATION GROWTH, 2010-2015
18. Attractors of GrowthBut it is not just cities who have been in population decline where the historic districts are magnets for growth. It also happens in cities that have not been shrinking.
Despite making up only 6% of the land area, historic districts account for 10% of the population of Nashville. Population change in historic districts also outpaces that of the city as a whole. Between 2000 and 2016, the population in historic districts increased by 3.4% compared to 2.4% in the rest of the city. Between 2010 and 2016—a period of significant population increase in Nashville— historic districts accounted for 20% of the city’s total population growth.
Miami-Dade County is growing in population and there have been concerns expressed about where that growth can be accommodated. While some believe that historic districts restrict growth, the evidence in Miami-Dade proves quite the opposite. Between 2010 and 2015, historic districts gained 14% in population while the rest of the county gained 6 percent. Overall historic districts accounted for 9% of total growth in the county. The appeal of historic districts is strong and these areas are attracting and accommodating a disproportionate share of the County’s population growth.
Historic districts restricting growth? Nonsense; they are accommodating growth.
Marathon Village - Nashville, TN
19. Allows Cities to Evolve“Historic districts are largely frozen in time”. Anyone who writes that certainly hasn’t been to many historic district commission sessions. Historic districts are not museums. Preservationists recognize that they both will and should change over time. The purpose of historic districts is not to set an entire neighborhood in amber; and, in fact, none of them do that. Rather the purpose is to manage change over time so that the character and quality of the entire neighborhood is not diminished by out of scale and out of context changes. The demonstrated preservation premium in property values does not emerge because everyone looks forward to going in front of some goofy preservation commission. Rather the premium comes from a confidence that the lunatic across the street will not be allowed to make drastic changes to his property that will have an adverse impact on the value of my property.
The High Line, NY
24

Property rights zealots who think regulations are inherently bad for the economy forget the basic rule of real estate, that the three most important variables are location, location, location. What that means is that the value of an individual building does not somehow magically emerge from within the property boundaries, but from its larger context. The three variables are not roof, walls, and foundation. The value of real estate is driven by its context, and the protection of that context is the economic essence of historic districts. This is a rational economic act. Real estate is inherently a long-term investment. The value of that investment is not driven primarily by what an owner does within her property lines, but what happens to the surrounding area. The economic impact of historic districts is to provide a degree of protection to the value of what for most people is by far their biggest financial asset.
Historic districts change, and that is how it should be.
In Nashville in the last 5 years, historic districts have seen an average of $62.8 million in permit investment and 373 projects per year, accounting for around 11% of investment and 14% projects citywide. Historic districts attract dollars, seeing more than $445 million in investment since 2006. Far from being frozen in time as museums, historic districts welcome appropriate new development. Since 2006, more than 70% of investment in historic districts has been in new construction. Historic districts have become a magnet for investment in rehabilitation of existing historic buildings, as well as new construction. Over the last decade almost $1.5 billion has been invested in buildings in San Antonio historic districts, almost 70% of which was for new construction.
Savannah is one of America’s most historic cities. The protections of historic properties there are robust. But has that deterred investment? Absolutely not. Every year between 2007 and 2013 the amount invested in new construction in Savannah’s historic districts was greater than the investment in rehabilitation. Over that seven-year period 53% of all investment in those districts was in new construction.
Instead of crying wolf about historic neighborhoods being frozen in place and discouraging investment, critics might take the time to look at what is actually happening there.
Savannah is one of America’s most historic cities. The protections of historic properties there are robust. But has that deterred investment? Absolutely not. Every year between 2007 and 2013, the amount invested in new construction in Savannah’s historic districts was greater than the investment in rehabilitation. Over that seven-year period 53% of all investment in those districts was in new construction.
Savannah, GA
25

20. Tax GenerationMayors, city council members, and other local elected officials may have the toughest political jobs in America. They are responsible for sewers, schools, snow removal, public safety, potholes, light poles, parks, and a myriad of other tasks. Unlike their brothers and sisters in Washington or even state capitals, these elected public servants see their constituents every day, at the grocery store, their kid’s soccer game, the hair salon, and at church or synagogue, or temple or mosque. They literally can’t get away. At the same time, they are limited by what the state legislature allows them to do. And most challenging is that the local property tax is often the primary source of paying the bills for public services.
Most property tax is based on the value of the property – as its value goes up, so do property tax receipts (and, as many found out in the Great Recession, it also goes the other way).
The fiscal health of a city depends largely on the revenue it receives and the effectiveness of distributing its resources. The municipality relies on property taxes to pay for public school teachers, police, and other public services. Indianapolis’ local historic districts contribute taxes at a rate disproportionately higher than their land area would suggest. The 4% land area contributes 15% of the total assessed value inside the Urban Compact Area and 5% of the total value of the city. On a per-square mile basis, these local historic districts are 4 times as valuable as non-designated acres inside the Urban Compact Area.
Both Miami-Dade County and the municipalities rely heavily on property taxes to pay for public goods and services. While local historic districts constitute just over 1% of the land area in Miami-Dade County, the cumulative assessed values in historic districts represent 5% of the total value. Furthermore, on a per acre value, historic districts have over 3.8 times more value than non-designated areas.
The primary beneficiary of the “preservation premium” is the homeowner. However, there is a public benefit as well. Local historic districts in Saratoga Springs represent only 6% of the land area but 14% of the assessed value of property within the city. On a cultural level, almost by definition historic districts contain buildings worth saving, but that is true from on a fiscal basis as well. From a tax revenue perspective, the historic districts disproportionately provide the needed revenue stream for the City of Saratoga Springs as well as Saratoga County and the local school districts.
Properties in historic districts average 2.5 times the assessed value per acre than the rest of the city.
The “preservation premium” from the faster rate of appreciation provides nearly $10 million dollars each year to Chatham County, the City of Savannah and the school district. If properties within Savannah’s historic districts had only appreciated at the rate of residential properties in the rest of the city, here would be the negative impact on the budgets of local government last year:
• School District: ($3,602,221)• City of Savannah: ($3,080,286)• Chatham County: ($2,948,592)
It is legitimate to ask where each of those levels of government would make up the nearly $10 million difference. Raise taxes? Cut services? Both? Keep in mind this is not all the taxes that the historic districts paid. This is only the amount in taxes attributable to the rate of appreciation greater than the rest of the city. What could be done with that much money?
• The School District could pay the salaries of 86 teachers.
• The County could pay a fourth of the total budget of the Sheriff’s Office.
• The City could provide a $200/month rental subsidy every month for 1,283 families.
Saratoga Springs, NY
26
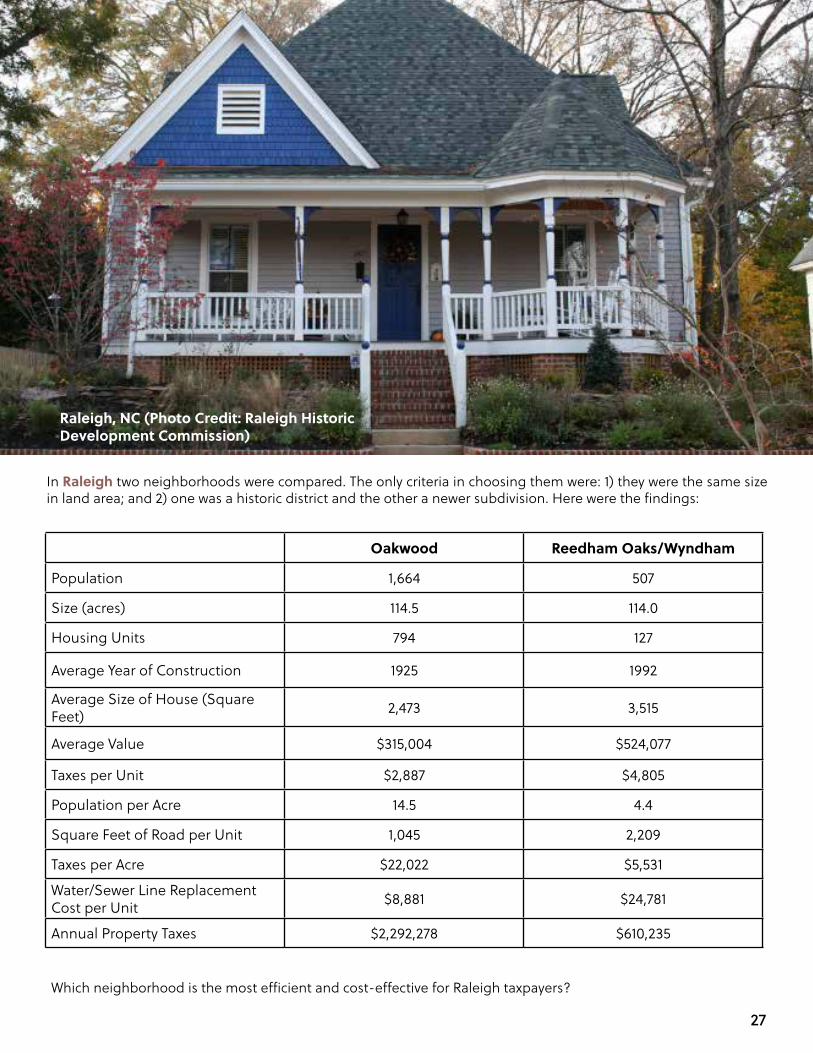
In Raleigh two neighborhoods were compared. The only criteria in choosing them were: 1) they were the same size in land area; and 2) one was a historic district and the other a newer subdivision. Here were the findings:
Oakwood Reedham Oaks/Wyndham
Population 1,664 507
Size (acres) 114.5 114.0
Housing Units 794 127
Average Year of Construction 1925 1992
Average Size of House (Square Feet) 2,473 3,515
Average Value $315,004 $524,077
Taxes per Unit $2,887 $4,805
Population per Acre 14.5 4.4
Square Feet of Road per Unit 1,045 2,209
Taxes per Acre $22,022 $5,531
Water/Sewer Line Replacement Cost per Unit $8,881 $24,781
Annual Property Taxes $2,292,278 $610,235
Which neighborhood is the most efficient and cost-effective for Raleigh taxpayers?
Raleigh, NC (Photo Credit: Raleigh Historic Development Commission)
27

(for good measure)reasons
Preservation as CatalystThe redevelopment and reuse of a historic building is often the catalyst that spurs additional investment nearby in both additional historic preservation and new construction. The area around the Sewell Cadillac Building in New Orleans saw virtually no investment between Katrina and 2012. Then the 50s International Style building was transformed into Rouses Market. This project catalyzed $140 million of new construction in the following four years.
In inner-city Baltimore the H.F. Miller & Son Building was built to manufacture bricks. After years of vacancy it was redeveloped as Millers Court, a mixed-use housing development providing discounted rents to teachers and non-profit organizations. While the City of Baltimore continued to lose population, the area immediately around Miller Court grew by more than 10%.
Home to social and cultural institutionsIn Nashville 9% of non-profits are located in historic districts. 31% of historic district residents live within walking distance of a museum, compared to 19% in the rest of the city. 40% of historic district residents live within 1/2 mile of a library, compared to 24% in the rest of the city. 84% of historic district residents live within walking distance of public art, compared to 47% in the rest of the city.
The wealth of social capital located in historic districts is further reinforced through institutions that honor the
heritage of people and place and through organized events that celebrate the history and culture of its residents. 30% of nonprofits in Indianapolis are located in historic districts as well as 56% of museums. In Miami/Dade County, 15% of nonprofits and 30% of museums are located in historic districts.
In San Antonio, 28% of historic district residents are within a quarter mile of a public school. That is true of only 4% of the population as a whole. 3% of historic district residents are within a quarter mile of a library and nearly one in ten are that close to a college or university. Both numbers are significantly higher than for the city at large.
New Orleans, LA (Photo Credit: Tulane News)
4 Additional
28

(for good measure)
Neighborhood Stability and Community EngagementNearly 40% of renters in Raleigh have lived in their historic district residence for more than a decade, moving in before 2004. Long-term residents are a strong indicator of neighborhood stability. People who have lived for years in a place often feel a heightened sense of responsibility to maintain their homes and shared community spaces. They are more likely to invest physically, monetarily, and socially in the neighborhood. Historic district homeowners stay put. Over 27% of Raleigh historic district homeowners moved into their current residence in 1989 or earlier—nearly double the citywide number of 15 percent.
An analysis of Keep Indianapolis Beautiful’s Adopt-a-Block program revealed, of active blocks, 18% are located within historic districts.
Housing VacancyThe biggest adverse impact on the value of a house is proximity to a vacant or abandon property. In Indianapolis the strength in the market is further reflected in the lack of neglected or abandoned properties in historic districts. Less than 2% of the city’s nearly 3,000 abandoned properties inside the urban context area are located in historic districts.
Coverage of the City So preservationists have thrown their regulatory net over nearly the entire city, stifling growth, making housing unaffordable, precluding the downtrodden real estate industry from making needed investments. Wait, really?In Indianapolis local historic districts cover 4% of the land area or 5% of the parcels within the urban context area.
Locally designated historic districts in Miami-Dade County represent 1.4% of the land area and 3.5% of the population.
Historic preservation and conservation overlay districts make up just 12% of parcels and 6% of the land area in Nashville.
Washington, DC
Nashville, TN
Miami, FL
29

Saratoga Springs has 8 local historic districts that collectively cover 6% of the land area and 9% of the properties within city limits.
Savannah’s historic districts comprise 8% of the city’s land area, 15% of its buildings; 16% of its population.2.6% of the parcels and 3.4% of the total land area in the City of Los Angeles have been designated as a Historic-Cultural Monument or a Historic Preservation Overlay Zone.
And where the “too much preservation” whine is heard the loudest – New York City — 3.4% of New York City’s total lots are under the purview of the Landmarks Preservation Commission, and that includes designated historic districts, individual landmarks, and interior landmarks. Specifically, 3.3% of the lots are within historic districts and a mere 0.1% of the lots are individual or interior landmarks. Citywide, those 3.4% of LPC-designated lots cover only 4.4% of New York City’s total lot area, leaving over 95% of the land to be developed without LPC oversight.
The author of that “Historic Designations Are Ruining Cities” raised the alarm that, “In some places it’s clear that historic designations have gone overboard. One analysis finds that over 19% of Washington, DC’s properties are covered by a historic designation, compared to only about 2% in Philadelphia and Chicago.” Is it remotely possible that Washington, DC, is the national capital, and that much of what is historically designated is the National Mall, the White House and Lafayette Square, the Federal Triangle, the Tidal Basin and Jefferson Memorial, St. Elizabeth’s Hospital, Rock Creek Park, the Capitol, and, and, and…? No, if that were the case, surely a PhD in economics would have recognized that.
Approval Rates“Those damn preservation commissioners, arbiters of what they think is good taste, the preservation police, all they do is tell people what they can’t do.”
In Raleigh, over a fifteen-year period, 40% of applications were approved at the staff level, 58% approved by the Raleigh Historic Development Commission, and less than 2% were denied.
In the last five years 5000 applications for Certificate of Appropriateness were filed with the Indianapolis Historic Preservation Commission. 60% of them were approved at the staff level; less than 1% were denied.
Infill in Nashville, TN
Raleigh, NC
In Nashville nearly 60% of all applications are approved at the staff level. For those that appear before the Metropolitan Historic Zoning Commission less than two or three a year are denied.
In New York City, the Landmarks Preservation Commission reviews 12,000 to 13,000 applications annually. Nearly 95% of those applications do not require applicants to appear at the Commission’s public hearings and are resolved at the staff level. Over the last fifteen years of those that went to a Commission hearing, an average of 86.7% of applications were approved, 12.9% were withdrawn or deactivated, and 3/10 of 1% or less were denied. Over the last five years more people have been struck by lightning in New York City than have had their application denied at the Landmarks Preservation Commission.
30

ConclusionLet’s be honest, we preservationists haven’t done a great job of making our case for historic preservation and its contributions to active, vibrant, prosperous cities. Too often the general public only hears us rambling on about paint colors or obsessing about window replacements. We need to do better.
The good news is the facts are on our side. When the first studies of the impact of historic preservation were done twenty-five years ago, there wasn’t much to measure – jobs, heritage tourism, property values, and downtown revitalization. That was about it. Today with the availability of big data, GIS, and smart young people who know how to use the technology, we’ve found dozens of ways historic preservation is great for cities. Every time PlaceEconomics takes on a new assignment we find more positive preservation impacts.
It’s perfectly fine when we talk among ourselves to argue about cornices and gargoyles. But when we are talking to those who don’t call themselves “preservationists”—when we talk to mayors and bankers and minority communities and housing advocates and real estate developers—we need to expand our vocabulary.
It is to the credit of the clients of PlaceEconomics that we’ve been privileged to conduct these studies. The “factoids” found in this report are only a small part of what we’ve been learning. But those lessons are important and need to be in the arsenal of preservationists making the case. Thank you for doing so.
31
SourcesPlaceEconomics Citywide Studies
Preservation Positive Los Angeles Location: Los Angeles, CAClient: Los Angeles ConservancyDate: 2020
The New Nashville: A Study of the Impacts of Historic PreservationLocation: Nashville, TNClient: Metro Historical CommissionDate: April 2019
Saratoga Springs: Enhancing the Values through Historic PreservationLocation: Saratoga Springs, NYClient: City of Saratoga Springs, Saratoga Springs Preservation FoundationDate: November 2018
Enhancing Paradise: The Impacts of Historic Preservation on Miami-Dade CountyLocation: Miami-Dade County, FLClient: Miami-Dade Board of County CommissionersDate: August 2018
Making the Connections: A Study of the Impact of Historic Preservation in IndianapolisLocation: Indianapolis, INClient: Indiana LandmarksDate: 2018
Historic Preservation: At the Core of a Dynamic New York CityLocation: New York, NYClient: New York Landmarks ConservancyDate: April 2016
Tourism: Historic Preservation in the Economy and Life in Savannah and Chatham CountyLocation: Savannah, GAClient: Historic Savannah FoundationDate: 2015
Historic Preservation: Part of the DNA of PittsburghLocation: Pittsburgh, PAClient: City of PittsburghDate: 2015
Historic Preservation: Essential to the Economy and Quality of Life in San AntonioLocation: San Antonio, TXClient: City of San Antonio Historic Preservation OfficeDate: 2015
Designing a 21st-Century City: Historic Preservation and the Raleigh of TomorrowLocation: Raleigh, NCClient: City of Raleigh Historic Development CommissionDate: 2014
Other Studies Cited
Historic Preservation: An Overlooked Economic Driver, A Study of the Impacts of Historic Preservation in Rhode IslandLocation: Rhode IslandClient: Preserve Rhode Island, The Preservation Society of Newport CountyDate: 2018
The Historic Tax Credit: Building the Future in LouisianaLocation: LouisianaClient: Louisiana Office of Cultural DevelopmentDate: 2017
The Economics of Historic Preservation: A Community Leader’s GuideLocation: NationwideClient: National Trust for Historic PreservationDate: 2014
Catalyst for Change: The Federal Historic Tax Credit: Transforming CommunitiesLocation: NationwideClient: National Trust for Historic PreservationDate: 2014
32

PlaceEconomics would like to thank all our amazing clients, colleagues, and friends who have learned with us through these city-wide studies.
A special thanks to PlaceEconomics associates past and present:
Cara Bertron Carla Bruni Caroline Cheong Katlyn Cotton* Emilie Evans Alyssa Frystak* Briana Grosicki* Raina Murray Donovan Rypkema*Sarah Shartzer Stephen Skilton Maggie Smith Rodney Swink*Courtney Williams
* Current employees at PlaceEconomics
Acknowledgements
33

“People who alter or destroy works of art and our cultural heritage for
profit or as an exercise of power are barbarians.”
George Lucas
New York City, NY

placeeconomics.com
reasonshistoric preservation is good for your community
twenty-four
Copyright © 2022 FDOKUMEN