
Drosophila Muller F Elements Maintain a Distinct Set of Genomic Properties Over 40 Million Years of...
39
1 Drosophila Muller F elements maintain a distinct set of genomic properties over 40 million years of evolution Wilson Leung a , Christopher D. Shaffer a , Laura K. Reed b , Sheryl T. Smith c , William Barshop a , William Dirkes a , Matthew Dothager a , Paul Lee a , Jeannette Wong a , David Xiong a , Han Yuan a , James E. J. Bedard d,1 , Joshua F. Machone d , Seantay D. Patterson d , Amber L. Price d , Bryce A. Turner d , Srebrenka Robic e , Erin K. Luippold e , Shannon R. McCartha e , Tezin A. Walji e , Chelsea A. Walker e , Kenneth Saville f , Marita K. Abrams f , Andrew R. Armstrong f , William Armstrong f , Robert J. Bailey f , Chelsea R. Barberi f , Lauren R. Beck f , Amanda L. Blaker f , Christopher E. Blunden f , Jordan P. Brand f , Ethan J. Brock f , Dana W. Brooks f , Marie Brown f , Sarah C. Butzler f , Eric M. Clark f , Nicole B. Clark f , Ashley A. Collins f , Rebecca J. Cotteleer f , Peterson R. Cullimore f , Seth G. Dawson f , Carter T. Docking f , Sasha L. Dorsett f , Grace A. Dougherty f , Kaitlyn A. Downey f , Andrew P. Drake f , Erica K. Earl f , Trevor G. Floyd f , Joshua D. Forsyth f , Jonathan D. Foust f , Spencer L. Franchi f , James F. Geary f , Cynthia K. Hanson f , Taylor S. Harding f , Cameron B. Harris f , Jonathan M. Heckman f , Heather L. Holderness f , Nicole A. Howey f , Dontae A. Jacobs f , Elizabeth S. Jewell f , Maria Kaisler f , Elizabeth A. Karaska f , James L. Kehoe f , Hannah C. Koaches f , Jessica Koehler f , Dana Koenig f , Alexander J. Kujawski f , Jordan E. Kus f , Jennifer A. Lammers f , Rachel R. Leads f , Emily C. Leatherman f , Rachel N. Lippert f , Gregory S. Messenger f , Adam T. Morrow f , Victoria Newcomb f , Haley J. Plasman f , Stephanie J. Potocny f , Michelle K. Powers f , Rachel M. Reem f , Jonathan P. Rennhack f , Katherine R. Reynolds f , Lyndsey A. Reynolds f , Dong K. Rhee f , Allyson B. Rivard f , Adam J. Ronk f , Meghan B. Rooney f , Lainey S. Rubin f , Luke R. Salbert f , Rasleen K. Saluja f , Taylor Schauder f , Allison R. Schneiter f , Robert W. Schulz f , Karl E. Smith f , Sarah Spencer f , Bryant R. Swanson f , Melissa A. Tache f , Ashley A. Tewilliager f , Amanda K. Tilot f , Eve VanEck f , Matthew M. Villerot f , Megan B. Vylonis f , David T. Watson f , Juliana A. Wurzler f , Lauren M. Wysocki f , Monica Yalamanchili f , Matthew A. Zaborowicz f , Julia A. Emerson g , Carlos Ortiz h , Frederic J. Deuschle c , Lauren A. DiLorenzo c , Katie L. Goeller c , Christopher R. Macchi c , Sarah E. Muller c , Brittany D. Pasierb c , Joseph E. Sable c , Jessica M. Tucci c , Marykathryn Tynon c , David A. Dunbar i , Levent H. Beken i , Alaina C. Conturso i , Benjamin L. Danner i , Gabriella A. DeMichele i , Justin A. Gonzales i , Maureen S. Hammond i , Colleen V. Kelley i , Elisabeth A. Kelly i , Danielle Kulich i , Catherine M. Mageeney i , Nikie L. McCabe i , Alyssa M. Newman i , Lindsay A. Spaeder i , Richard A. Tumminello i , Dennis Revie j , Jonathon M. Benson j , Michael C. Cristostomo j , Paolo A. DaSilva j , Katherine S. Harker j , Jenifer N. Jarrell j , Luis A. Jimenez j , Brandon M. Katz j , William R. Kennedy j , Kimberly S. Kolibas j , Mark T. LeBlanc j , Trung T. Nguyen j , Daniel S. Nicolas j , Melissa D. Patao j , Shane M. Patao j , Bryan J. Rupley j , Bridget J. Sessions j , Jennifer A. Weaver j , Anya L. Goodman k , Erica L. Alvendia k , Shana M. Baldassari k , Ashley S. Brown k , Ian O. Chase k , Maida Chen k , Scott Chiang k , Avery B. Cromwell k , Ashley F. Custer k , Tia M. DiTommaso k , Jad El-Adaimi k , Nora C. Goscinski k , Ryan A. Grove k , Nestor Gutierrez k , Raechel S. Harnoto k , Heather Hedeen k , Emily L. Hong k , Barbara L. Hopkins k , Vilma F. Huerta k , Colin Khoshabian k , Kristin M. LaForge k , Cassidy T. Lee k , Benjamin M. Lewis k , Anniken M. Lydon k , Brian J. Maniaci k , Ryan D. Mitchell k , Elaine V. Morlock k , William M. Morris k , Priyanka Naik k , Nicole C. Olson k , Jeannette M. Osterloh k , Marcos A. Perez k , Jonathan D. Presley k , Matt J. Randazzo k , Melanie K. Regan k , Franca G. Rossi k , Melanie A. Smith k , Eugenia A. Soliterman k , Ciani J. Sparks k , Danny L. Tran k , Tiffany Wan k , Anne A. Welker k , Jeremy N. Wong k , Aparna Sreenivasan l , Jim Youngblom m , Andrew Adams m , Justin Alldredge m , Ashley Bryant m , David Carranza m , Alyssa Cifelli m , Kevin Coulson m , Calise Debow m , Noelle Delacruz m , Charlene Emerson m , Cassandra Farrar m , Don Foret m , Edgar Garibay m , John Gooch m , Michelle Heslop m , Sukhjit Kaur m , Ambreen Khan m , Van Kim m , Travis Lamb m , Peter Lindbeck m , Gabi Lucas m , Elizabeth Macias m , Daniela Martiniuc m , Lissett Mayorga m , Joseph Medina m , Nelson Membreno m , Shady Messiah m , Lacey Neufeld m , San Francisco Nguyen m , Zachary Nichols m , George Odisho m , Daymon Peterson m , Laura Rodela m , Priscilla Rodriguez m , Vanessa Rodriguez m , Jorge Ruiz m , Will Sherrill m , Valeria Silva m , Jeri Sparks m , Geeta Statton m , Ashley Townsend m , Isabel Valdez m , Mary Waters m , Kyle Westphal m , Stacey Winkler m , Joannee Zumkehr m , Randall J. DeJong n , Arlene J. Hoogewerf n , Cheri M. Ackerman n , Isaac O. Armistead n , Lara Baatenburg n , Matthew J. Borr n , Lindsay K. Brouwer n , Brandon J. Burkhart n , Kelsey T. Bushhouse n , Lejla Cesko n , Tiffany Y. Y. Choi n , Heather Cohen n , Amanda M. Damsteegt n , Jess M. Darusz n , Cory M. Dauphin n , Yelena P. Davis n , Emily J. Diekema n , Melissa Drewry n , Michelle E. M. Eisen n , Hayley M. Faber n , Katherine J. Faber n , Elizabeth Feenstra n , Isabella T. Felzer-Kim n , Brandy L. Hammond n , Jesse Hendriksma n , Milton R. Herrold n , Julia A. Hilbrands n , Emily J. Howell n , Sarah A. Jelgerhuis n , Timothy R. Jelsema n , Benjamin K. Johnson n , Kelly K. Jones n , Anna Kim n , Ross D. Kooienga n , Erika E. Menyes n , Eric A. Nollet n , Brittany E. Plescher n , Lindsay Rios n , Jenny L. Rose n , Allison J. Schepers n , Geoff Scott n , Joshua R. Smith n , Allison M. Sterling n , Jenna C. Tenney n , Chris Uitvlugt n , Rachel E. VanDyken n , Marielle VanderVennen n , Samantha Vue n , Nighat P. Kokan o , Kwabea Agbley o , Sampson K. Boham o , Daniel Broomfield o , Kayla Chapman o , Ali Dobbe o , Ian Dobbe o , William Harrington o , Marwan Ibrahem o , Andre Kennedy o , Chad A. Koplinsky o , Cassandra Kubricky o , Danielle Ladzekpo o , Claire Pattison o , Roman E. Ramirez Jr. o , Lucia Wande o , Sarah Woehlke o , Matthew Wawersik p , Elizabeth Kiernan p , Jeffrey S. Thompson q , Roxanne Banker q , Justina R. Bartling q , Chinmoy I. Bhatiya q , Anna L. Boudoures q , Lena Christiansen q , Daniel S. Fosselman q , Kristin M. French q , Ishwar S. Gill q , Jessen T. Havill q , Jaelyn L. Johnson q , Lauren J. Keny q , John M. Kerber q , Bethany M. Klett q , Christina N. Kufel q , Francis J. May q , Jonathan P. Mecoli q , Callie R. Merry q , Lauren R. Meyer q , Emily G. Miller q , Gregory J. Mullen q , Katherine C. Palozola q , Jacob J. Pfeil q , Jessica G. Thomas q , Evan M. Verbofsky q , Eric P. Spana r , Anant Agarwalla r , Julia Chapman r , Ben Chlebina r , Insun Chong r , I.N. Falk r , John D. Fitzgibbons r , Harrison Friedman r , Osagie Ighile r , Andrew J. Kim r , Kristin A. Knouse r , Faith Kung r , G3: Genes|Genomes|Genetics Early Online, published on March 4, 2015 as doi:10.1534/g3.114.015966 © The Author(s) 2013. Published by the Genetics Society of America.
-
Upload
independent -
Category
Documents
-
view
0 -
download
0
Transcript of Drosophila Muller F Elements Maintain a Distinct Set of Genomic Properties Over 40 Million Years of...

1
Drosophila Muller F elements maintain a distinct set of genomic properties over 40 million years of evolution Wilson Leunga, Christopher D. Shaffera, Laura K. Reedb, Sheryl T. Smithc, William Barshopa, William Dirkesa, Matthew Dothagera, Paul Leea, Jeannette Wonga, David Xionga, Han Yuana, James E. J. Bedardd,1, Joshua F. Machoned, Seantay D. Pattersond, Amber L. Priced, Bryce A. Turnerd, Srebrenka Robice, Erin K. Luippolde, Shannon R. McCarthae, Tezin A. Waljie, Chelsea A. Walkere, Kenneth Savillef, Marita K. Abramsf, Andrew R. Armstrongf, William Armstrongf, Robert J. Baileyf, Chelsea R. Barberif, Lauren R. Beckf, Amanda L. Blakerf, Christopher E. Blundenf, Jordan P. Brandf, Ethan J. Brockf, Dana W. Brooksf, Marie Brownf, Sarah C. Butzlerf, Eric M. Clarkf, Nicole B. Clarkf, Ashley A. Collinsf, Rebecca J. Cotteleerf, Peterson R. Cullimoref, Seth G. Dawsonf, Carter T. Dockingf, Sasha L. Dorsettf, Grace A. Doughertyf, Kaitlyn A. Downeyf, Andrew P. Drakef, Erica K. Earlf, Trevor G. Floydf, Joshua D. Forsythf, Jonathan D. Foustf, Spencer L. Franchif, James F. Gearyf, Cynthia K. Hansonf, Taylor S. Hardingf, Cameron B. Harrisf, Jonathan M. Heckmanf, Heather L. Holdernessf, Nicole A. Howeyf, Dontae A. Jacobsf, Elizabeth S. Jewellf, Maria Kaislerf, Elizabeth A. Karaskaf, James L. Kehoef, Hannah C. Koachesf, Jessica Koehlerf, Dana Koenigf, Alexander J. Kujawskif, Jordan E. Kusf, Jennifer A. Lammersf, Rachel R. Leadsf, Emily C. Leathermanf, Rachel N. Lippertf, Gregory S. Messengerf, Adam T. Morrowf, Victoria Newcombf, Haley J. Plasmanf, Stephanie J. Potocnyf, Michelle K. Powersf, Rachel M. Reemf, Jonathan P. Rennhackf, Katherine R. Reynoldsf, Lyndsey A. Reynoldsf, Dong K. Rheef, Allyson B. Rivardf, Adam J. Ronkf, Meghan B. Rooneyf, Lainey S. Rubinf, Luke R. Salbertf, Rasleen K. Salujaf, Taylor Schauderf, Allison R. Schneiterf, Robert W. Schulzf, Karl E. Smithf, Sarah Spencerf, Bryant R. Swansonf, Melissa A. Tachef, Ashley A. Tewilliagerf, Amanda K. Tilotf, Eve VanEckf, Matthew M. Villerotf, Megan B. Vylonisf, David T. Watsonf, Juliana A. Wurzlerf, Lauren M. Wysockif, Monica Yalamanchilif, Matthew A. Zaborowiczf, Julia A. Emersong, Carlos Ortizh, Frederic J. Deuschlec, Lauren A. DiLorenzoc, Katie L. Goellerc, Christopher R. Macchic, Sarah E. Mullerc, Brittany D. Pasierbc, Joseph E. Sablec, Jessica M. Tuccic, Marykathryn Tynonc, David A. Dunbari, Levent H. Bekeni, Alaina C. Contursoi, Benjamin L. Danneri, Gabriella A. DeMichelei, Justin A. Gonzalesi, Maureen S. Hammondi, Colleen V. Kelleyi, Elisabeth A. Kellyi, Danielle Kulichi, Catherine M. Mageeneyi, Nikie L. McCabei, Alyssa M. Newmani, Lindsay A. Spaederi, Richard A. Tumminelloi, Dennis Reviej, Jonathon M. Bensonj, Michael C. Cristostomoj, Paolo A. DaSilvaj, Katherine S. Harkerj, Jenifer N. Jarrellj, Luis A. Jimenezj, Brandon M. Katzj, William R. Kennedyj, Kimberly S. Kolibasj, Mark T. LeBlancj, Trung T. Nguyenj, Daniel S. Nicolasj, Melissa D. Pataoj, Shane M. Pataoj, Bryan J. Rupleyj, Bridget J. Sessionsj, Jennifer A. Weaverj, Anya L. Goodmank, Erica L. Alvendiak, Shana M. Baldassarik, Ashley S. Brownk, Ian O. Chasek, Maida Chenk, Scott Chiangk, Avery B. Cromwellk, Ashley F. Custerk, Tia M. DiTommasok, Jad El-Adaimik, Nora C. Goscinskik, Ryan A. Grovek, Nestor Gutierrezk, Raechel S. Harnotok, Heather Hedeenk, Emily L. Hongk, Barbara L. Hopkinsk, Vilma F. Huertak, Colin Khoshabiank, Kristin M. LaForgek, Cassidy T. Leek, Benjamin M. Lewisk, Anniken M. Lydonk, Brian J. Maniacik, Ryan D. Mitchellk, Elaine V. Morlockk, William M. Morrisk, Priyanka Naikk, Nicole C. Olsonk, Jeannette M. Osterlohk, Marcos A. Perezk, Jonathan D. Presleyk, Matt J. Randazzok, Melanie K. Regank, Franca G. Rossik, Melanie A. Smithk, Eugenia A. Solitermank, Ciani J. Sparksk, Danny L. Trank, Tiffany Wank, Anne A. Welkerk, Jeremy N. Wongk, Aparna Sreenivasanl, Jim Youngblomm, Andrew Adamsm, Justin Alldredgem, Ashley Bryantm, David Carranzam, Alyssa Cifellim, Kevin Coulsonm, Calise Debowm, Noelle Delacruzm, Charlene Emersonm, Cassandra Farrarm, Don Foretm, Edgar Garibaym, John Goochm, Michelle Heslopm, Sukhjit Kaurm, Ambreen Khanm, Van Kimm, Travis Lambm, Peter Lindbeckm, Gabi Lucasm, Elizabeth Maciasm, Daniela Martiniucm, Lissett Mayorgam, Joseph Medinam, Nelson Membrenom, Shady Messiahm, Lacey Neufeldm, San Francisco Nguyenm, Zachary Nicholsm, George Odishom, Daymon Petersonm, Laura Rodelam, Priscilla Rodriguezm, Vanessa Rodriguezm, Jorge Ruizm, Will Sherrillm, Valeria Silvam, Jeri Sparksm, Geeta Stattonm, Ashley Townsendm, Isabel Valdezm, Mary Watersm, Kyle Westphalm, Stacey Winklerm, Joannee Zumkehrm, Randall J. DeJongn, Arlene J. Hoogewerfn, Cheri M. Ackermann, Isaac O. Armisteadn, Lara Baatenburgn, Matthew J. Borrn, Lindsay K. Brouwern, Brandon J. Burkhartn, Kelsey T. Bushhousen, Lejla Ceskon, Tiffany Y. Y. Choin, Heather Cohenn, Amanda M. Damsteegtn, Jess M. Daruszn, Cory M. Dauphinn, Yelena P. Davisn, Emily J. Diekeman, Melissa Drewryn, Michelle E. M. Eisenn, Hayley M. Fabern, Katherine J. Fabern, Elizabeth Feenstran, Isabella T. Felzer-Kimn, Brandy L. Hammondn, Jesse Hendriksman, Milton R. Herroldn, Julia A. Hilbrandsn, Emily J. Howelln, Sarah A. Jelgerhuisn, Timothy R. Jelseman, Benjamin K. Johnsonn, Kelly K. Jonesn, Anna Kimn, Ross D. Kooiengan, Erika E. Menyesn, Eric A. Nolletn, Brittany E. Pleschern, Lindsay Riosn, Jenny L. Rosen, Allison J. Schepersn, Geoff Scottn, Joshua R. Smithn, Allison M. Sterlingn, Jenna C. Tenneyn, Chris Uitvlugtn, Rachel E. VanDykenn, Marielle VanderVennenn, Samantha Vuen, Nighat P. Kokano, Kwabea Agbleyo, Sampson K. Bohamo, Daniel Broomfieldo, Kayla Chapmano, Ali Dobbeo, Ian Dobbeo, William Harringtono, Marwan Ibrahemo, Andre Kennedyo, Chad A. Koplinskyo, Cassandra Kubrickyo, Danielle Ladzekpoo, Claire Pattisono, Roman E. Ramirez Jr.o, Lucia Wandeo, Sarah Woehlkeo, Matthew Wawersikp, Elizabeth Kiernanp, Jeffrey S. Thompsonq, Roxanne Bankerq, Justina R. Bartlingq, Chinmoy I. Bhatiyaq, Anna L. Boudouresq, Lena Christiansenq, Daniel S. Fosselmanq, Kristin M. Frenchq, Ishwar S. Gillq, Jessen T. Havillq, Jaelyn L. Johnsonq, Lauren J. Kenyq, John M. Kerberq, Bethany M. Klettq, Christina N. Kufelq, Francis J. Mayq, Jonathan P. Mecoliq, Callie R. Merryq, Lauren R. Meyerq, Emily G. Millerq, Gregory J. Mullenq, Katherine C. Palozolaq, Jacob J. Pfeilq, Jessica G. Thomasq, Evan M. Verbofskyq, Eric P. Spanar, Anant Agarwallar, Julia Chapmanr, Ben Chlebinar, Insun Chongr, I.N. Falkr, John D. Fitzgibbonsr, Harrison Friedmanr, Osagie Ighiler, Andrew J. Kimr, Kristin A. Knouser, Faith Kungr,
G3: Genes|Genomes|Genetics Early Online, published on March 4, 2015 as doi:10.1534/g3.114.015966
© The Author(s) 2013. Published by the Genetics Society of America.

2
Danny Mammor, Chun Leung Ngr, Vinayak S. Nikamr, Diana Nortonr, Philip Phamr, Jessica W. Polkr, Shreya Prasadr, Helen Rankinr, Camille D. Ratliffr, Victoria Scalar, Nicholas U. Schwartzr, Jessica A. Shuenr, Amy Xur, Thomas Q. Xur, Yi Zhangr, Anne G. Rosenwalds, Martin G. Burgt, Stephanie J. Adamst, Morgan Bakert, Bobbi Botsfordt, Briana Brinkleyt, Carter Brownt, Shadie Emiaht, Erica Enocht, Chad Giert, Alyson Greenwellt, Lindsay Hoogenboomt, Jordan E. Matthewst, Mitchell McDonaldt, Amanda Mercert, Nicholaus Monsmat, Kristine Ostbyt, Alen Ramict, Devon Shallmant, Matthew Simont, Eric Spencert, Trisha Tomkinst, Pete Wendlandt, Anna Wyliet, Michael J. Wolyniaku, Gregory M. Robertsonu, Samuel I. Smithu, Justin R. DiAngelov, Eric D. Sassuv, Satish C. Bhallaw, Karim A. Sharifx,2, Tenzin Choeyingx, Jason S. Maciasx, Fareed Sanusix, Karvyn Torchonx, April E. Bednarskiy,3, Consuelo J. Alvarezz, Kristen C. Davisz, Carrie A. Dunhamz, Alaina J. Granthamz, Amber N. Harez, Jennifer Schottlerz, Zackary W. Scottz, Gary A. Kuleckaa,4, Nicole S. Yuaa, Marian M. Kaehlerbb, Jacob Jippbb, Paul J. Overvoordecc, Elizabeth Shoopdd, Olivia Cyrankowskicc, Betsy Hoovercc, Matt Kusnercc, Devry Lincc, Tijana Martinovcc, Jonathan Mischcc, Garrett Salzmancc, Holly Schiedermayercc, Michael Snavelycc, Stephanie Zarrasolacc, Susan Parrishee, Atlee Bakeree, Alissa Beckettee, Carissa Belellaee, Julie Bryantee, Turner Conradee, Adam Fearnowee, Carolina Gomezee, Robert A. Herbstsomeree, Sarah Hirschee, Christen Johnsonee, Melissa Jonesee, Rita Kabasoee, Eric Lemmonee, Carolina Marques dos Santos Vieiraee, Darryl McFarlandee, Christopher McLaughlinee, Abbie Morganee, Sepo Musokotwaneee, William Neutzlingee, Jana Nietmannee, Christina Paluskieviczee, Jessica Pennee, Emily Peoplesee, Caitlin Pozmanteree, Emily Reedee, Nichole Rigbyee, Lasse Schmidtee, Micah Sheltonee, Rebecca Shufordee, Tiara Tirasawasdichaiee, Blair Undemee, Damian Urickee, Kayla Vondyee, Bryan Yarringtonee, Todd T. Eckdahlff, Jeffrey L. Poetgg, Alica B. Allenff, John E. Andersonff, Jason M. Barnettff, Jordan S. Baumgardnerff, Adam D. Brownff, Jordan E. Carneyff, Ramiro A. Chavezff, Shelbi L. Christgenff, Jordan S. Christieff, Andrea N. Claryff, Michel A. Connff, Kristen M. Cooperff, Matt J. Crowleyff, Samuel T. Crowleyff, Jennifer S. Dotyff, Brian A. Dowff, Curtis R. Edwardsff, Darcie D. Elderff, John P. Fanningff, Bridget M. Janssenff, Anthony K. Lambrightff, Curtiss E. Laneff, Austin B. Limleff, Tammy Mazurff, Marly R. McCrackenff, Alexa M. McDonoughff, Amy D. Meltonff, Phillip J. Minnickff, Adam E. Musickff, William H. Newhartff, Joseph W. Noynaertff, Bradley J. Ogdenff, Michael W. Sanduskyff, Samantha M. Schmueckerff, Anna L. Shipmanff, Anna L. Smithff, Kristen M. Thomsenff, Matthew R. Unzickerff, William B. Vernonff, Wesley W. Winnff, Dustin S. Woyskiff, Xiao Zhuff, Chunguang Duhh, Caitlin Amenthh, Soham Asohh, Laura Simone Bisognohh, Jason Caronnahh, Nadezhda Fefelovahh, Lenin Lopezhh, Lorraine Malkowitzhh, Jonathan Marrahh, Daniella Menillohh, Ifeanyi Obiorahhh, Eric Nyabeta Onsarigohh, Shekerah Primushh, Mahdi Sooshh, Archana Tarehh, Ameer Zidanhh, Christopher J. Jonesii, Todd Aronhaltii, James M. Bellushii, Christa Burkeii, Steve DeFazioii, Benjamin R. Doesii, Todd D. Johnsonii, Nicholas Keysockii, Nelson H. Knudsenii, James Messlerii, Kevin Myirskiii, Jade Lea Rekaiii, Ryan Michael Rempeii, Michael S. Salgadoii, Erica Stagaardii, Justin R. Starcherii, Andrew W. Waggonerii, Anastasia K. Yemelyanovaii, Amy T. Harkjj, Anne Bertoletjj, Cyrus E. Kuschnerjj, Kesley Parryjj, Michael Quachjj, Lindsey Shantzerjj, Mary E. Shawkk, Mary A. Smithll, Omolara Glennll, Portia Masonll, Charlotte Williamsll, S. Catherine Silver Keymm, Tyneshia C. P. Henrymm, Ashlee G. Johnsonmm, Jackie X. Whitemm, Adam Habermannn,5, Sam Asinofnn, Kelly Drummnn, Trip Freeburgnn, Nadia Safann, Darrin Schultznn, Yakov Shevinnn, Petros Svoronosnn, Tam Vuongnn, Jules Wellinghoffnn, Laura L. M. Hoopesoo, Kim M. Chauoo, Alyssa Wardoo, E. Gloria C. Regisfordpp, LaJerald Augustinepp, Brionna Davis-Reyespp, Vivienne Echendupp, Jasmine Halespp, Sharon Ibarrapp, Lauriaun Johnsonpp, Steven Ovupp, John M. Bravermanqq, Thomas J. Bahrqq, Nicole M. Caesarqq, Christopher Campanaqq, Daniel W. Cassidyqq, Peter A. Cognettiqq, Johnathan D. Englishqq, Matthew C. Fadusqq, Cameron N. Fickqq, Philip J. Fredaqq, Bryan M. Hennessyqq, Kelsey Hockenbergerqq, Jennifer K. Jonesqq, Jessica E. Kingqq, Christopher R. Knobqq, Karen J. Kraftmannqq, Linghui Liqq, Lena N. Lupeyqq, Carl J. Minnitiqq, Thomas F. Mintonqq, Joseph V. Moranqq, Krishna Mudumbiqq, Elizabeth C. Nordmanqq, William J. Puetzqq, Lauren M. Robinsonqq, Thomas J. Roseqq, Edward P. Sweeneyqq, Ashley S. Timkoqq, Don W. Paetkaurr, Heather L. Eislerrr,6, Megan E. Aldruprr, Jessica M. Bodenbergrr, Mara G. Colerr, Kelly M. Deranekrr, Megan DeShetlerrr, Rose M. Dowdrr, Alexandra K. Eckardtrr, Sharon C. Ehretrr, Jessica Feserr, Amanda D. Garrettrr, Anna Kammrathrr, Michelle L. Kappesrr, Morgan R. Lightrr, Anne C. Meierrr, Allison O'Roukerr, Mallory Perellarr, Kimberley Ramseyrr, Jennifer R. Ramthunrr, Mary T. Reillyrr, Deirdre Robinettrr, Nadine L. Rossirr, Mary Grace Schuelerrr, Emma Shoemakerrr, Kristin M. Starkeyrr, Ashley Vetorrr, Abby Vrablerr, Vidya Chandrasekaranss, Christopher Beckss, Kristen R. Hatfieldss, Douglas A. Herrickss, Christopher B. Khouryss, Charlotte Leass, Christopher A. Louiess, Shannon M. Lowellss, Thomas J. Reynoldsss, Jeanine Schiblerss, Alexandra H. Scomass, Maxwell T. Smith-Geess, Sarah Tubertyss, Christopher D. Smithtt,7, Jane E. Lopilatouu, Jeanette Haukeuu, Jennifer A. Roecklein-Canfieldvv, Maureen Corrielusvv, Hannah Gilmanvv, Stephanie Intriagovv, Amanda Maffavv, Sabya A. Raufvv, Katrina Thistlevv, Melissa Trieuvv, Jenifer Wintersvv, Bib Yangvv, Charles R. Hauserww, Tariq Abusheikhww, Yara Ashrawiww, Pedro Benitezww, Lauren R. Boudreauxww, Megan Bourlandww, Miranda Chavezww, Samantha Cruzww, GiNell Elliottww, Jesse R. Farekww, Sarah Flohrww, Amanda H. Floresww, Chelsey Friedrichsww, Zach Fuscoww, Zane Goodwinww, Eric Helmreichww, John Kileyww, John Mark Knepperww, Christine Langnerww, Megan Martinezww, Carlos Mendozaww, Monal Naikww, Andrea Ochoaww, Nicolas Raglandww, England Raimeyww, Sunil Rathoreww, Evangelina Rezaww, Griffin Sadovskyww, Marie-Isabelle B. Seydouxww, Jonathan E. Smithww, Anna K. Unruhww, Vicente Velasquezww, Matthew W. Wolskiww, Yuying Gosserxx, Shubha Govindyy, Nicole Clarke-Medleyxx, Leslie Guadronxx, Dawn Lauxx, Alvin Luxx, Cheryl Mazzeoxx, Mariam Meghdarixx, Simon Ngxx, Brad Pamnanixx, Olivia Plantexx, Yuki Kwan Wa Shumxx, Roy Songxx, Diana E. Johnsonzz, Mai Abdelnabizz, Alexi Archambaultzz, Norma Chammazz, Shailly Gaurzz, Deborah Hammettzz, Adrese Kandaharizz, Guzal Khayrullinazz, Sonali Kumarzz, Samantha Lawrencezz, Nigel Maddenzz, Max Mandelbaumzz, Heather Milnthorpzz, Shiv Mohinizz, Roshni Patelzz, Sarah J. Peacockzz, Emily Perlingzz, Amber Quintanazz, Michael Rahimizz, Kristen Ramirezzz, Rishi Singhalzz, Corinne Weekszz, Tiffany Wongzz, Aubree T. Gillisb, Zachary D. Mooreb, Christopher D. Savellb, Reece Watsonb, Stephanie F. Melaaa,
3
Arjun A. Anilkumaraaa, Paul Bilinskiaaa, Rostislav Castilloaaa, Michael Closseraaa, Nathalia M. Cruzaaa, Tiffany Daiaaa, Giancarlo F. Garbagnatiaaa, Lanor S. Hortonaaa, Dongyeon Kimaaa, Joyce H. Lauaaa, James Z. Liuaaa, Sandy D. Machaaa, Thu A. Phanaaa, Yi Renaaa, Kenneth E. Stapletonaaa, Jean M. Strelitzaaa, Ray Sunjedaaa, Joyce Stammbbb, Morgan C. Andersonbbb, Bethany Grace Bonifieldbbb, Daniel Coomesbbb, Adam Dillmanbbb, Elaine J. Durchholzbbb, Antoinette E. Fafara-Thompsonbbb, Meleah J. Grossbbb, Amber M. Gygibbb, Lesley E. Jacksonbbb, Amy Johnsonbbb, Zuzana Kocsisovabbb, Joshua L. Manghellibbb, Kylie McNeilbbb, Michael Murillobbb, Kierstin L. Naylorbbb, Jessica Neelybbb, Emmy E. Ogawabbb, Ashley Richbbb, Anna Rogersbbb, J. Devin Spencerbbb, Kristina M. Stemlerbbb, Allison A. Thrombbb, Matt Van Campbbb, Katie Weihbrechtbbb, T. Aaron Wilesbbb, Mallory A. Williamsbbb, Matthew Williamsbbb, Kyle Zollbbb, Cheryl Baileyccc,8, Leming Zhouddd, Darla M. Balthaserddd, Azita Bashiriddd, Mindy E. Bowerddd, Kayla A. Florianddd, Nazanin Ghavamddd, Elizabeth S. Greiner-Sosankoddd, Helmet Karimddd, Victor W. Mullenddd, Carly E. Pelchenddd, Paul M. Yenerallddd, Jiayu Zhangddd, Michael R. Rubineee, Suzette M. Arias-Mejiaseee, Armando G. Bermudez-Capoeee, Gabriela V. Bernal-Vegaeee, Mariela Colon-Vazquezeee, Arelys Flores-Vazquezeee, Mariela Gines-Rosarioeee, Ivan G. Llavona-Cartagenaeee, Javier O. Martinez-Rodriguezeee, Lionel Ortiz-Fuenteseee, Eliezer O. Perez-Colombaeee, Joseph Perez-Oteroeee, Elisandra Riveraeee, Luke J. Rodriguez-Gironeee, Arnaldo J. Santiago-Sanabriaeee, Andrea M. Senquiz-Gonzalezeee, Frank R. Soto-delValleeee, Dorianmarie Vargas-Francoeee, Karla I. Velázquez-Sotoeee, Joan D. Zambrana-Burgoseee, Juan Carlos Martinez-Cruzadofff, Lillyann Asencio-Zayasfff, Kevin Babilonia-Figueroafff, Francis D. Beauchamp-Pérezfff, Juliana Belén-Rodríguezfff, Luciann Bracero-Quiñonesfff, Andrea P. Burgos-Bulafff, Xavier A. Collado-Méndezfff, Luis R. Colón-Cruzfff, Ana I. Correa-Mullerfff, Jonathan L. Crooke-Rosadofff, José M. Cruz-Garcíafff, Marianna Defendini-Ávilafff, Francheska M. Delgado-Perazafff, Alex J. Feliciano-Cancelafff, Valerie M. Gónzalez-Pérezfff, Wilfried Guibletfff, Aldo Heredia-Negrónfff, Jennifer Hernández-Muñizfff, Lourdes N. Irizarry-Gonzálezfff, Ángel L. Laboy-Coralesfff, Gabriela A. Llaurador-Caraballofff, Frances Marín-Maldonadofff, Ulises Marrero-Llerenafff, Héctor A. Martell-Martínezfff, Idaliz M. Martínez-Traversofff, Kiara N. Medina-Ortegafff, Sonya G. Méndez-Castellanosfff, Krizia C. Menéndez-Serranofff, Carol I. Morales-Caraballofff, Saryleine Ortiz-DeChoudensfff, Patricia Ortiz-Ortizfff, Hendrick Pagán-Torresfff, Diana Pérez-Afanadorfff, Enid M. Quintana-Torresfff, Edwin G. Ramírez-Apontefff, Carolina Riascos-Cuerofff, Michelle S. Rivera-Llovetfff, Ingrid T. Rivera-Pagánfff, Ramón E. Rivera-Vicénsfff, Fabiola Robles-Juarbefff, Lorraine Rodríguez-Bonillafff, Brian O. Rodríguez-Echevarríafff, Priscila M. Rodríguez-Garcíafff, Abneris E. Rodríguez-Laboyfff, Susana Rodríguez-Santiagofff, Michael L. Rojas-Vargasfff, Eva N. Rubio-Marrerofff, Albeliz Santiago-Colónfff, Jorge L. Santiago-Ortizfff, Carlos E. Santos-Ramosfff, Joseline Serrano-Gonzálezfff, Alina M. Tamayo-Figueroafff, Edna P. Tascón-Peñarandafff, José L. Torres-Castillofff, Nelson A. Valentín-Felicianofff, Yashira M. Valentín-Felicianofff, Nadyan M. Vargas-Barretofff, Miguel Vélez-Vázquezfff, Luis R. Vilanova-Vélezfff, Cristina Zambrana-Echevarríafff, Christy MacKinnonggg, Hui-Min Chunghhh, Chris Kayhhh, Anthony Pintohhh, Olga R. Koppiii, Joshua Burkhardtiii, Chris Harwardiii, Robert Allena, Pavan Bhata, Jimmy Hsiang-Chun Changa, York Chena, Christopher Chesleya, Dara Cohna, David DuPuisa, Michael Fasanoa, Nicholas Fazzioa, Katherine Gavinskia, Heran Gebreyesusa, Thomas Giarlaa, Marcus Gostelowa, Rachel Greensteina, Hashini Gunasinghea, Casey Hansona, Amanda Haya, Tao Jian Hea, Katie Homaa, Ruth Howea, Jeff Howensteina, Henry Huanga, Aaditya Khatria, Young Lu Kima, Olivia Knowlesa, Sarah Konga, Rebecca Krocka, Matt Krolla, Julia Kuhna, Matthew Kwonga, Brandon Leea, Ryan Leea, Kevin Levinea, Yedda Lia, Bo Liua, Lucy Liua, Max Liua, Adam Lousarariana, Jimmy Maa, Allyson Mallyaa, Charlie Mancheea, Joseph Marcusa, Stephen McDaniela, Michelle L. Millera, Jerome M. Mollestona, Cristina Montero Dieza, Patrick Nga, Natalie Ngaia, Hien Nguyena, Andrew Nylandera, Jason Pollacka, Suchita Rastogia, Himabindu Reddya, Nathaniel Regenolda, Jon Sarezkya, Michael Schultza, Jien Shima, Tara Skorupaa, Kenneth Smitha, Sarah J. Spencera, Priya Srikantha, Gabriel Stancua, Andrew P. Steina, Marshall Strothera, Lisa Sudmeiera, Mengyang Suna, Varun Sundarama, Noor Tazudeena, Alan Tsenga, Albert Tzenga, Rohit Venkata, Sandeep Venkatarama, Leah Waldmana, Tracy Wanga, Hao Yanga, Jack Y. Yua, Yin Zhenga, Mary L. Preussjjj, Angelica Garciajjj, Matt Juergensjjj, Robert W. Morriskkk, Alexis A. Nagengastlll, Julie Azarewiczlll, Thomas J. Carrlll, Nicole Chichearolll, Mike Colganlll, Megan Doneganlll, Bob Gardnerlll, Nik Kolballl, Janice L. Krummlll, Stacey Lytlelll, Laurell MacMillianlll, Mary Millerlll, Andrew Montgomerylll, Alysha Morettilll, Brittney Offenbackerlll, Mike Polenlll, John Tothlll, John Woytanowskilll, Lisa Kadlecmmm, Justin Crawfordmmm, Mary L. Sprattnnn, Ashley L. Adamsnnn, Brianna K. Barnardnnn, Martin N. Cheramiennn, Anne M. Eimennn, Kathryn L. Goldennnn, Allyson P. Hawkinsnnn, Jessica E. Hillnnn, Jessica A. Kampmeiernnn, Cody D. Kernnnn, Emily E. Magnusonnnn, Ashley R. Millernnn, Cody M. Morrownnn, Julia C. Peairsnnn, Gentry L. Pickettnnn, Sarah A. Popelkannn, Alexis J. Scottnnn, Emily J. Teepennn, Katie A. TerMeernnn, Carmen A. Watchinskinnn, Lucas A. Watsonnnn, Rachel E. Webernnn, Kate A. Woodardnnn, Daron C. Barnardooo, Isaac Appiahooo, Michelle M. Giddensooo, Gerard P. McNeilppp, Adeola Adebayoppp, Kate Bagaevappp, Justina Chinwongppp, Chrystel Dolppp, Eunice Georgeppp, Kirk Haltaufderhydeppp, Joanna Hayeppp, Manpreet Kaurppp, Max Semonppp, Dmitri Serjanovppp, Anika Toorieppp, Christopher Wilsonppp, Nicole C. Riddlea,9, Jeremy Buhlerqqq, Elaine R. Mardisrrr, Sarah C. R. Elgina
aDepartment of Biology, Washington University in St. Louis, St. Louis, MO 63130; bDepartment of Biological Sciences, University of Alabama, Tuscaloosa, AL 35401; cDepartment of Biology, Arcadia University, Glenside, PA 19038; dDepartment of Biology, Adams State University, Alamosa, CO 81101; eDepartment of Biology, Agnes Scott College, Decatur, GA 30030; fDepartment of Biology, Albion College, Albion, MI 49224; gDepartment of Biology, Amherst College, Amherst, MA 01002; hDepartment of Computer Science and Mathematics, Arcadia University, Glenside, PA 19038; iScience Department, Cabrini College, Radnor, PA 19087; jDepartment of Biology, California Lutheran University, Thousand Oaks, CA 91360; kDepartment of Chemistry and Biochemistry, California Polytechnic State University, San Luis Obispo, CA 93407; lDivision of Science and Environmental Policy, California State University, Monterey Bay, Seaside, CA 93950; mDepartment of Biology, California State University, Stanislaus, Turlock, CA 95382; nDepartment of Biology, Calvin College, Grand Rapids, MI 49546; oDepartment of Natural Sciences, Cardinal Stritch University, Milwaukee, WI 53217; pDepartment of Biology, College of William & Mary,
4
Williamsburg, VA 23187; qDepartment of Biology, Denison University, Granville, OH 43023; rDepartment of Biology, Duke University, Durham, NC 27708; sDepartment of Biology, Georgetown University, Washington, DC 20057; tDepartments of Biomedical Sciences & Cell and Molecular Biology, Grand Valley State University, Allendale, MI 49401; uBiology Department, Hampden-Sydney College, Hampden-Sydney, VA 23943; vDepartment of Biology, Hofstra University, Hempstead, NY 11549; wDepartment of Computer Science and Engineering, Johnson C. Smith University, Charlotte, NC 28216; xDepartment of Natural Sciences, LaGuardia Community College, Long Island City, NY 11101; yChemistry Department, Lindenwood University, St. Charles, MO 63301; zDepartment of Biological and Environmental Sciences, Longwood University, Farmville, VA 23909; aaDepartment of Biology, Loyola Marymount University, Los Angeles, CA 90045; bbBiology Department, Luther College, Decorah, IA 52101; ccDepartment of Biology, Macalester College, St. Paul, MN 55105; ddDepartment of Mathematics, Statistics, and Computer Science, Macalester College, St. Paul, MN 55105; eeBiology Department, McDaniel College, Westminster, MD 21157; ffDepartment of Biology, Missouri Western State University, St. Joseph, MO 64507; ggDepartment of Computer Science, Math and Physics, Missouri Western State University, St. Joseph, MO 64507; hhDepartment of Biology & Molecular Biology, Montclair State University, Montclair, NJ 07043; iiDepartment of Biological Sciences, Moravian College, Bethlehem, PA 18018; jjBiology Department, Muhlenberg College, Allentown, PA 18104; kkDepartment of Biology, New Mexico Highlands University, Las Vegas, NM 87701; llDepartment of Biology, North Carolina A&T State University, Greensboro, NC 27411; mmBiology Department, North Carolina Central University, Durham, NC 27707; nnBiology Department, Oberlin College, Oberlin, OH 44074; ooDepartment of Biology, Pomona College, Claremont, CA 91711; ppDepartment of Biology, Prairie View A&M University, Prairie View, TX 77446; qqDepartment of Biology, Saint Joseph's University, Philadelphia, PA 19131; rrDepartment of Biology, Saint Mary's College, Notre Dame, IN 46556; ssDepartment of Biology, Saint Mary's College of California, Moraga, CA 94556; ttDepartment of Biology, San Francisco State University, San Francisco CA 94132; uuBiology Department, Simmons College, Boston, MA 02115; vvDepartment of Chemistry, Simmons College, Boston, MA 02115; wwBioinformatics Program, St. Edward's University, Austin, TX 78704; xxGrove School of Engineering, City College / CUNY, New York, NY10031; yyBiology Department, The City College of New York, New York, NY 10031; zzDepartment of Biological Sciences, The George Washington University, Washington, DC 20052; aaaDivision of Biological Sciences, University of California, San Diego, La Jolla, CA 92093; bbbDepartment of Biology, University of Evansville, Evansville, IN 47722; cccDepartment of Biochemistry, University of Nebraska–Lincoln, Lincoln, NE 68588; dddDepartment of Health Information Management, University of Pittsburgh, Pittsburgh, PA 15213; eeeDepartment of Biology, University of Puerto Rico at Cayey, Cayey, PR 00736; fffDepartment of Biology, University of Puerto Rico at Mayagüez, Mayagüez, PR 00680; gggBiology Department, University of the Incarnate Word, San Antonio, TX 78209; hhhDepartment of Biology, University of West Florida, Pensacola, FL 32514; iiiDepartment of Biology, Utah Valley University, Orem, UT 84058; jjjDepartment of Biological Sciences, Webster University, Webster Groves, MO 63119; kkkDepartment of Biology, Widener University, Chester, PA 19013; lllDepartments of Chemistry and Biochemistry, Widener University, Chester, PA 19013; mmmDepartment of Biology, Wilkes University, Wilkes-Barre, PA 18766; nnnDepartment of Biology, William Woods University, Fulton, MO 65251; oooBiology Department, Worcester State University, Worcester, MA 01602; pppDepartment of Biology, York College / CUNY, Jamaica, NY 11451; qqqDepartment of Computer Science and Engineering, Washington University in St. Louis, St. Louis, MO 63130; and rrrGenome Institute, Department of Genetics, Washington University School of Medicine, St. Louis, MO 63108; 1Department of Biology, University of the Fraser Valley, Abbotsford, BC V2S 7M8, Canada; 2Biology Department, Massasoit Community College, Brockton, MA 02302; 3Department of Biology, Washington University in St. Louis, St. Louis, MO 63130; 4College of Engineering & Science, University of Detroit Mercy, Detroit, MI 48221; 5Department of Biology, University of San Diego, San Diego, CA 92110; 6Department of Biology, University of the Cumberlands, Williamsburg, KY 40769; 71 Cranberry Hill, Suite 403, Lexington, MA 02421; 8School of Natural and Health Sciences, Mount Mary University, Milwaukee, WI 53222; and 9Department of Biology, The University of Alabama at Birmingham, Birmingham, AL 35294
ABSTRACT The Muller F element (4.2 Mb, ~80 protein-‐coding genes) is an unusual autosome of Drosophila melanogaster; it is mostly heterochromatic with a low recombination rate. To investigate how these properties impact the evolution of repeats and genes, we manually improved the sequence and annotated the genes on the D. erecta, D. mojavensis, and D. grimshawi F elements and euchromatic domains from the Muller D element. We find that F elements have higher transposon density (25%–50%) than euchromatic reference regions (3%–11%). Among the F elements, D. grimshawi has the lowest transposon density (particularly DINE-‐1: 2% versus 11%–27%). F element genes have larger coding spans, more coding exons, larger introns, and lower codon bias. Comparison of the Effective Number of Codons with the Codon Adaptation Index shows that, in contrast to the other species, codon bias in D. grimshawi F element genes can be attributed primarily to selection instead of mutational biases, suggesting that density and types of transposons affect the degree of local heterochromatin formation. F element genes have lower estimated DNA melting temperatures than D element genes, potentially facilitating transcription through heterochromatin. Most F element genes (~90%) have remained on that element, but the F element has smaller syntenic blocks than genome averages (3.4–3.6 versus 8.4–8.8 genes per block), indicating higher rates of inversion despite lower rates of recombination. Overall, the F element has maintained characteristics that are distinct from other autosomes in the Drosophila lineage, illuminating the constraints imposed by a heterochromatic milieu.
5
INTRODUCTION Classically, chromatin has been demarcated into two major types based on the staining patterns in interphase nuclei. Regions that remain densely stained throughout the cell cycle are classified as heterochromatin, while regions that stain weakly during interphase are classified as euchromatin (Heitz 1928). Heterochromatic regions generally are late replicating, and have lower rates of recombination, lower gene density, higher repeat density, higher levels of histone 3 lysine 9 di-‐ and tri-‐methylation (H3K9me2/3) and associated Heterochromatin Protein 1a (HP1a) compared to euchromatic regions (reviewed in (Grewal and Elgin 2007)). With an estimated size of 4.2 Mb overall, the Drosophila melanogaster Muller F element, (also known as the dot chromosome, or the fourth chromosome in that species) is unusual in that it appears entirely heterochromatic by most criteria, but the distal 1.3 Mb has a gene density and fraction of active genes (~50% in S2 cells) that are similar to the euchromatic regions of the D. melanogaster genome (Riddle et al. 2009, 2012). Insertion of a PEV reporter (hsp70-‐driven white) in most cases results in a variegating phenotype (partial silencing; see SUPPLEMENTAL TEXT in File S1), indicating that even this distal region of the F element is packaged as heterochromatin (Sun et al. 2004; Riddle et al. 2008). Subsequent high-‐resolution mapping of the chromatin landscape of the F element supports this conclusion (Riddle et al. 2012). These characteristics of the F element have made it an ideal platform for elucidating factors that are involved in heterochromatin formation, and for exploring their impact on genes that are embedded in a heterochromatic domain (Elgin and Reuter 2013). Immunofluorescent staining of polytene chromosomes with antibodies directed against H3K9me2 shows that, similar to D. melanogaster, the F elements of D. erecta, D. mojavensis, and D. grimshawi are also enriched in H3K9me2 (Figure 1, left). These enrichment patterns indicate that the F element has maintained its heterochromatic properties in species (i.e. D. mojavensis and D. grimshawi) that last shared a common ancestor with D. melanogaster about 40 million years ago ((Powell 1997), Figure 1, right). To investigate the evolution of this unusual domain, we performed comparative analyses of the repeat and gene characteristics of the F element in four Drosophila species. The Drosophila 12 Genomes Consortium (Drosophila 12 Genomes Consortium et al. 2007) and the modENCODE project (Kharchenko et al. 2011) have produced a large collection of genomic datasets for D. melanogaster and 11 other Drosophila species. Previous analyses of the evolution of these Drosophila species have relied primarily on the Comparative Analysis Freeze 1 (CAF1) draft assembly and computational (GLEAN-‐R) gene predictions (Drosophila 12 Genomes Consortium et al. 2007). Most of these analyses only focused on the Muller elements A–E and the properties of the F element have generally not been examined carefully.

6
Figure 1 The Drosophila F element has maintained its heterochromatic properties in four different Drosophila species. (Left) Immunofluorescent staining of polytene chromosomes using H3K9me2-‐specific antibodies shows that the D. melanogaster, D. erecta, D. mojavensis, and D. grimshawi F elements (colored arrows) are enriched in H3K9me2 (a mark of heterochromatin). (Right) Phylogenetic tree of the Drosophila genomes sequenced by the Drosophila 12 Genomes Consortium (Powell 1997). The colored stars next to the species names in the phylogenetic tree denote the species analyzed in this study; the same color scheme is used in this and subsequent figures.
In this study, we have built on these genomic resources by performing manual sequence improvement and gene annotation of the D. erecta, D. mojavensis, and D. grimshawi F elements and euchromatic reference regions derived from the Muller D elements. The D element analysis regions (referred to as "base") are located proximal to the pericentric heterochromatin so that they have a similar topological position in the nucleus as the F element. To identify characteristics that are associated with the proximity to pericentric or telomeric heterochromatin, we also analyzed two additional euchromatic regions from the D. erecta D element: a 1.4 Mb region that extends further from the base of the D element (referred to as "extended") and a 1.3 Mb region adjacent to the telomeric region of the D element (referred to as "telomeric"). [See the exact coordinates of all the analysis regions in Table S1, Genome Browser views (showing repeat density and gaps) in Figure S1, and a detailed description of how these regions were selected in SUPPLEMENTAL METHODS.] The high quality assemblies and gene annotations generated in this study enable us to address several questions about the evolution of the F element: What are the differences in the types and distributions of repeats among the F elements? Do F element genes exhibit different characteristics (e.g., coding spans, intron sizes) compared to genes on the other autosomes? How does the low recombination rate affect codon bias, the selective pressure experienced by F element genes, and the frequency of gene movement?

7
Our analyses show that F element genes in both the Sophophora and Drosophila clades have maintained a set of distinct characteristics (larger gene size, lower codon bias, lower melting temperature) compared to genes on other autosomes. Most of the D. melanogaster F element genes (~90%) have remained on the same Muller element in all four Drosophila species, but there have been a large number of inversions. F elements of the species in the Drosophila clade (i.e. D. mojavensis and D. grimshawi) exhibit different repeat distributions and gene characteristics compared to the species in the melanogaster subgroup (i.e. D. melanogaster and D. erecta). F element genes generally exhibit lower codon bias and weaker positive selection compared to genes in the euchromatic reference regions; these characteristics are least pronounced in D. grimshawi, which also has a much lower density of the Drosophila INterspersed Element 1 (DINE-‐1) transposon. Despite these differences, our analyses show that F element genes in all four species generally share a common set of characteristics that presumably reflect the local environment and could contribute to their ability to function in a heterochromatic domain.
MATERIALS AND METHODS General overview Sequence improvement and gene annotation of the three Drosophila species studied here were organized using the framework provided by Genomics Education Partnership (Shaffer et al. 2010). Additional details for some of the analysis protocols are available in SUPPLEMENTAL METHODS. We have set up an instance of the UCSC Genome Browser (Kent et al. 2002) to facilitate the visualization and access to the improved sequences and gene annotations produced in this study (available at http://gander.wustl.edu). The improved sequences and annotations are also available in File S9. Most of the data conversions were done using tools in the Kent source utilities (part of the UCSC Genome Browser source tree, (Kent et al. 2002)). BEDTools was used to identify intersections and unions among genomic features and to manipulate BED files (Quinlan and Hall 2010). Custom scripts were used to facilitate data conversion and analysis. The analyses were run on a Dell Precision T5400 Linux server (with 8 Xeon processors and 8GB of RAM) and a MacBook Pro laptop (with an Intel Core i7 processor and 8GB of RAM). Some of the analyses were run in parallel using GNU Parallel (Tange 2011). Immunofluorescent staining of polytene chromosomes The D. erecta (14021-‐0224.01), D. mojavensis (15081-‐1352.22), and D. grimshawi (15287-‐2541.00) stocks were obtained from the Drosophila Species Stock Center at the University of California, San Diego. The protocol for the immunofluorescent staining of polytene chromosomes from Drosophila third instar larval salivary glands has previously been described (Stephens et al. 2004). An anti-‐H3K9me2 rabbit polyclonal antibody (Upstate 07-‐441) was used at a dilution of 1:250. Secondary antibody labeled with Alexa-‐Fluor 594 (red) was used at a 1:750 dilution (Invitrogen, catalog number A-‐11012). Formaldehyde fixation times were 12 minutes, with the exception of D. grimshawi salivary glands, which were fixed for 10 minutes prior to squashing and staining.
8
Sequence improvement The D. mojavensis and D. grimshawi Comparative Analysis Freeze 1 (CAF1) assemblies produced by the Drosophila 12 Genomes Consortium were retrieved from the AAA: 12 Drosophila Genomes web site (http://rana.lbl.gov/drosophila/). The placements of the fosmid end reads were specified in the reads.placed file in each CAF1 assembly. The F and D element scaffolds were partitioned into a list of overlapping fosmids based on the reads.placed file for each species. This set of fosmids was obtained from the Drosophila Genomics Resource Center (DGRC) at Indiana University and used as templates for sequencing reactions. However, because many of the fosmid clones used to construct the original D. grimshawi CAF1 assemblies were unavailable from the DGRC, we could only improve approximately 90% of the D. grimshawi F element. Hence the analysis of this region was performed on a mosaic of the original CAF1 assembly and improved regions. The overall sequence improvement protocol has previously been described (Slawson et al. 2006; Leung et al. 2010). Reads placed in each fosmid region were retrieved from the NCBI Trace Archive (http://www.ncbi.nlm.nih.gov/Traces/home/) and assembled using the Phred, Phrap, and Consed software package (Ewing and Green 1998; Gordon et al. 1998). In collaboration with the Genome Institute at Washington University, we improved each fosmid project by identifying and resolving misassemblies as well as designing additional sequencing reactions to resolve gaps and low quality regions. These fosmid projects were improved to a sequence improvement standard similar to the one used by the mouse genome project (Mouse Genome Sequencing Consortium et al. 2002). To ensure the correctness of the final assembly, inconsistent mate pairs within each fosmid project were resolved and restriction digests were used to confirm the final assembly. Each fosmid was digested with four restriction enzymes (i.e. EcoRI, EcoRV, HindIII, and SacI). The fragment sizes of the in-‐silico digests of the final consensus sequence must be in congruence with the fragment sizes of at least two of the actual restriction digests to meet the standard. Each fosmid project was completed by at least two students independently; experienced undergraduates worked with the GEP staff to reconcile the results and produce the final consensus sequence. To identify differences between the CAF1 and improved sequences, the CAF1 sequence was soft-‐masked using WindowMasker with default parameters. The improved sequences were compared against the original CAF1 sequence using MegaBLAST (Morgulis et al. 2008) with an E-‐value threshold of 1e-‐5. The UCSC Chain and Net protocol (Kent et al. 2003) was then applied to the MegaBLAST alignments. The Net alignments were converted into PSL and BED formats to facilitate analysis of the differences between the two assemblies. Repeat analysis WindowMasker (Morgulis et al. 2006) was run on the different analysis regions using default parameters and the results were converted into BED format using custom Perl scripts. Tallymer (Kurtz et al. 2008) was used to estimate k-‐mer frequencies in the different analysis regions. Each genome assembly was indexed using mkindex and the occratio program was used to determine the distributions of unique k-‐mers. The count of each 13-‐mer was generated using the search program in Tallymer. Tandem repeats were identified
9
using Tandem Repeats Finder (Benson 1999) with the following parameters: Match = 2, Mismatch = 7, Delta = 7, Match Probability = 80, Mismatch Probability = 10, Minscore = 50 and MaxPeriod = 2000. Simple repeats and low complexity regions were identified using tantan (Frith 2011) with default parameters (-‐r = 0.005), and the results were reported in BED format (-‐f 3). The distribution of dinucleotide repeats was determined using a Perl script that iterates from a dinucleotide repeat size of 2 to 100. Each dinucleotide repeat was searched against the analysis regions and the (potentially overlapping) matches were tabulated and plotted using Microsoft Excel. Transposon analysis The protocols used to construct and classify the species-‐specific transposon libraries are described in SUPPLEMENTAL METHODS. The Drosophila RepBase repeat library (release 17.07) was obtained from RepBase (Jurka et al. 2005). The ReAS repeat library (version 2) was obtained from the FlyBase FTP site at ftp://ftp.flybase.net/genomes/aaa/transposable_elements/ReAS/v2/consensus_fasta/. RepeatMasker (Smit et al. 1996) (version open-‐3.4.0) was run on the analysis regions using the cross_match search engine at the most sensitive (-‐s) setting, without masking low complexity or simple repeats (-‐nolow). Transposon fragments identified by RepeatMasker were converted into BED format using custom scripts for subsequent analysis. Overlapping transposon fragments identified by RepeatMasker were merged together using BEDTools only if the overlapping repeats had the same repeat class. Repeat density was calculated using a sliding window of 1 kb with a step size of 500 bp. Gene annotations This comparative analysis used the high quality D. melanogaster gene annotations (release 5.50) produced by FlyBase as reference (Marygold et al. 2013). The annotation protocol has previously been described (Shaffer et al. 2010). GEP students annotated each fosmid using computational evidence organized on an instance of the UCSC Genome Browser (Kent et al. 2002) set up by the GEP staff. The computational evidence included sequence similarity to D. melanogaster proteins as well as predictions from multiple ab initio and evidence-‐based gene predictors. For species with RNA-‐Seq data, additional evidence tracks such as RNA-‐Seq read coverage, splice junction predictions from TopHat (Trapnell et al. 2009) and assembled transcripts from Cufflinks (Trapnell et al. 2010) were also made available. See SUPPLEMENTAL METHODS for additional details on the protocol used to construct the RNA-‐Seq transcriptome and predicted protein libraries for each species. The GEP has developed a set of annotation guidelines (Annotation Instruction Sheet) in order to standardize the treatment of annotations that are ambiguous because of insufficient evidence. These annotation guidelines and additional resources supporting the GEP annotation protocol are available on the GEP web site (http://gep.wustl.edu). Each annotation project was completed independently by at least two GEP students. The GEP staff supervised students who reconciled the submitted annotations using the Apollo Genome Annotation Curation Tool (Lewis et al. 2002). These reconciled gene annotations
10
were mapped back to the improved genomic scaffolds and were incorporated into the GEP UCSC Genome Browser (available through the "GEP Genes" track, http://gander.wustl.edu). The GEP staff reviewed these gene models in the context of all the available evidence tracks to resolve any remaining annotation issues. The D. erecta, D. mojavensis, and D. grimshawi GLEAN-‐R gene annotations (Release 1.3) produced by the Drosophila 12 Genomes Consortium were compared to the annotations produced here. The GLEAN-‐R annotations were obtained from FlyBase (available at http://flybase.org/static_pages/downloads/bulkdata7.html) and converted into BED format using custom scripts. We used BLAT (Kent 2002) with default parameters to map the D. mojavensis and D. grimshawi GLEAN-‐R gene predictions against the improved assemblies because the underlying genomic sequences for these two species have changed due to the sequence improvements reported here. Utilities in BEDTools (Quinlan and Hall 2010) and custom scripts were then used to compare the GLEAN-‐R predictions with our gene annotations. Analysis of gene characteristics The GEP gene annotations are in BED format, and most of the gene characteristics (e.g., gene size, coding exon size) were determined using BEDTools (Quinlan and Hall 2010) and custom scripts. When calculating the coding exon sizes for the first and last coding exons, only the translated portion of the exon was included even though the transcribed exon may be larger because of untranslated regions. The gene characteristics of the most comprehensive isoform for each gene were imported into R (version 3.0.2) for subsequent analysis and visualization of the results. Violin plots of the different gene characteristics were generated by the vioplot function in the R vioplot package. The Kruskal-‐Wallis Rank Sum Test was performed using the kruskal.test function in R (R Core Team 2013). The kruskalmc function in the pgirmess package was used to perform the multiple comparison tests after Kruskal-‐Wallis. Codon bias analysis The Effective Number of Codons (Nc) and the Codon Adaptation Index (CAI) for each gene in the analysis regions were determined using the chips and the cai programs in the EMBOSS package (Rice et al. 2000), respectively. Typically, highly expressed genes are used as the reference set when calculating CAI because they are under the strongest translational selection and would typically show a strong preference for a subset of tRNAs (Rocha 2004). Because expression data were unavailable for some of the species used in this study, we used scnRCA (O’Neill et al. 2013) to analyze all of the GLEAN-‐R predictions in order to construct the species-‐specific reference gene set that exhibits the dominant codon bias for each species. The scnRCA parameters used to construct the reference gene sets were as follows: -‐i r -‐g true -‐d 2.0 -‐p 1.0 -‐m -‐1. The codon frequency table for each species was created by analyzing the species-‐specific reference gene set with the cusp program in the EMBOSS package. The species-‐specific codon usage tables were then used in the cai program (via the -‐cfile parameter) to calculate

11
the CAI value for each gene. The violin plots and Kruskal-‐Wallis Tests were created using the same procedure as described in the "Analysis of gene characteristics" section. Heat maps of codon bias for each gene in the analysis regions were created using the heatmap.2 function in the R package gplots. The dendrograms next to the heat maps were created using Ward hierarchical clustering with Euclidean distance. Nc versus CAI scatterplots The codon bias statistics for each gene were calculated as described above and the results were imported into R to produce the Nc versus CAI scatterplots. We then applied locally estimated scatterplot smoothing (LOESS) to identify the major trends in the scatterplots (Cleveland and Devlin 1988). The span parameter for the LOESS regression line was determined by generalized cross-‐validation (criterion=gcv, family=symmetric) using the loess.as function in the R package fANCOVA. Melting temperature metagene profile Because the transcription start sites have not been identified in D. erecta, D. mojavensis, and D. grimshawi gene annotations, we used the coding span (i.e. from start codon to stop codon, including introns) and the 2 kb upstream and downstream of the coding spans as a first approximation for this analysis. The melting temperatures were determined by the dan tool in the EMBOSS package using a sliding window of 9 bp (windowsize=9) and a step size of 1 (shiftincrement=1) with the following parameters: dnaconc=50, saltconc=50, mintemp=55. The results were converted into BigWig format (Kent et al. 2010) for subsequent analysis. Melting temperatures for the coding spans were normalized to 3 kb using bigWigSummary (part of the Kent source utilities). Melting temperatures for the normalized 3 kb region and the 2 kb flanking regions were imported into R and the standard graphics plot function in R was used to produce the metagene profiles. Distance–Distance plots of gene characteristics To determine whether any subset of F element genes has characteristics that differ from those of the group of genes as a whole, we constructed Distance–Distance plots for each F element separately using the rrcov package in R. Eight characteristics of the most comprehensive isoform of each gene were used in this analysis: coding span (bp from start to stop codon, including introns); intron repeat size (total size of all transposon fragments within introns); size of coding regions (sum of all coding exons in bp); number of coding exons; median size (in bp) of coding exons; median size (in bp) of introns; Nc and CAI (calculated as described above). Using these eight gene characteristics, we calculated the classical Mahalanobis distance (MD) for each gene. MD measures the difference between the characteristics of each gene and the centroid (which is derived from the multivariate distribution of the characteristics of all F element genes). Unlike Euclidean distances, MD accounts for the variance of each gene characteristic and the covariance among the eight gene characteristics. The

12
magnitude of MD corresponds to the dissimilarity of the characteristics of each gene compared to the centroid (i.e. large MD indicates that the gene has very different characteristics compared to the rest of the genes in the dataset). However, because MD is sensitive to extreme outliers, we also calculated the robust Mahalanobis distance (RD) using the Stahel-‐Donoho estimator (sde). This robust estimator mitigates the impact of outliers on MD by assigning a weight to each gene based on its outlyingness (calculated using projection pursuit, (Van Aelst et al. 2012)). Hence a scatterplot of MD versus RD (i.e. Distance–Distance plot) can be used to identify additional outliers that were masked by classical MD. To create the Distance–Distance plots, the gene characteristics were normalized using the scale function in R because the different variables have values that differ by orders of magnitude (e.g., gene span versus CAI). The CovRobust function in the rrcov package was used to calculate the robust distances (with the parameter "sde"). Plots of the robust distance versus the Mahalanobis distance were produced using the generic plot command in R (with the parameter "which='dd'"). Points were considered to be outliers if their values were greater than the square root of the 97.5% quantile of the χ2 distribution with 8 degrees of freedom (i.e. 4.19). Whole genome alignments To facilitate analysis of the wanderer genes (genes present on the F element in one species and on another Muller element in a different species), we produced a set of whole genome alignments for D. melanogaster, D. yakuba, D. erecta, D. mojavensis, D. virilis, and D. grimshawi. (The Chain and Net alignments are available on the GEP UCSC Genome Browser, http://gander.wustl.edu.) Repeats in each genome were soft masked and the genome assemblies were aligned against each other using LAST (Kiełbasa et al. 2011) with default parameters followed by the UCSC Chaining and Netting protocol (Kent et al. 2003).
RESULTS Improved F and D element assemblies and gene annotations Sequence improvement: Previous studies have shown that the Drosophila F elements have a higher repeat density than the other autosomes (Leung et al. 2010), which could lead to a higher frequency of gaps and misassemblies. These assembly issues could introduce substantial bias into the analysis of genome characteristics (Salzberg and Yorke 2005). Quality assessments (see SUPPLEMENTAL METHODS) of the Comparative Analysis Freeze 1 (CAF1) assemblies (Drosophila 12 Genomes Consortium et al. 2007) led us to improve the D. mojavensis F element, the D. grimshawi F element, and the D. mojavensis euchromatic reference region from the D element to a quality standard that is similar to those used for the mouse genome project. As part of this sequence improvement standard, we resolved inconsistent mate pairs within each assembly and confirmed each assembly using restriction digests (see MATERIALS AND METHODS for details). These experimental data provided additional confirmation of the accuracy of the final F element assemblies, and enabled us to perform genomic analysis of the F elements with high confidence, ensuring accuracy (in particular) in the repeat and gene movement analyses.
13
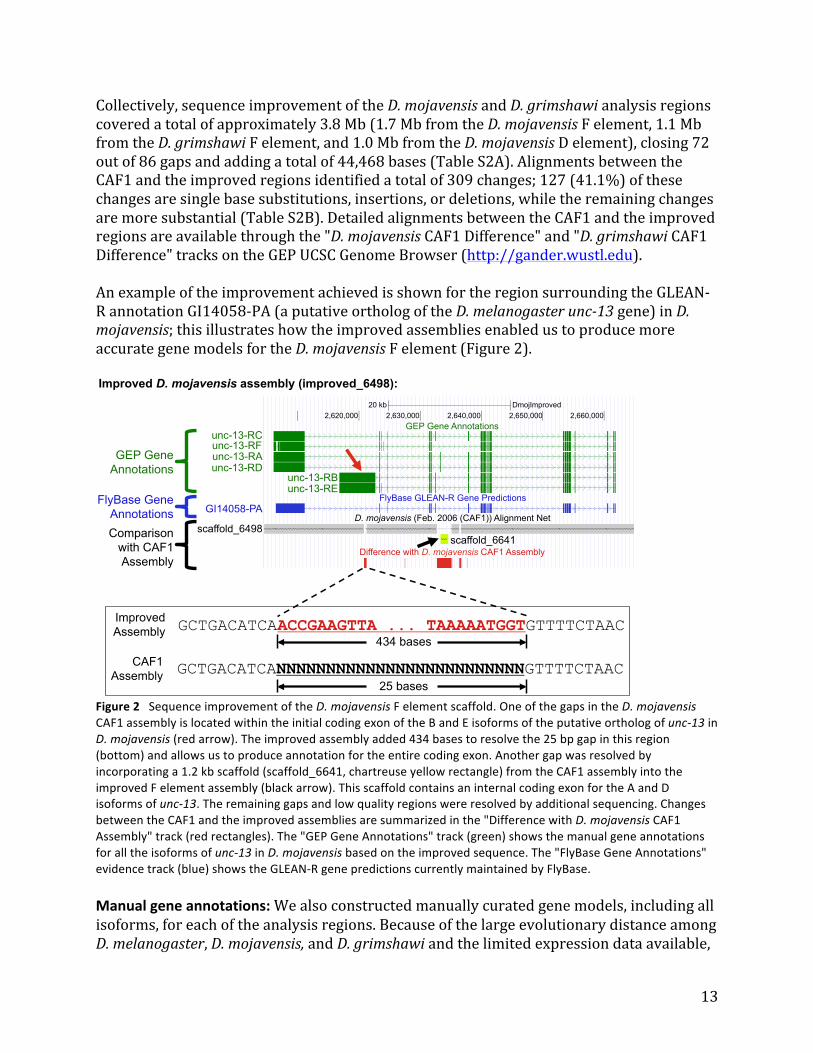
Collectively, sequence improvement of the D. mojavensis and D. grimshawi analysis regions covered a total of approximately 3.8 Mb (1.7 Mb from the D. mojavensis F element, 1.1 Mb from the D. grimshawi F element, and 1.0 Mb from the D. mojavensis D element), closing 72 out of 86 gaps and adding a total of 44,468 bases (Table S2A). Alignments between the CAF1 and the improved regions identified a total of 309 changes; 127 (41.1%) of these changes are single base substitutions, insertions, or deletions, while the remaining changes are more substantial (Table S2B). Detailed alignments between the CAF1 and the improved regions are available through the "D. mojavensis CAF1 Difference" and "D. grimshawi CAF1 Difference" tracks on the GEP UCSC Genome Browser (http://gander.wustl.edu). An example of the improvement achieved is shown for the region surrounding the GLEAN-‐R annotation GI14058-‐PA (a putative ortholog of the D. melanogaster unc-‐13 gene) in D. mojavensis; this illustrates how the improved assemblies enabled us to produce more accurate gene models for the D. mojavensis F element (Figure 2).
Figure 2 Sequence improvement of the D. mojavensis F element scaffold. One of the gaps in the D. mojavensis CAF1 assembly is located within the initial coding exon of the B and E isoforms of the putative ortholog of unc-‐13 in D. mojavensis (red arrow). The improved assembly added 434 bases to resolve the 25 bp gap in this region (bottom) and allows us to produce annotation for the entire coding exon. Another gap was resolved by incorporating a 1.2 kb scaffold (scaffold_6641, chartreuse yellow rectangle) from the CAF1 assembly into the improved F element assembly (black arrow). This scaffold contains an internal coding exon for the A and D isoforms of unc-‐13. The remaining gaps and low quality regions were resolved by additional sequencing. Changes between the CAF1 and the improved assemblies are summarized in the "Difference with D. mojavensis CAF1 Assembly" track (red rectangles). The "GEP Gene Annotations" track (green) shows the manual gene annotations for all the isoforms of unc-‐13 in D. mojavensis based on the improved sequence. The "FlyBase Gene Annotations" evidence track (blue) shows the GLEAN-‐R gene predictions currently maintained by FlyBase. Manual gene annotations: We also constructed manually curated gene models, including all isoforms, for each of the analysis regions. Because of the large evolutionary distance among D. melanogaster, D. mojavensis, and D. grimshawi and the limited expression data available,

14
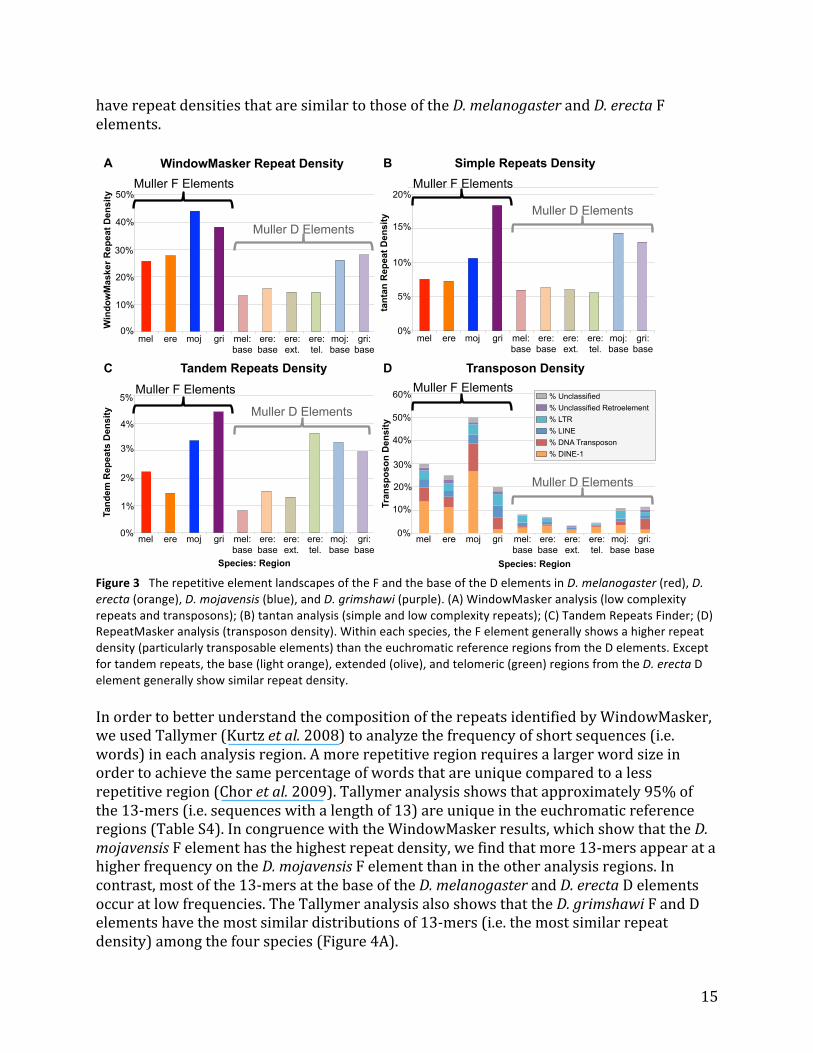
this analysis only focuses on the coding regions of genes. (See MATERIALS AND METHODS and SUPPLEMENTAL METHODS for detailed description of the annotation protocol.) The manual annotation process also allows us to identify potential annotation errors in D. melanogaster (e.g., rdgC as described in SUPPLEMENTAL METHODS). Collectively, we annotated a total of 878 genes (1619 isoforms). A summary of the changes in the number of isoforms and coding exons, as well as descriptions of other non-‐canonical features (e.g., novel GC donor sites) compared to D. melanogaster (release 5.50) is available in File S2. Overall, 58% (552/947) of the GLEAN-‐R gene predictions match our annotation of the most comprehensive isoform (i.e. the isoform with the largest coding region, Table S3A), and 85% (3648/4287) of the coding exons predicted by GLEAN-‐R match the coding exons in the most comprehensive isoform (Table S3B). While a similar percentage of the coding exons predicted by GLEAN-‐R match our annotations in both the F and D elements (80.7– 82.8%), a substantially lower percentage of the GLEAN-‐R gene models match our annotations on the D. mojavensis and D. grimshawi F elements (32.1% and 39.1%, respectively) than on the D elements (57.6% and 58.0%, respectively). Many of the differences between the GLEAN-‐R predictions and our annotations on the D. mojavensis and D. grimshawi F elements can be traced to improvement of the underlying sequence (e.g., unc-‐13 in Figure 2). Hence, the lower percentage of GLEAN-‐R gene models that match our annotations can primarily be attributed to the higher rate of assembly problems in the CAF1 assemblies for the D. mojavensis and D. grimshawi F elements. Our results show that manual sequence improvement and gene annotation can improve over half of the gene models in regions with high repeat density. F elements consistently show high repeat density but vary in repeat composition The most striking difference between the D. melanogaster F element and the other autosomes is its high density of repeats, primarily remnants of transposable elements (TEs) (Bergman et al. 2006; Riddle et al. 2009). To obtain an overview of the repetitive element landscape of F elements in the four Drosophila species, we analyzed the types and distribution of repeats using four different approaches: WindowMasker, tantan, Tandem Repeats Finder, and RepeatMasker with species-‐specific transposon libraries (Figure 3). (Detailed repeat statistics are available in File S3 and File S4.) WindowMasker analysis shows the F elements have high repeat density: To obtain an overview of the total repeat content, we tabulated the total number of bases masked by WindowMasker for each of the analysis regions. Unlike other repeat finding tools, WindowMasker relies only on the genomic sequence to identify over-‐represented sequences that correspond to low complexity sequences, simple repeats, or transposable elements, which makes it an ideal tool for analyzing the repeat contents of genomes without comprehensive repeat libraries (Morgulis et al. 2006). The results show that F elements consistently exhibit higher repeat densities than their corresponding euchromatic reference regions (D elements) in all four species (Figure 3A). D. mojavensis and D. grimshawi have higher repeat densities than D. melanogaster and D. erecta in both the F elements and the D elements. In fact, the D. mojavensis and D. grimshawi D elements
15
have repeat densities that are similar to those of the D. melanogaster and D. erecta F elements.
Figure 3 The repetitive element landscapes of the F and the base of the D elements in D. melanogaster (red), D. erecta (orange), D. mojavensis (blue), and D. grimshawi (purple). (A) WindowMasker analysis (low complexity repeats and transposons); (B) tantan analysis (simple and low complexity repeats); (C) Tandem Repeats Finder; (D) RepeatMasker analysis (transposon density). Within each species, the F element generally shows a higher repeat density (particularly transposable elements) than the euchromatic reference regions from the D elements. Except for tandem repeats, the base (light orange), extended (olive), and telomeric (green) regions from the D. erecta D element generally show similar repeat density. In order to better understand the composition of the repeats identified by WindowMasker, we used Tallymer (Kurtz et al. 2008) to analyze the frequency of short sequences (i.e. words) in each analysis region. A more repetitive region requires a larger word size in order to achieve the same percentage of words that are unique compared to a less repetitive region (Chor et al. 2009). Tallymer analysis shows that approximately 95% of the 13-‐mers (i.e. sequences with a length of 13) are unique in the euchromatic reference regions (Table S4). In congruence with the WindowMasker results, which show that the D. mojavensis F element has the highest repeat density, we find that more 13-‐mers appear at a higher frequency on the D. mojavensis F element than in the other analysis regions. In contrast, most of the 13-‐mers at the base of the D. melanogaster and D. erecta D elements occur at low frequencies. The Tallymer analysis also shows that the D. grimshawi F and D elements have the most similar distributions of 13-‐mers (i.e. the most similar repeat density) among the four species (Figure 4A).

16
Figure 4 Distributions of 13-‐mers and dinucleotide repeats in the regions analyzed. (A) Consistent with the WindowMasker results, more 13-‐mers are found to be repeated (present at a higher frequency) on the D. mojavensis F element (dark blue line) than the other analysis regions. The genomic sequence in each analysis region is partitioned into overlapping 13-‐mers and the frequency of each 13-‐mer is tabulated using Tallymer. The values on the x-‐axis correspond to the number of times that a particular 13-‐mer is found in the analysis region while the y-‐axis correspond to the total number of 13-‐mers (of all sequences) that appear at each frequency. For example, approximately 106 13-‐mers appear only once in each analysis region. (B) Cumulative dinucleotide repeats analysis shows a higher frequency of dinucleotide repeats on the D. mojavensis and D. grimshawi F elements (dark blue and purple lines, respectively) than on the D. melanogaster and D. erecta F elements (dark red and orange lines, respectively). A pseudocount of one has been added to the cumulative distribution plots in order to show a continuous distribution in the semi-‐log plot.
Examination of the 13-‐mers identified by Tallymer shows that many of the 13-‐mers that appear at a high frequency in D. mojavensis and D. grimshawi contain AT and CA dinucleotide repeats. Analyses of the distribution of dinucleotide repeats show that CA dinucleotide repeats are shorter on the D. melanogaster and D. erecta F elements, but longer on the D. mojavensis and D. grimshawi F elements, than in the euchromatic reference regions (Figure 4B). Thus, while low density of CA repeats was previously associated with the F element in D. melanogaster (Pardue et al. 1987), this does not seem to hold in general. The D. mojavensis and D. grimshawi F elements are also enriched in AT dinucleotide repeats compared to those of D. melanogaster and D. erecta. The lack of CG repeats in both the F and D elements is also striking (see DISCUSSION).

17
Simple and low complexity repeats are particularly abundant on the D. grimshawi F element: The tantan analysis (Frith 2011) shows that D. mojavensis and D. grimshawi have a higher density of simple and low complexity sequences in both the F element and the euchromatic reference regions compared to the corresponding regions in D. melanogaster and D. erecta (Figure 3B). The analysis also reveals some species-‐specific differences: simple and low complexity repeats appear to contribute the most to the repeat density of the D. grimshawi genome. The D. grimshawi F element has a substantially higher density of simple and low complexity repeats (18%) compared to the F elements of the other species examined (7%–11%). In contrast to the other species, the D. mojavensis F element shows a lower density of simple and low complexity repeats compared to its euchromatic reference region (11% versus 14%). Tandem repeats show a skewed distribution on the D. erecta D element: Tandem repeats may play a particular role in genome rearrangement and regulation of gene expression (Sinha and Siggia 2005; Farré et al. 2011). For this analysis, tandem repeats are defined as regions with a minimum size of 25 bases and a maximum period of 2000 (see MATERIALS AND METHODS for the complete list of search parameters). Results from Tandem Repeats Finder (TRF) (Benson 1999) show that the D. mojavensis and D. grimshawi F elements and their euchromatic reference regions have a higher density of tandem repeats than the corresponding regions in D. melanogaster and D. erecta (Figure 3C). While the base and the extended regions of the D. erecta D element both show a low density of tandem repeats, the analysis region near the telomere shows a high density, as do the euchromatic reference regions in D. mojavensis and D. grimshawi. A skew to a higher density of tandem repeats toward the telomere is apparent in a sliding window analysis of the D. erecta D element as a whole. In contrast, the D. melanogaster D element does not show the same skew in the density of tandem repeats (Figure S2). Recent expansion of DINE-‐1 transposons leads to high transposon density on the D. mojavensis F element: Transposons may play an important role in targeting heterochromatin formation (Grewal and Elgin 2007). Because many transposons are species-‐specific, we constructed transposon libraries for each species and then used RepeatMasker (Smit et al. 1996) to identify transposon remnants in each analysis region. (See SUPPLEMENTAL METHODS for the protocols used to construct and classify the species-‐specific transposon libraries, and File S4 for transposon density estimates using different species-‐specific transposon libraries.) Among the F elements, D. mojavensis has the highest transposon density (~50%) while D. grimshawi has the lowest (~20%). Strikingly, ~53% of the transposon fragments on the D. mojavensis F element show sequence similarity to DINE-‐1 elements. The RepeatMasker results are generally in concordance with the WindowMasker results (Figure 3D): F elements have a higher transposon density compared to the euchromatic reference regions (D elements). In some cases the transposon density estimate is higher than the total repeat density estimate by WindowMasker (e.g., D. mojavensis F element). This discrepancy is primarily caused by the difficulty associated with precisely defining the boundaries of each repeat copy (Bao and Eddy 2002).
18
While the WindowMasker analysis (Figure 3A) shows that the D. grimshawi and D. mojavensis F elements have a similar repeat density (38% and 44%, respectively), the RepeatMasker analysis (Figure 3D) shows that the D. grimshawi F element has a much lower density of transposons than the D. mojavensis F element (20% and 50%, respectively). This difference can primarily be attributed to the density of DINE-‐1 elements (2% in D. grimshawi versus 27% in D. mojavensis) and DNA transposons (5% versus 12%). In particular, DINE-‐1 (a helitron) accounts for 53% of the D. mojavensis F element transposon fragments but only 8% of the transposon fragments on the D. grimshawi F element (Figure S3). DINE-‐1 elements account for approximately half of all transposon fragments on the D. melanogaster and D. erecta F elements (46% and 45%, respectively). The high level of DINE-‐1 in D. mojavensis suggests a recent expansion. To ensure that the low transposon density found on the D. grimshawi F element is not an artifact of misassemblies in the CAF1 genome assembly (see SUPPLEMENTAL METHODS), we performed an additional repeat analysis using the species-‐specific ReAS libraries previously produced by the Drosophila 12 Genomes Consortium (Drosophila 12 Genomes Consortium et al. 2007). ReAS is less susceptible to the effects of misassemblies compared to alignment-‐based de novo repeat finders because it identifies repeats by finding over-‐represented sequences within genomic reads (Li et al. 2005). This analysis did not alter the conclusion that the D. grimshawi F element has the lowest transposon density among the species analyzed here (Figure S4). Multiple subfamilies of the DINE-‐1 element are observed: The RepeatMasker results show that most of the differences in the transposon density of the F elements can be attributed to the DINE-‐1 element (Figure 3D). Comparison of the DINE-‐1 fragments identified by RepeatMasker using the species-‐specific libraries versus the RepBase Drosophila library (Jurka et al. 2005) shows that there are additional DINE-‐1 elements in the D. grimshawi, D. mojavensis, and D. erecta species-‐specific transposon libraries that are not in the Drosophila RepBase library. Analysis of the distribution of the DINE-‐1 elements shows that 40% of the DINE-‐1 fragments (based on total size) on the D. grimshawi F and D elements, and 29% on the D. mojavensis D element found by the species-‐specific repeat libraries do not overlap with repeats in the Drosophila RepBase library. In contrast, while the D. mojavensis F element appears to have an expanded number of DINE-‐1 elements, only 9% do not overlap with repeats in the Drosophila RepBase library (Table S5 and File S5). Analysis of the scaffolds assembled from unmapped D. mojavensis modENCODE RNA-‐Seq reads suggests that some of these helitrons are being transcribed in the D. mojavensis genome; a potential candidate is shown in Figure S5. (See SUPPLEMENTAL TEXT and SUPPLEMENTAL METHODS for a more detailed description of this analysis.) Overall repeat distribution on the F element: Collectively, the repeat analysis shows the F elements have a higher repeat density than the euchromatic reference regions in all four Drosophila species. It also shows that while the D. mojavensis and D. grimshawi F elements have similar total repeat densities, they have strikingly different repeat compositions. 75% of the repeats that overlap with a repeat identified by WindowMasker on the D. mojavensis

19
F element are transposons (particularly DINE-‐1 elements) compared to only 27% on the D. grimshawi F element, while the D. grimshawi F element shows a higher density of simple and low complexity repeats than the D. mojavensis F element (39% versus 20%). These differences in repeat composition could impact the local chromatin structure and thus the evolution of the resident genes. Evolution of F element genes Despite its high repeat density, the distal arm of the D. melanogaster F element contains 79 genes, many of which have important developmental and housekeeping functions (Riddle et al. 2012). Our manual gene annotations (described above) show that the D. melanogaster, D. erecta, D. mojavensis, and D. grimshawi F elements all have around 80 genes. The gene density of the F element is lower than that of the euchromatic reference regions from the D element (~60 genes/Mb versus ~80 genes/Mb) for these four species (Table S6). Among the four species, the D. mojavensis F element has the lowest gene density (48 genes/Mb compared to 60–66 genes/Mb in the other F elements). This reflects the increased size of the D. mojavensis F element due to the expansion of repetitious elements (1.7 Mb versus 1.2–1.3 Mb in the other F elements) (Table S6 and Figure 3). While we have produced annotations for all isoforms, our analysis below is based only on the isoform with the largest coding region (i.e. the most comprehensive isoform) for each gene. Restricting our analysis to the most comprehensive isoform allows us to avoid counting the same region multiple times because of alternative splicing. We initially examined genes at the base, extended, and telomeric regions (described above) of the D. erecta D element. Since the genes in these three euchromatic regions exhibit similar characteristics, the primary focus of the following analysis is on the comparison of genes between the F element and the base of the D element (results for all of the analysis regions are available in Figure S6). Summary statistics for all of the gene characteristics, and results of multiple comparison tests after the Kruskal-‐Wallis (KW) rank sum tests (Kruskal and Wallis 1952), are available in File S6. F element genes are larger because they have larger introns and more coding exons: Comparisons of the distribution of gene characteristics using violin plots (Hintze and Nelson 1998) show that the coding span (i.e. the region that spans from the start codon to the stop codon, including introns) for F element genes is much larger (median 5156–7569 bp) than for genes at the base of the D elements (median 1028–1736 bp) (Figure 5, top left). The KW test shows that this difference is statistically significant (p-‐value: 2.12E-‐48). Part of this difference in the coding span can be attributed to the significantly higher transposon density (KW test p-‐value: 2.40E-‐82) within the introns of F element genes (Figure 5, top center; "repeat size" is the total size of the transposon fragments within the introns of a gene, in bp). Among the four species analyzed in this study, 71–83% of the F element genes contain at least one transposon fragment in an intron. In contrast, only 20–46% of the D element genes contain at least one transposon fragment. Consistent with the results of the transposon density analysis, we find that the D. mojavensis F element has the

20
highest intron transposon density (median 1930 bp) while D. grimshawi has the lowest (median 210 bp). In addition to differences in the repeat sizes within introns, the violin plots also show that the coding regions (i.e. the region that spans from the start codon to the stop codon, excluding introns) of F element genes are significantly larger (median 2313–2565 bp) than the coding regions for D element genes (median 918–1305 bp) (Figure 5, top right). The KW test shows that this difference in the size of the coding regions is statistically significant (p-‐value=7.03E-‐33). Furthermore, although the actual genes found at the base of the D elements of D. mojavensis and D. grimshawi differ from those found at the base of the D. melanogaster and D. erecta D elements (due to various rearrangements), a multiple comparison test after Kruskal-‐Wallis shows no significant difference in the size of the coding regions.
Figure 5 Violin plots of gene characteristics for each analysis region. A violin plot is composed of a boxplot and a kernel density plot: the black dot denotes the median; the darker regions and the thin white box denote the range between the first (Q1) and third (Q3) quartiles (i.e. the interquartile range (IQR)). Whiskers extending from the white box span from Q1-‐1.5ÍIQR to Q3+1.5ÍIQR; the data points beyond the whiskers are outliers. For violin plots using a log scale, a pseudocount of one was added to all data points. The larger coding spans of F element genes can be attributed not only to larger introns (often containing repeats), but also to larger coding regions. The larger coding regions reflect the higher number of coding exons.
To further analyze the difference in the distribution of coding spans and the coding regions between the genes on the F and D elements, we examined the distributions of the number

21
of exons, the coding exon sizes, and intron sizes. Previous analysis has shown that D. melanogaster F element genes have more transcribed exons than genes in other domains (Riddle et al. 2012). In congruence with this observation in D. melanogaster, our analysis shows that F element genes in the four Drosophila species have significantly more coding exons (median 6–7) than D element genes (median 2–3) (KW test p-‐value=5.59E-‐50) (Figure 5, bottom left). In contrast, the distributions of coding exon sizes are similar between F element genes (median 196–201.5 bp) and D element genes (median 195–284.5 bp). A KW test indicates that there is a significant difference in the distribution of coding exon sizes (p-‐value=2.12E-‐07). However, multiple comparison tests show that only the differences between the coding exons of all four F elements and the coding exons from the base of the D. melanogaster and D. erecta D elements are statistically significant (see File S6). Hence, in general, F element genes have larger coding regions because they tend to have more coding exons than D element genes. Consistent with the higher transposon density on the F element, we find that F element genes generally have significantly larger introns (median 172.5–228 bp) than D element genes (median 65–84 bp) (Figure 5, bottom right; KW test p-‐value=6.14E-‐62). Multiple comparison tests show that D. grimshawi is the exception, as the difference in intron sizes between the D. grimshawi F and D element genes is not statistically significant. The intron size distribution for the D. grimshawi D element is significantly different from that of the other D elements, but is not significantly different from that of the D. melanogaster and D. erecta F elements. These observations are in concordance with the results of the transposon density analysis, which shows that the D. grimshawi F and D elements have more similar transposon densities compared to those of other species (see Figure 3D). Hence the larger coding spans observed for F element genes (Figure 5, top left) can primarily be attributed to a combination of significantly larger repeat sizes within introns (Figure 5, top center) and larger coding regions (Figure 5, top right). The larger coding regions of F element genes can be attributed to a significantly higher number of coding exons (Figure 5, bottom left) but not to the size of the individual coding exons (Figure 5, bottom center). Introns of F element genes are significantly larger than introns of genes in the euchromatic reference regions for D. melanogaster, D. erecta, and D. mojavensis but not for D. grimshawi (Figure 5, bottom right). F element genes show lower codon bias than D element genes: Previous analysis of codon usage bias in 12 Drosophila species (using 33 D. melanogaster F element genes and their corresponding GLEAN-‐R annotations) showed that F element genes exhibit lower codon bias compared to genes on the other Muller elements (Vicario et al. 2007). Here we expand the codon bias analysis to all of the manually annotated F element genes in four Drosophila species using two metrics: the Effective Number of Codons (Nc), which measures deviations from uniform codon usage (Wright 1990), and the Codon Adaptation Index (CAI), which measures deviations from the species-‐specific optimal codon usage (Sharp and Li 1987). (Lower Nc values and higher CAI values indicate stronger codon bias.) Violin plots of Nc show that F element genes exhibit significantly smaller deviations from uniform codon usage (median 53.92–54.95) than genes at the base of the D elements

22
(median 48.35–50.33) in all four species (KW test p-‐value=8.84E-‐38) (Figure 6A). Multiple comparison tests show that the contrast between F and D genes is the only statistically significant difference in the distribution of Nc. Violin plots of CAI also show that F element genes exhibit significantly lower codon bias than D element genes (KW test p-‐value=1.66E-‐119) (Figure 6B). However, multiple comparison tests show that the CAIs for D. mojavensis and D. grimshawi are significantly higher (indicating more optimal codon usage) than those for D. melanogaster and D. erecta for both the F element genes (median 0.409–0.412 versus 0.185–0.188) and the D element genes (median 0.483–0.510 versus 0.372–0.397).
Figure 6 F element genes exhibit different patterns of codon bias in D. mojavensis and D. grimshawi compared to D. melanogaster and D. erecta. (A) Distributions of Effective Number of Codons (Nc). (B) Distributions of Codon Adaptation Index (CAI). (C) Scatterplots of Nc versus CAI show that, similar to the base of the D elements, codon bias in the D. grimshawi F element genes can be attributed primarily to selection rather than mutational biases, as indicated by a LOESS regression line (red line) with negative slope (see main text). The dotted line in each Nc versus CAI scatterplot demarcates the CAI value for a gene with no codon bias relative to the species-‐specific reference gene sets constructed by scnRCA (see MATERIALS AND METHODS). Codon bias in D. grimshawi F element genes can primarily be attributed to selection: To infer the selective pressure experienced by genes in the different analysis regions, we compared the Nc and CAI values of each gene using a scatterplot (Vicario et al. 2007). This analysis posits that Nc measures deviations from uniform codon usage that could either be attributed to mutational bias or selection, while CAI measures deviations from optimal

23
codon usage and primarily reflects selection. Hence, genes that exhibit both large deviations from uniform codon usage (i.e. low Nc) and small deviations from optimal codon usage (i.e. high CAI) are thought to be under stronger selective pressure, while genes with low Nc and low CAI are under stronger influence from mutational biases (Vicario et al. 2007). After constructing the Nc versus CAI scatterplots for each analysis region, we applied locally estimated scatterplot smoothing (LOESS, (Cleveland and Devlin 1988)) to capture the overall trends seen in each scatterplot (Figure 6C). Regression lines that show a positive slope indicate that the codon bias can primarily be attributed to mutational biases, while a negative slope indicates that the codon bias can primarily be attributed to selection on codon usage. Consistent with previous reports using a smaller gene set (Vicario et al. 2007), our analysis shows that codon bias for most of the genes on the D. melanogaster and D. erecta F elements can be attributed to mutational biases rather than selection (i.e. most of the genes are in the part of the LOESS regression line that shows a positive slope), indicating low selective pressure relative to what is seen for the D element genes. In contrast, we find that codon bias for most of the genes on the D. grimshawi F element, along with genes on the D elements, can primarily be attributed to selection (i.e. most of the genes are in the part of the LOESS regression line with negative slope). Thus we observe that the F element with the lowest transposon density (D. grimshawi) differs from the other F elements in this regard, with more of the genes showing evidence of response to selective pressure. We also find that most of the D. mojavensis F element genes have CAI values that are higher than those for a gene with equal codon usage (dotted line in Figure 6C), indicating a more optimal pattern of codon usage compared to F element genes in D. melanogaster and D. erecta. While most of the F element genes within each Nc versus CAI scatterplot follow a similar trend, there are a few outliers (Figure 6C). For example, the Muller F element genes ATPsyn-‐beta and RpS3A exhibit low Nc and high CAI in all four Drosophila species (Figure S7, see DISCUSSION). A subset of F element genes exhibits distinct characteristics in all four species: Our analyses show that the overall characteristics of F element genes are distinct from genes at the base of the D element. However, previous studies have shown that some regions on the D. melanogaster F element differ from the general case in being enriched in H3K27me3, rather than H3K9me2/3, in a tissue-‐specific fashion; genes that reside in these regions are associated with Polycomb (PcG) (Kharchenko et al. 2011; Riddle et al. 2012). PcG proteins regulate the expression of many genes involved in development (such as homeotic genes) by altering the chromatin structure (reviewed in (Lanzuolo and Orlando 2012)). Hence it is of particular interest to ask whether the six F element genes associated with PcG exhibit characteristics that differ from the rest of the F element genes. Because there are only six genes on the D. melanogaster F element that are associated with PcG, there is insufficient statistical power to analyze each gene characteristic separately to ascertain if PcG genes exhibit significantly different properties compared to the other F element genes. Consequently, we performed a multivariate analysis of the gene characteristics described above (see MATERIALS AND METHODS for details). For each F
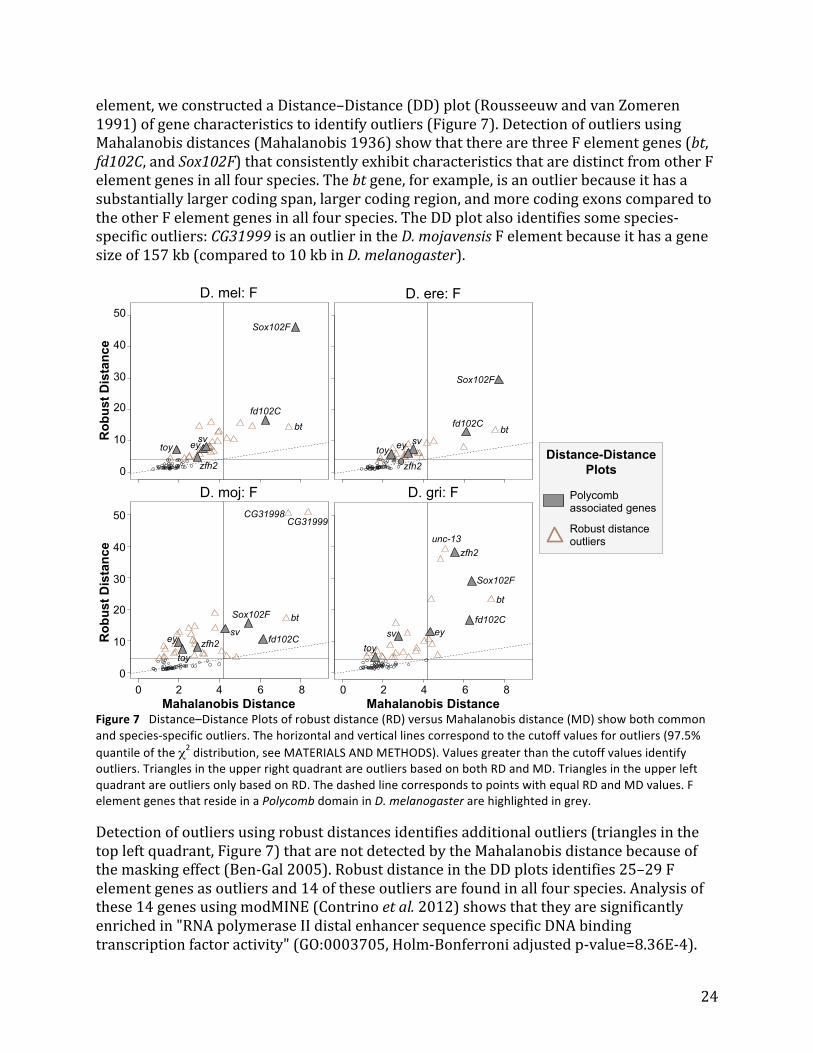
24
element, we constructed a Distance–Distance (DD) plot (Rousseeuw and van Zomeren 1991) of gene characteristics to identify outliers (Figure 7). Detection of outliers using Mahalanobis distances (Mahalanobis 1936) show that there are three F element genes (bt, fd102C, and Sox102F) that consistently exhibit characteristics that are distinct from other F element genes in all four species. The bt gene, for example, is an outlier because it has a substantially larger coding span, larger coding region, and more coding exons compared to the other F element genes in all four species. The DD plot also identifies some species-‐specific outliers: CG31999 is an outlier in the D. mojavensis F element because it has a gene size of 157 kb (compared to 10 kb in D. melanogaster).
Figure 7 Distance–Distance Plots of robust distance (RD) versus Mahalanobis distance (MD) show both common and species-‐specific outliers. The horizontal and vertical lines correspond to the cutoff values for outliers (97.5% quantile of the χ2 distribution, see MATERIALS AND METHODS). Values greater than the cutoff values identify outliers. Triangles in the upper right quadrant are outliers based on both RD and MD. Triangles in the upper left quadrant are outliers only based on RD. The dashed line corresponds to points with equal RD and MD values. F element genes that reside in a Polycomb domain in D. melanogaster are highlighted in grey.
Detection of outliers using robust distances identifies additional outliers (triangles in the top left quadrant, Figure 7) that are not detected by the Mahalanobis distance because of the masking effect (Ben-‐Gal 2005). Robust distance in the DD plots identifies 25–29 F element genes as outliers and 14 of these outliers are found in all four species. Analysis of these 14 genes using modMINE (Contrino et al. 2012) shows that they are significantly enriched in "RNA polymerase II distal enhancer sequence specific DNA binding transcription factor activity" (GO:0003705, Holm-‐Bonferroni adjusted p-‐value=8.36E-‐4).

25
Of the 14 outliers that are found in all four species, five of them (ey, fd102C, Sox102F, sv, and toy) are associated with PcG domains. The only exception is zfh2, which is an outlier in three of the four species (D. melanogaster, D. mojavensis, and D. grimshawi). Hence the DD plot analysis suggests that F element genes that reside in domains enriched in H3K27me3 might have different characteristics than F element genes that reside in domains enriched in H3K9me2/3. F element genes show lower melting temperature metagene profiles Despite residing in a domain with heterochromatic properties, D. melanogaster F element genes exhibit expression levels that are similar to those of other euchromatic genes (Riddle et al. 2012). One of the mechanisms for regulating gene expression is the pausing of RNA Polymerase II during early elongation (reviewed in (Adelman and Lis 2012)). Previous analysis has shown that the efficacy of elongation depends on the stability of the 9 bp RNA-‐DNA hybrid in the elongation complex (Tadigotla et al. 2006). Genes that exhibit polymerase pausing have a distinct 9 bp melting temperature profile (i.e. highest melting temperature at 25–30 bp downstream of the transcription start site, where pausing occurs) (Nechaev et al. 2010).
Figure 8 Metagene analyses show that F element genes have a lower median 9 bp melting temperature (Tm) than genes at the base of the D element. The 9 bp Tm was calculated using a sliding-‐window of 9 bp and a step size of 1 bp. The Tm for each coding span was subsequently normalized to 3 kb to create the metagene profile (see MATERIALS AND METHODS).
510
1520
Metagene melting temperature profile
Translation start relative position
Med
ian
mel
ting
tem
pera
ture
−2kb 0 3kb +2kb
D. mel.: Muller FD. ere.: Muller FD. moj.: Muller FD. gri.: Muller FD. mel.: Muller D (base)D. ere.: Muller D (base)D. moj.: Muller D (base)D. gri.: Muller D (base)
Med
ian
9 bp
Seq
uenc
e M
eltin
g Te
mpe
ratu
re (�
)
Translation Start Relative Position
5
10
15
20
-2kb 0 3kb +2kb
Coding Span 2kb 2kb 3kb M *
D. mel: F
D. ere: F
D. moj: F
D. gri: F
D. mel: D (base)
D. ere: D (base)
D. moj: D (base)
D. gri: D (base)

26
Previous studies have shown that D. melanogaster F element genes exhibit lower melting temperatures than genes that reside in other domains (Riddle et al. 2012). To ascertain whether this difference is conserved in other Drosophila species, we performed a metagene analysis of the melting temperature profile. (See MATERIALS AND METHODS for details on the definition of the metagene.) The metagene profiles show that F element genes in all four Drosophila species have lower melting temperatures than genes at the base of the D element. In all cases, the coding spans (i.e. from start codon to stop codon, including introns) show substantially higher melting temperatures than the 2 kb flanking regions (Figure 8). Coding spans of the D. mojavensis and D. grimshawi F elements show higher Tm than those of D. melanogaster and D. erecta. Comparing the F element and D element genes within a given species, we find that those of D. grimshawi show the smallest difference in the melting temperature profiles. F element gene rearrangements and gene movements Changes in F element gene order: Previous studies have estimated that approximately 95% of the genes in D. melanogaster remain on the same Muller element across the 12 Drosophila species (Bhutkar et al. 2008). To ascertain if the low rate of recombination would affect the rate of rearrangements and gene movements on the F element, we analyzed the placement of D. melanogaster F element genes in the other Drosophila species. Out of the 79 D. melanogaster F element genes annotated by FlyBase, two of the genes were omitted from the gene movement analysis because they are either a partial gene (JYalpha) or a possible misannotation (CG11231). (See SUPPLEMENTAL METHODS for details.) Out of the remaining 77 D. melanogaster F element genes, all 77 genes (100.0%) are found on the D. erecta F element, 72 (93.5%) are found on the D. mojavensis F element and 73 (94.8%) are found on the D. grimshawi F element. Except for CG11231, the D. erecta F element is completely syntenic with respect to the D. melanogaster F element. GRIMM (Tesler 2002) estimates that a minimum of 31 inversions are required to transform the D. melanogaster F element gene order and orientation to that observed in the D. mojavensis F element (72 genes in common). Similarly, at least 33 inversions are required to transform the D. melanogaster F element gene order to that observed in D. grimshawi (73 genes in common). There are 78 genes that are found on both the D. mojavensis and D. grimshawi F elements, and GRIMM estimates a minimum of seven inversions are required to transform the gene order in D. mojavensis to that observed in D. grimshawi. (See possible rearrangement scenarios estimated by GRIMM in Figure S8.) Analysis of the number of genes per syntenic block (i.e. syntenic block sizes) shows that the F elements have smaller syntenic blocks than the previously reported genome averages (Bhutkar et al. 2008). The D. mojavensis F element has an average syntenic block size of 3.4 genes compared to an average of 8.8 genes per syntenic block for the whole genome. The corresponding numbers for D. grimshawi are 3.6 and 8.4 genes per syntenic block for the F and D elements, respectively. Thus inversions are common on the F element despite its low rate of recombination.

27
Identifying a wanderer gene hotspot: Movement of genes between different chromosomes typically results from gene duplications (via ectopic recombination or retrotransposition) followed by the loss of the original copy of the gene (Meisel et al. 2009). There are 12 genes that are found on the F element in one Drosophila species, but on another Muller element in a different Drosophila species ("wanderer genes", Figure 9A). One of these wanderer genes is a putative paralog of Cyp1 (Cyp1_alpha) that is found on the D. mojavensis F element and the D. grimshawi B element but is not found in either D. melanogaster or D. erecta.
Figure 9 F element gene movements in the four Drosophila species analyzed in this study. (A) Placement of the 12 F element wanderer genes (five on the F element in D. melanogaster and D. erecta (top left), and seven on the F element in D. mojavensis (top right)). (B) Schematic representations of the wanderer gene hotspots on the D. mojavensis and D. grimshawi F elements where most of the wanderer genes are found. The genes PRY and Or13a (blue boxes) have moved from other Muller elements to the D. mojavensis F element. The gene yellow-‐h (purple box) has moved from the F element to the A element in D. mojavensis. Assignment of the D. virilis ortholog of Or13a to the A element (denoted by an asterisk) is based on the placement of the other seven genes found in that scaffold (13050) (see SUPPLEMENTAL METHODS). Placement of PRY on the Y chromosome is based on (Koerich et al. 2008).
To further analyze the distribution of wanderer genes on the F elements, we compared the genome assemblies of six Drosophila species (D. melanogaster, D. yakuba, D. erecta, D. virilis, D. mojavensis, and D. grimshawi) using the UCSC Chain and Net protocol (Kent et al. 2003). Examination of the Net alignment tracks shows there is a single region (i.e. hotspot) in both the D. mojavensis and D. grimshawi F elements where most of the wanderer genes
D. mel F D F F B C F D. yak F D F F B C F D. ere F D F F B C F D. vir F F F F F F F D. moj F F F A F F F
10kb D. gri: F
D. mel F D Y A B C F D. yak F D Y A B C F D. ere F D Y A B C F D. vir F F Y A* F F F D. gri F F Y E F F F
Gene D. mel. D. ere. D. moj. D. gri.
CG11077 F F A A CG9935 F F B B CG1732 F F D D CG11076 F F A E yellow-h F F A F
Gene D. mel. D. ere. D. moj. D. gri.
Or13a A A F E CG5367 B B F F rho-5 B B F F CG4038 C C F F CG5262 D D F F PRY chrY chrY F chrY Cyp1_alpha NA NA F B
A Muller F Element Wanderer Genes
D. moj: F
CG4038 rho-5 PRY CG5262 CG31999 Or13a Ank
1,500,000 1,550,000 1,600,000
50kb
improved_6498:
CG4038 rho-5 yellow-h CG5262 Crk CG31999 Ank
800,000 810,000 820,000 830,000 improved_F:
B Wanderer Genes
28
are found (Figure S9). The D. mojavensis F element hotspot contains five of the six wanderer genes relative to D. melanogaster (Figure 9B, top). The hotspot on the D. grimshawi F element contains three of the four wanderer genes relative to D. melanogaster and one of the wanderer genes (yellow-‐h) relative to D. mojavensis (Figure 9B, bottom). Since three of the wanderer genes (CG5262, rho-‐5, and CG4038) are found in the wanderer gene hotspots of both the D. mojavensis and D. grimshawi F elements (relative to D. melanogaster), we can use them to infer the direction of gene movements of the rest of the wanderer genes in the hotspot. The yellow-‐h gene likely moved from the F element to the A element in D. mojavensis. In contrast, both the PRY and Or13a genes likely moved from other chromosomes (the Y chromosome and the A element, respectively) to the D. mojavensis F element. Hence our analysis indicates that gene movement occurs in both directions on the F element and that the cumulative effect of these gene movements is that there are a similar number of genes (~80) on the F element in all four species.
DISCUSSION F elements exhibit distinct characteristics in Drosophila The D. melanogaster F element is unusual in that it appears to be predominantly heterochromatic, but in the distal 1.3 Mb has a gene density similar to the euchromatic chromosome arms (Sun et al. 2004; Riddle et al. 2011, 2012). Immunofluorescent staining of the polytene chromosomes shows that the D. melanogaster, D. erecta, D. mojavensis, and D. grimshawi F elements are enriched in H3K9me2 (Figure 1), which suggests that the F element is generally packaged as heterochromatin in these four species. In order to elucidate the impact of these unusual characteristics on the evolution of the F element and its genes, we performed a comparative analysis of the F elements and euchromatic regions near the base of the D elements (coordinates listed in Table S1). In order to increase the accuracy of our analysis, we improved the assemblies of the D. mojavensis and D. grimshawi F elements and the base of the D. mojavensis D element, closing 72 out of 86 gaps and adding 44,468 bases to these assemblies (Figure 2 and Table S2). Restriction digests and consistent mate pairs provide strong experimental support for the final assemblies. We also produced gene annotations for the regions under study in D. erecta, D. mojavensis, and D. grimshawi (878 genes, 1619 isoforms). Each gene was annotated at least twice independently and reconciled by a third investigator, giving increased confidence in the results. We find substantial differences between our manually curated gene models and the GLEAN-‐R gene predictions, with only 32–58% of the GLEAN-‐R gene models showing complete congruence in the cases of D. mojavensis and D. grimshawi (Table S3). These results illustrate the benefits of manual sequence improvement and gene annotations for regions with moderate repeat density. Our analysis shows that the F element has generally maintained its distinct characteristics compared to the other autosomes in species that diverged from D. melanogaster 40–60 million years ago. Compared to the euchromatic reference regions within each species, we find that F elements have higher repeat density (Figure 3 and Figure 4), and the genes are larger, have larger introns, more coding exons (Figure 5), lower codon bias (Figure 6) and lower melting temperatures (Figure 8). Most F element genes exhibit similar

29
characteristics within each species but there are also species-‐specific and common outliers among the four Drosophila species (Figure 7). Analysis of gene movements shows that the F elements have smaller syntenic blocks than the genome average and that there is a single hotspot in both the D. mojavensis and D. grimshawi F elements where most of the wanderer genes are found (Figure 9). We also identified genes that have moved both on and off of the F element, maintaining approximately the same number of genes in the four species. It is striking that these gene movements (presumably due to transposition) occur at a rate similar to that seen for the other autosomes, and inversions are more frequent, while recombination is reduced. This suggests that the frequency of such events is not dictated solely by DNA accessibility, as such a simple model of the consequences of heterochromatin packaging might have been thought to impact all three types of events equally. While the F elements generally show similar characteristics, we also find some differences among the four Drosophila species (particularly between the species in the Drosophila clade versus the species in the melanogaster subgroup of the Sophophora clade). These differences could provide insights into the impact of low recombination rate on the evolution of the genomic landscape (e.g., repeats and gene characteristics) of the F element. F elements have different repeat compositions One of the prominent characteristics of heterochromatin is its high repeat density. Previous studies have shown that the difference in total repeat density is one of the major contributors to the changes in genome size among the different Drosophila species (Bosco et al. 2007). A critical consideration here is that some classes of transposons and tandem repeats have been implicated in gene silencing and heterochromatin formation (Martienssen 2003; Riddle et al. 2008; Sentmanat and Elgin 2012). In concordance with previous reports for many eukaryotes (Tóth et al. 2000), our dinucleotide repeat analysis shows a lack of CG dinucleotide repeats on both the F and D elements in all four Drosophila species (Figure 4B). Previous studies have shown that there is a strong mutational bias in Drosophila toward A/T, while codon bias tends to favor G/C at synonymous sites (Moriyama and Powell 1997; Vicario et al. 2007). Hence the lack of CG dinucleotide repeats on the F element could be explained by its low recombination rate. However, this mutational bias does not explain the lack of CG dinucleotide repeats on the D elements. Previous studies have shown that methylated CpG sequences have a higher rate of mutation because they are susceptible to spontaneous deamination, and the low frequency of CG repeats has been attributed to this (Duncan and Miller 1980). Hence, the lack of CG dinucleotide repeats on the D element is striking given the low levels (if any) of DNA methylation in Drosophila (Raddatz et al. 2013; Takayama et al. 2014). Another explanation for the lack of CG repeats is clearly needed. Previous in situ hybridization analyses by Pardue and colleagues have shown that CA/GT dinucleotide repeats are highly enriched on the D. melanogaster X chromosome but are depleted in the F element and β-‐heterochromatin (i.e. heterochromatin that is replicated during polytenization). In contrast, the D. virilis F element is enriched in CA/GT dinucleotide repeats (Pardue et al. 1987). Our analysis shows that, similar to D. virilis, the D. mojavensis and D. grimshawi F elements have long CA and AG dinucleotide repeats, while

30
the D. melanogaster F element is notably depleted in these dinucleotide repeats (Figure 4B). However, the significance of these differences in the distribution of dinucleotide repeats is unclear. Our analysis also shows that the D. mojavensis and D. grimshawi F elements contain longer AT dinucleotide repeats than D. melanogaster and D. erecta (Figure 4B). Previous analyses have shown that long AT dinucleotide repeats inhibit the formation of nucleosomes (reviewed in (Struhl and Segal 2013)). Hence, this difference in the frequency of long AT dinucleotide repeats suggests that the D. mojavensis and D. grimshawi F elements might not be as densely packaged as the D. melanogaster and the D. erecta F elements. Estimates of the total repeat content with WindowMasker show that the D. mojavensis and D. grimshawi F elements have similar repeat density and both species have a higher repeat density than the D. melanogaster and D. erecta F elements (Figure 3A). However, the D. mojavensis and D. grimshawi F elements have different repeat compositions: most of the repeats in the D. mojavensis F element (~75%) are transposons while more of the repeats (~39%) in the D. grimshawi F element are simple and low complexity repeats. Among the four species, D. mojavensis has the highest F element transposon density (50%), while D. grimshawi has the lowest (20%). The differences in transposon density can primarily be attributed to changes in the density of the DINE-‐1 element (27% in D. mojavensis versus 2% in D. grimshawi) (Figure 3D). The DINE-‐1 element was first characterized in D. melanogaster and this transposon is primarily found on the F element and in pericentric heterochromatin (Locke et al. 1999). Subsequent studies have classified the DINE-‐1 as a helitron, and have shown that there has been a more recent transposition and expansion of DINE-‐1 elements in D. yakuba and D. mojavensis, which results in the higher density of DINE-‐1 elements in these species. In contrast, the D. grimshawi genome has the lowest density of DINE-‐1 elements among the 12 Drosophila species, possibly because it is geographically isolated (on the Hawaiian islands) and might not have experienced the same transpositional burst of the DINE-‐1 elements seen in many of the other Drosophila species (Yang et al. 2006; Yang and Barbash 2008). In concordance with previous reports (Kuhn and Heslop-‐Harrison 2011), comparison of the overlap between the DINE-‐1 fragments identified by the species-‐specific transposon library and the Drosophila RepBase library indicates that there are at least two major subfamilies of DINE-‐1 elements in D. mojavensis (Table S5). We found that 67% of the DINE-‐1 fragments in the species-‐specific library overlap with the Homo6 transposon while 22% overlap with the Helitron1_Dmoj transposon (File S5). Analysis of the D. mojavensis RNA-‐Seq data (Graveley et al. 2011) identified a scaffold that contains a conserved Helitron_like_N (Pfam accession: PF14214) domain (Figure S5), indicating that some of the DINE-‐1 elements may still be active. A transposable element present at a high density, in a genome that expresses that transposable element, could well be a target for silencing, promoting heterochromatin formation. The horizontal transfer and subsequent amplification of helitrons occur in many organisms, including mammals, reptiles, and insects (Thomas et al. 2010). Helitrons can

31
capture adjacent gene fragments during transposition and can affect the evolution of the host species (reviewed in (Kapitonov and Jurka 2007)). Previous analysis of 12 Drosophila species shows that DINE-‐1 fragments are often found in introns or within 1 kb of the coding regions (Yang and Barbash 2008). Hence the DINE-‐1 element may play an important role in shaping the genomic landscape of the F elements and their genes. The high repeat density of the F element has a direct impact on gene characteristics. One of the factors that contributes to the significantly larger coding span of F element genes compared to D element genes is that F element genes have significantly larger introns in all of the species examined here except for D. grimshawi (Figure 5, lower right). This difference in intron size can partly be attributed to the differences in intron repeat density (Figure 5, top center). However, this does not a priori explain the other factor contributing to the larger coding span of F element genes—the larger number of coding exons. The D. grimshawi F element genes exhibit different patterns of codon bias A salient characteristic of the F element is its low rate of recombination (Wang et al. 2002; Arguello et al. 2010). Codon bias is correlated with the recombination rate because of the Hill-‐Robertson effect (Hill and Robertson 1966; Kliman and Hey 1993). In agreement with this effect, we find that F element genes exhibit lower codon bias than D element genes based on both the Effective Number of Codons (Nc) and the Codon Adaptation Index (CAI) metric (Figure 6). While F element genes for all four species exhibit smaller deviations from uniform codon usage (i.e. low Nc) than D element genes, we find that D. mojavensis and D. grimshawi genes show a more optimal pattern of codon usage (i.e. higher CAI) than D. melanogaster and D. erecta genes in both the F and D elements. The higher CAIs in the D. mojavensis and D. grimshawi analysis regions are in congruence with the results from previous whole genome analysis of CAIs in 12 Drosophila species, which shows that the distribution of CAIs for species in the Drosophila subgroup are shifted to the right (i.e. higher CAI) compared to the melanogaster subgroup (Heger and Ponting 2007). In concordance with the hypothesis that higher CAI reflects stronger selection because of higher tRNA abundance (Moriyama and Powell 1997) and higher expression levels (Duret and Mouchiroud 1999), we find that the F element genes ATPsyn-‐beta and RpS3A exhibit strong codon bias in all four Drosophila species (Figure S7). ATPsyn-‐beta is an ATPase (Peña and Garesse 1993) and RpS3A is a ribosomal protein (van Beest et al. 1998). Both genes are very highly expressed in all developmental stages in D. melanogaster (Graveley et al. 2011). Scatterplots of Nc versus CAI can indicate whether the codon bias observed in each region can primarily be attributed to mutational bias or selection (Vicario et al. 2007). Unlike those of the other F elements, the D. grimshawi F element genes show a negative correlation between Nc and CAI, similar to the D element genes (Figure 6). Thus, in contrast to the other F elements, more of the codon bias in D. grimshawi F element genes can be attributed to selection rather than mutational biases.
32
The results of the repeat density and codon bias analyses suggest that the D. grimshawi F element has a higher rate of recombination. This might be a consequence of the lower transposon density, given that transposons can be targets for heterochromatin formation (Lippman and Martienssen 2004; Sentmanat et al. 2013). Furthermore, the low density of DINE-‐1 elements on the D. grimshawi F element compared to the other species suggests that this transposon might play an important role in promoting heterochromatin assembly. However, the transposon families present vary in the different species, and there may well be other transposable elements, present in other species but absent from D. grimshawi (e.g., 1360 and Galileo, (Marzo et al. 2008)) that could contribute substantially to silencing. Lower melting temperatures may facilitate transcription of F element genes Previous analysis has shown that a much smaller fraction of the D. melanogaster F element genes exhibit polymerase pausing (1.6%) compared to genes found in pericentric heterochromatin (12.5%) or euchromatin (15.0%). F element genes also show a lower melting temperature near the transcription start site than genes in the other D. melanogaster Muller elements, irrespective of whether the genes exhibit polymerase pausing (Riddle et al. 2012). Our metagene analysis of melting temperature profiles shows that F element genes in all four Drosophila species exhibit lower melting temperatures across the entire span of the metagene than D element genes (Figure 8). The lower melting temperature suggests that, similar to D. melanogaster, only a small fraction of the D. erecta, D. mojavensis, and D. grimshawi F element genes will exhibit polymerase pausing. The elongation rate of RNA Polymerase II can affect the total mRNA level (Danko et al. 2013) and previous studies have found that the rate of elongation is negatively correlated with GC content within the gene body, and with exon density (Jonkers et al. 2014). While F element genes are larger and have more coding exons than euchromatic genes (Figure 5), the metagene has a substantially lower melting temperature (Figure 8), presumably because of the high AT content within introns and the low codon bias. The high AT content in the genes could be a consequence of the less effective selection for codon bias (because of the low rate of recombination on the F elements) coupled with the A/T mutational bias in Drosophila. The lower GC content within the gene body could facilitate transcription and hence help explain how F element genes can have expression levels that are similar to genes in euchromatic regions, despite residing in a domain with heterochromatic properties. Conclusions This study provides an initial survey of the evolution of the F element and its genes in four Drosophila species. Our results show that the F element has maintained its distinct characteristics in both the Sophophora and Drosophila subgenera. The unusual mixture of a heterochromatic domain with a euchromatin-‐like gene density on the F element enabled us to investigate a number of interesting questions relating genome organization to gene function. The genomics resources (e.g., improved assemblies, gene annotations, genome browsers) produced in this study provide a foundation for future investigations into the factors that impact chromatin packaging and gene expression in a heterochromatic domain.

33
ACKNOWLEDGEMENTS In several cases a class worked together to produce a high-‐quality annotation of a given project; we thank the following classes for their contributions: Amherst College, Biology 19: Molecules, Genes & Cells (Fall 2009, Fall 2010, and Fall 2011); California State University, Monterey Bay, Biology 361: Eukaryotic Molecular Biology (Fall 2011); College of William & Mary, BIOL404: Genomics & Functional Proteomics (Spring 2009); Georgetown University, Cell Biology 363 (Fall 2007, Fall 2008, Fall 2009, and Fall 2010); Johnson C. Smith University, BIO 433: Explorations in Genomics (Fall 2010); Lindenwood University, BIO 422: Biochemistry: Metabolism (Spring 2011); Loyola Marymount University, Molecular Biology 439 (Fall 2007, Fall 2008, Fall 2009, and Fall 2010); New Mexico Highlands University, Biol 499: Independent Study (Fall 2008, Spring 2009, and Fall 2009); New Mexico Highlands University, Biol 620: Advanced Topic in Biology (Summer 2010); Prairie View A&M University, Biol 4061 -‐ Research (Spring 2008, Spring 2009, Spring 2010, Spring 2011, and Spring 2012); San Francisco State University, Biol 638/738: Bioinformatics & Genome Annotation (Fall 2007, Fall 2008, Fall 2009, and Fall 2010); The City College of New York, Grove School of Engineering, Sci280: Bioinformatics & Biomolecular Systems (Spring 2009, Fall 2009, Spring 2010, Fall 2010, Spring 2011, Fall 2011, and Spring 2012); The City College of New York, Grove School of Engineering, Sci316: Genomics and Structural Bioinformatics (Summer 2009); The City College of New York, Biology 31312: Genomics and Bioinformatics (Spring 2010); University of Nebraska-‐Lincoln, BIOC498: Eukaryotic Bioinformatics Research (Spring 2008, Spring 2009, Spring 2010, and Spring 2011); University of the Incarnate Word, BIOL 3461: Genetics & Lab (Fall 2011, Spring 2012, and Summer 2012); University of West Florida, PCB4905: Genome Data Analysis Class (Spring 2008); Wilkes University, Biology 345: Genetics (Fall 2009 and Fall 2010); Worcester State University, BI 371: Molecular Biology (Fall 2009). The authors also thank additional students who contributed data analysis to this project, but for various reasons did not participate in reviewing the manuscript. These students were enrolled in one of the classes listed in File S8, which lists all participating classes. We thank The Genome Institute at the Washington University School of Medicine for generating the raw sequences reported here and for providing training and support in sequence improvement for many of the coauthors. We also thank the two anonymous reviewers for valuable comments and suggestions. This work was supported by grant #52007051 from the Howard Hughes Medical Institute (HHMI) Precollege and Undergraduate Science Education Professors Program to Washington University (for S.C.R.E.) with additional funding for data analysis from National Institutes of Health (NIH) grant R01 GM068388 (to S.C.R.E.). The support provided by the Genome Institute at the Washington University School of Medicine was funded by grant 2U54 HG00307910 from the National Human Genome Research Institute (Richard K. Wilson, principal investigator). The content of this article is solely the responsibility of the authors and does not necessarily represent the official views of HHMI, the National Human Genome Research Institute, the National Institute of General Medical Sciences, or the NIH.

34
LITERATURE CITED Adelman, K., and J. T. Lis, 2012 Promoter-‐proximal pausing of RNA polymerase II: emerging
roles in metazoans. Nat. Rev. Genet. 13: 720–731. Arguello, J. R., Y. Zhang, T. Kado, C. Fan, R. Zhao et al., 2010 Recombination yet inefficient
selection along the Drosophila melanogaster subgroup’s fourth chromosome. Mol. Biol. Evol. 27: 848–861.
Bao, Z., and S. R. Eddy, 2002 Automated de novo identification of repeat sequence families in sequenced genomes. Genome Res. 12: 1269–1276.
Ben-‐Gal, I., 2005 Outlier detection, in Data Mining and Knowledge Discovery Handbook, edited by O. Z. Maimon and L. Rokach. Springer, New York.
Benson, G., 1999 Tandem repeats finder: a program to analyze DNA sequences. Nucleic Acids Res. 27: 573–580.
Bergman, C. M., H. Quesneville, D. Anxolabéhère, and M. Ashburner, 2006 Recurrent insertion and duplication generate networks of transposable element sequences in the Drosophila melanogaster genome. Genome Biol. 7: R112.
Bhutkar, A., S. W. Schaeffer, S. M. Russo, M. Xu, T. F. Smith et al., 2008 Chromosomal rearrangement inferred from comparisons of 12 Drosophila genomes. Genetics 179: 1657–1680.
Bosco, G., P. Campbell, J. T. Leiva-‐Neto, and T. A. Markow, 2007 Analysis of Drosophila species genome size and satellite DNA content reveals significant differences among strains as well as between species. Genetics 177: 1277–1290.
Chor, B., D. Horn, N. Goldman, Y. Levy, and T. Massingham, 2009 Genomic DNA k-‐mer spectra: models and modalities. Genome Biol. 10: R108.
Cleveland, W. S., and S. J. Devlin, 1988 Locally Weighted Regression: An Approach to Regression Analysis by Local Fitting. J. Am. Stat. Assoc. 83: 596.
Contrino, S., R. N. Smith, D. Butano, A. Carr, F. Hu et al., 2012 modMine: flexible access to modENCODE data. Nucleic Acids Res. 40: D1082–1088.
Danko, C. G., N. Hah, X. Luo, A. L. Martins, L. Core et al., 2013 Signaling pathways differentially affect RNA polymerase II initiation, pausing, and elongation rate in cells. Mol. Cell 50: 212–222.
Drosophila 12 Genomes Consortium, A. G. Clark, M. B. Eisen, D. R. Smith, C. M. Bergman et al., 2007 Evolution of genes and genomes on the Drosophila phylogeny. Nature 450: 203–218.
Duncan, B. K., and J. H. Miller, 1980 Mutagenic deamination of cytosine residues in DNA. Nature 287: 560–561.
Duret, L., and D. Mouchiroud, 1999 Expression pattern and, surprisingly, gene length shape codon usage in Caenorhabditis, Drosophila, and Arabidopsis. Proc. Natl. Acad. Sci. U. S. A. 96: 4482–4487.
Elgin, S. C. R., and G. Reuter, 2013 Position-‐effect variegation, heterochromatin formation, and gene silencing in Drosophila. Cold Spring Harb. Perspect. Biol. 5:
Ewing, B., and P. Green, 1998 Base-‐calling of automated sequencer traces using phred. II. Error probabilities. Genome Res. 8: 186–194.
Farré, M., M. Bosch, F. López-‐Giráldez, M. Ponsà, and A. Ruiz-‐Herrera, 2011 Assessing the role of tandem repeats in shaping the genomic architecture of great apes. PloS One 6: e27239.

35
Frith, M. C., 2011 A new repeat-‐masking method enables specific detection of homologous sequences. Nucleic Acids Res. 39: e23.
Gordon, D., C. Abajian, and P. Green, 1998 Consed: a graphical tool for sequence finishing. Genome Res. 8: 195–202.
Graveley, B. R., A. N. Brooks, J. W. Carlson, M. O. Duff, J. M. Landolin et al., 2011 The developmental transcriptome of Drosophila melanogaster. Nature 471: 473–479.
Grewal, S. I. S., and S. C. R. Elgin, 2007 Transcription and RNA interference in the formation of heterochromatin. Nature 447: 399–406.
Heger, A., and C. P. Ponting, 2007 Variable strength of translational selection among 12 Drosophila species. Genetics 177: 1337–1348.
Heitz, E., 1928 Das heterochromatin der moose. Jahrb Wiss Bot. 69: 762–818. Hill, W. G., and A. Robertson, 1966 The effect of linkage on limits to artificial selection.
Genet. Res. 8: 269–294. Hintze, J. L., and R. D. Nelson, 1998 Violin Plots: A Box Plot-‐Density Trace Synergism. Am.
Stat. 52: 181–184. Jonkers, I., H. Kwak, and J. T. Lis, 2014 Genome-‐wide dynamics of Pol II elongation and its
interplay with promoter proximal pausing, chromatin, and exons. eLife 3: e02407–e02407.
Jurka, J., V. V. Kapitonov, A. Pavlicek, P. Klonowski, O. Kohany et al., 2005 Repbase Update, a database of eukaryotic repetitive elements. Cytogenet. Genome Res. 110: 462–467.
Kapitonov, V. V., and J. Jurka, 2007 Helitrons on a roll: eukaryotic rolling-‐circle transposons. Trends Genet. TIG 23: 521–529.
Kent, W. J., 2002 BLAT — the BLAST-‐like alignment tool. Genome Res. 12: 656–664. Kent, W. J., R. Baertsch, A. Hinrichs, W. Miller, and D. Haussler, 2003 Evolution’s cauldron:
duplication, deletion, and rearrangement in the mouse and human genomes. Proc. Natl. Acad. Sci. U. S. A. 100: 11484–11489.
Kent, W. J., C. W. Sugnet, T. S. Furey, K. M. Roskin, T. H. Pringle et al., 2002 The human genome browser at UCSC. Genome Res. 12: 996–1006.
Kent, W. J., A. S. Zweig, G. Barber, A. S. Hinrichs, and D. Karolchik, 2010 BigWig and BigBed: enabling browsing of large distributed datasets. Bioinforma. Oxf. Engl. 26: 2204–2207.
Kharchenko, P. V., A. A. Alekseyenko, Y. B. Schwartz, A. Minoda, N. C. Riddle et al., 2011 Comprehensive analysis of the chromatin landscape in Drosophila melanogaster. Nature 471: 480–485.
Kiełbasa, S. M., R. Wan, K. Sato, P. Horton, and M. C. Frith, 2011 Adaptive seeds tame genomic sequence comparison. Genome Res. 21: 487–493.
Kliman, R. M., and J. Hey, 1993 Reduced natural selection associated with low recombination in Drosophila melanogaster. Mol. Biol. Evol. 10: 1239–1258.
Koerich, L. B., X. Wang, A. G. Clark, and A. B. Carvalho, 2008 Low conservation of gene content in the Drosophila Y chromosome. Nature 456: 949–951.
Kruskal, W. H., and W. A. Wallis, 1952 Use of Ranks in One-‐Criterion Variance Analysis. J. Am. Stat. Assoc. 47: 583–621.
Kuhn, G. C. S., and J. S. Heslop-‐Harrison, 2011 Characterization and genomic organization of PERI, a repetitive DNA in the Drosophila buzzatii cluster related to DINE-‐1 transposable elements and highly abundant in the sex chromosomes. Cytogenet. Genome Res. 132: 79–88.
36
Kurtz, S., A. Narechania, J. C. Stein, and D. Ware, 2008 A new method to compute K-‐mer frequencies and its application to annotate large repetitive plant genomes. BMC Genomics 9: 517.
Lanzuolo, C., and V. Orlando, 2012 Memories from the polycomb group proteins. Annu. Rev. Genet. 46: 561–589.
Leung, W., C. D. Shaffer, T. Cordonnier, J. Wong, M. S. Itano et al., 2010 Evolution of a distinct genomic domain in Drosophila: comparative analysis of the dot chromosome in Drosophila melanogaster and Drosophila virilis. Genetics 185: 1519–1534.
Lewis, S. E., S. M. J. Searle, N. Harris, M. Gibson, V. Lyer et al., 2002 Apollo: a sequence annotation editor. Genome Biol. 3: RESEARCH0082.
Li, R., J. Ye, S. Li, J. Wang, Y. Han et al., 2005 ReAS: Recovery of ancestral sequences for transposable elements from the unassembled reads of a whole genome shotgun. PLoS Comput. Biol. 1: e43.
Lippman, Z., and R. Martienssen, 2004 The role of RNA interference in heterochromatic silencing. Nature 431: 364–370.
Locke, J., L. T. Howard, N. Aippersbach, L. Podemski, and R. B. Hodgetts, 1999 The characterization of DINE-‐1, a short, interspersed repetitive element present on chromosome and in the centric heterochromatin of Drosophila melanogaster. Chromosoma 108: 356–366.
Mahalanobis, P. C., 1936 On the generalized distance in statistics. Proc. Natl. Inst. Sci. Calcutta 2: 49–55.
Marchler-‐Bauer, A., S. Lu, J. B. Anderson, F. Chitsaz, M. K. Derbyshire et al., 2011 CDD: a Conserved Domain Database for the functional annotation of proteins. Nucleic Acids Res. 39: D225–229.
Martienssen, R. A., 2003 Maintenance of heterochromatin by RNA interference of tandem repeats. Nat. Genet. 35: 213–214.
Marygold, S. J., P. C. Leyland, R. L. Seal, J. L. Goodman, J. Thurmond et al., 2013 FlyBase: improvements to the bibliography. Nucleic Acids Res. 41: D751–757.
Marzo, M., M. Puig, and A. Ruiz, 2008 The Foldback-‐like element Galileo belongs to the P superfamily of DNA transposons and is widespread within the Drosophila genus. Proc. Natl. Acad. Sci. U. S. A. 105: 2957–2962.
Meisel, R. P., M. V. Han, and M. W. Hahn, 2009 A complex suite of forces drives gene traffic from Drosophila X chromosomes. Genome Biol. Evol. 1: 176–188.
Morgulis, A., G. Coulouris, Y. Raytselis, T. L. Madden, R. Agarwala et al., 2008 Database indexing for production MegaBLAST searches. Bioinforma. Oxf. Engl. 24: 1757–1764.
Morgulis, A., E. M. Gertz, A. A. Schäffer, and R. Agarwala, 2006 WindowMasker: window-‐based masker for sequenced genomes. Bioinforma. Oxf. Engl. 22: 134–141.
Moriyama, E. N., and J. R. Powell, 1997 Codon usage bias and tRNA abundance in Drosophila. J. Mol. Evol. 45: 514–523.
Mouse Genome Sequencing Consortium, R. H. Waterston, K. Lindblad-‐Toh, E. Birney, J. Rogers et al., 2002 Initial sequencing and comparative analysis of the mouse genome. Nature 420: 520–562.
Nechaev, S., D. C. Fargo, G. dos Santos, L. Liu, Y. Gao et al., 2010 Global analysis of short RNAs reveals widespread promoter-‐proximal stalling and arrest of Pol II in Drosophila. Science 327: 335–338.
37
O’Neill, P. K., M. Or, and I. Erill, 2013 scnRCA: A Novel Method to Detect Consistent Patterns of Translational Selection in Mutationally-‐Biased Genomes. PloS One 8: e76177.
Pardue, M. L., K. Lowenhaupt, A. Rich, and A. Nordheim, 1987 (dC-‐dA)n.(dG-‐dT)n sequences have evolutionarily conserved chromosomal locations in Drosophila with implications for roles in chromosome structure and function. EMBO J. 6: 1781–1789.
Peña, P., and R. Garesse, 1993 The beta subunit of the Drosophila melanogaster ATP synthase: cDNA cloning, amino acid analysis and identification of the protein in adult flies. Biochem. Biophys. Res. Commun. 195: 785–791.
Powell, J. R., 1997 Progress and prospects in evolutionary biology the Drosophila model. Oxford University Press, New York.
Quinlan, A. R., and I. M. Hall, 2010 BEDTools: a flexible suite of utilities for comparing genomic features. Bioinforma. Oxf. Engl. 26: 841–842.
R Core Team, 2013 R: A Language and Environment for Statistical Computing. R Foundation for Statistical Computing.
Raddatz, G., P. M. Guzzardo, N. Olova, M. R. Fantappié, M. Rampp et al., 2013 Dnmt2-‐dependent methylomes lack defined DNA methylation patterns. Proc. Natl. Acad. Sci. U. S. A. 110: 8627–8631.
Rice, P., I. Longden, and A. Bleasby, 2000 EMBOSS: the European Molecular Biology Open Software Suite. Trends Genet. TIG 16: 276–277.
Riddle, N. C., Y. L. Jung, T. Gu, A. A. Alekseyenko, D. Asker et al., 2012 Enrichment of HP1a on Drosophila chromosome 4 genes creates an alternate chromatin structure critical for regulation in this heterochromatic domain. PLoS Genet. 8: e1002954.
Riddle, N. C., W. Leung, K. A. Haynes, H. Granok, J. Wuller et al., 2008 An investigation of heterochromatin domains on the fourth chromosome of Drosophila melanogaster. Genetics 178: 1177–1191.
Riddle, N. C., A. Minoda, P. V. Kharchenko, A. A. Alekseyenko, Y. B. Schwartz et al., 2011 Plasticity in patterns of histone modifications and chromosomal proteins in Drosophila heterochromatin. Genome Res. 21: 147–163.
Riddle, N. C., C. D. Shaffer, and S. C. R. Elgin, 2009 A lot about a little dot — lessons learned from Drosophila melanogaster chromosome 4. Biochem. Cell Biol. 87: 229–241.
Rocha, E. P. C., 2004 Codon usage bias from tRNA’s point of view: redundancy, specialization, and efficient decoding for translation optimization. Genome Res. 14: 2279–2286.
Rousseeuw, P., and B. van Zomeren, 1991 Robust Distances: Simulations and Cutoff Values, pp. 195–203 in Directions in Robust Statistics and Diagnostics, The IMA Volumes in Mathematics and its Applications, Springer New York.
Salzberg, S. L., and J. A. Yorke, 2005 Beware of mis-‐assembled genomes. Bioinforma. Oxf. Engl. 21: 4320–4321.
Schaeffer, S. W., A. Bhutkar, B. F. McAllister, M. Matsuda, L. M. Matzkin et al., 2008 Polytene chromosomal maps of 11 Drosophila species: the order of genomic scaffolds inferred from genetic and physical maps. Genetics 179: 1601–1655.
Sentmanat, M. F., and S. C. R. Elgin, 2012 Ectopic assembly of heterochromatin in Drosophila melanogaster triggered by transposable elements. Proc. Natl. Acad. Sci. U. S. A. 109: 14104–14109.

38
Sentmanat, M., S. H. Wang, and S. C. R. Elgin, 2013 Targeting heterochromatin formation to transposable elements in Drosophila: potential roles of the piRNA system. Biochem. (Moscow) 78: 562–571.
Shaffer, C. D., C. Alvarez, C. Bailey, D. Barnard, S. Bhalla et al., 2010 The genomics education partnership: successful integration of research into laboratory classes at a diverse group of undergraduate institutions. CBE Life Sci. Educ. 9: 55–69.
Sharp, P. M., and W. H. Li, 1987 The codon Adaptation Index — a measure of directional synonymous codon usage bias, and its potential applications. Nucleic Acids Res. 15: 1281–1295.
Sinha, S., and E. D. Siggia, 2005 Sequence turnover and tandem repeats in cis-‐regulatory modules in Drosophila. Mol. Biol. Evol. 22: 874–885.
Slawson, E. E., C. D. Shaffer, C. D. Malone, W. Leung, E. Kellmann et al., 2006 Comparison of dot chromosome sequences from D. melanogaster and D. virilis reveals an enrichment of DNA transposon sequences in heterochromatic domains. Genome Biol. 7: R15.
Smit, A. F. A., R. Hubley, and P. Green, 1996 RepeatMasker Open-‐3.0. Stephens, G. E., C. A. Craig, Y. Li, L. L. Wallrath, and S. C. R. Elgin, 2004 Immunofluorescent
staining of polytene chromosomes: exploiting genetic tools. Methods Enzymol. 376: 372–393.
Struhl, K., and E. Segal, 2013 Determinants of nucleosome positioning. Nat. Struct. Mol. Biol. 20: 267–273.
Sun, F.-‐L., K. Haynes, C. L. Simpson, S. D. Lee, L. Collins et al., 2004 cis-‐Acting determinants of heterochromatin formation on Drosophila melanogaster chromosome four. Mol. Cell. Biol. 24: 8210–8220.
Tadigotla, V. R., D. O Maoiléidigh, A. M. Sengupta, V. Epshtein, R. H. Ebright et al., 2006 Thermodynamic and kinetic modeling of transcriptional pausing. Proc. Natl. Acad. Sci. U. S. A. 103: 4439–4444.
Takayama, S., J. Dhahbi, A. Roberts, G. Mao, S.-‐J. Heo et al., 2014 Genome methylation in D. melanogaster is found at specific short motifs and is independent of DNMT2 activity. Genome Res. 24: 821–830.
Tange, O., 2011 GNU Parallel: The Command-‐Line Power Tool. Login USENIX Mag. 36: 42–47.
Tesler, G., 2002 GRIMM: genome rearrangements web server. Bioinforma. Oxf. Engl. 18: 492–493.
Thomas, J., S. Schaack, and E. J. Pritham, 2010 Pervasive horizontal transfer of rolling-‐circle transposons among animals. Genome Biol. Evol. 2: 656–664.
Tóth, G., Z. Gáspári, and J. Jurka, 2000 Microsatellites in different eukaryotic genomes: survey and analysis. Genome Res. 10: 967–981.
Trapnell, C., L. Pachter, and S. L. Salzberg, 2009 TopHat: discovering splice junctions with RNA-‐Seq. Bioinforma. Oxf. Engl. 25: 1105–1111.
Trapnell, C., B. A. Williams, G. Pertea, A. Mortazavi, G. Kwan et al., 2010 Transcript assembly and quantification by RNA-‐Seq reveals unannotated transcripts and isoform switching during cell differentiation. Nat. Biotechnol. 28: 511–515.
Van Aelst, S., E. Vandervieren, and G. Willems, 2012 A Stahel–Donoho estimator based on huberized outlyingness. Comput. Stat. Data Anal. 56: 531–542.

39
Van Beest, M., M. Mortin, and H. Clevers, 1998 Drosophila RpS3a, a novel Minute gene situated between the segment polarity genescubitus interruptus and dTCF. Nucleic Acids Res. 26: 4471–4475.
Vicario, S., E. N. Moriyama, and J. R. Powell, 2007 Codon usage in twelve species of Drosophila. BMC Evol. Biol. 7: 226.
Wang, W., K. Thornton, A. Berry, and M. Long, 2002 Nucleotide variation along the Drosophila melanogaster fourth chromosome. Science 295: 134–137.
Wright, F., 1990 The “effective number of codons” used in a gene. Gene 87: 23–29. Yang, H.-‐P., and D. A. Barbash, 2008 Abundant and species-‐specific DINE-‐1 transposable
elements in 12 Drosophila genomes. Genome Biol. 9: R39. Yang, H.-‐P., T.-‐L. Hung, T.-‐L. You, and T.-‐H. Yang, 2006 Genomewide comparative analysis of
the highly abundant transposable element DINE-‐1 suggests a recent transpositional burst in Drosophila yakuba. Genetics 173: 189–196.