Driving under the influence of cannabis: The problem and potential countermeasures
16
CRIME AND JUSTICE Bulletin NSW Bureau of Crime Statistics and Research A joint project by the NSW Bureau of Crime Statistics and Research and the National Drug and Alcohol Research Centre Contemporary Issues in Crime and Justice Number 87 September 2005 Driving under the influence of cannabis: The problem and potential countermeasures Craig Jones 1 , Neil Donnelly 1 , Wendy Swift 2 and Don Weatherburn 1 1 NSW Bureau of Crime Statistics and Research 2 National Drug and Alcohol Research Centre, University of NSW This bulletin assessed (a) whether recent drug-drivers were more likely to self-report accidents than non-intoxicated drivers; (b) the likely deterrent effect of roadside drug testing (RDT), increasing the severity of sanctions for drug-driving and providing factual information about accident risk associated with drug-driving; and (c) what factors were predictive of driving under the influence of cannabis (DUIC). Face-to-face structured interviews were conducted with 320 cannabis users in NSW. The results provided only limited support for a relationship between DUIC and accident risk, although replication with a larger sample size is recommended. RDT appears to act as a more effective deterrent against drug-driving than either increasing the severity of sanctions or providing factual information about the risks associated with the behaviour. Males, dependent users, early onset cannabis users, frequent drivers, cannabis users who had used more classes of other drugs and cannabis users who believed that their risk of accident would not change following cannabis use were all more likely to report DUIC. INTRODUCTION THE PREVALENCE OF DRUG DRIVING More than 60,000 Australians aged 14 years and over reported driving a motor vehicle in 2004 while “under the influence” of drugs other than alcohol (4.8% of males and 2% of females, Australian Institute of Health and Welfare 2005). This is likely to be an underestimate because the household survey from which these data were derived cannot measure drug-driving among hard-to-reach populations who are potentially at-risk of drug-driving. The prevalence of drug-driving in New South Wales (NSW) appears very similar to the national estimate. Recent survey data collected by the NSW Roads and Transport Authority (RTA) estimated the past year prevalence of driving after any illicit drug use to be four per cent. Four- fifths of recent drug-drivers reported using cannabis on the last occasion on which they drove under the influence of drugs (Hawkins, Bryant & Zipparo 2004). While quite low among the general population, the prevalence of drug-driving is more common among certain subgroups. Offender populations (Poyser et al. 2002; Turner 2004) and young drivers (AAMI 2004; Jones, Freeman & Weatherburn 2003; McLeod et al. 1998), for example, are more likely than non-offenders and older drivers to report drug-driving. As we might expect, the likelihood of drug-driving is also much higher among recent drug users. Secondary analyses of the 2001 National Drug Strategy Household Survey data revealed that 30 per cent of past-year cannabis users had driven under the influence of drugs other than alcohol in the past 12 months (personal communication, Mark Cooper-Stanbury, Australian Institute of Health and Welfare). Hawkins and colleagues (2004) estimated that 43 per cent of recent drug users (i.e. those who had used in the past 3 months) were also recent drug-drivers (i.e. had driven after using illicit drugs in the past 12 months). Among past-year cannabis users residing on the North Coast of NSW, Jones, Freeman and Weatherburn (2003) found that 43 per cent had driven within an hour of using cannabis in their lifetime and 29 per cent had done so in the past year. Forty-one per cent of participants who had used weekly or more frequently in the 12 months prior to being interviewed reported driving under the influence of cannabis (DUIC) at least once in the same year. Prevalence estimates are even more stark among populations of long-term cannabis users and injecting drug users (IDU). Among 268 long-term cannabis users interviewed on the far North Coast of NSW, Reilly et al. (1998) found that 90 per cent drove at least occasionally soon after using cannabis. Among a sample of
-
Upload
independent -
Category
Documents
-
view
2 -
download
0
Transcript of Driving under the influence of cannabis: The problem and potential countermeasures

B U R E A U O F C R I M E S T A T I S T I C S A N D R E S E A R C H
1
CRIME AND JUSTICEBulletin NSW Bureau of Crime
Statistics and ResearchA joint project by the NSW Bureau of Crime Statistics and Research and the National Drug and Alcohol Research Centre
Contemporary Issues in Crime and Justice Number 87September 2005
Driving under the influence of cannabis:The problem and potential countermeasuresCraig Jones1, Neil Donnelly1, Wendy Swift2 and Don Weatherburn1
1 NSW Bureau of Crime Statistics and Research2 National Drug and Alcohol Research Centre, University of NSW
This bulletin assessed (a) whether recent drug-drivers were more likely to self-report accidents thannon-intoxicated drivers; (b) the likely deterrent effect of roadside drug testing (RDT), increasing the severityof sanctions for drug-driving and providing factual information about accident risk associated withdrug-driving; and (c) what factors were predictive of driving under the influence of cannabis (DUIC).Face-to-face structured interviews were conducted with 320 cannabis users in NSW. The results providedonly limited support for a relationship between DUIC and accident risk, although replication with a largersample size is recommended. RDT appears to act as a more effective deterrent against drug-driving thaneither increasing the severity of sanctions or providing factual information about the risks associated withthe behaviour. Males, dependent users, early onset cannabis users, frequent drivers, cannabis users whohad used more classes of other drugs and cannabis users who believed that their risk of accident wouldnot change following cannabis use were all more likely to report DUIC.
INTRODUCTION
THE PREVALENCE OF DRUGDRIVING
More than 60,000 Australians aged 14years and over reported driving a motorvehicle in 2004 while “under theinfluence” of drugs other than alcohol(4.8% of males and 2% of females,Australian Institute of Health and Welfare2005). This is likely to be anunderestimate because the householdsurvey from which these data werederived cannot measure drug-drivingamong hard-to-reach populations whoare potentially at-risk of drug-driving. Theprevalence of drug-driving in New SouthWales (NSW) appears very similar to thenational estimate. Recent survey datacollected by the NSW Roads andTransport Authority (RTA) estimated thepast year prevalence of driving after anyillicit drug use to be four per cent. Four-
fifths of recent drug-drivers reportedusing cannabis on the last occasion onwhich they drove under the influence ofdrugs (Hawkins, Bryant & Zipparo 2004).
While quite low among the generalpopulation, the prevalence ofdrug-driving is more common amongcertain subgroups. Offender populations(Poyser et al. 2002; Turner 2004) andyoung drivers (AAMI 2004; Jones,Freeman & Weatherburn 2003; McLeodet al. 1998), for example, are more likelythan non-offenders and older drivers toreport drug-driving. As we might expect,the likelihood of drug-driving is also muchhigher among recent drug users.Secondary analyses of the 2001 NationalDrug Strategy Household Survey datarevealed that 30 per cent of past-yearcannabis users had driven under theinfluence of drugs other than alcohol in thepast 12 months (personal communication,Mark Cooper-Stanbury, Australian Instituteof Health and Welfare). Hawkins and
colleagues (2004) estimated that 43 percent of recent drug users (i.e. those whohad used in the past 3 months) were alsorecent drug-drivers (i.e. had driven afterusing illicit drugs in the past 12 months).
Among past-year cannabis usersresiding on the North Coast of NSW,Jones, Freeman and Weatherburn(2003) found that 43 per cent had drivenwithin an hour of using cannabis in theirlifetime and 29 per cent had done so inthe past year. Forty-one per cent ofparticipants who had used weekly ormore frequently in the 12 months prior tobeing interviewed reported driving underthe influence of cannabis (DUIC) at leastonce in the same year. Prevalenceestimates are even more stark amongpopulations of long-term cannabis usersand injecting drug users (IDU). Among268 long-term cannabis usersinterviewed on the far North Coast ofNSW, Reilly et al. (1998) found that 90per cent drove at least occasionally soonafter using cannabis. Among a sample of

B U R E A U O F C R I M E S T A T I S T I C S A N D R E S E A R C H
2
300 IDU interviewed in NSW, Darke,Kelly and Ross (2004) found that 74 percent had ever driven after usingcannabis, 57 per cent of drivers haddriven under the influence of cannabis inthe previous year, and 21 per cent haddone so weekly or more frequently.
Much less is known about the prevalenceof driving under the influence of cannabisand alcohol together (DUICA) amongpopulations of primary cannabis users,and almost nothing is known aboutdriving after using cannabis and otherillicit drugs together (DUICO). It appearsthat drug users sometimes DUICA,although it is much less common thandriving after having used cannabis alone(Aitken, Kerger & Crofts 2000; Lenne etal. 2001). Jones et al. (2003), forexample, found that only two per cent oftheir sample reported DUICA in the prior12 months. This figure rose to seven percent among participants who had usedcannabis in the previous year. Whilepower was a problem due to a smallsample size, about one in four cannabisusers who reported DUIC in the pastyear also reported DUICA.
THE RISKS ASSOCIATED WITHCANNABIS USE AND DRIVING
An increased risk of road traumaassociated with DUIC may be one of themost serious acute risks posed by theuse of cannabis. Yet, at present, thenature of the relationship betweencannabis use and accident risk is notentirely clear. Most researchers agreethat cannabis intoxication impairsperformance on laboratory-basedpsychomotor tasks, simulated drivingand actual on-road driving (e.g.European Monitoring Centre for Drugsand Drug Addiction 1999; Kelly, Darke &Ross 2004; Lenne, Triggs & Regan2001; Moskowitz 1985; Smiley 1999;Walsh et al. 2004). However drivingimpairment provides necessary, but notsufficient, evidence that cannabis useincreases accident risk. Studiescommonly find, for example, thatcannabis users are aware of theseperformance decrements and adjust theirdriving behaviour accordingly (e.g. bydriving more slowly, see Smiley 1999 fora review).
Delta-9-tetrahydrocannabinol (or THC,the psychoactive ingredient found in
cannabis) has been found in the blood ofbetween three and 14 per cent of fatallyinjured drivers (Drummer et al. 2003;Longo et al. 2000a; Ramaekers et al.2004; Walsh et al. 2004). Prevalenceestimates at the higher end of this rangemight suggest that cannabis-intoxicateddrivers are over-represented in fatalaccidents. One problem withepidemiological studies of this type,however, is that alcohol is often found incombination with cannabis in the blood ofaccident victims (Drummer et al. 2003;Hall, Degenhardt & Lynskey 2001). Astrong relationship between alcohol andaccident risk has been well established,which makes it difficult to partial out theindependent effects of alcohol andcannabis consumption on accident risk.1
One method used to separately analysethe effects of cannabis and alcohol isknown as culpability analysis. Thisinvolves rating each driver among acohort of accident victims as culpable,contributory or not responsible for theiraccident, based on a number ofstandardised criteria relating to thecircumstances of the accident. Eachdriver’s accident culpability is thenassessed in terms of the drugs they hadused prior to the accident, under theassumption that a higher proportion ofcannabis-positive drivers should bedeemed culpable for their accident ifcannabis use does indeed increaseaccident risk (Robertson & Drummer1994).
Culpability studies almost invariably findalcohol-affected drivers and thoseaffected by alcohol and cannabis incombination to be culpable at a higherrate than drug-free drivers (Drummer etal. 2004; Longo et al. 2000b; Terhune &Fell 1982; Terhune et al. 1992; Williamset al. 1985). The evidence relating tocannabis use by itself is not so clear.Early studies were marred by sample sizeproblems (Terhune & Fell 1982; Williamset al. 1985) and more recent large-scaleculpability studies have foundinconsistent results. Among a sample of2,500 non-fatally injured drivers in SouthAustralia, Longo et al. (2000b) found thatdrivers who tested positive for THC wereno more likely to be culpable for theiraccident than were drug-free drivers.Drummer and colleagues, on the otherhand, found large, dose-dependenteffects of THC on driver culpability among
a sample of 3,400 drivers killed in threeAustralian States over 10 years(Drummer et al. 2004). It is possible thatthis discrepancy is related to qualitativedifferences between fatal and non-fatalaccident victims. It could be, forexample, that when cannabis-intoxicateddrivers are involved in and responsiblefor accidents, these accidents tend to bevery serious.
While the results of Drummer andcolleagues’ (2004) study provide goodevidence that THC has some associationwith accident risk — among fatallyinjured drivers, at least — culpabilitystudies are not beyond criticism. A higherodds ratio among THC-positive driverscould be found simply because cannabisusers have other characteristics whichput them at increased risk of accident(e.g. because they are less experiencedor have more relaxed attitudes to drivingviolations). It is difficult to control forthese risk factors in culpability studies,particularly if the drivers were fatallyinjured in their accident, because thisinformation is not recorded onadministrative datasets. This problem isnot purely hypothetical. Survey-basedstudies of accident risk have foundevidence highlighting the importance ofcontrolling for all risk factors whenexamining the influence of cannabisconsumption on driving. Drivers whoreport cannabis-intoxicated driving withina defined period have sometimes beenfound to be at increased risk of accidentduring that same time period (e.g. delRio & Alvarez 1995; MacDonald et al.2004). This relationship tends to beattenuated, however, when other riskfactors — such as speeding, street-racing and regularly running red lights —are controlled for (Blows et al. 2005;Fergusson & Horwood 2001).2
The relationship between cannabis useand accident risk is clearly a contentiousone. The balance of evidence generallysuggests that cannabis use puts driversat increased risk of accident —particularly at higher doses — but theprecise effects of cannabis use onaccident culpability remain somewhatunclear (European Monitoring Centre forDrugs and Drug Addiction 1999; 2003;Hall, Degenhardt & Lynskey 2001;Ramaekers et al. 2004; World HealthOrganisation 1997). However, in light ofthe harm potentially caused by DUIC,

B U R E A U O F C R I M E S T A T I S T I C S A N D R E S E A R C H
3
especially in conjunction with alcohol,public policy makers around Australiahave recently begun to focus on howDUIC might be prevented, or how theharm associated with DUIC might bemitigated.
THE CURRENT STUDY
The current study had three primaryaims. The first was to further assess therelationship between DUIC and accidentrisk. We examined this relationship bycomparing the accident rates of cannabisusers who reported DUIC in the pastyear with the accident rates of cannabisusers who said they had not driven underthe influence of cannabis in the pastyear. Information on potentialconfounders of this relationship (such asdriving experience and driving frequency)was also collected. To supplement thisanalysis we also asked participants inthe sample about their perceived risk ofhaving an accident after using cannabis,their beliefs about their ability to control avehicle when intoxicated by cannabis,their actual frequency of having anaccident within a short time of usingcannabis and whether they felt that theircannabis use contributed to the accident.
The second aim of this paper was toassess the likely effectiveness of threedrug-driving prevention strategies:(a) roadside drug testing (RDT),(b) more severe penalties for DUIC and(c) providing factual information aboutthe risk of accident associated withDUIC.3 To assess the likely deterrenteffect of introducing RDT and increasingthe severity of penalties for DUIC, weused an experimental deterrenceparadigm developed by Nagin andPaternoster (1993). Participants in thesurvey were presented with ahypothetical scenario in which they hadthe opportunity to drive after usingcannabis. They were randomly assignedto one of four different groups whichdiffered according to the perceivedcertainty and severity of sanctions forDUIC. Participants were asked to ratetheir likelihood of driving given theconditions presented in the scenario.The question of interest in this part of thestudy was whether participants in thehigh certainty or severity conditions wereless likely to indicate a willingness to
drive while intoxicated than participants inthe lower certainty/severity conditions. Toassess the likely effect of educationalinitiatives on DUIC, participants wereasked to state their likelihood of driving ifthey came to believe that cannabis-intoxicated drivers were more likely to beresponsible for accidents than drug-freedrivers.
Any prevention strategy would be greatlyimproved by a detailed understanding ofwho is more likely to DUIC. For thisreason, this study's third aim was todetermine what factors were predictive ofhaving driven under the influence ofcannabis in the previous year. This wasassessed by regressing the probability ofreporting DUIC in the past year against anumber of potential risk factors, such asthe drug-driving behaviour of their peers,the participants’ use of cannabis andother drugs, and their past driving history.
METHOD
RECRUITMENT OFPARTICIPANTS
In pursuit of these aims we interviewed320 recent cannabis users in Sydney andNewcastle. Recruitment to the study wasreliant on targeted advertising on nationaland local radio stations, in mainstreamnewspapers, posting notices at oneuniversity campus, postingadvertisements at social services outlets,and advertising in popular street pressand student magazines. Someparticipants were also recruited throughsnowballing, whereby the initial base ofparticipants used informal social networksto refer the interviewer on to otherpotential participants. Participants whoread or heard about the study wereencouraged to phone a 1800-number toarrange a time to complete the interview.Participants were screened during theinitial phone call to ensure that they meteach of the inclusion criteria. Injectingdrug users and callers who were notNSW residents were screened outtowards the end of the data collectionperiod in order to limit their representationin the final sample. Interviewing began inOctober 2004 and ceased in early March2005. The final sample consisted of 120Newcastle participants and 200 Sydneyparticipants.
To be eligible for inclusion in the survey,participants had to be aged 18 years orolder, have used cannabis at least oncein the previous 12 months and havedriven a motor vehicle within theprevious 12 months (although notnecessarily engaging in the twobehaviours simultaneously). Allparticipants were volunteers who werepaid $30 immediately after the interviewas compensation for out-of-pocketexpenses. The mean age of participantswas 29 years (range: 18–73), two-thirdswere male and only a small proportion(6%) identified as Indigenous. Threequarters of the sample were born inAustralia and all but one participant,who was a native German speaker,spoke English as their first language.Forty-six per cent of the sample were insome form of paid employment.Slightly more than one-quarter (29%)had not completed their higher schoolcertificate (HSC).
QUESTIONNAIRE DESIGN
While much of the questionnaire eliciteddescriptive information bearing on thefirst and third aims of the research, italso contained a special section toassess the likely effect of perceived riskand perceived sanction severity onwillingness to engage in DUIC. In thissection, participants were presented witha hypothetical scenario in which they hadthe option of driving within a short time ofusing cannabis and each participantrated their likelihood of driving (out of100) under the circumstance describedin the scenario. All participants receivedessentially the same scenario but certainaspects of it were varied to create fourdifferent groups based on the perceivedcertainty of being caught and severity ofsanctions for DUIC (high certainty/highseverity, high certainty/low severity, lowcertainty/high severity, or low certainty/low severity, see Appendix A).Participants were block-randomised toone of these four conditions prior to theirarrival at the interview location. Separaterandomisation schedules wereestablished for the Sydney andNewcastle samples. Block sizes of eightwere employed for the first 96 Newcastleparticipants and block sizes of four wereused for the remaining 24 subjects.Twenty-five blocks of eight wereemployed for the Sydney sample.

B U R E A U O F C R I M E S T A T I S T I C S A N D R E S E A R C H
4
In the high certainty condition,participants were informed that they hadseen police in the area recently and wereled to believe that they could randomlydrug-test drivers. In the low certaintycondition, participants were informed thatthey had seen police in the area recentlybut they couldn’t randomly test driversfor drugs at the roadside. In the highseverity condition participants wereinformed that, if they were to get caughtfor DUIC, they would get a fine of about$1000 and have their licence disqualifiedfor a minimum of 12 months. In the lowerseverity condition, participants wereinformed that they would get a fine ofabout $500 and have their licencedisqualified for a minimum of 6 months.The actual vignettes are presented inAppendix A. We hypothesised that, ifRDT and harsher penalties for DUIC arelikely to exert a deterrent effect on drug-driving, those participants who were ledto believe that the certainty and severityof punishment are high would be lesslikely to report a willingness to drive thanthose in lower certainty/severityconditions.
MEASURES
Drug-driving
Participants were asked to indicate (1)their frequency of driving within one hourof using cannabis by itself in the previous12 months (2) their frequency of drivingwithin one hour of using cannabis andalcohol together (without using any otherdrugs) in the previous 12 months; and(3) their frequency of driving within anhour of using cannabis and other illicitdrugs together (with or without usingalcohol) in the previous 12 months. Onehour was selected because psychomotorimpairment is known to be most severewithin the first hour of consumingcannabis (Chesher 1991; Moskowitz1985; Ramaekers et al. 2004). Becauseintoxication may persist for longer thanone hour, our measure gives aconservative estimate of the incidence ofdrug-driving among this population.These drug-driving outcome measureswere later coded into a single variablewhich took one of the following sixvalues: no drugs; cannabis only;cannabis and alcohol together (but notwith other drugs); cannabis and otherdrugs together (but not with alcohol);
cannabis with alcohol and cannabis withother drugs but on separate occasions;and cannabis, alcohol and other drugssimultaneously.
Accident risk
The primary measure of accident risk waswhether or not a participant said they hadever been in an accident when they werethe driver of a vehicle and, if so, how longago their most recent accident was.Information that could potentiallyconfound this relationship (such asdriving experience) was also collected. Inaddition to this measure of accident risk,participants were asked a variety ofquestions about their beliefs and attitudestowards cannabis use and accident risk.
Likely effect of roadside drugtesting and severe penalties
After reading their respective scenarios,participants were asked to rate theirlikelihood of driving on a 100-point scaleranging from 0 (not at all) to 100(definitely). To avoid clustering aroundquartiles and end-points, visual analoguescales (VAS) were used. In this study, theVAS consisted of a 100mm line drawn onthe page and marked with ‘not at all’ atthe left extreme of the line and ‘definitely’at the right extreme of the line.Participants were asked to mark a crosson the line to indicate how likely theywould be to drive under the conditions inthe scenario. The participants’ responseswere later converted to a numerical scoreby measuring, with a ruler, the distancefrom the left end-point of the scale to thecentre of the ‘x’. As an independent checkon the effectiveness of the scenarios ingenerating variations in perceivedcertainty and severity, participants wereasked to rate (1) their chances of beingcaught by the police given that scenarioand (2) how big a problem the penaltiesfor the offence would create for them ifthey decided to drive and were caughtand convicted. Participants were alsoasked how likely they would be to drivehome under the circumstances in thescenario if there was no possibility ofbeing caught and punished.
Likely effect of educationalinitiatives
The effect of educational initiatives wasassessed by asking participants toindicate (on a VAS) their likelihood of
driving if they could be convinced thatcannabis-intoxicated drivers were “aboutthree to seven times more likely to beresponsible for their crash [than] drivers[who] have not used drugs or alcohol”.The quote was taken from a recentreview of the evidence for cannabis useand accident risk (Ramaekers et al.2004, p.109). Participants were alsoasked to indicate their likelihood ofdriving if they could be convinced thatthe combined use of cannabis “andalcohol produces severe drivingimpairment and sharply increases therisk of drivers accident” responsibility(Ramaekers et al. 2004, p.117).
Drug-driving predictors
The following potential predictors ofDUIC were obtained from eachparticipant:
1.Socio-demographic characteristics.Socio-demographic characteristicsmeasured were age, gender,Indigenous status, country of birth,employment status, and education.
2.Peer drug-driving behaviour.All participants were asked toestimate the proportion of theirfriends who drive at least sometimesafter using cannabis (without usingother drugs).
3.Past year cannabis use frequency.Participants were asked howfrequently they had used cannabis inthe previous 12 months on afive-point scale, with 1=once ortwice, 2=every few months, 3=aboutonce a month, 4=once a week ormore, and 5=every day.
4.Cannabis dependence.The Severity of Dependence Scale(SDS) was employed to measurecannabis dependence. The SDS is afive-item scale which focuses on theusers’ feelings of control, anxietyabout missing a smoke, concernabout cannabis use, compulsion touse and difficulty in ceasing use.Each of the five items are scored on ascale from zero to three, giving aminimum dependency score of zeroand a maximum score of 15. For thepurposes of this study, anyonescoring three or more on the SDSwere defined as cannabis-dependent(see Swift, Copeland & Hall 1998).

B U R E A U O F C R I M E S T A T I S T I C S A N D R E S E A R C H
5
Table 1: Proportion of sample who reported driving within one hour ofusing cannabis alone (DUIC), cannabis in combination withalcohol (DUICA), and cannabis and other drugs together(DUICO) during the previous 12 months
% At least once % Weekly or more
DUIC 77.8 26.9
DUICA 29.1 1.6
DUICO 30.4 3.4
5.Other drug use measures.Participants were asked how old theywere when they first used cannabis.They were also asked whether theyhad ever used each of alcohol,inhalants, hallucinogens,amphetamines, cocaine, other ‘party’drugs, benzodiazepines, heroin andother illicitly sourced opiates, andfurthermore whether they had everinjected each of these drugs (withthe exception of inhalants). Twovariables were then created toindicate (a) the number of drug typesthey reported using in their lifetimeand (b) whether they had everinjected any of these drugs.Participants were also asked to rate,on a seven-item scale, howfrequently they had consumedalcohol at acute-risk levels over thepreceding 12 months. NationalHealth and Medical ResearchCouncil (NHMRC) guidelines of sixstandard drinks in one day for men,and four standard drinks for women,were used to measure acute-riskdrinking. A standard drink wasdefined as “a middy of full strengthbeer, a schooner of light beer, asmall glass of wine, a glass of portor a nip of spirits”.
6.Driving-related factors.Participants were asked whetherthey had ever had their licencedisqualified or revoked for a trafficoffence, the average distance drivenin a typical week, how frequentlythey had been randomly breathtested for alcohol during the pastyear, and whether they had beenconvicted for a variety of drivingoffences. A variable was post-coded‘0’ if they had never been convictedfor a driving offence and ‘1’ if theyhad been convicted for one or moreoffences.
7.Perceived risk of accident.Participants were asked whetherthey felt that their accident riskincreased, decreased or remainedstable if they drove while feelingintoxicated by cannabis.
8.Perceived risk of apprehension andperceived sanction severity.Participants nominated theirperceived likelihood of being caughtfor DUIC on a five-point scale,ranging from ‘extremely unlikely’ to‘extremely likely’. Participants were
also asked to state whether theycould be fined for DUIC and, if so,what they thought the maximum finefor the offence would be under NSWlegislation; whether they could havetheir licence disqualified and, if so,what they thought the maximumdisqualification would be under NSWlegislation; and, finally, whether theycould be sentenced to imprisonmentand, if so, what they thought themaximum sentence would be underNSW legislation.
Procedure
Approval was obtained from theUniversity of NSW Human ResearchEthics Committee. A two-stage pilot study,with 20 participants in each stage, wasthen conducted to ensure that therandomisation procedures werepracticable and that the questionnaireitems were coherent and informative.Newcastle interviews were conducted inthe offices of the contractor employed toundertake the interviews. Most Sydneyinterviews were conducted in acommunity room in one inner-western citysuburb. Trained interviewers administeredall interviews face-to-face with theparticipant. The mean interview time was35 minutes. The interviewer first read aninformation statement to ensure that theparticipant understood what was requiredof them and to inform them of their rightsand entitlements. A copy of this documentwas given to the participants at the end ofthe interview for them to keep.Participants were also required to sign aninformed consent statement prior tocompleting the interview. Participantswere read each question aloud and theinterviewer coded responses on a papercopy of the questionnaire. Only for thequestions where visual analogue scaleswere used did the participants mark thequestionnaire themselves.
RESULTS
Table 1 shows the past year frequencyof driving within one hour of usingcannabis by itself (DUIC), cannabis incombination with alcohol (DUICA), andcannabis in combination with otherdrugs, with or without using alcohol atthe same time (DUICO). A very highproportion (78%) of this sample reporteddriving within one hour of using cannabisat least once in the previous year. Whilethe proportion reporting DUICA andDUICO were somewhat lower, nearly athird of all participants still reported eachof these behaviours at least once in thepreceding year. Among this sample, 15per cent had driven after using cannabisin combination with each of ecstasy andamphetamines, two per cent after usingcannabis with hallucinogens, one percent with benzodiazepines, four per centwith heroin, three per cent with cocaine,one per cent with methadone, and oneper cent with GHB.4 A high proportion ofthis sample also reported very frequentcannabis-intoxicated driving during theprevious 12 months. More than onequarter of the sample reported DUICweekly or more frequently in the previousyear. Very few participants reportedDUICA (2%) or DUICO (3%) with suchfrequency.
Many of the participants who had drivenafter using cannabis by itself at somepoint in the past year had also usedcannabis in combination with some otherdrug. This can be seen in Table 2, whichshows the proportion of participants whohad driven under the influence of variouscombinations of drugs in the past year.About one-third of participants had drivenafter using cannabis on its own; 16 percent had driven after using cannabis withalcohol (but not with other illicit drugs);15 per cent had driven after using

B U R E A U O F C R I M E S T A T I S T I C S A N D R E S E A R C H
6
Table 2: Drugs used while driving in the previous 12 months (n=319)
N %
None 68 21.3
Cannabis by itself 103 32.2
Cannabis/alcohol (but no other illicit drugs) 51 15.9
Cannabis/other (but not with alcohol) 47 14.7
Cannabis/alcohol and cannabis/other (on separate occasions) 13 4.1
Cannabis/alcohol/other (simultaneously) 37 11.6
Table 3: Likelihood of accident in previous year by drug-drivingbehaviour (n=319)
Accident
Drugs used while driving No. in group N %
None 68 5 7.4
Cannabis by itself 103 11 10.7
Cannabis/alcohol (but no other illicit drugs) 51 4 7.8
Cannabis/other (but not with alcohol) 47 4 8.5
Cannabis/alcohol and cannabis/other (on separate occasions) 13 3 23.1
Cannabis/alcohol/other (simultaneously) 37 9 24.3
Table 4: Mean and median driving likelihood scores (out of 100),by scenario
Scenario N Mean Median
Total sampleHigh certainty/high severity 80 32 19
High certainty/low severity 80 27 14
Low certainty/high severity 80 54 54
Low certainty/low severity 80 59 69
Kruskal-Wallis χ2=41.3, df=3, p<0.01
Current offendersHigh certainty/high severity 63 36 27
High certainty/low severity 59 31 19
Low certainty/high severity 62 62 73
Low certainty/low severity 65 67 75
Kruskal-Wallis χ2=42.7, df=3, p<0.01
Current non-offendersHigh certainty/high severity 17 16 5
High certainty/low severity 21 16 7
Low certainty/high severity 18 29 11
Low certainty/low severity 15 27 16
Kruskal-Wallis χ2=2.3, df=3, p=0.52
cannabis with other illicit drugs (but notwith alcohol); four per cent had driven —on separate occasions — after usingcannabis with alcohol (but not with otherillicit drugs) and cannabis with other illicitdrugs (but not with alcohol); and 12 percent had driven after using cannabis,alcohol and other drugs all at the sametime. One-fifth of participants had notdriven after using any drugs in theprevious 12 months. Among theparticipants who had driven after usingcannabis in combination with other illicitdrugs, most had used ecstasy and/oramphetamines, although a smallerproportion had also used heroin.
DUIC AND ACCIDENT RISK
Overall, 167 participants (52%) reportedhaving been in one or more accidents intheir lifetime, while 36 participants (11%)reported having been involved in anaccident in the previous year. Therelationship between the reportedlikelihood of having had an accident inthe previous 12 months and the drugsused while driving in the past 12 monthsis presented in Table 3. The likelihood ofhaving had an accident in the previousyear was much the same for those whosaid they had not driven within an hour ofusing a drug in the previous 12 months(7.4%), those who reported driving afterusing cannabis only (10.7%), those whoreported driving after using cannabis andalcohol together (7.8%) and those whoreported driving after using cannabis andother illicit drugs (8.5%). The proportionwho reported an accident in the previousyear was much higher for those whoreported driving after using cannabis withalcohol and other illicit drugs — eithersimultaneously (24%) or on differentoccasions (23%) — than it was for theother drivers. However the analysislacked power to detect differences inaccident rates between groups due tothe low number of participants in eachgroup reporting an accident in theprevious year.5
While we found no apparent relationshipbetween the use of cannabis by itselfand accident risk in the above analysis,there was some evidence thatparticipants were driving while feeling atincreased risk of having an accident.When participants who reported DUIC(by itself) in the last year were askedabout their feelings of intoxication on
B U R E A U O F C R I M E S T A T I S T I C S A N D R E S E A R C H
7
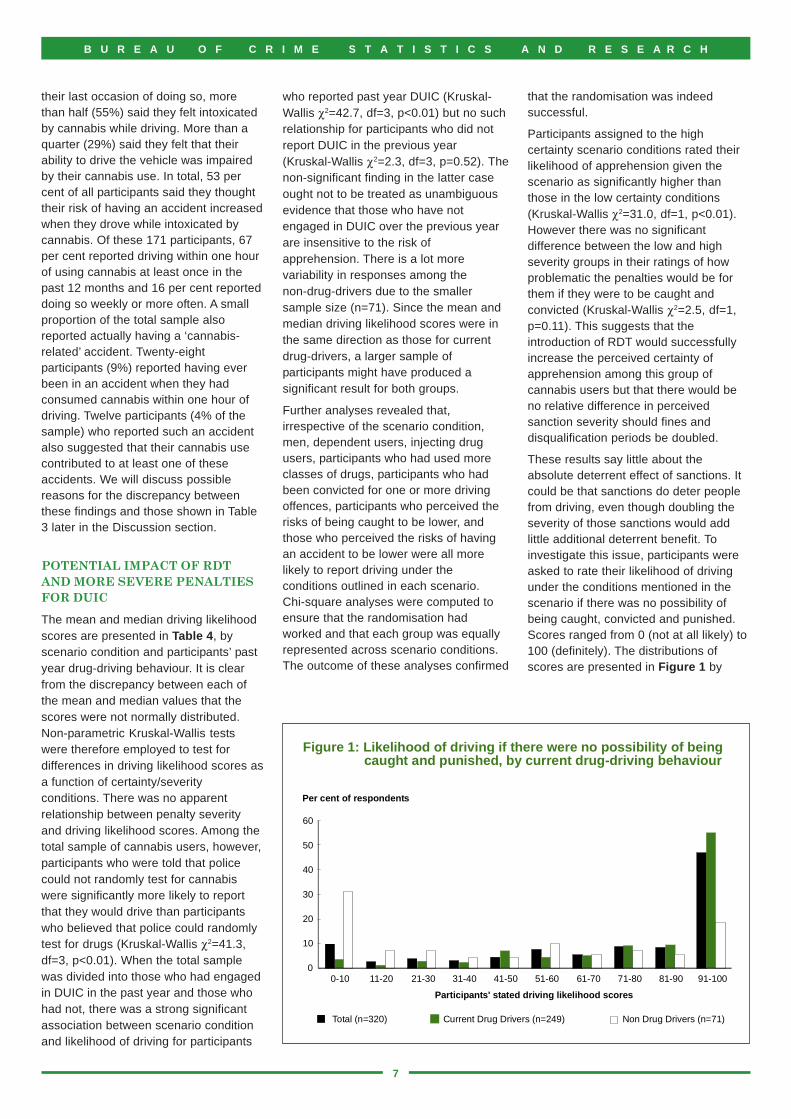
Figure 1: Likelihood of driving if there were no possibility of beingcaught and punished, by current drug-driving behaviour
Per cent of respondents
Participants' stated driving likelihood scores
0
10
20
30
40
50
60
0-10 11-20 21-30 31-40 41-50 51-60 61-70 71-80 81-90 91-100
Total (n=320) Current Drug Drivers (n=249) Non Drug Drivers (n=71)
their last occasion of doing so, morethan half (55%) said they felt intoxicatedby cannabis while driving. More than aquarter (29%) said they felt that theirability to drive the vehicle was impairedby their cannabis use. In total, 53 percent of all participants said they thoughttheir risk of having an accident increasedwhen they drove while intoxicated bycannabis. Of these 171 participants, 67per cent reported driving within one hourof using cannabis at least once in thepast 12 months and 16 per cent reporteddoing so weekly or more often. A smallproportion of the total sample alsoreported actually having a ‘cannabis-related’ accident. Twenty-eightparticipants (9%) reported having everbeen in an accident when they hadconsumed cannabis within one hour ofdriving. Twelve participants (4% of thesample) who reported such an accidentalso suggested that their cannabis usecontributed to at least one of theseaccidents. We will discuss possiblereasons for the discrepancy betweenthese findings and those shown in Table3 later in the Discussion section.
POTENTIAL IMPACT OF RDTAND MORE SEVERE PENALTIESFOR DUIC
The mean and median driving likelihoodscores are presented in Table 4, byscenario condition and participants’ pastyear drug-driving behaviour. It is clearfrom the discrepancy between each ofthe mean and median values that thescores were not normally distributed.Non-parametric Kruskal-Wallis testswere therefore employed to test fordifferences in driving likelihood scores asa function of certainty/severityconditions. There was no apparentrelationship between penalty severityand driving likelihood scores. Among thetotal sample of cannabis users, however,participants who were told that policecould not randomly test for cannabiswere significantly more likely to reportthat they would drive than participantswho believed that police could randomlytest for drugs (Kruskal-Wallis χ2=41.3,df=3, p<0.01). When the total samplewas divided into those who had engagedin DUIC in the past year and those whohad not, there was a strong significantassociation between scenario conditionand likelihood of driving for participants
who reported past year DUIC (Kruskal-Wallis χ2=42.7, df=3, p<0.01) but no suchrelationship for participants who did notreport DUIC in the previous year(Kruskal-Wallis χ2=2.3, df=3, p=0.52). Thenon-significant finding in the latter caseought not to be treated as unambiguousevidence that those who have notengaged in DUIC over the previous yearare insensitive to the risk ofapprehension. There is a lot morevariability in responses among thenon-drug-drivers due to the smallersample size (n=71). Since the mean andmedian driving likelihood scores were inthe same direction as those for currentdrug-drivers, a larger sample ofparticipants might have produced asignificant result for both groups.
Further analyses revealed that,irrespective of the scenario condition,men, dependent users, injecting drugusers, participants who had used moreclasses of drugs, participants who hadbeen convicted for one or more drivingoffences, participants who perceived therisks of being caught to be lower, andthose who perceived the risks of havingan accident to be lower were all morelikely to report driving under theconditions outlined in each scenario.Chi-square analyses were computed toensure that the randomisation hadworked and that each group was equallyrepresented across scenario conditions.The outcome of these analyses confirmed
that the randomisation was indeedsuccessful.
Participants assigned to the highcertainty scenario conditions rated theirlikelihood of apprehension given thescenario as significantly higher thanthose in the low certainty conditions(Kruskal-Wallis χ2=31.0, df=1, p<0.01).However there was no significantdifference between the low and highseverity groups in their ratings of howproblematic the penalties would be forthem if they were to be caught andconvicted (Kruskal-Wallis χ2=2.5, df=1,p=0.11). This suggests that theintroduction of RDT would successfullyincrease the perceived certainty ofapprehension among this group ofcannabis users but that there would beno relative difference in perceivedsanction severity should fines anddisqualification periods be doubled.
These results say little about theabsolute deterrent effect of sanctions. Itcould be that sanctions do deter peoplefrom driving, even though doubling theseverity of those sanctions would addlittle additional deterrent benefit. Toinvestigate this issue, participants wereasked to rate their likelihood of drivingunder the conditions mentioned in thescenario if there was no possibility ofbeing caught, convicted and punished.Scores ranged from 0 (not at all likely) to100 (definitely). The distributions ofscores are presented in Figure 1 by

B U R E A U O F C R I M E S T A T I S T I C S A N D R E S E A R C H
8
Table 5a: Demographic and peer-related correlates of driving within onehour of using cannabis in the previous 12 months
No.participants
Covariate Comparison in group % DUIC Sign.
Age group 18-22 88 76.1 ns
23-26 73 74.0
27-33 81 79.0
34+ 78 82.1
Gender Female 103 66.0 p<.01
Male 217 83.4
Indigenous status (n=319) Non-indigenous 300 77.3 ns
Indigenous 19 84.2
Country of birth Australia 244 78.3 ns
Other 76 76.3
Employment status Full-time 48 83.3 ns
Part-time 91 71.4
Temporary benefit 64 75.0
Pension 52 82.7
Student allowance 32 81.3
Other 33 81.8
Education Not completed HSC 92 84.8 ns
Completed HSC 103 75.7
Trade/other cert. 48 70.8
Degree/diploma or higher 77 76.6
Friends who DUIC (n=319) None/a few/about half 230 74.8 p<.05
Most/all 89 85.4
Participants' stated driving likelihood scores0-10 11-20 21-30 31-40 41-50 51-60 61-70 71-80 81-90 91-100
Figure 2: Likelihood of driving among all drug drivers (n=133)*if convinced that cannabis increased accident risk
Per cent or participants
7.5 7.54.5
9.8 9.8
5.3
11.29.8
8.3
26.3
0
5
10
15
20
25
30
* Past-year drug-drivers who felt their accident risk did not increase after using cannabis
current drug-driving behaviour. Overall,three-quarters of the sample rated theirchances of driving as 50 per cent orgreater (i.e. scored greater than 50 onthe VAS). Nearly half suggested that theywould be highly likely to drive if therewere no chance of being caught(i.e. scored between 91 and 100).Current drug-drivers were significantlymore likely than non-offenders to reporta willingness to drive if there was nochance of being caught and punished(Kruskal-Wallis χ2=47.0, df=1, p<0.01).
POTENTIAL IMPACT OFEDUCATION
Almost every participant (98%) felt thattheir risk of having an accident wouldincrease if they drove while feelingintoxicated by cannabis and alcoholtogether. Not every participant, however,held this view in relation to driving underthe influence of cannabis by itself. Toexplore the likely impact of factualinformation about the risks associatedwith DUIC, we focus our attention onparticipants who had in the past yearengaged in DUIC (while not under theinfluence of alcohol or other drugs) andwho believed that driving under theinfluence of cannabis on its own eitherreduced or did not affect their risk ofhaving an accident. Figure 2 shows thedistribution of participants’ stated drivinglikelihood scores (out of 100) if theycould be convinced that DUIC increasestheir risk of accident. There are threeimportant points to make about thisdistribution. First, a significant proportion(26.3%) indicated that they would behighly likely to continue to DUIC in thefuture (i.e. scores between 91 and 100),even if they could be convinced thatDUIC increased their risk of accident.Second, it is clear from the fact that themajority of participants had scores on theright side of the distribution that themajority would be more likely than not tocontinue to DUIC if convinced that itincreased their accident risk. Finally,very few participants (7.5%) indicatedthat they would be unlikely to drive if theycould be convinced that cannabisincreased their accident risk (i.e. scoresbetween 0 and 10).
Among this sample of 133 participants,weekly cannabis users were more likelythan less frequent users to say theywould drive under the influence of

B U R E A U O F C R I M E S T A T I S T I C S A N D R E S E A R C H
9
Table 5b: Drug-related correlates of driving within one hour of usingcannabis in the previous 12 months
No.participants
Covariate Comparison in group % DUIC Sign.
12 mth cannabis use freq. Less than weekly 95 50.5 p<.01
Weekly or more frequently 225 89.3
Cannabis dependence Non-dependent 177 69.5 p<.01
Dependent 143 88.1
Age first cannabis use 13 or younger 78 84.6 p<.05
14-15 128 81.3
16 or older 114 69.3
History of injecting No 239 77.4 ns
Yes 81 79.0
No. drug types ever used 3 or less 85 62.4 p<.01
4-5 99 79.8
6 or more 136 86.0
Risky drinking freq. Never 42 76.2 ns
Less than weekly 121 81.8
Weekly or more frequently 157 75.2
Table 5c: Driving-related correlates of driving within one hour of usingcannabis in the previous 12 months
No.participants
Covariate Comparison in group % DUIC Sign.
Previous licence disqual. No 215 74.0 p<.05
Yes 105 85.7
Km driven per week (n=315) 20 or less 84 63.1 p<.01
21-60 74 75.7
61-200 90 86.7
201 or more 67 86.6
RBT freq. last year 0 100 70.0 ns
1-2 85 76.5
3-4 60 85.0
5+ 75 84.0
Driving offence? No 120 69.2 p<.01
Yes 200 83.0
cannabis, even if convinced that itincreased their accident risk (Kruskal-Wallis χ2=6.7, df=1, p<0.05). Frequentdrivers (Kruskal-Wallis χ2=9.3, df=1,p<0.01) and participants who had drivenafter using cannabis and other drugs inthe past year (Kruskal-Wallis χ2=7.1,df=1, p<0.01) were also more likely tosay they would continue to drive underthe influence of cannabis, even ifconvinced that they were at increasedrisk of an accident.
CORRELATES OF DUIC
We now turn to the question of whatfactors predict willingness to drive underthe influence of cannabis. The bivariaterelationships between demographiccharacteristics and the likelihood ofhaving driven within one hour of usingcannabis in the previous year aredisplayed in Table 5a. Males (χ2=12.2,df=1, p<0.01) and participants whoreported having more peers who DUIC“at least sometimes” (χ2=4.2, df=1,p<0.05) were more likely to report DUICin the past year. No significantassociations were found between pastyear DUIC and age (χ2=1.6, df=3,p=0.65), Indigenous status (χ2=0.5, df=1,p=0.49), country of birth (χ2=0.1, df=1,p=0.72), employment status (χ2=4.5,df=5, p=0.48) or education (χ2=4.3, df=3,p=0.23).
The bivariate relationships betweenparticipants’ drug-using characteristicsand their likelihood of having drivenwithin one hour of using cannabis in theprevious year are displayed in Table 5b.Weekly cannabis users (χ2=58.3, df=1,p<0.01), dependent cannabis users(χ2=12.2, df=1, p<0.01), earlier onsetcannabis users (χ2=7.8, df=2, p<0.05)and participants who had used moreindividual drug classes in their lifetime(χ2=17.3, df=2, p<0.01) were more likelyto report DUIC in the previous year. Nosignificant associations were foundbetween past year DUIC and history ofinjecting drugs (χ2=0.1, df=1, p=0.76),nor between DUIC and acute-riskdrinking frequency (χ2=1.8, df=2,p=0.40).
The relationships between participants’driving-related characteristics and theirlikelihood of having driven within onehour of using cannabis in the previousyear are displayed in Table 5c.
Participants who had had their licencerevoked at least once (χ2=5.7, df=1,p<0.05), participants who had had one ormore driving convictions (χ2=5.7, df=1,p<0.05) and more frequent drivers(χ2=17.8, df=3, p<0.01) were all morelikely to report DUIC in the previous year.Participants who had been randomlybreath tested more often in the previous
year tended to be more likely to reportpast year DUIC, although the differencewas not significant at the conventionalfive per cent level (χ2=7.1, df=3, p=0.07).
The relationships between participants’beliefs and attitudes about drug-drivingand their likelihood of DUIC aredisplayed in Table 5d. Participants whofelt that their accident risk would either

B U R E A U O F C R I M E S T A T I S T I C S A N D R E S E A R C H
10
Table 5d: Attitudinal and belief-related correlates of driving within onehour of using cannabis in the previous 12 months
No.participants
Covariate Comparison in group % DUIC Sign.
Accident risk if DUIC? Increase 171 67.3 p<.01Decrease 33 90.9No change 116 89.7
Risk of apprehension Extremely unlikely/ (DUIC) unlikely 255 80.0 ns
Moderate/likely/ extremely likely 65 69.2
Fine severity (n=319) Cannot be fined 32 84.4 ns$550 or less 59 78.0$1100 55 72.7$2200 127 80.3No maximum 46 71.7
Disqualification severity Cannot be disqualified 108 74.1 ns9 months or less 19 84.212 months 122 79.5No maximum 71 78.9
Imprisonment severity Cannot be imprisoned 232 80.2 ns9 months or less 24 70.812 months 33 69.7No maximum 31 74.2
Table 6: Logistic regression model predicting likelihood of drivingwithin one hour of using cannabis in the previous 12 months
Covariate Comparison B S.E. p-value OR 95% CI
Gender Males v females 1.09 0.33 0.00 3.0 1.6-5.7
Km driven 21-60 v 20 or less 1.05 0.42 0.01 2.8 1.2-6.5 per week 61-200 v 20 or less 1.62 0.43 0.00 5.1 2.2-11.9
200+ v 20 or less 1.72 0.49 0.00 5.6 2.2-14.5
Perceived Decrease v Increase 1.06 0.68 0.12 2.9 0.8-11.0 accident risk No change v Increase 1.24 0.39 0.00 3.5 1.6-7.4
Num. drugs 4-5 v 3 or less 0.79 0.39 0.04 2.2 1.0-4.7 ever used 6 or more v 3 or less 1.19 0.39 0.00 3.3 1.5-7.0
Dependent Yes v No 0.76 0.35 0.03 2.1 1.1-4.3
Age first use 13 or younger v 16+ 0.91 0.45 0.04 2.5 1.0-6.014-15 v 16+ 0.61 0.37 0.09 1.8 0.9-3.8
Constant -2.2 0.50 0.00
perceived severity of imprisonment ifcaught DUIC (χ2=2.9, df=3, p=0.40).
Logistic regression models were fitted tothe data to determine which variablesindependently predicted the likelihood ofreporting DUIC in the past year. Allcovariates that were significantlyassociated with DUIC at a bivariate level(shown in Tables 5a–5d) were enteredinto the model and a backwardelimination approach was taken,whereby non-significant covariates weredropped from the model one-by-one. Thefinal model, with associated odds ratios(OR) and 95 per cent confident intervals(CI), is shown in Table 6.
Table 6 shows that males (OR=3),dependent cannabis users (OR=2.1),earlier onset cannabis users (OR=2.5),more frequent drivers (OR=2.8–5.6),cannabis users who had used moreclasses of other drugs (OR=2.2–3.3) andcannabis users who believed that theirrisk of accident does not changefollowing cannabis use (OR=3.5) weremore likely to report driving within anhour of using cannabis at least once inthe previous 12 months. The differencebetween cannabis users reporting thattheir accident risk would decrease andthose reporting that their risk wouldincrease following cannabis use was notsignificant at the five per cent level(p=0.12). However this may be due tothe relatively small number of peoplewho reported that their risk woulddecrease (n=33). The large standarderror and broad confidence intervalabout the odds ratio (shown in Table 6)reflect the variability associated with thissmall group of participants.
Odds ratios do not give a directindication of how much additional risk(among samples such as ours, at least)one factor adds to the likelihood of DUIC.To obtain this information we convertedthe parameter estimates in Table 6 topredicted probabilities. In order to dothis, we started from a base case thatrepresented the probability that a ‘typical’participant in our sample would DUIC.The base case that we started from wasmale, had driven between 21 km and 60km per week, had used less than threedrug types in their lifetime, was notcannabis-dependent, had first usedcannabis aged 16 years or older, andperceived their risk of accident toincrease following cannabis use. The
decrease or not change after cannabisuse were more likely to report DUIC inthe past year (χ2=23.7, df=2, p<0.01).The relationship between perceived riskof apprehension and likelihood of DUICapproached statistical significance but
was not significant at the 0.05 level(χ2=3.5, df=1, p=0.06). There was nosignificant association between DUIC andperceived severity of fines (χ2=3.1, df=4,p=0.55), perceived severity of licencedisqualification (χ2=1.6, df=3, p=0.67) or

B U R E A U O F C R I M E S T A T I S T I C S A N D R E S E A R C H
11
predicted probability that someone in oursample who fitted this set ofcharacteristics would report DUIC in theprevious year was estimated to be 49 percent. Changing the ‘dependence’characteristic in the base case from‘non-dependent’ to ‘dependent’increased the predicted probability ofDUIC to 67 per cent. Adding onto thishaving first used cannabis at 13 oryounger increased the predictedprobability of reporting DUIC to 83 percent and adding that the participant didnot believe that their chances of havingan accident would increase whenintoxicated with cannabis increased theestimated risk among this population to95 per cent. The cumulative predictedprobabilities are shown in Figure 3.
DISCUSSION
As noted in the introduction of thisreport, the present study had three aims.The first was to assess the relationshipbetween DUIC and accident risk. Thesecond was to assess the likely impactof RDT, severe penalties and theprovision of factual information aboutaccident risk on drug-driving behaviours.The third was to determine what factorswere predictive of having driven underthe influence of cannabis in the previousyear.
We found only limited evidence tosupport the claim that cannabis use
increases accident risk. Participants whohad driven under the influence ofcannabis in the previous year appearedto be no more likely than drug-free driversto report that they had had an accident inthe previous 12 months. Prima facie, thiswould seem to suggest that cannabis-intoxicated driving is not a risk factor fornon-fatal accidents. In this sense, theresults would support those of Longo etal. (2000b) who found no relationshipbetween recent cannabis use and driverculpability for non-fatal accidents. Itshould be remembered, however, thatthis finding is based on a much smallersample than the culpability studiesreviewed in the introduction to this report.We had very limited power to detect apositive effect of cannabis intoxication onaccident risk because the relatively smallnumber of participants6 who self-reportedan accident were split over six drugcombination conditions. These concernsabout low statistical power are reinforcedby the finding that more than a quarter ofpast-year cannabis-intoxicated drivers feltthat their driving was impaired on the lastoccasion that they drove within an hour ofusing cannabis (and no other drug). Theyare further reinforced by the observationthat a small but not insignificantproportion of participants reportedactually having an accident within a shorttime of using cannabis. Further large-scale culpability analyses that compareTHC-positive with drug-free accidentvictims while controlling for other accident
risk factors may be necessary before wehave a clear understanding of the impactof cannabis use on accident risk.
There was little evidence to suggest thatDUIC could be discouraged through theimposition of tougher penalties. This isconsistent with much of the deterrenceliterature (Nagin 1998). Nonetheless, itshould not be interpreted as anindication that existing penalties exert noeffect. Most of the drug-drivers in oursample indicated that they would behighly likely to drive if there was nopossibility of being caught and punished.The present results simply suggest thatfurther increases in the severity ofexisting sanctions, given the currentperceived risk of apprehension for DUIC,are unlikely to exert any marginaldeterrent effect.
Our results provide strong support formeasures that increase the perceivedrisk of apprehension (e.g. roadsidesaliva testing). Participants who wereasked to indicate how willing they wouldbe to drive in a scenario where policecould randomly test for drugs at theroadside indicated far less willingnessthan participants presented withscenarios in which there was littlepossibility of apprehension. Thisdeterrent effect was only observed forcurrent DUIC offenders, but this isneither surprising nor a matter ofconcern. A number of studies have foundthat non-offenders are less responsive tochanges in apprehension risk than activeoffenders (Decker, Wright & Logie 1993;Wright et al. 2004). The theory is thatnon-offenders are sufficiently deterred byother beliefs, attitudes or perceptions(e.g. informal social norms or moralinhibitions about breaking some laws).These extra-legal deterrents render theeffect of penalty threats irrelevant.Current offenders, on the other hand,because they are not deterred by pre-existing social norms, are more likely tobe responsive to law enforcementactivity.
It must be noted at this juncture thatscenario-based approaches todeterrence research have not beenwithout criticism. The primary difficulty isthat there is no way of knowing whetherintentions to offend would accuratelyreflect real-world behaviours. While wecannot check the validity of this criticismin the current study, it is worth noting that
Figure 3: Cumulative predicted probability of reporting DUIC in theprevious year, according to cannabis dependence, ageof first cannabis use, and perceived accident risk
Risk Factor
Cumulative probability of DUIC
No change inaccident risk
First used at 13years or younger
Dependent
Base Case
49
67
83
95
0
0.1
0.2
0.3
0.4
0.5
0.6
0.7
0.8
0.9
1.0

B U R E A U O F C R I M E S T A T I S T I C S A N D R E S E A R C H
12
there are other real-world exampleswhere intentions quite accurately predictbehaviour. Voter intention polls, forexample, usually predict electionoutcomes with a high degree ofaccuracy. Moreover, because manyparticipants had probably experienced asituation like the one depicted in thescenario, they might be able to veryaccurately predict how they wouldbehave.
Even if we accept that intentions mightclosely reflect real-world behaviours, itmust also be stressed that the deterrenteffect of RDT will rely largely on theaccuracy of the tests themselves. Theaccuracy of roadside testing iscollectively determined by fourmeasures: (a) the proportion of driverswho have used drugs who are correctlyidentified as positive by the test(sensitivity); (b) the proportion of driverswho have not used drugs who arecorrectly identified as negative by thetest (specificity); (c) the proportion ofdrivers with positive tests who haveactually used drugs (positive predictivevalue or PPV); and (d) the proportion ofdrivers with negative tests who have notused drugs (negative predictive value orNPV). Low sensitivity and NPVs wouldpotentially erode the deterrent effect ofthe enforcement, while low specificityand low PPVs would almost certainly beunacceptable to the wider drivingpopulation. An evaluation of twodrug-testing devices (ORALscreen® andRapiScan®) conducted by the EuropeanROSITA group found the sensitivity torange from 13–25 per cent, thespecificity to range from 0–84 per cent,PPVs ranging between 3–50 per centand NPVs ranging from 0–98 per cent(Verstraete & Puddu 2000).7 Resultssuch as these have led someresearchers to recommend furtherresearch before roadside drug testing isimplemented across-the-board (e.g.Laberge & Ward 2004; Lenne, Triggs &Regan 2001; Verstraete & Puddu 2000;Walsh et al. 2004).
Even if tests for drug-driving do not provefeasible in the short-run, there are otherways of increasing the perceived risk ofapprehension for this offence, such asStandardised Field Sobriety Assessments(e.g. the walk-and-turn test). Forcannabis at least, these sobriety testsappear to accord well with toxicological
urine tests conducted at the roadside(Brookoff et al. 1994). The efficacy ofthese assessments is currently beingevaluated in an Australian setting bySwinburne University under the auspicesof the National Drug Law EnforcementResearch Fund. The results of thisevaluation are eagerly awaited. Anotherprogram that is undoubtedly moreeffective, although much more resource-intensive, is the Drug Evaluation andClassification (DEC) Training Programmedeveloped by the Los Angeles PoliceDepartment (LAPD). Under the DECprogram, police officers undergo around200 hours of intensive training to enablethem to recognise drug-affected driversbased on their performance on a numberof behavioural or physical procedures(e.g. speech, appearance, performanceon divided attention tests, vital signs etc.).One evaluation cited by the VictorianParliament found that recognition expertswere able to correctly identify 95 per centof impaired drivers (99% for high dosesubjects) and identify the drug category in92 per cent of high dose subjects. Whileother evaluations were not so favourable,most have shown that trained recognitionexperts are still very accurate at detectingdrug impairment (Road Safety Committee1996b). Evaluations of DEC programs inthe USA have also reputedly shownincreases in drug-driving charges amongpolice forces that have adopted theprogram (Lane 1988; Road SafetyCommittee 1996a).
Our study findings in relation to thepotential effectiveness of educationalapproaches to drug-driving are lessencouraging than those in relation toroadside drug testing. In this regard, theymirror similar results from other studies(Terry 2004; Terry & Wright 2005).Educational approaches, nonetheless,should not be dismissed out of hand.Although Terry and Wright (2005) foundthat regular cannabis users wouldprobably be more responsive to roadsidetesting, 30 per cent still indicated thatthey would be deterred by ‘…a good TVadvertising campaign highlighting thedangers of driving after smokingcannabis…’ (p. 624). Our finding thatearly-onset cannabis users were morelikely to report DUIC in the past year alsopoints to the possible utility of prevention-based education in reducing drug-drivingrates. School-based education programshave been shown to reduce the risk of
abusing some substances (alcohol, forexample — Babor et al. 2003) and mightbe effective in delaying the onset ofcannabis use. In fact, Midford, Lentonand Hancock (2000) in their review ofcannabis education in schools suggestthat these programs can be effectiveprovided that they contain certainspecific elements. These essentialcomponents include being small in scale,interactive, being implemented asplanned, and ensuring that programparticipants have a sense of ‘ownership’of the intervention. At this stage all thatcan be said with certainty is thateducation appears less promising thanRDT as a means of reducing theincidence of DUIC. Further research intothe effectiveness of education programs,however, may yet change our view onthis issue.
Although we did not set out to evaluatethe effectiveness of treatment, ourfinding that cannabis dependence is astrong risk factor for DUIC suggests thattreatment programs dealing withcannabis dependence may provide someadditional leverage over this problem.Recent evidence suggests that briefcognitive-behavioural interventions canbe effective in reducing cannabis useand improving social outcomes fordependent cannabis users (Copeland etal. 2001). Motivational enhancementapproaches may also be particularlyuseful tools for change among cannabisusers who are ambivalent about theirbehaviour. These low-cost, client-centredand non-confrontational interventions aredesigned to encourage engagement andbehaviour change by helping clientsexplore and resolve ambivalence. Theapproach is flexible and can be tailoredfor a variety of populations, includingthose not committed to changing theiruse level. Its brevity and low barriers toaccess encourage participation withminimal effort. Monti and colleagues(2001) have successfully used thisapproach to provide an opportunisticintervention among young drink-driversin accident and emergency settings.Compared to those receiving standardcare, those who received a briefmotivational intervention showedsignificant reductions in drink-drivingbehaviour and alcohol-related injuries upto 12 months later. While this approachhas not been applied to cannabis anddriving behaviour per se, the recently

B U R E A U O F C R I M E S T A T I S T I C S A N D R E S E A R C H
13
completed Australian Cannabis Check-up successfully attracted and retainedyoung, non-treatment-seeking cannabisusers, who showed decreases in useand related problems at a three-monthfollow-up (Martin, Copeland & Swift inpress).
Perhaps the final point to make is thatthe very high prevalence of DUIC (78%),DUICA (29%) and DUICO (30%) amongthis sample of cannabis users is a matterthat must be viewed with seriousconcern. It is true that the studyemployed a purposive samplingframework and it cannot therefore beassumed that these prevalence figuresapply to the general population ofcannabis users. Our findings do,however, concur with a growing body ofresearch in NSW and other AustralianStates which have found high rates ofdrug-driving among samples of frequentdrug users (Darke, Kelly & Ross 2004;Jones, Freeman & Weatherburn 2003;Lenne et al. 2001; McLeod et al. 1998;Reilly et al. 1998).
ACKNOWLEDGEMENTS
We thank the Office of Drug and AlcoholPolicy, NSW Cabinet Office for fundingthe research, Sumitra Vignaendra for hercomments on an earlier draft of thispaper and Katherina Bilko for desktoppublishing the report. We would also liketo acknowledge the staff at Key InsightsPty Ltd who carried out the fieldwork forthis study. Most of all, thanks to theparticipants who sacrificed their time toshare their insights with us.
REFERENCES
AAMI 2004, Young Driver Index, OnlineReport, http://www.aami.com.au/about_aami_insurance/aami_news_centre/pdf/special_reports/AAMIYoungDriversIndex2004.pdf,accessed on 23 June, 2005.
Aitken, C., Kerger, M. & Crofts, N. 2000,‘Drivers who use illicit drugs: Behaviourand perceived risks’, Drugs: Education,Prevention and Policy, vol. 7, no. 1,pp. 39–50.
Australian Institute of Health and Welfare2005, 2004 National Drug StrategyHousehold Survey: First Results, DrugStatistics Series no. 13, AustralianInstitute of Health and Welfare, Canberra.
Babor, T., Caetano, R., Casswell, S.,Edwards, G., Giesbrecht, N., Graham, K.,Grube, J., Gruenewald, P. J., Hill, L.,Holder, H. D., Homel, R., Osterberg, E.,Rehm, J., Room, R. & Rossow, I. 2003,Alcohol: No Ordinary Commodity, OxfordUniversity Press, New York.
Blows, S., Ivers, R. Q., Connor, J.,Ameratunga, S., Woodward, M. & Norton,R. 2005, ‘Marijuana use and car crashinjury’, Addiction, vol. 100, pp. 605–611.
Brookoff, D., Cook, C. S., Williams, C. &Mann, C. S. 1994, ‘Testing recklessdrivers for cocaine and marijuana’, TheNew England Journal of Medicine, vol.331, pp. 518–522.
Chesher, G. B. 1991, ‘The scientific basisfor our drink-driving laws: Why we can’tapproach cannabis and prescribed drugsin the same way’, Current Affairs Bulletin,vol. 68, no. 1, pp. 4–11.
Chesher, G. B., Dauncey, H., Crawford, J.& Horn, K. 1986, The Interaction BetweenAlcohol and Marijuana: A Dose-DependentStudy of the Effects on Human Moodsand Performance Skills, Department ofTransport, Federal Office of Road Safety,Canberra.
Copeland, J., Swift, W., Roffman, R. &Stephens, R. 2001, ‘A randomisedcontrolled trial of brief cognitive-behavioural interventions for cannabisuse disorder’, Journal of SubstanceAbuse Treatment, vol. 21, pp. 55–64.
Darke, S., Kelly, E. & Ross, J. 2004,‘Drug driving among injecting drug usersin Sydney, Australia: Prevalence, riskfactors and risk perceptions’, Addiction,vol. 99, pp. 175–185.
Decker, S. H., Wright, R. & Logie, R.1993, ‘Perceptual deterrence amongactive residential burglars: A researchnote’, Criminology, vol. 31, no. 1,pp. 135–147.
del Rio, M. C. & Alvarez, F. J. 1995,‘Illegal drug taking and driving: Patternsof drug taking among Spanish drivers’,Drug and Alcohol Dependence, vol. 37,pp. 83–86.
Drummer, O. H., Gerostamoulos, J.,Batziris, H., Chu, M., Caplehorn, J. R. M.,Robertson, M. D. & Swann, P. 2003,‘The incidence of drugs in drivers killed inAustralian road traffic crashes’,Forensic Science International, vol. 134,pp. 154–162.
Drummer, O. H., Gerostamoulos, J.,Batziris, H., Chu, M., Caplehorn, J. R. M.,Robertson, M. D. & Swann, P. 2004, ‘Theinvolvement of drugs in drivers of motorvehicles killed in Australian road traffic
crashes’, Accident Analysis andPrevention, vol. 36, pp. 239–248.
European Monitoring Centre for Drugsand Drug Addiction 1999, LiteratureReview on the Relation Between DrugUse, Impaired Driving and TrafficAccidents, European Monitoring Centrefor Drugs and Drug Addiction, Lisbon.
European Monitoring Centre for Drugsand Drug Addiction 2003, Drugs andDriving, European Monitoring Centre forDrugs and Drug Addiction, Lisbon.
Fergusson, D. M. 2005, ‘Marijuana useand driver risks: The role ofepidemiology and experimentation’,Addiction, vol. 100, pp. 577–578.
Fergusson, D. M. & Horwood, L. J. 2001,‘Cannabis use and traffic accidents in abirth cohort of young adults’, AccidentAnalysis and Prevention, vol. 33,pp. 703–711.
Hall, W., Degenhardt, L. & Lynskey, M.2001, The Health and PsychologicalEffects of Cannabis Use (2nd Edition),Monograph Series no. 44,Commonwealth Department of Healthand Ageing, Canberra.
Hawkins, A., Bryant, P. & Zipparo, L.2004, Drug Users' Attitudes to Drugs andDriving, paper presented at the RoadSafety Research, Policing and EducationConference, Perth, Western Australia,14–16 November.
Jones, C., Freeman, K. & Weatherburn,D. 2003, Driving Under the Influence ofCannabis in a New South Wales RuralArea, Crime and Justice Bulletin no. 75,NSW Bureau of Crime Statistics andResearch, Sydney.
Kelly, E., Darke, S. & Ross, J. 2004, ‘Areview of drug use and driving:Epidemiology, impairment, risk factorsand risk perceptions’, Drug and AlcoholReview, vol. 23, pp. 319–344.
Laberge, J. C. & Ward, N. J. 2004,‘Research note: Cannabis and driving— research needs and issues fortransportation policy’, Journal of DrugIssues, vol. 34, no. 4, pp. 971–989.
Lamers, C. T. J. & Ramaekers, J. G.2001, ‘Visual search and urban citydriving under the influence of marijuanaand alcohol’, HumanPsychopharmacology, vol. 16,pp. 393–401.
Lane, M. 1988, ‘An answer to drugdriving?’ Australian Police Journal, vol.42, no. 4, pp. 133–137.
Lenne, M. G., Fry, C., Dietze, P. &Rumbold, G. 2001, ‘Attitudes and

B U R E A U O F C R I M E S T A T I S T I C S A N D R E S E A R C H
14
experiences of people who use cannabisand drive: Implications for drugs anddriving legislation in Victoria, Australia’,Drugs: Education, Prevention and Policy,vol. 8, no. 4, pp. 307–313.
Lenne, M. G., Triggs, T. J. & Regan, M.2001, Cannabis and Driving: A Review ofCurrent Evidence, paper presented atthe Road Safety Research, Policing andEducation Conference, Melbourne,18th–20th November.
Longo, M. C., Hunter, C. E., Lokan, R. J.,White, J. M. & White, M. A. 2000a, ‘Theprevalence of alcohol, cannabinoids,benzodiazepines and stimulantsamongst injured drivers and their role indriver culpability. Part I: The prevalenceof drug use in drivers, andcharacteristics of the drug-positivegroup’, Accident Analysis andPrevention, vol. 32, pp. 613–622.
Longo, M. C., Hunter, C. E., Lokan, R. J.,White, J. M. & White, M. A. 2000b, ‘Theprevalence of alcohol, cannabinoids,benzodiazepines and stimulantsamongst injured drivers and their role indriver culpability. Part II: The relationshipbetween drug prevalence and drugconcentration, and driver culpability’,Accident Analysis and Prevention, vol.32, pp. 623–632.
MacDonald, S., Mann, P., Chipman, M. &Anglin-Bodrug, K. 2004, ‘Collisions andtraffic violations of alcohol, cannabis andcocaine abuse clients before and aftertreatment’, Accident Analysis andPrevention, vol. 36, pp. 795–800.
Martin, G., Copeland, J. & Swift, W. inpress, ‘The Adolescent Cannabis Check-up: suitability of a brief intervention foryoung cannabis users’, in Journal ofSubstance Abuse Treatment.
McLeod, R., Stevens, M., Stockwell, T. &Phillips, M. 1998, Drug Use and Drivingin Western Australia: A Survey ofAttitudes, Beliefs and Behaviours,National Centre for Research into thePrevention of Drug Abuse, Perth.
Midford, R., Lenton, S. & Hancock, L.2000, A Critical Review and Analysis:Cannabis Education in Schools, NSWDepartment of Education and Training,Student Services and Equity Programs,Sydney.
Monti, P. M., Barnett, N. P., O’Leary, T.A. & Colby, S. M. 2001, ‘Motivationalenhancement for alcohol-involvedadolescents’, in Adolescents, Alcohol,and Substance Abuse: Reaching TeensThrough Brief Interventions, Eds P. M.
Monti, S. M. Colby & T. A. O’Leary, TheGuilford Press, New York, pp. 145–182.
Moskowitz, H. 1985, ‘Marihuana anddriving’, Accident Analysis andPrevention, vol. 17, no. 4, pp. 323–345.
Mura, P., Kintz, P., Ludes, B., Gaulier, J.M., Marquet, P., Martin-Dupont, S.,Vincent, F., Kaddour, A., Goulle, J. P.,Nouveau, J., Moulsma, M., Tilhet-Coartet,S. & Pourrat, O. 2003, ‘Comparison of theprevalence of alcohol, cannabis and otherdrugs between 900 injured drivers and900 control subjects: Results of a Frenchcollaborative study’, Forensic ScienceInternational, vol. 133, pp. 79–85.
Nagin, D. S. 1998, ‘Criminal deterrenceresearch at the outset of the twenty-firstcentury’, in Crime and Justice: A Reviewof Research, vol. 23, Ed. M. Tonry,University of Chicago Press, Chicago,pp. 1–42.
Nagin, D. S. & Paternoster, R. 1993,‘Enduring individual differences andrational choice theories of crime’, Lawand Society Review, vol. 27, no. 3, pp.467–496.
Poyser, C., Makkai, T., Norman, L. &Mills, L. 2002, Drug Driving Among PoliceDetainees in Three States of Australia,National Drug Strategy Monograph Seriesno. 50, Commonwealth Department ofHealth and Ageing, Canberra.
Ramaekers, J. G., Berghaus, G., vanLaar, M. & Drummer, O. H. 2004, ‘Doserelated risk of motor vehicle crashes aftercannabis use’, Drug and AlcoholDependence, vol. 73, pp. 109–119.
Reilly, D., Didcott, P., Swift, W. & Hall, W.1998, ‘Long-term cannabis use:Characteristics of users in an Australianrural area’, Addiction, vol. 93, no. 6,pp. 837–846.
Road Safety Committee 1996a, Effects ofDrugs (Other than Alcohol) on RoadSafety in Victoria: Volume One, RoadSafety Committee, Parliament of Victoria,Melbourne.
Road Safety Committee 1996b, Effects ofDrugs (Other than Alcohol) on RoadSafety in Victoria: Volume Two, RoadSafety Committee, Parliament of Victoria,Melbourne.
Robertson, M. D. & Drummer, O. H. 1994,‘Responsibility analysis: A methodologyto study the effects of drugs in driving’,Accident Analysis and Prevention, vol.26, no. 2, pp. 243–247.
Smiley, A. 1999, ‘Marijuana: On-road anddriving simulator studies’, in The Health
Effects of Cannabis, Eds H. Kalant, W.Corrigall, W. Hall & R. G. Smart, Centrefor Addiction and Mental Health, Toronto,pp. 173–191.
Staysafe Committee 1992, Alcohol andOther Drugs on New South WalesRoads: The Problem andCountermeasures, Staysafe no. 19, JointStanding Committee on Road Safety,NSW Parliament, Sydney.
Swift, W., Copeland, J. & Hall, W. 1998,‘Choosing a diagnostic cut-off forcannabis dependence’, Addiction, vol.93, no. 11, pp. 1681–1692.
Terhune, K. W. & Fell, J. C. 1982, TheRole of Alcohol, Marijuana and OtherDrugs in the Accidents of Injured Drivers,NHTSA Technical Report, DOT HS 806181, National Highway Traffic SafetyAdministration, U.S. Department ofTransport, Washington, D.C.
Terhune, K. W., Ippolito, C. A., Hendriks,D. L. & Michalovic, J. G. 1992, TheIncidence and Role of Drugs in FatallyInjured Drivers, National Highway TrafficSafety Administration, Washington.
Terry, P. 2004, Indirect Harm fromRegular Cannabis Use, UnpublishedManuscript, University of Birmingham,funded by United Kingdom Economicand Social Research Council.
Terry, P. & Wright, K. 2005, ‘Self-reported driving behaviour and attitudestowards driving under the influence ofcannabis among three different usergroups in England’, Addictive Behaviors,vol. 30, no. 3, pp. 619–626.
Turner, N. 2004, DUMA in SouthAustralia: Annual Report 2002/03,Volume 4: Addenda, Office of CrimeStatistics and Research, Adelaide.
Verstraete, A. G. & Puddu, M. 2000,Evaluation of Different Roadside DrugTests, ROSITA Deliverable DocumentD4, http://www.rosita.org/, accessed on10 November, 2004.
Walsh, J. M., de Gier, J. J.,Christophersen, A. S. & Verstraete, A. G.2004, ‘Drugs and driving’, Traffic InjuryPrevention, vol. 5, pp. 241–253.
Williams, A. F., Peat, M. A., Crouch, D.J., Wells, J. K. & Finkle, B. S. 1985,‘Drugs in fatally injured young maledrivers’, Public Health Reports, vol. 100,no. 1, pp. 19–25.
World Health Organisation 1997,Cannabis: A Health Perspective andResearch Agenda, no. WHO/MSA/PSA/97.4, Division of Mental Health and

B U R E A U O F C R I M E S T A T I S T I C S A N D R E S E A R C H
15
Prevention of Substance Abuse, WorldHealth Organisation.
Wright, B. R. E., Caspi, A., Moffitt, T. E.& Paternoster, R. 2004, ‘Does theperceived risk of punishment detercriminally prone individuals? Rationalchoice, self-control, and crime’, Journalof Research in Crime and Delinquency,vol. 41, no. 2, pp. 180–213.
APPENDIX A
The four scenario conditions were:
1.High Certainty/High Severity:“Suppose you are at a friend’s houseone night and you’ve just smokedsome cannabis. You suddenlyremember that you have to be homein ten minutes because you aremeeting another friend there. You’veseen police in the area recently andhave heard that they’ve begunconducting random roadside testsusing saliva swabs to detect recentcannabis use. If you get caught, youknow that you will get a fine of about$1000 and have your licencedisqualified for a minimum of 12months. You can either drive the 10km home or find some other wayhome but if you leave your car atyour friend’s house, you will have toreturn early the next morning to pickit up for work.”
2.High Certainty/Low Severity:“Suppose you are at a friend’s houseone night and you’ve just smokedsome cannabis. You suddenlyremember that you have to be homein ten minutes because you aremeeting another friend there. You’veseen police in the area recently andhave heard that they’ve begunconducting random roadside testsusing saliva swabs to detect recentcannabis use. If you get caught, youknow that you will get a fine of about$500 and have your licencedisqualified for a minimum of 6months. You can either drive the 10km home or find some other wayhome but if you leave your car atyour friend’s house, you will have toreturn early the next morning to pickit up for work.”
3.Low Certainty/High Severity:“Suppose you are at a friend’s houseone night and you’ve just smoked
some cannabis. You suddenlyremember that you have to be homein ten minutes because you aremeeting another friend there. You’veseen police in the area recently butyou know they can’t conduct randomroadside tests using equipment todetect recent cannabis use. However,if you do get caught, you know thatyou will get a fine of about $1000 andhave your licence disqualified for aminimum of 12 months. You caneither drive the 10 km home or findsome other way home, but if youleave your car at your friend’s house,you will have to return early the nextmorning to pick it up for work.”
4.Low Certainty/Low Severity:“Suppose you are at a friend’s houseone night and you’ve just smokedsome cannabis. You suddenlyremember that you have to be homein ten minutes because you aremeeting another friend there. You’veseen police in the area recently butyou know they can’t conduct randomroadside tests using equipment todetect recent cannabis use. However,if you do get caught, you know thatyou will get a fine of about $500 andhave your licence disqualified for aminimum of 6 months. You can eitherdrive the 10 km home or find someother way home, but if you leave yourcar at your friend’s house, you willhave to return early the next morningto pick it up for work.”
NOTES
1 There is little doubt that combining thetwo drugs has a serious detrimentalimpact on psychomotor performance andactual accident risk (Chesher et al. 1986;Drummer et al. 2004; Lamers &Ramaekers 2001; Longo et al. 2000b;Moskowitz 1985; Mura et al. 2003;Ramaekers et al. 2004; StaysafeCommittee 1992).
2 On a methodological note, it must also benoted that there is a tendency in thesesorts of studies to ‘over-control’ forrelevant risk factors (Fergusson 2005).For example, Blows et al. (2005)controlled for sleepiness in their analysis,which could be a direct consequence ofacute cannabis intoxication. Similarly,cannabis use may play a mediating rolein the relationship between these riskfactors and accident risk. It could be that
young, inexperienced, risk-taking driversare more likely to use cannabis and thisdrug use, in turn, is causally related toaccident risk.
3 While NSW police cannot currently carryout random drug testing, police inVictoria have begun a trial of saliva-based RDT. Other states, includingNSW, have also signalled their intentionto trial this technology.
4 The percentages do not total 30.4%because some participants drove afterusing cannabis and more than one otherillicit drug.
5 In order to increase the power of theanalysis, at the expense of the moresensitive comparison of the relationshipbetween different drug combinations andaccident risk, we collapsed across thelast four groups. When we compared theaccident rates of those who reported nodrug-driving with those who reporteddriving after using cannabis by itself andthose who reported driving after usingcannabis and any other drug (includingalcohol), we found no significantdifference between groups (7.4%, 10.7%and 13.5% reported an accidentrespectively; χ2=1.8, df=2, p=0.40).Replication with a larger sample sizewould be necessary before we couldhave confidence in this finding.
6 Even if we had found a relationshipbetween cannabis use and accident risk,it might be tempting to argue that thisamounts to a ‘storm in a teacup’ giventhe low frequency of accident actuallyreported by the sample. This argumentmisses the point. Notwithstanding thefact that accident rates are low in thegeneral driving population, theproportion reporting an accident (11%)among this sample was actually quitehigh. The low power to detectdifferences between the six drug usecombinations was related more to oursmall sample size (n=320) than it was tothe overall number reporting anaccident.
7 It should be noted, however, that thesample size for the RapiScan® testingwas very small. The authors also notethat the manufacturers were planningsignificant improvements to thetechnology in coming years. The statusof this technology at the time ofpublication was largely unclear.

B U R E A U O F C R I M E S T A T I S T I C S A N D R E S E A R C H
16
NSW Bureau of Crime Statistics and Research - Level 8, St James Centre, 111 Elizabeth Street, Sydney [email protected] • www.lawlink.nsw.gov.au/bocsar • Ph: (02) 9231 9190 • Fax: (02) 9231 9187
ISSN 1030 - 1046 • ISBN 0 7313 2668 7
Other titles in this seriesNo.86 The transition from juvenile to adult criminal careers
No.85 What caused the recent drop in property crime?
No.84 The deterrent effect of capital punishment: A review of the research evidence
No.83 Evaluation of the Bail Amendment (Repeat Offenders) Act 2002
No.82 Long-term trends in trial case processing in NSW
No.81 Sentencing drink-drivers: The use of dismissals and conditional discharges
No.80 Public perceptions of crime trends in New South Wales and Western Australia
No.79 The impact of heroin dependence on long-term robbery trends
No.78 Contact with the New South Wales court and prison systems: The influence of age,Indigenous status and gender
No.77 Sentencing high-range PCA drink-drivers in NSW
No.76 The New South Wales Criminal Justice System Simulation Model: Further Developments
No.75 Driving under the influence of cannabis in a New South Wales rural area
No.74 Unemployment duration, schooling and property crime
No.73 The impact of abolishing short prison sentences
No.72 Drug use monitoring of police detainees in New South Wales: The first two years
No.71 What lies behind the growth in fraud?
No.70 Recent trends in recorded crime and police activity in Cabramatta
No.69 Reducing Juvenile Crime: Conferencing versus Court
No.68 Absconding on bail
No.67 Crime increases in perspective: The regional dispersion of crime in NSW, 2001
No.66 Hung juries and aborted trials: An analysis of their prevalence, predictors and effects
No.65 Multiple drug use among police detainees
No.64 Law enforcement's Role in a Harm Reduction Regime
No.63 Do targeted arrests reduce crime?
No.62 Trends in Sentencing in the New South Wales Criminal Courts: 1999-2000
No.61 Preventing Corruption in Drug Law Enforcement
No.60 Reducing Cannabis Consumption
No.59 The Australian Heroin Drought and its Implications for Drug Policy
No.58 Does Prohibition Deter Cannabis Use?
No.57 Firearms and Violent Crime in New South Wales
No.56 The Problem of Mobile Phone Theft
No.55 The Scope for Reducing Indigenous Imprisonment Rates