Drivers and barriers of mobile travel and tourism service adoption: a study of individual...
181
Niklas Eriksson Drivers and Barriers of Mobile Travel and Tourism Service Adoption A Study of Individual Perceptions and Business Model Development in a Travel and Tourism Context
Transcript of Drivers and barriers of mobile travel and tourism service adoption: a study of individual...

Niklas Eriksson
Drivers and Barriers of Mobile Travel and Tourism Service AdoptionA Study of Individual Perceptions and Business Model Development in a Travel and Tourism Context
Niklas Eriksson | D
rivers and Barriers of Mobile Travel and Tourism
Service Adoption | 2013
Niklas Eriksson
Drivers and Barriers of Mobile Travel and Tourism Service AdoptionThe Travel and Tourism field is undergoing changes due to the rapid develop-ment of information technology and digital services. Mobile technology such as applications and services for mobile phones has the potential to take this deve-lopment even further. Travelers are generally on the go and therefore the indivi-duals’ perceived drivers and barriers to use mobile travel and tourism services in “during trip” settings seem particularly valuable to understand; thus this is one primary aim of the thesis.
I have conducted both survey and experimental studies and the findings suggest that a successful mobile travel and tourism service is a service which supports mobile motives (needs) of individuals such as spontaneous needs and time-critical arrangements. The service could be customized to support travelers’ style of traveling (e.g. organized travel or independent travel) and it should be easy to take into use during a trip (access, install and learn), without causing financial risks or security concerns for the user. Moreover, the following four user catego-ries were identified: info-seekers, checkers, bookers and all-rounders. For example ”all-rounders”, represented primarily by individuals who use their pocket device for almost any of the investigated mobile travel services, constituted primarily of 23 to 50 year old males with high travel frequency and great online experience.
The results also indicate that travel service providers will increasingly become multi-channel providers. To manage multiple channels it could be useful for travel service providers to focus more on developing browser-based mobile services (HTML5-solutions) than native applications that work only with specific operating systems and for specific devices. Based on an action research study, I and my research fellows found that HTML5 as an emerging platform, at least for now, has some limitations regarding e.g. the development of the user experience.
ISBN 978-952-12-2933-6
9 7 8 9 5 2 1 2 2 9 3 3 6

Niklas Eriksson
- is a Lecturer in Travel and Tourism Marketing and Digital Services at
Arcada University of Applied Sciences, Helsingfors, Finland. - carried out his dissertation work at IAMSR, Åbo Akademi University, Åbo,
Finland.

Drivers and Barriers of Mobile Travel and Tourism Service Adoption
A Study of Individual Perceptions and Business Model Development in a Travel and Tourism Context
Niklas Eriksson
Institute for Advanced Management Systems Research (IAMSR)
Department of Information Technologies Åbo Akademi University
Åbo, Finland, 2013

ii
Supervisors
Professor Dr. Christer Carlsson Institute for Advanced Management Systems Research (IAMSR) Department of Information Technologies Åbo Akademi University Åbo, Finland Professor Dr. Pirkko Walden Institute for Advanced Management Systems Research (IAMSR) Department of Information Technologies Åbo Akademi University Åbo, Finland Reviewed by Assistant Professor Dr. Marianna Sigala The Business Administration Department University of the Aegean Chios, Greece Associate Professor Dr. Jan Möller Jensen Department of Marketing and Management University of Southern Denmark Odense, Denmark Opponent Professor Dr. Dimitros Buhalis International Centre for Tourism and Hospitality Research (ICTHR) School of Tourism, Bournemouth University Poole, Dorset, UK ISBN 978-952-12-2933-6 Painosalama Oy – Turku, Finland 2013

iii
Abstract The Travel and Tourism field is undergoing changes due to the rapid development of information technology and digital services. Online travel has profoundly changed the way travel and tourism organizations interact with their customers. Mobile technology such as mobile services for pocket devices (e.g. mobile phones) has the potential to take this development even further. Nevertheless, many issues have been highlighted since the early days of mobile services development (e.g. the lack of relevance, ease of use of many services). However, the wide adoption of smartphones and the mobile Internet in many countries as well as the formation of so-called ecosystems between vendors of mobile technology indicate that many of these issues have been overcome. Also when looking at the numbers of downloaded applications related to travel in application stores like Google Play, it seems obvious that mobile travel and tourism services are adopted and used by many individuals. However, as business is expected to start booming in the mobile era, many issues have a tendency to be overlooked.
Travelers are generally on the go and thus services that work effectively in mobile settings (e.g. during a trip) are essential. Hence, the individuals’ perceived drivers and barriers to use mobile travel and tourism services in on-site or during trip settings seem particularly valuable to understand; thus this is one primary aim of the thesis. We are, however, also interested in understanding different types of mobile travel service users. Individuals may indeed be very different in their propensity to adopt and use technology based innovations (services). Research is also switching more from investigating issues of mobile service development to understanding individuals’ usage patterns of mobile services. But designing new mobile services may be a complex matter from a service provider perspective. Hence, our secondary aim is to provide insights into drivers and barriers of mobile travel and tourism service development from a holistic business model perspective.
To accomplish the research objectives seven different studies have been conducted over a time period from 2002 – 2013. The studies are founded on and contribute to theories within diffusion of innovations, technology acceptance, value creation, user experience and business model development. Several different research methods are utilized: surveys, field and laboratory experiments and action research.
The findings suggest that a successful mobile travel and tourism service is a service which supports one or several mobile motives (needs) of individuals such as spontaneous needs, time-critical arrangements, efficiency ambitions, mobility related needs (location features) and entertainment needs. The service could be customized to support travelers’ style of traveling (e.g. organized travel or independent travel) and should be easy to use, especially easy to take into use (access, install and learn) during a trip, without causing security concerns and/or

iv
financial risks for the user. In fact, the findings suggest that the most prominent barrier to the use of mobile travel and tourism services during a trip is an individual’s perceived financial cost (entry costs and usage costs). It should, however, be noted that regulations are put in place in the EU regarding data roaming prices between European countries and national telecom operators are starting to see ‘international data subscriptions’ as a sales advantage (e.g. Finnish Sonera provides a data subscription in the Baltic and Nordic region at the same price as in Finland), which will enhance the adoption of mobile travel and tourism services also in international contexts. In order to speed up the adoption rate travel service providers could consider e.g. more local initiatives of free Wi-Fi networks, development of services that can be used, at least to some extent, in an offline mode (do not require costly network access during a trip) and cooperation with telecom operators (e.g. lower usage costs for travelers who use specific mobile services or travel with specific vendors).
Furthermore, based on a developed framework for user experience of mobile trip arrangements, the results show that a well-designed mobile site and/or native application, which preferably supports integration with other mobile services, is a must for true mobile presence. In fact, travel service providers who want to build a relationship with their customers need to consider a downloadable native application, but in order to be found through the mobile channel and make contact with potential new customers, a mobile website should be available. Moreover, we have made a first attempt with cluster analysis to identify user categories of mobile services in a travel and tourism context. The following four categories were identified: info-seekers, checkers, bookers and all-rounders. For example “all-rounders”, represented primarily by individuals who use their pocket device for almost any of the investigated mobile travel services, constituted primarily of 23 to 50 year old males with high travel frequency and great online experience.
The results also indicate that travel service providers will increasingly become multi-channel providers. To manage multiple online channels, closely integrated and hybrid online platforms for different devices, supporting all steps in a traveler process should be considered. It could be useful for travel service providers to focus more on developing browser-based mobile services (HTML5-solutions) than native applications that work only with specific operating systems and for specific devices. Based on an action research study and utilizing a holistic business model framework called STOF we found that HTML5 as an emerging platform, at least for now, has some limitations regarding the development of the user experience and monetizing the application. In fact, a native application store (e.g. Google Play) may be a key mediator in the adoption of mobile travel and tourism services both from a traveler and a service provider perspective. Moreover, it must be remembered that many device and mobile operating system developers want

v
service providers to specifically create services for their platforms and see native applications as a strategic advantage to sell more devices of a certain kind. The mobile telecom industry has moved into a battle of ecosystems where device makers, developers of operating systems and service developers are to some extent forced to choose their development platforms.

vi
Sammanfattning
Rese- och turismbranschen går igenom stora förändringar på grund av den snabba utvecklingen inom informationsteknologi och den snabba ökningen av digitala tjänster. Näthandeln har förändrat förutsättningarna på marknaden och sättet på vilket rese- och turismorganisationer ser på sina kundkontakter. Mobil teknologi, såsom mobiltjänster för fickapparater (mobiltelefoner), har potential att föra utvecklingen ännu längre. Många problem i utvecklingen av mobiltjänster har dock lyfts fram under årens lopp (t.ex. tjänsternas relevans och användbarhet). Den omfattande användningen av s.k. smarta mobiltelefoner och mobilt Internet i många länder samt skapandet av s.k. ekosystem mellan leverantörer av mobil teknologi indikerar att många av de initiala problemen har tacklats. Även då vi tittar på siffor för nedladdning av applikationer från t.ex. applikationsbutiker som Google Play verkar det klart att mobila rese- och turismtjänster används av många individer. Men då affärerna förväntas skjuta i höjden i en mobil era har vi en tendens att se förbi olika viktiga frågeställningar.
Resenärer är i allmänhet i rörelse och därför är tjänster som fungerar effektivt i mobila kontexter (t.ex. under en resa) viktiga. Därför verkar det speciellt viktigt att förstå vad som driver och vad som hindrar användingen av mobila rese- och turismtjänster i en ”under resan”-kontext; vilket är ett primärt syfte med denna avhandling. Vi är också intresserade av att bättre förstå olika typers användare av mobila resetjänster. Individer kan ha väldigt olika benägenhet att ta till sig och använda teknologibaserade innovationer (tjänster). Forskning förflyttar också fokus från att undersöka problem i mobil tjänsteutveckling till att försöka förstå individers olika sätt att använda mobiltjänster. Att designa nya mobiltjänster kan dock vara en komplex fråga ur en tjänsteleverantörs synvinkel. Därför är ett sekundärt syfte att ge insikter i pådrivare och hinder för att utveckla mobila rese- och turismtjänster ur ett affärsmodellperspektiv.
För att uppnå forskningsmålen har sju olika studier genomförts under tidsperioden 2002 – 2013. Studierna utgår från och kontribuerar till teorier som diffusionsteori, acceptans av informationsteknologi, värdeskapande, användarupplevelse och utveckling av affärsmodeller. Flera olika forskningsmetoder används: enkäter, fält- och laboratorieexperiment och aktionsforskning.
Resultaten föreslår att en framgångsrik mobil rese- och turismtjänst är en tjänst som stöder ett eller flera mobila konsumentmotiv så som spontana behov, tidskritiska behov, effektivitetsbehov, mobilitetsbehov (lokaliseringsegenskaper) och underhållningsbehov. Tjänsten kunde även vara skräddarsydd för att stöda resenärers sätt att resa (t.ex. paketerad resa jämförd med en självorganiserad resa) och den bör vara enkel att ta i bruk under en resa (lätt åtkomlig, lätt att installera och lära sig), utan att förorsaka bekymmer för användaren i fråga om säkerhet

vii
och/eller finansiella utgifter. De facto föreslår resultaten att det viktigaste hindret för att använda mobila rese- och turismtjänster under en resa är individers uppfattning om finansiella kostnader (kostnader för ibruktagande och användning). Det bör dock poängteras att t.ex. EU skapar regleringar för dataroamingavgifter mellan EU-länder och att nationella teleoperatörer börjar se internationella datapaket som en försäljningsfördel (t.ex. Finska Sonera erbjuder dataöverföring i Baltikum och Norden till samma pris som i Finland), vilket kommer att öka användingen av mobila rese- och turismtjänster också i internationella kontexter. Men för att öka användingen kunde leverantörer av resetjänster överväga t.ex. flera initiativ till gratis Wifi-nätverk, utveckling av tjänster som också kan användas, åtminstone i viss utsträckning, off-line (kräver inte en dyr nätuppkoppling under en resa) och samarbete med teleoperatörer (t.ex. lägre användarkostnader för särskilda mobiltjänster eller då resan görs med särskilda leverantörer).
Vidare, på basis av ett utvecklat ramverk för användarupplevelse av mobila researrangemang, visar resultaten att en väl-designad mobil webbsajt och/eller en nativ applikation, vilken helst stöder integration med andra mobiltjänster, är ett måste för sann mobil närvaro. De facto behöver reseleverantörer som vill bygga en relation med sina kunder överväga en nedladdningsbar nativ applikation, men för att leverantören skall hittas i den mobila kanalen och få kontakt med nya potentiella nya kunder bör en mobil webbsajt finnas tillgänglig. Vidare har vi gjort ett första försök med hjälp av klusteranalys att identifiera användarkategorier för mobiltjänster i en rese- och turismkontext. Följande fyra kategorier identifierades: informationssökare, incheckare, bokare och mångsidigare brukare. Exempelvis gruppen ”mångsidiga brukare”, representerad av individer som använder sin fickapparat för nästan alla mobila resetjänster som vi undersökte, består av främst 23- till 50-åriga män med hög resefrekvens och en gedigen erfarenhet av Internet.
Resultaten indikerar också att reseleverantörer kommer att i ökad takt bli leverantörer i multipla kanaler. För att klara av multipla kanaler on-line, bör nära integrerade och hybrida plattformer för olika apparater, som stöder alla steg i en resenärs process, övervägas. Det kunde därmed vara till nytta för producenter av rese- och turismtjänster att fokusera mera på att utveckla webbläsar-baserade mobiltjänster (HTML5-lösningar) än på nativa applikationer som endast fungerar för särskilda operativsystem och särskilda apparater. Med hjälp av en aktionsforskningsstudie och genom att utnyttja ett holistiskt affärsmodell-ramverk kallat STOF såg vi trots allt att HTML5 som en nytillkommen plattform, åtminstone just nu, har vissa begränsningar i fråga om utvecklingen av användarupplevelse och möjligheter att förtjäna pengar på applikationen. De facto, kan nativa applikationsbutiker (t.ex. Google Play) vara i nyckelroll i ibruktagandet av mobila rese- och turismtjänster både ur en resenärs och ur en reseleverantörs synvinkel (bl.a. erbjuder dessa butiker betalningstjänster och sofistikerade verktyg

viii
för applikationsutveckling). Därtill bör vi komma ihåg att många apparattillverkare och leverantörer av mobila operativsystem vill att tjänsteleverantörer utvecklar tjänster särskilt för deras plattform och ser nativa applikationer som ett sätt att sälja fler apparater av en specifik typ. Den mobila telekomindustrin har gått in i en kamp om ekosystem där apparttillverkare, utvecklare av operativsystem och tjänsteutvecklare i viss mån är tvungna att välja sina utvecklingsplattformer.

ix
Acknowledgements
I would like to thank all the people who have supported my research in different ways. First of all I would like to thank my supervisors Professor Christer Carlsson and Professor Pirkko Walden. I truly appreciate your valuable input and advice on my research, especially during the final stages of the thesis.
There are many colleagues at Arcada University of Applied Sciences who deserve acknowledgement for my research. Dean Katarina Hägg and Program Director Hellevi Aittoniemi have always been very supportive of my research and given me the time and flexibility to bring this project to an end. Many thanks go to A.F. Lindstedts & Svenska handelsinstitutets fond för handelsutbildning which funded many of the different ARBIT-projects and hence made it possible to work with R&D-projects at Arcada. A special thank go to senior lecturer and room-mate Carl-Johan Rosenbröijer, with whom I have enjoyed many discussions regarding the peculiarities of academic research, the turbulence in Finnish University politics and just in general about life. Lecturer Magnus Westerlund deserves recognition for contributing both directly and indirectly to my research through ARBIT. Many thanks go to senior lecturer Peter Mildén who has given me plenty of advice regarding quantitative research and data analysis. Senior lecturer Kaj-Mikael Björk has also given me plenty of advice regarding practicalities in academic research. Lecturer Susanna Fabricius has inspired me in many ways through “team Tourism” at Arcada. Ted Mellin and Krista Fransman deserve acknowledgement for their work on the mobile guide application in cooperation with ADC Helsinki and Jan Ray has helped me improve the language of my work. There are also many others at Arcada that have helped me in different ways and I appreciate you all.
Many thanks go to Capilano University and Dean Graham Fane for the invitation to spend one semester at Capilano University in Vancouver, Canada, as a fellow institutional. I appreciate all my nice colleagues at Capilano and especially Cyri Jones and his family with whom I and my family spent many unforgettable moments with in Vancouver.
I would also like to thank Bill Anckar (former IAMSR researcher at ÅA) who a long time ago inspired me to pursue research within the field of digital services and tourism. Peter Strandvik deserves a special thank as a co-author and co-worker in the joint research efforts in the NIM-project on the Åland Islands. Many thanks also go to several anonymous reviewers of the submitted articles and to people at Omenahotels for helping with the setup of the surveys.
I would also like to thank my reviewers of the thesis, Associate Professor Jan Möller Jensen at University of Southern Denmark and Assistant Professor Marianna Sigala at University of the Aegean. I’m also extremely honored that Professor Dimitros Buhalis at Bournemouth University accepted the invitation to function as my opponent.

x
I’m also deeply grateful to my mum and Timppa for the support and encouragement you give me and my family in everything we do. My long working hours and night shifts at home to finalize my thesis has certainly been a challenge for my family. I sincerely thank my dear wife, Kati, and my precious boys, Anton and Amos for the sacrifices you have made and the understanding and love you have shown during this process. You mean everything to me.
Sottunga, July, 2013

xi
List of original publications:
1. Anckar, B. and Eriksson, N. (2003). Mobility: The Basis for Value Creation in Mobile Commerce?, in: Proceedings of the International Conference SSGRR’03, Telecom Italia learning Services, L’Aquila, Italy.
2. Eriksson, N. and Strandvik, P. (2009). Possible Determinants Affecting the
Use of Mobile Tourism Services, in: Filipe, J. and Obaidat, M. S. (eds.), e-Business and Telecommunications, Communications in Computer and Information Science (CCIS), revised selected papers from ICETE 2008, Porto, Portugal, Springer Verlag, 48, pp. 63 – 71.
3. Eriksson, N. (2012). User Experience of Trip Arrangements – a
Comparison of Mobile Device Users and Computer Users, Journal of eServices and mobile applications, 4 (2), pp. 55 – 69.
4. Eriksson, N. (2013). User categories of mobile travel services, forthcoming
in Journal of Hospitality and Tourism Technology.
5. Eriksson, N. and Strandvik, P. (2008). Introducing mobile tourism services in a peripheral region, in: Proceedings of IADIS international conference www/internet 2008, Best paper award, Freiburg, Germany.
6. Eriksson, N., Mellin, T., Westerlund, M., Aittoniemi, H., Fransman, K.,
and Rosenbröijer, C-J. (2013). A local outdoor mobile tour guide in HTML5 – Drivers and Barriers, in: Proceedings of the 12th International Conference on Mobile Business, ICMB 2013, Berlin, Germany.

xii
Table of content
1. Introduction ................................................................................................................. 3
1.1. The individuals’ adoption and use of new technology based services (innovations) ............................................................................................................... 5
1.1.1 The individuals’ perceived value and user experience ............................... 6
1.1.2. Adopter categories ........................................................................................ 7
1.2 Mobile business model development .................................................................. 8
1.3 Key definitions ...................................................................................................... 9
1.3.1 Characteristics of mobile devices ................................................................. 9
1.3.2 Characteristics of mobile travel and tourism services .............................. 10
1.3.3 Characteristics of usage settings ................................................................. 12
1.4 Objectives and research questions ..................................................................... 13
1.4.1 Research contributions to IS literature, the mobile and travel and tourism domain ..................................................................................................... 14
1.5 The structure of the thesis .................................................................................. 14
2. Literature review....................................................................................................... 17
2.1 Adoption and use of new products or services (innovations) ........................ 17
2.1.1 Diffusion of innovations ............................................................................. 18
2.1.2 Technology acceptance................................................................................ 19
2.1.3 Value creation .............................................................................................. 20
2.2 The individuals’ perceived value ....................................................................... 21
2.2.1 Perceived added-value ................................................................................. 21
2.2.2 Perceived ease of use .................................................................................... 24
2.2.3 Social influence ............................................................................................ 25
2.2.4 Perceived risk ............................................................................................... 25
2.3 User experience ................................................................................................... 26
2.4 Categorization of mobile adopters .................................................................... 28
2.5 Business models .................................................................................................. 29
2.6 Summary .............................................................................................................. 30
3. Methodology .............................................................................................................. 31
3.1 Natural social science vs. design science ........................................................... 31

xiii
3.2 Survey research .................................................................................................... 33
3.2.1 Cluster analysis ............................................................................................ 34
3.3 Experimental research ........................................................................................ 35
3.3.1 Partial least square (PLS) ............................................................................ 36
3.4 Action research.................................................................................................... 37
3.5 Summary .............................................................................................................. 38
4. The individuals’ perceived value (RQ1) .................................................................. 40
4.1 Mobility: The basis for value creation in mobile commerce? ......................... 40
4.1.1 Value dimensions ......................................................................................... 41
4.1.2 Value setting ................................................................................................. 42
4.2 The empirical study ............................................................................................ 42
4.3 The findings and discussion ............................................................................... 43
4.3.1 Value dimensions ......................................................................................... 43
4.3.2 Value setting ................................................................................................. 44
4.3.3 Primary services and channel preferences ................................................. 45
4.4 Conclusion ........................................................................................................... 46
4.5 Possible determinants affecting the use of mobile tourism services .............. 47
4.5.1 Description of the designed services .......................................................... 47
4.5.2 Possible determinants .................................................................................. 48
4.5.3 The field trail setup ...................................................................................... 50
4.5.4 Experiences from the trial ........................................................................... 52
4.5.5 Conclusion .................................................................................................... 54
4.6 Perceived barriers of Internet-/mobile services during a trip ......................... 55
4.6.1 The empirical study ..................................................................................... 56
4.6.2 Findings ........................................................................................................ 57
4.6.3 Conclusions .................................................................................................. 60
4.7 Summary .............................................................................................................. 61
5. User experience of trip arrangements (RQ2) ......................................................... 62
5.1 Potential problem areas in online self-arrangements for travel ..................... 62
5.1.1 Efficiency ...................................................................................................... 63
5.1.2 Effort ............................................................................................................. 64

xiv
5.1.3 Anxiety .......................................................................................................... 64
5.1.4 The online self-arrangement experience ................................................... 65
5.2 Mobile vs. computer users ................................................................................. 65
5.3 High-end mobile users ....................................................................................... 65
5.4 Travel services (applications) ............................................................................. 68
5.5 The setup of the experiment .............................................................................. 69
5.5.1 The task ......................................................................................................... 69
5.5.2 The samples .................................................................................................. 71
5.6 Analysis ................................................................................................................ 72
5.6.1 Analysis of mobile users vs. computer users (LRQ1) ............................... 75
5.6.2 Analysis of mobile high-end users (LRQ2) ............................................... 76
5.6.3 Analysis of travel service providers (LRQ3 and LRQ4) ........................... 77
5.7 Discussion ............................................................................................................ 78
5.8 Conclusions ......................................................................................................... 79
6. User categories of mobile travel services (RQ3) ..................................................... 82
6.1 Individual characteristics, perceived barriers and channel preferences ........ 82
6.1.1 Age and gender ............................................................................................ 82
6.1.2 Travel frequency .......................................................................................... 83
6.1.3 Online experience ........................................................................................ 83
6.1.4 Channel strategies ........................................................................................ 84
6.2 Research design ................................................................................................... 84
6.2.1 Categorization of consumers ...................................................................... 84
6.2.2 Data collection ............................................................................................. 85
6.2.3 Constructing the categories ........................................................................ 86
6.3 Analysis ................................................................................................................ 88
6.3.1 Individual characteristics ............................................................................ 88
6.3.2. The individuals’ perceived concerns to use Internet-/mobile services during a trip ........................................................................................................... 90
6.3.3. The individuals’ channel strategies ........................................................... 91
6.4 Conclusions ......................................................................................................... 92
7. Business model development (RQ4) ....................................................................... 96

xv
7.1 Introducing mobile tourism services in a peripheral region .......................... 96
7.1.1 Action research ............................................................................................ 97
7.1.2 Service domain ............................................................................................. 97
7.1.3 Technology domain ..................................................................................... 99
7.1.4 Organizational domain ............................................................................. 101
7.1.5 Financial domain ....................................................................................... 103
7.1.6 Barriers to implement the proposed business models ............................ 105
7.1.7 Action taken in the Project ....................................................................... 107
7.1.8 Discussion and conclusions ...................................................................... 108
7.2 A local outdoor mobile tour guide in HTML5 – drivers and barriers ......... 109
7.2.1 Action research and iterative design ........................................................ 110
7.2.2 Service domain ........................................................................................... 111
7.2.3 Technology domain ................................................................................... 113
7.2.4 Organization and finance domain............................................................ 114
7.2.5 Evaluation of drivers and barriers of HTML5 ......................................... 115
7.2.6 Conclusion .................................................................................................. 118
7.3 Summary ............................................................................................................ 118
8. Summary, implications and further research ....................................................... 120
8.1 Individual perceptions ...................................................................................... 120
8.2 Business model development ........................................................................... 124
8.3 Implications for practice .................................................................................. 125
8.4 Limitations ......................................................................................................... 126
8.5 Primary contributions to theory and further research .................................. 127
References .................................................................................................................... 129
Appendix 1 ................................................................................................................... 150
Appendix 2 ................................................................................................................... 156

xvi
List of Figures
Figure 1: Technology hype cycle (Gartner, 2012, p. 14) .............................................. 5
Figure 2: A classification of adopters (Rogers, 2003, p. 281) .................................... 19
Figure 3: The total wireless channel value framework (Anckar and Dincau, 2002)22
Figure 4: Components of user experience (Arhippainen and Tähti, 2003) ............. 27
Figure 5: The STOF-model (Bouwman et al. 2008, p. 36) ......................................... 30
Figure 6: The studies positioned according to a taxonomy of different IS
methodological research approaches by Järvinen (2008). ......................................... 33
Figure 7: Interfaces of the three trial services. ............................................................ 48
Figure 8: Structural model for all users ....................................................................... 73
Figure 9: Type of travel services used with a mobile device ...................................... 78
Figure 10: Internet and/or mobile service use for each activity of all respondents
(N = 882) ........................................................................................................................ 86
Figure 11: User interface of MobiTour and MobiFish ............................................. 101
Figure 12: An iterative development model.............................................................. 111
Figure 13: Interface views of the visitor client .......................................................... 113
Figure 14: The visitor perspective onsite .................................................................. 114
Figure 15: Back-office perspective ............................................................................. 115
Figure 16: Back-office client interfaces ..................................................................... 115

xvii
List of Tables
Table 1: A summary of research methodology, sample and core in each study ...... 39
Table 2: Observed importance scores for different value dimensions ..................... 44
Table 3: Observed interest scores for different value settings ................................... 45
Table 4: Observed channel preferences for the services subject of investigation .... 46
Table 5: Possible determinants for the intended or actual use of mobile tourism
services ........................................................................................................................... 50
Table 6: Analysis of samples ......................................................................................... 58
Table 7: The respondents’ perceived hindrances to use Internet- /mobile services
during a trip with a pocket device ............................................................................... 59
Table 8: Differences in mean values between the respondents’ perceived barriers to
use Internet- /mobile services during a trip with a pocket device 2004 and 2011 .. 60
Table 9: Research platform .......................................................................................... 67
Table 10: Characteristics of low- and high -complex travel arrangements (Anckar
and Walden, 2002) ........................................................................................................ 70
Table 11: Homogeneity test of samples ....................................................................... 72
Table 12: Descriptive statistics and quality criteria .................................................... 73
Table 13: Analysis of path coefficient impacts and differences between mobile user
groups in contrast to computer users .......................................................................... 74
Table 14: Difference between computer users and mobile users .............................. 75
Table 15: Difference between computer users, high-end mobile users and other
mobile users ................................................................................................................... 76
Table 16: Difference between computer users, mobile non-users of full-size web
sites and mobile users of fill-size web sites ................................................................. 78
Table 17: Consumer process in interaction with a travel service provider .............. 85
Table 18: Identified categories. Total proportions and proportions by category are
shown according to mobile use for the six activities.................................................. 87

xviii
Table 19: Difference between the categories in terms of age and gender. ............... 89
Table 20: Difference between the categories in terms of travel frequency and online
experience ...................................................................................................................... 89
Table 21: Category differences in relation to perceived barriers to use the mobile
Internet-/mobile services during a trip with a mobile phone/smartphone. ............ 90
Table 22: Category differences in terms of the preferred (I mainly use/I would
mainly use) channel. ..................................................................................................... 92
Table 23: Description of categories ............................................................................. 93
Table 24: Proposed mobile service packages .............................................................. 99
Table 25: Possible value network for MobiTour ...................................................... 102
Table 26: Possible value network for MobiFish ........................................................ 103
Table 27: Scenario of benefit or revenue sources for MobiTour ............................ 104
Table 28: Scenario of benefit or revenue sources for MobiFish .............................. 104
Table 29: Service domain requirements .................................................................... 112
Table 30: Description of mobile travelers ................................................................. 123

PART I: RESEARCH SUMMARY

2

3
1. Introduction Travel and Tourism is a field which has been and is undergoing changes due to the rapid development of information and communication technology (ICT) and digital services. Online travel has profoundly changed the conditions on the market and the way travel and tourism organizations think about customer interaction (WTTC, 2002; Buhalis and Law, 2008). Travelers are acting as their own travel agents and they are building their own travel packages and trip itineraries online (Werthner and Ricci, 2004; Sigala, 2010). The Internet has, in fact, become the primary source for information search in travel (Grønflaten, 2009a). Moreover, “travelers expect to get access to services and information from various devices, anywhere and at any time they need it” (Werthner and Ricci, 2004). New ways to support tourists are for example enabled with mobile pocket devices. Advanced mobile pocket devices such as smart phones are revolutionizing the travel industry thanks to services based on e.g. GPS technology (WTM, 2010). Mobile commerce, or e-commerce over mobile devices, has on the other hand had many conflicting predictions on its future popularity. For example, in the beginning of the m-commerce era there were several estimates that were overly optimistic (e.g. Durlacher Research, 2000). Later studies in Finland (e.g. Durlacher Research, 2005; Hyvönen and Repo, 2005b) showed that the mobile service market was growing steadily, but it seemed to be a sleeping giant (Walden et al., 2007). At that time the European market was, on the other hand, lagging behind when compared to Asian countries like Japan and Korea (e.g. Verkasalo, 2007; Kaikkonen, 2009; Walden et al., 2007). Mobile phones are now predicted to overtake PCs as the most common web access device worldwide and consumers’ smartphone adoption will drive more activities usually associated with the PC (Husson and Ask, 2011). In fact many travelers want to be online all the time, before the trip, during the trip and past the trip (Hjalager and Jensen, 2012). The development of mobile services and mobile commerce with ICT in the travel and tourism industry is therefore a relevant and interesting area for new type of interaction and commerce, and for research within the field. In fact, travel and tourism is a field in which several different research projects have been conducted where mobile services (applications) have been developed, tested and implemented during the past ten years (e.g. Schmidt-Belz et al., 2003; Repo et al., 2006; Riebeck et al., 2008). Moreover, when we take a look at different mobile application stores like Apple app store, Nokia Ovi store, Windows Marketplace and Google Play we find a great number of mobile applications (apps) categorized as services for travel.
Mobile commerce and mobile services have not only created an interest within the academic society and the business community but the interest has also come from ordinary people as the public press has given the mobile medium considerable attention. Recently the media focus has been on the success of

4
specific devices such as Apple’s iPhone, the number of mobile applications in mobile online stores and the battle for market shares and operating system (OS) platforms between global giants like Apple, Google, Nokia, Samsung and Microsoft just to name a few. The m-commerce era, however, encountered some initial challenges in the late 20th and early 21st centuries with WAP (Wireless application protocol) not living up to the expectations despite its early promise (Carlsson and Walden, 2012). The skepticism towards mobile commerce and mobile services lasted almost until the launch of the iPhone in 2007, which can be seen as the starting point for new m-commerce expectations and more importantly fulfillments of the early promises. Suddenly operating systems (OS) and applications (apps) for download were also on mainstream users’ mind on their way to the mobile phone store. Downloads from app stores are growing in number each day and apps are found on a growing number of peoples’ mobile devices. According to Purcell et al. (2010), an app culture has started to emerge among certain consumer segments such as men and young adults.
As described by Gartner’s hype cycle in figure 1, many novel technologies tend to be given a lot of visibility by the public press and business compared to more mature technologies. The excitement around the emerging technology often triggers a so-called hype or a peak of over dimensioned expectations on the new technology. The peak is achieved when there is almost no adoption in the marketplace. This was exactly what happened to WAP in the early 21st century. Now we see a clear boost and belief in mobile commerce and the use of mobile services, as the mobile technology platform has matured enough to create an up-slope in expectations (slope of enlightenment) and started mainstream adoption. Moreover, we can see ecosystems forming, where multiple providers of products and services emerge. According to Gartner (2012), the formation of ecosystems indicates the final stage plateau of productivity in the hype model. With the fourth generation (4G) of mobile networks currently rolling onto the market the expectations are becoming even higher.

5
Figure 1: Technology hype cycle (Gartner, 2012, p. 14)
Despite the described improvement in attitudes, great availability of mobile services recently and the reach of plateau stage of mobile technology (according to Gartner’s hype cycle), scholars, service producers and marketers are still looking into the pre-requisites of consumer adoption and use of mobile services for different contexts such as the travel and tourism context. In fact, according to Bouwman et al. (2012a), most research regarding mobile travel services has been focusing on building new services and, therefore, it seems essential to better understand why and how individuals adopt and use mobile services in travel and tourism. Furthermore, we have to remember that a majority of e.g. the Finnish population still has not adopted mobile services such as smartphone apps (Carlsson and Walden, 2012). Recent research from the Finnish market also suggests that there is a large group of smartphone users (38%) who do not use any advanced mobile services and have a low motivation to continue using smartphones in the future (Sell et al., 2012). Hence there seems to be a clear need to better understand the adoption and use of mobile services in different contexts.
1.1. The individuals’ adoption and use of new technology based services (innovations) To understand why and how individuals adopt and use mobile services; theories such as Diffusion of Innovation (DOI) by Rogers (1995), the Technology

6
acceptance model (TAM) by Davis (1989) and the Unified Theory of Acceptance and Use of Technology (UTAUT) (Venkatesh et al., 2003) have traditionally been used. These theories have been extended and merged in numerous ways to adapt them to different types of research contexts such as travel and tourism. There are, in fact, a few studies focusing on consumer acceptance of mobile services in travel and tourism (Höpken et al. 2007; Riebeck et al., 2008; Bader et al., 2012; Bouwman et al., 2012a; Peres et al., 2011; Fuchs et al., 2011). Many have also criticized that these so-called conventional theories cannot alone explain the use of mobile services but should be blended with other approaches (e.g. Carlsson et al., 2005; Nikou 2012). Such other approaches can be value creation and theories in user experience.
1.1.1 The individuals’ perceived value and user experience Nasution and Mavondo (2007) defined customer value as, “Customer value is a lived experience and is generally a trade-off between benefits and costs”. Many pointed out early on that the demand side of m-commerce is very much a search for value (e.g. Keen and Mackintosh, 2001; Anckar and Dincau, 2002). On digital markets it is possible for companies to create value for the consumer differently than in conventional business (Han and Han, 2001). Moreover, Carlsson and Walden (2010) pointed out that the future competitive advantages of the tourism industry are most likely to be built around effective mobile value services. Customer perceived value can be defined broadly as the total customer benefits in relation to total customer costs (Kotler and Keller, 2009). Research on drivers (benefits) and barriers (costs) have been used to investigate adoption of e-commerce in travel and tourism (Anckar, 2002) and mobile services (e.g. Anckar et al., 2003; Bouwman et al., 2007; Kleinen et al., 2007). Also in diffusion theories barriers are relevant when explaining differences between different types of adoption behaviors (Bouwman et al., 2007). Moreover, Pihlström (2008) sees that there is clear overlap between value creation theories and technology acceptance theories when investigating prerequisites to consumer adoption of mobile services. Therefore, it seems relevant to not only use the traditional adoption and acceptance theories to better understand why and how individuals adopt and use mobile services in travel and tourism but to also use value creation theories. By broadening the perspective, we see that we can contribute the most to previous information system (IS) research on the individuals’ adoption and use of mobile travel and tourism services. Therefore, we will here focus on investigating the individuals’ perceived value as drivers and barriers to adopt and use mobile services in a travel and tourism context.
According to Blythe and Wright (2003), user experience means enjoyment with a system. The concept user experience is something more than usability, which
7
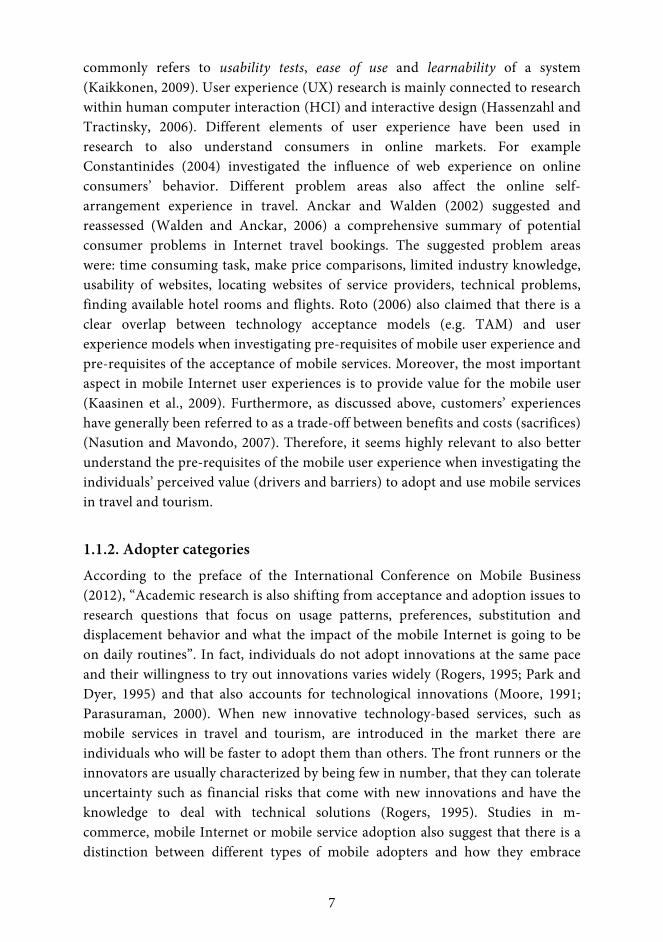
commonly refers to usability tests, ease of use and learnability of a system (Kaikkonen, 2009). User experience (UX) research is mainly connected to research within human computer interaction (HCI) and interactive design (Hassenzahl and Tractinsky, 2006). Different elements of user experience have been used in research to also understand consumers in online markets. For example Constantinides (2004) investigated the influence of web experience on online consumers’ behavior. Different problem areas also affect the online self-arrangement experience in travel. Anckar and Walden (2002) suggested and reassessed (Walden and Anckar, 2006) a comprehensive summary of potential consumer problems in Internet travel bookings. The suggested problem areas were: time consuming task, make price comparisons, limited industry knowledge, usability of websites, locating websites of service providers, technical problems, finding available hotel rooms and flights. Roto (2006) also claimed that there is a clear overlap between technology acceptance models (e.g. TAM) and user experience models when investigating pre-requisites of mobile user experience and pre-requisites of the acceptance of mobile services. Moreover, the most important aspect in mobile Internet user experiences is to provide value for the mobile user (Kaasinen et al., 2009). Furthermore, as discussed above, customers’ experiences have generally been referred to as a trade-off between benefits and costs (sacrifices) (Nasution and Mavondo, 2007). Therefore, it seems highly relevant to also better understand the pre-requisites of the mobile user experience when investigating the individuals’ perceived value (drivers and barriers) to adopt and use mobile services in travel and tourism.
1.1.2. Adopter categories According to the preface of the International Conference on Mobile Business (2012), “Academic research is also shifting from acceptance and adoption issues to research questions that focus on usage patterns, preferences, substitution and displacement behavior and what the impact of the mobile Internet is going to be on daily routines”. In fact, individuals do not adopt innovations at the same pace and their willingness to try out innovations varies widely (Rogers, 1995; Park and Dyer, 1995) and that also accounts for technological innovations (Moore, 1991; Parasuraman, 2000). When new innovative technology-based services, such as mobile services in travel and tourism, are introduced in the market there are individuals who will be faster to adopt them than others. The front runners or the innovators are usually characterized by being few in number, that they can tolerate uncertainty such as financial risks that come with new innovations and have the knowledge to deal with technical solutions (Rogers, 1995). Studies in m-commerce, mobile Internet or mobile service adoption also suggest that there is a distinction between different types of mobile adopters and how they embrace

8
mobile services. A few studies have attempted to categorize mobile adopters according to their use of Internet and mobile services (Aarnio et al., 2002), life-style (Sell et al., 2011) and attitude towards the mobile Internet and demographic variables (Okazaki, 2006). Moreover, Hjalager and Jensen (2012) provided a typology of travelers based on their propensity to go online before, during and after the trip. However, not enough attention has been paid to identify segments of mobile service users (Sell et al., 2011). Furthermore, to our best knowledge we have not found any attempts in IS literature to identify distinct groups of mobile travel service users. Therefore, it seems very important to identify different types of adopter categories of mobile services in travel and tourism and to understand the characteristics of these categories based on different factors affecting the use of mobile travel services. In fact, looking at different adopter groups may open up a new perspective on the diffusion process (Rogers, 1995). We should therefore identify user categories for mobile services in travel and tourism based on different factors that affect the adoption and use of mobile travel services (e.g. the individuals’ perceived value).
1.2 Mobile business model development The direct contribution of Travel and Tourism to GDP in 2011 was 2.8% of worldwide GDP and it is projected to grow by 4.2% pa by 2022 (World Tourism Council 2012). Travel and Tourism was one of the first sectors to embrace Information and Communication Technology (ICT). In fact, ICT is seen as crucial to the industry and its success. Perhaps the most crucial contribution to the industry was the development of computer reservation systems (CRS) and later on the development of global distribution systems (GDS), especially within the airline sector. eTourism reflects the digitalization of all processes and value chains in the tourism, travel, hospitality and catering industries (Buhalis, 2003). eTourism has in fact changed the industry structures, e.g. by creating disintermediation (travel providers bypass brick and mortar travel agents) and re-intermediation (new middle men such as online travel agents enter the market). Moreover, according to Law et al. (2009), “information technology is increasingly becoming critical for the competitive operations of the tourism and hospitality organizations as well as for managing the distribution and marketing of organizations on a global scale”.
However, designing new mobile services is a complex matter that needs to take into account several aspects. Service innovation is directly related to business model development, which according to the STOF-model by Bouwman et al. (2008) includes four interrelated elements: (1) Service domain, (2) Technology domain, (3) Organizational domain and (4) Financial domain. The STOF-model highlights both customer value and service provider value. Above we identified that we need to investigate the individuals’ perceived value and user experiences of

9
mobile travel and tourism services, and identify user categories (segments) of mobile travelers. In the STOF-model these aspects belong primarily to the service domain. However, also the other three domains need to be taken into account in mobile service development from a service provider perspective. Furthermore, from a destination perspective the development of services not only depends on the individual travel service providers but on all local actors and their willingness and possibility to support and develop travel and tourism within the region (Wilson et al., 2001). Moreover, a major proportion of all travel service providers in the world are small and medium sized tourism enterprises, SMTEs (Werthner and Klein, 1999), which raises the challenge of introducing new technology even more (Electronic Business in Tourism, 2004). Furthermore, the choice of technological platform may highly affect the delivered outcome (i.e. the user experience) of the mobile service. HTML5 is expected by many developers to be the future platform of mobile service delivery, thanks in part to its cross-platform capabilities which ought to reduce development costs (e.g. Charland and Leroux, 2011, Juntunen et al., 2013). Therefore, it seems essential to better understand possible drivers and barriers to develop and deliver mobile travel and tourism services in HTML5 from a holistic business model perspective.
1.3 Key definitions We will here define some key concepts that will be used throughout this thesis, namely characteristics of mobile devices, mobile travel and tourism services and usage settings.
1.3.1 Characteristics of mobile devices One definition of mobile commerce is the one by Keen and Mcintosh (2001, p. 23), ”Mobile Commerce is the term for the extension of Electronic Commerce from wired to wireless computers and telecommunications, and from fixed locations to anytime, anywhere, and anyone”. The Keen and Mcintosh (2001) definition indicates that mobile commerce can be performed with any type of wireless computer or device such as laptops, tablet devices, mobile phones and smartphones. The miniature size - fits into a pocket and can be carried everywhere - has, nevertheless, also been emphasized when differentiating between devices for mobile use (Tsalgatidou et al., 2000). We, therefore, define a mobile device as a mobile pocket device, as we see that true mobility (easily carried anywhere) can only be achieved with a pocket-sized device. In our research we will use the term mobile device as defined here, interchangeably with commonly thought of and widely adopted pocket sized devices such as mobile phones, smart phones and personal digital assistant (PDAs). It should, however, be noted that there is a

10
considerable overlap between different wireless computers and mobile devices in user experience and mobility features, especially between tablet devices and smart phones. The concept mobile device is also commonly (e.g. in the public press) used for different tablet computers and, therefore, we emphasis in this thesis that we focus on mobile pocket devices. It should also be noted that the tablet computer did not exist as a mass market product when this research began either. In fact, we see that tablet computers or hybrid versions of laptops/tablets should be investigated as separate platforms for interaction and commerce, although many aspects of this research can also be adapted to the tablet market and to other wireless computer platforms. It should also be noted that a mobile pocket device can be categorized according to its technical features and price (e.g. basic (dumb) phone, feature phone, smartphone, flag-ship smartphone).
1.3.2 Characteristics of mobile travel and tourism services Mobile services are here defined as services for mobile pocket devices like mobile phones/smartphones. These are services built upon technologies like web sites optimized for mobile devices, applications downloadable/streamable to mobile devices, localization (GPS), NFC (near field communication) and SMS/MMS services. We emphasize that peer to peer communication (i.e. traditional use of a mobile phone) is excluded from this research. We also delimit our research to Business to Consumer (B-to-C) services and the context is primarily travel and tourism. Therefore, we will in this thesis use the concept mobile travel and tourism services, when referring to services that are primarily aimed at consumers who travel to and stay in places outside their home environment. These consumers can be called travelers, visitors and/or tourists. For example, in an attempt to classify travelers for statistical purposes, tourists have been defined as, “persons traveling to and staying in places outside their usual environment for not more than one consecutive year for leisure, business and other purposes” (at the 1991 WTO Ottawa conference on Travel and Tourism statistics, as quoted in World Tourism Organization, 1995). Furthermore, two classes of visitors have been identified: (1) tourists, temporary visitors staying at least 24 hours and (2) same day-visitors, staying less than 24 hours (Commission of the European Communities et al., 2001). Hence, we see tourists as the narrowest definition of a consumer of travel and tourism services. We will, however, use all three concepts (travelers, visitors and tourists).
We also use the concept m-commerce. Anckar (2002) simply called m-commerce “e-commerce over a mobile device”, and used a broad definition of e-commerce by Wigand (1997). We have used the same broad definition of mobile commerce. Mobile commerce is e-commerce over mobile devices, where e-commerce according to Wigand (1997) includes, broadly speaking, any form of

11
economic activity conducted via electronic connections. We will, therefore, in this thesis use mobile services and m-commerce interchangeably. To emphasis our broad view we have also used terms such as mobile interaction and mobile presence. We, nevertheless, realize that there is a difference between informational or non-transactional services such as planning and/or experience enhancing services and transactional commerce services such as booking services in travel and tourism. For example Nikou (2012) identified the following generic categorization of mobile services:
Communication services (mobile telephony and SMS) Information services (mobile weather, mobile news) Entertainment services (mobile game, mobile music and mobile TV) Web 2.0 (mobile social networks) Transaction services (mobile banking, mobile shopping)
Bouwman et al. (2012a) named the following mobile services mobile travel
services: Checking flight, train time tables Reserving and purchasing travel tickets Information about destination, hotel reservation Locating a place Navigation Google maps
We are using concepts such as mobile travel services, mobile tourism services
and mobile trip arrangements to emphasize different service characteristics of mobile services in travel and tourism. The latter, mobile trip arrangements, here focus primarily on the decision- making process (planning and booking procedures) in travel and tourism. Whereas mobile travel services here focus on the total interaction process between the traveler (consumer) and the travel service provider. We have used a six step traveler process to identify the interaction between traveler and travel service providers:
1. Search for information 2. Reserve 3. Pay 4. Cancel or Change reservation 5. Check in 6. Reflect
See chapter 6 for a more thorough description of these steps. Mobile tourism services here focus on visitors to a destination. Hence, we have
named an information portal, a fishing permit reservation system, an attraction

12
tour guide and a social travel community aimed primarily at visitors to a destination as mobile tourism services (See chapter 4 and 7 for a more thorough description of these services). As described above we will here include mobile travel services, mobile trip arrangements and mobile tourism services under one umbrella, namely mobile travel and tourism services.
1.3.3 Characteristics of usage settings Early studies suggested that mobility is the greatest driver for the mobile Internet - the anywhere/anytime access to products and services. According to Nohria and Leestma (2001), the m-commerce opportunity is enormous if companies develop ubiquitous solutions that recognize the role that mobility plays in consumers’ lives. Herman and Neff (2002) argued that mobility and ubiquity complete the foundation on which m-commerce will be built. Also Anckar and Eriksson (see research study 1, section 4.1) suggested, based on empirical evidence, mobility to be the primary driver for m-commerce, although also fixed value was recognized. More recent studies have also emphasized mobility as a key determinant in acceptance of different types of mobile services. For example mobility, mediated by usage situation, had a direct effect on the intended use of a mobile ticketing service (Mallat et al., 2009). Bouwman et al. (2007) found perceived flexibility –defined as the anywhere/anytime access to services and products - to have a direct impact on the use of different types of mobile services in the future (e.g. mobile travel services). Nikou et al. (2012) argued that mobility has a direct effect on the perceived ease of use of mobile social network services. Bouwman et al. (2012a) highlighted the importance of contexts such as mobility context (mobile, e.g. on the road) and physical context (fixed, e.g. at home) as moderators to the use of mobile travel services. Consequently, we see that it is extremely important to understand the primary setting (fixed or mobile) a service is used in and/or investigated in.
Here fixed settings represent situations where we typically have access to desktop computers and high-speed Internet connections. Such fixed settings are primarily: the home and the office/school. Mobile settings represent situations when we are ‘on the go’, i.e. traveling, wandering or visiting (Kristoffersen et al., 2000). In these settings we do not generally have access to the wired devices that we regularly use (or at least have slower and more unstable connections). As defined above in a travel and tourism context tourists have been defined as persons who travel to and stay in places outside their familiar home environment for not more than one consecutive year for leisure, business and other purposes (World Tourism Organization, 1995). The tourist life-cycle has also been identified as a three step process: (1) pre-trip, (2) on-site and (3) after-trip (Whertner and Ricci, 2004). Consequently the first and third stage, pre-trip and after-trip, can be

13
defined as fixed settings from a tourist perspective (in a home environment). Thus the on-site stage, also many times referred to as the on-trip or during trip stage, can be defined as a mobile setting from a tourist perspective (outside the home environment). We will therefore here distinguish between mobile and fixed settings according to these definitions but our primary research focus will be on the during trip phase.
1.4 Objectives and research questions As discussed in the beginning there is a need to better understand why and how individuals adopt and use mobile travel and tourism services. However, ‘why and how do individuals adopt and use mobile travel and tourism services?’ is a very broad problem area and therefore we will specify more researchable questions to give partial answers to this broad problem area. Hence, based on the above discussion and identified knowledge gaps the first main aim of this research is to provide insights into the individuals’ value perceptions and user experience of mobile travel and tourism services, and to make a first attempt at categorizing users of mobile travel services.
RQ1: How do individuals perceive value in order to adopt and use mobile travel and tourism services during a trip?
RQ2: What factors affect the perceived user experience of mobile trip arrangements?
RQ3: Can we identify distinct user categories of mobile travel services based on differences in individual characteristics, the individuals’ perceived barriers to use Internet-/mobile services during a trip and the individuals’ channel preferences?
Answers to RQ2 and RQ3 we see as partial answers to RQ1 as they will provide insights on the individuals’ perceived value (drivers and barriers) on adopting and using mobile travel and tourism services during a trip.
Moreover, we attempt to provide insights on business model development for mobile travel and tourism services primarily aimed at consumers with mobile pocket devices in on-site settings (mobile setting), with the help of a theoretical framework called STOF. As described earlier the STOF model offers a focus not only on value for consumers but also on value for service providers. Furthermore, HTML5 is expected by many developers to be the future platform of mobile service delivery.

14
RQ4: Can HTML5 provide a feasible future platform for mobile service design and delivery from a business model perspective in a travel and tourism context?
The first set of research questions focus on exploring, describing and explaining
why and how individuals adopt and use mobile travel and tourism services and the fourth research question focuses on building services based on the findings and evaluating the outcome from a holistic business model perspective. These research questions reflect the overall aim of this thesis.
1.4.1 Research contributions to IS literature, the mobile and travel and tourism domain The main research questions will be answered based upon six research papers and some previously unpublished results. The research has been conducted during a time period from 2002 to 2013, which makes this thesis longitudinal in character. This we see as a major advantage as we to some extent can reflect on changes in the individuals’ perceptions and the development of mobile services over time. It needs, however, to be emphasized that the original research papers were written based on separate research projects and are, therefore, hard (if not impossible) to take out of the specific research contexts. Hence, each study and its set up will be thoroughly described. This thesis will, nevertheless, structure the findings to answer the main research questions (see below section 1.5 for the structure of the thesis). Therefore, we aim to contribute to the understanding of drivers and barriers to the individuals’ adoption and usage of mobile travel and tourism services and to the development of business models for these services. These results are relevant especially to travel service providers and mobile service providers. The results are validated through several empirical studies among consumers, through action research with travel service providers, and through an extensive review of academic research.
1.5 The structure of the thesis In chapter 2 ‘Literature review’ we present an extensive state of the art review of why individuals adopt and use new technology-based services such as mobile travel and tourism services. Technology acceptance, value creation, diffusion of innovations and user experience theories are presented. Moreover, we present the STOF-model for business model design of mobile services.
In chapter 3 ‘Methodology’ we present the methodologies used for each study that form the empirical core of this thesis. We also position the used methodologies within a taxonomy of research approaches in information system

15
(IS) research. The primary methods and techniques of analysis to be presented are survey research, experiment, action research, cluster analysis and partial least square (PLS) analysis.
In chapter 4 ‘The individuals’ perceived value’ we first present early findings on value drivers for mobile commerce and simple mobile trip arrangements. Second we present findings on possible determinants affecting visitors’ (individuals’) use of mobile tourism services. Third we present some previously unpublished results on the individuals’ perceived barriers to use Internet-/mobile services during a trip. The focus is primarily on answering research question RQ1 ‘How do individuals perceive value in order to adopt and use mobile travel and tourism services during a trip?’. The following two original research papers support this chapter.
Paper 1: Anckar, B. and Eriksson, N. (2003). Mobility: The Basis for Value Creation in Mobile Commerce?. In: Proceedings of the International Conference SSGRR’03, Telecom Italia learning Services, L’Aquila, Italy.
Paper 2: Eriksson, N. and Strandvik, P. (2009). Possible Determinants Affecting the Use of Mobile Tourism Services, in: Filipe, J. and Obaidat, M. S. (eds.), e-Business and Telecommunications, Communications in Computer and Information Science (CCIS), revised selected papers from ICETE 2008, Porto, Portugal, Springer Verlag, 48, pp. 63 – 71. In chapter 5 ‘User experience of trip arrangements’ we present findings on the
individuals’ perceived user experience of online trip arrangements. We compare the results between mobile users and computer users. The focus is primarily on answering research question RQ2 ‘What factors affect the perceived user experience of mobile trip arrangements?’. The following original research paper supports this chapter.
Paper 3: Eriksson N. (2012). User Experience of Trip Arrangements – a Comparison of Mobile Device Users and Computer Users, Journal of eServices and mobile applications, 4 (2), pp. 55 – 69.
In chapter 6 ‘User categories of mobile travel services’ we identify categories of
mobile travelers based on their use of mobile travel services, demographic variables, travel frequency, online experience, perceived concerns of Internet-/mobile services during a trip and preferred channel strategies. The focus is primarily on answering research question RQ3 ‘Can we identify distinct user categories of mobile travel services based on differences in individual characteristics, the individuals’ perceived barriers to use Internet- / mobile services

16
during a trip and the individuals’ channel preferences?’. The following original research paper supports this chapter.
Paper 4: Eriksson N. (2013). User categories of mobile travel services, forthcoming in Journal of Hospitality and Tourism Technology.
In chapter 7 ‘Business model development’ we present findings from two
applied efforts on drivers and barriers to build mobile services in a travel and tourism context and evaluate them from a holistic business model perspective. The focus is primarily on giving answers to research question RQ4 ‘Can HTML5 provide a feasible future platform for mobile service design and delivery from a business model perspective in a travel and tourism context?’. The following original research paper supports this chapter.
Paper 5: Eriksson N. and Strandvik P. (2008). Introducing mobile tourism services in a peripheral region, in: Proceedings of IADIS international conference www/internet 2008, best paper award, Freiburg, Germany.
Paper 6: Eriksson, N., Mellin, T., Westerlund, M., Aittoniemi, H., Fransman, K., and Rosenbröijer, C-J. (2013). A local outdoor mobile tour guide in HTML5 – Drivers and Barriers, in: Proceedings of the 12th International Conference on Mobile Business, ICMB 2013, Berlin, Germany. In chapter 8 ‘Summary, implications and further research’ we present the main
findings and implications, according to the research questions. Some limitations of the studies are stressed and directions for further research within the field are suggested.
Consequently chapter 4, 5 and 6 focus on exploring, describing and explaining why and how individuals’ adopt and use mobile travel and tourism services and chapter 7 focuses on building services based on the findings and evaluating the outcome from a holistic business model perspective.

17
2. Literature review In this chapter we will discuss the characteristics of some major approaches to investigating the individuals’ adoption and use of new technology-based services (innovations); diffusion of innovations, technology acceptance and value creation. Our first main aim (RQ1) of this thesis is to better understand the individuals’ perceived value (drivers and barriers) to adopt and use mobile travel and tourism services during a trip. Hence, based on an extensive state of the art literature review we will identify possible individual perceived attributes that affect the use of mobile travel and tourism services. Moreover, our second research question RQ2 is to better understand factors that influence individuals’ the perceived user experience of mobile trip arrangements. Therefore, we will present relevant literature regarding the individuals’ mobile user experience. Our third research question RQ3 is to identify user categories for mobile travel services. Consequently, we will discuss categorization of mobile users as well. All these topics are, nevertheless, interrelated when investigating why and how individuals’ adopt and use mobile travel and tourism services. Therefore, the presentation and discussion of the literature should be seen as a way to structure it. Our fourth main objective (RQ4) of this thesis is to provide insights into drivers and barriers when developing business models for mobile travel and tourism services on an emerging platform HTML5. Hence we will present the characteristics of the STOF-model, which is designed to analyze mobile service development from a holistic business model perspective.
Next we define an innovation and present some major approaches to investigating adoption and use of new technology based services (innovations).
2.1 Adoption and use of new products or services (innovations) An innovation is defined by Rogers (1995, p. 11) as, “an idea, practice or object perceived as new by an individual or other unit of adoption”. An innovation is any product or service that a consumer regards as new, which may be due to that a product or service is produced in a new way or is totally new (Solomon et al., 2006, p. 538), like mobile services in travel and tourism. Most innovations do not succeed and most of them take a long time to be adopted by masses of consumers. However, there is a tendency that technical products and online services diffuse (spreads through a population) more rapidly these days (Solomon et al., 2006, p. 538). For example the rate of smartphone users more than doubled in Finland between 2010 and 2011 (Statistics Finland, 2012a).
There are three categories of innovations according to the change they bring to people’s lives: continuous, dynamically continuous and discontinuous innovations (Robertson, 1967). Continuous innovations are only a modest change to existing
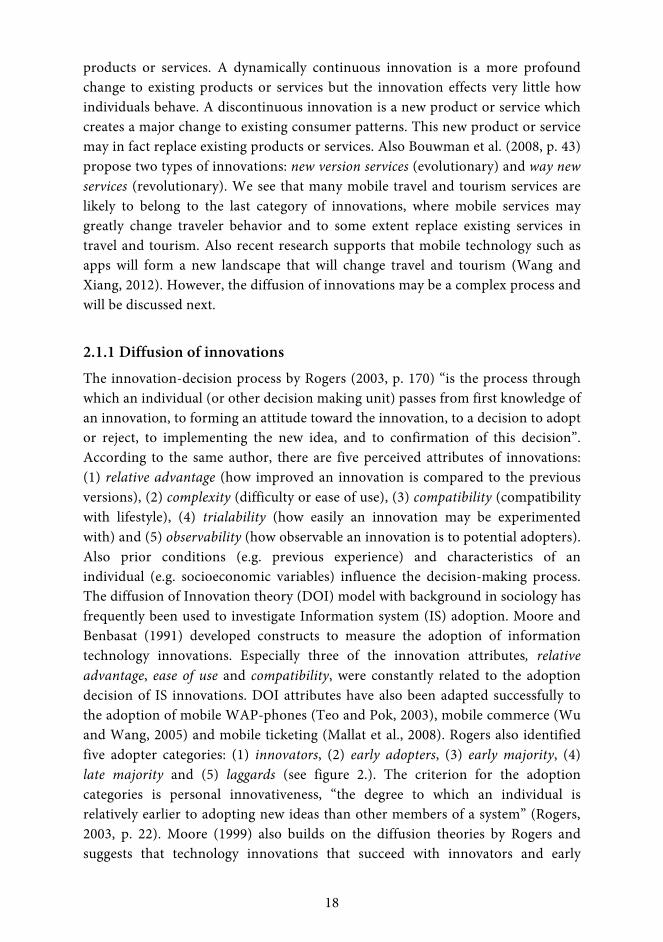
18
products or services. A dynamically continuous innovation is a more profound change to existing products or services but the innovation effects very little how individuals behave. A discontinuous innovation is a new product or service which creates a major change to existing consumer patterns. This new product or service may in fact replace existing products or services. Also Bouwman et al. (2008, p. 43) propose two types of innovations: new version services (evolutionary) and way new services (revolutionary). We see that many mobile travel and tourism services are likely to belong to the last category of innovations, where mobile services may greatly change traveler behavior and to some extent replace existing services in travel and tourism. Also recent research supports that mobile technology such as apps will form a new landscape that will change travel and tourism (Wang and Xiang, 2012). However, the diffusion of innovations may be a complex process and will be discussed next.
2.1.1 Diffusion of innovations The innovation-decision process by Rogers (2003, p. 170) “is the process through which an individual (or other decision making unit) passes from first knowledge of an innovation, to forming an attitude toward the innovation, to a decision to adopt or reject, to implementing the new idea, and to confirmation of this decision”. According to the same author, there are five perceived attributes of innovations: (1) relative advantage (how improved an innovation is compared to the previous versions), (2) complexity (difficulty or ease of use), (3) compatibility (compatibility with lifestyle), (4) trialability (how easily an innovation may be experimented with) and (5) observability (how observable an innovation is to potential adopters). Also prior conditions (e.g. previous experience) and characteristics of an individual (e.g. socioeconomic variables) influence the decision-making process. The diffusion of Innovation theory (DOI) model with background in sociology has frequently been used to investigate Information system (IS) adoption. Moore and Benbasat (1991) developed constructs to measure the adoption of information technology innovations. Especially three of the innovation attributes, relative advantage, ease of use and compatibility, were constantly related to the adoption decision of IS innovations. DOI attributes have also been adapted successfully to the adoption of mobile WAP-phones (Teo and Pok, 2003), mobile commerce (Wu and Wang, 2005) and mobile ticketing (Mallat et al., 2008). Rogers also identified five adopter categories: (1) innovators, (2) early adopters, (3) early majority, (4) late majority and (5) laggards (see figure 2.). The criterion for the adoption categories is personal innovativeness, “the degree to which an individual is relatively earlier to adopting new ideas than other members of a system” (Rogers, 2003, p. 22). Moore (1999) also builds on the diffusion theories by Rogers and suggests that technology innovations that succeed with innovators and early

19
adopters may fail with early majority due to differences in expectations. This interruption is called ‘the chasm’ and may be particularly applicable with discontinuous innovations.
Figure 2: A classification of adopters (Rogers, 2003, p. 281)
Note: Mean (bar{x}) and standard deviation (sd) of time of adoption
2.1.2 Technology acceptance The field of information systems (IS) has long been investigating the individuals’ acceptance of new information technologies. One of the most used models is the technology acceptance model (TAM) by Davis (1989) which is based on the theory of reason action (TRA) by Fishbein et al. (1975) with routes in psychology theories and its extension theory of planned behavior (TPB) by Ajzen (1991). The TAM model presents two determinants of technology acceptance, perceived usefulness and perceived ease of use. The first one, perceived usefulness, is defined as, “the degree to which a person believes that using a particular system would enhance his or her performance”. The second TAM determinant perceived ease of use is defined as, “the degree to which a person believes that using a particular system would be free of effort”. The two determinants perceived usefulness and perceived ease of use have been widely adapted to explain the acceptance of different types of mobile services. For example both determinants impacted the intended use of goal-oriented and experiential mobile services (Nysveed et al., 2005a), mobile ticketing (Mallat et al., 2008), advanced mobile services (Bouwman et al., 2012b) and mobile social network services (Nikou et al., 2012b).
The unified theory for the acceptance and use of technology (UTAUT) by Venkatech et al. (2003) combines TAM with several other models (e.g. diffusion of innovations). In UTAUT there are three determinants with direct impact on the intended behavior: effort expectancy, performance expectancy and social influence, and two determinants with direct impact on the usage behavior: intended behavior and facilitating conditions. Mediating determinants in the model are gender, age,

20
experience, and voluntariness of use. The UTAUT model has also been extended, improved and revised in both organizational and consumer contexts since it was first published. For example Carlsson et al. (2006) tested UTAUT to investigate the adoption of mobile devices/services. They found that performance expectancy, effort expectancy and attitude towards mobile devices/services could be explanations for behavioral intentions. However, social influence and anxiety did not show a significant influence in their study. They also emphasized that UTAUT is primarily developed for organizational contexts, whereas mobile service adoption is more individual, and therefore UTAUT should not be used as such to investigate the individuals’ adoption of mobile services.
2.1.3 Value creation As briefly discussed in the introduction, companies can online create value for consumers differently than in conventional business (Han and Han, 2001).Value is created in customers internal processes when interacting with the service provider (Grönroos, 2000). The Braudel rule refers to value as, “freedom becomes value by expanding the limits of the possible in the structures of everyday life” (as presented by Keen and Mackintosh, 2001, p. 31). Grönroos and Voima (2013) distinguish between potential value-in-use and value-in-use, where the former is referred to as the provider sphere and the latter to the customer sphere and joint sphere (interaction between provider and customer). The same authors define value as, “value-in-use, created by the user (individually and socially), during usage of resources and processes (and their outcomes). Usage can be a physical, virtual, or mental process, or it can be mere possession. Logically, value creation is the customer’s creation of value-in-use”. Bouwman et al. (2008) also distinguish between four types of values: (1) intended value, (2) delivered value, (3) expected value and (4) perceived value. Intended value is the value a provider proposes to a customer in a service offering (value proposition) and delivered value is what a provider in reality delivers to customers. Expected value refers to the value a customer expects (based on their previous experiences) from the service and perceived value is the value customers in reality perceive as consumers of the service. Customer perceived value has also been broadly defined as the total customer benefits in relation to total customer costs (Kotler and Keller, 2009). According to Nasution and Mavondo (2007), “Customer value is a lived experience and is generally a trade-off between benefits and costs”. When value creation often focuses on both drivers and barriers there is also research that focuses mainly on either the drivers or the resistance (barriers) of adoption of new innovations. For example Sheth et al. (1991) highlight five value dimensions or drivers (Functional, Social, Emotional, Epistemic and Conditional) in understanding consumers’ choices. These value dimensions have also been found
21
relevant to understanding the value of location-based mobile services (Pura, 2005) and touristic location-based services (Neuhofer, 2012). On the other hand Ram and Sheth (1989) emphasize five adoption barriers (use, value, risk, image and tradition), that have been found relevant to explain resistance of e.g. mobile banking (Laukkanen and Cruz, 2009).
2.2 The individuals’ perceived value Our literature review is based on studies related to all three research streams presented above - diffusion of innovations, technology acceptance and value creation - and other relevant literature. We will structure the potential perceived values (drivers and barriers) to adopt and use mobile travel and tourism services as perceived added-value, perceived ease of use, social influence and perceived risk.
2.2.1 Perceived added-value Tourism can be characterized as wandering, where tourists enjoy things and chance upon things of interest (Brown and Chalmers, 2003). As the mobility (on the move) capability is generally seen as the key value driver in m-commerce (see section 1.3.3), mobile technology clearly has the potential to support the wandering aspect of tourism. A word like flexibility has commonly been used to describe the independence of time and space that is provided by mobile technology. For example Anckar et al. (2003) found that adopters and intended adopters feel that the mobile Internet and m-commerce can offer especially flexibility. Bouwman et al. (2007) found perceived flexibility as an important driver of the future use of six different mobile services (e.g. mobile travel services). Also Nikou (2012) argued that mobility has a direct effect on the perceived ease of use of mobile social network services.
Anckar and Dincau (2002) nevertheless argued that concepts like flexibility and mobility are too generic to explain the anywhere/anytime value-adding elements of m-commerce. Consequently, they introduced an analytical framework that identifies the potential value-creating features of mobile commerce. In the framework, an important distinction is made between the value offered by the wireless Internet technology in itself; wireless value, and the value emerging from the actual mobile use of a device; mobile value. Wireless value can be created through the use of any wireless device, irrespective of the service/application whereas mobile value is created only through certain types of wireless services. Wireless value is referred to in the framework as a service-independent phenomenon and mobile value is referred to as a service-dependent phenomenon. As shown in figure 3 different mobile value elements and different wireless elements are identified. The mobile value elements are: (1) time-critical

22
arrangements refer to applications for situations where immediacy is essential (arise from external events), e.g. receive alerts of a changed transport schedule, (2) spontaneous needs are internally awakened (instinctive value) and not a result of external events, e.g. find a suitable restaurant while wandering around, (3) entertainment needs, refers to killing time/having fun, especially in situations when not being able to access wired entertainment appliances, e.g. kill or fill time in transportation, (4) efficiency ambitions aim at productivity, e.g. use dead spots during a trip to optimize time usage and (5) mobility-related needs refer to applications that in essence are of value only through a mobile medium, e.g. localization services. It should also be noted that the value elements are interrelated in the framework. For example, entertainment needs may indeed be very spontaneous in character. This framework will later be used when investigating the value-adding elements and value settings (usage settings) of mobile services, e.g. simple mobile trip arrangements. The research framework is also described in original research paper 1, which was co-published with Bill Anckar, one of the original authors of the framework.
Figure 3: The total wireless channel value framework (Anckar and Dincau, 2002)
Others have also emphasized that the perceived type and degree of perceived
value depend on the situation or context of usage of a mobile services, e.g. mobile ticket services (Mallat et al., 2008) and mobile commerce (Lee and Jun, 2005). Also Gummerus and Pihlström (2011) found strong evidence for two types of value regarding mobile services, namely context value and in-use-value. Context value is a result from physical elements and psychological circumstances and value-in-use

23
arise directly from using the service. Pura (2005) found conditional value (e.g. usage situation) to impact commitment and the behavioral intention to use location-based mobile services. Neuhofer (2012) also found the conditional value to be the primary indicator of a touristic location-based service. Bouwman et al. (2012b) highlighted the importance of contexts such as mobility context (mobile, e.g. on the road) and physical context (fixed e.g. at home) as moderators to the use of mobile travel services. Also Carlsson and Walden (2010) emphasized the importance of context-adaptive mobile value services e.g. mobile guide services for tourists.
Nevertheless, not only the medium or usage context creates value for the consumer but the essence of the services as well. Specific values are related to specific services (Bouwman et al., 2008). For example for a tourist in a planning and/or booking situation the key to success would be access to timely, precise and reliable information relevant to his or hers needs (Buhalis, 2003, p. 132). Equally important for a tourist visiting a historical attraction may be the satisfaction of educational and entertainment (edutainment) needs (HyunJeong and Schliesser, 2007). Similarly a person with an objective to share experiences with others may find satisfaction when a community responds (Arguello et al., 2006).
As described above the TAM model proposes two determinants for technology acceptance, perceived usefulness and perceived ease of use (Davis, 1989). In diffusion theories perceived usefulness is referred to as relative advantage. In the UTAUT model perceived usefulness has emerged into performance expectancy and defined as the degree to which an individual believes that using the system will help him or her to attain gains in job performance. Perceived usefulness has been shown to have a direct impact on the intended use of mobile chat services (Nysveed et al. 2005b) and mobile travel services (Bouwman et al., 2012b) and mobile commerce (Wuab and Wang, 2005). Moreover, Oh et al. (2009) found that travelers' intentions to use mobile technologies primarily depended on performance expectancy rather than effort expectancy. Also Peres et al. (2011) revealed that perceived usefulness is an important component in tourists' behavioral intentions towards using mobile electronic tourist guides.
However, in consumer markets consumer behavior is also influenced by other factors than performance enhancement. It is typical that non-efficiency factors impact consumer adoption of technology, for example “good tourist technologies are not only those that make tourists more efficient, but that also make tourism more enjoyable” (Brown and Chalmers, 2003). Digital information systems can be divided into productivity oriented and enjoyment (hedonic) oriented systems (Van der Heijden, 2004). The hedonic systems focus on the fun-aspect of using an information system rather than on productive use. Nysveed et al. (2005) used such words as fun, pleasant and entertaining to describe the pleasure of intentional use of mobile services. Also Bouwman et al. (2007) found perceived entertainment

24
value to be an important driver of the future use of six different mobile services (e.g. mobile travel services). Furthermore, Pura (2005) found emotional value (e.g. positive feelings, enjoyment, fun) to impact commitment and the behavioral intention to use location-based mobile services. Also Fuchs et al. (2011) strongly emphasized that service providers should draw attention to not only functional performance but also to hedonic aspects when designing mobile applications in tourism.
2.2.2 Perceived ease of use As described in section 2.1.2, the second TAM determinant perceived ease of use is defined as, “the degree to which a person believes that using a particular system would be free of effort” (Davis, 1989). In diffusion theories ease of use is referred to as complexity (simplicity). In the UTAUT model the ease of use determinant has emerged into effort expectancy and been defined as, “the degree of ease associated with the use of the system” (Venkatesh et al., 2003). Moreover, the ease of use aspect has been widely discussed in mobile commerce. Limitations of mobile devices such as screen size cause consumers to hesitate whether to adopt mobile commerce or not. According to Cho et al. (2007), device limitations suggest that focusing on easy to use mobile applications could enhance the consumer acceptance of mobile commerce. Others have also revealed perceived ease of use to have a positive effect on the intended use of a mobile ticketing service (Mallat et al., 2006) and advanced mobile services Bouwman et al. (2012a). Kaasinen (2005) pointed out that mobile services also need to be easy to take into use (ease of adoption), as mobile services are typically only occasionally utilized and some services may be available only in certain local settings. As a consequence, information on available services should be easy to get and the services should be easy to access, install and learn how to use in different settings (e.g. in onsite travel and tourism settings). Moreover, when problems arise, users in the consumer market are often expected to solve the problems on their own (Repo et al., 2006). Consequently the use may rely on proper instructions or on a helping hand from someone. Proper support conditions also in a consumer market may therefore be important especially for advanced mobile services. In the UTAUT this aspect is called facilitating conditions, which is proven to significantly influence the actual use of technology in organizational contexts (as described in section 2.1.2). Nevertheless consumers many times expect to take a new product or service into use without instructions or help. It cannot be a hassle to use a service, users are in general ‘lazy’ and choose the easiest option (Tetard and Collan, 2009). Also Nikou and Mezei (2012) found that individual mobile service adoption strongly depends on service functionality, the ability of a mobile service to perform a certain task (simplicity, usability, accessibility and flexibility).

25
2.2.3 Social influence In UTAUT social influence has been identified to influence the intended use of information technology. In UTAUT social influence is defined as, “the degree to which an individual perceives that important others believe he/she should use the new system” (Venkatech et al., 2003). Social influence is also known as subjective norm in the theory of reason action (Fishbein et al., 1975) and in its extension theory of planned behavior (Arjzen 1991). In consumer markets image and social status have been proposed to impact consumers’ intentions to adoption of a WAP-enabled mobile phone (Teo and Pok 2003). A positive or negative subjective norm can in fact in consumer markets make or break a new technology-based product or service (Schepers and Wetzels, 2007). Also Nysveed et al. (2005a) found evidence of normative pressure to significantly affect the intended use of mobile services, especially for person interactive services. Social influence may be even more important for mobile travel and tourism services as tourism services are often consumed or experienced together with other persons, especially persons close to oneself. Bader et al. (2012) indeed found that social influence to have a direct positive impact on the intentional behavior to use mobile tourism services. Fuchs et al. (2011) also found social influence to have a significant impact on the intended use of mobile information services in tourism. Bouwman et al. (2012b) highlighted the social context (i.e. when in company of others) as a mediator for the use of mobile travel services.
2.2.4 Perceived risk It should be noted that several barriers to a mass market adoption have been highlighted since the early days of m-commerce. According to Rogers (1995),”the innovation-decision is made through a cost benefit analysis where the major obstacle is uncertainty”. Perceived risk is, according to Featherman and Pavlou (2003), “commonly thought of as felt uncertainty regarding possible negative consequences of using a product or service”. Anxiety in UTAUT has been defined as, “evoking anxious or emotional reactions when it comes to performing a behavior” (e.g. using a computer), but has not been seen to have a direct influence on intentional behavior of information technology. However, perceived risk has been added to the two TAM determinants as a negative influence on intended adoption behavior of electronic services (Featherman and Pavlou 2003). They divide the perceived risk for digital services into the following elements: performance risk, financial risk, time risk, psychological risk, social risk and privacy risk. Trust, i.e. trust in the service vendor to minimize the risks, has also been added to the TAM model (e.g. Cho et al., 2007; Kaasinen 2005) and pointed out as

26
a strong influence on the intended use of mobile services due to that mobile commerce was still at its initial stage (Cho et al., 2007). Moreover, Anckar et al. (2003) found early on high costs, including operating costs and entry costs, to be highly ranked by consumers as hindrances for m-commerce. Carlsson et al. (2005) found that financial costs and security risks are the greatest barriers to the use of mobile services. Hyvönen and Repo (2005a) found financial factors to be the most important barrier to mobile service use in Finland. Bina et al. (2007) proposed financial barriers, technical barriers and security/privacy barriers as obstacles to the actual use of mobile data services grouped as mobile commerce, information services, communication services and entertainment services. Pagani (2004) listed the following determinants as obstacles to the use of third generation mobile multimedia services: ease of use and navigation, limitation in bandwidth, cost, hardware and software functionality and privacy, where especially cost stood out as highly important. Massoud and Gupta (2003) had the following barriers as the most prominent of mobile communication: ease of use, security and privacy, usefulness of services and affordability. Bader et al. (2012) emphasized the cost (equipment cost, access cost, and possible transaction fees) to have a negative influence on the actual use of mobile tourism services. Fuchs et al. (2011) also highlighted the perceived monetary transparency and perceived monetary fairness as important determinants to the acceptance of mobile information services in tourism. However, as users become familiar with the technologies they usually get over their initial anxieties and develop positive perceptions towards a system (Hackbarth et al., 2003).
2.3 User experience It seems to be hard to find an exact definition or a consensus regarding the characteristics of user experience (UX) in literature (Roto, 2006; Kaikkonen, 2009). However, as briefly presented in the introduction (section 1.1.1) there are definitions and models to explain the concept user experience. According to Blythe and Wright (2003), user experience means enjoyment with a system. Kaikkonen (2009) contended that the concept user experience is something more than usability, which commonly refers to usability tests, ease of use and learnability of a system. According to Kaasinen et al. (2009), many elements impact the user experience but the user experience is often determined by the weakest link among these. Arhippainen and Tähti (2003) included the following components in user experience: (1) user (e.g. age, skills, prior experience), (2) social factors (e.g. time pressure, pressure of success and fail), (3) cultural factors (e.g. habits, norms, language), (4) context of use (e.g. time, place, accompanying persons) and (5) product/system (e.g. usability, usefulness, mobility). See figure 4.

27
Figure 4: Components of user experience (Arhippainen and Tähti, 2003)
User experience (UX) research is mainly connected to research within human
computer interaction (HCI) and interactive design (Hassenzahl and Tractinsky, 2006). However, according to Roto (2006), there is a clear overlap between technology acceptance models (i.e. TAM) and user experience models when investigating the pre-requisites for mobile user experience and pre-requisites for the acceptance of mobile services. Different elements from user experience models have been used in research also to understand consumers in online markets. For example Constantinides (2004) investigated the influence of web experience on online consumers’ behavior. Also Fuchs et al. (2011) used UTAUT as a base but used user experience research as a source when investigating the intended use of mobile information services in tourism. Therefore the user experience research seems to be interdisciplinary in nature.
Roto (2006) revealed that mobile browsing user experience is affected by the user's internal state, context of use, mobile device, browser application (use of Internet on the device), network infrastructure (transfer of packages), and the services (websites) available. Arhippainen (2009) updated the model by Arhippainen and Tähti (2003), presented above, after investigating mobile users. The update included the following components in user experience: (1) user (e.g. demographics, values, prior experience), (2) social context (e.g. alone, with friends, with strangers), (3) cultural context (e.g. habits at home and in public) (4) physical context (e.g. changing or stable location, weather, season) and (5) product (e.g. usability, adaption, mobility). Moreover, according to Arhippainen (2009), user experiences can be subconscious, optimal or emotional and these experiences can be approached from subjective and collective perspectives.
Also different problem areas are affecting the online self-arrangement experience in travel. Anckar and Walden (2002) suggested a comprehensive summary of potential consumer problems in Internet travel bookings. The

28
suggested problem areas were: (1) time consuming task, (2) make price comparisons, (3) limited industry knowledge, (4) usability of websites, (5) locating websites of service providers, (6) technical problems, and (7) finding available hotel rooms and flights. The same authors, Walden and Anckar (2006), reassessed the potential problem areas later on, suggesting that some problems were decreasing (e.g. technical problems) but others had on the other hand increased (e.g. time consumption, uncertainty regarding what is a fair price).
Based on the suggested problems by Anckar and Walden (2002) and Walden and Anckar (2006), mobile user experience literature and in relation to the technology adoption theories as presented above, a research framework regarding the user experience of mobile trip arrangements will be presented in chapter 5.
2.4 Categorization of mobile adopters As shown in figure 2, there are differences between how individuals adopt innovations (Rogers, 2003). Studies in m-commerce, mobile Internet or mobile service adoption also suggest that there is a distinction between different types of mobile adopters. In a Finnish study with respondents between 9 – 34 years old the following five clusters were identified: (1) late adopting students, (2) late majority with minimal service usage, (3) teens without a phone, (4) early adopters using various Internet services, and (5) innovative opinion leaders based on their use of Internet and mobile services (Aarnio et al., 2002). Sell et al. (2011) carried out life-style segmentation of Finns and found five segments – (1) the skillful, (2) the efficient, (3) the trendy, (4) the basic and (5) the social. Okazaki (2006) profiled mobile Internet adopters in Japan and found that four clusters exist based on attitude towards the mobile Internet and demographical characteristics; (1) affluent single youth, (2) clerical office workers, (3) married housewives and (4) company executives. Vrechopoulos et al. (2002) found that consumer attitudes and behavioral patterns against m-commerce significantly differ between different European markets and between mobile shoppers and mobile users. Verksalo et al. (2010) also found differences in intentions between non-users and users of smartphone applications. Hjalager and Jensen (2012) identified five groups based on travelers’ propensity to use the Internet before, during and after a trip. The first group off-liners are marginal Internet users, the second group online planners mainly go online before the trip, the third group online explorers access online sources continuously before and during the trip, the fourth group online keepsakers collect and share information before and after the trip and the fifth group equilibrists are actively online in all travel phases. Furthermore, there are a few studies on segmenting the mobile phone market. For example, Kimiloglu et al. (2010) found the following mobile phone segments: (1) pragmatic consumers give high importance to the functionality, physical-attributes and convenience of a

29
mobile phone, (2) abstemious consumers find functionality and design important, (3) value-conscious consumers focus strongly on price, and (4) charismatic consumers represent a group that want it all and value for example technological superiority. However, to our best knowledge there are no existing categorizations of users of mobile travel and tourism services. Hence we will in chapter 6 present a systematic categorization of users of mobile travel services.
2.5 Business models With the breakdown of the Internet hype around the year 2000 the need to design and evaluate a proper business model was again highlighted (Margetta, 2002). There are many definitions of a business model. One of the most commonly used definitions of a business model is the one by Timmers (1998), “An architecture for the product, service and information flows, including a description of the various business actors and their roles; and a description of the potential benefits for the various business actors; and a description of the sources of revenues”. When comparing the definitions of Timmers and other definitions of business models Bouwman et al. (2008) proposed and evaluated a high-level framework for business models design for mobile ICT services. The STOF framework includes the following four elements:
In the (S) service domain the most crucial aspect is customer or end-user value. Service design is a description of the value that a service provider aims to offer to a specific target group of end-users or customers. Such components as context of use, user segments and end-user price should also be analyzed.
In the (T) technology domain the requirements are determined by the service domain. Technology design is a description of the fundamental organization of a technical system (e.g. technical architecture, application, device), which is needed to deliver the service offer exhibited in the service domain.
In the (O) organization domain resources and capabilities that enable the service delivery are key issues. Organizational design is primarily a description of the configuration of the value network and actors that are needed to deliver a particular service.
In the (F) finance domain financial resources are determined as the bottom line of most services to be designed. Finance design is a description of how a value network intends to capture monetary value from a particular service offer and how risks, investments and revenues are divided among the different actors of a value network.

30
The four business model domains are interrelated as shown in figure 5 and the aim is to create value for customers or end-users and service providers. We will in chapter 7 describe and evaluate three mobile services according to these four domains in the STOF-model.
Figure 5: The STOF-model (Bouwman et al. 2008, p. 36)
2.6 Summary We have here presented and discussed the different characteristics of diffusion of innovations, technology acceptance and value creation theories. Moreover, we discussed how these theories have contributed to the understanding of individual adoption and use of mobile services and mobile travel and tourism services. We gave an overview and showed the complexity of individuals’ perceived value (drivers and barriers) to adopt and use mobile travel and tourism services. The discussion was structured according to perceived added-value, perceived ease of use, social influence and perceived risk. Furthermore, we discussed the characteristics of user experience, categorizations of mobile adopters and business model elements.
Technology domain e.g. Service delivery system
Service domain e.g. Value proposition, Target group
Organization domain e.g. Division roles, Network strategy
Finance domain e.g. Revenue model
Value for customers
Value for service
providers
Business model
S
O
F
T

31
3. Methodology
The information systems (IS) discipline is a combination of management and computer science, where the main objective is to study information technology (IT) and its application in both organizations and society (Keen, 1980). Moreover, IS research has adopted different methodologies and approaches from other scientific areas such as organizational science, management science, economics and computer science. In fact, according to Keen (1991), reference disciplines should be seen as a major foundation and as a strength of IS research. According to Benbasat and Weber (1996), the diversity in IS research has been prominent because of (1) diversity of problems assessed (2) the diversity in the theoretical foundations and reference disciplines to account for IS phenomena and (3) the diversity in use of methods to collect, analyze and interpret data. Furthermore the same authors state that “an approach built around one or a few paradigms cannot account for all the problems or phenomena that occur within the IS research field, but it should be a controlled diversity”. A pluralist methodology approach in IS research should be used where it is possible (Mingers, 2001). M-commerce expands the concept of IS-research even further and it may even be difficult to group m-commerce under any specific discipline. In fact m-commerce articles are (Ngai and Gunaskarean, 2007) scattered across various journals in disciplines such as business, management, marketing, engineering, information technology (IT) and information systems (IS). IS and m-commerce are multidisciplinary in nature and obviously there is a wide variety of approaches to research the IS domain; indeed, issues that are addressed in m-commerce and mobile services can be addressed from different theoretical perspectives (as evident from chapters 1 and 2) and from different methodological perspectives.
Our first set of research questions (RQ1-RQ3) focus on exploring, describing and explaining why and how individuals adopt and use mobile travel and tourism services and the fourth research question focuses on building services based on the findings and evaluating the outcome from a holistic business model perspective. Hence, it seems obvious that we need multiple methodological perspectives to address our research questions properly. Next, we will briefly discuss a paradigm shift in IS research, natural social science vs. design science, and motivate our chosen methodological approaches according to an IS research taxonomy by Järvinen (2008).
3.1 Natural social science vs. design science There has been a major philosophical discussion in proper IS research regarding how to conduct IS research: positivism (natural social science) vs. interpretivism (design science). Generally speaking, the former primarily seeks to find what is

32
true and the latter seeks to create what is effective (the creation of effective IT artifacts). It can be argued that design science is context specific and thus its theory generating contribution is limited, as opposed to natural social science which seeks to test and generate theory (Hevner et al., 2004). One can also say that design science seeks to shape the world and natural social science seeks to explain and describe existing realities. According to Hevner et al. (2004), both paradigms are needed to ensure the relevance and effectiveness of IS research.
The taxonomy suggested by Järvinen (2008) presented in figure 6 gives a good overview of different IS methodological research approaches. We have positioned our different research projects (studies) within the taxonomy (see figure 6.). Our first set of research question (RQ1 – RQ3) aim at giving answers to ‘Why and How are things’ or converted into our research context ‘How and why individuals use mobile travel and tourism services’. Consequently, the primary research methods according to the taxonomy should be within natural social sciences. In theory-testing studies such methods as laboratory experiment, survey, field study, field experiment etc. are used and the theory, model or framework is either taken from the literature, or developed or refined for that study. In theory-developing studies such methods as grounded theory and case studies are included to find tentative theories. Studies 1, 3 and 5 represent survey research, study 2 a field experiment and study 4 a classroom (lab) experiment. Therefore, all these studies can according to the taxonomy be categorized under theory-testing approaches.
Our fourth research question (RQ4) focuses on the utility of innovations (drivers and barriers of mobile travel and tourism services in HTML5). In design science some criteria are used and some measurements performed to build and evaluate artifacts or innovations (e.g. a prototype of a mobile service). A researcher could ask: How effective is this innovation? Action research contains both building and evaluation in the same process (Järvinen, 2007). Studies 6 and 7 are action research and can be categorized both as building and evaluating innovations. Study 2 also evaluates trial mobile tourism services and can therefore also be categorized under evaluating innovations. Neither does study 2 use a strict theory-testing approach as unstructured observations and verbal communication are used to gather as much insight as possible from the field experiment.

33
Figure 6: The studies positioned according to a taxonomy of different IS methodological research approaches by Järvinen (2008).
As our primary research methods are survey, experiment and action research it seems essential to briefly describe these three methods. Moreover, we have used two advanced statistical techniques to analyze quantitative data collected in two of our studies and therefore we will also present these two techniques, namely cluster analysis and partial least square (PLS) analysis.
3.2 Survey research Survey techniques are used in both social sciences and professional disciplines and the technique has gained considerable credibility from its wide acceptance and use in academic institutions (Rea and Parker, 2005). The survey methodology is also widely used within the tourism research field to understand for example traveler behavior (Pan, 2010). According to Pinsonneault and Kreamer (1993), the purpose of surveys in IS research are: (1) to create quantitative descriptions of specific characteristics of the population under study, (2) to collect information by asking individuals questions that are structured and predefined and (3) to collect information about only a part of a population that can be generalized to an entire population. Moreover, the same authors claimed that survey research can be explorative, descriptive and explanatory in nature. Exploratory studies are usually
Study 6, 7Study 1, 3, 4, 5 Study 2

34
undertaken when we as researchers want to try out preliminary concepts and better understand a topic. Descriptive studies are usually undertaken to find out what is happening in a population. Explanatory studies are usually undertaken to test theory and to find causal relationships between variables. Newstedt et al. (1998, p. 553) proposed several reasons to conduct survey research, for example: simplicity to score and code, can be reused to compare responses over different times and groups, can test different theoretical propositions and can help qualitative research to quantify the findings.
We also use online surveys (study 3 and 5) which, according to Pan (2010), have some advantages to traditional surveys: they are (1) faster, (2) cheaper, (3) easier to implement, (4) more interactive, (5) better for open-ended questions and (6) can be tracked precisely. However, according to the same author, there are also some concerns: they might not represent the general population, there are technical uncertainties and the response-rates are usually lower. Next we will discuss cluster analysis, which will be used to systematically categorize users of mobile travel services based on data from an online survey.
3.2.1 Cluster analysis Cluster analysis is explorative in nature where the goal is to group objects into smaller sub-sets (Hair et al., 2010). According to Hastie et al. (2008, p. 501), “Cluster analysis, also called data segmentation, has a variety of goals. All relate to grouping or segmenting a collection of objects into subsets or clusters, such that those within each cluster are more closely related to one another than objects assigned to different clusters. An object can be described by a set of measurements, or by its relation to other objects. In addition, the goal is sometimes to arrange the clusters into a natural hierarchy. This involves successively grouping the clusters themselves so that at each level of the hierarchy, clusters within the same group are more similar to each other than those in different groups”.
Hierarchical cluster analysis is a common approach to cluster analysis. It can according to Hastie et al. (2008, p. 521), be divided into (1) agglomerative (bottom-up) and (2) divisive (top-down) analysis. In the agglomerative approach all relevant observations start at the bottom (in their own clusters). Thereafter clusters are merged as they proceed up in the hierarchy. On the contrary, divisive methods start at the top (in one cluster). Thereafter clusters at each level are recursively split into new clusters. We will in study 5 (see chapter 6) use the Ward method, which involves an agglomerative clustering algorithm. The Ward method is good to use with large samples (n>100) and when an exact optimal solution for a specific number of categories is not practical (Ward, 1963). Moreover, the Ward-method minimizes the within-cluster differences and maximizes the between-cluster differences and it should be used with the squared Euclidean distance measure.

35
Euclidean distance measures can be applied to both binary and continuous data (Clifford and Stephenson, 1975, p. 65). Squared Euclidean distance for binary data is “computed as the number of discordant cases. Its minimum value is 0, and it has no upper limit” whereas for interval data it is calculated as “the sum of the squared differences between the values for the items” (IBM SPSS Statistics, 2013). For example in medical research with binary data the Ward method with squared Euclidean distance measurement has been found successful when identifying appropriate groups (Alali et al., 2006). The Ward method and squared Euclidean distance measurement has also been used successfully with continuous data sets to identify typologies of travelers based on their rated importance of Internet access (Hjalager and Jensen, 2012). It should be noted that the Ward-method is biased toward equal-sized clusters and it tends to create clusters of small size. However, the Ward-method is in general regarded as a very efficient cluster approach (Statsoft Inc., 2013). More details on how cluster analysis was applied in our research will be presented together with the empirical findings of study 5 (see chapter 6).
3.3 Experimental research Experimental research is one of the most popular forms of information systems (IS) research. Two different types of experimental research can be identified, namely field and laboratory experiments. According to Harrisson and List (2004), field experiments are so named in order to draw a contrast with laboratory experiments. Moreover, they find that field experiments have the advantage that outcomes are observed in a natural setting rather than in a contrived laboratory environment. However, they continue that lab experiments can be better controlled and hence field experiments may suffer from contamination.
Researchers of mobile usability and mobile usage behavior have also shown concern that laboratory tests do not simulate the context the mobile device or services are aimed at and thus factors that may influence the performance by the users are not present in laboratory settings (Kaikkonen et al., 2005). Hence, Kaikkonen et al. (2005) tested whether there are substantial differences between conducting tests of mobile use in laboratory settings and in field settings. They could only find some minor differences, e.g. in time consumption and numbers of usability problems. Hence they concluded that field trials of mobile service use may not provide more validity to a study than a laboratory experiment. However, according to Roto et al. (2004), the field trial method is especially suitable for situations where not only interaction with a system is examined, but also end-user behavior and the context is investigated. Nevertheless, it seems that both field trials and laboratory experiments can provide valuable insights into the use of mobile services. Hence we will use both approaches in our research. The setup of our filed

36
trial will be discussed in detail in section 4.2 and our laboratory experiment will be discussed in detail in chapter 5. Next we will discuss partial least square (PLS), which will be used to analyze the theoretical platform in our laboratory experiment.
3.3.1 Partial least square (PLS) Structural Equation Modeling (SEM) has become one of the most important techniques of analysis in empirical research and it has been applied within several fields (Reinartz et al., 2009). Partial Least Square (PLS) was primarily developed as an alternative to CB-SEM (covariance-based structural equation modeling). Wold (1975) first presented the PLS analysis technique under the name NIPALS (nonlinear iterative partial least squares). PLS is now increasingly being used within several research fields such as behavioral sciences, business research (marketing and strategy) and management information systems, and as a valuable tool within corporate practice (Hensler, 2010). When researchers apply SEM, they must consider two types of methods: covariance-based techniques (CB-SEM) and variance-based techniques (PLS-SEM) (Hair et al., 2012). Moreover, the researcher needs to know when to apply which technique. PLS path modeling is very well suited for analyzing small samples (Chin and Newstedt, 1999). According to Reinartz et al. (2009), who compared PLS with CB-SEM techniques, PLS should be the method of choice for all situations in which the number of observations is lower than 250 and 100 observations can be sufficient to achieve acceptable levels of statistical power given a certain quality of the measurement model. PLS also works better when the focus is on prediction and theory development rather than on confirmation of theoretically indicated relationships.
According to Hensler (2010), PLS path models are formally defined by two sets of linear equations: the inner model and the outer model. The inner model specifies the relationships between unobserved or latent variables, while the outer model specifies the relationships between a latent variable and its observed indicators or manifest variables. In SEM models the inner model is often referred to as structural model and the outer model is referred to as measurement model. There are several rules of thumb to apply PLS-SEM techniques. Hair et al. (2012) summarized an extensive overview of guidelines for the researcher to consider: data characteristics (e.g. the sample characteristics, measurement scales), model characteristics (e.g. list of indicators, graphical description of inner model), PLS-SEM algorithm settings and software used, parameter settings for procedures used to evaluate results (e.g. bootstrapping, multi group comparison), outer model evaluation (e.g. composite reliability, AVE, cross loadings) and inner model evaluation (e.g. R2, effect size, path coefficient estimates). More details on how PLS

37
was applied in our research will be presented together with the empirical findings of study 4, which is a laboratory experiment (see chapter 5).
3.4 Action research The combination or differentiation between action research and design research has received considerable attention (e.g. Järvinen, 2007; Iivari, 2007; Iivari and Venable, 2009; Sein et al., 2011). As discussed above and according to Järvinen (2007) action research is similar to design science and includes both building and evaluating artifacts (here prototypes of a mobile services). Iivari (2007) on the other hand argues that design science and action research are not the same as they are for example historically and ontologically different. According to the same author, action research historically focuses on ‘treating’ problems in organizational contexts and design science in engineering focuses on designing artifacts. However, changes often come through development of IT artifacts and hence these two approaches are similar in character. Moreover, we are not only building and evaluating prototypes from a technological perspective but from a holistic business model perspective. Hence, principles of action research seem relevant to use in studies 6 and 7.
IS action research aims at improving real problems (needs) and expanding the scientific knowledge and it refers to a set of research approaches rather than a single research method (Baskerville, 1999). The same author identified different forms of IS action research approaches such as IS prototyping, soft systems methodology, participant observation and action learning. Action research is traditionally done in spiraling collaborative and interactive circles: plan, act, observe and reflect (Zuber-Skerritt, 2001). In traditional action research, the problems are of complex and practical character and usually very little is yet known about the problems (Perry and Gummesson, 2004). According to the same authors, the spiraling cycles are processes of action by a group of people who try to improve the identified problems and reports about what was found.
According to Baskerwille and Wood-Harper (1996), a number of problems confront the action researcher, namely: (1) lack of impartiality, (2) lack of discipline, (3) confusion with consulting and (4) its context bound nature. On the other hand, according to the same authors, these problems confront researchers using other methodological alternatives as well. Another problem with action research is that that its body of data often is broad and shallow rather than narrow and deep, which may lead to issues in analyzing the data and separating different components (Kock, 2004). An action research-based approach, nevertheless, fits well for instance with using the STOF-model to design business models for mobile services (Bouwman et al., 2008, p. 134). According to Hevner et al. (2004), “The dangers of a design-science research paradigm are an overemphasis on the

38
technological artifacts and a failure to maintain an adequate theory base, potentially resulting in well-designed artifacts that are useless in real organizational settings”. Hence it is extremely important to have a proper theoretical model as the base both when applying design science and carrying out action research. More details on how action research was carried out in our research process will be presented with the empirical findings of study 6 and 7 (see chapter 7).
3.5 Summary In table 1 is collected a summary of the research methodology, sample and core in each study. Table 1 also shows how each study supports each chapter and hence to which research question the studies primarily contribute to (see also section 1.5).
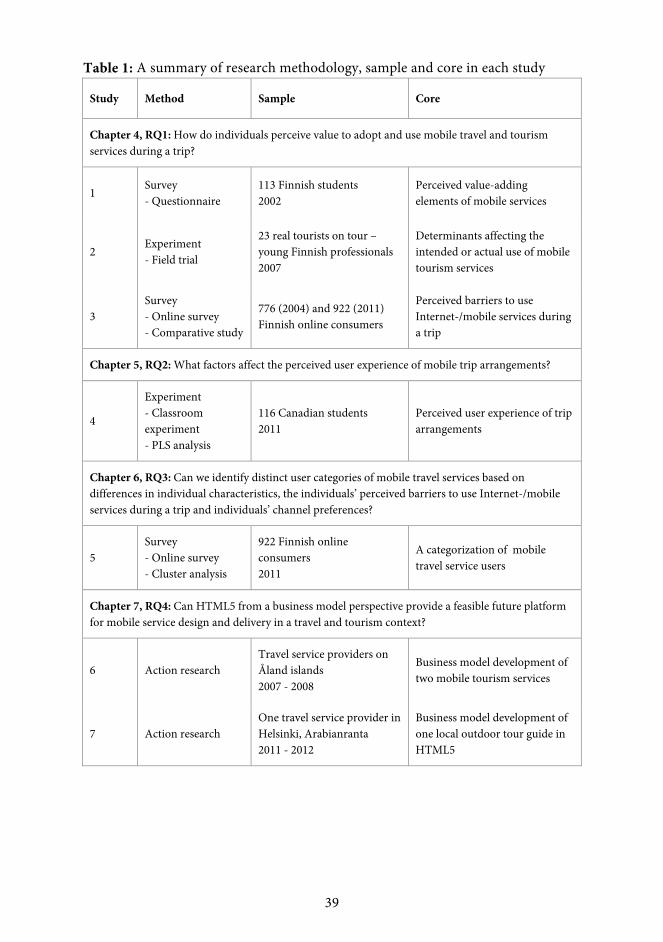
39
Table 1: A summary of research methodology, sample and core in each study
Study Method Sample Core
Chapter 4, RQ1: How do individuals perceive value to adopt and use mobile travel and tourism services during a trip?
1 Survey - Questionnaire
113 Finnish students 2002
Perceived value-adding elements of mobile services
2 Experiment - Field trial
23 real tourists on tour – young Finnish professionals 2007
Determinants affecting the intended or actual use of mobile tourism services
3 Survey - Online survey - Comparative study
776 (2004) and 922 (2011) Finnish online consumers
Perceived barriers to use Internet-/mobile services during a trip
Chapter 5, RQ2: What factors affect the perceived user experience of mobile trip arrangements?
4
Experiment - Classroom experiment - PLS analysis
116 Canadian students 2011
Perceived user experience of trip arrangements
Chapter 6, RQ3: Can we identify distinct user categories of mobile travel services based on differences in individual characteristics, the individuals’ perceived barriers to use Internet-/mobile services during a trip and individuals’ channel preferences?
5 Survey - Online survey - Cluster analysis
922 Finnish online consumers 2011
A categorization of mobile travel service users
Chapter 7, RQ4: Can HTML5 from a business model perspective provide a feasible future platform for mobile service design and delivery in a travel and tourism context?
6 Action research Travel service providers on Åland islands 2007 - 2008
Business model development of two mobile tourism services
7 Action research One travel service provider in Helsinki, Arabianranta 2011 - 2012
Business model development of one local outdoor tour guide in HTML5

40
4. The individuals’ perceived value (RQ1) In this chapter we will present findings from three studies, which aim at giving some answers to our first fundamental research question (RQ1: How do individuals perceive value in order to adopt and use mobile travel and tourism services during a trip?). The first study (research paper 1) was undertaken in the early m-commerce era (2002) to better understand the main value-adding elements of mobile commerce and the primary usage settings (fixed vs. mobile) for mobile services, e.g. simple trip arrangements. We selected a sample of students for this study because students usually belong to a generation that is most likely to adopt and use new technology-based innovations and students are similar in characteristics. The study provided us with some early insights relating to the main reasons for the individuals’ interest in different mobile services, suggesting that mobility indeed appeared to be the key driver for individual adoption and use of mobile services, e.g. for simple trip arrangements. Hence, it seemed logical to develop and evaluate mobile services aimed at travelers on the go (in mobile settings). Therefore, our second study (research paper 2) was a field trial in 2007 with incoming tourists to a destination. The results from our second study showed barriers to the use of three mobile tourism services aimed at travelers on tour (in mobile setting). Hence our third study concentrated on following up earlier proposed barriers to adopt and use Internet-/mobile services, especially in mobile settings. The data was collected in 2011 and compared to data from 2004 to see if significant changes in perceptions have happened over time. We concluded that barriers still must be taken into account in development of mobile travel and tourism services, at least in order to gain an even wider consumer adoption during trips (mobile settings).
Next we will start by presenting the first study and its findings in more detail. Thereafter we present studies 2 and 3 and the findings from them.
4.1 Mobility: The basis for value creation in mobile commerce? The first study was undertaken in 2002 to 2003. At that time there were almost no studies in the public domain directly related to consumer behavior and the wireless Internet. Moreover, as noted at that time by Keen and Mackintosh (2001), the demand-side of m-commerce is a search for value, but the same authors pointed out that a pure transformation of services into mobile services does not necessarily make them value-adding from a customer’s point of view. Consequently, there was a need to build an understanding of the elements and special features of wireless digital channels that are value-adding from the consumer’s point of view. Therefore, we found it highly relevant to look into value creation in mobile commerce in our first research project.

41
It should be noted that the 2G/2.5G mobile phones at that time were quite different from today’s 3G/4G smartphones and hence the findings should be viewed in relation to that. However, this project was the starting point of this research and has given the primary direction for our further research. Moreover, the used and evaluated research framework, originally developed by Anckar and Dincau (2002) and presented earlier in section 2.3, has been widely referred to in mobile service adoption research. It should also be noted that the Finnish mobile market was regarded at that time as a highly advanced market in Europe in terms of the adoption and use of advanced mobile services. In fact, according to Walden et al. (2007), a large range of different services for mobile devices were offered in the period 1999-2006 in Finland, e.g. ring tones and icons, instant messaging and WAP-based mobile banking, lottery, m-commerce and travel services (in 1999) to games and location-based services later on and mobile television (in 2005). Moreover, our aim was to focus on the value aspects of mobile services and where the mobile platform may win over the fixed Internet, rather than on novelty issues with the technology at that time.
We will therefore here present our early exploratory insights into the true value proposition of mobile commerce. In doing this, we especially focused on understanding the consumers’ perceived value of mobility, or in other words (as defined in section 1.3) the possibility to access, produce and send information, products and services from anywhere, any time - irrespective of the user’s location. In line with this, four interrelated topics were covered in this study:
(1) Primary services: To what extent are different mobile services likely to gain popularity among consumers in the early years of m-commerce, and which are the likely success applications? (2) Value dimensions: Which are the main value-adding features of mobile commerce, and are the perceived key value dimensions of wireless channels related to actual mobile use? (3) Value settings: Which are the primary usage settings for mobile services, and will these services actually be used primarily in mobile situations? (4) Channel preferences: Which electronic channel is the preferred one for accessing various services that commonly are hypothesized as being highly suitable for mobile commerce?
4.1.1 Value dimensions The research framework originally developed by Anckar and Dincau (2002) (presented in section 2.3) distinguishes between two types of value: wireless value and mobile value. As discussed earlier different mobile value elements and different wireless elements are categorized in the framework. The mobile value elements are: (1) time-critical arrangements, (2) spontaneous needs, (3)

42
entertainment needs, (4) efficiency ambitions and (5) mobility-related needs. The wireless value elements are: (1) only access device, (2) greater familiarity with mobile devices and (3) wireless convenience.
4.1.2 Value setting As suggested by the main categorization of value (wireless vs. mobile) a potentially important distinction as we analyze the value creation process in m-commerce is the difference between usage in mobile and fixed settings. As also discussed in section 1.3 fixed settings represent situations where we typically have access to desktop computers and high-speed Internet connections. First and foremost, such fixed settings are (1) the home and (2) the office/school. Mobile settings represent situations when we are ‘on the move’, i.e. traveling, wandering or visiting (Kristoffersen et al., 2000), and thus do not - as a rule - have access to the wired devices that we regularly use (or at least have slower and more unstable connections). Mobile settings are situations when we are, for instance, (1) sitting in restaurants/bars/cafés or (2) in transportation. Likewise, we are mobile while (3) walking in the street or while (4) on a journey abroad or (5) at the weekend/summer house. In all these situations, we typically do not have access to fixed Internet connections or even advanced computers. Mobile settings, therefore, represent mobile value in the framework and fixed settings represent wireless value in the framework. We therefore also investigated whether mobile services, which we hypothesized to be value-adding primarily in mobile settings, actually will be used primarily - or even exclusively - when the user is mobile.
4.2 The empirical study The research project used a survey study technique and data was collected among 113 Finnish polytechnic and university students taking part in courses on e-commerce. In April 2002 quantitative data were collected using a self-administered questionnaire in which the students were asked to state the likelihood that they would use different mobile services and to indicate their primary reasons for their interest in each of the mobile services. In addition, the students who indicated that they might be interested in a certain service were asked to state the likelihood that they would use it in certain settings and locations. Finally, the students were asked to indicate the electronic channel that would be their primary choice for using the services subject to investigation. Of the respondents, 75 (66,4%) were females, and 38 (33,6%) males. Nearly all (97,3%) reported that they visit the Internet every day or several times per week. 44,2% had, at least at some point, used the Internet through a mobile device. All of the students reported that they own a mobile device (GSM-phone: 90,3%; WAP-enabled phone: 14,2%; GPRS-phone: 6,2%). We

43
nevertheless noted that due to the obvious limitations of using a small convenient sample of students, care should be taken not to overgeneralize from the findings. Students are likely to differ from the general population in many ways. On the other hand students are, generally speaking, eager online consumers, which make them highly interesting to study.
4.3 The findings and discussion
4.3.1 Value dimensions The findings clearly suggested that mobile value constitutes a much greater driver for consumer adoption of m-commerce than wireless value, with none of the wireless value dimensions being seen as especially important by the surveyed students (see table 2). This finding also suggested that the distinction between wireless and mobile value dimensions is relevant as we speak of value creation in m-commerce. The ability to satisfy spontaneous needs stood out as the single most important value dimension in m-commerce, closely followed by the ability to address time-critical needs and arrangements. The possibility to satisfy mobility-related needs was also widely recognized, but it was not the main driver for adopting any of the services investigated. To make simple travel arrangements showed greatest importance for spontaneous needs, time critical arrangements, efficiency ambitions and mobility related needs.
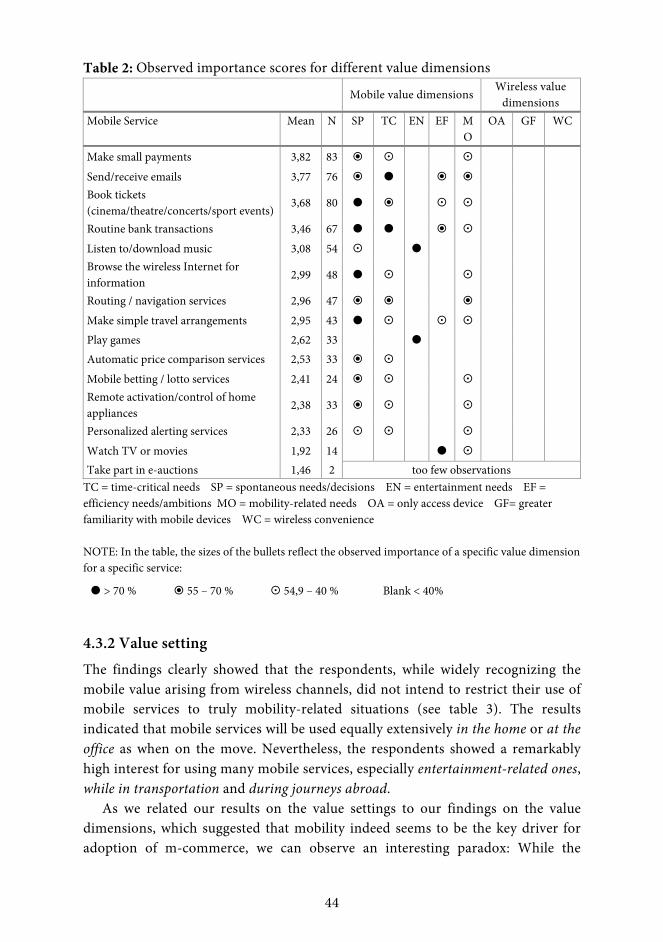
44
Table 2: Observed importance scores for different value dimensions
Mobile value dimensions Wireless value dimensions
Mobile Service Mean N SP TC EN EF MO
OA GF WC
Make small payments 3,82 83 Send/receive emails 3,77 76 Book tickets (cinema/theatre/concerts/sport events) 3,68 80
Routine bank transactions 3,46 67 Listen to/download music 3,08 54 Browse the wireless Internet for information 2,99 48
Routing / navigation services 2,96 47 Make simple travel arrangements 2,95 43 Play games 2,62 33 Automatic price comparison services 2,53 33 Mobile betting / lotto services 2,41 24 Remote activation/control of home appliances 2,38 33
Personalized alerting services 2,33 26 Watch TV or movies 1,92 14 Take part in e-auctions 1,46 2 too few observations
TC = time-critical needs SP = spontaneous needs/decisions EN = entertainment needs EF = efficiency needs/ambitions MO = mobility-related needs OA = only access device GF= greater familiarity with mobile devices WC = wireless convenience NOTE: In the table, the sizes of the bullets reflect the observed importance of a specific value dimension for a specific service:
> 70 % 55 – 70 % 54,9 – 40 % Blank < 40%
4.3.2 Value setting The findings clearly showed that the respondents, while widely recognizing the mobile value arising from wireless channels, did not intend to restrict their use of mobile services to truly mobility-related situations (see table 3). The results indicated that mobile services will be used equally extensively in the home or at the office as when on the move. Nevertheless, the respondents showed a remarkably high interest for using many mobile services, especially entertainment-related ones, while in transportation and during journeys abroad.
As we related our results on the value settings to our findings on the value dimensions, which suggested that mobility indeed seems to be the key driver for adoption of m-commerce, we can observe an interesting paradox: While the

45
respondents certainly did not rate wireless convenience as an important reason for using mobile services, their stated intentions in terms of settings of use would indicate that they regard the wireless convenience and efficiency in performing simple transactions to be, if not valuable, at least practical.
Table 3: Observed interest scores for different value settings
Mobile settings Fixed settings
Mobile Service Mean N RE TR AB ST WE HO WO
Make small payments 3,82 83 Send/receive emails 3,77 76 Book tickets (theatre/concerts/sport events) 3,68 80
Routine bank transactions 3,46 67 Listen to/download music 3,08 54 Browse the wireless Internet for information 2,99 48
Routing / navigation services 2,96 47 Make simple travel arrangements 2,95 43 Play games 2,62 33 Automatic price comparison services 2,53 33 Mobile betting / lotto services 2,41 24 Remote activation/control of home appliances 2,38 33
Personalized alerting services 2,33 26 Watch TV or movies 1,92 14 Take part in e-auctions 1,46 2 too few observations Aggregated 2,82 44
RE = In restaurants/bars/cafés HO = at Home TR = In transportation WO = at Work/School AB = Abroad ST = In the street WE = at weekend/summer house NOTE: In the table, the sizes of the bullets reflect the observed importance of a specific value dimension for a specific service: > 70 % 55 – 70 % 54,9 – 40 % Blank < 40%
4.3.3 Primary services and channel preferences E-mail, theatre/concert ticket reservations, and routine bank services stood out as the most likely success applications in the survey. To make simple travel

46
arrangements didn’t stand out as a primary service (ranked 8th in interest) that would be used on a mobile device. Thus no particular usage setting stood out for simple travel arrangements (See table 4). But more importantly the mobile device was the preferred channel by a majority of the respondents (58,8%) who showed a willingness to use simple mobile travel arrangements. Moreover, for 9 of the 15 investigated mobile services, a mobile device was rated as the primary channel choice by an overwhelming majority of the respondents (see table 4). The value of accessing services through an interactive digital TV was not acknowledged by the respondents, a finding which partly can be explained by the fact that the iDTV still in 2002 was an emerging technology.
Table 4: Observed channel preferences for the services subject of investigation Mobile Service Mean N Stationary
PC Mobile device
Interactive digital TV
Make small payments 3,82 63 15,9 84,1 0,0 Send/receive emails 3,77 65 61,5 33,8 4,6 Book tickets (theatre/concerts/sport events) 3,68 63 73,0 27,0 0,0 Routine bank transactions 3,46 54 59,3 38,9 1,9 Listen to/download music 3,08 42 52,4 47,6 0,0 Browse the wireless Internet for information 2,99 41 29,3 70,7 0,0 Routing / navigation services 2,96 38 10,5 89,5 0,0 Make simple travel arrangements 2,95 34 41,2 58,8 0,0 Play games 2,62 28 32,1 67,9 0,0 Automatic price comparison services 2,53 25 28,0 72,0 0,0 Mobile betting / lotto services 2,41 18 22,2 77,8 0,0 Remote activation/control of home appliances 2,38 28 7,1 92,9 0,0 Personalized alerting services 2,33 24 16,7 83,3 0,0 Watch TV or movies 1,92 10 40,0 40,0 20,0 Take part in e-auctions 1,46 2 too few observations
Aggregated 2,82 36 34,9 63,2 1,9 NOTE: These figures represent the ratings only for the respondents who indicated a willingness to use a service (responded yes, definitely or likely)
4.4 Conclusion The first research project helped to develop our understanding of the mobile Internet as a medium for commercial use in the B-to-C arena. Although just exploratory in nature, the study provided us with some early insights relating to the main reasons for individuals’ interest in different mobile services, suggesting that mobility indeed appears to be the key driver for consumer adoption of mobile

47
services. As presented earlier also more recent studies have confirmed that mobility is a significant driver of consumer adoption and acceptance of mobile services, e.g. mobile ticketing (Mallat et al., 2008), mobile travel services (Bouwman et al., 2007) and mobile social network services (Nikou and Bouwman, 2013). This study, nevertheless, not only identified mobility as a key value driver, but from a practitioner’s point of view it identified the features and add-on services needed to support the provision of mobile value to consumers. For example designing and marketing mobile services for simple travel arrangements should focus on one or several of the following consumer needs; spontaneous needs, time critical arrangements, efficiency ambitions and mobility-related needs. Moreover, simple travel arrangements stood out as highly potential services, with regards to channel preference. This result, although limited to students’ opinions, showed early on the potential of the mobile channel for simple travel arrangements and other proposed mobile services.
4.5 Possible determinants affecting the use of mobile tourism services As our first study indeed suggested that mobility is the primary driver for consumer adoption of mobile services and simple travel arrangements stood out as highly potential services, it seemed logical to develop and evaluate mobile services aimed at travelers on the go. Our second study was, therefore, undertaken in the fall of 2007 and was part of the New Interactive Media (NIM) project, with funding from the European Union and the regional government of the Åland islands. NIM was a development program of increasing the knowledge, production and use of new interactive media on the Åland Islands in Finland. Within the project several mobile applications were developed for the travel and tourism sector on the islands. A field trial was conducted with three of these services and incoming tourists to the Åland Islands using their own mobile phones. The main aim of the study was to better understand possible determinants for individuals’ intended or actual use of mobile tourism services.
4.5.1 Description of the designed services In the research project the mobile services were labeled destination services, (1) a travel information portal, (2) a guide service and (3) a travel community service; we referred to them as mobile tourism services as they primarily targeted incoming tourists and not local inhabitants (see figure 7 for interfaces of the trial services).
The travel information portal (MobiPortal) was a mobile version of an information portal (www.visitaland.com). The portal included search for events, restaurants etc., a map service and facts about the Åland Islands.

48
The mobile travel community (TraveLog) was aimed at incoming tourists to share experiences from the Åland Islands with each other. The virtual meeting place included stories, pictures, tips and interactions.
The mobile guide service (MobiTour) was a virtual tour of an attraction (the Bomarsund fortress) which was downloadable/streamable to the visitors’ own devices. The guide included voice and/or video guidance.
MobiPortal TraveLog MobiTour
Figure 7: Interfaces of the three trial services.
The services were planned to implement a common logic namely the Braudel
rule: freedom becomes value by expanding the limits of the possible in the structures of everyday life (as presented by Keen and Mackintosh, 2001, p. 31). The rule was then translated into a tourism setting which means that the tourists’ real or perceived need has to be met by the services and, moreover, the services need to profoundly change the way a tourist does or experience something – and to the better (Harkke, 2007). Consequently the three services were designed to expand the limits of what a tourist can do on the Åland Islands by enabling (1) instant access to local information, (2) enhanced communications with other people with the same interests and (3) experience better access to certain unmanned attractions. Especially features that enhance the customer experience are commonly seen as key drivers for successful customer satisfaction (Pine and Gilmore, 1999). Moreover, the trial services were designed to support the decision making and experience enhancement of a tourist in all facets of a trip: pre-trip, during a trip (on-site) and past-trip. The focus in our study was on the on-site facet as the experiment was performed as a field trial in a local destination with incoming tourists.
4.5.2 Possible determinants Based on extensive review of technology acceptance theories, diffusion of innovation theories, value creation theories and other relevant theories we proposed the following determinants for the study: mobile value and service value (perceived added-value), perceived ease of use, perceived risk and social influence. Also see section 2.3 for a detailed state of the art literature review of the

49
individuals’ perceptions to adopt and use mobile travel and tourism services. For this study we also identified possible tourist characteristics that may influence the intended or actual use of mobile tourism services directly or through other determinants. Tourist characteristics Demographic variables such as gender and age are commonly used in consumer research. It has been shown that gender and age may through other constructs influence the intended adoption behavior of mobile services, e.g. mobile chat services (Nysveed et al., 2005a). According to the theory of planned behavior (Ajzen, 1991), control beliefs constitute the individuals’ belief that they have the necessary resources and knowledge to successfully cope with an innovation. For example skills or earlier experience of using mobile services may influence the adoption intentions of new mobile services. According to Buhalis (2003, p. 131), “when discussing consumer buying behavior in tourism and the impact of ICTs a clear distinction should also be made between experienced and inexperienced travelers” (travel experience). The first group mainly feels more comfortable organizing their holidays and thereby taking advantage of ICT tools available to them more easily (Buhalis, 2003). Moreover inexperienced destination travelers usually need a lot more local information (destination experience). Innovations also need to comply with the existing values and needs of an individual (Moore and Benbasat, 1991), in this case while the individual is on tour. For example the values of the individual may differ depending on the type of travel they are on, e.g. leisure or business, where the former ought to call for services with enjoyability rather than efficiency. In consumer markets mobile services also compete against existing and constantly developing alternatives. Thus consumer habits are usually quite slow to change from known alternatives, e.g. for mobile payment services (Dahlberg and Öörni, 2007). People are commonly risk-averse. However, that is not true for everyone as we have individuals who are quicker to adopt new ideas than others (Rogers, 1995). Such personal characteristics make diffusion of innovations possible. As discussed in section 2.1.1, personal innovativeness is the willingness of an individual to try out new technology-based services. Individuals’ limited mobile device readiness has also been seen as a great negative influence of the usage of more advanced mobile services in the early stages of mobile commerce (Carlsson et al., 2004). We linked demographic variables (age and gender), experience of mobile services, travel experience, destination experience, type of travel, personal innovativeness and user device readiness with tourist characteristics as they illustrate key characteristics of an individual that may influence directly or through other constructs the intended or actual use of mobile tourism services. In

50
table 5 we have shortly summarized each possible determinant identified prior to this study.
Table 5: Possible determinants for the intended or actual use of mobile tourism services
4.5.3 The field trail setup According to Repo et al. (2006), TAM theories and similar approaches have little relevance in the real product development process. The same authors argued that product developers need first-hand user feedback in form of personal interaction. Their arguments were based on experiences from piloting a mobile blog service for tourists, where the user gave direct feedback to the developers orally and through survey forms. Involving the consumer in the development process of products or services can be very rewarding indeed (Von Hippel, 2005). With the theoretical foundation (Table 5) in mind and with the idea of directly interacting with the visitors to receive direct and spontaneous feedback to the product developers we designed a field trial which not only included questionnaire data collection but also oral and observation data collection.
The trial was conducted during a conference in Mariehamn the capital of the Åland Islands 21 – 22 of September 2007 in the legislative assembly hall, where the main activities of the conference were held. The conference called WestCongress2007 was arranged by the local Junior Chamber of Commerce organization. Members of similar organizations in the western regions of Finland were invited to attend the conference. A total of 191 participants had registered in advance for the conference. The trial was coordinated in cooperation with the conference director who offered assistance with for example stand preparations
Mobile value: the degree to which a person perceives value arising from the mobility of the mobile medium Service value: the degree to which a person perceives value arising from the essence of the service. Ease of use: the degree to which a person believes that using a particular service would be free of effortRisk: the degree to which a person feels uncertainty regarding possible negative consequences of using a service. Social influence: the degree to which an individual perceives that important others believe he should use the service Tourist characteristics: Demographics, Experience of mobile services, Travel experience, Destination experience, Type of travel, Personal Innovativeness, Personal device readiness

51
and informing the participants in advance of the mobile services in conference guides, online and during registration.
Our stand was set up at the main entrance of the building where the main activities were held. The main entrance was the place that we anticipated would be the busiest during the first parts of the conference when we were invited to promote and demonstrate the trial services. The stand was equipped with a video projector showing animated picks of the services and also flyers, tables and chairs for comfortable discussions with the conference attendants.
At our stand the conference participants were informed in more detail of the services. The services were also demonstrated, which gave us a chance to observe peoples’ initial reactions. The stand also provided a good place to freely discuss different issues regarding the services with the participants. Participants filled out (voluntarily, at the stand) a questionnaire which also was an agreement to contact them by e-mail after the conference to follow up on their own independent use of the mobile services during their stay on the Åland Islands. Each phone and operator connection (device readiness) was checked by the stand representatives to ensure that the participants actually were able to use their own phones for the services.
In the questionnaire the participants were asked to fill out questions according to the constructs defined for tourist characteristics (see table 5):
Demographics: Gender and age Experiences of mobile services: Commonly used services were listed with
the alternatives: [1] continuously using [2] have tried [3] have never tried. Travel frequency: How often they travel for more than one day: [1] several
times a month [2] ~ once a month [3] 3 – 9 times a year [4] < three times a year.
Destination experience: If they have visited the Åland Islands before: [1] Yes, > 5 times [2] Yes, 2 – 5 times [3] Yes, once [4] Never and their knowledge of the Åland Islands [1] Excellent [2] Good [3] Satisfactory [4] Not at all.
Type of travel: if they consider WestCongress2007 to be: [1] a leisure trip [2] a business trip.
Personal Innovativeness: Three statements were proposed on a five point scale: [5] definitely agree - [1] definitely disagree: I want to get local information through my mobile phone when… [1] I plan my program e.g. in the hotel [2] I’m on my way to a local place with e.g. bus and [3] I get acquainted with a local place on foot.
For the follow up a semi-open web questionnaire was used to receive feedback on the participant’s actual use of the three services. The web questionnaire was sent to the participants by e-mail two days after the conference finished ensuring

52
that their service experience would be fresh in their minds. A reminder was sent a week later. The participants were asked to state for each of the three services whether they had used it or not. Their answer was followed up with an open question on their primary motivation for using or not using the service. In the analysis the answers were interpreted according to the theoretical foundation on possible determinants for the intended or actual use of mobile tourism services. Additionally, the participants were asked to state what kinds of problems they had run into if problems occurred. The participants were also to state on a five point Likert scale ([5] Yes, definitely - [1] Definitely not) for each service what their intentions are to use similar services in the future while visiting a destination. Finally the participants were free to comment on the service.
4.5.4 Experiences from the trial The individuals who signed up in advance for the conference were 191 in total. However, about thirty persons didn’t register. We estimated that about 50 persons visited our stand. Out of these 50 persons voluntarily and without a prize draw 23 filled out the questionnaire at the stand and allowed us to contact them after the conference for the follow up. 20 out of 23 persons had a mobile phone and an operator connection (device readiness) that allowed them to use the trial services. Thereby it was relevant to send the follow up by e-mail to these 20 persons. Two mail addresses did not respond. Out of the 18 persons that the follow up went to 9 answered it. Of the 23 persons who filled out the questionnaire 12 were men and 11 women. The average age was 35.
Most people who visited the stand expressed a positive response. Comments like “that seems practical” and “I already use mobile news services so why not use these services” were given. MobiPortal was bookmarked by a couple of stand visitors and hence awakened concrete interest. A few persons also praised the visual design of the mobile tour guide. However, even though many participants expressed a general interest in the services it is also a fact that no one reported that they actually used the services on trial. None of the nine respondents to the follow up had on their own used any of the trial services. All reported that their primary motivation for the no-use was that they didn’t experience a need to use the services during their stay at the conference on the Åland Islands. Our further experiences we structure according to the theory presented: Tourist characteristics, perceived added-value (mobile and service value), perceived ease of use, perceived risk and social influence. Tourist characteristics The primary target group for the three mobile services on trial was visitors to the Åland Islands (participants of WestCongress2007). When we analyzed the trial

53
group it can be said that it was both right and wrong. It ought to be the right group based on the fact that most participants who filled out the questionnaire (N=23) had a device readiness (87%) that allowed the services to be used on their own phone. The group already continuously used mobile services to a great extent (66%) and thereby the barrier to take on new services ought to be lower. Their knowledge of the Åland islands was only satisfactory or none (66%) which ought to create a need for local information. Also their willingness to get local information in different situations (74%) with their mobile phone was positive. Moreover, the group was an experienced group of tourists (66%), which generally is found to be positive regarding usage of information and communication technology. Almost all (96%) felt the WestCongress2007 to be a leisure trip, which ought to call for services that support enjoyment. On the other hand, the group had a readymade program during the weekend and we observed that they also asked their hosts for tips and directions. The need for local information and guidance may therefore have been satisfied. Moreover they had their conference group that they met continuously and shared their experiences with. In fact in the follow up all respondents experienced a lack of need for the trial services. Consequently the service value of the three trial services was already met by other means of interaction. Perceived added-value The analyses of the trial group indicated that the same people but with another purpose to visit the Åland Islands could be a potential user group for the services on trial. The added-value of using mobile services is, as discussed in the literature review, very situation-based. Moreover, the proposed value needs to comply with the user’s existing on-tour values. In this case self-arrangement values by using a mobile phone necessarily didn’t exist due to the package-tour set-up of the conference. Consequently the type of travel, as package or non-package, is therefore to be taken into account as an influence on the value aspect of mobile tourism services. A non-package tour ought to comply better with an individual’s values of self-arrangement/-service. Nevertheless customized mobile services aimed at specific needs of packaged groups such as conference attendants may indeed generate value for the end user. Moreover, as presented above, most people who visited the stand expressed a positive response. Perceived risk Questions on the prices of the trial services were the most frequent ones asked during the trial. Therefore it seemed that the financial risk was carefully accounted for by the consumers in their intentions to use a mobile tourism service. In this trial the services were free of charge and the transaction costs didn’t seem to be a

54
barrier. Still, our experience from this trial is that the service price and potential transaction costs must be transparent to the consumers to minimize uncertainty of the monetary layout. The monetary aspect may be even more important for foreign visitors as the transaction cost may rise noticeably due to the setup of international roaming agreements between operators. Perceived ease of use Product developers need to remember to look at things from a consumer perspective. For example in this trial the consumers thought the trial services didn’t work because of an operator problem. In the eyes of the consumer this means a malfunctioning product which is useless. Similarly, long download times to access a service for a temporary use in a mobile setting may cause the consumer to view the service as too time consuming to take into use. In fact, some conference attendants were spontaneously skeptic about the long download times for MobiTour. Neither can we expect all travelers to install services in advance (e.g. before the trip or pre-site), as according to Kaasinen (2005), “users are not willing to spend their time on something that they do not get immediate benefit from”. Consequently the ease of use aspect must be highlighted by product developers as mobile tourism services may be only temporarily taken into use (accessed, installed and learned how to use) and used during a visit to a destination or a local place. Social influence People were moving around in groups but based on our follow-up, stand observations and discussions we didn’t experience any concrete indications of social influence, neither negative nor positive, towards the trial services.
4.5.5 Conclusion Many showed a genuine interest towards the trial services but no-one actually used the trial services on their own due to a lack of perceived need. Based on the experience from the trial we argue that the type of travel as non-package or package tour is an important underlying determinant to the perceived added-value of mobile tourism services. A non-package tour ought to comply better with an individual’s values of self-arrangement /-service. Similar results have also been found by Grønflaten (2009b), who among several variables distinguished between independent travelers and travelers on an organized tour, in predicting traveler’s (visitors to Norway) choice of information sources and channels. In that study it appeared that independent travelers had a greater need to do their own research about the trip and the destination than organized travelers, and the Internet is a channel that supports this. In fact travel style (independent vs. organized travel)

55
was, together with age and nationality, the most significant predictor in that study. Hence independent travelers on tour seem to be the main target group for mobile tourism services. Nevertheless, customized mobile services aimed at specific needs of organized groups such as conference attendants may indeed generate added-value. In fact, Sigala (2006) found customization of mobile phone services to be a vital part of effective mobile commerce strategies. Moreover, we argue that the ease of use of mobile tourism services may be even more important than for other types of services as these services may be only temporarily accessed and taken into use in different field settings on-site or during a trip. Furthermore, the financial risk (perceived service fees and transactions costs) of using a mobile tourism service is carefully accounted for by the traveler on tour. In fact, Bader et al. (2012) verify our observation that the cost (equipment cost, access cost, and possible transactions fees) has a negative influence on the actual use of mobile tourism services. Also Fuchs et al. (2011) confirm our observation that mobile information services in tourism are perceived by individuals as provoking significant cost for usage. Consequently, a mobile tourism service may be positively viewed as ‘nice technology’ by a traveler on tour (in mobile settings) but if the service doesn’t: (1) comply with the traveler’s on-tour values, (2) is perceived hard to take into use (access, install and learn) and use and/or (3) is perceived a financial risk, then the traveler is likely to not adopt and use the service.
The results of the study are limited as our experience was based on only one field trial with 23 participants. The recruitment of trial users could also have been done differently. According to Kaasinen (2005), users should ideally be allowed to use the trial services freely but it may, as in this trial, lead to a no usage. Therefore some rules on minimum trial times should be set up in similar trials as this, where usage in addition to the minimum can be considered as real usage. Logs can also be helpful in data collection to receive prompt service usage data in addition to follow up data from the respondent. Moreover, phone interviews may give more extensive answers and better response rates in a follow-up data collection of the same character as in this trial. On the other hand, we received first-hand user feedback from incoming tourists in an authentic on-site context, which makes the insights from this trial valuable.
4.6 Perceived barriers of Internet-/mobile services during a trip Our first study (see section 4.1) indeed indicated that mobility seemed to be the main driver for m-commerce and to make simple travel arrangements stood out as highly potential mobile services. However, study 2 (see section 4.5) showed barriers to the use of three mobile tourism services aimed at travelers on tour (in mobile setting). Moreover, it should be noted that several barriers to a mass market adoption have been highlighted since the early days of m-commerce. See

56
section 2.2.4 for a description of the proposed barriers to adopt and use mobile services in general and in a travel and tourism context specifically.
As discussed in the introduction, the mobile-travel industry sees a tremendous growth at the moment, which indicates that most consumer concerns have been overcome. But based on the literature review and our own empirical results above it seemed essential to follow up on earlier proposed consumer-perceived barriers of m-commerce and mobile interaction in order to understand if the barriers really are overcome or whether there still are barriers that may hinder a wider consumer adoption, especially in mobile settings (during a trip).
Already in 2004 we conducted an online survey which included questions on perceived barriers but the results from this data collection were never properly analyzed nor published. It, therefore, seemed relevant to follow up on this survey and we repeated the online survey in 2011 in order to investigate the following proposed barriers to use Internet- /mobile services, especially during a trip:
Entry costs (e.g. expensive devices) Usage costs (e.g. connection costs, service charges) Security issues (worry about personal information and/or payment
transactions) The technology is not sufficient (e.g. bad usability) Relevant services are missing or the traveler is not aware of them
4.6.1 The empirical study The primary data needed for the surveys was collected through a self-administered web-questionnaire, which was linked from the website of a cooperating company within the lodging sector in Finland. For the first data collection in November 2004 the questionnaire received a total of 766 answers. The second data collection in June 2011 the questionnaire received a total of 922 answers. Of the respondents in 2004, 33% were males and 67% were females. The average age of the respondents was 34 years; the youngest was 18 years old and the oldest 67 years old. The respondents were all Internet adopters since the questionnaire was filled out on-line and nearly all (93,9%) reported that they visit the Internet every day or several times per week. 18,7% used Internet with a mobile phone at least every now and then and 36.8% were frequent travelers who travel at least once per month either on business or leisure for a minimum duration of one day. Of the respondents in 2011, 24.1% were males and 75.9% were females. The average age of the respondents was 38 years; the youngest was 18 years old and the oldest 71 years old. The respondents were all Internet adopters since the questionnaire was filled out on-line and nearly all (98,5%) reported that they visit the Internet every day or several times per week. 50,2% used Internet with a mobile phone / smart

57
phone at least every now and then and 29% were frequent travelers, travel at least once per month either on business or leisure for a minimum duration of one day.
We checked the samples for equality as they were not randomly selected from a predefined population (see table 6.). The two samples are similar in character as both have a clear majority of female respondents, representation of every age group, a clear majority of non-frequent travelers and respondents with very high Internet use. However, it has to be pointed out that the 2011 sample is significantly more skewed towards females, older consumers and non-frequent travelers. The way the Internet is used in Finland is, however, fairly similar regardless of gender, and Internet use is nowadays very widespread among different age groups (Statistics Finland, 2012a). The 2011 sample includes, not surprisingly, significantly more frequent Internet users and a lot more mobile Internet users. According to Statistics Finland (2012b), 90% of the Finnish population uses the Internet and 49% have a smartphone. Due to the online data collection method and the self-selective process, non-Internet adopters and non-users of the linked lodging company website are excluded in both samples. Hence, both samples may be biased towards respondents finding electronic travel services important. However, due to the large size of the samples and their similar characteristics we find them suitable to compare. The findings should nevertheless not be overgeneralized for the total Finnish population and nor for the total Finnish Internet population.
The original questionnaire in Finnish is attached in the appendix 1. The questionnaire was only available in Finnish and has been converted from a web format to fit the format of this thesis. Not all questions in the questionnaire have been analyzed for the purpose of this thesis.
4.6.2 Findings As our study was conducted online we automatically targeted only Internet adopters. Internet adopters are, on the other hand, an interesting group of consumers as they are likely to be the first ones to adopt mobile services or the mobile Internet (Anckar and Dincau, 2002), at least in countries where the stationary Internet has a strong foothold (like Finland). We also divided the samples into mobile users and mobile non-users to take into account differences

58
Table 6: Analysis of samples Variable Sample
2004 N = 766
Sample 2011
N = 922
χ2 / df Sig. (2–sided)
Gender: Males Females
33,0% 67,0%
24,1% 75.9%
17,819 / 1
0,000
Age: 18 – 24 25 – 34 35 – 44 45 – 54 55 – 64 65 +
21,5% 29,0% 29,0% 15,5% 2,9% 0,3%
14,5% 23,1% 29,2% 21,5% 8,5% 2,1%
59,157 / 6
0,000
Internet adoption - use at least several times per week
93,7% 98,5% 24,704 / 1 0,000
Mobile Internet adoption - use Internet with a mobile phone / smart phone at least every now and then
18,7% 50,2% 252,598 / 1 0,000
Travel frequency- travel at least once per month (business and/or leisure) for a minimum duration of one day
36,8% 29,0% 9,548 / 1 0,002
between subjects who actually use the mobile Internet and subjects who do not. This is important as we are investigating why individuals undertake or do not undertake mobile services in travel and tourism. Other researchers have also emphasized the importance of distinguishing between potential users and actual users. For example Gerpot (2011) found that perceived diffusion of innovation-based attributes explained mobile Internet acceptance better for actual users than for potential users. We defined mobile users as persons who use the mobile Internet with a smartphone/mobile phone either regularly or every now and then and mobile non-users as persons who do not yet use the mobile Internet with a smartphone/mobile phone.
In 2004, according to table 7, the perceived concerns rank: (1) entry costs and usage costs (3) relevant services are missing or the traveler is not aware of them (4) security issues and (5) the technology is not sufficient. In 2011 they rank: (1) usage costs (2) security issues (3) the technology is not sufficient (4) entry costs and (5) relevant services are missing or the traveler is not aware of them.

59
Table 7: The respondents’ perceived barriers to use Internet- /mobile services during a trip with a pocket device
Barriers Year N Mean Std.
Deviation % Very
important Usage cost (e.g. connections costs, service charges)
2011 904 2,32 0,706 46,2% 2004 759 2,41 0,649 49,5%
Security issues (worry about personal information and/or payment transactions)
2011 904 2,30 0,717 45,4% 2004 759 2,22 0,739 41,0%
The technology is not sufficient (e.g. bad usability)
2011 895 2,27 0,655 38,3% 2004 755 2,16 0,648 30,5%
Entry costs (e.g. expensive devices) 2011 904 2,09 0,762 34,1% 2004 760 2,41 0,701 53,0%
Relevant services are missing or the traveler is not aware of them
2011 889 2,07 0,676 26,4% 2004 754 2,24 0,659 36,7%
NOTE: scale: 1 = not important, 2 = somewhat important, 3 = very important
As table 8 clearly shows there is a clear and significant change between 2004 and 2011 in perceptions of the barriers to use Internet-/mobile services during a trip with a pocket device (mobile phone/smartphone). Not surprisingly entry costs, usage cost and relevant services are missing are found less important in 2011 than in 2004, especially among mobile users. Indeed prices on smartphones and/or subscription packages have come down and the availability of mobile services can be seen in for example the number of applications provided in different application stores. Even more important is the fact that the relevance (added-value) of the provided services seems to be acknowledged by especially mobile users in 2011. It should, nevertheless, be noted that in 2011 usage costs is perceived to be the primary barrier to use Internet- /mobile services during a trip. Interesting is also that technology is not sufficient is ranked significantly higher in 2011 than in 2004. Undoubtedly the technology (devices, networks, applications etc.) has improved a lot during the past years; however, it seems that the individuals’ requirements on the technology have increased even more. It also seems that people are increasingly aware of security issues and perceived them more important in 2011 than in 2004. Especially mobile non-users seem to worry more about security issues in 2011. Overall the aggregated mean shows that in total the perceived barriers indeed have decreased between 2004 and 2011. This is especially true among mobile users. However, among non-users the aggregated mean is on the same level as in 2004, but the worry has primarily changed from entry costs to security issues while technology is not sufficient, usage cost and relevant service are missing or the traveler is not aware of them remain almost on the same level as in 2004.

60
Table 8: Differences in mean values between the respondents’ perceived barriers to use Internet-/mobile services during a trip with a pocket device 2004 and 2011
Barriers All 2011
All 2004
Sig. Mobile
user 2011
Mobile user 2004
Sig. Mobile Non-user 2011
Mobile non-user 2004
Sig.
Usage cost (e.g. connections costs, service charges)
2,32 2,41 0,013* 2,28 2,43 0,045* 2,37 2,41 0,378
Security issues (worry about personal information and/or payment transactions)
2,30 2,22 0,030* 2,27 2,15 0,112 2,33 2,21 0,011*
The technology is not sufficient (e.g. bad usability)
2,27 2,16 0,001* 2,3 2,17 0,053 2,23 2,16 0,092
Entry costs (e.g. expensive devices)
2,09 2,41 0,000* 1,94 2,49 0,000* 2,25 2,40 0,002*
Relevant services are missing or the traveler is not aware of them
2,07 2,24 0,000* 2,02 2,33 0,000* 2,12 2,20 0,054
Aggregated 2,21 2,29 0,000* 2,16 2,31 0,001* 2,26 2,27 0,542
All 2011 = 922, All 2004 = 766, Mobile user 2011 = 461, Mobile user 2004 = 115, Mobile non-user 2011 = 458, Mobile non-user 2004 = 500 NOTE: scale: 1 = not important, 2 = somewhat important, 3 = very important *Significant at probability level 0,05
4.6.3 Conclusions The presented data shows that the investigated barriers still must be taken into account in development of mobile services in travel and tourism contexts, at least in order to gain an even wider consumer adoption during trips (mobile settings). The results confirm our observations from study 2 that the financial risks are carefully accounted for by travelers on tour (in mobile settings). Also our observations in study 2 regarding ease of use aspects seem to be confirmed, as it seems in this study that the individuals’ requirements on the technology have increased especially among mobile users. Consequently, in order to minimize existing mobile users’ concerns and encourage non-users to adoption, practitioners should take serious note of potential security issues, focus on usability (ease of use), minimize costs and extensively promote and demonstrate the relevance (added-value) of mobile travel services especially during trips.

61
4.7 Summary This chapter has focused on providing answers to our first main research question (RQ1 ‘How do individuals perceive value in order to adopt and use mobile travel and tourism services during a trip?’).
In our first study, we discussed key value-elements of mobile commerce, including value-adding features for simple travel arrangements. Although the study was only exploratory in nature, it provided us with some early adoption insights and suggested that mobility indeed appears to be the key driver for consumer adoption of mobile services. Furthermore, simple travel arrangements stood out as highly potential services on a mobile device. Our second study was therefore conducted in an on-site (mobile setting) with incoming tourists to a destination. We argued that the type of travel that the tourist participates in (as non-package or package tour) seems to be an important underlying determinant to the individuals’ perceived added-value to use mobile tourism services. A non-package tour ought to comply better with an individual’s values of self-arrangement /-service. Moreover, we argued that the perceived ease of use (lack of ease to take into use) and perceived financial risk seemed to be important barriers to the use of mobile tourism services in an on-site context. Therefore, our third study focused entirely on following up earlier proposed barriers to use Internet-/mobile services, especially during a trip (mobile setting). We concluded in our third study that we still need to take into account the individuals’ perceived barriers when designing and marketing mobile services aimed at the during trip face of the tourist cycle, at least in order to gain a wider consumer adoption in mobile settings.
Based on the results from this chapter we conclude that the practitioner focus when designing and marketing mobile travel and tourism services should be on reducing the individuals’ perceived financial risk and perceived security concerns, and enhancing the individuals’ perceived ease of use and perceived added-value. Hence the findings suggest that a successful mobile travel and tourism service is a service which supports one or several mobile motives (needs) of individuals such as spontaneous needs, time-critical arrangements, efficiency ambitions, mobility related needs (location features) and entertainment needs. The service could be customized to support travelers’ style of traveling (e.g. organized travel or independent travel) and should be easy to use, especially easy to take into use (access, install and learn) during a trip, without causing security concerns and/or financial risks for the user. Next we will discuss the user experience of mobile trip arrangements.

62
5. User experience of trip arrangements (RQ2) As noted as a result from our first study (section 4.1), mobile services are likely to be used equally extensively in the home or at the office/school as when on the move. As we (as discussed earlier) often have desktops/laptops in these fixed settings it seems logical to compare mobile device users with computer users in order to better understand potential problems that individuals may run into using existing travel and tourism services on a mobile device. The same barriers may indeed be very important also in a mobile setting, although mobility features such as localization (GPS) may improve the user experience essentially while on the go. Moreover, individuals may bring a laptop with them on trips and service providers may offer travelers access to stationary computers in on-site settings (e.g. in the hotel). Hence, it seems very relevant to compare mobile users and computer users. Furthermore, in order to develop effective channel strategies (here for the mobile channel) we need to understand how it differs from other channels (Neslin et al., 2006). Therefore we conducted a study (research paper 3) in a fixed classroom setting which focused on comparing the user experience of trip arrangements on a mobile pocket device to the user experience on a computer. The objective here is primarily to provide answers to our second main research question (RQ2 ‘What factors affect the perceived user experience of mobile trip arrangements?’). In this chapter we will also raise four more specific research questions (here referred to as local RQs = LRQ). These research questions are, nevertheless, all interrelated to RQ2. For this study we created a research framework, which will be discussed next.
5.1 Potential problem areas in online self-arrangements for travel As discussed earlier (section 2.3) Anckar and Walden (2002) suggested a comprehensive summary of potential consumer problems in Internet travel bookings. The suggested problem areas were: time consuming task, make price comparisons, limited industry knowledge, usability of websites, locating websites of service providers, technical problems as well as finding available hotel rooms and flights. The same authors, Walden and Anckar (2006), reassessed the potential problem areas later on, suggesting that some problems were decreasing (e.g. technical problems) but others had on the other hand increased (e.g. time consumption, uncertainty regarding what is a fair price). The model is therefore still a good starting point when looking into potential problem areas for doing online self-arrangements, although the online era has come a long way since the model was proposed and reassessed. For example specialized online service providers for availability and price comparisons are now better established. Many

63
specialized online brands have also been fast to move into mobile commerce, which ought to reduce the suggested problem areas, such as making price comparisons on a mobile device as well. Next we will discuss the by Anckar and Walden (2002) suggested problems with other relevant literature to create an appropriate research platform for this study.
5.1.1 Efficiency Increased efficiency or productivity is an important determinant for electronic information systems (Davis, 1989; Venkatesh et al., 2003) but also for the use of advanced mobile services (Ristola, 2010). We will here refer to efficiency provided by the system, not to efficiency provided by the mobility of the mobile medium, as the experiment in this study will be completed in a fixed setting. For example, being able to optimize time in transport by booking a room through a mobile device (when not being able to access a PC) would be regarded as mobile efficiency and not efficiency provided by the system (save time by doing it faster online rather than having a physical travel agent doing it for you). As there is a growing amount of apps and websites optimized for mobile devices, plus full-size websites, there shouldn’t be difficulties finding travel and tourism services for planning and booking activities. On the other hand, the high amount of services may constitute a problem, as consumers do not know which service to use. Locating the right service providers may in fact require knowledge (Anckar and Walden, 2002). Site discovery has also been highlighted as an issue when measuring mobile user experience (Roto, 2006).
A tourist is generally faced with problems such as (1) what to do in an unfamiliar environment, (2) when having a limited time schedule (has to go home at some point) and (3) finding where things are (Brown and Chalmers, 2003). The following examples can represent the tourist situation described: (1) finding a specific attraction of interest to visit (what to do), (2) booking an available hotel room for a specific date (when to do) and (3) finding a route to a specific location (where things are). Performing the three activities efficiently may be found problematic by the consumer. Making price comparisons may be even harder for a consumer (Anckar and Walden, 2002). In fact, making travel arrangements should not take too much time, especially if you are on the road and may have a schedule to follow. If the arrangements take too much time or are a hassle through a mobile device a consumer may find it easier to contact an agent or find a computer to do it on. An industry expert would not take more than 30 minutes to make booking arrangements (Anckar and Walden, 2002). We therefore expected that efficiency issues have an effect on the perceived online self-arrangement experience.
64
5.1.2 Effort The perceived effort (ease of use) aspect has been widely discussed in mobile commerce (see section 2.4 and findings above). Limitations of mobile devices (e.g. screen size) effect individuals’ perceptions about the mobile user experience. Obviously the consumers’ mobile device readiness can still be an issue which can lead to technical problems and/or system limitations to make trip arrangements over a mobile device. In the early stages of the web, poor websites were perceived to be a hindrance to use online travel services (Anckar and Walden, 2002). Usability is also an issue in mobile browsing (Roto, 2006) and in mobile travel planning (Schnieder et al., 2010). Consequently, poor mobile apps, mobile websites or the need to use full size websites not optimized for a mobile device may constitute a problem. Usability is defined by various aspects such as color, fonts, sound and navigation. A user may also need to download and install a new app on the device and learn how to use it, which may be found problematic. We therefore expected that effort issues will have an effect on the perceived online self-arrangement experience.
5.1.3 Anxiety As discussed in section 2.2.4 perceived risk or anxiety is commonly thought of as felt uncertainty regarding possible negative consequences of using a product or service (Rogers, 1995). Limited industry knowledge may cause individuals to feel uncertainty when engaged in self-booking arrangements (Anckar and Walden, 2002). The price issue may especially bother people (Walden and Anckar, 2006). Also the rise of social media plays an increasingly important role in travel planning (Xiang and Gretzel, 2010). A lot of travel information such as reviews is co-traveler created through different online community platforms, which may affect the consumers’ trust of online travel service providers (Yoo et al., 2009). The perceived risk regarding online travel content may therefore be problematic. Individuals’ confidence of content correctness has also been highlighted to influence the mobile user experience (Roto, 2006). As our study is based on a task (subjects are not going on the trip they are planning) the uncertainty aspect may be underestimated by the subjects; ‘If I went on this trip myself I would certainly check the correctness of the results again’. Uncertainty is in fact a well-established concept in consumer search in online markets (Lauraeus-Niinivaara et al., 2008). We therefore expected anxiety, as uncertainty towards the correctness of the content, to have an effect on the perceived online self-arrangement experience.

65
5.1.4 The online self-arrangement experience According to Blythe and Wright (2003), user experience means enjoyment with a system. The fun aspect of using an information system may be as important as the productive use. In fact, electronic information systems can be divided into hedonic- (Enjoyment) and productivity-oriented systems (Van der Hejiden, 2004). For example, “good tourist technologies are not only those that make tourists more efficient, but those that also make tourism more enjoyable” (Brown & Chalmers, 2003). Especially when people arrange leisure trips they may spend a lot of time reviewing different options (Yoo et al., 2009). Therefore, arranging a trip with limited time may be found stressful or frustrating rather than fun, especially if running into problems.
5.2 Mobile vs. computer users In this study we were interested in knowing more about possible problems within the mobile channel. Thus we wanted to compare the results against computer users, which will here be used as a control group. Effort, efficiency and anxiety as discussed above will here constitute the platform for investigating the perceived experience when arranging a trip on either a mobile device or a computer. The developed statements representing the four constructs are summarized in table 9. We adapted the statements for efficiency and effort primarily as used in Anckar and Walden (2002). But in order to fit the research setting and the literature review above we composed the statements for anxiety and experience, and additional statements for efficiency and effort. The research platform is applicable for both mobile users and computer users, except for one statement ‘To download, install and to start using new apps was difficult’, which is explicitly for mobile device users and not to be taken into account for computer users. Therefore, in this study both mobile device users and computer users with similar background performed the same task and filled out the same evaluation form. Hereby we raised the following research question.
LRQ1: Is there a significant difference in the self-arrangement experience that arise on a mobile device than on a computer and why?
5.3 High-end mobile users A general barrier to the use of mobile services is still the users’ device readiness, which is affected by for example costs of entry (e.g. device expenses, see section 4.3). This is not only an issue for the travel and tourism market but for any industry operating in the digital mobile market. High-end device users are nevertheless an interesting user group as they have access to the most powerful

66
tools that exist on the mobile market. In this study we defined high-end devices as devices with touch-screen and flag ship devices from leading mobile device manufacturers. Such devices were in the spring of 2011 in Canada Apple iPhone, Samsung Galaxy, HTC Desire and Blackberry Torch. Similar high-end device definitions have been made by Kamwar et al. (2009), where the search behavior of iPhone users was compared to computer-based search behavior. In that study high-end device behavior closely resembled the behavior on a computer, whereas other types of mobile device users exhibited slightly different behavior. On the other hand, a high-end device without a skilled user of the mobile internet may constitute as serious a barrier as a user without a high level device. Therefore we defined a high-end user as one with high proficiency with the mobile Internet who owns a high-end device. We raised the following research question.
LRQ2: Is there a significant difference in the self-arrangement experience perceived by high-end mobile users compared to computer users and why?

67
Table 9: Research platform Constructs Items Sources
Efficiency issues Finding an interesting attraction / place was difficult**
E1 Anckar and Walden 2002; Roto, 2006; Brown and Chalmers, 2003; Schnieder et al., 2010
Finding available rooms was difficult* E2 Anckar and Walden 2002
Making price comparisons was difficult* E3 Anckar and Walden 2002
Finding the route was difficult ** E4 Anckar and Waldén 2002; Roto, 2006; Brown and Chalmers, 2003; Schnieder et al., 2010
The tasks were time consuming* E5 Anckar and Walden 2002
Locating websites/apps for service providers was difficult *
E6 Anckar and Walden 2002
Effort issues The usability of the services was poor (e.g. navigation, fonts, colors)*
EI1 Anckar and Walden 2002
To download, install and to start using new apps was difficult**
EI2 Roto, 2006; Schnieder et al., 2010, Kaasinen, 2005
I had technical problems* EI3 Anckar and Walden 2002
Anxiety issues I fear that my results may be incorrect** A1 Roto, 2006; Lauraeus-Niinivaara et al.,
2008; Yoo et al., 2009; Anckar and Walden 2002
I fear that my hotel price may not be the lowest**
A2 Roto, 2006; Lauraeus-Niinivaara et al., 2008; Yoo et al., 2009; Anckar and Walden 2002
I feel that it would be good to check the results by for example calling an agent**
A3 Roto, 2006; Lauraeus-Niinivaara et al., 2008; Yoo et al., 2009; Anckar and Walden 2002
If I went on this trip myself I would certainly check the correctness of the results again**
A4 Roto, 2006; Lauraeus-Niinivaara et al., 2008; Yoo et al., 2009; Anckar and Walden 2002
Self-arrangement experience
Finding an interesting attraction / place was stressful **
SAE1 Blythe and Wright, 2003; Brown and Chalmers, 2003; Yoo et al., 2009
Finding available rooms was stressful ** SAE2 Blythe and Wright, 2003; Brown and Chalmers, 2003; Yoo et al., 2009
Making price comparisons was stressful ** SAE3 Blythe and Wright, 2003; Brown and Chalmers, 2003; Yoo et al., 2009
Finding the route was stressful ** SAE4 Blythe and Wright, 2003; Brown and Chalmers, 2003; Yoo et al., 2009
* Statements used in Anckar and Walden (2002) ** Statements composed to fit the research setting

68
5.4 Travel services (applications) Search engines like Google and Bing, Travel sites with review and opinion features like Tripadvisor and map services like MapQuest and Google maps provide a ‘good lead’ (a potential customer) to different online travel agents (OTAs) like hotels.com and booking.com or directly to different suppliers of accommodation, flights and attractions. This pattern leaves OTAs and travel suppliers to primarily make booking transactions on the web. According to Werthner and Ricci (2004), “travel agents act as information brokers, providing the final consumer with the relevant information and booking facilities”. Now many OTAs and travel producers are providing sophisticated apps, which are downloaded from different application (app) stores, for different mobile platforms. An emerging app culture (Purcell et al., 2010) may in fact change the search behavior from the stationary web as mobile apps take the consumers directly to specialized travel planners, OTAs and producers of travel services instead of doing web searches when planning and booking a trip. Moreover, social media platforms with localization features like Facebook places and Foursquare especially suitable for mobile use are emerging as significant planning platforms for travel. This scenario may lead to disintermediation of traditional web search engines in m-commerce for travel or could at least decrease their importance and enhance the importance of specialized planning services directly integrated with booking services for m-commerce. Moreover, the search process through a mobile device may, due to the size and constraints of the interface, be more focused and shallower than on the stationary Web (Curch et al., 2008; Kamwar et al., 2009). Despite an emerging app culture and perhaps a change in web search behavior we argue that many mobile users are very much copying their travel planning behavior from the web, at least at the beginning of their mobile learning curve. Also, many travel vendors have been slow to enter the mobile channel and provide only full size websites instead of light and optimized mobile versions. Therefore, the mobile user may end up using full size websites instead of optimized mobile services, which may spoil the mobile trip arrangement experience. On the other hand there may also be users who find the light mobile websites or applications are too light. For example, when making trip arrangements, a full- scale website may not only offer more pictures and informative text but also more advanced search functionality than stripped mobile versions. However, full size websites are primarily designed for computers. Therefore the use of full size websites can be expected to constitute a problem when arranging a trip on a mobile device. Based on the discussion above we raised the following research questions.
LRQ3: What kinds of services are used in order to arrange a trip on a mobile device?

69
LRQ4: If full-sized websites are used, do the users of these services perceive a significant difference in the self-arrangement experience compared to computer users and why?
5.5 The setup of the experiment In order to investigate the user experience of arranging a trip with a mobile device we conducted a classroom experiment. The students were asked to complete a trip arrangement task either on a classroom computer or on their own mobile devices with Internet access, wireless (WiFi) or mobile (3G). All students were not able to do the task on their own mobile device, due to such obvious reasons as that they did not own a mobile device with Internet readiness. Therefore, in order to collect a large enough sample of students to perform the task on their mobile devices, we asked as many as possible to use their mobile device. As a result we collected a total sample of 116 students, of which 51 students completed the assignment on a computer and 65 students did it on their mobile devices.
We limited the time to complete the task to 30 minutes with the following motivations. Travel arrangements shouldn’t take too much time to make, especially when on tour with perhaps a time schedule to follow. As earlier mentioned, an industry expert probably would not spend more time than 30 minutes to make the arrangement for you. We wanted to avoid a situation where results would be heavily influenced by how much time was spent on the task by the subjects. The task was also to be completed individually to avoid influences by other subjects. Moreover, the task was to be completed in a fixed classroom setting, to exclude mobility (on the go) aspects.
The experiment was conducted during 16.3.2011 – 23.3.2011 in five different classes in the Faculty of Business at Capilano University in North Vancouver, BC, Canada. The classes were primarily selected based on equally represented genders and ages. The questionnaire was handed out to each individual together with the task. They were asked to document their results and to consider the statements summarized in table 9 on a 5-point Likert scale (5 = strongly agree, 4 = Agree, 3 = Can’t say, 2 = Disagree, 1 = Strongly Disagree). They were also asked to state what services they used, of what kind they were and, if they ran into problems, what sort these problems were. Finally they were asked to state their preferred channel (1. Visting/Calling, 2.Computer, 3.Tablet, 4.Mobile device) for making similar travel arrangements as in this task in the future.
5.5.1 The task The complexity of travel arrangements can be very different depending on what kind of trip is arranged. The complexity level of a task under investigation also

70
needs to be identified in order to understand the validity of a study (Järvenpää et al., 1985). A complex task may reflect the problem solving process of the subjects rather than the efficiency and effort aspects of the used mobile services. Low-complexity and high-complexity travel arrangements have been summarized by Anckar and Walden (2002) as described in table 10.
Table 10: Characteristics of low- and high -complex travel arrangements (Anckar and Walden, 2002)
The task under investigation in this study is divided into three steps based on a
typical traveler scenario, as discussed earlier. The three steps can also be seen as a typical consumer process when arranging a trip.
1. Find one attraction/place in downtown Helsinki, Finland that you may be interested in visiting. It should be accessible on April 9th 2011. Name the place.
2. Find an available four-star hotel room in Helsinki, Finland for one night for two persons on April 9th 2011. Name the hotel and the price for a double room. Try to find the lowest price.
3. Find the route from your hotel to the attraction/place you are interested in. Explain shortly the route, e.g. how far is it? Is it walkable or do you need transport?
The three tasks all represent inflexible travel dates, a non-routine journey and independent travel which would categorize all tasks as high complexity travel. On the other hand, it’s a single destination journey and it is an easily accessible destination which would categorize the tasks as low-complexity travel. Task 1 (find an attraction) is certainly more flexible in nature than task 2 and 3 as it is open to the subjects’ own interest. Task 3 (find the route) also involves coordination between task 1 and 2, which makes the depth of the route arrangement the most
Low-complexity Travel High-complexity TravelDomestic travelSingle destination journeys Single-leg flights Routine journeys Flexible travel/dates Flexibility with airports Insignificant product depth (no/ little coordination of service involved) Heavily traveled routes/easily accessible destinations Inclusive packaged tours
International travelMulti-destination journeys Multi-legged flights Non-routine journeys Inflexible travel dates/times Inflexibility with airports Significant product depth (involves coordination of services) Lightly traveled routes/poor destination accessibility Independent travel

71
complex in nature. The mobile channel is obviously more limited when performing complex tasks, due to screen size and interface limitations when compared to a computer. Nevertheless, all three tasks are very straightforward and are by no means of high complexity; rather they are on a low-intermediate level. Therefore the tasks should not cause more problems on a mobile device than on a computer due to complexity; rather the tasks will measure other potential problem areas as discussed earlier.
5.5.2 The samples In our study mobile device users consisted of male 44,6% and female 55,4% and an average age of 22 and computer users consisted of male 40% and female 60% and an average age of 24. Characteristics such as user resources and knowledge of a system are important building blocks in a total user experience (Roto, 2006), for example the users’ perceived skills or knowledge of the Internet affect the experience of using online travel services. Both mobile device users (93,9%) and computer users (82%) reported either very high or high Internet proficiency. 84,6% of mobile users and 89,1% of computer users stated that they travel for more than a day less than three to nine times a year. Moreover, neither group knew Helsinki better than not at all or just a little bit (mobile users 98,4% and computer users 100%). We tested the homogeneity of the two samples by using the Pearson Chi-Square test and were unable to find any significant difference between gender, Internet proficiency, travel frequency and destination knowledge (see table 11). Neither was there an age difference between the groups (Mean difference = 2, T-test sig. 0,788). The sample of students possessed a mobile Internet proficiency that exceeds that of the average consumer. Therefore, the findings from the classroom experiment should not be overgeneralized for a larger population. However, a sample of students seemed justifiable due to that we were able to control certain variables and to study skilled users of the mobile Internet.

72
Table 11: Homogeneity test of samples Variables Mobile users
N = 65 Computer
users N = 51
χ2 / df Sig.
Gender 44,6 % male55.6 % female
40% male60% female
0,575 / 1 0,448
High Internet proficiency - either very high or high Internet proficiency
93,9% 82% 3,11 / 1 0,078
Low travel frequency - travel for more than a day less than three to nine times a year
84,6% 89,1% 0,470 / 1 0,493
Low destination knowledge - knew Helsinki not at all or just a little bit
98,4% 100,0% 0,802 / 1 0,670
5.6 Analysis We used the software Smart PLS 2.0 (Ringle et al., 2005) to analyze the research platform. As discussed in section 3.3.1, Partial Least Square (PLS) path modeling is very appropriate technique for analyzing small samples (Chin and Newstedt, 1999). An analytical procedure was conducted to assess the measurement model (outer model) and the structural relationships (inner model).
First we tested the quality of the statements (items) representing the suggested research platform by calculating Cronbach’s alpha, average variance extracted (AVE), and composite reliability (CR) for each suggested construct. All four areas exceed 0,7 for Cronbach’s alpha, which shows acceptable reliability of the measurement constructs. According to Hensler et al. (2009), composite reliability should exceed 0,7 in reflective measurement models and AVE should exceed 0,5. All constructs also showed good composite reliability and AVE. Moreover, the specific statements (items) should load heavier on their own constructs than the other constructs. All statements of the model showed the highest loadings for their own construct. See table 12 for details.

73
Table 12: Descriptive statistics and quality criteria Constructs Items Mean SD Cronbach’s
alfa AVE CR Factor
loading Efficiency
E1 E2 E3 E4 E5 E6 AGG
1,732,23 2,59 2,84 2,72 2,27 2,39
1,091,34 1,30 1,67 1,48 1,33 1,08
0,875
0,616
0,905
0,705 0,797 0,767 0.711 0,860 0,856
Effort
EI1 EI2 EI3 AGG
2,232,68 1,99 2,09
1,181,16 1,31 1,09
0,842 0,581
0,799 0,829 0,573 0,847
Anxiety
A1 A2 A3 A4 AGG
2,463,49 3,22 4,06 3,32
1,311,18 1,34 1,12 0,94
0,736 0,577 0,847 0,778 0,828 0,709 0,731
Self-arrangement experience
SAE1 SAE2 SAE3 SAE4 AGG
1,902,22 2,65 2,72 2,37
1,151,25 1,32 1,61 1,08
0,818 0,663 0,887 0,747 0,880 0,850 0,774
*Note AGG = Aggregated mean of the construct
Next we calculated the relationships between the independent variables (efficiency, effort and anxiety) and the dependent variable self-arrangement experience (see figure 8). Efficiency and anxiety showed significant direct impact on the self-arrangement experience. Effort on the other hand did not have a direct, but an indirect impact through the efficiency construct and the anxiety construct, which is conceptually logical as well. The model explains 69,6% (R2 = 0,696) of the variation in the perceived online self-arrangement experience for all users (both mobile and computer users).
Figure 8: Structural model for all users Significance levels of path coefficients: * p < 0,01, ** p < 0,001
O,454 ** O,143 *
O,745 ** O,796 **
Effort issues
Efficiency issues R2 = 0,634
Anxiety issues R2 = 0,206
Self-arrangement experience R2 = 0,696

74
Finally we validated the structural model for different mobile user groups in
contrast to computer users, as computer users stand as a control group in this experiment. We divided the mobile user sample into all mobile users, high-end mobile users and mobile users who used a full size website as defined by our literature review. Then, as suggested by Hensler et al. (2009), we analyzed the path coefficients of the structural models for the different sub groups (see table 13). There are no significant differences between the different mobile user groups in contrast to computer users for any of the path coefficients. Anxiety, nevertheless, has a significant impact on experience for mobile device users but not for computer users. Therefore, anxiety is relevant for mobile device users, but should in fact be dropped for computer users. The impact of anxiety on the self-arrangement experience is, nevertheless, much lower than the impact of efficiency. Also effort has a greater impact on efficiency than on anxiety. Therefore, efficiency and, indirectly, effort issues are the decisive problem areas for the perceived self-arrangement experience on a mobile device.
Table 13: Analysis of path coefficient impacts and differences between mobile user groups in contrast to computer users
Path Computer
(A)
All Mobile
(B)
Diff. Sig.
(A-B)
High-end mobile
(C)
Diff. Sig.
(A-C)
Mobile full size websites
(D)
Diff. Sig.
(A-D)
Effort -> Efficiency
0,803** 0,756** n.s. 0,828** n.s. 0,801** n.s.
Effort -> Anxiety
0,508** 0,423** n.s. 0,610** n.s. 0,538** n.s.
Efficiency -> Experience
0,783** 0,716** n.s. 0,680** n.s. 0,668** n.s.
Anxiety -> Experience
0,068 n.s. 0,164* n.s. 0,190* n.s. 0,187* n.s.
* p < 0,01 level, ** p < 0,001 level, n.s. = not significant at 0,05 level
Consequently, we concluded that our research platform is reliable and valid for studying user online experience when arranging a trip, especially on a mobile device. The mean differences between the constructs are interesting to study next, as there are no significant differences between the groups regarding causal effects. An aggregated mean score based on the mean values of the items for each construct was used (see table 12). We structure our further analysis according to our research questions.

75
5.6.1 Analysis of mobile users vs. computer users (LRQ1) We compared all mobile device users to all computer users and found that there are significant differences in the mean scores for perceived self-arrangement experience between the two groups (T-test sig. 0,008). Mobile users perceived the experience more negative (Mean 2,59) than computer users (Mean 2,07). Many mobile device users complained about the screen size, slow loadings and websites that didn’t load properly or were hard to use on their mobile device. Multitasking issues (switching/navigating between services) was also highlighted by the mobile device users as problematic compared to using a computer. The multitasking issue was emphasized in finding a route where information from the earlier tasks needed to be used, which seemed to be harder on a mobile device. As one user put it, “I couldn’t find an application which would smoothly have done everything for me, now I had to jump back and forth on my mobile which was frustrating”. These effort problems seem to be the source to the efficiency issues that mobile users had. In fact the mean difference for effort between mobile users and computer users was 0,770 (T-test sig. 0,001) and the mean difference for efficiency was 0,800 (T-test sig. 0,000) to the advantage of computer users. See table 14 for details.
The task by far most commonly left uncompleted, or for which the results obtained were incorrect, was finding a route on a mobile device (29,2% = 19 of all 65 attempts). Therefore, concerns about the correctness of route results can to some extent explain the perceived anxiety issues on a mobile device. On the other hand the mean difference for anxiety between mobile users and computer users was only 0,102 and not significant (T-test sig. 0,769). Language barriers were mentioned by a few subjects as names of places and streets were hard to figure out in a foreign language. However, the language barrier is not a unique problem for the mobile device channel but it rather is a general international travel dilemma. There were also mobile device users who commented, “That was smooth” or “That was fun”, which indicated a certain ease and pleasure in the whole mobile self-arrangement experience. Therefore, it is essential to analyze different types of mobile users next.
Table 14: Difference between computer users and mobile users Constructs Computer users
N = 51 Mobile users
N = 65 Sig. (2-tailed)
Efficiency 1,94 2,73 0,000 Effort 1,71 2,36 0,001 Anxiety 3,28 3,34 0,769 Self-arrangement experience
2,07 2,59 0,008
* Note aggregated mean score based scale 1 – 5.

76
5.6.2 Analysis of mobile high-end users (LRQ2) When analyzing a Scheffe post-hoc test for 34 high-end mobile users (in this case users of iPhone, HTC Desire, Samsung Galaxy and Blackberry Torch) the difference compared to computer users is no longer significant for the mean of the perceived self-arrangement experience (Mean difference = 0,264, Sig. 0,524). The high-end users stated a significantly higher proficiency (Chi-square = 9,631 / df = 3, Sig. 0,022) with the mobile Internet compared to other mobile users. Therefore, the result cannot alone be explained with that the high-end device platforms are much better than other mobile device platforms. Rather a high-end user is, as expected, a mix of both user proficiency and a practical user platform.
The mean differences in the Scheffe post-hoc test between the two groups are not significant for efficiency (Mean difference = 0,393 Sig. 0,209), for effort (Mean difference = 0,336 Sig. 0,338) nor for anxiety (Mean difference = -0,105 Sig. 0,885). See table 15. Therefore, effort issues, efficiency issues and anxiety issues seem to be no more problematic on a high-end device than on a computer. That does not necessarily mean that all proficient smart phone users will prefer to use their mobile device to perform similar, quite straightforward and non-complex travel arrangements. In fact, after they had completed this task, the preference among high-end users to do similar travel arrangements was a computer (70,6%), with a mobile device in second place (17,6%), visiting or calling third (8,8%) and a tablet computer fourth (2,9%). As one subject put it, “If I need to do more extensive research I would certainly use a computer but on the go I would definitely use my smart phone”. As discussed earlier the mobility aspect (on the go) and the complexity of the task are key aspects in the perceived mobile experience as well. In this study we nevertheless excluded the mobility aspect and limited the task to low-intermediate complexity.
Table 15: Difference between computer users, high-end mobile users and other mobile users
Constructs Computer users
N = 51
High-end mobile users
N = 34
Other mobile users
N = 31
F / Sig
Efficiency 1,936 a 2,328 a 3,191 b 14,597 / 0,000 Effort 1,707 a 2,043 a 2,750 b 9,698/ 0,000 Anxiety 3,284 a 3,179 a 3,525 a 1,144 / 0,322 Self-arrangement experience
2,043 a 2,307 a, b 2,911 b 6,636 / 0,002
* Mean values tested with an ANOVA. Scheffe post hoc test are not significant at 0,05 level if the lowercase superscripts are the same.

77
5.6.3 Analysis of travel service providers (LRQ3 and LRQ4) Google maps as either a web app (website optimized for mobile devices) or native app (phone platform-specific application) was by far the most-used service to find the route. Both destination-focused OTA websites such as Helsinki-hotels.com and internationally specialized mobile OTA applications by for example Kayak, Expedia and Booking.com were used to find an available room and make price comparisons. Web searches were primarily made to find the attraction, but also specialized travel planning applications such as Trip Advisor were used. In figure 9 we can see what type of services the subjects reported they used. It may have been hard for the subjects to know precisely what type of services they used in their mobile web browser, as many sites automatically convert into light versions when accessed from a mobile device (as they are designed to do). Therefore, figure 9 describes the subjects’ perception of the type of services they used rather than what they actually used. On the other hand, only one subject reported that she did not know what type of services she used. Based on the information in figure 9, the type of services used is to a great extent a mixture of downloaded applications and web based services. A total of 75% reported that they used optimized websites for mobile devices, which shows that mobile web browsing is very important when arranging a trip on a mobile device. 52% of the subjects reported that they used applications that they already had on their device and 9% that they downloaded an application for this task, which shows that mobile applications are important services when arranging a trip on a mobile device as well. A relatively low percentage (9%) downloaded an application especially for this task, whereas a high percentage (52%) used an application either pre-installed by the manufacturer or downloaded at some earlier point, which indicates that mobile apps are utilized for repeated use with already known vendors but a web search may be more effective to find new service providers than going to an app store. Also extensive use of full size websites was reported, which may at least to some extent explain the effort and efficiency problems described earlier faced by many mobile device users. We therefore tested with Scheffe post-hoc whether the 34 mobile users making use of full size websites in addition to mobile services displayed a more negative self-arrangement experience than computer users. The results show that users of full size websites on their mobile device stand out with a significantly more negative self-arrangement experience score than users of computers (Mean difference = 0,795, sig. 0,004). Moreover, the Scheffe post-hoc test shows that there are significant differences in perceived effort (Mean difference = 0,923, Sig. 0,001) and efficiency (Mean difference = 0,854, Sig. 0,002) between the two groups to the advantage of computer users. Anxiety did not show a significant mean difference (Mean difference = 0,255, Sig. 0,497). See table 16. Therefore, efficiency issues and effort issues are the main causes for mobile full size website users to perceive a more negative self-arrangement experience than computer users.

78
Table 16: Difference between computer users, mobile non-users of full-size web sites and mobile users of fill-size web sites
Constructs Computer users
N = 51
Mobile non-user of full
size web site N = 31
Mobile user of full size web site N = 34
F / Sig
Efficiency 1,937 a 2,558 a, b 2,859 b 8,344 / 0,000 Effort 1,707 a 2,172 a, b 2,561 b 6,623 / 0,002 Anxiety 3,283 a 3,133 a 3,538 a 1,568 / 0,213 Self-arrangement experience
2,044 a 2,328 a, b 2,838 b 5,748 / 0,004
* Mean values tested with an ANOVA. Scheffe post hoc test are not significant at 0,05 level if the lowercase superscripts are the same.
Figure 9: Type of travel services used with a mobile device
5.7 Discussion The perceived self-arrangement experience on a mobile device was significantly more negative than on a computer. However, but not surprisingly, high mobile Internet user proficiency combined with a high-end mobile device had a positive impact on the self-arrangement experience. The user experience when making similar low-intermediate travel arrangements as in this experiment on a high end mobile device in a fixed setting was in fact as good as on a computer. If we add the mobility aspect to the experience, we end up with a channel which potentially is even better than the computer channel for making travel arrangements of the same kind as in this experiment. That does not necessarily mean that the mobile channel will be the preferred channel for similar travel arrangements in the future, but
9 % (6)
52 % (34)
72 % (47)
52 % (34)
2 % (1)
Applications you downloaded for this task
Applications you already had on your device
Web sites optimized for mobile devices
Full size (normal) Web sites
I don’t know
Type of services used
Mobile device users N = 65

79
rather that the consumers' decision to use their mobile device is dependent on the situation of use rather than on practical user experience problems.
Efficiency issues and anxiety issues showed significant direct impacts on the self-arrangement experience on a mobile device. Effort issues showed indirect causal effect through efficiency issues and anxiety issues. The self-arrangement experience for mobile device users (including high-end users) was primarily impacted by efficiency issues and indirectly by effort issues. Especially multi-tasking issues were highlighted by the subjects. Therefore, emphasizing multitasking or integration between services in service development ought to enhance the trip arrangement experience for mobile users.
Despite the positive impact of a high end mobile device and user skills, it must be noted that the use of full-size websites had a negative impact on the user experience on a mobile device in contrast to computer users. Therefore, all travel companies that want true mobile presence or m-commerce revenue need to consider a well-designed mobile site or app as an addition to a conventional Internet presence or e-commerce, as full-size web services are not sufficient. Optimized mobile websites showed the highest usage percentage in this study. Only a few subjects reported that they downloaded an application for this task but many used applications which were either preinstalled by the device manufacturer or downloaded by the users themselves at some point prior to this study. This indicates that mobile apps are primarily utilized for repeated use with already known vendors, but web search and browsing is more likely to be used for finding new services than going to an application store to find them there. Therefore, we see that travel companies who want to build a relationship with their customers need to consider a downloadable application, but in order to be found through the mobile channel and make contact with potential new customers, a mobile website should be available. It must also be remembered that many device and mobile operating system (OS) developers want service developers to specifically create services for their platforms and see mobile apps as a strategic advantage to sell more mobile devices of a certain kind. The mobile telecom industry has very much moved into a battle of ecosystems where device makers, developers of operating systems, service developers and innovators are to some extent forced to pick their development platforms and are thereby perhaps not able to target all potential customers, thus possibly making mobile travel applications less available to consumers.
5.8 Conclusions Our aim in this chapter was to answer our second main research question (RQ2 ‘What factors affect the perceived user experience of mobile trip arrangements?’). We provided a picture of potential user problems (effort, efficiency and anxiety)

80
that impact the user experience when arranging a trip of low-intermediate complexity with an existing set of mobile devices and an existing set of services on the market (spring 2011 in Canada). The designed research platform was proven reliable and valid - it explains well the users’ trip arrangement experience online, especially with a mobile device. We also found that high mobile Internet user proficiency combined with a high-end mobile device had a positive impact on the self-arrangement experience. Despite the positive impact of a high end mobile device and user skills, we also noted that the use of full-size websites had a negative impact on the user experience on a mobile device in contrast to computer users. It should also be highlighted that the study was conducted in a classroom setting (fixed setting) which excluded mobility features. However, the same factors may indeed be very important also in a mobile setting (during a trip); although mobility features such as localization (GPS) may improve the user experience essentially while on the go.
From a practitioner’s point of view the presented empirical findings have demonstrated important insights:
(1) The mobile channel can provide as good a user experience as the computer channel in a fixed setting for similar trip arrangements as in this experiment. If we add the mobility aspect (e.g. GPS features) we may end up with a channel that is superior to the computer-based channel for similar arrangements as investigated here.
(2) Mobile service development should emphasize multitasking and/or integration between services.
(3) A well-designed mobile site or app is a must for true mobile presence or m-commerce.
(4) Travel service providers who want to build a relationship with their customers need to consider a downloadable application, but in order to be found through the mobile channel and make contact with potential new customers, a mobile website should be available.
This experiment was based on tasks that we defined as being of low to intermediate complexity. It should be noted that the level of task complexity was established conceptually and not based on the students’ opinion on task complexity. The complexity of the tasks could, nevertheless, be increased in future studies in order to understand user experience in high complexity tasks. A general assumption is that due to the limitations of screen size and interface restrictions the users are not likely to perform high-complexity tasks on a mobile device. The complexity level on mobile devices may not rise to the level of stationary computers but as shown in this study when devices, user skills and services improve, the user experience is significantly positively impacted, which means that the behavior is likely to become more complex as well.

81
In order to address whether consumer behavior when making use of mobile apps, mobile websites and full size websites for trip arrangements will change significantly, future experiments should be repeated over time. To investigate mobile travel arrangement behavior empirical studies with larger and more representative samples are certainly needed as well. It should also be noted that the students in the sample are likely to possess a mobile Internet proficiency that exceeds that of the average consumer. But as average users adopt high-end devices, become more familiar with mobile self-arrangement processes and mobile travel services, the problems they face are very likely to reduce significantly. Individuals are also different when it comes to pace of adoption and propensity to embrace innovations. Hence, we will next make an attempt to categorize different types of users of mobile travel services.

82
6. User categories of mobile travel services (RQ3) This chapter will present our fifth study (research paper 4), which aimed at providing a systematic categorization of mobile travel service users (here referred to as mobile travelers). As discussed earlier in the introduction (chapter 1), individuals do not adopt innovations at the same pace and their propensity to embrace innovations varies widely. In fact, looking at different adopter groups may open up a new perspective on the diffusion process (Rogers, 1995). Furthermore, not enough effort has been put on identifying segments of mobile service users (Sell et al., 2011). Moreover, we could not find any attempt to categorize mobile travelers in IS research literature. Therefore, it seemed very logical to make a first attempt to identify mobile travelers and understand their differences based on their actual usage of different mobile travel services, individual characteristics, perceived barriers to use Internet-/mobile services during a trip and channel preferences (RQ3).
6.1 Individual characteristics, perceived barriers and channel preferences In this study we focused on individual characteristics such as age, gender, travel frequency (business and leisure) and online experience. In addition we looked at perceived barriers to use Internet-/mobile services during a trip as presented in section 4.3. We also took into account the individuals’ preferred channel strategies.
6.1.1 Age and gender Studies in online consumer behavior have emphasized the importance of different aspects of demographics such as age and gender. The younger population has commonly been found as the first mover segment in online Internet access before, during and after the trip (Hjalager and Jensen 2012). Pagani (2004) found young people (18 to 24) to be the innovators of mobile multimedia services. Carlsson et al. (2005) found, among several predictor variables, significant age and gender differences in adoption patterns of different types of mobile services. Also Constantiou et al. (2007) reported differences in demographics such as age and gender between different types of mobile users. Anckar and Dincau (2002) found women in Finland showing a higher willingness than men to use mobile services for several investigated services and the oldest population (66+) showed a much lower willingness than the youngest population (16 – 22). Weiser (2000) reported on differences in Internet use patterns and Internet application preferences between genders, where women seemed to prefer more communicative applications. Hiroshi and Madeline (2003) reported a gender gap in Internet use

83
intensity and frequency, although the gap seemed to diminish over time. The way the Internet is used in Finland is in fact fairly similar regardless of gender, and Internet use is nowadays very widespread among different age groups (Statistics Finland, 2012b). However, according to Statistics Finland (2012a), men and the younger population seem to use mobile devices for connecting to the Internet in Finland more frequently than women and the older population.
6.1.2 Travel frequency As presented in section 4.5.2, when discussing adoption of online travel activities, a clear distinction should also be made between experienced and inexperienced travelers. Those individuals who travel intensively find access to Internet more important than others (Jensen, 2012; Hjalager and Jensen, 2012). Moreover, mobility (on the go) seems to be the main driver of m-commerce and mobile services (as described earlier). Therefore, it seems logical that an individual who is more frequently away from their home environment will be the one who primarily takes advantage of mobile travel and tourism services. The travel market is also often divided into business and leisure. We will, therefore, refer to travel frequency as business and leisure travel frequency.
6.1.3 Online experience As mentioned earlier innovators usually have the knowledge to deal with technical solutions (Rogers, 2003). According to Sääksjärvi (2003), personal innovativeness is usually characterized by (1) a positive attitude towards technology, (2) extensive technical knowledge, (3) willingness to learn about new technological innovations and (4) confidence in independently operating the technological innovation. The same author argued that personal innovativeness constructs can be represented under a more universal variable, namely extensive technical knowledge. Therefore, we assume that individuals with extensive knowledge to deal with online solutions have greater personal innovativeness than individuals with less knowledge to deal with online solutions.
Knowledge or earlier experience of a system seems to be an important component in online travel adoption and consumer behavior (Kah et al., 2008; Hjalager and Jensen, 2012). Studies of online shopping for high and low complexity travel products also show that low- and high-skilled Internet users are profoundly different in their behavior (Beldona et al., 2005). Moreover, Oh et al. (2009) found an indirect effect of travelers’ previous ICT usage on their intentions to use mobile technologies. Alba and Hutchnsson (1987) distinguish between two elements of consumer knowledge, familiarity and expertise, where the former is “the number of product-related experiences that has been accumulated by the

84
consumer”, and the latter is “the ability to perform product-related tasks successfully”. Hence, we will refer to online experience as individuals’ perceived online proficiency (expertise), frequency of Internet use and mobile Internet use (familiarity).
6.1.4 Channel strategies Channel management is a challenge from a vendor perspective (Neslin et al., 2006). Online activities should in fact be studied in a multi-channel environment as consumers are likely to swap between various media (Kaufman-Scarborough and Lindquist, 2002). Noble (2001) highlights that if we investigate only one channel at a time we are not able to understand how consumers choose between channels. Frambach et al. (2007) contended that companies are becoming multi-channel companies and therefore we need to better understand how different channels enhance value in the consumers’ purchasing processes: pre-purchase, purchase, and post-purchase. Similar thoughts for a travel and tourism context have been presented by Pearce and Schott (2005) who argued that we should address the use of multiple channels from a visitor perspective. Also Buhalis (2003) highlighted the need for better planning of multi-channel strategies in travel and tourism in the future due to the emergence of different digital service platforms (e.g. mobile devices). We will here primarily focus on the following channels: (1) Offline (e.g. face to face, voice call) (2) Internet service for desktop/laptop computer (3) Internet-/mobile service for tablet devices and (4) Internet-/mobile service for pocket devices.
6.2 Research design
6.2.1 Categorization of consumers Categorization of consumers in travel and tourism can be done in different ways. One way is by using consumer stages of buying and usage processes (Middleton et al., 2009). Also Seybold (2002) emphasized customer scenarios as a great tool to investigate online behavior. Generally speaking a customer life cycle is divided into three phases; initial contact, purchasing and consumption (Grönroos, 2000, p. 239). Similar processes have been presented in travel and tourism by for example Crotts (1999). For this study, which was delimited to the purchasing and the consumption of travel services, a scenario with six activities was used: (1) search (e.g. compare prices, check availability, look for destination information), (2) reserve (make the actual reservation of a travel service, e.g. hotel rooms, flight tickets, travel packages, train tickets), (3) pay (pay by e.g. credit card or Internet bank transaction for the travel service), (4) cancel/change reservation (make

85
changes to or cancel the reservation), (5) check in (activate the purchased travel service) and (6) reflect (write reviews and/or check such things as bonus points during or past a trip). See table 17.
Table 17: Consumer process in interaction with a travel service provider Scenario activities Example features1. Search The consumer for example compares prices, checks availability
and looks for destination information 2. Reserve The consumer makes the actual reservation of a travel service
(e.g. hotel rooms, flight tickets, travel packages, train tickets) 3. Pay The consumer pays by e.g. credit card or Internet bank
transaction for the travel service 4. Cancel/Change The consumer makes changes to or cancels the reservation 5. Check-in The consumer checks in / activates the purchased travel service
6. Reflect The consumer writes reviews and/or checks such things as bonus points during or past a trip
6.2.2 Data collection In order to accomplish the research objective (RQ3) a questionnaire based on the consumer scenario presented was developed (see also appendix 1 for the original Finnish version of the questionnaire). The primary data needed for the survey was collected through a self-administered web-questionnaire, which for three weeks in June 2011 was linked from the website of one cooperating company within the lodging sector in Finland. In the final data analysis we included only complete answers of all relevant variables, due to that the missing values are missing at random. Consequently we analyzed 882 of 922 answers. Of the respondents, 24.1% were males and 75.9% were females. The youngest respondent was 18 years old and the oldest 71 years old. Nearly all (98.5%) reported that they visit the Internet every day or several times per week. 67.7% had, at least at some point, used the Internet through a smartphone/mobile phone and 29% were frequent travelers, travel at least once per month (business and/or leisure) for a minimum duration of one day. According to Statistics Finland (2012a), 90% of the Finnish population uses the Internet, with an equal use among men and women. Due to the online data collection method and the self-selective process, non-Internet adopters and non-users of the linked lodging company website are excluded in our sample. Hence, the sample may be biased towards respondents finding digital travel services important. We also have a clear female dominance in our sample. The findings should therefore not be overgeneralized for the total Finnish population nor for the total Finnish Internet population.

86
6.2.3 Constructing the categories For each consumer activity we asked the respondents to state their Internet and/or mobile service use (1. No use, 2. Only a computer, 3. Both a computer and smartphone/mobile phone, 4. Only a smartphone/mobile phone). See figure 10. We then formed a new variable mobile use to get the use of a smartphone/mobile phone (non-usage = 1 and 2, and usage = 3 and 4) for each investigated activity. In table 17 we can see the usage according to each investigated activity. The first activity search draws the highest use score (25.1% of all respondents). Of the respondents 43.1% used at least one of the investigated activities with their smartphone/mobile phone.
Figure 10: Internet and/or mobile service use for each activity of all respondents (N = 882)
The next step was to determine whether it was possible to identify distinct
categories of pocket device users for travel services, here referred to as mobile travelers. As discussed in section 3.2.1 hierarchical cluster analysis is a common approach and it is advisable to use it with different methods and measurements to find an optimal solution (Hair et al., 2010). Based on the mobile use for the six activities we conducted a hierarchical cluster analysis. We tried different hierarchical cluster methods (e.g. nearest neighbor and farthest-neighbor) with different measurements but we could not find a reasonable solution in SPSS Statistics 20. We then used the Ward method and selected as measurement the
0%
10%
20%
30%
40%
50%
60%
70%
80%
90%
100%
1. Search 2. Reserve 3. Pay 4. Cancel /Change
5. Check in 6. Reflect
2,8 % 3,3 % 6,1 %14,1 %
48,1 %40,4 %
72,1 %79,7 %
87,0 % 69,2 %
35,8 % 52,7 %
24,6 %16%
6,2 %
15,1 % 14,6 %
6,3 %0,5 % 1,0 % 0,7 % 1,6 % 1,5 % 0,6 %
Only a mobile phone/ smartphone
Both a computerand mobilephone/smartphone
Only a computer
No use

87
squared Euclidean distance for binary data (see section 3.2.1 for a description). Our results were analyzed in the range between two to six clusters. We decided upon a five cluster solution as it was the only solution that seemed reasonable based on the characteristics of the categories (e.g. cluster size, distances in the dendrogram and proportions of the six activity variables in relation to the categories). According to Hair et al. (2010) it is important that the researcher uses reason judgment in the design and interpretation decisions. The proportions of the six activity variables in relation to the identified categories are shown in table 18.
Table 18: Identified categories. Total proportions and proportions by category are shown according to mobile use for the six activities. Total
N=882Non-users
N = 502
Info-seekers N = 86
CheckersN = 77
Bookers N = 109
All-rounders N = 108
Category size 100% 56,9% 8,7% 9,8% 12,4% 12,2% 1. Mobile search 25,1% 0% 100% 32,5% 33,9% 67,6% 2. Mobile reserve 17,0% 0% 0% 39,0% 62,4% 73,2% 3. Mobile pay 6,9% 0% 0% 0% 0% 56,5% 4. Mobile change/cancel 16,7% 0% 0% 0% 62,4% 73,2% 5. Mobile check in 16,1% 0% 0% 84,4% 0% 71,3% 6. Mobile reflect 6,9% 0% 0% 28,6% 0% 36,1% Note: In bold numbers determine the description of the categories
We developed the following descriptions:
(1) Non-users = the group is represented by individuals who don’t use any travel services on a pocket device.
(2) Info-seekers = the group is represented by individuals who only search for travel information on a pocket device.
(3) Checkers = the group is represented by individuals who primarily use their pocket device for check in services.
(4) Bookers = the group is represented by individuals who primarily use their pocket device to reserve, change and cancel a travel service.
(5) All-rounders = the group is represented by individuals who primarily use their pocket device for almost any of the investigated travel services.
The following categories we refer to as mobile travelers: info-seekers, checkers,
bookers and all-rounders and one category we refer to as non-users. We find these categories appropriate to use for this study and thereby analyze the differences between them next. Analyzing variables not included in the cluster analysis is important for profiling and validating the categories (Hair et al., 2010).

88
6.3 Analysis
6.3.1 Individual characteristics Significant differences in variance are shown for all variables when analyzed with cross tabulation and Chi-square for the variables age and gender in table 19 and with one- way ANOVA with Scheffe post-hoc test for the variables of travel frequency and online experience in table 20.
The fact that all-rounders have the highest travel frequency (both business and leisure) of all groups and high online experience supports that there is a group of skilled and frequent travelers who take advantage of their pocket device in almost any type of interaction with travel service providers. This group is overrepresented by men (relative to their percentage of the sample), which in Finland, as discussed earlier, is the primary group to adopt the mobile Internet in general. Interesting is that this group seems not to be overrepresented by the youngest users (18 to 22) but rather by individuals between 23 and 50. Info-seekers seem instead to be overrepresented by men in the youngest age group and by individuals with very high online experience; however, they do not travel as frequently (neither business nor leisure) as the all-rounders. Interesting is that checkers state that they do not use the mobile Internet as much as all-rounders and info-seekers. This may be because major air carriers in Finland like Finnair and SAS have text messaging as a mobile check-in service. Checkers report fairly high travel frequency and the category seems to be slightly overrepresented by men in the age group 23 – 50. Bookers show the second lowest online experience but fairly high travel frequency. A relatively low proportion of bookers stated that they use their pocket device to search for travel information, rather they use their pocket device to make, change or cancel a reservation (See table 18). This indicates that bookers use their pocket device primarily for some travel bookings that require neither high product involvement nor high online experience. In fact, purchases of travel services may be preceded by complex search behavior but they may also become routines that include very limited search behavior or no search at all (Moutinho, 1987). Non-users seem to be overrepresented by females and slightly by individuals above 51. The travel frequency and online experience of this group is the lowest of all groups.

89
Table 19: Difference between the categories in terms of age and gender. Total
N =882 Non-users
N = 502
Info-seekers N = 86
Checkers N = 77
Bookers N = 109
All-rounders N = 108
Chi-square /
df
Sig.
Gender 45,916 / 4
0,000
Male 23,9% 17,0% 43,0% 32,5% 20,2% 38,0% Female 76,1% 83,0% 57,0% 67,5% 79,8% 62,0%
Age 32,37 / 16
0,009
18 – 22 10,8% 11,0% 22,4% 7,8% 6,5% 6,7% 23 – 35 30,8% 27,8% 35,3% 33,8% 33,3% 36,5% 36 – 50 40,8% 40,6% 30,6% 44,2% 43,5% 45,2% 51 – 65 16,0% 18,8% 10,6% 13,0% 16,7% 8,7% 66 + 1,6% 1,8% 1,3% 1,2% ,0% 2,9%
Table 20: Difference between the categories in terms of travel frequency and online experience Total
N=882Non-users
N=502
Info-seekers N = 86
Checkers N = 77
Bookers N = 109
All-round
ers N=108
F-value Sig.
Travel frequency Business travel frequency 1,37 1,25a 1,42ab 1,49ab 1,47ab 1,69b 10,383 0,000 Leisure travel frequency 2,06 1,94a 2,19ab 2,17ab 2,19ab 2,33b 9,180 0,000 Online experience Internet proficiency 4,01 3,88a 4,24bc 4,23bc 3,91ab 4,27c 10,334 0,000 Internet use 4,88 4,85a 4,94a 4,92a 4,88a 4,96a 2,512 0,040 Mobile Internet use 3,27 2,76a 4,48c 3,73b 3,33b 4,29c 70,335 0,000 NOTE scales: Business and leisure travel frequency (trip lasts at least 24h): 1 = Less than three times a year, 2 = Three to seven times a year, 3 = About once a month, 4 = Several times a month Perceived personal Internet proficiency: 1 = Poor , 2 = Mediocre, 3 = Fair, 4 = Good, 5 = Excellent Internet use: 1 = Less than once a month, 2 = One to three times a month, 3 = Once a week, 4 = Several times a week, 5 = Every day Mobile Internet use with a mobile phone/smartphone: 1 = No, and I won’t, 2 = Not yet, but I’m interested, 3 = I have only tried, 4 = I use every now and then, 5 = I use regularly Respondents selecting ascending category of Travel frequency, Internet use and Mobile internet use (e.g. selecting 4 rather than 3) indicates higher frequency (cf. Hjalager and Jensen, 2012). Scheffe post-hoc tests are not significant at 0,05 level if the superscripts are the same.

90
6.3.2. The individuals’ perceived concerns to use Internet-/mobile services during a trip Significant differences in variance are only shown for entry costs and usage costs when analyzed with one-Way ANOVA with Scheffe post-hoc test for all five variables in table 21. Therefore, security risks, technology is not sufficient and relevant services are missing do not seem to be issues that significantly influence the usage behavior of mobile travelers. All-rounders perceive the high entry costs significantly less important than non-users and score a lower usage costs mean as well. Interesting is that checkers score the lowest mean on entry costs and usage costs. We interpret this to be related to that, as discussed earlier, check-in services can commonly be made through text messaging services with major air carriers in Finland. Many individuals of this category likely perceive that they just need a basic mobile phone with text messaging capabilities, and thereby perceive lower entry and usage costs than the other categories. Non-users score the highest mean score of all groups for both high entry costs and usage costs.
Table 21: Category differences in relation to perceived barriers to use the mobile Internet-/mobile services during a trip with a mobile phone/smartphone. Total
N=882 Non-users N = 502
Info-seekers N = 86
Checkers N = 77
Bookers N = 109
All-rounders N = 108
Chi-square /
df
Sig.
Entry costs (e.g. expensive devices) 2,10 2,20a 1,98a, b 1,84b 2,09a, b 1,87b 7,662 0,000
Usage costs (e.g. connection costs, service charges)
2,33 2,39a 2,36a 2,15a 2,25a 2,22a 3,221 0,012
Security issues (worry about personal information and/or payment transactions)
2,29 2,29a 2,24a 2,29a 2,33a 2,31a 0,232 0,921
The technology is not sufficient (e.g. bad usability)
2,27 2,25a 2,32a 2,28a 2,28a 2,28a 0,248 0,911
Relevant services are missing or I’m not aware of them
2,07 2,07a 1,99a 2,14a 2,11a 2,05a 0,616 0,651
NOTE: scale: 1 = not important, 2 = somewhat important, 3 = very important Mean values tested with an ANOVA. Scheffe post-hoc test are not significant at 0,05 level if the lowercase superscripts are the same.

91
6.3.3. The individuals’ channel strategies Significant differences in the distribution of preferred channels are shown for all variables when analyzed with cross tabulation and Chi-square in table 22. The result shows that the selection of a pocket device as main channel strategy largely follows the same pattern as the usage behavior. All-rounders are the most likely to select a pocket device as their main channel strategy overall, info-seekers have the highest proportion for search activities, checkers have the highest proportion for check in activities, bookers rank change/cancel activities relatively high and non-users score low pocket device proportions for all of the activities.
The highest overall proportion for a pocket device is for check-in activities, which we described earlier to be provided by major Finnish air carriers as a simple text message service (does not require an Internet connection or a smartphone). The desktop/laptop seems overall to be the clear main strategy for all the six activities. Interesting is that the tablet device, which is a fast growing online channel, also shows relatively high proportions among all-rounders. This indicates that also other developing online channels such as the tablet device are very relevant options for the mobile traveler, at least for certain activities. As discussed earlier a pocket device may not be the optimal tool to provide the information support needed for more complex trip arrangements (high product involvement) and here indeed the tablet device scores a higher proportion than the pocket device among all-rounders for information search. In fact both overall and among all-rounders the latter part of the process (change/cancel, check-in and reflect) seem to draw higher pocket device proportions than the first part (search, reserve and pay), indicating that these latter activities are perceived more suitable on a pocket device. It should also be highlighted that the online channels (desktop/laptop, tablet and pocket device) clearly win over the off-line channel for all six activities.

92
Table 22: Category differences in terms of the preferred (I mainly use/I would mainly use) channel. Total
N=882 Non-users N = 502
Info-seekers N = 86
Checkers N = 77
Bookers N = 109
All-roundersN = 108
Chi-square/ df
Sig.
Search Off-line 1,7% 3,5% 0,0% 1,4% 3,0% 2,2% 94,586 / 12 0,000 Desktop/Laptop 92,0% 95,0% 88,6% 95,7% 92,0% 77,2% Tablet device 1,9% 0,4% 0,0% 1,4% 1,0% 12,0% Pocket device 3,4% 1,1% 11,4% 1,4% 4,0% 8,7% Reserve Off-line 8,8% 9,2% 5,1% 1,4% 13,1% 10,8% 70,010 / 12 0,000 Desktop/Laptop 87,7% 89,7% 91,1% 97,1% 82,8% 73,1% Tablet device 1,5% ,9% 0,0% 1,4% ,0% 7,5% Pocket device 2,0% 0,2% 3,8% 0,0% 4,0% 8,6% Pay Off-line 4,9% 4,9% 1,3% 3,3% 8,2% 4,4% 111,777 / 12 0,000 Desktop/Laptop 91,8% 93,9% 97,4% 94,3% 89,7% 76,7% Tablet device 1,4% 0,4% ,0% 1,4% 2,1% 6,7% Pocket device 1,9% 0,7% 1,3% 0,0% 0,0% 12,2% Change/Cancel Off-line 18,7% 17,8% 10,7% 12,7% 32,7% 18,9% 112,237 / 12 0,000 Desktop/Laptop 74,8% 80,5% 81,7% 85,3% 52,0% 56,7% Tablet device 1,8% 0,9% 1,3% 2,8% 3,1% 4,4% Pocket device 4,7% 0,7% 2,7% 2,8% 12,2% 20,0% Check in Off-line 30,0% 33,7% 23,4% 7,4% 48,3% 18,0% 140,932 / 16 0,000 Self-service Machines
14,9% 12,0% 16,9% 20,6% 21,3% 15,7%
Desktop/Laptop 45,9% 51,1% 55,8% 41,2% 24,7% 38,2% Tablet device 0,8% 0,5% 0,0% 1,5% 1,1% 2,2% Pocket device 8,4% 2,7% 3,9% 29,4% 4,5% 25,8% Reflect Off-line 10,4% 11,4% 1,4% 7,5% 12,5% 13,0% 69,541 / 12 0,000 Desktop/Laptop 83,5% 86,7% 93,0% 79,1% 82,3% 66,3% Tablet device 1,2% 1,0% 1,4% 0,0% ,0% 4,3% Pocket device 4,9% 1,0% 4,2% 13,4% 5,2% 16,3%
* In bold numbers are highlighted as most interesting
6.4 Conclusions The main aim of this chapter was to give answers to RQ3 (‘Can we identify distinct user categories of mobile travel services based on differences in individual

93
characteristics, the individuals’ perceived barriers to use Internet-/mobile services during a trip and the individuals’ channel preferences?’). We have here, based on a cluster analysis, presented four categories of mobile travelers: info-seekers, checkers, bookers and all-rounders and one category that we referred to as non-users. There are significant differences in individual characteristics, perceived financial barriers and preferred channel strategy between these categories. In table 23 we summarize a description of each category.
Table 23: Description of categories Categories Description All-rounders
The group is represented primarily by individuals who use their pocket device for almost any of the investigated travel services. We found all-rounders to primarily constitute of 23 to 50 year old males with high travel frequency (business and leisure) and great online experience. All-rounders also perceive possible financial barriers such as entry costs and usage costs during a trip as less important than the other four categories. They are also the most likely category to select a pocket device as their main channel strategy overall.
Info-seekers
The group is represented only by individuals who search for travel information on a pocket device. We found the youngest age group (18 to 22) and males to be over-represented as info-seekers. These young info-seekers, dominated by males, with very high mobile online experience are, nevertheless, likely to convert into all-rounders when or if their travel frequency (business or leisure) increases and usage cost obstacles decrease.
Checkers The group is represented primarily by individuals who use their pocket device for check-in services. Checkers state that they do not use the mobile Internet as much as all-rounders and info-seekers. This may be because major air carriers in Finland like Finnair and SAS have text messaging as a mobile check in service. Checkers report fairly high travel frequency (both business and leisure) and the category seems to be slightly overrepresented by men and the age group 23 – 50.
Bookers The group is represented primarily by individuals who use their pocket device to reserve, change and cancel a travel service. Bookers seem to use their pocket device for routine travel bookings (make, change and cancel a reservation), as they report a rather low online experience and only a few of them use mobile travel information search services.
Non-users The group is represented only by individuals who do not use any travel services on a pocket device. Non-users seem to be overrepresented by females and slightly by individuals above 51. The travel frequency (both business and leisure) and online experience of this group is the lowest of all groups. Non-users score the highest mean score of all groups for both high entry costs and usage costs.
*In bold categories are referred to as mobile travelers

94
Considering the rapid adoption rates of smartphones and the mobile Internet in general it is highly likely that large proportions of non-users will soon also convert into mobile travelers. For example between 2010 and 2011 the rate of smartphone users more than doubled in Finland and in 2012 49% of the population uses a smartphone (Statistics Finland, 2012b). It should, however, be noted that recent research from the Finnish market suggests that there is a large group of smartphone users (38%) that does not use any advanced mobile services and have a low motivation to continue using smartphones in the future (Sell et al., 2012). Hence, the adoption of smartphones may not be a direct indicator of mobile travel service adoption and the low motivation to continue using smartphones may also indicate a possible disruption in the diffusion process, also referred to as ‘the chasm’ by Moore (1999) (see section 2.1.1.).
Regulations are also taking place in for example the EU regarding roaming charges between the European countries and national telecom operators are starting to see ‘international data subscriptions’ as a sales advantage (e.g. Finnish Sonera provides a data subscription in the Baltic and Nordic region at the same price as in Finland), which will enhance the adoption of mobile travel services also in international contexts. But in order to speed up the adoption rate travel service providers could consider (1) more local initiatives of free Wi-Fi networks (2) development of mobile travel services that can be used, at least to some extent, in offline mode (do not require costly network access during a trip) and/or (3) cooperation with telecom operators (e.g. lower usage costs for travelers who use specific mobile services or travel with a specific vendor). The categories can also be seen as consumer segments, for which travel service providers (4) can target mobile services. For example, satisfying the needs of all-rounders may indeed require mobile travel services that efficiently support all six steps in the investigated scenario.
The results showed that the selection of a pocket device as main channel strategy largely follows the same pattern as for the usage behavior among the identified categories, where all-rounders are the most likely category to select a pocket device as their main channel strategy overall. The results also suggest that the latter part of the investigated process (change/cancel, check-in and reflect) is perceived the most suitable on a pocket device. Nevertheless, it seems that existing desktop/laptop online channels will remain highly relevant to mobile travelers for all investigated activities (at least during a transition period) and other developing online channels such as the tablet device will grow in importance as well. This will force travel service providers to become increasingly multi-channel firms. To manage these multiple online channels, (1) closely integrated and hybrid online platforms for different devices, supporting all steps in the investigated process should be developed. It could be useful for travel service providers to focus more on developing browser based mobile applications than mobile applications that work

95
only on specific operating systems and for specific devices. Moreover, it could be useful (2) to centralize content and commercial transactions to manage the different online channels simultaneously. But, as discussed in chapter 5, it must be remembered that many device and mobile operative system developers want service developers to specifically create services for their platforms and see native applications as a strategic advantage to sell more devices of a certain kind. The mobile telecom industry has very much moved into a battle of ecosystems where device makers, developers of operating systems and service developers are to some extent forced to pick their development platforms. Nevertheless, it seems highly relevant to better understand from a holistic business model aspect the emergence of HTML5 as a new web-based platform to design and deliver mobile travel and tourism services. Hence, we will next provide insights on business model development for mobile travel and tourism services.

96
7. Business model development (RQ4) In this chapter we will present two studies which focus on building mobile tourism services based on the findings from our earlier studies and evaluate the outcome from a holistic business model perspective. Hence, the aim here is primarily to provide insight into business model development for mobile travel and tourism services and give some answers to our fourth research question (RQ4: ‘Can HTML5 from a business model perspective provide a feasible future platform for mobile service design and delivery in a travel and tourism context?’). The four elements of the STOF-model are used as a platform to direct the investigation: Service domain, Technological domain, Organizational domain and Financial domain (see section 2.4 for a presentation of the model).
First we will present our sixth study (research paper 5) on introducing mobile tourism services in a peripheral region. The study shows interesting barriers and drivers to implement mobile tourism services on the Åland islands in 2007 – 2008 and hence contributes to the understanding of why application stores may today play an important mediating role in the adoption of mobile travel and tourism services from both a user (traveler) and a service provider perspective (here small businesses in a peripheral region). Second we will present our seventh study (research paper 6), which focuses entirely on developing an outdoor mobile tour guide in HTML5. In fact, HTML5 may challenge the application store model by allowing service providers and developers to directly reach the consumers (Juntunen et al., 2013).
7.1 Introducing mobile tourism services in a peripheral region As described earlier the New Interactive Media (NIM) project, with funding from the European Union and the regional government of the Åland Islands, was a development program for the increase of knowledge, production and use of new interactive media on the Åland Islands in Finland. Within the project some 20 mobile services (prototypes) were developed for the tourism sector on the islands. The design of a proper business model was a key issue in the development of these services. However, interesting hurdles in the development process were discovered along the way. Hence the aim of this study is to give an overview of two developed mobile tourism services (MobiTour and MobiFish) from a business model point of view and to map the drivers and barriers for implementing mobile tourism services from a local travel service provider perspective. Actions taken in the project to resolve the identified barriers will also be presented. The primary insights are drawn within a time period from fall 2007 to spring 2008. Therefore, we will here make some revisions to our original study (research paper 5) by adding more

97
recent findings to the discussion of the designed services and the evaluation of the proposed business models.
7.1.1 Action research The action research methodology (see section 3.4) turned out to be well suited for the NIM-project as the problems were complex and practical of which little was still known due to the new and unproven mobile service channel at that time (2007 to 2008). The local actors in the NIM project were the problem owners and they had the experience of their actual context. In contrast we as a research group had the theoretical knowledge which, according to Argyris (1983) as quoted in Perry and Gummesson (2004), can be crucial when identifying actual problems and clarifying assumptions more precisely. As theoretical framework we used theories of designing business models for mobile ICT services including theories in service design, value networks, revenue models and technical design. We as researchers participated in the NIM-project not only to guide the research program (as consultants who told what to do) but as project workers who together with the local actors aimed at improving and changing the conditions. The research findings were drawn upon a total action learning experience (Baskerville, 1999) of designing business models for two mobile tourism services developed within the NIM context.
7.1.2 Service domain MobiTour was designed as a guide for attractions such as the Bomarsund fortress on the Åland Islands to be downloadable/streamable to the visitors’ own mobile devices. The guide included video and/or voice guidance in different languages and for selectable geographical parts of an attraction. MobiTour can be defined as a support service to an attraction as guiding necessarily is not mandatory for an attraction. MobiTour as an application was divided into core functions, support functions and facilitating functions. The core function in MobiTour was downloading, playing or streaming content (stories) about different parts of the attraction (e.g. on how battles were fought at the Bomarsund fortress). Moreover, functions such as localization on a map were possible to add to the service. As described earlier mobile situations (mobility-related needs, see section 4.1) seem to be a relevant value-adding element for the use of mobile services. Therefore, situation awareness (e.g. providing relevant stories based on geographical position) was an essential feature of the guide to make it more attractive. The core mobile service package is described in table 24.
Furthermore, offering interactive guiding in unmanned places was the proposed main motivation for an attraction provider to set up MobiTour. Hence,

98
experience enhancement in form of educational and entertainment (edutainment) wherever and whenever visiting attractions was the primary intended value for the tourist. Experience enhancement features are, as discussed earlier, are commonly seen as key drivers for successful customer satisfaction (Pine and Gilmore, 1999). Mobile guides may also function as a platform for travelers to plan local attractions to visit in advance (Brown and Chalmers, 2003; Tussyadiah and Fesenmaier, 2007). We also highlighted in our second study (see section 4.2) that independent travelers seem to be the primary target group of mobile tourism services. Carlsson and Walden (2010) also proposed that mobile guides could provide additional value as bundled services (not as standalone services). For example by integrating the Bomarsund guide with other mobile services developed in the NIM-project (e.g. a tourist info portal and a tourist community). Study 4 (chapter 5) also indicated that integration of mobile travel services ought to improve the user experience on a mobile device.
MobiFish was designed as a reservation system of sports fishing permits for predefined fishing areas in a region. Hence the MobiFish service could be seen as a mandatory service to sports fishing as legal fishing often cannot be done without purchasing a permit. The booking function was the core function for MobiFish as an application. Mobile payment and maps of the fishing areas were defined as facilitating functions, which must be used for the application to work. See table 24. MobiFish was designed to provide a backbone for a unified fishing permit system on the Åland Islands. There was in 2007 about 58 different fishing areas for the islands owned by private persons, fishing “teams”, municipalities and the regional government. At that time the system was un-integrated which meant that permits were sold from various places, with various opening hours and with access to various fishing areas. For travelers who have planned on fishing on the Åland Islands or are in a fishing group this is generally not a problem as they have often purchased their permit in advance through for example an activity package provider. The mobile application therefore primarily targeted individuals whose fishing needs occur spontaneously while visiting Åland. Spontaneous travel arrangements should indeed be supported by mobile services (see our first study in section 4.1). Due to the un-integrated permit system the number of permits sold for sports fishing was hard to estimate. At least 19.000 accommodations per year on the islands were estimated in 2006 to be connected with sports fishing (Åland Local Government 2006). Therefore, MobiFish was primarily planned to help potential customers to purchase a permit more easily, enable more legal fishing and create a greater cash flow for the fishing area owners.
MobiFish was also planned to enable integration of community features, enabling sports fishers to share similar experiences during or after the trip. Experience-sharing has been shown to enhance the total tourism experience (Brown et al., 2005). Furthermore, social influence has by several studies been

99
identified to be a prominent driver to use mobile travel and tourism services (as described in section 2.2). Therefore, it ought to be useful to make mobile tourism services social by integrating community features from existing social networks and/or tourist communities, e.g. for the Åland islands. Also see a detailed description of a designed mobile community prototype for tourists in the Åland Islands (Carlsson et al., 2008). MobiFish was also proposed to be a context- or location-aware service (understands based on position on a map which permit should be purchased). See table 24.
Table 24: Proposed mobile service packages
7.1.3 Technology domain Both MobiTour and MobiFish were built on open source components. Components such as Tomacat server, MySQL and WebMacro were used together with common programming languages such as JavaScript, C-sharp, JavaServlets, J2ME and XHTML. The application provider in the value networks needed to support the open source components and the programming languages used, and thus needed to hold an open source license valid for possible commercial redistribution of the components.
In study 2 we found that too long download times and services mal-functioning due to network problems caused problems for the participants in the field trial. Especially long download times downloading a service for temporary use may cause the participants to view the service as too time consuming to take into use. We also noted that we cannot expect all consumers to install and learn how to use a mobile service in advance (e.g. pre-trip). Therefore, the technological platform (e.g. transmission rates) has to be sufficient enough also on-site in different field
Mobile service packages C = Core function; the reason for the service to exist F = Facilitating function; mandatory for the service to work S = Support function; makes the service more attractive, optional functions Functions Explanation M
obiF
ish
Mob
iTou
r
Reservation Reservation with options of product alternatives and confirmation message C
Payment Payment option integrated in the reservation process F Video Video content for download or streaming C Voice Voice content for download or streaming F Maps Interactive maps for limited areas F F Positioning GPS positioning on a map S S Community Mobile meeting place (pictures, interaction, tips, stories etc.) S S
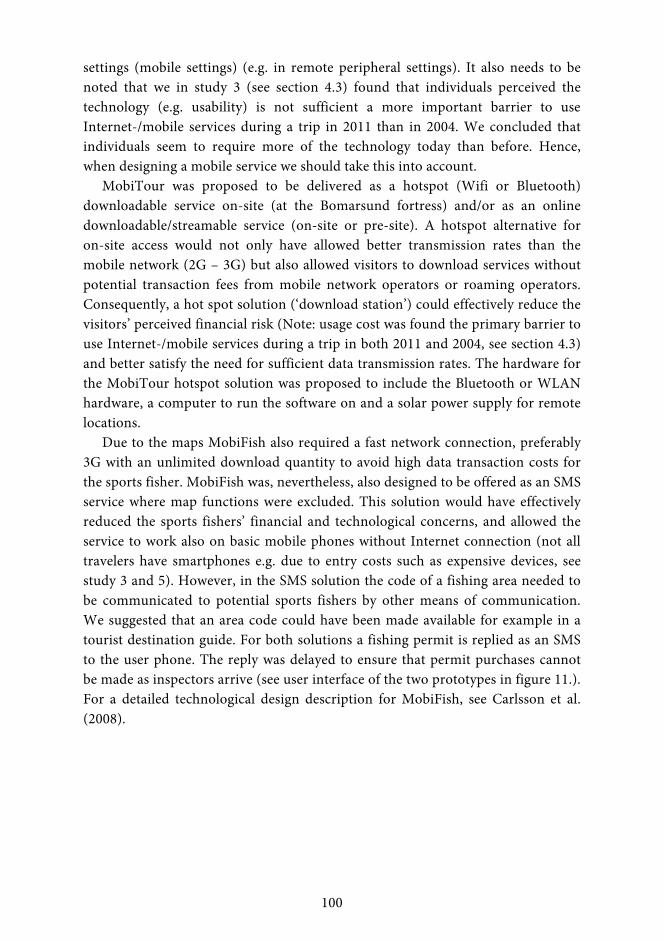
100
settings (mobile settings) (e.g. in remote peripheral settings). It also needs to be noted that we in study 3 (see section 4.3) found that individuals perceived the technology (e.g. usability) is not sufficient a more important barrier to use Internet-/mobile services during a trip in 2011 than in 2004. We concluded that individuals seem to require more of the technology today than before. Hence, when designing a mobile service we should take this into account.
MobiTour was proposed to be delivered as a hotspot (Wifi or Bluetooth) downloadable service on-site (at the Bomarsund fortress) and/or as an online downloadable/streamable service (on-site or pre-site). A hotspot alternative for on-site access would not only have allowed better transmission rates than the mobile network (2G – 3G) but also allowed visitors to download services without potential transaction fees from mobile network operators or roaming operators. Consequently, a hot spot solution (‘download station’) could effectively reduce the visitors’ perceived financial risk (Note: usage cost was found the primary barrier to use Internet-/mobile services during a trip in both 2011 and 2004, see section 4.3) and better satisfy the need for sufficient data transmission rates. The hardware for the MobiTour hotspot solution was proposed to include the Bluetooth or WLAN hardware, a computer to run the software on and a solar power supply for remote locations.
Due to the maps MobiFish also required a fast network connection, preferably 3G with an unlimited download quantity to avoid high data transaction costs for the sports fisher. MobiFish was, nevertheless, also designed to be offered as an SMS service where map functions were excluded. This solution would have effectively reduced the sports fishers’ financial and technological concerns, and allowed the service to work also on basic mobile phones without Internet connection (not all travelers have smartphones e.g. due to entry costs such as expensive devices, see study 3 and 5). However, in the SMS solution the code of a fishing area needed to be communicated to potential sports fishers by other means of communication. We suggested that an area code could have been made available for example in a tourist destination guide. For both solutions a fishing permit is replied as an SMS to the user phone. The reply was delayed to ensure that permit purchases cannot be made as inspectors arrive (see user interface of the two prototypes in figure 11.). For a detailed technological design description for MobiFish, see Carlsson et al. (2008).

101
Figure 11: User interface of MobiTour and MobiFish
7.1.4 Organizational domain In a value network not only products or services are distributed to the end user and revenues collected but knowledge and intangible benefits are also shared among the actors (Allee, 2000). The term ‘actor’ we used for the local actors who primarily were involved in the business model proposals in the NIM-project. These companies formed from a local destination perspective, which was the primary NIM-perspective, the potential value network for MobiTour and MobiFish. Potential local actors in the value network were attraction providers (e.g. museum), advertising agencies, the official tourism organization, network operators, IT-companies, fishing area owners (e.g. private persons, fishing teams, municipalities, the regional government) and fishing guides/hospitality services (e.g. providers of support services for sports fishing).
For mobile commerce many potential roles have been identified. For instance, Camponovo and Pigneur (2003) identified: (1) content provider, (2) payment agent, (3) government, (4) network operator, (5) device maker and (6) user as relevant roles while, for instance, Kallio (2004) differentiated: (1) terminal manufacturing, (2) application provider, (3) application service provider, (4) content aggregator, (5) content integrator, (6) content provider, (7) infrastructure provider, (8) network operator, (9) service provider and (10) end user. The term ‘role’ as we used it related to a set of activities in the value network. We identified potential roles that seemed relevant in the local context. Infrastructure roles such as device manufacturer and network provider were excluded, as was the user role, since the focus was primarily on the potential roles of the local actors.
Proposed roles in the value network for MobiTour in a local context: Service provider: providing the guiding service, holds the rights of the
guiding content Content composer: storytelling Content producer: making of guiding content Application service provider: providing the application, application
services such as maintenance and possibly necessary hardware
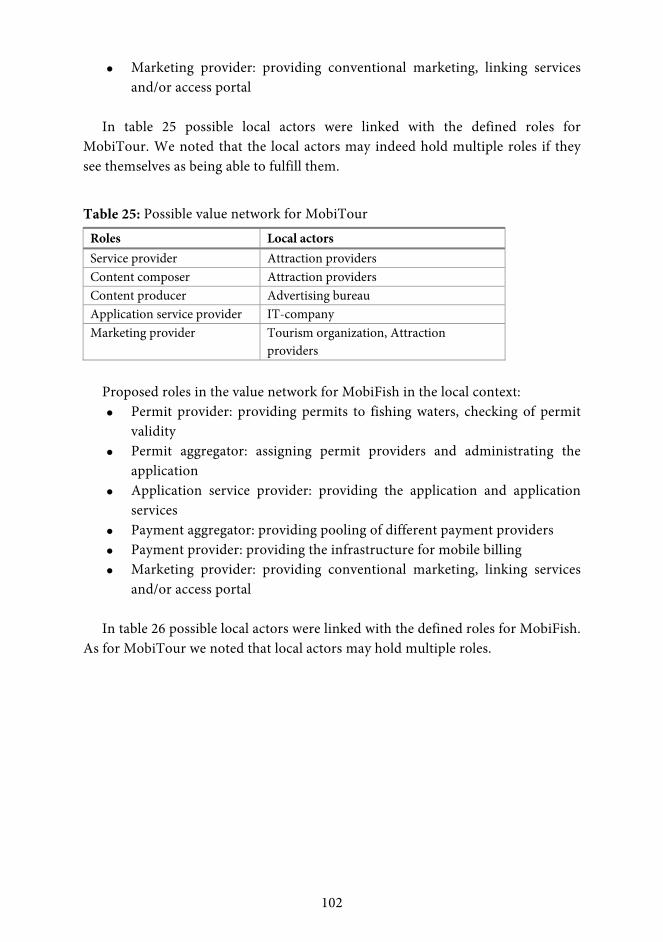
102
Marketing provider: providing conventional marketing, linking services and/or access portal
In table 25 possible local actors were linked with the defined roles for
MobiTour. We noted that the local actors may indeed hold multiple roles if they see themselves as being able to fulfill them.
Table 25: Possible value network for MobiTour
Proposed roles in the value network for MobiFish in the local context: Permit provider: providing permits to fishing waters, checking of permit
validity Permit aggregator: assigning permit providers and administrating the
application Application service provider: providing the application and application
services Payment aggregator: providing pooling of different payment providers Payment provider: providing the infrastructure for mobile billing Marketing provider: providing conventional marketing, linking services
and/or access portal In table 26 possible local actors were linked with the defined roles for MobiFish.
As for MobiTour we noted that local actors may hold multiple roles.
Roles Local actorsService provider Attraction providersContent composer Attraction providersContent producer Advertising bureauApplication service provider IT-companyMarketing provider Tourism organization, Attraction
providers

103
Table 26: Possible value network for MobiFish
7.1.5 Financial domain Revenue streams for content operators online generally come from: (1) advertising, (2) subscription fees of periodic use or access to content, (3) revenue sharing with other online services, (4) per-unit charges, (5) online sale of non-content merchandise and (6) services and shared profits from directing buyers to an electronic storefront (Gallaugher et al., 2001). Generic revenue models for software business are according to Rajala et al. (as quoted in Rajala et al., 2007): (1) licensing (license sale and royalties), (2) revenue sharing with partners and profits sharing with users, (3) loss-leader pricing (meaning giving something for less than its value, for example to grow customer base), (4) media model (where the revenue is based on advertising), (5) effort-, cost- or value-based pricing (which is a common approach in customized or tailor-made software solutions and made to order software projects) and (6) hybrid models (various combinations of different models). Also cost sources such as running costs and investment costs/risks need to be accounted for by the local actors. These aspects were considered in the discussion with the local actors but here only the proposed revenue models will be presented.
No end user tariffs could be charged with MobiTour as the prototype did not include a payment function. Without end user tariffs the main business drivers for the attraction providers were greater visitor satisfaction and cost reductions compared to other alternatives. Instead of providing other more expensive guiding alternatives (e.g. fixed multimedia terminals, human guides), a self-service mobile application may indeed save costs and provide an increased visitor experience.
The proposed software business model for MobiTour was a service-alone model including setup, maintenance and hosting services. The services were intended to be provided by the application service provider in the value network. An effort- 1 Quedro in 2007 offered different packages of contracted network operators, including the local operator Ålands mobiltelefon. The packages were offered countrywise (in e.g. Finland and Sweden). The users were identified based on their phone number as an automatic user SMS with price information is sent to the service of Quedro. The user’s network operator as payment provider receives the chargeable amount and bills the phone number owner by sending a phone bill.
Roles Local actorsPermit provider Fishing area ownersPermit aggregator Fishing bureauApplication service provider IT-companyPayment aggregator Quedro1 Payment provider Network operators Marketing provider Fishing guides, Hospitality services

104
based model for content production was proposed as the content production is more or less customized according to the attraction. See table 27 for a description.
Table 27: Scenario of benefit or revenue sources for MobiTour
The end user tariff for a one day fishing permit was in 2007 on average about
five euros on the Åland Islands. A revenue sharing model together with a service model was primarily suggested for the application service provider in the value network of MobiFish. Consequently the application service provider charges a monthly fee for services such as maintenance and a commission for each permit transaction. The payment providers, in this case the network operators in Finland, Sweden and the local operator: based their income on revenue sharing. The payment aggregator’s, in this case the local actor Quedro’s, revenue model was at that time based on services such as maintenance and on revenue sharing. The local non-profit fishing bureau was proposed to support a local unified permit system by financing the service fees charged for in the value network. Thereby the fishing area owners were proposed to share their permit tariff with the application service provider, payment aggregator and network operators. Moreover, marketing providers like fishing guides and hospitality services may benefit from more possible customers for their own services. See table 28 for a description.
Table 28: Scenario of benefit or revenue sources for MobiFish
Local actors Roles Benefit or Revenue sources Attraction provider Service Provider, Content
composer, Marketing provider
Greater visitor satisfaction Cost reductions compared to other alternatives
Advertising bureau Content producer Effort-basedIT-company Application service provider Service feeTourism organization Marketing provider Goodwill to the destination
Local actors Roles Benefit or Revenue sources Fishing area owners Permit provider Revenue sharingFishing bureau Permit aggregator Goodwill to the destination IT-company Application service provider Service fee, Revenue sharing Quedro Payment aggregator Service fee, Revenue sharing Network operators Payment providers Revenue sharing Fishing guides / Hospitality services
Marketing provider Possibly more customers

105
7.1.6 Barriers to implement the proposed business models New technology was generally seen as an opportunity among the local actors on the Åland islands to provide a new interaction channel with visitors. The proposed business models for MobiFish and MobiTour as described promised benefits and to some extent direct revenue for the local actors. Nevertheless, several barriers were also discovered during the process of bringing the two investigated services to the market. The most concrete ones were:
Local actor features: Focus on core competences, Limited financial resources
Regional features: Complex regional structure Mobile channel features: Immature mobile payment systems, Technology
readiness where local actor features represent barriers that depend on the local actors themselves, regional features represent barriers that depend on the regional infrastructure and mobile channel features represent barriers that depend on the channel of interaction. Focus on Core Competences In peripheral regions IT-companies with the right competencies are hard to find or their staff is extremely busy (Anckar and Walden, 2001). For the Åland Islands at least the latter was true in 2007 - 2008. There were a few local IT-companies on the island with the potential of running the services but their staffs were extremely busy. The region actually saw an IT boom at that time where some of the local IT-companies expanded heavily to mainland Finland and Sweden. The recruitment of staff was in fact intense from a local point of view. Consequently there were a limited number of local actors interested in further developing and commercializing the proposed mobile services, as they needed to focus on their core business which necessarily did not directly adapt to a role in the value network of a mobile service. The companies certainly acknowledged the potential of not only a local commercialization of the services but also a commercialization outside the region. Nevertheless a slight skepticism towards the open source philosophy was also recognized where the concerns laid in the ability to make a commercially successful product without the full rights to the software package. Neither did the local actors at that time support all the open source components that were needed to run MobiFish and MobiTour, which also called for competence enhancement. Moreover, for some IT-companies the support or non-support of the open source philosophy was also an important strategic issue.

106
Limited Financial Resources Lack of financial resources to introduce new technology has been identified by several studies (e.g. OECD, 2004; European E-business report, 2007) to be a major barrier for any small and medium sized organization. The financing dilemma is generally problematic when speaking of introducing new innovations by SMEs in Finland (PK-yritysbarometri, 2007). The vast majority of the enterprises and organizations, non-profit or commercial, on the Åland Islands were small and medium sized. Hence the lack of financial resources to take full advantage of new technology opportunities was obvious. The local actors showed certain skepticism towards the financial efforts needed to bring the proposed mobile services to the market. Already the investment cost of 5000 Euros for purchasing the intangible rights to the service packages from the NIM project caused companies to hesitate. Complex Regional Structure Issues regarding the complexity of designing and implementing new business models that fit for the whole region are challenging. As Gretzel et al. (2000) pointed out, “destination success in the new economy is more about change in approach than about technology itself”. The complexity of implementing MobiFish for the whole of Åland as a destination became very obvious when the structure of today’s fishing area ownership was unfolded. As described above there are about 58 different fishing areas for the Islands owned by private persons, fishing teams, municipalities and the regional government. For the visitor, the visiting sports fisherman, the optimal solution would be a unified system which offers equal access to any fishing water in the region. Now tariffs and fishing rules may differ for neighboring waters, making a unified system very complex to develop. Many of the owners acknowledged the advantages of a joint fishing permit standard but due to different views on the regional fishing policy many were nevertheless not willing to change and join a unified system. Due to the fishing policy complexity only a few owners showed an interest in implementing MobiFish, which would have made the service very limited from a region or destination perspective. Immature Mobile Payment Systems The immaturity of mobile payment systems was striking when we designed the business models. A sufficient mobile payment system from a user perspective should include: (1) applicability in any payment scenario, (2) suitability for any payment amount level and (3) availability for every mobile phone (Pousttchi, 2004). Although there were several mobile payment consortia in the world driven by actors such as network operators, banks, device manufacturers, technology and cross industry players (Karnouskos and Fokus, 2004), it seemed to be difficult to find suitable payment systems on a local level. Network operators, including the

107
local network operator, did provide a post paying billing infrastructure model based on SMS communication. The commission charged by the network operator was about 25 – 60% per transaction, making the revenue stream quite unfavorable from a mobile service vendor perspective. The high commission charges were mainly motivated by credit risks, low volumes and collection costs from roaming network operators. The transactions are also low value transactions called micro payments, not allowing transactions exceeding about 20 euros, making it hard to purchase for example MobiFish permits with longer durations than a couple of days. No other payment methods which covered a broad consumer base such as banking and credit card payments seemed to be available for mobile service providers with consumers primarily from Finland and Sweden at that time. We noted, however, that the payment and distribution infrastructure was evolving. Technology Readiness As described in the technological domain section we found mobile network transmission rates, potential connection costs and individuals’ device readiness to be obstacles to successful implementation of more advanced mobile tourism services (map and video featured services) in field settings. Our more recent findings from 2011 also indicate that these issues are still relevant, at least for a wider adoption (see section 4.3). Today, the next generation (fourth generation) of mobile networks that are being rolled out globally as we speak, promise improved usability in terms of e.g. high speed data access. The 3G networks are also being extended to cover more peripheral regions and smartphones are purchased in millions. Despite these highly important technological improvements we still argue that in order to guarantee appropriate mobile solutions for travelers in especially different field settings (e.g. in remote peripheral settings) local travel service providers should consider (as discussed earlier) more local initiatives of free Wi-Fi hotspot solutions (‘download stations’) and development of mobile services that can be also used, at least to some extent, in offline mode. Similar suggestions have also been made by Bader et al. (2012) who investigated the acceptance of mobile tourism services in Switzerland. It should also be noted that low transmission rates or connection problems in different field settings is not only a mobile network issue but also an antenna problem among some popular smartphones (Strand, 2013).
7.1.7 Action taken in the Project Different actions were taken in the NIM-project in order to deal with the identified barriers. For example a live pilot of MobiFish was set up according to the proposed business model. The model was, nevertheless, delimited to only include the local government as permit provider and the project acted as application service

108
provider. Permits were purchased and real monetary transactions were made by using the pilot service. Therefore, by piloting the service and the business model the project was able to set an example for further discussions of a unified fishing system on the Åland islands. Furthermore, the project applied for an extension of the project to further develop and support the commercialization process of all the services generated in the project. The project was granted an extension by a few months, but without new funding. The focus in the extension was on competence enhancement of potential local entrepreneurs and lowering the entry costs. By taking these actions we felt that the commercialization process of the services took a step in the right direction. Nevertheless, neither MobiFish nor MobiTour were within the time frame of the NIM-project launched as commercial services on the Åland islands.
7.1.8 Discussion and conclusions The study provides insights in designing business models for mobile tourism services from a local service provider perspective. Two services were described according to four elements in a business model. Nevertheless the described business models were only proposed scenarios. We noted in the NIM-project that the models needed to be developed further by the local actors depending on their final role in the value network. But by learning from the development experience we concluded that implementing business models for mobile tourism services from a local service provider perspective in a peripheral region depends on local actor features, regional features and mobile channel features. The following barriers for implementing the proposed business models for MobiTour and MobiFish were identified:
Focus on core competences: where local actors due to lack of staff, lack of competence or for strategic reasons cannot take on new service concepts.
Limited financial resources: where local actors financially are not able to commercialize new services.
Complex regional structure: where the region has an infrastructure which limits the introduction of new services in full scale in the region.
Immature mobile payment systems: where payment features in the mobile channel have not matured enough to provide a feasible platform for commerce.
Technology readiness: where end user devices and connections, network coverage, limit the use of more advanced mobile services in field settings.
Drivers such as greater visitor experience and new cash flow the local actors
were also recognized. Moreover, based on the experience of the NIM-project, we believed that at least the local actor and regional barriers were lowered

109
significantly on the Åland islands due to the set-up of pilot services, enhancement of local competence and lowered entry costs to take into use new technology.
Now looking back at the development process we see that the application stores (e.g. Google Play for the open source platform Android) handle many of the barriers that we highlighted in the NIM-project. Today vendors of these international application stores provide enhanced developer environments and licensing services to help service providers to develop quality applications and prevent unauthorized installation and use of applications. These stores also provide widely accepted infrastructures for customer management and payment procedures (e.g. credit card payments). According to Kimbler (2010) the revenue sharing models in application stores are from a service provider perspective reasonable (the standard is that the App store retains 30% and the provider 70% of the price). Moreover, the application stores often include in-app billing that lets a service provider sell digital content (e.g. a fishing permit, content for a guide) from inside the mobile application. This feature enables free distribution of the application but content can still be charged for from inside the application. Moreover, the application stores ought to provide familiar and secure payment features for the consumer. In our third study individuals seemed indeed to perceive security issues more important in 2011 than in 2004. Hence, this study shows a good example of the key mediating role that application stores can play a in the adoption of mobile travel and tourism services both from a consumer (here visitors to a destination) and a service provider perspective (here small local businesses in a peripheral region). However, according to Juntunen et al. (2013), web-based mobile services enhanced by HTML 5 are challenging the application store model by allowing service providers to directly reach the consumer. Hence, it seems highly relevant to develop and evaluate mobile travel and tourism services in HTML5 from a business model perspective.
7.2 A local outdoor mobile tour guide in HTML5 – drivers and barriers As described above in study 6 the development of mobile tourism services may be a challenge for small local service providers due to e.g. limited financial resources and lack of competence. Therefore, we found that there is a need to conduct research projects which aim at lowering the entry barriers for local travel service providers, e.g. by exploring technological options for new ways of mobile service delivery. Moreover, study 5 indicated that travelers’ channel preferences are forcing travel service providers to become increasingly multi-channel providers. Hence there may be a need to focus more on developing cross-platform solutions such as browser-based mobile travel and tourism services rather than on

110
developing native travel and tourism applications that support only specific operating systems and devices. The main goal of the MobiTourism project at Arcada University of Applied Sciences was, therefore, to look into the possibility of using HTML5 as a development platform for a local outdoor mobile tour guide (here referred to as MTG). HTML5 is expected by many developers to be the future platform of mobile service delivery, e.g. thanks to its cross-platform capabilities which ought to reduce development costs (e.g. Charland and Leroux, 2011, Juntunen et al., 2013). However, as discussed earlier when designing new mobile technology-based services, we must not only look at the technological aspects of the service but we need to take a holistic approach in order to understand critical success factors from both a customer and a service provider perspective (Bouwman et al., 2008). Therefore, our first aim is to briefly describe a mobile tour guide developed in HTML5 with the help of the STOF-model. Our second aim is to evaluate the drivers and barriers of HTML5 as a future platform, especially within a travel and tourism context (RQ4). The experiences have been gained from fall 2011 to spring 2012.
7.2.1 Action research and iterative design As discussed in section 3.4, an action research-based approach fits well with using the STOF-model for all domains (Bouwman et al., 2008, p. 134). According to Järvinen (2007), action research includes both building and evaluating artifacts (here a prototype of a mobile service). Furthermore, IS action research refers to a set of research approaches rather than a single research method (Baskerville, 1999). Here, we focused on IS prototyping and principles of agile software development processes, which often include brainstorming and short but continuous feedback cycles in small teams. However, we also used organized field trials with questionnaires as method. Hence, the final evaluation of HTML5 as a platform is based on a total action learning experience (Baskerville, 1999) rather than on data collected via a single method. See figure 12 for a description of our approach.

111
Figure 12: An iterative development model
7.2.2 Service domain Mobile services should support different types of consumer needs: spontaneous, time-critical arrangements, efficiency, entertainment and/or mobility related needs (see study 1, section 4.1). Offering interactive guiding in unmanned places is the proposed main motivation for a travel service provider to set up a local outdoor mobile tour guide. Hence, experience enhancement in the form of educational entertainment (edutainment) wherever and whenever visiting attractions is the intended core value for the traveler. Mobile guides may also work as platforms for travelers to plan local attractions to visit in advance (see study 6, section 7.1.1) However, as discussed earlier, we cannot expect all travelers to pre-plan and/or pre-install mobile services before they visit local sites. Therefore, mobile services such as mobile guides should be made easily available also in different on-site settings (see study 6, section 7.1.2). Research also suggests that independent travelers (not participating in organized travel such as a package tour) are likely to be the primary target group for Internet travel information services (Grønflaten, 2009a) and mobile tourism services (see study 2, section 4.2). Moreover, Kristoffersen and Ljungberg (2001) distinguish between three types of mobility: visiting, traveling and wandering. Visiting, an actor performs activities at different locations (e.g. a hotel). Traveling, an actor performs activities while moving between different locations, usually inside a vehicle (e.g. a bus). Wandering, an actor performs activities while moving between different locations where the locations are locally defined within a building or local area (e.g. on foot). Our focus was in this study primarily on the latter, the wandering aspect of mobility. To support the value proposition of wandering independent visitors the guide was decided to include (1) map of a local outdoor area, (2) location features with GPS, (3) predefined points of historical and design interest and (4) text and/or multimedia material for each point of interest (POI) within the local area.
Service domain, Technical domain, Organizational domain and Finance domain 1. Initial planning Brain storming with partner and literature review to map real needs
2. Spiraling steps 1. Plan 2. Act/Design 3. Observe/Test 4. Reflect Continuous feedback by any means
3. Final test Field trials with two groups of test users (N = 60 students)
4. Evaluation Documentation and planning further actions

112
A prototype of the service was to be set up within the context of Arabianranta2 in Helsinki, Finland. The Arabianranta area is visited both by domestic and international travelers, which required the application to take into account language options and on-site usage costs especially for roaming visitors. In fact, our findings suggest (see chapter 4 and 6) that the most prominent barrier to the use of mobile travel and tourism services during a trip is an individual’s perceived financial cost. Service providers of mobile tourism services should minimize transaction costs and deliver information (content) for free (Bader et al., 2012). Also Fuchs et al. (2011) argued that overall cost reductions and tariff transparency extremely important in usage of mobile information service in tourism. Moreover, providing a service on-site with map and multimedia content sets requirements on the mobile network transmission rate. Too long download/streaming times may lead to that travelers view the service as too time consuming to temporarily take into use in an onsite context (see study 2, section 4.2). Moreover, accessibility of mobile services plays a significant role in consumers’ adoption decisions (Nikou and Mezei, 2012). Consequently, (1) smooth accessibility, (2) easy installation and usage procedures, and (3) minimal financial risk are key factors in order for mobile services to succeed in an on-site travel and tourism context. It was also decided that the guide should be a free-of-charge service in order to make the area more attractive rather than trying to monetize from the service by charging the visitor. The quality of the content provided for each POI was also decided to be of high priority to ensure a relevant and interesting visitor experience. Therefore, 10 POIs of high relevance were initially picked out for the Arabianranta area. With these requirements in mind (summarized in table 29) we started to develop a prototype of a local outdoor mobile tour guide in HTML5 with focus on the Arabianranta area in Helsinki.
Table 29: Service domain requirements
2 Arabianranta, one of the capitals most important design areas, is represented by Art and Design City Helsinki (ADC). ADC worked as a partner during the development of the MTG service.
The main target group consists of independent domestic or international travelers who visit Arabianranta, for example by taking the tram or bus from the city center. The visitor information point of Arabianranta is located in the old Arabia factory centrally situated in the Arabianranta area. This point is a natural starting point for any kind of visit to the area for a non-local. 10 points of interest (POIs) within about one kilometer from the starting point were initially identified for the area. The visitor should be able to freely on foot (without a specific predefined route) easily find and experience these points of interest. Moreover, the mobile solution needs to support smooth accessibility, easy installation and usage procedures and no concerns regarding financial risks.

113
7.2.3 Technology domain HTML5 (incl. HTML5.1) is not considered an official standard yet (when
writing this), but it is already partially supported in the latest versions of desktop and mobile browsers. HTML5 provides several application programming interfaces (APIs), for example: video, local storage, offline web applications and localization (GPS) (Mellin, 2012). Hence HTML5 makes it possible to create more feature-rich web applications that resemble native applications that run on the desktop of mobile devices (Charland and Leroux, 2011; Anthes, 2012). The following main building blocks, in addition to the markup language HTML, were utilized in the development of the MTG-prototype: PHP framework CodeIgniter and the mobile JavaScript framework jQueryMobile (Mellin, 2012).
The MTG-prototype primarily utilizes two of the APIs provided by HTML5. The first API is the offline web applications API for downloading and storing data on the visitor’s device. As described above one key requirement was that it had to be possible to use MTG in offline mode to ensure that the financial risk for the visitors is kept at a minimum. The second API is the localization (GPS) API for locating the visitor. A second key requirement as presented above was that the visitor on-foot easily can find the POIs. Furthermore, a third key requirement was to provide smooth accessibility (short download times) for the visitor. Hence the zoom feature was locked to ensure that the amount of map tiles to download is kept to a minimum. We also decided that the map API was to be touch capable. This supported yet another requirement, namely easy usage. (Mellin, 2012)
The interface views of the visitor client are shown in figure 13. See Mellin (2012) for a detailed technology description of the MTG-prototype.
Language Online/Offline List Map POI
Figure 13: Interface views of the visitor client
Figure 14 shows an overview of the primary steps the visitor is proposed to undertake when utilizing the MTG application in an on-site context. (1) The URL (e.g. arbit.fi/guide) of the application needs to be entered in the browser or activated from a QR-code (Quick Response code). (2) To access the service a data connection on the device has to be activated, for example by using a free local on-site Wi-Fi or a user operator/roaming operator mobile network. (3) The visitor is given the option of choosing a language and the option of using local storage for

114
the content (download for offline use) or an online connection. (4) When on-foot, the visitor uses the various features of the application (e.g. map, location and POI features) in either online or offline mode
Figure 14: The visitor perspective onsite
The technological domain also included a back office client. The back-office component is designed for the actors and the value network behind the MTG and will hence be presented under the organization and finance domain.
7.2.4 Organization and finance domain The back office client is built to function as a service, which means that anyone invited to use the service (e.g. travel service providers) could register and start creating maps and POIs of their own online MTG via a web browser (creating their own mobile guides for specific outdoor areas). The model is often referred to as ‘software as a service’ (SaaS) (see figure 15). The intention is that the regional tourist organization could use the service to build different area specific MTGs within the region in cooperation with local service providers such as ADC Helsinki. Hence, the main target group of the back-office client is travel service providers of different kinds. Therefore, there needs to be a way to customize the guides according to the needs of different types of providers. This is why the back-office client contains functions for customizing maps, colors, logos, languages and POIs.
1. Arrival of visitor - Enters the URL into the bowser or uses a QR code
2. Access - Chooses access network: WiFi or mobile network
3. Off-line or On-line mode - Chooses language - Downloads content or connects online
Web server - HTML5 application, Local map, Data of POIs
Start-point Wi-Fi
User operator/ roaming
-Instructions on how to proceed at start-point -URL/QR-code
4. Use - On-foot, visiting different local outdoor POIs - Locates and activates POIs
If Online

115
Service providers Back-office client Guide User segments N = Multiple numbers of service providers, guides and end-user segments
Figure 15: Back-office perspective
The main value proposition for service providers to use the service is to be able to provide greater customer experiences in especially unmanned locations (as described in section 7.2.2 service domain). Moreover, the possibilities to customize the MTG and reduce print costs (e.g. print of traditional paper brochures) are also important value propositions to travel service providers. The key needs of the local non-profit organization ADC in Arabianranta were indeed identified as (1) provide enhanced visitor experience with state of the art technology, (2) simplicity to maintain and customize the application and (3) potential financial savings. See figure 16 for the interfaces of the back office client. See also Mellin (2012) for a detailed technical description of the back-office client.
Map creation Language setting Style editor POI definition
Figure 16: Back-office client interfaces
7.2.5 Evaluation of drivers and barriers of HTML5 Above we presented the MTG application according to the four domains in the STOF model: service, technology, organization and finance. We also tested the functionality of the prototype and the quality of the content designed for each POI both continuously in our development team and by organizing a field trial with groups of University students in the real Arabianranta context. As discussed in section 4.5.3 product developers need first-hand user feedback in form of personal
ADC Web server hub - map creation - language setting - style editing -POI-definition
N
N
ArabianrantaN
N
Arabianranta-visitors
N
N

116
interaction. Hence our trial persons (N=60) were handed a task which instructed them to visit four POIs within the Arabiaranta area on their own and with the help of the MTG-application. Feedback was collected with a semi-open questionnaire (see appendix 2) and by orally discussing the MTG with the trial groups. As a result of the trial many flaws were found (and fixed). There are, nevertheless, still countless of possibilities to improve the functionality of the application (e.g. advanced map routing) and the quality of the content (e.g. possibility to choose font sizes and lengths of POI texts based on personal preferences). See also Mellin (2012) and Fransman (2012). The scope here is, nevertheless, not to present detailed functionality and content feedback from the field trial but to evaluate, based on a total action-learning experience (Baskerville, 1999), HTML5 as a platform for mobile services such as the MTG (RQ4). Cross-platform One of the most important advantages of an application running on HTML5 is that it enables cross-platform operation – it works on many types of devices and operating systems. It should also be noted that there are other cross-platform frameworks available on the market and we considered several of them, for example PhoneGap, Titanium Appcelerator and even pure HTML5. HTML5 with jQueryMobile was eventually chosen, as the newest browser versions of most mobile phones, tablets and computers support the technology (as discussed in the technical domain section). An additional later consideration was to be able to use the MTG application from both desktop computers and mobile devices and by using jQueryMobile and HTML5 this was possible. Had a mobile only framework such as Titanium Appcelerator been chosen, it would have resulted in more work as the application would not run directly in the browser. Considering this may save an application provider effort and resources both in the development and maintenance stages as the visitor client need not be optimized for different types of devices and operative systems. In study 5 we also found that travel service providers are becoming increasingly multi-channel providers, thus a cross-platform approach seems even more relevant. Online vs. Offline As described earlier, individuals worry about financial risk when using Internet-/mobile services during a trip. The access cost may be different in different countries and also depend on the mobile subscription plan of the user. In international roaming contexts the data transmission charges may be very high. Therefore, the possibility in HTML5 to locally store the content on a mobile device is crucial and as shown above an important building block in the MTG service. Earlier a similar feature was only possible by using a native application.

117
Marketing, distribution and monetizing As opposed to a native application, which needs to be installed on the device, an application in HTML5 works directly in the browser and requires no installation. Therefore a user only needs to enter an URL in the browser rather than entering an application store to download and install an application. The simplicity of the access and installation procedure may be an advantage especially in an on-site (on foot) setting like in Arabianranta (as discussed above in the service domain section). On the other hand, if a travel service provider wants to monetize on the application (i.e. charge the user a fee) then a native application listed in an application store (e.g. Google Play) may be better as the store provides the payment channel. With a web application based on HTML5 a separate payment gateway needs to be set up to allow for in-app-purchase or pre-download payment if monetizing is crucial. Setting up such a payment infrastructure causes additional expenses to the service provider. Moreover, many mobile users (especially advanced users) may be used to their application stores and may find native apps to be the ‘real thing’. Therefore, from a distribution and marketing point of view it may be essential to be listed in a native application store. On the other hand, study 4 (see chapter 5) showed that mobile travel services are utilized by users both as web services and native applications. Furthermore, in our case the primary effort of marketing and distribution of the application was intended to be onsite (where the visitor arrives on-foot). Moreover, monetizing was not an issue in the Arabianranta context. It should, however, be noted that application stores are emerging also for HTML5-based applications (e.g. http://openappmkt.com/). These stores provide similar monetizing procedures as in native application stores. Furthermore, HTML5-based applications are not tied to specific application stores and can hence be monetized on without sharing the revenue with an application store (usually 30%). Maturity of HTML5 HTML5 does not provide all capabilities a native platform may provide. For example, in our initial plans we were aiming for an augmented reality application to visualize the POIs. However, augmented reality is not widely supported in HTML5 currently, as camera support is still incomplete on many platforms. On native platforms such as Android, augmented reality is already used in many applications and efforts implementing the WebRTC API in the browser will allow us to do this also with HTML5. Even though HTML5 still lacks certain capabilities, it has been widely implemented by developers of both desktop and mobile browsers. However, some of the HTML5 capabilities are supported differently depending on the browser. Our tests confirmed that there are differences between

118
how browsers support HTML5. Also different support sites (e.g. http://mobilehtml5.org) that show current HTML5 compability status of different browsers confirm the differences between browsers. Nevertheless, HTML5 is maturing as a platform and devices with browsers that fully support it are currently purchased in their millions. The performance gap between HTML5 and native platforms is starting to diminish (Juntunen et al., 2013).
7.2.6 Conclusion Taking guidance from the STOF model we described a local outdoor mobile
tour guide developed in HTML5. We also evaluated HTML5 as a platform for mobile service delivery, especially within a travel and tourism context. The primary drivers for HTML5 are (1) cross-platform (can save development resources) and (2) offline storage capabilities. The offline storage capability is crucial in an onsite setting due to traveler concerns about usage costs. Moreover, an HTML5 based mobile service provides (3) easy access and installation procedures for a traveler on foot; simply enter an URL in the browser. A barrier of HTML5 may be the need to set up (1) a separate payment gateway for a travel service provider to monetize on an HTML5-application or its content. However, HTML5-applications are not tied to the revenue sharing models of application stores. Also (2) the maturity of HTML5 is a question mark and it sets at least for now some limitations to the development of the user experience (e.g. due to differences in browser support). These factors we see as the primary drivers and barriers of HTML5 as a platform for similar mobile services as the local outdoor mobile tour guide. In our case the lack of payment gateway is not a barrier as the application and content is provided for free. Therefore, future actions with the MTG application should concentrate on developing the user experience.
7.3 Summary The main aim of this chapter was to provide insights to business model development for mobile travel and tourism services and give some answers to our fourth research question (RQ4: ‘Can HTML5 from a business model perspective provide a feasible future platform for mobile service design and delivery in a travel and tourism context?’). Hence, the chapter presented two action research studies to illustrate how business models can be designed with the help of the STOF-model. The STOF model proved to be a useful way of structuring the complexity of the issues that we have dealt with when designing the services. The two studies presented here fall back on findings from our five earlier presented studies on the individuals’ perceptions on adopting and using mobile travel and tourism services. Hence we believe that we have shown how to design mobile travel and tourism

119
services based on factors that affect the individual adoption and use of these services. We also believe that we have demonstrated the key mediating role that application stores can play in the adoption of mobile travel and tourism services both from a traveler and a local service provider perspective. However, we also showed in our second action research study that web based platforms (HTML5) may provide a feasible alternative for local service providers to deliver mobile travel and tourism services directly to travelers.

120
8. Summary, implications and further research In this chapter we summarize the findings according to the research questions. We will also discuss implications for practitioners, provide contributions to theory, suggest further research and highlight important limitations. The first main objective of this research was to better understand why and how individuals adopt and use mobile travel and tourism services. However, ‘why and how do individuals adopt and use mobile travel and tourism services’ is a broad problem area and thus we broke it down into more specific research questions. Hence, we will next provide a summary of our findings regarding the individuals’ value perceptions and user experience of mobile travel and tourism services, and a categorization of mobile travel services users.
8.1 Individual perceptions In each chapter we have already provided some answers to our research questions but here we will provide a final summary of the answers.
Our first research question:
RQ1: How do individuals’ perceive value in order to adopt and use mobile travel and tourism services during a trip?
We have empirically, although limited to students opinion early in the m-
commerce era, identified the main value adding-elements to use mobile services (study 1). The primary value-drivers seemed to be especially related to spontaneous and time critical needs of the individuals. The possibility to satisfy mobility-related needs (e.g. localization features) was also widely recognized, but it was not the main value driver for adopting any of the services investigated. To make simple travel arrangements showed the greatest importance for mobile value elements such as spontaneous needs, time critical arrangements, efficiency ambitions and mobility-related needs. Furthermore, a remarkably high interest for using many mobile services, especially entertainment-related ones, while in transportation and during journeys abroad (in a mobile setting) was shown among the students in the empirical study. Therefore, mobility (the mobile setting) indeed seemed early on to be the primary driver for m-commerce, although fixed value was also realized (using mobile services at home/work/school). As thoroughly discussed in chapter 1 and 2, other research has also confirmed our results that mobility (mobile setting) is a key driver for the individuals’ adoption and use of mobile services in general and in a travel and tourism context. Moreover, in study 4 we found that the mobile channel can provide as good a user experience as the computer channel in a fixed setting for trip arrangements conceptually defined to be of low to intermediate

121
complexity. This also confirms that a mobile pocket device is likely to be used extensively in fixed settings (home/work/school) for simple pre-trip arrangements, although mobility aspects seem to be the primary value drivers for the adoption and use.
Furthermore, based on our empirical results from study 2 we argue that the type of travel as non-package or package tour is an important underlying determinant to the travelers’ perceived added-value to use mobile tourism services onsite or during a trip (mobile setting). A non-package tour ought to comply better with an individual’s values of self-arrangement /-service. Similar results have also been found by Grønflaten (2009b), who among several variables distinguished between independent travelers and travelers on an organized tour, in predicting the travelers’ (visitors to Norway) choice of information sources and channels. In that study it appeared that independent travelers had a greater need to do their own research about the trip and the destination than organized travelers, and the Internet is the channel that supports this.
The individuals’ perceived ease of use has been seen as both a driver and a barrier to use mobile services and mobile travel and tourism services. In study 2 we found travelers’ perceived ease of use to be highly important, especially the procedure to temporarily take into use (e.g. access, install and learn) more advanced mobile tourism services (e.g. map and video featured services) on-site (mobile setting). Furthermore, the financial cost (service charges and transaction costs) of using a mobile tourism service is carefully accounted for by the traveler on tour (mobile setting). In fact, Bader et al. (2012) verifies our observation in study 2 that the cost (equipment cost, access cost and possible transactions fees) has a negative influence on the actual use of mobile tourism services. Also Fuchs et al. (2011) have highlighted perceived monetary barriers (monetary transparency and perceived monetary fairness) as important determinants to the acceptance and use of mobile information services in tourism.
We have also empirically, in a Finnish online survey in 2004 and 2011 (study 3), identified the change in the individuals’ perceived barriers to use Internet-/mobile services with a mobile pocket device during a trip (mobile setting). In 2004 the perceived barriers ranked: (1) entry costs and usage costs (3) relevant services are missing or the traveler is not aware of them (4) security issues and (5) the technology is not sufficient. In 2011 they ranked (1) usage costs (2) security issues (3) the technology is not sufficient (4) entry costs and (5) relevant services are missing or the traveler is not aware of them. Overall the perceived barriers have decreased since 2004, especially for mobile Internet users. However, the findings show that the investigated barriers still must be taken into account in development and marketing of mobile travel and tourism services, at least in order to gain an even wider consumer adoption in mobile settings (during a trip). The results confirm our observations from study 2 that the financial costs are carefully accounted for

122
by travelers on tour (in mobile settings). Also our observations in study 2 regarding ease of use aspects seem to be confirmed as, it seems in this study that individuals’ requirements on the technology have increased especially among mobile Internet users. This is in line with the lazy user concept by Tetard and Collan (2009), who argue that mobile services that do not require a lot of effort will be the ones that are primarily used in the future.
Moreover, in study 5 we found significant differences in terms of perceived usage cost and entry costs to use Internet-/mobile services during a trip between the identified categories. The perceived financial cost (usage cost and entry cost) was the highest for non-users of mobile travel services which confirms the made findings above by us and by others that the financial aspect during a trip is particularly important for the individuals’ use of mobile travel and tourism services. Consequently, we conclude that the perceived financial cost (usage cost and entry cost) seem to be the most prominent barrier to use mobile travel and tourism services during a trip (mobile setting).
Our second research question:
RQ2: What factors affect the perceived user experience of mobile trip arrangements?
We have empirically in study 4, although limited to an experiment with
students, identified three perceived problem areas: (1) effort issues (usability/ease of use), (2) efficiency issues (time consumption) and (3) anxiety issues (uncertainty regarding the content) that affect the mobile user experience of mobile trip arrangement defined as of low to intermediate task complexity. Furthermore, we found that users with high-end pocket devices and proficient online skills (referred to as high-end users) found the trip arrangement experience as good as computer users. Despite the positive impact of a high-end mobile device and user skills, we noted that the use of full-size websites had a negative impact on the user experience on a mobile device when compared to computer users. The study was conducted in a classroom setting (fixed setting) which excluded mobility features. However, the same factors may indeed be very important also in a mobile setting (during a trip); although mobility features such as localization (GPS) may improve the user experience essentially while on the go.
Our third research question:
RQ3: Can we identify distinct user categories of mobile travel services and find differences between these categories based on individual characteristics, the individuals’ perceived barriers to use Internet-/mobile services during a trip and the individuals’ channel preferences?

123
In study 5 we were able to identify four user categories of mobile travel services: (1) info-seekers, (2) checkers, (3) bookers and (4) all-rounders, referred to as mobile travelers, and a fifth group that we referred to as non-users. We found significant differences between these categories in terms of age, gender, travel frequency and online experience. Moreover, we found significant differences in terms of perceived financial barriers (usage cost and entry costs) to use Internet-/mobile services during a trip and in terms of preferred channel strategy. In table 30 a summary of the characteristics of mobile travelers.
Table 30: Description of mobile travelers Categories Description All-rounders
The group is represented primarily by individuals who use their pocket device for almost any of the investigated travel services. We found all-rounders to primarily constitute of 23 to 50 year old males with high travel frequency (business and leisure) and great online experience. All-rounders also perceive possible financial barriers such as entry costs and usage costs during a trip as less important than the other four categories. They are also the most likely category to select a pocket device as their main channel strategy overall.
Info-seekers The group is represented only by individuals who search for travel information on a pocket device. We found the youngest age group (18 to 22) and males to be over-represented as info-seekers. These young info-seekers, dominated by males, with very high mobile online experience are, nevertheless, likely to convert into all-rounders when or if their travel frequency (business or leisure) increases and usage cost obstacles decrease.
Checkers The group is represented primarily by individuals who use their pocket device for check-in services. Checkers state that they do not use the mobile Internet as much as all-rounders and info-seekers. This may be because major air carriers in Finland like Finnair and SAS have text messaging as a mobile check in service. Checkers report fairly high travel frequency (both business and leisure) and the category seems to be slightly overrepresented by men and the age group 23 – 50.
Bookers The group is represented primarily by individuals who use their pocket device to reserve, change and cancel a travel service. Bookers seem to use their pocket device for routine travel bookings (make, change and cancel a reservation), as they report a rather low online experience and only a few of them use mobile travel information search services.

124
8.2 Business model development We also attempted to provide insight into business model development for mobile travel and tourism services primarily aimed at travelers in on-site settings (mobile setting), by taking guidance from a theoretical framework called STOF. Two separate action research projects were conducted, both falling back on the findings presented above. Our first action research project (study 6) provided us with insights on the complexity of introducing mobile tourism services in a peripheral region with small businesses. Several barriers and drivers to successful deployment of the developed services were discovered in the NIM-project 2007 – 2008 (see section 7.1.7). Looking back at the results from the NIM-project now we see that application stores (e.g. Google Play) reduce or eliminate many of the barriers that we highlighted. Application stores ought to provide familiar and secure payment features for the traveler. Moreover, application stores provide enhanced developer environments and licensing services to help service providers to develop quality applications and prevent unauthorized installation and use of applications. The revenue sharing model in application stores is also reasonable from a service provider perspective (the standard is that the store retains 30% and the provider 70% of the price). Hence, we believe that our first action research project showed a good example of the key mediating role that application stores can play in the adoption of mobile travel and tourism services both from a traveler (here visitors to a destination) and a service provider perspective (here small businesses in a peripheral region). However, HTML5 is expected by many developers to be the future platform of mobile service delivery, thanks e.g. to its cross-platform capabilities which ought to reduce development costs (e.g. Charland and Leroux, 2011). Hence, we raised our fourth main research question:
RQ 4: Can HTML5 from a business model perspective provide a feasible future platform for mobile service design and delivery in a travel and tourism context?
In the second action research project (study 7) the STOF-model helped us
identify the key drivers and barriers to develop and deliver a local outdoor mobile tour guide service (MTG) based on the emerging platform HTML5. We identified that the primary drivers for HTML5 are (1) cross-platform (can save development resources) and (2) offline storage capabilities. The offline storage capability is crucial in an onsite setting due to traveler concerns about usage costs (as identified above). Moreover, an HTML5 based mobile service provides (3) easy access and installation procedures (ease to take into use) for a traveler on foot; simply enter an URL in the browser. A barrier of HTML5 may be the need to set up (1) a separate payment gateway for a travel service provider to monetize on an HTML5-application or its content (requires additional investments in infrastructure). On

125
the other hand, HTML5-applications are not tied to the revenue sharing models of application stores. Also (2) the maturity of HTML5 is a question mark and it sets at least for now some limitations to the development of the user experience (e.g. due to differences in browser support). However, the performance gap between HTML5 and native platforms is diminishing (Juntunen et al., 2013). Hence, we see that HTML5 is already in several ways a feasible platform for design and delivery of mobile travel and tourism services and it is likely that HTML5 will become an even more viable option in the future for mobile services within the travel and tourism context.
8.3 Implications for practice Each chapter or sub-chapter has provided detailed managerial insights from the different studies that make up the core of this thesis. Our applied efforts presented in chapter 7 also demonstrated in detail how the findings from chapter 4 – 6 (studies 1 - 5) can be applied to the development of business models for mobile travel and tourism services.
From a practitioner point of view the results suggest that a successful mobile travel and tourism service is a service which supports one or several mobile motives (needs) of consumers: spontaneous needs, time-critical arrangements, efficiency ambitions, entertainment and mobility related needs (location features). The service should be easy to use, especially easy to take into use (access, install and learn) during a trip (in mobile settings), without causing security concerns and/or financial risks for the user. For example, travel service providers could consider more local initiatives of free Wi-Fi networks (‘download stations’), development of mobile travel services that can be used, at least to some extent, in an offline mode (do not require costly network access during a trip) and/or cooperation with telecom operators (e.g. lower usage costs for travelers who use specific mobile services or travel with specific vendors). Similar suggestions have also been made by others (Bader et al., 2012; Fuchs et al., 2011). It should, however, be noted that regulations are put in place in the EU regarding data roaming prices between the European countries. National telecom operators are also starting to see international data subscriptions as a sales advantage (e.g. Finnish Sonera provides a data subscription in the Baltic and Nordic region at the same price as in Finland), which will enhance the adoption of mobile travel and tourism services also in international contexts. On the other hand, some national telecom operators have recently announced that they are considering raising data transaction fees and/or limit the amount of data transmitted due to that the mobile data usage is growing rapidly and is starting to exceed the capacity of the networks. Hence, the operators have to make considerable network investments in order to keep up with the demand.

126
Furthermore, the service could be customized to support the travelers’ style of traveling (e.g. package travel or independent travel) and must be either a well-designed mobile site and/or native application, which preferably supports integration with other mobile services. In fact, travel service providers who want to build a relationship with their customers need to consider a downloadable native application, but in order to be found through the mobile channel and make contact with potential new customers, a mobile website should be available. Moreover, travel service providers and mobile service developers should consider individual characteristics such as age, gender, travel frequency and online experience when designing and marketing mobile travel and tourism services.
Furthermore, the results indicate that travel service providers will increasingly become multi-channel providers. To manage multiple online channels, closely integrated and hybrid online platforms for different devices, supporting all steps in a traveling process should be considered. It could for example be useful for travel service providers to focus more on developing browser-based mobile services (HTML5-solutions) than native applications that work only with specific operating systems and for specific devices. Moreover, it could be useful to centralize content and commercial transactions to manage the different online channels simultaneously. It should, however, be noted that HTML5 as a platform, at least for now, has some limitations regarding the development of the user experience and monetizing the application and/or content. In fact, a native application store (e.g. Google Play) may be a key mediator in the adoption of mobile travel and tourism services both from a traveler and a service provider perspective. Moreover, it must be remembered that many device and mobile operating system developers want service providers to specifically create services for their platforms and see native applications as a strategic advantage to sell more devices of a certain kind. The mobile telecom industry has moved into a battle of ecosystems where device makers, developers of operating systems and service developers are to some extent forced to choose their development platforms.
8.4 Limitations Five studies were undertaken to better understand why and how individuals adopt and use mobile travel and tourism services. The data was primarily collected in Finland, except for one study, which was conducted in Canada. Hence, this thesis is primarily valid for Finland. It should also be noted that none of the studies is representative for the total Finnish population, due to the undertaken data collection procedures (the respondents were not chosen randomly). However, the large samples from 2004 and 2011 made it possible to also analyze individual characteristics and thus also contribute to the understanding of changes in the

127
individuals’ perceptions over time and differences between different types of adopters.
It could be argued as a negative aspect that this thesis has not provided one statistically proven theoretical framework to explain why and how individuals adopt and use mobile travel and tourism services. However, this thesis shows the complexity of the issue under investigation, which would make such a model limited in character. Rather we have built our understanding and contribution on more focused research questions and adapted theories for specific research settings. In fact, generic models like TAM have been criticized to have limited explanatory value regarding the use of mobile services (e.g. Carlsson et al., 2006; Nikou, 2012) and to contribute with little insight for practitioners in the real development process (e.g. Repo et al., 2006).
In our two applied action research efforts it needs to be emphasized that our research focused on prototypes and suggested commercialization procedures and not on already commercialized services that are available on the market. Nevertheless, the prototypes were extensively tested in their real intended contexts together with local travel service providers and potential consumers. Moreover, we used the STOF-model as a base which proved to be a useful framework when analyzing the prototypes from a holistic business model perspective.
8.5 Primary contributions to theory and further research We primarily focused on the on-site/during a trip stage (mobile setting) of the tourist life cycle. Hence, we have primarily contributed to theory on the individuals’ perceived value (drivers and barriers) to adopt and use mobile travel and tourism services during a trip (in mobile settings). Consequently, a study where pre-trip, during trip and past-trip settings are compared based on the individuals’ usage; factors that affect the individual adoption and use of mobile travel and tourism service and the individuals’ channel preferences ought to be highly interesting.
We have also contributed with factors (effort, efficiency and anxiety) that significantly affect the perceived user experience of mobile trip arrangement. The investigated task in study 4 was conceptually defined as being of low to intermediate complexity. The complexity of the tasks could, nevertheless, be increased in future studies in order to better understand user experience in high complexity tasks. A general assumption is that due to the limitations of screen size and interface restrictions the users are not likely to perform high-complexity tasks on a mobile pocket device. The complexity level on mobile pocket devices may not rise to the level of stationary computers but as shown in study 4 when devices, user skills and services improve, the user experience is positively impacted which means that the behavior is likely to become more complex as well.

128
Moreover, we have contributed with a first attempt to systematically categorize users of mobile travel services: info-seekers, bookers, checkers and all-rounders. Study 5 also indicated that there may be a difference in the individuals’ mobile adoption behavior regarding low and high travel product involvement. The category bookers seemed to use their pocket device primarily for some routine travel arrangements, which did not require high product involvement or high online experience. Moreover, larger proportions of the group all-rounders preferred a tablet device over a pocket device for travel information search. Therefore, as discussed above, travel product characteristics as low vs. high complexity (e.g. routine vs. non-routine travel), should be investigated in future research when focusing specifically on mobile trip arrangements (plan and book procedures).
This thesis has also attempted to bridge the gap between demand and supply by providing concrete applied efforts on building and evaluating three prototypes from a holistic business model perspective. Hence, we believe that we have thoroughly described how our findings, regarding why and how individuals adopt mobile travel and tourism services, can be converted into designing business models of mobile services aimed at on-site settings (mobile settings) in a travel and tourism context. Furthermore, we believe that we have contributed to the understanding of designing and delivering mobile travel and tourism services from a business model perspective and to the understanding of HTML5 as a future platform for mobile travel and tourism service delivery. Further research could look at different commercial mobile services deployed with HTML5 to further clarify the feasibility of HTML5 as a future platform in a travel and tourism context.

129
References Aarnio, A., Enkenberg, A., Heikkilä, J. and Hirvola, S. (2002). Adoption and Use of Mobile Services Empirical Evidence from a Finnish Survey, in: Proceedings of the 35th Hawaii International Conference on System Science, HICSS 2002, IEEE Computer Society Press. Ajzen, I. (1991). The Theory of Planned Behavior, Journal of Organizational Behavior and Human Decision Processes, 50(2), pp. 179-211. Alali, W.Q., Scott, H.M. and Gold, D.L. (2006). Identifying Groups among Binary and Ordinal Phenotypic Antimicrobial Resistance Data Using Cluster Analysis Techniques, in: Proceedings of the 11th International Symposium on Veterinary Epidemiology and Economics, Cairns, Australia. Alba, J.W. and Hutchinson, J.W. (1987). Dimensions of consumer expertise, Journal of Consumer Research, 13(4), pp. 411-454. Allee, V. (2000). Reconfiguring the Value Network, Journal of Business Strategy, 21(4), pp. 1-6. Anckar, B. (2002). Contextual Insights into the Value Creation Process in E-commerce. Antecedents and Consequences of Consumer Adoption of Electronic Travel Services. Doctoral Dissertation at Åbo Akademi University, Kirjanpaino Grafia Oy, Turku, Finland. Anckar, B., Carlsson C. and Walden, P. (2003). Factors affecting consumer adoption decisions and intents in mobile commerce: empirical insights, in: Proceedings of the 16th Bled eConference: eTransformation, Bled, Slovenia. Anckar, B. and D’Incau, D. (2002). Value creation in mobile commerce: Findings from a consumer survey, Journal of Information Technology Theory and Application, 4(1), pp. 43-65. Anckar, B. and Walden, P. (2001). Introducing Web technology in a small peripheral hospitality organization, International Journal of Contemporary Hospitality Management, 13(5), pp. 241-250. Anckar, B. and Walden, P. (2002). Self-booking of high- and low-complexity travel products: Exploratory findings, Information technology & Tourism, 4(3-4), pp. 151-165.

130
Anthes, G. (2012). HTML5 Leads a Web Revolution, Communications of the ACM, 55(7), pp. 16-17. Arguello, J., Butler, B., Joyce, E., Kraut, R., Ling, K., Rosé, C. and Wang, X. (2006). Talk to me: foundations for successful individual-group interactions in online communities, in: Proceedings of the SIGCHI conference on Human Factors in computing systems, ACM, Montréal, Canada. Arhippainen, L. (2009). Studying user experience: issues and problems of mobile services – case adamos: user experience (im) possible to catch? Doctoral Dissertation at University of Oulu, Oulu, Finland. Arhippainen, L. and Tähti, M. (2003). Empirical Evaluation of User Experience in Two Adaptive Mobile Application Prototypes, in: Proceedings of the 2nd International Conference on Mobile and Ubiquitous Multimedia, Norrköping, Sweden. Bader, A., Baldauf, M., Leinert, S., Fleck, M. and Liebrich, A. (2012). Mobile tourism services and technology acceptance in a mature domestic tourism market: The case of Switzerland, in: Fuchs, M., Ricci, F. and Cantoni L. (eds.), Proceedings of Information and communication technologies in tourism, ENTER 2012, Helsingborg, Sweden, pp. 296-307. Baskerville, R. (1999). Investigating information systems with action research, Communications of the Association for Information System Research, Vol. 2, Article 19. Baskerville, R. and Wood-Harper, T. (1996). A critical perspective on action research as a method for information systems research, Journal of Information Technology, 11(3), pp. 235-246. Beldona, S., Morrison, A.M. and O’Learyc, J. (2005). Online shopping motivations and pleasure travel products: a correspondence analysis, Tourism Management, 26(4), pp. 561-570. Benbasta, I. and Weber, R. (1996). Research Commentary: Rethinking the ‘Diversity’ in Information Systems Research, Information Systems Research, 7(4), pp. 389-399.

131
Bina, M., Karaiskos, D. and Giaglis, G.M. (2007). Motives and Barriers Affecting the Use of Mobile Data Services, in: Proceedings of 6th International Conference on the Management of Mobile Business, ICMB 2007, IEEE Computer Society. Blackwell, R.D., Miniard, P.W. and Engel, J.F. (2001). Consumer behavior, 9th ed., Thomson South-Western, Mason, OH. Blythe, M. and Wright, P. (2003). From Usability to Enjoyment, Introduction, in: Blythe, M., Overbeeke, K., Monk, A.F. and Wright, P. (eds.), Funology: From Usability to Enjoyment, Kluwer Academic Publishers, Dordrecht, the Netherlands. Bouwman, H., Carlsson, C., Lop ez-Nicolas, C., McKenna B., Molina-Castillo, F.T., Tuunanen, V. and Walden, P. (2012a). Mobile Travel Services: The Effect of Moderating Context Factors, Information Technology & Tourism, 13(2), pp. 57-74. Bouwman, H., Carlsson, C., Molina-Castillo, F.J. and Walden, P. (2007). Barriers and drivers in the adoption of current and future mobile services in Finland, Telematics and Informatics, 24(2), pp. 145-160. Bouwman, H., Carlsson, C., Molina-Castillo, F.J. and Walden, P. (2008). Reconsidering the actual and future use of mobile services, Information Systems and E-Business Management, 7(3), pp. 301-317. Bouwman, H., López–Nicolás, C., Molina–Castillo, F–J. and Van Hattum, P. (2012b). Consumer lifestyles: alternative adoption patterns for advanced mobile services, International Journal of Mobile Communications, 10(2), pp. 169-189. Bouwman, H., Vos, H. and Haaker, T. (2008). Mobile Service Innovation and Business Models, Springer-Verlag, Berlin Heidelberg, Germany. Brown, B. and Chalmers, M. (2003). Tourism and mobile technology, in: Kuutti, K. and Karsten, E.H. (eds.), Proceedings of the 8th European Conference on Computer Supported Cooperative Work, Kluwer Academic Press, Helsinki, Finland. Brown, B., Chalmers, M., Bell, M., Maccoll, I., Hall, M. and Rudman, P. (2005). Sharing the square: collaborative leisure in the city streets, in: Proceedings of European Conference on Computer Supported Cooperative Work (ECSCW 2005), Wien, Austria, pp. 427-447. Buhalis, D. (2003). eTourism: information technology for strategic tourism management, Pearson Education, Essex, UK.

132
Buhalis, D. and Law, R. (2008). Progress in information technology and tourism management: 20 years on and 10 years after the Internet – The state of the eTourism research, Tourism Management, 29(4), pp. 609-623. Camponovo, G. and Pigneur Y. (2003). Business Model Analysis Applied to Mobile Business, in: Proceedings of the 5th International Conference on Enterprise Information Systems, ICEIS'2003, Angres, France. Carlsson, C., Carlsson, J., Hyvönen, K., Puhakainen, J. and Walden, P. (2006). Adoption of Mobile Devices/Services – Searching for Answers with the UTAUT, in: Proceedings of the 39th Hawaii International Conference on System Sciences, HICSS 2006, IEEE Computer Society Press. Carlsson, C., Havnen, A. and Walden, P. (2008). Making the Fun of Fishing Legal with Mobile Value Services, in: Proceedings of the 41st Hawaii International Conference on System Sciences, HICSS 2008, IEEE Computer Society Press. Carlsson, C. Hyvönen, K., Repo, P. and Walden, P. (2004). It’s All About My Phone! Use Of Mobile Services In Two Finnish Consumer Samples, in: Proceedings in the 17th Bled eCommerce conference, Bled, Slovenia. Carlsson, C., Hyvönen, K., Repo, P. and Walden, P. (2005). Asynchronous Adoption Patterns of Mobile Services, in: Proceedings of the 38th Hawaii International Conference on System Sciences, HICSS 2005, IEEE Computer Society Press. Carlsson, C. and Walden, P. (2010). Supporting Tourists at the Bomarsund Fortress with a Mobile Value Service, Journal of Information Technology Theory and Application, 11(1), pp. 43-56. Carlsson, C. and Walden, P. (2012). From Mcom Visions to Mobile Value Services, in: Proceedings of the 25th Bled eConference – Special Issue, paper 6-2012, Bled, Slovenia. Charland, A. and Leroux, B. (2011). Mobile application development: web vs. native, Communications of the ACM, 54(5), pp. 49-53. Chin, W.W. and Newsted, P.R. (1999). Structural equation modeling analysis with small samples using partial least squares, in: Hoyle, R.H. (ed.), Statistical strategies for small sample research, Sage, Thousand Oaks, CA.

133
Clifford, H. T. and Stephenson, W. (1975). An introduction to numerical classification, Academic Press, New York, NY. Commission of the European Communities Eurostat, Organisation for Economic Co-operation and Development, World Tourism Organization and United Nations Statistics Division (2001). Tourism Satellite Account: Recommended Methodological Framework, Luxembourg, Madrid, New York, Paris, retrieved April 15, 2013, from http://unstats.un.org/unsd/publication/SeriesF/SeriesF_80e.pdf Constantinides, E. (2004). Influencing the online consumer's behavior: the Web experience, Internet Research, 14(2), pp.111-126. Constantiou, D., Damsgaar, J. and Knutsen, L. (2007). The four incremental steps toward advanced mobile service adoption - exploring mobile device user adoption patterns and market segmentation, Communications of the ACM, 50(6), pp. 51-55. Crotts, J.C. (1999). Consumer decision making and pre-purchase information search, in: Mansfield and Pizam (eds.), Consumer behaviour in travel and tourism, Haworth Press, Binghamton, NY, pp. 149-168. Curch, K., Smyth, B., Bradly, K. and Cotter, P. (2008). A Large Scale Study of European Mobile Search Behaviour. In: Proceedings of Mobile HCI, ACM Press, Amsterdam, the Netherlands. Dahlberg, T. and Öörni, A. (2007). Understanding changes in consumer payment habits – Do mobile payments and electronic invoices attract consumers? in: Proceedings of the 40th Hawaii International Conference on System Science, HICSS 2007, IEEE Computer Society Press. Davis, F.D. (1989). Perceived Usefulness, Perceived Ease of Use and User Acceptance of Information Technology, MIS Quarterly, 13(3), pp. 319-340. Durlacher Research. (2000). UMTS Report, An Investment perspective, retrieved June 13, 2003, from www.durlacher.com. Durlacher Research. (2005). UMTS Report, An Investment perspective, retrieved February 20, 2006, from www.durlacher.com.

134
Electronic Business in Tourism, sector report. (2004). e-BusinessWatch, No. 07-II, European Commission. Featherman, M. and Pavlou, P. (2003). Predicting e-services adoption: a perceived risk facets perspective, Journal of Human Computer studies, 59(4), pp. 451-474. Fishbein, M. and Ajzen, I. (1975). Belief, attitude, intention and behavior: an introduction to theory and research, Addison-Wesley, Reading, MA. Frambach, R.T., Roest, H.A.C. and Krishnan, T.V. (2007). The impact of consumer internet experience on channel preference and usage intentions across the different stages of the buying process, Journal of Interactive Marketing, 21(2), pp. 26-41. Fransman, K. (2012). Matkaoppaana Arabianrannassa toimiva mobiilisovellus: Tehtävänä sisällöntuotanto, Bachelor thesis in tourism management at Arcada University of Applied Sciences, retrieved December 15, 2012, http://publications.theseus.fi/handle/10024/41379 Fuchs, M., Höpken, W. and Rasinger, J. (2011). Behavioral intention to use mobile information services in tourism: The case of the tourist guide DolomitiSuperski.mobi, Information Technology & Tourism, 13(4), pp. 285-307. Gallaugher, J.M., Auger, P. and Barnir, A. (2001). Revenue streams and digital content providers: an empirical investigation, Journal of Information & Management, 38(7), pp. 473-485. Gartner. (2012). Inside Gartner Research, retrieved September 20, 2012, from http://imagesrv.gartner.com/research/methodologies/inside_gartner_research.pdf Gerpott, T.J. (2011). Attribute perceptions as factors explaining Mobile Internet acceptance of cellular customers in Germany – An empirical study comparing actual and potential adopters with distinct categories of access appliances, Expert Systems with Applications, 38(3), pp. 2148–2162. Goh, D.H., Ang, R.P., Lee, Chei, S.L. and Chu, C.K. (2010). Determining services for the mobile tourist, Journal of Computer Information Systems, 51(1), pp. 31-40. Gretzel, U., Yuan, Y-L. and Fesenmaier, F.R. (2000). Preparing for the new economy: Advertising strategies and change in destination marketing organizations, Journal of Travel Research, 39(2), pp. 146-155.

135
Grønflaten, Ø. (2009a). The Tourist Information Matrix – Differentiating Between Sources and Channels in the Assessment of Travellers' Information Search, Scandinavian Journal of Hospitality and Tourism, 9(1), pp. 39-64. Grønflaten, Ø. (2009b). Predicting Travelers’ Choice of Information Sources and Information Channels, Journal of Travel Research, 48(2), pp. 230-244. Grönroos, C. (2000). Service Management and Marketing – A Customer Relationship Management Approach, 2nd ed., Wiley, Chichester, UK. Grönroos, C. and Voima, P. (2013). Critical service logic: making sense of value creation and co-creation, Journal of the Academy of Marketing Science, 41(2), pp. 133-150. Gummerus, J. and Pihlström, M. (2011). Context and mobile services' value-in-use, Journal of Retailing and Consumer Services, 18(6), pp. 521–533. Hackbarth, G., Grover, V. and Mun Y.Y. (2003). Computer playfulness and anxiety: positive and negative mediators of the system experience effect on perceived ease of use, Information & Management, 40(3), pp. 221-232. Hair, J., Black, W., Babin, B., Anderson, R. (2010). Multivariate Data Analysis, Pearson Prentice Hall, Upper Saddle River, NJ. Hair, J.F., Sarstedt, M., Ringle, M. and Mena, J.A. (2012). An assessment of the use of partial least squares structural equation modeling in marketing research, Journal of the Academy of Marketing Science, 40(3), pp. 414-433. Han, J. and Han, D. (2001). A Framework for Analyzing Customer Value of Internet Business, Journal of Information Technology Theory and Application, 3(5), pp. 25-38. Harkke, V. (2007). NIM Åland: the quest for useful mobile services, in: Proceedings of the 20th Bled eConference, Bled, Slovenia. Harrisson, G.W. and List, J.A. (2004). Field experiments, Journal of Economic Literature, 42(4), pp. 1009-1055. Hassenzahl, M. and Tractinsky, N. (2006). User experience – a research agenda, Behaviour Information Technology, 25(2), pp. 91-97.

136
Hastie, T., Tibshirani, R. and Friedman, J. (2008).The Elements of Statistical Learning - Data Mining, Inference, and Prediction, 2nd ed., Springer-Verlag, retrieved from http://www-stat.stanford.edu/~tibs/ElemStatLearn/. Henseler, J., Ringle, C.M. and Sinkovics, R.R. (2009). The use of partial least squares path modeling in international marketing, in: Sinkovics, R.R. and Ghauri, P.N. (eds.), New Challenges to International Marketing (Advances in International Marketing, Volume 20), Emerald Group Publishing Limited, pp.277-319. Herman, J. and Neff, T. (2002). Managing through the M-Commerce Storm. World Market Series Business Briefings: Wireless Technology 2002. World Markets Research Centre, pp. 78-82. Hevner, A.R., March, S.T., Park, J. and Ram, S. (2004). Design science in information systems research, MIS Quarterly, 28(1), pp. 75-105. Hiroshi, O. and Madeline, Z. (2003). Gender and the Internet, Social Science Quarterly, 84(1), pp. 111-121. Hjalager, A-M., and Jensen, J.M. (2012). A typology of travellers based on their propensity to go online before, during and after the trip, in: Fuchs, M., Ricci, F. and Cantoni, L. (eds.), Proceedings of Information and communication technologies in tourism, ENTER 2012, Helsingborg, Sweden, pp. 96-107. Husson, T. and Ask, J. (2011). 2011 Mobile Trends, Forrester Research, Cambridge, MA. HyunJeong, K. and Schliesser, J. (2007). Adaptation of Storytelling to Mobile Information Service for a Site- Specific Cultural and Historical Tour, Journal of Information Technology & Tourism, 9(3-4), pp. 97-108. Hyvönen, K. and Repo, P. (2005a). The Use of Mobile Services in Finland: Adoption Challenges Diffusion Theory, GESTS International Transactions on Computer Science and Engineering, 20(1), pp.166-178. Hyvönen, K. and Repo, P. (2005b). Mobiilipalvelut suomalaisten arjessa, Kuluttajatutkimus-keskuksen vuosikirja, Savion Kirjapaino Oy, Kerava, Finland.

137
Höpken, W., Rasinger, J. and Fuchs, M. (2007). Information Search with Mobile Tourist Guides: A Survey of Usage Intention, Journal of Information Technology & Tourism, 9(3-4), pp. 177-194. IBM SPSS Statistics (2013). Distances Dissimilarity Measures for Binary Data, retrieved May 17, 2013, from http://publib.boulder.ibm.com/infocenter/spssstat/v20r0m0/index.jsp?topic=%2 Fcom.ibm.spss.statistics.help%2Fcmd_proximities_dissim_measure_binary.htm Iivari, J. (2007). A Paradigmatic Analysis of Information Systems As a Design Science, Scandinavian Journal of Information Systems, 19(2), pp. 39-64. Iivari, J. and Venable, J. (2009). Action Research and Design Science Research: Seemingly Similar But Decidedly Dissimilar, in: Proceedings of 17th European Conference on Information Systems, Verona, Italy. International Conference on Mobile Business. (2012). Mobile Business in Everyday life: users’ routines versus provider’s turbulence, Delft, The Netherlands, retrieved September 5th, 2012, from http://www.mbusiness2012.org/. Jensen, J.M. (2012). Shopping Orientation and Online Travel Shopping: the Role of Travel Experience, International Journal of Tourism Research, 14(1), pp. 56-70. Juntunen, A.; Jalonen, E. and Luukkainen, S. (2013). HTML 5 in Mobile Devices -- Drivers and Restraints, in: Proceedings of the 46th Hawaii International Conference on System Sciences, HICSS 2013, IEEE Computer Society Press, pp. 1053-1062. Järvenpää, S., Dickson, G. and DeSanctis, G. (1985). Methodological Issues in Experimental IS Research: Experiences and Recommendations, MIS Quarterly, 9(2). Järvinen, P. (2007). Action Research is Similar to Design Science, Quality & Quantity, 41(1), pp. 37-54. Järvinen, P. (2008). Mapping Research Questions to Research Methods, Advances in Information Systems Research, Education and Practice IFIP – The International Federation for Information Processing, 274, pp. 29-41. Kaasinen, E. (2005). User acceptance of mobile services – value, ease of use, trust and ease of adoption, Doctoral Dissertation at Tampere University of Technology, 566 VTT, Espoo, Finland.
138
Kaasinen, E., Roto, V., Rolof, K., Väänänen-Vainio-Mattila, K., Vainio, T., Maehr, W., Joshi, S. and Shrestha, D. (2009). User experience of Mobile internet- Analysis and Recommendations, Journal of Mobile HCI, Special issue on Mobile Internet User eXperience, 1(4), p. 20. Kah, J.A., Vogt, C. and MacKay, K. (2008). Online Travel Information Search and Purchasing by Internet Use Experiences, Information Technology & Tourism, 10(3), pp. 227-243. Kaikkonen, A. (2009). Internet on mobiles: Evolution of usability and user experience, Doctoral disseration at Helsinki University of Technology, Mutliprint Oy, Helsinki, Finland. Kaikkonen, A., Kekäläinen, A., Cankar, M., Kallio, T. and Kankainen, A. (2005). Usability Testing of Mobile Applications: A Comparison between Laboratory and Field Testing, Journal of Usability Studies, 1(1), pp. 4-16. Kallio, P. (2004). Emergence of Wireless Services. Business Actors and Their Roles in Networked Component-based Development, Doctoral Dissertation at University of Oulu, VTT Publications 534, Espoo, Finland. Kamwar, M., Kellar, M., Patel, R. and Xu, Y. (2009). Computers and iPhones and Mobile Phones, oh my!, in: Proceedings of 18th international conference on WWW 2009, ACM Press, Madrid, Spain, pp. 801-810. Karnouskos, S. and Fokus, F. (2004). Mobile Payment: A journey through existing procedures and standardization initiatives surveys, IEEE Communications Surveys & Tutorials, 6(4), pp. 44-66. Kaufman-Scarborough, C. and Lindqvist, J.D. (2002). E-shopping in a multiple channel environment, Journal of Consumer Marketing, 19(4), pp. 333-350. Keen, P. (1980). MIS Research. Reference Disciplines and a Cumulative Tradition, in: McLean, E.R. (ed.), Proceedings of First International conference on Information Systems, pp. 9-18. Keen, P. (1991). Relevance and Rigor in Information Systems Research: Improving Quality, Confidence, Cohesion and Impact, in: Nissen, H.E., Klein, H.K. and Hirschheim T. (eds), Information Systems Research Contemporary Approaches and Emergent Traditions, North Holland, Amsterdam, The Netherlands, pp. 27-49.

139
Keen, P. and Macintosh, R. (2001). The Freedom Economy – Gaining the M-commerce Edge in the Era of the Wireless Internet, McGraw-Hill, Berkeley, CA. Kimbler, K. (2010). App Store Strategies for Service Providers, in: Proceedings of the 14th International Conference on Intelligence in Next Generation Networks, ICIN 2010, IEEE Computer Science Press, pp. 1-5. Kimiloglu, H., Aslihan Nasir, V. and Nasir, S. (2010). Discovering behavioral segments in the mobile phone market, Journal of Consumer Marketing, 27(5), pp. 401-413. Kleijnen, A., Ruyter, K. and Wetzels, M. (2007). An assessment of value creation in mobile service delivery and the moderating role of time consciousness, Journal of Retailing, 83(1), pp. 33-46. Kock, N. (2004). The three threats of action research: a discussion of methodological antidotes in the context of an information systems study, Decision Support Systems, 37, pp. 265-286. Kotler, P. and Keller, K.L. (2009). Marketing Management, 13th ed., Pearson Education Inc, Upper Sadle River, New Jersey. Kristoffersen, S. and Ljungberg, F. (2000). Mobility: From Stationary to Mobile Work. in: Braa K., Sorensen C.and Dahlbom B. (eds.), Planet Internet, Studentlitteratur, Lund, Sweden. Kyungae, P. and Dyer C.L. (1995). Consumer use innovative behavior: an approach toward its causes, in: Kardes, F.R. and Provo, M.S. (eds.), Advances in Consumer Research, UT: Association for Consumer Research, pp. 566-572. Laukkanen, T. and Cruz, P. (2009). Comparing Consumer Resistance to Mobile Banking in Finland and Portugal, in: Filipe J.and Obaidat M.S. (eds.), e-Business and Telecommunications, Communications in Computer and Information Science, Springer Verlag. Lauraeus-Niinivaara, T., Saarinen, T., Sunikka, A. and Öörni, A. (2008). Relationship between Uncertainty and Patterns of Pre-purchase Consumer Search in Electronic Markets, in: Proceedings of the 41st Hawaii International Conference on System Sciences, HICSS 2008, IEEE Computer Society Press, pp. 138.

140
Law, R., Leung, R. and Buhalis, D. (2009). Information technology applications in hospitality and tourism: a review of publications from 2005 to 2007, Journal of Travel & Tourism Marketing, 26(5-6), pp. 599-623. Lee, T. and Jun, J. (2005). Contextual perceived usefulness? Toward an understanding of mobile commerce acceptance, in: Proceedings of the International Conference on Mobile Business, IEEE Computer Science Press. Mallat, N., Rossi, M., Tuunainen, V. and Öörni, A. (2006). The impact of use situation and mobility on the acceptance of mobile ticketing services, in: Proceedings of the 39th Hawaii International Conference on System Science, HICSS 2006, IEEE Computer Society Press. Mallat, N., Rossi, M., Tuunainen, V. and Öörni, A. (2008). An empirical investigation of mobile ticketing service adoption in public transportation, Journal Personal and Ubiquitous Computing, 12(1), pp. 57-65. Margetta, J. (2002). Why Business Models Matter, Harvard Business Review. Massoud, S. and Gupta O.K. (2004). Consumer perception and attitude toward mobile communication, International Journal of Mobile Communications, 1(4), pp. 390-408. Mellin, T. (2012). Mobile Guide - An offline web application for mobile devices, Bachelor thesis in Engineering at Arcada University of Applied Sciences, retrieved December 15, 2012, from http://publications.theseus.fi/handle/10024/38758. Middleton, V.T.C., Fyall, A. and Morgan, M. (2009). Marketing in Travel and Tourism, 4th ed., Elsevier, Oxford, UK. Mingers, J. (2001). Combining IS Research Methods: Towards a Pluralist Methodology, Information Systems Research, 12(3), pp. 240-259. Moore, G.A. (1999). Crossing the Chasm, 2nd edition, Capstone Publishing, Oxford, UK. Moore, G. and Benbasat, I. (1991). Development of an Instrument to Measure the Perceptions of Adopting an Information Technology Innovation, Journal of Information Systems Research, 2(3), pp. 192-222.

141
Moutinho, L. (1987). Consumer Behavior in Tourism, European Journal of Marketing, 21(10), pp. 5-44. Nasution, H. N. and Mavondo, F. T. (2007). Customer value in the hotel industry: What managers believe they deliver and what customer experience, International Journal of Hospitality Management, 27(2), pp. 204–213. Neslin, S. A., Dhruv, G., Leghorn, R., Venkatesh, S., Teerling, M. L., Thomas, J. and Verhoef, P. C. (2005). Challenges and Opportunities in Multichannel Customer Management, Journal of Service Research, 9(2), pp. 95-112. Neuhofer, B. (2012). An analysis of the perceived value of touristic location based services. In: Fuchs, M., Ricci, F. and Cantoni, L. (eds.), Proceedings of Information and communication technologies in tourism, ENTER 2012, Helsingborg, Sweden, pp. 84-95. Newstedt, P.R., Huff, S.L. and Munro, M.C. (1998). Survey Instruments in Information Systems, MIS Quarterly, 22(4), pp. 553-554. Ngai, E.W.T. and Gunasekaran, A. (2007). A review for mobile commerce research and applications, Decision Support Systems, 43(2007), pp. 3-15. Nikou, S. (2012). Opening the black box of IT artefacts, Doctoral Dissertation at Åbo Akademi University, Painosalma Oy, Turku, Finland. Nikou, S., Guo, J. and Bouwman, H. (2012). Mobile social network services: Chinese Users’ Adoption Patterns, in: Proceeeding of 11th International Conference in Mobile Business, ICMB 2012, Delft, The Netherlands. Nikou, S. and Mezei, J. (2012). Evaluation of Mobile Services and Substantial Adoption Factors with Analytic Hierarchy Process (AHP), Telecommunications policy, retrieved from http://dx.doi.org/10.1016/j.telpol.2012.09.007 Noble, S.M. (2001). Consumers' channel preferences: An integrated model, Doctoral Dissertations at UMass Amherst, MA. Nohria, N. and Leestma, M. (2001). A Moving Target: The Mobile-Commerce Customer, MIT Sloan Management Review, 42(3), pp 104-105.

142
Nysveen, H., Pedersen, P.E. and Thorbjørnsen, H. (2005a). Explaining intention to use mobile chat services: moderating effects of gender, Journal of Consumer Marketing, 22(5), pp. 247-256. Nysveen, H., Pedersen, P.E. and Thorbjørnsen, H. (2005b). Intentions to Use Mobile Services: Antecedents and Cross Service Comparisons, Academy of Marketing Science, 33(3), pp. 330-346. OECD. 2004. ICT, e-Business and SMEs, Paris, France, retrieved February 11, 2013, from http://www.oecd.org/cfe/smes/31919255.pdf Oha, S., Lehto, Y.X. and Parka, J. (2009). Travelers' Intent to Use Mobile Technologies as a Function of Effort and Performance Expectancy, Journal of Hospitality Marketing & Management, Special Issue: E-Business and Hospitality Management, (18)8, pp. 765-781. Okazaki, S. (2006). What do we know about mobile Internet adopters? A cluster analysis, Information & Management, 43(2), pp. 127-141. Pagani, M. (2004). Determinants of adoption of third generation mobile multimedia services, Journal of Interactive Marketing, 18(3), pp. 46-59. Pan, B. (2010). Online Travel Surveys and Response Patterns, Journal of Travel Research, 49(1), pp. 121-135. Parasuraman, A. (2000). Technology readiness index (TRI): a multiple-item scale to measure readiness to embrace new technology, Journal of Service Research, 2(4), pp. 307-320. Park, K. and Dyer C.L. (1995). Consumer use innovative behavior: an approach toward its causes, In: Kardes, F.R. and Provo, M.S. (eds.), Advances in Consumer Research, UT: Association for Consumer Research, pp. 566-572. Pearce, D.G. and Schott, C. (2005). Tourism Distribution Channels: The Visitors' Perspective, Journal of Travel Research, 44(August), pp. 50-63. Peres, R., Correia, A. and Moital, M. (2011). The indicators of intention to adopt mobile electronic tourist guides, Journal of Hospitality and Tourism Technology, 2(2), pp. 120-138.

143
Perry, C. and Gummesson, E. (2004). Action research in marketing, European Journal of Marketing, 38(3/4), pp. 310-320. Pihlström, M. (2008). Perceived value of mobile service use and its consequences. Doctoral Dissertation at Swedish School of Economics and Business Administration, Edita Prima Ltd, Helsinki, Finland. Pine, J. and Gilmore, J. (1999). The Experience Economy, Harvard Business School Press, Boston, MA. Pinsounneualt, A. and Kraemer, K.L. (1993). Survey research methodology in management information systems: an assessment, Journal of Management Information Systems, 10(2), pp. 75-105. PK-yritysbarometri (2007). Finnish SME Barometer, Suomen yrittäjät, Finnvera, Finland. Pousttchi, K. (2004). An Analysis of the Mobile Payment Problem in Europe, in: Branki, C.; Unland, R. and Wanner, G. (eds.), Multikonferenz Wirtschaftsinformatik, MKWI 2004, Universität Duisburg-Essen, Germany, pp.260-268. Pura, M. (2005). Linking perceived value and loyalty in location-based mobile services, Managing Service Quality, 15(6), pp. 509-538. Purcell, K., Entner, R. and Hendernson, N. (2010). The rise of Apps culture, Nielsen Pew Research Center’s Internet & American Life Project, retrieved February 5, 2011, from http://pewinternet.org/Reports/2010/The-Rise-of-Apps-Culture.aspx Rajala, R., Rossi, M., Tuunainen, V.K. and Vihinen, J. (2007). Revenue Logics of Mobile Entertainment Software – Observations from Companies Producing Mobile Games, Journal of Theoretical and Applied Electronic Commerce Research, 2(2), pp. 34-47. Ram, S. and Seth, J.N. (1989). Consumer resistance to innovations: The marketing problem and its solutions, Journal of Consumer Marketing, 6(2), pp. 5-14. Rea, L.M. and Parker, R.A. (2005). Designing and Conducting Survey Research: A Comprehensive Guide, 3rd ed., John Wiley & Sons, San Fransisco, CA.

144
Reinartz, W., Haenlein, M. and Henseler, J. (2009). An empirical comparison of the efficacy of covariance-based and variance-based SEM, International Journal of Research in Marketing, 26(4), pp. 332-344. Repo, P., Hyvönen, K. and Saastamoinen, M. (2006). Traveling from B2B to B2C: Piloting a Moblog Service for Tourists, in: Proceedings of the International Conference on Mobile Business, IEEE Computer Science Press. Riebeck, M., Stark, A., Modsching, M. and Kawalek, J. (2008). Studying the user acceptance of a Mobile Information System for Tourists in the field, Journal of Information Technology & Tourism, 10(3), pp. 189-199. Ristola, A. (2010). Insights into consumers’ emerging interest in mobile services, Doctoral dissertation at University of Oulu, Oulu, Finland. Robertson, T.S. (1967). The process of Innovation and the Diffusion of Innovation, Journal of Marketing, 31(1), pp. 14-19. Rogers, E.M. (1995). Diffusion of Innovations, 4th ed., Free Press, New York, NY. Rogers, E.M. (2003). Diffusion of Innovations, 5th ed., Free Press, New York, NY. Roto, V. (2006). Web browsing on mobile phones – Characteristics of user experience, Doctoral Dissertation at Helsinki University of Technology, TKK 49, Espoo, Finland. Roto, V.,Oulasvirta, A., Haikarainen, T., Lehmuskallio, H. and Nyyssönen, T. (2004). Examining mobile phone use in the wild with quasi-experimentation, August 13, HIIT TechnicalReport 2004-1, retrieved from https://www.hiit.fi/files/admin/publications/Technical_Reports/hiit2004-1.pdf Schepers, J. and Wetzels, M. (2007). A meta-analysis of the technology acceptance model: Investigating subjective norm and moderation effects, Journal of Information Management, 44(1), pp. 90-103. Schmidt-Belz, B., Zipf, A., Poslad, S. and Laamanen, H. (2003). Location-based mobile tourist services – first user experiences, in: Frew, A.J., Hitz, M. and O’Connor, P. (eds.), Information and Communication Technologies in Tourism, Springer, Wien, Austria, pp. 115-123.

145
Schneider, S., Ricci, F., Venturini, A. and Not, E. (2010). Usability Guidelines for WAP-based Travel Planning Tools, in: Gretzel, U., Law, R. and Fuchs, M. (eds.), Proceedings of Information and Communication Technologies in Tourism, ENTER 2010, Lugano, Switzerland, pp. 125-136. Schoenbachler, D.D. and Gordon, G.L. (2002). Multi-channel shopping: understanding what drives channel choice, Journal of Consumer Marketing, 19(1), pp. 42-53. Sein, M.K., Henfridsson, O., Purao, S., Rossi, M. and Lindgren, R. (2011). Action Design Research, MIS Quarterly, 35(1), pp. 37-56. Sell, A., Walden, P. and Carlsson, C. (2011). Segmentation Matters: An Exploratory Study of Mobile Service Users, International Journal of Systems and Service-Oriented Engineering, 2(3), pp. 1-17. Sell, A., Walden, P. and Carlsson, C. (2012). I’m a smart phone user – Key insights from the Finnish market, in: Proceedings of the International conference on Mobile Business, ICMB 2012, Delft, the Netherlands. Seybold, P. (2001). Get Inside the Lives of Your Customers, Harvard Business Review, 79(5), pp. 80-89. Sheth, J.N., Newman, B.I. and Gross, B.L. (1991). Why We Buy What We Buy: A Theory of Consumption Values, Journal of Business Research, 22(2), pp. 159-170. Sigala, M. (2006). Mass customization implementation models and customer value in mobile phones services - Preliminary findings from Greece, Managing Service Quality, 16(4), pp. 395-420. Sigala, M. (2010). Measuring customer value in online collaborative trip planning processes, Marketing Intelligence & Planning, 28(4), pp. 418-443. Smith, A.D. (2006). Mobile technology and communications: exploring aspects of Customer Relationship Management, International Journal of Mobile Communications, 4(6), pp. 682-703. Solomon, M., Bamossy, G., Askegaard, S. and Hogg, M.K. (2006). Consumer Behavior. A European Perspective, 3rd ed., Pearson Education, Harrow, UK.

146
Statistics Finland. (2012a). Internetin käytön muutokset, retrieved January 12, 2013, from http://www.stat.fi/til/sutivi/2012/sutivi_2012_2012-11-07_kat_001_fi.html Statistics Finland. (2012b). Internetin käyttö muualla kuin kotona tai työpaikalla, retrieved January 12, 2013, from http://www.stat.fi/til/sutivi/2012/sutivi_2012_2012-11-07_kat_003_fi.html StatSoft, Inc. (2013). Electronic Statistics Textbook, StatSoft, Tulsa, OK, available at http://www.statsoft.com/textbook/. Strand, J. (2013). Keynote: Current market trends in mobile business, in: The 12th International Conference on Mobile Business, Berlin, Germany, 10 – 13 June 2013. Sääksjärvi, M. (2003). Consumer adoption of technological innovations, European Journal of Innovation Management, 6(2), pp. 90-100. Teo, T.S.H. and Pok, S.H. (2003). Adoption of WAP-Enabled Mobile Phones among Internet Users, Omega, 31(6), pp. 483-498. Tetard, F. and Collan, M. (2009). Lazy User Theory: A Dynamic Model to Understand User Selection of Products and Services, in: Proceedings of the 42nd Hawaii International Conference on System Sciences, HICSS 2009, IEEE Computer Society Press, pp. 1-9, Timmers, P. (1998). Business Models for Electronic Markets, Electronic Markets, 8(2), pp. 3-8. Tsalgatidou, A., Veijalainen, J. and Pitoura, E. (2000). Challenges in Mobile Electronic Commerce, in: Proceedings of IeC 2000, 3rd International Conference on Innovation through E-Commerce, Manchester, UK. Tussyadiah, I. and Fesenmaier, D. (2007). Interpreting tourist experiences from first person stories: a foundation for mobile guides, in: Proceedings of the 15th European Conference on Information Systems, ECIS 2007, St. Gallen, Switzerland. Venkatesh, V., Morris, M.G., Davis, G.B. and Davis, F.D. (2003). User acceptance of information technology: toward a unified view, MIS Quarterly, 27(3), pp. 425-478.

147
Verkasalo, H., López-Nicolás, C., Molina-Castillo, F.J. and Bouwman, H. (2010). Analysis of users and non-users of smartphone applications, Telematics and Informatics, 27(3), pp. 242-255. Verksalo, H. (2007). A Cross-Country Comparison of Mobile Service and Handset Usage, Licentiate Thesis at Helsinki University of Technology, Networking Laboratory, Helsinki, Finland. Vrechopoulos A., Constantiou I. and Sideris, I. (2002). Strategic Marketing Planning for Mobile Commerce Diffusion and Consumer Adoption, in: Proceedings of the 1st International Conference on Mobile Business: Evolution Scenarios for Emerging Mobile Commerce Services, M-BUSINESS 2002, Athens, Greece. Walden, P. and Anckar, B. (2006). Reassessment of the Efficacy of Self-booking in Travel, in: Proceedings of the 39th Hawaii International Conference on System Sciences, HICSS 2006, IEEE Computer Society Press, p. 132b. Walden P., Han S., Carlsson, C. and Majlender, P. (2007). The Sleeping Giant – A Longitudinal Study Surveying the Mobile Service Market in Finland, in: Österle, H., Schelp, J. and Winter, R. (eds.), Proceedings of the 15th European Conference on Information Systems, ECIS 2007, St Gallen, Switzerland. Van der Heijden, H. (2004). User Acceptance of hedonic information systems, MIS Quarterly, 28(4), pp. 695-704. Von Hippel, E. (2005). Democratizing Innovation, The MIT Press, London, UK. Wang, D., Park, S. and Fesenmaier, D.R. (2012). The role of smartphones in mediating the tourist experience, Journal of Travel Research, 51(4), pp. 371-387. Wang, D. and Xiang, Z. (2012). The new landscape of travel: a comprehensive analysis of smartphone apps, in: Fuchs, M., Ricci, F. and Cantoni, L. (eds.), Proceedings of Information and communication technologies in tourism, ENTER 2012, Helsingborg, Sweden, pp. 308-319. Ward, J.H. (1963). Hierarchical Grouping to optimize an objective function, Journal of American Statistical Association, 58(301), pp. 236-244.

148
Weiser, E.B. (2000). Gender Differences in Internet Use Patterns and Internet Application Preferences: A Two-Sample Comparison, Cyberpsychology & Behavior, 3(2), pp. 167-178. Werthner, H. and Klein, S. (1999). Information Technology and tourism: A challenging relationship, Springer-Verlag, Wien, Austria. Werthner, H. and Ricci, F. (2004). E-commerce and tourism, The communication of ACM, 47(12), pp. 101-105. Wigand, R. (1997). Electronic Commerce: Definition, Theory, and Context, The Information Society, 13(1), pp. 1-16. Wilson, S., Fesenmaier, D., Fesenmaier, J. and Van Es, J.C. (2001). Factors for Success in Rural Tourism Development, Journal of Travel Research, 40(2), pp. 132-138. Wold, H. (1975). Path models with latent variables: The NIPALS approach, in: Blalock, H.M., Aganbegian, A., Borodkin, F.M., Boudon, R. and Capecchi, V. (eds.), Quantitative sociology: International perspectives on mathematical and statistical modeling, Academic, NewYork, NY, pp. 307-357. World Tourism Organization. (1995). Technical manual: Collection of Tourism Expenditure Statistics, retrieved September 5, 2012, from http://pub.unwto.org/WebRoot/Store/Shops/Infoshop/Products/1034/1034-1.pdf World travel and tourism council. (2012). The economic impact 2012, retrieved August 23, 2012, from http://www.wttc.org/site_media/uploads/downloads/world2012.pdf WTTC. (2002). Customer-Centric Systems for the Travel and Tourism Industry, Report by Accenture for World Travel and Tourism Council (WTTC) IT / eCommerce Task force, last retrieved January 3, 2013, from http://195.130.87.21:8080/dspace/handle/123456789/406 Wu, J-H. and Wanga, S-C. (2005). What drives mobile commerce? An empirical evaluation of the revised technology acceptance model, Information & Management, 42(5), pp. 719-729. WTM. (2010). World Travel Market (WTM) Industry report, retrieved 12 January 2011 from http://www.wtmlondon.com/files/wtm2010_industry_report.pdf

149
Xiang, Z. and Gretzel, U. (2010). Role of social media in online travel information search, Tourism Management, 31(2), pp. 179-188. Yoo, K.H., Lee, Y., Gretzel, U. and Fesenmaier, D.R. (2009). Trust in Travel-Related Consumer Generated Media, in: Höpken, W., Gretzel, U. and Law, R. (eds.), Information and Communication Technologies in Tourism, ENTER 2009, Amsterdam, the Netherlands, pp. 49-59. Zuber-Skerritt, O. (2001). Action learning and action research: paradigm, praxis and programs, in: Sankaran, S., Dick, B., Passfield, R. and Swepson, P. (eds), Effective Change Management Using Action Research and Action Learning: Concepts, Frameworks, Processes and Applications, Southern Cross University Press, Lismore, pp. 1-20. Åland local government. (2006). Nationell strategisk plan för fiskerinäringen inom landskapet Åland 2007-2013, retrieved December 12, 2007, from http://www.ls.aland.fi/.composer/upload/naringsavd/fiskeribyran/strategi_fisketurism.pdf

150
Appendix 1 Online questionnaire (converted from a Web format to fit the format of this thesis). Miten haluat asioida sähköisesti? Ole ystävällinen ja paina "Aloita" nappia. Lomakkeen täyttäminen kestää n. viisi minuuttia. Taustatiedot Ikä: Sukupuoli: Mies, Nainen Miten taitava olet käyttämään Internetiä?
Erinomainen, Hyvä, Kohtalainen, Välttävä, Heikko, En osaa sanoa Kuinka usein käytät Internetiä?
Joka päivä, Monta kertaa viikossa, Kerran viikossa, 1 - 3 kertaa kuukaudessa, Vähemmän kuin kerran kuukaudessa
Oletko käyttänyt Internetiä matkapuhelimen* avulla? (käyttäen matkapuhelimen selainta)
Käytän sitä säännöllisesti, Käytän sitä silloin tällöin, Olen ainoastaan kokeillut, Ei vielä mutta olen kiinnostunut, En, enkä tule käyttämään
Kuinka usein olet vähintään vuorokauden kestävällä, vapaa-ajan viettoon liittyvällä matkalla?
Monta kertaa kuukaudessa, Noin kerran kuukaudessa, 3 - 7 kertaa vuodessa, Vähemmän kuin kolme kertaa vuodessa
Kuinka usein olet vähintään vuorokauden kestävällä työmatkalla? Monta kertaa kuukaudessa, Noin kerran kuukaudessa, 3 - 7 kertaa
vuodessa, Vähemmän kuin kolme kertaa vuodessa *älypuhelin / kännykkä 1. Tietojen haku Internetin ja/tai mobiilipalvelun välityksellä (esim. hinta- ja saatavuustietoa sekä tietoa matkakohteesta). a) Käytän jo tämäntapaisia palveluja:
En käytä, Kyllä, vain tietokoneella, Kyllä, vain matkapuhelimella, Kyllä, sekä tietokoneella että matkapuhelimella
b) Jos kyllä, pidätkö palveluja hyödyllisinä? Erittäin hyödyllisinä, Melko hyödyllisinä, Ei kovinkaan hyödyllisinä, Ei
lainkaan hyödyllisinä, En osaa sanoa Jos ei, oletko kiinnostunut tämäntapaisista palveluista? Kyllä, ehdottomasti, Todennäköisesti, Epätodennäköistä, Ehdottomasti en,
En osaa sanoa

151
c) Pääsääntöisesti käytän / käyttäisin seuraavaa kanavaa tietojen hakemiseen, Puhelinsoitto tai käynti palvelutarjoajan liikkeessä, Lehtiä / Esitteitä,
Internetpalvelu tietokoneen (pöytäkoneen /kannettavan) välityksellä, Internet-/mobiilipalvelu taulutietokoneen (tabletin) välityksellä, Internet- /mobiilipalvelu matkapuhelimen välityksellä
2. Matkailupalvelujen varaaminen (esim. hotellihuoneita, lentolippuja, valmismatkoja, junalippuja) Internetin ja/tai mobiilipalvelun välityksellä. a) Käytän jo tämäntapaisia palveluja:
En käytä, Kyllä, vain tietokoneella, Kyllä, vain matkapuhelimella, Kyllä, sekä tietokoneella että matkapuhelimella
b) Jos kyllä, pidätkö palveluja hyödyllisinä? Erittäin hyödyllisinä, Melko hyödyllisinä, Ei kovinkaan hyödyllisinä, Ei
lainkaan hyödyllisinä, En osaa sanoa Jos ei, oletko kiinnostunut tämäntapaisista palveluista? Kyllä, ehdottomasti, Todennäköisesti, Epätodennäköistä, Ehdottomasti en,
En osaa sanoa c) Pääsääntöisesti käytän / käyttäisin seuraavaa kanavaa matkojen varaamiseen
Puhelinsoitto tai käynti palvelutarjoajan liikkeessä, Sihteeri hoitaa valitsemallaan tavalla, Internetpalvelu tietokoneen (pöytäkoneen /kannettavan) välityksellä, Internet-/mobiilipalvelu taulutietokoneen (tabletin) välityksellä, Internet- /mobiilipalvelu matkapuhelimen välityksellä
3. Matkailupalvelujen maksaminen Internetin ja/tai mobiilipalvelun välityksellä (esim. VISAlla, Internetpankin välityksellä). a) Käytän jo tämäntapaisia palveluja:
En käytä, Kyllä, vain tietokoneella, Kyllä, vain matkapuhelimella, Kyllä, sekä tietokoneella että matkapuhelimella
b) Jos kyllä, pidätkö palveluja hyödyllisinä?
Erittäin hyödyllisinä, Melko hyödyllisinä, Ei kovinkaan hyödyllisinä, Ei lainkaan hyödyllisinä, En osaa sanoa
Jos ei, oletko kiinnostunut tämäntapaisista palveluista? Kyllä, ehdottomasti, Todennäköisesti, Epätodennäköistä, Ehdottomasti en,
En osaa sanoa c) Pääsääntöisesti käytän / käyttäisin seuraavaa kanavaa matkojen maksamiseen

152
Puhelinsoitto tai käynti palvelutarjoajan liikkeessä, Sihteeri hoitaa valitsemallaan tavalla, Internetpalvelu tietokoneen (pöytäkoneen /kannettavan) välityksellä, Internet-/mobiilipalvelu taulutietokoneen (tabletin) välityksellä, Internet- /mobiilipalvelu matkapuhelimen välityksellä
4. Matkavarausten peruuttaminen tai muuttaminen Internetin ja/tai mobiilipalvelun välityksellä. a) Käytän jo tämäntapaisia palveluja:
En käytä, Kyllä, vain tietokoneella, Kyllä, vain matkapuhelimella, Kyllä, sekä tietokoneella että matkapuhelimella
b) Jos kyllä, pidätkö palveluja hyödyllisinä?
Erittäin hyödyllisinä, Melko hyödyllisinä, Ei kovinkaan hyödyllisinä, Ei lainkaan hyödyllisinä, En osaa sanoa
Jos ei, oletko kiinnostunut tämäntapaisista palveluista? Kyllä, ehdottomasti, Todennäköisesti, Epätodennäköistä, Ehdottomasti en,
En osaa sanoa c) Pääsääntöisesti käytän / käyttäisin seuraavaa kanavaa matkavarausten peruuttamiseen tai muuttamiseen
Puhelinsoitto tai käynti palvelutarjoajan liikkeessä, Sihteeri hoitaa valitsemallaan tavalla, Internetpalvelu tietokoneen (pöytäkoneen /kannettavan) välityksellä, Internet-/mobiilipalvelu taulutietokoneen (tabletin) välityksellä, Internet- /mobiilipalvelu matkapuhelimen välityksellä
5. Tuloselvityksen hoitaminen (lentokentällä tai hotellissa) Internetin ja/tai mobiilipalvelun välityksellä. a) Käytän jo tämäntapaisia palveluja:
En käytä, Kyllä, vain tietokoneella, Kyllä, vain matkapuhelimella, Kyllä, sekä tietokoneella että matkapuhelimella
b) Jos kyllä, pidätkö palveluja hyödyllisinä?
Erittäin hyödyllisinä, Melko hyödyllisinä, Ei kovinkaan hyödyllisinä, Ei lainkaan hyödyllisinä, En osaa sanoa
Jos ei, oletko kiinnostunut tämäntapaisista palveluista? Kyllä, ehdottomasti, Todennäköisesti, Epätodennäköistä, Ehdottomasti en,
En osaa sanoa

153
c) Pääsääntöisesti käytän / käyttäisin seuraavaa kanavaa matkavarausten peruuttamiseen tai muuttamiseen
Käynti vastaanottotiskillä, Itsepalveluautomaatti hotellissa tai lentokentällä, Internetpalvelu tietokoneen (pöytäkoneen/kannettavan) välityksellä, Internet-/mobiilipalvelu taulutietokoneen (tabletin) välityksellä, Internet- /mobiilipalvelu matkapuhelimen välityksellä
6. Palautteen antaminen ja/tai bonuspistetilanteen seuranta matkan aikana tai sen jälkeen Internetin ja/tai mobiilipalvelun välityksellä. a) Käytän jo tämäntapaisia palveluja:
En käytä, Kyllä, vain tietokoneella, Kyllä, vain matkapuhelimella, Kyllä, sekä tietokoneella että matkapuhelimella
b) Jos kyllä, pidätkö palveluja hyödyllisinä?
Erittäin hyödyllisinä, Melko hyödyllisinä, Ei kovinkaan hyödyllisinä, Ei lainkaan hyödyllisinä, En osaa sanoa
Jos ei, oletko kiinnostunut tämäntapaisista palveluista? Kyllä, ehdottomasti, Todennäköisesti, Epätodennäköistä, Ehdottomasti en,
En osaa sanoa c) Pääsääntöisesti käytän / käyttäisin seuraavaa kanavaa matkavarausten peruuttamiseen tai muuttamiseen
Puhelinsoitto/Sähköpostiviesti tai käynti palveluntarjoajan liikkeessä, Internetpalvelu tietokoneen (pöytäkoneen /kannettavan) välityksellä, Internet-/mobiilipalvelu taulutietokoneen (tabletin) välityksellä, Internet- /mobiilipalvelu matkapuhelimen välityksellä
7. Internetin käyttö matkan aikana (esim. langallinen tai langaton laajakaistayhteys esim. hotellissa, kahvilassa lentokentällä/koneessa, junassa). a) Käytän jo tämäntapaisia palveluja: Kyllä, En b) Jos kyllä, pidätkö palveluja hyödyllisinä?
Erittäin hyödyllisinä, Melko hyödyllisinä, Ei kovinkaan hyödyllisinä, Ei lainkaan hyödyllisinä, En osaa sanoa
Jos ei, oletko kiinnostunut tämäntapaisista palveluista? Kyllä, ehdottomasti ,Todennäköisesti ,Epätodennäköistä, Ehdottomasti en,
En osa sanoa c) Pääsääntöisesti käytän / käyttäisin Internetiä matkan aikana
Palveluntarjoajan tarjoaman laitteen (esim. PCn) välityksellä (esim. hotellissa, nettikahvilassa, junassa), Omaa kannettavaa tietokonetta / taulutietokonetta palveluntarjoajan nopealla Internetyhteydellä, Omaa kannettavaa tietokonetta / taulutietokonetta oman Internetyhteyden (esim.
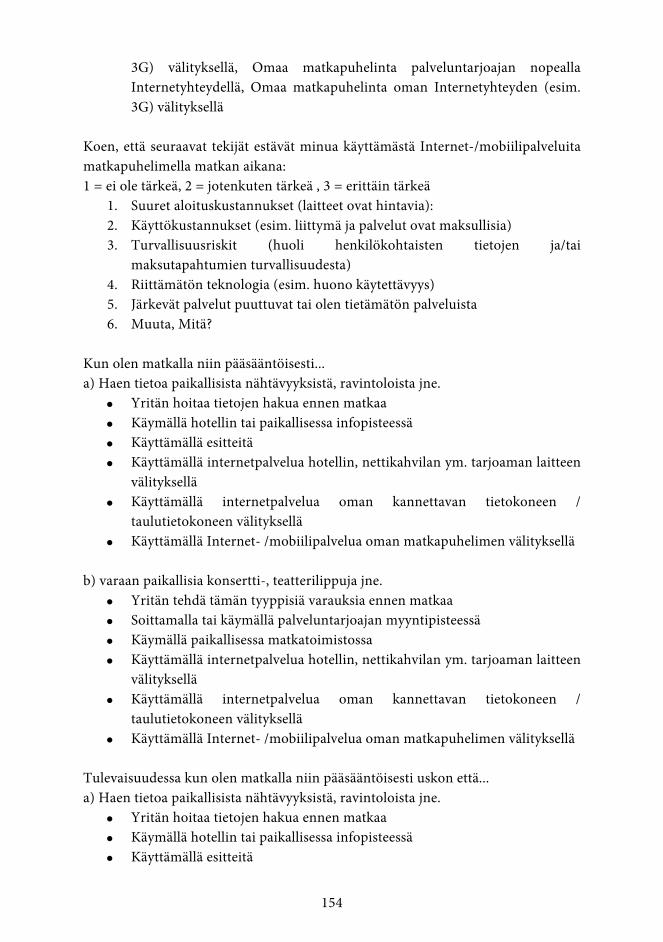
154
3G) välityksellä, Omaa matkapuhelinta palveluntarjoajan nopealla Internetyhteydellä, Omaa matkapuhelinta oman Internetyhteyden (esim. 3G) välityksellä
Koen, että seuraavat tekijät estävät minua käyttämästä Internet-/mobiilipalveluita matkapuhelimella matkan aikana: 1 = ei ole tärkeä, 2 = jotenkuten tärkeä , 3 = erittäin tärkeä
1. Suuret aloituskustannukset (laitteet ovat hintavia): 2. Käyttökustannukset (esim. liittymä ja palvelut ovat maksullisia) 3. Turvallisuusriskit (huoli henkilökohtaisten tietojen ja/tai
maksutapahtumien turvallisuudesta) 4. Riittämätön teknologia (esim. huono käytettävyys) 5. Järkevät palvelut puuttuvat tai olen tietämätön palveluista 6. Muuta, Mitä?
Kun olen matkalla niin pääsääntöisesti... a) Haen tietoa paikallisista nähtävyyksistä, ravintoloista jne.
Yritän hoitaa tietojen hakua ennen matkaa Käymällä hotellin tai paikallisessa infopisteessä Käyttämällä esitteitä Käyttämällä internetpalvelua hotellin, nettikahvilan ym. tarjoaman laitteen
välityksellä Käyttämällä internetpalvelua oman kannettavan tietokoneen /
taulutietokoneen välityksellä Käyttämällä Internet- /mobiilipalvelua oman matkapuhelimen välityksellä
b) varaan paikallisia konsertti-, teatterilippuja jne.
Yritän tehdä tämän tyyppisiä varauksia ennen matkaa Soittamalla tai käymällä palveluntarjoajan myyntipisteessä Käymällä paikallisessa matkatoimistossa Käyttämällä internetpalvelua hotellin, nettikahvilan ym. tarjoaman laitteen
välityksellä Käyttämällä internetpalvelua oman kannettavan tietokoneen /
taulutietokoneen välityksellä Käyttämällä Internet- /mobiilipalvelua oman matkapuhelimen välityksellä
Tulevaisuudessa kun olen matkalla niin pääsääntöisesti uskon että... a) Haen tietoa paikallisista nähtävyyksistä, ravintoloista jne.
Yritän hoitaa tietojen hakua ennen matkaa Käymällä hotellin tai paikallisessa infopisteessä Käyttämällä esitteitä

155
Käyttämällä internetpalvelua hotellin, nettikahvilan ym. tarjoaman laitteen välityksellä
Käyttämällä internetpalvelua oman kannettavan tietokoneen / taulutietokoneen välityksellä
Käyttämällä Internet- /mobiilipalvelua oman matkapuhelimen välityksellä b) varaan paikallisia konsertti-, teatterilippuja jne.
Yritän tehdä tämän tyyppisiä varauksia ennen matkaa Soittamalla tai käymällä palveluntarjoajan myyntipisteessä Käymällä paikallisessa matkatoimistossa Käyttämällä internetpalvelua hotellin, nettikahvilan ym. tarjoaman laitteen
välityksellä Käyttämällä internetpalvelua oman kannettavan tietokoneen /
taulutietokoneen välityksellä Käyttämällä Internet- /mobiilipalvelua oman matkapuhelimen välityksellä
Antamalla yhteystietosi (alla) osallistut 10 ilmaisen Omenayöpymisen arvontaan (arvo 45 euroa). Arvonta suoritetaan kesäkuussa 2011. Voittajille ilmoitetaan henkilökohtaisesti sähköpostitse. Nimi: Sähköposti: Kiitos vastauksistasi! Paina TÄSTÄ päästäksesi Omenahotellin sivuille

156
Appendix 2 The Question Guide (in Finnish) for the field trial3 Testaaminen suoritetaan pienryhmissä (2 – 3 henkilöä). Ryhmiin jakautuminen tulee tehdä niin, että yhdessä pienryhmässä on vähintään yksi mobiilisovelluksen toimintaa tukeva tukeva puhelin. Jokaisen pienryhmän tulee analysoida yhteensä neljän kohteen opastekstejä. Kaikkien pienryhmien yhteinen kohde on Arcadan Stora Torgetin seinällä sijaitseva Önskebrunnen, ja muut kolme kohdetta kierretään seuraavasti: Ryhmä 1: Oasen – Arabian ranta – Tapio Wirkkalan puisto Ryhmä 2: Bokvillan – Bokvillanin eläimet – Veistos (ei nimeä) Ryhmä 3: Lehvästö – Lintuparatiisi – Arabiassa Sovelluksen käyttöä varten tulee puhelimen selaimen osoiteruutuun kirjoittaa: www.arbit.fi/guide Pienryhmät voivat itse valita, käyttävätkö sovellusta online- vai offline-tilassa. Kyselylomakkeeseen vastataan tehdyn valinnan mukaisesti. Kaikkien kohteiden tekstit ovat sovelluksessa saatavilla koko ajan, ja näin ollen testaajan ei tekstin näkymistä varten tarvitse olla kohteen lähettyvillä. Jotta testitilanne olisi mahdollisimman pitkälti todellista tilannetta vastaava, tulee pienryhmien kuitenkin testata sovelluksen ja sen sisällön toimivuus kohteiden äärellä. Tällöin myös Arabianrannan design-kohteiden kiinnostavuutta ja teoksia koskevia tekstejä voidaan arvioida totuudenmukaisesti Kysymys 1: Millä puhelimella testasit sovelluksen? Kysymys 2: Suorititko testin yhteydettömässä tilassa (Offline)? Kysymys 3: Mikäli vastasit edelliseen kysymykseen kyllä, kuinka kauan sovelluksen lataus suunnilleen kesti? Kysymys 4: Oliko ongelmia GPS-paikannuksen kanssa? Kuvaile niitä. Kysymys 5: Pääsitkö karttanäkymään ongelmitta? Jos vastaus on ei, kerro mihin jäit kiinni.
3 The question guide was developed under my supervision by two project team members, Ted Mellin and Krista Fransman, for their Bachelor theses at the Arcada University of Applied Sciences. The questionnaire is converted to fit the format of this thesis and is used with their permission.

157
Kysymys 6: Oliko karttanäkymän rakenne mielestäsi toimiva? Kysymys 7: Ymmärsitkö nopeasti miten ohjelmassa liikutaan karttanäkymästä listanäkymään? Kysymys 8: Oliko karttanäkymän painikkeista (Koti & Minun sijainti) apua? Kysymys 9: Oliko sovelluksessa graafisia ongelmia? Kuvaile niitä tarkasti. Kysymys 10: Jos olisit turistina vieraassa kaupungissa ja Mobile Guide -palvelu olisi saatavana, mitä parannuksia / muutoksia kaipaisit, jotta jättäisit perinteisen paperisen kaupunkioppaan hotellille? Kysymys 11: Mitä mieltä olet sovelluksen sisällöstä ja luettavuudesta? Kuvaile lukukokemustasi. Kysymys 12: Mistä olisit halunnut lisää tietoa? Mitä tietoa oli liikaa? Kysymys 13: Oliko tekstien rakenne sekä sisältö helposti seurattava ja ymmärrettävä? Millaisia muutoksia olisit toivonut tekstien rakenteeseen? Kysymys 14: Millaisia ajatuksia tai tunteita eri kohteisiin liittyvät tekstit herättivät? Olisitko näiden opastekstien perusteella kiinnostunut tietämään lisää Arabianrannan alueen muista taideteoksista tai arkkitehtuurisista kohteista? Kysymys 15: Miten arvioisit mobiilisovellusta kokonaisuudessaan? Suosittelisitko sen käyttöämuille Arabianrannassa liikkuville? Miksi/ miksi et? Arabianranta on Helsingin kaupungissa tärkeä design-kokonaisuus; tuoko mobiilisovellus mielestäsi lisäarvoa alueelle suuntautuvalle vierailulle? Muuta kommentoitavaa:

158

159

160

Niklas Eriksson
Drivers and Barriers of Mobile Travel and Tourism Service AdoptionA Study of Individual Perceptions and Business Model Development in a Travel and Tourism Context
Niklas Eriksson | D
rivers and Barriers of Mobile Travel and Tourism
Service Adoption | 2013
Niklas Eriksson
Drivers and Barriers of Mobile Travel and Tourism Service AdoptionThe Travel and Tourism field is undergoing changes due to the rapid develop-ment of information technology and digital services. Mobile technology such as applications and services for mobile phones has the potential to take this deve-lopment even further. Travelers are generally on the go and therefore the indivi-duals’ perceived drivers and barriers to use mobile travel and tourism services in “during trip” settings seem particularly valuable to understand; thus this is one primary aim of the thesis.
I have conducted both survey and experimental studies and the findings suggest that a successful mobile travel and tourism service is a service which supports mobile motives (needs) of individuals such as spontaneous needs and time-critical arrangements. The service could be customized to support travelers’ style of traveling (e.g. organized travel or independent travel) and it should be easy to take into use during a trip (access, install and learn), without causing financial risks or security concerns for the user. Moreover, the following four user catego-ries were identified: info-seekers, checkers, bookers and all-rounders. For example ”all-rounders”, represented primarily by individuals who use their pocket device for almost any of the investigated mobile travel services, constituted primarily of 23 to 50 year old males with high travel frequency and great online experience.
The results also indicate that travel service providers will increasingly become multi-channel providers. To manage multiple channels it could be useful for travel service providers to focus more on developing browser-based mobile services (HTML5-solutions) than native applications that work only with specific operating systems and for specific devices. Based on an action research study, I and my research fellows found that HTML5 as an emerging platform, at least for now, has some limitations regarding e.g. the development of the user experience.
ISBN 978-952-12-2933-6
9 7 8 9 5 2 1 2 2 9 3 3 6