Accessible Translations for an English-Speaking Audience.pdf
Economic impact and travel patterns of Accessible Tourism in Europe FINAL REPORT 1
ECONOMIC IMPACT AND TRAVEL PATTERNS OF ACCESSIBLE TOURISM IN EUROPE FINAL REPORT Service Contract SI2.ACPROCE052481700 European Commission, DG Enterprise and Industry
Economic impact and travel patterns of Accessible Tourism in Europe FINAL REPORT 2
Table of contents
1 Executive summary................................................................................................................... 21
1.1 Task 1 Demographic profiling of tourists with special access needs ................................ 21
1.1.1 Task 1a Cluster analysis ............................................................................................ 21
1.1.2 Task 1b Forecasting .................................................................................................. 22
1.2 Task 2 Behavioural profiling of tourist with special access needs .................................... 23
1.2.1 Task 2a - Website analysis ........................................................................................... 23
1.2.2 Task 2b Online survey and focus groups .................................................................. 23
1.3 Task 3 Evaluation of the tourist experience across different tourism sectors................... 24
1.3.1 Task 3a - Case-studies ................................................................................................. 24
1.3.2 Task 3b - Desk research on existing barriers faced or perceived by people with access
needs 24
1.4 Task 4 - Estimate of the current and future economic contribution of accessible tourism .. 26
1.4.1 Task - 4a Stakeholder consultation .............................................................................. 26
1.4.2 Task 4b - Scenarios and impact assessment ............................................................... 26
2 Presentation of the study ......................................................................................................... 29
2.1 Objectives of the study ......................................................................................................... 29
2.2 Key concepts and definitions ............................................................................................... 32
3 Task 1 Demographic profiling of tourists with special access needs .............................. 36
3.1 Task 1a Cluster analysis ................................................................................................... 36
3.1.1 Methodology ................................................................................................................. 36
3.1.2 Results .......................................................................................................................... 37
3.2 Task 1b Forecasting ......................................................................................................... 40
3.2.1 Methodology ................................................................................................................. 40
3.2.1.1 Current demand estimation ................................................................................... 40
3.2.1.2 Future demand estimation ..................................................................................... 42
3.2.1.3 Tourism demand estimation under different scenarios of improvements ............. 43

Economic impact and travel patterns of Accessible Tourism in Europe FINAL REPORT 3
3.2.2 Population of people with special access needs .......................................................... 44
3.2.2.1 Evolution of population .......................................................................................... 44
3.2.2.2 People with special access needs ......................................................................... 54
3.2.3 Demand for accessible tourism .................................................................................... 73
3.2.3.1 Travel behaviour .................................................................................................... 73
3.2.3.2 Current tourism demand and forecasts ................................................................. 84
3.2.4 Demand for accessible tourism under different scenarios of improvements ................ 94
3.2.4.1 Travel behaviour under different scenarios ........................................................... 94
3.2.4.2 Tourism demand and forecasts under different scenarios .................................... 98
3.2.5 Demand for accessible tourism International inbound markets ............................... 103
3.2.5.1 Travel behaviour .................................................................................................. 103
3.2.5.2 Current tourism demand and forecasts ............................................................... 107
3.2.6 Demand for accessible tourism under different scenarios International inbound
markets 111
3.2.6.1 Travel behaviour under different scenarios ......................................................... 111
3.2.6.2 Tourism demand and forecasts under different scenarios .................................. 114
4 Task 2 Behavioural profiling of tourist with special access needs ................................ 119
4.1 Task 2a - Website analysis ................................................................................................ 119
4.1.1 Methodology ............................................................................................................... 119
4.1.1.1 Scope ................................................................................................................... 119
4.1.1.2 Website analysis .................................................................................................. 122
4.1.1.3 Print media analysis ............................................................................................ 126
4.1.2 Results ........................................................................................................................ 126
4.1.2.1 Tourist boards ...................................................................................................... 126
4.1.2.2 Railways .............................................................................................................. 130
4.1.2.3 Airlines ................................................................................................................. 133
4.1.2.4 Tour operators ..................................................................................................... 135

Economic impact and travel patterns of Accessible Tourism in Europe FINAL REPORT 4
4.1.2.5 Booking portals .................................................................................................... 136
4.1.2.6 Hotels ................................................................................................................... 137
4.1.2.7 Beach destinations .............................................................................................. 138
4.1.2.8 City destinations .................................................................................................. 139
4.1.2.9 Good practice examples ...................................................................................... 141
4.1.3 Summary and discussion ............................................................................................ 149
4.1.4 Brochure analysis ....................................................................................................... 152
4.2 Task 2b Online survey and focus groups ....................................................................... 154
4.2.1 Overview ..................................................................................................................... 154
4.2.2 EU - Overall results ..................................................................................................... 155
4.2.2.1 Travel behaviour .................................................................................................. 155
4.2.2.2 Decision-making .................................................................................................. 169
4.2.2.3 Experience ........................................................................................................... 174
4.2.2.4 Expectations & future .......................................................................................... 187
4.2.3 EU - Results by limitation ............................................................................................ 193
4.2.3.1 Travel behaviour .................................................................................................. 193
4.2.3.1.1 Reasons for not travelling ................................................................................ 193
4.2.3.1.2 Preferred holiday periods ................................................................................. 194
4.2.3.1.3 Travel companions ........................................................................................... 195
4.2.3.1.4 Destinations ..................................................................................................... 196
4.2.3.1.5 Reasons for travelling outside the EU ............................................................. 196
4.2.3.1.6 Type of accommodation ................................................................................... 197
4.2.3.1.7 Modes of transport to and from destination ..................................................... 198
4.2.3.1.8 Modes of transport at destination .................................................................... 199
4.2.3.1.9 Participation in activities ................................................................................... 200
4.2.3.2 Decision-making .................................................................................................. 202
4.2.3.2.1 Most important information sources when deciding travel plans ..................... 202
Economic impact and travel patterns of Accessible Tourism in Europe FINAL REPORT 5
4.2.3.2.2 Booking channels ............................................................................................. 205
4.2.3.2.3 Checking of accessibility conditions and/or available help at travel destination
before travelling .................................................................................................................. 207
4.2.3.3 Experience ........................................................................................................... 208
4.2.3.3.1 Aspects of importance when choosing travel destination ................................ 208
4.2.3.3.2 Satisfaction with each of these aspects ........................................................... 210
4.2.3.3.3 Experience of barriers or restrictions ............................................................... 211
4.2.3.3.4 Aspects regarding buildings visited ................................................................. 212
4.2.3.4 Expectations & future .......................................................................................... 213
4.2.3.4.1 Likelihood to travel more or return to the same destination ............................. 213
4.2.3.4.2 Paying more for accessible products or services ............................................ 213
4.2.3.4.3 Use of specific items ........................................................................................ 214
4.2.4 EU - Country results ................................................................................................... 214
4.2.4.1 People who travel with children ........................................................................... 214
4.2.4.2 People aged 65 and above.................................................................................. 220
4.2.4.3 People with a limitation ........................................................................................ 222
4.2.5 EU - Socio-demographic profile .................................................................................. 227
4.2.5.1 Gender and age ................................................................................................... 227
4.2.5.2 Special access needs .......................................................................................... 227
4.2.5.3 Occupation and income ....................................................................................... 229
4.2.5.4 Education ............................................................................................................. 231
4.2.5.5 Living situation ..................................................................................................... 231
4.2.6 Focus groups Overall results ................................................................................... 231
4.2.6.1 Overall findings .................................................................................................... 232
4.2.6.2 Detailed findings for Ireland ................................................................................. 232
4.2.6.3 Detailed findings for Lithuania ............................................................................. 234
4.2.7 EU - Hypotheses ......................................................................................................... 237
Economic impact and travel patterns of Accessible Tourism in Europe FINAL REPORT 6
4.2.8 Inbound markets Overall results .............................................................................. 239
4.2.8.1 Travel behaviour .................................................................................................. 239
4.2.8.2 Decision-making and booking ............................................................................. 240
4.2.8.3 Experience ........................................................................................................... 241
4.2.8.4 Expectations & future .......................................................................................... 242
5 Task 3 Evaluation of the tourist experience across different tourism sectors ............. 243
5.1 Task 3a - Case-studies ...................................................................................................... 243
5.1.1 Methodology ............................................................................................................... 243
5.1.2 Preliminary results and hypotheses ............................................................................ 246
5.1.3 Case studies ............................................................................................................... 248
5.1.3.1 Case Study: The City of Erfurt ............................................................................. 248
5.1.3.2 Case Study: Accessible Poland Tours ................................................................ 251
5.1.3.3 Case Study: Château des Ducs de Bretagne...................................................... 255
5.1.3.4 Case Study: Cave St Martin Winery Remich, Luxemburg ............................... 260
5.1.3.5 Case Study: Berlin City, Germany ....................................................................... 264
5.1.3.6 Case Study: Barcelona metro.............................................................................. 269
5.1.3.7 Case Study: Scandic Hotels ................................................................................ 273
5.1.3.8 Case Study: GVAM ............................................................................................. 276
5.1.3.9 Case study: Restaurant Monnalisa Beach Restaurant ....................................... 278
5.1.3.10 Case study: Restaurant I Girasoli ........................................................................ 281
5.1.4 Analysis of the case studies ....................................................................................... 284
5.1.5 Conclusions ................................................................................................................ 287
5.2 Task 3b - Desk research on existing barriers faced or perceived by people with access needs 288
5.2.1 Methodology ............................................................................................................... 288
5.2.1.1 Desk research ..................................................................................................... 288
5.2.1.1.1 First round of desk research: Identification of secondary sources .................. 289
Economic impact and travel patterns of Accessible Tourism in Europe FINAL REPORT 7
5.2.1.1.2 First round of desk research: Examination/ assessment of relevant secondary
sources 292
5.2.1.1.3 Second round of desk research: Identification of additional secondary sources
296
5.2.1.2 Development of hypotheses and hypothesis testing procedures ........................ 299
5.2.1.3 Comparative analysis of primary and secondary data sources ........................... 304
5.2.2 Findings ...................................................................................................................... 304
5.2.2.1 Barriers encountered in the pre-travel / information-gathering stage .................. 306
5.2.2.2 Barriers encountered in the transit/ transport stage: arrival/ departure ............... 335
5.2.2.3 Barriers encountered with transport at the destination and access paths .......... 340
5.2.2.4 Barriers encountered in the accommodation sector ............................................ 347
5.2.2.5 Barriers encountered in the catering/ gastronomy/ food & beverage sector ....... 358
5.2.2.6 Barriers encountered with attractions/ activities .................................................. 362
5.2.2.7 Barriers: cross-sector comparisons ..................................................................... 369
5.2.2.7.1 1st cross-sector hypothesis: Physical access versus attitudinal barriers across
all sectors 370
5.2.2.7.2 2nd cross-sector hypothesis: Frequency of barriers across all sectors ........... 375
5.2.2.7.3 3rd cross-sector hypothesis: Inaccessible toilets as most important barrier
across all sectors ............................................................................................................... 381
6 Task 4 - Estimate of the current and future economic contribution of accessible tourism 387
6.1 Task - 4a Stakeholder consultation .................................................................................... 387
6.1.1 Methodology ............................................................................................................... 387
6.1.1.1 Focus groups ....................................................................................................... 387
6.1.1.2 In-depth-interviews (IDIs) .................................................................................... 391
6.1.2 Results ........................................................................................................................ 392
6.1.2.1 Associations with accessible tourism .................................................................. 392
6.1.2.2 Product development and marketing ................................................................... 392

Economic impact and travel patterns of Accessible Tourism in Europe FINAL REPORT 8
6.1.2.3 Motivations .......................................................................................................... 393
6.1.2.4 Success factors and recommendations .............................................................. 393
6.1.2.5 Economic meaning and potential impact ............................................................. 394
6.1.2.6 Scenario Analysis ................................................................................................ 394
6.1.2.7 Conclusion ........................................................................................................... 396
6.2 Current economic contribution ........................................................................................... 397
6.2.1 Methodology ............................................................................................................... 397
6.2.1.1 Direct economic contribution estimation .............................................................. 397
6.2.1.2 Total economic contribution estimation indirect and induced effects ............... 397
6.2.1.3 Effect of travel companions ................................................................................. 399
6.2.2 Results ........................................................................................................................ 400
6.2.2.1 Direct economic contribution ............................................................................... 400
6.2.2.2 Total economic contribution................................................................................. 414
6.2.2.3 Effect of travel companions ................................................................................. 419
6.2.3 Results International inbound markets .................................................................... 425
6.2.3.1 Direct economic contribution ..................................................................................... 425
6.2.3.2 Total economic contribution ....................................................................................... 429
6.2.3.3 Effects of travel companions ............................................................................... 434
6.3 Task 4b - Scenarios and impact assessment .................................................................... 437
6.3.1 Methodology ............................................................................................................... 437
6.3.2 Results ........................................................................................................................ 438
6.3.2.1 Direct economic contribution under different scenarios ...................................... 438
6.3.2.2 Total economic contribution under different scenarios ........................................ 442
6.3.2.3 Effect of travel companions ................................................................................. 445
6.3.3 Results International inbound markets .......................................................................... 447
6.3.3.1 Direct economic contribution under different scenarios ............................................ 447
6.3.3.2 Total economic contribution under different scenarios .............................................. 452

Economic impact and travel patterns of Accessible Tourism in Europe FINAL REPORT 9
6.3.3.3 Effect of travel companions ....................................................................................... 455
6.4 Summary of hypothesis results .......................................................................................... 457
6.5 Limitations of demand forecasting and economic impact assessment .............................. 461
7 Task 5 - Recommendations and success factors ................................................................ 463
1. Commitment of the decision-makers ........................................................................................ 464
2. Coordinating and continuity ...................................................................................................... 465
3. Networking and participation .................................................................................................... 465
4. Strategic planning ..................................................................................................................... 466
5. Knowledge management and qualification ............................................................................... 467
6. Optimisation of resources ......................................................................................................... 467
7. Communication and marketing ................................................................................................. 468
Roadmap to success .................................................................................................................... 469
Economic impact and travel patterns of Accessible Tourism in Europe FINAL REPORT 10
Table of figures
Figure 1 - Key study tasks .................................................................................................................. 30 Figure 2 - Analysis of Demand for Accessible Tourism and its Economic Impacts ........................... 31 Figure 3 - Results of cluster analysis (detailed table) ........................................................................ 38 Figure 4 - Results of cluster analysis (map) ....................................................................................... 39 Figure 5 - Estimation of Demand for Accessible Tourism .................................................................. 40 Figure 6 - The working age population trend in the EU27 countries over 1960-2011 and forecasts
from 2012- ........................................................................................... 46 Figure 7 - The working age population trend in key inbound markets over 1960-2011 and forecasts
from 2012- ........................................................................................... 47 Figure 8 - The elderly population trend in the EU27 countries over 1960-2011 and forecasts from
2012- ................................................................................................... 48 Figure 9 - The elderly population trend in key inbound markets over 1960-2011 and forecasts from
2012- ................................................................................................... 49 Figure 10 - Average annual growth rate of working age population in EU27 countries over 1960-
2011 (unit: %) .............................................................................................................................. 50 Figure 11 - Average annual growth rate of elderly population in EU27 countries over 1960-2011
(unit: %) ....................................................................................................................................... 51 Figure 12 - Average annual growth rate of working age population in key inbound markets over
1960-2011 (unit: %) ..................................................................................................................... 52 Figure 13 - Average annual growth rate of elderly population in key inbound markets over 1960-2011
(unit: %) ....................................................................................................................................... 53 Figure 14 - The population of people with disabilities in the EU27 countries and key inbound markets
in 2011 (unit: ......................................................................................................... 56 Figure 15 -
persons) ...................................................................................................................................... 57 Figure 16 - The population with access needs in the EU27 countries and key inbound markets in
............................................................................................................ 58 Figure 17 - People with access needs in the EU27 countries and key inbound markets as of 2011
...................................................................................................................... 59 Figure 18 - .......... 60 Figure 19 - Implied annual growth rate of people with access needs in the EU27 countries over 2011
2020 (unit: %) ........................................................................................................................... 61 Figure 20 - Implied annual growth rate of people with access needs in the EU27 area and the key
international inbound markets over 2011 2020 (unit: %) ......................................................... 62

Economic impact and travel patterns of Accessible Tourism in Europe FINAL REPORT 11
Figure 21 - Prevalence rate of disabilities in EU27 countries (%) ...................................................... 63 Figure 22 - Prevalence rate of disabilities in the EU27 area and key inbound markets (%) .............. 63 Figure 23 - Estimations of prevalence of disability in Europe ............................................................ 65 Figure 24 - Distribution of each type of disability in EU countries ...................................................... 69 Figure 25 - Distribution of each type of disability in key inbound markets ......................................... 70 Figure 26 - Elderly population in EU27 countries by gender in 2011 (unit: thousands) ..................... 71 Figure 27 - Elderly population in major international inbound markets by gender in 2011 (unit:
thousands) ................................................................................................................................... 72 Figure 28 - Travel behaviour of people with access needs: EU-wide averages, 2012 ...................... 75 Figure 29 - Travel behaviour of people with disabilities in the EU27 countries: country-specific
averages, 2012 Day trips ......................................................................................................... 76 Figure 30 - Travel behaviour of people with disabilities in the EU27 countries: country-specific
averages, 2012 Overnight trips ................................................................................................ 78 Figure 31 - Travel behaviour of the elderly population in the EU27 countries: country-specific
averages, 2012 Day trips ......................................................................................................... 80 Figure 32 - Travel behaviour of the elderly population in the EU27 countries: country-specific
averages, 2012 Overnight trips ................................................................................................ 82 Figure 33 - .... 85 Figure 34 - -
................................................................................................................... 87 Figure 35 -
2012- ......................................................................................................... 88 Figure 36 -
2012- ......................................................................................................... 89 Figure 37 -
............................................................................................... 90 Figure 38 -
............................................................................................... 91 Figure 39 -
............................................................................................... 92 Figure 40
........................................................... 93 Figure 41 - Increased willingness to travel under different scenarios existing travellers ..... 95 Figure 42 - Willingness to travel under different scenarios non-travellers ............................. 96 Figure 43 - Travel behaviour of people with access needs under different scenario A (minimum
improvements): EU-wide averages ............................................................................................. 96

Economic impact and travel patterns of Accessible Tourism in Europe FINAL REPORT 12
Figure 44 - Travel behaviour of people with access needs under different scenario B (medium
improvements): EU-wide averages ............................................................................................. 97 Figure 45 - Travel behaviour of people with access needs under different scenario C (extensive
improvements): EU-wide averages ............................................................................................. 97 Figure 46 - Summary of potential demand for accessible tourism under different scenarios in 2012 99 Figure 47 -
.......................................................................................................................... 100 Figure 48 -
.......................................................................................................................... 101 Figure 49 -
.......................................................................................................................... 102 Figure 50- Departures to the EU per 100 people in 2011 by all tourists from key international
inbound markets (unit: trips per year) .................................................................................. 106 Figure 51 -
key international inbound markets in 2012 .......................................................................... 107 Figure 52-
from key international inbound markets in 2012 ................................................................. 109 Figure 53 -
needs from the key international inbound markets from 2012-2020 (uni ..... 110 Figure 54. Increased willingness to travel under scenarios existing travellers ................... 112 Figure 55 - Willingness to travel under different scenarios new travellers ........................... 113 Figure 56 - Departures to the EU per 100 people by all tourists from key international inbound
markets under different scenarios (unit: trips per year) ..................................................... 114 Figure 57- Summary of potential total demand for accessible tourism by the key international
inbound markets under different scenarios in 2012 ............................................................ 115 Figure 58 -
rips) ...................................................... 116 Figure 59 -
key international inbound m ........................................................... 117 Figure 60 -
key ........................................................... 117 Figure 61 - Key questions to address in the website analysis ......................................................... 120 Figure 62 - Website analysis approach ............................................................................................ 122 Figure 63 - Target groups ................................................................................................................. 127 Figure 64 - Number of websites addressing each part of the service chain .................................... 128
Economic impact and travel patterns of Accessible Tourism in Europe FINAL REPORT 13
Figure 65 - Number of websites offering information in each language (national language of the
website is included) ................................................................................................................... 129 Figure 66 - Target groups ................................................................................................................. 130 Figure 67 - Number of websites addressing each part of the service chain .................................... 131 Figure 68 - Number of websites offering information in each language (national language of the
website is included) ................................................................................................................... 132 Figure 69 - Target groups ................................................................................................................. 133 Figure 70 - Number of websites addressing each part of the service chain .................................... 134 Figure 71 - Number of websites offering information in each language (national language of the
website is included) ................................................................................................................... 135 Figure 72 - Number of websites offering information in each language (national language of the
website is included) ................................................................................................................... 136 Figure 73 - Number of websites offering information in each language (national language of the
website is included) ................................................................................................................... 137 Figure 74 - Number of websites offering information in each language (national language of the
website is included) ................................................................................................................... 138 Figure 75 - Number of websites offering information in each language (national language of the
website is included) ................................................................................................................... 139 Figure 76 - Target groups ................................................................................................................. 140 Figure 77 - Number of websites offering information in each language (national language of the
website is included) ................................................................................................................... 141 Figure 78 - Screenshot of "Visit England" with attractive pictures and helpful information .............. 142 Figure 79 - Number of websites offering information in each language (national language of the
website is included) ................................................................................................................... 143 Figure 80 God Adgang case-study ................................................................................................ 144 Figure 81 Visit England case-study ............................................................................................... 145 Figure 82 - Toegankelijk Vlaanderen case-study ............................................................................. 146 Figure 83 - Tourisme et Handicap case-study ................................................................................. 147 Figure 84 Eurewelcome case-study .............................................................................................. 148 Figure 85 - Number of websites with (yes) and without (no) information on accessible offers ........ 149 Figure 86 - Number of websites with (yes) and without (no) external links to specialized websites 152 Figure 87 Reasons for not travelling in the past 12 months .......................................................... 155 Figure 88 - Seasonality ..................................................................................................................... 157 Figure 89 Travel companions ........................................................................................................ 158 Figure 90 - Destinations ................................................................................................................... 160 Figure 91 Reasons for travelling outside the EU ........................................................................... 162
Economic impact and travel patterns of Accessible Tourism in Europe FINAL REPORT 14
Figure 92 Accommodation............................................................................................................. 164 Figure 93 Transport means ........................................................................................................... 165 Figure 94 Activities at destination .................................................................................................. 167 Figure 95 Information sources ....................................................................................................... 169 Figure 96 Booking channels .......................................................................................................... 171 Figure 97 Checking accessibility prior to trips ............................................................................... 172 Figure 98 Accessibility information ................................................................................................ 173 Figure 99 Importance of trip aspects People with limitations ..................................................... 174 Figure 100 - Importance of trip aspects People above 65 ............................................................ 175 Figure 101 - Importance of trip aspects Travel with children ........................................................ 176 Figure 102 Satisfaction with trip aspects People with limitations ............................................... 178 Figure 103 Satisfaction with trip aspects People above 65 ........................................................ 179 Figure 104 Satisfaction with trip aspects Travel with children.................................................... 180 Figure 105 Barriers ........................................................................................................................ 182 Figure 106 Importance of building aspects People with limitations ........................................... 183 Figure 107 Importance of building aspects Travel with children ................................................ 184 Figure 108 Importance of building aspects People above 65 .................................................... 184 Figure 109 Satisfaction with building aspects People with limitations ....................................... 185 Figure 110 Satisfaction with building aspects People above 65 ................................................ 186 Figure 111 Satisfaction with building aspects Travel with children ............................................ 186 Figure 112 Likelihood to travel more often .................................................................................... 187 Figure 113 Spending more for accessibility People with limitations .......................................... 188 Figure 114 - Spending more for accessibility People above 65 .................................................... 189 Figure 115 - Spending more for accessibility Travel with children ................................................ 189 Figure 116 Potential use of accessibility items ............................................................................. 191 Figure 117 Likelihood to go back to the same destination ............................................................ 192 Figure 118 Case studies................................................................................................................ 247 Figure 119 Official logo of Erfurt tourism board ............................................................................ 251 Figure 120 Official logo of Accessible Poland Tours ..................................................................... 254 Figure 121 English version of the flyer .......................................................................................... 254 Figure 122 ................................... 255 Figure 123 Château des Ducs de Bretagne .................................................................................. 260 Figure 124 Parking place and entrance to the Winery (Photo: www.welcome.lu) ........................ 262 Figure 125 The Eurewelcome label at the Winery entrance door (Photo: NeumannConsult 2013)
................................................................................................................................................... 262 Figure 126 The wine cellar (Photo: NeumannConsult 2013) ........................................................ 263

Economic impact and travel patterns of Accessible Tourism in Europe FINAL REPORT 15
Figure 127 Webpage www.welcome.lu ......................................................................................... 263 Figure 128
) ................................................................................................................................................. 265 Figure 129 Website www.visitberlin.de ......................................................................................... 268 Figure 130 Evolution of the adapted stations ................................................................................ 270 Figure 131 Evolution of the client satisfaction index ..................................................................... 271 Figure 132 Official logo of the FGC ............................................................................................... 272 Figure 133 Website of the FGC ..................................................................................................... 272 Figure 134 Official logo of Scandic ................................................................................................ 275 Figure 135 Scandic webpage ........................................................................................................ 275 Figure 136 GVAM webpage .......................................................................................................... 278 Figure 137 Official logo of SGVAM ............................................................................................... 278 Figure 138 Monnalisa restaurant (Photo: http://www.campingflorenz.it/ita/servizi/monnalisa.php )
................................................................................................................................................... 281 Figure 139 Girasoli restaurant (Photos: http://www.igirasoli.ar.it) ................................................. 284 Figure 140 Case studies and success factors .............................................................................. 285 Figure 141 Case study analysis .................................................................................................... 286 Figure 142 Purposes of desk research ......................................................................................... 289 Figure 143 Keywords/ parameters used for the identification of secondary sources.................... 290 Figure 144 Publication period of articles identified during the first search round.......................... 291 Figure 145 Simultaneous screening process used for the examination/ assessment of secondary
sources ...................................................................................................................................... 292 Figure 146 Articles dealing with access barriers by type of impairment/ restriction...................... 294 Figure 147 Articles dealing with access barriers by tourism sector .............................................. 295 Figure 148 Articles dealing with access barriers by geographical coverage ................................ 296 Figure 149 The desk research process ......................................................................................... 297 Figure 150 Five main categories of access needs for analysis..................................................... 299 Figure 151 Summary of testing procedures .................................................................................. 302 Figure 152 Summary of categories of barriers .............................................................................. 306 Figure 153 Imbalance between Information Requirements and Information Provision ................ 307 Figure 154 Barriers in the pre-travel stage .................................................................................... 313 Figure 155 Geographical coverage of analysed Accessible Tourism Information Schemes ........ 315 Figure 156 Framework of interrelated information need components .......................................... 316 Figure 157 Useful and counterproductive aspects of access schemes ........................................ 317 Figure 158 H24: Barriers - Pre-travel stage/ Information gathering stage by type of access need
................................................................................................................................................... 321
Economic impact and travel patterns of Accessible Tourism in Europe FINAL REPORT 16
Figure 159 H24 Barriers - Pre-travel stage/ Information gathering stage by country of origin ...... 322 Figure 160 H25 Barriers: Pre-travel stage/ Information gathering stage: importance of general
information sources by type of access need ............................................................................. 324 Figure 161 H25 Barriers: Pre-travel stage/ Information gathering stage: importance of general
information sources by country of origin ................................................................................... 325 Figure 162 H25 Barriers: Pre-travel stage/ Information gathering stage: Most important source of
information Individuals with mobility difficulties ...................................................................... 327 Figure 163 H25 Barriers: Pre-travel stage/ Information gathering stage: Most important source of
information Individuals with sensory difficulties ..................................................................... 327 Figure 164 H25 Barriers: Pre-travel stage/ Information gathering stage: Most important source of
information Individuals with communication difficulties .......................................................... 328 Figure 165 H25 Barriers: Pre-travel stage/ Information gathering stage: Most important source of
information Individuals with behavioural difficulties ............................................................... 328 Figure 166 H25 Barriers: Pre-travel stage/ Information gathering stage: Most important source of
information Individuals with hidden difficulties ....................................................................... 329 Figure 167 H26 Barriers: Pre-travel stage/ Information gathering stage: Information is sufficient,
reliable and accessible by type of access need ........................................................................ 331 Figure 168 H26 Barriers: Pre-travel stage/ Information gathering stage: Information is sufficient,
reliable and accessible by country of origin .............................................................................. 333 Figure 169 Barriers at airports and airlines ................................................................................... 336 Figure 170 H27 Barriers: Transit stage: Attitudinal versus physical access barriers by type of
access need .............................................................................................................................. 340 Figure 171 Barriers experienced when moving around at the destination .................................... 341 Figure 172 H28 Barriers: At the destination: Importance of access pathways and accessible
parking by type of access need ................................................................................................. 344 Figure 173 H28 Barriers: At the destination: Importance of access pathways and accessible
parking by destination ............................................................................................................... 346 Figure 174 Barriers experienced with hotel establishments .......................................................... 348 Figure 175 Physical access and attitudinal barriers encountered in the accommodation sector
(United States) .......................................................................................................................... 348 Figure 176 Physical access and attitudinal barriers encountered in the accommodation sector
(China) ....................................................................................................................................... 349 Figure 177 H29 Barriers: Accommodation sector: Physical access barriers versus attitudinal
barriers by type of access need ................................................................................................ 352 Figure 178 H29 Barriers: Accommodation sector: Physical access barriers versus attitudinal
barriers by destination ............................................................................................................... 354

Economic impact and travel patterns of Accessible Tourism in Europe FINAL REPORT 17
Figure 179 H30 Barriers: Accommodation sector: Satisfaction with toilets by type of access need
................................................................................................................................................... 356 Figure 180 H30 Barriers: Accommodation sector: Satisfaction with toilets by destination ........... 356 Figure 181 Barriers experienced in the Food and Beverage Sector ............................................ 359 Figure 182 H31 Barriers: Food & Beverage sector compared to other sectors by type of access
need........................................................................................................................................... 360 Figure 183 H31 Barriers: Food & Beverage sector compared to other sectors by destination ..... 361 Figure 184 Main barriers encountered when visiting historic attractions ...................................... 363 Figure 185 Main barriers encountered when visiting historic attractions and outdoor attractions
(Australia) .................................................................................................................................. 363 Figure 186 H32 Barriers: Attraction sector: Nature-based activities by type of access need ....... 367 Figure 187 H32 Barriers: Attraction sector: Nature-based activities by destination ...................... 367 Figure 188 Physical access and attitudinal barriers encountered in different sectors (United States)
................................................................................................................................................... 371 Figure 189 Physical access and attitudinal barriers encountered in different sectors (China) ..... 372 Figure 190 H33 Barriers: Cross-sector comparison: Physical access vs. attitudinal barriers by type
of access need .......................................................................................................................... 372 Figure 191 H33 Barriers: Cross-sector comparison: Physical access vs. attitudinal barriers by
destination ................................................................................................................................. 374 Figure 192 Frequency of barriers encountered in different sectors (United States I) ................... 376 Figure 193 Frequency of barriers encountered in different sectors (United States II) .................. 376 Figure 194 Frequency of barriers encountered in different sectors (China) ................................. 377 Figure 195 H34 Barriers: Cross-sector comparison: Frequency of barriers by type of access need
................................................................................................................................................... 378 Figure 196 H34 Barriers: Cross-sector comparison: Frequency of barriers by destination .......... 380 Figure 197 H35 Barriers: Cross-sector comparison: Importance of barriers by type of access need
................................................................................................................................................... 384 Figure 198 H35 Barriers: Cross-sector comparison: Importance of barriers by destination ......... 385 Figure 199 - Pre-focus group participants ........................................................................................ 388 Figure 200 - Focus group participants .............................................................................................. 390 Figure 201 - Travel behaviour of people with access needs: EU-wide averages of per person
spending, 2012 .......................................................................................................................... 401 Figure 202- Travel behaviour of people with disabilities in the EU27 countries: country-specific
averages of per person spending, 2012 ................................................................................... 402 Figure 203 - Travel behaviour of the elderly population in the EU27 countries: country-specific
averages of per person spending, 2012 ................................................................................... 405

Economic impact and travel patterns of Accessible Tourism in Europe FINAL REPORT 18
Figure 204 -
countries in 2012 ....................................................................................................................... 409 Figure 205 - ............................... 410 Figure 206 - Breakdown of Gross Turnover Contributed by People with Access Needs in EU27
Countries ................................................................................................................................... 411 Figure 207 - Breakdown of Direct Gross Value Added Contributed by People with Access Needs in
EU27 Countries ......................................................................................................................... 412 Figure 208 - Breakdown of Direct Employment Contributed by People with Access Needs in EU27
Countries ................................................................................................................................... 413 Figure 209 -
access needs in the EU27 countries ......................................................................................... 414 Figure 210 -
.......................................................................................................... 415 Figure 211 -
................................................................................. 415 Figure 212 -
....................................................................................... 416 Figure 213 - Breakdown of Total Output Contribution of EU's Accessible Tourism by Source Market
................................................................................................................................................... 417 Figure 214 - Breakdown of Total Gross Value Added Contribution of EU's Accessible Tourism by
Source Market ........................................................................................................................... 418 Figure 215 - Breakdown of Total Employment Contribution of EU's Accessible Tourism by Source
Market ....................................................................................................................................... 418 Figure 216 - ... 420 Figure 217 - Potential travel market and tourism revenues of Accessible Tourism ......................... 422 Figure 218 - Average number of companions travelled with people with disabilities from the EU27
countries .................................................................................................................................... 423 Figure 219 - Average number of companions travelled with the elderly population from the EU27
countries .................................................................................................................................... 424 Figure 220 - Travel behaviour of people with disabilities in the 11 key international inbound markets:
averages of per person spending, 2012 ................................................................................... 426 Figure 221 - Travel behaviour of the elderly population in the 11 key international inbound markets:
averages of per person spending, 2012 ................................................................................... 427 Figure 222 -
international inbound markets in 2012 ...................................................................................... 428

Economic impact and travel patterns of Accessible Tourism in Europe FINAL REPORT 19
Figure 223 -
access needs from the key international inbound markets in 2012 .......................................... 428 Figure 224 -
access needs from all the 11 key international inbound markets ............................................. 429 Figure 225 -
.......................................................... 430 Figure 226 -
key international inbound markets ................................................... 430 Figure 227 -
international inbound markets in 2012 (unit: '000 persons) ...................................................... 431 Figure 228 - Breakdown of Total Output Contribution of EU's Accessible Tourism by Source Market
................................................................................................................................................... 432 Figure 229 - Breakdown of Total Gross Value Added Contribution of EU's Accessible Tourism by
Source Market ........................................................................................................................... 433 Figure 230 - Breakdown of Total Employment Contribution of EU's Accessible Tourism by Source
Market ....................................................................................................................................... 434 Figure 231 - Average number of companions travelled with people with disabilities from the 11 key
international inbound markets ................................................................................................... 435 Figure 232 - Average number of companions travelled with the elderly population from the 11 key
international inbound markets ................................................................................................... 435 Figure 233 - ... 436 Figure 234 - Percentage of extra budget under different scenarios by all existing travellers with
access needs from the EU27 countries .................................................................................... 439 Figure 235 -
scenarios ................................................................................................................................... 440 Figure 236 - Breakdown of direct economic contribution under different scenarios between existing
travellers and new travellers ..................................................................................................... 441 Figure 237 -
people with access needs in the EU27 countries ..................................................................... 442 Figure 238 -
people with access needs in the EU27 countries ..................................................................... 443 Figure 239 - Total output contribution under different scenarios by people with access needs (unit:
'000 000 ................................................................................................................................. 443 Figure 240 - Total gross value added contribution under different scenarios by people with access
............................................................................................................. 444
Economic impact and travel patterns of Accessible Tourism in Europe FINAL REPORT 20
Figure 241 - Total employment contribution under different scenarios by people with access needs
(unit: '000 persons) .................................................................................................................... 444 Figure 242 -
without/with travel companions ................................................................................................. 445 Figure 243 - Percentage of extra budget under different scenarios by all travellers with access needs
from the 11 key international inbound markets ......................................................................... 447 Figure 244 -
under different scenarios ........................................................................................................... 449 Figure 245 - Breakdown of direct economic contribution under different scenarios between existing
travellers and new travellers ..................................................................................................... 450 Figure 246 -
people with access needs from the 11 key international inbound markets............................... 451 Figure 247 - sible tourism under different scenarios by
people with access needs from all the 11 key international inbound markets .......................... 452 Figure 248 - Total output contribution under different scenarios by people with access needs (unit:
................................................................................................................................. 453 Figure 249 - Total gross value added contribution under different scenarios by people with access
............................................................................................................. 454 Figure 250 - Total employment contribution under different scenarios by people with access needs
(unit: '000 persons) .................................................................................................................... 455 Figure 251 - Economic
without/with travel companions ................................................................................................. 456 Figure 252 - Top 10 source markets for accessible tourism demand in EU .................................... 458 Figure 253 - Roadmap to success ................................................................................................... 471

Economic impact and travel patterns of Accessible Tourism in Europe FINAL REPORT 21
1 Executive summary
This is one of three studies commissioned by the European Commission, DG Enterprise and
Industry (DG ENTR) in 2012-2013 in order to build a comprehensive picture of Accessible Tourism
in the European Union (EU). The main aim of the present study is to better understand demand for
Accessible Tourism in order to guide policy-making in this field. For this purpose, five main research
objectives were identified:
To examine the current and future demand for Accessible Tourism in Europe and beyond
To investigate the travel patterns and behaviours of, and information provision for people
with access needs
To evaluate the tourist experience across different tourism sectors from demand and
supply-side perspectives
To estimate the current and future economic contribution of Accessible Tourism and its
impact on employment
To propose recommendations and success factors to improve the supply of Accessible
Tourism offers
These objectives were translated into five key tasks whose key findings are presented below.
1.1 Task 1 Demographic profiling of tourists with special access needs
1.1.1 Task 1a Cluster analysis To take the most effective use of available resources, this project conducted a cluster analysis,
aiming to group 27 EU member states into different clusters and then selecting one or two countries
to represent each cluster to carry out the primary data collection. It was presumed that the people in
the same cluster should exhibit similar travelling behaviour. Hence, the primary data collected from
the representative countries could be used to infer the behaviour of people in other countries.
Ultimately, the estimation of demand and economic contribution for different countries will use the
same p
and education were used as clustering criteria. In total 8 clusters and 12 representative countries
derived from the analysis. The decision on the representative countries was based on both
quantitative evidence, such as correlation coefficients, and qualitative judgement. The 12
representative countries include Belgium, Bulgaria, France, Ireland, Italy, Lithuania, the Netherlands,
Poland, Slovenia, Spain, Sweden, and the United Kingdom.
Economic impact and travel patterns of Accessible Tourism in Europe FINAL REPORT 22
1.1.2 Task 1b Forecasting In order to forecast the demand for Accessible Tourism, the analysis first addressed the current
situation. More than half of the individuals with disabilities in the EU travelled during the 12 months
between mid-2012 and mid-2013. On average, each individual took 6.7 daily trips, plus a further 6.7
overnight trips during the period, mostly within Europe. In total, this group of travellers made about
170 million day trips and a similar number of overnight trips within the EU. In comparison, a slightly
smaller proportion of elderly people aged 65 or above travelled during the same period. On average
this group took 6.9 day trips and 5.5 overnight trips per person. They travelled slightly more widely
than individuals with disabilities. In total, they made over 225 million day trips and 217 million
overnight trips over the 12 months. Overall, people with special access needs in the EU took nearly
783 million trips within EU, including both domestic travel and intra-EU travel. Among all EU member
states, France, the UK and Germany are the top source markets for accessible tourism, taking both
domestic and intra-EU travel into account.
As for the key international inbound markets, according to the ratio between departures into the EU
and the population with special access needs, people from the developed countries are more likely
to travel to the EU than people fro
tourism by people with special access needs was 17.6 million trips in 2012, of which 7.2 million was
taken by people with disabilities and 10.4 million by the elderly population. Among the 11 key
inbound markets, the USA, Switzerland and Russia are the biggest source countries.
To forecast the future growth of accessible tourism demand, a two-step forecasting approach was
followed. As the first step, three statistical forecasting methods were employed to generate forecasts
separately; secondly, combination forecasts were derived based on the average of the results of
these three individual forecasting techniques. Based on the forecasted growth of the elderly
population and the growth of individuals with disabilities, and assuming stable travel propensity and
frequency of these people, a baseline forecast is obtained. It is suggested that by 2020 the demand
llion trips
per year, and the demand by the key international inbound markets will reach 21 million trips per
year.
scenarios of accessibility improvements, i.e., minimum, medium and extensive levels of
improvements. Three potential scenarios for future improvements in the accessibility of tourism
destinations were proposed to people with special access needs: Scenario A offered a destination
with partial accessibility of buildings, hotels, restaurants and museums, with no additional accessible
services; Scenario B offered extended accessibility of buildings, hotels, restaurants and museums,

Economic impact and travel patterns of Accessible Tourism in Europe FINAL REPORT 23
with some accessible services; Scenario C offered almost complete accessibility of buildings, hotels,
restaurants and museums with various accessible services available.
It was predicted that the demand by people within the EU would increase by 24.2%, 33.2% and
43.6% against the baseline under Scenarios A, B and C, respectively. By 2020 the total accessible
tourism demand by people within the EU would reach 1,067, 1,143, and 1,231 million trips per year
under Scenarios A, B and C, respectively. The demand by people from the key international inbound
markets would increase 27.8%, 49.3% and 74.6% against the baseline under Scenarios A, B and C,
inbound markets could be up to 26 million, 31 million and 36 million by 2020 under Scenarios A, B
and C, respectively. However, it should be noted that due to a small base size of 66 respondents,
these results should be interpreted with caution.
1.2 Task 2 Behavioural profiling of tourist with special access needs
1.2.1 Task 2a - Website analysis For this task, 66 tourism-related websites and brochures from 12 tourism offices were analysed to
Almost 70% of all 66 surveyed websites provide information on accessible offers, but accessible
features are almost never used in marketing and advertising. Information remains technical and
does not seek to promote a destination.
Special interest brochures with information for guests with access needs are not present on the level
of the tourism boards of the 12 surveyed countries.
1.2.2 Task 2b Online survey and focus groups An online survey was conducted among people with access needs in 12 EU Member States and 4
inbound markets and 2 focus groups were conducted with people aged 65 and above.
Overall, people with access needs share many behavioural patterns with other travellers, with
minorities selecting answers specific to this group. More differentiated behavioural patterns appear
in the preparation process: people with access needs tend to take their specific needs into account
when preparing and booking their trip, with many checking accessibility conditions in advance or
selecting trips where issues are unlikely to arise.
In terms of barriers, the price of accessibility seems to be an issue for some, while medical help and
the availability of information about accessibility are mentioned as barriers as much as the
accessibility of locations itself. An important finding is that many people say they do not experience
Economic impact and travel patterns of Accessible Tourism in Europe FINAL REPORT 24
barriers with the items mentioned, a finding supported by the focus group results indicating that
some people adapt to issues as they arise and do not perceive them as barriers as such.
People with access needs are not a uniform group: although some overall trends are consistent,
results vary across groups (people who travel with children, people aged 65 and above and people
with limitations), countries, as well as across limitations within the third group.
The survey asked a number of questions related to expectations and changes to the accessible
tourism offer with results pointing towards possible behaviour changes if accessibility conditions
were improved, such as an increase in travel budget or travel frequency. Besides, respondents
mentioned a range of improvements which would improve the experience of various groups with
access needs.
1.3 Task 3 Evaluation of the tourist experience across different tourism sectors
1.3.1 Task 3a - Case-studies 10 case-studies were analysed in order to better understand the tourist experience and identify good
practices. It has emerged that in most cases accessibility is integrated as part of the quality policy.
It is clear that the closer the cooperation with other local service providers the greater the success.
Although results are also good where cooperation is not that close but the provision of accessible
services is assured along the tourism chain. Although social responsibility is a motivation, it does not
imply that the company deviates from its own business focus. The engagement and training of all
the staff is a key issue in improving results.
Knowledge transfer flows more easily when the organisation is part of a number of professional
networks such as Design for All Foundation. Planning and anticipating the results before starting is
also a key element of success.
Finally it should be underlined that all cases that have succeed in managing the 7 ISF have
validated all the working hypotheses proposed.
1.3.2 Task 3b - Desk research on existing barriers faced or perceived by people with access needs
The main aim for task 3b was to reach a thorough understanding of the barriers faced by people with
access needs. The analysis, employing desk research in conjunction with hypotheses testing
procedures, revealed key barriers for each stage of the tourism value chain as well as across
different tourism sectors. Key findings include:
In the pre-travel/ information gathering stage, the lack or limited availability of information about
accessible services represents the biggest barrier for people with access needs, particularly for
individuals with mobility, sensory and behavioural difficulties. While accessibility information
Economic impact and travel patterns of Accessible Tourism in Europe FINAL REPORT 25
schemes, set up by specialised organisations, have been designed to overcome existing
informational barriers, it is highlighted that information about the level of accessibility of products and
services should be incorporated in mainstream channels.
Barriers encountered in the transit/ transport stage largely refer to airlines not ensuring an
accessible environment. In addition, these barriers augment when using low-cost carriers. Yet,
while a number of physical access barriers impede a comfortable arrival/ departure, attitudinal
barriers are more important, particularly for people with mobility, sensory and behavioural access
needs.
Once at the destination, the desk research together with the empirical testing revealed the
importance of access paths and accessible parking for moving around at the destination, particularly
for people with mobility limitations.
In general, past research indicates that physical access barriers are perceived as greater obstacles
when compared to attitudinal barriers in the accommodation sector. Yet, for European travellers
physical access barriers are ranked as being equally important compared to attitudinal barriers.
While previous research highlighted that the food and beverage sector causes the greatest amount
of barriers to individuals with access needs, European travellers with mobility, sensory, behavioural
and hidden restrictions felt that the transport at the destination is the sector where most barriers are
encountered. Yet, for people with sensory, communication and hidden limitations, barriers
encountered in the food and beverage sector are encountered significantly more often than in the
accommodation sector.
As part of the attraction sector, nature-based activities are in high demand by people with access
needs. Yet, these activities are accompanied by the most barriers. Only for individuals with sensory
and behavioural difficulties, both nature and shopping opportunities are equally important barriers in
the attraction sector.
The cross-sector comparisons revealed that overall, attitudinal barriers are encountered more often
than physical access barriers across all sectors by individuals with different types of access needs.
Barriers experienced in the transport (at the destination) stage are faced more often compared to
other sectors, particularly for individuals with mobility, sensory, behavioural and hidden limitations.
Destination specific differences were also identified when investigating the importance of accessible
toilets across all key tourism sectors. Thus, all sectors must strengthen their efforts to improve the
availability of toilets and bathrooms as an indispensable element for people with access needs when
being on holiday.
Economic impact and travel patterns of Accessible Tourism in Europe FINAL REPORT 26
1.4 Task 4 - Estimate of the current and future economic contribution of accessible tourism
1.4.1 Task - 4a Stakeholder consultation A pre-focus group, a focus group and in-depth interviews were conducted with a range of
stakeholders. The findings show that accessible tourism is considered a business opportunity but
there is a lack of coordination, particularly between the public and private sector. Accessibility is
mainly understood as a feature for disabled guests and almost never understood as a plus in
comfort and service and, therefore, not used in marketing and advertising.
Product development and marketing mainly targets disabled people. For the tourism business,
political and financial support, awareness raising and activation of service providers are important
drivers. For the guest, reliable information on accessible offers and services is a key factor for
success.
1.4.2 Task 4b - Scenarios and impact assessment With regard to the economic contribution of accessible tourism in the EU generated by the people
with special access needs of EU27 countries, the elderly population spent more nights and more
money on their trips and therefore generated more economic contribution than individuals with
-coun
approximately 352 billion Euros, in terms
of the economic output or gross turnover of tourism-related service providers. After the deduction of
intermediate consumption, the net output, or gross value added, amounted about 150 billion Euros.
Equivalently the economic contribution in terms of gross domestic product (GDP) was 164 billion
Euros, which is equal to gross value added (GVA) plus taxes and subsidies on products. This scale
of economic output corresponds to over 4.2 million persons employed directly in tourism-related
businesses in the EU. In addition to the direct contribution to the revenues of tourism-related service
providers directly through trip expenditures, accessible tourism contributes to the wider-scale of
on includes the economic benefits
received by the backward-linked industries supplying goods and services to tourism businesses (i.e.,
an indirect effect), and the benefits received at a destination from household spending of the income
earned from tourism and its supporting sectors (i.e., an induced effect). The indirect and induced
multipliers were derived from national and regional input-output tables collected from Eurostat.
Taking all the direct, indirect and induced effects into consideration, accessible tourism demand
within the EU generated a total economic contribution of 786 billion Euros in terms of economic
Economic impact and travel patterns of Accessible Tourism in Europe FINAL REPORT 27
output, 356 billion Euros in terms of gross value added, and 394 billion Euros in terms of GDP. To
provide this amount of economic output, in total 8.7 million people were employed within region.
For the 11 key international inbound markets, on average people with special access needs spent
economy was estimated to be 16 billion Euros, in terms of the economic output or gross turnover; 7
billion Euros of net output or gross value added (GVA), or 8 billion Euros of GDP. To meet the needs
by the people from the 11 inbound markets, roughly 268 thousand persons in the EU would be
employed directly in tourism-related businesses. In addition to the direct economic contribution,
further benefits to the EU economy will be generated via the multiplier effect. The total economic
contribution was estimated to be 34 billion Euros, in terms of economic output, 15 billion Euros of
gross value added, and 17 billion Euros of GDP. The associated employment within the economy
would be 538 thousand persons.
Under the three scenarios of accessibility improvements, there is also potentially increased
economic demand from people in the EU who did not participate in travel in the past. The scenarios
measured the willingness to travel to some new destinations - currently relatively weak in offering
accessible facilities - if their offer improved in terms of accessibility. In particular, the survey results
showed that, if accessibility could be improved under Scenarios A, B and C, up to 24%, 37% and
44%, respectively, of respondents in the EU who did not participate in travel in the past would be
willing to travel to some of these new destinations.
accessible tourism demand would increase by 18.3-19.7% against the baseline across the three
indicators (economic output, gross value added and employment). Under Scenario B (medium
improvements of accessibility), the economic contribution would increase further, by 24.8-26.6%
against the baseline. With extensive improvements of accessibility (i.e., Scenario C), up to 39.4% of
additional economic contribution to the baseline level could be achieved, which suggests that 1,073
billion Euros of economic output, 484 billion Euros of gross value added and 537 billion Euros of
GDP could be generated associated with the demand by people with special access needs within
the EU, along with 12.1 million employed persons within the whole EU economy, taking all direct,
indirect and induced effects into account.
Under the scenarios of improvements, the potential tourism demand and economic contribution
generated by people with special access needs from the 11 key international inbound markets would
also significantly increase. Under Scenarios A, B and C, up to 33%, 40% and 46% of respondents
from the international markets who did not travelled to the EU would participate in travel to some of
74.9% under Scenarios A, B and C against the baseline across the three indicators. Hence, under
Economic impact and travel patterns of Accessible Tourism in Europe FINAL REPORT 28
the best scenario, up to 60 billion Euros of economic output, 26 billion Euros of gross value added,
30 billion Euros of GDP could be generated by the people from the key international markets, and
940 thousand persons would be employed within the whole EU economy, considering all direct,
indirect and induced effects.
People with special access needs often travelled with companions. According to the survey question
ip, it was calculated that, on
average, each individual with special access needs (in the EU and beyond) travelled with 1.9
companions. Individuals with disabilities tend to travel with slightly more companions than the elderly
population. With the additional contribution from travel companions taken into consideration, the
overall economic contribution related to accessible tourism demand could be further amplified by a
similar scale.

Economic impact and travel patterns of Accessible Tourism in Europe FINAL REPORT 29
2 Presentation of the study
This is one of three studies commissioned by the European Commission, DG Enterprise and
Industry (DG ENTR) in 2012-2013 in order to build a comprehensive picture of Accessible Tourism
in the European Union (EU). The present study focuses on the demand side of Accessible Tourism.
t practices and
tools.
2.1 Objectives of the study The main aim of the present study is to better understand demand for Accessible Tourism in order to
guide policy-making in this field. For this purpose, five main research objectives were identified:
To examine the current and future demand for Accessible Tourism in Europe and beyond
To investigate the travel patterns and behaviours of, and information provision for people
with access needs
To evaluate the tourist experience across different tourism sectors from demand and
supply-side perspectives
To estimate the current and future economic contribution of Accessible Tourism and its
impact on employment
To propose recommendations and success factors to improve the supply of Accessible
Tourism offers
These objectives were translated into five key tasks which structure the study and the present report
(see Figure 1). Figure 2 indicates how the various activities undertaken as part of this study fit
together and with the study objectives.
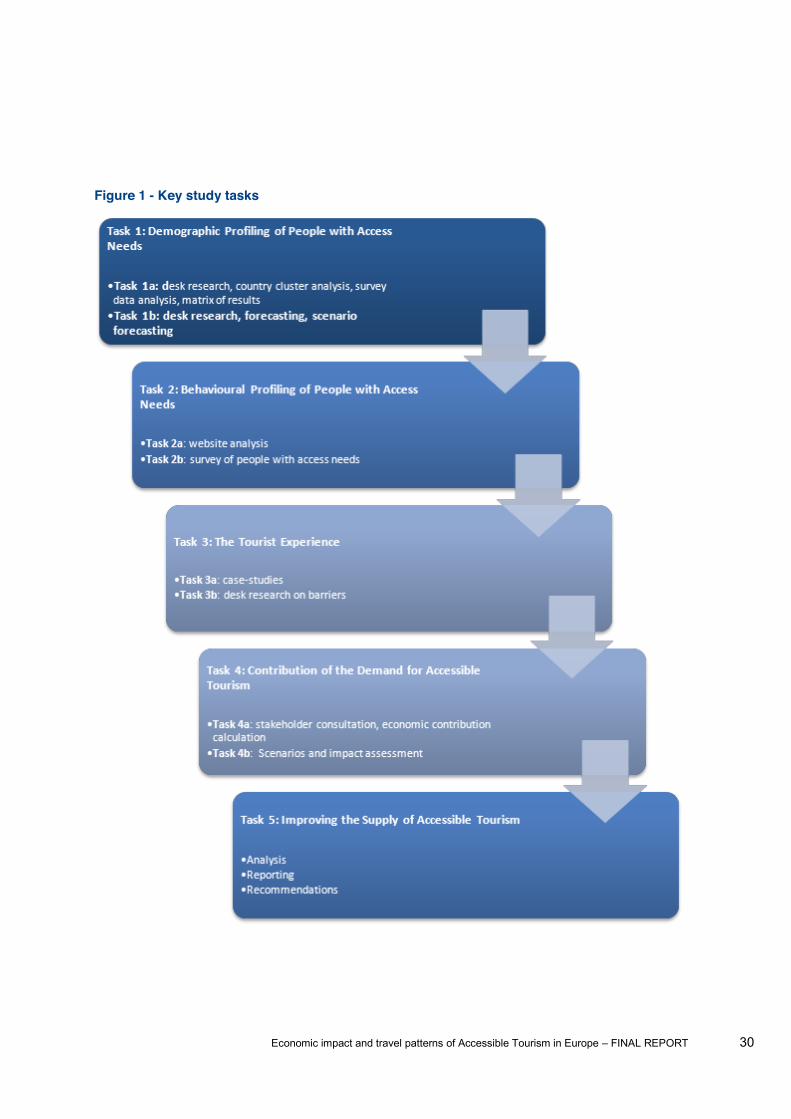
Economic impact and travel patterns of Accessible Tourism in Europe FINAL REPORT 30
Figure 1 - Key study tasks
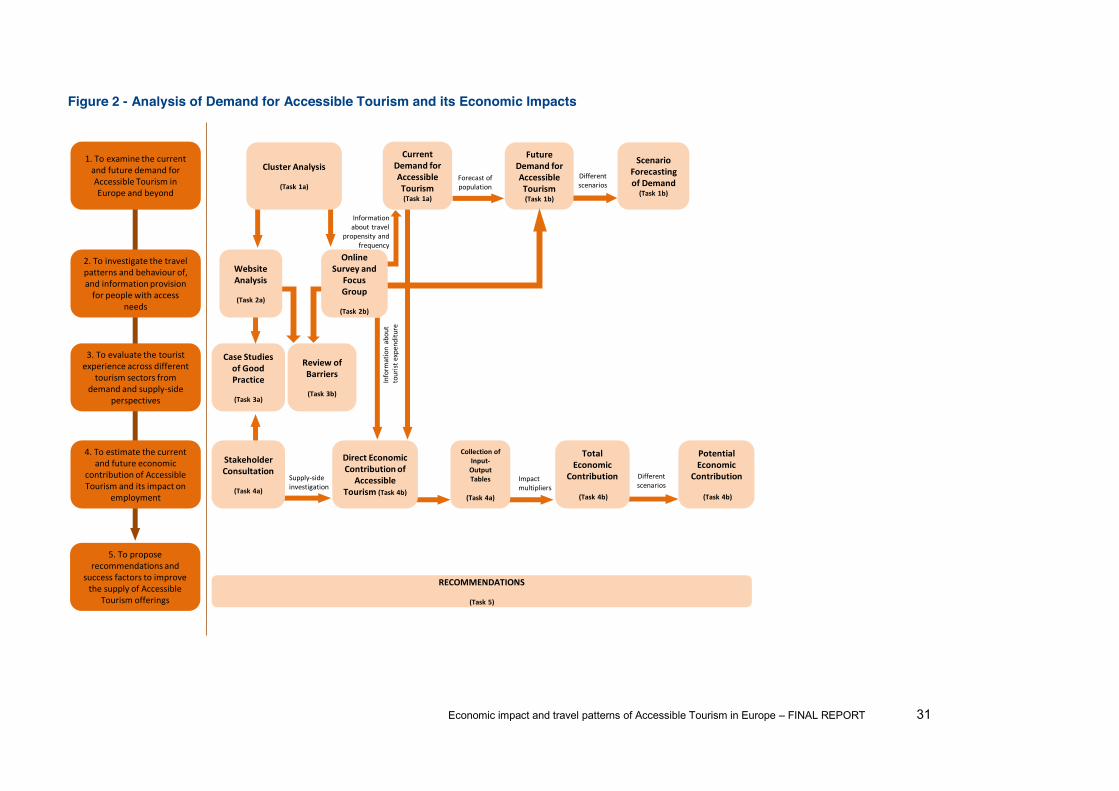
Economic impact and travel patterns of Accessible Tourism in Europe FINAL REPORT 31
Figure 2 - Analysis of Demand for Accessible Tourism and its Economic Impacts
Information about travel
propensity and frequency
Forecast of population
Future Demand for Accessible Tourism (Task 1b)
Different scenarios
Scenario Forecasting of Demand (Task 1b)
Inform
ation abou
t tourist expenditure
Potential Economic
Contribution
(Task 4b)
Impact multipliers
Different scenarios
Cluster Analysis
(Task 1a)
Collection of Input-‐Output Tables
(Task 4a)
Supply-‐sideinvestigation
5. To propose recommendations and
success factors to improve the supply of Accessible
Tourism offerings
RECOMMENDATIONS
(Task 5)
Direct Economic Contribution of
Accessible Tourism (Task 4b)
Online Survey and
Focus Group
(Task 2b)
Case Studies of Good Practice
(Task 3a)
Total Economic
Contribution
(Task 4b)
Review of Barriers
(Task 3b)
Current Demand for Accessible Tourism (Task 1a)
Stakeholder Consultation
(Task 4a)
Website Analysis
(Task 2a)
1. To examine the current and future demand for Accessible Tourism in Europe and beyond
2. To investigate the travel patterns and behaviour of, and information provision for people with access
needs
3. To evaluate the tourist experience across different
tourism sectors from demand and supply-‐side
perspectives
4. To estimate the current and future economic
contribution of Accessible Tourism and its impact on
employment
Economic impact and travel patterns of Accessible Tourism in Europe FINAL REPORT 32
2.2 Key concepts and definitions Investigating Accessible Tourism first requires defining the scope of the exercise, as some of the key
concepts used in this study are multi-faceted. The following glossary clarifies the definitions and the
scope of the concepts used in this study.1
Access needs
The requirements that need to be met for a customer to enjoy a tourism experience. Access needs
can be grouped into:
Needs for care or assistance
Obstacles or difficulties in using, finding or using objects and tools, or communicating
(with a person or a machine)
Accessible Tourism
Refers to the provision of
situation regardless of the activity limitation(s) or impairment(s) they may present. Further, the
European Network for Accessible Tourism (ENAT) refers to Accessible Tourism as the set of
which enable persons with special access needs, either permanent or temporary, to enjoy a holiday
and leisure time with no particular barrier
Accessible Tourism is inclusive of all people with access needs, that is people with disabilities but
also all other people who may benefit from accessible infrastructures, such as elderly people, people
carrying heavy luggage or parents with small children.
Accessible Tourism stakeholders
All sector stakeholders from both supply and demand side, together with those public organisations
committed to improving the accessibility of destinations, products and services.
Accessibility
This is the quality of an environment, product, service or information item that makes it reachable
and/or usable by everyone regardless of his or her abilities. This definition of the concept of
accessibility is used in the social, disability and architectural fields. In civil engineering, the term
1 Unless otherwise mentioned, these definitions are in line with the definitions used by the Design for All Foundation (http://www.designforall.org/en/)

Economic impact and travel patterns of Accessible Tourism in Europe FINAL REPORT 33
accessibility is also used to refer to the connectivity of a city or place. Travel bloggers also often use
accessibility in this sense.
Disability
According to the World Health Organization,1 disability is an umbrella term, covering impairments,
activity limitations, and participation restrictions. An impairment is a problem in body function or
structure; an activity limitation is a difficulty encountered by an individual in executing a task or
action; while a participation restriction is a problem experienced by an individual in involvement in
life situations. Thus disability is a complex phenomenon, reflecting an interaction between features
ociety in which he or she lives.
The UN Convention on the Rights of Persons with Disabilities defines people with disabilities as
-term physical, mental, intellectual or sensory impairments which in interaction
with various barriers may hinder their full and effective participation in society on an equal basis with
Disability is an evolving concept and results from the interaction between persons with impairments
and attitudinal and environmental barriers that hinders their full and effective participation in society
on an equal basis with others.2
Therefore a person is rendered disabled due to the physical and social environment not catering for
people with access needs.
Economic contribution
The economic contribution of tourism is a measure of the size and overall significance of this
industry within an economy.
Economic impact
Economic impact refers to the changes in the economic contribution resulting from specific events or
Inbound/outbound tourism
For the purpose of this study, inbound tourism refers to travellers who arrive and stay in EU
countries for a short period of time (excluding for employment and formal studies). Outbound tourism
refers to EU citizens who take part in tourism activities outside the EU.
1World Health Organisation, retrieved from http://www.who.int/topics/disabilities/en/ on 03/05/2013 2United Nations, retrieved from http://www.un.org/disabilities/convention/conventionfull.shtml on 03/05/2013
Economic impact and travel patterns of Accessible Tourism in Europe FINAL REPORT 34
People with access needs
Access needs cover a wide range of situations. Within the scope of this study, people with access
needs refers to people above 65, people who travel with (small) children and people who have
difficulties that have an impact on their daily life in a range of activities, including mobility, sensorial,
communication or behavioural issues, as well as hidden limitations.
Seniors
The segment of the population considered elderly in certain environments. Various cut-off points,
such as 50, 55 or 60 can all be found in the literature, but this study will use one of the most
commonly used, which is 65.
Special needs
This is the term generally used by the industry to define the access needs of their guests.
Supply/demand sides
Supply refers to the products and services providers in the tourism sector. Demand side refers to the
users of these services, whether they are actual customers or not.
Tourism for All
Tourism for All consists of providing a tourism experience that anybody can enjoy regardless of any
individual characteristics such as abilities, age, height, race, gender, sexual orientation, beliefs,
ideology or cultural background.
According to the Nordiska Handikappolitiska rådet1, the aim of Tourism for All is that everyone
should be able to travel to a country, within a country and to whatever place, attraction or event they
should wish to visit.
The concepts of Accessible Tourism and Tourism for All are evolving and the terms are often
misused. Nevertheless there is a trend to seek to go beyond the idea of mere accessibility for
disabled people and to stress the need to fulfil the expectations of any potential guest.
Tourism sector
Economic activity related to providing products and services to travelling people for leisure or
business reasons. For the purpose of this project, the tourism sector includes the following sub-
sectors: accommodation, food and beverage, entertainment, transportation and travel services.
1Nordiska Handikappolitiska rådet (ed.) (2002): Aktuellt i Norden. Tourism för alla. Rosersberg
Economic impact and travel patterns of Accessible Tourism in Europe FINAL REPORT 35
Travel frequency and propensity
Within the scope of the survey, travel frequency is measured as the number of trips taken by each
traveller per year. Travel propensity is defined as the percentage of people that are willing to travel.
Universal Design/Design for All/Inclusive Design
extent possible, without the need for adaptation or specialis 1
Design for All is about ensuring that environments, products, services and interfaces work for people
of all ages and abilities in different situations and under various circumstances, while Universal
Design refers to producing buildings, products and environments that are inherently accessible to
both people without disabilities and people with disabilities. More recently, professionals working in
the field have tried to come to a common definition on the grounds of basic rights, obligations and
attitudes described in www.societyforall.org. The British Standards Institute defines inclusive design
and usable by, as
many people as reasonably possible ... without the need for special adaptation or specialized 2
These concepts are used by professionals that strive for a more inclusive approach in the tourism
sector but have not yet been fully adopted by the industry.
1United Nations, retrieved from http://www.un.org/disabilities/convention/conventionfull.shtml on 03/05/2013 2British Standards Institute (2005). Design management systems. Managing inclusive design Guide, BS BS 7000-6:2005.
Economic impact and travel patterns of Accessible Tourism in Europe FINAL REPORT 36
3 Task 1 Demographic profiling of tourists with special access needs
3.1 Task 1a Cluster analysis
3.1.1 Methodology Cluster analysis aims at separating the EU27 countries into different groups according to their socio-
economic and demographic profile, so that countries within the same group share high similarities
and are distinctive from the countries in other groups. For example, if countries are grouped
according to their GDP level, they can be separated into high income countries and low income
countries.
The current cluster analysis follows the same logic, but considers 13 criteria simultaneously. The 13
collected from the Eurostat (see Annex A for the variable names), and are the most up-to-date
figures. The clustering process was carried out using SPSS software.
Although the clusters are scientifically based on the data, the number of clusters identified is more
subjective and can be
number of groups was limited to 10, in order to identify a suitable number of clusters and countries
for the primary data collection. In total, 8 clusters were finalised, with more than one country in each
cluster.
After the clustering, representative countries of each cluster were chosen. The selection was based
on multiple criteria including both quantitative evidence and qualitative judgement. First of all,
correlations on key criterion variables for the cluster analysis were calculated among all member
states within the same cluster. Ideally, the country which shows the highest correlation coefficients
on most variables is the most representative of the cluster and should be chosen to ensure the best
representation of the whole cluster. In cases where no clear-cut statistical evidence could be found,
other non-statistical criteria were adopted and consultations with project partners were conducted.
The key criteria include the ease of data access (for example, whether the response rate is
anticipated to be high or not), the relative importance of the country (for example, a larger population
will be favoured, as the sample size could potentially be larger), and the project partners
market research experience.
Given that countries within the same cluster have high similarities, it is presumed that the people in
the same cluster should exhibit similar travelling behaviour. Hence, the primary data collected from
the representative countries could be used to infer the behaviour of people in other countries.
Ultimately, the estimation of demand and economic contribution for different countries will use the
ry data.
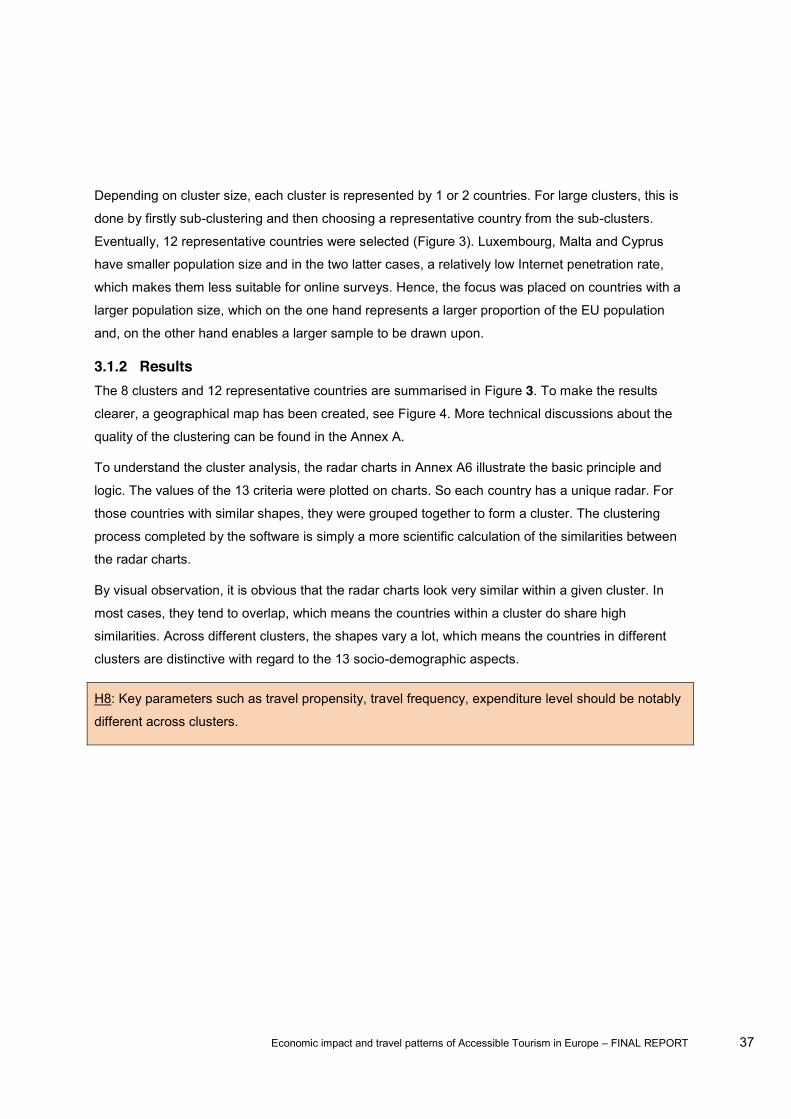
Economic impact and travel patterns of Accessible Tourism in Europe FINAL REPORT 37
Depending on cluster size, each cluster is represented by 1 or 2 countries. For large clusters, this is
done by firstly sub-clustering and then choosing a representative country from the sub-clusters.
Eventually, 12 representative countries were selected (Figure 3). Luxembourg, Malta and Cyprus
have smaller population size and in the two latter cases, a relatively low Internet penetration rate,
which makes them less suitable for online surveys. Hence, the focus was placed on countries with a
larger population size, which on the one hand represents a larger proportion of the EU population
and, on the other hand enables a larger sample to be drawn upon.
3.1.2 Results The 8 clusters and 12 representative countries are summarised in Figure 3. To make the results
clearer, a geographical map has been created, see Figure 4. More technical discussions about the
quality of the clustering can be found in the Annex A.
To understand the cluster analysis, the radar charts in Annex A6 illustrate the basic principle and
logic. The values of the 13 criteria were plotted on charts. So each country has a unique radar. For
those countries with similar shapes, they were grouped together to form a cluster. The clustering
process completed by the software is simply a more scientific calculation of the similarities between
the radar charts.
By visual observation, it is obvious that the radar charts look very similar within a given cluster. In
most cases, they tend to overlap, which means the countries within a cluster do share high
similarities. Across different clusters, the shapes vary a lot, which means the countries in different
clusters are distinctive with regard to the 13 socio-demographic aspects.
H8: Key parameters such as travel propensity, travel frequency, expenditure level should be notably
different across clusters.
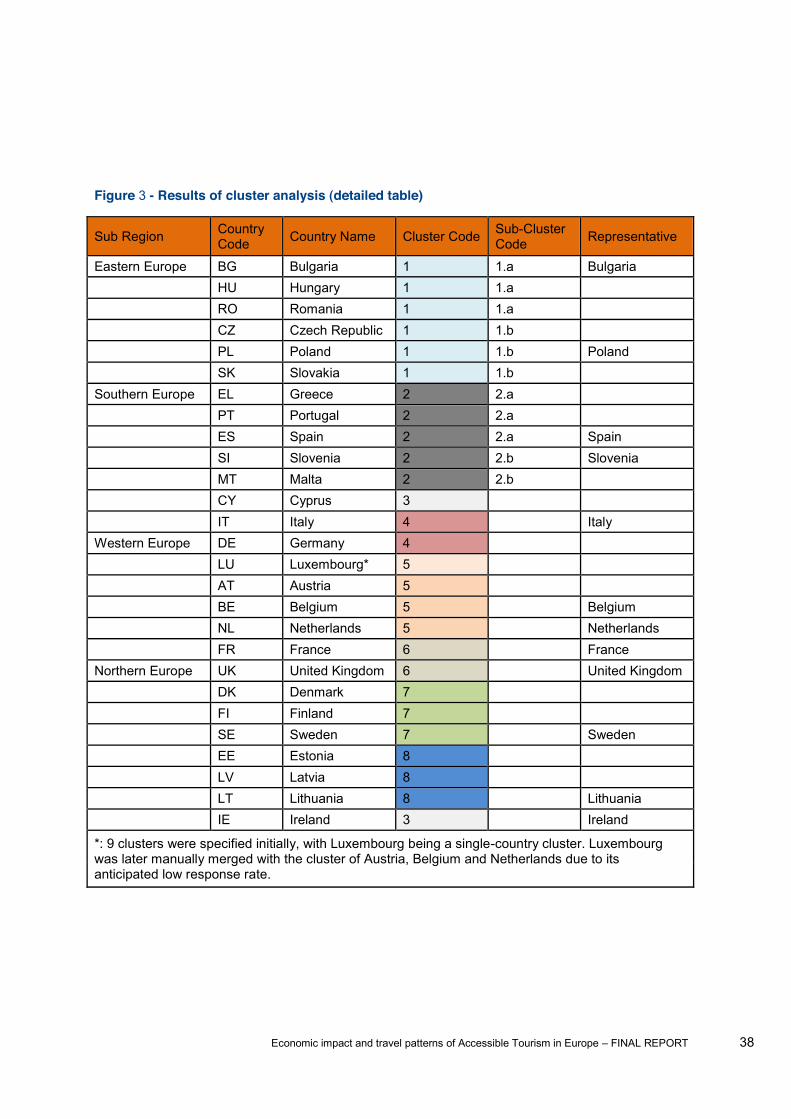
Economic impact and travel patterns of Accessible Tourism in Europe FINAL REPORT 38
Figure 3 - Results of cluster analysis (detailed table)
Sub Region Country Code Country Name Cluster Code Sub-Cluster
Code Representative
Eastern Europe BG Bulgaria 1 1.a Bulgaria HU Hungary 1 1.a RO Romania 1 1.a CZ Czech Republic 1 1.b PL Poland 1 1.b Poland SK Slovakia 1 1.b Southern Europe EL Greece 2 2.a PT Portugal 2 2.a ES Spain 2 2.a Spain SI Slovenia 2 2.b Slovenia MT Malta 2 2.b CY Cyprus 3 IT Italy 4 Italy Western Europe DE Germany 4 LU Luxembourg* 5 AT Austria 5 BE Belgium 5 Belgium NL Netherlands 5 Netherlands FR France 6 France Northern Europe UK United Kingdom 6 United Kingdom DK Denmark 7 FI Finland 7 SE Sweden 7 Sweden EE Estonia 8 LV Latvia 8 LT Lithuania 8 Lithuania IE Ireland 3 Ireland
*: 9 clusters were specified initially, with Luxembourg being a single-country cluster. Luxembourg was later manually merged with the cluster of Austria, Belgium and Netherlands due to its anticipated low response rate.
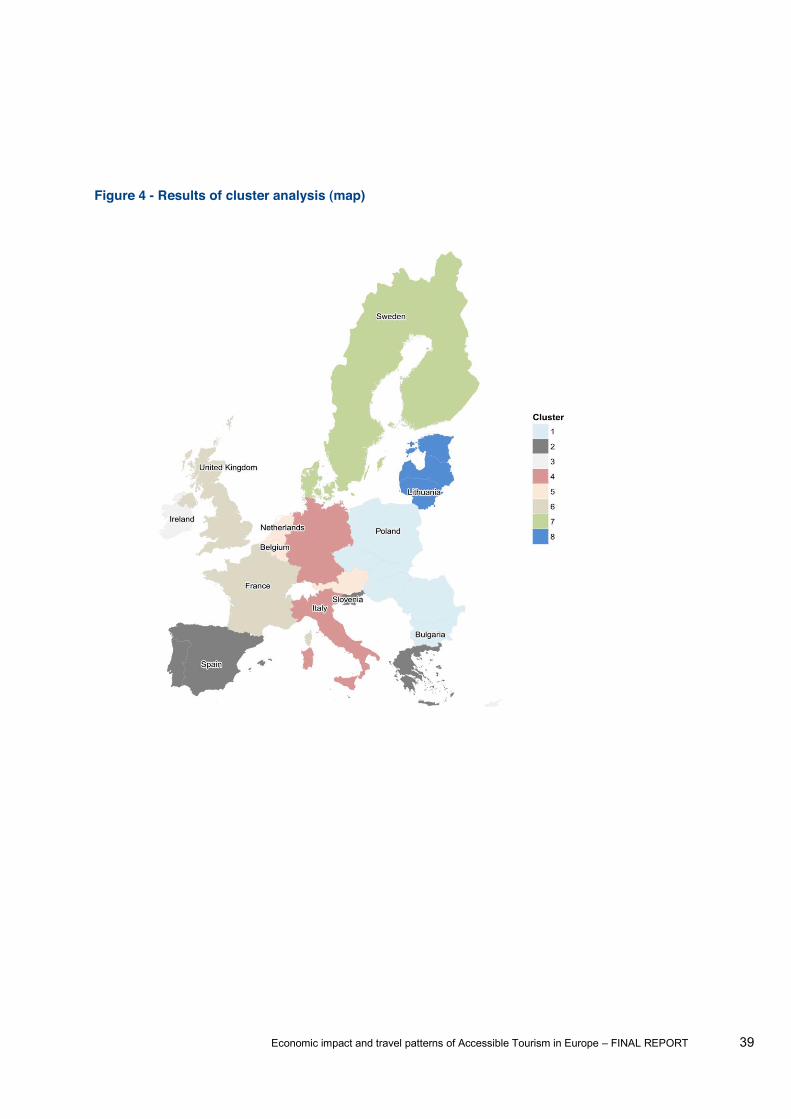
Economic impact and travel patterns of Accessible Tourism in Europe FINAL REPORT 39
Figure 4 - Results of cluster analysis (map)
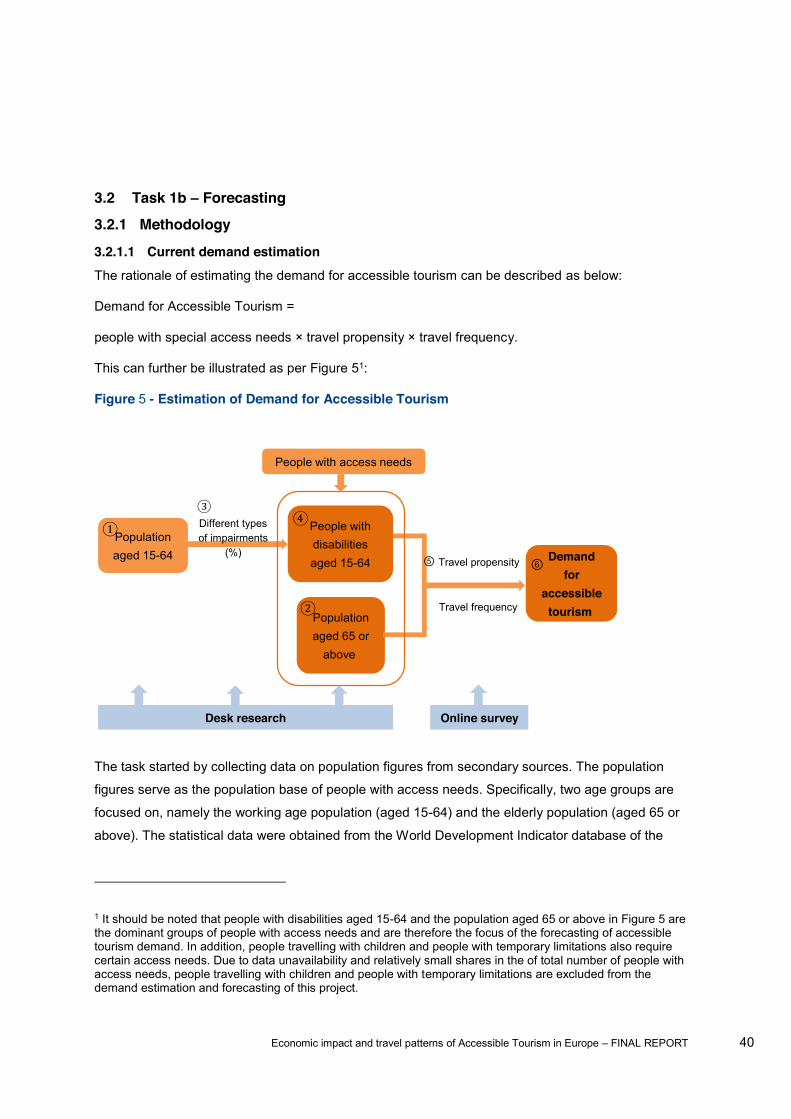
Economic impact and travel patterns of Accessible Tourism in Europe FINAL REPORT 40
3.2 Task 1b Forecasting
3.2.1 Methodology
3.2.1.1 Current demand estimation The rationale of estimating the demand for accessible tourism can be described as below:
Demand for Accessible Tourism =
people with special access needs × travel propensity × travel frequency.
This can further be illustrated as per Figure 51:
Figure 5 - Estimation of Demand for Accessible Tourism
The task started by collecting data on population figures from secondary sources. The population
figures serve as the population base of people with access needs. Specifically, two age groups are
focused on, namely the working age population (aged 15-64) and the elderly population (aged 65 or
above). The statistical data were obtained from the World Development Indicator database of the
1 It should be noted that people with disabilities aged 15-64 and the population aged 65 or above in Figure 5 are the dominant groups of people with access needs and are therefore the focus of the forecasting of accessible tourism demand. In addition, people travelling with children and people with temporary limitations also require certain access needs. Due to data unavailability and relatively small shares in the of total number of people with access needs, people travelling with children and people with temporary limitations are excluded from the demand estimation and forecasting of this project.
Travel propensity
Different types of impairments
(%)Population aged 15-64
People with disabilities aged 15-64
Population aged 65 or
above
Demand for
accessible tourismTravel frequency
People with access needs
Desk research Online survey
⑤ ⑥

Economic impact and travel patterns of Accessible Tourism in Europe FINAL REPORT 41
World Bank1. They span from 1960 to 2011, covering the EU27 countries and 11 key international
inbound markets. A breakdown of the data in 2011 by gender has also been obtained.
The task then proceeded to calculate the population of people with access needs, namely people
with disabilities (aged 15-64) together with the elderly population (aged 65 or above).
The number of people with disabilities is estimated using the working age population (aged 15-64)
and the prevalence rates (i.e., percentage of people with disabilities among certain population). The
data on prevalence rates of different types of impairments for the EU27 countries and the key
international inbound markets were collected from various secondary sources, including online
databases and academic publications. Annex B provides a summary of the sources. Since the
secondary data were published on an ad hoc basis, no consistent time-series data were available.
Besides, the figures of the prevalence rates were published in different years. Hence, the
assumption is made that these figures would remain stable and current. This is supported by a study
by Picavet and Hoeymans (2002)2 based on data from the Netherlands and the USA.
comprehensive data set on the people with different types of impairments in 24 European countries.
The data set contains two sets of numbers, i.e., the overall prevalence rates of disabilities and the
prevalence rates of a particular type of impairment. The reason for obtaining two sets of numbers is
that people with multiple impairments will be counted repetitively. For example, a person who has
both visual and hearing impairments may be counted twice towards the total, under the category of
visual impairment as well as that of hearing impairment. Simply adding up the number of people with
each type of impairment would exaggerate the total number of people with access needs.
For the demand estimation, two parameters, i.e., the travel propensity (percentage of people that are
willing to travel) and the travel frequency (number of trips per year) are largely not available from
secondary sources. Hence, they have to be obtained from the online survey that was conducted in
the 12 representative countries.
From the questionnaire of the online survey, both the travel propensity and the travel frequency can
be inferred from
Q1. In the past 12 months, how many times have you travelled for private or business reasons?
Please give a figure for each travel type and destination.
1http://data.worldbank.org/indicator 2 Picavet, H., & Hoeymans, N. (2002). Physical disability in The Netherlands: prevalence, risk groups and time trends. Public Health, 116, 231-237.
Economic impact and travel patterns of Accessible Tourism in Europe FINAL REPORT 42
The travel propensity was calculated as the percentage of respondents that travelled more than
once over the last 12 months. The travel frequency was calculated as the average number of trips
among all those who had travelled.
The current demand estimation was then conducted using the figures described above, namely the
population of people access needs, the travel propensity and the travel frequency, according to the
rationale above (the formula in Section 3.2.1.1, and Figure 5).
3.2.1.2 Future demand estimation The future demand estimation follows exactly the same rationale as the current demand calculation.
Demand for Accessible Tourism = People with special access needs × Travel propensity × Travel
frequency.
The only further aspect that needs to be addressed is the forecast of population of people with
access needs. Specifically, of the three key parameters described in the formula above, only the
people with special access needs are to be forecasted up to 2020, whilst the travel propensity and
the travel frequency figures are assumed to remain unchanged.
As the people with special access needs consist of those from the working age population (aged 15-
64) and the elderly population (aged 65 or above), the forecasting was performed on the population
of these two groups of people. Secondary data on population figures were obtained from the World
Development Indicator database of the World Bank1. They span from 1960 to 2011, covering the
EU27 countries and 11 key international inbound markets. Based on these historic data, the
evolution of population can be established, and the forecasts are made assuming the historic trend
will be maintained in the coming years up to 2020.
Three forecasting techniques were used to predict the evolution of the population. Specifically, they
are structural time-series model (STSM), autoregressive integrated moving average (ARIMA) model
and the Naïve II model. The STSM decomposes the population time series ( ) into a trend
component ( ), a cycle component ( ) and an irregular component ( ). Hence, .
Forecasting is then based on the three components. The ARIMA model expresses the population
time series ( ) as , where B is the backshift operator and L
the seasonal periodicity. Forecasting is then based on the intrinsic properties of population. The
Naïve II model assumes that the forecast for period t+1 is equal to the value of the forecast variable
1http://data.worldbank.org/indicator

Economic impact and travel patterns of Accessible Tourism in Europe FINAL REPORT 43
in period t multiplied by the growth rate of the forecast variable over the previous period
. Forecasting is based on the formula.
With the forecasts obtained from the three techniques, the average of the forecasts are calculated
according to , which means that the three forecasts are to be
combined to form the final figures of forecasts. The advantage of forecast combination is that it helps
to strike a balance between techniques. As each technique may only capture certain aspects of the
historic data and follow certain assumptions, the results from any one of them tend to over- or under-
estimate the real situation. After the combination, more information can be embedded into the
forecasts. Hence the combined forecasts are preferred.
With the forecasts of both the working age population and the elderly population, the population of
people with special access needs can be established. Furthermore, the future tourism demand is
then calculated according to the rationale (formula) described at the beginning of the section.
3.2.1.3 Tourism demand estimation under different scenarios of improvements The demand estimation under different scenarios follows exactly the same rationale as the current
and future demand estimation.
Demand for Accessible Tourism = People with special access needs × Travel propensity (scenario)
× Travel frequency (scenario)
The only part that is different is with regard to the two travelling behaviour parameters, i.e., travel
propensity and travel frequency.
Under different scenarios of improvements, people are believed to be more willing to travel and
should also increase their budget to explore new destinations that they have not been to before.
Hence, new travel propensities and new travel frequencies under different scenarios need to be
established. These figures can be inferred from the questionnaire of the online survey:
Q26. Thinking about the last 12 months, there are some destinations in the European Union (EU)
that you may have wanted to visit, but you couldn't because of accessibility problems. For example,
you did not go because no services have been made accessible and basic things like wheelchairs
are not available.
If Scenarios A, B or C were true for any EU destinations you were interested in visiting, would you
consider including some of these EU destinations in your travel plans for the next 12 months?
Q29. How many day trips AND overnight trips would you go on to such destinations in the next 12
months if options A, B or C were true?
Economic impact and travel patterns of Accessible Tourism in Europe FINAL REPORT 44
Please answer in each column for each type of trip. For overnight trips, please indicate how many
nights you would spend at such destinations in the next 12 months.
Specifically, Q26 investigates the number of respondents that are willing to increase their budget
and/or their number of trips. For those who have not travelled over the last 12 months, Q26 captures
the respondents that are willing to travel under different scenarios. Hence, with some non-travellers
converted to be travellers, the travel propensity (scenario) can be calculated.
Q29 specifies the additional number of trips taken by existing travellers (those who have travelled
over the last 12 months) as well as the trips made by the newly converted travellers (those who have
not travelled but are willing to travel under different scenarios). With the additional trips specified in
Q29 and the existing travel trip numbers deriving from Q1, the travel frequency (scenario) can thus
be computed.
With the parameters, travel propensity (scenario) and travel frequency (scenario) inferred from the
survey data and the population of people with access needs available from the current/ future
demand estimation task, the tourism demand under different scenarios can be estimated.
3.2.2 Population of people with special access needs
3.2.2.1 Evolution of population The evolution of the population has been plotted in Figure 6 to Figure 9. The forecasts from 2012 to
2020 are the combined figures from the three forecasting techniques. In addition, Figure 10 to Figure
13 provide an overview of the annual population growth rates over the past half a century, for the
EU27 countries as well as the key international inbound markets. The annual population growth
rates over the forecast horizon will, however, be provided in the next section.
During 1960-2011, the working age population in the EU27 countries has grown steadily at an
average annual rate of 0.5% (Figure 10). It is anticipated that by 2020, the working age population in
the EU27 area will have reached 338 million (Figure 6). Looking across countries (Figure 10),
Cyprus has the highest growth rate over 1960-2011, at 1.7% per year. Notably, Bulgaria is the only
country that registers negative yearly population growth. The female working age population is also
shrinking in Latvia, although this is counter-balanced by the high growth rate of the male population.
Across international inbound markets (Figure 12), the emerging countries generally enjoy faster
growth of the working age population. Among the developed countries, only Australia and Canada
see a yearly growth rate comparable to that of the emerging countries. With the current growth
patterns set to continue, China and India are expected to be the countries with largest working age
population by 2020 (Figure 9).
Regarding the elderly population, the trend of ageing is quite apparent, regardless of whether it is an
EU country or an international market (Figure 8 and Figure 9). Over 1960-2011, the EU27 area has
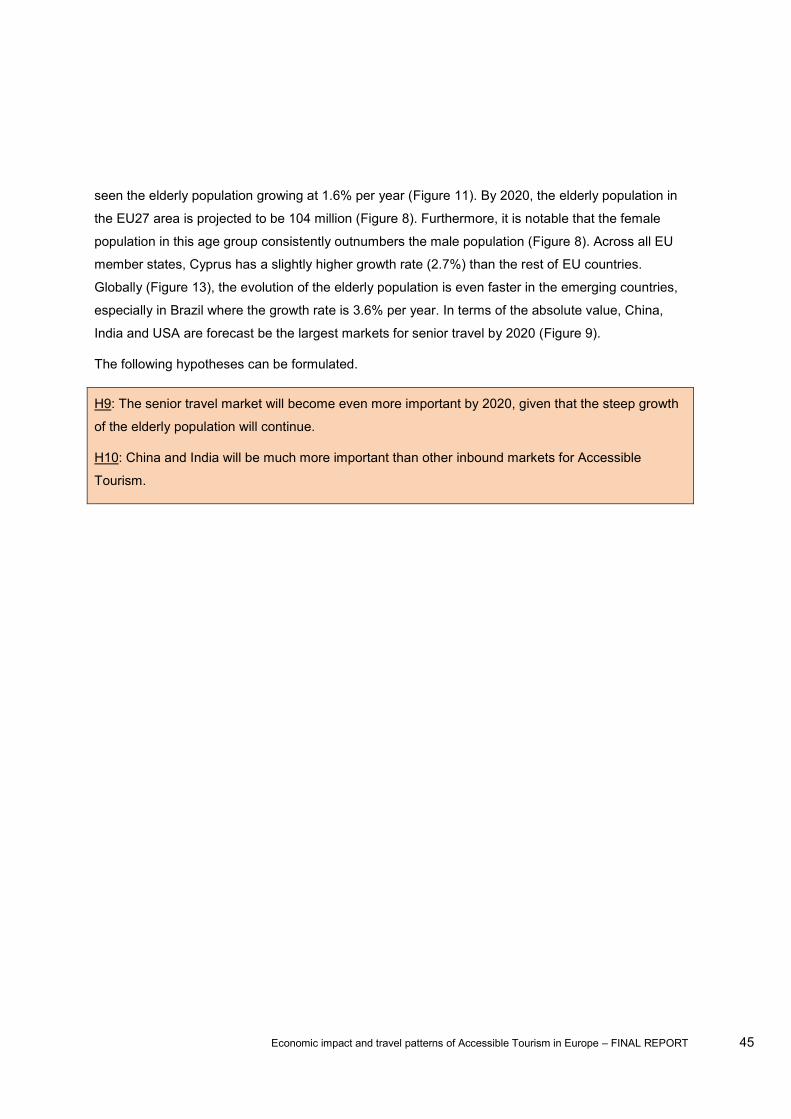
Economic impact and travel patterns of Accessible Tourism in Europe FINAL REPORT 45
seen the elderly population growing at 1.6% per year (Figure 11). By 2020, the elderly population in
the EU27 area is projected to be 104 million (Figure 8). Furthermore, it is notable that the female
population in this age group consistently outnumbers the male population (Figure 8). Across all EU
member states, Cyprus has a slightly higher growth rate (2.7%) than the rest of EU countries.
Globally (Figure 13), the evolution of the elderly population is even faster in the emerging countries,
especially in Brazil where the growth rate is 3.6% per year. In terms of the absolute value, China,
India and USA are forecast be the largest markets for senior travel by 2020 (Figure 9).
The following hypotheses can be formulated.
H9: The senior travel market will become even more important by 2020, given that the steep growth
of the elderly population will continue.
H10: China and India will be much more important than other inbound markets for Accessible
Tourism.
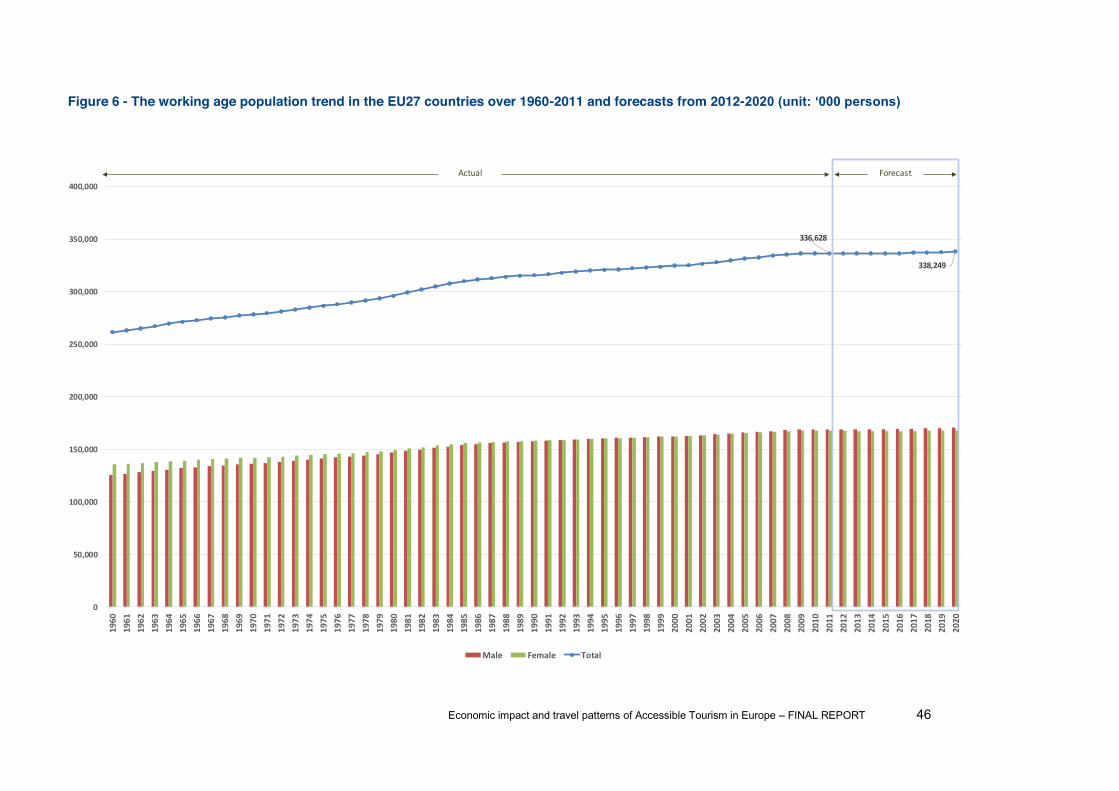
Economic impact and travel patterns of Accessible Tourism in Europe FINAL REPORT 46
Figure 6 - The working age population trend in the EU27 countries over 1960-2011 and forecasts from 2012-
336,628
338,249
0
50,000
100,000
150,000
200,000
250,000
300,000
350,000
400,000
1960
1961
1962
1963
1964
1965
1966
1967
1968
1969
1970
1971
1972
1973
1974
1975
1976
1977
1978
1979
1980
1981
1982
1983
1984
1985
1986
1987
1988
1989
1990
1991
1992
1993
1994
1995
1996
1997
1998
1999
2000
2001
2002
2003
2004
2005
2006
2007
2008
2009
2010
2011
2012
2013
2014
2015
2016
2017
2018
2019
2020
Male Female Total
Actual Forecast
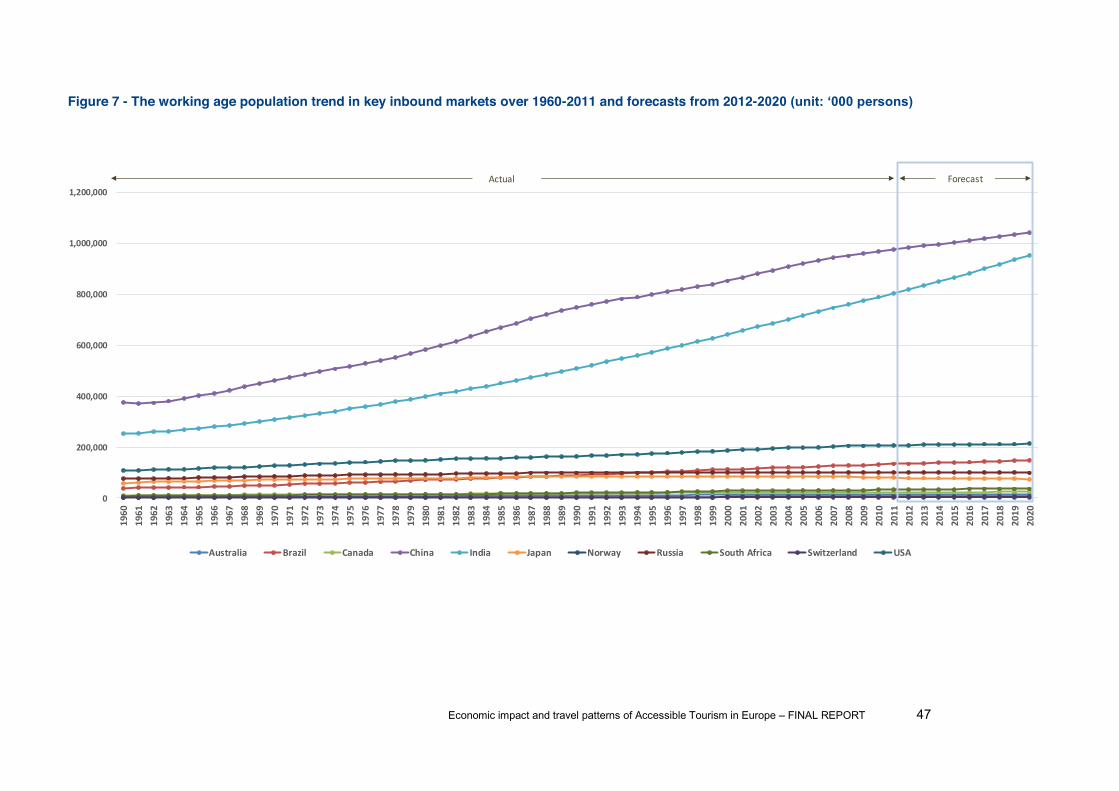
Economic impact and travel patterns of Accessible Tourism in Europe FINAL REPORT 47
Figure 7 - The working age population trend in key inbound markets over 1960-2011 and forecasts from 2012-
0
200,000
400,000
600,000
800,000
1,000,000
1,200,000
1960
1961
1962
1963
1964
1965
1966
1967
1968
1969
1970
1971
1972
1973
1974
1975
1976
1977
1978
1979
1980
1981
1982
1983
1984
1985
1986
1987
1988
1989
1990
1991
1992
1993
1994
1995
1996
1997
1998
1999
2000
2001
2002
2003
2004
2005
2006
2007
2008
2009
2010
2011
2012
2013
2014
2015
2016
2017
2018
2019
2020
Australia Brazil Canada China India Japan Norway Russia South Africa Switzerland USA
Actual Forecast
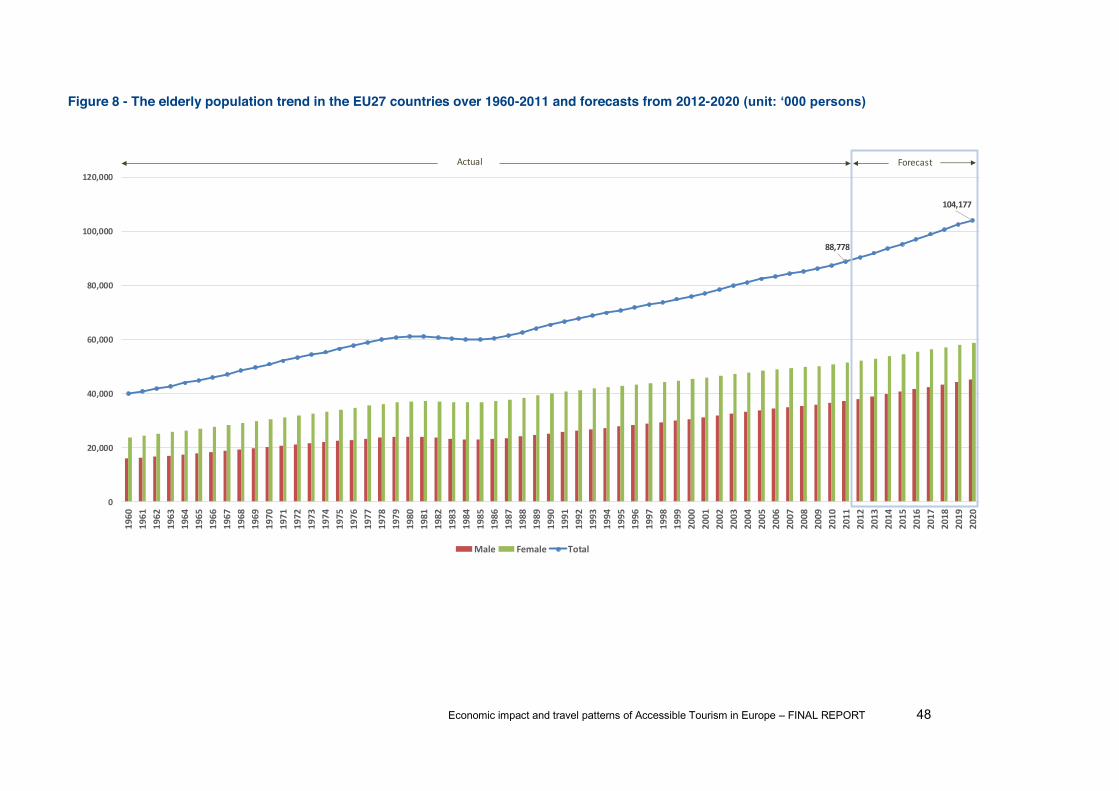
Economic impact and travel patterns of Accessible Tourism in Europe FINAL REPORT 48
Figure 8 - The elderly population trend in the EU27 countries over 1960-2011 and forecasts from 2012-2
88,778
104,177
0
20,000
40,000
60,000
80,000
100,000
120,000
1960
1961
1962
1963
1964
1965
1966
1967
1968
1969
1970
1971
1972
1973
1974
1975
1976
1977
1978
1979
1980
1981
1982
1983
1984
1985
1986
1987
1988
1989
1990
1991
1992
1993
1994
1995
1996
1997
1998
1999
2000
2001
2002
2003
2004
2005
2006
2007
2008
2009
2010
2011
2012
2013
2014
2015
2016
2017
2018
2019
2020
Male Female Total
ForecastActual
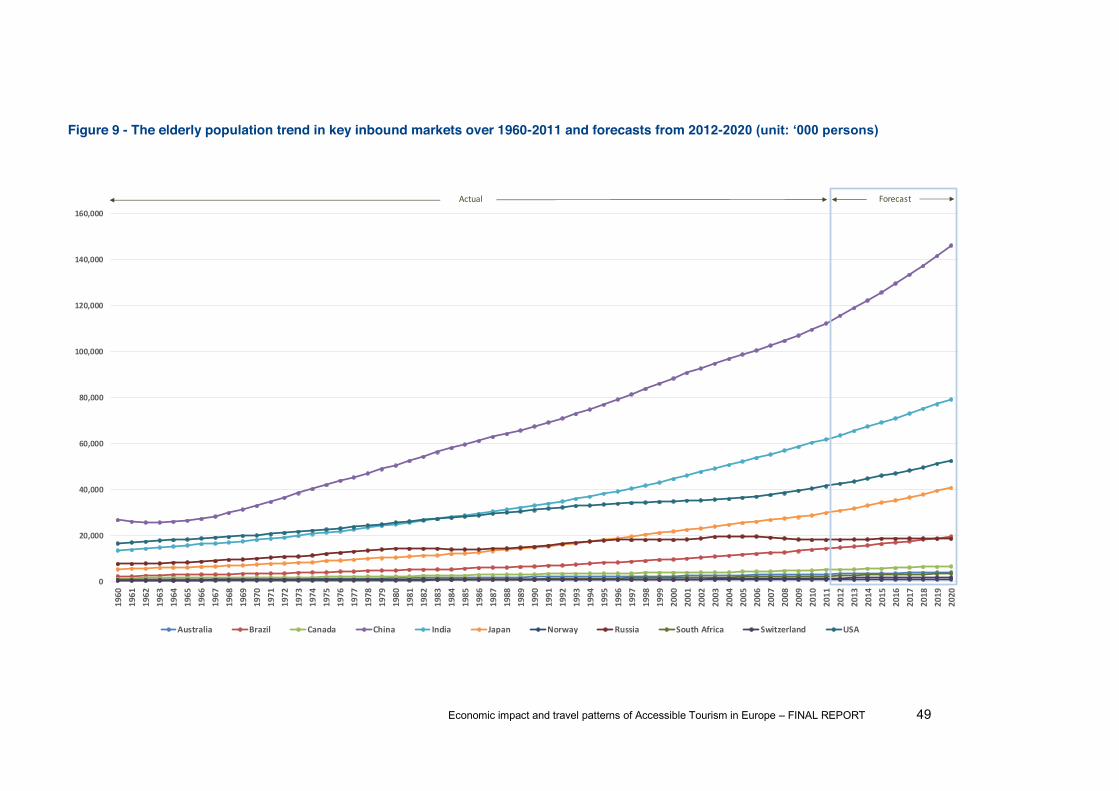
Economic impact and travel patterns of Accessible Tourism in Europe FINAL REPORT 49
Figure 9 - The elderly population trend in key inbound markets over 1960-2011 and forecasts from 2012-
0
20,000
40,000
60,000
80,000
100,000
120,000
140,000
160,000
1960
1961
1962
1963
1964
1965
1966
1967
1968
1969
1970
1971
1972
1973
1974
1975
1976
1977
1978
1979
1980
1981
1982
1983
1984
1985
1986
1987
1988
1989
1990
1991
1992
1993
1994
1995
1996
1997
1998
1999
2000
2001
2002
2003
2004
2005
2006
2007
2008
2009
2010
2011
2012
2013
2014
2015
2016
2017
2018
2019
2020
Australia Brazil Canada China India Japan Norway Russia South Africa Switzerland USA
ForecastActual
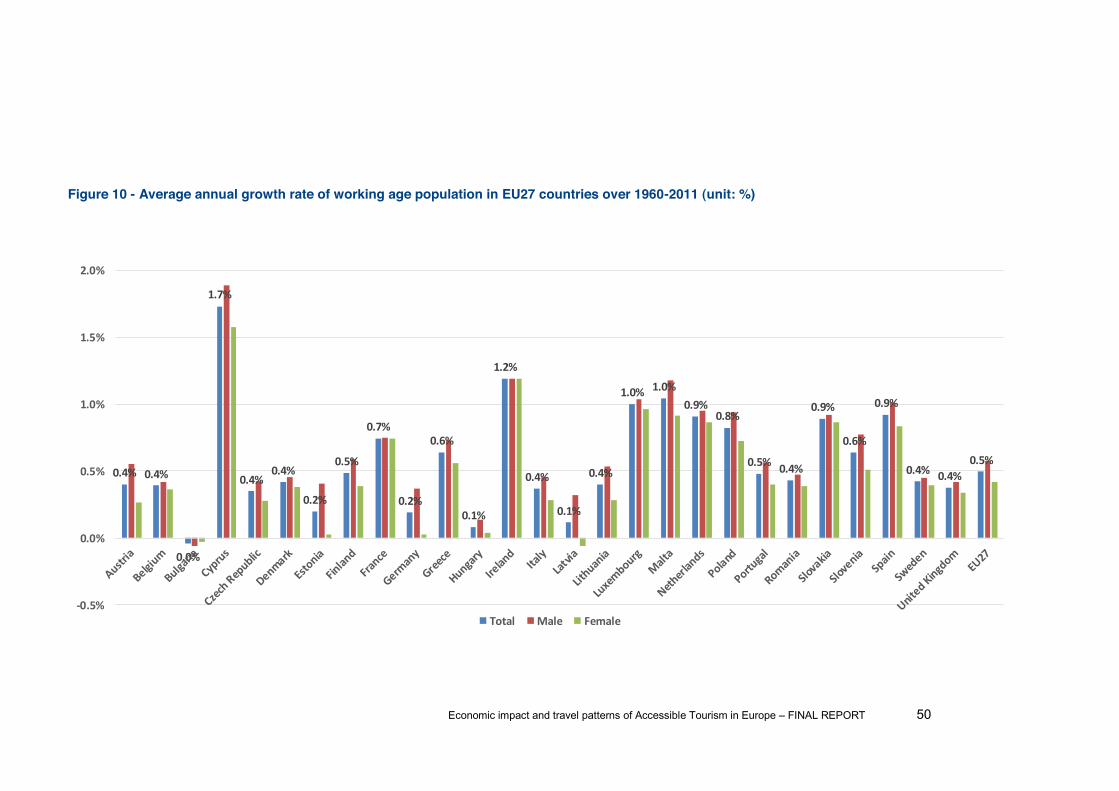
Economic impact and travel patterns of Accessible Tourism in Europe FINAL REPORT 50
Figure 10 - Average annual growth rate of working age population in EU27 countries over 1960-2011 (unit: %)
0.4% 0.4%
0.0%
1.7%
0.4%0.4%
0.2%
0.5%
0.7%
0.2%
0.6%
0.1%
1.2%
0.4%
0.1%
0.4%
1.0% 1.0%0.9%
0.8%
0.5% 0.4%
0.9%
0.6%
0.9%
0.4% 0.4%0.5%
-‐0.5%
0.0%
0.5%
1.0%
1.5%
2.0%
Total Male Female
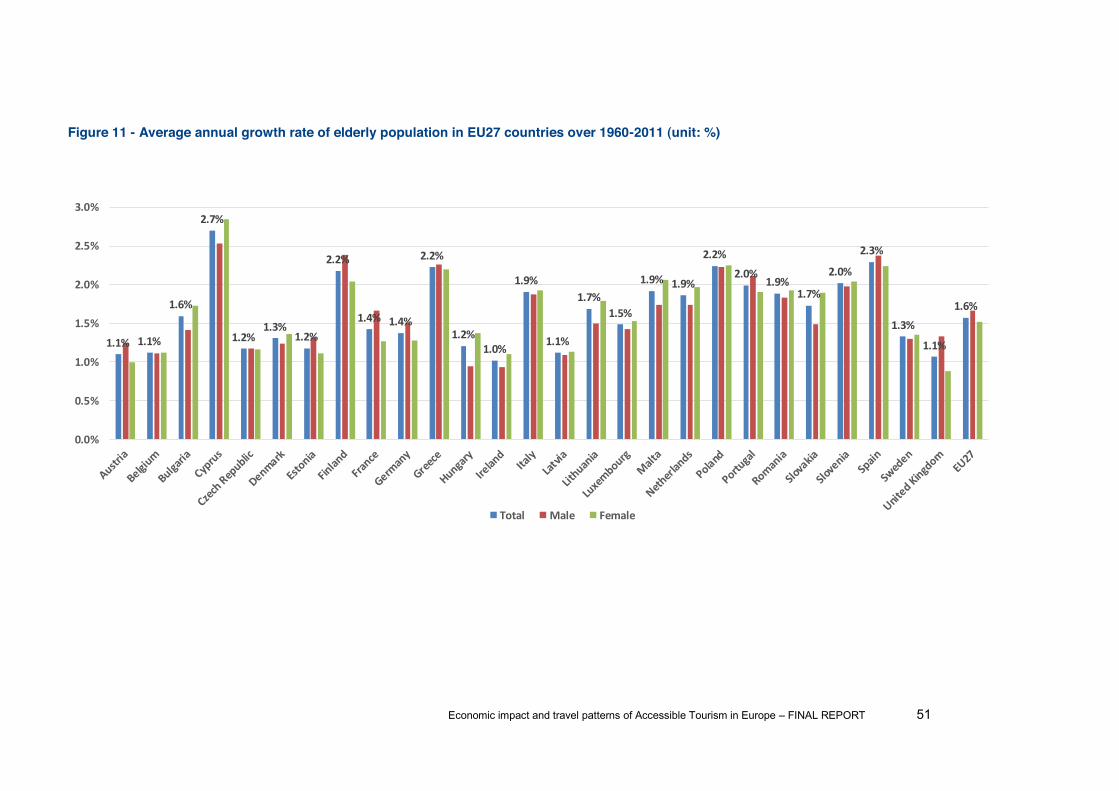
Economic impact and travel patterns of Accessible Tourism in Europe FINAL REPORT 51
Figure 11 - Average annual growth rate of elderly population in EU27 countries over 1960-2011 (unit: %)
1.1% 1.1%
1.6%
2.7%
1.2%1.3%
1.2%
2.2%
1.4% 1.4%
2.2%
1.2%1.0%
1.9%
1.1%
1.7%1.5%
1.9% 1.9%
2.2%2.0%
1.9%1.7%
2.0%
2.3%
1.3%
1.1%
1.6%
0.0%
0.5%
1.0%
1.5%
2.0%
2.5%
3.0%
Total Male Female
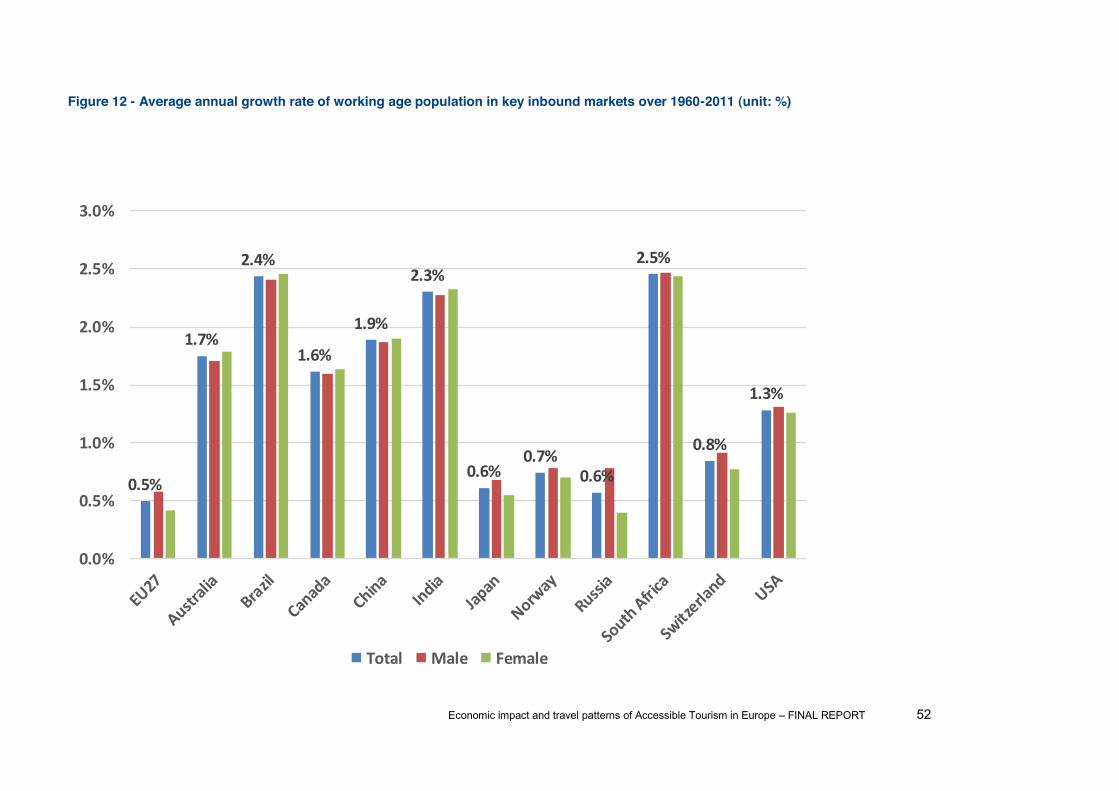
Economic impact and travel patterns of Accessible Tourism in Europe FINAL REPORT 52
Figure 12 - Average annual growth rate of working age population in key inbound markets over 1960-2011 (unit: %)
0.5%
1.7%
2.4%
1.6%
1.9%
2.3%
0.6%0.7%
0.6%
2.5%
0.8%
1.3%
0.0%
0.5%
1.0%
1.5%
2.0%
2.5%
3.0%
Total Male Female
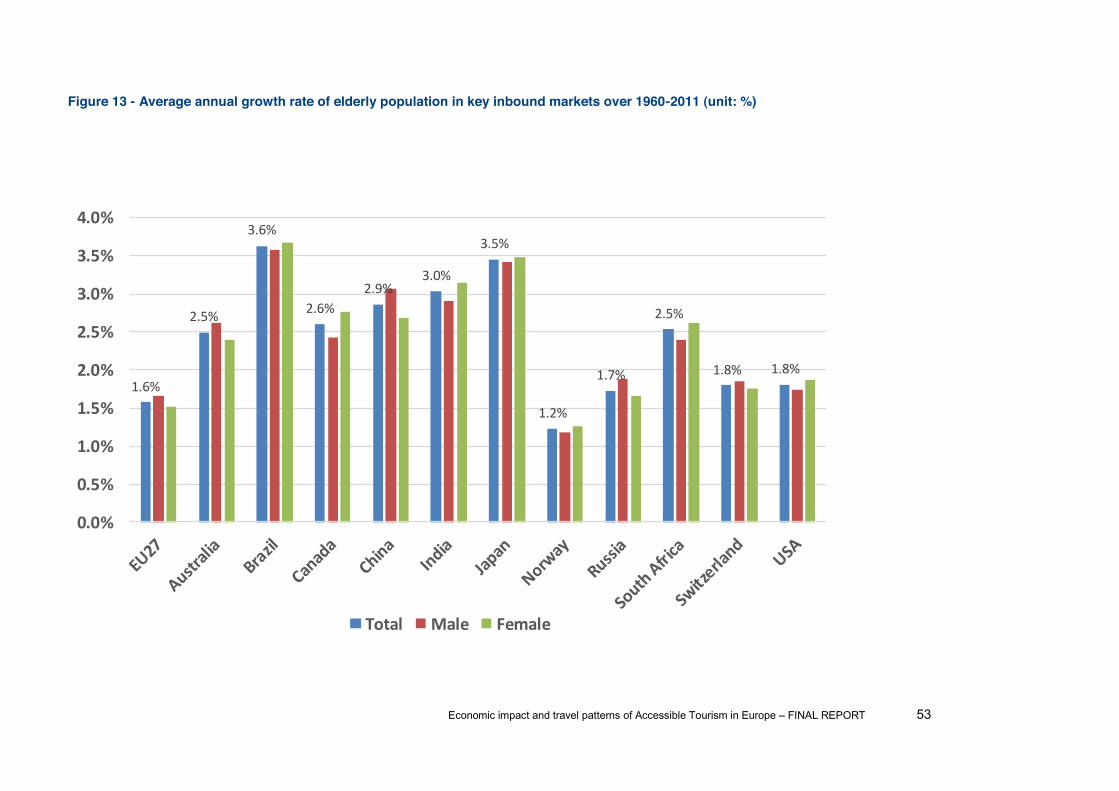
Economic impact and travel patterns of Accessible Tourism in Europe FINAL REPORT 53
Figure 13 - Average annual growth rate of elderly population in key inbound markets over 1960-2011 (unit: %)
1.6%
2.5%
3.6%
2.6%2.9%
3.0%
3.5%
1.2%
1.7%
2.5%
1.8% 1.8%
0.0%
0.5%
1.0%
1.5%
2.0%
2.5%
3.0%
3.5%
4.0%
Total Male Female
Economic impact and travel patterns of Accessible Tourism in Europe FINAL REPORT 54
3.2.2.2 People with special access needs In 2011, in the EU27 area the total number of working age people (aged 15-64) that have one or
more disabilities amounted to 49.8 million, and the total elderly population (aged 65 or above) was
88.8 million. Hence, the population of people with access needs in EU27 area in 2011 was up to
138.6 million. This is basically in line with the findings of the OSSATE research by Buhalis et al.
(2005)1 that there were 46.6 million people with disabilities (aged 16-64) and 80.9 million elderly
population (aged 65 or above), or equivalently 127.5 million people with access needs in 2005. The
narrow gap between the two estimates can be explained by the fact that the population of people
with access needs experienced a mild growth over the past few years2. A brief summary comparing
the access needs in EU27 area and those in key international inbound markets can be found below
in Figure 17. Furthermore, Figure shows the access needs in each of the EU27 countries. To
visualise the information in Figure 17 and Figure 18, geographic maps are supplemented, see
Figure 14, Figure 15, and Figure 16. Please note that due to the size of the world map and for clarity
purposes, the key inbound markets are not presented on the geographical maps, but noted
numerically alongside the maps.
With regard to the population of people with disabilities (Figure 17 and Figure 18), it is apparent that
France and the UK are the two EU countries with the largest population of this group, with 10 million
and 11 million respectively. China, the USA and Brazil are the largest inbound markets for people
with disabilities, with 61 million, 32 million, and 32 million respectively.
With regard to the elderly population (Figure 17 and Figure 18), France, Germany, Italy and the UK
are the four countries with the largest elderly population. Around the globe, China and India are the
two potentially largest markets for senior tourism.
In summary, Figure 16 shows that France, Germany and the UK are the EU countries with highest
access needs, whilst China leads the list among the international inbound markets.
From 2011 to 2020, the population of people with access needs in the EU27 area is expected to
experience a mild growth of 1.2% per year (see Figure 19). This means that the total population of
people with access needs will jump from 138.6 million in 2011 to 154.6 million in 2020. Noticeably,
the growth rate of the elderly population (1.8%) is predicted to be much higher than that of the
1 Buhalis, D., Eichhorn, V., Michopoulou, E., & Miller, G. (2005). Accessibility market and stakeholder analysis. OSSATE project Guildford: University of Surrey. http://www.ossate.org/doc_resources/OSSATE_Market&Stakeholder%20Analysis_Public_Version_Fina..pdf 2 Based on historical data, the population of people with access needs grows at 1.2% per year (Figure 19).

Economic impact and travel patterns of Accessible Tourism in Europe FINAL REPORT 55
people with disabilities (0.1%). This confirms the importance of the senior market as the potential
driving force of accessible tourism.
Across the EU area, however, the growth rate ranges from -2.3% to 3.1%. Latvia and Lithuania are
the two countries that will experience negative growth across both groups of people. At the other
end, Malta sees the highest growth rate of people with access needs, at 3.1%, although in terms of
the senior market Netherlands comes in the top place.
When compared to the situation of the international inbound markets (Figure 20
rate is less impressive. Except for Russia, which will have a stagnant growth, the majority of
international markets can expect a growth rate at more than 2% annually. In the cases of Norway
and Japan, these can be even higher, at 3.4% and 3.0% respectively.
It should be pointed out that, the growth rates in Figure 19 and Figure 20 are implied rates from the
population forecast. Specifically, this means that the growth rates are calculated from the forecasts.
The population of people with access needs were forecasted first using three advanced econometric
techniques. Then the implied growth rates were calculated from the forecasts. As the forecast used
historic information of population (Figure 6 to Figure 9), a strong correlation can thus be spotted
between Figure 19 and Figure 20, on one hand and Figure 10 to Figure 13 on the other.
Annex C shows the forecast figures for people with access needs.
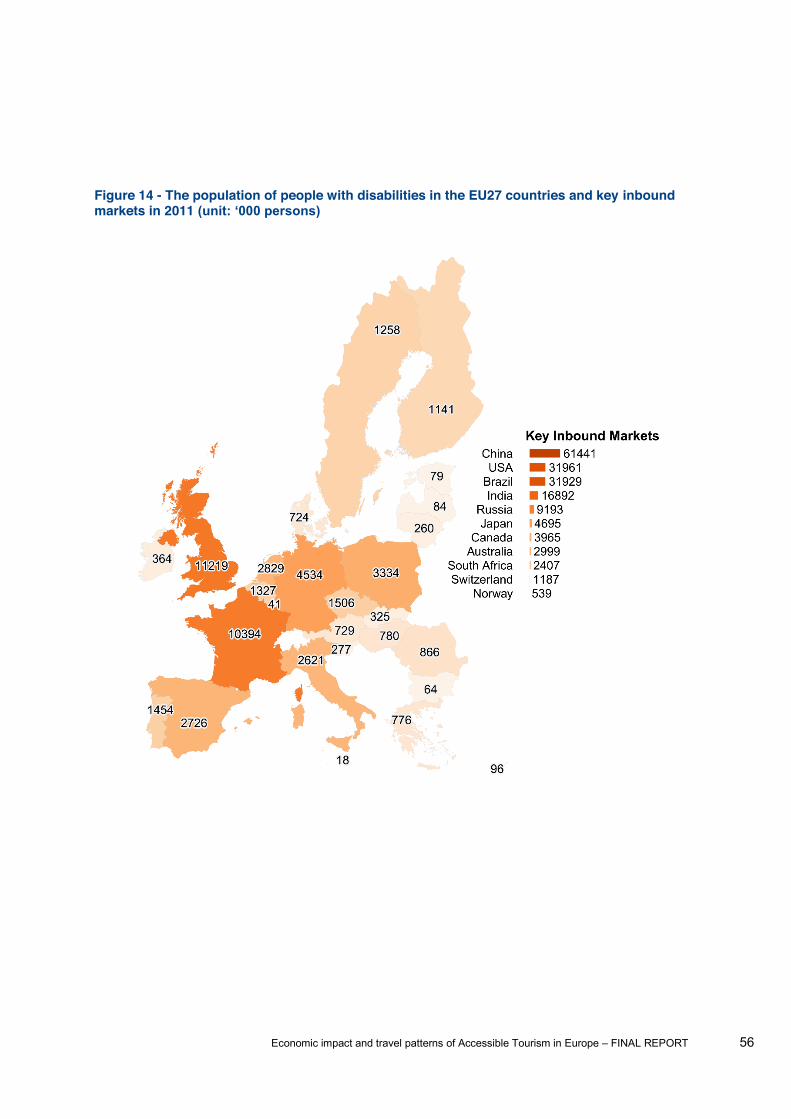
Economic impact and travel patterns of Accessible Tourism in Europe FINAL REPORT 56
Figure 14 - The population of people with disabilities in the EU27 countries and key inbound markets in 2011
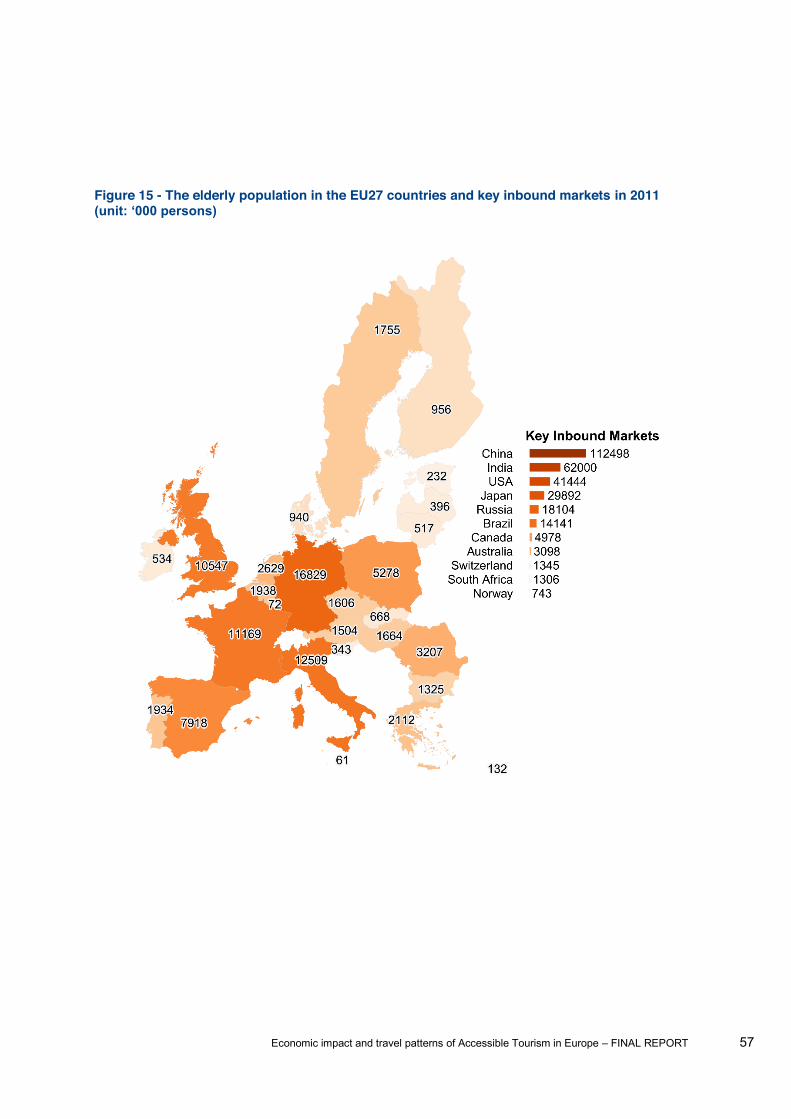
Economic impact and travel patterns of Accessible Tourism in Europe FINAL REPORT 57
Figure 15 - The elderly population in the EU27 countries and key inbound markets in 2011

Economic impact and travel patterns of Accessible Tourism in Europe FINAL REPORT 58
Figure 16 - The population with access needs in the EU27 countries and key inbound markets in 2011
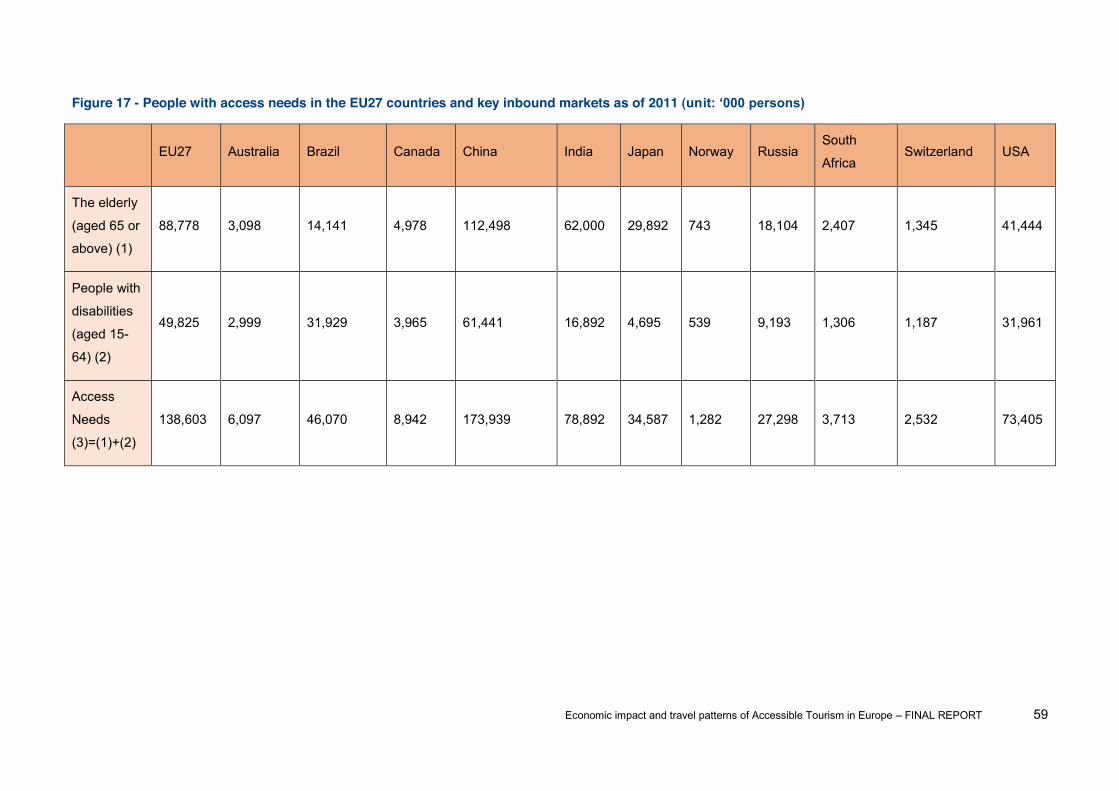
Economic impact and travel patterns of Accessible Tourism in Europe FINAL REPORT 59
Figure 17 - People with access needs in the EU27 countries and key inbound markets as of 2011 (un
EU27 Australia Brazil Canada China India Japan Norway Russia South
Africa Switzerland USA
The elderly
(aged 65 or
above) (1)
88,778 3,098 14,141 4,978 112,498 62,000 29,892 743 18,104 2,407 1,345 41,444
People with
disabilities
(aged 15-
64) (2)
49,825 2,999 31,929 3,965 61,441 16,892 4,695 539 9,193 1,306 1,187 31,961
Access
Needs
(3)=(1)+(2)
138,603 6,097 46,070 8,942 173,939 78,892 34,587 1,282 27,298 3,713 2,532 73,405

Economic impact and travel patterns of Accessible Tourism in Europe FINAL REPORT 60
Figure 18 -
Austria Belgium Bulgaria Cyprus Czech Republic Denmark Estonia Finland France Germany Greece Hungary Ireland Italy
The elderly (aged 65 or above) (1)
1,504 1,938 1,325 132 1,606 940 232 956 11,169 16,829 2,112 1,664 534 12,509
People with disabilities (aged 15-64) (2)
729 1,327 64 96 1,506 724 79 1,141 10,394 4,534 776 780 364 2,621
Access Needs (3)=(1)+(2)
2,233 3,265 1,389 228 3,112 1,665 311 2,097 21,563 21,363 2,888 2,444 898 15,130
Latvia Lithuania Luxembourg Malta Netherlands Poland Portugal Romania Slovakia Slovenia Spain Sweden United Kingdom
EU27 Countries
The elderly (aged 65 or above) (1)
396 517 72 61 2,629 5,278 1,934 3,207 668 343 7,918 1,755 10,547 88,778
People with disabilities (aged 15-64) (2)
84 260 41 18 2,829 3,334 1,454 866 325 277 2,726 1,258 11,219 49,825
Access Needs (3)=(1)+(2)
480 778 113 79 5,458 8,612 3,388 4,073 992 621 10,645 3,013 21,766 138,603
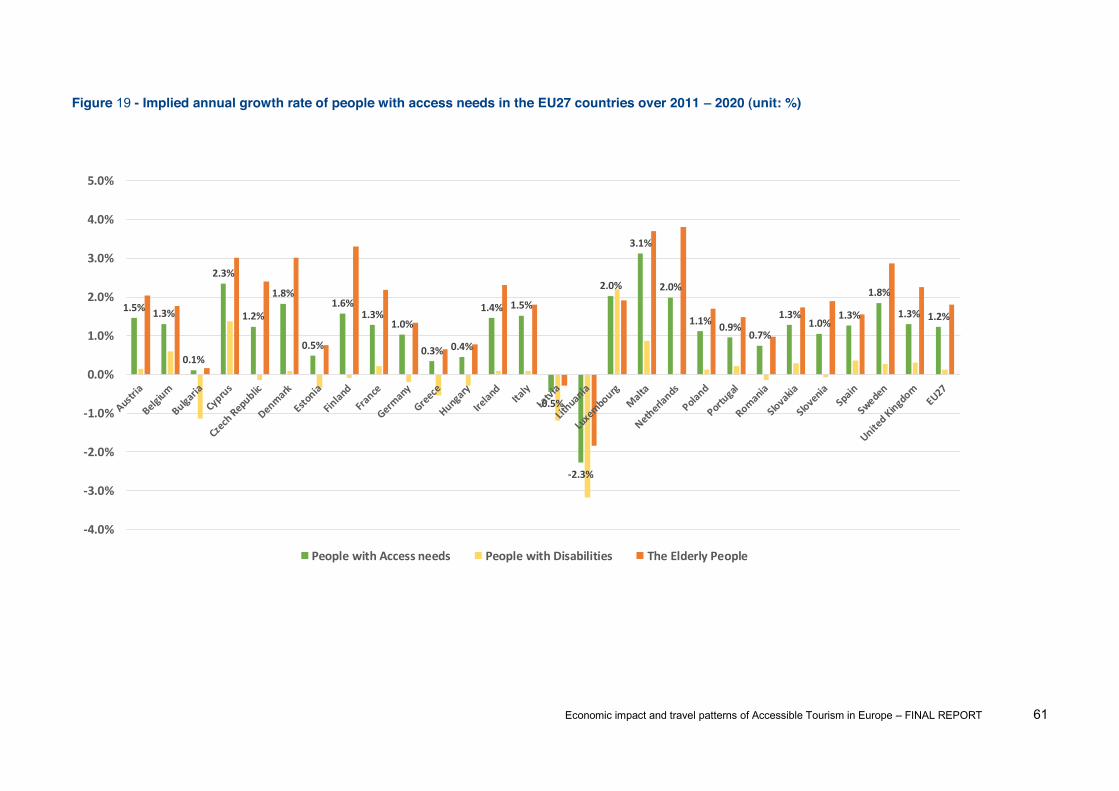
Economic impact and travel patterns of Accessible Tourism in Europe FINAL REPORT 61
Figure 19 - Implied annual growth rate of people with access needs in the EU27 countries over 2011 2020 (unit: %)
1.5% 1.3%
0.1%
2.3%
1.2%
1.8%
0.5%
1.6%1.3%
1.0%
0.3% 0.4%
1.4% 1.5%
-‐0.5%
-‐2.3%
2.0%
3.1%
2.0%
1.1% 0.9%0.7%
1.3%1.0%
1.3%
1.8%
1.3% 1.2%
-‐4.0%
-‐3.0%
-‐2.0%
-‐1.0%
0.0%
1.0%
2.0%
3.0%
4.0%
5.0%
People with Access needs People with Disabilities The Elderly People
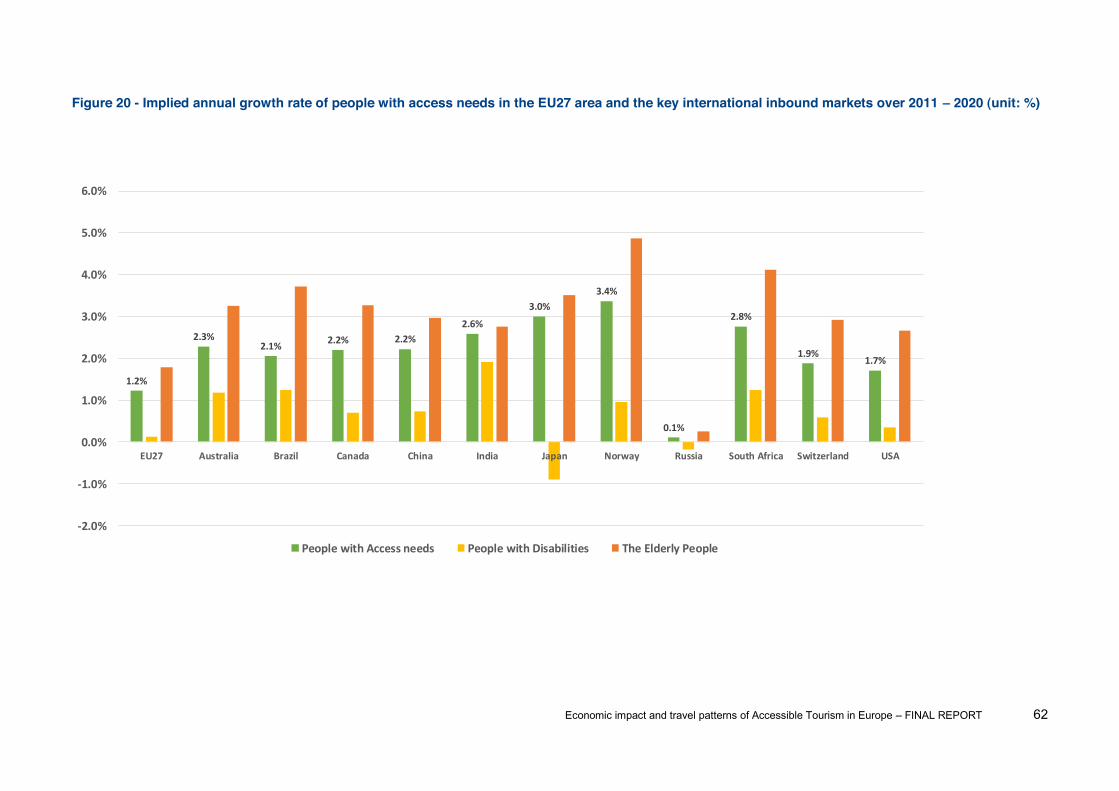
Economic impact and travel patterns of Accessible Tourism in Europe FINAL REPORT 62
Figure 20 - Implied annual growth rate of people with access needs in the EU27 area and the key international inbound markets over 2011 2020 (unit: %)
1.2%
2.3%2.1% 2.2% 2.2%
2.6%
3.0%3.4%
0.1%
2.8%
1.9%1.7%
-‐2.0%
-‐1.0%
0.0%
1.0%
2.0%
3.0%
4.0%
5.0%
6.0%
EU27 Australia Brazil Canada China India Japan Norway Russia South Africa Switzerland USA
People with Access needs People with Disabilities The Elderly People
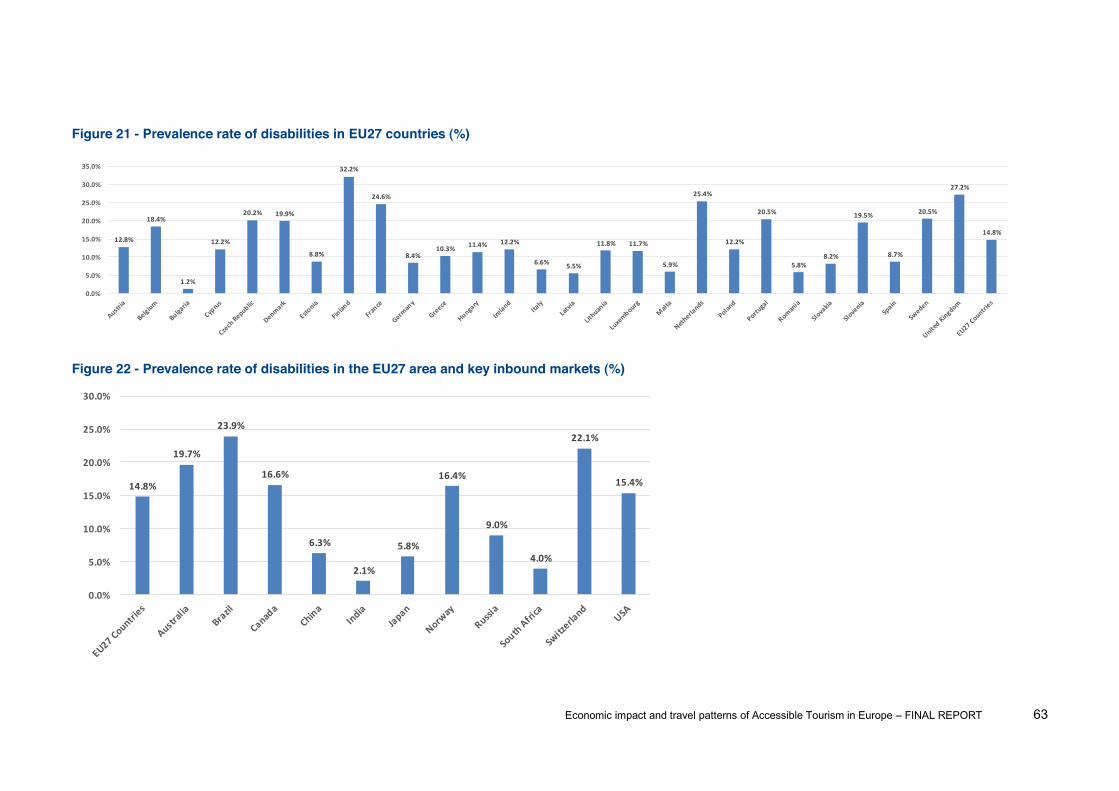
Economic impact and travel patterns of Accessible Tourism in Europe FINAL REPORT 63
Figure 21 - Prevalence rate of disabilities in EU27 countries (%)
Figure 22 - Prevalence rate of disabilities in the EU27 area and key inbound markets (%)
12.8%
18.4%
1.2%
12.2%
20.2% 19.9%
8.8%
32.2%
24.6%
8.4%10.3% 11.4% 12.2%
6.6% 5.5%
11.8% 11.7%
5.9%
25.4%
12.2%
20.5%
5.8%8.2%
19.5%
8.7%
20.5%
27.2%
14.8%
0.0%
5.0%
10.0%
15.0%
20.0%
25.0%
30.0%
35.0%
14.8%
19.7%
23.9%
16.6%
6.3%
2.1%
5.8%
16.4%
9.0%
4.0%
22.1%
15.4%
0.0%
5.0%
10.0%
15.0%
20.0%
25.0%
30.0%
Economic impact and travel patterns of Accessible Tourism in Europe FINAL REPORT 64
With the evolution of the population with access needs in mind, the following paragraphs take a
closer look at both components of this population, i.e., the people with disabilities and the elderly
population.
As shown in Figure 18, the number of people with disabilities was 49.8 million in 2011. To verify how
valid this estimation is, a comparison with previous studies has been conducted. A press release by
the European Commission estimated that approximately 80 million people (among all the age
groups) in the EU area live with a disability - roughly one out of six people1. However, this figure (80
million) includes those aged 65 or above, whereas the estimation in the current project (49.8 million)
only refers to those aged 15-64. In 2011, the working age population (aged 15-64) in the EU27 area
was 337 million. In proportional terms, roughly one in six people of working age has a disability,
which is in line with the general statistics for all age groups, as mentioned above.
Figure 23 summarises the estimations made by other researchers. These estimations range from 45
million to 115 million, depending on the age group in question and the geographic coverage.
Focusing on a similar age group, the Dupré & Karjalainen study estimated that about 45 million
people (working age population/aged 16 to 64) in 25 European countries had a disability. This
further supports the validity of the current estimation.
1http://europa.eu/rapid/press-release_IP-10-1505_en.htm

Economic impact and travel patterns of Accessible Tourism in Europe FINAL REPORT 65
Figure 23 - Estimations of prevalence of disability in Europe
Estimation (total number) % of population Sources/ references Approximately 45 million (working age population/ aged 16 to 64) in 25 European countries
15.70% Dupré & Karjalainen published in Eurostat (2003)1
45 to 90 million in Europe having at least one type of impairment
10% to 20% Toerisme Vlaanderen (2001)2; National Disability Authority (2003)3 (Ireland)
50 million in the enlarged EU Approx. 11% European Disability Forum, 20054; Gerlin, 20055; Qualitas, 20046; Brown, 19917; van Horn, 20028; Horgan-Jones & Ringaert, 20049
69 to 92 million in the EU 15% to 20% Pühretmair, 2004 10 60 to 80 million disabled/ people with reduced mobility
13% to 17% Community Researchand Development Information Service CORDIS (1995) 11
92 to 115 million in the EU 20% to 25% Stumbo & Pegg (2005) 12 Source: adapted from Buhalis et al.(2005)13
In terms of the prevalence rates of disabilities in each member state, Figure 21 and Figure 22 give
an overview.
1Eurostat (2003). Employment of Disabled People in Europe in 2002.ISBN, 1024-4352, catalogue number: KS-NK-03-026-EN-N, European Communities 2003. http://epp.eurostat.cec.eu.int/cache/ITY_OFFPUB/KSNK-03-026/EN/KS-NK-03-026-EN.PDF 2Toerisme Vlaanderen (2001). Tourism for all in the European Union. Status Report on Tourist Accommodation Schemes in Europe. st - 2nd of July 2001. http://www.toegankelijkheidsbureau.be/docs/Tourism%20for%20All%20Report%20Final%20SEP2001b.pdf 3National Disability Authority (2003). Accessibility and Tourism. Tourism Policy Review Group. http://www.nda.ie/ 4European Disability Forum (2005). People with Disabilities in the European Union: Some facts and figures.http://www.edffeph.org/Papers/StructuralFunds/HearingMarch2005/General%20facts%20and%20 figures%20on%20disability.doc 5Gerlin, A. (2005). Access Denied. Time Europe, Vol. 165 (15). http://www.time.com/time/europe/magazine/article/0,13005,901050411-1044655,00.html?promoid=rss_world 6Qualitas (2004). Conclusions of the 1st http://www.worldtourism.org/quality/E/standards2.htm 7Brown, F. (1991). Tourism for all. Tourism Management, Vol. 12 (3), pp. 258-260 8Van Horn, L. (2002). Travellers with Disabilities: Market Size and Trends. http://ncpedp.org/access/isu-travel.htm 9Horgan-Jones, M., & Ringaert, L. (2004). Accessible Tourism in Manitoba. http://www.ttra.com/pub/uploads/AccessibleTourismInManitoba.htm 10 In Miesenberger, K., Klaus, J., Zagler, W. & Burger, D. (Eds.) Computers helping people with special needs. 9th International Conference, ICCHP 2004, Paris, France, July 2004, Proceedings, Berlin, Springer Verlag 11Cordis (1995). Cost 322: Low Floor Busses. Final report. http://www.cordis.lu/cost-transport/src/cost-322.htm 12Stumbo, N.J., & Pegg, S. (2005). Travellers and Tourists with Disabilities: A Matter of Priorities and Loyalties. Tourism Review International, Vol. 8 (3), pp. 195-209 13Buhalis, D., Eichhorn, V., Michopoulou, E., & Miller, G. (2005). Accessibility market and stakeholder analysis. OSSATE project Guildford: University of Surrey.
Economic impact and travel patterns of Accessible Tourism in Europe FINAL REPORT 66
Across the EU27 countries, the overall prevalence rate of disabilities among the working age
population is 14.8% (Figure 22), which is comparable to that of Canada (16.6%), Norway (16.4%),
and USA (15.4%). Among the key inbound markets, India has the lowest prevalence rate (2.1%),
whereas Brazil has the highest rate (23.9%). There is no obvious pattern across the 11 key inbound
markets, although arguably the developed countries tend to register a higher percentage of people
with disabilities than the emerging countries.
Within the EU27 area (Figure 21), Finland has the highest prevalence rate (32.2%), and Bulgaria the
lowest (1.2%). Again, higher percentages could be found in countries with a higher GDP, such as
France (24.6%), the Netherlands (25.4%) and the UK (27.2%). Overall, prevalence rates are from
8% to 15% for most countries.
Figure 24 and Figure 25 present the distribution of impairment types across countries. Consistently
across the EU27 countries (Figure 24), mobility impairments and hidden impairments are the major
types of disabilities, followed by cognitive impairments and sensory impairments. Of the three types
of sensory impairments, the majority are visually impaired, and the minority speech impaired.
Bulgaria is an exception, with a much lower prevalence rate of disabilities than other countries.
A similar pattern can be found in the international inbound markets (Figure 25), with mobility
impairments being the major type of disability. For the other impairment types, their distribution
varies significantly across the different markets.
Given the high proportion of mobility impairments, a straightforward implication is that many
travellers with disabilities show certain dependence on a companion (or companions), in order to be
others for mobility and performance of many activities of daily living is inevitable (Smith, 19871).
Furthermore, Darcy (2002)2 pointed out that brain injury/stroke, cerebral palsy and quadriplegia have
substantially higher levels of travel dependence than other impairment types. Overall, in the Darcy
(2002) study, 70% of the 2562 Australian respondents required the assistance of a companion.
Similarly, in a survey of 350 respondents from North America attending the 2001 Society for
Disability Studies conference, Horgan-Jones and Ringaert (2001)3 found that 2/3 of the respondents
travelled with a companion, usually a spouse or family member. A slightly more recent study was
1 Smith, R. W. (1987). Leisure of disabled tourists Barriers to participation. Annals of Tourism Research, 14, 376-389. 2 Darcy, S. (2002). Marginalised participation: Physical disability, high support needs and tourism. Journal of Hospitality and Tourism Management, 9, 61-72. 3 Horgan-Jones, M., & Ringaert, L. (2001). Accessible tourism in Manitoba.TTRA Travel and Tourism Research Association, Niagara Falls, Canada.
Economic impact and travel patterns of Accessible Tourism in Europe FINAL REPORT 67
done by Neumann and Reuber (2004)1, which surveyed 4,062 Germans with disabilities. 52% of
them depended on a companion. Of these, over half required full-time assistance in the form of
support in moving around or pursuing leisure activities.
In estimating the possible impact of accessible tourism, it is often argued that tourism suppliers who
cannot accommodate the travel needs of persons with disabilities are also losing the business of
their friends and family members2 red
tourism demand, proves to be tricky, because the numbers of travel companions for each person are
largely missing or unreported. Neumann and Reuber (2004) showed that the respondents with
dependence needs were on average accompanied by 1.56 persons. Buhalis et al.(2005)3 suggested
However, it has to be noted that the numbers above were usually yielded on an ad hoc basis, in the
sense that the studies were conducted in a specific country and basically only those with physical
cover the whole EU27 area. Besides, strictly speaking, it will exaggerate the market size of
accessible tourism by attributing
facilities.
Regarding the elderly population, in 2011 it totalled 88.8 million across EU27 area, of which 37.3
million were male and the remainder female (51.4 million). Figure 26 and Figure 27 provide an
overview of the gender distribution. The female elderly population is consistently larger than the
male elderly population, across the EU27 area and in the key inbound markets.
The following hypotheses can be formulated.
Accessible Tourism.
H2: The BRICS countries and the USA are the most important international inbound markets
Tourism.
1 Neumann, P., & Reuber, P. (2004). Economic Impulses of Accessible Tourism for All. Study commissioned by the Federal Ministry of Economics and Labour (BMWA), Berlin, Germany. 2 http://ncpedp.org/access/isu-travel.htm 3 Buhalis, D., Eichhorn, V., Michopoulou, E., & Miller, G. (2005). Accessibility market and stakeholder analysis. OSSATE project Guildford: University of Surrey.

Economic impact and travel patterns of Accessible Tourism in Europe FINAL REPORT 68
H3: Mobility facilities are the primary area of access needs, and sufficient attention should be
paid to these facilities.1
H4: The seniors have higher spending power than the people with disabilities, because they
have higher wealth level and are more willing to spend on leisure activities.
H5: The seniors are more frequent travellers than the people with disabilities.
H6: The motivation of travelling and activities by the seniors are pretty diverse.
H7: Female senior customers will dominate the senior travel market, given the higher
proportion of population.
1Please note hidden impairments are a major type of disability but that related access needs are more varied and therefore less widely used and needed by smaller proportions of people.
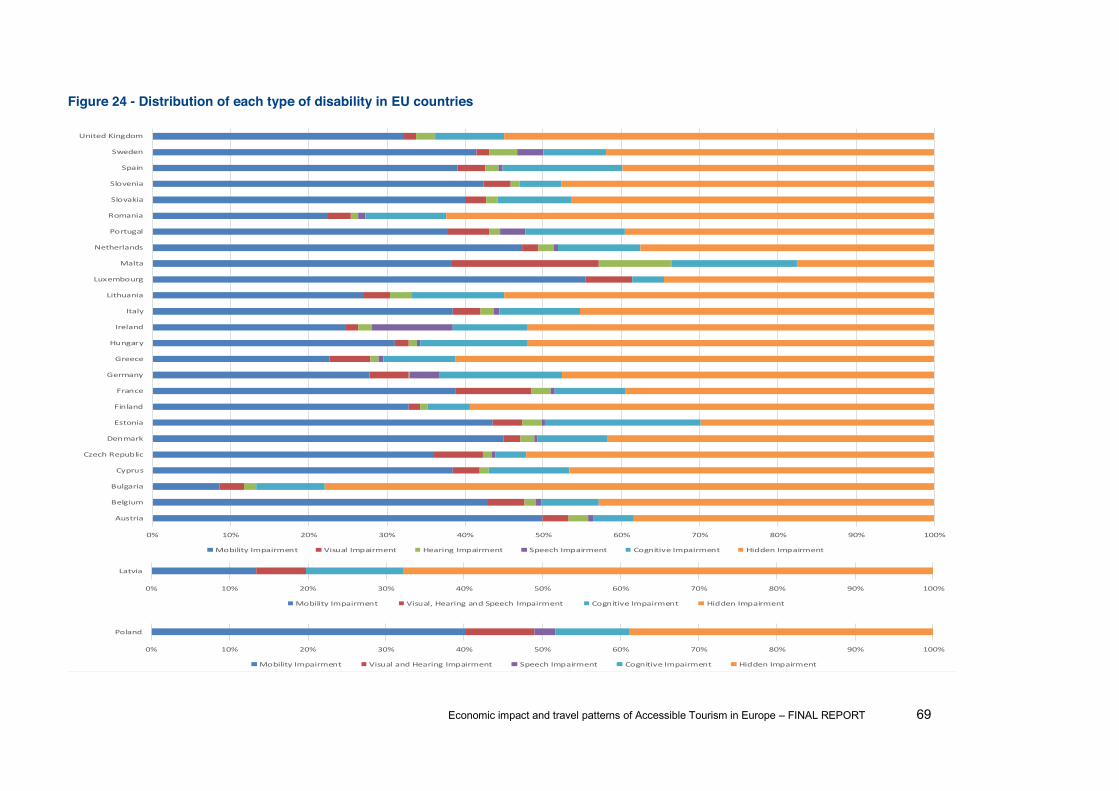
Economic impact and travel patterns of Accessible Tourism in Europe FINAL REPORT 69
Figure 24 - Distribution of each type of disability in EU countries
0% 10% 20% 30% 40% 50% 60% 70% 80% 90% 100%
Austria
Belgium
Bulgaria
Cyprus
Czech Republic
Denmark
Estonia
Finland
France
Germany
Greece
Hungary
Ireland
Italy
Lithuania
Luxembourg
Malta
Netherlands
Portugal
Romania
Slovakia
Slovenia
Spain
Sweden
United Kingdom
Distribution of Each Type of Disability in EU Countries
Mobility Impairment Visual Impairment Hearing Impairment Speech Impairment Cognitive Impairment Hidden Impairment
0% 10% 20% 30% 40% 50% 60% 70% 80% 90% 100%
Latvia
Mobility Impairment Visual, Hearing and Speech Impairment Cognitive Impairment Hidden Impairment
0% 10% 20% 30% 40% 50% 60% 70% 80% 90% 100%
Poland
Mobility Impairment Visual and Hearing Impairment Speech Impairment Cognitive Impairment Hidden Impairment
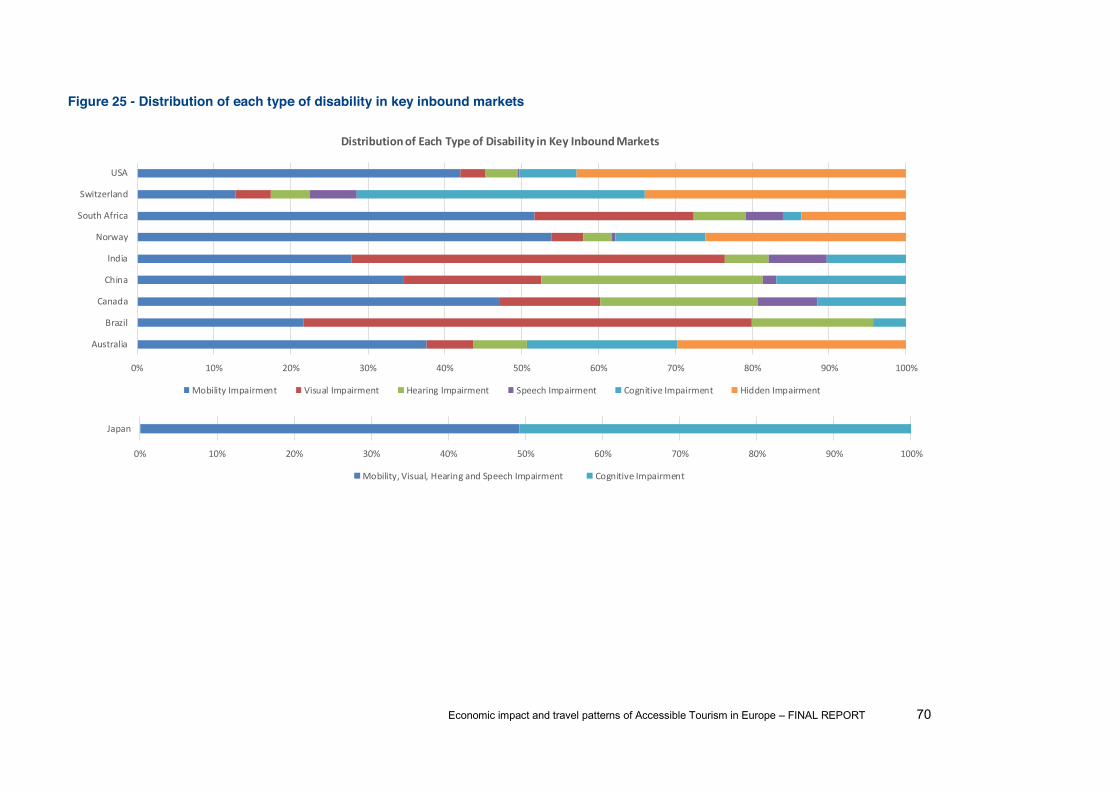
Economic impact and travel patterns of Accessible Tourism in Europe FINAL REPORT 70
Figure 25 - Distribution of each type of disability in key inbound markets
0% 10% 20% 30% 40% 50% 60% 70% 80% 90% 100%
Japan
Mobility, Visual, Hearing and Speech Impairment Cognitive Impairment
0% 10% 20% 30% 40% 50% 60% 70% 80% 90% 100%
Australia
Brazil
Canada
China
India
Norway
South Africa
Switzerland
USA
Distribution of Each Type of Disability in Key Inbound Markets
Mobility Impairment Visual Impairment Hearing Impairment Speech Impairment Cognitive Impairment Hidden Impairment
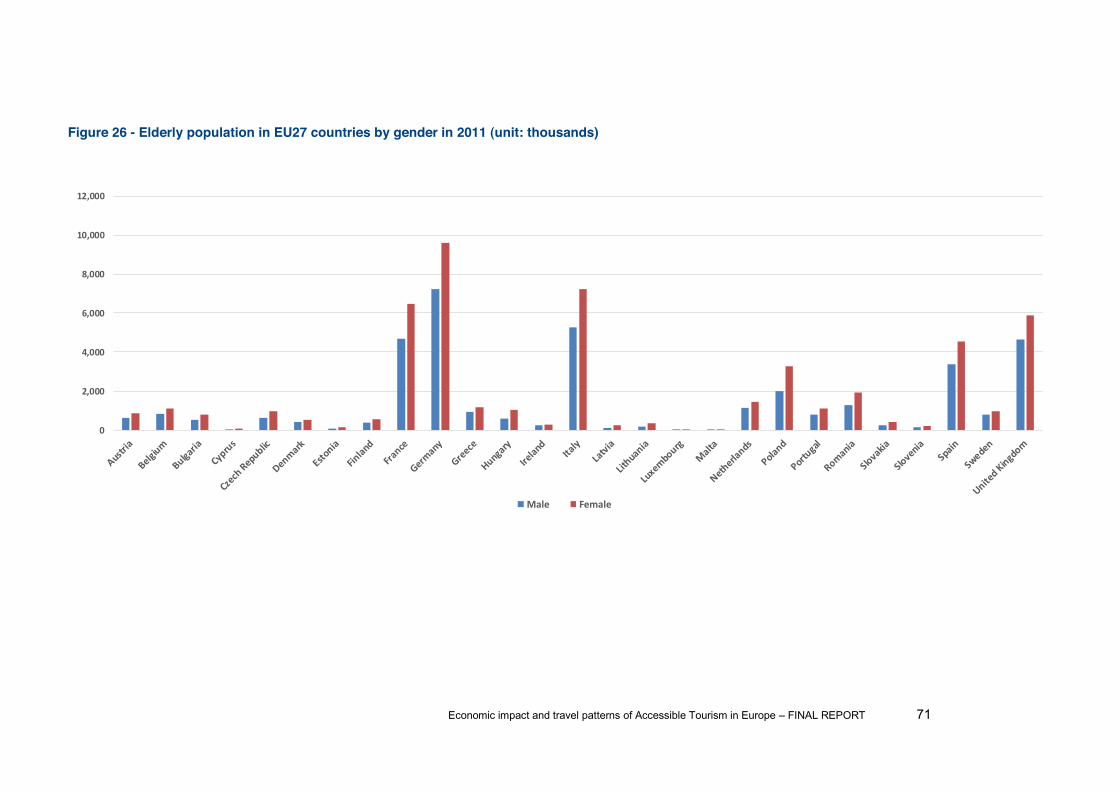
Economic impact and travel patterns of Accessible Tourism in Europe FINAL REPORT 71
Figure 26 - Elderly population in EU27 countries by gender in 2011 (unit: thousands)
0
2,000
4,000
6,000
8,000
10,000
12,000
Male Female
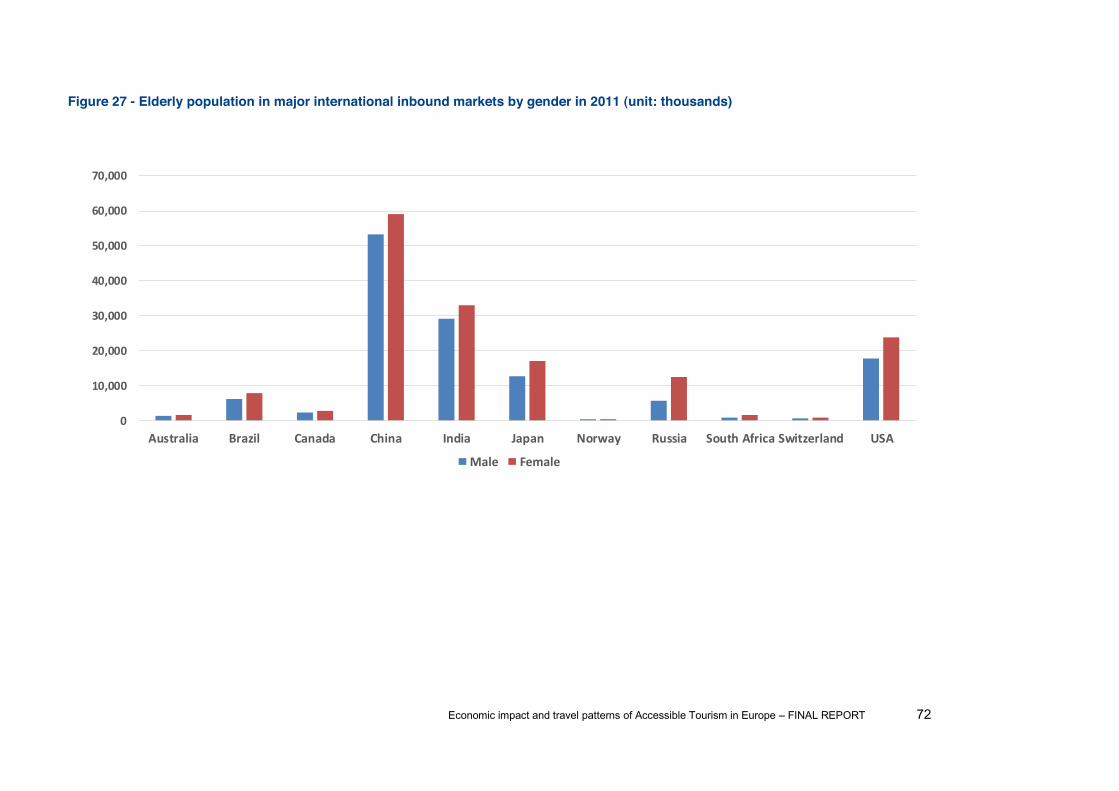
Economic impact and travel patterns of Accessible Tourism in Europe FINAL REPORT 72
Figure 27 - Elderly population in major international inbound markets by gender in 2011 (unit: thousands)
0
10,000
20,000
30,000
40,000
50,000
60,000
70,000
Australia Brazil Canada China India Japan Norway Russia South Africa Switzerland USA
Male Female
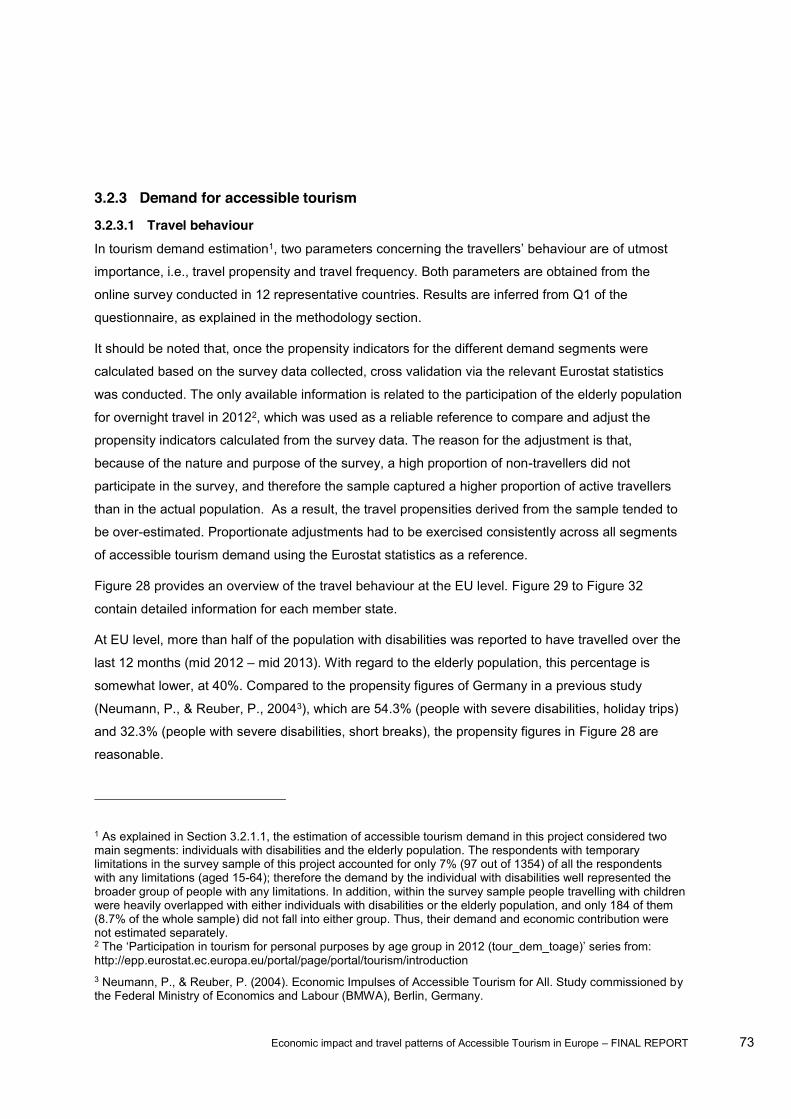
Economic impact and travel patterns of Accessible Tourism in Europe FINAL REPORT 73
3.2.3 Demand for accessible tourism
3.2.3.1 Travel behaviour In tourism demand estimation1, of utmost
importance, i.e., travel propensity and travel frequency. Both parameters are obtained from the
online survey conducted in 12 representative countries. Results are inferred from Q1 of the
questionnaire, as explained in the methodology section.
It should be noted that, once the propensity indicators for the different demand segments were
calculated based on the survey data collected, cross validation via the relevant Eurostat statistics
was conducted. The only available information is related to the participation of the elderly population
for overnight travel in 20122, which was used as a reliable reference to compare and adjust the
propensity indicators calculated from the survey data. The reason for the adjustment is that,
because of the nature and purpose of the survey, a high proportion of non-travellers did not
participate in the survey, and therefore the sample captured a higher proportion of active travellers
than in the actual population. As a result, the travel propensities derived from the sample tended to
be over-estimated. Proportionate adjustments had to be exercised consistently across all segments
of accessible tourism demand using the Eurostat statistics as a reference.
Figure 28 provides an overview of the travel behaviour at the EU level. Figure 29 to Figure 32
contain detailed information for each member state.
At EU level, more than half of the population with disabilities was reported to have travelled over the
last 12 months (mid 2012 mid 2013). With regard to the elderly population, this percentage is
somewhat lower, at 40%. Compared to the propensity figures of Germany in a previous study
(Neumann, P., & Reuber, P., 20043), which are 54.3% (people with severe disabilities, holiday trips)
and 32.3% (people with severe disabilities, short breaks), the propensity figures in Figure 28 are
reasonable.
1 As explained in Section 3.2.1.1, the estimation of accessible tourism demand in this project considered two main segments: individuals with disabilities and the elderly population. The respondents with temporary limitations in the survey sample of this project accounted for only 7% (97 out of 1354) of all the respondents with any limitations (aged 15-64); therefore the demand by the individual with disabilities well represented the broader group of people with any limitations. In addition, within the survey sample people travelling with children were heavily overlapped with either individuals with disabilities or the elderly population, and only 184 of them (8.7% of the whole sample) did not fall into either group. Thus, their demand and economic contribution were not estimated separately. 2 http://epp.eurostat.ec.europa.eu/portal/page/portal/tourism/introduction 3 Neumann, P., & Reuber, P. (2004). Economic Impulses of Accessible Tourism for All. Study commissioned by the Federal Ministry of Economics and Labour (BMWA), Berlin, Germany.

Economic impact and travel patterns of Accessible Tourism in Europe FINAL REPORT 74
Across the EU27 countries and the two groups of people with special access needs (Figure 29 to
Figure 32), the propensity figures vary a lot. Within the group of people with disabilities, Bulgaria
sees the lowest percentage of people that have travelled, no matter whether it was a day trip or
overnight trip, at below 10%. The next lowest figures are found in Romania, at roughly 10%. At the
other end, the Netherlands has the keenest travellers with disabilities, with more than 80% who
reported to have travelled during the last year. Within the group of the elderly population, a similar
pattern is maintained, that is, the elderly population from Bulgaria are least likely to travel (less than
10%). The elderly population from the Netherlands are, just as the younger people with disabilities,
keen travellers, for both day trips and overnight trips. However, the highest propensity in the elderly
population is found in Denmark and Sweden, which is 72.1% for overnight trips.
In terms of the travel frequency, the EU average figures are up to slightly less than 7 trips per year
for both day trips and overnight trips (Figure 28). Generally, individuals with disabilities conduct more
trips than the elderly population, especially when it comes to overnight trips1. However, travel
frequency figures across both travel types (day trips and overnight trips) cannot be added up to yield
a total number of annual trips, because people who conduct day trips do not necessarily take
overnight trips (for example, one can take 7 day trips per year without taking any overnight trips).
Thus, adding up the fre
behaviour.
With regard to the destination, the pattern is very obvious in that most of the trips are conducted
day trips. At the EU level (Figure
28), slightly under 90% of all day trips were domestic trips, whereas around 70% of overnight trips
were domestic. Compared to day trips, a higher proportion of overnight trips were spent in the intra-
EU area or internationally. At country level (Figure 29 to Figure 32), the same pattern can be
observed with few exceptions. Individuals with disabilities from Austria, Belgium and the Netherlands
conducted more intra-EU overnight trips (roughly 50%) than domestic overnight trips (roughly 30%)
during mid-2012 to mid-2013. For those from Slovenia, the overnight trips were almost evenly
spread among domestic, intra-EU and international destinations. For the elderly population from
Austria, Belgium and the Netherlands, they made very similar choices, with about 30% of overnight
trips in the home country and more than 50% in intra-EU destinations.
1 Reuber, P., 2004), which are 1.3 holiday trips and 2.18 short breaks, the travel frequency figures in Figure 28
only included those with severe disabilities, whereas the sample of the current survey have a much broader population base since people with less severe disabilities as well as those with temporary limitations have been included.
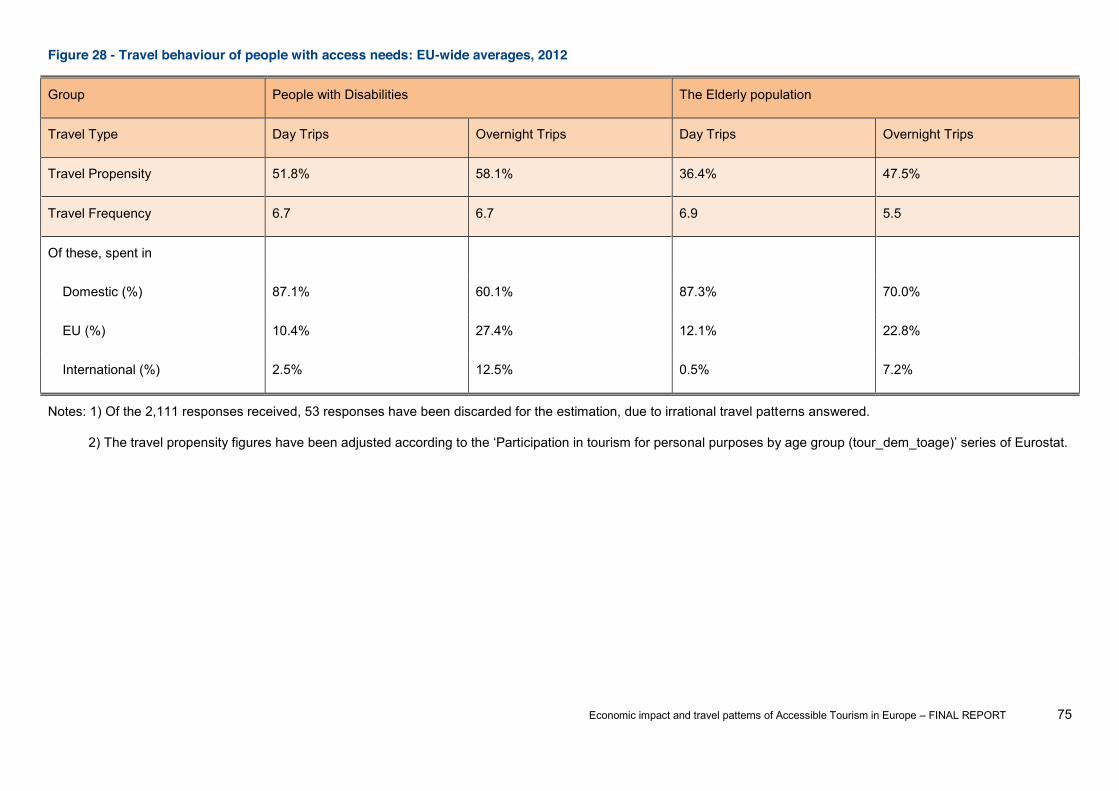
Economic impact and travel patterns of Accessible Tourism in Europe FINAL REPORT 75
Figure 28 - Travel behaviour of people with access needs: EU-wide averages, 2012
Group People with Disabilities The Elderly population
Travel Type Day Trips Overnight Trips Day Trips Overnight Trips
Travel Propensity 51.8% 58.1% 36.4% 47.5%
Travel Frequency 6.7 6.7 6.9 5.5
Of these, spent in
Domestic (%) 87.1% 60.1% 87.3% 70.0%
EU (%) 10.4% 27.4% 12.1% 22.8%
International (%) 2.5% 12.5% 0.5% 7.2%
Notes: 1) Of the 2,111 responses received, 53 responses have been discarded for the estimation, due to irrational travel patterns answered.
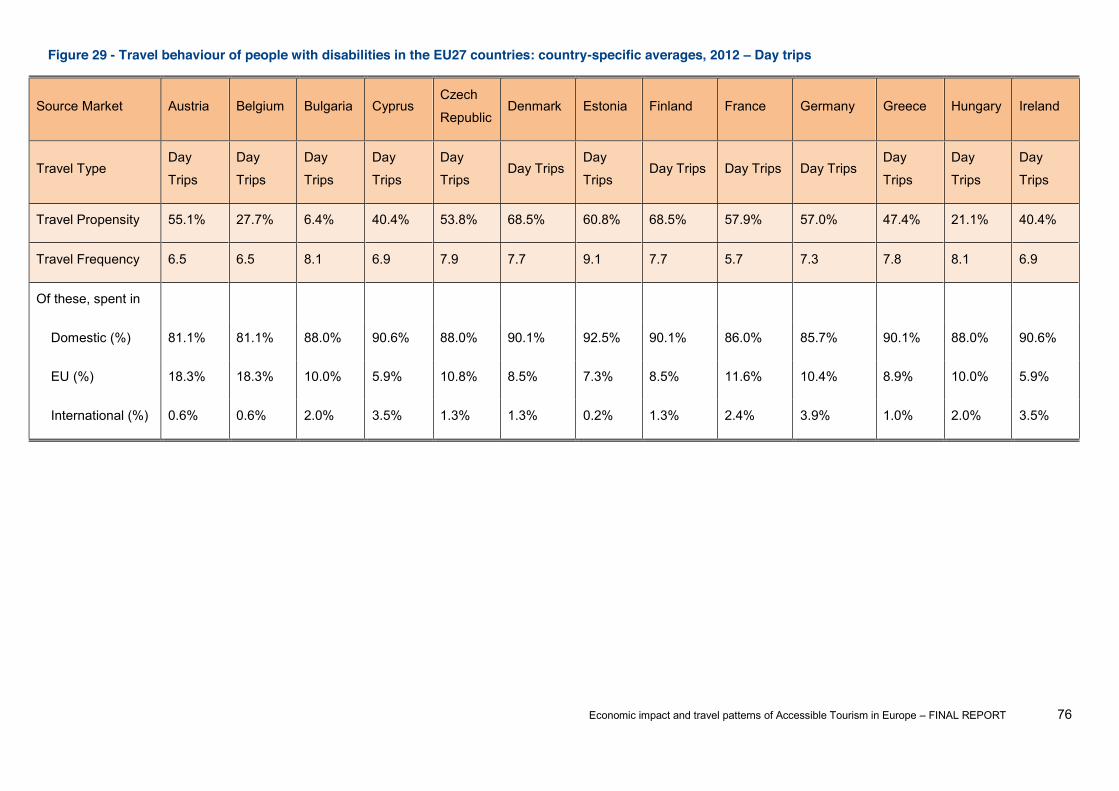
Economic impact and travel patterns of Accessible Tourism in Europe FINAL REPORT 76
Figure 29 - Travel behaviour of people with disabilities in the EU27 countries: country-specific averages, 2012 Day trips
Source Market Austria Belgium Bulgaria Cyprus Czech
Republic Denmark Estonia Finland France Germany Greece Hungary Ireland
Travel Type Day
Trips
Day
Trips
Day
Trips
Day
Trips
Day
Trips Day Trips
Day
Trips Day Trips Day Trips Day Trips
Day
Trips
Day
Trips
Day
Trips
Travel Propensity 55.1% 27.7% 6.4% 40.4% 53.8% 68.5% 60.8% 68.5% 57.9% 57.0% 47.4% 21.1% 40.4%
Travel Frequency 6.5 6.5 8.1 6.9 7.9 7.7 9.1 7.7 5.7 7.3 7.8 8.1 6.9
Of these, spent in
Domestic (%) 81.1% 81.1% 88.0% 90.6% 88.0% 90.1% 92.5% 90.1% 86.0% 85.7% 90.1% 88.0% 90.6%
EU (%) 18.3% 18.3% 10.0% 5.9% 10.8% 8.5% 7.3% 8.5% 11.6% 10.4% 8.9% 10.0% 5.9%
International (%) 0.6% 0.6% 2.0% 3.5% 1.3% 1.3% 0.2% 1.3% 2.4% 3.9% 1.0% 2.0% 3.5%

Economic impact and travel patterns of Accessible Tourism in Europe FINAL REPORT 77
Source Market Italy Latvia Lithuania Luxembourg Malta Netherlands Poland Portugal Romania Slovakia Slovenia Spain Sweden United
Kingdom
Travel Type Day
Trips
Day
Trips
Day
Trips Day Trips
Day
Trips Day Trips
Day
Trips
Day
Trips
Day
Trips
Day
Trips
Day
Trips
Day
Trips
Day
Trips Day Trips
Travel Propensity 20.7% 46.5% 47.8% 55.4% 40.2% 81.7% 19.8% 32.6% 9.3% 25.4% 45.0% 47.4% 68.5% 62.0%
Travel Frequency 7.3 9.1 9.1 6.5 7.8 5.8 7.9 7.8 8.1 7.9 7.8 7.8 7.7 6.7
Of these, spent in
Domestic (%) 85.7% 92.5% 92.5% 81.1% 74.0% 80.1% 88.0% 90.1% 88.0% 88.0% 74.0% 90.1% 90.1% 88.9%
EU (%) 10.4% 7.3% 7.3% 18.3% 16.3% 15.4% 10.8% 8.9% 10.0% 10.8% 16.3% 8.9% 8.5% 8.3%
International (%) 3.9% 0.2% 0.2% 0.6% 9.7% 4.4% 1.3% 1.0% 2.0% 1.3% 9.7% 1.0% 1.3% 2.8%
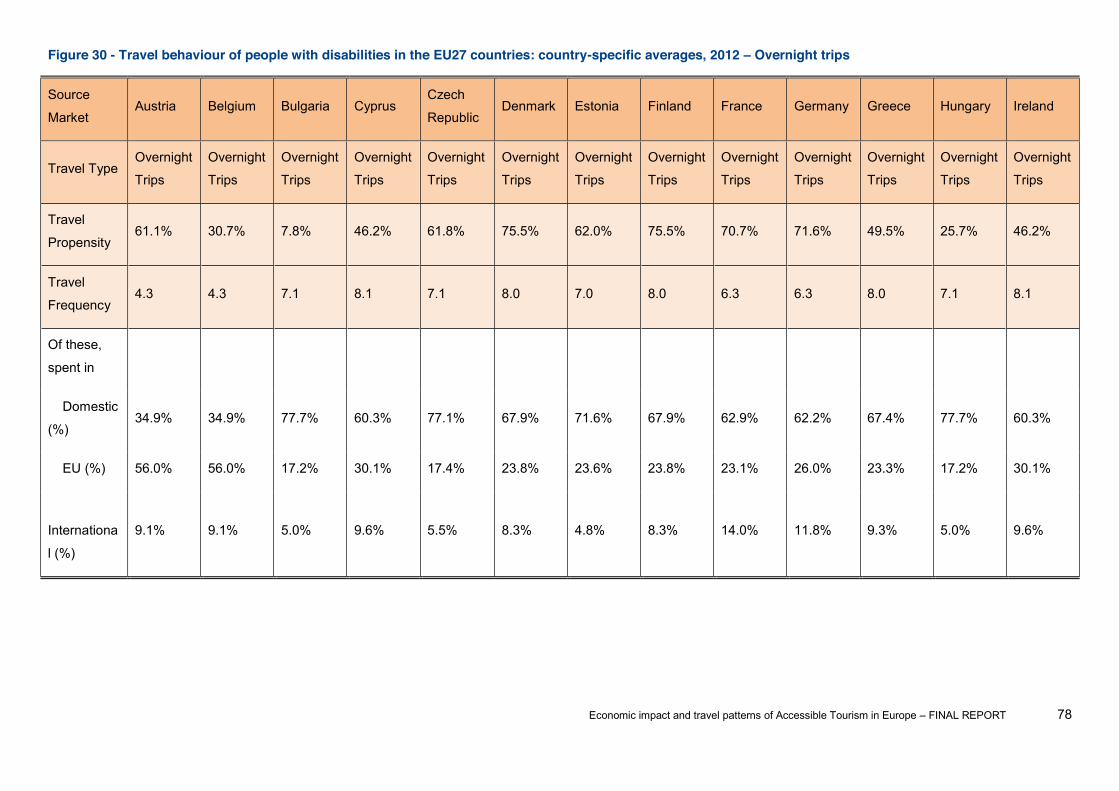
Economic impact and travel patterns of Accessible Tourism in Europe FINAL REPORT 78
Figure 30 - Travel behaviour of people with disabilities in the EU27 countries: country-specific averages, 2012 Overnight trips
Source
Market Austria Belgium Bulgaria Cyprus
Czech
Republic Denmark Estonia Finland France Germany Greece Hungary Ireland
Travel Type Overnight
Trips
Overnight
Trips
Overnight
Trips
Overnight
Trips
Overnight
Trips
Overnight
Trips
Overnight
Trips
Overnight
Trips
Overnight
Trips
Overnight
Trips
Overnight
Trips
Overnight
Trips
Overnight
Trips
Travel
Propensity 61.1% 30.7% 7.8% 46.2% 61.8% 75.5% 62.0% 75.5% 70.7% 71.6% 49.5% 25.7% 46.2%
Travel
Frequency 4.3 4.3 7.1 8.1 7.1 8.0 7.0 8.0 6.3 6.3 8.0 7.1 8.1
Of these,
spent in
Domestic
(%) 34.9% 34.9% 77.7% 60.3% 77.1% 67.9% 71.6% 67.9% 62.9% 62.2% 67.4% 77.7% 60.3%
EU (%) 56.0% 56.0% 17.2% 30.1% 17.4% 23.8% 23.6% 23.8% 23.1% 26.0% 23.3% 17.2% 30.1%
Internationa
l (%)
9.1% 9.1% 5.0% 9.6% 5.5% 8.3% 4.8% 8.3% 14.0% 11.8% 9.3% 5.0% 9.6%
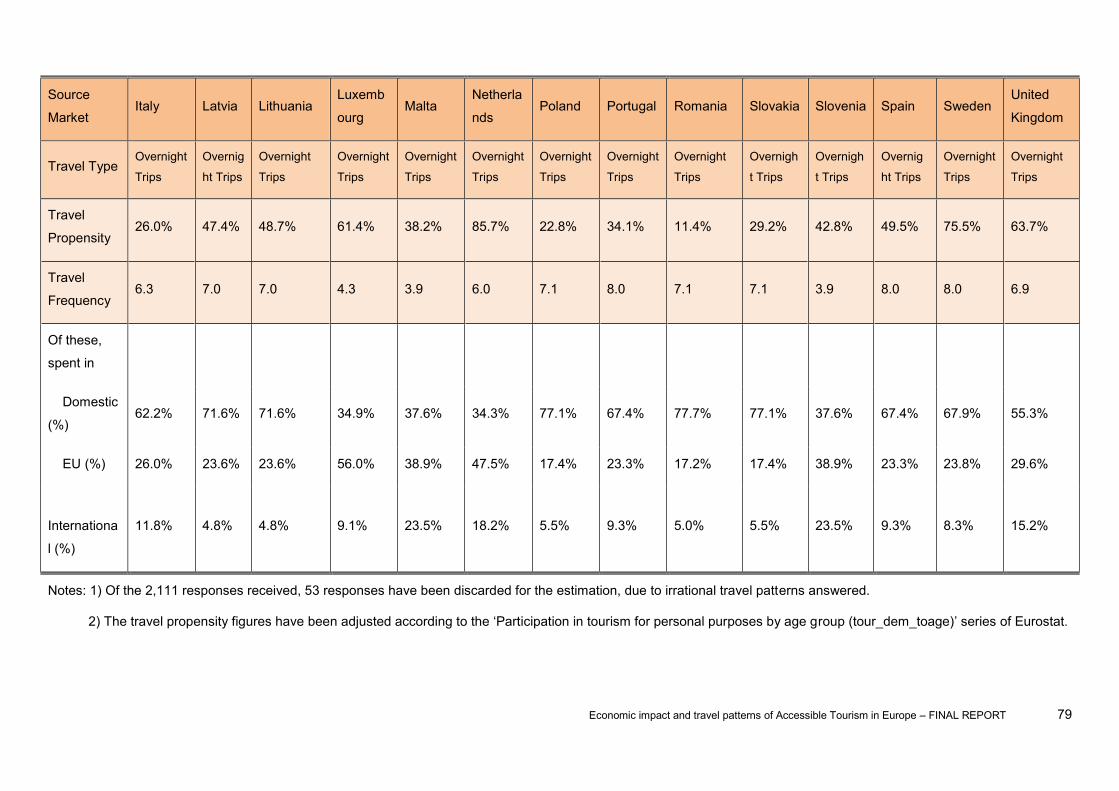
Economic impact and travel patterns of Accessible Tourism in Europe FINAL REPORT 79
Source
Market Italy Latvia Lithuania
Luxemb
ourg Malta
Netherla
nds Poland Portugal Romania Slovakia Slovenia Spain Sweden
United
Kingdom
Travel Type Overnight
Trips
Overnig
ht Trips
Overnight
Trips
Overnight
Trips
Overnight
Trips
Overnight
Trips
Overnight
Trips
Overnight
Trips
Overnight
Trips
Overnigh
t Trips
Overnigh
t Trips
Overnig
ht Trips
Overnight
Trips
Overnight
Trips
Travel
Propensity 26.0% 47.4% 48.7% 61.4% 38.2% 85.7% 22.8% 34.1% 11.4% 29.2% 42.8% 49.5% 75.5% 63.7%
Travel
Frequency 6.3 7.0 7.0 4.3 3.9 6.0 7.1 8.0 7.1 7.1 3.9 8.0 8.0 6.9
Of these,
spent in
Domestic
(%) 62.2% 71.6% 71.6% 34.9% 37.6% 34.3% 77.1% 67.4% 77.7% 77.1% 37.6% 67.4% 67.9% 55.3%
EU (%) 26.0% 23.6% 23.6% 56.0% 38.9% 47.5% 17.4% 23.3% 17.2% 17.4% 38.9% 23.3% 23.8% 29.6%
Internationa
l (%)
11.8% 4.8% 4.8% 9.1% 23.5% 18.2% 5.5% 9.3% 5.0% 5.5% 23.5% 9.3% 8.3% 15.2%
Notes: 1) Of the 2,111 responses received, 53 responses have been discarded for the estimation, due to irrational travel patterns answered.
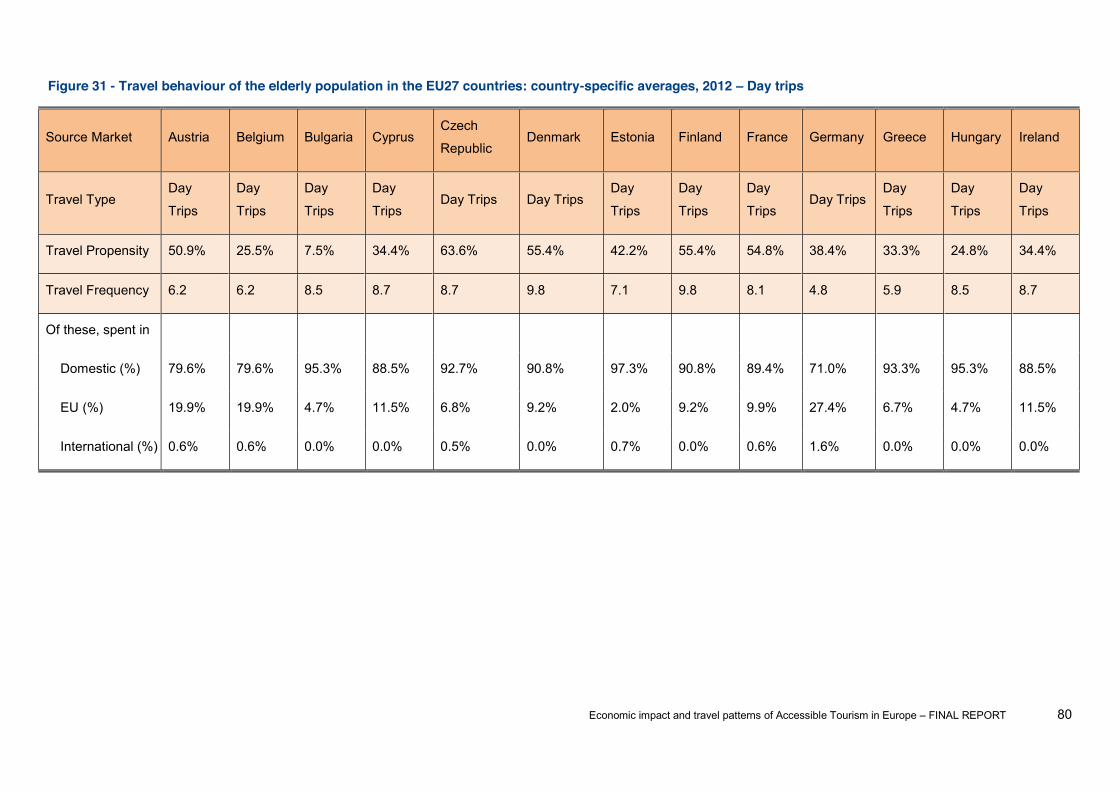
Economic impact and travel patterns of Accessible Tourism in Europe FINAL REPORT 80
Figure 31 - Travel behaviour of the elderly population in the EU27 countries: country-specific averages, 2012 Day trips
Source Market Austria Belgium Bulgaria Cyprus Czech
Republic Denmark Estonia Finland France Germany Greece Hungary Ireland
Travel Type Day
Trips
Day
Trips
Day
Trips
Day
Trips Day Trips Day Trips
Day
Trips
Day
Trips
Day
Trips Day Trips
Day
Trips
Day
Trips
Day
Trips
Travel Propensity 50.9% 25.5% 7.5% 34.4% 63.6% 55.4% 42.2% 55.4% 54.8% 38.4% 33.3% 24.8% 34.4%
Travel Frequency 6.2 6.2 8.5 8.7 8.7 9.8 7.1 9.8 8.1 4.8 5.9 8.5 8.7
Of these, spent in
Domestic (%) 79.6% 79.6% 95.3% 88.5% 92.7% 90.8% 97.3% 90.8% 89.4% 71.0% 93.3% 95.3% 88.5%
EU (%) 19.9% 19.9% 4.7% 11.5% 6.8% 9.2% 2.0% 9.2% 9.9% 27.4% 6.7% 4.7% 11.5%
International (%) 0.6% 0.6% 0.0% 0.0% 0.5% 0.0% 0.7% 0.0% 0.6% 1.6% 0.0% 0.0% 0.0%

Economic impact and travel patterns of Accessible Tourism in Europe FINAL REPORT 81
Source Market Italy Latvia Lithuania Luxembourg Malta Netherlands Poland Portugal Romania Slovakia Slovenia Spain Sweden United
Kingdom
Travel Type Day
Trips
Day
Trips
Day
Trips Day Trips
Day
Trips Day Trips
Day
Trips
Day
Trips
Day
Trips
Day
Trips
Day
Trips
Day
Trips
Day
Trips Day Trips
Travel Propensity 13.9% 32.3% 33.1% 51.1% 33.1% 64.7% 23.4% 22.9% 11.0% 30.0% 37.0% 33.3% 55.4% 47.9%
Travel Frequency 4.8 7.1 7.1 6.2 9.7 5.0 8.7 5.9 8.5 8.7 9.7 5.9 9.8 8.0
Of these, spent in
Domestic (%) 71.0% 97.3% 97.3% 79.6% 69.4% 80.7% 92.7% 93.3% 95.3% 92.7% 69.4% 93.3% 90.8% 94.2%
EU (%) 27.4% 2.0% 2.0% 19.9% 28.9% 19.3% 6.8% 6.7% 4.7% 6.8% 28.9% 6.7% 9.2% 5.8%
International (%) 1.6% 0.7% 0.7% 0.6% 1.7% 0.0% 0.5% 0.0% 0.0% 0.5% 1.7% 0.0% 0.0% 0.0%

Economic impact and travel patterns of Accessible Tourism in Europe FINAL REPORT 82
Figure 32 - Travel behaviour of the elderly population in the EU27 countries: country-specific averages, 2012 Overnight trips
Source Market Austria Belgium Bulgaria Cyprus Czech
Republic Denmark Estonia Finland France Germany Greece Hungary Ireland
Travel Type Overnight
Trips
Overnight
Trips
Overnight
Trips
Overnight
Trips
Overnight
Trips
Overnight
Trips
Overnight
Trips
Overnight
Trips
Overnight
Trips
Overnight
Trips
Overnight
Trips
Overnight
Trips
Overnight
Trips
Travel Propensity 56.1% 28.2% 8.2% 47.5% 60.7% 72.1% 32.1% 72.1% 65.8% 65.0% 40.0% 27.2% 47.5%
Travel Frequency 3.9 3.9 3.8 6.4 8.0 7.2 5.7 7.2 5.4 5.3 6.3 3.8 6.4
Of these, spent in
Domestic (%) 29.6% 29.6% 90.5% 53.5% 70.7% 81.2% 79.1% 81.2% 83.8% 64.7% 75.4% 90.5% 53.5%
EU (%) 53.6% 53.6% 9.5% 34.6% 24.6% 15.6% 14.3% 15.6% 8.5% 29.3% 19.3% 9.5% 34.6%
International (%) 16.8% 16.8% 0.0% 11.9% 4.8% 3.2% 6.6% 3.2% 7.7% 6.0% 5.3% 0.0% 11.9%
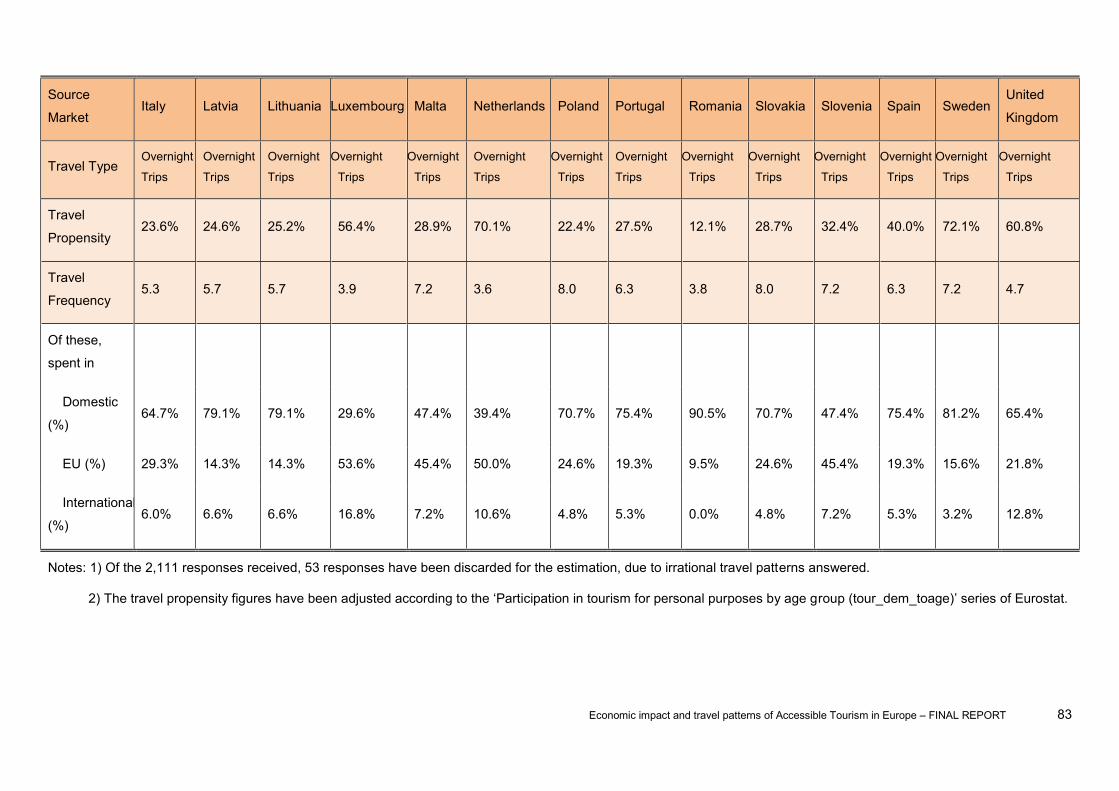
Economic impact and travel patterns of Accessible Tourism in Europe FINAL REPORT 83
Source
Market Italy Latvia Lithuania Luxembourg Malta Netherlands Poland Portugal Romania Slovakia Slovenia Spain Sweden
United
Kingdom
Travel Type Overnight
Trips
Overnight
Trips
Overnight
Trips
Overnight
Trips
Overnight
Trips
Overnight
Trips
Overnight
Trips
Overnight
Trips
Overnight
Trips
Overnight
Trips
Overnight
Trips
Overnight
Trips
Overnight
Trips
Overnight
Trips
Travel
Propensity 23.6% 24.6% 25.2% 56.4% 28.9% 70.1% 22.4% 27.5% 12.1% 28.7% 32.4% 40.0% 72.1% 60.8%
Travel
Frequency 5.3 5.7 5.7 3.9 7.2 3.6 8.0 6.3 3.8 8.0 7.2 6.3 7.2 4.7
Of these,
spent in
Domestic
(%) 64.7% 79.1% 79.1% 29.6% 47.4% 39.4% 70.7% 75.4% 90.5% 70.7% 47.4% 75.4% 81.2% 65.4%
EU (%) 29.3% 14.3% 14.3% 53.6% 45.4% 50.0% 24.6% 19.3% 9.5% 24.6% 45.4% 19.3% 15.6% 21.8%
International
(%) 6.0% 6.6% 6.6% 16.8% 7.2% 10.6% 4.8% 5.3% 0.0% 4.8% 7.2% 5.3% 3.2% 12.8%
Notes: 1) Of the 2,111 responses received, 53 responses have been discarded for the estimation, due to irrational travel patterns answered.
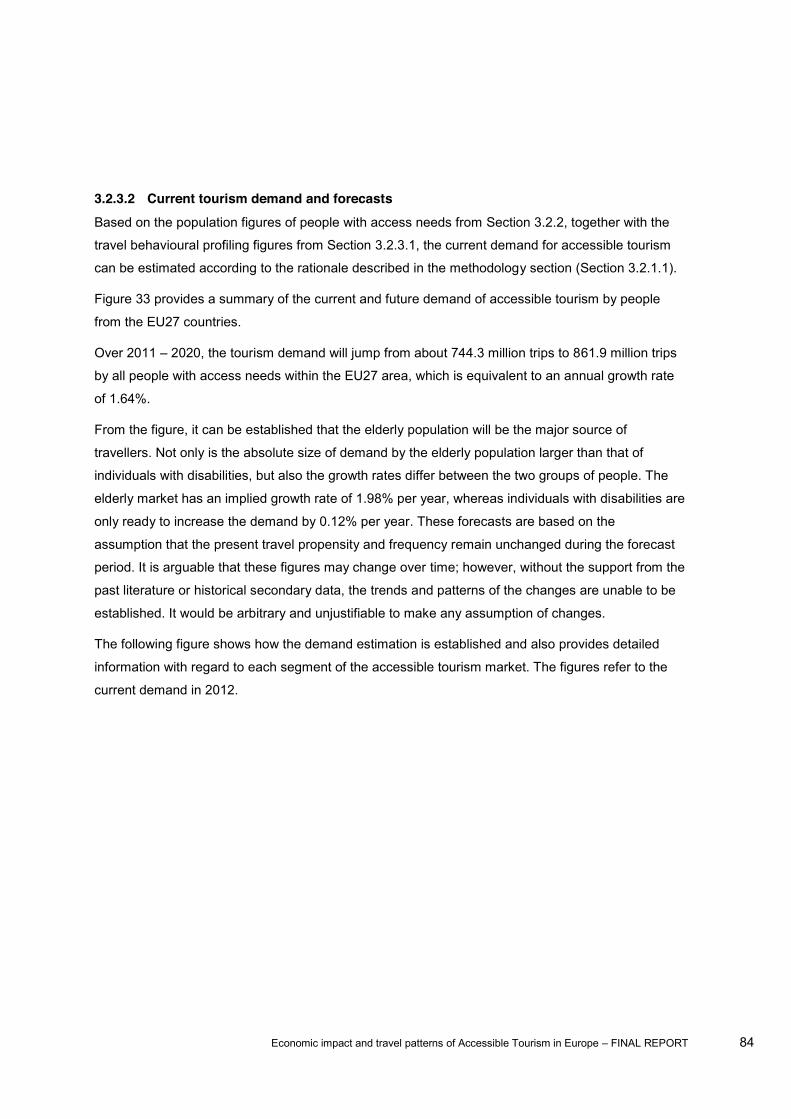
Economic impact and travel patterns of Accessible Tourism in Europe FINAL REPORT 84
3.2.3.2 Current tourism demand and forecasts Based on the population figures of people with access needs from Section 3.2.2, together with the
travel behavioural profiling figures from Section 3.2.3.1, the current demand for accessible tourism
can be estimated according to the rationale described in the methodology section (Section 3.2.1.1).
Figure 33 provides a summary of the current and future demand of accessible tourism by people
from the EU27 countries.
Over 2011 2020, the tourism demand will jump from about 744.3 million trips to 861.9 million trips
by all people with access needs within the EU27 area, which is equivalent to an annual growth rate
of 1.64%.
From the figure, it can be established that the elderly population will be the major source of
travellers. Not only is the absolute size of demand by the elderly population larger than that of
individuals with disabilities, but also the growth rates differ between the two groups of people. The
elderly market has an implied growth rate of 1.98% per year, whereas individuals with disabilities are
only ready to increase the demand by 0.12% per year. These forecasts are based on the
assumption that the present travel propensity and frequency remain unchanged during the forecast
period. It is arguable that these figures may change over time; however, without the support from the
past literature or historical secondary data, the trends and patterns of the changes are unable to be
established. It would be arbitrary and unjustifiable to make any assumption of changes.
The following figure shows how the demand estimation is established and also provides detailed
information with regard to each segment of the accessible tourism market. The figures refer to the
current demand in 2012.
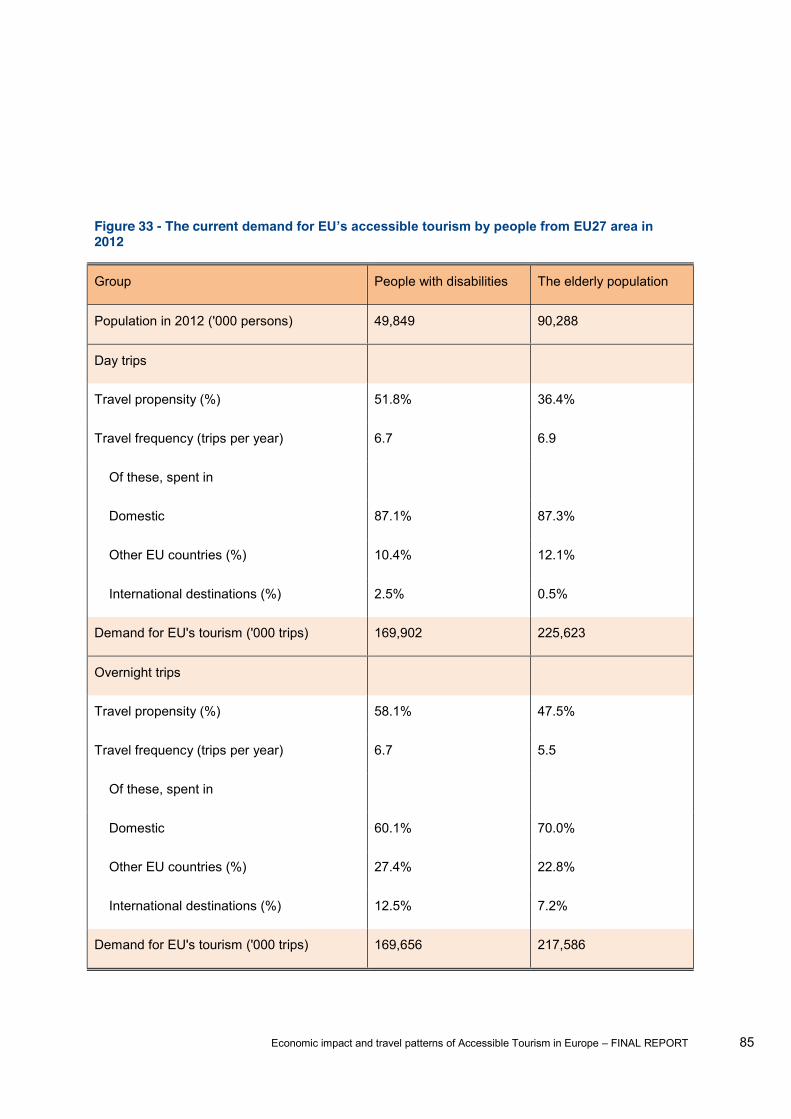
Economic impact and travel patterns of Accessible Tourism in Europe FINAL REPORT 85
Figure 33 - The current 2012
Group People with disabilities The elderly population
Population in 2012 ('000 persons) 49,849 90,288
Day trips
Travel propensity (%) 51.8% 36.4%
Travel frequency (trips per year) 6.7 6.9
Of these, spent in
Domestic 87.1% 87.3%
Other EU countries (%) 10.4% 12.1%
International destinations (%) 2.5% 0.5%
Demand for EU's tourism ('000 trips) 169,902 225,623
Overnight trips
Travel propensity (%) 58.1% 47.5%
Travel frequency (trips per year) 6.7 5.5
Of these, spent in
Domestic 60.1% 70.0%
Other EU countries (%) 27.4% 22.8%
International destinations (%) 12.5% 7.2%
Demand for EU's tourism ('000 trips) 169,656 217,586

Economic impact and travel patterns of Accessible Tourism in Europe FINAL REPORT 86
Figure 35 and Figure 36 show the current and future demand trends of both the people with
disabilities and the elderly population from 2012 to 2020. As the travel frequencies are very similar
between day trips and overnight trips (Figure 33), it is not surprising that in Figure 35 and Figure 36,
demand for both types of trips only differ marginally.
At country level, current and future demand figures can be found in Annex T
tourism demand and economic contribution figures are compiled. Figure 37 to Figure 39 visualise
the current demand figures in geographical maps.
From the maps, it can be easily discerned that France, the United Kingdom and Germany are the
population size.
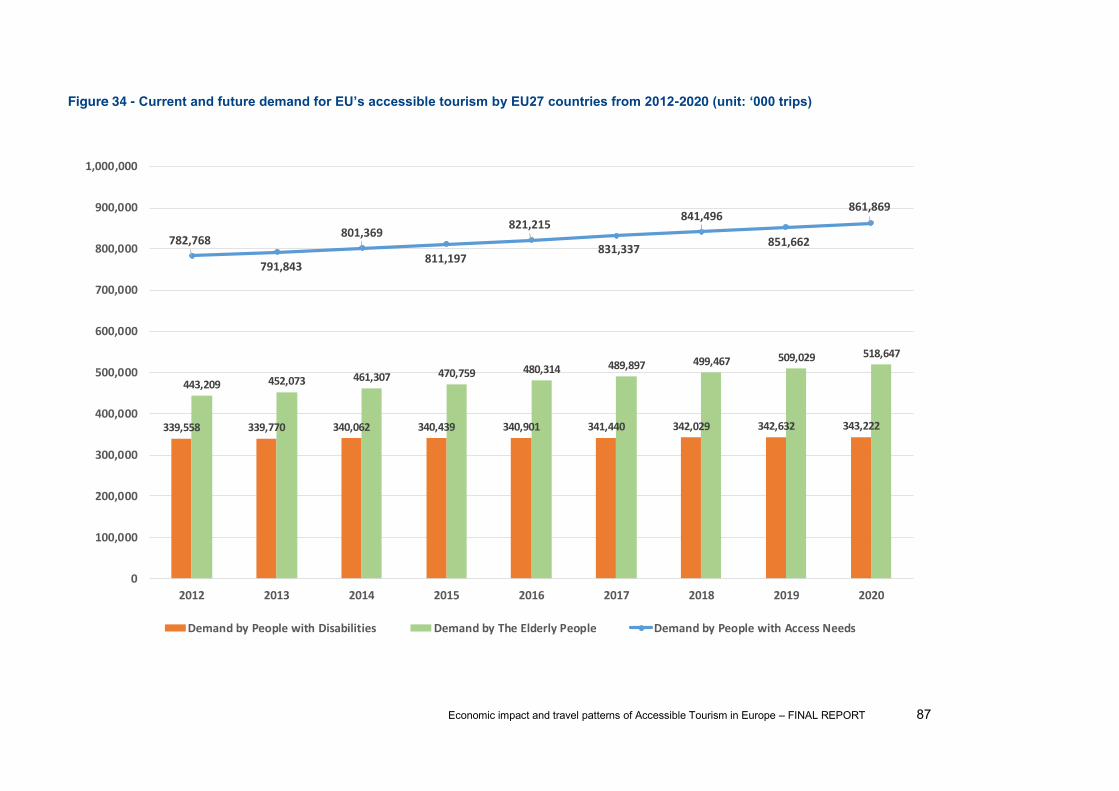
Economic impact and travel patterns of Accessible Tourism in Europe FINAL REPORT 87
Figure 34 - -2020
339,558 339,770 340,062 340,439 340,901 341,440 342,029 342,632 343,222
443,209 452,073 461,307 470,759 480,314 489,897 499,467 509,029 518,647
782,768
791,843
801,369
811,197
821,215
831,337
841,496
851,662
861,869
0
100,000
200,000
300,000
400,000
500,000
600,000
700,000
800,000
900,000
1,000,000
2012 2013 2014 2015 2016 2017 2018 2019 2020
Demand by People with Disabilities Demand by The Elderly People Demand by People with Access Needs
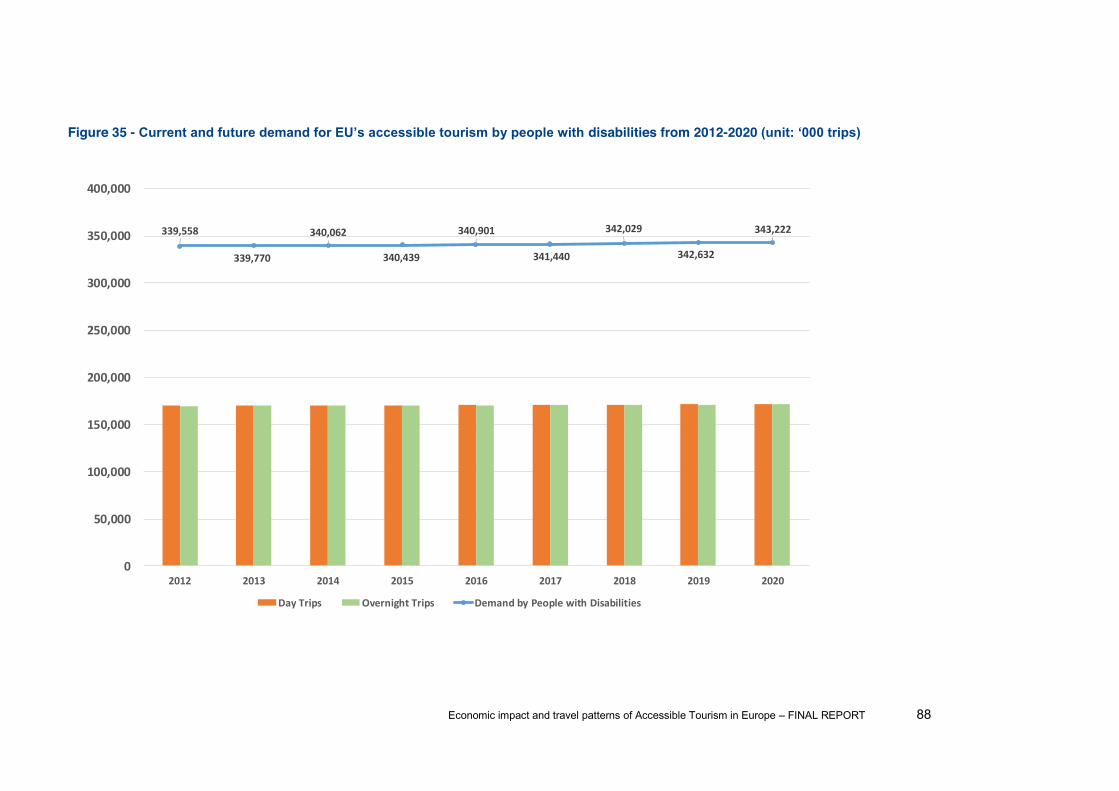
Economic impact and travel patterns of Accessible Tourism in Europe FINAL REPORT 88
Figure 35 - disabilities from 2012-2020
339,558
339,770
340,062
340,439
340,901
341,440
342,029
342,632
343,222
0
50,000
100,000
150,000
200,000
250,000
300,000
350,000
400,000
2012 2013 2014 2015 2016 2017 2018 2019 2020
Day Trips Overnight Trips Demand by People with Disabilities

Economic impact and travel patterns of Accessible Tourism in Europe FINAL REPORT 89
Figure 36 - -2020
443,209
452,073
461,307
470,759
480,314
489,897
499,467
509,029
518,647
0
100,000
200,000
300,000
400,000
500,000
600,000
2012 2013 2014 2015 2016 2017 2018 2019 2020
Day Trips Overnight Trips Demand by The Elderly People
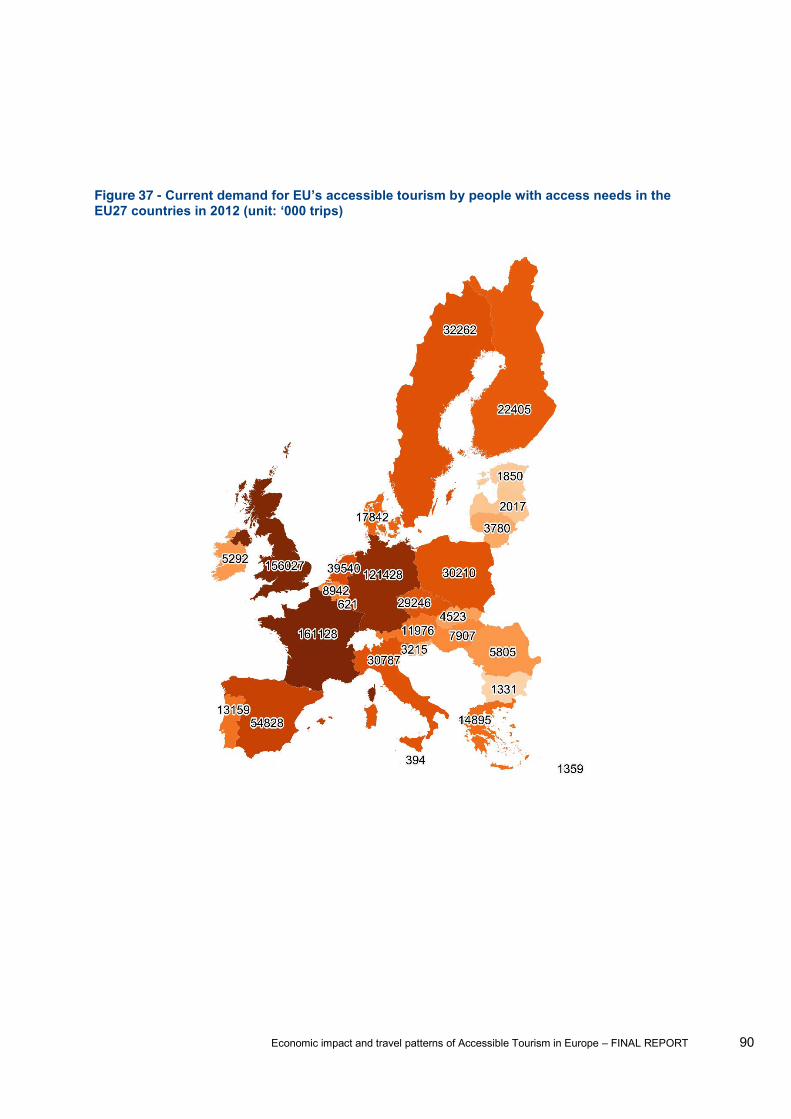
Economic impact and travel patterns of Accessible Tourism in Europe FINAL REPORT 90
Figure 37 -
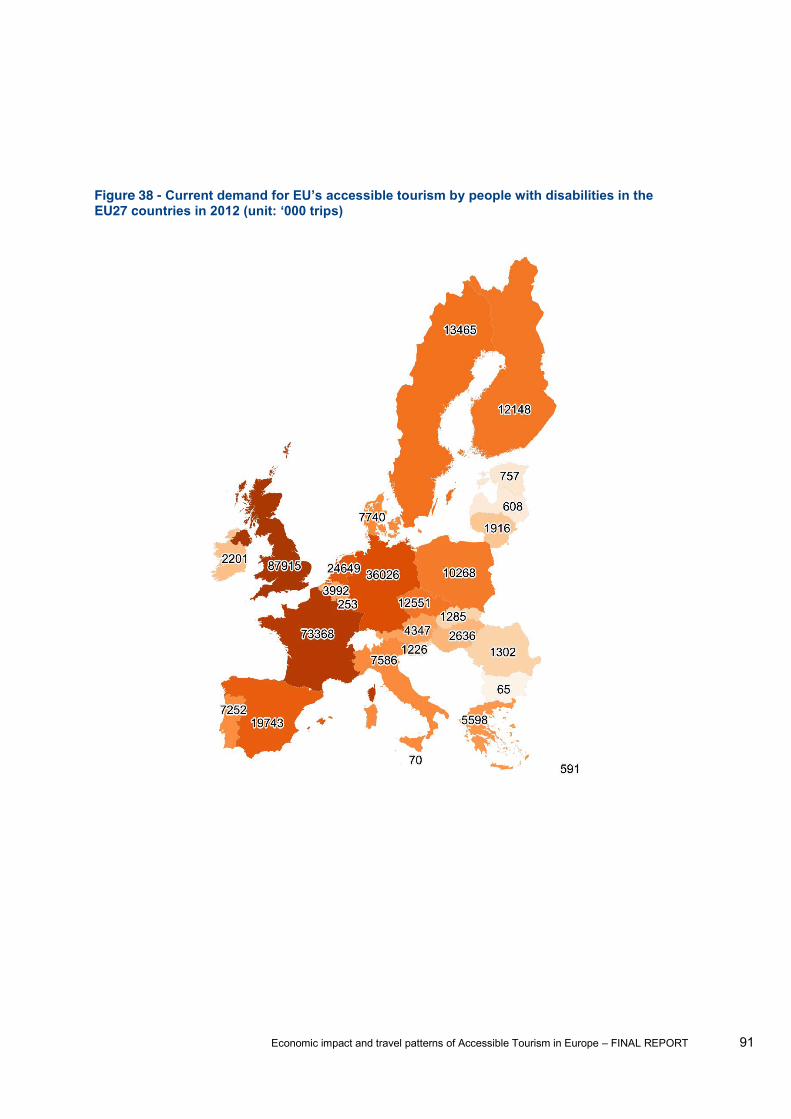
Economic impact and travel patterns of Accessible Tourism in Europe FINAL REPORT 91
Figure 38 - EU27 c

Economic impact and travel patterns of Accessible Tourism in Europe FINAL REPORT 92
Figure 39 -
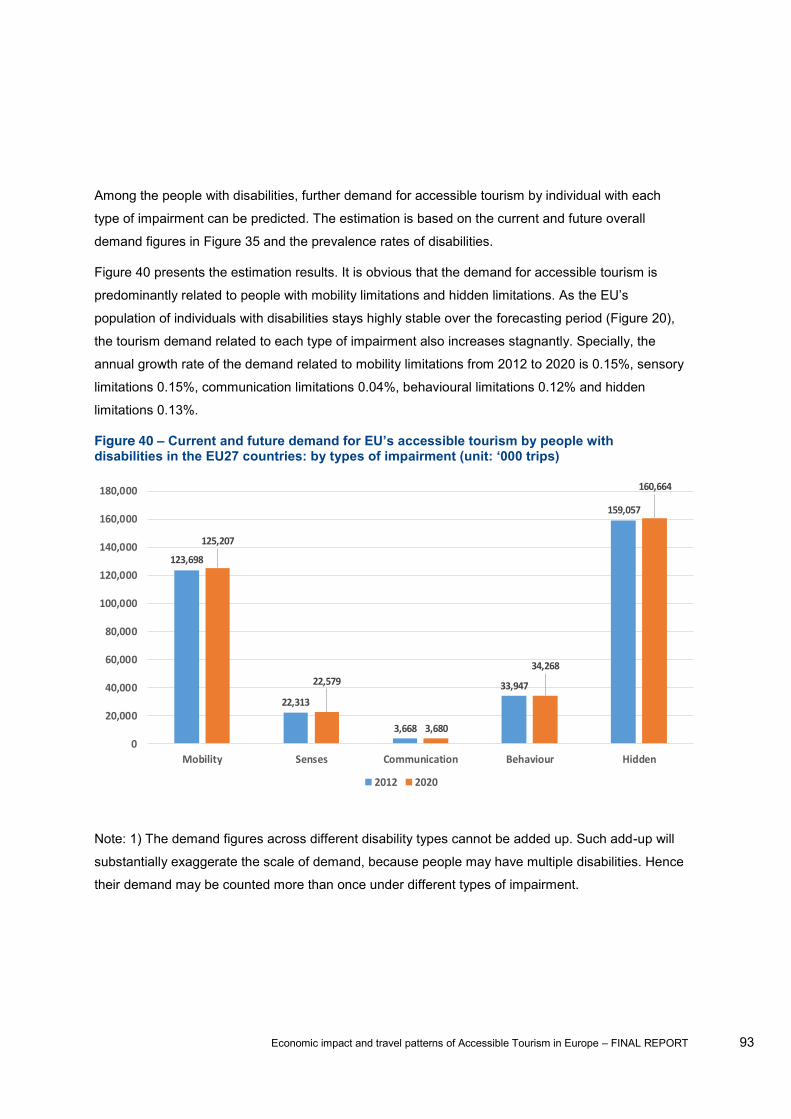
Economic impact and travel patterns of Accessible Tourism in Europe FINAL REPORT 93
Among the people with disabilities, further demand for accessible tourism by individual with each
type of impairment can be predicted. The estimation is based on the current and future overall
demand figures in Figure 35 and the prevalence rates of disabilities.
Figure 40 presents the estimation results. It is obvious that the demand for accessible tourism is
population of individuals with disabilities stays highly stable over the forecasting period (Figure 20),
the tourism demand related to each type of impairment also increases stagnantly. Specially, the
annual growth rate of the demand related to mobility limitations from 2012 to 2020 is 0.15%, sensory
limitations 0.15%, communication limitations 0.04%, behavioural limitations 0.12% and hidden
limitations 0.13%.
Figure 40
Note: 1) The demand figures across different disability types cannot be added up. Such add-up will
substantially exaggerate the scale of demand, because people may have multiple disabilities. Hence
their demand may be counted more than once under different types of impairment.
123,698
22,313
3,668
33,947
159,057
125,207
22,579
3,680
34,268
160,664
0
20,000
40,000
60,000
80,000
100,000
120,000
140,000
160,000
180,000
Mobility Senses Communication Behaviour Hidden
2012 2020

Economic impact and travel patterns of Accessible Tourism in Europe FINAL REPORT 94
3.2.4 Demand for accessible tourism under different scenarios of improvements
3.2.4.1 Travel behaviour under different scenarios It is anticipated that by improving the level of accessible facilities across the European Union, more
tourism demand can be elicited. This is generally supported by the responses to the survey.
This is addressed byQ26 in the questionnaire:
Q26. If Scenarios A, B or C were true for any EU destinations you were interested in visiting, would
you consider including some of these EU destinations in your travel plans for the next 12 months?
Among the people with disabilities that travelled last year, about 32.7%, 46.4% and 53.2% of them
would like to visit some of the destinations which are currently relatively weak in offering accessible
facilities, if the level of their accessible infrastructure could be improved under different scenarios A
(minimum improvements), B (medium improvements) and C (extensive improvements) respectively
(see Figure 41 and Annex S). Nevertheless, among these positive respondents only a small
proportion (13.8%, 13.9% and 41.1% respectively under different scenarios A, B and C, equivalent
to 4.5%, 6.4% and 21.9% of all respondents with disabilities) felt ready to increase their travel
budget and make additional trips to these destinations. The rest of the positive respondents were
more likely to switch between their previous travel destinations and new destinations without
increasing their usual travel budget1. The relatively cautious consideration of their travel budget is
likely to be influenced by the current uncertain economic climate in Europe.
Among the elderly population that travelled last year, about 20.5%, 29.5% and 38.0% of them
would like to visit some new destinations if accessibility were to be improved under different
scenarios A, B and C, respectively (see Figure 41 and Annex S). Compared to the travellers with
disabilities, a smaller proportion of elderly travellers who showed positive attitudes (8.3%, 10.5% and
26.1% respectively under different scenarios A, B and C, equivalent to 1.7%, 3.1% and 9.9% of all
the elderly respondents who travelled last year) was willing to increase their travel budget.
Understandably, the elderly travellers were more cautious with their financial planning especially in a
tough economic situation.
1 Effectively they would not contribute to the additional demand and additional economic contribution under each scenario. Therefore, the scenario forecasting and the following scenario economic impact estimation only considered the proportion of the respondents who were willing to both increase their budget and take additional trips. The same consideration was also applied to the calculations in relation to the other segment (i.e., the elderly population who travelled last year).

Economic impact and travel patterns of Accessible Tourism in Europe FINAL REPORT 95
Figure 41 - Increased willingness to travel under different scenarios existing travellers
However, an important dimension that needs to be taken into consideration is that under each
scenario, there will be people who but would be willing to travel, due to the
improvements in accessibility. Also from Q26 in the questionnaire, among the people with disabilities
that have not travelled last year, up to 24.2% would be willing to travel under Scenario A (minimum
improvements). Under Scenario B (medium improvements), 36.8% of these non-travellers would
become travellers, and under Scenario C (extensive improvements), the percentage would be
44.2%.
For the elderly people, though their willingness to convert from non-travellers to travellers is
apparently lower, the figures are still positive. Under Scenario A (minimum improvements), 16.1%
would be going to travel, whereas under Scenario B (medium improvements) and Scenario C
(extensive improvements), the percentage would become 19.5% and 25.3%, respectively.
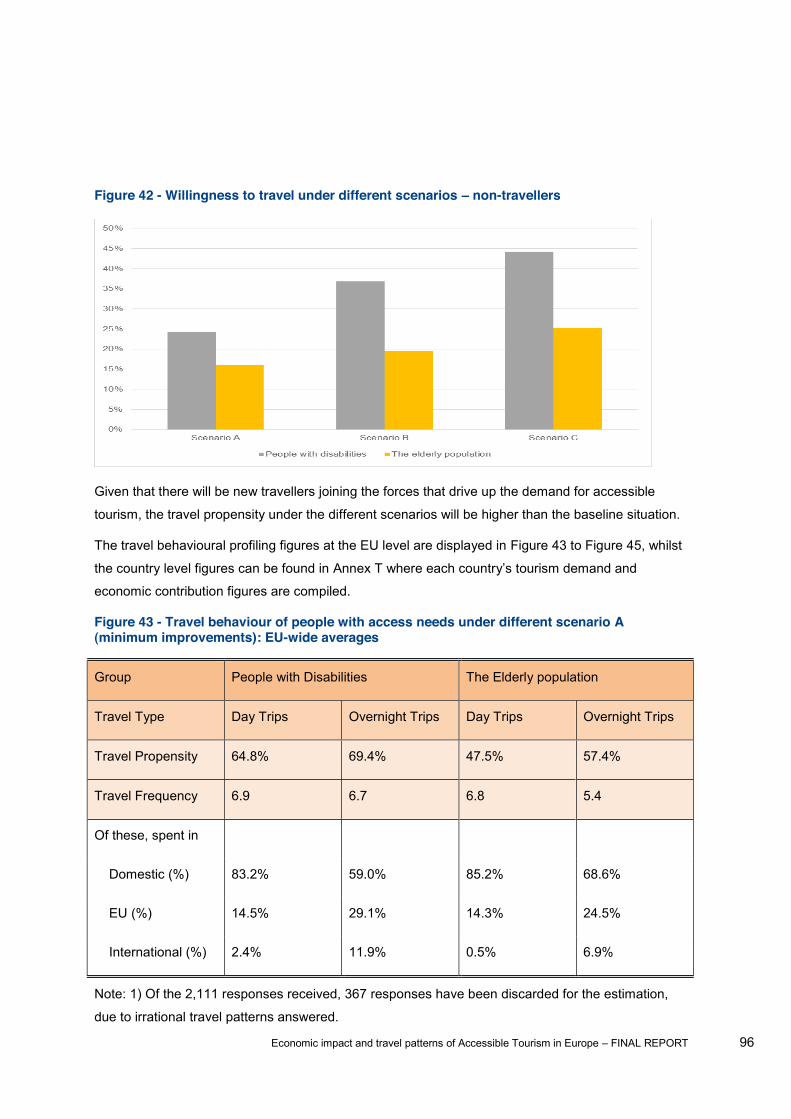
Economic impact and travel patterns of Accessible Tourism in Europe FINAL REPORT 96
Figure 42 - Willingness to travel under different scenarios non-travellers
Given that there will be new travellers joining the forces that drive up the demand for accessible
tourism, the travel propensity under the different scenarios will be higher than the baseline situation.
The travel behavioural profiling figures at the EU level are displayed in Figure 43 to Figure 45, whilst
the country level figures can be found in Annex T where each coun
economic contribution figures are compiled.
Figure 43 - Travel behaviour of people with access needs under different scenario A (minimum improvements): EU-wide averages
Group People with Disabilities The Elderly population
Travel Type Day Trips Overnight Trips Day Trips Overnight Trips
Travel Propensity 64.8% 69.4% 47.5% 57.4%
Travel Frequency 6.9 6.7 6.8 5.4
Of these, spent in
Domestic (%) 83.2% 59.0% 85.2% 68.6%
EU (%) 14.5% 29.1% 14.3% 24.5%
International (%) 2.4% 11.9% 0.5% 6.9%
Note: 1) Of the 2,111 responses received, 367 responses have been discarded for the estimation,
due to irrational travel patterns answered.
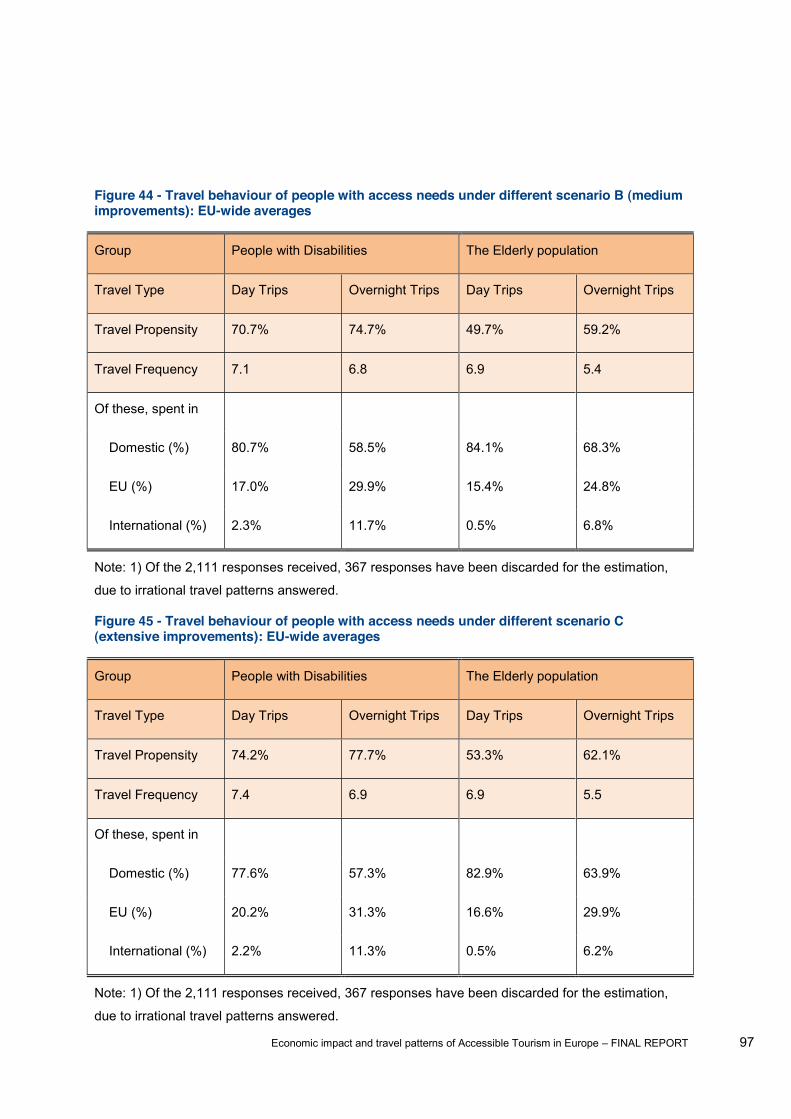
Economic impact and travel patterns of Accessible Tourism in Europe FINAL REPORT 97
Figure 44 - Travel behaviour of people with access needs under different scenario B (medium improvements): EU-wide averages
Group People with Disabilities The Elderly population
Travel Type Day Trips Overnight Trips Day Trips Overnight Trips
Travel Propensity 70.7% 74.7% 49.7% 59.2%
Travel Frequency 7.1 6.8 6.9 5.4
Of these, spent in
Domestic (%) 80.7% 58.5% 84.1% 68.3%
EU (%) 17.0% 29.9% 15.4% 24.8%
International (%) 2.3% 11.7% 0.5% 6.8%
Note: 1) Of the 2,111 responses received, 367 responses have been discarded for the estimation,
due to irrational travel patterns answered.
Figure 45 - Travel behaviour of people with access needs under different scenario C (extensive improvements): EU-wide averages
Group People with Disabilities The Elderly population
Travel Type Day Trips Overnight Trips Day Trips Overnight Trips
Travel Propensity 74.2% 77.7% 53.3% 62.1%
Travel Frequency 7.4 6.9 6.9 5.5
Of these, spent in
Domestic (%) 77.6% 57.3% 82.9% 63.9%
EU (%) 20.2% 31.3% 16.6% 29.9%
International (%) 2.2% 11.3% 0.5% 6.2%
Note: 1) Of the 2,111 responses received, 367 responses have been discarded for the estimation,
due to irrational travel patterns answered.
Economic impact and travel patterns of Accessible Tourism in Europe FINAL REPORT 98
3.2.4.2 Tourism demand and forecasts under different scenarios Based on the travel behaviour profiling figures, the tourism demand can be estimated in a way
similar to Figure 33, which follows exactly the rationale described in the methodology section.
The tourism demand trends from 2012 to 2020 are displayed in Figure 47 to Figure 49. To highlight
the new trips taken under the scenarios of improvements, the figures use stacked columns, which
illustrate the build-up of demand with improvements in accessibility.
Overall, the demand will see a leap from the baseline situation to Scenario A. By drawing on the
figures from 2012, the baseline current demand is 782.8 million trips by all people with access needs
in the EU27 area1. With minimum improvements, the tourism demand could jump to 971.9 million
trips, or an increase of 24.2%. From Scenario A to Scenario B, however, the difference is relatively
small, at around 7.3% when compared to Scenario A, or 33.2% when compared to the baseline. A
further 7.8% from Scenario B to Scenario C can be expected, when almost all buildings are made
accessible together with services catered to special access needs. Figure 46 summarises the
increase of tourism demand under all three scenarios.
The figures for country level tourism demand under different scenarios can be found in Annex T.
1 The baseline figures can be found in Section 3.2.3.2. More specifically, the demand numbers in Figure 47 to Figure 49 are all baseline figures.
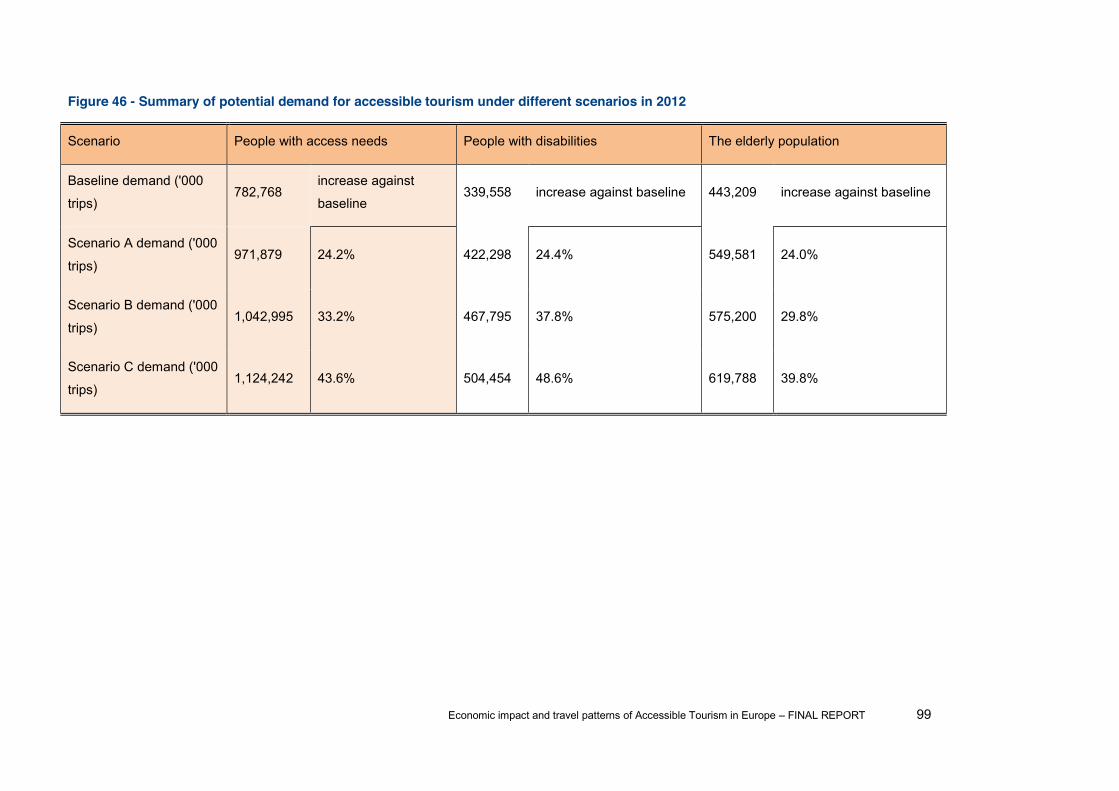
Economic impact and travel patterns of Accessible Tourism in Europe FINAL REPORT 99
Figure 46 - Summary of potential demand for accessible tourism under different scenarios in 2012
Scenario People with access needs People with disabilities The elderly population
Baseline demand ('000
trips) 782,768
increase against
baseline 339,558 increase against baseline 443,209 increase against baseline
Scenario A demand ('000
trips) 971,879 24.2% 422,298 24.4% 549,581 24.0%
Scenario B demand ('000
trips) 1,042,995 33.2% 467,795 37.8% 575,200 29.8%
Scenario C demand ('000
trips) 1,124,242 43.6% 504,454 48.6% 619,788 39.8%
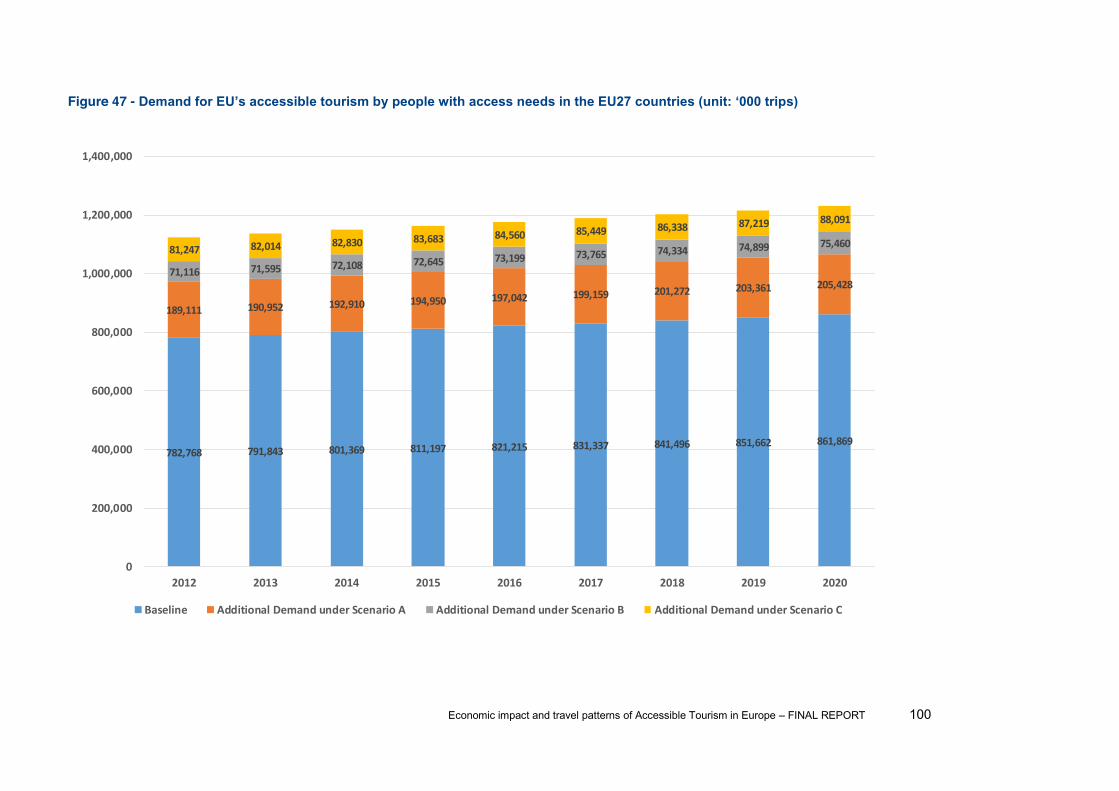
Economic impact and travel patterns of Accessible Tourism in Europe FINAL REPORT 100
Figure 47 -
782,768 791,843 801,369 811,197 821,215 831,337 841,496 851,662 861,869
189,111 190,952 192,910 194,950 197,042 199,159 201,272 203,361 205,42871,116 71,595 72,108 72,645 73,199 73,765 74,334 74,899 75,46081,247 82,014 82,830 83,683 84,560 85,449 86,338 87,219 88,091
0
200,000
400,000
600,000
800,000
1,000,000
1,200,000
1,400,000
2012 2013 2014 2015 2016 2017 2018 2019 2020
Baseline Additional Demand under Scenario A Additional Demand under Scenario B Additional Demand under Scenario C
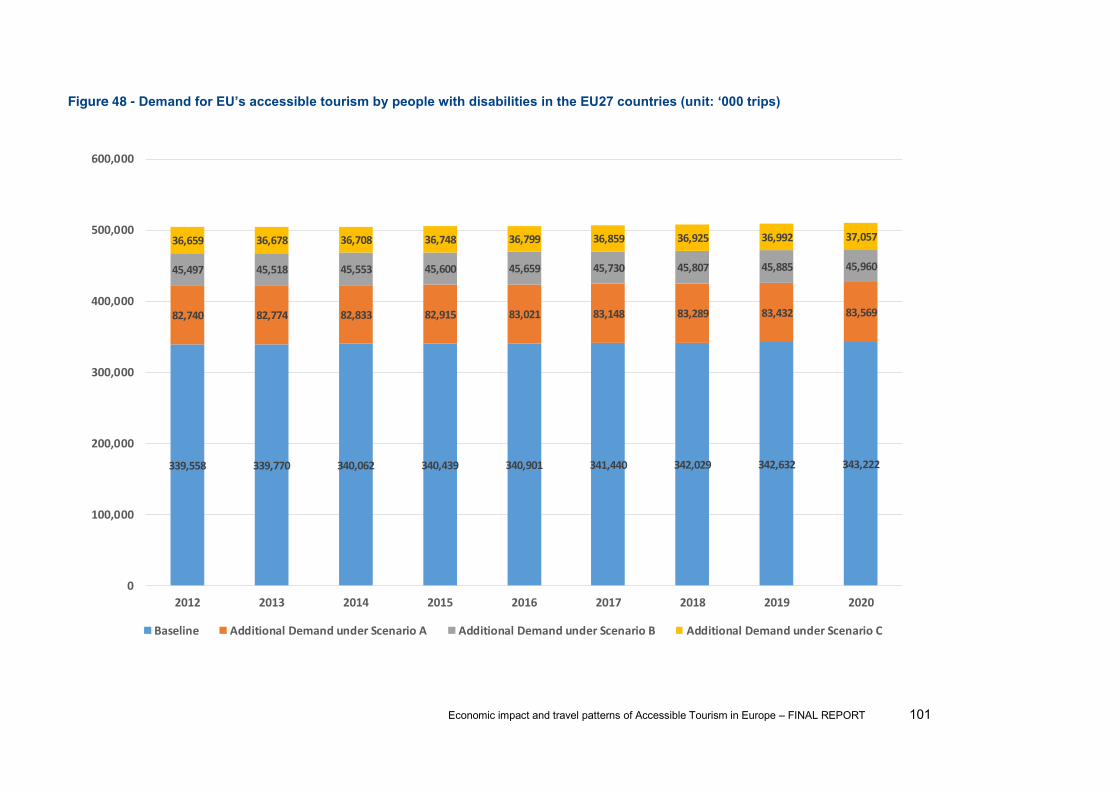
Economic impact and travel patterns of Accessible Tourism in Europe FINAL REPORT 101
Figure 48 -
339,558 339,770 340,062 340,439 340,901 341,440 342,029 342,632 343,222
82,740 82,774 82,833 82,915 83,021 83,148 83,289 83,432 83,569
45,497 45,518 45,553 45,600 45,659 45,730 45,807 45,885 45,960
36,659 36,678 36,708 36,748 36,799 36,859 36,925 36,992 37,057
0
100,000
200,000
300,000
400,000
500,000
600,000
2012 2013 2014 2015 2016 2017 2018 2019 2020
Baseline Additional Demand under Scenario A Additional Demand under Scenario B Additional Demand under Scenario C
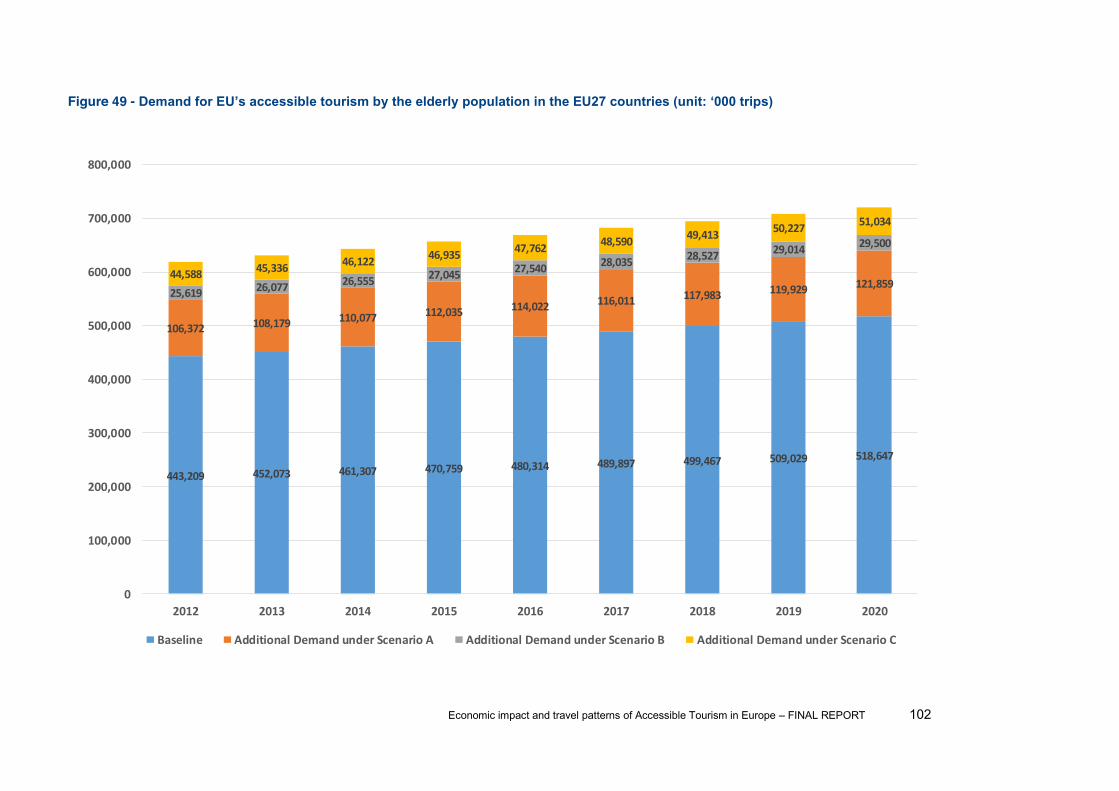
Economic impact and travel patterns of Accessible Tourism in Europe FINAL REPORT 102
Figure 49 -
443,209 452,073 461,307 470,759 480,314 489,897 499,467 509,029 518,647
106,372 108,179 110,077 112,035 114,022 116,011 117,983 119,929 121,85925,619 26,077 26,555 27,045 27,540 28,035 28,527 29,014 29,500
44,588 45,336 46,122 46,935 47,762 48,590 49,413 50,227 51,034
0
100,000
200,000
300,000
400,000
500,000
600,000
700,000
800,000
2012 2013 2014 2015 2016 2017 2018 2019 2020
Baseline Additional Demand under Scenario A Additional Demand under Scenario B Additional Demand under Scenario C

Economic impact and travel patterns of Accessible Tourism in Europe FINAL REPORT 103
3.2.5 Demand for accessible tourism International inbound markets
3.2.5.1 Travel behaviour
For the international inbound markets, a literature review was carried out with regard to mainly the
profile of senior travellers from these markets. Thirty-seven journal articles and books were
identified, with the key findings of each study summarised (see Annex D1 for full details of the
summary, Annex D2 for additional numerical profiling of selected markets, and Annex D3 for a full
list of the 37 articles and books).
The demographic profiling of the EU27 accessible tourism demand was performed based on the
primary data collected from the online survey among cluster representative countries. With regard to
international inbound markets, an online survey was conducted via specialised organisations based
in those countries. In order to validate and support the data collected through these additional
channels, efforts have been made to collect relevant information from secondary data sources
mainly quantitative studies published in academic journals and books.
The key non-EU inbound markets covered in this literature review include Brazil, China, the USA,
Japan, Australia, Norway and Switzerland. For the Russian market, only general tourist behaviour,
not specifically related to the senior traveller segment, was identified. For the Indian market, no
studies were found. This indicates a lack of knowledge of the Russian and Indian outbound tourism
markets, despite the fact that they are two emerging source markets for outbound travel.
A general observation of the senior tourism market is that it has received much attention from
industry practitioners in many countries. A major reason for this is that the number of international
senior tourists, especially from Europe and North America, has consistently increased over the past
10 years (Alén et al., 2012) 1. It is widely recognised that senior travellers often have large amounts
of discretionary income due to the wealth they have accumulated over their lifetimes (Chon and
Singh, 19952 3; Bai et al., 20014). Many are willing to spend a large portion of
1 Alén, E., Domínguez, T., & Losada, N. (2012). New Opportunities for the Tourism Market: Senior Tourism and -Creating and Sustaining
en.com).. 2 Chon S, & Singh A. (1995). Marketing resorts to 2000: review of trends in the USA. Tourism Management 16(6):463 469. 3 Journal of Travel and Tourism Marketing 9(1/2): 21 42. 4 States. Journal of Hospitably and Leisure Marketing 8(3): 147 168.
Economic impact and travel patterns of Accessible Tourism in Europe FINAL REPORT 104
this income on leisure activities, including overseas travel (Teaff and Turpin, 19961; Thai Farmers
Research Center, 19992; Bai et al., 20013). And, importantly, senior travellers often have more time
to travel than any other age groups, as most are retired, and have fewer family responsibilities (Teaff
and Turpin, 19964). Time flexibility after retirement among seniors, makes the senior travel market
more attractive to travel businesses that suffer from seasonal demand fluctuation (Jang and Wu,
20065).
In addition to the profiling of the senior travel market, the literature regarding the profile of travellers
with disabilities from the international inbound markets was examined. However, only very limited
research has been found containing relevant quantitative information of profiling.
Van Horn (2012)6 analysed the travel behaviour of people with disabilities in the USA, based on the
roughly 70% of adults with disabilities travel at least once in a two-year period. In terms of travel
frequency, they take about two trips every two years, with each trip lasting 5 days. Whilst travelling,
the typical adult with a disability spends US$430. But the typical spending on international travel is
up to almost US$1,600 per trip7.
Dwyer and Darcy (2010)8 conducted an economic impact study on accessible tourism in Australia.
The study made use of the data from the Australian Tourism Satellite Account (TSA) and the
National Visitor Survey. The data suggest that when a person with a disability travels on an
overnight trip, they are in a group of between 2 to 8 people (on average 3). With regard to spending,
the expenditure on overnight trips by people with disabilities (AU$444) is roughly 76% of their non-
1 Teaff J, & Turpin T. (1996). Travel and the elderly. Parks and Recreation 31(6): 16 19. 2 Thai Farmers Research Center. (1999). Senior Tourists: Next Target Visitors with High Purchasing Power. Available at http://www.krc.co.th/tfrc/cgi/ticket/ticket.exe 3 Bai, B., United States. Journal of Hospitably and Leisure Marketing 8(3): 147 168. 4 Teaff, J., & Turpin, T. (1996). Travel and the elderly. Parks and Recreation 31(6): 16 19. 5 Jang, S., & Wu, C. (2006). Seniors travel motivation and the influential factors: an examination of Taiwanese senior. Tourism Management 27(2):306 316. 6 Van Horn, L. (2012). The United States: Travellers with disabilities. Best practice in accessible tourism: Inclusion, disability, ageing population and tourism, 65-78. 7 Research among Adults with Disabilities: Travel and Hospitality. (https://www.google.co.uk/url?sa=t&rct=j&q=&esrc=s&source=web&cd=6&cad=rja&ved=0CFMQFjAF&url=http%3A%2F%2Fwww.ossate.org%2Fdocs%2Fresults_2nd_Intern_workshop%2FZografopoulos.ppt&ei=8t6pUvHiC83xhQe-uYDwBA&usg=AFQjCNEmPpbYHOIios96LxDLbYHO43IYFw&bvm=bv.57967247,d.ZG4) 8 Dwyer, L., & Darcy, S. (2010). Economic contribution of tourists with disabilities: An Australian approach and methodology. Accessible Tourism.

Economic impact and travel patterns of Accessible Tourism in Europe FINAL REPORT 105
disabled counterparts (AU$582). On average they had 5 trips away annually, staying for 4.98 nights.
However, as the study focuses only on the domestic and inbound tourism in Australia, it is of limited
use with regard to the behaviour of the Australians with disabilities travelling to the EU. As with the
estimation for the EU markets, a tourism demand calculation for the key international markets has to
make use of the primary data collected via the specialised organisations. Four major countries,
namely Brazil, China, Russia and the USA, have been selected to conduct the online survey. In total
423 responses (including both people with disabilities and the elderly population) have been
received ; of which 9 responses were discarded during the estimation process, as irrational travel
patterns have been identified (for example, the total number of days travelled over the last 12
months exceeds 365).
Following the rationale described in Section 3.2.1, two behavioural parameters, i.e., the travel
propensity and the travel frequency, are to be extracted from the survey data. A preliminary
calculation showed that, among people with disabilities that have been surveyed, between 14.8%
and 64.6% claimed that they had overnight trips1 to the EU over the last 12 months. The travel
frequency of those travellers can be up to 2.5 to 4.0 times per year. Similarly, among the elderly
population surveyed, between 5.5% and 18.4% reported that they had travelled to the EU on
overnight trips. The frequency is about 1.0 to 2.3 times per year.
From the preliminary results, the departure number (i.e., travel propensity × travel frequency) ranges
between 59.3 trips and 162.5 trips for every 100 people with disabilities, and between 5.5 trips and
39.6 trips for every 100 elderly people.
Compared with the generic tourism sector (all age groups, with or without access needs), the
preliminary results draw a too optimistic picture of accessible tourism. According to the statistics
from Eurostat (series code: tour_occ_arnraw2) and the population figures from the World Bank3, the
departures to the EU per 100 people for the international inbound markets are shown in Figure 50.
1 As it would be unrealistic to travel from the international markets to the EU within a day trip, the estimation for the international inbound markets only focused on the overnight trips. 2 http://appsso.eurostat.ec.europa.eu/nui/show.do?dataset=tour_occ_arnraw&lang=en 3 Population dynamics and structure, World Development Indicators database (http://databank.worldbank.org/data/home.aspx)
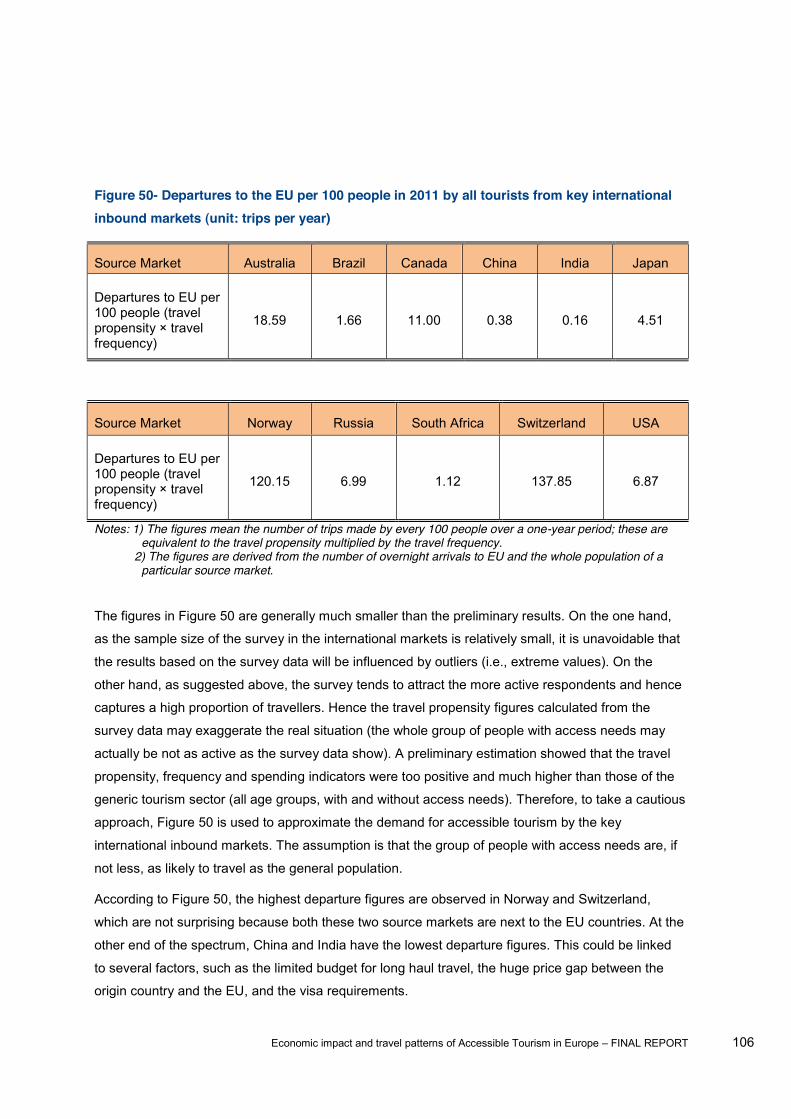
Economic impact and travel patterns of Accessible Tourism in Europe FINAL REPORT 106
Figure 50- Departures to the EU per 100 people in 2011 by all tourists from key international inbound markets (unit: trips per year)
Source Market Australia Brazil Canada China India Japan
Departures to EU per 100 people (travel propensity × travel frequency)
18.59 1.66 11.00 0.38 0.16 4.51
Source Market Norway Russia South Africa Switzerland USA
Departures to EU per 100 people (travel propensity × travel frequency)
120.15 6.99 1.12 137.85 6.87
Notes: 1) The figures mean the number of trips made by every 100 people over a one-year period; these are equivalent to the travel propensity multiplied by the travel frequency.
2) The figures are derived from the number of overnight arrivals to EU and the whole population of a particular source market.
The figures in Figure 50 are generally much smaller than the preliminary results. On the one hand,
as the sample size of the survey in the international markets is relatively small, it is unavoidable that
the results based on the survey data will be influenced by outliers (i.e., extreme values). On the
other hand, as suggested above, the survey tends to attract the more active respondents and hence
captures a high proportion of travellers. Hence the travel propensity figures calculated from the
survey data may exaggerate the real situation (the whole group of people with access needs may
actually be not as active as the survey data show). A preliminary estimation showed that the travel
propensity, frequency and spending indicators were too positive and much higher than those of the
generic tourism sector (all age groups, with and without access needs). Therefore, to take a cautious
approach, Figure 50 is used to approximate the demand for accessible tourism by the key
international inbound markets. The assumption is that the group of people with access needs are, if
not less, as likely to travel as the general population.
According to Figure 50, the highest departure figures are observed in Norway and Switzerland,
which are not surprising because both these two source markets are next to the EU countries. At the
other end of the spectrum, China and India have the lowest departure figures. This could be linked
to several factors, such as the limited budget for long haul travel, the huge price gap between the
origin country and the EU, and the visa requirements.
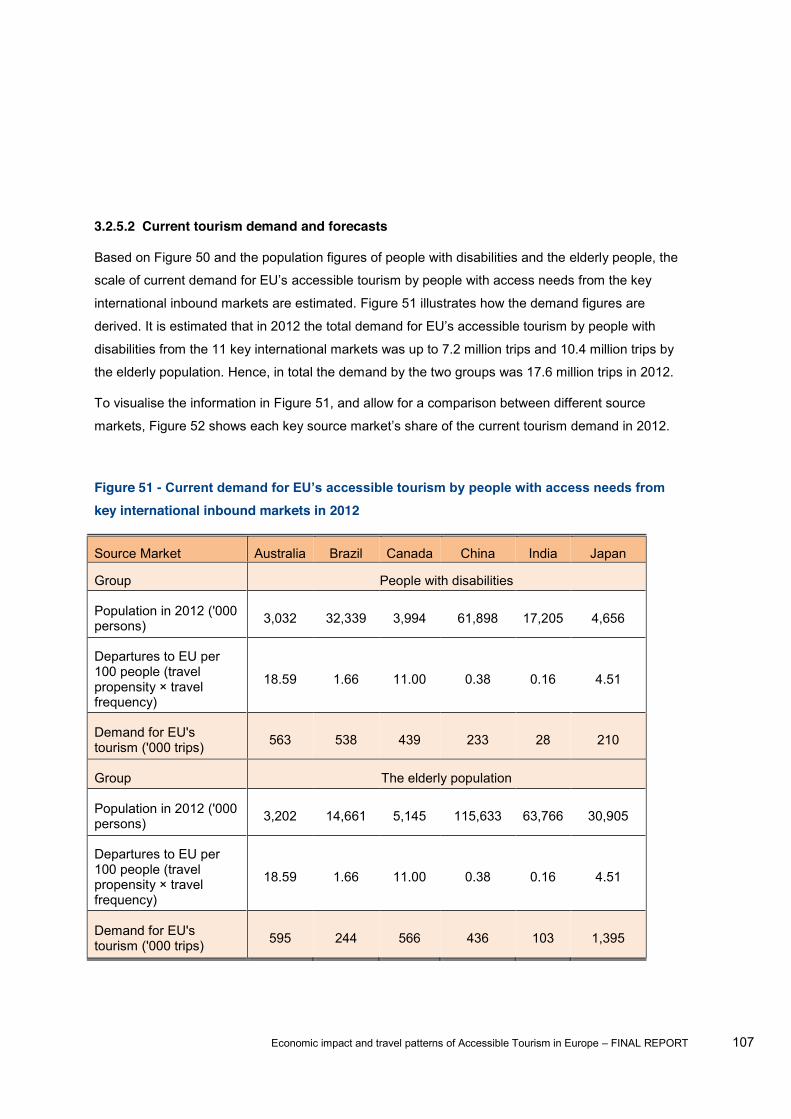
Economic impact and travel patterns of Accessible Tourism in Europe FINAL REPORT 107
3.2.5.2 Current tourism demand and forecasts
Based on Figure 50 and the population figures of people with disabilities and the elderly people, the
accessible tourism by people with access needs from the key
international inbound markets are estimated. Figure 51 illustrates how the demand figures are
disabilities from the 11 key international markets was up to 7.2 million trips and 10.4 million trips by
the elderly population. Hence, in total the demand by the two groups was 17.6 million trips in 2012.
To visualise the information in Figure 51, and allow for a comparison between different source
markets, Figure 52
Figure 51 - key international inbound markets in 2012
Source Market Australia Brazil Canada China India Japan
Group People with disabilities
Population in 2012 ('000 persons) 3,032 32,339 3,994 61,898 17,205 4,656
Departures to EU per 100 people (travel propensity × travel frequency)
18.59 1.66 11.00 0.38 0.16 4.51
Demand for EU's tourism ('000 trips) 563 538 439 233 28 210
Group The elderly population
Population in 2012 ('000 persons) 3,202 14,661 5,145 115,633 63,766 30,905
Departures to EU per 100 people (travel propensity × travel frequency)
18.59 1.66 11.00 0.38 0.16 4.51
Demand for EU's tourism ('000 trips) 595 244 566 436 103 1,395
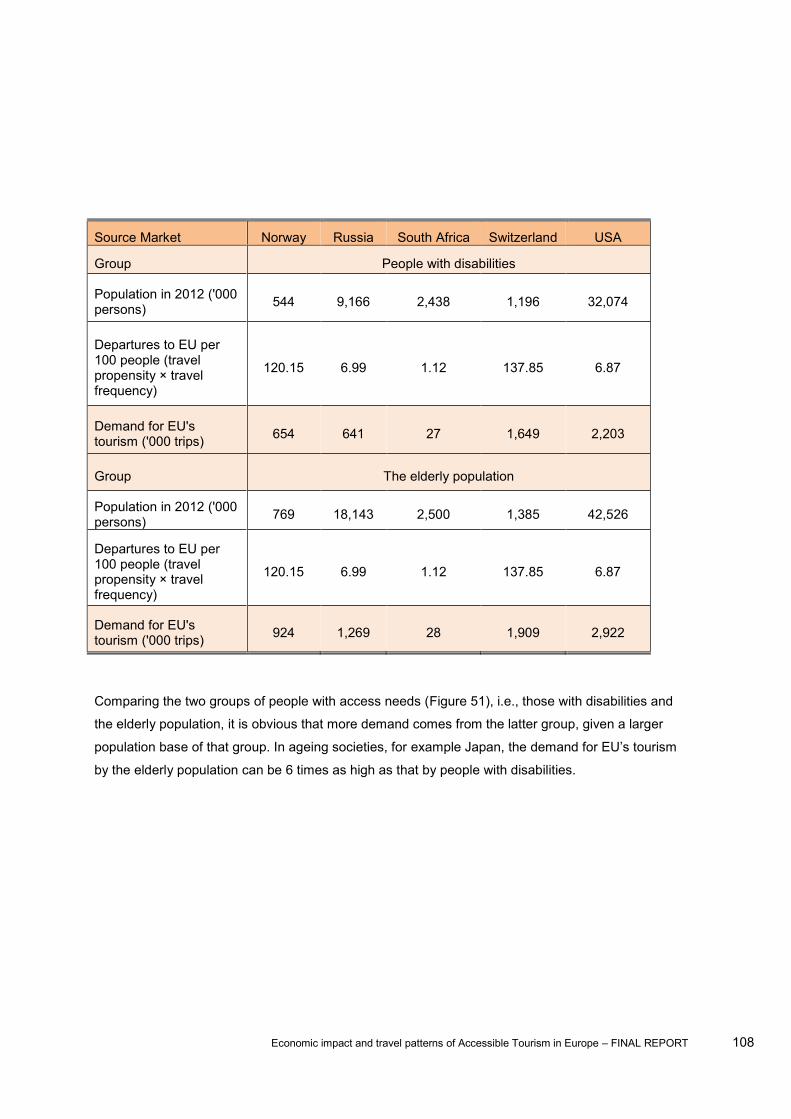
Economic impact and travel patterns of Accessible Tourism in Europe FINAL REPORT 108
Source Market Norway Russia South Africa Switzerland USA
Group People with disabilities
Population in 2012 ('000 persons) 544 9,166 2,438 1,196 32,074
Departures to EU per 100 people (travel propensity × travel frequency)
120.15 6.99 1.12 137.85 6.87
Demand for EU's tourism ('000 trips) 654 641 27 1,649 2,203
Group The elderly population
Population in 2012 ('000 persons) 769 18,143 2,500 1,385 42,526
Departures to EU per 100 people (travel propensity × travel frequency)
120.15 6.99 1.12 137.85 6.87
Demand for EU's tourism ('000 trips) 924 1,269 28 1,909 2,922
Comparing the two groups of people with access needs (Figure 51), i.e., those with disabilities and
the elderly population, it is obvious that more demand comes from the latter group, given a larger
population base of that group. In ageing societies, for
by the elderly population can be 6 times as high as that by people with disabilities.
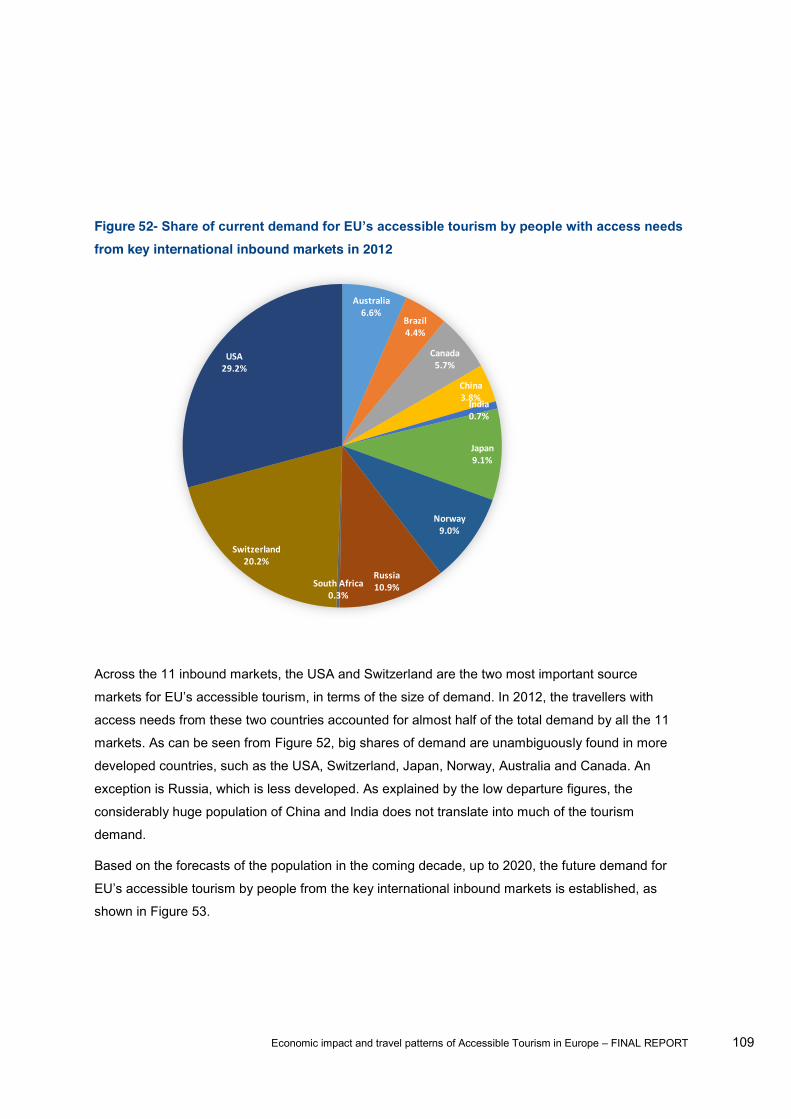
Economic impact and travel patterns of Accessible Tourism in Europe FINAL REPORT 109
Figure 52- from key international inbound markets in 2012
Across the 11 inbound markets, the USA and Switzerland are the two most important source
access needs from these two countries accounted for almost half of the total demand by all the 11
markets. As can be seen from Figure 52, big shares of demand are unambiguously found in more
developed countries, such as the USA, Switzerland, Japan, Norway, Australia and Canada. An
exception is Russia, which is less developed. As explained by the low departure figures, the
considerably huge population of China and India does not translate into much of the tourism
demand.
Based on the forecasts of the population in the coming decade, up to 2020, the future demand for
shown in Figure 53.
Australia6.6%
Brazil4.4%
Canada5.7%
China3.8%India0.7%
Japan9.1%
Norway9.0%
Russia10.9%South Africa
0.3%
Switzerland20.2%
USA29.2%

Economic impact and travel patterns of Accessible Tourism in Europe FINAL REPORT 110
Figure 53 - needs from the key international inbound markets from 2012-2020
As with the pattern found in the EU source markets, the tourism demand from the international
markets will also continue to be dominated by the elderly population over the years to come.
Specifically, from Figure 53 it can be seen that the implied growth rate of demand by people with
disabilities is merely 0.55% per year, whereas that for the elderly population could reach 2.90% per
year. Compared with the EU sources markets (annual growth rates at 0.12% for people with
disabilities, and 1.98% for the elderly population), the international inbound markets look much more
promising.
Among the people with disabilities, the demand for accessible tourism according to each type of
impairment can be further established. As official secondary data on the prevalence of each
impairment type are not found in every inbound market, the estimation is only carried out for those
countries where the data are available. No total demand figures for each impairment type are
provided. The estimation results at the country level can be found in Annex T, which consists of the
7,186 7,228 7,269 7,308 7,346 7,384 7,425 7,467 7,511
10,390 10,679 10,984 11,300 11,630 11,969 12,318 12,681 13,058
17,576 17,906 18,252 18,608 18,976 19,353 19,743 20,148 20,569
0
5,000
10,000
15,000
20,000
25,000
2012 2013 2014 2015 2016 2017 2018 2019 2020People with disabilities The elderly population People with access needs
Economic impact and travel patterns of Accessible Tourism in Europe FINAL REPORT 111
3.2.6 Demand for accessible tourism under different scenarios International inbound markets
3.2.6.1 Travel behaviour under different scenarios
Under different scenarios of improvements, it is expected that ever more people with access needs
from the international inbound markets would be willing to visit EU destinations.
When investigating the survey data, a distinction is made between existing travellers and new
travellers. It should be noted that the existing travellers mentioned in this section refer to those who
have visited the EU over the last 12 months. Accordingly, the new travellers are those who have not visited the EU during this past year but are willing to travel under different scenarios; this group
includes both those who simply have not travelled to any destination at all and those who have only
travelled to destinations other than the EU countries.
Of the 423 responses received, as explained in Section 3.2.5.1, 9 were discarded due to irrational
travel behaviour reported. Another 84 responses were further filtered out, due to irrational answers
to travel behaviour under different scenarios. Hence, for the purpose of this calculation, only 330
responses were used.
For people from the international markets (specifically Brazil, China, Russia and the USA which
were included in the survey), it is a long haul journey to travel to the EU destinations. It is thus not
surprising that only a small fraction of the population can travel to the EU, considering that many will
be constrained by limited time and budget.
Of the 330 respondents with access needs, only 66 (or 20% of the sample) reported that they had travelled to the EU over this last year. Answers from these 66 respondents are still quite
encouraging when it comes to their travel behaviour under different scenarios. However, due to the
low base size, the results should be interpreted with caution.
Figure 54 and Annex S summarise the statistics.
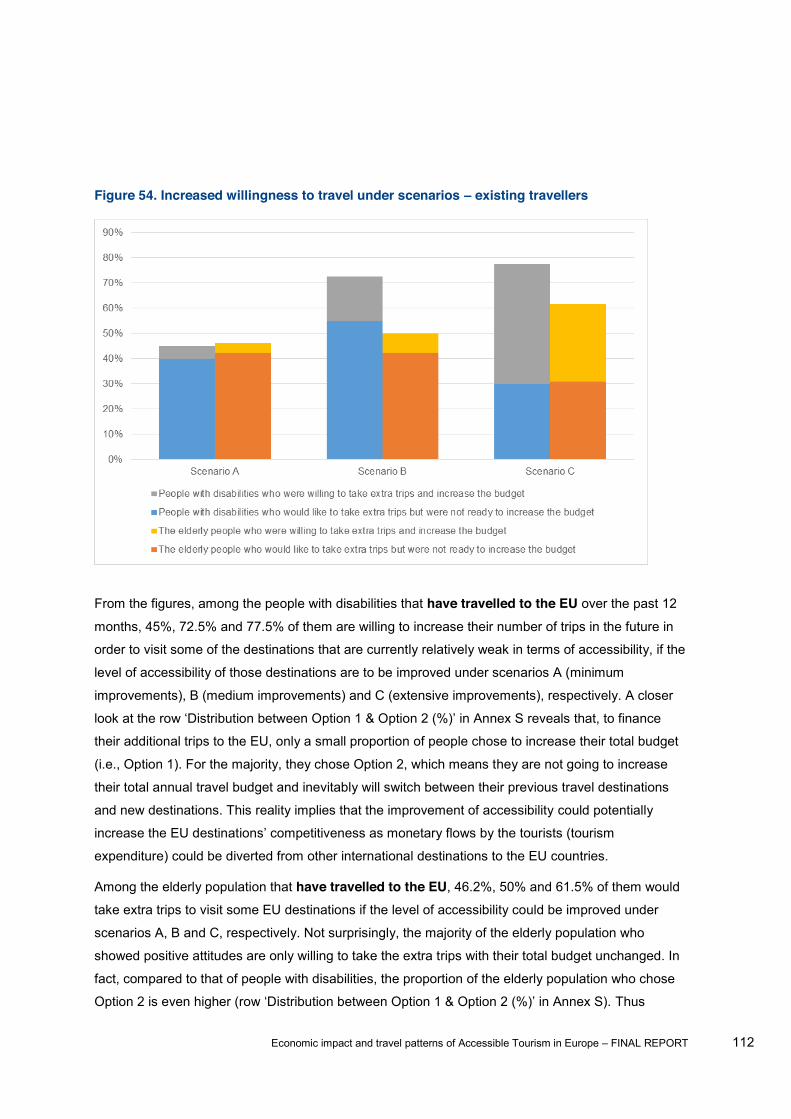
Economic impact and travel patterns of Accessible Tourism in Europe FINAL REPORT 112
Figure 54. Increased willingness to travel under scenarios existing travellers
From the figures, among the people with disabilities that have travelled to the EU over the past 12
months, 45%, 72.5% and 77.5% of them are willing to increase their number of trips in the future in
order to visit some of the destinations that are currently relatively weak in terms of accessibility, if the
level of accessibility of those destinations are to be improved under scenarios A (minimum
improvements), B (medium improvements) and C (extensive improvements), respectively. A closer
their additional trips to the EU, only a small proportion of people chose to increase their total budget
(i.e., Option 1). For the majority, they chose Option 2, which means they are not going to increase
their total annual travel budget and inevitably will switch between their previous travel destinations
and new destinations. This reality implies that the improvement of accessibility could potentially
increase the EU destinat
expenditure) could be diverted from other international destinations to the EU countries.
Among the elderly population that have travelled to the EU, 46.2%, 50% and 61.5% of them would
take extra trips to visit some EU destinations if the level of accessibility could be improved under
scenarios A, B and C, respectively. Not surprisingly, the majority of the elderly population who
showed positive attitudes are only willing to take the extra trips with their total budget unchanged. In
fact, compared to that of people with disabilities, the proportion of the elderly population who chose
Thus
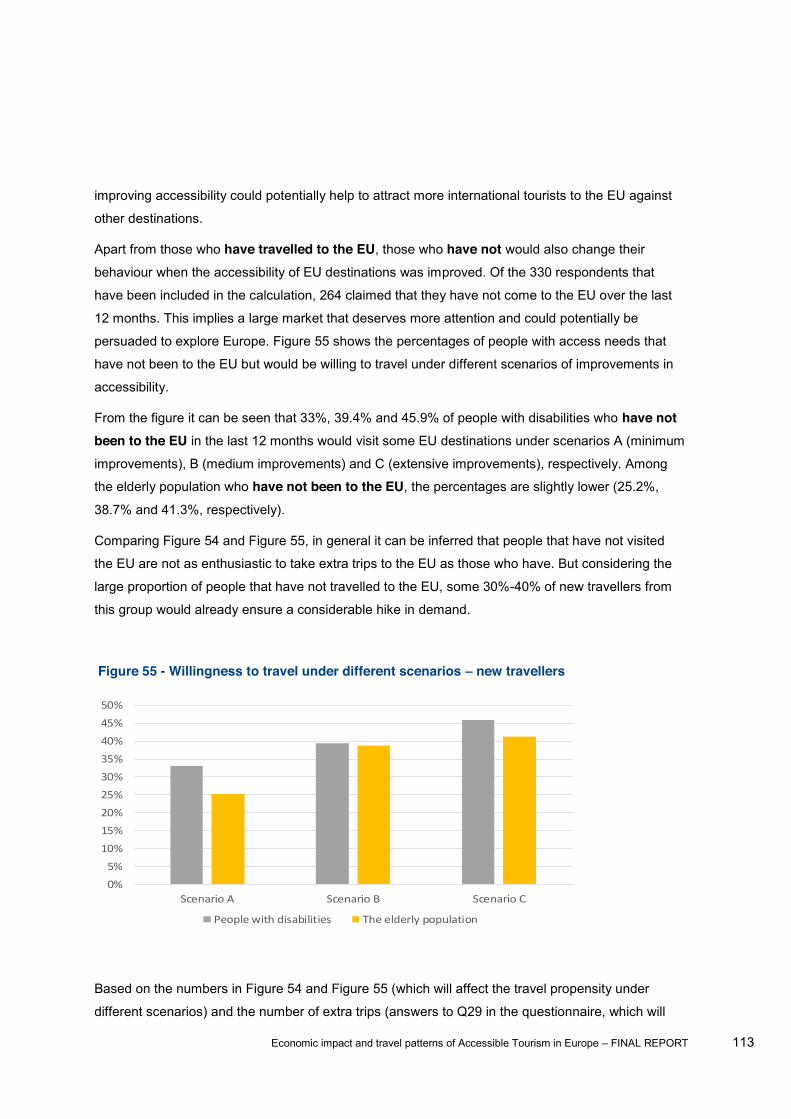
Economic impact and travel patterns of Accessible Tourism in Europe FINAL REPORT 113
improving accessibility could potentially help to attract more international tourists to the EU against
other destinations.
Apart from those who have travelled to the EU, those who have not would also change their
behaviour when the accessibility of EU destinations was improved. Of the 330 respondents that
have been included in the calculation, 264 claimed that they have not come to the EU over the last
12 months. This implies a large market that deserves more attention and could potentially be
persuaded to explore Europe. Figure 55 shows the percentages of people with access needs that
have not been to the EU but would be willing to travel under different scenarios of improvements in
accessibility.
From the figure it can be seen that 33%, 39.4% and 45.9% of people with disabilities who have not been to the EU in the last 12 months would visit some EU destinations under scenarios A (minimum
improvements), B (medium improvements) and C (extensive improvements), respectively. Among
the elderly population who have not been to the EU, the percentages are slightly lower (25.2%,
38.7% and 41.3%, respectively).
Comparing Figure 54 and Figure 55, in general it can be inferred that people that have not visited
the EU are not as enthusiastic to take extra trips to the EU as those who have. But considering the
large proportion of people that have not travelled to the EU, some 30%-40% of new travellers from
this group would already ensure a considerable hike in demand.
Figure 55 - Willingness to travel under different scenarios new travellers
Based on the numbers in Figure 54 and Figure 55 (which will affect the travel propensity under
different scenarios) and the number of extra trips (answers to Q29 in the questionnaire, which will
0%5%10%15%20%25%30%35%40%45%50%
Scenario A Scenario B Scenario C
People with disabilities The elderly population

Economic impact and travel patterns of Accessible Tourism in Europe FINAL REPORT 114
affect the travel frequency), a preliminary estimation reveals that the departures to the EU per 100
people should accordingly increase by 27.8%, 49.3% and 74.6% for people with access needs (both
people with disabilities and the elderly population). Figure 56 summarises the departure per 100
people figures under different scenarios, on which the calculation of scenario tourism demand is
based.
Figure 56 - Departures to the EU per 100 people by all tourists from key international inbound markets under different scenarios (unit: trips per year)
Australia Brazil Canada China India Japan
Baseline 18.59 1.66 11.00 0.38 0.16 4.51
Scenario A 23.75 2.13 14.05 0.48 0.21 5.77
Scenario B 27.75 2.48 16.42 0.56 0.24 6.74
Scenario C 32.45 2.90 19.20 0.66 0.28 7.88
Norway Russia South Africa Switzerland USA
Baseline 120.15 6.99 1.12 137.85 6.87
Scenario A 153.51 8.93 1.43 176.13 8.78
Scenario B 179.42 10.44 1.67 205.86 10.26
Scenario C 209.77 12.21 1.95 240.68 11.99
3.2.6.2 Tourism demand and forecasts under different scenarios
With the numbers in Figure 56
people from the key international inbound markets can be established in exactly the same way as
Figure 51.
Figure 57 presents the change of total demand by the 11 key international markets under different
scenarios. The demand figures have already considered both the extra trips taken by the existing
travellers and the trips by the new travellers.
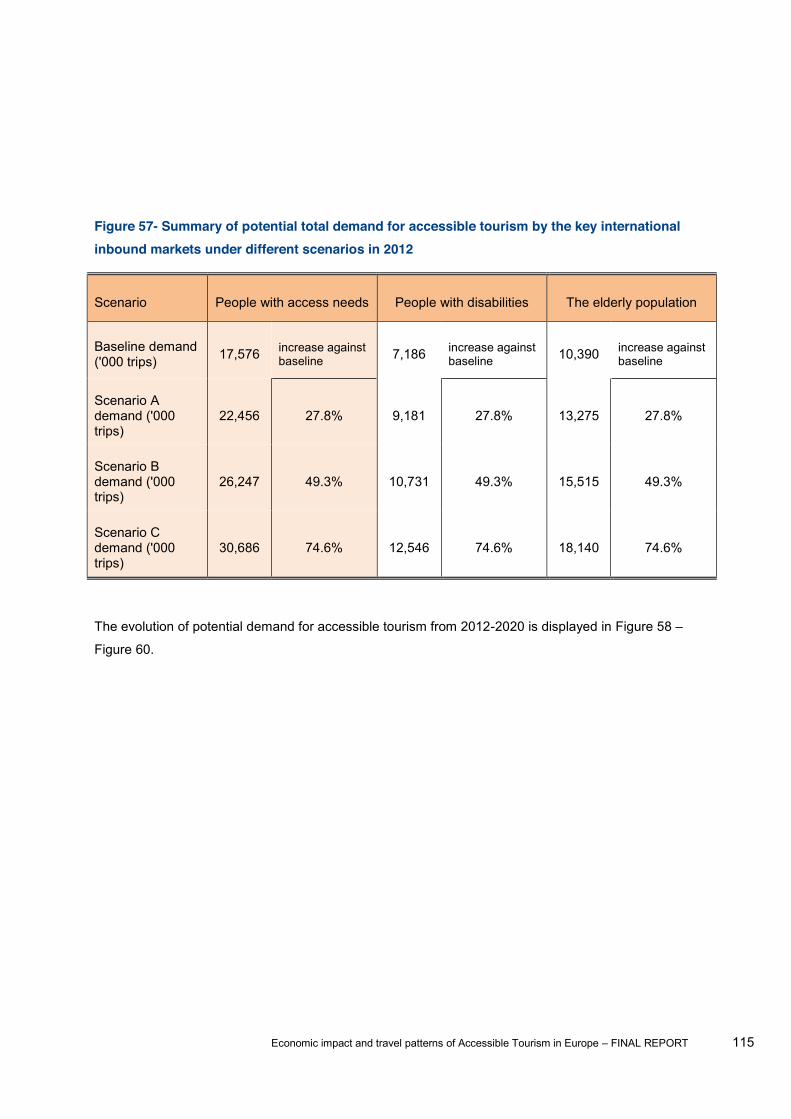
Economic impact and travel patterns of Accessible Tourism in Europe FINAL REPORT 115
Figure 57- Summary of potential total demand for accessible tourism by the key international inbound markets under different scenarios in 2012
Scenario People with access needs People with disabilities The elderly population
Baseline demand ('000 trips) 17,576 increase against
baseline 7,186 increase against baseline 10,390 increase against
baseline
Scenario A demand ('000 trips)
22,456 27.8% 9,181 27.8% 13,275 27.8%
Scenario B demand ('000 trips)
26,247 49.3% 10,731 49.3% 15,515 49.3%
Scenario C demand ('000 trips)
30,686 74.6% 12,546 74.6% 18,140 74.6%
The evolution of potential demand for accessible tourism from 2012-2020 is displayed in Figure 58
Figure 60.

Economic impact and travel patterns of Accessible Tourism in Europe FINAL REPORT 116
Figure 58 -
17,576 17,906 18,252 18,608 18,976 19,353 19,743 20,148 20,569
4,880 4,972 5,068 5,167 5,269 5,373 5,482 5,594 5,7113,791 3,862 3,936 4,013 4,092 4,174 4,258 4,345 4,4364,440 4,523 4,610 4,700 4,793 4,888 4,987 5,089 5,196
0
5,000
10,000
15,000
20,000
25,000
30,000
35,000
40,000
2012 2013 2014 2015 2016 2017 2018 2019 2020
Baseline Additional demand under Scenario A Additional demand under Scenario B Additional demand under Scenario C
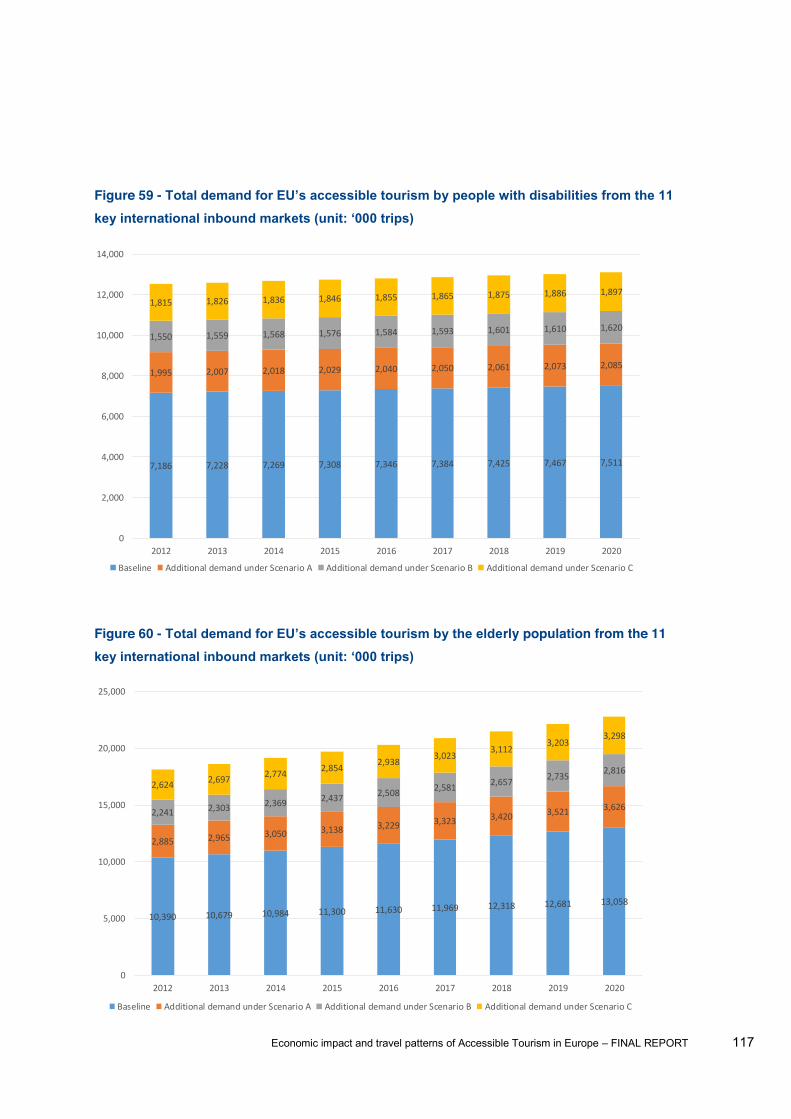
Economic impact and travel patterns of Accessible Tourism in Europe FINAL REPORT 117
Figure 59 -
Figure 60 - rly population from the 11
7,186 7,228 7,269 7,308 7,346 7,384 7,425 7,467 7,511
1,995 2,007 2,018 2,029 2,040 2,050 2,061 2,073 2,085
1,550 1,559 1,568 1,576 1,584 1,593 1,601 1,610 1,620
1,815 1,826 1,836 1,846 1,855 1,865 1,875 1,886 1,897
0
2,000
4,000
6,000
8,000
10,000
12,000
14,000
2012 2013 2014 2015 2016 2017 2018 2019 2020
Baseline Additional demand under Scenario A Additional demand under Scenario B Additional demand under Scenario C
10,390 10,679 10,984 11,300 11,630 11,969 12,318 12,681 13,058
2,885 2,965 3,050 3,138 3,229 3,323 3,420 3,521 3,6262,241 2,303 2,369 2,437 2,508 2,581 2,657 2,735 2,8162,624 2,697 2,774 2,854 2,938 3,023
3,1123,203
3,298
0
5,000
10,000
15,000
20,000
25,000
2012 2013 2014 2015 2016 2017 2018 2019 2020
Baseline Additional demand under Scenario A Additional demand under Scenario B Additional demand under Scenario C
Economic impact and travel patterns of Accessible Tourism in Europe FINAL REPORT 118
From Figure 57 to Figure 60, it can be identified that the leap of tourism demand between scenarios
is relatively steady. This would be very much desirable when the improvements of accessible
facilities and services are fulfilled gradually from one stage to the next. Therefore, the implication
here is that whilst the accessibility level is being improved, the inflow of tourists from the
international markets is likely to grow at a stable pace, rather than a radical one.
In addition to the total figures, the potential current and future demand for each key international
market under different scenarios can be found in Annex T.

Economic impact and travel patterns of Accessible Tourism in Europe FINAL REPORT 119
4 Task 2 Behavioural profiling of tourist with special access needs
4.1 Task 2a - Website analysis Task 2a: Supply: To investigate the provision of information about accessible offers
4.1.1 Methodology The main aims of the website analyses are to improve the understanding of current Accessible
Tourism offers and to evaluate the information available to travellers with accessibility needs. The
analysis, which will also include printed materials, will focus principally on websites as one of the
major sources of information for travellers in general and people with access needs in particular.
4.1.1.1 Scope -
pose as ordinary guests, checking for specific information
on a website they are visiting for the first time. In the process, a number of questions are addressed
(see Figure 61). Figure 62 presents an example of the analysis conducted.
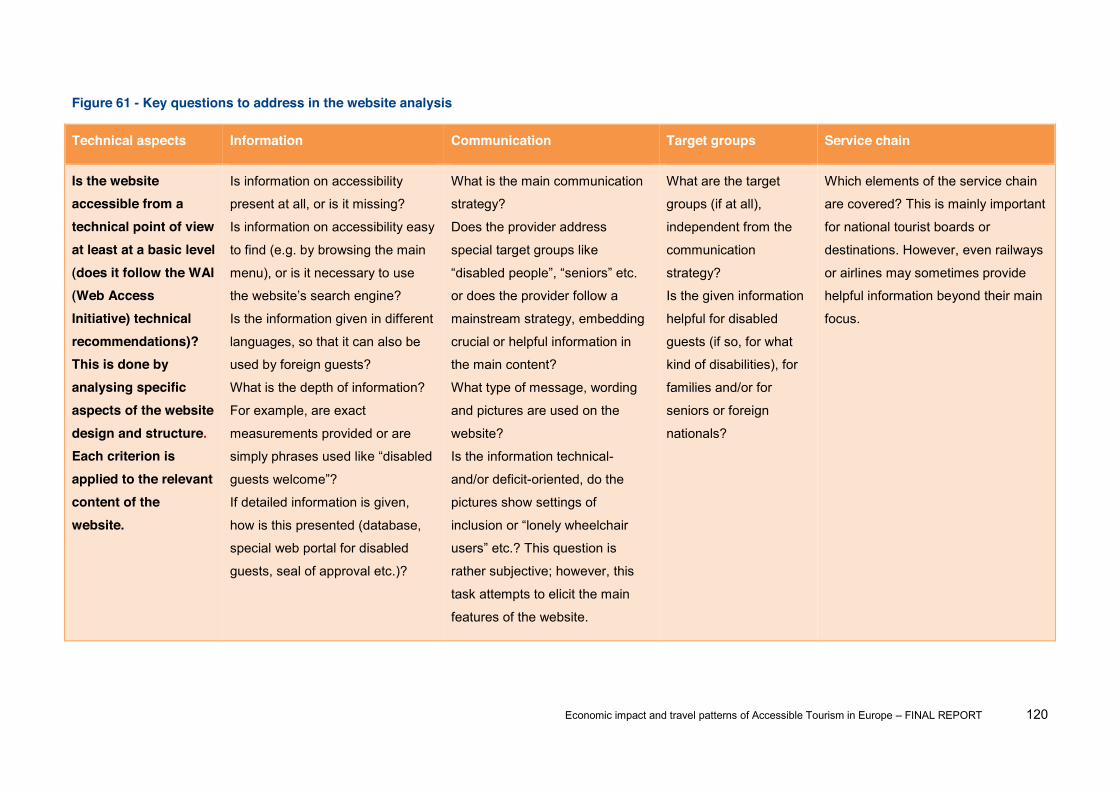
Economic impact and travel patterns of Accessible Tourism in Europe FINAL REPORT 120
Figure 61 - Key questions to address in the website analysis
Technical aspects Information Communication Target groups Service chain
Is the website accessible from a technical point of view at least at a basic level (does it follow the WAI (Web Access Initiative) technical recommendations)? This is done by analysing specific aspects of the website design and structure. Each criterion is applied to the relevant content of the website.
Is information on accessibility
present at all, or is it missing?
Is information on accessibility easy
to find (e.g. by browsing the main
menu), or is it necessary to use
th
Is the information given in different
languages, so that it can also be
used by foreign guests?
What is the depth of information?
For example, are exact
measurements provided or are
guests welco
If detailed information is given,
how is this presented (database,
special web portal for disabled
guests, seal of approval etc.)?
What is the main communication
strategy?
Does the provider address
special target groups like
or does the provider follow a
mainstream strategy, embedding
crucial or helpful information in
the main content?
What type of message, wording
and pictures are used on the
website?
Is the information technical-
and/or deficit-oriented, do the
pictures show settings of
rather subjective; however, this
task attempts to elicit the main
features of the website.
What are the target
groups (if at all),
independent from the
communication
strategy?
Is the given information
helpful for disabled
guests (if so, for what
kind of disabilities), for
families and/or for
seniors or foreign
nationals?
Which elements of the service chain
are covered? This is mainly important
for national tourist boards or
destinations. However, even railways
or airlines may sometimes provide
helpful information beyond their main
focus.
Economic impact and travel patterns of Accessible Tourism in Europe FINAL REPORT 121
The technical accessibility of the websites has been surveyed following the principles of the Web
Access Initiative (WAI) from the World Wide Web Consortium (www.w3.org ) who summarises the
accessibility requirements as following:
Perceivable
Provide text alternatives for non-text content.
Provide captions and other alternatives for multimedia.
Create content that can be presented in different ways, including by assistive
technologies, without losing meaning.
Make it easier for users to see and hear content. Operable
Make all functionality available from a keyboard.
Give users enough time to read and use content.
Do not use content that causes seizures.
Help users navigate and find content. Understandable
Make text readable and understandable.
Make content appear and operate in predictable ways.
Help users avoid and correct mistakes.
Robust
Maximize compatibility with current and future user tools.1
Among all the WAI requirements the following features that according the Design for All Foundation
are the more relevant to ensure ease of navigation for people with or without access limitations have
been checked:
Sufficient colour Contrast
Alt text for images
HTML written to accepted Web standards
The ability to enlarge text
Functional without JavaScript
Accessibility information about the site
No horizontal scroll when zooming
No use of frames
1 Source: http://www.w3.org/WAI/WCAG20/glance/

Economic impact and travel patterns of Accessible Tourism in Europe FINAL REPORT 122
Following the results of the survey the technical level of accessibility - based on the features from
WAI standard from W3C (World Wide Web Consortium) selected above has been assessed for
the above mentioned requirements for the pages inspected. They have been ranked as follows
although to ensure their accessibility level all WAI criteria should be present in all their pages:
AA = level required for public administrations and companies in many countries
A = lower level of accessibility 4.1.1.2 Website analysis Figure 62 summarises the scope of the website analysis, while the section below explains it in more
detail.
Figure 62 - Website analysis approach
National websites Europe-wide
websites
Belgium
Official Tourism Office/
Board
Tour operators Bulgaria
France Booking portals
Ireland
Italy
Main railway company
Hotel chains Lithuania
Poland
Destinations - Cities Slovenia
Spain
Main airline Sweden
Destinations - Beaches Netherlands
UK
Good practices
Economic impact and travel patterns of Accessible Tourism in Europe FINAL REPORT 123
The website analysis is conducted along the service chain, according to the five main sectors:
1. Travel services
2. Transportation
3. Accommodation
4. Food and Beverages
5. Entertainment
The category "travel services" comprises all services which make travelling more comfortable for
those with special needs. For example wheelchair assistance, guide dogs, service hotlines etc. Most
of these services were offered on the airline and rail company sites.
The category portation" refers to transportation means for disabled people, such as
accessible taxis or buses. Additionally information about station facilities was looked at.
The geographical range consists of the 12 countries identified in the cluster analysis and,
importantly, some European-wide providers. In detail the analysis covers the:
Official Tourist Office / Tourist Board (especially information concerning the five service
chain elements),
Principal Railway operator and
Principal Airline
For the following countries:
1. Belgium
2. Bulgaria
3. France
4. Ireland
5. Italy
6. Lithuania
7. Poland
8. Slovenia
9. Spain
10. Sweden
11. The Netherlands
12. United Kingdom

Economic impact and travel patterns of Accessible Tourism in Europe FINAL REPORT 124
In addition, analysis was conducted on the websites of the five leading European tour operator brands, listed by market share in Europe1:
TUI Travel (18.6 %)
Thomas Cook (13.9 %)
REWE (5.1 %)
Kuoni (3.4 %)
Club Med (2.1 %)
booking portals were also analysed, here listed by Alexa ranking2:
Booking.com (157)
Expedia.com (427)
Hotels.com (601)
Priceline.com (697)
Kayak.com (816)
The websites of leading European hotel chains were analysed:
Accor (2,345 hotels /254,535 rooms3)
Best Western (1,316/89,743)
Intercontinental (559/86,780)
Groupe du Louvre (956/67,687)
Carlson Rezidor (253/51,498)
Looking at the destinations, we analysed a selection of websites of destinations that reflect the
most important reasons for going on holiday. According to Eurobarometer data, enjoying the sun and
the beach were the most popular reasons given for going on holiday in 2012, followed by visiting
family members and friends. Nature and culture rank third and fourth respectively, while city trips
follow in fifth place.4
In analysing the five most important European beach sites (which are not in cities) and five
European city destinations both cities and rural sites are covered in order to reflect the main reasons
given for going on holiday.
1 Source: Viardot, E. (2009). European Tour Operators: confronting competition in the tourism industry. 2 Source: alexa.com 3 Source: MKG Hospitality 2012 4 Source: European Commission (2013): Attitudes of Europeans toward Tourism. Flash Eurobarometer 370: p. 6

Economic impact and travel patterns of Accessible Tourism in Europe FINAL REPORT 125
The object of our investigations are five of the most well-known beach destinations in Europe,
selected from the 2013 shortlist for the World Travel Awards in the category of 1:
Cannes, France
Corfu, Greece
Costa Smeralda, Sardinia, Italy
Marbella, Spain
Algarve, Portugal
Also part of the analysis are the five most popular city destinations in Europe, listed here by
overnight stays in millions2:
London (48.7m overnight stays)
Paris (35.8)
Berlin (20.8)
Rome (20.4)
Madrid (15.2)
Food and beverages websites were not included, as previous analysis reveals that these services
are highly fragmented Inclusion would require a highly detailed analysis of several hundred websites
in each EU Member State, which would be beyond the scope of the present study.
Finally we analysed a selection of five websites that demonstrate good practice in website design
and content for Tourism for All. The selection has been curated in order to cover what we believe
are the most interesting and professionally conceived websites encompassing differing approaches
as well as providing benchmarks for good practice:
Denmark: God Adgang (www.godadgang.dk)
England: Visit England (www.visitengland.com/ee/Practical-Information/Accessible-
England)
Belgium/Flanders: Toegankelijk Vlaanderen (www.toegankelijkvlaanderen.be)
France: Tourisme et Handicap (www.tourisme-handicaps.org)
Belgium/Luxembourg/Germany: Eurewelcome
(www.eurecard.org/projekte/eurewelcome.html)
1 Source: http://www.worldtravelawards.com/award-europes-leading-beach-destination-2013 2 Source: European Cities Marketing (ECM) 2011: http://www.europeancitiesmarketing.com/userfiles/file/Press/Europaweiter%20St%C3%A4dtetourismus%20-Wirtschaftskrise%20%C3%BCberwunden,%20U_S_A_%20und%20Deutschland%20Hauptm%C3%A4rkte.pdf
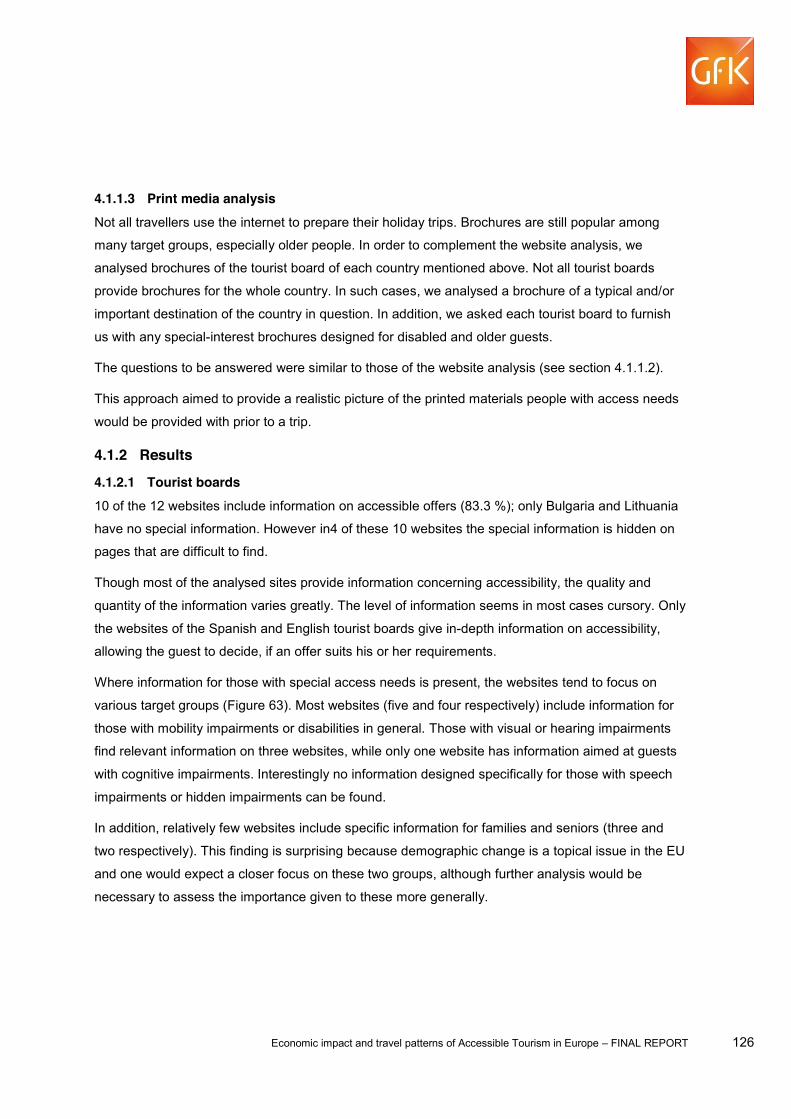
Economic impact and travel patterns of Accessible Tourism in Europe FINAL REPORT 126
4.1.1.3 Print media analysis Not all travellers use the internet to prepare their holiday trips. Brochures are still popular among
many target groups, especially older people. In order to complement the website analysis, we
analysed brochures of the tourist board of each country mentioned above. Not all tourist boards
provide brochures for the whole country. In such cases, we analysed a brochure of a typical and/or
important destination of the country in question. In addition, we asked each tourist board to furnish
us with any special-interest brochures designed for disabled and older guests.
The questions to be answered were similar to those of the website analysis (see section 4.1.1.2).
This approach aimed to provide a realistic picture of the printed materials people with access needs
would be provided with prior to a trip.
4.1.2 Results
4.1.2.1 Tourist boards 10 of the 12 websites include information on accessible offers (83.3 %); only Bulgaria and Lithuania
have no special information. However in4 of these 10 websites the special information is hidden on
pages that are difficult to find.
Though most of the analysed sites provide information concerning accessibility, the quality and
quantity of the information varies greatly. The level of information seems in most cases cursory. Only
the websites of the Spanish and English tourist boards give in-depth information on accessibility,
allowing the guest to decide, if an offer suits his or her requirements.
Where information for those with special access needs is present, the websites tend to focus on
various target groups (Figure 63). Most websites (five and four respectively) include information for
those with mobility impairments or disabilities in general. Those with visual or hearing impairments
find relevant information on three websites, while only one website has information aimed at guests
with cognitive impairments. Interestingly no information designed specifically for those with speech
impairments or hidden impairments can be found.
In addition, relatively few websites include specific information for families and seniors (three and
two respectively). This finding is surprising because demographic change is a topical issue in the EU
and one would expect a closer focus on these two groups, although further analysis would be
necessary to assess the importance given to these more generally.
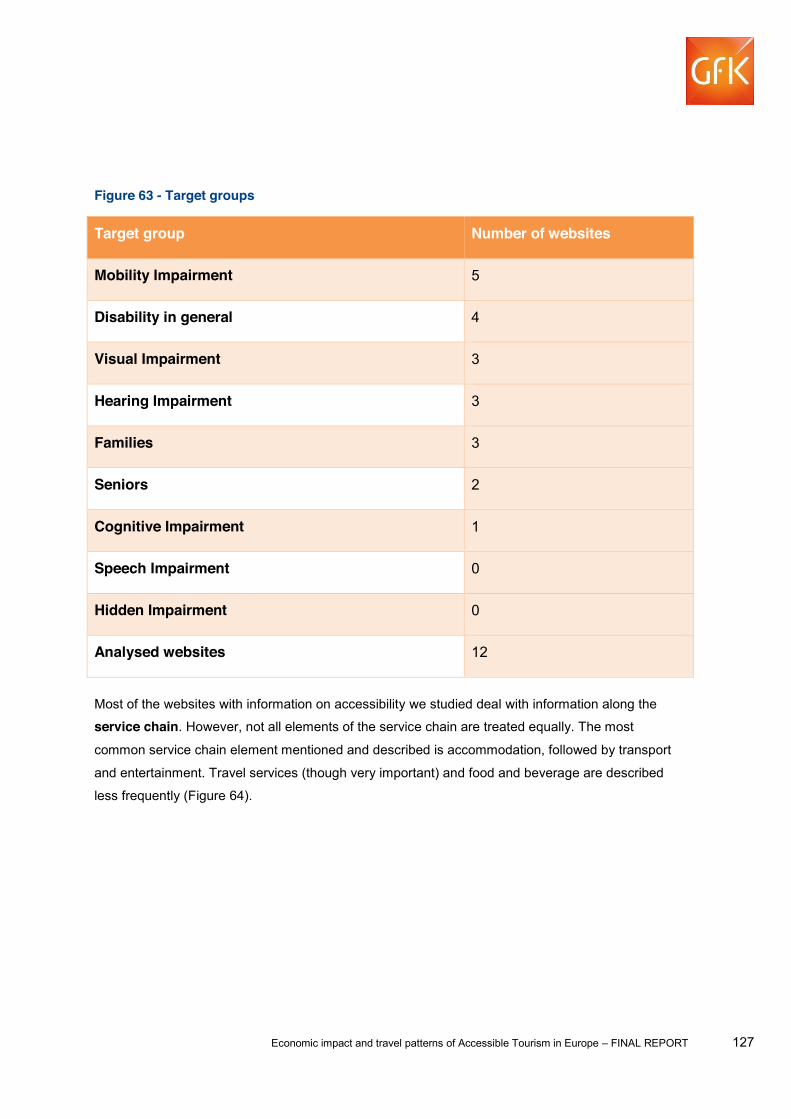
Economic impact and travel patterns of Accessible Tourism in Europe FINAL REPORT 127
Figure 63 - Target groups
Target group Number of websites
Mobility Impairment 5
Disability in general 4
Visual Impairment 3
Hearing Impairment 3
Families 3
Seniors 2
Cognitive Impairment 1
Speech Impairment 0
Hidden Impairment 0
Analysed websites 12
Most of the websites with information on accessibility we studied deal with information along the
service chain. However, not all elements of the service chain are treated equally. The most
common service chain element mentioned and described is accommodation, followed by transport
and entertainment. Travel services (though very important) and food and beverage are described
less frequently (Figure 64).
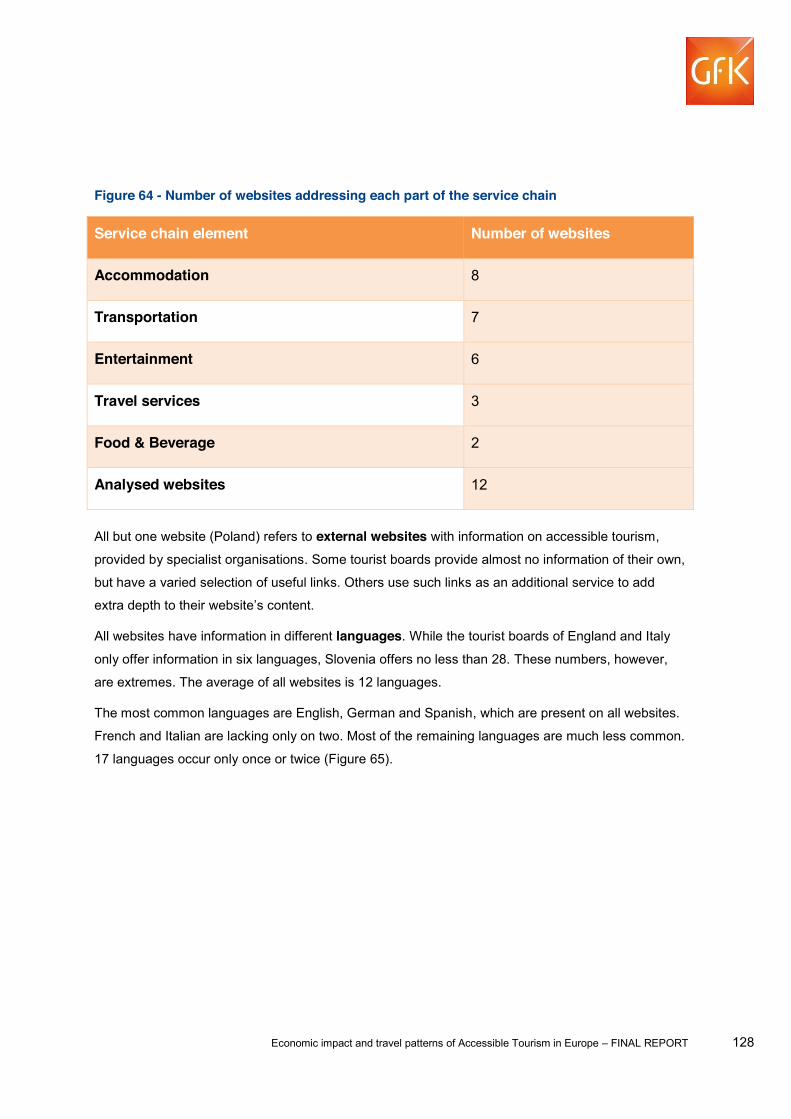
Economic impact and travel patterns of Accessible Tourism in Europe FINAL REPORT 128
Figure 64 - Number of websites addressing each part of the service chain
Service chain element Number of websites
Accommodation 8
Transportation 7
Entertainment 6
Travel services 3
Food & Beverage 2
Analysed websites 12
All but one website (Poland) refers to external websites with information on accessible tourism,
provided by specialist organisations. Some tourist boards provide almost no information of their own,
but have a varied selection of useful links. Others use such links as an additional service to add
All websites have information in different languages. While the tourist boards of England and Italy
only offer information in six languages, Slovenia offers no less than 28. These numbers, however,
are extremes. The average of all websites is 12 languages.
The most common languages are English, German and Spanish, which are present on all websites.
French and Italian are lacking only on two. Most of the remaining languages are much less common.
17 languages occur only once or twice (Figure 65).
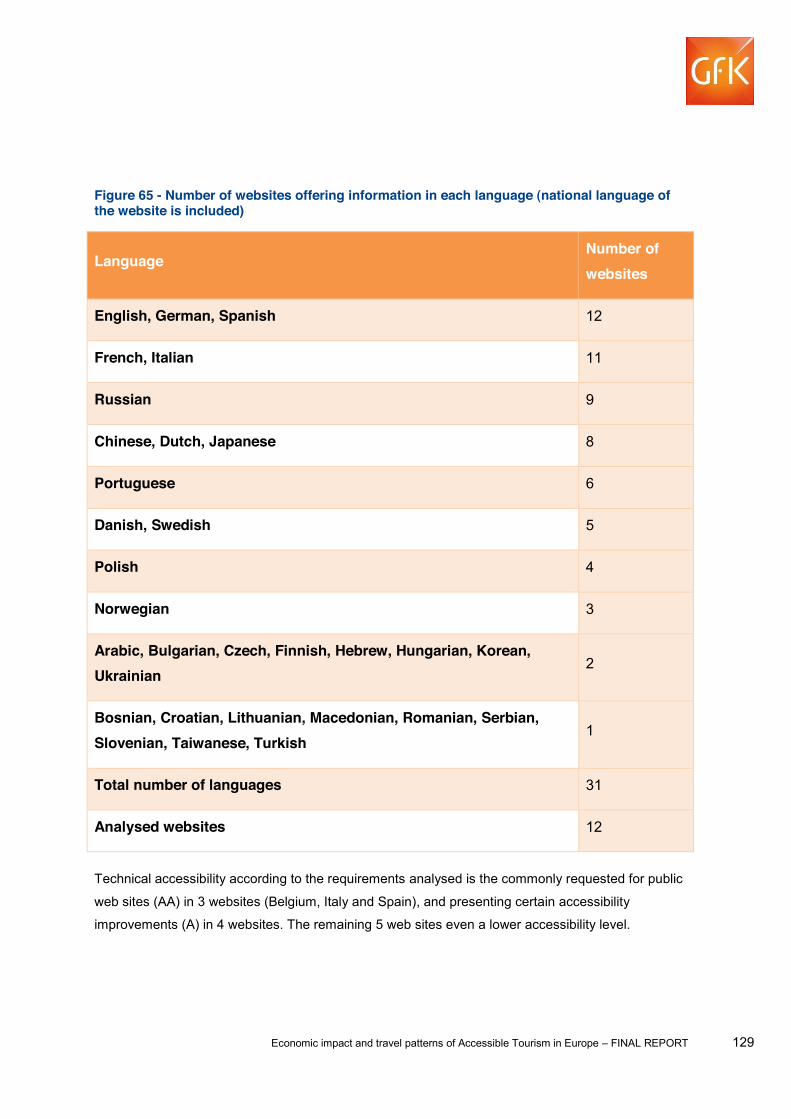
Economic impact and travel patterns of Accessible Tourism in Europe FINAL REPORT 129
Figure 65 - Number of websites offering information in each language (national language of the website is included)
Language Number of websites
English, German, Spanish 12
French, Italian 11
Russian 9
Chinese, Dutch, Japanese 8
Portuguese 6
Danish, Swedish 5
Polish 4
Norwegian 3
Arabic, Bulgarian, Czech, Finnish, Hebrew, Hungarian, Korean, Ukrainian
2
Bosnian, Croatian, Lithuanian, Macedonian, Romanian, Serbian, Slovenian, Taiwanese, Turkish
1
Total number of languages 31
Analysed websites 12
Technical accessibility according to the requirements analysed is the commonly requested for public
web sites (AA) in 3 websites (Belgium, Italy and Spain), and presenting certain accessibility
improvements (A) in 4 websites. The remaining 5 web sites even a lower accessibility level.
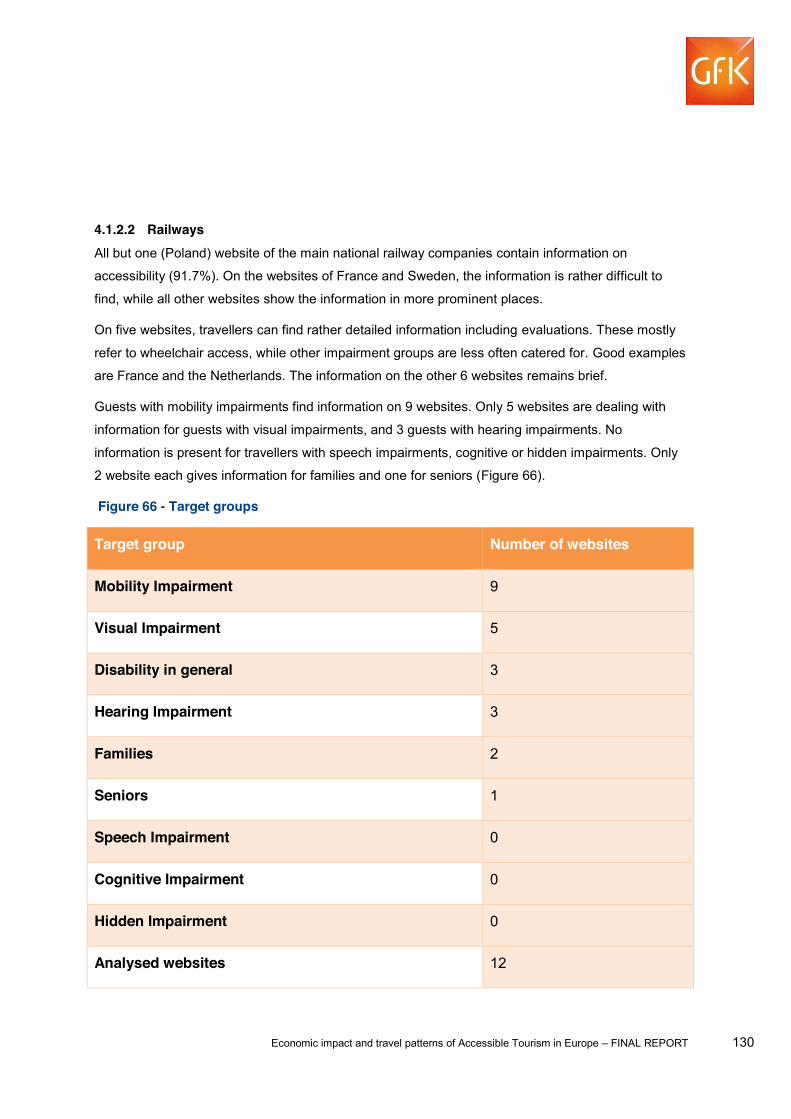
Economic impact and travel patterns of Accessible Tourism in Europe FINAL REPORT 130
4.1.2.2 Railways All but one (Poland) website of the main national railway companies contain information on
accessibility (91.7%). On the websites of France and Sweden, the information is rather difficult to
find, while all other websites show the information in more prominent places.
On five websites, travellers can find rather detailed information including evaluations. These mostly
refer to wheelchair access, while other impairment groups are less often catered for. Good examples
are France and the Netherlands. The information on the other 6 websites remains brief.
Guests with mobility impairments find information on 9 websites. Only 5 websites are dealing with
information for guests with visual impairments, and 3 guests with hearing impairments. No
information is present for travellers with speech impairments, cognitive or hidden impairments. Only
2 website each gives information for families and one for seniors (Figure 66).
Figure 66 - Target groups
Target group Number of websites
Mobility Impairment 9
Visual Impairment 5
Disability in general 3
Hearing Impairment 3
Families 2
Seniors 1
Speech Impairment 0
Cognitive Impairment 0
Hidden Impairment 0
Analysed websites 12
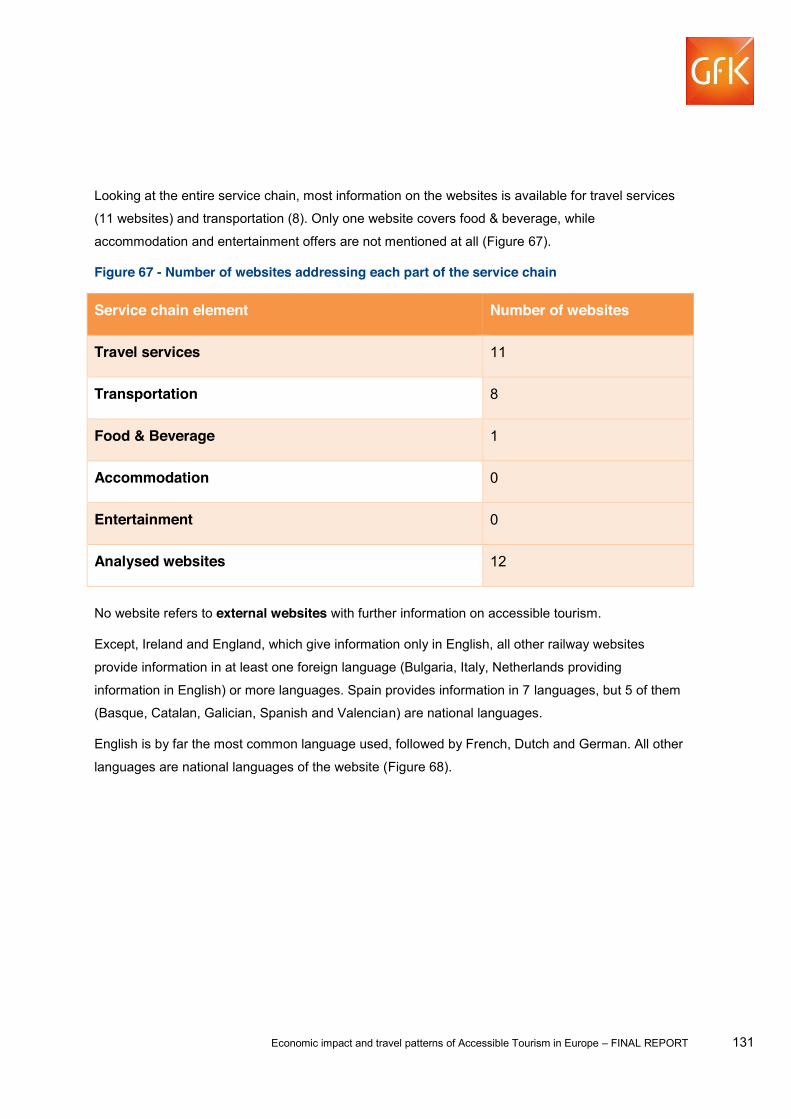
Economic impact and travel patterns of Accessible Tourism in Europe FINAL REPORT 131
Looking at the entire service chain, most information on the websites is available for travel services
(11 websites) and transportation (8). Only one website covers food & beverage, while
accommodation and entertainment offers are not mentioned at all (Figure 67).
Figure 67 - Number of websites addressing each part of the service chain
Service chain element Number of websites
Travel services 11
Transportation 8
Food & Beverage 1
Accommodation 0
Entertainment 0
Analysed websites 12
No website refers to external websites with further information on accessible tourism.
Except, Ireland and England, which give information only in English, all other railway websites
provide information in at least one foreign language (Bulgaria, Italy, Netherlands providing
information in English) or more languages. Spain provides information in 7 languages, but 5 of them
(Basque, Catalan, Galician, Spanish and Valencian) are national languages.
English is by far the most common language used, followed by French, Dutch and German. All other
languages are national languages of the website (Figure 68).
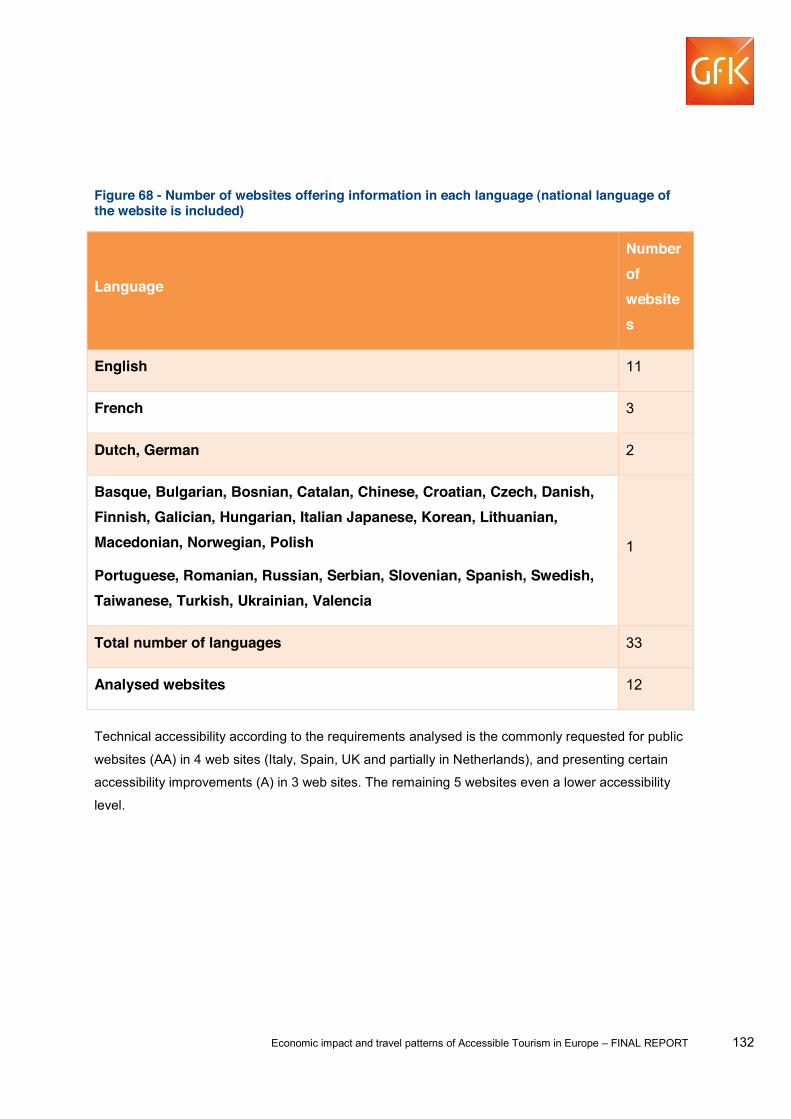
Economic impact and travel patterns of Accessible Tourism in Europe FINAL REPORT 132
Figure 68 - Number of websites offering information in each language (national language of the website is included)
Language
Number of websites
English 11
French 3
Dutch, German 2
Basque, Bulgarian, Bosnian, Catalan, Chinese, Croatian, Czech, Danish, Finnish, Galician, Hungarian, Italian Japanese, Korean, Lithuanian, Macedonian, Norwegian, Polish
Portuguese, Romanian, Russian, Serbian, Slovenian, Spanish, Swedish, Taiwanese, Turkish, Ukrainian, Valencia
1
Total number of languages 33
Analysed websites 12
Technical accessibility according to the requirements analysed is the commonly requested for public
websites (AA) in 4 web sites (Italy, Spain, UK and partially in Netherlands), and presenting certain
accessibility improvements (A) in 3 web sites. The remaining 5 websites even a lower accessibility
level.
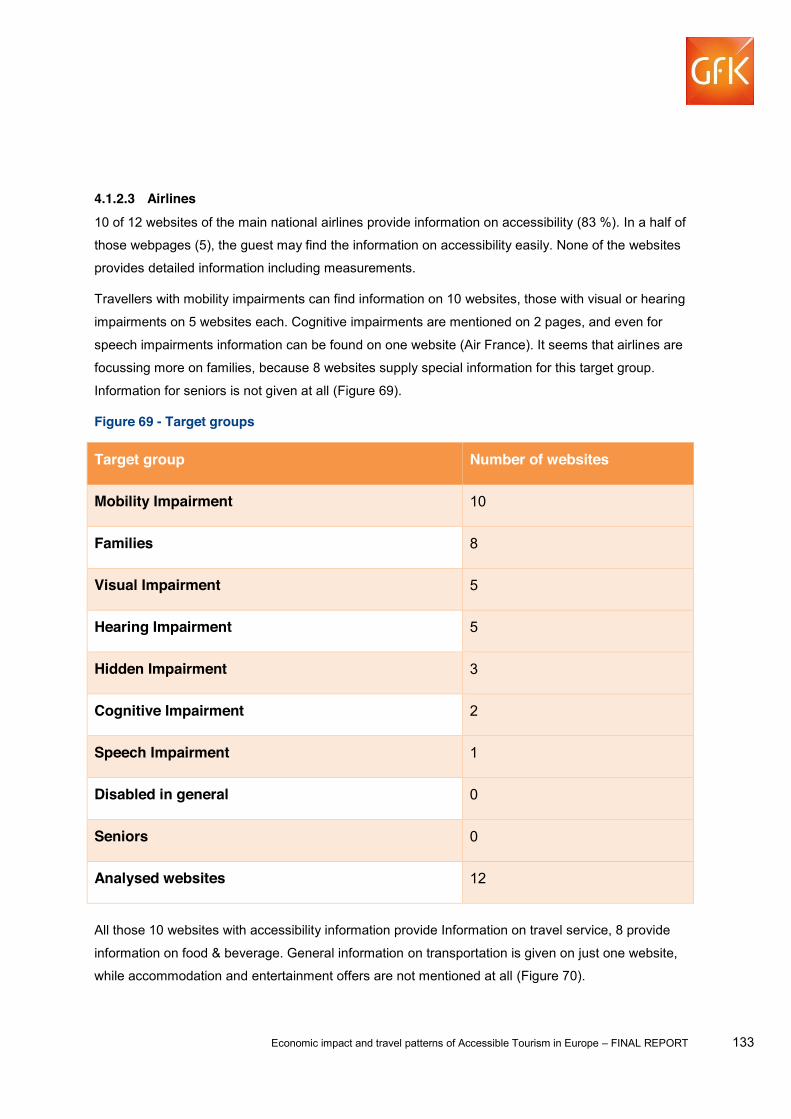
Economic impact and travel patterns of Accessible Tourism in Europe FINAL REPORT 133
4.1.2.3 Airlines 10 of 12 websites of the main national airlines provide information on accessibility (83 %). In a half of
those webpages (5), the guest may find the information on accessibility easily. None of the websites
provides detailed information including measurements.
Travellers with mobility impairments can find information on 10 websites, those with visual or hearing
impairments on 5 websites each. Cognitive impairments are mentioned on 2 pages, and even for
speech impairments information can be found on one website (Air France). It seems that airlines are
focussing more on families, because 8 websites supply special information for this target group.
Information for seniors is not given at all (Figure 69).
Figure 69 - Target groups
Target group Number of websites
Mobility Impairment 10
Families 8
Visual Impairment 5
Hearing Impairment 5
Hidden Impairment 3
Cognitive Impairment 2
Speech Impairment 1
Disabled in general 0
Seniors 0
Analysed websites 12
All those 10 websites with accessibility information provide Information on travel service, 8 provide
information on food & beverage. General information on transportation is given on just one website,
while accommodation and entertainment offers are not mentioned at all (Figure 70).

Economic impact and travel patterns of Accessible Tourism in Europe FINAL REPORT 134
Figure 70 - Number of websites addressing each part of the service chain
Service chain element Number of websites
Travel services 10
Food & Beverage 8
Transportation 1
Accommodation 0
Entertainment 0
Analysed websites 12
All 12 websites are available in English, followed by French (9), German and Russian (8 each)
(Figure 71).
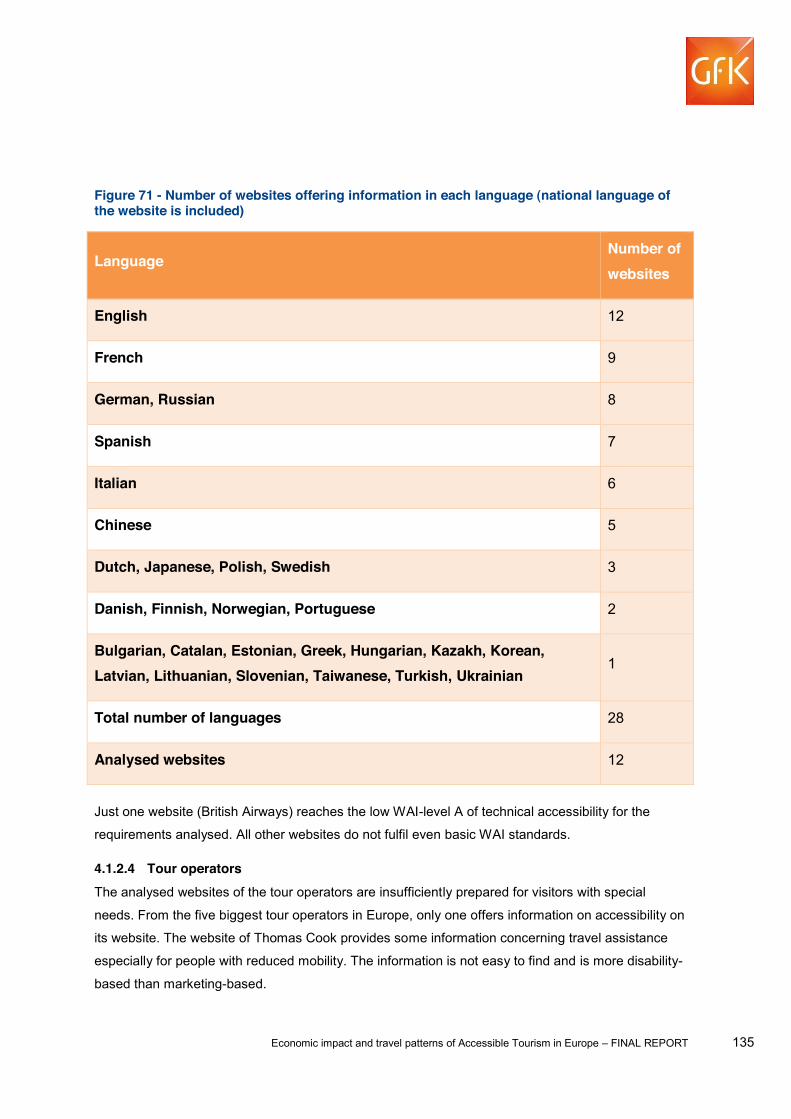
Economic impact and travel patterns of Accessible Tourism in Europe FINAL REPORT 135
Figure 71 - Number of websites offering information in each language (national language of the website is included)
Language Number of websites
English 12
French 9
German, Russian 8
Spanish 7
Italian 6
Chinese 5
Dutch, Japanese, Polish, Swedish 3
Danish, Finnish, Norwegian, Portuguese 2
Bulgarian, Catalan, Estonian, Greek, Hungarian, Kazakh, Korean, Latvian, Lithuanian, Slovenian, Taiwanese, Turkish, Ukrainian
1
Total number of languages 28
Analysed websites 12
Just one website (British Airways) reaches the low WAI-level A of technical accessibility for the
requirements analysed. All other websites do not fulfil even basic WAI standards.
4.1.2.4 Tour operators The analysed websites of the tour operators are insufficiently prepared for visitors with special
needs. From the five biggest tour operators in Europe, only one offers information on accessibility on
its website. The website of Thomas Cook provides some information concerning travel assistance
especially for people with reduced mobility. The information is not easy to find and is more disability-
based than marketing-based.
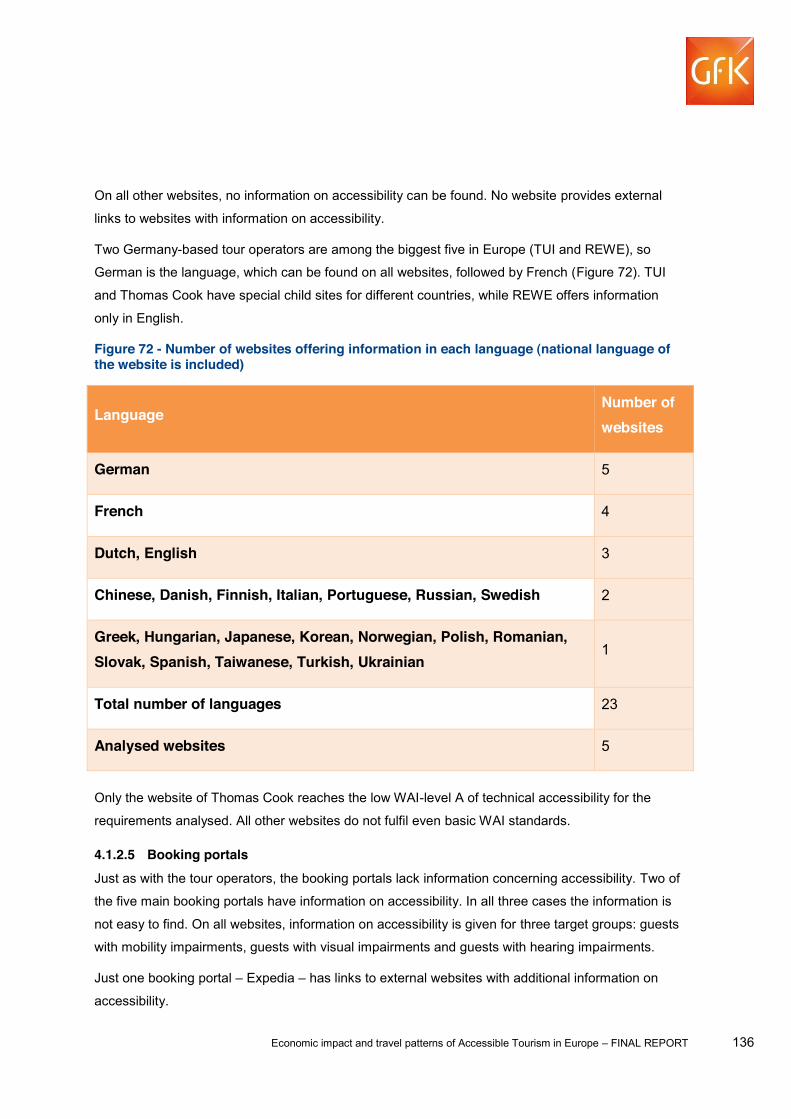
Economic impact and travel patterns of Accessible Tourism in Europe FINAL REPORT 136
On all other websites, no information on accessibility can be found. No website provides external
links to websites with information on accessibility.
Two Germany-based tour operators are among the biggest five in Europe (TUI and REWE), so
German is the language, which can be found on all websites, followed by French (Figure 72). TUI
and Thomas Cook have special child sites for different countries, while REWE offers information
only in English.
Figure 72 - Number of websites offering information in each language (national language of the website is included)
Language Number of websites
German 5
French 4
Dutch, English 3
Chinese, Danish, Finnish, Italian, Portuguese, Russian, Swedish 2
Greek, Hungarian, Japanese, Korean, Norwegian, Polish, Romanian, Slovak, Spanish, Taiwanese, Turkish, Ukrainian
1
Total number of languages 23
Analysed websites 5
Only the website of Thomas Cook reaches the low WAI-level A of technical accessibility for the
requirements analysed. All other websites do not fulfil even basic WAI standards.
4.1.2.5 Booking portals Just as with the tour operators, the booking portals lack information concerning accessibility. Two of
the five main booking portals have information on accessibility. In all three cases the information is
not easy to find. On all websites, information on accessibility is given for three target groups: guests
with mobility impairments, guests with visual impairments and guests with hearing impairments.
Just one booking portal Expedia has links to external websites with additional information on
accessibility.
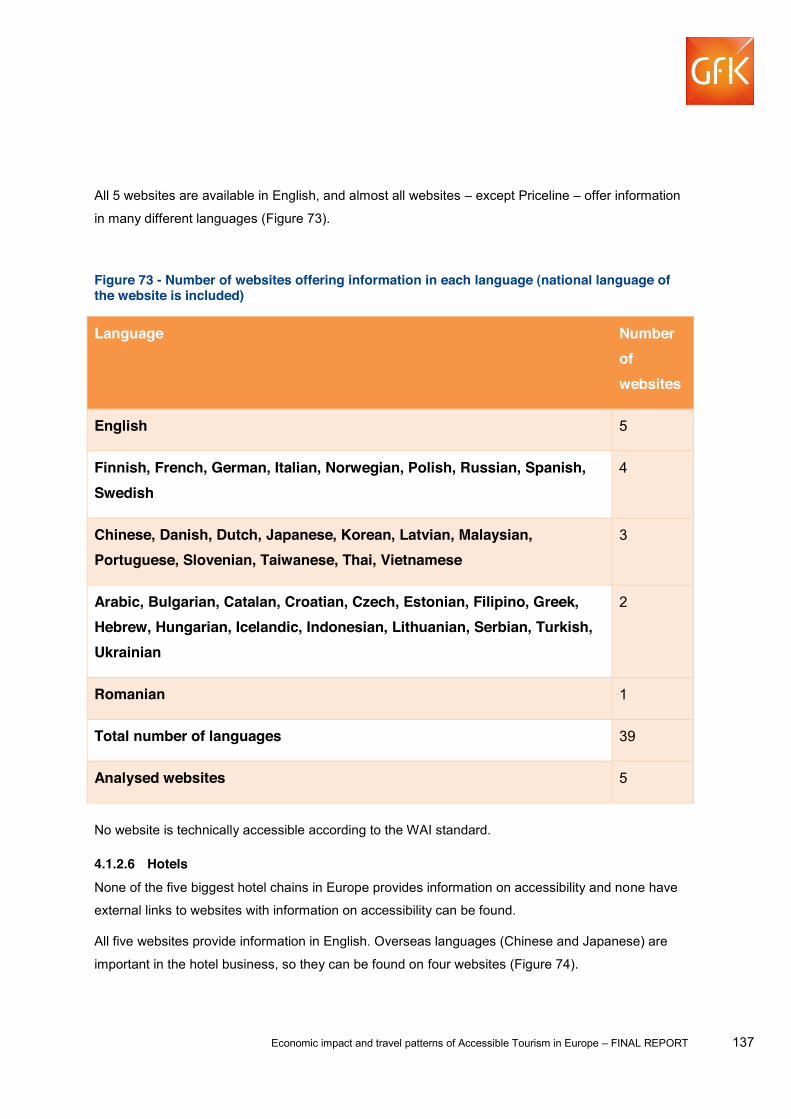
Economic impact and travel patterns of Accessible Tourism in Europe FINAL REPORT 137
All 5 websites are available in English, and almost all websites except Priceline offer information
in many different languages (Figure 73).
Figure 73 - Number of websites offering information in each language (national language of the website is included)
Language Number of websites
English 5
Finnish, French, German, Italian, Norwegian, Polish, Russian, Spanish, Swedish
4
Chinese, Danish, Dutch, Japanese, Korean, Latvian, Malaysian, Portuguese, Slovenian, Taiwanese, Thai, Vietnamese
3
Arabic, Bulgarian, Catalan, Croatian, Czech, Estonian, Filipino, Greek, Hebrew, Hungarian, Icelandic, Indonesian, Lithuanian, Serbian, Turkish, Ukrainian
2
Romanian 1
Total number of languages 39
Analysed websites 5
No website is technically accessible according to the WAI standard.
4.1.2.6 Hotels None of the five biggest hotel chains in Europe provides information on accessibility and none have
external links to websites with information on accessibility can be found.
All five websites provide information in English. Overseas languages (Chinese and Japanese) are
important in the hotel business, so they can be found on four websites (Figure 74).
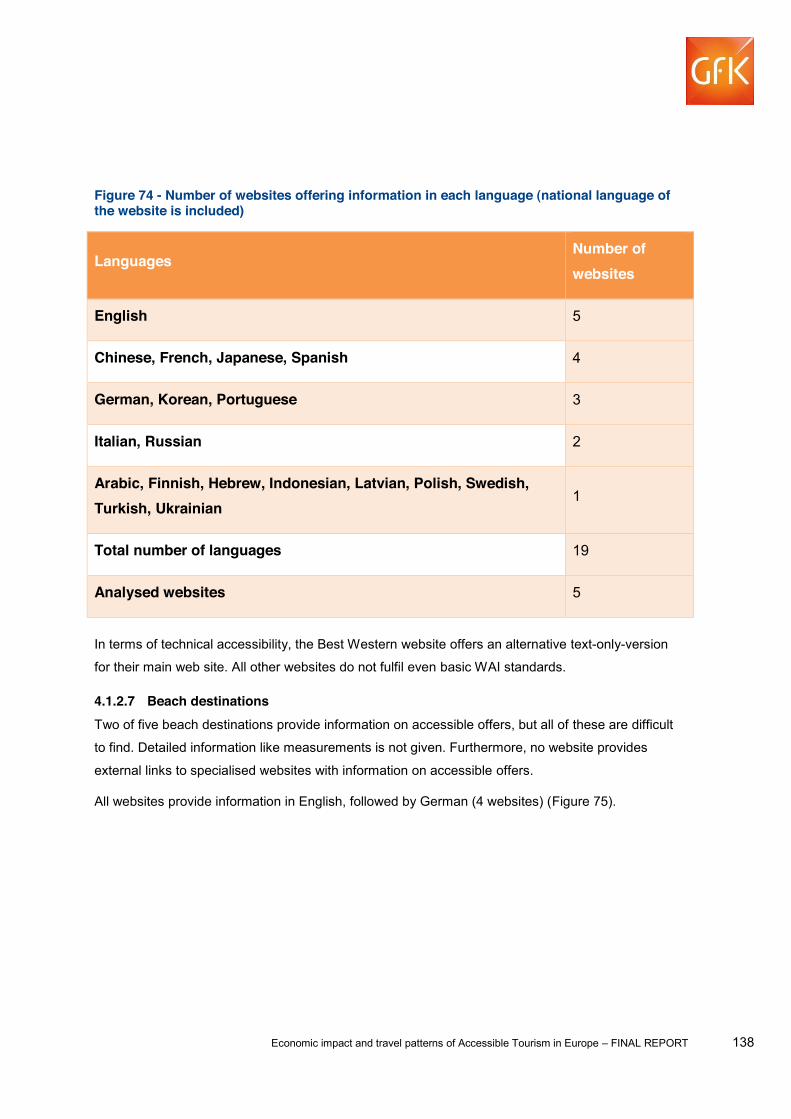
Economic impact and travel patterns of Accessible Tourism in Europe FINAL REPORT 138
Figure 74 - Number of websites offering information in each language (national language of the website is included)
Languages Number of websites
English 5
Chinese, French, Japanese, Spanish 4
German, Korean, Portuguese 3
Italian, Russian 2
Arabic, Finnish, Hebrew, Indonesian, Latvian, Polish, Swedish, Turkish, Ukrainian
1
Total number of languages 19
Analysed websites 5
In terms of technical accessibility, the Best Western website offers an alternative text-only-version
for their main web site. All other websites do not fulfil even basic WAI standards.
4.1.2.7 Beach destinations Two of five beach destinations provide information on accessible offers, but all of these are difficult
to find. Detailed information like measurements is not given. Furthermore, no website provides
external links to specialised websites with information on accessible offers.
All websites provide information in English, followed by German (4 websites) (Figure 75).
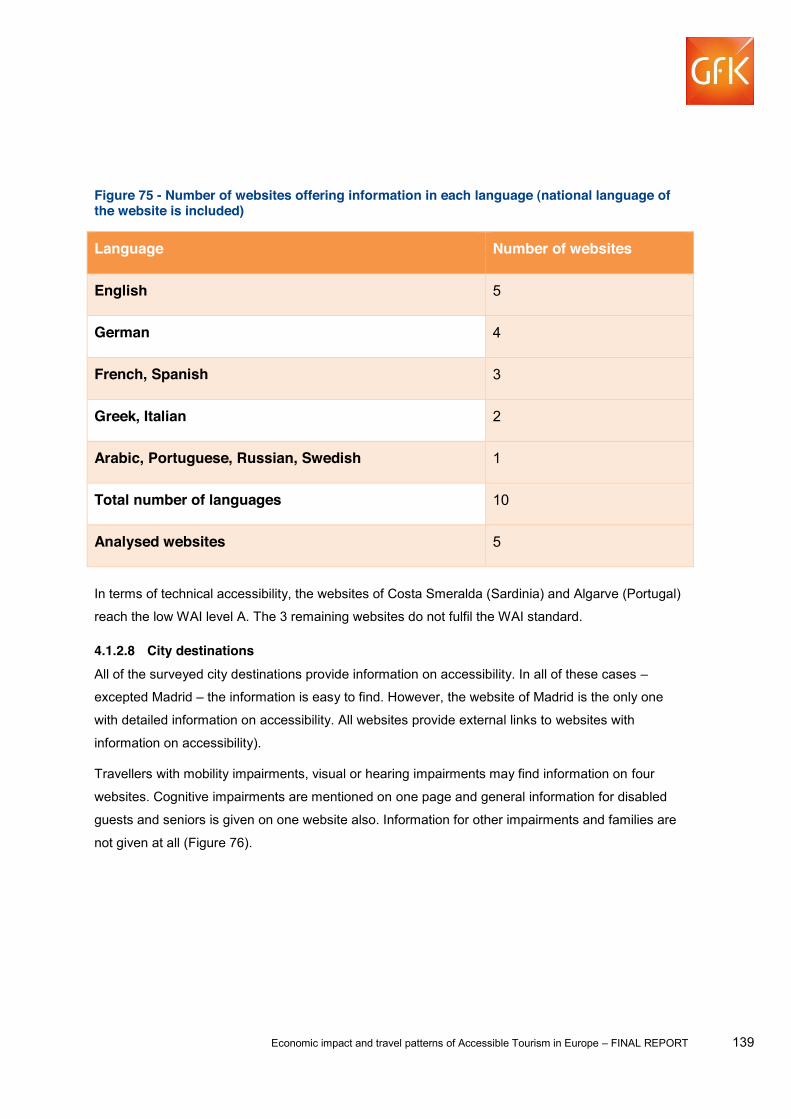
Economic impact and travel patterns of Accessible Tourism in Europe FINAL REPORT 139
Figure 75 - Number of websites offering information in each language (national language of the website is included)
Language Number of websites
English 5
German 4
French, Spanish 3
Greek, Italian 2
Arabic, Portuguese, Russian, Swedish 1
Total number of languages 10
Analysed websites 5
In terms of technical accessibility, the websites of Costa Smeralda (Sardinia) and Algarve (Portugal)
reach the low WAI level A. The 3 remaining websites do not fulfil the WAI standard.
4.1.2.8 City destinations All of the surveyed city destinations provide information on accessibility. In all of these cases
excepted Madrid the information is easy to find. However, the website of Madrid is the only one
with detailed information on accessibility. All websites provide external links to websites with
information on accessibility).
Travellers with mobility impairments, visual or hearing impairments may find information on four
websites. Cognitive impairments are mentioned on one page and general information for disabled
guests and seniors is given on one website also. Information for other impairments and families are
not given at all (Figure 76).

Economic impact and travel patterns of Accessible Tourism in Europe FINAL REPORT 140
Figure 76 - Target groups
Target group Number of websites
Mobility Impairment 4
Visual Impairment 4
Hearing Impairment 4
Disabled in general 1
Cognitive Impairment 1
Seniors 1
Families 1
Speech Impairment 0
Hidden Impairment 0
Analysed websites 5
All three websites with information on accessibility cover all elements of the service chain (Travel
services, Transportation, Accommodation, Food & Beverage, Entertainment).
The most frequent languages are English, French and Spanish (Figure 77).
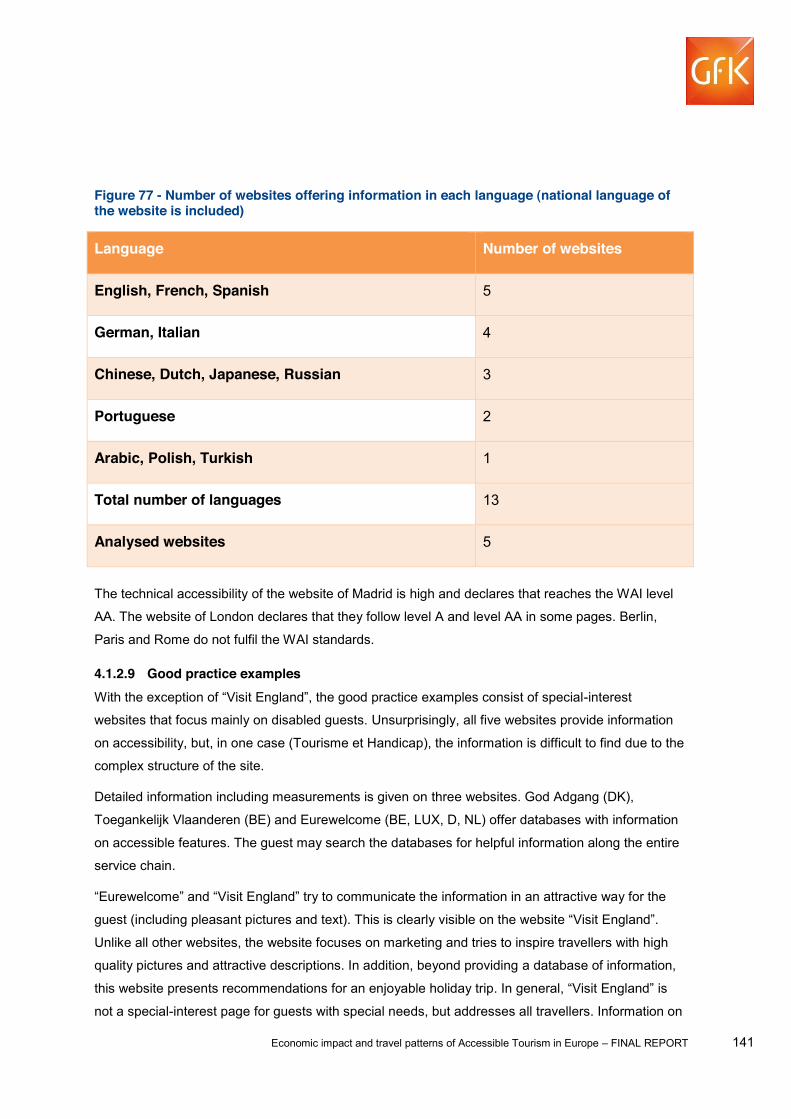
Economic impact and travel patterns of Accessible Tourism in Europe FINAL REPORT 141
Figure 77 - Number of websites offering information in each language (national language of the website is included)
Language Number of websites
English, French, Spanish 5
German, Italian 4
Chinese, Dutch, Japanese, Russian 3
Portuguese 2
Arabic, Polish, Turkish 1
Total number of languages 13
Analysed websites 5
The technical accessibility of the website of Madrid is high and declares that reaches the WAI level
AA. The website of London declares that they follow level A and level AA in some pages. Berlin,
Paris and Rome do not fulfil the WAI standards.
4.1.2.9 Good practice examples -interest
websites that focus mainly on disabled guests. Unsurprisingly, all five websites provide information
on accessibility, but, in one case (Tourisme et Handicap), the information is difficult to find due to the
complex structure of the site.
Detailed information including measurements is given on three websites. God Adgang (DK),
Toegankelijk Vlaanderen (BE) and Eurewelcome (BE, LUX, D, NL) offer databases with information
on accessible features. The guest may search the databases for helpful information along the entire
service chain.
guest (including pleasan
Unlike all other websites, the website focuses on marketing and tries to inspire travellers with high
quality pictures and attractive descriptions. In addition, beyond providing a database of information,
not a special-interest page for guests with special needs, but addresses all travellers. Information on
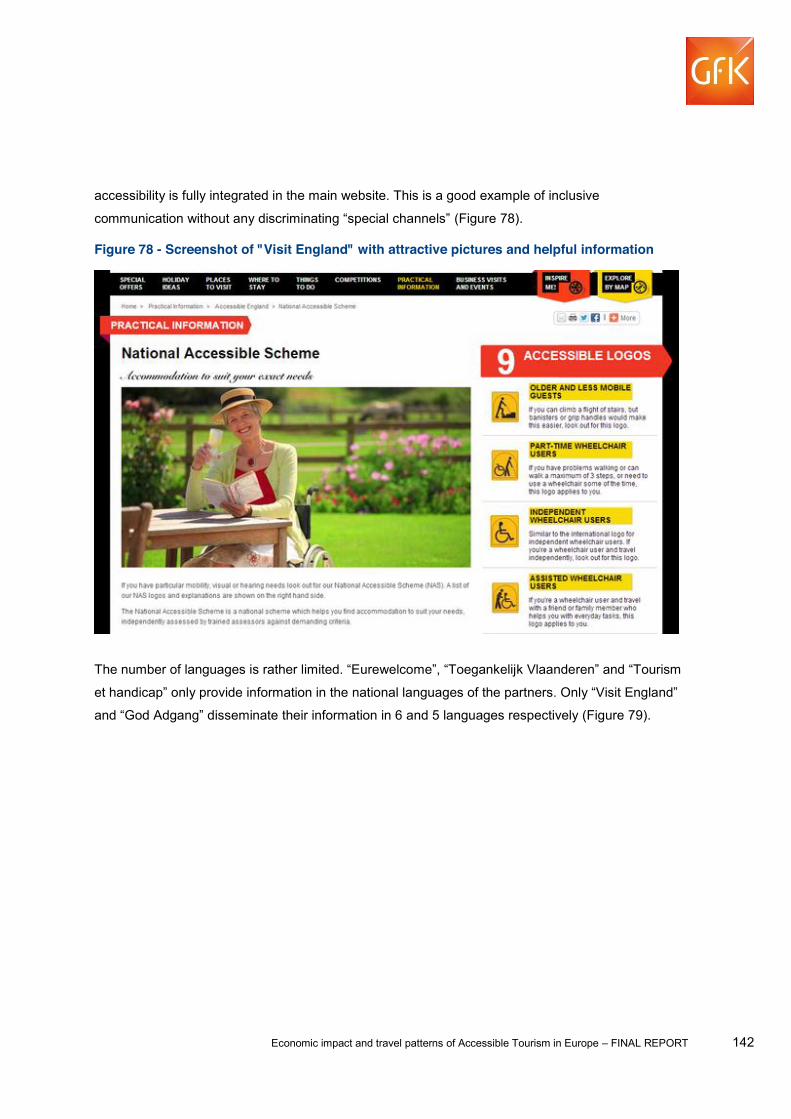
Economic impact and travel patterns of Accessible Tourism in Europe FINAL REPORT 142
accessibility is fully integrated in the main website. This is a good example of inclusive
(Figure 78).
Figure 78 - Screenshot of "Visit England" with attractive pictures and helpful information
disseminate their information in 6 and 5 languages respectively (Figure 79).
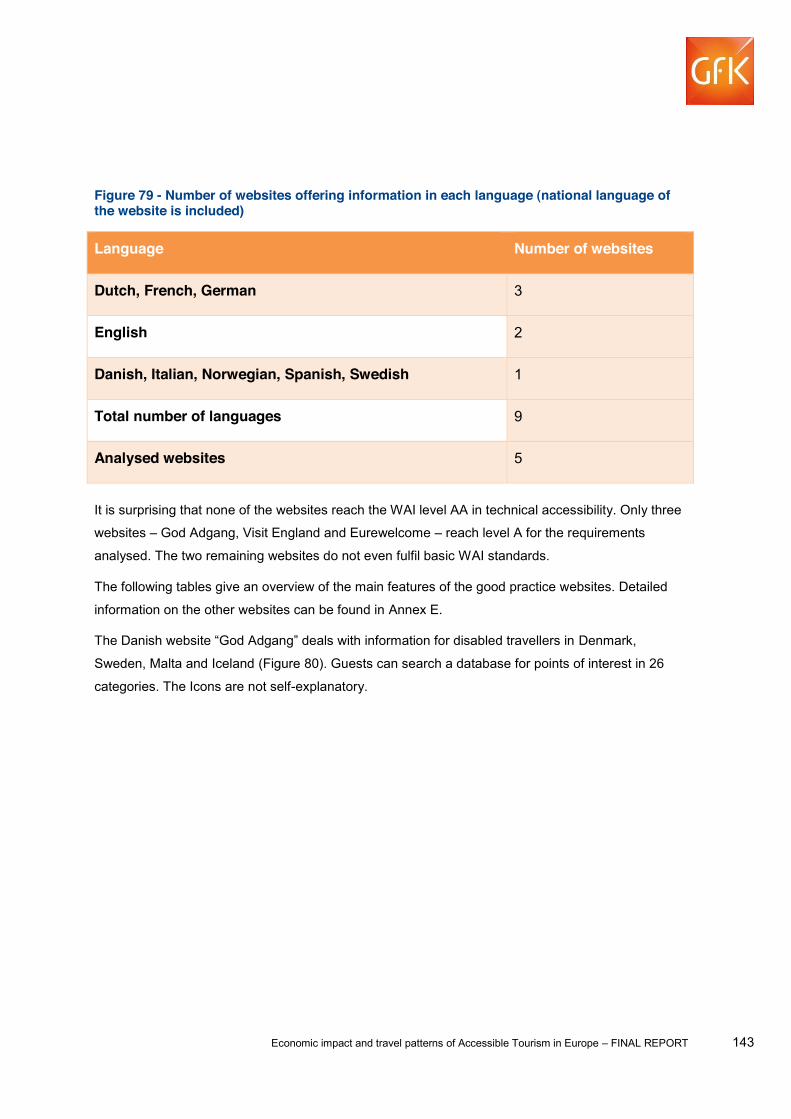
Economic impact and travel patterns of Accessible Tourism in Europe FINAL REPORT 143
Figure 79 - Number of websites offering information in each language (national language of the website is included)
Language Number of websites
Dutch, French, German 3
English 2
Danish, Italian, Norwegian, Spanish, Swedish 1
Total number of languages 9
Analysed websites 5
It is surprising that none of the websites reach the WAI level AA in technical accessibility. Only three
websites God Adgang, Visit England and Eurewelcome reach level A for the requirements
analysed. The two remaining websites do not even fulfil basic WAI standards.
The following tables give an overview of the main features of the good practice websites. Detailed
information on the other websites can be found in Annex E.
The Denmark,
Sweden, Malta and Iceland (Figure 80). Guests can search a database for points of interest in 26
categories. The Icons are not self-explanatory.

Economic impact and travel patterns of Accessible Tourism in Europe FINAL REPORT 144
Figure 80 God Adgang case-study
God Adgang (www.godadgang.dk)
Country Denmark
Target groups The information is targeted to the following groups:
Wheel chair users
Guests with walking- arm- or hand-impairments
Guests with visual impairments
Guests with hearing impairments
Guests with Asthma or allergies
Mentally disabled guests
Guests with dyslexia
Icons Icons are used for each group.
Service chain The service chain is covered comprehensively.
Website
languages
The website is available in Danish, English, German, Swedish and Icelandic.
Technical
accessibility
WAI-
people with visual impairments. No web site map or description of web site
design criteria.
(Figure 81). Information on accessibility is given on integrated subsites. Unlike all other websites, the
website focuses on marketing and tries to inspire travellers with high quality pictures and attractive
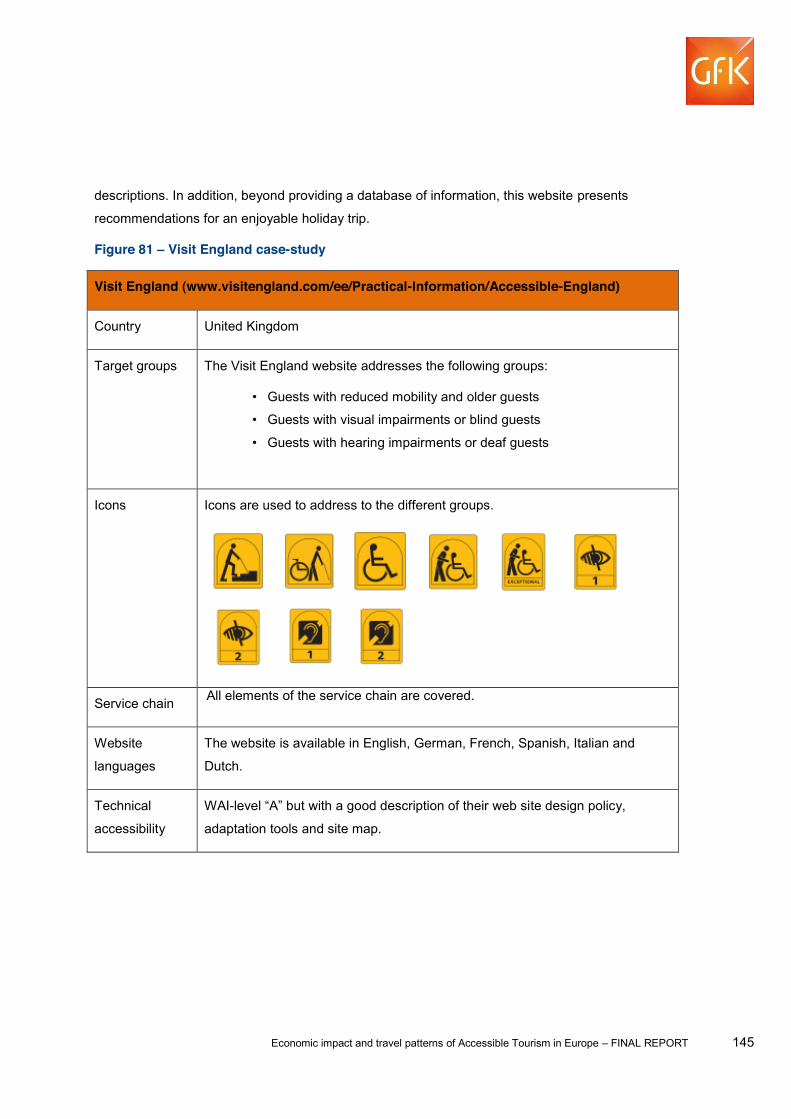
Economic impact and travel patterns of Accessible Tourism in Europe FINAL REPORT 145
descriptions. In addition, beyond providing a database of information, this website presents
recommendations for an enjoyable holiday trip.
Figure 81 Visit England case-study
Visit England (www.visitengland.com/ee/Practical-Information/Accessible-England)
Country United Kingdom
Target groups The Visit England website addresses the following groups:
Guests with reduced mobility and older guests
Guests with visual impairments or blind guests
Guests with hearing impairments or deaf guests
Icons Icons are used to address to the different groups.
Service chain All elements of the service chain are covered.
Website
languages
The website is available in English, German, French, Spanish, Italian and
Dutch.
Technical
accessibility
WAI- te design policy,
adaptation tools and site map.
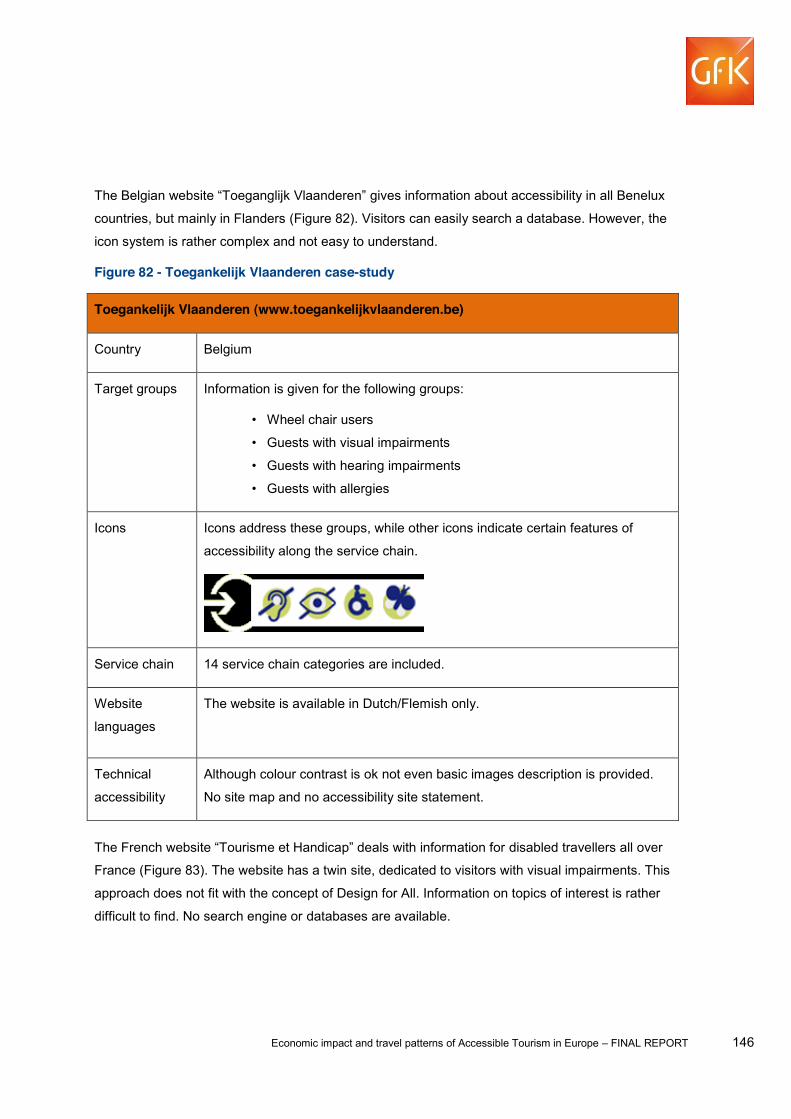
Economic impact and travel patterns of Accessible Tourism in Europe FINAL REPORT 146
gives information about accessibility in all Benelux
countries, but mainly in Flanders (Figure 82). Visitors can easily search a database. However, the
icon system is rather complex and not easy to understand.
Figure 82 - Toegankelijk Vlaanderen case-study
Toegankelijk Vlaanderen (www.toegankelijkvlaanderen.be)
Country Belgium
Target groups Information is given for the following groups:
Wheel chair users
Guests with visual impairments
Guests with hearing impairments
Guests with allergies
Icons Icons address these groups, while other icons indicate certain features of
accessibility along the service chain.
Service chain 14 service chain categories are included.
Website
languages
The website is available in Dutch/Flemish only.
Technical
accessibility
Although colour contrast is ok not even basic images description is provided.
No site map and no accessibility site statement.
disabled travellers all over
France (Figure 83). The website has a twin site, dedicated to visitors with visual impairments. This
approach does not fit with the concept of Design for All. Information on topics of interest is rather
difficult to find. No search engine or databases are available.

Economic impact and travel patterns of Accessible Tourism in Europe FINAL REPORT 147
Figure 83 - Tourisme et Handicap case-study
Tourisme et Handicap (www.tourisme-handicaps.org)
Country France
Target groups The information is designed for the following groups:
Guests with walking impairments
Guests with visual impairments
Guests with hearing impairments
Mentally disabled guests
Icons General label with additional icons, addressing different disabilities.
Service chain Information is given along the service chain, divided in three categories:
Accommodation
Food and Beverage
Entertainment
Website
languages
The website is only available in French.
Technical
accessibility impaired people but this has only larger text and better contrast. The images are
not described.
Eurewelcome is a joint venture of regions of four EU member states: Belgium (Limburg, Luttich,
German Community), Germany (Northrhine-Westfalia, Rhineland-Palatinate), Luxembourg and the
Netherlands (Limburg) (Figure 84). Visitors may use a database to search for the accessibility of
points of interest.

Economic impact and travel patterns of Accessible Tourism in Europe FINAL REPORT 148
Figure 84 Eurewelcome case-study
Eurewelcome (www.eurecard.org)
Country Belgium/Luxembourg/Germany/Netherlands
Target groups It is designed for all guests, but mainly guests with disabilities will find helpful
information.
Icons No icons, but a label to designate partners.
Service chain In general, Eurewelcome covers all elements of the service chain.
Website
languages
The website is available in German, French and Dutch.
Technical
accessibility
WAI- ncrease accessibility
for those who are visually impaired. Site map. Although the images are not
described the text is sufficiently explanatory.

Economic impact and travel patterns of Accessible Tourism in Europe FINAL REPORT 149
4.1.3 Summary and discussion Almost 70 % of all 66 surveyed websites provide information on accessible offers (Figure 85).
However, the information is very often hard to find. Of the 46 websites with information on
accessibility, only 28 (60%) have placed the information prominently and easy to find. Many guests
will not be able to find the information easily. So even if information is present, it may be lost for a
good deal of clients.
Figure 85 - Number of websites with (yes) and without (no) information on accessible offers
Yes No
Tourism boards 10 2
Railways 11 1
Airlines 9 3
Tour operators 1 4
Booking portals 3 2
Hotel chains 0 5
Beach destinations 2 3
City destinations 5 0
Good examples 5 0
Total 46 20
% 70 30
Furthermore, only 11 websites out of 66 (17 %) are technically accessible on the level usually
requested for public web sites (WAI level AA for the pages and requirements inspected). 14
websites (21 %) reach the lower WAI level A for these requirements. 41 websites more than 61 %
do not even reach basic accessibility requirements. Many guests with visual impairments or other
special needs are excluded from that information, even if information on accessibility is present. The
difficult navigation on
Economic impact and travel patterns of Accessible Tourism in Europe FINAL REPORT 150
small devices, mobiles and tablets. This implies a compromise not only for the users with access
limitations but to all users in general.
Most destinations, on a national or local level, provide information on accessibility. The same goes
for railway companies and airlines. But tour operators and hotel chains almost never give
information on accessible features. This is surprising, because accommodation is a main element of
the service chain, and of course, all guests with special access needs are in need for information, if
they want to stay overnight. Tour operators and hotels obviously do not use the full potential of
guests when they do not communicate their accessible offers.
In all cases, accessibility is mainly understood as a feature for disabled guests. There could not be
found a single case, where accessibility is communicated as a plus in service and comfort for all
guests. This is a pity, because destinations and service providers are not taking the opportunity to
address the majority of guests without special needs. In particular the big and fast growing group of
older people and the important group of families (with small children), that could benefit to a large
extend from accessible offers, is widely neglected.
As a result, accessibility is almost never used in marketing and advertising. Information remains
essibility, but is not a special
interest site for disabled guests. On the other hand, the site communicates the subject in an
attractive way, far beyond pure technical details.
If information on accessibility is given, most websites focus on guests with mobility impairment.
Information for guests with visual and hearing impairments is less frequently found, while the level of
information for guests with cognitive or hidden impairments are exceptional. As mentioned above,
seniors and/or families are almost never considered as a target group for accessible information.
Only the airlines (8 out of 12) cover special information for families more often, but they do not focus
on accessible features for this target group.
Information along the service chain is usually not comprehensive and is mostly provided on special
interest websites. Tourism boards often try to cover the whole service chain, but mainly provide
information on accommodation, transport and entertainment. In particular the city destinations take
all elements of the service chain into account. It is not surprising that railway companies and airlines
focus on travel services and transportation. Airlines in addition inform guests about food and
beverages.
If destinations or service providers wish to deal with information on accessibility, they do not
necessarily have to do it on their own websites. Alternatively, they may link to relevant special

Economic impact and travel patterns of Accessible Tourism in Europe FINAL REPORT 151
to discrimination of a special target group and to a loss of information for guests without special
needs, who are just seeking good services and comfortable offers. However, a link to external pages
may be useful, when information on accessibility is gathered in databases (like Toeganglijk
Vlaanderen, God Adgang and Eurewelcome in the chapter of good examples). All in all, only a
quarter of the websites provides external links for further and/or more detailed information on
accessibility (Figure 86). As mentioned above, it is usually better to have information for guests with
and without special needs in one source in order to prevent discrimination and to provide all guests
with helpful information. However, at least for the websites without information on accessibility, it
could be a first step to improving the information and link to specialized sites prominently.

Economic impact and travel patterns of Accessible Tourism in Europe FINAL REPORT 152
Figure 86 - Number of websites with (yes) and without (no) external links to specialized websites
Yes No
Tourism boards 9 3
Railways 0 12
Airlines 1 11
Tour operators 0 5
Booking portals 1 4
Hotel chains 0 5
Beach destinations 0 5
City destinations 5 0
Good examples 2 3
Total 17 49
% 26 74
The findings of the research do correspond mainly with the findings of the recent ENAT study on
accessible websites.1 ENAT checked all European tourism boards (including the ones that are not in
the EU), so the focus of the two studies is different; just nine websites have been studied in both
cases.
4.1.4 Brochure analysis Though the internet is the most important source for information, many guests still prefer written
information like leaflets, flyers and brochures. The reasons may be different. Some guests,
1 ENAT (Ed.) (2912): Accessibility Review of Europea

Economic impact and travel patterns of Accessible Tourism in Europe FINAL REPORT 153
especially a proportion of older guests, have no access to the internet, others do not want to use the
internet abroad or simply like the feel of printed papers.
We ordered brochures from the 12 countries identified in the cluster analysis. We asked for general
information on tourism and for special interest brochures for guests with access needs.
Not all tourism board send printed information. The tourism boards of Italy and the Netherlands just
is just given electronically due to the higher
costs of printed material. However, we managed to collect a brochure from the Netherlands (Island
of Texel), so only Italy is missing in the analysis.
Furthermore, not all tourism boards have brochures for the whole country. Belgium, England and
The Netherlands only provide printed information for single destinations or regions. In this case, we
looked for typical or important destinations and analysed their brochures. An overview of the
brochures and the results is given in Annex E.
No tourism board sent special interest brochures with information for guests with access needs.
From the 11 analysed brochures, 9 use a font size which is too small for guests with visual
impairments. This is a very general result, because most brochures use different font sizes and
some of them are big enough.
In all but one brochure (Poland), the contrast between text and background is sufficient and all
brochures are dazzle-free.
It is often difficult for guests with visual impairments to read text that crosses pictures or graphics.
With the exception of Spain, all brochures separate text and pictures.
All but one brochure was structured clearly and well laid out. Only in the case of England was it
difficult to distinguish text and description among a lot of advertisement images.
As mentioned above, no tourism board provided special interest brochures for guests with access
needs. However, in four brochures (England, Ireland, The Netherlands and Sweden), information for
this group of guests is given in the regular brochure. In half of the cases, the information is easy to
find. All four brochures supply external links to special websites with more detailed information on
accessibility. In fact, there is no space in a brochure to deal with detailed measurements of
accessible offers.
Economic impact and travel patterns of Accessible Tourism in Europe FINAL REPORT 154
4.2 Task 2b Online survey and focus groups
4.2.1 Overview The travel patterns and behaviour of people with access needs were investigated via two main
channels: an online survey among people with access needs and two focus groups among seniors.
The online survey was conducted among 2111 people in 12 EU Member States selected to
represent the different country clusters: Bulgaria and Poland represent Cluster 1, Spain and
Slovenia Cluster 2, Ireland Cluster 3, Italy Cluster 4, Belgium and the Netherlands Cluster 5, France
and the UK Cluster 6, Sweden Cluster 7, and Lithuania Cluster 8. In addition, 423 interviews were
conducted with people with limitations and seniors in inbound markets. The two focus groups were
conducted in Lithuania and Ireland among people aged over 65. A full description of the
methodology and survey materials can be found in Annexes F, G, H and J.
The results in this section are presented split by access need profile: people above 65, people with a
limitation and/or people who travel with children. The groups overlap to some extent since a
respondent may belong to two or three of these groups depending on his/her personal situation.
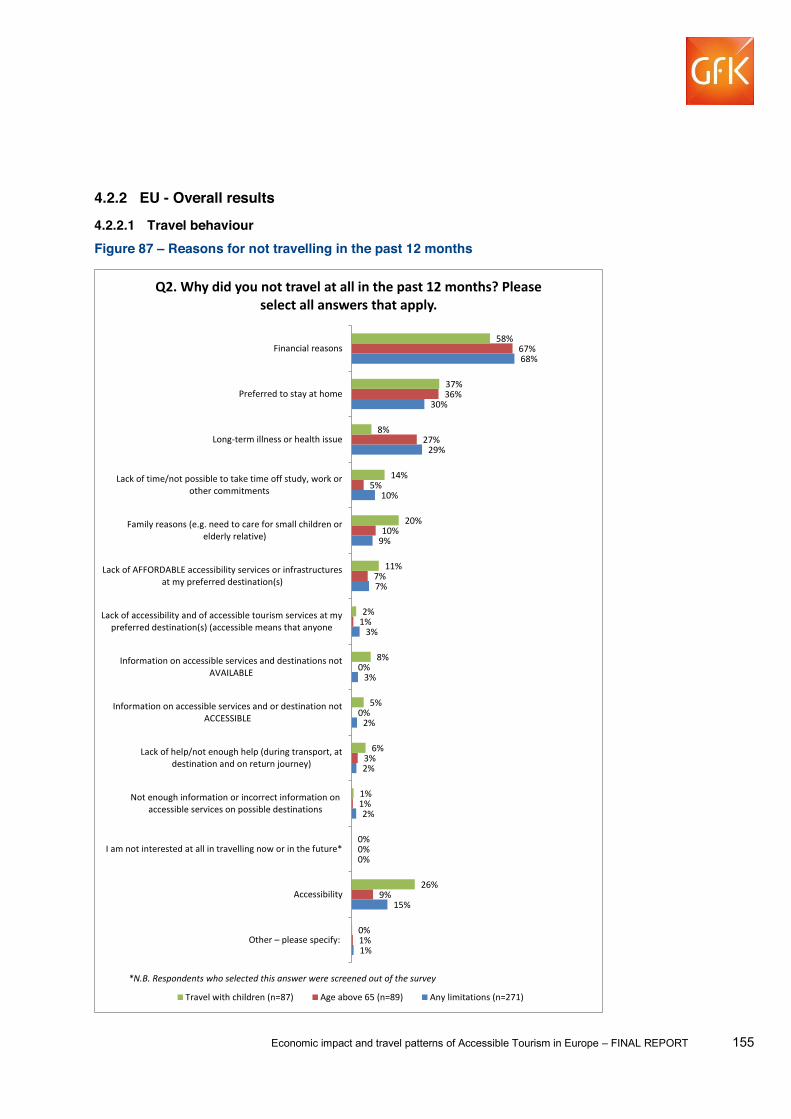
Economic impact and travel patterns of Accessible Tourism in Europe FINAL REPORT 155
4.2.2 EU - Overall results
4.2.2.1 Travel behaviour Figure 87 Reasons for not travelling in the past 12 months
1%
15%
0%
2%
2%
2%
3%
3%
7%
9%
10%
29%
30%
68%
1%
9%
0%
1%
3%
0%
0%
1%
7%
10%
5%
27%
36%
67%
0%
26%
0%
1%
6%
5%
8%
2%
11%
20%
14%
8%
37%
58%
Other please specify:
Accessibility
I am not interested at all in travelling now or in the future*
Not enough information or incorrect information onaccessible services on possible destinations
Lack of help/not enough help (during transport, atdestination and on return journey)
Information on accessible services and or destination notACCESSIBLE
Information on accessible services and destinations notAVAILABLE
Lack of accessibility and of accessible tourism services at mypreferred destination(s) (accessible means that anyone
Lack of AFFORDABLE accessibility services or infrastructuresat my preferred destination(s)
Family reasons (e.g. need to care for small children orelderly relative)
Lack of time/not possible to take time off study, work orother commitments
Long-‐term illness or health issue
Preferred to stay at home
Financial reasons
Q2. Why did you not travel at all in the past 12 months? Please select all answers that apply.
Travel with children (n=87) Age above 65 (n=89) Any limitations (n=271)
*N.B. Respondents who selected this answer were screened out of the survey

Economic impact and travel patterns of Accessible Tourism in Europe FINAL REPORT 156
In total, 20% of people over 65 report not travelling at all in the past 12 months. These respondents
were asked why they did not travel and a majority mentioned financial reasons (67%), followed by
personal preference (36%). 27% mentioned a long-term illness or health issue and 10% family
reasons. Overall, 9% mentioned a reason linked to accessibility such as the lack of accessibility of
destinations, the availability and accessibility of information or the affordability of accessible
services.
18% of people with any limitations report not travelling at all in the past 12 months. These
respondents were asked why they did not travel and a majority mentioned financial reasons (68%),
followed by personal preference (30%). 29% mentioned a long-term illness or health issue and 9%
family reasons. Overall, 15% mentioned a reason linked to accessibility such as the lack of
accessibility of destinations, the availability and accessibility of information or the affordability of
accessible services.
9% of people who travel with children report not travelling at all in the past 12 months. These
respondents were asked why they did not travel and a majority mentioned financial reasons (58%),
followed by personal preference (37%). 8% mentioned a long-term illness or health issue and 20%
family reasons. Overall, 26% mentioned a reason linked to accessibility such as the lack of
accessibility of destinations, the availability and accessibility of information or the affordability of
accessible services.

Economic impact and travel patterns of Accessible Tourism in Europe FINAL REPORT 157
Figure 88 - Seasonality
Turning to seasonality, respondents were asked for their main holiday period in general. 64% of
people with any limitations report being most likely to travel during the summer holidays, followed by
off-season holidays (48%). When asked over which other periods they travel, spring holidays are
cited most frequently, at 41%, followed by school holidays (38%), autumn holidays (37%) and winter
holidays (36%). Other periods are the least popular (24%).
Travelling during summer holidays (55%) and off-season holidays (42%) is also popular for people
who are older than 65. Besides these holidays, the results indicate that 37% of the 65s travel during
24%
36%
37%
38%
41%
48%
64%
31%
29%
37%
25%
37%
42%
55%
23%
37%
38%
39%
41%
46%
69%
Other
Winter holidays
Autumn holidays
School holidays
Spring holidays
Off-‐season/outside main school holidays
Summer holidays
Q3. In general, when are you most likely to schedule trips? And when are you also likely to schedule trips?
All answers
Travel with children (n=965) Age above 65 (n=318) Any limitations (n=1341)
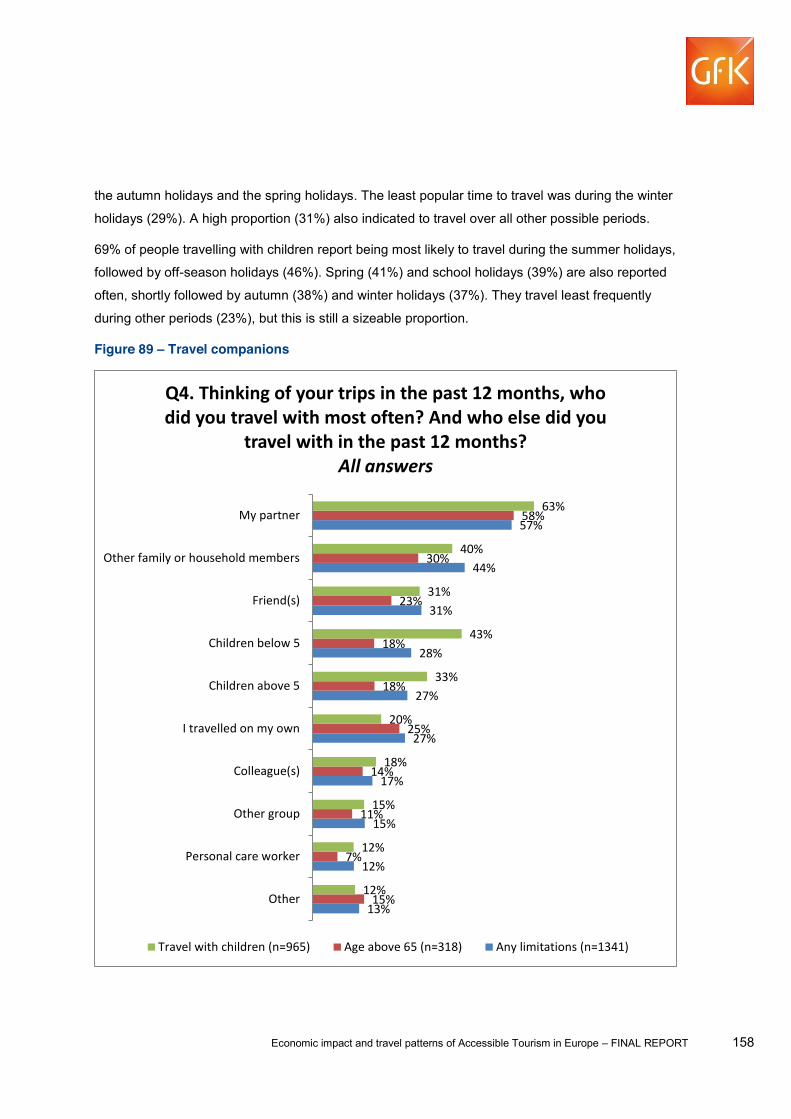
Economic impact and travel patterns of Accessible Tourism in Europe FINAL REPORT 158
the autumn holidays and the spring holidays. The least popular time to travel was during the winter
holidays (29%). A high proportion (31%) also indicated to travel over all other possible periods.
69% of people travelling with children report being most likely to travel during the summer holidays,
followed by off-season holidays (46%). Spring (41%) and school holidays (39%) are also reported
often, shortly followed by autumn (38%) and winter holidays (37%). They travel least frequently
during other periods (23%), but this is still a sizeable proportion.
Figure 89 Travel companions
13%
12%
15%
17%
27%
27%
28%
31%
44%
57%
15%
7%
11%
14%
25%
18%
18%
23%
30%
58%
12%
12%
15%
18%
20%
33%
43%
31%
40%
63%
Other
Personal care worker
Other group
Colleague(s)
I travelled on my own
Children above 5
Children below 5
Friend(s)
Other family or household members
My partner
Q4. Thinking of your trips in the past 12 months, who did you travel with most often? And who else did you
travel with in the past 12 months? All answers
Travel with children (n=965) Age above 65 (n=318) Any limitations (n=1341)

Economic impact and travel patterns of Accessible Tourism in Europe FINAL REPORT 159
A majority of people with any limitations mention their partner (57%) as their most frequent travel
companion, followed by other family or household members (44%). When asked which other travel
companions they may travel with, they mentioned friends (31%), children below (28%) and above 5
(27%) and with nobody else (27%). A smaller group of people with any limitations travelled with
colleagues (17%) and with other groups (15%). A minority stated to travel with other people that
were not specifically mentioned (13%) and with personal care workers (12%) in the past 12 months.
People older than 65 also reported travelling most frequently with their partner (58%) and other
family or household members (30%) in the past 12 months. Travelling on their own (25%) and with
friends (23%) were also mentioned relatively frequently. Furthermore, the results show that two
smaller segments travel with children who are above or below 5 years old (both 18%). Over 65s
least often mentioned personal care workers (7%).
People with children travelled most often with their partner (63%) and with children below five (43%),
followed by family and other household members (40%), children above 5 (33%) and friends (31%).
A smaller proportion of people with children travelled on their own (20%), with colleagues (18%) or
with other groups (15%).
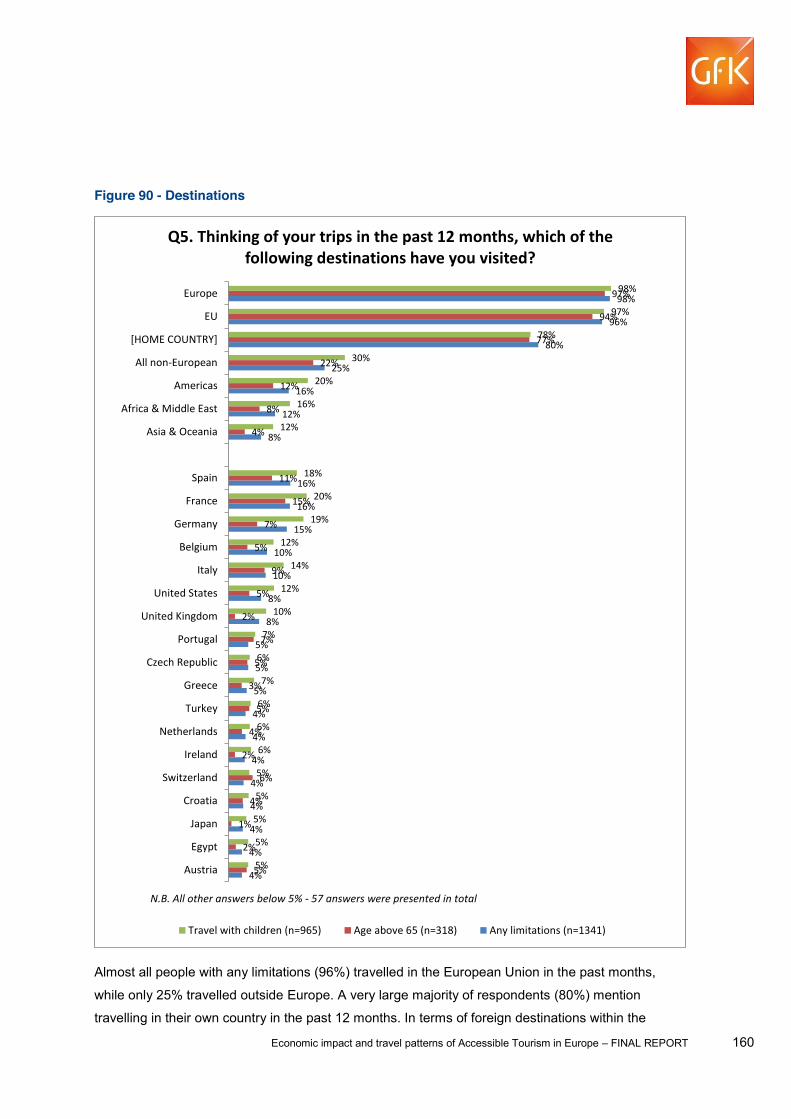
Economic impact and travel patterns of Accessible Tourism in Europe FINAL REPORT 160
Figure 90 - Destinations
Almost all people with any limitations (96%) travelled in the European Union in the past months,
while only 25% travelled outside Europe. A very large majority of respondents (80%) mention
travelling in their own country in the past 12 months. In terms of foreign destinations within the
4%
4%
4%
4%
4%
4%
4%
4%
5%
5%
5%
8%
8%
10%
10%
15%
16%
16%
8%
12%
16%
25%
80%
96%
98%
5%
2%
1%
4%
6%
2%
4%
5%
3%
5%
7%
2%
5%
9%
5%
7%
15%
11%
4%
8%
12%
22%
77%
94%
97%
5%
5%
5%
5%
5%
6%
6%
6%
7%
6%
7%
10%
12%
14%
12%
19%
20%
18%
12%
16%
20%
30%
78%
97%
98%
Austria
Egypt
Japan
Croatia
Switzerland
Ireland
Netherlands
Turkey
Greece
Czech Republic
Portugal
United Kingdom
United States
Italy
Belgium
Germany
France
Spain
Asia & Oceania
Africa & Middle East
Americas
All non-‐European
[HOME COUNTRY]
EU
Europe
Q5. Thinking of your trips in the past 12 months, which of the following destinations have you visited?
Travel with children (n=965) Age above 65 (n=318) Any limitations (n=1341)
N.B. All other answers below 5% -‐ 57 answers were presented in total
Economic impact and travel patterns of Accessible Tourism in Europe FINAL REPORT 161
European Union, the most frequent mentions are of Spain (16%), France (16%), Germany (15%),
Belgium (10%), Italy (10%), the UK (8%) and Portugal (5%).
Almost all over 65s (94%) travelled in the European Union in the past months, while only 22%
travelled outside Europe. A very large majority of respondents mention travelling in their own country
in the past 12 months. In terms of foreign destinations within the European Union, the most frequent
mentions are France (15%), Spain (11%), Italy (9%), Germany (7%), Portugal (7%), Belgium (5%),
and the UK (2%).
Almost all people who travel with children (967%) travelled in the European Union in the past
months, while only 30% travelled outside Europe. A very large majority of respondents mention
travelling in their own country in the past 12 months. In terms of foreign destinations within the
European Union, the most frequent mentions are France (20%), Germany (19%), Spain (18%), Italy
(14%), Belgium (12%), the UK (10%) and Portugal (7%).
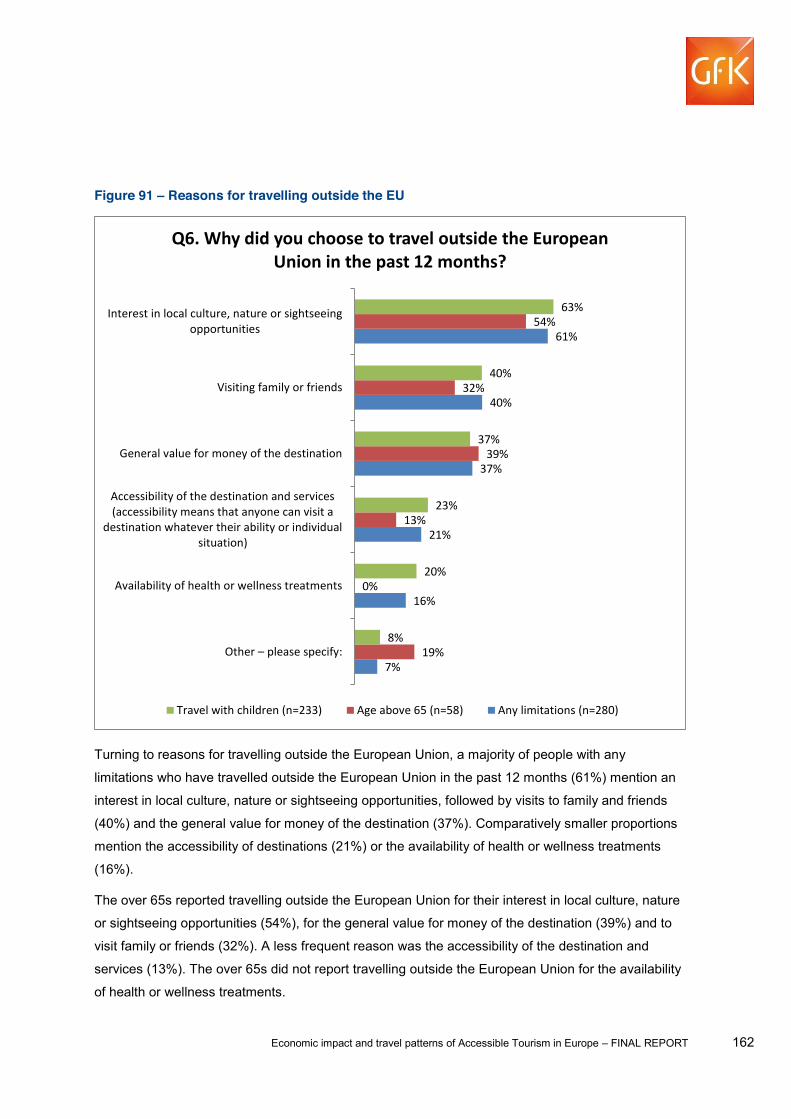
Economic impact and travel patterns of Accessible Tourism in Europe FINAL REPORT 162
Figure 91 Reasons for travelling outside the EU
Turning to reasons for travelling outside the European Union, a majority of people with any
limitations who have travelled outside the European Union in the past 12 months (61%) mention an
interest in local culture, nature or sightseeing opportunities, followed by visits to family and friends
(40%) and the general value for money of the destination (37%). Comparatively smaller proportions
mention the accessibility of destinations (21%) or the availability of health or wellness treatments
(16%).
The over 65s reported travelling outside the European Union for their interest in local culture, nature
or sightseeing opportunities (54%), for the general value for money of the destination (39%) and to
visit family or friends (32%). A less frequent reason was the accessibility of the destination and
services (13%). The over 65s did not report travelling outside the European Union for the availability
of health or wellness treatments.
7%
16%
21%
37%
40%
61%
19%
0%
13%
39%
32%
54%
8%
20%
23%
37%
40%
63%
Other please specify:
Availability of health or wellness treatments
Accessibility of the destination and services(accessibility means that anyone can visit a
destination whatever their ability or individualsituation)
General value for money of the destination
Visiting family or friends
Interest in local culture, nature or sightseeingopportunities
Q6. Why did you choose to travel outside the European Union in the past 12 months?
Travel with children (n=233) Age above 65 (n=58) Any limitations (n=280)

Economic impact and travel patterns of Accessible Tourism in Europe FINAL REPORT 163
Looking at the reasons why people with children travel outside the European Union, the pattern is
more or less the same. They reported choosing a country outside the European Union especially for
their interest in local culture, nature or sightseeing opportunities (63%). They also mentioned
frequently wanting to visit family or friends (40%) or the general value for money of the destination
(37%). A smaller proportion reported that the accessibility of the destination and services (23%) and
the availability of health or wellness treatments (20%) were important.

Economic impact and travel patterns of Accessible Tourism in Europe FINAL REPORT 164
Figure 92 Accommodation
59% of people with any limitations usually mention staying in a hotel or B&B in the past 12 months,
followed by 43% staying with family or friends, 20% in a rental house or flat and 15% staying in a
tent, caravan or mobile home. Respectively 10%, 11%, 8% and 3% said they had stayed in a spa or
wellness resort, their own holiday house or flat, a youth hostel or hostel or in a medical or healthcare
institution. Most of the people with any limitations paid for their accommodation (81%).
78% of the over 65s paid for their accommodation. 63% stayed in a hotel or B&B and 41% stated
they had stayed at the home of friends or family members. People above 65 stayed less frequently
in a rental house or flat (17%), in a holiday house or flat they owned (9%) or in a spa or wellness
4%
3%
8%
10%
11%
15%
20%
43%
59%
7%
3%
2%
9%
9%
6%
17%
41%
63%
4%
3%
9%
13%
13%
15%
22%
43%
61%
Other
In a medical or healthcare institution (e.g. a clinic orpost-‐surgery rehabilitation centre)
In a youth hostel or hostel
In a spa or wellness resort
In your own holiday house or flat
In a tent/caravan/mobile home
In a rental house or flat
At the home of friends or family members
In a hotel or Bed & Breakfast
Q7. Thinking of your trips in the past 12 months, in what type of accommodation did you usually stay?
Travel with children (n=921) Age above 65 (n=281) Any limitations (n=1250)
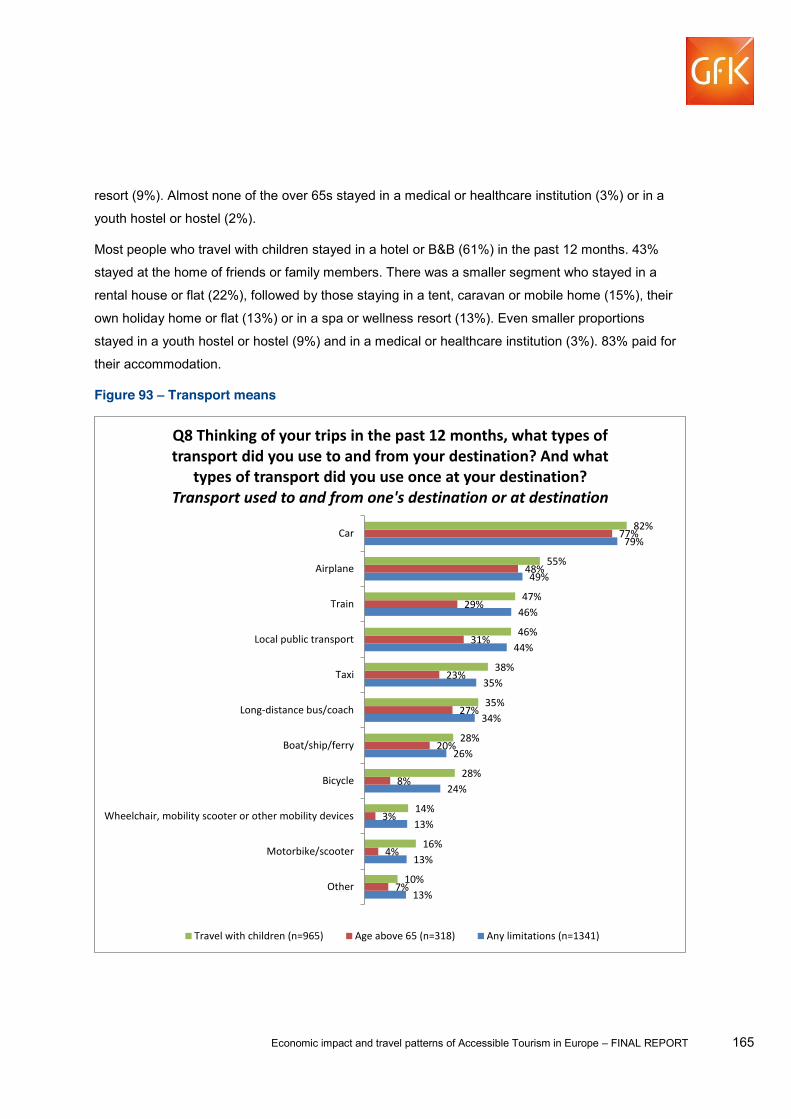
Economic impact and travel patterns of Accessible Tourism in Europe FINAL REPORT 165
resort (9%). Almost none of the over 65s stayed in a medical or healthcare institution (3%) or in a
youth hostel or hostel (2%).
Most people who travel with children stayed in a hotel or B&B (61%) in the past 12 months. 43%
stayed at the home of friends or family members. There was a smaller segment who stayed in a
rental house or flat (22%), followed by those staying in a tent, caravan or mobile home (15%), their
own holiday home or flat (13%) or in a spa or wellness resort (13%). Even smaller proportions
stayed in a youth hostel or hostel (9%) and in a medical or healthcare institution (3%). 83% paid for
their accommodation.
Figure 93 Transport means
13%
13%
13%
24%
26%
34%
35%
44%
46%
49%
79%
7%
4%
3%
8%
20%
27%
23%
31%
29%
48%
77%
10%
16%
14%
28%
28%
35%
38%
46%
47%
55%
82%
Other
Motorbike/scooter
Wheelchair, mobility scooter or other mobility devices
Bicycle
Boat/ship/ferry
Long-‐distance bus/coach
Taxi
Local public transport
Train
Airplane
Car
Q8 Thinking of your trips in the past 12 months, what types of transport did you use to and from your destination? And what
types of transport did you use once at your destination? Transport used to and from one's destination or at destination
Travel with children (n=965) Age above 65 (n=318) Any limitations (n=1341)
Economic impact and travel patterns of Accessible Tourism in Europe FINAL REPORT 166
months, 79% of people with any limitations used a car, 49% an airplane, 46% the train and 44 local
public transport. Other transportations mentioned often were the taxi (35%), long-distance bus or
coach (34%), or boats, hips or ferries (26%).
People above 65 choose to use the car (77%), airplane (48%) and local public transport (31%) the
most frequently for their transportation. Less people over 65 used the train (29%), long-distance bus
(27%), followed by the taxi (23%) and the boat, ship or ferry (20%).
People who travelled with children used more often the car (82%), the airplane (55%) and the train
(47%) to reach their destination. The proportion of people with children that used local public
transport (46%), the taxi (38%), the long-distance bus (35%), and the boat, ship or ferry (28%) was
lower, but was still high.

Economic impact and travel patterns of Accessible Tourism in Europe FINAL REPORT 167
Figure 94 Activities at destination
4%
8%
10%
13%
16%
17%
29%
29%
31%
32%
37%
45%
45%
49%
59%
63%
64%
65%
8%
4%
6%
6%
7%
13%
34%
21%
17%
15%
37%
36%
30%
53%
46%
58%
64%
56%
2%
8%
10%
15%
18%
21%
34%
32%
37%
43%
43%
49%
48%
50%
58%
60%
63%
64%
Other
Health care or other medical activities
Other outdoor activities (e.g. fishing, bird-‐watching)
Other sports (e.g. cycling, skiing, water or airsports)
Business or other work-‐related activities
Spa, massages or other wellness activities
Guided tours/excursions
Local events (e.g. festivals, pilgrimages or sportsevents)
Animal or wildlife parks (e.g. aquarium, zoo)
Activities for families or children
Natural visits (e.g. national parks)
Walking, hiking or running
Swimming/sunbathing
Cultural visits (museums, monuments, art,heritage)
Spending time with family or friends/socialactivities
Sightseeing/walking around
Dining out at a local restaurant or café/trying localfood and drinks/going out
Shopping
Q9. Thinking of your trips in the past 12 months, which of the following activities did you take part in?
Travel with children (n=965) Age above 65 (n=318) Any limitations (n=1341)
Economic impact and travel patterns of Accessible Tourism in Europe FINAL REPORT 168
The tourism activities that people with any limitations mentioned most frequently are shopping
(65%), dining out or going out (64%), sightseeing/walking around (63%) and spending time with
family or friends (59%). Wellness and healthcare activities were less popular (respectively 17% and
8%).
The activities mentioned most frequently by the over 65s are dining out or going out (64%), shopping
(56%), spending time with family or friends (46%) and sightseeing/walking around (58%). A small
amount of the over 65s were interested in wellness activities (13%) and health care (4%).
Most of the people who travelled with children frequently went out to shop (64%), to dinner or to go
out (63%), to sightsee or walk around (60%) and to spend time with family and friends (58%).
Wellness activities (21%) were more popular compared with the two other groups, but a small
proportion of people mentioned health care (8%).
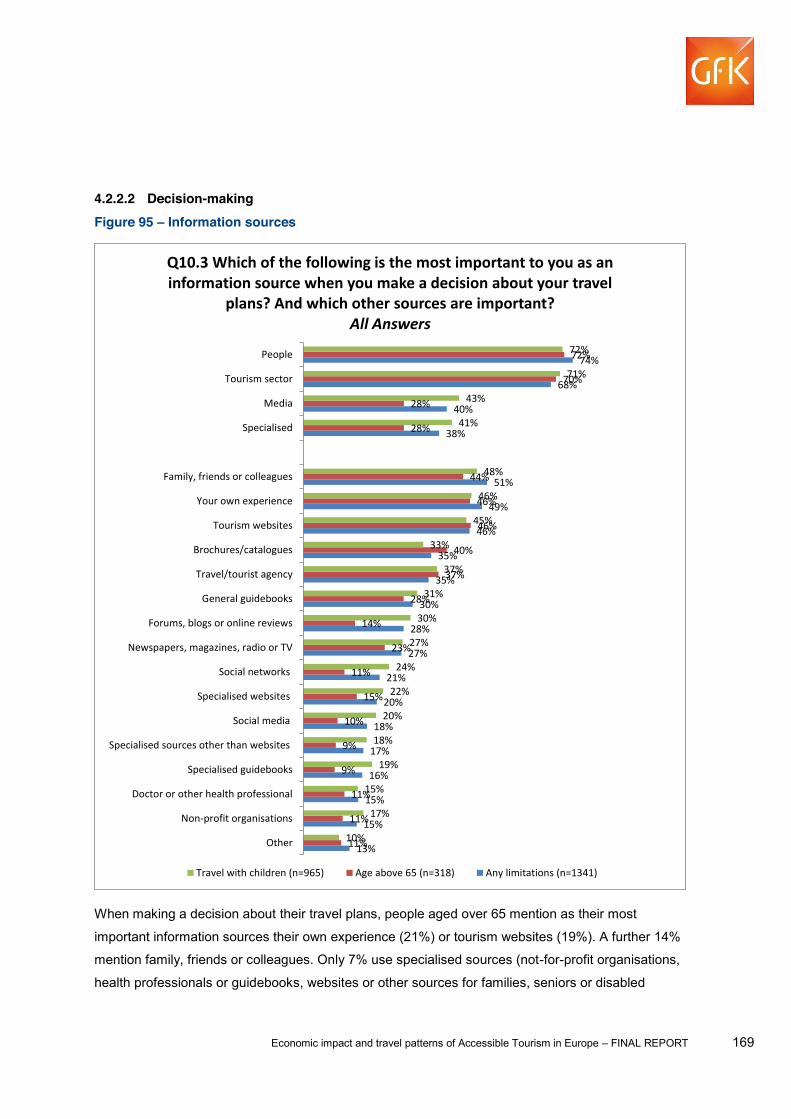
Economic impact and travel patterns of Accessible Tourism in Europe FINAL REPORT 169
4.2.2.2 Decision-making Figure 95 Information sources
When making a decision about their travel plans, people aged over 65 mention as their most
important information sources their own experience (21%) or tourism websites (19%). A further 14%
mention family, friends or colleagues. Only 7% use specialised sources (not-for-profit organisations,
health professionals or guidebooks, websites or other sources for families, seniors or disabled
13%
15%
15%
16%
17%
18%
20%
21%
27%
28%
30%
35%
35%
46%
49%
51%
38%
40%
68%
74%
11%
11%
11%
9%
9%
10%
15%
11%
23%
14%
28%
37%
40%
46%
46%
44%
28%
28%
70%
72%
10%
17%
15%
19%
18%
20%
22%
24%
27%
30%
31%
37%
33%
45%
46%
48%
41%
43%
71%
72%
Other
Non-‐profit organisations
Doctor or other health professional
Specialised guidebooks
Specialised sources other than websites
Social media
Specialised websites
Social networks
Newspapers, magazines, radio or TV
Forums, blogs or online reviews
General guidebooks
Travel/tourist agency
Brochures/catalogues
Tourism websites
Your own experience
Family, friends or colleagues
Specialised
Media
Tourism sector
People
Q10.3 Which of the following is the most important to you as an information source when you make a decision about your travel
plans? And which other sources are important? All Answers
Travel with children (n=965) Age above 65 (n=318) Any limitations (n=1341)
Economic impact and travel patterns of Accessible Tourism in Europe FINAL REPORT 170
people). However, this proportion rises to 28% when the over 65s can indicate all information
sources they find important.
When making a decision about their travel plans, people with any limitations mention as their most
important information sources family, friends or colleagues (20%) or their own experience (19%).
Another 17% mentions tourism websites. Only 12% use specialised sources (not-for-profit
organisations, health professionals or guidebooks, websites or other sources for families, seniors or
disabled people). However, this proportion rises to 38% when people with any limitations can
indicate all information sources they find important.
When making a decision about their travel plans, people travelling with children mention as their
most important information sources family, friends or colleagues or their own experience (both 18%).
Another 16% mentions tourism websites. Only 14% use specialised sources (not-for-profit
organisations, health professionals or guidebooks, websites or other sources for families, seniors or
disabled people). However, this proportion rises to 41% when people travelling with children can
indicate all information sources they find important.
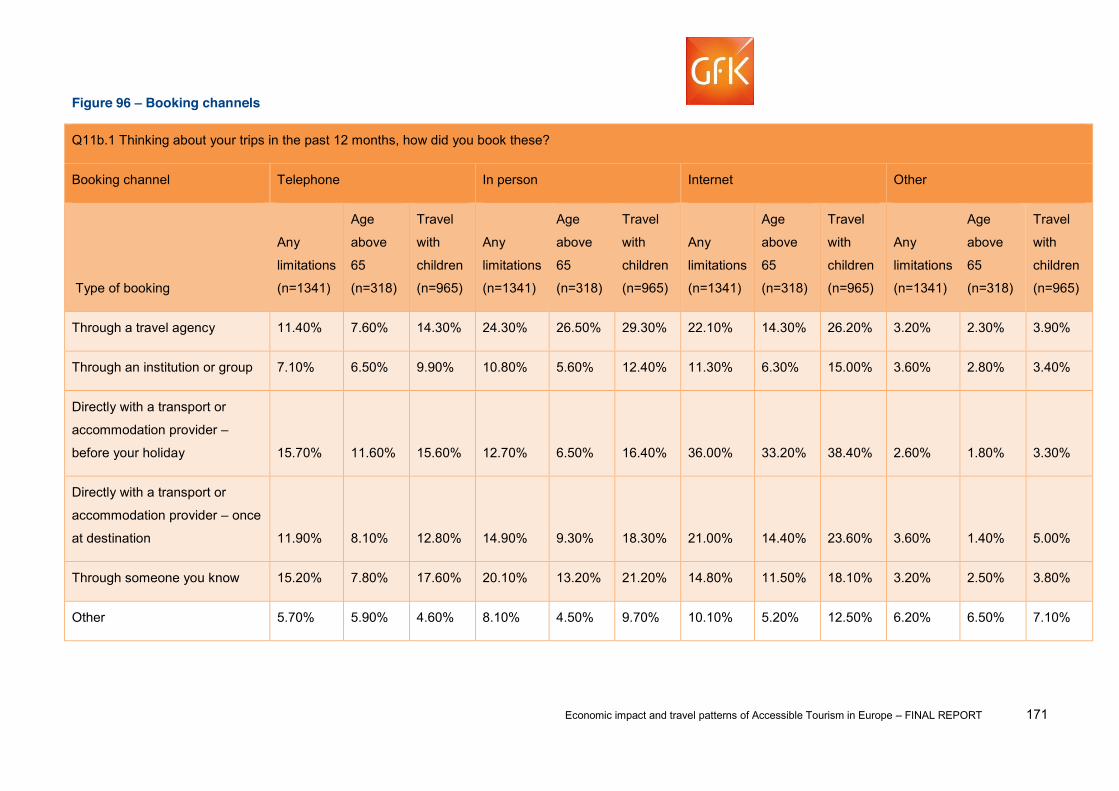
Economic impact and travel patterns of Accessible Tourism in Europe FINAL REPORT 171
Figure 96 Booking channels
Q11b.1 Thinking about your trips in the past 12 months, how did you book these?
Booking channel Telephone In person Internet Other
Type of booking
Any
limitations
(n=1341)
Age
above
65
(n=318)
Travel
with
children
(n=965)
Any
limitations
(n=1341)
Age
above
65
(n=318)
Travel
with
children
(n=965)
Any
limitations
(n=1341)
Age
above
65
(n=318)
Travel
with
children
(n=965)
Any
limitations
(n=1341)
Age
above
65
(n=318)
Travel
with
children
(n=965)
Through a travel agency 11.40% 7.60% 14.30% 24.30% 26.50% 29.30% 22.10% 14.30% 26.20% 3.20% 2.30% 3.90%
Through an institution or group 7.10% 6.50% 9.90% 10.80% 5.60% 12.40% 11.30% 6.30% 15.00% 3.60% 2.80% 3.40%
Directly with a transport or
accommodation provider
before your holiday 15.70% 11.60% 15.60% 12.70% 6.50% 16.40% 36.00% 33.20% 38.40% 2.60% 1.80% 3.30%
Directly with a transport or
accommodation provider once
at destination 11.90% 8.10% 12.80% 14.90% 9.30% 18.30% 21.00% 14.40% 23.60% 3.60% 1.40% 5.00%
Through someone you know 15.20% 7.80% 17.60% 20.10% 13.20% 21.20% 14.80% 11.50% 18.10% 3.20% 2.50% 3.80%
Other 5.70% 5.90% 4.60% 8.10% 4.50% 9.70% 10.10% 5.20% 12.50% 6.20% 6.50% 7.10%
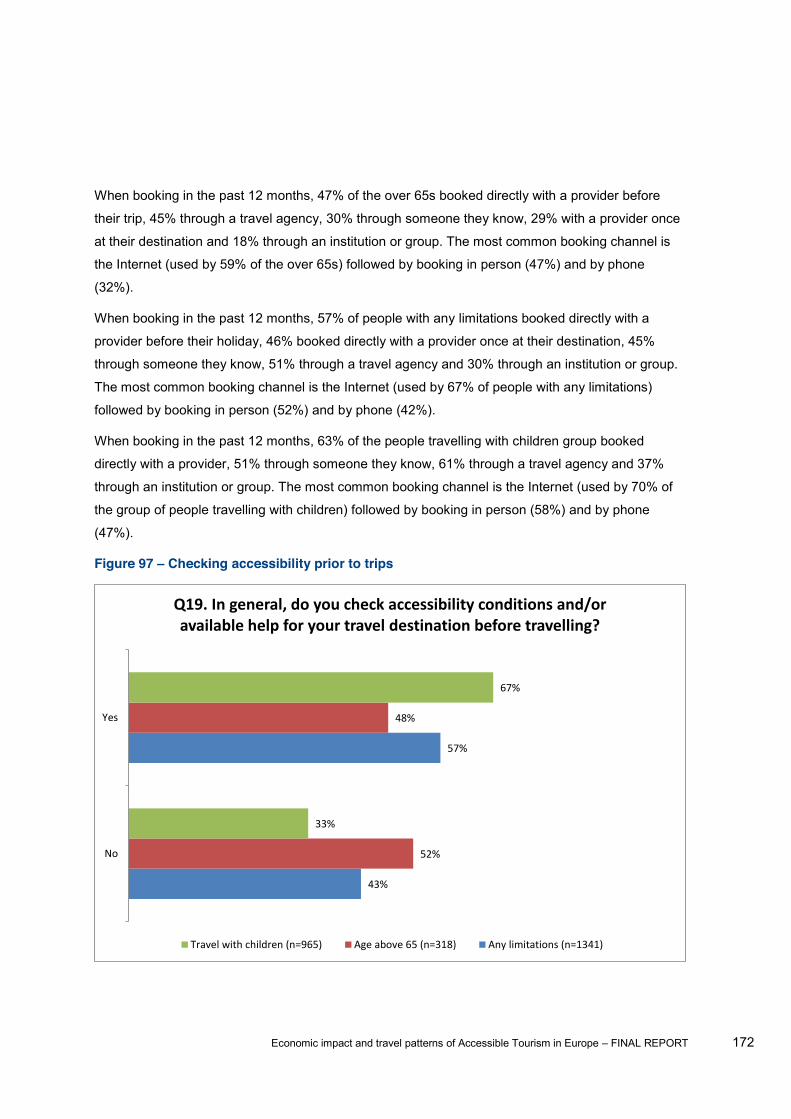
Economic impact and travel patterns of Accessible Tourism in Europe FINAL REPORT 172
When booking in the past 12 months, 47% of the over 65s booked directly with a provider before
their trip, 45% through a travel agency, 30% through someone they know, 29% with a provider once
at their destination and 18% through an institution or group. The most common booking channel is
the Internet (used by 59% of the over 65s) followed by booking in person (47%) and by phone
(32%).
When booking in the past 12 months, 57% of people with any limitations booked directly with a
provider before their holiday, 46% booked directly with a provider once at their destination, 45%
through someone they know, 51% through a travel agency and 30% through an institution or group.
The most common booking channel is the Internet (used by 67% of people with any limitations)
followed by booking in person (52%) and by phone (42%).
When booking in the past 12 months, 63% of the people travelling with children group booked
directly with a provider, 51% through someone they know, 61% through a travel agency and 37%
through an institution or group. The most common booking channel is the Internet (used by 70% of
the group of people travelling with children) followed by booking in person (58%) and by phone
(47%).
Figure 97 Checking accessibility prior to trips
43%
57%
52%
48%
33%
67%
No
Yes
Q19. In general, do you check accessibility conditions and/or available help for your travel destination before travelling?
Travel with children (n=965) Age above 65 (n=318) Any limitations (n=1341)
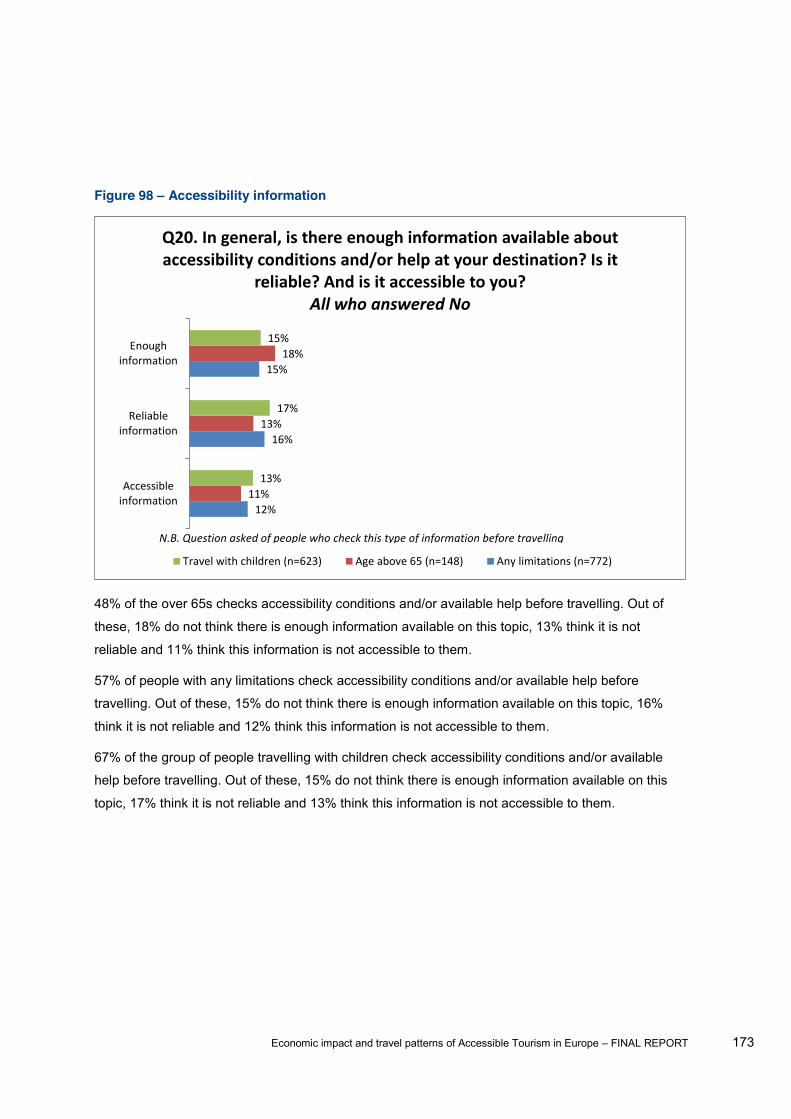
Economic impact and travel patterns of Accessible Tourism in Europe FINAL REPORT 173
Figure 98 Accessibility information
48% of the over 65s checks accessibility conditions and/or available help before travelling. Out of
these, 18% do not think there is enough information available on this topic, 13% think it is not
reliable and 11% think this information is not accessible to them.
57% of people with any limitations check accessibility conditions and/or available help before
travelling. Out of these, 15% do not think there is enough information available on this topic, 16%
think it is not reliable and 12% think this information is not accessible to them.
67% of the group of people travelling with children check accessibility conditions and/or available
help before travelling. Out of these, 15% do not think there is enough information available on this
topic, 17% think it is not reliable and 13% think this information is not accessible to them.
12%
16%
15%
11%
13%
18%
13%
17%
15%
Accessibleinformation
Reliableinformation
Enoughinformation
Q20. In general, is there enough information available about accessibility conditions and/or help at your destination? Is it
reliable? And is it accessible to you?All who answered No
Travel with children (n=623) Age above 65 (n=148) Any limitations (n=772)
N.B. Question asked of people who check this type of information before travelling
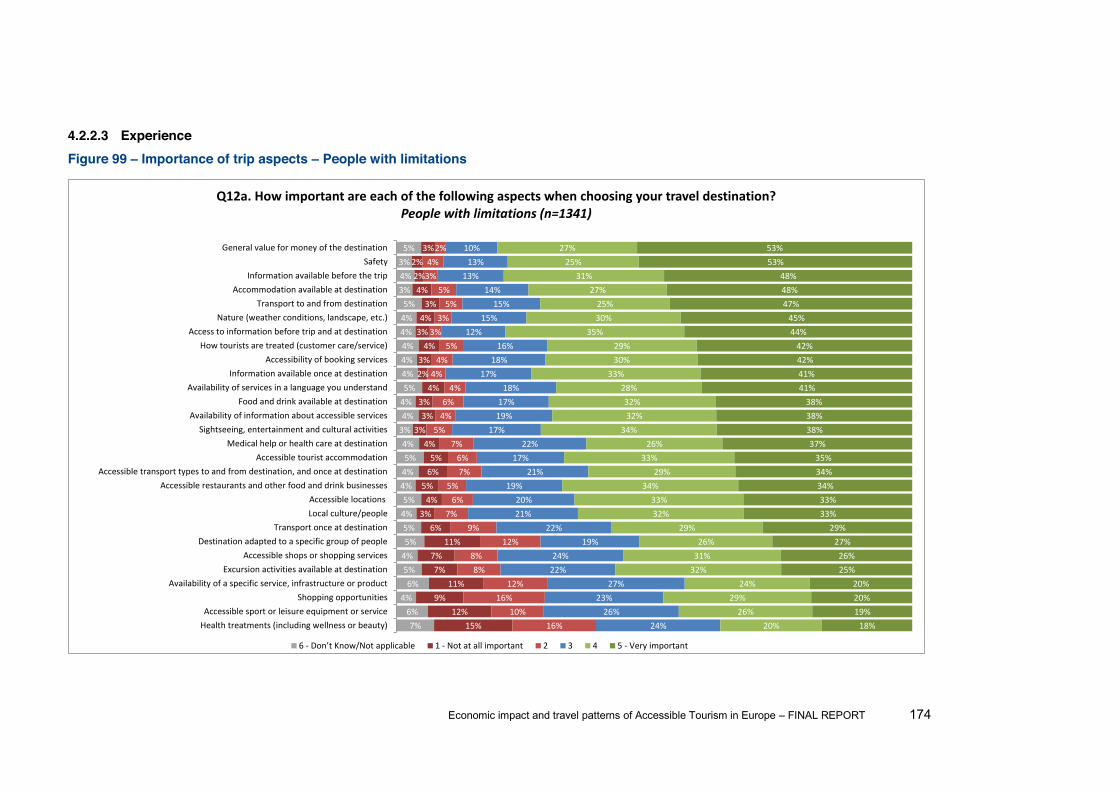
Economic impact and travel patterns of Accessible Tourism in Europe FINAL REPORT 174
4.2.2.3 Experience Figure 99 Importance of trip aspects People with limitations
7%6%
4%6%5%4%5%5%4%5%4%4%5%4%3%4%4%5%4%4%4%4%4%5%3%4%3%5%
15%12%
9%11%
7%7%
11%6%
3%4%5%6%5%
4%3%3%3%4%
2%3%4%
3%4%3%
4%2%2%
3%
16%10%
16%12%
8%8%
12%9%
7%6%
5%7%6%
7%5%4%6%4%
4%4%
5%3%3%5%
5%3%4%2%
24%26%
23%27%
22%24%
19%22%
21%20%
19%21%
17%22%
17%19%17%18%
17%18%16%
12%15%
15%14%
13%13%10%
20%26%
29%24%
32%31%26%
29%32%33%
34%29%
33%26%
34%32%32%28%
33%30%29%
35%30%25%
27%31%
25%27%
18%19%20%20%
25%26%27%
29%33%33%34%34%35%
37%38%38%38%
41%41%42%42%
44%45%
47%48%48%
53%53%
Health treatments (including wellness or beauty)Accessible sport or leisure equipment or service
Shopping opportunitiesAvailability of a specific service, infrastructure or product
Excursion activities available at destinationAccessible shops or shopping services
Destination adapted to a specific group of peopleTransport once at destination
Local culture/peopleAccessible locations
Accessible restaurants and other food and drink businessesAccessible transport types to and from destination, and once at destination
Accessible tourist accommodationMedical help or health care at destination
Sightseeing, entertainment and cultural activitiesAvailability of information about accessible services
Food and drink available at destinationAvailability of services in a language you understand
Information available once at destinationAccessibility of booking services
How tourists are treated (customer care/service)Access to information before trip and at destination
Nature (weather conditions, landscape, etc.)Transport to and from destination
Accommodation available at destinationInformation available before the trip
SafetyGeneral value for money of the destination
Q12a. How important are each of the following aspects when choosing your travel destination? People with limitations (n=1341)
6 -‐ 1 -‐ Not at all important 2 3 4 5 -‐ Very important
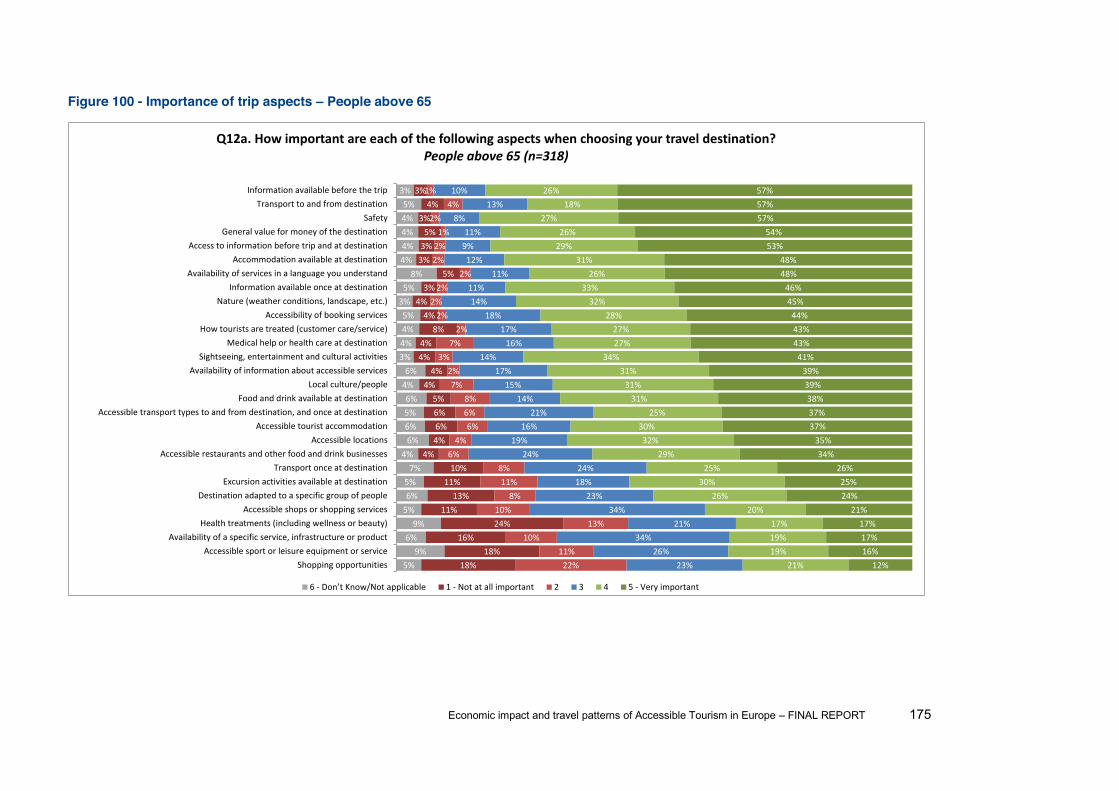
Economic impact and travel patterns of Accessible Tourism in Europe FINAL REPORT 175
Figure 100 - Importance of trip aspects People above 65
5%9%
6%9%
5%6%5%7%
4%6%6%5%6%4%6%
3%4%4%5%3%5%8%
4%4%4%4%5%3%
18%18%
16%24%
11%13%
11%10%
4%4%6%6%5%
4%4%
4%4%
8%4%
4%3%
5%3%3%5%
3%4%
3%
22%11%
10%13%
10%8%
11%8%
6%4%
6%6%8%
7%2%
3%7%2%
2%2%2%
2%2%2%1%
2%4%
1%
23%26%
34%21%
34%23%
18%24%
24%19%
16%21%
14%15%
17%14%
16%17%
18%14%11%
11%12%9%11%
8%13%
10%
21%19%19%17%
20%26%
30%25%
29%32%30%
25%31%
31%31%
34%27%27%
28%32%
33%26%
31%29%26%
27%18%
26%
12%16%17%17%
21%24%25%26%
34%35%
37%37%38%39%39%
41%43%43%44%45%46%
48%48%
53%54%
57%57%57%
Shopping opportunitiesAccessible sport or leisure equipment or service
Availability of a specific service, infrastructure or productHealth treatments (including wellness or beauty)
Accessible shops or shopping servicesDestination adapted to a specific group of people
Excursion activities available at destinationTransport once at destination
Accessible restaurants and other food and drink businessesAccessible locations
Accessible tourist accommodationAccessible transport types to and from destination, and once at destination
Food and drink available at destinationLocal culture/people
Availability of information about accessible servicesSightseeing, entertainment and cultural activities
Medical help or health care at destinationHow tourists are treated (customer care/service)
Accessibility of booking servicesNature (weather conditions, landscape, etc.)
Information available once at destinationAvailability of services in a language you understand
Accommodation available at destinationAccess to information before trip and at destination
General value for money of the destinationSafety
Transport to and from destinationInformation available before the trip
Q12a. How important are each of the following aspects when choosing your travel destination? People above 65 (n=318)
6 -‐ 1 -‐ Not at all important 2 3 4 5 -‐ Very important
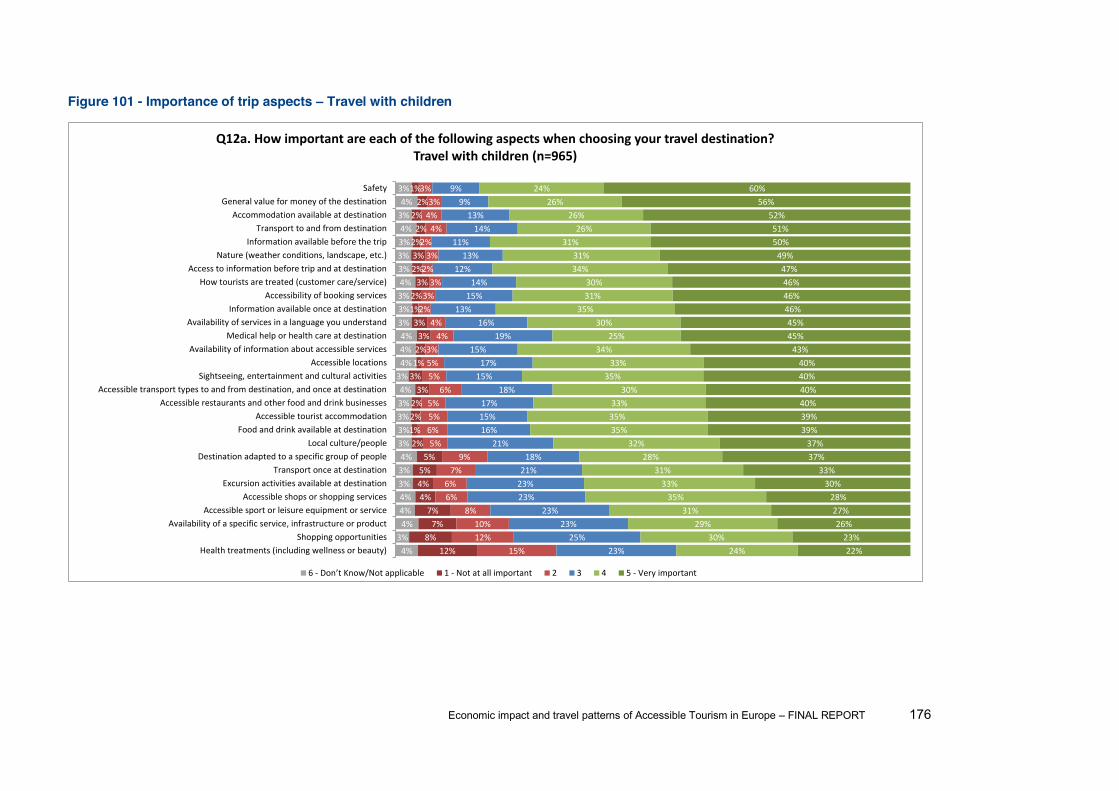
Economic impact and travel patterns of Accessible Tourism in Europe FINAL REPORT 176
Figure 101 - Importance of trip aspects Travel with children
4%3%4%4%4%3%3%4%3%3%3%3%4%3%4%4%4%3%3%3%4%3%3%3%4%3%4%3%
12%8%7%7%
4%4%5%5%
2%1%2%2%3%
3%1%2%3%3%1%2%3%
2%3%2%2%2%2%
1%
15%12%10%
8%6%6%7%9%
5%6%5%5%
6%5%5%3%
4%4%
2%3%3%
2%3%
2%4%4%3%
3%
23%25%
23%23%
23%23%21%18%
21%16%15%17%
18%15%17%
15%19%
16%13%
15%14%
12%13%
11%14%
13%9%
9%
24%30%
29%31%
35%33%
31%28%
32%35%35%33%
30%35%33%
34%25%
30%35%31%30%
34%31%
31%26%
26%26%
24%
22%23%
26%27%28%
30%33%
37%37%
39%39%40%40%40%40%
43%45%45%46%46%46%47%49%50%51%52%
56%60%
Health treatments (including wellness or beauty)Shopping opportunities
Availability of a specific service, infrastructure or productAccessible sport or leisure equipment or service
Accessible shops or shopping servicesExcursion activities available at destination
Transport once at destinationDestination adapted to a specific group of people
Local culture/peopleFood and drink available at destination
Accessible tourist accommodationAccessible restaurants and other food and drink businesses
Accessible transport types to and from destination, and once at destinationSightseeing, entertainment and cultural activities
Accessible locationsAvailability of information about accessible services
Medical help or health care at destinationAvailability of services in a language you understand
Information available once at destinationAccessibility of booking services
How tourists are treated (customer care/service)Access to information before trip and at destination
Nature (weather conditions, landscape, etc.)Information available before the trip
Transport to and from destinationAccommodation available at destination
General value for money of the destinationSafety
Q12a. How important are each of the following aspects when choosing your travel destination? Travel with children (n=965)
6 -‐ 1 -‐ Not at all important 2 3 4 5 -‐ Very important

Economic impact and travel patterns of Accessible Tourism in Europe FINAL REPORT 177
The most important aspects for the over-65 age-group are safety (with a mean importance of 4.4 out of 5), information available before the trip
(4.4), general value of money of the destination (4.3), transport to and from destination (4.3), and access to information before the trip and at
destination (4.3).
The most important aspects for people with any limitations are general value for money at the destination (with a mean importance of 4.3 out of 5),
safety (4.3) and information available before trip (4.3).
The most important aspects for the people travelling with children are general value for money of the destination (with a mean importance of 4.4
out of 5), safety (4.4), accommodation available at destination (4.3), information available before the trip (4.3), information available once at the
destination (4.3) and access to information before trip and at destination (4.3).
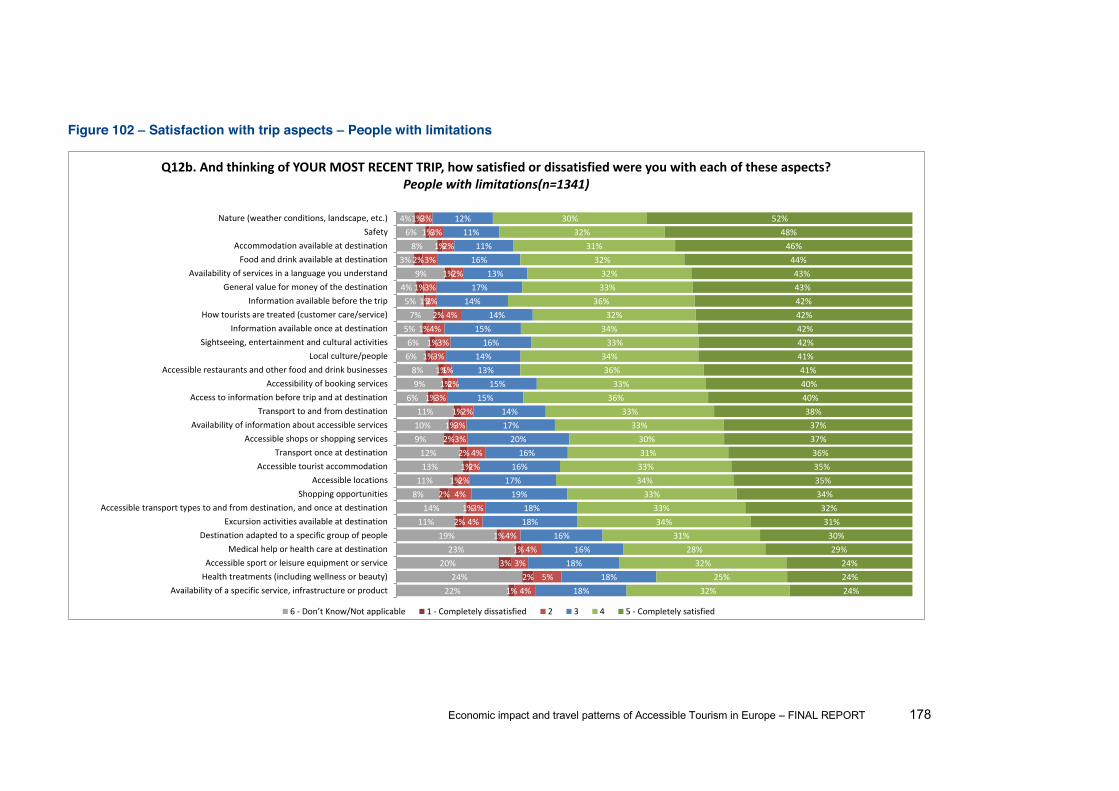
Economic impact and travel patterns of Accessible Tourism in Europe FINAL REPORT 178
Figure 102 Satisfaction with trip aspects People with limitations
22%24%
20%23%
19%11%14%
8%11%13%12%
9%10%11%
6%9%8%
6%6%5%7%
5%4%
9%3%
8%6%
4%
1%2%
3%1%
1%2%1%
2%1%
1%2%
2%1%1%
1%1%1%
1%1%
1%2%
1%1%
1%2%
1%1%
1%
4%5%
3%4%
4%4%3%
4%2%
2%4%
3%3%2%
3%2%
1%3%3%
4%4%
2%3%
2%3%
2%3%
3%
18%18%
18%16%
16%18%18%
19%17%16%16%
20%17%14%
15%15%
13%14%16%
15%14%
14%17%
13%16%11%
11%12%
32%25%
32%28%
31%34%33%
33%34%33%31%30%
33%33%
36%33%
36%34%33%
34%32%
36%33%32%
32%31%
32%30%
24%24%24%
29%30%31%32%34%35%35%36%37%37%38%40%40%41%41%42%42%42%42%43%43%44%46%
48%52%
Availability of a specific service, infrastructure or productHealth treatments (including wellness or beauty)Accessible sport or leisure equipment or service
Medical help or health care at destinationDestination adapted to a specific group of people
Excursion activities available at destinationAccessible transport types to and from destination, and once at destination
Shopping opportunitiesAccessible locations
Accessible tourist accommodationTransport once at destination
Accessible shops or shopping servicesAvailability of information about accessible services
Transport to and from destinationAccess to information before trip and at destination
Accessibility of booking servicesAccessible restaurants and other food and drink businesses
Local culture/peopleSightseeing, entertainment and cultural activities
Information available once at destinationHow tourists are treated (customer care/service)
Information available before the tripGeneral value for money of the destination
Availability of services in a language you understandFood and drink available at destination
Accommodation available at destinationSafety
Nature (weather conditions, landscape, etc.)
Q12b. And thinking of YOUR MOST RECENT TRIP, how satisfied or dissatisfied were you with each of these aspects? People with limitations(n=1341)
6 -‐ 1 -‐ Completely dissatisfied 2 3 4 5 -‐ Completely satisfied

Economic impact and travel patterns of Accessible Tourism in Europe FINAL REPORT 179
Figure 103 Satisfaction with trip aspects People above 65
31%33%34%
29%29%
16%17%
21%19%22%
16%12%13%12%12%
7%5%9%7%8%
14%7%
3%5%10%9%
5%4%
2%3%3%
0%0%
3%2%
1%0%
2%2%
2%0%3%3%
2%1%
1%2%0%
1%0%
2%0%
0%0%
1%0%
3%3%5%
2%3%
6%2%
1%2%
3%5%
1%2%
3%2%
1%1%
1%3%
1%4%
2%2%2%
1%1%
1%2%
19%17%
16%19%
16%14%
19%14%
15%13%
16%13%18%11%
8%14%
14%10%
13%11%
8%11%
10%9%
12%12%
9%10%
27%27%
21%24%
26%30%29%
31%32%26%
26%35%31%
29%32%30%
33%33%29%
33%27%
34%35%35%
27%26%
32%31%
18%18%
22%25%27%
31%31%32%33%34%36%37%38%
41%44%45%46%46%47%47%47%47%48%49%50%
52%53%54%
Availability of a specific service, infrastructure or productAccessible sport or leisure equipment or serviceHealth treatments (including wellness or beauty)
Medical help or health care at destinationDestination adapted to a specific group of people
Shopping opportunitiesAccessible shops or shopping services
Accessible tourist accommodationAccessible transport types to and from destination, and once at destination
Transport once at destinationExcursion activities available at destination
Accessible locationsAvailability of information about accessible services
How tourists are treated (customer care/service)Availability of services in a language you understand
Sightseeing, entertainment and cultural activitiesGeneral value for money of the destination
Accessible restaurants and other food and drink businessesLocal culture/people
Access to information before trip and at destinationTransport to and from destination
Information available once at destinationFood and drink available at destinationInformation available before the trip
Accessibility of booking servicesAccommodation available at destination
SafetyNature (weather conditions, landscape, etc.)
Q12b. And thinking of YOUR MOST RECENT TRIP, how satisfied or dissatisfied were you with each of these aspects? People above 65 (n=318)
6 -‐ 1 -‐ Completely dissatisfied 2 3 4 5 -‐ Completely satisfied

Economic impact and travel patterns of Accessible Tourism in Europe FINAL REPORT 180
Figure 104 Satisfaction with trip aspects Travel with children
17%14%
9%6%
15%8%10%
7%10%
6%6%7%6%8%
5%4%5%4%4%4%2%3%3%6%
4%4%3%3%
2%1%
2%2%
1%1%1%
2%1%
2%1%1%
1%1%
1%1%1%
1%1%1%
1%1%1%
2%0%1%1%1%
6%5%
4%4%
3%3%3%
4%3%
3%3%3%
3%2%
3%3%2%3%2%3%
3%3%2%
2%2%2%2%2%
19%19%
19%18%
17%20%17%21%16%
20%16%15%17%14%
14%14%14%14%
14%14%
14%14%17%13%
14%11%11%12%
29%34%
37%38%
30%33%
35%31%
33%32%
37%36%35%
33%34%
37%36%36%37%35%
35%35%32%32%
34%36%
34%32%
27%28%
30%32%34%35%35%36%36%38%38%39%39%
42%42%42%42%43%43%43%44%44%45%45%46%47%
49%51%
Health treatments (including wellness or beauty)Availability of a specific service, infrastructure or product
Accessible sport or leisure equipment or serviceExcursion activities available at destinationMedical help or health care at destination
Accessible transport types to and from destination, and once at destinationDestination adapted to a specific group of people
Shopping opportunitiesTransport once at destination
Accessible shops or shopping servicesAccessible tourist accommodation
Accessible locationsAvailability of information about accessible services
Transport to and from destinationHow tourists are treated (customer care/service)
Access to information before trip and at destinationAccessibility of booking services
Sightseeing, entertainment and cultural activitiesAccessible restaurants and other food and drink businesses
Local culture/peopleFood and drink available at destination
Information available once at destinationGeneral value for money of the destination
Availability of services in a language you understandInformation available before the trip
Accommodation available at destinationSafety
Nature (weather conditions, landscape, etc.)
Q12b. And thinking of YOUR MOST RECENT TRIP, how satisfied or dissatisfied were you with each of these aspects? Travel with children (n=965)
6 -‐ 1 -‐ Completely dissatisfied 2 3 4 5 -‐ Completely satisfied

Economic impact and travel patterns of Accessible Tourism in Europe FINAL REPORT 181
The age above 65 group is most satisfied with nature (mean satisfaction of 4.4 out of 5),
accommodation available at destination (4.4), information available before the trip (4.4), access to
information before the trip and at destination (4.4), and safety (4.4).
In contrast, the over-65 group is most dissatisfied with health treatments (mean satisfaction 3.8 out
of 5), accessible sport or leisure equipment or service (3.8), or availability of services in a language
they understand (3.8). None of the aspects had both a high importance and low satisfaction.
People with any limitations are most satisfied with nature (mean satisfaction of 4.3 out of 5),
accommodation available at destination (4.3) and safety (4.3). In contrast, people with any
limitations are most dissatisfied with health treatments (including wellness or beauty) (mean
satisfaction of 3.8 out of 5), accessible sport of leisure equipment or service (3.9) and availability of a
specific service, infrastructure or product (3.9). The priorities for action (aspects with a high
importance and low satisfaction) are general value for money and information available before the
trip.
The people travelling with children is most satisfied with nature (mean satisfaction of 4.3 out of 5),
accommodation available at destination (4.3), safety (4.3) and information available before the trip
(4.3). In contrast, people travelling with children are most dissatisfied with shopping opportunities
(mean satisfaction of 4 out of 5), excursion activities available at destination (4.0), accessible sport
of leisure equipment or services (4.0), the availability of a specific service, infrastructure or product
(4.0) and health treatments (3.9). The priorities for action (aspects with a relatively high importance
and low satisfaction) are general value for money, safety and access to information before trip and
at destination
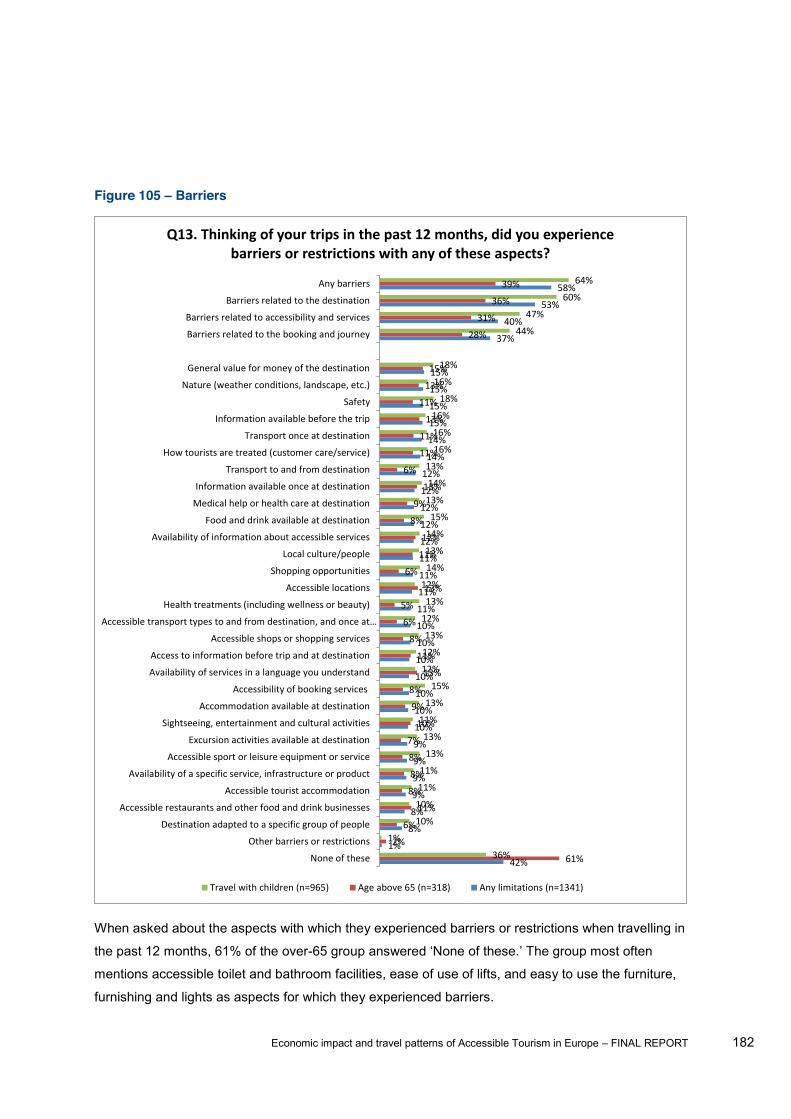
Economic impact and travel patterns of Accessible Tourism in Europe FINAL REPORT 182
Figure 105 Barriers
When asked about the aspects with which they experienced barriers or restrictions when travelling in
the past 12 months, 61% of the over-
mentions accessible toilet and bathroom facilities, ease of use of lifts, and easy to use the furniture,
furnishing and lights as aspects for which they experienced barriers.
42%
1%
8%
8%
9%
9%
9%
9%
10%
10%
10%
10%
10%
10%
10%
11%
11%
11%
11%
12%
12%
12%
12%
12%
14%
14%
15%
15%
15%
15%
37%
40%
53%
58%
61%
2%
6%
11%
8%
8%
8%
7%
10%
9%
8%
13%
11%
8%
6%
5%
13%
6%
11%
12%
8%
9%
13%
6%
11%
11%
13%
11%
13%
15%
28%
31%
36%
39%
36%
1%
10%
10%
11%
11%
13%
13%
11%
13%
15%
12%
12%
13%
12%
13%
12%
14%
13%
14%
15%
13%
14%
13%
16%
16%
16%
18%
16%
18%
44%
47%
60%
64%
None of these
Other barriers or restrictions
Destination adapted to a specific group of people
Accessible restaurants and other food and drink businesses
Accessible tourist accommodation
Availability of a specific service, infrastructure or product
Accessible sport or leisure equipment or service
Excursion activities available at destination
Sightseeing, entertainment and cultural activities
Accommodation available at destination
Accessibility of booking services
Availability of services in a language you understand
Access to information before trip and at destination
Accessible shops or shopping services
Health treatments (including wellness or beauty)
Accessible locations
Shopping opportunities
Local culture/people
Availability of information about accessible services
Food and drink available at destination
Medical help or health care at destination
Information available once at destination
Transport to and from destination
How tourists are treated (customer care/service)
Transport once at destination
Information available before the trip
Safety
Nature (weather conditions, landscape, etc.)
General value for money of the destination
Barriers related to the booking and journey
Barriers related to accessibility and services
Barriers related to the destination
Any barriers
Q13. Thinking of your trips in the past 12 months, did you experience barriers or restrictions with any of these aspects?
Travel with children (n=965) Age above 65 (n=318) Any limitations (n=1341)

Economic impact and travel patterns of Accessible Tourism in Europe FINAL REPORT 183
When asked about the aspects with which they experienced barriers or restrictions when travelling in
The people with any limitations group most often mentions accessible toilet and bathroom facilities,
easy to use the furniture, furnishing and lights, mobility within the room, mobility within the building,
ease of use of lifts as aspects for which they experienced barriers.
When asked about the aspects with which they experienced barriers or restrictions when travelling in
travelling with children group most often mentions accessibility of booking services, accessible sport
or leisure equipment and accessible shops and shopping services as aspects for which they
experienced barriers.
Figure 106 Importance of building aspects People with limitations
When people with any limitations are asked about the importance of various aspects of building they
can visit at their destination, 70% cited accessible toilet and bathroom facilities as being important or
very important.
65% mentioned the use of lifts as being important or very important and 64% mentioned accessible
parking spaces.
The group of people with any limitations also cited the importance of the ease of using the furniture,
furnishing and lights (61%), mobility within the building (60%) and mobility within the room (59%).
A last group of aspects, access to services other than accommodation, type of access (ramps, etc.)
and alarm systems were accorded scores of 57%, 52% and 49% importance respectively.
10%
8%
7%
8%
8%
7%
6%
7%
5%
9%
10%
6%
5%
6%
5%
6%
10%
3%
9%
10%
7%
7%
6%
6%
5%
4%
5%
24%
20%
23%
21%
20%
21%
18%
15%
17%
25%
25%
30%
30%
30%
31%
29%
26%
28%
24%
27%
27%
29%
30%
30%
36%
38%
42%
Alarm systems
Type of access (ramps, steps, stairs, doors)
Access to services other than accommodation (e.g. spa, gym,
Mobility within the building
Easy to use the furniture, furnishing and lights
Ease of use of lifts
Accessible parking spaces
Accessible toilet and bathroom facilities
Q17a. Thinking of buildings you can visit at your destination (hotels, museums, etc.), how important are each of the following aspects?
People with limitations (n=1341)
1 Not at all important 2 3 4 5 -‐ Very important
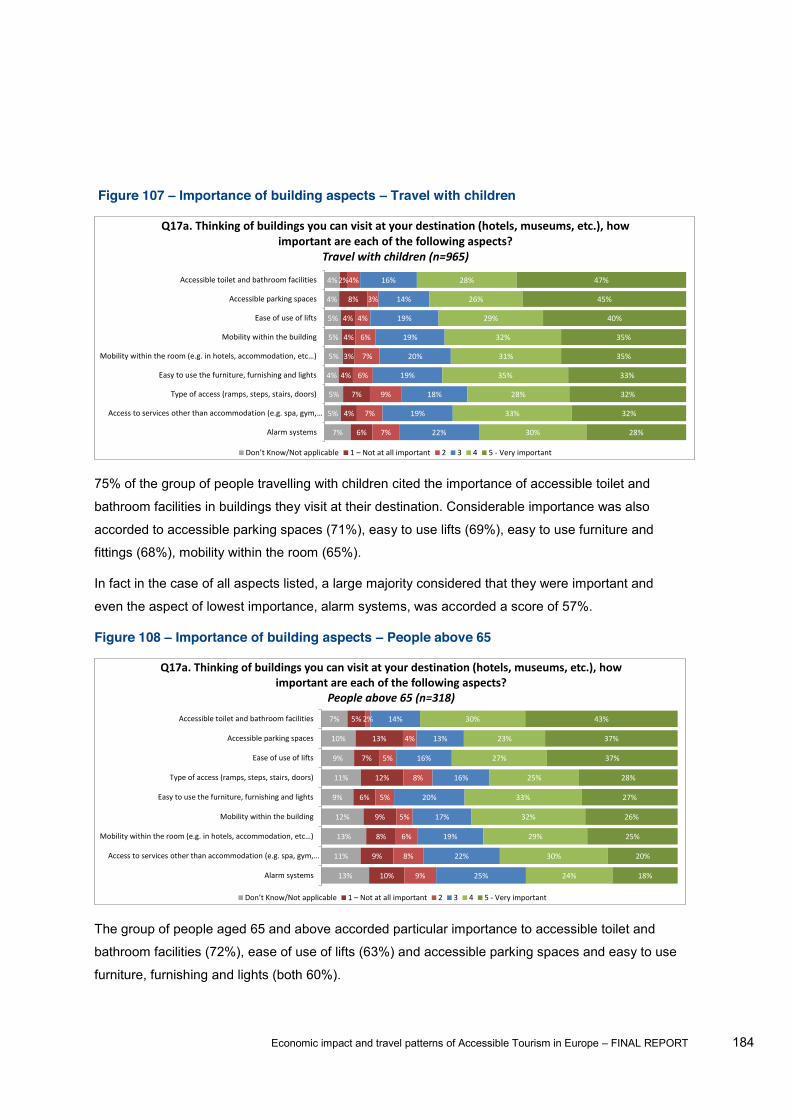
Economic impact and travel patterns of Accessible Tourism in Europe FINAL REPORT 184
Figure 107 Importance of building aspects Travel with children
75% of the group of people travelling with children cited the importance of accessible toilet and
bathroom facilities in buildings they visit at their destination. Considerable importance was also
accorded to accessible parking spaces (71%), easy to use lifts (69%), easy to use furniture and
fittings (68%), mobility within the room (65%).
In fact in the case of all aspects listed, a large majority considered that they were important and
even the aspect of lowest importance, alarm systems, was accorded a score of 57%.
Figure 108 Importance of building aspects People above 65
The group of people aged 65 and above accorded particular importance to accessible toilet and
bathroom facilities (72%), ease of use of lifts (63%) and accessible parking spaces and easy to use
furniture, furnishing and lights (both 60%).
7%
5%
5%
4%
5%
5%
5%
4%
4%
6%
4%
7%
4%
3%
4%
4%
8%
2%
7%
7%
9%
6%
7%
6%
4%
3%
4%
22%
19%
18%
19%
20%
19%
19%
14%
16%
30%
33%
28%
35%
31%
32%
29%
26%
28%
28%
32%
32%
33%
35%
35%
40%
45%
47%
Alarm systems
Access to services other than accommodation (e.g. spa, gym,
Type of access (ramps, steps, stairs, doors)
Easy to use the furniture, furnishing and lights
Mobility within the building
Ease of use of lifts
Accessible parking spaces
Accessible toilet and bathroom facilities
Q17a. Thinking of buildings you can visit at your destination (hotels, museums, etc.), how important are each of the following aspects?
Travel with children (n=965)
1 Not at all important 2 3 4 5 -‐ Very important
13%
11%
13%
12%
9%
11%
9%
10%
7%
10%
9%
8%
9%
6%
12%
7%
13%
5%
9%
8%
6%
5%
5%
8%
5%
4%
2%
25%
22%
19%
17%
20%
16%
16%
13%
14%
24%
30%
29%
32%
33%
25%
27%
23%
30%
18%
20%
25%
26%
27%
28%
37%
37%
43%
Alarm systems
Access to services other than accommodation (e.g. spa, gym,
Mobility within the building
Easy to use the furniture, furnishing and lights
Type of access (ramps, steps, stairs, doors)
Ease of use of lifts
Accessible parking spaces
Accessible toilet and bathroom facilities
Q17a. Thinking of buildings you can visit at your destination (hotels, museums, etc.), how important are each of the following aspects?
People above 65 (n=318)
1 Not at all important 2 3 4 5 -‐ Very important
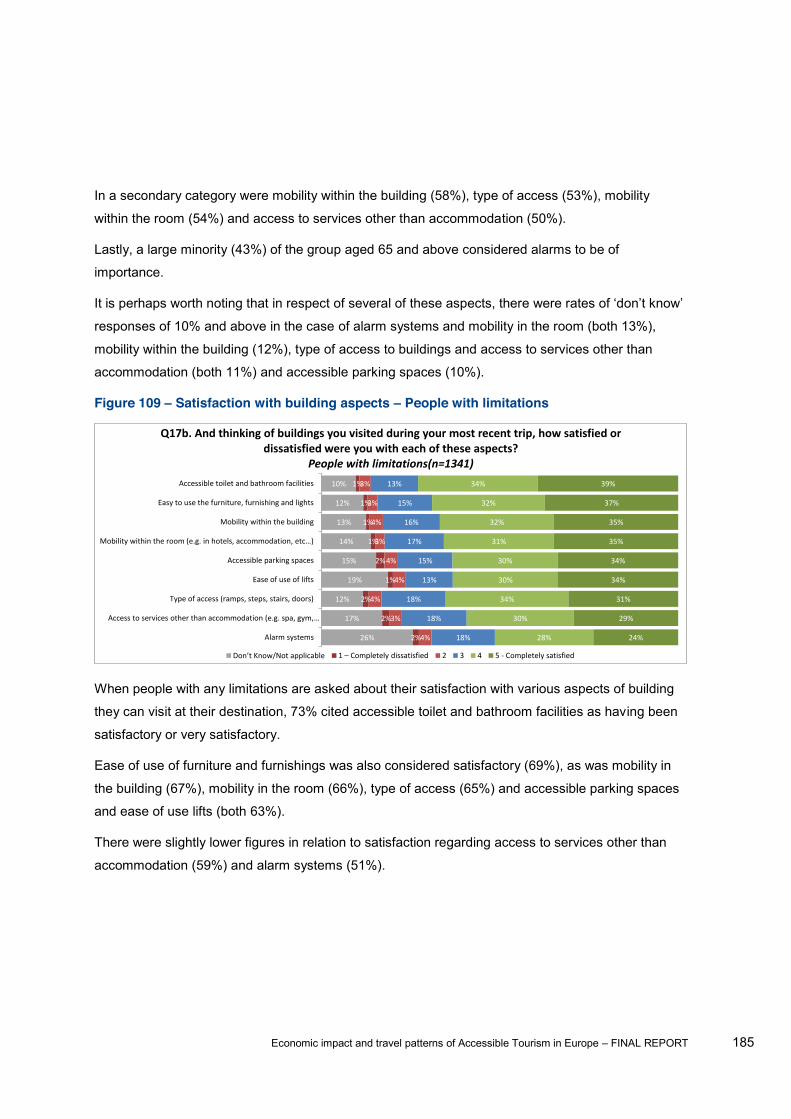
Economic impact and travel patterns of Accessible Tourism in Europe FINAL REPORT 185
In a secondary category were mobility within the building (58%), type of access (53%), mobility
within the room (54%) and access to services other than accommodation (50%).
Lastly, a large minority (43%) of the group aged 65 and above considered alarms to be of
importance.
responses of 10% and above in the case of alarm systems and mobility in the room (both 13%),
mobility within the building (12%), type of access to buildings and access to services other than
accommodation (both 11%) and accessible parking spaces (10%).
Figure 109 Satisfaction with building aspects People with limitations
When people with any limitations are asked about their satisfaction with various aspects of building
they can visit at their destination, 73% cited accessible toilet and bathroom facilities as having been
satisfactory or very satisfactory.
Ease of use of furniture and furnishings was also considered satisfactory (69%), as was mobility in
the building (67%), mobility in the room (66%), type of access (65%) and accessible parking spaces
and ease of use lifts (both 63%).
There were slightly lower figures in relation to satisfaction regarding access to services other than
accommodation (59%) and alarm systems (51%).
26%
17%
12%
19%
15%
14%
13%
12%
10%
2%
2%
2%
1%
2%
1%
1%
1%
1%
4%
3%
4%
4%
4%
3%
4%
3%
3%
18%
18%
18%
13%
15%
17%
16%
15%
13%
28%
30%
34%
30%
30%
31%
32%
32%
34%
24%
29%
31%
34%
34%
35%
35%
37%
39%
Alarm systems
Access to services other than accommodation (e.g. spa, gym,
Type of access (ramps, steps, stairs, doors)
Ease of use of lifts
Accessible parking spaces
Mobility within the building
Easy to use the furniture, furnishing and lights
Accessible toilet and bathroom facilities
Q17b. And thinking of buildings you visited during your most recent trip, how satisfied or dissatisfied were you with each of these aspects?
People with limitations(n=1341)
1 Completely dissatisfied 2 3 4 5 -‐ Completely satisfied

Economic impact and travel patterns of Accessible Tourism in Europe FINAL REPORT 186
Figure 110 Satisfaction with building aspects People above 65
77% of the group of people aged over 65 said they were satisfied or completely satisfied with the
accessibility of toilet and bathroom facilities. 73% were satisfied with mobility in the room, 72% with
mobility in the building and 71% with the ease of use of furniture and fittings.
However, only 68% expressed satisfaction with the lifts and it is particularly noteworthy that only
55% expressed satisfaction with the accessibility of parking spaces and 54% with access to services
other than accommodation.
systems, as well as one of 22% in relation to the accessibility of parking spaces.
Figure 111 Satisfaction with building aspects Travel with children
The group of people travelling with children were satisfied in relation to all aspects. In all cases,
other than for alarm systems (57%), satisfaction levels exceeded 66%.
32%
26%
14%
22%
25%
17%
14%
15%
9%
2%
2%
2%
2%
1%
2%
2%
0%
0%
4%
2%
3%
3%
2%
2%
2%
3%
4%
16%
17%
16%
18%
6%
7%
11%
11%
10%
26%
30%
35%
24%
31%
35%
34%
32%
34%
19%
24%
31%
32%
36%
38%
38%
39%
43%
Alarm systems
Access to services other than accommodation (e.g. spa, gym,
Type of access (ramps, steps, stairs, doors)
Accessible parking spaces
Ease of use of lifts
Mobility within the building
Easy to use the furniture, furnishing and lights
Accessible toilet and bathroom facilities
Q17b. And thinking of buildings you visited during your most recent trip, how satisfied or dissatisfied were you with each of these aspects?
People above 65 (n=318)
1 Completely dissatisfied 2 3 4 5 -‐ Completely satisfied
18%
8%
9%
13%
7%
8%
7%
6%
5%
2%
2%
2%
1%
2%
2%
3%
1%
1%
3%
4%
3%
4%
4%
3%
5%
3%
4%
20%
21%
19%
15%
17%
19%
17%
16%
14%
30%
37%
34%
34%
36%
34%
31%
36%
34%
26%
29%
33%
34%
35%
36%
37%
37%
41%
Alarm systems
Type of access (ramps, steps, stairs, doors)
Access to services other than accommodation (e.g. spa, gym,
Ease of use of lifts
Mobility within the building
Accessible parking spaces
Easy to use the furniture, furnishing and lights
Accessible toilet and bathroom facilities
Q17b. And thinking of buildings you visited during your most recent trip, how satisfied or dissatisfied were you with each of these aspects?
Travel with children (n=965)
1 Completely dissatisfied 2 3 4 5 -‐ Completely satisfied
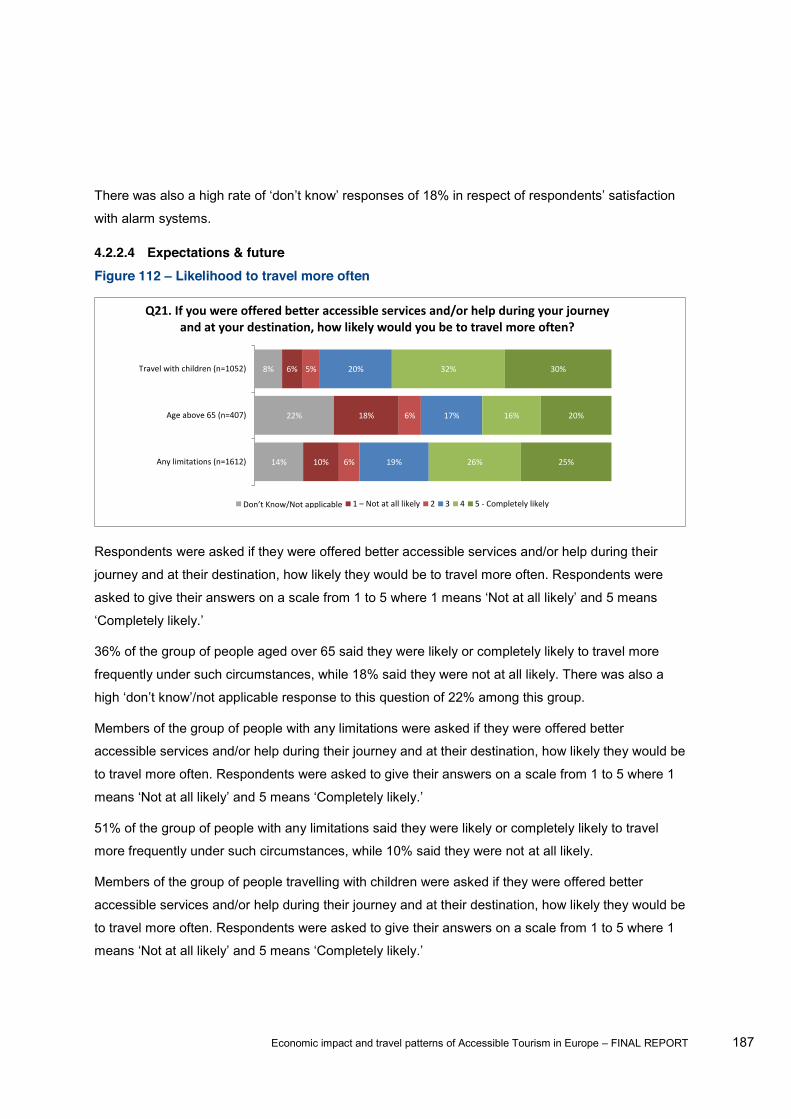
Economic impact and travel patterns of Accessible Tourism in Europe FINAL REPORT 187
with alarm systems.
4.2.2.4 Expectations & future Figure 112 Likelihood to travel more often
Respondents were asked if they were offered better accessible services and/or help during their
journey and at their destination, how likely they would be to travel more often. Respondents were
36% of the group of people aged over 65 said they were likely or completely likely to travel more
frequently under such circumstances, while 18% said they were not at all likely. There was also a
Members of the group of people with any limitations were asked if they were offered better
accessible services and/or help during their journey and at their destination, how likely they would be
to travel more often. Respondents were asked to give their answers on a scale from 1 to 5 where 1
51% of the group of people with any limitations said they were likely or completely likely to travel
more frequently under such circumstances, while 10% said they were not at all likely.
Members of the group of people travelling with children were asked if they were offered better
accessible services and/or help during their journey and at their destination, how likely they would be
to travel more often. Respondents were asked to give their answers on a scale from 1 to 5 where 1
14%
22%
8%
10%
18%
6%
6%
6%
5%
19%
17%
20%
26%
16%
32%
25%
20%
30%
Any limitations (n=1612)
Age above 65 (n=407)
Travel with children (n=1052)
Q21. If you were offered better accessible services and/or help during your journey and at your destination, how likely would you be to travel more often?
1 Not at all likely 2 3 4 5 -‐ Completely likely

Economic impact and travel patterns of Accessible Tourism in Europe FINAL REPORT 188
62% of the group of people travelling with children said they were likely or completely likely to travel
more frequently under such circumstances, while 6% said they were not at all likely.
Figure 113 Spending more for accessibility People with limitations
Members of the group with limitations were asked about the frequency they had to switch to a more
expensive product or service because of their need for them to be accessible (e.g. choose a more
expensive hotel). Almost half (48%) said that, at least sometimes, this was the case, although 36%
said that this was never the case.
People with limitations were also asked about the frequency they had to pay more than the standard
price because of their need for accessible products or services (e.g. need to pay an additional fee).
Virtually half (49%) said that, at least sometimes, this was the case, although slightly over a third
(35%) said that this was never the case.
35%
36%
28%
26%
14%
15%
7%
6%
16%
16%
Paying more than the standard price because youneed accessible products or services (e.g. pay an
additional fee)
Switching to a more expensive product or servicebecause you need them to be accessible (e.g.
choose a more expensive hotel)
Q24.1 Thinking of travelling in general, how often do you have to do the following?
People with limitations (n=1612)
Never Sometimes Often Always

Economic impact and travel patterns of Accessible Tourism in Europe FINAL REPORT 189
Figure 114 - Spending more for accessibility People above 65
Members of the group aged over 65 were asked about the frequency they had to switch to a more
expensive product or service because of their need for them to be accessible (e.g. choose a more
expensive hotel). More than half (52%) said that this was never the case, although 28% said that
this happened at least sometimes.
People aged over 65 were also asked about the frequency they had to pay more than the standard
price because of their need for accessible products or services (e.g. need to pay an additional fee).
Although almost a third (32%) said that, at least sometimes, this was the case, virtually a half (48%)
said that this was never the case.
Figure 115 - Spending more for accessibility Travel with children
Members of the group travelling with children were asked about the frequency they had to switch to
a more expensive product or service because of their need for them to be accessible (e.g. choose a
48%
52%
22%
21%
10%
7%
1%
1%
20%
20%
Paying more than the standard price because youneed accessible products or services (e.g. pay an
additional fee)
Switching to a more expensive product or servicebecause you need them to be accessible (e.g.
choose a more expensive hotel)
Q24.1 Thinking of travelling in general, how often do you have to do the following?
People above 65 (n=407)
Never Sometimes Often Always
31%
32%
33%
31%
18%
21%
9%
7%
8%
9%
Paying more than the standard price because youneed accessible products or services (e.g. pay an
additional fee)
Switching to a more expensive product or servicebecause you need them to be accessible (e.g.
choose a more expensive hotel)
Q24.1 Thinking of travelling in general, how often do you have to do the following?
Travel with children (n=1052)
Never Sometimes Often Always
Economic impact and travel patterns of Accessible Tourism in Europe FINAL REPORT 190
more expensive hotel). Almost six out of ten (59%) said that, at least sometimes, this was the case,
although 32% said that this was never the case.
People travelling with children were also asked about the frequency they had to pay more than the
standard price because of their need for accessible products or services (e.g. need to pay an
additional fee). 61% said that, at least sometimes, this was the case, although 31% said that this
was never the case.
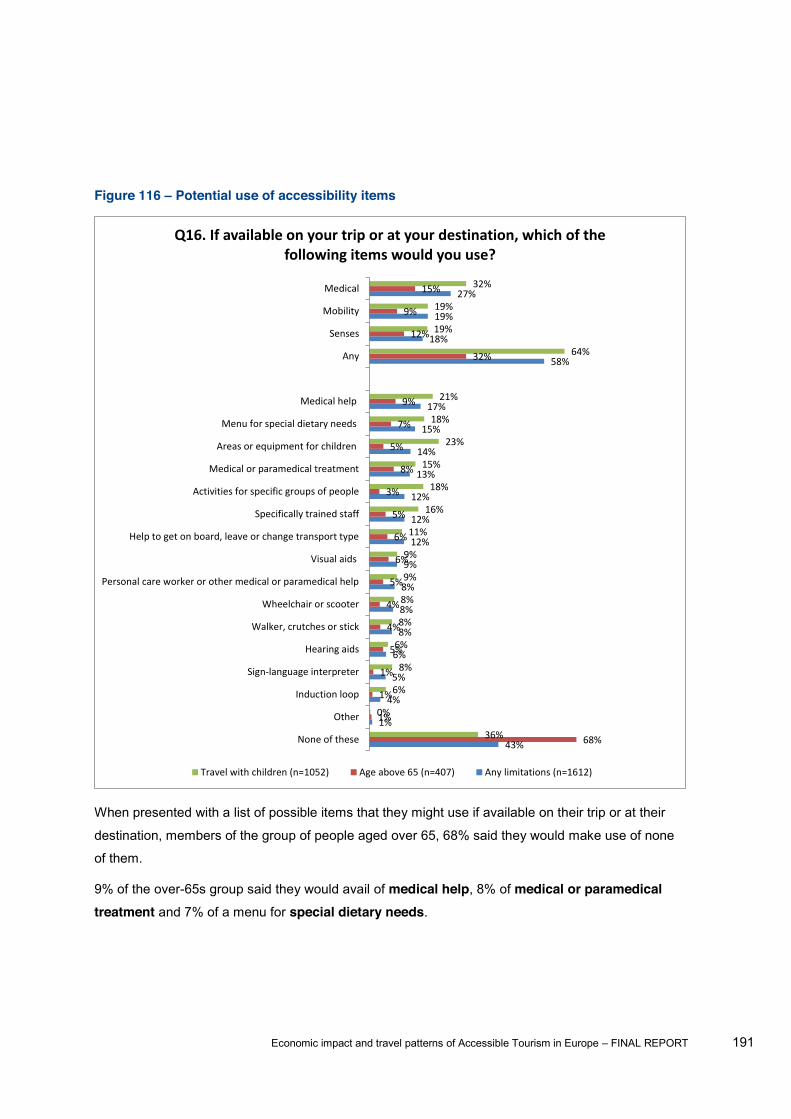
Economic impact and travel patterns of Accessible Tourism in Europe FINAL REPORT 191
Figure 116 Potential use of accessibility items
When presented with a list of possible items that they might use if available on their trip or at their
destination, members of the group of people aged over 65, 68% said they would make use of none
of them.
9% of the over-65s group said they would avail of medical help, 8% of medical or paramedical treatment and 7% of a menu for special dietary needs.
43%
1%
4%
5%
6%
8%
8%
8%
9%
12%
12%
12%
13%
14%
15%
17%
58%
18%
19%
27%
68%
1%
1%
1%
5%
4%
4%
5%
6%
6%
5%
3%
8%
5%
7%
9%
32%
12%
9%
15%
36%
0%
6%
8%
6%
8%
8%
9%
9%
11%
16%
18%
15%
23%
18%
21%
64%
19%
19%
32%
None of these
Other
Induction loop
Sign-‐language interpreter
Hearing aids
Walker, crutches or stick
Wheelchair or scooter
Personal care worker or other medical or paramedical help
Visual aids
Help to get on board, leave or change transport type
Specifically trained staff
Activities for specific groups of people
Medical or paramedical treatment
Areas or equipment for children
Menu for special dietary needs
Medical help
Any
Senses
Mobility
Medical
Q16. If available on your trip or at your destination, which of the following items would you use?
Travel with children (n=1052) Age above 65 (n=407) Any limitations (n=1612)
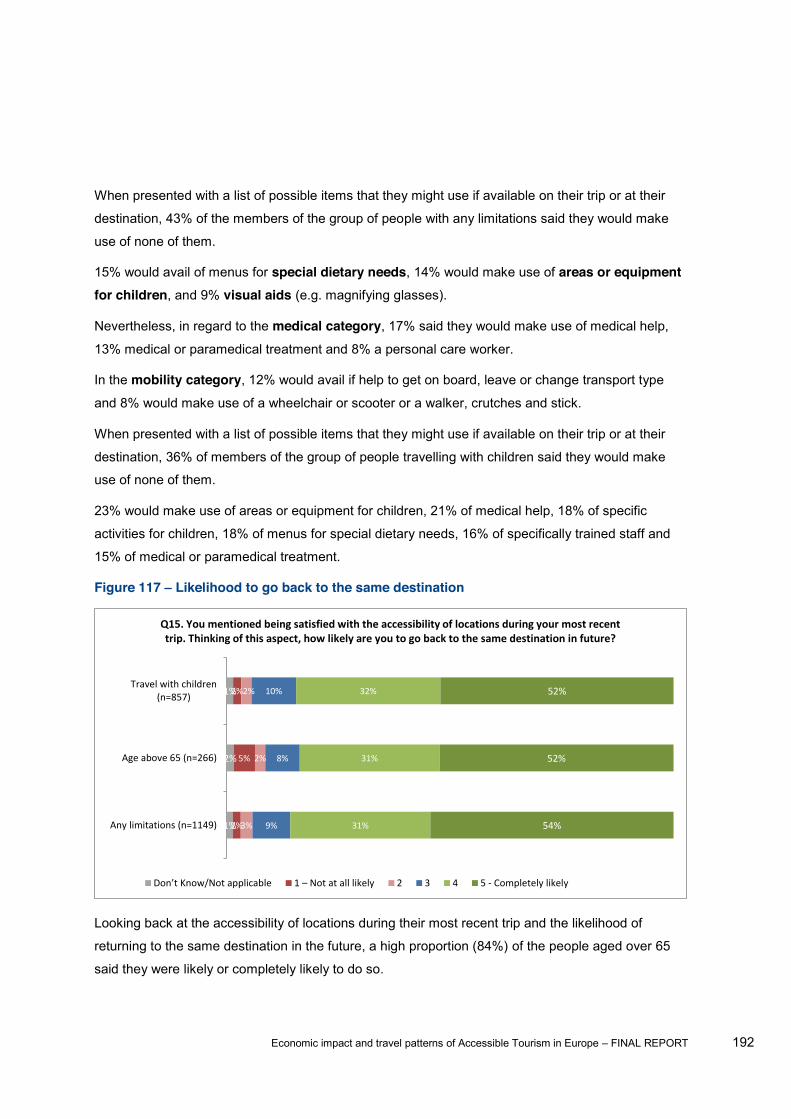
Economic impact and travel patterns of Accessible Tourism in Europe FINAL REPORT 192
When presented with a list of possible items that they might use if available on their trip or at their
destination, 43% of the members of the group of people with any limitations said they would make
use of none of them.
15% would avail of menus for special dietary needs, 14% would make use of areas or equipment for children, and 9% visual aids (e.g. magnifying glasses).
Nevertheless, in regard to the medical category, 17% said they would make use of medical help,
13% medical or paramedical treatment and 8% a personal care worker.
In the mobility category, 12% would avail if help to get on board, leave or change transport type
and 8% would make use of a wheelchair or scooter or a walker, crutches and stick.
When presented with a list of possible items that they might use if available on their trip or at their
destination, 36% of members of the group of people travelling with children said they would make
use of none of them.
23% would make use of areas or equipment for children, 21% of medical help, 18% of specific
activities for children, 18% of menus for special dietary needs, 16% of specifically trained staff and
15% of medical or paramedical treatment.
Figure 117 Likelihood to go back to the same destination
Looking back at the accessibility of locations during their most recent trip and the likelihood of
returning to the same destination in the future, a high proportion (84%) of the people aged over 65
said they were likely or completely likely to do so.
1%
2%
1%
2%
5%
2%
3%
2%
2%
9%
8%
10%
31%
31%
32%
54%
52%
52%
Any limitations (n=1149)
Age above 65 (n=266)
Travel with children(n=857)
Q15. You mentioned being satisfied with the accessibility of locations during your most recent trip. Thinking of this aspect, how likely are you to go back to the same destination in future?
1 Not at all likely 2 3 4 5 -‐ Completely likely
Economic impact and travel patterns of Accessible Tourism in Europe FINAL REPORT 193
Looking back at the accessibility of locations during their most recent trip and the likelihood of
returning to the same destination in the future, a high proportion (86%) of the people with any
limitations group said they were likely or completely likely to do so.
Looking back at the accessibility of locations during their most recent trip and the likelihood of
returning to the same destination in the future, a high proportion (84%) of the group of people
travelling with children said they were likely or completely likely to do so.
4.2.3 EU - Results by limitation This section details the survey results for people with limitations split by type of limitation:
Mobility: includes difficulties with walking, picking up objects or daily activities
Senses: includes difficulties with seeing, hearing or other senses
Communication: includes difficulties with speaking or understanding complex information
Behaviour: includes fears, mental, nervous or emotional problems and learning disabilities
Hidden limitations: includes allergies and chronic diseases
Special needs: includes help from a person or animal, specific equipment or medical treatments
4.2.3.1 Travel behaviour Of the total sample of those with limitations, 18% did not travel at all. A slightly higher proportion
(20%) of those with special needs, mobility (19%) and communication (19%) limitations compared
with 16% of those with sensory limitations and 17% of those with hidden limitations did not travel.
4.2.3.1.1 Reasons for not travelling A little over two-thirds (68%) of people with any limitation cited financial reasons for not travelling in
the previous 12 months. Those with hidden limitations (71%) were more likely to cite this reason
than those in the other categories and those with mobility issues (64%) were least likely to do so.
The proportions for the other categories ranged from 67% to 68%.
Those with a behavioural limitation (34%) were more likely to cite a preference for staying at home
as their reason for not travelling, followed by those with special needs (33%) and communication
limitations (32%). Those with mobility issues (28%) were least likely to cite this reason. Those with
sensory or hidden limitations gave this reason in 30% of cases.
communication and hidden limitations (11%) with special needs at 10%, behaviour limitations at 9%,
and those with mobility limitations at 7%.
Long-term illness or health issues: those with mobility limitations (36%) and those with special needs
(37%) are, by some margin, most likely to cite long term illness or a health issue as a reason for not
travelling. Those with sensory, communication and hidden limitations mentioned this reason less

Economic impact and travel patterns of Accessible Tourism in Europe FINAL REPORT 194
frequently at 29% -31%, while considerably fewer with behavioural limitations cited this reason
(25%).
Family reasons (e.g. the need to care for small children or an elderly relative): 12% of those with
hidden limitations cited this as a reason for not travelling, closely followed by those with special
needs at 10%. At the other end of the scale, a little under 7% of those with behavioural limitations
mentioned this as a reason. Those in the mobility, sensory and communication categories
mentioned this reason with a frequency of between 8 and 9%.
Lack of affordable accessibility services or infrastructures at the destination: those with
communication limitations mentioned this most frequently at 9%, whereas this was a less important
reason for those with hidden limitations at 7%. This reason was cited by 8% of those falling within
the other categories.
Other reasons were mentioned by too small a proportion of respondents to be analysed across
groups: lack of accessibility and of accessible tourism services at the preferred destination,
information on accessible services and destinations not available, information on accessible services
and/or destinations not accessible, lack of help/not enough help, not enough information or incorrect
information on accessible services on possible destinations.
4.2.3.1.2 Preferred holiday periods Unsurprisingly perhaps, those with all types of limitations express a preference for scheduling trips in
the summer holidays. However, this would appear a particularly strong response among those with
communication limitations, 71% of whom gave this response, followed by those with special needs
at 70%. Summer holidays were least likely to be scheduled by those with mobility (64%) and
sensory (65%) limitations.
From the figures, we also see that winter holidays show a preference spike amongst those with
communication issues compared with the average with 47% citing this reason contrasting with 36%
overall.
A sizeable proportion said they would be likely to schedule trips off-season or outside the main school holidays, with those with special needs leading the way with 55%. This alternative was least
favoured by those with mobility limitations, at 48%, while those in the other categories of limitation
varied from 50 to 52%.
Although the majority of the sensory limitation group opt for summer holidays, winter holidays show
up as a strong preference in relation to the norm (42% over 36% norm) of those choosing to holiday
at that time of year. Similarly, this applied to those with mobility issues where the figures are 40% to
36%.

Economic impact and travel patterns of Accessible Tourism in Europe FINAL REPORT 195
The school holidays preference shows up slightly more frequently in the profile of those with
behaviour limitations (44% against the 38% norm).
In the same way, the figures for those with a hidden limitation show that there is a slightly greater
tendency to schedule winter (40 against 36%) or spring (45 against 41%) holidays than the
respondents in other limitation categories. In the same way, with special needs, there is a slight
indication of similar preferences 44 against 36% for winter holidays and 48% against 41% for
spring holidays.
If we now look at figures which indicate which holiday periods are less favoured by those with
different types of limitations, we see that those with mobility issues may have a slightly lower
tendency to schedule trips during the summer holidays (63.9% of respondents compared with a
figure of 63.6% across all the limitation ranges, a figure which also includes those who have not
taken a trip).
Among those with communication issues, we can infer that off-season trips are least favoured in
comparison with the general profile of preferences across all the limitations (52% against 48%).
The figures show quite strongly among those with behaviour limitations that autumn holidays are
proportionately less favoured, this period being mentioned by 39% in this category compared with
37% across the board.
In a similar analysis of the figures, there is a hint that for the hidden limitation category, that autumn holidays are proportionately slightly less favoured at 40% compared with 37% (a figure which itself
includes those taking no holiday).
4.2.3.1.3 Travel companions We have seen that a majority of respondents (44%) said they most frequently travelled with a
partner, and those with hidden limitations were most likely to give this response with 46% with those
with behavioural limitations rather less likely to give the same response (41%).
Those with behavioural limitations (22%) gave the highest proportion of responses for those
travelling with other family or household members in contrast to under 17% of those with mobility
limitations giving the same response. When other travel companions are incorporated in the figures
for family or household members, the special needs group (49%) generates the highest figure
amongst those who travel with other family or household members, as a primary or secondary
companion.
At just under 10%, those with mobility issues were more likely to say they travelled on their own than
those in other categories of limitations, while the hidden limitations segment were proportionately
less likely to travel alone, at 8%. When all travel companions are aggregated, those respondents

Economic impact and travel patterns of Accessible Tourism in Europe FINAL REPORT 196
with communication limitations then become proportionally the most likely to say they had travelled
on their own.
Of those who travel with children most frequently, people with special needs and communication
limitations are more likely to travel with children over the age of 5 whereas those in the other four
categories tend more to travel with under-5s.
When other travelling companions are added to those most frequently travelled with, children
become a much more important part of the picture with, in most cases, more than 30% of all the
limitation categories saying they had travelled with children of both age groups below and above
age 5.
People with sensory limitations are the least likely to have a friend or colleague as their most
frequent travel companion, at a little over 10%, while almost 12% of those with communication
issues were those who travelled most frequently with a friend or colleague.
A personal care worker (1.6%) was the most frequent travel companion for those with behaviour
limitations but around 1.0% of those with mobility, sensory and hidden limitations were least likely to
give this answer.
When the figures include all travel companions, the proportion who said they travelled with personal
care workers at times grows considerably with 21% of those with communication limitations and
19% of those with special needs travelling at some time with a personal care worker. This practice is
less evident among those with mobility, sensory and hidden limitations, where the figure falls to
15%.
4.2.3.1.4 Destinations People with mobility limitations were less likely than average to have travelled in their home country.
30% of those with communication limitations travelled to non-European countries while a little over
24% of those with special needs did the same. Also it is less likely to travel outside Europe, at 25%
and 26% respectively, were those with hidden limitations and those with behaviour limitations.
4.2.3.1.5 Reasons for travelling outside the EU The most frequently cited reason for travelling outside Europe was for local culture, nature or
sightseeing opportunities (61%). This was particularly true for those with sensory limitations 64% of
whom referred to this aspect. This reason was less important for those with mobility limitations with
only 56% citing this.
A little over half (50%) of those with special needs were visiting family or friends but only 41% of
those with sensory issues travelled in order to visit their family or friends.

Economic impact and travel patterns of Accessible Tourism in Europe FINAL REPORT 197
For 40% of those with sensory limitations, the general value of money of the destination was
important, whereas this only applied to 31% of those with hidden limitations and 32% of those with
special needs.
Accessibility of the destination and services was an issue for 24% of those with sensory,
communication or behavioural issues but less important to those with mobility issues, hidden
limitations or special needs (22%, 21% and 21% respectively).
While 20% of those with communication issues were interested in the availability of health or
wellness treatments, this was of concern to under 17% of those with sensory, behavioural or special
needs.
4.2.3.1.6 Type of accommodation A hotel or bed and breakfast was the chosen accommodation for over 60% of those with hidden
limitations or special needs, while only 55% of those with communication issues usually stayed in
such accommodation.
Almost 45% of those with behaviour issues chose to stay with friends or family. 41% of those with
special needs usually stayed with friends or family, while this figure was 42% for the other
categories.
There was little variation among the categories in terms of usually staying in a rental house or flat
but this form of accommodation was most likely to be occupied by someone with communication
limitations (a little over 20%). Those with mobility and behaviour issues were marginally less likely to
use this form of accommodation (19%).
Those with behavioural limitations and those with special needs were more likely to take advantage
of accommodation in a tent, caravan or mobile home at 18% and 17% respectively. Those with
hidden limitations, however, were least likely to stay in such accommodation (13%).
14% of those with behaviour limitations cited their own holiday house or flat as their usual form of
accommodation, whereas those with sensory issues were least likely to stay in their own holiday
house or flat (12%).
A spa or wellness resort was most likely to be the choice of someone with communication limitations
(14%) whereas, for those with sensory issues, it was the least likely at under 11%. Those with
hidden limitations and special needs were only slightly more likely to usually stay in a spa or
wellness resort at a little over 11%.
Youth hostel or hostel accommodation was the accommodation of choice for almost 10% of those
with sensory limitations compared with only 8% with hidden limitations and special needs.
Economic impact and travel patterns of Accessible Tourism in Europe FINAL REPORT 198
A small percentage usually made use of a medical or healthcare institution with under 4% of those
with mobility or communication issues usually staying in such accommodation. A little over 3% of
those in the other limitation categories usually stayed in such establishments.
Overall, around four in five people usually stayed in paid-for accommodation, with the highest take-
up among those with hidden limitations or special needs (83%) and behaviour limitations (82%). The
proportion of those with mobility, sensory or communication limitations who usually stayed in paid for
accommodation ranged from 80% to 81%.
4.2.3.1.7 Modes of transport to and from destination With almost 68% of those with special needs using car as transport to their destination, this form of
transport was, by a considerable margin, the most popular. However, only 61% of those with mobility
issues cited this as their mode of transport.
There was little variation in the proportions of those who flew to their destination, with figures ranging
from 44% (mobility and special needs) and 46% (sensory, behaviour and hidden limitations).
Those with behaviour limitations mentioned train travel most often, at 39%, followed by those with
communication limitations and special needs (38%). However, the train was mentioned by only 36%
of those with mobility or sensory limitations.
23% of those with communication or behavioural issues used long-distance buses or coaches to get
to their destination whereas only 21% of those in other categories used this form of transport.
Over 19% of those with communication or behaviour limitations said they used local public transport
to get to their destination but this figure dropped to 15% for those with hidden limitations and 16% for
those with special needs.
15% of those with communication, behavioural or special needs used boats, ships or ferries, while
this figure dropped below 14% for those with sensory or hidden limitations and below 13% for those
with mobility issues.
People with communication or behavioural limitations were the largest users of taxis at 17% but
those with sensory limitations were the lowest users at under 13%. Those with mobility, hidden
limitations or special needs took the middle ground with 15% using taxis.
Leading those who used bicycles by a considerable margin were those with communication
limitations, at over 12%. Only 9% of those with sensory or hidden limitations or special needs,
travelled by bicycle, whereas this figure was less than 8% for those with mobility issues.
Wheelchairs or other mobility devices were most often used by those with special needs and those
with communication issues (both 8%). This figure drops to 6% for those with sensory or hidden
limitations. It should be noted that 7% of those with mobility issues said they used such devices.
Economic impact and travel patterns of Accessible Tourism in Europe FINAL REPORT 199
Almost 10% of those with communication issues said they used a motorbike or scooter to get to their
destination. This figure drops markedly among the other categories of limitation, 7% for those with
behavioural and hidden limitations and special needs and 6% for those with mobility and sensory
limitations.
Overall, those with behavioural limitations more often tended to pay for their transportation to their
destination, at 77%, whereas this figure was 74% for those with sensory limitations and special
needs. 75% of those with mobility, communication and hidden limitations paid for their
transportation.
4.2.3.1.8 Modes of transport at destination The car was the most popular type of transport once at the holiday destination with 57% of those
with special needs making use of it, falling to 49% of those with communication issues.
Local public transport was used most by those with sensory, communication, behaviour limitations
and special needs (39%-41%) and least used by those with mobility and hidden limitations (36-
37%).
29-30% of all those with limitations reported using taxis at their destination with very little variation
amongst the categories, although, notably, those with mobility issues used taxis most often.
27% of those with communication issues used long-distance buses or coaches at their destination
though this form of transport was used somewhat less by those in other categories, the lowest use
being among those with mobility or hidden limitations (22%).
The bicycle was the chosen form of transport by 26% of those with communication limitations,
although this figure dropped to 20% for those with mobility issues and 21% for those with sensory
limitations or special needs.
21% of those with communication or behaviour issues made use of the train at their destination,
while this figure dropped to 17% for those with special needs and 18% for those with mobility or
hidden limitations.
The highest users of water transport were those with communication limitations at 22%. Least liable
to use this mode of transport were those with mobility or sensory limitations, at 17%.
Those with communication limitations were ahead of the other categories in the use of air travel at
their destination, at 19%, though 15% of those with sensory, mobility, behaviour limitations or special
needs used air travel at their destination. The lowest users of air travel were those with hidden
limitations, at 13%.
Economic impact and travel patterns of Accessible Tourism in Europe FINAL REPORT 200
17% of those with communication issues used a motorbike or scooter at their destination, a mode of
transport used far less often by those in other categories of limitation. 12% of those with mobility,
sensory or hidden limitations used this form of transport.
15% of those with communication limitations made use of wheelchairs or other mobility devices.
However, only 11% of those with mobility, sensory or hidden limitations used this form of transport at
destination.
Overall, approaching 70% of those with communication or behavioural limitations used paid for
transportation at their destination. This figure dropped marginally to 68% of those with mobility or
sensory limitations and 66% and 65% respectively for those with special needs or hidden limitations.
4.2.3.1.9 Participation in activities Spending time with family or friends and social activities was relatively popular with all those
with limitations but particularly so for those in the behaviour and hidden limitations and special needs
categories (59-60%) but slightly less favoured by those with mobility, sensory or communication
limitations (55-57%).
Sightseeing and walking around was slightly favoured by those with sensory limitations (63%)
followed by those with behaviour or hidden limitations (both 61%) and those with mobility and
special needs (60%). However, a little more than 57% of those with communication limitations said
they took part in this activity.
18% of those with sensory, communication, behavioural or hidden limitations reported that they took
part in work-related activities, while this activity was less common for those with mobility and
special needs at 16% and 17% respectively.
Those with sensory limitations (49%) preferred to take part in cultural visits compared with people
with other types of limitation. This activity was least preferred by those with mobility limitations or
special needs (46% and 45% respectively).
Natural visits was a favoured activity for those with sensory and communication limitations, at 41-
42%, and less favoured by those with mobility, hidden and behavioural limitations and with special
needs (between 38% and 40%).
Zoo visits were more popular with those with behavioural or communication limitations (37% and
36% respectively). This was an activity less favoured by those in other categories of limitation, with
those with mobility issues at the bottom of the list (32%).
Swimming and sunbathing was a favoured activity for those with special needs (49%), followed by
those with behavioural limitations (48%). Those with mobility issues were, again, at the bottom of the
list with 45% reporting that they had taken part in this activity.
Economic impact and travel patterns of Accessible Tourism in Europe FINAL REPORT 201
47% of those with sensory limitations said they had taken part in walking, hiking or running activities. These activities were much less favoured by those with special needs (40%) or mobility
limitations (41%).
Almost 15% of those with sensory limitations enjoyed other sports (e.g. cycling, skiing, water or air sports). In contrast, fewer than 11% of people with mobility issues and fewer than 12% of those with
special needs took part in such other sports.
Other outdoor activities (e.g. fishing, bird-watching) were enjoyed across the board by all
categories of limitations and were mentioned by 10-11% of the sample. Those with mobility issues
were at the lower end of this range.
Heading the list of those enjoying guided tours and excursions were those with sensory limitations
or special needs (32%). The activity was less favoured by those with behavioural (28%) or mobility
limitations (29%).
Shopping was enjoyed across the board by around two-thirds of the sample. The activity was
marginally more popular among those with sensory, hidden or behavioural limitations (66-67%).
Those with mobility issues and special needs were slightly less likely to take part, with the figure
being 64% for these groups.
Those with hidden limitations were more likely to dine out, by a relatively considerable margin, with
65% saying that they took part in this activity. This compares with 62% of those with mobility,
sensory, behavioural limitations or special needs. Slightly lagging behind in this group were those
with communication issues 61% of whom reported taking part in this activity.
Over 21% of those with communication issues reported that they had taken part in spa or wellness activities. In contrast, those with mobility and behaviour limitations were least likely to take part in
such activities (18%).
Around 10% of the sample group took part in healthcare or other medical activities, with very little
deviation among the different categories of limitation.
Taking part in local events was marginally more favoured by those with behavioural or hidden
limitations, 32% of whom reported being involved in such events. At the lower end of the scale, only
29% of those with mobility limitations or special needs took part in these activities.
Topping the list of those who took part in activities for families or children were those with special
needs with 36% of people in this category saying they had taken part. This was closely followed by
those with behavioural limitations (35%). People with mobility issues were less likely to take part in
such activities with 31% reporting they had done so.

Economic impact and travel patterns of Accessible Tourism in Europe FINAL REPORT 202
A little over 90% of all activities experienced involved a financial cost, with little variation in this figure
between the categories of limitation.
4.2.3.2 Decision-making
4.2.3.2.1 Most important information sources when deciding travel plans The relative profile of information sources that are important to the various limitation groups changes
slightly when all the answers given are aggregated, for instance where more than one source is
taken into account, not just the factor deemed most important.
In making decisions about travel plans those with communication limitations (12%) were the group
most likely to make use of a travel agency as a first resort. Least likely to turn principally to a travel
agency are those with sensory, behavioural or hidden limitations (10%).
When all sources of information used are collated, travel agencies remain an important resource,
with 40% of those with communication issues mentioning them. Again, it is those with mobility and
sensory limitations who are slightly less likely to use this source of information.
Those with communication limitations (18%) are the least likely to use family friends or colleagues
as their most importance source.
More than 19% of those with mobility limitations rely principally on their own experience when
making travel plans. Similarly, 18% of those with special needs tend to rely on personal knowledge.
People with behavioural and communication limitations are slightly less likely than the others to use
their own experience as the most important source (15%).
Tourism websites are most likely to be relied upon by those with sensory, behavioural or hidden
limitations, with 18% in these categories saying they were their most important source of
information. At the other end of the scale, only around 16% of those with mobility, communication
and special needs said that tourism websites were their most important resource.
In summary, 40% of those with sensory limitations use the tourism sector as their most important
source of information. This compares with a figure of just over 36% of those with mobility limitations
or special needs.
When the figures for all forms of individual advice are added together, for example, family,
friends, colleagues, online information from members of the public, and personal experience, the
special needs group (41%) is the group relying most on this information. Much less likely to make
use of such personal recommendations are those with communication limitations, with fewer than
36% saying they made use of this information as a first resort.
Economic impact and travel patterns of Accessible Tourism in Europe FINAL REPORT 203
Those with communication limitations or special needs (15%) tend to make use of sources such as
specialised guidebooks or websites when seeking information. Those with sensory limitations
(12%) are least likely to go to these specialised resources.
In terms of the most important source cited by the sample, travel agents, word of mouth from family,
friends or colleagues, personal experience and tourism websites were the most important. When all
sources mentioned by respondents are aggregated, newspapers, magazines, radio, television, forums and blogs, and general guide books all increase in importance. Brochures and catalogues also become important back-up sources of information.
Boosted, particularly by those with communication limitations, 34% of whom mentioned
newspapers and magazines, radio and television, as a source of back up information, these
media become an important general resource across the board when we look at the aggregated
figure for all sources of information. The same source is, however, only mentioned by 29% of those
with mobility or hidden limitations.
Similarly, social networks, for example, Facebook, are an important secondary source of
information. When figures are aggregated for all sources, those with communication and behavioural
limitations lead the way with more than 28% mentioning this as a source of information, although
only 2% or 3% of these groups said it was their principal resource. In comparison, fewer than 24% of
those with mobility or hidden limitations mentioned social networks as a source of information.
Although fewer than 2% saw social media, for example Twitter, as their most important source of
information, 27% of those with communication issues cited social media as one of their sources
although not necessarily their primary source. This was, by a clear margin, ahead of those in other
limitation categories where only 20% of those with mobility issues and 21% of those with hidden
limitations made use of this source of information.
When all responses concerning family, friends and colleagues are collated, those with behavioural
limitations are clearly ahead of the other categories of limitations with 55% of them saying they
made some use of this source of information. The figure was 50-51% among other categories.
Figures for those relying on their personal knowledge to some extent were relatively consistent
across the board with between 47% and 49% mentioning this source. Slightly ahead of the rest
were those with behavioural or hidden limitations.
Although not generally considered to be an important primary source of information, forums, blogs or online reviews were particularly important to those with behaviour limitations 33% of whom
mentioned this resource. At the other end of the scale, this source of information was important to
only 27% of those with mobility issues.
Economic impact and travel patterns of Accessible Tourism in Europe FINAL REPORT 204
Similarly, brochures and catalogues were an important back-up resource, with 40% of those with
communication or behavioural issues making some use of this resource. The figure was 37% for
those with mobility, sensory or hidden limitations.
Support groups and consumer organisations remained a relatively minor source of information
when all answers were aggregated. However, this was a slightly more important resource for those
with communication limitations than those in other categories of limitation with 22% mentioning they
at some time used these sources. Fewer than 18% with mobility, sensory or hidden limitations
mentioned this source of information.
General guidebooks were also mentioned as useful, mostly secondary, sources of information,
particularly important to those with communication issues, 37% of whom made some use of them.
General guide books were considered somewhat less useful by those with mobility and hidden
limitations where the figure was 31%.
Specialised guidebooks also had their adherents with, again, those with communication issues
leading the way with 23% using this resource. Such guidebooks were less important for those with
mobility and hidden limitations (19%).
Although only one in six used tourism websites as a first resort, getting on for 50% made use of
this resource to some extent. Those with behavioural limitations were most likely to consult such
websites (49%), with those with mobility issues least likely (43%).
Specialised websites were of particular importance to those with communication limitations with
29% making use of these resources overall. However, only 22% of those with mobility limitations
consulted the more specialised websites.
Specialised sources other than websites were also cited and, again, it was those with
communication limitations who made use of these resources more often (24%) and those with
mobility and hidden limitations (19%) were least likely to make use of this kind of resource.
Doctors and other health professionals were a source of information particularly for those with
communication limitations with 24% citing this source. This resource was much less important to
those with other categories of limitation, in particular those with sensory issues, of whom 17%
mentioned this source.
Turning to an analysis of general tendencies of the sample in making decisions about travel plans,
most appear to turn to word of mouth and the tourism sector as their most important source of
information. However, this appears to be backed up by use of websites and social media, as well as
more specialist resources.

Economic impact and travel patterns of Accessible Tourism in Europe FINAL REPORT 205
Those with communication limitations are more likely to rely on media in general as an information
source than those with other types of limitations. 47% of this group consults this type of resource at
some point. This compares with 42% of those with special needs. Also slightly less inclined to follow
advice gathered from the media are those with mobility or hidden limitations (43%).
Members of all limitation groups tend to equally seek information from the tourism sector, amounting to around 70% of each group, although significantly those with mobility limitations (67%)
are less likely to use this resource. Those with behavioural and hidden limitation are more likely to
rely on their own resources or friends, families, colleagues and online blogs (74%) than those
with other types of limitation. Least likely to follow personal recommendations are those with
communication limitations (71%).
It is those with communication limitations and special needs (respectively 47 and 48%) who are
most likely to turn to specialised advice compared with those with mobility or sensory limitations who
make use of these resources less often, at 42% and 41% respectively.
4.2.3.2.2 Booking channels Those with communication limitations (62%) were clearly more likely to have booked through a
travel agency. People with hidden limitations are least likely to do the same (53%). Figures for
those in other limitation groups varied between 54% and 56%.
Those with communication limitations (41%) were also the most likely to book through an institutional group, whereas those with hidden limitations were much less likely to do so at 33%.
The figures for the other types of limitation varied between 36% and 37%.
Over 60% of those with those with communication limitations chose to book directly with providers before their holiday. The figure for all the other groups was 59% with the exception of those with
special needs of whom fewer than 57% chose this method of booking.
A similar pattern emerges once at their destination where 54% of those with communication
limitations are the most likely to book directly with providers. Those with sensory or hidden
limitations or those with special needs are least likely to take this course, at 49%.
Those with communication limitations (53%) were also the most likely to book through people they know, while those with special needs or hidden limitations (both 48%) were somewhat less likely to
choose this option.
If a booking is made through a travel agency, this is more likely to be done in person with those with
communication limitations leading the way - 29% of whom said they had booked in person. Those
with hidden limitations (25%) were least likely to book in person, when they booked with a travel
agency.

Economic impact and travel patterns of Accessible Tourism in Europe FINAL REPORT 206
Similarly, those with communication limitations were more likely to have used the telephone (16%)
or the internet (26%) to make their booking through a travel agency than those with other types of
limitation. Those with hidden limitations or special needs were least likely to telephone when booking
with a travel agent (between 12 and 13%).
Also, in the case of internet booking, it was those with mobility, sensory or hidden limitations who are
least likely to use that form of communication when booking with a travel agent (all 23%).
When booking through an institution or group, those with communication limitations and special
needs were more likely to use the telephone than those in other categories (9% having said they
used this form of communication). In contrast, only 7% of those with hidden limitations used the
telephone when booking through an institution or group.
Similarly, it was those with communication limitations or special needs who led the field in terms of
booking in person when booking through an institution or group (14%). Personal booking was used
by fewer than 13% in the other segments when booking through an institution or group.
Those with communication limitations were joined by those with mobility or sensory limitations (13-
14%) in preferring to make their bookings through an institution or group via the internet. In contrast,
this was a less favoured option for those with hidden limitations (under 12%).
Booking directly with a provider by telephone in advance of a holiday was a generally equally
preferred option of communication for most categories at a little over 16%. However, those with
sensory limitations were less likely to telephone (under 15%).
Over 16% of those with communication limitations made their advance booking directly with
providers in person, whereas for those with hidden limitations, this was a far less preferred
communication option (13%) and this group, instead, was the group which most preferred booking
direct with providers over the internet (37%). Significantly, those with communication limitations
were, on this occasion, least likely to make their booking directly with a provider over the internet
(31%).
Those with mobility limitations (15%) are top of the list of those preferring to make their booking
directly with a provider by telephone once at their destination, closely followed by those with
communication limitations (14%). In contrast, those with hidden limitations were least likely to use
the telephone to make such a booking (11%).
19% of those with communication limitations said that where they booked directly they did it in
person with providers once at destination, closely followed by those with special needs (18%).
Those with mobility or hidden limitations were the least likely to make bookings in person when
making bookings directly with providers (16%).
Economic impact and travel patterns of Accessible Tourism in Europe FINAL REPORT 207
The group most likely to make a direct booking at destination via the internet was those with
behavioural limitations (23%). Those with mobility or sensory limitations or special needs were least
likely to use the internet for this type of booking at just under 21%.
Those with sensory and behavioural limitations were more likely than those in other segments to use
the telephone when booking through someone they knew (17%). This was the least likely form of
communication for those with communication or hidden limitations or with special needs (15%).
There was a wider disparity between the groups in relation to using the internet when booking
through someone they knew. 20% of those with communication limitations said they used this form
of communication compared with under 16% of those with mobility limitations.
4.2.3.2.3 Checking of accessibility conditions and/or available help at travel destination before travelling
Respondents were asked whether, before travelling, they checked accessibility conditions and/or
available help at their destination. Those with communication limitations (68%) were more likely to
check such conditions than respondents with sensory or hidden limitations (respectively 63% and
62%). The other groups were clustered between 65% and 66%.
As to whether there is sufficient information of this nature, high proportions in all the groups
appeared to think so. 81% of those with mobility, sensory or hidden limitations held this view, while
the figures were marginally lower at 78% for those with special needs and 79% for those with
communication and behavioural limitations. It is perhaps worth noting that there were relatively high
When asked to rate the reliability of the information received before travelling regarding accessibility
behavioural limitations, at the other end of the scale. 75% of those with communication limitations
and 74% of those with special needs, sensory, communication or hidden limitations felt that this
information was reliable, while the figure was slightly lower for those with behavioural limitations, at
72%.
Around 80% of respondents felt this information about accessibility conditions and/or the availability
of help at travel destination before travelling was generally accessible with little variation across the
board. Again, the
communication limitations.
Economic impact and travel patterns of Accessible Tourism in Europe FINAL REPORT 208
4.2.3.3 Experience
4.2.3.3.1 Aspects of importance when choosing travel destination In choosing their travel destination, information about weather conditions and landscape, etc. was
more important to those with sensory, communication or hidden limitations or those with special
needs (4.2 on a scale of 1 to 5, where 1 is not at all important and 5 is very important).
This was only slightly less important for those in the other groups (4.1).
Customer care and service was of prime importance to those with communication limitations (4.2)
whereas those with sensory limitations were, by a small margin, the least concerned with an
average score of 4.0.
Of all the groups, those with hidden limitations were most concerned about value for money of the
destination (4.4 out of 5). This was also very important for all the other groups, but slightly less so, at
4.3.
Sightseeing, entertainment and cultural activities were equally important aspects for all groups with
scores of 4.0.
One of the least important factors was shopping opportunities, though this was relatively more
important for those with communication limitations (3.6) compared with those with sensory or hidden
limitations or special needs (3.4).
Information about food and drink at destination generally gained an importance level of 4.0 but was
marginally more important for those with hidden limitations (4.1).
Those with mobility limitations or hidden limitations expressed most concern about accommodation
when choosing their travel destination giving it a score of 4.2 compared with 4.1 for the other groups.
Excursion activities were a little less important scoring 3.7 in general but were marginally more
important for those with communication limitations who scored this factor at 3.8.
Interest in local culture scored 3.9 across the board, while information about health treatments was
the least important of all the factors for all groups when choosing their destination, scoring between
3.2 and 3.4 (those with communication limitations).
Transport at destination was considered moderately important with most of the groups scoring it at
3.8. Those with sensory limitations said it was slightly less important (3.7).
Safety was the most important issue for all groups with most scoring this factor at 4.3, but with those
with communication limitations or special needs rating this factor at an importance of 4.4.
Transport to destination was important for all categories of limitation (4.2) with only those with
mobility limitations scoring this factor at 4.1.

Economic impact and travel patterns of Accessible Tourism in Europe FINAL REPORT 209
Information being available before the trip was also seen as quite important, scoring 4.3 for most
groups and 4.2 for those with special needs.
The availability of information once at the destination was considered only slightly less important at
4.2 across the board, although those with behavioural limitations rated this aspect at the slightly
lower rating of 4.1.
When asked about access to information before the trip and at destination, most groups scored this
as important or very important, at 4.2, with this aspect being considered especially important by
those with communication limitations who gave this 4.3.
Those with communication limitations were also the group feeling that availability of information
about accessible services was most important scoring 4.2, though this was slightly less of an issue
for those in the hidden limitations or special needs categories (4.0).
Accessibility of booking services was rated 4.1 in importance across the board, while there was
generally less concern about the accessibility of locations, sightseeing and entertainment, scoring
between 3.9 and 4.0. Those with sensory limitation and communication limitations felt this aspect
was slightly more important than did the other groups, scoring 4.0.
Accessibility of accommodation was considered slightly more important to most groups than
accessible locations, scoring 4.0 across the board, with the exception of 3.9 for those with hidden
limitations.
Accessible restaurants were considered to be similarly important, scoring between 3.9 and 4.0, with
this aspect being slightly more important for those with mobility, communication or behaviour
limitations.
Only moderately important were accessible shops when choosing a destination, generally scoring
between 3.6 and 3.8. This aspect was deemed to be most important by those with communication
limitations and of least importance, relatively, by those with hidden limitations.
Also deemed to be of relatively lesser importance was the accessibility of leisure equipment. Those
with communication limitations were, however, most keen on this (3.6), whilst all but those with
sensory limitations (3.5) gave this an importance rating of 3.4.
The availability of accessible transport was important to all the groups who mostly gave this a rating
of 3.9, the exception being those with communication limitations who felt this was slightly more
important, meriting a score of 4.0.
Of moderate importance for most groups, at 3.6, was the question of whether the destination was
adapted for a specific group, for example, seniors or children. However, those with communication
limitations felt that this was slightly more important, scoring 3.7.

Economic impact and travel patterns of Accessible Tourism in Europe FINAL REPORT 210
The question of medical help or healthcare at destination was important to all groups with a score of
4.0 across the board. Slightly more important was the availability of services in a language
understandable to the individual, scoring 4.1. Perhaps significantly, those with communication
limitations scored this even higher, at 4.2.
The availability of specific services, infrastructure or products (e.g. special foods) was considered
only moderately important. Those with communication limitations scored this highest of all the
groups, at 3.6, while those with sensory or behavioural limitations were least concerned, at 3.4.
4.2.3.3.2 Satisfaction with each of these aspects Respondents were asked to rate the same aspects in terms of their level of satisfaction following
their most recent trip.
There are a number of aspects where the level of satisfaction is rated less than the level of
importance accorded to them in choosing a destination.
General value for money of the destination is given a satisfaction score of 4.2 compared with
importance of 4.3 while, similarly, the question of information available before the trip is given a
satisfaction rating of 4.2 compared with an importance rating of 4.3. Within these figures, there is
some variation among the different limitation groups.
Those with communication limitations have a more consistent mismatch between satisfaction rating
and the corresponding importance rating. For instance, they are the only group where satisfaction is
lower on customer service issues but they are in agreement with three other groups in terms of
relative dissatisfaction over general value for money. These groups are those with behavioural or
hidden limitations or special needs.
Those with communication limitations are joined by those with special needs in giving a lower score
for satisfaction compared with their importance rating on safety issues.
The figures show that four groups are relatively dissatisfied in terms of transport to and from
destination. These are those with sensory, communication or behavioural limitations or special
needs.
By the same measure, relative dissatisfaction seems to be generally across the board as regards
information available before the trip, though an exception is those with special needs.
Those with sensory or communication issues are perhaps relatively dissatisfied with access to
information before the trip and at destination, while those with communication limitations are the only
group where level of satisfaction does not accord with the level of importance they gave to the
availability of information about accessible services.
Economic impact and travel patterns of Accessible Tourism in Europe FINAL REPORT 211
In most of the other aspects, satisfaction levels seem to exceed comfortably the levels of importance
given to them, especially in relation to shopping opportunities, accessible shopping, accessible
sport, availability of specific services and health treatments.
4.2.3.3.3 Experience of barriers or restrictions When respondents were asked about their experience in the past 12 months of barriers or
restrictions in relation to all the important aspects of travel destinations covered above, we observe
that, with regard to almost all of these aspects, the group with communication limitations recorded
higher figures than all of the other groups.
For example, when we look at the aggregated figures for destination-related aspects, such as nature
(weather conditions, landscape, etc.), how tourists are treated, general value for money, etc.), we
see that those with communications limitations, at 65%, record a substantially higher figure than the
other groups, all of which had figures of 60% or below.
More specifically, when we look at the nature aspect, it can be seen that the figure relating to those
with communication limitations (22%) exceeds by at least three percentage points the figures
relating to those with behavioural or hidden limitations or special needs (all at 19%). In contrast, the
corresponding figures for those with sensory and mobility limitations, at 17 and 18% respectively
were somewhat lower.
We can note quite often that the figures recorded for those with hidden limitations are lower than
those recorded for other groups, perhaps, precisely because their limitations are hidden. This may
be seen in the case of many of the destination-related aspects, such as accommodation available at
destination, general value of the destination, and how tourists are treated, to cite a few specific
examples.
For those with mobility limitations, their relative experience of barriers and restrictions compared with
the other groups appears to have been most marked in relation to aspects such as how tourists are
treated, transport to and from destination, and accessible restaurants.
Where those with sensory limitations tend to experience barriers and restrictions, it would appear to
be more common in relation to aspects such as general value for money of the destination, medical
help or healthcare at destination, or availability of services in a language they understand.
The group with behavioural limitations tends to experience barriers or restrictions more often than
most other groups in relation to aspects such as shopping opportunities, transport to and from
destination, nature, general value for money of the destination, sightseeing, entertainment and
cultural activities, food and drink available at destination, excursion activities, and issues relating to
the access to and availability of information in its various forms, accessibility of booking services,
etc.
Economic impact and travel patterns of Accessible Tourism in Europe FINAL REPORT 212
The special needs group felt that it had experienced barriers or restrictions more so than most other
groups in relation to shopping opportunities, accommodation available at destination, local
culture/people, transport once at destination, safety, availability to information in its various forms,
accessible shops, accessible sport, availability of services in a language they understand, and
medical help or healthcare at destination. This group and the behavioural limitations group appear to
share a number of similar experiences.
4.2.3.3.4 Aspects regarding buildings visited On a scale of 1 to 5 (where 1 means not at all important and 5 means very important), respondents
proceeded to rank aspects of buildings they can visit when travelling. In terms of buildings visited
during their most recent trip, they also ranked these aspects on a scale of 1 to 5, where 1 means
completely dissatisfied and 5 means completely satisfied.
Accessible parking space was accorded a mean of 4 in terms of importance by those with mobility
limitations. All of the other groups gave it a score of 3.9, for those with sensory limitations (3.8).
Satisfaction with this aspect was 4.0 across the board, except for the special needs group which
gave it the slightly higher score of 4.1.
Type of access (ramps, steps, doors, etc.) was given greatest importance, at 3.7, by those with
mobility and communication limitations, with the rest of the groups giving it a score of 3.6. In terms of
satisfaction in this regard with buildings visited on their most recent trip, all groups give a satisfaction
score of 4.0.
In terms of importance, accessible toilet and bathroom facilities are given a score of 4.1 by all
d those with behavioural or hidden
limitations and those with special needs also give an identical score.
Ease of using furniture, furnishings and lights was accorded greatest importance by those with
mobility and communication limitations (4.0), with scores of 3.9 from the other groups, except those
with sensory limitations (3.8). In terms of satisfaction with this aspect, all groups gave an identical
satisfaction score of 4.1.
As regards access to services other than accommodation, all groups rated its importance at 3.8
except for those with sensory limitations (3.7). Satisfaction ratings with this aspect were 4.0 across
the board.
Alarm systems were of greater importance to those with communication limitations (3.8), than all the
rest of the groups (3.7 except those with sensory limitations with 3.6). Satisfaction with alarm
systems was rated at 3.9 (mobility, sensory or behavioural limitations) and 4.0 (communication or
hidden limitations, or special needs).

Economic impact and travel patterns of Accessible Tourism in Europe FINAL REPORT 213
Mobility within the room was most important for those with communication limitations (4.0), with
those with mobility or behavioural limitations or special needs giving it 3.9 and the remaining groups
3.8. Satisfaction levels in this regard were a uniform 4.1 across the board.
Mobility within the building was assigned most importance by those with communication limitations
(4.0) followed by those with mobility or behavioural limitations or special needs (3.9), and the
remaining groups at 3.8. Again, satisfaction with this aspect was given a score of 4.1 across the
board (with the exception of people with communication limitations, who gave an average score of
4.0).
Ease of use of lifts was of equally high importance (4.0) for all of the groups, except for those with
sensory limitations. Satisfaction, in respect of this aspect was given a score of 4.1 by all the groups.
4.2.3.4 Expectations & future
4.2.3.4.1 Likelihood to travel more or return to the same destination Respondents were asked whether, if offered more accessible services and/or help during their
journey and at their destination, they would be likely to travel more often.
A majority in each limitation group said they were likely or completely likely to travel more often in
these circumstances.
People with communication limitations (57%) were somewhat more likely than those with mobility,
sensory or behavioural limitations or special needs (all 56%) to travel more often were services
and/or help more accessible during their journey and at their destination. Those with hidden
limitations (54%) were least likely to give this response.
Respondents satisfied with the accessibility of locations during their most recent trip were asked
about the likelihood of returning to the same destination in the future.
Those with sensory limitations (87%) were most likely to say they would be likely to return to the
same destination, while three groups, those with communication or behavioural limitations or special
needs (84%) least likely to say they would return.
4.2.3.4.2 Paying more for accessible products or services Respondents were asked if they paid more than the standard price for accessible products or
services (e.g. an additional fee) and, if so, how often.
Those with communication limitations (61%) were significantly more likely to say that this happens at least sometimes than those who had hidden limitations or special needs (both 52%).
communication limitations) to 17% (those with hidden limitations).
Economic impact and travel patterns of Accessible Tourism in Europe FINAL REPORT 214
When asked whether it often happened that they had to switch to a more expensive product or
service because they needed to be accessible, those with communication limitations (58%) were
most likely to respond that this was their experience at least sometimes in contrast to those with
hidden limitations or special needs (both 50%).
4.2.3.4.3 Use of specific items Respondents were given a list of 15 items in three main groups (mobility, senses and medical)
ranging from a personal care worker, through a sign language interpreter and a wheelchair to
hearing aids. They were then asked whether, if these items were available on a trip or at their
destination, they would use them.
Those with special needs (25%) were more likely to cite items in the mobility group items (e.g. help
to get on board, leave or change transport, wheelchair, walker, crutches, etc.) than those with
sensory (20%), behavioural or hidden limitations (both 21%).
Those with communication limitations (26%) would be more likely to use items falling within the
senses group (sign language interpreter, induction loop, hearing aids) than those with hidden
limitations (19%) or mobility (21%) or behavioural (21%) limitations.
Those with communication limitations (34%) would be more likely to use items falling within the
medical group (personal care worker, medical or paramedical treatment or medical help) than those
with either mobility (31%) or sensory (30%) limitations.
4.2.4 EU - Country results The section below presents statistically significant differences between countries. Non-significant
differences and questions with a base size below 25 are not included in the analysis.
4.2.4.1 People who travel with children People from The Netherlands who travel with children are more likely than average to schedule their
trips during the school holidays. Their Italian counterparts show a strong tendency to use the
summer holidays for their travelling plans but the lowest preference for travelling off-season or
outside main school holidays. People from the UK are least likely to use summer holidays for their
travels. Among all the respondents, Lithuanians are the people with the lowest tendency to use
winter and spring holidays for the traveling plans. While Slovenians show the lowest preference for
autumn holidays as the period to do their travelling, although they have a low preference for spring
holidays as well. Poles are more likely, regarding the average, to travel during off-season or outside
main school holidays.
In general lines, Lithuanians, Dutch and Polish people show the highest tendency to use other
periods for their travelling plans.
Economic impact and travel patterns of Accessible Tourism in Europe FINAL REPORT 215
When it comes to travelling companions, people from the Netherlands who travel with children show
the highest variety. They are more likely than average to travel on their own, or with friends, with
other groups or with their personal care worker. Polish people show a higher tendency to travel with
their partner, other groups and their personal care worker. Lithuanians have an above average
preference to travel on their own or with colleagues, although they are the less likely to travel with
their partner. French respondents are more likely to travel with their children above 5 years old,
while Irish are the less likely to do this. Irish people also report the lower preference for travelling
with children below 5 years old. Swedish respondents are the less likely to travel with members of
their family or household. British people are less likely to travel with children above 5 years old or
with their colleagues.
In general lines, Dutch respondents are less likely in average to visit the EU. Irish are the ones less
likely to travel in Europe. Africa and the Middle East are less likely to be visited by Lithuanians,
Slovenians and Swedish. The Americas are less likely to be visited, on average, by Belgians,
Lithuanians, Poles and Slovenians. On average, Italians and Slovenians are less likely to have
visited Asia and Oceania.
When talking about the reasons chosen to travel outside the EU, British respondents are the most
likely to report accessibility of the destination and services as a relevant reason for picking the
destination.
When asked about the type of accommodation chosen when travelling, Slovenians are more likely to
use, in average, a rental house/flat, a tent/caravan/mobile home or a spa or wellness resort. French
respondents show an above average preference for using rental houses/flats, and spa or wellness
resorts. Polish respondents show a preference for the house of friends or relatives, or a rental
house/flat. Respondents from the Netherlands are more likely to choose their own holiday house or
flat. Belgians are more likely to use a spa or a wellness resort. Lithuanians will prefer the house of
friends or family members. Spanish respondents are more likely than average to go to a hotel or a
Bed & Breakfast.
On the other hand, houses of friends or family are less likely to be used by respondents from
Belgium, the Netherlands and Slovenia. Rental houses or flats are less preferred by Dutch and
British respondents. Hotels or Bed & Breakfast are less likely to be chosen by respondents from
France, Lithuania and Slovenia. Youth hostels and hostel are less preferred by people from the
Netherlands. Tent/caravan/mobile homes are less likely to be used by Italians and Spanish. Spa and
wellness resorts are less likely, in average, to be chosen by Swedish respondents.
Economic impact and travel patterns of Accessible Tourism in Europe FINAL REPORT 216
Regarding the type of transport preferred, to and from destination/at destination, there are quite
different choices. Irish respondents are more likely than average to use airplanes, taxis and
wheelchairs/mobility scooters. Spanish respondents prefer airplanes, trains and taxis. Respondents
from the Netherlands show a preference for bicycles and wheelchair/mobility devices. Respondents
from Poland are more likely than average to use long-distance buses/coaches and bicycles. Belgian
and Slovenian respondents report a preference above average to use cars.
On the other hand, airplanes are less likely to be used by French, Lithuanians, Polish and
Slovenians. Cars are less preferred by Swedish respondents. Long-distance buses/coaches are less
likely than average to be used by Irish and Swedish respondents. Trains are less preferred by
respondents from Lithuania and Slovenia. Swedish respondents are less likely than average to use
local public transport. Taxis are less likely than average to be used by respondents from Belgium
and Lithuania. Bicycles are less preferred by Italian and British respondents. Wheelchair and
mobility devices are less likely to be used by Italians.
Regarding the type of activities the respondents took part during the past 12 months, Polish
respondents give the widest variety of answers. Pols will prefer, more than average: going shopping,
going to local events, spending time with family or friends, sightseeing/walking around, doing work-
related activities, visiting natural areas, and walking or running. Slovenian respondents are more
likely to engage in spa/wellness activities, go to local events, spend time with friend or families,
swimming or sunbathing. Lithuanian respondents declare a preference for going to local events and
doing cultural visits. French respondents are more likely than average to do sightseeing and walking
around, and running or hiking. Respondents from Ireland show a preference for going to local
events, and swimming and sunbathing. Dutch respondents are more likely to prefer swimming or
sunbathing, while respondents from Belgium and the UK choose to do activities for families and
children.
On the other hand, Italian and Dutch respondents show the lower preference for spending time with
family or friends. Sightseeing and walking around have the lower preference on Italian and Swedish
respondents. Respondents from Belgium, Ireland and Poland are the groups with the lower
tendency to do cultural visits. Natural visits are less preferred by Swedish and Irish respondents.
Swimming and sunbathing is mentioned less often by Italian respondents. Walking or hiking is
chosen the least by Irish, Italian, Lithuanian, Dutch and Swedish respondents. French, Lithuanian
and Slovenian respondents mention less often shopping as an activity they take part in. Trying local
food or drinks, and doing activities for families and children are less often chosen by respondents
from Italy.

Economic impact and travel patterns of Accessible Tourism in Europe FINAL REPORT 217
In general lines, activities that imply some kind of payment are less often chosen by respondents
from Sweden.
When it comes to source of information for travelling, there are four categories that are preferred.
Forums, blogs and online reviews are more often mentioned by Slovenian and Spanish
respondents. Family, friends and colleagues are more likely to be used by Lithuanians and Spanish
people. Newspapers, magazines, radio or TV are more often preferred by Polish respondents as
source of information. Belgian respondents travelling with children are more likely than average to
use brochures or catalogues.
On the contrary, newspapers, magazines, radio or TV are less often mentioned by Spanish
respondents as a source of information. Social media is less preferred by Belgians and Slovenians
travelling with children. Italians report the less using their own experience as a source of information.
Respondents from the UK use the least non-profit organizations, and Swedish are less likely to rely
on general guidebooks.
Regarding the booking procedure for travelling, Spanish respondents travelling with children are
more likely to go through a travel agency, while Polish are less likely to use this way. Institutions or
groups are less often preferred by Belgian and Swedish respondents. Irish respondents report more
often to use directly a transport or an accommodation provider before their holiday, while their
counterparts from Belgium, Lithuania and Sweden are less likely to use this method. Once at their
destination, Belgian respondents report to be less likely to use directly a transport or an
accommodation provider. Swedish respondents report less often to use someone they know.
Booking the trip by phone is more likely done by Belgian, Irish, Dutch and Swedish respondents.
Swedish also report more often to do the booking in person, while the internet is more likely used by
Irish respondents, and less often used by Lithuanian, Polish and Slovenian respondents.
When it comes to check accessibility conditions and the availability of help at the travel destination
before travelling, Italian respondents are the most likely to do it, while Belgian, Irish and Lithuanian
report less often to do this.
Regarding the information about accessibility and its availability, respondents from the UK report
more often there is enough information, while Spanish respondents are less likely to say this.
Regarding the reliability of the information, respondents from Belgium and Poland declare more
often they do not know about this. And when it comes to the accessibility of the information,
Slovenian respondents are more likely to declare it is, while Belgian respondents are less likely to
Economic impact and travel patterns of Accessible Tourism in Europe FINAL REPORT 218
Poland and Slovenia are less likely to say the information is not accessible.
Regarding the aspects considered as important when choosing the travel destinations, Italian
respondents show the widest range of options. They are more likely than average to give importance
to: the general value for money of the destination, the food and drink available, the accommodation,
the health treatments, the transport at the location, the availability of information about accessible
services, the destination being adapted to a specific group of people, the medical help or health care
at the destination, the availability of services in an understandable language, and the availability of a
certain service, infrastructure or product. Polish respondents declare more often to give importance
to aspects such as: nature, the accommodation available, safety, the information about accessible
services, the accessible tourist accommodation, the medical help and health care and the available
services in an understandable language. However, they will give a below the average importance to
the excursions available at the destination and the availability of certain products or services at the
destination. Respondents from Lithuania are more likely to give importance to the information
available before and once at the destination. French respondents report more often than average
the excursions available at the destination as important, but they give less importance to the food
and drinks at destination, the accommodation, safety and the accessible restaurants at destination.
Slovenians are more likely to give the accommodations available at the destination a score above
the average, although they will give less importance to several elements, such as: general value for
money at the destination, sightseeing and entertainment, shopping opportunities, available
excursions, transport at destination, accessible locations and accessible sport or leisure equipment.
On the other hand, Swedish respondents travelling with children are more likely to score below
average in almost all categories. In the case of Lithuanian respondents, it is possible to observe a
trend in their responses as well: they have a below average score in almost all items related to
accessibility. Belgian respondents are less likely to refer to some variables as important: local
culture/people, information available before the trip, accessibility of booking services, accessible
locations, accessible tourist accommodation and medical help or health care at destination.
Respondents from Ireland give less importance to available excursions, health treatments and
accessible products and services in general. Dutch respondents travelling with children give less
importance to excursions available at the destination, while Spanish respondents give a below
average importance to health treatments.
Regarding satisfaction with their most recent trip, some differences and similarities with the previous
question can be observed.
Belgian respondents who travel with children are more satisfied than average to health treatments,

Economic impact and travel patterns of Accessible Tourism in Europe FINAL REPORT 219
but less satisfied with local culture/people, transport to and from destination, destination adapted to
a certain group and information available in an understandable language. Italian respondents are
more satisfied with the availability of food and drinks at the destination. Respondents from Lithuania
are more satisfied with excursions at destination, while they are less satisfied with shopping
opportunities and information about accessible services. Respondents from the UK are more likely
to be satisfied with accessible tourist accommodation, accessible shops, and shopping services and
opportunities.
On the other hand, Swedish respondents travelling with children have a tendency to be less satisfied
with most of the items related to accessibility, nature, and transport in general (at the destination,
and to and from the destination). Slovenian respondents are less satisfied than average with
sightseeing and cultural activities, shopping opportunities, transport to and from destination,
information available at the destination, accessible locations, accessible accommodations and
availability of specific services and products. Respondents from Poland, travelling with children, are
less satisfied with excursions available at the destination, health treatments and availability of
specific services or products. French respondents are less satisfied with food and drinks available at
the destination, and Spanish respondents with health treatments.
When it comes to mention barriers or restrictions, Polish people travelling with children are more
likely to mention nature, availability of services in a language they understand, and transport to and
from their destination. Spanish respondents are more likely to refer to sightseeing and cultural
activities, while they mention less often the treatment received as tourists. Slovenian respondents
report below the average in the majority of the items. Dutch respondents are less likely to mention
the transport (to and from their destination, and an accessible one), the accessibility of booking
services, and health treatments as aspects they perceived as barriers or restrictions. Respondents
from Sweden mention less often how tourists are treated, the general value for money at the
destination, the accommodation available at the destination and the accommodation being adapted
for a specific group of people. Irish travelling with children are less likely to mention the excursion
activities at the destination, while Lithuanians mention less often health treatments, and accessible
sports or leisure equipment and services. Respondents from the UK refer less often to the
availability of services in a language they understand as an aspect in which they experienced a
barrier or restriction.
People who travel with children and are satisfied with the accessibility of locations during their most
recent trip were asked how likely they would be to go back to the same destination in future. Italian
people are less likely to say they would go back.
Economic impact and travel patterns of Accessible Tourism in Europe FINAL REPORT 220
Turning to the likelihood to travel more often if better accessible services were offered, Swedish
people are less likely than average to say they would travel more often in these circumstances.
Polish people who travel with children are more likely than average to pay more than the standard
price for accessible services at least sometimes, while Irish, Lithuanian and Swedish people are less
likely to do so. Belgian, Irish and Lithuanian people who travel with children are less likely to mention
having to switch at least sometimes to a more expensive service for it to be accessible.
Looking into the items people who travel with children would use when travelling, Polish people are
more likely to mention a wide range of items, and particularly medical ones, while UK people
mention many items and particularly mobility-related ones. Belgian and French people who travel
with children are less likely to select any of the items, while Dutch people mention less often than
average a range of items. French and Swedish people mention medical help less often. Lithuanian,
Slovenian and Spanish people who travel with children are more likely than average to mention
areas or equipment for children, while people in Spain also mention more often wheelchairs and
hearing aids.
In terms of satisfaction with building aspects, Lithuanian people who travel with children tend to find
most items less important than average. Polish people find accessible parking spaces and toilets,
easy to use furniture and access to services other than accommodation more important. Slovenian
people find accessible parking spaces and toilets more important, and alarm systems and the ease
of use of lifts less important. Swedish people who travel with children find accessible parking
spaces, mobility within the building, ease of use of lifts and types of access less important than
average, while Belgians feel the same way about types of access and alarm systems. Finally, Italian
people who travel with children find types of access more important and the ease of use of furniture
less important. Turning to satisfaction with the same items, fewer differences appear. UK people
who travel with children are more satisfied than average with accessible parking spaces and toilets,
and alarm systems. Belgians are less satisfied than average with alarm systems, while Spaniards
are less satisfied with accessible parking spaces, and toilets, and alarm systems. Finally, French
people who travel with children are less satisfied than average with accessible toilets and the ease
of use of furniture.
4.2.4.2 People aged 65 and above In terms of most likely period for a holiday, three countries stand out for seniors: people aged 65 and
over in Sweden, Belgium and the UK are less likely than average to travel over the summer
holidays. In contrast, Swedish seniors are more likely to travel during the spring holidays, UK seniors
over the winter holidays and Belgian seniors off-season.
Belgian seniors are less likely than average to have stayed with family or friends in the past 12
months but more likely to have stayed in a rental house or flat, or in a spa or wellness resort.
Economic impact and travel patterns of Accessible Tourism in Europe FINAL REPORT 221
Seniors in the UK are more likely than average to mention a hotel or bed and breakfast. Swedish
seniors are more likely than average to have used a boat, ship or ferry to go to their destination or
come back from it.
Turning to activities, Swedish seniors are less likely than average to mention the following activities:
sightseeing/walking around, natural visits, hiking/running, guided tours and shopping. Belgian
seniors are less likely to mention natural visits and local events, and UK seniors hiking or running.
Swedish seniors are less likely than average to use a travel agency as their most important
information source when preparing a trip, but more likely to use social media or their own
experience. UK seniors are also more likely to rely on their own experience. In parallel, Swedish
seniors are less likely to book their trips in person through a travel agency. UK seniors are more
likely to say that booking through an institution or group does not apply to them and less likely than
average to mention booking in person through someone they know.
Looking into the importance of various items, shopping opportunities are more important than
average for Belgian and UK seniors. In contrast, Belgian seniors find the availability of services in a
language you understand less important and UK seniors find the following items less important than
average: health treatments, accessible tourist accommodation, and destination adapted to a specific
group of people. No significant differences appear in terms of satisfaction with these items.
Turning to barriers, Belgian seniors are less likely than average to mention experiencing barriers
with the following items: nature, how tourists are treated, general value for money, local culture and
people, transport once at destination, and accessible locations. UK seniors are less likely to mention
barriers with the general value for money of the destination, information available before the trip, and
the availability of information about accessible services.
In terms of the importance of building-related items, Belgian seniors find accessible parking spaces,
mobility within the building and the ease of use of lifts more important than average. UK seniors are
more satisfied than average with accessible toilet and bathroom facilities.
When asked how likely they would be to travel more often if they were offered better accessible
services, Dutch and Swedish seniors were less likely than average to say they would travel more
often.1 In contrast, Irish and Lithuanian seniors are less likely than average to say they would not
travel more often.2
1 Based on the proportion of answers 4 or 5 on a 5-point scale. 2 Based on the proportion of answers 1 or 2 on a 5-point scale.
Economic impact and travel patterns of Accessible Tourism in Europe FINAL REPORT 222
Seniors in Lithuania and the UK are less likely than average to report having to pay more than the
standard price at least sometimes because they need accessible products or services. Seniors in
Belgium, Lithuania and the UK are less likely than average to report having to switch to a more
expensive product or service because you need them to be accessible.
When asked which items could help on their trips, Slovenian seniors are more likely than average to
mention help to get on board, leave or change transport type induction loops, areas or equipment for
children and menus for special dietary needs. Both Slovenian and Lithuanian seniors mention
medical help more often, while Lithuanian seniors are also more likely to mention activities for
specific groups of people. Irish, Lithuanian, Dutch and UK seniors are more likely than average to
mention a wheelchair or scooter. UK seniors are also more likely to mention walkers, crutches or
sticks, or induction loops. Belgian and Swedish seniors are more likely than average to select the
Belgian seniors who were satisfied with the accessibility of locations during their most recent trip
give a below average score to their likelihood of going back to the same destination in future.
4.2.4.3 People with a limitation Polish people with any limitation are more likely to mention a lack of help, a lack of affordable
accessibility services or infrastructures, family reasons or a long term illness or health issue as a
reason not to have travelled in the past 12 months. Their Swedish counterparts are less likely to
mention a long term illness or health issue. Dutch people with any limitation are more likely than
average to mention a lack of help but mention less often that they preferred to stay at home.
Turning to seasonality, people with any limitation in Italy and Spain are more likely to travel during
the summer holidays, while UK people are less likely to do so. Autumn holidays are more often
mentioned in Ireland, Poland and Sweden, and less often in France. People with any limitation in
Belgium and Poland are more likely to travel off-season, while Italians are less likely to do so.
Lithuanian and Slovenian people with any limitation mention less often spring holidays, while Poles
are more likely to travel over the winter holidays.
In terms of travelling companions, Polish people with any limitation are more likely than average to
mention a range of situations: children below or above 5, colleagues, personal care worker, other
group, but also travelling on their own. Irish people mention less often travelling with children below
or above 5 and other family or household members. People with any limitation in Lithuania travel
more often with colleagues or another group and less often with their partner. Dutch people are
more likely to mention and other group or a personal care worker. People with any limitation in Spain
are more likely to travel with their partner, while Swedes travel more often on their own and less
Economic impact and travel patterns of Accessible Tourism in Europe FINAL REPORT 223
often with children below 5. Finally, people with any limitation in the UK are less likely to travel with
colleagues.
In terms of destinations, Lithuanian, Polish and Slovenian people with any limitation are less likely to
say they have travelled to a non-European destination in the past 12 months, while Dutch people
less often mention travelling in their home country, the most frequent answer overall. People with
any limitation in the UK who travelled outside the EU in the past 12 months are more likely to
mention the accessibility of the destination as a reason for their choice.
Slovenian people with any limitation are more likely to mention staying in a rental house or flat, in a
tent, caravan or mobile home, or in a spa or wellness resort, but mention less often staying with
family or friends, or at a hotel or B&B. Lithuanian people mention more often than average staying
with family or friends, in a tent, caravan or mobile home, or in a spa or wellness resort. People with
any limitation in France stay more often in a rental house or flat, and in a spa or wellness resort, but
less often in a hotel or B&B. Swedish people stay less often in a rental house or flat, in their own
holiday house or in a spa or wellness resort. Polish people with any limitation mention more often
staying with friends and family, or in a rental house or flat, while Dutch people are less likely to
choose these two answers. Italian and Spanish people with limitation stay less often in a tent,
caravan or mobile home, while Spanish people with any limitation mention more often hotels or
B&Bs. UK people also mention this last answer more often, and are less likely to stay in a spa or
wellness resort. Belgian people with any limitation mention less often staying with family or friends.
In terms of transport, people with any limitation in France are less likely than average to use the
airplane, a boat, ship or ferry, or a taxi to travel to and from their destination, or once at destination.
Polish people also mention airplanes less often but mention a range of other transport means more
often than average: cars, coaches, trains, local public transport, boats, motorbikes, bicycles and
wheelchairs.
Slovenian people mention airplanes and trains less often, and cars and bicycles more often.
Lithuanian people mention trains less often, but travel more often by coach, local public transport,
bike or wheelchair. Irish people with any limitation mention more often airplanes, local public
transport, boats, or taxis. Besides, Italian people mention more often airplanes and boats and
Spanish people airplanes and trains. Swedes with any limitation mention more often boats and are
less likely to travel by car or with a wheelchair. People in the UK are less likely to travel by coach or
bicycles and Belgian people by taxi, while Dutch people with any limitation travel more often by
bicycle.
Turning to activities at destination, there is a number of country differences among the activities
mentioned most often overall. Dutch people mention less often spending time with family and friends
and sightseeing, and more often swimming or sunbathing. Italian people with any limitation also
Economic impact and travel patterns of Accessible Tourism in Europe FINAL REPORT 224
mention less often spending time with family or friends and sightseeing. Belgians are less likely to
spend time with their family or friends, or go shopping. French people are more likely to go
sightseeing but less likely to take part in local events. Irish people with any limitation mention less
often hiking, while people in the UK mention more often spending time with family or friends.
Lithuanian people are less likely to go hiking, shopping or dine out while travelling. Slovenian people
with any limitation are more likely to go swimming or sunbathing or on natural visits and less likely to
go shopping or dine out. Spanish people mention more often hiking and dining out, while Swedes
with any limitation are less likely than average to mention sightseeing, natural visits or hiking. Polish
people with any limitation mention less often cultural visits and more often than average a range of
activities: spending time with family and friends, sightseeing, hiking, and shopping. Besides, they are
more likely to mention one of the less frequent answers, health care or other medical activities.
Looking into information sources before travelling, Polish people with any limitation mention more
often using the media and specialised sources, while Swedish people mention these less often than
average. Slovenian and Lithuanian people mention more often their own experience or other people
as a source, with Lithuanian people relying less on the tourism sector. UK people also rely on their
own experience more than average. In contrast, Dutch people with any limitation mention people
and media less often than average. People with any limitation use media less often in Belgium and
the tourism sector less often in Ireland.
Looking at booking channels, Italian people with any limitation are more likely to book through a
travel agency. Polish people mention more often booking through an institution or group, an answer
less often mentioned in Sweden. Both Lithuanians and Poles with any limitation are more likely than
average to book through someone they know. Direct booking with the provider before a holiday or
once at destination are both more frequent in Ireland and less frequent in Belgium.
Telephone booking is more frequent in Poland and less frequent in Belgium, Ireland, the
Netherlands and Sweden. In Italy and Spain, booking in person is more likely than average, with the
opposite trend in Sweden. Internet booking is more frequent in Ireland, the Netherlands and the UK
and less frequent in Poland and Slovenia.
People with any limitation in Italy and Poland are more likely than average to check accessibility
conditions before travelling, while this is less likely in Belgium, France, Ireland, Lithuania and
Sweden.
Among people who check accessibility conditions before travelling, people in the UK are more likely
than average to say there is enough information, while people in Italy, Spain and Sweden are less
likely to say so. Irish people with any limitation who check accessibility information are less likely to
say this information is accessible, and there are no country differences in terms of the perceived
reliability of the information.
Economic impact and travel patterns of Accessible Tourism in Europe FINAL REPORT 225
In terms of importance of aspects when travelling, Lithuanian and Swedish people with any limitation
tend to give lower scores to a wide range of aspects, while people in Italy give higher importance
scores to a wide range of items. However, Lithuanians find nature, safety, transport and information
available at destination more important than average. People with any limitation in Ireland find
excursions, accessible sports equipment, the availability of services in a language you understand,
and the availability of a specific service of infrastructure less important than average, and
accommodation and transport to and from their destination more important. French people with any
limitation find accessible restaurants, medical help, food and drink, accommodation and safety less
important than average, but excursions more important, while Belgians find the accessibility of
booking services less important and nature more important. Polish people with any limitation find
medical help and safety more important and excursions, and the availability of specific services,
infrastructures or products less important. Dutch people give shopping more importance and
excursions less importance, while Spanish people with any limitation find health treatments less
important. In contrast, people in Slovenia give a higher importance score to health treatments and
lower scores to excursions, sightseeing and shopping. Finally, UK people find accommodation and
food and drink more important than average.
In terms of satisfaction with these same items, people with any limitation are more satisfied than
average with a wide range of items in the UK, and tend to be less satisfied in Sweden, Slovenia and
Spain. Lithuanian people are more satisfied with nature, excursions and local culture, and less with
destinations being adapted to specific groups of people and the availability of information about
accessible services. French people with any limitation are less satisfied with food and drink, and
transport to and from their destination. Irish people are more satisfied than average with this last
aspect. Belgians with any limitation are less satisfied with accommodation, local culture, transport
once at destination, destinations being adapted to specific groups of people and medical help.
Italians are less satisfied about the way tourists are treated, accessible shops and accessible sports
equipment. People with any limitation in Poland are less satisfied than average with excursions,
health treatments, accessible restaurants, destinations being adapted to specific groups of people
and the availability of specific services.
Turning to barriers, Polish people with any limitation are more likely than average to mention any
barriers, and particularly related to nature, shopping opportunities, the way tourists are treated, food
and drink, safety, information available at destination, accessible shops, destinations being adapted
to specific groups of people, and the availability of services in a language they understand.
Lithuanians are more likely to mention the value for money of the destination. Italians mention more
often barriers linked to local culture, accessible locations or the availability of services in a language
they understand. Belgians with any limitation mention less often barriers related to health
treatments, value for money or accessible accommodation and are less likely to mention

Economic impact and travel patterns of Accessible Tourism in Europe FINAL REPORT 226
experiencing any barriers in the past 12 months in general. This is also the case for people with any
limitation in the UK, who are less likely to mention a barrier, and less likely to answer the availability
of services in a language you understand. Slovenians experience fewer barriers linked to local
culture, safety and the accessibility of booking services. Spanish people with any limitation mention
less often nature and the way tourists are treated. Swedes are less likely to mention the way tourists
are treated, food and drink, accommodation, information at destination, information about accessible
services, accessible locations, and the availability of a specific service. French people with any
limitation are more likely to experience barriers with transport to and from their destination and less
likely than average to say they did not experience any barriers in the past 12 months. Dutch people
experience fewer barriers with the accessibility of booking services and transport types.
When asked how important building infrastructures are to them, Polish people with any limitation find
accessible parking spaces, building access, accessible toilets, the ease of use of furniture, alarm
systems and access to services other than accommodation more important than average. Italians
find access of the building more important than average. Slovenian people with any limitation give a
higher importance score to accessible parking spaces, and lower scores to alarm systems and the
ease of use of lifts. Swedish people find accessible toilets more important and accessible parking
spaces, alarm systems, building access, and the ease of use of lifts less important. Lithuanian
people with any limitation find accessible parking spaces and toilets less important, while this is the
case of the ease of use of furniture and alarm systems in Belgium.
Looking into satisfaction with these same aspects during one's most recent trip, people with any
limitation in the UK are more satisfied than average with all items, while Spanish and Lithuanian
people are less satisfied than average with most items. French people with any limitation are less
satisfied with accessible toilets and the ease of use of the furniture, Dutch people with the ease of
use of lifts, and Slovenians with access to services other than accommodation. People with any
limitation in Poland are less satisfied than average with mobility within the room (e.g. in a hotel) and
within buildings, while Swedes give a lower score to mobility within the room and alarm systems.
When asked how likely they would be to travel more often if they were offered better accessible
services, people with any limitation in Italy and Poland give a higher than average score, while
people in Belgium, Lithuania and Sweden are less likely to mention travelling more often.
People with any limitation in Italy and Slovenia are more likely than average to say they have to pay
more than the standard price at least sometimes because they need accessible products or
services. Belgian, Irish, Lithuanian and Swedish people are less likely to say so. In terms of
switching to a more expensive product because they need it to be accessible, a similar pattern can
be seen, with Italians mentioning this more often and Belgians, Lithuanians and Swedes mentioning
it less often.
Economic impact and travel patterns of Accessible Tourism in Europe FINAL REPORT 227
People who are satisfied with the accessibility of their most recent trip were asked how likely they
would be to return to the same destination. Belgians, Slovenians and Swedes are less likely than
average to say they would return to the same destination.
In terms of items that people would use at destination, Swedes and Belgians with any limitation are
less likely to mention any useful items overall. Dutch people mention less often a range of items, but
more often induction loops. French people with any limitation mention less often wheelchairs,
walkers or medical help. Italians are more likely to select personal care workers or specifically
trained staff, and Lithuanians medical help. People with any limitation in the UK are more likely to
mention personal care workers, wheelchairs or walkers. Poles are more likely to mention any
answer, and specifically medical treatments or help, specifically trained staff, and menus for special
dietary needs. People with any limitation in Slovenia are more likely to mention areas or equipment
for children and less likely to mention walkers or personal care workers. Spanish people are more
likely to mention hearing aids.
4.2.5 EU - Socio-demographic profile
4.2.5.1 Gender and age Of the total sample of 1612 persons with any limitations, 51% were male and 49% female. There is,
however, some variation in the gender split when we look at the individual groups. In the over-65 group, there is a greater preponderance of males (59%) and in the people who travel with children group, males make up 55% of the group.
The mean age of people with any limitations group is 44.5 years. In the group of people who travel with children, the mean age is 41.4 years and the average age of those in the over-65 group is 68.6 years.
4.2.5.2 Special access needs When we look at travel accompanied by children younger than 5, respondents could include their
own children, grandchildren or other children for whom they took regular responsibility. In the case of
persons with any limitations, 47% of the group said they had travelled with such children, as did
26% of those aged over 65.
The people with any limitations group comprised the following1:
74% had mobility limitations,
68% sensory limitations,
1

Economic impact and travel patterns of Accessible Tourism in Europe FINAL REPORT 228
67% hidden limitations,
60% behaviour limitations,
54% special needs, and
47% communication limitations.
The over-65s group comprised:
51% mobility limitations,
42% sensory limitations,
39% hidden limitations,
35% special needs,
26% behaviour limitations, and
24% communication limitations.
The group of people travelling with children comprises:
56% mobility limitations,
54% sensory limitations,
51% hidden limitations,
47% behaviour limitations,
40% special needs, and
38% communication limitations.
Overall, figures on self-perceived limitations contrast markedly with the figures obtained by asking
people which specific difficulties they experience in their everyday lives they are overall much
lower.
In the people with any limitations group, 60% considered themselves as a person with one or
several of the listed limitations and the remaining 40% considered that they had none of these
limitations.1
5% considered themselves as having behavioural limitations, 12% hearing limitations, 20% mobility
limitations, 22% visual limitations and 26% hidden limitations.
1 This difference corresponds to the difference between self-perceptions (people who consider themselves as having a limitation at question SD9) limitations listed at question S2).

Economic impact and travel patterns of Accessible Tourism in Europe FINAL REPORT 229
In the over-65s group, on the other hand, a lower proportion of members (58%) considered
themselves as a person with one or several of the listed limitations. Of the remaining 42% of the
group who said they had any of these limitations, 16% said they had hidden limitations, 17% mobility
limitations, and 13% hearing and/or visual limitations.
In the group of people who travel with children, 54% of the group considered they had none of the
listed limitations.
Of the remaining 46% who said they had one or several limitations, 20% said they had a visual
limitation, 15% a mobility limitation, 15% a hidden limitation, 10% a hearing limitation, and 4% a
behavioural limitation.
4.2.5.3 Occupation and income1 At 36%, the largest segment of the people with any limitations group comprised employees, 7%
managers and an additional 7% self-employed. A further 20% were retired. 8% were respectively
unable to work because of long term illness/disability, studying or unemployed. A final segment of
6% were house persons/responsible for everyday shopping and looking after the home.
Because of their age profile, 83% of the over 65s group was retired. 6% of this group were self-
employed, 3% managers, and 2% employees. An additional 5% were house persons and 1%
unemployed.
47% of the group of people who travel with children were employees, 14% retired, 9% managers,
7% self-employed or house persons, 6% unemployed or students and 3% unable to work due to
long-term illness or disability.
51% of the group of people with any limitations earned wages or salaries and 26% received
pensions. 10% were disability benefit recipients, 9% received income from self-employment,
disability benefits, support from family or friends, or had other sources of income (e.g. from property,
stocks, etc.) respectively, and 8% received unemployment benefits.
87% of the group of over-65s received pensions, 14% other income, 9% wages or salaries, 7%
income from self-employment, 4% disability benefit or other social benefits, and 2% support from
family and friends.
In the group of people travelling with children, 62% had a wage or salary, 18% a pension,10% an
income from self-employment, 9% other income, 8% support from family and friends or
unemployment benefit, while 7% had disability benefit or another social benefit.
1 In some cases, respondents had more than one source of income, which means that overall totals may exceed 100%.

Economic impact and travel patterns of Accessible Tourism in Europe FINAL REPORT 230
Respondents were also asked to provide an indication of their net monthly income (including any
benefits or pensions).
9% of the group of people with any limitations
-1500 and a
-
55% of the group had an inc
- -4000 range. Lastly, 9%
Looking at the over-65s group, we note that there are proportionally fewer members of the group
the people with any limitations group (22%).
At the upper end of the income scale, 20% had an income in excess
equivalent figure for the people with any limitations group is 17%. Over 11% of the group preferred
not to answer the question.
Moving on to the group of people who travel with children, it is observed that 19% of the group
had an inc
-65s
group. There is also a lower proportion (8%) of members preferring not to answer the question than
in the other two groups.
Economic impact and travel patterns of Accessible Tourism in Europe FINAL REPORT 231
4.2.5.4 Education In the group of people with any limitations, it can be seen that 39% had completed at least the first
stage of tertiary education, 7% had completed post-secondary non-tertiary education, and 34% had
completed upper secondary education.
In the over-65s group, there were somewhat higher proportions who had only completed pre-
primary education (2%) and primary education (3%) than in the other two groups (1% and 2%
respectively among the people with any limitations group and 1% in each case for members of the
group travelling with children, respectively).
In this group also, there are lower proportions of both those who had completed upper secondary
education (33%) and the first stage of tertiary education (35%), although there was a higher
proportion of those who had completed post-secondary non-tertiary education (9%).
In the group of people who travel with children, a significantly higher proportion (42%) had
completed the first stage of tertiary education than in the other two groups. There were also
correspondingly lower proportions of people whose highest level of education was pre-primary,
primary, lower secondary or upper secondary and post-secondary non-tertiary education.
4.2.5.5 Living situation 70% of the group of people with any limitations lived with their family or spouse and a further 21%
lived alone. An additional 2% lived in a flatshare or community, 1% with a personal care assistant
and 1% lived alone with help (e.g. regular visits from a nurse). Under 1% lived in an
institution/nursing home.
Higher proportions of the over-65s group (24%) lived on their own and with their family or spouse
(71%). There were smaller proportions in this group living alone with help, living with a personal care
assistant, living in an institution, or living in a community/flatshare. None of the group lived in an
institution or nursing home.
As for the group of people who travel with children, there are significantly lower proportions that
live alone (12%) and a correspondingly higher proportion (81%) who lives with their family or
spouse. Just under 1% lived in an institution or a nursing home or lived alone with help or lived with
a personal care assistant.
4.2.6 Focus groups Overall results Two focus groups with people above 65 were conducted in Lithuania and Ireland in order to better
capture the behaviour and specific needs of this group. The methodological details can be found in
Annex G.
Economic impact and travel patterns of Accessible Tourism in Europe FINAL REPORT 232
4.2.6.1 Overall findings Ireland and Lithuania have different profiles in terms of
behaviour, which brings useful information on variations within the EU. Overall, elderly people in
Ireland were more likely to travel and organise their trips independently, particularly using the
Internet, while elderly people in Lithuania were more likely to rely on a travel agent or association.
In both cases, accessibility when travelling was not perceived as a major issue as participants have
developed strategies to avoid experiencing barriers. In Ireland, this was likely to involve researching
a destination before the trip, while Lithuanian participants were more likely to carefully select a trip
organiser who would take into account their specific needs. Advance planning taking into account
therefore a major behavioural pattern identified in the two focus groups. In
parallel, participants also reported selecting trip types adapted to their needs, for instance shorter
trips to nearby destinations instead of longer, more distant trips where their health condition or
specific needs may be issues.
The general hypotheses for the online survey were adapted to elderly people for the focus groups:
Senior people have specific behavioural patterns when preparing a trip and travelling
Senior people experience obstacles and barriers of different kinds when travelling
Senior people are not a uniform group and their type of needs and socio-demographic
characteristics have an influence on their attitudes and behaviour
Hypothesis H6 can also be addressed here:
H6: The motivation of travelling and activities by the seniors are pretty diverse.
The focus groups support the idea that seniors have specific behavioural patterns when preparing
and booking a trip in both focus group, advance planning and the prevention of risks and issues
was a common topic. Besides, in spite of common trends, elderly people had different motivations
and preferred activities when travelling, while obstacles and barriers were more linked to specific
access needs than old age as such. Overall, these results show that seniors are not a uniform group
and that their needs need to be taken into account in a flexible manner.
4.2.6.2 Detailed findings for Ireland Irish participants had various profiles in terms of travel and health issues. Interestingly, there is a
perception that elderly people in Ireland are more active and socially engaged than a few decades
ago participants to the group tend to regularly go out, travel or use the Internet. Overall, they are
likely to go on holidays (1 or 2 weeks on average), on short breaks or to visit family or friends (for a
few days) as well as on trips to the city or to funerals (day trips).

Economic impact and travel patterns of Accessible Tourism in Europe FINAL REPORT 233
As most of the Irish group was retired, they did not travel at a specific time of the year. Most
overseas travel took place in Europe or the US, while domestic destinations varied as many of these
were visits to family or friends. Irish participants most often travel with their spouses and/or grown
children and stay in hotels, B&Bs, self-catering apartments or with family and friends.
Common means of transportation were the plane and public transport for overseas destinations and
the car and public transport for domestic trips. In particular, the fact that public transport on bus,
trains and trams is free for 65+ people in Ireland was seen as a crucial factor for travelling and
explains why these means of transportation are particularly popular for this category. Activities at
destination depended more on personal preferences than age or health issues, with spending time
with family and friends, sightseeing or going to the beach mentioned as popular activities.
Aging had both a positive and negative influence on their travel patterns: some participants travel
less than before due to health issues, while others travel more as they have more time now they are
pensioners.
Health issues influence travel choices: for instance, people with mobility of sight issues cannot drive
a car anymore and rely on public transport or someone else driving for them. However, this was
seen more as a necessary adjustment to their lifestyle than as a problem. Similarly, accessibility was
not seen as a restriction to travelling but meant that most participants had to be aware of their
limitations when making travel plans. For instance, participants tend to choose overseas
destinations where they are unlikely to have accessibility issues or domestic meeting places they
can easily reach, and check beforehand if their needs will be met.
In terms of information and booking, family or friends and the Internet (hotel websites or tourism
websites) are the most common information sources. A majority of participants were Internet users,
others would ask friends or family to take care of the online information search or booking for them.
The use of travel agencies remained limited. Information was seen as easy to find as hotel websites
include information on the hotel itself and the surrounding area, which can be completed by
additional internet searches.
Lack of accessibility was highlighted as a problem for people with mobility issues but problems were
rarely reported as they check conditions in advance for instance by checking beforehand the
presence of lifts or ramps and pre-booking airport assistance. Usually, participants did not expect to
have accessibility issues as lifts and ramps are seen as basic facilities. Footpaths and pedestrian
areas were seen more as an issue, with mentions of potholes or loose pavement stones.
More generally, participants planned their trips according to their preferences, needs and interests
and therefore did not report any specific barriers to travelling. The main specific service they use is
Economic impact and travel patterns of Accessible Tourism in Europe FINAL REPORT 234
free travel on public transport for 65+. No one mentioned looking for specific information about
services for elderly people or experiencing accessibility issues when looking for information.
When deciding on a trip, price is the main consideration, but it is weighted against other aspects
(activities, destination, and accessibility). The destination itself and things to do at destination are the
most important aspects of the trip and also the ones participants measured their experience against.
The main travel-related issues mentioned were the availability of public toilets on public transport
(train, bus), the availability of late night or 24 hour chemists in case of health issues and the quality
of tourism staff. Chemists were seen as important for their peace of mind. In terms of staff, the
availability of staff fluent in English and able to provide information on sightseeing and landmarks
was seen as an important factor of satisfaction.
expect to have to pay as this should be standard. However, they choose services based on their
suitability for their needs: basic services are expected, but participants are ready to pay more for
comfort if they can afford it, for instance booking a 4-star hotel closer to public transport instead of a
3-star hotel that requires walking more.
Participants had the feeling they could already travel as much as they can afford without barriers
other than their disposable income. Therefore, improvements to accessibility and related information
were not seen as likely to influence their future travel behaviour. However, free public transport for
65+ was seen as a major factor in terms of their travel behaviour, with some commenting that
removing this service would limit their opportunities to go out and travel.
4.2.6.3 Detailed findings for Lithuania Lithuanian participants typically travelled less often than their Irish counterparts. Travel frequency
aks in
Lithuania and neighbouring countries being the most frequent trip type. More distant or longer trips
typically occurred once or twice a year. Lithuanian participants tended to travel in later spring or late
summer/early autumn, because of the milder weather, longer days and differences in available
budget. Popular destinations are neighbouring countries (Latvia, Estonia, Poland) and other
European countries (e.g. Scandinavia, the UK, etc.). As in Ireland, some participants travel more
often than before as they have more time while others travel less due to poor health.
Participants did not mention experiencing many issues when travelling, partly because they plan
their trips well to avoid putting themselves in situations where issues may occur. They also select
trip types that are adapted to their condition, with participants in good health being more likely to go
on longer trips, while participants with poor health choose shorter trips to nearby destinations
(Lithuania or neighbouring countries). Participants do not want to cause issues to trip organisers or
Economic impact and travel patterns of Accessible Tourism in Europe FINAL REPORT 235
fears, anxiety and limitations also have a negative influence on the number of trips.
The main limitations mentioned by participants are a slow pace which may prevent them from joining
a group, understanding information more slowly, which may be an issue when listening to a guide or
visiting many places in one trip. Besides, some participants say their health issues limit their
freedom of movement as they often need outside help or regular medical checks. For instance,
participants with issues such as diabetes are afraid of distant and long travels and prefer to travel
with people who know how to react in case of issues, for instance with other members of a diabetic
Overall, the majority of participants adapt to new situations and issues as they arise during trips and
do not tend to focus on their difficulties. In addition, it was sometimes difficult for participants to
verbalise their needs in the words of one participant, "We are not used to express our needs and
ask for them". Therefore, special needs have a limited influence on travel choices at the moment.
Participants preferred to travel with like-minded people, such as friends or club members. The most
common accommodation was hotels, with the main factors of choice being cleanliness, separate
toilets and bathroom, peace and quiet, and food. Staying with family or friends was also popular, as
was camping in more expensive destinations.
The most usual transportation mean was the bus it was seen as the safest and most familiar by
participants. Travelling by plane was seen as more stressful, more likely to be an issue in terms of
their health condition and requiring additional skills to book the trip. Once at destination, participants
were most likely to go round with a sightseeing bus or by car with family or friends.
Family and friends are the main information sources. For instance, travel agencies were usually
recommended by someone or tried and tested during earlier trips. Participants who travel with
organised groups get information from the trip organisers; they trust them and leave the logistics of
the trip to them. A few participants checked information online, mostly related to sightseeing places.
As participants rely on a trip organiser, they do not report any difficulties finding the information they
need: "Everything is perfectly organized for us."
Participants also expect the trip organiser to take into account their specific needs. Participants are
not usually offered senior-specific services and are not sure of what this could entail. Besides, they
do not know what type of accessibility information they could look for. The information they get from
trip organisers is seen as reliable and understandable. Participants tend to go on trips organised by
a community or club, or if they go through a travel agency, to book through the travel agent. These
booking channels are seen as accessible. In contrast, external help is usually required to book via
other channels, for instance for plane ticket bookings.
Economic impact and travel patterns of Accessible Tourism in Europe FINAL REPORT 236
The first consideration when organising a trip is the budget, followed by health. The destination is
the next most important factor in the trip decision. Transport and accommodation are mentioned
next. Besides, recommendations and previous experience with the trip organiser and the choice of
travel companions (like-minded people with similar goals) are important.
In terms of satisfaction, participants mention the importance of having a good tour guide: someone
pace or the availability of medical help. The choice of suitable transport and accommodation is seen
as a factor depending on the choice of a good tour guide. Once they have found a trip organiser who
meets their needs, participants tend to travel with them again.
One of the main obstacles faced by seniors when travelling is travel agencies' lack of interest in
older customers as they often do not offer trips tailored to this target audience. Another barrier is
travel insurance: participants tend not to trust it because they experienced issues or heard stories
where the travel insurance did not cover medical expenses or was invalid.
Age is seen as a barrier when preparing a trip as it sometimes means a lack of knowledge,
particularly of modern technology and a poorer understanding of information. Therefore, individual
trips are seen as complicated and participants favour organised trips, which seem more reliable and
less stressful.
Some participants have already benefited from discounts for seniors in museums or on public
transport, but otherwise find it difficult to imagine what other services they could use. In terms or
building infrastructures, participants mentioned lifts, en-suite toilets and bathroom, a quiet
environment, the right temperature (e.g. air conditioning in hot weather), and low curbs and stairs.
Participants mentioned having to pay more to get an individual room, to get an extra seat or for
specific meal requirements (for instance vegetarian food). Participants typically had limited financial
resources and adapted to the circumstances rather than select a more expensive service.
One of the factors that would encourage participants to travel is travel agencies more widely
welcoming seniors and considering them attractive clients. Besides, offering travel at reasonable
prices would be imp
and improve health care when travelling were offered, participants would be likely to consider them
provided the price was acceptable. Offering these services was seen as a positive move which
would improve the choice of travel options.
Economic impact and travel patterns of Accessible Tourism in Europe FINAL REPORT 237
4.2.7 EU - Hypotheses The following hypotheses were identified before the data collection phase.
H17: People with access needs have specific behavioural patterns when preparing a trip and
travelling
H18: People with access needs experience obstacles and barriers of different kinds when
travelling
H19: People with access needs are not a uniform group and their type of needs and socio-
demographic characteristics have an influence on their attitudes and behaviour
H20: Other factors, such as changes to the offer, have an influence on people with access
Based on the results of the survey, it is possible to draw the following conclusions.
H17. Overall, people with access needs share many behavioural patterns with other travellers, with
minorities selecting answers specific to this group. For instance, between 7% and 12% of each sub-
group (people aged 65 and above, people with limitations and people who travel with children)
mention travelling with a personal care worker in the past 12 months, compared with 57% to 63%
travelling with their partner. The same trend appears for people staying in a medical institution or
using wheelchairs as transportation a minority selects this answer, but the majority uses more
standard infrastructures.
More striking findings appear for the trip preparation process. Between 28% and 41% of each sub-
group uses specialised sources to get information when making travel plans, while 18% to 37% of
each sub-group books through an institution or group. Besides, although the most important trip
aspects are not related to access needs, the items related to access needs with the highest
importance scores, the accessibility of booking services, information on accessible services and
medical help or health care at destination, are considered important by large proportions of each
sub-group. This can also be linked to the finding that between 48% and 67% of each sub-group
checks accessibility conditions and/or available help before travelling. Overall, large majorities find
information about accessibility at destination sufficient, reliable and accessible, although these seem
to be an issue for a minority in each sub-group. Findings from the focus groups similarly support the
hypothesis that people with access needs have specific behavioural patterns when preparing a trip,
as they show evidence of advance planning and adaptation behaviours aiming at preventing issues
and fulfilling their specific needs, for instance by selecting shorter trips to nearby destinations.
H18. More differentiated results can be seen when looking at barriers. Only a minority mentions
travelling outside the European Union due to the accessibility of their destination. Interestingly, the
most frequent accessibility-related answer is not about a lack of information or accessible services,

Economic impact and travel patterns of Accessible Tourism in Europe FINAL REPORT 238
but about the lack of affordable accessibility services and infrastructures. Moreover, 32% of seniors,
49% of people with limitations and 61% of people who travel with children had to pay more than the
standard price for accessible services at least sometimes with similar proportions mentioning they
had to switch to a more expensive product or service because they needed them to be accessible.
These results point towards issues with the price of accessibility.
Turning to satisfaction, the accessibility-related items with the highest scores are the accessibility of
restaurant and booking services. Several other accessibility-related items get lower scores, but for
some of them, this is linked to high proportions of respondents saying these do not apply to them:
health treatments, medical help, the availability of specific services or products, accessible sports
equipment, and the destination being adapted to specific groups of people. The last three items are
least frequently mentioned when respondents are asked which aspects they have experienced
barriers with. In contrast, medical help and health treatments both get low satisfaction scores and
are mentioned fairly frequently as barriers. Other accessibility-related aspects often mentioned as
barriers are the availability of information about accessible services and accessible locations.
Turning to buildings, satisfaction is the lowest for alarm systems, types of access and access to
services other than accommodation, although many people feel these do not apply to them.
It is also important to note that 61% of people aged 65 and over, 36% of people who travel with
children and 42% of people with limitations say they did not experience barriers with any of the trip
aspects mentioned. This is consistent with the results of the focus groups, where few participants
reported issues when travelling. Some participants pointed out that they simply adapt to local
circumstances and issues as they arise.
H19. The survey confirms that people with access needs are not a uniform group: their types of
access needs and personal characteristics have an influence on their behaviour. The survey results
are different on most questions for the three sub-groups (people who travel with children, people
aged 65 and above and people with limitations), although some overall trends apply to all three.
Besides, looking at results for people with limitations by type of limitation (e.g. sensory, mobility) also
shows important differences between groups. Another difference impacting behaviour is the country
of origin, with differences appearing on most questions between countries.
H20. The survey asked a number of questions related to expectations and changes to the
accessible tourism offer with results pointing towards possible behaviour changes if accessibility
conditions were improved. Around one third of people aged 65 and above and almost half of the two
other groups would consider increasing their travel budget in the next 12 months if barriers were
removed. Besides, over 80% of people who are satisfied with the accessibility conditions of their last
trip are likely to return to the same destination in future. Results are less clear-cut regarding the
travel frequency if better accessible services were offered: 36% of people aged 65 and above, 51%
Economic impact and travel patterns of Accessible Tourism in Europe FINAL REPORT 239
of people with any limitations and 62% of people who travel with children would be likely to travel
more often in these circumstances.
Looking at the aspects that could be improved, 64% of people who travel with children, 58% of
people with limitations and 32% of people aged 65 and above selected at least one item they would
use when travelling out of a list of equipment and services. Seniors and people with limitations most
often mention medical help and menus for special dietary needs. These items are also mentioned
often by people who travel with children, together with equipment and activities for children. In terms
of building accessibility, the aspects seen as most important by all three groups are accessible
toilets, accessible parking spaces and the ease of use of lifts.
4.2.8 Inbound markets Overall results A total of 423 interviews were conducted in four inbound markets following the same methodology
as the main European Union survey: Brazil, China, Russia and the United States. The main results
of this survey are presented below.
4.2.8.1 Travel behaviour Travel behaviour among seniors and people with limitations in the inbound markets is overall in line
with the results of the EU surveys, particularly in terms of travel companions, accommodation and
transport.
Reasons for not travelling in the past 12 months are close to the EU survey results: 58% of people
with any limitations and 57% of people aged 65 and above mention financial reasons, followed by
personal preference with respectively 25% and 35% of answers.
People with any limitation most often mention travelling over the summer and off-season (both 54%),
which is also the case of people aged 65 and above with 56% mentioning off-season holidays and
51% mentioning the summer.
In terms of travel companions, partners are mentioned most often, by 63% of people with any
limitation and 54% of people aged 65 and above. Other family or household members come next
with respectively 47% and 45%. People with any limitation also mention often friends, with 44% of
mentions.
Economic impact and travel patterns of Accessible Tourism in Europe FINAL REPORT 240
Turning to destinations, 85% of people with any limitations and 88% of people aged 65 and above
mention travelling within their home country in the past 12 months, while respectively 96% and 95%
of the two surveyed groups mentioned travelling to the EU in the past 12 months.1
A majority of respondents mentions staying in a hotel or Bed & Breakfast 77% of people with any
limitation and 75% of people aged 65 or above. These figures are respectively 36% and 33% for the
second highest mention, staying with family or friends.
Looking at transportation means , the main mentions
among people with any limitations are airplanes and cars (both 73%) while people aged 65 and
above most often mention the car (74%) followed by airplanes with 65%.
In terms of activities, the main mentions across both groups are natural visits (68% for people with
any limitations and 69% of people aged 65 and above), sightseeing (both 64%), cultural visits
(respectively 61% and 64%), shopping (respectively 64% and 52%) and dining out (respectively
51% and 50%).
4.2.8.2 Decision-making and booking Travel agencies and tourism providers play a more important role in the booking process in inbound
markets than in the EU, while respondents in inbound markets are more likely to mention issues with
information about accessibility conditions.
People with any limitation most often mention family, friends or colleagues as an information source
when planning a trip (59%), followed by tourism websites (54%) and travel agencies (46%). People
aged 65 and above mention the same sources, with respectively 60%, 48% and 45% of answers.
Turning to booking channels, a majority books through an agency (75% of people with any limitation
and 65% of people aged 65 and above). Only 32% of seniors book through an institution or group,
while 54% of people with any limitations do so. There are limited differences between telephone, in
person and Internet booking, although people with any limitations are more likely to book in person
or through the Internet than the elderly.
63% of people with limitations and 51% of people aged 65 and above check accessibility conditions
before travelling. Among these, the majority think there is enough information and that this
information is reliable and accessible. Still, these aspects seem to be an issue for minorities in both
groups: 20% of people with limitations and 28% of people aged 65 or above do not think there is
1 Respondents were interviewed online and people who did not wish to travel at all were not invited to complete the survey these figures are therefore higher than could be expected for the overall population of people with limitation and/or aged 65 and above in the four target countries.
Economic impact and travel patterns of Accessible Tourism in Europe FINAL REPORT 241
enough information; 20% of the first group and 22% of the second think this information is not
reliable; and respectively 8% and 18 of the two groups do not think that this information is
accessible.
4.2.8.3 Experience Respondents in the inbound markets have a slightly different profile than EU respondents in terms of
barriers and the importance of and satisfaction with trip aspects.
Looking into the trip aspects that are considered important, safety comes first for all (with average
scores of 4.7 out of 5 for both groups), while natures comes second (with 4.4). People with any
limitations also give a 4.4 score on average to the general value for money of a destination.
Respondents were asked about their satisfaction with the same aspects during their most recent trip.
Safety and nature come first, with average scores of 4.5 among people aged 65 and above, and
average scores of 4.4 among people with limitations.
Shopping opportunities and health treatments (both 3.8) received the lowest scores among people
with limitations, while health treatments (3.6) and accessible sport equipment (3.7) score the lowest
among seniors.
Turning to building accessibility, people with any limitations find the ease of use of lifts (with an
average score of 4.3 out of 5) and mobility within the room (4.1) most important. People aged 65 and
above give the highest scores to the ease of use of lifts (4.2), mobility within the room and the ease
of use of the furniture (both 3.9). People with limitations also find access to services other than
accommodation more important than people aged 65 and above.
Satisfaction with these aspects is highest for the ease of use of lifts, ease of use of the furniture and
accessible toilets and bathroom (all 4.1 out of 5 on average) among people with limitations. People
aged 65 and above are most satisfied with the same aspects: the ease of use of lifts (4.3), the ease
of use of furniture and accessible toilets and bathrooms (both 4.2). People aged 65 and above are
more satisfied with the ease of use of the lifts than people with limitations.
In terms of barriers, the main mentions for people aged 65 and above are information available once
at destination (16%), food and drinks available at destination (14%), and the general value for
money of the destination (13%), although 52% say they have not experienced any barriers with any
of the aspects mentioned. Among people with limitations, the availability of information about
accessible services is the main issue with 22% of answers, followed by transport once at destination
(20%), food and drink available at destination (19%) and the availability of services in a language

Economic impact and travel patterns of Accessible Tourism in Europe FINAL REPORT 242
59% of people with any limitations and 44% of people aged 65 and above mention they have to pay
more than the standard price for accessible services or products at least sometimes. Besides,
respectively 49% and 36% of the two groups say they have to switch to a more expensive product or
service at least sometimes for them to be accessible.
4.2.8.4 Expectations & future People in inbound markets seem more likely than EU respondents to mention they would change
their behaviour if accessibility conditions changed.
79% of people with limitations and 69% of people aged 65 and above say they would increase their
travel budget if barriers disappeared. Besides, among people who are satisfied with the accessibility
of locations during their most recent trip, respectively 85% of people with limitations and 80% of
people aged 65 and above say they are likely to go back to the same destination in future.
When asked which items they would use if available at destination, people with any limitations most
often mention a sign-language interpreter (28%), help to get on board, leave or change transport
type (25%) and medical help (25%). Among people aged 65 and above, 45% did not pick any of the
items, while 22% mentioned help to get on board, 19% medical help and 18% a sign-language
interpreter.
If they were offered better accessible services, 69% of people with limitations and 55% of people
aged 65 or above would be likely to travel more often.
Economic impact and travel patterns of Accessible Tourism in Europe FINAL REPORT 243
5 Task 3 Evaluation of the tourist experience across different tourism sectors
5.1 Task 3a - Case-studies 3a: Supply: To examine good practice/success stories in the supply of accessible offerings which act
as enabling factors affecting the quality of the tourist experience of people with access needs
5.1.1 Methodology The aim of the analysis of case-studies is to confirm or to refute the hypothesis stated in section
5.1.4. The following activities were conducted for this task:
Hypothesis formulation
Provisional criteria to identify case-studies were established
List of potential cases has been analysed
List of study cases has been discussed with the other project team in Avila during the IV.
International Congress of Tourism for All.
Submission of the provisional list to the EC
Approval of the list with a suggestion for an amendment
Contact with the cases
Reception of documentation from cases
Writing of cases
Analysis and conclusions from the study-cases
A set of criteria have been defined to select the appropriate study cases. These criteria follow
consultation with the team carrying out the other studies. The provisional criteria were as follows:
They should be cases from all sectors of the tourism chain
The cases should present evidence of business improvement (number of clients,
employees, investment return, popularity, etc.) as the aim of this study is to provide
evidence of the economic impact of Accessible Tourism and therefore we should present
cases where the accessibility improvements were followed to some degree by business
success
Where measurements of client numbers are possible, figures about tourists will be
presented generally, as only a small proportion of impairments is visible (i.e.: an hotel
manager can recall how many wheelchair users or blind clients have been received, but
may not know if a guest has an artificial limb, allergies or many other limitations as

Economic impact and travel patterns of Accessible Tourism in Europe FINAL REPORT 244
Scandic hotels states, 70% of disabilities are invisible).1
They should target the general public (as business opportunities are not only based on
targeting people with access needs, and the ethical and political will is integration, not
segregation).
As much as possible the cases are selected from different countries or concern the
reception of tourists from different EU countries and abroad to ensure a wide
representation of the EU.
They should be transferable to other locations or sectors
As far as possible, the cases are drawn from both the private sector (SMEs and large
companies) and the public sector.
Following definition of the criteria a provisional list of cases was defined and later amended and
confirmed by the EC.
Tourism for All can be implemented in many ways. Various experiences across Europe have shown
that in spite of different approaches, certain factors emerged which positively influence the
development of a Tourism for All approach. These are the 7 Interdependent Success Factors (ISF),
which have to be taken into account in order to ensure successful and satisfactory implementation.[1]
Case studies from all over Europe have shown that there is a strong link between the success of
projects or initiatives and the simultaneous presence of all 7 ISF. If one or more ISF is missing or
disappears, there is a high risk of the project not reaching its expected goals or results.
These ISF are:
1. Decision-maker commitment: The decision to start and follow the process should be taken at the
highest level.
2. Coordinating and continuity: A responsible person should be in charge of the process and
guarantee the continuity if key players change.
3. Networking and participation: The internal and external stakeholders should be identified and
should be involved in the process.
4. Strategic planning: Actions should be carefully planned in advance and all critical aspects should
be defined.
1 http://www.scandichotels.com/Always-at-Scandic/Special-needs/ [1] Aragall/Neumann/Sagramola 2008,ECA for Administrations, European Concept for Accessibility Network, www.eca.lu . Neumann/ Pagenkopf/Schiefer/Lorenz 2008, IDZ 2009

Economic impact and travel patterns of Accessible Tourism in Europe FINAL REPORT 245
5. Knowledge management: Considering both the internal knowledge development and transfer, and
the knowledge derived from involvement in external networks.
6. Resources: Devoting the appropriate human, technical and economic resources to the actions
planned.
7. Communication and marketing: Both in the sense of external communication in the usual
dissemination tools but also acknowledge the contribution of all stakeholders.
In order to collect the information about the cases in a comparable way it was decided to use the
Seven Interdependent Success Factors (7 ISF) to be used in the recommendations chapter.
An additional reason for using 7ISF is because our experience and experience of cases already
collected from other sectors have demonstrated that to succeed in putting Design for All principles
into practise none of the Interdependent Success Factors should be neglected. We also aim to
validate or refute this hypothesis by finding out if there is a successful case that has disregarded any
of the factors.
After this a questionnaire with open questions was designed and sent to the cases after personal,
telephone or e-mail contact.
The completed questionnaires and the complementary information received have been used to write
the case studies and the conclusions. For the questionnaire see Annex K.

Economic impact and travel patterns of Accessible Tourism in Europe FINAL REPORT 246
5.1.2 Preliminary results and hypotheses Our working hypotheses are:
H21: In mainstream tourism services investment in accessibility result in an increase in clients.
H22: Destinations that take account of accessibility are usually focused on quality of service in
general.
H23: The successful accessible destinations show evidence of a degree of cooperation among
service providers.
H24: At least some destinations succeed in including accessibility, comfort and services in their
branding.
One of the most challenging aspects of the case-studies will be to track the investments made at a
touristic destination and to obtain data about the economic outcomes of a project. This type of data
is likely to be available for the suggested case-studies and will be requested from the key
stakeholder, particularly if it is not otherwise available.
The case-studies have been selected to represent a range of tourism chain sectors and our
suggestion is indicated on Figure 118.
The selected cases have been confirmed by the expert team and the EC.

Economic impact and travel patterns of Accessible Tourism in Europe FINAL REPORT 247
Figure 118 Case studies
Case-study Type Country
City of Erfurt Destination Germany
Accessible Poland Tours Travel agency Poland
Chateau des Ducs de Bretagne
Heritage France
St. Martin Wine Cellar Entertainment and shopping Luxembourg
Berlin Destination Germany
Barcelona Metro Transport Spain
Scandic Hotels Accommodation Sweden
GVAM Mobile Guides for All
Assistive Technologies Spain
Restaurant Monnalisa Food and beverage Italy
Restaurant Girasoli Food and beverage Italy
Economic impact and travel patterns of Accessible Tourism in Europe FINAL REPORT 248
5.1.3 Case studies
5.1.3.1 Case Study: The City of Erfurt
Erfurt, the capital of the federal state of Thuringia (Germany) with 203,485 inhabitants (31 December
2012) has a medieval city centre with many points of historical interest. C. 11.2 million guests visit
Erfurt every year, on average spending principal places of
interest are, in general, not particularly accessible. However, Erfurt is considered to be one of the
most famous accessible destinations in Germany. The wide range of barrier-free offers of the Erfurt
Tourism and Marketing Board includes:
Guided tours or sightseeing tours by bus/ tram with access for disabled people
Inclusive packages
Accommodation
Culinary specialities
Events and visits to the many places of interest
Offers in German Sign Language
Monitoring of the success factors reveals the following findings:
1. Commitment of decision-makers
Accessible tourism is located at the top of the tourism hierarchy. The CEO of the tourist
board (Erfurt Tourismus und Marketing GmbH) is responsible for the subject.
Political supervision does exist, but politics does not control the tourism board. The decision
to prioritise accessible tourism derives from marketing needs.
2. Coordination and continuity
The tourist board has worked since 1999 on accessible tourism.
3. Networking and participation
On a local scale, a network of service suppliers from different tourism sectors and other
associated sectors like transport meets regularly with associations of disabled people.
Since 2008 Erfurt has been a -free destinations in
-reiseziele.de). This is an association of eight German regions
particularly committed to the concept of accessible tourism for all. Its members include the
Eifel region, the city of Erfurt, the Franconian Lake region, the city of Magdeburg, East
Economic impact and travel patterns of Accessible Tourism in Europe FINAL REPORT 249
Frisia, the Ruppiner Land region, Saxon Switzerland and Lower Lusatia. The group thus
works on a national and inter-regional level.1
On a national and international scale, the head of the Erfurt tourist board is often invited to
speak at congresses and meetings. International contacts also exist.
4. Strategic planning
The Erfurt Tourism & Marketing Board is responsible for strategic development.
Accessible tourism is part of marketing plans and strategic planning
Many offers for disabled guests have been developed; accessible tourism is widely
understood as tourism for disabled guests.
5. Qualification and knowledge transfer
The management and the service team are trained in accessibility in general. Some
members of the staff have obtained further knowledge, e. g. in sign languages, or have
attended seminars on guiding tours for blind guests. Furthermore, co-operation with local
disability NGOs is strong. A constant exchange between guests and service providers is
assured, and are welcomed.
City guides have been trained
Special training for service suppliers has been offered
Exchange of knowledge is assured within the association "Barrier-free Destinations in
Germany"
Entwicklung und Vermarktung barrierefreier Angebote
. The project,
commissioned by the German Ministry for Economics and conducted by the German
Seminar for Tourism (DSFT) and the National Coordination Centre for Tourism for All
(NatKo), aims to implement a German-wide system to validate and label accessible offers in
tourism.
1 The catalyst that brought six of these eight destinations together was their selection as test subjects for the -free tourism for all in
study was collected from these six model regions with their successful approaches and projects in barrier-free tourism. The charter of the Barrier-free Destinations in Germany Association was signed at the ITB trade fair in 2008. The association closely cooperates with the German Tourism Board (DZT) and other important players in tourism like German Railway (Deutsche Bahn).

Economic impact and travel patterns of Accessible Tourism in Europe FINAL REPORT 250
6. Communication and distribution
Website is highly accessible, including for example easy language and videos with sign
language (www.erfurt-tourismus.de)
Special-interest
groups (guests with walking difficulties, wheelchair users, sight and hearing impairments,
mentally handicapped guests).
On a national scale, accessible offers are promoted through a marketing cooperation within
the association "Barrier-free Destinations in Germany".
On an international scale, offers are promoted by the German Tourism Board (DZT).
Offers are promoted by the German Railway
7. Improvement of resources and capabilities
Low-floor buses and trams
Offer:
City guides for disabled guests
Arrangements for disabled guests
Guidebooks for guests with sight impairments
Offers presented in German Sign Language
Drivers & Obstacles
Drivers
Constant personal engagement of stakeholders was the main driver of accessible tourism in
Erfurt
Motivation of many service suppliers was often achieved by a social approach
The number of guests taking part in guided tours increased and Erfurt has an increasing
number of individual guests with disabilities. The accessible rooms in the hotels are heavily
booked.
Accessible tourism leads to positive outcomes in internal marketing
Obstacles
The level of necessary investment is higher than expected, especially in time and human
resources
Projects for disabled guests are sometimes rather expensive and need support from public
bodies, usually from the Ministry for Social affairs in Thuringia
Constant personal engagement of stakeholders is needed
Economic impact and travel patterns of Accessible Tourism in Europe FINAL REPORT 251
Financial investment is currently low in this sector and it can be difficult to motivate partners
to invest in common marketing projects
Further comments
-
Erfurt has been nominated for the German Tourism award 2013 for barrier-free projects
Figure 119 Official logo of Erfurt tourism board
5.1.3.2 Case Study: Accessible Poland Tours
has offered services since 2009, when the
company was the first travel agency strongly focussed upon services for disabled people in Poland.
Most clients are severely disabled people with mobility problems such as wheelchair users or slow
walkers and guests with intellectual impairments such as Down syndrome. The offered services
consist of:
Incoming and outgoing tourism
Package tours 1-6 days within Poland and abroad
Arranging accessible hotels
Arranging accessible transport: buses, air travel, taxis, trains
Tailor-made tours for individuals and groups: NGO organisations
Organising accessible routes, including accessible toilets and tourist attractions
Booking tickets to tourist attractions, theatres
Arranging local guides with multi-language skills
Arranging special rehabilitation equipment.
Economic impact and travel patterns of Accessible Tourism in Europe FINAL REPORT 252
Monitoring of the success factors reveals the following findings:
1. Commitment of decision-makers
The founder and managing director has a disability herself and therefore is strongly
committed to the ideas of accessible Tourism for All
Where possible, the managing director conducts the tours personally guaranteeing a
consistent implementation of accessibility in all its offers
2. Coordinating and continuity
The company started in 2009 and has been managed by the same committed person since
that time
The founder and managing director usually works on her own and is always seeking
constant improvements
3. Networking and participation
a member of the European Network for accessible Tourism
(ENAT)
Strong and enduring links with NGOs of people with disabilities would be highly desirable
4. Strategic planning
The project has not been planned
Methods and strategies gleaned from each tour experience, changes and improvements
were introduced progressively
5. Qualification and knowledge transfer
The managing director is herself disabled of the needs of
the target groups
The managing director also completed the required training to be a tour guide, but had no
special educational background when starting the business
6. Communication and distribution
Website (www.accessibletour.pl), which is also available in English due to the high
importance of foreign markets
Brochure is also available in English
Congresses and meetings (often abroad)
7. Improvement of resources and capabilities
Economic impact and travel patterns of Accessible Tourism in Europe FINAL REPORT 253
Each tour is unique and demands an individual approach to the range of differing client
needs
The company is reactive to users requests; for example, the need for a higher than normal
bed, a special diet or piece of equipment or the assistance of volunteers, since guests
frequently travel without a carer
Drivers & Obstacles
Drivers
Personal engagement and idealism of the managing director
eds of the managing director from her own experience
Encouragement of satisfied guests
Obstacles
No financial or institutional support; the main problem running the business is that it is much
more expensive than expected. Only between three and six groups with mostly few
participants take place per year, which is not sufficient to cover costs
Lack of accessible rooms for those on limited budgets and lack of accessible means of
transport in Poland
People with disabilities in Poland would like to travel, but often do not have the financial
means
NGOs, as potential clients, avoid using the services of the company and try to organise the
trips themselves in order to save money
Further comments
The motivation to run the business was from experienced during an organised trip to
Australia
Due to the disappointing financial situation, the business activities may be suspended or the
business transformed into a Foundation

Economic impact and travel patterns of Accessible Tourism in Europe FINAL REPORT 254
Figure 120 Official logo of Accessible Poland Tours
Figure 121 English version of the flyer
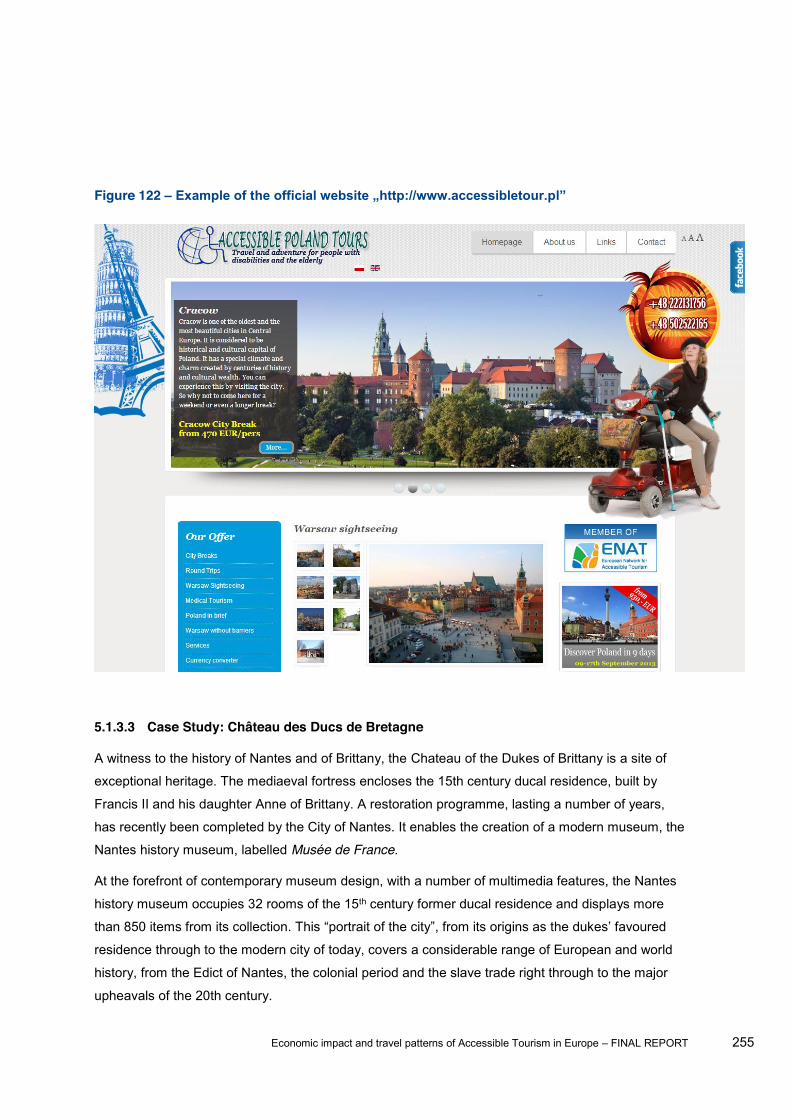
Economic impact and travel patterns of Accessible Tourism in Europe FINAL REPORT 255
Figure 122
5.1.3.3 Case Study: Château des Ducs de Bretagne
A witness to the history of Nantes and of Brittany, the Chateau of the Dukes of Brittany is a site of
exceptional heritage. The mediaeval fortress encloses the 15th century ducal residence, built by
Francis II and his daughter Anne of Brittany. A restoration programme, lasting a number of years,
has recently been completed by the City of Nantes. It enables the creation of a modern museum, the
Nantes history museum, labelled Musée de France.
At the forefront of contemporary museum design, with a number of multimedia features, the Nantes
history museum occupies 32 rooms of the 15th century former ducal residence and displays more
than 850 items from its collection. This portrait of the city , from its origins as
residence through to the modern city of today, covers a considerable range of European and world
history, from the Edict of Nantes, the colonial period and the slave trade right through to the major
upheavals of the 20th century.
Economic impact and travel patterns of Accessible Tourism in Europe FINAL REPORT 256
Every type of disability is catered for:
Visitors with a motor disability: 28 out of 32 rooms are accessible. The ramparts are partly
accessible and reached by a lift. Free wheelchair loans.
Sight-impaired visitors: touch and sound devices are provided around the museum, with special
Visitors with learning disabilities: specific assistance at the visit, large print colour cards, fun areas
in the exhibitio
Monitoring of the success factors reveals the following findings:
1. Commitment of decision-makers
The city of Nantes, proprietors of the Chateau of the Dukes of Brittany, re-opened the
chateau for visitors in 2007 after 15 years of renovation.
The museum advertises its commitment to inclusion for everyone.
Nantes has a long-standing commitment, both political and practical, to improving facilities
and services for disabled people across various aspects of city life. Among French
accessibility professionals is, together with Grenoble, one of the more accessible cities in
France.
In 2013, Nantes obtained the Access City Award (European prize), just behind Berlin.
The Chateau of the Dukes of Brittany operates a visitor policy based on four main principles:
to promote the pleasure of discovery, to respect the spirit of the place, to communicate the
knowledge object, and to develop subjects for further reflection. They declare that they aim
to create facilitating environments.
It offers a diversified range of visits, events, educational and learning initiatives, cultural
programs aimed at people with little or no familiarity with the world of museums and
heritage.
The approaches offered are both interactive and multidisciplinary, making the Castle a place
of exchange and encounter, inviting its visitors to build a long-term relationship with it.
The low-floor tram system provides a good connexion with the city centre.
2. Coordinating and continuity
There is a manager responsible for development and visitor policy who coordinates staff
activities under the municipal structure.
Economic impact and travel patterns of Accessible Tourism in Europe FINAL REPORT 257
3. Networking and participation
The City has adopted a Disability Action Plan. Therefore, the manager worked with technical
staff from the municipality and with the Nantes Council of Disabled People. Associations of
disabled people also participated in the project.
4. Strategic planning
It was been a planned project since the beginning aiming to devise innovative approaches
for all visitors.
Finance, time and human resources planned from the beginning.
The restoration program cost 51,530,000 . The finance for the restoration programme
comes from : 58% the municipality ,2% the metropolitan area,7% the department of Loire-
Atlantique,10% the Pays de la Loire region and 10% European Regional Development
Fund.
The chateau does not have specific budget allocated for improvements to meet the needs
disabled people. Each project integrates financially the needs of disabled people.
5. Qualification and knowledge transfer
The process was based on trial and error through the engagement of users. Disabled
people tested the infrastructures until a suitable solution was found.
An important network including among others museums, associations and design schools
also contributed to improvements
Vocational training has been provided to the staff.
6. Communication and distribution
The chateau website.
Brochures.
Information directly shared with a network of associations
7. Improvement of resources and capabilities
Visitors with a disability are welcome at the Chateau of the Dukes of Brittany. Tours and
features adapted to specific disabilities as the following offer summarises:
Sensory tours open to everyone: these visits allow visitors to discover some of the
Economic impact and travel patterns of Accessible Tourism in Europe FINAL REPORT 258
topics covered by the museum and its exhibitions through the use of objects, as well as
sound, visual, olfactory and tactile experiences.
Accessible exhibition spaces: visitors can use rest areas and borrow wheelchairs or
folding stools.
Guided tours: Visitors with physical disabilities can follow general or themed guided
Audio guide tactile tour of the museum: using both a special audio guide (only available
in French) and different tactile and sound features available throughout the museum, the
visit is made accessible to visitors with visual disabilities
Exhibition booklets and guides: in Braille, embossed or in large print
Guide dogs are welcome
The ticket-front desk has induction loops available
The multimedia terminals are subtitled and interactive.
Leaflets summarizing the content of certain films are also available.
Visual descriptions in French Sign Language (FSL) are available all year round in order
to allow visitors with hearing disabilities to discover the museum and the chateau,
whether on their own or accompanied. Tours in FSL linked to exhibitions are also on
offer.
The Internet site offers practical information and a presentation of the site in FSL.
A booklet and educational materials designed for visitors with developmental or learning
disabilities: a selection of objects in a dozen or so rooms is highlighted in a booklet and
educational materials, for example commentaries, treasure trails, the use of magnets
and associations of ideas.
Different materials allow visitors to discover the museum at their own pace:
o Colour maps depicting Nantes in a simplified fashion down through the ages.
o Multimedia features (films, terminals, interactive maps) provide information on a
variety of subjects.
o The exhibitions include interactive spaces.
Group tours:
o With a guide, by reservation only: a variety of bespoke visits have been designed
based on a sensory approach, observation, the handling/touching of objects and
participation, such as: the castle down through the ages: architectural tour that
includes the handling of materials and models; monsters and stone animals: tour of
sculpted features; sailors and sea monsters: tour of the museum followed by a
modelling workshop; and the contours of the city: an interactive tour to enable
Economic impact and travel patterns of Accessible Tourism in Europe FINAL REPORT 259
through the ages.
o Without a guide: the group leader may make use of the booklet and educational
materials, available free of charge, at the front desk.
Drivers & Obstacles
Drivers
The most important factors are commitment at the highest level within the City to improved
accessibility and a clear and continuing link between the City at political and operational levels and
citizens with a disability and older citizens.
The Chateau of the Dukes of Brittany is a core feature of the cultural, economic and tourist
development of Nantes and its estuary. Their refurbishments, with the creation of the history
museum, and its artistic events program running throughout the
interest and appeal.
As of early 2013, six years after the museum reopened to the public, more than 7,500,000 people
have visited the castle. The museum and the exhibits have received more than 1,100,000 visitors.
In the museum, people with a disability represent 1.7% of the visitors (those who identify themselves
as such when obtaining free entrance) - 68% of them are individual visitors and 32% in a group.
The geographical distribution of the national disabled visitors is as follows:
67% come from the surrounding department of Loire-Atlantique
7% come from the Brittany region
6% come from the Paris region
4% come from Pays de la Loire region
10.5% come from other regions of France
5.5% disabled visitors are foreign visitors. They are mainly European.
The museum team estimates that 6% of those visiting the Castle have some kind of disability that
impacts their daily lives.
recognition of its accessibility policy.
In 2011, the castle obtained the label «tourism and disability» for the 4 impairments, mobility, visual,
audio, and mental.
The Castle has made accessibility and Design for All a core priority.
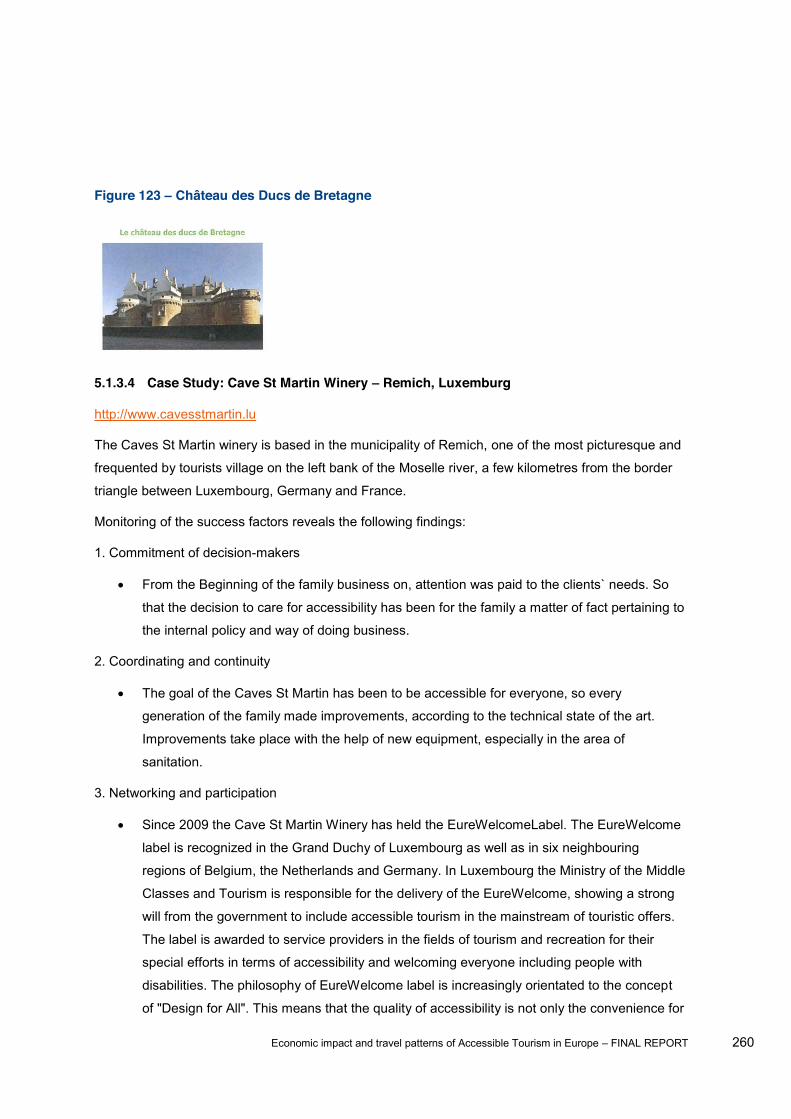
Economic impact and travel patterns of Accessible Tourism in Europe FINAL REPORT 260
Figure 123 Château des Ducs de Bretagne
5.1.3.4 Case Study: Cave St Martin Winery Remich, Luxemburg
http://www.cavesstmartin.lu
The Caves St Martin winery is based in the municipality of Remich, one of the most picturesque and
frequented by tourists village on the left bank of the Moselle river, a few kilometres from the border
triangle between Luxembourg, Germany and France.
Monitoring of the success factors reveals the following findings:
1. Commitment of decision-makers
From the Beginning of the family business on, attention was paid to the clients` needs. So
that the decision to care for accessibility has been for the family a matter of fact pertaining to
the internal policy and way of doing business.
2. Coordinating and continuity
The goal of the Caves St Martin has been to be accessible for everyone, so every
generation of the family made improvements, according to the technical state of the art.
Improvements take place with the help of new equipment, especially in the area of
sanitation.
3. Networking and participation
Since 2009 the Cave St Martin Winery has held the EureWelcomeLabel. The EureWelcome
label is recognized in the Grand Duchy of Luxembourg as well as in six neighbouring
regions of Belgium, the Netherlands and Germany. In Luxembourg the Ministry of the Middle
Classes and Tourism is responsible for the delivery of the EureWelcome, showing a strong
will from the government to include accessible tourism in the mainstream of touristic offers.
The label is awarded to service providers in the fields of tourism and recreation for their
special efforts in terms of accessibility and welcoming everyone including people with
disabilities. The philosophy of EureWelcome label is increasingly orientated to the concept
of "Design for All". This means that the quality of accessibility is not only the convenience for
Economic impact and travel patterns of Accessible Tourism in Europe FINAL REPORT 261
disabled people, but also for society in general.
The accessible premises are brought to the attention of potential customers and visitors via
the website www.welcome.lu as well as via brochures and links to nationally and
internationally repute as cultural and tourist sites.
4. Strategic planning
Different offers for guests have been developed, such as guided tours through the cellars
accessible for wheelchair users, with the possibility of having explanations in simplified
language. The guided tour lasts about 45 minutes. On demand, it is also possible to have a
guided tour in German sign language through the integration service from the city of
Luxembourg.
Tasting experiences are offered for different target groups: wine for adults and grape juice
for children.
Accessible tourism is mainly understood as tourism for disabled guests.
5. Qualification and knowledge transfer
Management and staff are trained in accessible tourism and have personal experiences with
guests with special needs. Communication with guests is ensured, management and staff
are ready to learn from the suggestions of their guests.
6. Communication and distribution
Info about the accessibility condition of the winery is available in the EureWelcome Label
website (www.welcome.lu), but only in French. Other languages are likely to follow soon.
Communication about accessibility is mainly due to the word-to-mouth way among visitors.
7. Improvement of resources and capabilities
Designated parking place for people with disabilities.
Entrance door and internal route without threshold, steps and obstacles.
An adapted toilet is available next to the visitor reception.
Guided tour in simplified language and with the help of gesture.
Drivers & Obstacles
Drivers
Constant personal engagement was the main driver of being accessible for the winery
owners.
The winery owners feel that the loyalty of their clients, disabled or not, is proving that they
are working in the right way and that they are providing the visitors what they need and look
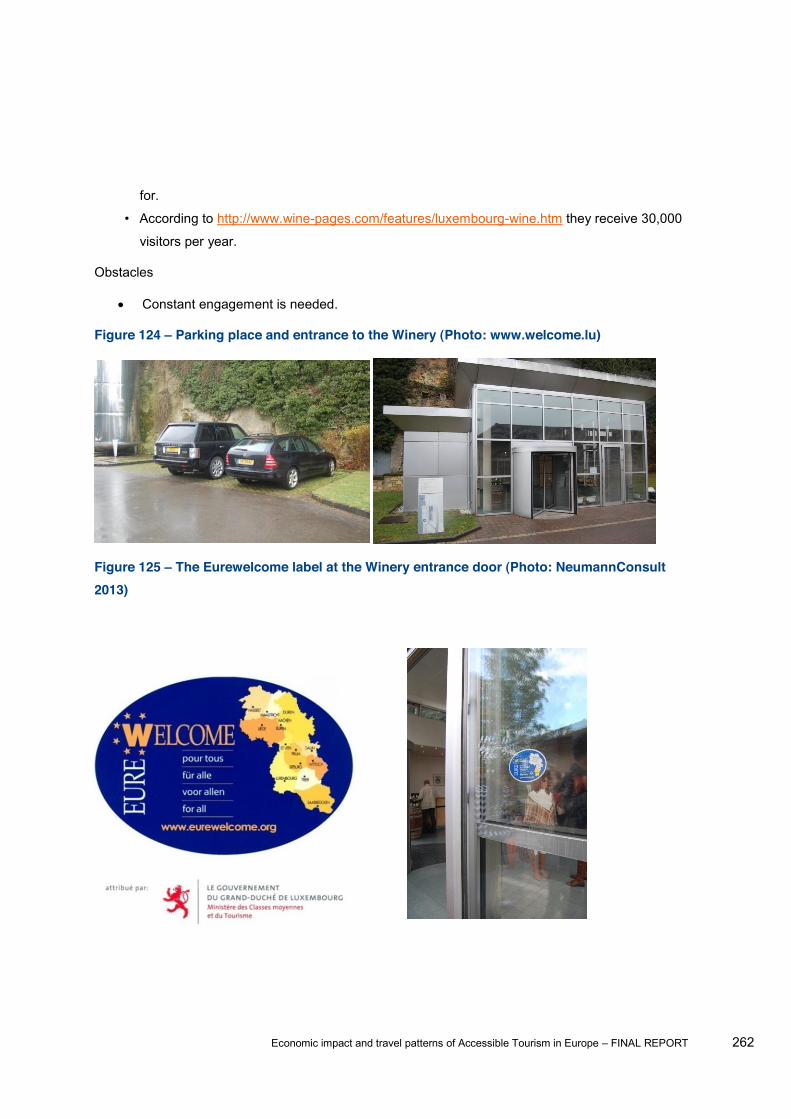
Economic impact and travel patterns of Accessible Tourism in Europe FINAL REPORT 262
for.
According to http://www.wine-pages.com/features/luxembourg-wine.htm they receive 30,000
visitors per year.
Obstacles
Constant engagement is needed.
Figure 124 Parking place and entrance to the Winery (Photo: www.welcome.lu)
Figure 125 The Eurewelcome label at the Winery entrance door (Photo: NeumannConsult 2013)
Economic impact and travel patterns of Accessible Tourism in Europe FINAL REPORT 263
Figure 126 The wine cellar (Photo: NeumannConsult 2013)
Figure 127 Webpage www.welcome.lu
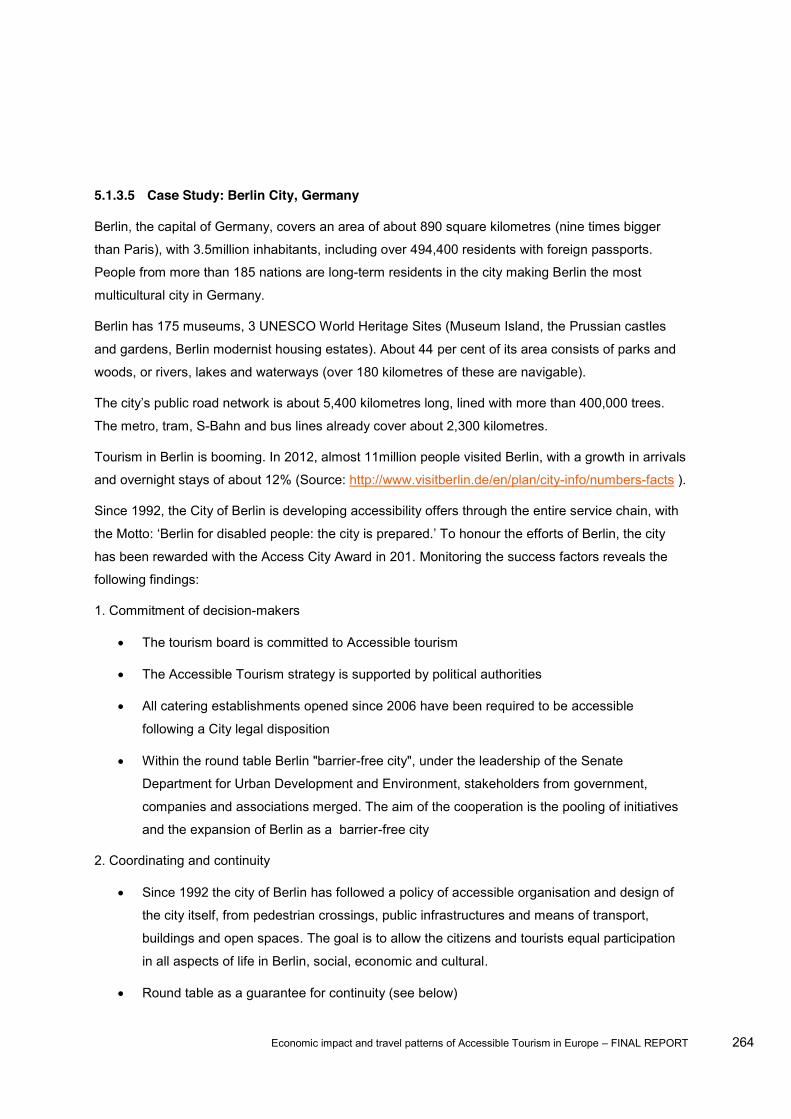
Economic impact and travel patterns of Accessible Tourism in Europe FINAL REPORT 264
5.1.3.5 Case Study: Berlin City, Germany
Berlin, the capital of Germany, covers an area of about 890 square kilometres (nine times bigger
than Paris), with 3.5million inhabitants, including over 494,400 residents with foreign passports.
People from more than 185 nations are long-term residents in the city making Berlin the most
multicultural city in Germany.
Berlin has 175 museums, 3 UNESCO World Heritage Sites (Museum Island, the Prussian castles
and gardens, Berlin modernist housing estates). About 44 per cent of its area consists of parks and
woods, or rivers, lakes and waterways (over 180 kilometres of these are navigable).
The metro, tram, S-Bahn and bus lines already cover about 2,300 kilometres.
Tourism in Berlin is booming. In 2012, almost 11million people visited Berlin, with a growth in arrivals
and overnight stays of about 12% (Source: http://www.visitberlin.de/en/plan/city-info/numbers-facts ).
Since 1992, the City of Berlin is developing accessibility offers through the entire service chain, with
has been rewarded with the Access City Award in 201. Monitoring the success factors reveals the
following findings:
1. Commitment of decision-makers
The tourism board is committed to Accessible tourism
The Accessible Tourism strategy is supported by political authorities
All catering establishments opened since 2006 have been required to be accessible
following a City legal disposition
Within the round table Berlin "barrier-free city", under the leadership of the Senate
Department for Urban Development and Environment, stakeholders from government,
companies and associations merged. The aim of the cooperation is the pooling of initiatives
and the expansion of Berlin as a barrier-free city
2. Coordinating and continuity
Since 1992 the city of Berlin has followed a policy of accessible organisation and design of
the city itself, from pedestrian crossings, public infrastructures and means of transport,
buildings and open spaces. The goal is to allow the citizens and tourists equal participation
in all aspects of life in Berlin, social, economic and cultural.
Round table as a guarantee for continuity (see below)
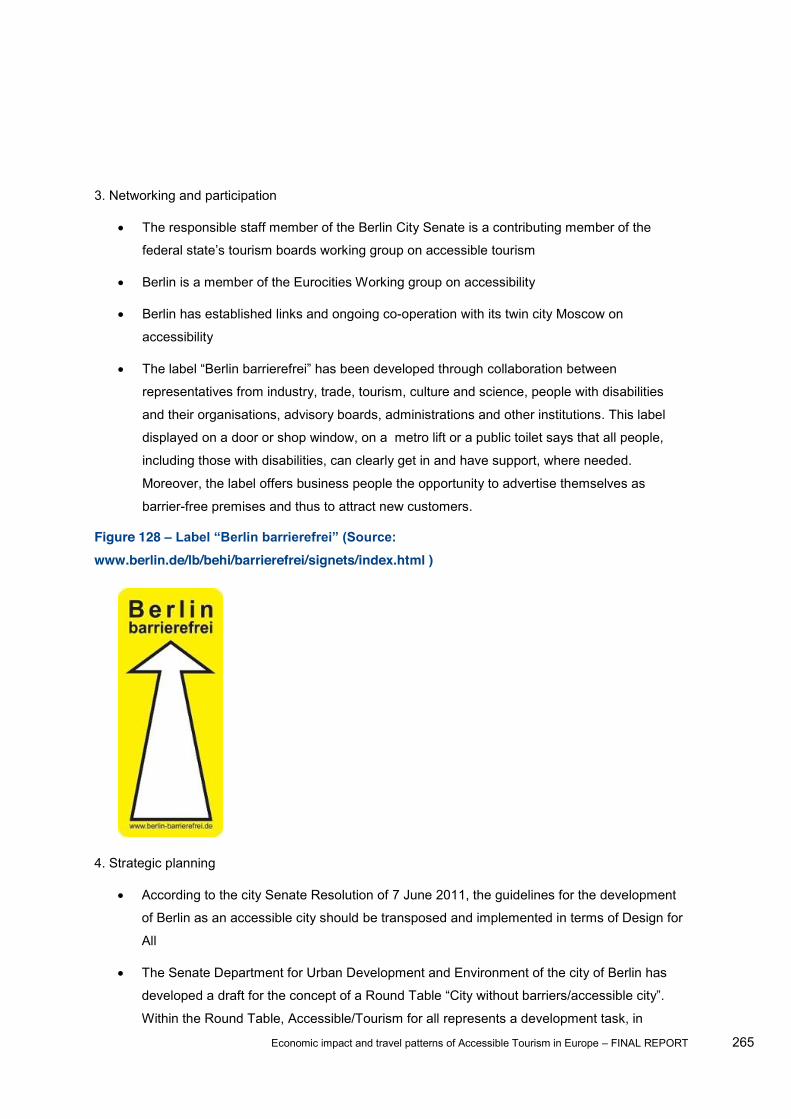
Economic impact and travel patterns of Accessible Tourism in Europe FINAL REPORT 265
3. Networking and participation
The responsible staff member of the Berlin City Senate is a contributing member of the
Berlin is a member of the Eurocities Working group on accessibility
Berlin has established links and ongoing co-operation with its twin city Moscow on
accessibility
collaboration between
representatives from industry, trade, tourism, culture and science, people with disabilities
and their organisations, advisory boards, administrations and other institutions. This label
displayed on a door or shop window, on a metro lift or a public toilet says that all people,
including those with disabilities, can clearly get in and have support, where needed.
Moreover, the label offers business people the opportunity to advertise themselves as
barrier-free premises and thus to attract new customers.
Figure 128 www.berlin.de/lb/behi/barrierefrei/signets/index.html )
4. Strategic planning
According to the city Senate Resolution of 7 June 2011, the guidelines for the development
of Berlin as an accessible city should be transposed and implemented in terms of Design for
All
The Senate Department for Urban Development and Environment of the city of Berlin has
Within the Round Table, Accessible/Tourism for all represents a development task, in
Economic impact and travel patterns of Accessible Tourism in Europe FINAL REPORT 266
connection with the accessibility of infrastructures of the city itself. This should require a
coordinated effort on team working between the Senate and public administrations with
organisations and initiatives from civil society
Destination Berlin" - is a basic empirical investigation of the EBC
Hochschule Berlin which was initiated by Visitberlin. This study is a comprehensive analysis
of the situation and represents the status quo in Berlin, making also a comparison with
Brandenburg
Berlin further steps towards a more accessible city and tourist offers will be:
Creating more accessible packages,
Strengthening co-operations and communication
Web marketing, fairs participation, Advertisement und Media campaign,
Standardising labelling of barrier free offers for all Germany
Developing of quality standards
Training of staff within the tourism service chain
Working closely with political decision makers
5. Qualification and knowledge transfer
Knowledge stems from internal capacities, engagement and qualification
transport system gets regular training in services for disabled guests
accessible tourism, the Eurocities Network and twin cities partner programmes, all meant to
transfer know-how and knowledge
6. Communication and distribution
On the website www.visitBerlin.de there is a great deal of information about offers of
accessible tourism. The site works closely in joint working groups with different partners in
order to formulate offers responding to the requirements of the different target groups. The
offers cover the entire service chain: arrival, mobility on site, accommodation, food and drink,
entertainment and departure.
Information about accessibility issues: http://www.berlin.de/tourismus/infos/1730823-721039-
barrierefreies-berlin.html http://www.visitberlin.de/en/plan/city-info/accessible-berlin
http://www.berlin.de/lb/behi/barrierefrei/
Mobidat provides an important database on tourism and accessibility in Berlin
Economic impact and travel patterns of Accessible Tourism in Europe FINAL REPORT 267
http://www.mobidat.net/links/tourismus/
The "Berlin Special Guides" guide people with and without disabilities in the Reichstag,
t
episodes are described, as well as providing a wealth of information and background on the
Cross-border cooperation with Potsdam / Brandenburg is continually being expanded and
deepened in joint projects
The issue of "accessibility" is also integrated in the work program of "service in the City .
7. Improvement of resources and capabilities
Qualification of individuals (e.g. continuing training programme of
transport system)
Networking and collaboration with the main service providers of the city
The wide range of barrier-free offers in Berlin includes:
Guided tours or sightseeing tours by bus with access for disabled people
Accessible accommodation, restaurants and shops
Inclusive packages
Events & visits to the many places of interest
Offers in German Sign Language and in Braille, audio-guides, experiences for the
senses of smell and touch
Drivers & Obstacles
Drivers
Constant engagement
Accessible tourism leads to positive results in marketing
Access City Award 2013 as an additional motivation for stakeholders and politicians
Obstacles
Large investments needed
Constant engagement of stakeholder is needed.
Further comments
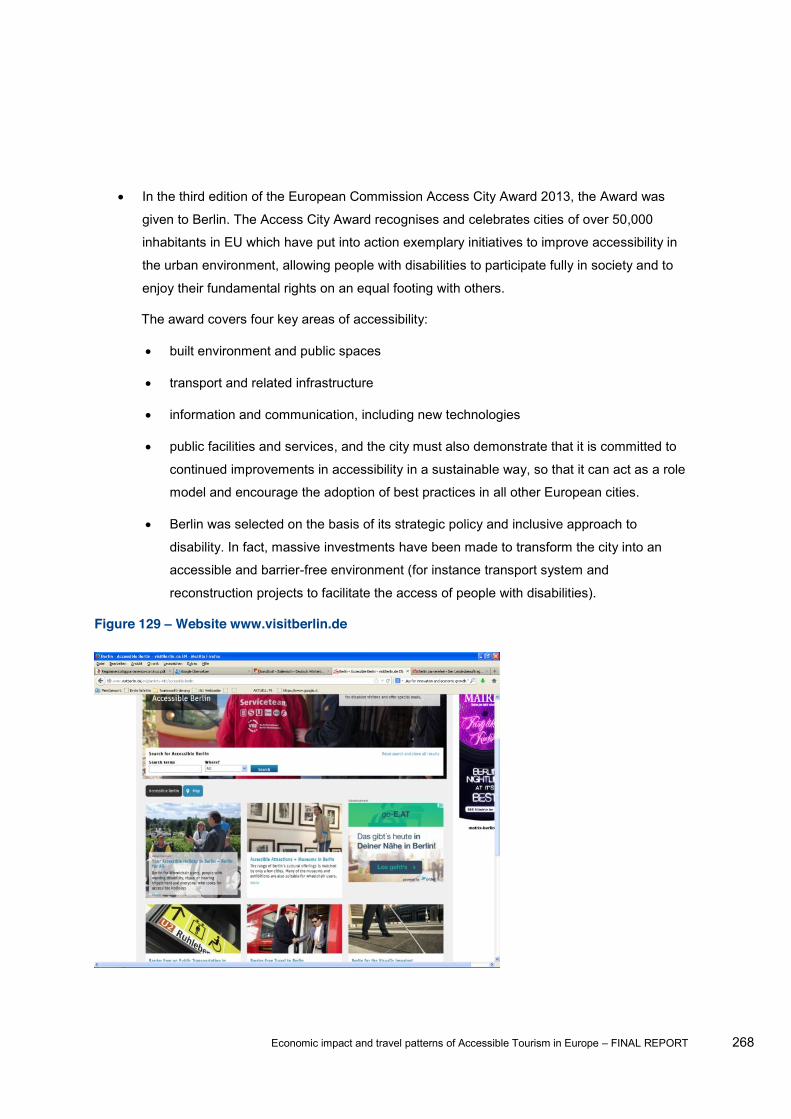
Economic impact and travel patterns of Accessible Tourism in Europe FINAL REPORT 268
In the third edition of the European Commission Access City Award 2013, the Award was
given to Berlin. The Access City Award recognises and celebrates cities of over 50,000
inhabitants in EU which have put into action exemplary initiatives to improve accessibility in
the urban environment, allowing people with disabilities to participate fully in society and to
enjoy their fundamental rights on an equal footing with others.
The award covers four key areas of accessibility:
built environment and public spaces
transport and related infrastructure
information and communication, including new technologies
public facilities and services, and the city must also demonstrate that it is committed to
continued improvements in accessibility in a sustainable way, so that it can act as a role
model and encourage the adoption of best practices in all other European cities.
Berlin was selected on the basis of its strategic policy and inclusive approach to
disability. In fact, massive investments have been made to transform the city into an
accessible and barrier-free environment (for instance transport system and
reconstruction projects to facilitate the access of people with disabilities).
Figure 129 Website www.visitberlin.de
Economic impact and travel patterns of Accessible Tourism in Europe FINAL REPORT 269
5.1.3.6 Case Study: Barcelona metro
The Catalan railways (FGC) transport more than 80 million passengers every year. FGC operates
some of the Barcelona commuter rail network. There are two distinct (and separate) systems:
the Metro del Vallès and Línia de Balmes are standard-gauge lines, while the Metro del Baix
Llobregat and Línia Llobregat-Anoia are metre-gauge lines.
The check of the success factors reveals the following findings:
1. Commitment of decision-makers
Since late eighties when Catalan society become aware of the need to improve the city for
the organisation of the 1992 Olympics and Paralympics Games the top management of the
company has supported the constant accessibility improvements.
2. Coordinating and continuity
for All are key elements of the service quality.
department, from planning and design to service provision, information, public relations,
ticketing, etc.
3. Networking and participation
Since FGC was aware of the need for improving accessibility has been in close contact and
consultation with administrations and NGOs dealing with the People with Reduced Mobility
but also with experts.
They have a close collaboration with the other metro company and transport authorities to
guarantee the easy navigation of passengers along the different transport networks.
They have actively participated in public transport international organisations and have also
been invited to lecture at international events dealing with Design for All.
4. Strategic planning
All the improvements made have been accurately planned and budgeted over the years.
Assessment of accessibility conditions considering the typical accessibility aspects but also
lighting, loudspeakers, etc.
Satisfaction survey and constant contact with representatives (disabled or not
disabled) bring new improvement opportunities.
5. Qualification and knowledge transfer

Economic impact and travel patterns of Accessible Tourism in Europe FINAL REPORT 270
Personnel training is also included in the planned activities (for example a course on how to
communicate with deaf customers)
Staff aware of Design for All and provided with appropriate training
6. Communication and distribution
Website www.fgc.cat , which is also available in English.
Brochure and maps also available in English
Website indicates which client offices can deal with deaf clients and the accessibility
facilities for each station.
7. Improvement of resources and capabilities
95% of their stations are accessible. The cumulative investments in these stations were 17.1
Figure 130 Evolution of the adapted stations
Satisfaction Index that is
constantly improving
Line Barcelona-Vallès Evolution of the stations adapted to PRM
05
101520253035
1985
1986
1987
1988
1989
1990
1991
1992
1993
1994
1995
1996
1997
1998
1999
2000
2001
2002
2003
2004
2005
2006
2007
2008
BV adapted BV not adapted
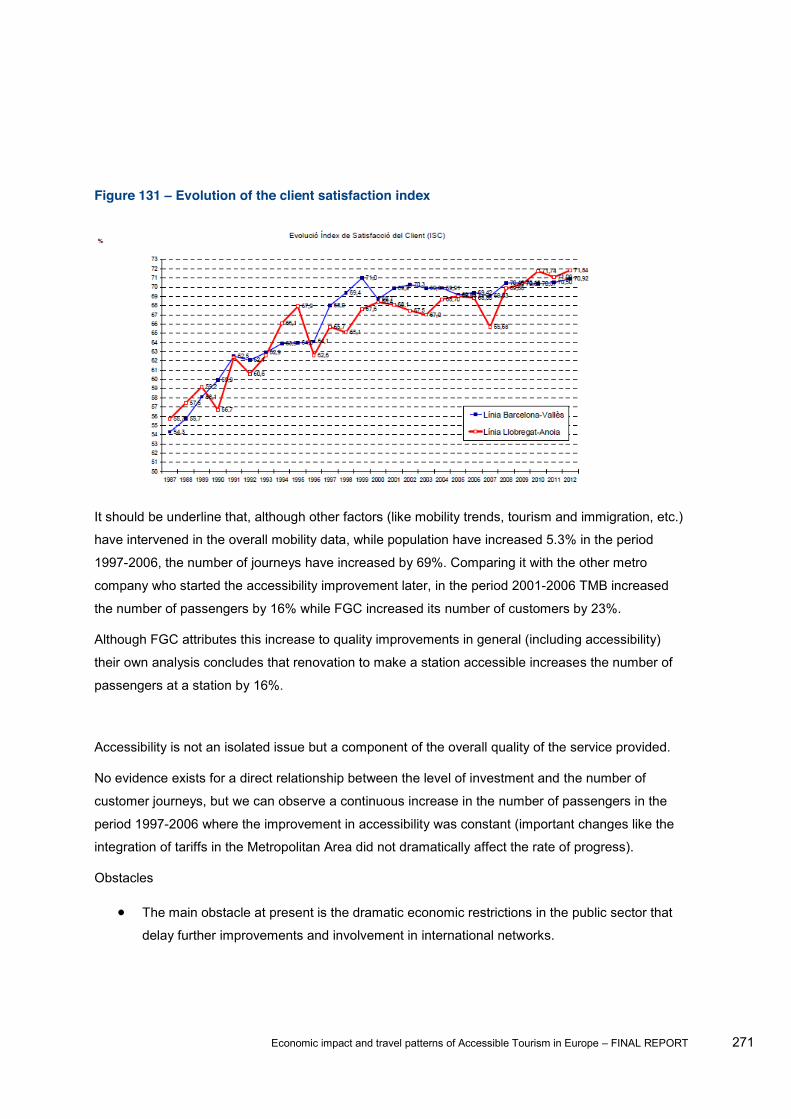
Economic impact and travel patterns of Accessible Tourism in Europe FINAL REPORT 271
Figure 131 Evolution of the client satisfaction index
It should be underline that, although other factors (like mobility trends, tourism and immigration, etc.)
have intervened in the overall mobility data, while population have increased 5.3% in the period
1997-2006, the number of journeys have increased by 69%. Comparing it with the other metro
company who started the accessibility improvement later, in the period 2001-2006 TMB increased
the number of passengers by 16% while FGC increased its number of customers by 23%.
Although FGC attributes this increase to quality improvements in general (including accessibility)
their own analysis concludes that renovation to make a station accessible increases the number of
passengers at a station by 16%.
Accessibility is not an isolated issue but a component of the overall quality of the service provided.
No evidence exists for a direct relationship between the level of investment and the number of
customer journeys, but we can observe a continuous increase in the number of passengers in the
period 1997-2006 where the improvement in accessibility was constant (important changes like the
integration of tariffs in the Metropolitan Area did not dramatically affect the rate of progress).
Obstacles
The main obstacle at present is the dramatic economic restrictions in the public sector that
delay further improvements and involvement in international networks.

Economic impact and travel patterns of Accessible Tourism in Europe FINAL REPORT 272
Further comments
Although it is not the object of this case study FGC manages five ski stations and their
premises (ski facilities, hotels, restaurants, etc.) and also manages the transport systems
(cable car, funicular, mountain train) in Montserrat, one of the most outstanding religious
tourism destinations with more than 2m visitors/year. The same Design for All criteria are
also applied to these other services.
Figure 132 Official logo of the FGC
Figure 133 Website of the FGC

Economic impact and travel patterns of Accessible Tourism in Europe FINAL REPORT 273
5.1.3.7 Case Study: Scandic Hotels
Scandic Hotels is a hotel chain operating in Sweden, Denmark, Finland, Norway, Germany, the
Netherlands, Belgium and Poland.
The first hotel was established in 1963 and now they have 155 hotels in operation with 29,696
rooms and they plan to open three new hotels soon. They have 7,500 employees.
Their offer is aimed at companies, families, couples and events.
Around 500 hotel rooms have been adapted to meet the requirements of people with some kind of
disability.
which is their Accessibility
Standard. The standard has grown over the years and today it contains 110 check points to follow.
81 of these points are mandatory for all hotels and for new hotels all points must be considered. This
standard works as a checklist and template for the hotels.
Scandic offers:
Rooms for disabled people (equally well-designed as any other room)
Full accessibility information online every Scandic Hotel has its own page with unique
information about the hotel and its facilities. They also provide a general information page about
accessibility such as recommended hotels in different cities, tips and advice, useful links and
more
Public areas at the hotel that are adapted for people with special needs, such as a lowered
reception desk for wheelchair users, a hearing loop in conference facilities, vibrating alarm clock
and more.
Food & Beverage - No allergenic garnish on the buffet breakfast, Gluten- and lactose-free bread
at breakfast
Guide dogs are always welcome at the hotels
Monitoring the success factors reveals the following findings:
1. Commitment of decision-makers
The Scandic Group Executive Committee is responsible for any action carried out about
accessibility, the Disability Ambassador report directly to them.
2. Coordinating and continuity
The accessibility commitment started in 2003. Since then Magnus Berglund, now appointed
as Accessibility Director at Scandic is responsible for this activity.
Economic impact and travel patterns of Accessible Tourism in Europe FINAL REPORT 274
3. Networking and participation
Magnus Berglund is member of ENAT
They work continuously with disability organizations, hotel guests and team members
4. Strategic planning
Its strategy is to include accessibility and Design for All in all operations of the company.
A check list is applied to any new hotel and renovation.
Staff education has been included as a planned strategy.
5. Qualification and knowledge transfer
To increase constantly their own knowledge and listen to the clients is the key factor for
qualification.
6. Communication and distribution
The Scandic group us their website, marketing material, PR, internal communications and
lectures, for instance at accessibility conferences to advertise their business.
7. Improvement of resources and capabilities
As the accessibility improvements are included in the general budget there is no need for
any special resource.
Drivers & Obstacles
Drivers
A former employee of Scandic suggested using accessibility to gain a competitive
advantage after being affected by a long term illness.
Their goal is that everyone should be welcome at Scandic regardless of whether they have
a disability or not.
hotel until they started to work with disability.
Already 2005 they could see that they sold 15,000 more room nights in Sweden due to that
they can offer rooms for disabled.
They can see increased business every year in all countries.
Many of their investments have been repaid in less than one year.
Obstacles
No specific obstacles were mentioned by the stakeholder
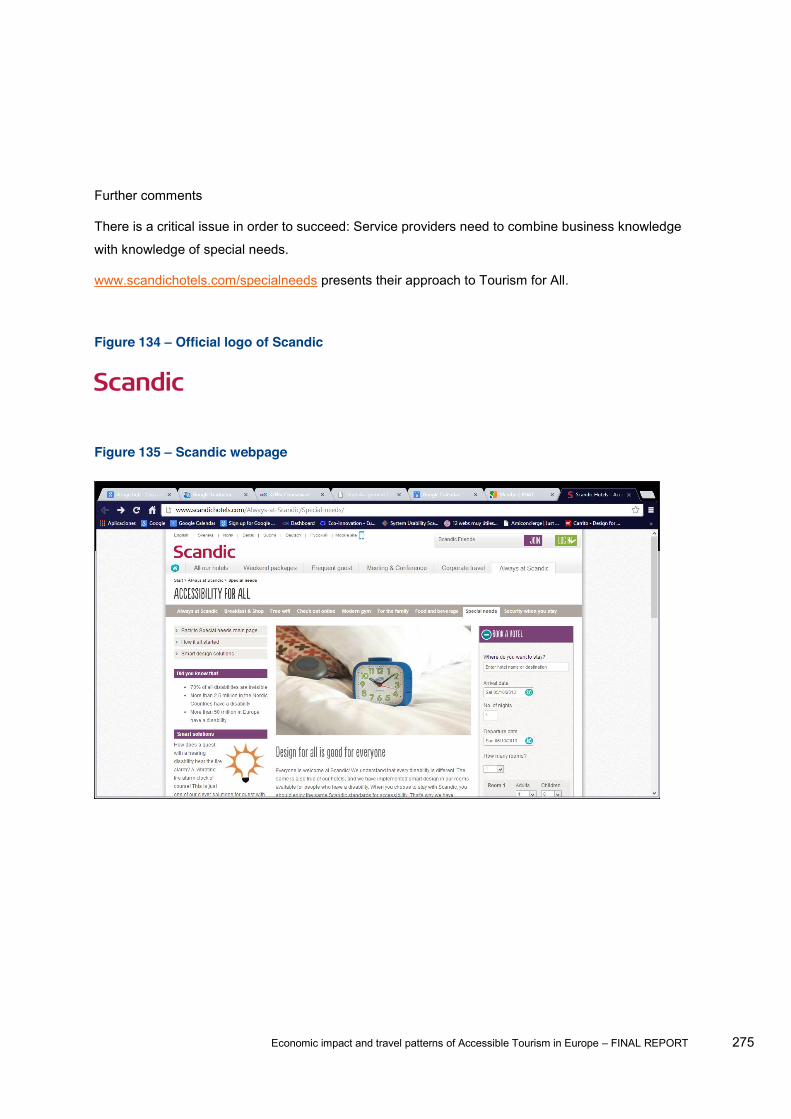
Economic impact and travel patterns of Accessible Tourism in Europe FINAL REPORT 275
Further comments
There is a critical issue in order to succeed: Service providers need to combine business knowledge
with knowledge of special needs.
www.scandichotels.com/specialneeds presents their approach to Tourism for All.
Figure 134 Official logo of Scandic
Figure 135 Scandic webpage

Economic impact and travel patterns of Accessible Tourism in Europe FINAL REPORT 276
5.1.3.8 Case Study: GVAM
GVAM was created in 2007 with the aim of reinventing the concept of a guided tour. Their aim was
to provide the best educational and emotional experience when exploring cultural and tourist areas.
Their business model is based on focussing on people. They consider accessibility as synonymous
of good design and good performance. Their aim is that their technologies are and will always be
easy to understand, simple and cost-effective implemented.
The team consists of professionals from the world of graphic, industrial and interactive design,
computer engineering, social communication, international marketing and research.
They offer accessible mobile apps made with GVAM, an online system for creating and publishing
audio tours and multimedia guides on major mobile platforms
GVAM was conceived as a universal guidance system including people with disabilities.
The check of the success factors reveals the following findings:
1. Commitment of decision-makers
Culture must be accessible for all. That was the main idea of founder partners since
beginning.
It is not only a rewarding point but a responsible attitude before society.
2. Coordinating and continuity
The company started as a partnership between Dos de Mayo SL (multimedia and web
production), Universidad Carlos III de Madrid (R&D&i), ONCE (Spanish blind people main
NGO) and CESyA (Spanish Centre for Audio description and subtitling) ), CNSE and
FIAPAS (both federations of associations of deaf people, one with a more sign language
approach and the other with a more oral one) ) and with the support of the Real Patronato
sobre Discapacidad (Official Spanish organisation dealing with disability). Although they
maintain excellent relations the company is run by their staff independently.
3. Networking and participation
The service was launched with the advice of national associations of people with disabilities
and the National Administration and they still keep strong links.
4. Strategic planning
The process was planned since the beginning but improvements have been made in order
Economic impact and travel patterns of Accessible Tourism in Europe FINAL REPORT 277
5. Qualification and knowledge transfer
GVAM have in its team external advisers about special access needs although internal
knowledge grows day by day.
6. Communication and distribution
Their own web site, Apps (can be downloaded in Apple Store the ones for Museo Lázaro
Galdiano, Alcázar, Museo Sorolla) and brochures.
Speeches in professional museum and accessibility events.
7. Improvement of resources and capabilities
The requested investments for initial R&D&i were planned from the beginning but not the
ones related to technical evolution. The investment pay back for the start-up was 3 years.
They are really proud of GVAM as the only accessible guiding system in the market, as they
claim. It was a good investment for society because they consider that we all have special
er experiences with no extra
costs.
The published Apps are compatible with the native accessibility features in iOS and Android,
such as VoiceOver and TalkBalk.
They claim that visitors of all ages, abilities and languages may use the guides thanks to the
advanced editing tools that incorporate:
Automatic audio-navigation for the visually impaired.
Subtitled voiceover speeches and automatic full review online editor.
Sign language videos.
Easy reading texts and pictograms.
Drivers & Obstacles
Drivers
Social Responsibility and detection of a lack of communication about accessibility in cultural
premises.
Obstacles
The critical issues are institutions in charge of incorporating accessible products or services.
They have no knowledge about what to do and they are afraid of costs and technologies.

Economic impact and travel patterns of Accessible Tourism in Europe FINAL REPORT 278
Figure 136 GVAM webpage
Figure 137 Official logo of SGVAM
5.1.3.9 Case study: Restaurant Monnalisa Beach Restaurant
The Monnalisa Beach Restaurant is situated inside the Holiday Village Florenz in Lido degli Scacchi,
Comacchio (Ferrara),built in 2008 according to the Italian accessibility laws.
The menu is normally based on seafood and fish. On demand it is also possible to have meals for
people with food allergies and intolerances.
The restaurant is open also to external guests and is available for special events, celebrations and
parties.
Monitoring the success factors reveals the following findings:
1. Commitment of decision-makers
The property owner are aware of Accessible tourism and committed to it
Economic impact and travel patterns of Accessible Tourism in Europe FINAL REPORT 279
The propriety decided in 2006 to arrange in an accessible way the facilities within the
Holiday Village. In this perspective, some bungalows and holiday flats had been built and
furnished in a way that could fit the needs of as many guests as possible; moreover the
restaurant Monnalisa was built barrier-free to allow every guest (internal and external) to
fully enjoy the time within the Holiday Village.
2. Coordinating and continuity
Since 2006 the internal policy of the propriety has started to develop the accessibility
organization and design of the Holiday Village, from car parks, to paths leading to the
facilities, to the restaurant and to the beach, toilets and to the restaurant itself. Moreover, the
staff is also specifically trained to meet the needs of guests with disabilities. They have the
idea to developing it always consistently further, for example, for the next season it is
foreseen to install some fittings for people with visual impairments and also to have menus
in Braille.
3. Networking and participation
The Restaurant Monnalisa, being in the Holiday Village Florenz, belong also to the Network
Village4All, a Quality Brand Hospitality for All, that provides accessibility survey and makes
the info freely available in the own website.
The property has regular
4. Strategic planning
business reasons.
It carries out careful and constant promotion activities on its website and through specific
sporting events and tourist promotions.
The further steps towards more accessible offers will be:
Creating more accessible packages and providing more fittings and facilities for guest
with different disabilities
Increase Web marketing, fairs participation, Advertisement and Media campaigns
5. Qualification and knowledge transfer
Staff have been trained in services to fulfil the needs of guests with disabilities

Economic impact and travel patterns of Accessible Tourism in Europe FINAL REPORT 280
6. Communication and distribution
Through the link www.campingflorenz.it/eng/village/camping-for-disabled.php it is possible
to find out much information about the accessibility of the Holiday Village.
Info about the accessibility condition are also available here: www.villageforall.net/en/italia-
emilia_romagna-lido_degli_scacchi_comacchio_ferrara-campeggio_villaggio_accessibile-
holiday_village_florenz/
7. Improvement of resources and capabilities
Website improvement
Networking and collaboration
It is possible to rent a wheelchair to move within the Holiday Village and also to reach the
Restaurant. It is possible to have the meals delivered from the restaurant to the holiday
houses within the village.
Drivers & Obstacles
Drivers
Constant engagement
Accessible tourism leads to positive results in marketing and business
Obstacles
Investment is needed
Further comments
The accessibility improvements have given to the restaurant and Village the possibility of
hosting groups of people with disabilities and also to host accessible sporting events.
Moreover, the accessibility of the facilities guarantees more comfortable experiences for all
the guests, who are mainly families.
Economic impact and travel patterns of Accessible Tourism in Europe FINAL REPORT 281
Figure 138 Monnalisa restaurant (Photo: http://www.campingflorenz.it/ita/servizi/monnalisa.php )
5.1.3.10 Case study: Restaurant I Girasoli
I Girasoli Restaurant is situated within the Casa Vacanze I Girasoli in the southern part of Tuscany.
The all facilities haves been built in 2000 according to the Italian accessibility laws. Everything was
designed and built with a special focus to the needs of guests with mobility impairment. The Casa
Vacanze belongs to AISM, (Italian Multiple Sclerosis Society), an Italian national charity on Multiple
Sclerosis and it was foreseen to host the own members and families.
On demand it is possible to have meals for people with food allergies and intolerances.
The restaurant is open to external guests and is available for meetings and special events.
Casa Vacanze is fully accessible to people with mobility impairment. In this perspective, the 51
rooms and 9 bungalows, the restaurant, the paths in the surrounding park and the external areas
can be fully enjoyed by all the guests (there are also 2 swimming pools with lifting equipment to
access to water and a gym).
Not only the buildings, connection paths and open spaces are accessible, but the staff can propose
a series of accessible service to the guests, i.e. shuttle service from and to the airports or arrival
spots, accessible guided tour to the main tourist highlights of the surroundings and of the neighbour
regions, wine tours and testing, educational tour with sommelier. Wheelchairs and other equipment
can be borrowed free of charge. Moreover, the staff is also specifically sensitised and trained to
match the needs of guest with mobility impairment.
Economic impact and travel patterns of Accessible Tourism in Europe FINAL REPORT 282
Monitoring the success factors reveals the following findings:
1. Commitment of decision-makers
The aim of the propriety was since the beginning to allow the members of AISM and their
families to enjoy an active and relaxing holiday in the wonderful Tuscan setting. Accessible
tourism for people with mobility impairment was (and still is) the goal of the propriety.
2. Coordinating and continuity
The propriety has started since some years to become mainstream and to open up to the
market, national and international. In this respect, they have already gained a lot of new
tourists. To go further in this direction, they have the intention to start renovating some of the
rooms in the direction of Design for All, thus maintaining the high accessibility level that they
already have.
3. Networking and participation
The Restaurant I Girasoli and the all Casa Vacanze belongs to the Network of AISM
properties likehome.it.
It is also included in the Network Village4All, a Quality Brand Hospitality for All that performs
accessibility surveys and makes the information freely available on their website.
It is also member of ENAT - European Network for Accessible Tourism (non-profit
association).
The facility is also present on booking.com, expedia.com and other national and
international tourist booking internet portals.
4. Strategic planning
accessibility is based on social reasons.
The further steps towards a more accessible offers will be:
Providing more fittings and facilities for guest with different disabilities
Re-designing in a more appealing way the accessible rooms.
5. Qualification and knowledge transfer
Staff have been trained in services to fulfil the needs of guests with disabilities
6. Communication and distribution
The link www.igirasoli.ar.it/ provides information on accessibility of the Casa Vacanze and
the restaurant.

Economic impact and travel patterns of Accessible Tourism in Europe FINAL REPORT 283
Information about the accessibility of the property are available on www.likehome.it and
http://www.villageforall.net/en/italia-toscana-croce_di_lucignano_arezzo-
villaggio_accessibile-casa_vacanze_i_girasoli/
They carry out promotional activities through specific events and tourist promotions.
For some years the property has been to the national and international mainstream market
7. Improvement of resources and capabilities
Networking and collaboration
Drivers & Obstacles
Drivers
Constant engagement
Opening to mainstream tourism having accessible facilities leads to positive results
Obstacles
The house is clearly devoted to guests with disabilities. This may lead to a social
segregation of guests.
Further comments
The management has also to opened other facilities (i.e. the swimming pools) to the citizens
of the surrounding area and it is also organising events open to all (aqua gym courses and
other special events).

Economic impact and travel patterns of Accessible Tourism in Europe FINAL REPORT 284
Figure 139 Girasoli restaurant (Photos: http://www.igirasoli.ar.it)
5.1.4 Analysis of the case studies To analyse the case studies the available information about organisation and actions were collected
and the results grouped according to the already mentioned 7 ISF.
To render the analysis easier to understand we have grouped the case studies in a table that state
H21: In mainstream tourism services investment in accessibility results in increased client
numbers.
H22: Destinations that take care for accessibility usually are focused on service quality in
general.
H23: The successful accessible destinations show some kind of cooperation among service
providers.
H24: Some destinations succeed in including accessibility, comfort and services in their
branding.
In the same row the 7 ISF have been listed to show if each of the Success Factors has been well
(Figure 140).

Economic impact and travel patterns of Accessible Tourism in Europe FINAL REPORT 285
Figure 140 Case studies and success factors
CASE H21
H22
H23
H24
1 ISF
2 IFS
3 ISF
4 ISF
5 ISF
6 ISF
7 ISF
Erfurt x x x x x x x x x x x
Acc. Poland * o o x x o o o o x o
Château x x x x x x x x x x x
Wine Cellar x x o o x x x o x o x
Berlin x x x x x x x x x x x
Barcelona Metro
x x x x x x x x x x x
Scandic x x x x x x x x x x x
GVAM x x x x x x x x x x x
Rest. Monnalisa
x x x x x x x x x x x
Rest. I Girasoli * x x x x x x x x x x
*H21 is not applicable to these cases as they do not address mainstream tourism.
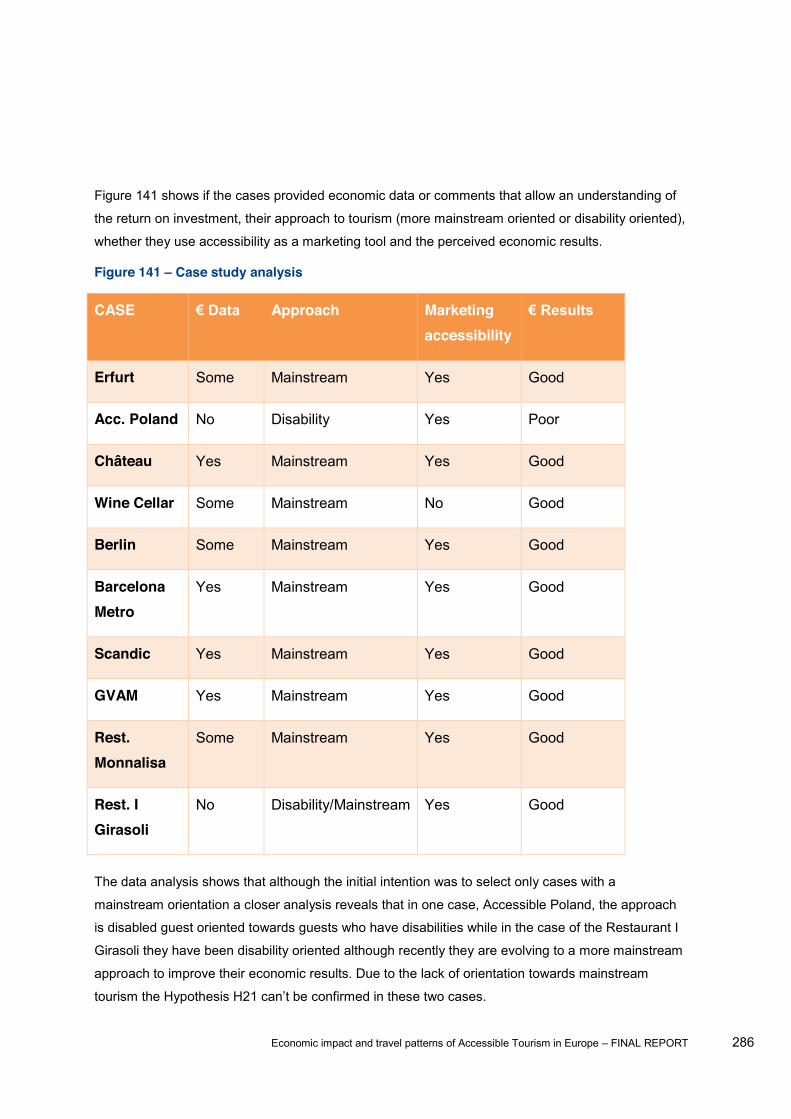
Economic impact and travel patterns of Accessible Tourism in Europe FINAL REPORT 286
Figure 141 shows if the cases provided economic data or comments that allow an understanding of
the return on investment, their approach to tourism (more mainstream oriented or disability oriented),
whether they use accessibility as a marketing tool and the perceived economic results.
Figure 141 Case study analysis
CASE Approach Marketing accessibility
Erfurt Some Mainstream Yes Good
Acc. Poland No Disability Yes Poor
Château Yes Mainstream Yes Good
Wine Cellar Some Mainstream No Good
Berlin Some Mainstream Yes Good
Barcelona Metro
Yes Mainstream Yes Good
Scandic Yes Mainstream Yes Good
GVAM Yes Mainstream Yes Good
Rest. Monnalisa
Some Mainstream Yes Good
Rest. I Girasoli
No Disability/Mainstream Yes Good
The data analysis shows that although the initial intention was to select only cases with a
mainstream orientation a closer analysis reveals that in one case, Accessible Poland, the approach
is disabled guest oriented towards guests who have disabilities while in the case of the Restaurant I
Girasoli they have been disability oriented although recently they are evolving to a more mainstream
approach to improve their economic results. Due to the lack of orientation towards mainstream

Economic impact and travel patterns of Accessible Tourism in Europe FINAL REPORT 287
In the cases of Erfurt and Berlin the lack of available economic data is understandable as the
investments for improving accessibility are assumed by many public and private operators in an
isolated way.
In the case of St. Martin Wine Cellar it was only possible to obtain indirect data about guests
received without indication of the evolution of these numbers. We estimate that there are two
reasons for this: their main activity is to produce and sell wine, the visits being a marketing tool and,
on the other hand, the small investments done to improve accessibility are considered by them as
valuable for all guests as they are not especially focussed on disabled guests.
Finally in the Restaurant Monnalisa case the economic data cannot be concretised as they have
designed and built the property to be accessible from the beginning and therefore no special
investment was made although they declare that more investment should be made without defining
its amount. We have also been unable to obtain data about the increase in guest numbers.
5.1.5 Conclusions The hypotheses status confirmed for the analysed cases:
It has emerged that the increase in guest numbers consists not only of disabled customers but of
customers in general.
It has emerged that in most cases accessibility is integrated as part of the quality policy.
It is clear that cooperation with other local service providers is close success is greater although if
cooperation is not close, but the provision of accessible services is assured along the tourism chain
the results are also good.
In most of the cases the way of including accessibility in their advertising tools is as a characteristic
or service included among others emphasising more what they offer than to whom the offer it. The
Accessible Poland Tours is not a mainstream service. Their economic results are not
good
I Girasoli is evolving from a disabled marketing orientation to a more mainstream
orientation. Their economic results are improving.
It is more likely that a business will succeed if the management are professionals in
their sector with awareness of accessibility needs rather than being disability
professionals running a tourism business.
All the cases that show good economic results and that communicate their offer
efficiently have been managed well each aspect of the 7 ISF:

Economic impact and travel patterns of Accessible Tourism in Europe FINAL REPORT 288
Although social responsibility is a motivation it does not make the company deviate from its own
business focus.
The engagement and training of all the staff is a key issue that improves results.
Knowledge transfer flows more easily when the organisation is part of a number of professional
networks such as Design for All.
To plan the actions and anticipate the results before starting is also a key element of success.
The importance of investment varies largely depending on the type of services provided and whether
the accessibility improvements have been included since inception, have been planned or have
been made in response to demand. But even in the case of the highest investment among the cases
which resulted in an investment of
for each new passenger in the following year, this implied a payback in less than two years,
based on an increase of 16% in passenger numbers as estimated by the company. This example,
together with the others from cases from which we have obtained concrete economic data, allow us
to conclude that planned and reasonable investments pay back in a short period if the 7 IFS has
been correctly addressed.
Finally it should be underlined that all cases that have succeed in managing the 7 ISF have
validated all the working hypotheses proposed.
5.2 Task 3b - Desk research on existing barriers faced or perceived by people with access needs
5.2.1 Methodology
5.2.1.1 Desk research The main aim for task 3b is to reach a thorough understanding of the barriers faced by people with
access needs. It is important that the barriers for each tourism sector are identified in order to allow
for the development of specific action plans to eliminate existing obstacles. Findings from task 3b
are channelled into the recommendation section (section 7).
In order to meet the objective of Task 3b, desk research was employed. Desk research, e.g. the
collection of secondary data, is a widely used research technique in market research. The
systematic review of the literature on access barriers was essential to fulfil four purposes (see Figure
142).
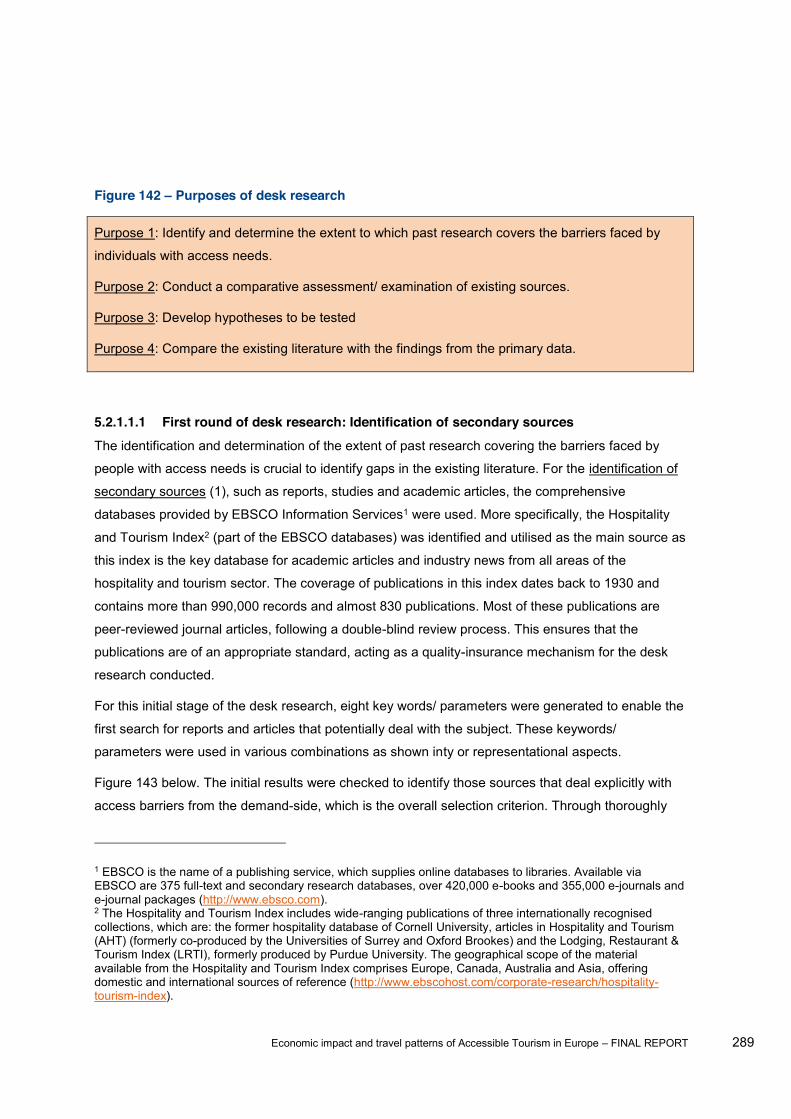
Economic impact and travel patterns of Accessible Tourism in Europe FINAL REPORT 289
Figure 142 Purposes of desk research
Purpose 1: Identify and determine the extent to which past research covers the barriers faced by
individuals with access needs.
Purpose 2: Conduct a comparative assessment/ examination of existing sources.
Purpose 3: Develop hypotheses to be tested
Purpose 4: Compare the existing literature with the findings from the primary data.
5.2.1.1.1 First round of desk research: Identification of secondary sources The identification and determination of the extent of past research covering the barriers faced by
people with access needs is crucial to identify gaps in the existing literature. For the identification of
secondary sources (1), such as reports, studies and academic articles, the comprehensive
databases provided by EBSCO Information Services1 were used. More specifically, the Hospitality
and Tourism Index2 (part of the EBSCO databases) was identified and utilised as the main source as
this index is the key database for academic articles and industry news from all areas of the
hospitality and tourism sector. The coverage of publications in this index dates back to 1930 and
contains more than 990,000 records and almost 830 publications. Most of these publications are
peer-reviewed journal articles, following a double-blind review process. This ensures that the
publications are of an appropriate standard, acting as a quality-insurance mechanism for the desk
research conducted.
For this initial stage of the desk research, eight key words/ parameters were generated to enable the
first search for reports and articles that potentially deal with the subject. These keywords/
parameters were used in various combinations as shown inty or representational aspects.
Figure 143 below. The initial results were checked to identify those sources that deal explicitly with
access barriers from the demand-side, which is the overall selection criterion. Through thoroughly
1 EBSCO is the name of a publishing service, which supplies online databases to libraries. Available via EBSCO are 375 full-text and secondary research databases, over 420,000 e-books and 355,000 e-journals and e-journal packages (http://www.ebsco.com). 2 The Hospitality and Tourism Index includes wide-ranging publications of three internationally recognised collections, which are: the former hospitality database of Cornell University, articles in Hospitality and Tourism (AHT) (formerly co-produced by the Universities of Surrey and Oxford Brookes) and the Lodging, Restaurant & Tourism Index (LRTI), formerly produced by Purdue University. The geographical scope of the material available from the Hospitality and Tourism Index comprises Europe, Canada, Australia and Asia, offering domestic and international sources of reference (http://www.ebscohost.com/corporate-research/hospitality-tourism-index).
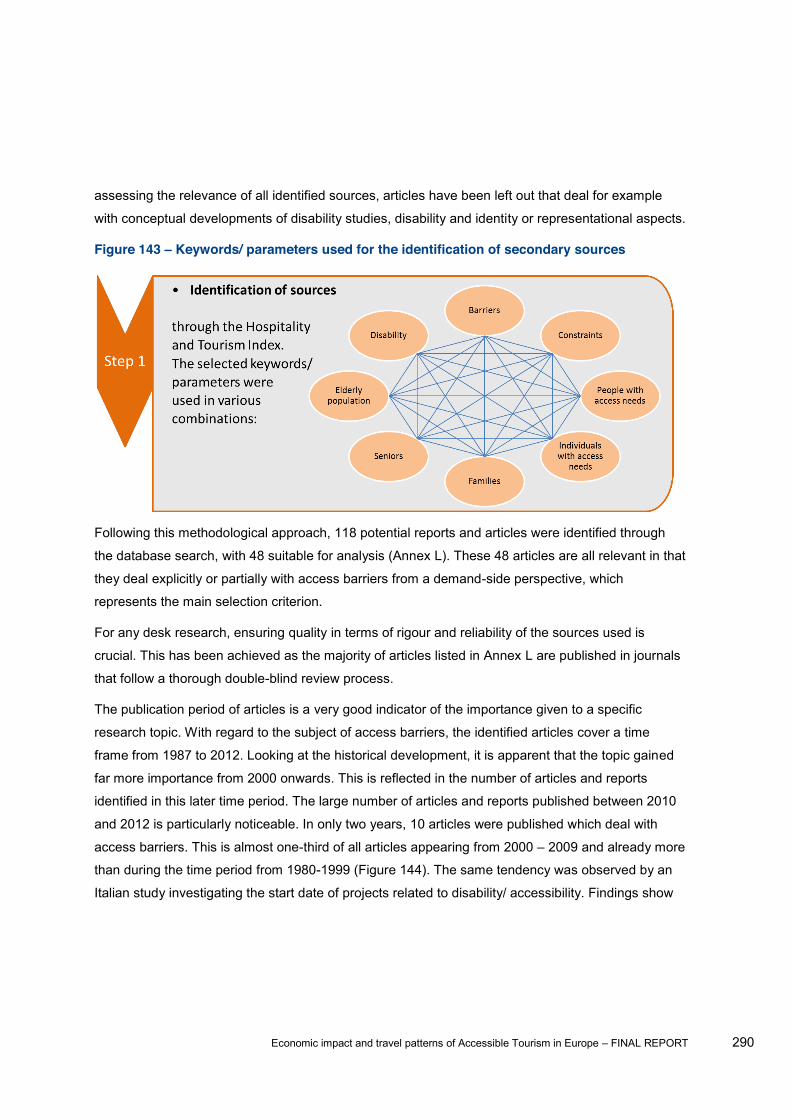
Economic impact and travel patterns of Accessible Tourism in Europe FINAL REPORT 290
assessing the relevance of all identified sources, articles have been left out that deal for example
with conceptual developments of disability studies, disability and identity or representational aspects.
Figure 143 Keywords/ parameters used for the identification of secondary sources
Following this methodological approach, 118 potential reports and articles were identified through
the database search, with 48 suitable for analysis (Annex L). These 48 articles are all relevant in that
they deal explicitly or partially with access barriers from a demand-side perspective, which
represents the main selection criterion.
For any desk research, ensuring quality in terms of rigour and reliability of the sources used is
crucial. This has been achieved as the majority of articles listed in Annex L are published in journals
that follow a thorough double-blind review process.
The publication period of articles is a very good indicator of the importance given to a specific
research topic. With regard to the subject of access barriers, the identified articles cover a time
frame from 1987 to 2012. Looking at the historical development, it is apparent that the topic gained
far more importance from 2000 onwards. This is reflected in the number of articles and reports
identified in this later time period. The large number of articles and reports published between 2010
and 2012 is particularly noticeable. In only two years, 10 articles were published which deal with
access barriers. This is almost one-third of all articles appearing from 2000 2009 and already more
than during the time period from 1980-1999 (Figure 144). The same tendency was observed by an
Italian study investigating the start date of projects related to disability/ accessibility. Findings show

Economic impact and travel patterns of Accessible Tourism in Europe FINAL REPORT 291
that a high percentage of projects were initiated from 2009 20121, which indicates that the topic
has received more attention and achieved more significance over the last ten years.
Figure 144 Publication period of articles identified during the first search round
With regard to the nature of the research approach of the identified sources, some articles deal with
access barriers in a purely conceptual manner (e.g. Smith, 1987) and relatively few articles deal with
the topic from a quantitative perspective. Thus, the majority of sources focus on an exploratory,
qualitative approach mainly based on interviewing people with access needs.
The qualitative nature of the data found on barriers can be explained as follows:
Research into disability is a relatively new and evolving area in tourism and hospitality, therefore
qualitative research is mainly employed to build theory which can be tested at a later stage
through quantitative methods
The focus of the research is mainly based on gaining a better understanding of individual,
subjective tourist experiences which are often investigated by using qualitative methodologies2
Due to the subjective perceptions of barriers, concepts and issues have to be defined by the
people who face access constraints (qualitative methods) instead of providing definitions in
advance (quantitative methods)
In summary, qualitative, exploratory research has been mostly employed in order to gain a deeper
understanding of the subjective experiences of barriers in a tourism context. The information
collected through this approach does not lend itself to statistical analysis as the focus is placed on
1 Presidenxa del Consiglio dei Ministri (2013). Accessibile è meglio: Primo Libro Bianco sul Turismo per Tutti in Italia 2013. Comitato per la Promozione e il Sostegno del Turismo Accessibile. Available at: http://www.unifg.it/dwn/ateneo/sportello_west/accessibile_libro_bianco.pdf 2 McCabe, S., & Stokoe, E. (2009) "Have you been away?": Holiday Talk in Ordinary and Institutional Interaction. IN Richards, V. & Raguz, A. (Eds.) 3rd Critical Tourism Studies Conference. Connecting Academies of Hope: Critical Actions and Creative Vistas. Zadar, Croatia, 21.-24. June 2009.

Economic impact and travel patterns of Accessible Tourism in Europe FINAL REPORT 292
gathering large amounts of relatively detailed information about a relatively few cases. However, a
primary data collection process based on the online survey (task 2b) is used after the completion of
the desk research to obtain more quantitative information related to the barriers faced by people with
access needs.
5.2.1.1.2 First round of desk research: Examination/ assessment of relevant secondary sources
After assessing the relevance of sources, focusing only on articles that deal with access barriers
faced by people with access needs, the examination/ assessment of reports and academic articles
was conducted (2). This was based on following a simultaneous screening process related to three
dimensions (Annex M):
Type of impairment/ restriction1
Tourism sector
Geographical coverage
Figure 145 Simultaneous screening process used for the examination/ assessment of secondary sources
1 ho have impairments, such as for example mobility or sight impairments, as well as people who are temporarily restricted due to e.g. travelling with small children.

Economic impact and travel patterns of Accessible Tourism in Europe FINAL REPORT 293
Using these screening dimensions at the same time allows for a comprehensive understanding of:
Which types of impairment/ restriction are covered by secondary data
Which tourism sectors are covered by secondary data
Which countries have been investigated by existing research
The initial search enabled the first round of evaluation/ assessment providing an overview of the
barriers faced by individuals with access needs. The next section provides an explanation on how
the identified sources were assessed, followed by a justification for pursuing a second round of
literature search.
Following the simultaneous screening process based on three dimensions (Figure 145), the
identified 48 articles revealed the following subcategories which have been used for assessment:
Dimension: Type of impairment/ restriction:
Mobility Impairment
Blind/ Vision Impairment
Deaf/ Hearing Impairment
Speech Impairment
Cognitive Impairment
Hidden Impairment
Elderly Population
Parents of disabled children
Families
In addition to these 9 groups, a large number of sources did not explicitly specify the impairment/
barriers faced by individuals with mobility impairments, followed by articles not directly specifying the
type of impairment/ restriction and people with vision impairments. Very limited research exists
which deals with barriers faced by people with hidden impairments, cognitive impairments, speech
impairments or families and parents with disabled children (Figure 146). These findings are in line
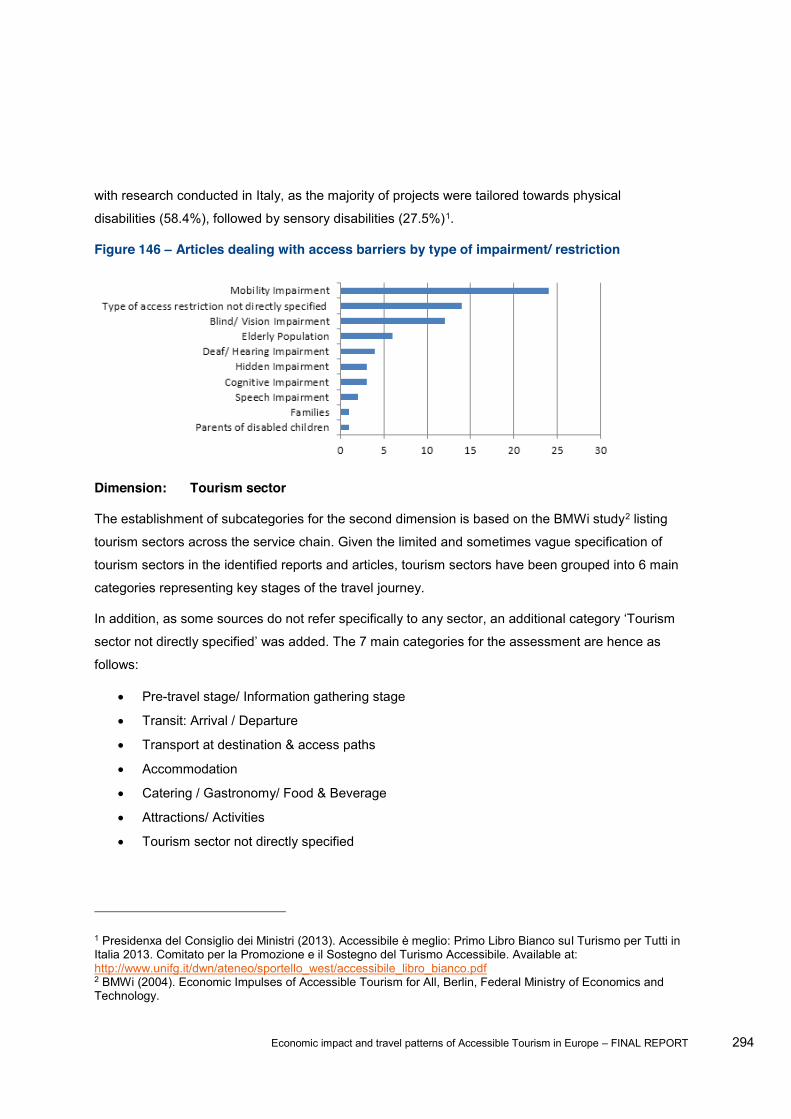
Economic impact and travel patterns of Accessible Tourism in Europe FINAL REPORT 294
with research conducted in Italy, as the majority of projects were tailored towards physical
disabilities (58.4%), followed by sensory disabilities (27.5%)1.
Figure 146 Articles dealing with access barriers by type of impairment/ restriction
Dimension: Tourism sector
The establishment of subcategories for the second dimension is based on the BMWi study2 listing
tourism sectors across the service chain. Given the limited and sometimes vague specification of
tourism sectors in the identified reports and articles, tourism sectors have been grouped into 6 main
categories representing key stages of the travel journey.
follows:
Pre-travel stage/ Information gathering stage
Transit: Arrival / Departure
Transport at destination & access paths
Accommodation
Catering / Gastronomy/ Food & Beverage
Attractions/ Activities
Tourism sector not directly specified
1 Presidenxa del Consiglio dei Ministri (2013). Accessibile è meglio: Primo Libro Bianco sul Turismo per Tutti in Italia 2013. Comitato per la Promozione e il Sostegno del Turismo Accessibile. Available at: http://www.unifg.it/dwn/ateneo/sportello_west/accessibile_libro_bianco.pdf 2 BMWi (2004). Economic Impulses of Accessible Tourism for All, Berlin, Federal Ministry of Economics and Technology.
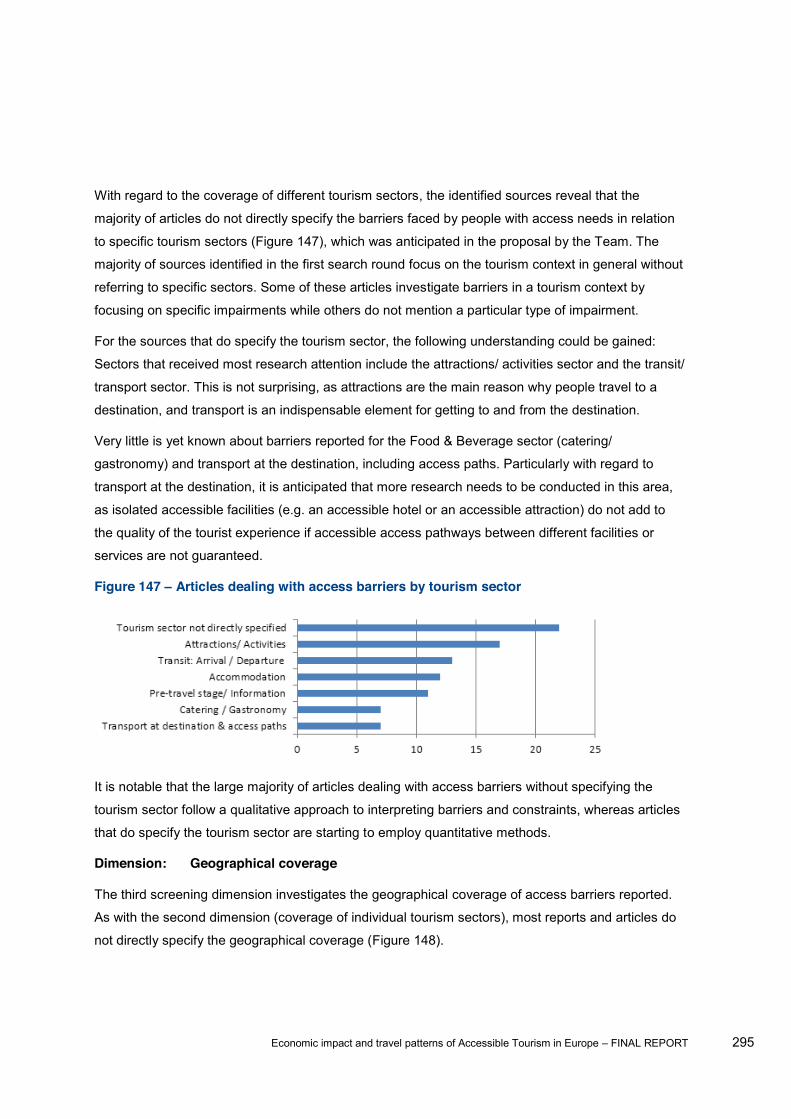
Economic impact and travel patterns of Accessible Tourism in Europe FINAL REPORT 295
With regard to the coverage of different tourism sectors, the identified sources reveal that the
majority of articles do not directly specify the barriers faced by people with access needs in relation
to specific tourism sectors (Figure 147), which was anticipated in the proposal by the Team. The
majority of sources identified in the first search round focus on the tourism context in general without
referring to specific sectors. Some of these articles investigate barriers in a tourism context by
focusing on specific impairments while others do not mention a particular type of impairment.
For the sources that do specify the tourism sector, the following understanding could be gained:
Sectors that received most research attention include the attractions/ activities sector and the transit/
transport sector. This is not surprising, as attractions are the main reason why people travel to a
destination, and transport is an indispensable element for getting to and from the destination.
Very little is yet known about barriers reported for the Food & Beverage sector (catering/
gastronomy) and transport at the destination, including access paths. Particularly with regard to
transport at the destination, it is anticipated that more research needs to be conducted in this area,
as isolated accessible facilities (e.g. an accessible hotel or an accessible attraction) do not add to
the quality of the tourist experience if accessible access pathways between different facilities or
services are not guaranteed.
Figure 147 Articles dealing with access barriers by tourism sector
It is notable that the large majority of articles dealing with access barriers without specifying the
tourism sector follow a qualitative approach to interpreting barriers and constraints, whereas articles
that do specify the tourism sector are starting to employ quantitative methods.
Dimension: Geographical coverage
The third screening dimension investigates the geographical coverage of access barriers reported.
As with the second dimension (coverage of individual tourism sectors), most reports and articles do
not directly specify the geographical coverage (Figure 148).
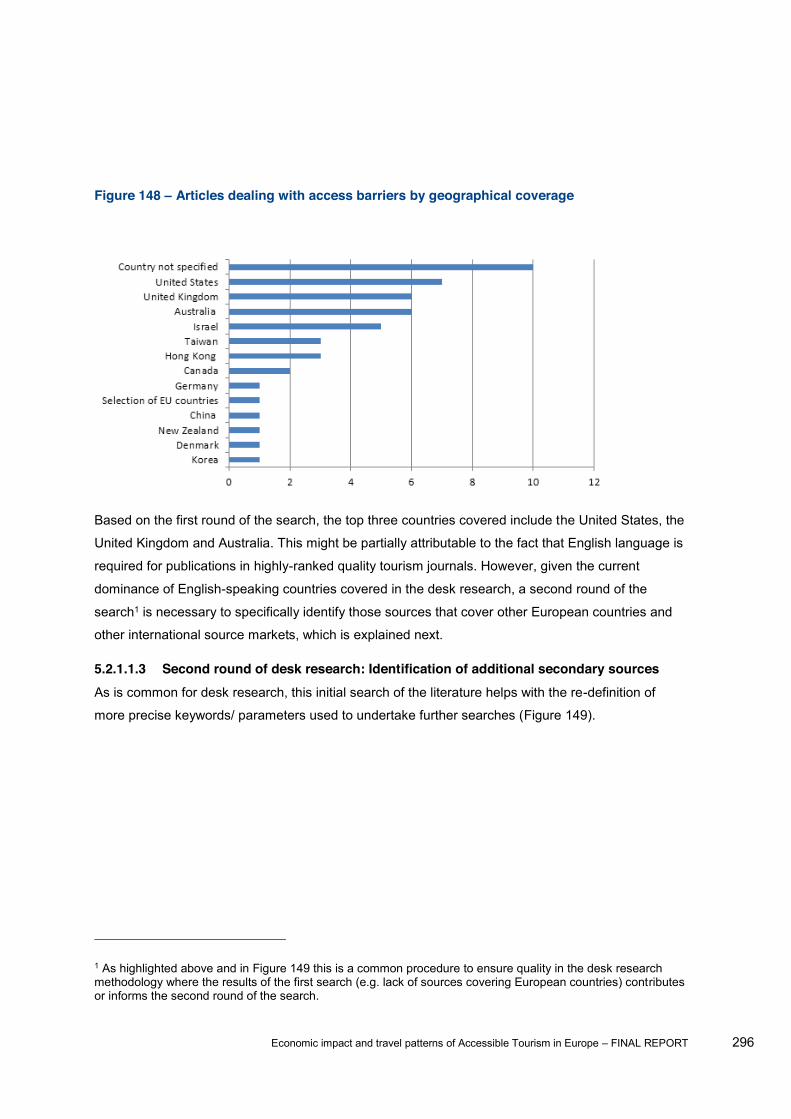
Economic impact and travel patterns of Accessible Tourism in Europe FINAL REPORT 296
Figure 148 Articles dealing with access barriers by geographical coverage
Based on the first round of the search, the top three countries covered include the United States, the
United Kingdom and Australia. This might be partially attributable to the fact that English language is
required for publications in highly-ranked quality tourism journals. However, given the current
dominance of English-speaking countries covered in the desk research, a second round of the
search1 is necessary to specifically identify those sources that cover other European countries and
other international source markets, which is explained next.
5.2.1.1.3 Second round of desk research: Identification of additional secondary sources As is common for desk research, this initial search of the literature helps with the re-definition of
more precise keywords/ parameters used to undertake further searches (Figure 149).
1 As highlighted above and in Figure 149 this is a common procedure to ensure quality in the desk research methodology where the results of the first search (e.g. lack of sources covering European countries) contributes or informs the second round of the search.

Economic impact and travel patterns of Accessible Tourism in Europe FINAL REPORT 297
Figure 149 The desk research process1
Thus, for the second round of search, the focus is placed on relevant material not identified through
the first round of search following a set of different variables, such as for example keywords/
parameters in different languages and/ or geographical areas2. The variables employed for the
second round of search focused on expanding the source of literature and keywords/ parameters
used to cover different geographical areas:
1 Saunders, M., Lewis, P., & Thornhill, A. (2003) Research Methods for Business Studies. Harlow, Pearson Education Limited. 2 Saunders, M., Lewis, P., & Thornhill, A. (2003) Research Methods for Business Studies. Harlow, Pearson Education Limited.
Research questions and objectives
Defineparameters
Generate and refine
keywords
Start draftingreview
Redefineparameters
Generate and refine
keywords
Update and revise draft
Redefine parameters
1. Conductsearch
2. Obtainliterature
3. Evaluate4. Record
Generate and refine
keywords
1. Conductsearch
2. Obtainliterature
3. Evaluate4. Record
1. Conductsearch
2. Obtainliterature
3. Evaluate4. Record

Economic impact and travel patterns of Accessible Tourism in Europe FINAL REPORT 298
Source of literature: Keywords/ parameters were employed for searching for relevant sources on
different internet sites. While the internet is a useful source, attention was paid to ensure a quality
control procedure. Reports were considered for inclusion if they are, for example, published by
recognised disability and/ or elderly organisations or other established social institutions in the
respective countries.
Keywords/ parameters: Using keywords/ parameters in different languages:
To identify sources in Spanish language:
barreras/ obstáculos (barriers) restricciónes (constraints) personas con nececidades
especiales/ personas con discapacidades/ personas con movilidad reducida (people/
individuals with access needs) familias (families) Personas de la tercera edad (seniors)
ancianos (elderly) incapacidad/ discapacidad/ minusvalía (disability)
To identify sources in German language:
Barrieren (barriers) Mobilitätseingeschränkte Menschen/ Aktivitätseingeschränkte
Menschen/ behinderte Menschen (people/ individuals with access needs) Familien
(families) Senioren (seniors) Ältere Bevölkerung (elderly population) Behinderung
(disability)
To identify sources in French language:
Barrières (barriers) limitations (constraints) personnes handicapées/ individus atteints
d'un handicap moteur (people/ individuals with access needs) familles (families) séniors
(seniors) personnes âgées (elderly population) déficience/ handicap (disability)
To identify sources in Portuguese language:
Barreiras (barriers) restrições (constraints) pessoas/individuos com necessidades de
acessibilidade (people/ individuals with access needs) familias (families) idosos (seniors)
população idosa (elderly population) deficiência (disability)
To identify sources in Italian language:
barriere (barriers) vincoli (constraints) persone con bisogni/esigenze di accessibilità
(people/ individuals with access needs) famiglie (families) anziani/senior (seniors)
popolazione anziana (elderly population) disabilità (disability)
Applying different keywords/ parameters and expanding on the source of literature led to the
inclusion of 75 new sources to ensure a sufficient coverage of European countries and major
inbound source markets. The full list of a total of 123 sources (from the first and second round of
desk research) used can be found in Annex N. Overall, the addition of these new sources
contributed to:
Substantiate or re-define the hypotheses (purpose of desk research 3)
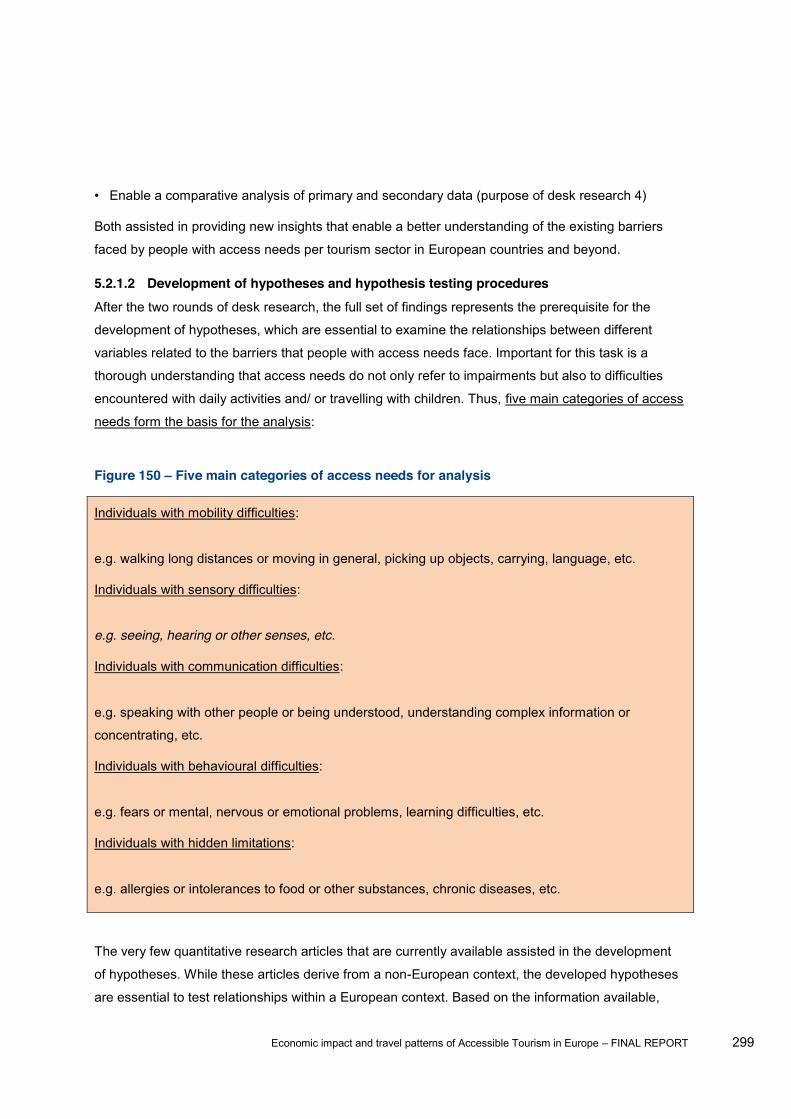
Economic impact and travel patterns of Accessible Tourism in Europe FINAL REPORT 299
Enable a comparative analysis of primary and secondary data (purpose of desk research 4)
Both assisted in providing new insights that enable a better understanding of the existing barriers
faced by people with access needs per tourism sector in European countries and beyond.
5.2.1.2 Development of hypotheses and hypothesis testing procedures After the two rounds of desk research, the full set of findings represents the prerequisite for the
development of hypotheses, which are essential to examine the relationships between different
variables related to the barriers that people with access needs face. Important for this task is a
thorough understanding that access needs do not only refer to impairments but also to difficulties
encountered with daily activities and/ or travelling with children. Thus, five main categories of access
needs form the basis for the analysis:
Figure 150 Five main categories of access needs for analysis
Individuals with mobility difficulties:
e.g. walking long distances or moving in general, picking up objects, carrying, language, etc.
Individuals with sensory difficulties:
e.g. seeing, hearing or other senses, etc.
Individuals with communication difficulties:
e.g. speaking with other people or being understood, understanding complex information or
concentrating, etc.
Individuals with behavioural difficulties:
e.g. fears or mental, nervous or emotional problems, learning difficulties, etc.
Individuals with hidden limitations:
e.g. allergies or intolerances to food or other substances, chronic diseases, etc.
The very few quantitative research articles that are currently available assisted in the development
of hypotheses. While these articles derive from a non-European context, the developed hypotheses
are essential to test relationships within a European context. Based on the information available,
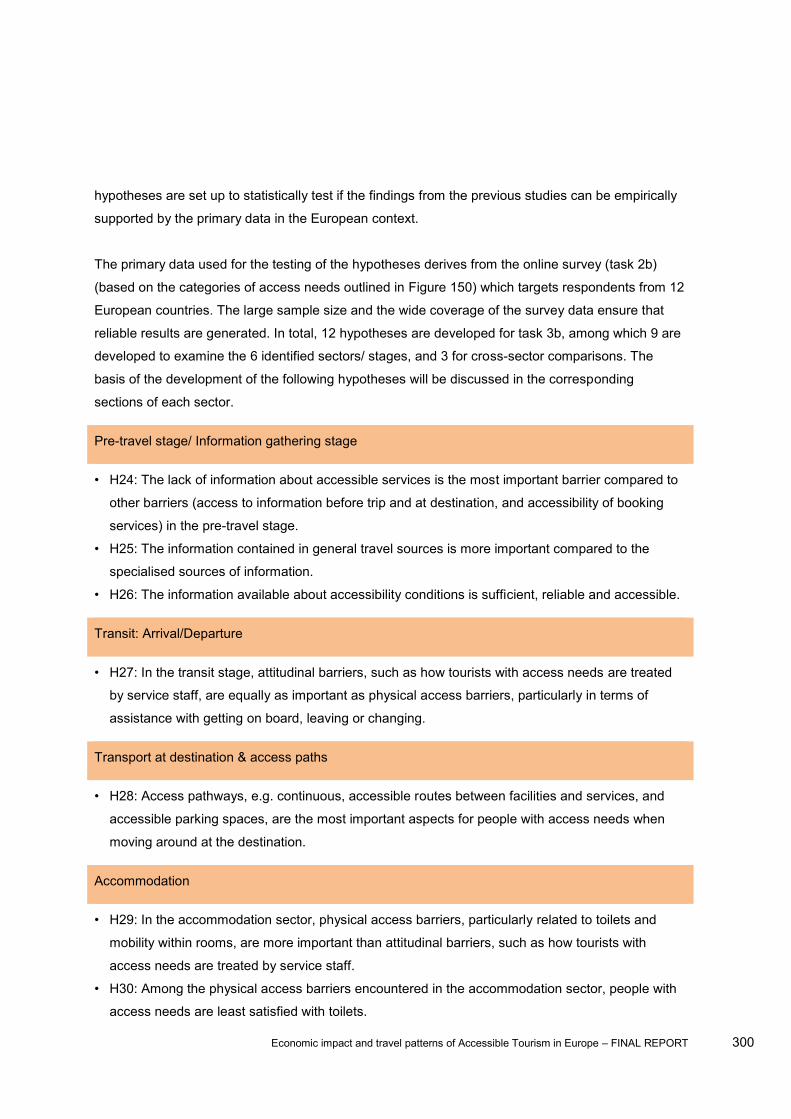
Economic impact and travel patterns of Accessible Tourism in Europe FINAL REPORT 300
hypotheses are set up to statistically test if the findings from the previous studies can be empirically
supported by the primary data in the European context.
The primary data used for the testing of the hypotheses derives from the online survey (task 2b)
(based on the categories of access needs outlined in Figure 150) which targets respondents from 12
European countries. The large sample size and the wide coverage of the survey data ensure that
reliable results are generated. In total, 12 hypotheses are developed for task 3b, among which 9 are
developed to examine the 6 identified sectors/ stages, and 3 for cross-sector comparisons. The
basis of the development of the following hypotheses will be discussed in the corresponding
sections of each sector.
Pre-travel stage/ Information gathering stage
H24: The lack of information about accessible services is the most important barrier compared to
other barriers (access to information before trip and at destination, and accessibility of booking
services) in the pre-travel stage.
H25: The information contained in general travel sources is more important compared to the
specialised sources of information.
H26: The information available about accessibility conditions is sufficient, reliable and accessible.
Transit: Arrival/Departure
H27: In the transit stage, attitudinal barriers, such as how tourists with access needs are treated
by service staff, are equally as important as physical access barriers, particularly in terms of
assistance with getting on board, leaving or changing.
Transport at destination & access paths
H28: Access pathways, e.g. continuous, accessible routes between facilities and services, and
accessible parking spaces, are the most important aspects for people with access needs when
moving around at the destination.
Accommodation
H29: In the accommodation sector, physical access barriers, particularly related to toilets and
mobility within rooms, are more important than attitudinal barriers, such as how tourists with
access needs are treated by service staff.
H30: Among the physical access barriers encountered in the accommodation sector, people with
access needs are least satisfied with toilets.
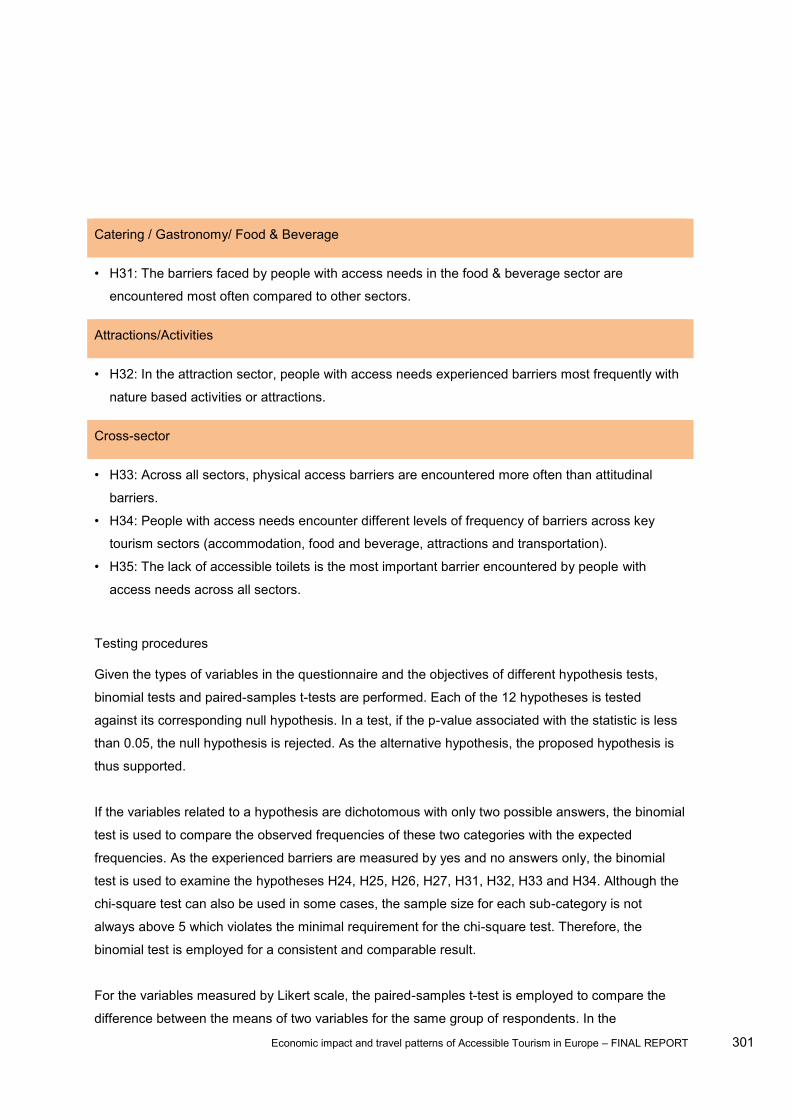
Economic impact and travel patterns of Accessible Tourism in Europe FINAL REPORT 301
Catering / Gastronomy/ Food & Beverage
H31: The barriers faced by people with access needs in the food & beverage sector are
encountered most often compared to other sectors.
Attractions/Activities
H32: In the attraction sector, people with access needs experienced barriers most frequently with
nature based activities or attractions.
Cross-sector
H33: Across all sectors, physical access barriers are encountered more often than attitudinal
barriers.
H34: People with access needs encounter different levels of frequency of barriers across key
tourism sectors (accommodation, food and beverage, attractions and transportation).
H35: The lack of accessible toilets is the most important barrier encountered by people with
access needs across all sectors.
Testing procedures
Given the types of variables in the questionnaire and the objectives of different hypothesis tests,
binomial tests and paired-samples t-tests are performed. Each of the 12 hypotheses is tested
against its corresponding null hypothesis. In a test, if the p-value associated with the statistic is less
than 0.05, the null hypothesis is rejected. As the alternative hypothesis, the proposed hypothesis is
thus supported.
If the variables related to a hypothesis are dichotomous with only two possible answers, the binomial
test is used to compare the observed frequencies of these two categories with the expected
frequencies. As the experienced barriers are measured by yes and no answers only, the binomial
test is used to examine the hypotheses H24, H25, H26, H27, H31, H32, H33 and H34. Although the
chi-square test can also be used in some cases, the sample size for each sub-category is not
always above 5 which violates the minimal requirement for the chi-square test. Therefore, the
binomial test is employed for a consistent and comparable result.
For the variables measured by Likert scale, the paired-samples t-test is employed to compare the
difference between the means of two variables for the same group of respondents. In the
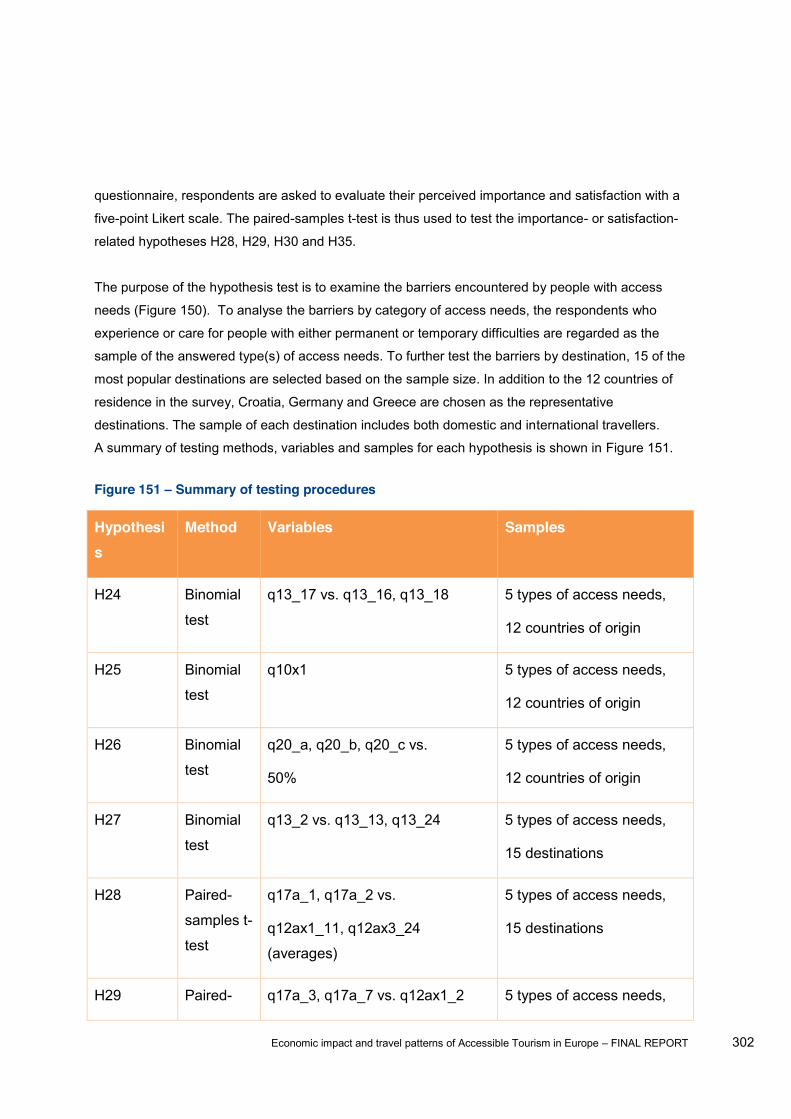
Economic impact and travel patterns of Accessible Tourism in Europe FINAL REPORT 302
questionnaire, respondents are asked to evaluate their perceived importance and satisfaction with a
five-point Likert scale. The paired-samples t-test is thus used to test the importance- or satisfaction-
related hypotheses H28, H29, H30 and H35.
The purpose of the hypothesis test is to examine the barriers encountered by people with access
needs (Figure 150). To analyse the barriers by category of access needs, the respondents who
experience or care for people with either permanent or temporary difficulties are regarded as the
sample of the answered type(s) of access needs. To further test the barriers by destination, 15 of the
most popular destinations are selected based on the sample size. In addition to the 12 countries of
residence in the survey, Croatia, Germany and Greece are chosen as the representative
destinations. The sample of each destination includes both domestic and international travellers.
A summary of testing methods, variables and samples for each hypothesis is shown in Figure 151.
Figure 151 Summary of testing procedures
Hypothesis
Method Variables Samples
H24 Binomial
test
q13_17 vs. q13_16, q13_18 5 types of access needs,
12 countries of origin
H25 Binomial
test
q10x1 5 types of access needs,
12 countries of origin
H26 Binomial
test
q20_a, q20_b, q20_c vs.
50%
5 types of access needs,
12 countries of origin
H27 Binomial
test
q13_2 vs. q13_13, q13_24 5 types of access needs,
15 destinations
H28 Paired-
samples t-
test
q17a_1, q17a_2 vs.
q12ax1_11, q12ax3_24
(averages)
5 types of access needs,
15 destinations
H29 Paired- q17a_3, q17a_7 vs. q12ax1_2 5 types of access needs,
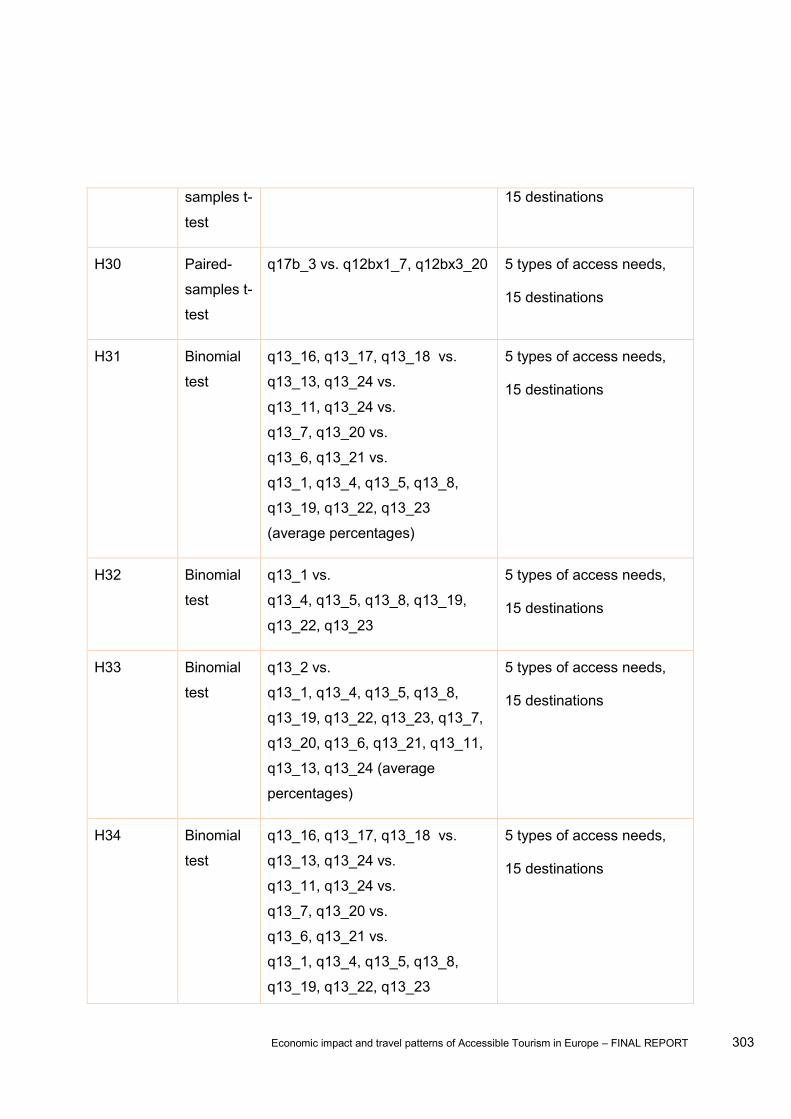
Economic impact and travel patterns of Accessible Tourism in Europe FINAL REPORT 303
samples t-
test
15 destinations
H30 Paired-
samples t-
test
q17b_3 vs. q12bx1_7, q12bx3_20 5 types of access needs,
15 destinations
H31 Binomial
test
q13_16, q13_17, q13_18 vs.
q13_13, q13_24 vs.
q13_11, q13_24 vs.
q13_7, q13_20 vs.
q13_6, q13_21 vs.
q13_1, q13_4, q13_5, q13_8,
q13_19, q13_22, q13_23
(average percentages)
5 types of access needs,
15 destinations
H32 Binomial
test
q13_1 vs.
q13_4, q13_5, q13_8, q13_19,
q13_22, q13_23
5 types of access needs,
15 destinations
H33 Binomial
test
q13_2 vs.
q13_1, q13_4, q13_5, q13_8,
q13_19, q13_22, q13_23, q13_7,
q13_20, q13_6, q13_21, q13_11,
q13_13, q13_24 (average
percentages)
5 types of access needs,
15 destinations
H34 Binomial
test
q13_16, q13_17, q13_18 vs.
q13_13, q13_24 vs.
q13_11, q13_24 vs.
q13_7, q13_20 vs.
q13_6, q13_21 vs.
q13_1, q13_4, q13_5, q13_8,
q13_19, q13_22, q13_23
5 types of access needs,
15 destinations
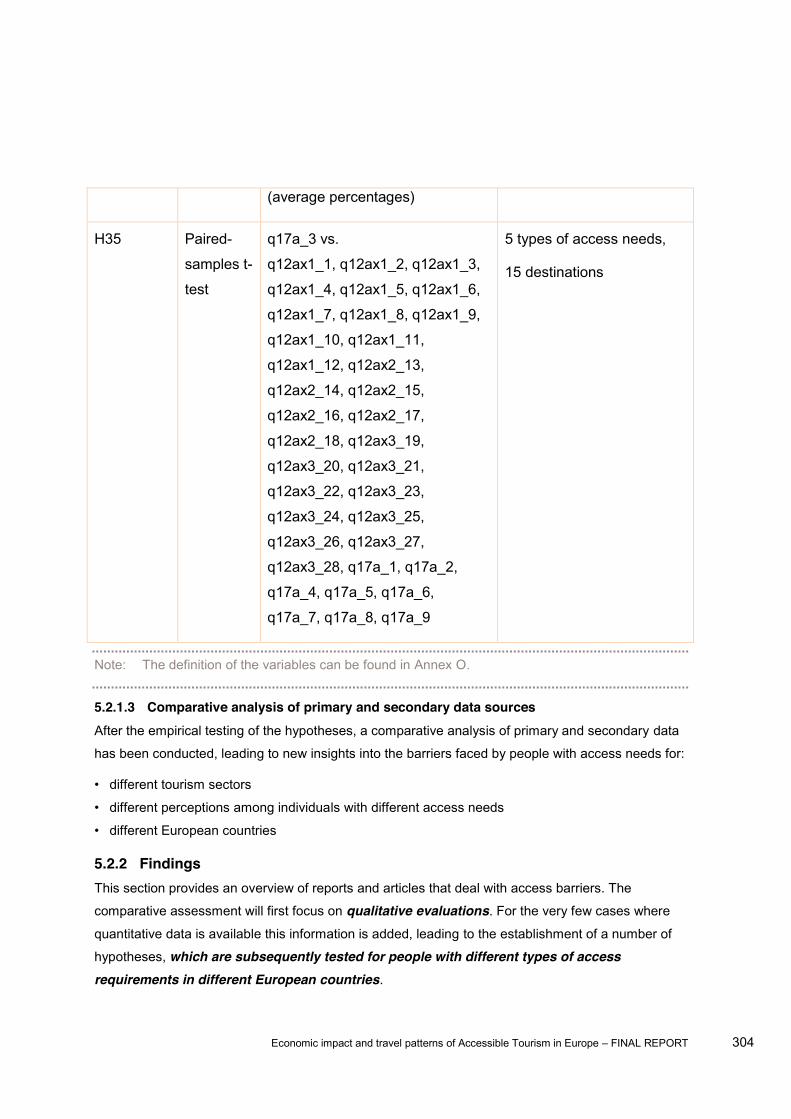
Economic impact and travel patterns of Accessible Tourism in Europe FINAL REPORT 304
(average percentages)
H35 Paired-
samples t-
test
q17a_3 vs.
q12ax1_1, q12ax1_2, q12ax1_3,
q12ax1_4, q12ax1_5, q12ax1_6,
q12ax1_7, q12ax1_8, q12ax1_9,
q12ax1_10, q12ax1_11,
q12ax1_12, q12ax2_13,
q12ax2_14, q12ax2_15,
q12ax2_16, q12ax2_17,
q12ax2_18, q12ax3_19,
q12ax3_20, q12ax3_21,
q12ax3_22, q12ax3_23,
q12ax3_24, q12ax3_25,
q12ax3_26, q12ax3_27,
q12ax3_28, q17a_1, q17a_2,
q17a_4, q17a_5, q17a_6,
q17a_7, q17a_8, q17a_9
5 types of access needs,
15 destinations
Note: The definition of the variables can be found in Annex O.
5.2.1.3 Comparative analysis of primary and secondary data sources After the empirical testing of the hypotheses, a comparative analysis of primary and secondary data
has been conducted, leading to new insights into the barriers faced by people with access needs for:
different tourism sectors
different perceptions among individuals with different access needs
different European countries
5.2.2 Findings This section provides an overview of reports and articles that deal with access barriers. The
comparative assessment will first focus on qualitative evaluations. For the very few cases where
quantitative data is available this information is added, leading to the establishment of a number of
hypotheses, which are subsequently tested for people with different types of access requirements in different European countries.

Economic impact and travel patterns of Accessible Tourism in Europe FINAL REPORT 305
In general, articles which deal with access barriers without specifying the type of restriction focus on
establishing categories of barriers. The seminal paper by Smith (1987) highlights three main barriers
to tourism participation. The first category relates to intrinsic barriers, including lack of knowledge,
health-related problems, social ineffectiveness and physical and psychological dependency. The
second category embraces environmental barriers, encompassing attitudinal, architectural,
ecological, transportation, and rules and regulations barriers. The last category refers to interactive
barriers highlighting skill challenges, incongruities and communication barriers1. A study conducted
in the UK confirms that these barriers also apply to people with hidden disabilities2.
Eichhorn and Buhalis (2011) also refer to three categories of barriers but focus on those constraints
that can be addressed by the tourism industry. These include: physical access barriers, attitudinal
barriers and the lack of information3. This coincides with other studies emphasising physical barriers
(e.g. inaccessible transport and holiday resorts) as well as environmental, economic, social and
attitudinal barriers. The lack of information and appropriate assistance is also highlighted in addition
to stressing the problem that accessibility is not consistently defined across sectors, leading to
standards and legislation not being enforced4.
Industry reports outline the main barriers as being low income, acceptance, marketing/ information,
transport, physical environment, service barriers, and wider social and economic issues (e.g. the
social exclusion experienced by people with access needs as reflected in wider society)5.
Figure 152 provides a summary of all categories of barriers. Overall, there is a strong consensus
that interactive barriers exist throughout all sectors. These interactive barriers often relate to
negative, demeaning and condescending attitudes. Together with the lack of information, these
barriers have a very detrimental effect on the overall quality of the tourism experience and are
overall rated as being stronger than other barriers. This is mainly because people with access needs
require more detailed information before embarking on a holiday experience, with information acting
barriers if detailed and reliable information is available, they cannot plan for avoiding negative
attitudes.
1 Smith, R.W. (1987). Leisure of Disabled Tourists - Barriers to Participation. Annals of Tourism Research, 14, 376-389. 2Horgan-Jones, M., & Ringaert, L. (2001). Accessible Tourism in Manitoba. TTRA - Travel and Tourism Research Association. Niagara Falls, Canada, 14.-16. October 2001 3 Eichhorn, V. & Buhalis, D. (2011). Accessibility: A Key Objective for the Tourism Industry. IN D. Buhalis & S. Darcy (Eds.) Accessible Tourism: Concepts and Issues, (pp. 46-61). Bristol, Channel View Publications. 4 EDF - European Disability Forum (2001). EDF Position Paper: Framing the Future of European Tourism, Doc. EDF 01/13 EN, (pp. 1-10). London, European Disability Forum. 5 Veitch, C., & Shaw, G. (2004). Understanding Barriers to Tourism in the UK. IN British Tourist Authority (Ed.) Insights - Tourism Intelligence Papers, A-185, May 2004.
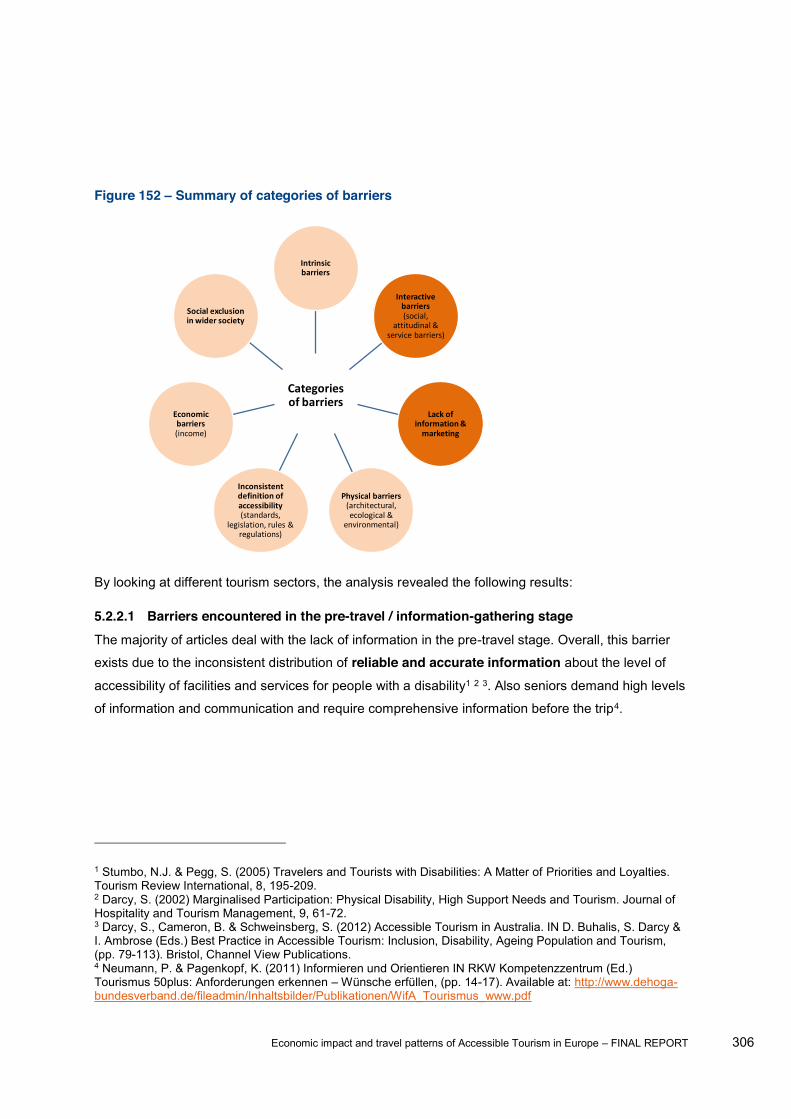
Economic impact and travel patterns of Accessible Tourism in Europe FINAL REPORT 306
Figure 152 Summary of categories of barriers
By looking at different tourism sectors, the analysis revealed the following results:
5.2.2.1 Barriers encountered in the pre-travel / information-gathering stage The majority of articles deal with the lack of information in the pre-travel stage. Overall, this barrier
exists due to the inconsistent distribution of reliable and accurate information about the level of
accessibility of facilities and services for people with a disability1 2 3. Also seniors demand high levels
of information and communication and require comprehensive information before the trip4.
1 Stumbo, N.J. & Pegg, S. (2005) Travelers and Tourists with Disabilities: A Matter of Priorities and Loyalties. Tourism Review International, 8, 195-209. 2 Darcy, S. (2002) Marginalised Participation: Physical Disability, High Support Needs and Tourism. Journal of Hospitality and Tourism Management, 9, 61-72. 3 Darcy, S., Cameron, B. & Schweinsberg, S. (2012) Accessible Tourism in Australia. IN D. Buhalis, S. Darcy & I. Ambrose (Eds.) Best Practice in Accessible Tourism: Inclusion, Disability, Ageing Population and Tourism, (pp. 79-113). Bristol, Channel View Publications. 4 Neumann, P. & Pagenkopf, K. (2011) Informieren und Orientieren IN RKW Kompetenzzentrum (Ed.) Tourismus 50plus: Anforderungen erkennen Wünsche erfüllen, (pp. 14-17). Available at: http://www.dehoga-bundesverband.de/fileadmin/Inhaltsbilder/Publikationen/WifA_Tourismus_www.pdf
Categories of barriers
Intrinsic barriers
Interactive barriers (social,
attitudinal & service barriers)
Lack of information & marketing
Physical barriers(architectural, ecological &
environmental)
Inconsistent definition of accessibility (standards,
legislation, rules & regulations)
Economic barriers (income)
Social exclusion in wider society
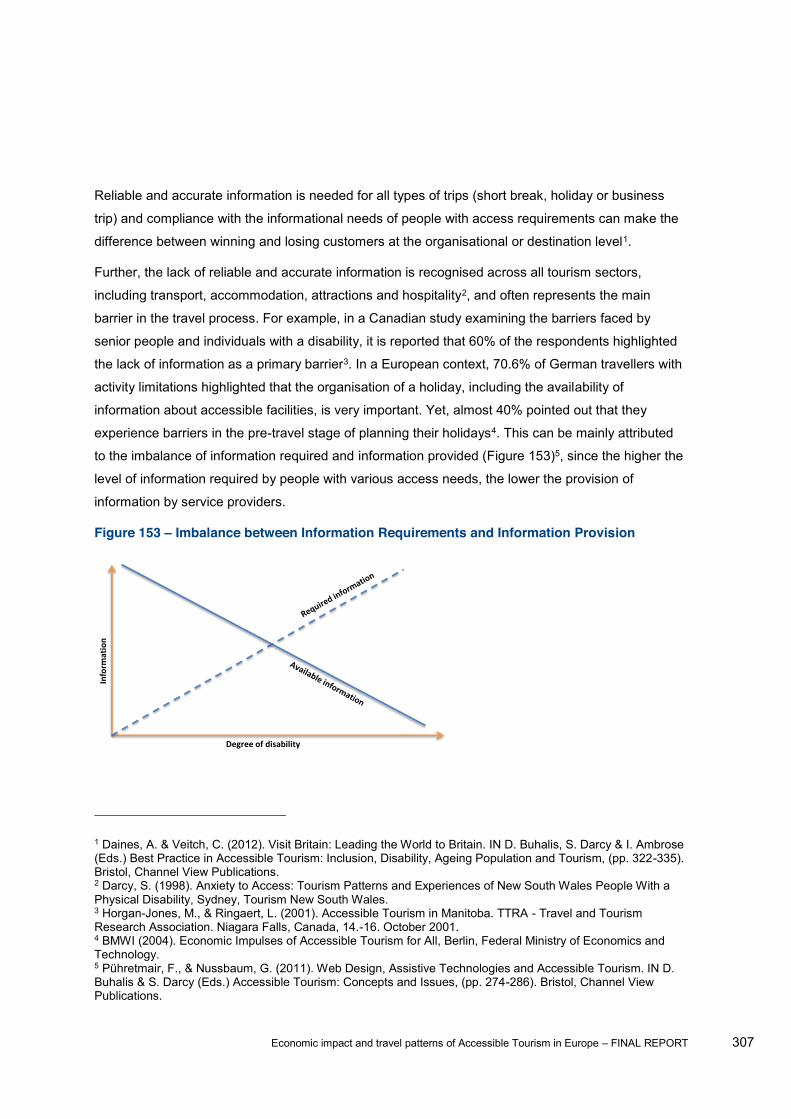
Economic impact and travel patterns of Accessible Tourism in Europe FINAL REPORT 307
Reliable and accurate information is needed for all types of trips (short break, holiday or business
trip) and compliance with the informational needs of people with access requirements can make the
difference between winning and losing customers at the organisational or destination level1.
Further, the lack of reliable and accurate information is recognised across all tourism sectors,
including transport, accommodation, attractions and hospitality2, and often represents the main
barrier in the travel process. For example, in a Canadian study examining the barriers faced by
senior people and individuals with a disability, it is reported that 60% of the respondents highlighted
the lack of information as a primary barrier3. In a European context, 70.6% of German travellers with
activity limitations highlighted that the organisation of a holiday, including the availability of
information about accessible facilities, is very important. Yet, almost 40% pointed out that they
experience barriers in the pre-travel stage of planning their holidays4. This can be mainly attributed
to the imbalance of information required and information provided (Figure 153)5, since the higher the
level of information required by people with various access needs, the lower the provision of
information by service providers.
Figure 153 Imbalance between Information Requirements and Information Provision
1 Daines, A. & Veitch, C. (2012). Visit Britain: Leading the World to Britain. IN D. Buhalis, S. Darcy & I. Ambrose (Eds.) Best Practice in Accessible Tourism: Inclusion, Disability, Ageing Population and Tourism, (pp. 322-335). Bristol, Channel View Publications. 2 Darcy, S. (1998). Anxiety to Access: Tourism Patterns and Experiences of New South Wales People With a Physical Disability, Sydney, Tourism New South Wales. 3 Horgan-Jones, M., & Ringaert, L. (2001). Accessible Tourism in Manitoba. TTRA - Travel and Tourism Research Association. Niagara Falls, Canada, 14.-16. October 2001. 4 BMWI (2004). Economic Impulses of Accessible Tourism for All, Berlin, Federal Ministry of Economics and Technology. 5 Pühretmair, F., & Nussbaum, G. (2011). Web Design, Assistive Technologies and Accessible Tourism. IN D. Buhalis & S. Darcy (Eds.) Accessible Tourism: Concepts and Issues, (pp. 274-286). Bristol, Channel View Publications.
Degree of disability
Inform
ation
Economic impact and travel patterns of Accessible Tourism in Europe FINAL REPORT 308
This is confirmed by a mystery shopper study, investigating the provision of information by
accommodation establishments in Austria, Switzerland and Germany. The results revealed that
people with access needs were only inadequately served. It was particularly the limited supply of 1. This was
supported by a study in Spain, reporting that a person with access needs encounters numerous
difficulties in obtaining the right information. Very few service providers offer the information that
people with access needs require and as a consequence, individuals often have to contact the
provider numerous times, which adds to levels of stress and anxiety in the travel planning process2.
As a result of these information deficiencies, a number of projects have been initiated in Italy to
improve the information provision for people with access needs3.
The limited availability of information is one of four recurrent themes4 in the discussion about
informational barriers for people with access needs:
1) Lack or limited availability of information
E.g. service providers not making information about the level of accessibility for people with different
access needs available
2) Lack of accuracy of information provided
E.g. service providers claim that the hotel is fully accessible but hotel restaurant contains steps to
gain entry
3) Low levels of detail of the information provided
E.g. lack of objective measurements, such as the width of the door
4) Format of the information provided
1 -MysteryCheck 2007 das Abenteuer Unterkunftssuche. Deutsches Seminar für Tourismus (DSFT), Berlin. Available at: http://www.wissen.dsft-berlin.de/medien/PRE/pre_mysterycheck-2007_dsft-studie_barrierefreiheit.pdf 2 IMSERSO (2006). El Hotel Accesible - Guía para su diseño, organización y gestión. Ministerio de Trabajo y Asuntos Sociales - Secretaría de Estado de Servicios Sociales, Familias y Discapacidad. Instituto de Mayores y Servicios Sociales (IMSERSO), Madrid, Spain. Available at: http://www.imserso.es/InterPresent2/groups/imserso/documents/binario/hotelaccesible.pdf 3 SL & A: Turismo e Territorio (2008). Turhttp://www.turismabile.it/file/lib/files/access0_rapp_tur_acc.pdf 4Darcy, S. (1998) Anxiety to Access: Tourism Patterns and Experiences of New South Wales People With a Physical Disability, Sydney, Tourism New South Wales.
Economic impact and travel patterns of Accessible Tourism in Europe FINAL REPORT 309
E.g. Alternative ways to provided information (Braille, large sign, audio recordings) are often absent
and websites are often inaccessible (e.g. not providing alternative text for images), hence not
following strategies and guidelines by the Web Accessibility Initiative (WAI)1
In examining these four access barriers, the lack of information about accessible services (1) is often stated as the main constraint. This is supported by a study from Italy reporting that the lack
of correct and reliable information on accessibility features is the most important barrier2. The
general lack of information is followed by the lack of accuracy (2) and less detailed information (3).
With regard to the format of information (4), the main barrier relates to websites being inaccessible
for people with access needs. This contributes to the exclusion of people with mobility, visual,
hearing or cognitive impairments3. Yet, the format of the information provided affects people with
different impairments differently. For example, for someone in a wheelchair, the lack of alternative
text for images or alternative means to provide information might not represent an obstacle, whereas
it would restrict a blind person to access certain information necessary to plan his/ her holiday.
Outside Europe, numerous studies can be identified that deal with the problem of inaccessible
websites. For example, a study of businesses on the West Coast of the South Island of New
Zealand found that more than half of the tourist information sites were difficult to access and
navigate although claiming to be accessible4. Particularly with regard to the format of information
provided, it is argued that so far limited insights are available that outline w
formats of information provision in the accommodation sector actually are5. Specific to the Asia-
Pacific region, inaccessible websites are also a great problem as the adoption of accessible Internet
technologies remains very limited6.
Within Europe, studies confirm the inaccessibility of websites as a major problem. For example, in
Italy it has been reported that particularly young mobility-restricted individuals rely on the internet for
1 Web Accessibility Initiative (WAI) http://www.w3.org/WAI/guid-tech.html 2 Minuti, M.Ssviluppo dei sistemi turistici territoriali. Available at: http://www.sinergiejournal.it/rivista/index.php/slow/article/view/768 3 Pühretmair, F. (2004). It's Time to Make eTourism Accessible. IN Miesenberger, K., Klaus, J., Zagler, W. & Burger, D. (Eds.) Computers Helping People with Special Needs, (pp. 272-279). Berlin, Springer. 4 Rhodda, S. (2012). Accessible Tourism in New Zealand. IN D. Buhalis, S. Darcy & I. Ambrose (Eds.) Best Practice in Accessible Tourism: Inclusion, Disability, Ageing Population and Tourism, (pp. 114-123). Bristol, Channel View Publications. 5 Darcy, S. (2007). A Methodology for Testing Accessible Accommodation Information Provision Formats.
http://www.accessibletourism.org/resources/sdarcy_2007_cauthe_conference_paper_en.pdf 6 Economic and Social Commission for Asia and the Pacific (2003). Barrier-free Tourism for People with Disabilities in the Asian and Pacific Regions, United Nations, New York. Available at: http://www.unescap.org/ttdw/Publications/TPTS_pubs/pub_2316/pub_2316_tor.pdf

Economic impact and travel patterns of Accessible Tourism in Europe FINAL REPORT 310
obtaining information. Yet, often the information is misleading so that young mobility-restricted adults
are forced to call the service provider to find out that the establishment is not accessible to them1.
Investigating the usability of websites for different user groups, a Swiss study found that none of the
50 websites which were tested is fully accessible for people with multiple restrictions, blind or
visually impaired people or seniors2. This can be supported by a study conducted in 2004 showing
that none of the destination management systems and web pages of the National Tourism Boards in
Europe are accessible due to not complying with the guidelines by the Web Accessibility Initiative
(WAI)3. The website analysis (task 2a) has also shown that only 17% of the investigated websites
are technically accessible at a high level, which causes difficulties to people with access needs to
obtain the information they need to successfully plan their holiday trip. Particularly disadvantaged
and excluded are individuals with visual difficulties or people with special needs. The general lack of
implementing access standards also leads to navigation difficulties on other devices which affect all
users regardless of their specific access needs. Thus, it can be argued that inaccessible websites
still remain a major obstacle in the pre-travel information gathering stage.
Overcoming the barrier of accessible websites is of high importance as research shows that people
with disabilities use the internet more than people without disabilities4. Further, the internet is not
only used as a vital source for obtaining travel-related information about establishments and
destinations, but represents also a central booking tool. In the United States, a study confirms the
importance of the internet to book holidays. For those individuals that search for information
online, 33% also booked their trips online in 2002. In 2005, half of the people who travel (51%) used
the internet to book their trips. This is higher than the usage by the general population5.
1 Consiglio dei Ministri - Dipartimento della Gioventù (no date). Turisti Senza Ostacoli Indagine ismo Accessibile. Available at:
http://www.unisa.it/uploads/2405/turisti_senza_ostacoli.pdf 2 Zugang für alle (2007) Schweizer Accessibility-Studie 2007 - Bestandesaufnahme der Zugänglichkeit von Schweizer Websites des Gemeinwesens für Menschen mit Behinderungen. Schweizerische Stiftung zur behindertengerechten Technologienutzung, Schweiz. Available at: https://www.google.co.uk/url?sa=t&rct=j&q=&esrc=s&source=web&cd=7&ved=0CFUQFjAG&url=http%3A%2F%2Fwww.edi.admin.ch%2Febgb%2F01700%2F01707%2Findex.html%3Fdownload%3DNHzLpZeg7t%2Clnp6I0NTU042l2Z6ln1acy4Zn4Z2qZpnO2Yuq2Z6gpJCDe3x3gGym162epYbg2c_JjKbNoKSn6A--%26lang%3Dde&ei=a4DEUYyvPKqF4gTn9YGwBg&usg=AFQjCNFmDdMR0mQHWD_JTRfnow1La7bc0w&sig2=Gii_coMC6jc6_CVRvsvPvw 3 Oertel, B. et al., (2004). Accessibility of Tourism Web Sites within the European Union. Proceedings of the 11th International Conference on Information and Communication Technologies in Tourism (ENTER 2004). ISBN 3-211-20669-8, Springer Verlag, pp. 358-368, Cairo, Egypt. 4 Huber, W. & Vitouch, P. (2008) Usability and Accessibility on the Internet: Effects of Accessible Web Design on Usability. 11th International Conference on Computers Helping People with Special Needs (ICCHP 2008). ISBN 3-540-70539-2, Springer Verlag, pp. 482-489, Linz, Austria. 5 Van Horn, L. (2012). The United States: Travellers with Disabilities. IN D. Buhalis, S. Darcy & I. Ambrose (Eds.) Best Practice in Accessible Tourism: Inclusion, Disability, Ageing Population and Tourism, (pp. 65-78). Bristol, Channel View Publications.
Economic impact and travel patterns of Accessible Tourism in Europe FINAL REPORT 311
In addition to websites not being accessible, hence disallowing an efficient and effortless booking
procedure, it is the existence of segregated booking systems that represents an additional barrier.
This was particularly noted when analysing airline procedures, as people with access needs will
need to call airlines to ensure that the airline will permit them onto the aircraft. During the phone
conversation, people with access needs are often asked about their level of health, independence,
equipment needs and baggage, which leads to feelings of discomfort. Further, low cost carriers have
oxygen mask, for example, then he/ she is required to travel with a 1.
The same situation occurs when analysing current practices by tour operators. For example, in May
2013, Thomson/ TUI told a blind couple just two weeks before their holiday and after they had
booked a package to Mallorca that they were not allowed to travel without a chaperone2.
This already shows that tour operators and travel agencies often also represent a barrier in the
pre-travel stage. For example, a study conducted in the US highlights four main difficulties for people
with access needs when dealing with travel agencies and tour operators. These are:
Travel agencies and tour operators not having access to all disability-related information, which is
necessary for people with access needs to plan their trip
E.g. this is the case when not all service providers that are part of the package holiday (e.g. an
attraction facility) provide information about the level of accessibility
Travel agencies and tour operators not being able to provide information about ground
transportation
E.g. lack of comprehensive information about ground transportation related to air travel
Not providing accurate information about accessibility
E.g. hotel and restaurants which are less than fully accessible for different access requirements
Not understanding the different needs of people with access needs3
E.g. often service providers only think about wheelchair users, ignoring the access needs of people
with sight, speech or hearing impairments, for example
1 Darcy, S. (2007). Improving Airline Practices by Understanding the Experiences of People with Disabilities. Travel and Tourism Research Association - TTRA. Charlottetown, Canada, TTRA, 17.- 20. October 2007. 2 TravelMole (2013). Thomson tells blind couple they can't travel alone, May 2nd 2013, http://www.travelmole.com/news_feature.php?news_id=2006258 3 Cavinato, J., & Cuckovich, M. (1992). Transportation and Tourism for the Disabled: An Assessment. Transportation Journal 31, 46-53.

Economic impact and travel patterns of Accessible Tourism in Europe FINAL REPORT 312
In fact, it can be argued that the lack of understanding of different needs of individuals with different
access requirements triggers the inability to provide accurate and comprehensive information, which
is necessary to successfully plan a holiday trip. This is supported by Stumbo and Pegg (2005),
highlighting that the information provided by tour operators is often misleading and inaccurate. For
example, 45% of people with a physical impairment in New South Wales/ Australia noted that the
information provided by tour operators is either misleading or inaccurate1, which often leads to high
levels of dissatisfaction with travel agencies and tour operators2. As a consequence, people with
access needs have to rely on their own experiences and the recommendations of others with similar
access needs3.
An additional barrier relates to the discrimination by travel services and operators4. For example in
Hong Kong, a research study reported that some travel agents hold the extreme belief that travelling
and having a disability are not compatible. Further, and by focusing on specific types of impairments,
it is argued that the inflexible design of package holidays is seen as major problem in addition to
negative attitudes on behalf of travel agencies5. This was highlighted by mobility and visually
impaired individuals alike.
Thus, in sum, the main barriers faced by people with access needs in the pre-travel stage are
summarised in Figure 154.
1Darcy, S. (1998). Anxiety to Access: Tourism Patterns and Experiences of New South Wales People With a Physical Disability, Sydney, Tourism New South Wales. 2 Hitsch, W. (2005). Probleme, Risiken und Chancen des barrierefreien Tourismus. Institut für Unternehmensführung, Tourismus und Dienstleistungswirtschaft, Fakultät für Betriebswirtschaft der Leopold-Franzens-Universität Innsbruck. Available at: http://www.ibft.at/ibft/doc/Diplomarbeit%20-%20Barrierefreies%20Reisen.pdf 3 Stumbo, N.J., & Pegg, S. (2005). Travelers and Tourists with Disabilities: A Matter of Priorities and Loyalties. Tourism Review International, 8, 195-209. 4 EDF - European Disability Forum (2001). EDF Position Paper: Framing the Future of European Tourism, Doc. EDF 01/13 EN, (pp. 1-10). London, European Disability Forum. 5McKercher, B., Packer, T., Yau, M.K. & Lam, P. (2003). Travel agents as facilitators or inhibitors of travel: Perceptions of people with disabilities, Tourism Management, 24:465-474.

Economic impact and travel patterns of Accessible Tourism in Europe FINAL REPORT 313
Figure 154 Barriers in the pre-travel stage
Sources Barriers
Travel agencies/Tour operators
Lack of accuracy/reliability of information
Lack of availability of information
Lack of detailed information
Not understanding the needs of people with access
needs
Negative attitudes
Websites of individual service providers
Lack of accuracy/reliability of information
Lack of availability of information
Lack of detailed information
Inappropriate format
Segregated booking systems
The barriers reported so far relate to mainstream sources, which triggers the need to compare the
importance of mainstream versus specialised sources. A research study from Sweden
highlights that people with access needs often do not trust the information that is provided in
mainstream brochures1. This indicates that general information sources, such as websites of
individual service providers, are perceived as falling short in providing reliable information.
It is hence argued that in contrast to mainstream operators, specialised tour agencies are able to
provide reliable and accurate information. For example, in France, specialised organisations exist for
people with mobility restrictions (e.g. individuals with osteoarthritis) to help with information provision
1 Müller, L. (2012). Accessible Tourism in Sweden: Experiences, Stakeholders, Marketing. IN D. Buhalis, S. Darcy & I. Ambrose (Eds.) Best Practice in Accessible Tourism: Inclusion, Disability, Ageing Population and Tourism, (pp. 157-167). Bristol, Channel View Publications.

Economic impact and travel patterns of Accessible Tourism in Europe FINAL REPORT 314
particularly at the pre-travel stage1 tor) stresses
that the specialised organisation is able to address the main difficulties that a person with access
needs might encounter2.
In this context, research from Denmark emphasises that disability organisations play an important
role by providing trustworthy information3, ultimately assisting in reducing informational barriers.
Many of these organisations operate accessible tourism information schemes. A study investigating
accessible tourism information schemes4 established a list of existing schemes through secondary
research. With the subsequent employment of snowball sampling, 43 access schemes were
identified. The geographical coverage of the schemes is shown below in Figure 155.
1 Euller-Ziegler, L., & Bieganowski, G. (2004). Arthrose, Handicap, voyages et loisirs: Le regard des médecins et des professionnels du tourisme, La Presse Médicale, 33(9):19 20. 2 Prates, J., & Garcia, A. (2009). Turismo Acessível em Portugal - O Caso do Turismo para Pessoas com Mobilidade Reduzida, Revista Turismo & Desenvolvimento N.º 11, pp.171-173. 3Stilling Blichfeldt, B., & Nicolaisen, J. (2011). Disabled Travel: Not Easy, But Doable, Current Issues in Tourism, 14(1):79-102. 4 Eichhorn, V., Miller, G., Michopoulou, E., & Buhalis, D. (2008) Enabling Access to Tourism through Information Schemes. Annals of Tourism Research, 35, 189-210.

Economic impact and travel patterns of Accessible Tourism in Europe FINAL REPORT 315
Figure 155 Geographical coverage of analysed Accessible Tourism Information Schemes
The majority of these schemes were set up by charities, private or non-governmental organisations,
and nine schemes were operated by governmental or public bodies. All schemes were sent a survey
covering aspects such as information content, target audience, accessibility information, online and
offline schemes, and accessibility criteria. All organisations operating a scheme and participating in
this survey were ensured anonymity. The responses obtained from these organisations were
checked against a framework of inter-related informational needs, as shown in Figure 156.
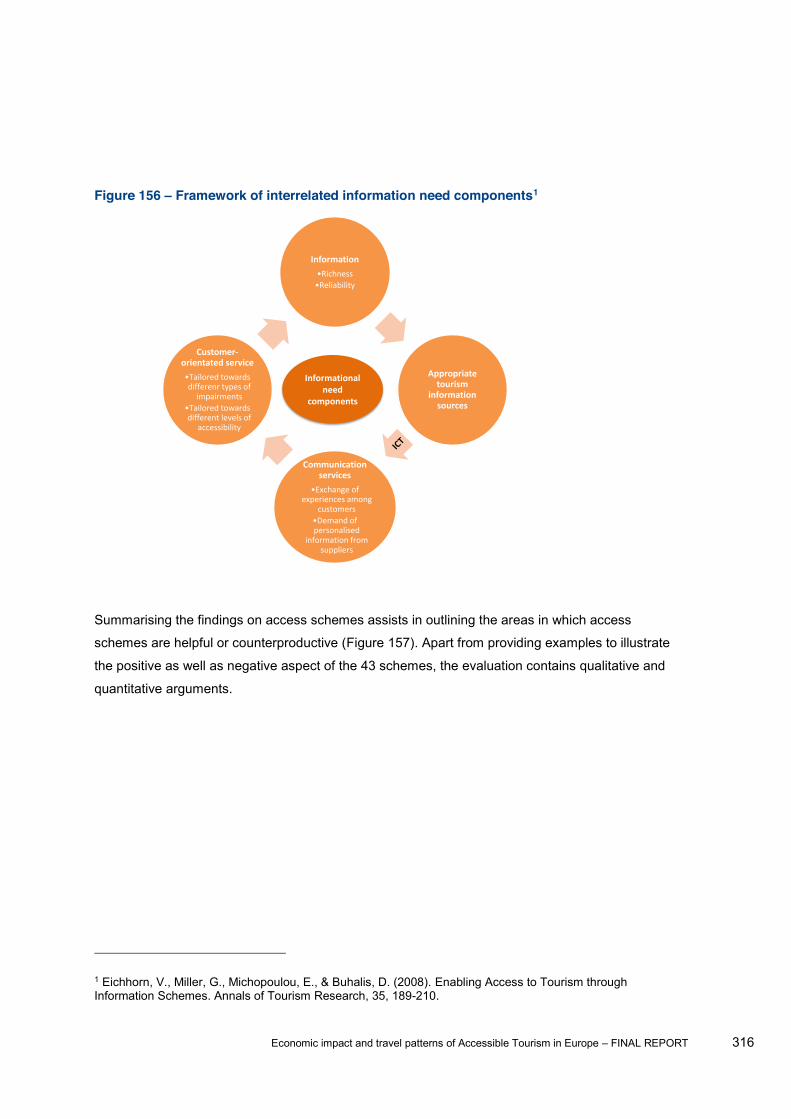
Economic impact and travel patterns of Accessible Tourism in Europe FINAL REPORT 316
Figure 156 Framework of interrelated information need components1
Summarising the findings on access schemes assists in outlining the areas in which access
schemes are helpful or counterproductive (Figure 157). Apart from providing examples to illustrate
the positive as well as negative aspect of the 43 schemes, the evaluation contains qualitative and
quantitative arguments.
1 Eichhorn, V., Miller, G., Michopoulou, E., & Buhalis, D. (2008). Enabling Access to Tourism through Information Schemes. Annals of Tourism Research, 35, 189-210.
InformationRichnessReliability
Appropriatetourism
information sources
Communication servicesExchange of
experiences amongcustomersDemand of personalised
information fromsuppliers
Customer-‐orientated serviceTailored towardsdifferenr types of impairments
Tailored towardsdifferent levels of
accessibility
Informationalneed
components

Economic impact and travel patterns of Accessible Tourism in Europe FINAL REPORT 317
Figure 157 Useful and counterproductive aspects of access schemes1
While specialised organisations are able to provide accurate and reliable information, mainly due to
operating access schemes, the analysis above shows that schemes are limited in number and
geographical coverage. Furthermore, a study from the Rhône-Alpes region in France reports that the
accessibility labelling system that was developed only offers limited economic benefits for tourism
providers so far2.
1 Eichhorn, V., Miller, G., Michopoulou, E. & Buhalis, D. (2008). Enabling Access to Tourism through Information Schemes. Annals of Tourism Research, 35, 189-210. 2 Tourisme & Handicap (2011). Tourisme et Handicap - État des Lieux et Perspectives. Rhône-Alpes Tourisme, Association Tourisme et Handicaps. Available at: http://documents.scribd.com.s3.amazonaws.com/docs/23ls7j8v0g16p8cf.pdf?t=1318584308
Economic impact and travel patterns of Accessible Tourism in Europe FINAL REPORT 318
developing an accessibility labelling system for tourist
destinations highlights three main challenges in the process of standardising access criteria1:
1. Variety of user requirements within each user group
- E.g. competing and conflicting interests have to be dealt with
2. Conflicts of requirements between different groups
- E.g. requirements of one user group may conflict with requirements of another user group
3. Balance between requirements of people with access needs and the requirements for
designing a practical market-oriented tool
- E.g. the requirements of people have to be met while at the same time ensuring the industry that the tool can be implemented easily
Given these difficulties and counterproductive aspects as highlighted above, specialised sources of
information might not be able to fully overcome the informational barriers that people with access
needs face. In addition, specialised operators have been criticised for restricting the individual input
by people with access needs, hence limiting the flexibility with regard to changing elements of the
package by the traveller him/herself2. Also the higher costs for this type of travel represents a major
barrier3. All these arguments have led numerous European countries to highlight the importance of
mainstreaming accessibility information4 5 6 7.
Based on the whole discussion on barriers encountered in the pre-travel/ information gathering
stage, three main problem areas can be identified which are used for the hypotheses testing stage.
1 Management Systems. Available at: http://www.accessibletourism.org/resources/norway_accesible_destinations_standards_article.pdf 2 Cavinato, J., & Cuckovich, M. (1992). Transportation and Tourism for the Disabled: An Assessment. Transportation Journal 31, 46-53. 3 Cavinato, J., & Cuckovich, M. (1992) Transportation and Tourism for the Disabled: An Assessment. Transportation Journal 31, 46-53. 4 Neumann, P. (2012). Accessible Tourism for All in Germany. IN D. Buhalis, S. Darcy & I. Ambrose (Eds.) Best Practice in Accessible Tourism: Inclusion, Disability, Ageing Population and Tourism, (pp. 46-54). Bristol, Channel View Publications. 5 Voulgaropoulos, N., Strati, E. & Fyka, G. (2012). Accessible Tourism in Greece: Beaches and Bathing for All. IN D. Buhalis, S. Darcy & I. Ambrose (Eds.) Best Practice in Accessible Tourism: Inclusion, Disability, Ageing Population and Tourism, (pp. 55-64). Bristol, Channel View Publications. 6 Müller, L. (2012). Accessible Tourism in Sweden: Experiences, Stakeholders, Marketing. IN D. Buhalis, S. Darcy & I. Ambrose (Eds.) Best Practice in Accessible Tourism: Inclusion, Disability, Ageing Population and Tourism, (pp. 157-167). Bristol, Channel View Publications. 7 Sandøy Tveitan, B. (2012). VisitOSLO, Norway: Supporting Accessible Tourism Content within Destination Tourism Marketing. IN D. Buhalis, S. Darcy & I. Ambrose (Eds.) Best Practice in Accessible Tourism: Inclusion, Disability, Ageing Population and Tourism, (pp. 297-309). Bristol, Channel View Publications.
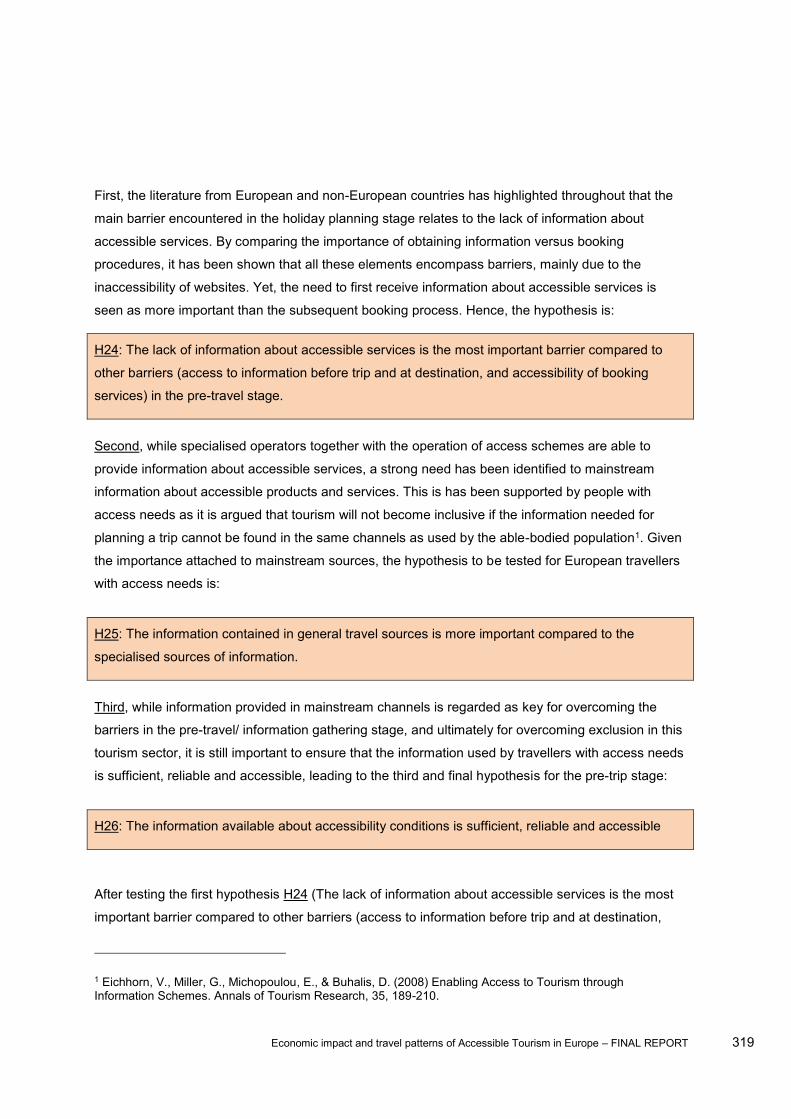
Economic impact and travel patterns of Accessible Tourism in Europe FINAL REPORT 319
First, the literature from European and non-European countries has highlighted throughout that the
main barrier encountered in the holiday planning stage relates to the lack of information about
accessible services. By comparing the importance of obtaining information versus booking
procedures, it has been shown that all these elements encompass barriers, mainly due to the
inaccessibility of websites. Yet, the need to first receive information about accessible services is
seen as more important than the subsequent booking process. Hence, the hypothesis is:
H24: The lack of information about accessible services is the most important barrier compared to
other barriers (access to information before trip and at destination, and accessibility of booking
services) in the pre-travel stage.
Second, while specialised operators together with the operation of access schemes are able to
provide information about accessible services, a strong need has been identified to mainstream
information about accessible products and services. This is has been supported by people with
access needs as it is argued that tourism will not become inclusive if the information needed for
planning a trip cannot be found in the same channels as used by the able-bodied population1. Given
the importance attached to mainstream sources, the hypothesis to be tested for European travellers
with access needs is:
H25: The information contained in general travel sources is more important compared to the
specialised sources of information.
Third, while information provided in mainstream channels is regarded as key for overcoming the
barriers in the pre-travel/ information gathering stage, and ultimately for overcoming exclusion in this
tourism sector, it is still important to ensure that the information used by travellers with access needs
is sufficient, reliable and accessible, leading to the third and final hypothesis for the pre-trip stage:
H26: The information available about accessibility conditions is sufficient, reliable and accessible
After testing the first hypothesis H24 (The lack of information about accessible services is the most
important barrier compared to other barriers (access to information before trip and at destination,
1 Eichhorn, V., Miller, G., Michopoulou, E., & Buhalis, D. (2008) Enabling Access to Tourism through Information Schemes. Annals of Tourism Research, 35, 189-210.

Economic impact and travel patterns of Accessible Tourism in Europe FINAL REPORT 320
and accessibility of booking services) in the pre-travel stage), findings reveal that the hypothesis is
partially supported.
The lack of information about accessible services is the most important barrier in the pre-travel stage
which confirms findings from outside Europe1 and Italy2. Statistically, information about accessible
services is more important than access to information before trip and at destination, and as
important as the accessibility of booking services. By comparing different types of access needs, the
results revealed that for individuals with communication and hidden difficulties, information about
accessible services, access to information before and at the destination and the accessibility of
booking services weigh equally (Figure 158).
1 Darcy, S. (1998) Anxiety to Access: Tourism Patterns and Experiences of New South Wales People With a Physical Disability, Sydney, Tourism New South Wales. 2 sviluppo dei sistemi turistici territoriali. Available at: http://www.sinergiejournal.it/rivista/index.php/slow/article/view/768
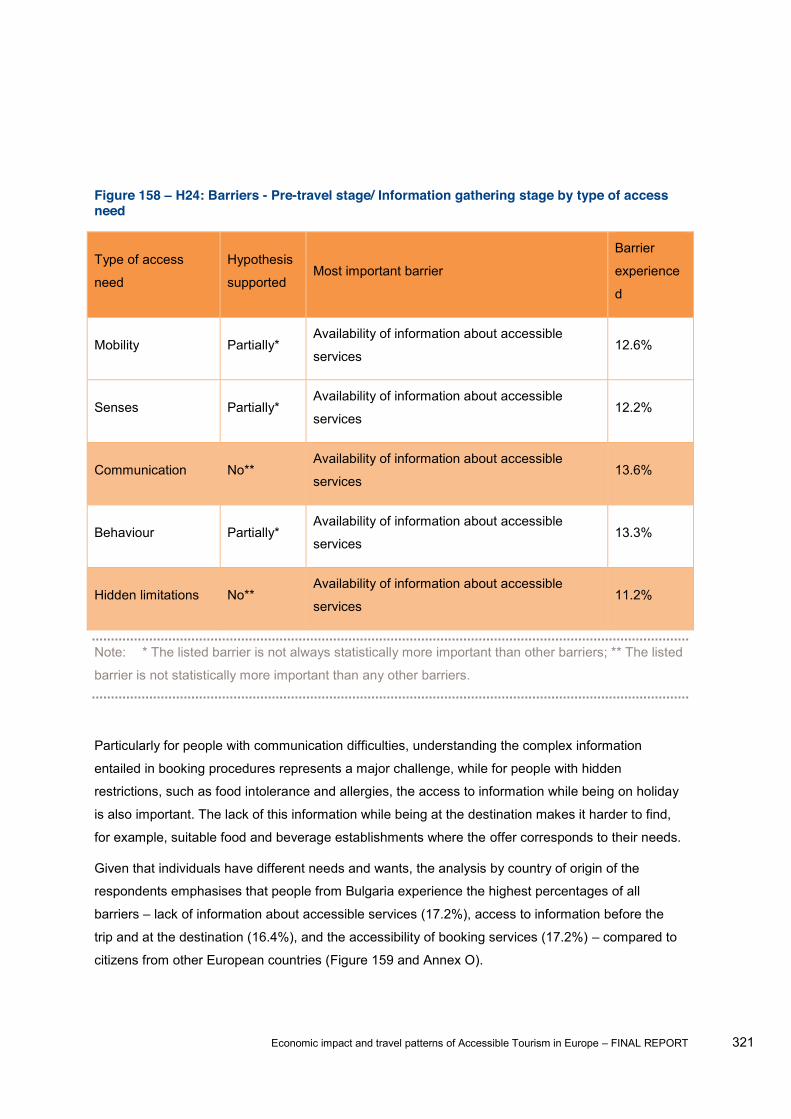
Economic impact and travel patterns of Accessible Tourism in Europe FINAL REPORT 321
Figure 158 H24: Barriers - Pre-travel stage/ Information gathering stage by type of access need
Type of access
need
Hypothesis
supported Most important barrier
Barrier
experience
d
Mobility Partially* Availability of information about accessible
services 12.6%
Senses Partially* Availability of information about accessible
services 12.2%
Communication No** Availability of information about accessible
services 13.6%
Behaviour Partially* Availability of information about accessible
services 13.3%
Hidden limitations No** Availability of information about accessible
services 11.2%
Note: * The listed barrier is not always statistically more important than other barriers; ** The listed
barrier is not statistically more important than any other barriers.
Particularly for people with communication difficulties, understanding the complex information
entailed in booking procedures represents a major challenge, while for people with hidden
restrictions, such as food intolerance and allergies, the access to information while being on holiday
is also important. The lack of this information while being at the destination makes it harder to find,
for example, suitable food and beverage establishments where the offer corresponds to their needs.
Given that individuals have different needs and wants, the analysis by country of origin of the
respondents emphasises that people from Bulgaria experience the highest percentages of all
barriers lack of information about accessible services (17.2%), access to information before the
trip and at the destination (16.4%), and the accessibility of booking services (17.2%) compared to
citizens from other European countries (Figure 159 and Annex O).
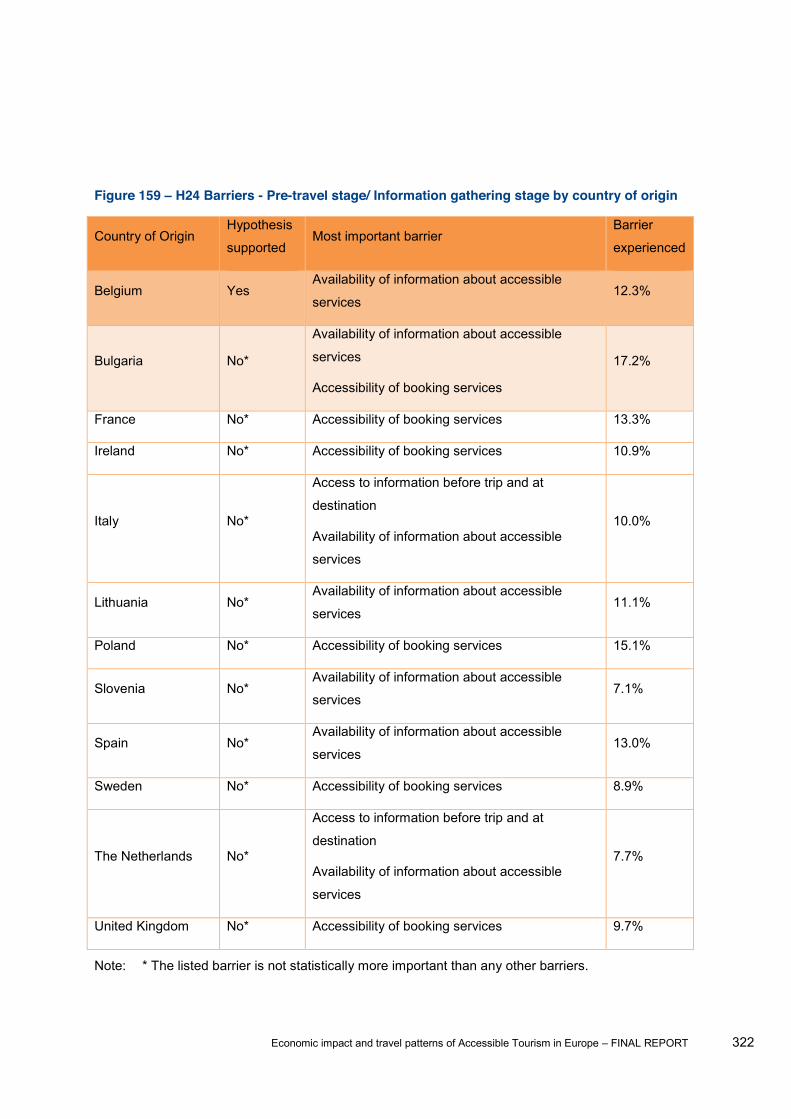
Economic impact and travel patterns of Accessible Tourism in Europe FINAL REPORT 322
Figure 159 H24 Barriers - Pre-travel stage/ Information gathering stage by country of origin
Country of Origin Hypothesis
supported Most important barrier
Barrier
experienced
Belgium Yes Availability of information about accessible
services 12.3%
Bulgaria No*
Availability of information about accessible
services
Accessibility of booking services
17.2%
France No* Accessibility of booking services 13.3%
Ireland No* Accessibility of booking services 10.9%
Italy No*
Access to information before trip and at
destination
Availability of information about accessible
services
10.0%
Lithuania No* Availability of information about accessible
services 11.1%
Poland No* Accessibility of booking services 15.1%
Slovenia No* Availability of information about accessible
services 7.1%
Spain No* Availability of information about accessible
services 13.0%
Sweden No* Accessibility of booking services 8.9%
The Netherlands No*
Access to information before trip and at
destination
Availability of information about accessible
services
7.7%
United Kingdom No* Accessibility of booking services 9.7%
Note: * The listed barrier is not statistically more important than any other barriers.

Economic impact and travel patterns of Accessible Tourism in Europe FINAL REPORT 323
Importantly, residents in Belgium perceive the lack of information about accessible services as the
main barrier compared to people from other European countries where the hypothesis (H24) could
not be supported. As shown in the Annex O, the percentages of the other two barriers (5.7% and
4.9% respectively) are lower than the average, which makes the lack of information about accessible
services stand out as the most significant barrier for travellers from Belgium. Additionally, three
potential interpretations can be provided for this result:
1. It is possible that respondents referred to the lack of information sources outside their home
country.
2. If respondents referred to the lack of information sources in Belgium, then the argument can
be established that Belgium has limited success in offering access information for its
citizens. Accessibility analyses in 1999 and 2000 have shown that parts of Belgium need to
improve their infrastructure in terms of accessible facilities together with the provision of
reliable information. Particularly with regard to the latter, the lack of information has been
identified as a major obstacle for people with access needs in the region of Flanders. While
a number of efforts were invested to improve the situation over the years, it is argued that
informational barriers still persist1
3. Over the years, Belgium has developed various labels for accessible tourism, such as the 2. While labels ensure high levels
of reliability, the absence of information in mainstream channels might explain why people
from Belgium report the lack of information about accessible services as the most important
barrier. In this case, it is not necessarily the general lack of access information but the
perceived lack of this vital information as part of mainstream travel sources which is being
expressed.
The previous argument leads directly into presenting the results of H25 (The information contained in general travel sources is more important compared to the specialised sources of information). After the hypothesis testing procedure, H25 is supported. The information
contained in general travel sources is more important compared to the specialised sources of
information when investigating the responses by individuals with different access needs (Figure
160). Individuals with mobility, sensory, communication, behavioural or hidden difficulties all
1 Ghijsels, P. (2012). Accessible Tourism in Flanders: Policy Support and Incentives. IN D. Buhalis, S. Darcy & I. Ambrose (Eds.) Best Practice in Accessible Tourism: Inclusion, Disability, Ageing Population and Tourism, (pp. 36-45). Bristol, Channel View Publications. 2 Ghijsels, P. (2012). Accessible Tourism in Flanders: Policy Support and Incentives. IN D. Buhalis, S. Darcy & I. Ambrose (Eds.) Best Practice in Accessible Tourism: Inclusion, Disability, Ageing Population and Tourism, (pp. 36-45). Bristol, Channel View Publications.
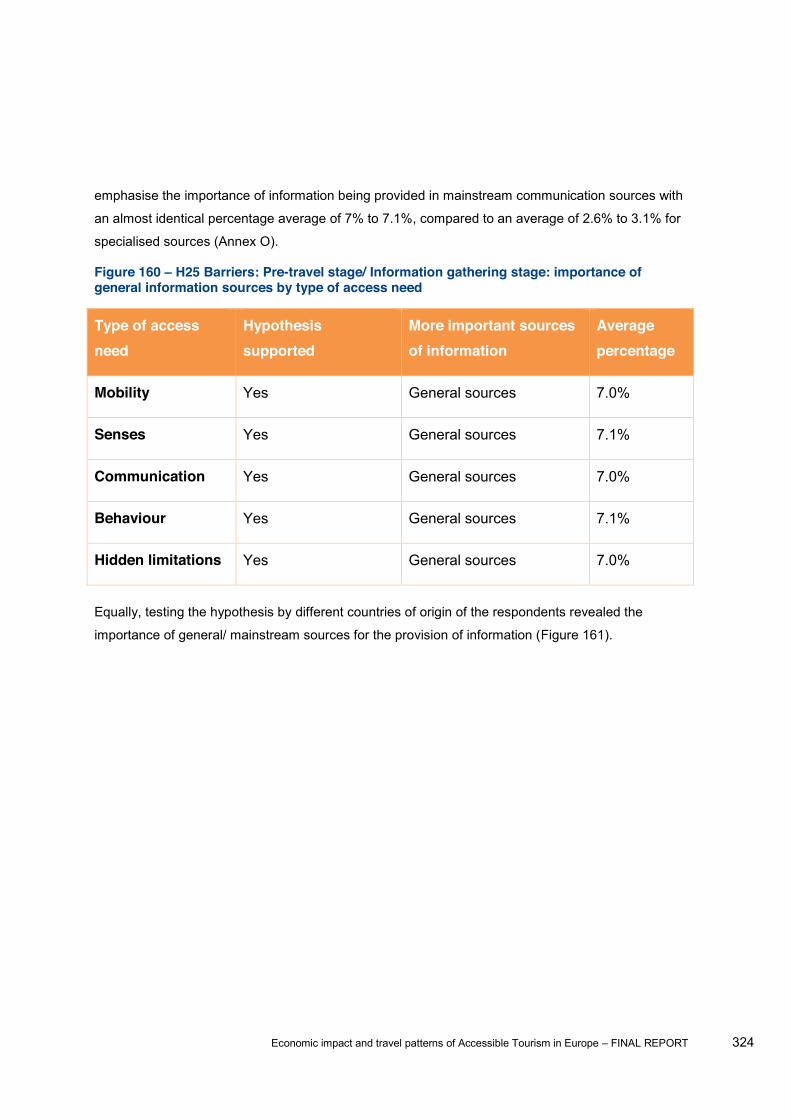
Economic impact and travel patterns of Accessible Tourism in Europe FINAL REPORT 324
emphasise the importance of information being provided in mainstream communication sources with
an almost identical percentage average of 7% to 7.1%, compared to an average of 2.6% to 3.1% for
specialised sources (Annex O).
Figure 160 H25 Barriers: Pre-travel stage/ Information gathering stage: importance of general information sources by type of access need
Type of access need
Hypothesis supported
More important sources of information
Average percentage
Mobility Yes General sources 7.0%
Senses Yes General sources 7.1%
Communication Yes General sources 7.0%
Behaviour Yes General sources 7.1%
Hidden limitations Yes General sources 7.0%
Equally, testing the hypothesis by different countries of origin of the respondents revealed the
importance of general/ mainstream sources for the provision of information (Figure 161).
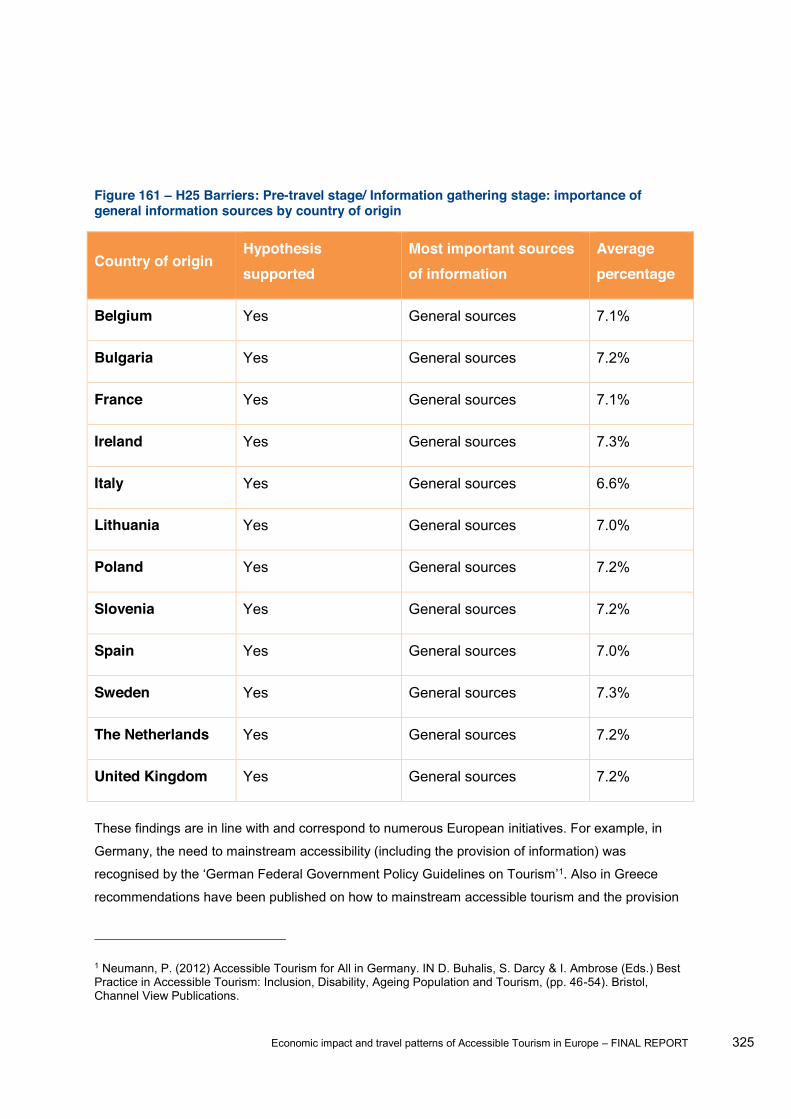
Economic impact and travel patterns of Accessible Tourism in Europe FINAL REPORT 325
Figure 161 H25 Barriers: Pre-travel stage/ Information gathering stage: importance of general information sources by country of origin
Country of origin Hypothesis supported
Most important sources of information
Average percentage
Belgium Yes General sources 7.1%
Bulgaria Yes General sources 7.2%
France Yes General sources 7.1%
Ireland Yes General sources 7.3%
Italy Yes General sources 6.6%
Lithuania Yes General sources 7.0%
Poland Yes General sources 7.2%
Slovenia Yes General sources 7.2%
Spain Yes General sources 7.0%
Sweden Yes General sources 7.3%
The Netherlands Yes General sources 7.2%
United Kingdom Yes General sources 7.2%
These findings are in line with and correspond to numerous European initiatives. For example, in
Germany, the need to mainstream accessibility (including the provision of information) was 1. Also in Greece
recommendations have been published on how to mainstream accessible tourism and the provision
1 Neumann, P. (2012) Accessible Tourism for All in Germany. IN D. Buhalis, S. Darcy & I. Ambrose (Eds.) Best Practice in Accessible Tourism: Inclusion, Disability, Ageing Population and Tourism, (pp. 46-54). Bristol, Channel View Publications.
Economic impact and travel patterns of Accessible Tourism in Europe FINAL REPORT 326
of information1. The same holds true for Sweden as providing information in mainstream channels is
regarded as being of great importance2. At the regional level, the presentation of accessibility
content within mainstream channels is emphasised since it allows for capturing a larger and wider
audience for all channel partners of VisitOslo3.
Having stressed the importance of general/ mainstream information sources, it is also vital to identify
the specific sources which are used for obtaining travel-related information. By comparing
individuals with different types of access needs, it is recognisable that for people with mobility and
communication difficulties as well as for persons with hidden restrictions, information provided by
experience and tourism websites. For individuals with sensory and behavioural difficulties, tourism
Figure 162 to Figure
166). Social media is the least important primary source and also specialised sources, such as
specialised websites and specialised guidebooks rank relatively low.
1 Voulgaropoulos, N., Strati, E., & Fyka, G. (2012). Accessible Tourism in Greece: Beaches and Bathing for All. IN D. Buhalis, S. Darcy & I. Ambrose (Eds.) Best Practice in Accessible Tourism: Inclusion, Disability, Ageing Population and Tourism, (pp. 55-64). Bristol, Channel View Publications. 2 Müller, L. (2012). Accessible Tourism in Sweden: Experiences, Stakeholders, Marketing. IN D. Buhalis, S. Darcy & I. Ambrose (Eds.) Best Practice in Accessible Tourism: Inclusion, Disability, Ageing Population and Tourism, (pp. 157-167). Bristol, Channel View Publications. 3 Sandøy Tveitan, B. (2012). VisitOSLO, Norway: Supporting Accessible Tourism Content within Destination Tourism Marketing. IN D. Buhalis, S. Darcy & I. Ambrose (Eds.) Best Practice in Accessible Tourism: Inclusion, Disability, Ageing Population and Tourism, (pp. 297-309). Bristol, Channel View Publications.
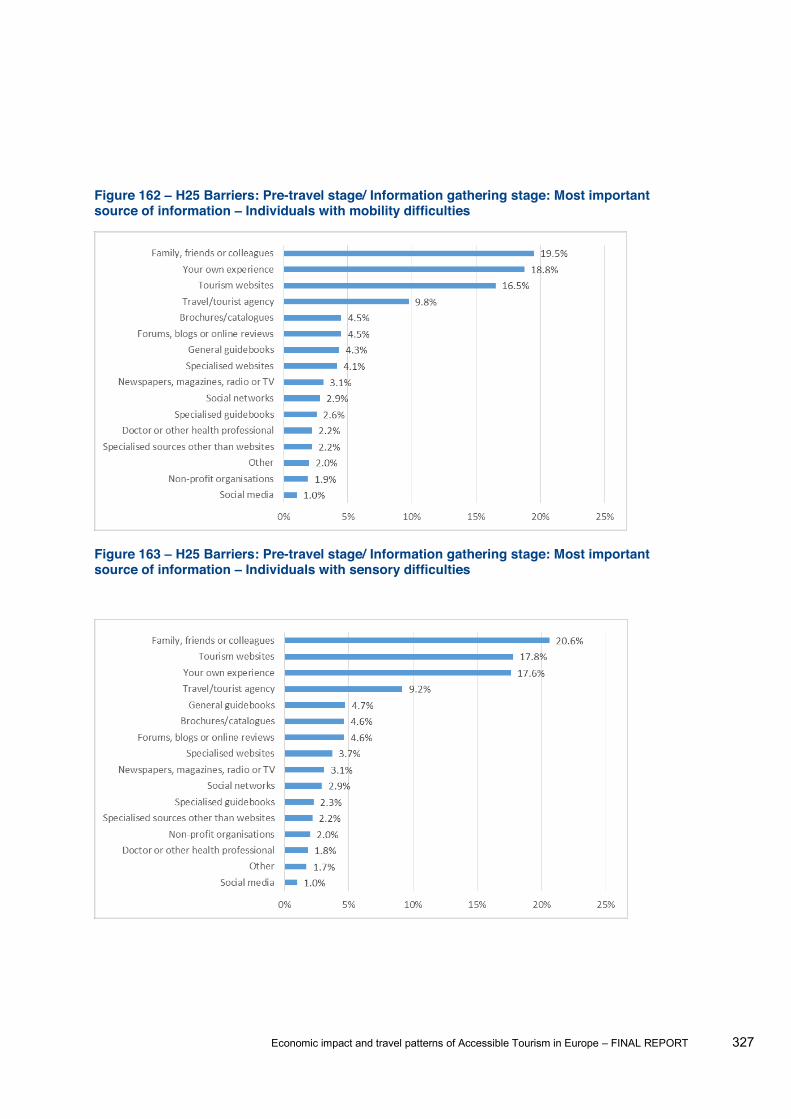
Economic impact and travel patterns of Accessible Tourism in Europe FINAL REPORT 327
Figure 162 H25 Barriers: Pre-travel stage/ Information gathering stage: Most important source of information Individuals with mobility difficulties
Figure 163 H25 Barriers: Pre-travel stage/ Information gathering stage: Most important source of information Individuals with sensory difficulties
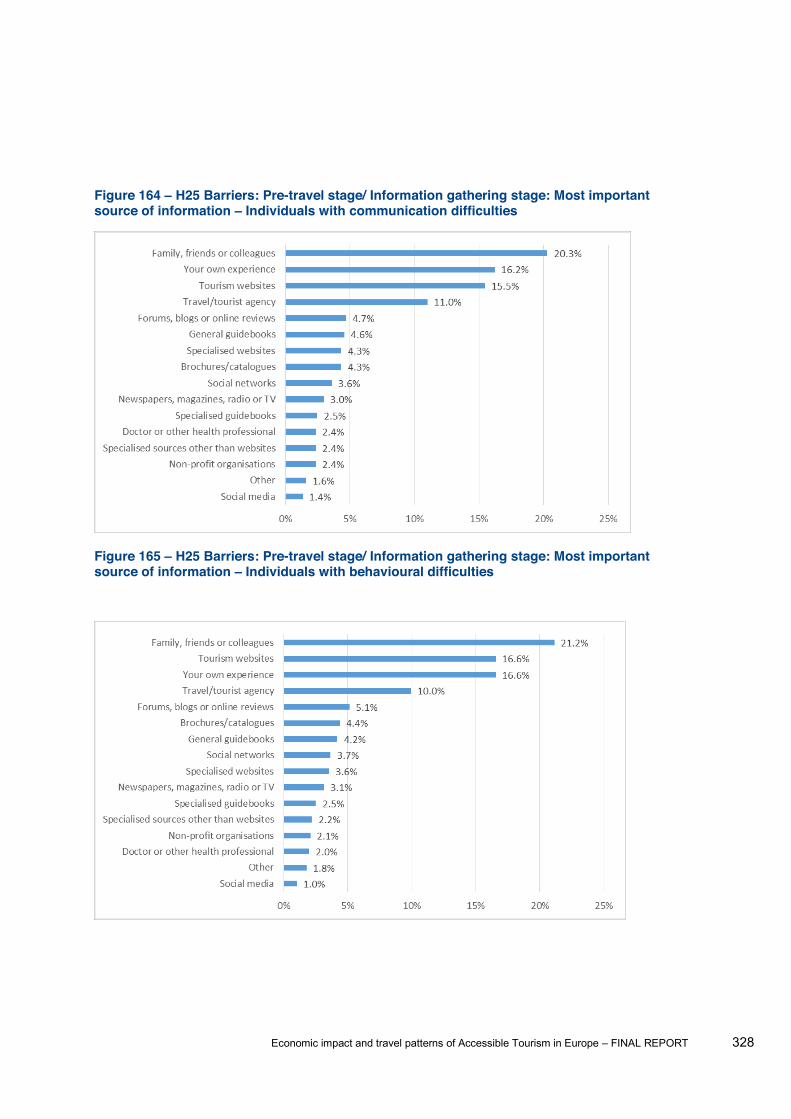
Economic impact and travel patterns of Accessible Tourism in Europe FINAL REPORT 328
Figure 164 H25 Barriers: Pre-travel stage/ Information gathering stage: Most important source of information Individuals with communication difficulties
Figure 165 H25 Barriers: Pre-travel stage/ Information gathering stage: Most important source of information Individuals with behavioural difficulties
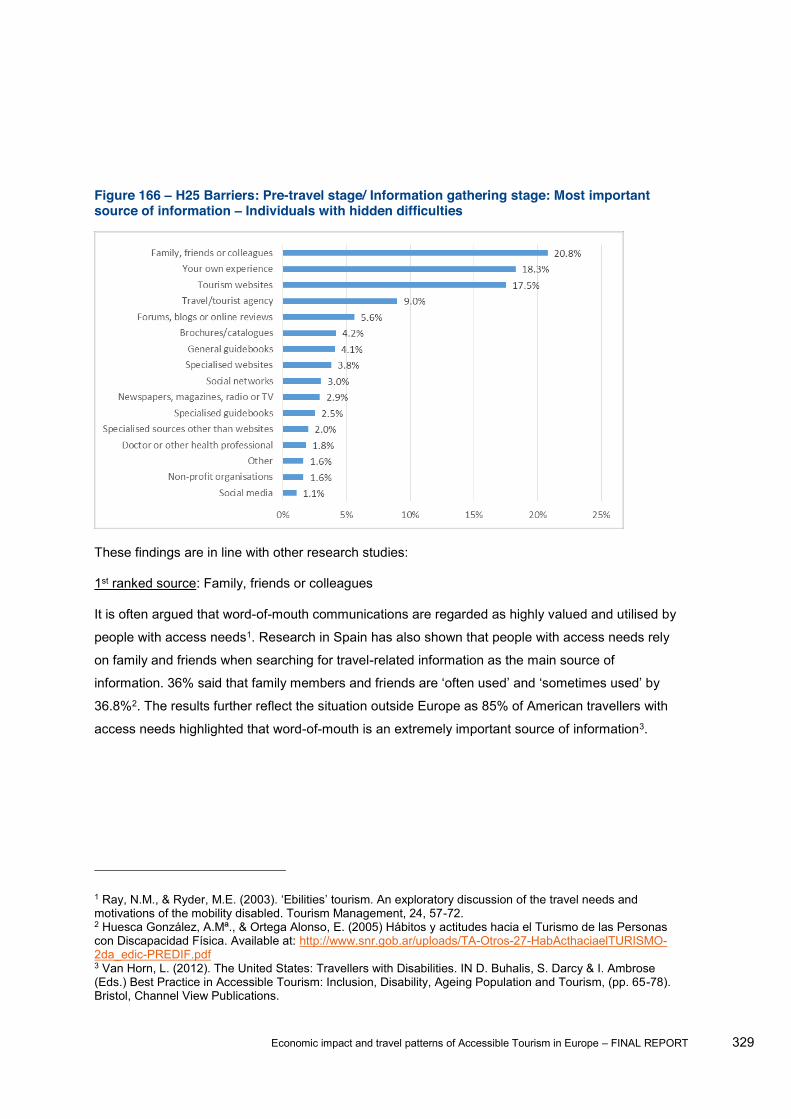
Economic impact and travel patterns of Accessible Tourism in Europe FINAL REPORT 329
Figure 166 H25 Barriers: Pre-travel stage/ Information gathering stage: Most important source of information Individuals with hidden difficulties
These findings are in line with other research studies:
1st ranked source: Family, friends or colleagues
It is often argued that word-of-mouth communications are regarded as highly valued and utilised by
people with access needs1. Research in Spain has also shown that people with access needs rely
on family and friends when searching for travel-related information as the main source of
information. 36% said that family members and fri
36.8%2. The results further reflect the situation outside Europe as 85% of American travellers with
access needs highlighted that word-of-mouth is an extremely important source of information3.
1 motivations of the mobility disabled. Tourism Management, 24, 57-72. 2 Huesca González, A.Mª., & Ortega Alonso, E. (2005) Hábitos y actitudes hacia el Turismo de las Personas con Discapacidad Física. Available at: http://www.snr.gob.ar/uploads/TA-Otros-27-HabActhaciaelTURISMO-2da_edic-PREDIF.pdf 3 Van Horn, L. (2012). The United States: Travellers with Disabilities. IN D. Buhalis, S. Darcy & I. Ambrose (Eds.) Best Practice in Accessible Tourism: Inclusion, Disability, Ageing Population and Tourism, (pp. 65-78). Bristol, Channel View Publications.

Economic impact and travel patterns of Accessible Tourism in Europe FINAL REPORT 330
2nd ranked source: Own experience
The results confirm that individuals often have to rely on their own experiences when planning a
holiday1. This also indicates that people with access needs frequently return to destinations which
they have experienced and tested as it ensures that the level of accessibility actually corresponds to
their requirements. It is the own experience that provides the guarantee that the destination will offer
an enjoyable holiday.
3rd ranked source: Tourism websites
The importance of tourism websites as a source of information substantiates the assumption that the
internet is an important source for people with access needs2 3. This corresponds to research
findings from America, where almost half of the respondents (46%) reported that the internet is used
for obtaining travel-related information4. Also in an European context, the Internet is stated as an 5.
Also in line with other research is that only a few people with access needs use dedicated,
specialised websites and guidebooks. In Spain, only 9% of survey participants reported that 6.
While highlighting the importance of general/ mainstream sources of information, it is central to
investigate the reliability of the information sources consulted, which was stressed as a key aspect
when discussing the barriers faced by people with access needs in the pre-travel stage. This is
addressed by hypothesis H26 (the information available about accessibility conditions is sufficient, reliable and accessible).
1 Stumbo, N.J., & Pegg, S. (2005) Travelers and Tourists with Disabilities: A Matter of Priorities and Loyalties. Tourism Review International, 8, 195-209. 2 Huber, W., & Vitouch, P. (2008) Usability and Accessibility on the Internet: Effects of Accessible Web Design on Usability. 11th International Conference on Computers Helping People with Special Needs (ICCHP 2008). ISBN 3-540-70539-2, Springer Verlag, pp. 482-489, Linz, Austria. 3 Pühretmair, F. (2004). It's Time to Make eTourism Accessible. IN Miesenberger, K., Klaus, J., Zagler, W. & Burger, D. (Eds.) Computers Helping People with Special Needs, (pp. 272-279). Berlin, Springer. 4 Van Horn, L. (2012). The United States: Travellers with Disabilities. IN D. Buhalis, S. Darcy & I. Ambrose (Eds.) Best Practice in Accessible Tourism: Inclusion, Disability, Ageing Population and Tourism, (pp. 65-78). Bristol, Channel View Publications. 5 Huesca González, A.Mª., & Ortega Alonso, E. (2005) Hábitos y actitudes hacia el Turismo de las Personas con Discapacidad Física. Available at: http://www.snr.gob.ar/uploads/TA-Otros-27-HabActhaciaelTURISMO-2da_edic-PREDIF.pdf 6 Huesca González, A.Mª. & Ortega Alonso, E. (2005). Hábitos y actitudes hacia el Turismo de las Personas con Discapacidad Física. Available at: http://www.snr.gob.ar/uploads/TA-Otros-27-HabActhaciaelTURISMO-2da_edic-PREDIF.pdf

Economic impact and travel patterns of Accessible Tourism in Europe FINAL REPORT 331
The results revealed that H26 is supported. The information available about accessibility conditions
is regarded as sufficient, reliable and accessible as the hypothesis could be supported for all types
of access needs (Figure 167).
Figure 167 H26 Barriers: Pre-travel stage/ Information gathering stage: Information is sufficient, reliable and accessible by type of access need
Type of access need Hypothesis supported Percentage answered "Yes"
Sufficient information
Mobility Yes 83.4%
Senses Yes 84.6%
Communication Yes 84.1%
Behaviour Yes 83.1%
Hidden limitations Yes 83.8%
Reliable information
Mobility Yes 80.0%
Senses Yes 81.4%
Communication Yes 81.4%
Behaviour Yes 80.5%
Hidden limitations Yes 79.3%
Accessible information
Mobility Yes 87.0%
Senses Yes 88.3%
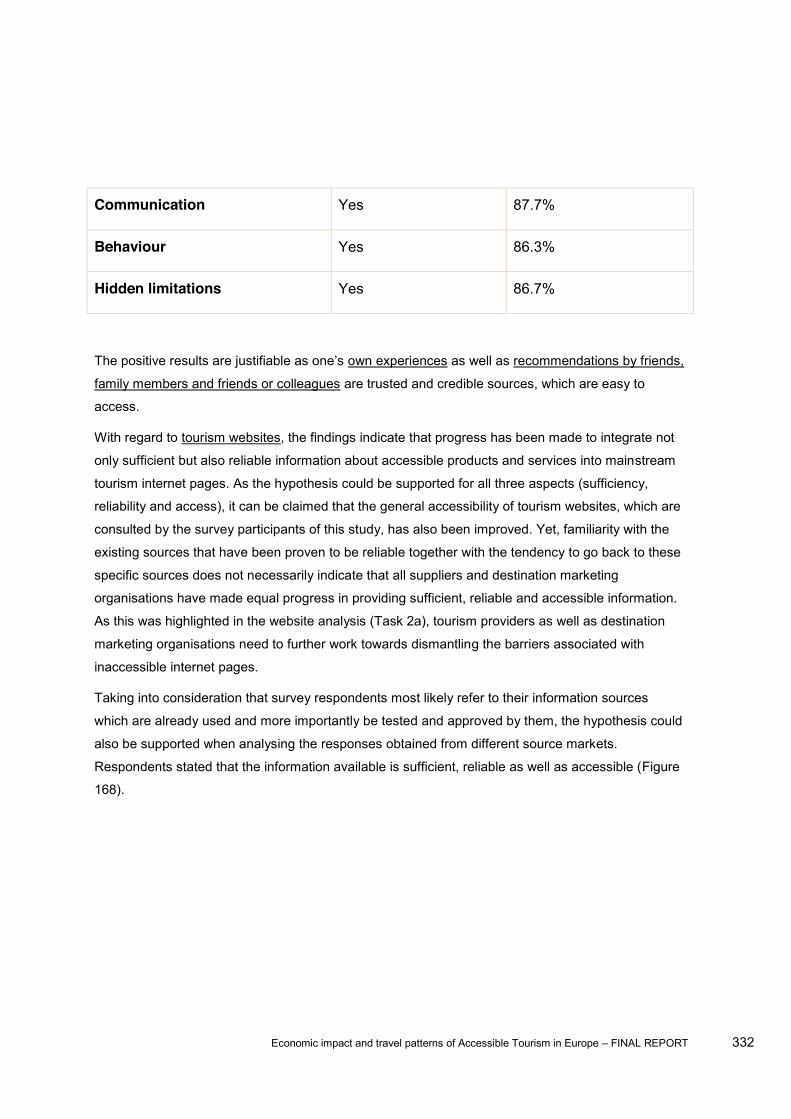
Economic impact and travel patterns of Accessible Tourism in Europe FINAL REPORT 332
Communication Yes 87.7%
Behaviour Yes 86.3%
Hidden limitations Yes 86.7%
own experiences as well as recommendations by friends,
family members and friends or colleagues are trusted and credible sources, which are easy to
access.
With regard to tourism websites, the findings indicate that progress has been made to integrate not
only sufficient but also reliable information about accessible products and services into mainstream
tourism internet pages. As the hypothesis could be supported for all three aspects (sufficiency,
reliability and access), it can be claimed that the general accessibility of tourism websites, which are
consulted by the survey participants of this study, has also been improved. Yet, familiarity with the
existing sources that have been proven to be reliable together with the tendency to go back to these
specific sources does not necessarily indicate that all suppliers and destination marketing
organisations have made equal progress in providing sufficient, reliable and accessible information.
As this was highlighted in the website analysis (Task 2a), tourism providers as well as destination
marketing organisations need to further work towards dismantling the barriers associated with
inaccessible internet pages.
Taking into consideration that survey respondents most likely refer to their information sources
which are already used and more importantly be tested and approved by them, the hypothesis could
also be supported when analysing the responses obtained from different source markets.
Respondents stated that the information available is sufficient, reliable as well as accessible (Figure
168).
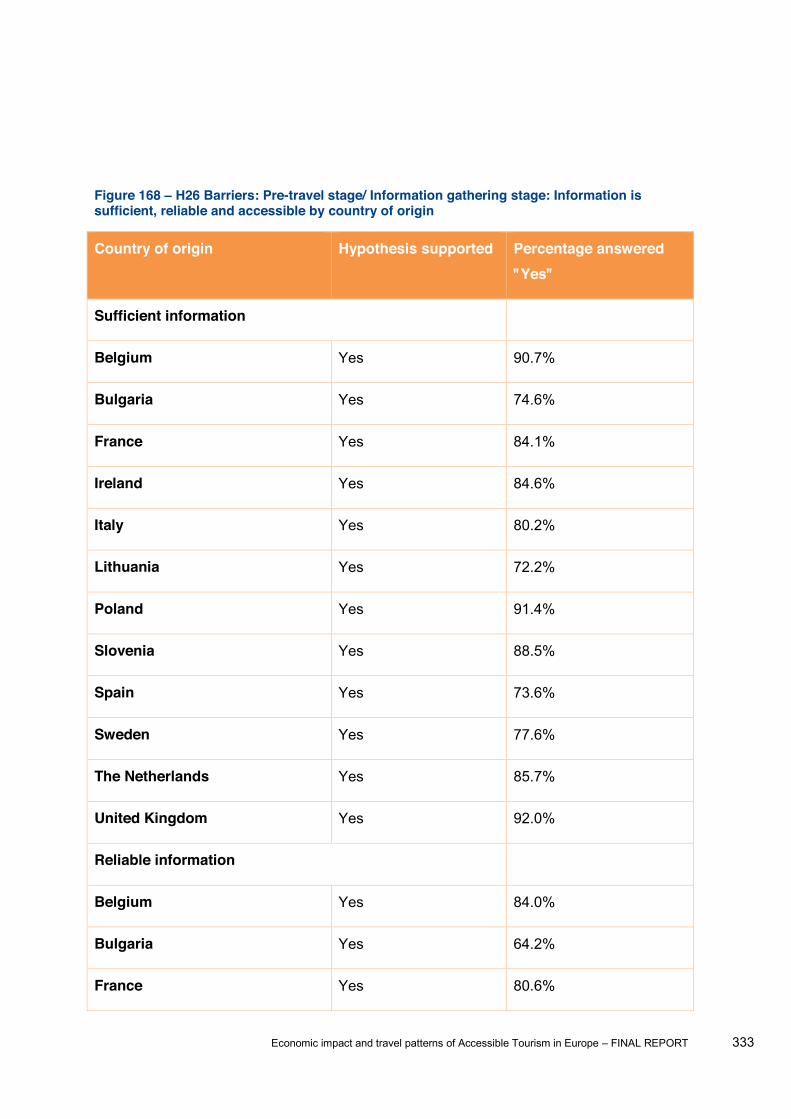
Economic impact and travel patterns of Accessible Tourism in Europe FINAL REPORT 333
Figure 168 H26 Barriers: Pre-travel stage/ Information gathering stage: Information is sufficient, reliable and accessible by country of origin
Country of origin Hypothesis supported Percentage answered "Yes"
Sufficient information
Belgium Yes 90.7%
Bulgaria Yes 74.6%
France Yes 84.1%
Ireland Yes 84.6%
Italy Yes 80.2%
Lithuania Yes 72.2%
Poland Yes 91.4%
Slovenia Yes 88.5%
Spain Yes 73.6%
Sweden Yes 77.6%
The Netherlands Yes 85.7%
United Kingdom Yes 92.0%
Reliable information
Belgium Yes 84.0%
Bulgaria Yes 64.2%
France Yes 80.6%
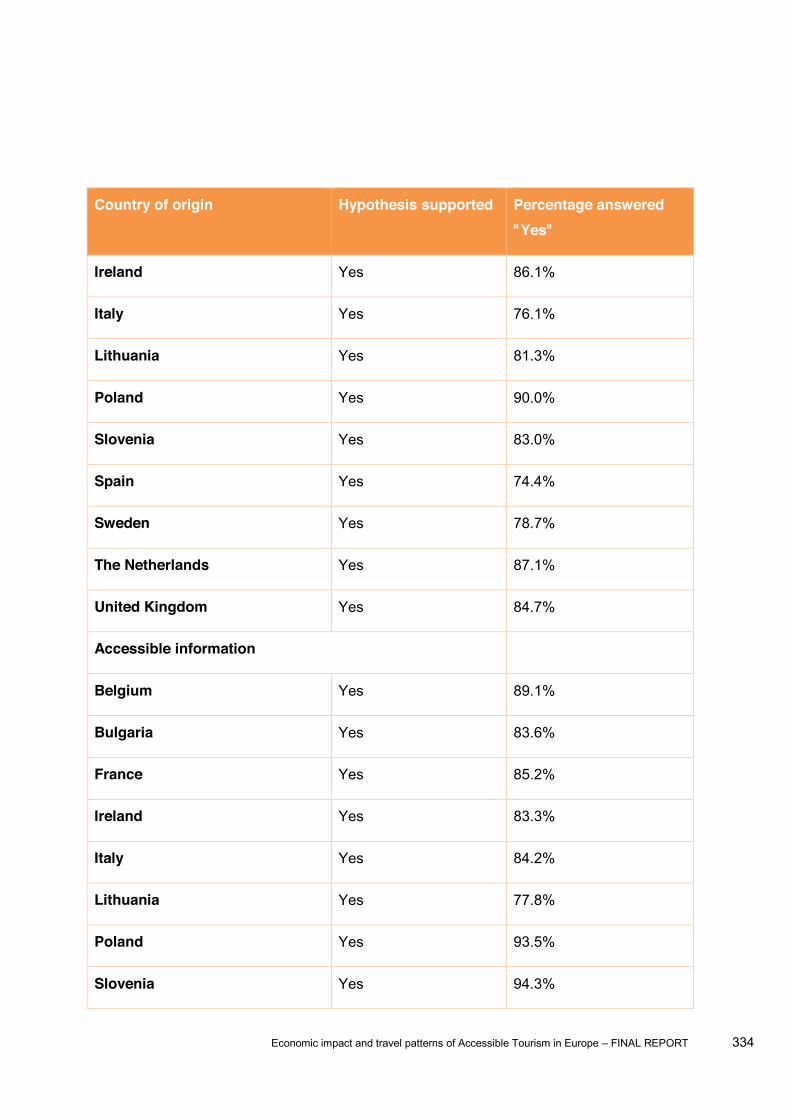
Economic impact and travel patterns of Accessible Tourism in Europe FINAL REPORT 334
Country of origin Hypothesis supported Percentage answered "Yes"
Ireland Yes 86.1%
Italy Yes 76.1%
Lithuania Yes 81.3%
Poland Yes 90.0%
Slovenia Yes 83.0%
Spain Yes 74.4%
Sweden Yes 78.7%
The Netherlands Yes 87.1%
United Kingdom Yes 84.7%
Accessible information
Belgium Yes 89.1%
Bulgaria Yes 83.6%
France Yes 85.2%
Ireland Yes 83.3%
Italy Yes 84.2%
Lithuania Yes 77.8%
Poland Yes 93.5%
Slovenia Yes 94.3%
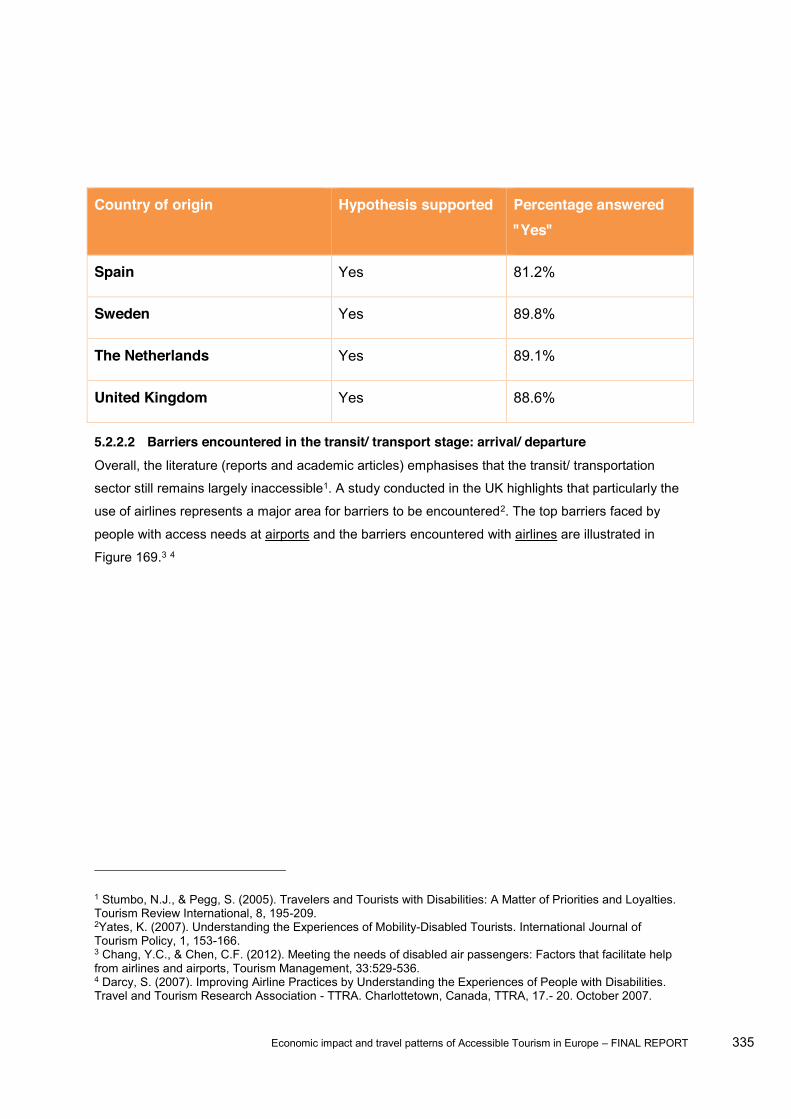
Economic impact and travel patterns of Accessible Tourism in Europe FINAL REPORT 335
Country of origin Hypothesis supported Percentage answered "Yes"
Spain Yes 81.2%
Sweden Yes 89.8%
The Netherlands Yes 89.1%
United Kingdom Yes 88.6%
5.2.2.2 Barriers encountered in the transit/ transport stage: arrival/ departure Overall, the literature (reports and academic articles) emphasises that the transit/ transportation
sector still remains largely inaccessible1. A study conducted in the UK highlights that particularly the
use of airlines represents a major area for barriers to be encountered2. The top barriers faced by
people with access needs at airports and the barriers encountered with airlines are illustrated in
Figure 169.3 4
1 Stumbo, N.J., & Pegg, S. (2005). Travelers and Tourists with Disabilities: A Matter of Priorities and Loyalties. Tourism Review International, 8, 195-209. 2Yates, K. (2007). Understanding the Experiences of Mobility-Disabled Tourists. International Journal of Tourism Policy, 1, 153-166. 3 Chang, Y.C., & Chen, C.F. (2012). Meeting the needs of disabled air passengers: Factors that facilitate help from airlines and airports, Tourism Management, 33:529-536. 4 Darcy, S. (2007). Improving Airline Practices by Understanding the Experiences of People with Disabilities. Travel and Tourism Research Association - TTRA. Charlottetown, Canada, TTRA, 17.- 20. October 2007.
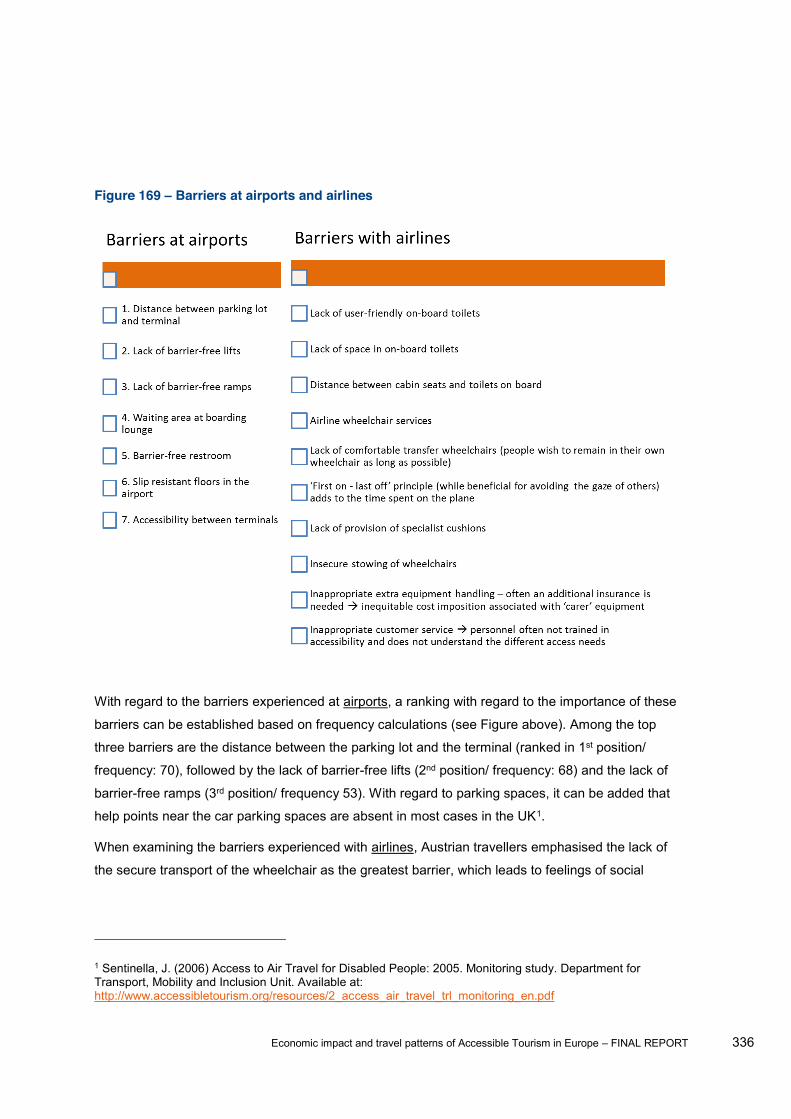
Economic impact and travel patterns of Accessible Tourism in Europe FINAL REPORT 336
Figure 169 Barriers at airports and airlines
With regard to the barriers experienced at airports, a ranking with regard to the importance of these
barriers can be established based on frequency calculations (see Figure above). Among the top
three barriers are the distance between the parking lot and the terminal (ranked in 1st position/
frequency: 70), followed by the lack of barrier-free lifts (2nd position/ frequency: 68) and the lack of
barrier-free ramps (3rd position/ frequency 53). With regard to parking spaces, it can be added that
help points near the car parking spaces are absent in most cases in the UK1.
When examining the barriers experienced with airlines, Austrian travellers emphasised the lack of
the secure transport of the wheelchair as the greatest barrier, which leads to feelings of social
1 Sentinella, J. (2006) Access to Air Travel for Disabled People: 2005. Monitoring study. Department for Transport, Mobility and Inclusion Unit. Available at: http://www.accessibletourism.org/resources/2_access_air_travel_trl_monitoring_en.pdf

Economic impact and travel patterns of Accessible Tourism in Europe FINAL REPORT 337
exclusion and discrimination1. Further, issues related to on-board toilets (including lack of user-
friendly on-board toilets, lack of space in on-board toilets and the distance between the cabin seats
and the toilets on board) seem to represent the most significant barriers. In addition, it is anticipated
that these barriers augment when choosing low-cost carriers. The most crucial barriers here refer
to2:
- Fares and baggage allowances e.g. people with a disability are charged a higher fare due to strict baggage allowances
- Airport (ground) facilities and services e.g. lack of trained staff / staff not understanding the needs of people with different access needs
- In-flight services and facilities e.g. seating density
- Aircraft used e.g. lack of accessible toilets and on-board aisle chairs
Apart from the on-board toilets, inappropriate customer service triggers the emergence of other
barriers, which are:
At the boarding and disembarking stage:
Staff not trained in understanding different access needs are unaware of the importance of
understanding different access needs often leads to ignoring
the desire of people with access needs to remain in their wheelchair as long as possible (barrier
At the equipment handling stage:
Staff not trained in understanding different access needs will not know how to securely stow
1 Hitsch, W. (2005) Probleme, Risiken und Chancen des barrierefreien Tourismus. Institut für Unternehmensführung, Tourismus und Dienstleistungswirtschaft, Fakultät für Betriebswirtschaft der Leopold-Franzens-Universität Innsbruck. Available at: http://www.ibft.at/ibft/doc/Diplomarbeit%20-%20Barrierefreies%20Reisen.pdf 2 Darcy, S., & Ravinder, R. (2012) Air Travel for People with a Disability. IN D. Buhalis, S. Darcy & I. Ambrose (Eds.) Best Practice in Accessible Tourism: Inclusion, Disability, Ageing Population and Tourism, (pp. 207-221). Bristol, Channel View Publications.
Economic impact and travel patterns of Accessible Tourism in Europe FINAL REPORT 338
Additional services:
Staff not trained in understanding different access needs have very limited knowledge about how
a
It is surmised that all of these barriers contribute to feelings of helplessness and the fact of needing
help results in feelings of embarrassment and discomfort.
When more specific information on the barriers faced by people with different types of access needs
is included, an additional important element can be added to the debate. For both types of difficulty
(mobility and visual) there appears to be a question with regard to the importance of attitudinal barriers versus physical access barriers in the transit stage. For example, a study conducted in
Israel strongly highlights that social obstacles, e.g. negative attitudes, weigh stronger than physical
access barriers. This is because social barriers affect the feelings of individuals to a greater extent
than physical access issues1. Similar results were revealed by a study in the UK, where respondents
reported the greater importance of attitudinal barriers (e.g. staff not understanding the needs of
people with access needs) at 75% compared to physical access barriers (e.g. problems boarding the
aircraft) at 66%2.
However, in contrast, studies from China and the United States stress that people with mobility
impairments perceive physical access barriers as being more important than attitudinal barriers3 4. A
study by the Open Doors Organization (ODO) reports that the biggest barrier refers to physical
obstacles (67%) with cramped seating areas (52%) heading the list, followed by service/ personnel
issues with 60%5. In Germany, and by focusing on visually restricted individuals, it was found that
1Poria, Y., Reichel, A., & Brandt, Y. (2010). The flight experiences of people with disabilities: An exploratory study, Journal of Travel Research, 49(2):216-227. 2 Wright, A. (2012) Tour Operating for the less mobile traveller. IN D. Buhalis, S. Darcy & I. Ambrose (Eds.) Best Practice in Accessible Tourism: Inclusion, Disability, Ageing Population and Tourism, (pp. 195-206). Bristol, Channel View Publications. 3Bi, Y., Card, J.A., & Cole, S.T. (2007). Accessibility and Attitudinal barriers encountered by Chinese Travellers with Physical Disabilities, International Journal of Tourism Research, 9:205-216. 4Card, J. A., Cole, S. T., & Humphrey, A. H. (2006) A Comparison of the Accessibility and Attitudinal Barriers Model: Travel Providers and Travelers with Physical Disabilities. Asia Pacific Journal of Tourism Research, 11, 161-175. 5 Van Horn, L. (2012). The United States: Travellers with Disabilities. IN D. Buhalis, S. Darcy & I. Ambrose (Eds.) Best Practice in Accessible Tourism: Inclusion, Disability, Ageing Population and Tourism, (pp. 65-78). Bristol, Channel View Publications.
Economic impact and travel patterns of Accessible Tourism in Europe FINAL REPORT 339
fewer attitudinal barriers (e.g. assistance from personnel) exist compared to physical access
barriers1.
As the importance attached to physical access barriers versus attitudinal access barriers remains an
unresolved question in the debate on barriers encountered in the transit stage, the hypothesis to be
tested for the European context is:
H27: In the transit stage, attitudinal barriers, such as how tourists with access needs are treated by
service staff, are equally as important as physical access barriers, particularly in terms of assistance
with getting on board, leaving or changing.
The hypothesis test results revealed that H27 is partially supported for the European context.
Attitudinal barriers are more important than physical access barriers in the transit stage,
which does not only support the research conducted in Israel2, highlighting the importance of
negative attitudes in the transit stage weighing stronger than physical access barriers, but also
backs-up the monitoring study of access to air travel in the UK, indicating that further improvements
are needed to enhance the communication between staff and passengers. In addition, greater
attention needs to be paid to the general disability awareness of staff working in this sector3. Yet,
attitudinal barriers are equally as important as some physical access barriers, such as transport to
and from the destination for people with communication and hidden limitations (Figure 170).
1 Becker, M. (2007). Barrierefreier Tourismus für Alle untersucht am Beispiel von Reisen blinder und sehbehinderter Menschen. Universität Paderborn, Fakultät für Kulturwissenschaften Geografie, Deutschland. Available at: http://www.accessibletourism.org/resources/magister_monika_becker_de-2.pdf 2 Poria, Y., Reichel, A., & Brandt, Y. (2010). The flight experiences of people with disabilities: An exploratory study, Journal of Travel Research, 49(2):216-227. 3 Sentinella, J. (2006). Access to Air Travel for Disabled People: 2005. Monitoring study. Department for Transport, Mobility and Inclusion Unit. Available at: http://www.accessibletourism.org/resources/2_access_air_travel_trl_monitoring_en.pdf

Economic impact and travel patterns of Accessible Tourism in Europe FINAL REPORT 340
Figure 170 H27 Barriers: Transit stage: Attitudinal versus physical access barriers by type of access need
Type of access need Hypothesis supported
More important barriers
Barriers experienced
Mobility No Attitudinal barriers 14.8%
Senses No Attitudinal barriers 14.5%
Communication Partially* Attitudinal barriers 15.7%
Behaviour No Attitudinal barriers 15.5%
Hidden limitations Partially* Attitudinal barriers 13.4%
Note: * Statistically, attitudinal barriers are equally as important as transport to and from
destination, and more important than accessible transport types
Given that people with communication difficulties give equal importance to attitudes, e.g. how they
are treated, and physical aspects, e.g. transport to and from the destination, it can be argued that
the National Society for the Deaf in Italy has taken appropriate actions in tailoring its efforts to both
private car transport, a programme to remove physical access barriers was put in place in addition to
improving levels of awareness among the general public, including service personnel1.
5.2.2.3 Barriers encountered with transport at the destination and access paths Overall, barriers related to transport at the destination often only highlight that these services,
including taxis and trains, remain largely inaccessible23. Further barriers include missing kerb cuts,
1 Collu, I. (2010). The access to tourism for deaf people: requirements and good practice. IN IsITT Istituto Italiano per il Turismo per Tutti (ed.) Viaggiare senza limiti: il turismo per tutti in Europa. Available at: http://www.turismabile.it/file/lib/files/viaggiare_senza_limiti_web.pdf 2 Stumbo, N.J., & Pegg, S. (2005). Travelers and Tourists with Disabilities: A Matter of Priorities and Loyalties. Tourism Review International, 8, 195-209. 3 Murray, M., & Sproats, J. (1990). The Disabled Traveller: Tourism and Disability in Australia. Journal of Tourism Studies 1, 9-14.
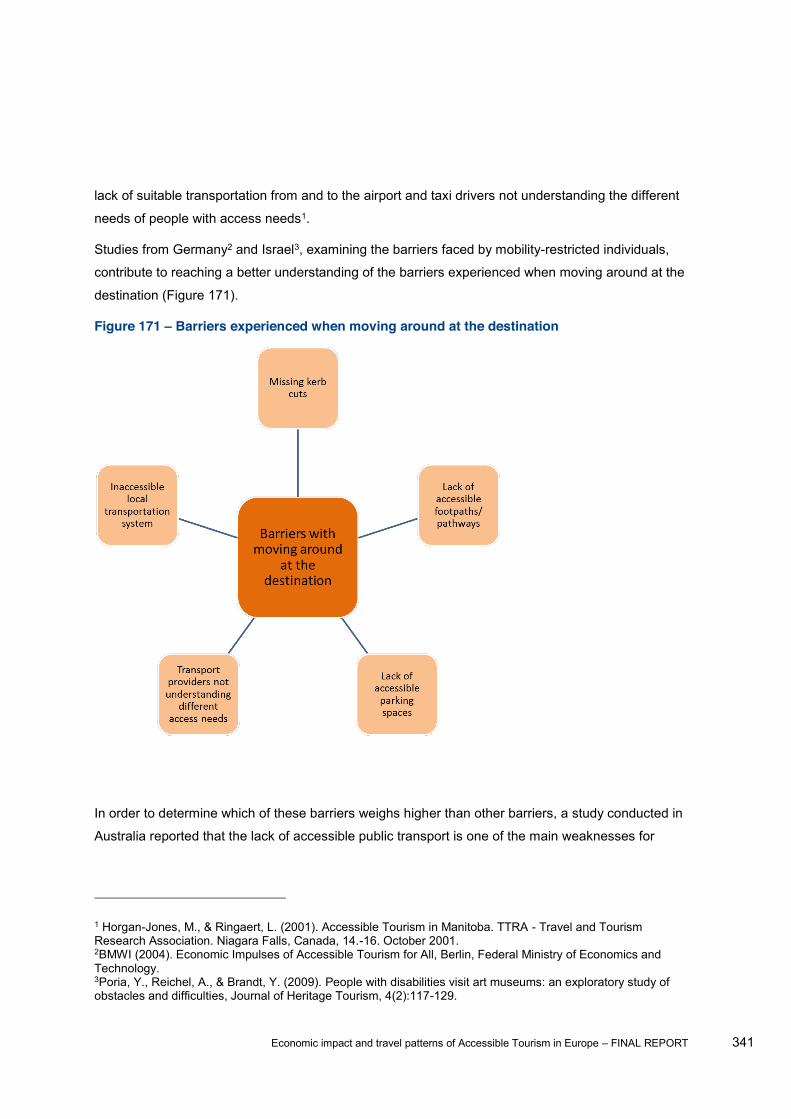
Economic impact and travel patterns of Accessible Tourism in Europe FINAL REPORT 341
lack of suitable transportation from and to the airport and taxi drivers not understanding the different
needs of people with access needs1.
Studies from Germany2 and Israel3, examining the barriers faced by mobility-restricted individuals,
contribute to reaching a better understanding of the barriers experienced when moving around at the
destination (Figure 171).
Figure 171 Barriers experienced when moving around at the destination
In order to determine which of these barriers weighs higher than other barriers, a study conducted in
Australia reported that the lack of accessible public transport is one of the main weaknesses for
1 Horgan-Jones, M., & Ringaert, L. (2001). Accessible Tourism in Manitoba. TTRA - Travel and Tourism Research Association. Niagara Falls, Canada, 14.-16. October 2001. 2BMWI (2004). Economic Impulses of Accessible Tourism for All, Berlin, Federal Ministry of Economics and Technology. 3Poria, Y., Reichel, A., & Brandt, Y. (2009). People with disabilities visit art museums: an exploratory study of obstacles and difficulties, Journal of Heritage Tourism, 4(2):117-129.
Economic impact and travel patterns of Accessible Tourism in Europe FINAL REPORT 342
Australia as a holiday destination1. Another research study, also from outside Europe, ranked the
relative importance of certain accessibility features. It was found that when the number of visitations
increases, the relative importance of paths and accessible parking increases, while the
significance of restrooms, sidewalks, elevators and access ramps decreases2. In order to test this
assumption for the European context, the following hypothesis was set-up:
H28: Access pathways, e.g. continuous, accessible routes between facilities and services, and
accessible parking spaces, are the most important aspects for people with access needs when
moving around at the destination.
The statistical analysis has shown that H28 is partially supported. Access pathways and accessible
parking spaces are perceived as the most important aspects for people with access needs when
moving around at the destination for people with mobility difficulties (
1 Economic and Social Commission for Asia and the Pacific (2003). Barrier-free Tourism for People with Disabilities in the Asian and Pacific Regions, United Nations, New York. Available at: http://www.unescap.org/ttdw/Publications/TPTS_pubs/pub_2316/pub_2316_tor.pdf 2Israeli, A.A. (2002). A Preliminary Investigation of the Importance of Site Accessibility Factors for Disabled Tourists. Journal of Travel Research, 41, 101-104.
Economic impact and travel patterns of Accessible Tourism in Europe FINAL REPORT 343
Figure 172). This not only supports research from non-European countries such as Israel1 and
Australia2 but also existing studies from a European context, such as Italy3, Finland4 and Spain5.
1 Israeli, A.A. (2002) A Preliminary Investigation of the Importance of Site Accessibility Factors for Disabled Tourists. Journal of Travel Research, 41, 101-104. 2 Darcy, S., Cameron, B., & Schweinsberg, S. (2012). Accessible Tourism in Australia. IN D. Buhalis, S. Darcy & I. Ambrose (Eds.) Best Practice in Accessible Tourism: Inclusion, Disability, Ageing Population and Tourism, (pp. 79-113). Bristol, Channel View Publications. 3 Vitali, G., & Vitali, R. (2010). The results of a complex project to the sea: statistics, economic impact, best practices and customer satisfaction. IN IsITT Istituto Italiano per il Turismo per Tutti (ed.) Viaggiare senza limiti: il turismo per tutti in Europa. Available at: http://www.turismabile.it/file/lib/files/viaggiare_senza_limiti_web.pdf 4 Ministry of Transport and Communications (2003) Towards Accessible Transport Accessibility Strategy of the Ministry of Transport and Communication. Programmes and Strategies of the Ministry of Transport and Communications, Finland. Available at: http://www.accessibletourism.org/resources/18_toward_accessible_transport_en.pdf 5 Ministerio de Industria, Turismo y Comercio (no date) Decálogo de Buenas Prácticas en Accesibilidad Turística. Available at: http://www.planaccesibilidadturistica.es/UserFiles/publicaciones/ficheros/Decalogo_Buenas_Practicas_Accesibilidad_Turistica.pdf
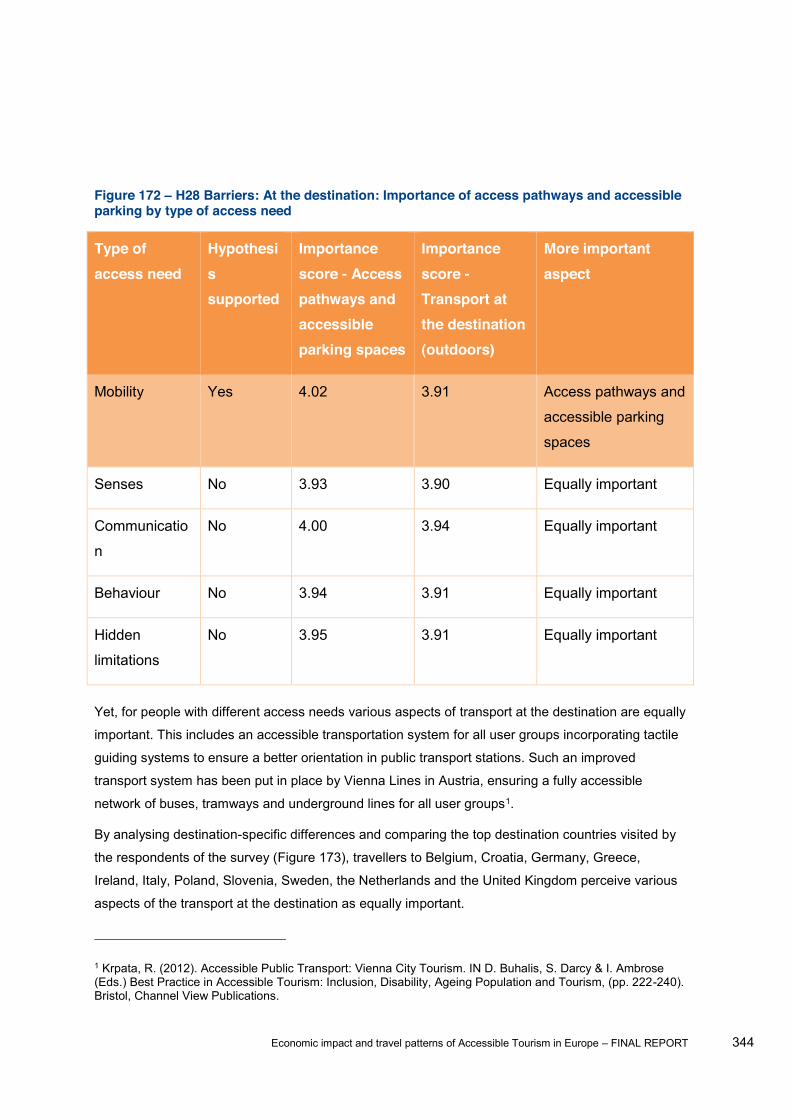
Economic impact and travel patterns of Accessible Tourism in Europe FINAL REPORT 344
Figure 172 H28 Barriers: At the destination: Importance of access pathways and accessible parking by type of access need
Type of access need
Hypothesis supported
Importance score - Access pathways and accessible parking spaces
Importance score - Transport at the destination (outdoors)
More important aspect
Mobility Yes 4.02 3.91 Access pathways and
accessible parking
spaces
Senses No 3.93 3.90 Equally important
Communicatio
n
No 4.00 3.94 Equally important
Behaviour No 3.94 3.91 Equally important
Hidden
limitations
No 3.95 3.91 Equally important
Yet, for people with different access needs various aspects of transport at the destination are equally
important. This includes an accessible transportation system for all user groups incorporating tactile
guiding systems to ensure a better orientation in public transport stations. Such an improved
transport system has been put in place by Vienna Lines in Austria, ensuring a fully accessible
network of buses, tramways and underground lines for all user groups1.
By analysing destination-specific differences and comparing the top destination countries visited by
the respondents of the survey (Figure 173), travellers to Belgium, Croatia, Germany, Greece,
Ireland, Italy, Poland, Slovenia, Sweden, the Netherlands and the United Kingdom perceive various
aspects of the transport at the destination as equally important.
1 Krpata, R. (2012). Accessible Public Transport: Vienna City Tourism. IN D. Buhalis, S. Darcy & I. Ambrose (Eds.) Best Practice in Accessible Tourism: Inclusion, Disability, Ageing Population and Tourism, (pp. 222-240). Bristol, Channel View Publications.
Economic impact and travel patterns of Accessible Tourism in Europe FINAL REPORT 345
Evidence can be found that some of these countries already pay attention to reducing the barriers
encountered with transport at the destination and access paths. For example in Italy, the city of
Genoa has improved access paths by designing new barrier-free pedestrian crossings and public
elevators to reach specific tourism facilities1. Yet, improving access paths can be challenging for
cities such as Venice. While improvements have been made in terms of making individual
attractions, such as museums accessible, the most predominant difficulty rests with improving the
pathways from and to specific attractions which requires the involvement of all stakeholders2.
1 Coop. Sociale La Cruna (2008). Genova per tutti noi a guide for tourism without barriers. Ambient Intelligence System of Agents for Knowledge-based and Integrated Services for Mobility impaired users (ASK-IT), Genova, Italy. Available at: http://www.lacruna.com/amministra/media/9.pdf 2 Mengardo, G. (2012). Turismo Accessibile a Venezia. Un' "isola dell'accessibilità" attorno ai Musei Civici per
http://dspace.unive.it/handle/10579/2057

Economic impact and travel patterns of Accessible Tourism in Europe FINAL REPORT 346
Figure 173 H28 Barriers: At the destination: Importance of access pathways and accessible parking by destination
Destination Hypothesis supported
Importance score - Access pathways and accessible parking spaces
Importance score - Transport at the destination (outdoors)
More important aspect
Belgium No 3.91 3.81 Equally important
Bulgaria Yes 3.91 3.57 Access pathways and accessible parking spaces
Croatia No 3.83 3.68 Equally important
France Yes 3.92 3.75 Access pathways and accessible parking spaces
Germany No 4.14 4.00 Equally important
Greece No 3.70 4.04 Equally important
Ireland No 3.99 4.08 Equally important
Italy No 4.08 4.00 Equally important
Lithuania Yes 4.24 3.66 Access pathways and accessible parking spaces
Poland No 4.12 4.00 Equally important
Slovenia No 3.77 3.64 Equally important
Spain No 3.73 3.89 Transportation at destination (outdoors)
Sweden No 3.90 3.65 Equally important
The Netherlands No 3.71 3.79 Equally important
United Kingdom No 3.93 3.84 Equally important
Economic impact and travel patterns of Accessible Tourism in Europe FINAL REPORT 347
In contrast to the destinations mentioned above, where various aspects of the transport at the
destination are perceived as equally important by travellers, tourists visiting Bulgaria, France and
Lithuania found that access paths and accessible parking spaces represent the most important
aspects. This highlights the need for these countries to invest their efforts in ensuring that visitors
can fully enjoy the destination by creating uninterrupted paths to or within a building providing
access to all required facilities, also incorporating accessible parking1. Evidence can be found that
France seems to tackle these problems as among the suggestions provided by the National Tourist
Board it is highlighted that the concept of ease of use should become a predominant value for all
touristic services provided2.
Spain was identified as the only country where transport at the destination represents the most
important aspect by visitors. This is line with other research conducted in Spain highlighting that
55.4% of the research participants encountered major problems particularly with the transfers at the
destination3 while improvements have been made with regard to improving accessible parking in
cities such as Avila4.
5.2.2.4 Barriers encountered in the accommodation sector In the accommodation sector, an often-stated barrier refers to hotels not complying with access
standards and legislation, such as in the United States despite the existence of the Americans with
Disabilities Act (ADA)5. In addition to this, a number of other barriers are reported with regard to
hotel establishments6 7 8 9 1 2 (Figure 174).
1 Darcy, S., Cameron, B., Pegg, S., & Packer, T. (2008) Developing Business Case Studies for Accessible Tourism. STCRC (Sustainable Tourism Cooperative Research Centre), Queensland, Australia. Available at: http://www.crctourism.com.au/wms/upload/images/disc%20of%20images%20and%20pdfs/for%20bookshop/documents/90042_Darcy_DevBusCaseWEB.pdf 2 aux vacances. Available at: http://www.ladocumentationfrancaise.fr/var/storage/rapports-publics/054000368/0000.pdf 3 Huesca González, A.Mª., & Ortega Alonso, E. (2005). Hábitos y actitudes hacia el Turismo de las Personas con Discapacidad Física. Available at: http://www.snr.gob.ar/uploads/TA-Otros-27-HabActhaciaelTURISMO-2da_edic-PREDIF.pdf 4 Melgosa Arcos, F.J. (2009). Turismo accesible, Turismo para Todos en una Ciudad Patrimonio de la Humanidad: el caso de Ávila. Revista Turismo & Desenvolvimento N.º 11. 5 Stumbo, N.J., & Pegg, S. (2005). Travelers and Tourists with Disabilities: A Matter of Priorities and Loyalties. Tourism Review International, 8, 195-209. 6 Murray, M., & Sproats, J. (1990). The Disabled Traveller: Tourism and Disability in Australia. Journal of Tourism Studies 1, 9-14. 7 Murray, M., & Sproats, J. (1990). The Disabled Traveller: Tourism and Disability in Australia. Journal of Tourism Studies 1, 9-14. 8 Horgan-Jones, M., & Ringaert, L. (2001). Accessible Tourism in Manitoba. TTRA - Travel and Tourism Research Association. Niagara Falls, Canada, 14.-16. October 2001. 9Darcy, S. (2002). Marginalised Participation: Physical Disability, High Support Needs and Tourism. Journal of Hospitality and Tourism Management, 9, 61-72.
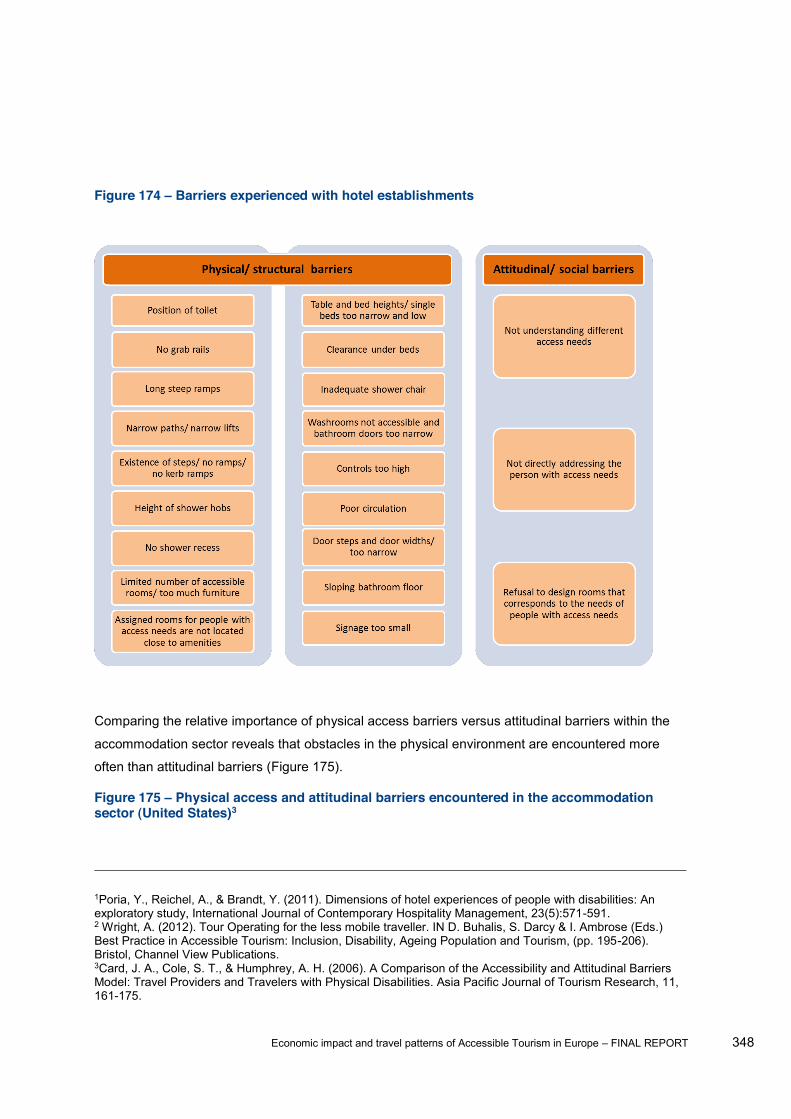
Economic impact and travel patterns of Accessible Tourism in Europe FINAL REPORT 348
Figure 174 Barriers experienced with hotel establishments
Comparing the relative importance of physical access barriers versus attitudinal barriers within the
accommodation sector reveals that obstacles in the physical environment are encountered more
often than attitudinal barriers (Figure 175).
Figure 175 Physical access and attitudinal barriers encountered in the accommodation sector (United States)3
1Poria, Y., Reichel, A., & Brandt, Y. (2011). Dimensions of hotel experiences of people with disabilities: An exploratory study, International Journal of Contemporary Hospitality Management, 23(5):571-591. 2 Wright, A. (2012). Tour Operating for the less mobile traveller. IN D. Buhalis, S. Darcy & I. Ambrose (Eds.) Best Practice in Accessible Tourism: Inclusion, Disability, Ageing Population and Tourism, (pp. 195-206). Bristol, Channel View Publications. 3Card, J. A., Cole, S. T., & Humphrey, A. H. (2006). A Comparison of the Accessibility and Attitudinal Barriers Model: Travel Providers and Travelers with Physical Disabilities. Asia Pacific Journal of Tourism Research, 11, 161-175.

Economic impact and travel patterns of Accessible Tourism in Europe FINAL REPORT 349
Physical access barriers Attitudinal barriers
Accommodation 81% Accommodation 65%
The tendency for physical access barriers to be perceived as greater than attitudinal barriers in the
accommodation sector is supported by another study from the United States where the biggest
barrier relates to physical obstacles (48%) followed by service/ personnel (45%). Among the most
prevailing physical access barriers are doors being too hard to open (36%), limited mobility in the
rooms (20%) and inaccessible bath facilities (19%)1.
Similar results highlighting that physical access barriers are greater when compared to attitudinal
barriers were also obtained from a Chinese study (Figure 176).
Figure 176 Physical access and attitudinal barriers encountered in the accommodation sector (China)2
Physical access barriers Attitudinal barriers
Accommodation 2.80 Accommodation 2.21
Note: The numbers in the table refer to the means of physical and attitudinal barrier levels, based
on a 1 to 5 measurement scale, where 1 means few and 5 means many.
The studies discussed above have provided crucial information and assist in establishing the first
hypothesis for the accommodation sector. Key information deriving from these qualitative and
quantitative findings from various studies outside Europe highlights that physical access barriers are ranked higher compared to attitudinal barriers in the accommodation sector. Therefore,
the hypothesis to be tested for the European context is:
H29: In the accommodation sector, physical access barriers, particularly related to toilets and
mobility within rooms, are more important than attitudinal barriers, such as how tourists with access
needs are treated by service staff.
1 Van Horn, L. (2012). The United States: Travellers with Disabilities. IN D. Buhalis, S. Darcy & I. Ambrose (Eds.) Best Practice in Accessible Tourism: Inclusion, Disability, Ageing Population and Tourism, (pp. 65-78). Bristol, Channel View Publications. 2Bi, Y., Card, J.A., & Cole, S.T. (2007). Accessibility and Attitudinal barriers encountered by Chinese Travellers with Physical Disabilities, International Journal of Tourism Research, 9:205-216.
Economic impact and travel patterns of Accessible Tourism in Europe FINAL REPORT 350
Following on from this hypothesis and particularly focusing on individual physical access barriers
within the accommodation sector (Figure 174), a study from Italy highlights a variety of features,
such as architectural barriers, unsuitable lifts, inaccessible bathrooms and rooms being too small as
barriers1, yet without indicating the relative importance of these aspects. In contrast, focusing on the
relative importance of different physical access barriers, studies from the United States, Israel and
Australia found that the inaccessibility of toilets and bathrooms resides among the greatest barriers2 3 4 5.
Specialised tour operators confirm toilets and bathrooms as representing a major obstacle6. As
these studies derive from a non-European context, it is essential to examine this assumption by
investigating whether toilets represent the barrier which causes the greatest dissatisfaction among
individuals with access needs for the European context. As such, the second hypothesis for the
accommodation sector is as follows:
H30: Among the physical access barriers encountered in the accommodation sector, people with
access needs are least satisfied with toilets.
The hypothesis testing procedure for H29 (in the accommodation sector, physical access barriers,
particularly related to toilets and the mobility within rooms, are more important than attitudinal
barriers, such as how tourists with access needs are treated by service staff) revealed that H29 is
partially supported for the European context. Physical access barriers are perceived as being
equally as important as attitudinal barriers in the accommodation sector for all groups of individuals
with access needs (Figure 177), with the exception of one destination country (discussed further
below).
1 Presidenxa del Consiglio dei Ministri (2013). Accessibile è meglio: Primo Libro Bianco sul Turismo per Tutti in Italia 2013. Comitato per la Promozione e il Sostegno del Turismo Accessibile. Available at: http://www.unifg.it/dwn/ateneo/sportello_west/accessibile_libro_bianco.pdf 2Turco, D.M., Stumbo, N.J., & Garncarz, J. (1998). Tourism Constraints for People with Disabilities. Parks and Recreations, 33, 78-84. 3Poria, Y., Reichel, A., & Brandt, Y. (2011). Dimensions of hotel experiences of people with disabilities: An exploratory study, International Journal of Contemporary Hospitality Management, 23(5):571-591. 4Darcy, S. (2002). Marginalised Participation: Physical Disability, High Support Needs and Tourism. Journal of Hospitality and Tourism Management, 9, 61-72. 5 Van Horn, L. (2012). The United States: Travellers with Disabilities. IN D. Buhalis, S. Darcy & I. Ambrose (Eds.) Best Practice in Accessible Tourism: Inclusion, Disability, Ageing Population and Tourism, (pp. 65-78). Bristol, Channel View Publications. 6 Wright, A. (2012). Tour Operating for the less mobile traveller. IN D. Buhalis, S. Darcy & I. Ambrose (Eds.) Best Practice in Accessible Tourism: Inclusion, Disability, Ageing Population and Tourism, (pp. 195-206). Bristol, Channel View Publications.
Economic impact and travel patterns of Accessible Tourism in Europe FINAL REPORT 351
The result that respondents of the survey stated that physical access barriers are equally as
important as attitudinal barriers in the accommodation sector contradicts research findings from the
United States1 and China2. It also stands in contrast to other studies. For example, particularly for
visually restricted people, it has been reported that physical access barriers, such as navigating
through areas with steps, are less important when compared to attitudinal or emotional aspects of
the service3. Yet, the equal importance afforded to attitudinal barriers highlights the crucial role of
well-trained personnel, since positive attitudes and professionalism in the accommodation sector
contribute greatly to the satisfaction of visitors with access needs4. A French report goes even
further by arguing that accommodation establishments should be in the position of offering 5.
1 Van Horn, L. (2012). The United States: Travellers with Disabilities. IN D. Buhalis, S. Darcy & I. Ambrose (Eds.) Best Practice in Accessible Tourism: Inclusion, Disability, Ageing Population and Tourism, (pp. 65-78). Bristol, Channel View Publications. 2 Bi, Y., Card, J.A., & Cole, S.T. (2007) Accessibility and Attitudinal barriers encountered by Chinese Travellers with Physical Disabilities, International Journal of Tourism Research, 9:205-216. 3 Rolli, R. (2010). Tourism for all and people with visual impairment. IN IsITT Istituto Italiano per il Turismo per Tutti (ed.) Viaggiare senza limiti: il turismo per tutti in Europa. Available at: http://www.turismabile.it/file/lib/files/viaggiare_senza_limiti_web.pdf 4 Weiß, C., Adler, P., Grundner, M.R., Hirschmugl-Fuchs, M., Kirchsteiger, D., Marano, D., Petrovics, G., Pisecky, J., Strzalka, A., Wanecek, H., & Zimmer, C. (2011). Tourismus für alle - Barrierefreies Reisen - ein Leitfaden zum Umgang mit dem Gast. BMWFJ, Sektion Tourismus und Historische Objekte WKO, Bundessparte Tourismus und Freizeitwirtschaft. Available at: http://www.bmwfj.gv.at/Tourismus/TourismusstudienUndPublikationen/Documents/Leitfaden_umgang%20mit%20dem%20Gast%20MINIMIERT.pdf 5 Rigalleau, R. (2001). Incitation au départ en vacances des non-partants. Conseil National du Tourisme, Commission Droit aux vacances. Available at: http://www.vacances-ouvertes.asso.fr/publications/cnt/cnt2001.pdf
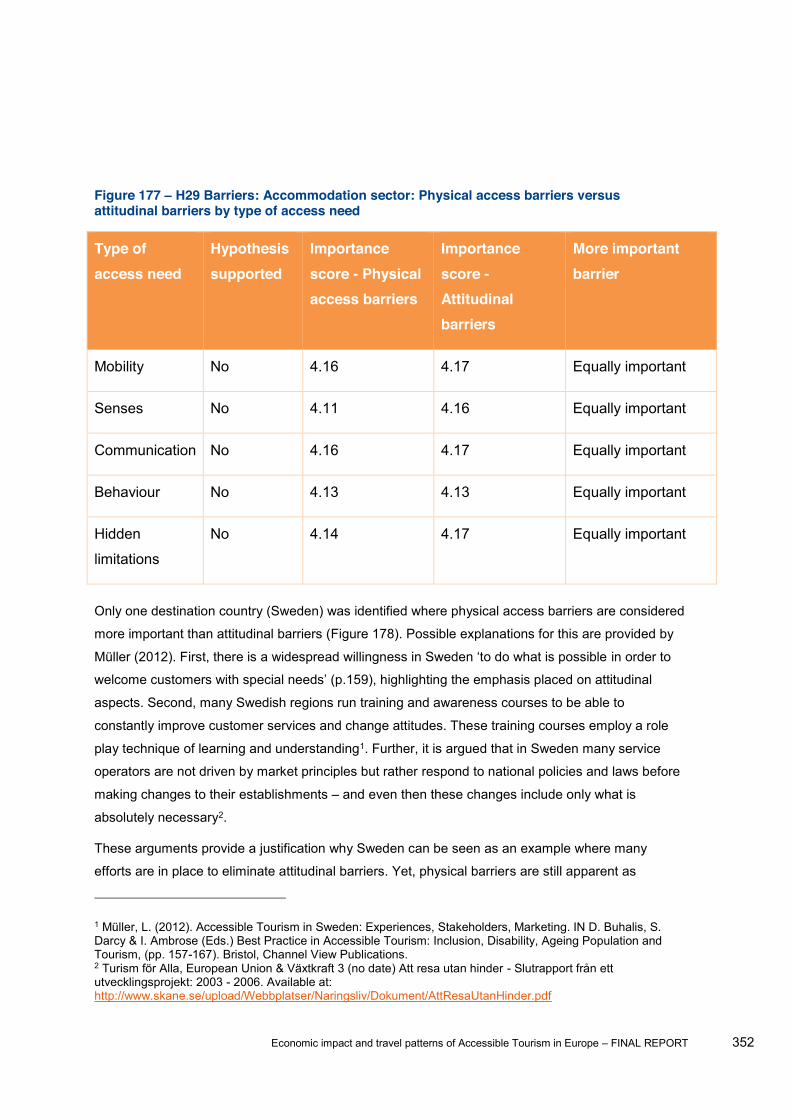
Economic impact and travel patterns of Accessible Tourism in Europe FINAL REPORT 352
Figure 177 H29 Barriers: Accommodation sector: Physical access barriers versus attitudinal barriers by type of access need
Type of access need
Hypothesis supported
Importance score - Physical access barriers
Importance score - Attitudinal barriers
More important barrier
Mobility No 4.16 4.17 Equally important
Senses No 4.11 4.16 Equally important
Communication No 4.16 4.17 Equally important
Behaviour No 4.13 4.13 Equally important
Hidden
limitations
No 4.14 4.17 Equally important
Only one destination country (Sweden) was identified where physical access barriers are considered
more important than attitudinal barriers (Figure 178). Possible explanations for this are provided by
in order to
aspects. Second, many Swedish regions run training and awareness courses to be able to
constantly improve customer services and change attitudes. These training courses employ a role
play technique of learning and understanding1. Further, it is argued that in Sweden many service
operators are not driven by market principles but rather respond to national policies and laws before
making changes to their establishments and even then these changes include only what is
absolutely necessary2.
These arguments provide a justification why Sweden can be seen as an example where many
efforts are in place to eliminate attitudinal barriers. Yet, physical barriers are still apparent as
1 Müller, L. (2012). Accessible Tourism in Sweden: Experiences, Stakeholders, Marketing. IN D. Buhalis, S. Darcy & I. Ambrose (Eds.) Best Practice in Accessible Tourism: Inclusion, Disability, Ageing Population and Tourism, (pp. 157-167). Bristol, Channel View Publications. 2 Turism för Alla, European Union & Växtkraft 3 (no date) Att resa utan hinder - Slutrapport från ett utvecklingsprojekt: 2003 - 2006. Available at: http://www.skane.se/upload/Webbplatser/Naringsliv/Dokument/AttResaUtanHinder.pdf
Economic impact and travel patterns of Accessible Tourism in Europe FINAL REPORT 353
perceived by the respondents of the survey, potentially also due to the fact that Sweden is a key
destination for nature-based activities and attractions which entail greater barriers compared to other
activities and attractions (see section 5.2.2.6 barriers in the attraction sector).
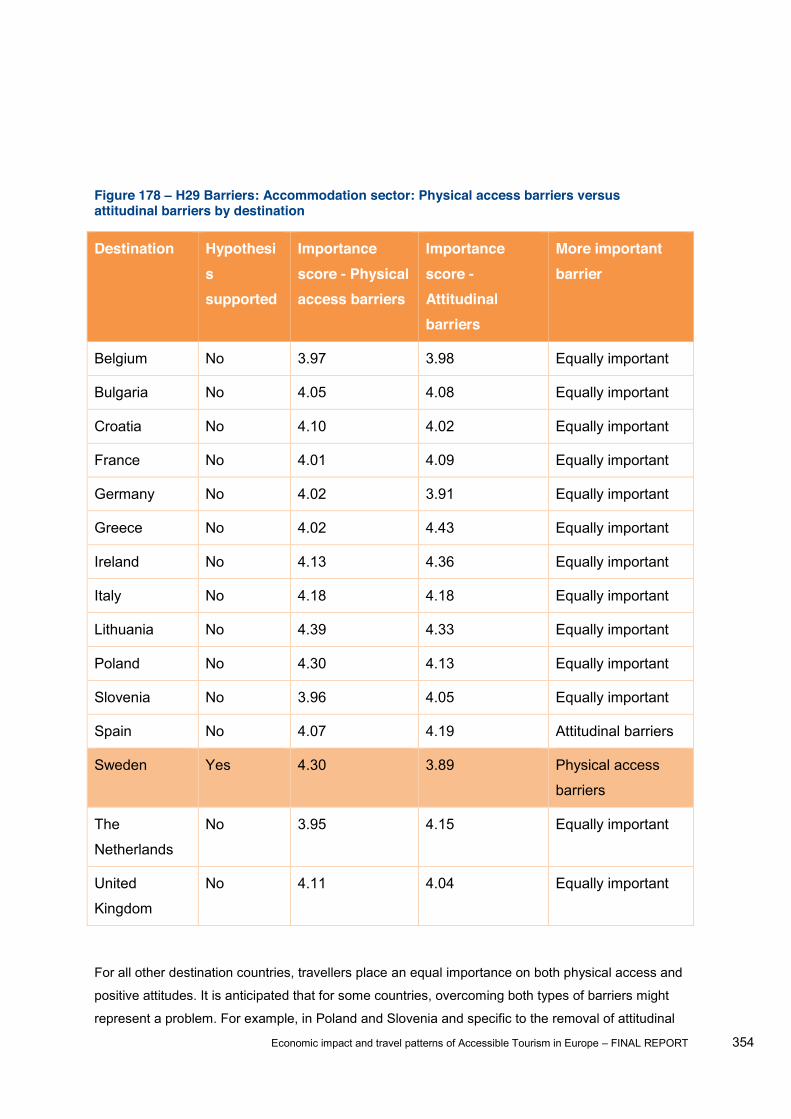
Economic impact and travel patterns of Accessible Tourism in Europe FINAL REPORT 354
Figure 178 H29 Barriers: Accommodation sector: Physical access barriers versus attitudinal barriers by destination
Destination Hypothesis supported
Importance score - Physical access barriers
Importance score - Attitudinal barriers
More important barrier
Belgium No 3.97 3.98 Equally important
Bulgaria No 4.05 4.08 Equally important
Croatia No 4.10 4.02 Equally important
France No 4.01 4.09 Equally important
Germany No 4.02 3.91 Equally important
Greece No 4.02 4.43 Equally important
Ireland No 4.13 4.36 Equally important
Italy No 4.18 4.18 Equally important
Lithuania No 4.39 4.33 Equally important
Poland No 4.30 4.13 Equally important
Slovenia No 3.96 4.05 Equally important
Spain No 4.07 4.19 Attitudinal barriers
Sweden Yes 4.30 3.89 Physical access
barriers
The
Netherlands
No 3.95 4.15 Equally important
United
Kingdom
No 4.11 4.04 Equally important
For all other destination countries, travellers place an equal importance on both physical access and
positive attitudes. It is anticipated that for some countries, overcoming both types of barriers might
represent a problem. For example, in Poland and Slovenia and specific to the removal of attitudinal
Economic impact and travel patterns of Accessible Tourism in Europe FINAL REPORT 355
barriers, staff competences are rather weak and participation levels in training courses for the
industry are still relatively low. This is mainly due to two reasons. First, there is limited supply of
training courses and second, the demand for accessibility training is still very low1.
While respondents rate physical access and attitudes as equally important, it is still essential to
identify the specific physical access barriers that cause the greatest dissatisfaction, leading to the
presentation of the results of the hypothesis testing for H30 (among the physical access barriers encountered in the accommodation sector, people with access needs are least satisfied with toilets). The hypothesis H30 is partially supported. People with access needs are least satisfied with
toilets among all physical access barriers encountered in the accommodation sector. This supports a
study from Austria, pointing out that the lack of accessible bathrooms and toilets represent the
greatest barriers for people with mobility difficulties, including the elderly population in the
accommodation sector2.
Yet, in order to reach a more nuanced understanding, the current study shows that individuals with
behavioural restrictions rank toilets as equal when compared to other physical access elements
(Figure 179). In this context, it can be argued that this is mainly due to the nature of behavioural
limitations as learning disabilities and/ or emotional and mental problems do not interfere with the
ability to use bathrooms. Thus, people with behavioural restrictions face different sets of barriers.
This has been identified by UNAPEI, a specialised organisation in France, which has subsequently
outlined how the existing barriers for people with behavioural problems can be addressed by
developing a special access guide for this group3.
1 MIT! Make It Accessible (no date).WP3 Report on Research & Exploitation Learning about MIT! Target Groups. Available at: http://www.mit-makeitaccessible.eu/MIT%20WP3%20Report%20on%20Research%20&%20Exploitation.pdf 2 Hitsch, W. (2005) Probleme, Risiken und Chancen des barrierefreien Tourismus. Institut für Unternehmensführung, Tourismus und Dienstleistungswirtschaft, Fakultät für Betriebswirtschaft der Leopold-Franzens-Universität Innsbruck. Available at: http://www.ibft.at/ibft/doc/Diplomarbeit%20-%20Barrierefreies%20Reisen.pdf 3 UNAPEI (Union National des Associations de Parents, de Personnes Handicapées Mentales et de leurs Amis) (2009). Guide pratique de l'accessibilité - Pour vous accompagner dans vos démarches en matière d'accessibilité en faveur des personnes en situation de handicap mental. UNAPEI. Available at: http://www.unapei.org/IMG/pdf/GuidePratiqueAccessibilite.pdf
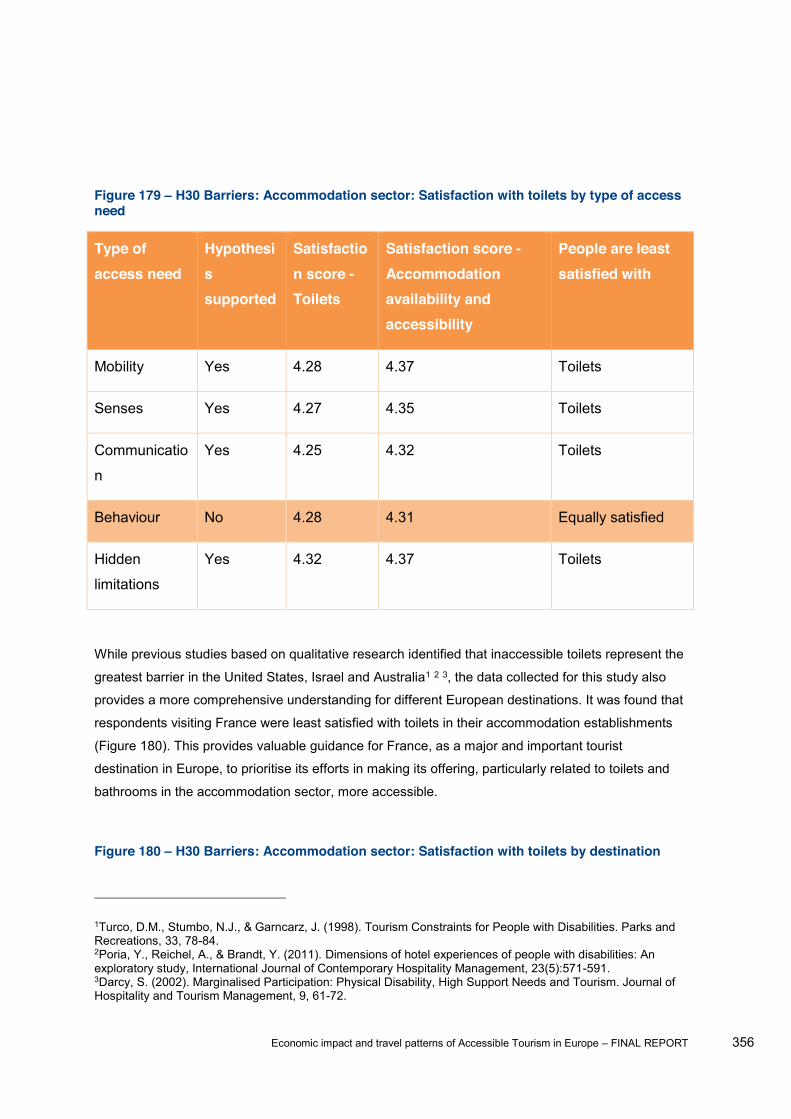
Economic impact and travel patterns of Accessible Tourism in Europe FINAL REPORT 356
Figure 179 H30 Barriers: Accommodation sector: Satisfaction with toilets by type of access need
Type of access need
Hypothesis supported
Satisfaction score - Toilets
Satisfaction score - Accommodation availability and accessibility
People are least satisfied with
Mobility Yes 4.28 4.37 Toilets
Senses Yes 4.27 4.35 Toilets
Communicatio
n
Yes 4.25 4.32 Toilets
Behaviour No 4.28 4.31 Equally satisfied
Hidden
limitations
Yes 4.32 4.37 Toilets
While previous studies based on qualitative research identified that inaccessible toilets represent the
greatest barrier in the United States, Israel and Australia1 2 3, the data collected for this study also
provides a more comprehensive understanding for different European destinations. It was found that
respondents visiting France were least satisfied with toilets in their accommodation establishments
(Figure 180). This provides valuable guidance for France, as a major and important tourist
destination in Europe, to prioritise its efforts in making its offering, particularly related to toilets and
bathrooms in the accommodation sector, more accessible.
Figure 180 H30 Barriers: Accommodation sector: Satisfaction with toilets by destination
1Turco, D.M., Stumbo, N.J., & Garncarz, J. (1998). Tourism Constraints for People with Disabilities. Parks and Recreations, 33, 78-84. 2Poria, Y., Reichel, A., & Brandt, Y. (2011). Dimensions of hotel experiences of people with disabilities: An exploratory study, International Journal of Contemporary Hospitality Management, 23(5):571-591. 3Darcy, S. (2002). Marginalised Participation: Physical Disability, High Support Needs and Tourism. Journal of Hospitality and Tourism Management, 9, 61-72.

Economic impact and travel patterns of Accessible Tourism in Europe FINAL REPORT 357
Destination Hypothesis supported
Satisfaction score - Toilets
Satisfaction score - Accommodation availability and accessibility
People are least satisfied with
Belgium No 4.17 4.07 Equally satisfied
Bulgaria No 3.85 3.97 Equally satisfied
Croatia No 4.30 4.36 Equally satisfied
France Yes 4.12 4.38 Toilets
Germany No 4.44 4.38 Equally satisfied
Greece No 4.39 4.48 Equally satisfied
Ireland No 4.47 4.51 Equally satisfied
Italy No 4.32 4.32 Equally satisfied
Lithuania No 4.63 4.67 Equally satisfied
Poland No 4.31 4.36 Equally satisfied
Slovenia No 4.11 4.20 Equally satisfied
Spain No 4.24 4.33 Equally satisfied
Sweden No 4.37 4.42 Equally satisfied
The
Netherlands
No 4.29 4.25 Equally satisfied
United
Kingdom
No 4.64 4.61 Equally satisfied
Economic impact and travel patterns of Accessible Tourism in Europe FINAL REPORT 358
5.2.2.5 Barriers encountered in the catering/ gastronomy/ food & beverage sector Overall, very limited research has been conducted that investigates the barriers encountered by
people with access needs in the food and beverage sector. The few existing studies report that the
accessibility of gastronomic organisations is regarded as highly problematic1. For example, it was
reported that many catering establishments in Greece are promoted as accessible while in reality
they are not2. In addition, discrimination by restaurants providers plays a crucial role in the debate on
barriers in this sector3, apart from the existence of physical access barriers.
Particularly, in the United States, physical access barriers represent a major concern. These include
the lack of room between tables (stated by 40% of respondents), doors being too heavy to open
(stated by 33% of respondents) and steps at the entrance or in the restaurant (stated by 28% of
respondents)4. By investigating individuals with different access needs, the following specific barriers
can be summarised (Figure 181):
1 Hitsch, W. (2005). Probleme, Risiken und Chancen des barrierefreien Tourismus. Institut für Unternehmensführung, Tourismus und Dienstleistungswirtschaft, Fakultät für Betriebswirtschaft der Leopold-Franzens-Universität Innsbruck. Available at: http://www.ibft.at/ibft/doc/Diplomarbeit%20-%20Barrierefreies%20Reisen.pdf 2 MIT! Make It Accessible (no date).WP3 Report on Research & Exploitation Learning about MIT! Target Groups. Available at: http://www.mit-makeitaccessible.eu/MIT%20WP3%20Report%20on%20Research%20&%20Exploitation.pdf 3 EDF - European Disability Forum (2001). EDF Position Paper: Framing the Future of European Tourism, Doc. EDF 01/13 EN, (pp. 1-10). London, European Disability Forum. 4 Van Horn, L. (2012). The United States: Travellers with Disabilities. IN D. Buhalis, S. Darcy & I. Ambrose (Eds.) Best Practice in Accessible Tourism: Inclusion, Disability, Ageing Population and Tourism, (pp. 65-78). Bristol, Channel View Publications.

Economic impact and travel patterns of Accessible Tourism in Europe FINAL REPORT 359
Figure 181 Barriers experienced in the Food and Beverage Sector1 2
By assessing the overall scope of barriers based on quantitative findings from the United States3 4, it
is assumed that the food and beverage sector causes the greatest amount of barriers to people with access needs. In order to test this assumption for the European context, the
hypothesis is:
H31: The barriers faced by people with access needs in the food & beverage sector are encountered
most often compared to other sectors.
The analysis showed that H31 is not supported. Respondents did not encounter barriers most often
in the food and beverage sector. Hence, findings from a European context differ from studies
1Poria, Y., Reichel, A., & Brandt, Y. (2011). Dimensions of hotel experiences of people with disabilities: An exploratory study, International Journal of Contemporary Hospitality Management, 23(5):571-591. 2 Van Horn, L. (2012). The United States: Travellers with Disabilities. IN D. Buhalis, S. Darcy & I. Ambrose (Eds.) Best Practice in Accessible Tourism: Inclusion, Disability, Ageing Population and Tourism, (pp. 65-78). Bristol, Channel View Publications. 3Takeda, K., & Card, J.A. (2002). U.S. Tour Operators and Travel Agencies: Barriers Encountered When Providing Package Tours to People Who Have Difficulty Walking. Journal of Travel and Tourism Marketing 12, 47-61. 4Card, J. A., Cole, S. T., & Humphrey, A. H. (2006). A Comparison of the Accessibility and Attitudinal Barriers Model: Travel Providers and Travelers with Physical Disabilities. Asia Pacific Journal of Tourism Research, 11, 161-175.

Economic impact and travel patterns of Accessible Tourism in Europe FINAL REPORT 360
conducted in United States1 2 as for the US it has been reported that most barriers are encountered
in the food and beverage sector whereas this is not the case for Europe. Instead barriers are faced
by people with access needs in the transport (at destination) sector most often compared to other
sectors, particularly for individuals with mobility, sensory, behavioural and hidden difficulties (Figure
182).
Figure 182 H31 Barriers: Food & Beverage sector compared to other sectors by type of access need
Type of access need Hypothesis supported
Sector with most barriers Barriers experienced
Mobility No Transport at destination 12.6%
Senses Partially* Transport at destination 12.1%
Communication Partially* Transit 13.4%
Behaviour No Transport at destination 13.3%
Hidden limitations Partially* Transport at destination 12.0%
Note: * Barriers in the food & beverage sector are encountered significantly more often than in the
accommodation sector. See Annex O for details.
For people with communication difficulties barriers are encountered most often in the transit sector.
Hence, for no single group of people with access needs is the food and beverage sector the most
problematic. Yet, for individuals with sensory, communication and hidden limitations, barriers in the
food & beverage sector are encountered significantly more often than in the accommodation sector.
After investigating different geographical regions, the study found that the food and beverage sector
is not the sector where survey participants encountered barriers most often (Figure 183). These
1Takeda, K., & Card, J.A. (2002) U.S. Tour Operators and Travel Agencies: Barriers Encountered When Providing Package Tours to People Who Have Difficulty Walking. Journal of Travel and Tourism Marketing 12, 47-61. 2Card, J. A., Cole, S. T., & Humphrey, A. H. (2006) A Comparison of the Accessibility and Attitudinal Barriers Model: Travel Providers and Travelers with Physical Disabilities. Asia Pacific Journal of Tourism Research, 11, 161-175.

Economic impact and travel patterns of Accessible Tourism in Europe FINAL REPORT 361
findings are in line with a report from Spain, highlighting that only 22% of people with access needs
had indicated that restaurants have little or no accessibility1.
Figure 183 H31 Barriers: Food & Beverage sector compared to other sectors by destination
Destination Hypothesis supported
Sector with most barriers Barriers experienced
Belgium Partially* Food and beverage 12.5%
Bulgaria Partially* Information 18.9%
Croatia No Attractions/Activities 8.4%
France No Transport at destination 15.4%
Germany No Transport at destination;
Accommodation
10.9%
Greece No Attractions/Activities 14.9%
Ireland No Accommodation 16.0%
Italy No Attractions/Activities 11.5%
Lithuania No Transit;
Transport at destination
10.9%
Poland No Attractions/Activities 13.2%
Slovenia No Transport at destination 8.1%
Spain No Transport at destination 12.4%
1 Huesca González, A.Mª., & Ortega Alonso, E. (2005). Hábitos y actitudes hacia el Turismo de las Personas con Discapacidad Física. Available at: http://www.snr.gob.ar/uploads/TA-Otros-27-HabActhaciaelTURISMO-2da_edic-PREDIF.pdf

Economic impact and travel patterns of Accessible Tourism in Europe FINAL REPORT 362
Sweden Partially* Food and beverage 10.3%
The Netherlands No Accommodation 9.2%
United Kingdom No Accommodation 9.4%
Note: * Barriers in the food & beverage sector are not always encountered significantly more often
than in other sectors.
See Annex O for details.
For Belgium and Sweden, most barriers are encountered in the food and beverage sector, yet the
results show that they are not experienced significantly more often than in other sectors, except in
the accommodation sector in Belgium and in attractions in Sweden. The same can be argued for
Bulgaria as most barriers are faced in the pre-travel stage. Respondents who visited Bulgaria
experienced more barriers in the food and beverage sector than in the attractions sector, but again
the percentage is not different enough from other sectors to support the hypothesis (Annex O).
5.2.2.6 Barriers encountered with attractions/ activities It is often reported that the attractions/ activities sector remains inaccessible due to a number of
environmental and architectural barriers1. For example, studies call for the elimination of
architectural barriers in places of cultural interest2 3. Museums and galleries count as sites of cultural
interest and the emphasis of the Council for Museums, Archives and Libraries in the UK is placed on
removing barriers, which are physical and sensory, intellectual, cultural, attitudinal and financial4.
Further, museum operators need to find a balance between providing access for people with
different requirements while at the same time ensuring the conservation of historical and artistic
1Turco, D.M., Stumbo, N.J., & Garncarz, J. (1998). Tourism Constraints for People with Disabilities. Parks and Recreations, 33, 78-84. 2 Cirelli, C. (2011). Turismo Urbano e Disabilità. Available at: http://www.siciliaccessibile.it/wp-content/uploads/paper-turismo-urbano-disabilit%C3%A0-caterina-cirelli.pdf 3 National Disability Authority (NDA) (2012). Access - Improving the Accessibility of Historic Buildings and Places. Government of Ireland. Available at: http://www.nda.ie/website/nda/cntmgmtnew.nsf/0/911AA8C52EA2A0D98025798700303E93/$File/Access_Improving_accessibility_Historic_Buildings_and_Places.pdf 4 The Council for Museums, Archives and Libraries (2001). Disability Directory for Museums and Galleries. London, UK. Available at: http://www.accessibletourism.org/resources/uk_museumsand-galleries_disability_directory_pdf_6877.pdf
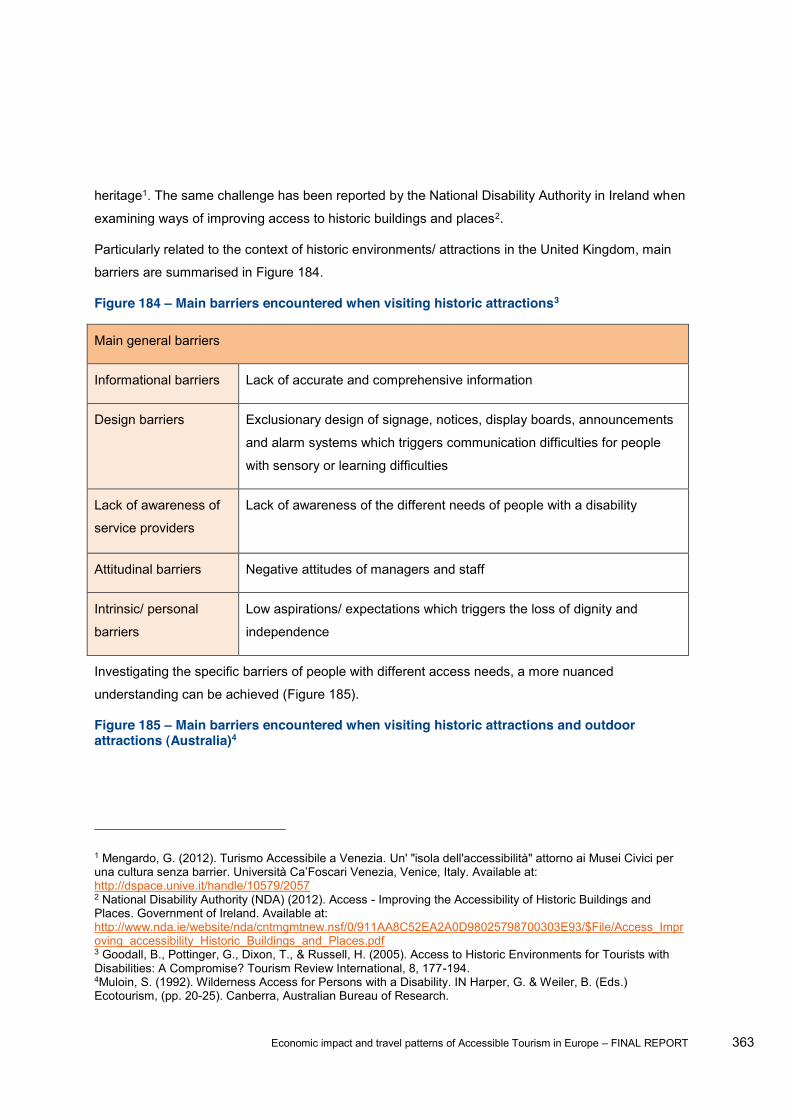
Economic impact and travel patterns of Accessible Tourism in Europe FINAL REPORT 363
heritage1. The same challenge has been reported by the National Disability Authority in Ireland when
examining ways of improving access to historic buildings and places2.
Particularly related to the context of historic environments/ attractions in the United Kingdom, main
barriers are summarised in Figure 184.
Figure 184 Main barriers encountered when visiting historic attractions3
Main general barriers
Informational barriers Lack of accurate and comprehensive information
Design barriers Exclusionary design of signage, notices, display boards, announcements
and alarm systems which triggers communication difficulties for people
with sensory or learning difficulties
Lack of awareness of
service providers
Lack of awareness of the different needs of people with a disability
Attitudinal barriers Negative attitudes of managers and staff
Intrinsic/ personal
barriers
Low aspirations/ expectations which triggers the loss of dignity and
independence
Investigating the specific barriers of people with different access needs, a more nuanced
understanding can be achieved (Figure 185).
Figure 185 Main barriers encountered when visiting historic attractions and outdoor attractions (Australia)4
1 Mengardo, G. (2012). Turismo Accessibile a Venezia. Un' "isola dell'accessibilità" attorno ai Musei Civici per ce, Italy. Available at:
http://dspace.unive.it/handle/10579/2057 2 National Disability Authority (NDA) (2012). Access - Improving the Accessibility of Historic Buildings and Places. Government of Ireland. Available at: http://www.nda.ie/website/nda/cntmgmtnew.nsf/0/911AA8C52EA2A0D98025798700303E93/$File/Access_Improving_accessibility_Historic_Buildings_and_Places.pdf 3 Goodall, B., Pottinger, G., Dixon, T., & Russell, H. (2005). Access to Historic Environments for Tourists with Disabilities: A Compromise? Tourism Review International, 8, 177-194. 4Muloin, S. (1992). Wilderness Access for Persons with a Disability. IN Harper, G. & Weiler, B. (Eds.) Ecotourism, (pp. 20-25). Canberra, Australian Bureau of Research.
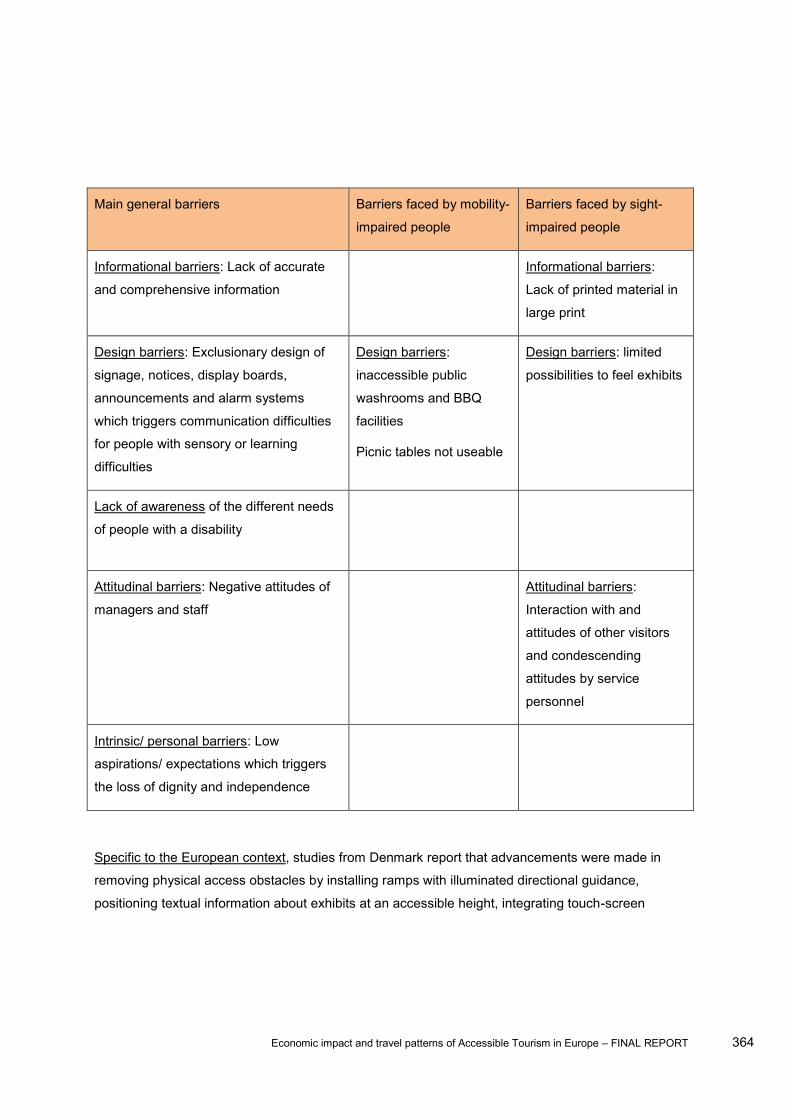
Economic impact and travel patterns of Accessible Tourism in Europe FINAL REPORT 364
Main general barriers Barriers faced by mobility-
impaired people
Barriers faced by sight-
impaired people
Informational barriers: Lack of accurate
and comprehensive information
Informational barriers:
Lack of printed material in
large print
Design barriers: Exclusionary design of
signage, notices, display boards,
announcements and alarm systems
which triggers communication difficulties
for people with sensory or learning
difficulties
Design barriers:
inaccessible public
washrooms and BBQ
facilities
Picnic tables not useable
Design barriers: limited
possibilities to feel exhibits
Lack of awareness of the different needs
of people with a disability
Attitudinal barriers: Negative attitudes of
managers and staff
Attitudinal barriers:
Interaction with and
attitudes of other visitors
and condescending
attitudes by service
personnel
Intrinsic/ personal barriers: Low
aspirations/ expectations which triggers
the loss of dignity and independence
Specific to the European context, studies from Denmark report that advancements were made in
removing physical access obstacles by installing ramps with illuminated directional guidance,
positioning textual information about exhibits at an accessible height, integrating touch-screen
Economic impact and travel patterns of Accessible Tourism in Europe FINAL REPORT 365
displays and providing text in large print. Yet, it has equally shown that outdoor settings are still inadequately designed with regard to access and use1 2.
Numerous studies report that many outdoor settings, such as parks in general or national parks in
particular are still not accessible, causing numerous barriers to people with different access needs
when wanting to access these natural attractions or activities3 4 5. For example, it is argued that the
accessibility of national parks is quite poor in Spain and much remains to be done to ensure equal
access to facilities, activities and programs offering positive experiences in protected natural areas
to people with access needs6. Similar results were reported in Italy, as mountain areas are often
difficult to access for people with mobility restrictions7 8. In fact, mountainous areas are said to
represent the least accessible attractions as only 1.9% of respondents of a study in Spain found
these to be accessible (33.2%)9.
Barriers to the enjoyment of nature-based activities and attractions such as parks, national parks
and other protected natural areas need to be reduced as studies illustrate that, for example,
-based
activities and attractions10.
1 Jensen, P.H. (2008). Merging Architecture and Accessibility, IN: Ethical Barrier-Free Tourism. Available at: www.tourism-review/com/fm485.org/ethical-barrier-free-tourism.pdf 2 Jensen, P.H. (2007). Merging architecture and accessibility. Ordrupgaards and the Danish Jewish Museum. Access by Design, Issue 112. Available at: http://www.accessibletourism.org/resources/jensen_2007__merging_architecture_and_accessibility-1.pdf 3 Kreiter, J.N. (2010). A holiday for all from the perspective of a tourist with disabilities. IN IsITT Istituto Italiano per il Turismo per Tutti (ed.) Viaggiare senza limiti: il turismo per tutti in Europa. Available at: http://www.turismabile.it/file/lib/files/viaggiare_senza_limiti_web.pdf 4 Ministerio de Industria, Turismo y Comercio (no date). Decálogo de Buenas Prácticas en Accesibilidad Turística - Destinos y Recursos Culturales y Naturales. Available at: http://www.planaccesibilidadturistica.es/UserFiles/publicaciones/ficheros/Decalogo_de_Buenas_Practica_2.pdf 5 Marcos Pérez, D. & González Velasco, D.J. (2003). Turismo Accesible - Hacia un Turismo Para Todos. Comité Español de Representantes de Personas con Discapacidad CERMI. Available at: http://www.planaccesibilidadturistica.es/UserFiles/publicaciones/ficheros/Turismo_Accesible.pdf 6 Ministerio de Industria, Turismo y Comercio (2008). El mercado potencial del turismo accesible para el sector turístico español. Available at: http://www.planaccesibilidadturistica.es/UserFiles/publicaciones/ficheros/Mercado_Potencial_Turismo_Accesible.pdf 7 Cosentino, M. (2010). Accessible tourism in mountain areas: tourism for all in a hostile environment. IN IsITT Istituto Italiano per il Turismo per Tutti (ed.) Viaggiare senza limiti: il turismo per tutti in Europa. Available at: http://www.turismabile.it/file/lib/files/viaggiare_senza_limiti_web.pdf 8 Martin, G. (2010). The ideal winter resort: professionalism and organisational skills in the service of tourism. IN IsITT Istituto Italiano per il Turismo per Tutti (ed.) Viaggiare senza limiti: il turismo per tutti in Europa. Available at: http://www.turismabile.it/file/lib/files/viaggiare_senza_limiti_web.pdf 9 Huesca González, A.Mª. & Ortega Alonso, E. (2005). Hábitos y actitudes hacia el Turismo de las Personas con Discapacidad Física. Available at: http://www.snr.gob.ar/uploads/TA-Otros-27-HabActhaciaelTURISMO-2da_edic-PREDIF.pdf 10 Lohmann, M. & Grimm, B. (2011). Urlaubsreisen und motive der Altergruppe 50plus: Daten und Trends IN RKW Kompetenzzentrum (Ed.) Tourismus 50plus: Anforderungen erkennen Wünsche erfüllen, (pp. 11-13).
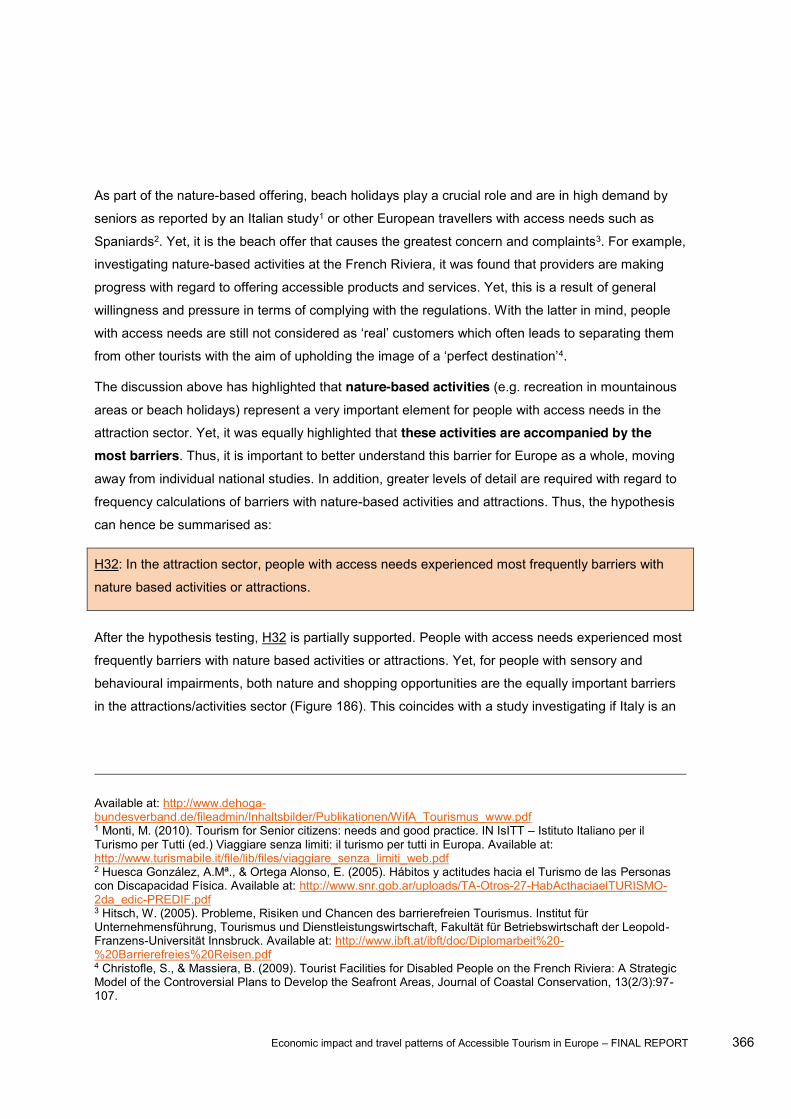
Economic impact and travel patterns of Accessible Tourism in Europe FINAL REPORT 366
As part of the nature-based offering, beach holidays play a crucial role and are in high demand by
seniors as reported by an Italian study1 or other European travellers with access needs such as
Spaniards2. Yet, it is the beach offer that causes the greatest concern and complaints3. For example,
investigating nature-based activities at the French Riviera, it was found that providers are making
progress with regard to offering accessible products and services. Yet, this is a result of general
willingness and pressure in terms of complying with the regulations. With the latter in mind, people
from other tourists with the aim of upholdin 4.
The discussion above has highlighted that nature-based activities (e.g. recreation in mountainous
areas or beach holidays) represent a very important element for people with access needs in the
attraction sector. Yet, it was equally highlighted that these activities are accompanied by the most barriers. Thus, it is important to better understand this barrier for Europe as a whole, moving
away from individual national studies. In addition, greater levels of detail are required with regard to
frequency calculations of barriers with nature-based activities and attractions. Thus, the hypothesis
can hence be summarised as:
H32: In the attraction sector, people with access needs experienced most frequently barriers with
nature based activities or attractions.
After the hypothesis testing, H32 is partially supported. People with access needs experienced most
frequently barriers with nature based activities or attractions. Yet, for people with sensory and
behavioural impairments, both nature and shopping opportunities are the equally important barriers
in the attractions/activities sector (Figure 186). This coincides with a study investigating if Italy is an
Available at: http://www.dehoga-bundesverband.de/fileadmin/Inhaltsbilder/Publikationen/WifA_Tourismus_www.pdf 1 Monti, M. (2010). Tourism for Senior citizens: needs and good practice. IN IsITT Istituto Italiano per il Turismo per Tutti (ed.) Viaggiare senza limiti: il turismo per tutti in Europa. Available at: http://www.turismabile.it/file/lib/files/viaggiare_senza_limiti_web.pdf 2 Huesca González, A.Mª., & Ortega Alonso, E. (2005). Hábitos y actitudes hacia el Turismo de las Personas con Discapacidad Física. Available at: http://www.snr.gob.ar/uploads/TA-Otros-27-HabActhaciaelTURISMO-2da_edic-PREDIF.pdf 3 Hitsch, W. (2005). Probleme, Risiken und Chancen des barrierefreien Tourismus. Institut für Unternehmensführung, Tourismus und Dienstleistungswirtschaft, Fakultät für Betriebswirtschaft der Leopold-Franzens-Universität Innsbruck. Available at: http://www.ibft.at/ibft/doc/Diplomarbeit%20-%20Barrierefreies%20Reisen.pdf 4 Christofle, S., & Massiera, B. (2009). Tourist Facilities for Disabled People on the French Riviera: A Strategic Model of the Controversial Plans to Develop the Seafront Areas, Journal of Coastal Conservation, 13(2/3):97-107.
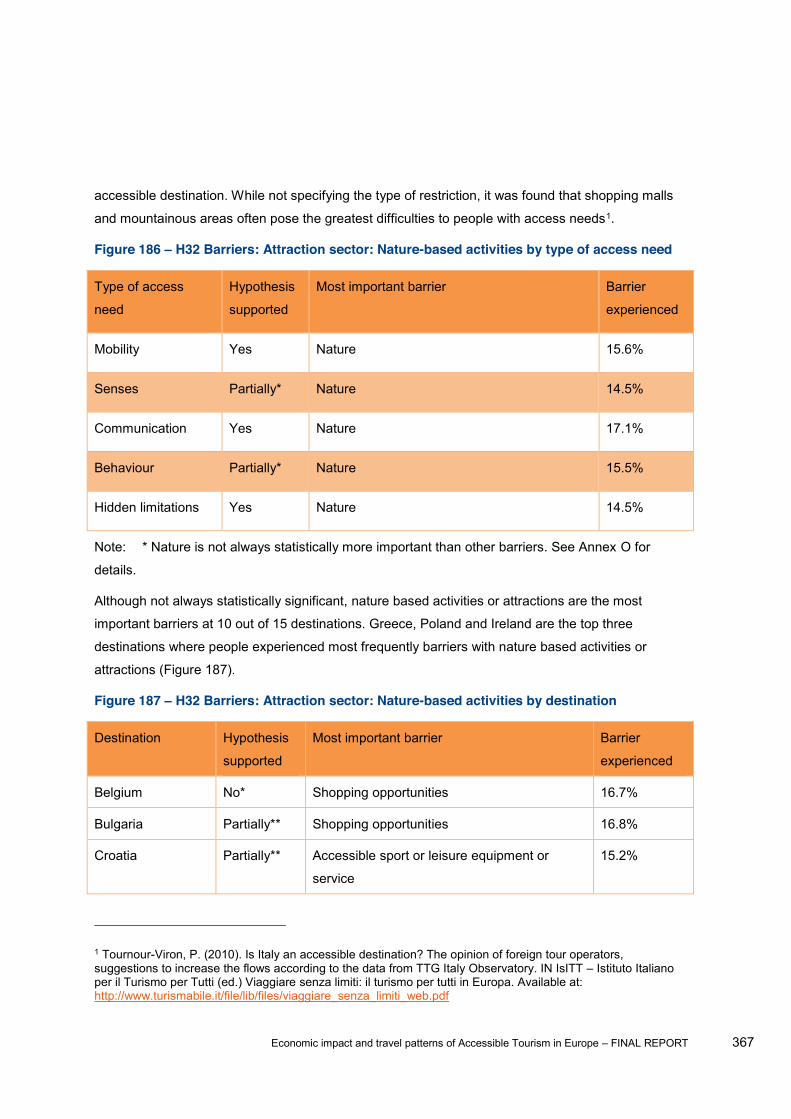
Economic impact and travel patterns of Accessible Tourism in Europe FINAL REPORT 367
accessible destination. While not specifying the type of restriction, it was found that shopping malls
and mountainous areas often pose the greatest difficulties to people with access needs1.
Figure 186 H32 Barriers: Attraction sector: Nature-based activities by type of access need
Type of access
need
Hypothesis
supported
Most important barrier Barrier
experienced
Mobility Yes Nature 15.6%
Senses Partially* Nature 14.5%
Communication Yes Nature 17.1%
Behaviour Partially* Nature 15.5%
Hidden limitations Yes Nature 14.5%
Note: * Nature is not always statistically more important than other barriers. See Annex O for
details.
Although not always statistically significant, nature based activities or attractions are the most
important barriers at 10 out of 15 destinations. Greece, Poland and Ireland are the top three
destinations where people experienced most frequently barriers with nature based activities or
attractions (Figure 187).
Figure 187 H32 Barriers: Attraction sector: Nature-based activities by destination
Destination Hypothesis
supported
Most important barrier Barrier
experienced
Belgium No* Shopping opportunities 16.7%
Bulgaria Partially** Shopping opportunities 16.8%
Croatia Partially** Accessible sport or leisure equipment or
service
15.2%
1 Tournour-Viron, P. (2010). Is Italy an accessible destination? The opinion of foreign tour operators, suggestions to increase the flows according to the data from TTG Italy Observatory. IN IsITT Istituto Italiano per il Turismo per Tutti (ed.) Viaggiare senza limiti: il turismo per tutti in Europa. Available at: http://www.turismabile.it/file/lib/files/viaggiare_senza_limiti_web.pdf

Economic impact and travel patterns of Accessible Tourism in Europe FINAL REPORT 368
Destination Hypothesis
supported
Most important barrier Barrier
experienced
France Partially** Nature 13.6%
Germany Partially** Nature 18.8%
Greece Partially** Nature 26.1%
Ireland Partially** Nature 22.6%
Italy Partially** Nature 15.5%
Lithuania Partially** Nature;
Accessible locations;
Accessible shops or shopping services
13.0%
Poland Yes Nature 23.1%
Slovenia No* Accessible locations;
Accessible shops or shopping services
8.1%
Spain No* Excursion activities available at destination 10.4%
Sweden Partially** Nature 11.0%
The Netherlands Partially** Nature 12.3%
United Kingdom Partially** Nature 12.5%
Note: * The listed barrier is not statistically more important than any other barriers;
** Nature is statistically more important than certain other barriers. See Annex O for details.
This is supported by reports from Greece, highlighting that while some nature-based activities (e.g.
beaches) offer accessible features, the situation does not apply to the majority of areas where
nature-based beach activities can be enjoyed1. Yet, improving access to nature-based activities is
not impossible as shown by the city of Arona (Spain), acting as a best practice case for nature-
1 Voulgaropoulos, N., Strati, E., & Fyka, G. (2012). Accessible Tourism in Greece: Beaches and Bathing for All. IN D. Buhalis, S. Darcy & I. Ambrose (Eds.) Best Practice in Accessible Tourism: Inclusion, Disability, Ageing Population and Tourism, (pp. 55-64). Bristol, Channel View Publications.
Economic impact and travel patterns of Accessible Tourism in Europe FINAL REPORT 369
based beach activities as numerous obstacles have been removed to allow for the enjoyment of
beaches by all users1. Similar examples can be found in Germany, where not only barriers were
removed but solutions found to enable greater independence, for example by providing a well-
designed vehicle (Mobile Strand- und Badeinsel) to move around and to enter the water2.
Nature based activities or attractions also include the enjoyment of national parks and a pre-
requisite for overcoming barriers is a thorough understanding of all different requirements as well as
the incorporation of people with access needs in all aspects of planning, implementation and
operation3. Portugal has shown that successfully reducing the barriers in parks and nature reserves
is possible when implementing principles of universal access to allow for the enjoyment of this part
of the attraction sector4. Further, Greenways are said to provide the most inclusive access to natural
areas. Greenways are characterised by being among the few nature routes which are accessible to
all people with access needs. Due to the importance of Greenways, they have been incorporated
into the grant programme of the European General Directorate of Tourism (2011) in recognition of
their great potential and value for the development of sustainable tourism development in Europe.
Among the most important benefits of Greenways is the higher level of safety due to their separation
from roads. Yet, while Greenways are said to be fully accessible and safe, all destinations need to
ensure that all elements of the tourism system contribute to or enhance the accessibility of
Greenways. Particularly important in this context is transport to and from dedicated Greenways)5.
5.2.2.7 Barriers: cross-sector comparisons After discussing the results of the specific hypotheses for each individual tourism sector, this section
introduces three main cross-sector hypotheses and their results. This is important as it permits a
holistic overview of the relative importance of barriers encountered in each sector. These cross-
1 Hernández Galán, J. (2012). Accessible Tourism in Spain: Arona and Madrid. IN D. Buhalis, S. Darcy & I. Ambrose (Eds.) Best Practice in Accessible Tourism: Inclusion, Disability, Ageing Population and Tourism, (pp. 310-321). Bristol, Channel View Publications. 2 Knigge, M. (2011). Mehr Gäste durch komfortables and attraktives Design, IN: RKW Kompetenzzentrum (Ed.) Gesund und sicher unterwegs - Konzepte und Marktchancen für kleine und mittlere Unternehmen im Tourismus. Available at: http://www.rkw-kompetenzzentrum.de/fileadmin/media/Dokumente/Publikationen/2011_LF_dfa-gesund-unterwegs.pdf 3 Frank, G. (2011). Natur erlebbar machen Rangertouren im Nationalpark Eifel, IN: RKW Kompetenzzentrum (Ed.) Gesund und sicher unterwegs - Konzepte und Marktchancen für kleine und mittlere Unternehmen im Tourismus. Available at: http://www.rkw-kompetenzzentrum.de/fileadmin/media/Dokumente/Publikationen/2011_LF_dfa-gesund-unterwegs.pdf 4 Espírito Santo, R. (2009). Iniciativa Natureza para Todos: o acesso universal às áreas protegidas portuguesas, Revista Turismo & Desenvolvimento N.º 11. 5 Hernández Colorado, A., & Aycart Luengo, C. with the collaboration of Martínez Pastor, I. (2013). Guide to Best Practices and Recommendations for Accessible Greenways. Environmental Activities and Greenways Department (FFE). Available at: http://www.aevv-egwa.org/SiteResources/data/MediaArchive/pdf/Greenways4tour/G4T_Guide%20to%20best%20practices%20for%20accesible%20Greeways.pdf
Economic impact and travel patterns of Accessible Tourism in Europe FINAL REPORT 370
sector hypotheses derive from the qualitative and quantitative assessments of barriers faced by
people with access needs reported within the individual sectors (sections 5.2.2.1 to 5.2.2.6). Reports
and studies from both European and non-European countries have assisted in establishing these
hypotheses.
5.2.2.7.1 1st cross-sector hypothesis: Physical access versus attitudinal barriers across all sectors
Almost throughout all sectors, the desk research highlighted the importance of investigating physical
access barriers compared to attitudinal barriers. In analysing studies from non-European and
European countries, contrasting evidence was found with regard to the extent of physical and
attitudinal barriers across different tourism sectors.
For example, when talking about the most positive holiday experience, Austrian travellers referred to
positive attitudes and willingness to help1. Also Australian tourists with access needs highlighted
knowledge and positive attitudes of others as key in reducing exclusion in the tourist experience2.
Similar results were reported by a number of Italian studies. Overall, it was found that attitudinal
barriers weigh higher compared to physical access barriers particularly with regard to how tour
operators treat customers with access needs3. The main barriers often relate to information and
reception (attitudinal perspective 57%) compared to infrastructural barriers (physical access
barriers 43%) from a service provider perspective as well4 5. As a consequence, it is argued that
not only physical access barriers need to be dismantled but also efforts need to be in place to
improve staff qualification6. Yet, by comparing the perceptions of the population without immediately
apparent access needs with people who do have explicit access needs, it was highlighted that the
1 Hitsch, W. (2005). Probleme, Risiken und Chancen des barrierefreien Tourismus. Institut für Unternehmensführung, Tourismus und Dienstleistungswirtschaft, Fakultät für Betriebswirtschaft der Leopold-Franzens-Universität Innsbruck. Available at: http://www.ibft.at/ibft/doc/Diplomarbeit%20-%20Barrierefreies%20Reisen.pdf 2 STCRC (Sustainable Tourism Cooperative Research Centre) (2008). Accessible Tourism Challenges and Opportunities. Understanding an evolving aspect of Australian tourism. Sustainable Tourism Cooperative Research Centre (STCRC), Queensland. Available at: http://www.accessibletourism.org/resources/crc_accessible_tourism_final_en.pdf 3 Mengardo, G. (2012). Turismo Accessibile a Venezia. Un' "isola dell'accessibilità" attorno ai Musei Civici per
http://dspace.unive.it/handle/10579/2057 4 SL & A: Turismo e Territorio (2008). http://www.turismabile.it/file/lib/files/access0_rapp_tur_acc.pdf 5 Presidenxa del Consiglio dei Ministri (2013). Accessibile è meglio: Primo Libro Bianco sul Turismo per Tutti in Italia 2013. Comitato per la Promozione e il Sostegno del Turismo Accessibile. Available at: http://www.unifg.it/dwn/ateneo/sportello_west/accessibile_libro_bianco.pdf 6 Consiglio dei Ministri - Dipartimento della Gioventù (no date). Turisti Senza Ostacoli Indagine
Available at: http://www.unisa.it/uploads/2405/turisti_senza_ostacoli.pdf
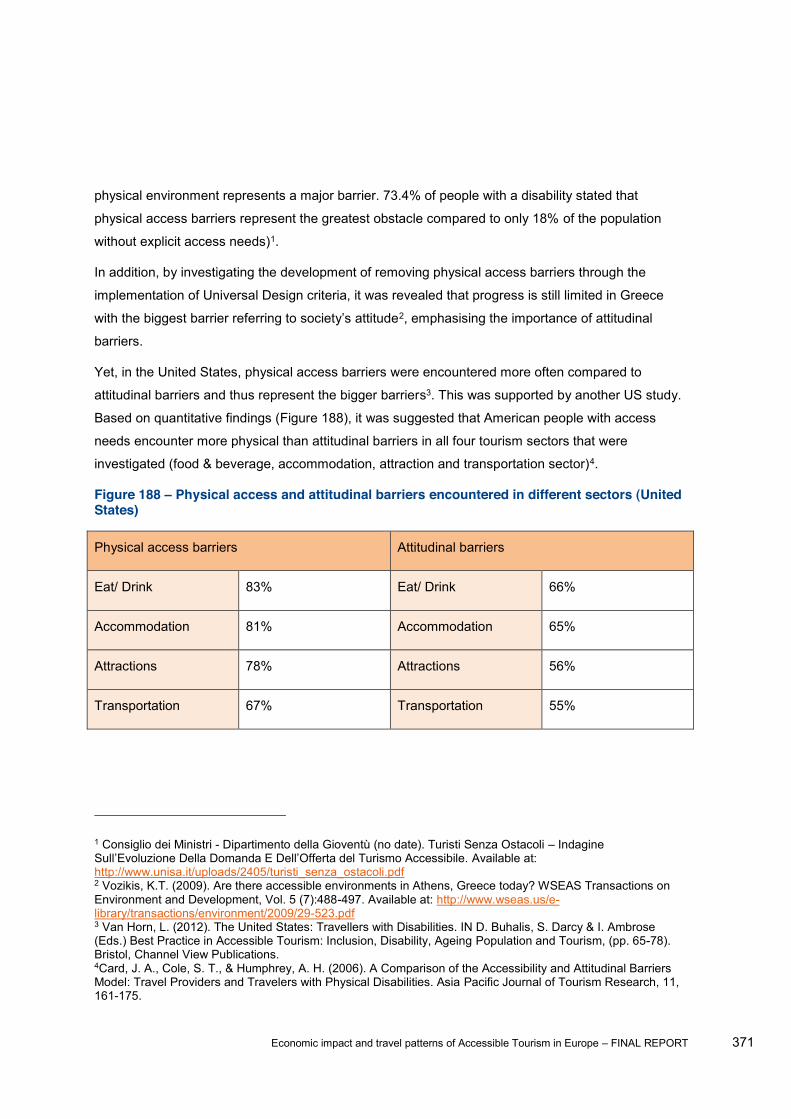
Economic impact and travel patterns of Accessible Tourism in Europe FINAL REPORT 371
physical environment represents a major barrier. 73.4% of people with a disability stated that
physical access barriers represent the greatest obstacle compared to only 18% of the population
without explicit access needs)1.
In addition, by investigating the development of removing physical access barriers through the
implementation of Universal Design criteria, it was revealed that progress is still limited in Greece
with t 2, emphasising the importance of attitudinal
barriers.
Yet, in the United States, physical access barriers were encountered more often compared to
attitudinal barriers and thus represent the bigger barriers3. This was supported by another US study.
Based on quantitative findings (Figure 188), it was suggested that American people with access
needs encounter more physical than attitudinal barriers in all four tourism sectors that were
investigated (food & beverage, accommodation, attraction and transportation sector)4.
Figure 188 Physical access and attitudinal barriers encountered in different sectors (United States)
Physical access barriers Attitudinal barriers
Eat/ Drink 83% Eat/ Drink 66%
Accommodation 81% Accommodation 65%
Attractions 78% Attractions 56%
Transportation 67% Transportation 55%
1 Consiglio dei Ministri - Dipartimento della Gioventù (no date). Turisti Senza Ostacoli Indagine Available at:
http://www.unisa.it/uploads/2405/turisti_senza_ostacoli.pdf 2 Vozikis, K.T. (2009). Are there accessible environments in Athens, Greece today? WSEAS Transactions on Environment and Development, Vol. 5 (7):488-497. Available at: http://www.wseas.us/e-library/transactions/environment/2009/29-523.pdf 3 Van Horn, L. (2012). The United States: Travellers with Disabilities. IN D. Buhalis, S. Darcy & I. Ambrose (Eds.) Best Practice in Accessible Tourism: Inclusion, Disability, Ageing Population and Tourism, (pp. 65-78). Bristol, Channel View Publications. 4Card, J. A., Cole, S. T., & Humphrey, A. H. (2006). A Comparison of the Accessibility and Attitudinal Barriers Model: Travel Providers and Travelers with Physical Disabilities. Asia Pacific Journal of Tourism Research, 11, 161-175.
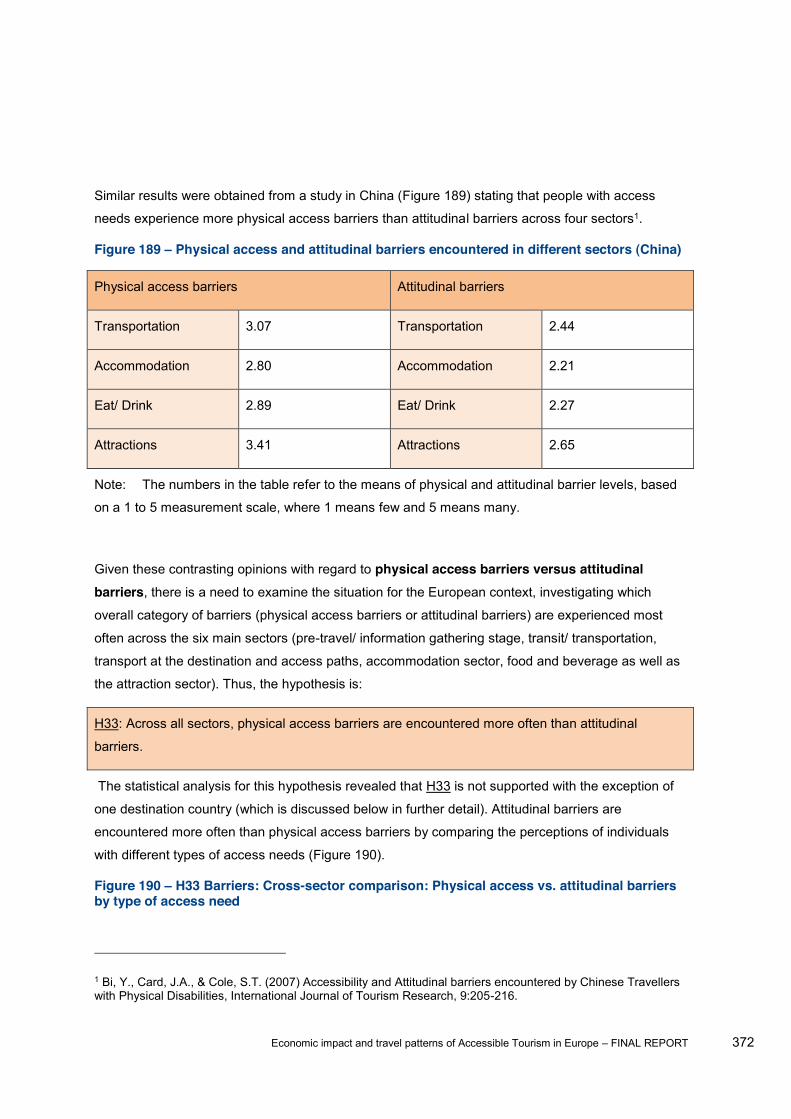
Economic impact and travel patterns of Accessible Tourism in Europe FINAL REPORT 372
Similar results were obtained from a study in China (Figure 189) stating that people with access
needs experience more physical access barriers than attitudinal barriers across four sectors1.
Figure 189 Physical access and attitudinal barriers encountered in different sectors (China)
Physical access barriers Attitudinal barriers
Transportation 3.07 Transportation 2.44
Accommodation 2.80 Accommodation 2.21
Eat/ Drink 2.89 Eat/ Drink 2.27
Attractions 3.41 Attractions 2.65
Note: The numbers in the table refer to the means of physical and attitudinal barrier levels, based
on a 1 to 5 measurement scale, where 1 means few and 5 means many.
Given these contrasting opinions with regard to physical access barriers versus attitudinal barriers, there is a need to examine the situation for the European context, investigating which
overall category of barriers (physical access barriers or attitudinal barriers) are experienced most
often across the six main sectors (pre-travel/ information gathering stage, transit/ transportation,
transport at the destination and access paths, accommodation sector, food and beverage as well as
the attraction sector). Thus, the hypothesis is:
H33: Across all sectors, physical access barriers are encountered more often than attitudinal
barriers.
The statistical analysis for this hypothesis revealed that H33 is not supported with the exception of
one destination country (which is discussed below in further detail). Attitudinal barriers are
encountered more often than physical access barriers by comparing the perceptions of individuals
with different types of access needs (Figure 190).
Figure 190 H33 Barriers: Cross-sector comparison: Physical access vs. attitudinal barriers by type of access need
1 Bi, Y., Card, J.A., & Cole, S.T. (2007) Accessibility and Attitudinal barriers encountered by Chinese Travellers with Physical Disabilities, International Journal of Tourism Research, 9:205-216.

Economic impact and travel patterns of Accessible Tourism in Europe FINAL REPORT 373
Type of access need Hypothesis supported More important barriers Barriers experienced
Mobility No Attitudinal barriers 14.8%
Senses No Attitudinal barriers 14.5%
Communication No Attitudinal barriers 15.7%
Behaviour No Attitudinal barriers 15.5%
Hidden No Attitudinal barriers 13.4%
By investing destination-specific differences, only Spain was identified as the country supporting the
hypothesis. This means that visitors to Spain encounter more physical access barriers compared to
attitudinal barriers. Yet, in most other cases, attitudinal barriers are encountered more often than
physical access barriers (Figure 191).

Economic impact and travel patterns of Accessible Tourism in Europe FINAL REPORT 374
Figure 191 H33 Barriers: Cross-sector comparison: Physical access vs. attitudinal barriers by destination
Destination Hypothesis supported More important
barriers
Barriers experienced
Belgium No Attitudinal barriers 16.7%
Bulgaria No Attitudinal barriers 20.0%
Croatia No Attitudinal barriers 23.9%
France No Attitudinal barriers 16.0%
Germany No* Physical access
barriers
10.3%
Greece No Attitudinal barriers 17.4%
Ireland No Attitudinal barriers 20.8%
Italy No Attitudinal barriers 15.5%
Lithuania No* Attitudinal barriers 8.7%
Poland No Attitudinal barriers 18.2%
Slovenia No Attitudinal barriers 13.5%
Spain Yes Physical access
barriers
8.9%
Sweden No* Attitudinal barriers 8.2%
The Netherlands No Attitudinal barriers 13.8%
United Kingdom No Attitudinal barriers 9.4%
Note: * The encounter frequencies of attitudinal barriers and physical barriers are not significantly
different.

Economic impact and travel patterns of Accessible Tourism in Europe FINAL REPORT 375
While reports from Spain underline that people with access needs were not treated adequately and
with limited respect1 2, the findings from this current study draw attention to the need to focus on the
removal of physical access barriers alongside changing attitudes of service providers.
In addition to investigating the relative importance of physical access barriers versus attitudinal
barriers, it is also important to gain a more in-depth understanding of the frequency of barriers
across all sectors, which is discussed next.
5.2.2.7.2 2nd cross-sector hypothesis: Frequency of barriers across all sectors In order to be able to develop initiatives and set-up policies to reduce barriers in the tourism industry,
it is essential to identify the sector where most barriers are experienced by people with access
needs.
In this context, the desk research assisted in providing a preliminary overview of the frequency of
barriers encountered in different countries and regions in and outside Europe.
Outside Europe, investigating the relative importance of barriers, it was found that in the United
States, mobility-restricted individuals ranked the barriers encountered at the hotel bar, in eating/ and
drinking establishments and at bus/ coach stations as the top three sectors where most barriers are
experienced3 (Figure 192).
1 Ministerio de Industria, Turismo y Comercio (no date). Decálogo de Buenas Prácticas en Accesibilidad Turística - Destinos y Recursos Culturales y Naturales. Available at: http://www.planaccesibilidadturistica.es/UserFiles/publicaciones/ficheros/Decalogo_de_Buenas_Practica_2.pdf 2 Huesca González, A.Mª., & Ortega Alonso, E. (2005). Hábitos y actitudes hacia el Turismo de las Personas con Discapacidad Física. Available at: http://www.snr.gob.ar/uploads/TA-Otros-27-HabActhaciaelTURISMO-2da_edic-PREDIF.pdf 3 Takeda, K., & Card, J.A. (2002). U.S. Tour Operators and Travel Agencies: Barriers Encountered When Providing Package Tours to People Who Have Difficulty Walking. Journal of Travel and Tourism Marketing 12, 47-61.

Economic impact and travel patterns of Accessible Tourism in Europe FINAL REPORT 376
Figure 192 Frequency of barriers encountered in different sectors (United States I)
Tourism Sectors
Hotel Bar 80.8%
Eating/ Drinking Establishments 80.6%
Bus/ Coach station 80%
Accommodation (Hotels & Motels) 75.8%
Ship/ Port 69.2%
Train/ Train Station 69.2%
Concurring with another study from the US, the food and beverage sector is highlighted as the
sector which entails the most barriers for people with access needs (Figure 193)1. Here, food and
beverage establishments do not only represent the most problematic sector overall but also when
comparing physical access barriers and attitudinal barriers.
Figure 193 Frequency of barriers encountered in different sectors (United States II)
Physical access barriers Attitudinal barriers
Eat/ Drink 83% Eat/ Drink 66%
Accommodation 81% Accommodation 65%
Attractions 78% Attractions 56%
Transportation 67% Transportation 55%
1 Card, J. A., Cole, S. T., & Humphrey, A. H. (2006) A Comparison of the Accessibility and Attitudinal Barriers Model: Travel Providers and Travelers with Physical Disabilities. Asia Pacific Journal of Tourism Research, 11, 161-175.

Economic impact and travel patterns of Accessible Tourism in Europe FINAL REPORT 377
Yet, in contrast to the American studies discussed above, research conducted in China revealed that
people with access needs encounter most barriers in the attraction sector. This result is also
consistent when comparing physical access barriers and attitudinal barriers (Figure 194)1.
Figure 194 Frequency of barriers encountered in different sectors (China)
Physical access barriers Attitudinal barriers
Transportation 3.07 Transportation 2.44
Accommodation 2.80 Accommodation 2.21
Eat/ Drink 2.89 Eat/ Drink 2.27
Attractions 3.41 Attractions 2.65
Note: The numbers in the table refer to the means of physical and attitudinal barrier levels, based
on a 1 to 5 measurement scale, where 1 means few and 5 means many.
Summarising the discussion above, it can be stated that sectors where most barriers are
encountered vary according to different geographical contexts. In order to provide a comprehensive
analysis for the European situation, the following hypothesis is established to offer insights into
different levels of frequency of barriers experienced in different tourism sectors:
H34: People with access needs encounter different levels of frequency of barriers across key
tourism sectors (accommodation, food and beverage, attractions and transportation).
After finalising the statistical testing, H34 is supported. People with access needs encounter
different levels of frequency of barriers across key tourism sectors. Barriers experienced in the
transport (at the destination) stage are encountered more often compared to other sectors,
particularly for individuals with mobility, sensory, behavioural and hidden limitations (Figure 195).
This is supported by an Italian study reporting that the main barriers can be found in transport-
related sectors2. Particularly the distances between service offerings including access to
transportation heavily reduce the possibilities for all citizens and the autonomy of people with special
1 Bi, Y., Card, J.A., & Cole, S.T. (2007). Accessibility and Attitudinal barriers encountered by Chinese Travellers with Physical Disabilities, International Journal of Tourism Research, 9:205-216. 2 Tournour-Viron, P. (2010). Is Italy an accessible destination? The opinion of foreign tour operators, suggestions to increase the flows according to the data from TTG Italy Observatory. IN IsITT Istituto Italiano per il Turismo per Tutti (ed.) Viaggiare senza limiti: il turismo per tutti in Europa. Available at: http://www.turismabile.it/file/lib/files/viaggiare_senza_limiti_web.pdf
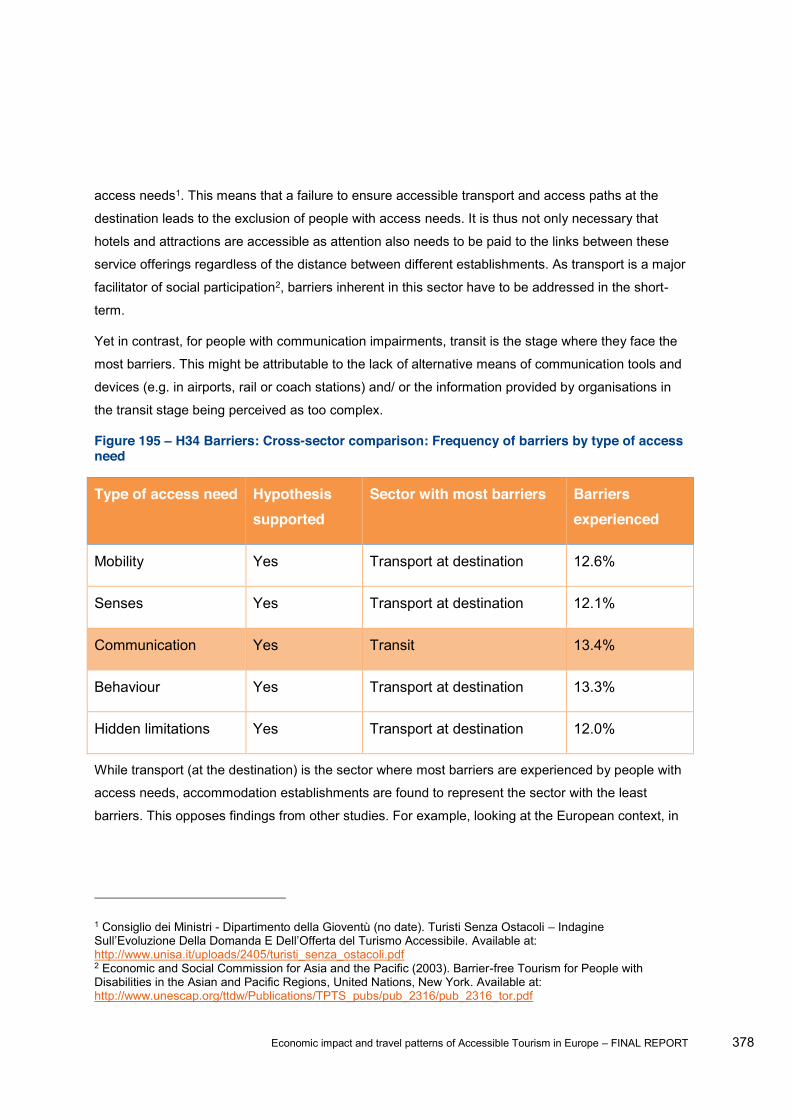
Economic impact and travel patterns of Accessible Tourism in Europe FINAL REPORT 378
access needs1. This means that a failure to ensure accessible transport and access paths at the
destination leads to the exclusion of people with access needs. It is thus not only necessary that
hotels and attractions are accessible as attention also needs to be paid to the links between these
service offerings regardless of the distance between different establishments. As transport is a major
facilitator of social participation2, barriers inherent in this sector have to be addressed in the short-
term.
Yet in contrast, for people with communication impairments, transit is the stage where they face the
most barriers. This might be attributable to the lack of alternative means of communication tools and
devices (e.g. in airports, rail or coach stations) and/ or the information provided by organisations in
the transit stage being perceived as too complex.
Figure 195 H34 Barriers: Cross-sector comparison: Frequency of barriers by type of access need
Type of access need Hypothesis supported
Sector with most barriers Barriers experienced
Mobility Yes Transport at destination 12.6%
Senses Yes Transport at destination 12.1%
Communication Yes Transit 13.4%
Behaviour Yes Transport at destination 13.3%
Hidden limitations Yes Transport at destination 12.0%
While transport (at the destination) is the sector where most barriers are experienced by people with
access needs, accommodation establishments are found to represent the sector with the least
barriers. This opposes findings from other studies. For example, looking at the European context, in
1 Consiglio dei Ministri - Dipartimento della Gioventù (no date). Turisti Senza Ostacoli Indagine Available at:
http://www.unisa.it/uploads/2405/turisti_senza_ostacoli.pdf 2 Economic and Social Commission for Asia and the Pacific (2003). Barrier-free Tourism for People with Disabilities in the Asian and Pacific Regions, United Nations, New York. Available at: http://www.unescap.org/ttdw/Publications/TPTS_pubs/pub_2316/pub_2316_tor.pdf
Economic impact and travel patterns of Accessible Tourism in Europe FINAL REPORT 379
all sectors, accommodation appears as the main concern due to different European interpretations 1.
In addition to the different perceptions held by people with different access needs, opinions with
regard to the sector that entails most barriers also vary with regard to the destination context (Figure
196).
1 Kreiter, J.N. (2010). A holiday for all from the perspective of a tourist with disabilities. IN IsITT Istituto Italiano per il Turismo per Tutti (ed.) Viaggiare senza limiti: il turismo per tutti in Europa. Available at: http://www.turismabile.it/file/lib/files/viaggiare_senza_limiti_web.pdf

Economic impact and travel patterns of Accessible Tourism in Europe FINAL REPORT 380
Figure 196 H34 Barriers: Cross-sector comparison: Frequency of barriers by destination
Destination Hypothesis supported
Sector with most barriers Barriers experienced
Belgium Yes Food and beverage 12.5%
Bulgaria Yes Information 18.9%
Croatia Yes Attractions/Activities 8.4%
France Yes Transport at destination 15.4%
Germany Yes Transport at destination;
Accommodation
10.9%
Greece Yes Attractions/Activities 14.9%
Ireland No* Accommodation 16.0%
Italy Yes Attractions/Activities 11.5%
Lithuania Yes Transit;
Transport at destination
10.9%
Poland Yes Attractions/Activities 13.2%
Slovenia No* Transport at destination 8.1%
Spain Yes Transport at destination 12.4%
Sweden No* Food and beverage 10.3%
The Netherlands Yes Accommodation 9.2%
United Kingdom No* Accommodation 9.4%
Note: * The frequencies of barriers encountered across sectors are not significantly different.

Economic impact and travel patterns of Accessible Tourism in Europe FINAL REPORT 381
Summarising the table above, transport at the destination is the sector where most barriers are
encountered for destinations such as France, Germany, Lithuania, Slovenia and Spain. This is
partially supported by a study conducted in Spain where it was highlighted that transport represents
the second most important sector where respondents felt that they were treated badly or very badly1.
In contrast, destination countries such as Germany, Ireland, the Netherlands and the United
Kingdom need to work further in reducing obstacles in the accommodation sector. This coincides
with research from the UK, indicating that the lack of accessible accommodation (mean score of
3.99) ranks highest followed by no accessible transportation at the destination (mean score of 3.94),
no accessible transport to get to the destination (mean score of 3.93) and inaccurate information on
accessibility (mean score of 3.91) 2. Thus, it is the accommodation sector that is perceived as
containing the most obstacles in a holiday environment.
Visitors to Belgium and Sweden experience most barriers in the food and beverage sector, whereas
tourists holidaying in Poland, Italy, Croatia and Greece encounter most obstacles and difficulties with
the attractions sector. The latter can be explained by the fact that these destination countries rely
heavily on nature-based attractions and activities such as beach tourism, where people with access
needs most frequently encountered barriers (see section 5.2.2.6 barriers encountered with
attractions/ activities).
Having identified and discussed the frequency of barriers encountered in different tourism sectors,
the final cross-sector analysis deals with one specific access element that was reported as a barrier
throughout almost all sectors.
5.2.2.7.3 3rd cross-sector hypothesis: Inaccessible toilets as most important barrier across all sectors
The desk research covering studies from European and non-European countries has identified the
lack of accessible toilets as a key barrier throughout all sectors.
For the transit stage, numerous studies have highlighted that the lack of accessible toilets
represents a major barrier at airports as well as for low-cost and standard airlines which causes
1 Huesca González, A.Mª., & Ortega Alonso, E. (2005). Hábitos y actitudes hacia el Turismo de las Personas con Discapacidad Física. Available at: http://www.snr.gob.ar/uploads/TA-Otros-27-HabActhaciaelTURISMO-2da_edic-PREDIF.pdf 2 Buj, C. (2010). Paving the way to accessible tourism. International Centre for Responsible Tourism, Leeds Metropolitan University, Leeds, UK. Available at: http://turismo-sostenible.net/Paving%20the%20way%20to%20accessible%20tourism-Carlos%20Buj.pdf
Economic impact and travel patterns of Accessible Tourism in Europe FINAL REPORT 382
many difficulties and obstacles for people with access needs1 2 3. Similar results were obtained from
Code of
-flight services such as toilets and assistance in
reaching toilets were not always provided by airlines4. Equally, motorway service stations create
concern with regard to accessible bathrooms5.
In the accommodation sector, inaccessible toilets and bathrooms were emphasised by articles and
reports conducting research in the United States6 7, Australia8 and Israel9. Within Europe, a
qualitative research study from Austria also confirms the importance of an accessible bathroom and
toilet as the most significant aspect in the accommodation sector10.
In Germany, research has shown that many people refrain from visiting restaurants due to the lack
of accessible toilets in the food & beverage sector11.
The attractions sector portrays a similar situation with regard to the failure to provide accessible
toilet facilities. For example, outside Europe, a study investigating the accessibility of various
museums in Rio de Janeiro, noted poorly adapted bathrooms (if adapted at all) among the principal
1 Darcy, S., & Ravinder, R. (2012). Air Travel for People with a Disability. IN D. Buhalis, S. Darcy & I. Ambrose (Eds.) Best Practice in Accessible Tourism: Inclusion, Disability, Ageing Population and Tourism, (pp. 207-221). Bristol, Channel View Publications. 2 Darcy, S. (2007). Improving Airline Practices by Understanding the Experiences of People with Disabilities. Travel and Tourism Research Association - TTRA. Charlottetown, Canada, TTRA, 17.- 20. October 2007. 3 Chang, Y.C. & Chen, C.F. (2012). Meeting the needs of disabled air passengers: Factors that facilitate help from airlines and airports, Tourism Management, 33:529-536. 4 Sentinella, J. (2006) Access to Air Travel for Disabled People: 2005. Monitoring study. Department for Transport, Mobility and Inclusion Unit. Available at: http://www.accessibletourism.org/resources/2_access_air_travel_trl_monitoring_en.pdf 5 Masala, D. (2010). Tourism for all and people with intellectual disabilities from a families point of view. IN IsITT
Istituto Italiano per il Turismo per Tutti (ed.) Viaggiare senza limiti: il turismo per tutti in Europa. Available at: http://www.turismabile.it/file/lib/files/viaggiare_senza_limiti_web.pdf 6 Turco, D.M., Stumbo, N.J., & Garncarz, J. (1998). Tourism Constraints for People with Disabilities. Parks and Recreations, 33, 78-84. 7 Van Horn, L. (2012). The United States: Travellers with Disabilities. IN D. Buhalis, S. Darcy & I. Ambrose (Eds.) Best Practice in Accessible Tourism: Inclusion, Disability, Ageing Population and Tourism, (pp. 65-78). Bristol, Channel View Publications. 8 Darcy, S. (2002). Marginalised Participation: Physical Disability, High Support Needs and Tourism. Journal of Hospitality and Tourism Management, 9, 61-72. 9 Poria, Y., Reichel, A., & Brandt, Y. (2011). Dimensions of hotel experiences of people with disabilities: An exploratory study, International Journal of Contemporary Hospitality Management, 23(5):571-591. 10 Hitsch, W. (2005). Probleme, Risiken und Chancen des barrierefreien Tourismus. Institut für Unternehmensführung, Tourismus und Dienstleistungswirtschaft, Fakultät für Betriebswirtschaft der Leopold-Franzens-Universität Innsbruck. Available at: http://www.ibft.at/ibft/doc/Diplomarbeit%20-%20Barrierefreies%20Reisen.pdf 11 BMWi (Ed.) (2010). Wirtschaftsfaktor Alter. Faktenblatt 4. Available at: http://www.bmwi.de/BMWi/Redaktion/PDF/Publikationen/wirtschaftsfaktor-alter-faktenblatt-4-barrierefreiheit,property=pdf,bereich=bmwi,sprache=de,rwb=true.pdf
Economic impact and travel patterns of Accessible Tourism in Europe FINAL REPORT 383
barriers encountered in this part of the attraction sector1. In contrast, examples can be found for
Europe where progress has been made in terms of the accessibility of museums. For example in
Genoa/ Italy, many museums offer accessible toilets2. Understandably, the National Disability
Authority of Ireland argues that accommodating accessible toilets in historic buildings is more 3.
Also with regard to nature-based activities in Spain4 and sport facilities5 in general, the lack of
accessible toilets represents a major obstacle preventing people with access needs engaging and
enjoy this part of the tourism offer at destinations. Particularly with regard to beach holidays, reports
call for more accessible toilets at beaches to be made available6. This is important as bathrooms
with accessible toilets are mentioned as the first element that needs to be in place in order to
remove existing architectural barriers in Italy7.
The examination of the importance of accessible toilets and bathrooms across different sectors has
p.314)8. In order to test this assumption
empirically, the hypothesis is:
H35: The lack of accessible toilets is the most important barrier encountered by people with access
1 Cohen, R., Rose de Siqueira Duarte, C., de Barros Horizonte Brasileiro, A., & Rogrigues de Melo, N. (2012). Tourism in Brazilian Cities: Accessibility Condition for Museums declared as Historic Patrimony in Rio de Janeiro, Brazil. Available at: http://www.transed2012.in/Common/Uploads/Theme_C_Session_1_Regency_III/346-paper_transedAbstract00155.pdf 2 Coop. Sociale La Cruna (2008). Genova per tutti noi a guide for tourism without barriers. Ambient Intelligence System of Agents for Knowledge-based and Integrated Services for Mobility impaired users (ASK-IT), Genova, Italy. Available at: http://www.lacruna.com/amministra/media/9.pdf 3 National Disability Authority (NDA) (2012). Access - Improving the Accessibility of Historic Buildings and Places. Government of Ireland. Available at: http://www.nda.ie/website/nda/cntmgmtnew.nsf/0/911AA8C52EA2A0D98025798700303E93/$File/Access_Improving_accessibility_Historic_Buildings_and_Places.pdf 4 Hernández Galán, J. (2012). Accessible Tourism in Spain: Arona and Madrid. IN D. Buhalis, S. Darcy & I. Ambrose (Eds.) Best Practice in Accessible Tourism: Inclusion, Disability, Ageing Population and Tourism, (pp. 310-321). Bristol, Channel View Publications. 5 Kreiter, J.N. (2010). A holiday for all from the perspective of a tourist with disabilities. IN IsITT Istituto Italiano per il Turismo per Tutti (ed.) Viaggiare senza limiti: il turismo per tutti in Europa. Available at: http://www.turismabile.it/file/lib/files/viaggiare_senza_limiti_web.pdf 6 Ministerio de Industria, Turismo y Comercio (no date). Decálogo de Buenas Prácticas en Accesibilidad Turística - Destinos y Recursos Culturales y Naturales. Available at: http://www.planaccesibilidadturistica.es/UserFiles/publicaciones/ficheros/Decalogo_de_Buenas_Practica_2.pdf 7 Venezia, Venice, Italy. Available at: http://dspace.unive.it/bitstream/handle/10579/2036/834819-1163227.pdf?sequence=2 8 Kreiter, J.N. (2010). A holiday for all from the perspective of a tourist with disabilities. IN IsITT Istituto Italiano per il Turismo per Tutti (ed.) Viaggiare senza limiti: il turismo per tutti in Europa. Available at: http://www.turismabile.it/file/lib/files/viaggiare_senza_limiti_web.pdf
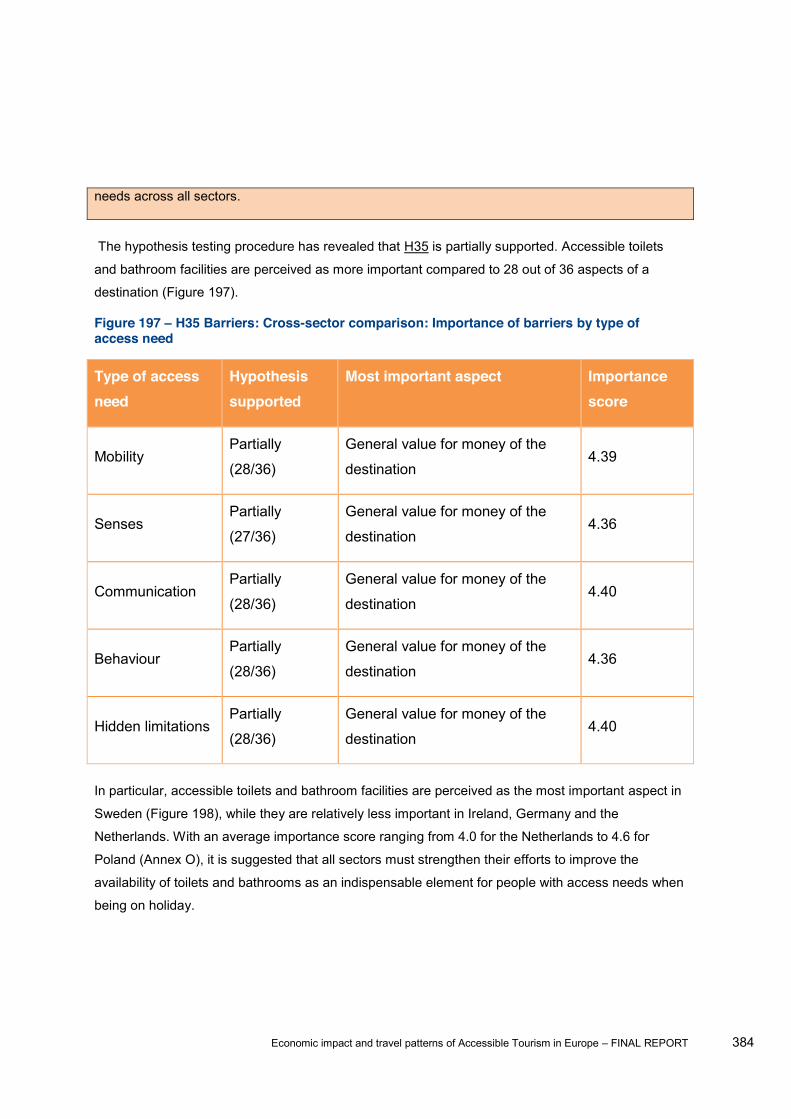
Economic impact and travel patterns of Accessible Tourism in Europe FINAL REPORT 384
needs across all sectors.
The hypothesis testing procedure has revealed that H35 is partially supported. Accessible toilets
and bathroom facilities are perceived as more important compared to 28 out of 36 aspects of a
destination (Figure 197).
Figure 197 H35 Barriers: Cross-sector comparison: Importance of barriers by type of access need
Type of access need
Hypothesis supported
Most important aspect Importance score
Mobility Partially
(28/36)
General value for money of the
destination 4.39
Senses Partially
(27/36)
General value for money of the
destination 4.36
Communication Partially
(28/36)
General value for money of the
destination 4.40
Behaviour Partially
(28/36)
General value for money of the
destination 4.36
Hidden limitations Partially
(28/36)
General value for money of the
destination 4.40
In particular, accessible toilets and bathroom facilities are perceived as the most important aspect in
Sweden (Figure 198), while they are relatively less important in Ireland, Germany and the
Netherlands. With an average importance score ranging from 4.0 for the Netherlands to 4.6 for
Poland (Annex O), it is suggested that all sectors must strengthen their efforts to improve the
availability of toilets and bathrooms as an indispensable element for people with access needs when
being on holiday.
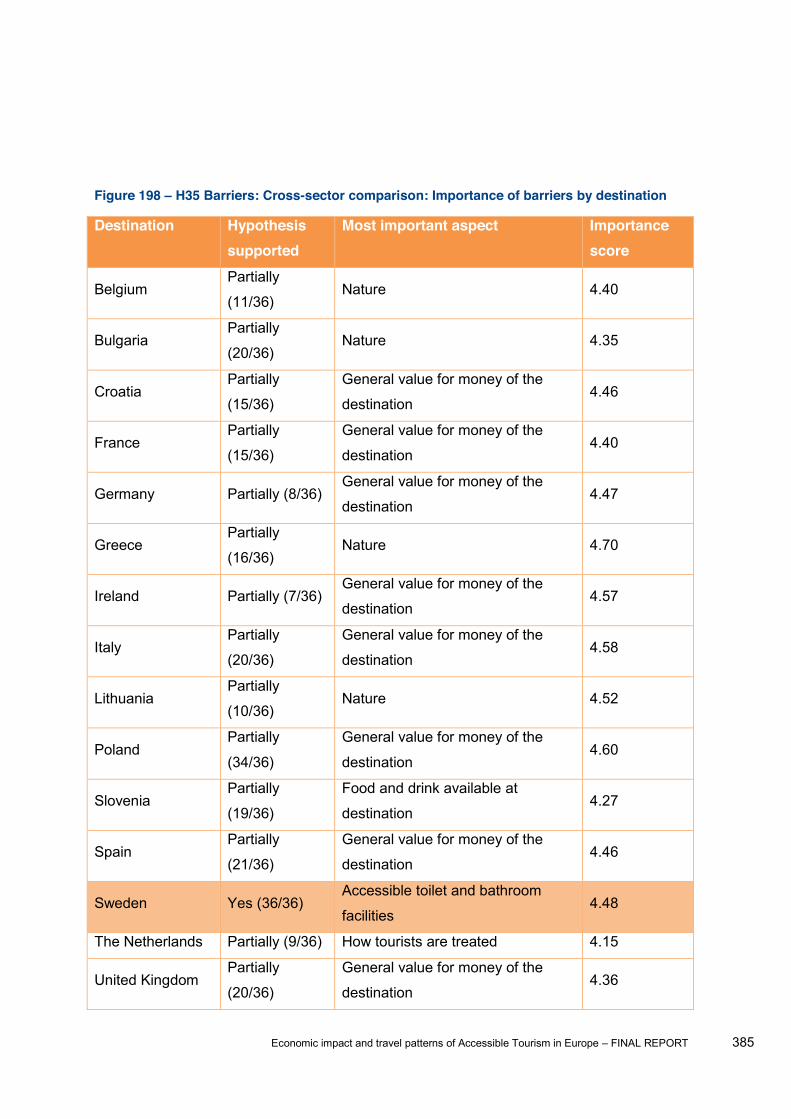
Economic impact and travel patterns of Accessible Tourism in Europe FINAL REPORT 385
Figure 198 H35 Barriers: Cross-sector comparison: Importance of barriers by destination
Destination Hypothesis supported
Most important aspect Importance score
Belgium Partially
(11/36) Nature 4.40
Bulgaria Partially
(20/36) Nature 4.35
Croatia Partially
(15/36)
General value for money of the
destination 4.46
France Partially
(15/36)
General value for money of the
destination 4.40
Germany Partially (8/36) General value for money of the
destination 4.47
Greece Partially
(16/36) Nature 4.70
Ireland Partially (7/36) General value for money of the
destination 4.57
Italy Partially
(20/36)
General value for money of the
destination 4.58
Lithuania Partially
(10/36) Nature 4.52
Poland Partially
(34/36)
General value for money of the
destination 4.60
Slovenia Partially
(19/36)
Food and drink available at
destination 4.27
Spain Partially
(21/36)
General value for money of the
destination 4.46
Sweden Yes (36/36) Accessible toilet and bathroom
facilities 4.48
The Netherlands Partially (9/36) How tourists are treated 4.15
United Kingdom Partially
(20/36)
General value for money of the
destination 4.36

Economic impact and travel patterns of Accessible Tourism in Europe FINAL REPORT 386
As can be seen from the table above, respondents also stressed the general value for money. It can
be argued that this is not different compared to the population without explicit access needs as
during times of economic downturn and recessions, individuals pay closer attention to what they get
for their money spent. Recent news stories highlight that tourism to Ireland has significantly
improved by giving value for money, which also leads to tourists being more willing to recommend
the destination to friends and family members1.
1 TheJournal.ie (2013) Ireland getting better in offering value for money, say tourists. Available at: http://www.thejournal.ie/ireland-value-for-money-tourism-878516-Apr2013/
Economic impact and travel patterns of Accessible Tourism in Europe FINAL REPORT 387
6 Task 4 - Estimate of the current and future economic contribution of accessible tourism
6.1 Task - 4a Stakeholder consultation
6.1.1 Methodology The consultation of stakeholders is a qualitative approach and an additional tool to complement the
Gathering information regarding the current impact of the demand for accessible tourism
Surveying means and tools of relevant service providers in product development and
marketing
Contributing to the definition of success factors and recommendations
Refining the definition of the three possible future scenarios to be used in the surveys.
Last but not least, the stakeholder consultation plays an important role in reaching and
informing key influencers in tourism about the project itself and Accessible Tourism in
general.
6.1.1.1 Focus groups Two focus groups have been conducted. The first one in Luxembourg was a preliminary one in order
to test the questions and the procedure. This first focus group was organised within the European
Grundtvig workshop: "EMPOWER - MUNICIPALITIES ENABLING THE CITIZENS" on May 12th
2013. The members of the focus group represent 10 countries (Figure 199). Their common interest
was accessibility and Design for All although from different perspectives: some as public servants in
local administrations, some as disability NGOs members, some as tourism professionals, some as
design professionals (industrial design, ergonomists, architects, engineers) and tourism agencies
employees.
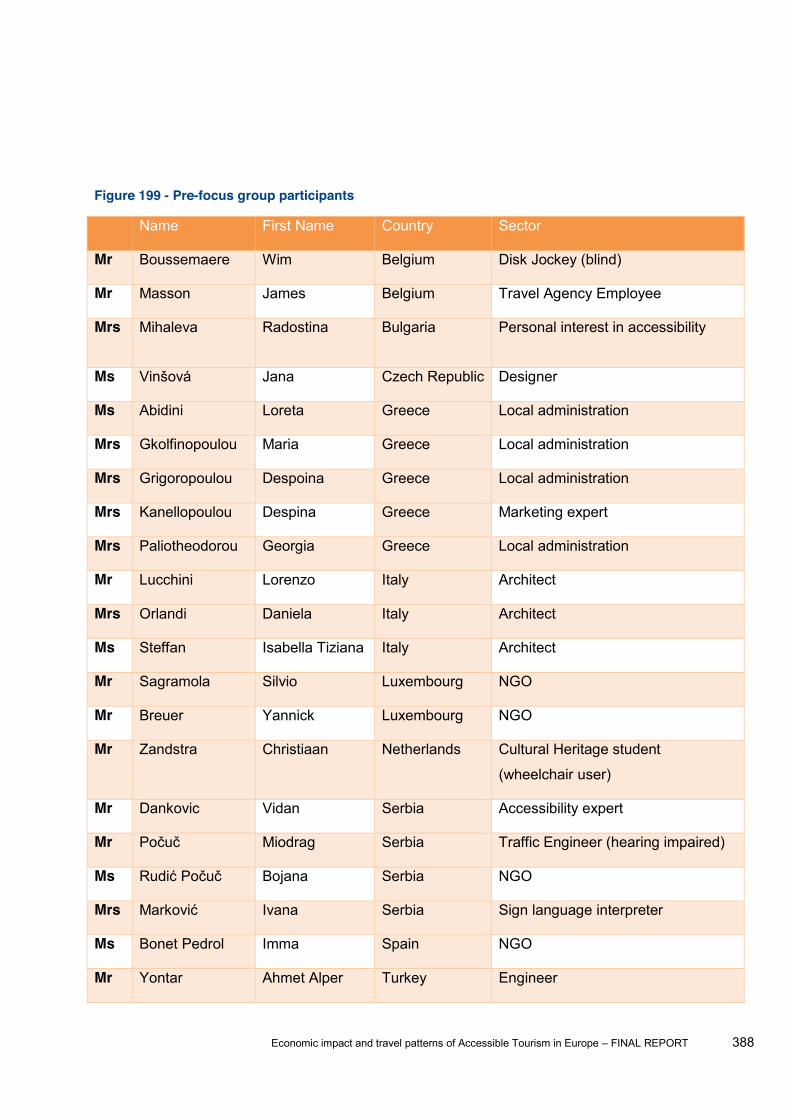
Economic impact and travel patterns of Accessible Tourism in Europe FINAL REPORT 388
Figure 199 - Pre-focus group participants
Name First Name Country Sector
Mr Boussemaere Wim Belgium Disk Jockey (blind)
Mr Masson James Belgium Travel Agency Employee
Mrs Mihaleva Radostina Bulgaria Personal interest in accessibility
Ms Jana Czech Republic Designer
Ms Abidini Loreta Greece Local administration
Mrs Gkolfinopoulou Maria Greece Local administration
Mrs Grigoropoulou Despoina Greece Local administration
Mrs Kanellopoulou Despina Greece Marketing expert
Mrs Paliotheodorou Georgia Greece Local administration
Mr Lucchini Lorenzo Italy Architect
Mrs Orlandi Daniela Italy Architect
Ms Steffan Isabella Tiziana Italy Architect
Mr Sagramola Silvio Luxembourg NGO
Mr Breuer Yannick Luxembourg NGO
Mr Zandstra Christiaan Netherlands Cultural Heritage student
(wheelchair user)
Mr Dankovic Vidan Serbia Accessibility expert
Mr Miodrag Serbia Traffic Engineer (hearing impaired)
Ms Bojana Serbia NGO
Mrs Ivana Serbia Sign language interpreter
Ms Bonet Pedrol Imma Spain NGO
Mr Yontar Ahmet Alper Turkey Engineer
Economic impact and travel patterns of Accessible Tourism in Europe FINAL REPORT 389
The IVth International Congress of Tourism for All in Avila (27 June 2013) provided an excellent
opportunity to conduct a focus group with experts from many fields in Tourism for All. Many experts
from different countries and different branches gathered in one place.
The focus group duration was approximately two hours, and yielded an in-depth discussion amongst
the participants on a wide range of aspects of accessible tourism.
Figure 200 presents the list of participants. The discussion guide is available in Annex P.
To investigate certain aspects at a deeper level the participants agreed to comment further on the
three future scenarios by e-mail (see below).
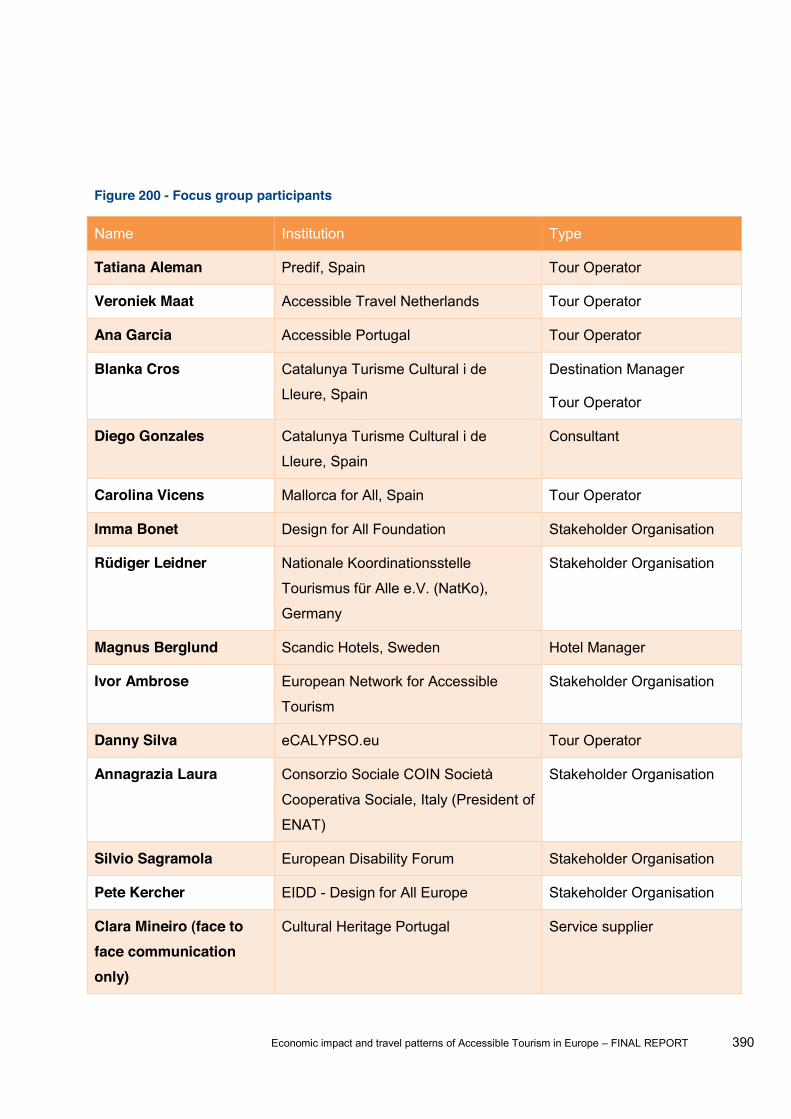
Economic impact and travel patterns of Accessible Tourism in Europe FINAL REPORT 390
Figure 200 - Focus group participants
Name Institution Type
Tatiana Aleman Predif, Spain Tour Operator
Veroniek Maat Accessible Travel Netherlands Tour Operator
Ana Garcia Accessible Portugal Tour Operator
Blanka Cros Catalunya Turisme Cultural i de
Lleure, Spain
Destination Manager
Tour Operator
Diego Gonzales Catalunya Turisme Cultural i de
Lleure, Spain
Consultant
Carolina Vicens Mallorca for All, Spain Tour Operator
Imma Bonet Design for All Foundation Stakeholder Organisation
Rüdiger Leidner Nationale Koordinationsstelle
Tourismus für Alle e.V. (NatKo),
Germany
Stakeholder Organisation
Magnus Berglund Scandic Hotels, Sweden Hotel Manager
Ivor Ambrose European Network for Accessible
Tourism
Stakeholder Organisation
Danny Silva eCALYPSO.eu Tour Operator
Annagrazia Laura Consorzio Sociale COIN Società
Cooperativa Sociale, Italy (President of
ENAT)
Stakeholder Organisation
Silvio Sagramola European Disability Forum Stakeholder Organisation
Pete Kercher EIDD - Design for All Europe Stakeholder Organisation
Clara Mineiro (face to face communication only)
Cultural Heritage Portugal Service supplier
Economic impact and travel patterns of Accessible Tourism in Europe FINAL REPORT 391
6.1.1.2 In-depth-interviews (IDIs) The stakeholder consultation included not just the focus groups, but in-depth interviews (IDIs)
additionally. Indeed, these two approaches are complementary. IDIs were preferred for stakeholders
for whom confidentiality is important (e.g. economic operators) or for experts who could not join the
focus group.
11 IDIs were conducted with stakeholders in 10 countries:
Austria
Belgium
Bulgaria
Czech Republic
Denmark
Germany
Italy
Romania
Spain
Sweden
The stakeholders come from the following branches:
Advocacy group (6 x)
Information organisation (2 x)
Marketing organisation (1 x)
Public body (1 x)
Service provider (1 x)
The interviews were carried out by telephone with a semi-structured questionnaire. Each interview
lasted around 20 minutes. The interviews were conducted by highly trained and experienced
interviewers.
Semi-structured interviews were conducted with a fairly open framework which allow for focused,
conversational, two-way communication. Unlike the traditional questionnaire framework, where
detailed questions are formulated ahead, semi structured interviewing starts with more general
questions or topics. Relevant topics are initially identified and the possible relationship between
these topics becomes the basis for more specific questions which do not need to be prepared in
advance. The majority of questions were created during the interview, allowing both the interviewer
and the person being interviewed the flexibility to probe for details or discuss issues.
Economic impact and travel patterns of Accessible Tourism in Europe FINAL REPORT 392
6.1.2 Results The following findings result from both the focus groups and the in-depth-interviews. They are
grouped by the most important branches of interest.
6.1.2.1 Associations with accessible tourism
tends to put accessible tourism in a positive context. Definitions of accessible tourism put forward by
focus group participants and interview partners include the following aspects:
Making tourism possible for everybody
Equal opportunities including financial opportunities for everybody
Respect for diversity including gender questions
Reliable Information
Adapting services offered to each guest
connected with
Tourism for A
comprehension among some stakeholders, especially tourism operators. One of the focus group
participants with limited understanding of the two terms suggested that alternatively terminology
Despi
accepted among professionals, as they recognise its potential in terms of driving a specific tourism
yet found
6.1.2.2 Product development and marketing In general, the stakeholders clearly favour a mainstream approach of accessible tourism instead of a
special interest approach for disabled guests.
A summary of opinion is that all services should be available for all guests, so that no special offers
for disabled people are needed. However, the view is also expressed that the lack of information at
present about accessible services at the destination requires that some specialised agents provide
this information in order to build relations between clients and providers (especially when disabled
people travel in group).

Economic impact and travel patterns of Accessible Tourism in Europe FINAL REPORT 393
The stakeholders do not perceive that elderly people have any special requirement as a target
group, but acknowledge that elderly people are more likely than younger tourists to request
improved access.
Business-to-business relationships must be established and fostered in order to provide guests with
consistency along the service chain. In addition, co-operation helps providers to learn from each
other and strive for continuous improvement in the delivery of client satisfaction, while keeping up
with the offers of rival companies.
n mind that there will not always be people available to deliver assistance
services. Therefore, environments where elderly people can be as autonomous as possible is a
Due to the importance of considering the whole service chain, accessible tourisms needs both
political and public support. Some elements of the service chain, such as public transport and public
infrastructure, will not be improved by private enterprises, but rather by public authorities. With this in
mind, legislation and its enforcement are required.
6.1.2.3 Motivations Enjoying holidays is the main need for consumers of tourism services, and the stakeholders agree
on the social necessity to care for all members of the society.
However, profitability is an important driver and motivational factor for tourism service providers
(destination manager, tour operators, hotel manager). Even the stakeholders with a social
background (advocacy groups) tend to bring the financial argument forward.
6.1.2.4 Success factors and recommendations The stakeholders identified the following success factors to support accessible tourism:
Political and public support
Enhancing public-private-cooperation
Direct financial support
Harmonisation of standards and legislation
Encouraging service providers to invest in accessible tourism
Identifying and disseminating success cases
learn or treat a guest as well as possible are more likely to have a returning guest, regardless of
the a
disabilities and you create customers
Communication with the guests:
Detailed and reliable information is important
Economic impact and travel patterns of Accessible Tourism in Europe FINAL REPORT 394
in wheelchairs, but just 10 rooms
demands and often are able to find good solutions themselves
Product development:
Develop accessible tourism step by step, beginning with an inventory of the current offer in
Think about the
access needs are more open to diversity and challenge than the organisations that
6.1.2.5 Economic meaning and potential impact The stakeholders agreed that accessible tourism is profitable, whether taking the definition of
le
tourism may bring a return on investment within the first year. At present, tourism service providers
in general do not fully realise that many disabled or elderly guests have a lot of money.
However, some stakeholders stress the social facet of accessible tourism and insist on including
Tourism for
A
Looking to the future, the stakeholders expect that this market will grow and there is a growing
acceptance of accessible tourism due to the demographic change that will push the market.
As a further note, one stakeholder underlined that accessibility may primarily assist the decision to
travel but without a diverse and qualified offer, no tourism business can thrive.
6.1.2.6 Scenario Analysis The comments on the single scenarios (including the additional feedback received by e-mail) can be
summarised as follows:
Scenario 1: the hotels, restaurants and museums have been adapted for access needs, but no other services
such as wheelchairs
The general view was that this scenario is more or less identical to the reality of many tourist
destinations today.
People with access needs will travel less or seek out trusted locations rather than new
destinations.
Economic impact and travel patterns of Accessible Tourism in Europe FINAL REPORT 395
Since information is not always available and/or not reliable, it becomes harder to decide whether
or not to travel.
Such a scenario would not change the spending habits of a traveller. Rather it will influence their
choices. Such a location will most likely be dismissed as an option.
Most services providers have a lack of training and hence no good offers.
lled.
Scenario 2: and museums are adapted for access needs, and some services like wheelchairs, visual and
hearing aids
This scenario comes closer to the concept of Tourism for All.
This scenario will enlarge the potential market to a certain extent, and would enlarge it further with
additional investments in infrastructure.
Factors that will have a particularly positive impact on increasing demand include:
Accessibility of visiting cultural sites
Accessibility of hotels of 3 stars or less
Provision of additional information about accessibility
However, since a number of buildings and transport service are not accessible, this might
constrain their tourism experience or travel pattern. The tourist with access needs would still be
required to spend more money to assure quality.
Depending on the level (hotels stars) of adapted facilities, this destination will attract different
segments. For example, a destination where the most accessible buildings are relatively
expensive hotels rather than cheaper hotels may be more attractive to older people with more
disposable income, but it may still be an unattractive offer to tourists with more severe access
needs and limited income resources.
Since not all the service chain elements are better adapted or made more user-friendly, this might
require additional costs which may not be planned in the organizational phase of the travel, but
will be faced by the tourist while at the destination, thus compromising the overall satisfaction for
the whole trip.
A better training of tourism sector staff will improve the relationship with the customer, and lead to
a more satisfactory experience for the customer.
The fidelity of tourists will increase, and the positive image of the destination will be enhanced too.
This means that the destination will become more attractive and the tourism offer there will
become more competitive.
Economic impact and travel patterns of Accessible Tourism in Europe FINAL REPORT 396
Scenario 3: buildings are made accessible. Almost all of the hotels,
restaurants and museums are adapted for access needs, and many services like wheelchairs,
visual or hearing aids, medical services, dedicated personal assistants etc.
Obviously such a destination offers comfort and trust to the tourist. The likely impact is to have a
high average of return guests/visitors, thus ensuring sustainability, provided that the destination
has an attractive and constantly renewed offer.
Tourists with access needs will not be treated differently from any other tourist. We are not talking
about tourist with special needs, or disabled tourist, or accessible tourism, because the
accessibility is already everywhere. Therefore, the offer of Scenario 3 closes matches the concept
of Tourism for All.
Persons with disabilities will certainly travel more frequently and thus would spend more money.
If all accommodation, transport systems within and to/from the destinations and the tourist sites
would really be accessible, tourists with access needs would have to spend less to guarantee a
good experience.
Accessibility should be available on all service levels when it comes to travel costs (hostels, 3 star
hotels, 4 star hotels etc.)
The likely impact is to have a high average of return guests
There are 80 million people who are disabled or with reduced mobility in the EC. All of them
would be a potential tourist to this destination, and so this tourist destination will increase its
competitiveness and income.
Accessibility then, will be always part of the design, management and in any of the tourist
resources /services /offer. They will use the same commercialisation channels (they will be for
both customers with special needs or not), so the demand will increase significantly.
The comments made by the stakeholders were very useful for the team to refine the scenarios and
to formulate and support the hypotheses formulated for this study.
6.1.2.7 Conclusion Focus groups and in-depth-interviews with experienced stakeholders show that:
Accessible tourism is considered a business opportunity but there is a lack of coordination,
particularly between the public and private sector.
Accessibility is mainly understood as a feature for disabled guests and almost never understood
as a plus in comfort and service and, therefore, not used in marketing and advertising.
Product development and marketing is mainly targeted only to disabled people.
For the tourism business, political and financial support, awareness raising and activation of
service providers are important drivers
For the guest, reliable information on accessible offers and services is a key factor for success
Economic impact and travel patterns of Accessible Tourism in Europe FINAL REPORT 397
6.2 Current economic contribution
6.2.1 Methodology
6.2.1.1 Direct economic contribution estimation The rationale of estimating the economic contribution of accessible tourism can be described as
below:
Direct economic contribution =
daily spending × length of stay × people with access needs × travel propensity × travel frequency
From the formula above, it is apparent that the key indicator to be considered is the spending by
travellers. Briefly speaking, the economic contribution is the tourism demand in monetary terms.
The first two parameters, daily spending and length of st
Although secondary data on tourist expenditure may be available regarding generic tourism, figures
for the accessible tourism are not available. For the current project, the daily spending and length of
stay figures were gathered from an online survey conducted in the 12 representative countries.
Specifically, this information can be extracted from:
Q18. We will now ask you about your travel budget.
Thinking of your most recent trip, how much money did you spend per person on the following
items?
Please write down your destination and the number of nights you spent at your destination.
Please give an amount for each category in [CURRENCY]. If you are unsure about the answer,
please give your best estimate.
In the estimation of economic contribution, the other three parameters, i.e., people with access
needs, travel propensity and travel frequency, are the backbone of demand estimation. The sources
and methods for demand estimation have been explained in Section 3.2.
6.2.1.2 Total economic contribution estimation indirect and induced effects Apart from the direct economic contribution generated by directly serving the accessible tourism
market, there are secondary effects incurred.
As with any economic contribution estimation, two types of secondary effects are identified, namely
the indirect effect and the induced effect. Indirect effect means the changes in income and
employment within the destination in backward-linked industries supplying goods and services to
tourism businesses. For example, the increased revenue of local farms resulting from supplying
fruits and vegetables to hotels are an indirect effect of tourist spending. Induced effect means the
increased sales within a destination from household spending of the income earned from tourism
Economic impact and travel patterns of Accessible Tourism in Europe FINAL REPORT 398
and its supporting sectors. Such income is spent by tourism employees on other consumer goods
and services or housing. This generates additional income and employment throughout the
Therefore, via the indirect and induced effects that help to circulate the revenue of tourism
businesses, one euro received by the accessible tourism operators can benefit the whole economy
by more than one euro.
The rationale of total economic contribution estimation is as follows:
Total of direct and indirect contribution = direct economic contribution × indirect multiplier
Total of direct, indirect and induced contribution = direct economic contribution × induced multiplier
The multipliers are derived from the input-output tables, which are collected from Eurostat1. The idea
of an input-output table is to track the inputs used in the producing different categories of products.
For example, a restaurant uses such inputs as food & beverage, utilities (water, electricity, gas etc.),
transport (or logistics), and so on. Hence, via the supply chain linkage the revenue earned by the
restaurant is channelled to other industries providing supplies to the restaurant, and is magnified
across all industries in the economy.
The derivation of multipliers follows standard procedures, which involve matrix operation. A more
detailed explanation of the methodology is provided by the Eurostat Manual of Supply, Use and
Input-Output Figures2 (pp.497-506) and the Input-Output Methodology Guide by the Scottish
Government3 (pp.22-26). A brief technical description is provided in Annex Q.
Specifically, in this task three major contributions were investigated, namely the contribution in terms
of output, gross value added and employment. Basically, output consists of those goods or services
that are produced within an establishment that become available for use outside that establishment,
plus any goods and services produced for own final use4. Gross value added (GVA) is the value of
output less the value of intermediate consumption; it is a measure of the contribution to GDP made
by an individual producer, industry or sector5. As a component of GDP, gross value added of the
total economy usually accounts for more than 90% of GDP. The difference between GVA and GDP
1 http://epp.eurostat.ec.europa.eu/portal/page/portal/esa95_supply_use_input_tables/data/workbooks 2 http://epp.eurostat.ec.europa.eu/cache/ITY_OFFPUB/KS-RA-07-013/EN/KS-RA-07-013-EN.PDF 3 http://www.scotland.gov.uk/Resource/Doc/919/0116738.pdf 4 http://epp.eurostat.ec.europa.eu/cache/ITY_OFFPUB/KS-RA-07-013/EN/KS-RA-07-013-EN.PDF, p.569. 5 http://epp.eurostat.ec.europa.eu/cache/ITY_OFFPUB/KS-RA-07-013/EN/KS-RA-07-013-EN.PDF, p.558.
Economic impact and travel patterns of Accessible Tourism in Europe FINAL REPORT 399
is the taxes and subsidies on products1. Conceptually, both GVA and GDP measure the same value
added (or net output) in an economy over a certain period. In the following sections, the contribution
in terms of GVA will be presented alongside the output contribution and employment contribution,
whilst the contribution in terms of GDP were presented in the text as a supplement to the GVA
figures. Output, gross value added (GVA) and GDP are all measured in monetary terms, while
employment is measured in terms of persons.
For the three terms of contribution, both the indirect and the induced effects were estimated. Hence
the total set of contribution figures includes six indicators.
6.2.1.3 Effect of travel companions
travel companions.
The data is available from the survey questionnaire, specifically
Q18. We will now ask you about your travel budget.
Thinking of your most recent trip, how much money did you spend per person on the following
items?
Please write down your destination and the number of nights you spent at your destination.
Please give an amount for each category in [CURRENCY].If you are unsure about the answer,
please give your best estimate.
To calculate the average number of companions at country level, the answers to the question right
above were taken simple average for a specific group (with disabilities, or elderly) of a specific
country.
To calculate the number of companions at the EU level, the numbers at the country level were taken
weighted average, with the weights being the corresponding current tourism demand. Equivalently,
this means the calculation is the ratio between the total number of people (including the people with
1 The sum of GVA at basic prices over all industries plus taxes on products minus subsidies on products gives gross domestic product (GDP). http://epp.eurostat.ec.europa.eu/statistics_explained/index.php/Glossary:Value_added
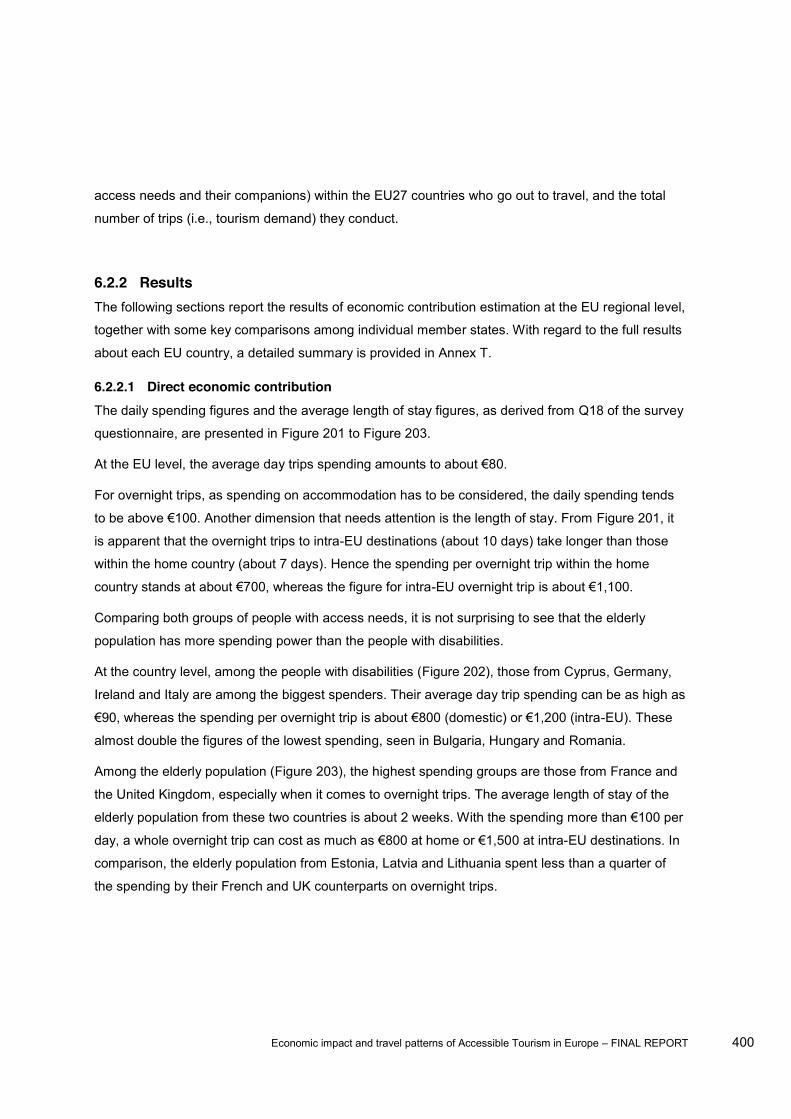
Economic impact and travel patterns of Accessible Tourism in Europe FINAL REPORT 400
access needs and their companions) within the EU27 countries who go out to travel, and the total
number of trips (i.e., tourism demand) they conduct.
6.2.2 Results The following sections report the results of economic contribution estimation at the EU regional level,
together with some key comparisons among individual member states. With regard to the full results
about each EU country, a detailed summary is provided in Annex T.
6.2.2.1 Direct economic contribution The daily spending figures and the average length of stay figures, as derived from Q18 of the survey
questionnaire, are presented in Figure 201 to Figure 203.
For overnight trips, as spending on accommodation has to be considered, the daily spending tends
Figure 201, it
is apparent that the overnight trips to intra-EU destinations (about 10 days) take longer than those
within the home country (about 7 days). Hence the spending per overnight trip within the home
-
Comparing both groups of people with access needs, it is not surprising to see that the elderly
population has more spending power than the people with disabilities.
At the country level, among the people with disabilities (Figure 202), those from Cyprus, Germany,
Ireland and Italy are among the biggest spenders. Their average day trip spending can be as high as
-EU). These
almost double the figures of the lowest spending, seen in Bulgaria, Hungary and Romania.
Among the elderly population (Figure 203), the highest spending groups are those from France and
the United Kingdom, especially when it comes to overnight trips. The average length of stay of the
0 at intra-EU destinations. In
comparison, the elderly population from Estonia, Latvia and Lithuania spent less than a quarter of
the spending by their French and UK counterparts on overnight trips.
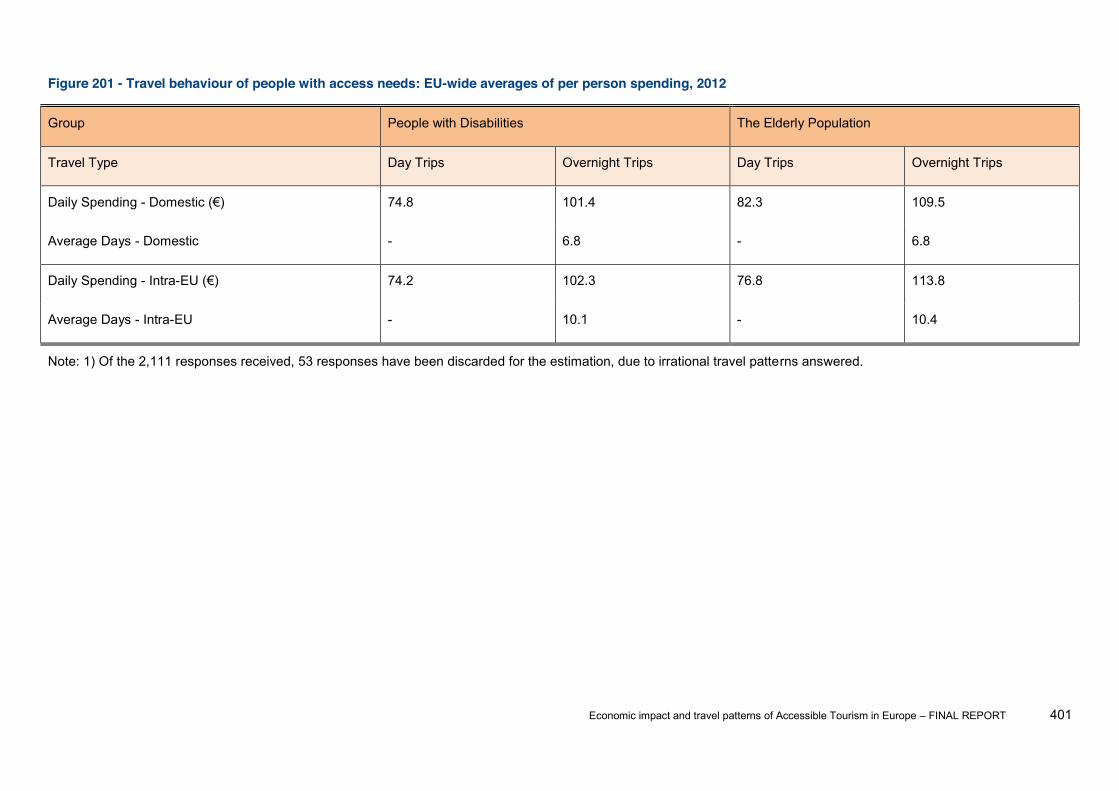
Economic impact and travel patterns of Accessible Tourism in Europe FINAL REPORT 401
Figure 201 - Travel behaviour of people with access needs: EU-wide averages of per person spending, 2012
Group People with Disabilities The Elderly Population
Travel Type Day Trips Overnight Trips Day Trips Overnight Trips
Daily Spending - 74.8 101.4 82.3 109.5
Average Days - Domestic - 6.8 - 6.8
Daily Spending - Intra- 74.2 102.3 76.8 113.8
Average Days - Intra-EU - 10.1 - 10.4
Note: 1) Of the 2,111 responses received, 53 responses have been discarded for the estimation, due to irrational travel patterns answered.
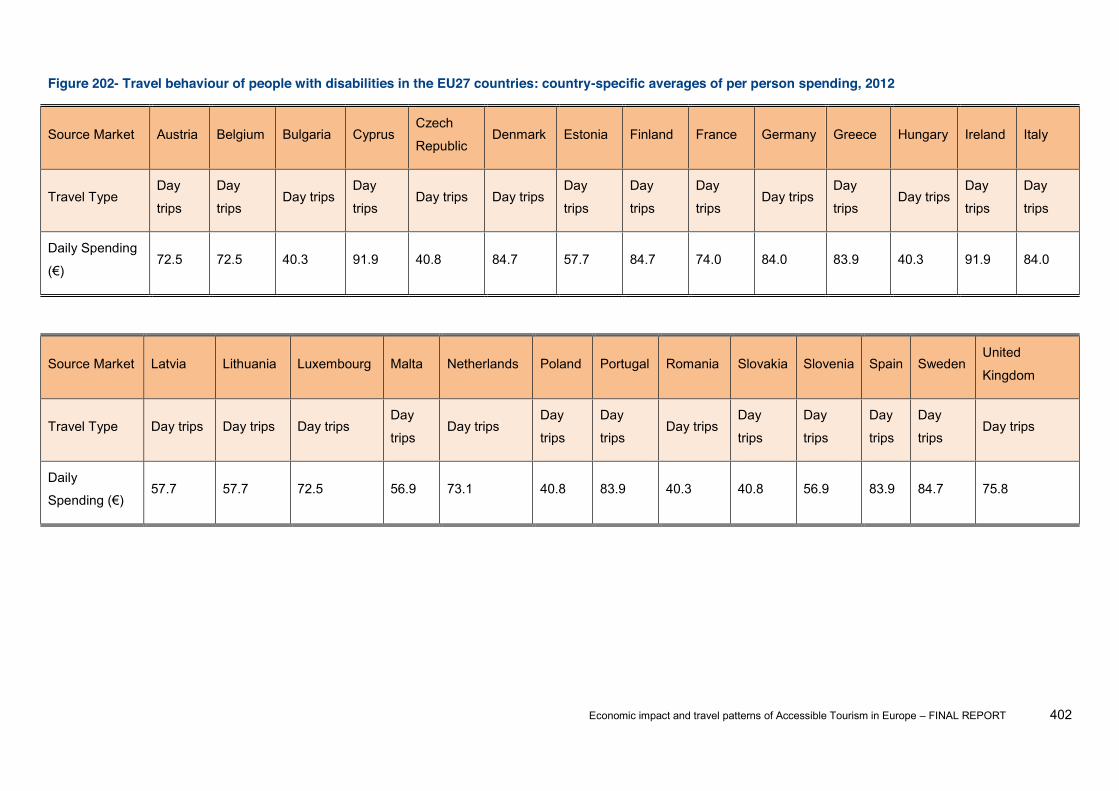
Economic impact and travel patterns of Accessible Tourism in Europe FINAL REPORT 402
Figure 202- Travel behaviour of people with disabilities in the EU27 countries: country-specific averages of per person spending, 2012
Source Market Austria Belgium Bulgaria Cyprus Czech
Republic Denmark Estonia Finland France Germany Greece Hungary Ireland Italy
Travel Type Day
trips
Day
trips Day trips
Day
trips Day trips Day trips
Day
trips
Day
trips
Day
trips Day trips
Day
trips Day trips
Day
trips
Day
trips
Daily Spending
72.5 72.5 40.3 91.9 40.8 84.7 57.7 84.7 74.0 84.0 83.9 40.3 91.9 84.0
Source Market Latvia Lithuania Luxembourg Malta Netherlands Poland Portugal Romania Slovakia Slovenia Spain Sweden United
Kingdom
Travel Type Day trips Day trips Day trips Day
trips Day trips
Day
trips
Day
trips Day trips
Day
trips
Day
trips
Day
trips
Day
trips Day trips
Daily
57.7 57.7 72.5 56.9 73.1 40.8 83.9 40.3 40.8 56.9 83.9 84.7 75.8
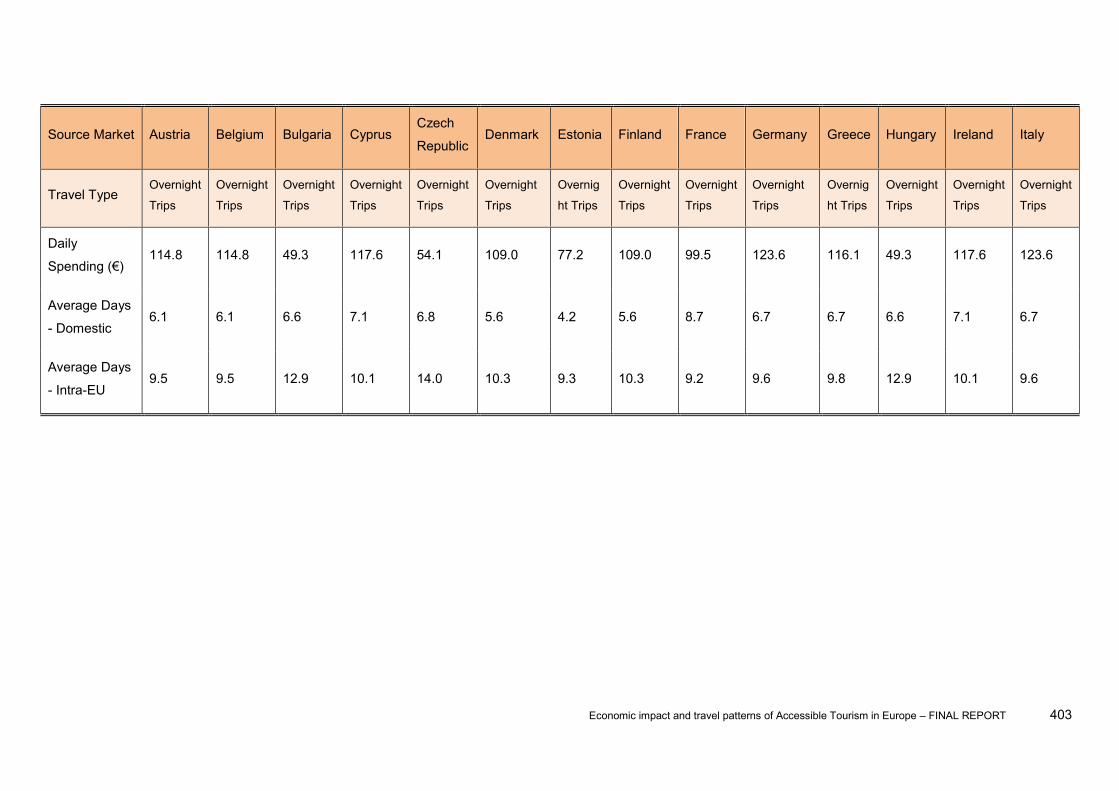
Economic impact and travel patterns of Accessible Tourism in Europe FINAL REPORT 403
Source Market Austria Belgium Bulgaria Cyprus Czech
Republic Denmark Estonia Finland France Germany Greece Hungary Ireland Italy
Travel Type Overnight
Trips
Overnight
Trips
Overnight
Trips
Overnight
Trips
Overnight
Trips
Overnight
Trips
Overnig
ht Trips
Overnight
Trips
Overnight
Trips
Overnight
Trips
Overnig
ht Trips
Overnight
Trips
Overnight
Trips
Overnight
Trips
Daily
114.8 114.8 49.3 117.6 54.1 109.0 77.2 109.0 99.5 123.6 116.1 49.3 117.6 123.6
Average Days
- Domestic 6.1 6.1 6.6 7.1 6.8 5.6 4.2 5.6 8.7 6.7 6.7 6.6 7.1 6.7
Average Days
- Intra-EU 9.5 9.5 12.9 10.1 14.0 10.3 9.3 10.3 9.2 9.6 9.8 12.9 10.1 9.6

Economic impact and travel patterns of Accessible Tourism in Europe FINAL REPORT 404
Source
Market Latvia Lithuania Luxembourg Malta Netherlands Poland Portugal Romania Slovakia Slovenia Spain Sweden
United
Kingdom
Travel Type Overnight
Trips
Overnight
Trips
Overnight
Trips
Overnight
Trips
Overnight
Trips
Overnight
Trips
Overnight
Trips
Overnight
Trips
Overnight
Trips
Overnigh
t Trips
Overnight
Trips
Overnight
Trips
Overnight
Trips
Daily
77.2 77.2 114.8 73.5 95.5 54.1 116.1 49.3 54.1 73.5 116.1 109.0 103.3
Average
Days -
Domestic
4.2 4.2 6.1 5.0 6.5 6.8 6.7 6.6 6.8 5.0 6.7 5.6 5.7
Average
Days - Intra-
EU
9.3 9.3 9.5 8.9 10.8 14.0 9.8 12.9 14.0 8.9 9.8 10.3 10.2
Note: 1) Of the 2,111 responses received, 53 responses have been discarded for the estimation, due to irrational travel patterns answered.
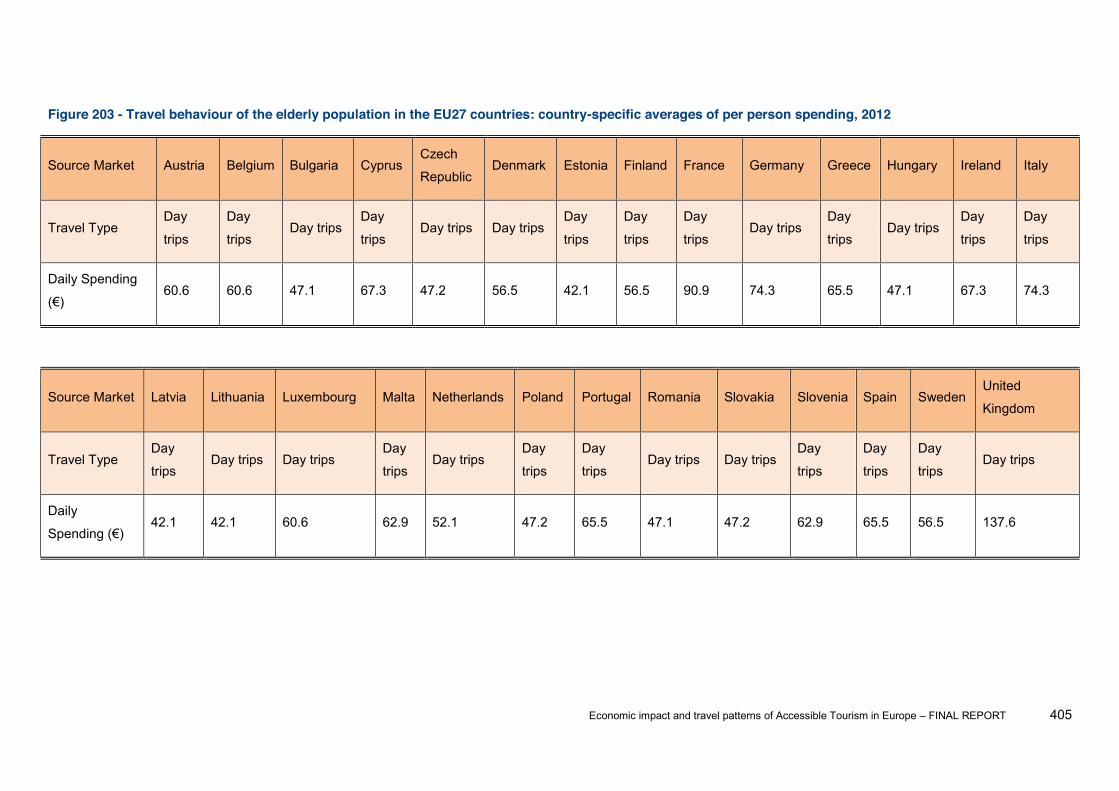
Economic impact and travel patterns of Accessible Tourism in Europe FINAL REPORT 405
Figure 203 - Travel behaviour of the elderly population in the EU27 countries: country-specific averages of per person spending, 2012
Source Market Austria Belgium Bulgaria Cyprus Czech
Republic Denmark Estonia Finland France Germany Greece Hungary Ireland Italy
Travel Type Day
trips
Day
trips Day trips
Day
trips Day trips Day trips
Day
trips
Day
trips
Day
trips Day trips
Day
trips Day trips
Day
trips
Day
trips
Daily Spending
60.6 60.6 47.1 67.3 47.2 56.5 42.1 56.5 90.9 74.3 65.5 47.1 67.3 74.3
Source Market Latvia Lithuania Luxembourg Malta Netherlands Poland Portugal Romania Slovakia Slovenia Spain Sweden United
Kingdom
Travel Type Day
trips Day trips Day trips
Day
trips Day trips
Day
trips
Day
trips Day trips Day trips
Day
trips
Day
trips
Day
trips Day trips
Daily
42.1 42.1 60.6 62.9 52.1 47.2 65.5 47.1 47.2 62.9 65.5 56.5 137.6

Economic impact and travel patterns of Accessible Tourism in Europe FINAL REPORT 406
Source
Market Austria Belgium Bulgaria Cyprus
Czech
Republic Denmark Estonia Finland France Germany Greece Hungary Ireland Italy
Travel Type Overnigh
t Trips
Overnight
Trips
Overnight
Trips
Overnight
Trips
Overnight
Trips
Overnight
Trips
Overnight
Trips
Overnight
Trips
Overnight
Trips
Overnight
Trips
Overnight
Trips
Overnight
Trips
Overnight
Trips
Overnight
Trips
Daily
97.1 97.1 57.1 96.3 62.6 93.6 51.4 93.6 110.2 112.7 111.1 57.1 96.3 112.7
Average
Days -
Domestic
7.0 7.0 7.2 5.8 6.3 4.4 3.6 4.4 7.4 8.8 6.2 7.2 5.8 8.8
Average
Days - Intra-
EU
10.1 10.1 16.0 9.3 8.3 7.4 6.8 7.4 13.7 10.8 5.8 16.0 9.3 10.8
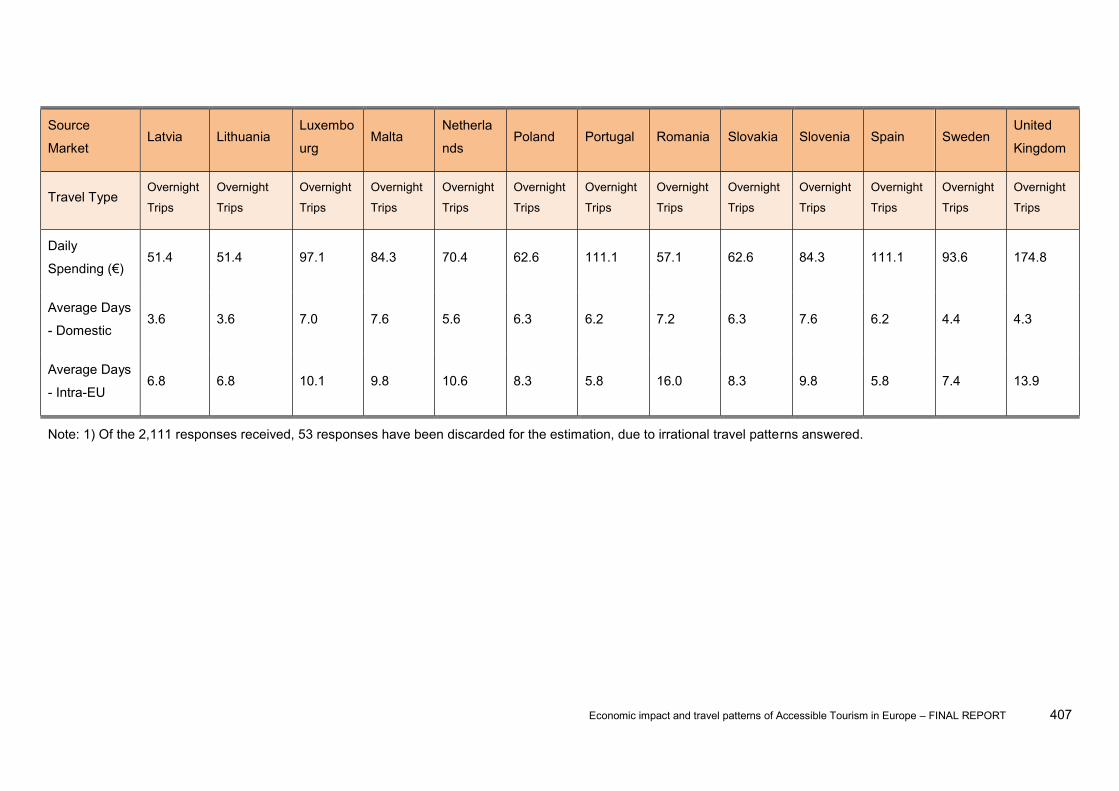
Economic impact and travel patterns of Accessible Tourism in Europe FINAL REPORT 407
Source
Market Latvia Lithuania
Luxembo
urg Malta
Netherla
nds Poland Portugal Romania Slovakia Slovenia Spain Sweden
United
Kingdom
Travel Type Overnight
Trips
Overnight
Trips
Overnight
Trips
Overnight
Trips
Overnight
Trips
Overnight
Trips
Overnight
Trips
Overnight
Trips
Overnight
Trips
Overnight
Trips
Overnight
Trips
Overnight
Trips
Overnight
Trips
Daily
51.4 51.4 97.1 84.3 70.4 62.6 111.1 57.1 62.6 84.3 111.1 93.6 174.8
Average Days
- Domestic 3.6 3.6 7.0 7.6 5.6 6.3 6.2 7.2 6.3 7.6 6.2 4.4 4.3
Average Days
- Intra-EU 6.8 6.8 10.1 9.8 10.6 8.3 5.8 16.0 8.3 9.8 5.8 7.4 13.9
Note: 1) Of the 2,111 responses received, 53 responses have been discarded for the estimation, due to irrational travel patterns answered.
Economic impact and travel patterns of Accessible Tourism in Europe FINAL REPORT 408
With the spending figures, it is feasible to establish the current direct economic contribution of
accessible tourism.
Error! Reference source not found. illustrates the estimation process of direct economic
contribution of accessible tourism at the EU level.
The direct economic contribution is usually measured by gross turnover and net turnover. The gross
turnover directly captures the final demand for goods and services by travellers and is equivalent to
the direct economic contribution in terms of output. The net turnover is basically the gross turnover
deducted by valued added tax (VAT)1. An EU-wide average VAT rate of 12.1% was applied for
calculation purpose. The VAT was calculated according to the rates announced at Eurostat2 and the
tourism revenue at each member state3. Only the VAT rates related to accessible tourism were
considered, namely those for transport, hotel accommodation, restaurant, sightseeing and medical
care.
1 In business, both the VAT and the trade discounts (if applicable) need to be deducted from the gross turnover to yield the net turnover. 2 http://ec.europa.eu/taxation_customs/resources/documents/taxation/vat/how_vat_works/rates/vat_rates_en.pdf 3 http://epp.eurostat.ec.europa.eu/cache/ITY_OFFPUB/KS-RA-10-031/EN/KS-RA-10-031-EN.PDF; http://epp.eurostat.ec.europa.eu/cache/ITY_OFFPUB/KS-TC-13-006/EN/KS-TC-13-006-EN.PDF

Economic impact and travel patterns of Accessible Tourism in Europe FINAL REPORT 409
Figure 204 - EU27 countries in 2012
Group People with disabilities The elderly population
Day trips
Demand for EU's tourism ('000 trips) 169,902 225,623
74.7 81.6
12,698 18,420
11,162 16,191
Overnight trips
Demand for EU's tourism ('000 trips) 169,656 217,586
798 852
135,362 185,457
118,983 163,016
Notes:
Figure 33, which have already taken into
consideration the population of people with access needs, travel propensity and travel frequency.
2) The spending per trip figures are averages for both domestic trips and intra-EU trips, derived from
Figure 201.
3) The gross turnover is equivalent to the output, which measures the final tourism demand in
monetary terms.
4) The EU-wide weighted averaged VAT rate is 12.1%, by own calculation.
From Figure 204 the direct economic contribution, in terms of gross turnover (o
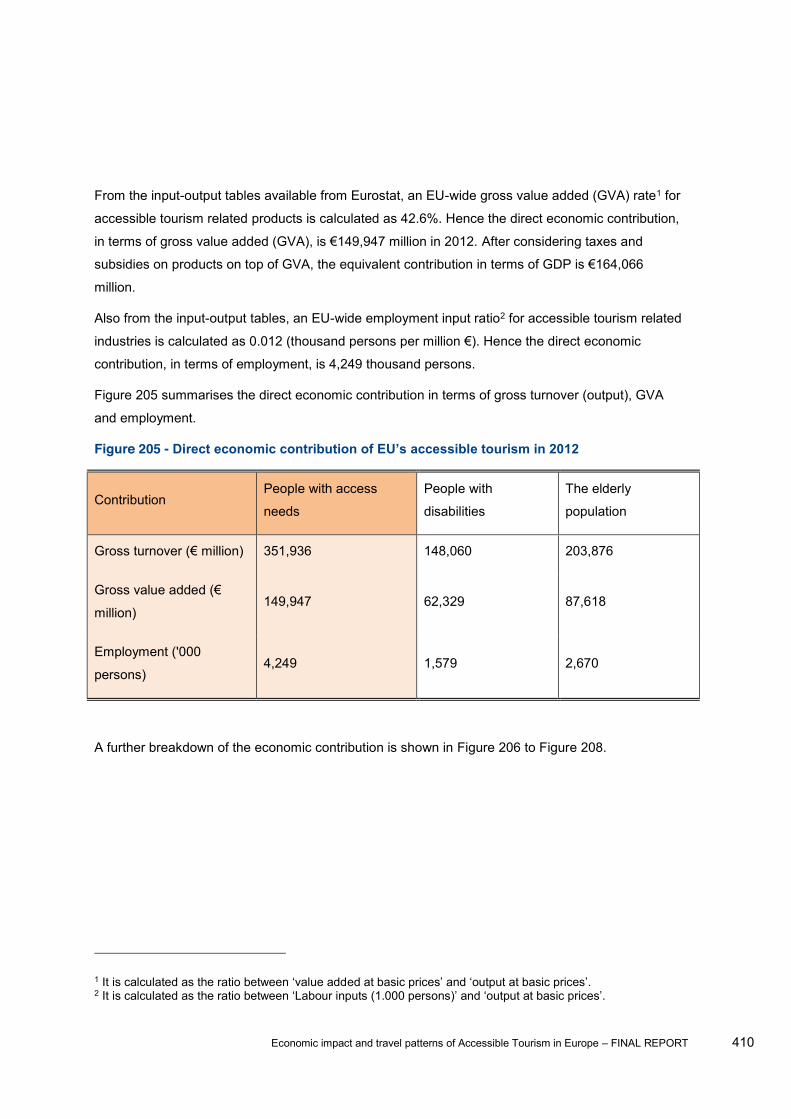
Economic impact and travel patterns of Accessible Tourism in Europe FINAL REPORT 410
From the input-output tables available from Eurostat, an EU-wide gross value added (GVA) rate1 for
accessible tourism related products is calculated as 42.6%. Hence the direct economic contribution,
in After considering taxes and
subsidies on products on top of GVA, the equivalent contr
million.
Also from the input-output tables, an EU-wide employment input ratio2 for accessible tourism related
contribution, in terms of employment, is 4,249 thousand persons.
Figure 205 summarises the direct economic contribution in terms of gross turnover (output), GVA
and employment.
Figure 205 -
Contribution People with access
needs
People with
disabilities
The elderly
population
351,936 148,060 203,876
Gross
million) 149,947 62,329 87,618
Employment ('000
persons) 4,249 1,579 2,670
A further breakdown of the economic contribution is shown in Figure 206 to Figure 208.
1 2
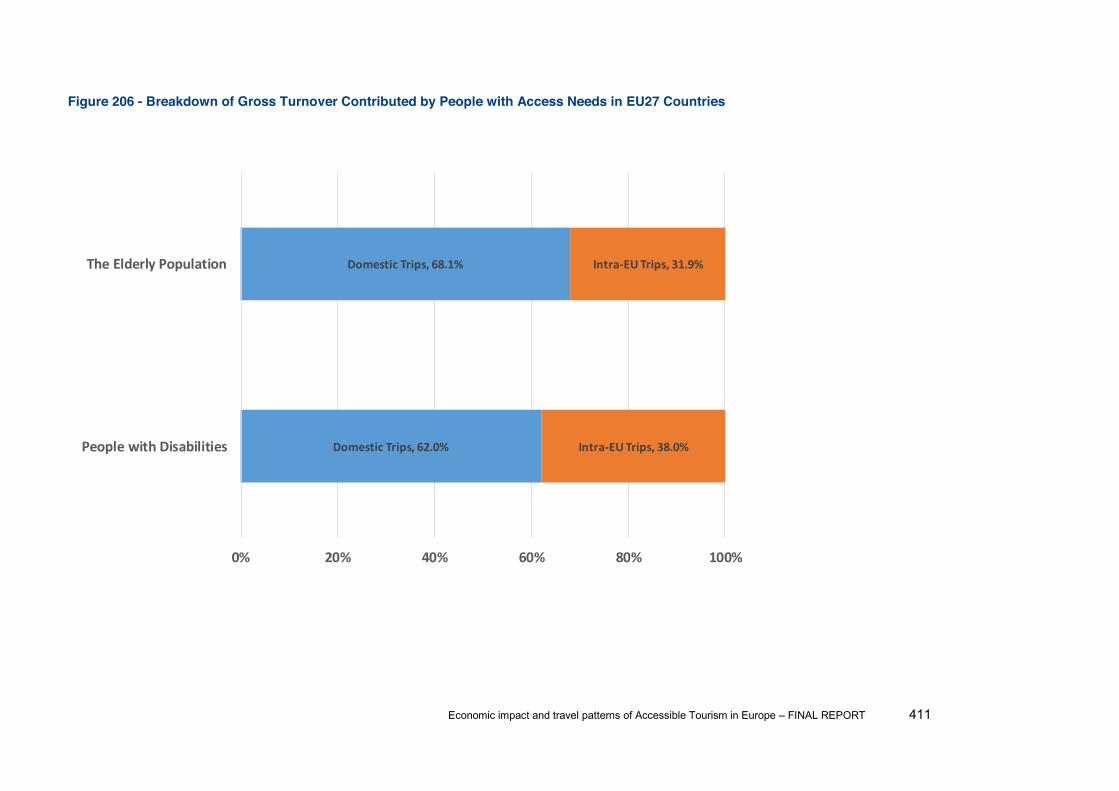
Economic impact and travel patterns of Accessible Tourism in Europe FINAL REPORT 411
Figure 206 - Breakdown of Gross Turnover Contributed by People with Access Needs in EU27 Countries
Domestic Trips, 62.0%
Domestic Trips, 68.1%
Intra-‐EU Trips, 38.0%
Intra-‐EU Trips, 31.9%
0% 20% 40% 60% 80% 100%
People with Disabilities
The Elderly Population
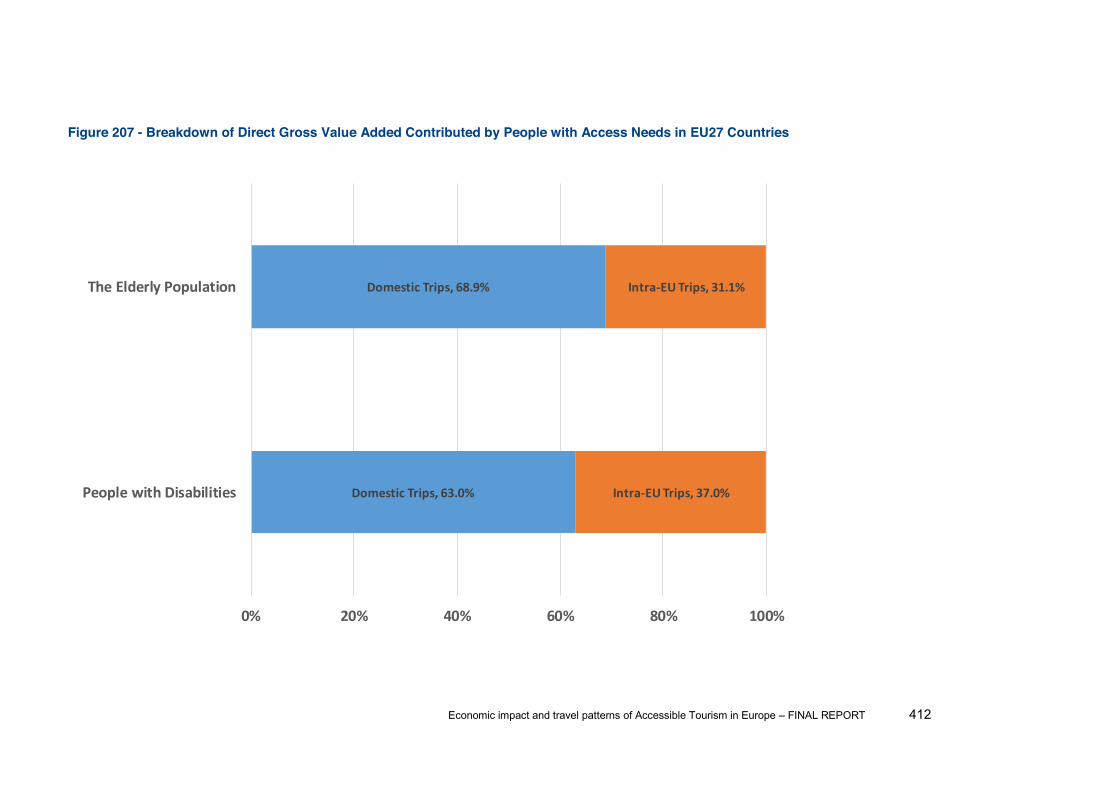
Economic impact and travel patterns of Accessible Tourism in Europe FINAL REPORT 412
Figure 207 - Breakdown of Direct Gross Value Added Contributed by People with Access Needs in EU27 Countries
Domestic Trips, 63.0%
Domestic Trips, 68.9%
Intra-‐EU Trips, 37.0%
Intra-‐EU Trips, 31.1%
0% 20% 40% 60% 80% 100%
People with Disabilities
The Elderly Population
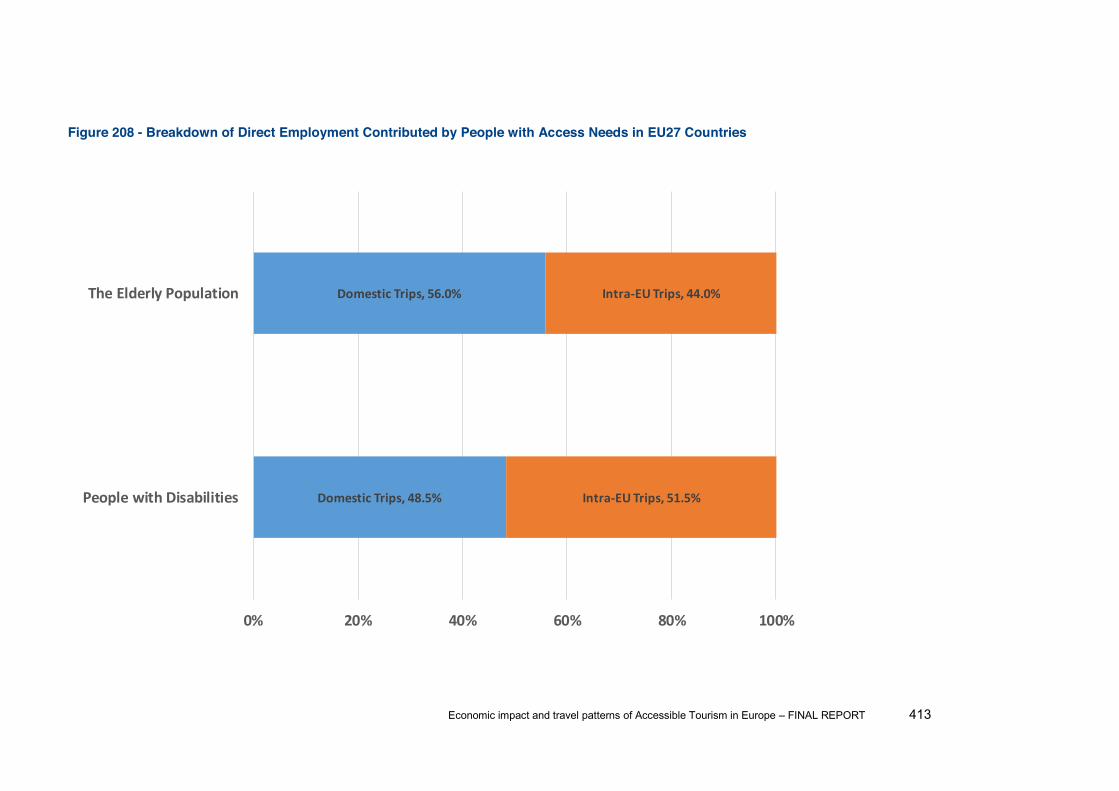
Economic impact and travel patterns of Accessible Tourism in Europe FINAL REPORT 413
Figure 208 - Breakdown of Direct Employment Contributed by People with Access Needs in EU27 Countries
Domestic Trips, 48.5%
Domestic Trips, 56.0%
Intra-‐EU Trips, 51.5%
Intra-‐EU Trips, 44.0%
0% 20% 40% 60% 80% 100%
People with Disabilities
The Elderly Population
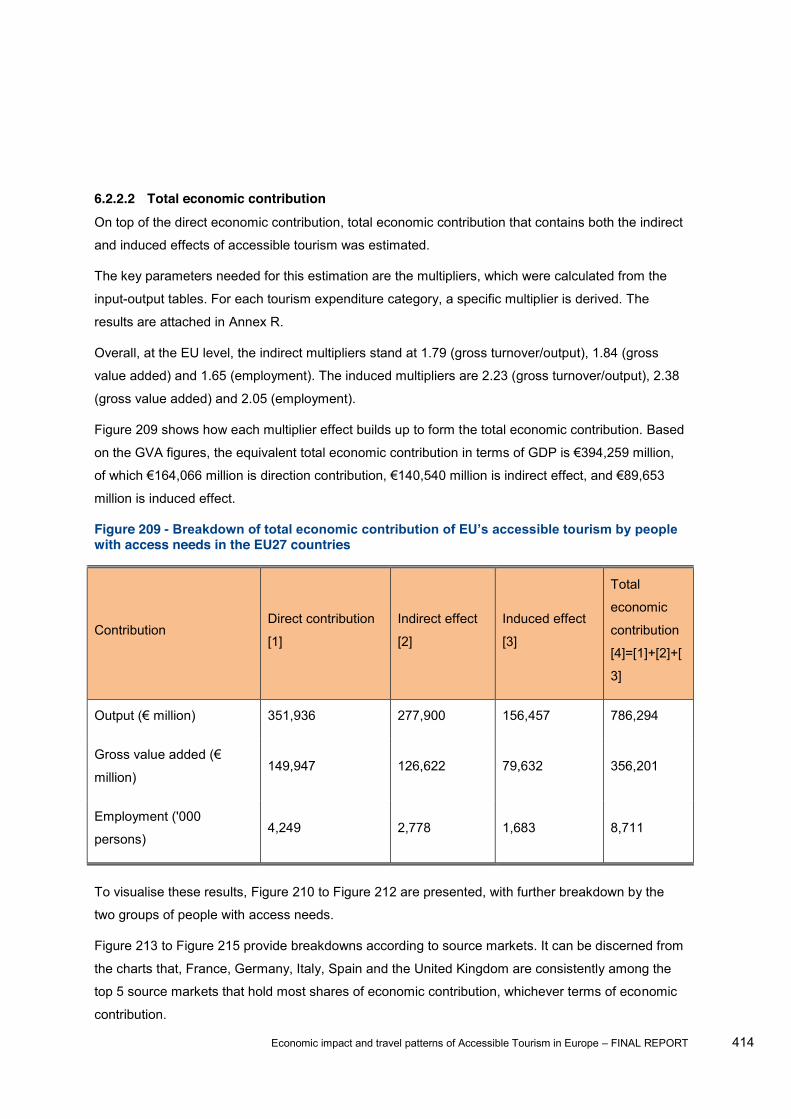
Economic impact and travel patterns of Accessible Tourism in Europe FINAL REPORT 414
6.2.2.2 Total economic contribution On top of the direct economic contribution, total economic contribution that contains both the indirect
and induced effects of accessible tourism was estimated.
The key parameters needed for this estimation are the multipliers, which were calculated from the
input-output tables. For each tourism expenditure category, a specific multiplier is derived. The
results are attached in Annex R.
Overall, at the EU level, the indirect multipliers stand at 1.79 (gross turnover/output), 1.84 (gross
value added) and 1.65 (employment). The induced multipliers are 2.23 (gross turnover/output), 2.38
(gross value added) and 2.05 (employment).
Figure 209 shows how each multiplier effect builds up to form the total economic contribution. Based
million is induced effect.
Figure 209 - with access needs in the EU27 countries
Contribution Direct contribution
[1]
Indirect effect
[2]
Induced effect
[3]
Total
economic
contribution
[4]=[1]+[2]+[
3]
351,936 277,900 156,457 786,294
million) 149,947 126,622 79,632 356,201
Employment ('000
persons) 4,249 2,778 1,683 8,711
To visualise these results, Figure 210 to Figure 212 are presented, with further breakdown by the
two groups of people with access needs.
Figure 213 to Figure 215 provide breakdowns according to source markets. It can be discerned from
the charts that, France, Germany, Italy, Spain and the United Kingdom are consistently among the
top 5 source markets that hold most shares of economic contribution, whichever terms of economic
contribution.

Economic impact and travel patterns of Accessible Tourism in Europe FINAL REPORT 415
Figure 210 -
Figure 211 - Total gross value added contribution of
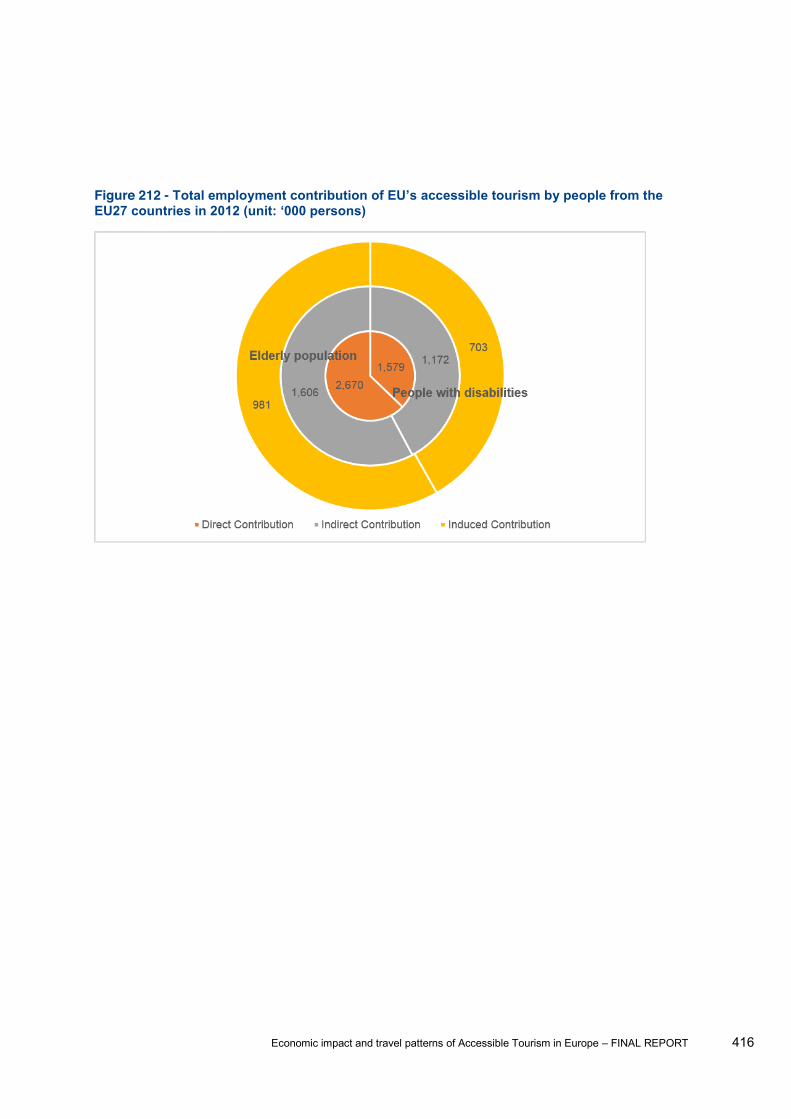
Economic impact and travel patterns of Accessible Tourism in Europe FINAL REPORT 416
Figure 212 -
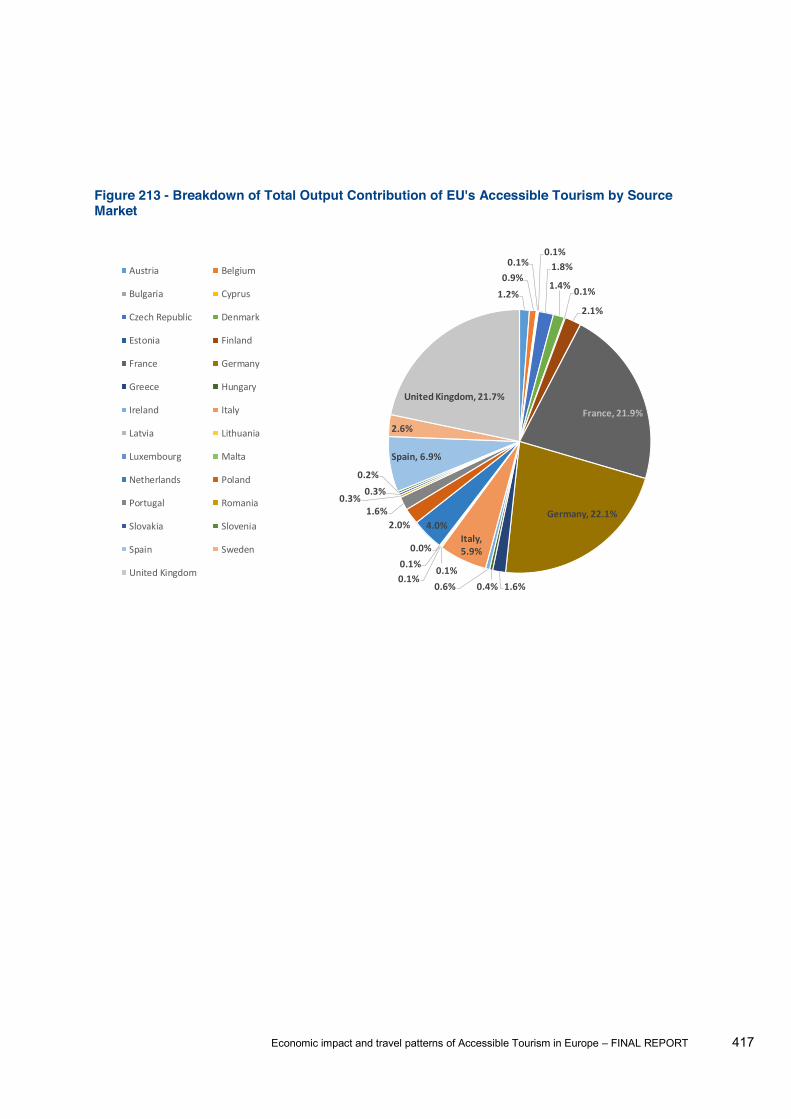
Economic impact and travel patterns of Accessible Tourism in Europe FINAL REPORT 417
Figure 213 - Breakdown of Total Output Contribution of EU's Accessible Tourism by Source Market
1.2%0.9%0.1%
0.1%1.8%
1.4% 0.1%
2.1%
France, 21.9%
Germany, 22.1%
1.6%0.4%0.6%
Italy, 5.9%
0.1%0.1%0.1%0.0%
4.0%2.0%1.6%
0.3%0.3%
0.2%
Spain, 6.9%
2.6%
United Kingdom, 21.7%
Austria Belgium
Bulgaria Cyprus
Czech Republic Denmark
Estonia Finland
France Germany
Greece Hungary
Ireland Italy
Latvia Lithuania
Luxembourg Malta
Netherlands Poland
Portugal Romania
Slovakia Slovenia
Spain Sweden
United Kingdom
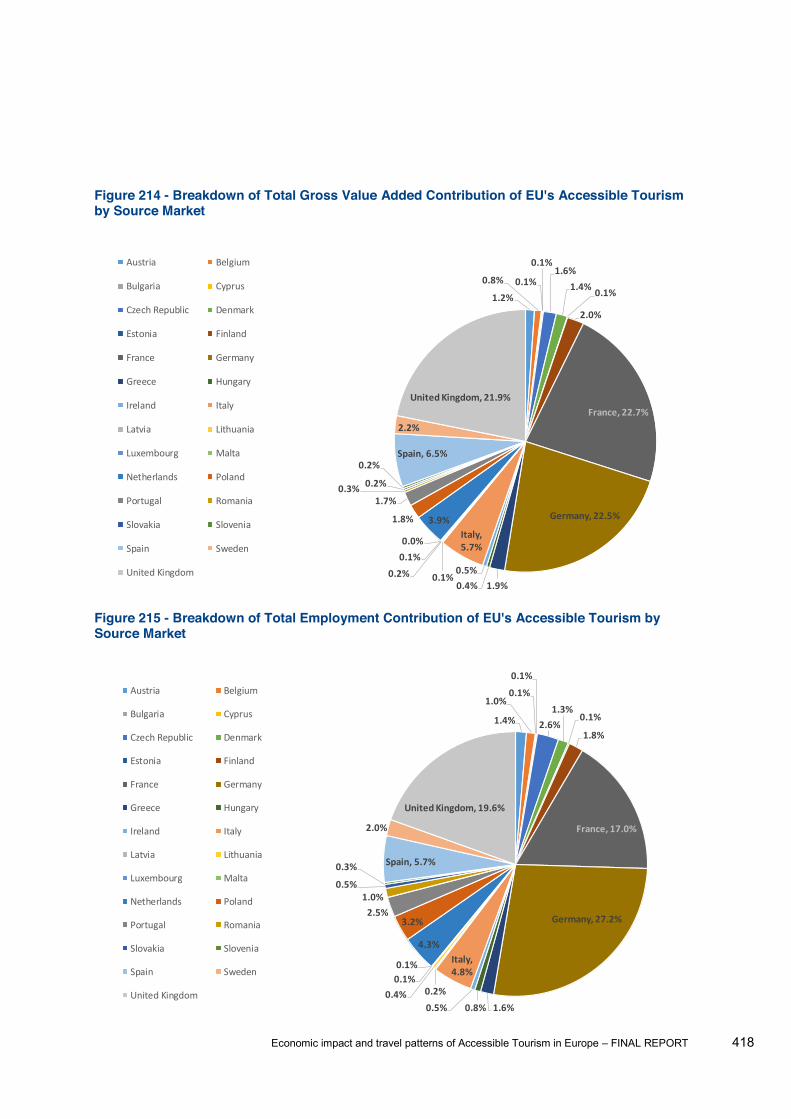
Economic impact and travel patterns of Accessible Tourism in Europe FINAL REPORT 418
Figure 214 - Breakdown of Total Gross Value Added Contribution of EU's Accessible Tourism by Source Market
Figure 215 - Breakdown of Total Employment Contribution of EU's Accessible Tourism by Source Market
1.2%
0.8% 0.1%
0.1%1.6%
1.4% 0.1%
2.0%
France, 22.7%
Germany, 22.5%
1.9%0.4%0.5%
Italy, 5.7%
0.1%0.2%0.1%0.0%
3.9%1.8%
1.7%0.3% 0.2%
0.2%Spain, 6.5%
2.2%
United Kingdom, 21.9%
Austria Belgium
Bulgaria Cyprus
Czech Republic Denmark
Estonia Finland
France Germany
Greece Hungary
Ireland Italy
Latvia Lithuania
Luxembourg Malta
Netherlands Poland
Portugal Romania
Slovakia Slovenia
Spain Sweden
United Kingdom
1.4%
1.0%0.1%
0.1%
2.6%1.3%
0.1%
1.8%
France, 17.0%
Germany, 27.2%
1.6%0.8%0.5%
Italy, 4.8%
0.2%0.4%0.1%0.1%
4.3%
3.2%2.5%1.0%
0.5%
0.3% Spain, 5.7%
2.0%
United Kingdom, 19.6%
Austria Belgium
Bulgaria Cyprus
Czech Republic Denmark
Estonia Finland
France Germany
Greece Hungary
Ireland Italy
Latvia Lithuania
Luxembourg Malta
Netherlands Poland
Portugal Romania
Slovakia Slovenia
Spain Sweden
United Kingdom
Economic impact and travel patterns of Accessible Tourism in Europe FINAL REPORT 419
6.2.2.3 Effect of travel companions Figure 218 and Figure 219
people with access needs. Generally speaking, across the EU27 countries the people with
disabilities travel with more companions (on average 2.2 persons) than the elderly population do (on
average 1.6 persons). Overall at the EU level, the weighted average number of companions the
people with access needs (both those with disabilities and the elderly) travel with is 1.9. This result is
consistent with the previous studies. For example, Neumann and Reuber (2004)1 showed that the
respondents with dependence needs were on average accompanied by 1.56 persons. Buhalis,
Eichhorn and Miller (2005)2 h regard to travel companions.
When travel companions are taken into consideration, there will be additional demand generated by
this group of people.
Figure 216 provides a contrast between two sets of estimation at the EU level for people with access
needs (both those with disabilities and the elderly population). It should be noted that the numbers
and the travel companions. When taxes and subsidies on products are considered on top of GVA,
the direct economic contribution in terms of GDP generated by both the people with access needs
lion, and the total contribution in terms of GDP
million.
1 Neumann, P., & Reuber, P. (2004). Economic Impulses of Accessible Tourism for All. Study commissioned by the Federal Ministry of Economics and Labour (BMWA), Berlin, Germany. 2 Buhalis, D., Eichhorn, V., Michopoulou, E., & Miller, G. (2005). Accessibility market and stakeholder analysis. OSSATE project Guildford: University of Surrey.
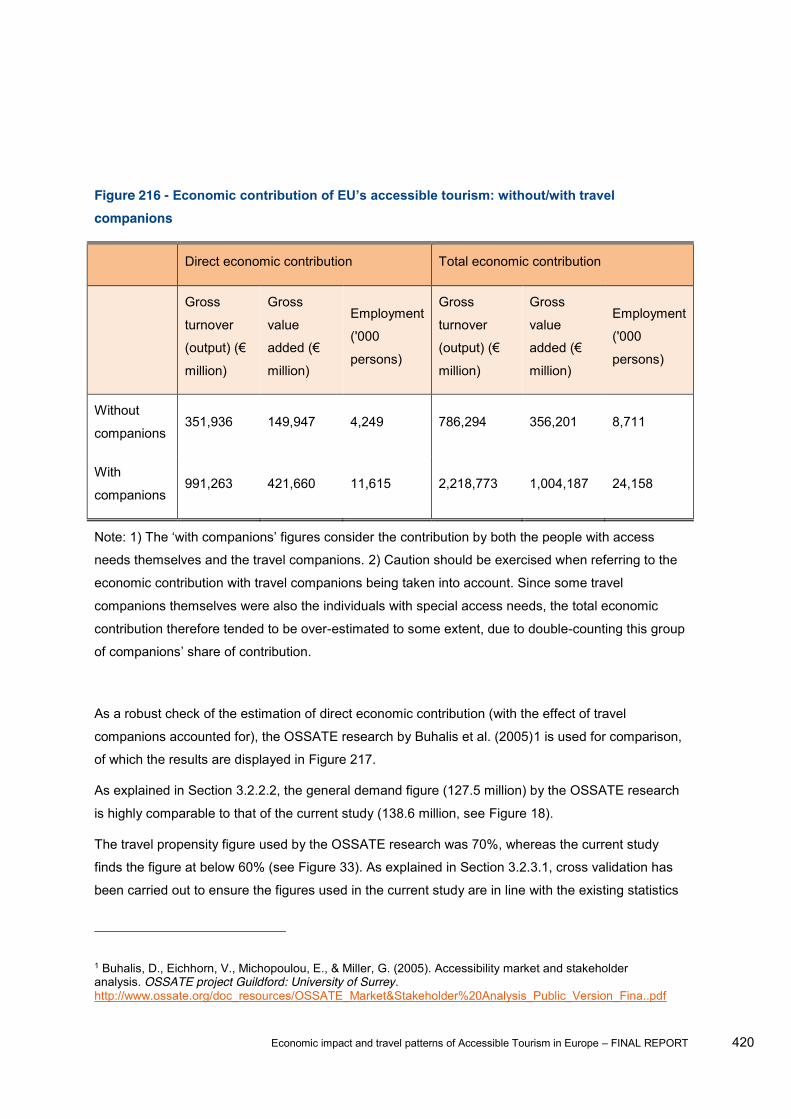
Economic impact and travel patterns of Accessible Tourism in Europe FINAL REPORT 420
Figure 216 - companions
Direct economic contribution Total economic contribution
Gross
turnover
million)
Gross
value
million)
Employment
('000
persons)
Gross
turnover
million)
Gross
value
million)
Employment
('000
persons)
Without
companions 351,936 149,947 4,249 786,294 356,201 8,711
With
companions 991,263 421,660 11,615 2,218,773 1,004,187 24,158
the contribution by both the people with access
needs themselves and the travel companions. 2) Caution should be exercised when referring to the
economic contribution with travel companions being taken into account. Since some travel
companions themselves were also the individuals with special access needs, the total economic
contribution therefore tended to be over-estimated to some extent, due to double-counting this group
As a robust check of the estimation of direct economic contribution (with the effect of travel
companions accounted for), the OSSATE research by Buhalis et al. (2005)1 is used for comparison,
of which the results are displayed in Figure 217.
As explained in Section 3.2.2.2, the general demand figure (127.5 million) by the OSSATE research
is highly comparable to that of the current study (138.6 million, see Figure 18).
The travel propensity figure used by the OSSATE research was 70%, whereas the current study
finds the figure at below 60% (see Figure 33). As explained in Section 3.2.3.1, cross validation has
been carried out to ensure the figures used in the current study are in line with the existing statistics
1 Buhalis, D., Eichhorn, V., Michopoulou, E., & Miller, G. (2005). Accessibility market and stakeholder analysis. OSSATE project Guildford: University of Surrey. http://www.ossate.org/doc_resources/OSSATE_Market&Stakeholder%20Analysis_Public_Version_Fina..pdf
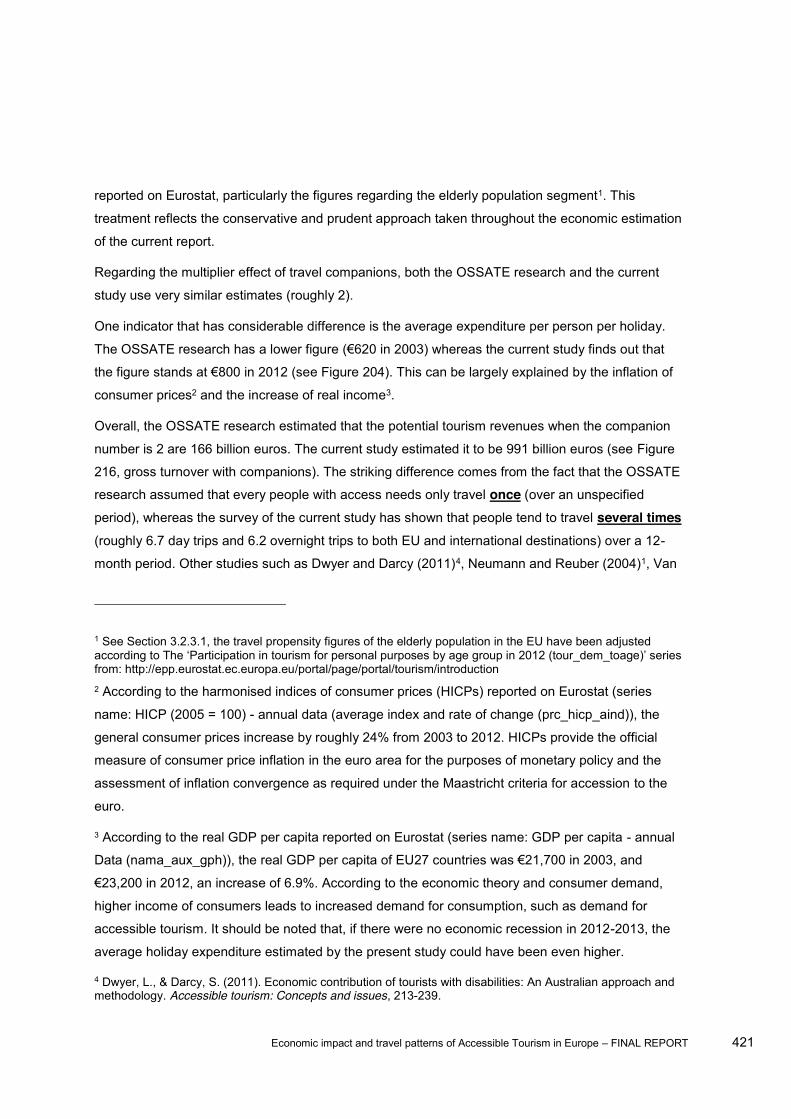
Economic impact and travel patterns of Accessible Tourism in Europe FINAL REPORT 421
reported on Eurostat, particularly the figures regarding the elderly population segment1. This
treatment reflects the conservative and prudent approach taken throughout the economic estimation
of the current report.
Regarding the multiplier effect of travel companions, both the OSSATE research and the current
study use very similar estimates (roughly 2).
One indicator that has considerable difference is the average expenditure per person per holiday.
t e Figure 204). This can be largely explained by the inflation of
consumer prices2 and the increase of real income3.
Overall, the OSSATE research estimated that the potential tourism revenues when the companion
number is 2 are 166 billion euros. The current study estimated it to be 991 billion euros (see Figure
216, gross turnover with companions). The striking difference comes from the fact that the OSSATE
research assumed that every people with access needs only travel once (over an unspecified
period), whereas the survey of the current study has shown that people tend to travel several times
(roughly 6.7 day trips and 6.2 overnight trips to both EU and international destinations) over a 12-
month period. Other studies such as Dwyer and Darcy (2011)4, Neumann and Reuber (2004)1, Van
1 See Section 3.2.3.1, the travel propensity figures of the elderly population in the EU have been adjusted
from: http://epp.eurostat.ec.europa.eu/portal/page/portal/tourism/introduction 2 According to the harmonised indices of consumer prices (HICPs) reported on Eurostat (series
name: HICP (2005 = 100) - annual data (average index and rate of change (prc_hicp_aind)), the
general consumer prices increase by roughly 24% from 2003 to 2012. HICPs provide the official
measure of consumer price inflation in the euro area for the purposes of monetary policy and the
assessment of inflation convergence as required under the Maastricht criteria for accession to the
euro.
3 According to the real GDP per capita reported on Eurostat (series name: GDP per capita - annual
economic theory and consumer demand,
higher income of consumers leads to increased demand for consumption, such as demand for
accessible tourism. It should be noted that, if there were no economic recession in 2012-2013, the
average holiday expenditure estimated by the present study could have been even higher.
4 Dwyer, L., & Darcy, S. (2011). Economic contribution of tourists with disabilities: An Australian approach and methodology. Accessible tourism: Concepts and issues, 213-239.
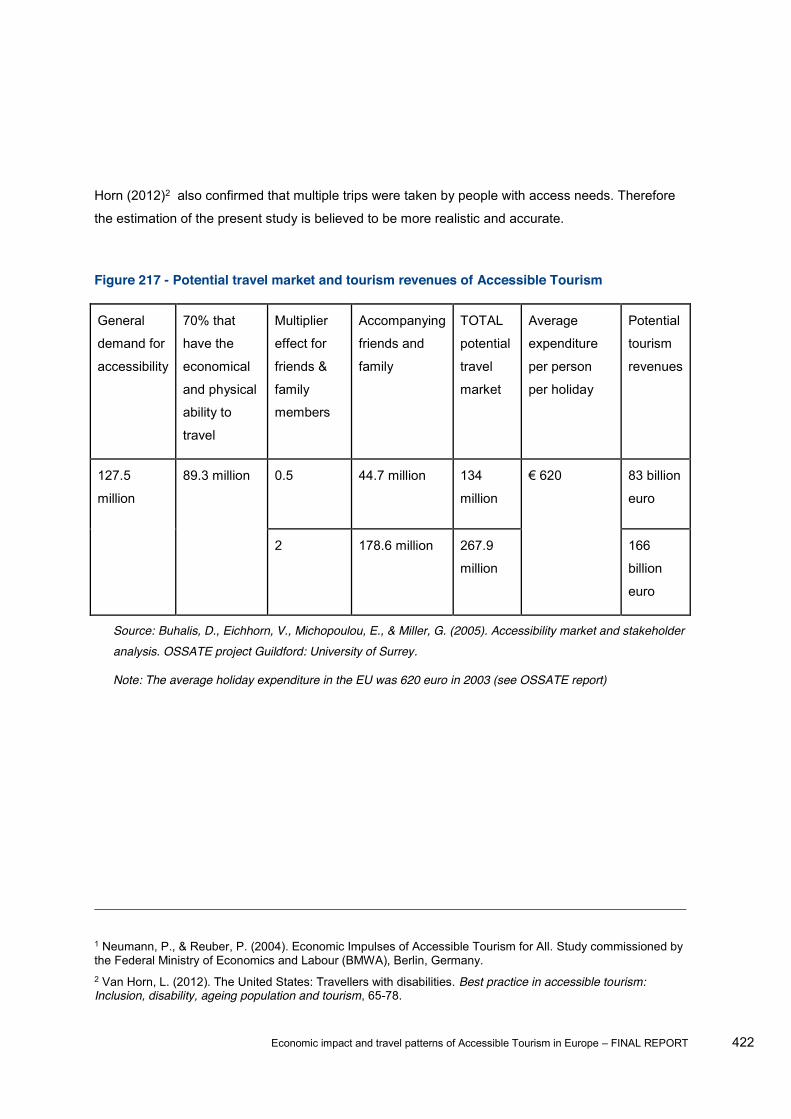
Economic impact and travel patterns of Accessible Tourism in Europe FINAL REPORT 422
Horn (2012)2 also confirmed that multiple trips were taken by people with access needs. Therefore
the estimation of the present study is believed to be more realistic and accurate.
Figure 217 - Potential travel market and tourism revenues of Accessible Tourism
General
demand for
accessibility
70% that
have the
economical
and physical
ability to
travel
Multiplier
effect for
friends &
family
members
Accompanying
friends and
family
TOTAL
potential
travel
market
Average
expenditure
per person
per holiday
Potential
tourism
revenues
127.5
million
89.3 million 0.5 44.7 million 134
million
83 billion
euro
2 178.6 million 267.9
million
166
billion
euro
Source: Buhalis, D., Eichhorn, V., Michopoulou, E., & Miller, G. (2005). Accessibility market and stakeholder analysis. OSSATE project Guildford: University of Surrey.
Note: The average holiday expenditure in the EU was 620 euro in 2003 (see OSSATE report)
1 Neumann, P., & Reuber, P. (2004). Economic Impulses of Accessible Tourism for All. Study commissioned by the Federal Ministry of Economics and Labour (BMWA), Berlin, Germany. 2 Van Horn, L. (2012). The United States: Travellers with disabilities. Best practice in accessible tourism: Inclusion, disability, ageing population and tourism, 65-78.

Economic impact and travel patterns of Accessible Tourism in Europe FINAL REPORT 423
Figure 218 - Average number of companions travelled with people with disabilities from the EU27 countries
Source Market Austria Belgium Bulgaria Cyprus Czech Republic Denmark Estonia Finland France Germany Greece Hungary Ireland Italy
Number of Companions 2.5 2.5 2.5 2.0 1.8 2.3 2.2 2.3 2.1 2.3 2.1 2.5 2.0 2.3
Source Market Latvia Lithuania Luxembourg Malta Netherlands Poland Portugal Romania Slovakia Slovenia Spain Sweden United Kingdom
Number of Companions 2.2 2.2 2.5 2.3 2.1 1.8 2.1 2.5 1.8 2.3 2.1 2.3 2.4

Economic impact and travel patterns of Accessible Tourism in Europe FINAL REPORT 424
Figure 219 - Average number of companions travelled with the elderly population from the EU27 countries
Source Market Austria Belgium Bulgaria Cyprus Czech Republic Denmark Estonia Finland France Germany Greece Hungary Ireland Italy
Number of Companions 1.7 1.7 1.1 1.9 1.7 1.5 1.7 1.5 1.7 1.1 1.9 1.1 1.9 1.1
Source Market Latvia Lithuania Luxembourg Malta Netherlands Poland Portugal Romania Slovakia Slovenia Spain Sweden United Kingdom
Number of Companions 1.7 1.7 1.7 1.7 1.7 1.7 1.9 1.1 1.7 1.7 1.9 1.5 2.0
Economic impact and travel patterns of Accessible Tourism in Europe FINAL REPORT 425
6.2.3 Results International inbound markets
6.2.3.1 Direct economic contribution
The starting point of estimating the economic contribution, as explained in Section 6.2.1.1, is
survey questionnaire. However, a close examination of the answers to Q18, which reports the
destination and spe
respondents across the four countries surveyed have visited the EU during their last trip1. This
n the EU, only 34
responses can be used. This renders the sample base rather small. A preliminary estimation
showed that the average spending figures were biased due to some reported extreme values.
To pursue a robust solution, the spending structure statistics yielded from the main survey
conducted in 12 EU representative countries were used as proxies for the international markets. The
calculation involves only deriving the average daily spending in the EU by the respondents in the 12
representative countries, excluding their average transport spending between the destination and
the origin. The implicit assumption is that the level of spending within the EU by the international
tourists is much comparable to that of their EU counterparts. This is plausible, as the international
tourists and the EU tourists are both subject to the same prices of goods and services when
travelling across the EU. Their levels of average daily spending should thus be similar. The only part
of spending that sees considerable difference between the international tourists and the EU tourists
is the transport to/from destinations, which has been removed from the calculation (in line with
tourism statistics of most countries and international organisations such as UNWTO), as this
spending is not expected to benefit the EU tourism.
As to the length of stay, which also determines the total spending per trip, the statistics are derived
from the Q18 of the survey.
ay and the average spending per
trip are presented in Figure 220 and Figure 221.
1 After 9 responses being discarded due to irrational answers, of the 414 respondents, 96 reported that they had visited the EU over the last 12 months. However, to derive the spending behaviour of the tourists, the answers to their last tripreported their spending in the EU, the rest reported spending in either domestic destinations or other international destinations.
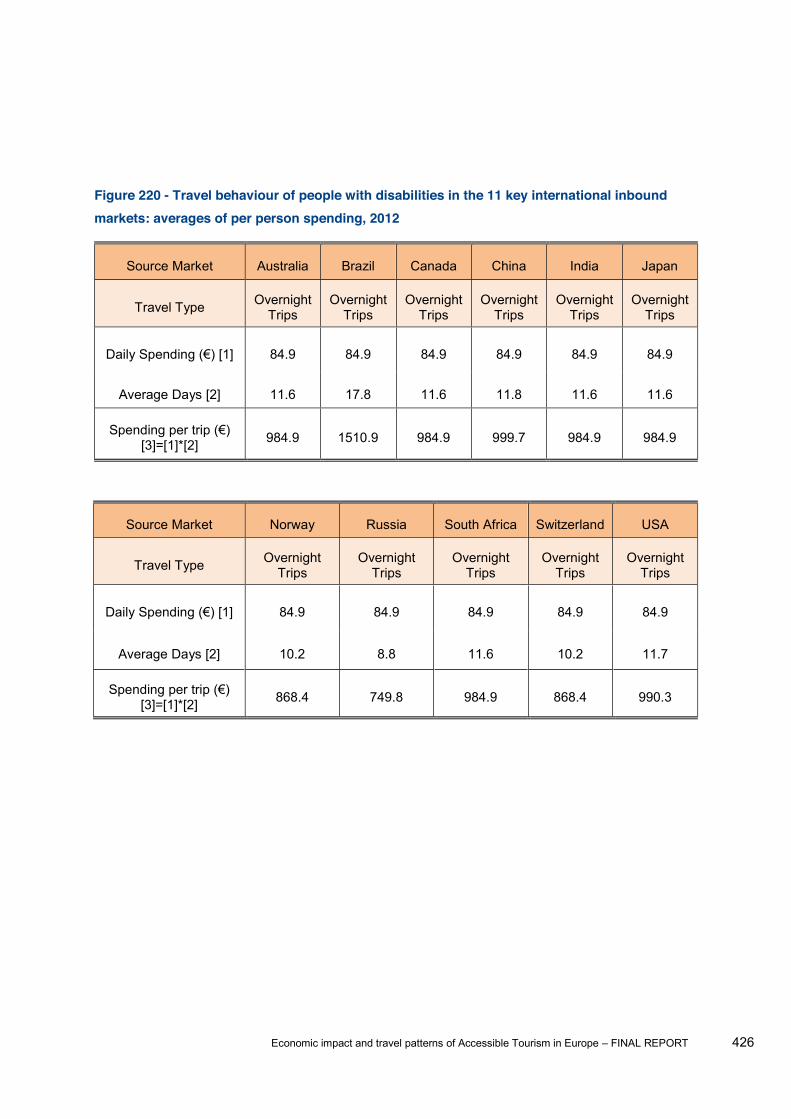
Economic impact and travel patterns of Accessible Tourism in Europe FINAL REPORT 426
Figure 220 - Travel behaviour of people with disabilities in the 11 key international inbound markets: averages of per person spending, 2012
Source Market Australia Brazil Canada China India Japan
Travel Type Overnight Trips
Overnight Trips
Overnight Trips
Overnight Trips
Overnight Trips
Overnight Trips
84.9 84.9 84.9 84.9 84.9 84.9
Average Days [2] 11.6 17.8 11.6 11.8 11.6 11.6
[3]=[1]*[2] 984.9 1510.9 984.9 999.7 984.9 984.9
Source Market Norway Russia South Africa Switzerland USA
Travel Type Overnight Trips
Overnight Trips
Overnight Trips
Overnight Trips
Overnight Trips
84.9 84.9 84.9 84.9 84.9
Average Days [2] 10.2 8.8 11.6 10.2 11.7
[3]=[1]*[2] 868.4 749.8 984.9 868.4 990.3
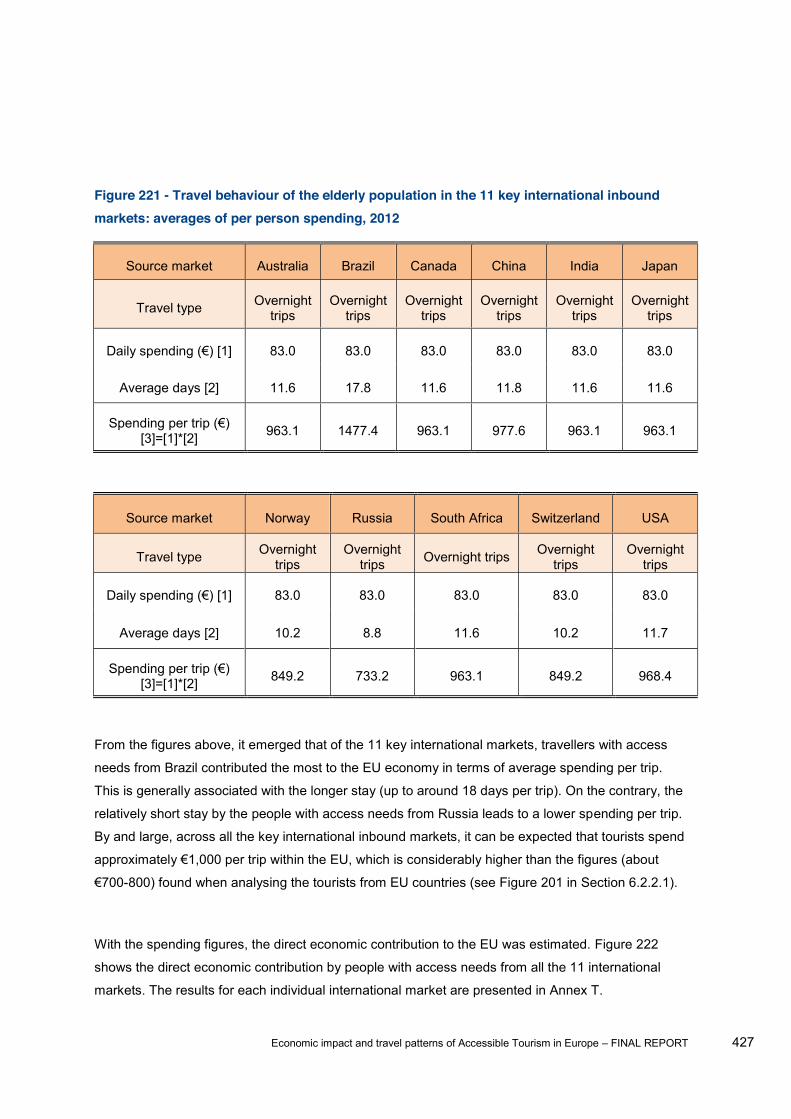
Economic impact and travel patterns of Accessible Tourism in Europe FINAL REPORT 427
Figure 221 - Travel behaviour of the elderly population in the 11 key international inbound markets: averages of per person spending, 2012
Source market Australia Brazil Canada China India Japan
Travel type Overnight trips
Overnight trips
Overnight trips
Overnight trips
Overnight trips
Overnight trips
83.0 83.0 83.0 83.0 83.0 83.0
Average days [2] 11.6 17.8 11.6 11.8 11.6 11.6
[3]=[1]*[2] 963.1 1477.4 963.1 977.6 963.1 963.1
Source market Norway Russia South Africa Switzerland USA
Travel type Overnight trips
Overnight trips Overnight trips Overnight
trips Overnight
trips
83.0 83.0 83.0 83.0 83.0
Average days [2] 10.2 8.8 11.6 10.2 11.7
[3]=[1]*[2] 849.2 733.2 963.1 849.2 968.4
From the figures above, it emerged that of the 11 key international markets, travellers with access
needs from Brazil contributed the most to the EU economy in terms of average spending per trip.
This is generally associated with the longer stay (up to around 18 days per trip). On the contrary, the
relatively short stay by the people with access needs from Russia leads to a lower spending per trip.
By and large, across all the key international inbound markets, it can be expected that tourists spend
-800) found when analysing the tourists from EU countries (see Figure 201 in Section 6.2.2.1).
With the spending figures, the direct economic contribution to the EU was estimated. Figure 222
shows the direct economic contribution by people with access needs from all the 11 international
markets. The results for each individual international market are presented in Annex T.
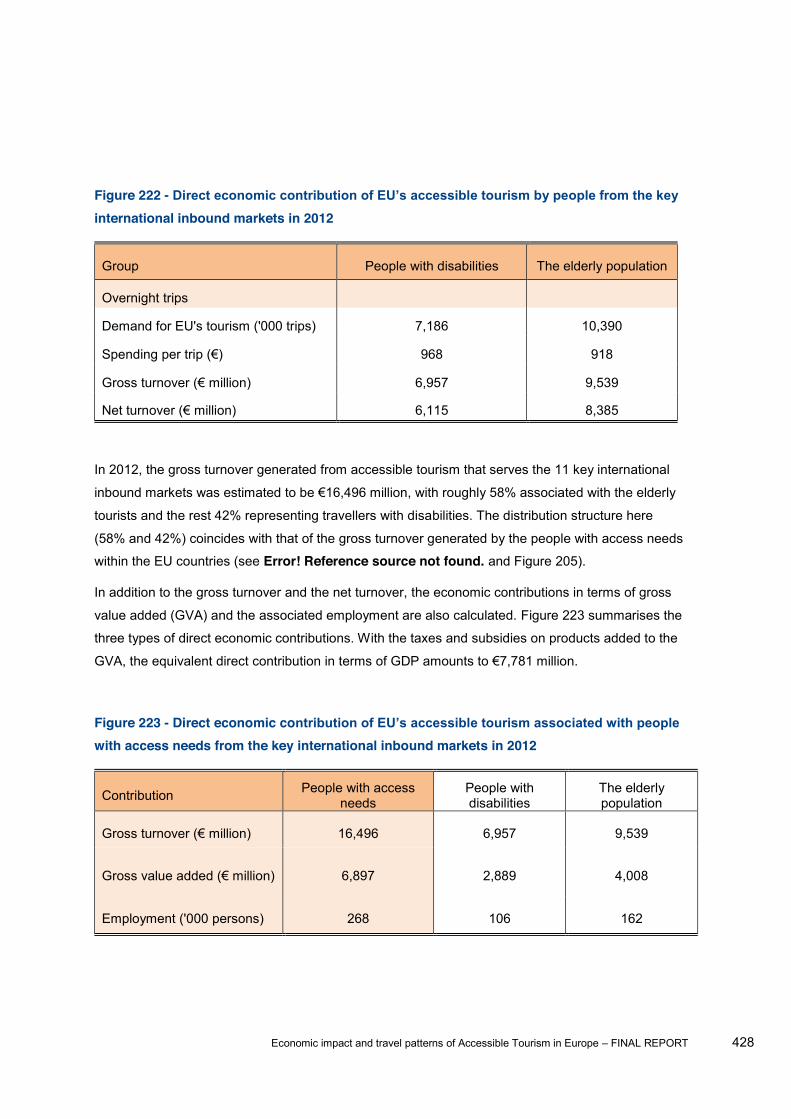
Economic impact and travel patterns of Accessible Tourism in Europe FINAL REPORT 428
Figure 222 - international inbound markets in 2012
Group People with disabilities The elderly population
Overnight trips
Demand for EU's tourism ('000 trips) 7,186 10,390
968 918
6,957 9,539
6,115 8,385
In 2012, the gross turnover generated from accessible tourism that serves the 11 key international
tourists and the rest 42% representing travellers with disabilities. The distribution structure here
(58% and 42%) coincides with that of the gross turnover generated by the people with access needs
within the EU countries (see Error! Reference source not found. and Figure 205).
In addition to the gross turnover and the net turnover, the economic contributions in terms of gross
value added (GVA) and the associated employment are also calculated. Figure 223 summarises the
three types of direct economic contributions. With the taxes and subsidies on products added to the
Figure 223 - Direct economic cowith access needs from the key international inbound markets in 2012
Contribution People with access needs
People with disabilities
The elderly population
16,496 6,957 9,539
6,897 2,889 4,008
Employment ('000 persons) 268 106 162
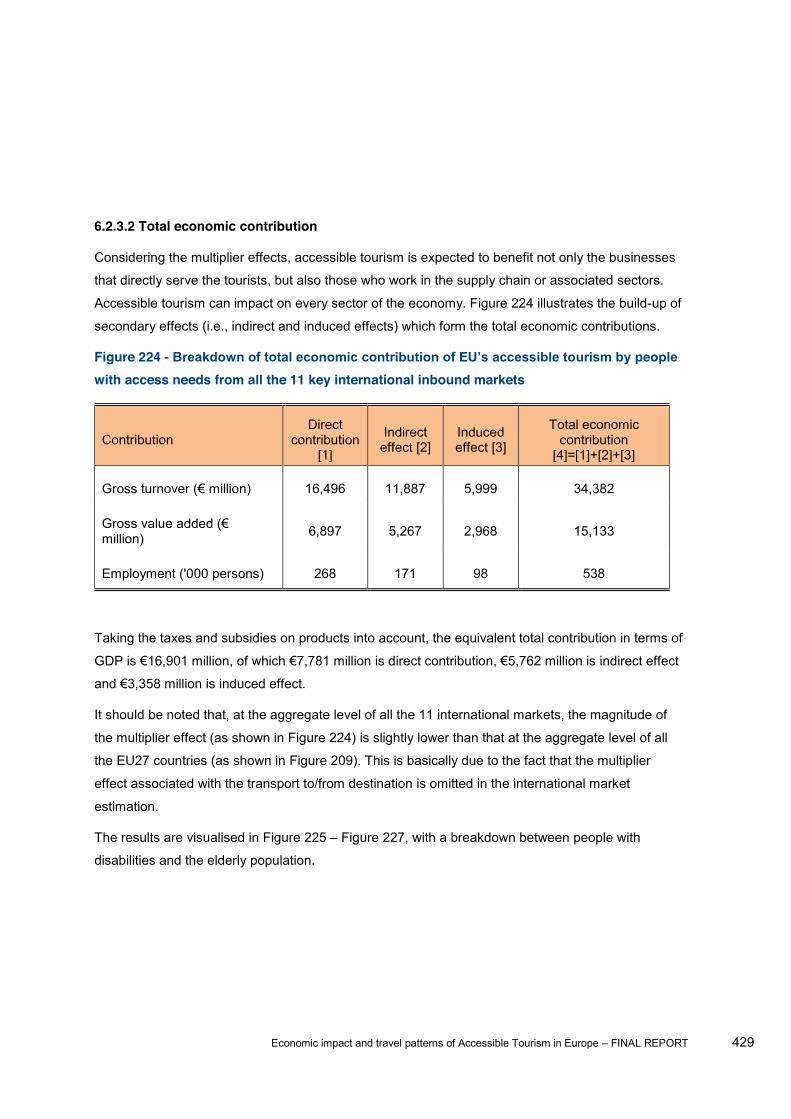
Economic impact and travel patterns of Accessible Tourism in Europe FINAL REPORT 429
6.2.3.2 Total economic contribution
Considering the multiplier effects, accessible tourism is expected to benefit not only the businesses
that directly serve the tourists, but also those who work in the supply chain or associated sectors.
Accessible tourism can impact on every sector of the economy. Figure 224 illustrates the build-up of
secondary effects (i.e., indirect and induced effects) which form the total economic contributions.
Figure 224 - with access needs from all the 11 key international inbound markets
Contribution Direct
contribution [1]
Indirect effect [2]
Induced effect [3]
Total economic contribution
[4]=[1]+[2]+[3]
16,496 11,887 5,999 34,382
million) 6,897 5,267 2,968 15,133
Employment ('000 persons) 268 171 98 538
Taking the taxes and subsidies on products into account, the equivalent total contribution in terms of
It should be noted that, at the aggregate level of all the 11 international markets, the magnitude of
the multiplier effect (as shown in Figure 224) is slightly lower than that at the aggregate level of all
the EU27 countries (as shown in Figure 209). This is basically due to the fact that the multiplier
effect associated with the transport to/from destination is omitted in the international market
estimation.
The results are visualised in Figure 225 Figure 227, with a breakdown between people with
disabilities and the elderly population.
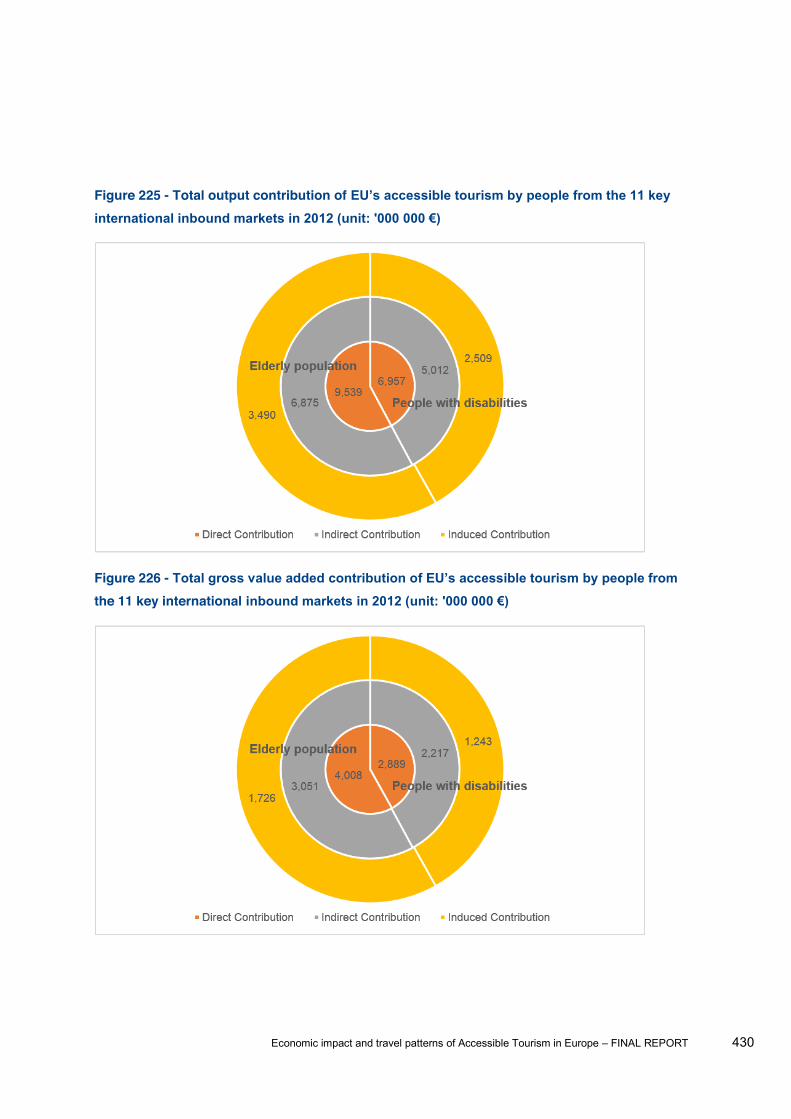
Economic impact and travel patterns of Accessible Tourism in Europe FINAL REPORT 430
Figure 225 - Total output contribution of
Figure 226 - the 11 key international

Economic impact and travel patterns of Accessible Tourism in Europe FINAL REPORT 431
Figure 227 - key international inbound markets in 2012 (unit: '000 persons)
In addition, the distributions of total economic contributions according to the source markets are
provided in Figure 228 Figure 230.

Economic impact and travel patterns of Accessible Tourism in Europe FINAL REPORT 432
Figure 228 - Breakdown of Total Output Contribution of EU's Accessible Tourism by Source Market
Australia6.8%
Brazil7.1%
Canada5.9%
China4.0%India0.8%
Japan9.4%
Norway8.2%
Russia8.6%
South Africa0.3%
Switzerland18.5%
USA30.4%

Economic impact and travel patterns of Accessible Tourism in Europe FINAL REPORT 433
Figure 229 - Breakdown of Total Gross Value Added Contribution of EU's Accessible Tourism by Source Market
Australia6.8%
Brazil7.1%
Canada5.9%
China4.0%India0.8%
Japan9.4%
Norway8.2%
Russia8.6%
South Africa0.3%
Switzerland18.5%
USA30.4%
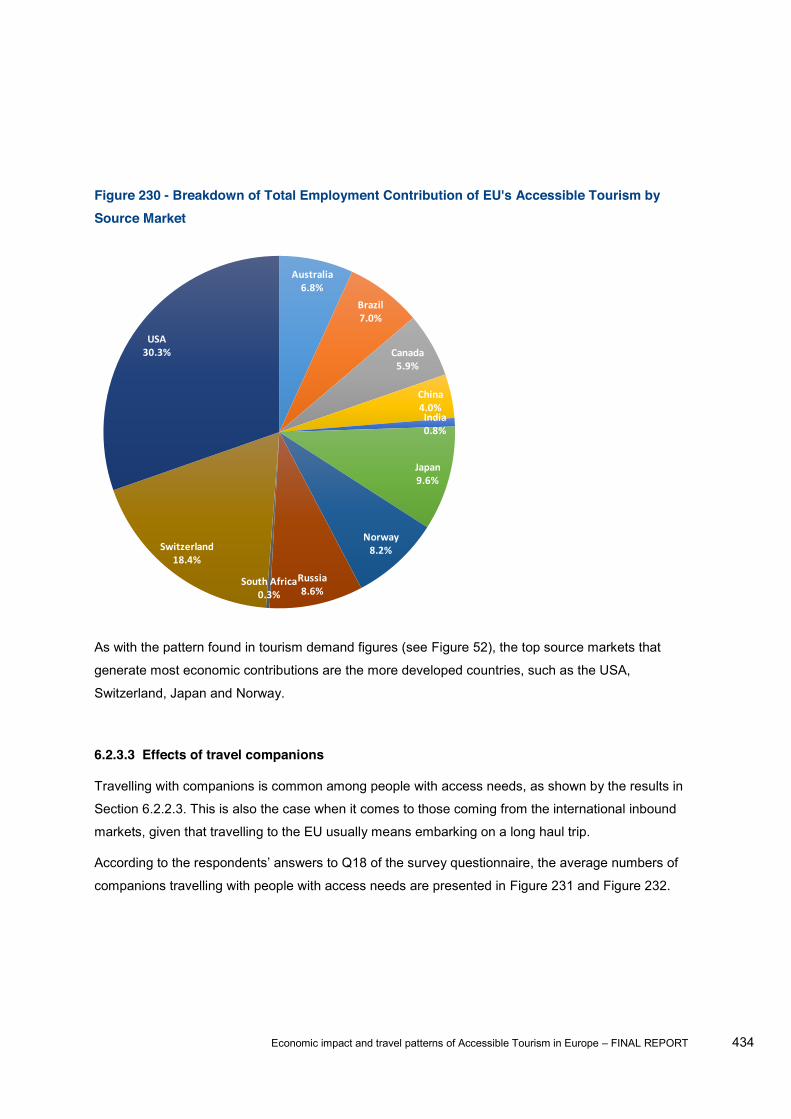
Economic impact and travel patterns of Accessible Tourism in Europe FINAL REPORT 434
Figure 230 - Breakdown of Total Employment Contribution of EU's Accessible Tourism by Source Market
As with the pattern found in tourism demand figures (see Figure 52), the top source markets that
generate most economic contributions are the more developed countries, such as the USA,
Switzerland, Japan and Norway.
6.2.3.3 Effects of travel companions
Travelling with companions is common among people with access needs, as shown by the results in
Section 6.2.2.3. This is also the case when it comes to those coming from the international inbound
markets, given that travelling to the EU usually means embarking on a long haul trip.
companions travelling with people with access needs are presented in Figure 231 and Figure 232.
Australia6.8%
Brazil7.0%
Canada5.9%
China4.0%India0.8%
Japan9.6%
Norway8.2%
Russia8.6%
South Africa0.3%
Switzerland18.4%
USA30.3%
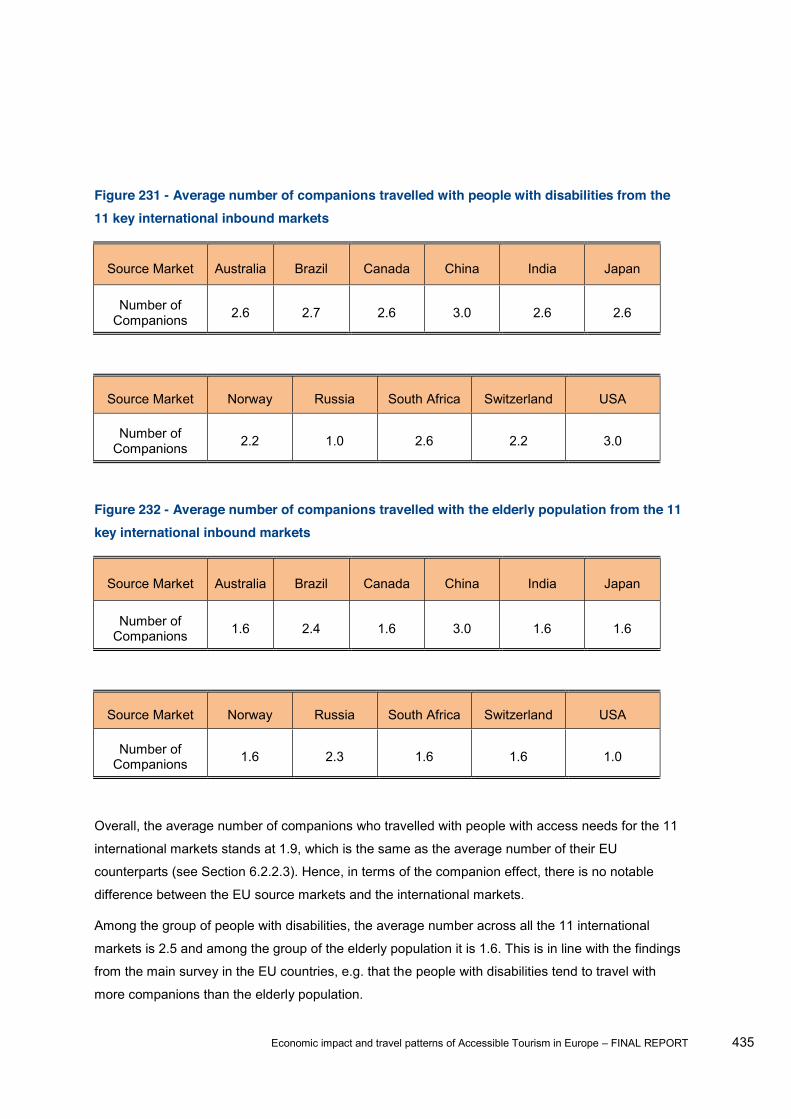
Economic impact and travel patterns of Accessible Tourism in Europe FINAL REPORT 435
Figure 231 - Average number of companions travelled with people with disabilities from the 11 key international inbound markets
Source Market Australia Brazil Canada China India Japan
Number of Companions 2.6 2.7 2.6 3.0 2.6 2.6
Source Market Norway Russia South Africa Switzerland USA
Number of Companions 2.2 1.0 2.6 2.2 3.0
Figure 232 - Average number of companions travelled with the elderly population from the 11 key international inbound markets
Source Market Australia Brazil Canada China India Japan
Number of Companions 1.6 2.4 1.6 3.0 1.6 1.6
Source Market Norway Russia South Africa Switzerland USA
Number of Companions 1.6 2.3 1.6 1.6 1.0
Overall, the average number of companions who travelled with people with access needs for the 11
international markets stands at 1.9, which is the same as the average number of their EU
counterparts (see Section 6.2.2.3). Hence, in terms of the companion effect, there is no notable
difference between the EU source markets and the international markets.
Among the group of people with disabilities, the average number across all the 11 international
markets is 2.5 and among the group of the elderly population it is 1.6. This is in line with the findings
from the main survey in the EU countries, e.g. that the people with disabilities tend to travel with
more companions than the elderly population.
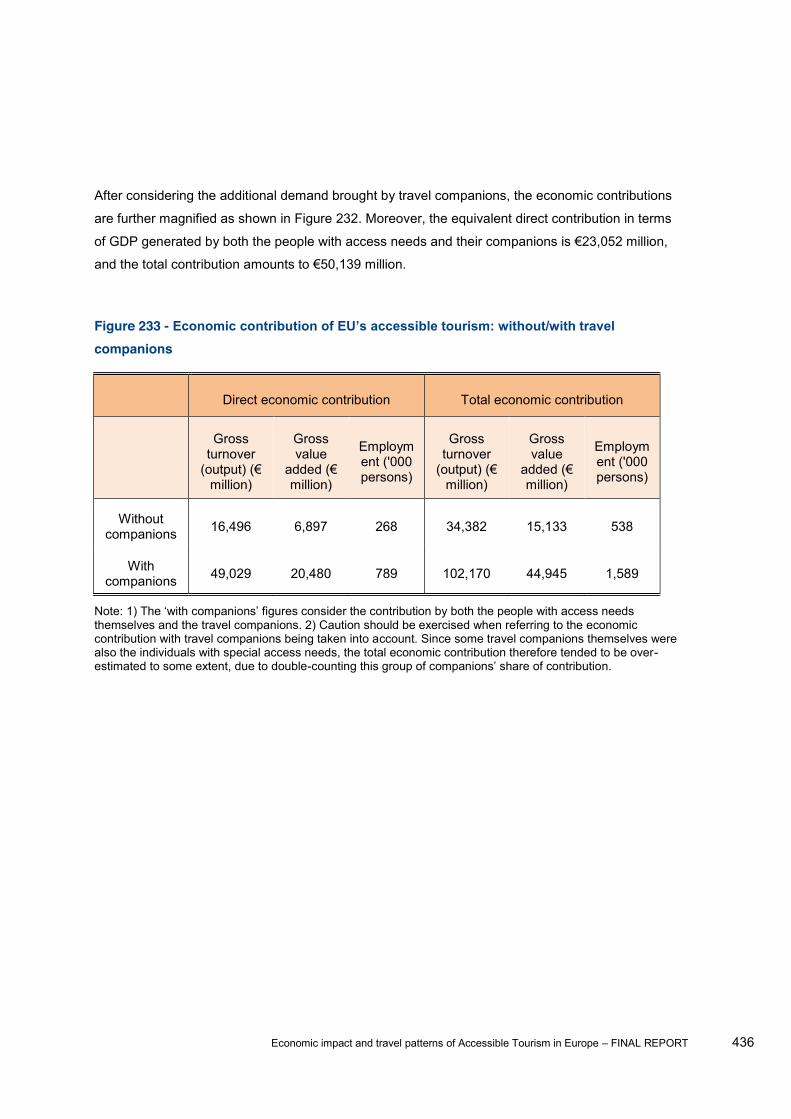
Economic impact and travel patterns of Accessible Tourism in Europe FINAL REPORT 436
After considering the additional demand brought by travel companions, the economic contributions
are further magnified as shown in Figure 232. Moreover, the equivalent direct contribution in terms
and the total contribution amounts to
Figure 233 - companions
Direct economic contribution Total economic contribution
Gross turnover
million)
Gross value
million)
Employment ('000 persons)
Gross turnover
million)
Gross value
million)
Employment ('000 persons)
Without companions 16,496 6,897 268 34,382 15,133 538
With companions 49,029 20,480 789 102,170 44,945 1,589
themselves and the travel companions. 2) Caution should be exercised when referring to the economic contribution with travel companions being taken into account. Since some travel companions themselves were also the individuals with special access needs, the total economic contribution therefore tended to be over-estimated to some extent, due to double- n.
Economic impact and travel patterns of Accessible Tourism in Europe FINAL REPORT 437
6.3 Task 4b - Scenarios and impact assessment
6.3.1 Methodology The estimation of direct economic contribution under different scenarios is largely based on the
baseline contribution estimation.
With improvements of accessibility, it is expected that the people with access needs who have
travelled before are willing to travel more often and, furthermore they are willing to increase their
budget to explore new destinations. In addition, those who have not travelled are believed to be
more willing to travel, because a wide range of destinations will be more accessible if the
improvements under each scenario would be made.
Hence, the estimation makes use of the additional budget that the existing travellers (those who
have travelled this last year) will make, and the contribution generated by the new travellers (those
who have not travelled but are willing to travel under different scenarios).
Direct economic contribution (scenario) =
Direct economic contribution (baseline) + additional budget by existing travellers + contribution by
new travellers
The baseline direct economic contribution can be found in Figure 205. The additional budget by
existing travellers can be extracted from the questionnaire:
Q26. Thinking about the last 12 months, there are some destinations in the European Union (EU)
that you may have wanted to visit, but you couldn't because of accessibility problems. For example,
you did not go because no services have been made accessible and basic things like wheelchairs
are not available.
If Scenarios A, B or C were true for any EU destinations you were interested in visiting, would you
consider including some of these EU destinations in your travel plans for the next 12 months?
Q27. You said that you would visit some of these EU destinations and increase your travel budget
for the next 12 months if options A, B or C were true. How much extra budget would you be ready to
spend for your trip(s) to such destinations? Please give your best estimate as a percentage of your
current travel budget per year.
The contribution generated by the new travellers can be estimated following the exact rationale
described in Section 6.2.1.1, which relies on the spending behaviour of travellers and the tourism
demand. Specifically this will make use of the travel spending figures found in Figure 201 to Figure
203 and the scenario tourism demand Figure 48 and Figure 49, and the country level scenario
tourism demand found in Annex T.
Economic impact and travel patterns of Accessible Tourism in Europe FINAL REPORT 438
The estimation of total economic contribution of accessible tourism under different scenarios follows
the exact rationale described in Section 6.2.1.2, which is
Total of direct and indirect economic contribution (scenario) = direct economic contribution
(scenario) × indirect multiplier
Total of direct, indirect and induced economic contribution (scenario) = direct economic contribution
(scenario) × induced multiplier
Apparently, as long as the direct economic contribution (scenario) is available, the scenario
contribution can be derived accordingly.
It should be noted that the direct and total economic contributions estimated based on the rationale
Tourism, whereas the costs (i.e., investments) to be made to improve accessibility have not been
considered. Since details about the scale of investments under each scenario are not available yet,
the cost aspect of Accessible Tourism is omitted in the current report. Hence, the economic
contribution figures are gross values, rather than net values. Nevertheless, the figures would still
give a clear sense of the size of Accessible Tourism under each scenario of improvements.
6.3.2 Results The following sections report the results of economic impact assessment under different scenarios
at the EU regional level. With regard to the results about each EU member state, a detailed
summary is provided in Annex T.
6.3.2.1 Direct economic contribution under different scenarios Under different scenarios of improvement, people who have travelled are likely to spare additional
budget to explore new destinations.
According to answers to Q27 of the questionnaire, among all the people with access needs who
have travelled during last 12 months, the percentage of budget they are willing to expend are
presented in Figure 234. It should be noted that the numbers are weighted averages among all
existing travellers according to their travel spending over the last 12 months.
Figure 235 further shows how the direct economic contribution under different scenarios is
established following the rationale described in Section 6.3.1. The numbers are at the EU level.
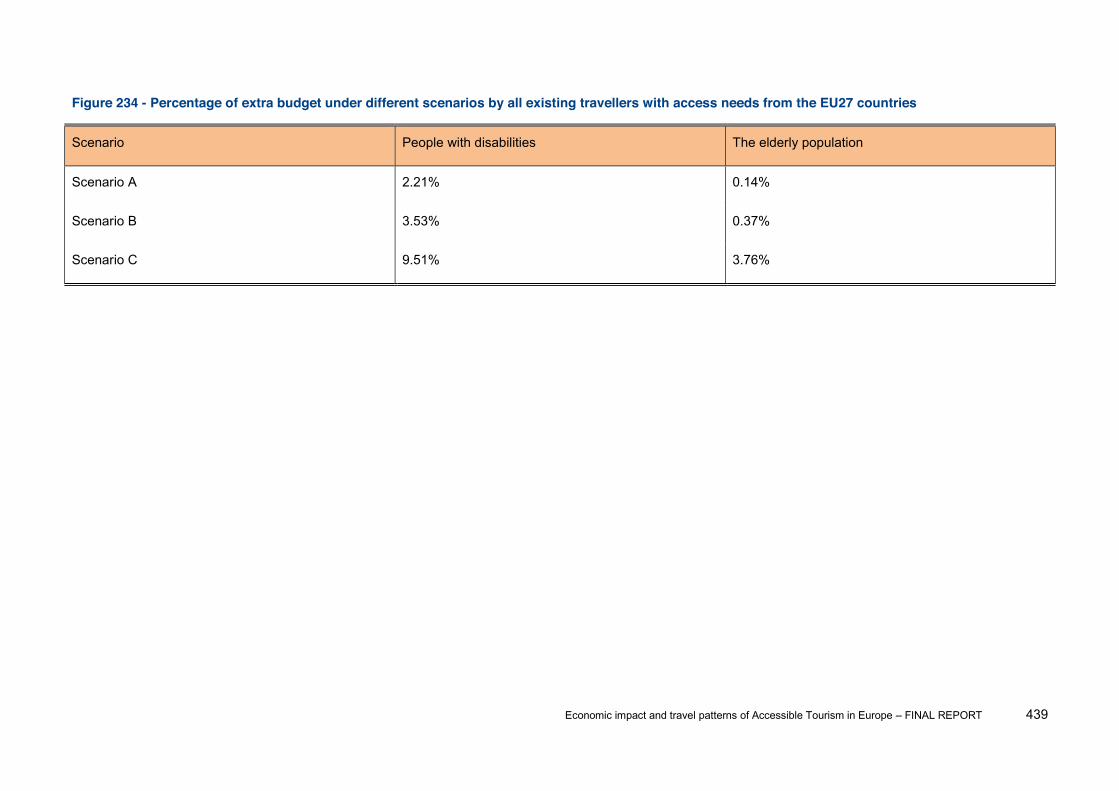
Economic impact and travel patterns of Accessible Tourism in Europe FINAL REPORT 439
Figure 234 - Percentage of extra budget under different scenarios by all existing travellers with access needs from the EU27 countries
Scenario People with disabilities The elderly population
Scenario A 2.21% 0.14%
Scenario B 3.53% 0.37%
Scenario C 9.51% 3.76%
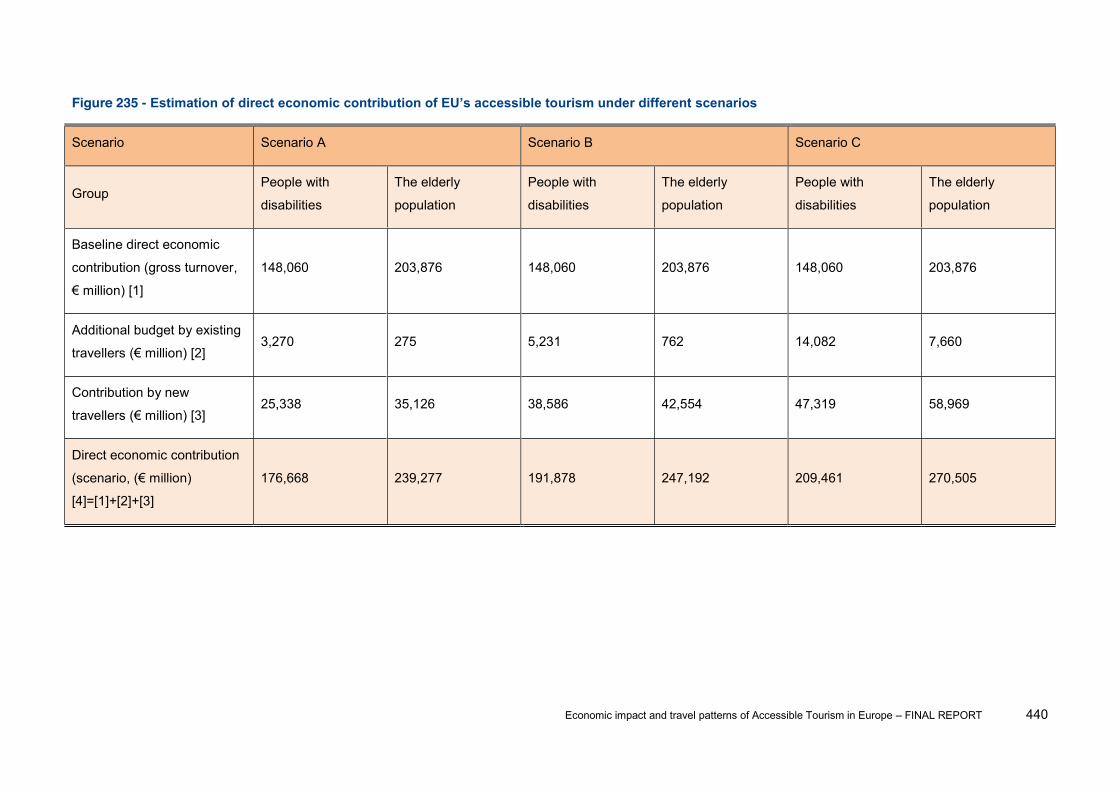
Economic impact and travel patterns of Accessible Tourism in Europe FINAL REPORT 440
Figure 235 -
Scenario Scenario A Scenario B Scenario C
Group People with
disabilities
The elderly
population
People with
disabilities
The elderly
population
People with
disabilities
The elderly
population
Baseline direct economic
contribution (gross turnover,
) [1]
148,060 203,876 148,060 203,876 148,060 203,876
Additional budget by existing
travellers [2] 3,270 275 5,231 762 14,082 7,660
Contribution by new
travellers [3] 25,338 35,126 38,586 42,554 47,319 58,969
Direct economic contribution
(scenario )
[4]=[1]+[2]+[3]
176,668 239,277 191,878 247,192 209,461 270,505

Economic impact and travel patterns of Accessible Tourism in Europe FINAL REPORT 441
Figure 236 - Breakdown of direct economic contribution under different scenarios between existing travellers and new travellers
Scenario Scenario A Scenario B Scenario C
Group People with
disabilities
The elderly
population
People with
disabilities
The elderly
population
People with
disabilities
The elderly
population
Direct economic contribution
(scenario ) 176,668 239,277 191,878 247,192 209,461 270,505
of which, generated by
Existing travellers 85.7% 85.3% 79.9% 82.8% 77.4% 78.2%
New travellers 14.3% 14.7% 20.1% 17.2% 22.6% 21.8%
Note: 1) This table is inferred from Figure 235.

442
Figure 235 can be used to further infer the structure of contribution between existing travellers
and new travellers. As shown in Figure 236, the existing travellers would still be the major
driving forces of accessible tourism under different scenarios of improvements.
In addition to the direct economic contribution in terms of gross turnover (output) (as in Figure
235), the other types of direct economic contribution, namely in terms of gross value added
and employment, are also calculated. The results are presented in Figure 237, and the
comparison against baseline has also been provided. Considering the taxes and subsidies on
products on top of GVA, the equivalent direct contributions in terms of GDP under baseline
disabilities and the elderly population.
.
Figure 237 - scenarios by people with access needs in the EU27 countries
Scenario million) million)
Employment ('000
persons)
Baseline 351,936 increase against
baseline 149,947
increase against
baseline 4,249
increase against
baseline
Scenario A 415,946 18.2% 176,943 18.0% 5,068 19.3%
Scenario B 439,070 24.8% 186,696 24.5% 5,352 26.0%
Scenario C 479,966 36.4% 204,073 36.1% 5,888 38.6%
6.3.2.2 Total economic contribution under different scenarios Since the estimation of total economic contribution under different scenarios relies on the
same set of multipliers in Section 6.2.2.2 and Annex R, Figure 238 only presents the total
economic contribution numbers at the EU level. Considering the taxes and subsidies on
products on top of GVA, the equivalent total economic contributions in terms of GDP are
Scenario A, B and C. The numbers include the contribution by both the people with disabilities
and the elderly population. Figure 239 to Figure 241 visualise the indirect and induced effects
under different scenarios.

443
Figure 238 - scenarios by people with access needs in the EU27 countries
Scenario Total output
Total gross value added
million)
Total employment
contribution ('000 persons)
Baseline 786,294
increase
against
baseline
356,201
increase
against
baseline
8,711
increase
against
baseline
Scenario A 929,801 18.3% 420,240 18.0% 10,426 19.7%
Scenario B 981,603 24.8% 443,380 24.5% 11,032 26.6%
Scenario C 1,073,179 36.5% 484,476 36.0% 12,145 39.4%
Figure 239 - Total output contribution under different scenarios by people with access
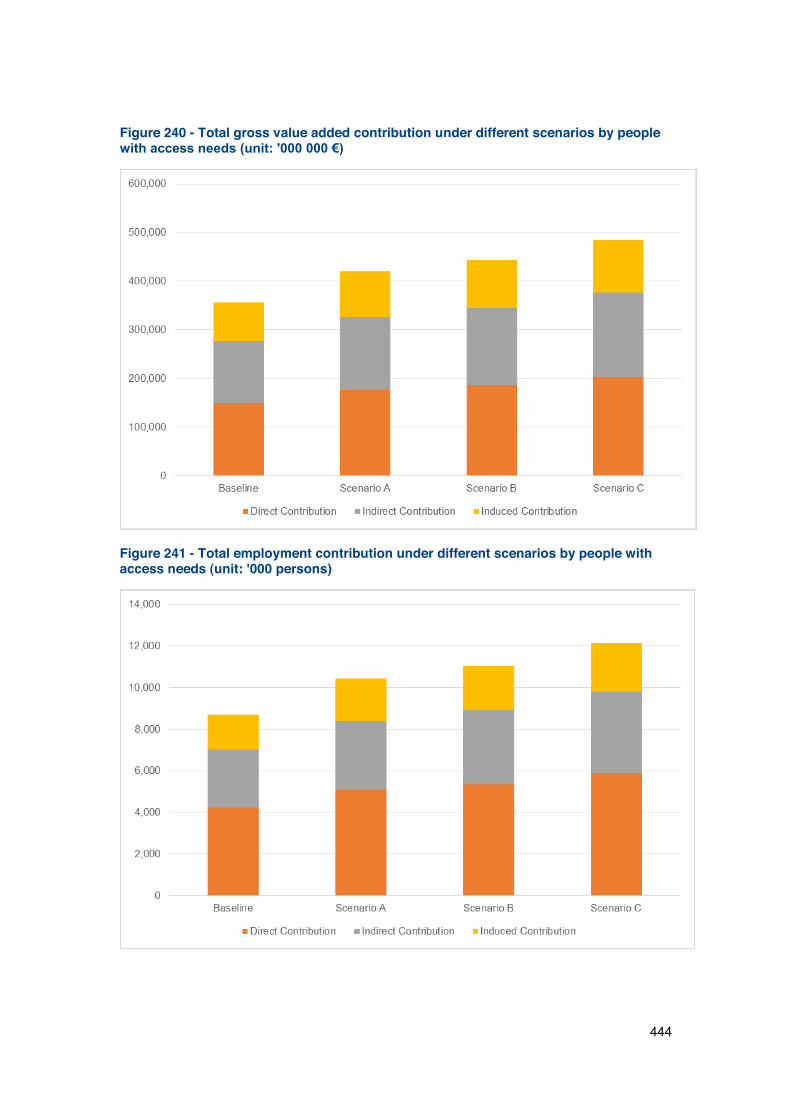
444
Figure 240 - Total gross value added contribution under different scenarios by people
Figure 241 - Total employment contribution under different scenarios by people with access needs (unit: '000 persons)
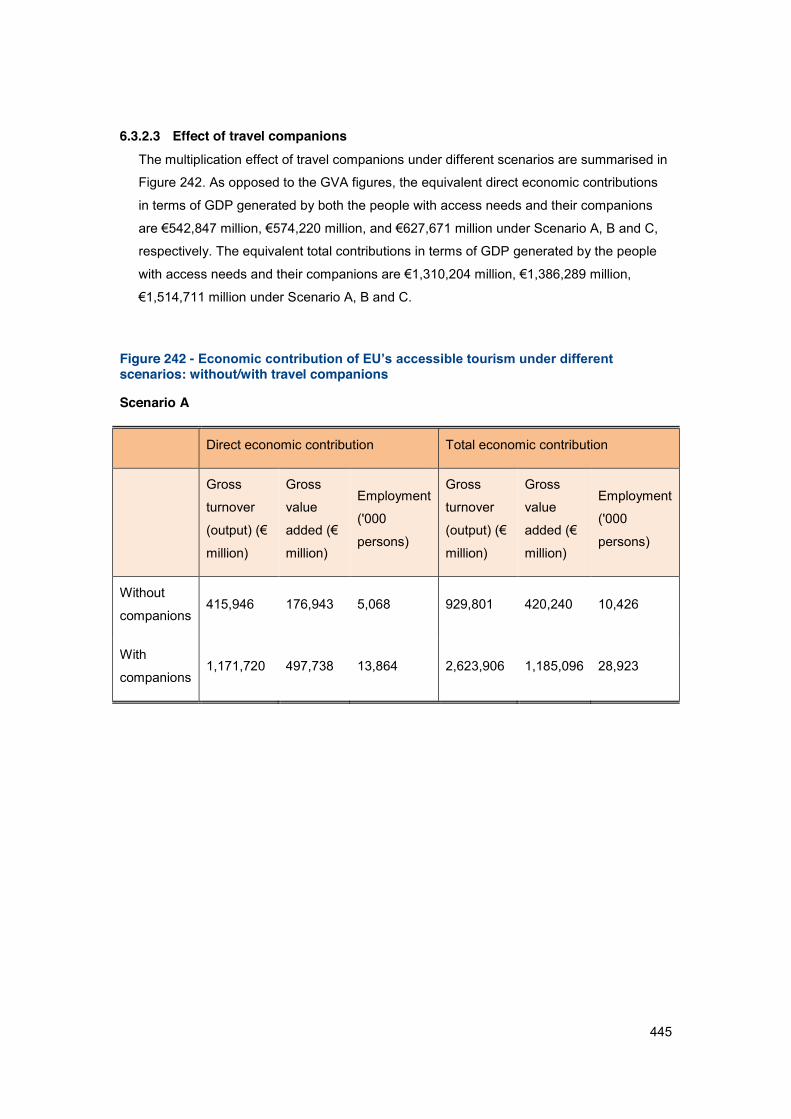
445
6.3.2.3 Effect of travel companions The multiplication effect of travel companions under different scenarios are summarised in
Figure 242. As opposed to the GVA figures, the equivalent direct economic contributions
in terms of GDP generated by both the people with access needs and their companions
respectively. The equivalent total contributions in terms of GDP generated by the people
cenario A, B and C.
Figure 242 - scenarios: without/with travel companions
Scenario A
Direct economic contribution Total economic contribution
Gross
turnover
million)
Gross
value
million)
Employment
('000
persons)
Gross
turnover
million)
Gross
value
million)
Employment
('000
persons)
Without
companions 415,946 176,943 5,068 929,801 420,240 10,426
With
companions 1,171,720 497,738 13,864 2,623,906 1,185,096 28,923
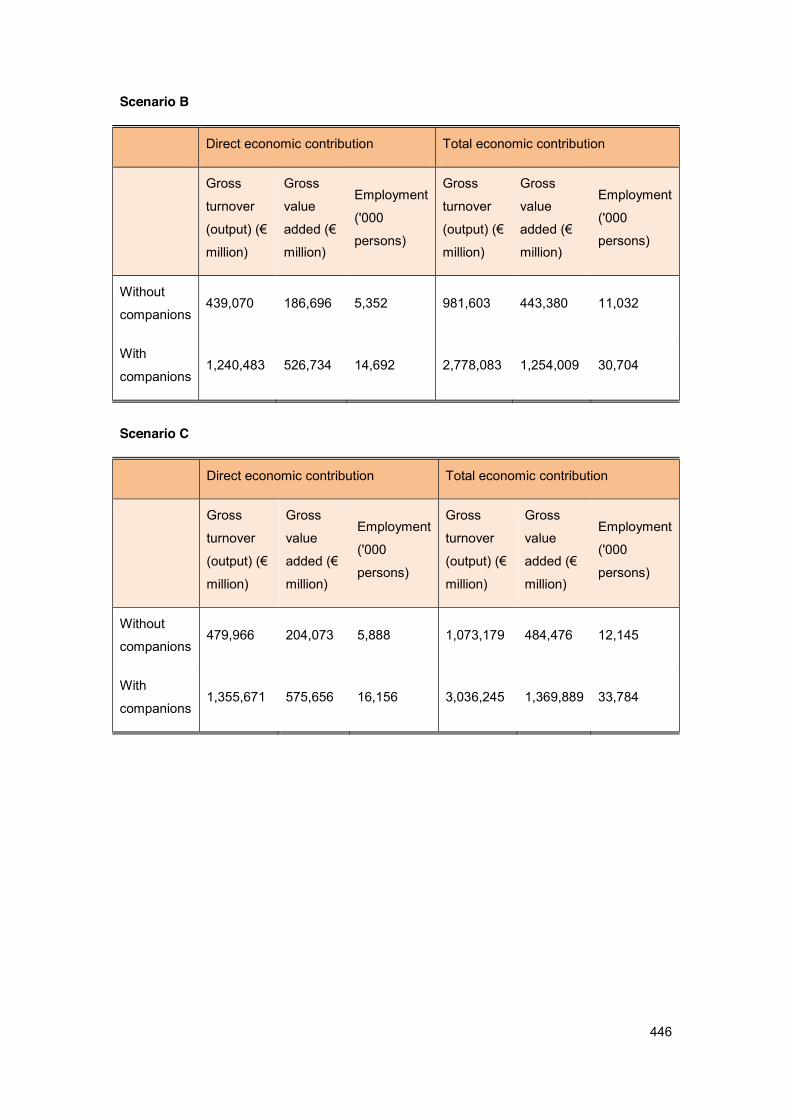
446
Scenario B
Direct economic contribution Total economic contribution
Gross
turnover
million)
Gross
value
million)
Employment
('000
persons)
Gross
turnover
million)
Gross
value
million)
Employment
('000
persons)
Without
companions 439,070 186,696 5,352 981,603 443,380 11,032
With
companions 1,240,483 526,734 14,692 2,778,083 1,254,009 30,704
Scenario C
Direct economic contribution Total economic contribution
Gross
turnover
million)
Gross
value
million)
Employment
('000
persons)
Gross
turnover
million)
Gross
value
million)
Employment
('000
persons)
Without
companions 479,966 204,073 5,888 1,073,179 484,476 12,145
With
companions 1,355,671 575,656 16,156 3,036,245 1,369,889 33,784
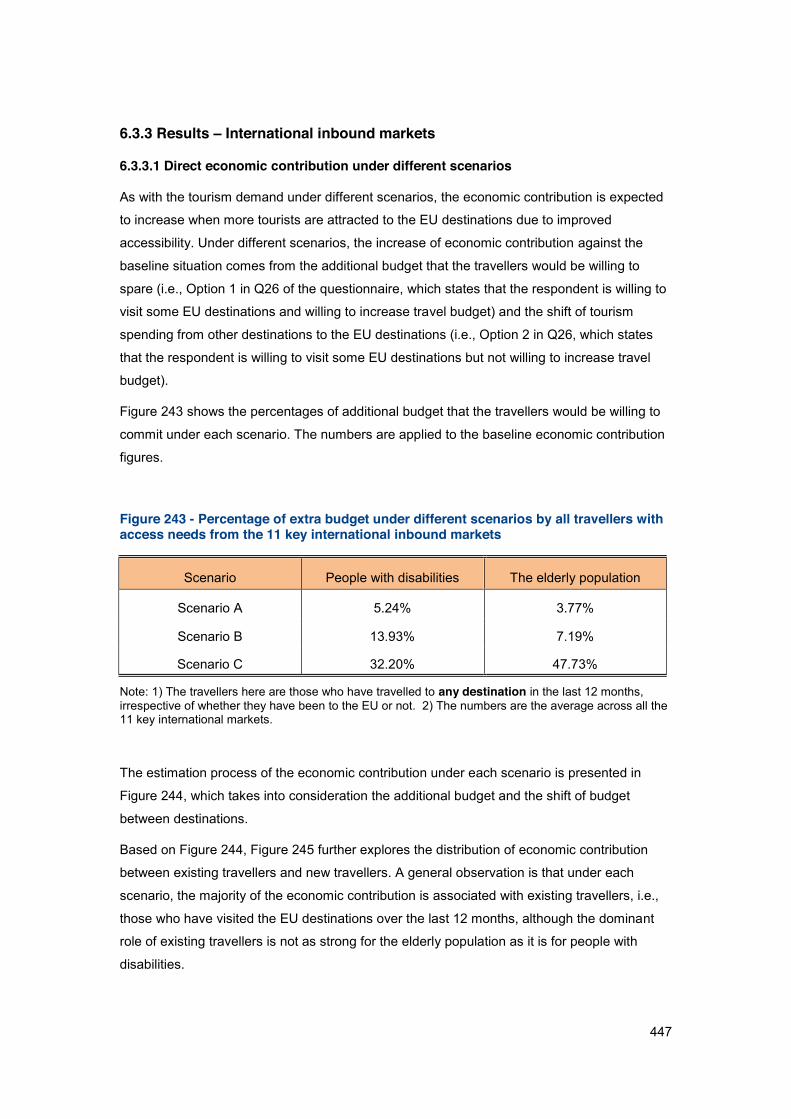
447
6.3.3 Results International inbound markets
6.3.3.1 Direct economic contribution under different scenarios
As with the tourism demand under different scenarios, the economic contribution is expected
to increase when more tourists are attracted to the EU destinations due to improved
accessibility. Under different scenarios, the increase of economic contribution against the
baseline situation comes from the additional budget that the travellers would be willing to
spare (i.e., Option 1 in Q26 of the questionnaire, which states that the respondent is willing to
visit some EU destinations and willing to increase travel budget) and the shift of tourism
spending from other destinations to the EU destinations (i.e., Option 2 in Q26, which states
that the respondent is willing to visit some EU destinations but not willing to increase travel
budget).
Figure 243 shows the percentages of additional budget that the travellers would be willing to
commit under each scenario. The numbers are applied to the baseline economic contribution
figures.
Figure 243 - Percentage of extra budget under different scenarios by all travellers with access needs from the 11 key international inbound markets
Scenario People with disabilities The elderly population
Scenario A 5.24% 3.77%
Scenario B 13.93% 7.19%
Scenario C 32.20% 47.73%
Note: 1) The travellers here are those who have travelled to any destination in the last 12 months, irrespective of whether they have been to the EU or not. 2) The numbers are the average across all the 11 key international markets.
The estimation process of the economic contribution under each scenario is presented in
Figure 244, which takes into consideration the additional budget and the shift of budget
between destinations.
Based on Figure 244, Figure 245 further explores the distribution of economic contribution
between existing travellers and new travellers. A general observation is that under each
scenario, the majority of the economic contribution is associated with existing travellers, i.e.,
those who have visited the EU destinations over the last 12 months, although the dominant
role of existing travellers is not as strong for the elderly population as it is for people with
disabilities.
448
It can also be discerned that with the improvements in accessibility going further (from
scenario A to scenario C), the role of new travellers becomes more and more important. The
share of economic contribution generated by new travellers increases progressively, from
14.2% to 19.5% for people with disabilities, and from 17.1% to 34.6% for the elderly
population.

449
Figure 244 -
Scenario Scenario A Scenario B Scenario C
Group People with disabilities
The elderly population
People with disabilities
The elderly population
People with disabilities
The elderly population
Baseline direct economic
million) [1] 6,957 9,539 6,957 9,539 6,957 9,539
Additional contribution by existing 645 735 1,856 1,021 2,372 1,719
million) [3] 1,263 2,115 1,811 4,105 2,254 5,968
Direct economic contribution 8,865 12,390 10,624 14,665 11,583 17,226
Notes: 1) Existing travellers are those who have visited the EU in the last 12 months; 2) Under different scenarios, the additional contribution by existing travellers comes from either the additional budget they would be willing to commit or the shift of
spending from other destinations to EU destinations; 3) New travellers are those who have not been to the EU in the last 12 months but would be willing to travel to the EU under different scenarios; they may have been to
domestic destinations or other international destinations, or simply have not travelled at all in the last 12 months; 4) Under different scenarios, the contribution by new travellers comes from either the additional budget they would be willing to commit or the shift of spending from
other destinations to EU destinations.
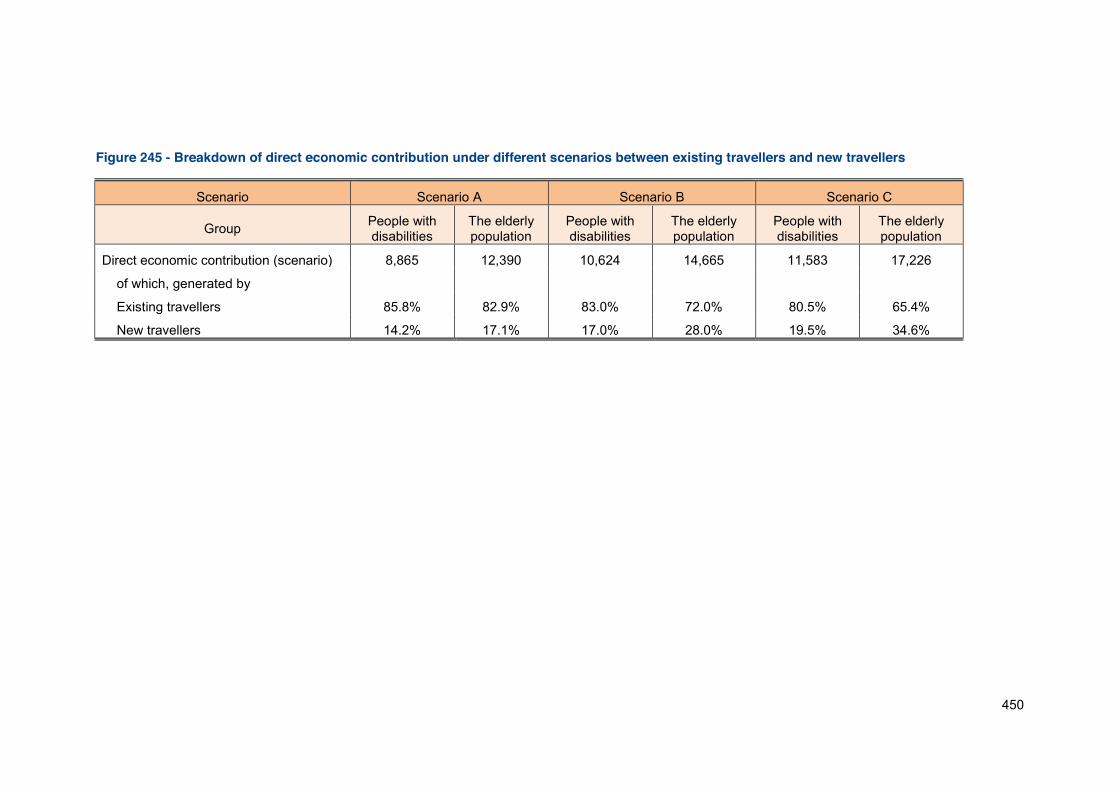
450
Figure 245 - Breakdown of direct economic contribution under different scenarios between existing travellers and new travellers
Scenario Scenario A Scenario B Scenario C
Group People with disabilities
The elderly population
People with disabilities
The elderly population
People with disabilities
The elderly population
Direct economic contribution (scenario) 8,865 12,390 10,624 14,665 11,583 17,226
of which, generated by
Existing travellers 85.8% 82.9% 83.0% 72.0% 80.5% 65.4%
New travellers 14.2% 17.1% 17.0% 28.0% 19.5% 34.6%
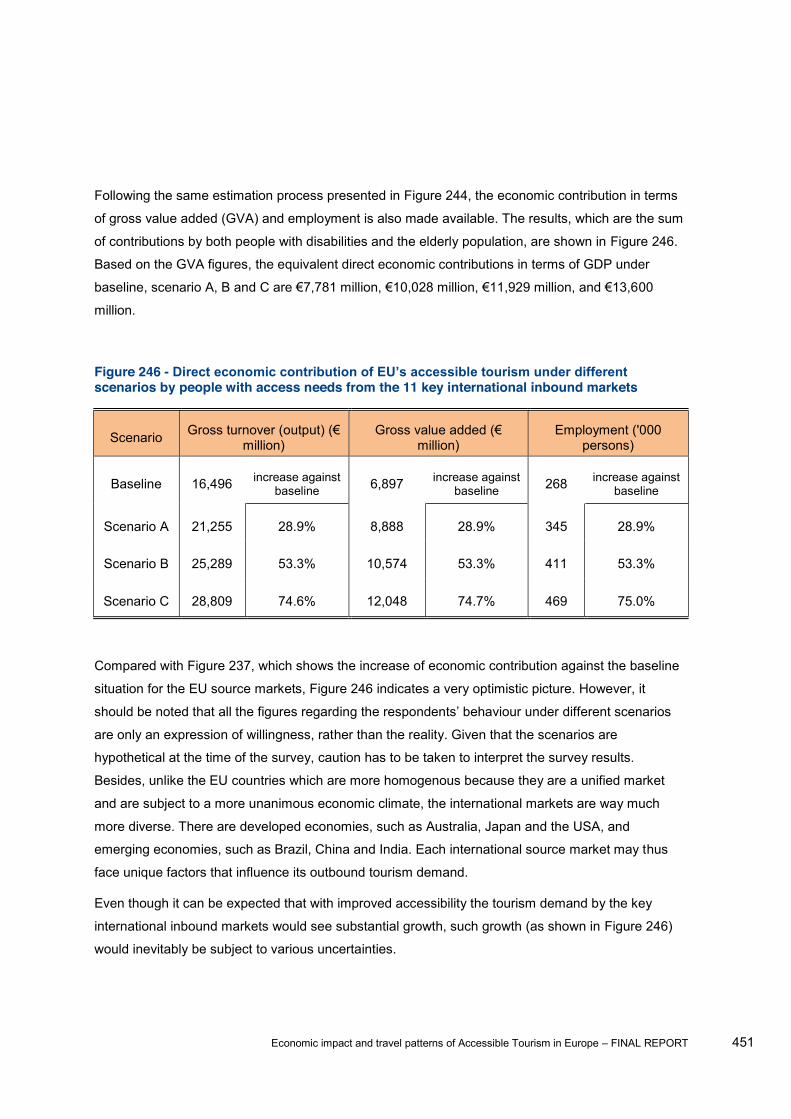
Economic impact and travel patterns of Accessible Tourism in Europe FINAL REPORT 451
Following the same estimation process presented in Figure 244, the economic contribution in terms
of gross value added (GVA) and employment is also made available. The results, which are the sum
of contributions by both people with disabilities and the elderly population, are shown in Figure 246.
Based on the GVA figures, the equivalent direct economic contributions in terms of GDP under
00
million.
Figure 246 - scenarios by people with access needs from the 11 key international inbound markets
Scenario million) million) Employment ('000
persons)
Baseline 16,496 increase against baseline 6,897 increase against
baseline 268 increase against baseline
Scenario A 21,255 28.9% 8,888 28.9% 345 28.9%
Scenario B 25,289 53.3% 10,574 53.3% 411 53.3%
Scenario C 28,809 74.6% 12,048 74.7% 469 75.0%
Compared with Figure 237, which shows the increase of economic contribution against the baseline
situation for the EU source markets, Figure 246 indicates a very optimistic picture. However, it
are only an expression of willingness, rather than the reality. Given that the scenarios are
hypothetical at the time of the survey, caution has to be taken to interpret the survey results.
Besides, unlike the EU countries which are more homogenous because they are a unified market
and are subject to a more unanimous economic climate, the international markets are way much
more diverse. There are developed economies, such as Australia, Japan and the USA, and
emerging economies, such as Brazil, China and India. Each international source market may thus
face unique factors that influence its outbound tourism demand.
Even though it can be expected that with improved accessibility the tourism demand by the key
international inbound markets would see substantial growth, such growth (as shown in Figure 246)
would inevitably be subject to various uncertainties.
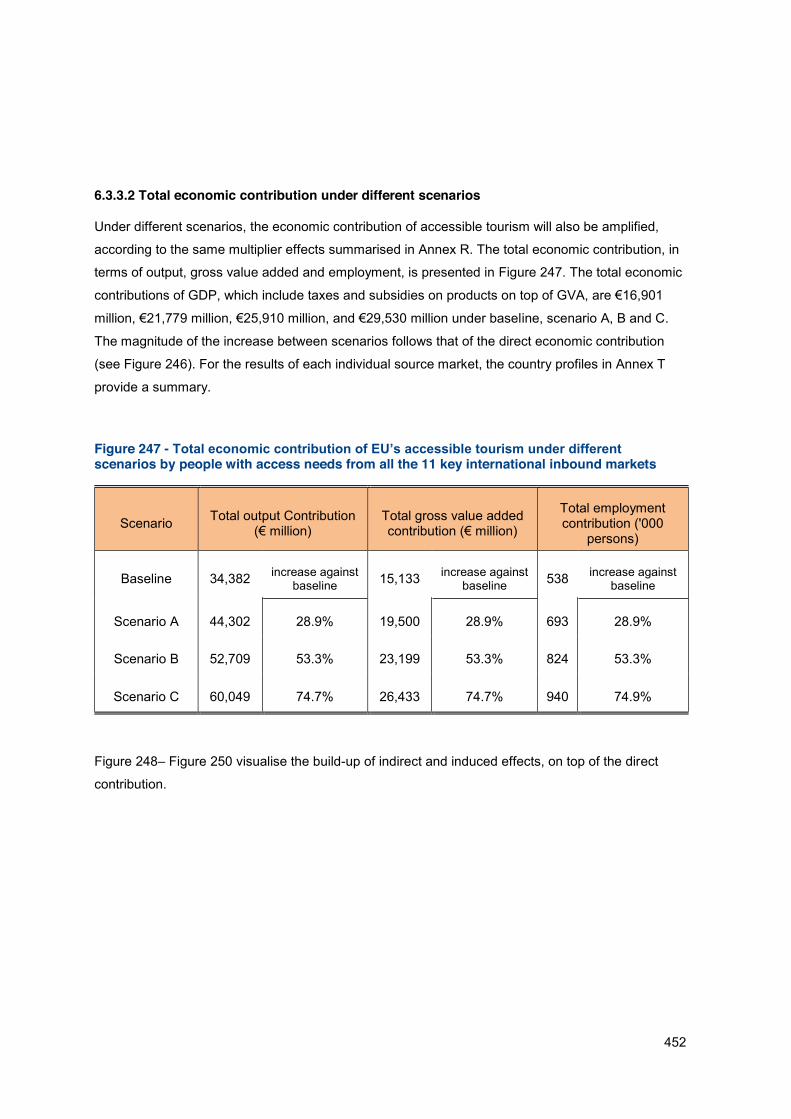
452
6.3.3.2 Total economic contribution under different scenarios
Under different scenarios, the economic contribution of accessible tourism will also be amplified,
according to the same multiplier effects summarised in Annex R. The total economic contribution, in
terms of output, gross value added and employment, is presented in Figure 247. The total economic
ine, scenario A, B and C.
The magnitude of the increase between scenarios follows that of the direct economic contribution
(see Figure 246). For the results of each individual source market, the country profiles in Annex T
provide a summary.
Figure 247 - scenarios by people with access needs from all the 11 key international inbound markets
Scenario Total output Contribution
Total gross value added
Total employment contribution ('000
persons)
Baseline 34,382 increase against baseline 15,133 increase against
baseline 538 increase against baseline
Scenario A 44,302 28.9% 19,500 28.9% 693 28.9%
Scenario B 52,709 53.3% 23,199 53.3% 824 53.3%
Scenario C 60,049 74.7% 26,433 74.7% 940 74.9%
Figure 248 Figure 250 visualise the build-up of indirect and induced effects, on top of the direct
contribution.

453
Figure 248 - Total output contribution under different scenarios by people with access needs
16,49621,255
25,28928,809
11,887
15,317
18,223
20,760
5,999
7,730
9,197
10,480
0
10,000
20,000
30,000
40,000
50,000
60,000
70,000
Baseline Scenario A Scenario B Scenario C
Direct Contribution Indirect Contribution Induced Contribution

454
Figure 249 - Total gross value added contribution under different scenarios by people with
6,8978,888
10,57412,048
5,267
6,787
8,075
9,199
2,968
3,825
4,551
5,186
0
5,000
10,000
15,000
20,000
25,000
30,000
Baseline Scenario A Scenario B Scenario C
Direct Contribution Indirect Contribution Induced Contribution
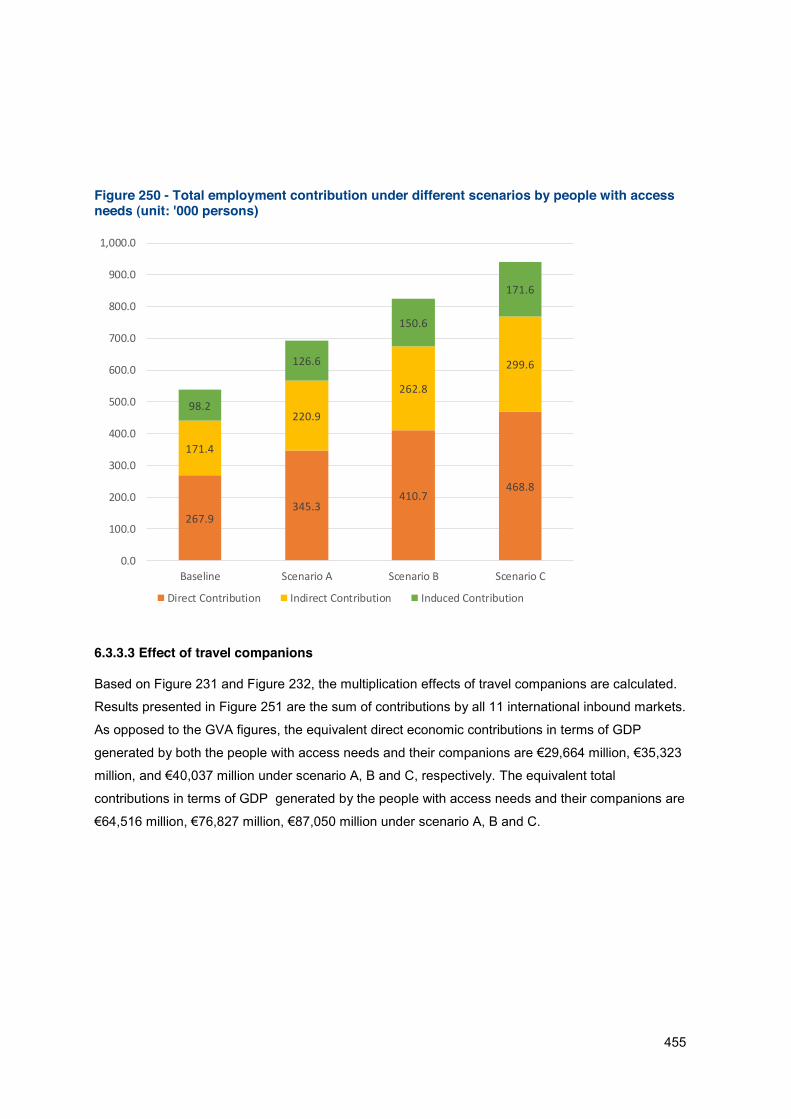
455
Figure 250 - Total employment contribution under different scenarios by people with access needs (unit: '000 persons)
6.3.3.3 Effect of travel companions
Based on Figure 231 and Figure 232, the multiplication effects of travel companions are calculated.
Results presented in Figure 251 are the sum of contributions by all 11 international inbound markets.
As opposed to the GVA figures, the equivalent direct economic contributions in terms of GDP
generated by both the people
The equivalent total
contributions in terms of GDP generated by the people with access needs and their companions are
267.9345.3
410.7468.8
171.4
220.9
262.8
299.6
98.2
126.6
150.6
171.6
0.0
100.0
200.0
300.0
400.0
500.0
600.0
700.0
800.0
900.0
1,000.0
Baseline Scenario A Scenario B Scenario C
Direct Contribution Indirect Contribution Induced Contribution
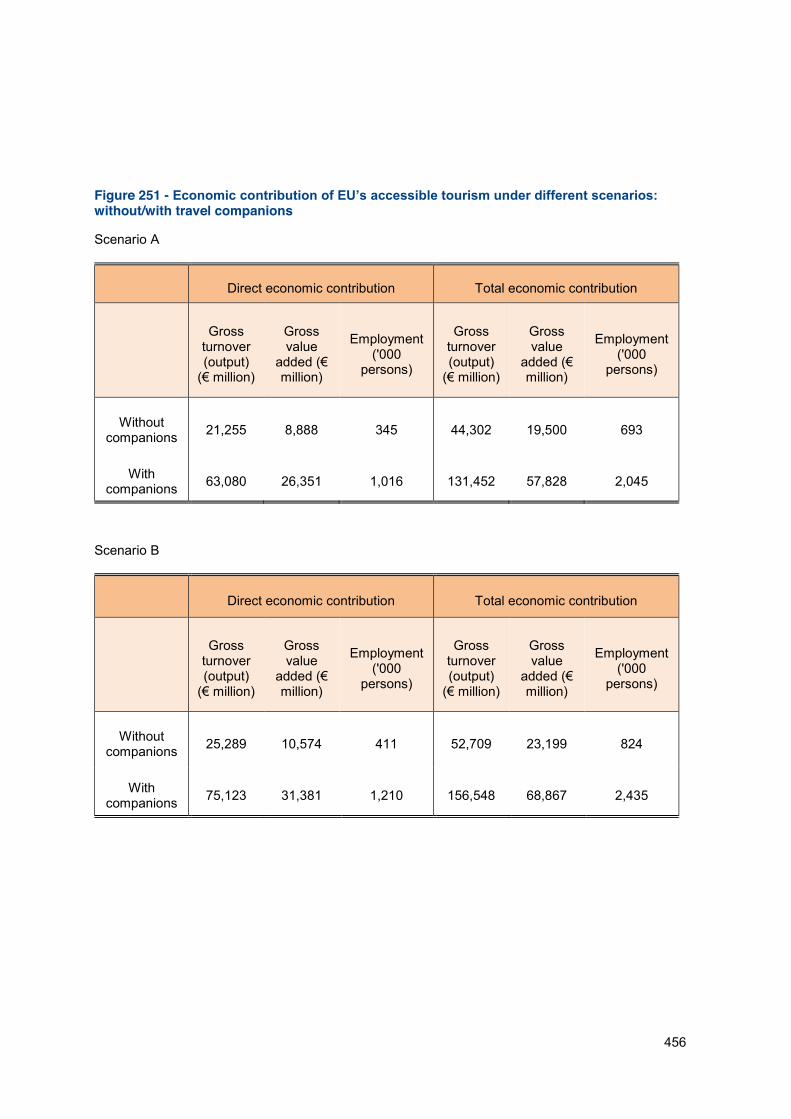
456
Figure 251 - without/with travel companions
Scenario A
Direct economic contribution Total economic contribution
Gross turnover (output)
Gross value
million)
Employment ('000
persons)
Gross turnover (output)
Gross value
million)
Employment ('000
persons)
Without companions 21,255 8,888 345 44,302 19,500 693
With companions 63,080 26,351 1,016 131,452 57,828 2,045
Scenario B
Direct economic contribution Total economic contribution
Gross turnover (output)
Gross value
million)
Employment ('000
persons)
Gross turnover (output)
Gross value
million)
Employment ('000
persons)
Without companions 25,289 10,574 411 52,709 23,199 824
With companions 75,123 31,381 1,210 156,548 68,867 2,435
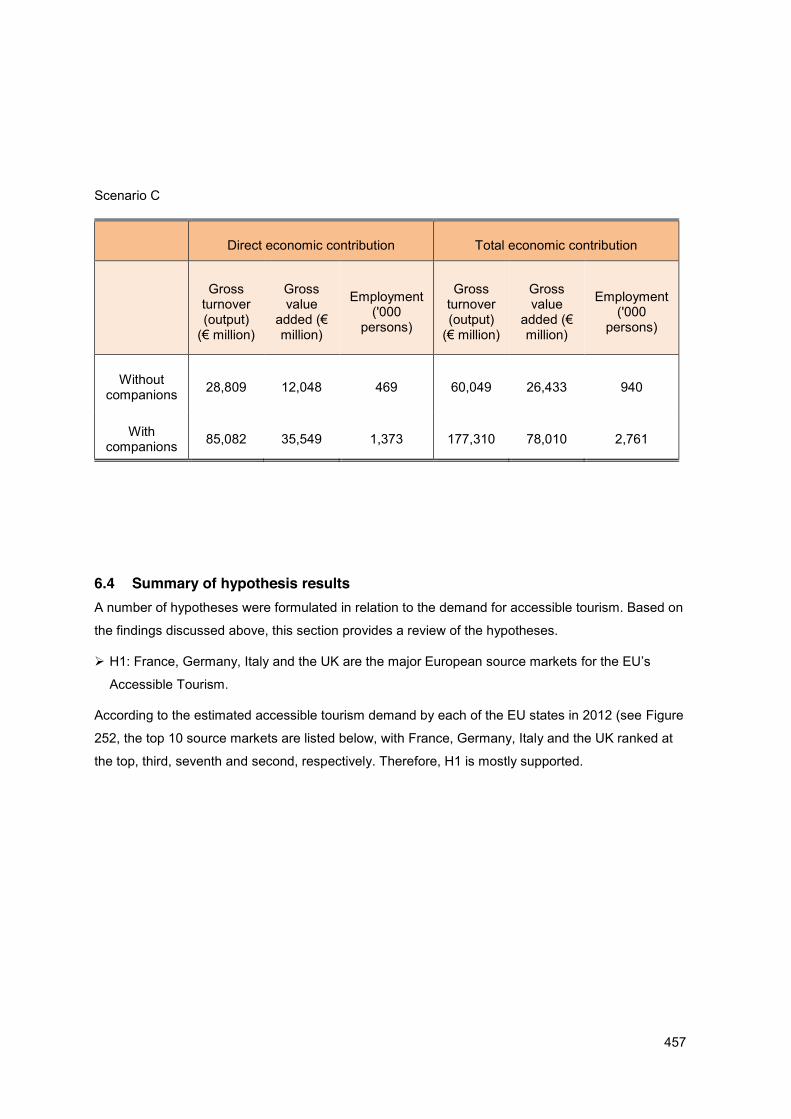
457
Scenario C
Direct economic contribution Total economic contribution
Gross turnover (output)
Gross value
million)
Employment ('000
persons)
Gross turnover (output)
Gross value
million)
Employment ('000
persons)
Without companions 28,809 12,048 469 60,049 26,433 940
With companions 85,082 35,549 1,373 177,310 78,010 2,761
6.4 Summary of hypothesis results A number of hypotheses were formulated in relation to the demand for accessible tourism. Based on
the findings discussed above, this section provides a review of the hypotheses.
H1: France, Germany, Italy and the UK are the major European source markets
Accessible Tourism.
According to the estimated accessible tourism demand by each of the EU states in 2012 (see Figure
252, the top 10 source markets are listed below, with France, Germany, Italy and the UK ranked at
the top, third, seventh and second, respectively. Therefore, H1 is mostly supported.
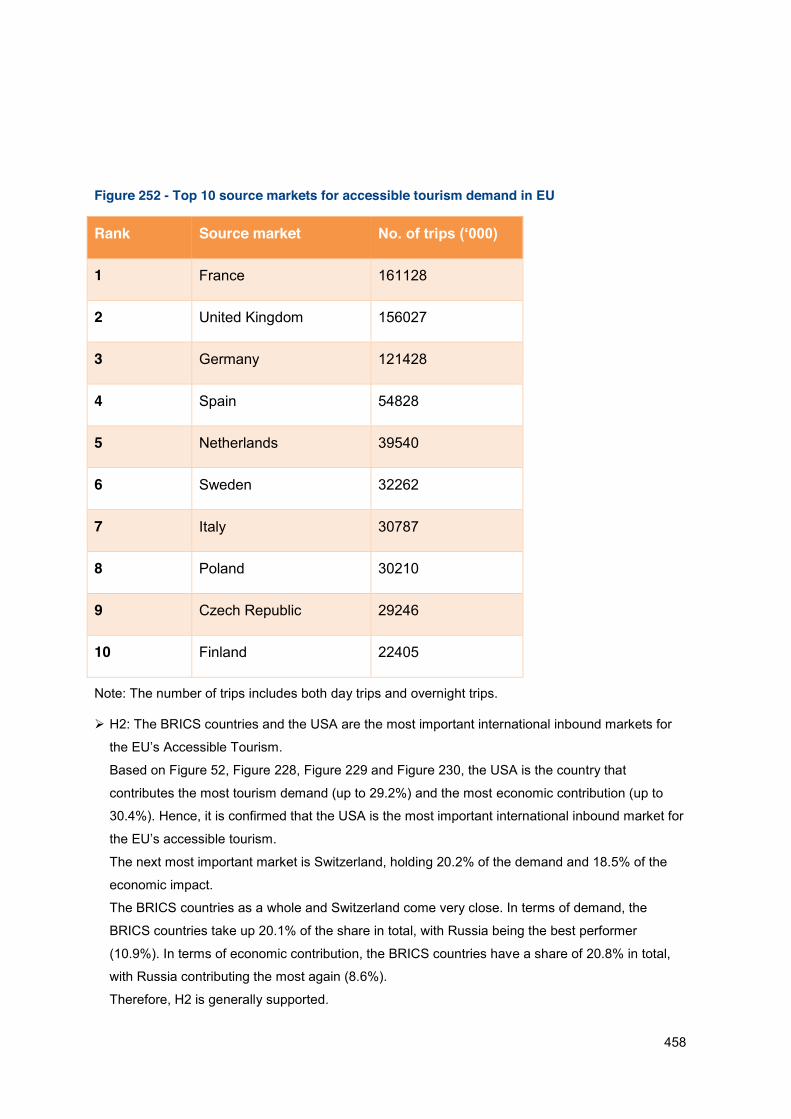
458
Figure 252 - Top 10 source markets for accessible tourism demand in EU
Rank Source market
1 France 161128
2 United Kingdom 156027
3 Germany 121428
4 Spain 54828
5 Netherlands 39540
6 Sweden 32262
7 Italy 30787
8 Poland 30210
9 Czech Republic 29246
10 Finland 22405
Note: The number of trips includes both day trips and overnight trips.
H2: The BRICS countries and the USA are the most important international inbound markets for
Based on Figure 52, Figure 228, Figure 229 and Figure 230, the USA is the country that
contributes the most tourism demand (up to 29.2%) and the most economic contribution (up to
30.4%). Hence, it is confirmed that the USA is the most important international inbound market for
The next most important market is Switzerland, holding 20.2% of the demand and 18.5% of the
economic impact.
The BRICS countries as a whole and Switzerland come very close. In terms of demand, the
BRICS countries take up 20.1% of the share in total, with Russia being the best performer
(10.9%). In terms of economic contribution, the BRICS countries have a share of 20.8% in total,
with Russia contributing the most again (8.6%).
Therefore, H2 is generally supported.

459
H3: Mobility facilities are the primary area of access needs, and sufficient attention should be paid
to these facilities.1
According to the distribution of impairment types among all individuals with disabilities in EU27
(see Figure 24) and the estimated accessible tourism demand by different types of impairments
(see Figure 38), mobility impairments account for the highest proportion (about 36% within EU27
overall) apart from hidden impairments. Therefore mobility facilities are the primary area of access
needs, and it is necessary to pay particular attention to these facilities. Hence H3 is supported.
H4: The seniors have higher spending power than the people with disabilities, because they have
higher wealth level and are more willing to spend on leisure activities.
According to Figure 201, the EU-wide average daily spending of the elderly travellers is slightly
higher than of people with disabilities as far as both day trips and overnight trips are concerned.
Nevertheless, this pattern does not always hold at the individual country level (see Figure 202 and
Figure 203). Overall, within EU27 the elderly population spent more on travel than individuals with
disabilities and thus contributed more to the EU economy (see Error! Reference source not found.). Beyond the EU area, the elderly population from the key international inbound markets
spend roughly the same as the people with disabilities, when they travel to the EU (see Figure
219 and Figure 220). This general observation basically holds at the individual country level. Both
Therefore, H4 is generally supported for the EU population with access needs, but not for the
international inbound markets.
H5: The seniors are more frequent travellers than the people with disabilities.
As shown in Figure 28, the elderly population in EU27 travelled slightly more frequently than the
people with disabilities for day trips (6.9 versus 6.7 trips per year), but the opposite trend is found
with regard to overnight trips. Across EU27, on average the elderly population travelled 1.2 times
less than people with disabilities. Therefore, H5 is partially supported.
H7: Female senior customers will dominate the senior travel market, given the higher proportion
of population.
1Please note hidden impairments are a major type of disability but the related access needs are more varied and therefore less widely used and needed by smaller proportions of people.

460
As Figure 8, Figure 26 and Figure 27 show, the female senior population always outnumbers the
male counterpart, and therefore account for a higher share of the senior travel market (58% with
EU27 overall, 55% within 11 key inbound markets). Therefore H7 is supported.
H8: Key parameters such as travel propensity, travel frequency, and expenditure level should be
notably different across clusters.
According to Figure 29 to Figure 32, Figure 202 and Figure 203, across EU 27 countries the
propensity, travel frequency, and average expenditure figures vary significantly for both groups of
the people with access needs and as far as both day trips and overnight trips are concerned.
Using overnight trips of the people with disabilities as an example, the travel propensity varied
from 7.8% in Bulgaria to 85.7% in the Netherlands. The travel frequency varied from 3.9 trips in
Malta and Slovenia to 8.1 trips in Ireland and Cyprus. With regard to average spending per night,
it varied between 49.3 Euros (in Bulgaria/Hungary/Romania) and 123.6 Euros (in Germany/Italy).
So H8 is supported.
H9: The senior travel market will become even more important by 2020, given that the steep
growth of the elderly population will continue.
Within the EU27 area, based on the predicted growth both market segments of accessible tourism
demand (see Figure 34), the senior travellers segment will grow much faster (about 2% annually)
than the segment of the people with disabilities (only 0.12% per year)1. By 2020 the demand of
the senior travel market is predicted to reach 518,647 thousand trips, accounting for 60% of total
accessible tourism demand in EU27, 66% higher than the demand of the segment of individuals
with disabilities (343,222 thousand trips). As to the key inbound markets, Figure 53 shows that
the senior travellers segment will significantly outperform the segment of the people with
disabilities, in the sense that the annual growth rate of demand by the senior travellers is
predicted to be 2.9%, versus 0.55% by the people with disabilities.
Thus H9 is supported.
H10: China and India will be much more important than other inbound markets for Accessible
Tourism.
From Figure 52, Figure 228, Figure 229 and Figure 230, it emerged that the USA is the most
important inbound market due to its high share of tourism demand (29.2%) and economic
1 These are baseline forecasts assuming the travel propensity and frequency of the people with access needs remain unchanged.
461
contribution (30.4%) among all the inbound markets. In contrast, the shares of China and India
are much lower. In terms of demand, China only accounted for 3.8% and India 0.7% in 2012. In
terms of economic contribution, China accounted for 4.0% and India 0.8%. The reason for China
and India falling behind is related to the extremely low departures per 100 people. Compared to a
figure of 6.87 for the USA, it is only 0.38 for China and 0.16 for India.
Therefore, H10 is rejected.
H41: The improvement of accessibility will help attract people with access needs to explore new
destinations.
Figure 41, Figure 42, Figure 54 and Figure 55 show clear evidence that by improving accessibility
of those destinations which are currently less accessible in Europe, people with access needs
were keen to expand their travel to these new destinations. In particular, current non-travellers
showed higher interest in travelling in future if accessibility could be improved. A higher level of
accessibility improvements corresponds to a higher level of willingness to travel to the new
destinations. Therefore, H41 is supported.
H42: Extensive improvements of accessibility can generate significant economic contributions
with respect to output and employment. As Figure 237 to Figure 241 and Figure 246 to Figure 250
clearly show, extensive improvements of accessibility (i.e., Scenario C) can improve the overall
economic contributions by up to 36.5% and 39.4% (EU27 travellers), and up to 74.7% and 74.9%
(international travellers) with regard to economic output and employment, respectively, as far as
direct, indirect and induced effects are concerned all together. Therefore H42 is supported.
6.5 Limitations of demand forecasting and economic impact assessment This project aimed to provide a broad picture of the scale of accessible tourism and its economic
contribution in the European Union. Although rigorous methodologies and scientific procedures have
been followed to achieve the objectives, the precision of the estimated results were inevitably
affected by some limitations of the research design, which could not be avoided.
On the one hand, this project has three limitations that to some extent may lead to over-estimated
results. First, using cluster repres
other countries could only provide the best possible approximation rather than actual figures.
Second, although the overall sample size of the main survey in the EU representative countries is
large, the country specific sample sizes are relatively small for estimating the demand and economic
contribution at the country level. The small sample also represented a challenge for the international
462
market survey as outliers (i.e. extreme values) were identified. Hence approximation is unavoidable
in order to achieve meaningful results, even though this means the estimation would be less
accurate. Third, an online survey is an effective way for primary data collection. Nevertheless, its
limitation is also unavoidable, particularly in relation to the representativeness of the sample. Online
survey tends to capture a higher proportion of active internet users. Particularly among the people
with disabilities and the elderly population, these respondents may represent relatively well-
educated population whose income level is likely to be above average. Their travel and spending
behaviour also tends to be above average.
On the other hand, some underlying issues may render the results relatively conservative. First, the
online survey was conducted in mid- -2012
to mid-2013, during which the debt crisis in the Eurozone still haunted the EU area. Due to reduced
personal income, the tourists might have acted conservatively when travelling. Once the economy
-crisis level, the behavioural profiling parameters,
such as travel propensity, travel frequency and expenditure per trip, could be improved against the
current figures captured by the survey. Second, in forecasting the future tourism demand (in terms of
trips), it is assumed that the behavioural profiling parameters will remain unchanged over the next
decade. The reason for this assumption is that there are no relevant historical data available to infer
a one-off. Such restriction may
overlook the intrinsic trend of people travel behaviour over time.
All in all, caution has to be taken when interpreting the estimation results, as exaggeration factors
and conservative factors co-exist.
463
7 Task 5 - Recommendations and success factors
The study results show that the accessible tourism demand by people with special access needs
from the EU generated a total economic contribution of 786 billion Euros in terms of total output and
356 billion Euros in terms of gross value added or 394 billion Euros in terms of GDP within the EU.
This scale is equivalent to about 3% of total GDP of EU27 in 20121. In addition, the people with
special access needs from the 11 key international inbound markets generated a total economic
contribution of 34 billion Euros in terms of total output and 15 billion Euros in terms of gross value
added or 17 billion Euros in terms of GDP to the EU.
Demand for accessible tourism will also continue to grow in future, with the forecast of future growth
suggesting that by 2020 the demand by people within the EU will grow to about 862 million trips per
year whilst the demand by the key international inbound markets will reach 21 million trips per year,
and possibly more if accessibility improves in the tourism sector. The forecast based on the most
optimistic scenario tested in this study, based on extensive improvements in accessibility (Scenario
C), shows that up to 39.4% of additional economic contribution associated with the demand by
people within the EU could be achieved, which suggests that up to 1,073 billion Euros of total output
could be generated, along with up to 12.1 million employed persons within the whole EU economy -
taking all direct, indirect and induced effects into account. Moreover, under Scenario C, up to 74.9%
of additional economic contribution associated with the demand by people from the key international
inbound markets would be reached, which the whole EU economy will in total benefit from 60 billion
Euros of economic output and 940 thousand employed persons. Besides, it was estimated that each
individual with special access needs in the EU and beyond travelled with 1.9 companions on
average. With the additional contribution from travel companions taken into consideration, the
overall economic contribution related to accessible tourism demand could be further amplified by a
similar scale. Another interesting trend is the growth of the population with access needs in inbound
markets, which can have a positive impact on the EU tourism sector (see Tasks 1b and 4b).
However, the study shows that travellers with access needs encounter problems and obstacles while preparing a trip or travelling and that, in general, destinations and service providers in tourism have insufficient awareness of the importance of accessible tourism (see Tasks 3b,
2b and 4a). Many are not yet prepared for the demands of guests with access needs in terms of
1 According to the latest statistics from Eurostat: http://epp.eurostat.ec.europa.eu/tgm/refreshTableAction.do?tab=table&plugin=1&init=1&pcode=tec00001&language=en
464
infrastructure, services and attitudes. Nevertheless the results show that the majority of tourists with
access needs managed to find destinations that, in general, were satisfactory for them in that
respect. This illustrates two important aspects:
Even when facing difficulties in finding information, tourists with access needs are often able to
choose destinations adapted to their needs.
A number of destinations already benefit from accessibility as a competitive tool, either following
the implementation of a specific strategy or through word-of-mouth.
In order to improve the accessible tourism offer and encourage demand, isolated and individual
responses to support or develop accessible tourism do not address the issue adequately. Success
depends on a professional and coherent approach tackling a range of factors and leading to a cost-
effective implementation of initiatives. The present study therefore makes the following
recommendations:
1. Commitment of the decision-makers Under three scenarios of increasing accessibility levels, it was estimated that demand would
increase respectively by 24.2%, 33.2% and 43.6% (see Task 1). For the tourism industry to realise
these benefits and taking into account the diversity of social, economic or political systems, the
implementation of accessible tourism generally stands a greater chance of success when it is also of
benefit to the general tourist and integrated in mainstream offers. It is also an important task for
decision makers to encourage service providers to invest in accessible tourism and to demonstrate
its economic and social benefits to the whole community.
Service providers in tourism may also feel unsure about the strategy to follow because they are
unaware of how to implement accessibility. Similarly guests encounter a variety of standards and
labels across Europe and even within the same country (see Task 3b). The study suggests that the
question of harmonising standards and legislation could be an important factor in improving
accessibility, through better guidance for providers and clearer information for users. Existing
legislation such as, for example, the Lifts Directive 95/16/EC have already shown the benefits of this
type of approach. This harmonisation towards improved accessibility could also be an effective way
to attract tourists with access needs from the growing inbound markets.
Strong and on-going support from politicians, administrators and decision makers in business is
another key factor. This includes support in education and training as well as direct financial

465
support (see Tasks 3a, 3b and 4a). Many service providers who are aware of the issues are looking
for stronger financial support and funding especially for accessible offers. In many countries, tourism
in general is crucially dependent on public money. Accessibility and Design for All1 should be
considered for inclusion in the criteria for public funding and may also be considered a requirement
in public procurements.
2. Coordinating and continuity The study findings show that accessible tourism is considered a valuable business opportunity. Yet,
in order to ensure future growth, it is anticipated that the industry needs to improve its coordination efforts, particularly through public-private partnerships and on local and regional level (see
Task 4a). Accessible tourism requires long term commitment. Enhancement of services and
infrastructure is an on-going task, which requires technical and financial resources as well as human
resources and knowledge. To ensure the sustainability of the development process and a
professional approach, it is useful to assign a dedicated work unit or coordinator within the
management structure of tourism organisation with appropriate resources, particularly in terms of
setting up and maintaining network communication, following up strategies and actions defined
within the process plan and storing and circulating knowledge accumulated during the process. The
higher the position of the coordinator within the management structure, the greater the impact of
internal and external communication is.
3. Networking and participation Accessible tourism is a complex subject and there are many potential pitfalls for service providers
and destinations. Analysis of good practice and success stories shows that knowledge transfer flows
more easily when organisations are part of wider professional networks of experienced service
providers and experts on accessibility (see Task 3a). European countries have access to the ENAT
network, and national or regional networks exist in many countries. Among the benefits are the
exchange of knowledge, enhanced advertising opportunities and improved communication with
client groups. In addition, these networks play an important role in putting accessible tourism issues
on the political and administrative agenda.
1Design for All is about ensuring that environments, products, services and interfaces work for people of all ages and abilities in different situations and under various circumstances.
466
Local networks among providers at a destination are a key factor for success as they enable closer
collaboration to ensure accessibility along the entire tourism chain. In addition to including the entire
chain, it is equally important to guarantee the accessible offer across all categories of services and prices offered at the destination. Indeed, the study shows that sizeable proportions of travellers
feel they have to pay more or switch to more expensive services to benefit from an accessible offer
(see Task 2b).
4. Strategic planning Service providers, destinations and other decision-makers in tourism may often respond to demands
of guests in an ad hoc
However, strategic planning is crucial for sustainable success, particularly when the forecasted
increase in demand is taken into account. So, the development of accessible tourism should
proceed strategically, and step by step:
1. On a strategic and long-term level, it is important to be aware of the diversity of access needs and patterns of travel behaviour across different groups and countries, but also across individuals within groups, and to target them in the most appropriate way.
For instance, the results of the study show that it is not enough to focus just on wheelchair
users or older guests. Those travelling with children complain about a lack of services for
children, while diet-related aspects, such as special menus for allergies and religious
2. An inventory of the current offer in terms of infrastructure, services and possibilities for improvement might be a first step. It is important to involve guests and other
stakeholders already at this stage of the process in order to incorporate the very best
practice.
3. Having identified the strengths and weaknesses of the offer and the demands of potential
guests, it can be advisable to improve the offer gradually. Often, just minor changes are
enough to substantially enhance services and comfort for the guests (see Task 2b).
Furthermore, accessibility should be an important feature of long-term planning and investments in modernisation of infrastructure. It is also crucial to develop tools to listen to the specific requirements of guests to establish accessibility priorities (see Task 3a).
4. The study shows that a well planned investment in infrastructures and service provision can
make a good return on investment in the relatively short term as high proportions of tourists
with access needs tend to return (see Tasks 3a and 2b). This can also be enhanced through
improved marketing and advertising strategies taking into account accessibility features.
467
5. Knowledge management and qualification Though accessibility is often considered merely a matter of infrastructure, services are at least as
important. As shown in the study (see Tasks 2b and 3a), good services can overcome many
obstacles in infrastructure, while poor service may prevent guests from enjoying accessible offers.
For instance, an accessible toilet (the main barrier identified in Task 3b) is useless if staff do not
inform guests that it is available. It is therefore important that all members of the staff acquire a solid
knowledge base on accessibility through good knowledge management. This can be
supplemented by information about good practice examples and with the experience of external
experts in order to learn from the experience of other successful providers (see Task 3a).
Regular training of staff and management is also important to keep all service providers up-to-
date and to help them to understand the demands and wishes of all guests. Many service providers
still feel uncertain about how to treat a disabled guest or the specific needs of families with children.
This is why many guests experience attitudinal barriers and find the way they are treated an
important aspect of their trip (see Tasks 3b and 2b). Special training involving guests of different
groups is very helpful and can ensure an on-going exchange between guests and providers
ultimately leading to better quality services.
6. Optimisation of resources Optimisation of resources has two dimensions: using as many resources as possible to meet the
demands of a strategic development of accessible tourism while prioritising tasks along the service
chain. A better understanding of travel behaviour and patterns can help improve specific aspects of
the service chain within different tourism sectors (see Tasks 2b and 3b).
Most importantly, the study shows that overall, attitudinal barriers are encountered more often than
physical access barriers across all sectors by individuals with different types of access needs. The
awareness and level of training of service providers is thus an important factor across all
sectors, as highlighted above.
In the pre-travel/ information gathering stage, the lack or limited availability of information about accessible services represents the biggest barrier for people with access needs. Therefore, the
communication of accessible features of infrastructure and services remains to be improved (see
recommendation 7.Communication and marketing).
Barriers encountered in the transport stage largely refer to airlines not ensuring an accessible
environment. The infrastructure of airports and aircrafts (although significantly improved in recent
years for people with mobility impairments) should therefore be better adapted to the needs of
468
travellers with access needs. In addition to transport from home to destination, moving around at the
destination was seen as the sector where most barriers are encountered. This result shows the
importance to improve, for example, the accessibility of public transport, pathways and parking for travellers with access needs.
In the entertainment sector, people experience the most barriers with nature-based activities,
indicating that destinations should develop their offer on experiencing nature in an accessible way.
Usually all guests benefit from improvements in infrastructure and services. However, the results of
the survey show that different sub-groups report different barriers (see Tasks 2b and 3b). While
guests with limitations and seniors experience problems with the accessibility of toilets and private
space, families face more problems in public services and leisure activities. In planning improvements, the different needs and expectations of guests have to be taken into account. Therefore, although improvement of toilets and ergonomics in general along with additional space
are important factors, it is not possible to give general recommendations on how a service provider
or a destination should invest: improvements targeting specific sub-groups are more likely to have
an impact on the quality of the offer.
Aside from tourism chain stages and target group needs, seasonality and price offers are also
aspects to take into account (see Task 2b). For many service providers, it may be profitable to shift
the focus from the high season to the high percentage of people in all groups that travel off season.
Besides, the study shows that many potential guests do not travel due to financial reasons. This
underlines the need for accessible offers in the lower budget sector. In addition, it supplies a strong
argument for social tourism not just for guests with access needs.
7. Communication and marketing People with access needs demand specific information when preparing their trip (see Task 2b).
However, information on accessibility on websites and especially in brochures and other printed
materials is often insufficient, technical and not user-friendly. Once individuals have tried and tested
websites, these sources are then subsequently considered sufficient and reliable (see task 3b). Yet,
familiarity with the existing sources that have been proven to be reliable together with the tendency
to go back to these specific sources does not necessarily indicate that sufficient progress has been
made in this area. Most importantly, information on accessibility is not integrated in general
marketing and communication materials (see Task 2a). This is an issue as the results of the study
show that people with access needs show similar patterns in preparing their holiday trips to tourists
in general and only a small proportion use special-interest resources (see Task 2b). This is a strong
indicator to include sufficient accessibility information in mainstream tourism information.

469
However, detailed features may be difficult to fully integrate in all general materials and special-
interest media remain a useful resource to share more in-depth information. Regarding market
segmentation, the study results advise against segmenting target groups based on different types of
access needs. On the contrary, it suggests that as different access needs are present in any target
group, accessibility should always be part of the offer.
Besides, many guests rely on personal information and recommendations which should be an element of marketing strategies. Social media play an important role in word-of-mouth-
communication, especially among younger groups of guests, for instance the important group of
families with children (see Task 2b).
Further to the efforts to improve accessibility through the involvement of decision-makers, better
coordination, networking, strategic planning, knowledge management and the optimisation of
resources, the key final step is to promote these accessible tourism services and products among
travellers. Communication and marketing are therefore of particular relevance to embracing the
business opportunities created by the demand for Accessible Tourism.
Roadmap to success The above-mentioned recommendations and success factors should be integrated part of a process
to implement Tourism for All approaches. This process can only be completed step by step and
according to the specific situation at hand. Service providers, destination managers and
administrations have to decide when and how to start, which path to follow and what targets to be
achieved.
The development process usually takes place in four phases of transition1:
1. Awareness Phase
2. Starting Phase
3. Developing Phase
4. Consolidating Phase
All four phases display certain characteristics and actions that are common to all developments and
the recommendations are of different importance in the different phases. Nevertheless, the
recommendations can be prioritised and grouped according to the seven success factors and four
phases of transitions as per Figure 253.
1 Neumann/Reuber 2004, Aragall/Neumann/Sagramola 2008, Neumann/ Pagenkopf/Schiefer/Lorenz 2008

470
In order to respond in an appropriate and balanced way to all recommendations and success factors
mentioned before, the participation of all stakeholders and available resources has to be considered
in all phases according to the local or regional culture and conditions.
.
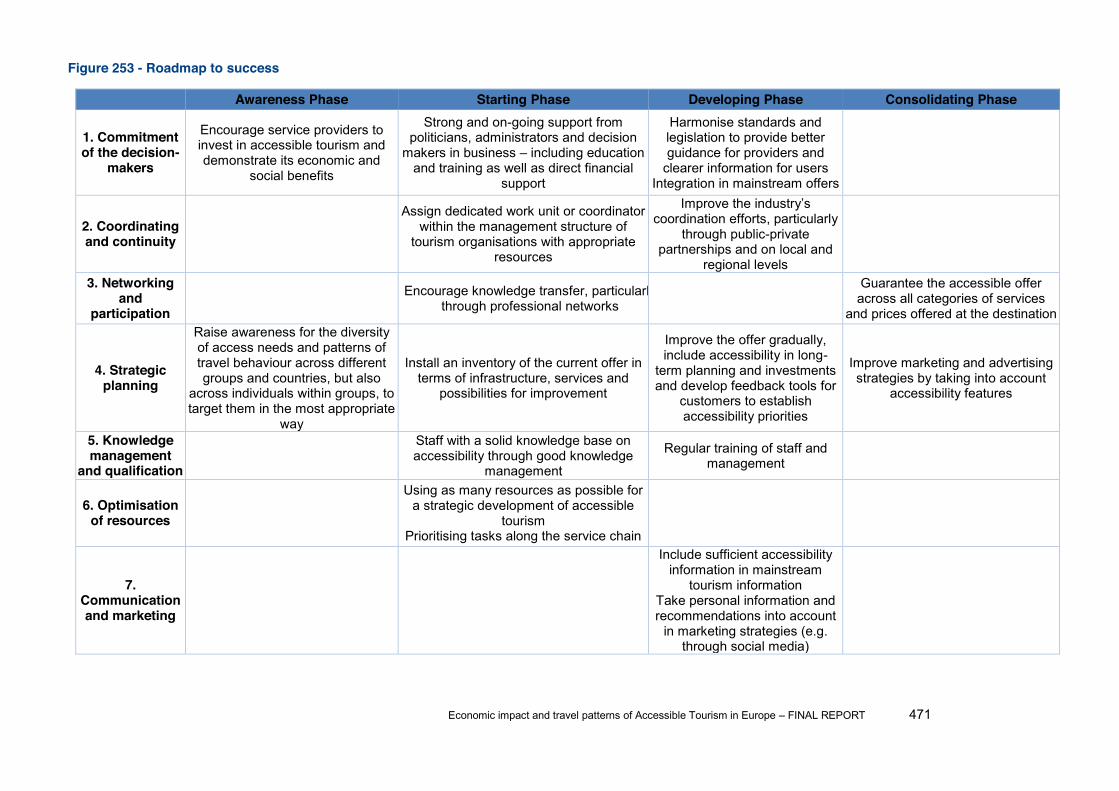
Economic impact and travel patterns of Accessible Tourism in Europe FINAL REPORT 471
Figure 253 - Roadmap to success
Awareness Phase Starting Phase Developing Phase Consolidating Phase
1. Commitment of the decision-
makers
Encourage service providers to invest in accessible tourism and demonstrate its economic and
social benefits
Strong and on-going support from politicians, administrators and decision
makers in business including education and training as well as direct financial
support
Harmonise standards and legislation to provide better guidance for providers and
clearer information for users Integration in mainstream offers
2. Coordinating and continuity
Assign dedicated work unit or coordinator within the management structure of
tourism organisations with appropriate resources
coordination efforts, particularly through public-private
partnerships and on local and regional levels
3. Networking and
participation Encourage knowledge transfer, particularly
through professional networks
Guarantee the accessible offer across all categories of services
and prices offered at the destination
4. Strategic planning
Raise awareness for the diversity of access needs and patterns of travel behaviour across different groups and countries, but also
across individuals within groups, to target them in the most appropriate
way
Install an inventory of the current offer in terms of infrastructure, services and
possibilities for improvement
Improve the offer gradually, include accessibility in long-
term planning and investments and develop feedback tools for
customers to establish accessibility priorities
Improve marketing and advertising strategies by taking into account
accessibility features
5. Knowledge management
and qualification
Staff with a solid knowledge base on accessibility through good knowledge
management
Regular training of staff and management
6. Optimisation of resources
Using as many resources as possible for a strategic development of accessible
tourism Prioritising tasks along the service chain
7. Communication and marketing
Include sufficient accessibility information in mainstream
tourism information Take personal information and recommendations into account
in marketing strategies (e.g. through social media)
Copyright © 2022 FDOKUMEN