Drinking water source and reproductive outcomes in Sprague-Dawley rats
13
Pergamon 0890-6238(95)02005-8 Reproductive Toxicology, Vol. 9, No. 6. pp. 549-561, 1995 Coavrieht 0 1995 Elsevier Science Inc. Printed in the USA. All rights reserved OWO-6238/95 $9.50+ .OO DRINKING WATER SOURCE AND REPRODUCTIVE OUTCOMES IN SPRAGUE-DAWLEY RATS’ JANET Y. URIU-HARE,* SHANNAH. SWAN,? LINH M. Bur,* RAYMOND R. NEUTRA,~and CARL L. KEEN** *Department of Nutrition, *Department of Internal Medicine, University of California at Davis, Davis, California, tDivision of Environmental and Occupational Disease Control, California Department of Health Services, Berkeley, California Abstract - As part of our work on the influence of water source on reproductive outcome, Sprague-Dawley rats were randomized to tap water, bottled water, or deionized water treatment groups, utilizing 160 animals per treatment; animals received the water prior to and during pregnancy. Rats were shipped in four batches (A-D). Batch effects were seen for several reproductive parameters. Because the tap water supply was interrupted by an earthquake resulting in an unbalanced design, primary analyses utilized only batches C and D, which included most of the tap water-treated rats. A treatment effect with respect to resorption frequency was seen that was marginally significant using a fixed-effects analysis of variance (P = 0.053), but not when batch was entered as a random effect (I’ = 0.36). The data were modeled by logistic regression, controlling for batch, litter size, and batch-treatment interaction. The odds ratio comparing tap to bottled water was 1.8 (95% CI 1.0 to 3.3, P = 0.05), which was similar to the epidemiologic result that prompted this study. The magnitude of this association varied by batch, and the difference in resorption frequency was within the range of variation seen for control animals. Although these findings do not justify pubiic health action at this time, further investigation is warranted. Key Words: reproduction; pregnancy outcome; resorption; water; bacteria; rats. INTRODUCTION Several recent epidemiologic studies conducted by the California Department of Health Services sug- gested that risk of spontaneous abortion may be related to source and amount of drinking water con- sumed during early pregnancy (l-4). In this group of studies, conducted primarily in one county in California, spontaneous abortion rates were higher among women who reported drinking tap water dur- ing the first trimester than among women who re- ported drinking bottled water. Although the magni- tude of the association differed somewhat among studies, the results suggested a 25 to 50% greater risk of spontaneous abortion in women who drank tap (or mostly tap) water during the first trimester of their pregnancy compared to those who drank bottled (or mostly bottled) water (5). If causal, these results could be explained by a reproductive toxicant ‘Supported in part by the California Department of Health Services, and HD 072241 (J.Y.U-H). Address correspondence to Dr. Carl L. Keen, Department of Nutrition, University of California at Davis, Davis, CA 95616- 8669. Received 3 March 1995; Revision received 5 June 1995; Ac- cepted 10 June 1995. 549 in the tap water in (some or all of) the study areas, by something beneficial in the bottled water con- sumed in those areas, or both. These results prompted additional epidemiologic studies, exten- sive water analyses, and two animal studies. The first of these animal studies (6) examined resorption frequency in Fischer 344 rats treated between days 0 and 20 of gestation. The study included three treat- ment groups, each with 60 dams, to which rats were assigned after mating. Treatments included tap wa- ter collected from the homes of subjects in one of the epidemiologic studies, a commercial bottled water used widely in the study area, and HPLC laboratory- grade water (water in which all organics were below the limit of detection using -high-performance liquid chromatography). That study found a somewhat higher resorption frequency (average resorptions/ litter) in rats fed tap water compared to bottled water (5.5% vs. 3.4%; one-sided P-value = 0.05). This result of a 60% greater resorption frequency in tap than bottled water-fed rats was similar to results in the epidemiologic studies. In the first animal study it was necessary to examine 78 HPLC water-fed rats, compared to 69 bottled and 69 tap water-fed rats that showed sperm plugs to reach the desired
-
Upload
independent -
Category
Documents
-
view
3 -
download
0
Transcript of Drinking water source and reproductive outcomes in Sprague-Dawley rats

Pergamon
0890-6238(95)02005-8
Reproductive Toxicology, Vol. 9, No. 6. pp. 549-561, 1995 Coavrieht 0 1995 Elsevier Science Inc. Printed in the USA. All rights reserved
OWO-6238/95 $9.50 + .OO
DRINKING WATER SOURCE AND REPRODUCTIVE OUTCOMES IN SPRAGUE-DAWLEY RATS’
JANET Y. URIU-HARE,* SHANNA H. SWAN,? LINH M. Bur,* RAYMOND R. NEUTRA,~ and CARL L. KEEN**
*Department of Nutrition, *Department of Internal Medicine, University of California at Davis, Davis, California, tDivision of Environmental and Occupational Disease Control, California Department
of Health Services, Berkeley, California
Abstract - As part of our work on the influence of water source on reproductive outcome, Sprague-Dawley rats were randomized to tap water, bottled water, or deionized water treatment groups, utilizing 160 animals per treatment; animals received the water prior to and during pregnancy. Rats were shipped in four batches (A-D). Batch effects were seen for several reproductive parameters. Because the tap water supply was interrupted by an earthquake resulting in an unbalanced design, primary analyses utilized only batches C and D, which included most of the tap water-treated rats. A treatment effect with respect to resorption frequency was seen that was marginally significant using a fixed-effects analysis of variance (P = 0.053), but not when batch was entered as a random effect (I’ = 0.36). The data were modeled by logistic regression, controlling for batch, litter size, and batch-treatment interaction. The odds ratio comparing tap to bottled water was 1.8 (95% CI 1.0 to 3.3, P = 0.05), which was similar to the epidemiologic result that prompted this study. The magnitude of this association varied by batch, and the difference in resorption frequency was within the range of variation seen for control animals. Although these findings do not justify pubiic health action at this time, further investigation is warranted.
Key Words: reproduction; pregnancy outcome; resorption; water; bacteria; rats.
INTRODUCTION
Several recent epidemiologic studies conducted by the California Department of Health Services sug- gested that risk of spontaneous abortion may be related to source and amount of drinking water con- sumed during early pregnancy (l-4). In this group of studies, conducted primarily in one county in California, spontaneous abortion rates were higher among women who reported drinking tap water dur- ing the first trimester than among women who re- ported drinking bottled water. Although the magni- tude of the association differed somewhat among studies, the results suggested a 25 to 50% greater risk of spontaneous abortion in women who drank tap (or mostly tap) water during the first trimester of their pregnancy compared to those who drank bottled (or mostly bottled) water (5). If causal, these results could be explained by a reproductive toxicant
‘Supported in part by the California Department of Health Services, and HD 072241 (J.Y.U-H).
Address correspondence to Dr. Carl L. Keen, Department of Nutrition, University of California at Davis, Davis, CA 95616- 8669.
Received 3 March 1995; Revision received 5 June 1995; Ac- cepted 10 June 1995.
549
in the tap water in (some or all of) the study areas, by something beneficial in the bottled water con- sumed in those areas, or both. These results prompted additional epidemiologic studies, exten- sive water analyses, and two animal studies. The first of these animal studies (6) examined resorption frequency in Fischer 344 rats treated between days 0 and 20 of gestation. The study included three treat- ment groups, each with 60 dams, to which rats were assigned after mating. Treatments included tap wa- ter collected from the homes of subjects in one of the epidemiologic studies, a commercial bottled water used widely in the study area, and HPLC laboratory- grade water (water in which all organics were below the limit of detection using -high-performance liquid chromatography). That study found a somewhat higher resorption frequency (average resorptions/ litter) in rats fed tap water compared to bottled water (5.5% vs. 3.4%; one-sided P-value = 0.05). This result of a 60% greater resorption frequency in tap than bottled water-fed rats was similar to results in the epidemiologic studies. In the first animal study it was necessary to examine 78 HPLC water-fed rats, compared to 69 bottled and 69 tap water-fed rats that showed sperm plugs to reach the desired

550 Reproductive Toxicology Volume 9. Number 6. 199.5
sample size of 60 “successful” pregnancies (i.e.. evidence of fetuses and/or resorptions). Although these differences were not statistically significant (P = 0.12 comparing HPLC-water vs. either tap OI bottled water), they suggested that HPLC-water had no advantage over distilled deionized water, the usual control water in this laboratory. Therefore, in this second experiment, distilled deionized water was selected as the treatment against which tap and bottled water were compared.
The study reported here differed from the first animal study in other ways. First, Sprague-Dawley rats were used instead of Fischer 344 rats to obtain data from a second strain, as well as to utilize a strain of animals commonly used in our laboratory. Secondly, the sample size was increased to 160 ani- mals per treatment group so that a 50% increase in the proportion of dams with one or more resorptions could be reliably detected, even in this strain with a low resorption frequency. Resorption frequencies in “control” groups have typically averaged < SC/c over the past several years in our laboratory. Third, dams were treated prior to, as well as during, preg- nancy in an attempt to amplify any differences among treatment groups.
This experiment also differed from many toxi- cology protocols in several respects. The difference in resorption frequency of4 to 5.5% that was hypoth- esized is smaller than that usually sought in toxico- logic studies. Moreover, no single “agent” was tested. Therefore. there was no attempt to obtain a dose response. Although this might have been possi- ble by concentrating or diluting the drinking water. such procedures might also have altered the (hypo- thetical) biologic or chemical agent. For this reason. animals were treated with tap and bottled water as consumed by subjects in the epidemiologic study. Although this approach is nontraditional, the prior epidemiologic and toxicologic results suggested that a change in resorption frequency of the magnitude predicted should be detectable with the study design and sample size employed.
MATERIALS AND METHODS
Virgin female Sprague-Dawley rats weighing between 180 and 200 g were obtained from a com- mercial vendor (Bantin and Kingman, Fremont. CA) between September 1989 and June 1990. Rats were housed individually in stainless steel cages (7 x
9-l /4 x 7-l/4”) in a controlled environment (2 1 to 23 “C; 12 h light: dark cycle, lights on at 0700 h). Humidity was 40 to 70%; air changes were 10 to 15/h. The animals were fed a commercial rat chow
(Purina Rat Chow, Belmont, CA) ad lib throughout the study. Tap water samples were taken from five of the homes in which participants in the epidemiologic study resided. These households were served by a single water company and received unchlorinated and untreated ground water. Water samples were collected weekly in autoclaved glass carboys and samples from the five households were pooled be- fore storage. The brand of bottled water used in this study was that consumed most often by study subjects in the area from which tap water was ob- tained. Distilled deionized water is the control water routinely employed by this laboratory. Rats were randomly assigned to one of three treatment groups: tap water (TAP); bottled water (BOTTLED); and deionized distilled water (DEIONIZED). In the Fischer 344 rat study, conducted previously, an in- crease in normally occurring saprophytic bacteria had been observed after refrigerated storage of the water for several weeks. Therefore, in the current study, all water samples were collected weekly and stored in glass bottles at 4 “C to minimize bacterial growth. Water was provided to the rats in glass bot- tles with stainless steel sippers. Drinking water was changed and water intake recorded every 2 d.
Females were provided their respective waters for a 2-week adaptation period. Subsequently, rats were mated overnight using chow-fed Sprague-Dawley males. Mating was confirmed by the presence of sperm plugs (designated day 0 of pregnancy). Males were rotated within each group every 4 nights. Females not showing evidence of mating after 3 weeks were removed from the study. Males were provided distilled deionized water ad lib except on mating nights, when they had access to the same water as the females. Subsequent to mat- ing, dams were given their respective water source throughout gestation. Animals were bred until a sample size of 160 “successfully” pregnant rats/ group was reached (i.e., evidence of fetuses and/or resorptions). Although this protocol is somewhat unusual, it was selected to obtain a fixed sample size in each treatment group. The sample size chosen insured that the study had 80% power to detect a 50% increase in the number of dams with at least one resorption. Animals were examined daily for any overt signs of toxicity. Successfully mated fe- males were monitored every 5 d for body weight. Research staff were blinded to the treatment group of each animal except for those individuals who only fed and cared for the animals.
Because of the large sample size and practical limitations of the animal facility, female rats arrived in four batches (A-D). Each batch was intended

Water source and rat reproduction l J. Y. URIU-HARE ET AL. 551
to constitute a replicate experiment. However, on October 17, 1989, a major earthquake occurred in the San Francisco Bay Area (the Loma Prieta earth- quake), which interrupted the supply of fresh tap water from the study area. There was only enough tap water left from the previous week’s supply to maintain a small subset (n = 7) of the TAP animals in batch A; the remaining rats in this group were removed from the study. Because of the unavailabil- ity of fresh tap water, these seven animals received tap water (during days 6 through 13 of their preg- nancy) that had been stored for up to 2 weeks. This was contrary to study protocol, which required that fresh water samples be obtained weekly. In addition, the rats in batch B that had been adapting to tap water at the time of the earthquake had to be re- moved from the study. As a result, there were no TAP rats in batch B. Therefore, the majority of ani- mals in the TAP treatment group came from the last two batches (C and D). For this reason, the primary analyses presented here only utilize animals from batches C and D.
On day 20 of gestation, all animals that had shown a copulatory plug were weighed, anesthetized with methoxyflurane (Pitman-Moore, Inc., Wash- ington Crossing, NJ), and killed via open cardiac puncture. After removing and weighing the uterus, the number of corpora lutea, implantation sites, re- sorptions, and live fetuses were recorded. Resorp- tions were classified as early (no discernible embryo or placenta), mid (discernible embryo, placenta or fetus, including autolyzed fetus), or late (dead fe- tuses with no obvious autolysis).
The variables “number of resorptions per lit- ter” and “proportion of dams with one or more resorptions” were both calculated using the number of dams who showed evidence of pregnancy (pres- ence of live fetuses or resorptions) at the time of sacrifice (gestation day 20) as the denominator. However, these variables do not reflect the loss of an entire litter before implantation or the resorption of all implanted embryos very early in pregnancy. Therefore, we examined maternal weight gain as a means of identifying litters that might have been totally resorbed. For this purpose, the weight gain in females that had shown a copulatory plug at mat- ing, but who had no evidence of pregnancy on day 20, was examined. Weight gain in these dams was compared to the weight gain of the known pregnant dams in our study, as well as to the expected weight gain for nonpregnant female rats, as obtained from the supplier. Rats without evidence of pregnancy at day 20 could be divided into two subsets. One subset consisted of rats with a pattern of weight gain compa-
rable to that of nonpregnant female rats. We as- sumed these were truly nonpregnant females. The second subset consisted of rats whose pattern of weight gain for approximately the first 10 d after mating was similar to that of pregnant dams (those with evidence of pregnancy on day 20 of gestation). However, weight gain in dams in this second subset slowed after day 10 in marked contrast to the pattern in rats who were known to be pregnant. We called this latter subset “possibly totally resorbed.” This subset may have included dams in whom no fetusus implanted, or alternatively, dams who were pseudo- pregnant. We examined the proportion of such rats in each batch and treatment group.
All fetuses were examined for external maifor- mations and anomalies, sexed, the crown-rump length measured, and the fetuses weighed. In addi- tion, placental weights were recorded. Alternate fe- tuses were placed in 95% ethanol for subsequent staining with Alizarin Red S and Alcian Blue (7). The remaining fetuses were placed in 10% formalin. An average of two fetuses per litter were taken for visceral exam using standard protocols (8). All of the fetuses prepared for skeletal and cartilage devel- opment assessment were examined.
In an attempt to identify possible etiologic agents, the three water sources were characterized using a number of analytic and microbiologic tests. Concentrations of 21 trace elements were detet- mined by inductively coupled plasma mass spec- trometry. Volatile organic chemicals (VOC) were analyzed by the EPA methods 502.1, 503.1, and 524.2 (9). Total organic carbon (TOC) was detet- mined by EPA method 9060, and total organic ha- lides (TOX) were analyzed by EPA method 9020 (10). Water samples from some of the wells supply- ing homes in the study area were also analyzed.
A 100 mL sample from the tap water composite was sent to the Sanitary Engineering and Environ- mental Health Research Laboratory of the Univet- sity of California, Berkeley, for bacteriologic analy- ses, which were performed within 24 h of collection. Bacterial counts were obtained by the same labora- tory on samples taken from the cage water bottles after 2 d of use. Counts of organisms culturable on heterotrophic plate media (HPC) were obtained using the pour plate method (11). These plates were incubated in a high humidity incubator at 35 “C for 48 h. In addition, direct bacterial counts, using acridine orange stain (AODC), were obtained using the method of Hobbie and collegues (I 2). Randomly se- lected isolates from HPC medium were purified and identification was attempted using two biochemical identification systems (API and Biolog). Also, iden-

552 Reproductive Toxicology Volume 9. Number 6. 1995
tification was attempted on a number of the isolates by analysis of the fatty acid content of the cell walls (Microbiological Identification, Inc.).
Statistical analysis The epidemiologic results could not distinguish
between three alternative hypotheses: I) an in- creased risk of spontaneous abortion in tap water drinkers; 2) a “protective” effect of bottled water; or 3) an increased risk in both tap and bottled water drinkers relative to some “ideal” control water, with tap water drinkers at greater risk than bottled water drinkers. By comparing tap water to both deionized and bottled water we hoped to distinguish among these three alternatives.
Although all animals within a treatment group are often combined for the purpose of statistical analysis, the analyses reported here consider the variation of resorption frequencies across batches. This was necessary because the October, 1989, earthquake resulted in approximately equal numbers of animals in the BOTTLED and DEIONIZED groups in each of the four batches, but few rats in the TAP group other than in batches C and D. Secu- lar trends in several reproductive parameters over the course of the study suggested that pooling data across batches was inappropriate.
Multiple reproductive endpoints are usually given equal weight in traditional toxicology studies. However, this study, as well as in the prior study of Fischer 344 rats, was conducted to follow-up on epidemiologic studies that linked spontaneous abor- tion to drinking water. Therefore, fetal resorption was singled out a priori as the parameter of primary interest. Traditional reproductive parameters, in- cluding fetal length and weight, proportion of fe- males vs. males, number of corpora lutea, and fetal anomalies (gross, visceral, and skeletal), were exam- ined as well.
Because of the statistical dependence of implan- tation sites within litter, all models in these analyses used the litter (or dam) as the unit of analysis. Two analysis of variance (ANOVA) models were initially utilized to test for the presence of a batch effect, a treatment effect, and a treatment-by-batch interac- tion. The first used a fixed effects model. However, because batch is more appropriately viewed as a random than a fixed effect, we also used a mixed model in which batch was random while treatment remained fixed (I 3).
ANOVA models assume that observations fol- low a normal (Gaussian) distribution. However, be- cause of the high proportion of litters with no resorp- tions, the number of resorptions per litter has a
distribution that is extremely skewed (see Figure I). Several transformations were considered, including the Freeman-Tukey transformation, which was de- rived for binomial data (14), but the transformed data failed to fit a normal curve. Because all ANOVA models fit poorly, alternative methods were utilized to analyze resorption frequency.
We turned to methods traditionally employed in epidemiology, including the odds ratio, the Man- tel-Haenszel method for combining estimates across strata, and logistic regression (15). Each of these methods assumes that the outcome of interest is a binomial variable. In this analysis, each dam is coded as a “failure” (one or more resorptions) or a “success” (no resorptions). Because the Mantel-Haenszel and logistic regression methods yield odds ratios (OR) as the estimate of the rate ratio, these have been used throughout for consis- tency. The OR estimates the relative risk, the rate of failure in one treatment group divided by the rate in a comparison group. It is usual epidemiologic practice to include a confidence interval for either the odds ratio or the relative risk (traditionally at the 95% confidence level). These confidence intervals incorporate the variability of the estimate and can also be used to provide a traditional test of signifi- cance: obtaining a 95% confidence interval that ex- cludes I .O is equivalent to obtaining an association that is significant at the 5% level (15). The odds ratios were first calculated separately for batches C and D. A summary estimate across batches C and D was then obtained using the method of Mantel-Haenszel (15) with confidence intervals calculated by the exact method of Greenland and Robins (16). To examine the possible effect of litter size on the probability of failure, this variable was entered into a multivariate model. A logistic regression model was used to estimate the treat- ment effect, while controlling for the effects of batch, treatment-by-batch interaction, and litter size. Separate logistic regression models were car- ried out to compare TAP to DEIONIZED and TAP to BOTTLED treatment groups.
RESULTS
As discussed above, only data from batches C and D were modeled when comparing all three treatments. Significant differences were seen be- tween batch C and D for some parameters, though not all. For this reason, a batch effect is included in all analyses. We present results using both the fixed effects model of ANOVA and the mixed model. These are included here because ANOVA is often

Bot
tled-
A
Bol
tled
-B
Bot
tled
-c
(N=4
6)
(N=3
7)
(N=4
2)
Bot
tled
-D
(N=3
5)
% o
f tm
plan
lalio
m
Res
orbe
d X
ol
lm
pbnt
atbn
r R
esor
hd
X.
of l
mpl
anla
lionr
R
ecor
lwd
Dis
tille
d-A
D
isti
lled-
B
Dis
lille
d-C
(N
=49)
fN
=32)
(N
=32)
D
islil
leLD
(N
=47)
‘%t o
f Im
pl~n
talio
nc
Rrs
orhr
d
Fig.
1.
Inc
iden
ce
of t
he
perc
enta
ge
of r
esor
ptio
ns
(#
reso
rptio
ns/#
im
plan
tatio
n si
tes
x 10
0) a
cros
s ba
tche
s (B
atch
es
A-D
),
from
da
ms
fed
diff
eren
t w
ater
so
urce
s th
roug
hout
ge
stat
ion.

554 Reproductive Toxicology Volume 9, Number 6. 1995
the method of choice for the analysis of toxicologic data. However, we think these models are inappro- priate for the analysis of resorption frequencies, though useful for variables such as weight gain or placental weight, which are approximately normally distributed (or transformable to approximately nor- mal distributions). For this reason, resorption data were analyzed using the alternative statistical meth- ods described above. Reproductive outcomes other than resorption frequency have been analyzed using ANOVA models only. Treatment effects for out- comes other than resorptions were minimal, and it is unlikely that results would be changed substantially using logistic regression.
and 0.09 for fixed effect and mixed models). Mean water intake was slightly less for batch C rats in the BOTTLED and DEIONIZED groups and only marginally different for TAP rats (41.5 vs. 41.8 mL/ d). The batch effect for water intake was significant only in the fixed-effects model (P = 0.006 vs. P = 0.21). An effect of water source on the number of resorptionsilitter was seen using the fixed effect model (P = 0.05), but not the mixed model (P = 0.36). As noted above, the departure from normality in the original and transformed resorption data re- sulted in a poor fit to these ANOVA models and led us to consider other models.
Reproductive outcomes The mean (?SEM) of selected maternal and
fetal parameters by batch and treatment are shown in Table I. The (two-sided) significance probabilities for these comparisons, obtained using ANOVA models, are shown in Table 2. Batch C rats were slightly heavier on gestation day 0 in all treatment groups but somewhat lighter on gestation day 20, resulting in a mean weight gain that was 11 g greater in batch D than in batch C. This batch effect was highly significant in both the fixed-effect and the mixed models (P = 0.0001 and 0.002, respectively). Batch C rats also showed evidence of mating about one-half day later than those in batch D (P = 0.06
The percentage of dams in each batch with evi- dence of fetal loss (one or more postimplantation losses) was compared between batches and treat- ment groups. Fetal loss among DEIONIZED ani- mals nearly doubled between batches C and D (21.9 and 38.3%). increased slightly among the BOT- TLED group, but decreased by 22% in TAP animals (Table 3).
After controlling for batch using the Man-
tel-Haenszel summary odds ratio, the proportion of dams with one or more resorptions was 80% greater in TAP than BOTTLED (OR = 1.8,95% CI I .O-3.3) and 120% greater in TAP than DEIONIZED (OR = 2.2. 95% CI 1.2-4. I ). The incidence of the per- centage of resorptions across batches is shown in Figure 1.
Table 1. Reproductive parameters by treatment and batch (mean i SEM)
Parameter BATCH TAP
Treatment
BOTTLED DEIONIZED
Number of dams
Weight gain (g, day O-20)
Water intake tmL/day) during gestation
Number implantation sites/litter
Number live fetuses/litter
Fetal wt (g)
Fetal length (cm)
Placental wt (g)
Number of resorptionsilitter
Postimplantation loss index“ (percent resorption)
Number corpora lutes/litter
c D C D C D C D c D c D C D C D C D C D C D
85 68
I38 -t 2 147 + 2
31.5 + 0.9 41.8 + I.0 14.4 * 0.3 14.0 i- 0.3 13.6 ? 0.3 13.4 + 0.3 3.44 t 0.03 3.55 i 0.05 3.85 + 0.01 3.94 + 0.02 0.49 * 0.01 0.49 ? 0.01 0.79 t 0. IO 0.60 ? 0.10
5.7 + 0.7 4.2 t 0.7
14.7 t 0.2 14.3 % 0.3
42 35
134 f 3 I46 -+ 3
40.1 + I.6 42.8 ? I.2 13.8 + 0.2 13.9 t 0.4 13.4 r 0.2 13.3 + 0.4 3.46 lr 0.0.5 3.40 2 0.03 3.84 2 0.02 3.87 + 0.03 0.50 % 0.01 0.50 t- 0.01 0.45 2 0.1 I 0.60 ? 0.21
3.2 ? 0.8 4.5 + I.4
14.0 f 0.2 14.4 + 0.4
32 47
I38 + 3 I49 + 3
37.4 ?z I.1 42.9 t I.2 13.8 k 0.3 14.3 ? 0.3 13.5 2 0.3 13.8 + 0.3 3.43 + 0.03 3.55 2 0.07 3.84 -’ 0.02 3.94 t 0.03 0.48 + 0.01 0.49 + 0.01 0.31 2 0.11 0.51 2 0.12
2.2 -t 0.8 3.8 2 I.0
14.2 2 0.3 14.7 + 0.2
aPostimplantation loss index = #implantation sites - # live births x loo
#implantation sites

Water source and rat reproduction l J. Y. URIU-HARE ET AL. 555
Table 2. Significance probabilities for two analysis of variance models (fixed effect vs. mixed) comparing reproductive parameters by treatment and batch
Parameter
Wt gain (g. day O-20)
Water intake (mL/day) during gestation
Number implantation sites/litter
Number live fetuses/litter
Fetal wt (g)
Fetal length (cm)
Placental wt tgl
Number of resorptionsilitter
Postimplantation loss index” (percent resorption)
Number corpora lutes/litter
Treatment 0.38 0.16 Batch 0.0001 0.002 Treatment x Batch 0.83 0.83 Treatment 0.45 0.75 Batch 0.006 0.21 Treatment X Batch 0.09 0.09 Treatment 0.62 0.64 Batch 0.76 0.77 Treatment X Batch 0.42 0.42 Treatment 0.71 0.37 Batch 0.92 0.84 Treatment x Batch 0.82 0.82 Treatment 0.29 0.59 Batch 0.17 0.40 Treatment x Batch 0.16 0.16 Treatment 0.06 0.36 Batch 0.0001 0.07 Treatment x Batch 0.20 0.20 Treatment 0.29 0.07 Batch 0.41 0.09 Treatment x Batch 0.90 0.90 Treatment 0.05 0.36 Batch 0.61 0.72 Treatment x Batch 0.19 0.19 Treatment 0.08 0.46 Batch 0.56 0.73 Treatment x Batch 0.11 0.11 Treatment 0.62 0.75 Batch 0.41 0.60 Treatment x Batch 0.24 0.24
P-value
Fixed effect model Mixed model
aPostimplantation loss index = #implantation sites - # live births x loo
#implantation sites
We considered the possible effect of litter size on the probability of failure; a smaller litter might have a smaller probability of including one or more resorptions than a larger one. We also included a term to assess the interaction between batch and treatment. These factors were explored using logis-
Table 3. Odds ratio for risk of resorption” by treatment adjusted for batch
Treatment Batch C Batch D Adjusted Table 4. Logistic regression analysis of risk of
(9%) %‘c) odds ratioh 95% Cl P-value resorption” (TAP vs. DEIONIZED)
TAP 48/85 30/68 - - - (56.5) (44. I)
BOTTLED 14142 14135 1.8C I .o-3.3 0.05 (33.3) (40.0)
DEIONIZED 7132 18/47 2.2d I .2-4.1 0.01 (21.9) (38.3)
aDams with one or more resorptions. bAdjusted for batch using Mantel-Haenszel procedure, with Greenland/Robins 95% confidence intervals (Cl). CTAP vs. BOTTLED. dTAP vs. DEIONIZED.
tic regression (Table 4). Treatment effect was statis- tically significant (in this analysis), as was the treat- ment-by-batch interaction. Litter size appeared to have little effect on risk of failure after controlling for batch and treatment (RR = 1.08, P = 0.09).
Resorptions were classified as early, mid, or late. As expected, most resorptions were early in all three treatment groups. Numbers were small and
Treatment Batch Litter size
Treatment x batch
Coefficienth 1.50 -0.47 0.08 -1.24 P-value 0.001 0.08 0.09 0.03 Odds Ratioh I .08
Batch C 4.48 Batch D 1.30
aDams with one or more resorptions. bAdjusted for treatment, batch, litter size, and treatment x batch. (Odds ratio estimates the rate ratio).

556 Reproductive Toxicology Volume 9, Number 6, 1995
Table 5. Fetal skeletal ossification by treatment and batch (mean 5 SEM)
Treatment
Parameter BATCH TAP
Number fetuses examined C 534 (85) (number of litters) D 442 (68) Number of ossification centers”
Sternum C 4.61 t 0.04 D 4.73 r 0.06
Caudal vertebrae c 5.25 + 0.05 D 5.36 t 0.08
Metacarpals C 3.18 ? 0.03 D 3.17 f 0.03
Anterior phalanges C 0.02 ? 0.01 D 0.09 + 0.06
“Number of fetal ossification centers expressed as an average per litter.
BOTTLED DEIONIZED
270 (42) 206 (32) 226 (35) 313 (47)
4.68 2 0.08 4.S2 2 0.07 4.52 + 0.08 4.61 + 0.09 5.19 2 0.09 5.21 t 0.06 5.16 2 0.08 5.17 k 0.11 3.14 2 0.04 3.13 2 0.03 3.13 2 0.04 3.17 + 0.05 0.07 i 0.07 0.00 5 0.00 0.00 k 0.00 0.11 + 0.06
treatment effects were nonsignificant in each of these categories (data not shown). The number of corpora lutea did not differ among treatment groups or batches, suggesting that implantation rates were similar, at least in dams with a continuing pregnancy (Table 1).
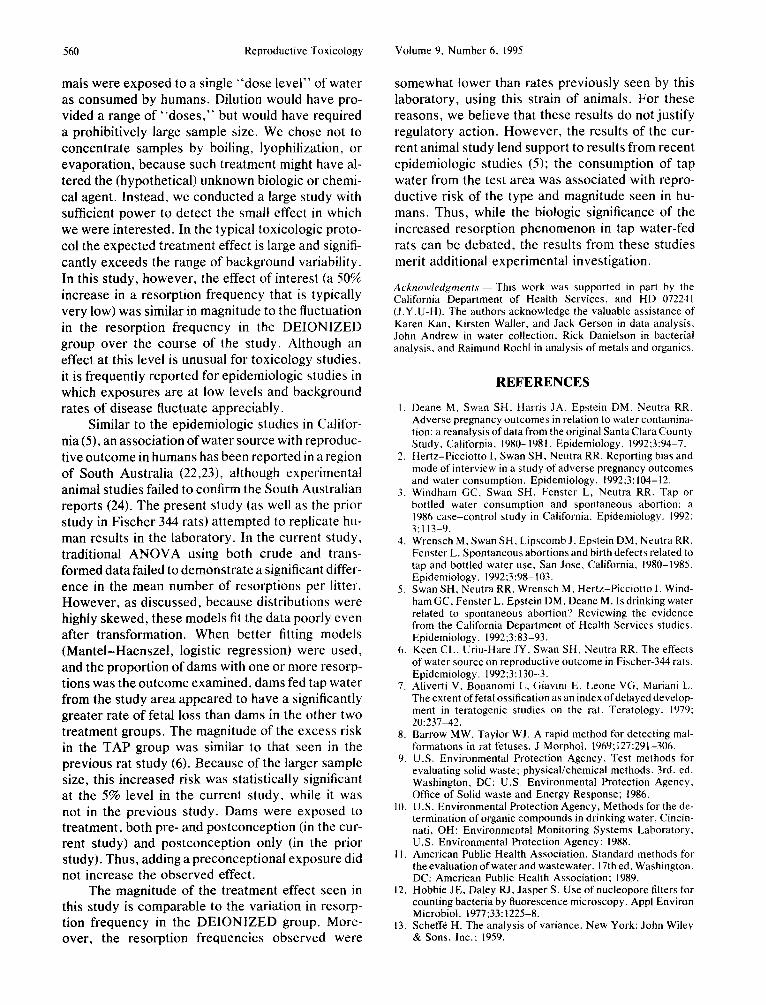
We also calculated the proportion of dams in each treatment group classified as “possibly totally resorbed.” Data are shown for DEIONIZED dams in batch C (Figure 2). In batches C and D, 13.6% (2.5 out of 184) of TAP rats and 8.6% (8 out of 93) of DEIONIZED rats were classified as “possibly
Data from Supplier - Non Pregnant (N=100)
I/ I
Fig. 2. Cumulative weight gain (grams) for batch C rats fed deionized water with and without evidence of implantation sites on gestation day 20 (Mean ;t SEM) compared to weight gain data of known nonpregnant rats (supplied by Bantin and Kingman, Fremont, CA). 0 *Pregnant-rats with evidence of one or more implantation sites on gesta- tion day 20. + **Possibly pregnant-rats with no evidence of implantation sites on gestation day 20. A **Not preg- nant-rats with no evidence of implantation sites on gesta- tion day 20. W Nonpregnant-weight gain data of known non pregnant rats (supplied by Bantin and Kingman, Fre- mont, CA).
totally resorbed,” compared to only 2.5% of rats in the BOTTLED group (2 out of 80). In batches A and B, the percentages for TAP, DEIONIZED, and BOTTLED groups were 12.5%, 7.8%, and l.l%, respectively. Thus, the lower rate in the BOTTLED group is seen in all four batches. Although this obser- vation is intriguing, it needs to be confirmed using a study design in which rats are killed early in gesta- tion rather than on day 20.
Fetal olrtcome Fetal length varied significantly by batch, while
fetal weight and placental weight were similar among batches and water sources (Tables 1 and 2). The proportions of males and females were similar in all batches and treatment groups (data not shown). The number of fetal skeletal ossification centers at any site were also similar in all treatment groups (Tables 5 and 6).
Table 6. Significance probabilities for two analysis of variance models (fixed effect vs. mixed) for comparing
fetal skeletal ossification by treatment and batch
P-value
Number of ossification centers Fixed effect Mixed
model model
Sternum Treatment 0.28 0.64 Batch 0.78 0.87 Treatment x Batch 0.1 I 0.11
Caudal vertebrae Treatment 0.17 0.26 Batch 0.81 0.78 Treatment x Batch 0.54 0.54
Metacarpals Treatment 0.49 0.20 Batch 0.78 0.58 Treatment x Batch 0.84 0.84
Anterior phalanges Treatment 0.93 0.95 Batch 0.36 0.54 Treatment x Batch 0.20 0.20

Water source and rat reproduction l J. Y. URIU-HARE ET AL. 551
Table 7. Incidence of specific skeletal abnormalities by treatment (batches C and D)
Treatment
TAP BOTTLED DEIONIZED
No. fetuses examined 976 496 519 (No. of litters) (153) (77) (79) Hemiverfebrae 7 3 5 Unossified vertebral centra 14 5 Misaligned sternebrae 3 0 ; Supernumerary rib(s) 105 57 27 Missing 13th rib 0 0 I Very poorly ossified 13th rib 0 I 0
All fetuses in batches C and D were examined for gross external anomalies (Table 7). The only major malformation noted occurred in the tap water group with one fetus with both cranioschisis and gastroschisis. Supernumerary ribs comprised the majority of the skeletal anomalies. These were pres- ent in 5.2% of fetuses in the DEIONIZED group vs. 10.8% of fetuses in the TAP group and 11.5% in the BOTTLED group.
The proportion of litters in which one or more fetus had a skeletal anomaly was similar in the TAP and BOTTLED animals (44.4% and 45.5%, respec- tively) but elevated compared to those in the DE- IONIZED group (29.1%) (Table 8). Using a two- tailed test, TAP and BOTTLED animals had rates of skeletal anomalies that were significantly higher than those in the DEIONIZED group. As with re- sorption frequency, the difference between groups was more marked in batch C than batch D.
Water characterization None of the water samples had concentrations
of trace elements, VOC, TOC, TOX, or bacterial counts outside the range of typical levels found in the U.S. drinking water supplies (9,10), although there were some differences among the three types of water.
Fifteen elements (aluminum, barium, boron, calcium, chromium, copper, lead, lithium, magne- sium, nickel, scandium, sodium, strontium, vana- dium, and zinc) were present at higher concentra- tions in tap water than in either bottled or deionized water. Among these elements, the tap water samples contained, on average, 1320 Fug/L of zinc and 7.6 PgIL of lead, while bottled and deionized waters contained mean levels of zinc that were < 2 pg/L and undetectable amounts of lead. Although several elements were present in tap water at levels that exceeded typical US drinking water levels (17), they did not exceed California drinking water standards
(18). Bacterial counts (AODC and HPC) were consis-
tently higher in tap water than in bottled or deionized waters (Table 10). In tap water, there were approxi- mately lo3 to lo4 organisms/ml by AODC. This measure represents a count of individual bacteria that are captured on a water filter and then stained with acridine orange. This count estimates the num- ber of viable organisms in a given volume of water. The heterotrophic plate count (HPC) involves cul- turing a known aliquot of water on a medium de- signed to facilitate the growth of bacteria. Not all species can be induced to grow on this medium. Indeed, of the lo3 to lo4 bacteria recovered from tap water, only 10’ organisms/ml were culturable on HPC. In the bottled and deionized waters, there were approximately lo2 to lo3 organisms/ml by AODC, and very few culturable bacteria. After rats had drunk from the water bottles, the average HPC counts in cage water were about 10’ to lo6 organ- isms/ml, regardless of the type of water. However, the AODC on water samples from cages in the tap water group were consistently higher than the AODC on bottled and deionized cage water samples (lo5 vs. lo6 organisms/ml).
We succeeded in culturing only a small propor- tion of the organisms counted by AODC. Of these
Table 8. Skeletal abnormalities by treatment (batches C and D)
TAPa
Treatment Significance probability
BOTTLEDa DEIONIZEDa TAP vs. BOTTLED TAP vs. DEIONIZED
Fetuses with ~1 122 (12.5) Jl_ (12.3) 36 (6.9) 0.91 0.001 skeletal abnormality 976 496 519
Fetuses with multiple 6 (0.6) 3 (0.6) 0 (0.0) 0.98 0.07 skeletal abnormalities 976 496 519
Litters with 21 68 (44.4) 35 (45.5) 23 (29. I) 0.88 0.02 skeletal abnormality 153 77 79
“# Abnormal (%) # Examined

558 Reproductive Toxicology Volume 9. Number 6. 1995
Table 9. Concentrations of trace elements by water source, in comparison to California drinking water standards and typical levels in United States drinking water supplies
(pg/L) (average of two measurements)
Element Tap Bottled Deionized
California Drinking
Water Standard (17)
Typical U.S.
drinking water
level (Range) (18)
Barium
Boron
Calcium”
Chromium
Copper
Lead
Lithium
Magnesium”
Nickel
Scandium
Sodium”
Strontium
Vanadium
Zinc
24.5 4.0 2.5 1,000 74 (ND-2.760) I 06 I.5 0.8s I .ooo 29 (ND-172)
123.5 <3 <3 NA NA
S5,SOO 1214.5 555 NA 26.000 (to 145,000)
Il.4 CO.2 10.3 SO 8.S (ND-I 12)
156.5 O.SS co.3 I .oooh 100 (ND-450)
1.6 co.2 co.2 SO 3.7 (ND-621
9.6 10.2 SO.2 NA NA
32.350 817.S 44.5 NA 6.250 (to 120.000)
9.9 0,s <0.4 NA S (0.4-75)
41.1s 10.2 10.2 NA NA
24.050 4150 <20 NA 28,000 (to 220,000)
449.5 3.0 <0.2 NA 10,000 (2,200-12,000)
3.8.5 10.2 co.2 NA 4 (ND-70)
I320 1.35 0.7s 5,oooh 200 (ND-1,500)
“Analyzed in well water only
bAesthetic standard only.
NA = Not available.
ND = Nondetectable.
colonies cultured, most could not be identified. Or- ganisms identified from tap water included opportu- nistic pathogens such as Pusterrrella haemolytica. Pasteurella anatipesti$er, Vihrio damselrr. and Pseudomonas spp. However. these identifications are suspect because the identification systems em- ployed are primarily used in the identification of clinical isolates. On matched isolates, identifications
by these three systems seldom agreed to the genus level.
DISCUSSION
This study was designed with a sample size large enough to have a high probability of detecting a 50% increase in fetal loss (the end point of concern in
Table 10. Bacterial counts by treatment
Type of water II Percentile AODC” HPCh HPCiAODC (%)
Fresh
TAP
BOTTLED
DEIONIZED
Cage water TAP
BOTTLED
DEIONIZED
64
66
32
25th 4.200 SOth 7.037 75th I0.000 2Sth 94 50th 235 75th I.135 25th II7 50th 274 75th I.500
33
39
41
25th 690,000 125,000 8.70 50th I ,600.OOO 330,000 22.00 75th 2,300,ooo 520,000 72.50 2Sth 250,000 350,000 66.70 SOth 430,000 670,000 103.30 75th 670,000 990,000 254.60 25th 60.200 78,000 55.80 50th 140.000 I70,OOO 106.90 7Sth 235.250 300.000 171.90
S6
83
I03 <I
4
<I
<I I
0.50 1.04
2.74
0.04 0.22
1.92
0.00 0.05
0.30
“AODC in counts/ml. ‘HPC in colony forming units/ml.

Water source and rat reproduction l J. Y. URIU-HARE ET AL. 559
humans). This is an increase similar to that seen in several epidemiologic studies (5). After controlling for batch using the mixed model ANOVA, the effect of treatment on number of resorptions per litter was not significant (P = 0.36). Because the number of resorptions per litter followed a distribution that was highly skewed, we chose to compare the number of dams with one or more resorptions (“failures”) in the tap water group to that proportion in the other treatment groups. These data are summarized as odds ratios that compare the risk of failure between two treatment groups. For the TAP and BOTTLED water comparison, we observed an odds ratio of 1.8 (95% CI l.O-3.3), after controlling for batch. When TAP was compared to DEIONIZED, this associa- tion appeared slightly stronger (OR = 2.2, 95% CI I .2-4. l), and both associations were significant (P < 0.05). However, logistic regression identified a significant batch-treatment interaction; the eleva- tion in resorption frequency was seen primarily in batch C.
Chernoff and co-workers reported significant month-to-month variation in maternal and fetal pa- rameters in mice given either distilled water or a municipal drinking water source over an &month study (19). In our study, the number of resorptions per litter increased in successive batches in both the deionized and bottled water groups, but resorptions in the tap water group decreased in successive batches. Although interbatch variation for resorp- tion frequencies was substantial, logistic regression analysis showed a significant treatment effect for resorptions, even after controlling for this batch ef- fect. This is also true when the full data set (including batches A and B) is analyzed.
Because of small numbers, we chose not to present data from batches A and B. However, re- sults from these batches are of interest. Among the seven TAP rats in batch A, five had evidence of fetal loss (71.4%), compared to a rate of 28.3% in the 46 BOTTLED rats and 18.4% in the 49 DEIONIZED rats. Unlike TAP rats in batches C and D, these seven rats received water stored for up to 2 weeks during days 6 through 13 of their pregnancy. This was due to the interruption of the tap water supply as a result of the Loma Prieta earthquake. It is possi- ble that longer storage amplified some component in tap water that resulted in a higher resorption fre- quency in these animals. This difference might be the result of chance, although the resorption fre- quency in the seven TAP rats was significantly higher than corresponding frequencies for the BOTTLED (P < 0.01) and DEIONIZED (P < 0.001) groups.
We also compared the proportion of “failures” (dams with one or more resorption) between the BOTTLED and DEIONIZED animals across all four batches. Although the failure rate was some- what higher in BOTTLED rats in each batch, the magnitude of the excess was inconsistent. The Man- tel-Haenszel summary odds ratio for BOTTLED compared to DEIONIZED was similar in magnitude to that seen when comparing TAP and BOTTLED rats in batches C and D, though the former did not achieve statistical significance (OR = 1.41, 95% CI 0.81-2.46).
The four manifestations of developmental toxic- ity typically considered in standard toxicology stud- ies are fetal growth, functional deficits, embryo- lethality, and structural changes. No effect of water treatment on fetal growth was seen, and functional deficits were not assessed in this study. However, our data suggest a difference between treatment groups with respect to embryolethality. In addition, both TAP and BOTTLED groups showed somewhat greater frequencies of fetal skeletal anomalies than the DEIONIZED group, and this was seen in all batches. Chernoff and co-workers (19) also reported an increase in the incidence of supernumerary ribs in fetuses from mice drinking municipal drinking water vs. purified distilled water. The significance of these anomalies, which are considered to be minor variations by some investigators, is uncertain. How- ever, it is clear that they reflect a subtle alteration in normal development.
Characterization of the three waters did not identify an etiologic agent. None of the chemical constituents nor bacteria were present at levels un- usual for U.S. drinking water (10). Could bacterial differences in the source waters, at the time of col- lection, or after laboratory handling, explain the dif- ferences in the resorption rates seen in this study? Several studies have dealt with the bacteriologic quality of water and reproductive outcomes. It has been suggested that disinfection of laboratory water can affect bacteriologic quality (20) and that water treatment may influence reproduction (21). The tap water did contain higher bacterial counts than either bottled or deionized waters. However, less than 2% of the bacteria in tap water based on AODC were culturable on HPC medium and most culturable or- ganisms could not be identified. Of those bacteria that were identified, none are known to cause repro- ductive toxicity.
Unlike standard toxicology studies, no single agent was tested in this experiment. Rather, both tap and bottled water contained an unknown and complex mixture of possible agents. Moreover, ani-
560 Reproductive Toxicology Volume 9, Number 6, 1995
mals were exposed to a single “dose level” of water as consumed by humans. Dilution would have pro- vided a range of “doses,” but would have required a prohibitively large sample size. We chose not to concentrate samples by boiling, lyophilization, or evaporation, because such treatment might have al- tered the (hypothetical) unknown biologic or chemi- cal agent. Instead, we conducted a large study with sufficient power to detect the small effect in which we were interested. In the typical toxicologic proto- col the expected treatment effect is large and signifi- cantly exceeds the range of background variability. In this study, however, the effect of interest (a 50% increase in a resorption frequency that is typically very low) was similar in magnitude to the fluctuation in the resorption frequency in the DEIONIZED group over the course of the study. Although an effect at this level is unusual for toxicology studies, it is frequently reported for epidemiologic studies in which exposures are at low levels and background rates of disease fluctuate appreciably.
somewhat Iower than rates previously seen by this laboratory, using this strain of animals. For these reasons, we believe that these results do not justify regulatory action. However, the results of the cur- rent animal study lend support to results from recent epidemiologic studies (5); the consumption of tap water from the test area was associated with repro- ductive risk of the type and magnitude seen in hu- mans. Thus, while the biologic significance of the increased resorption phenomenon in tap water-fed rats can be debated, the results from these studies merit additional experimental investigation.
Ackno~~‘/e&~?zanf.s - This work was supported in part by the California Denartment of Health Services. and HD 072241 (J.Y.U-H). The authors acknowledge the valuable assistance of Karen Kan. Kirsten Wailer, and Jack Gerson in data analysis. John Andrew in water collection, Rick Danielson in bacterial analysis. and Raimund Roehl in analysis of metals and organics.
REFERENCES
I.
Similar to the epidemiologic studies in Califor- nia (5), an association of water source with reproduc- tive outcome in humans has been reported in a region of South Australia (22,23), although experimental animal studies failed to confirm the South Australian reports (24). The present study (as well as the prior study in Fischer 344 rats) attempted to replicate hu- man results in the laboratory. in the current study, traditional ANOVA using both crude and trans- formed data failed to demonstrate a significant differ- ence in the mean number of resorptions per litter. However, as discussed, because distributions were highly skewed, these models fit the data poorly even after transformation. When better fitting models (Mantel-Haenszel, logistic regression) were used, and the proportion of dams with one or more resorp- tions was the outcome examined, dams fed tap water from the study area appeared to have a significantly greater rate of fetal loss than dams in the other two treatment groups. The magnitude of the excess risk in the TAP group was similar to that seen in the previous rat study (6). Because of the larger sample size, this increased risk was statistically significant at the 5% level in the current study, while it was not in the previous study. Dams were exposed to treatment, both pre- and postconception (in the cur- rent study) and postconception only (in the prior study). Thus, adding a preconceptional exposure did not increase the observed effect.
2.
3.
Deane M, Swan SH. Harris JA. Epstein DM. Neutra RR. Adverse pregnancy outcomes in relation to water contamina- tion: a reanalysis of data from the original Santa Clara County Study. California, 1980-1981. Epidemiology. 1992;3:94-7. Hertz-Picciotto 1. Swan SH. Neutra RR. Reporting bias and mode of interview in a study of adverse pregnancy outcomes and water consumption. Epidemiology. 1992;3: 104-12. Windham GC, Swan SH, Fenster L, Neutra RR. Tap or bottled water consumption and spontaneous abortion: a 1986 case-control study in California. Epidemiology. 1992: 3:113-Y.
4.
5.
6.
7.
Wrensch M. Swan SH. Lipscomb J, Epstein DM, Neutra RR. Fenster L. Spontaneous abortions and birth defects related to tap and bottled water use. San Jose. California, 1980-1985. Epidemiology. 19Y2,2;3:98-103. Swan SH. Neutra RR. Wrensch M. Hertz-Picciotto 1. Wind- ham GC, Fenster L. Epstein DM, Deane M. Is drinking water related to spontaneous abortion? Reviewing the evidence from the California Department of Health Services studies. Epidemiology. 1992;3:83-93. Keen CL. Uriu-Hare JY, Swan SH, Neutra RR. The effects of water source on reproductive outcome in Fischer-344 rats. Epidemiology. 1992;3: 130-3. Aliverti V. Bonanomi L. Giavini E, Leone VG. Mariani L. The extent of fetal ossification as an index ofdelayed develop- ment in teratogenic studies on the rat. Teratology. 1979: 201237-42.
8.
9.
The magnitude of the treatment effect seen in this study is comparable to the variation in resorp- tion frequency in the DEIONIZED group. More- over, the resorption frequencies observed were
IO.
II.
12.
13.
Barrow MW, Taylor WJ. A rapid method for detecting mal- formations in rat fetuses. J Morphol. 1969;127:291-306. U.S. Environmental Protection Agency. Test methods for evaluating solid waste; physical/chemical methods. 3rd. ed. Washington, DC: U.S. Environmental Protection Agency. Office of Solid waste and Energy Response; 1986. U.S. Environmental Protection Agency, Methods for the de- termination of organic compounds in drinking water, Cincin- nati, OH: Environmental Monitoring Systems Laboratory. U.S. Environmental Protection Agency: 1988. American Public Health Association. Standard methods for the evaluation of water and wastewater. 17th ed. Washington, DC: American Public Health Association; 1989. Hobbie JE, Daley RJ, Jasper S. Use of nucleopore filters for counting bacteria by fluorescence microscopy. Appl Environ Microbial. 1977;33: 1225-8. Scheffe H. The analysis of variance. New York: John Wiley & Sons, Inc.; 1959.

14.
15.
16.
17.
18.
19.
20.
Water source and rat reproduction l J. Y. URIU-HARE ET AL. 561
Freeman M, Tukey JW. Transformations related to the angu- lar and the square root. Ann Math Stat. 1950;21:607-11. Rothman K. Modern epidemiology. Toronto: Little Brown & Co.; 1986.
21.
Greenland S, Robins JM. Estimation of a common effect parameter from sparse follow-up data. Biometrics. 198s; 4155-68.
22.
National Academy of Sciences Safe Drinking Water Commit- tee, Drinking Water and Health, vol. 1 (1977), vol. 3 (1980), and vol. 4 (1982). Section 4024, California Health Safety Code. Chernoff N, Rogers E, Carver B, Kavlock R, Gray E. The fetotoxic potential of municipal drinking water in the mouse. Teratology. 1979;19: 165-70.
Schaedler RW, Dubos RJ. The fecal flora of various strains
23.
24.
of mice. Its bearing on their susceptibility to endotoxin. J Exp Med. 1962;115:1149-61. Les EP. Effect of acidified-chlorinated water on reproduction in C3HIHeJ and C57BL/6J mice. Lab Anim Care. 1968; 18:210-3. Scragg RKR, Dorsch MM, McMichael AJ, Baghurst PA. Birth defects and household water supply; epidemiological studies in the Mount Gambier region of South Australia. Med .I Aust. 1982;2:577-9. Dorsch MM, Scragg RR, McMichael AJ, Gaghurst PA, Dyer KF. Congenital malformations and maternal drinking water supply in rural South Australia. Am J Epidemiol. 1984; 119:473-86. Dreosti IE, McMichael AJ, Bridle TM. Mount Gambier drinking water and birth defects. Med J Aust. 1984; 141:409-11.