Draft report on EIA study IREL Block No IVEE Chavara ,Kollam ...
99
Draft report on EIA study IREL Block No IVEE Chavara ,Kollam District 0.0 INTRODUCTION 0.1 As per work order from the,National Institute for Inter disciplinary Sciences and Technology .(NIIST, CSIR ) Trivandrum vide letter no CSIR-NIIST/Envt.IREL/2015/09 dt 23- 04-2015, for conducting Environmental Impact Assessment EIA in the Heavy mineral sand mining block allotted to the Indian Rare Earths Ltd (IREL), at Alappad-Panmana area (Block IV Eastern Extension ) covering an area of 180 Ha , the following report is submitted. IREL is a Public Sector Undertaking under Department of Atomic Energy, Government of India. It has beach sand mining and processing operations at Chavara in Kerala, Manavalakurichi in Tamil Nadu and in Chhatrapur in Orissa. The IREL in 1965 became the successors to M/s Travancore Mineral Concern and M/s. Hopkin& Williams Ltd., taking over the assets of these companies and rationalized and reorganized the production of the economic mineral concentrates from these sand deposits. Their activities were earlier confined to the utilization of beach washings, the rich heavy mineral concentrates that were deposited over the beach by the wave action between high and low watermarks. The company has started inland dredge mining operation since 1990. The study area falls in the coastal stretch from just north of Neendakara containing rich deposits of heavy mineral sands. Apart from the potential adverse impacts of mining of heavy mineral sands in detail, the report also include the overall impacts on the geo environment, shore-line dynamics of the designated coastal stretches and EMP. . The following paragraphs outline the objectives of the study, the scope of the work and the methodology to be followed for the EIA study of the IREL mining lease block ( BlockIVEE) in Panmana- Ayanivelikulangara area,Karunagapally Kollam district . 1.1Back ground: The area has been under mining from around 1900 by various companies. A number of sand operating firms were taken over by the Indian Rare Earths Ltd. (IRE), a Central Public Sector Unit under the Department of Atomic Energy. IRE held Mining Lease for the area stretching from Neendakara to KayamkulamPozhi in Kollam District. The stretch was divided into 8 blocks and mining lease for block II, IV, VI and VIII was granted M/s. Indian Rare Earths Ltd., a Govt of India Atomic undertaking under Department of Energy. Indian Rare Earths Ltd. (IREL), a public sector undertaking under the Department of Atomic Energy is engaged in separation of six heavy minerals (HM), namely; ilmenite, rutile, zircon , monazite, sillimanite and garnet from beach sand deposits of Kerala, Tamil Nadu and Orissa. The Block IV Eastern extension falls east of the Block IV and located on either banks of Trivandrum Shertallai Canal (T.S.Canal).( Fig 1 and Fig 2 ) The ground gradually rises from sea level and reaches a height of about 2.50 m above the sea level. Part of the seashore is protected by sea walls of 1 to 2 m height. There are no streams passing through the plot. As the plot is situatedon either banks of T.S.Canal ,the area drains easily. Mining of minerals with more than 50 hectares as mining area are categorized as A category projects and mining lease area between 5 -50 hectares as B Category project as per the EIA notification ,2006under Environment protection act ,1986. The buffer zones prescribed are of 10 Km radius from the boundary limits of the mining lease area of >50 hectares .The present study consist of the ML area of 180 Ha and its buffer zone of 10 Km radius around it( Fig3) 1.2 Objective: The prime object of the study is to understand the geo-environmental impacts of heavy mineral sand mining and its consequences on the ecologically fragile coastal stretch. The potential
-
Upload
khangminh22 -
Category
Documents
-
view
3 -
download
0
Transcript of Draft report on EIA study IREL Block No IVEE Chavara ,Kollam ...
Draft report on EIA study IREL Block No IVEE Chavara ,Kollam District
0.0 INTRODUCTION
0.1 As per work order from the,National Institute for Inter disciplinary Sciences and
Technology .(NIIST, CSIR ) Trivandrum vide letter no CSIR-NIIST/Envt.IREL/2015/09 dt 23-
04-2015, for conducting Environmental Impact Assessment EIA in the Heavy mineral sand
mining block allotted to the Indian Rare Earths Ltd (IREL), at Alappad-Panmana area (Block
IV Eastern Extension ) covering an area of 180 Ha , the following report is submitted. IREL is a
Public Sector Undertaking under Department of Atomic Energy, Government of India. It has beach sand
mining and processing operations at Chavara in Kerala, Manavalakurichi in Tamil Nadu and in Chhatrapur
in Orissa. The IREL in 1965 became the successors to M/s Travancore Mineral Concern and M/s.
Hopkin& Williams Ltd., taking over the assets of these companies and rationalized and reorganized the
production of the economic mineral concentrates from these sand deposits. Their activities were earlier
confined to the utilization of beach washings, the rich heavy mineral concentrates that were deposited over
the beach by the wave action between high and low watermarks. The company has started inland dredge
mining operation since 1990.
The study area falls in the coastal stretch from just north of Neendakara containing rich deposits
of heavy mineral sands. Apart from the potential adverse impacts of mining of heavy mineral
sands in detail, the report also include the overall impacts on the geo environment, shore-line
dynamics of the designated coastal stretches and EMP.
. The following paragraphs outline the objectives of the study, the scope of the work and the
methodology to be followed for the EIA study of the IREL mining lease block ( BlockIVEE) in
Panmana- Ayanivelikulangara area,Karunagapally Kollam district .
1.1Back ground:
The area has been under mining from around 1900 by various companies. A number of sand
operating firms were taken over by the Indian Rare Earths Ltd. (IRE), a Central Public Sector
Unit under the Department of Atomic Energy. IRE held Mining Lease for the area stretching from
Neendakara to KayamkulamPozhi in Kollam District. The stretch was divided into 8 blocks and
mining lease for block II, IV, VI and VIII was granted M/s. Indian Rare Earths Ltd., a Govt of
India Atomic undertaking under Department of Energy. Indian Rare Earths Ltd. (IREL), a public
sector undertaking under the Department of Atomic Energy is engaged in separation of six heavy minerals
(HM), namely; ilmenite, rutile, zircon , monazite, sillimanite and garnet from beach sand deposits of
Kerala, Tamil Nadu and Orissa.
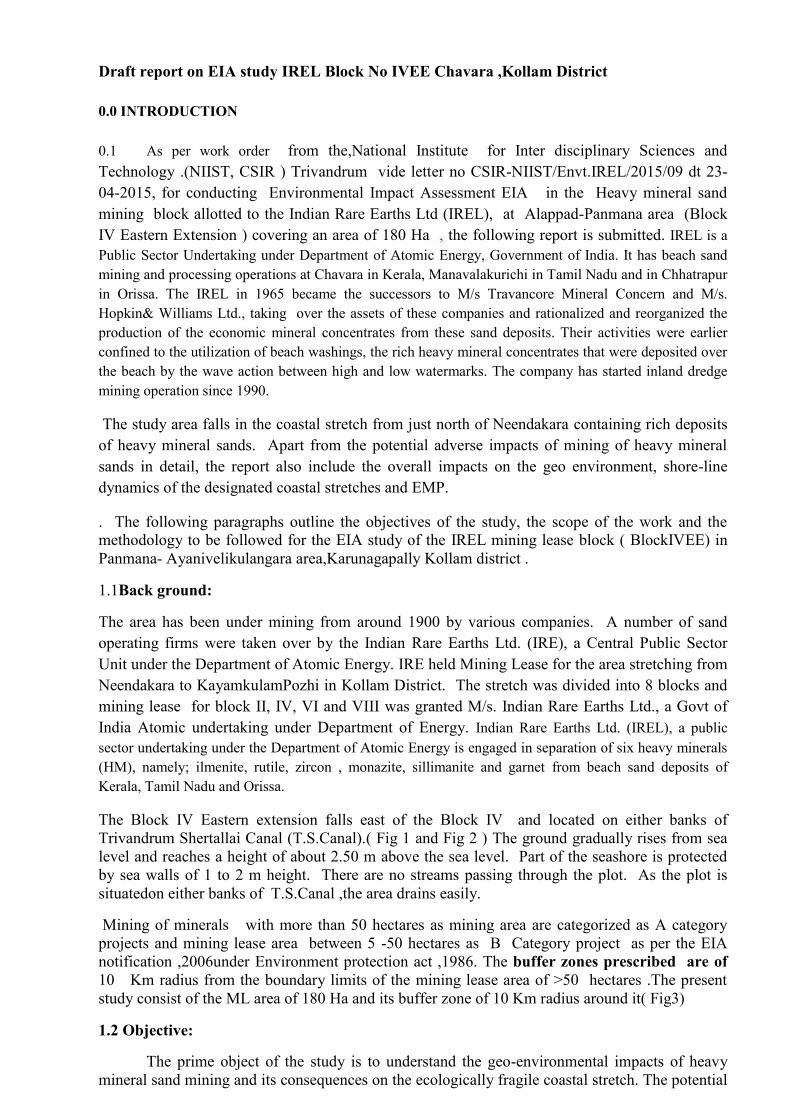
The Block IV Eastern extension falls east of the Block IV and located on either banks of
Trivandrum Shertallai Canal (T.S.Canal).( Fig 1 and Fig 2 ) The ground gradually rises from sea
level and reaches a height of about 2.50 m above the sea level. Part of the seashore is protected
by sea walls of 1 to 2 m height. There are no streams passing through the plot. As the plot is
situatedon either banks of T.S.Canal ,the area drains easily.
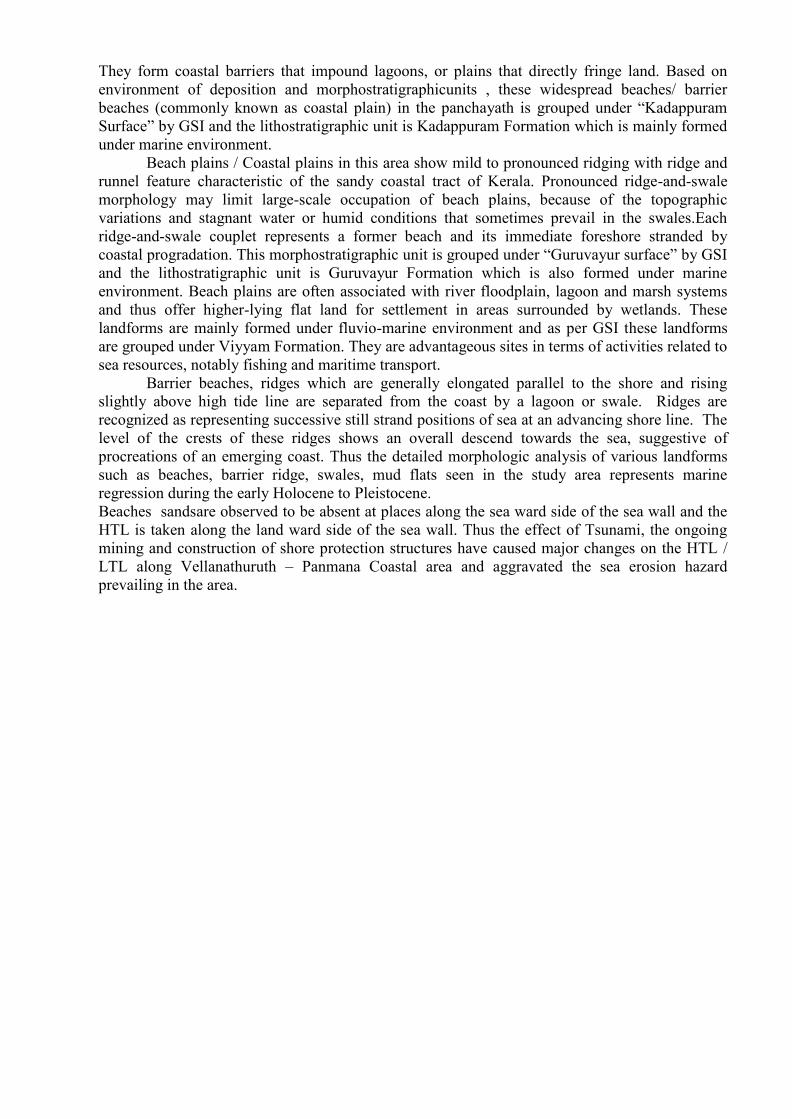
Mining of minerals with more than 50 hectares as mining area are categorized as A category
projects and mining lease area between 5 -50 hectares as B Category project as per the EIA
notification ,2006under Environment protection act ,1986. The buffer zones prescribed are of
10 Km radius from the boundary limits of the mining lease area of >50 hectares .The present
study consist of the ML area of 180 Ha and its buffer zone of 10 Km radius around it( Fig3)
1.2 Objective:
The prime object of the study is to understand the geo-environmental impacts of heavy
mineral sand mining and its consequences on the ecologically fragile coastal stretch. The potential
adverse impacts of mining on the land and water system of the area are sought to be brought out
in detail. The water system consists of surface and ground water domains. The land system
consists of human settlements, existing land use patterns, fragile shore-line and eco-protective
land cover. All these are prone to multiple changes from time to time, in tune with the prevalent
socio-economic scenario, systemic anomalies in the seasons and coastal dynamics and
anthropogenic activities. The impact of mining on heavy mineral sand in all these environs
wasevaluated and possible measures to mitigate their adverse impacts has been worked out.
1.3 Scope of the study:
The heavy mineral sand deposits of the coastal stretch of Kollam and Alappuzha districts
are one of the richest in the world. These sands contain ilmenite, sillimanite, rutile, leucoxene,
zircon and the highly radioactive monazite which were being mined and separated by the IRE
during the last many decades and this has been a source of sizeable revenue for the Govt., and
due to pressure of land and CZR restrictions for mining in the coastal stretch, the IREL and other
industrial users have to find suitable locales for sustained retrieval of the strategic raw material
without causing any environmental imbalance. It is therefore important to collect temporal data on
the original land and water systems in the area from existing sources to assess the changes due to
seasonal variations and anthropogenic influence. ThisThe scope of the work includes includes
collection of representative water and soil samples to assess from the designated block and its
buffer impact peripheries. These data have been synthesized and collated to prepare spatial
outputs and workable models vis-a- vis existing environment, to project EMPs.The report identifies
the impact of mining on the coastal ecology, management of overburden , slope stability,
recommendation of post mining land use and reclamation and restoration of mined out areas with plans.
review of actual mining operations at IRE Chavara, identification of mining practice related environmental
issues and specific recommendations to mitigate environmental impacts.
.
1.4 Plan of approach :The IREL propose the continuation of inland mining in tandem the Beach
washing collection. Beach washing collection involves collection of minerals deposited by the
wave action on the beach which is areplenishable resource.
The study in general, comprised of a holistic assessment of IREL mining lease block IVEE , its
coastal geomorphology, geology, hydrogeology using all available details maps and satellite data
products with ground truth collection and incorporation. An EMP thus was evolved, keeping in
view the Environmental Guidelines and the EIA notification 1994 issued by the MOEF.As per
the notification on EIA, environmental clearance is mandatory for all mining operations over 5 ha.
However, the singular socio economic scenario of the region and the apprehensions among the
public at large on the adverse impacts on the fragile environs necessitates a comprehensive
environmental impact assessment of mining activities in the block located along the coastal
stretch including it a 10 km radius buffer zone. Environmental data was collected in relation to the
mining project of IREL block IV EE for an assessment of Land environment and water
environment. .
1.5Methodology:
Standard methodology for EIA and preparation of EMP was followed by systematic
collection and analysis of temporal water samples to assess existing geochemical domains and
changes caused by seasonal variations and anthropogenic activities. This would constitute the
primary data. The primary data sources would be identified through well inventories and
preparation of groundwater flow maps. The secondary data would be a value addition on the
primary data through laboratory analysis.
1.6 Data sources:
The data source will be the State and central Govt. organizations dealing with mining,
geology and hydrogeology .Satellite data products if available would be an added data source.
Ground truthing would be conducted to finalize the data outputs. The synthesized data outputs as
thematic maps will be presented in GIS formats.
2.1 Physiography: Kerala State covers an area of 38,864 sq km and is located in the south
western part of the Indian Peninsular shield. This linear strip of land is bounded by the Western
Ghats on the east and the LakshwadeepSea on the west. Of the total area, 35,955 sq km area is
constituted by hard rock crystallines and the rest by soft sediments. Physiographically the state
can be divided into 4domains from east to west, viz., the (i) Western Ghats(ii) Foothillsiii)
Midland region and(iv) Coastal low land (i) Western Ghats: The hill ranges of the Western Ghats rise to an altitude of over 2500m above
the MSL and the crest of the ranges marks the inter-state boundary in most of the places. A breach
in the continuity of the ranges marks the Palghat Gap with a sinistral shift of 50 km between the
shifted crests. The Wynad plateau and the Munnar upland fall within this zone.
(ii) Foothills: The foothills of the Western Ghats comprise the rocky area 200 to 600 m above
MSL. It is a transitional zone between the high-ranges and midland.
(iii) Midland region: This forms an area of gently undulating topography with hillocks and
mounds. Laterite capping is commonly noticeable on these hillocks. The low, flat topped hillocks
forming the laterite plateau range in altitude from 30-200m and are observed between coastal low-
land and the foothills.
(iv) Coastal low land: Coastal low-land is identified with alluvial plains, sandy stretches, abraded
platforms, beach ridges, raised beaches, lagoons and estuaries.
Fig: 1Location map of IREL Block IV &EE
The low-land and the plains are generally less than 10m above msl.The Kallada river basin has its
highest elevation at Karimalaikodkal (1763 m amsl) on the eastern side and reaches almost sea
level west of Karunagapally. The river originating from the Western Ghats drains into Ashtamudi
backwaters near Kollam. The length of the river is 121 km and drainage area is 1996 km2.
Kalladariver is a fifth order stream with a gradient of 12.6 m/km. It confluence with the
Ashtamudi lake which is 6424 Hain extent.The Kallada river basin has its highest elevation at
Karimalaikodkal (1763 m amsl) on the eastern side and reaches almost sea level west of
Karunagapally. The river originating from the Western Ghats drains into Ashtamudilake. The
study area comprises the costal lowland portion and part of Midland region of Kollam district.
Karunagapallyis a Municipal town along the north of the area and Kollam Corporation along the
southern side of the study area.
IMPORTANT WATER BODIES, STREAMS AND RIVER
Important Water bodies in the area are the following
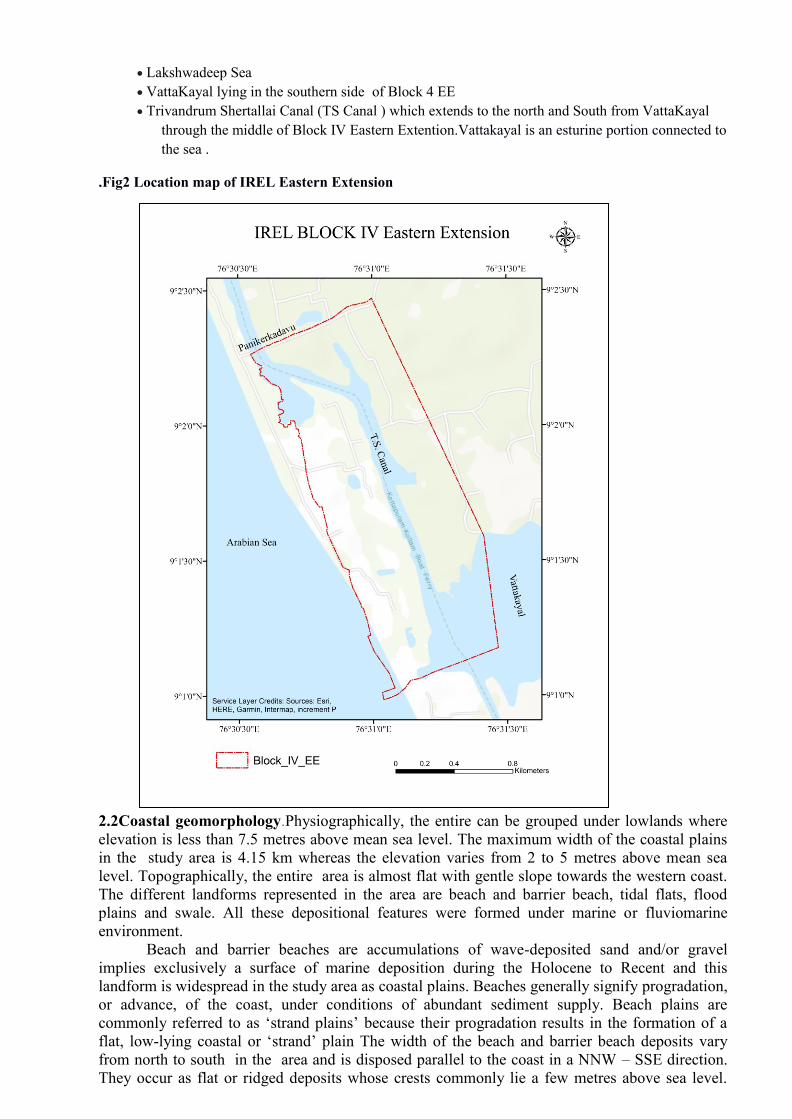
Lakshwadeep Sea
VattaKayal lying in the southern side of Block 4 EE
Trivandrum Shertallai Canal (TS Canal ) which extends to the north and South from VattaKayal
through the middle of Block IV Eastern Extention.Vattakayal is an esturine portion connected to
the sea .
.Fig2 Location map of IREL Eastern Extension
2.2Coastal geomorphology.Physiographically, the entire can be grouped under lowlands where
elevation is less than 7.5 metres above mean sea level. The maximum width of the coastal plains
in the study area is 4.15 km whereas the elevation varies from 2 to 5 metres above mean sea
level. Topographically, the entire area is almost flat with gentle slope towards the western coast.
The different landforms represented in the area are beach and barrier beach, tidal flats, flood
plains and swale. All these depositional features were formed under marine or fluviomarine
environment.
Beach and barrier beaches are accumulations of wave-deposited sand and/or gravel
implies exclusively a surface of marine deposition during the Holocene to Recent and this
landform is widespread in the study area as coastal plains. Beaches generally signify progradation,
or advance, of the coast, under conditions of abundant sediment supply. Beach plains are
commonly referred to as ‘strand plains’ because their progradation results in the formation of a
flat, low-lying coastal or ‘strand’ plain The width of the beach and barrier beach deposits vary
from north to south in the area and is disposed parallel to the coast in a NNW – SSE direction.
They occur as flat or ridged deposits whose crests commonly lie a few metres above sea level.
They form coastal barriers that impound lagoons, or plains that directly fringe land. Based on
environment of deposition and morphostratigraphicunits , these widespread beaches/ barrier
beaches (commonly known as coastal plain) in the panchayath is grouped under “Kadappuram
Surface” by GSI and the lithostratigraphic unit is Kadappuram Formation which is mainly formed
under marine environment.
Beach plains / Coastal plains in this area show mild to pronounced ridging with ridge and
runnel feature characteristic of the sandy coastal tract of Kerala. Pronounced ridge-and-swale
morphology may limit large-scale occupation of beach plains, because of the topographic
variations and stagnant water or humid conditions that sometimes prevail in the swales.Each
ridge-and-swale couplet represents a former beach and its immediate foreshore stranded by
coastal progradation. This morphostratigraphic unit is grouped under “Guruvayur surface” by GSI
and the lithostratigraphic unit is Guruvayur Formation which is also formed under marine
environment. Beach plains are often associated with river floodplain, lagoon and marsh systems
and thus offer higher-lying flat land for settlement in areas surrounded by wetlands. These
landforms are mainly formed under fluvio-marine environment and as per GSI these landforms
are grouped under Viyyam Formation. They are advantageous sites in terms of activities related to
sea resources, notably fishing and maritime transport.
Barrier beaches, ridges which are generally elongated parallel to the shore and rising
slightly above high tide line are separated from the coast by a lagoon or swale. Ridges are
recognized as representing successive still strand positions of sea at an advancing shore line. The
level of the crests of these ridges shows an overall descend towards the sea, suggestive of
procreations of an emerging coast. Thus the detailed morphologic analysis of various landforms
such as beaches, barrier ridge, swales, mud flats seen in the study area represents marine
regression during the early Holocene to Pleistocene.
Beaches sandsare observed to be absent at places along the sea ward side of the sea wall and the
HTL is taken along the land ward side of the sea wall. Thus the effect of Tsunami, the ongoing
mining and construction of shore protection structures have caused major changes on the HTL /
LTL along Vellanathuruth – Panmana Coastal area and aggravated the sea erosion hazard
prevailing in the area.
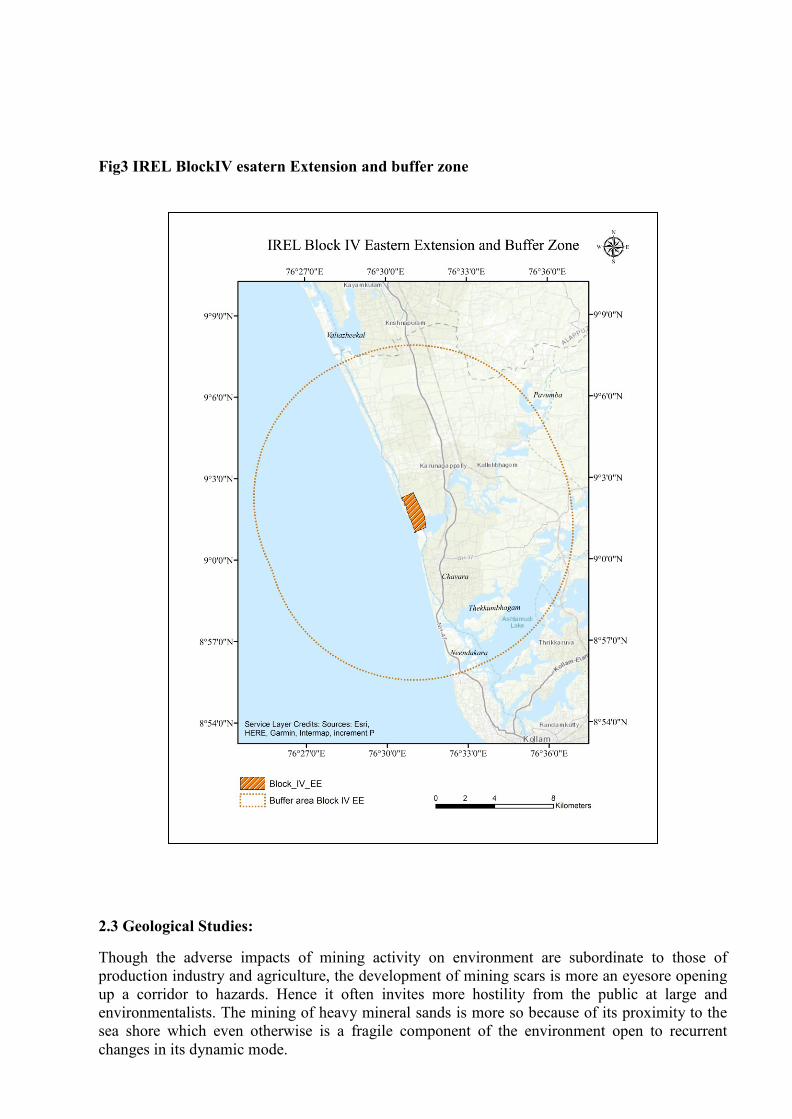
Fig3 IREL BlockIV esatern Extension and buffer zone
2.3 Geological Studies:
Though the adverse impacts of mining activity on environment are subordinate to those of
production industry and agriculture, the development of mining scars is more an eyesore opening
up a corridor to hazards. Hence it often invites more hostility from the public at large and
environmentalists. The mining of heavy mineral sands is more so because of its proximity to the
sea shore which even otherwise is a fragile component of the environment open to recurrent
changes in its dynamic mode.
2.4 Regional stratigraphy: Geologically, Kerala is occupied by Precambrian crystalline rocks ,
acid to ultra basic intrusives of Archaean to Proterozoic age, Tertiary (Mio-Pliocene) sedimentary
rocks and Quaternary sediments of fluvial and marine origin. Both the crystallines and the
Tertiary sediments have been extensively lateritised.
2.5 Geological setting :The Coastal plains between Neendakara (Kollam Districts) and
Kayamkulam (Alappuzha District) are covered by Recent and quaternary sediments which overlie
the Tertiary formations. The area exposes the recent coastal alluvium and estuarine deposits.
Recent formations are represented by beach, barrier beach and alluvial sand deposits. Presence of
organic matter in these deposits reveals estuarine deposits in the wetland zone. The Recent
sediments are underlain by Quaternary formations comprising of sand and clay, black clay and
alluvial clay. The Recent coastal alluvium along with the Quaternary base has a thickness ranging
from a few meters to over 40 or 50 m. This zone has a potential phreatic aquifer which is in
hydraulic continuity with the Estuarine area and sea. These sediments have been classified into 4
different morpho stratigraphic units based on their environment of formations, litho content and
morphological characteras described below. (Fig.4) The geological succession along Kollam –
Cochin sedimentary basin is given in Table .1
Fig 4
Fig 4Geoplgical map IREL Block IV eastern extension and buffer zone
.1 Guruvayoor formation:This represents an old marine deposit of beach ridges, strandlines of late
Pleistocene-early Holocene Other three formations viz., Kadappuram formation, Periyar
formation, and Viyyem formation are all contemporary and of late Holocene
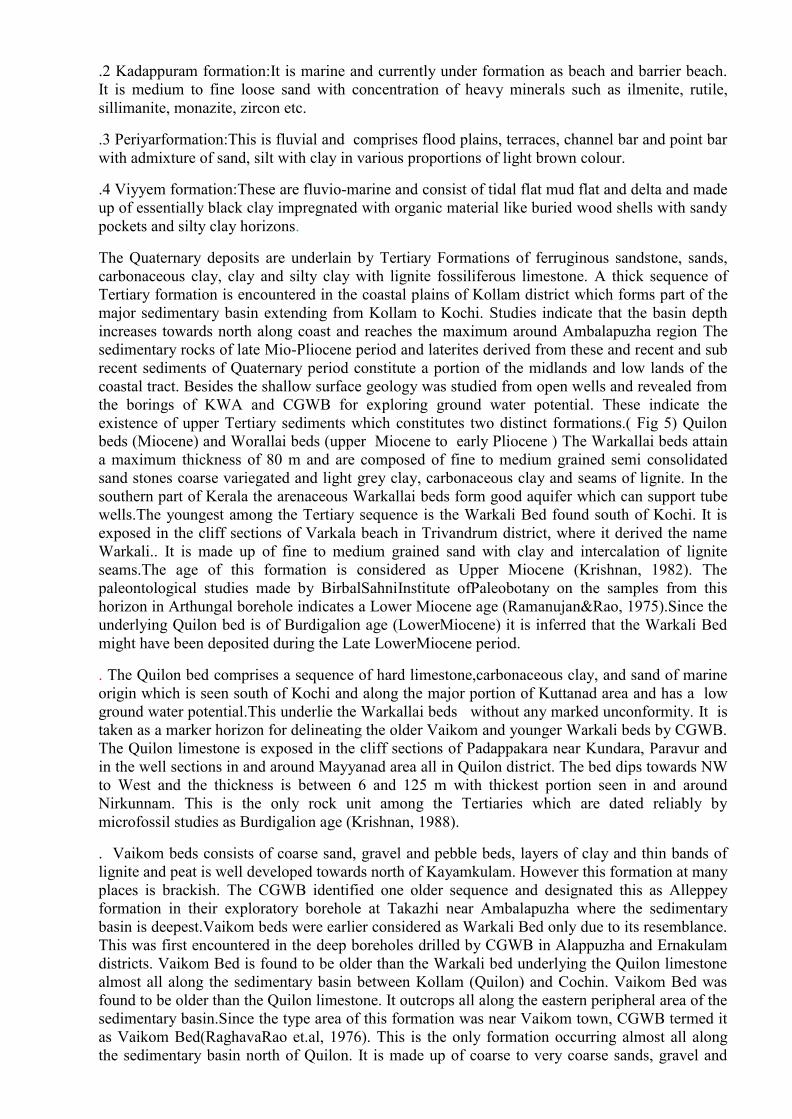
.2 Kadappuram formation:It is marine and currently under formation as beach and barrier beach.
It is medium to fine loose sand with concentration of heavy minerals such as ilmenite, rutile,
sillimanite, monazite, zircon etc.
.3 Periyarformation:This is fluvial and comprises flood plains, terraces, channel bar and point bar
with admixture of sand, silt with clay in various proportions of light brown colour.
.4 Viyyem formation:These are fluvio-marine and consist of tidal flat mud flat and delta and made
up of essentially black clay impregnated with organic material like buried wood shells with sandy
pockets and silty clay horizons.
The Quaternary deposits are underlain by Tertiary Formations of ferruginous sandstone, sands,
carbonaceous clay, clay and silty clay with lignite fossiliferous limestone. A thick sequence of
Tertiary formation is encountered in the coastal plains of Kollam district which forms part of the
major sedimentary basin extending from Kollam to Kochi. Studies indicate that the basin depth
increases towards north along coast and reaches the maximum around Ambalapuzha region The
sedimentary rocks of late Mio-Pliocene period and laterites derived from these and recent and sub
recent sediments of Quaternary period constitute a portion of the midlands and low lands of the
coastal tract. Besides the shallow surface geology was studied from open wells and revealed from
the borings of KWA and CGWB for exploring ground water potential. These indicate the
existence of upper Tertiary sediments which constitutes two distinct formations.( Fig 5) Quilon
beds (Miocene) and Worallai beds (upper Miocene to early Pliocene ) The Warkallai beds attain
a maximum thickness of 80 m and are composed of fine to medium grained semi consolidated
sand stones coarse variegated and light grey clay, carbonaceous clay and seams of lignite. In the
southern part of Kerala the arenaceous Warkallai beds form good aquifer which can support tube
wells.The youngest among the Tertiary sequence is the Warkali Bed found south of Kochi. It is
exposed in the cliff sections of Varkala beach in Trivandrum district, where it derived the name
Warkali.. It is made up of fine to medium grained sand with clay and intercalation of lignite
seams.The age of this formation is considered as Upper Miocene (Krishnan, 1982). The
paleontological studies made by BirbalSahniInstitute ofPaleobotany on the samples from this
horizon in Arthungal borehole indicates a Lower Miocene age (Ramanujan&Rao, 1975).Since the
underlying Quilon bed is of Burdigalion age (LowerMiocene) it is inferred that the Warkali Bed
might have been deposited during the Late LowerMiocene period.
. The Quilon bed comprises a sequence of hard limestone,carbonaceous clay, and sand of marine
origin which is seen south of Kochi and along the major portion of Kuttanad area and has a low
ground water potential.This underlie the Warkallai beds without any marked unconformity. It is
taken as a marker horizon for delineating the older Vaikom and younger Warkali beds by CGWB.
The Quilon limestone is exposed in the cliff sections of Padappakara near Kundara, Paravur and
in the well sections in and around Mayyanad area all in Quilon district. The bed dips towards NW
to West and the thickness is between 6 and 125 m with thickest portion seen in and around
Nirkunnam. This is the only rock unit among the Tertiaries which are dated reliably by
microfossil studies as Burdigalion age (Krishnan, 1988).
. Vaikom beds consists of coarse sand, gravel and pebble beds, layers of clay and thin bands of
lignite and peat is well developed towards north of Kayamkulam. However this formation at many
places is brackish. The CGWB identified one older sequence and designated this as Alleppey
formation in their exploratory borehole at Takazhi near Ambalapuzha where the sedimentary
basin is deepest.Vaikom beds were earlier considered as Warkali Bed only due to its resemblance.
This was first encountered in the deep boreholes drilled by CGWB in Alappuzha and Ernakulam
districts. Vaikom Bed is found to be older than the Warkali bed underlying the Quilon limestone
almost all along the sedimentary basin between Kollam (Quilon) and Cochin. Vaikom Bed was
found to be older than the Quilon limestone. It outcrops all along the eastern peripheral area of the
sedimentary basin.Since the type area of this formation was near Vaikom town, CGWB termed it
as Vaikom Bed(RaghavaRao et.al, 1976). This is the only formation occurring almost all along
the sedimentary basin north of Quilon. It is made up of coarse to very coarse sands, gravel and
pebble beds with alternating clay layers. Lignite is also encountered in this formation. The
thickness of this formation ranges from a few meters to 238 m.
The oldest Tertiary sediments are known as Alleppey Beds. They are highly carbonaceous clay
and sandy clay beds encountered in the depth range of 475 to 600 m bgl in boreholes drilled by
CGWB at Nirkunnam, Trikunnapuzha, Kalarcode and Kattoor along the coast of Alappuzha
(Alleppey) district. These beds contain fine to medium sands intercalated with dark brown to buff
coloured clay which are carbonaceous and with thin seams of lignite. These are distinctly different
from the overlying Tertiaries in their lithological character and could be easily identified in
borehole lithological samples and electric log data. The exact age of this formation is not known
since no systematic dating was carried out. However, the results of limited paleontological studies
carried out by BirbalSahni Institute indicate an interesting fossil assemblage belonging to Eocene
Period.Since this formation is encountered only in the deep bore holes in and around Alleppey
coast it was termed by CGWB as Alleppeybeds .
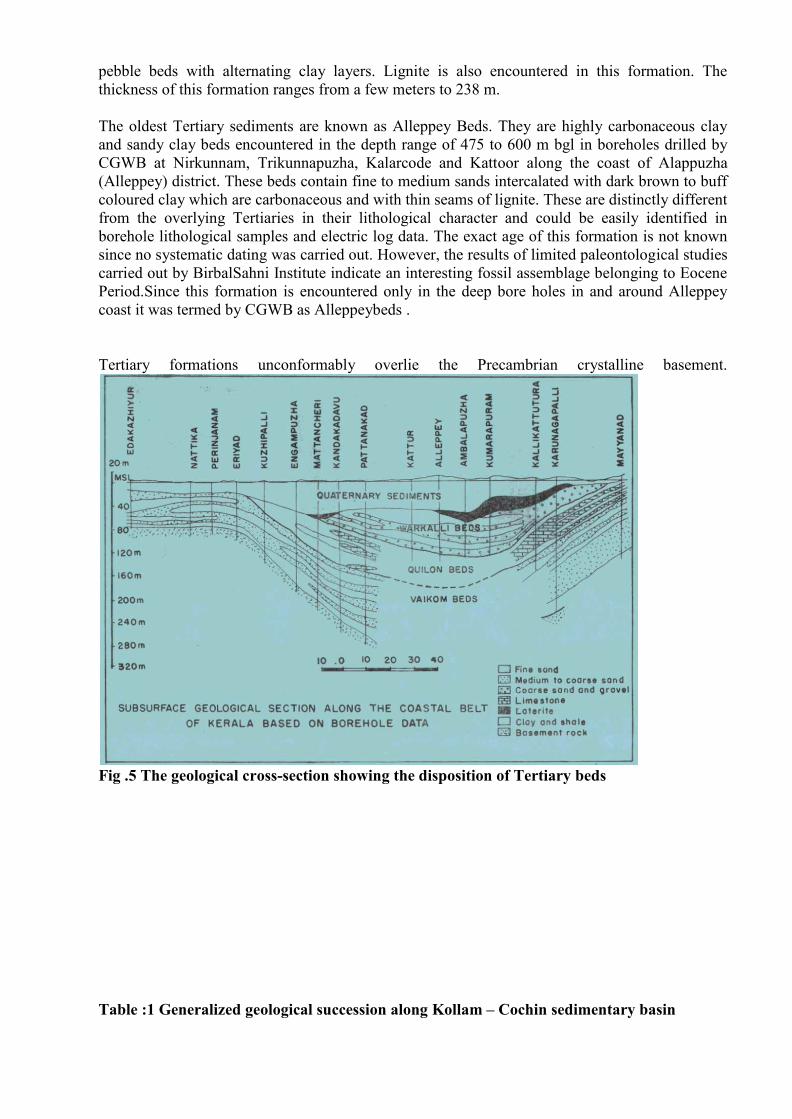
Tertiary formations unconformably overlie the Precambrian crystalline basement.
Fig .5 The geological cross-section showing the disposition of Tertiary beds
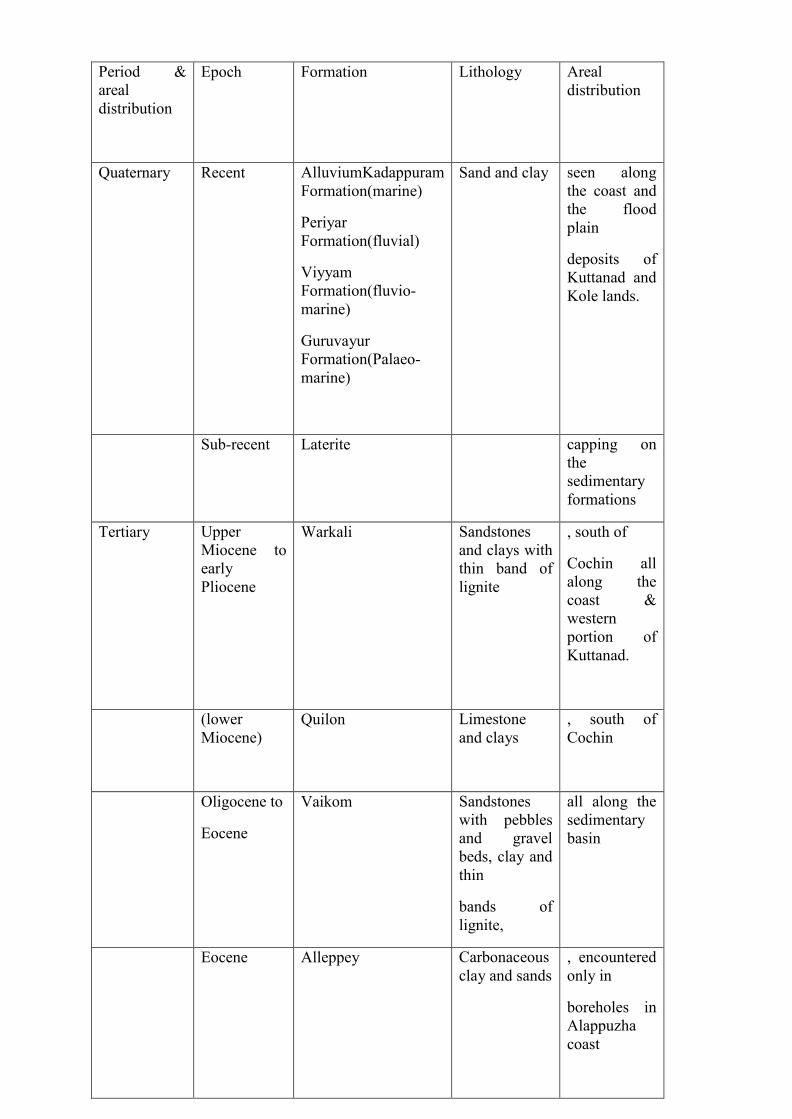
Table :1 Generalized geological succession along Kollam – Cochin sedimentary basin
Period &
areal
distribution
Epoch Formation Lithology Areal
distribution
Quaternary
Recent AlluviumKadappuram
Formation(marine)
Periyar
Formation(fluvial)
Viyyam
Formation(fluvio-
marine)
Guruvayur
Formation(Palaeo-
marine)
Sand and clay seen along
the coast and
the flood
plain
deposits of
Kuttanad and
Kole lands.
Sub-recent Laterite capping on
the
sedimentary
formations
Tertiary Upper
Miocene to
early
Pliocene
Warkali Sandstones
and clays with
thin band of
lignite
, south of
Cochin all
along the
coast &
western
portion of
Kuttanad.
(lower
Miocene)
Quilon Limestone
and clays
, south of
Cochin
Oligocene to
Eocene
Vaikom Sandstones
with pebbles
and gravel
beds, clay and
thin
bands of
lignite,
all along the
sedimentary
basin
Eocene Alleppey Carbonaceous
clay and sands
, encountered
only in
boreholes in
Alappuzha
coast
2.6 Sedimentary basin configuration and tectonics :The studies carried out in the coastal area
of Kerala indicate that the sediments were deposited in a faulted basement. It is also inferred that
there could have been lateral movements along existing weak planes, which brought thicker
sediments by the side of thinner ones. Due to the near horizontal dip of the sediments this may not
get reflected in the hydraulic continuity. It is also suspected that the basin was a sinking one with
the sediment load. The sedimentary formation of this area is still unconsolidated and hence
smaller movements subsequently might not have affected the beds. The studies carried out by
ONGC along off shore Kerala have brought out valuable information on the basin configuration
and tectonics. The sedimentary thickness increases from south to north in the off shore. There is a
major basin margin fault almost parallel to the coast in the off shore. Two principal faults run in
NE- SW direction. Some of the NW- SE faults are observed to be disturbed by E-W faults. The
alluvial formations are represented by back water and lagoonal deposit of black clay, fine to
medium grained pure white quartzite sands, dirty white silt and silty sands of the flood plains,
grey to dark grey beach sands and red Teri sands. These deposits have been brought down by the
west flowing rivers which debouch into the back water lagoons and estuaries and get reworked by
the waves and tides
2.7 Laterites:
The geological investigations carried out by GSI in parts of Kollam District reveal that
lateritisation has been successive to the deposition of both quaternary formation as well as the
tertiary formation . The laterite in the sedimentary sequence of tertiary period are thin in
comparison to the thick laterite profile in the crystalline hard rocks . The evidence of laterisation
having taken place were also noticed in tnthe zone of alluvium and beach sands in Haripad and
Kayamkulaam etc. After the deposition of the teriary sediments and its exposure by uplift or
sealevel change ( regression of sea )the same were laterirised . The occurrence of laterite well into
the present day seaaround Kollam indicates that a portion of the present day marine continental
shelf was land porion previously ( Mallikarjuna and Kapali GSI 1981)
The boreholes drilled by CGWB in Kollam district have revealed that the area under the present
study which is sandy alluvial tract is underlain by laterite . The laterite formation when
encountered in the boreholes below the recent alluvium , act as a marker horizon to differentiate
the quaternary sediments from the underlying tertiary sediments ( ground water exploration in
Kerala CGWB1999). The laterites are not continuous in occurrence. The thickness of laterite
varies , it is depended on the degree of lateritisation and subsequent erosion before deposition of
of recent sane and alluvium .
The lithological log of two tube wells constructed in the premises of KMML at Sankarangalam
also indicate that lateritic soil occur in the area from ground level to a depth of 9.90m. The soil
investigation here for the construction of settling tank and sludge ponds was undertaken by the
department of Civil Engineering, CUSAT . 12borehole were drilled limiting depth to 6m As per
the borehole logs in the study report the top layer of loose sand varying in thickness from 2m to
4.75 m underlain by laterite .
2.8 Basement rocks
The tertiary sedimentary sequence of rocks are unconformably underlain by precrambrian
crystalline rocks of the Khondalite suite of rocks.The basements rocks of Precambrian crystalline
complex of gneiss, charnockites and leptinites and khonodolites underlies the sedimentariesThe
rocks of Precambrian crystalline complex consisting of gneisses, charnockites, leptinites,
khondalites and associated pegmatite’s occupy the high lands and the portion of mid land terrain.
2.9 Geology of heavy mineral deposit: The Chavara heavy mineral sand deposit extends for
about 23km between Kayamkulam in the north (N908’24”, E76027’36”) and Neendakara in the
south N8056’03”, E76032’34”. The heavy mineral sand deposits mainly consists of minerals of
ilmenite, rutile, leucoxene, sillimanite, zircon and monazite. The area exposes unconsolidated
heavy mineral bearing sand (recent-Sub-recent) derived from the hinterland of Khondallites,
Charnockite (Pre-cambrian) Warkalai-sandstone (tertiary) and laterites (tertiary age). The heavy
mineral beach sand deposit extends inland from the present coast across a low coastal plain which
is covered by recent sands overlying Pleistocene Warkala formation consists of laterites, sand
stone, clays and lignite. The high ground to east is composed of Archaean crystalline rocks. The
present coast is marked by a raised barrier dune behind which there is a canal which links a series
of lagoon between the tidal channels.The deposit along the coast is formed by the tidal waves of
the sea and in between the two tidal channels. The origin of the sand deposits attributed to the
weathering action in the Western Ghats and minerals carried down along the rivers to the sea. The
minerals are thus deposited along coast and there is no overburden in the deposit. The general
depth of occurrence of beach mineral sand deposit is 7.5 to 8 m from the ground.
The Atomic Minerals Division AMD (now called Atomic Minerals Directorate for Exploration and
Research),under the Department of Atomic Energy carried out geological exploration of the area. The
deposits has been divided into two major parts viz. (1) The Beach zone (consists of beach-front
and mid-zone) and Easterly extension. As per the AMD report, the economically valuable
minerals occur dominantly in the beach zone with width 122 to 183 m. The evidence indicates
that the reserves and highest grade occur in this zone and economic grade occur up to about 8 m
above clay bottom. It is reported that the beach is subject to intermittent marine erosion and
replenishment of heavy mineral takes place from abundant off-shore and submarine deposits. The
proportion of heavy minerals decreases with depth.
The lower grade deposit occurs in eastern extension and intermittently for some miles to east
across the plain. The mineralized layer is of the order of 7 to 8 m deep but the grade is generally
much lower than those of the beach zone. The proportion of heavy minerals decreases with depth.
The deposit has an average width of about 200 metres. The maximum elevation of the deposit is 3
m above the mean sea level with very little relief. As per geological study of the area by the IBM,
the heavy mineral sand tract lies between high and low tide area of the beach and is of
replenish able nature due to tidal wave action of the sea
2.10Chavara Beach sand deposit
The Chavara Beach sand deposit, also known as the Neendakara-Kayamkulam deposit, is a barrier
beach extending over a length of 22.54 Km between two tidal channels, the southern at
Neendakara of the Ashtamudi estuary and the northern at Kayamkulam of the
Kayamkulamlagoon.The deposit has an average width of 200m .. The total area of the barrier
beach is 4.20 sq.km and it consists ofIlmenite, rutile, Leucoxene, Zircon, Sillimanite with quartz
as gangue mineral.. It has been the only deposit so far on the Indian coast having heavy mineral
contents ranging as high as 60 to 70 % renowned as world class deposit. Consequently this
deposit has been under intensive mining for nearly sixty years and is reputed as one of the most
important production and export centres of ilmenite in the world..Though heavy mineral deposits
have been identified elsewhere in Kerala, the deposit at Chavara is the largest and richest and
rated as one of the best of its kind in the world (world class deposit) owing to its unique
mineralogical assemble, vast reserves and altered/leucoxenised chemical character of ilmenite
with> 60% TiO2.
The Atomic Minerals Directorate for Exploration and Research( AMD) divided the deposits into
three zones parallel to the coast for the purpose of sampling on the basis of its deposition and
relative concentration of heavy minerals. The first zone is the beach zone with a width of 30.5
meter from the berm. This is the transitional zone where the highest concentration of heavy
minerals occurring and the effects of surface wave action are directly felt. The second zone is the
middle portion of the deposit with the width varying from 61 m to 122 m which forms the stable
part of the deposit on which surface wave action has no direct effect. The third zone is the interior
zone which is generally poorer in heavy minerals but richer in silt content. It borders the inland
water way or kayal which in this case also corresponds to the eastern extremity of the mining
lease
2.11Block No IV EE of IREL
The raw sand exploited by IREL are available in the form of as inland deposits formed over the
years below and above the ground level in areas away from the shore line and as beach washings
thrown by the sea at the shore line.The study area comprise 10 Km Buffer zone around ML
periphery i.e. Block IV of IREL .(Fig ) of area 180 Ha which belongs to the IREL. The Block
falls between the Lakshwadeep Sea andIREL lease called Block IV Eastern
Extension.Trivandrum Shertallai Canal (T.S.CanalTrivandrum-Shertallai Canal (T.S.Canal)
passes through Block IV Eastern Extension.). The ground gradually rises from sea level and
reaches a height of about 2.50 m above the sea level. Part of the seashore is protected by sea
walls of 1 to 3 m height. There are no streams passing through the block and, the area drains
easily as it is located on either banks of TS canal. After the Tsunami of 26th December 2004, the
sea has transgressed into the southern part of Block IV and has reached Block IV Eastern
Extension)
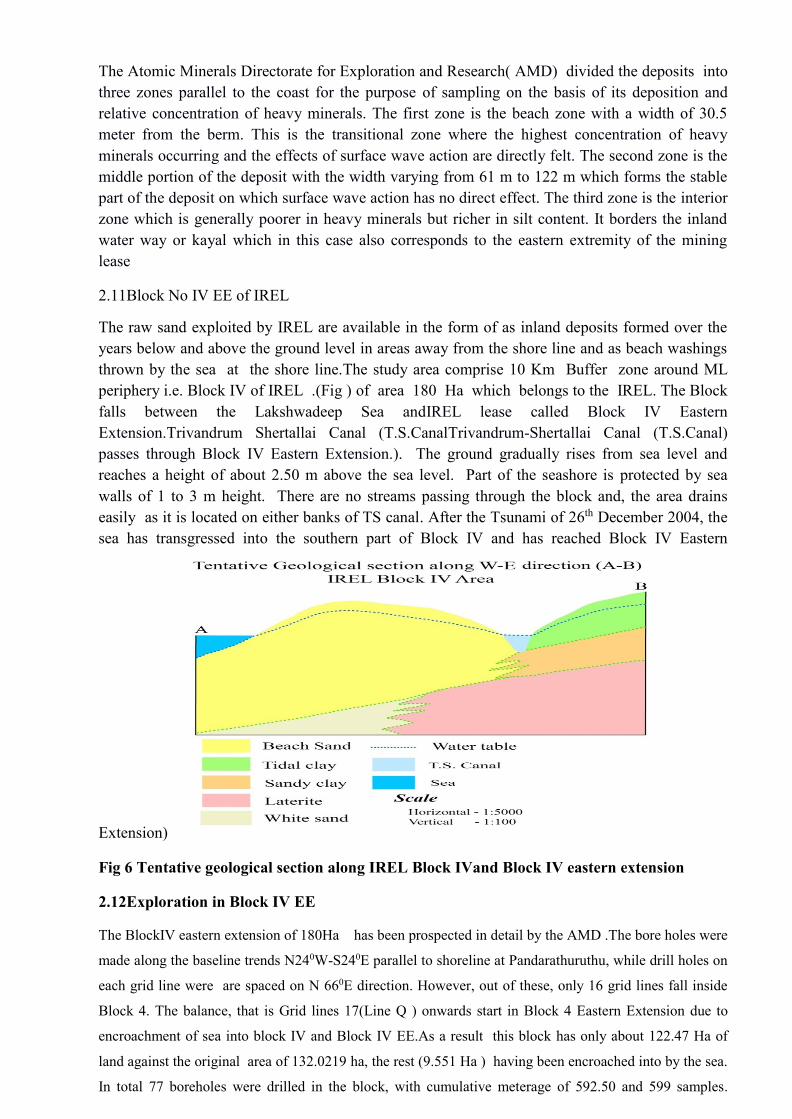
Fig 6 Tentative geological section along IREL Block IVand Block IV eastern extension
2.12Exploration in Block IV EE
The BlockIV eastern extension of 180Ha has been prospected in detail by the AMD .The bore holes were
made along the baseline trends N240W-S240E parallel to shoreline at Pandarathuruthu, while drill holes on
each grid line were are spaced on N 660E direction. However, out of these, only 16 grid lines fall inside
Block 4. The balance, that is Grid lines 17(Line Q ) onwards start in Block 4 Eastern Extension due to
encroachment of sea into block IV and Block IV EE.As a result this block has only about 122.47 Ha of
land against the original area of 132.0219 ha, the rest (9.551 Ha ) having been encroached into by the sea.
In total 77 boreholes were drilled in the block, with cumulative meterage of 592.50 and 599 samples.
The deepest borehole NK4/B/01 was to a depth of 17.50 m, while the shallowest was 4.0m, with an
average 7.9 m depth for the 77 drill holes. The deposit has a thickness of 7.62m and grade gradually
depletes with depth. THM concentration within the barrier beach (close to sea coast ) are at higher levels,
i.e., = 98 – 60 % (panned concentrate) upto 4.0 – 5.0 m depth, further it reduces as 25 to 5 %, towards
depth. Sand along the barrier beach contains black heavy minerals, light brown and grey to white sand. (
Fig 6 ) Towards inland, the sand is greenish grey or buff coloured clayey sand, possibly deposited in a
marshy fluvio- marine environment. In the deepest borehole, it was seen that clean washing pebbly white
quartz sand was found below 11.0 m depth , with <10% THM dominated by garnet.
2.13 Important Minerals in the Heavy mineral deposits are the following:
Ilmenite - Fe TiO3 (Grade - 98%, TiO2 - 59%)
Rutile – TiO2 (Grade – 92%, TiO2 - 95%)
Leucoxene - TiO2 - 75%
Zircon - ZrSiO4 (Grade - 97%, ZrO2 - 65%).
.Monazite (ThO2-9%, REO-58%, U308-0.35%,P205- 29%)
Sillimanite – Al2SiO5 (Grade – 92%, Al2O3 – 58%)
2.14 Reserves in Block IV Eastern extension
The area was prospected by AMD in October 1981 to April 1982. The balance, that is Grid
lines 17(Line Q ) onwards start in Block 4 Eastern Extension, due to encroachment of sea
into block IV and Block IV EE. Based on the Heavy Mineral data of the boreholes, the
weighted average of heavy mineral content of the boreholes in the area in possession of IRE
was worked out. The gridlines from118 to 144 relate to this area, weighted average of the
data from the core analysis for this area is seen to be 18.85%.
The total reserves of Heavy mineral sand in 180Ha of Block IV Eastern Extension was
estimated as 24,949,183 tonnes ( 24.94 million tonnes ) . The sea erosion in parts of Block IV
EE was studied using satellite imagery , cadastral maps and geo referencing and it was
estimated that a land area 9.551 Ha was lost in the sea , Therefore the reserves in the land
area of the BlockIV EE was re estimated for 122.4709 ha in lieu of 132.0219 Ha as 17,6970
44 tonnes . Thus the total reserves in the block IV EE including the 4749832 tonnes of the
water spread area( Vattakayal and portion of TS canal ) are estimated as 22466876tonnes (
22.466 million tonnes)
.
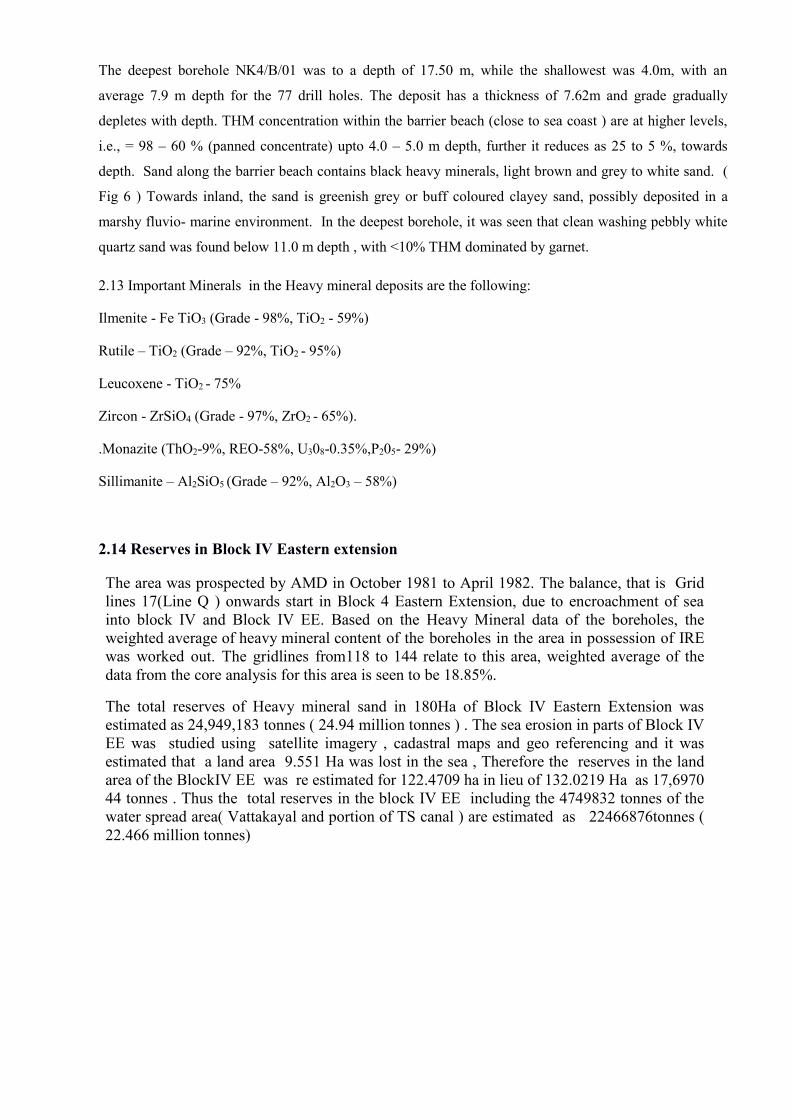
Photo 1. Toyo Pump and Pontoon used for dredging in Trivandrum –Sherthala canal
2.15 Inland mining of Beach Deposit Block IVEE
Deposit of beach sand minerals in the inland area of beach are being mined by semi-mechanized
methods. This is done by using a dredge(DWUP) or pontoon mounted Toyo pumps( photo 1 )
working in a manmade pond, by using conventional mining equipments like front end loader and
shovels.In case of dredge mining, the pond will progress in a strip of 50 m and the tails generated
from the dredge will be discarded and the concentrate generated will be loaded by wheel loaders
into tipping trucks for transport to the plant at Chavara. Wheel loader will be used for spreading
the tailings to refill the pond to the rear side of dredge.
In plots which are too small for mining by mechanized dredge or pontoon mounted Toyo Pump,
sand is extracted by conventional mining equipments; wheel loaders, hydraulic excavators and
tipping trucks .Sand extracted by dredge and by Toyo pump are heaped near the dredge pit . This
is loaded by wheel loaders to 10ton/ 12 ton tipping trucks for transportation to the Pre-
Concentration plant. The tailing from the Pre-Concentration plant are brought to the mine pit and
are used for refilling the mine pit from the rear end.
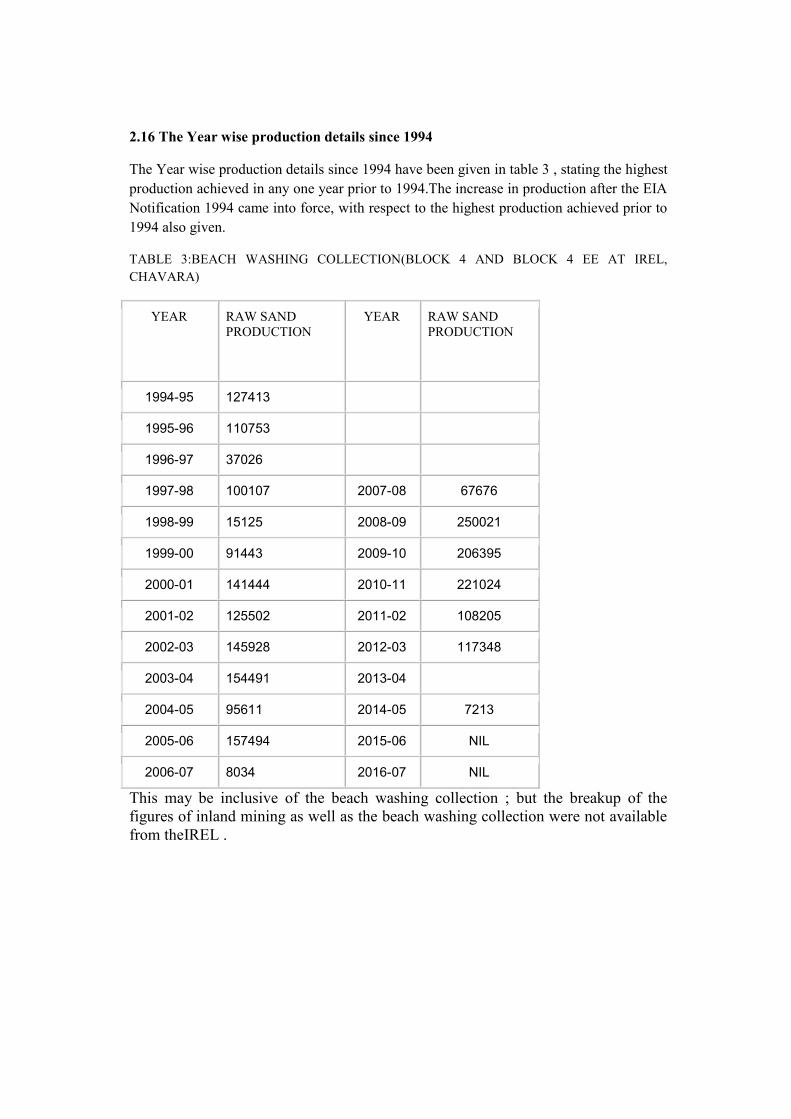
2.16 The Year wise production details since 1994
The Year wise production details since 1994 have been given in table 3 , stating the highest
production achieved in any one year prior to 1994.The increase in production after the EIA
Notification 1994 came into force, with respect to the highest production achieved prior to
1994 also given.
TABLE 3:BEACH WASHING COLLECTION(BLOCK 4 AND BLOCK 4 EE AT IREL,
CHAVARA)
YEAR RAW SAND
PRODUCTION
YEAR RAW SAND
PRODUCTION
1994-95 127413
1995-96 110753
1996-97 37026
1997-98 100107 2007-08 67676
1998-99 15125 2008-09 250021
1999-00 91443 2009-10 206395
2000-01 141444 2010-11 221024
2001-02 125502 2011-02 108205
2002-03 145928 2012-03 117348
2003-04 154491 2013-04
2004-05 95611 2014-05 7213
2005-06 157494 2015-06 NIL
2006-07 8034 2016-07 NIL
This may be inclusive of the beach washing collection ; but the breakup of the
figures of inland mining as well as the beach washing collection were not available
from theIREL .
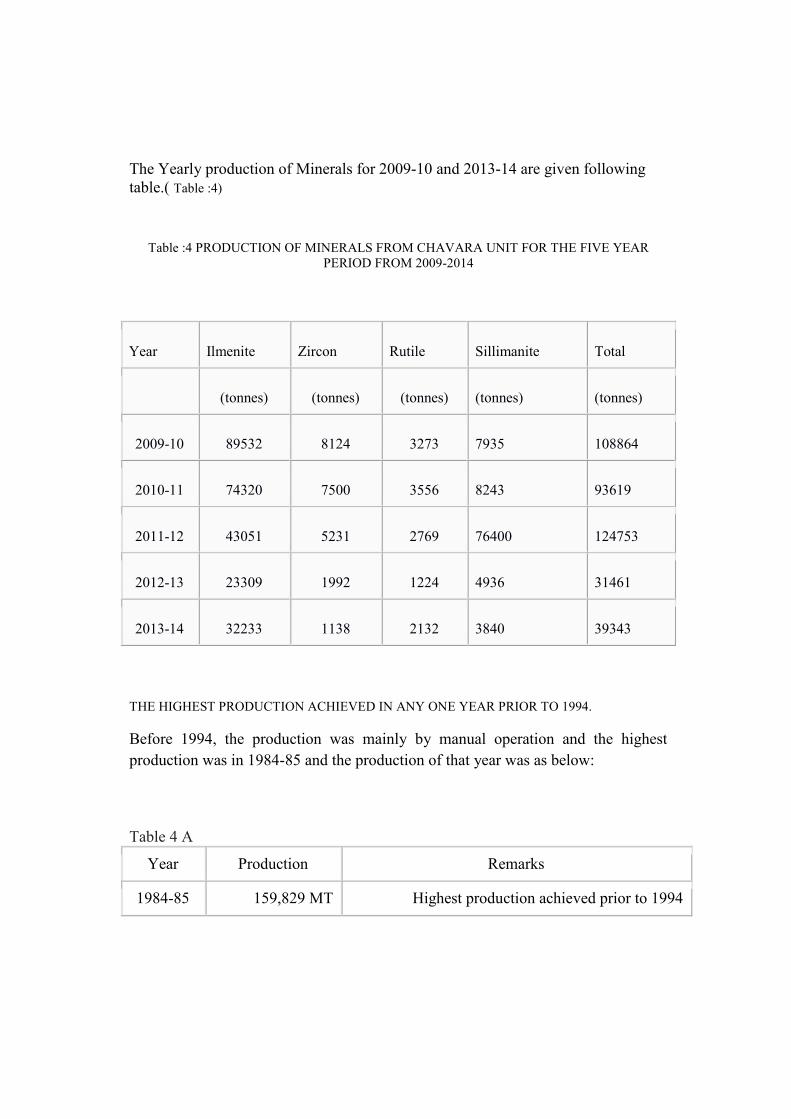
The Yearly production of Minerals for 2009-10 and 2013-14 are given following
table.( Table :4)
Table :4 PRODUCTION OF MINERALS FROM CHAVARA UNIT FOR THE FIVE YEAR
PERIOD FROM 2009-2014
Year Ilmenite Zircon Rutile Sillimanite Total
(tonnes) (tonnes) (tonnes) (tonnes) (tonnes)
2009-10 89532 8124 3273 7935 108864
2010-11 74320 7500 3556 8243 93619
2011-12 43051 5231 2769 76400 124753
2012-13 23309 1992 1224 4936 31461
2013-14 32233 1138 2132 3840 39343
THE HIGHEST PRODUCTION ACHIEVED IN ANY ONE YEAR PRIOR TO 1994.
Before 1994, the production was mainly by manual operation and the highest
production was in 1984-85 and the production of that year was as below:
Table 4 A
Year Production Remarks
1984-85 159,829 MT Highest production achieved prior to 1994
.
2.17 Rate of production; the expected life of the mine
Of the IRE Block IVEE mining area of 180 Ha, 132.0219Ha was land area and the
remaining area 47.9781Ha was water spread area inclusive of TS canal portion and
Vattakayal estuarine area . However , an extent of land of 9.551 Ha has been lost
in the sea due to marine erosion. This was assessed by overlaying the old cadastral
maps with survey numbers of Alappad and Panmana villages with the satellite
imagery of 2017. The maximum elevation of the mining lease area is 2.50m
above the msl.The remaining land area of the Block IVEE mining lease is only
122.4709 Ha .The minable reserves of Heavy mineral sands in the land portion of
the mining lease area is assessed as 10410,026 Cum or 17697,044tonnes
The proposed raw heavy mineral sand production for the five year period would be
7,50,000tonnes or 441176 cum . Of this volume, the heavy mineral recovery would
be 18,85% apporox.Thus the tailing generated would be 6,00,000 to 6,60,000
tonnes per year. After pre concentration and mineral separation of the heavy
mineral fractions, the waste sand portion would amount to 80. 15 % of the volume
of the raw mineral sand raised from the area. If the entire quantity of waste sand is
used for refilling the void spaced due to mining, that will not be sufficient to fully
restore the land to the original level and the topography will be lower in elevation.
This deficit could only be redressed by also utilizing the beach washing tailings
from other areas for refilling simultaneously.
The remaining land area of the Block IVEE mining lease is only 122.4709 Ha .The
minable reserves of Heavy mineral sands in the land portion of the mining lease
area is assessed as 10410,026 Cum or 17697,044tonnes The maximum elevation
of the mining lease area is 2.50m above the msl
The life of the inland reserves in Block 4EEat the rate of 750,000 tons per year will
be around 18to 20 years if the permission is not obtained for dredging closer to the
canal or to recover the heavy mineral sands from the portion of the mining lease
area lost in the sea due to sea erosion .As per the ML conditions the stipulation of
50 M barrier with the canal. Actually there is no need to leave a barrier from the
canal bank. . A rip-rap wall at the canal border after mining the canal and the
adjoining lands may be provided after mining to the canal bank. For this, approval
will have to be obtained from Inland Water Authority of India (IWAI) and the Govt
of Kerala.
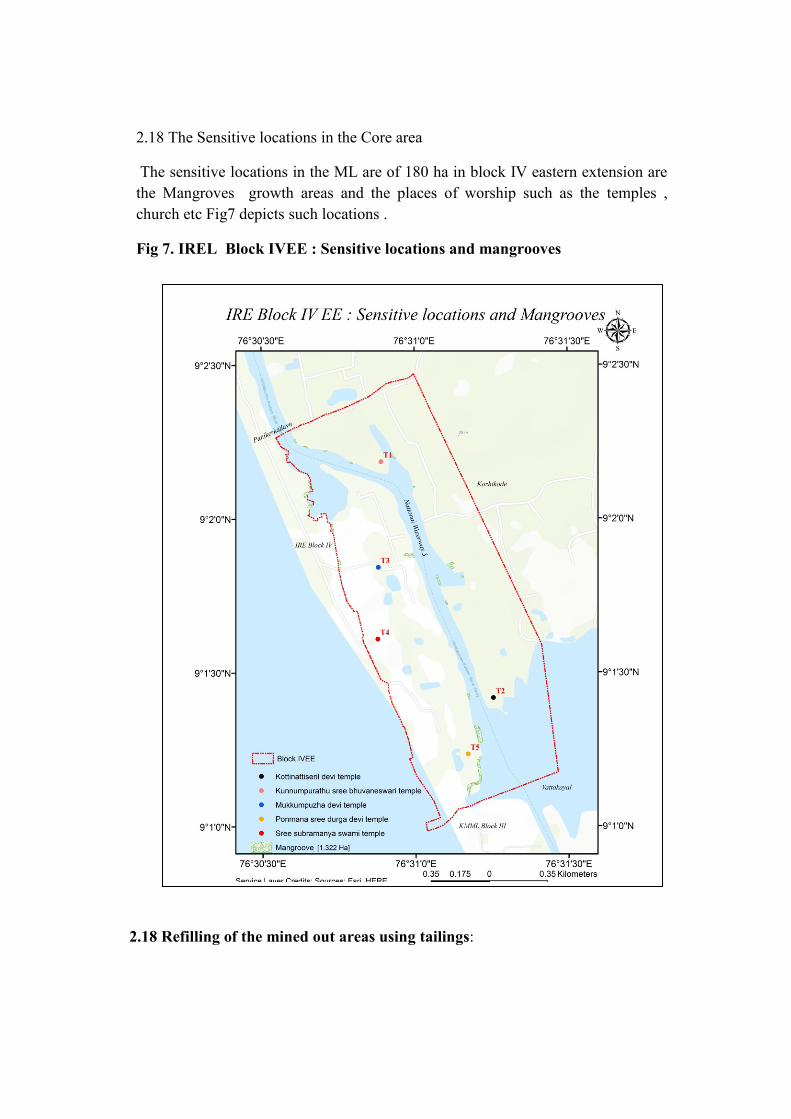
2.18 The Sensitive locations in the Core area
The sensitive locations in the ML are of 180 ha in block IV eastern extension are
the Mangroves growth areas and the places of worship such as the temples ,
church etc Fig7 depicts such locations .
Fig 7. IREL Block IVEE : Sensitive locations and mangrooves
2.18 Refilling of the mined out areas using tailings:
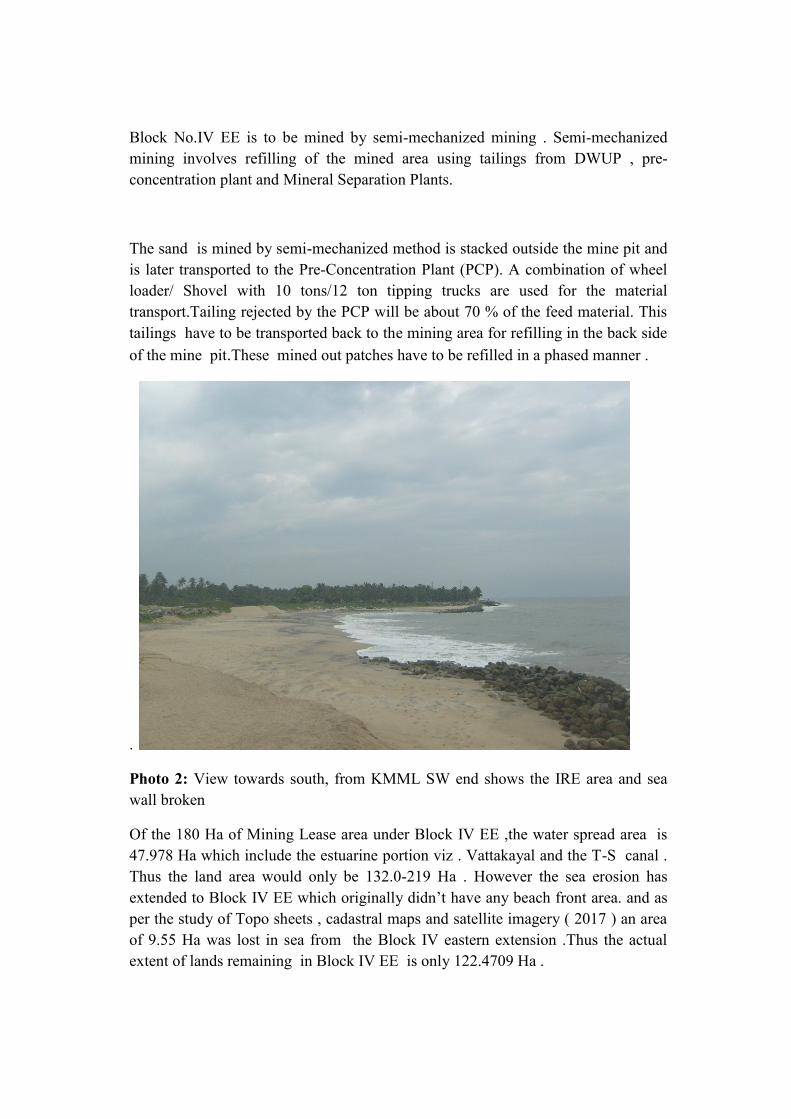
Block No.IV EE is to be mined by semi-mechanized mining . Semi-mechanized
mining involves refilling of the mined area using tailings from DWUP , pre-
concentration plant and Mineral Separation Plants.
The sand is mined by semi-mechanized method is stacked outside the mine pit and
is later transported to the Pre-Concentration Plant (PCP). A combination of wheel
loader/ Shovel with 10 tons/12 ton tipping trucks are used for the material
transport.Tailing rejected by the PCP will be about 70 % of the feed material. This
tailings have to be transported back to the mining area for refilling in the back side
of the mine pit.These mined out patches have to be refilled in a phased manner .
.
Photo 2: View towards south, from KMML SW end shows the IRE area and sea
wall broken
Of the 180 Ha of Mining Lease area under Block IV EE ,the water spread area is
47.978 Ha which include the estuarine portion viz . Vattakayal and the T-S canal .
Thus the land area would only be 132.0-219 Ha . However the sea erosion has
extended to Block IV EE which originally didn’t have any beach front area. and as
per the study of Topo sheets , cadastral maps and satellite imagery ( 2017 ) an area
of 9.55 Ha was lost in sea from the Block IV eastern extension .Thus the actual
extent of lands remaining in Block IV EE is only 122.4709 Ha .
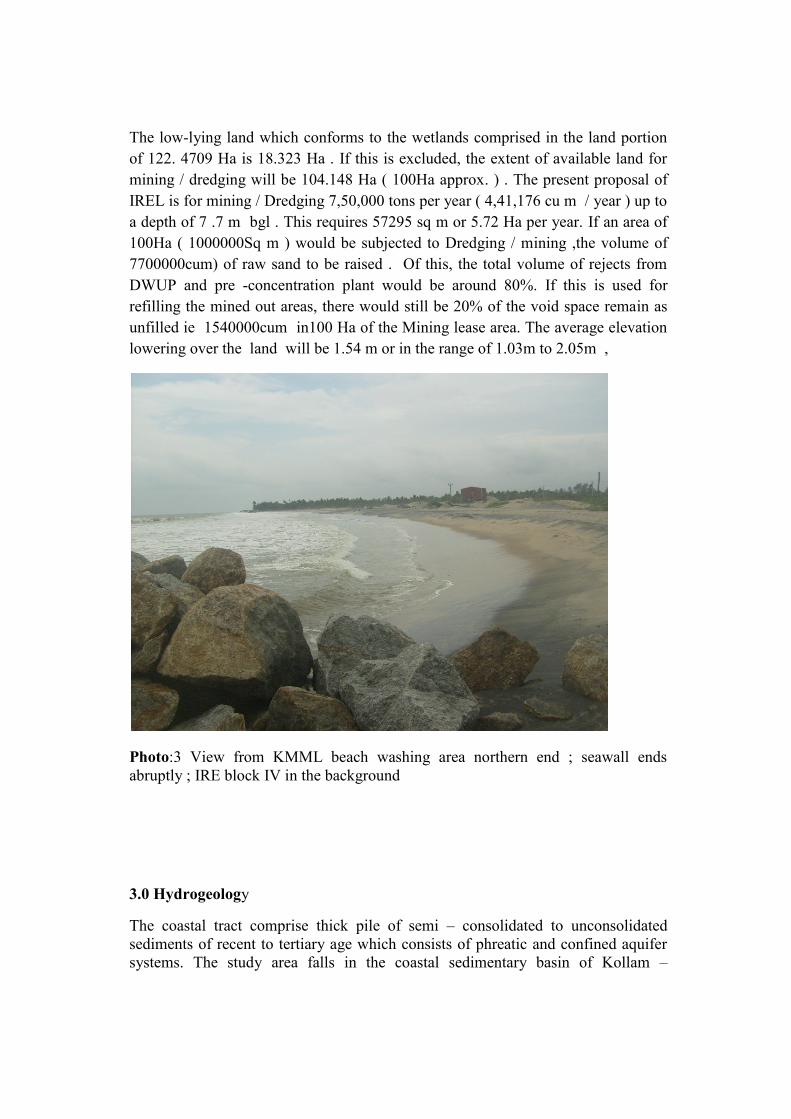
The low-lying land which conforms to the wetlands comprised in the land portion
of 122. 4709 Ha is 18.323 Ha . If this is excluded, the extent of available land for
mining / dredging will be 104.148 Ha ( 100Ha approx. ) . The present proposal of
IREL is for mining / Dredging 7,50,000 tons per year ( 4,41,176 cu m / year ) up to
a depth of 7 .7 m bgl . This requires 57295 sq m or 5.72 Ha per year. If an area of
100Ha ( 1000000Sq m ) would be subjected to Dredging / mining ,the volume of
7700000cum) of raw sand to be raised . Of this, the total volume of rejects from
DWUP and pre -concentration plant would be around 80%. If this is used for
refilling the mined out areas, there would still be 20% of the void space remain as
unfilled ie 1540000cum in100 Ha of the Mining lease area. The average elevation
lowering over the land will be 1.54 m or in the range of 1.03m to 2.05m ,
Photo:3 View from KMML beach washing area northern end ; seawall ends
abruptly ; IRE block IV in the background
3.0 Hydrogeology
The coastal tract comprise thick pile of semi – consolidated to unconsolidated
sediments of recent to tertiary age which consists of phreatic and confined aquifer
systems. The study area falls in the coastal sedimentary basin of Kollam –
Ponnaniarea. The exploration byThe Central Ground Water Board ( CGWB)
indicated a maximum depth of 600m for the sedimentary basin comprising 3
sedimentary formations ;Workallai , Quilon and Vaikom beds. Of these, the
Workallai and Vaikom beds are the most potential aquifers .A sub surface
geological section along the coastal belt based on borehole data is shown ( Fig; )
The Vaikom beds form artesian aquifers between Kollam and Poannani and
Workallai beds cater to the requirements of drinking water of urban and rural
population between Kollam and Kochi .Water is fresh south of Cherthalla in
Workallai beds whereas it is fresh south of Karuvatta in Vaikom beds . The quality
of ground water is brackish in nature at various places along the coast and was
considered due to sea water intrusion. But the detailed hydro – geo chemical survey
by the CGWB revealed that the brackishness is also due to leaching of salts from
the formation materials.
The recharge of the tertiary aquifers take place from direct precipitation as well as
by down ward percolation from the overlying recent to sub recent formations all
along the inland margin of the coastal belt.The nature of discharge from these
aquifers takesplace directly into sea or into the tidal lagoon all along the coastal
line. The dug wells in the area tap the phreatic aquifers in the recent sediments
whereas the deep tube wells draw water from the semi- confined to confined
aquifers.Ground water occurs in the porous granular formations such as alluvium, laterite,
the Tertiary sediments and weathered and decomposed crystalline rocks as well as in the
fissures, joints and fractures in the fresh crystalline rocks.Inthe study area recent
alluviumto Tertiary sediments,ground water occurseither in unconfined or semi-
confined/confined conditions. Phreatic conditions mainly exist in coastal alluvium.
Ground water is mainly developed through dug wells or filter point wells for
domestic or irrigation purposes. In the coastal region, the Quaternary alluvial
deposits form potential water table aquifers.
Laterite
The occurrence and movement of ground water in laterite are mainly controlled by
the topography. Laterite forms potential aquifers along valleys and topographic
lows where the thickness of saturated zone is more and can sustain large diameter
open wells for domestic and irrigation use.
Recent Alluvial Deposits
These constitute the most potential phreatic aquifer in thearea and is extensively
developed by dug wells and filter point wells for domestic and irrigation needs. The
depth to water level in this formation ranges from 0.50 to 5.9 m which is 1 to 6 m
above msl. The depth of the wells ranges from 2.76 to 10.6 m bgl. The yield of the
shallow dug wells ranges from 15 to 50 m3/day. The area around Chavara,
Karunagapally where the saturated thickness exceeds 5.0 m form promising area for
filter point wells. The filter point wells are constructed to a maximum depth of 12.0
m bgl and the yield ranges from 20 to 60m3/day.
The shallow phreatic aquifers in alluvium are developed through dug wells and
filter point wells. Filter point wells are more economical in the alluvium areas in
comparison to dug wells. However, filter points can be constructed only in very
restricted areas where the saturated sand thickness in the shallow zone exceeds 5
m.Filter point wells are feasible in coastal areas especially along Chavara,
Karunagapally blocks and the yield from these wells ranges from 20 to 60m3/day.
3.1 CGWBStudies in Kollam District:
The Central Groundwater board ( CGWB) had drilled 19 bore well for the ground
water exploration along the coastal sedimentary formations in Kollam district The
depth of boreholes ranges from 30.10 to 416m and the discharge of the bore wells
varies from 0.67lps to 42.96lps which much higher than the bore wells in hard rock
terrain . The yield of the shallow dug wells range from 15 to 50 50m3 /day .Along
the area around Chavara area the saturated thickness exceeds5m .The long
termwater level 1997-2006 Chavaraarea premonsoon and post monsoontrends show
a falling trendin wells Chavarablock
3.2 Ground water resources of Chavara and Karunagappally( asper GEC1997 ) as
on March 2004
Table:5
Block Total
annual
recharge
Net annual
ground
water
availability
Existing
gross draft
in MCM
Stage of
ground
water %
Category for
futureground
water
development
Chavara 20.9 18.81 12.54 66.67 Safe
Karunagappally 25.51 22.96 14.88 69.79 Safe
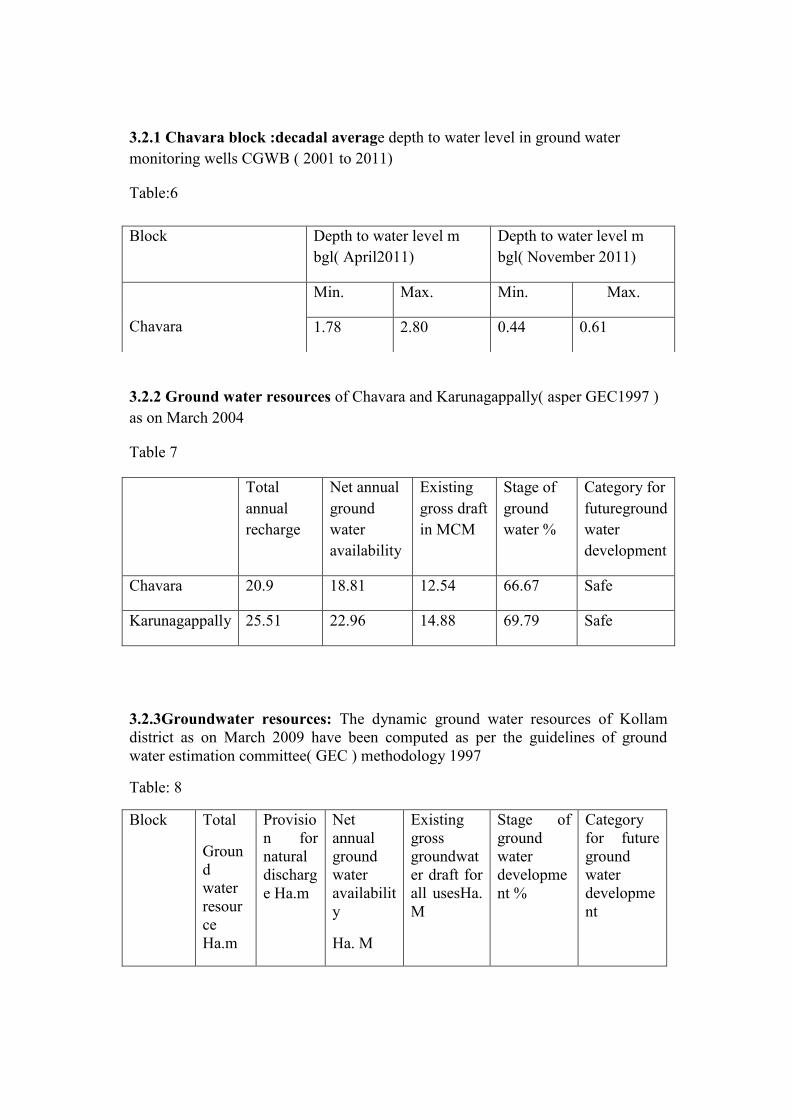
3.2.1 Chavara block :decadal average depth to water level in ground water
monitoring wells CGWB ( 2001 to 2011)
Table:6
3.2.2 Ground water resources of Chavara and Karunagappally( asper GEC1997 )
as on March 2004
Table 7
Total
annual
recharge
Net annual
ground
water
availability
Existing
gross draft
in MCM
Stage of
ground
water %
Category for
futureground
water
development
Chavara 20.9 18.81 12.54 66.67 Safe
Karunagappally 25.51 22.96 14.88 69.79 Safe
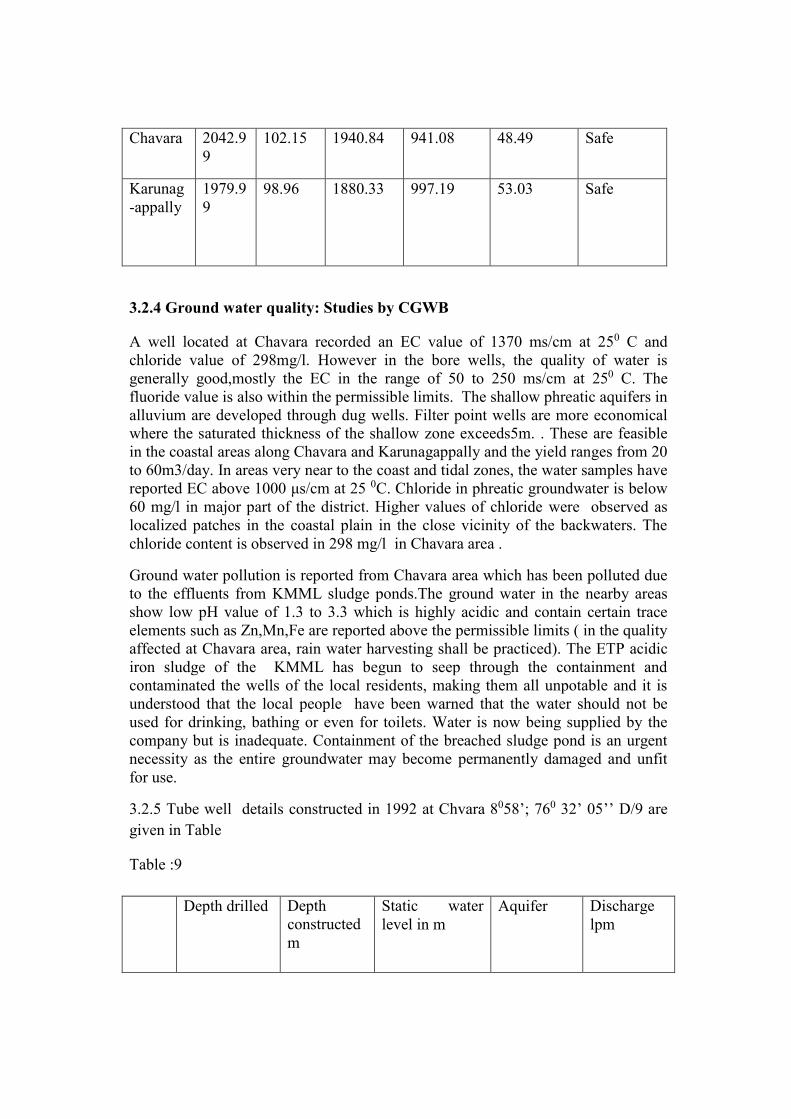
3.2.3Groundwater resources: The dynamic ground water resources of Kollam
district as on March 2009 have been computed as per the guidelines of ground
water estimation committee( GEC ) methodology 1997
Table: 8
Block Total
Groun
d
water
resour
ce
Ha.m
Provisio
n for
natural
discharg
e Ha.m
Net
annual
ground
water
availabilit
y
Ha. M
Existing
gross
groundwat
er draft for
all usesHa.
M
Stage of
ground
water
developme
nt %
Category
for future
ground
water
developme
nt
Block Depth to water level m
bgl( April2011)
Depth to water level m
bgl( November 2011)
Chavara
Min. Max. Min. Max.
1.78 2.80 0.44 0.61
Chavara 2042.9
9
102.15 1940.84 941.08 48.49 Safe
Karunag
-appally
1979.9
9
98.96 1880.33 997.19 53.03 Safe
3.2.4 Ground water quality: Studies by CGWB
A well located at Chavara recorded an EC value of 1370 ms/cm at 250 C and
chloride value of 298mg/l. However in the bore wells, the quality of water is
generally good,mostly the EC in the range of 50 to 250 ms/cm at 250 C. The
fluoride value is also within the permissible limits. The shallow phreatic aquifers in
alluvium are developed through dug wells. Filter point wells are more economical
where the saturated thickness of the shallow zone exceeds5m. . These are feasible
in the coastal areas along Chavara and Karunagappally and the yield ranges from 20
to 60m3/day. In areas very near to the coast and tidal zones, the water samples have
reported EC above 1000 μs/cm at 25 0C. Chloride in phreatic groundwater is below
60 mg/l in major part of the district. Higher values of chloride were observed as
localized patches in the coastal plain in the close vicinity of the backwaters. The
chloride content is observed in 298 mg/l in Chavara area .
Ground water pollution is reported from Chavara area which has been polluted due
to the effluents from KMML sludge ponds.The ground water in the nearby areas
show low pH value of 1.3 to 3.3 which is highly acidic and contain certain trace
elements such as Zn,Mn,Fe are reported above the permissible limits ( in the quality
affected at Chavara area, rain water harvesting shall be practiced). The ETP acidic
iron sludge of the KMML has begun to seep through the containment and
contaminated the wells of the local residents, making them all unpotable and it is
understood that the local people have been warned that the water should not be
used for drinking, bathing or even for toilets. Water is now being supplied by the
company but is inadequate. Containment of the breached sludge pond is an urgent
necessity as the entire groundwater may become permanently damaged and unfit
for use.
3.2.5 Tube well details constructed in 1992 at Chvara 8058’; 760 32’ 05’’ D/9 are
given in Table
Table :9
Depth drilled Depth
constructed
m
Static water
level in m
Aquifer Discharge
lpm
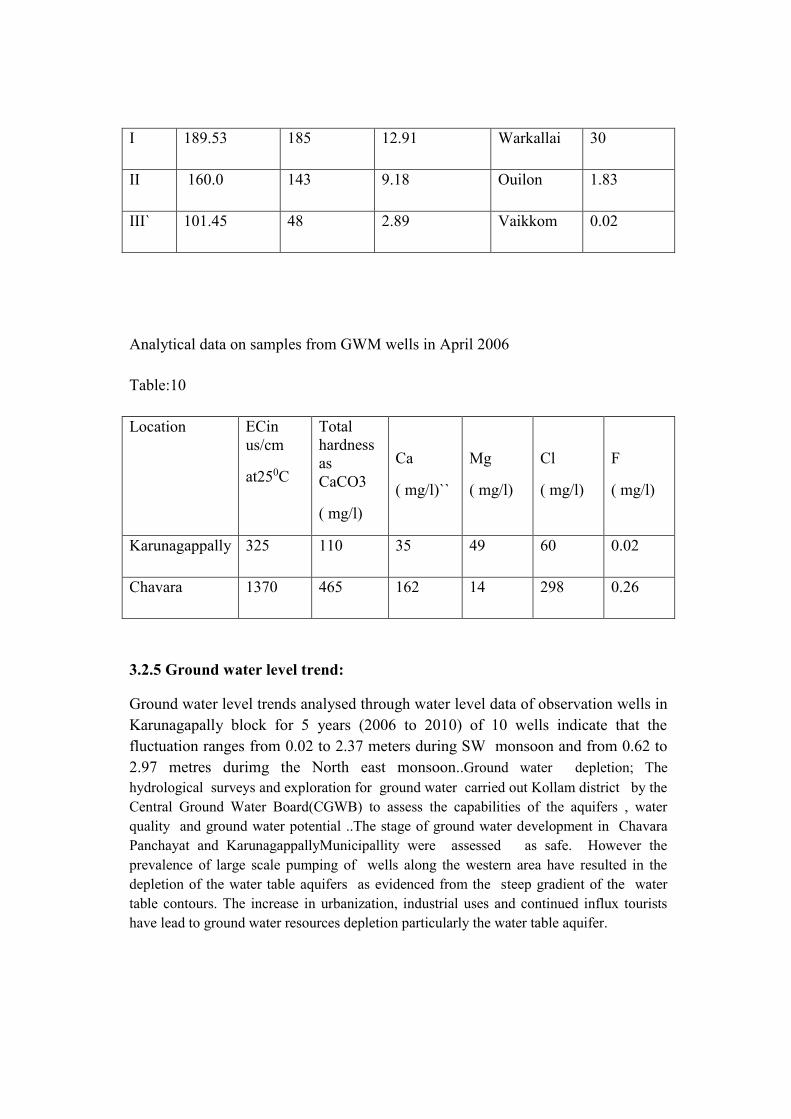
I 189.53 185 12.91 Warkallai 30
II 160.0 143 9.18 Ouilon 1.83
III` 101.45 48 2.89 Vaikkom 0.02
Analytical data on samples from GWM wells in April 2006
Table:10
Location ECin
us/cm
at250C
Total
hardness
as
CaCO3
( mg/l)
Ca
( mg/l)``
Mg
( mg/l)
Cl
( mg/l)
F
( mg/l)
Karunagappally 325 110 35 49 60 0.02
Chavara 1370 465 162 14 298 0.26
3.2.5 Ground water level trend:
Ground water level trends analysed through water level data of observation wells in
Karunagapally block for 5 years (2006 to 2010) of 10 wells indicate that the
fluctuation ranges from 0.02 to 2.37 meters during SW monsoon and from 0.62 to
2.97 metres durimg the North east monsoon..Ground water depletion; The
hydrological surveys and exploration for ground water carried out Kollam district by the
Central Ground Water Board(CGWB) to assess the capabilities of the aquifers , water
quality and ground water potential ..The stage of ground water development in Chavara
Panchayat and KarunagappallyMunicipallity were assessed as safe. However the
prevalence of large scale pumping of wells along the western area have resulted in the
depletion of the water table aquifers as evidenced from the steep gradient of the water
table contours. The increase in urbanization, industrial uses and continued influx tourists
have lead to ground water resources depletion particularly the water table aquifer.
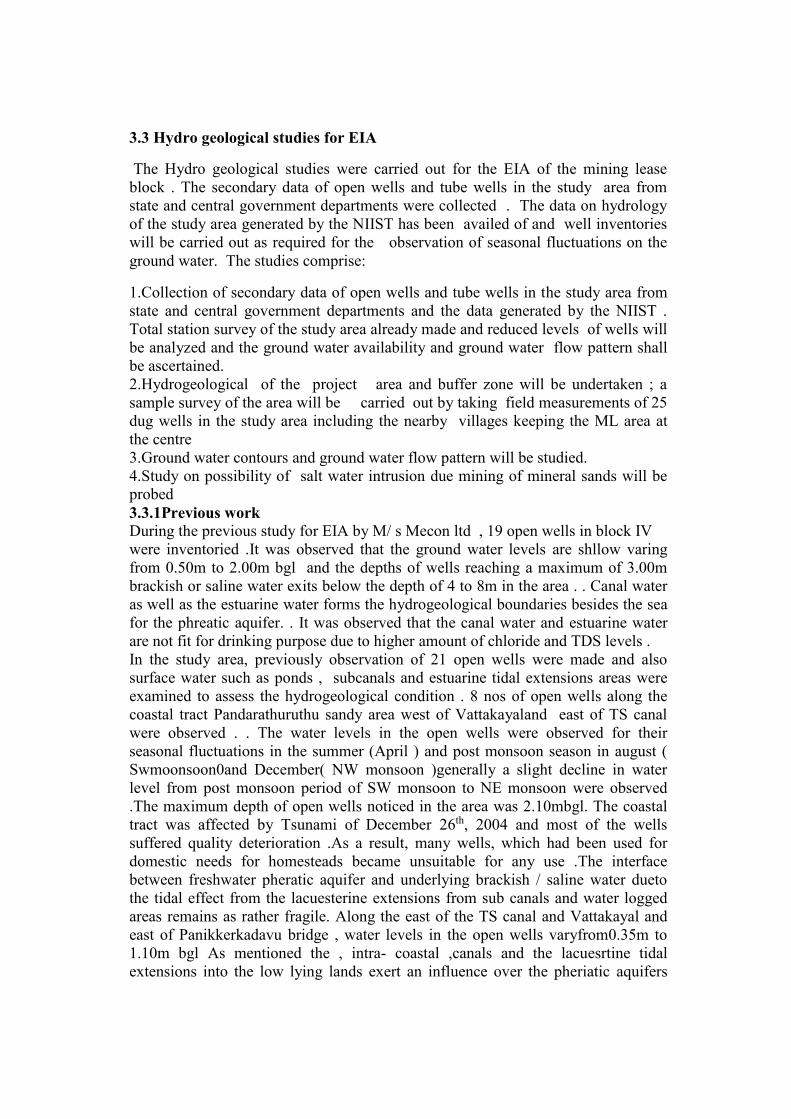
3.3 Hydro geological studies for EIA
The Hydro geological studies were carried out for the EIA of the mining lease
block . The secondary data of open wells and tube wells in the study area from
state and central government departments were collected . The data on hydrology
of the study area generated by the NIIST has been availed of and well inventories
will be carried out as required for the observation of seasonal fluctuations on the
ground water. The studies comprise:
1.Collection of secondary data of open wells and tube wells in the study area from
state and central government departments and the data generated by the NIIST .
Total station survey of the study area already made and reduced levels of wells will
be analyzed and the ground water availability and ground water flow pattern shall
be ascertained.
2.Hydrogeological of the project area and buffer zone will be undertaken ; a
sample survey of the area will be carried out by taking field measurements of 25
dug wells in the study area including the nearby villages keeping the ML area at
the centre
3.Ground water contours and ground water flow pattern will be studied.
4.Study on possibility of salt water intrusion due mining of mineral sands will be
probed
3.3.1Previous work
During the previous study for EIA by M/ s Mecon ltd , 19 open wells in block IV
were inventoried .It was observed that the ground water levels are shllow varing
from 0.50m to 2.00m bgl and the depths of wells reaching a maximum of 3.00m
brackish or saline water exits below the depth of 4 to 8m in the area . . Canal water
as well as the estuarine water forms the hydrogeological boundaries besides the sea
for the phreatic aquifer. . It was observed that the canal water and estuarine water
are not fit for drinking purpose due to higher amount of chloride and TDS levels .
In the study area, previously observation of 21 open wells were made and also
surface water such as ponds , subcanals and estuarine tidal extensions areas were
examined to assess the hydrogeological condition . 8 nos of open wells along the
coastal tract Pandarathuruthu sandy area west of Vattakayaland east of TS canal
were observed . . The water levels in the open wells were observed for their
seasonal fluctuations in the summer (April ) and post monsoon season in august (
Swmoonsoon0and December( NW monsoon )generally a slight decline in water
level from post monsoon period of SW monsoon to NE monsoon were observed
.The maximum depth of open wells noticed in the area was 2.10mbgl. The coastal
tract was affected by Tsunami of December 26th, 2004 and most of the wells
suffered quality deterioration .As a result, many wells, which had been used for
domestic needs for homesteads became unsuitable for any use .The interface
between freshwater pheratic aquifer and underlying brackish / saline water dueto
the tidal effect from the lacuesterine extensions from sub canals and water logged
areas remains as rather fragile. Along the east of the TS canal and Vattakayal and
east of Panikkerkadavu bridge , water levels in the open wells varyfrom0.35m to
1.10m bgl As mentioned the , intra- coastal ,canals and the lacuesrtine tidal
extensions into the low lying lands exert an influence over the pheriatic aquifers
tapped by open wells as the shallow water levels as 0.35m to 1.110m exists in the
wells. The depth of wells in the eastern side of TS canal was found to vary from
1.60m to 3.83m bgl. The water quality was reported to be bad to fair . The water
drawn from most of the wells is trbid to reddish to pink in color . The people in the
area who solely depend on the municipal water supply whichwas erraic . .it was
also observed that during the field visits that only a few houses in the localty which
possesess more extent of land than One acre and located away from the canal and
sub canals have fairly good qualty of water in their wells. It is significant that the
susceptibility of open wells of homesteads of small land holdings are more prone to
the tidal influence of brackish water from near by intra canals and estuarine areas
The intra coastal canals which permit intrusion of sea water by tidal action exert
influence to the hydro dynamic equilibrium of the coastal tract especially in the
pheratic aquifer systems .
3.3.2Pumping at Vellanathuruthu for water supply
The Kerala Water Authority (KWA ) pump house and deep tube well under
RGWSS scheme for water supplly to Cheriyazhikkal – Alappad area are situated in
the area under study near Sree Mukkumpuzha temple .The water from the tube
well is pumped directly 20 hours per day to the water supply lines to Alappad
Panchayat . The depth of the tube well is about150m which taps the confined
aquifers comprised in the deeper layers in tertiary sedimentary formation and
possibly belonging to Workallai and Vaikomm beds and there is no depletion of
the phreatic aquifers in the locality .
3.3.3 Hydrogeological survey of the project area and buffer zone
The field data collection in core zone and buffer zone were carried out and traverses
along the buffer zone were made and collection of samples of ground water and
surface water.
Hydrogeological survey of the project area and buffer zone was undertaken by
conducting a sample survey of the area taking field measurements of 23 wells in the
study area including the nearby villages keeping the ML area at the centre.Of these
10 wells pertains to the project area and 13 wells were in the buffer zone The water
levels in the 23nos of wells were inventoried.( Annexure )The depth of the wells
varies from 1.59mto 5.78m .The water level of the wells in the project area varies
from0.61m to 2.18mand in the buffer zone the water level varies from 0.64mto
4.55m in the Pre monsoon( May )whereas in the post monsoon ie Oct the water
level of the wells in the project area varies from0.55m to 2.05mand in the buffer
zone the water level varies from 0.33mto 4.38m). The average water level n the
project area in the pre-monsoon was found to be 1.22m below ground level and in
the post monsoon season it was observed to be 1.12 m below ground level . The
average water level in the project area being 1.17m below ground level . Thus it is
evident that the mining / dredging operations in the area in the project area for the
working of the mine will intersect water table aquifer .of the area .( Fig 6 )
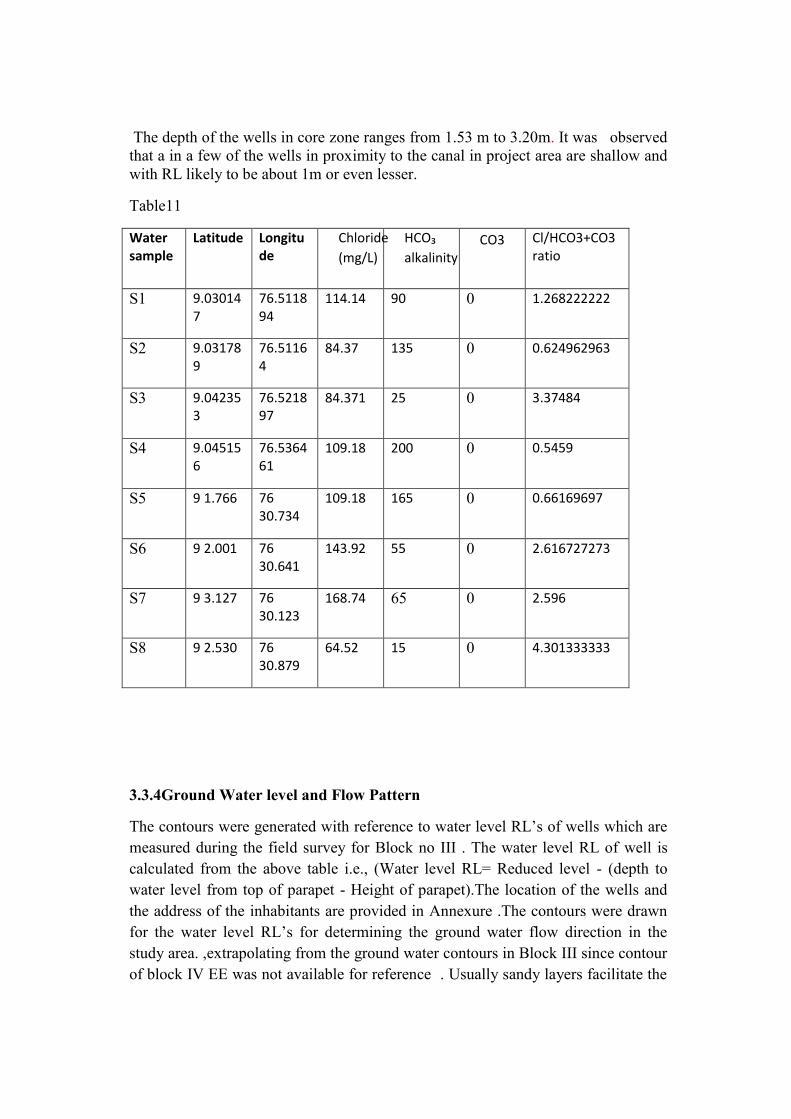
The depth of the wells in core zone ranges from 1.53 m to 3.20m. It was observed
that a in a few of the wells in proximity to the canal in project area are shallow and
with RL likely to be about 1m or even lesser.
Table11
Water sample
Latitude Longitude
Chloride
(mg/L)
HCO₃
alkalinity
CO3
Cl/HCO3+CO3 ratio
S1 9.030147
76.511894
114.14 90 0 1.268222222
S2 9.031789
76.51164
84.37 135 0 0.624962963
S3 9.042353
76.521897
84.371 25 0 3.37484
S4 9.045156
76.536461
109.18 200 0 0.5459
S5 9 1.766 76 30.734
109.18 165 0 0.66169697
S6 9 2.001 76 30.641
143.92 55 0 2.616727273
S7 9 3.127 76 30.123
168.74 65 0 2.596
S8 9 2.530 76 30.879
64.52 15 0 4.301333333
3.3.4Ground Water level and Flow Pattern
The contours were generated with reference to water level RL’s of wells which are
measured during the field survey for Block no III . The water level RL of well is
calculated from the above table i.e., (Water level RL= Reduced level - (depth to
water level from top of parapet - Height of parapet).The location of the wells and
the address of the inhabitants are provided in Annexure .The contours were drawn
for the water level RL’s for determining the ground water flow direction in the
study area. ,extrapolating from the ground water contours in Block III since contour
of block IV EE was not available for reference . Usually sandy layers facilitate the
flow of water whereas clayey layer retards it. The contours were drawn for the
water level RL’s for determining the ground water flow direction in the study area.
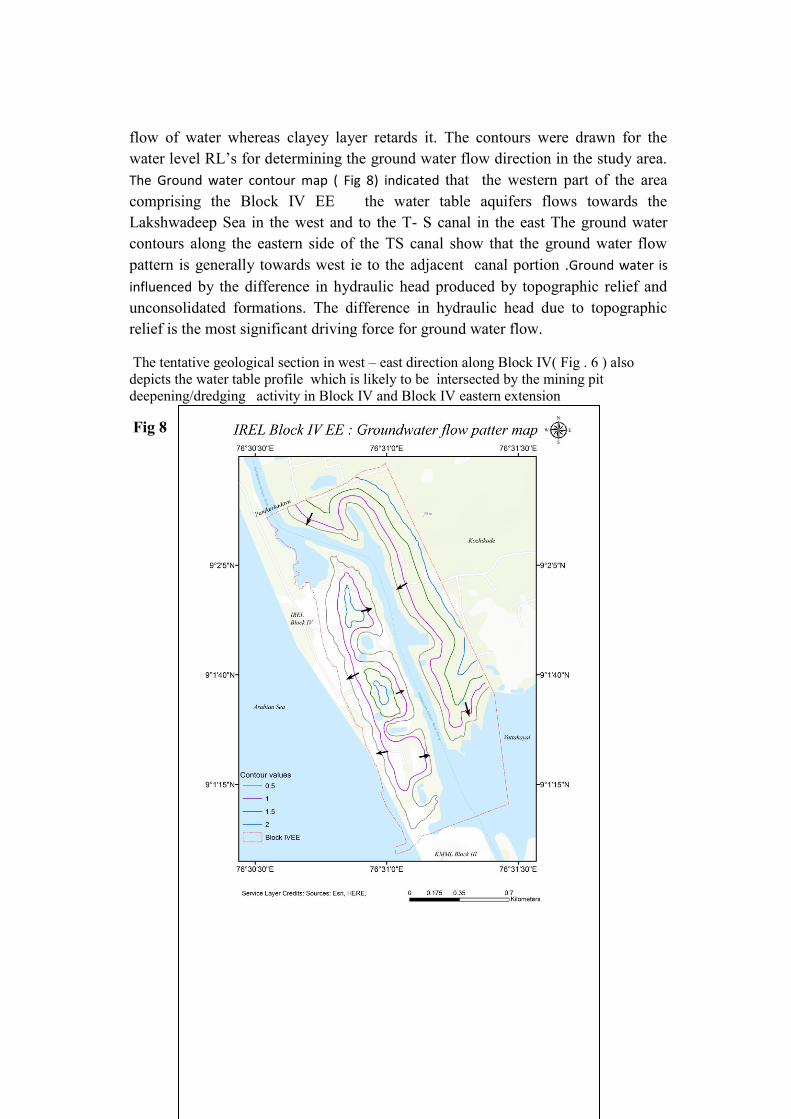
The Ground water contour map ( Fig 8) indicated that the western part of the area
comprising the Block IV EE the water table aquifers flows towards the
Lakshwadeep Sea in the west and to the T- S canal in the east The ground water
contours along the eastern side of the TS canal show that the ground water flow
pattern is generally towards west ie to the adjacent canal portion .Ground water is
influenced by the difference in hydraulic head produced by topographic relief and
unconsolidated formations. The difference in hydraulic head due to topographic
relief is the most significant driving force for ground water flow.
The tentative geological section in west – east direction along Block IV( Fig . 6 ) also
depicts the water table profile which is likely to be intersected by the mining pit
deepening/dredging activity in Block IV and Block IV eastern extension
Fig 8
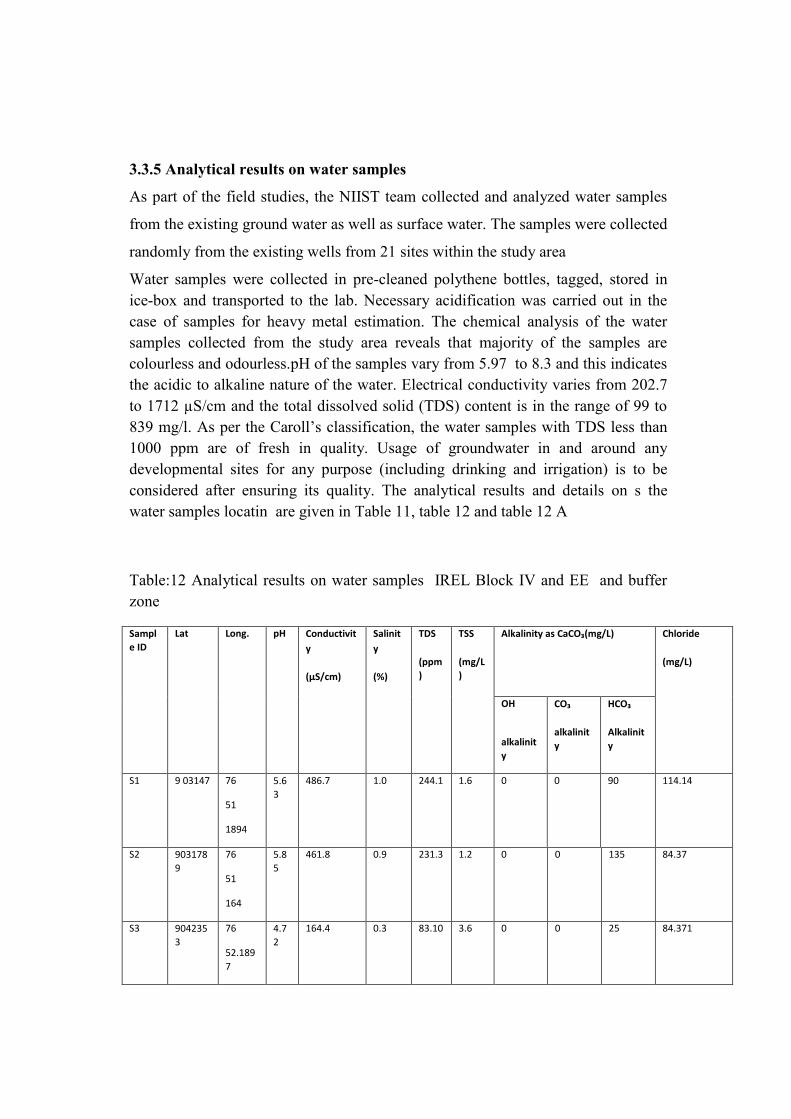
3.3.5 Analytical results on water samples
As part of the field studies, the NIIST team collected and analyzed water samples
from the existing ground water as well as surface water. The samples were collected
randomly from the existing wells from 21 sites within the study area
Water samples were collected in pre-cleaned polythene bottles, tagged, stored in
ice-box and transported to the lab. Necessary acidification was carried out in the
case of samples for heavy metal estimation. The chemical analysis of the water
samples collected from the study area reveals that majority of the samples are
colourless and odourless.pH of the samples vary from 5.97 to 8.3 and this indicates
the acidic to alkaline nature of the water. Electrical conductivity varies from 202.7
to 1712 µS/cm and the total dissolved solid (TDS) content is in the range of 99 to
839 mg/l. As per the Caroll’s classification, the water samples with TDS less than
1000 ppm are of fresh in quality. Usage of groundwater in and around any
developmental sites for any purpose (including drinking and irrigation) is to be
considered after ensuring its quality. The analytical results and details on s the
water samples locatin are given in Table 11, table 12 and table 12 A
Table:12 Analytical results on water samples IREL Block IV and EE and buffer
zone
Sampl
e ID
Lat Long. pH Conductivit
y
(µS/cm)
Salinit
y
(%)
TDS
(ppm
)
TSS
(mg/L
)
Alkalinity as CaCO₃(mg/L) Chloride
(mg/L)
OH
alkalinit
y
CO₃
alkalinit
y
HCO₃
Alkalinit
y
S1 9 03147 76
51
1894
5.6
3
486.7 1.0 244.1 1.6 0 0 90 114.14
S2 903178
9
76
51
164
5.8
5
461.8 0.9 231.3 1.2 0 0 135 84.37
S3 904235
3
76
52.189
7
4.7
2
164.4 0.3 83.10 3.6 0 0 25 84.371
S4 904156 76
53.646
1
5.5
6
493.3 1.0 247 0.4 0 0 200 109.18
S5 9 1.766 76
30.734
5.8
0
828.9 1.6 417 0.8 0 0 165 109.18
S6 9 2.001 76
30.641
4.9
8
266.5 0.5 135.6 3.2 0 0 55 143.92
S7 9 3.127 76
30.123
5.2
5
660.2 1.3 331.5 2 0 0 65 168.74
S8 9 2.536 76
30.879
5.5
4
99.74 0.2 50.52 0.4 0 0 15 64.52
Table 13
Sa
mp
le
pH Cond
uctiv
ity
Salinit
y
TDS Chlori
de
Alkalinity Cl/
(
HCO3+
CO#3 )
Ratio
Calcium Magn
e
sium
Sodium Potassi
um
ID µS/c
m
ppt mg/L mg/L Carbonate
mg/L
Bicar
bona
temg
/L
mg/L mg/L mg/L mg/L
-
W1
7.87 1367 0.7 670 198.8 0 356 0.55 128.26 21.87 220.8 32.8
-
W2
7.86 26.1 0.1 128 39.76 0 70 0.568 28.06 9.72 30.43 2.5
-
W3
7.71 622 0.3 305 89.46 0 150 0.596 56.11 0 84.33 21.38
W4 7.67 543 0.3 266 74.55 0 150 0.497 56.11 19.44 57.29 9.42
W5 7.38 2333
0
14.3 1153 7057.4 0 40 176.43 132.26 493.29 7349 198
-
W6
7.60 506 0.2 248 54.67 0 110 0.497 52.1 0 64.1 18.71
-
W7
7.46 140.
9
0.1 210 24.85 0 110 0.225 8.02 2.43 60 15
-
W8
7.57 338 0.2 165 29.82 2 116 0.257 40.08 13.61 28.54 12.22
W9 7.32 354 0.2 173 49.7 0 68 0.73 30.46 5.83 0.94 0.15
W1
0
6.55 265.
9
0.1 69 53.68 0 12 4.47 16.03 4.86 34.71 4.21
W1
1
7.55 62.1 0 30 15.9 0 16 0.99 4.81 1.94 16.88 1.75
W1
2
7.13 1545 0.8 757 308.14 24 360 0.92 73.75 25.27 221 21.46
W1
3
7.68 371 0.2 182 59.64 0 66 0.90 43.29 1.94 33.12 28.69
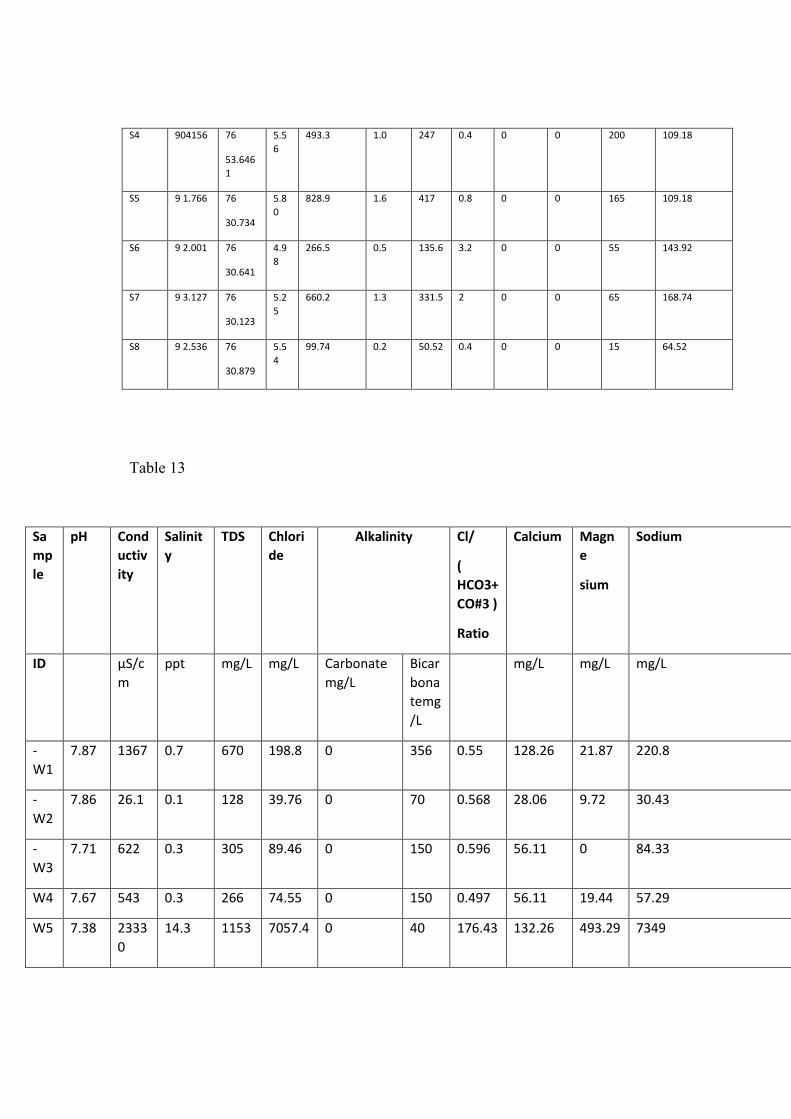
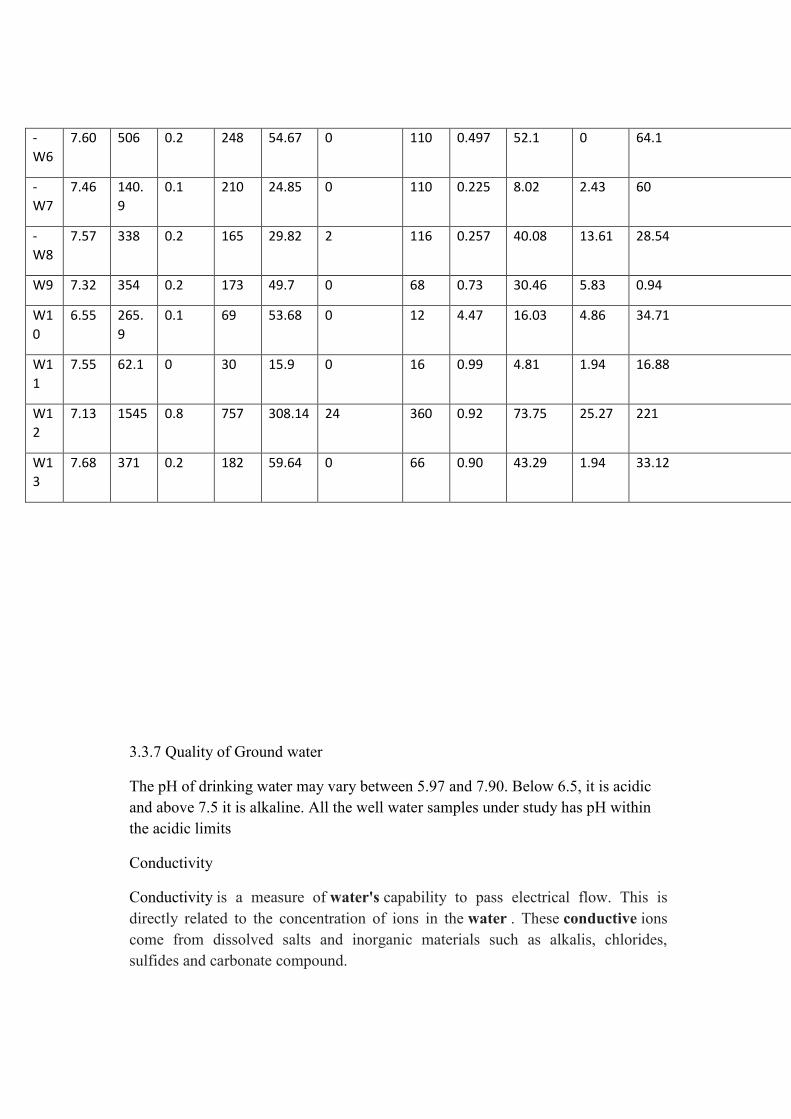
3.3.7 Quality of Ground water
The pH of drinking water may vary between 5.97 and 7.90. Below 6.5, it is acidic
and above 7.5 it is alkaline. All the well water samples under study has pH within
the acidic limits
Conductivity
Conductivity is a measure of water's capability to pass electrical flow. This is
directly related to the concentration of ions in the water . These conductive ions
come from dissolved salts and inorganic materials such as alkalis, chlorides,
sulfides and carbonate compound.
Usually dissolved metal ions in water contribute to higher conductivity. Pure water
devoid of metal ions exhibits a conductivity of zero. 5samples(S1, S2,S4, S5and S7
) under study possessed high conductivity with significant variations; 461.8
µS/cmto 828.9µS/cm(S2 -S5)
Salinity
Salinity is a measure of the dissolved salt content in a volume of water. It
determines osmotic pressure which affects the geographic range of particular
marine organisms.Theaverage salinity of river water is0.5ppt and average salinity
of seawater is 35ppt (35000ppm). The recommended value is 500 mg/l above which
water tastes unpleasant. As per the Caroll’s classification, the water samples with
TDS less than 1000 ppm are of fresh in quality. Salinity(Chloride CalciumSodium
and potassium)
The possible signature of sea water intrusion in the study area was investigated
using the standard Cl/HCO3 ratio (in equivalents) (Revelle, 1941). The Cl/HCO3
ratio for sample S8 indicates that there the ratio is 4.301333333
The mine pit development will intersect the water table aquifers .( Fig 6 )Sea water
intrusion in coastal aquifers is largely due to over exploitation of groundwater. The
over exploitation of groundwater leads to reversal of hydraulic gradient towards the
landward side and ultimately leads to ingress of the sea water to the coastal aquifer
gradually. In the present study, it is observed that all the groundwater sources had
negative head as a sequel to mining along the mining pits.
Alkalinity
Alkalinity is a measure of the capacity of water to neutralise acid in terms of
CaCO3. It is also a measure of the buffering capacity of water. It is caused by the
dissolved salts in ground water. Alkalinity is primarily due to the presence of
carbonate(CO3 2),bicarbonate(HCO3 -) and hydroxide(OH-)ions in water. Whereas
the source of carbonate and bicarbonate ions in ground water is the presence of their
Na,Mg, Ca and K salts in rocks and soil, hydroxide ions are introduced by
manmade activity. Total alkalinity is therefore a measure of carbonate, bicarbonate
and hydroxide ion concentration in water. Alkalinity of >60 mg/l indicates hard
waterThe permissible limit of alkalinity is 20- 200 mg/l as per WHO and BIS
standards
Chloride
Chloride is one of the major anions found in water and sewage. Its presence in large
amounts may be due to natural processes such as the passage of water through
natural salt formations in the earth or it may be an indication of pollution.The
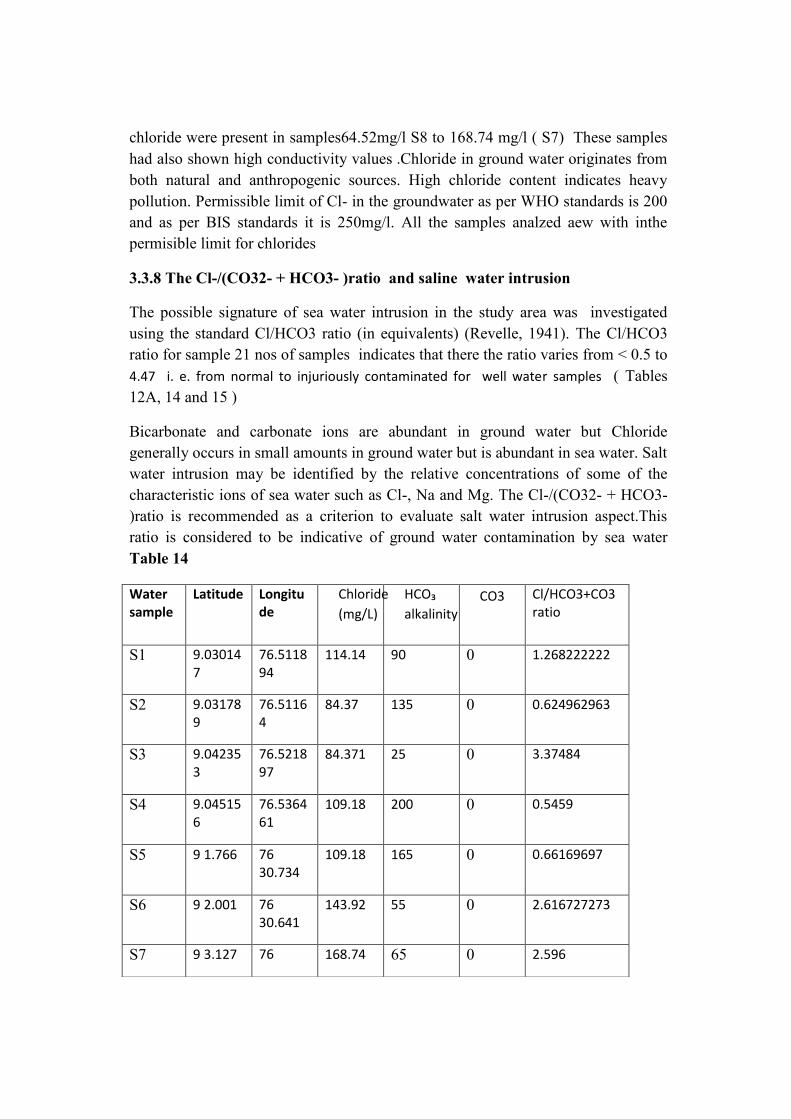
chloride were present in samples64.52mg/l S8 to 168.74 mg/l ( S7) These samples
had also shown high conductivity values .Chloride in ground water originates from
both natural and anthropogenic sources. High chloride content indicates heavy
pollution. Permissible limit of Cl- in the groundwater as per WHO standards is 200
and as per BIS standards it is 250mg/l. All the samples analzed aew with inthe
permisible limit for chlorides
3.3.8 The Cl-/(CO32- + HCO3- )ratio and saline water intrusion
The possible signature of sea water intrusion in the study area was investigated
using the standard Cl/HCO3 ratio (in equivalents) (Revelle, 1941). The Cl/HCO3
ratio for sample 21 nos of samples indicates that there the ratio varies from < 0.5 to
4.47 i. e. from normal to injuriously contaminated for well water samples ( Tables
12A, 14 and 15 )
Bicarbonate and carbonate ions are abundant in ground water but Chloride
generally occurs in small amounts in ground water but is abundant in sea water. Salt
water intrusion may be identified by the relative concentrations of some of the
characteristic ions of sea water such as Cl-, Na and Mg. The Cl-/(CO32- + HCO3-
)ratio is recommended as a criterion to evaluate salt water intrusion aspect.This
ratio is considered to be indicative of ground water contamination by sea water
Table 14
Water sample
Latitude Longitude
Chloride
(mg/L)
HCO₃
alkalinity
CO3
Cl/HCO3+CO3 ratio
S1 9.030147
76.511894
114.14 90 0 1.268222222
S2 9.031789
76.51164
84.37 135 0 0.624962963
S3 9.042353
76.521897
84.371 25 0 3.37484
S4 9.045156
76.536461
109.18 200 0 0.5459
S5 9 1.766 76 30.734
109.18 165 0 0.66169697
S6 9 2.001 76 30.641
143.92 55 0 2.616727273
S7 9 3.127 76 168.74 65 0 2.596
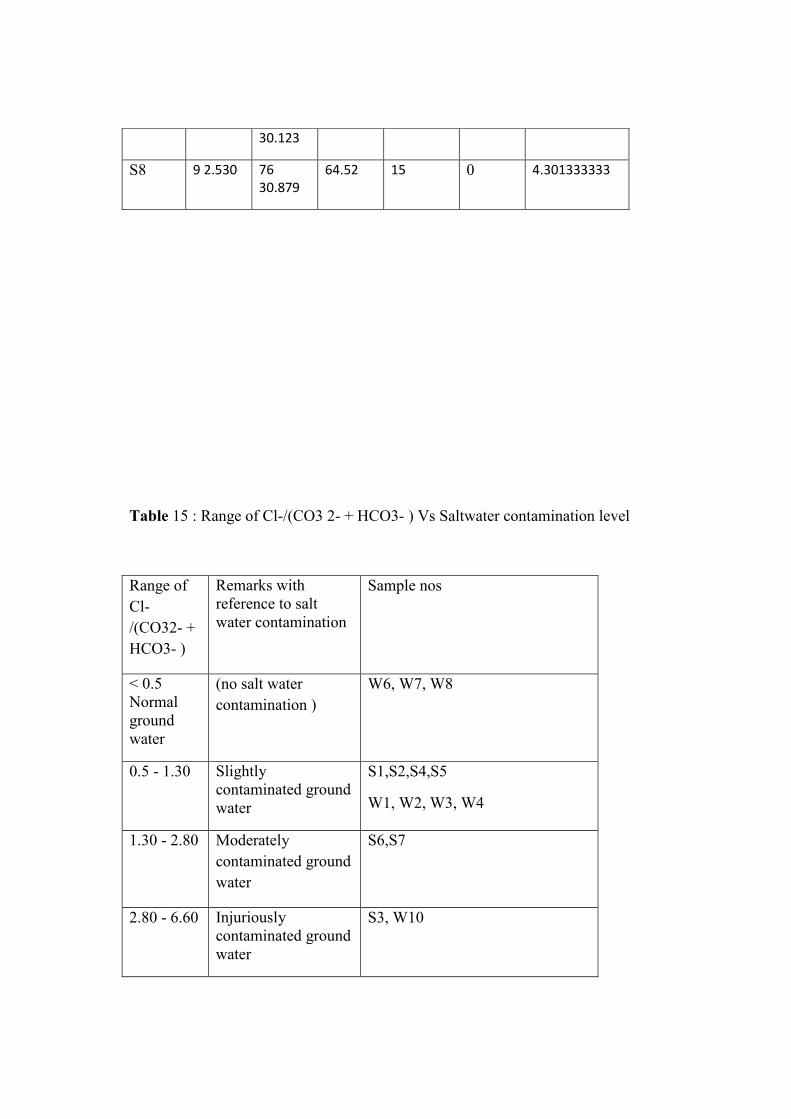
Table 15 : Range of Cl-/(CO3 2- + HCO3- ) Vs Saltwater contamination level
Range of
Cl-
/(CO32- +
HCO3- )
Remarks with
reference to salt
water contamination
Sample nos
< 0.5
Normal
ground
water
(no salt water
contamination )
W6, W7, W8
0.5 - 1.30 Slightly
contaminated ground
water
S1,S2,S4,S5
W1, W2, W3, W4
1.30 - 2.80 Moderately
contaminated ground
water
S6,S7
2.80 - 6.60 Injuriously
contaminated ground
water
S3, W10
30.123
S8 9 2.530 76 30.879
64.52 15 0 4.301333333
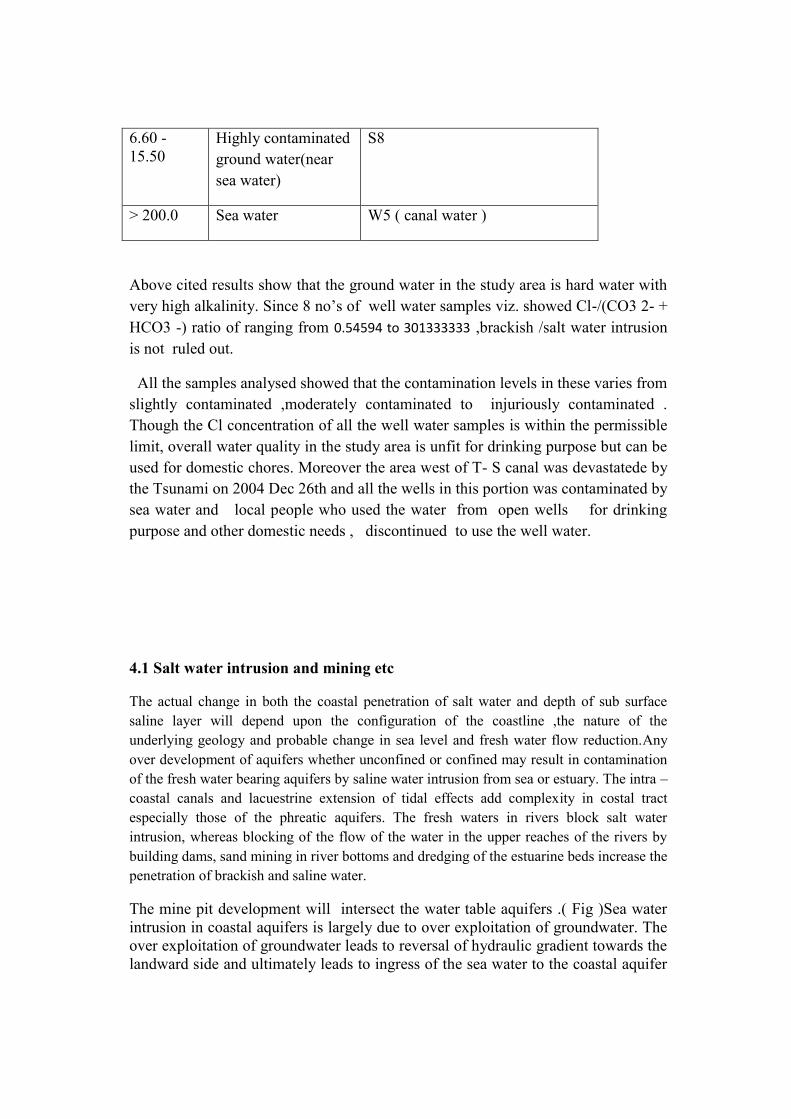
6.60 -
15.50
Highly contaminated
ground water(near
sea water)
S8
> 200.0 Sea water W5 ( canal water )
Above cited results show that the ground water in the study area is hard water with
very high alkalinity. Since 8 no’s of well water samples viz. showed Cl-/(CO3 2- +
HCO3 -) ratio of ranging from 0.54594 to 301333333 ,brackish /salt water intrusion
is not ruled out.
All the samples analysed showed that the contamination levels in these varies from
slightly contaminated ,moderately contaminated to injuriously contaminated .
Though the Cl concentration of all the well water samples is within the permissible
limit, overall water quality in the study area is unfit for drinking purpose but can be
used for domestic chores. Moreover the area west of T- S canal was devastatede by
the Tsunami on 2004 Dec 26th and all the wells in this portion was contaminated by
sea water and local people who used the water from open wells for drinking
purpose and other domestic needs , discontinued to use the well water.
4.1 Salt water intrusion and mining etc
The actual change in both the coastal penetration of salt water and depth of sub surface
saline layer will depend upon the configuration of the coastline ,the nature of the
underlying geology and probable change in sea level and fresh water flow reduction.Any
over development of aquifers whether unconfined or confined may result in contamination
of the fresh water bearing aquifers by saline water intrusion from sea or estuary. The intra –
coastal canals and lacuestrine extension of tidal effects add complexity in costal tract
especially those of the phreatic aquifers. The fresh waters in rivers block salt water
intrusion, whereas blocking of the flow of the water in the upper reaches of the rivers by
building dams, sand mining in river bottoms and dredging of the estuarine beds increase the
penetration of brackish and saline water.
The mine pit development will intersect the water table aquifers .( Fig )Sea water
intrusion in coastal aquifers is largely due to over exploitation of groundwater. The
over exploitation of groundwater leads to reversal of hydraulic gradient towards the
landward side and ultimately leads to ingress of the sea water to the coastal aquifer
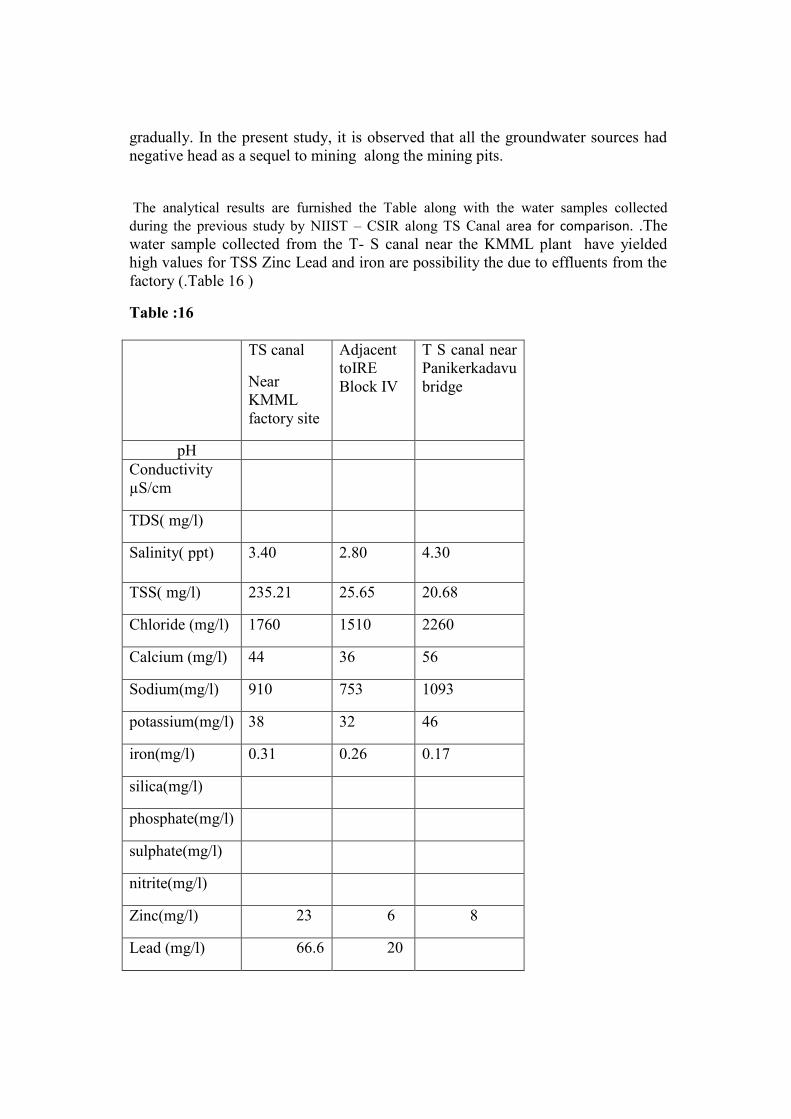
gradually. In the present study, it is observed that all the groundwater sources had
negative head as a sequel to mining along the mining pits.
The analytical results are furnished the Table along with the water samples collected
during the previous study by NIIST – CSIR along TS Canal area for comparison. .The
water sample collected from the T- S canal near the KMML plant have yielded
high values for TSS Zinc Lead and iron are possibility the due to effluents from the
factory (.Table 16 )
Table :16
TS canal
Near
KMML
factory site
Adjacent
toIRE
Block IV
T S canal near
Panikerkadavu
bridge
pH
Conductivity
µS/cm
TDS( mg/l)
Salinity( ppt) 3.40 2.80 4.30
TSS( mg/l) 235.21 25.65 20.68
Chloride (mg/l) 1760 1510 2260
Calcium (mg/l) 44 36 56
Sodium(mg/l) 910 753 1093
potassium(mg/l) 38 32 46
iron(mg/l) 0.31 0.26 0.17
silica(mg/l)
phosphate(mg/l)
sulphate(mg/l)
nitrite(mg/l)
Zinc(mg/l) 23 6 8
Lead (mg/l) 66.6 20
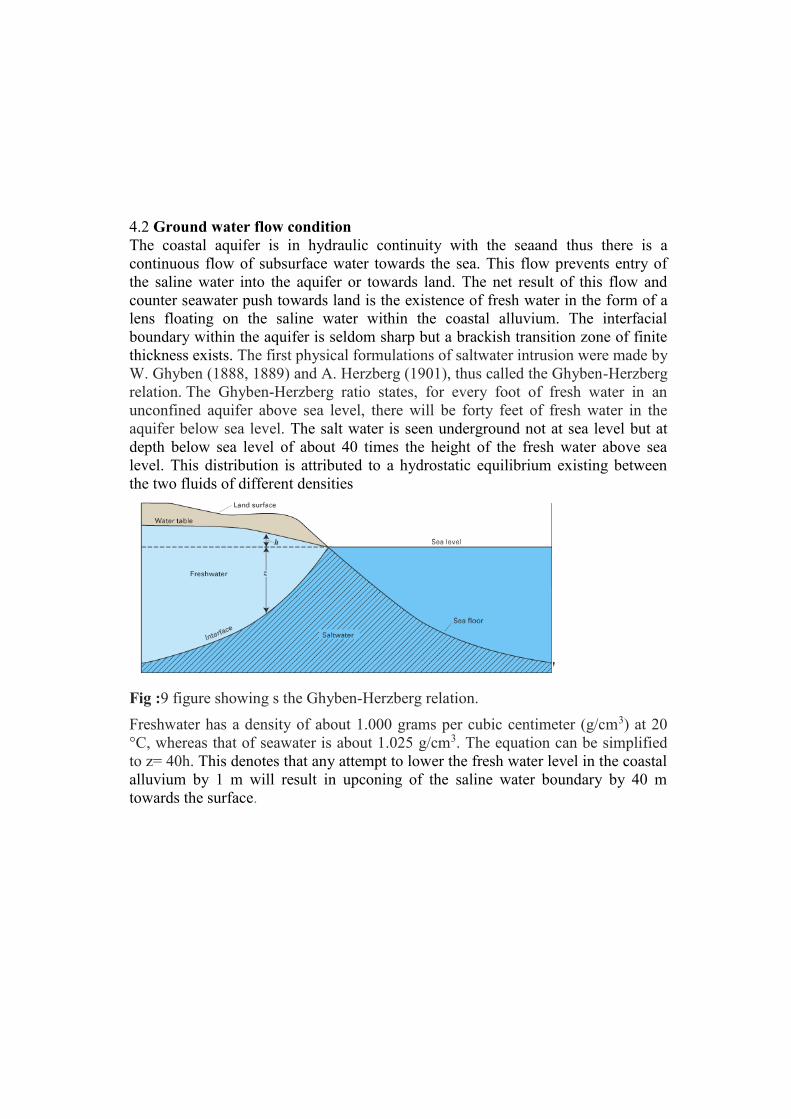
4.2 Ground water flow condition
The coastal aquifer is in hydraulic continuity with the seaand thus there is a
continuous flow of subsurface water towards the sea. This flow prevents entry of
the saline water into the aquifer or towards land. The net result of this flow and
counter seawater push towards land is the existence of fresh water in the form of a
lens floating on the saline water within the coastal alluvium. The interfacial
boundary within the aquifer is seldom sharp but a brackish transition zone of finite
thickness exists. The first physical formulations of saltwater intrusion were made by
W. Ghyben (1888, 1889) and A. Herzberg (1901), thus called the Ghyben-Herzberg
relation. The Ghyben-Herzberg ratio states, for every foot of fresh water in an
unconfined aquifer above sea level, there will be forty feet of fresh water in the
aquifer below sea level. The salt water is seen underground not at sea level but at
depth below sea level of about 40 times the height of the fresh water above sea
level. This distribution is attributed to a hydrostatic equilibrium existing between
the two fluids of different densities
'
Fig :9 figure showing s the Ghyben-Herzberg relation.
Freshwater has a density of about 1.000 grams per cubic centimeter (g/cm3) at 20
°C, whereas that of seawater is about 1.025 g/cm3. The equation can be simplified
to z= 40h. This denotes that any attempt to lower the fresh water level in the coastal
alluvium by 1 m will result in upconing of the saline water boundary by 40 m
towards the surface.
.
4.3 Groundwater extraction
Groundwater extraction can lower the level of the fresh water table, reducing the
pressure exerted by the freshwater column and allowing the denser saltwater to
move inland laterally. Since withdrawals of groundwater due inland mining have
lowered groundwater levels, reducing the water table to nearly or below sea level
and causing saline or brackish intrusion and contamination of domestic dug wells. Pumping of groundwater strengthens this effect by lowering the water table, reducing the
downward push of freshwater.
4.4 Canals and drainage networks
Canals provide conduits for saltwater to be carried inland, as does the deepening of
existing channels for navigation purposes. Waterways have allowed saltwater to
move into the lake, and upstream into the rivers feeding the lake. Drainage
networks constructed to drain flat areas can lead to intrusion by lowering the
freshwater table, reducing the water pressure exerted by the freshwater column.
Saltwater intrusion may occur largely as a result of drainage canals built The main
cause of intrusion was the lowering of the water table, though the canals also
conveyed seawater inland o
4.5 Effect on water supply: The consequences of saltwater intrusion for supply
wells vary widely, depending on extent of the intrusion, the intended use of the
water, and whether the salinity exceeds standards for the intended use. Table 12
illustrates that the ratio of Cl-/(CO3 2- + HCO3- )in water samples from wells in
the study area is contaminated slightly to moderately to injuriously level.
Even though the coastal alluvium of the study areahas potential to support the water
supply needs,the industrial pollution has resulted in substantial decrease in potable
water resources in the area.The fresh water aquifer resource potential the
development needs proper planning of the extraction structures. The structures or
wells are to be designed in such a way that there will be a very limited drawdown
so that it never goes beyond the mean sea level. It is better to restrict the drawdown
to a level above the mean sea level. The process is termed as skimming the lens.
This process will not promote any up coning or severe disturbances within the
aquifer. However, sand has very high permeability and hydraulic conductivity
which is second only to gravel. As such even with limited drawdown considerable
water will be transmitted into the skimming well within a short span of time for
extraction.
4.6 Scope of ground water development
The main groundwater abstraction structures for domestic and agricultural
purposes in the area are dug wells. A good percentage of the households have their
own dug wells. The most potential aquifer in the area is constituted by alluvial
deposits, which are composed of sand and clays. Filter point wells are more suitable
and economic in the alluvial area in comparison with the dug wells and tube wells.
This can be constructed in areas where the saturated thickness exceeds 5 m. The
groundwater potential in the alluvial terrain can be developed through various
groundwater structures viz. dug wells, filter points and shallow tube wells. Dug
wells ranging in depth from 2.50 to 6.0 m with diameter of 1.50 to 2.0 m is
recommended. Filter point wells are feasible in areas around Chavara blocks
wherever the saturated sand thickness exceeds 5 m.
The Tertiary sediments can be developed through tube wells. There is scope for
additional tube wells in the district in the depth range of 100-150 m tapping the
Warkali aquifer with a minimum granular thickness of 15 m. The deeper Vaikom
aquifer in the Tertiary formation can be developed through tube wells and an
additional 10 tube wells in the depth range of 150-300 m can be constructed. All the
wet lands of study area should be protected from contamination and encroachment.
Suitable artificial recharge schemes should be implemented for conserving surface
runoff from rainfall. Rainwater harvesting schemes should be practiced in the area
and artificial recharge schemes such as percolation tank and infiltration wells may
be considered in suitable locations Large scale rainwater harvesting may be
considered to be taken up in the quality affected areas of Chavara which may
improve the quality of water through dilution over a period of time.
Ground water development should be coupled with management of rain water
harvesting and surface water. There should be proper water budgeting. The existing
water resources and dug wells, ponds, tanks etc should be cleaned, protected and
conserved. Artificial recharge schemes should be practiced in large scale along with
rain water harvesting. Rainwater in situ collection can be practiced along the coastal
region
5.1 Sea erosion in Kerala The shoreline of Kerala has been subjected to severe
coastal erosion in recent times .In the monsoons, two third of the shore line is
vulnerable to dynamic changes. Recent experience drives home the point that there
can be events like Tsunamis .In a study by the AMD in Chavara deposit in the
period between 1887 to 1977an extent of 177.04Ha of land was lost by marine
erosion with an average of loss of 0.86m per year .Hence uninterrupted sediment
flow from hinterland to the sea is a major factor to contain sea erosion, building of
raised beaches.
The sand on beaches is not static .the wave action constantly keeps the sand moving
in the surf ans swash zones and when waves strikes the coast at an angle , the net
result is is long shore current and beach drift which collectively move sand along
the coast ( Littoral drift ) The sand on the coastal beaches is supplied by rivers the
transport it from areas up stream where it has been produced by weathering of
crystalline rocks.The material flow is hindered by building dams in the upper
reaches of the rivers that effectively trap the sand , consequently the beaches are
deprived of sediments .
Seawalls or concrete or rip rap may help to retard erosion, but are not always
because considerable erosion may occur at the extremity of the protective structure .
Besides the sea walls tend to produce a narrower beach with less sand particularly if
the waves are strongly reflected and unless adequately designed will be detrimental.
Beach erosion along the coast also maybe result of heavy monsoons, unrestrained
sand mining in rivers, estuaries / lakes
5.2 Sea Erosion in parts of Kollam –Alapuzhza
5.2.1 The shoreline fluctuation studies over a time gap of 55 years (1910-1965)
byThrivikramji et al. (1983) using Survey of India toposheets have shown that the
Kerala coast has gained 41 km2 by accretion and lost 22 km2 by erosion.studies on
beach profile conducted by Thrivikramji . et al.1983) during the pre-and post-
monsoon showed that all along the coast from Cape Comorin to Mangalore, 30
million tons of sand were removed by waves from the shore face of Keralawhile 11
million tons were added in different sectors.
Apart from natural phenomenon, the man-made structures along the coastline act as
barriers to the material' and energy balance, and produce adverse effects on the
stability of the nearby coast. Some of the man made barriers are dredged channels,
jetties, groins, seawalls and break waters. The structures constructed along ports
and harbours have triggered many environmental problems in addition to upsetting
the sand balance in many locations ofthe coastal zone. Eravipuram beach south of
Kollam is a narrow curved beach south of Thankassery headland. The entire stretch
of the beach is protected by sea walls. Ithikkara river falls south of this beach -
andAshtamudi Lake present on the north. The beach width is about 50 m with a
gently sloping backshore covered beach vegetation and foreshore with maximum
seasonal variations. The beach undergoes rapid erosion during April to June
followed by a slow accretion till July and erosion during August to September.
Subsequently the beach builds till December and shows an erosional trend during
December-January. The storage volume shows that the beach has a maximum
storage volume in April (425.4 m3/m), and a minimum storage volume in June (371
m3/m) followed by a slight building up during July-August and erosion during
September (373.6 m3/m). This is followed by an accretional trend during October-
December. In general, the beach loses material over a period of the year.·At Kollam
, the average grain size, shows the presence of coarse sand (>5 mm). From March
to June, the sand size shows medium sand size class (0.30 mm - 0.38 mm) except in
May (0.53 mm). Two peaks of coarser grain size are present, one during the south-
west monsoon season and another during the north-east monsoon season with size
class 0.95 mm during July and 0.96 mm during October. Medium sand present in
the other seasons. During July to August, the sorting value shows a poorly sorted
tendency).The samples show negatively skewed nature during most of the period
except during April and June when they are symmetrical. This shows that the beach
in general undergoes erosion during this period .
5.2.2 The Satellite imageries 2003, 2009,2011and 2015 showing the progress of
sea erosion and shore line changes in the south of IREL Block IV ( KMML Block
III northern side )are shown in the 4 figures . The satellite imagery January 2003
shows accretion along the sea western side of the Block III ( KMML mining area . )
But the imagery of March 2009 shows that in the post Tsunami period ie after 26th
December 2004, the scenario has changed from accretion to erosion as evidenced
by the imagery on March 2009 . The imageries of the area on January 2011 and
April 2015 depict the increasing erosion in the area.
Fig :10 Satellite imageries 2003, 2009,2011and 2015 showing the progress of sea
erosion and shore line changes in the south of IREL Block IV ( KMML Block III
northern side )
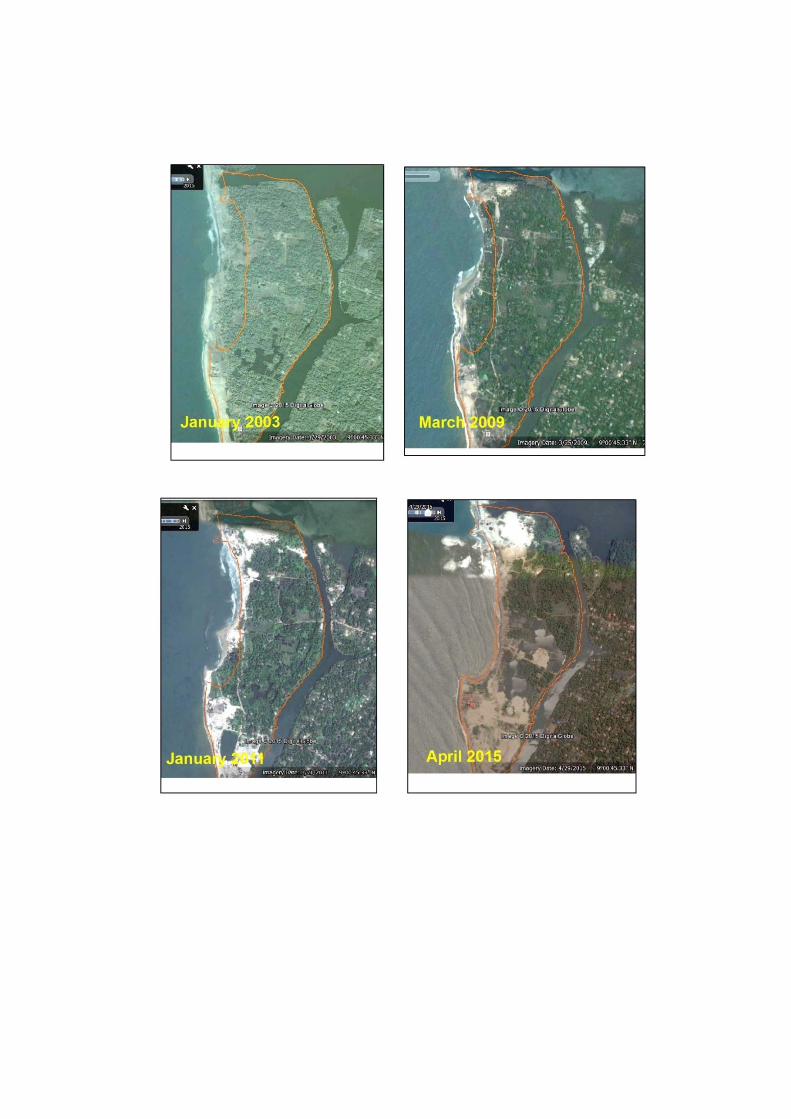
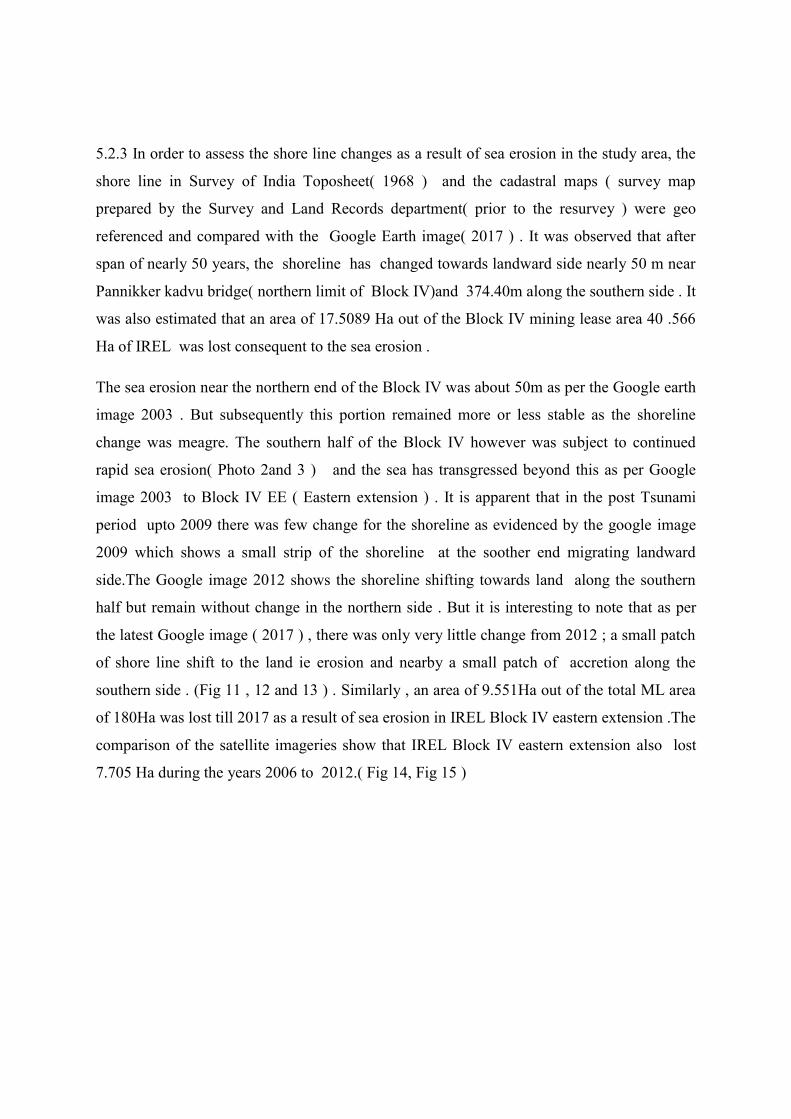
5.2.3 In order to assess the shore line changes as a result of sea erosion in the study area, the
shore line in Survey of India Toposheet( 1968 ) and the cadastral maps ( survey map
prepared by the Survey and Land Records department( prior to the resurvey ) were geo
referenced and compared with the Google Earth image( 2017 ) . It was observed that after
span of nearly 50 years, the shoreline has changed towards landward side nearly 50 m near
Pannikker kadvu bridge( northern limit of Block IV)and 374.40m along the southern side . It
was also estimated that an area of 17.5089 Ha out of the Block IV mining lease area 40 .566
Ha of IREL was lost consequent to the sea erosion .
The sea erosion near the northern end of the Block IV was about 50m as per the Google earth
image 2003 . But subsequently this portion remained more or less stable as the shoreline
change was meagre. The southern half of the Block IV however was subject to continued
rapid sea erosion( Photo 2and 3 ) and the sea has transgressed beyond this as per Google
image 2003 to Block IV EE ( Eastern extension ) . It is apparent that in the post Tsunami
period upto 2009 there was few change for the shoreline as evidenced by the google image
2009 which shows a small strip of the shoreline at the soother end migrating landward
side.The Google image 2012 shows the shoreline shifting towards land along the southern
half but remain without change in the northern side . But it is interesting to note that as per
the latest Google image ( 2017 ) , there was only very little change from 2012 ; a small patch
of shore line shift to the land ie erosion and nearby a small patch of accretion along the
southern side . (Fig 11 , 12 and 13 ) . Similarly , an area of 9.551Ha out of the total ML area
of 180Ha was lost till 2017 as a result of sea erosion in IREL Block IV eastern extension .The
comparison of the satellite imageries show that IREL Block IV eastern extension also lost
7.705 Ha during the years 2006 to 2012.( Fig 14, Fig 15 )
Fig .11
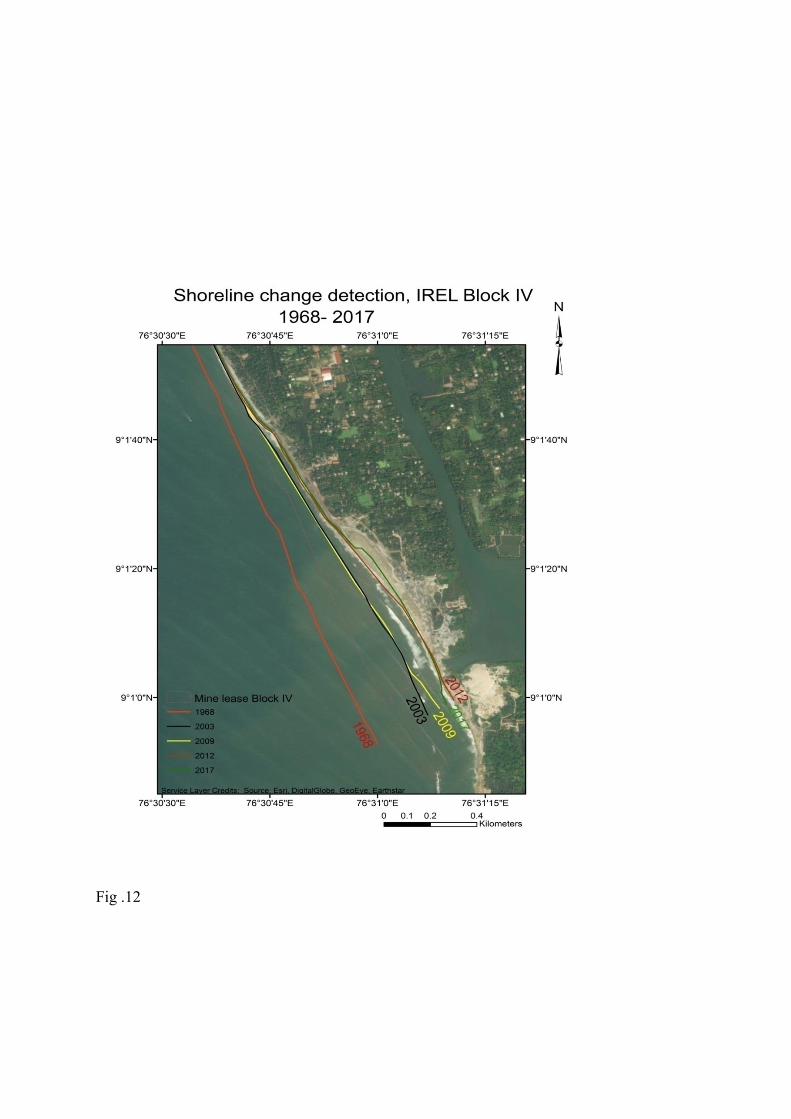
Fig .12
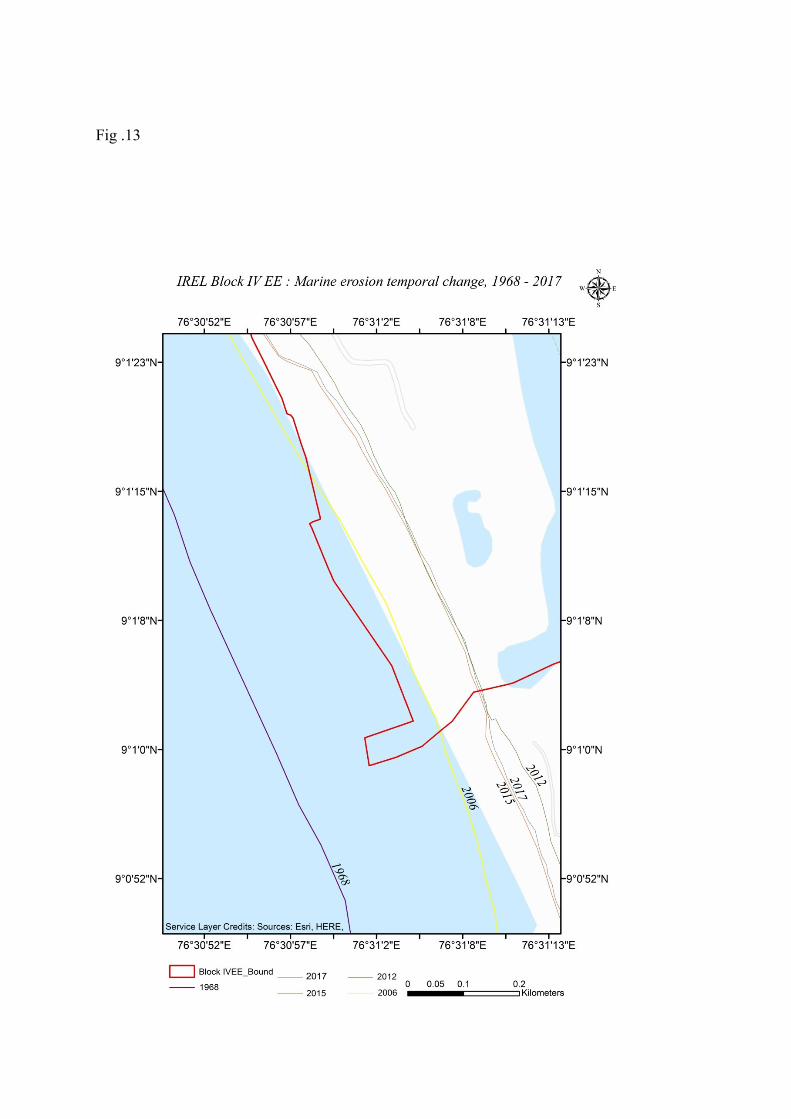
Fig .13
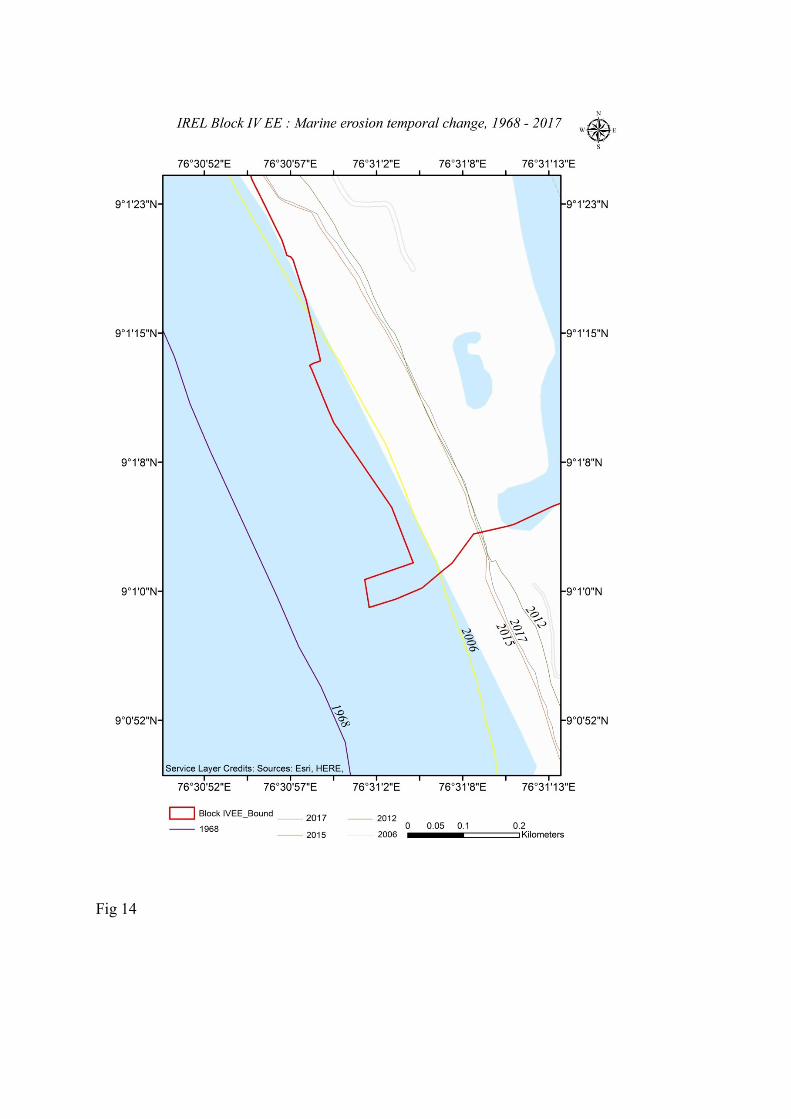
Fig 14
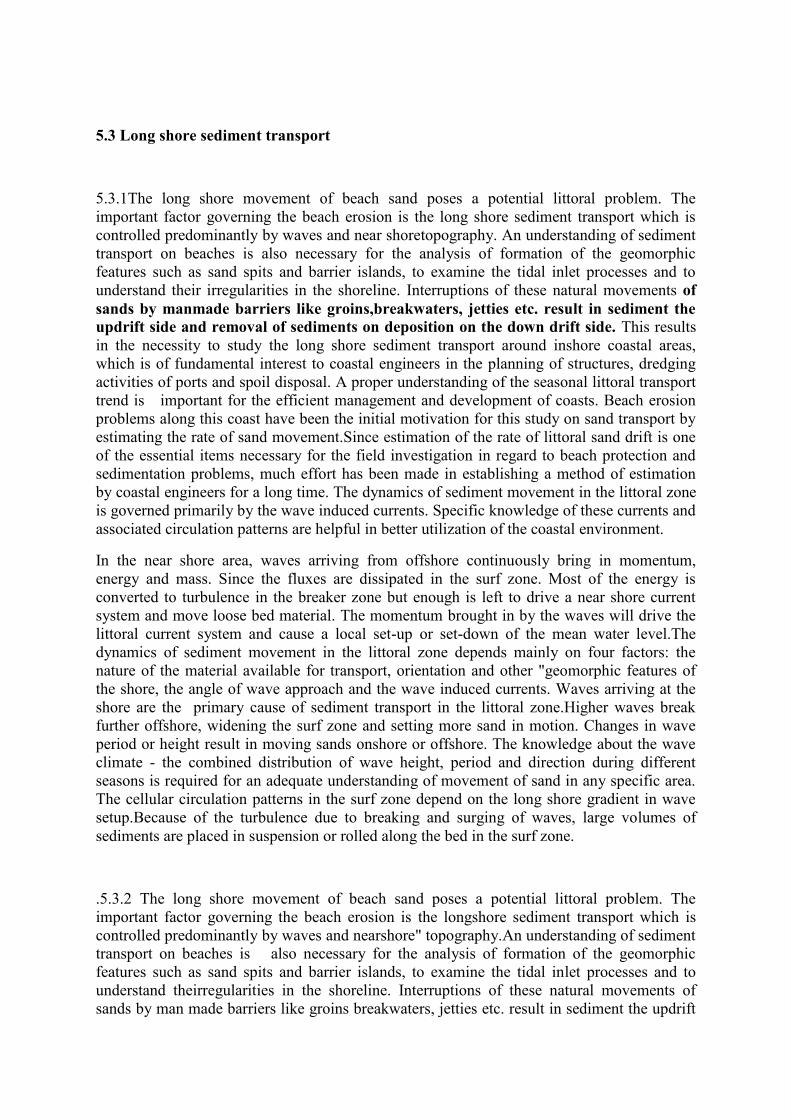
5.3 Long shore sediment transport
5.3.1The long shore movement of beach sand poses a potential littoral problem. The
important factor governing the beach erosion is the long shore sediment transport which is
controlled predominantly by waves and near shoretopography. An understanding of sediment
transport on beaches is also necessary for the analysis of formation of the geomorphic
features such as sand spits and barrier islands, to examine the tidal inlet processes and to
understand their irregularities in the shoreline. Interruptions of these natural movements of
sands by manmade barriers like groins,breakwaters, jetties etc. result in sediment the
updrift side and removal of sediments on deposition on the down drift side. This results
in the necessity to study the long shore sediment transport around inshore coastal areas,
which is of fundamental interest to coastal engineers in the planning of structures, dredging
activities of ports and spoil disposal. A proper understanding of the seasonal littoral transport
trend is important for the efficient management and development of coasts. Beach erosion
problems along this coast have been the initial motivation for this study on sand transport by
estimating the rate of sand movement.Since estimation of the rate of littoral sand drift is one
of the essential items necessary for the field investigation in regard to beach protection and
sedimentation problems, much effort has been made in establishing a method of estimation
by coastal engineers for a long time. The dynamics of sediment movement in the littoral zone
is governed primarily by the wave induced currents. Specific knowledge of these currents and
associated circulation patterns are helpful in better utilization of the coastal environment.
In the near shore area, waves arriving from offshore continuously bring in momentum,
energy and mass. Since the fluxes are dissipated in the surf zone. Most of the energy is
converted to turbulence in the breaker zone but enough is left to drive a near shore current
system and move loose bed material. The momentum brought in by the waves will drive the
littoral current system and cause a local set-up or set-down of the mean water level.The
dynamics of sediment movement in the littoral zone depends mainly on four factors: the
nature of the material available for transport, orientation and other "geomorphic features of
the shore, the angle of wave approach and the wave induced currents. Waves arriving at the
shore are the primary cause of sediment transport in the littoral zone.Higher waves break
further offshore, widening the surf zone and setting more sand in motion. Changes in wave
period or height result in moving sands onshore or offshore. The knowledge about the wave
climate - the combined distribution of wave height, period and direction during different
seasons is required for an adequate understanding of movement of sand in any specific area.
The cellular circulation patterns in the surf zone depend on the long shore gradient in wave
setup.Because of the turbulence due to breaking and surging of waves, large volumes of
sediments are placed in suspension or rolled along the bed in the surf zone.
.5.3.2 The long shore movement of beach sand poses a potential littoral problem. The
important factor governing the beach erosion is the longshore sediment transport which is
controlled predominantly by waves and nearshore" topography.An understanding of sediment
transport on beaches is also necessary for the analysis of formation of the geomorphic
features such as sand spits and barrier islands, to examine the tidal inlet processes and to
understand theirregularities in the shoreline. Interruptions of these natural movements of
sands by man made barriers like groins breakwaters, jetties etc. result in sediment the updrift
side and removal of sediments on deposition on the down drift side. This results in the
necessity to study the longshore sediment transport around inshore coastal areas, which is of
fundamental interest to coastal engineers in the planning of structures, dredging activities of
ports and spoil disposal.A proper understanding of the seasonal littoral transport trend is
important for the efficient management and development of coasts. At Kollam , the
estimated monthly drift values are higher in magnitude than the Alleppey beach.During pre
and post-monsoon months, the monthly drift shows northerly trend, while during monsoon it
is southerly. The magnitude of drift values shows a followed by a shift in direction.
The lowest northerly drift value during December. The annual net transport is towards south
with a magnitude of0.38 X 106 m3 .At Kollam the estimated monthly drift values are higher
in magnitude than the Alappuzha beach.During pre and post-monsoon months, the monthly
drift shows northerly trend, while during monsoon it is southerly The Kollam beach, south of
Thankasseri headland, is a narrow beach. During the south-west monsoon, the beach erodes
rapidlyloosing about 54 m3 /m of the beach material from it's initial storage volume of 425
m3/m in April 1990. By the end of the survey the beach has only 404 m3 Im of storage
volume ,indicating a net deficiency of about 21 m3 /m of the material.Thus the beach at
Kollam undergoes erosion. The mean grain size shows the presence of coarser sand most of
the time. It shows coarsest sediment during the south west and north-east monsoon seasons
with poor sorting. The intensive sand mining activity, for black sand, along this stretch of the
beach could be a factor affecting the long-term equilibrium of this beach. The littoral drift
shows higher values compared to Aappuzha beach with a maximum drift of 3.91 X 10⁵ m3
towards south in June.It shows a typical monsoonal character i.e. southerly drift during south-
west monsoon period and northerly drift during rest of the year. The annual net drift is
southerly with a magnitude of 0.38 X 10⁶ m3
6.0 IDENTIFICATION OF IMPACTS
6.1 .0The impact assessment describes the beneficial and adverse effects of the IREL Block
IVEE Heavy mineral sand mining project. The study carried out evaluate as to how the
mining project would impact the land and water environment scenario in their basic grain.
The mining activity mostly by dredging is a purely a wet process and there is no significant
impact on air except fugitive emissions due to the material transport
6.1.2 Topography and Land use: The Mining operations have to be carried out in tandem
with reclamation. About 75%of the raw sand will be deposited back to the mining area and
will be used for to reclaim the mined out area. Original topography of the beach sand mining
extension area will change due to removal of 25% heavies. Since the land elevation is not
more than 2.50 m above the high tide line and also since water table is is very shallow i.e.
mostly less than 2.00m belowground level a small change in topography will have significant
impact. It is recommended that the back fill and tailing alone be used to the land to the
original elevation and to leave the remaining areas enlarged pond areas for and wet land. The
selection of environment management plan covers these aspects in detail. The mining and
recovery of heavy mineral will eliminate the radioactive mineral ( monazite )present in the
raw sand
The T- S canal area will be mined with the concurrence of the Inland water authority. The
rejects from the canal area will also be used to refill the mined out area .in the land
.Deepening of the canal will facilitate the movement of larger boats. . The surplus rejects
from the canal can be used to refill the land area mined and also for making sand dunes along
the sea shore for coastal protection .to make up the volume lost as heavies output .
As the back filling is integrated into the mining process, the excavated land will be
subsequently reclaimed and the ground surface of the reclaimed land will be brought back to
the contours matching with the surrounding topography .the mined out land will be converted
to artificial sand dunes stabilized with vegetation and beaches . The land utilization plan will
be finalized in consultation elected local government bodies and the state government.
IREL will ensure that the infrastructure facility extended to the rehabilitated/ relocated
inhabitants will be maintained. No temple or any sensitive locations will be disturbed. The
reclamation will improve the overall landscape considerably in a phased manner by green
belt development, sand dunes and ponds for water conservation and ground water recharge,
to improve the water quality. It will also be sustainable source for water resource availing
infiltration of water where ever feasible. .
6.1.3 Water environment
The mining lease is on a narrow strip of sandy formation being surrounded by saline water on
either sides and fresh water has been very thin in the locality.
Water from dredge pond will be utilized for primary circuit in DWUP. No water is consumed
and the entire water will be recycled for the process except for very minor evaporation loss.
Drainage
The deposit is totally isolated from the land side by TS canal. Seasonal/perennial streams join
TS canal at places instead of directly discharging into sea. The canal is connected with sea at
two ends of the deposits. Natural Drainage of water from the project site is not at all a
problem since the canal is just on the eastern side of the project. Floating of the dredge on the
canal water or sand extraction at the canal bed for some period will not have any appreciable
impact on drainage. Thus beach sand mining will not have any impact on the network of
backwater bodies including TS canal.
6.1.4 Impact of inland mining on ground water conditions
Saline water intrusion
The project area was adversely hit by Tsunami of December 2004 and many wells in the area
used by the local people became unsuitable for drinking/ domestic purpose . Owing to this a
number of wells were abandoned by the local people and they solely depend on piped water
supply . However the possibility of salt water intrusion due mining of sands was probed .The
structures or wells are to be designed in such a way that there will be a very limited
drawdown so that it never goes beyond the mean sea level. It is better to restrict the
drawdown to a level above the mean sea level. The process is termed as skimming the lens.
This process will not promote any upconing or severe disturbances within the aquifer.
However, sand has very high permeability and hydraulic conductivity which is second only to
gravel. As such even with limited drawdown considerable water will be transmitted into the
skimming well within a short span of time for extraction. The major constraint in utilization
of the available resources within the coastal alluvium is the salinity influx through upconing.
However, this could be effectively avoided and the sustainability ensured through properly
designed extraction structures.
The possible signature of sea water intrusion in the study area is investigated using the
standard Cl/HCO3 ratio (in equivalents) (Revelle, 1941). Table 12 illustrates that the ratio of
Cl-/(CO3 2- + HCO3- )in water samples from wells in the study area is contaminated
slightly to moderately to injuriously level. The contamination of all these samples may not
be solely due to saline water intrusion .However in a few locations it may be true , the fresh
phereatic aquifers in the study area west of TS canal contaminated by the Tsunami of
Decembers 2004 remains as a major causative factor
6.1.5 Sea erosion
The shoreline of Kerala has been subjected to severe coastal erosion in recent times .In the
monsoons, two third of the shore line is vulnerable to dynamic changes. Beach erosion is a
major environmental and public issue in the area and indeed throughout the Kerala coast.
The mining and removal of sand will, prima facie, have a negative impact on the coastal
topography. But it cannot be presumed with certainty that beach sand mining is the primary
cause of erosion in this area. Moreover, the dredging operation will not lead to any erosion at
any point of time and the project under consideration is aimed at dredging operation only. .
The NCESS had conducted a detailed sand budgeting study at the instance of IREL.
Coastal protection measures undertaken here include sea wall construction by the State
Government and IRE in its mining areas. These measures are also being taken up by IREL
over the stretches of mining areas every year in controlling erosion.
.However the beach washing collection might be causative factor sea erosion if carried out
without any restraint in an unscientific manner However the mining operations in the very
loose unconsolidated sand near sea may upset the stability of land area which is only about 1
to 2.5m m above msl . This may be an additional factor even though subordinate to the sea
erosion for the subsidence of the sea wall as it basement loose strata subsides . The sea walls
constructed along mining lease area are in unstable condition due slumping of sand at its
bottom and some of the locations the same has been breached or collapsed due the severity of
sea erosion.( Photo ) The possibility of alternate engineering structures such as groynes for
the coastal protection measures may be looked into for mitigating the problem of sea erosion.
The coastal protection measures undertaken include; Seawall construction, by the state
government and IREL in its mining areas . These measure are also being taken up by IREL
over the stretches of mining areas every year for controllong erosion. The mining and
removal of sand will primafacie ,have negative impact on coastal topography .. Besides the
dredging of sand from land area will not lead to any erosion.. However the mining operations
in the very loose unconsolidated sand near seamay upset the stability of land area which is
only about 1 to 2,5m m above msl . This may be a n addition factor even though subordinate
to the sea erosion for the subsidence of the sea wall as it basement loose strata subsides . The
sea walls constructed along mining lease area are in unstable condition due slumping of sand
at its bottom and some of the locations the same has been breached or collapsed due the
severity of sea erosion. The possibility of alternate engineering structures such as groynes
for the coastal protection measures may be looked into for mitigating the problem of sea
erosion
6.2 Impacts on ecology
The existing and proposed core zones are the beach and inland areas to the beach. All native
vegetation in the area has long been replaced by planted coconut up to the edges of the beach.
In order to carry out mining, the coconut trees will have to be cut down. The plants and
shrubs growing on the beach and inland will also have to be removed. Due to mining the
beach fauna(consisting of crabs, mole crabs, bivalves, and small gastropods) will perish.
Similarly the benthic flora and fauna in mining areas in the back-waters will also perish due
to mining. However, the effects of mining will be temporary. Ipomeas pes-caprae and
spinifex sps, which are the main plants growing on the sand will be planted soon after back-
filling to stabilize the sand. Seed of other plants are air-borne and will recolonise the back-
filled areas within a few months. Larval forms of the beach fauna are present in the sea water
and will start recolonising the back-filled area within a few days after completion of mining.
The air pollutants released by diesel powered machinery will be of very small quantity and
will be easily diluted and will have no significant impacts on the ecosystems.
6.3Impacts on soil and agriculture
The core zone soil is basically sandy soil. The mining will involve extraction of this sandy
soil, and dumping back the tailings in the mined out areas. Since the heavy mineral extraction
is a simple physical process, the sand which dumped back will not differ chemically from the
pre-mining sand except that the heavy minerals are no longer present. The physical changes
which will occur will be minor and will have no lasting impacts. Mining will involve cutting
down of coconut trees leading to loss in coconut production. These trees can be placed by
new sapling of improved variety to improve the agricultural yield. However, the coconut
farm sector has been under decline in Kerala due to price/wage factors and small holding
sizes. This project provides opportunity to move away from coconut and create new
livelihood opportunities. Such plans should preferably be entrusted to the elected local
government.
The emission from MSP is too small to have any impact on the soil or agriculture production
in the study area.
7.0 ENVIRONMENT MANAGEMENT PLAN
7.1. The progress made in environmental management during the last few decades have been
phenomenal with the result that there is a certain confluence of the science and technology
system ,the socio-economic system and the political system with the common objectives of
evolving strategies for planning and implementation of environmental management to the
desired level. The most reliable way to ensure the implementation of the management plan is
to integrate the management measures in the overall planning, designing, constructing and
operating phases.
The aim of the environmental management plan (EMP) is to maintain ecological balance and
to prevent adverse impact due the project. It ensures integration of environmental
management measures into the process of the implementation of the project. Many of the
areas of environmental management planning involve multi disciplinary approach. Hence the
measures proposed are to be regarded as the guidelines and continued advice to be taken from
experts of relevant fields like hydrology, ecology, socio-economics, rehabilitation &
resettlement etc. The proposals are to be detailed and amended in due course to meet the
statutory requirements. The changes warranted as per site specific conditions are to be
accounted for, during actual implementation and the environmental impacts to be monitored
to frame suitable mitigation measures.
The aim of the environmental management plan (EMP) is to maintain ecological balance and
check harmful effect due to the dredge mining of this project. It ensures integration of the
environmental control measures into the process of mine planning. The Environment
Management Plan suggests measures to minimize adverse impacts. It also put forward
reclamation plans for mining scars, replenishment plans for beach conservation and
landscaping with a future vision for retrieval and conservation of all land components. The
EMP isalso formulated in line with the CRZ norms
Many of the areas of environmental management planning require multi-disciplinary
approach. Therefore the measures envisaged in this report are to be regarded as guidelines
and continued advice is proposed to be taken from experts of relevant fields. therefore the
measures envisaged in this report are to be regarded as guidelines and continued advice is
proposed to be taken from experts from relevant fields like environment pollution ,
meteorology, costal management , hydrology mine planning ,ecology , soil chemistry, socio-
economics ,radiation , rehabilitation ans resettlement etc. The suggested schemes are to be
detailed and if necessary , be modified from time to time to meet statutory reqirements. The
changes warranted as per site specific conditions are to be accounted for , during actual
implementation In this chapter all, technical , biological and socio- economic control
measures have been envisaged . Any mining management project that requires the opening of
mining pit can provide significant economic benefits in its capacity However, the adverse
environmental effects of such a project can also be substantial. In order to make the Block IV
EE mining Project fully eco-friendly and ameliorate all possible negative impacts on the
economy and ecology of the area, the Environmental Management Plan for the proposed
project, including Resettlement and Rehabilitation Program for the project - affected human
population has been prepared based on the findings of the EIA study of the project and
Buffer zone. Under the present project , the total environmental management plan for the
proposed 180 Ha mining project can be divided into several categories . The suggested
schemes are to be detailed and if necessary , be modified from time to time meet comply with
the statutory requirements .the changes warranted as per site specific conditions are to be
accounted for during actual implementation . Besides, in the light of the experience likely to
be gained during the initial year of operation, proposed schemes may require periodic
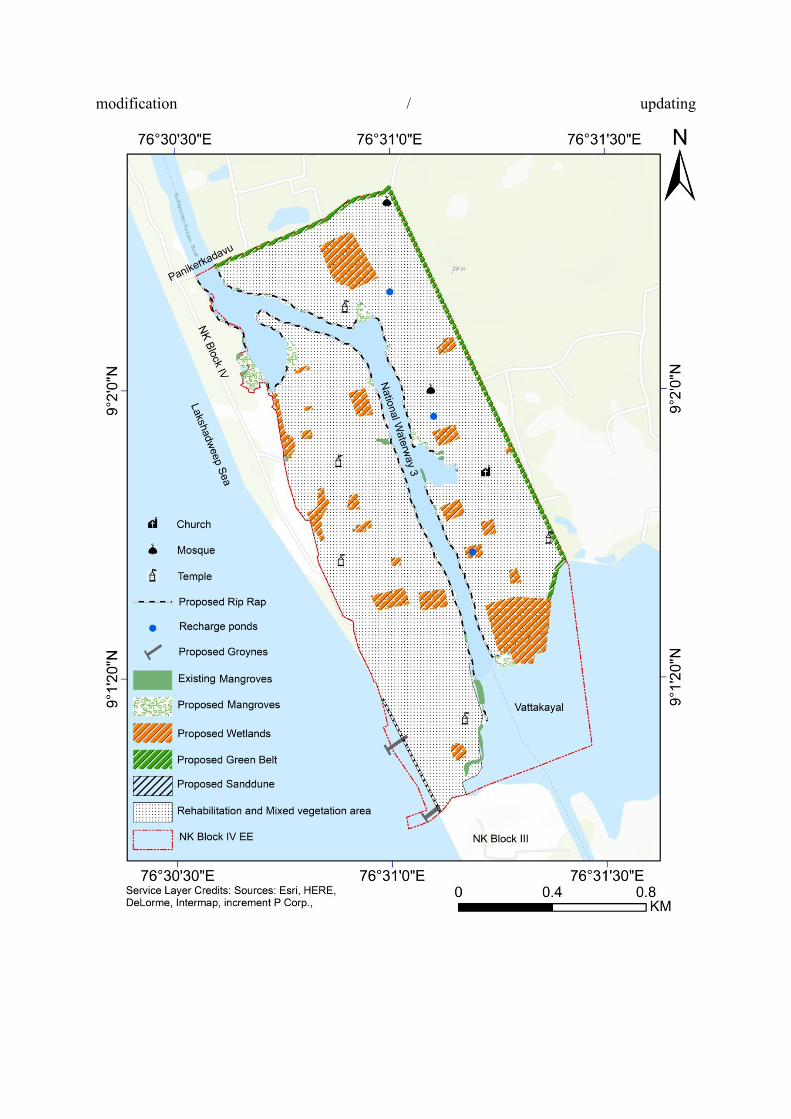
modification / updating
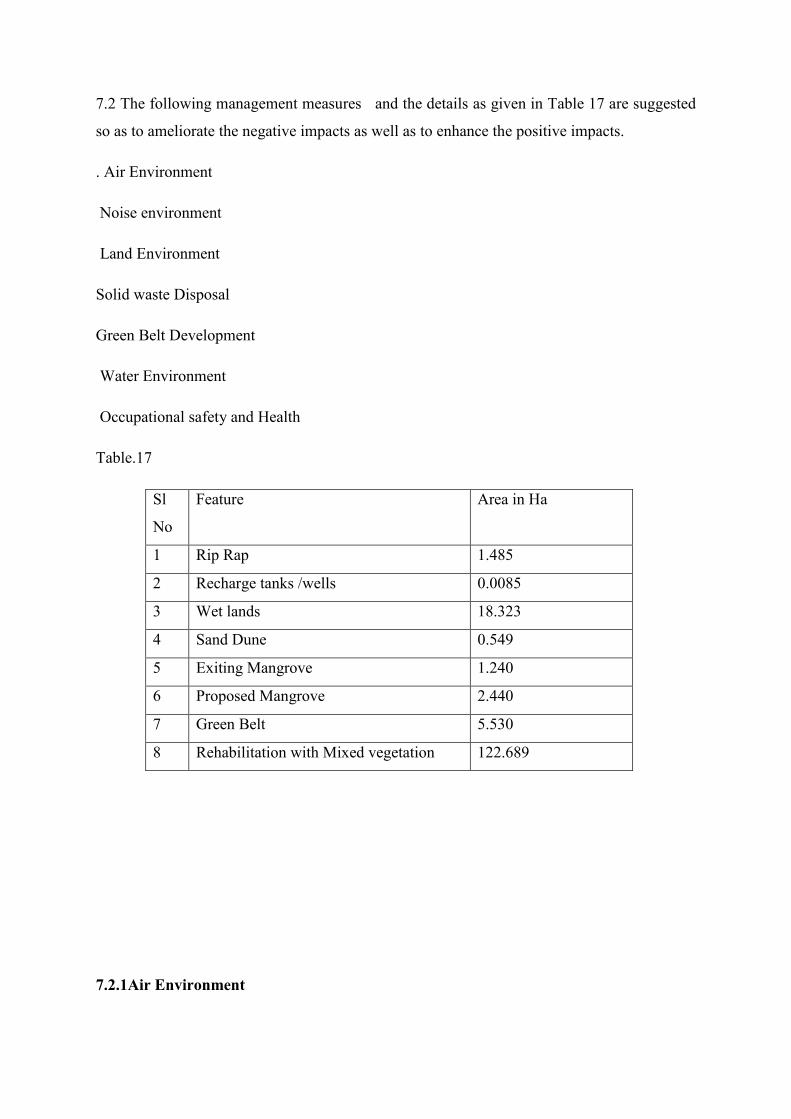
7.2 The following management measures and the details as given in Table 17 are suggested
so as to ameliorate the negative impacts as well as to enhance the positive impacts.
. Air Environment
Noise environment
Land Environment
Solid waste Disposal
Green Belt Development
Water Environment
Occupational safety and Health
Table.17
Sl
No
Feature Area in Ha
1 Rip Rap 1.485
2 Recharge tanks /wells 0.0085
3 Wet lands 18.323
4 Sand Dune 0.549
5 Exiting Mangrove 1.240
6 Proposed Mangrove 2.440
7 Green Belt 5.530
8 Rehabilitation with Mixed vegetation 122.689
7.2.1Air Environment
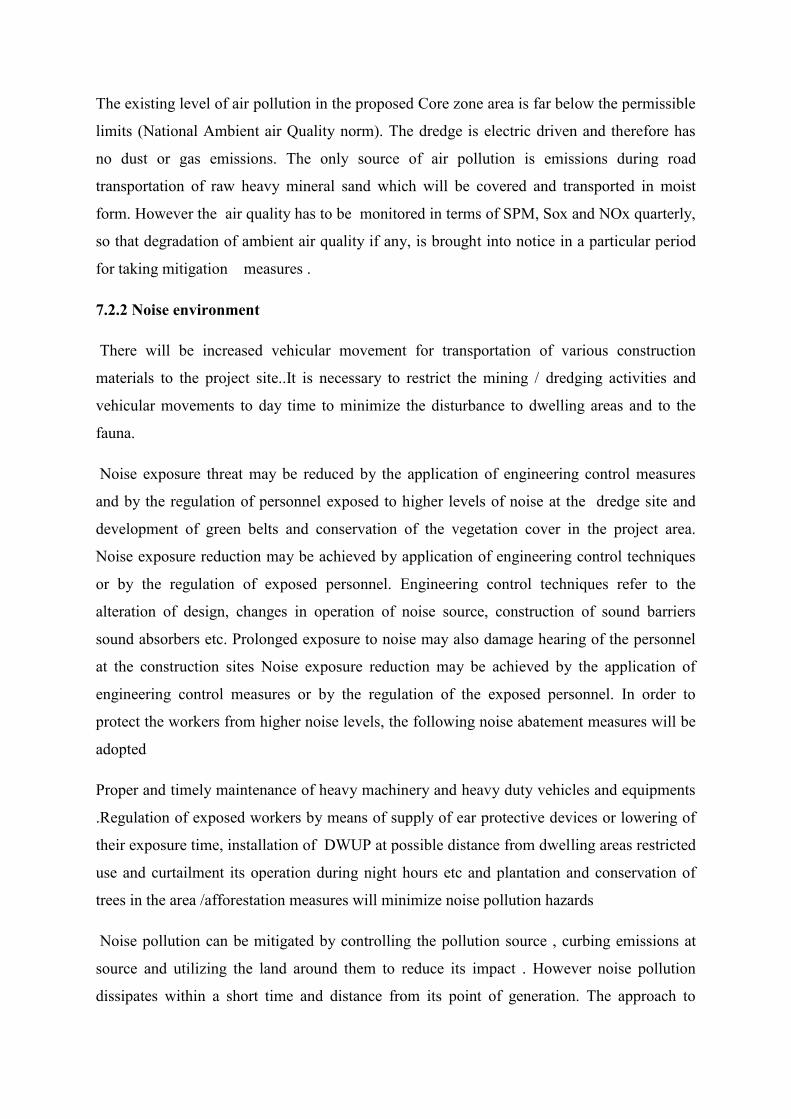
The existing level of air pollution in the proposed Core zone area is far below the permissible
limits (National Ambient air Quality norm). The dredge is electric driven and therefore has
no dust or gas emissions. The only source of air pollution is emissions during road
transportation of raw heavy mineral sand which will be covered and transported in moist
form. However the air quality has to be monitored in terms of SPM, Sox and NOx quarterly,
so that degradation of ambient air quality if any, is brought into notice in a particular period
for taking mitigation measures .
7.2.2 Noise environment
There will be increased vehicular movement for transportation of various construction
materials to the project site..It is necessary to restrict the mining / dredging activities and
vehicular movements to day time to minimize the disturbance to dwelling areas and to the
fauna.
Noise exposure threat may be reduced by the application of engineering control measures
and by the regulation of personnel exposed to higher levels of noise at the dredge site and
development of green belts and conservation of the vegetation cover in the project area.
Noise exposure reduction may be achieved by application of engineering control techniques
or by the regulation of exposed personnel. Engineering control techniques refer to the
alteration of design, changes in operation of noise source, construction of sound barriers
sound absorbers etc. Prolonged exposure to noise may also damage hearing of the personnel
at the construction sites Noise exposure reduction may be achieved by the application of
engineering control measures or by the regulation of the exposed personnel. In order to
protect the workers from higher noise levels, the following noise abatement measures will be
adopted
Proper and timely maintenance of heavy machinery and heavy duty vehicles and equipments
.Regulation of exposed workers by means of supply of ear protective devices or lowering of
their exposure time, installation of DWUP at possible distance from dwelling areas restricted
use and curtailment its operation during night hours etc and plantation and conservation of
trees in the area /afforestation measures will minimize noise pollution hazards
Noise pollution can be mitigated by controlling the pollution source , curbing emissions at
source and utilizing the land around them to reduce its impact . However noise pollution
dissipates within a short time and distance from its point of generation. The approach to
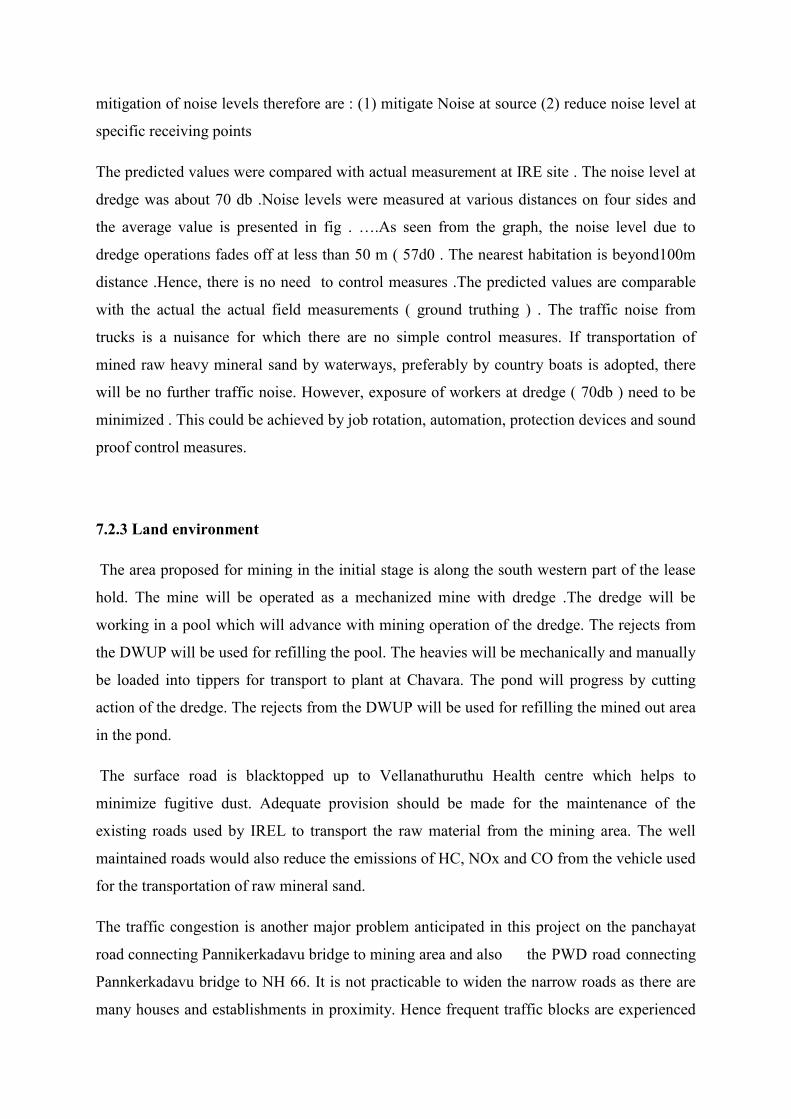
mitigation of noise levels therefore are : (1) mitigate Noise at source (2) reduce noise level at
specific receiving points
The predicted values were compared with actual measurement at IRE site . The noise level at
dredge was about 70 db .Noise levels were measured at various distances on four sides and
the average value is presented in fig . ….As seen from the graph, the noise level due to
dredge operations fades off at less than 50 m ( 57d0 . The nearest habitation is beyond100m
distance .Hence, there is no need to control measures .The predicted values are comparable
with the actual the actual field measurements ( ground truthing ) . The traffic noise from
trucks is a nuisance for which there are no simple control measures. If transportation of
mined raw heavy mineral sand by waterways, preferably by country boats is adopted, there
will be no further traffic noise. However, exposure of workers at dredge ( 70db ) need to be
minimized . This could be achieved by job rotation, automation, protection devices and sound
proof control measures.
7.2.3 Land environment
The area proposed for mining in the initial stage is along the south western part of the lease
hold. The mine will be operated as a mechanized mine with dredge .The dredge will be
working in a pool which will advance with mining operation of the dredge. The rejects from
the DWUP will be used for refilling the pool. The heavies will be mechanically and manually
be loaded into tippers for transport to plant at Chavara. The pond will progress by cutting
action of the dredge. The rejects from the DWUP will be used for refilling the mined out area
in the pond.
The surface road is blacktopped up to Vellanathuruthu Health centre which helps to
minimize fugitive dust. Adequate provision should be made for the maintenance of the
existing roads used by IREL to transport the raw material from the mining area. The well
maintained roads would also reduce the emissions of HC, NOx and CO from the vehicle used
for the transportation of raw mineral sand.
The traffic congestion is another major problem anticipated in this project on the panchayat
road connecting Pannikerkadavu bridge to mining area and also the PWD road connecting
Pannkerkadavu bridge to NH 66. It is not practicable to widen the narrow roads as there are
many houses and establishments in proximity. Hence frequent traffic blocks are experienced
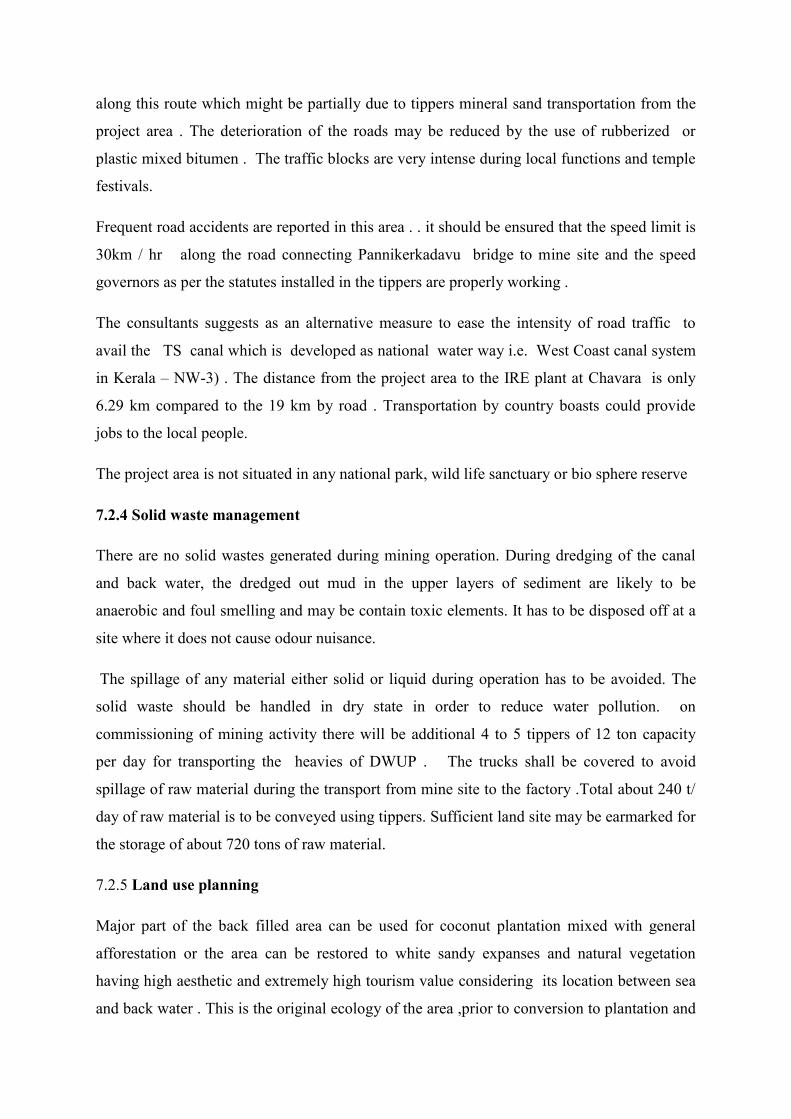
along this route which might be partially due to tippers mineral sand transportation from the
project area . The deterioration of the roads may be reduced by the use of rubberized or
plastic mixed bitumen . The traffic blocks are very intense during local functions and temple
festivals.
Frequent road accidents are reported in this area . . it should be ensured that the speed limit is
30km / hr along the road connecting Pannikerkadavu bridge to mine site and the speed
governors as per the statutes installed in the tippers are properly working .
The consultants suggests as an alternative measure to ease the intensity of road traffic to
avail the TS canal which is developed as national water way i.e. West Coast canal system
in Kerala – NW-3) . The distance from the project area to the IRE plant at Chavara is only
6.29 km compared to the 19 km by road . Transportation by country boasts could provide
jobs to the local people.
The project area is not situated in any national park, wild life sanctuary or bio sphere reserve
7.2.4 Solid waste management
There are no solid wastes generated during mining operation. During dredging of the canal
and back water, the dredged out mud in the upper layers of sediment are likely to be
anaerobic and foul smelling and may be contain toxic elements. It has to be disposed off at a
site where it does not cause odour nuisance.
The spillage of any material either solid or liquid during operation has to be avoided. The
solid waste should be handled in dry state in order to reduce water pollution. on
commissioning of mining activity there will be additional 4 to 5 tippers of 12 ton capacity
per day for transporting the heavies of DWUP . The trucks shall be covered to avoid
spillage of raw material during the transport from mine site to the factory .Total about 240 t/
day of raw material is to be conveyed using tippers. Sufficient land site may be earmarked for
the storage of about 720 tons of raw material.
7.2.5 Land use planning
Major part of the back filled area can be used for coconut plantation mixed with general
afforestation or the area can be restored to white sandy expanses and natural vegetation
having high aesthetic and extremely high tourism value considering its location between sea
and back water . This is the original ecology of the area ,prior to conversion to plantation and
dwelling place .The restored land may be utilized for tourism and fisheries projects with local
and district government bodies taking the lead in planning.
The mined out land has to be refilled to the original elevation considering that the land is
only a few meters above the high tide level and water table. The refilling should also to be
carried out with sand alone to preserve the ecology of the area. Since the mining rejects
accumulated due to working of dredge and wet upgrading plant (DWUP) and the waste
material brought back from the pre- concentration plant would not be sufficient to restore
entire the land subjected to mining to the original topography , some patches of land may
remain as unfilled after mining . Thus the extent of water body portion and wet land will
increase after mining. The wet land portion will be planted with mangrove and other suitable
species of local vegetation. The water body portion which emerges as ponds of various
shapes can be used as fresh water storage reservoirs by suitable landscaping after mining.
These measures thus adopted would result in net improvement of the land environment.
7.2.6 Green Belt Development: The tree cover is not a significant issue in this project unlike
in other mining projects . The area is clearof natural vegetation that grows sparsely on
nutrient poor soil . No sand dune are found in the Project area and coconut plantations are
exiting in the area. An important environmental issue of coastal regions of Kerala is the loss
of natural sand dunes due to conversion to farm lands. Therefore this project offers
opportunity to restore sandy expanses and natural vegetation, if replanting is avoided. White
sandy expanses have high aesthetic and tourism value and provides alternate livelihood .
Therefore suitable landscaping with sand dunes, stabilized with indigenous shrubs is
recommended in 0.549 Ha . The existing 1.240 Ha Mangrove area will not be mined; on the
other hand mangrove afforestation will be taken up at identified locations over an area of
2.440 Ha contiguous with Vattakayal .These measure , if implemented will be
environmentally better option in this area than traditional greenbelt and tree cover . Green
belt of 5.530 is recommended along the eastern part of the mining lease area The Fig
presents the Environmental Management plan for the Project area . . Continuity of green
cover is major aesthetic features that may be affected by project implementation
In case canal dredging is carried out, then rip rap protection will be provided in 1.485 Ha
along the banks of the canal by Inland Water Ways Authority of India
Establishment of various components of the scheme will have significant impact on the
aesthetics features of the project areaThe access roads to some extent affect the continuity of
the green cover of the area. The cut portions of the slopes construction of the access roads
have to be stabilized with proper bunding and growing of soil binding grasses bushes and
trees along with the use of geotextiles if necessitated. The plants used in the process must be
indigenous and identical with the components with the existing green cover. Culverts and
other forms of ventilation must be provides to the road bed wherever it cuts across the natural
drainage/streams While the above forms an outline, the actual plan of action for
compensatory afforestation must be finalized in consultation with the State Forest
Department.
7.2 7Compensatory afforestation programme
The activities connected with compensatory afforestation must continue in the post-
mining phase, with maintenance of irrigation (drip irrigation), removal of weeds and planting
of saplings in vacant spaces etc.
Social Forestry; along fallow and open lands, tree species which meet the fuel and fodder
demands can be grown. The trees make best use of land and water to generate biomass,
increase soil fertility and reduce soil erosion.
Pasture management: Shallow soils with moderate slopes are suitable lands for pasture
development. But cattle grazing there will cause soil erosion. .Better pasture management can
be achieved by not allowing cattle to graze on the lands, but allowing the grass to be cut after
it attains full growth and providing stall feeding to the cattle.
Environment friendly agricultural practices: The environment friendly agricultural practices
in the reclaimed area after dredging can have a significant effect on water quality as follows:
Nutrient supply to crops to be made by balanced application of fertilizers and manure,
deciding the dose on the basis of soil test as per the crop requirement.
Cropping pattern and crop rotation can be adopted to maintain soil fertility and productivity.
The leguminous crops along with green manuring improve soil fertility.
Application of bio-fertilizers will also improve the soil fertility.
7.3 Water Environment
Water transport is an effective solution to the prevailing road congestion experienced in the
study area extending from the present mining lease area to the Plant area at Chavara . The
beneficial aspects in this regard are:
No environmental pollution ( zero contribution to air , water , noise pollution )
employment generation to the local people
redeployment of displaced fishermen
proximity to the water ways
The main infra structure – the water ways; NW3 is available adjacent to the mining area
and stretches upto the IRE plant and this can be advantageously made use of avoiding
heavy road traffic. (a feasibility study on water transport from mining area to the plant at
Chavara including trial is recommended )
7.3.1Coastal Zone management
The existing and proposed core zone is part of a narrow strip of land between sea and T. S.
canal and estuarine areas. During the operation stage of mining for the Heavy mineral sand
deposits by dredging ,no waste water is generated .
Coastal protection measures against sea erosion are a major part of the environmental
management planning to be implemented in the area. The method of construction of seawall
on regular basis is undertaken by the State water resources Department. It is recommended
that additional protection may be bestowed for land protection by construction of 2 groynes.
A feasibility study may be conducted on the effectiveness of groynes for preventing sea
erosion
Sand dunes may be constructed stabilized with vegetation. Beach nourishment measures also
may be undertaken .Sand for beach nourishment can be provided from the dredge rejects and
mineral separation rejects. In fact the dredge mining facilitates beach nourishment. The
removal of heavy mineral sand from the inland mining lease area obviously leaves behind a
void space even after refilling the mined out area is carried out with the rejects/tailing of the
dredging and mineral separation units.Since back filling to the original elevation will leave
some area unfilled ; the extent of water body and low lying wet land will increase. The
beach front portion may be landscaped into sand dunes sufficient height. The middle portion
along the east of the dunes may be converted into gently sloping ground .and may be
provided with gravity collection wells and infiltration wells or storage ponds for water
conservation and pisiculture.The elevation of T-S canal front portion can also be increased
.If IREL is accorded permission by the Inland Waterways Authority of India( IWAI) to
dredge the T-S canal adjacent to Block IVEE mining area, the dredged out material after
separation of the Heavy Mineral fraction can be utilized for increasing the elevation of the
canal front portion in Block IVEE.
The soil is mostly sandy. The area receives heavy to very heavy rains during south west
monsoon .In addition the dredge and Wet upgrading plant (DWUP ) which is proposed to be
used at this block has a capacity of 125t /h ( 15-16 operation per day ) . The man power
requirement is 8 operators and 3 engineers. The total manpower envisaged including
unskilled will be 18 nos . During operation stage, no waste water is generated. The quantity
of waste water generated from domestic source is 2.4m3/day .it is proposed to utilize the
already existing toilet blocks with septic tanks / soak pit at Vellanathuruthu site office.
7.3. 2 Water quality management
Since there is long-term stagnancy in the in the mining / dredged out pits , severe
quality deterioration of water is expected due to project operation. Larval growth; spread of
weeds and accumulation of pollutants in the unfilled pits and low-lying areas are to be
monitored continuously.. Although the loss of flora due to the mining and construction of
other project appurtenances would be compensated as a part of compensatory afforestation, it
is proposed to develop greenbelts around the perimeter of various project appurtenances,;
selected stretches along mine periphery and access roads in project area.
Control of water –related diseases
The increase of water fringe areas provide suitable habitat for the growth of vectors of
various diseases and increase the possibility of communication of water –related diseases.
Malaria and dengue fever are likely to be some of the Vector borne diseases. The main
breading season of the anopheles mosquitoes (malaria vector) are the months of August to
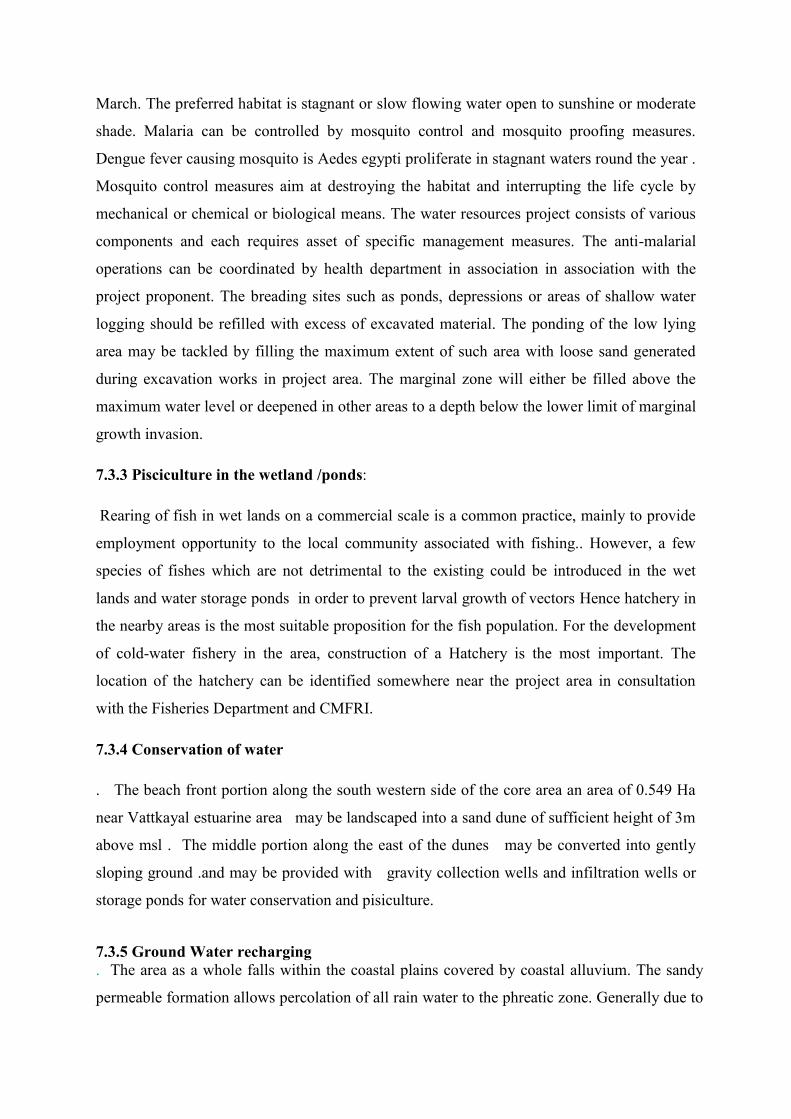
March. The preferred habitat is stagnant or slow flowing water open to sunshine or moderate
shade. Malaria can be controlled by mosquito control and mosquito proofing measures.
Dengue fever causing mosquito is Aedes egypti proliferate in stagnant waters round the year .
Mosquito control measures aim at destroying the habitat and interrupting the life cycle by
mechanical or chemical or biological means. The water resources project consists of various
components and each requires asset of specific management measures. The anti-malarial
operations can be coordinated by health department in association in association with the
project proponent. The breading sites such as ponds, depressions or areas of shallow water
logging should be refilled with excess of excavated material. The ponding of the low lying
area may be tackled by filling the maximum extent of such area with loose sand generated
during excavation works in project area. The marginal zone will either be filled above the
maximum water level or deepened in other areas to a depth below the lower limit of marginal
growth invasion.
7.3.3 Pisciculture in the wetland /ponds:
Rearing of fish in wet lands on a commercial scale is a common practice, mainly to provide
employment opportunity to the local community associated with fishing.. However, a few
species of fishes which are not detrimental to the existing could be introduced in the wet
lands and water storage ponds in order to prevent larval growth of vectors Hence hatchery in
the nearby areas is the most suitable proposition for the fish population. For the development
of cold-water fishery in the area, construction of a Hatchery is the most important. The
location of the hatchery can be identified somewhere near the project area in consultation
with the Fisheries Department and CMFRI.
7.3.4 Conservation of water
. The beach front portion along the south western side of the core area an area of 0.549 Ha
near Vattkayal estuarine area may be landscaped into a sand dune of sufficient height of 3m
above msl . The middle portion along the east of the dunes may be converted into gently
sloping ground .and may be provided with gravity collection wells and infiltration wells or
storage ponds for water conservation and pisiculture.
7.3.5 Ground Water recharging
. The area as a whole falls within the coastal plains covered by coastal alluvium. The sandy
permeable formation allows percolation of all rain water to the phreatic zone. Generally due to
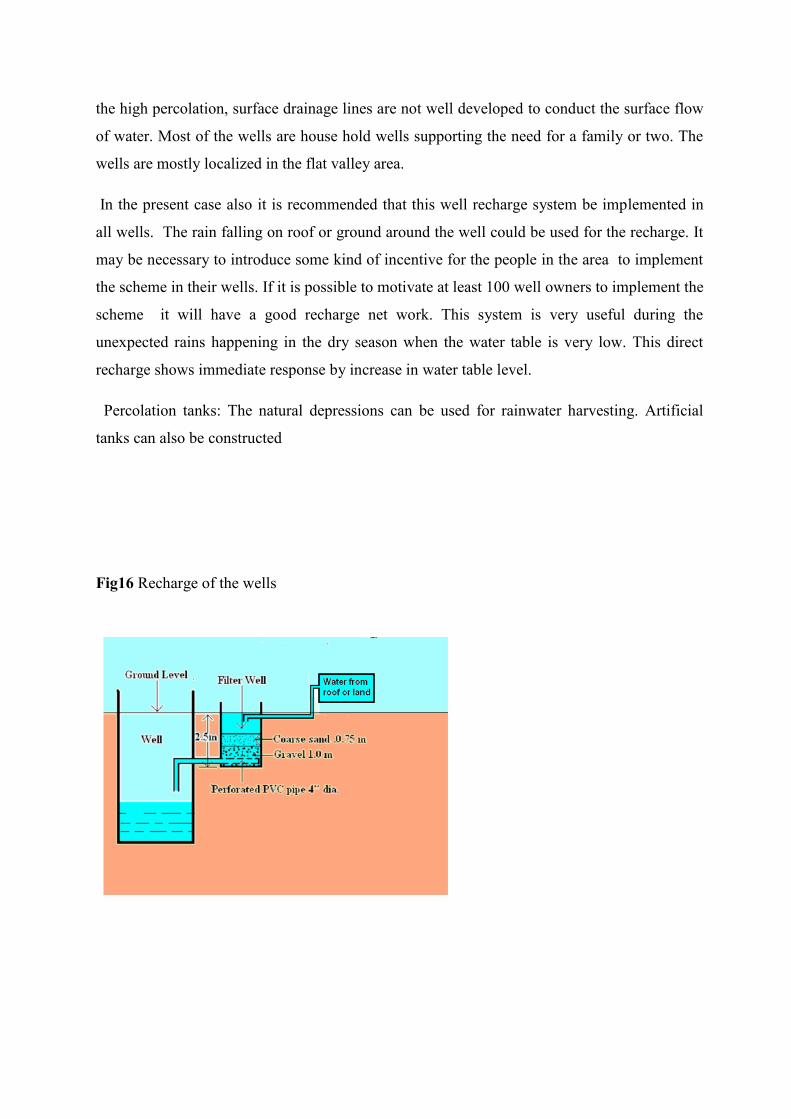
the high percolation, surface drainage lines are not well developed to conduct the surface flow
of water. Most of the wells are house hold wells supporting the need for a family or two. The
wells are mostly localized in the flat valley area.
In the present case also it is recommended that this well recharge system be implemented in
all wells. The rain falling on roof or ground around the well could be used for the recharge. It
may be necessary to introduce some kind of incentive for the people in the area to implement
the scheme in their wells. If it is possible to motivate at least 100 well owners to implement the
scheme it will have a good recharge net work. This system is very useful during the
unexpected rains happening in the dry season when the water table is very low. This direct
recharge shows immediate response by increase in water table level.
Percolation tanks: The natural depressions can be used for rainwater harvesting. Artificial
tanks can also be constructed
Fig16 Recharge of the wells
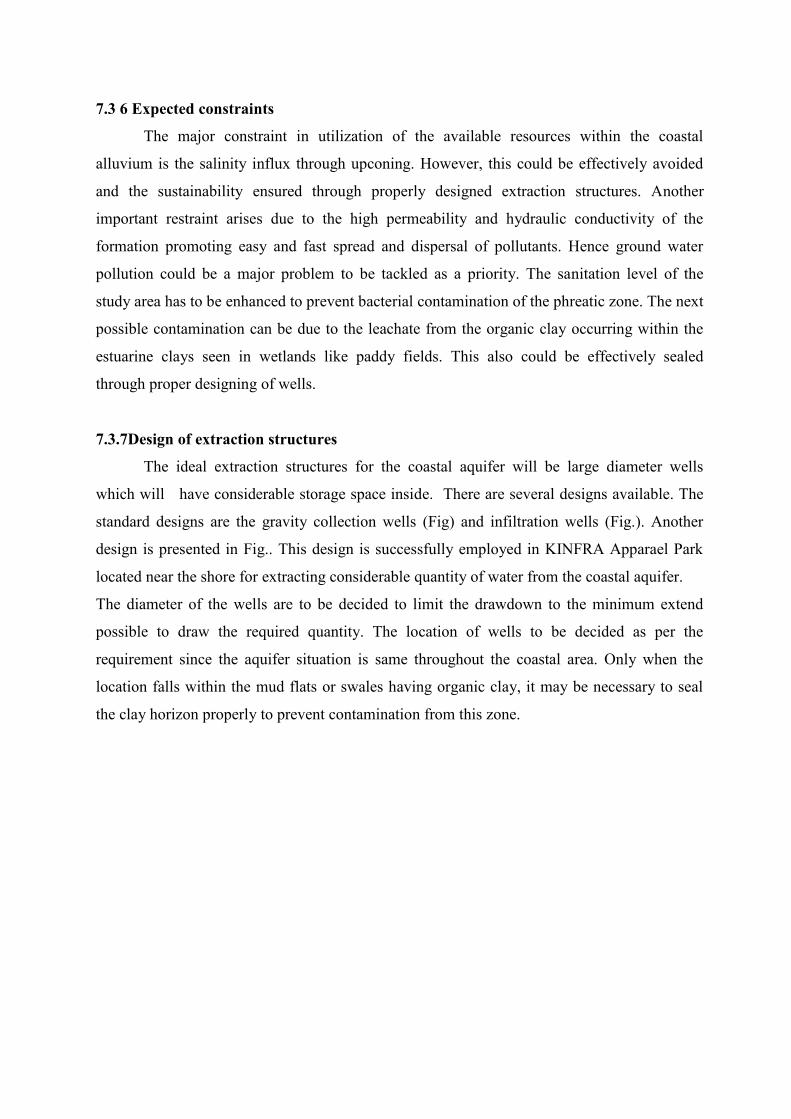
7.3 6 Expected constraints
The major constraint in utilization of the available resources within the coastal
alluvium is the salinity influx through upconing. However, this could be effectively avoided
and the sustainability ensured through properly designed extraction structures. Another
important restraint arises due to the high permeability and hydraulic conductivity of the
formation promoting easy and fast spread and dispersal of pollutants. Hence ground water
pollution could be a major problem to be tackled as a priority. The sanitation level of the
study area has to be enhanced to prevent bacterial contamination of the phreatic zone. The next
possible contamination can be due to the leachate from the organic clay occurring within the
estuarine clays seen in wetlands like paddy fields. This also could be effectively sealed
through proper designing of wells.
7.3.7Design of extraction structures
The ideal extraction structures for the coastal aquifer will be large diameter wells
which will have considerable storage space inside. There are several designs available. The
standard designs are the gravity collection wells (Fig) and infiltration wells (Fig.). Another
design is presented in Fig.. This design is successfully employed in KINFRA Apparael Park
located near the shore for extracting considerable quantity of water from the coastal aquifer.
The diameter of the wells are to be decided to limit the drawdown to the minimum extend
possible to draw the required quantity. The location of wells to be decided as per the
requirement since the aquifer situation is same throughout the coastal area. Only when the
location falls within the mud flats or swales having organic clay, it may be necessary to seal
the clay horizon properly to prevent contamination from this zone.
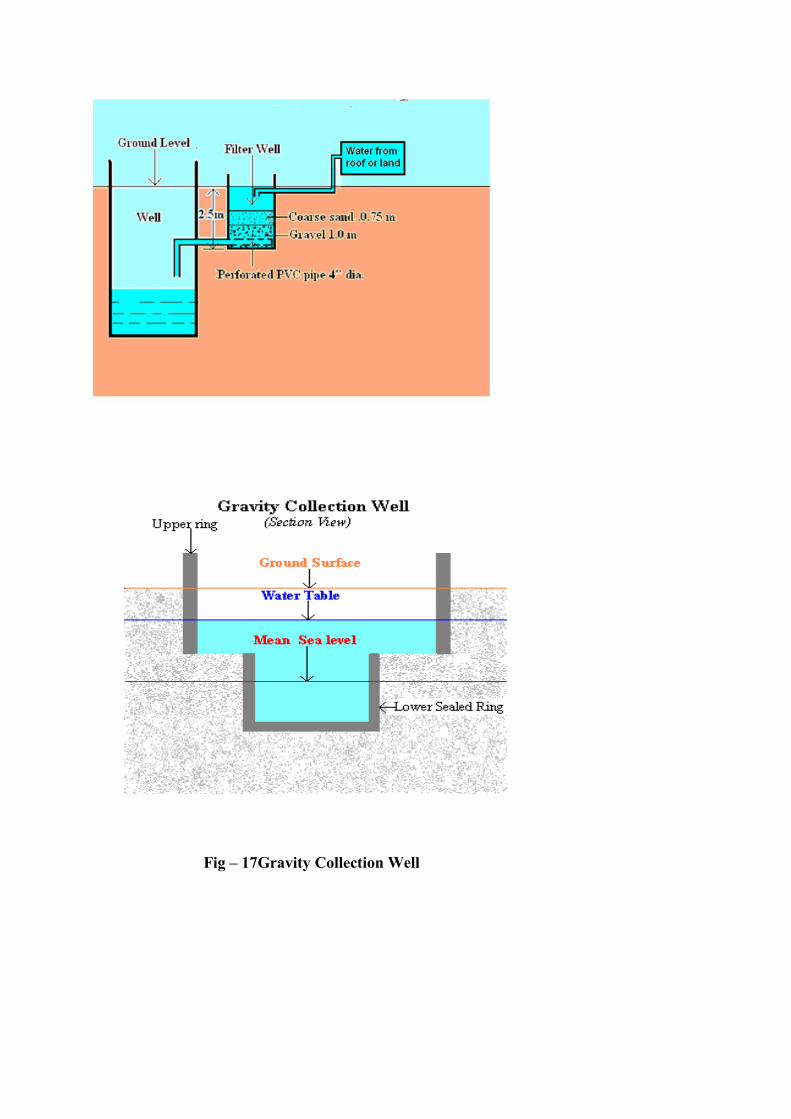
Fig – 17Gravity Collection Well
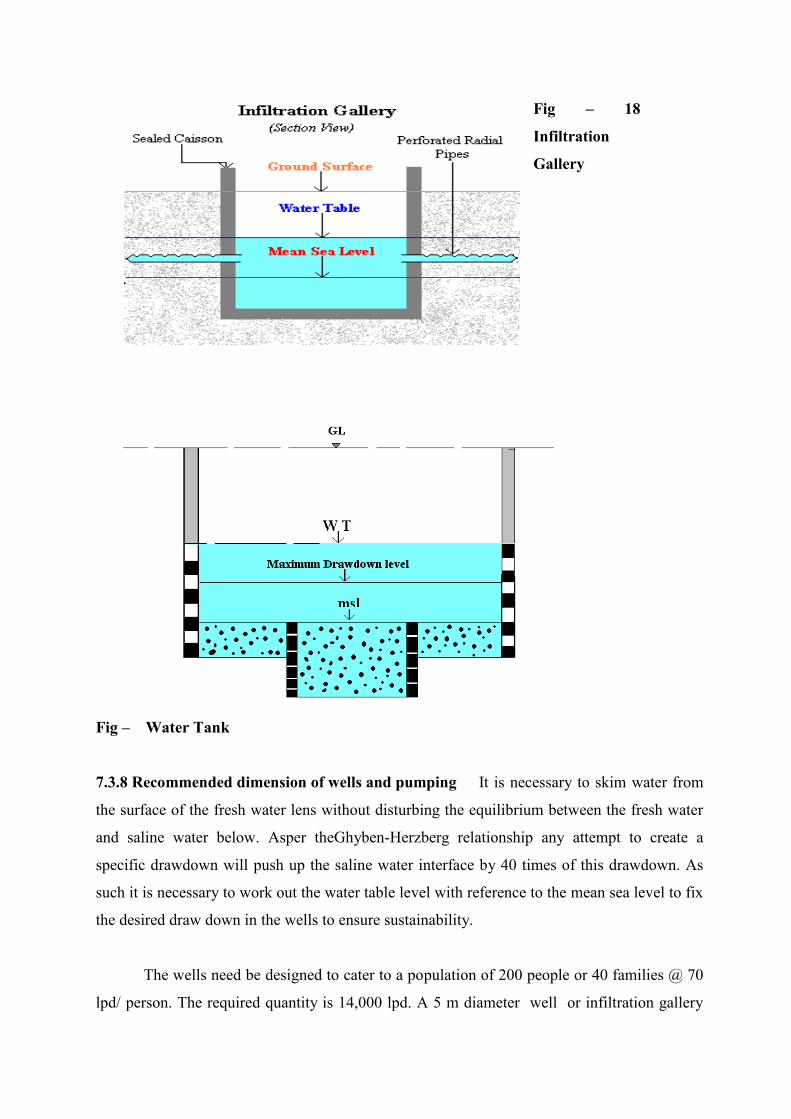
Fig – 18
Infiltration
Gallery
Fig – Water Tank
7.3.8 Recommended dimension of wells and pumping It is necessary to skim water from
the surface of the fresh water lens without disturbing the equilibrium between the fresh water
and saline water below. Asper theGhyben-Herzberg relationship any attempt to create a
specific drawdown will push up the saline water interface by 40 times of this drawdown. As
such it is necessary to work out the water table level with reference to the mean sea level to fix
the desired draw down in the wells to ensure sustainability.
The wells need be designed to cater to a population of 200 people or 40 families @ 70
lpd/ person. The required quantity is 14,000 lpd. A 5 m diameter well or infiltration gallery
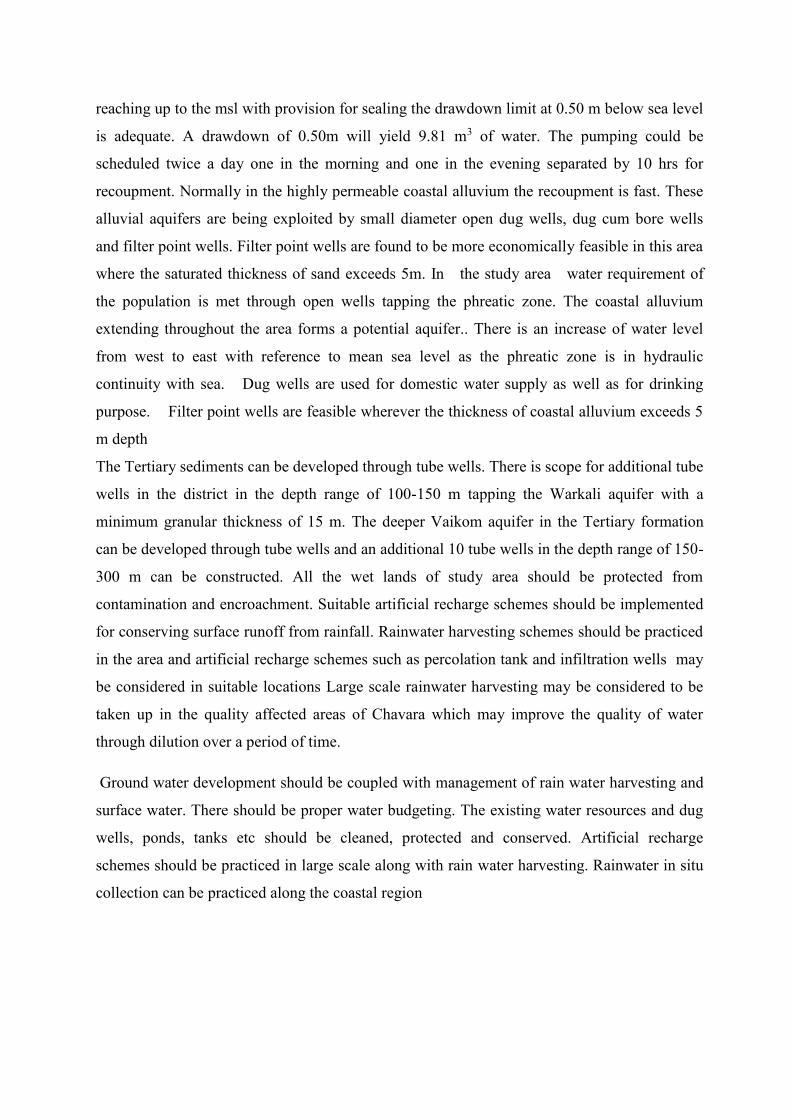
reaching up to the msl with provision for sealing the drawdown limit at 0.50 m below sea level
is adequate. A drawdown of 0.50m will yield 9.81 m3 of water. The pumping could be
scheduled twice a day one in the morning and one in the evening separated by 10 hrs for
recoupment. Normally in the highly permeable coastal alluvium the recoupment is fast. These
alluvial aquifers are being exploited by small diameter open dug wells, dug cum bore wells
and filter point wells. Filter point wells are found to be more economically feasible in this area
where the saturated thickness of sand exceeds 5m. In the study area water requirement of
the population is met through open wells tapping the phreatic zone. The coastal alluvium
extending throughout the area forms a potential aquifer.. There is an increase of water level
from west to east with reference to mean sea level as the phreatic zone is in hydraulic
continuity with sea. Dug wells are used for domestic water supply as well as for drinking
purpose. Filter point wells are feasible wherever the thickness of coastal alluvium exceeds 5
m depth
The Tertiary sediments can be developed through tube wells. There is scope for additional tube
wells in the district in the depth range of 100-150 m tapping the Warkali aquifer with a
minimum granular thickness of 15 m. The deeper Vaikom aquifer in the Tertiary formation
can be developed through tube wells and an additional 10 tube wells in the depth range of 150-
300 m can be constructed. All the wet lands of study area should be protected from
contamination and encroachment. Suitable artificial recharge schemes should be implemented
for conserving surface runoff from rainfall. Rainwater harvesting schemes should be practiced
in the area and artificial recharge schemes such as percolation tank and infiltration wells may
be considered in suitable locations Large scale rainwater harvesting may be considered to be
taken up in the quality affected areas of Chavara which may improve the quality of water
through dilution over a period of time.
Ground water development should be coupled with management of rain water harvesting and
surface water. There should be proper water budgeting. The existing water resources and dug
wells, ponds, tanks etc should be cleaned, protected and conserved. Artificial recharge
schemes should be practiced in large scale along with rain water harvesting. Rainwater in situ
collection can be practiced along the coastal region
7.4 Water environment and coastal zone management
The existing and proposed core zone is part of the narrow strip of land between sea and on
either banks of T-S canal . During the operation stage of mining for Heavy mineral sand
deposits by dredging ,no waste water is generated .
Coastal protection measures against sea erosion are a major part of the environmental
management planning to be implemented in the area. The method of construction of seawall
on regular basis is undertaken by the State water resources Department. It is recommended that
additional protection may be bestowed for land protection by construction of 2 groynes. A
feasibility study may be conducted on the effectiveness of groynes for preventing sea erosion
Sand dunes may be constructed stabilized with vegetation. Beach nourishment measures also
may be undertaken .Sand for beach nourishment can be provided from the dredge rejects and
mineral separation rejects. In fact the dredge mining facilitates beach nourishment. The
removal of heavy mineral sand from the inland mining lease area obviously leaves behind a
void space even after refilling the mined out area is carried out with the rejects/tailing of the
dredging and mineral separation units.Since back filling to the original elevation will leave
some area unfilled ; the extent of water body and low lying wet land will increase. This could
be redressed availing of the rejects portion of the beach washing collection which could be
continued for sufficient period after the inland mining by dredging is completed.
The beach front portion may be landscaped into sand dunes sufficient height. The middle
portion along the east of the dunes may be converted into gently sloping ground .and may be
provided with gravity collection wells and infiltration wells or storage ponds for water
conservation and pisiculture.The elevation of T-S canal front portion can also be increased .If
IREL is accorded permission by the Inland Waterways Authority of India( IWAI) to dredge
the T-S canal adjacent to Block IVEE mining area, the dredged out material after separation of
the Heavy Mineral fraction can be utilized for increasing the elevation of the canal front
portion in Block IVEE.
7.5 Sea erosion
Of the IRE Block IVEE mining area of 180 Ha, 132.0219Ha was land area and the remaining
area 47.9781Ha was water spread area inclusive of TS canal portion and Vattakayal estuarine
area . However, an extent of land of 9.551 Ha has been lost in the sea due to marine erosion.
This was assessed by overlaying the old cadastral maps with survey numbers of Alappad and
Panmana villages with the satellite imagery of 2017.(During the period 2006 to 2012 an area
of 7.705 Ha was inundated by the sea . As on 2017 a total land of 9.551Ha was lost in Block
IV EE .The sea erosion near the northern end of the Block IV was about 50m as per the
Google earth image 2003 . But subsequently this portion remained more or less stable as the
shoreline change was meagre. The southern half of the Block IV however was subject to
continued rapid sea erosion ( Photo 2and 3 ) and the sea has transgressed beyond this as per
Google image 2003 to Block IV EE ( Eastern extension ) . It is apparent that in the post
Tsunami period upto 2009 there was few change for the shoreline as evidenced by the google
image 2009 which shows a small strip of the shoreline at the soother end migrating landward
side.The Google image 2012 shows the shoreline shifting towards land along the southern half
but remain without change in the northern side . But it is interesting to note that as per the
latest Google image ( 2017 ) , there was only very little change from 2012 ; a small patch of
shore line shift to the land ie erosion and nearby a small patch of accretion along the southern
side . (Fig 11 and 12) . Similarly , an area of 9.551Ha out of the total ML area of 180Ha was
lost till 2017 as a result of sea erosion in IREL Block IV eastern extension .The comparison of
the satellite imageries show that IREL Block IV eastern extension also lost 7.705 Ha during
the years 2006 to 2012.( Fig 13, Fig 14 )
7.5.1 Engineering structures in the costal environment are designed to improve navigation
and to retard sea erosion. Groynes are linear structure constructed perpendicular the shore and
usually constructed in groups called Groins –fields . The groyne trap a portion of the littoral
transport alone the up drift side building irregular but wide beaches while accretion occurs in
the updrift side of the groin , erosion tend to occur in drown in down drift direction .. This
happens as the groins or groin fields become filled with trapped sediments while the
downdrift side remain improverished in sediment drift , . Once a groyne is saturated with
sediments , sand begins to be transported around its off- shore end to continue its littoral
Drift .Therefore erosion may be reduced by beach nourishment of each groyne ; artificially
filling the up drift side by trucking of sands . Thus nourished , the groins will be minimized.
Groyne may be unsuitable in areas of low drift. Therefore before commencing any
programme for installation of such structures the actual sand budget in the littoral drift unit
may be assessed by scientific studies
A Groyne is a rigid hydraulic structure built from an sea shore (in costal engineering) that
interrupts water flow and limits the movement of sediment. It is usually made up of rubbles or
concrete. In the ocean, groynes create beaches or prevent them being washed away by long
shore drift. Ocean groynes run generally perpendicular to the shore, extending from the
upper or into the water. All of a groyne may be under water, in which case it is a submerged
groyne. The areas between groups of groynes are groyne fields. Groynes are generally made
of concrete or rock piles, and placed in groups. They are often used in tandem with sea walls.
Groynes, however, may cause a shoreline to be perceived as unnatural.
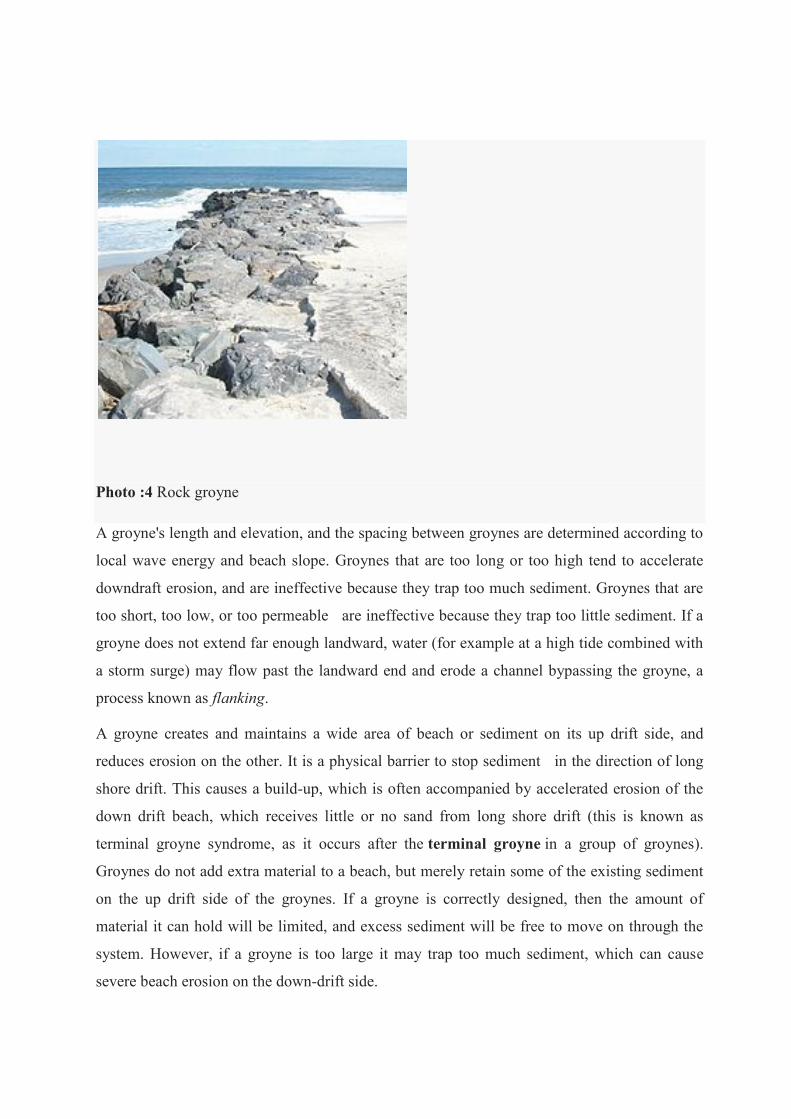
Photo :4 Rock groyne
A groyne's length and elevation, and the spacing between groynes are determined according to
local wave energy and beach slope. Groynes that are too long or too high tend to accelerate
downdraft erosion, and are ineffective because they trap too much sediment. Groynes that are
too short, too low, or too permeable are ineffective because they trap too little sediment. If a
groyne does not extend far enough landward, water (for example at a high tide combined with
a storm surge) may flow past the landward end and erode a channel bypassing the groyne, a
process known as flanking.
A groyne creates and maintains a wide area of beach or sediment on its up drift side, and
reduces erosion on the other. It is a physical barrier to stop sediment in the direction of long
shore drift. This causes a build-up, which is often accompanied by accelerated erosion of the
down drift beach, which receives little or no sand from long shore drift (this is known as
terminal groyne syndrome, as it occurs after the terminal groyne in a group of groynes).
Groynes do not add extra material to a beach, but merely retain some of the existing sediment
on the up drift side of the groynes. If a groyne is correctly designed, then the amount of
material it can hold will be limited, and excess sediment will be free to move on through the
system. However, if a groyne is too large it may trap too much sediment, which can cause
severe beach erosion on the down-drift side.
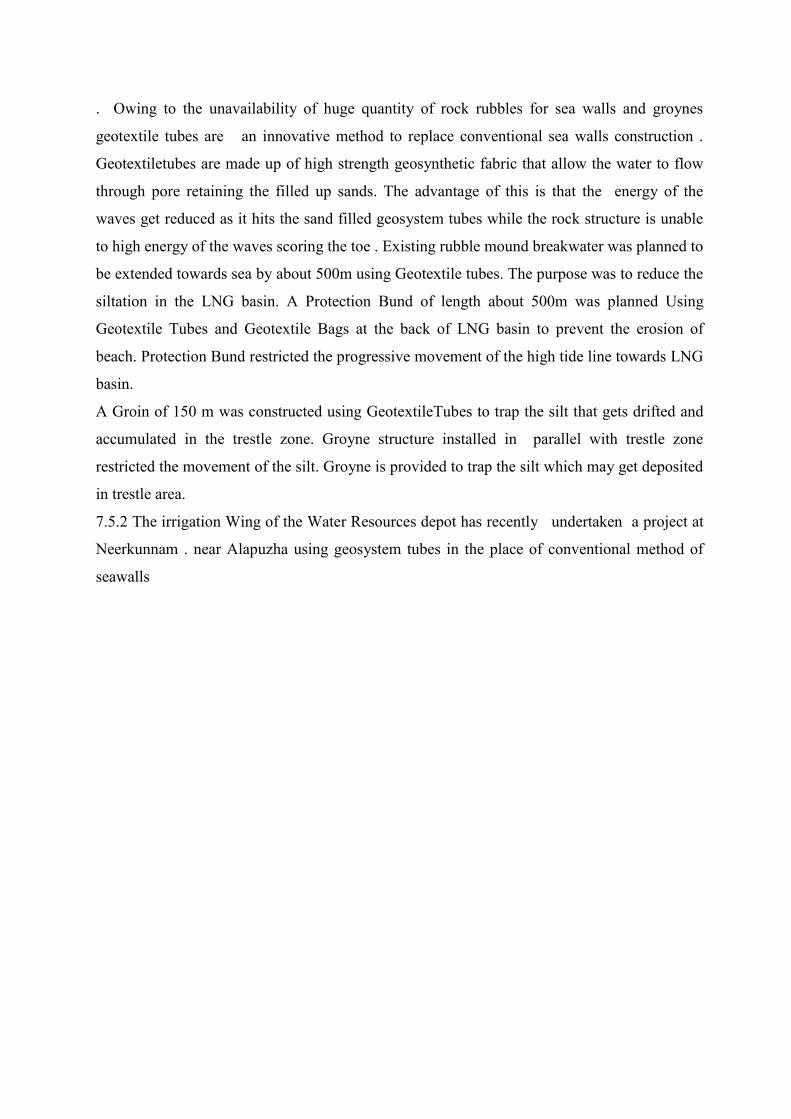
. Owing to the unavailability of huge quantity of rock rubbles for sea walls and groynes
geotextile tubes are an innovative method to replace conventional sea walls construction .
Geotextiletubes are made up of high strength geosynthetic fabric that allow the water to flow
through pore retaining the filled up sands. The advantage of this is that the energy of the
waves get reduced as it hits the sand filled geosystem tubes while the rock structure is unable
to high energy of the waves scoring the toe . Existing rubble mound breakwater was planned to
be extended towards sea by about 500m using Geotextile tubes. The purpose was to reduce the
siltation in the LNG basin. A Protection Bund of length about 500m was planned Using
Geotextile Tubes and Geotextile Bags at the back of LNG basin to prevent the erosion of
beach. Protection Bund restricted the progressive movement of the high tide line towards LNG
basin.
A Groin of 150 m was constructed using GeotextileTubes to trap the silt that gets drifted and
accumulated in the trestle zone. Groyne structure installed in parallel with trestle zone
restricted the movement of the silt. Groyne is provided to trap the silt which may get deposited
in trestle area.
7.5.2 The irrigation Wing of the Water Resources depot has recently undertaken a project at
Neerkunnam . near Alapuzha using geosystem tubes in the place of conventional method of
seawalls
Photo 5
Construction of beach protection bund and groyne using geotextile tubes by Pertonet LNG ,
Kochi , India
7.6 Socio- economic Measures
7.6.1 Rehabilitation and Resettlement Plan
The principles governing rehabilitation envisages a total rehabilitation concept, which
is holistic in approach and integrated in performance. Resettlement of the project displaced
families/Affected persons (APs) should bring about an improved resource base in their new
abode, not inferior to that of their original habitat. At the same time, the whole process should
be administered in tune with the cultural ethos, economic pursuits and social harmony.
Suggesting a pragmatic plan of action, satisfying all the Principles of Resettlement and
Rehabilitation, both in letter and spirit, is therefore a challenging task. Land acquisition
process often results in public resentment and good arable land itself being a scarce
commodity and procurement of even such 1 ha of land will be arduous. Based on these ground
realities, a comprehensive R & R plan has been evolved on the basis of the socio-economic
survey, which outlines the best possible course of action that could be attempted taking in to
account the socio economic pursuits, hopes and apprehensions of the local people.
The necessity of R & R plan for the projects of this kind is to given adequate protection to the
displaced people by applying the fair principles of equity, justice and equality before law, and
thus transferring the negatively affected people to an alternative area, where they can continue
to live using the same skill in a more or less same environmental conditions. While executing
the R & R programme the project proponent and the land acquisition authority may give due
consideration to the principles of rehabilitation of people affected by such development
projects. Keeping in view of the limited impact of the proposed development project on the
human environment, a pragmatic, cost-effective and sustainable rehabilitation action plan may
be adopted. With due consideration of the above mentioned principles of R & R on the one
hand and local feasibility conditions on the other, the following package of
R& R Scheme has been formulated after tripartite decision between the District
Administration, Affected people, and Project Authorities. The present Rehabilitation and
Resettlement Action Plan is mainly focused on the affected persons who dwell in the Project
area to be evicted from their houses. The project-displaced families could be classified in to
two groups as:
a) Those displaced as a result of their eviction from their dwelling, demanding resettlement
b) Those deprived of their agricultural land holding and hence needing compensation
The Schemes for those dislocated family dwellings/ affected persons (AP) (requiring
resettlement) which has been approved by District authorities. The following decision have
been taken
1. Basic land value shall be fixed by revenue authorities Adequate compensation, as per
existing rules, must be paid for (i) the homestead land (to a maximum of 405 m2 or 10 cents)
acquired for the project execution, and (ii) for the family dwelling and other adjunct structure /
machinery standing on the procured land.
2. Value of trees , buildings and other structures shall be added to the above to obtain market
value .The market value obtained ( by adding to the basic land value of the structure ,trees ,and
other improvements )will be enhanced to obtain the compensation price . Over and above the
following rehabilitation benefits and shifting / goodwill charges will be provided . The
affected families can retain the ownership of materials that they possess ,original home and a
financial assistance up to Rs. 20,000/- must be given for transporting their household
belongings to the new place of residence.
3. A list of evictees will be maintained to provide employment on priority basis wherever there
is an opportunity.
4 The APs should be encouraged to form co-operative ventures with others or to set up one's
own activity/enterprise, utilizing their skill coupled with the monetary benefits for productive
purposes. Till then, such money (compensation), should ideally, be deposited in any of the
national banks or otherwise profitably invested. The concern is the security of the
compensation money, due to the displaced people so as to ensure that they would not get any
raw deal at any stage and pushed into impoverishment of any kind.
5. During the socio-economic survey some of the APs preferred monetary compensation for
the land acquired for project execution and they wish to procure land preferably in the
neighboring village/near municipal town. If the APs are interested to get settled in the land to
be acquired for resettlement outside the project area they may be given monetary assistance to
construct a new dwelling with all essential livelihood units (dug well or bore well, toilet, cattle
shed etc.) not inferior to the one enjoyed by them both in size and quality at a place of their
choice. In calculating the assistance, due weightage must be given to the present construction
cost prevailing in the area.. All sincere efforts should be made to provide suitable job, to at
least one member from each affected family on the basis of his/her qualification, in the project.
The APs should get preference in the civic amenities; such as electrification of their new
houses and other welfare measures undertaken by the project authority.
7.6.2 Measures for fishermen community
The local fishermen shall be engaged in transporting the mineral heavies from the
project area to IRE plant at Chavara .
The local fishermen could be associated to monitor ecology of the area as well as for
planting mangroves/ trees
8.0 ENVIRONMENTAL MONITORING PROGRAMME
Environment status/quality monitoring is an essential element for achieving sustainability of
any water related project. Monitoring of environmental indicators signals the potential
problems and facilitates timely implementation of effective remedial measures. The baseline
data on existing environment generated by the present study and the impacts identified can
form the basis of such future assessment. During the course of the operational stage of the
project, certain impacts which have not been not perceived at the initial stage or during
implementation stage might arise as unforeseen negative impacts. These have also to be given
due consideration in the monitoring programme. Environmental Monitoring should enlist the
collaboration/ involvement and allocation of responsibilities of various agency/ organizations.
It becomes essential to ensure that the mitigation measures planned for environmental
protection function effectively during the entire period of project operation. It will also allow
for validation of the assumption and assessments made in the present study.
8.1The Need
Monitoring is essential to ensure that mitigation measures planned by way of environmental
protection, function effectively during the entire period of mining and reclamation. Various
measures have been suggested as part of environmental management plan for mitigation of
impacts . These have to be implemented as per suggestions and monitored regularly to
prevent any lapses. In particular, a monitoring strategy is required to ensure that all
environmental resources which may be subjected to contamination are kept under review and
hence monitoring of individual elements is necessary.
Increased fishing activity due to better approach to sea face as well as improved inland
fisheries due to more mangrove area and wet land / more extent of water storage ponds.
productive area
Conversion of non – productive area into a tourist white sand natural ecological area
with sand dunes , management measures against sea erosion , back water bank
protection using Rip rap , increase income from TS canal
However changes external to the activity may beat any future stage endanger environmental
conditions rendering the existing mitigation measures inadequate .Hence, the necessity of
remaining vigilant through a well planned and meticulously implemental environmental
monitoring programme is essential.
8.1.1 Areas of Concern:
The aim of monitoring programme is to develop an early warning system of indicators to
detect when pollution begins to approach or exceed the permitted levels. Such indicators can
be categorized under three groups: physical, chemical, and biological as applicable to each
mode of pollutant transmission, viz. air, water, traffic, radiation and noise. The Environment
Monitoring Programme may be focused in the following areas.
8.1.2 Meteorological Observatory
A small meteorological observation station to record daily continuous synoptic data hasto be
set up at the proposed project site. Wind speed data would help in making changes if required
for stabilization of sand dunes. Arrangements for recording temperature, humidity, wind
direction, and speed and rain fall would be required at the project site. The cost of
instruments would be around Rs 20 lakhs and 2 lakhs for maintenance annually. An
automatic wave height and direction recorder is suggested to generate data on coastal erosion
. A provision of Rs 10 lakh is to be earmarked for equipment per year and Rs 2 lakh for
annual maintenance .
8.1.3Topography; Periodic contour mapping of dune created should be undertaken to
determine whether wind erosion is causing any damage. An Amount of Rs 5 lakh is estimated
per year.
8.1.4 Coastal Protection
Land use, change in landscape and habitat to be reconnoitred
Monitoring of shore line evaluation provides valuable data on accretion and sediment
transport rates. An amount of Rs 20 lakh is estimated per year . This could be done by a
competent organization
Regular photographic images of sites from the same positions would identify the changes in
beach alignment, sand levels and sand movement.
Monitoring of adjacent shorelines and those immediately within the groyne scheme to be
taken up .
Assessment to be carried out bimonthly to assess the beach – dune evolution and successes
of the scheme relative to the objectives
Construction and maintenance of sea wall and groyes and their maintenance on regular basis
may be taken in consideration
Soil and appraisal of soil salinity, soil conservation
Changes in faunal composition, including seasonal movements and migration
Fisheries; variation in aquatic life forms
Spread of aquatic weeds to be watched for protective measures
8.1.5 Water
Rain water harvesting in artificial aquifer in refilled area is recommended. Ground water
quality in these areas should be monitored once in every season in the project area and
surroundings to check for possible contamination. A provision of Rs 5lakhs ( Capital) and Rs
2Lakhs as recurring cost could be earmarked . Water Resources including changes in water
quality, particularly of the Dredged out land including depletion of ground water resources,
Water logging of the areas near to mining area and change in drainage pattern may be
monitored.
8.1.6 Socio- economic development
IREL authorities have to be in regular touch with people residing in the around the project
area to monitor the various development schemes .They will also consider any emergent
requirements, which could be taken care of in the near future
8.1.7 Green Belt development
The green belt as per the environmental management plan is recommended . An area of …Ha
is recommended along the .
An amount of Rs 5 Lakhs as capital and 3 Lakhs as per annum as recurring expenses has been
assessed……….Locations in the estuarine portion are recommended as for mangrove
afforestation A provision of Rs 15 lahs is estimated as ca[ital and Rs lakhs as recurring for
monitoring and sustenance of mangrove areas / as well as wet land ecology . Impacts of
Agro chemicals
Ecology; vegetation changes in terms of species composition, density and diversity
Changes in agricultural and industrial sectors of the surrounding areas
8.1.7 Development of Dunes
The reclaimed area to be converted into sandy dune and plain should be monitored with
regard to ecology. A capital of Rs 5 lakhs and recurring expenditure of Rs 3 lakhs id
estimated annually /
8.2. Environmental Management Office (EMO) An Environmental Management Office
(EMO) will be formed in order to assess and review the progress of the various mitigation
measures suggested in the Environmental Management Plan and for coordination,
implementation and monitoring of all the environmental mitigation discussed above. The
EMO should be multidisciplinary in composition with the inclusion of an environmental
engineer and an environmental quality (air and water) analyst, and two technical assistants.
The EMO will periodically report the compliance to the regulating authorities’ .They shall
consult the Environment Monitoring Committee (EMC) in assessing the projects impacts
and also for coordinating the activities of various agencies. This office will function for
implementing the mitigation measures for various adverse impacts identified for the
construction and operational phases as below:
a. Monitoring of the air quality, noise, and vibration at construction sites
b. Surface water quality monitoring of streams in the project area and groundwater condition
of lowering of the water levels and water logging of the area in proximity to the reservoir
8.1.8 Occupational safety and Health
Occupational safety and health very closely related to productivity and good employer –
employee relationship .The main factors of occupational health in Beach sand project are
noise and radiation. Safety of the employees during operation and maintenance etc shall be as
per mines rules and regulations. The following measures relating to safety and health which
are practiced in IRE Plant at Chavara shall be continued in the proposed expansion
programme .
Provision of rest shelters for mine workers with amenities like drinking water , toilet
etc
All safety measures like use of safety appliances, safety awards, posters , slogans
related to safety etc.
Training of employees for use of safety appliances and first aid
Regular maintenance and testing of all equipments as per manufactures guidelines
Periodical medical examination ( PME ) of all workers by a medical specialist so that
any adverse effect may e detected at early stage
c. Groundwater levels and surface water discharge monitoring along the tunnel alignment on
a weekly basis
d. Map out the existing landslides and potential areas within the project area for the
mitigation measures
e. Stream flow measurement of sediment load monitoring
f. Supervision of the afforestaton/ green belt development
g. conservation of the protected flora and fauna in the areas reserves designated and
implementation of the recommendations of bio-diversity assessment
h. Vigilance on the encroachments to the project areas and sides of the roads and access
pathways by the local people and migrants
The EMO .will carry out necessary laboratory analysis, collection of data’s and information
regarding the progress and will prepare the progress report in every two months and will
present to the Environment Monitoring Committee. For any major comments or obstacles the
independent agency may call a meeting where representatives from independent agency,
project authority and environmental committee will be present and any issue may be
discussed in the meeting. The major progress report will be with respect to:
• Leveling and slope stabilization works at dumping sites.
• Status of afforestation / turfing works on the dumping sites.
Based on the findings of the Environmental Impact Assessment study in various
Environmental Management Plan the important parameter viz., Biodiversity Conservation &
Management, Public Health Delivery System, Fish Management, Restoration of Dumping
Sites, Landscaping and Restoration of mined out Area, Green Belt Development etc. have
been proposed. The surface water and ground water quality of the project should be
monitored twice a year (one in a pre-monsoon and another in a post-monsoon season). About
6 samples need to be analyzed. This analysis shall be done during the implementation of the
project.
Air Quality will also be monitored by the cell in terms of SPM, Sox and NOx quarterly so
that degradation of ambient air quality if any is brought into notice in a particular period.
Status of afforestation programmes, changes in migration patterns of the aquatic and
terrestrial fauna species soil erosion rates, slope stability of embankment etc. should be
studied. The study could be undertaken with a frequency of every 2 years during tenure of the
project.
Identification of water-related diseases, sites, adequacy of local vector control and curative
measures, status of public health are some of the parameters which should be closely
monitored once in two year with the help of data maintained in the government
dispensaries/hospitals
In addition to above, following parameters will also be monitored by the EMO:
a) Status of protection measures, Rip rap etc. at the reclamation sites.
b) Levelling and slope stabilization works at mined out / dredged sites.
c) Status of afforestation / turfing on the mined out / dredged sites.
8.3 Environment Monitoring Committee (EMC)
In order to assess the implementation of the proposed mitigation measures in the EIA report/
comprehensive EIA study report, an Environment Monitoring Committee may be constituted
The EMC should consist of scientists, officials of local administration and. the
representatives of the local inhabitants .The EMC will have sittings at predetermined
intervals for verifying the progress of the EMO. Environmental Monitoring Committee shall
function for supervision and monitoring of the environmental management components. This
independent supervising agency will review and scrutinize the programmes taken up by the
project environmental office from time to time and give necessary recommendations
ANNEXURE :
WELL INVENTORY DETAILS OF IREL BLOCK IVEE AND BUFFER AREA
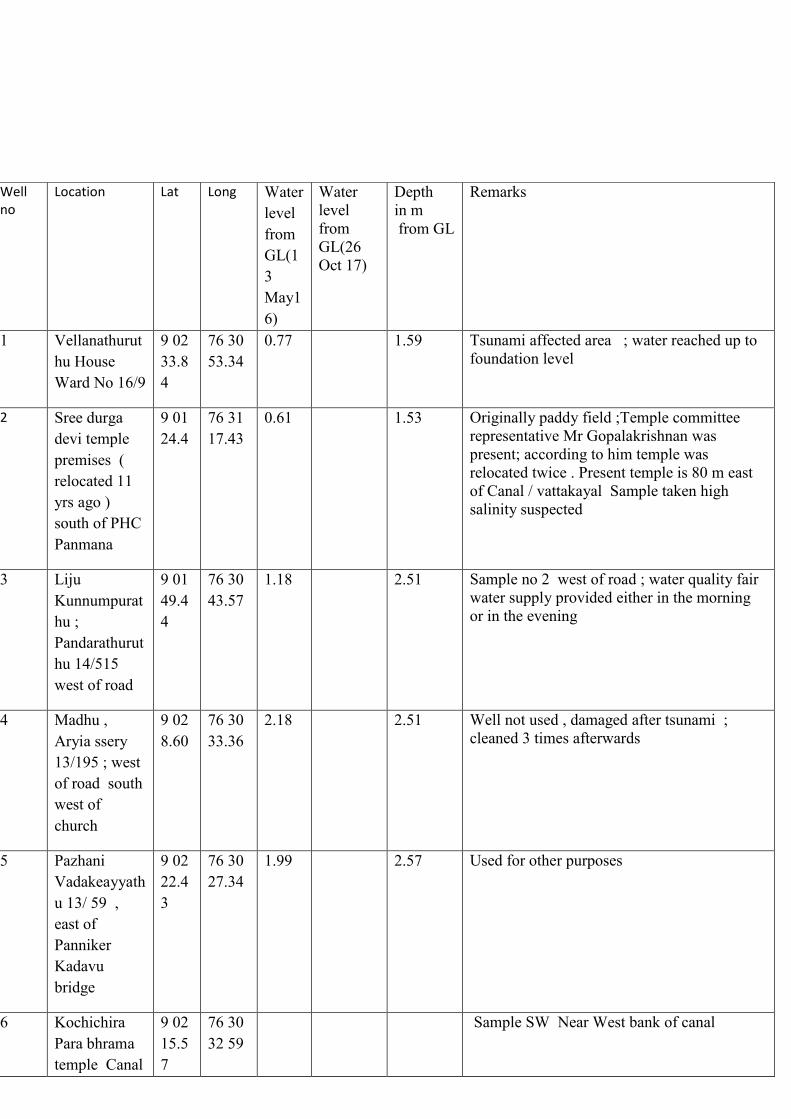
Well no
Location Lat Long Water
level
from
GL(1
3
May1
6)
Water
level
from
GL(26
Oct 17)
Depth
in m
from GL
Remarks
1 Vellanathurut
hu House
Ward No 16/9
9 02
33.8
4
76 30
53.34
0.77 1.59 Tsunami affected area ; water reached up to
foundation level
2 Sree durga
devi temple
premises (
relocated 11
yrs ago )
south of PHC
Panmana
9 01
24.4
76 31
17.43
0.61 1.53 Originally paddy field ;Temple committee
representative Mr Gopalakrishnan was
present; according to him temple was
relocated twice . Present temple is 80 m east
of Canal / vattakayal Sample taken high
salinity suspected
3 Liju
Kunnumpurat
hu ;
Pandarathurut
hu 14/515
west of road
9 01
49.4
4
76 30
43.57
1.18 2.51 Sample no 2 west of road ; water quality fair
water supply provided either in the morning
or in the evening
4 Madhu ,
Aryia ssery
13/195 ; west
of road south
west of
church
9 02
8.60
76 30
33.36
2.18 2.51 Well not used , damaged after tsunami ;
cleaned 3 times afterwards
5 Pazhani
Vadakeayyath
u 13/ 59 ,
east of
Panniker
Kadavu
bridge
9 02
22.4
3
76 30
27.34
1.99 2.57 Used for other purposes
6 Kochichira
Para bhrama
temple Canal
9 02
15.5
7
76 30
32 59
Sample SW Near West bank of canal
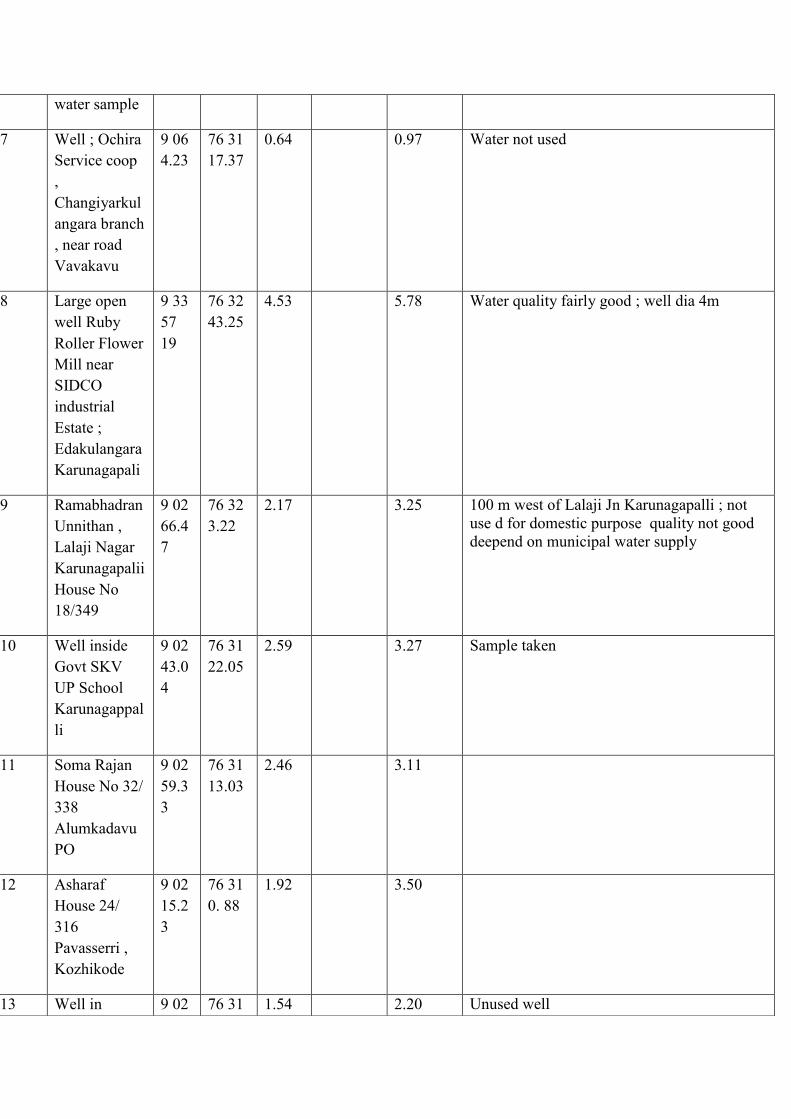
water sample
7 Well ; Ochira
Service coop
,
Changiyarkul
angara branch
, near road
Vavakavu
9 06
4.23
76 31
17.37
0.64 0.97 Water not used
8 Large open
well Ruby
Roller Flower
Mill near
SIDCO
industrial
Estate ;
Edakulangara
Karunagapali
9 33
57
19
76 32
43.25
4.53 5.78 Water quality fairly good ; well dia 4m
9 Ramabhadran
Unnithan ,
Lalaji Nagar
Karunagapalii
House No
18/349
9 02
66.4
7
76 32
3.22
2.17 3.25 100 m west of Lalaji Jn Karunagapalli ; not
use d for domestic purpose quality not good
deepend on municipal water supply
10 Well inside
Govt SKV
UP School
Karunagappal
li
9 02
43.0
4
76 31
22.05
2.59 3.27 Sample taken
11 Soma Rajan
House No 32/
338
Alumkadavu
PO
9 02
59.3
3
76 31
13.03
2.46 3.11
12 Asharaf
House 24/
316
Pavasserri ,
Kozhikode
9 02
15.2
3
76 31
0. 88
1.92 3.50
13 Well in 9 02 76 31 1.54 2.20 Unused well
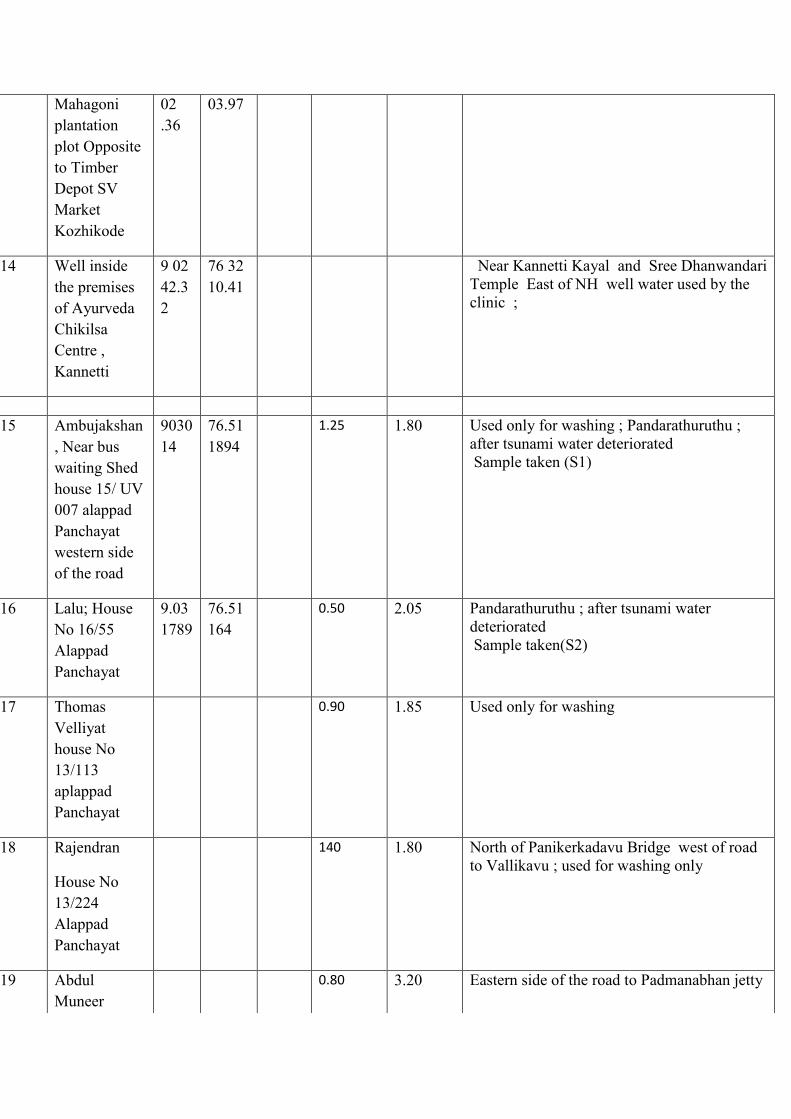
Mahagoni
plantation
plot Opposite
to Timber
Depot SV
Market
Kozhikode
02
.36
03.97
14 Well inside
the premises
of Ayurveda
Chikilsa
Centre ,
Kannetti
9 02
42.3
2
76 32
10.41
Near Kannetti Kayal and Sree Dhanwandari
Temple East of NH well water used by the
clinic ;
15 Ambujakshan
, Near bus
waiting Shed
house 15/ UV
007 alappad
Panchayat
western side
of the road
9030
14
76.51
1894
1.25 1.80 Used only for washing ; Pandarathuruthu ;
after tsunami water deteriorated
Sample taken (S1)
16 Lalu; House
No 16/55
Alappad
Panchayat
9.03
1789
76.51
164
0.50 2.05 Pandarathuruthu ; after tsunami water
deteriorated
Sample taken(S2)
17 Thomas
Velliyat
house No
13/113
aplappad
Panchayat
0.90 1.85 Used only for washing
18 Rajendran
House No
13/224
Alappad
Panchayat
140 1.80 North of Panikerkadavu Bridge west of road
to Vallikavu ; used for washing only
19 Abdul
Muneer
0.80 3.20 Eastern side of the road to Padmanabhan jetty
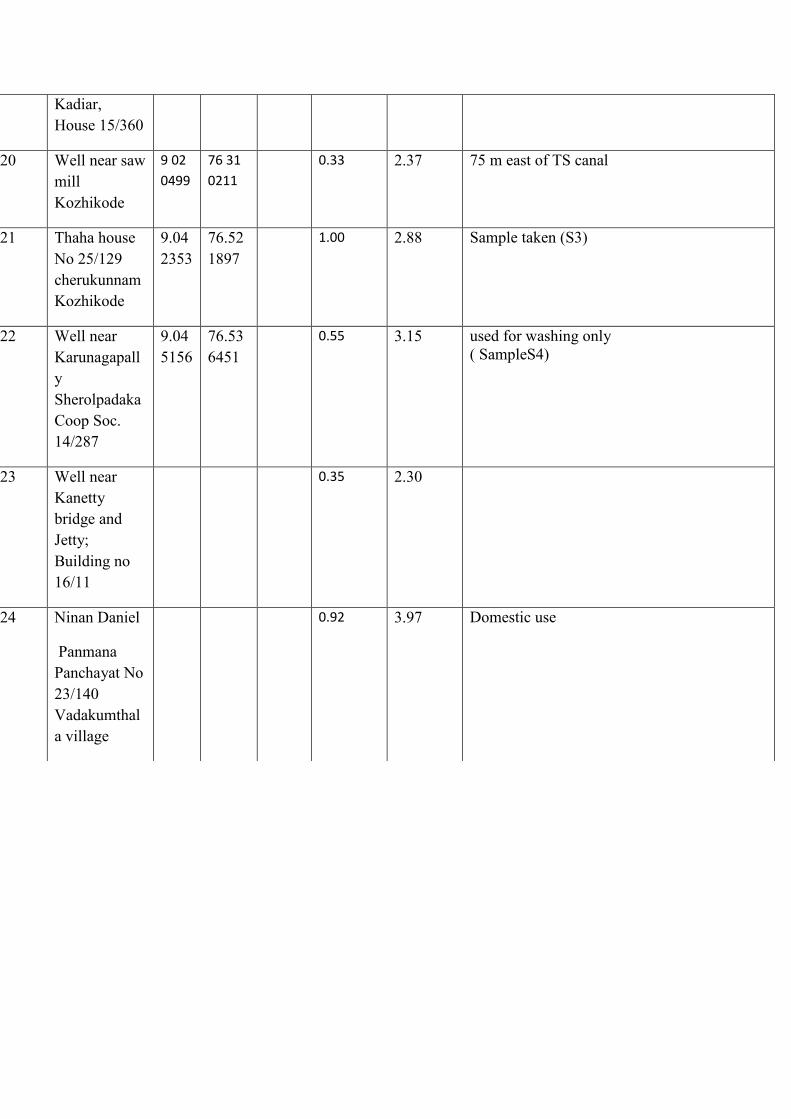
Kadiar,
House 15/360
20 Well near saw
mill
Kozhikode
9 02
0499
76 31
0211
0.33 2.37 75 m east of TS canal
21 Thaha house
No 25/129
cherukunnam
Kozhikode
9.04
2353
76.52
1897
1.00 2.88 Sample taken (S3)
22 Well near
Karunagapall
y
Sherolpadaka
Coop Soc.
14/287
9.04
5156
76.53
6451
0.55 3.15 used for washing only
( SampleS4)
23 Well near
Kanetty
bridge and
Jetty;
Building no
16/11
0.35 2.30
24 Ninan Daniel
Panmana
Panchayat No
23/140
Vadakumthal
a village
0.92 3.97 Domestic use

1
2
3
4 Madhu , Aryia
ssery 13/195 ;
9 02
8.60
76 30
33.36
2.18 2.51 Well not used , damaged after tsunami ;
cleaned 3 times afterwards
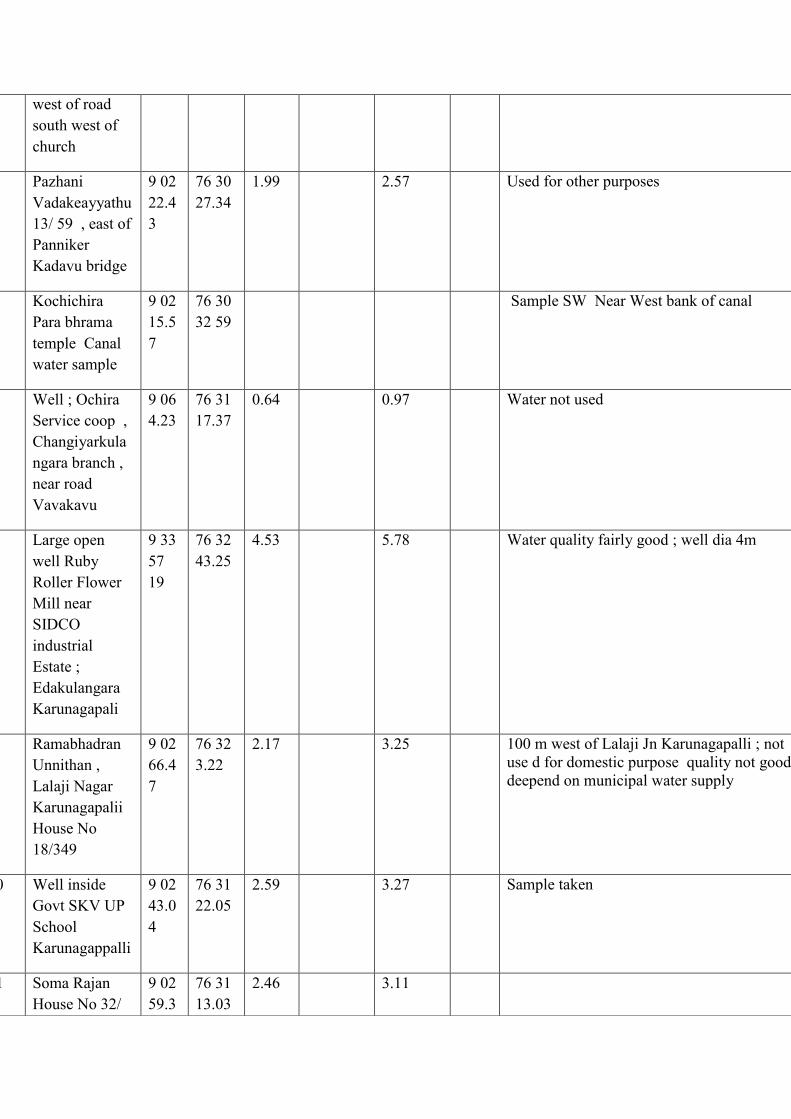
west of road
south west of
church
5 Pazhani
Vadakeayyathu
13/ 59 , east of
Panniker
Kadavu bridge
9 02
22.4
3
76 30
27.34
1.99 2.57 Used for other purposes
6 Kochichira
Para bhrama
temple Canal
water sample
9 02
15.5
7
76 30
32 59
Sample SW Near West bank of canal
7 Well ; Ochira
Service coop ,
Changiyarkula
ngara branch ,
near road
Vavakavu
9 06
4.23
76 31
17.37
0.64 0.97 Water not used
8 Large open
well Ruby
Roller Flower
Mill near
SIDCO
industrial
Estate ;
Edakulangara
Karunagapali
9 33
57
19
76 32
43.25
4.53 5.78 Water quality fairly good ; well dia 4m
9 Ramabhadran
Unnithan ,
Lalaji Nagar
Karunagapalii
House No
18/349
9 02
66.4
7
76 32
3.22
2.17 3.25 100 m west of Lalaji Jn Karunagapalli ; not
use d for domestic purpose quality not good
deepend on municipal water supply
10 Well inside
Govt SKV UP
School
Karunagappalli
9 02
43.0
4
76 31
22.05
2.59 3.27 Sample taken
11 Soma Rajan
House No 32/
9 02
59.3
76 31
13.03
2.46 3.11
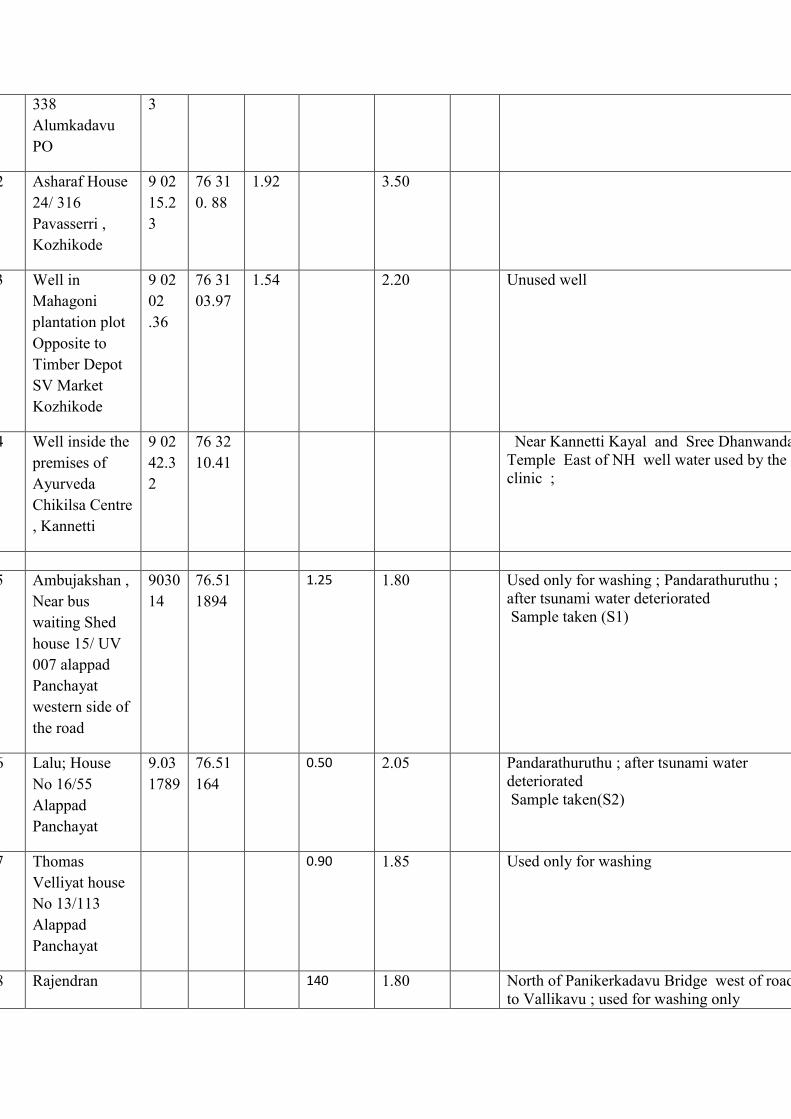
338
Alumkadavu
PO
3
12 Asharaf House
24/ 316
Pavasserri ,
Kozhikode
9 02
15.2
3
76 31
0. 88
1.92 3.50
13 Well in
Mahagoni
plantation plot
Opposite to
Timber Depot
SV Market
Kozhikode
9 02
02
.36
76 31
03.97
1.54 2.20 Unused well
14 Well inside the
premises of
Ayurveda
Chikilsa Centre
, Kannetti
9 02
42.3
2
76 32
10.41
Near Kannetti Kayal and Sree Dhanwandari
Temple East of NH well water used by the
clinic ;
15 Ambujakshan ,
Near bus
waiting Shed
house 15/ UV
007 alappad
Panchayat
western side of
the road
9030
14
76.51
1894
1.25 1.80 Used only for washing ; Pandarathuruthu ;
after tsunami water deteriorated
Sample taken (S1)
16 Lalu; House
No 16/55
Alappad
Panchayat
9.03
1789
76.51
164
0.50 2.05 Pandarathuruthu ; after tsunami water
deteriorated
Sample taken(S2)
17 Thomas
Velliyat house
No 13/113
Alappad
Panchayat
0.90 1.85 Used only for washing
18 Rajendran 140 1.80 North of Panikerkadavu Bridge west of road
to Vallikavu ; used for washing only
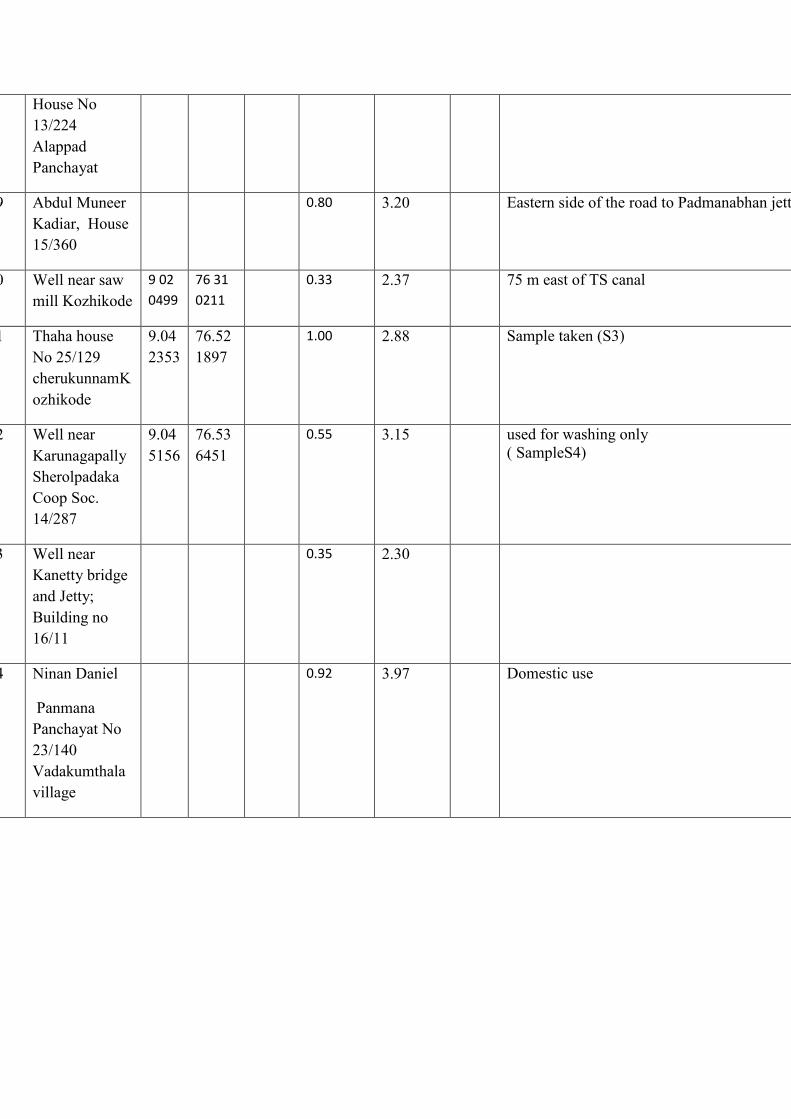
House No
13/224
Alappad
Panchayat
19 Abdul Muneer
Kadiar, House
15/360
0.80 3.20 Eastern side of the road to Padmanabhan jetty
20 Well near saw
mill Kozhikode
9 02
0499
76 31
0211
0.33 2.37 75 m east of TS canal
21 Thaha house
No 25/129
cherukunnamK
ozhikode
9.04
2353
76.52
1897
1.00 2.88 Sample taken (S3)
22 Well near
Karunagapally
Sherolpadaka
Coop Soc.
14/287
9.04
5156
76.53
6451
0.55 3.15 used for washing only
( SampleS4)
23 Well near
Kanetty bridge
and Jetty;
Building no
16/11
0.35 2.30
24 Ninan Daniel
Panmana
Panchayat No
23/140
Vadakumthala
village
0.92 3.97 Domestic use