Downloaded on 2018-09-21T13:42:20Z - CORE
383
Title Adverse drug reactions and targets for deprescribing in high risk older adults Author(s) Lavan, Amanda Hanora Publication date 2018 Original citation Lavan, A. H. 2018. Adverse drug reactions and targets for deprescribing in high risk older adults. PhD Thesis, University College Cork. Type of publication Doctoral thesis Rights © 2018, Amanda Hanora Lavan. http://creativecommons.org/licenses/by-nc-nd/3.0/ Embargo information Not applicable Item downloaded from http://hdl.handle.net/10468/6800 Downloaded on 2018-09-21T13:42:20Z
-
Upload
khangminh22 -
Category
Documents
-
view
0 -
download
0
Transcript of Downloaded on 2018-09-21T13:42:20Z - CORE
Title Adverse drug reactions and targets for deprescribing in high risk olderadults
Author(s) Lavan, Amanda Hanora
Publication date 2018
Original citation Lavan, A. H. 2018. Adverse drug reactions and targets for deprescribingin high risk older adults. PhD Thesis, University College Cork.
Type of publication Doctoral thesis
Rights © 2018, Amanda Hanora Lavan.http://creativecommons.org/licenses/by-nc-nd/3.0/
Embargo information Not applicable
Item downloadedfrom
http://hdl.handle.net/10468/6800
Downloaded on 2018-09-21T13:42:20Z
1
Ollscoil na hÉireann, Corcaigh
National University of Ireland, Cork
Adverse drug reactions and targets for
deprescribing in high risk older adults
Volume 1 of 1
Thesis presented by
Dr Amanda Hanora Lavan
Mb BCh BAO BSc (Biomedical Science) MRCPI
for the degree of Doctor of Philosophy
Department of Medicine
University College Cork, Ireland
Head of Department: Prof Fergus Shanahan
Supervisors: Prof. Denis O’Mahony and Dr. Paul Gallagher
January 2018

2
Dedicated to my husband, Mick
3
TABLE OF CONTENTS
Declaration ………………………………………………………………………………………………… 12
List of Tables ……………………………………………………………………………………………… 13
List of Figures …………………………………………………………………………………………….. 19
List of abbreviations ………………………………………………………………………………….. 22
List of statistical symbols …………………………………………………………………………… 25
Acknowledgements …………………………………………………………………………………… 26
Thesis Overview ………………………………………………………………………………………... 28
Chapter 1: Introduction ……………………………………………………………………………… 31
1.1 Ageing demographics and multimorbidity …………………………………….. 32
1.1.1 Predicted demographic changes nationally and
internationally ……………………………………………………………………………….
32
1.1.2 Multimorbidity in high risk older adults …………………………….. 33
1.1.3 Specific population changes ………………………………………………. 34
1.2 Prescribing for older adults; considerations and challenges ………….. 35
1.2.1 Prescribing for older adults: general considerations ………….. 35
1.2.2 Pharmacokinetics and pharmacodynamics ………………………… 36
1.2.3 Medication use and polypharmacy ……………………………………. 37
1.2.4 Potentially inappropriate prescribing ………………………………… 39
1.2.5 Current prescribing assessment tools ………………………………… 42
1.3 Consequences of inappropriate prescribing ………………………………….. 43
1.3.1 Adverse drug reactions ……………………………………………………… 43
1.3.2 Prevalence of ADRs in different populations ……………………… 45
1.3.3 ADR risk factors in older people ………………………………………… 46
1.3.4 Effects of ADRs ………………………………………………………………….. 47
1.3.5 Current difficulties in ADR reporting ………………………………….. 49
1.4 Targets for intervention in populations at high risk of ADRs ………….. 54
1.4.1 Deprescribing ……………………………………………………………………. 54
1.4.2 Need for a new prescribing tools ………………………………………. 54
1.4.3 Limited life expectancy ……………………………………………………… 55
4
1.4.4 Frailty ………………………………………………………………………………… 55
1.5 Conclusions …………………………………………………………………………………… 56
1.6 Objectives of this thesis ………………………………………………………………… 57
Chapter 2: Development and validation of an adverse drug reaction
trigger list ……………………………………………………………………………………………………
59
2.1 Introduction ………………………………………………………………………………….. 60
2.1.1 Objectives …………………………………………………………………………. 62
2.2 Methods ……………………………………………………………………………………….. 63
2.2.1 Development of the AE Trigger List …………………………………… 63
2.2.2 Development of a standardized investigative process for
each AE on the trigger list in order to ascertain whether or not the
event was an ADR ………………………………………………………………………….
66
2.2.3 Development of a standardized process for ascertaining
ADR-related morbidity …………………………………………………………………..
70
2.2.4 Conduct of a study to test the IRR of the process between
doctors, nurses, pharmacists and biomedical scientists using
clinical cases ………………………………………………………………………………….
71
2.2.5 Statistical analysis ……………………………………………………………… 76
2.3 Results ………………………………………………………………………………………….. 78
2.3.1 The AE Trigger List …………………………………………………………….. 78
2.3.2 A standardized investigative process for each AE on the
Trigger List to ascertain whether an ADR occurred and assessment
of the associated morbidity ……………………………………………………………
79
2.3.3 The IRR of this new ADR process ……………………………………….. 81
2.4 Discussion ……………………………………………………………………………………… 90
Chapter 3: Prevalence of adverse drug reactions (ADRs) in an acute
unselected hospital population as determined by new ADR ascertainment
methodology ………………………………………………………………………………………………
93
3.1 Introduction ………………………………………………………………………………….. 94
5
3.1.1 Objectives …………………………………………………………………………. 94
3.2 Methods ……………………………………………………………………………………….. 95
3.2.1 Study setting and design ……………………………………………………. 95
3.2.2 Patient eligibility and consent ……………………………………………. 95
3.2.3 Study population and sample size calculation ……………………. 96
3.2.4 Data collection ………………………………………………………………….. 96
3.2.5 Potentially inappropriate prescribing ………………………………… 101
3.2.6 Adverse drug reactions ……………………………………………………… 102
3.2.7 Adverse drug reaction causality, severity, predictability and
preventability ………………………………………………………………………………..
103
3.2.8 Statistical analysis ……………………………………………………………… 103
3.3 Results ………………………………………………………………………………………….. 104
3.3.1 Screening ………………………………………………………………………….. 104
3.3.2 Population characteristics …………………………………………………. 106
3.3.3 Level of multimorbidity ……………………………………………………… 107
3.3.4 Diagnoses ………………………………………………………………………….. 111
3.3.5 Prescription medications …………………………………………………… 113
3.3.6 Medication use according to age ………………………………………. 114
3.3.7 Medication use according to drug class …………………………….. 115
3.3.8 Drug class use according to gender ……………………………………. 116
3.3.9 Drug class use according to age category …………………………… 117
3.3.10 Medication adherence ………………………………………………………. 118
3.3.11 Potentially inappropriate prescriptions as determined by
STOPP criteria …………….………………………………………………………………….
118
3.3.12 Risk factors for receiving a potentially inappropriate
medication according to STOPP criteria …………………………………………
121
3.3.13 Potential prescribing omissions as determined by START
(Screening Tool to Alert doctors to Right Treatment) criteria ………..
123
3.3.14 Risk factors for potentially prescribing omissions according
to START criteria …………………………………………………………………………….
125
3.3.15 Adverse drug reactions prevalence rates …………………………… 125
6
3.3.16 Types of adverse drug reactions ………………………………………… 127
3.3.17 Adverse drug reaction causality ………………………………………… 128
3.3.18 Adverse drug reaction severity, predictability and
preventability ………………………………………………………………………………..
129
3.3.19 Adverse drug reaction risk factors and outcomes ……………… 130
3.4 Discussion …………………………………………………………………………………….. 131
Chapter 4: Prevalence of multimorbidity, potentially inappropriate
prescribing and adverse drug reactions (ADRs) in patients with cancer …….
137
4.1 Introduction ………………………………………………………………………………….. 138
4.1.1 Multimorbidity in patients with cancer ……………………………… 138
4.1.2 Medication use in patients with cancer ……………………………… 139
4.1.3 Adverse drug reactions in patients with cancer …………………. 141
4.1.4 Objectives …………………………………………………………………………. 142
4.2 Methods ……………………………………………………………………………………….. 144
4.2.1 Study setting and design ……………………………………………………. 144
4.2.2 Patient eligibility and consent ……………………………………………. 144
4.2.3 Study population and sample size calculation ……………………. 146
4.2.4 Data collection …………………………………………………………………… 148
4.2.5 Potentially inappropriate prescribing ………………………………… 149
4.2.6 Adverse drug reactions (ADRs) ………………………………………….. 149
4.2.7 Adverse drug reaction causality, severity, predictability and
preventability ………………………………………………………………………………..
150
4.2.8 Statistical analysis …………..…………………………………………………. 151
4.3 Results ………………………………………………………………………………………….. 152
4.3.1 Screening ………………………………………………………………………….. 152
4.3.2 Population characteristics …………………………………………………. 153
4.3.3 Level of morbidity ……………………………………………………………… 156
4.3.4 Cumulative Illness Rating Scale (CIRS) scores …………………….. 159
4.3.5 Cancer diagnoses ………………………………………………………………. 160
4.3.6 Non-cancer diagnoses ……………………………………………………….. 161
7
4.3.7 Prescription medications …………………………………………………… 164
4.3.8 Medication use according to age category ………………………… 164
4.3.9 Medication use according to drug class …………………………….. 167
4.3.10 Drug class use according to gender ……………………………………. 168
4.3.11 Drug class use according to age …………………………………………. 169
4.3.12 Prescription of chemotherapy and radiation therapy for
cancer ……………………………………………………………………………………………
170
4.3.13 Potentially inappropriate prescribing as determined by
STOPP criteria ………….…………………………………………………………………….
171
4.3.14 Risk factors for receiving a potentially inappropriate
medication according to STOPP criteria …………………………………………
173
4.3.15 Potentially inappropriate prescribing as determined by
OncPal criteria ……………………………………………………………………………….
175
4.3.16 Risk factors for receiving a potentially inappropriate
medication according to OncPal criteria ………………………………………..
178
4.3.17 Patients in whom both STOPP and OncPal criteria were
applied …………………………………………………………………………………………..
180
4.3.18 Adverse drug reactions in patients with cancer …………………. 180
4.3.19 Types of adverse drug reactions ………………………………………… 182
4.3.20 Adverse drug reaction causality ………………………………………… 183
4.3.21 Adverse drug reaction severity, predictability and
preventability ………………………………………………………………………………..
185
4.3.22 ADR risk factors and outcomes ………………………………………….. 185
4.4 Discussion …………………………………………..………………………………………… 187
Chapter 5: STOPPFrail (Screening Tool of Older Persons Prescriptions in
Frail adults with limited life expectancy): Consensus validation ………………..
194
5.1 Introduction ………………………………………………………………………………….. 195
5.1.1 Deprescribing in frail older adults ……………………………………… 196
5.2.2 Objectives …………………………………………………………………………. 198
5.2 Methods ……………………………………………………………………………………….. 199
8
5.2.1 Local development of draft criteria ……………………………………. 200
5.2.2 Comprehensive literature review to support draft criteria
inclusion ………………………………………………………………………………………..
202
5.2.3 Use of Delphi consensus methodology and selection of
expert panel …………………………………………………………………………………..
202
5.2.4 Determination of content validity of the criteria ……………….. 205
5.3 Results ………………………………………………………………………………………….. 207
5.3.1 Round 1 …………………………………………………………………………..... 207
5.3.1.1 Criteria accepted for inclusion after round 1 ……….. 211
5.3.1.2 Criteria rejected for inclusion after round 1 …………. 211
5.3.1.3 Criteria deemed inconclusive after round 1 …………. 214
5.3.2 Round 2 …………………………………………………………………………….. 217
5.3.3 Round 3 …………………………………………………………………………….. 220
5.4 Discussion ……………………………………………………………………………………… 223
Chapter 6: Inter-rater reliability of STOPPFrail criteria amongst physicians
from three clinical specialty services ………………………………………………………….
226
6.1 Introduction ………………………………………………………………………………….. 227
6.1.1 Objectives ………….……………………………………………………………… 227
6.2 Methods ……………………………………………………………………………………….. 227
6.2.1 Clinical case histories …………………………………………………………. 227
6.2.2 Expert Gold Standard Assessment of PIM use according to
STOPPFrail criteria …………………………………………………………………………
229
6.2.3 Physician recruitment ……………………………………………………….. 229
6.2.4 Statistical analysis ……………………………………………………………… 231
6.3 Results ………………………………………………………………………………………….. 232
6.3.1 Identification of clinical cases eligible for STOPPFrail criteria
application …………………………………………………………………………………….
232
6.3.2 Time to deploy STOPPFrail criteria …………………………………….. 233
6.3.3 Medication identified for deprescribing …………………………….. 233
6.3.4 Variations between raters …………………………………………………. 235
9
6.3.5 Criteria with major variations ..………………………………………….. 240
6.4 Discussion …………………………………………………………………………………….. 241
Chapter 7: Prevalence of potentially inappropriate prescribing as
determined by STOPPFrail criteria in a representative population of older
patients undergoing assessment for long term nursing home placement
and of older adults presenting with acute illness to hospital …………………….
245
7.1 Introduction ………………………………………………………………………………….. 246
7.1.1 Objectives …………………………………………………………………………. 247
7.2 Methods ……………………………………………………………………………………….. 248
7.2.1 Study population ………….……………………………………………………. 248
7.2.2 Cork City and County Local Placement Forum and the
Common Summary Assessment Report …………………………………………
248
7.2.3 Study period …….………….……………………………………………………. 249
7.2.4 Data collection …….………….………………………………………………… 249
7.2.5 Determination of potentially inappropriate prescribing
practices using STOPPFrail criteria ………………………………………………...
250
7.2.6 Statistical analysis ………….………………………………………………….. 251
7.3 Results ………………………………………………………………………………………….. 252
7.3.1 Screening …………………………………………………………………………… 252
7.3.2 Population characteristics …………………………………………………. 253
7.3.3 Characteristics of patients who were eligible for the
application of STOPPFrail criteria …………………………………………………..
253
7.3.4 Level of morbidity ……………………………………………………………… 255
7.3.5 Prescription medications …………………………………………………… 257
7.3.6 General prescribing trends ………………………………………………… 259
7.3.7 Life limiting diagnoses of older adults meeting STOPPFrail
eligibility criteria …..……………………………………………………………………….
262
7.3.8 Potentially inappropriate medication (PIM) use as
determined by STOPPFrail criteria …………………………………………………
263
10
7.3.9 Risk factors for being prescribing a PIM as determined by
STOPPFrail criteria …………………………………………………………………………
265
7.3.10 Application of STOPPFrail criteria to hospitalised older
adults …………………………………………………………………………………………….
267
7.3.11 Potentially inappropriate medication (PIM) use as
determined by STOPPFrail criteria in hospitalised older adults ………
270
7.4 Discussion …………………………………………………………………………………….. 272
Chapter 8: Summary and conclusions ……………………………………………………….. 278
8.1 Summary of research findings ………………………………………………………. 279
8.1.1 Development and validation of an AE Trigger List ……………… 280
8.1.2 Prevalence of ADRs causing hospitalisation in older adults .. 282
8.1.3 Prevalence of ADRs causing hospitalisation in patients with
cancer ……………………………………………………………………………………………
284
8.1.4 Validation of STOPPFrail criteria ………………………………………… 285
8.1.5 Prevalence of potentially inappropriate prescribing as
determined by STOPPFrail criteria …………………………………………………
286
8.2 Limitations of these research findings …………………………………………… 287
8.3 Directions for future research ……………………………………………………….. 291
Chapter 9: Publications in peer-reviewed journals and awards ………………… 294
9.1 Publications …………………………………………………………………………………… 295
9.2 Submitted papers …………………………………………………………………………. 297
9.3 Awards …………………………….……………………………………………………………. 297
Reference List …………………………………………………………………………………………….. 298
Appendices ………………………………………………………………………………………………… 325
1 Clinical case histories ……………………………………………………………………. 326
2 Ethical approval from the Clinical Research Ethics Committee
(CREC) for acute medicine and oncology observational studies ……..
330
11
3 Data collection sheet …………………………………………………………………….. 333
4 Barthel Index ………………………………………………………………………………… 341
5 Mini mental state examination (MMSE) ……………………………………….. 341
6 Structured History of Medication Use Questionnaire (SHiM) ………… 342
7 Rockwood’s clinical frailty scale …………………………………………………….. 342
8 STOPP/START criteria ……………………………………………………………………. 343
9 OncPal criteria …………………………………………………………………. 350
10 STOPPFrail questionnaire on survey monkey ………………………………… 351
11 Physicians who participants in the IRR of STOPPFrail criteria ………… 356
12 Twenty clinical cases for assessment of STOPPFrail IRR ………………… 357
13 Twenty answer sheets for assessment of STOPPFrail IRR ………………. 367
14 Common Summary Assessment Report (CSAR) …………………………….. 377
15 Montreal Cognitive Assessment (MOCA) ………………………………………. 379
16 Ethical approval for STOPPFrail observational study ……………………… 380

12
Declaration
I declare that the work contained within this thesis has not been previously
submitted for a degree at this or any other university. All the work contained within
this thesis is entirely my own work, apart from that indicated in the
acknowledgements. I give my permission for the library to lend or copy this thesis
upon request.
Signed: ______________________
Date: ________________________
13
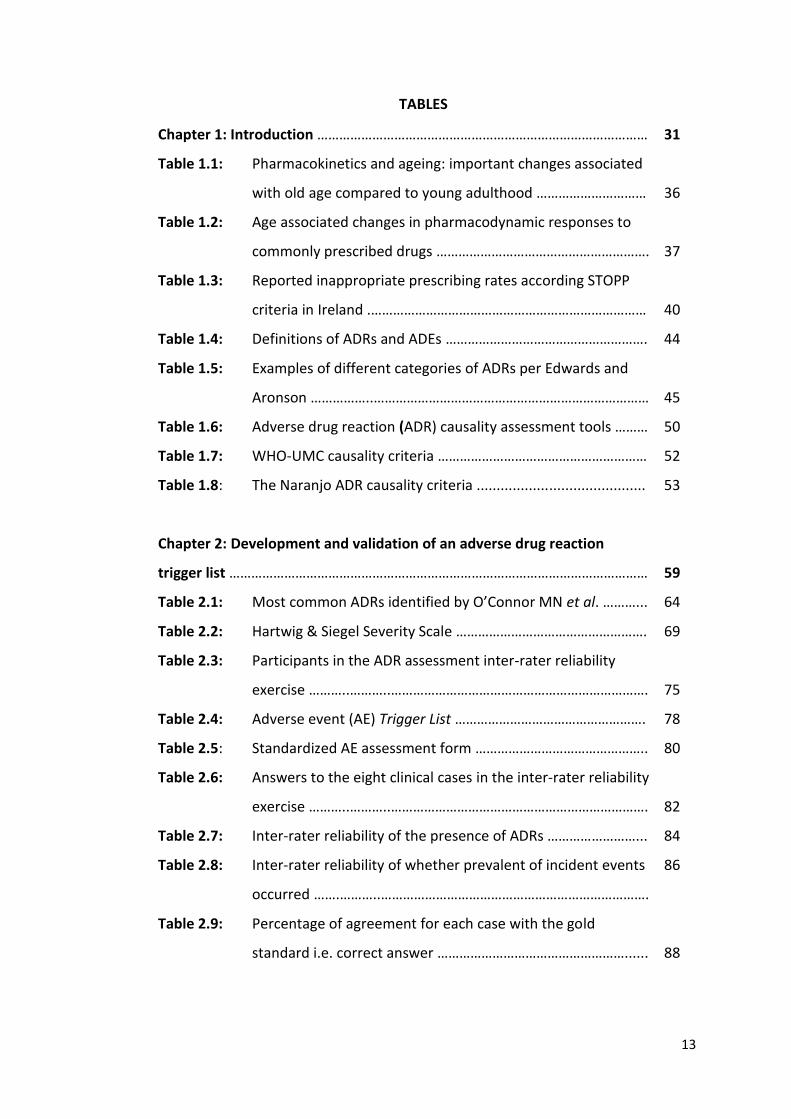
TABLES
Chapter 1: Introduction ……………………………………………………………………………… 31
Table 1.1: Pharmacokinetics and ageing: important changes associated
with old age compared to young adulthood …………………………
36
Table 1.2: Age associated changes in pharmacodynamic responses to
commonly prescribed drugs ………………………………………………….
37
Table 1.3: Reported inappropriate prescribing rates according STOPP
criteria in Ireland .…………………………………………………………………
40
Table 1.4: Definitions of ADRs and ADEs ………………………………………………. 44
Table 1.5: Examples of different categories of ADRs per Edwards and
Aronson ……………..…………………………………………………………………
45
Table 1.6: Adverse drug reaction (ADR) causality assessment tools ……… 50
Table 1.7: WHO-UMC causality criteria ………………………………………………… 52
Table 1.8: The Naranjo ADR causality criteria .......................................... 53
Chapter 2: Development and validation of an adverse drug reaction
trigger list ……………………………………………………………………………………………………
59
Table 2.1: Most common ADRs identified by O’Connor MN et al. ………... 64
Table 2.2: Hartwig & Siegel Severity Scale ……………………………………………. 69
Table 2.3: Participants in the ADR assessment inter-rater reliability
exercise ………..………..…………………………………………………………….
75
Table 2.4: Adverse event (AE) Trigger List ……………………………………………. 78
Table 2.5: Standardized AE assessment form ……………………………………….. 80
Table 2.6: Answers to the eight clinical cases in the inter-rater reliability
exercise ………..………..…………………………………………………………….
82
Table 2.7: Inter-rater reliability of the presence of ADRs ……………………... 84
Table 2.8: Inter-rater reliability of whether prevalent of incident events
occurred …….………..……………………………………………………………….
86
Table 2.9: Percentage of agreement for each case with the gold
standard i.e. correct answer ……………………………………………......
88
14
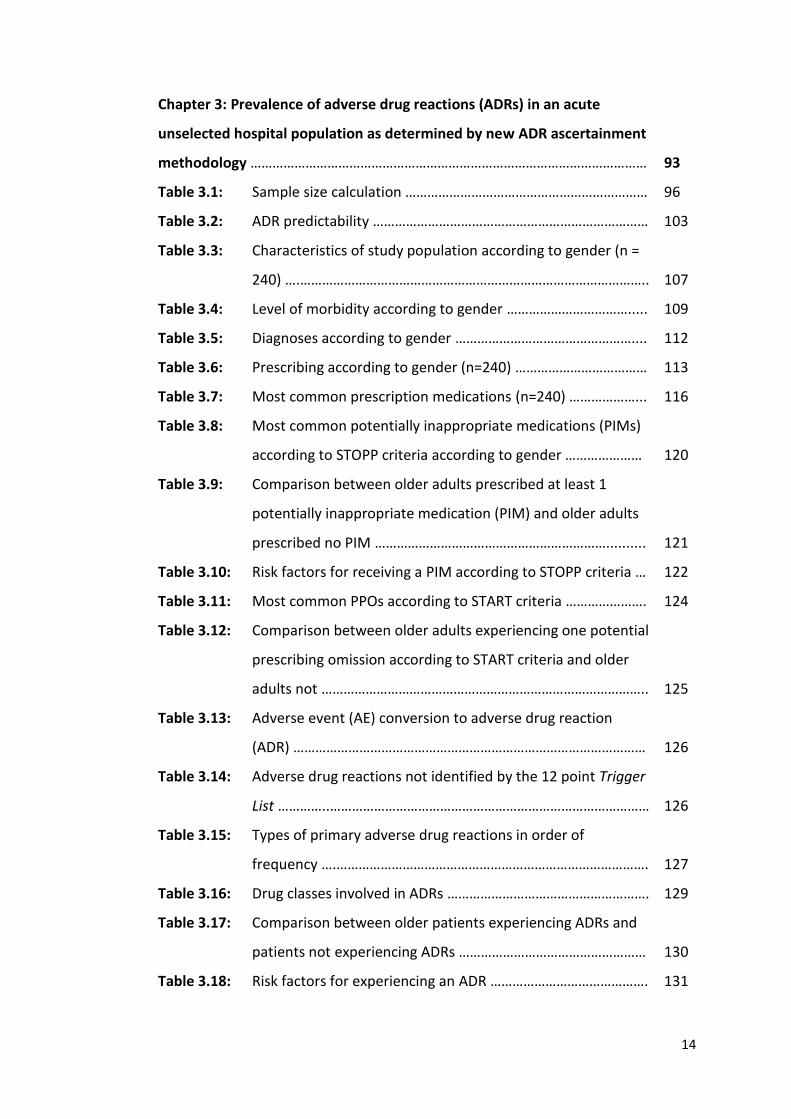
Chapter 3: Prevalence of adverse drug reactions (ADRs) in an acute
unselected hospital population as determined by new ADR ascertainment
methodology ………………………………………………………………………………………………
93
Table 3.1: Sample size calculation ………………………………………………………… 96
Table 3.2: ADR predictability ………………………………………………………………… 103
Table 3.3: Characteristics of study population according to gender (n =
240) ….…………………………………………………………………………………..
107
Table 3.4: Level of morbidity according to gender ……………………………..... 109
Table 3.5: Diagnoses according to gender ………………………………………….... 112
Table 3.6: Prescribing according to gender (n=240) ……………………………… 113
Table 3.7: Most common prescription medications (n=240) ………………... 116
Table 3.8: Most common potentially inappropriate medications (PIMs)
according to STOPP criteria according to gender …………………
120
Table 3.9: Comparison between older adults prescribed at least 1
potentially inappropriate medication (PIM) and older adults
prescribed no PIM ………………………………………………………..........
121
Table 3.10: Risk factors for receiving a PIM according to STOPP criteria … 122
Table 3.11: Most common PPOs according to START criteria …………………. 124
Table 3.12: Comparison between older adults experiencing one potential
prescribing omission according to START criteria and older
adults not ……………………………………………………………………………..
125
Table 3.13: Adverse event (AE) conversion to adverse drug reaction
(ADR) ……………………………………………………………………………………
126
Table 3.14: Adverse drug reactions not identified by the 12 point Trigger
List …………..……………………………………………………………………………
126
Table 3.15: Types of primary adverse drug reactions in order of
frequency ….………………………………………………………………………….
127
Table 3.16: Drug classes involved in ADRs ………………………………………………. 129
Table 3.17: Comparison between older patients experiencing ADRs and
patients not experiencing ADRs ……………………………………………
130
Table 3.18: Risk factors for experiencing an ADR ……………………………………. 131
15
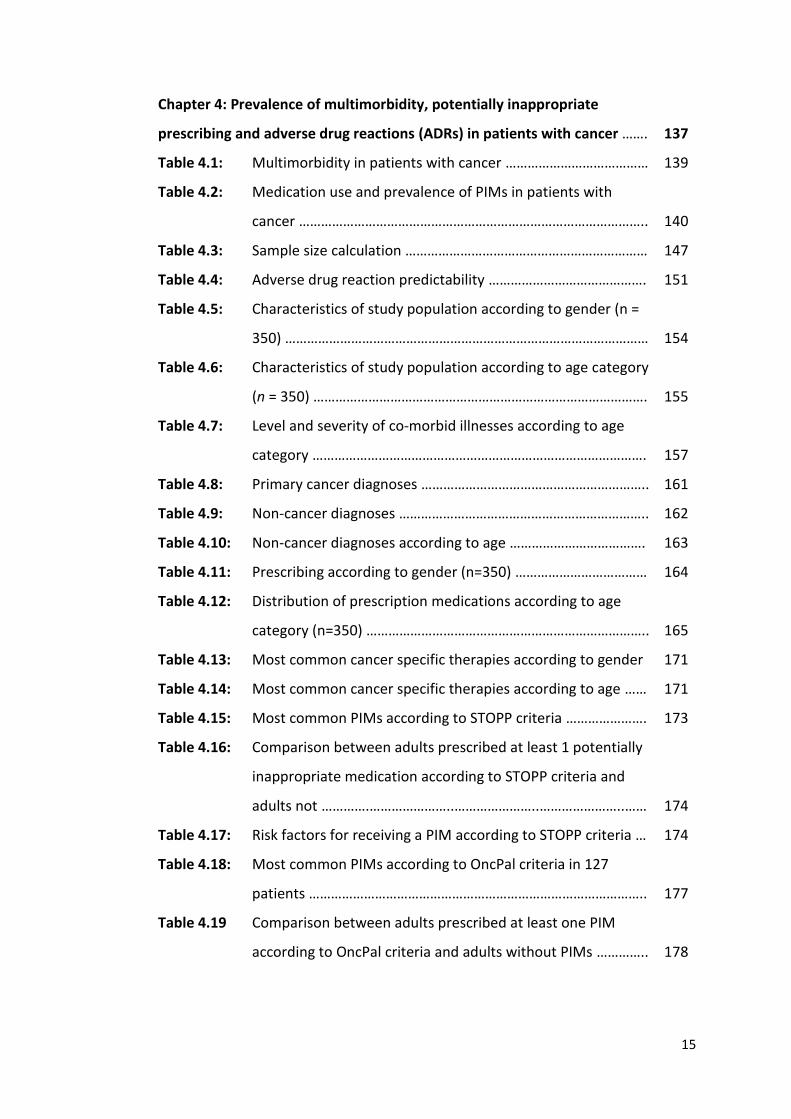
Chapter 4: Prevalence of multimorbidity, potentially inappropriate
prescribing and adverse drug reactions (ADRs) in patients with cancer …….
137
Table 4.1: Multimorbidity in patients with cancer ………………………………… 139
Table 4.2: Medication use and prevalence of PIMs in patients with
cancer …………………………………………………………………………………..
140
Table 4.3: Sample size calculation ………………………………………………………… 147
Table 4.4: Adverse drug reaction predictability ……………………………………. 151
Table 4.5: Characteristics of study population according to gender (n =
350) ………………………………………………………………………………………
154
Table 4.6: Characteristics of study population according to age category
(n = 350) ……………………………………………………………………………….
155
Table 4.7: Level and severity of co-morbid illnesses according to age
category ……………………………………………………………………………….
157
Table 4.8: Primary cancer diagnoses …………………………………………………….. 161
Table 4.9: Non-cancer diagnoses ………………………………………………………….. 162
Table 4.10: Non-cancer diagnoses according to age ………………………………. 163
Table 4.11: Prescribing according to gender (n=350) ……………………………… 164
Table 4.12: Distribution of prescription medications according to age
category (n=350) …………………………………………………………………..
165
Table 4.13: Most common cancer specific therapies according to gender 171
Table 4.14: Most common cancer specific therapies according to age …… 171
Table 4.15: Most common PIMs according to STOPP criteria …………………. 173
Table 4.16: Comparison between adults prescribed at least 1 potentially
inappropriate medication according to STOPP criteria and
adults not ………….…………………..…………………..…………………..……
174
Table 4.17: Risk factors for receiving a PIM according to STOPP criteria … 174
Table 4.18: Most common PIMs according to OncPal criteria in 127
patients ………………………………………………………………………………..
177
Table 4.19 Comparison between adults prescribed at least one PIM
according to OncPal criteria and adults without PIMs …………..
178
16
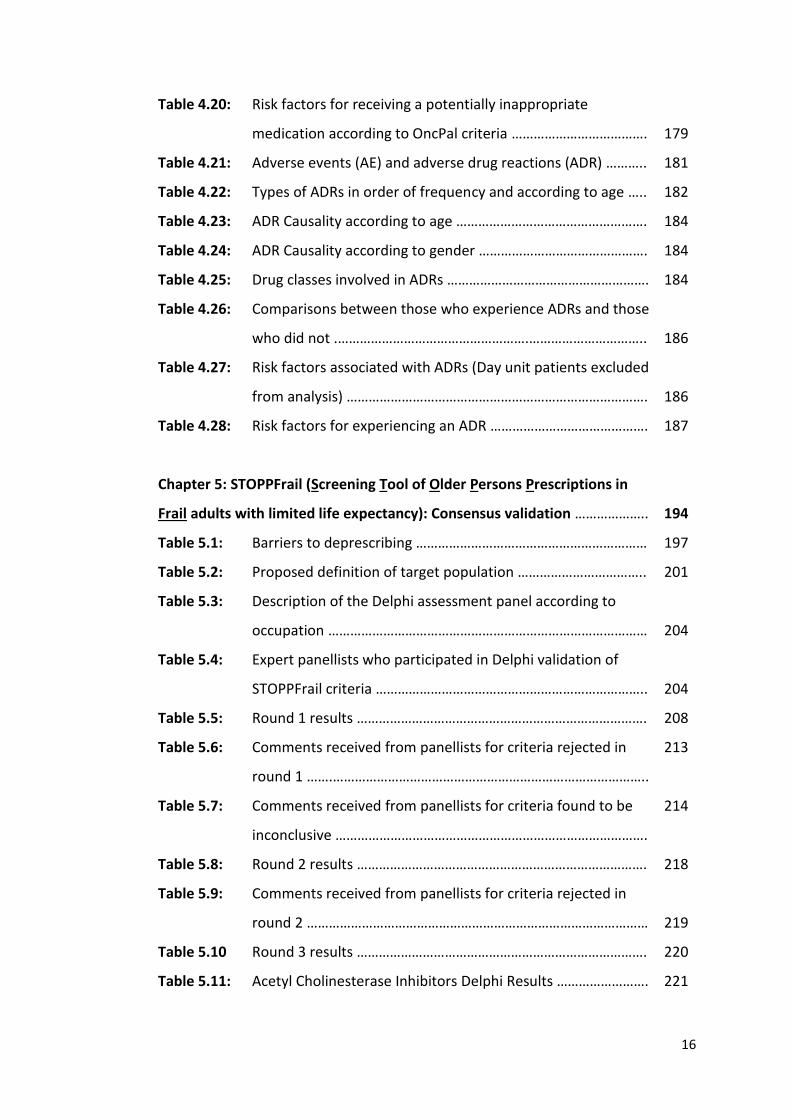
Table 4.20: Risk factors for receiving a potentially inappropriate
medication according to OncPal criteria ……………………………….
179
Table 4.21: Adverse events (AE) and adverse drug reactions (ADR) ……….. 181
Table 4.22: Types of ADRs in order of frequency and according to age ….. 182
Table 4.23: ADR Causality according to age ……………………………………………. 184
Table 4.24: ADR Causality according to gender ………………………………………. 184
Table 4.25: Drug classes involved in ADRs ………………………………………………. 184
Table 4.26: Comparisons between those who experience ADRs and those
who did not .…………………………………………….…………………………..
186
Table 4.27: Risk factors associated with ADRs (Day unit patients excluded
from analysis) ……………………………………………………………………….
186
Table 4.28: Risk factors for experiencing an ADR ……………………………………. 187
Chapter 5: STOPPFrail (Screening Tool of Older Persons Prescriptions in
Frail adults with limited life expectancy): Consensus validation ………………..
194
Table 5.1: Barriers to deprescribing ……………………………………………………… 197
Table 5.2: Proposed definition of target population …………………………….. 201
Table 5.3: Description of the Delphi assessment panel according to
occupation ……………………………………………………………………………
204
Table 5.4: Expert panellists who participated in Delphi validation of
STOPPFrail criteria ………………………………………………………………..
204
Table 5.5: Round 1 results ……………………………………………………………………. 208
Table 5.6: Comments received from panellists for criteria rejected in
round 1 …….…………………………………………………………………………..
213
Table 5.7: Comments received from panellists for criteria found to be
inconclusive ………………………………………………………………………….
214
Table 5.8: Round 2 results ……………………………………………………………………. 218
Table 5.9: Comments received from panellists for criteria rejected in
round 2 …………………………………………………………………………………
219
Table 5.10 Round 3 results ……………………………………………………………………. 220
Table 5.11: Acetyl Cholinesterase Inhibitors Delphi Results ……………………. 221
17
Table 5.12: Comments received from panellists for criteria rejected ……… 221
Table 5.13 Final STOPPFrail criteria ……………………………………………………….. 222
Chapter 6: Inter-rater reliability of STOPPFrail criteria amongst physicians
from three clinical specialty services ………………………………………………………….
226
Table 6.1: Level of agreement in numbers of STOPPFrail criteria applied
and numbers of drugs recommended for deprescribing ……….
234
Table 6.2: Criteria where total agreement, minor variations or most
variations were noted …………………………………………………………..
236
Table 6.3: Reasons for major variations in identification of STOPPFrail
indicators ……………………………………………………………………………..
237
Table 6.4: Frequency of STOPPFrail observations according to each
rater ……………………………………………………………………………………..
238
Chapter 7: Prevalence of potentially inappropriate prescribing as
determined by STOPPFrail criteria in a representative population of older
patients undergoing assessment for long term nursing home placement
and of older adults presenting with acute illness to hospital …………………….
245
Table 7.1: Characteristics of study population ……………………………………… 254
Table 7.2: Comparison of patients eligible for STOPPFrail criteria and
patients not eligible for STOPPFrail criteria in terms of
morbidity specific details ………………………………………………………
256
Table 7.3 Number of prescription medications in 426 patients applying
for nursing home care …………………………………………………………..
258
Table 7.4: Number of prescription medications and numbers of co-
morbid illnesses according to age group ……………………………….
259
Table 7.5: Common prescriptions …………………………………………………………. 260
Table 7.6: Most frequently encountered potentially inappropriate
prescriptions according to STOPPFrail criteria in 274 eligible
patients ………………………………………………………………………………..
265
18
Table 7.7: Risk factors for receiving a PIM as determined by STOPPFrail
criteria ………………………………………………………………………………….
266
Table 7.8: Characteristics of study population (n=240) …………………………. 268
Table 7.9: Reasons for participants not completing the Mini Mental
State Examination (MMSE) (n= 41) ……………………………………….
269
Table 7.10: Most frequently encountered potentially inappropriate
prescriptions according to STOPPFrail criteria in 48 patients ..
272
19
FIGURES
Chapter 2: Development and validation of an adverse drug reaction
trigger list ……………………………………………………………………………………………………
59
Figure 2.1: Example of a clinical case …………………………………………………….. 72
Figure 2.2: Example of questions asked for a clinical case ……………………… 73
Figure 2.3: Calculation of the kappa statistic and proportions of positive
and negative agreement between raters 1 and 3 ………………….
77
Figure 2.4: Adjudication Process ……………………………………………………………. 81
Chapter 3: Prevalence of adverse drug reactions (ADRs) in an acute
unselected hospital population as determined by new ADR ascertainment
methodology ………………………………………………………………………………………………
93
Figure 3.1: Cumulative illness rating scale (CIRS) scoring system …………… 98
Figure 3.2: 4-AT delirium screening test ………………………………………………… 100
Figure 3.3: Participant screening, exclusion and enrolment …………………… 105
Figure 3.4: Distribution of admissions according to specialty ………………… 106
Figure 3.5: Frailty according to age category …………………………………………. 108
Figure 3.6: Number of chronic conditions according to age category …….. 110
Figure 3.7: Mean (SD) CIRS scores according to age category ………………… 110
Figure 3.8: The number of participants that rated at least one system a
0, 1, 2, 3 or 4 according to age (n=240) …………………………………
111
Figure 3.9: Medication use according to age group ……………………………….. 114
Figure 3.10: Prevalence of polypharmacy and high level polypharmacy
according to age ……………………………………………………………………
114
Figure 3.11: Drug classes most commonly prescribed (n=240) ………………… 115
Figure 3.12: Drug classes most commonly prescribed according to age
(n=240) ……………….………………………………………………………………..
118
Figure 3.13: Percentage of patients who experienced ADRs who had a
Sequence of Events (n=53) ……………………………………………………
128
20
Chapter 4: Prevalence of multimorbidity, potentially inappropriate
prescribing and adverse drug reactions (ADRs) in patients with cancer …….
137
Figure 4.1: Participant screening, exclusion and enrolment …………………… 152
Figure 4.2: Prevalence of multimorbidity according to age category ……… 158
Figure 4.3: Number of chronic conditions according to age category …….. 158
Figure 4.4: CIRS score according to age category …………………………………… 159
Figure 4.5: The number of participants according to age that rated at
least one system with a score of 0, 1, 2, 3 or 4 (n = 350) ……….
160
Figure 4.6: Polypharmacy and high level polypharmacy according to age
(n=350) …………………………………………………………………………………
165
Figure 4.7: Numbers of prescribed medications according to age groups 166
Figure 4.8: Drug classes most commonly prescribed (n=350) ………………… 167
Figure 4.9: Drug classes most commonly prescribed according to gender
(n=350) …………………………………………………………………………………
168
Figure 4.10: Drug classes most commonly prescribed according to age
category (n=350) …………………………………………………………………..
169
Figure 4.11: Chemotherapy and radiation therapy according to age
(n=350) …………………………………………………………………………………
170
Figure 4.12: Percentage of patients with potentially inappropriate
medications as determined by OncPal criteria according to
gender ………………………………………………………………………………….
176
Figure 4.13: Proportions of patients with potentially inappropriate
medications as determined by OncPal criteria according to
age ……………………………………………………………………………………….
176
Figure 4.14: Adverse drug reactions classification …………………………………… 181
Figure 4.15: Percentage of patients who experienced ADRs who had a
Sequence of Events (n=75) ……………………………………………………
183
Chapter 5: STOPPFrail (Screening Tool of Older Persons Prescriptions in
Frail adults with limited life expectancy): Consensus validation ………………..
194
Figure 5.1: Delphi consensus method of validation ……………………………….. 199
21
Figure 5.2: Sample question from round 1 of the Delphi consensus
survey …………………………………………………………………………………..
206
Figure 5.3: Flow chart of Delphi process ……………………………………………….. 207
Chapter 6: Inter-rater reliability of STOPPFrail criteria amongst physicians
from three clinical specialty services ………………………………………………………….
226
Figure 6.1: Calculation of the kappa statistic and proportions of positive
and negative agreement between raters 1 and 2 …………………
232
Chapter 7: Prevalence of potentially inappropriate prescribing as
determined by STOPPFrail criteria in a representative population of older
patients undergoing assessment for long term nursing home placement
and of older adults presenting with acute illness to hospital …………………….
245
Figure 7.1 Same size calculation …………………………………………………………… 248
Figure 7.2 Participant screening, exclusion and enrolment ………………….. 252
Figure 7.3: Level of frailty according to STOPPFrail eligibility criteria
(n=274) …………………………………………………………………………………
255
Figure 7.4 CIRS score according to STOPPFrail eligibility criteria …………… 257
Figure 7.5: Numbers of medications according to eligibility for
STOPPFrail criteria ………………………………………………………………..
258
Figure 7.6: Life limiting diagnoses in those eligible for STOPPFrail
application (n = 274) …………………………………………………………….
263
Figure 7.7: Numbers of patients on potentially inappropriate
medications as determined by STOPPFrail criteria (n = 274) …
264
Figure 7.8: Clinical Frailty Scale status of patients (n = 240) according to
STOPPFrail eligibility criteria …………………………………………………
269
Figure 7.9: Life limiting diagnoses in those eligible for STOPPFrail
application (n=48) …………………………………………………………………
270
Figure 7.10: Percentage of patients on potentially inappropriate
medications as determined by STOPPFrail criteria (n = 48)
271
22
LIST OF ABBREVIATIONS
ACE inhibitor Angiotensin converting enzyme inhibitor
ADE Adverse drug event
ADLs Activities of daily living
ADR Adverse drug reaction
AE Adverse event
AKI Acute kidney injury
ARB Angiotensin II receptor blocker
Biomed Biomedical Scientist
Bpm Beats per minute
Ca++ Calcium
CCB Calcium channel blocker
CIRS Cumulative illness rating scale
CKD Chronic kidney disease
COPD Chronic obstructive pulmonary disease
CUH Cork University Hospital
DI Drug interaction
DILI Drug induced liver injury
DM Diabetes mellitus
DOAC Drug-acting oral anticoagulants
Dr. Doctor
DSM-V Diagnostic & Statistical Manual of Mental Disorders
ECG Electrocardiogram
ED Emergency department
eGFR estimated Glomerular Filtration Rate
GORD Gastro-oesophageal reflux disease
GP General Practitioner
GS Gold standard
HF Heart failure
23
HRB-CRF Health Research Board – Clinical Research Facility
HSE Health Service Executive
IHD Ischaemic heart disease
IP Inappropriate prescribing
IRR Inter-rater reliability
K+ Potassium
Kg Kilogram
LLE Limited life expectancy
LO Liaison officer
MAI Medication appropriateness index
MBT Months backward test
MDRD Modification of Diet in Renal Disease
Mg Milligram
MMSE Mini-Mental State Examination
MOCA Montreal Cognitive Assessment
MUH Mercy University Hospital
Na+ Sodium
NASSa Noradrenergic and selective serotonergic anti-depressants
NCPOP National Clinical Program for Older Persons
NSAIDs Non-steroidal anti-inflammatory drugs
OA Osteoarthritis
OH Orthostatic hypotension
OncPal Oncological palliative care deprescribing guideline
Pharm Pharmacists
PI Principal Investigator
PIM Potentially inappropriate medication
PIP Potentially inappropriate prescribing
Phys Physicians
PPI Proton pump inhibitor
24
PPO Potential prescribing omission
PR Primary researcher
Prof. Professor
RCPI Royal College of Physicians Ireland
RCT Randomized control trial
SHiM Structured History taking of Medication use
SSRI Selective serotonin reuptake inhibitor
SENATOR Software ENgine for the Assessment & optimisation of drug and non-
drug Therapy in Older peRsons
SPC Summary of product characteristics
START Screening Tool to Alert doctors to Right Treatment
STOPP Screening Tool of Older Persons potentially inappropriate
Prescriptions
STOPPFrail Screening Tool of Older Persons Prescriptions in Frail adults with
limited life expectancy
TCA Tricyclic antidepressant
TILDA The Irish Longitudinal stuDy on Ageing
UCC University College Cork
UK United Kingdom
UN United Nations
US United States
WHO World Health Organisation
WHO-UMC World Health Organisation - Uppsala Monitoring Center
↑ Increased
↓ Decreased
25
STATISTICAL SYMBOLS
CI Confidence interval
df Degrees of Freedom
n Sample size
P Probability
p-value Probability value
r Pearson correlation coefficient
t Test statistic for independent t-test
U Test statistic for Mann-Whitney test
Χ2 Chi-squared test statistic
26
ACKNOWLEDGEMENTS
I am indebted to the funding I received from the European Union Seventh Framework
Program (FP7/2007-2013), as part of the SENATOR project, without which I would
not have been able to complete my PhD studies. I also wish to express my sincere
thanks to the following people.
My PhD supervisors Prof. Denis O’Mahony and Dr. Paul Gallagher, who have
inspired, guided and supported me. Your mentorship has been invaluable and I am
grateful to have had the opportunity to work alongside you both. I cannot thank you
enough for all you have done. Above all thank you for your friendship.
Prof. Joesph Eustace, Consultant Nephrologist and Director of the Clinical Research
Faculty, Cork. Your hard work, optimism and endless laughter in times of crisis has
been inspiring. Thank you for embracing my impromptu meetings!
Dr. Norma Harnedy and Dr. Mike O’Connor, Consultant Geriatricians at Cork
University Hospital, with whom I had the pleasure to work with as part my Specialist
Registrar Training in Geriatric Medicine. Your work ethic, professionalism and clinical
acumen are inspiring. I have enjoyed each and every one of our nights out!
Prof. Deirdre O’Mahony, Consultant Oncologist at Cork University Hospital. Thank
you for embracing the oncology project and for supporting me throughout.
Dr. Evelyn Flanagan, Data Manager with the Clinical Research Facility. Thank you for
your support and for all the laughter (and for taking my calls no matter what!)
Dr. Shane Cullinane, Dr. Denis Curtin, Kieran Dalton and Michael McCarthy, my
fellow researchers. Thank you for your support, your insights and friendship.
27
Members of the SENATOR consortium. I really enjoyed collaborating with you all
over the last three years. It has been an invaluable experience, which will serve me
well with future research projects. Thank you.
The consultants and non-consultant hospital doctors of Cork University Hospital
and Mercy University Hospital, particularly the Specialist Registrars and Registrars
in Geriatric Medicine. Thank you all for your support.
Dr. Mary Buckley. Thank you for your help with data collection.
Louise, Dónál and Terry from the Nursing Home Support Office. Thank you for
welcoming me into your office with open arms and for giving me own desk.
The administrative staff of CUH. Your help has been appreciated.
Patients and their families. I am very grateful to all the patients and their families for
participating in these studies, without whom this research would not have been
possible. You all gave up their time generously in difficult circumstances.
Thank you to the Department of Clinical Pharmacology at St James’s Hospital for
facilitating me in terms of finding time to write up this thesis. A special thanks to Dr.
Cormac Kennedy.
My family, particularly my parents Clare and Frank, for their ongoing
encouragement, love and support, without whom I would never have enjoyed so
many opportunities.
Finally, a heartfelt thanks to my husband Mick, for your unwavering support,
encouragement, laughter, endless patience and for always being a rock of sense!

28
Thesis Overview
29
Over the last twenty years, many prescribing tools have been developed and
validated to identify inappropriate prescribing (IP) in older adults and assist
physicians in medication optimisation. However, these prescribing tools have
predominantly focused on identifying IP in the general older adult population, rather
than targeting the population cohort that is growing at the fastest rate and that is at
the highest risk of IP and adverse drug reactions (ADRs) i.e. older frailer multimorbid
patients with a poor survival prognosis.
Extensive research on the prevalence of ADRs has been published. However
many different definitions of ADRs and many different ADR causality tools have been
employed across different studies, making it difficult to compare the results of
studies. To confound this area of investigation further, many ADR causality tools are
not appropriate to use in older frail multimorbid adults. In addition, a limited amount
of research has occurred identifying the morbidity associated with ADRs in older
adults. To date, there is no standardized approach to identifying, assessing and
reporting ADRs in older adults.
This doctoral thesis was designed to (i) standardise the identification,
assessment and reporting of ADRs in older adults, (ii) assess ADRs using this new
methodology in high risk populations, and (iii) develop and validate a new usable set
of criteria called STOPPFrail (Screening Tool of Older Persons Prescriptions in Frail
adults with limited life expectancy) to assist deprescribing in older frail multimorbid
adults with a poor survival prognosis i.e. patients where the role of preventative
therapy is questionable.
30
This thesis comprises eleven chapters. The first chapter is an introduction,
divided into four sections i.e. (i) demographic changes and the proportional increase
in high risk older adults, (ii) prescribing considerations for older adults, (iii)
consequences of IP including ADRs and (iv) potential targets for intervention. The
second chapter proposes a methodologically robust way of identifying, assigning
causality and reporting ADRs and tests this theory on physicians, pharmacists,
biomedical scientists and nurses. The third chapter uses this new ADR methodology
to identify the prevalence of ADRs in older adults presenting to hospital. The fourth
chapter compares older and younger adults with cancer in terms of multimorbidity,
medication use and ADRs using the same methodology proposed in Chapter 2. The
fifth chapter develops and validates STOPPFrail criteria, an explicit prescribing tool
to assist deprescribing in frail older adults with a poor one year survival prognosis.
The sixth chapter describes the inter-rater reliability (IRR) of STOPPFrail criteria
between physicians. The seventh chapter, applies STOPPFrail criteria to two
representative populations i.e. a proportion of older adults deemed suitable for
nursing home care and a proportion of older adults presenting for hospitalisation.
Chapter eight considers the relevance of the research data developed in this thesis
as well as questions any issues arising from these research studies. Chapter nine
contains peer-reviewed articles that were published and awards received during the
writing of this thesis. Finally, chapters ten and eleven list the references and
appendices, respectively.

31
CHAPTER 1:
Introduction
32
1.1 AGEING DEMOGRAPHICS & MULTIMORBIDITY
1.1.1 Predicted demographic changes nationally and internationally
The United Nations (UN) defines an older person as ≥ 60 years and the oldest old as
≥ 80 years of age (1). In well-resourced developed countries transition to older age is
generally accepted as occurring at the age of retirement. Therefore, older age is often
defined as ≥ 65 years. More people are now reaching older age than ever before due
to improvements in nutrition, drinking water and sanitation, as well as improvements
in the treatment of infectious diseases and overall improvements in healthcare. In
addition to increasing life expectancy, fertility rates have dropped which has led to a
shift in the population demographics of developed countries where there are now
more adults ≥ 65 years than there are children under 10 years.
The National Clinical Program for Older People (NCPOP), a joint initiative by
the Health Service Executive (HSE) and the Royal College of Physicians Ireland (RCPI),
highlights that, in Ireland, those ≥ 65 years of age are predicted to increase from
11.4% in 2012 to 18% in 2042 (2). In addition, those ≥ 85 years are expected to
increase by 150% by 2031 (2). At a European level, Eurostat foresees that those ≥ 65
years will continue to increase in the coming years and that those ≥ 80 years will likely
double (3). The World Health Organisation (WHO) predicts that the global population
of those aged ≥ 60 years will increase from 11.3% in 2013 to 21.2% in 2050, with
those ≥ 80 years expected to quadruple (4). Overall, the absolute increase in those ≥
65 years is expected to increase by 976 million internationally, between 2010 and
2050, with the largest increase in older adults expected in developing countries.
33
1.1.2 Multimorbidity in high risk older adults
With ageing comes an increase in the number and severity of medical conditions (5),
functional impairment, cognitive impairment (6) and frailty (7). Thus, the evolving
demographic changes in the population pyramid will have a very large impact on
healthcare delivery. Comorbidity was the original term used to define the occurrence
of medical conditions in addition to an index disease (8). Subsequently, in 1976, the
term multimorbidity was introduced by Brandlmeier to capture the co-existence of
two or more diseases, rather than the focus being on one primary condition (9).
However, the most widely used and accepted definition is that of the WHO i.e. the
co-occurrence of two or more chronic medical conditions in one person (10).
As a result of different definitions of multimorbidity being employed across
different studies, the prevalence of multimorbidity can be difficult to truly ascertain.
To date, observational studies and systematic reviews have focused on the
prevalence of multimorbidity in community dwelling older adults, with no study to
date focusing primarily on hospitalised older adults. In primary care, two systematic
reviews by Violan et al. and Fortin et al. have reported multimorbidity prevalence
rates of 12.9 – 95.1% (11) and 13.1 – 71.8% (12), respectively. A United States (US)
population-focused systematic review, based on Medicare data, reports a
multimorbidity prevalence rate of 67% with this rate increasing with advancing age
i.e. 50% for persons under age 65 years, 62% for those aged 65–74 years and 81.5%
for those aged ≥ 85 years (13). At age 85 compared to age 70, the prevalence of
chronic multimorbidity has been reported to increase 3-fold (14). Older age, female
gender and lower socio-economic status are factors known to be independently
associated with multimorbidity (5)
34
Multimorbidity has been linked to increased mortality, with one study
reporting a 73% increase in death for adults with 2 conditions or more compared to
those without multimorbidity (Odds ratio 1.73 [95%CI: 1.41 - 2.13]) and a 172%
increase in the mortality rate for those with 3 conditions or more compared to those
without (Odds ratio 2.72 [95%CI: 1.81 - 4.08] (15). Multimorbidity, will certainly
increase in prevalence in tandem with the ageing of populations globally.
1.1.3 Specific population changes
Populations at highest risk of multimorbidity are increasing at a very rapid rate i.e.
persons aged ≥ 80 years will account for 19% of the total international population in
2050 and 28% in 2100. This means that there will be seven times as many persons ≥
80 years at the end of the century compared to 2013 (1). For adults aged ≥ 85 years,
approximately 1 in every 5 persons has chronic cognitive impairment, 2 in every 5
persons have urinary incontinence and 1 in every 2 persons are dependant in basic
and instrumental activities of daily living (14). In such multimorbid patients, the final
months of life are commonly characterised by frailty and increased dependency with
many patients requiring nursing home care (16, 17). In Ireland, 4.5% of adults’ ≥ 65
years reside in nursing homes, increasing to 49% for females’ ≥ 95 years and 26% for
males’ ≥ 95 years (18). In the US, approximately 5% of adults aged ≥ 67 years reside
in residential care facilities (19). Therefore, with the predicted demographic shifts,
the number of frailer multimorbid older adults will very likely increase, as will the
demand for nursing home care.
35
Another population that will increase substantially over the coming decades
is older adults with a diagnosis of cancer. Between 2010 and 2030, the incidence of
cancer in older adults is expected to increase from 61% to 70% (20), coinciding with
the ageing population (1, 3, 21). Thus, the demand for cancer treatment services in
older patients is likely to increase concomitantly. However, as outlined above,
multimorbidity increases with age so cancer may be only one of several complex
diagnoses in an older individual. A diagnosis of cancer, coupled with co-existing
polypharmacy, cognitive impairment and functional impairment can present the
treating clinician with challenging pharmacotherapeutic and ethical dilemmas. High
risk populations such as multimorbid frailer older adults and multimorbid older
adults with cancer will increase in numbers which will inevitably lead to an increase
in medication use, presenting many unique challenges for the prescriber.
1.2 PRESCRIBING FOR OLDER ADULTS; CONSIDERATION AND CHALLENGES
1.2.1 Prescribing for older adults: general considerations
Prescribing for the heterogeneous older adult population is challenging, in particular
prescribing for frail older adults with multiple medical conditions. Prescribers need
to be cognizant of age-related anatomical, biochemical and physiological changes
that affect pharmacokinetics and pharmacodynamics. They also must be aware of
the potential for important drug-drug interactions as well as drug-disease
interactions with concurrently prescribed drugs and co-existing disease states.
Prescribers should have an appreciation of the potentially low therapeutic yield in
very frail older patients with poor life expectancy where the risk of certain treatments
36
can exceed the potential clinical benefit. These important tenets of appropriate
prescribing for older patients are briefly summarised below.
1.2.2 Pharmacokinetics and pharmacodynamics
The key pharmacokinetic changes commonly associated with ageing are summarized
in Table 1.1.
Table 1.1: Pharmacokinetics and ageing: important changes associated with old age compared to young adulthood (22)
Absorption Distribution Metabolic Excretion
↓ amount of saliva
↓ gastric acid secretion
↓ gastric surface area
↓ gastrointestinal motility
↓ active transport mechanisms
↑ gastric pH
↑ gastric emptying
↓ cardiac output
↑ Peripheral vascular resistance
↓ renal blood flow
↓ hepatic blood flow
↓ body water
↑ body fat tissue
↓ serum albumin levels
↑ for lipid soluble and decrease for water soluble drugs
↓ microsomal hepatic oxidation
↓ clearance
↑ steady state levels
↑ half lives
↑ levels of active metabolites
↓ first pass metabolism due to reduced ↓ blood flow
↓ renal perfusion
↓ renal size
↓ glomerular filtration rate
↓ tubular secretion
↓ tubular reabsorption
Legend: ↑ = increased, ↓ = decreased
Older people also experience significantly different pharmacodynamic responses to
similar drug concentrations than their younger counterparts. Differences can be
caused by a shift in receptor affinity, density, post receptor events at the cellular
level, or in adaptive homeostatic response mechanisms. Pathologic organ changes
may also affect pharmacodynamic responses, particularly in frail older patients.
Prescribers should be aware of commonly encountered age-related
pharmacodynamic differences as listed in Table 1.2. Generally, it is recommended to
37
initiate medications at the smallest possible dose and titrate slowly according to
response.
Table 1.2: Age associated changes in pharmacodynamic responses to commonly prescribed drugs (22)
Drug type Specific drug Pharmacodynamic response in an older person
Potential clinical consequence
Analgesia Morphine ↑ Excessive sedation, confusion, constipation, respiratory depression
Anticoagulants Warfarin Dabigatran (≥75 years, <50kg)
↑ ↑
Bleeding Bleeding
ACE inhibitor Enalapril ↑ Hypotension
CCB Diltiazem ↑ Hypotension
Diuretic Furosemide, Bumetanide
↓ ↓
Reduced diuretic effect at a standard dose
Psychoactive
drugs
Diazepam,
Temazepam,
Triazolam,
Midazolam
↑ Excessive sedation, confusion,
postural sway, falls
Psychoactive
drugs
Haloperidol ↑ Excessive sedation, confusion,
postural sway, falls
Legend: ACE = angiotensin converting enzyme, CCB = calcium channel blocker, ↑ = increased
pharmacodynamics response, ↓ = decreased pharmacodynamics response, Kg = Kilogram
1.2.3 Medication use and polypharmacy
Over recent decades, the incidence and prevalence of polypharmacy has been
increasing steadily due to a rapidly increasing ageing population experiencing
multimorbid illness and advances in the treatment of chronic diseases. Various
definitions of polypharmacy have been employed in research studies (23).
Historically, polypharmacy has been defined in two ways. The first definition is
‘concomitant use of multiple drugs, which is measured by a simple count of
38
medications’, with many using 3-5 medications as a cut-off point (24). The second
definition is the daily intake of 6 or more drugs (25). High level polypharmacy has
been proposed to encompass the daily consumption of ≥ 11 prescription drugs. It is
a characteristic feature of multimorbid older people and is likely to increase markedly
in prevalence as a by-product of global ageing in the 21st century. Another definition
of polypharmacy is ‘the administration of one medication or more that is not clinically
indicated’ (24).
Recently, a clear distinction has emerged to differentiate between
appropriate and inappropriate or problematic polypharmacy (26). Appropriate
polypharmacy has been defined as ‘prescribing for an individual with complex or
multiple conditions in circumstances where medicine use has been optimised and
the medicines are prescribed according to best evidence’ (26). Maintaining good
quality of life, improving life-span and minimising drug related harm are the aims of
appropriate polypharmacy (26). Problematic, or inappropriate polypharmacy occurs
when ‘multiple medications are prescribed inappropriately, or where the intended
benefit of the medication is not realised’ (26). The causes of inappropriate
polypharmacy are several, principally the lack of an evidence base for particular
prescriptions and an unfavourable risk/benefit ratio from particular drugs in
individual patients. On other occasions, the demands of taking multiple medications
compromise adherence. Finally, inappropriate polypharmacy can result from so-
called ‘prescribing cascades’ i.e. the prescribing of additional drugs to counteract
symptoms that are not recognised as adverse effects of other drugs taken by the
same patient (27).
39
Currently, the highest rates of polypharmacy are seen in older people (28). In
the UK, approximately 20% of the population is aged over 65 years, but receive 45%
of all dispensed drugs (29). Similarly in the US, people aged 65 to 79 years
proportionately take five times more medication than young adults aged 19 to 25,
with those over 80 years remaining the largest per person users of prescription drugs
(30). Inappropriate polypharmacy exists to similar degrees in the community and
hospital settings. In nursing home residents, approximately 15 – 40% of residents
take ≥ 9 medications and approximately 1 in 2 older persons take one or more
medications that aren’t medically indicated (28).
Prescription of multiple drugs impacts negatively on adherence and
compliance. Clinicians are sometimes unaware of their patients complete
prescription record, sometimes because of multiple prescribers or under reporting
of medication intake by patients at time of consultation. Frank et al. reported that
almost 40% of patients were taking drugs without the knowledge of their doctors,
and approximately 1 out of 20 patients were not taking medications listed on their
prescription record (31). Prescribers should make every effort to obtain an accurate
medication list and pharmacy reconciliation protocols are useful for this purpose in
hospital environments. Tools to facilitate medication reconciliation such as the
Structured History of Medications use (SHiM) can also be very useful (32).
1.2.4 Potentially inappropriate prescribing
Inappropriate prescribing (IP) refers to use of medications that may cause more harm
than good and, of equal importance, the under-prescription of clinically indicated
40
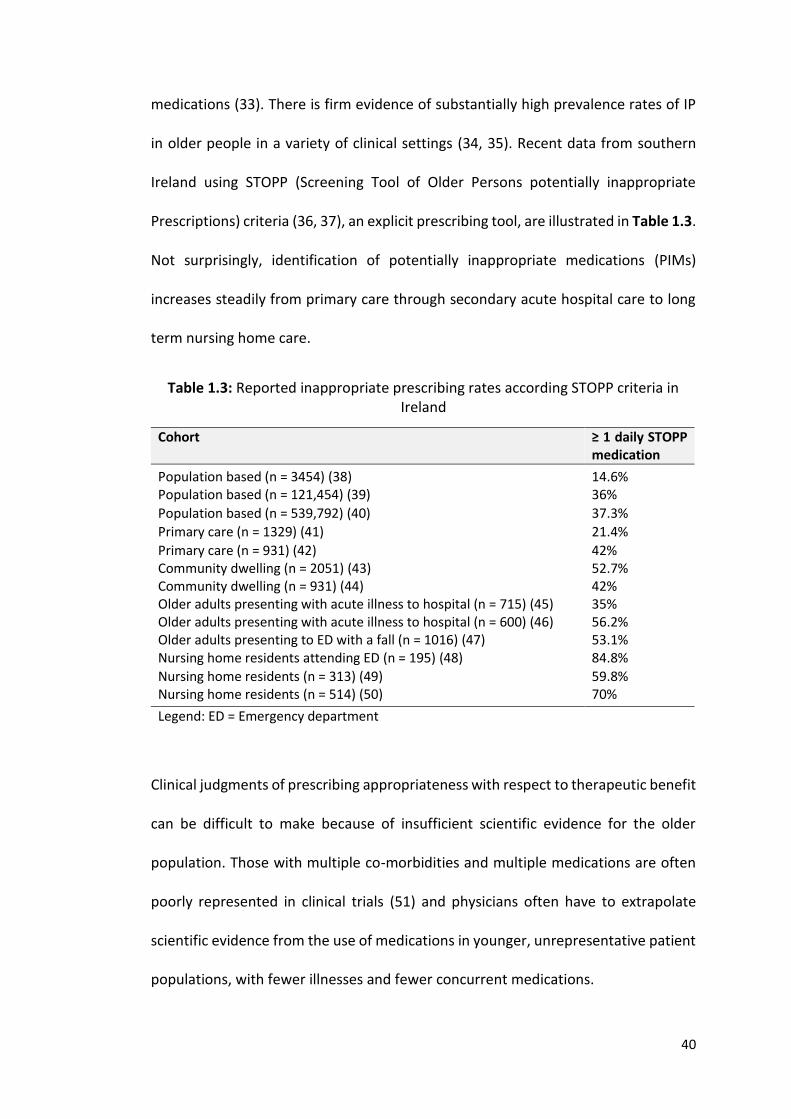
medications (33). There is firm evidence of substantially high prevalence rates of IP
in older people in a variety of clinical settings (34, 35). Recent data from southern
Ireland using STOPP (Screening Tool of Older Persons potentially inappropriate
Prescriptions) criteria (36, 37), an explicit prescribing tool, are illustrated in Table 1.3.
Not surprisingly, identification of potentially inappropriate medications (PIMs)
increases steadily from primary care through secondary acute hospital care to long
term nursing home care.
Table 1.3: Reported inappropriate prescribing rates according STOPP criteria in Ireland
Cohort ≥ 1 daily STOPP medication
Population based (n = 3454) (38)
14.6% Population based (n = 121,454) (39) 36%
Population based (n = 539,792) (40) 37.3%
Primary care (n = 1329) (41) 21.4%
Primary care (n = 931) (42) 42% Community dwelling (n = 2051) (43) 52.7% Community dwelling (n = 931) (44) 42% Older adults presenting with acute illness to hospital (n = 715) (45) 35% Older adults presenting with acute illness to hospital (n = 600) (46) 56.2% Older adults presenting to ED with a fall (n = 1016) (47) 53.1% Nursing home residents attending ED (n = 195) (48) 84.8%
Nursing home residents (n = 313) (49) 59.8% Nursing home residents (n = 514) (50) 70%
Legend: ED = Emergency department
Clinical judgments of prescribing appropriateness with respect to therapeutic benefit
can be difficult to make because of insufficient scientific evidence for the older
population. Those with multiple co-morbidities and multiple medications are often
poorly represented in clinical trials (51) and physicians often have to extrapolate
scientific evidence from the use of medications in younger, unrepresentative patient
populations, with fewer illnesses and fewer concurrent medications.
41
Under-prescribing of essential medication, particularly for preventive benefit,
is perhaps an even bigger concern than misuse of medications in older patients (52).
The risk of cardio-embolic stroke in those with atrial fibrillation increases with age
i.e. 1.2% - 2.5% annual risk in persons aged 60-69 years versus 7.3%-13.7% annual
risk in persons aged 80 years and over (53-55). Despite this age-related risk, many do
not receive evidence-based preventative anticoagulation (56). The Irish Longitudinal
stuDy on Ageing (TILDA) recently reported that 30% of patients had a potential
prescribing omission (PPO), most commonly appropriate anti-hypertensive therapy
(38). Even greater proportions of hospitalised older patients are reported to have
PPOs. Barry et al. reported a 57% prevalence of prescribing omissions in one
prospective study of 600 hospitalised older adults in Ireland (57).
Prescribing appropriateness must also take into consideration a patient’s
ability to comply with the prescription as well as their physical ability to take the
prescribed medication. In older adults following coronary artery bypass surgery, one
study found that in-hospital education was paramount in helping patients adhere to
their medication regimens (58). However, almost 25% of patients aged ≥ 80 years will
have significant cognitive and memory deficits, which can often contribute to
suboptimal medication use (59). Patients may also take multiple doses concurrently,
thus placing them at an increased risk of ADRs (60). Physical impairments such as
hearing loss, visual loss and impaired manual dexterity can also impact on adherence
to prescribed medications, contributing to reduced therapeutic impact and
consequently poorer treatment outcomes in some cases.
42
1.2.5 Current prescribing assessment tools
Prescribing tools have been developed to help prescribers identify inappropriate
prescribing and avoid the unintended negative consequences of same. Prescribing
tools can be implicit (e.g. Medication Appropriate Index (MAI) (61, 62)), explicit (e.g.
Beers criteria (63-67), STOPP/START (Screening Tool of Older Persons
Prescriptions/Screening Tool to Alert doctors to the Right Treatment) criteria (36,
37), FORTA criteria (68, 69)) or a combination of both (Australian prescribing
indicators tool (70)).
Explicit criteria are developed from literature reviews, expert opinions and
often use consensus techniques for their development. They consist of list of drugs
or drug classes with or without doses that are known to cause harm in specific
circumstances or in conjunction with specific diseases. They can be applied with
limited clinical judgement and are generally time efficient. Limitations of explicit
criteria are that they often don’t take into consideration patient preferences, they
require regular updating with advances in evidence-based medicine and can be
country specific. In contrast, implicit criteria rely on expert professional judgement,
focus on the patient in question and address the entire medication regimen.
However, implicit criteria are generally highly time-consuming and have low inter-
rater reliability (IRR) as they are based on the judgement of the clinician in question.
In 2013, Kauffman et al., completed a comprehensive and structured
systematic review of existing prescribing tools to assess appropriate prescribing (71).
They identified 46 tools, of which 28 (61%) used an explicit approach, 8 (17%) used
implicit approach and 10 (22%) used a mixed approach. Thirty six tools (89%) focused
43
on older adults, 19 (41%) were designed to detect IP in a specific healthcare setting
and 6 (13%) were specific to nursing home residents.
The most frequently cited and applied explicit criteria are Beers criteria (62-
66), and STOPP/START criteria (36, 37). Potentially inappropriate medications (PIMs)
listed in STOPP criteria, have been shown to be significantly associated with
avoidable adverse drug events (ADEs) in older people that cause or contribute to
hospitalisation (odds ratio 1.8; 95% confidence interval (CI) 1.5–2.3) (46). In addition,
the application of STOPP/START criteria has been shown to improve prescribing
appropriateness (34, 72) and reduce falls in nursing home residents (73). A recently
published randomized control trial (RCT) by O’Connor et al., showed that the
application of STOPP/START criteria by an experienced physician within 48 hours of
admission reduced ADRs occurring in hospital from 21.0% to 11.7% (74).
Prescribing tools have allowed researchers to identify and report potentially
inappropriate prescribing (PIP) in a structured fashion and subsequently complete
RCTs to see if their application can improve patients’ outcomes.
1.3 CONSEQUENCES OF INAPPROPRIATE PRESCRIBING
1.3.1 Adverse drug reactions
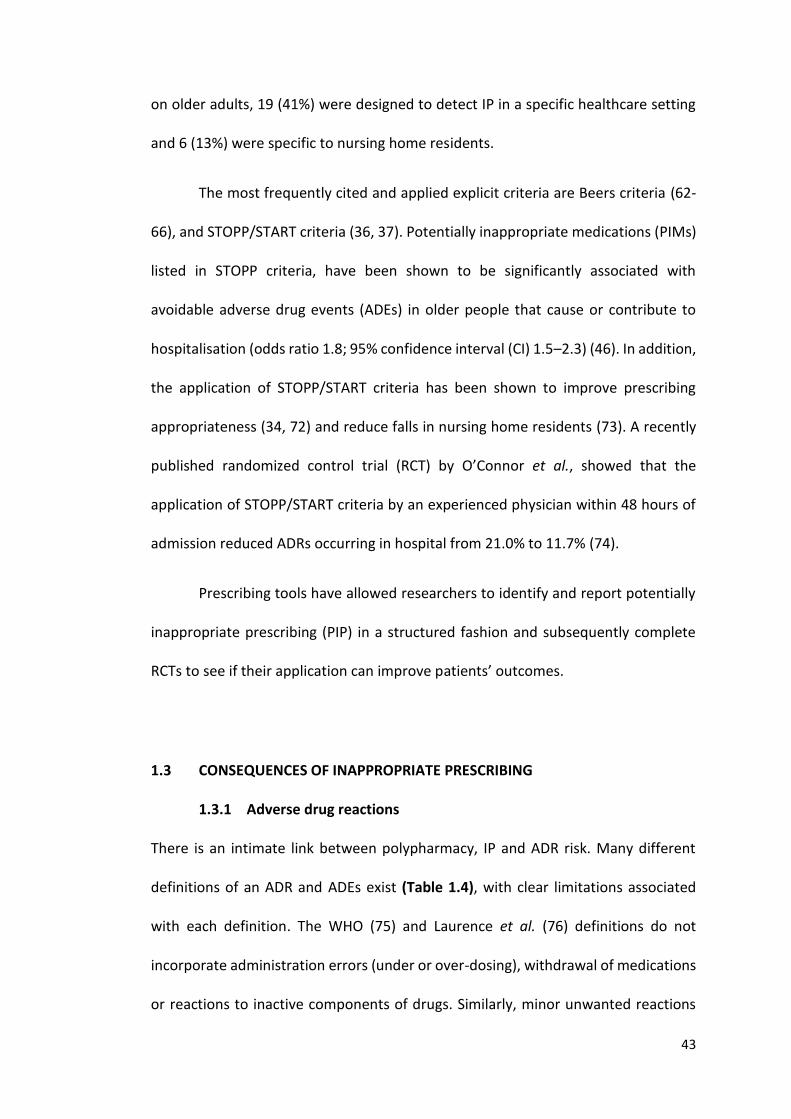
There is an intimate link between polypharmacy, IP and ADR risk. Many different
definitions of an ADR and ADEs exist (Table 1.4), with clear limitations associated
with each definition. The WHO (75) and Laurence et al. (76) definitions do not
incorporate administration errors (under or over-dosing), withdrawal of medications
or reactions to inactive components of drugs. Similarly, minor unwanted reactions
44
are not included. In the Bates et al. definition (77, 78), the word “injury” is ambiguous
and leaves ADR assessment open to subjectivity. Despite differences in these
definitions, they have been used interchangeably, which has led to difficulty with
reporting, interpreting and comparing observational and interventional studies. The
definition of an ADR proposed by Edwards and Aronson (79) is the most
comprehensive and incorporates what other definitions have lacked. Thus, it is the
most all-encompassing and appropriate to use, particularly when assessing ADRs in
older adults.
Table 1.4: Definitions of ADRs and ADEs
Author Year Definition
WHO (75)
1972
ADR – A response to a drug that is noxious and unintended and occurs at doses normally used in man for the prophylaxis, diagnosis or therapy of disease, or for modification of physiological function.
Bates et al. (77,
78)
1995 ADE - An injury resulting from medical intervention related to a drug.
Laurence et al.
(76)
1998 ADR - A harmful or significantly unpleasant effect caused by a drug at doses intended for therapeutic effect (or prophylaxis or diagnosis) which warrants reduction of dose or withdrawal of the drug and/or foretells hazard from future administration.
Edwards and
Aronson (79)
2000 ADR - An appreciably harmful or unpleasant reaction, resulting from an intervention related to the use of a medicinal product, which predicts hazard from future administration and warrants prevention or specific treatment, or alteration of the dosage regimen, or withdrawal of the product.
Nebeker et al.
(80)
2004 ADE - Any physical or mental harm resulting from medication use be it misuse, under-dosing or overdosing
Legend: ADR = adverse drug reaction, ADE = adverse drug event
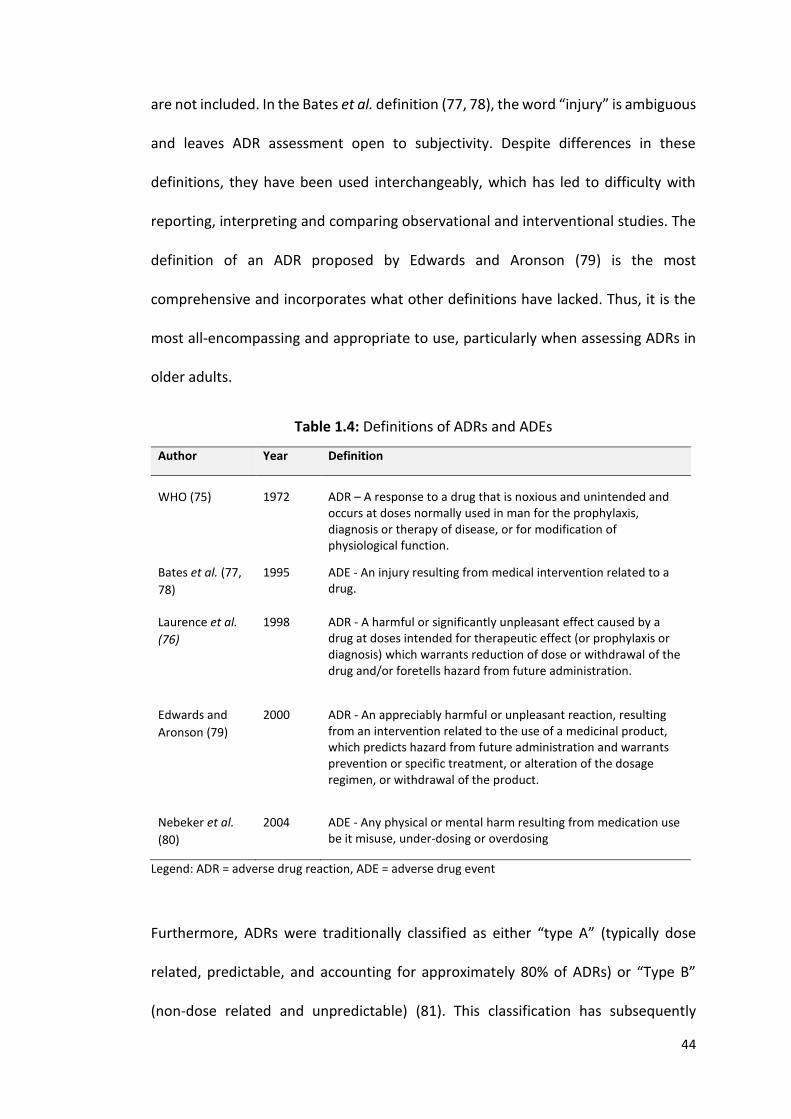
Furthermore, ADRs were traditionally classified as either “type A” (typically dose
related, predictable, and accounting for approximately 80% of ADRs) or “Type B”
(non-dose related and unpredictable) (81). This classification has subsequently
45
broadened into 6 categories defined by Edwards and Aronson i.e. (i) dose related
(augmented), (ii) non-dose related (bizarre), (iii) dose related and time related
(chronic), (iv) time related (delayed), (v) withdrawal related (end of use) and (vi)
failure of therapy (failure) (78). Examples are listed in Table 1.5. Edwards and
Aronson’s classification is also most appropriate to use when assessing older adults.
Table 1.5: Examples of different categories of ADRs per Edwards and Aronson (79)
ADR type Drug involved ADR
Dose related (augmented)
Warfarin
Bleeding
Bizarre (non-dose related) NSAIDs Interstitial nephritis
Dose related and time related (chronic) Neuroleptics Tardive dyskinesia
Time related (delayed) Immunosuppressant therapy Lymphoma
Withdrawal (end of use) Benzodiazepines Seizure
Failure of therapy (failure) Warfarin and carbamazepine ↓anti-coagulant effect
Legend: ADR = adverse drug reaction, NSAIDs = non-steroidal anti-inflammatories, ↓ = reduced
1.3.2 Prevalence of ADRs in different populations
ADRs are a common cause of hospitalisation and their incidence increases with
ageing (82). A meta-analysis by Kongkaew et al. reported that 6.3% (IQR 3.9-9%) of
all adult admissions are secondary to ADRs and that this proportion increases to
10.7% (IQR 9.3-13.3%) for older adults (83). A meta-analysis, by Lazarou et al.
concluded that on average 10.9% (CI 7.9-13.9%) of adults experience an ADR during
hospitalisation, with 2.1% reported to be clinically serious (84). A more recent meta-
analysis by Alhawassi et al. found that ADRs cause hospitalisation in 10% (CI 7.2-
12.8%) and occur during hospitalisation in 11.5% (CI 0-27.7%) of adults aged 65 years
and older.
46
Fewer studies have been undertaken on both community dwelling older
adults and nursing home residents such that to date there is no systematic review to
report same. Hanlon et al. reported that 35% of high risk older adults, defined as
those on ≥ 5 medications, living in the community experienced an ADR over a 1 year
period (85). In addition, Cooper et al. reported that 217 out of 332 older people
(67.4%) living in nursing homes experienced an ADR over a 2 year period (86).
1.3.3 ADR risk factors in older people
Polypharmacy is strongly predictive of ADRs (87, 88) which is linked to increased
frequency of hospitalisation, negative health outcomes and increased healthcare
resource utilisation (89-93). The risk of an ADR when taking two concurrent
medications is 13%. This risk rises to 38% in patients taking 4 medications and to 82%
in those taking ≥ 7 medications (94). This is a cause of concern because the risk of
clinically significant ADRs increases in a linear fashion in proportion to the number of
daily prescription medicines taken by hospitalised patients (95). The highest rate of
polypharmacy occurs in nursing home residents (28), so it is not surprising that ADRs
are more prevalent in this group (96).
IP is highly prevalent in older patients. The association between IP and ADRs
is well established with Lindley et al. showing that 50% of ADRs in older adults are
caused by IP (60). A significant association has also been found between IP, ADRs,
acute hospitalization, death (97, 98) and higher healthcare costs (99). The association
between IP and negative clinical outcomes has been shown in numerous studies in
Europe (46, 60, 100) the US (101-103) and Asia (104).
47
Women have a 1.5 to 1.7 fold increased risk of ADRs compared with men
(105). This can be attributed to gender differences in immunological and hormonal
physiology which influence pharmacodynamics and pharmacokinetic response,
particularly in relation to cardiac and psychotropic medications (106). Genetic factors
are thought to play a role in serious ADRs that have been traditionally classified as
idiosyncratic, for example drug-induced liver injury, statin-induced myotoxicity and
macrolide-induced long QT syndrome (107). Genotyping at an individual level has the
potential to optimize drug therapy thereby reducing ADRs (108).
1.3.4 Effects of ADRs
ADRs have major clinical and economic consequences. They prolong hospital stay
(109), increase resource utilisation (110), can be fatal (111) and are costly (112). IP
and related ADRs represent a major drain on health budgets. One study estimated
that 5 - 9% of all hospital costs were related to ADRs (113). In 2004, Pirmohamed et
al. (114) estimated that ADRs were costing the United Kingdom (UK) National Health
Service approximately €700 million per annum. The HARM study in the Netherlands
estimated that the average cost of preventable medication related acute
hospitalisation was €6009 (115). This figure was calculated by adding the direct
medical costs and the productive losses of all preventable admission. The authors
extrapolated this average cost to represent approximately 0.5% of the total national
Dutch hospital budget (115). The median length of stay of patients hospitalised as a
result of medication adversity in the HARM study was the same as that recorded by
Pirmohamed et al. (114) in the earlier UK study i.e. 8 days. In another recent German
48
study, Rottenkolber et al. (116) calculated that approximately 3.25% of all acute
hospital admissions were directly related to ADRs. In that study, the median age of
affected patients was 74 years, the median length of stay was once again 8 days and
the extrapolated cost to the national exchequer was €434 million i.e. approximately
€650 million in 2015 terms. These European studies indicate a consistent level of
ADRs resulting directly in acute hospitalisation, affecting older people in the majority
and imposing very serious strain on healthcare budgets.
The mortality rate attributable to ADRs in hospitalised patients is reported to
be between 0.14% and 4.7% (84, 114). In the US, annual mortality rates of 0.08–
0.12/100,000 have been reported, with this rate significantly increasing over the last
7 years (111), with those at greatest risk being aged ≥ 75 years. Mortality associated
with ADRs is due to commonly prescribed drugs with predictable side effects such as
anticoagulants, opioids and immunosuppressant drugs (111). In the future, the
demand for these drugs will increase as the incidence and prevalence of illness
requiring these drug treatments increases with age i.e. atrial fibrillation, stroke,
cancer and arthritis. In the US, the overall incidence of serious and fatal ADRs are
reported as 6.7% and 0.32% respectively during a hospital episode, such that ADRs
are now listed as fifth leading cause of death (114). The implication from all these
studies is that whilst ADRs are highly prevalent in older sicker patients, they are also
predictable and therefore preventable in most cases.
49
1.3.5 Current difficulties in ADR reporting
Identifying and reporting of ADRs can be challenging in older adults. Older adults are
a heterogeneous population, with high levels of multimorbidity and polypharmacy.
Therefore, the ADR risk varies considerably between different older patient groups
e.g. nursing home patients are at the highest risk. Older adults experiencing ADRs
often present with nonspecific symptoms such as cognitive decline, recurrent falls
and reduced mobility, such that it can be difficult to discern whether medications
have been implicated or not.
Many definitions for ADRs exist (75, 76, 78-80) and variability in ADR
definitions means that identification and reporting of ADRs can also vary depending
on the definition being employed. Variability in defining ADRs also makes it difficult
to compare published studies. Similarly, several standardized methods of assessing
ADR causality exist, the advantages and disadvantages of each being summarised in
Table 1.6. None of the ADR causality tools is universally used or accepted in everyday
clinical practice and no method is specifically validated for use in older adults with
multimorbidity and polypharmacy.
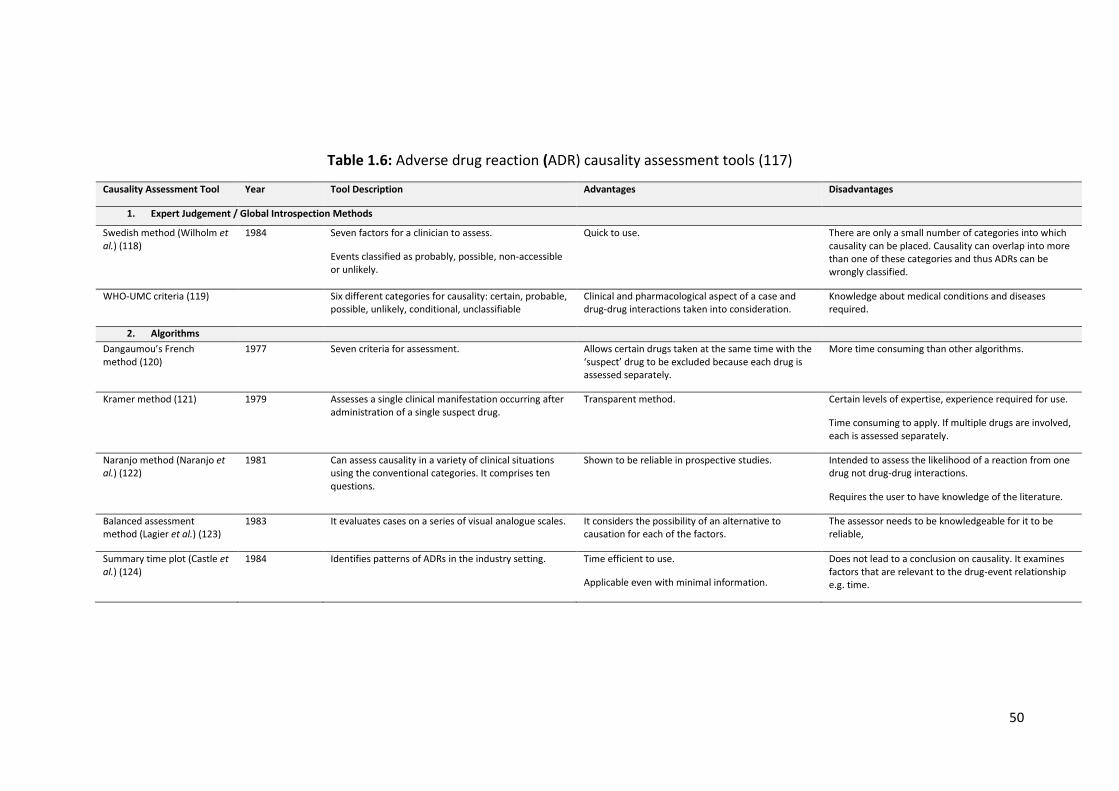
50
Table 1.6: Adverse drug reaction (ADR) causality assessment tools (117)
Causality Assessment Tool Year Tool Description Advantages Disadvantages
1. Expert Judgement / Global Introspection Methods
Swedish method (Wilholm et al.) (118)
1984 Seven factors for a clinician to assess.
Events classified as probably, possible, non-accessible or unlikely.
Quick to use. There are only a small number of categories into which causality can be placed. Causality can overlap into more than one of these categories and thus ADRs can be wrongly classified.
WHO-UMC criteria (119) Six different categories for causality: certain, probable, possible, unlikely, conditional, unclassifiable
Clinical and pharmacological aspect of a case and drug-drug interactions taken into consideration.
Knowledge about medical conditions and diseases required.
2. Algorithms
Dangaumou’s French method (120)
1977 Seven criteria for assessment. Allows certain drugs taken at the same time with the ‘suspect’ drug to be excluded because each drug is assessed separately.
More time consuming than other algorithms.
Kramer method (121) 1979 Assesses a single clinical manifestation occurring after administration of a single suspect drug.
Transparent method. Certain levels of expertise, experience required for use.
Time consuming to apply. If multiple drugs are involved, each is assessed separately.
Naranjo method (Naranjo et al.) (122)
1981 Can assess causality in a variety of clinical situations using the conventional categories. It comprises ten questions.
Shown to be reliable in prospective studies. Intended to assess the likelihood of a reaction from one drug not drug-drug interactions.
Requires the user to have knowledge of the literature.
Balanced assessment method (Lagier et al.) (123)
1983 It evaluates cases on a series of visual analogue scales. It considers the possibility of an alternative to causation for each of the factors.
The assessor needs to be knowledgeable for it to be reliable,
Summary time plot (Castle et al.) (124)
1984 Identifies patterns of ADRs in the industry setting. Time efficient to use.
Applicable even with minimal information.
Does not lead to a conclusion on causality. It examines factors that are relevant to the drug-event relationship e.g. time.
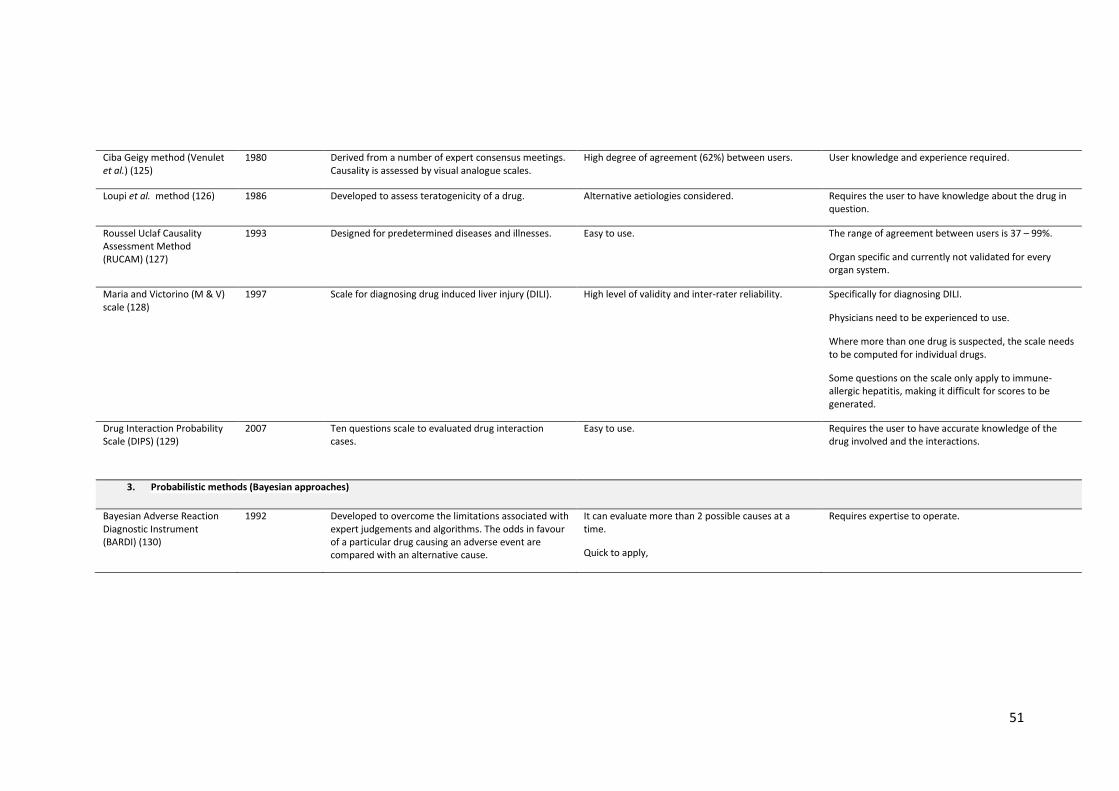
51
Ciba Geigy method (Venulet et al.) (125)
1980 Derived from a number of expert consensus meetings. Causality is assessed by visual analogue scales.
High degree of agreement (62%) between users. User knowledge and experience required.
Loupi et al. method (126) 1986 Developed to assess teratogenicity of a drug. Alternative aetiologies considered. Requires the user to have knowledge about the drug in question.
Roussel Uclaf Causality Assessment Method (RUCAM) (127)
1993 Designed for predetermined diseases and illnesses. Easy to use. The range of agreement between users is 37 – 99%.
Organ specific and currently not validated for every organ system.
Maria and Victorino (M & V) scale (128)
1997 Scale for diagnosing drug induced liver injury (DILI). High level of validity and inter-rater reliability. Specifically for diagnosing DILI.
Physicians need to be experienced to use.
Where more than one drug is suspected, the scale needs to be computed for individual drugs.
Some questions on the scale only apply to immune-allergic hepatitis, making it difficult for scores to be generated.
Drug Interaction Probability Scale (DIPS) (129)
2007 Ten questions scale to evaluated drug interaction cases.
Easy to use. Requires the user to have accurate knowledge of the drug involved and the interactions.
3. Probabilistic methods (Bayesian approaches)
Bayesian Adverse Reaction Diagnostic Instrument (BARDI) (130)
1992 Developed to overcome the limitations associated with expert judgements and algorithms. The odds in favour of a particular drug causing an adverse event are compared with an alternative cause.
It can evaluate more than 2 possible causes at a time.
Quick to apply,
Requires expertise to operate.
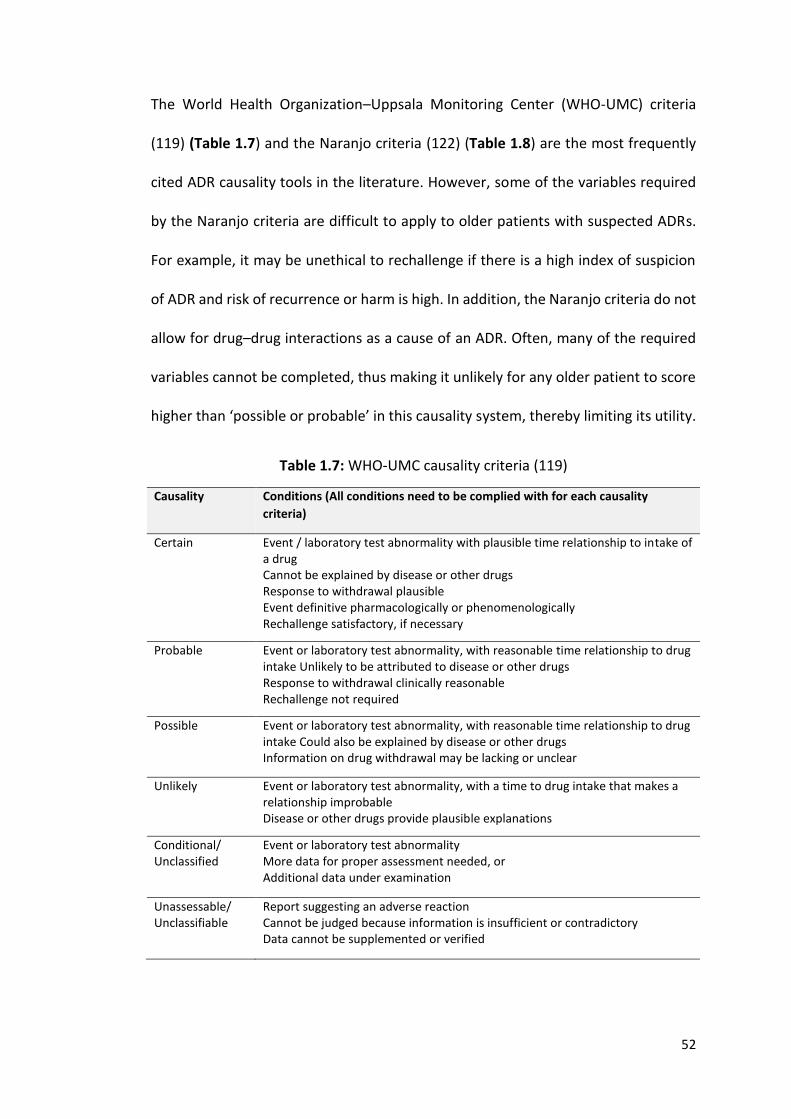
52
The World Health Organization–Uppsala Monitoring Center (WHO-UMC) criteria
(119) (Table 1.7) and the Naranjo criteria (122) (Table 1.8) are the most frequently
cited ADR causality tools in the literature. However, some of the variables required
by the Naranjo criteria are difficult to apply to older patients with suspected ADRs.
For example, it may be unethical to rechallenge if there is a high index of suspicion
of ADR and risk of recurrence or harm is high. In addition, the Naranjo criteria do not
allow for drug–drug interactions as a cause of an ADR. Often, many of the required
variables cannot be completed, thus making it unlikely for any older patient to score
higher than ‘possible or probable’ in this causality system, thereby limiting its utility.
Table 1.7: WHO-UMC causality criteria (119)
Causality Conditions (All conditions need to be complied with for each causality
criteria)
Certain Event / laboratory test abnormality with plausible time relationship to intake of a drug Cannot be explained by disease or other drugs Response to withdrawal plausible Event definitive pharmacologically or phenomenologically Rechallenge satisfactory, if necessary
Probable Event or laboratory test abnormality, with reasonable time relationship to drug intake Unlikely to be attributed to disease or other drugs Response to withdrawal clinically reasonable Rechallenge not required
Possible Event or laboratory test abnormality, with reasonable time relationship to drug intake Could also be explained by disease or other drugs Information on drug withdrawal may be lacking or unclear
Unlikely Event or laboratory test abnormality, with a time to drug intake that makes a relationship improbable Disease or other drugs provide plausible explanations
Conditional/ Unclassified
Event or laboratory test abnormality More data for proper assessment needed, or Additional data under examination
Unassessable/ Unclassifiable
Report suggesting an adverse reaction Cannot be judged because information is insufficient or contradictory Data cannot be supplemented or verified
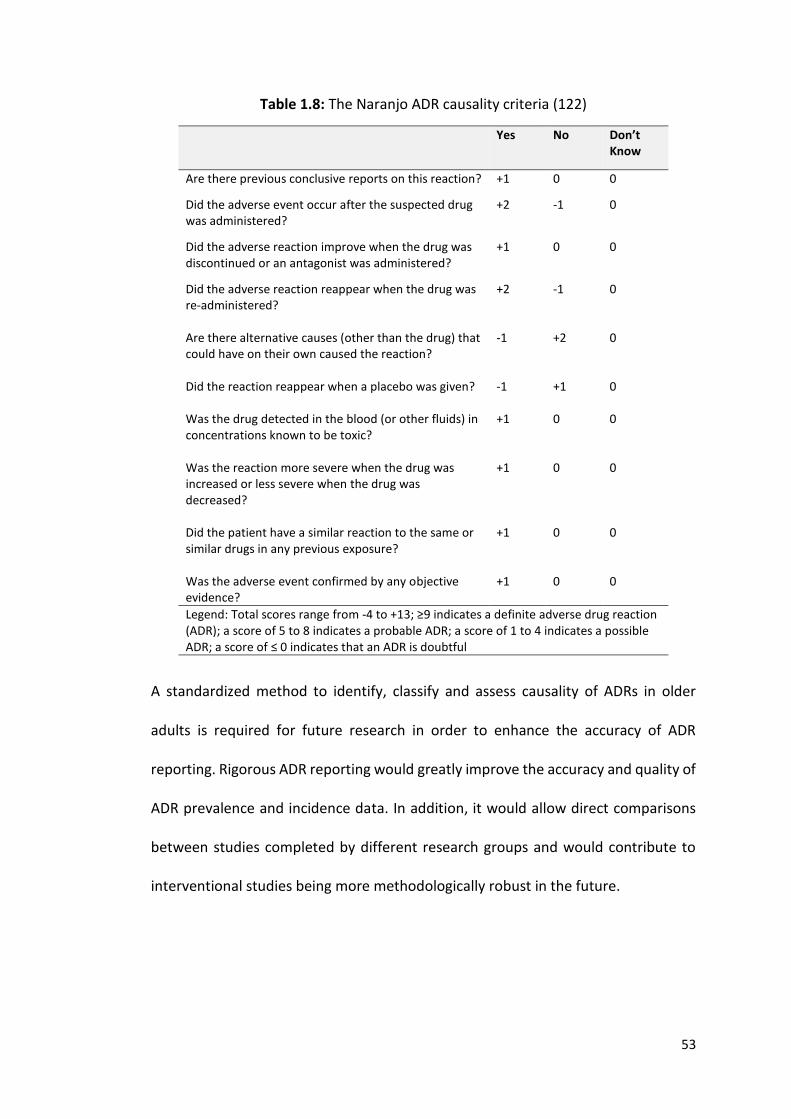
53
Table 1.8: The Naranjo ADR causality criteria (122)
Yes No Don’t Know
Are there previous conclusive reports on this reaction? +1 0 0
Did the adverse event occur after the suspected drug was administered?
+2 -1 0
Did the adverse reaction improve when the drug was discontinued or an antagonist was administered?
+1 0 0
Did the adverse reaction reappear when the drug was re-administered?
+2 -1 0
Are there alternative causes (other than the drug) that could have on their own caused the reaction?
-1 +2 0
Did the reaction reappear when a placebo was given?
-1 +1 0
Was the drug detected in the blood (or other fluids) in concentrations known to be toxic?
+1 0 0
Was the reaction more severe when the drug was increased or less severe when the drug was decreased?
+1 0 0
Did the patient have a similar reaction to the same or similar drugs in any previous exposure?
+1 0 0
Was the adverse event confirmed by any objective evidence?
+1 0 0
Legend: Total scores range from -4 to +13; ≥9 indicates a definite adverse drug reaction (ADR); a score of 5 to 8 indicates a probable ADR; a score of 1 to 4 indicates a possible ADR; a score of ≤ 0 indicates that an ADR is doubtful
A standardized method to identify, classify and assess causality of ADRs in older
adults is required for future research in order to enhance the accuracy of ADR
reporting. Rigorous ADR reporting would greatly improve the accuracy and quality of
ADR prevalence and incidence data. In addition, it would allow direct comparisons
between studies completed by different research groups and would contribute to
interventional studies being more methodologically robust in the future.
54
1.4 TARGETS FOR INTERVENTION IN POPULATIONS AT HIGH RISK OF ADRS
1.4.1 Deprescribing
Deprescribing is defined as “the process of withdrawal of an inappropriate
medication, supervised by a health care professional with the goal of managing
polypharmacy and improving outcomes” (131). It involves (i) reviewing all
medications prescribed, (ii) identifying those medications that are inappropriate, (iii)
deciding when and how these medications should be reduced or stopped and (iv)
arranging adequate monitoring and follow-up (132). Many physicians, healthcare
professionals, patients and their relatives all acknowledge the burden of
polypharmacy for older frail adults, yet all groups display passivity towards
deprescribing (133) with less than half of attending clinicians use a consistent
approach to deprescribing (134) and many clinicians avoid it completely.
1.4.2 Need for new deprescribing tools
To date, numerous prescribing tools have been developed to guide physicians with
cessation of PIMs in the general older adult population. However, comprehensive
tools such as Beers criteria (63-67), STOPP/START criteria (36, 37) and FORTA criteria
(68, 69) were not developed to specifically address IP in frail multimorbid older adults
with a poor survival prognosis. Prescribing needs for these patients differ from those
of the general older population. For instance, patients with limited life expectancy
(LLE) would be unlikely to survive long enough to derive benefit from most
medications listed in the START criteria. Furthermore, STOPP criteria do not suggest
discontinuing major drugs classes that are least likely to have benefits in the last year
of life, e.g. statins. Therefore, the population at the highest risk of IP and ADRs that
55
is growing most rapidly is the one where there is the least clear guidance on
prescribing and deprescribing for physicians. To date, no explicit guidelines exist for
deprescribing in frailer older people with LLE, other than NORGEP-NH criteria, which
are specific to the older nursing home population (135). Therefore, with the accepted
need for deprescribing in frailer older persons with LLE, there is a clear associated
need for specific explicit deprescribing criteria.
1.4.3 Limited life expectancy
LLE is defined in most studies as a life expectancy of one year or less (136-138).
Recognition of a LLE can be challenging for less experienced physicians. However
there are some simple mortality predictive tools available that can help guide and
support junior physicians in assessing this e.g. Walter Index (139). However,
deprescribing in older frailer adults is usually undertaken by patients’ General
Practitioners (GPs) or senior hospital physicians with high-level prognostic
knowledge. The literature to date indicates that co-morbidities and functional
impairment are the most consistent predictors of mortality (140).
1.4.4 Frailty
Many older adults with LLE are not clinically frail. Conversely, some older adults who
are clinically frail do not have a poor one year survival prognosis. However, in most
instances, frailty and poor survival prognosis do co-exist. Frailty in some
circumstances can be reversible, but in patients where there is an irreversible, end-
stage diagnosis e.g. dementia or disseminated progressive malignancy with
56
associated severe functional impairment, frailty is implicit and prognosis is usually
poor.
Many different frailty assessment tools are available which have been
validated across many different healthcare settings and applied to various age
groups. In addition, many frailty tools use different criteria. Of 79 frailty instruments
recently systematically reviewed by Azzopardi et al. (141), 24 included physical
characteristic components alone, with all other instruments consisting of two or
more components from the following domains: medical, physical, functional and
cognitive. Some components were self-reported, others were based on objective
measures and in those remaining, a combination of both were employed. Frailty
indices are used to assist identification and diagnosis of frailty and are not intended
to supersede clinical judgement but rather guide physicians in clinical decision
making. The prevalence of frailty in older adults is reported to be 10.7% in the
community (7), 14% in hospitals (142) and 52.3% in nursing homes (143).
1.5 CONCLUSIONS
Prescribing for frail multimorbid older patients is often complex and time-consuming,
particularly when all of the patients’ variables are considered. In addition, older
people are a heterogeneous population, with a wide variation in physical, cognitive
and functional status. Prescribing appropriately and safely for frail older multimorbid
adults with a poor survival prognosis is often highly challenging, particularly when
considering the many preventative therapies that may carry greater risk than a clear
benefit.
57
Older frail multimorbid adults surviving with complex clinical conditions
contribute to the population that is growing at the fastest rate and will continue to
grow for several decades to come. Therefore, research needs to focus on identifying
potentially adverse polypharmacy and IP in these multimorbid patients as well as
interventions to improve prescribing appropriateness and safety. ADRs need to be
identified speedily and accurately, correctly classified and reported in a standardized
manner to assist best clinical practice and ensure that research studies are
methodologically robust.
Evaluation of the therapeutic goal must take into account the scientific
rationale of using a drug as well as the potential benefit to the patient. There is a lack
of guidance on deprescribing in older frail multimorbid patients for present day
physicians. Explicit deprescribing criteria are required so that the evidence base for
deprescribing in this growing population can develop and support physicians in their
routine clinical decision making.
1.6 OBJECTIVES OF THIS THESIS
The objectives of this thesis were to:
(i) Develop a standardized method of assessing, classifying and reporting
ADRs in older people.
(ii) Identify multimorbidity, medication use and IP in older adults with
unselected acute illness presenting to hospital for admission.
(iii) To assess the prevalence of ADRs causing hospitalisation in an acutely ill
general older unselected population using this new ADR assessment
58
methodology and to compare these rates to those reported in the
literature to date.
(iv) Identify multimorbidity, medication use and IP in older adults with cancer
using the same ADR methodology in order to determine the prevalence
of ADRs causing hospitalisation in this cohort.
(v) Develop a new explicit prescribing tool to address deprescribing in older
frail multimorbid patients with a poor one year survival prognosis.
(vi) Determine the inter-rater reliability of this newly developed deprescribing
tool and apply it to a representative population of frail, multimorbid older
people.
59
CHAPTER 2:
Development and validation of an adverse drug reaction (ADR) trigger list
60
2.1 INTRODUCTION
Adverse drug reactions (ADRs) are common and their incidence increases with ageing
(82). A recent meta-analysis reported that ADRs cause or contribute to
hospitalisation in approximately 10% of older adults (83, 144). Furthermore, ADRs
occur in approximately 11.5% of older adults during their hospital admission (84,
144). However, it is often difficult to compare individual studies because of
considerable heterogeneity in (i) definition of ADRs, (ii) identification of causality and
(iii) variations in population cohorts studied.
The economic burden of ADRs in terms of healthcare resource consumption
(99, 113-116, 145) and mortality (84, 111, 114) is well established and has been
discussed in Chapter 1. However, the clinical nature and severity of ADRs is often
poorly described. More specifically, differences in drug-related morbidity between
older and younger patients are rarely investigated or compared. Recognition and
diagnosis of ADRs can be challenging in everyday clinical practice, particularly in older
patients with multiple symptoms that may feasibly be attributed to multiple co-
morbid illnesses e.g. falls, cognitive decline, fatigue or constipation. ADRs that
require intensive medical input are generally identified and managed accordingly e.g.
acute liver injury secondary to a statin or clinically significant bleeding secondary to
an anticoagulant. However, in cases where symptomatology is milder, or viewed as
non-life threatening e.g. severe constipation, drug causation is often under-
recognised. Older adults often experience a large burden of co-morbid illnesses and
frequently present with non-specific symptoms such as falls, delirium and dizziness,
most of which have several causative factors. A fall may occur in a patient with visual
impairment and gait instability attributable to severe osteoarthritis, but that same
61
patient may also fall because of postural hypotension attributable to a new
antihypertensive agent. All factors may have contributed to the fall, thus making it
difficult to precisely conclude that the event was caused by a drug.
Ideally, a standardized approach should be employed to accurately identify
and classify suspected ADRs, in order to minimise associated morbidity and prevent
recurrence. One such approach would be to determine an individual’s risk of
developing an ADR using a tool such as the GerontoNet ADR risk prediction score
(146). This tool considers an individual’s risk of developing an ADR according to the
presence or absence of variables including increasing numbers of medications,
presence of liver dysfunction and renal dysfunction. This approach, though
promising, is not universally applicable, with one study (outside of the original
research validation exercise) showing poor predictive ability in correctly identifying
ADRs, thus limiting the clinical applicability of GerontoNet as a reliable ADR
prediction tool (146).
Another approach would be to focus on the most common adverse clinical
syndromes attributable to medications in older patients e.g. falls, bleeding,
electrolyte disturbance and cognitive dysfunction. The presence of such symptoms
in an older person should prompt a medication review to investigate whether or not
such symptoms could be caused by a prescribed medication i.e. these symptoms
should “trigger” further investigation of the adverse event (AE) in question and
determine whether a drug is implicated i.e. an “AE trigger”. This would require a
standardized definition of an ADR and a robust and valid process of determining
whether or not a drug contributed to the clinical event. Accordingly, the aim of this
62
study was to develop and validate a new Trigger List of clinical symptoms and
syndromes that may herald the presence of an ADR and to devise a robust,
standardized process of assessing these symptoms to determine whether or not a
drug is culprit. The specific study objectives are detailed below.
2.1.1 Objectives
The objectives of this study were:
(i) To develop a Trigger List of clinical symptoms or events to identify
potential ADRs in older patients.
(ii) To develop and validate a standardized investigative process for each
event on the Trigger List in order to ascertain whether or not the event
was an ADR.
(iii) To develop a standardized approach to assessing the morbidity associated
with ADRs.
(iv) To determine the inter-rater reliability (IRR) of this new methodology
amongst physicians, pharmacists, nurses and biomedical scientists, all of
whom are working as researchers on a multi-centred RCT investigating
the role of medication optimisation software on ADRs that occur during
hospital stay.
The work in this chapter was undertaken with support and input from the SENATOR
(Software ENgine for the Assessment and optimisation of drug and non-drug
Therapies in Older peRsons) consortium (147).
63
2.2 METHODS
This study involved four distinct phases: (i) development of a list of common potential
ADRs in older patients i.e. the AE Trigger List; (ii) development of a standardized
investigative process for each AE on the Trigger List in order to ascertain whether or
not the event was an ADR, (iii) development of a standardized process for
ascertaining ADR-related morbidity i.e. inter-dependent relationships between AE
Trigger List symptoms deemed ADRs i.e. Sequence of Events, and (iv) conduct of a
study to test the IRR of the process between doctors, nurses, pharmacists and
biomedical scientists using clinical cases. Each of these phases is described in more
detail below.
2.2.1 Development of the AE Trigger List
Each AE on the Trigger List should be a clinical symptom or syndrome that may be
indicative of an ADR and requires investigation using a standardized process to
determine if this is the case. The Trigger List must (i) incorporate the most common
ADRs reported in older adults and (ii) include clear definitions of all AEs to avoid any
ambiguity around whether the event in question occurred or not.
As discussed in Chapter 1, the definition of an ADR proposed by Edwards and
Aronson (79) is the most comprehensive definition and incorporates what other
definitions lack. Thus, it is the most all-encompassing and appropriate to use,
particularly when assessing ADRs in older adults. Therefore it will be the definition
used going forward for this thesis i.e. “An appreciably harmful or unpleasant
reaction, resulting from an intervention related to the use of a medicinal product,
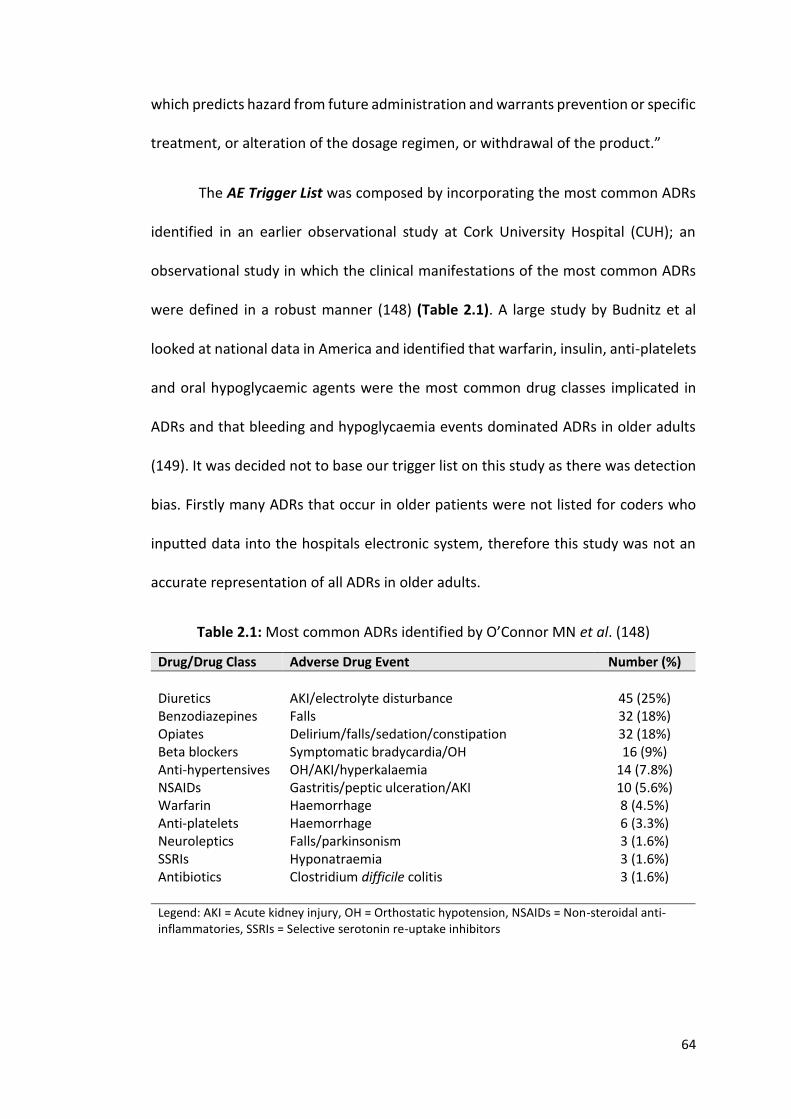
64
which predicts hazard from future administration and warrants prevention or specific
treatment, or alteration of the dosage regimen, or withdrawal of the product.”
The AE Trigger List was composed by incorporating the most common ADRs
identified in an earlier observational study at Cork University Hospital (CUH); an
observational study in which the clinical manifestations of the most common ADRs
were defined in a robust manner (148) (Table 2.1). A large study by Budnitz et al
looked at national data in America and identified that warfarin, insulin, anti-platelets
and oral hypoglycaemic agents were the most common drug classes implicated in
ADRs and that bleeding and hypoglycaemia events dominated ADRs in older adults
(149). It was decided not to base our trigger list on this study as there was detection
bias. Firstly many ADRs that occur in older patients were not listed for coders who
inputted data into the hospitals electronic system, therefore this study was not an
accurate representation of all ADRs in older adults.
Table 2.1: Most common ADRs identified by O’Connor MN et al. (148)
Drug/Drug Class Adverse Drug Event Number (%)
Diuretics
AKI/electrolyte disturbance
45 (25%)
Benzodiazepines Falls 32 (18%) Opiates Delirium/falls/sedation/constipation 32 (18%) Beta blockers Symptomatic bradycardia/OH 16 (9%) Anti-hypertensives OH/AKI/hyperkalaemia 14 (7.8%) NSAIDs Gastritis/peptic ulceration/AKI 10 (5.6%) Warfarin Haemorrhage 8 (4.5%) Anti-platelets Haemorrhage 6 (3.3%) Neuroleptics Falls/parkinsonism 3 (1.6%) SSRIs Hyponatraemia 3 (1.6%) Antibiotics Clostridium difficile colitis 3 (1.6%) Legend: AKI = Acute kidney injury, OH = Orthostatic hypotension, NSAIDs = Non-steroidal anti-inflammatories, SSRIs = Selective serotonin re-uptake inhibitors
65
In this prospective observational study, ADRs were defined rigorously according to
the World Health Organisation-Uppsala Monitoring Center (WHO-UMC) causality
criteria (119), a causality assessment tool that has been discussed in Chapter 1. Two
physicians jointly reviewed all ADRs and only included those where there was
consensus between them that a probable/certain ADR had occurred. The 10 ADRs
most commonly reported were (i) acute kidney injury (AKI), (ii) electrolyte
disturbance, (iii) falls, (iv) delirium, (v) constipation, (vi) orthostatic hypotension (OH),
(vii) dyspepsia, (viii) bleeding (ix) diarrhoea and (x) symptomatic bradycardia. These
ADRs formed the basis of the AE Trigger List of potential ADRs i.e. AEs requiring
further investigation.
The SENATOR consortium (of which I am a member), is a European group
comprising of renowned researchers from across Europe that has a strong clinical
and research background in Geriatric Pharmacotherapy. Although I was funded by
the SENATOR project, this chapter is the only part of my PhD that is linked to the
consortium. The SENATOR group discussed this AE Trigger List. On the basis of
clinical experience, two additional AEs were proposed for inclusion i.e. gait
disturbance and symptomatic hypoglycaemia. Their inclusion was agreed by
consensus. The result, a 12 AE Trigger List, to assist in the unbiased reporting of
ADRs. It was acknowledged that not all potential ADRs were included on the 12 point
Trigger List e.g. anaphylaxis, but those not included were those that were more likely
to have severe symptomatology and consequently less likely to be missed; an
“unspecified AE” was added to the AE Trigger List to capture these.
66
2.2.2 Development of a standardized investigative process for each AE on
the trigger list in order to ascertain whether or not the event was an
ADR
As I worked as a primary researcher on the SENATOR feasibility study (150), the first
study to employ the AE Trigger List, it became evident that there was huge variability
in AE assessments between researchers. This was due to the subjective nature in
assessing a drug’s role in symptomatology, lack of clarity around the timing of events,
lack of clarity around the duration of events and in general the unstandardized
approach employed to assessing whether an ADR occurred. This inevitably can lead
to the inaccurate reporting of ADRs.
Therefore after developing the AE Trigger List, I set out to develop a robust
and valid process, of determining whether or not a drug contributed to clinical AEs
that could be used by researchers going forward. The aim was to remove the current
subjective nature of this process, thus ensuring accurate capture and reporting of
ADRs. This work was undertaken by me under the guidance of Prof. Denis O’Mahony
(senior academic consultant/geriatrician, University College Cork), Dr. Paul Gallagher
(senior academic consultant/geriatrician, University College Cork) and Prof. Joseph
Eustace (senior academic consultant/nephrologist/Director of the Health Research
Board Clinical Research Facility (HRB-CRF), University College Cork (UCC)).
This involved (i) each AE on the Trigger List having a clear definition, (ii) a
clear definition around the timing and duration of each AE, (iii) a clear standardized
approach to assessing whether a drug was involved using both direct focused
questions and the WHO-UMC causality criteria (119) and ensuring a structured scale
67
to apply severity was employed if an AE was deemed an ADR i.e. Hartwig & Siegel
Scale (151) and lastly (iv) the use of an independent adjudication process to confirm
the presence of an ADR. Each of these phases is described in more detail below.
(i) AE Trigger List definitions
Each of the 12 AEs on the AE Trigger List were given a clear definition based on what
was deemed clinically significant e.g. it was proposed that the definition for
symptomatic bradycardia be “a heart rate of < 50 beats/minute with symptoms”.
Definitions were included to ensure that a drug cause was investigated only for
clinically significant AEs. Older adults can often present to hospital with an acute
illness, such as a urinary tract infection, and incidentally be found to have for example
bradycardia but are asymptomatic and don’t require intervention. I wanted to ensure
that clinically asymptomatic AEs were not being investigated inappropriately and
consequently ADRs were not being over reported. Each definition was proposed
based on clinical experience and subsequently agreed upon by consensus by the
SENATOR consortium.
(ii) Timing and duration of AEs
The SENATOR feasibility study also highlighted the inability, in most cases, for
researchers to reliably and reproducibly separate prolonged or repeated occurrences
of the same ADR into separate discrete events e.g. if a persons had 3 falls (AEs) and
it is discovered that there was a drug cause (ADR), this had the potential to be
68
reported as either 3 ADRs or 1 ADR. Lack of clarity as to what precisely defines an AE
leads to subjectivity in ADR reporting and can lead to over-estimation of ADRs. I
proposed that AEs and subsequently ADRs should be viewed as processes rather than
discrete events i.e. in the example case above, falling occurs secondary to a
medication. The only time a second ADR should be declared is if a second drug
becomes implicated after the first original drug and is felt to cause re-emergence of
the same symptoms or worsening of current symptoms. For example, if a person
developed hyponatraemia secondary to a thiazide diuretic, which was subsequently
stopped and the hyponatraemia resolved and then the same person was prescribed
an selective serotonin reuptake inhibitor (SSRI) and a further substantial drop in Na+
(sodium) occurred then this would be classified as two separate ADRs.
In addition, it became apparent that there was confusion around the timing
of AEs, which subsequently led to inaccurate reporting of the timing of ADRs. As a
result I proposed that ADRs occurring pre-hospital should be distinct from those
occurring during hospitalisation i.e. “prevalent” ADRs and “incident” ADRs. A
prevalent event is one which commences pre hospital and an incident event is one
which commences post admission to hospital. This distinction between prevalent
and incident ADRs is paramount to assess ADRs in order to prevent future ADRs.
(iii) Development of a standardized approach to causality and severity
As discussed in detail in Chapter 1, in 2015, I completed a review looking at ADR
causality tools (152). I reviewed 13 tools, and concluded that the WHO-UMC causality
assessment tool was the most appropriate to apply to older adults (119). As a tool, it
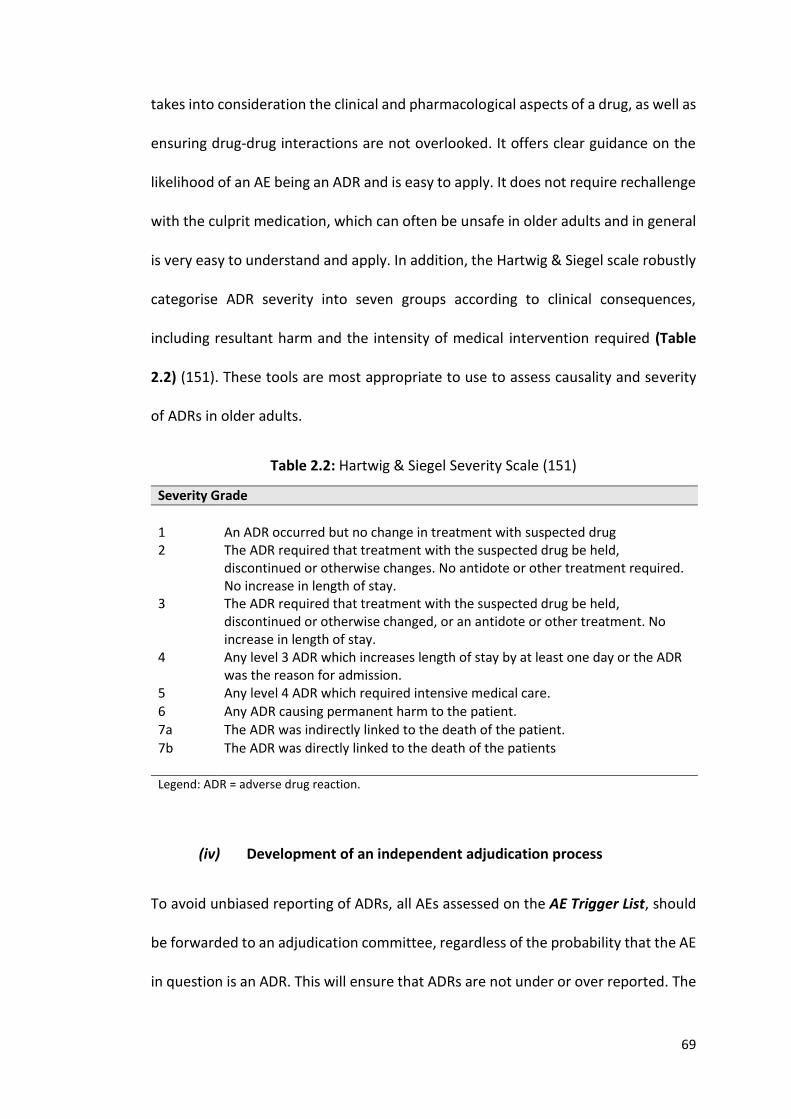
69
takes into consideration the clinical and pharmacological aspects of a drug, as well as
ensuring drug-drug interactions are not overlooked. It offers clear guidance on the
likelihood of an AE being an ADR and is easy to apply. It does not require rechallenge
with the culprit medication, which can often be unsafe in older adults and in general
is very easy to understand and apply. In addition, the Hartwig & Siegel scale robustly
categorise ADR severity into seven groups according to clinical consequences,
including resultant harm and the intensity of medical intervention required (Table
2.2) (151). These tools are most appropriate to use to assess causality and severity
of ADRs in older adults.
Table 2.2: Hartwig & Siegel Severity Scale (151)
Severity Grade
1
An ADR occurred but no change in treatment with suspected drug
2 The ADR required that treatment with the suspected drug be held, discontinued or otherwise changes. No antidote or other treatment required. No increase in length of stay.
3 The ADR required that treatment with the suspected drug be held, discontinued or otherwise changed, or an antidote or other treatment. No increase in length of stay.
4 Any level 3 ADR which increases length of stay by at least one day or the ADR was the reason for admission.
5 Any level 4 ADR which required intensive medical care. 6 Any ADR causing permanent harm to the patient.
7a The ADR was indirectly linked to the death of the patient. 7b The ADR was directly linked to the death of the patients Legend: ADR = adverse drug reaction.
(iv) Development of an independent adjudication process
To avoid unbiased reporting of ADRs, all AEs assessed on the AE Trigger List, should
be forwarded to an adjudication committee, regardless of the probability that the AE
in question is an ADR. This will ensure that ADRs are not under or over reported. The
70
evidence for each AE must be presented in a standardized fashion to those involved
in the adjudication committee. Evidence that indicates causality (temporal
relationship, appropriate time line in resolution or recurrence etc.) must be stated
along with additional qualifying explanatory text. To ensure this information was
presented in a standardized format, a form for each AE, incorporating all the
components as discussed above, was compiled. This standardised AE form is present
in Table 2.5, page 80.
2.2.3 Development of a standardized process for ascertaining ADR-related
morbidity
It also was apparent from the SENATOR feasibility study that for many patients there
was an interrelationship between different types of AEs that were deemed ADRs e.g.
a patient could present with diarrhoea secondary to an antibiotic, leading to fluid
depletion and subsequently orthostatic hypotension, which subsequently leads to a
fall and injury. Data collection processes to date have not captured this associated
morbidity, but rather report the starting event or the event causing hospitalisation
i.e. in the example given above, diarrhoea or a fall would be reported.
In order to capture the morbidity associated with ADRs, I proposed that the
Sequence of Events surrounding an ADR should be evaluated. AEs that are deemed
drug-related, as determined by the WHO-UMC causality tool (119), should have their
inter-dependent relationships captured to ensure the associated morbidity is not
missed. The use of the AE Trigger List and determination of the inter-dependant
relationships between events will capture this morbidity prospectively i.e. Sequence
of Events.
71
2.2.4 Conduct of a study to test the IRR of the process between doctors,
nurses, pharmacists and biomedical scientists using clinical cases
(i) Application of AE Trigger List process to clinical cases
The aim was to determine the inter-rater reliability (IRR) of the AE process between
healthcare professionals. Eight clinical cases histories were selected from a cohort of
240 consecutive patients, aged ≥ 65 years, who were admitted with an acute medical
(i.e. non-surgical) illness to the general medical services at Cork University Hospital,
between August 2014 and July 2016. The purpose of this observational study was to
determine ADR incidence causing hospitalisation. This study will be discussed in
Chapter 3, however for the purpose of this IRR exercise, participants included in this
observational study had their medical conditions, concurrent medications, cognitive
and functional impairment documented. The eight cases were selected based on
case complexity to ensure a variety of clinical scenarios were presented to
participants. The details of these 8 clinical cases can be found in Appendix 1.
Each clinical case was presented in the same format with an appropriate
amount of information to make an ADR assessment i.e. medical diagnoses,
concurrent medications, allergies, laboratory tests, electrocardiogram (ECG),
functional status and cognitive status. Participants were also given information
regarding what occurred during hospitalisation to assist their assessments. Survey
Monkey© was the platform used to distribute this information to participants. An
example of one clinical case is presented in Figure 2.1 and the questions asked,
incorporating the key concepts as discussed above to guide ADR assessment of the
AEs, is presented in Figure 2.2.
72
Figure 2.1: Example of a clinical case.
Patient & symptoms: 66 year old male presented with a 3 day history of new painless jaundice.
HPC: He presented with cellulitis of his right leg to his GP 5 days earlier. At this time he was commenced on Flucloxacillin. After 2 days of treatment a yellow discoloration of his skin occurred which became worse over the following days. After 5 days of treatment he stopped taking the antibiotics and presented to the emergency department. No nausea, no diarrhoea, no constipation, no vomiting, on confusion, no falls.
Medical History:
1. Varicose veins 2. Gastro-oesophageal reflux disease (GORD) 3. Hiatus hernia – Gastroscopy 6 months ago 4. Hypertension
Medications (regular):
Drug Name Dose Route Frequency Duration
1 Tramadol 50mg Oral Once a day 2 weeks
2 Diclofenac gel One application Topical Three times a day 2 weeks
3 Esomeprazole 40mg Oral Once a day 6 months – 1 yr
4 Bisoprolol 5mg Oral Once a day >5 years
5 Ramipril 10mg Oral Once a day >5 years
6 Paracetamol 1g Oral As required (last took 6 weeks ago) >5 years
Recent short courses of treatment:
Drug Name Dose Route Frequency Duration
1 Flucloxacillin 500mg Oral Four times a day 5 days
Courses was started 5 days prior to admission
Allergies: Amoxicillin/clavulanate – history of jaundice
Social History: Ex-smoker, no alcohol, lives with wife, fully independent of ADLs
Barthel Index score: 20/20, MMSE score: 30/30, 4AT score: 0
Blood results (at admission): Serum creatinine 70 µmol/l, eGFR 104 ml/min/1.72m2, Na+ 137, K+ 4.8, Haemoglobin 12.8g/l, WCC 9.8, Neutrophils 5.4, Platelets 304, Albumin 36 g/l, Bilirubin 242 µmol/l ↑, Ca++ (corrected) 2.30 mmol/l, ALT 40, ALP 753↑, GGT 152
ECG: Normal sinus rhythm, 65 bpm, no conduction blocks
Course of events in hospital:
- Diagnosis made by attending team: Acute Liver Failure - The patient spent a total of 6 weeks in hospital - His liver function recovered with monitoring. - It took 6 weeks until liver function tests were within normal limits. - During the hospitalisation he had no falls, no nausea, no vomiting, no diarrhoea, no constipation.
Medication changes during admission:
1. Tramadol stopped 2. Flucloxacillin stopped by the patient the day before admission
Legend: MMSE = Mini mental state examination, 4AT = Screening test for delirium (≥4 possible delirium +/-
cognitive impairment, 1-2 possible cognitive impairment, 0 = delirium or severe cognitive impairment)
73
Figure 2.2: Questions asked on each clinical case.
Did this patients have any AE: yes or no
If yes:
Event y/n
Prevalent or incident
Drug implicated y/n
Drug 1
WHO causality
Drug 2
WHO causality
New onset fall
New unsteady gait
Acute kidney injury
Symptomatic orthostatic hypotension
Severe electrolyte disturbance
Symptomatic bradycardia
New major constipation
Acute bleeding
Dyspepsia, nausea or vomiting
Acute diarrhoea
Delirium
Symptomatic hypoglycaemia
Unspecified
If an ADR occurred, grade severity according to Hartwig and Siegel? 1 – 7 ____________
Was there a Sequence of Events? If yes list order:
Order of events Order of events
New onset fall New major constipation
New unsteady gait Acute bleeding
Acute kidney injury Dyspepsia, nausea or vomiting
Symptomatic orthostatic hypotension
Acute diarrhoea
Severe electrolyte disturbance Delirium
Symptomatic bradycardia Symptomatic hypoglycaemia
Unspecified
Narrative:
Legend: AE = adverse event
74
The median age of patients in the 8 clinical cases was 77 (IQR 69 – 24) years. Four of
eight patients were male. The median number of active medical conditions was 10
10 (IQR 7.5 – 11.75) and the median number of prescribed medications was 9 (IQR
6.25 – 10) regular medications. Their median Barthel score was 18/20 (IQR 17.25 –
20) and their median MMSE was 26 (IQR 18.5 – 29.75). Four patients experienced an
ADR; there were four prevalent ADRs and one of these patients had an incident ADR
during the acute hospitalisation.
(ii) Participant recruitment and training
Twenty one persons, across 6 European centres, were asked to participate, all of
whom accepted. Participants were selected on the basis of their recognised academic
credentials, clinical practice, experience and geographical diversity. All participants
were researchers, either primary investigators or primary researchers, for an
observational study determining ADR incidence during hospitalisation across 6
European sites (SENATOR) (150). Participants consisted of physicians (Consultant
Geriatricians, Consultant Clinical Pharmacologists and registrars training in Geriatric
Medicine), clinical pharmacists, biomedical scientists and nurses (Table 2.3).
Participants were invited to attend a training session. This training was offered during
one afternoon and encompassed training on ADR identification, classification and
their associated morbidity. Following training, 4 cases experiencing AEs,
incorporating the key concepts highlighted above, were discussed.
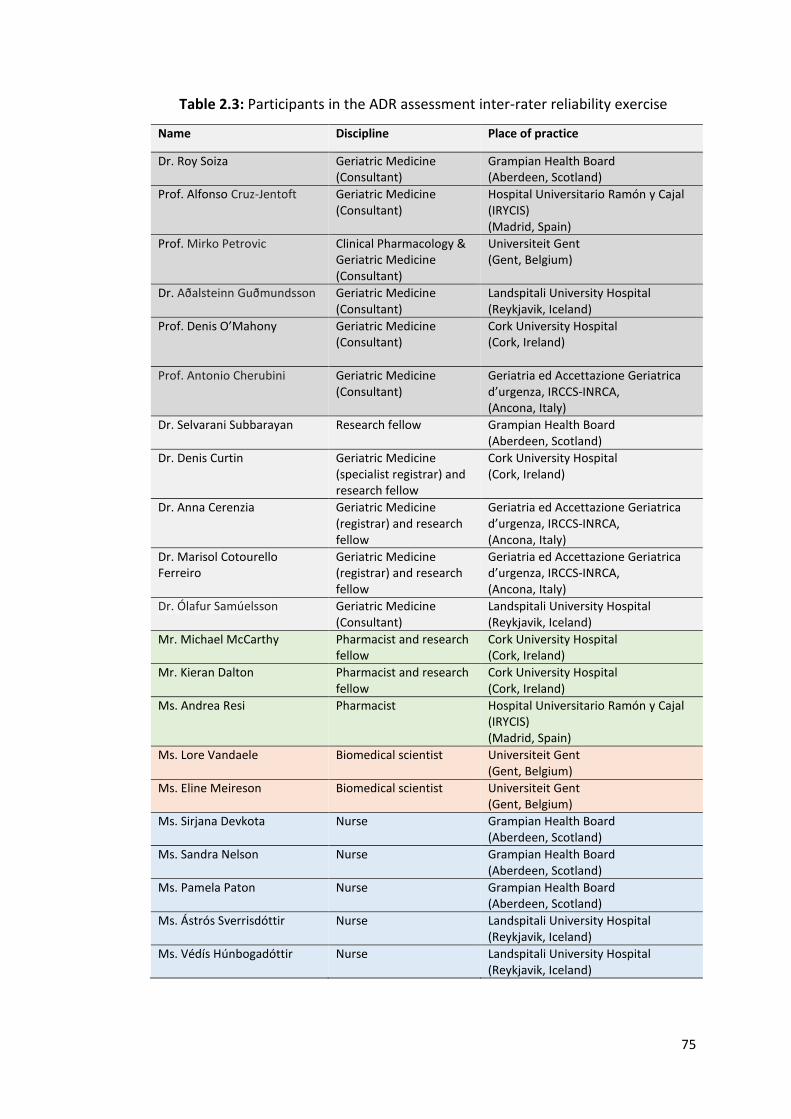
75
Table 2.3: Participants in the ADR assessment inter-rater reliability exercise
Name Discipline Place of practice
Dr. Roy Soiza Geriatric Medicine (Consultant)
Grampian Health Board (Aberdeen, Scotland)
Prof. Alfonso Cruz-Jentoft Geriatric Medicine (Consultant)
Hospital Universitario Ramón y Cajal (IRYCIS) (Madrid, Spain)
Prof. Mirko Petrovic Clinical Pharmacology & Geriatric Medicine (Consultant)
Universiteit Gent (Gent, Belgium)
Dr. Aðalsteinn Guðmundsson Geriatric Medicine (Consultant)
Landspitali University Hospital (Reykjavik, Iceland)
Prof. Denis O’Mahony Geriatric Medicine (Consultant)
Cork University Hospital (Cork, Ireland)
Prof. Antonio Cherubini Geriatric Medicine (Consultant)
Geriatria ed Accettazione Geriatrica d’urgenza, IRCCS-INRCA, (Ancona, Italy)
Dr. Selvarani Subbarayan Research fellow
Grampian Health Board (Aberdeen, Scotland)
Dr. Denis Curtin Geriatric Medicine (specialist registrar) and research fellow
Cork University Hospital (Cork, Ireland)
Dr. Anna Cerenzia Geriatric Medicine (registrar) and research fellow
Geriatria ed Accettazione Geriatrica d’urgenza, IRCCS-INRCA, (Ancona, Italy)
Dr. Marisol Cotourello Ferreiro
Geriatric Medicine (registrar) and research fellow
Geriatria ed Accettazione Geriatrica d’urgenza, IRCCS-INRCA, (Ancona, Italy)
Dr. Ólafur Samúelsson Geriatric Medicine (Consultant)
Landspitali University Hospital (Reykjavik, Iceland)
Mr. Michael McCarthy Pharmacist and research fellow
Cork University Hospital (Cork, Ireland)
Mr. Kieran Dalton Pharmacist and research fellow
Cork University Hospital (Cork, Ireland)
Ms. Andrea Resi Pharmacist Hospital Universitario Ramón y Cajal (IRYCIS) (Madrid, Spain)
Ms. Lore Vandaele Biomedical scientist
Universiteit Gent (Gent, Belgium)
Ms. Eline Meireson Biomedical scientist
Universiteit Gent (Gent, Belgium)
Ms. Sirjana Devkota Nurse
Grampian Health Board (Aberdeen, Scotland)
Ms. Sandra Nelson Nurse Grampian Health Board (Aberdeen, Scotland)
Ms. Pamela Paton Nurse Grampian Health Board (Aberdeen, Scotland)
Ms. Ástrós Sverrisdóttir Nurse
Landspitali University Hospital (Reykjavik, Iceland)
Ms. Védís Húnbogadóttir Nurse
Landspitali University Hospital (Reykjavik, Iceland)
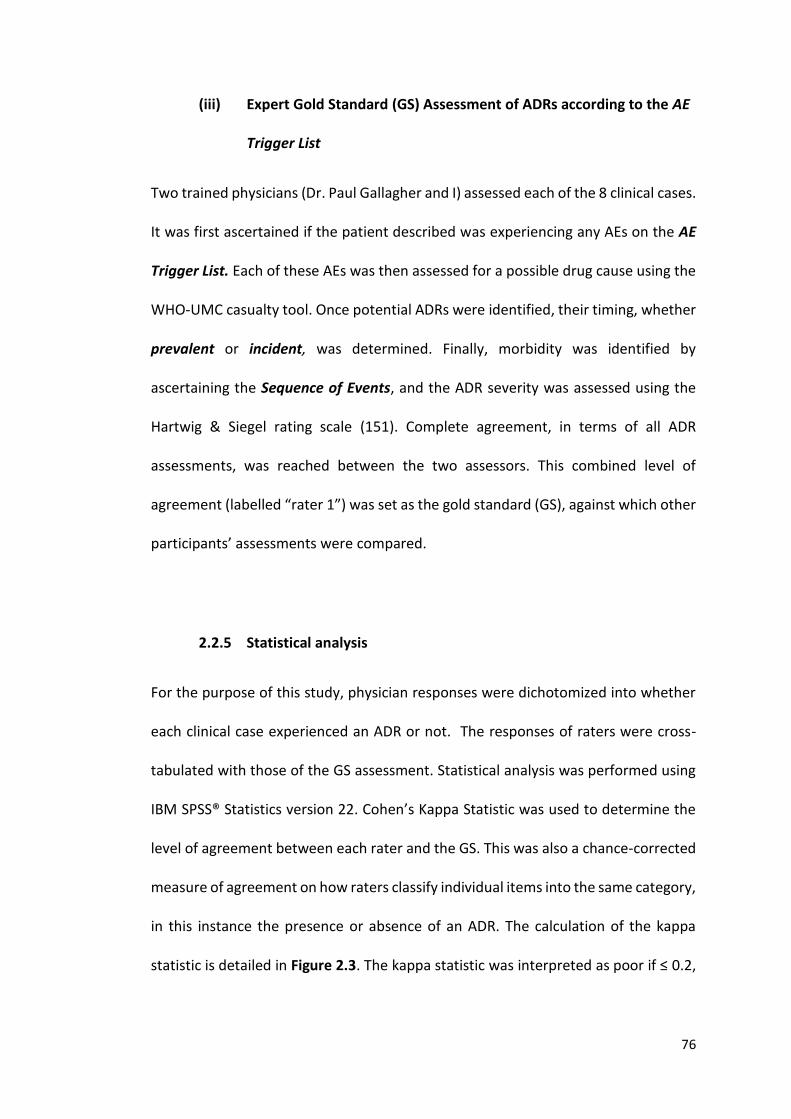
76
(iii) Expert Gold Standard (GS) Assessment of ADRs according to the AE
Trigger List
Two trained physicians (Dr. Paul Gallagher and I) assessed each of the 8 clinical cases.
It was first ascertained if the patient described was experiencing any AEs on the AE
Trigger List. Each of these AEs was then assessed for a possible drug cause using the
WHO-UMC casualty tool. Once potential ADRs were identified, their timing, whether
prevalent or incident, was determined. Finally, morbidity was identified by
ascertaining the Sequence of Events, and the ADR severity was assessed using the
Hartwig & Siegel rating scale (151). Complete agreement, in terms of all ADR
assessments, was reached between the two assessors. This combined level of
agreement (labelled “rater 1”) was set as the gold standard (GS), against which other
participants’ assessments were compared.
2.2.5 Statistical analysis
For the purpose of this study, physician responses were dichotomized into whether
each clinical case experienced an ADR or not. The responses of raters were cross-
tabulated with those of the GS assessment. Statistical analysis was performed using
IBM SPSS® Statistics version 22. Cohen’s Kappa Statistic was used to determine the
level of agreement between each rater and the GS. This was also a chance-corrected
measure of agreement on how raters classify individual items into the same category,
in this instance the presence or absence of an ADR. The calculation of the kappa
statistic is detailed in Figure 2.3. The kappa statistic was interpreted as poor if ≤ 0.2,
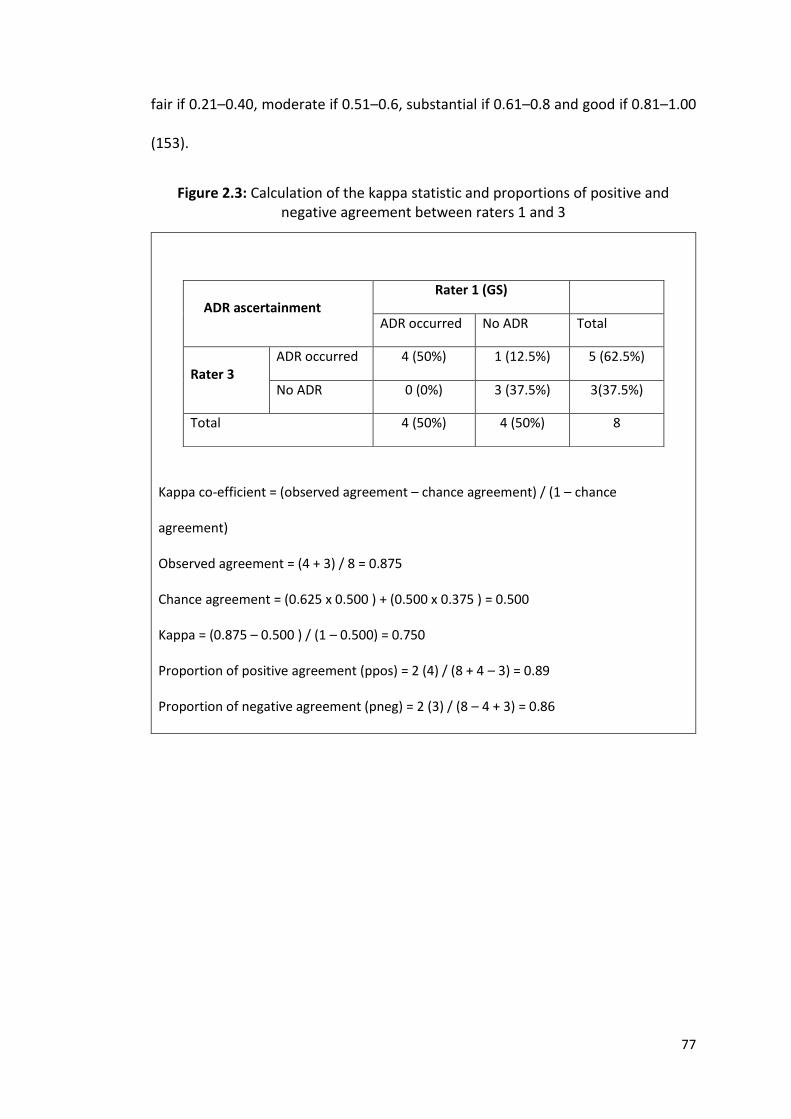
77
fair if 0.21–0.40, moderate if 0.51–0.6, substantial if 0.61–0.8 and good if 0.81–1.00
(153).
Figure 2.3: Calculation of the kappa statistic and proportions of positive and negative agreement between raters 1 and 3
Kappa co-efficient = (observed agreement – chance agreement) / (1 – chance
agreement)
Observed agreement = (4 + 3) / 8 = 0.875
Chance agreement = (0.625 x 0.500 ) + (0.500 x 0.375 ) = 0.500
Kappa = (0.875 – 0.500 ) / (1 – 0.500) = 0.750
Proportion of positive agreement (ppos) = 2 (4) / (8 + 4 – 3) = 0.89
Proportion of negative agreement (pneg) = 2 (3) / (8 – 4 + 3) = 0.86
ADR ascertainment
Rater 1 (GS)
ADR occurred No ADR Total
Rater 3
ADR occurred 4 (50%) 1 (12.5%) 5 (62.5%)
No ADR 0 (0%) 3 (37.5%) 3(37.5%)
Total 4 (50%) 4 (50%) 8
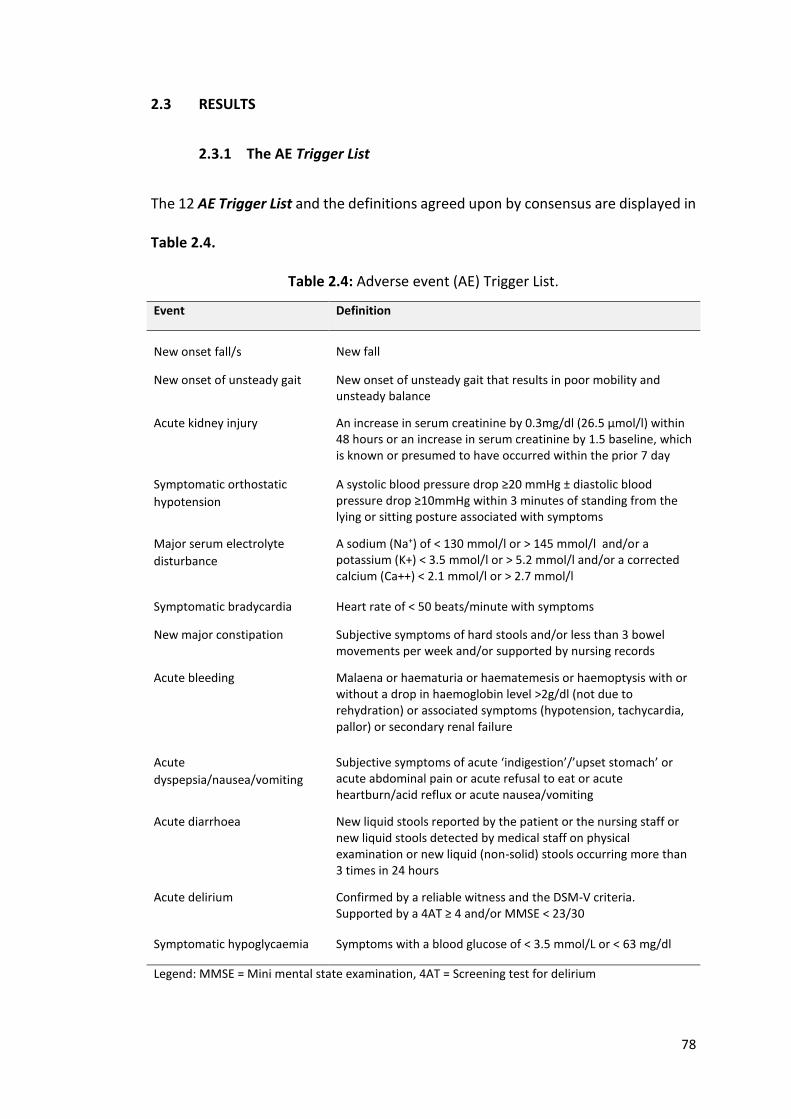
78
2.3 RESULTS
2.3.1 The AE Trigger List
The 12 AE Trigger List and the definitions agreed upon by consensus are displayed in
Table 2.4.
Table 2.4: Adverse event (AE) Trigger List.
Event Definition
New onset fall/s
New fall
New onset of unsteady gait New onset of unsteady gait that results in poor mobility and unsteady balance
Acute kidney injury An increase in serum creatinine by 0.3mg/dl (26.5 μmol/l) within 48 hours or an increase in serum creatinine by 1.5 baseline, which is known or presumed to have occurred within the prior 7 day
Symptomatic orthostatic
hypotension
A systolic blood pressure drop ≥20 mmHg ± diastolic blood pressure drop ≥10mmHg within 3 minutes of standing from the lying or sitting posture associated with symptoms
Major serum electrolyte
disturbance
A sodium (Na+) of < 130 mmol/l or > 145 mmol/l and/or a potassium (K+) < 3.5 mmol/l or > 5.2 mmol/l and/or a corrected calcium (Ca++) < 2.1 mmol/l or > 2.7 mmol/l
Symptomatic bradycardia Heart rate of < 50 beats/minute with symptoms
New major constipation Subjective symptoms of hard stools and/or less than 3 bowel movements per week and/or supported by nursing records
Acute bleeding Malaena or haematuria or haematemesis or haemoptysis with or without a drop in haemoglobin level >2g/dl (not due to rehydration) or associated symptoms (hypotension, tachycardia, pallor) or secondary renal failure
Acute
dyspepsia/nausea/vomiting
Subjective symptoms of acute ‘indigestion’/’upset stomach’ or acute abdominal pain or acute refusal to eat or acute heartburn/acid reflux or acute nausea/vomiting
Acute diarrhoea New liquid stools reported by the patient or the nursing staff or new liquid stools detected by medical staff on physical examination or new liquid (non-solid) stools occurring more than 3 times in 24 hours
Acute delirium Confirmed by a reliable witness and the DSM-V criteria. Supported by a 4AT ≥ 4 and/or MMSE < 23/30
Symptomatic hypoglycaemia Symptoms with a blood glucose of < 3.5 mmol/L or < 63 mg/dl
Legend: MMSE = Mini mental state examination, 4AT = Screening test for delirium
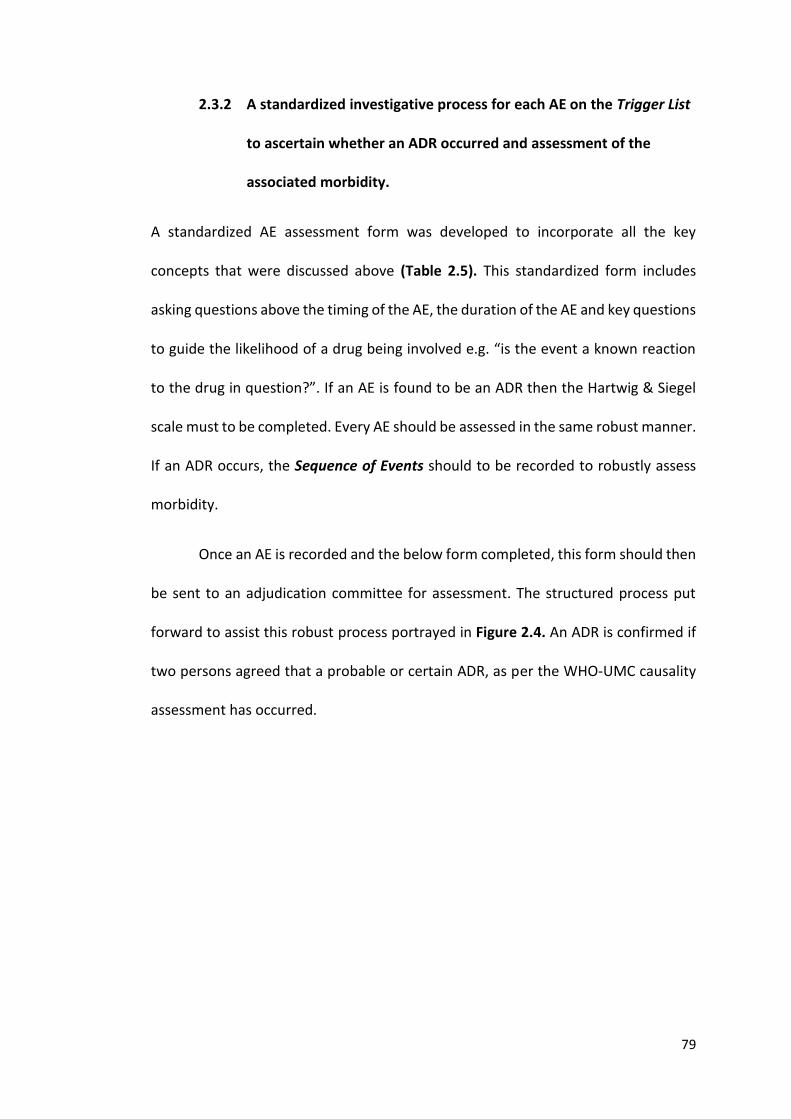
79
2.3.2 A standardized investigative process for each AE on the Trigger List
to ascertain whether an ADR occurred and assessment of the
associated morbidity.
A standardized AE assessment form was developed to incorporate all the key
concepts that were discussed above (Table 2.5). This standardized form includes
asking questions above the timing of the AE, the duration of the AE and key questions
to guide the likelihood of a drug being involved e.g. “is the event a known reaction
to the drug in question?”. If an AE is found to be an ADR then the Hartwig & Siegel
scale must to be completed. Every AE should be assessed in the same robust manner.
If an ADR occurs, the Sequence of Events should to be recorded to robustly assess
morbidity.
Once an AE is recorded and the below form completed, this form should then
be sent to an adjudication committee for assessment. The structured process put
forward to assist this robust process portrayed in Figure 2.4. An ADR is confirmed if
two persons agreed that a probable or certain ADR, as per the WHO-UMC causality
assessment has occurred.
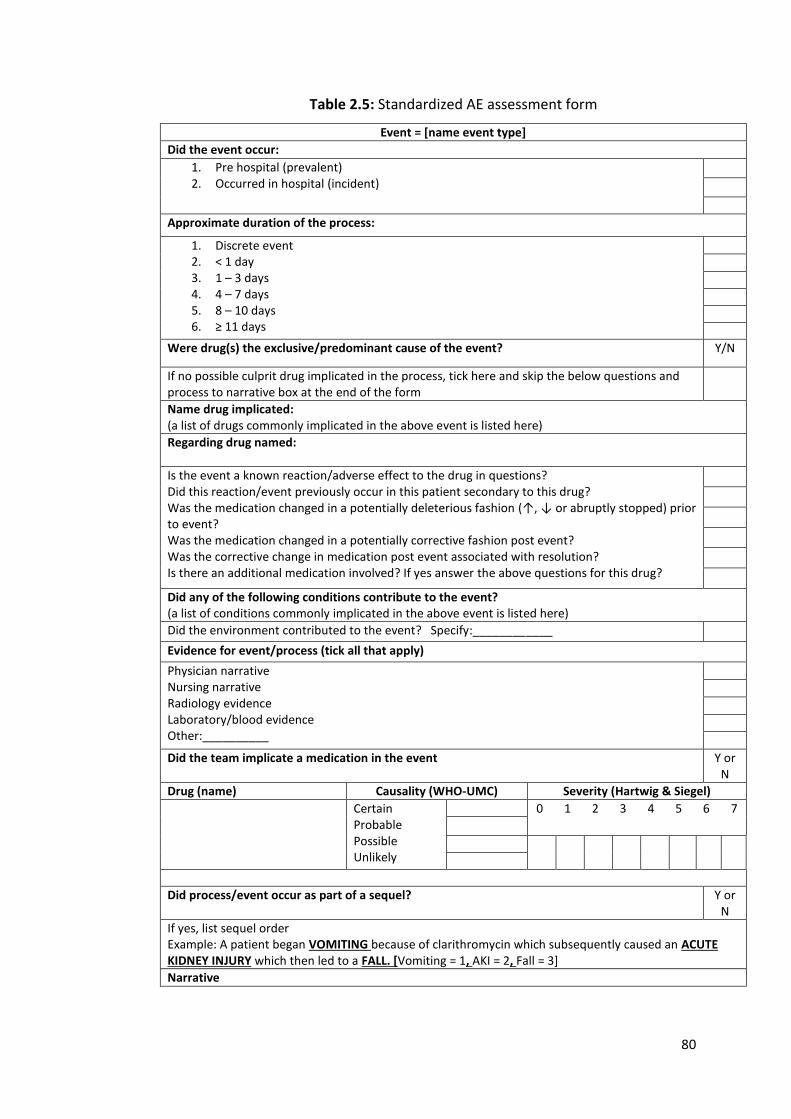
80
Table 2.5: Standardized AE assessment form
Event = [name event type]
Did the event occur:
1. Pre hospital (prevalent) 2. Occurred in hospital (incident)
Approximate duration of the process:
1. Discrete event 2. < 1 day 3. 1 – 3 days 4. 4 – 7 days 5. 8 – 10 days 6. ≥ 11 days
Were drug(s) the exclusive/predominant cause of the event? Y/N
If no possible culprit drug implicated in the process, tick here and skip the below questions and process to narrative box at the end of the form
Name drug implicated: (a list of drugs commonly implicated in the above event is listed here)
Regarding drug named:
Is the event a known reaction/adverse effect to the drug in questions? Did this reaction/event previously occur in this patient secondary to this drug? Was the medication changed in a potentially deleterious fashion (↑, ↓ or abruptly stopped) prior to event? Was the medication changed in a potentially corrective fashion post event? Was the corrective change in medication post event associated with resolution? Is there an additional medication involved? If yes answer the above questions for this drug?
Did any of the following conditions contribute to the event? (a list of conditions commonly implicated in the above event is listed here)
Did the environment contributed to the event? Specify:____________
Evidence for event/process (tick all that apply)
Physician narrative Nursing narrative Radiology evidence Laboratory/blood evidence Other:__________
Did the team implicate a medication in the event Y or N
Drug (name) Causality (WHO-UMC) Severity (Hartwig & Siegel)
Certain Probable Possible Unlikely
0 1 2 3 4 5 6 7
Did process/event occur as part of a sequel? Y or N
If yes, list sequel order Example: A patient began VOMITING because of clarithromycin which subsequently caused an ACUTE KIDNEY INJURY which then led to a FALL. [Vomiting = 1, AKI = 2, Fall = 3]
Narrative
81
Figure 2.4: Adjudication Process
2.3.3 The IRR of this new ADR process
(i) Participants and training
The 21 participants included 11 physicians, 5 nurses, 3 pharmacists, and 2 biomedical
scientists, of whom 12 attended the training session i.e. 4 of 11 physicians, 2 of 3
pharmacists, 2 of 2 biomedical scientists and 4 of 5 nurses. There was no significant
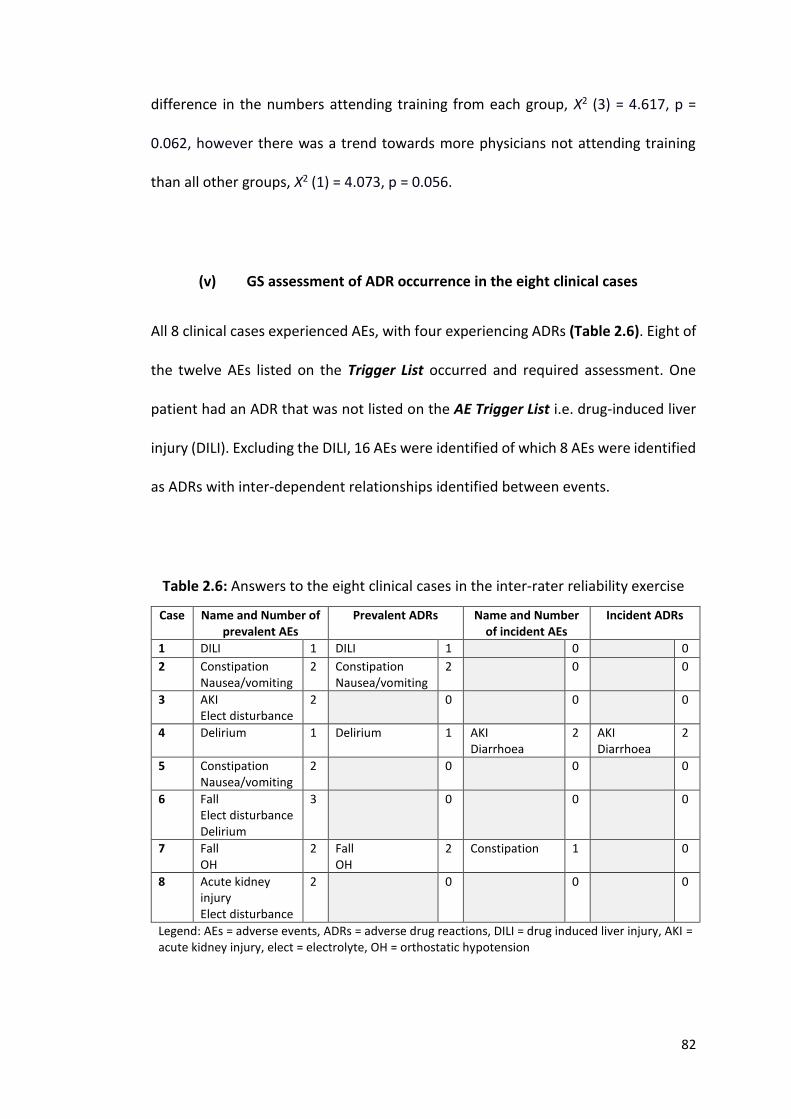
82
difference in the numbers attending training from each group, Χ2 (3) = 4.617, p =
0.062, however there was a trend towards more physicians not attending training
than all other groups, Χ2 (1) = 4.073, p = 0.056.
(v) GS assessment of ADR occurrence in the eight clinical cases
All 8 clinical cases experienced AEs, with four experiencing ADRs (Table 2.6). Eight of
the twelve AEs listed on the Trigger List occurred and required assessment. One
patient had an ADR that was not listed on the AE Trigger List i.e. drug-induced liver
injury (DILI). Excluding the DILI, 16 AEs were identified of which 8 AEs were identified
as ADRs with inter-dependent relationships identified between events.
Table 2.6: Answers to the eight clinical cases in the inter-rater reliability exercise
Case Name and Number of prevalent AEs
Prevalent ADRs Name and Number of incident AEs
Incident ADRs
1 DILI 1 DILI 1 0 0
2 Constipation Nausea/vomiting
2 Constipation Nausea/vomiting
2 0 0
3 AKI Elect disturbance
2 0 0 0
4 Delirium 1 Delirium 1 AKI Diarrhoea
2 AKI Diarrhoea
2
5 Constipation Nausea/vomiting
2 0 0 0
6 Fall Elect disturbance Delirium
3 0 0 0
7 Fall OH
2 Fall OH
2 Constipation 1 0
8 Acute kidney injury Elect disturbance
2 0 0 0
Legend: AEs = adverse events, ADRs = adverse drug reactions, DILI = drug induced liver injury, AKI = acute kidney injury, elect = electrolyte, OH = orthostatic hypotension
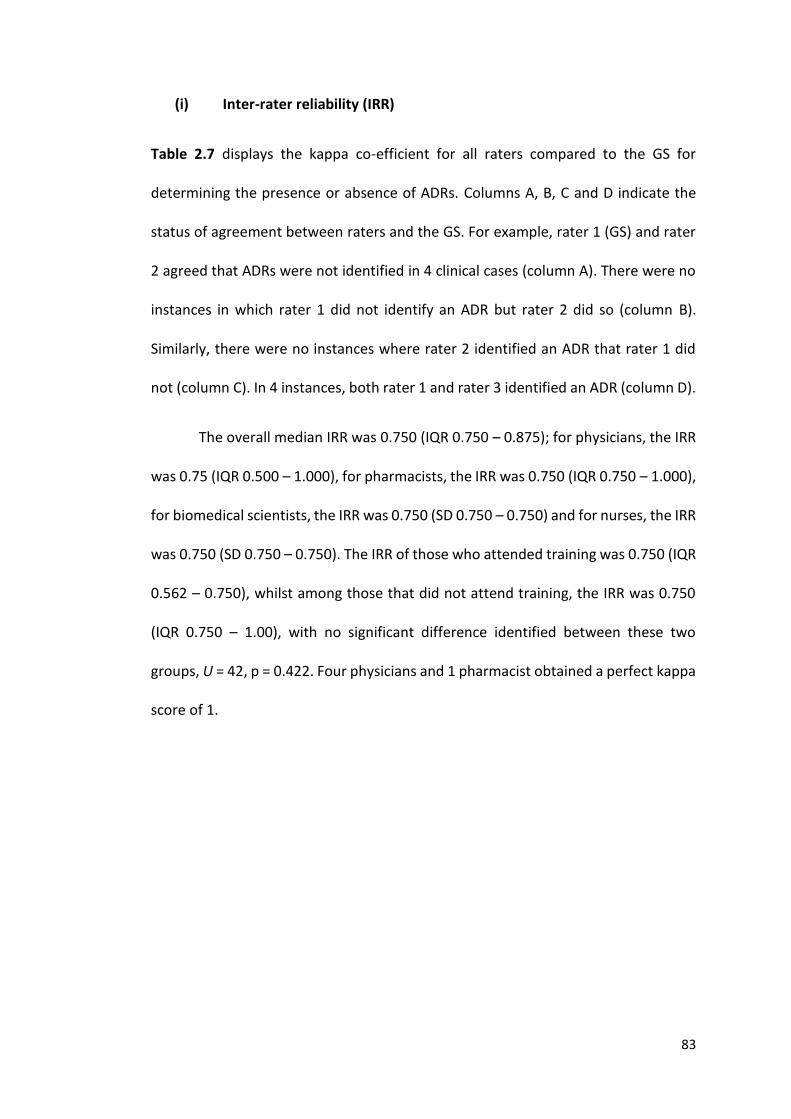
83
(i) Inter-rater reliability (IRR)
Table 2.7 displays the kappa co-efficient for all raters compared to the GS for
determining the presence or absence of ADRs. Columns A, B, C and D indicate the
status of agreement between raters and the GS. For example, rater 1 (GS) and rater
2 agreed that ADRs were not identified in 4 clinical cases (column A). There were no
instances in which rater 1 did not identify an ADR but rater 2 did so (column B).
Similarly, there were no instances where rater 2 identified an ADR that rater 1 did
not (column C). In 4 instances, both rater 1 and rater 3 identified an ADR (column D).
The overall median IRR was 0.750 (IQR 0.750 – 0.875); for physicians, the IRR
was 0.75 (IQR 0.500 – 1.000), for pharmacists, the IRR was 0.750 (IQR 0.750 – 1.000),
for biomedical scientists, the IRR was 0.750 (SD 0.750 – 0.750) and for nurses, the IRR
was 0.750 (SD 0.750 – 0.750). The IRR of those who attended training was 0.750 (IQR
0.562 – 0.750), whilst among those that did not attend training, the IRR was 0.750
(IQR 0.750 – 1.00), with no significant difference identified between these two
groups, U = 42, p = 0.422. Four physicians and 1 pharmacist obtained a perfect kappa
score of 1.
84
Table 2.7: Inter-rater reliability (IRR) of the presence of ADRs
Kappa Co-efficient Level of agreement to gold standard identifying
out of 8 patients how many had ADRs
Rater A B C D Kappa
Gold standard * Rater 2 – physician 4 0 0 4 1.000
Gold standard * Rater 3 – physician 3 1 0 4 0.750
Gold standard * Rater 4 – physician 4 0 0 4 1.000
Gold standard * Rater 5 – physician 3 1 0 4 0.750
Gold standard * Rater 6 – physician 3 1 0 4 0.750
Gold standard * Rater 7 – physician 4 0 0 4 1.000
Gold standard * Rater 8 – physician 2 2 1 3 0.250
Gold standard * Rater 9 – physician 4 0 0 4 1.000
Gold standard * Rater 10 – physician 4 0 2 2 0.500
Gold standard * Rater 11 – physician 4 0 2 2 0.500
Gold standard * Rater 12 - physician 1 3 0 4 0.250
Gold standard * Rater 13 - pharmacist 4 0 0 4 1.000
Gold standard * Rater 14 - pharmacist 4 0 1 3 0.750
Gold standard * Rater 15 - pharmacist 4 0 1 3 0.750
Gold standard * Rater 16 – Biomedical
scientist
4 0 1 3 0.750
Gold standard * Rater 17 - Biomedical
scientist
4 0 1 3 0.750
Gold standard * Rater 18 – nurse 4 0 1 3 0.750
Gold standard * Rater 19 – nurse 4 0 1 3 0.750
Gold standard * Rater 20 - nurse 4 0 1 3 0.750
Gold standard * Rater 21 – nurse 3 1 0 4 0.750
Gold standard * Rater 22 – nurse 4 0 1 3 0.750
Median Kappa 0.750
(IQR0.750 –
0.875)
A – Both the gold standard and rater in question agreed no ADR occurred
B – Gold standard concluded an ADR did not occur / rater in question concluded an ADR did occur
C – Gold standard concluded an ADR occur / rater in question concluded an ADR did not occur
D – Both the gold standard and rater in question agreed an ADR occurred
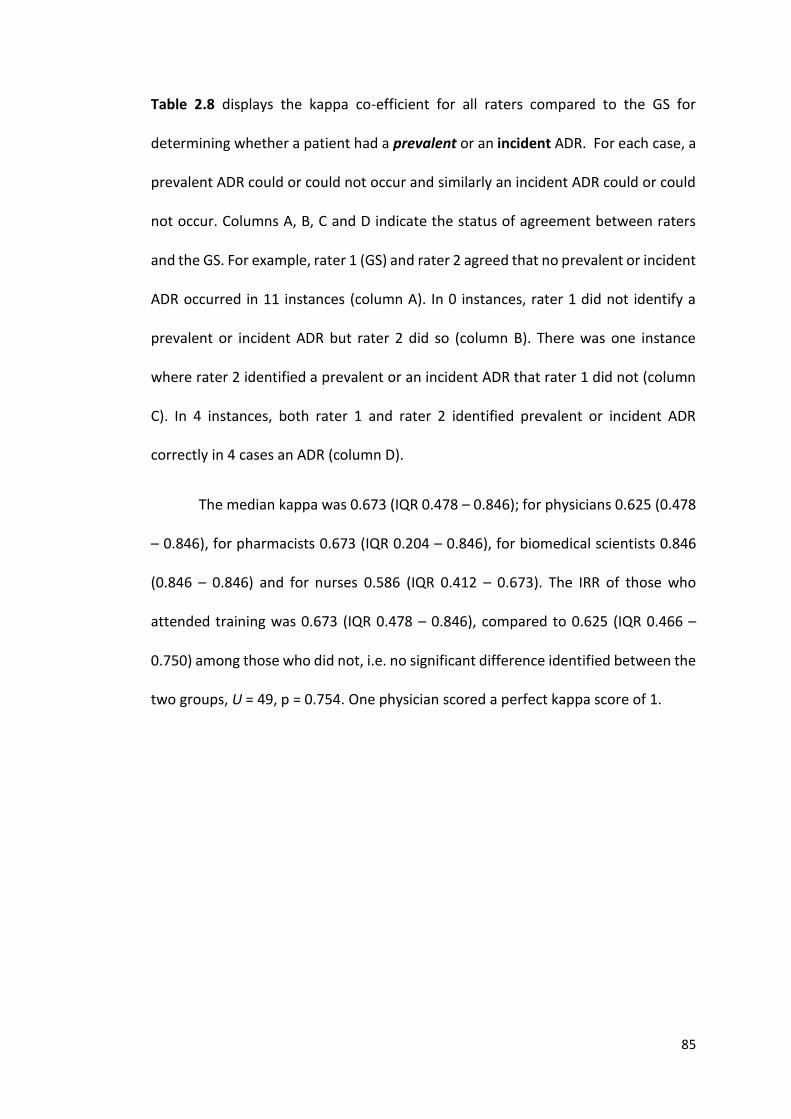
85
Table 2.8 displays the kappa co-efficient for all raters compared to the GS for
determining whether a patient had a prevalent or an incident ADR. For each case, a
prevalent ADR could or could not occur and similarly an incident ADR could or could
not occur. Columns A, B, C and D indicate the status of agreement between raters
and the GS. For example, rater 1 (GS) and rater 2 agreed that no prevalent or incident
ADR occurred in 11 instances (column A). In 0 instances, rater 1 did not identify a
prevalent or incident ADR but rater 2 did so (column B). There was one instance
where rater 2 identified a prevalent or an incident ADR that rater 1 did not (column
C). In 4 instances, both rater 1 and rater 2 identified prevalent or incident ADR
correctly in 4 cases an ADR (column D).
The median kappa was 0.673 (IQR 0.478 – 0.846); for physicians 0.625 (0.478
– 0.846), for pharmacists 0.673 (IQR 0.204 – 0.846), for biomedical scientists 0.846
(0.846 – 0.846) and for nurses 0.586 (IQR 0.412 – 0.673). The IRR of those who
attended training was 0.673 (IQR 0.478 – 0.846), compared to 0.625 (IQR 0.466 –
0.750) among those who did not, i.e. no significant difference identified between the
two groups, U = 49, p = 0.754. One physician scored a perfect kappa score of 1.
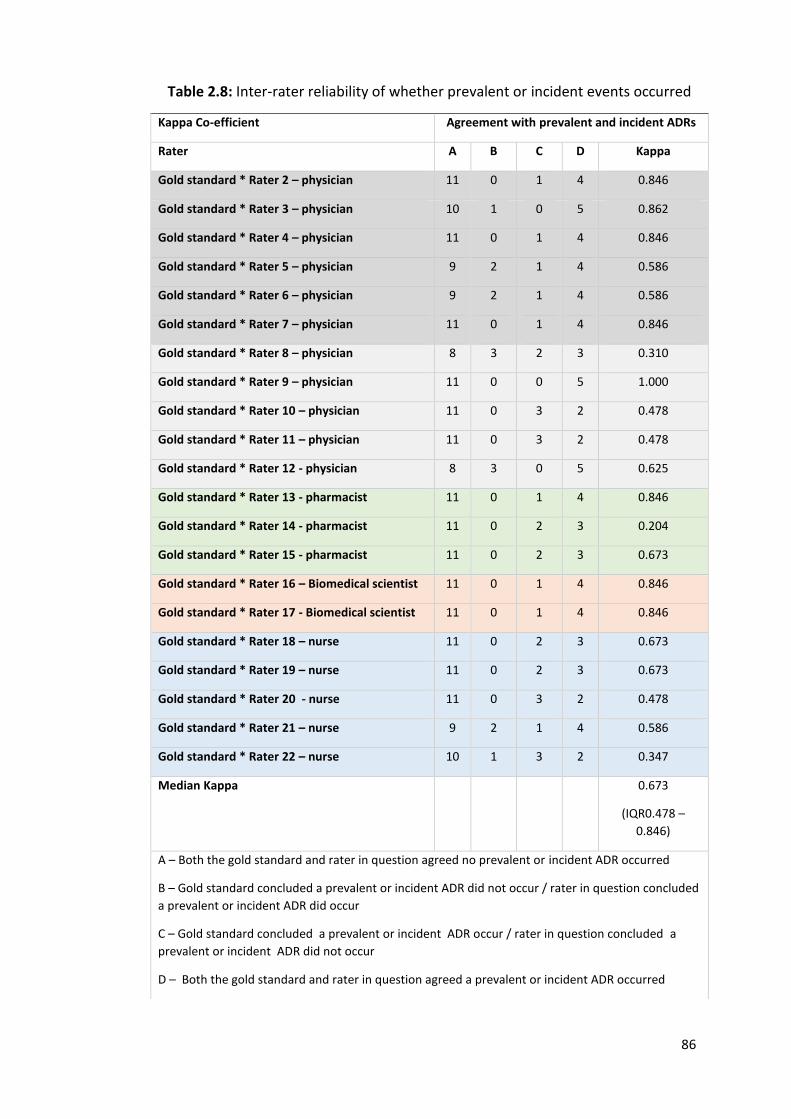
86
Table 2.8: Inter-rater reliability of whether prevalent or incident events occurred
Kappa Co-efficient Agreement with prevalent and incident ADRs
Rater A B C D Kappa
Gold standard * Rater 2 – physician 11 0 1 4 0.846
Gold standard * Rater 3 – physician 10 1 0 5 0.862
Gold standard * Rater 4 – physician 11 0 1 4 0.846
Gold standard * Rater 5 – physician 9 2 1 4 0.586
Gold standard * Rater 6 – physician 9 2 1 4 0.586
Gold standard * Rater 7 – physician 11 0 1 4 0.846
Gold standard * Rater 8 – physician 8 3 2 3 0.310
Gold standard * Rater 9 – physician 11 0 0 5 1.000
Gold standard * Rater 10 – physician 11 0 3 2 0.478
Gold standard * Rater 11 – physician 11 0 3 2 0.478
Gold standard * Rater 12 - physician 8 3 0 5 0.625
Gold standard * Rater 13 - pharmacist 11 0 1 4 0.846
Gold standard * Rater 14 - pharmacist 11 0 2 3 0.204
Gold standard * Rater 15 - pharmacist 11 0 2 3 0.673
Gold standard * Rater 16 – Biomedical scientist 11 0 1 4 0.846
Gold standard * Rater 17 - Biomedical scientist 11 0 1 4 0.846
Gold standard * Rater 18 – nurse 11 0 2 3 0.673
Gold standard * Rater 19 – nurse 11 0 2 3 0.673
Gold standard * Rater 20 - nurse 11 0 3 2 0.478
Gold standard * Rater 21 – nurse 9 2 1 4 0.586
Gold standard * Rater 22 – nurse 10 1 3 2 0.347
Median Kappa 0.673
(IQR0.478 –
0.846)
A – Both the gold standard and rater in question agreed no prevalent or incident ADR occurred
B – Gold standard concluded a prevalent or incident ADR did not occur / rater in question concluded
a prevalent or incident ADR did occur
C – Gold standard concluded a prevalent or incident ADR occur / rater in question concluded a
prevalent or incident ADR did not occur
D – Both the gold standard and rater in question agreed a prevalent or incident ADR occurred
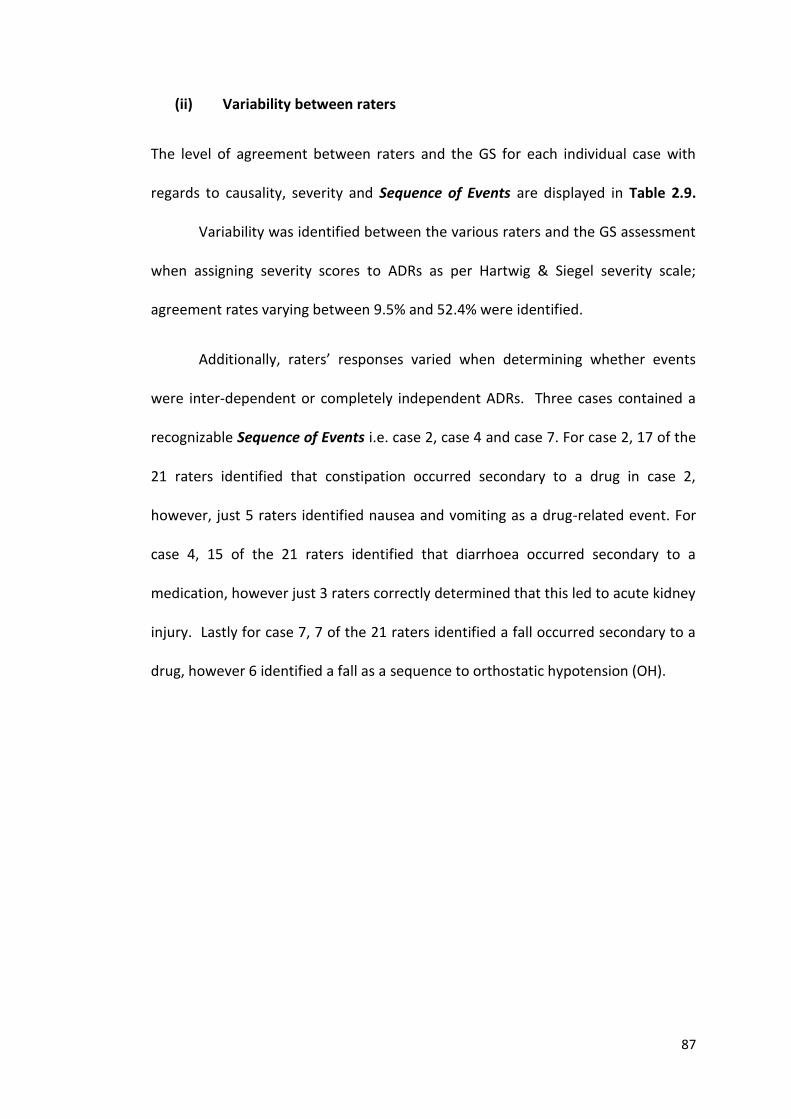
87
(ii) Variability between raters
The level of agreement between raters and the GS for each individual case with
regards to causality, severity and Sequence of Events are displayed in Table 2.9.
Variability was identified between the various raters and the GS assessment
when assigning severity scores to ADRs as per Hartwig & Siegel severity scale;
agreement rates varying between 9.5% and 52.4% were identified.
Additionally, raters’ responses varied when determining whether events
were inter-dependent or completely independent ADRs. Three cases contained a
recognizable Sequence of Events i.e. case 2, case 4 and case 7. For case 2, 17 of the
21 raters identified that constipation occurred secondary to a drug in case 2,
however, just 5 raters identified nausea and vomiting as a drug-related event. For
case 4, 15 of the 21 raters identified that diarrhoea occurred secondary to a
medication, however just 3 raters correctly determined that this led to acute kidney
injury. Lastly for case 7, 7 of the 21 raters identified a fall occurred secondary to a
drug, however 6 identified a fall as a sequence to orthostatic hypotension (OH).
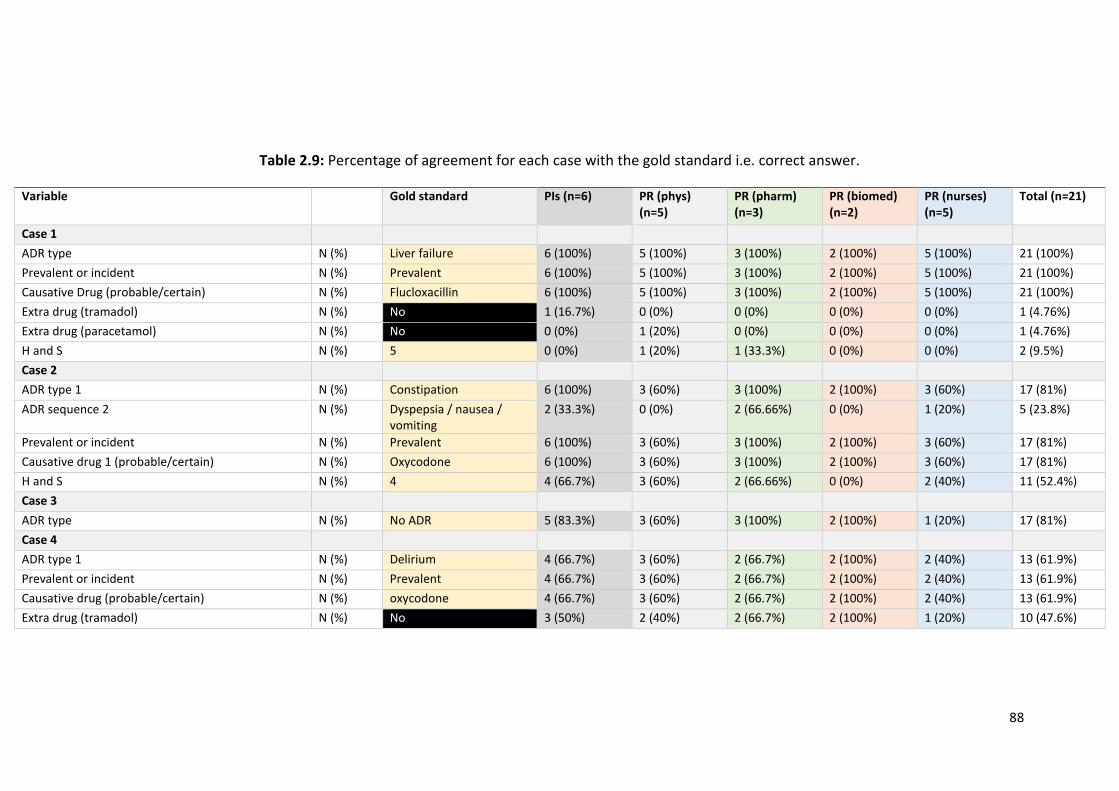
88
Table 2.9: Percentage of agreement for each case with the gold standard i.e. correct answer.
Variable Gold standard PIs (n=6) PR (phys) (n=5)
PR (pharm) (n=3)
PR (biomed) (n=2)
PR (nurses) (n=5)
Total (n=21)
Case 1
ADR type N (%) Liver failure 6 (100%) 5 (100%) 3 (100%) 2 (100%) 5 (100%) 21 (100%)
Prevalent or incident N (%) Prevalent 6 (100%) 5 (100%) 3 (100%) 2 (100%) 5 (100%) 21 (100%)
Causative Drug (probable/certain) N (%) Flucloxacillin 6 (100%) 5 (100%) 3 (100%) 2 (100%) 5 (100%) 21 (100%)
Extra drug (tramadol) N (%) No 1 (16.7%) 0 (0%) 0 (0%) 0 (0%) 0 (0%) 1 (4.76%)
Extra drug (paracetamol) N (%) No 0 (0%) 1 (20%) 0 (0%) 0 (0%) 0 (0%) 1 (4.76%)
H and S N (%) 5 0 (0%) 1 (20%) 1 (33.3%) 0 (0%) 0 (0%) 2 (9.5%)
Case 2
ADR type 1 N (%) Constipation 6 (100%) 3 (60%) 3 (100%) 2 (100%) 3 (60%) 17 (81%)
ADR sequence 2 N (%) Dyspepsia / nausea / vomiting
2 (33.3%) 0 (0%) 2 (66.66%) 0 (0%) 1 (20%) 5 (23.8%)
Prevalent or incident N (%) Prevalent 6 (100%) 3 (60%) 3 (100%) 2 (100%) 3 (60%) 17 (81%)
Causative drug 1 (probable/certain) N (%) Oxycodone 6 (100%) 3 (60%) 3 (100%) 2 (100%) 3 (60%) 17 (81%)
H and S N (%) 4 4 (66.7%) 3 (60%) 2 (66.66%) 0 (0%) 2 (40%) 11 (52.4%)
Case 3
ADR type N (%) No ADR 5 (83.3%) 3 (60%) 3 (100%) 2 (100%) 1 (20%) 17 (81%)
Case 4
ADR type 1 N (%) Delirium 4 (66.7%) 3 (60%) 2 (66.7%) 2 (100%) 2 (40%) 13 (61.9%)
Prevalent or incident N (%) Prevalent 4 (66.7%) 3 (60%) 2 (66.7%) 2 (100%) 2 (40%) 13 (61.9%)
Causative drug (probable/certain) N (%) oxycodone 4 (66.7%) 3 (60%) 2 (66.7%) 2 (100%) 2 (40%) 13 (61.9%)
Extra drug (tramadol) N (%) No 3 (50%) 2 (40%) 2 (66.7%) 2 (100%) 1 (20%) 10 (47.6%)
89
H and S N (%) 4 3 (50%) 2 (40%) 2 (66.7%) 1 (50%) 1 (20%) 9 (42.9%)
ADR type 2 N (%) Diarrhoea 5 (83.3%) 4 (80%) 0 (0%) 2 (100%) 4 (80%) 15 (71.4%)
ADR type 3 N (%) AKI 2 (33.3%) 1 (20%) 0 (0%) 0 (0%) 0 (0%) 3 (14.3%)
Prevalent or incident N (%) Incident 5 (83.3%) 4 (80%) 0 (0%) 2 (100%) 4 (80%) 15 (71.4%)
Causative drug (probable/certain) N (%) Piperacillin / tazobactam 4 (66.7%) 4 (80%) 0 (0%) 2 (100%) 3 (60%) 13 (61.9%)
Extra drug (cefuroxime) N (%) No 1 (16.7%) 0 (0%) 0 (0%) 0 (0%) 1 (20%) 2 (9.5%)
H and S N (%) 4 3 (50%) 3 (60%) 0 (0%) 1 (50%) 4 (80%) 11 (52.4%)
Case 5
ADR type N (%) No ADR 6 (100%) 4 (80%) 3 (100%) 2 (100%) 5 (100%) 20 (85.2%)
Case 6
ADR type N (%) No ADR 5 (83.3%) 4 (80%) 3 (100%) 2 (100%) 5 (100%) 19 (90.5%)
Case 7
ADR type 1 N (%) OH 1 (16.7%) 1 (20%) 2 (66.6%) 0 (0%) 0 (0%) 6 (28.6%)
ADR type 2 N (%) Fall 3 (50%) 2 (40%) 2 (66.6%) 0 (0%) 0 (0%) 7 (33.3%)
Prevalent or incident N (%) Prevalent 4 (66.7%) 2 (40%) 2 (66.6%) 0 (0%) 0 (0%) 7 (33.3%)
Causative drug (probable/certain) N (%) furosemide 4 (66.7%) 1 (20%) 2 (66.6%) 0 (0%) 0 (0%) 7 (33.3%)
Extra drug (Dosulepin) N (%) No 0 (0%) 1 (20%) 0 (0%) 0 (0%) 0 (0%) 1 (4.8%)
Extra drug (Diltiazem) N (%) No 0 (0%) 1 (20%) 0 (0%) 0 (0%) 0 (0%) 1 (4.8%)
H and S N (%) 2 (33.3%) 2 (40%) 1 (33.3%) 0 (0%) 0 (0%) 5 (23.8%)
Case 8
ADR type N (%) No ADR 6 (100%) 4 (80%) 3 (100%) 2 (100%) 5 (100%) 20 (95.2%)
Legend: PI = principal investigator, PR = primary researcher, phys = physicians, pharm = pharmacists, biomed = biomedical scientist
90
2.4 DISCUSSION
An AE Trigger List, based on the 12 most common ADRs that occur in older adults,
was developed and validated for application in older adults. Each AE on the Trigger
List was given a clear definition to ensure accurate capture of clinically significant AEs
and thus clinically significant ADRs. ADRs should be clearly classified as occurring
prehospital, prevalent ADRs, or during hospitalisation, incident ADRs. To avoid over-
reporting of ADRs, all AEs and ADRs should be viewed as processes rather than
discrete events. To capture the morbidity associated with ADRs, the inter-dependent
relationship between AEs on the Trigger list, if deemed drug related, should be
recorded i.e. Sequence of Events. Lastly to further strengthened ADR assessments,
all AEs assessed for a drug cause should be sent to an adjudication committee to
ensure 2 people agree on the final causality per the WHO-UMC causality criteria.
The above proposed approach to ADR assessments has the potential to
standardise the identification, classification and reporting of ADRs. ADR assessments
approached in this manner has the potential to allow comparisons between future
observational studies. In addition, where ADRs are the primary endpoints in
interventional studies, it will ensure ADRs are captured in a clear and robust manner
and thus, interventions to reduce same are appropriately assessed. Using this
approach may also mean that more ADRs are identified and therefore the offending
drug is stopped earlier and the associated morbidity and mortality avoided. To date,
economic consequences and mortality associated with ADRs has been captured but
the true morbidity associated has not. The role of Sequence of Events will be
paramount going forward.
91
The IRR of ascertaining ADRs using this 12 point AE Trigger List and the IRR of
ascertaining the of the timing of ADRs (prevalent vs incident) was found to be
substantial with median values of 0.750 (IQR 0.750 – 0.875) and 0.673 (IQR 0.478 –
0.846) respectively. Disagreements were identified regarding the grading of ADR
severity using the standardized Hartwig & Siegel scale (151). In addition, variations
were identified when identifying the Sequence of Events. Overall, the kappa co-
efficient indicate that the common reading and interpretation of the above proposed
methodology was good.
However, there were limitations identified for the IRR exercise. Firstly, not all
participants attended the training session, notably fewer physicians attended,
presumably because they considered themselves already proficient in ADR
ascertainment. Furthermore, for those that did attend the ADR ascertainment
training, there was no pre-training exercise with which to compare their post training
answers i.e. to determine if the training exercise improved their ADR ascertainment
capabilities. It is speculative whether improvements in kappa co-efficient would have
been observed if all participants had attended the training exercise and all
participants completed this assessment pre- and post-training. This study could have
benefited from participants applying the methodology to more than 8 clinical cases.
Kappa coefficient results for physicians for ADR identifications were skewed, with
two physicians scoring 0.250 and two others scoring 0.500. This may relate to the
fact that English was not the first language among the first pair of physicians. This
fact may have resulted in limited value for them from the training exercise.
92
This research was completed as part of the SENATOR (Development and
clinical trials of a new Software ENgine for the Assessment and optimization of drug
and non-drug Therapy in Older peRsons) clinical trial feasibility study (150), which
examined the prevalent rates of incident ADRs in older hospitalised adults. This study
highlighted many challenges with assessing ADRs as discussed through the chapter
and instigated the proposed methodology for the SENATOR RCT. The SENATOR RCT
is looking at a software intervention advising on medication optimisation at reducing
in hospital ADRs and will be using the methodology proposed in this chapter.
Since this research, two further ADR trigger lists have been developed (154,
155). Both differ from the trigger list proposed in this chapter. The trigger list by Silva
et al. does not incorporate clinical symptoms of ADRs but rather looks at triggers such
as abrupt medication withdrawal or the prescription of specific drug classes (154).
This trigger list has been tested and has been found to identify ADRs in only 53.3% of
patients. The later, by Guzmán et al. comprises a much larger 51 point trigger list.
Triggers here are based on medications and their concentrations, antidotes and
abnormal lab values. This trigger list has yet to be tested in an observational study.
The ADR ascertainment methodology described in this study, along with the
ADR adjudication process could be used to standardize the reporting of ADRs in
future ADR studies. This would greatly help with assessment and comparison of ADR
attenuating interventions. The next two chapters will report on (i) prevalent ADRs in
the acute unselected older hospitalised patients and (ii) prevalent ADRs in
hospitalised adults with cancer, using the above methodology.
93
CHAPTER 3:
Prevalence of adverse drug reactions (ADRs) in an acute unselected hospital
population as determined by new ADR ascertainment methodology
94
3.1 INTRODUCTION
The lack of studies examining the prevalence of multimorbidity in hospitalised older
adults was discussed in Chapter 1. The subjective nature of ADR identification,
classification and reporting was discussed in Chapter 2, in which a novel approach to
ADR ascertainment was described and validated. ADRs are reported to cause
hospitalisation in approximately 10% of older adults by two large meta-analyses (83,
144), however more recent observational studies report higher prevalent ADR rates
of 21% to 26.3% (46, 74).
3.1.1 Objectives
The objectives of this study were:
(i) To investigate and describe the burden of multimorbidity in unselected
older (≥ 65 years) adults presenting to hospital with an acute illness.
(ii) To use the newly developed AE Trigger List to determine the prevalence
of ADRs causing or contributing significantly to hospital admission in an
acute unselected older (≥ 65 years) adult population.
(iii) To classify the identified ADRs according to type, causality, associated
morbidity, severity, predictability and preventability.
(iv) To identify risk factors for ADRs in this patient cohort.
The work undertaken in this chapter, including study design, data collection and
statistical analysis, is entirely my own.
95
3.2 METHODS
3.2.1 Study setting and design
This prospective observational study was conducted at Cork University Hospital
(CUH), an academic teaching hospitals in southern Ireland, over 107 days between
August 2014 and March 2017. CUH is a major university teaching hospital with 850
inpatient beds and over 25,000 emergency admissions per year. In 2016, there were
approximately 65,000 emergency department presentations, approximately 210,000
outpatient attendances and just over 45,000 inpatient discharges.
3.2.2 Patient eligibility and consent
All patients’ aged ≥ 65 years admitted as emergency cases under the care of any
medical or surgical speciality were eligible for inclusion. Exclusion criteria were as
follows: (i) patients who had already enrolled in the study on a previous hospital
admission, (ii) patients deemed to be actively dying by the attending physician, at the
point of admission, and (iii) patients who declined to participate.
The study’s objectives were explained to patients. If they agreed to
participate, patients provided written informed consent. In circumstances where
patients were unable to give consent due to reduced decision making ability e.g.
delirium or advanced dementia, consent was obtained from their legal
representative. Inclusion in the study was documented in patients’ medical records.
The study protocol was assessed and approved by the local research ethics
committees at University College Cork (Appendix 2).
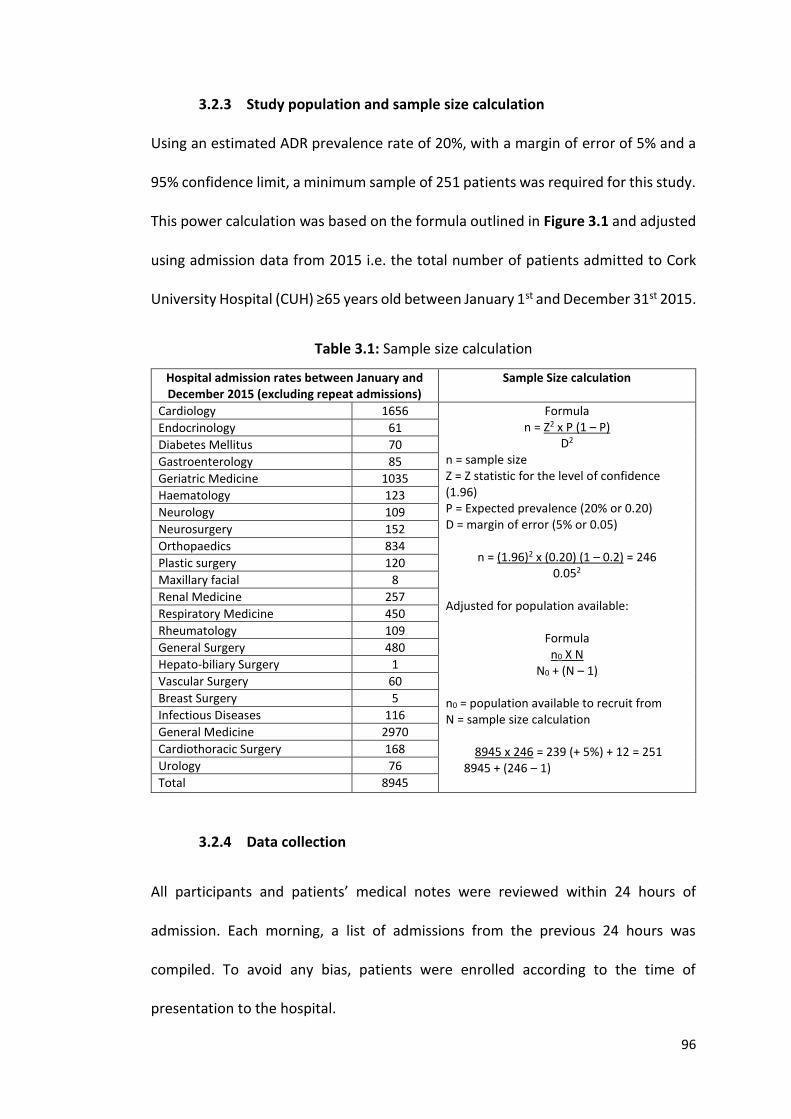
96
3.2.3 Study population and sample size calculation
Using an estimated ADR prevalence rate of 20%, with a margin of error of 5% and a
95% confidence limit, a minimum sample of 251 patients was required for this study.
This power calculation was based on the formula outlined in Figure 3.1 and adjusted
using admission data from 2015 i.e. the total number of patients admitted to Cork
University Hospital (CUH) ≥65 years old between January 1st and December 31st 2015.
Table 3.1: Sample size calculation
Hospital admission rates between January and December 2015 (excluding repeat admissions)
Sample Size calculation
Cardiology 1656 Formula n = Z2 x P (1 – P)
D2
n = sample size Z = Z statistic for the level of confidence (1.96) P = Expected prevalence (20% or 0.20) D = margin of error (5% or 0.05)
n = (1.96)2 x (0.20) (1 – 0.2) = 246 0.052
Adjusted for population available:
Formula n0 X N
N0 + (N – 1) n0 = population available to recruit from N = sample size calculation
8945 x 246 = 239 (+ 5%) + 12 = 251
8945 + (246 – 1)
Endocrinology 61
Diabetes Mellitus 70
Gastroenterology 85
Geriatric Medicine 1035
Haematology 123
Neurology 109
Neurosurgery 152
Orthopaedics 834
Plastic surgery 120
Maxillary facial 8
Renal Medicine 257
Respiratory Medicine 450
Rheumatology 109
General Surgery 480
Hepato-biliary Surgery 1
Vascular Surgery 60
Breast Surgery 5
Infectious Diseases 116
General Medicine 2970
Cardiothoracic Surgery 168
Urology 76
Total 8945
3.2.4 Data collection
All participants and patients’ medical notes were reviewed within 24 hours of
admission. Each morning, a list of admissions from the previous 24 hours was
compiled. To avoid any bias, patients were enrolled according to the time of
presentation to the hospital.
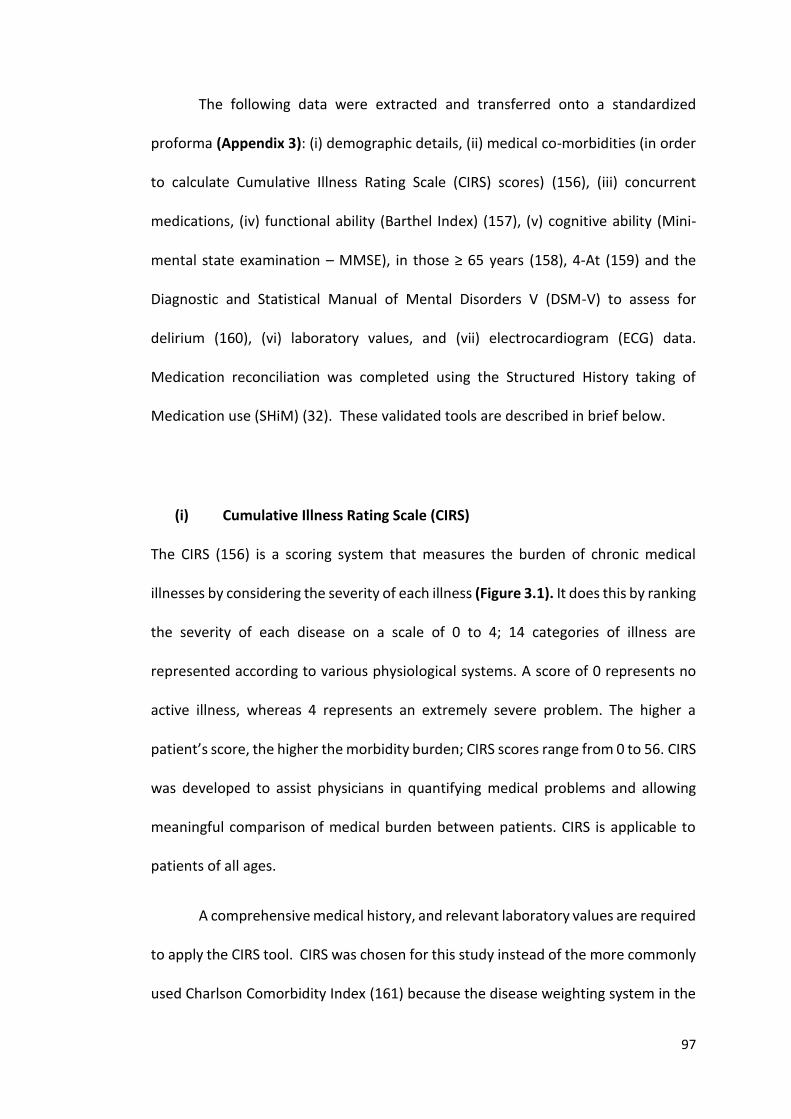
97
The following data were extracted and transferred onto a standardized
proforma (Appendix 3): (i) demographic details, (ii) medical co-morbidities (in order
to calculate Cumulative Illness Rating Scale (CIRS) scores) (156), (iii) concurrent
medications, (iv) functional ability (Barthel Index) (157), (v) cognitive ability (Mini-
mental state examination – MMSE), in those ≥ 65 years (158), 4-At (159) and the
Diagnostic and Statistical Manual of Mental Disorders V (DSM-V) to assess for
delirium (160), (vi) laboratory values, and (vii) electrocardiogram (ECG) data.
Medication reconciliation was completed using the Structured History taking of
Medication use (SHiM) (32). These validated tools are described in brief below.
(i) Cumulative Illness Rating Scale (CIRS)
The CIRS (156) is a scoring system that measures the burden of chronic medical
illnesses by considering the severity of each illness (Figure 3.1). It does this by ranking
the severity of each disease on a scale of 0 to 4; 14 categories of illness are
represented according to various physiological systems. A score of 0 represents no
active illness, whereas 4 represents an extremely severe problem. The higher a
patient’s score, the higher the morbidity burden; CIRS scores range from 0 to 56. CIRS
was developed to assist physicians in quantifying medical problems and allowing
meaningful comparison of medical burden between patients. CIRS is applicable to
patients of all ages.
A comprehensive medical history, and relevant laboratory values are required
to apply the CIRS tool. CIRS was chosen for this study instead of the more commonly
used Charlson Comorbidity Index (161) because the disease weighting system in the
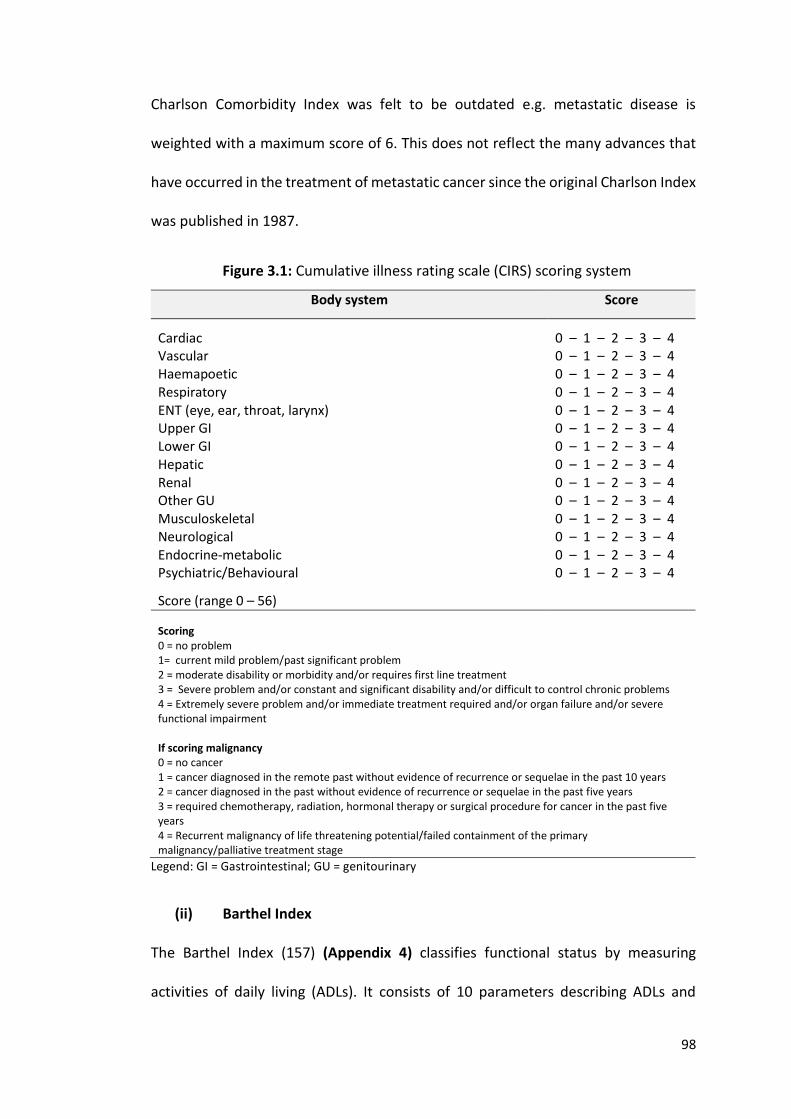
98
Charlson Comorbidity Index was felt to be outdated e.g. metastatic disease is
weighted with a maximum score of 6. This does not reflect the many advances that
have occurred in the treatment of metastatic cancer since the original Charlson Index
was published in 1987.
Figure 3.1: Cumulative illness rating scale (CIRS) scoring system
Body system Score
Cardiac 0 – 1 – 2 – 3 – 4 Vascular 0 – 1 – 2 – 3 – 4 Haemapoetic 0 – 1 – 2 – 3 – 4 Respiratory 0 – 1 – 2 – 3 – 4 ENT (eye, ear, throat, larynx) 0 – 1 – 2 – 3 – 4 Upper GI 0 – 1 – 2 – 3 – 4 Lower GI 0 – 1 – 2 – 3 – 4 Hepatic 0 – 1 – 2 – 3 – 4 Renal 0 – 1 – 2 – 3 – 4 Other GU 0 – 1 – 2 – 3 – 4 Musculoskeletal 0 – 1 – 2 – 3 – 4 Neurological 0 – 1 – 2 – 3 – 4 Endocrine-metabolic 0 – 1 – 2 – 3 – 4 Psychiatric/Behavioural 0 – 1 – 2 – 3 – 4
Score (range 0 – 56)
Scoring 0 = no problem 1= current mild problem/past significant problem 2 = moderate disability or morbidity and/or requires first line treatment 3 = Severe problem and/or constant and significant disability and/or difficult to control chronic problems 4 = Extremely severe problem and/or immediate treatment required and/or organ failure and/or severe functional impairment If scoring malignancy 0 = no cancer 1 = cancer diagnosed in the remote past without evidence of recurrence or sequelae in the past 10 years 2 = cancer diagnosed in the past without evidence of recurrence or sequelae in the past five years 3 = required chemotherapy, radiation, hormonal therapy or surgical procedure for cancer in the past five years 4 = Recurrent malignancy of life threatening potential/failed containment of the primary malignancy/palliative treatment stage
Legend: GI = Gastrointestinal; GU = genitourinary
(ii) Barthel Index
The Barthel Index (157) (Appendix 4) classifies functional status by measuring
activities of daily living (ADLs). It consists of 10 parameters describing ADLs and
99
mobility. Each parameter can be scored a 0 or 1 and for some parameters a score 2
can be given. The maximum score is 20 i.e. fully independent in personal activities of
daily living. The lower the score, the more dependent a person is. To apply the
Barthel Index, patients or caregivers need to be able to answer questions on
functional ability.
(iii) Mini Mental State Examination (MMSE)
The MMSE is a validated tool designed to assess cognitive status in patients aged ≥65
years old (Appendix 5) (158). This 30 item questionnaire is widely used to identify
cognitive impairment in both the clinical and research settings. It is a poor
discriminator of mild cognitive impairment from dementia, in which case the
Montreal Cognitive Assessment (MOCA) is more frequently deployed instead (162).
(iv) 4-AT Test
The 4-AT test is a validated tool to assess for the prevalence of delirium (159). It
assesses 4 components (Figure 3.2): alertness, orientation, attention and fluctuating
consciousness. It incorporates the Months Backwards Test (MBT). It is quick and easy
to use. The maximum score on the 4-AT is 14. A score of ≥ 4 suggests a possible
delirium with or without an underlying cognitive impairment, a score of 1 or 2
suggested possible cognitive impairment and a score of 0 indicates that delirium or
severe cognitive impairment is unlikely.
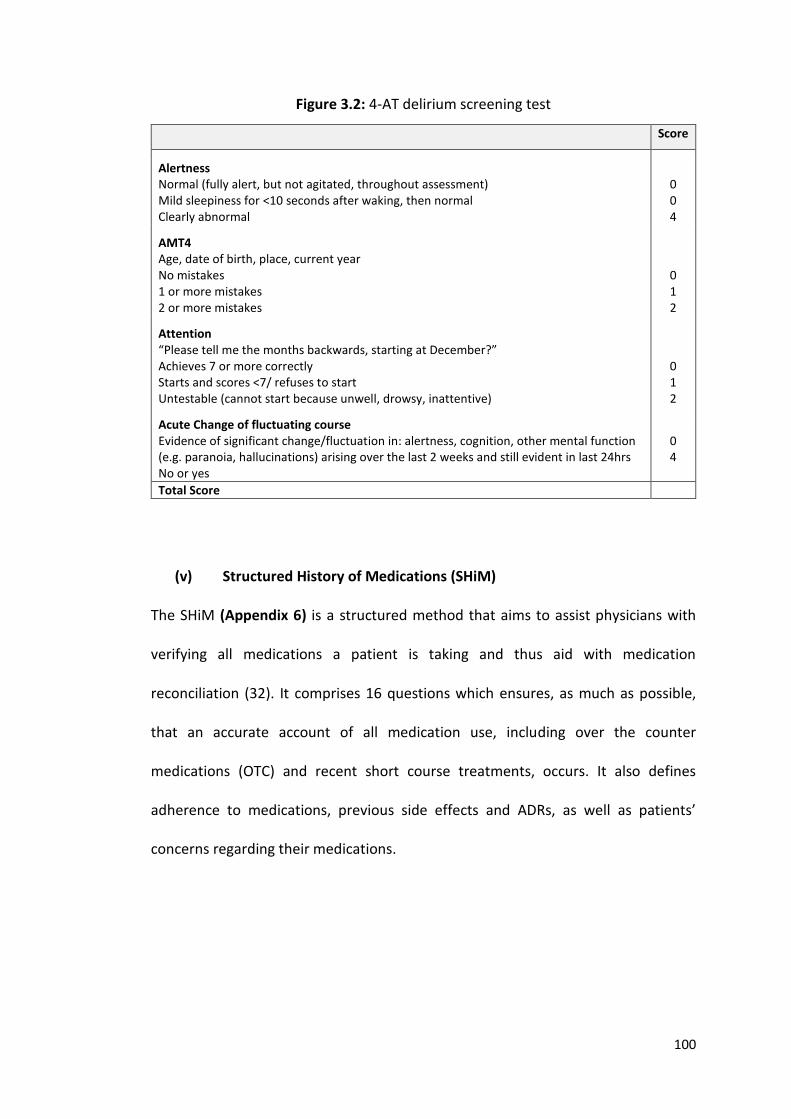
100
Figure 3.2: 4-AT delirium screening test
Score
Alertness Normal (fully alert, but not agitated, throughout assessment) Mild sleepiness for <10 seconds after waking, then normal Clearly abnormal
0 0 4
AMT4 Age, date of birth, place, current year No mistakes 1 or more mistakes 2 or more mistakes
0 1 2
Attention “Please tell me the months backwards, starting at December?” Achieves 7 or more correctly Starts and scores <7/ refuses to start Untestable (cannot start because unwell, drowsy, inattentive)
0 1 2
Acute Change of fluctuating course Evidence of significant change/fluctuation in: alertness, cognition, other mental function (e.g. paranoia, hallucinations) arising over the last 2 weeks and still evident in last 24hrs No or yes
0 4
Total Score
(v) Structured History of Medications (SHiM)
The SHiM (Appendix 6) is a structured method that aims to assist physicians with
verifying all medications a patient is taking and thus aid with medication
reconciliation (32). It comprises 16 questions which ensures, as much as possible,
that an accurate account of all medication use, including over the counter
medications (OTC) and recent short course treatments, occurs. It also defines
adherence to medications, previous side effects and ADRs, as well as patients’
concerns regarding their medications.
101
(vi) Rockwood’s Clinical Frailty Scale (CFS)
The Rockwood Clinical Frailty Scale (Appendix 7) is a 9 point scale that was developed
to help classify patients according to their level of frailty (163). A score of 1 implies a
patient is very fit, whereas a score of 8 indicates high level dependency and
impending end-of-life status. Persons receive a score of 9 if they have a terminal
diagnosis with a known life expectancy of ≤ 6 months. This tool, although primarily
developed for use in classifying frailty in patients with dementia, is now used to
identify and classify frailty in all patients. It usually takes less than 30 seconds to
apply.
3.2.5 Potentially inappropriate prescribing
Potentially inappropriate prescribing was assessed using STOPP/START criteria (37)
(Appendix 8). STOPP/START criteria were originally developed and validated through
Delphi technique in 2008 (36) and further updated in 2014 (37). STOPP/START is an
explicit prescribing tool that aims to highlight common instances of potentially
inappropriate prescribing and potentially prescribing omissions (PPOs) in adults 65
years and older. It consists of 80 potentially inappropriate prescriptions (PIPs) and 34
PPOs and is divided according to physiological system. For their application, a
physician requires an up to date list of all medical diagnoses, concurrent medications,
baseline laboratory values and an ECG. STOPP/START criteria have been used to
identify potentially inappropriate medication (PIM) use in multiple studies of older
adults, both in Ireland (41, 45, 50) and Europe (34, 164) and elsewhere. PIMs listed
in STOPP/START criteria are significantly associated with ADRs (46). The application
102
of STOPP/START criteria has been shown by way of RCTs to result in sustained
improvement in various domains of medication appropriateness (72, 165), and
reductions in incident ADRs in hospitalised older patients (74) as well as fewer
incident falls in nursing home residents (73). The presence or absence of a PIM,
according to STOPP/START criteria, was categorised as a dichotomous variable.
Where there was uncertainty regarding appropriateness of a prescription this was
treated conservatively i.e. the prescription was deemed appropriate.
3.2.6 Adverse drug reactions
The proportion of patients experiencing one or more non-trivial, probable or certain,
ADR causing or contributing significantly to hospital admission was also recorded. For
this study, Edwards and Aronson’s definition of an ADR was applied i.e. “An
appreciably harmful or unpleasant reaction, resulting from an intervention related to
the use of a medicinal product, which predicts hazard from future administration and
warrants prevention or specific treatment, or alteration of the dosage regimen, or
withdrawal of the product” (79).
To limit potential bias from selective ADR reporting and to ensure ADRs were
not missed, the validated AE Trigger List of the 12 most common ADRs, as discussed
in Chapter 2, was used. Data on any ADR not listed in the AE Trigger List was also
collected e.g. acute liver injury. All AEs representing potential ADRs were recorded
prospectively and subsequently reviewed to assess the causative role of current
medications. The morbidity associated with ADRs was captured using the Sequence
of Events.
103
3.2.7 ADR causality, severity, predictability and preventability
Causality was assessed using the World Health Organisation Uppsala Monitoring
Centre (WHO-UMC) criteria (119). ADR severity was assessed using the Hartwig &
Siegel scale, as discussed in Chapter 2 (151). ADR preventability was assessed using
Hallas criteria i.e. definitely avoidable, possibly avoidable, unavoidable and
unclassifiable (166). ADR predictability was assessed using the summary of product
characteristics (SPC) (Table 3.2). ADRs were deemed predictable if they commonly
(≥1/100 and <1/10) or very commonly (≥1/10) occurred in patients prescribed the
medication in question.
Table 3.2: ADR predictability
Incident rate
Incident description Predictability
≥1/10 ≥1/100 and < 1/10 ≥1/1000 and < 1/100 ≥1/10,000 and < 1/1000 < 1/10,000
Very common Common Uncommon Rare Very rare
Predictable Predictable Unpredictable Unpredictable Unpredictable
3.2.8 Statistical analysis
Statistical analysis was performed using SPSS® version 22 for windows. Descriptive
data were reported using the mean and standard deviation (SD) for variables that
were normally distributed and median and interquartile range (IQR) for non-
parametric variables. Differences in the distribution of categorical variables were
compared using Pearson’s Chi-square (Χ2) test and continuous variables using the
independent t test. The Mann Whitney U and Kruskal-Wallis tests were used to
determine independence of two or more non-parametric variables respectively.
104
Pearson’s kappa coefficient was used to assess correlation between variables.
Multivariable logistic regression was used to examine the influence of gender, age,
number of medications and burden of co-morbidity on potentially inappropriate
prescribing practices. One-way ANOVA was used to determine the difference in the
mean of a dependent variable when there were 3 or more categories to the
independent variable. The Hosmer & Lemeshow statistic was used to test the
goodness-of-fit of the regression model. A probability value of less than 0.05 was
considered statistically significant.
3.3 RESULTS
3.3.1 Screening
Between August 2014 and March 2017, a total of 274 emergency admissions were
screened for study inclusion. Of these, 240 patients agreed to participate, 81.7%
(n=196) of whom were medical patients and 18.3% (n=44) were surgical patients.
These data are summarised in Figure 3.3 together with reasons for study exclusion.
The distribution of admissions according to specialty are summarised in Figure 3.4.
105
Figure 3.3: Participant screening, exclusion and enrolment
Figure 3.4: Distribution of admissions according to specialty
0.0%
5.0%
10.0%
15.0%
20.0%
25.0%
106
3.3.2 Population characteristics
Baseline characteristics are displayed in Table 3.3. Similar numbers of males and
females participated in this study (50.4% vs 49.6%). The mean age was 78.0 (SD 7.6)
years. Almost half of the patients (44.2%) were ≥ 80 years old and approximately 1 in
5 (22.5%) were ≥ 85 years old. Most patients were functionally independent, with
71.4% (n=171) being categorised as independent or low level dependency (Barthel
Index scores ≥16). Eighty three percent of patients (n=199) completed the MMSE.
From these scores, normal cognition and mild cognitive impairment were identified
in 57.9% and 15% respectively. Approximately 1 in every 5 patients had moderate or
severe cognitive impairment. It must be mentioned that acutely ill patients can
underperform on a MMSE due to delirium and thus mild cognitive impairment and
dementia may be over-estimated. Delirium was identified in 19.6% (n=47) using the
4-AT test and DSM-5 criteria. Collateral history was taken to confirm the presence of
delirium. No differences in Rockwood Clinical Frailty Scale scores were identified
between genders (Χ2 (8) = 12.018, p = 0.150). Differences in the level of frailty were
identified between age groups (Χ2 (16) = 37.662, p = 0.002) (Figure 3.5).
One in four (25.4%) participants consumed alcohol on a weekly basis. Men
were significantly more likely to do so (33.9% vs 16.8%, Χ2 (1) = 9.034, p = 0.003) and
significantly more likely to drink more than the recommended weekly allowance
(10.7% vs 1.7%, Χ2 (1) = 3.416, p = 0.004). Eight (3.3%) older adults drank more than
25 units per week. Collateral history was obtained to confirm alcohol intake. One
hundred and nineteen (49.6%) patients had a history of smoking and 10.4% (n=25)
were current smokers.
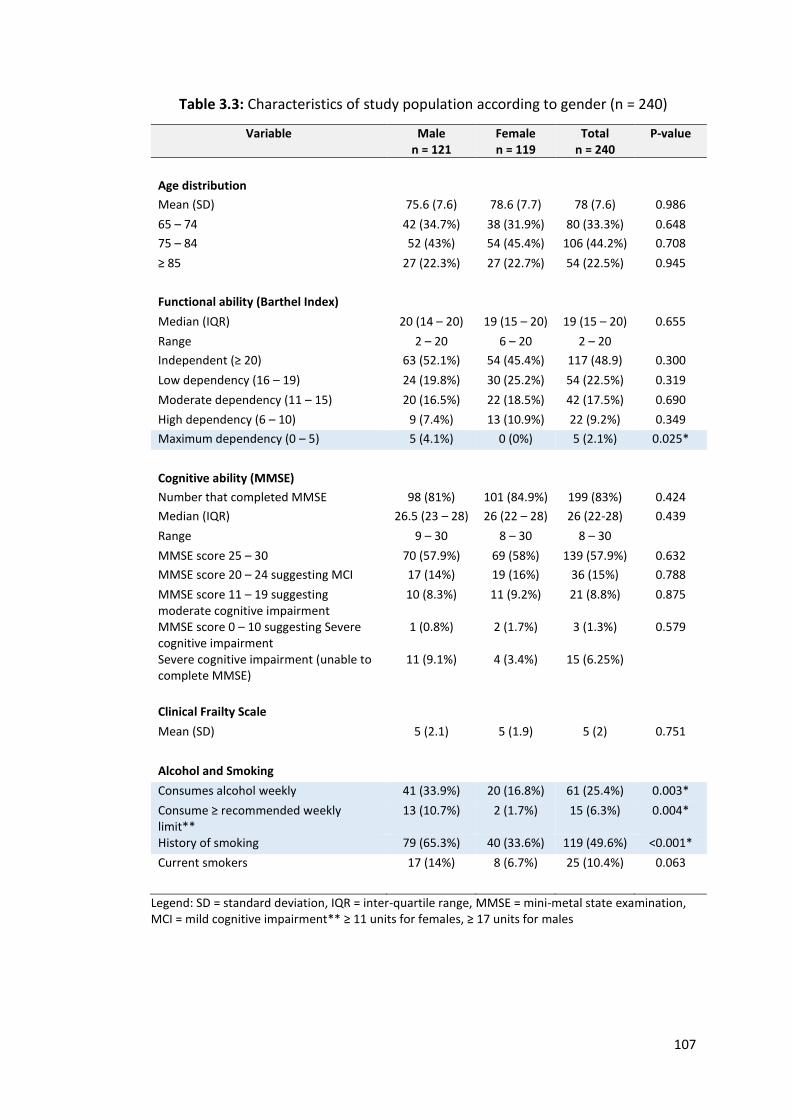
107
Table 3.3: Characteristics of study population according to gender (n = 240)
Variable Male n = 121
Female n = 119
Total n = 240
P-value
Age distribution
Mean (SD) 75.6 (7.6) 78.6 (7.7) 78 (7.6) 0.986
65 – 74 42 (34.7%) 38 (31.9%) 80 (33.3%) 0.648
75 – 84 52 (43%) 54 (45.4%) 106 (44.2%) 0.708
≥ 85 27 (22.3%) 27 (22.7%) 54 (22.5%) 0.945
Functional ability (Barthel Index)
Median (IQR) 20 (14 – 20) 19 (15 – 20) 19 (15 – 20) 0.655
Range 2 – 20 6 – 20 2 – 20
Independent (≥ 20) 63 (52.1%) 54 (45.4%) 117 (48.9) 0.300
Low dependency (16 – 19) 24 (19.8%) 30 (25.2%) 54 (22.5%) 0.319
Moderate dependency (11 – 15) 20 (16.5%) 22 (18.5%) 42 (17.5%) 0.690
High dependency (6 – 10) 9 (7.4%) 13 (10.9%) 22 (9.2%) 0.349
Maximum dependency (0 – 5) 5 (4.1%) 0 (0%) 5 (2.1%) 0.025*
Cognitive ability (MMSE)
Number that completed MMSE 98 (81%) 101 (84.9%) 199 (83%) 0.424
Median (IQR) 26.5 (23 – 28) 26 (22 – 28) 26 (22-28) 0.439
Range 9 – 30 8 – 30 8 – 30
MMSE score 25 – 30 70 (57.9%) 69 (58%) 139 (57.9%) 0.632
MMSE score 20 – 24 suggesting MCI 17 (14%) 19 (16%) 36 (15%) 0.788
MMSE score 11 – 19 suggesting moderate cognitive impairment
10 (8.3%) 11 (9.2%) 21 (8.8%) 0.875
MMSE score 0 – 10 suggesting Severe cognitive impairment
1 (0.8%) 2 (1.7%) 3 (1.3%) 0.579
Severe cognitive impairment (unable to complete MMSE)
11 (9.1%) 4 (3.4%) 15 (6.25%)
Clinical Frailty Scale
Mean (SD) 5 (2.1) 5 (1.9) 5 (2) 0.751
Alcohol and Smoking
Consumes alcohol weekly 41 (33.9%) 20 (16.8%) 61 (25.4%) 0.003*
Consume ≥ recommended weekly limit**
13 (10.7%) 2 (1.7%) 15 (6.3%) 0.004*
History of smoking 79 (65.3%) 40 (33.6%) 119 (49.6%) <0.001*
Current smokers 17 (14%) 8 (6.7%) 25 (10.4%) 0.063
Legend: SD = standard deviation, IQR = inter-quartile range, MMSE = mini-metal state examination, MCI = mild cognitive impairment** ≥ 11 units for females, ≥ 17 units for males
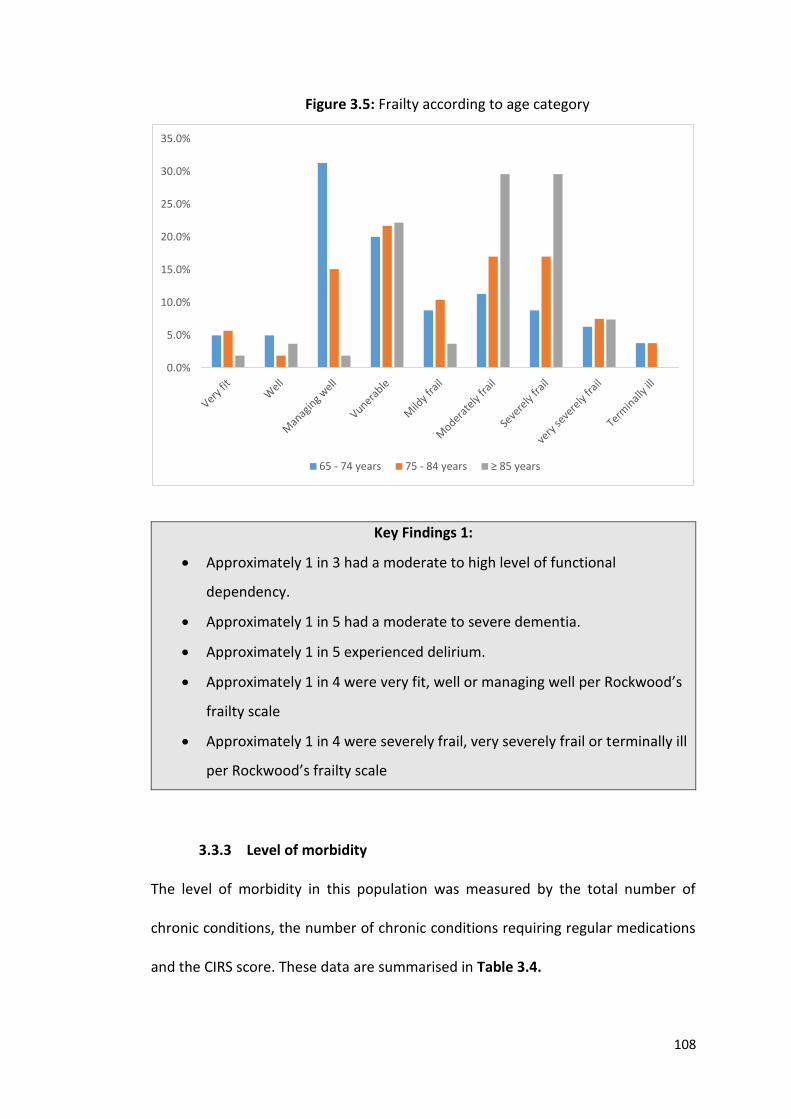
108
Figure 3.5: Frailty according to age category
Key Findings 1:
Approximately 1 in 3 had a moderate to high level of functional
dependency.
Approximately 1 in 5 had a moderate to severe dementia.
Approximately 1 in 5 experienced delirium.
Approximately 1 in 4 were very fit, well or managing well per Rockwood’s
frailty scale
Approximately 1 in 4 were severely frail, very severely frail or terminally ill
per Rockwood’s frailty scale
3.3.3 Level of morbidity
The level of morbidity in this population was measured by the total number of
chronic conditions, the number of chronic conditions requiring regular medications
and the CIRS score. These data are summarised in Table 3.4.
0.0%
5.0%
10.0%
15.0%
20.0%
25.0%
30.0%
35.0%
65 - 74 years 75 - 84 years ≥ 85 years
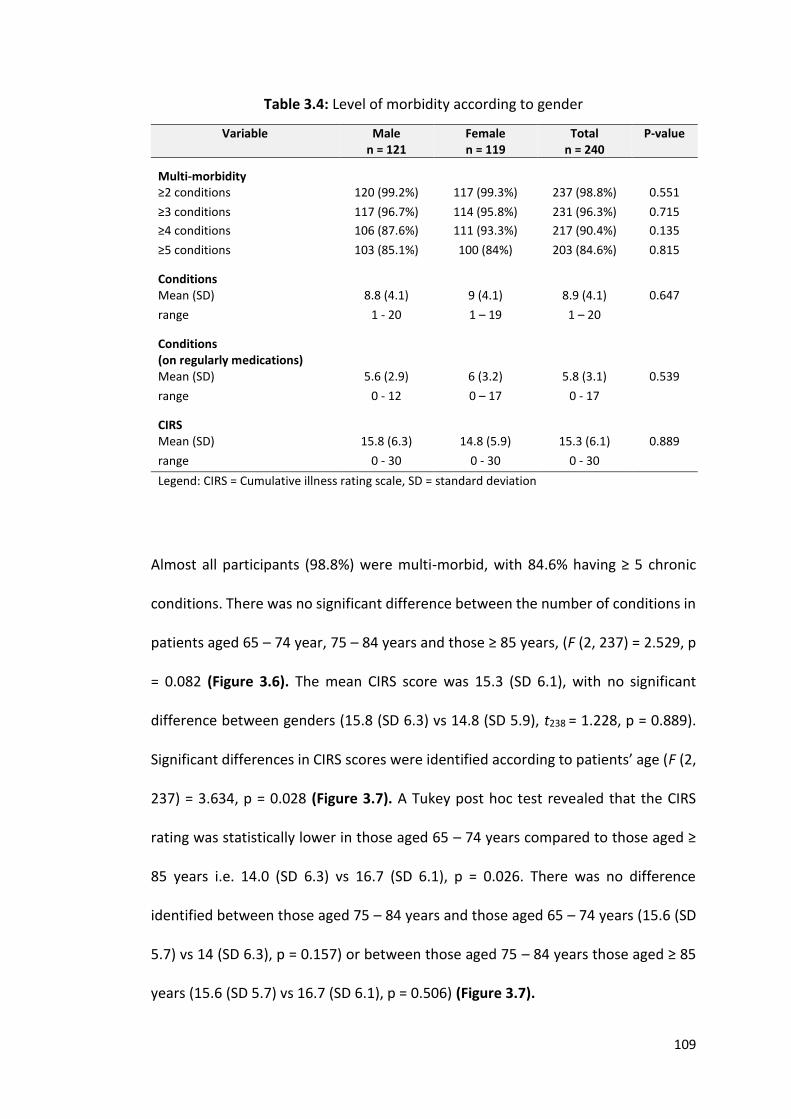
109
Table 3.4: Level of morbidity according to gender
Variable Male n = 121
Female n = 119
Total n = 240
P-value
Multi-morbidity
≥2 conditions 120 (99.2%) 117 (99.3%) 237 (98.8%) 0.551
≥3 conditions 117 (96.7%) 114 (95.8%) 231 (96.3%) 0.715
≥4 conditions 106 (87.6%) 111 (93.3%) 217 (90.4%) 0.135
≥5 conditions 103 (85.1%) 100 (84%) 203 (84.6%) 0.815
Conditions
Mean (SD) 8.8 (4.1) 9 (4.1) 8.9 (4.1) 0.647
range 1 - 20 1 – 19 1 – 20
Conditions (on regularly medications)
Mean (SD) 5.6 (2.9) 6 (3.2) 5.8 (3.1) 0.539
range 0 - 12 0 – 17 0 - 17
CIRS
Mean (SD) 15.8 (6.3) 14.8 (5.9) 15.3 (6.1) 0.889
range 0 - 30 0 - 30 0 - 30
Legend: CIRS = Cumulative illness rating scale, SD = standard deviation
Almost all participants (98.8%) were multi-morbid, with 84.6% having ≥ 5 chronic
conditions. There was no significant difference between the number of conditions in
patients aged 65 – 74 year, 75 – 84 years and those ≥ 85 years, (F (2, 237) = 2.529, p
= 0.082 (Figure 3.6). The mean CIRS score was 15.3 (SD 6.1), with no significant
difference between genders (15.8 (SD 6.3) vs 14.8 (SD 5.9), t238 = 1.228, p = 0.889).
Significant differences in CIRS scores were identified according to patients’ age (F (2,
237) = 3.634, p = 0.028 (Figure 3.7). A Tukey post hoc test revealed that the CIRS
rating was statistically lower in those aged 65 – 74 years compared to those aged ≥
85 years i.e. 14.0 (SD 6.3) vs 16.7 (SD 6.1), p = 0.026. There was no difference
identified between those aged 75 – 84 years and those aged 65 – 74 years (15.6 (SD
5.7) vs 14 (SD 6.3), p = 0.157) or between those aged 75 – 84 years those aged ≥ 85
years (15.6 (SD 5.7) vs 16.7 (SD 6.1), p = 0.506) (Figure 3.7).
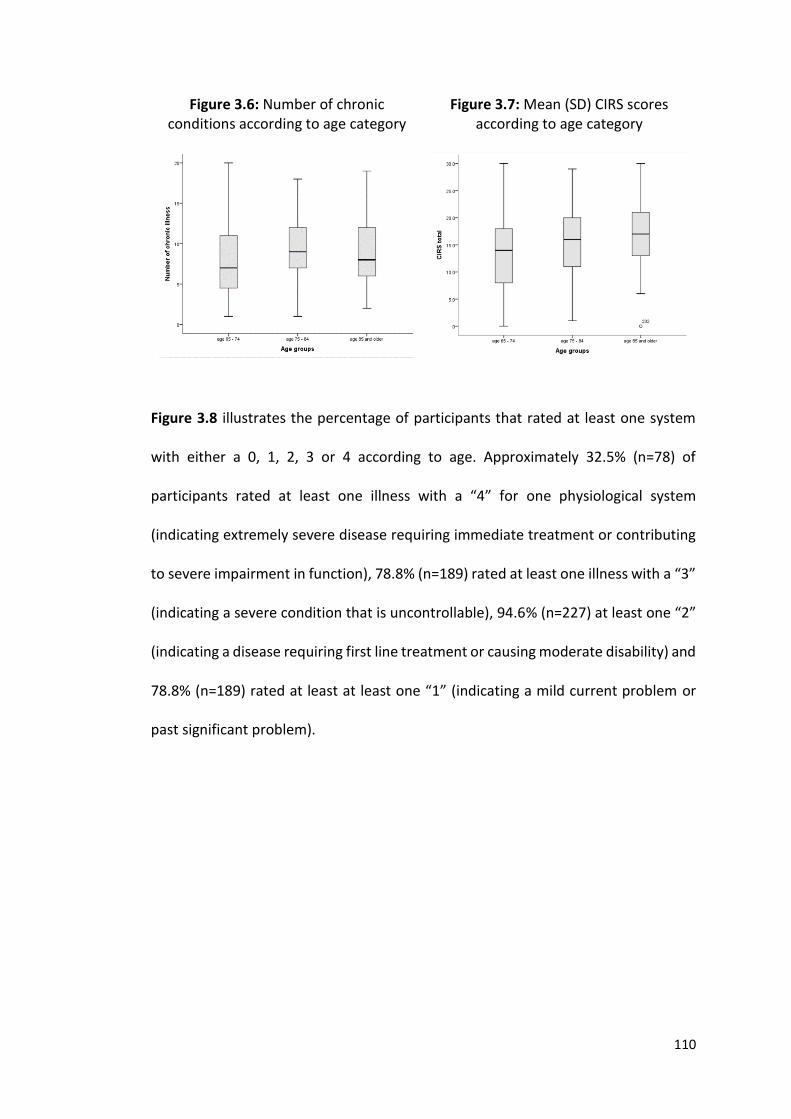
110
Figure 3.6: Number of chronic conditions according to age category
Figure 3.7: Mean (SD) CIRS scores according to age category
Figure 3.8 illustrates the percentage of participants that rated at least one system
with either a 0, 1, 2, 3 or 4 according to age. Approximately 32.5% (n=78) of
participants rated at least one illness with a “4” for one physiological system
(indicating extremely severe disease requiring immediate treatment or contributing
to severe impairment in function), 78.8% (n=189) rated at least one illness with a “3”
(indicating a severe condition that is uncontrollable), 94.6% (n=227) at least one “2”
(indicating a disease requiring first line treatment or causing moderate disability) and
78.8% (n=189) rated at least at least one “1” (indicating a mild current problem or
past significant problem).
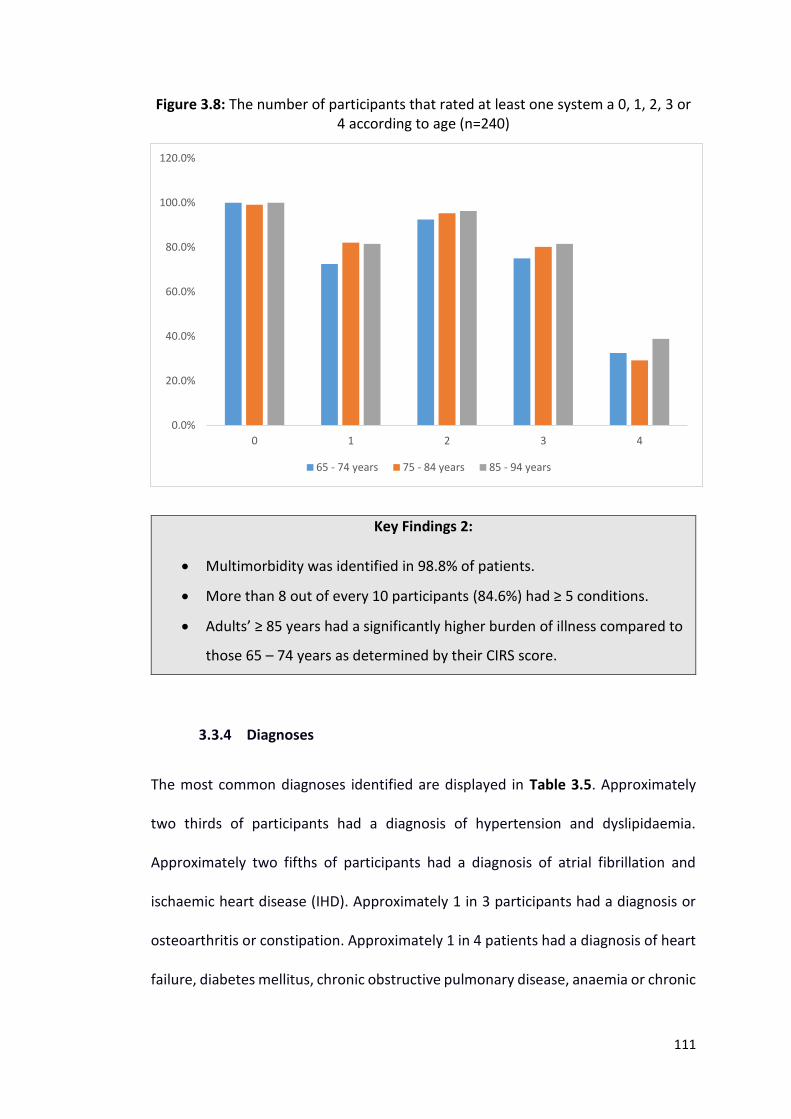
111
Figure 3.8: The number of participants that rated at least one system a 0, 1, 2, 3 or 4 according to age (n=240)
Key Findings 2:
Multimorbidity was identified in 98.8% of patients.
More than 8 out of every 10 participants (84.6%) had ≥ 5 conditions.
Adults’ ≥ 85 years had a significantly higher burden of illness compared to
those 65 – 74 years as determined by their CIRS score.
3.3.4 Diagnoses
The most common diagnoses identified are displayed in Table 3.5. Approximately
two thirds of participants had a diagnosis of hypertension and dyslipidaemia.
Approximately two fifths of participants had a diagnosis of atrial fibrillation and
ischaemic heart disease (IHD). Approximately 1 in 3 participants had a diagnosis or
osteoarthritis or constipation. Approximately 1 in 4 patients had a diagnosis of heart
failure, diabetes mellitus, chronic obstructive pulmonary disease, anaemia or chronic
0.0%
20.0%
40.0%
60.0%
80.0%
100.0%
120.0%
0 1 2 3 4
65 - 74 years 75 - 84 years 85 - 94 years
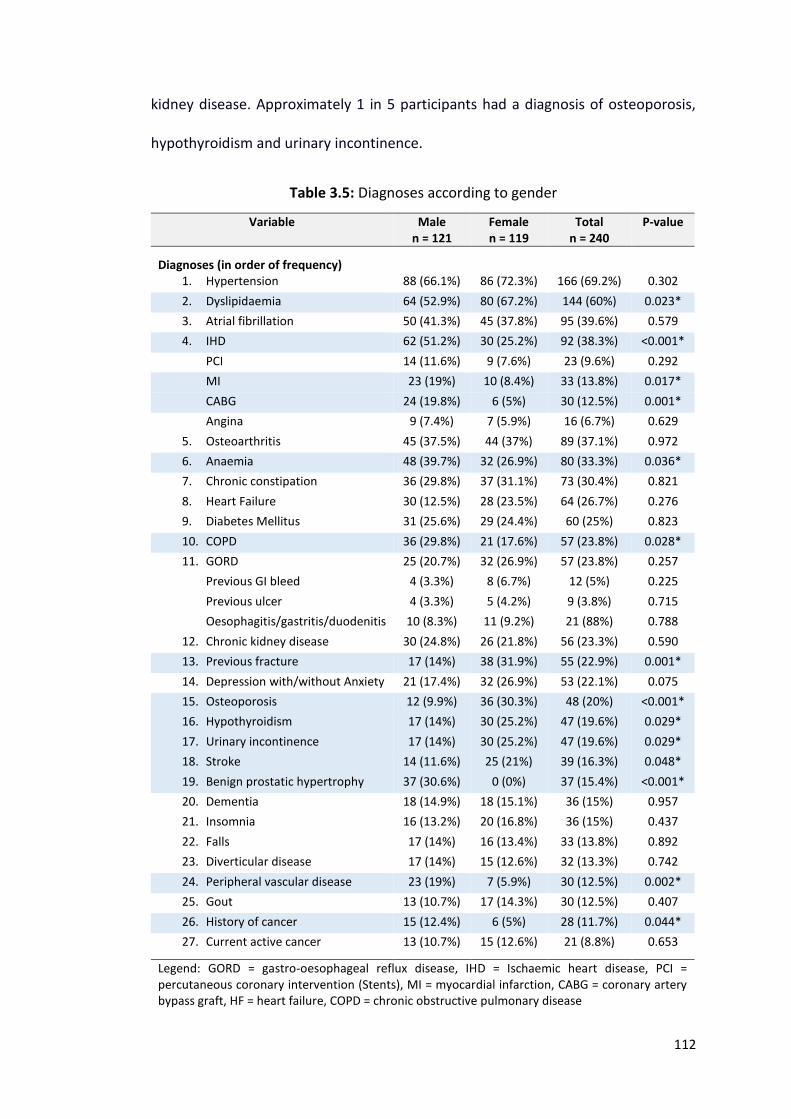
112
kidney disease. Approximately 1 in 5 participants had a diagnosis of osteoporosis,
hypothyroidism and urinary incontinence.
Table 3.5: Diagnoses according to gender
Variable Male n = 121
Female n = 119
Total n = 240
P-value
Diagnoses (in order of frequency)
1. Hypertension 88 (66.1%) 86 (72.3%) 166 (69.2%) 0.302
2. Dyslipidaemia 64 (52.9%) 80 (67.2%) 144 (60%) 0.023*
3. Atrial fibrillation 50 (41.3%) 45 (37.8%) 95 (39.6%) 0.579
4. IHD 62 (51.2%) 30 (25.2%) 92 (38.3%) <0.001*
PCI 14 (11.6%) 9 (7.6%) 23 (9.6%) 0.292
MI 23 (19%) 10 (8.4%) 33 (13.8%) 0.017*
CABG 24 (19.8%) 6 (5%) 30 (12.5%) 0.001*
Angina 9 (7.4%) 7 (5.9%) 16 (6.7%) 0.629
5. Osteoarthritis 45 (37.5%) 44 (37%) 89 (37.1%) 0.972
6. Anaemia 48 (39.7%) 32 (26.9%) 80 (33.3%) 0.036*
7. Chronic constipation 36 (29.8%) 37 (31.1%) 73 (30.4%) 0.821
8. Heart Failure 30 (12.5%) 28 (23.5%) 64 (26.7%) 0.276
9. Diabetes Mellitus 31 (25.6%) 29 (24.4%) 60 (25%) 0.823
10. COPD 36 (29.8%) 21 (17.6%) 57 (23.8%) 0.028*
11. GORD 25 (20.7%) 32 (26.9%) 57 (23.8%) 0.257
Previous GI bleed 4 (3.3%) 8 (6.7%) 12 (5%) 0.225
Previous ulcer 4 (3.3%) 5 (4.2%) 9 (3.8%) 0.715
Oesophagitis/gastritis/duodenitis 10 (8.3%) 11 (9.2%) 21 (88%) 0.788
12. Chronic kidney disease 30 (24.8%) 26 (21.8%) 56 (23.3%) 0.590
13. Previous fracture 17 (14%) 38 (31.9%) 55 (22.9%) 0.001*
14. Depression with/without Anxiety 21 (17.4%) 32 (26.9%) 53 (22.1%) 0.075
15. Osteoporosis 12 (9.9%) 36 (30.3%) 48 (20%) <0.001*
16. Hypothyroidism 17 (14%) 30 (25.2%) 47 (19.6%) 0.029*
17. Urinary incontinence 17 (14%) 30 (25.2%) 47 (19.6%) 0.029*
18. Stroke 14 (11.6%) 25 (21%) 39 (16.3%) 0.048*
19. Benign prostatic hypertrophy 37 (30.6%) 0 (0%) 37 (15.4%) <0.001*
20. Dementia 18 (14.9%) 18 (15.1%) 36 (15%) 0.957
21. Insomnia 16 (13.2%) 20 (16.8%) 36 (15%) 0.437
22. Falls 17 (14%) 16 (13.4%) 33 (13.8%) 0.892
23. Diverticular disease 17 (14%) 15 (12.6%) 32 (13.3%) 0.742
24. Peripheral vascular disease 23 (19%) 7 (5.9%) 30 (12.5%) 0.002*
25. Gout 13 (10.7%) 17 (14.3%) 30 (12.5%) 0.407
26. History of cancer 15 (12.4%) 6 (5%) 28 (11.7%) 0.044*
27. Current active cancer 13 (10.7%) 15 (12.6%) 21 (8.8%) 0.653
Legend: GORD = gastro-oesophageal reflux disease, IHD = Ischaemic heart disease, PCI = percutaneous coronary intervention (Stents), MI = myocardial infarction, CABG = coronary artery bypass graft, HF = heart failure, COPD = chronic obstructive pulmonary disease
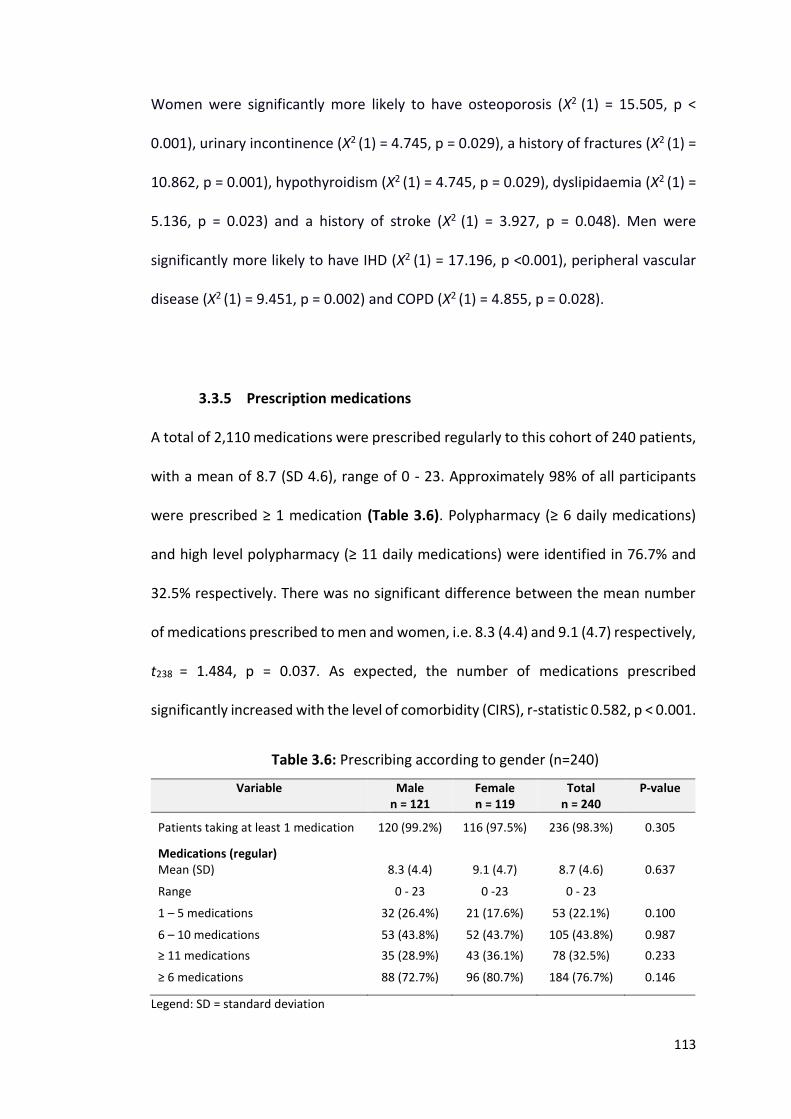
113
Women were significantly more likely to have osteoporosis (Χ2 (1) = 15.505, p <
0.001), urinary incontinence (Χ2 (1) = 4.745, p = 0.029), a history of fractures (Χ2 (1) =
10.862, p = 0.001), hypothyroidism (Χ2 (1) = 4.745, p = 0.029), dyslipidaemia (Χ2 (1) =
5.136, p = 0.023) and a history of stroke (Χ2 (1) = 3.927, p = 0.048). Men were
significantly more likely to have IHD (Χ2 (1) = 17.196, p <0.001), peripheral vascular
disease (Χ2 (1) = 9.451, p = 0.002) and COPD (Χ2 (1) = 4.855, p = 0.028).
3.3.5 Prescription medications
A total of 2,110 medications were prescribed regularly to this cohort of 240 patients,
with a mean of 8.7 (SD 4.6), range of 0 - 23. Approximately 98% of all participants
were prescribed ≥ 1 medication (Table 3.6). Polypharmacy (≥ 6 daily medications)
and high level polypharmacy (≥ 11 daily medications) were identified in 76.7% and
32.5% respectively. There was no significant difference between the mean number
of medications prescribed to men and women, i.e. 8.3 (4.4) and 9.1 (4.7) respectively,
t238 = 1.484, p = 0.037. As expected, the number of medications prescribed
significantly increased with the level of comorbidity (CIRS), r-statistic 0.582, p < 0.001.
Table 3.6: Prescribing according to gender (n=240)
Variable Male n = 121
Female n = 119
Total n = 240
P-value
Patients taking at least 1 medication
120 (99.2%)
116 (97.5%)
236 (98.3%)
0.305
Medications (regular)
Mean (SD) 8.3 (4.4) 9.1 (4.7) 8.7 (4.6) 0.637
Range 0 - 23 0 -23 0 - 23
1 – 5 medications 32 (26.4%) 21 (17.6%) 53 (22.1%) 0.100
6 – 10 medications 53 (43.8%) 52 (43.7%) 105 (43.8%) 0.987
≥ 11 medications 35 (28.9%) 43 (36.1%) 78 (32.5%) 0.233
≥ 6 medications
88 (72.7%) 96 (80.7%) 184 (76.7%) 0.146
Legend: SD = standard deviation
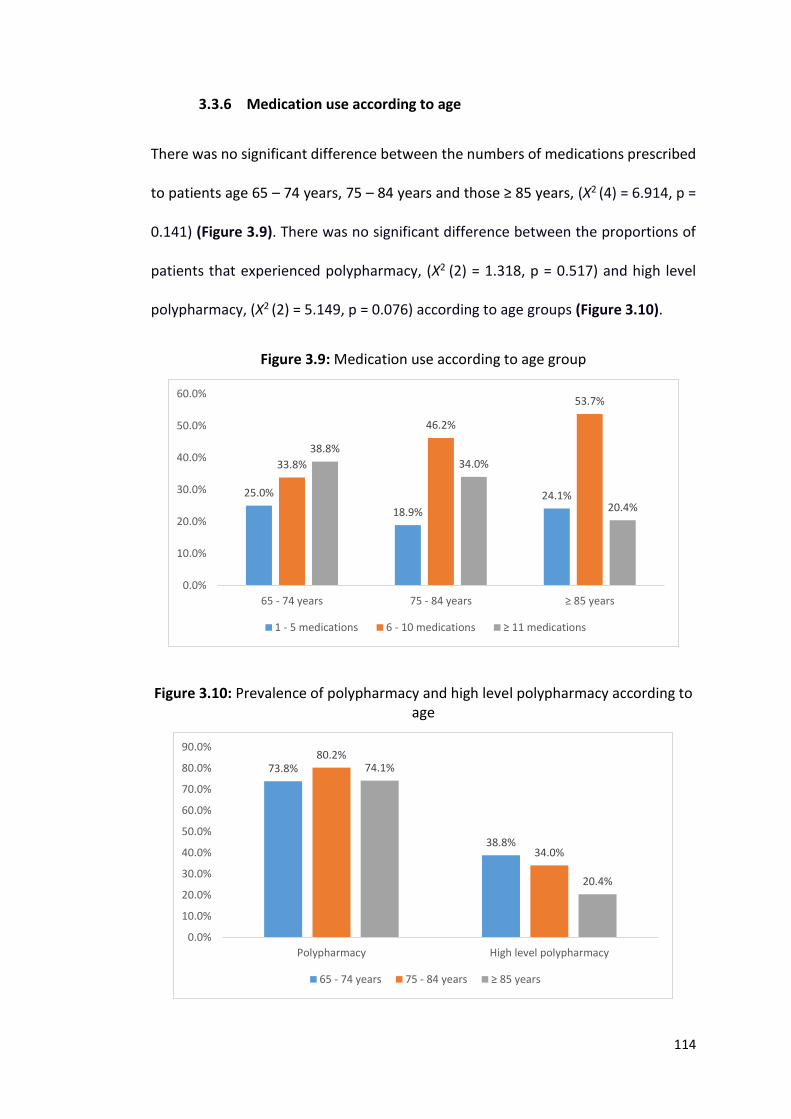
114
3.3.6 Medication use according to age
There was no significant difference between the numbers of medications prescribed
to patients age 65 – 74 years, 75 – 84 years and those ≥ 85 years, (Χ2 (4) = 6.914, p =
0.141) (Figure 3.9). There was no significant difference between the proportions of
patients that experienced polypharmacy, (Χ2 (2) = 1.318, p = 0.517) and high level
polypharmacy, (Χ2 (2) = 5.149, p = 0.076) according to age groups (Figure 3.10).
Figure 3.9: Medication use according to age group
Figure 3.10: Prevalence of polypharmacy and high level polypharmacy according to age
25.0%
18.9%
24.1%
33.8%
46.2%
53.7%
38.8%
34.0%
20.4%
0.0%
10.0%
20.0%
30.0%
40.0%
50.0%
60.0%
65 - 74 years 75 - 84 years ≥ 85 years
1 - 5 medications 6 - 10 medications ≥ 11 medications
73.8%
38.8%
80.2%
34.0%
74.1%
20.4%
0.0%
10.0%
20.0%
30.0%
40.0%
50.0%
60.0%
70.0%
80.0%
90.0%
Polypharmacy High level polypharmacy
65 - 74 years 75 - 84 years ≥ 85 years
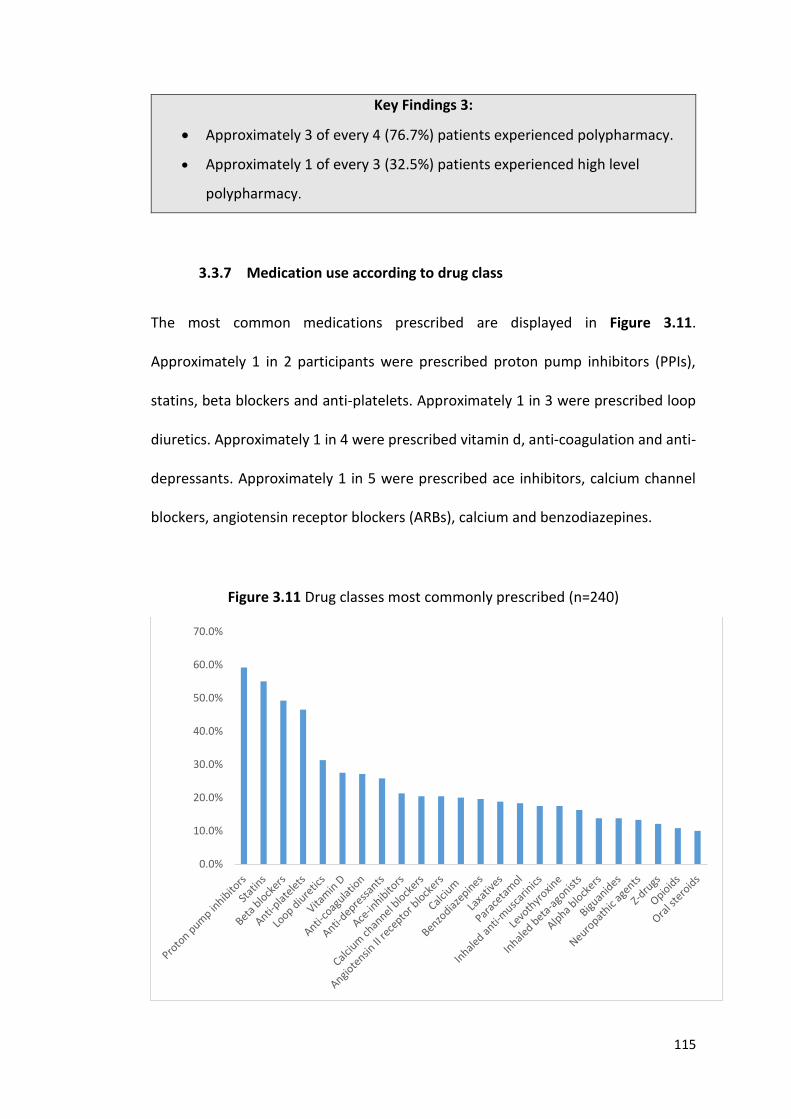
115
Key Findings 3:
Approximately 3 of every 4 (76.7%) patients experienced polypharmacy.
Approximately 1 of every 3 (32.5%) patients experienced high level
polypharmacy.
3.3.7 Medication use according to drug class
The most common medications prescribed are displayed in Figure 3.11.
Approximately 1 in 2 participants were prescribed proton pump inhibitors (PPIs),
statins, beta blockers and anti-platelets. Approximately 1 in 3 were prescribed loop
diuretics. Approximately 1 in 4 were prescribed vitamin d, anti-coagulation and anti-
depressants. Approximately 1 in 5 were prescribed ace inhibitors, calcium channel
blockers, angiotensin receptor blockers (ARBs), calcium and benzodiazepines.
Figure 3.11 Drug classes most commonly prescribed (n=240)
0.0%
10.0%
20.0%
30.0%
40.0%
50.0%
60.0%
70.0%
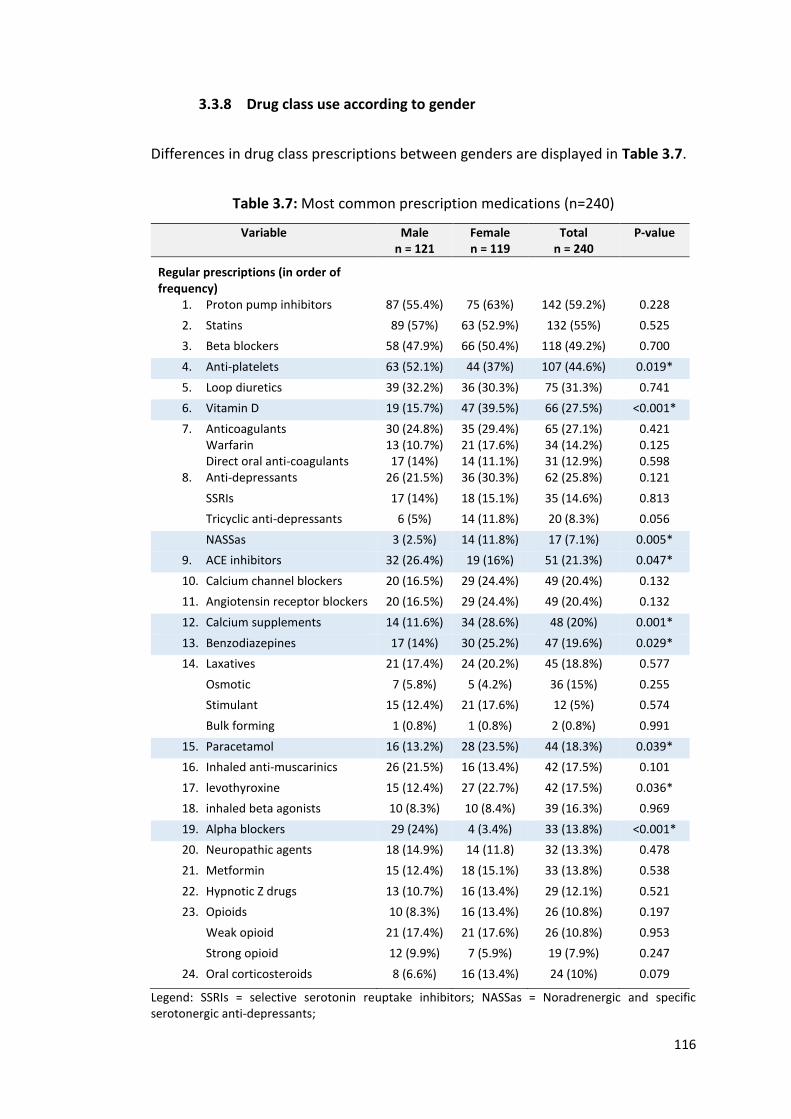
116
3.3.8 Drug class use according to gender
Differences in drug class prescriptions between genders are displayed in Table 3.7.
Table 3.7: Most common prescription medications (n=240)
Variable Male n = 121
Female n = 119
Total n = 240
P-value
Regular prescriptions (in order of frequency)
1. Proton pump inhibitors 87 (55.4%) 75 (63%) 142 (59.2%) 0.228
2. Statins 89 (57%) 63 (52.9%) 132 (55%) 0.525
3. Beta blockers 58 (47.9%) 66 (50.4%) 118 (49.2%) 0.700
4. Anti-platelets 63 (52.1%) 44 (37%) 107 (44.6%) 0.019*
5. Loop diuretics 39 (32.2%) 36 (30.3%) 75 (31.3%) 0.741
6. Vitamin D 19 (15.7%) 47 (39.5%) 66 (27.5%) <0.001*
7. Anticoagulants Warfarin Direct oral anti-coagulants
30 (24.8%) 13 (10.7%) 17 (14%)
35 (29.4%) 21 (17.6%) 14 (11.1%)
65 (27.1%) 34 (14.2%) 31 (12.9%)
0.421 0.125 0.598
8. Anti-depressants 26 (21.5%) 36 (30.3%) 62 (25.8%) 0.121
SSRIs 17 (14%) 18 (15.1%) 35 (14.6%) 0.813
Tricyclic anti-depressants 6 (5%) 14 (11.8%) 20 (8.3%) 0.056
NASSas 3 (2.5%) 14 (11.8%) 17 (7.1%) 0.005*
9. ACE inhibitors 32 (26.4%) 19 (16%) 51 (21.3%) 0.047*
10. Calcium channel blockers 20 (16.5%) 29 (24.4%) 49 (20.4%) 0.132
11. Angiotensin receptor blockers 20 (16.5%) 29 (24.4%) 49 (20.4%) 0.132
12. Calcium supplements 14 (11.6%) 34 (28.6%) 48 (20%) 0.001*
13. Benzodiazepines 17 (14%) 30 (25.2%) 47 (19.6%) 0.029*
14. Laxatives 21 (17.4%) 24 (20.2%) 45 (18.8%) 0.577
Osmotic 7 (5.8%) 5 (4.2%) 36 (15%) 0.255
Stimulant 15 (12.4%) 21 (17.6%) 12 (5%) 0.574
Bulk forming 1 (0.8%) 1 (0.8%) 2 (0.8%) 0.991
15. Paracetamol 16 (13.2%) 28 (23.5%) 44 (18.3%) 0.039*
16. Inhaled anti-muscarinics 26 (21.5%) 16 (13.4%) 42 (17.5%) 0.101
17. levothyroxine 15 (12.4%) 27 (22.7%) 42 (17.5%) 0.036*
18. inhaled beta agonists 10 (8.3%) 10 (8.4%) 39 (16.3%) 0.969
19. Alpha blockers 29 (24%) 4 (3.4%) 33 (13.8%) <0.001*
20. Neuropathic agents 18 (14.9%) 14 (11.8) 32 (13.3%) 0.478
21. Metformin 15 (12.4%) 18 (15.1%) 33 (13.8%) 0.538
22. Hypnotic Z drugs 13 (10.7%) 16 (13.4%) 29 (12.1%) 0.521
23. Opioids 10 (8.3%) 16 (13.4%) 26 (10.8%) 0.197
Weak opioid 21 (17.4%) 21 (17.6%) 26 (10.8%) 0.953
Strong opioid 12 (9.9%) 7 (5.9%) 19 (7.9%) 0.247
24. Oral corticosteroids
8 (6.6%) 16 (13.4%) 24 (10%) 0.079
Legend: SSRIs = selective serotonin reuptake inhibitors; NASSas = Noradrenergic and specific serotonergic anti-depressants;
117
Men were prescribed significantly more angiotensin converting enzymes (ACE)
inhibitors (26.4% vs 16%, Χ2 (1) = 3.938, p = 0.047), angiotensin receptor blockers
(ARBs) (24.0% vs 3.4%, Χ2 (1) = 2.270, p <0.001) and anti-platelets (52.1% vs 37.0%,
Χ2 (1) = 5.530, p = 0.019). Women were more commonly prescribed levothyroxine
(22.7% vs 12.4%, Χ2 (1) = 4.402, p = 0.036), benzodiazepines (25.2% vs 14.0%, Χ2 (1) =
4.745, p = 0.029), paracetamol (23.5%) vs 13.2%, Χ2(1) = 4.256 p = 0.039), calcium
(28.6% vs 11.6%, Χ2 (1) = 10.838, p = 0.001), vitamin d (39.5% vs 15.7%, Χ2 (1) =
17.036, p <0.001) and NASSa (11.8% vs 2.5%, Χ2 (1) = 7.859, p = 0.005.
3.3.9 Drug class use according to age category
Differences identified in drug class prescriptions between the different age
categories are displayed in Figure 3.12. The only drug class in which a significant
difference in prescribing rate was shown between the 3 age groups was anti-
coagulants, (i.e. 16.3% vs 34% vs 29.6%, Χ2 (2) =7.471, p = 0.024), reflecting
significantly higher prevalence of atrial fibrillation in the older age groups compared
to patients aged 65 to 74 years.
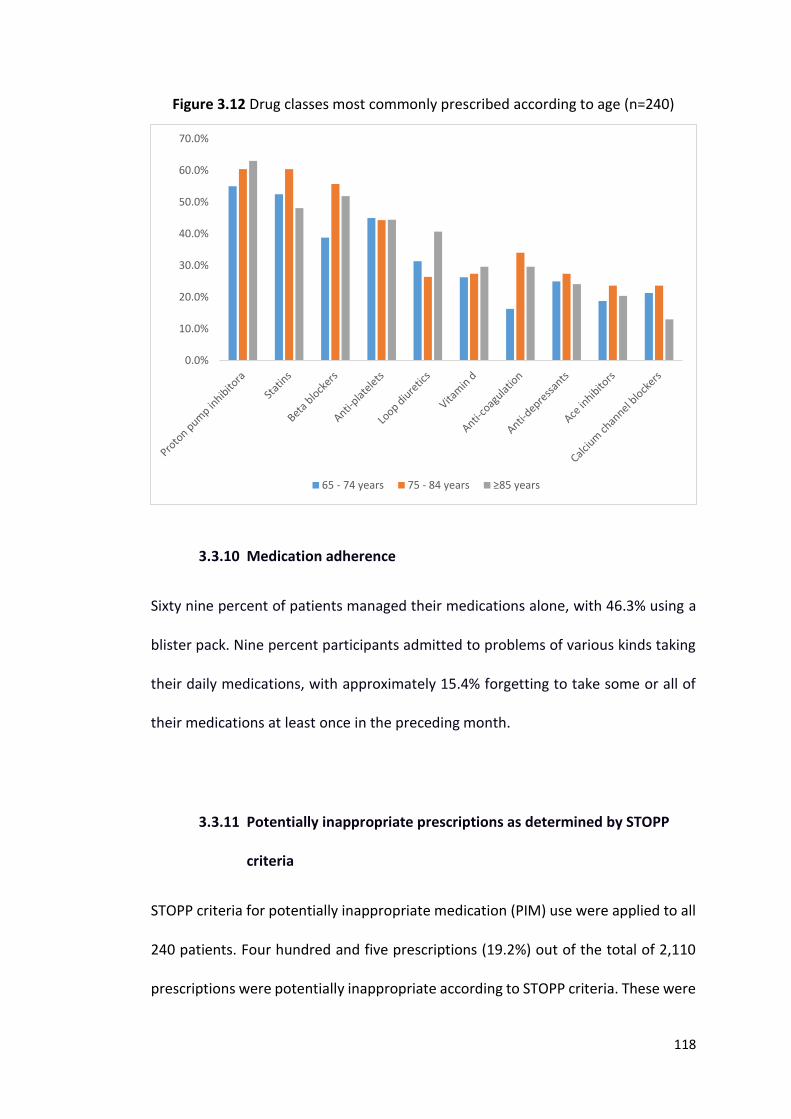
118
Figure 3.12 Drug classes most commonly prescribed according to age (n=240)
3.3.10 Medication adherence
Sixty nine percent of patients managed their medications alone, with 46.3% using a
blister pack. Nine percent participants admitted to problems of various kinds taking
their daily medications, with approximately 15.4% forgetting to take some or all of
their medications at least once in the preceding month.
3.3.11 Potentially inappropriate prescriptions as determined by STOPP
criteria
STOPP criteria for potentially inappropriate medication (PIM) use were applied to all
240 patients. Four hundred and five prescriptions (19.2%) out of the total of 2,110
prescriptions were potentially inappropriate according to STOPP criteria. These were
0.0%
10.0%
20.0%
30.0%
40.0%
50.0%
60.0%
70.0%
65 - 74 years 75 - 84 years ≥85 years
119
distributed amongst 67.5% (n=162) of the study population with 53 patients (22.1%)
receiving 1 PIM, 43 patients (17.9%) receiving 2 PIMs and 66 patients (27.5%)
receiving ≥3 PIMs. An increasing number of daily medications number was
significantly associated with increasing PIM number (R = 0.644, p < 0.001).
The most frequently encountered PIMs identified by STOPP criteria are listed
in order of descending frequency in Table 3.8. More than 1 in 3 participants (41.3%)
were prescribed a drug beyond the recommended duration. Approximately 1 in 4
(24.8%) participants were prescribed a PPI for uncomplicated PUD/erosive
oesophagitis at full therapeutic dosage for more than 8 weeks. One in five (20%)
participants were prescribed a drug without an evidence-based clinical indication.
Over 1 in 6 participants (17.6%) were prescribed a benzodiazepine for ≥ 4 weeks. A
similar proportion of patients who were at risk of falls were prescribed a
benzodiazepine (15.4%). Table 3.8 displays the most prevalent PIMs in the patient as
a whole and also according to gender. Females were more likely than males to be
inappropriately prescribed anti-cholinergic drugs in the context of delirium or
dementia i.e. 6.7% vs 1.7%, Χ2 (1) = 3.862, p = 0.049. Criteria STOPP A2 (Any drug
prescribed beyond the recommended duration) was based on BNF indications and
up to date clinical guidelines.
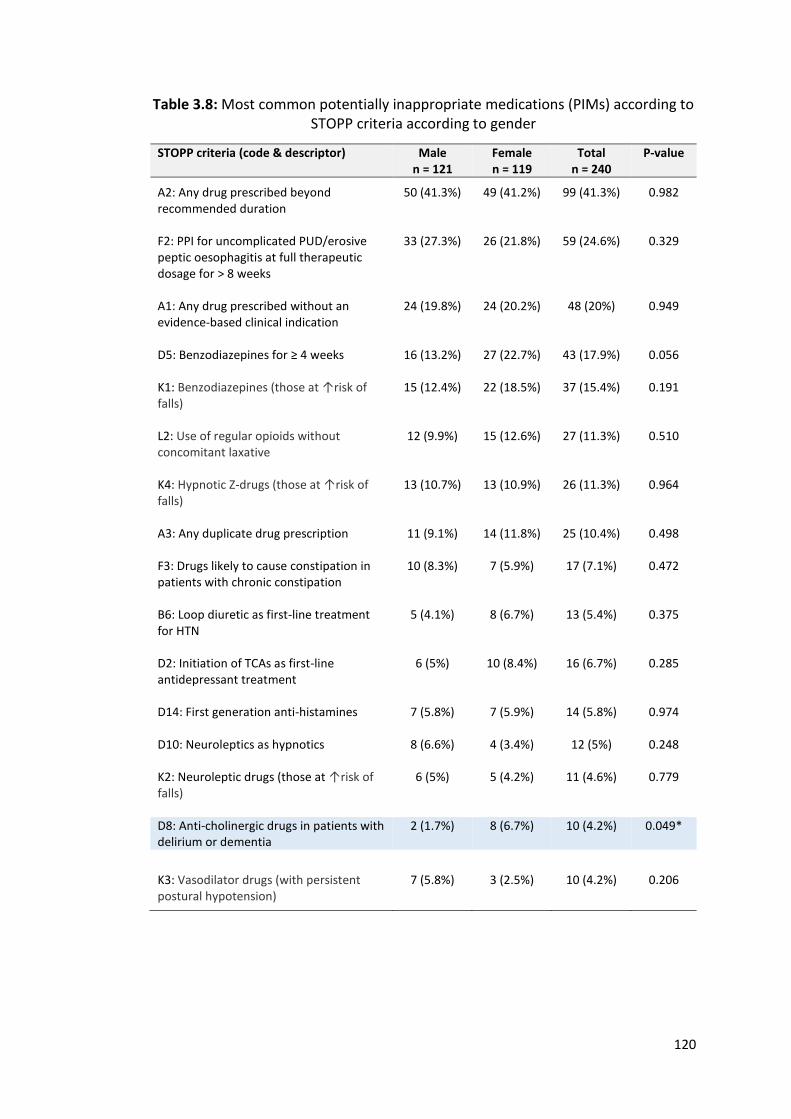
120
Table 3.8: Most common potentially inappropriate medications (PIMs) according to STOPP criteria according to gender
STOPP criteria (code & descriptor) Male n = 121
Female n = 119
Total n = 240
P-value
A2: Any drug prescribed beyond recommended duration
50 (41.3%)
49 (41.2%)
99 (41.3%)
0.982
F2: PPI for uncomplicated PUD/erosive peptic oesophagitis at full therapeutic dosage for > 8 weeks
33 (27.3%) 26 (21.8%) 59 (24.6%) 0.329
A1: Any drug prescribed without an evidence-based clinical indication
24 (19.8%) 24 (20.2%) 48 (20%) 0.949
D5: Benzodiazepines for ≥ 4 weeks
16 (13.2%) 27 (22.7%) 43 (17.9%) 0.056
K1: Benzodiazepines (those at ↑risk of falls)
15 (12.4%) 22 (18.5%) 37 (15.4%) 0.191
L2: Use of regular opioids without concomitant laxative
12 (9.9%) 15 (12.6%) 27 (11.3%) 0.510
K4: Hypnotic Z-drugs (those at ↑risk of falls)
13 (10.7%) 13 (10.9%) 26 (11.3%) 0.964
A3: Any duplicate drug prescription
11 (9.1%) 14 (11.8%) 25 (10.4%) 0.498
F3: Drugs likely to cause constipation in patients with chronic constipation
10 (8.3%) 7 (5.9%) 17 (7.1%) 0.472
B6: Loop diuretic as first-line treatment for HTN
5 (4.1%) 8 (6.7%) 13 (5.4%) 0.375
D2: Initiation of TCAs as first-line antidepressant treatment
6 (5%) 10 (8.4%) 16 (6.7%) 0.285
D14: First generation anti-histamines
7 (5.8%) 7 (5.9%) 14 (5.8%) 0.974
D10: Neuroleptics as hypnotics 8 (6.6%) 4 (3.4%) 12 (5%) 0.248
K2: Neuroleptic drugs (those at ↑risk of falls)
6 (5%) 5 (4.2%) 11 (4.6%) 0.779
D8: Anti-cholinergic drugs in patients with delirium or dementia
2 (1.7%) 8 (6.7%) 10 (4.2%) 0.049*
K3: Vasodilator drugs (with persistent postural hypotension)
7 (5.8%) 3 (2.5%) 10 (4.2%) 0.206
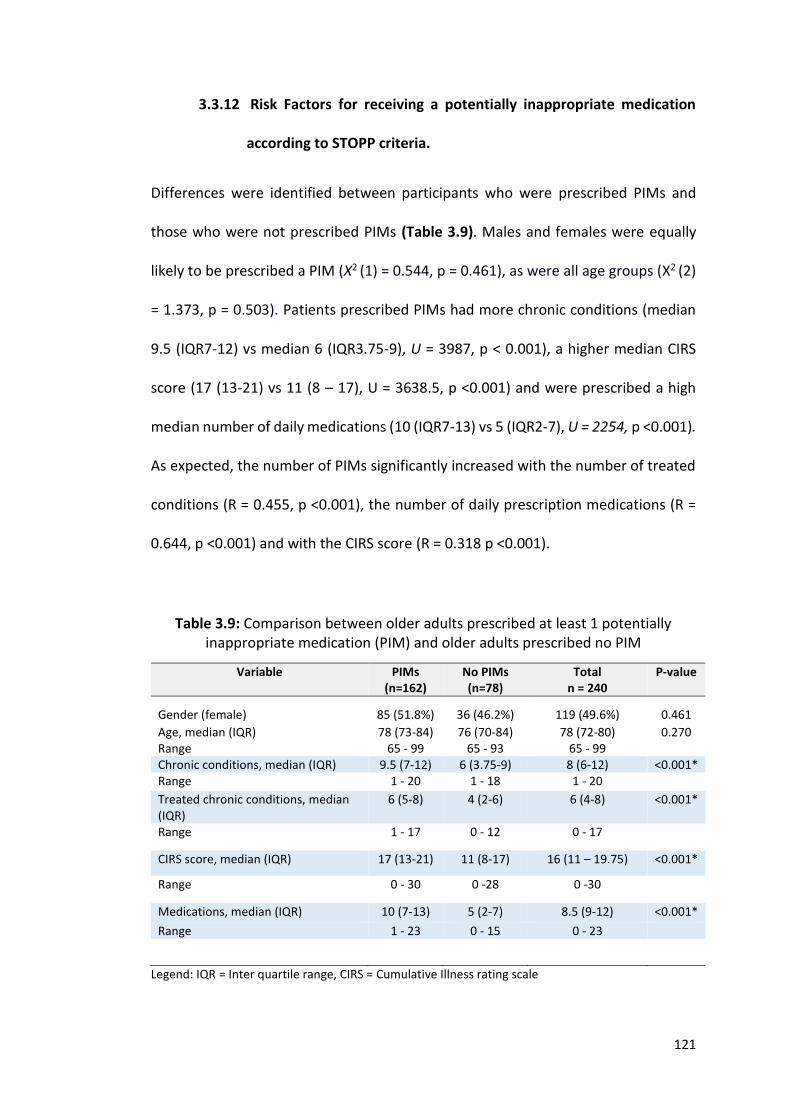
121
3.3.12 Risk Factors for receiving a potentially inappropriate medication
according to STOPP criteria.
Differences were identified between participants who were prescribed PIMs and
those who were not prescribed PIMs (Table 3.9). Males and females were equally
likely to be prescribed a PIM (Χ2 (1) = 0.544, p = 0.461), as were all age groups (Χ2 (2)
= 1.373, p = 0.503). Patients prescribed PIMs had more chronic conditions (median
9.5 (IQR7-12) vs median 6 (IQR3.75-9), U = 3987, p < 0.001), a higher median CIRS
score (17 (13-21) vs 11 (8 – 17), U = 3638.5, p <0.001) and were prescribed a high
median number of daily medications (10 (IQR7-13) vs 5 (IQR2-7), U = 2254, p <0.001).
As expected, the number of PIMs significantly increased with the number of treated
conditions (R = 0.455, p <0.001), the number of daily prescription medications (R =
0.644, p <0.001) and with the CIRS score (R = 0.318 p <0.001).
Table 3.9: Comparison between older adults prescribed at least 1 potentially inappropriate medication (PIM) and older adults prescribed no PIM
Variable PIMs (n=162)
No PIMs (n=78)
Total n = 240
P-value
Gender (female)
85 (51.8%)
36 (46.2%)
119 (49.6%)
0.461
Age, median (IQR) Range
78 (73-84) 65 - 99
76 (70-84) 65 - 93
78 (72-80) 65 - 99
0.270
Chronic conditions, median (IQR) 9.5 (7-12) 6 (3.75-9) 8 (6-12) <0.001* Range 1 - 20 1 - 18 1 - 20
Treated chronic conditions, median (IQR)
6 (5-8) 4 (2-6) 6 (4-8) <0.001*
Range 1 - 17 0 - 12 0 - 17
CIRS score, median (IQR) 17 (13-21) 11 (8-17) 16 (11 – 19.75) <0.001*
Range 0 - 30 0 -28 0 -30
Medications, median (IQR) 10 (7-13) 5 (2-7) 8.5 (9-12) <0.001*
Range 1 - 23 0 - 15 0 - 23
Legend: IQR = Inter quartile range, CIRS = Cumulative Illness rating scale
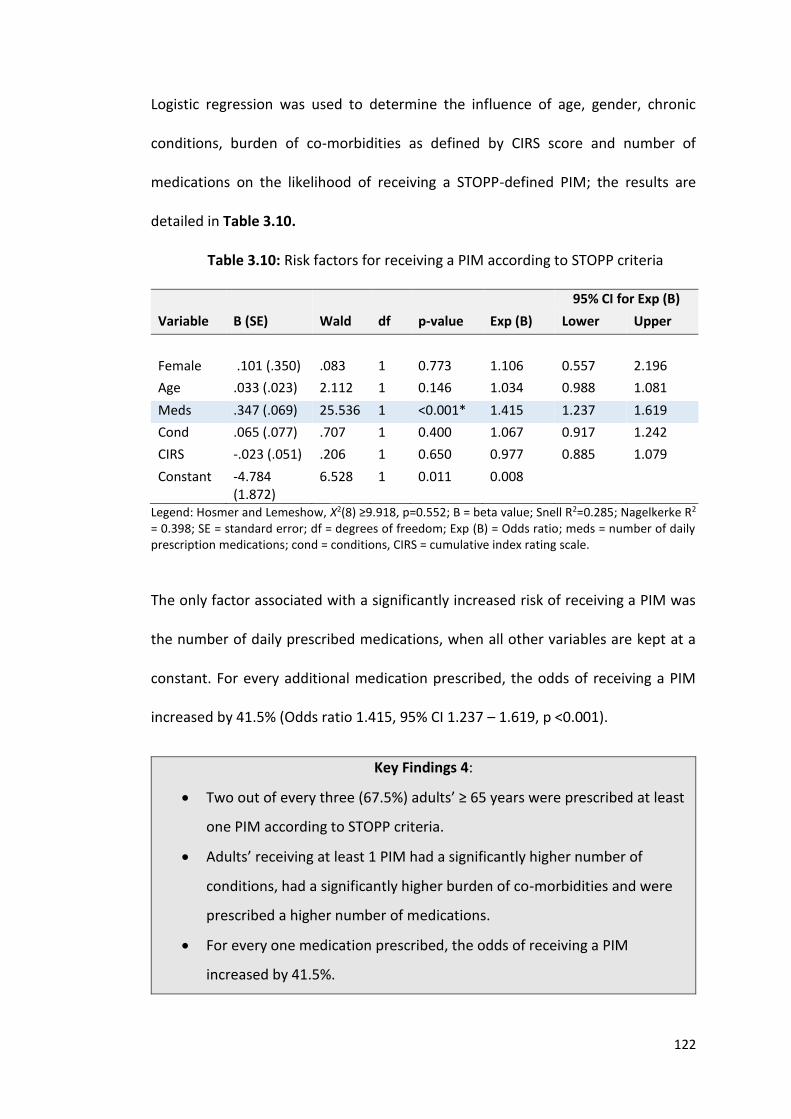
122
Logistic regression was used to determine the influence of age, gender, chronic
conditions, burden of co-morbidities as defined by CIRS score and number of
medications on the likelihood of receiving a STOPP-defined PIM; the results are
detailed in Table 3.10.
Table 3.10: Risk factors for receiving a PIM according to STOPP criteria
95% CI for Exp (B)
Variable B (SE) Wald df p-value Exp (B) Lower Upper
Female .101 (.350) .083 1 0.773 1.106 0.557 2.196
Age .033 (.023) 2.112 1 0.146 1.034 0.988 1.081
Meds .347 (.069) 25.536 1 <0.001* 1.415 1.237 1.619
Cond .065 (.077) .707 1 0.400 1.067 0.917 1.242
CIRS -.023 (.051) .206 1 0.650 0.977 0.885 1.079
Constant -4.784 (1.872)
6.528 1 0.011 0.008
Legend: Hosmer and Lemeshow, Χ2(8) ≥9.918, p=0.552; B = beta value; Snell R2=0.285; Nagelkerke R2 = 0.398; SE = standard error; df = degrees of freedom; Exp (B) = Odds ratio; meds = number of daily prescription medications; cond = conditions, CIRS = cumulative index rating scale.
The only factor associated with a significantly increased risk of receiving a PIM was
the number of daily prescribed medications, when all other variables are kept at a
constant. For every additional medication prescribed, the odds of receiving a PIM
increased by 41.5% (Odds ratio 1.415, 95% CI 1.237 – 1.619, p <0.001).
Key Findings 4:
Two out of every three (67.5%) adults’ ≥ 65 years were prescribed at least
one PIM according to STOPP criteria.
Adults’ receiving at least 1 PIM had a significantly higher number of
conditions, had a significantly higher burden of co-morbidities and were
prescribed a higher number of medications.
For every one medication prescribed, the odds of receiving a PIM
increased by 41.5%.
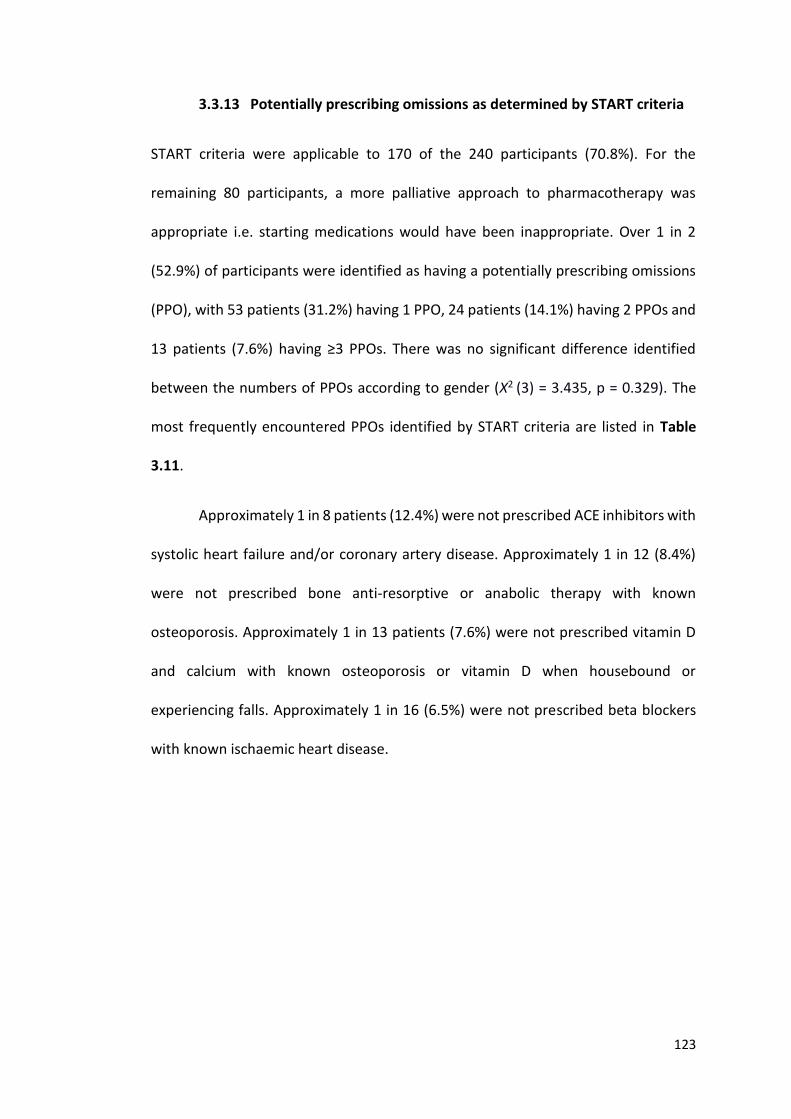
123
3.3.13 Potentially prescribing omissions as determined by START criteria
START criteria were applicable to 170 of the 240 participants (70.8%). For the
remaining 80 participants, a more palliative approach to pharmacotherapy was
appropriate i.e. starting medications would have been inappropriate. Over 1 in 2
(52.9%) of participants were identified as having a potentially prescribing omissions
(PPO), with 53 patients (31.2%) having 1 PPO, 24 patients (14.1%) having 2 PPOs and
13 patients (7.6%) having ≥3 PPOs. There was no significant difference identified
between the numbers of PPOs according to gender (Χ2 (3) = 3.435, p = 0.329). The
most frequently encountered PPOs identified by START criteria are listed in Table
3.11.
Approximately 1 in 8 patients (12.4%) were not prescribed ACE inhibitors with
systolic heart failure and/or coronary artery disease. Approximately 1 in 12 (8.4%)
were not prescribed bone anti-resorptive or anabolic therapy with known
osteoporosis. Approximately 1 in 13 patients (7.6%) were not prescribed vitamin D
and calcium with known osteoporosis or vitamin D when housebound or
experiencing falls. Approximately 1 in 16 (6.5%) were not prescribed beta blockers
with known ischaemic heart disease.
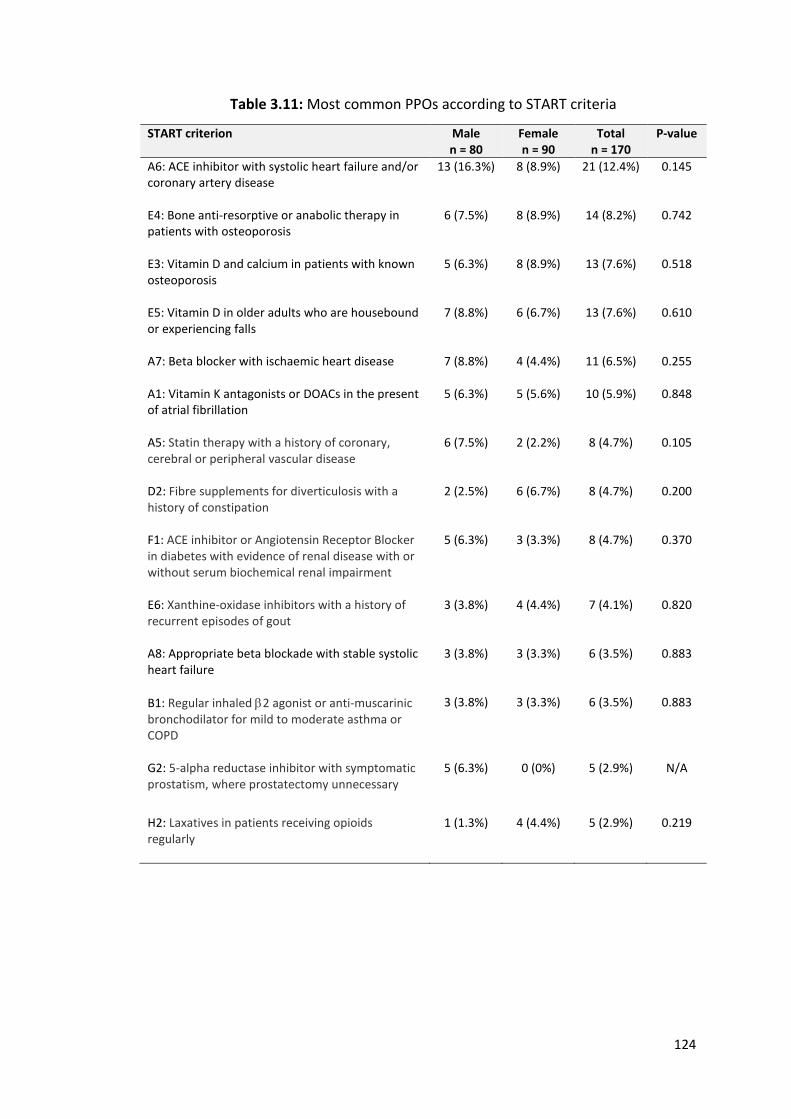
124
Table 3.11: Most common PPOs according to START criteria
START criterion Male n = 80
Female n = 90
Total n = 170
P-value
A6: ACE inhibitor with systolic heart failure and/or coronary artery disease
13 (16.3%) 8 (8.9%) 21 (12.4%) 0.145
E4: Bone anti-resorptive or anabolic therapy in patients with osteoporosis
6 (7.5%) 8 (8.9%) 14 (8.2%) 0.742
E3: Vitamin D and calcium in patients with known osteoporosis
5 (6.3%) 8 (8.9%) 13 (7.6%) 0.518
E5: Vitamin D in older adults who are housebound or experiencing falls
7 (8.8%) 6 (6.7%) 13 (7.6%) 0.610
A7: Beta blocker with ischaemic heart disease
7 (8.8%) 4 (4.4%) 11 (6.5%) 0.255
A1: Vitamin K antagonists or DOACs in the present of atrial fibrillation
5 (6.3%) 5 (5.6%) 10 (5.9%) 0.848
A5: Statin therapy with a history of coronary, cerebral or peripheral vascular disease
6 (7.5%) 2 (2.2%) 8 (4.7%) 0.105
D2: Fibre supplements for diverticulosis with a history of constipation
2 (2.5%) 6 (6.7%) 8 (4.7%) 0.200
F1: ACE inhibitor or Angiotensin Receptor Blocker in diabetes with evidence of renal disease with or without serum biochemical renal impairment
5 (6.3%) 3 (3.3%) 8 (4.7%) 0.370
E6: Xanthine-oxidase inhibitors with a history of recurrent episodes of gout
3 (3.8%) 4 (4.4%) 7 (4.1%) 0.820
A8: Appropriate beta blockade with stable systolic heart failure
3 (3.8%) 3 (3.3%) 6 (3.5%) 0.883
B1: Regular inhaled 2 agonist or anti-muscarinic bronchodilator for mild to moderate asthma or COPD
3 (3.8%) 3 (3.3%) 6 (3.5%) 0.883
G2: 5-alpha reductase inhibitor with symptomatic prostatism, where prostatectomy unnecessary
5 (6.3%) 0 (0%) 5 (2.9%) N/A
H2: Laxatives in patients receiving opioids regularly
1 (1.3%) 4 (4.4%) 5 (2.9%) 0.219
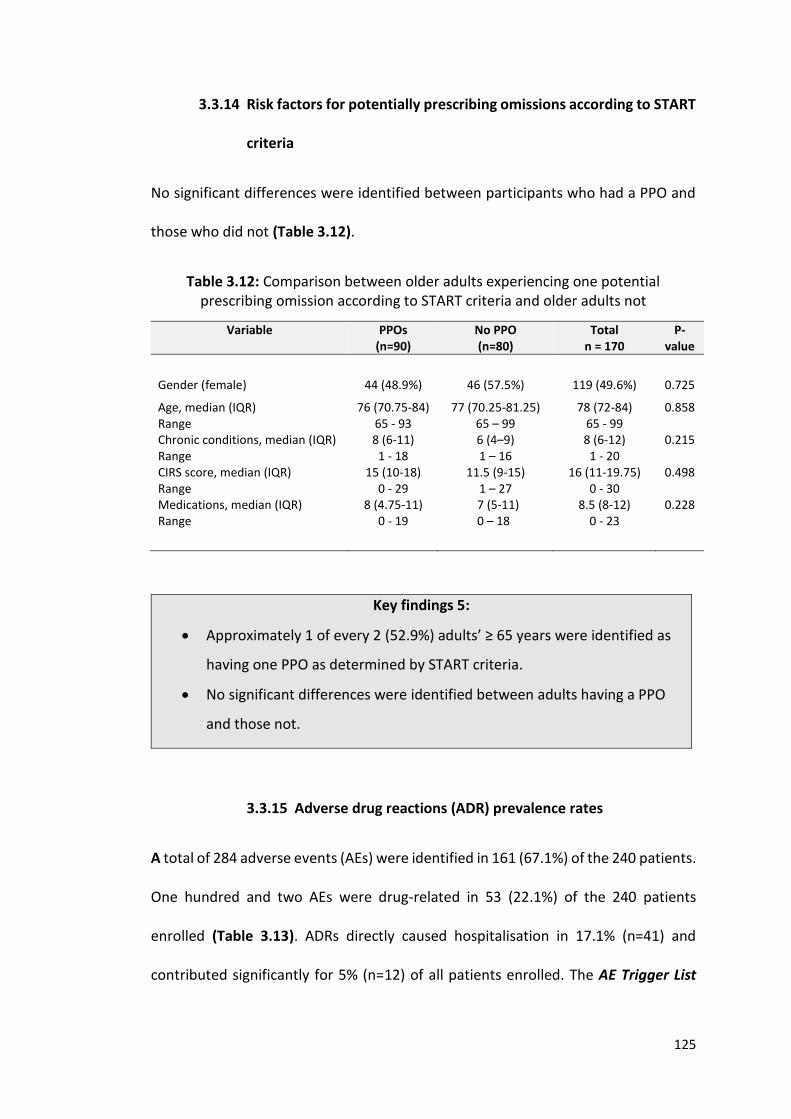
125
3.3.14 Risk factors for potentially prescribing omissions according to START
criteria
No significant differences were identified between participants who had a PPO and
those who did not (Table 3.12).
Table 3.12: Comparison between older adults experiencing one potential prescribing omission according to START criteria and older adults not
Variable PPOs (n=90)
No PPO (n=80)
Total n = 170
P-value
Gender (female) 44 (48.9%) 46 (57.5%) 119 (49.6%) 0.725
Age, median (IQR) Range
76 (70.75-84) 65 - 93
77 (70.25-81.25) 65 – 99
78 (72-84) 65 - 99
0.858
Chronic conditions, median (IQR) Range
8 (6-11) 1 - 18
6 (4–9) 1 – 16
8 (6-12) 1 - 20
0.215
CIRS score, median (IQR) Range
15 (10-18) 0 - 29
11.5 (9-15) 1 – 27
16 (11-19.75) 0 - 30
0.498
Medications, median (IQR) Range
8 (4.75-11) 0 - 19
7 (5-11) 0 – 18
8.5 (8-12) 0 - 23
0.228
Key findings 5:
Approximately 1 of every 2 (52.9%) adults’ ≥ 65 years were identified as
having one PPO as determined by START criteria.
No significant differences were identified between adults having a PPO
and those not.
3.3.15 Adverse drug reactions (ADR) prevalence rates
A total of 284 adverse events (AEs) were identified in 161 (67.1%) of the 240 patients.
One hundred and two AEs were drug-related in 53 (22.1%) of the 240 patients
enrolled (Table 3.13). ADRs directly caused hospitalisation in 17.1% (n=41) and
contributed significantly for 5% (n=12) of all patients enrolled. The AE Trigger List
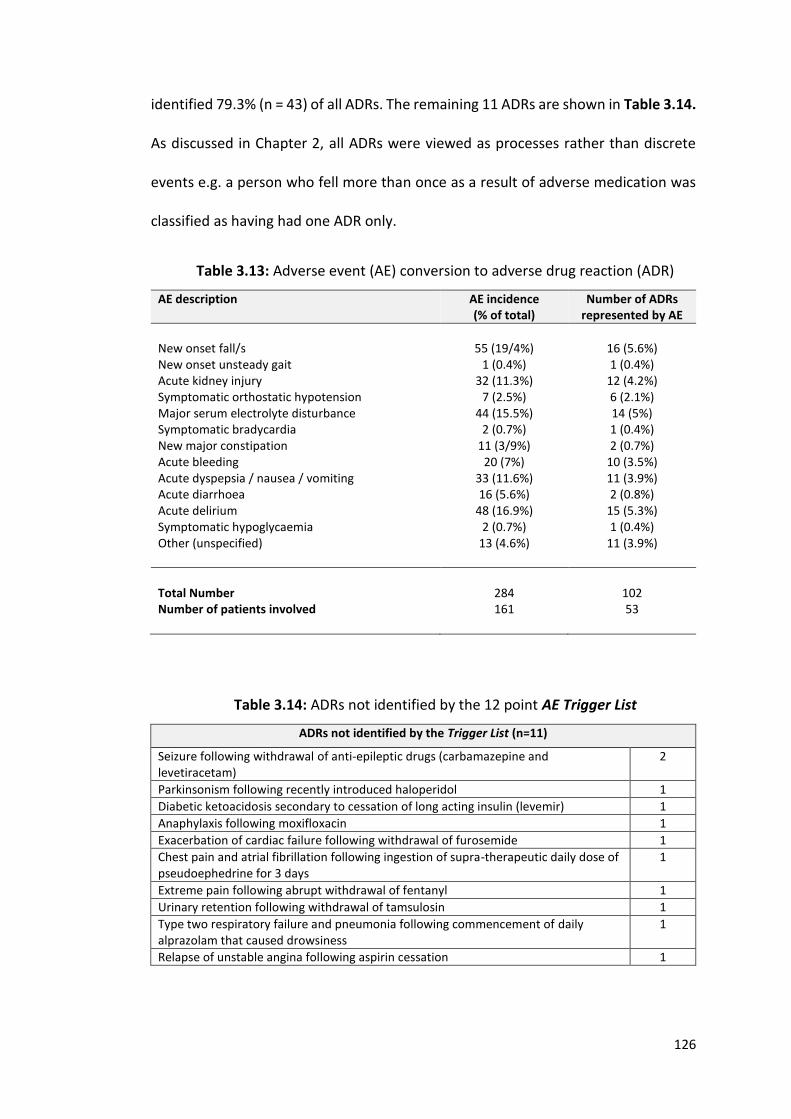
126
identified 79.3% (n = 43) of all ADRs. The remaining 11 ADRs are shown in Table 3.14.
As discussed in Chapter 2, all ADRs were viewed as processes rather than discrete
events e.g. a person who fell more than once as a result of adverse medication was
classified as having had one ADR only.
Table 3.13: Adverse event (AE) conversion to adverse drug reaction (ADR)
AE description AE incidence (% of total)
Number of ADRs represented by AE
New onset fall/s 55 (19/4%) 16 (5.6%) New onset unsteady gait 1 (0.4%) 1 (0.4%) Acute kidney injury 32 (11.3%) 12 (4.2%) Symptomatic orthostatic hypotension 7 (2.5%) 6 (2.1%) Major serum electrolyte disturbance 44 (15.5%) 14 (5%) Symptomatic bradycardia 2 (0.7%) 1 (0.4%) New major constipation 11 (3/9%) 2 (0.7%) Acute bleeding 20 (7%) 10 (3.5%) Acute dyspepsia / nausea / vomiting 33 (11.6%) 11 (3.9%) Acute diarrhoea 16 (5.6%) 2 (0.8%) Acute delirium 48 (16.9%) 15 (5.3%) Symptomatic hypoglycaemia 2 (0.7%) 1 (0.4%) Other (unspecified) 13 (4.6%) 11 (3.9%)
Total Number 284 102 Number of patients involved 161 53
Table 3.14: ADRs not identified by the 12 point AE Trigger List
ADRs not identified by the Trigger List (n=11)
Seizure following withdrawal of anti-epileptic drugs (carbamazepine and levetiracetam)
2
Parkinsonism following recently introduced haloperidol 1
Diabetic ketoacidosis secondary to cessation of long acting insulin (levemir) 1
Anaphylaxis following moxifloxacin 1
Exacerbation of cardiac failure following withdrawal of furosemide 1
Chest pain and atrial fibrillation following ingestion of supra-therapeutic daily dose of pseudoephedrine for 3 days
1
Extreme pain following abrupt withdrawal of fentanyl 1
Urinary retention following withdrawal of tamsulosin 1
Type two respiratory failure and pneumonia following commencement of daily alprazolam that caused drowsiness
1
Relapse of unstable angina following aspirin cessation 1
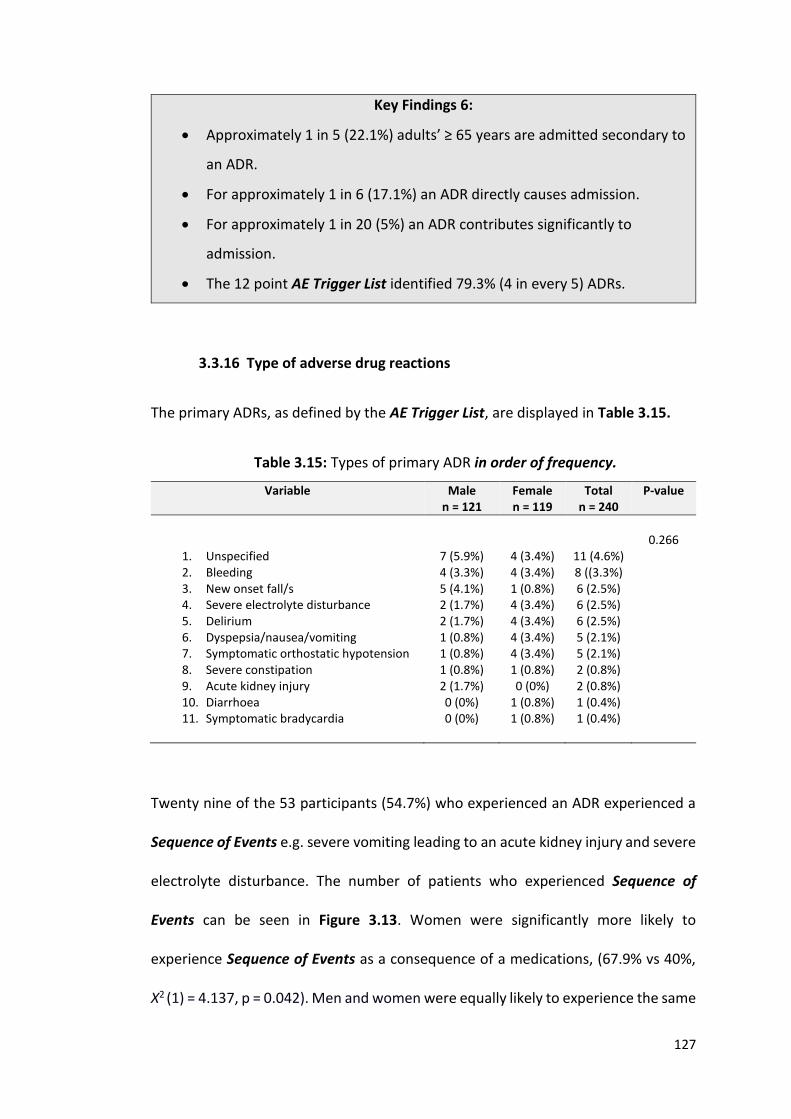
127
Key Findings 6:
Approximately 1 in 5 (22.1%) adults’ ≥ 65 years are admitted secondary to
an ADR.
For approximately 1 in 6 (17.1%) an ADR directly causes admission.
For approximately 1 in 20 (5%) an ADR contributes significantly to
admission.
The 12 point AE Trigger List identified 79.3% (4 in every 5) ADRs.
3.3.16 Type of adverse drug reactions
The primary ADRs, as defined by the AE Trigger List, are displayed in Table 3.15.
Table 3.15: Types of primary ADR in order of frequency.
Variable Male n = 121
Female n = 119
Total n = 240
P-value
0.266
1. Unspecified 7 (5.9%) 4 (3.4%) 11 (4.6%) 2. Bleeding 4 (3.3%) 4 (3.4%) 8 ((3.3%) 3. New onset fall/s 5 (4.1%) 1 (0.8%) 6 (2.5%) 4. Severe electrolyte disturbance 2 (1.7%) 4 (3.4%) 6 (2.5%) 5. Delirium 2 (1.7%) 4 (3.4%) 6 (2.5%) 6. Dyspepsia/nausea/vomiting 1 (0.8%) 4 (3.4%) 5 (2.1%) 7. Symptomatic orthostatic hypotension 1 (0.8%) 4 (3.4%) 5 (2.1%) 8. Severe constipation 1 (0.8%) 1 (0.8%) 2 (0.8%) 9. Acute kidney injury 2 (1.7%) 0 (0%) 2 (0.8%) 10. Diarrhoea 0 (0%) 1 (0.8%) 1 (0.4%) 11. Symptomatic bradycardia 0 (0%) 1 (0.8%) 1 (0.4%)
Twenty nine of the 53 participants (54.7%) who experienced an ADR experienced a
Sequence of Events e.g. severe vomiting leading to an acute kidney injury and severe
electrolyte disturbance. The number of patients who experienced Sequence of
Events can be seen in Figure 3.13. Women were significantly more likely to
experience Sequence of Events as a consequence of a medications, (67.9% vs 40%,
Χ2 (1) = 4.137, p = 0.042). Men and women were equally likely to experience the same
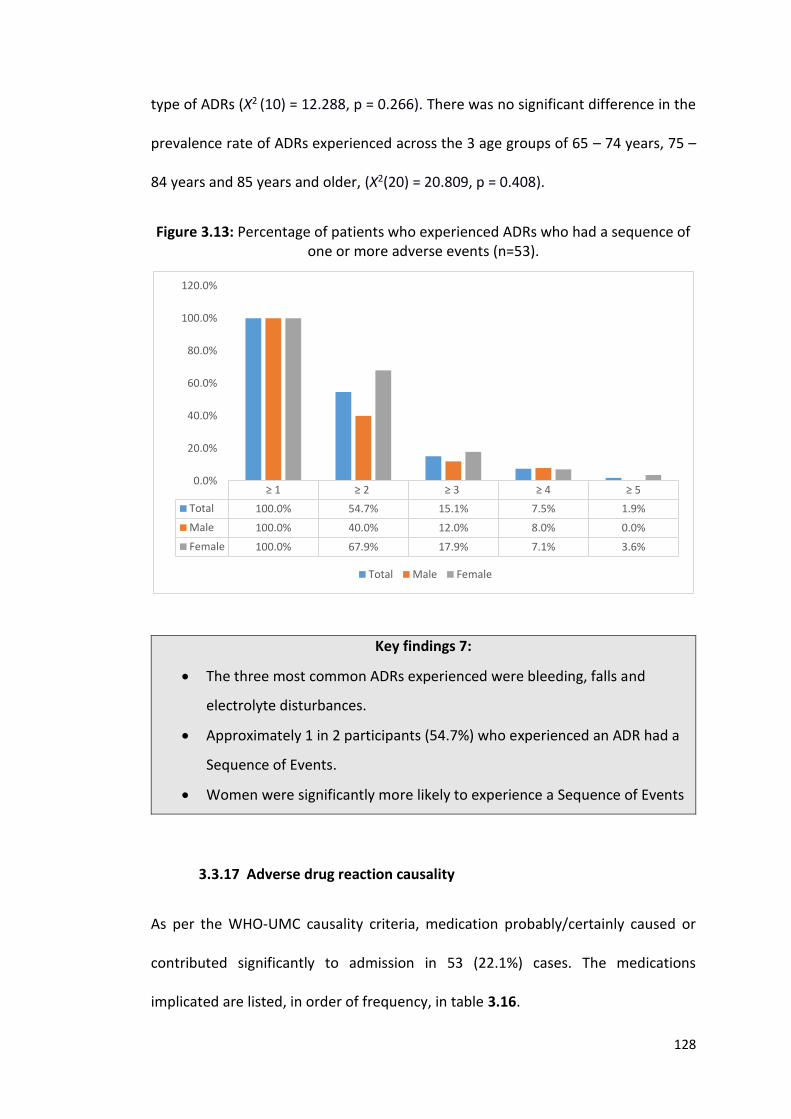
128
type of ADRs (Χ2 (10) = 12.288, p = 0.266). There was no significant difference in the
prevalence rate of ADRs experienced across the 3 age groups of 65 – 74 years, 75 –
84 years and 85 years and older, (Χ2(20) = 20.809, p = 0.408).
Figure 3.13: Percentage of patients who experienced ADRs who had a sequence of one or more adverse events (n=53).
Key findings 7:
The three most common ADRs experienced were bleeding, falls and
electrolyte disturbances.
Approximately 1 in 2 participants (54.7%) who experienced an ADR had a
Sequence of Events.
Women were significantly more likely to experience a Sequence of Events
3.3.17 Adverse drug reaction causality
As per the WHO-UMC causality criteria, medication probably/certainly caused or
contributed significantly to admission in 53 (22.1%) cases. The medications
implicated are listed, in order of frequency, in table 3.16.
≥ 1 ≥ 2 ≥ 3 ≥ 4 ≥ 5
Total 100.0% 54.7% 15.1% 7.5% 1.9%
Male 100.0% 40.0% 12.0% 8.0% 0.0%
Female 100.0% 67.9% 17.9% 7.1% 3.6%
0.0%
20.0%
40.0%
60.0%
80.0%
100.0%
120.0%
Total Male Female
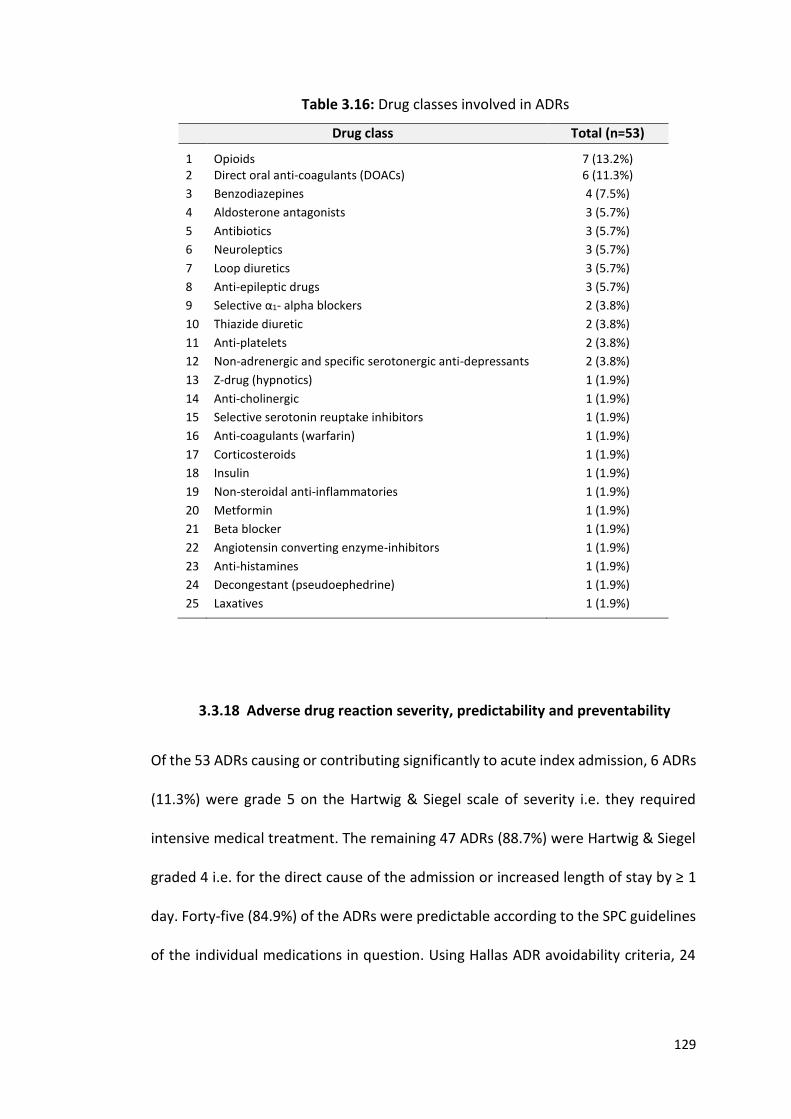
129
Table 3.16: Drug classes involved in ADRs
Drug class Total (n=53)
1
Opioids
7 (13.2%) 2 Direct oral anti-coagulants (DOACs) 6 (11.3%)
3 Benzodiazepines 4 (7.5%)
4 Aldosterone antagonists 3 (5.7%)
5 Antibiotics 3 (5.7%)
6 Neuroleptics 3 (5.7%)
7 Loop diuretics 3 (5.7%)
8 Anti-epileptic drugs 3 (5.7%)
9 Selective α1- alpha blockers 2 (3.8%)
10 Thiazide diuretic 2 (3.8%)
11 Anti-platelets 2 (3.8%)
12 Non-adrenergic and specific serotonergic anti-depressants 2 (3.8%)
13 Z-drug (hypnotics) 1 (1.9%)
14 Anti-cholinergic 1 (1.9%)
15 Selective serotonin reuptake inhibitors 1 (1.9%)
16 Anti-coagulants (warfarin) 1 (1.9%)
17 Corticosteroids 1 (1.9%)
18 Insulin 1 (1.9%)
19 Non-steroidal anti-inflammatories 1 (1.9%)
20 Metformin 1 (1.9%)
21 Beta blocker 1 (1.9%)
22 Angiotensin converting enzyme-inhibitors 1 (1.9%)
23 Anti-histamines 1 (1.9%)
24 Decongestant (pseudoephedrine) 1 (1.9%)
25 Laxatives 1 (1.9%)
3.3.18 Adverse drug reaction severity, predictability and preventability
Of the 53 ADRs causing or contributing significantly to acute index admission, 6 ADRs
(11.3%) were grade 5 on the Hartwig & Siegel scale of severity i.e. they required
intensive medical treatment. The remaining 47 ADRs (88.7%) were Hartwig & Siegel
graded 4 i.e. for the direct cause of the admission or increased length of stay by ≥ 1
day. Forty-five (84.9%) of the ADRs were predictable according to the SPC guidelines
of the individual medications in question. Using Hallas ADR avoidability criteria, 24
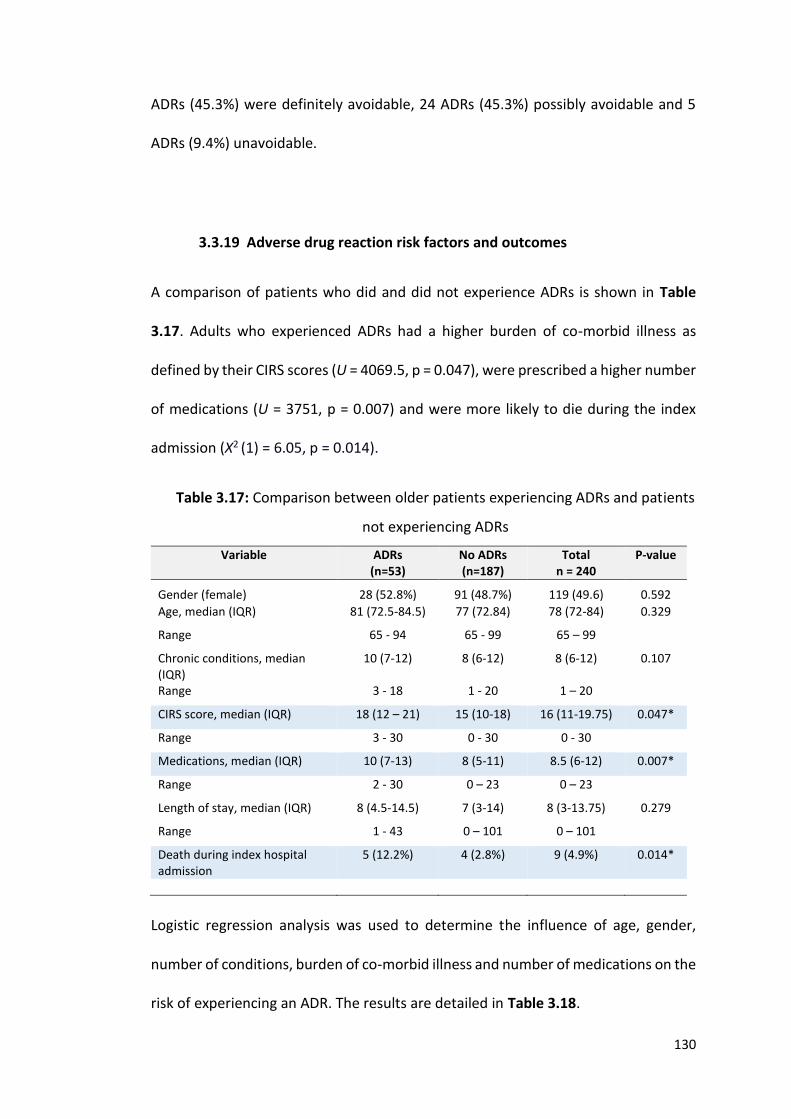
130
ADRs (45.3%) were definitely avoidable, 24 ADRs (45.3%) possibly avoidable and 5
ADRs (9.4%) unavoidable.
3.3.19 Adverse drug reaction risk factors and outcomes
A comparison of patients who did and did not experience ADRs is shown in Table
3.17. Adults who experienced ADRs had a higher burden of co-morbid illness as
defined by their CIRS scores (U = 4069.5, p = 0.047), were prescribed a higher number
of medications (U = 3751, p = 0.007) and were more likely to die during the index
admission (Χ2 (1) = 6.05, p = 0.014).
Table 3.17: Comparison between older patients experiencing ADRs and patients
not experiencing ADRs
Variable ADRs (n=53)
No ADRs (n=187)
Total n = 240
P-value
Gender (female)
28 (52.8%)
91 (48.7%)
119 (49.6)
0.592
Age, median (IQR) 81 (72.5-84.5) 77 (72.84) 78 (72-84) 0.329
Range 65 - 94 65 - 99 65 – 99
Chronic conditions, median (IQR)
10 (7-12) 8 (6-12) 8 (6-12) 0.107
Range 3 - 18 1 - 20 1 – 20
CIRS score, median (IQR) 18 (12 – 21) 15 (10-18) 16 (11-19.75) 0.047*
Range 3 - 30 0 - 30 0 - 30
Medications, median (IQR) 10 (7-13) 8 (5-11) 8.5 (6-12) 0.007*
Range 2 - 30 0 – 23 0 – 23
Length of stay, median (IQR) 8 (4.5-14.5) 7 (3-14) 8 (3-13.75) 0.279
Range 1 - 43 0 – 101 0 – 101
Death during index hospital admission
5 (12.2%) 4 (2.8%) 9 (4.9%) 0.014*
Logistic regression analysis was used to determine the influence of age, gender,
number of conditions, burden of co-morbid illness and number of medications on the
risk of experiencing an ADR. The results are detailed in Table 3.18.
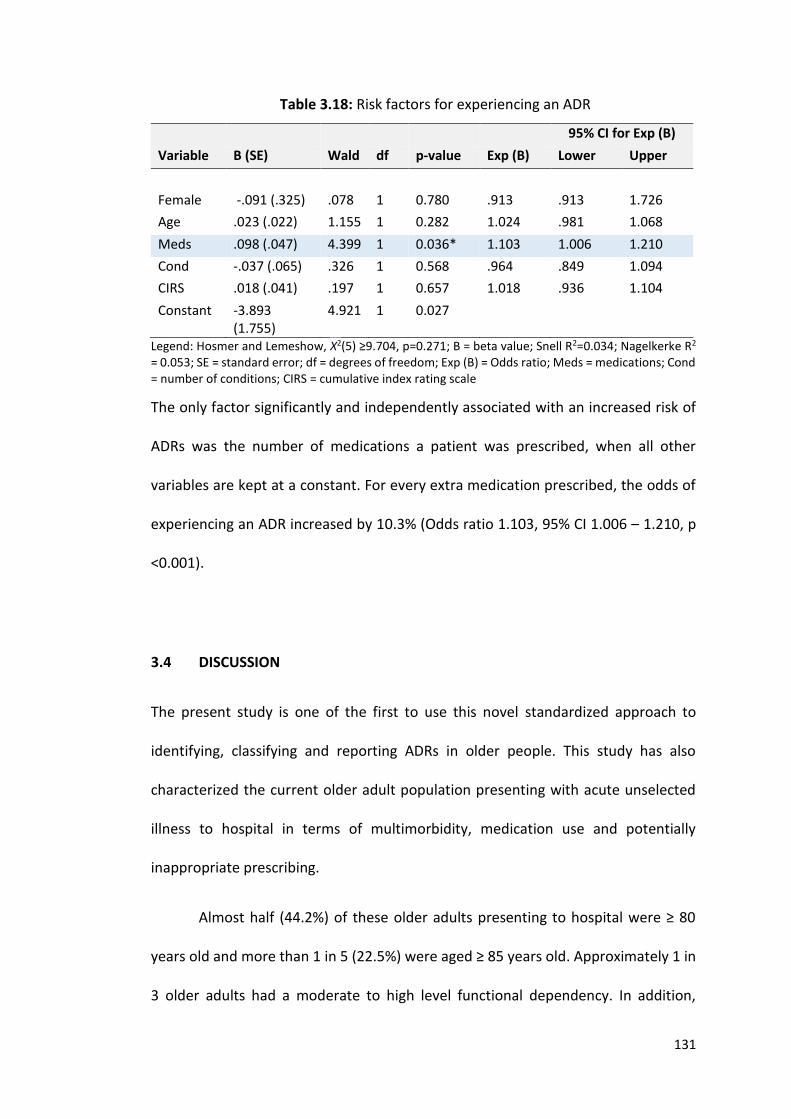
131
Table 3.18: Risk factors for experiencing an ADR
95% CI for Exp (B)
Variable B (SE) Wald df p-value Exp (B) Lower Upper
Female -.091 (.325) .078 1 0.780 .913 .913 1.726
Age .023 (.022) 1.155 1 0.282 1.024 .981 1.068
Meds .098 (.047) 4.399 1 0.036* 1.103 1.006 1.210
Cond -.037 (.065) .326 1 0.568 .964 .849 1.094
CIRS .018 (.041) .197 1 0.657 1.018 .936 1.104
Constant -3.893 (1.755)
4.921 1 0.027
Legend: Hosmer and Lemeshow, Χ2(5) ≥9.704, p=0.271; B = beta value; Snell R2=0.034; Nagelkerke R2 = 0.053; SE = standard error; df = degrees of freedom; Exp (B) = Odds ratio; Meds = medications; Cond = number of conditions; CIRS = cumulative index rating scale
The only factor significantly and independently associated with an increased risk of
ADRs was the number of medications a patient was prescribed, when all other
variables are kept at a constant. For every extra medication prescribed, the odds of
experiencing an ADR increased by 10.3% (Odds ratio 1.103, 95% CI 1.006 – 1.210, p
<0.001).
3.4 DISCUSSION
The present study is one of the first to use this novel standardized approach to
identifying, classifying and reporting ADRs in older people. This study has also
characterized the current older adult population presenting with acute unselected
illness to hospital in terms of multimorbidity, medication use and potentially
inappropriate prescribing.
Almost half (44.2%) of these older adults presenting to hospital were ≥ 80
years old and more than 1 in 5 (22.5%) were aged ≥ 85 years old. Approximately 1 in
3 older adults had a moderate to high level functional dependency. In addition,
132
approximately 1 in 5 had moderate to severe dementia and in a further 1 in 5
patients, delirium was evident at the time of presentation to hospital. Applying the
Rockwood Clinical Frailty Scale, approximately 1 in 4 patients were severely frail, very
severely frail or terminally ill.
Multimorbidity was identified in almost all patients (98.8%), with 84% of
patients having ≥ 5 chronic medical conditions. Two in five older adults had atrial
fibrillation and IHD, 1 in 3 had symptomatic osteoarthritis and constipation, 1 in 4
had heart failure, diabetes mellitus, COPD or chronic kidney disease and 1 in 5 had
osteoporosis, hypothyroidism or urinary incontinence. These result illustrate the
higher rates of multimorbidity encountered in hospitalised older adults compared to
clinically stable older adults living in the community.
Approximately 3 out of 4 (76.7%) patients experienced polypharmacy (≥ 6
medications) and 1 in 3 (32.5%) experienced high level polypharmacy (≥ 11
medications). Further analysis shows that approximately 1 in 2 patients were
prescribed a PPI, statin, beta blocker or loop diuretic. One in four were prescribed
vitamin D, anti-coagulants and anti-depressants. Lastly, 1 in 5 were prescribed an
ACE-inhibitor, ARB, calcium channel blocker or benzodiazepine. One in 10 (9%)
patients had problems taking their daily medications and 1 in 3 required another
person to oversee the management of same. 1 in 6 (15.4%) had forgotten to take
some or all of their daily medications in the month preceding admission. Considering
the extent of multimorbidity generally and cognitive impairment specifically in this
patient cohort, these findings of problematic or impaired medication adherence are
not surprising.
133
Potentially inappropriate prescribing was evident in two-thirds (67.5%) of the
patients studied. Less than half (41.3%) of the patients were taking at least one drug
beyond the recommended duration, 24.8% of patients were on a potentially
inappropriate high dose of PPI drug for 8 weeks or more with uncomplicated disease
and 20% of patients were prescribed a drug without any clear clinical indication. In
addition, 17.6% of patients were prescribed a benzodiazepine for ≥ 4 weeks and
15.4% of patients were prescribed a benzodiazepines whilst simultaneously being at
risk of falls. Those who were prescribed at least 1 PIM had a higher burden of co-
morbid illness and were prescribed a higher number of medications than patients
who were not prescribed PIMs. For every extra medication prescribed, the odds of
receiving a PIM increased by 41.5%.
Approximately 1 in every 2 (52.9%) patients were prescribed ≥ 1 PPO. One in
eight (12.4%) patients were not prescribed an ACE inhibitor with a known diagnosis
of heart failure of coronary heart disease and 1 in 12 (8.4%) were not prescribed anti-
resorptive medication with known osteoporosis, where no contraindications to these
medications existed.
ADRs caused or contributed to acute admission in approximately 1 in 5
(22.1%) older adults. The AE Trigger List identified 79.3% of all verified ADRs. The
most common ADRs reported were bleeding, falls and electrolyte disturbances.
Approximately 1 in 2 (54.7%) patients who experienced an ADR had a Sequence of
Events, with women significantly more likely to experience this adverse sequence
than their male counterparts (67.9% vs 40%). This is the first time this AE Trigger List
approach has been used to classify ADR morbidity.
134
The three drugs most commonly implicated in ADRs were opioids (13.2%),
direct oral anti-coagulants (11.7%) and benzodiazepines (7.5%). Forty-five (84.9%) of
ADRs were predictable, with 45.3% (n = 24) ADRs definitely avoidable and 45.3% (n =
24) possibly avoidable. Those who experienced ADRs had a higher burden of co-
morbid illness, were prescribed more medications and more likely to die during the
index admission than patients who did not experience ADRs. For every extra
medication prescribed, the odds of experiencing an ADR increased by 10.3%.
These results demonstrate that a significant proportion of older adults
presenting with acute unselected illness to hospital for admission are over 80 years
and are often highly frail and multimorbid with cognitive and functional impairment,
consistent with the changing population demographic profile, as predicted by the
NCPOP (2), Eurostat (3) and WHO (4). Importantly, despite most of these older adults
being multimorbid and having significant complex care needs, just 1 in 8 (12.5%)
were admitted to the specialist Geriatric Medicine service. This emphasizes the need
for all doctors practising in all specialties who care for acutely ill older patients to
have continued postgraduate education in managing the pharmacotherapy of older
adults. This education need is likely to grow as the general population in Ireland and
elsewhere expands.
This study confirms what has already been reported in other studies in Ireland
(45-47, 167) i.e. that many older adults presenting to hospital are prescribed at least
one PIM and thus at risk of ADRs. Hospitalisation is an opportune time to optimise
prescribing in a high risk population, through comprehensive geriatric assessment
(CGA) and IP screening tools. However, there are currently no explicit IP criteria
135
designed to guide prescribing in frail multimorbid adults with a poor one year survival
prognosis.
The ability of patients to adhere to prescribed medications is a key
consideration in medication review of frailer, multimorbid older people. The present
study identified that at least 1 in 10 older adults experience serious problems taking
their medications according to SHiM assessment and are therefore likely to have
reduced medication benefit. This is not a new finding, but it is consistent with
previous studies of medication adherence in the multimorbid older patient
population (168, 169).
The ADR prevalence rate at admission to hospital reported here (22.1%) is
consistent with the most recent observational studies on ADRs causing
hospitalisation conducted at CUH, in which the reported prevalence rate ranges from
21.0% to 26.3% (46, 74). The ADR prevalence in multimorbid acutely ill older people
reported in the CUH studies is significantly higher than in most other studies. A recent
systematic review by Alhawassi et al. (144) of the prevalence and risk factors for ADRs
in older people in the acute care setting indicated a median ADR prevalence of 10%.
Using the AE Trigger List in the present study, as well as rigorous approach to ADR
assessment, resulted in detection of approximately twice as many prevalent ADRs as
reported by Alhawassi et al. Serious under detection of ADRs in acutely ill frailer
multimorbid older people has serious clinical ramifications and supports the case for
routine scrutiny of AE Trigger List events as possible ADRs and follow-up rigorous
structured medication review by appropriately trained medical and pharmacist staff
in the hospital setting.
136
The AE Trigger List highlighted 4 in 5 verified ADRs in the present study. The
AE Trigger List also allowed capture of sequential morbidity associated with ADRs i.e.
one Trigger List ADR leading to further Trigger List ADRs. The present study shows
that in more than half (54.7%) of the patients who experience a primary ADR, there
were ≥ 1 further ADR that was directly related to the primary ADR. For 1 in 7 patients
(15.1%), there was a sequence of 3 events and for 1 in 13 (7.5%), this progressed to
4 sequential, related ADRs. Women are more prone to this sequence phenomenon
than men, highlighting the importance of early detection of ADRs early to prevent
further ADR-related problems.
There were some limitations with this study. Firstly, patients were only
recruited to the study on one admission, and thus it is possible that ADRs causing
readmission were missed. Secondly, only one person assessed patients, their case
records and laboratory data for evidence of ADR occurrence. Ideally, all putative
ADRs would be corroborated by a second trained assessor in an unbiased manner as
suggested in Chapter 2. Thirdly, prevalent ADR assessment took place in one clinical
setting only. Evaluation of older frailer multimorbid patients in other settings, such
as ambulatory assessment units, primary care and nursing home care would be
important for comparison with similar older patients in the acute hospital setting.
137
CHAPTER 4:
Prevalence of multimorbidity, potentially inappropriate prescribing and
adverse drug reactions (ADRs) in patients with cancer
138
4.1 INTRODUCTION
Between 2010 and 2030, the incidence of cancer in older adults is expected to
increase from 61% to 70% (20), coinciding with an ageing population (2-4). The
demand for cancer treatment services in older patients is also likely to increase
concomitantly. However, cancer may be only one of several complex diagnoses in an
older individual. These, coupled with co-existing polypharmacy, cognitive and
functional impairments can present the treating clinician with challenging
therapeutic and ethical dilemmas.
4.1.1 Multimorbidity in patients with cancer
Multimorbidity, defined as the co-occurrence of two or more chronic medication
conditions in one person (10), is highly prevalent in the general (non-cancer) older
population; prevalence rates of 50% in those aged ≤65 years and 80% in those ≥80
years have been reported (13). To date, there has been a relative paucity of research
into the burden of co-morbid illnesses in patients with cancer. Wedding et al.
reported multimorbidity rates of 51% in patients with cancer aged < 65 years and
76% in patients with cancer aged ≥ 65 years (170).
Data from insurance company databases identifies multimorbidity in two
thirds of patients with cancer, with older adults with cancer having a higher rate of
co-morbid illness than their age-matched controls (171-173). However, the reliability
of these data is likely to be limited by the accuracy of patient recall and precision of
data input. Studies of medication use in patients with cancer have identified a high
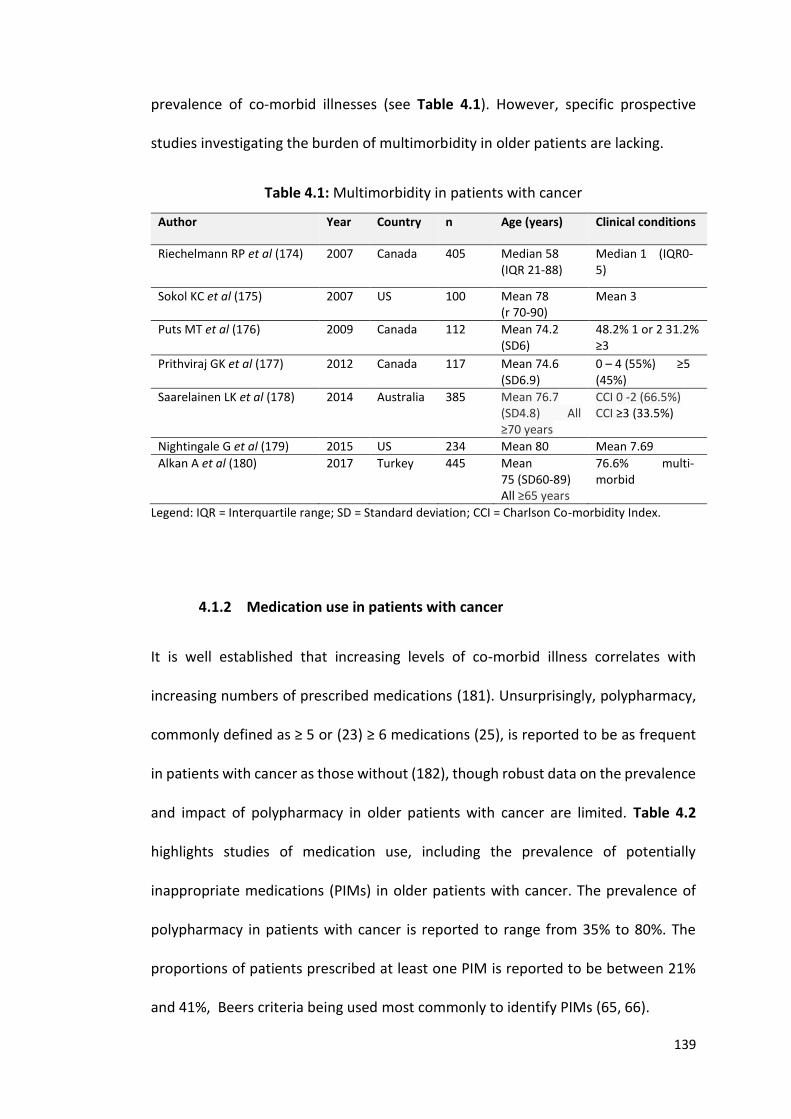
139
prevalence of co-morbid illnesses (see Table 4.1). However, specific prospective
studies investigating the burden of multimorbidity in older patients are lacking.
Table 4.1: Multimorbidity in patients with cancer
Author Year Country n Age (years) Clinical conditions
Riechelmann RP et al (174) 2007 Canada 405 Median 58 (IQR 21-88)
Median 1 (IQR0-5)
Sokol KC et al (175) 2007 US 100 Mean 78 (r 70-90)
Mean 3
Puts MT et al (176) 2009 Canada 112 Mean 74.2 (SD6)
48.2% 1 or 2 31.2% ≥3
Prithviraj GK et al (177) 2012 Canada 117 Mean 74.6 (SD6.9)
0 – 4 (55%) ≥5 (45%)
Saarelainen LK et al (178) 2014 Australia 385 Mean 76.7 (SD4.8) All ≥70 years
CCI 0 -2 (66.5%) CCI ≥3 (33.5%)
Nightingale G et al (179) 2015 US 234 Mean 80 Mean 7.69
Alkan A et al (180) 2017 Turkey 445 Mean 75 (SD60-89) All ≥65 years
76.6% multi-morbid
Legend: IQR = Interquartile range; SD = Standard deviation; CCI = Charlson Co-morbidity Index.
4.1.2 Medication use in patients with cancer
It is well established that increasing levels of co-morbid illness correlates with
increasing numbers of prescribed medications (181). Unsurprisingly, polypharmacy,
commonly defined as ≥ 5 or (23) ≥ 6 medications (25), is reported to be as frequent
in patients with cancer as those without (182), though robust data on the prevalence
and impact of polypharmacy in older patients with cancer are limited. Table 4.2
highlights studies of medication use, including the prevalence of potentially
inappropriate medications (PIMs) in older patients with cancer. The prevalence of
polypharmacy in patients with cancer is reported to range from 35% to 80%. The
proportions of patients prescribed at least one PIM is reported to be between 21%
and 41%, Beers criteria being used most commonly to identify PIMs (65, 66).
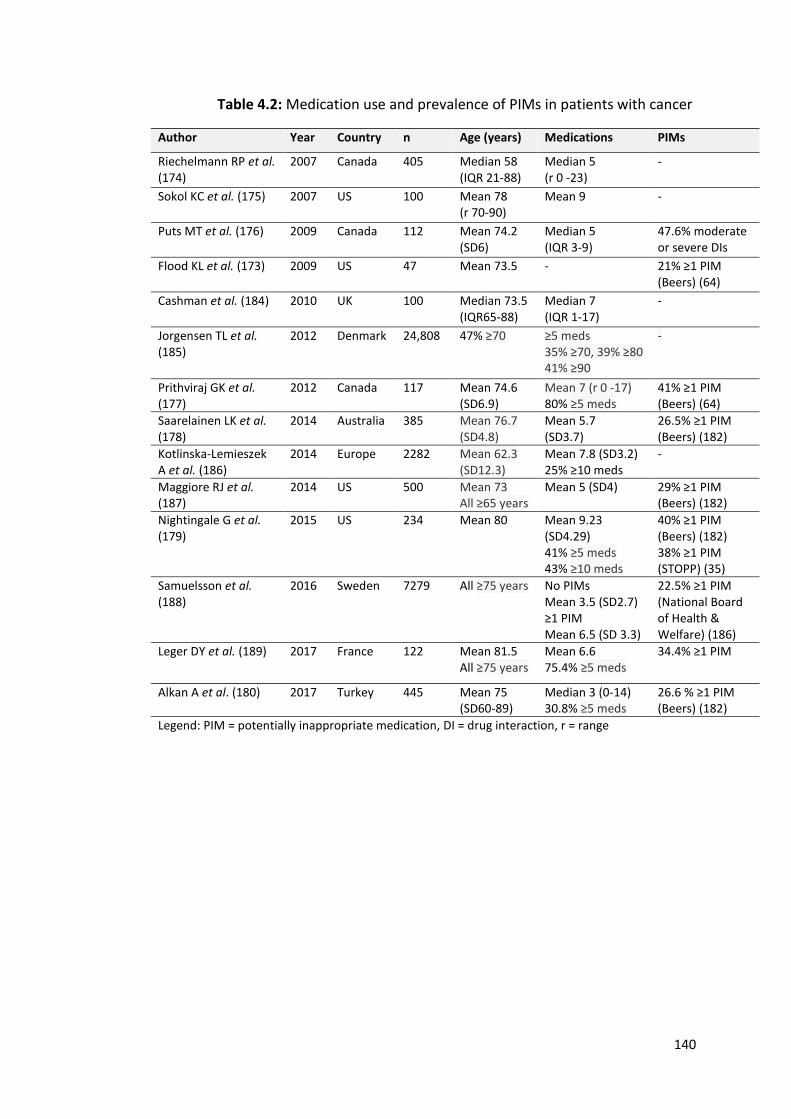
140
Table 4.2: Medication use and prevalence of PIMs in patients with cancer
Author Year Country n Age (years) Medications PIMs
Riechelmann RP et al. (174)
2007 Canada 405 Median 58 (IQR 21-88)
Median 5 (r 0 -23)
-
Sokol KC et al. (175) 2007 US 100 Mean 78 (r 70-90)
Mean 9 -
Puts MT et al. (176) 2009 Canada 112 Mean 74.2 (SD6)
Median 5 (IQR 3-9)
47.6% moderate or severe DIs
Flood KL et al. (173) 2009 US 47 Mean 73.5 - 21% ≥1 PIM (Beers) (64)
Cashman et al. (184) 2010 UK 100 Median 73.5 (IQR65-88)
Median 7 (IQR 1-17)
-
Jorgensen TL et al. (185)
2012 Denmark 24,808 47% ≥70 ≥5 meds 35% ≥70, 39% ≥80 41% ≥90
-
Prithviraj GK et al. (177)
2012 Canada 117 Mean 74.6 (SD6.9)
Mean 7 (r 0 -17) 80% ≥5 meds
41% ≥1 PIM (Beers) (64)
Saarelainen LK et al. (178)
2014 Australia 385 Mean 76.7 (SD4.8)
Mean 5.7 (SD3.7)
26.5% ≥1 PIM (Beers) (182)
Kotlinska-Lemieszek A et al. (186)
2014 Europe 2282 Mean 62.3 (SD12.3)
Mean 7.8 (SD3.2) 25% ≥10 meds
-
Maggiore RJ et al. (187)
2014 US 500 Mean 73 All ≥65 years
Mean 5 (SD4)
29% ≥1 PIM (Beers) (182)
Nightingale G et al. (179)
2015 US 234 Mean 80 Mean 9.23 (SD4.29) 41% ≥5 meds 43% ≥10 meds
40% ≥1 PIM (Beers) (182) 38% ≥1 PIM (STOPP) (35)
Samuelsson et al. (188)
2016 Sweden 7279 All ≥75 years
No PIMs Mean 3.5 (SD2.7) ≥1 PIM Mean 6.5 (SD 3.3)
22.5% ≥1 PIM (National Board of Health & Welfare) (186)
Leger DY et al. (189) 2017 France 122 Mean 81.5 All ≥75 years
Mean 6.6 75.4% ≥5 meds
34.4% ≥1 PIM
Alkan A et al. (180) 2017 Turkey 445 Mean 75 (SD60-89)
Median 3 (0-14) 30.8% ≥5 meds
26.6 % ≥1 PIM (Beers) (182)
Legend: PIM = potentially inappropriate medication, DI = drug interaction, r = range
141
4.1.3 Adverse drug reactions in patients with cancer
Polypharmacy (144) and IP (35) contribute to ADRs. ADRs are common, the
prevalence in the general older adult population at time of hospital admission being
as high as 20% depending on the definitions and methodologies used to identify
ADRs. ADRs associated specifically with chemotherapy have been well studied.
Indeed, potential toxicities are well documented in medications’ summary of product
characteristics (SPCs) e.g. neutropenia can occur in 30% of patients receiving
chemotherapy (190). In addition, multiple online educational resources exist e.g.
http\\:www.chemocare.com and http\\:www.MacMillan.com. These clearly list,
classify and risk stratify potential ADRs of chemotherapy so that patients, and clinical
practitioners can be aware of, and vigilant for ADRs prior to and during treatment.
However, little is known about the prevalence rates of non-chemotherapy related
ADRs in patients with cancer and whether or not older patients with cancer are more
vulnerable to ADRs than their younger counterparts.
Lau et al. investigated the potential for cancer specific treatments as well non-
cancer specific treatments to cause ADRs during hospitalisation in patients with
cancer and reported that the following ADRs were most commonly experienced by
patients: (i) constipation, (ii) nausea/vomiting, (iii) fatigue, (iv) alopecia, (v)
drowsiness, (vi) myelosuppression, (vii) skin reactions, (viii) anorexia, (ix) mucositis
and (x) diarrhoea, with 74.3% of patients experiencing at least 1 ADR during
hospitalisation (191). This study population had a mean age of 59 years (range 20 –
92), however no comparisons were made between the prevalence and nature of
ADRs in younger versus older patients.
142
There is relative paucity of research on the prevalence and impact of
multimorbidity, IP and ADRs in older patients with cancer. Studies to date that report
on this weren’t all designed to capture multimorbidity, IP and ADRs in older patient
with cancer and for some data is from large databases where the precision of data
input may not accurate. Medical and radiation oncologists are managing and treating
cancer in a heterogeneous group of older patients, many of whom have age-related
physiological change, complex co-morbidities, complex polypharmacy as well as
functional and cognitive impairments. The burden of multimorbidity, prevalence of
medication use and related ADRs has not been studied in older patients with cancer
in Ireland, nor has there been an investigation into the differences between older
and younger patients with cancer in Ireland. With a rapidly changing demographic
distribution, more older patients are expected to be diagnosed with cancer in the
coming decades. This will require more complex and multidisciplinary clinical and
social care. More robust data are required about this patient group in order to
effectively design and administer appropriate interventions.
4.1.4 Objectives
The specific objectives of this study were:
(i) To investigate and describe the burden of multimorbidity in patients
attending a tertiary specialist oncology unit, comparing younger and older
adults.
(ii) To assess the pattern of prescription drug use in these patients, both
oncological and non-oncological.
143
(iii) To determine the prevalence of polypharmacy (≥ 6 medications) and high
level polypharmacy (≥ 11 medications) in patients attending a specialist
oncology unit.
(iv) To determine the prevalence of potentially inappropriate prescribing,
where applicable, using STOPP (Screening Tool of Older Person’s
potentially inappropriate Prescriptions) criteria (Appendix 8) (36) and
OncPal (Oncological palliative care deprescribing guideline) (Appendix 9)
(190).
(v) To determine the incidence of ADRs causing or contributing significantly
to hospital admission in patients with cancer.
(vi) To classify ADRs according to type, causality, associated morbidity,
severity, predictability and preventability.
(vii) To identify risk factors for ADRs in older and younger patients with cancer.
(viii) To analyse the outcomes for patients who experience ADRs.
The work undertaken in this chapter, including study design, data collection and
statistical analysis, is entirely my own.
144
4.2 METHODS
4.2.1 Study setting and design
This prospective observational study was conducted in two academic teaching
hospitals in the Republic of Ireland; Cork University Hospital (CUH) and Mercy
University Hospital (MUH). It was conducted over a 12 month period (January 1st
2016 – December 31st 2016), following a one month pilot in which study procedures
and logistics were refined and finalised.
CUH is a level 4 University Teaching Hospital with 850 inpatients beds and
over 25,000 emergency admissions per year. It caters for approximately 5300
medical oncology admissions per year comprising 4500 day cases, 500 emergency
inpatient admissions and 300 elective inpatient admissions. In addition, there are
approximately 30,000 day unit radiation oncology admissions per year. MUH is a 300
bed level 3 University Teaching Hospital, with a smaller medical oncology service
catering for 4400 admissions per year. This comprises 4000 day cases, 300 emergency
inpatient admissions and 100 elective inpatient admissions. MUH has no radiation
oncology service. Both hospitals serve a population of over 800,000 people and
together form one of the eight regional cancer centres in the Republic of Ireland.
4.2.2 Patient eligibility and consent
All patients’ aged 16 years and older, admitted under the medical oncology or
radiation oncology services in CUH and MUH, were eligible for inclusion in this
prospective study. For the purpose of this study older adults were defined as being
145
aged ≥70 years. Participants were enrolled from three different admission pathways;
emergency, elective and medical oncology day unit admissions. Radiation oncology
day unit admissions were excluded due to logistical difficulties noted during the 1
month pilot phase, principally due to rapid treatment turnover times and lack of
appropriate office space to conduct patient interviews in the radiation oncology
centre.
Emergency and elective admissions to the medical oncology service were
recruited within 72 hours of presentation to hospital. Chemotherapy day unit
admissions i.e. patients attending for daily treatment on a regular basis, were
reviewed over a two week period (March 28th to April 8th 2016); one week being
allocated to each hospital. Day unit admissions encompass patients undergoing
regular cycles of cancer treatment and therefore the same patients attend weekly
for a defined period of time. Exclusion criteria were as follows: (i) patients already
enrolled in the study on a previous hospital admission and (ii) patients deemed to be
actively dying by the attending physician, at the point of admission.
The study’s objectives were explained to patients. If agreeable, patients
provided written consent to participate. In circumstances where patients were
unable to give consent due to reduced decision making ability e.g. delirium or
advanced dementia, consent was obtained from their legal representative. Inclusion
in the study was voluntary and was clearly documented in patients’ medical records.
The study protocol was assessed and approved by the local Clinical Research Ethics
Committees at University College Cork (Appendix 2).
146
4.2.3 Study population and sample size calculation
(i) Sample size required to determine the prevalence of potentially
inappropriate prescribing
Using an estimated prevalence of potentially inappropriate prescribing (PIP) of 20%,
a margin of error of 4% and 95% level of confidence, a minimum sample of 322
patients was required for this study. This power calculation was based on the formula
outlined in Table 4.3 and adjusted using oncology service admissions data from 2015.
(ii) Sample size required to determine the prevalence of adverse drug
reactions
In the acute unselected population of all ages, the reported ADR rate is
approximately 7%, therefore this study was powered to record an ADR rate of 7%
with a margin of error of 2% with 95% confidence. This determined that a minimum
sample of 333 patients was required (Table 4.3).
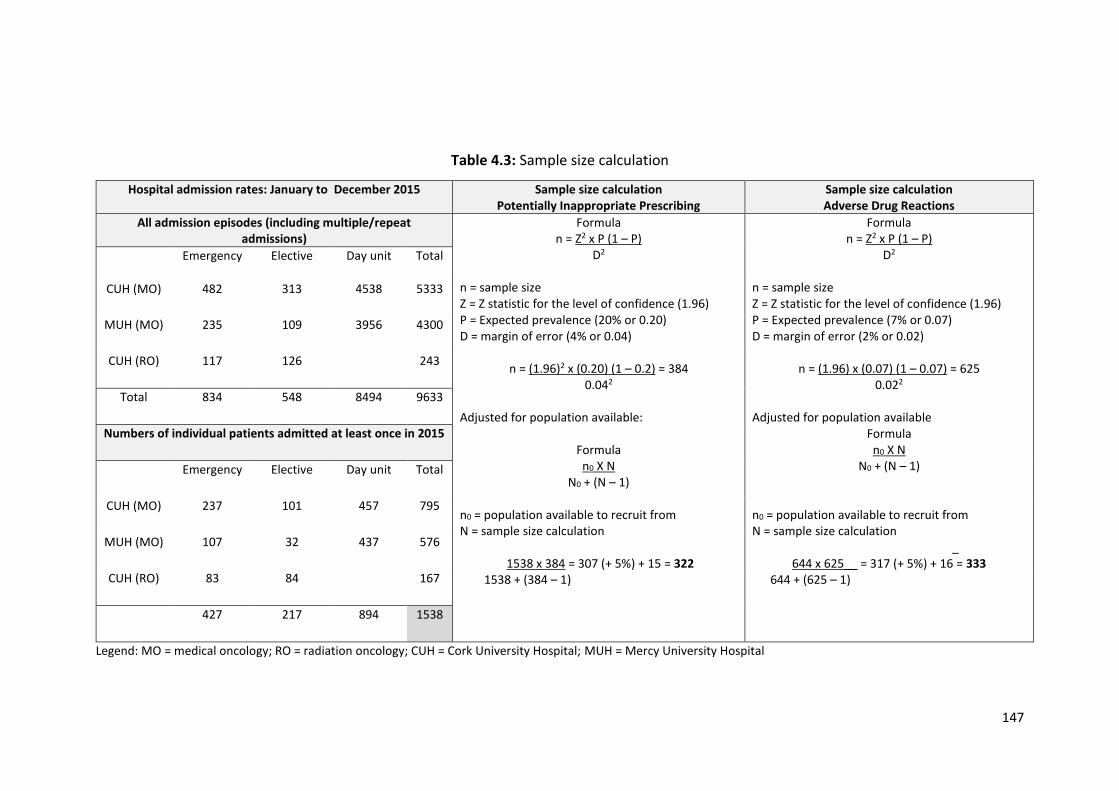
147
Table 4.3: Sample size calculation
Hospital admission rates: January to December 2015 Sample size calculation Potentially Inappropriate Prescribing
Sample size calculation Adverse Drug Reactions
All admission episodes (including multiple/repeat admissions)
Formula n = Z2 x P (1 – P)
D2
n = sample size Z = Z statistic for the level of confidence (1.96) P = Expected prevalence (20% or 0.20) D = margin of error (4% or 0.04)
n = (1.96)2 x (0.20) (1 – 0.2) = 384 0.042
Adjusted for population available:
Formula n0 X N
N0 + (N – 1) n0 = population available to recruit from N = sample size calculation
1538 x 384 = 307 (+ 5%) + 15 = 322
1538 + (384 – 1)
Formula n = Z2 x P (1 – P)
D2
n = sample size Z = Z statistic for the level of confidence (1.96) P = Expected prevalence (7% or 0.07) D = margin of error (2% or 0.02)
n = (1.96) x (0.07) (1 – 0.07) = 625 0.022
Adjusted for population available
Formula n0 X N
N0 + (N – 1) n0 = population available to recruit from N = sample size calculation
_ 644 x 625__ = 317 (+ 5%) + 16 = 333
644 + (625 – 1)
Emergency Elective Day unit Total
CUH (MO) 482 313 4538 5333
MUH (MO) 235 109 3956 4300
CUH (RO) 117 126 243
Total 834 548 8494 9633
Numbers of individual patients admitted at least once in 2015
Emergency Elective Day unit Total
CUH (MO) 237 101 457 795
MUH (MO) 107 32 437 576
CUH (RO) 83 84 167
427 217 894 1538
Legend: MO = medical oncology; RO = radiation oncology; CUH = Cork University Hospital; MUH = Mercy University Hospital
148
4.2.4 Data collection
All participants were reviewed within 72 hours of admission. Each morning, a list of
admissions from the previous 72 hours was compiled. To avoid any bias, patients
were enrolled in chronological order of admission i.e. those in hospital the longest
were recruited first.
The following data were abstracted onto a standardized proforma (Appendix
3): (i) demographic details, (ii) medical co-morbidities using the Cumulative Illness
Rating Scale – CIRS (156), (iii) concurrent medications, (iv) functional ability using the
Barthel Index (157), (v) cognitive status using a standardized Mini-mental state
examination – MMSE), in those ≥ 65 years (158), the 4-AT (159) and the Diagnostic
and Statistical Manual of Mental Disorders V - DSM-V to assess for delirium (160), (vi)
laboratory values, and (vii) electrocardiogram (ECG). Medication reconciliation was
completed using the Structured History taking of Medication use (SHiM) (32). These
tools have been described in detail in Chapter 3.
Potentially inappropriate prescribing (PIP) was assessed using STOPP criteria
(Appendix 8) (37) and OncPal (Appendix 9) (192). A brief description of STOPP criteria
has been presented in chapter 3. A brief description of the development and validity
of OncPal follows. OncPal (192) is an explicit prescribing tool, developed and
validated in Australia, to assist physicians with deprescribing for patients with cancer
and a poor survival prognosis. It aims to highlight medications that are of limited
benefit in this patient group. Similar to STOPP criteria it is divided into physiological
systems. It focuses primarily on preventative therapy e.g. aspirin for primary
prevention and anti-hypertensives. To date, only one study has been published that
149
used OncPal (192). This prospective study of 61 patients (mean age 66 (range 23 - 93)
showed that 70% of patients with cancer and a limited life expectancy were
prescribed at least one potentially inappropriate medication (PIM) and that 21.4% of
all medications prescribed to this population were potentially inappropriate (192).
4.2.5 Potentially inappropriate prescribing
STOPP criteria (Appendix 8) (37) were applied to the abstracted data of all patients
≥ 65 years. OncPal criteria (Appendix 9) (192) were applied to the abstracted data on
participants who died within 6 months of enrolment. The presence or absence of a
PIM, according to STOPP and OncPal criteria, was categorised as a dichotomous
variable. Where there was uncertainty regarding appropriateness of a prescription
this was treated conservatively i.e. the medication was deemed appropriate.
4.2.6 Adverse drug reactions (ADRs)
The proportion of patients experiencing one or more non-trivial, probable or certain,
ADR causing or contributing significantly to hospital admission was determined using
Edwards and Aronson’s definition of an ADR i.e. “An appreciably harmful or
unpleasant reaction, resulting from an intervention related to the use of a medicinal
product, which predicts hazard from future administration and warrants prevention
or specific treatment, or alteration of the dosage regimen, or withdrawal of the
product” (79).
150
To limit potential bias from selective ADR reporting and to ensure ADRs were
not missed, the AE Trigger List of the 12 most common adverse events (AEs) linked
to ADRs was used, as previously discussed in Chapter 2, data on any ADR not listed
in the AE Trigger List were also collected e.g. drug anaphylaxis. All AEs including
potential ADRs were recorded and subsequently reviewed to assess the causative
role of prescribed medications. ADRs were assessed prospectively at the time of
enrolment.
4.2.7 ADR causality, severity, predictability and preventability
Causality was assessed using the World Health Organisation Uppsala Monitoring
Centre (WHO-UMC) criteria whereby the likelihood of a drug causing the adverse
event is classified as either certain, probable, possible, unlikely or unrelated (119).
ADR severity was assessed using the Hartwig & Siegel scale. This grades ADR severity
according to clinical consequence on a scale of 1 to 7 with a grade 1 ADR being trivial
and requiring no medical intervention and a grade 7 ADR representing a fatal event
(151). Preventability of the ADR was assessed using Hallas criteria i.e. definitely
avoidable, possibly avoidable, unavoidable and unclassifiable (166). Predictability
was assessed using the summary of product characteristics (SPC) (Table 4.4). ADRs
were deemed predictable if they were listed in the relevant SPC as occurring
commonly (≥1/100 and <1/10) or very commonly (≥1/10).
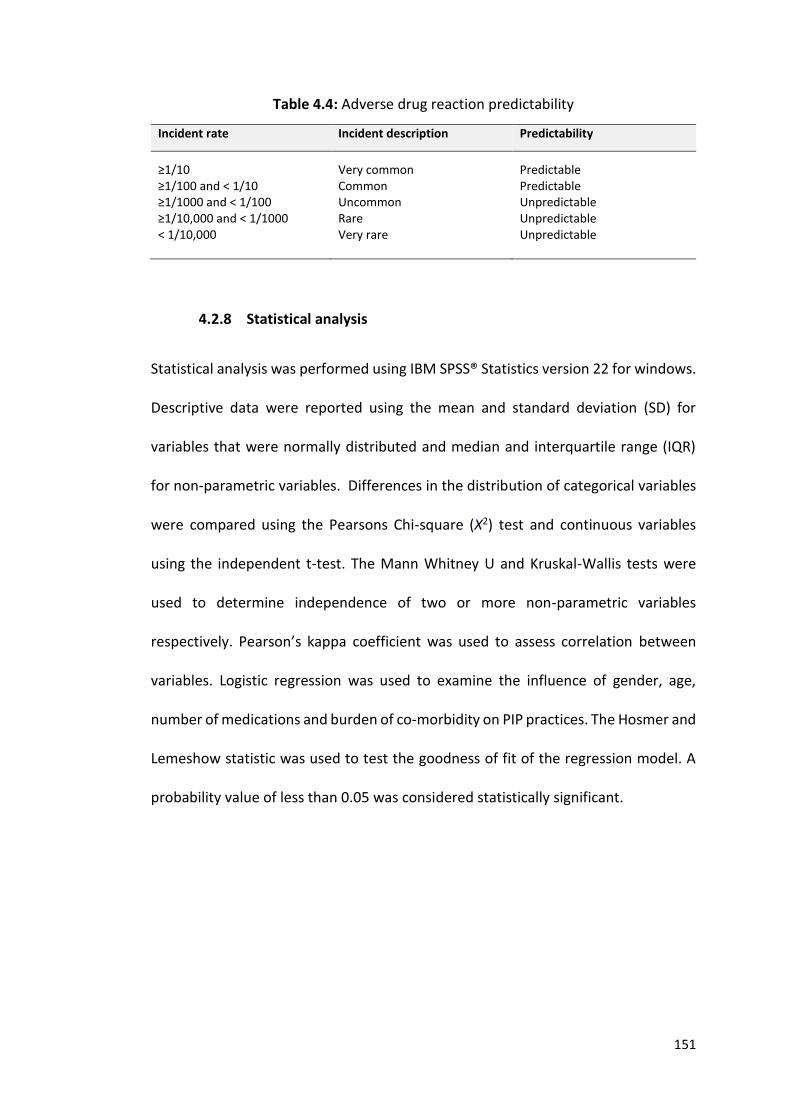
151
Table 4.4: Adverse drug reaction predictability
Incident rate
Incident description Predictability
≥1/10 ≥1/100 and < 1/10 ≥1/1000 and < 1/100 ≥1/10,000 and < 1/1000 < 1/10,000
Very common Common Uncommon Rare Very rare
Predictable Predictable Unpredictable Unpredictable Unpredictable
4.2.8 Statistical analysis
Statistical analysis was performed using IBM SPSS® Statistics version 22 for windows.
Descriptive data were reported using the mean and standard deviation (SD) for
variables that were normally distributed and median and interquartile range (IQR)
for non-parametric variables. Differences in the distribution of categorical variables
were compared using the Pearsons Chi-square (Χ2) test and continuous variables
using the independent t-test. The Mann Whitney U and Kruskal-Wallis tests were
used to determine independence of two or more non-parametric variables
respectively. Pearson’s kappa coefficient was used to assess correlation between
variables. Logistic regression was used to examine the influence of gender, age,
number of medications and burden of co-morbidity on PIP practices. The Hosmer and
Lemeshow statistic was used to test the goodness of fit of the regression model. A
probability value of less than 0.05 was considered statistically significant.
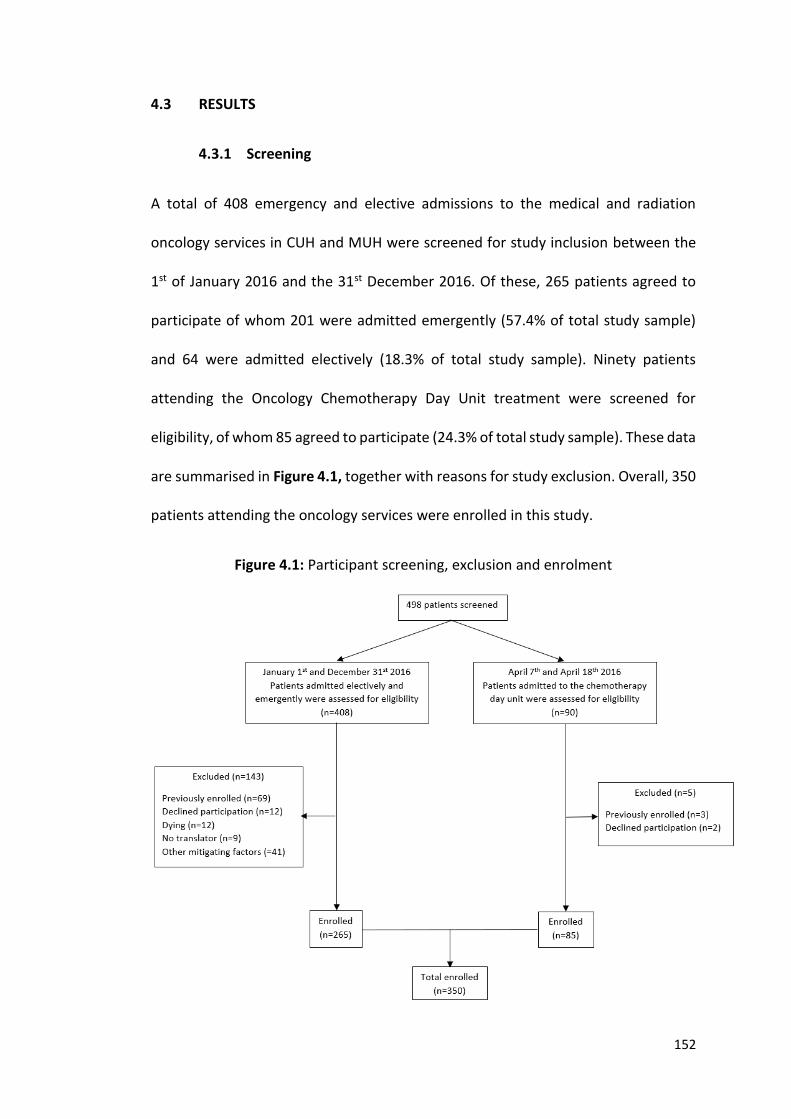
152
4.3 RESULTS
4.3.1 Screening
A total of 408 emergency and elective admissions to the medical and radiation
oncology services in CUH and MUH were screened for study inclusion between the
1st of January 2016 and the 31st December 2016. Of these, 265 patients agreed to
participate of whom 201 were admitted emergently (57.4% of total study sample)
and 64 were admitted electively (18.3% of total study sample). Ninety patients
attending the Oncology Chemotherapy Day Unit treatment were screened for
eligibility, of whom 85 agreed to participate (24.3% of total study sample). These data
are summarised in Figure 4.1, together with reasons for study exclusion. Overall, 350
patients attending the oncology services were enrolled in this study.
Figure 4.1: Participant screening, exclusion and enrolment
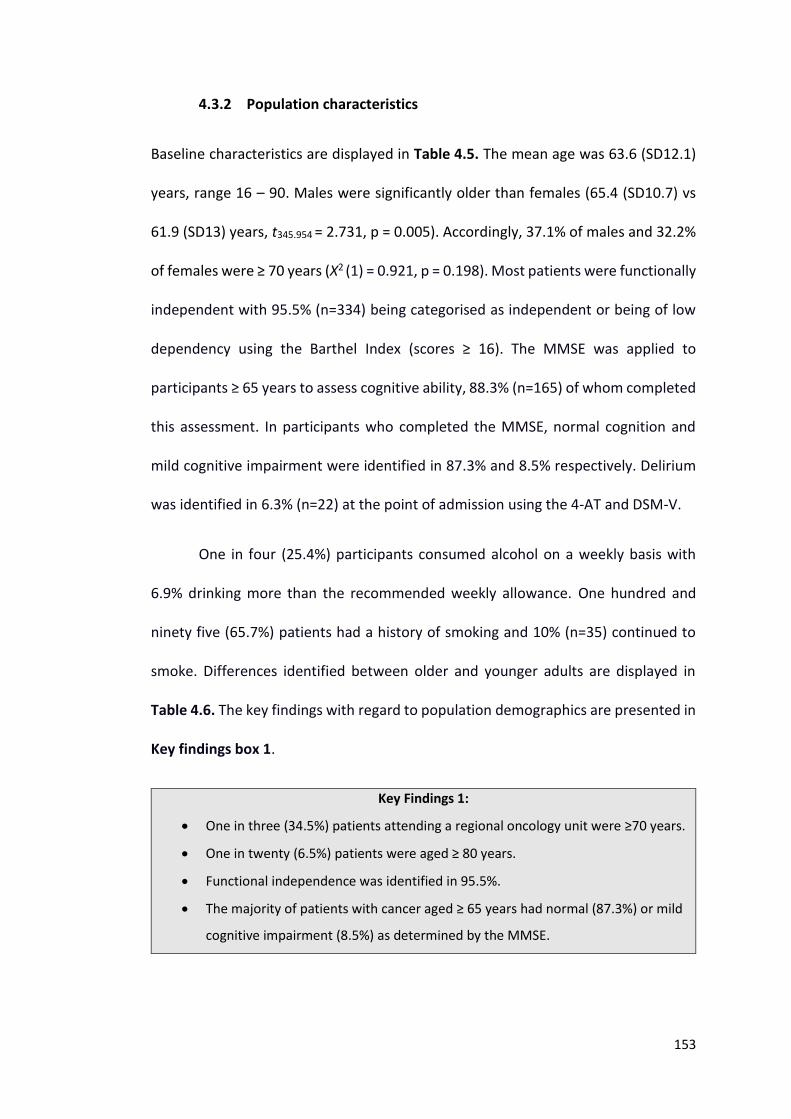
153
4.3.2 Population characteristics
Baseline characteristics are displayed in Table 4.5. The mean age was 63.6 (SD12.1)
years, range 16 – 90. Males were significantly older than females (65.4 (SD10.7) vs
61.9 (SD13) years, t345.954 = 2.731, p = 0.005). Accordingly, 37.1% of males and 32.2%
of females were ≥ 70 years (Χ2 (1) = 0.921, p = 0.198). Most patients were functionally
independent with 95.5% (n=334) being categorised as independent or being of low
dependency using the Barthel Index (scores ≥ 16). The MMSE was applied to
participants ≥ 65 years to assess cognitive ability, 88.3% (n=165) of whom completed
this assessment. In participants who completed the MMSE, normal cognition and
mild cognitive impairment were identified in 87.3% and 8.5% respectively. Delirium
was identified in 6.3% (n=22) at the point of admission using the 4-AT and DSM-V.
One in four (25.4%) participants consumed alcohol on a weekly basis with
6.9% drinking more than the recommended weekly allowance. One hundred and
ninety five (65.7%) patients had a history of smoking and 10% (n=35) continued to
smoke. Differences identified between older and younger adults are displayed in
Table 4.6. The key findings with regard to population demographics are presented in
Key findings box 1.
Key Findings 1:
One in three (34.5%) patients attending a regional oncology unit were ≥70 years.
One in twenty (6.5%) patients were aged ≥ 80 years.
Functional independence was identified in 95.5%.
The majority of patients with cancer aged ≥ 65 years had normal (87.3%) or mild
cognitive impairment (8.5%) as determined by the MMSE.
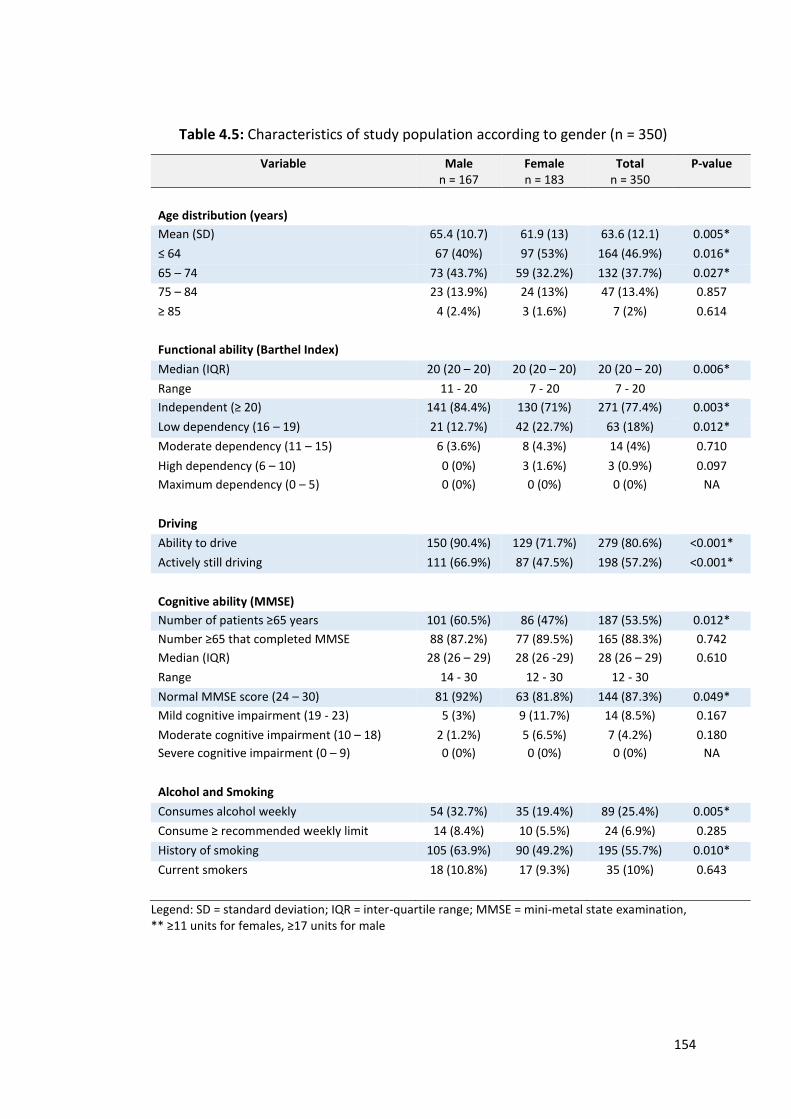
154
Table 4.5: Characteristics of study population according to gender (n = 350)
Variable Male n = 167
Female n = 183
Total n = 350
P-value
Age distribution (years)
Mean (SD) 65.4 (10.7) 61.9 (13) 63.6 (12.1) 0.005*
≤ 64 67 (40%) 97 (53%) 164 (46.9%) 0.016*
65 – 74 73 (43.7%) 59 (32.2%) 132 (37.7%) 0.027*
75 – 84 23 (13.9%) 24 (13%) 47 (13.4%) 0.857
≥ 85 4 (2.4%) 3 (1.6%) 7 (2%) 0.614
Functional ability (Barthel Index)
Median (IQR) 20 (20 – 20) 20 (20 – 20) 20 (20 – 20) 0.006*
Range 11 - 20 7 - 20 7 - 20
Independent (≥ 20) 141 (84.4%) 130 (71%) 271 (77.4%) 0.003*
Low dependency (16 – 19) 21 (12.7%) 42 (22.7%) 63 (18%) 0.012*
Moderate dependency (11 – 15) 6 (3.6%) 8 (4.3%) 14 (4%) 0.710
High dependency (6 – 10) 0 (0%) 3 (1.6%) 3 (0.9%) 0.097
Maximum dependency (0 – 5) 0 (0%) 0 (0%) 0 (0%) NA
Driving
Ability to drive 150 (90.4%) 129 (71.7%) 279 (80.6%) <0.001*
Actively still driving 111 (66.9%) 87 (47.5%) 198 (57.2%) <0.001*
Cognitive ability (MMSE)
Number of patients ≥65 years 101 (60.5%) 86 (47%) 187 (53.5%) 0.012*
Number ≥65 that completed MMSE 88 (87.2%) 77 (89.5%) 165 (88.3%) 0.742
Median (IQR) 28 (26 – 29) 28 (26 -29) 28 (26 – 29) 0.610
Range 14 - 30 12 - 30 12 - 30
Normal MMSE score (24 – 30) 81 (92%) 63 (81.8%) 144 (87.3%) 0.049*
Mild cognitive impairment (19 - 23) 5 (3%) 9 (11.7%) 14 (8.5%) 0.167
Moderate cognitive impairment (10 – 18) 2 (1.2%) 5 (6.5%) 7 (4.2%) 0.180
Severe cognitive impairment (0 – 9) 0 (0%) 0 (0%) 0 (0%) NA
Alcohol and Smoking
Consumes alcohol weekly 54 (32.7%) 35 (19.4%) 89 (25.4%) 0.005*
Consume ≥ recommended weekly limit 14 (8.4%) 10 (5.5%) 24 (6.9%) 0.285
History of smoking 105 (63.9%) 90 (49.2%) 195 (55.7%) 0.010*
Current smokers 18 (10.8%) 17 (9.3%) 35 (10%) 0.643
Legend: SD = standard deviation; IQR = inter-quartile range; MMSE = mini-metal state examination, ** ≥11 units for females, ≥17 units for male
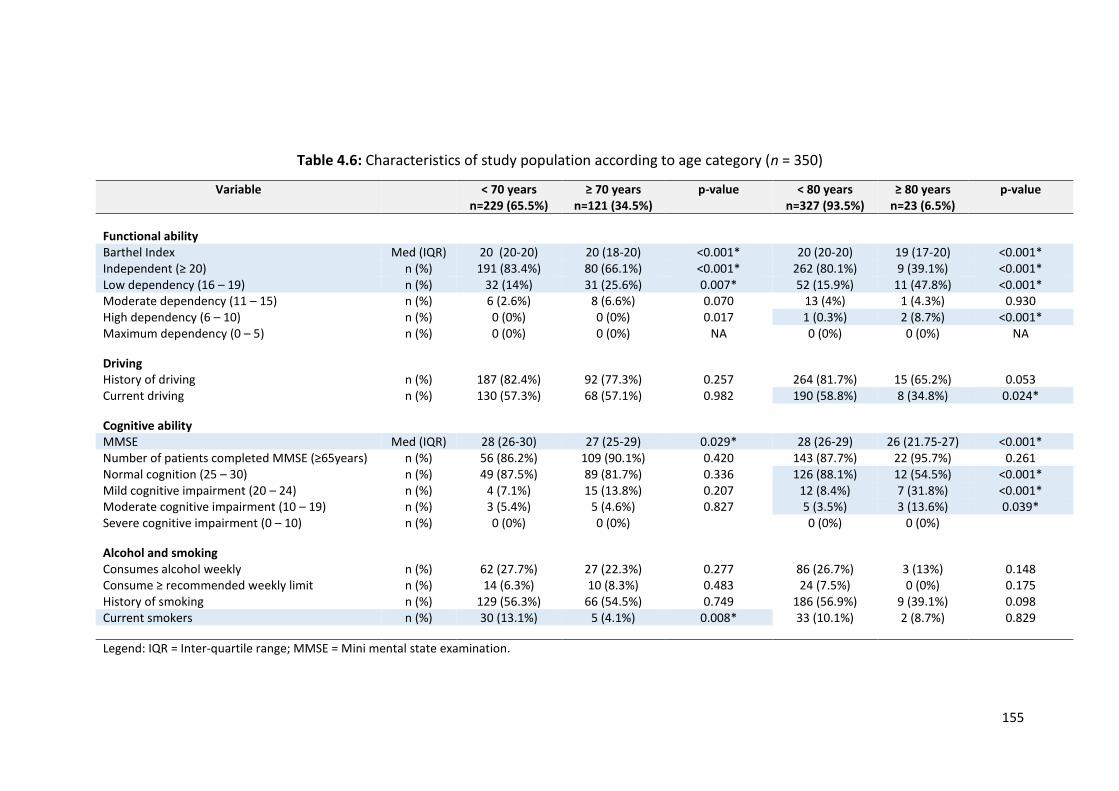
155
Table 4.6: Characteristics of study population according to age category (n = 350)
Variable < 70 years n=229 (65.5%)
≥ 70 years n=121 (34.5%)
p-value < 80 years n=327 (93.5%)
≥ 80 years n=23 (6.5%)
p-value
Functional ability Barthel Index Med (IQR) 20 (20-20) 20 (18-20) <0.001* 20 (20-20) 19 (17-20) <0.001* Independent (≥ 20) n (%) 191 (83.4%) 80 (66.1%) <0.001* 262 (80.1%) 9 (39.1%) <0.001* Low dependency (16 – 19) n (%) 32 (14%) 31 (25.6%) 0.007* 52 (15.9%) 11 (47.8%) <0.001* Moderate dependency (11 – 15) n (%) 6 (2.6%) 8 (6.6%) 0.070 13 (4%) 1 (4.3%) 0.930 High dependency (6 – 10) n (%) 0 (0%) 0 (0%) 0.017 1 (0.3%) 2 (8.7%) <0.001* Maximum dependency (0 – 5) n (%) 0 (0%) 0 (0%) NA 0 (0%) 0 (0%) NA
Driving History of driving n (%) 187 (82.4%) 92 (77.3%) 0.257 264 (81.7%) 15 (65.2%) 0.053 Current driving n (%) 130 (57.3%) 68 (57.1%) 0.982 190 (58.8%) 8 (34.8%) 0.024*
Cognitive ability MMSE Med (IQR) 28 (26-30) 27 (25-29) 0.029* 28 (26-29) 26 (21.75-27) <0.001* Number of patients completed MMSE (≥65years) n (%) 56 (86.2%) 109 (90.1%) 0.420 143 (87.7%) 22 (95.7%) 0.261 Normal cognition (25 – 30) n (%) 49 (87.5%) 89 (81.7%) 0.336 126 (88.1%) 12 (54.5%) <0.001* Mild cognitive impairment (20 – 24) n (%) 4 (7.1%) 15 (13.8%) 0.207 12 (8.4%) 7 (31.8%) <0.001* Moderate cognitive impairment (10 – 19) n (%) 3 (5.4%) 5 (4.6%) 0.827 5 (3.5%) 3 (13.6%) 0.039* Severe cognitive impairment (0 – 10) n (%) 0 (0%) 0 (0%) 0 (0%) 0 (0%)
Alcohol and smoking Consumes alcohol weekly n (%) 62 (27.7%) 27 (22.3%) 0.277 86 (26.7%) 3 (13%) 0.148 Consume ≥ recommended weekly limit n (%) 14 (6.3%) 10 (8.3%) 0.483 24 (7.5%) 0 (0%) 0.175 History of smoking n (%) 129 (56.3%) 66 (54.5%) 0.749 186 (56.9%) 9 (39.1%) 0.098 Current smokers n (%) 30 (13.1%) 5 (4.1%) 0.008* 33 (10.1%) 2 (8.7%) 0.829
Legend: IQR = Inter-quartile range; MMSE = Mini mental state examination.
156
4.3.3 Level of morbidity
The level of morbidity in this population was measured by the total number of
chronic conditions, the number of chronic conditions requiring regular drug
treatment and the CIRS score. These data are summarised in Table 4.7.
Most participants (96.9%) were multimorbid, with almost 7 out of every 10
patients (68%) having 5 or more chronic conditions. Older adults (≥ 70 years) were
significantly more likely to be multimorbid than younger adults, 100% vs 95.2%, Χ2
(1) = 6.001, p = 0.014 (Figure 4.2). Older adults (≥ 70 years) were also significantly
more likely to have 5 or more chronic conditions than younger adults, 81.1% vs
60.7%, Χ2 (1) = 16.228, p < 0.001.
Participants had a median of 6 (IQR 4-8) clinical conditions, with a median of
3 (IQR2-5) requiring regular medication use. Older adults (≥ 70 years) had a
significantly higher number of conditions compared to younger adults, median of 7
(IQR 5-10) vs 5 (IQR 3-7) U = 8168.5, p <0.001 (Figure 4.3). Additionally they had a
significantly higher number of conditions requiring regular medication use, 4 (IQR 3-
6) vs 3 (IQR 2-4) U = 8827, p <0.001.
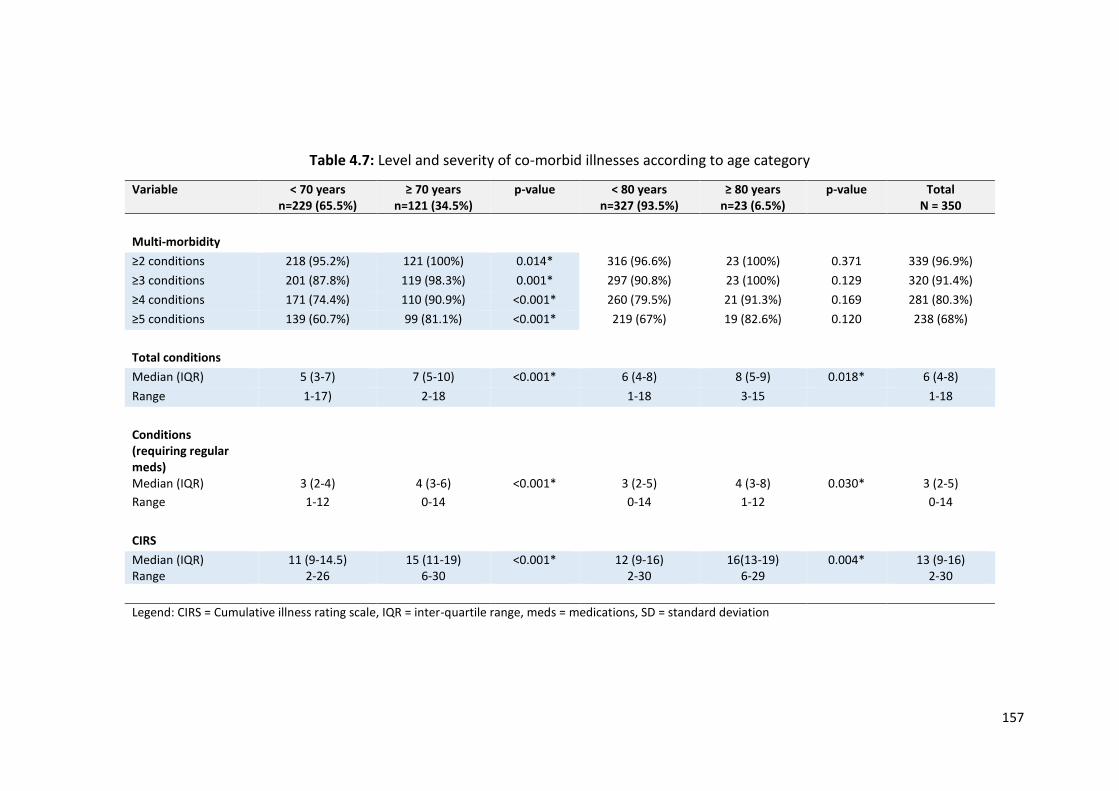
157
Table 4.7: Level and severity of co-morbid illnesses according to age category
Variable < 70 years n=229 (65.5%)
≥ 70 years n=121 (34.5%)
p-value < 80 years n=327 (93.5%)
≥ 80 years n=23 (6.5%)
p-value Total N = 350
Multi-morbidity
≥2 conditions 218 (95.2%) 121 (100%) 0.014* 316 (96.6%) 23 (100%) 0.371 339 (96.9%)
≥3 conditions 201 (87.8%) 119 (98.3%) 0.001* 297 (90.8%) 23 (100%) 0.129 320 (91.4%)
≥4 conditions 171 (74.4%) 110 (90.9%) <0.001* 260 (79.5%) 21 (91.3%) 0.169 281 (80.3%)
≥5 conditions 139 (60.7%) 99 (81.1%) <0.001* 219 (67%) 19 (82.6%) 0.120 238 (68%)
Total conditions
Median (IQR) 5 (3-7) 7 (5-10) <0.001* 6 (4-8) 8 (5-9) 0.018* 6 (4-8)
Range 1-17) 2-18 1-18 3-15 1-18
Conditions (requiring regular meds)
Median (IQR) 3 (2-4) 4 (3-6) <0.001* 3 (2-5) 4 (3-8) 0.030* 3 (2-5)
Range 1-12 0-14 0-14 1-12 0-14
CIRS
Median (IQR) Range
11 (9-14.5) 2-26
15 (11-19) 6-30
<0.001*
12 (9-16) 2-30
16(13-19) 6-29
0.004* 13 (9-16) 2-30
Legend: CIRS = Cumulative illness rating scale, IQR = inter-quartile range, meds = medications, SD = standard deviation
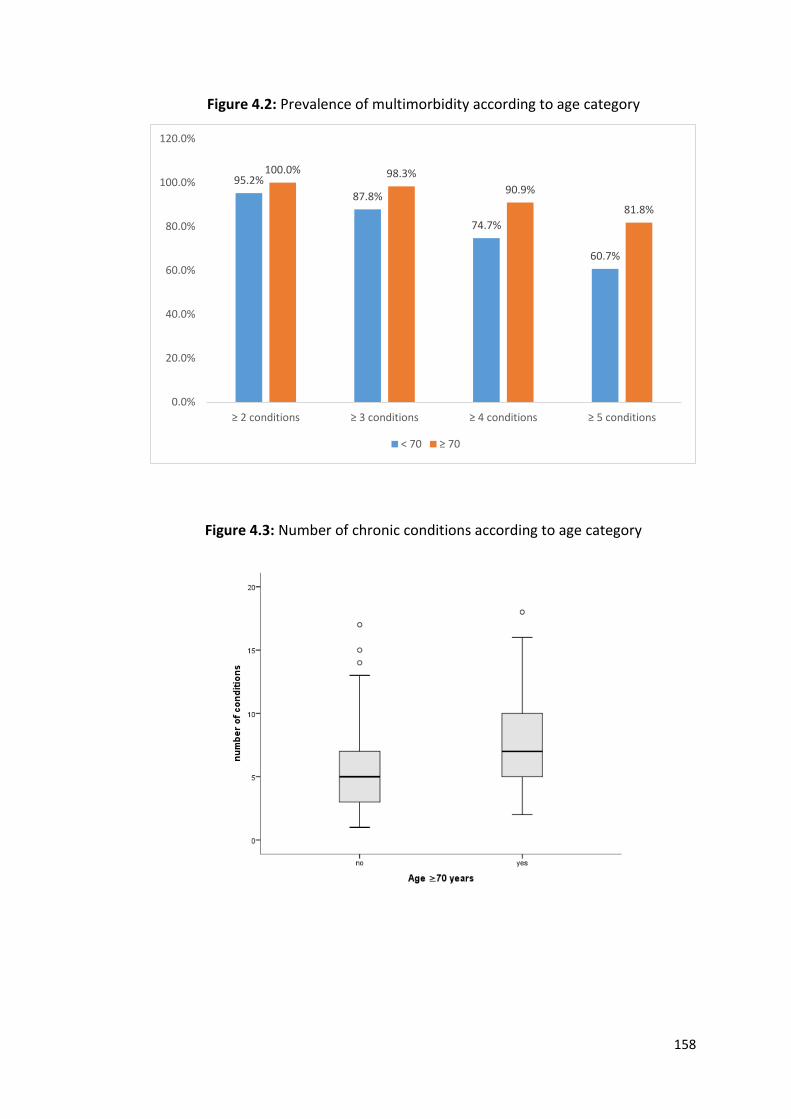
158
Figure 4.2: Prevalence of multimorbidity according to age category
Figure 4.3: Number of chronic conditions according to age category
95.2%
87.8%
74.7%
60.7%
100.0% 98.3%
90.9%
81.8%
0.0%
20.0%
40.0%
60.0%
80.0%
100.0%
120.0%
≥ 2 conditions ≥ 3 conditions ≥ 4 conditions ≥ 5 conditions
< 70 ≥ 70
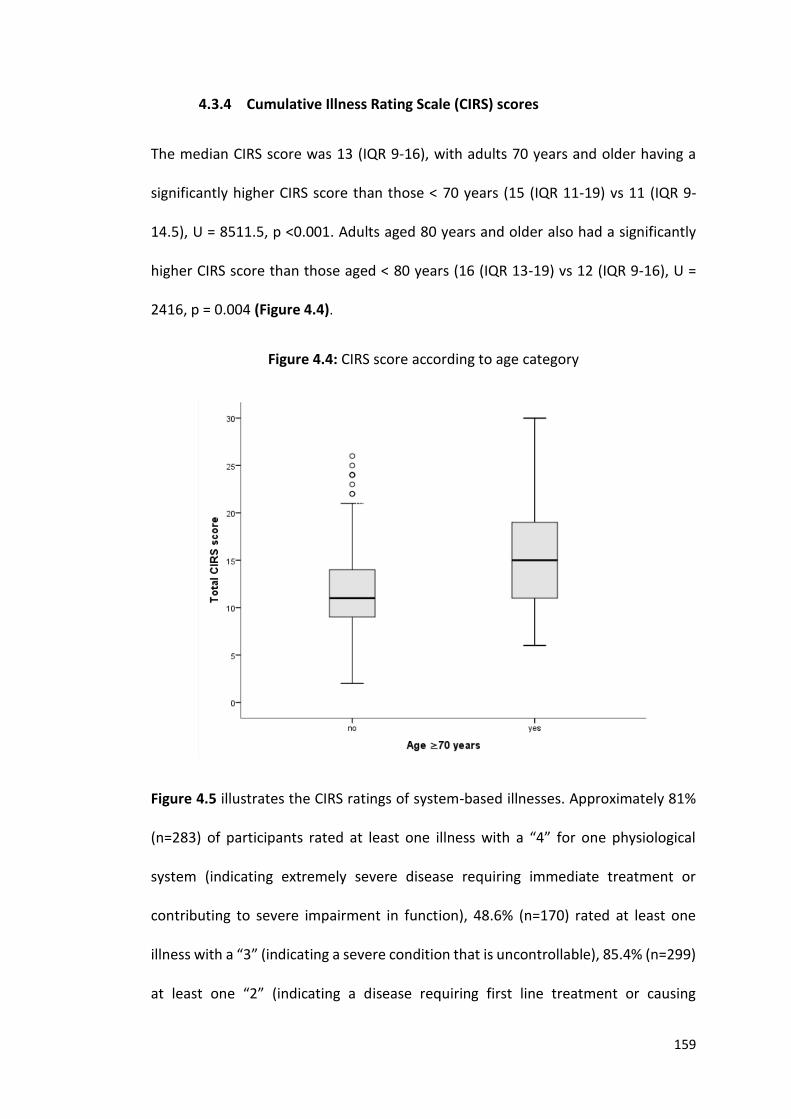
159
4.3.4 Cumulative Illness Rating Scale (CIRS) scores
The median CIRS score was 13 (IQR 9-16), with adults 70 years and older having a
significantly higher CIRS score than those < 70 years (15 (IQR 11-19) vs 11 (IQR 9-
14.5), U = 8511.5, p <0.001. Adults aged 80 years and older also had a significantly
higher CIRS score than those aged < 80 years (16 (IQR 13-19) vs 12 (IQR 9-16), U =
2416, p = 0.004 (Figure 4.4).
Figure 4.4: CIRS score according to age category
Figure 4.5 illustrates the CIRS ratings of system-based illnesses. Approximately 81%
(n=283) of participants rated at least one illness with a “4” for one physiological
system (indicating extremely severe disease requiring immediate treatment or
contributing to severe impairment in function), 48.6% (n=170) rated at least one
illness with a “3” (indicating a severe condition that is uncontrollable), 85.4% (n=299)
at least one “2” (indicating a disease requiring first line treatment or causing
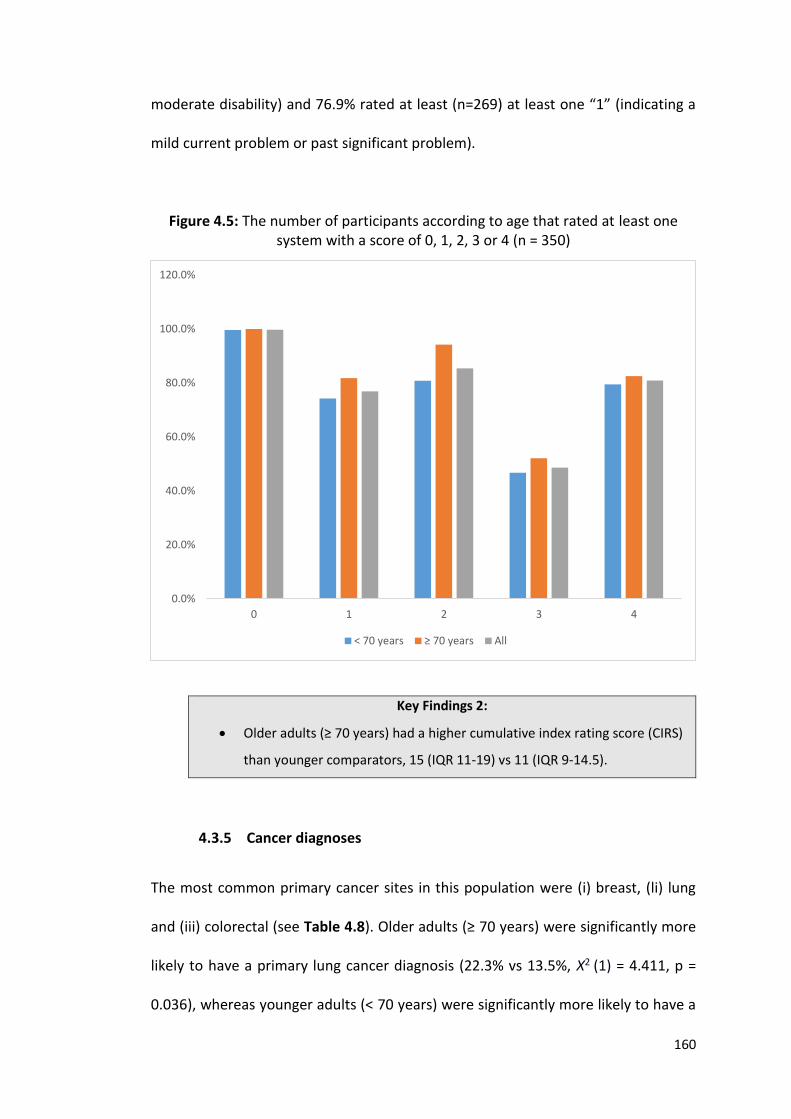
160
moderate disability) and 76.9% rated at least (n=269) at least one “1” (indicating a
mild current problem or past significant problem).
Figure 4.5: The number of participants according to age that rated at least one system with a score of 0, 1, 2, 3 or 4 (n = 350)
Key Findings 2:
Older adults (≥ 70 years) had a higher cumulative index rating score (CIRS)
than younger comparators, 15 (IQR 11-19) vs 11 (IQR 9-14.5).
4.3.5 Cancer diagnoses
The most common primary cancer sites in this population were (i) breast, (li) lung
and (iii) colorectal (see Table 4.8). Older adults (≥ 70 years) were significantly more
likely to have a primary lung cancer diagnosis (22.3% vs 13.5%, Χ2 (1) = 4.411, p =
0.036), whereas younger adults (< 70 years) were significantly more likely to have a
0.0%
20.0%
40.0%
60.0%
80.0%
100.0%
120.0%
0 1 2 3 4
< 70 years ≥ 70 years All
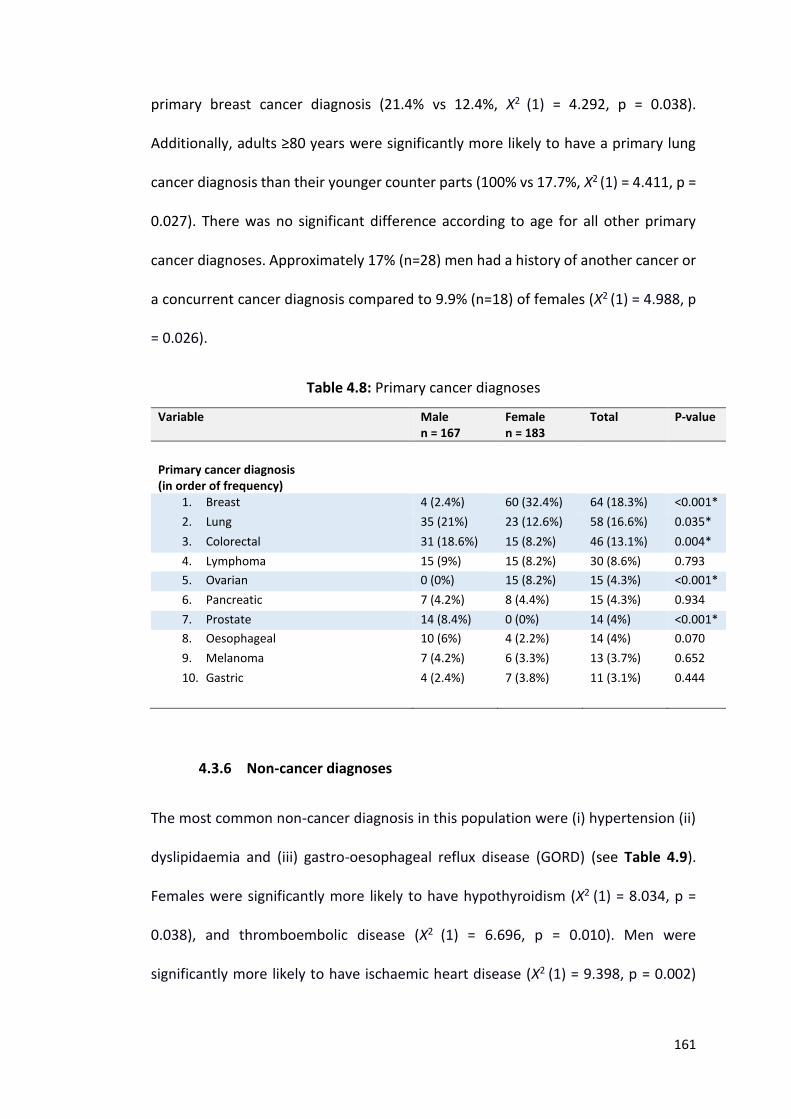
161
primary breast cancer diagnosis (21.4% vs 12.4%, Χ2 (1) = 4.292, p = 0.038).
Additionally, adults ≥80 years were significantly more likely to have a primary lung
cancer diagnosis than their younger counter parts (100% vs 17.7%, Χ2 (1) = 4.411, p =
0.027). There was no significant difference according to age for all other primary
cancer diagnoses. Approximately 17% (n=28) men had a history of another cancer or
a concurrent cancer diagnosis compared to 9.9% (n=18) of females (Χ2 (1) = 4.988, p
= 0.026).
Table 4.8: Primary cancer diagnoses
Variable Male n = 167
Female n = 183
Total P-value
Primary cancer diagnosis (in order of frequency)
1. Breast 4 (2.4%) 60 (32.4%) 64 (18.3%) <0.001*
2. Lung 35 (21%) 23 (12.6%) 58 (16.6%) 0.035*
3. Colorectal 31 (18.6%) 15 (8.2%) 46 (13.1%) 0.004*
4. Lymphoma 15 (9%) 15 (8.2%) 30 (8.6%) 0.793
5. Ovarian 0 (0%) 15 (8.2%) 15 (4.3%) <0.001*
6. Pancreatic 7 (4.2%) 8 (4.4%) 15 (4.3%) 0.934
7. Prostate 14 (8.4%) 0 (0%) 14 (4%) <0.001*
8. Oesophageal 10 (6%) 4 (2.2%) 14 (4%) 0.070
9. Melanoma 7 (4.2%) 6 (3.3%) 13 (3.7%) 0.652
10. Gastric 4 (2.4%) 7 (3.8%) 11 (3.1%) 0.444
4.3.6 Non-cancer diagnoses
The most common non-cancer diagnosis in this population were (i) hypertension (ii)
dyslipidaemia and (iii) gastro-oesophageal reflux disease (GORD) (see Table 4.9).
Females were significantly more likely to have hypothyroidism (Χ2 (1) = 8.034, p =
0.038), and thromboembolic disease (Χ2 (1) = 6.696, p = 0.010). Men were
significantly more likely to have ischaemic heart disease (Χ2 (1) = 9.398, p = 0.002)
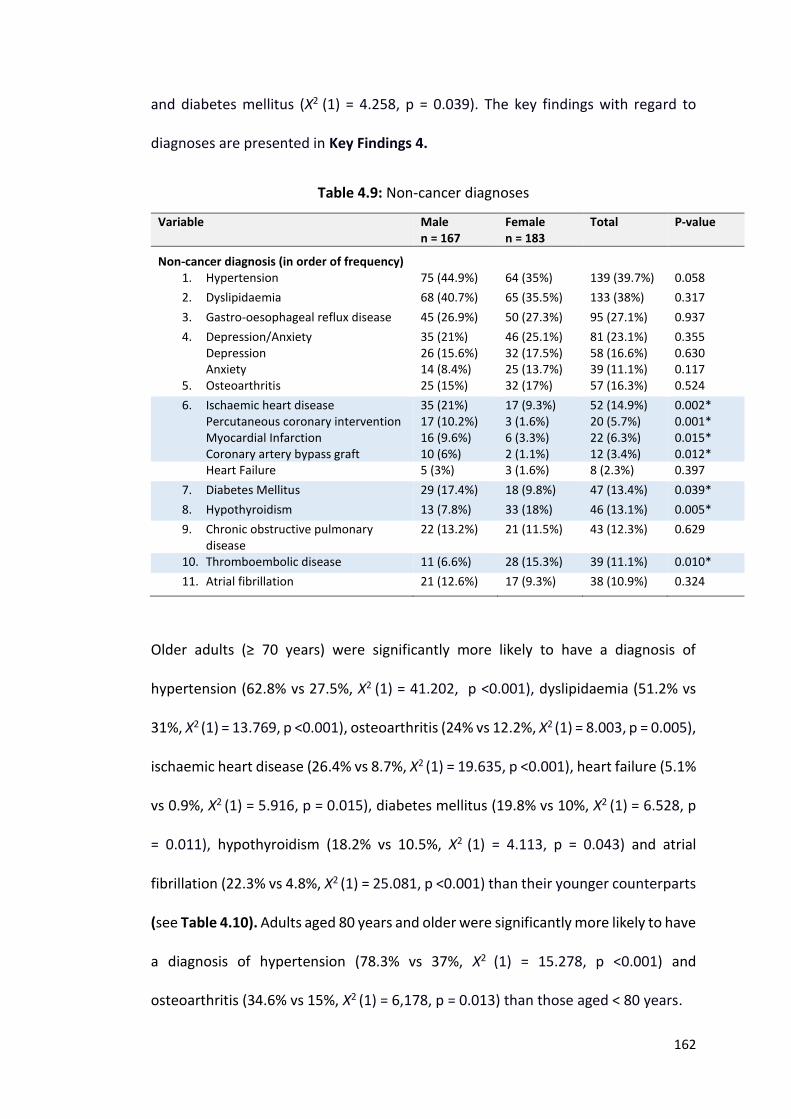
162
and diabetes mellitus (Χ2 (1) = 4.258, p = 0.039). The key findings with regard to
diagnoses are presented in Key Findings 4.
Table 4.9: Non-cancer diagnoses
Variable Male n = 167
Female n = 183
Total P-value
Non-cancer diagnosis (in order of frequency)
1. Hypertension 75 (44.9%) 64 (35%) 139 (39.7%) 0.058
2. Dyslipidaemia 68 (40.7%) 65 (35.5%) 133 (38%) 0.317
3. Gastro-oesophageal reflux disease 45 (26.9%) 50 (27.3%) 95 (27.1%) 0.937
4. Depression/Anxiety Depression Anxiety
35 (21%) 26 (15.6%) 14 (8.4%)
46 (25.1%) 32 (17.5%) 25 (13.7%)
81 (23.1%) 58 (16.6%) 39 (11.1%)
0.355 0.630 0.117
5. Osteoarthritis 25 (15%) 32 (17%) 57 (16.3%) 0.524
6. Ischaemic heart disease Percutaneous coronary intervention Myocardial Infarction Coronary artery bypass graft
35 (21%) 17 (10.2%) 16 (9.6%) 10 (6%)
17 (9.3%) 3 (1.6%) 6 (3.3%) 2 (1.1%)
52 (14.9%) 20 (5.7%) 22 (6.3%) 12 (3.4%)
0.002* 0.001* 0.015* 0.012*
Heart Failure 5 (3%) 3 (1.6%) 8 (2.3%) 0.397
7. Diabetes Mellitus 29 (17.4%) 18 (9.8%) 47 (13.4%) 0.039*
8. Hypothyroidism 13 (7.8%) 33 (18%) 46 (13.1%) 0.005*
9. Chronic obstructive pulmonary disease
22 (13.2%) 21 (11.5%) 43 (12.3%) 0.629
10. Thromboembolic disease 11 (6.6%) 28 (15.3%) 39 (11.1%) 0.010*
11. Atrial fibrillation
21 (12.6%) 17 (9.3%) 38 (10.9%) 0.324
Older adults (≥ 70 years) were significantly more likely to have a diagnosis of
hypertension (62.8% vs 27.5%, Χ2 (1) = 41.202, p <0.001), dyslipidaemia (51.2% vs
31%, Χ2 (1) = 13.769, p <0.001), osteoarthritis (24% vs 12.2%, Χ2 (1) = 8.003, p = 0.005),
ischaemic heart disease (26.4% vs 8.7%, Χ2 (1) = 19.635, p <0.001), heart failure (5.1%
vs 0.9%, Χ2 (1) = 5.916, p = 0.015), diabetes mellitus (19.8% vs 10%, Χ2 (1) = 6.528, p
= 0.011), hypothyroidism (18.2% vs 10.5%, Χ2 (1) = 4.113, p = 0.043) and atrial
fibrillation (22.3% vs 4.8%, Χ2 (1) = 25.081, p <0.001) than their younger counterparts
(see Table 4.10). Adults aged 80 years and older were significantly more likely to have
a diagnosis of hypertension (78.3% vs 37%, Χ2 (1) = 15.278, p <0.001) and
osteoarthritis (34.6% vs 15%, Χ2 (1) = 6,178, p = 0.013) than those aged < 80 years.
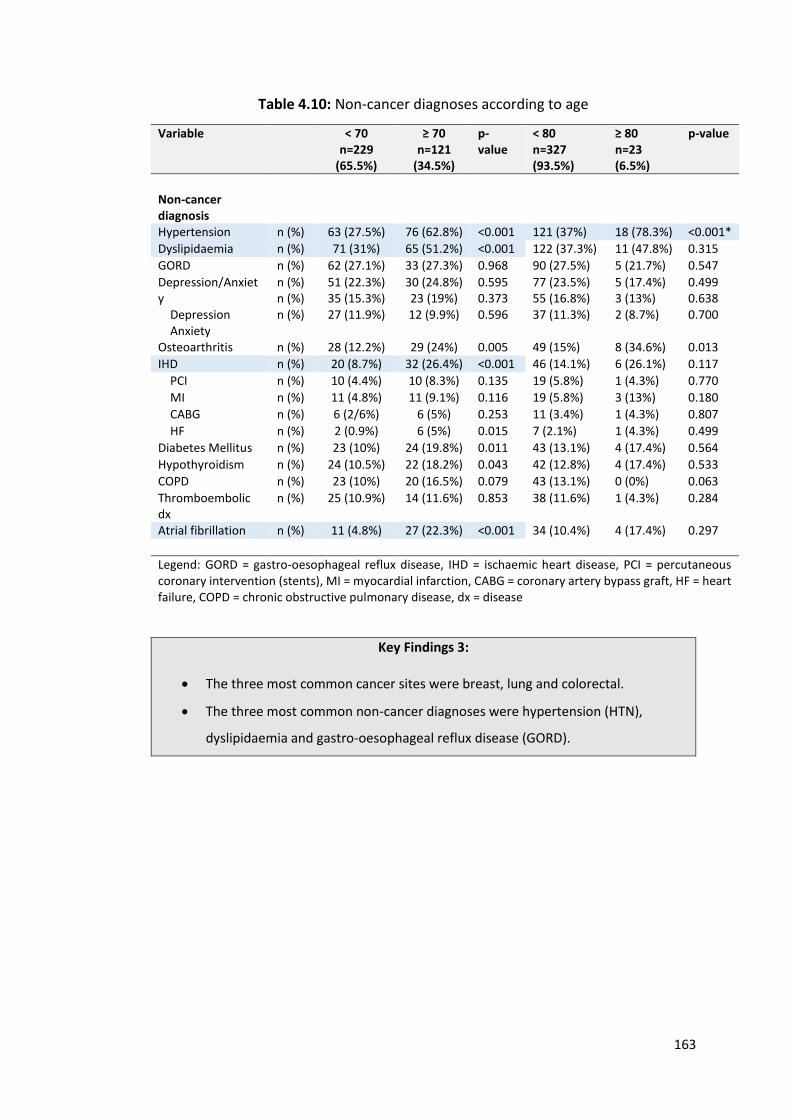
163
Table 4.10: Non-cancer diagnoses according to age
Variable < 70 n=229
(65.5%)
≥ 70 n=121
(34.5%)
p-value
< 80 n=327 (93.5%)
≥ 80 n=23 (6.5%)
p-value
Non-cancer diagnosis
Hypertension n (%) 63 (27.5%) 76 (62.8%) <0.001 121 (37%) 18 (78.3%) <0.001*
Dyslipidaemia n (%) 71 (31%) 65 (51.2%) <0.001 122 (37.3%) 11 (47.8%) 0.315
GORD n (%) 62 (27.1%) 33 (27.3%) 0.968 90 (27.5%) 5 (21.7%) 0.547
Depression/Anxiety Depression Anxiety
n (%) n (%) n (%)
51 (22.3%) 35 (15.3%) 27 (11.9%)
30 (24.8%) 23 (19%) 12 (9.9%)
0.595 0.373 0.596
77 (23.5%) 55 (16.8%) 37 (11.3%)
5 (17.4%) 3 (13%) 2 (8.7%)
0.499 0.638 0.700
Osteoarthritis n (%) 28 (12.2%) 29 (24%) 0.005 49 (15%) 8 (34.6%) 0.013
IHD n (%) 20 (8.7%) 32 (26.4%) <0.001 46 (14.1%) 6 (26.1%) 0.117
PCI n (%) 10 (4.4%) 10 (8.3%) 0.135 19 (5.8%) 1 (4.3%) 0.770
MI n (%) 11 (4.8%) 11 (9.1%) 0.116 19 (5.8%) 3 (13%) 0.180
CABG n (%) 6 (2/6%) 6 (5%) 0.253 11 (3.4%) 1 (4.3%) 0.807
HF n (%) 2 (0.9%) 6 (5%) 0.015 7 (2.1%) 1 (4.3%) 0.499
Diabetes Mellitus n (%) 23 (10%) 24 (19.8%) 0.011 43 (13.1%) 4 (17.4%) 0.564
Hypothyroidism n (%) 24 (10.5%) 22 (18.2%) 0.043 42 (12.8%) 4 (17.4%) 0.533
COPD n (%) 23 (10%) 20 (16.5%) 0.079 43 (13.1%) 0 (0%) 0.063
Thromboembolic dx
n (%) 25 (10.9%) 14 (11.6%) 0.853 38 (11.6%) 1 (4.3%) 0.284
Atrial fibrillation n (%) 11 (4.8%) 27 (22.3%) <0.001 34 (10.4%) 4 (17.4%) 0.297
Legend: GORD = gastro-oesophageal reflux disease, IHD = ischaemic heart disease, PCI = percutaneous coronary intervention (stents), MI = myocardial infarction, CABG = coronary artery bypass graft, HF = heart failure, COPD = chronic obstructive pulmonary disease, dx = disease
Key Findings 3:
The three most common cancer sites were breast, lung and colorectal.
The three most common non-cancer diagnoses were hypertension (HTN),
dyslipidaemia and gastro-oesophageal reflux disease (GORD).
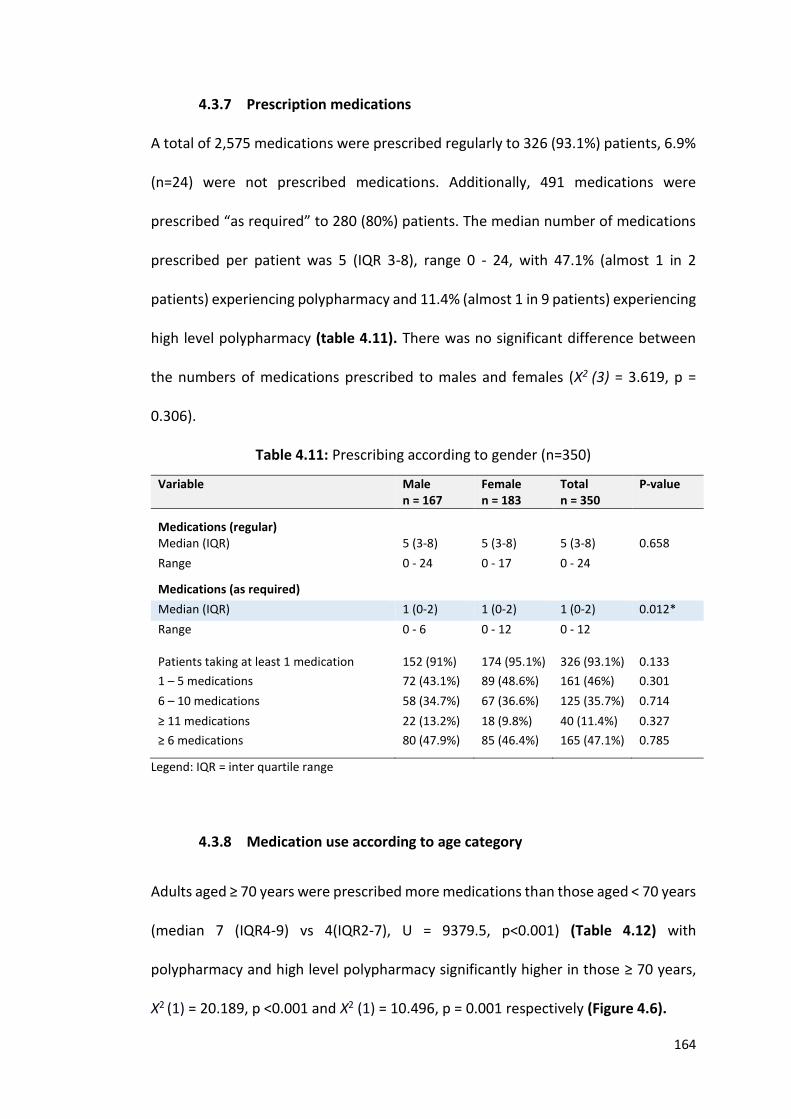
164
4.3.7 Prescription medications
A total of 2,575 medications were prescribed regularly to 326 (93.1%) patients, 6.9%
(n=24) were not prescribed medications. Additionally, 491 medications were
prescribed “as required” to 280 (80%) patients. The median number of medications
prescribed per patient was 5 (IQR 3-8), range 0 - 24, with 47.1% (almost 1 in 2
patients) experiencing polypharmacy and 11.4% (almost 1 in 9 patients) experiencing
high level polypharmacy (table 4.11). There was no significant difference between
the numbers of medications prescribed to males and females (Χ2 (3) = 3.619, p =
0.306).
Table 4.11: Prescribing according to gender (n=350)
Variable Male n = 167
Female n = 183
Total n = 350
P-value
Medications (regular)
Median (IQR) 5 (3-8) 5 (3-8) 5 (3-8) 0.658
Range
0 - 24 0 - 17 0 - 24
Medications (as required)
Median (IQR) 1 (0-2) 1 (0-2) 1 (0-2) 0.012*
Range
0 - 6 0 - 12 0 - 12
Patients taking at least 1 medication 152 (91%) 174 (95.1%) 326 (93.1%) 0.133
1 – 5 medications 72 (43.1%) 89 (48.6%) 161 (46%) 0.301
6 – 10 medications 58 (34.7%) 67 (36.6%) 125 (35.7%) 0.714
≥ 11 medications 22 (13.2%) 18 (9.8%) 40 (11.4%) 0.327
≥ 6 medications
80 (47.9%) 85 (46.4%) 165 (47.1%) 0.785
Legend: IQR = inter quartile range
4.3.8 Medication use according to age category
Adults aged ≥ 70 years were prescribed more medications than those aged < 70 years
(median 7 (IQR4-9) vs 4(IQR2-7), U = 9379.5, p<0.001) (Table 4.12) with
polypharmacy and high level polypharmacy significantly higher in those ≥ 70 years,
Χ2 (1) = 20.189, p <0.001 and Χ2 (1) = 10.496, p = 0.001 respectively (Figure 4.6).
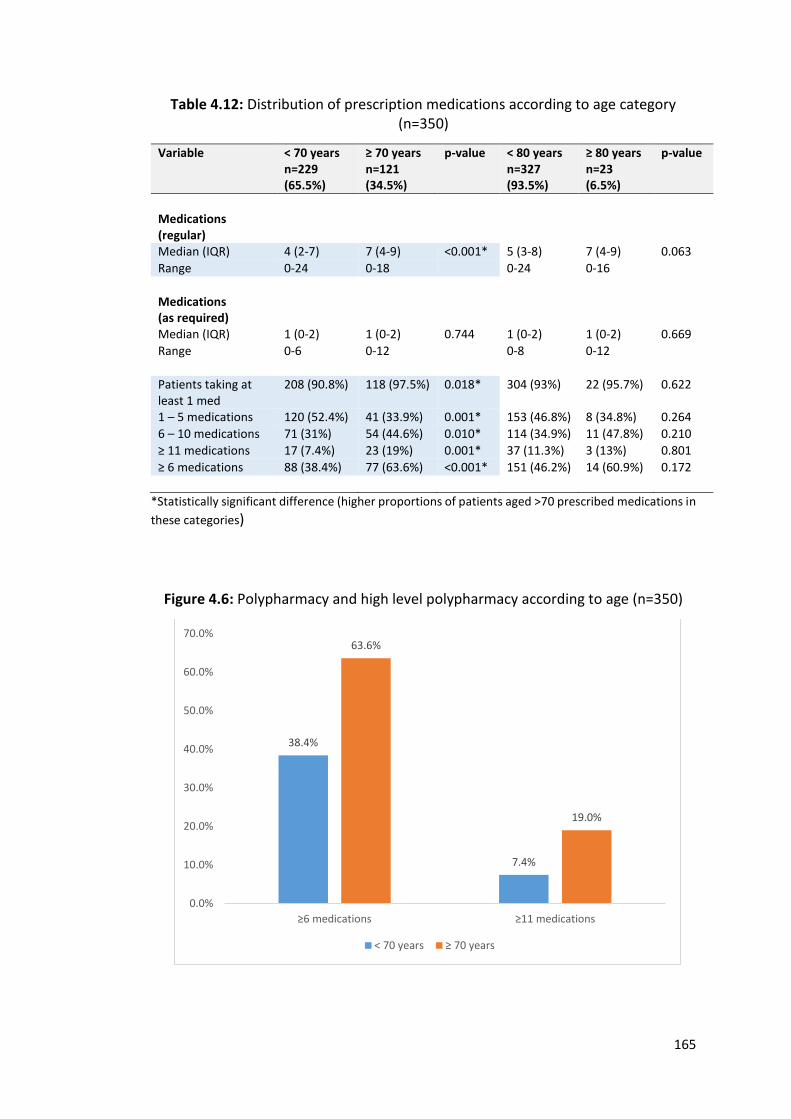
165
Table 4.12: Distribution of prescription medications according to age category (n=350)
Variable < 70 years n=229 (65.5%)
≥ 70 years n=121 (34.5%)
p-value < 80 years n=327 (93.5%)
≥ 80 years n=23 (6.5%)
p-value
Medications (regular)
Median (IQR) 4 (2-7) 7 (4-9) <0.001* 5 (3-8) 7 (4-9) 0.063
Range 0-24 0-18 0-24 0-16
Medications (as required)
Median (IQR) 1 (0-2) 1 (0-2) 0.744 1 (0-2) 1 (0-2) 0.669
Range 0-6 0-12 0-8 0-12
Patients taking at least 1 med
208 (90.8%) 118 (97.5%) 0.018* 304 (93%) 22 (95.7%) 0.622
1 – 5 medications 120 (52.4%) 41 (33.9%) 0.001* 153 (46.8%) 8 (34.8%) 0.264
6 – 10 medications 71 (31%) 54 (44.6%) 0.010* 114 (34.9%) 11 (47.8%) 0.210
≥ 11 medications 17 (7.4%) 23 (19%) 0.001* 37 (11.3%) 3 (13%) 0.801
≥ 6 medications 88 (38.4%) 77 (63.6%) <0.001* 151 (46.2%) 14 (60.9%) 0.172
*Statistically significant difference (higher proportions of patients aged >70 prescribed medications in
these categories)
Figure 4.6: Polypharmacy and high level polypharmacy according to age (n=350)
38.4%
7.4%
63.6%
19.0%
0.0%
10.0%
20.0%
30.0%
40.0%
50.0%
60.0%
70.0%
≥6 medications ≥11 medications
< 70 years ≥ 70 years
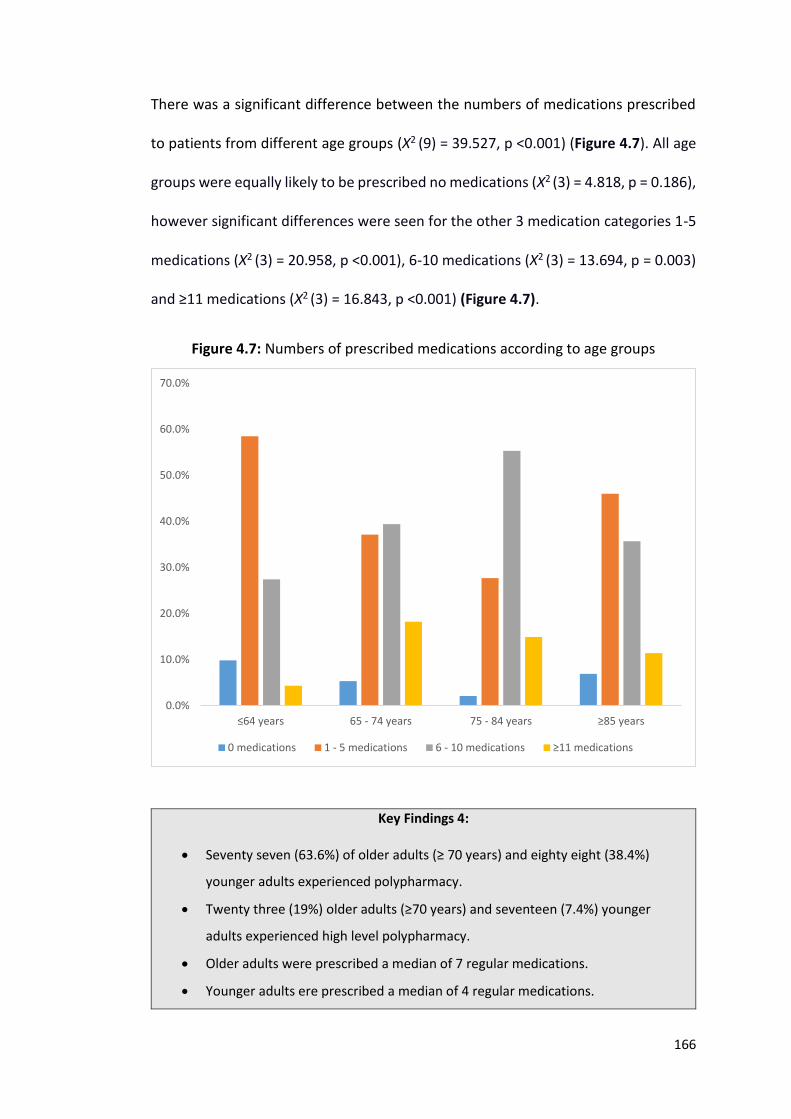
166
There was a significant difference between the numbers of medications prescribed
to patients from different age groups (Χ2 (9) = 39.527, p <0.001) (Figure 4.7). All age
groups were equally likely to be prescribed no medications (Χ2 (3) = 4.818, p = 0.186),
however significant differences were seen for the other 3 medication categories 1-5
medications (Χ2 (3) = 20.958, p <0.001), 6-10 medications (Χ2 (3) = 13.694, p = 0.003)
and ≥11 medications (Χ2 (3) = 16.843, p <0.001) (Figure 4.7).
Figure 4.7: Numbers of prescribed medications according to age groups
Key Findings 4:
Seventy seven (63.6%) of older adults (≥ 70 years) and eighty eight (38.4%)
younger adults experienced polypharmacy.
Twenty three (19%) older adults (≥70 years) and seventeen (7.4%) younger
adults experienced high level polypharmacy.
Older adults were prescribed a median of 7 regular medications.
Younger adults ere prescribed a median of 4 regular medications.
0.0%
10.0%
20.0%
30.0%
40.0%
50.0%
60.0%
70.0%
≤64 years 65 - 74 years 75 - 84 years ≥85 years
0 medications 1 - 5 medications 6 - 10 medications ≥11 medications
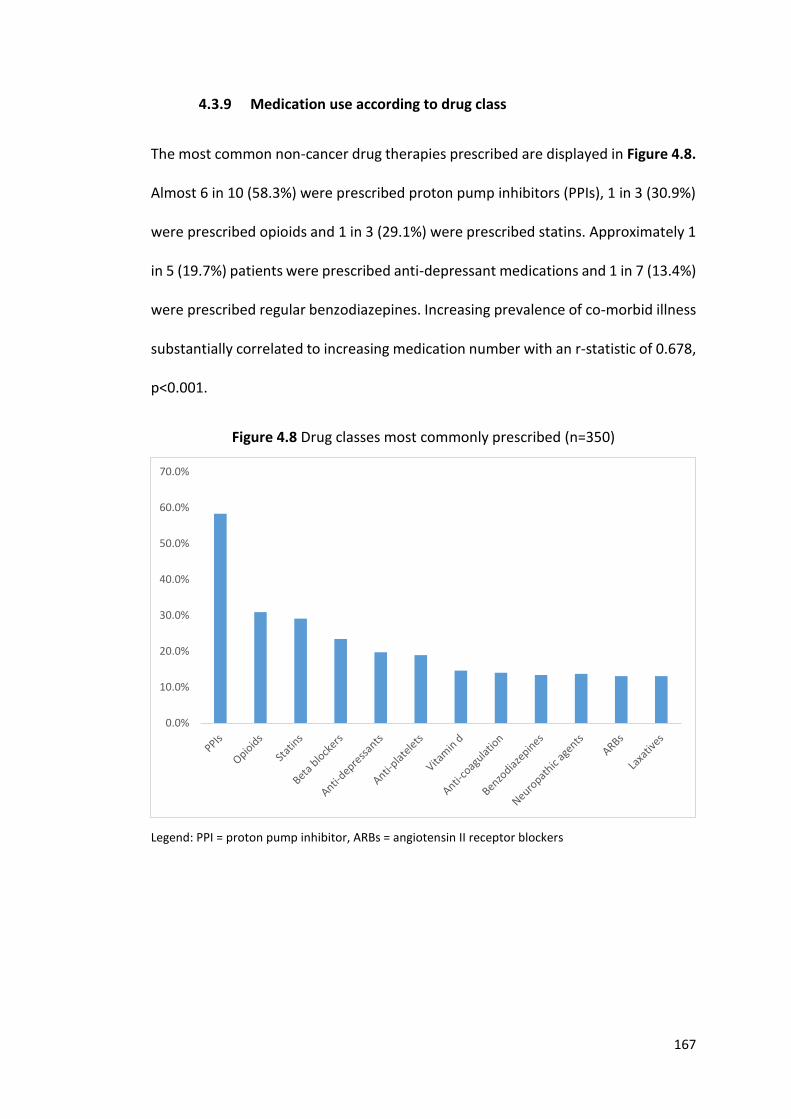
167
4.3.9 Medication use according to drug class
The most common non-cancer drug therapies prescribed are displayed in Figure 4.8.
Almost 6 in 10 (58.3%) were prescribed proton pump inhibitors (PPIs), 1 in 3 (30.9%)
were prescribed opioids and 1 in 3 (29.1%) were prescribed statins. Approximately 1
in 5 (19.7%) patients were prescribed anti-depressant medications and 1 in 7 (13.4%)
were prescribed regular benzodiazepines. Increasing prevalence of co-morbid illness
substantially correlated to increasing medication number with an r-statistic of 0.678,
p<0.001.
Figure 4.8 Drug classes most commonly prescribed (n=350)
Legend: PPI = proton pump inhibitor, ARBs = angiotensin II receptor blockers
0.0%
10.0%
20.0%
30.0%
40.0%
50.0%
60.0%
70.0%
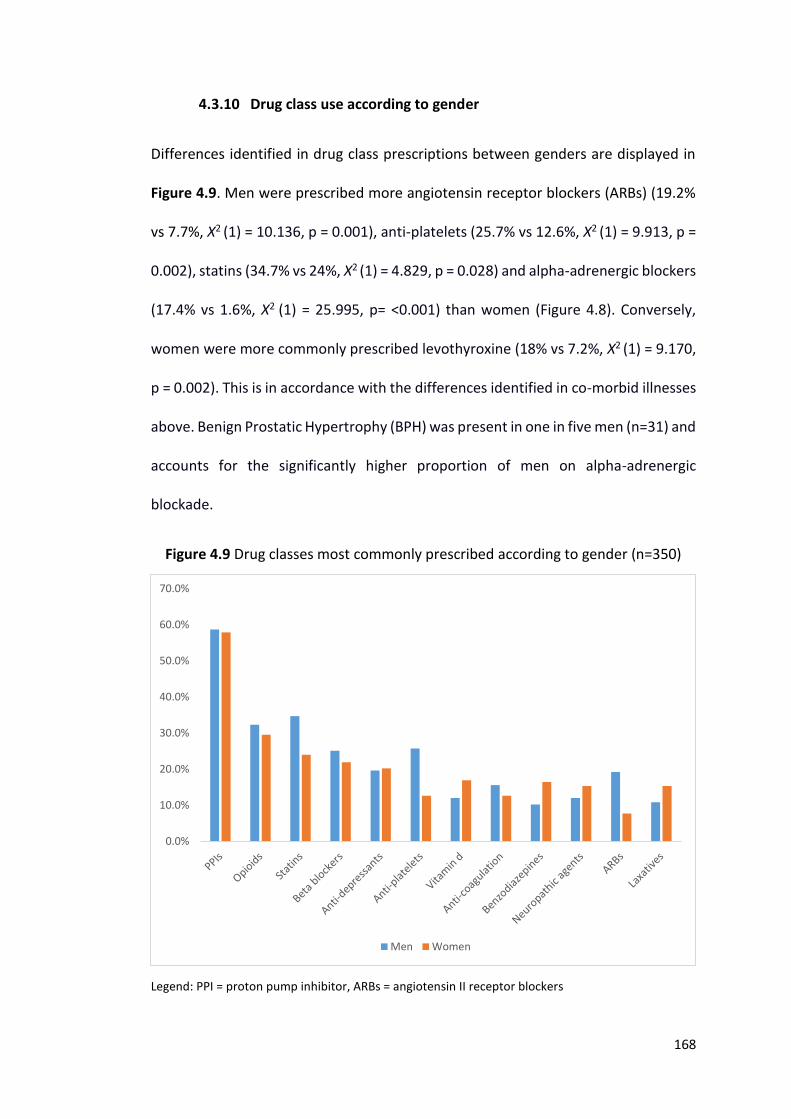
168
4.3.10 Drug class use according to gender
Differences identified in drug class prescriptions between genders are displayed in
Figure 4.9. Men were prescribed more angiotensin receptor blockers (ARBs) (19.2%
vs 7.7%, Χ2 (1) = 10.136, p = 0.001), anti-platelets (25.7% vs 12.6%, Χ2 (1) = 9.913, p =
0.002), statins (34.7% vs 24%, Χ2 (1) = 4.829, p = 0.028) and alpha-adrenergic blockers
(17.4% vs 1.6%, Χ2 (1) = 25.995, p= <0.001) than women (Figure 4.8). Conversely,
women were more commonly prescribed levothyroxine (18% vs 7.2%, Χ2 (1) = 9.170,
p = 0.002). This is in accordance with the differences identified in co-morbid illnesses
above. Benign Prostatic Hypertrophy (BPH) was present in one in five men (n=31) and
accounts for the significantly higher proportion of men on alpha-adrenergic
blockade.
Figure 4.9 Drug classes most commonly prescribed according to gender (n=350)
Legend: PPI = proton pump inhibitor, ARBs = angiotensin II receptor blockers
0.0%
10.0%
20.0%
30.0%
40.0%
50.0%
60.0%
70.0%
Men Women
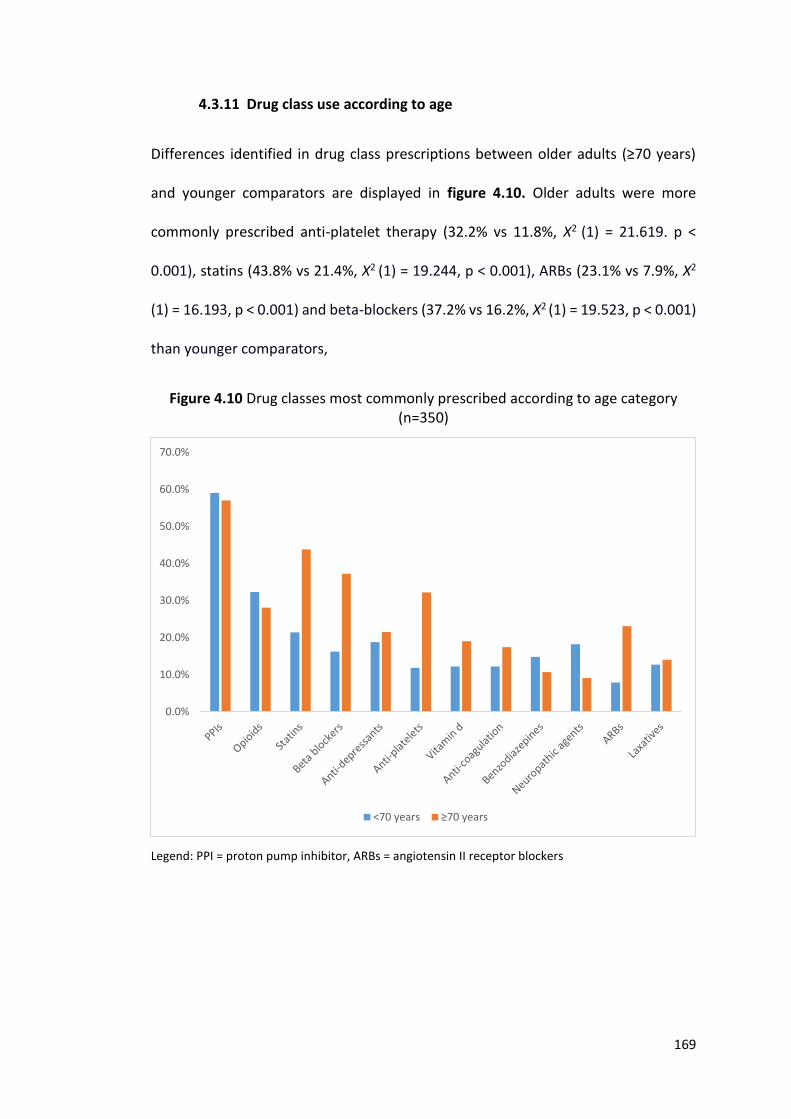
169
4.3.11 Drug class use according to age
Differences identified in drug class prescriptions between older adults (≥70 years)
and younger comparators are displayed in figure 4.10. Older adults were more
commonly prescribed anti-platelet therapy (32.2% vs 11.8%, Χ2 (1) = 21.619. p <
0.001), statins (43.8% vs 21.4%, Χ2 (1) = 19.244, p < 0.001), ARBs (23.1% vs 7.9%, Χ2
(1) = 16.193, p < 0.001) and beta-blockers (37.2% vs 16.2%, Χ2 (1) = 19.523, p < 0.001)
than younger comparators,
Figure 4.10 Drug classes most commonly prescribed according to age category (n=350)
Legend: PPI = proton pump inhibitor, ARBs = angiotensin II receptor blockers
0.0%
10.0%
20.0%
30.0%
40.0%
50.0%
60.0%
70.0%
<70 years ≥70 years
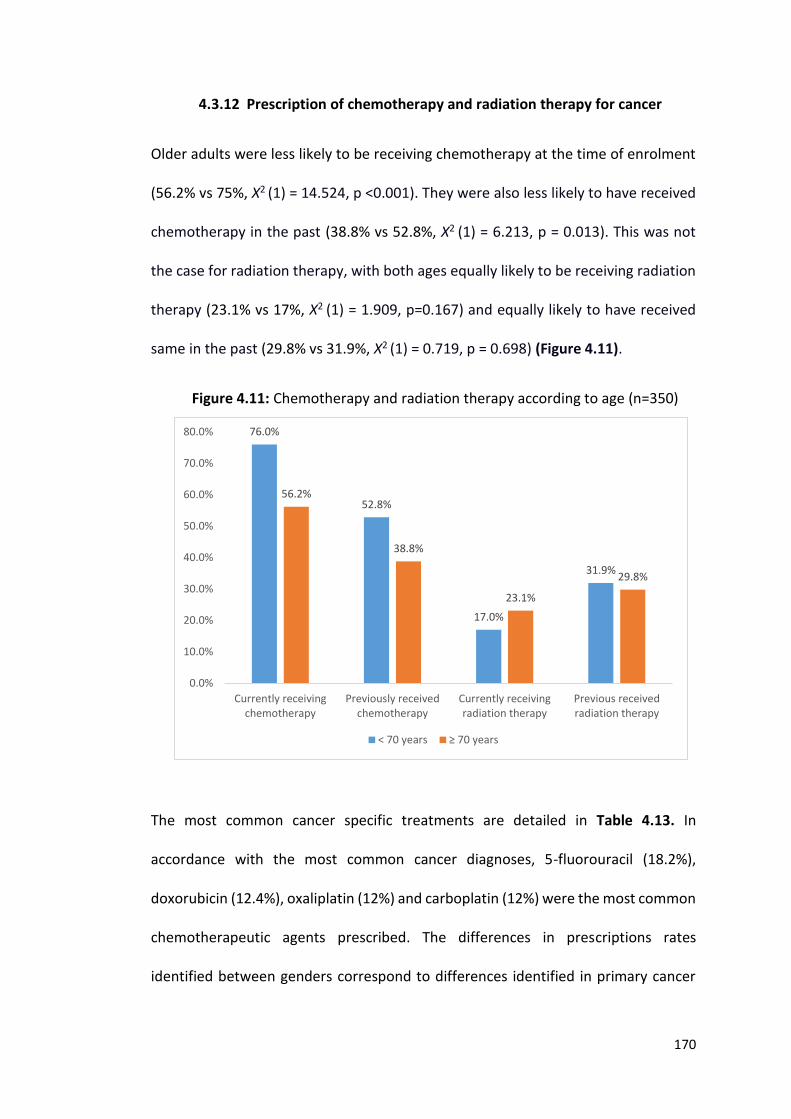
170
4.3.12 Prescription of chemotherapy and radiation therapy for cancer
Older adults were less likely to be receiving chemotherapy at the time of enrolment
(56.2% vs 75%, Χ2 (1) = 14.524, p <0.001). They were also less likely to have received
chemotherapy in the past (38.8% vs 52.8%, Χ2 (1) = 6.213, p = 0.013). This was not
the case for radiation therapy, with both ages equally likely to be receiving radiation
therapy (23.1% vs 17%, Χ2 (1) = 1.909, p=0.167) and equally likely to have received
same in the past (29.8% vs 31.9%, Χ2 (1) = 0.719, p = 0.698) (Figure 4.11).
Figure 4.11: Chemotherapy and radiation therapy according to age (n=350)
The most common cancer specific treatments are detailed in Table 4.13. In
accordance with the most common cancer diagnoses, 5-fluorouracil (18.2%),
doxorubicin (12.4%), oxaliplatin (12%) and carboplatin (12%) were the most common
chemotherapeutic agents prescribed. The differences in prescriptions rates
identified between genders correspond to differences identified in primary cancer
76.0%
52.8%
17.0%
31.9%
56.2%
38.8%
23.1%
29.8%
0.0%
10.0%
20.0%
30.0%
40.0%
50.0%
60.0%
70.0%
80.0%
Currently receivingchemotherapy
Previously receivedchemotherapy
Currently receivingradiation therapy
Previous receivedradiation therapy
< 70 years ≥ 70 years
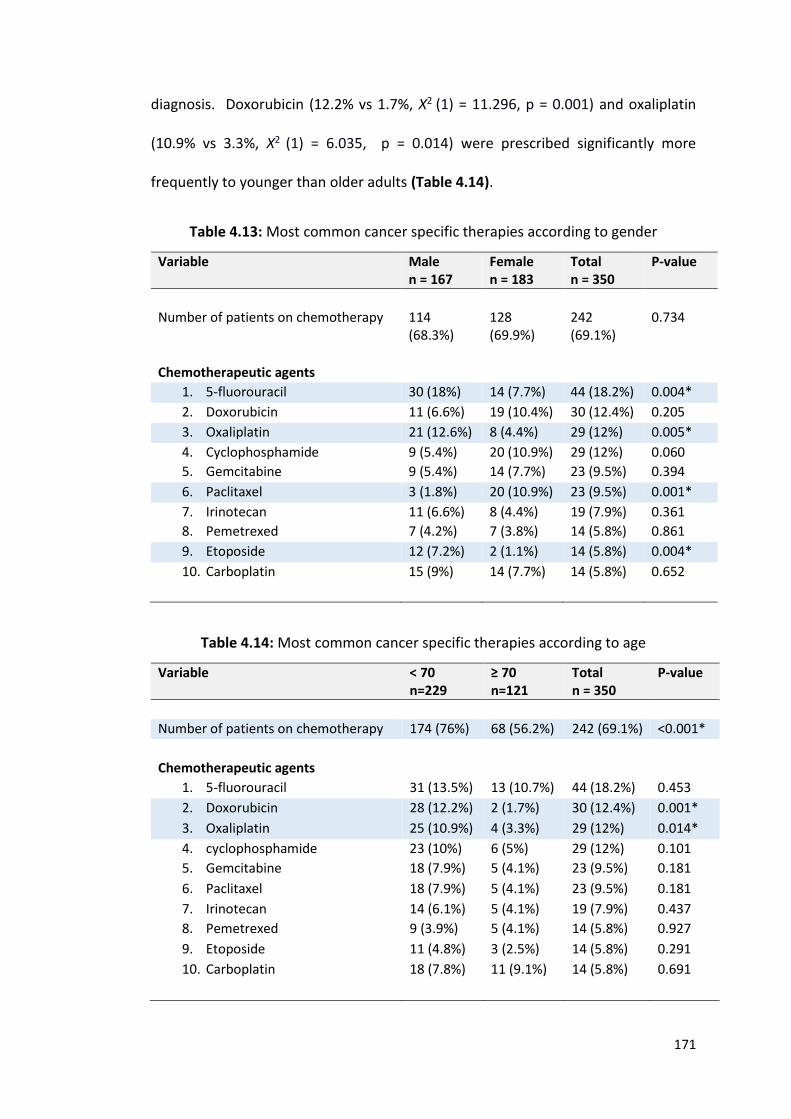
171
diagnosis. Doxorubicin (12.2% vs 1.7%, Χ2 (1) = 11.296, p = 0.001) and oxaliplatin
(10.9% vs 3.3%, Χ2 (1) = 6.035, p = 0.014) were prescribed significantly more
frequently to younger than older adults (Table 4.14).
Table 4.13: Most common cancer specific therapies according to gender
Variable Male n = 167
Female n = 183
Total n = 350
P-value
Number of patients on chemotherapy 114 (68.3%)
128 (69.9%)
242 (69.1%)
0.734
Chemotherapeutic agents
1. 5-fluorouracil 30 (18%) 14 (7.7%) 44 (18.2%) 0.004*
2. Doxorubicin 11 (6.6%) 19 (10.4%) 30 (12.4%) 0.205
3. Oxaliplatin 21 (12.6%) 8 (4.4%) 29 (12%) 0.005*
4. Cyclophosphamide 9 (5.4%) 20 (10.9%) 29 (12%) 0.060
5. Gemcitabine 9 (5.4%) 14 (7.7%) 23 (9.5%) 0.394
6. Paclitaxel 3 (1.8%) 20 (10.9%) 23 (9.5%) 0.001*
7. Irinotecan 11 (6.6%) 8 (4.4%) 19 (7.9%) 0.361
8. Pemetrexed 7 (4.2%) 7 (3.8%) 14 (5.8%) 0.861
9. Etoposide 12 (7.2%) 2 (1.1%) 14 (5.8%) 0.004*
10. Carboplatin 15 (9%) 14 (7.7%) 14 (5.8%) 0.652
Table 4.14: Most common cancer specific therapies according to age
Variable < 70 n=229
≥ 70 n=121
Total n = 350
P-value
Number of patients on chemotherapy 174 (76%) 68 (56.2%) 242 (69.1%) <0.001*
Chemotherapeutic agents
1. 5-fluorouracil 31 (13.5%) 13 (10.7%) 44 (18.2%) 0.453
2. Doxorubicin 28 (12.2%) 2 (1.7%) 30 (12.4%) 0.001*
3. Oxaliplatin 25 (10.9%) 4 (3.3%) 29 (12%) 0.014*
4. cyclophosphamide 23 (10%) 6 (5%) 29 (12%) 0.101
5. Gemcitabine 18 (7.9%) 5 (4.1%) 23 (9.5%) 0.181
6. Paclitaxel 18 (7.9%) 5 (4.1%) 23 (9.5%) 0.181
7. Irinotecan 14 (6.1%) 5 (4.1%) 19 (7.9%) 0.437
8. Pemetrexed 9 (3.9%) 5 (4.1%) 14 (5.8%) 0.927
9. Etoposide 11 (4.8%) 3 (2.5%) 14 (5.8%) 0.291
10. Carboplatin 18 (7.8%) 11 (9.1%) 14 (5.8%) 0.691
172
4.3.13 Potentially inappropriate prescribing as determined by STOPP
criteria
STOPP criteria for potentially inappropriate medication (PIM) use were applied to
186 patients who were ≥65 years (53.1% of study population). PIMs were observed
in 136 patients, giving a prevalence rate of 73.1%. Of these, 54 (29%) patients were
prescribed 1 PIM, 35 (18.8%) were prescribed 2 PIMs, 26 (14%) were prescribed 3
PIMs, 13 (7%) were prescribed 4 PIMs, 4 (2.2%) patients were prescribed 5 PIMs, 4
(2.2%) patients were prescribed 6 PIMs and 1 (0.5%) patient was prescribed 7 PIMs.
Men and women were equally likely to receive 0, 1, 2 or ≥3 PIMs (Χ2 (3) = 6.671, p =
0.083). Increasing medication number, medical conditions and reducing function
according to Barthel were substantially correlated to increasing PIM number with r-
statistics of 0.622, p < 0.001, 0.490, p < 0.001 and 0.452, p <0.001 respectively.
The most common PIMs identified are detailed in descending order in table
4.15. Almost 1 in 2 (46.8%) participants 65 years and older with a cancer diagnosis
were prescribed drugs beyond their recommended duration. Approximately 1 in 3
were prescribed a PPI for uncomplicated PUD/erosive peptic oesophagitis at full
therapeutic dosage for > 8 weeks and 1 in 5 were prescribed regular opioids without
concomitant laxatives. Both genders were equally likely to be on the above PIMs.
One PIM was prescribed more commonly in men i.e. vasodilator drugs with
persistent hypotension (10% vs 1.2%, Χ2 (1) = 6.489 p=0.011).
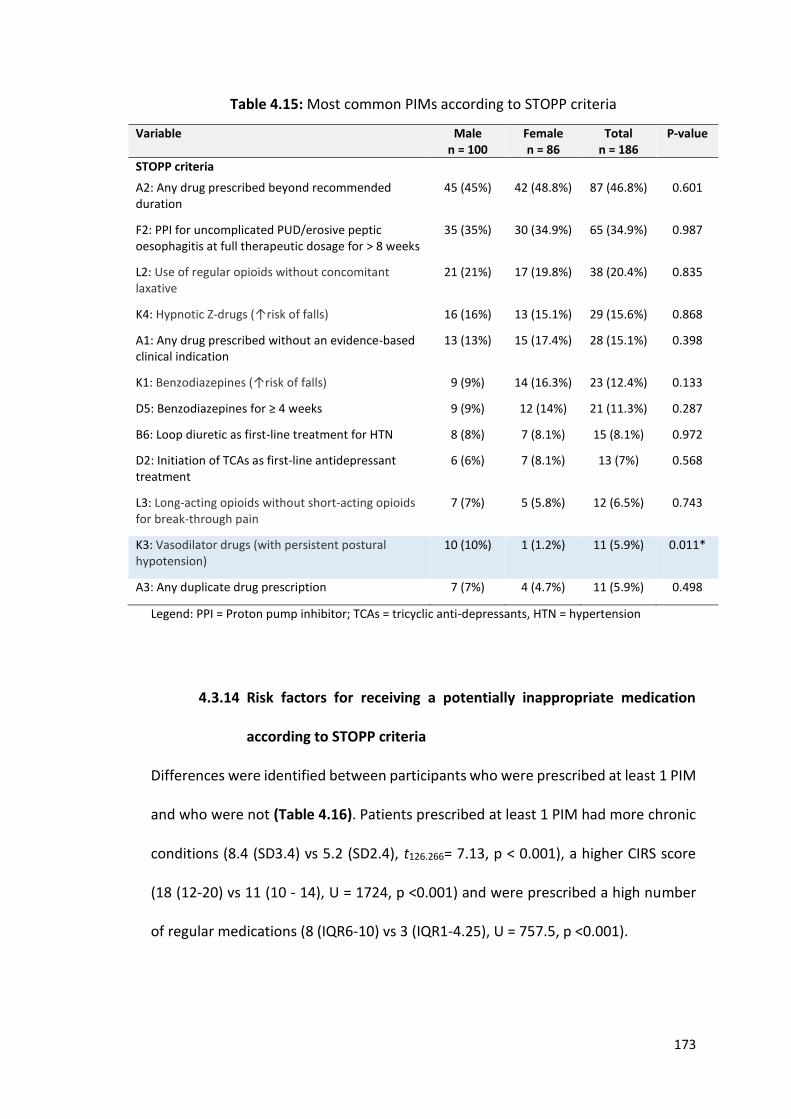
173
Table 4.15: Most common PIMs according to STOPP criteria
Variable Male n = 100
Female n = 86
Total n = 186
P-value
STOPP criteria
A2: Any drug prescribed beyond recommended duration
45 (45%) 42 (48.8%) 87 (46.8%) 0.601
F2: PPI for uncomplicated PUD/erosive peptic oesophagitis at full therapeutic dosage for > 8 weeks
35 (35%) 30 (34.9%) 65 (34.9%) 0.987
L2: Use of regular opioids without concomitant laxative
21 (21%) 17 (19.8%) 38 (20.4%) 0.835
K4: Hypnotic Z-drugs (↑risk of falls)
16 (16%) 13 (15.1%) 29 (15.6%) 0.868
A1: Any drug prescribed without an evidence-based clinical indication
13 (13%) 15 (17.4%) 28 (15.1%) 0.398
K1: Benzodiazepines (↑risk of falls)
9 (9%) 14 (16.3%) 23 (12.4%) 0.133
D5: Benzodiazepines for ≥ 4 weeks
9 (9%) 12 (14%) 21 (11.3%) 0.287
B6: Loop diuretic as first-line treatment for HTN
8 (8%) 7 (8.1%) 15 (8.1%) 0.972
D2: Initiation of TCAs as first-line antidepressant treatment
6 (6%) 7 (8.1%) 13 (7%) 0.568
L3: Long-acting opioids without short-acting opioids for break-through pain
7 (7%) 5 (5.8%) 12 (6.5%) 0.743
K3: Vasodilator drugs (with persistent postural hypotension)
10 (10%) 1 (1.2%) 11 (5.9%) 0.011*
A3: Any duplicate drug prescription
7 (7%) 4 (4.7%) 11 (5.9%) 0.498
Legend: PPI = Proton pump inhibitor; TCAs = tricyclic anti-depressants, HTN = hypertension
4.3.14 Risk factors for receiving a potentially inappropriate medication
according to STOPP criteria
Differences were identified between participants who were prescribed at least 1 PIM
and who were not (Table 4.16). Patients prescribed at least 1 PIM had more chronic
conditions (8.4 (SD3.4) vs 5.2 (SD2.4), t126.266= 7.13, p < 0.001), a higher CIRS score
(18 (12-20) vs 11 (10 - 14), U = 1724, p <0.001) and were prescribed a high number
of regular medications (8 (IQR6-10) vs 3 (IQR1-4.25), U = 757.5, p <0.001).
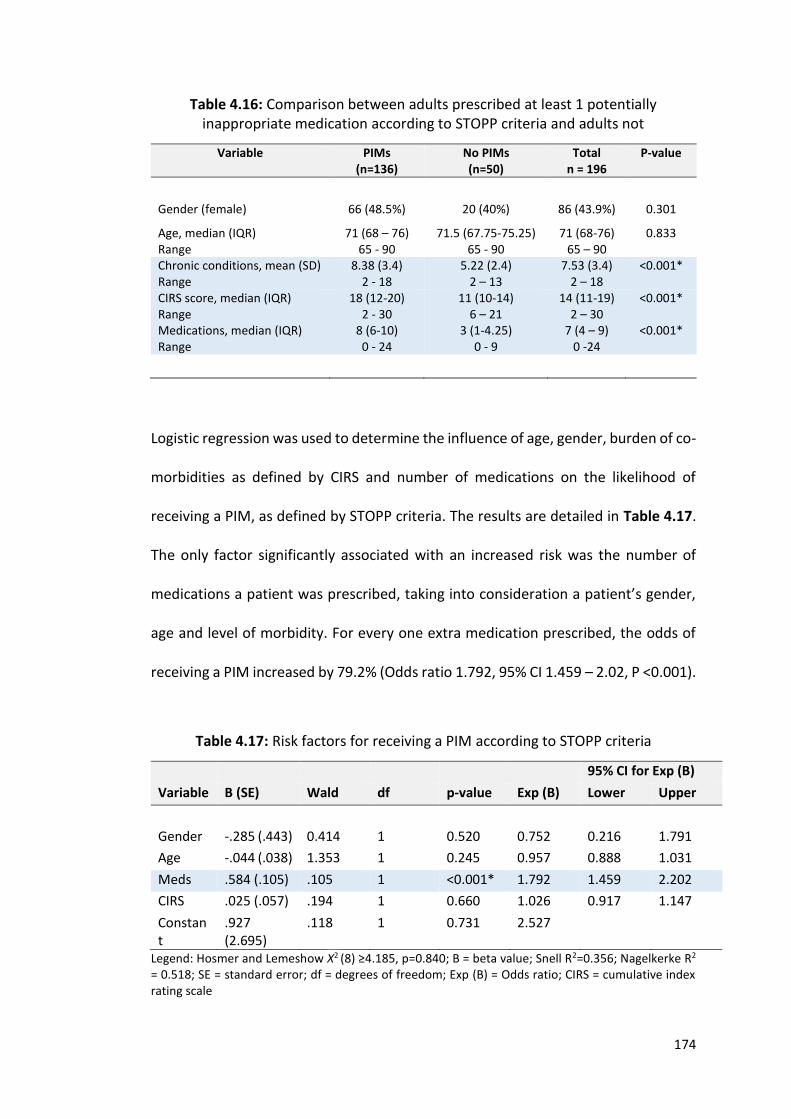
174
Table 4.16: Comparison between adults prescribed at least 1 potentially inappropriate medication according to STOPP criteria and adults not
Variable PIMs (n=136)
No PIMs (n=50)
Total n = 196
P-value
Gender (female) 66 (48.5%) 20 (40%) 86 (43.9%) 0.301
Age, median (IQR) Range
71 (68 – 76) 65 - 90
71.5 (67.75-75.25) 65 - 90
71 (68-76) 65 – 90
0.833
Chronic conditions, mean (SD) Range
8.38 (3.4) 2 - 18
5.22 (2.4) 2 – 13
7.53 (3.4) 2 – 18
<0.001*
CIRS score, median (IQR) Range
18 (12-20) 2 - 30
11 (10-14) 6 – 21
14 (11-19) 2 – 30
<0.001*
Medications, median (IQR) Range
8 (6-10) 0 - 24
3 (1-4.25) 0 - 9
7 (4 – 9) 0 -24
<0.001*
Logistic regression was used to determine the influence of age, gender, burden of co-
morbidities as defined by CIRS and number of medications on the likelihood of
receiving a PIM, as defined by STOPP criteria. The results are detailed in Table 4.17.
The only factor significantly associated with an increased risk was the number of
medications a patient was prescribed, taking into consideration a patient’s gender,
age and level of morbidity. For every one extra medication prescribed, the odds of
receiving a PIM increased by 79.2% (Odds ratio 1.792, 95% CI 1.459 – 2.02, P <0.001).
Table 4.17: Risk factors for receiving a PIM according to STOPP criteria
95% CI for Exp (B)
Variable B (SE) Wald df p-value Exp (B) Lower Upper
Gender -.285 (.443) 0.414 1 0.520 0.752 0.216 1.791
Age -.044 (.038) 1.353 1 0.245 0.957 0.888 1.031
Meds .584 (.105) .105 1 <0.001* 1.792 1.459 2.202
CIRS .025 (.057) .194 1 0.660 1.026 0.917 1.147
Constant
.927 (2.695)
.118 1 0.731 2.527
Legend: Hosmer and Lemeshow Χ2 (8) ≥4.185, p=0.840; B = beta value; Snell R2=0.356; Nagelkerke R2 = 0.518; SE = standard error; df = degrees of freedom; Exp (B) = Odds ratio; CIRS = cumulative index rating scale
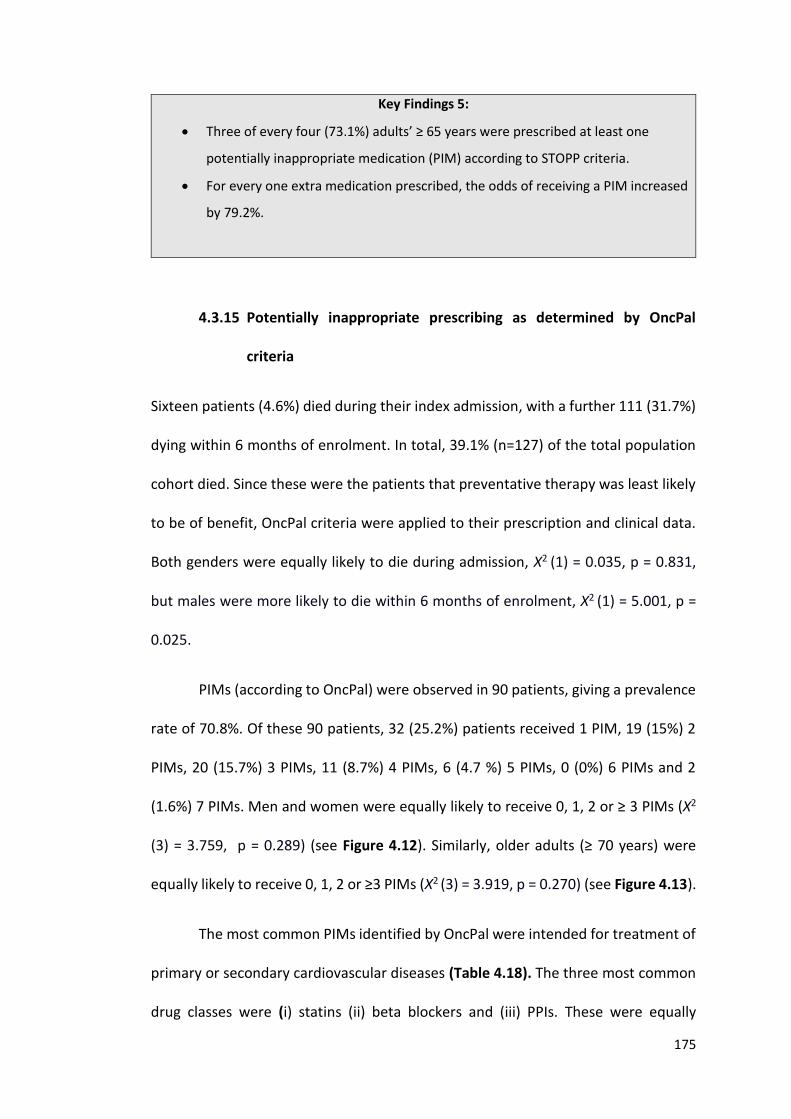
175
Key Findings 5:
Three of every four (73.1%) adults’ ≥ 65 years were prescribed at least one
potentially inappropriate medication (PIM) according to STOPP criteria.
For every one extra medication prescribed, the odds of receiving a PIM increased
by 79.2%.
4.3.15 Potentially inappropriate prescribing as determined by OncPal
criteria
Sixteen patients (4.6%) died during their index admission, with a further 111 (31.7%)
dying within 6 months of enrolment. In total, 39.1% (n=127) of the total population
cohort died. Since these were the patients that preventative therapy was least likely
to be of benefit, OncPal criteria were applied to their prescription and clinical data.
Both genders were equally likely to die during admission, Χ2 (1) = 0.035, p = 0.831,
but males were more likely to die within 6 months of enrolment, Χ2 (1) = 5.001, p =
0.025.
PIMs (according to OncPal) were observed in 90 patients, giving a prevalence
rate of 70.8%. Of these 90 patients, 32 (25.2%) patients received 1 PIM, 19 (15%) 2
PIMs, 20 (15.7%) 3 PIMs, 11 (8.7%) 4 PIMs, 6 (4.7 %) 5 PIMs, 0 (0%) 6 PIMs and 2
(1.6%) 7 PIMs. Men and women were equally likely to receive 0, 1, 2 or ≥ 3 PIMs (Χ2
(3) = 3.759, p = 0.289) (see Figure 4.12). Similarly, older adults (≥ 70 years) were
equally likely to receive 0, 1, 2 or ≥3 PIMs (Χ2 (3) = 3.919, p = 0.270) (see Figure 4.13).
The most common PIMs identified by OncPal were intended for treatment of
primary or secondary cardiovascular diseases (Table 4.18). The three most common
drug classes were (i) statins (ii) beta blockers and (iii) PPIs. These were equally
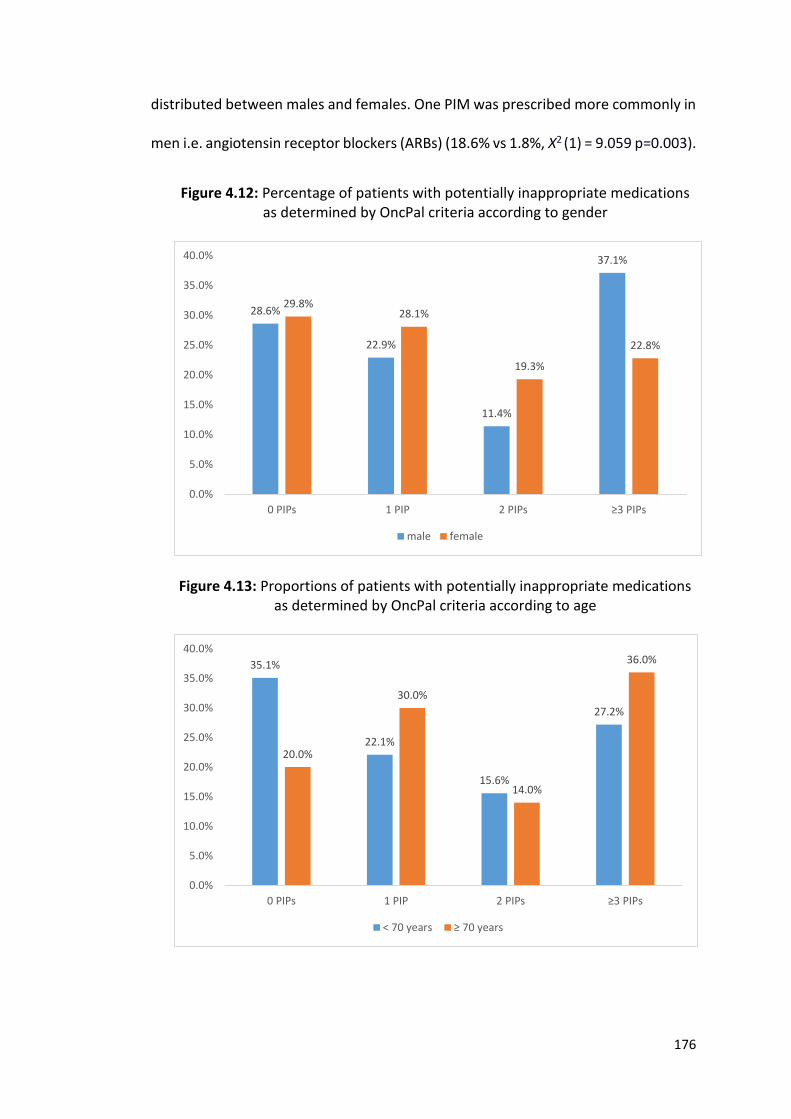
176
distributed between males and females. One PIM was prescribed more commonly in
men i.e. angiotensin receptor blockers (ARBs) (18.6% vs 1.8%, Χ2 (1) = 9.059 p=0.003).
Figure 4.12: Percentage of patients with potentially inappropriate medications as determined by OncPal criteria according to gender
Figure 4.13: Proportions of patients with potentially inappropriate medications as determined by OncPal criteria according to age
28.6%
22.9%
11.4%
37.1%
29.8%28.1%
19.3%
22.8%
0.0%
5.0%
10.0%
15.0%
20.0%
25.0%
30.0%
35.0%
40.0%
0 PIPs 1 PIP 2 PIPs ≥3 PIPs
male female
35.1%
22.1%
15.6%
27.2%
20.0%
30.0%
14.0%
36.0%
0.0%
5.0%
10.0%
15.0%
20.0%
25.0%
30.0%
35.0%
40.0%
0 PIPs 1 PIP 2 PIPs ≥3 PIPs
< 70 years ≥ 70 years
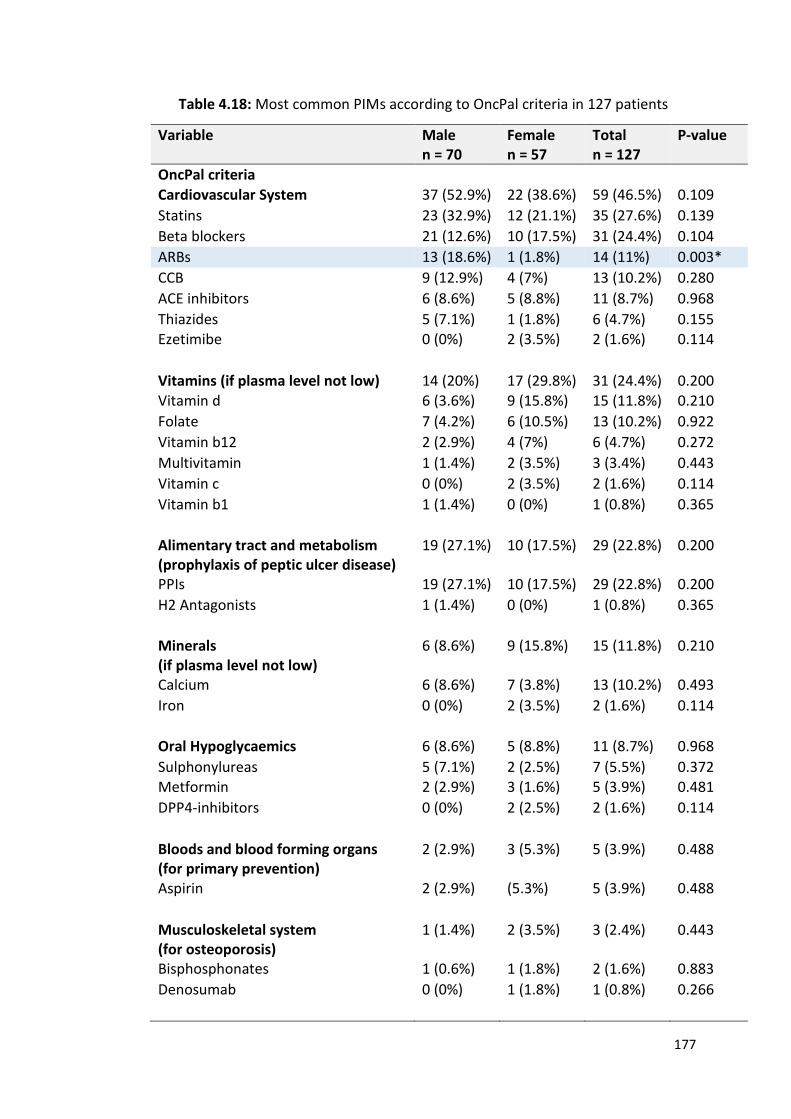
177
Table 4.18: Most common PIMs according to OncPal criteria in 127 patients
Variable Male n = 70
Female n = 57
Total n = 127
P-value
OncPal criteria
Cardiovascular System 37 (52.9%) 22 (38.6%) 59 (46.5%) 0.109
Statins 23 (32.9%) 12 (21.1%) 35 (27.6%) 0.139
Beta blockers 21 (12.6%) 10 (17.5%) 31 (24.4%) 0.104
ARBs 13 (18.6%) 1 (1.8%) 14 (11%) 0.003*
CCB 9 (12.9%) 4 (7%) 13 (10.2%) 0.280
ACE inhibitors 6 (8.6%) 5 (8.8%) 11 (8.7%) 0.968
Thiazides 5 (7.1%) 1 (1.8%) 6 (4.7%) 0.155 Ezetimibe 0 (0%) 2 (3.5%) 2 (1.6%) 0.114
Vitamins (if plasma level not low) 14 (20%) 17 (29.8%) 31 (24.4%) 0.200 Vitamin d 6 (3.6%) 9 (15.8%) 15 (11.8%) 0.210
Folate 7 (4.2%) 6 (10.5%) 13 (10.2%) 0.922
Vitamin b12 2 (2.9%) 4 (7%) 6 (4.7%) 0.272
Multivitamin 1 (1.4%) 2 (3.5%) 3 (3.4%) 0.443
Vitamin c 0 (0%) 2 (3.5%) 2 (1.6%) 0.114
Vitamin b1 1 (1.4%) 0 (0%) 1 (0.8%) 0.365
Alimentary tract and metabolism (prophylaxis of peptic ulcer disease)
19 (27.1%) 10 (17.5%) 29 (22.8%) 0.200
PPIs 19 (27.1%) 10 (17.5%) 29 (22.8%) 0.200
H2 Antagonists 1 (1.4%) 0 (0%) 1 (0.8%) 0.365
Minerals (if plasma level not low)
6 (8.6%) 9 (15.8%) 15 (11.8%) 0.210
Calcium 6 (8.6%) 7 (3.8%) 13 (10.2%) 0.493
Iron 0 (0%) 2 (3.5%) 2 (1.6%) 0.114
Oral Hypoglycaemics 6 (8.6%) 5 (8.8%) 11 (8.7%) 0.968
Sulphonylureas 5 (7.1%) 2 (2.5%) 7 (5.5%) 0.372 Metformin 2 (2.9%) 3 (1.6%) 5 (3.9%) 0.481
DPP4-inhibitors 0 (0%) 2 (2.5%) 2 (1.6%) 0.114
Bloods and blood forming organs (for primary prevention)
2 (2.9%) 3 (5.3%) 5 (3.9%) 0.488
Aspirin 2 (2.9%) (5.3%) 5 (3.9%) 0.488
Musculoskeletal system (for osteoporosis)
1 (1.4%) 2 (3.5%) 3 (2.4%) 0.443
Bisphosphonates 1 (0.6%) 1 (1.8%) 2 (1.6%) 0.883
Denosumab 0 (0%) 1 (1.8%) 1 (0.8%) 0.266
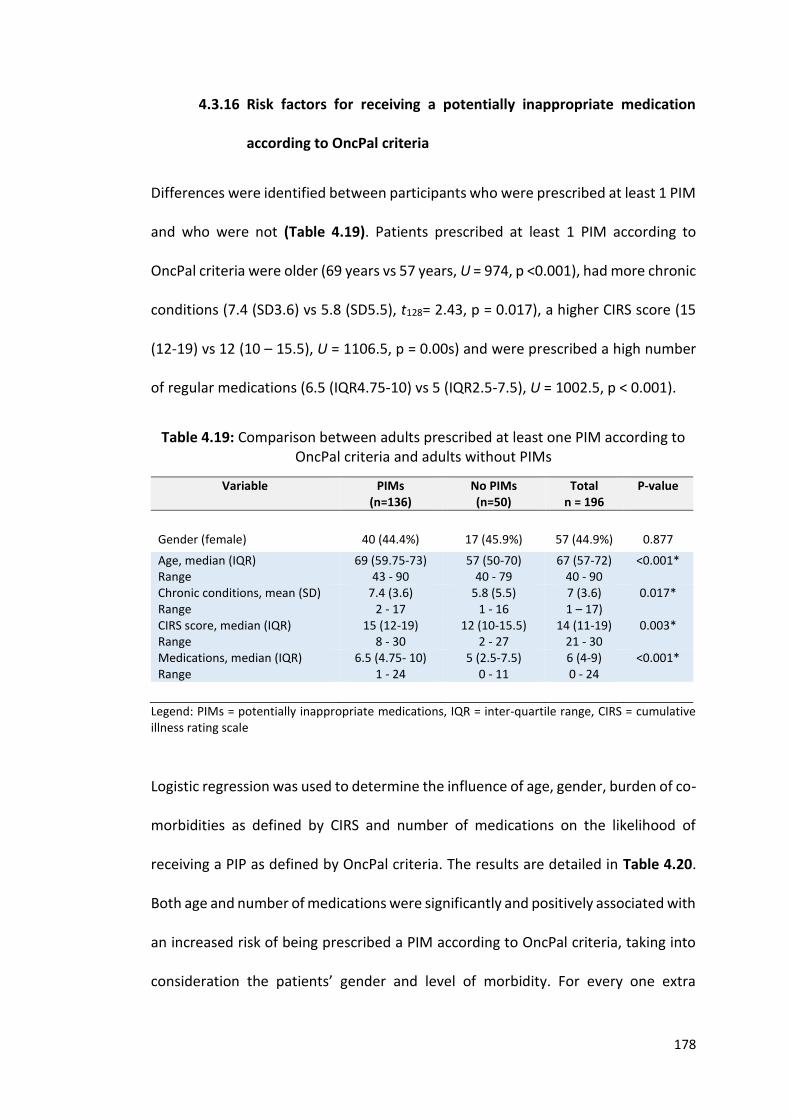
178
4.3.16 Risk factors for receiving a potentially inappropriate medication
according to OncPal criteria
Differences were identified between participants who were prescribed at least 1 PIM
and who were not (Table 4.19). Patients prescribed at least 1 PIM according to
OncPal criteria were older (69 years vs 57 years, U = 974, p <0.001), had more chronic
conditions (7.4 (SD3.6) vs 5.8 (SD5.5), t128= 2.43, p = 0.017), a higher CIRS score (15
(12-19) vs 12 (10 – 15.5), U = 1106.5, p = 0.00s) and were prescribed a high number
of regular medications (6.5 (IQR4.75-10) vs 5 (IQR2.5-7.5), U = 1002.5, p < 0.001).
Table 4.19: Comparison between adults prescribed at least one PIM according to OncPal criteria and adults without PIMs
Variable PIMs (n=136)
No PIMs (n=50)
Total n = 196
P-value
Gender (female) 40 (44.4%) 17 (45.9%) 57 (44.9%) 0.877
Age, median (IQR) Range
69 (59.75-73) 43 - 90
57 (50-70) 40 - 79
67 (57-72) 40 - 90
<0.001*
Chronic conditions, mean (SD) Range
7.4 (3.6) 2 - 17
5.8 (5.5) 1 - 16
7 (3.6) 1 – 17)
0.017*
CIRS score, median (IQR) Range
15 (12-19) 8 - 30
12 (10-15.5) 2 - 27
14 (11-19) 21 - 30
0.003*
Medications, median (IQR) Range
6.5 (4.75- 10) 1 - 24
5 (2.5-7.5) 0 - 11
6 (4-9) 0 - 24
<0.001*
Legend: PIMs = potentially inappropriate medications, IQR = inter-quartile range, CIRS = cumulative illness rating scale
Logistic regression was used to determine the influence of age, gender, burden of co-
morbidities as defined by CIRS and number of medications on the likelihood of
receiving a PIP as defined by OncPal criteria. The results are detailed in Table 4.20.
Both age and number of medications were significantly and positively associated with
an increased risk of being prescribed a PIM according to OncPal criteria, taking into
consideration the patients’ gender and level of morbidity. For every one extra
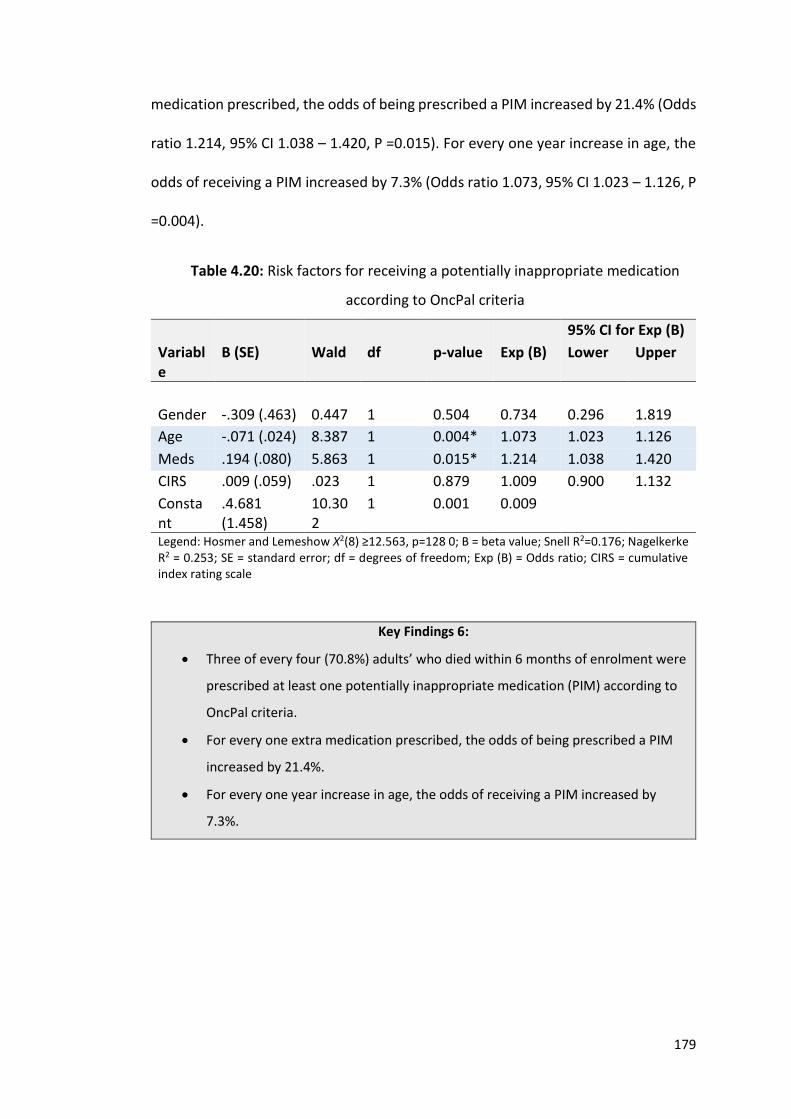
179
medication prescribed, the odds of being prescribed a PIM increased by 21.4% (Odds
ratio 1.214, 95% CI 1.038 – 1.420, P =0.015). For every one year increase in age, the
odds of receiving a PIM increased by 7.3% (Odds ratio 1.073, 95% CI 1.023 – 1.126, P
=0.004).
Table 4.20: Risk factors for receiving a potentially inappropriate medication
according to OncPal criteria
95% CI for Exp (B)
Variable
B (SE) Wald df p-value Exp (B) Lower Upper
Gender -.309 (.463) 0.447 1 0.504 0.734 0.296 1.819
Age -.071 (.024) 8.387 1 0.004* 1.073 1.023 1.126
Meds .194 (.080) 5.863 1 0.015* 1.214 1.038 1.420
CIRS .009 (.059) .023 1 0.879 1.009 0.900 1.132
Constant
.4.681 (1.458)
10.302
1 0.001 0.009
Legend: Hosmer and Lemeshow Χ2(8) ≥12.563, p=128 0; B = beta value; Snell R2=0.176; Nagelkerke R2 = 0.253; SE = standard error; df = degrees of freedom; Exp (B) = Odds ratio; CIRS = cumulative index rating scale
Key Findings 6:
Three of every four (70.8%) adults’ who died within 6 months of enrolment were
prescribed at least one potentially inappropriate medication (PIM) according to
OncPal criteria.
For every one extra medication prescribed, the odds of being prescribed a PIM
increased by 21.4%.
For every one year increase in age, the odds of receiving a PIM increased by
7.3%.
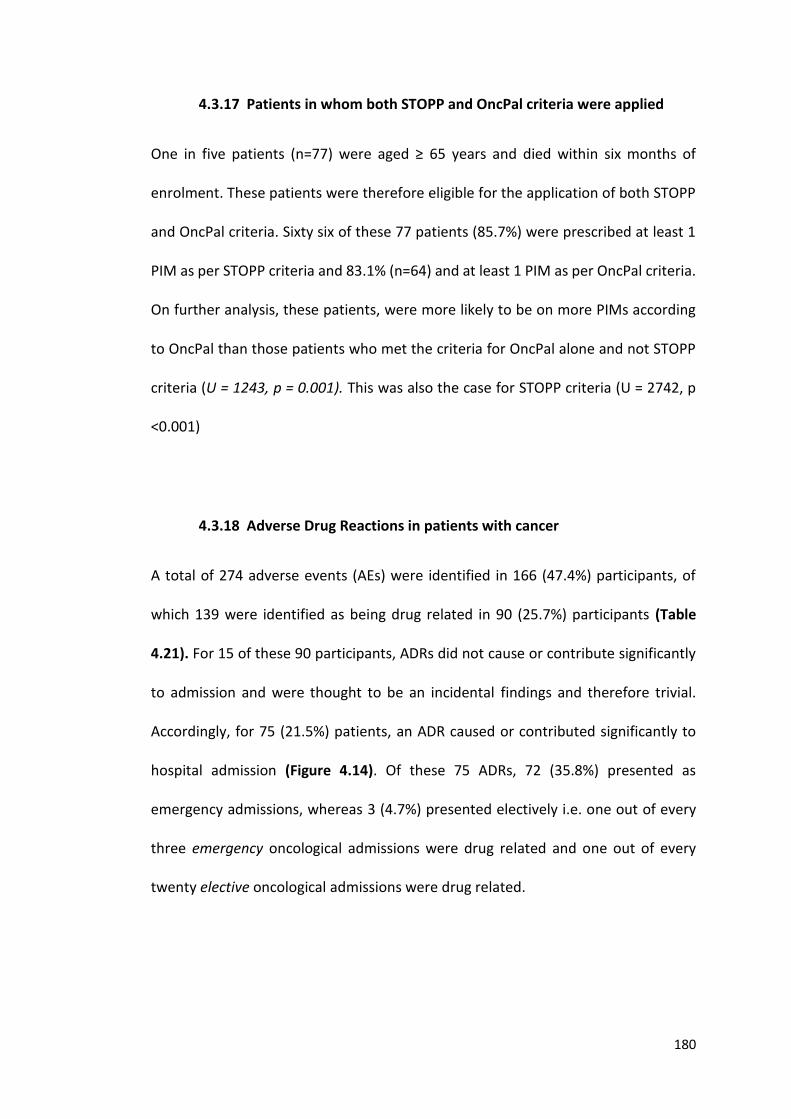
180
4.3.17 Patients in whom both STOPP and OncPal criteria were applied
One in five patients (n=77) were aged ≥ 65 years and died within six months of
enrolment. These patients were therefore eligible for the application of both STOPP
and OncPal criteria. Sixty six of these 77 patients (85.7%) were prescribed at least 1
PIM as per STOPP criteria and 83.1% (n=64) and at least 1 PIM as per OncPal criteria.
On further analysis, these patients, were more likely to be on more PIMs according
to OncPal than those patients who met the criteria for OncPal alone and not STOPP
criteria (U = 1243, p = 0.001). This was also the case for STOPP criteria (U = 2742, p
<0.001)
4.3.18 Adverse Drug Reactions in patients with cancer
A total of 274 adverse events (AEs) were identified in 166 (47.4%) participants, of
which 139 were identified as being drug related in 90 (25.7%) participants (Table
4.21). For 15 of these 90 participants, ADRs did not cause or contribute significantly
to admission and were thought to be an incidental findings and therefore trivial.
Accordingly, for 75 (21.5%) patients, an ADR caused or contributed significantly to
hospital admission (Figure 4.14). Of these 75 ADRs, 72 (35.8%) presented as
emergency admissions, whereas 3 (4.7%) presented electively i.e. one out of every
three emergency oncological admissions were drug related and one out of every
twenty elective oncological admissions were drug related.
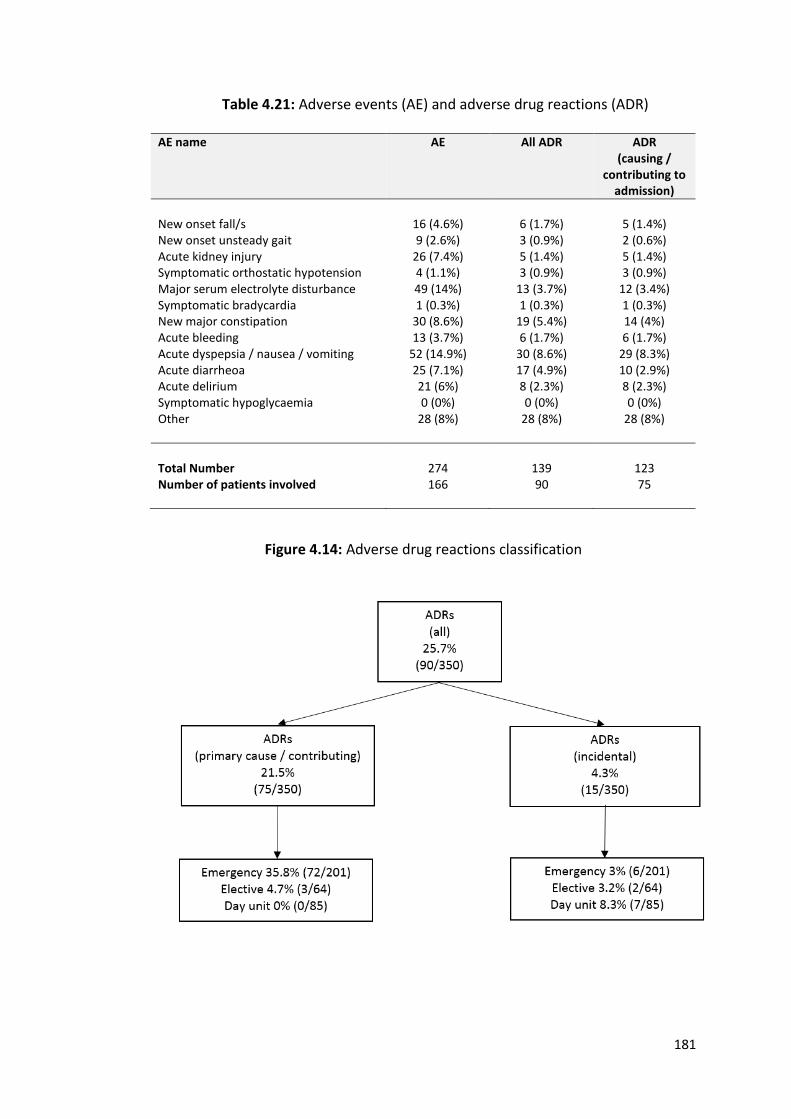
181
Table 4.21: Adverse events (AE) and adverse drug reactions (ADR)
AE name AE
All ADR
ADR (causing /
contributing to admission)
New onset fall/s 16 (4.6%) 6 (1.7%) 5 (1.4%) New onset unsteady gait 9 (2.6%) 3 (0.9%) 2 (0.6%) Acute kidney injury 26 (7.4%) 5 (1.4%) 5 (1.4%) Symptomatic orthostatic hypotension 4 (1.1%) 3 (0.9%) 3 (0.9%) Major serum electrolyte disturbance 49 (14%) 13 (3.7%) 12 (3.4%) Symptomatic bradycardia 1 (0.3%) 1 (0.3%) 1 (0.3%) New major constipation 30 (8.6%) 19 (5.4%) 14 (4%) Acute bleeding 13 (3.7%) 6 (1.7%) 6 (1.7%) Acute dyspepsia / nausea / vomiting 52 (14.9%) 30 (8.6%) 29 (8.3%) Acute diarrheoa 25 (7.1%) 17 (4.9%) 10 (2.9%) Acute delirium 21 (6%) 8 (2.3%) 8 (2.3%) Symptomatic hypoglycaemia 0 (0%) 0 (0%) 0 (0%) Other
28 (8%) 28 (8%) 28 (8%)
Total Number 274 139 123 Number of patients involved 166 90 75
Figure 4.14: Adverse drug reactions classification
182
4.3.19 Types of adverse drug reactions
The primary ADR symptoms causing clinical presentation are listed in table 4.22. The
12 point AE Trigger List identified 64% (n=48) of all ADRs. Older and younger adults
were equally like to experience the same type of ADRs (Χ2 (17) = 16.434, p = 0.493),
as were men and women (Χ2 (17) = 23.230, p = 0.142).
Table 4.22: Types of ADRs in order of frequency and according to age
Variable < 70 years n=229
≥ 70 years n=121
Total n = 350
P-value
0.493 Neutropenia with infection 15 (6.6%) 3 (2.5%) 19 (5.1%) Acute dyspepsia / nausea / vomiting 10 (4.4%) 5 (4.1%) 15 (4.3%) New major constipation 10 (4.4%) 2 (1.7%) 12 (3.4%) Acute diarrhea 5 (2.2%) 3 (2.5%) 8 (2.8%) Acute bleeding 3 (1.3%) 3 (2.5%) 6 (1.7%) Acute delirium 0 (0%) 2 (1.7%) 2 (0.6%) Symptomatic orthostatic hypotension 1 (0.4%) 1 (0.8%) 2 (0.6%) New unsteady gait 1 (0.4%) 1 (0.8%) 2 (0.6%) Steroid induced hyperglycaemia 1 (0.4%) 1 (0.8%) 2 (0.6%) Steroid induced insomnia 1 (0.4%) 0 (0%) 1 (0.3%) Symptomatic bradycardia 1 (0.4%) 0 (0%) 1 (0.3%) Electrolyte disturbance 0 (0%) 1 (0.8%) 1 (0.3%) Acute liver failure 1 (0.4%) 0 (0%) 1 (0.3%) Pancreatitis 1 (0.4%) 0 (0%) 1 (0.3%) Urinary retention 0 (0%) 1 (0.8%) 1 (0.3%) Anxiety secondary to levothyroxine 1 (0.4%) 0 (0%) 1 (0.3%) Mouth sores and neutropenia
1 (0.4%) 0 (0%) 1 (0.3%)
Thirty two (42.7%) of participants that experienced an ADR had a Sequence of events
e.g. one patient that presented with new major constipation had associated vomiting
and acute kidney injury. Men and women were equally likely to experience a
Sequence of Events, 43.8% vs 41.9%, Χ2 (1) = 0.027, p = 0.870, as were all age groups,
Χ2(3) = 1.423, p = 0.700 (Figure 4.15).
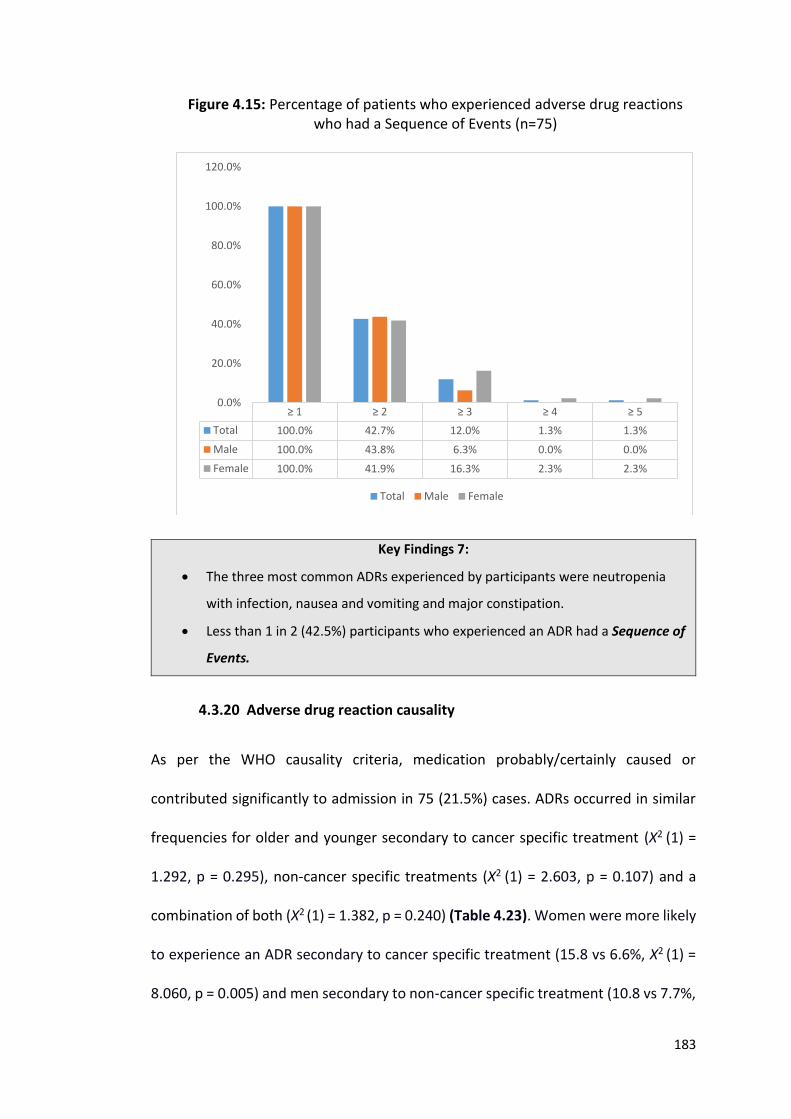
183
Figure 4.15: Percentage of patients who experienced adverse drug reactions who had a Sequence of Events (n=75)
Key Findings 7:
The three most common ADRs experienced by participants were neutropenia
with infection, nausea and vomiting and major constipation.
Less than 1 in 2 (42.5%) participants who experienced an ADR had a Sequence of
Events.
4.3.20 Adverse drug reaction causality
As per the WHO causality criteria, medication probably/certainly caused or
contributed significantly to admission in 75 (21.5%) cases. ADRs occurred in similar
frequencies for older and younger secondary to cancer specific treatment (Χ2 (1) =
1.292, p = 0.295), non-cancer specific treatments (Χ2 (1) = 2.603, p = 0.107) and a
combination of both (Χ2 (1) = 1.382, p = 0.240) (Table 4.23). Women were more likely
to experience an ADR secondary to cancer specific treatment (15.8 vs 6.6%, Χ2 (1) =
8.060, p = 0.005) and men secondary to non-cancer specific treatment (10.8 vs 7.7%,
≥ 1 ≥ 2 ≥ 3 ≥ 4 ≥ 5
Total 100.0% 42.7% 12.0% 1.3% 1.3%
Male 100.0% 43.8% 6.3% 0.0% 0.0%
Female 100.0% 41.9% 16.3% 2.3% 2.3%
0.0%
20.0%
40.0%
60.0%
80.0%
100.0%
120.0%
Total Male Female
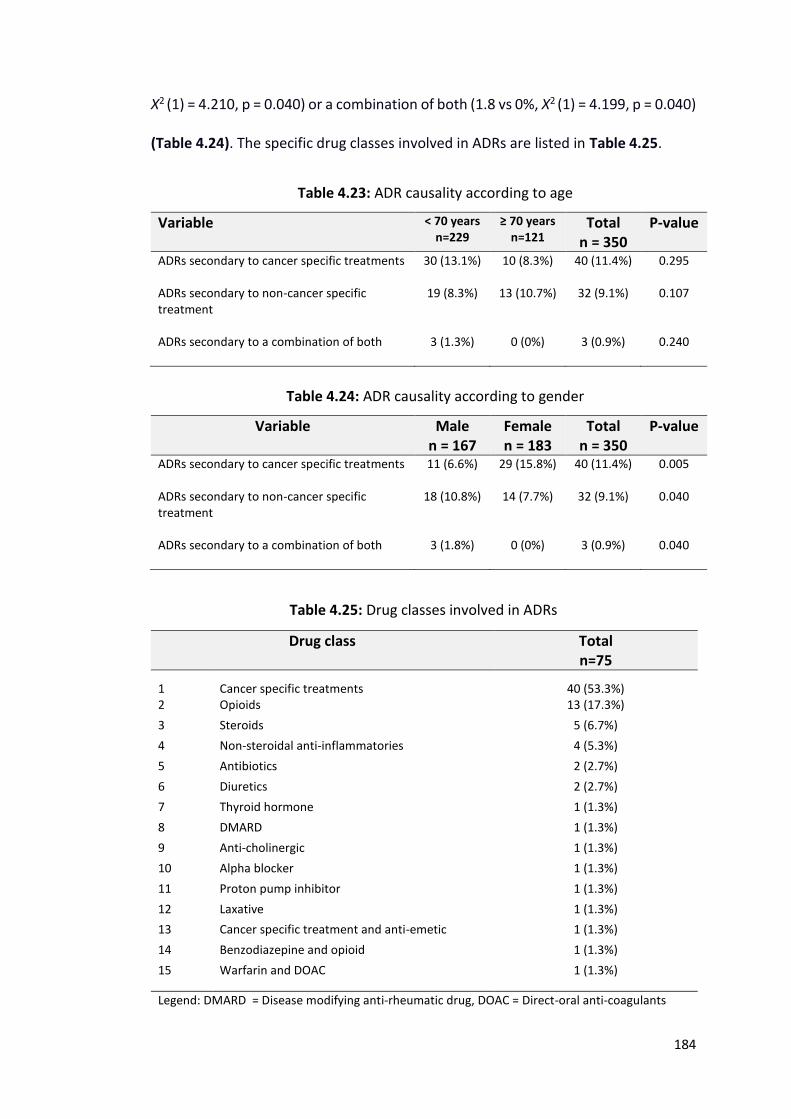
184
Χ2 (1) = 4.210, p = 0.040) or a combination of both (1.8 vs 0%, Χ2 (1) = 4.199, p = 0.040)
(Table 4.24). The specific drug classes involved in ADRs are listed in Table 4.25.
Table 4.23: ADR causality according to age
Variable < 70 years n=229
≥ 70 years n=121
Total n = 350
P-value
ADRs secondary to cancer specific treatments
30 (13.1%) 10 (8.3%) 40 (11.4%) 0.295
ADRs secondary to non-cancer specific treatment
19 (8.3%) 13 (10.7%) 32 (9.1%) 0.107
ADRs secondary to a combination of both
3 (1.3%) 0 (0%) 3 (0.9%) 0.240
Table 4.24: ADR causality according to gender
Variable Male n = 167
Female n = 183
Total n = 350
P-value
ADRs secondary to cancer specific treatments
11 (6.6%) 29 (15.8%) 40 (11.4%) 0.005
ADRs secondary to non-cancer specific treatment
18 (10.8%) 14 (7.7%) 32 (9.1%) 0.040
ADRs secondary to a combination of both
3 (1.8%) 0 (0%) 3 (0.9%) 0.040
Table 4.25: Drug classes involved in ADRs
Drug class Total n=75
1
Cancer specific treatments
40 (53.3%) 2 Opioids 13 (17.3%)
3 Steroids 5 (6.7%)
4 Non-steroidal anti-inflammatories 4 (5.3%)
5 Antibiotics 2 (2.7%)
6 Diuretics 2 (2.7%)
7 Thyroid hormone 1 (1.3%)
8 DMARD 1 (1.3%)
9 Anti-cholinergic 1 (1.3%)
10 Alpha blocker 1 (1.3%)
11 Proton pump inhibitor 1 (1.3%)
12 Laxative 1 (1.3%)
13 Cancer specific treatment and anti-emetic 1 (1.3%)
14 Benzodiazepine and opioid 1 (1.3%)
15
Warfarin and DOAC 1 (1.3%)
Legend: DMARD = Disease modifying anti-rheumatic drug, DOAC = Direct-oral anti-coagulants
185
Key Findings 8:
ADRs were equally likely to be caused by cancer specific treatment as
non-cancer specific treatment in both younger and older (≥70 years)
The three most common drug implicated were cancer specific treatments,
opioids and steroids.
4.3.21 Adverse drug reaction severity, predictability and preventability
Of the 75 ADRs causing or contributing significantly to admission 73 (97.3%) were
graded as “four” on the Hartwig and Siegel severity scale i.e. any ADR which was the
reason for the admission or increased the length of stay by at least 1 day. Two ADRS
(2.7%) required intensive medical input (grade 5 on Hartwig and Siegel severity
scale). Of 75 ADRs, 67 (89.3%) were predictable i.e. were listed in the ‘drugs'
summary of product characteristics of the drugs as being common or very common
adverse effect. Using Hallas criteria of avoidability, 22 of 75 ADRs (29.3%) were
definitely avoidable, 25 (33.3%) possibly avoidable and 28 (37.4%) unavoidable i.e. 2
out of every 3 ADRs were potentially avoidable.
4.3.22 ADR Risk factors and Outcomes
There were no differences between participants who experience ADRs and those
who did not (Table 4.26). However, when day unit admissions (patients who
attended for a couple of hours for treatment) were removed from analysis, all of
whom had no significant ADR, it was identified that patients on chemotherapy had a
significantly higher chance of experiencing an ADR than those not currently receiving
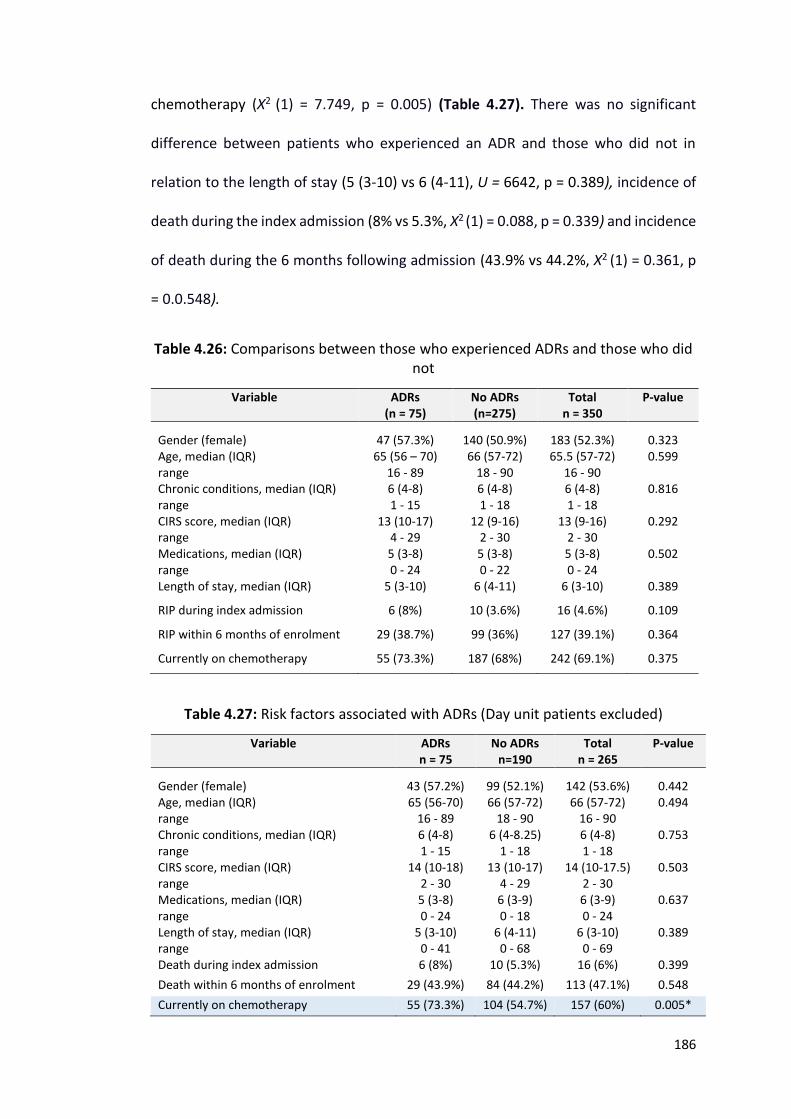
186
chemotherapy (Χ2 (1) = 7.749, p = 0.005) (Table 4.27). There was no significant
difference between patients who experienced an ADR and those who did not in
relation to the length of stay (5 (3-10) vs 6 (4-11), U = 6642, p = 0.389), incidence of
death during the index admission (8% vs 5.3%, Χ2 (1) = 0.088, p = 0.339) and incidence
of death during the 6 months following admission (43.9% vs 44.2%, Χ2 (1) = 0.361, p
= 0.0.548).
Table 4.26: Comparisons between those who experienced ADRs and those who did not
Variable ADRs (n = 75)
No ADRs (n=275)
Total n = 350
P-value
Gender (female)
47 (57.3%)
140 (50.9%)
183 (52.3%)
0.323 Age, median (IQR) range
65 (56 – 70) 16 - 89
66 (57-72) 18 - 90
65.5 (57-72) 16 - 90
0.599
Chronic conditions, median (IQR) range
6 (4-8) 1 - 15
6 (4-8) 1 - 18
6 (4-8) 1 - 18
0.816
CIRS score, median (IQR) range
13 (10-17) 4 - 29
12 (9-16) 2 - 30
13 (9-16) 2 - 30
0.292
Medications, median (IQR) range
5 (3-8) 0 - 24
5 (3-8) 0 - 22
5 (3-8) 0 - 24
0.502
Length of stay, median (IQR) 5 (3-10) 6 (4-11) 6 (3-10) 0.389
RIP during index admission 6 (8%) 10 (3.6%) 16 (4.6%) 0.109
RIP within 6 months of enrolment 29 (38.7%) 99 (36%) 127 (39.1%) 0.364
Currently on chemotherapy 55 (73.3%) 187 (68%) 242 (69.1%) 0.375
Table 4.27: Risk factors associated with ADRs (Day unit patients excluded)
Variable ADRs n = 75
No ADRs n=190
Total n = 265
P-value
Gender (female)
43 (57.2%)
99 (52.1%)
142 (53.6%)
0.442 Age, median (IQR) range
65 (56-70) 16 - 89
66 (57-72) 18 - 90
66 (57-72) 16 - 90
0.494
Chronic conditions, median (IQR) range
6 (4-8) 1 - 15
6 (4-8.25) 1 - 18
6 (4-8) 1 - 18
0.753
CIRS score, median (IQR) range
14 (10-18) 2 - 30
13 (10-17) 4 - 29
14 (10-17.5) 2 - 30
0.503
Medications, median (IQR) range
5 (3-8) 0 - 24
6 (3-9) 0 - 18
6 (3-9) 0 - 24
0.637
Length of stay, median (IQR) range
5 (3-10) 0 - 41
6 (4-11) 0 - 68
6 (3-10) 0 - 69
0.389
Death during index admission 6 (8%) 10 (5.3%) 16 (6%) 0.399
Death within 6 months of enrolment 29 (43.9%) 84 (44.2%) 113 (47.1%) 0.548
Currently on chemotherapy 55 (73.3%) 104 (54.7%) 157 (60%) 0.005*
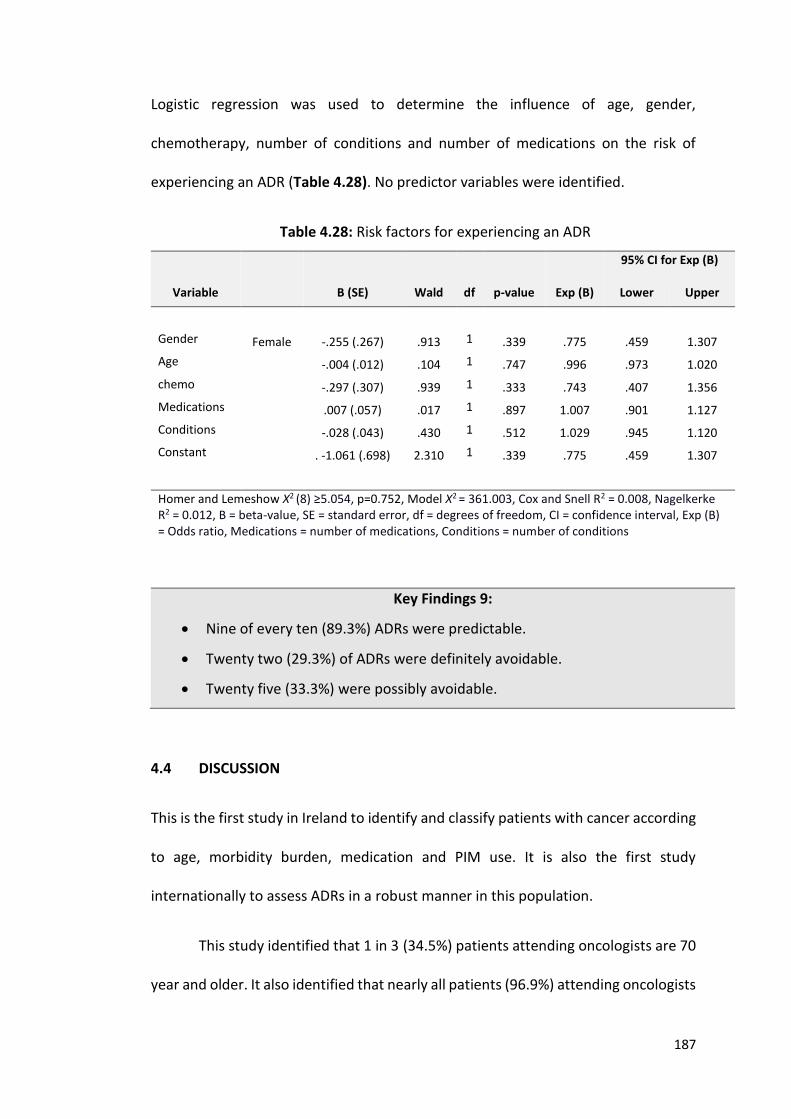
187
Logistic regression was used to determine the influence of age, gender,
chemotherapy, number of conditions and number of medications on the risk of
experiencing an ADR (Table 4.28). No predictor variables were identified.
Table 4.28: Risk factors for experiencing an ADR
95% CI for Exp (B)
Variable B (SE) Wald df p-value Exp (B) Lower Upper
Gender Female -.255 (.267) .913 1 .339 .775 .459 1.307
Age -.004 (.012) .104 1 .747 .996 .973 1.020
chemo -.297 (.307) .939 1 .333 .743 .407 1.356
Medications .007 (.057) .017 1 .897 1.007 .901 1.127
Conditions -.028 (.043) .430 1 .512 1.029 .945 1.120
Constant . -1.061 (.698) 2.310 1 .339 .775 .459 1.307
Homer and Lemeshow Χ2 (8) ≥5.054, p=0.752, Model Χ2 = 361.003, Cox and Snell R2 = 0.008, Nagelkerke R2 = 0.012, B = beta-value, SE = standard error, df = degrees of freedom, CI = confidence interval, Exp (B) = Odds ratio, Medications = number of medications, Conditions = number of conditions
Key Findings 9:
Nine of every ten (89.3%) ADRs were predictable.
Twenty two (29.3%) of ADRs were definitely avoidable.
Twenty five (33.3%) were possibly avoidable.
4.4 DISCUSSION
This is the first study in Ireland to identify and classify patients with cancer according
to age, morbidity burden, medication and PIM use. It is also the first study
internationally to assess ADRs in a robust manner in this population.
This study identified that 1 in 3 (34.5%) patients attending oncologists are 70
year and older. It also identified that nearly all patients (96.9%) attending oncologists
188
are multimorbid with 68% of participants having ≥ 5 chronic conditions. Four in every
five (81.1%) older adults (≥ 70 years) have ≥ 5 chronic conditions compared to more
than one in every two (60.7%) younger adults. Older adults had a significantly higher
burden of comorbidity as determined by their CIRS scores. Cardiovascular conditions
were highly prevalent with approximately 1 in 2 having a diagnosis of hypertension
and dyslipidaemia, 1 in 7 having a diagnosis of IHD and DM and 1 in 10 having a
diagnosis of atrial fibrillation.
Polypharmacy and high level polypharmacy were identified in 47.1% and
11.4% respectively. Their prevalence was significantly higher in older adults
compared to younger adults, 63.6% vs 38.4% and 19% vs 7.4% respectively. Older
adults were less likely to be prescribed chemotherapy and less likely to have received
chemotherapy in the past. Three out of every four (73.1%) adults’ ≥ 65 years were
prescribed at least one PIM according to STOPP criteria, one in four received ≥ 3 PIMs.
This was also the case for those eligible for the application of OncPal criteria; 3 in
every 4 (70.8%) were prescribed at least 1 PIM and 1 in every 3 received ≥ 3 PIMs.
Ninety (25.7%) patients experienced an ADR. For 75 (21.5%) patients
admissions to the oncology service (emergency, elective or day unit), ADRs caused or
contributed significantly to hospital admission. ADRs were more prevalent in those
presenting as emergency admissions i.e. ADRs cause/significantly contributed to 1 in
3 (35.8%) emergency admissions. ADRs were equally likely to be caused by cancer
specific treatment as non-cancer specific treatment with no difference in rates
identified between older and younger adults. Of these ADRs, 89.3% were predictable
and 62.6% possibly or definitely avoidable i.e. approximately 2 of every 3 were
189
potentially avoidable. Chemotherapy, opioids, steroids and NSAIDs were the most
common drugs implicated. One in twenty (4.6%) patients enrolled died during the
index admission with 4 out of 10 (39.1%) dying within the following 6 months.
As predicted for patients with cancer, cancer is often one of several
diagnoses. This has implications for the management and treatment of cancer as
many of the medications involved in cancer treatment regimens have the potential
to worsen other diagnoses e.g. corticosteroid use in diabetes mellitus. Despite their
multimorbidity, these patients were almost exclusively functionally independently
and cognitively intact, with a lower average age then expected of 63.6 years. This
suggests that perhaps older adults with medium to severe level dependency or
moderate to severe cognitive impairment either (i) do not get referred to oncology
specialists for assessment or (ii) do but they are not put forward for intensive
treatment regimens. This could mean that appropriate patient selection occurs,
however we have to ensure that patients who could benefit from treatment, have a
discussion regarding this with a thorough risk benefit assessment.
In accordance with earlier studies the prevalence of polypharmacy and high
level polypharmacy was high. Approximately every second patient (47.1%) was
prescribed 6 or more medications and 1 out of every 10 (11.4%) were prescribed ≥
11 medications. Some of the most commonly prescribed drugs identified in this study
have the potential to interact with chemotherapy e.g. 5-fluorouracil increases the
level of warfarin. During treatment with chemotherapeutic agents up to 30% will
experience nausea, vomiting or diarrhoea. This can have implications for other
medications specifically antihypertensive agents, which when fluid depleted, could
190
provoke dizziness and falls. Ongoing diuretic use in this context could increase the
risk of a patient developing an acute kidney injury with continued use. The vast
majority of cancer drugs, as expected, are prescribed by oncologists but the vast
majority of other drugs are prescribed by patients’ General Practitioners (GP) or
other hospital specialists. It is pertinent that there is clear communication between
these specialists. An extensive knowledge of chemotherapeutic agents and
medications required to treat other conditions is required to assess risk and adjust
medications accordingly. At present, this is not the sole responsibility of any one
doctor. Often once a cancer diagnosis is made, patients and other doctors defer to
the treating oncologist for treatment of all ailments.
Similar to other patient populations, PIM prescription was highly prevalent in
this cohort. This increases medication burden and places patients at an increased risk
of ADRs. Additionally, this can place a financial burden on an already stretched
healthcare system. The discussion around deprescribing of medications with patients
with cancer is challenging. Deprescribing of medications, even if inappropriate, can
be viewed by patients as withdrawal of care, in a time that presents many
psychological difficulties. This is supported by the findings of this study that identified
that 1 in 4 patients had a diagnosis of depression or anxiety and that 13.4% of
patients were prescribed benzodiazepines on a daily basis. Tapering or stopping of
medications can often lead to a discussion around end of life care. It is important a
clear discussion is had with patients regarding medication use addressing the risks of
continued use so that patients understand that it is not withdrawing of care, but
rather the optimisation of prescribing to reduce potential risks e.g. interactions
between a regular medication and chemotherapy.
191
Worryingly, 1 in 10 patients continued to smoke despite their cancer
diagnosis and 1 in 10 continued to drink more than the recommended weekly alcohol
allowance. Alcohol in small amounts can be good for patients (e.g. appetite
stimulation), but in excess can be harmful and can interact with chemotherapy. Its
use in patients who are already on many high risk medications i.e. chemotherapy
(69.1%), anticoagulation (14%), opioids (30%), steroids (12.3%), benzodiazepines
(3.4%), z-drugs (11.1%) and neuroleptics (5.1%), potentially places these patients at
a higher risk of ADRs.
The most common non-cancer specific treatments implicated in ADRs were
medications that are commonly implicated in ADRs in the acute (non-cancer)
population i.e. opioids, steroids and NSAIDs. This highlights that the high risk
medicines, regardless of the patient population, are the ones that most likely cause
ADRs. This offers an opportunity to intervene in prescribing practices early and thus
either avoid ADRs or improve their recognition so that they can be identified early
and adverse consequences can be minimised or avoided.
This study has some limitations. Firstly it was limited by the small sample size.
For the sample size calculation at the start of the study, it was predicted that 313
older adults would be required to estimate the true prevalence of PIM according to
STOPP criteria in this population. Unfortunately, this was not feasible for two
reasons; (i) time allocated to the study and (ii) inability to recruit from the radiation
oncology day unit. In total, 186 older adults were enrolled i.e. 59% of the target
amount required. In the pilot phase of this study, the logistics of recruiting radiation
oncology patients was identified as challenging secondary to (i) limited space and (ii)
192
the time patients spend in hospital undergoing treatment. Space was allocated to
this research for one afternoon a week. Frequently patients attend for radiation
treatment weekly at the same day, with patients with the same cancer diagnoses
allocated the same time slots. This would have biased our sample. Additionally,
patients spend a short time receiving radiotherapy (i.e. approximately 10 -15
minutes), and are therefore eager to receive treatment and leave. Perhaps if the
radiation oncology day unit had been included in this study our overall sample
population would have been older, more functionally and cognitively impaired and
on more medications. Even so, our results are consistent with the rates of PIM
identified by the Nightingale study (179), supporting this high PIM prevalent rate.
Another limitation of this study was the exclusion criteria i.e. the ability to
only recruit patients on one admission. Prevalence rates of multimorbidity,
medication use and PIM are accurate because of this, however it is possible that ADRs
were missed due to the exclusion of repeat admissions.
This study highlights the importance of an integrated care approach for
patients with cancer, particularly older adults. Older adults could benefit from
gerontology input, as well as ongoing GP input at the time of cancer diagnosis as well
as during treatment. During treatment for cancer, the risk of drug-drug and drug-
disease interactions is likely at its highest. This is a key time for comprehensive
geriatric assessment to (i) adjust medications, (ii) optimise other chronic conditions
and (iii) optimise both cognitive and functional ability through a multi-disciplinary
approach. The application of prescribing tools such as STOPP and OncPal could assist
in reducing medication burden in a structure fashion as well as avoiding ADRs. Going
193
forward medication reviews are an important part of the treatment of cancer and
both oncologists and GPs need to be educated regarding their potentially for harm
during this high risk time. The use of the ADR trigger list could assist oncologists to
identify ADRs and in doing so deprescribe or adjust medications accordingly, so that
repeated ADRs do not occur.
The prescription of preventative medications, as determined by OncPal
criteria, in patients with cancer and a poor prognosis, was highly prevalent. The
prescription of preventative medications in the acute (non-cancer) older frailer
population with a poor survival prognosis is an evolving entity with limited evidence
available to guide best practice. On reviewing all common explicit prescribing tools
to date, none address this. STOPP (36, 37), Beers (63-67) and FORTA (68, 69) criteria
all look at PIMs in the general older population and NORGEP-NH (135) criteria
addresses PIMs in the nursing home population. However no prescribing tool to date
addresses the deprescription of preventative medications in older frailer
multimorbid patients with a poor survival prognosis, regardless of place of residence.
NORGEP-NH addresses prescribing in nursing homes, but fundamentally doesn’t
acknowledge that not all patients living in residential care are frail, multimorbid with
a poor survival prognosis. The following chapters will discuss the development,
validation and inter-rater reliability (IRR) of a new explicit prescribing tool
(STOPPFrail criteria) to address this. The final chapter will apply STOPPFrail criteria to
a representative population.
194
CHAPTER 5:
STOPPFrail (Screening Tool of Older Persons Prescriptions in Frail adults with limited
life expectancy): Consensus validation
195
5.1 INTRODUCTION
Many explicit prescribing tools have been developed to guide clinicians on cessation
of potentially inappropriate medications (PIMs) in older adults; the most commonly
cited are Beers criteria (63-67), STOPP (Screening Tool of Older Persons’
Prescriptions)/START (Screening Tool to Alert doctors to Right Treatment) criteria
(36, 37) and FORTA (Fit FOR The Aged) criteria (68, 69). These explicit tools are
designed to detect common instances of potentially inappropriate medication (PIM)
use in the general older population. In chapters 3, I reported PIM prevalence
according to STOPP/START criteria (36, 37) in an unselected population of older
adults presenting with acute illness and requiring hospital admission. Similarly, in
chapter 4, I reported on the prevalence of PIMs in patients attending a medical
oncology service using STOPP/START criteria (36, 37) and OncPal (Oncological
palliative care deprescribing guideline) (192). It is evident that existing explicit criteria
for PIM identification are unsuitable for older frail adults with multiple co-
morbidities, high levels of functional dependency and a poor survival prognosis, a
population which is becoming increasingly prevalent and is increasingly encountered
in clinical practice (3).
Older patients are now surviving longer with complex co-morbid illnesses
including cancer, dementia, chronic kidney disease, cardiovascular disease,
cerebrovascular disease and chronic lung disease, many of which contribute to frailty
and poor survival prognosis (193, 194). Chronic illnesses, together with the effects of
physiological ageing can impact negatively on cognitive and physical functional
ability. In such patients, the final months of life are often characterised by frailty and
increased dependency, necessitating re-evaluation of drug treatment goals. In these
196
circumstances, medications intended to have long-term preventative effects such as
lipid-lowering drugs, anti-diabetic agents and cognitive enhancing drugs may no
longer be appropriate. This is well recognised by doctors and patients. However,
polypharmacy and inappropriate prescribing (IP) remain highly prevalent in this
patient population (195, 196), placing these individuals at an increased risk of
adverse drug reactions (ADRs), hospitalisation and death. Accordingly, appropriate
deprescribing of medications needs to be considered in frailer, multi-morbid patients
with a poor survival prognosis.
5.1.1 Deprescribing in frail older adults
Deprescribing is defined as “the process of withdrawal of an inappropriate
medication, supervised by a health care professional with the goal of managing
polypharmacy and improving outcomes” (131). It involves (i) reviewing all
medications prescribed, (ii) identifying those medications that are inappropriate, (iii)
deciding when and how these medications should be tapered, reduced or stopped
and (iv) arranging adequate monitoring and follow-up (132). Healthcare
professionals, patients and their relatives all acknowledge the burden of
polypharmacy for older frail adults, yet all groups display passivity towards
deprescribing (133). There are many barriers to deprescribing, which are listed in
Table 5.1 (132-134, 197, 198). As a consequence of these challenges, less than half
of attending clinicians use a consistent approach to deprescribing (134) and many
clinicians avoid it completely.
197
Table 5.1 Barriers to deprescribing
Patient factors
Patients’ preference/resistance to change
Patients’ communication ability
Organisational factors
Time constraints
Access and maintenance of medical and pharmacy records
Inter-professional relationships/prescribers from multiple specialties
Limited training of nursing staff
Nursing preferences/resistance to change
Co-ordinating and involving all relevant personnel e.g. pharmacists
Physician factors
Deficiency of knowledge
Fear of causing adverse events
Fear of litigation
Ease of following the “path of least resistance”
Concern that it may initiate end of life/life expectancy discussions
Lack of motivation
Research factors
Lack of deprescribing guidelines
Lack of evidence based research on deprescribing
Single-disease guidelines driving prescribing and hindering deprescribing
198
The growing burden of polypharmacy and IP has promoted national bodies in the UK
and Ireland such as the National Institute for health and Care Excellence (NICE) (199-
201) and Health Information Quality Authority (HIQA) (202, 203), to offer guidance
on deprescribing. NICE recommends annual medication reviews for care home
residents, during which appropriateness of medications should be optimised and
medications deprescribed where necessary (199). Similarly they recommend review
of medications for community dwelling older adults with chronic diseases, however
no time frame is suggested (200, 201). Despite this, to date, no explicit guidelines
exist for deprescribing in frailer older adults with poor one year survival prognosis,
other than NORGEP-NH criteria, which are specific to the nursing home population
(135).
5.1.2 Objectives
There is an accepted need for deprescribing in the frailer older population and a clear
associated need for specific explicit criteria to guide the prescriber. With these
considerations in mind, the principal objective of this research was to devise and
validate an explicit set of criteria, using the Delphi technique, aimed at assisting
physicians with the challenging task of deprescribing medications in older frail adults
with limited life expectancy. It was envisaged that this tool could be used in all
healthcare settings where such patients are encountered. The work undertaken in
this chapter, including study design, data collection and statistical analysis, is entirely
my own.
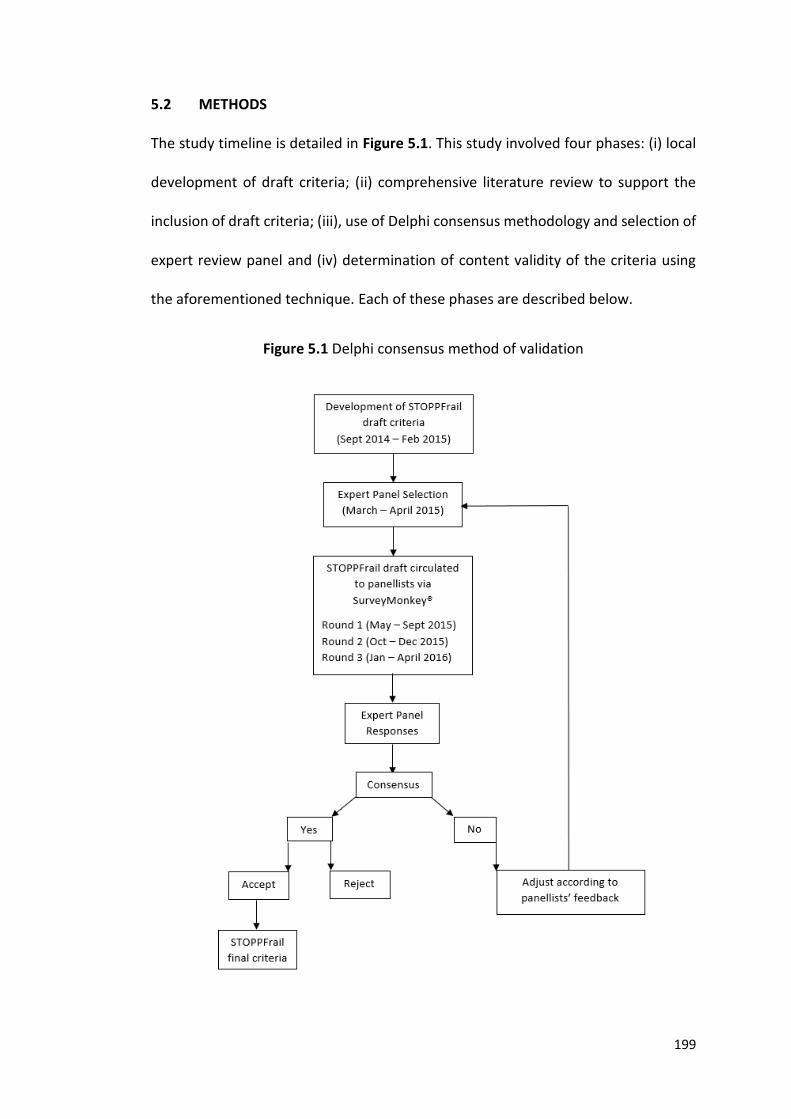
199
5.2 METHODS
The study timeline is detailed in Figure 5.1. This study involved four phases: (i) local
development of draft criteria; (ii) comprehensive literature review to support the
inclusion of draft criteria; (iii), use of Delphi consensus methodology and selection of
expert review panel and (iv) determination of content validity of the criteria using
the aforementioned technique. Each of these phases are described below.
Figure 5.1 Delphi consensus method of validation
200
5.2.1 Local development of draft criteria
Prof. Denis O’Mahony (senior academic consultant/geriatrician, University College
Cork), Dr. Paul Gallagher (senior academic consultant/geriatrician, University College
Cork), Dr. Carole Parsons (academic pharmacist, Queen’s University Belfast), all of
whom have recognised expertise in geriatric pharmacotherapy, and I were involved
in the original development of the deprescribing tool. It was decided that the tool
should: (i) have an appropriate name to reflect its purpose, (ii) include a clear
definition of the target patient population, (iii) incorporate common instances of PIM
encountered in clinical practice in frail older people with poor survival prognosis, (iv)
be concise and lend itself to be time-efficient and easy to use, and (v) be based on
the most current up to date evidence available. Medication appropriateness would
be assessed according to the risk-benefit definition i.e. it is appropriate to prescribe
an indicated medication if its potential benefit outweighs its’ potential risk of harm,
while considering patients’ comorbidities, co-prescribed medications and altered
physiology associated with ageing and disease progression. These five components
were considered to be mandatory for development of a deprescribing tool that could
easily be used in both the clinical and research setting.
The deprescribing tool was named STOPPFrail (Screening Tool of Older
Person’s potentially inappropriate Prescriptions in Frail adults with limited life
expectancy), in an attempt to highlight the proposed appropriate target
subpopulation of older people. Similar to STOPP/START criteria (36, 37), the initial
draft of STOPPFrail indicators was arranged according to physiological systems. For
patients to be suitable for medication review according to STOPPFrail criteria, four
eligibility criteria were proposed (Table 5.2). Since the most consistent predictors of
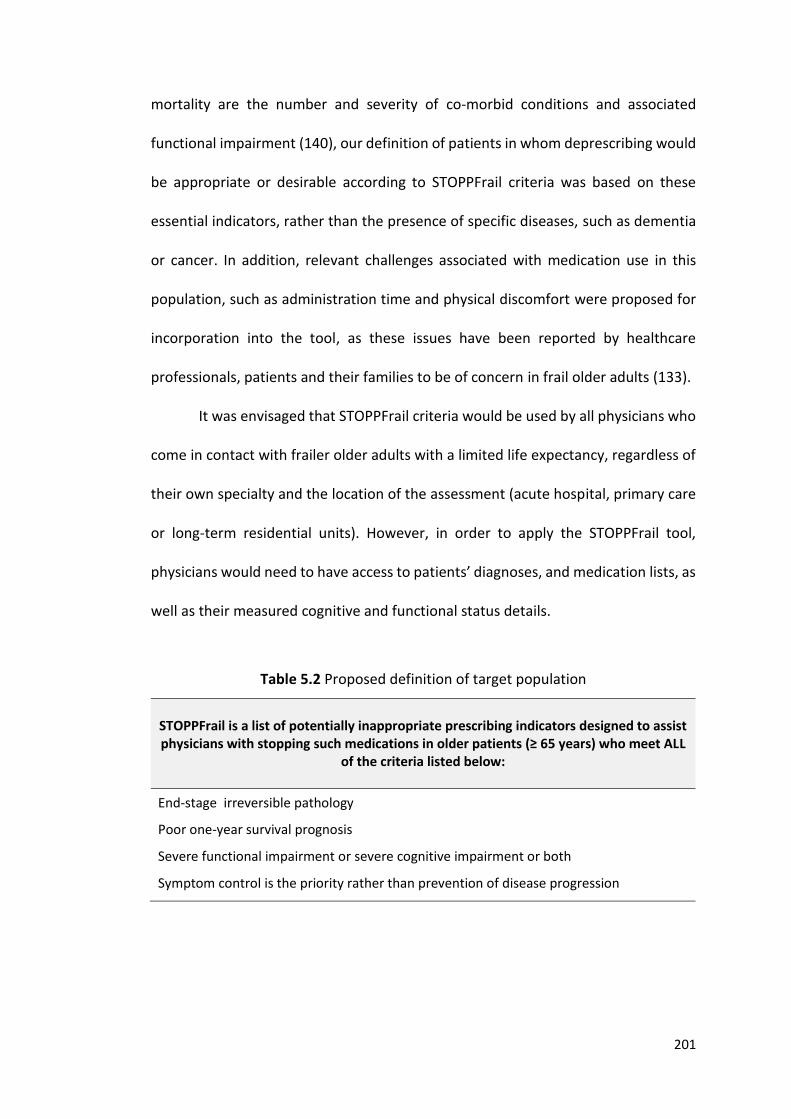
201
mortality are the number and severity of co-morbid conditions and associated
functional impairment (140), our definition of patients in whom deprescribing would
be appropriate or desirable according to STOPPFrail criteria was based on these
essential indicators, rather than the presence of specific diseases, such as dementia
or cancer. In addition, relevant challenges associated with medication use in this
population, such as administration time and physical discomfort were proposed for
incorporation into the tool, as these issues have been reported by healthcare
professionals, patients and their families to be of concern in frail older adults (133).
It was envisaged that STOPPFrail criteria would be used by all physicians who
come in contact with frailer older adults with a limited life expectancy, regardless of
their own specialty and the location of the assessment (acute hospital, primary care
or long-term residential units). However, in order to apply the STOPPFrail tool,
physicians would need to have access to patients’ diagnoses, and medication lists, as
well as their measured cognitive and functional status details.
Table 5.2 Proposed definition of target population
STOPPFrail is a list of potentially inappropriate prescribing indicators designed to assist physicians with stopping such medications in older patients (≥ 65 years) who meet ALL
of the criteria listed below:
End-stage irreversible pathology
Poor one-year survival prognosis
Severe functional impairment or severe cognitive impairment or both
Symptom control is the priority rather than prevention of disease progression
202
5.2.2 Comprehensive literature review to support draft criteria inclusion
The evidence base to support the use of each drug or drug class in frailer older
patients with limited life expectancy was checked using the British National
Formulary and an extensive literature review, limited to the last 20 years. Drugs and
drug classes were selected based on clinical judgement of the authors as well as
available data on inappropriate prescribing in patients with limited life expectancy.
Literature searches of the PubMed, Cinahl and Google Scholar databases were
undertaken. Searches included the drug in question combined with key words i.e.
“life expectancy”, “frailty”, “older adults”, “poor prognosis”, “deprescribing”,
“inappropriate prescribing”, “adverse drug reactions” and “adverse drug events”.
Randomised control trials (RCTs), systematic reviews and up-to-date guidelines were
included. Where none of the above was found, observational studies were reviewed.
Articles had to be written in the English language and include older adults. The panel
was provided with an electronic repository containing supporting references for the
proposed STOPPFrail criteria.
5.2.3. Use of Delphi consensus methodology and selection of expert panel
The Delphi consensus method was used for this research. It is a well-established
method that aims to gather information from persons in the domain of their relevant
expertise, with the goal of reaching a group consensus on a complex subject where
information is lacking. In this instance, the complex subject in question is potentially
inappropriate medication use in older frailer adults with poor survival prognosis.
Delphi panellists must have expertise in the topic under consideration and the panel
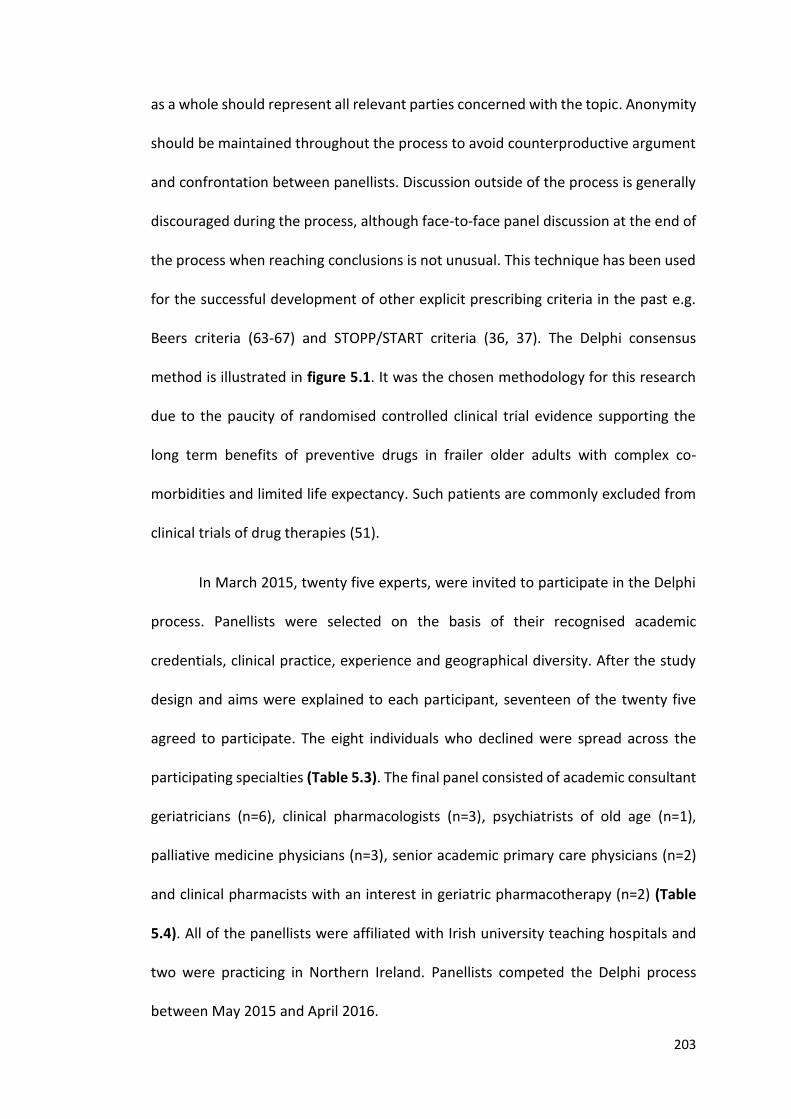
203
as a whole should represent all relevant parties concerned with the topic. Anonymity
should be maintained throughout the process to avoid counterproductive argument
and confrontation between panellists. Discussion outside of the process is generally
discouraged during the process, although face-to-face panel discussion at the end of
the process when reaching conclusions is not unusual. This technique has been used
for the successful development of other explicit prescribing criteria in the past e.g.
Beers criteria (63-67) and STOPP/START criteria (36, 37). The Delphi consensus
method is illustrated in figure 5.1. It was the chosen methodology for this research
due to the paucity of randomised controlled clinical trial evidence supporting the
long term benefits of preventive drugs in frailer older adults with complex co-
morbidities and limited life expectancy. Such patients are commonly excluded from
clinical trials of drug therapies (51).
In March 2015, twenty five experts, were invited to participate in the Delphi
process. Panellists were selected on the basis of their recognised academic
credentials, clinical practice, experience and geographical diversity. After the study
design and aims were explained to each participant, seventeen of the twenty five
agreed to participate. The eight individuals who declined were spread across the
participating specialties (Table 5.3). The final panel consisted of academic consultant
geriatricians (n=6), clinical pharmacologists (n=3), psychiatrists of old age (n=1),
palliative medicine physicians (n=3), senior academic primary care physicians (n=2)
and clinical pharmacists with an interest in geriatric pharmacotherapy (n=2) (Table
5.4). All of the panellists were affiliated with Irish university teaching hospitals and
two were practicing in Northern Ireland. Panellists competed the Delphi process
between May 2015 and April 2016.
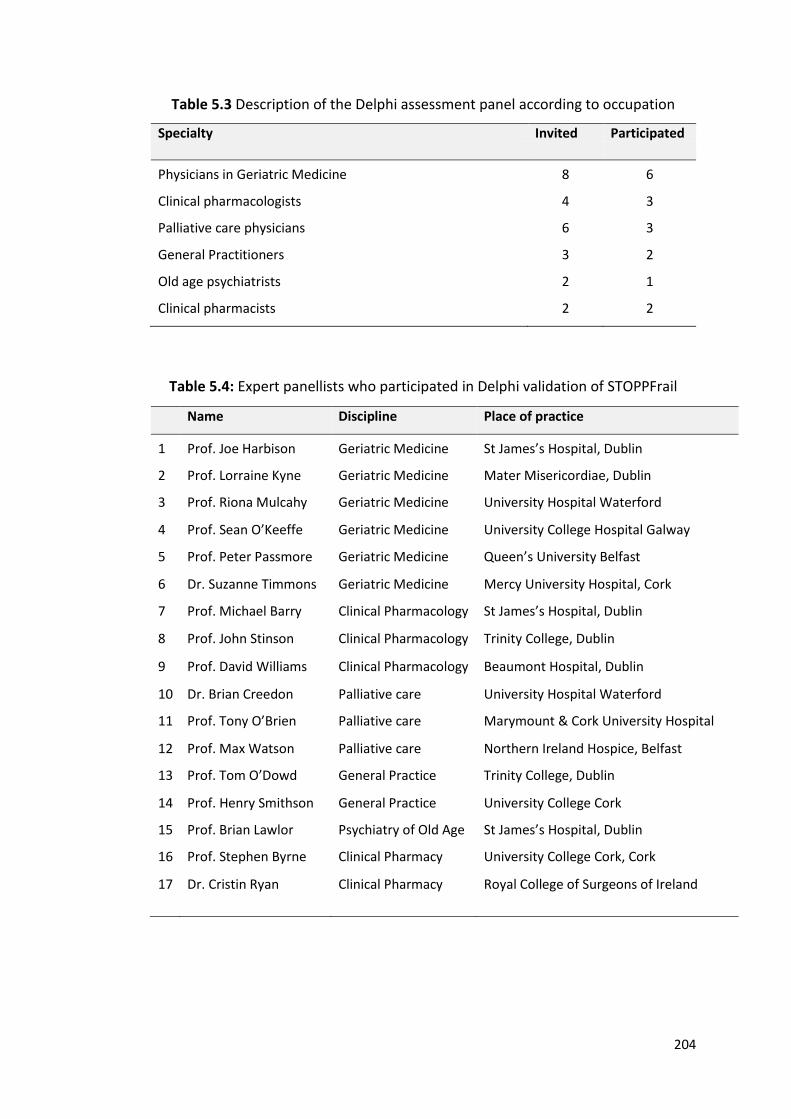
204
Table 5.3 Description of the Delphi assessment panel according to occupation
Specialty Invited Participated
Physicians in Geriatric Medicine
8
6
Clinical pharmacologists 4 3
Palliative care physicians 6 3
General Practitioners 3 2
Old age psychiatrists 2 1
Clinical pharmacists 2 2
Table 5.4: Expert panellists who participated in Delphi validation of STOPPFrail
Name Discipline Place of practice
1
Prof. Joe Harbison
Geriatric Medicine
St James’s Hospital, Dublin
2 Prof. Lorraine Kyne Geriatric Medicine Mater Misericordiae, Dublin
3 Prof. Riona Mulcahy Geriatric Medicine University Hospital Waterford
4 Prof. Sean O’Keeffe Geriatric Medicine University College Hospital Galway
5 Prof. Peter Passmore Geriatric Medicine Queen’s University Belfast
6 Dr. Suzanne Timmons Geriatric Medicine Mercy University Hospital, Cork
7 Prof. Michael Barry Clinical Pharmacology St James’s Hospital, Dublin
8 Prof. John Stinson Clinical Pharmacology Trinity College, Dublin
9 Prof. David Williams Clinical Pharmacology Beaumont Hospital, Dublin
10 Dr. Brian Creedon Palliative care University Hospital Waterford
11 Prof. Tony O’Brien Palliative care Marymount & Cork University Hospital
12 Prof. Max Watson Palliative care Northern Ireland Hospice, Belfast
13 Prof. Tom O’Dowd General Practice Trinity College, Dublin
14 Prof. Henry Smithson General Practice University College Cork
15 Prof. Brian Lawlor Psychiatry of Old Age St James’s Hospital, Dublin
16 Prof. Stephen Byrne Clinical Pharmacy University College Cork, Cork
17 Dr. Cristin Ryan Clinical Pharmacy Royal College of Surgeons of Ireland
205
5.2.4 Determination of content validity of the criteria
Each round was sent to the panellists using an online survey [SurveyMonkey®]. The
first Delphi round consisted of 30 proposed criteria with each criterion presented in
a standardized format i.e. a drug or drug class deemed potentially inappropriate
followed by an explanatory sentence (see Appendix 10). An example of such a
statement is displayed in Figure 5.2. Panellists rated their agreement with each
statement on a 5-point Likert scale, where 5 = strongly agree, 4 = agree, 3 = neutral,
2 = disagree, 1 = strongly disagree, 0 = unable to offer an opinion (204). In round 1,
panellists were also asked to offer suggestions or comments (including new drugs) as
appropriate on the proposed criteria.
For each statement, consensus was based on the median Likert scale
response and interquartile range. A median value of 4 or 5 with a 25th centile of ≥4
was accepted for inclusion in the tool i.e. only statements with at least 75% of
respondents agreeing or strongly agreeing were included. Proposed criteria with a
median value of ≤3 were rejected: those with a median value of 4 or 5 and a 25th
centile of < 4 were rephrased in accordance with panellists’ suggestions and included
in the next Delphi round. Statistical analysis was performed using IBM SPSS® Statistics
version 22.
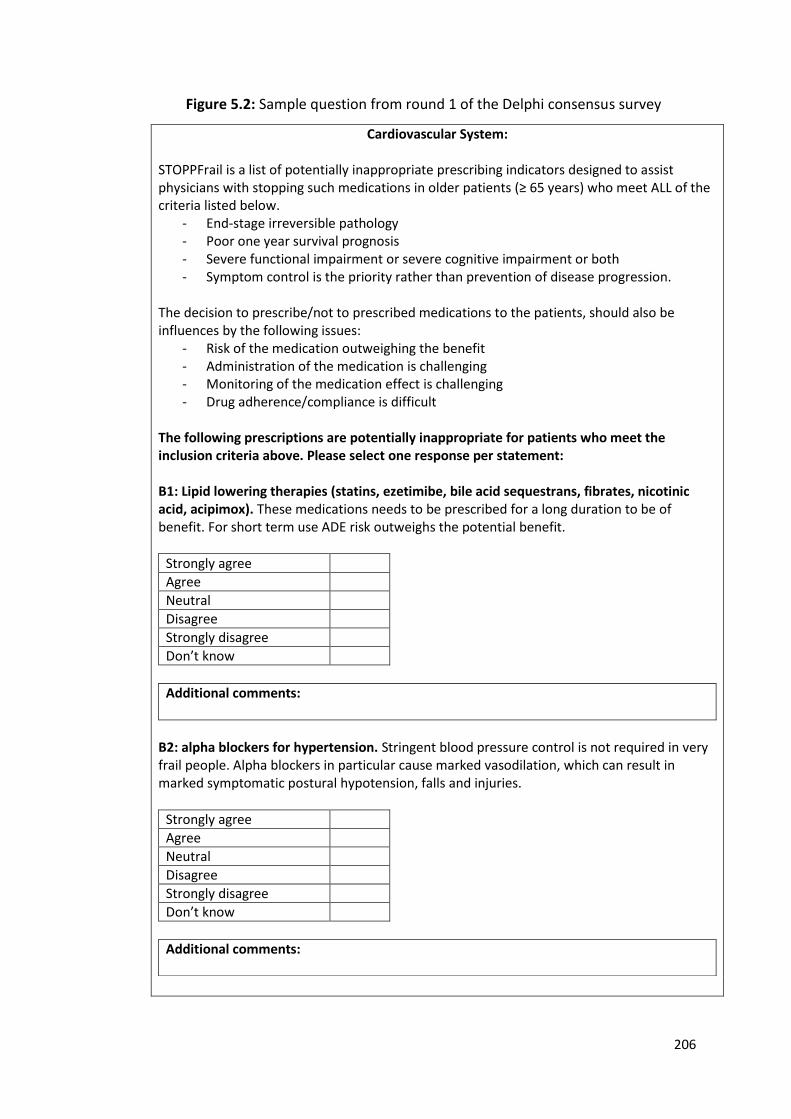
206
Figure 5.2: Sample question from round 1 of the Delphi consensus survey
Cardiovascular System:
STOPPFrail is a list of potentially inappropriate prescribing indicators designed to assist physicians with stopping such medications in older patients (≥ 65 years) who meet ALL of the criteria listed below.
- End-stage irreversible pathology - Poor one year survival prognosis - Severe functional impairment or severe cognitive impairment or both - Symptom control is the priority rather than prevention of disease progression.
The decision to prescribe/not to prescribed medications to the patients, should also be influences by the following issues:
- Risk of the medication outweighing the benefit - Administration of the medication is challenging - Monitoring of the medication effect is challenging - Drug adherence/compliance is difficult
The following prescriptions are potentially inappropriate for patients who meet the inclusion criteria above. Please select one response per statement: B1: Lipid lowering therapies (statins, ezetimibe, bile acid sequestrans, fibrates, nicotinic acid, acipimox). These medications needs to be prescribed for a long duration to be of benefit. For short term use ADE risk outweighs the potential benefit.
Strongly agree
Agree
Neutral
Disagree
Strongly disagree
Don’t know
Additional comments:
B2: alpha blockers for hypertension. Stringent blood pressure control is not required in very frail people. Alpha blockers in particular cause marked vasodilation, which can result in marked symptomatic postural hypotension, falls and injuries.
Strongly agree
Agree
Neutral
Disagree
Strongly disagree
Don’t know
Additional comments:
207
5.3 RESULTS
All panellists completed the Delphi validation process in three rounds; 27 criteria
comprise the final STOPPFrail tool (for summary, see Figure 5.3).
Figure 5.3: Flow chart of Delphi process
5.3.1 Round 1
Round 1 draft criteria were prepared and sent to panellists. The draft criteria, the
responses received and their outcomes are displayed in Table 5.5.
Final STOPPFrail criteria
27 criteria listed according to physiological system
Round 3 (2 criteria)
1 accepted 0 rejected 1 remained inconclusive
Round 2 (8 criteria)
6 accepted 0 rejected 2 prepared for round 3
Round 1 (30 criteria)
20 accepted 2 rejected 8 prepared for round 2
208
Table 5.5: Round 1 results
STOPPFrail is a list of potentially inappropriate prescribing indicators designed to assist physicians with
stopping such medications in older patients (≥ 65 years) who meet ALL of the criteria listed below:
End-stage irreversible pathology
Poor Prognosis
Severe functional impairment or severe cognitive impairment or both
Symptom control is the priority rather than prevention of disease progression
The decision to prescribe/not prescribe medications to the patient, should also be influenced by the
following issues:
Risk of the medication outweighing the benefit
Administration of the medication is challenging
Monitoring of the medication effect is challenging
Drug adherence/compliance is difficult
Med IQR Outcome
Section A: General
A1. Any drug that the patient persistently fails to comply with for any reason
4.0
3.5-5
Inconclusive
A2. Any drug without clear clinical indication 5.0 5.0-5.0
Accepted
Section B: Cardiology System
B1. Lipid lowering therapies (statins, ezetimibe, bile acid sequestrans, fibrates, nicotinic acid and acipimox) These medications need to be prescribed for a long duration to be of benefit. For short-term use, the risk of adverse drug events outweighs the potential benefits
5.0 4.0-5.0 Accepted
B2. Alpha-blockers for hypertension Stringent blood pressure control is not required in very frail older people. Alpha blockers in particular can cause marked vasodilatation, which can result in marked postural hypotension, falls and injuries
5.0
4.0-5.0 Accepted
Section C: Coagulation System
C1. Anticoagulants (warfarin/novel oral anticoagulants) Anticoagulation as a preventative measure (e.g. with atrial fibrillation) as distinct from treatment of acute venous thromboembolic (VTE) disease
3.0 2.0-4.0 Rejected
C2. Anti-platelet agents No role for anti-platelet agents in primary cardiovascular prevention, only beneficial for secondary cardiovascular prevention, therefore discontinue unless there is a previous history of ischaemic heart disease, cerebrovascular disease or arterial stent insertion
4.0 3.0-5.0 Inconclusive
Section D: Central Nervous System
D1. Memantine Discontinue unless it has been prescribed for behavioural and psychological symptoms of dementia (BPSD) in patients with Alzheimer’s disease and has been shown to improve symptoms
4.0 2.25-5.0 Inconclusive
209
D2. Acetylcholinesterase inhibitors There is no significant clinical benefit from continuation of these drugs in those with advanced Alzheimer’s disease (Mini-Mental State Examination score <10/30 and functionally dependent). No role in other dementia syndromes in the advanced stages.
4.0
3.25-5.0
Inconclusive
D3. Anti-depressants There is no proven role for anti-depressants in advanced dementia (MMSE <10/30 and functionally dependent)
3.0
2.0-4.0
Rejected
D4. Neuroleptic antipsychotics Aim to reduce dose and discontinue these drugs in patients taking them for longer than 12 weeks if there are no current clinical features of behavioural and psychiatric symptoms of dementia (BPSD)
5.0
4.0-5.0
Accepted
Section E: Gastrointestinal System
E1. Proton Pump Inhibitors Proton Pump Inhibitors at full therapeutic dose ≥ 8/52, unless persistent dyspeptic symptoms at lower maintenance dose.
4.0
4.0-5.0
Accepted
E2. H2 Receptor Antagonists H2 Receptor Antagonists at full therapeutic dose for ≥ 8/52, unless persistent dyspeptic symptoms or symptoms reoccur after discontinuation
4.0 3.5-5.0 Inconclusive
E3. Gastrointestinal antispasmodics Regular daily prescription of gastrointestinal antispasmodics agents unless the patient has frequent relapse of colic symptoms because of high risk of anti-cholinergic side effects
4.0 4.0-5.0 Accepted
Section F: Respiratory System
F1. Theophylline This drug has a narrow therapeutic index, requires monitoring of serum levels and interacts with other commonly prescribed drugs putting patients at an increased risk of adverse drug events (ADEs)
5.0 4.0-5.0 Accepted
F2. Leukotriene antagonists (Montelukast, Zafirlukast) These drugs have no proven role in COPD, they are indicated only in asthma.
5.0 4.0-5.0 Accepted
Section G: Musculoskeletal System
G1. Calcium and vitamin D supplementation Unlikely to be of any benefit in the short term
4.0 3.0-5.0 Inconclusive
G2. Anti-resorptive/bone anabolic drugs for osteoporosis (bisphosphonates, strontium, teriparatide, denosumab) Benefits unlikely to be achieved within 1 year, increased short-intermediate term risk of associated adverse drug events
4.0 3.0-5.0 Inconclusive
G3. Selective Estrogen Receptor Modulators (SERMs) for osteoporosis Benefits unlikely to be achieved within 1 year, increased short-intermediate term risk of associated ADEs particularly venous thromboembolism and stroke.
5.0 4.0-5.0 Accepted
G4. Long-term oral NSAIDs Increased risk of side effects (peptic ulcer disease, bleeding, worsening heart failure etc.) when taken regularly for ≥ 2 months
5.0 4.0-5.0 Accepted
210
G5. Long-term oral steroids Increased risk of side effects (peptic ulcer disease etc.) when taken regularly for ≥ 2 months. Consider careful dose reduction and discontinuation
5.0 4.0-5.0 Accepted
Section H: Urogenital System
H1. 5-alpha reductase inhibitors No benefit with long term urinary bladder catheterisation
5.0
4.0-5.0
Accepted
H2. Alpha blockers with urinary catheter No benefit with long term urinary bladder catheterisation
5.0 4.0-5.0 Accepted
H3. Muscarinic antagonists No benefit with long term urinary bladder catheterisation, unless clear history of painful detrusor hyperactivity
5.0 4.0-5.0 Accepted
Section I: Endocrine System
I1. Diabetic oral agents Aim for monotherapy. Target of HbA1c <8%/64mmol/mol. Stringent glycaemic control is unnecessary
4.0 4.0-4.5 Accepted
I2. ACE-Inhibitors for diabetes Stop where prescribed only for prevention and treatment of diabetic nephropathy. There is no clear benefit in older people with advanced frailty with poor survival prognosis
4.0 4.0-5.0 Accepted
I3. Angiotensin Receptor Blockers (ARBs) Stop where prescribed only for prevention and treatment of diabetic nephropathy. There is no clear benefit in older people with advanced frailty with poor survival prognosis
4.0 4.0-5.0 Accepted
I4. Systemic oestrogens for menopausal symptoms Increases risk of stroke and VTE disease. Discontinue and only consider recommencing if recurrence of symptoms
4.0 4.0-5.0 Accepted
Section J: Miscellaneous
J1. Multi-vitamin combination supplements Discontinue when prescribed for prophylaxis rather than treatment
5.0 4.0-5.0
Accepted
J2. Nutritional supplements (other than vitamins) Discontinue when prescribed for prophylaxis rather than treatment
5.0
4.0-5.0
Accepted
J3. Prophylactic antibiotics No firm evidence for a role for prophylactic antibiotics for recurrent cellulitis or recurrent UTI
4.0 3.0-5.0 Inconclusive
*Legend: Med = median; IQR = inter-quartile range; ADE=adverse drug event
211
5.3.1.1 Criteria accepted for inclusion after round 1
In round 1, twenty criteria were accepted (Table 5.5). The first proposed criterion
included in STOPPFrail was a general statement that any drug prescribed without a
clinical indication should be discontinued. The remaining 19 criteria accepted
included deprescribing of lipid-lowering agents, alpha-blockers for hypertension,
neuroleptics, proton pump inhibitors, theophylline, leukotriene receptor
antagonists, selective oestrogen receptor modulators, non-steroidal anti-
inflammatories, steroids, 5-alpha reductase inhibitors and alpha-blockers in
catheterised patients, muscarinic antagonists, diabetic oral agents, Ace-inhibitors,
angiotensin receptor antagonists, multivitamins and nutritional supplements.
5.3.1.2 Criteria rejected for inclusion after round 1
Two criteria were rejected in round 1 (Table 5.5). See Table 5.6 for the comments
received by panellists.
(i) Anticoagulants as a preventative measure.
Our research group proposed discontinuation of anticoagulation because bleeding
risk and cost of treatment outweighed the potential benefits to patients in whom
cognition and activities of daily living function were poor. Panellists agreed that in
the majority of people meeting the inclusion criteria for STOPPFrail, anticoagulants
should be stopped. However, this criterion was rejected due to the panel’s concern
over the minority of patients in whom stopping anticoagulants could be potentially
212
inappropriate. Specifically, the majority of panel members considered that,
regardless of frailty and life expectancy, stroke or systemic embolism was an
unfavourable outcome in patients with atrial fibrillation deprived of anticoagulant
therapy. The panellists and authors agreed that individual clinical judgement should
be applied based on individual clinician and patient preferences and individual
priorities with regard to anti-coagulation therapy. In recent years, anticoagulation
has become easier, safer and more efficient due to the development of direct oral
anticoagulants i.e. apixaban, rivaroxaban, edoxaban and dabigatran. Therefore
panellists felt that in patients receiving anti-coagulants with a good indication and
incurring minimal or no side-effects, continuation was reasonable.
(ii) Use of anti-depressants in patients with advanced dementia
Reasons for rejection of this proposed criterion included possible benefits outside of
anti-depressant effects, such as analgesic effects, appetite stimulation and anxiolytic
properties. Panellist feedback suggested that cessation of antidepressants in patients
with severe dementia was a generally reasonable approach, but not in all such
patients with limited life expectancy as a general rule. Panellists feared that
antidepressant therapy could be stopped in patients who derived benefit from
treatment that was not measureable because of the communication problems
associated with severe dementia and that overall, the risk of relapse of symptoms
outweighed the potential benefit of discontinuation.
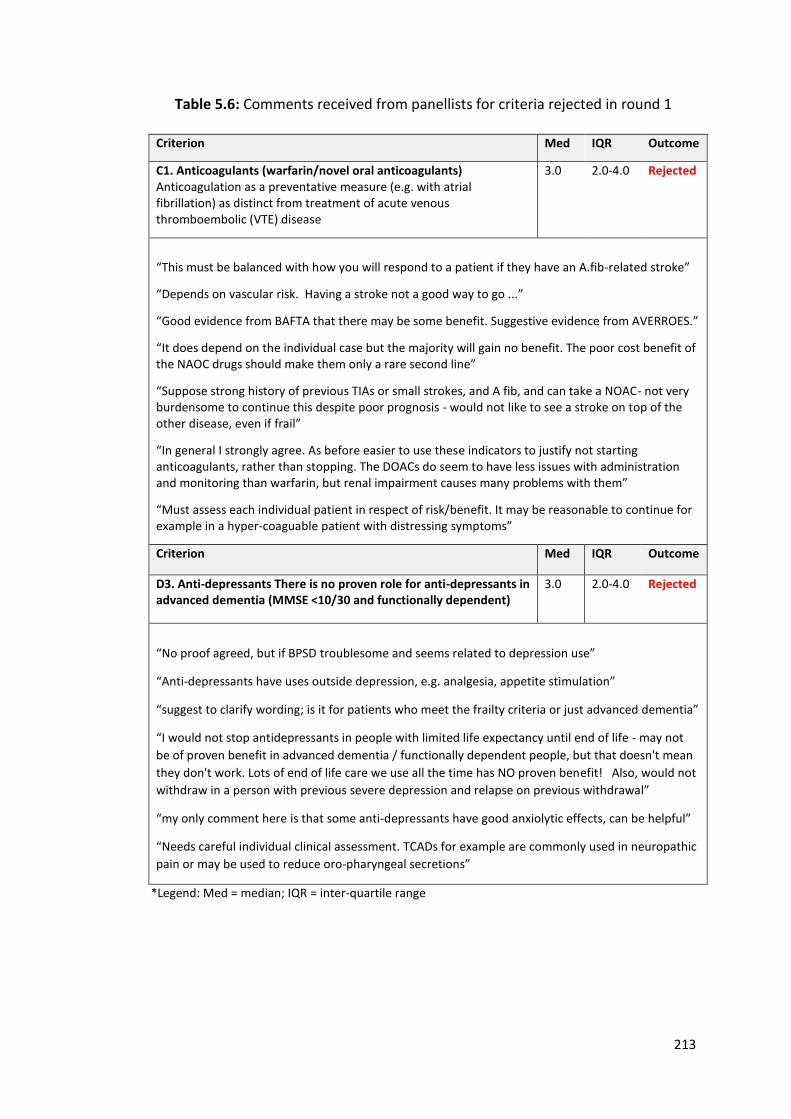
213
Table 5.6: Comments received from panellists for criteria rejected in round 1
Criterion Med IQR Outcome
C1. Anticoagulants (warfarin/novel oral anticoagulants) Anticoagulation as a preventative measure (e.g. with atrial fibrillation) as distinct from treatment of acute venous thromboembolic (VTE) disease
3.0 2.0-4.0 Rejected
“This must be balanced with how you will respond to a patient if they have an A.fib-related stroke”
“Depends on vascular risk. Having a stroke not a good way to go ...”
“Good evidence from BAFTA that there may be some benefit. Suggestive evidence from AVERROES.”
“It does depend on the individual case but the majority will gain no benefit. The poor cost benefit of the NAOC drugs should make them only a rare second line”
“Suppose strong history of previous TIAs or small strokes, and A fib, and can take a NOAC- not very burdensome to continue this despite poor prognosis - would not like to see a stroke on top of the other disease, even if frail”
“In general I strongly agree. As before easier to use these indicators to justify not starting anticoagulants, rather than stopping. The DOACs do seem to have less issues with administration and monitoring than warfarin, but renal impairment causes many problems with them”
“Must assess each individual patient in respect of risk/benefit. It may be reasonable to continue for example in a hyper-coaguable patient with distressing symptoms”
Criterion Med IQR Outcome
D3. Anti-depressants There is no proven role for anti-depressants in advanced dementia (MMSE <10/30 and functionally dependent)
3.0
2.0-4.0
Rejected
“No proof agreed, but if BPSD troublesome and seems related to depression use”
“Anti-depressants have uses outside depression, e.g. analgesia, appetite stimulation”
“suggest to clarify wording; is it for patients who meet the frailty criteria or just advanced dementia”
“I would not stop antidepressants in people with limited life expectancy until end of life - may not
be of proven benefit in advanced dementia / functionally dependent people, but that doesn't mean
they don't work. Lots of end of life care we use all the time has NO proven benefit! Also, would not
withdraw in a person with previous severe depression and relapse on previous withdrawal”
“my only comment here is that some anti-depressants have good anxiolytic effects, can be helpful”
“Needs careful individual clinical assessment. TCADs for example are commonly used in neuropathic
pain or may be used to reduce oro-pharyngeal secretions”
*Legend: Med = median; IQR = inter-quartile range
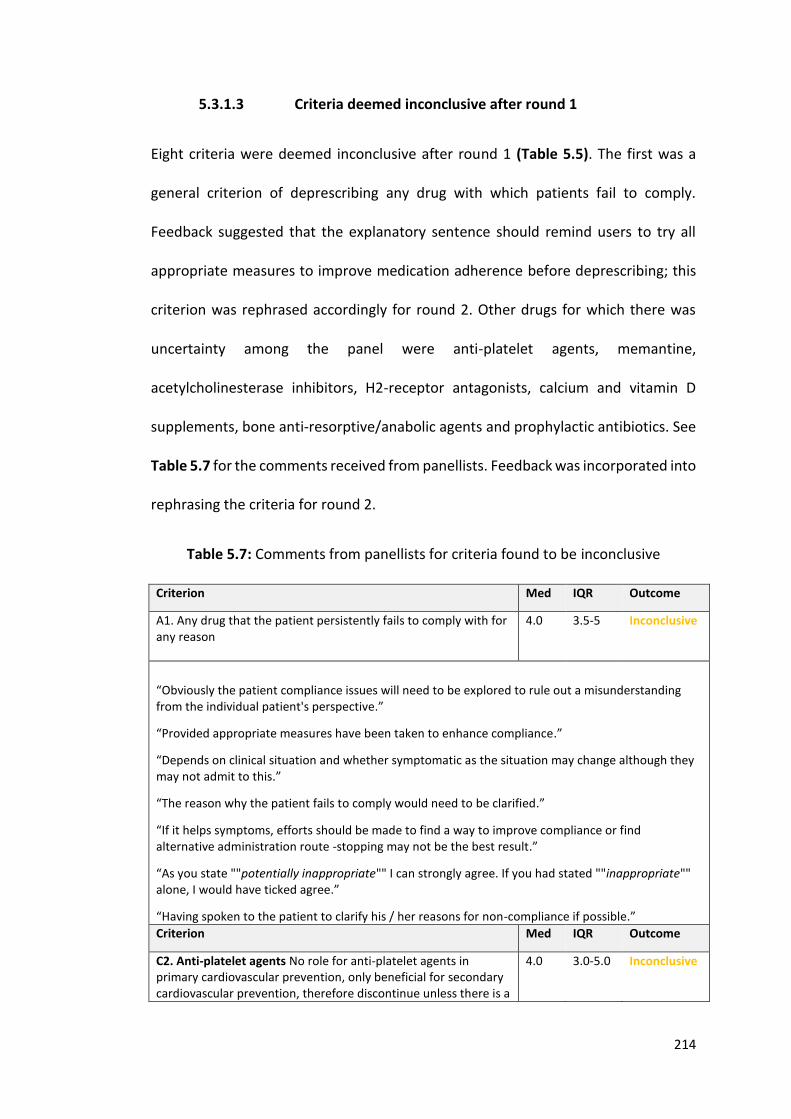
214
5.3.1.3 Criteria deemed inconclusive after round 1
Eight criteria were deemed inconclusive after round 1 (Table 5.5). The first was a
general criterion of deprescribing any drug with which patients fail to comply.
Feedback suggested that the explanatory sentence should remind users to try all
appropriate measures to improve medication adherence before deprescribing; this
criterion was rephrased accordingly for round 2. Other drugs for which there was
uncertainty among the panel were anti-platelet agents, memantine,
acetylcholinesterase inhibitors, H2-receptor antagonists, calcium and vitamin D
supplements, bone anti-resorptive/anabolic agents and prophylactic antibiotics. See
Table 5.7 for the comments received from panellists. Feedback was incorporated into
rephrasing the criteria for round 2.
Table 5.7: Comments from panellists for criteria found to be inconclusive
Criterion Med IQR Outcome
A1. Any drug that the patient persistently fails to comply with for any reason
4.0 3.5-5 Inconclusive
“Obviously the patient compliance issues will need to be explored to rule out a misunderstanding from the individual patient's perspective.”
“Provided appropriate measures have been taken to enhance compliance.”
“Depends on clinical situation and whether symptomatic as the situation may change although they may not admit to this.”
“The reason why the patient fails to comply would need to be clarified.”
“If it helps symptoms, efforts should be made to find a way to improve compliance or find alternative administration route -stopping may not be the best result.”
“As you state ""potentially inappropriate"" I can strongly agree. If you had stated ""inappropriate"" alone, I would have ticked agree.”
“Having spoken to the patient to clarify his / her reasons for non-compliance if possible.”
Criterion Med IQR Outcome
C2. Anti-platelet agents No role for anti-platelet agents in primary cardiovascular prevention, only beneficial for secondary cardiovascular prevention, therefore discontinue unless there is a
4.0 3.0-5.0 Inconclusive
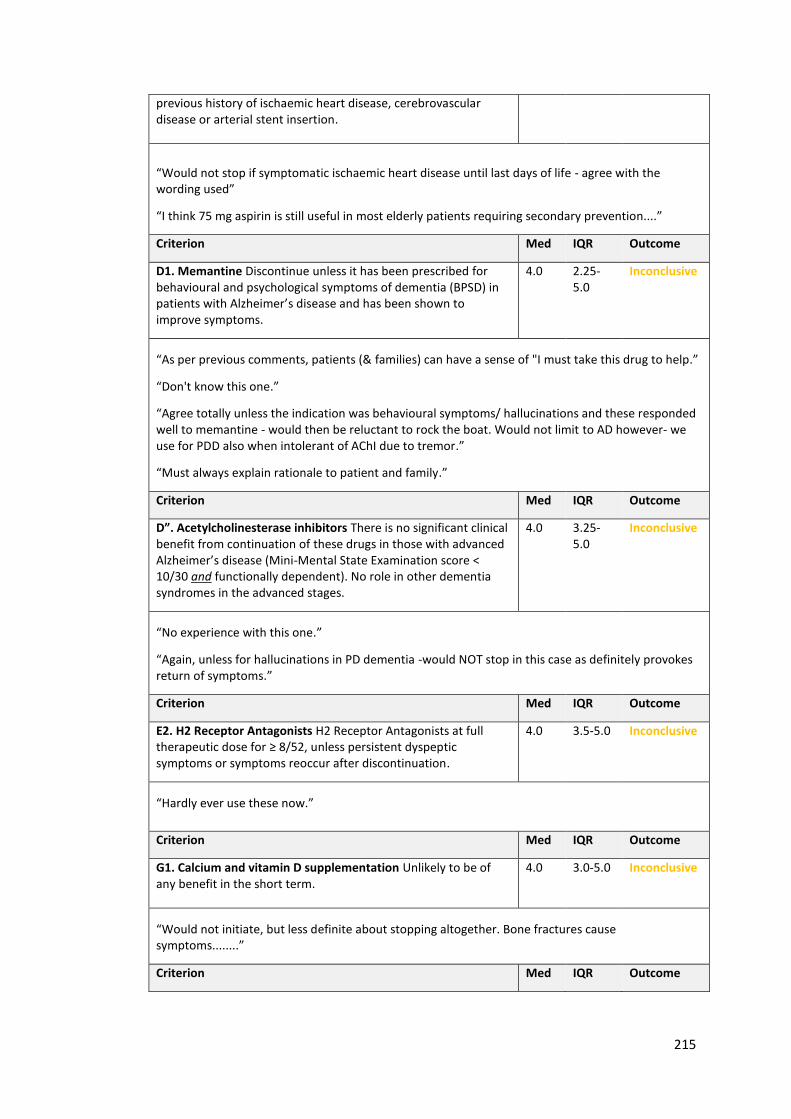
215
previous history of ischaemic heart disease, cerebrovascular disease or arterial stent insertion.
“Would not stop if symptomatic ischaemic heart disease until last days of life - agree with the wording used”
“I think 75 mg aspirin is still useful in most elderly patients requiring secondary prevention....”
Criterion Med IQR Outcome
D1. Memantine Discontinue unless it has been prescribed for behavioural and psychological symptoms of dementia (BPSD) in patients with Alzheimer’s disease and has been shown to improve symptoms.
4.0 2.25-5.0
Inconclusive
“As per previous comments, patients (& families) can have a sense of "I must take this drug to help.”
“Don't know this one.”
“Agree totally unless the indication was behavioural symptoms/ hallucinations and these responded well to memantine - would then be reluctant to rock the boat. Would not limit to AD however- we use for PDD also when intolerant of AChI due to tremor.”
“Must always explain rationale to patient and family.”
Criterion Med IQR Outcome
D”. Acetylcholinesterase inhibitors There is no significant clinical benefit from continuation of these drugs in those with advanced Alzheimer’s disease (Mini-Mental State Examination score < 10/30 and functionally dependent). No role in other dementia syndromes in the advanced stages.
4.0 3.25-5.0
Inconclusive
“No experience with this one.”
“Again, unless for hallucinations in PD dementia -would NOT stop in this case as definitely provokes return of symptoms.”
Criterion Med IQR Outcome
E2. H2 Receptor Antagonists H2 Receptor Antagonists at full therapeutic dose for ≥ 8/52, unless persistent dyspeptic symptoms or symptoms reoccur after discontinuation.
4.0 3.5-5.0 Inconclusive
“Hardly ever use these now.”
Criterion Med IQR Outcome
G1. Calcium and vitamin D supplementation Unlikely to be of any benefit in the short term.
4.0 3.0-5.0 Inconclusive
“Would not initiate, but less definite about stopping altogether. Bone fractures cause symptoms........”
Criterion Med IQR Outcome
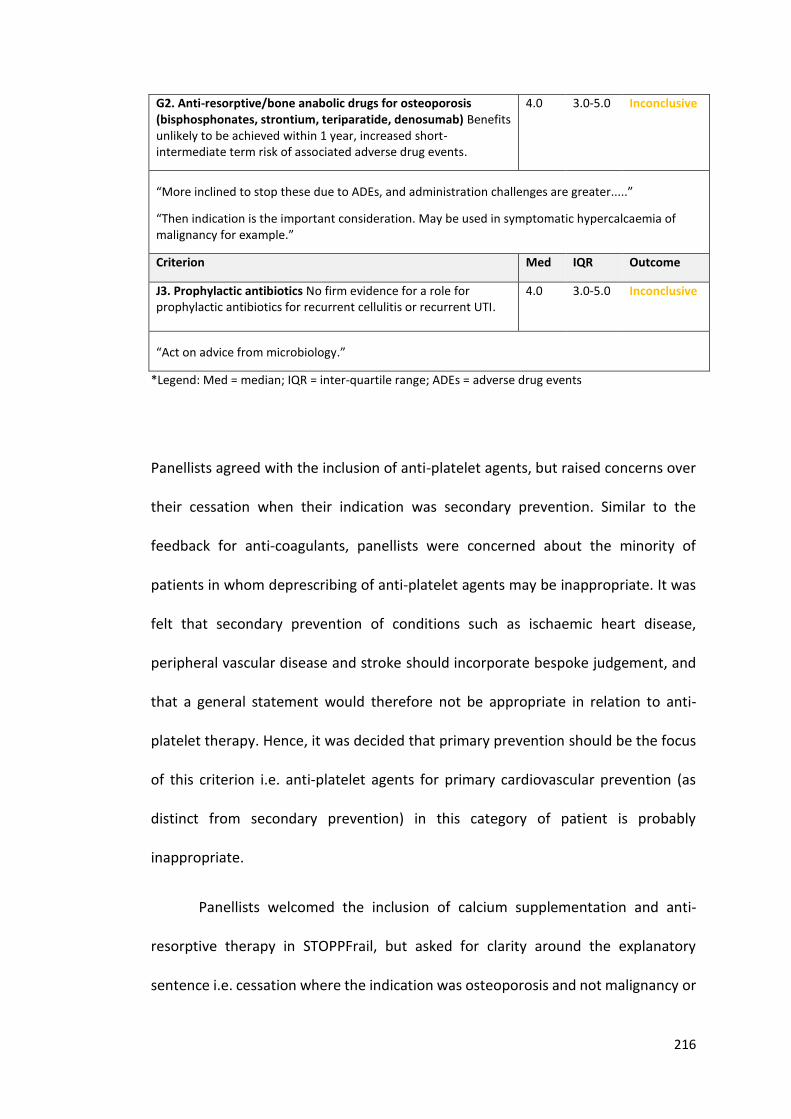
216
G2. Anti-resorptive/bone anabolic drugs for osteoporosis (bisphosphonates, strontium, teriparatide, denosumab) Benefits unlikely to be achieved within 1 year, increased short-intermediate term risk of associated adverse drug events.
4.0 3.0-5.0 Inconclusive
“More inclined to stop these due to ADEs, and administration challenges are greater.....”
“Then indication is the important consideration. May be used in symptomatic hypercalcaemia of malignancy for example.”
Criterion Med IQR Outcome
J3. Prophylactic antibiotics No firm evidence for a role for prophylactic antibiotics for recurrent cellulitis or recurrent UTI.
4.0 3.0-5.0 Inconclusive
“Act on advice from microbiology.”
*Legend: Med = median; IQR = inter-quartile range; ADEs = adverse drug events
Panellists agreed with the inclusion of anti-platelet agents, but raised concerns over
their cessation when their indication was secondary prevention. Similar to the
feedback for anti-coagulants, panellists were concerned about the minority of
patients in whom deprescribing of anti-platelet agents may be inappropriate. It was
felt that secondary prevention of conditions such as ischaemic heart disease,
peripheral vascular disease and stroke should incorporate bespoke judgement, and
that a general statement would therefore not be appropriate in relation to anti-
platelet therapy. Hence, it was decided that primary prevention should be the focus
of this criterion i.e. anti-platelet agents for primary cardiovascular prevention (as
distinct from secondary prevention) in this category of patient is probably
inappropriate.
Panellists welcomed the inclusion of calcium supplementation and anti-
resorptive therapy in STOPPFrail, but asked for clarity around the explanatory
sentence i.e. cessation where the indication was osteoporosis and not malignancy or
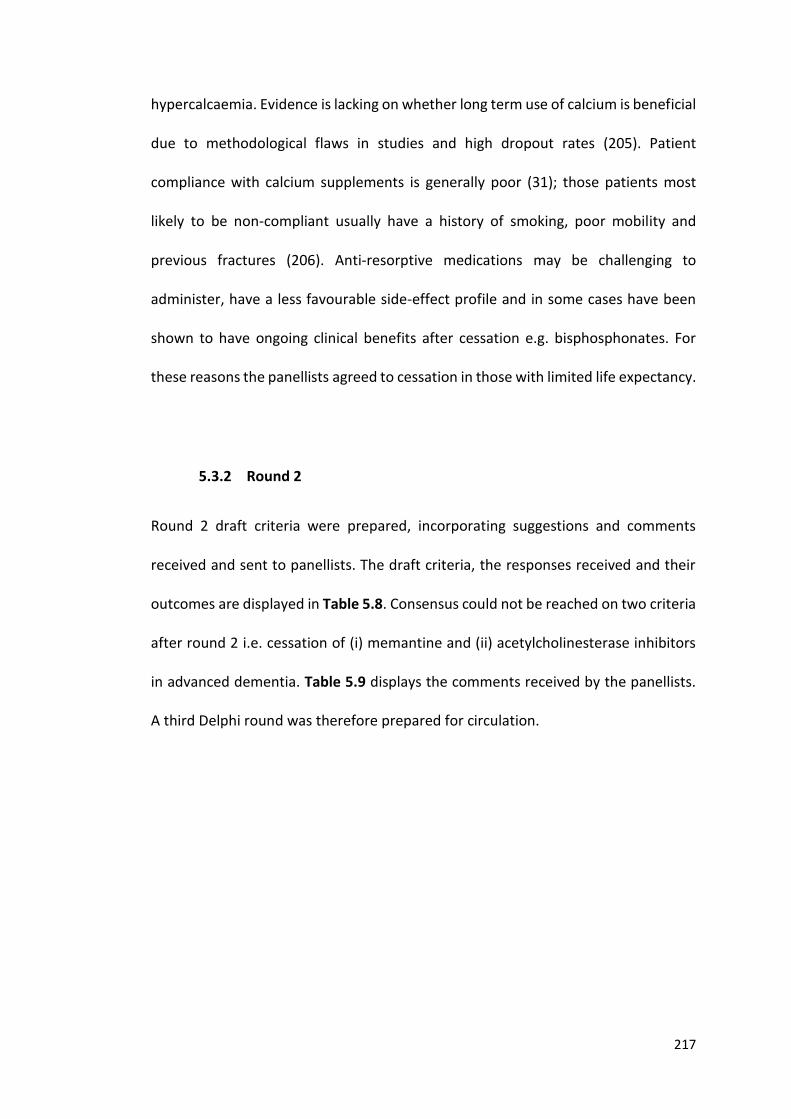
217
hypercalcaemia. Evidence is lacking on whether long term use of calcium is beneficial
due to methodological flaws in studies and high dropout rates (205). Patient
compliance with calcium supplements is generally poor (31); those patients most
likely to be non-compliant usually have a history of smoking, poor mobility and
previous fractures (206). Anti-resorptive medications may be challenging to
administer, have a less favourable side-effect profile and in some cases have been
shown to have ongoing clinical benefits after cessation e.g. bisphosphonates. For
these reasons the panellists agreed to cessation in those with limited life expectancy.
5.3.2 Round 2
Round 2 draft criteria were prepared, incorporating suggestions and comments
received and sent to panellists. The draft criteria, the responses received and their
outcomes are displayed in Table 5.8. Consensus could not be reached on two criteria
after round 2 i.e. cessation of (i) memantine and (ii) acetylcholinesterase inhibitors
in advanced dementia. Table 5.9 displays the comments received by the panellists.
A third Delphi round was therefore prepared for circulation.
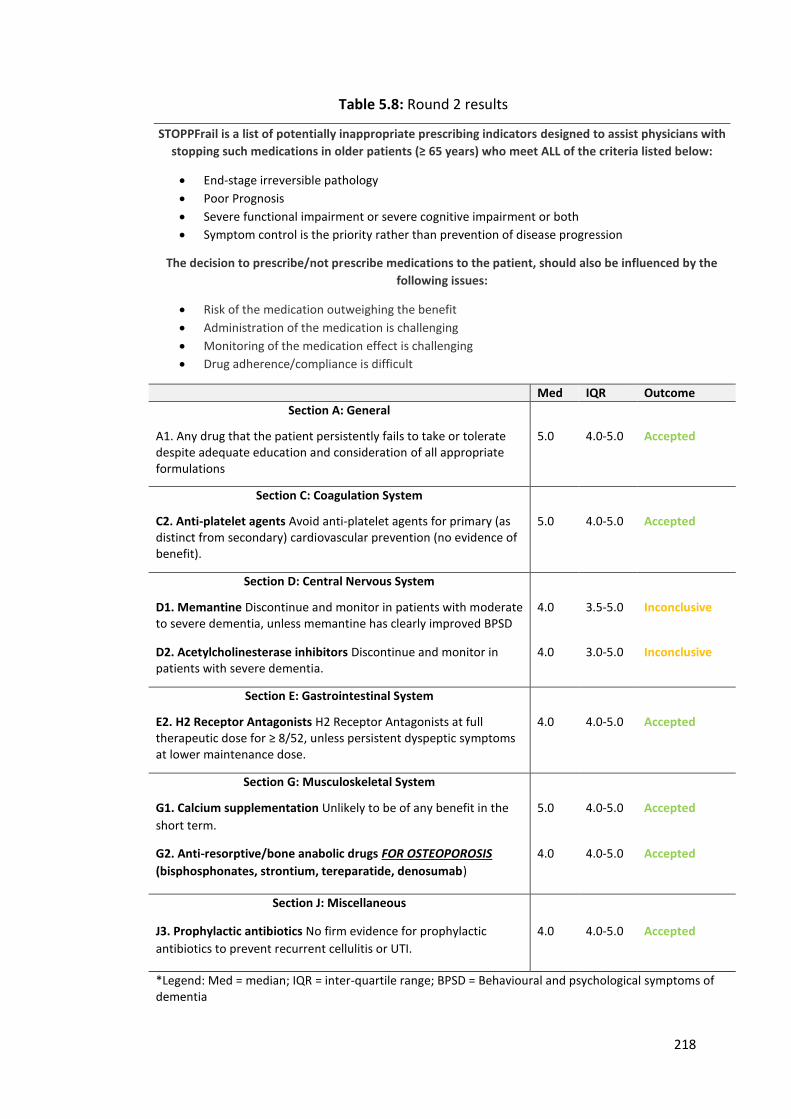
218
Table 5.8: Round 2 results
STOPPFrail is a list of potentially inappropriate prescribing indicators designed to assist physicians with
stopping such medications in older patients (≥ 65 years) who meet ALL of the criteria listed below:
End-stage irreversible pathology
Poor Prognosis
Severe functional impairment or severe cognitive impairment or both
Symptom control is the priority rather than prevention of disease progression
The decision to prescribe/not prescribe medications to the patient, should also be influenced by the
following issues:
Risk of the medication outweighing the benefit
Administration of the medication is challenging
Monitoring of the medication effect is challenging
Drug adherence/compliance is difficult
Med IQR Outcome
Section A: General
A1. Any drug that the patient persistently fails to take or tolerate despite adequate education and consideration of all appropriate formulations
5.0 4.0-5.0 Accepted
Section C: Coagulation System
C2. Anti-platelet agents Avoid anti-platelet agents for primary (as distinct from secondary) cardiovascular prevention (no evidence of benefit).
5.0 4.0-5.0 Accepted
Section D: Central Nervous System
D1. Memantine Discontinue and monitor in patients with moderate to severe dementia, unless memantine has clearly improved BPSD
4.0 3.5-5.0 Inconclusive
D2. Acetylcholinesterase inhibitors Discontinue and monitor in patients with severe dementia.
4.0 3.0-5.0 Inconclusive
Section E: Gastrointestinal System
E2. H2 Receptor Antagonists H2 Receptor Antagonists at full therapeutic dose for ≥ 8/52, unless persistent dyspeptic symptoms at lower maintenance dose.
4.0 4.0-5.0 Accepted
Section G: Musculoskeletal System
G1. Calcium supplementation Unlikely to be of any benefit in the
short term.
5.0 4.0-5.0 Accepted
G2. Anti-resorptive/bone anabolic drugs FOR OSTEOPOROSIS
(bisphosphonates, strontium, tereparatide, denosumab)
4.0 4.0-5.0 Accepted
Section J: Miscellaneous
J3. Prophylactic antibiotics No firm evidence for prophylactic
antibiotics to prevent recurrent cellulitis or UTI.
4.0 4.0-5.0 Accepted
*Legend: Med = median; IQR = inter-quartile range; BPSD = Behavioural and psychological symptoms of dementia
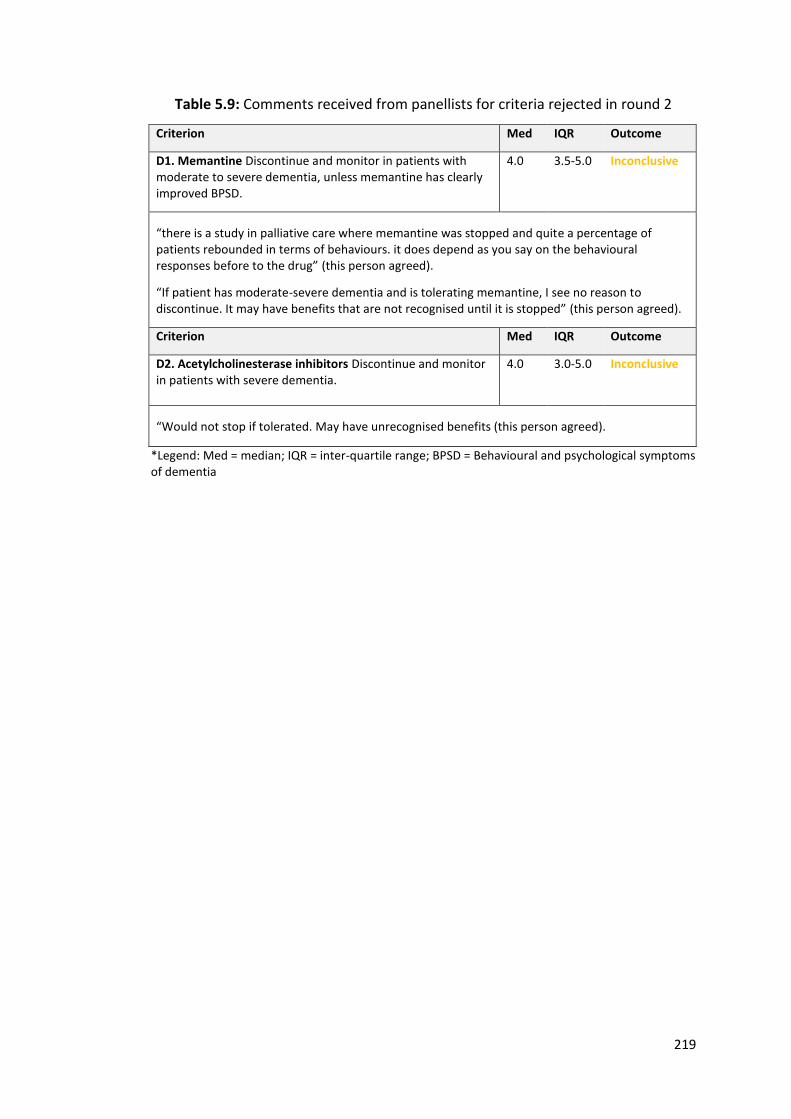
219
Table 5.9: Comments received from panellists for criteria rejected in round 2
Criterion Med IQR Outcome
D1. Memantine Discontinue and monitor in patients with moderate to severe dementia, unless memantine has clearly improved BPSD.
4.0 3.5-5.0 Inconclusive
“there is a study in palliative care where memantine was stopped and quite a percentage of patients rebounded in terms of behaviours. it does depend as you say on the behavioural responses before to the drug” (this person agreed).
“If patient has moderate-severe dementia and is tolerating memantine, I see no reason to discontinue. It may have benefits that are not recognised until it is stopped” (this person agreed).
Criterion Med IQR Outcome
D2. Acetylcholinesterase inhibitors Discontinue and monitor in patients with severe dementia.
4.0 3.0-5.0 Inconclusive
“Would not stop if tolerated. May have unrecognised benefits (this person agreed).
*Legend: Med = median; IQR = inter-quartile range; BPSD = Behavioural and psychological symptoms of dementia
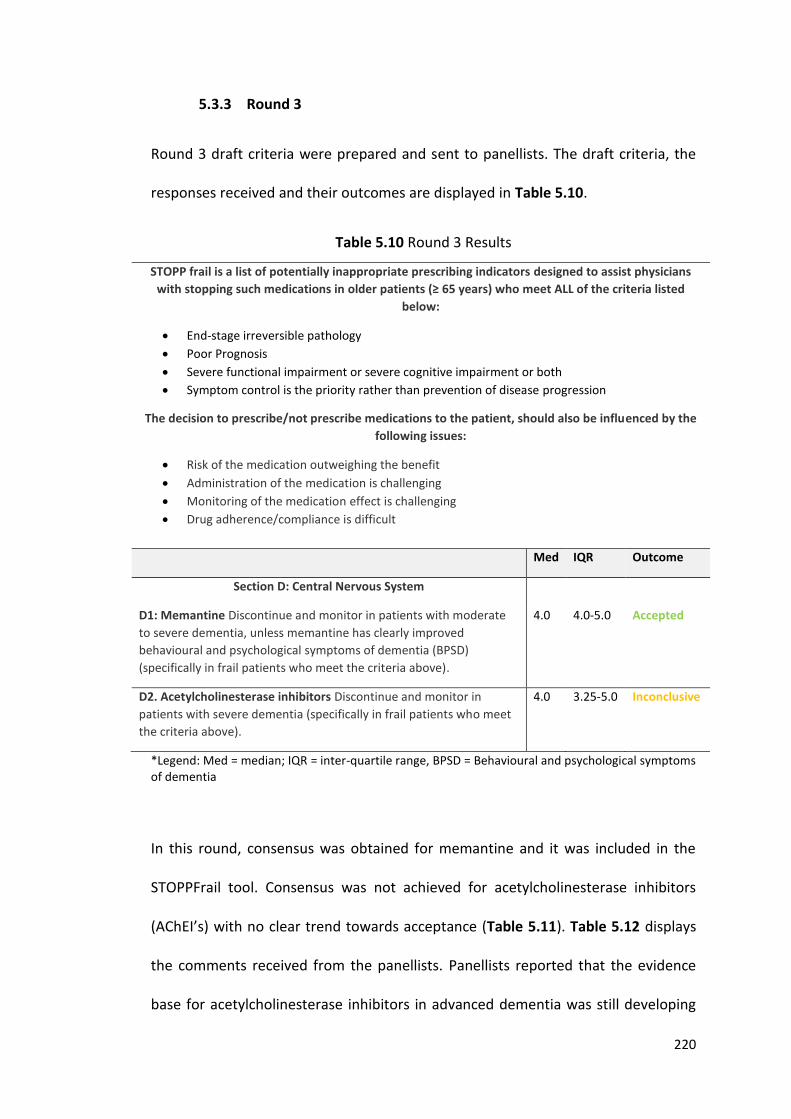
220
5.3.3 Round 3
Round 3 draft criteria were prepared and sent to panellists. The draft criteria, the
responses received and their outcomes are displayed in Table 5.10.
Table 5.10 Round 3 Results
STOPP frail is a list of potentially inappropriate prescribing indicators designed to assist physicians
with stopping such medications in older patients (≥ 65 years) who meet ALL of the criteria listed
below:
End-stage irreversible pathology
Poor Prognosis
Severe functional impairment or severe cognitive impairment or both
Symptom control is the priority rather than prevention of disease progression
The decision to prescribe/not prescribe medications to the patient, should also be influenced by the
following issues:
Risk of the medication outweighing the benefit
Administration of the medication is challenging
Monitoring of the medication effect is challenging
Drug adherence/compliance is difficult
Med IQR Outcome
Section D: Central Nervous System
D1: Memantine Discontinue and monitor in patients with moderate
to severe dementia, unless memantine has clearly improved
behavioural and psychological symptoms of dementia (BPSD)
(specifically in frail patients who meet the criteria above).
4.0 4.0-5.0 Accepted
D2. Acetylcholinesterase inhibitors Discontinue and monitor in
patients with severe dementia (specifically in frail patients who meet
the criteria above).
4.0 3.25-5.0 Inconclusive
*Legend: Med = median; IQR = inter-quartile range, BPSD = Behavioural and psychological symptoms of dementia
In this round, consensus was obtained for memantine and it was included in the
STOPPFrail tool. Consensus was not achieved for acetylcholinesterase inhibitors
(AChEI’s) with no clear trend towards acceptance (Table 5.11). Table 5.12 displays
the comments received from the panellists. Panellists reported that the evidence
base for acetylcholinesterase inhibitors in advanced dementia was still developing
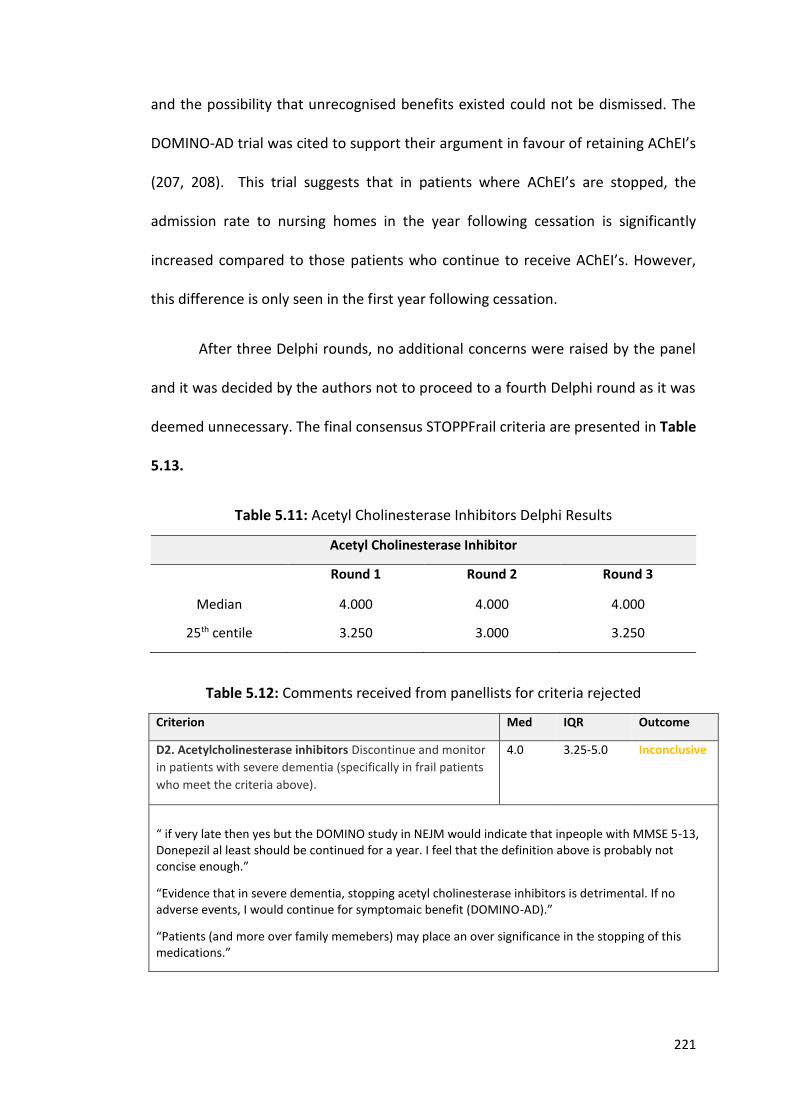
221
and the possibility that unrecognised benefits existed could not be dismissed. The
DOMINO-AD trial was cited to support their argument in favour of retaining AChEI’s
(207, 208). This trial suggests that in patients where AChEI’s are stopped, the
admission rate to nursing homes in the year following cessation is significantly
increased compared to those patients who continue to receive AChEI’s. However,
this difference is only seen in the first year following cessation.
After three Delphi rounds, no additional concerns were raised by the panel
and it was decided by the authors not to proceed to a fourth Delphi round as it was
deemed unnecessary. The final consensus STOPPFrail criteria are presented in Table
5.13.
Table 5.11: Acetyl Cholinesterase Inhibitors Delphi Results
Acetyl Cholinesterase Inhibitor
Round 1 Round 2 Round 3
Median 4.000 4.000 4.000
25th centile 3.250 3.000 3.250
Table 5.12: Comments received from panellists for criteria rejected
Criterion Med IQR Outcome
D2. Acetylcholinesterase inhibitors Discontinue and monitor
in patients with severe dementia (specifically in frail patients
who meet the criteria above).
4.0 3.25-5.0 Inconclusive
“ if very late then yes but the DOMINO study in NEJM would indicate that inpeople with MMSE 5-13, Donepezil al least should be continued for a year. I feel that the definition above is probably not concise enough.”
“Evidence that in severe dementia, stopping acetyl cholinesterase inhibitors is detrimental. If no adverse events, I would continue for symptomaic benefit (DOMINO-AD).”
“Patients (and more over family memebers) may place an over significance in the stopping of this medications.”
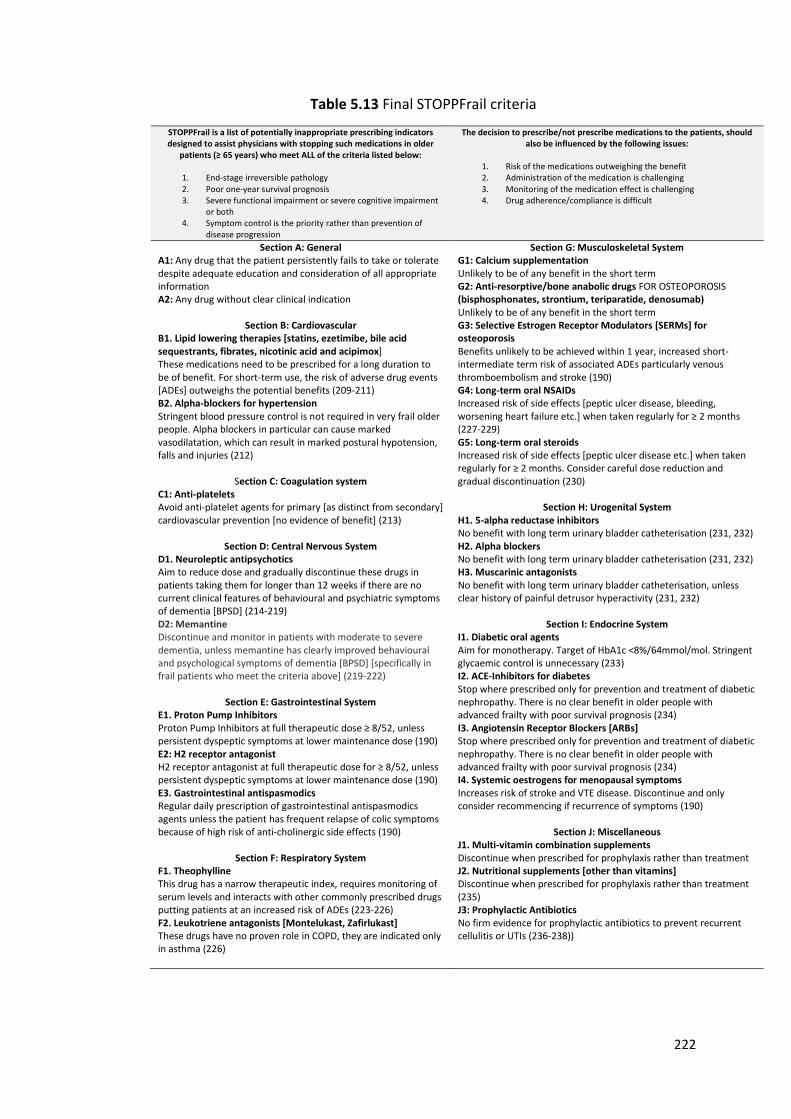
222
Table 5.13 Final STOPPFrail criteria
STOPPFrail is a list of potentially inappropriate prescribing indicators designed to assist physicians with stopping such medications in older
patients (≥ 65 years) who meet ALL of the criteria listed below:
1. End-stage irreversible pathology 2. Poor one-year survival prognosis 3. Severe functional impairment or severe cognitive impairment
or both 4. Symptom control is the priority rather than prevention of
disease progression
The decision to prescribe/not prescribe medications to the patients, should also be influenced by the following issues:
1. Risk of the medications outweighing the benefit 2. Administration of the medication is challenging 3. Monitoring of the medication effect is challenging 4. Drug adherence/compliance is difficult
Section A: General A1: Any drug that the patient persistently fails to take or tolerate despite adequate education and consideration of all appropriate information A2: Any drug without clear clinical indication
Section B: Cardiovascular B1. Lipid lowering therapies [statins, ezetimibe, bile acid sequestrants, fibrates, nicotinic acid and acipimox] These medications need to be prescribed for a long duration to be of benefit. For short-term use, the risk of adverse drug events [ADEs] outweighs the potential benefits (209-211) B2. Alpha-blockers for hypertension Stringent blood pressure control is not required in very frail older people. Alpha blockers in particular can cause marked vasodilatation, which can result in marked postural hypotension, falls and injuries (212)
Section C: Coagulation system C1: Anti-platelets Avoid anti-platelet agents for primary [as distinct from secondary] cardiovascular prevention [no evidence of benefit] (213)
Section D: Central Nervous System D1. Neuroleptic antipsychotics Aim to reduce dose and gradually discontinue these drugs in patients taking them for longer than 12 weeks if there are no current clinical features of behavioural and psychiatric symptoms of dementia [BPSD] (214-219) D2: Memantine Discontinue and monitor in patients with moderate to severe dementia, unless memantine has clearly improved behavioural and psychological symptoms of dementia [BPSD] [specifically in frail patients who meet the criteria above] (219-222)
Section E: Gastrointestinal System E1. Proton Pump Inhibitors Proton Pump Inhibitors at full therapeutic dose ≥ 8/52, unless persistent dyspeptic symptoms at lower maintenance dose (190) E2: H2 receptor antagonist H2 receptor antagonist at full therapeutic dose for ≥ 8/52, unless persistent dyspeptic symptoms at lower maintenance dose (190) E3. Gastrointestinal antispasmodics Regular daily prescription of gastrointestinal antispasmodics agents unless the patient has frequent relapse of colic symptoms because of high risk of anti-cholinergic side effects (190)
Section F: Respiratory System F1. Theophylline This drug has a narrow therapeutic index, requires monitoring of serum levels and interacts with other commonly prescribed drugs putting patients at an increased risk of ADEs (223-226) F2. Leukotriene antagonists [Montelukast, Zafirlukast] These drugs have no proven role in COPD, they are indicated only in asthma (226)
Section G: Musculoskeletal System G1: Calcium supplementation Unlikely to be of any benefit in the short term G2: Anti-resorptive/bone anabolic drugs FOR OSTEOPOROSIS (bisphosphonates, strontium, teriparatide, denosumab) Unlikely to be of any benefit in the short term G3: Selective Estrogen Receptor Modulators [SERMs] for osteoporosis Benefits unlikely to be achieved within 1 year, increased short-intermediate term risk of associated ADEs particularly venous thromboembolism and stroke (190) G4: Long-term oral NSAIDs Increased risk of side effects [peptic ulcer disease, bleeding, worsening heart failure etc.] when taken regularly for ≥ 2 months (227-229) G5: Long-term oral steroids Increased risk of side effects [peptic ulcer disease etc.] when taken regularly for ≥ 2 months. Consider careful dose reduction and gradual discontinuation (230)
Section H: Urogenital System H1. 5-alpha reductase inhibitors No benefit with long term urinary bladder catheterisation (231, 232) H2. Alpha blockers No benefit with long term urinary bladder catheterisation (231, 232) H3. Muscarinic antagonists No benefit with long term urinary bladder catheterisation, unless clear history of painful detrusor hyperactivity (231, 232)
Section I: Endocrine System I1. Diabetic oral agents Aim for monotherapy. Target of HbA1c <8%/64mmol/mol. Stringent glycaemic control is unnecessary (233) I2. ACE-Inhibitors for diabetes Stop where prescribed only for prevention and treatment of diabetic nephropathy. There is no clear benefit in older people with advanced frailty with poor survival prognosis (234) I3. Angiotensin Receptor Blockers [ARBs] Stop where prescribed only for prevention and treatment of diabetic nephropathy. There is no clear benefit in older people with advanced frailty with poor survival prognosis (234) I4. Systemic oestrogens for menopausal symptoms Increases risk of stroke and VTE disease. Discontinue and only consider recommencing if recurrence of symptoms (190)
Section J: Miscellaneous J1. Multi-vitamin combination supplements Discontinue when prescribed for prophylaxis rather than treatment J2. Nutritional supplements [other than vitamins] Discontinue when prescribed for prophylaxis rather than treatment (235) J3: Prophylactic Antibiotics No firm evidence for prophylactic antibiotics to prevent recurrent cellulitis or UTIs (236-238))
223
5.4 DISCUSSION
The final STOPPFrail criteria is an explicit list of 27 PIMs in older frail adults with
limited life expectancy, arranged according to physiological systems. Each criterion
is presented in the same manner i.e. a drug/drug class followed up by an explanatory
sentence to support and guide deprescribing. This list of PIMs was developed and
validated using the Delphi technique. Delphi panellists included a variety of
specialists with expertise in geriatric pharmacotherapy. The first two criteria
recommend deprescribing medications without indication or where compliance is
poor. The remaining 25 criteria include lipid-lowering therapies, alpha-blockers for
hypertension, anti-platelets, neuroleptics, memantine, proton-pump inhibitors, H2-
receptor antagonists, anti-spasmodic agents, theophylline, leukotriene antagonists,
calcium supplements, bone anti-resorptive therapy, selective oestrogen receptor
modulators, non-steroidal anti-inflammatories, corticosteroids, 5-alpha-reductase
inhibitors, alpha-1-selective blockers, muscarinic antagonists, oral diabetic agents,
ACE-inhibitors, angiotensin receptor blockers, systemic oestrogens, multivitamins,
nutritional supplements and prophylactic antibiotics. Consensus could not be
reached on the inclusion of acetylcholinesterase inhibitors. Full consensus was
reached on the exclusion of anticoagulants and antidepressants from the list.
The criteria are not designed to replace clinical judgement, but rather to assist
clinicians with medication reviews and assessment of treatment goals in this specific
patient population. Recognition of those patients in whom STOPPFrail criteria are
applicable may be challenging for less experienced physicians; in these
circumstances, the use of simple mortality predictive tools may be helpful to guide
224
life expectancy e.g. the Walter Index (139) or the Cumulative Illness Rating Scale
adapted for geriatric patients (CIRS-G) (239). However, one anticipates that the
majority of clinicians who use STOPPFrail will be experienced in recognising patients
who are appropriate for deprescribing i.e. general practitioners who regularly attend
nursing home patients and hospital specialists with prognostic knowledge of the
diseases in older patients that they manage on a regular basis. In the interest of
simplicity and user-friendliness, we did not want STOPPFrail criteria to be contingent
on the use of another tool to determine eligibility.
Unnecessary or potentially harmful polypharmacy is a well described problem
in frailer older people with limited life expectancy. This research aims to put a
framework on the guiding principle of deprescribing in late life i.e. that the benefits
of many preventive medications are unlikely to be realised in those with a limited life
expectancy. Although many IP explicit tools exist (71), there is an unmet need for a
concise explicit tool to assist deprescribing in this specific patient population.
STOPPFrail is a concise deprescribing assistive tool, focusing on 27 specific indicators,
suggesting that it will be easy to use, time efficient and therefore more likely to be
implemented in routine clinical practice. Like STOPP/START criteria (36, 37),
STOPPFrail criteria are listed according to physiological systems, thereby allowing
users to structure their approach to deprescribing. We aimed for a concise set of
criteria that can be easily deployed in paper and electronic format.
Developing this tool required discussion of many controversial treatments in
frail, end-stage older patients e.g. hypertension. The Delphi panellists agreed that a
generalised statement about discontinuing all anti-hypertensives would be
225
contentious. Therefore, it was decided to focus on the drug class least likely to be
prescribed as a first line agent and most likely to cause orthostatic hypotension and
falls in an older cohort i.e. alpha-1 receptor blockers.
Appropriate use of STOPPFrail criteria may have pharmacoeconomic benefits.
Older frailer adults with a poor survival prognosis account for a growing proportion
of the population and a disproportionately high level of medication consumption.
Implementation of safe, evidence-based deprescribing in this population, may
improve patients’ quality of life through reduced adverse drug reactions, related
hospitalisations and mortality. Before the true value of STOPPFrail can be used as a
measure of prescribing appropriateness in older frailer patients with poor one year
survival prognosis or tested by means of RCTs, its inter-rater reliability needs to be
evaluated. This is the subject of chapter 6 of this thesis. Following on from this, the
prevalence of PIMs according to STOPPFrail criteria need to be assessed. This is the
subject of chapter 7.
226
CHAPTER 6
Inter-rater reliability of STOPPFrail criteria amongst physicians from three clinical
specialty services
227
6.1 INTRODUCTION
The development and validation of STOPPFrail criteria was described in Chapter 5. In
brief, STOPPFrail criteria were validated using a Delphi consensus methodology to
highlight commonly encountered instances of potentially inappropriate medication
(PIM) use in frail older adults with limited life expectancy. The primary goal of
STOPPFrail is to assist clinicians with the decision to deprescribe medications that are
of limited value or appropriateness in this population (240). However, before the
STOPPFrail tool can be used in clinical practice, its reliability between clinical
practitioners and generalizability between specialist disciplines must be
demonstrated.
6.1.1. Objectives
The objective of this study is to determine the inter-rater reliability (IRR) of
STOPPFrail criteria between physicians practising in different clinical specialties. The
work undertaken in this chapter, including study design, data collection and
statistical analysis, is entirely my own.
6.2 METHODS
6.2.1 Clinical case histories
Twenty detailed clinical case histories were collated by Dr. Paul Gallagher (Consultant
Geriatrician / Senior Lecturer, University College Cork) (PG) and I (AL), modified from
real world anonymised clinical cases. These clinical cases were obtained from a
228
sample of participants enrolled in the prevalence study described in Chapter 3.
Recorded data included the participant’s co-morbid illnesses, concurrent medication
use and cognitive and functional abilities. . The Structured History of Medication use
(SHiM) was employed to accurately capture concurrent medications, including
medication adherence (241). Case details were amended, where necessary, to
ensure, the 20 clinical cases described frail multi-morbid patients with an appreciable
incidence of potentially inappropriate prescriptions (PIPs), according to STOPPFrail
criteria. Each clinical case history was presented in a standardized format and
included the patient’s age, gender, co-morbidities, a detailed medication history,
medication allergies, and cognitive status and activities of daily living (ADL) functional
status.
The participants featured in the 20 clinical cases had a mean (± standard
deviation) age of 79.3 (± 5.68) years, twelve were female. The total number of
prescribed medications was 181, median 9 (IQR 7-11). The median number of
conditions was 7 (IQR 4-8). Eighteen of the twenty clinical cases (90%) were eligible
for the application of STOPPFrail criteria i.e. end stage irreversible pathology, a poor
one year survival prognosis, severe cognitive or functional impairment or both and
symptom management was the priority. The irreversible diagnoses for the 18 cases
meeting STOPPFrail inclusion criteria were severe dementia (n=6), advanced
metastatic cancer (n=4), severe disabling stroke (n=2), stage IV chronic obstructive
pulmonary disease (COPD) (n=2), advanced Parkinson’s disease with associated
dementia (n=1), motor neuron disease (n=1), stage 4 congestive cardiac failure (n=1)
and rheumatoid arthritis with dementia (n=1).
229
6.2.2 Expert Gold Standard Assessment of PIM use according to
STOPPFrail criteria
For each of the 20 clinical cases, two physicians (AL and PG), with expertise in
geriatric pharmacotherapy, first determined if the patient described in the clinical
case was eligible for application of STOPPFrail criteria. STOPPFrail criteria were then
applied to identify potentially inappropriate medications that could be deprescribed.
Complete agreement between the two expert assessors was reached in terms of
prescribing appropriateness according to STOPPFrail criteria. This combined level of
agreement (labelled “rater 1”) was set as the gold standard [GS], against which other
physicians’ ratings were compared.
6.2.3 Physician recruitment
Twelve physicians were invited to participate; 6 geriatricians (3 consultant
geriatricians and 3 specialist registrars in geriatric medicine), 3 general practitioners
(GPs) (2 qualified GPs and 1 specialist trainee in general practice) and 3 palliative care
physicians (Appendix 11). This was a convenience sample with an optimum
proportion of raters to subjects. It was anticipated that raters would agree 80% of
the time with a relative error of 30%, thus a minimum of 17 cases was required for
review (242). Invited participants had no prior knowledge of STOPPFrail criteria and
did not routinely use other IP tools.
230
The study’s objectives were explained to each invited physician. Subsequently, all
physicians agreed to participate. Physicians independently completed the exercise
between January and February 2017. Each physician was supplied, in paper format,
(i) the STOPPFrail criteria (Chapter 5, Table 5.13 page 222) (ii) the 20 clinical cases
(Appendix 12) and (iii) an answer booklet with clear instructions (Appendix 13).
Participants were asked to decide, for each individual clinical case, (i) if the patient
was eligible for application of STOPPFrail criteria (ii) for the cases that were eligible,
to identify PIPs listed in STOPPFrail criteria and (iii) suggest which ones, in theory,
could be deprescribed, but only if they deemed it clinically appropriate to do so.
Participants were asked, after they had familiarised themselves with STOPPFrail
criteria, to measure the time taken to apply STOPPFrail criteria in each case.
For criterion A1 (any drug that the patient persistently fails to take or tolerate
despite adequate education and consideration of all formulations), raters were
instructed to assume that all formulations and delivery mechanisms had been tried
without success, unless stated otherwise. For criterion A2 (drugs with no clear
indication), raters were asked to base this on the known indications of the
medications, as per the summary of product characteristics (SPC) of the medicine,
the British National Formulary (BNF) and/or their clinical judgement.
Physicians were allocated the following rater numbers: consultant
geriatricians [raters 2, 3, 4], specialist registrars in geriatric medicine [raters 5, 6, 7],
general practitioners [raters 8, 9], specialist trainee in general practice [rater 10] and
palliative care physicians [raters 11, 12, 13].
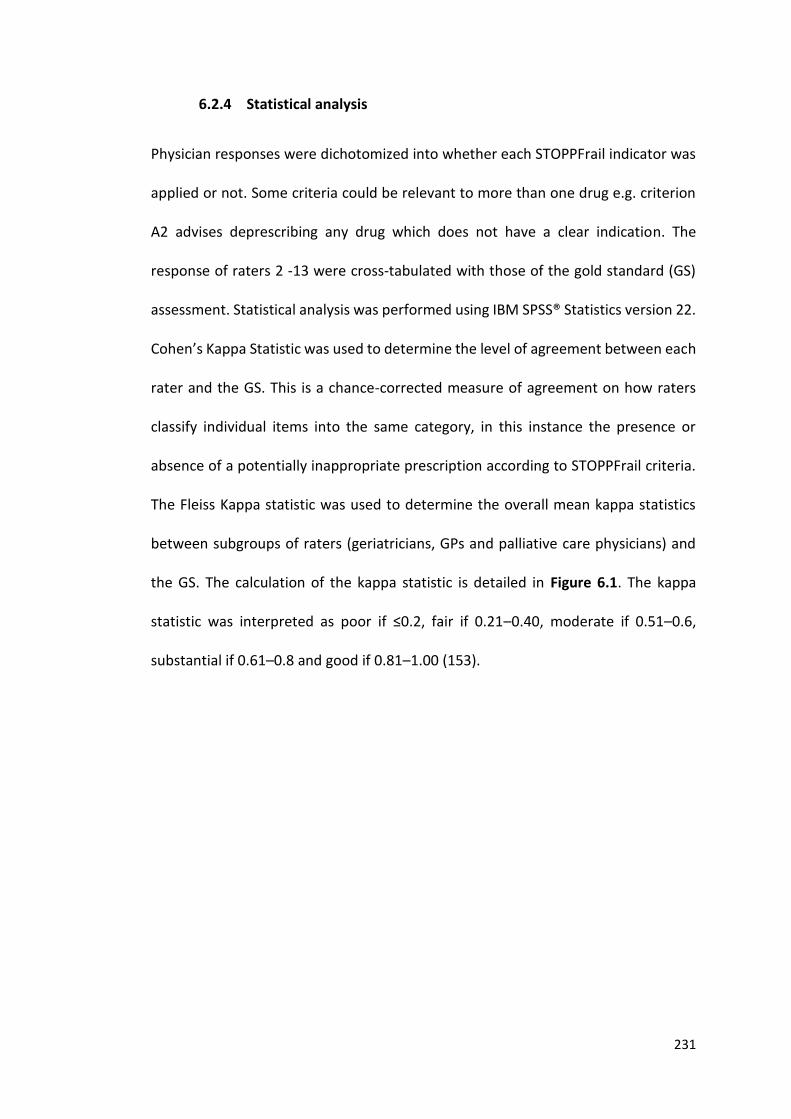
231
6.2.4 Statistical analysis
Physician responses were dichotomized into whether each STOPPFrail indicator was
applied or not. Some criteria could be relevant to more than one drug e.g. criterion
A2 advises deprescribing any drug which does not have a clear indication. The
response of raters 2 -13 were cross-tabulated with those of the gold standard (GS)
assessment. Statistical analysis was performed using IBM SPSS® Statistics version 22.
Cohen’s Kappa Statistic was used to determine the level of agreement between each
rater and the GS. This is a chance-corrected measure of agreement on how raters
classify individual items into the same category, in this instance the presence or
absence of a potentially inappropriate prescription according to STOPPFrail criteria.
The Fleiss Kappa statistic was used to determine the overall mean kappa statistics
between subgroups of raters (geriatricians, GPs and palliative care physicians) and
the GS. The calculation of the kappa statistic is detailed in Figure 6.1. The kappa
statistic was interpreted as poor if ≤0.2, fair if 0.21–0.40, moderate if 0.51–0.6,
substantial if 0.61–0.8 and good if 0.81–1.00 (153).
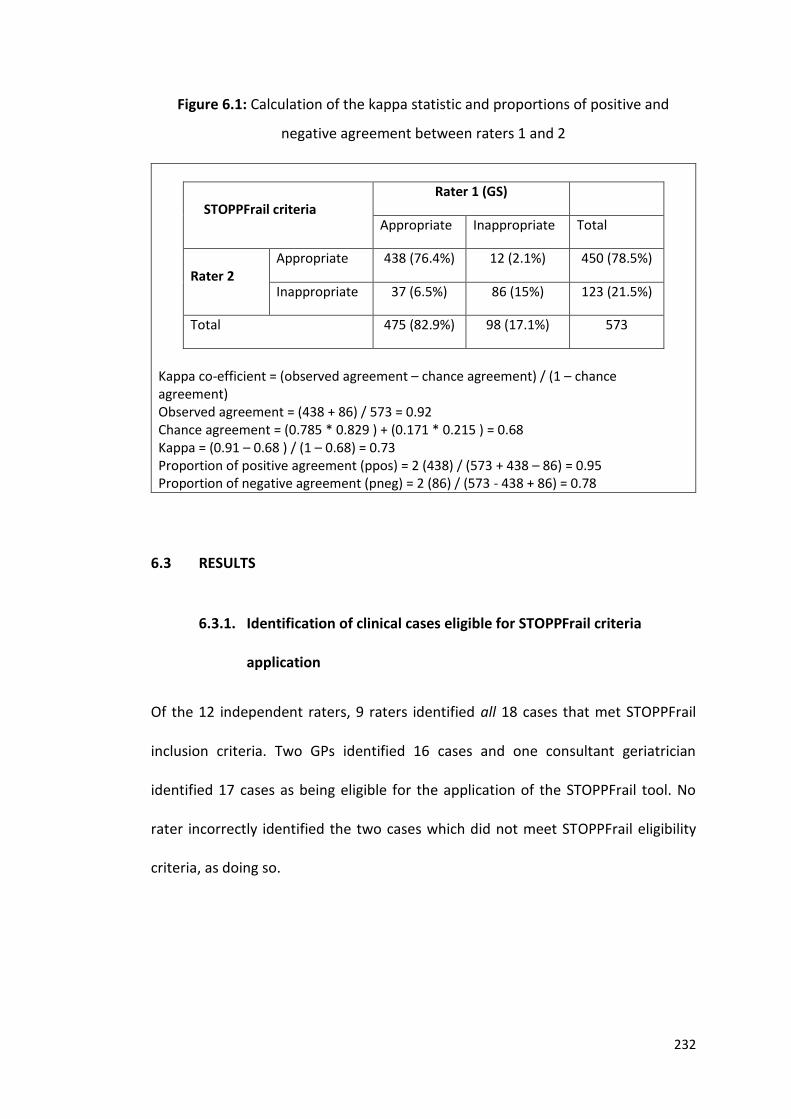
232
Figure 6.1: Calculation of the kappa statistic and proportions of positive and
negative agreement between raters 1 and 2
Kappa co-efficient = (observed agreement – chance agreement) / (1 – chance agreement) Observed agreement = (438 + 86) / 573 = 0.92 Chance agreement = (0.785 * 0.829 ) + (0.171 * 0.215 ) = 0.68 Kappa = (0.91 – 0.68 ) / (1 – 0.68) = 0.73 Proportion of positive agreement (ppos) = 2 (438) / (573 + 438 – 86) = 0.95 Proportion of negative agreement (pneg) = 2 (86) / (573 - 438 + 86) = 0.78
STOPPFrail criteria
Rater 1 (GS)
Appropriate Inappropriate Total
Rater 2
Appropriate 438 (76.4%) 12 (2.1%) 450 (78.5%)
Inappropriate 37 (6.5%) 86 (15%) 123 (21.5%)
Total 475 (82.9%) 98 (17.1%) 573
6.3 RESULTS
6.3.1. Identification of clinical cases eligible for STOPPFrail criteria
application
Of the 12 independent raters, 9 raters identified all 18 cases that met STOPPFrail
inclusion criteria. Two GPs identified 16 cases and one consultant geriatrician
identified 17 cases as being eligible for the application of the STOPPFrail tool. No
rater incorrectly identified the two cases which did not meet STOPPFrail eligibility
criteria, as doing so.
233
6.3.2 Time taken to deploy the criteria
Geriatricians, GPs and Palliative Medicine physicians took an average of 2.33, 3.41
and 2.7 minutes respectively to apply STOPPFrail criteria to each clinical case, a
combined overall mean (± standard deviation) of 2.7 (0.94) minutes. During this time
the physician read the clinical case in question and applied STOPPFrail accordingly.
This time did not include the time taken for participants to read the instruction
manual and familiarise themselves with the STOPPFrail tool.
6.3.3 Medications identified for deprescribing
Of the 165 medications prescribed to 18 patients, the gold standard (GS) determined
that 91 medications were potentially inappropriate according to STOPPFrail criteria
and should be deprescribed. Table 6.1 displays the kappa statistics for each rater
compared to the GS. Columns A, B, C and D indicate the status of agreement between
raters and the GS. For example, rater 1 (GS) and rater 3 agreed that STOPPFrail
criteria were not identified in 471 instances (column A). In 27 instances, rater 1 did
not identify a STOPPFrail criterion but rater 3 did (column B). There were 20 instances
where rater 3 identified a STOPPFrail criterion that rater 1 did not (column C). In 83
instances, both rater 1 and rater 3 identified a STOPPFrail criterion (column D). The
Fleiss kappa co-efficient between all 12 raters and the GS was 0.76 (SD 0.059). The
Fleiss kappa co-efficient between the GS and geriatricians, GPs and palliative care
physicians were 0.80 (SD0.6), 0.77 (SD0.9) and 0.75 (SD0.1) respectively, with no
significant difference noted between groups or between participants within groups,
as determined by one way ANOVA (df (2, 9) = 0.712, p=0.516).
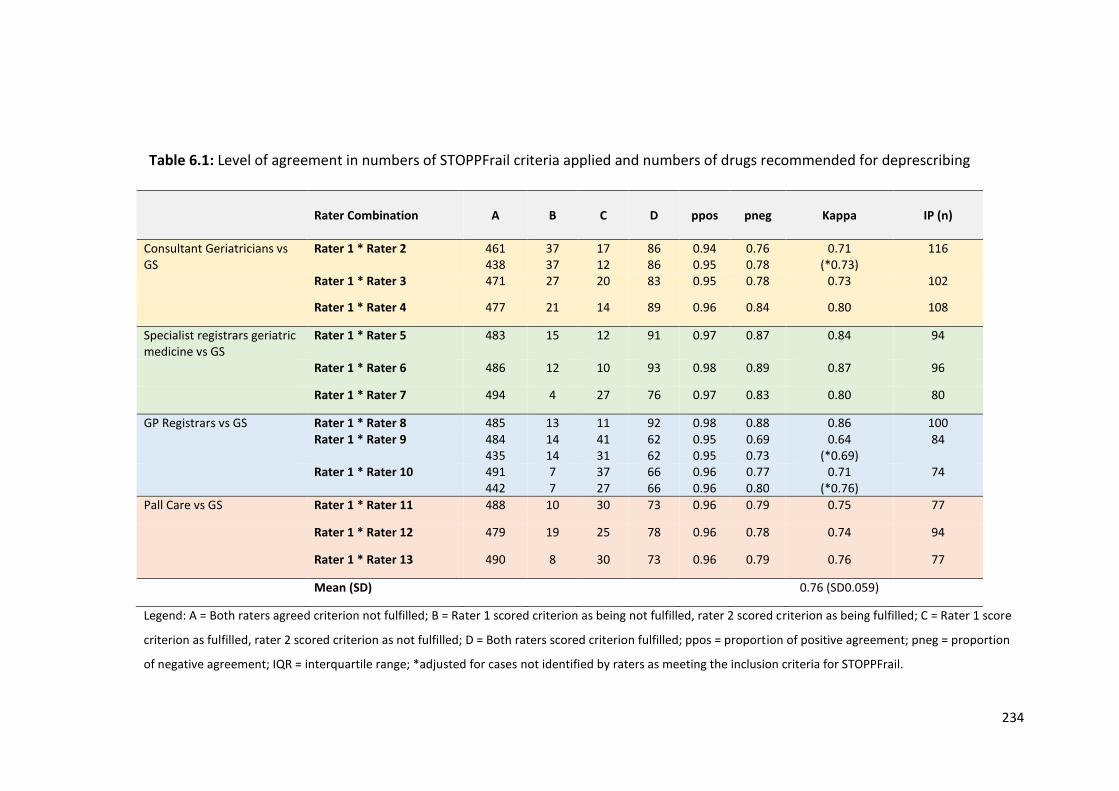
234
Table 6.1: Level of agreement in numbers of STOPPFrail criteria applied and numbers of drugs recommended for deprescribing
Rater Combination
A
B
C
D
ppos
pneg
Kappa
IP (n)
Consultant Geriatricians vs GS
Rater 1 * Rater 2 461 438
37 37
17 12
86 86
0.94 0.95
0.76 0.78
0.71 (*0.73)
116
Rater 1 * Rater 3 471 27 20 83 0.95 0.78 0.73 102
Rater 1 * Rater 4 477 21 14 89 0.96 0.84 0.80 108
Specialist registrars geriatric medicine vs GS
Rater 1 * Rater 5 483 15 12 91 0.97 0.87 0.84 94
Rater 1 * Rater 6 486 12 10 93 0.98 0.89 0.87 96
Rater 1 * Rater 7 494 4 27 76 0.97 0.83 0.80 80
GP Registrars vs GS Rater 1 * Rater 8 485 13 11 92 0.98 0.88 0.86 100 Rater 1 * Rater 9 484
435 14 14
41 31
62 62
0.95 0.95
0.69 0.73
0.64 (*0.69)
84
Rater 1 * Rater 10 491 442
7 7
37 27
66 66
0.96 0.96
0.77 0.80
0.71 (*0.76)
74
Pall Care vs GS Rater 1 * Rater 11 488 10 30 73 0.96 0.79 0.75 77
Rater 1 * Rater 12 479 19 25 78 0.96 0.78 0.74 94
Rater 1 * Rater 13 490 8 30 73 0.96 0.79 0.76 77
Mean (SD) 0.76 (SD0.059)
Legend: A = Both raters agreed criterion not fulfilled; B = Rater 1 scored criterion as being not fulfilled, rater 2 scored criterion as being fulfilled; C = Rater 1 score
criterion as fulfilled, rater 2 scored criterion as not fulfilled; D = Both raters scored criterion fulfilled; ppos = proportion of positive agreement; pneg = proportion
of negative agreement; IQR = interquartile range; *adjusted for cases not identified by raters as meeting the inclusion criteria for STOPPFrail.
235
6.3.4 Variations between raters
Total agreement between all raters and the GS was observed for 4 STOPPFrail
criteria. Minor variations (defined as the identification or omission of up to 2
STOPPFrail criteria by a rater other than the gold standard rater) were observed for
16 STOPPFrail criteria. Major variations (defined as the identification or omission of
≥3 STOPPFrail criteria by a rater other than the gold standard rater) were observed
for 7 STOPPFrail criteria. These rater variations are detailed in Tables 6.2. The reasons
for variations of each STOPPFrail observation according to each rater is shown in
Table 6.3. The breakdown of variations between each rater and the GS and for each
case is presented in Table 6.4.
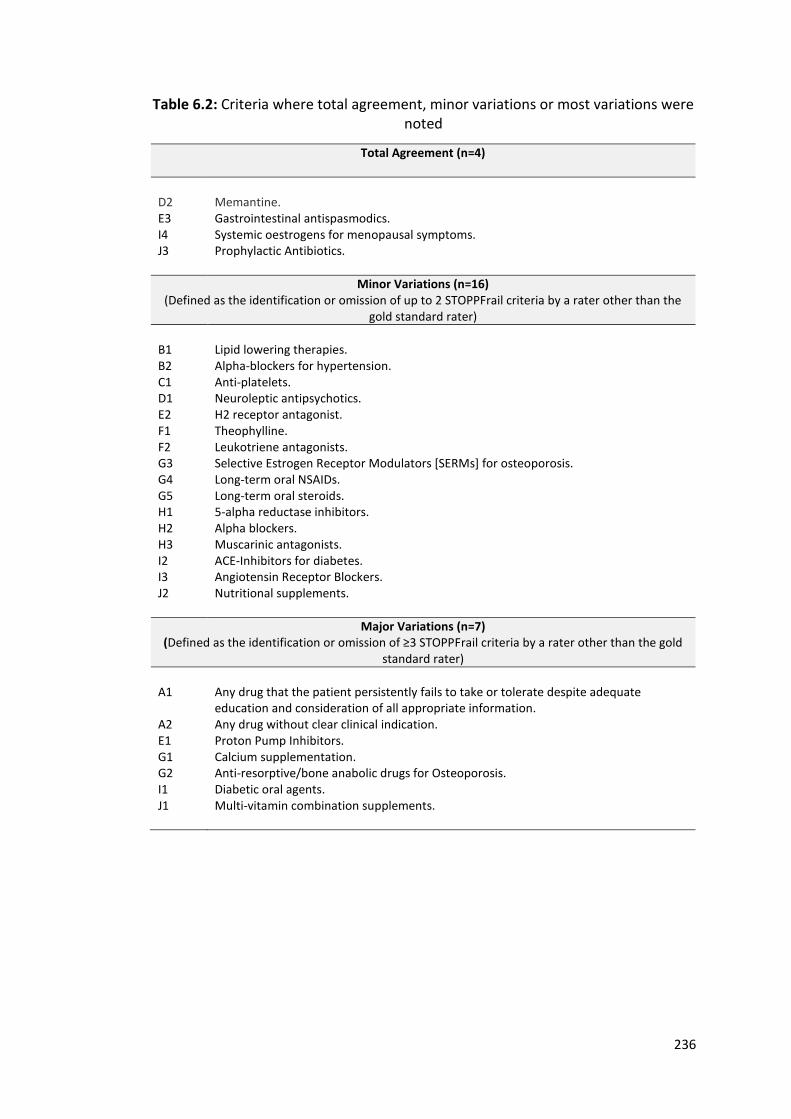
236
Table 6.2: Criteria where total agreement, minor variations or most variations were noted
Total Agreement (n=4)
D2 E3 I4 J3
Memantine. Gastrointestinal antispasmodics. Systemic oestrogens for menopausal symptoms. Prophylactic Antibiotics.
Minor Variations (n=16) (Defined as the identification or omission of up to 2 STOPPFrail criteria by a rater other than the
gold standard rater)
B1 B2 C1 D1 E2 F1 F2 G3 G4 G5 H1 H2 H3 I2 I3 J2
Lipid lowering therapies. Alpha-blockers for hypertension. Anti-platelets. Neuroleptic antipsychotics. H2 receptor antagonist. Theophylline. Leukotriene antagonists. Selective Estrogen Receptor Modulators [SERMs] for osteoporosis. Long-term oral NSAIDs. Long-term oral steroids. 5-alpha reductase inhibitors. Alpha blockers. Muscarinic antagonists. ACE-Inhibitors for diabetes. Angiotensin Receptor Blockers. Nutritional supplements.
Major Variations (n=7) (Defined as the identification or omission of ≥3 STOPPFrail criteria by a rater other than the gold
standard rater)
A1 A2 E1 G1 G2 I1 J1
Any drug that the patient persistently fails to take or tolerate despite adequate education and consideration of all appropriate information. Any drug without clear clinical indication. Proton Pump Inhibitors. Calcium supplementation. Anti-resorptive/bone anabolic drugs for Osteoporosis. Diabetic oral agents. Multi-vitamin combination supplements.
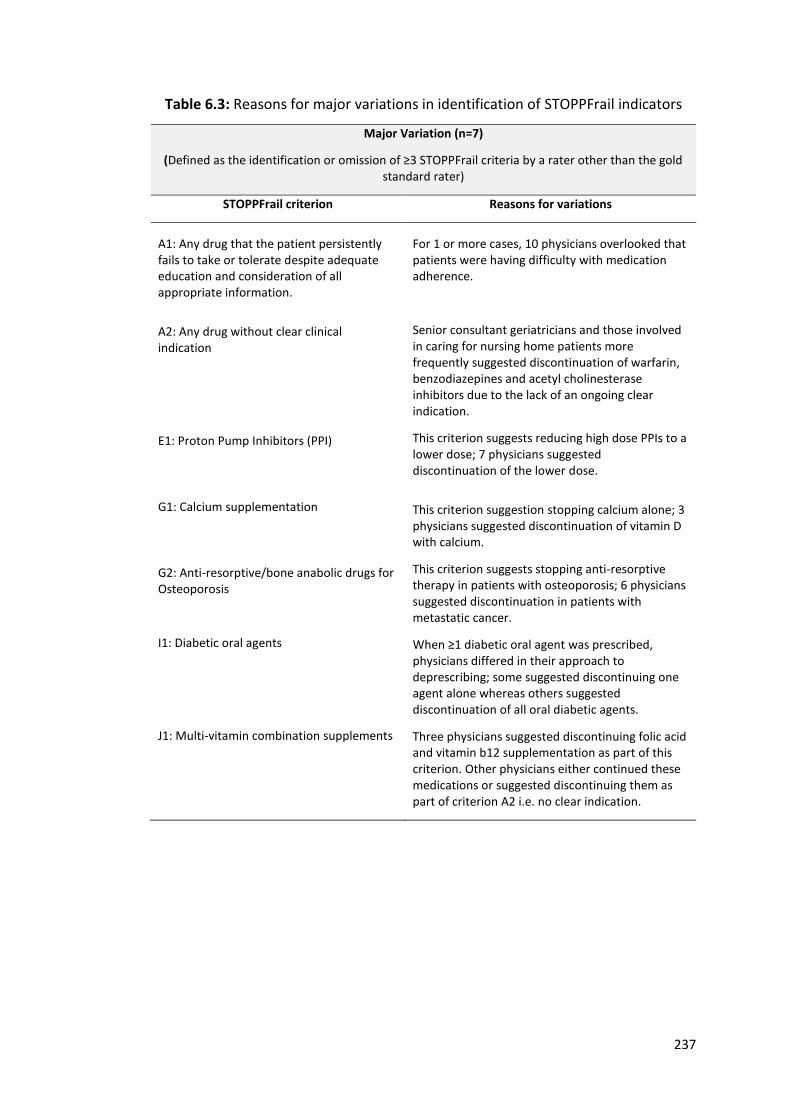
237
Table 6.3: Reasons for major variations in identification of STOPPFrail indicators
Major Variation (n=7)
(Defined as the identification or omission of ≥3 STOPPFrail criteria by a rater other than the gold standard rater)
STOPPFrail criterion Reasons for variations
A1: Any drug that the patient persistently fails to take or tolerate despite adequate education and consideration of all appropriate information.
A2: Any drug without clear clinical indication
E1: Proton Pump Inhibitors (PPI)
G1: Calcium supplementation
G2: Anti-resorptive/bone anabolic drugs for Osteoporosis
I1: Diabetic oral agents
J1: Multi-vitamin combination supplements
For 1 or more cases, 10 physicians overlooked that patients were having difficulty with medication adherence.
Senior consultant geriatricians and those involved in caring for nursing home patients more frequently suggested discontinuation of warfarin, benzodiazepines and acetyl cholinesterase inhibitors due to the lack of an ongoing clear indication.
This criterion suggests reducing high dose PPIs to a lower dose; 7 physicians suggested discontinuation of the lower dose.
This criterion suggestion stopping calcium alone; 3 physicians suggested discontinuation of vitamin D with calcium.
This criterion suggests stopping anti-resorptive therapy in patients with osteoporosis; 6 physicians suggested discontinuation in patients with metastatic cancer.
When ≥1 diabetic oral agent was prescribed, physicians differed in their approach to deprescribing; some suggested discontinuing one agent alone whereas others suggested discontinuation of all oral diabetic agents.
Three physicians suggested discontinuing folic acid and vitamin b12 supplementation as part of this criterion. Other physicians either continued these medications or suggested discontinuing them as part of criterion A2 i.e. no clear indication.
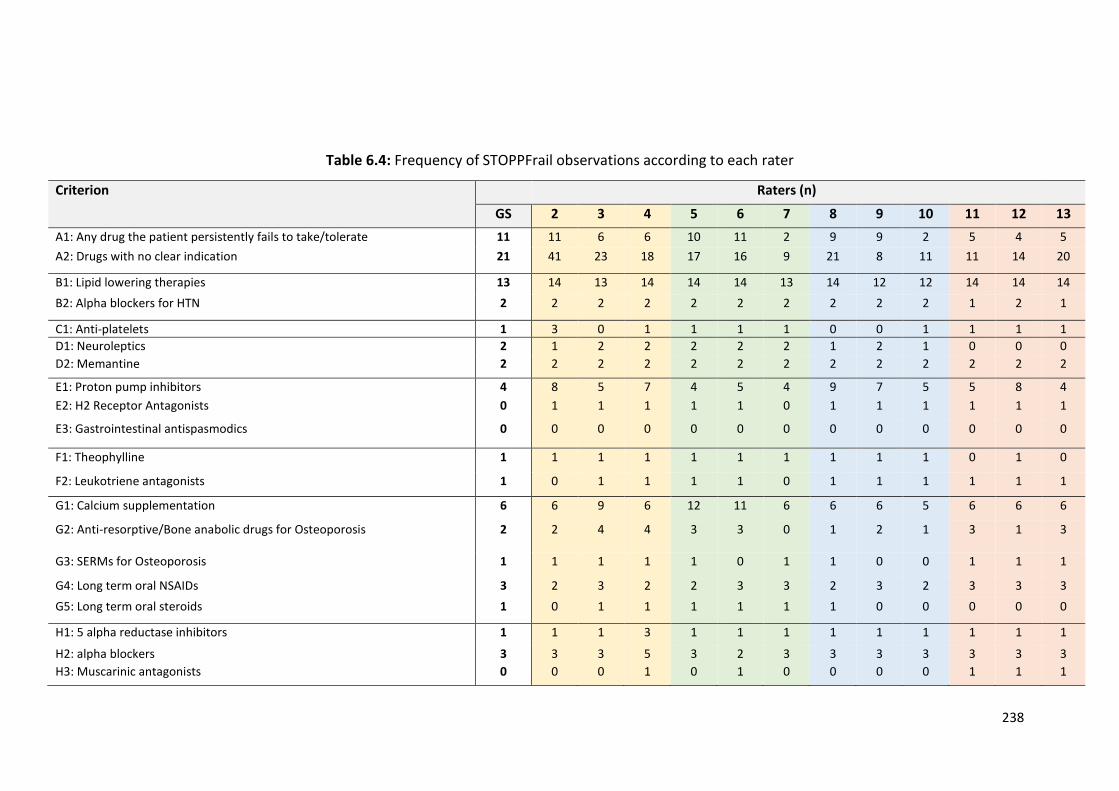
238
Table 6.4: Frequency of STOPPFrail observations according to each rater
Criterion Raters (n)
GS 2 3 4 5 6 7 8 9 10 11 12 13
A1: Any drug the patient persistently fails to take/tolerate 11 11 6 6 10 11 2 9 9 2 5 4 5
A2: Drugs with no clear indication 21 41 23 18 17 16 9 21 8 11 11 14 20
B1: Lipid lowering therapies 13 14 13 14 14 14 13 14 12 12 14 14 14
B2: Alpha blockers for HTN 2 2 2 2 2 2 2 2 2 2 1 2 1
C1: Anti-platelets 1 3 0 1 1 1 1 0 0 1 1 1 1
D1: Neuroleptics 2 1 2 2 2 2 2 1 2 1 0 0 0
D2: Memantine 2 2 2 2 2 2 2 2 2 2 2 2 2
E1: Proton pump inhibitors 4 8 5 7 4 5 4 9 7 5 5 8 4
E2: H2 Receptor Antagonists 0 1 1 1 1 1 0 1 1 1 1 1 1
E3: Gastrointestinal antispasmodics 0 0 0 0 0 0 0 0 0 0 0 0 0
F1: Theophylline 1 1 1 1 1 1 1 1 1 1 0 1 0
F2: Leukotriene antagonists 1 0 1 1 1 1 0 1 1 1 1 1 1
G1: Calcium supplementation 6 6 9 6 12 11 6 6 6 5 6 6 6
G2: Anti-resorptive/Bone anabolic drugs for Osteoporosis 2 2 4 4 3 3 0 1 2 1 3 1 3
G3: SERMs for Osteoporosis 1 1 1 1 1 0 1 1 0 0 1 1 1
G4: Long term oral NSAIDs 3 2 3 2 2 3 3 2 3 2 3 3 3
G5: Long term oral steroids 1 0 1 1 1 1 1 1 0 0 0 0 0
H1: 5 alpha reductase inhibitors 1 1 1 3 1 1 1 1 1 1 1 1 1
H2: alpha blockers 3 3 3 5 3 2 3 3 3 3 3 3 3
H3: Muscarinic antagonists 0 0 0 1 0 1 0 0 0 0 1 1 1
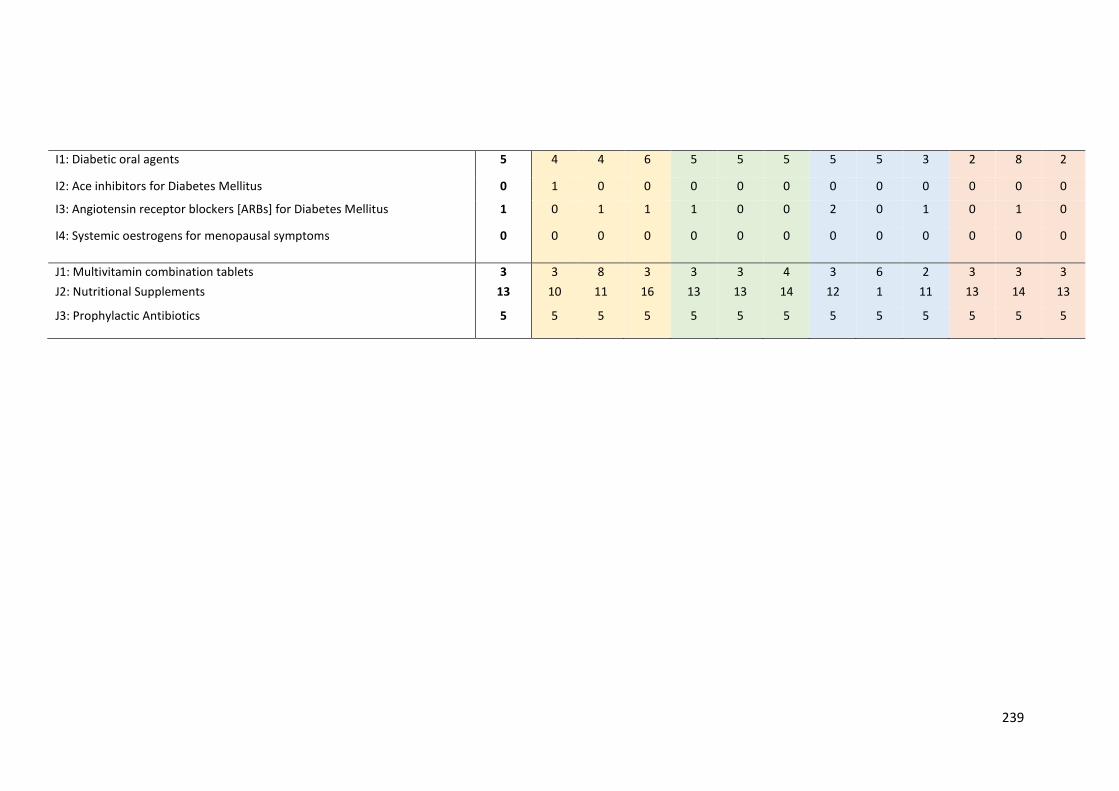
239
I1: Diabetic oral agents 5 4 4 6 5 5 5 5 5 3 2 8 2
I2: Ace inhibitors for Diabetes Mellitus 0 1 0 0 0 0 0 0 0 0 0 0 0
I3: Angiotensin receptor blockers [ARBs] for Diabetes Mellitus 1 0 1 1 1 0 0 2 0 1 0 1 0
I4: Systemic oestrogens for menopausal symptoms 0 0 0 0 0 0 0 0 0 0 0 0 0
J1: Multivitamin combination tablets 3 3 8 3 3 3 4 3 6 2 3 3 3
J2: Nutritional Supplements 13 10 11 16 13 13 14 12 1 11 13 14 13
J3: Prophylactic Antibiotics 5 5 5 5 5 5 5 5 5 5 5 5 5
240
6.3.5 Criteria with major variations
The criteria where most variations between raters were observed are listed in Table
6.3. Differences in opinion regarding drug indication was identified for warfarin,
benzodiazepines and acetyl cholinesterase inhibitors. Two Consultant Geriatricians
and one GP with experience in attending patients in residential care units were more
likely to identify these prescriptions as being potentially inappropriate. Ten raters did
not observe that patients were having difficulty with medication adherence for all
cases. Seven raters identified the lower dose of a proton pump inhibitor (PPI) as being
inappropriate as part of criterion E1; this criterion suggests reducing the higher dose
to a lower dose. Three raters suggested Vitamin D was inappropriate as part of
criterion G1. However, this criterion suggests stopping calcium alone i.e. it does not
mention Vitamin D. When three diabetic oral agents were prescribed, raters’ opinion
on appropriateness varied. Raters either identified that one agent alone was
inappropriate and suggested that deprescribing should occur in a staggered fashion
i.e. one agent at a time. Others identified all diabetic oral agents as inappropriate and
suggested that they could, in theory, be deprescribed all at the one time. For 3 raters,
folic acid and vitamin b12 supplementation were identified as inappropriate as part
of STOPPFrail criterion J1 (combination multivitamins) criterion. Other raters either
deemed these drugs appropriate and suggested continuation or else deemed them
inappropriate as part of criterion A2 i.e. prescription of a medication without a clear
indication.
241
6.4 DISCUSSION
The Inter-rater reliability of STOPPFrail criteria is substantial to good (mean 0.76 (SD
0.059)), when tested between multiple physicians practising across three different
specialities, despite physicians having no prior knowledge of the tool or experience
of using it. It takes approximately 3 minutes to apply STOPPFrail criteria to one clinical
case. No discrepancies in its application were identified for 4 STOPPFrail criteria.
Minor variations were identified for 16 criteria and major variations were identified
for 7 criteria. There was no difference between the three different physician groups,
or between the participants within each group, in their ability to apply STOPPFrail
criteria (df (2, 9) = 0.712, p=0.516).
The strength of this study is the robust methodology employed. Three groups
of physicians, all of whom had no experience in using IP criteria and who were given
the same clear instructions, participated in this research. The clinical cases used were
based on real patients and therefore reflected common clinical practice. However,
there were limitations. Firstly, this was a theoretical exercise i.e. physicians assessed
the suitability of STOPPFrail criteria according to a clinical case history presented to
them in a structured format and identified IP accordingly. Assessments were not
completed on patients in person and medications were not actually deprescribed. It
could be suggested that physicians are more conservative when dealing with real life
patients rather than theoretical cases. However, it could be also be suggested that
the IRR could be under-estimated here. Where there is perceived ambiguity in the
information provided and patients are not there to clarify information, physicians
could also assume medications are appropriate.
242
Efficient and safe deprescribing depends on the quality of the available
clinical data. The more comprehensive the clinical information, the more accurate IP
criteria can be applied leading to higher levels of IRR (243). However, ambiguity is
often present in clinical practice due to incomplete records (244, 245), and
consequently, physicians often make decisions based on limited information.
Therefore, these cases, in this theoretical exercise, do reflect common clinical
scenarios.
Major variations, found in 7 STOPPFrail criteria, were as a result of (i)
differences in physician opinion regarding clinical indications, (ii) criteria mis-
interpretation and (iii) failure to acknowledge problems with medication adherence.
Differing opinions on clinical indication for medications could be as a consequence of
physician specialty and/or physician level of training e.g. Consultant Geriatricians
deemed acetyl-cholinesterase inhibitors inappropriate in late stage dementia more
frequently than their trainee geriatricians or GP colleagues. Mis-interpretation of
criteria was identified for the prescription of Vitamin D and low dose PPIs. The
identification of both these prescriptions as inappropriate was not necessarily
incorrect, however for the purpose of this exercise, they were deemed incorrect as
they were not specifically listed as PIP in STOPPFrail criteria. STOPPFrail criteria was
developed and validated to guide physicians on deprescribing, as well as open
dialogue around the appropriateness of all medications and in doing so encourage
medication review in its entirety, thus these variations seen here cannot be assumed
to be inappropriate.
243
Despite clear documentation of medication adherence in the clinical cases,
physicians did not observe this every time. This was probably the result of a reading
error and once not identified in one case, was unlikely to be identified in other cases.
This is a challenge with a theoretical exercise as participants rely on their ability to
assess the clinical information as it is presented to them, rather than confirming
medications and adherence with a patient directly. This could also be explained by
user fatigue as the exercise progressed and the process became repetitive.
Physicians are frequently under time pressure where completing medication
reviews and using criteria like STOPPFrail can encourage identification of medications
that can potentially be deprescribed in a time-efficient structured fashion. Explicit
criteria that require time to deploy often do not translate to clinical practice and
inevitably are used primarily as research tools (19). STOPPFrail criteria has shown
itself here to, not only assist physicians with identifying inappropriate medications in
frailer older adults with a poor survival prognosis, but to also do this in a time efficient
manner, which suggests it will translate across to clinical practise, where it hopefully,
will have impact.
Deprescribing requires a culture change for many physicians, particularly
physicians wherein contact with frail older adults with a poor one year survival
prognosis comprises a small part of their everyday clinical practice. Deprescribing
requires extensive knowledge around disease trajectory, pharmacological actions of
medications and the likely risks involved with their use. Deprescribing in patients with
a poor survival prognosis is more challenging than deprescribing specific drugs for
specific reasons in older adults as this process can often initiate a more extensive
244
discussion around end of life care. Future studies, using STOPPFrail criteria, will be
needed to ascertain the extent of PIP in this population cohort. The substantial to
good IRR demonstrated in this study, indicates that prevalence studies of PIP,
according to STOPPFrail criteria, will be comparable between researchers and across
research centres. Following this, randomised controlled trials can be planned to
assess whether deprescribing in this population can affect patient outcomes and
provide the evidence required to support physicians undertaking deprescribing. Our
data suggests that STOPPFrail provides reliable explicit guidance for any clinician
undertaking routine medication review in frailer older patients with poor one year
survival prognosis.
245
CHAPTER 7:
Prevalence of potentially inappropriate prescribing as determined by
STOPPFrail criteria in a representative population of older patients
undergoing assessment for long term nursing home placement and of older
adults presenting with acute illness to hospital.
246
7.1 INTRODUCTION
STOPPFrail criteria were devised to highlight instances of potentially inappropriate
prescribing practices in frail older adults with a poor one year survival prognosis.
Their content was validated by Delphi consensus methodology, in which 17 senior
academic clinicians participated (240). As demonstrated in Chapter 6, the inter-rater
reliability (IRR) of STOPPFrail criteria was good when deployed by physicians
practising in different specialties (246).
The prevalence of potentially inappropriate prescribing in older frail adults
with a poor survival prognosis is unknown. One population of older adults with such
functional impairment are those who require long term nursing home admission.
Such patients are often very frail (16), with multiple co-morbidities (17), carry a high
burden of medication (195) and often have a very poor survival prognosis (247).
In Ireland, the Health Service Executive (HSE) operates the Nursing Home
Support Scheme (NHSS) to provide assessment and subsequently financial support
to older adults requiring long term nursing home care. Prior to nursing home
application, a care needs assessment must be performed by appropriate healthcare
professionals. Through this assessment, applicants’ medical, functional and cognitive
status details are established. The completion of this comprehensive report is
overseen by a consultant in Geriatric Medicine or Old Age Psychiatry, who provides
a detailed clinical assessment and confirms that long term nursing care is required
for the person. This application document contains a large amount of relevant clinical
information on frail older adults suitable for long term care. For this reason, it was
deemed a reliable source of relevant information on this population of older people.
247
In Ireland, older frailer people with a poor one year survival prognosis are
commonly referred to hospital with acute illness. As pointed out previously, these
patients are commonly exposed to major polypharmacy as a result of multi-morbid
illness. The extent to which such patients are exposed to medications that are likely
not appropriate for them is unknown.
7.1.1 Objectives
The objectives of this study were:
(i) To determine the proportion of older adults requiring long-term nursing
care eligible for the application of STOPPFrail criteria.
(ii) To determine the prevalence of potentially inappropriate prescribing
using STOPPFrail criteria, and the risk factors for prescription of
STOPPFrail medications.
(iii) To determine the proportion of older adults presenting to hospital with
an acute illness to hospital (see Chapter 3) who are eligible for the
application of STOPPFrail criteria.
(iv) To determine the prevalence of potentially inappropriate prescribing
using STOPPFrail criteria in this acutely ill hospitalised cohort.
The work undertaken in this chapter, including study design, data collection and
statistical analysis, is entirely my own.
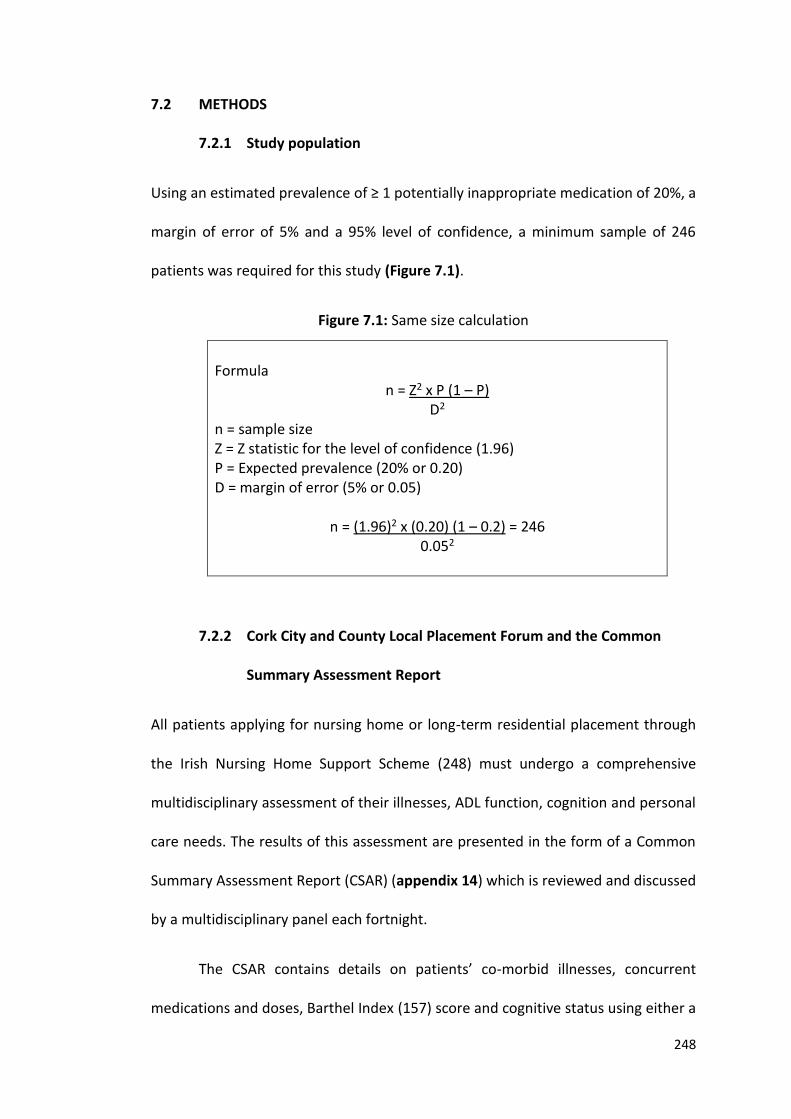
248
7.2 METHODS
7.2.1 Study population
Using an estimated prevalence of ≥ 1 potentially inappropriate medication of 20%, a
margin of error of 5% and a 95% level of confidence, a minimum sample of 246
patients was required for this study (Figure 7.1).
Figure 7.1: Same size calculation
Formula
n = Z2 x P (1 – P) D2
n = sample size Z = Z statistic for the level of confidence (1.96) P = Expected prevalence (20% or 0.20) D = margin of error (5% or 0.05)
n = (1.96)2 x (0.20) (1 – 0.2) = 246 0.052
7.2.2 Cork City and County Local Placement Forum and the Common
Summary Assessment Report
All patients applying for nursing home or long-term residential placement through
the Irish Nursing Home Support Scheme (248) must undergo a comprehensive
multidisciplinary assessment of their illnesses, ADL function, cognition and personal
care needs. The results of this assessment are presented in the form of a Common
Summary Assessment Report (CSAR) (appendix 14) which is reviewed and discussed
by a multidisciplinary panel each fortnight.
The CSAR contains details on patients’ co-morbid illnesses, concurrent
medications and doses, Barthel Index (157) score and cognitive status using either a
249
Mini-mental state examination (MMSE) (158) or the Montreal cognitive assessment
(MoCA) (162). The Barthel Index and the MMSE have been described in detail in
Chapter 3. The MoCA is a 30-point cognitive assessment tool, which has been
validated in patients with mild cognitive impairment and dementia (Appendix 15). It
assesses several cognitive domains including short-term memory, visuospatial
abilities, executive function, language, attention, concentration, abstract thinking
and orientation.
7.2.3 Study period
All CSARs submitted as part of the applications for long term nursing home or
residential facility care to the Cork Nursing Home Support Scheme office, between
Jan 1st and June 30th 2016, were retrospectively reviewed. The local Clinical Research
Ethics Committee approved the study protocol (appendix 16).
7.2.4 Data Collection
The following data were transferred from the CSARs onto an excel spreadsheet: (i)
standard demographic details, (ii) medical diagnoses, (iii) concurrent medications
and doses, (iv) functional ability (Barthel Index score) (157), (vi) cognitive ability
(MMSE (158) or MOCA score (162), and (vii) frailty using the Rockwood clinical frailty
scale category (163). Where available, supplementary clinical information was
obtained from case records.
250
Recorded medications were those prescribed at the time of nursing home
application. Short term medications documented on the CSAR were excluded from
evaluation e.g. heparinoids for deep vein thrombosis prophylaxis. Co-morbidities
were quantified according to the Cumulative Illness Rating Scale (CIRS) (156). Details
of both the Clinical Frailty Scale and CIRS have been described in Chapter 3.
7.2.5 Determination of potentially inappropriate prescribing practices
using STOPPFrail criteria
STOPPFrail criteria for potentially inappropriate prescriptions were applied to
patients who meet STOPPFrail eligibility criteria i.e. the presence of an end-stage
irreversible pathology, a poor one year survival prognosis, severe cognitive or
functional impairment or both and patients in whom symptom management was the
overriding priority, as opposed to long-term prevention.
The presence or absence of a potentially inappropriate medication (PIM) was
categorised as a dichotomous variable i.e. a medication was either potentially
inappropriate according to STOPPFrail criteria or not. Some prescriptions could
pertain to 1 or more STOPPFrail criteria (e.g. a drug may have no clear indication and
also be listed elsewhere in the criteria as being inappropriate) but for the purpose of
this study the identification of one drug was categorised as being inappropriate,
regardless of whether or not it fulfilled one or more STOPPFrail criteria i.e. the
potentially inappropriate drug was the unit of measurement, not the numbers of
STOPPFrail criteria it breached. Uncertainty regarding the appropriateness of a
251
prescription was treated conservatively i.e. the prescribing decision was deemed to
be appropriate in such circumstances.
7.2.6 Statistical analysis
Statistical analysis was performed using SPSS© version 22. Descriptive data were
reported using the mean and standard deviation (SD) for variables normally
distributed and median and interquartile range (IQR) for non-parametric variables.
Differences in the distribution of categorical variables were compared using the
Pearson Chi-square (Χ2) test and continuous variables using the independent t-test.
The Mann Whitney U and Kruskal-Wallis tests were used to determine independence
of two or more non-parametric variables respectively. Multivariable logistic
regression was used to examine the influence of gender, age, presence of dementia,
the number of medical conditions and the number of medications on the presence
of potentially inappropriate prescribing practices. The Hosmer & Lemeshow statistic
was used to test the goodness-of-fit of the regression model. A probability value of <
0.05 was considered statistically significant.
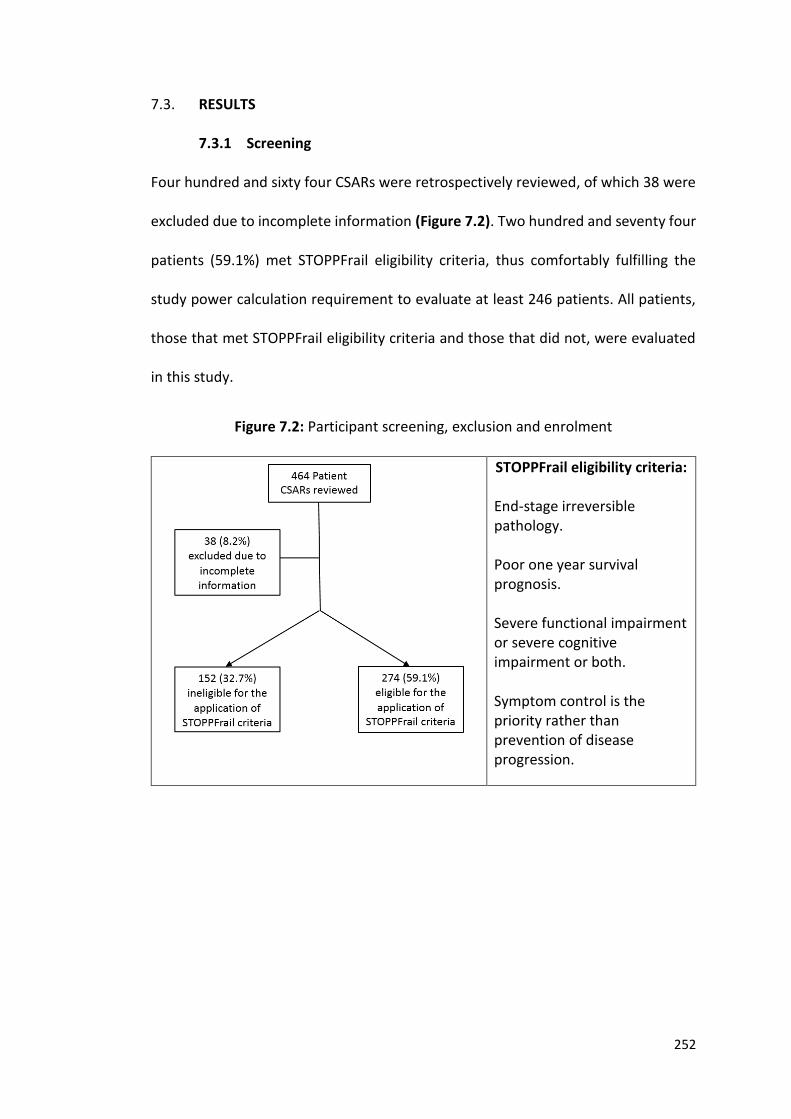
252
7.3. RESULTS
7.3.1 Screening
Four hundred and sixty four CSARs were retrospectively reviewed, of which 38 were
excluded due to incomplete information (Figure 7.2). Two hundred and seventy four
patients (59.1%) met STOPPFrail eligibility criteria, thus comfortably fulfilling the
study power calculation requirement to evaluate at least 246 patients. All patients,
those that met STOPPFrail eligibility criteria and those that did not, were evaluated
in this study.
Figure 7.2: Participant screening, exclusion and enrolment
STOPPFrail eligibility criteria:
End-stage irreversible pathology. Poor one year survival prognosis. Severe functional impairment or severe cognitive impairment or both. Symptom control is the priority rather than prevention of disease progression.
253
7.3.2 Population characteristics (n = 426)
Fifty five percent (n=233) of the 426 study patients were female (Table 7.1). The
median (IQR) age was 83 (77.2 – 88) years, with an overall range of 40 to 99 years.
Thirty three patients (7.7%) were < 65 years old. Approximately two thirds of patients
(64.1%) requiring long term care resided in hospital at the time of nursing home
application; 15.7% were already in emergency nursing home accommodation. The
remainder of patients were at home (19.7%), in hospice care (0.2%) or in temporary
hostel accommodation (0.2%).
7.3.3 Characteristics of patients who were eligible for the application of
STOPPFrail criteria
Differences between older adults that met STOPPFrail eligibility criteria and those
that did not are displayed in Table 7.1.Two hundred and eighty four (66.7%) of adults
had a MMSE score available, whereas 58 (13.6%) adults had a MOCA score only.
Older adults who met STOPPFrail eligibility criteria were older (83.5 (IQR78.75 – 88)
vs 80 (70.25 – 86) years, U = 15940, p<0.001), had lower mean MMSE scores (14.6
(SD7) vs 21 (5.6) t248.48 =7.47, p<0.001) and had lower mean Barthel Index scores (7.6
(SD4.3) vs 12 (3.9) t341.281 =10.86, p=0.03) compared to older patients who did not
meet STOPPFrail criteria.
Older adults meeting STOPPFrail eligibility criteria had a higher level of frailty
on the Rockwood Clinical Frailty Scale (Χ2 (7) ≥93.616 p=<0.001) (Figure 7.3) than
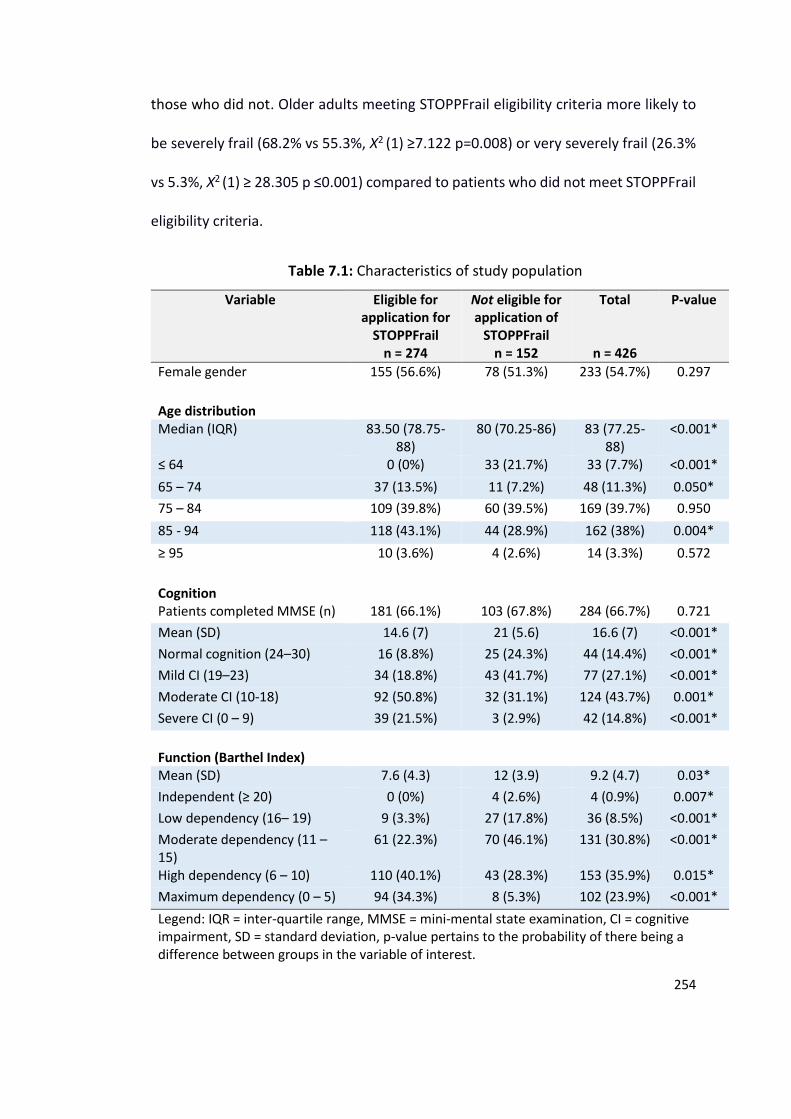
254
those who did not. Older adults meeting STOPPFrail eligibility criteria more likely to
be severely frail (68.2% vs 55.3%, Χ2 (1) ≥7.122 p=0.008) or very severely frail (26.3%
vs 5.3%, Χ2 (1) ≥ 28.305 p ≤0.001) compared to patients who did not meet STOPPFrail
eligibility criteria.
Table 7.1: Characteristics of study population
Variable Eligible for application for
STOPPFrail n = 274
Not eligible for application of
STOPPFrail n = 152
Total
n = 426
P-value
Female gender 155 (56.6%) 78 (51.3%) 233 (54.7%) 0.297
Age distribution
Median (IQR) 83.50 (78.75-88)
80 (70.25-86) 83 (77.25-88)
<0.001*
≤ 64 0 (0%) 33 (21.7%) 33 (7.7%) <0.001*
65 – 74 37 (13.5%) 11 (7.2%) 48 (11.3%) 0.050*
75 – 84 109 (39.8%) 60 (39.5%) 169 (39.7%) 0.950
85 - 94 118 (43.1%) 44 (28.9%) 162 (38%) 0.004*
≥ 95 10 (3.6%) 4 (2.6%) 14 (3.3%) 0.572
Cognition
Patients completed MMSE (n) 181 (66.1%) 103 (67.8%) 284 (66.7%) 0.721
Mean (SD) 14.6 (7) 21 (5.6) 16.6 (7) <0.001*
Normal cognition (24–30) 16 (8.8%) 25 (24.3%) 44 (14.4%) <0.001*
Mild CI (19–23) 34 (18.8%) 43 (41.7%) 77 (27.1%) <0.001*
Moderate CI (10-18) 92 (50.8%) 32 (31.1%) 124 (43.7%) 0.001*
Severe CI (0 – 9) 39 (21.5%) 3 (2.9%) 42 (14.8%) <0.001*
Function (Barthel Index)
Mean (SD) 7.6 (4.3) 12 (3.9) 9.2 (4.7) 0.03*
Independent (≥ 20) 0 (0%) 4 (2.6%) 4 (0.9%) 0.007*
Low dependency (16– 19) 9 (3.3%) 27 (17.8%) 36 (8.5%) <0.001*
Moderate dependency (11 – 15)
61 (22.3%) 70 (46.1%) 131 (30.8%) <0.001*
High dependency (6 – 10) 110 (40.1%) 43 (28.3%) 153 (35.9%) 0.015*
Maximum dependency (0 – 5) 94 (34.3%) 8 (5.3%) 102 (23.9%) <0.001*
Legend: IQR = inter-quartile range, MMSE = mini-mental state examination, CI = cognitive impairment, SD = standard deviation, p-value pertains to the probability of there being a difference between groups in the variable of interest.
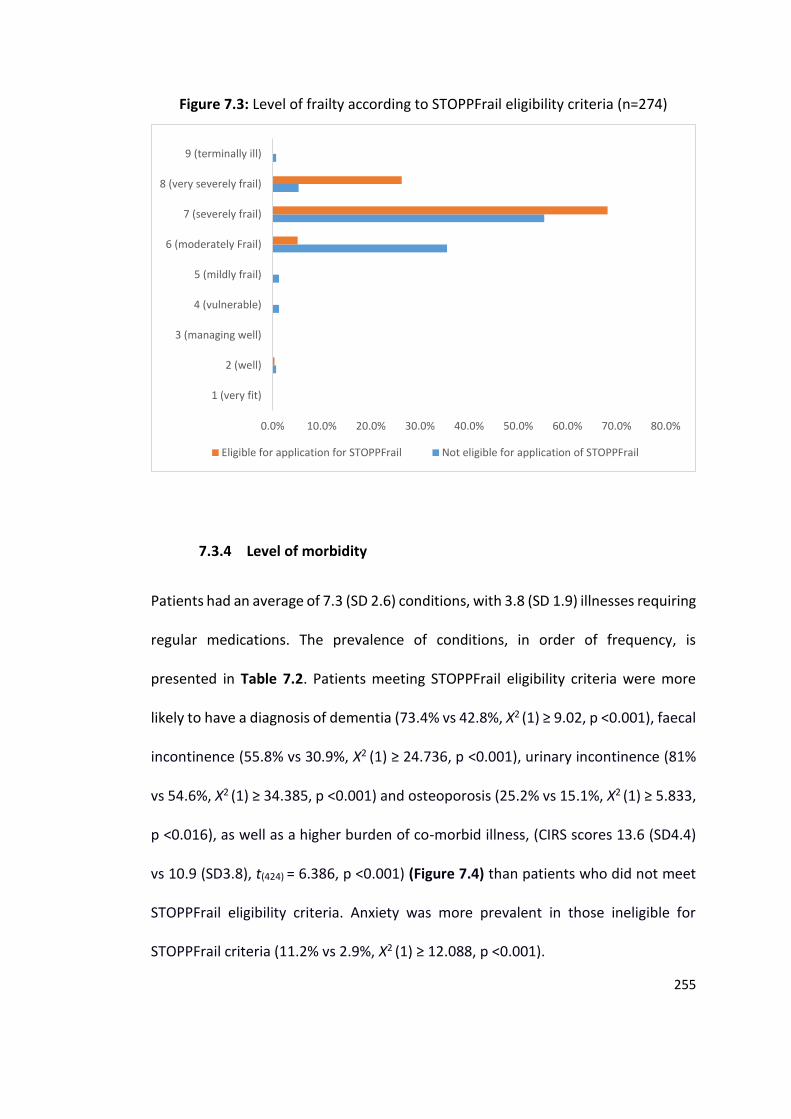
255
Figure 7.3: Level of frailty according to STOPPFrail eligibility criteria (n=274)
7.3.4 Level of morbidity
Patients had an average of 7.3 (SD 2.6) conditions, with 3.8 (SD 1.9) illnesses requiring
regular medications. The prevalence of conditions, in order of frequency, is
presented in Table 7.2. Patients meeting STOPPFrail eligibility criteria were more
likely to have a diagnosis of dementia (73.4% vs 42.8%, Χ2 (1) ≥ 9.02, p <0.001), faecal
incontinence (55.8% vs 30.9%, Χ2 (1) ≥ 24.736, p <0.001), urinary incontinence (81%
vs 54.6%, Χ2 (1) ≥ 34.385, p <0.001) and osteoporosis (25.2% vs 15.1%, Χ2 (1) ≥ 5.833,
p <0.016), as well as a higher burden of co-morbid illness, (CIRS scores 13.6 (SD4.4)
vs 10.9 (SD3.8), t(424) = 6.386, p <0.001) (Figure 7.4) than patients who did not meet
STOPPFrail eligibility criteria. Anxiety was more prevalent in those ineligible for
STOPPFrail criteria (11.2% vs 2.9%, Χ2 (1) ≥ 12.088, p <0.001).
0.0% 10.0% 20.0% 30.0% 40.0% 50.0% 60.0% 70.0% 80.0%
1 (very fit)
2 (well)
3 (managing well)
4 (vulnerable)
5 (mildly frail)
6 (moderately Frail)
7 (severely frail)
8 (very severely frail)
9 (terminally ill)
Eligible for application for STOPPFrail Not eligible for application of STOPPFrail
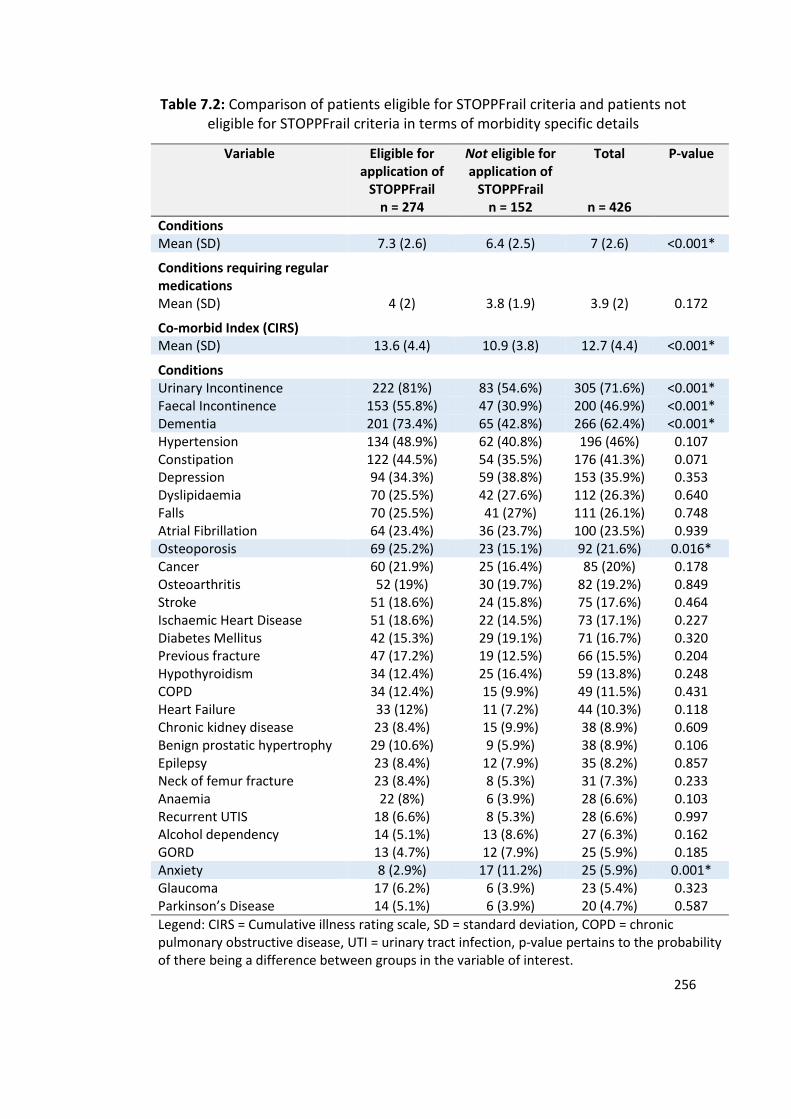
256
Table 7.2: Comparison of patients eligible for STOPPFrail criteria and patients not eligible for STOPPFrail criteria in terms of morbidity specific details
Variable Eligible for application of
STOPPFrail n = 274
Not eligible for application of
STOPPFrail n = 152
Total
n = 426
P-value
Conditions Mean (SD) 7.3 (2.6) 6.4 (2.5) 7 (2.6) <0.001*
Conditions requiring regular medications
Mean (SD) 4 (2) 3.8 (1.9) 3.9 (2) 0.172
Co-morbid Index (CIRS)
Mean (SD) 13.6 (4.4) 10.9 (3.8) 12.7 (4.4) <0.001*
Conditions
Urinary Incontinence 222 (81%) 83 (54.6%) 305 (71.6%) <0.001* Faecal Incontinence 153 (55.8%) 47 (30.9%) 200 (46.9%) <0.001* Dementia 201 (73.4%) 65 (42.8%) 266 (62.4%) <0.001* Hypertension 134 (48.9%) 62 (40.8%) 196 (46%) 0.107 Constipation 122 (44.5%) 54 (35.5%) 176 (41.3%) 0.071 Depression 94 (34.3%) 59 (38.8%) 153 (35.9%) 0.353 Dyslipidaemia 70 (25.5%) 42 (27.6%) 112 (26.3%) 0.640 Falls 70 (25.5%) 41 (27%) 111 (26.1%) 0.748 Atrial Fibrillation 64 (23.4%) 36 (23.7%) 100 (23.5%) 0.939 Osteoporosis 69 (25.2%) 23 (15.1%) 92 (21.6%) 0.016* Cancer 60 (21.9%) 25 (16.4%) 85 (20%) 0.178 Osteoarthritis 52 (19%) 30 (19.7%) 82 (19.2%) 0.849 Stroke 51 (18.6%) 24 (15.8%) 75 (17.6%) 0.464 Ischaemic Heart Disease 51 (18.6%) 22 (14.5%) 73 (17.1%) 0.227 Diabetes Mellitus 42 (15.3%) 29 (19.1%) 71 (16.7%) 0.320 Previous fracture 47 (17.2%) 19 (12.5%) 66 (15.5%) 0.204 Hypothyroidism 34 (12.4%) 25 (16.4%) 59 (13.8%) 0.248 COPD 34 (12.4%) 15 (9.9%) 49 (11.5%) 0.431 Heart Failure 33 (12%) 11 (7.2%) 44 (10.3%) 0.118 Chronic kidney disease 23 (8.4%) 15 (9.9%) 38 (8.9%) 0.609 Benign prostatic hypertrophy 29 (10.6%) 9 (5.9%) 38 (8.9%) 0.106 Epilepsy 23 (8.4%) 12 (7.9%) 35 (8.2%) 0.857 Neck of femur fracture 23 (8.4%) 8 (5.3%) 31 (7.3%) 0.233 Anaemia 22 (8%) 6 (3.9%) 28 (6.6%) 0.103 Recurrent UTIS 18 (6.6%) 8 (5.3%) 28 (6.6%) 0.997 Alcohol dependency 14 (5.1%) 13 (8.6%) 27 (6.3%) 0.162 GORD 13 (4.7%) 12 (7.9%) 25 (5.9%) 0.185 Anxiety 8 (2.9%) 17 (11.2%) 25 (5.9%) 0.001* Glaucoma 17 (6.2%) 6 (3.9%) 23 (5.4%) 0.323 Parkinson’s Disease 14 (5.1%) 6 (3.9%) 20 (4.7%) 0.587
Legend: CIRS = Cumulative illness rating scale, SD = standard deviation, COPD = chronic pulmonary obstructive disease, UTI = urinary tract infection, p-value pertains to the probability of there being a difference between groups in the variable of interest.
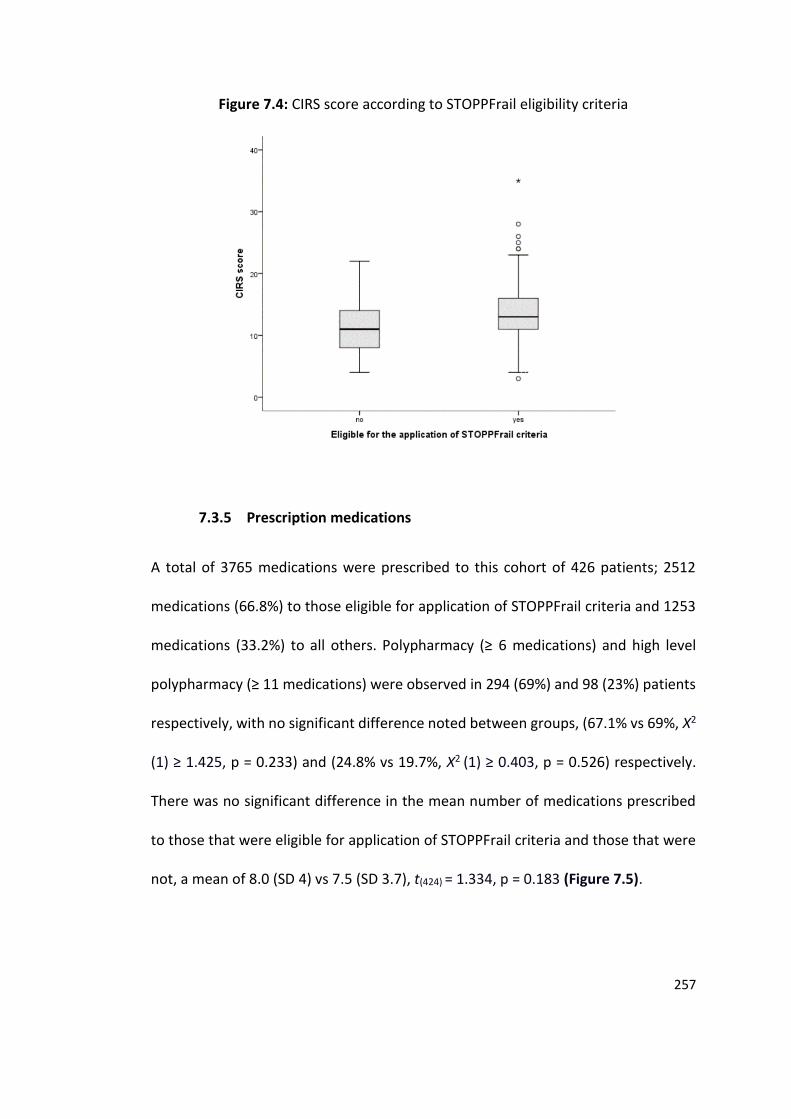
257
Figure 7.4: CIRS score according to STOPPFrail eligibility criteria
7.3.5 Prescription medications
A total of 3765 medications were prescribed to this cohort of 426 patients; 2512
medications (66.8%) to those eligible for application of STOPPFrail criteria and 1253
medications (33.2%) to all others. Polypharmacy (≥ 6 medications) and high level
polypharmacy (≥ 11 medications) were observed in 294 (69%) and 98 (23%) patients
respectively, with no significant difference noted between groups, (67.1% vs 69%, Χ2
(1) ≥ 1.425, p = 0.233) and (24.8% vs 19.7%, Χ2 (1) ≥ 0.403, p = 0.526) respectively.
There was no significant difference in the mean number of medications prescribed
to those that were eligible for application of STOPPFrail criteria and those that were
not, a mean of 8.0 (SD 4) vs 7.5 (SD 3.7), t(424) = 1.334, p = 0.183 (Figure 7.5).
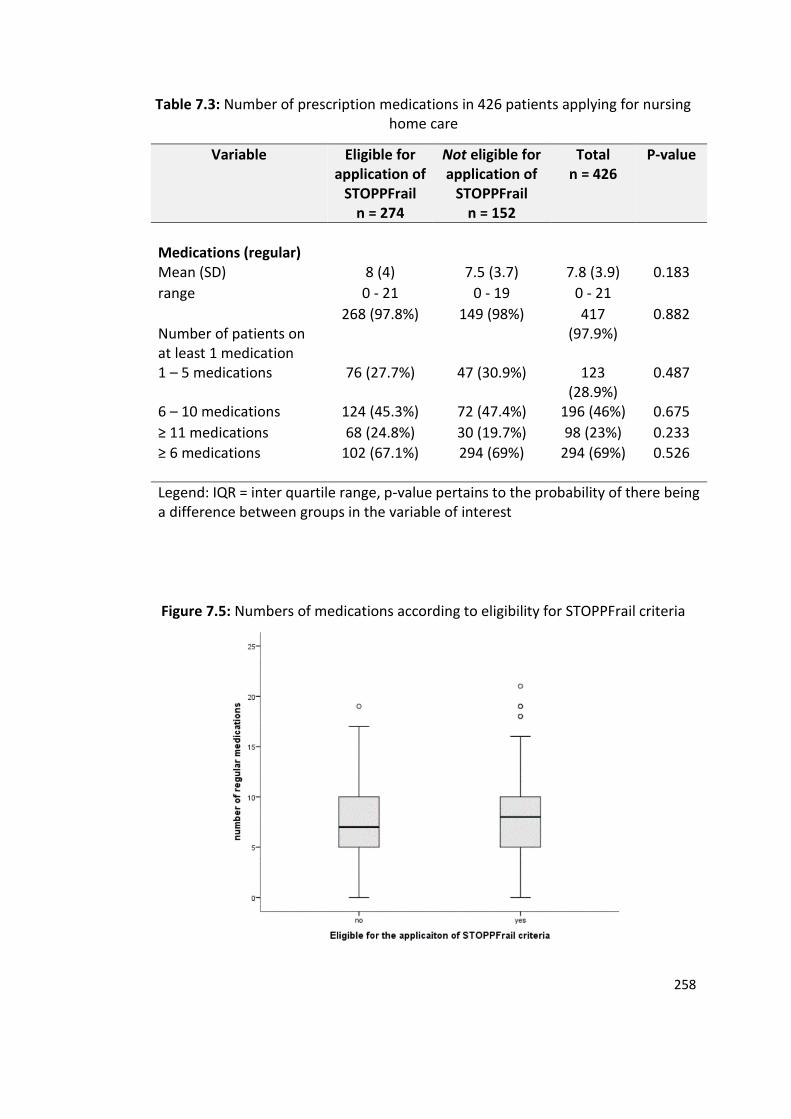
258
Table 7.3: Number of prescription medications in 426 patients applying for nursing home care
Variable Eligible for application of
STOPPFrail n = 274
Not eligible for application of
STOPPFrail n = 152
Total n = 426
P-value
Medications (regular)
Mean (SD) 8 (4) 7.5 (3.7) 7.8 (3.9) 0.183
range 0 - 21 0 - 19 0 - 21
Number of patients on at least 1 medication
268 (97.8%) 149 (98%) 417 (97.9%)
0.882
1 – 5 medications 76 (27.7%) 47 (30.9%) 123 (28.9%)
0.487
6 – 10 medications 124 (45.3%) 72 (47.4%) 196 (46%) 0.675
≥ 11 medications 68 (24.8%) 30 (19.7%) 98 (23%) 0.233
≥ 6 medications
102 (67.1%) 294 (69%) 294 (69%) 0.526
Legend: IQR = inter quartile range, p-value pertains to the probability of there being a difference between groups in the variable of interest
Figure 7.5: Numbers of medications according to eligibility for STOPPFrail criteria
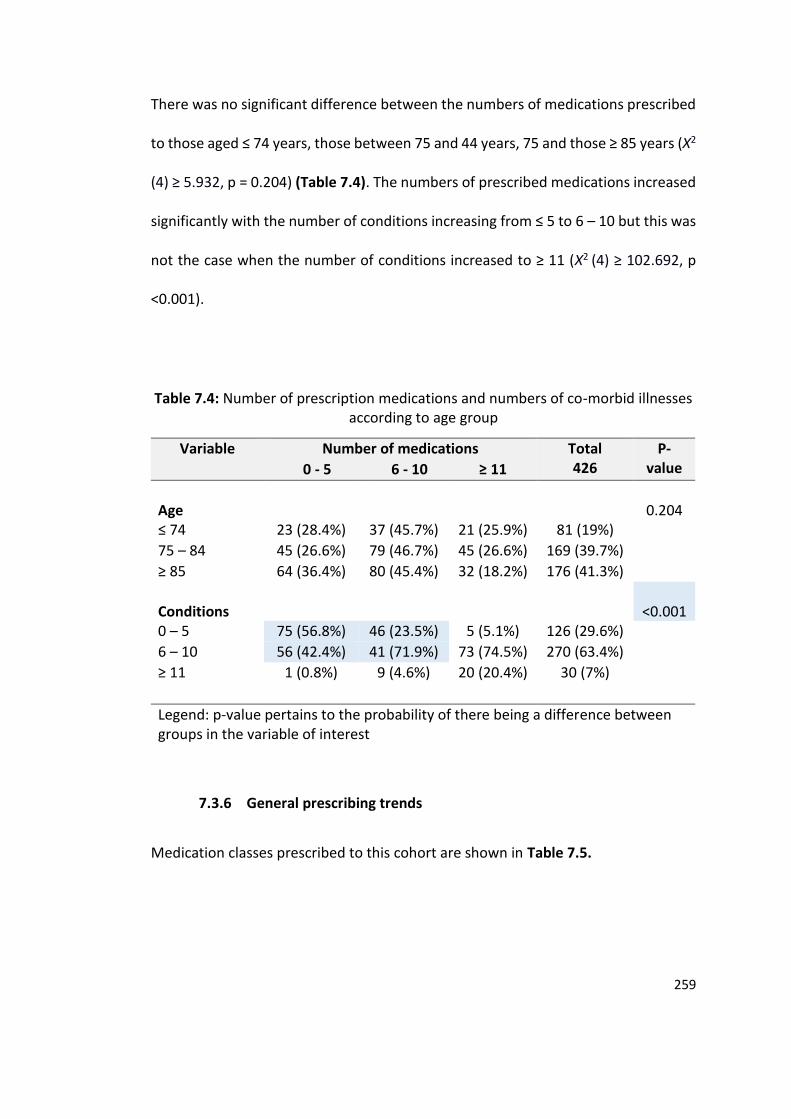
259
There was no significant difference between the numbers of medications prescribed
to those aged ≤ 74 years, those between 75 and 44 years, 75 and those ≥ 85 years (Χ2
(4) ≥ 5.932, p = 0.204) (Table 7.4). The numbers of prescribed medications increased
significantly with the number of conditions increasing from ≤ 5 to 6 – 10 but this was
not the case when the number of conditions increased to ≥ 11 (Χ2 (4) ≥ 102.692, p
<0.001).
Table 7.4: Number of prescription medications and numbers of co-morbid illnesses according to age group
Variable Number of medications Total 426
P-value 0 - 5 6 - 10 ≥ 11
Age
0.204
≤ 74 23 (28.4%) 37 (45.7%) 21 (25.9%) 81 (19%)
75 – 84 45 (26.6%) 79 (46.7%) 45 (26.6%) 169 (39.7%)
≥ 85 64 (36.4%) 80 (45.4%) 32 (18.2%) 176 (41.3%)
Conditions
<0.001
0 – 5 75 (56.8%) 46 (23.5%) 5 (5.1%) 126 (29.6%)
6 – 10 56 (42.4%) 41 (71.9%) 73 (74.5%) 270 (63.4%)
≥ 11 1 (0.8%) 9 (4.6%) 20 (20.4%) 30 (7%)
Legend: p-value pertains to the probability of there being a difference between groups in the variable of interest
7.3.6 General prescribing trends
Medication classes prescribed to this cohort are shown in Table 7.5.
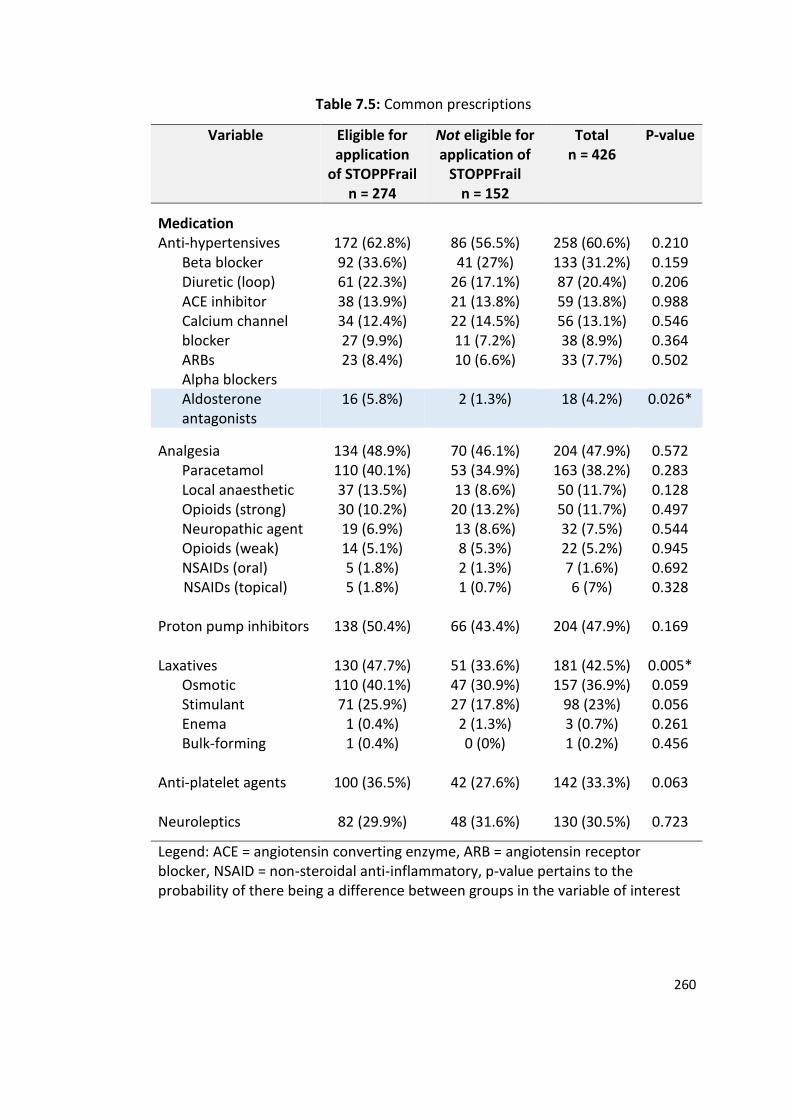
260
Table 7.5: Common prescriptions
Variable Eligible for application
of STOPPFrail n = 274
Not eligible for application of
STOPPFrail n = 152
Total n = 426
P-value
Medication
Anti-hypertensives 172 (62.8%) 86 (56.5%) 258 (60.6%) 0.210 Beta blocker Diuretic (loop) ACE inhibitor Calcium channel blocker ARBs Alpha blockers
92 (33.6%) 61 (22.3%) 38 (13.9%) 34 (12.4%) 27 (9.9%) 23 (8.4%)
41 (27%) 26 (17.1%) 21 (13.8%) 22 (14.5%) 11 (7.2%) 10 (6.6%)
133 (31.2%) 87 (20.4%) 59 (13.8%) 56 (13.1%) 38 (8.9%) 33 (7.7%)
0.159 0.206 0.988 0.546 0.364 0.502
Aldosterone antagonists
16 (5.8%) 2 (1.3%) 18 (4.2%) 0.026*
Analgesia
134 (48.9%)
70 (46.1%)
204 (47.9%)
0.572 Paracetamol Local anaesthetic Opioids (strong) Neuropathic agent Opioids (weak) NSAIDs (oral)
NSAIDs (topical)
110 (40.1%) 37 (13.5%) 30 (10.2%) 19 (6.9%) 14 (5.1%) 5 (1.8%) 5 (1.8%)
53 (34.9%) 13 (8.6%)
20 (13.2%) 13 (8.6%) 8 (5.3%) 2 (1.3%) 1 (0.7%)
163 (38.2%) 50 (11.7%) 50 (11.7%) 32 (7.5%) 22 (5.2%) 7 (1.6%) 6 (7%)
0.283 0.128 0.497 0.544 0.945 0.692 0.328
Proton pump inhibitors 138 (50.4%) 66 (43.4%) 204 (47.9%) 0.169 Laxatives
Osmotic Stimulant Enema Bulk-forming
130 (47.7%) 110 (40.1%) 71 (25.9%)
1 (0.4%) 1 (0.4%)
51 (33.6%) 47 (30.9%) 27 (17.8%)
2 (1.3%) 0 (0%)
181 (42.5%) 157 (36.9%)
98 (23%) 3 (0.7%) 1 (0.2%)
0.005* 0.059 0.056 0.261 0.456
Anti-platelet agents 100 (36.5%) 42 (27.6%) 142 (33.3%) 0.063 Neuroleptics
82 (29.9%) 48 (31.6%) 130 (30.5%) 0.723
Legend: ACE = angiotensin converting enzyme, ARB = angiotensin receptor blocker, NSAID = non-steroidal anti-inflammatory, p-value pertains to the probability of there being a difference between groups in the variable of interest
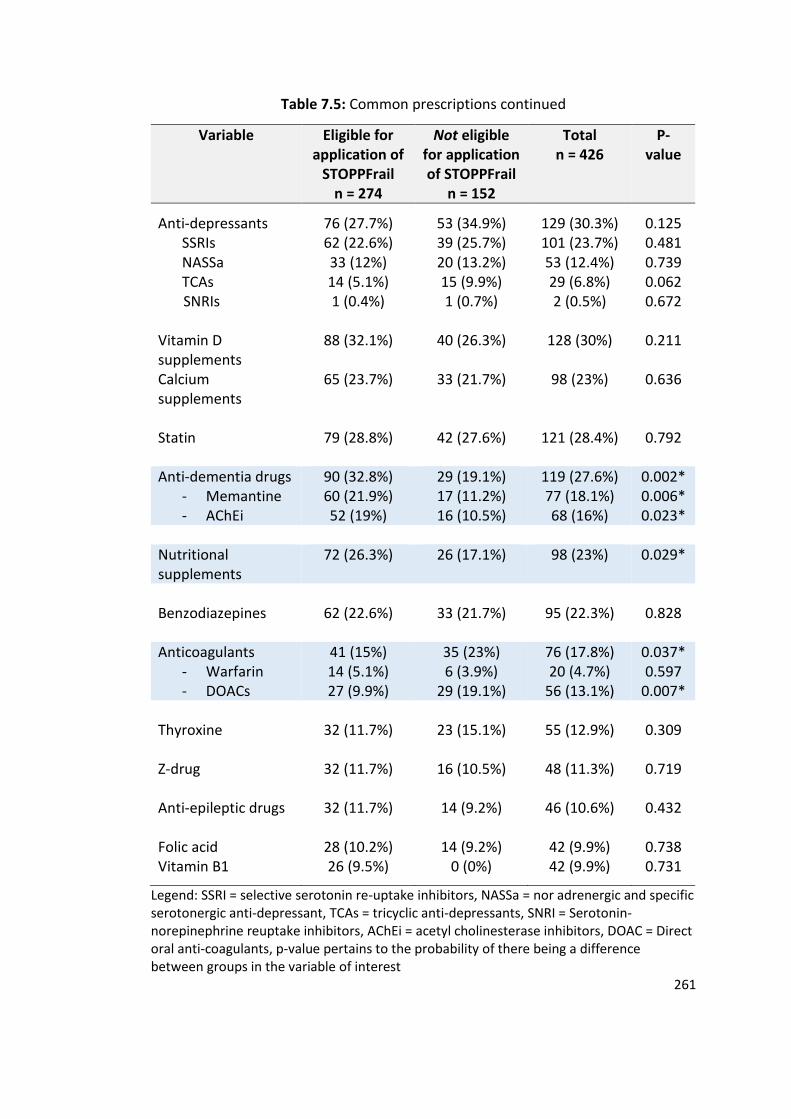
261
Table 7.5: Common prescriptions continued
Variable Eligible for application of
STOPPFrail n = 274
Not eligible for application of STOPPFrail
n = 152
Total n = 426
P-value
Anti-depressants SSRIs NASSa TCAs
SNRIs
76 (27.7%) 62 (22.6%) 33 (12%) 14 (5.1%) 1 (0.4%)
53 (34.9%) 39 (25.7%) 20 (13.2%) 15 (9.9%) 1 (0.7%)
129 (30.3%) 101 (23.7%) 53 (12.4%) 29 (6.8%) 2 (0.5%)
0.125 0.481 0.739 0.062 0.672
Vitamin D supplements
88 (32.1%) 40 (26.3%) 128 (30%) 0.211
Calcium supplements
65 (23.7%) 33 (21.7%) 98 (23%) 0.636
Statin 79 (28.8%) 42 (27.6%) 121 (28.4%) 0.792 Anti-dementia drugs
- Memantine - AChEi
90 (32.8%) 60 (21.9%) 52 (19%)
29 (19.1%) 17 (11.2%) 16 (10.5%)
119 (27.6%) 77 (18.1%) 68 (16%)
0.002* 0.006* 0.023*
Nutritional supplements
72 (26.3%) 26 (17.1%) 98 (23%) 0.029*
Benzodiazepines 62 (22.6%) 33 (21.7%) 95 (22.3%) 0.828 Anticoagulants
- Warfarin - DOACs
41 (15%) 14 (5.1%) 27 (9.9%)
35 (23%) 6 (3.9%)
29 (19.1%)
76 (17.8%) 20 (4.7%)
56 (13.1%)
0.037* 0.597
0.007* Thyroxine 32 (11.7%) 23 (15.1%) 55 (12.9%) 0.309 Z-drug 32 (11.7%) 16 (10.5%) 48 (11.3%) 0.719 Anti-epileptic drugs 32 (11.7%) 14 (9.2%) 46 (10.6%) 0.432 Folic acid 28 (10.2%) 14 (9.2%) 42 (9.9%) 0.738 Vitamin B1 26 (9.5%) 0 (0%) 42 (9.9%) 0.731
Legend: SSRI = selective serotonin re-uptake inhibitors, NASSa = nor adrenergic and specific serotonergic anti-depressant, TCAs = tricyclic anti-depressants, SNRI = Serotonin-norepinephrine reuptake inhibitors, AChEi = acetyl cholinesterase inhibitors, DOAC = Direct oral anti-coagulants, p-value pertains to the probability of there being a difference between groups in the variable of interest
262
The three most commonly prescribed medications were: (i) proton pump inhibitors
(47.9%), (ii) paracetamol (38.2%) and (iii) osmotic laxatives (36.9%). Opioids were
prescribed to 17.2% of patients, 30.5% were prescribed neuroleptics, 30.3% were
prescribed antidepressants and 11.3% of patients were prescribed Z drug hypnotics.
Patients meeting STOPPFrail eligible criteria were more likely to be prescribed
aldosterone antagonists (5.8% vs 1.3%), Χ2 (1) ≥ 4.944, p = 0.026), laxatives (40.1% vs
30.9%, Χ2 (1) ≥ 7.722, p = 0.005) and nutritional supplements (26.3% vs 17.1%, Χ2 (1)
≥ 4.789, p = 0.029). Consistent with a higher prevalence of dementia in these
patients, they were also more likely to be prescribed acetyl cholinesterase inhibitors
(21.9% vs 11.2%, Χ2 (1) ≥ 5.206, p = 0.023) and memantine (19.0% vs. 10.5%, Χ2 (1) ≥
7.578, p=0.006). In contrast, anti-coagulants were less frequently prescribed to these
STOPPFrail eligible patients (15% vs 23%, Χ2 (1) ≥ 7.287, p = 0.037).
7.3.7 Life limiting diagnoses of older adults meeting STOPPFrail eligibility
criteria
STOPPFrail eligibility criteria requires a patient to have end-stage irreversible
pathology with an associated poor one year life expectancy e.g. advanced dementia
with recurrent infections. Life-limiting conditions for those meeting STOPPFrail
eligibility criteria are displayed in Figure 7.6. One in two patients (51%) had a
diagnosis of advanced dementia with major cognitive and functional impairment, a
further 19% had advanced dementia with another life-limiting diagnosis. Those who
had dementia as a life-limiting illness were either experiencing recurrent infections
263
or maximum dependency with significant dysphasia. Those classified as “others”
included end-stage liver disease, multi-system atrophy, motor neuron disease,
multiple sclerosis and severe peripheral vascular disease.
Figure 7.6: Life limiting diagnoses in those eligible for STOPPFrail criteria (n = 274)
7.3.8 Potentially inappropriate Medication (PIM) use as determined by
STOPPFrail criteria
Applying STOPPFrail criteria, 828 of 2512 (33.0%) medicines were potentially
inappropriate. These were identified in 250 of 274 patients (91.2%) who were eligible
for STOPPFrail criteria. One PIM was identified in 38 patients (13.9%), 2 PIMs in 55
patients (20.1%), 3 PIMs in 48 patients (17.5%), 4 PIMs in 50 patients (18.2%), 5 PIMs
in 34 patients (12.4%), 6 PIMs in 17 patients (6.2%), 7 PIMs in 4 patients (1.5%), 8
PIMs in 2 patients (0.7%), 10 PIMs in 1 patient (0.4%) and 11 PIMs in 1 patient (0.4%).
Both males and females were equally likely to be prescribed 1, 2 or ≥ 3 PIMs (Χ2 (3) ≥
0.567, p = 0.904) (Figure 7.7).
58.5%
18.9%
5.7%
4.7%
3.8%
0.9%
0.9%
6.6%
0.0% 10.0% 20.0% 30.0% 40.0% 50.0% 60.0% 70.0%
Advanced dementia
Advanced dementia plus another life limitingdiagnosis
Cancer
Stroke
Chronic lung disease
Heart Failure
Parkinsons disease
Others
264
Figure 7.7: Numbers of patients on potentially inappropriate medications as determined by STOPPFrail criteria (n = 274)
The most frequently encountered PIMs identified by STOPPFrail criteria are detailed
in Table 7.6. These include (i) medications with no clear indication (47.0%), (ii) high
dose proton pump inhibitors (31.4%), (iii) lipid-lowering therapies (29.6%), (iv)
nutritional supplements (25.5%) and (v) neuroleptics (24.5%). Females were more
likely to be inappropriately prescribed medications with no clear indication (52.6% vs
24.1%, Χ2 (1) ≥ 3.84, p = 0.05), anti-platelets for primary prevention, (23.3% vs 5.5%,
Χ2 (1) ≥ 9.261, p = 0.002), calcium, (33.5% vs 6%, Χ2 (1) ≥ 20.7, p <0.001) and anti-
resorptive therapy for osteoporosis, (16.3% vs 2.5%, Χ2 (1) ≥ 9.822, p = 0.002). Males
were more likely to be prescribed alpha blockers for hypertension, (3.5% vs 0.65%,
Χ2 (1) ≥ 6.514, p = 0.011), and neuroleptics (19.6% vs 18%, Χ2 (1) ≥ 7.884, p = 0.005)
8.4%
15.1%
20.2%
56.3%
9.7%12.3%
20.0%
58.1%
0.0%
10.0%
20.0%
30.0%
40.0%
50.0%
60.0%
70.0%
0 PIMs 1 PIM 2 PIMs ≥3 PIMs
male female
265
and alpha blockers with long term catheterisation (1.5% vs 0%, Χ2 (1) ≥ 3.951, p =
0.047).
Table 7.6: Most frequently encountered potentially inappropriate prescriptions according to STOPPFrail criteria in 274 eligible patients
STOPPFrail Criterion Total n=274
A2 No clear indication 182 instances in 129 patients (47%)
E1 High dose PPI 86 instances in 86 patients (31.4%)
B1 Lipid lowering therapies 83 instances in 81 patients (29.6%)
J2 Nutritional Supplements 108 instances in 70 patients (25.5%)
D1 Neuroleptics 73 instances in 67 patients (24.5%)
G1 Calcium 64 instances in 64 patients (23.4%)
D2 Memantine 49 instances in 49 patients (17.9%)
C1 Anti-platelet for primary prevention
47 instances in 47 patients (17.1%)
G2 Anti-resorptive therapies for OP 30 instances in 30 patients (10.9%)
J1 Multivitamins 22 instances in 22 patients (8%)
I1 Diabetic oral agents 22 instances in 20 patients (7.3%)
G5 Long term oral steroids 14 instances in 14 patients (5.1%)
B2 Alpha blockers for HTN 8 instances in 8 patients (2.9%) Legend: PPI = proton pump inhibitor; OP = osteoporosis; HTN = hypertension
7.3.9 Risk factors for being prescribed a PIM as determined by
STOPPFrail criteria
Logistic regression was used to determine the influence of age, gender, dementia,
number of conditions and number of medications on the risk of receiving a
potentially inappropriate prescription according to STOPPFrail criteria. The results
are detailed in Table 7.7.
266
Table 7.7: Risk factors for receiving a PIM as determined by STOPPFrail criteria
95% CI for Exp (B)
Variable B (SE) df p-value Exp (B)
Lower Upper
Gender Female 0.10 (0.50) 1 .837 1.11 0.42 2.95
Age 65 – 74 3 .233
75 – 84 0.50 (0.72) 1 .490 1.65 0.40 6.76
85 – 94 1.14 (0.75) 1 .131 3.12 0.71 13.69
≥ 95 -0.37 (1.04) 1 .724 0.69 0.09 5.34
Dementia -0.07 (0.58) 1 .902 0.93 0.30 2.88
Medications 0.46 (0.09) 1 <0.001* 1.58 1.32 1.89
Conditions -0.11 (0.10) 1 .262 0.89 0.73 1.09
Constant -0.30 (1.00) 1 .763 0.74
Homer and Lemeshow Χ2 (8) ≥2.795, p=0.947, Model Χ2 = 125.022, Cox and Snell R2 = 0.141, Nagelkerke R2 = 0.309, B = beta-value, SE = standard error, df = degrees of freedom, CI = confidence interval, Exp (B) = Odds ratio, Medications = number of medications, Conditions = number of conditions
The number of medications a patient was prescribed was significantly associated
with an increased risk of receiving a STOPPFrail criteria PIM, controlling for gender,
age, presence of dementia and the number of medical conditions. For every one
extra medication prescribed, the odds of receiving a STOPPFrail PIM increased by
57.9% (Odds ratio 1.579, 95% CI 1.318 – 1.89, P <0.001).
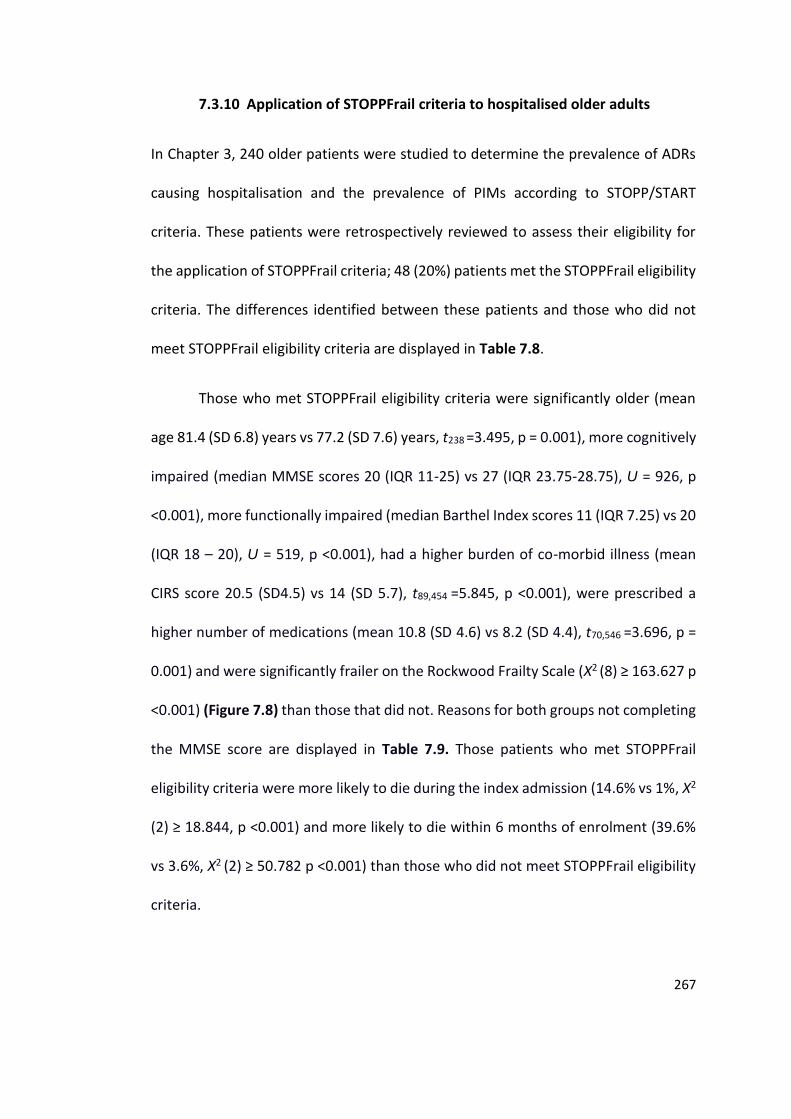
267
7.3.10 Application of STOPPFrail criteria to hospitalised older adults
In Chapter 3, 240 older patients were studied to determine the prevalence of ADRs
causing hospitalisation and the prevalence of PIMs according to STOPP/START
criteria. These patients were retrospectively reviewed to assess their eligibility for
the application of STOPPFrail criteria; 48 (20%) patients met the STOPPFrail eligibility
criteria. The differences identified between these patients and those who did not
meet STOPPFrail eligibility criteria are displayed in Table 7.8.
Those who met STOPPFrail eligibility criteria were significantly older (mean
age 81.4 (SD 6.8) years vs 77.2 (SD 7.6) years, t238 =3.495, p = 0.001), more cognitively
impaired (median MMSE scores 20 (IQR 11-25) vs 27 (IQR 23.75-28.75), U = 926, p
<0.001), more functionally impaired (median Barthel Index scores 11 (IQR 7.25) vs 20
(IQR 18 – 20), U = 519, p <0.001), had a higher burden of co-morbid illness (mean
CIRS score 20.5 (SD4.5) vs 14 (SD 5.7), t89,454 =5.845, p <0.001), were prescribed a
higher number of medications (mean 10.8 (SD 4.6) vs 8.2 (SD 4.4), t70,546 =3.696, p =
0.001) and were significantly frailer on the Rockwood Frailty Scale (Χ2 (8) ≥ 163.627 p
<0.001) (Figure 7.8) than those that did not. Reasons for both groups not completing
the MMSE score are displayed in Table 7.9. Those patients who met STOPPFrail
eligibility criteria were more likely to die during the index admission (14.6% vs 1%, Χ2
(2) ≥ 18.844, p <0.001) and more likely to die within 6 months of enrolment (39.6%
vs 3.6%, Χ2 (2) ≥ 50.782 p <0.001) than those who did not meet STOPPFrail eligibility
criteria.
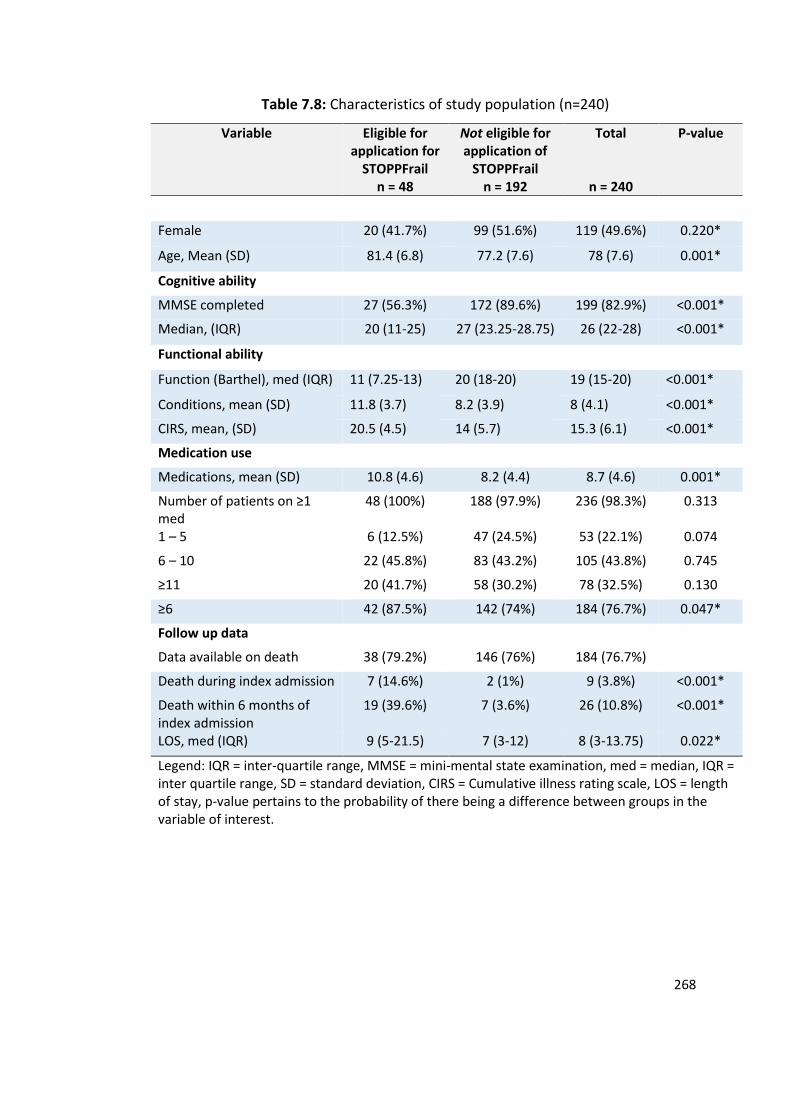
268
Table 7.8: Characteristics of study population (n=240)
Variable Eligible for application for
STOPPFrail n = 48
Not eligible for application of
STOPPFrail n = 192
Total
n = 240
P-value
Female 20 (41.7%) 99 (51.6%) 119 (49.6%) 0.220*
Age, Mean (SD) 81.4 (6.8) 77.2 (7.6) 78 (7.6) 0.001*
Cognitive ability
MMSE completed 27 (56.3%) 172 (89.6%) 199 (82.9%) <0.001*
Median, (IQR) 20 (11-25) 27 (23.25-28.75) 26 (22-28) <0.001*
Functional ability
Function (Barthel), med (IQR) 11 (7.25-13) 20 (18-20) 19 (15-20) <0.001*
Conditions, mean (SD) 11.8 (3.7) 8.2 (3.9) 8 (4.1) <0.001*
CIRS, mean, (SD) 20.5 (4.5) 14 (5.7) 15.3 (6.1) <0.001*
Medication use
Medications, mean (SD) 10.8 (4.6) 8.2 (4.4) 8.7 (4.6) 0.001*
Number of patients on ≥1 med
48 (100%) 188 (97.9%) 236 (98.3%) 0.313
1 – 5 6 (12.5%) 47 (24.5%) 53 (22.1%) 0.074
6 – 10 22 (45.8%) 83 (43.2%) 105 (43.8%) 0.745
≥11 20 (41.7%) 58 (30.2%) 78 (32.5%) 0.130
≥6 42 (87.5%) 142 (74%) 184 (76.7%) 0.047*
Follow up data
Data available on death 38 (79.2%) 146 (76%) 184 (76.7%)
Death during index admission 7 (14.6%) 2 (1%) 9 (3.8%) <0.001*
Death within 6 months of index admission
19 (39.6%) 7 (3.6%) 26 (10.8%) <0.001*
LOS, med (IQR) 9 (5-21.5) 7 (3-12) 8 (3-13.75) 0.022*
Legend: IQR = inter-quartile range, MMSE = mini-mental state examination, med = median, IQR = inter quartile range, SD = standard deviation, CIRS = Cumulative illness rating scale, LOS = length of stay, p-value pertains to the probability of there being a difference between groups in the variable of interest.
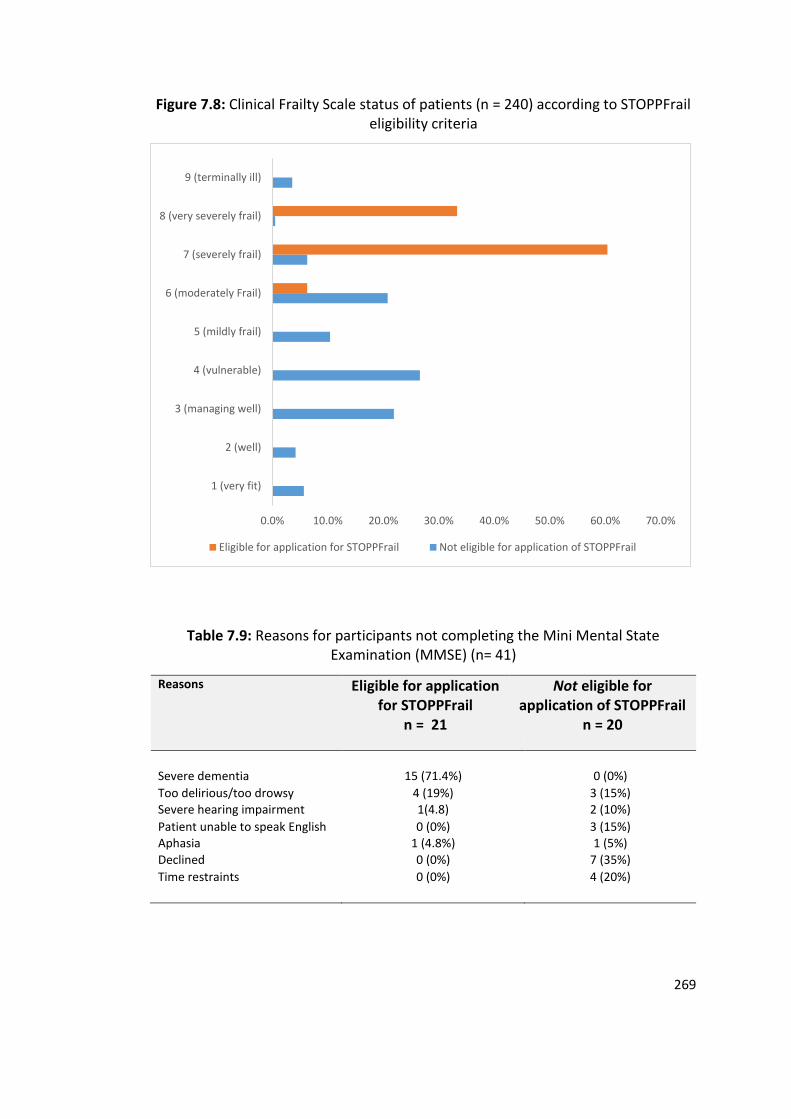
269
Figure 7.8: Clinical Frailty Scale status of patients (n = 240) according to STOPPFrail eligibility criteria
Table 7.9: Reasons for participants not completing the Mini Mental State Examination (MMSE) (n= 41)
Reasons Eligible for application for STOPPFrail
n = 21
Not eligible for application of STOPPFrail
n = 20
Severe dementia 15 (71.4%) 0 (0%)
Too delirious/too drowsy 4 (19%) 3 (15%) Severe hearing impairment 1(4.8) 2 (10%)
Patient unable to speak English 0 (0%) 3 (15%) Aphasia 1 (4.8%) 1 (5%)
Declined 0 (0%) 7 (35%)
Time restraints 0 (0%) 4 (20%)
0.0% 10.0% 20.0% 30.0% 40.0% 50.0% 60.0% 70.0%
1 (very fit)
2 (well)
3 (managing well)
4 (vulnerable)
5 (mildly frail)
6 (moderately Frail)
7 (severely frail)
8 (very severely frail)
9 (terminally ill)
Eligible for application for STOPPFrail Not eligible for application of STOPPFrail
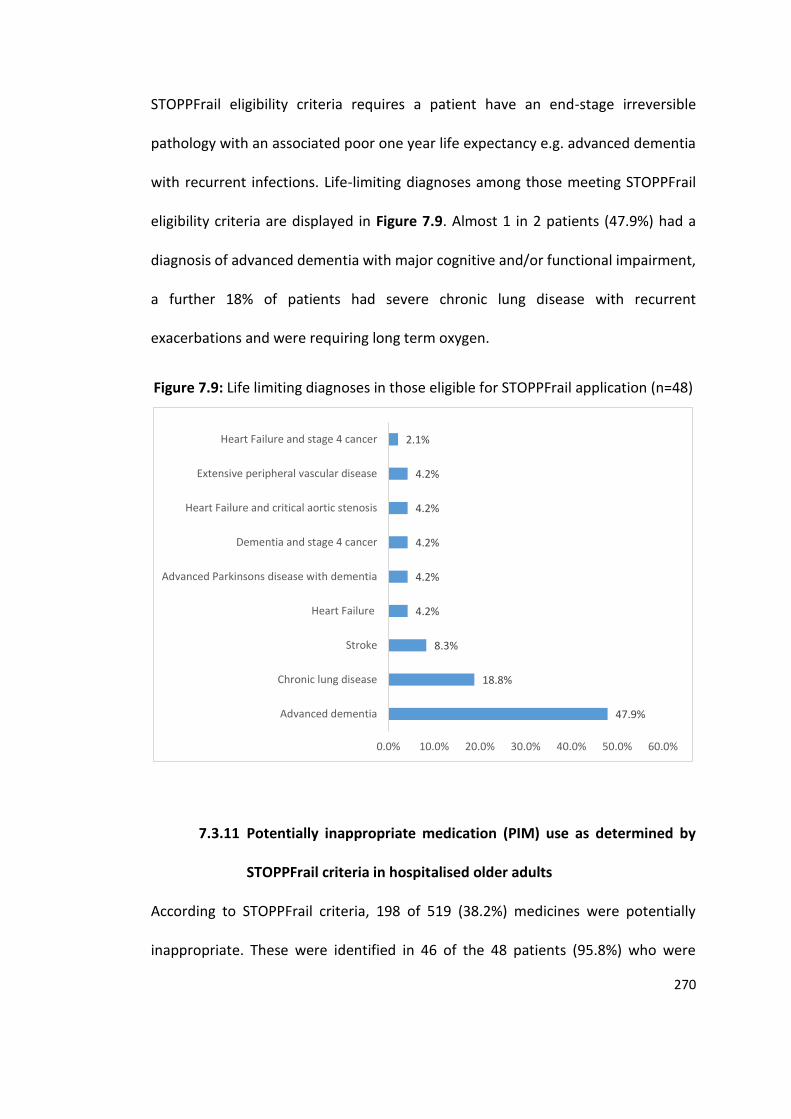
270
STOPPFrail eligibility criteria requires a patient have an end-stage irreversible
pathology with an associated poor one year life expectancy e.g. advanced dementia
with recurrent infections. Life-limiting diagnoses among those meeting STOPPFrail
eligibility criteria are displayed in Figure 7.9. Almost 1 in 2 patients (47.9%) had a
diagnosis of advanced dementia with major cognitive and/or functional impairment,
a further 18% of patients had severe chronic lung disease with recurrent
exacerbations and were requiring long term oxygen.
Figure 7.9: Life limiting diagnoses in those eligible for STOPPFrail application (n=48)
7.3.11 Potentially inappropriate medication (PIM) use as determined by
STOPPFrail criteria in hospitalised older adults
According to STOPPFrail criteria, 198 of 519 (38.2%) medicines were potentially
inappropriate. These were identified in 46 of the 48 patients (95.8%) who were
47.9%
18.8%
8.3%
4.2%
4.2%
4.2%
4.2%
4.2%
2.1%
0.0% 10.0% 20.0% 30.0% 40.0% 50.0% 60.0%
Advanced dementia
Chronic lung disease
Stroke
Heart Failure
Advanced Parkinsons disease with dementia
Dementia and stage 4 cancer
Heart Failure and critical aortic stenosis
Extensive peripheral vascular disease
Heart Failure and stage 4 cancer
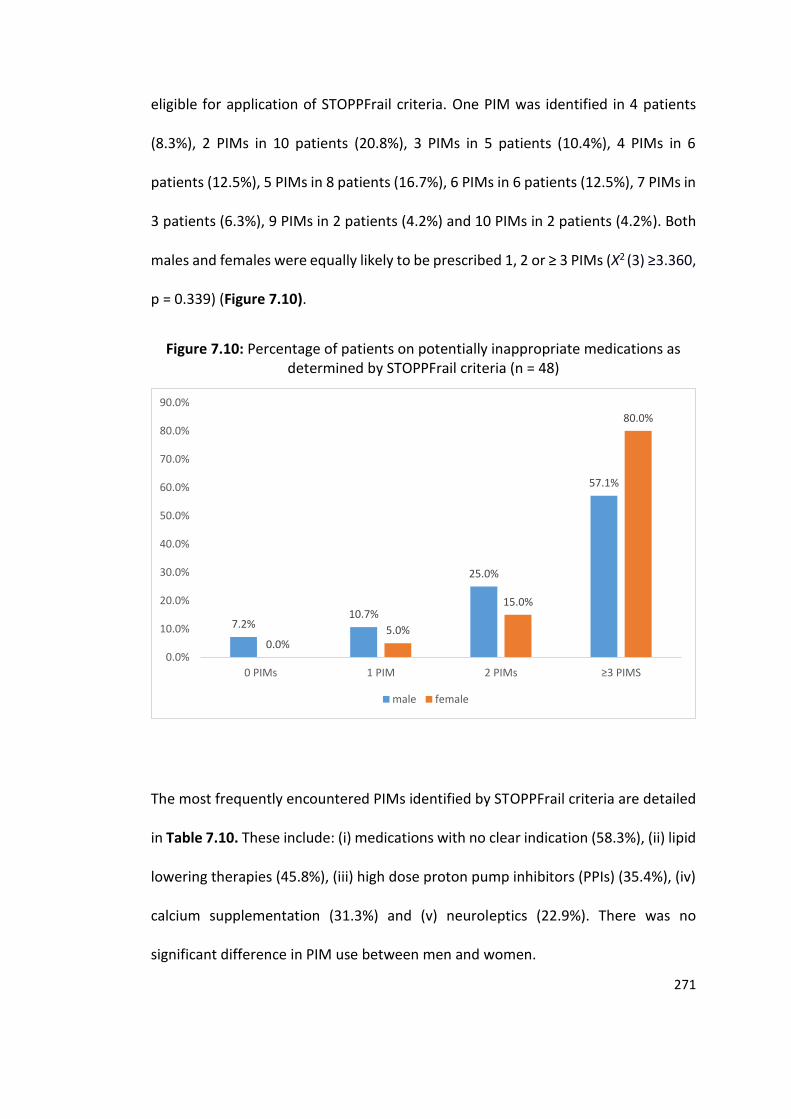
271
eligible for application of STOPPFrail criteria. One PIM was identified in 4 patients
(8.3%), 2 PIMs in 10 patients (20.8%), 3 PIMs in 5 patients (10.4%), 4 PIMs in 6
patients (12.5%), 5 PIMs in 8 patients (16.7%), 6 PIMs in 6 patients (12.5%), 7 PIMs in
3 patients (6.3%), 9 PIMs in 2 patients (4.2%) and 10 PIMs in 2 patients (4.2%). Both
males and females were equally likely to be prescribed 1, 2 or ≥ 3 PIMs (Χ2 (3) ≥3.360,
p = 0.339) (Figure 7.10).
Figure 7.10: Percentage of patients on potentially inappropriate medications as determined by STOPPFrail criteria (n = 48)
The most frequently encountered PIMs identified by STOPPFrail criteria are detailed
in Table 7.10. These include: (i) medications with no clear indication (58.3%), (ii) lipid
lowering therapies (45.8%), (iii) high dose proton pump inhibitors (PPIs) (35.4%), (iv)
calcium supplementation (31.3%) and (v) neuroleptics (22.9%). There was no
significant difference in PIM use between men and women.
7.2%10.7%
25.0%
57.1%
0.0%5.0%
15.0%
80.0%
0.0%
10.0%
20.0%
30.0%
40.0%
50.0%
60.0%
70.0%
80.0%
90.0%
0 PIMs 1 PIM 2 PIMs ≥3 PIMS
male female
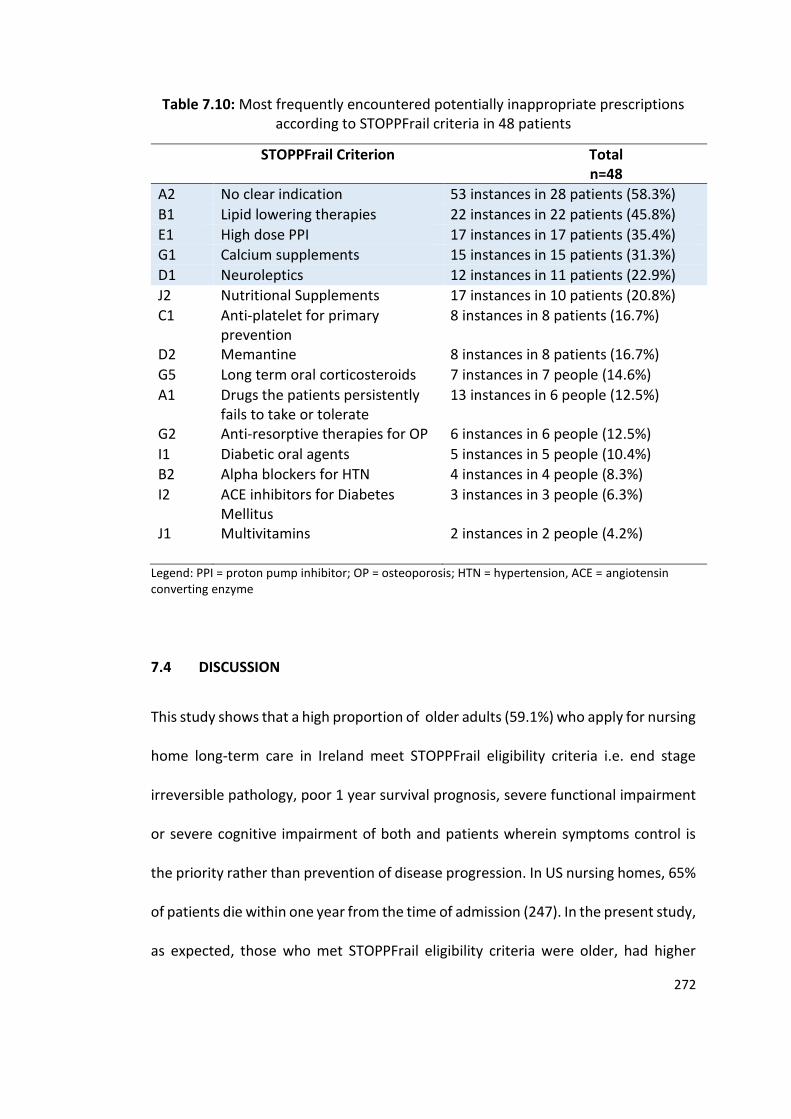
272
Table 7.10: Most frequently encountered potentially inappropriate prescriptions according to STOPPFrail criteria in 48 patients
STOPPFrail Criterion Total n=48
A2 No clear indication 53 instances in 28 patients (58.3%)
B1 Lipid lowering therapies 22 instances in 22 patients (45.8%)
E1 High dose PPI 17 instances in 17 patients (35.4%)
G1 Calcium supplements 15 instances in 15 patients (31.3%)
D1 Neuroleptics 12 instances in 11 patients (22.9%)
J2 Nutritional Supplements 17 instances in 10 patients (20.8%)
C1 Anti-platelet for primary prevention
8 instances in 8 patients (16.7%)
D2 Memantine 8 instances in 8 patients (16.7%)
G5 Long term oral corticosteroids 7 instances in 7 people (14.6%)
A1 Drugs the patients persistently fails to take or tolerate
13 instances in 6 people (12.5%)
G2 Anti-resorptive therapies for OP 6 instances in 6 people (12.5%)
I1 Diabetic oral agents 5 instances in 5 people (10.4%)
B2 Alpha blockers for HTN 4 instances in 4 people (8.3%)
I2 ACE inhibitors for Diabetes Mellitus
3 instances in 3 people (6.3%)
J1 Multivitamins 2 instances in 2 people (4.2%)
Legend: PPI = proton pump inhibitor; OP = osteoporosis; HTN = hypertension, ACE = angiotensin converting enzyme
7.4 DISCUSSION
This study shows that a high proportion of older adults (59.1%) who apply for nursing
home long-term care in Ireland meet STOPPFrail eligibility criteria i.e. end stage
irreversible pathology, poor 1 year survival prognosis, severe functional impairment
or severe cognitive impairment of both and patients wherein symptoms control is
the priority rather than prevention of disease progression. In US nursing homes, 65%
of patients die within one year from the time of admission (247). In the present study,
as expected, those who met STOPPFrail eligibility criteria were older, had higher
273
levels of cognitive impairment, were more functionally impaired and were
objectively frailer than those who did not meet STOPPFrail eligibility criteria.
Those who met STOPPFrail eligibility criteria had a significantly higher mean
number of medicated conditions (7.3 (SD 2.6) vs 6.4 (SD 2.5), p <0.001). For patients
that met STOPPFrail eligibility criteria, the most prevalent life limiting diagnosis was
advanced dementia, seen in 70% of cases. Dementia was also present, but generally
in its earlier stages in 42.8% of those not meeting STOPPFrail eligibility criteria.
Despite the fact of those who met STOPPFrail eligibility criteria having a poor
one year survival prognosis, they nevertheless received the same median number of
daily medications as those patients who did not meet STOPPFrail eligibility criteria (8
(SD4) vs 7.5 (SD3.7), p = 0.183). Approximately two thirds (69%) of all study
participants experienced polypharmacy (≥ 6 daily medications) and one quarter
(23%) experienced high-level polypharmacy (≥ 11 daily medications). No significant
differences in rates of overall polypharmacy and high-level polypharmacy were
identified between those that met STOPPFrail eligibility criteria and those that did
not (67.1% vs 69% p = 0.233 and 24.8% vs 19.7% p = 0.526, respectively). Similar
prevalence rates of 48.7% and 24.3% for overall polypharmacy (5-9 medications) and
high-level polypharmacy (≥ 10 medications), have been reported by the SHELTER
study (195).
Nearly two-thirds (60.6%) of patients were prescribed an anti-hypertensive,
approximately 1 in 2 patients (47.9%) were prescribed a proton pump inhibitor,
approximately 1 in 3 patients (33.3%) were prescribed an anti-platelet, almost 1 in 3
274
patients (30.5%) were prescribed neuroleptics, over 1 in 4 patients (28.4%) were
prescribed a statin and almost 1 in 4 (22.3%) were prescribed long-term
benzodiazepines. The prevalence of neuroleptic prescriptions in nursing homes in the
US is reported to be approximately 22% to 25% (249, 250). In other countries, varying
daily neuroleptic prevalence rates have been reported: 11% in Hong Kong, 26-27% in
Canada, 34% in Switzerland, 38% in Finland (251) and 32.8% in Europe (252). This
study suggests that the prescription of regular daily anti-psychotic medication often
precedes nursing home placement in frailer, older people in Ireland.
Potentially inappropriate prescribing was highly prevalent in this sample
population with 1 in 3 prescriptions being potentially inappropriate according to
STOPPFrail criteria and 90% of patients receiving at least 1 STOPPFrail PIM.
Approximately 1 in 7 patients (13.9%) received 1 PIM alone, 1 in 5 patients (20.1%)
received 2 PIMs and 1 in 2 patients (57.7%) received ≥3 PIMs. Approximately 1 in 2
of these patients (47%) were prescribed a medication without any clear indication.
Approximately 1 in 3 of these patients (31.4%) were prescribed a high dose, long-
term proton pump inhibitor without any clear reason. Approximately 1 in 3 (29.6%)
of these patients were prescribed a statin for long-term cardiovascular prevention.
The odds of receiving a PIM increased by 57.9% for every extra medication
prescribed.
One in five older adults (20%) presenting to hospital with an acute illness met
STOPPFrail eligibility criteria. Similar to patients who applied for nursing home
placement, those that met STOPPFrail eligibility criteria and were being admitted to
275
hospital with acute illness were older, more cognitively impaired, more functionally
impaired, had a higher burden of co-morbid illness and were frailer than those that
did not meet STOPPFrail eligibility criteria; they were also prescribed more
medications. These findings are not surprising, since eligibility for STOPPFrail criteria
means higher levels of frailty and dependency. Approximately 1 in 7 (14.6%) of those
who met STOPPFrail eligibility criteria died during the index admission. More than 1
in 3 (39.6%) patients died within 6 months of enrolment in the study. For nearly half
(47.9%) of the patients, the life-limiting diagnosis was advanced dementia. For
approximately 1 in 5 (18%) patients, the life-limiting diagnosis with chronic lung
disease with recurrent exacerbations and a need for long-term oxygen therapy.
For older adults admitted with an acute illness to hospital, nearly all patients
(95.8%) who met STOPPFrail eligibility criteria were on at least 1 STOPPFrail PIM. The
most prevalent PIMs were drugs with no clear indication, statins, high dose PPIs,
calcium supplements and neuroleptics.
Clinicians who undertake medication review of multi-morbid older people
with poor survival prognosis need to be aware of these highly prevalent PIMs,
particularly at points of care transition, such as hospital discharge and admission to
nursing homes for long-term care. Given the high prevalence of STOPPFrail PIMs
identified in the present study, there is potential for STOPPFrail to be beneficial in
routine medication review in older nursing home residents, both on admission and
during routine clinical review thereafter.
276
This study indicates that regardless of poor survival prognosis, IP, according
to STOPPFrail criteria, is highly prevalent. This suggests that prescribers are either (a)
failing to identify when patients have a poor survival prognosis, or (b) identifying
patients with a poor survival prognosis but are not adjusting their prescribing
practices accordingly. Polypharmacy and IP contribute to ADRs (160), and associated
increased morbidity and mortality. Older adults who reside in nursing homes are at
the highest risk from iatrogenic morbidity and mortality (195).
Deprescribing of PIMs in this particular population not only has the potential
to reduce ADRs, but could be economically highly beneficial, given the direct and
indirect costs associated with STOPPFrail-defined PIMs. Adults aged 85 years and
older are the fastest growing segment of the population in most developed nations
(3, 4). Multimorbidity is more prevalent in this population cohort than in any other
cohort, with prevalence rates of over 80% reported (13), with proportionately high
levels of polypharmacy and associated IP. Internationally, several studies
demonstrate the potential magnitude of health budget wastage resulting from ADRs
(113-116). In addition, the overall expenditure on prescription medications in older
people is substantial with drug costs being one of the fastest growing areas of all
healthcare expenditure in general. In Ireland, Europe and the US the annual
expenditure on drugs continues to rise in recent years (253-255). STOPPFrail criteria,
through (i) identifying the correct patient population that would benefit from
deprescribing and (ii) identifying medications that are potentially inappropriate in a
systems-based structured fashion, has the potential to guide physicians with
277
deprescribing decisions and consequently to lower costs of drug treatment and
thereby to have a positive impact on the current healthcare expenditure.
Prescribing for the older patients is often complex, particularly prescribing for
older, frailer multimorbid adults. One continuing challenge is the paucity of clinical
trial evidence to support prescribing and deprescribing in this group. Older adults
with multimorbid illness are often excluded from clinical trials and when they are
included they are, more often than not, under-represented compared to other adult
age groups (256, 257). Clinical trials often concentrate on reporting on how
efficaciously a drug works, with very little research focused on the potential impact
of deprescribing. This observational study is important in the planning of future
randomised control trials of deprescribing in older frail adults with a poor one year
survival prognosis. Power calculation in particular will be facilitated by the present
study as well as the choice of appropriate clinical trial endpoints.
The global ageing demographic shift also increases the demand for more
specialist geriatricians than are currently available. Unfortunately, in many countries,
the proportion of geriatricians to the number of persons aged over 75 is diminishing,
not rising. This results in many older complex patients being prescribed for primarily
by their General Practitioners or hospital specialists who do have specialist training
in Geriatric Medicine and pharmacotherapy. In this context, explicit tools like
STOPPFrail criteria, can assist and empower less experienced physicians with
medication management and deprescribing in complex, multimorbid older patients.

278
CHAPTER 8:
Summary & Conclusions
279
8.1 Summary of research findings
In the introduction to this thesis, I reported the demographic changes predicted for
Ireland, Europe and worldwide i.e. substantial increases in the numbers of older
frailer patients surviving with complex co-morbid illnesses. I discussed the various
challenges and considerations when prescribing for such patients. I discussed the role
of prescribing indicators in identifying potentially inappropriate prescribing in older
adults and highlighted an important deficiency in the literature, namely the lack of
an IP screening tool to guide deprescribing in frail multimorbid older adults with poor
survival prognosis. I subsequently described the negative outcomes associated with
IP, including ADRs and their associated morbidity, higher mortality and greater
healthcare costs. I discussed the challenges with current approaches employed by
researchers and physicians for identifying, classifying and reporting ADRs. I also
discussed the negative impact these varied methodologies have on the accurate
ascertainment of ADR prevalence in older adults. I emphasized how such
heterogeneity in reporting of ADRs results in difficulty with comparing prevalence
studies in the literature to date.
This thesis aimed to contribute to the medical literature by presenting a
standardized method for identification, assessment and reporting of ADRs in older
adults. To do this, I reviewed the existing literature relevant to ADR ascertainment,
including the various ADR definitions and ADR causality tools. The concept of an
Adverse Event (AE) Trigger List was subsequently developed and validated to assist
with identification of the most commonly occurring ADRs in older people using a
280
structured and unbiased process. This novel ADR assessment methodology was
found to have good inter-rater reliability (IRR) amongst physicians chosen from a
variety of clinical disciplines in everyday clinical practice. This new process of
evaluating potential ADRs related to commonly encountered AEs was then applied
to two high risk populations’ i.e. (i) older multimorbid adults attending hospital with
acute illness and (ii) patients with cancer requiring hospitalisation.
In addition, I developed and validated a new explicit prescribing tool, called
STOPPFrail criteria, through the Delphi consensus technique, to assist deprescribing
in older frailer multimorbid adults with a poor survival prognosis. This tool was
designed to aid the deprescription of commonly prescribed pharmacotherapies that
are unlikely to be beneficial in this particular patient population. The IRR of
STOPPFrail criteria was then assessed amongst physicians practising across three
different specialties and subsequently STOPPFrail criteria was applied to two
representative populations. The principle findings and conclusions of these studies
are listed below.
8.1.1 Development and validation of an AE Trigger List
The newly developed and validated AE Trigger List consists of twelve commonly
occurring clinical symptoms or syndromes that may be indicative of underlying ADRs
and thus require investigation using a standardized process to determine if this is the
case. This AE Trigger List was developed based on the type of ADRs identified in a
previous robust study of ADR prevalence in older adults (146) and augmented by
281
group consensus. The group consensus involved in the refinement of this AE Trigger
List comprised co-principal investigators and primary researchers involved in the FP7-
funded SENATOR project which began in 2012 (147). Each AE on the AE Trigger List
was given a concise definition to remove any ambiguity for the user.
This study also aimed to standardise the approach to assessing the morbidity
associated with ADRs and thus the AE Trigger List was also used to assess the inter-
dependent relationships between symptoms experienced secondary to an ADR; this
assessment was referred to as Sequence of Events. Not only were all AEs on the
Trigger List assessed for a drug cause but when a drug cause was found, the
relationship between AEs was also assessed, allowing the associated morbidity to be
captured in a structured process. The assessment of AEs on the AE Trigger List was
then sent to an adjudication committee for review where senior academic clinicians
with extensive experience in Geriatric Medicine and pharmacotherapy could agree
or disagree with the assessment undertaken.
The IRR of using this AE Trigger List was assessed amongst 21 persons, all of
whom were principal investigators and primary researchers on the SENATOR project.
The median IRR was found to be substantial for identifying ADRs. This method of
evaluating adverse events and determining whether or not they are caused by ADRs
has been used to determine the principal outcome measure in the SENATOR clinical
trial which is a large randomised controlled trial to determine the effect of SENATOR
software on incident ADRs in multimorbid older patients who are hospitalised with
acute medical and surgical illnesses (147, 150).
282
8.1.2 Prevalence of ADRs causing hospitalisation in older adults
This is one of the first studies to use a standardized approach to identify, classify and
report ADRs in older people. The AE Trigger List was applied prospectively to 240
older adults presenting to hospital with an acute unselected illness. This population
included many older frailer patients with complex co-morbid illnesses. Of the
participants studied, 44.2% were aged ≥ 80 years and 84.6% had ≥ 5 conditions. In
addition, 16.3% had moderate or severe dementia. Using Rockwood’s clinical frailty
scale, 1 in 4 older adults were severely frail, very severely frail or terminally ill.
Approximately three quarters of the patients experienced polypharmacy i.e. ≥ 6 daily
prescription drugs and one third experienced high level polypharmacy i.e. ≥ 11 daily
prescription drugs.
Potentially inappropriate prescribing practices were identified in 67.5% of
patients using STOPP criteria. Among these patients, 19.2% of prescriptions were
potentially inappropriate according to STOPP criteria. The most frequently
encountered PIMs identified by STOPP criteria were: (i) medications prescribed
beyond a recommended duration (41.3%), (ii) PPI’s for uncomplicated peptic ulcer
disease/reflux oesophagitis at full therapeutic dosage for > 8 weeks (24.6%), (iii)
medications prescribed without an evidence-based clinical indication (20%), and (iv)
use of benzodiazepines for ≥ 4 weeks (17.9%). For every additional medication
prescribed, the odds of being prescribing a PIM increased by 41.5% (odds ratio 1.415,
95% CI 1.237 – 1.619, p <0.001).
283
START criteria for potentially inappropriate prescribing omissions were
applicable in 170 of the 240 participants (70.8%). For the remaining 70 participants,
a more palliative approach to pharmacotherapy was appropriate. More than one half
of participants (52.9%) ≥ 1 PPO. The most common PPOs were: (i) omission of an ACE
inhibitor in patients with systolic heart failure and/or coronary artery disease
(12.4%), (ii) omission of bone anti-resorptive or anabolic therapy with osteoporosis
(8.2%), (iii) omission of vitamin D and calcium with osteoporosis (7.6%) and (iv)
vitamin D when housebound or experiencing falls (7.6%).
ADRs caused or significantly contributed to acute admission in 22.1% of these
patients. The most common ADRs were bleeding, falls and clinically relevant
electrolyte disturbances. The AE Trigger List identified 79.3% of these ADRs. Twenty
nine (54.7%) patients who experienced an ADR had a clear Sequence of Events
according to the Adverse Event assessment process, with women being more likely
to experience this phenomenon than men (67.9% vs 40%). The most commonly
implicated drugs were opioids, direct oral anti-coagulants and benzodiazepines. The
vast majority of ADRs (85%) were predictable. Using Hallas ADR avoidability criteria,
45.3% were definitely avoidable and 45.3% possibly avoidable. Those who
experienced ADRs had a higher burden of co-morbid illness, were prescribed more
medications and more likely to die during the index admission than patients who did
not have ADRs. For each additional prescribed medication, the odds of experiencing
an ADR increased by 10.3% (Odds ratio 1.103, 95% CI 1.006 – 1.210, p <0.001).
284
8.1.3 Prevalence of ADRs causing hospitalisation in patients with cancer
This is the first study in Ireland to identify and classify patients with cancer according
to age, burden of co-morbidity, medication and PIM use. It is also the first study
internationally to assess ADRs attributable to drugs other than cytotoxic
chemotherapeutic agents in a comprehensive manner in this population. In this
prospective study, 34.5% of all patients attending an oncology service were aged ≥
70 years and 81.1% of these older patients had ≥ 5 chronic comorbid clinical
conditions. A higher prevalence of polypharmacy and high level polypharmacy were
identified in the older patients compared to the younger patients i.e. 63.6% vs 38.4%
and 19.0% vs 7.4% respectively. In addition, older adults were less likely to be
prescribed chemotherapy. According to STOPP criteria, 73.1% of patients aged ≥ 65
years were prescribed at least one PIM and 25.3% were prescribed ≥ 3 PIMs. Similar
results emerged from application of OncPal criteria; 70.8% of older patients were
prescribed ≥ 1 PIM and 30.7% were prescribed ≥ 3 PIMs.
The 12 point AE Trigger List identified 64% of all ADRs in this population. ADRs
caused or contributed significantly to 21.5% of all oncology admissions (emergency,
elective and day unit). ADRs were more prevalent in those patients presenting to
hospital as an emergency (35.8%). ADRs were equally likely to result from cancer-
specific pharmacotherapy as non-cancer specific pharmacotherapy, with no
difference in prevalence rates identified between older and younger patients. The
three most common ADRs in the cohort were: (i) neutropenia with infection, (ii)
nausea/vomiting and (iii) major constipation. Thirty two (42.7%) of all participants
285
who experienced an ADR had a Sequence of Events. Of the 75 ADRs identified, 67
(89.3%) were entirely predictable. Using Hallas criteria of avoidability, 29.3% were
definitely avoidable, 33.3% possibly avoidable and 37.4% were unavoidable.
Chemotherapeutic agents, opioids, corticosteroids and NSAIDs were the most
commonly implicated drugs in relation to identified ADRs.
8.1.4 Validation of STOPPFrail criteria
STOPPFrail is a novel validated list of prescribing indicators for older frailer patients
with a poor survival prognosis. It is comprised of 27 prescribing indicators designed
to assist with deprescribing in a structured fashion in this particular patient
population. STOPPFrail criteria are organised according to physiological systems for
ease of use and each indicator is accompanied by a concise statement which explains
why the prescription is potentially inappropriate.
Its content validity was established by a Delphi consensus methodology, in
which a panel of seventeen experts in geriatric pharmacotherapy participated. The
inter-rater reliability of STOPPFrail application was found to be substantial amongst
twelve physicians practising in Geriatric Medicine, Palliative Medicine and General
Practice.
286
8.1.5 Prevalence of potentially inappropriate prescribing as determined
by STOPPFrail criteria
STOPPFrail criteria were applied to eligible patients from two study cohorts: (i) older
adults undergoing comprehensive geriatric assessment when applying for the Irish
Nursing Home Support Scheme towards long-term nursing home care, and (ii) older
adults presenting to hospital with an acute unselected illness admitted under the
care of specialist services other than Geriatric Medicine.
Two hundred and seventy four (59.1%) of patients applying for nursing home
placement were eligible for application of STOPPFrail criteria. Potentially
inappropriate prescribing according to STOPPFrail criteria was highly prevalent in
these patients, with 91.2% having ≥ 1 PIM and 33.0% of all prescribed medications
being potentially inappropriate according to STOPPFrail criteria. The most frequently
prescribed STOPPFrail PIMs in these frail older patients with a poor one year survival
prognosis were: (i) medications without a clear clinical indication (47%), (ii) long-
term, high dose proton pump inhibitors without a clinical indication for high-dose
therapy (31.4%), and (iii) lipid lowering therapies (statins in the great majority)
(29.4%).
Twenty percent of older adults presenting to hospital with an acute illness
were eligible for the application of STOPPFrail criteria. Potentially inappropriate
prescribing was highly prevalent in this subgroup of 48 patients, with 46 patients
(95.8%) being regularly prescribed at ≥ 1 PIM. Over one-third (38.2%) of all
medications prescribed to these frail older patients with limited life expectancy were
287
potentially inappropriate according to STOPPFrail criteria. The most frequently
prescribed STOPPFrail PIMs were: (i) medications without a clear indication (58.3%),
(ii) lipid lowering therapies (45.8%) and (iii) high dose proton pump inhibitors without
a clinical indication for high-dose therapy (35.4%). The prevalence of PIM use in older
adults eligible for STOPPFrail criteria was the same in both studies i.e. at the point of
admission to hospital with acute illness and at the point of consideration for
transition to long-term nursing home care. Such “transition of care” time points could
present viable opportunities for application of STOPPFrail criteria and effective
deprescribing of unnecessary and potentially futile medications in this particular
older patient population.
8.2 Limitations of these research findings
All participants who completed the IRR exercise on the assessment of ADRs, using
the AE Trigger List, were part of the SENATOR project. This research consortium’s
main purpose is to develop a software engine capable of advising on medication
appropriateness for older multimorbid patients with polypharmacy. In the second
phase of this project, which is currently ongoing, a multi-centred RCT is in progress
investigating whether the use of SENATOR software at the point of admission to
hospital in older multimorbid adults will reduce incident hospital ADRs compared to
standard pharmaceutical management in 6 European medical centres. It could be
argued that because these participants had a good knowledge and background on
ADR assessment prior to the IRR exercise these results are not generalizable to the
288
average physician, pharmacist or nurse working in hospital setting. However, of the
21 persons who participated, 15 were junior researchers who were either working
for their first time on a large research project or were working in the area of Geriatric
Pharmacotherapy where they hadn’t worked before. Thus, it is likely that with the
appropriate training, most healthcare staff could learn to use the AE Trigger List
effectively and identify, assess and report ADRs in a standardized manner.
Furthermore, if this standardized approach to assessing ADRs were to be used in
future research studies and RCTs, comparisons between studies would be more
reliable and determination of ADRs as trial outcomes would consequently be more
robust.
In both prospective observational studies investigating the prevalence of
ADRs (Chapters 3 and 4), ADR assessments were completed entirely by me. These
studies could possibly have been strengthened by all AE Trigger List assessments had
been sent to an adjudication panel to assess whether or not an ADR had occurred.
This has been done for the SENATOR feasibility study (150) and is currently the
methodology employed for ADR ascertainment in the SENATOR RCT. In the SENATOR
feasibility study, 21.6% of all participants experienced an incident ADR during acute
hospital admission under the care of specialist teams other than Geriatric Medicine
or Clinical Pharmacology (150). In my study investigating the prevalence of ADRs in
older patients presenting to hospital, ADRs accounted for 22.1% of all hospital
admissions, consistent with the SENATOR feasibility study. In previous meta-analyses
of ADRs causing hospitalisation and ADRs occurring during hospitalisation in older
289
adults, ADR occurrence rates of 10.0% of (83, 144) and 11.5% (84, 144), respectively
have been reported. This suggests that although under-reporting of ADRs is likely,
older adults experience ADRs at similar frequency prior to (prevalent ADRs) and
during hospital admission (incident ADRs). However, more recent studies at Cork
University Hospital have reported higher rates of 26.3% (45) and 21% (74) for
prevalence and incident ADRs respectively. My research results presented in this
thesis concur with these higher ADR prevalence and incidence findings than had been
reported previously.
The use of Delphi Consensus Methodology for the development and
validation of STOPPFrail criteria has some intrinsic limitations. This approach is not
based on rigorous scientific evidence, but rather on the informed opinions of experts
where robust scientific evidence may be lacking. Methodological concerns have
been raised regarding the Delphi method, specifically the selection of expert
panellists and the potential for bias at this stage of the process. Expertise can
sometimes be overstated and clinical knowledge in a particular area does not
necessarily equate with expert status. I have tried to be as methodologically robust
with the Delphi panel selection as possible. Panellists from 5 different and relevant
clinical practice backgrounds, who were senior academic clinicians regularly dealing
with the patient cohort in question, were selected. In addition, panellists had to have
extensive knowledge of the current literature on pharmacotherapy in frail older
people. In this way, potential bias in the Delphi panel was minimized.
290
The Delphi consensus technique employs anonymity in each of its assessment
rounds. This allows panellists to react in an unbiased fashion without influence from
other panellists when presented with particular items for assessment/judgement.
Thus each panellist’s opinion carries the same weight and importance as every other
panellist. Concerns have been raised regarding the true anonymity of this process,
with some researchers suggesting that anonymity isn’t employed when the
researcher overseeing the process knows the answers given by each panellists (258).
To avoid this, I ensured answers were returned to panellists in an anonymous
fashion. I was aware of panellists’ disciplines and was unaware of which answers
were given by whom. However, some panellists did know each other and could
possibly have discussed particular aspects of the research without my knowledge.
Lack of communication between panellists can be viewed as a strength as well as a
weakness in a particular Delphi consensus process. However, despite these intrinsic
limitations, the Delphi technique is a widely recognized and accepted approach to
achieving consensus when there is a paucity of evidence. It also allows the
development of tools which can be used to further develop or refine the evidence
base and reaffirm the original Delphi consensus. Use of the Delphi technique has
proven beneficial in the development and validation of other IP prescribing tools (36,
63, 69, 199).
STOPPFrail is a novel tool consisting of explicit deprescribing indicators in frail
older people with a poor one year survival prognosis. Therefore, it does not take into
consideration the clinical context of the prescribing decision for each individual
291
patient but rather focuses on general prescribing principles. This means that the
criteria may not be generalizable to all patients in the population that it is designed
for. However, to minimise this effect we included clinical eligibility criteria that
patients needed to have for the criteria to be appropriate and applicable. However,
some clinicians may take the view that not all of the STOPPFrail deprescribing
indicators are appropriate to all frail older patients with poor one year survival
prognosis. Nonetheless, STOPPFrail criteria provides explicit guidance and assistance
to physicians with deprescribing in this population in a structured fashion. As
guidelines and not dictats, STOPPFrail criteria allow physicians the freedom to refrain
from deprescribing if they consider that stopping a particular drug it is not in a
particular patient’s best interest.
8.3 Directions for future research
This thesis has identified several areas that warrant further investigation. Firstly, the
AE Trigger List needs to be validated in other patient populations. This method of
ADR ascertainment could potentially reduce the element of subjectivity in ADR
identification and reporting in patient populations other than multimorbid older
people with polypharmacy. If deployed in a standardized process, the AE Trigger List
has the potential to improve comparison between studies and the accuracy of the
study results. It would also make it easier for researchers to undertake meta-analyses
reporting ADR prevalence and incidence in various clinical settings. However, the AE
292
Trigger List process does not identify all potential ADRs and will always require an
additional ‘unspecified’ adverse event criterion.
Patients with cancer frequently have complex co-morbidities, complex
medication regimes and higher susceptibility to ADRs. Traditionally, these patients
are managed by specialist oncologists. However, with the increasing complexity of
prescribing regimes and high prevalence of ADRs from non-cancer pharmacotherapy
in this cohort, there is a clear role for specialist geriatricians and clinical
pharmacologists in contributing to the non-cancer therapeutic decisions in this
vulnerable patient group. The data from my study should be replicated in other
cancer centres to see if the results are similar and to identify potential areas for
intervention to reduce the risk of ADRs and related negative outcomes. Future
research could also investigate IP and ADRs in patients attending specialist radiation
oncology services. These patients represented only a small proportion of my study
population and are likely to comprise a higher number of older frailer patients than
those hospitalized under the care of medical oncologists. There is a need to
investigate incident ADRs in this population using this methodology as limited
research has been completed on this to date. Potential interventional studies could
examine the role of comprehensive geriatric assessment (CGA), IP screening tools,
prescriber education, computer-based prescribing/decision support systems and
clinical pharmacist assessments on reducing ADRs in this population.
The prevalence of potentially inappropriate prescribing according to
STOPPFrail criteria needs to be determined in other patient groups such as those
293
residing in nursing home facilities, those attending specialist palliative care services
as well as those living in the community attending hospital outpatients. Furthermore,
the practical value of implementation of STOPPFrail criteria as an intervention needs
to be tested by way of a randomised controlled trial. Its effect on key health
outcomes such as ADRs, falls, quality of life, morbidity, mortality, health care
utilisation and medication cost needs to be investigated. There is the potential for
this tool to be used in RCTs across different healthcare settings. This would allow the
evidence base to expand and support physicians with deprescribing.
Finally, many IP prescribing tools have been incorporated into electronic
prescribing decision support systems e.g. STOPP/START criteria in the current
SENATOR and OPERAM clinical trials. There is the potential for STOPPFrail to be
incorporated into an electronic prescribing system in a similar manner in both
primary and secondary care. However, this would require considerable ICT
developmental work and close collaboration between clinical and ICT experts.
Ultimately, this thesis aimed to devise strategies to improve identification,
classification and reporting of ADRs in older adults who are at particularly high risk
of serious ADRs. The work described above has also tried to develop strategies to
improve prescribing in older frailer patients with complex multimorbidity and a
limited life expectancy. Hopefully, these research findings facilitate better
prescribing decisions made for these highly vulnerable patient groups in the future.
294
CHAPTER 9:
Publications in peer-reviewed journals and awards
295
9.1 PUBLICATIONS
Chapter 1: Introduction
Lavan AH, O’Mahony D, Gallagher P. Comments on “intervention with the
screening tool of older persons potentially inappropriate
prescriptions/screening tool to alert doctors to right treatment criteria in
elderly residents of a chronic geriatric facility: a randomized clinical trial. J
Am Geriatr Soc 2015; 63(5): 1043-4. PMID 25989577
Lavan AH, O’Grady J, Gallagher P. Appropriate prescribing in the elderly:
Current Perspectives. World J Pharmacol 2015; 4(2): 193-209
Lavan AH, Gallagher P. Predicting risk of adverse drug reactions in older
adults. Ther Adv Drug Saf 2016; 7(1): 11-22. PMID 26834959
Lavan AH, Gallagher P, O’Mahony. Future perspective in drug therapy of
older adults in “Developing Drug Products in an Aging Society”. Springer
international Publishing, 2016. 737-757 (Book Chapter)
Lavan AH, Gallagher P, O’Mahony D. Methods to reduce prescribing errors
in elderly patients with multimorbidity. Clin Interv Aging 2016; 11: 857-866.
PMID 27382268
Gallagher P, Lavan AH, O’Mahony D. Prescribing for Older Patients in
“Geriatric Emergency Medicine”. Springer International Publishing, 2018.
299-313 (Book Chapter)
Chapter 2: Development and validation of an adverse drug reaction trigger list
Lavan AH, Eustace J, Dahly D, Flanagan E, Gallagher P, Cullinane S, Petrovic
M, Perehudoff K, Guðmundsson A, Sverrisdóttir Á, Samuelsson O, Cherubini
A, Dimitri F, Rimland J, Cruz-Jentoft A, Vélez-Díaz-Pallarés M, Lozano-
Montoya I, Soiza R, Subbarayan S, O’Mahony D. Incidence of adverse drugs
296
reactions in a cohort of older inpatients – a multi-centred prospective
observational study. Ther Adv Drug Saf 2018; 9 (1): 13-23
Chapter 5: STOPPFrail (Screening Tool of Older Persons Prescriptions in Frail
adults with limited life expectancy): Consensus validation
Lavan AH, Gallagher P, Parsons C, O’Mahony D. STOPPFrail (Screening Tool
of Older Persons Prescriptions in Frail adults with limited life expectancy):
consensus validation. Age Ageing 2017; 46 (4): 600-607. PMID 28119312
Lavan AH, O’Mahony D, Gallagher P. Response to Dr Caballero-Mora's
comments. Age Ageing 2017; 46 (5): 875. PMID 28874009
Chapter 6: Inter-rater reliability of STOPPFrail criteria amongst physicians from
three clinical specialty services
Lavan AH, Gallagher P, O’Mahony D. Inter-rater reliability of STOPPFrail
(Screening Tool of Older Persons Prescriptions in Frail adults with limited life
expectancy) criteria amongst 12 physicians. Eur J Clin Pharmacol 2018; 74
(3): 331-338. PMID 29159488
297
9.2 SUBMITTED PAPERS
Chapter 4: Prevalence of multimorbidity, potentially inappropriate prescribing
and adverse drug reactions (ADRs) in patients with cancer
Adverse drug reactions in an oncological population; prevalence,
predictability and preventability (The Oncologist)
Chapter 7: Prevalence of potentially inappropriate prescribing as determined by
STOPPFrail criteria in a representative population of older patients undergoing
assessment for long term nursing home placement and of older adults presenting
with acute illness to hospital
STOPPFrail criteria: application to a representative population awaiting long
term care (European Journal of Clinical Pharmacology)
9.3 AWARDS
Irish Gerontology Society, oral presentation award 2016
STOPPFrail (Screening Tool of Older Persons Prescriptions in Frail adults with limited life
expectancy): consensus validation (Chapter 5)
European Geriatric Medicine Society, best poster award 2016
STOPPFrail (Screening Tool of Older Persons Prescriptions in Frail adults with limited life
expectancy): consensus validation (Chapter 5)
Irish Society of Medical Oncology, oral presentation award 2017
The prevalence of adverse drug reactions causing hospitalisation in patients with cancer
(Chapter 4)

298
Reference List
299
1. United Nations Department of Economic and Social Affairs. World Population
Ageing. 2013.
2. Health Service Executive and Royal College of Physicians Ireland. National
Clinical Program for Older People. 2012.
3. Eurostat. Population structure and ageing. 2014.
4. National Institue on Ageing and National Institutes of Health. World Health
Organisation: Global Health and Ageing. 2011.
5. Marengoni A, Angleman S, Melis R, Mangialasche F, Karp A, Garmen A, et al.
Aging with multimorbidity: a systematic review of the literature. Ageing Res
Rev. 2011;10(4):430-9.
6. Park HL, O'Connell JE, Thomson RG. A systematic review of cognitive decline
in the general elderly population. Int J Geriatri Psychiatry. 2003;18(12):1121-
34.
7. Collard RM, Boter H, Schoevers RA, Oude Voshaar RC. Prevalence of frailty in
community-dwelling older persons: a systematic review. J Am Geriatr Soc.
2012;60(8):1487-92.
8. Feinstein AR. The pre-therapeutic classification of co-morbidity in chronic
disease. J Chronic Dis. 1970;23(7):455-68.
9. Brandlmeier P. Multimorbidity among elderly patients in an urban general
practice. ZFA (Stuttgart). 1976;52(25):1269-75.
10. World Health Organization. The World Health Report 2008. Primary Health
Care (now more than ever). New York: The World Health Report. 2008:148.
11. Violan C, Foguet-Boreu Q, Flores-Mateo G, Salisbury C, Blom J, Freitag M, et
al. Prevalence, determinants and patterns of multimorbidity in primary care:
a systematic review of observational studies. PloS one. 2014;9(7):e102149.
12. Fortin M, Stewart M, Poitras ME, Almirall J, Maddocks H. A systematic review
of prevalence studies on multimorbidity: toward a more uniform
methodology. Ann Fam Med. 2012;10(2):142-51.
13. Salive ME. Multimorbidity in older adults. Epidemiol Rev. 2013;35:75-83
300
14. Jacobs JM, Maaravi Y, Cohen A, Bursztyn M, Ein-Mor E, Stessman J. Changing
profile of health and function from age 70 to 85 years. Gerontology.
2012;58(4):313-21.
15. Nunes BP, Flores TR, Mielke GI, Thume E, Facchini LA. Multimorbidity and
mortality in older adults: A systematic review and meta-analysis. Arch
Gerontol Geriatr. 2016;67:130-8.
16. Kojima G. Prevalence of frailty in nursing homes: A systematic review and
meta-analysis. J Am Med Dir Assoc. 2015;16(11):940-5.
17. Moore KL, Boscardin WJ, Steinman MA, Schwartz JB. Patterns of chronic co-
morbid medical conditions in older residents of U.S. nursing homes:
differences between the sexes and across the agespan. J Nutr Health Aging.
2014;18(4):429-36.
18. Economic and Social Research Institute (ESRI). Projections in demand for
healthcare in Ireland. Research Series, number 67. 2017.
19. Ribbe MW, Ljunggren G, Steel K, Topinkova E, Hawes C, Ikegami N, et al.
Nursing homes in 10 nations: a comparison between countries and settings.
Age Ageing. 1997;26 Suppl 2:3-12.
20. Smith BD, Smith GL, Hurria A, Hortobagyi GN, Buchholz TA. Future of cancer
incidence in the United States: burdens upon an aging, changing nation. J Clin
Onc. 2009;27(17):2758-65.
21. Centers for Disease Control and Prevention (CDC). Trends in aging - United
States and worldwide. MMWR Morb Mort Wkly Rep. 2003;52(6):101-4, 106.
22. Mangoni. AA, Jackson SH. Age-related changes in pharmacokinestics and
pharmacodynamics: basic principles and practical applications. Br J Clin
Pharmacol. 2004;57:6-14.
23. Masnoon N, Shakib S, Kalisch-Ellett L, Caughey GE. What is polypharmacy? A
systematic review of definitions. BMC Geriatr. 2017;17(1):230.
24. Hanlon JT, Schmader KE, Ruby CM, Weinberger M. Suboptimal prescribing in
older inpatients and outpatients. J Am Geriatr Soc. 2001;49(2):200-9.
301
25. Bushardt RL, Massey EB, Simpson TW, Ariail JC, Simpson KN. Polypharmacy:
misleading, but manageable. Clin Interv Aging. 2008;3(2):383-9.
26. Duerden M, Payne R. Polypharmacy–what is it and how common is it?
Prescriber. 2014;25(21):44-7.
27. Rochon PA, Gurwitz JH. Optimising drug treatment for elderly people: the
prescribing cascade. BMJ. 1997;315(7115):1096-9.
28. Maher RL, Hanlon J, Hajjar ER. Clinical consequences of polypharmacy in
elderly. Expert Opin Drug Saf. 2014;13(1):57-65.
29. Wynne HA, Blagburn J. Drug treatment in an ageing population: practical I
mplications. Maturitas. 2010;66(3):246-50.
30. IMF Healthcare Institute for Informatics. Medicine use and shifting cost of
healthcare - A review of the use of medicines in the United States in 2013.
2014.
31. Frank C, Godwin M, Verma S, Kelly A, Birenbaum A, Seguin R, et al. What drugs
are our frail elderly patients taking? Do drugs they take or fail to take put
them at increased risk of interactions and inappropriate medication use? Can
Fam Physician. 2001;47:1198-204.
32. Drenth-van Maanen AC, Spee J, van Hensbergen L, Jansen PA, Egberts TC, van
Marum RJ. Structured history taking of medication use reveals iatrogenic
harm due to discrepancies in medication histories in hospital and pharmacy
records. J Am Geriatr Soc. 2011;59(10):1976-7.
33. Spinewine A, Schmader KE, Barber N, Hughes C, Lapane KL, Swine C, et al.
Appropriate prescribing in elderly people: how well can it be measured and
optimised? Lancet. 2007;370(9582):173-84.
34. Gallagher P, Lang PO, Cherubini A, Topinková E, Cruz-Jentoft A, Errasquín BM,
et al. Prevalence of potentially inappropriate prescribing in an acutely ill
population of older patients admitted to six European hospitals. Eur J Clin
Pharmacol. 2011;67(11):1175-88.
35. O'Connor MN, Gallagher P, O'Mahony D. Inappropriate prescribing: criteria,
detection and prevention. Drugs Aging. 2012;29(6):437-52.
302
36. Gallagher P, Ryan C, Byrne S, Kennedy J, O'Mahony D. STOPP (Screening Tool
of Older Person's Prescriptions) and START (Screening Tool to Alert doctors to
Right Treatment). Consensus validation. Int J Clin Pharmacol Ther.
2008;46(2):72-83.
37. O'Mahony D, O'Sullivan D, Byrne S, O'Connor MN, Ryan C, Gallagher P.
STOPP/START criteria for potentially inappropriate prescribing in older
people: version 2. Age Ageing. 2015;44(2):213-8.
38. Galvin R, Moriarty F, Cousins G, Cahir C, Motterlini N, Bradley M, et al.
Prevalence of potentially inappropriate prescribing and prescribing
omissions in older Irish adults: findings from The Irish LongituDinal Study on
Ageing study (TILDA). Eur J Clin Pharmacol. 2014;70(5):599-606.
39. Cahir C, Fahey T, Teeling M, Teljeur C, Feely J, Bennett K. Potentially
inappropriate prescribing and cost outcomes for older people: a national
population study. Br J Clin Pharmacol. 2010;69(5):543-52.
40. Moriarty F, Hardy C, Bennett K, Smith SM, Fahey T. Trends and interaction of
polypharmacy and potentially inappropriate prescribing in primary care over
15 years in Ireland: a repeated cross-sectional study. BMJ Open.
2015;5(9):e008656.
41. Ryan C, O'Mahony D, Kennedy J, Weedle P, Byrne S. Potentially inappropriate
prescribing in an Irish elderly population in primary care. Br J Clin Pharmacol.
2009;68(6):936-47.
42. Cahir C, Moriarty F, Teljeur C, Fahey T, Bennett K. Potentially inappropriate
prescribing and vulnerability and hospitalization in older community-dwelling
patients. Ann Pharmacother. 2014;48(12):1546-54.
43. Moriarty F, Bennett K, Fahey T, Kenny RA, Cahir C. Longitudinal prevalence of
potentially inappropriate medicines and potential prescribing omissions in a
cohort of community-dwelling older people. Eur J Clin Pharmacol.
2015;71(4):473-82.
303
44. Cahir C, Bennett K, Teljeur C, Fahey T. Potentially inappropriate prescribing
and adverse health outcomes in community dwelling older patients. Br J Clin
Pharmacol. 2014;77(1):201-10.
45. Gallagher P, O'Mahony D. STOPP (Screening Tool of Older Persons' potentially
inappropriate Prescriptions): application to acutely ill elderly patients and
comparison with Beers' criteria. Age Ageing. 2008;37(6):673-9.
46. Hamilton H, Gallagher P, Ryan C, Byrne S, O'Mahony D. Potentially
inappropriate medications defined by STOPP criteria and the risk of adverse
drug events in older hospitalized patients. Arch Intern Med.
2011;171(11):1013-9.
47. McMahon CG, Cahir CA, Kenny RA, Bennett K. Inappropriate prescribing in
older fallers presenting to an Irish emergency department. Age Ageing. 2
014;43(1):44-50.
48. Grace AR, Briggs R, Kieran RE, Corcoran RM, Romero-Ortuno R, Coughlan TL,
et al. A comparison of beers and STOPP criteria in assessing potentially
inappropriate medications in nursing home residents attending the
emergency department. J Am Med Dir Ass. 2014;15(11):830-4.
49. Ryan C, O'Mahony D, Kennedy J, Weedle P, Cottrell E, Heffernan M, et al.
Potentially inappropriate prescribing in older residents in Irish nursing homes.
Age Ageing. 2013;42(1):116-20.
50. O'Sullivan DP, O'Mahony D, Parsons C, Hughes C, Murphy K, Patterson S, et
al. A prevalence study of potentially inappropriate prescribing in Irish long-
term care residents. Drugs Aging. 2013;30(1):39-49.
51. Crome P, Lally F, Cherubini A, Oristrell J, Beswick AD, Clarfield AM, et al.
Exclusion of older people from clinical trials: professional views from nine
European countries participating in the PREDICT study. Drugs Aging.
2011;28(8):667-77.
52. Rochon PA, Gurwitz JH. Prescribing for seniors: neither too much nor too
little. JAMA. 1999;282(2):113-5.
304
53. Wolf PA, Abbott RD, Kannel WB. Atrial fibrillation as an independent risk
factor for stroke: the Framingham Study. Stroke. 1991;22(8):983-8.
54. Lake FR, Cullen KJ, de Klerk NH, McCall MG, Rosman DL. Atrial fibrillation and
mortality in an elderly population. Aust NZ J Med. 1989;19(4):321-6.
55. Furberg CD, Psaty BM, Manolio TA, Gardin JM, Smith VE, Rautaharju PM.
Prevalence of atrial fibrillation in elderly subjects (the Cardiovascular Health
Study). Am J Cardiol. 1994;74(3):236-41.
56. Elliott RA, Woodward MC, Oborne CA. Antithrombotic prescribing in atrial
fibrillation: application of a prescribing indicator and multidisciplinary
feedback to improve prescribing. Age Ageing. 2002;31(5):391-6.
57. Barry PJ, Gallagher P, Ryan C, O'Mahony D. START (screening tool to alert
doctors to the right treatment)--an evidence-based screening tool to detect
prescribing omissions in elderly patients. Age Ageing. 2007;36(6):632-8.
58. Sengstock D, Vaitkevicius P, Salama A, Mentzer RM. Under-prescribing and
non-adherence to medications after coronary bypass surgery in older adults:
strategies to improve adherence. Drugs Aging. 2012;29(2):93-103.
59. Murray MD, Morrow DG, Weiner M, Tu W, Deer MM, Brater DC, et al. A
conceptual framework to study medication adherence in older adults. Am J
Geriatr Pharmacother. 2004;2(1):36-43.
60. Lindley CM, Tully MP, Paramsothy V, Tallis RC. Inappropriate medication is a
major cause of adverse drug reactions in elderly patients. Age Ageing.
1992;21(4):294-300.
61. Hanlon JT, Schmader KE, Samsa GP, Weinberger M, Uttech KM, Lewis IK, et
al. A method for assessing drug therapy appropriateness. J Clin Epidemiol.
1992;45(10):1045-51.
62. Samsa GP, Hanlon JT, Schmader KE, Weinberger M, Clipp EC, Uttech KM, et
al. A summated score for the medication appropriateness index:
development and assessment of clinimetric properties including content
validity. J Clin Epidemiol. 1994;47(8):891-6.
305
63. Beers MH, Ouslander JG, Rollingher I, Reuben DB, Brooks J, Beck JC. Explicit
criteria for determining inappropriate medication use in nursing home
residents. UCLA Division of Geriatric Medicine. Arch Intern Med.
1991;151(9):1825-32.
64. Beers MH. Explicit criteria for determining potentially inappropriate
medication use by the elderly. An update. Arch Intern Med.
1997;157(14):1531-6.
65. Fick DM, Cooper JW, Wade WE, Waller JL, Maclean JR, Beers MH. Updating
the Beers criteria for potentially inappropriate medication use in older adults:
results of a US consensus panel of experts. Arch Intern Med.
2003;163(22):2716-24.
66. Fick DM, Semla TP. 2012 American Geriatrics Society Beers Criteria: new year,
new criteria, new perspective. J Am Geriatr Soc. 2012;60(4):614-5.
67. American Geriatrics Society 2015 Beers Criteria Update Expert Panel.
American Geriatrics Society 2015 Updated Beers Criteria for Potentially
Inappropriate Medication Use in Older Adults. J Am Geriatr Soc.
2015;63(11):2227-46.
68. Wehling M. [Drug therapy in the elderly: too much or too little, what to do?
A new assessment system: fit for the aged (FORTA]. Dtsch Med Wochenschr.
2008;133(44):2289-91.
69. Kuhn-Thiel AM, Weiss C, Wehling M. Consensus validation of the FORTA (Fit
fOR The Aged) List: a clinical tool for increasing the appropriateness of
pharmacotherapy in the elderly. Drugs Aging. 2014;31(2):131-40.
70. Basger BJ, Chen TF, Moles RJ. Inappropriate medication use and prescribing
indicators in elderly Australians: development of a prescribing indicators tool.
Drugs Aging. 2008;25(9):777-93.
71. Kaufmann CP, Tremp R, Hersberger KE, Lampert ML. Inappropriate
prescribing: a systematic overview of published assessment tools. Eur J Clin
Pharmacol. 2014;70(1):1-11.
306
72. Dalleur O, Boland B, Losseau C, Henrard S, Wouters D, Speybroeck N, et al.
Reduction of potentially inappropriate medications using the STOPP criteria
in frail older inpatients: a randomised controlled study. Drugs Aging.
2014;31(4):291-8.
73. Frankenthal D, Lerman Y, Kalendaryev E, Lerman Y. Intervention with the
screening tool of older persons potentially inappropriate
prescriptions/screening tool to alert doctors to right treatment criteria in
elderly residents of a chronic geriatric facility: a randomized clinical trial. J Am
Geriatr Soc. 2014;62(9):1658-65.
74. O'Connor MN, O'Sullivan D, Gallagher PF, Eustace J, Byrne S, O'Mahony D.
Prevention of Hospital-Acquired Adverse Drug Reactions in Older People
Using Screening Tool of Older Persons' Prescriptions and Screening Tool to
Alert to Right Treatment Criteria: A Cluster Randomized Controlled Trial. J Am
Geriatr Soc. 2016;64(8):1558-66.
75. World Health Organisation. International drug monitoring: the role of
national centres. 1972.
76. Laurence D CJ. A dictionary of pharmacology and allied topics, 2nd edn:
Amsterdam: Elsevier; 1998.
77. Bates DW, Boyle DL, Vander Vliet MB, Schneider J, Leape L. Relationship
between medication errors and adverse drug events. J Gen Int Med.
1995;10(4):199-205.
78. Bates DW, Cullen DJ, Laird N, Petersen LA, Small SD, Servi D, et al. Incidence
of adverse drug events and potential adverse drug events. Implications for
prevention. ADE Prevention Study Group. JAMA. 1995;274(1):29-34.
79. Edwards IR, Aronson JK. Adverse drug reactions: definitions, diagnosis, and
management. Lancet. 2000;356(9237):1255-9.
80. Nebeker JR, Barach P, Samore MH. Clarifying adverse drug events: a clinician's
guide to terminology, documentation, and reporting. Ann Int Med.
2004;140(10):795-801.
307
81. Rawlins M, Thompson J. Pathogenesis of adverse drug reactions. In: Davies
DM, editor. Textbook of adverse drug reactions: Oxford: Oxford University
Press; 1977. p. 10.
82. Beijer HJ, de Blaey CJ. Hospitalisations caused by adverse drug reactions
(ADR): a meta-analysis of observational studies. Pharm World Sci:
2002;24(2):46-54.
83. Kongkaew C, Noyce PR, Ashcroft DM. Hospital admissions associated with
adverse drug reactions: a systematic review of prospective observational
studies. Annals Pharmacother. 2008;42(7):1017-25.
84. Lazarou J, Pomeranz BH, Corey PN. Incidence of adverse drug reactions in
hospitalized patients: a meta-analysis of prospective studies. JAMA.
1998;279(15):1200-5.
85. Hanlon JT, Schmader KE, Koronkowski MJ, Weinberger M, Landsman PB,
Samsa GP, et al. Adverse drug events in high risk older outpatients. J Am
Geriatr Soc. 1997;45(8):945-8.
86. Cooper JW. Probable adverse drug reactions in a rural geriatric nursing home
population: a four-year study. J Am Geriatr Soc. 1996;44(2):194-7.
87. Hajjar ER, Hanlon JT, Artz MB, Lindblad CI, Pieper CF, Sloane RJ, et al. Adverse
drug reaction risk factors in older outpatients. Tam J Geriatr Pharmacother.
2003;1(2):82- 9.
88. Viktil KK, Blix HS, Moger TA, Reikvam A. Polypharmacy as commonly defined
is an indicator of limited value in the assessment of drug-related problems. Br
J Clin Pharmacol. 2007;63(2):187-95.
89. Juurlink DN, Mamdani MM, Kopp A, Rochon PA, Shulman KI, Redelmeier DA.
Drug-induced lithium toxicity in the elderly: a population-based study. J Am
Geriatr Soc. 2004;52(5):794-8.
90. Holbrook AM, Pereira JA, Labiris R, McDonald H, Douketis JD, Crowther M, et
al. Systematic overview of warfarin and its drug and food interactions. Arch
Intern Med. 2005;165(10):1095-106.
308
91. Shorr RI, Ray WA, Daugherty JR, Griffin MR. Concurrent use of nonsteroidal
anti-inflammatory drugs and oral anticoagulants places elderly persons at
high risk for hemorrhagic peptic ulcer disease. Arch Intern Med.
1993;153(14):1665-70.
92. Battistella M, Mamdami MM, Juurlink DN, Rabeneck L, Laupacis A. Risk of
upper gastrointestinal hemorrhage in warfarin users treated with
nonselective NSAIDs or COX-2 inhibitors. Arch Intern Med. 2005;165(2):189-
92.
93. Juurlink DN, Mamdani M, Kopp A, Laupacis A, Redelmeier DA. Drug-drug
interactions among elderly patients hospitalized for drug toxicity. JAMA.
2003;289(13):1652-8.
94. Goldberg RM, Mabee J, Chan L, Wong S. Drug-drug and drug-disease
interactions in the ED: analysis of a high-risk population. Am J Emer Med.
1996;14(5):447-50.
95. Denham MJ. Adverse drug reactions. Br Med Bull. 1990;46(1):53-62.
96. Hajjar ER, Cafiero AC, Hanlon JT. Polypharmacy in elderly patients. Am J
Geriatr Pharmacother. 2007;5(4):345-51.
97. Klarin I, Wimo A, Fastbom J. The association of inappropriate drug use with
hospitalisation and mortality. Drugs Aging. 2005;22(1):69-82.
98. Lau DT, Kasper JD, Potter DE, Lyles A, Bennett RG. Hospitalization and death
associated with potentially inappropriate medication prescriptions among
elderly nursing home residents. Arch Intern Med. 2005;165(1):68-74.
99. Chiatti C, Bustacchini S, Furneri G, Mantovani L, Cristiani M, Misuraca C, et al.
The economic burden of inappropriate drug prescribing, lack of adherence
and compliance, adverse drug events in older people: a systematic review.
Drug Saf. 2012;35 Suppl 1:73-87.
100. Hedna K, Hakkarainen KM, Gyllensten H, Jonsson AK, Petzold M, Hagg S.
Potentially inappropriate prescribing and adverse drug reactions in the
elderly: a population-based study. Eur J Clin Pharmacol. 2015;71(12):1525-33.
309
101. Lund BC, Carnahan RM, Egge JA, Chrischilles EA, Kaboli PJ. Inappropriate
prescribing predicts adverse drug events in older adults. Ann Pharmacother.
2010;44(6):957-63.
102. Page RL, 2nd, Ruscin JM. The risk of adverse drug events and hospital-related
morbidity and mortality among older adults with potentially inappropriate
medication use. Am J Geriatr Pharmacother. 2006;4(4):297-305.
103. Hanlon JT, Schmader KE. What types of inappropriate prescribing predict
adverse drug reactions in older adults? Ann Pharmacother. 2010;44(6):1110-
1.
104. Liu CL, Peng LN, Chen YT, Lin MH, Liu LK, Chen LK. Potentially inappropriate
prescribing (IP) for elderly medical inpatients in Taiwan: a hospital-based
study. Arch Gerontol Geriatr. 2012;55(1):148-51.
105. Rademaker M. Do women have more adverse drug reactions? Am J Clin Derm.
2001;2(6):349-51.
106. Soldin OP, Chung SH, Mattison DR. Sex differences in drug disposition. J
Biomed Biotechnol. 2011;2011:187103.
107. Wilke RA, Lin DW, Roden DM, Watkins PB, Flockhart D, Zineh I, et al.
Identifying genetic risk factors for serious adverse drug reactions: current
progress and challenges. Nat Rev Drug Discov. 2007;6(11):904-16.
108. Meyer UA. Pharmacogenetics and adverse drug reactions. Lancet.
2000;356(9242):1667-71.
109. Davies EC, Green CF, Taylor S, Williamson PR, Mottram DR, Pirmohamed M.
Adverse drug reactions in hospital in-patients: a prospective analysis of 3695
patient-episodes. PloS one. 2009;4(2):e4439.
110. Rottenkolber D, Schmiedl S, Rottenkolber M, Thuermann PA, Hasford J. Drug-
induced blood consumption: the impact of adverse drug reactions on demand
for blood components in German departments of internal medicine. Basic Clin
pharmacol Toxicol. 2012;111(4):240-7.
310
111. Shepherd G, Mohorn P, Yacoub K, May DW. Adverse drug reaction deaths
reported in United States vital statistics, 1999-2006. Ann Pharmacother.
2012;46(2):169-75.
112. Khan LM. Comparative epidemiology of hospital-acquired adverse drug
reactions in adults and children and their impact on cost and hospital stay--a
systematic review. Eur J Clin Pharmacol. 2013;69(12):1985-96.
113. Moore N, Lecointre D, Noblet C, Mabille M. Frequency and cost of serious
adverse drug reactions in a department of general medicine. Br J Clin
Pharmacol. 1998;45(3):301-8.
114. Pirmohamed M, James S, Meakin S, Green C, Scott AK, Walley TJ, et al.
Adverse drug reactions as cause of admission to hospital: prospective analysis
of 18 820 patients. BMJ. 2004;329(7456):15-9.
115. Leendertse AJ, Van Den Bemt PM, Poolman JB, Stoker LJ, Egberts AC, Postma
MJ. Preventable hospital admissions related to medication (HARM): cost
analysis of the HARM study. Value Health. 2011;14(1):34-40.
116. Rottenkolber D, Schmiedl S, Rottenkolber M, Farker K, Salje K, Mueller S, et
al. Adverse drug reactions in Germany: direct costs of internal medicine
hospitalizations. Pharmacoepidemiol Drug Saf. 2011;20(6):626-34.
117. Hire RC, Kinage P, Gaikwad N. Causality Assessment in Pharmacovigilance: A
Step Towards Quality Care. Sch J App Med Sci. 2013;1(5):386-92.
118. Wiholm BE. The Swedish drug-event assessment methods. Special workshop-
regulatory. Drug Inf J. 1984;18(3-4):267-9.
119. World Health Organisation Uppsala Monitoring Centre. The use of the WHO-
UMC system for standardized case causality assessment. Available at:
http://www.who-umc.org/graphics/4409.pdf.
120. Dangoumau J, Evreux JC, Jouglard J. [Mehtod for determination of
undesirable effects of drugs]. Therapie. 1978;33(3):373-81.
121. Kramer MS, Leventhal JM, Hutchinson TA, Feinstein AR. An algorithm for the
operational assessment of adverse drug reactions. I. Background, description,
and instructions for use. JAMA. 1979;242(7):623-32.
311
122. Naranjo CA, Busto U, Sellers EM, Sandor P, Ruiz I, Roberts EA, et al. A method
for estimating the probability of adverse drug reactions. Clin Pharmacol Ther.
1981;30(2):239-45.
123. Lagier G, Vincens M, Castot A. [Imputability in drug monitoring. Principles of
the balanced drug reaction assessment method and principal errors to avoid].
Therapie. 1983;38(3):303-18.
124. Castle WM. Assessment of causality in industrial settings. Drug Inf J.
1984;18:297-302.
125. Venulet J, Ciucci A, Berneker GC. Standardized assessment of drug-adverse
reaction associations--rationale and experience. Int J Clin Pharmacol Ther
Toxicol. 1980;18(9):381-8.
126. Loupi E, Ponchon AC, Ventre JJ, Evreux JC. [Imputability of a teratogenic
effect]. Therapie. 1986;41(3):207-10.
127. Danan G, Benichou C. Causality assessment of adverse reactions to drugs--I.
A novel method based on the conclusions of international consensus
meetings: application to drug-induced liver injuries. J Clin Epidemiol.
1993;46(11):1323-30.
128. Maria VA, Victorino RM. Development and validation of a clinical scale for the
diagnosis of drug-induced hepatitis. Hepatology (Baltimore, Md).
1997;26(3):664-9.
129. Horn JR, Hansten PD, Chan LN. Proposal for a new tool to evaluate drug
interaction cases. Ann Pharmacother. 2007;41(4):674-80.
130. Naranjo CA LK. A consultant‟s view on the role of Bayesian differential
diagnosis in the safety assessment of pharmaceuticals. Drug Inf J
1992;26:593-601.
131. Reeve E, Gnjidic D, Long J, Hilmer S. A systematic review of the emerging
definition of 'deprescribing' with network analysis: implications for future
research and clinical practice. Br J Clin Pharmacol. 2015;80(6):1254-68.
312
132. Ailabouni NJ, Nishtala PS, Mangin D, Tordoff JM. Challenges and Enablers of
Deprescribing: A General Practitioner Perspective. PloS one.
2016;11(4):e0151066.
133. Palagyi A, Keay L, Harper J, Potter J, Lindley RI. Barricades and brickwalls – a
qualitative study exploring perceptions of medication use and deprescribing
in long-term care. BMC Geriatr. 2016;16(1):1-11.
134. Harriman K, Howard L, McCracken R. Deprescribing medication for frail
elderly patients in nursing homes: A survey of Vancouver family physicians.
British Columbia Medical Journal. 2014;56(9).
135. Nyborg G, Straand J, Klovning A, Brekke M. The Norwegian General Practice-
Nursing Home criteria (NORGEP-NH) for potentially inappropriate medication
use: A web-based Delphi study. Scand J Prim Health Care. 2015;33(2):134-41.
136. Maddison AR, Fisher J, Johnston G. Preventive medication use among persons
with limited life expectancy. Prog Palliat Care. 2011;19(1):15-21.
137. Vollrath AM, Sinclair C, Hallenbeck J. Discontinuing cardiovascular
medications at the end of life: lipid-lowering agents. J Palliat Med.
2005;8(4):876-81.
138. Holmes HM, Hayley DC, Alexander GC, Sachs GA. Reconsidering medication
appropriateness for patients late in life. Arch Intern Med. 2006;166(6):605-9.
139. Walter LC, Brand RJ, Counsell SR, Palmer RM, Landefeld CS, Fortinsky RH, et
al. Development and validation of a prognostic index for 1-year mortality in
older adults after hospitalization. JAMA. 2001;285(23):2987-94.
140. Yourman LC, Lee SJ, Schonberg MA, Widera EW, Smith AK. Prognostic indices
for older adults: a systematic review. JAMA. 2012;307(2):182-92.
141. Azzopardi RV, Vermeiren S, Gorus E, Habbig AK, Petrovic M, Van Den
Noortgate N, et al. Linking Frailty Instruments to the International
Classification of Functioning, Disability, and Health: A Systematic Review. J
Am Med Dir Assoc. 2016;17(11):1066.e1-.e11.
142. Soong J, Poots AJ, Scott S, Donald K, Woodcock T, Lovett D, et al. Quantifying
the prevalence of frailty in English hospitals. BMJ Open. 2015;5(10):e008456.
313
143. Kojima G. Prevalence of Frailty in Nursing Homes: A Systematic Review and
Meta-Analysis. J Am Med Dir Assoc. 2015;16(11):940-5.
144. Alhawassi TM, Krass I, Bajorek BV, Pont LG. A systematic review of the
prevalence and risk factors for adverse drug reactions in the elderly in the
acute care setting. Clin Interv Aging. 2014;9:2079-86.
145. Bordet R, Gautier S, Le Louet H, Dupuis B, Caron J. Analysis of the direct cost
of adverse drug reactions in hospitalised patients. Eur J Clin Pharmacol.
2001;56(12):935-41.
146. Onder G, Petrovic M, Tangiisuran B, Meinardi MC, Markito-Notenboom WP,
Somers A, et al. Development and validation of a score to assess risk of
adverse drug reactions among in-hospital patients 65 years or older: the
GerontoNet ADR risk score. Arch Intern Med. 2010;170(13):1142-8.
147. http://www.senator-project.eu/the-group/consortium/
148. O'connor MN, Gallagher P, Byrne S, O'mahony D. Adverse drug reactions in
older patients during hospitalisation: are they predictable? Age Ageing.
2012;41(6):771-6.
149. Budnitz DS, Lovegrove MC, Shehab N, Richards CL. Emergency `
hospitalizations for adverse drug events in older Americans. N Engl J Med.
2011;365(21):2002-12
150. Lavan A, Eustace J, Dahly D, Flanagan E, Gallagher P, Cullinane S, et al. Incident
adverse drug reactions in geriatric inpatients: a multicentred observational
study. Ther Adv Drug Saf. 2017:2042098617736191.
151. Hartwig SC, Siegel J, Schneider PJ. Preventability and severity assessment in
reporting adverse drug reactions. Am J Hosp Pharm. 1992;49(9):2229-32.
152. Lavan AH, Gallagher P. Predicting risk of adverse drug reactions in older
adults. Ther Adv Drug Saf.. 2015:2042098615615472.
153. Landis JR, Koch GG. The measurement of observer agreement for categorical
data. Biometrics. 1977;33(1):159-74.
154. Silva MDDG, Martins MAP, Viana LG, PAssaglia LG, de Menezes RR, Oliverira
JAQ et al. Evaluation of accurace of iHI Trigger Tool in identifying adverse
314
drug events: a prospective observational study. Br J Clin Pharmacol. 2018
(Epub ahead of print)
155. Guzmán T, Banqueri GM, Otero MJ, Alfaro Lara ER, Casaius Lagrania P, Santos
Ramos B. Development of a Trigger Tool to Identify Adverse Drug Events in
Elderly Patients with Multimorbidity. J Patient Saf. 2017. (Epub ahead of print)
156. Linn BS, Linn MW, Gurel LEE. CUMULATIVE ILLNESS RATING SCALE. J Am
Geriatr Soc. 1968;16(5):622-6.
157. Mahoney FI, Barthel DW. Functional Avaluation: The Barthel Index. Md State
Med J. 1965;14:61-5.
158. Folstein MF, Folstein SE, McHugh PR. "Mini-mental state". A practical method
for grading the cognitive state of patients for the clinician. J Psychiatr Res.
1975;12(3):189-98.
159. www.the4at.com
160. The Diagnostic and Statistical Manual of Mental Disorders. 2012-2013.
161. Charlson ME, Pompei P, Ales KL, MacKenzie CR. A new method of classifying
prognostic comorbidity in longitudinal studies: development and validation. J
Chronic Dis. 1987;40(5):373-83.
162. Nasreddine ZS, Phillips NA, Bedirian V, Charbonneau S, Whitehead V, Collin I,
et al. The Montreal Cognitive Assessment, MoCA: a brief screening tool for
mild cognitive impairment. J Am Geriatr Soc. 2005;53(4):695-9.
163. Rockwood K, Stadnyk K, MacKnight C, McDowell I, Hebert R, Hogan DB. A brief
clinical instrument to classify frailty in elderly people. Lancet.
1999;353(9148):205-6.
164. Tosato M, Landi F, Martone AM, Cherubini A, Corsonello A, Volpato S, et al.
Potentially inappropriate drug use among hospitalised older adults: results
from the CRIME study. Age Ageing. 2014;43(6):767-73.
165. Gallagher P, O'connor M, O'mahony D. Prevention of potentially
inappropriate prescribing for elderly patients: a randomized controlled trial
using STOPP/START criteria. Clin Pharmacol Ther. 2011;89(6):845-54.
315
166. Hallas J, Harvald B, Gram LF, Grodum E, Brosen K, Haghfelt T, et al. Drug
related hospital admissions: the role of definitions and intensity of data
collection, and the possibility of prevention. J Intern Med. 1990;228(2):83-90.
167. Grace AR, Briggs R, Kieran RE, Corcoran RM, Romero-Ortuno R, Coughlan TL,
et al. A comparison of Beers and STOPP criteria in assessing potentially
inappropriate medications in nursing home residents attending the
emergency department. J Am Med Dir Assoc. 2014;15(11):830-4.
168. Campbell NL, Boustani MA, Skopelja EN, Gao S, Unverzagt FW, Murray MD.
Medication adherence in older adults with cognitive impairment: a
systematic evidence-based review. Am J Geriatr Pharmacother.
2012;10(3):165-77.
169. Marcum ZA, Zheng Y, Perera S, Strotmeyer E, Newman AB, Simonsick EM, et
al. Prevalence and correlates of self-reported medication non-adherence
among older adults with coronary heart disease, diabetes mellitus, and/or
hypertension. Res Social Adm Pharm. 2013;9(6):817-27.
170. Wedding U, Roehrig B, Klippstein A, Steiner P, Schaeffer T, Pientka L, et al.
Comorbidity in patients with cancer: prevalence and severity measured by
cumulative illness rating scale. Crit Rev Oncol Hematol. 2007;61(3):269-76.
171. Jorgensen TL, Hallas J, Friis S, Herrstedt J. Comorbidity in elderly cancer
patients in relation to overall and cancer-specific mortality. Br J Cancer.
2012;106(7):1353-60.
172. Koroukian SM, Murray P, Madigan E. Comorbidity, disability, and geriatric
syndromes in elderly cancer patients receiving home health care. J Clin Onc
2006;24(15):2304-10.
173. Williams GR, Mackenzie A, Magnuson A, Olin R, Chapman A, Mohile S, et al.
Comorbidity in older adults with cancer. J Geriatr Oncol. 2016;7(4):249-57.
174. Riechelmann RP, Tannock IF, Wang L, Saad ED, Taback NA, Krzyzanowska MK.
Potential drug interactions and duplicate prescriptions among cancer
patients. J Nati Cancer Inst. 2007;99(8):592-600.
316
175. Sokol K, Knudsen J, Li M. Polypharmacy in older oncology patients and the
need for an interdisciplinary approach to side‐effect management1. J Clin
Pharm Ther. 2007;32(2):169-75.
176. Puts MT, Costa-Lima B, Monette J, Girre V, Wolfson C, Batist G, et al.
Medication problems in older, newly diagnosed cancer patients in Canada:
How common are they? A prospective pilot study. Drugs Aging.
2009;26(6):519-36.
177. Prithviraj GK, Koroukian S, Margevicius S, Berger NA, Bagai R, Owusu C.
Patient Characteristics Associated with Polypharmacy and Inappropriate
Prescribing of Medications among Older Adults with Cancer. J Geriatr Oncol.
2012;3(3):228-37.
178. Saarelainen LK, Turner JP, Shakib S, Singhal N, Hogan-Doran J, Prowse R, et al.
Potentially inappropriate medication use in older people with cancer:
prevalence and correlates. J Geriatr Oncol. 2014;5(4):439-46.
179. Nightingale G, Hajjar E, Swartz K, Andrel-Sendecki J, Chapman A. Evaluation
of a pharmacist-led medication assessment used to identify prevalence of and
associations with polypharmacy and potentially inappropriate medication use
among ambulatory senior adults with cancer. J Clin Oncol 2015;33(13):1453-
9.
180. Alkan A, Yasar A, Karci E, Koksoy EB, Urun M, Senler FC, et al. Severe drug
interactions and potentially inappropriate medication usage in elderly cancer
patients. Supportive Care Cancer. 2017;25(1):229-36.
181. Mannucci PM, Nobili A. Multimorbidity and polypharmacy in the elderly:
lessons from REPOSI. Intern Emerg Med. 2014;9(7):723-34.
182. Balducci L, Goetz-Parten D, Steinman MA. Polypharmacy and the
management of the older cancer patient. Ann Oncol. 2013;24 Suppl 7:vii36-
40.
183. Flood KL, Carroll MB, Le CV, Brown CJ. Polypharmacy in hospitalized older
adult cancer patients: experience from a prospective, observational study of
317
an oncology-acute care for elders unit. Am J Geriatr Pharmaco.
2009;7(3):151-8.
184. Cashman J, Wright J, Ring A. The treatment of co-morbidities in older patients
with metastatic cancer. Supportive Care Cancer. 2010;18(5):651-5.
185. Jorgensen TL, Herrstedt J, Friis S, Hallas J. Polypharmacy and drug use in
elderly Danish cancer patients during 1996 to 2006. J Geriatr Oncol.
2012;3(1):33-40.
186. Kotlinska-Lemieszek A, Paulsen O, Kaasa S, Klepstad P. Polypharmacy in
patients with advanced cancer and pain: a European cross-sectional study of
2282 patients. J Paim Symptom Manage. 2014;48(6):1145-59.
187. Maggiore RJ, Dale W, Gross CP, Feng T, Tew WP, Mohile SG, et al.
Polypharmacy and potentially inappropriate medication use in older adults
with cancer undergoing chemotherapy: effect on chemotherapy-related
toxicity and hospitalization during treatment. J Am Geriatri Soc.
2014;62(8):1505-12.
188. Samuelsson KS, Egenvall M, Klarin I, Lokk J, Gunnarsson U. Inappropriate drug
use in elderly patients is associated with prolonged hospital stay and
increased postoperative mortality after colorectal cancer surgery: a
population-based study. Colorectal Dis. 2016;18(2):155-62.
189. Leger DY, Moreau S, Signol N, Fargeas JB, Picat MA, Penot A, et al.
Polypharmacy, potentially inappropriate medications and drug-drug
interactions in geriatric patients with hematologic malignancy: Observational
single-center study of 122 patients. J Geriatr Oncol. 2017.
190. Bristich National Formulary. BNF 67 The Authority on the Selection and Use
of Medicines. March - September 2014.
191. Lau PM, Stewart K, Dooley M. The ten most common adverse drug reactions
(ADRs) in oncology patients: do they matter to you? Supportive Care Cancer.
2004;12(9):626-33.
192. Lindsay J, Dooley M, Martin J, Fay M, Kearney A, Khatun M, et al. The
development and evaluation of an oncological palliative care deprescribing
318
guideline: the ‘OncPal deprescribing guideline’. Supportive Care Cancer.
2015;23(1):71-8.
193. Jiaquan Xu MD, Sherry L. Murphy BS, Kenneth D. Kochanek MA, Brigham A.
Bastian BS. Deaths: Final Data for 2013. National vital statistics reports: from
the Centers for Disease Control and Prevention, National Center for Health
Statistics, National Vital Statistics System. 2016;64.
194. Eurostat. Causes of death statistics - people over 65. 2014.
195. Onder G, Liperoti R, Fialova D, Topinkova E, Tosato M, Danese P, et al.
Polypharmacy in nursing home in Europe: results from the SHELTER study.
The journals of gerontology Series A, Biological sciences and medical sciences.
2012;67(6):698-704.
196. Tjia J, Briesacher BA, Peterson D, Liu Q, Andrade SE, Mitchell SL. Use of
medications of questionable benefit in advanced dementia. JAMA Int Med.
2014;174(11):1763-71.
197. Cullinan S, Raae Hansen C, Byrne S, O'Mahony D, Kearney P, Sahm L.
Challenges of deprescribing in the multimorbid patient. Eur J Hosp Pharm.
2017;24(1):43-6.
198. Schuling J, Gebben H, Veehof LJG, Haaijer-Ruskamp FM. Deprescribing
medication in very elderly patients with multimorbidity: the view of Dutch
GPs. A qualitative study. BMC Fam Pract. 2012;13(1):56.
199. National Instititue of Clinical Excellence (NICE). NICE guidelines: Managing
medicines in care homes. 2014.
200. National Instititue of Clinical Excellence (NICE). NICE guidelines: Medicines
optimisation: the safe and effective use of medicines to enable the best
possible outcomes. 2015.
201. National Instititue of Clinical Excellence (NICE). NICE guidelines:
Multimorbidity: clinical assessment and management. 2016.
202. Health Information and Quality Authority (HIQA). Medicines Management
Guidance. 2015.
319
203. Health Information and Quality Authority (HIQA). Guidance for good practice
in medication reconciliation. 2014.
204. Matell MS, Jacoby J. Is There an Optimal Number of Alternatives for Likert
Scale Items? Study. Educ Psychol Meas. 1971;31:657-74.
205. Seeman E. Evidence that calcium supplements reduce fracture risk is lacking.
Clin J Am Soc Nephrol : CJASN. 2010;5 Suppl 1:S3-11.
206. Castelo-Branco C, Cortes X, Ferrer M. Treatment persistence and compliance
with a combination of calcium and vitamin D. Climacteric:the journal of the
International Menopause Society. 2010;13(6):578-84.
207. Jones R, Sheehan B, Phillips P, Juszczak E, Adams J, Baldwin A, et al. DOMINO-
AD protocol: donepezil and memantine in moderate to severe Alzheimer's
disease - a multicentre RCT. Trials. 2009;10:57.
208. Howard R, McShane R, Lindesay J, Ritchie C, Baldwin A, Barber R, et al. Nursing
home placement in the Donepezil and Memantine in Moderate to Severe
Alzheimer's Disease (DOMINO-AD) trial: secondary and post-hoc analyses.
Lancet Neurol. 2015;14(12):1171-81.
209. Kutner JS, Blatchford PJ, Taylor DH, Ritchie CS, Bull JH, Fairclough DL. Safety
and benefit of discontinuing statin therapy in the setting of advanced, life-
limiting illness: a randomized clinical trial. JAMA Int Med. 2015;175.
210. Bayliss EA, Bronsert MR, Reifler LM, Ellis JL, Steiner JF, McQuillen DB, et al.
Statin prescribing patterns in a cohort of cancer patients with poor prognosis.
J Palliat Med. 2013;16(4):412-8.
211. Zoungas S, Curtis A, Tonkin A, McNeil J. Statins in the elderly: an answered
question? Curr Opin Cardiol. 2014;29(4):372-80.
212. Mancia G, Fagard R, Narkiewicz K, Redon J, Zanchetti A, Bohm M, et al. 2013
ESH/ESC Practice Guidelines for the Management of Arterial Hypertension.
Blood Press. 2014;23(1):3-16.
213. Cleland JG. Is aspirin useful in primary prevention? Eur Heart J.
2013;34(44):3412-8.
320
214. Ballard C, Margallo-Lana M, Juszczak E, Douglas S, Swann A, Thomas A, et al.
Quetiapine and rivastigmine and cognitive decline in Alzheimer's disease:
randomised double blind placebo controlled trial. BMJ. 2005;330(7496):874.
215. Ballard C, Lana MM, Theodoulou M, Douglas S, McShane R, Jacoby R, et al. A
randomised, blinded, placebo-controlled trial in dementia patients
continuing or stopping neuroleptics (the DART-AD trial). PLoS medicine.
2008;5(4):e76.
216. Cohen-Mansfield J, Lipson S, Werner P, Billig N, Taylor L, Woosley R.
Withdrawal of haloperidol, thioridazine, and lorazepam in the nursing home:
a controlled, double-blind study. Arch Intern Med. 1999;159(15):1733-40.
217. Ruths S, Straand J, Nygaard HA, Aarsland D. Stopping antipsychotic drug
therapy in demented nursing home patients: a randomized, placebo-
controlled study--the Bergen District Nursing Home Study (BEDNURS). Int J
Geriatr Psychiatry. 2008;23(9):889-95.
218. Schneider LS, Tariot PN, Dagerman KS, Davis SM, Hsiao JK, Ismail MS, et al.
Effectiveness of atypical antipsychotic drugs in patients with Alzheimer's
disease. N Engl J Med. 2006;355(15):1525-38.
219. Sorbi S, Hort J, Erkinjuntti T, Fladby T, Gainotti G, Gurvit H, et al. EFNS-ENS
Guidelines on the diagnosis and management of disorders associated with
dementia. Eur J Neurol. 2012;19(9):1159-79.
220. Qaseem A, Snow V, Cross JT, Jr., Forciea MA, Hopkins R, Jr., Shekelle P, et al.
Current pharmacologic treatment of dementia: a clinical practice guideline
from the American College of Physicians and the American Academy of Family
Physicians. Ann Int Med. 2008;148(5):370-8.
221. Waldemar G, Dubois B, Emre M, Georges J, McKeith IG, Rossor M, et al.
Recommendations for the diagnosis and management of Alzheimer's disease
and other disorders associated with dementia: EFNS guideline. Eur J Neurol.
2007;14(1):e1-26.
321
222. Herrmann N, Gauthier S. Diagnosis and treatment of dementia: 6.
Management of severe Alzheimer disease. Can Med Assoc J.
2008;179(12):1279-87.
223. Ramsdell J. Use of theophylline in the treatment of COPD. Chest. 1995;107(5
Suppl):206s-9s.
224. Ohnishi A, Kato M, Kojima J, Ushiama H, Yoneko M, Kawai H. Differential
pharmacokinetics of theophylline in elderly patients. Drugs Aging.
2003;20(1):71-84.
225. Rabe KF, Hurd S, Anzueto A, Barnes PJ, Buist SA, Calverley P, et al. Global
strategy for the diagnosis, management, and prevention of chronic
obstructive pulmonary disease: GOLD executive summary. Am J Respir Crit
Care Med. 2007;176(6):532-55.
226. GOLD. Global Initiative for Chronic Obstructive Lung Disease - A Guide for
Healthcare Professionals. 2015.
227. Makris UE, Abrams RC, Gurland B, Reid MC. Management of persistent pain
in the older patient: a clinical review. JAMA. 2014;312(8):825-36.
228. O'Neil CK, Hanlon JT, Marcum ZA. Adverse effects of analgesics commonly
used by older adults with osteoarthritis: focus on non-opioid and opioid
analgesics. Am J Geriatr Pharmacother. 2012;10(6):331-42.
229. Bjordal JM, Ljunggren AE, Klovning A, Slordal L. Non-steroidal anti-
inflammatory drugs, including cyclo-oxygenase-2 inhibitors, in osteoarthritic
knee pain: meta-analysis of randomised placebo controlled trials. BMJ.
2004;329(7478):1317.
230. Yood RA, American College of Rheumatology Subcommittee on Rheumatoid
Arthritis Guidelines. Guidelines for the management of rheumatoid arthritis:
2002 update. 2002.
231. Gravas S, Bachmann A, Descazeaud A, Drake M, Gratzke C, Madersbacher S,
et al. Guidelines on the management of non-neurogenic male lower urinary
tract symptoms (LUTS), incl. benign prostatic obstruction (BPO). Eur Assoc
Urol. 2014.
322
232. Gratzke C, Bachmann A, Descazeaud A, Drake MJ, Madersbacher S,
Mamoulakis C, et al. EAU guidelines on the assessment of non-neurogenic
male lower urinary tract symptoms including benign prostatic obstruction.
Eur Urol. 2015;67(6):1099-109.
233. Kirkman MS, Briscoe VJ, Clark N, Florez H, Haas LB, Halter JB, et al. Diabetes
in older adults. Diabetes care. 2012;35(12):2650-64.
234. Diabetes. AGSPCfEw. Guidelines for improving the care of the older person
with diabetes mellitus. J Am Geriatr Soc. 2003;51(5s):265-80.
235. Volkert D, Berner Y, Berry E, Cederholm T, Bertrand PC, Milne A, et al. ESPEN
guidelines on enteral nutrition: geriatrics. Clin Nutr. 2006;25(2):330-60.
236. Hooton TM, Bradley SF, Cardenas DD, Colgan R, Geerlings SE, Rice JC, et al.
Diagnosis, prevention, and treatment of catheter-associated urinary tract
infection in adults: 2009 International Clinical Practice Guidelines from the
Infectious Diseases Society of America. Clin Infect Dis. 2010;50(5):625-63.
237. Stevens DL, Bisno AL, Chambers HF, Dellinger EP, Goldstein EJ, Gorbach SL, et
al. Practice guidelines for the diagnosis and management of skin and soft
tissue infections: 2014 update by the infectious diseases society of America.
Clin Infect Dis. 2014;59(2):147-59.
238. Thomas K, Crook A, Foster K, Mason J, Chalmers J, Bourke J, et al. Prophylactic
antibiotics for the prevention of cellulitis (erysipelas) of the leg: results of the
UK Dermatology Clinical Trials Network's PATCH II trial. Br J Dermatol.
2012;166(1):169-78.
239. Zekry D, Loures Valle BH, Lardi C, Graf C, Michel JP, Gold G, et al. Geriatrics
index of comorbidity was the most accurate predictor of death in geriatric
hospital among six comorbidity scores. J Clin Epidemiol. 2010;63(9):1036-44.
240. Lavan AH, Gallagher P, Parsons C, O'Mahony D. STOPPFrail (Screening Tool of
Older Persons Prescriptions in Frail adults with limited life expectancy):
consensus validation. Age Ageing. 2017.
241. Drenth-van Maanen A, Spee J, van Marum R, Egberts A, van Hensbergen L,
Jansen P. Iatrogenic harm due to discrepancies in medication histories in
323
hospital and pharmacy records revealed by structured history taking of
medication use. J Am Geriatr Soc. 2011;59:1976-7.
242. Cantor AB. Sample-size calculations for Cohen's kappa. Psychol Methods.
1996;1(2):150.
243. Gallagher P, Baeyens J-P, Topinkova E, Madlova P, Cherubini A, Gasperini B,
et al. Inter-rater reliability of STOPP (Screening Tool of Older Persons’
Prescriptions) and START (Screening Tool to Alert doctors to Right Treatment)
criteria amongst physicians in six European countries. Age Ageing.
2009;38(5):603-6.
244. Majeed A, Car J, Sheikh A. Accuracy and completeness of electronic patient
records in primary care. Fam Pract. 2008;25(4):213-4.
245. Lau HS, Florax C, Porsius AJ, De Boer A. The completeness of medication `
histories in hospital medical records of patients admitted to general internal
medicine wards. Br J Clin Pharmacol. 2000;49(6):597-603.
246. Lavan AH, Gallagher P, O'Mahony D. Inter-rater reliability of STOPPFrail
[Screening Tool of Older Persons Prescriptions in Frail adults with limited life
expectancy] criteria amongst 12 physicians. Eur J Clin Pharmacol. 2017.
247 Kelly A, Conell-Price J, Covinsky K, Cenzer IS, Chang A, Boscardin WJ, et al.
Length of stay for older adults residing in nursing homes at the end of life. J
Am Geriatr Soc. 2010;58(9):1701-6.
248. Health Service Executive. Nursing Home Support Scheme (Available from:
http://www.hse.ie/eng/services/list/4/olderpeople/nhss/.)
249. Briesacher BA, Tjia J, Field T, Peterson D, Gurwitz JH. Antipsychotic use among
nursing home residents. JAMA. 2013;309(5):440-2.
250. Kamble P, Chen H, Sherer J, Aparasu RR. Antipsychotic drug use among elderly
nursing home residents in the United States. Am J Geriatri Pharmacother.
2008;6(4):187-97.
251. Feng Z, Hirdes JP, Smith TF, Finne-Soveri H, Chi I, Du Pasquier JN, et al. Use of
physical restraints and antipsychotic medications in nursing homes: a cross-
national study. Int J Geriatr Psychiatry. 2009;24(10):1110-8.
324
252. Foebel AD, Liperoti R, Onder G, Finne-Soveri H, Henrard JC, Lukas A, et al. Use
of antipsychotic drugs among residents with dementia in European long-term
care facilities: results from the SHELTER study. J Am Med Dir Assoc.
2014;15(12):911-7.
253. Barry M, Usher C, Tilson L. Public drug expenditure in the Republic of Ireland.
Expert Rev Pharmacoecon Outcomes Res. 2010;10(3):239-45.
254. Executive Agency for Health and Consumers (EAHC) Eurpean Commission. EU
pharmaceutical expenditure forecast. 2012.
255. Aitken M, Berndt ER, Cutler DM. Prescription drug spending trends in the
United States: looking beyond the turning point. Health Aff. 2009;28(1):w151-
60.
256. Bugeja G, Kumar A, Banerjee AK. Exclusion of elderly people from clinical
research: a descriptive study of published reports. BMJ.
1997;315(7115):1059.
257. Cherubini A, Del Signore S, Ouslander J, Semla T, Michel JP. Fighting against
age discrimination in clinical trials. J Am Geriatr Soc. 2010;58(9):1791-6.
258. Keeney, S. Hasson, F. McKenna, H. P. A critical review of the Delphi technique
as a research methodology for nursing. Int J Nurs Stud. 2001;38(2):195-200

325
Appendices
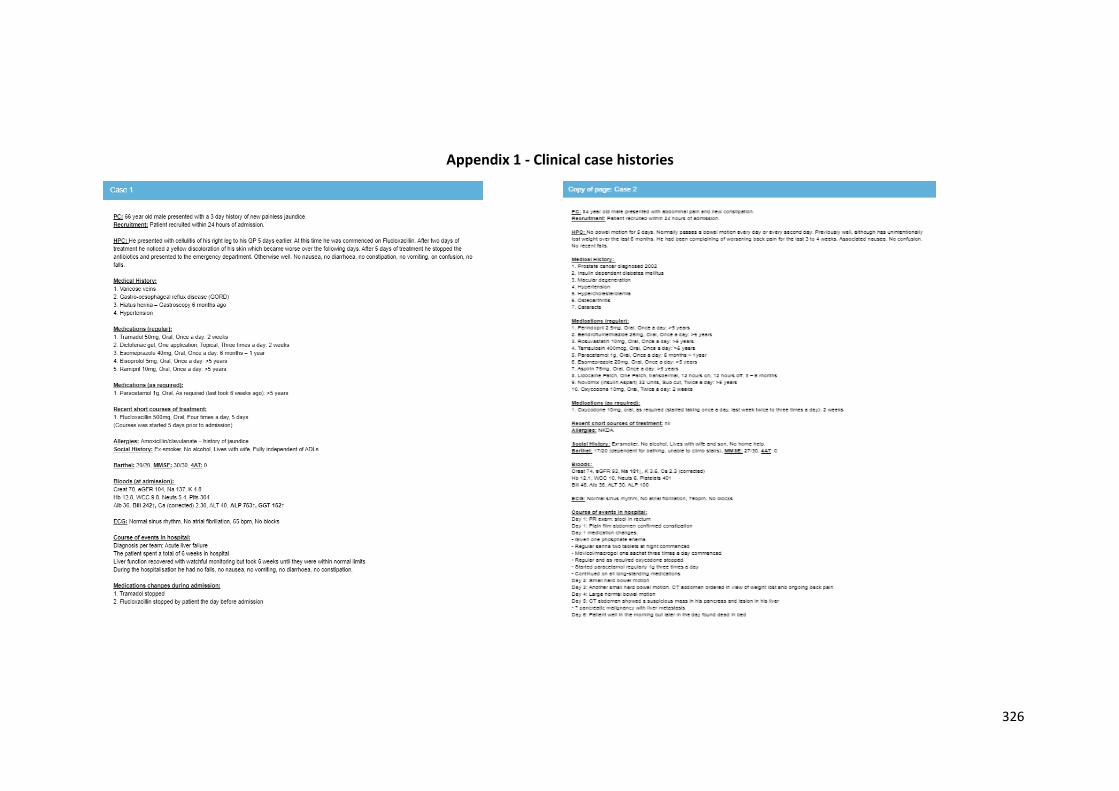
326
Appendix 1 - Clinical case histories
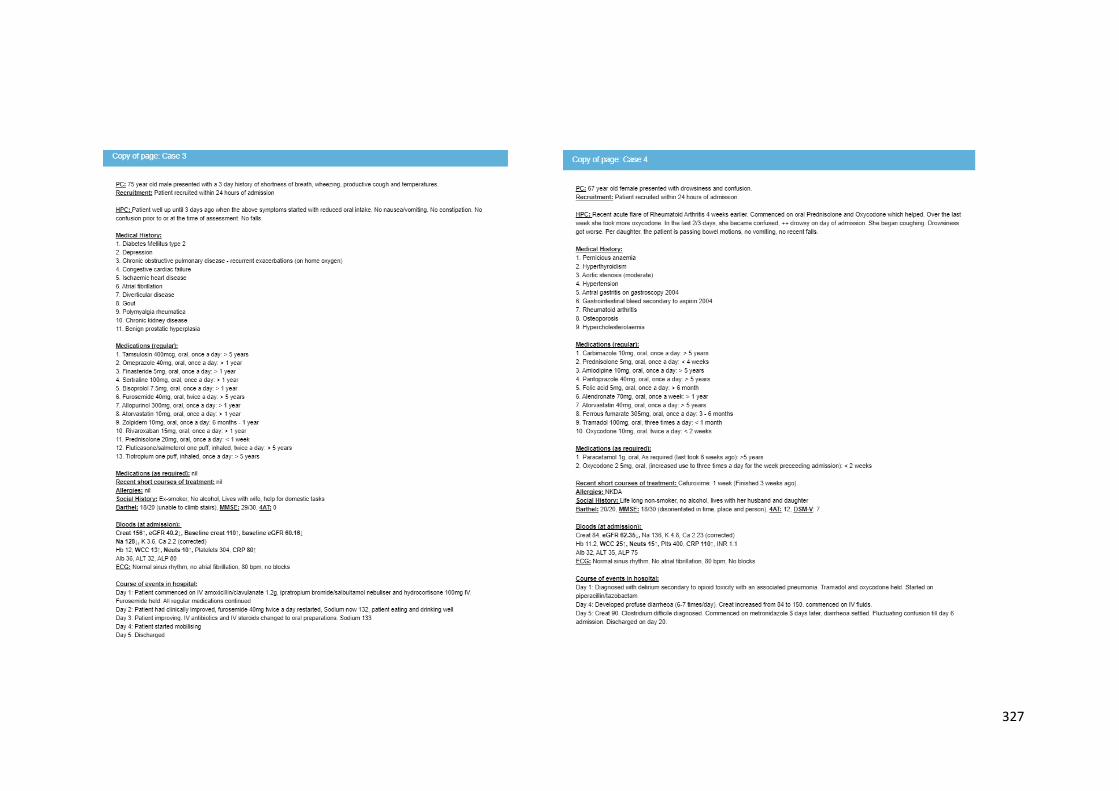
327
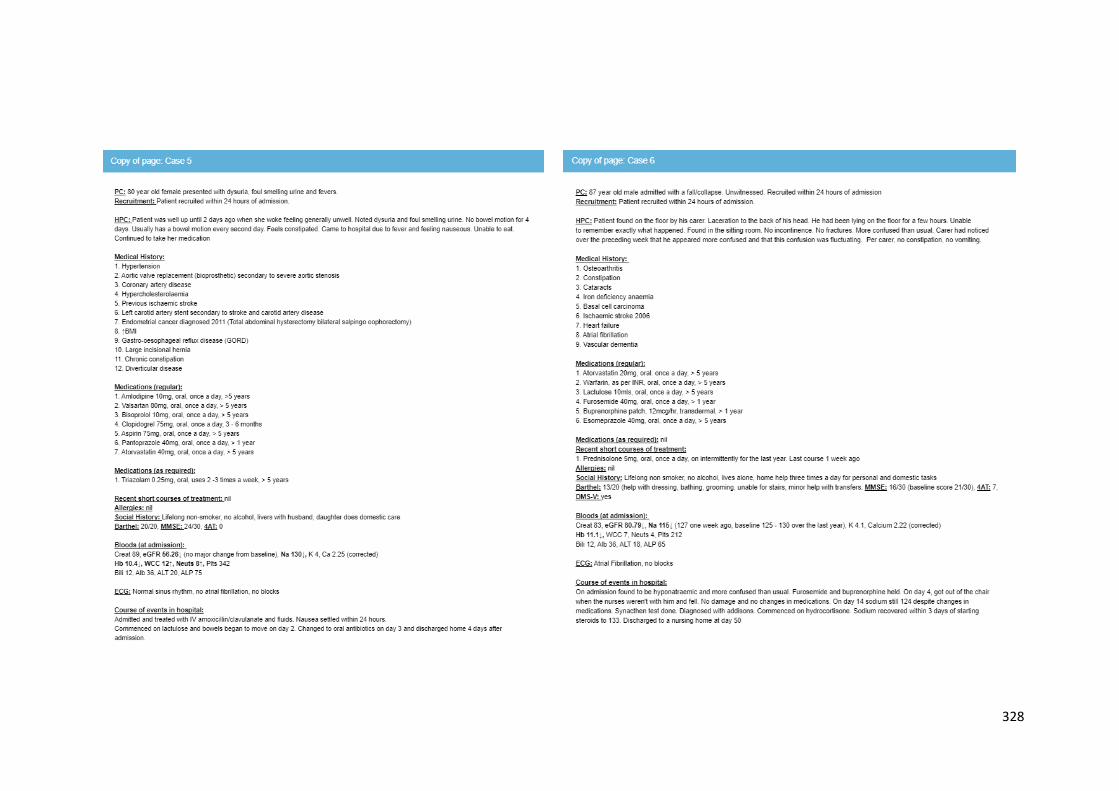
328
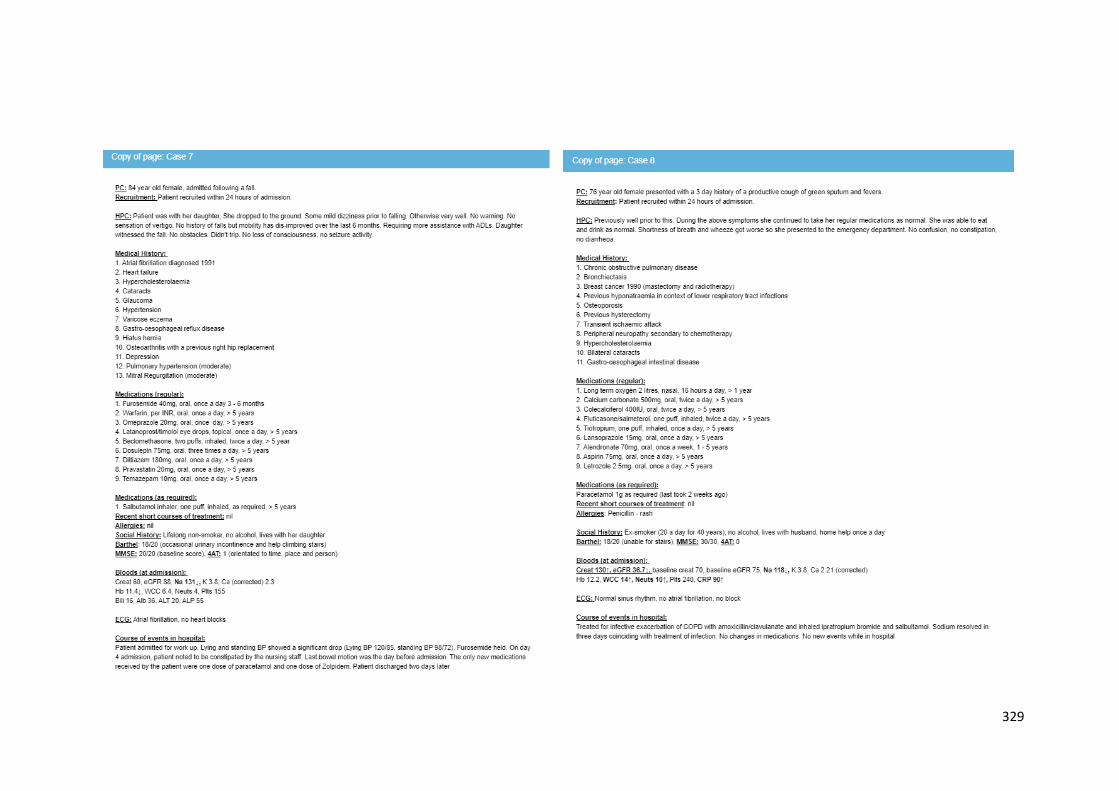
329
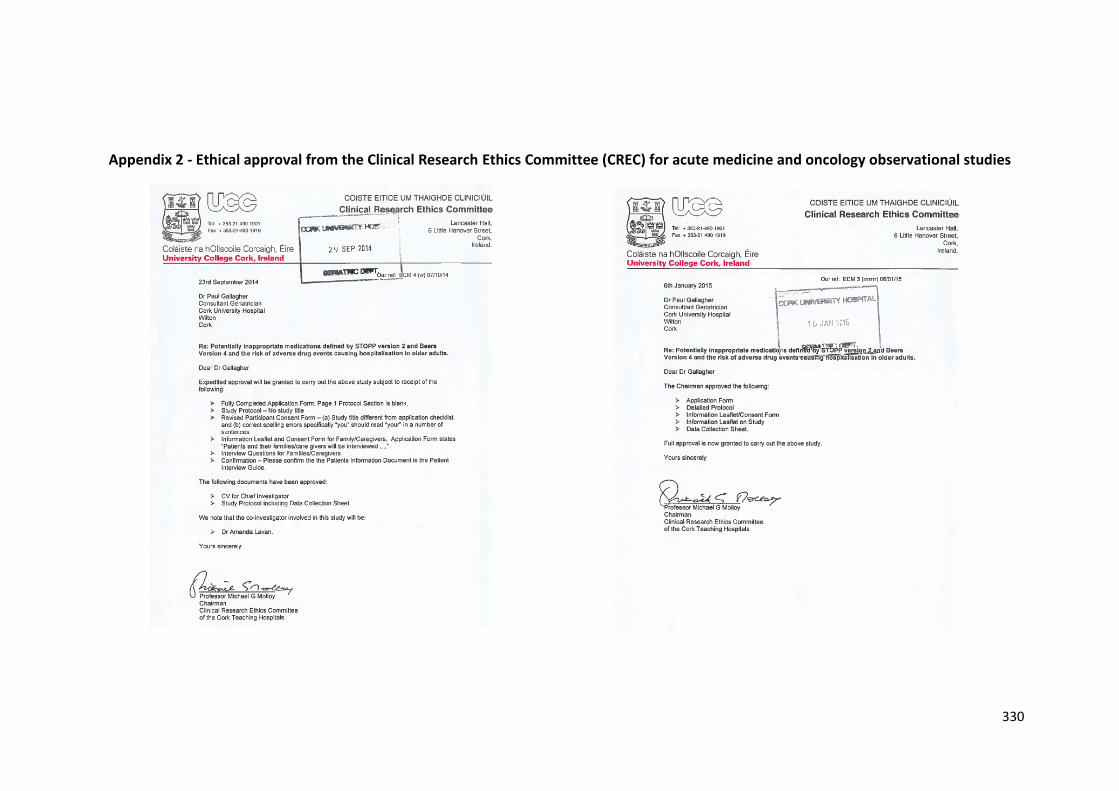
330
Appendix 2 - Ethical approval from the Clinical Research Ethics Committee (CREC) for acute medicine and oncology observational studies
331
332
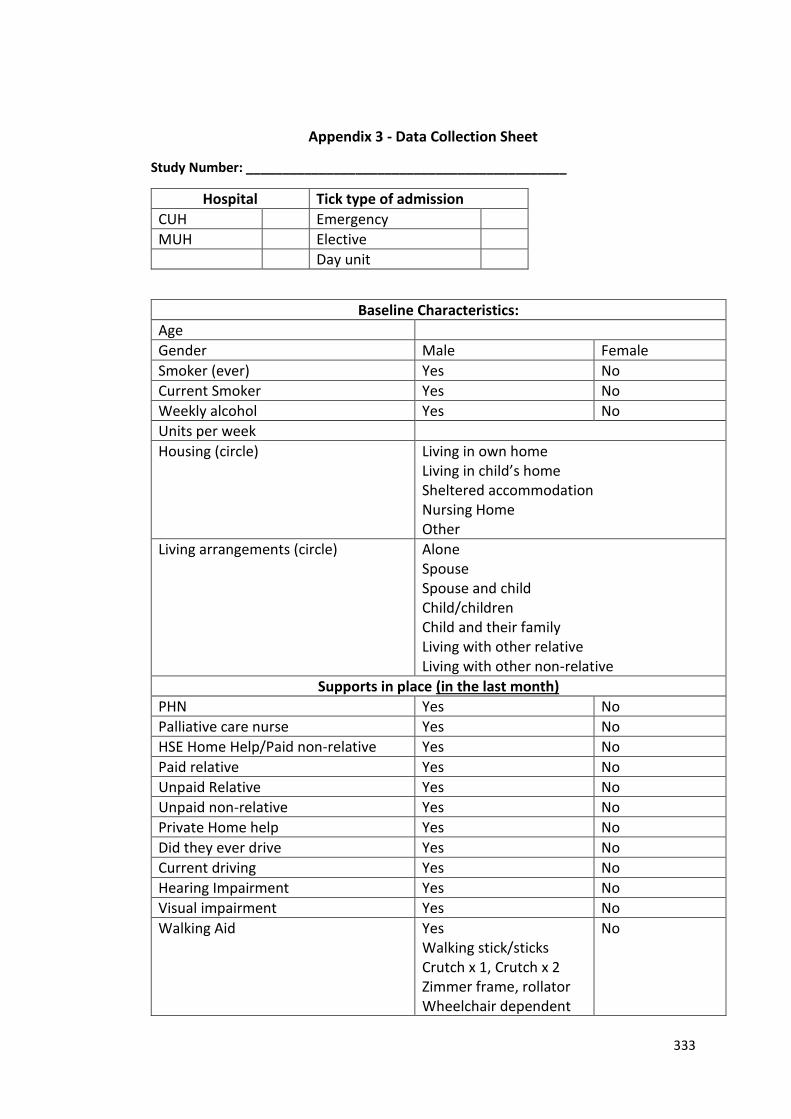
333
Appendix 3 - Data Collection Sheet
Study Number: ____________________________________________
Hospital Tick type of admission
CUH Emergency
MUH Elective
Day unit
Baseline Characteristics:
Age
Gender Male Female
Smoker (ever) Yes No
Current Smoker Yes No
Weekly alcohol Yes No
Units per week
Housing (circle)
Living in own home Living in child’s home Sheltered accommodation Nursing Home Other
Living arrangements (circle)
Alone Spouse Spouse and child Child/children Child and their family Living with other relative Living with other non-relative
Supports in place (in the last month)
PHN Yes No
Palliative care nurse Yes No
HSE Home Help/Paid non-relative Yes No
Paid relative Yes No
Unpaid Relative Yes No
Unpaid non-relative Yes No
Private Home help Yes No
Did they ever drive Yes No
Current driving Yes No
Hearing Impairment Yes No
Visual impairment Yes No
Walking Aid
Yes Walking stick/sticks Crutch x 1, Crutch x 2 Zimmer frame, rollator Wheelchair dependent
No
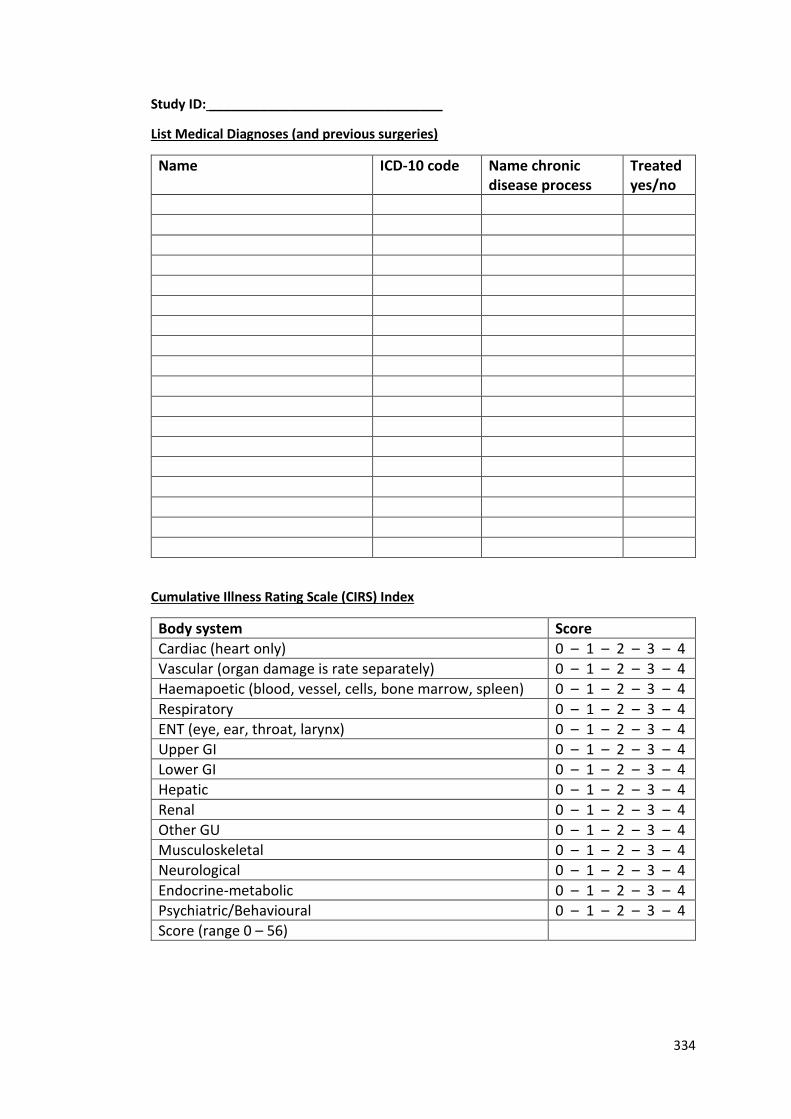
334
Study ID: ________________________________
List Medical Diagnoses (and previous surgeries)
Name ICD-10 code Name chronic disease process
Treated yes/no
Cumulative Illness Rating Scale (CIRS) Index
Body system Score
Cardiac (heart only) 0 – 1 – 2 – 3 – 4
Vascular (organ damage is rate separately) 0 – 1 – 2 – 3 – 4
Haemapoetic (blood, vessel, cells, bone marrow, spleen) 0 – 1 – 2 – 3 – 4
Respiratory 0 – 1 – 2 – 3 – 4
ENT (eye, ear, throat, larynx) 0 – 1 – 2 – 3 – 4
Upper GI 0 – 1 – 2 – 3 – 4
Lower GI 0 – 1 – 2 – 3 – 4
Hepatic 0 – 1 – 2 – 3 – 4
Renal 0 – 1 – 2 – 3 – 4
Other GU 0 – 1 – 2 – 3 – 4
Musculoskeletal 0 – 1 – 2 – 3 – 4
Neurological 0 – 1 – 2 – 3 – 4
Endocrine-metabolic 0 – 1 – 2 – 3 – 4
Psychiatric/Behavioural 0 – 1 – 2 – 3 – 4
Score (range 0 – 56)
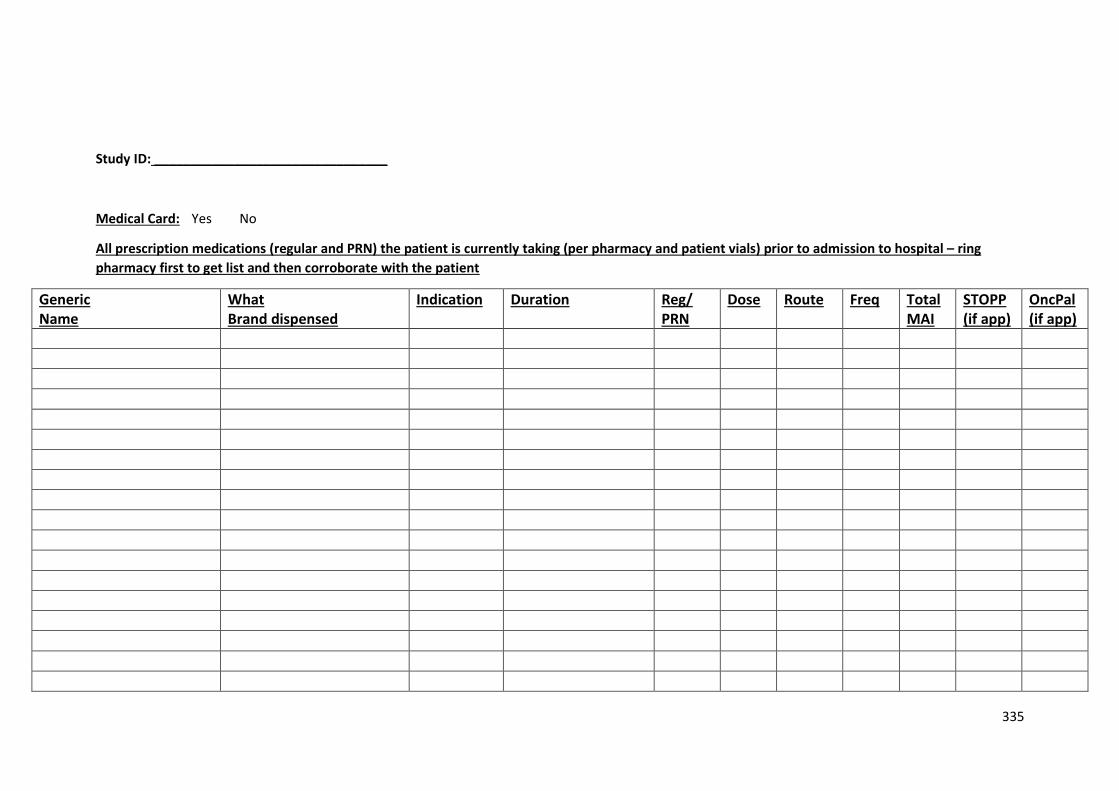
335
Study ID: ________________________________
Medical Card: Yes No
All prescription medications (regular and PRN) the patient is currently taking (per pharmacy and patient vials) prior to admission to hospital – ring
pharmacy first to get list and then corroborate with the patient
Generic Name
What Brand dispensed
Indication Duration
Reg/ PRN
Dose Route Freq Total MAI
STOPP (if app)
OncPal (if app)
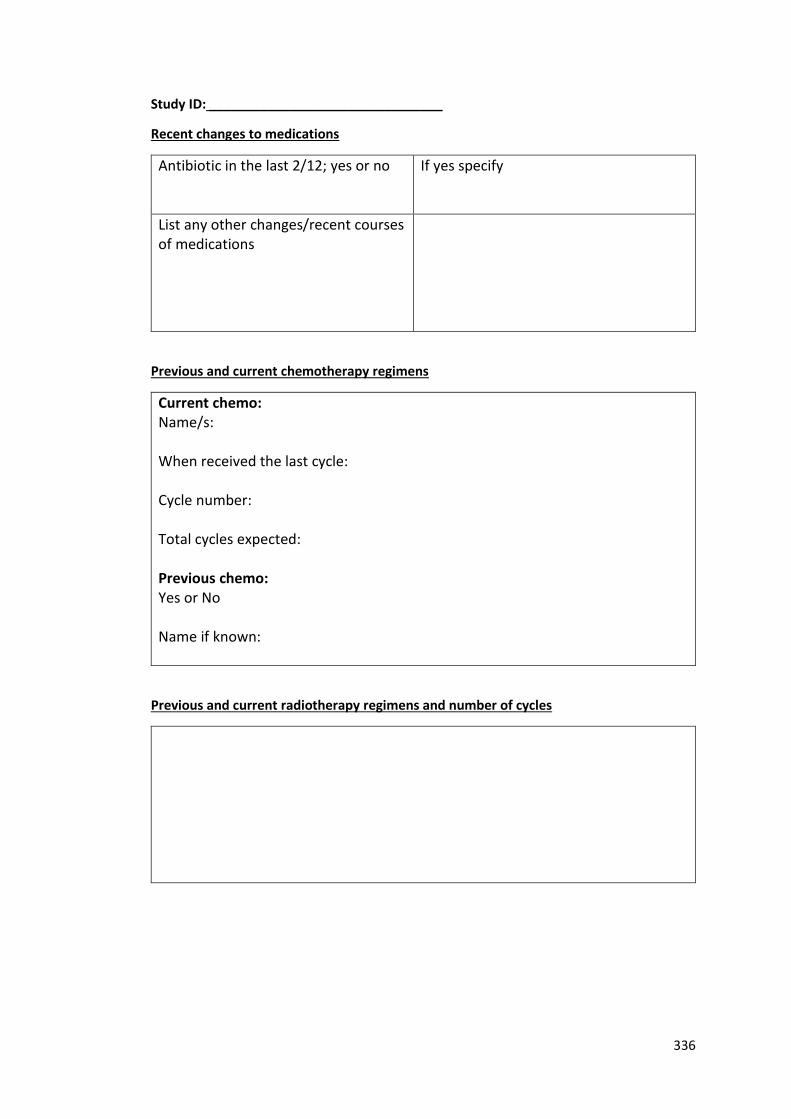
336
Study ID: ________________________________
Recent changes to medications
Antibiotic in the last 2/12; yes or no If yes specify
List any other changes/recent courses of medications
Previous and current chemotherapy regimens
Current chemo: Name/s: When received the last cycle: Cycle number: Total cycles expected: Previous chemo: Yes or No Name if known:
Previous and current radiotherapy regimens and number of cycles
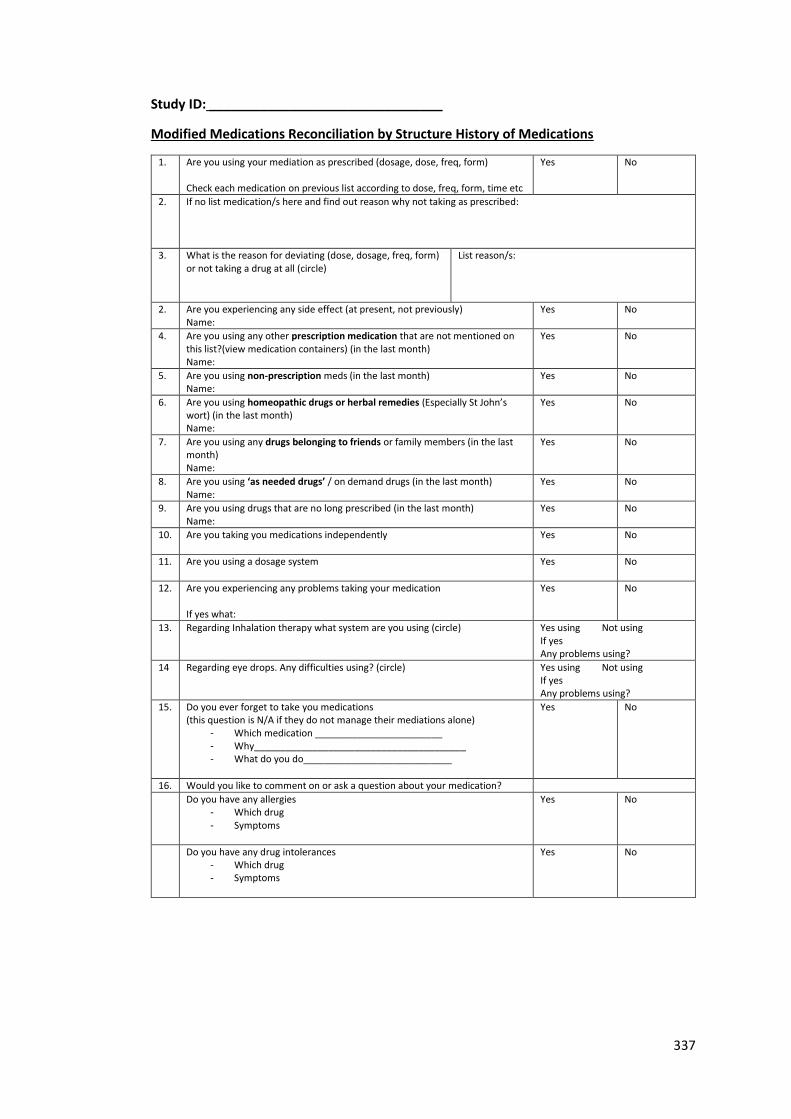
337
Study ID: ________________________________
Modified Medications Reconciliation by Structure History of Medications
1. Are you using your mediation as prescribed (dosage, dose, freq, form) Check each medication on previous list according to dose, freq, form, time etc
Yes No
2. If no list medication/s here and find out reason why not taking as prescribed:
3. What is the reason for deviating (dose, dosage, freq, form) or not taking a drug at all (circle)
List reason/s:
2. Are you experiencing any side effect (at present, not previously) Name:
Yes No
4. Are you using any other prescription medication that are not mentioned on this list?(view medication containers) (in the last month) Name:
Yes No
5. Are you using non-prescription meds (in the last month) Name:
Yes No
6. Are you using homeopathic drugs or herbal remedies (Especially St John’s wort) (in the last month) Name:
Yes No
7. Are you using any drugs belonging to friends or family members (in the last month) Name:
Yes No
8. Are you using ‘as needed drugs’ / on demand drugs (in the last month) Name:
Yes No
9. Are you using drugs that are no long prescribed (in the last month) Name:
Yes No
10. Are you taking you medications independently
Yes No
11.
Are you using a dosage system Yes No
12.
Are you experiencing any problems taking your medication If yes what:
Yes No
13. Regarding Inhalation therapy what system are you using (circle) Yes using Not using If yes Any problems using?
14 Regarding eye drops. Any difficulties using? (circle)
Yes using Not using If yes Any problems using?
15. Do you ever forget to take you medications (this question is N/A if they do not manage their mediations alone)
- Which medication ________________________ - Why________________________________________ - What do you do____________________________
Yes No
16. Would you like to comment on or ask a question about your medication?
Do you have any allergies - Which drug - Symptoms
Yes No
Do you have any drug intolerances - Which drug - Symptoms
Yes No
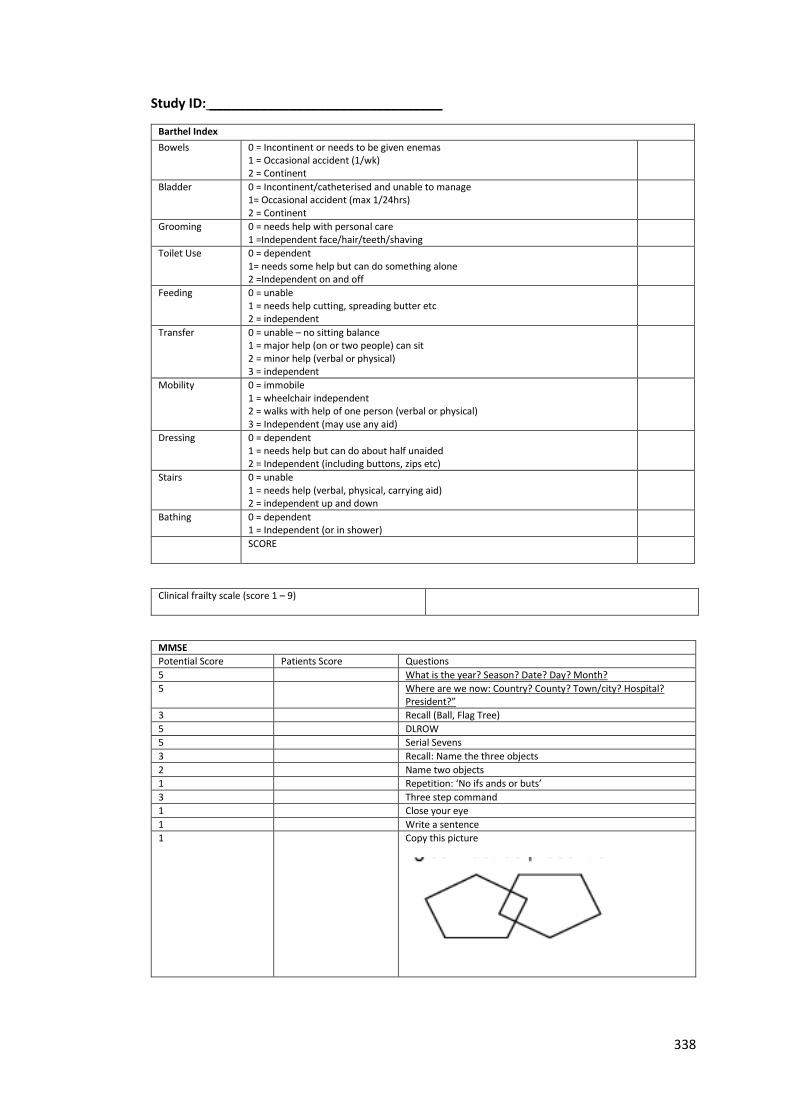
338
Study ID: ________________________________
Barthel Index
Bowels 0 = Incontinent or needs to be given enemas 1 = Occasional accident (1/wk) 2 = Continent
Bladder 0 = Incontinent/catheterised and unable to manage 1= Occasional accident (max 1/24hrs) 2 = Continent
Grooming 0 = needs help with personal care 1 =Independent face/hair/teeth/shaving
Toilet Use 0 = dependent 1= needs some help but can do something alone 2 =Independent on and off
Feeding 0 = unable 1 = needs help cutting, spreading butter etc 2 = independent
Transfer 0 = unable – no sitting balance 1 = major help (on or two people) can sit 2 = minor help (verbal or physical) 3 = independent
Mobility 0 = immobile 1 = wheelchair independent 2 = walks with help of one person (verbal or physical) 3 = Independent (may use any aid)
Dressing 0 = dependent 1 = needs help but can do about half unaided 2 = Independent (including buttons, zips etc)
Stairs 0 = unable 1 = needs help (verbal, physical, carrying aid) 2 = independent up and down
Bathing 0 = dependent 1 = Independent (or in shower)
SCORE
Clinical frailty scale (score 1 – 9)
MMSE
Potential Score Patients Score Questions
5 What is the year? Season? Date? Day? Month?
5 Where are we now: Country? County? Town/city? Hospital? President?”
3 Recall (Ball, Flag Tree)
5 DLROW
5 Serial Sevens
3 Recall: Name the three objects
2 Name two objects
1 Repetition: ‘No ifs ands or buts’
3 Three step command
1 Close your eye
1 Write a sentence
1 Copy this picture
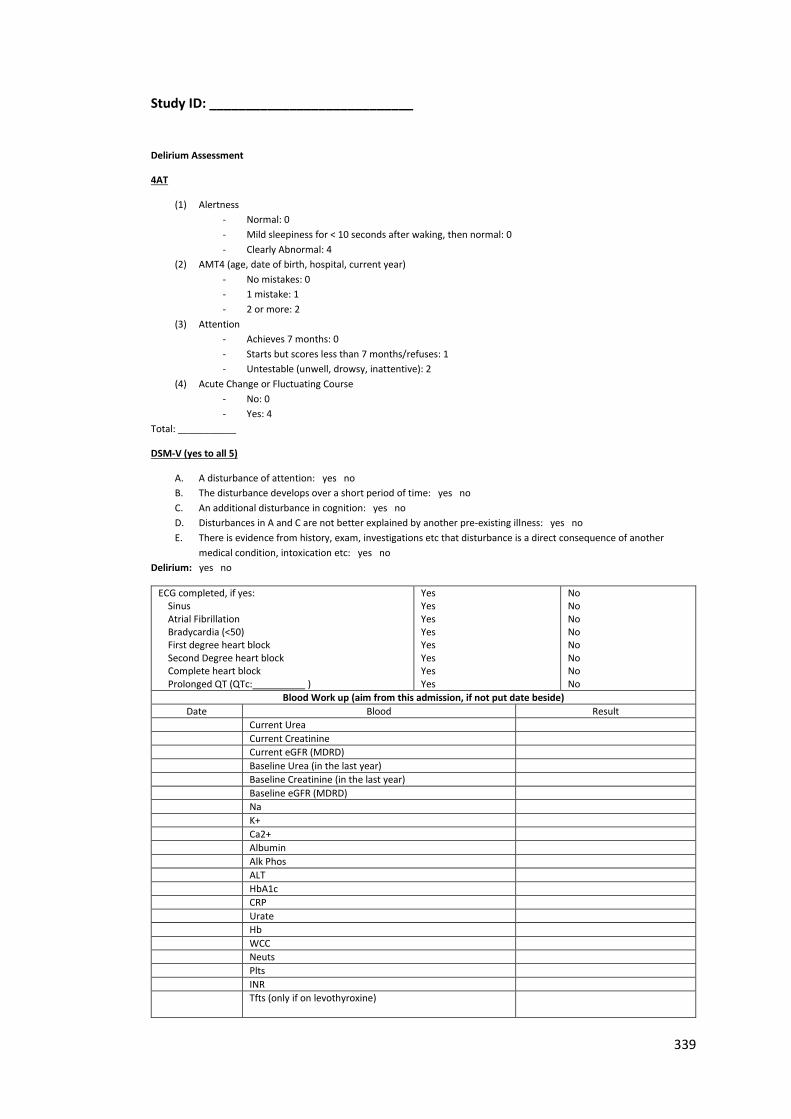
339
Study ID: ____________________________
Delirium Assessment
4AT
(1) Alertness
- Normal: 0
- Mild sleepiness for < 10 seconds after waking, then normal: 0
- Clearly Abnormal: 4
(2) AMT4 (age, date of birth, hospital, current year)
- No mistakes: 0
- 1 mistake: 1
- 2 or more: 2
(3) Attention
- Achieves 7 months: 0
- Starts but scores less than 7 months/refuses: 1
- Untestable (unwell, drowsy, inattentive): 2
(4) Acute Change or Fluctuating Course
- No: 0
- Yes: 4
Total: ___________
DSM-V (yes to all 5)
A. A disturbance of attention: yes no
B. The disturbance develops over a short period of time: yes no
C. An additional disturbance in cognition: yes no
D. Disturbances in A and C are not better explained by another pre-existing illness: yes no
E. There is evidence from history, exam, investigations etc that disturbance is a direct consequence of another
medical condition, intoxication etc: yes no
Delirium: yes no
ECG completed, if yes: Sinus Atrial Fibrillation Bradycardia (<50) First degree heart block Second Degree heart block Complete heart block Prolonged QT (QTc:__________ )
Yes Yes Yes Yes Yes Yes Yes Yes
No No No No No No No No
Blood Work up (aim from this admission, if not put date beside)
Date Blood Result
Current Urea
Current Creatinine
Current eGFR (MDRD)
Baseline Urea (in the last year)
Baseline Creatinine (in the last year)
Baseline eGFR (MDRD)
Na
K+
Ca2+
Albumin
Alk Phos
ALT
HbA1c
CRP
Urate
Hb
WCC
Neuts
Plts
INR
Tfts (only if on levothyroxine)
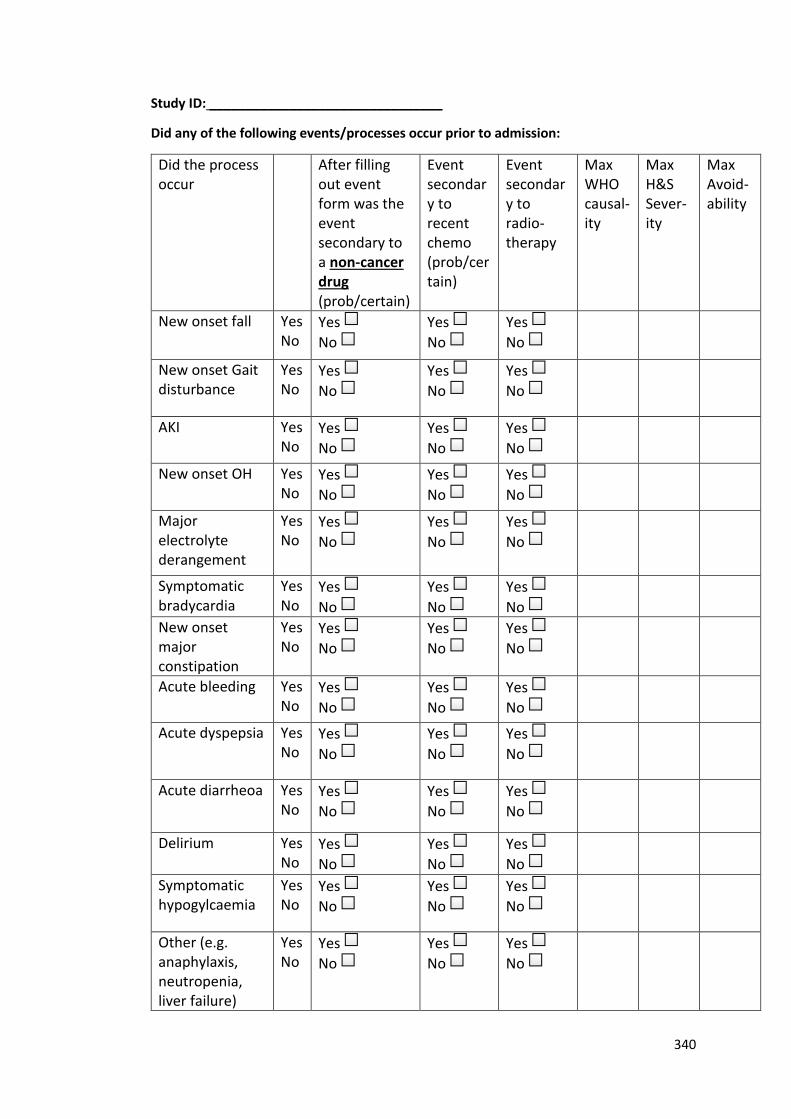
340
Study ID: ________________________________
Did any of the following events/processes occur prior to admission:
Did the process occur
After filling out event form was the event secondary to a non-cancer drug (prob/certain)
Event secondary to recent chemo (prob/certain)
Event secondary to radio-therapy
Max WHO causal-ity
Max H&S Sever-ity
Max Avoid-ability
New onset fall Yes No
Yes
No
Yes
No
Yes
No
New onset Gait disturbance
Yes No
Yes
No
Yes
No
Yes
No
AKI Yes No
Yes
No
Yes
No
Yes
No
New onset OH Yes No
Yes
No
Yes
No
Yes
No
Major electrolyte derangement
Yes No
Yes
No
Yes
No
Yes
No
Symptomatic bradycardia
Yes No
Yes
No
Yes
No
Yes
No
New onset major constipation
Yes No
Yes
No
Yes
No
Yes
No
Acute bleeding Yes No
Yes
No
Yes
No
Yes
No
Acute dyspepsia Yes No
Yes
No
Yes
No
Yes
No
Acute diarrheoa Yes No
Yes
No
Yes
No
Yes
No
Delirium Yes No
Yes
No
Yes
No
Yes
No
Symptomatic hypogylcaemia
Yes No
Yes
No
Yes
No
Yes
No
Other (e.g. anaphylaxis, neutropenia, liver failure)
Yes No
Yes
No
Yes
No
Yes
No
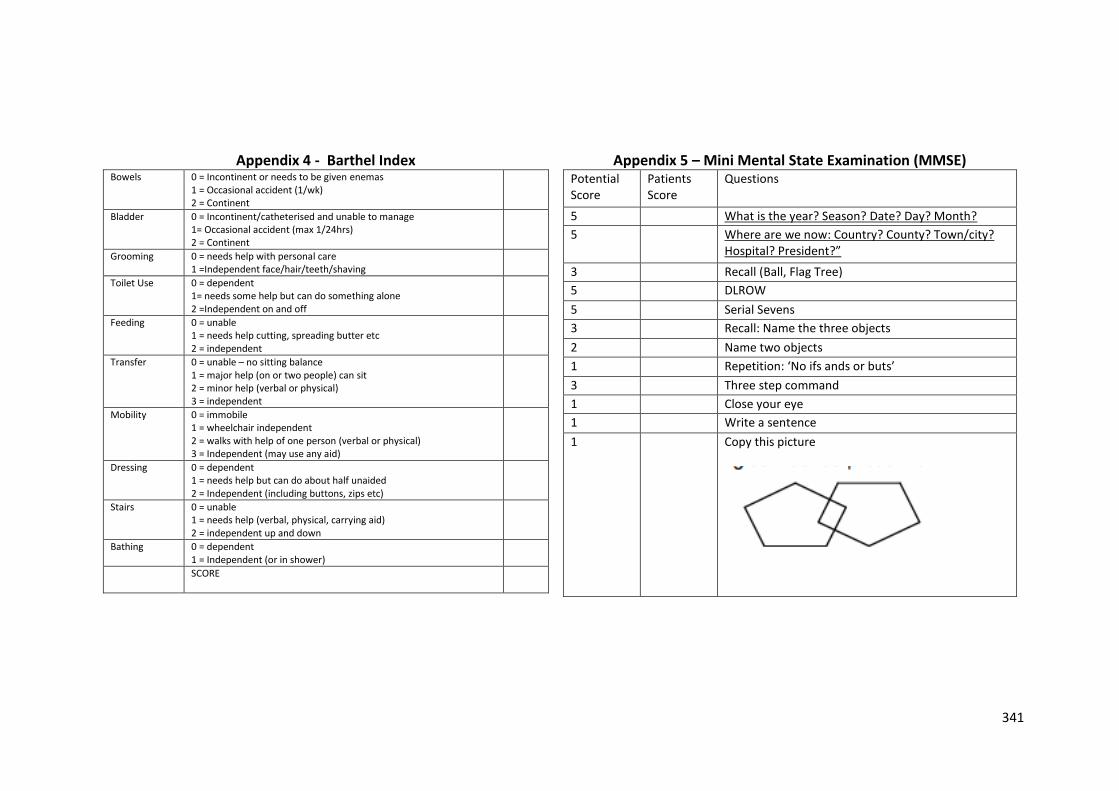
341
Appendix 4 - Barthel Index Appendix 5 – Mini Mental State Examination (MMSE) Bowels 0 = Incontinent or needs to be given enemas
1 = Occasional accident (1/wk) 2 = Continent
Bladder 0 = Incontinent/catheterised and unable to manage 1= Occasional accident (max 1/24hrs) 2 = Continent
Grooming 0 = needs help with personal care 1 =Independent face/hair/teeth/shaving
Toilet Use 0 = dependent 1= needs some help but can do something alone 2 =Independent on and off
Feeding 0 = unable 1 = needs help cutting, spreading butter etc 2 = independent
Transfer 0 = unable – no sitting balance 1 = major help (on or two people) can sit 2 = minor help (verbal or physical) 3 = independent
Mobility 0 = immobile 1 = wheelchair independent 2 = walks with help of one person (verbal or physical) 3 = Independent (may use any aid)
Dressing 0 = dependent 1 = needs help but can do about half unaided 2 = Independent (including buttons, zips etc)
Stairs 0 = unable 1 = needs help (verbal, physical, carrying aid) 2 = independent up and down
Bathing 0 = dependent 1 = Independent (or in shower)
SCORE
Potential Score
Patients Score
Questions
5 What is the year? Season? Date? Day? Month?
5 Where are we now: Country? County? Town/city? Hospital? President?”
3 Recall (Ball, Flag Tree)
5 DLROW
5 Serial Sevens
3 Recall: Name the three objects
2 Name two objects
1 Repetition: ‘No ifs ands or buts’
3 Three step command
1 Close your eye
1 Write a sentence
1 Copy this picture
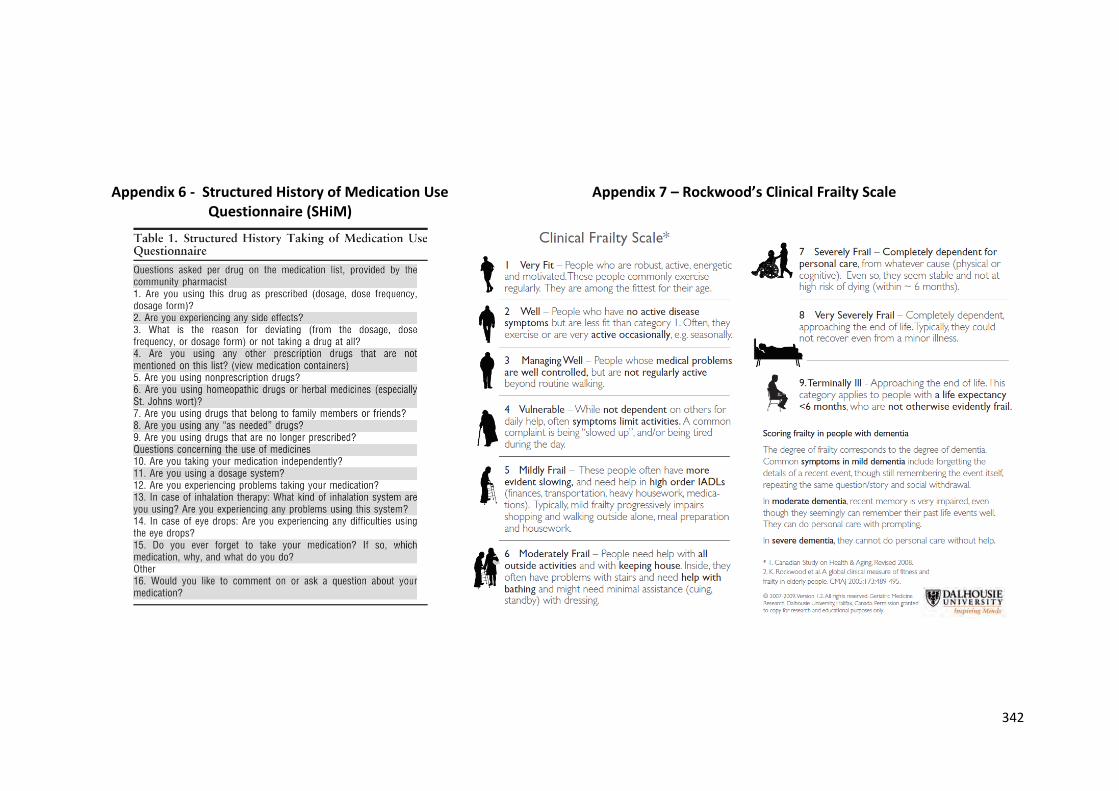
342
Appendix 6 - Structured History of Medication Use Questionnaire (SHiM)
Appendix 7 – Rockwood’s Clinical Frailty Scale
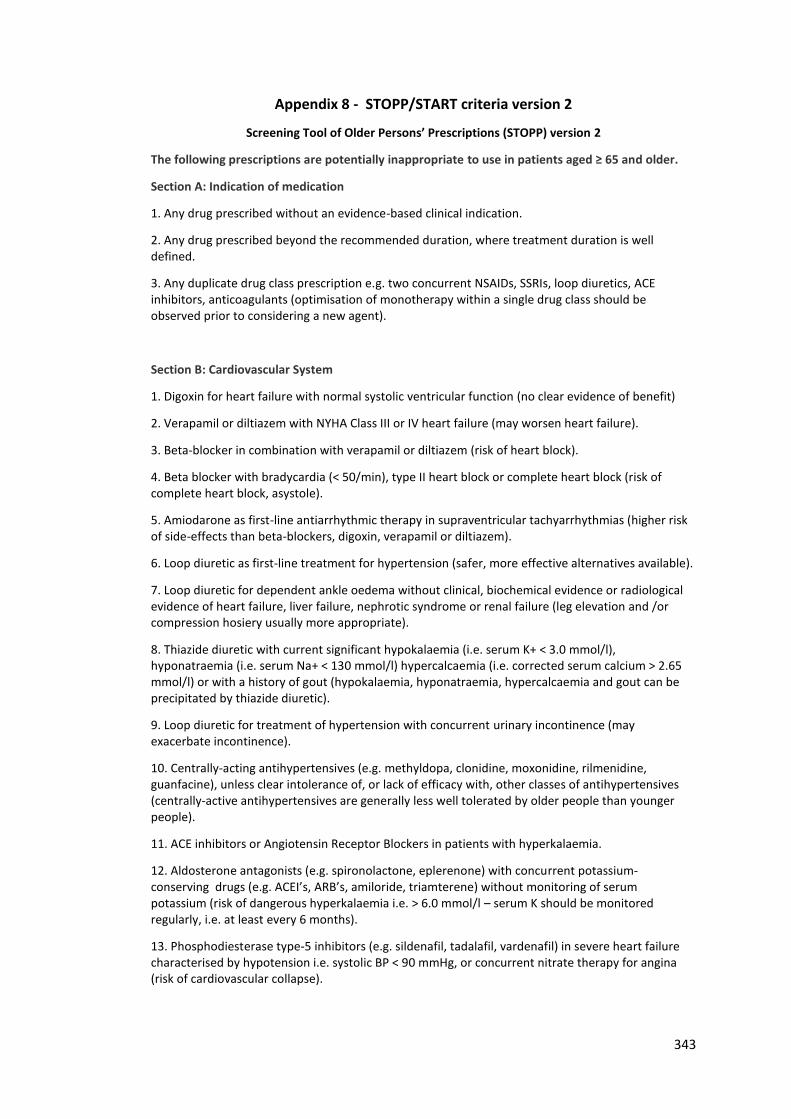
343
Appendix 8 - STOPP/START criteria version 2
Screening Tool of Older Persons’ Prescriptions (STOPP) version 2
The following prescriptions are potentially inappropriate to use in patients aged ≥ 65 and older.
Section A: Indication of medication
1. Any drug prescribed without an evidence-based clinical indication.
2. Any drug prescribed beyond the recommended duration, where treatment duration is well defined.
3. Any duplicate drug class prescription e.g. two concurrent NSAIDs, SSRIs, loop diuretics, ACE inhibitors, anticoagulants (optimisation of monotherapy within a single drug class should be observed prior to considering a new agent).
Section B: Cardiovascular System
1. Digoxin for heart failure with normal systolic ventricular function (no clear evidence of benefit)
2. Verapamil or diltiazem with NYHA Class III or IV heart failure (may worsen heart failure).
3. Beta-blocker in combination with verapamil or diltiazem (risk of heart block).
4. Beta blocker with bradycardia (< 50/min), type II heart block or complete heart block (risk of complete heart block, asystole).
5. Amiodarone as first-line antiarrhythmic therapy in supraventricular tachyarrhythmias (higher risk of side-effects than beta-blockers, digoxin, verapamil or diltiazem).
6. Loop diuretic as first-line treatment for hypertension (safer, more effective alternatives available).
7. Loop diuretic for dependent ankle oedema without clinical, biochemical evidence or radiological evidence of heart failure, liver failure, nephrotic syndrome or renal failure (leg elevation and /or compression hosiery usually more appropriate).
8. Thiazide diuretic with current significant hypokalaemia (i.e. serum K+ < 3.0 mmol/l), hyponatraemia (i.e. serum Na+ < 130 mmol/l) hypercalcaemia (i.e. corrected serum calcium > 2.65 mmol/l) or with a history of gout (hypokalaemia, hyponatraemia, hypercalcaemia and gout can be precipitated by thiazide diuretic).
9. Loop diuretic for treatment of hypertension with concurrent urinary incontinence (may exacerbate incontinence).
10. Centrally-acting antihypertensives (e.g. methyldopa, clonidine, moxonidine, rilmenidine, guanfacine), unless clear intolerance of, or lack of efficacy with, other classes of antihypertensives (centrally-active antihypertensives are generally less well tolerated by older people than younger people).
11. ACE inhibitors or Angiotensin Receptor Blockers in patients with hyperkalaemia.
12. Aldosterone antagonists (e.g. spironolactone, eplerenone) with concurrent potassium-conserving drugs (e.g. ACEI’s, ARB’s, amiloride, triamterene) without monitoring of serum potassium (risk of dangerous hyperkalaemia i.e. > 6.0 mmol/l – serum K should be monitored regularly, i.e. at least every 6 months).
13. Phosphodiesterase type-5 inhibitors (e.g. sildenafil, tadalafil, vardenafil) in severe heart failure characterised by hypotension i.e. systolic BP < 90 mmHg, or concurrent nitrate therapy for angina (risk of cardiovascular collapse).
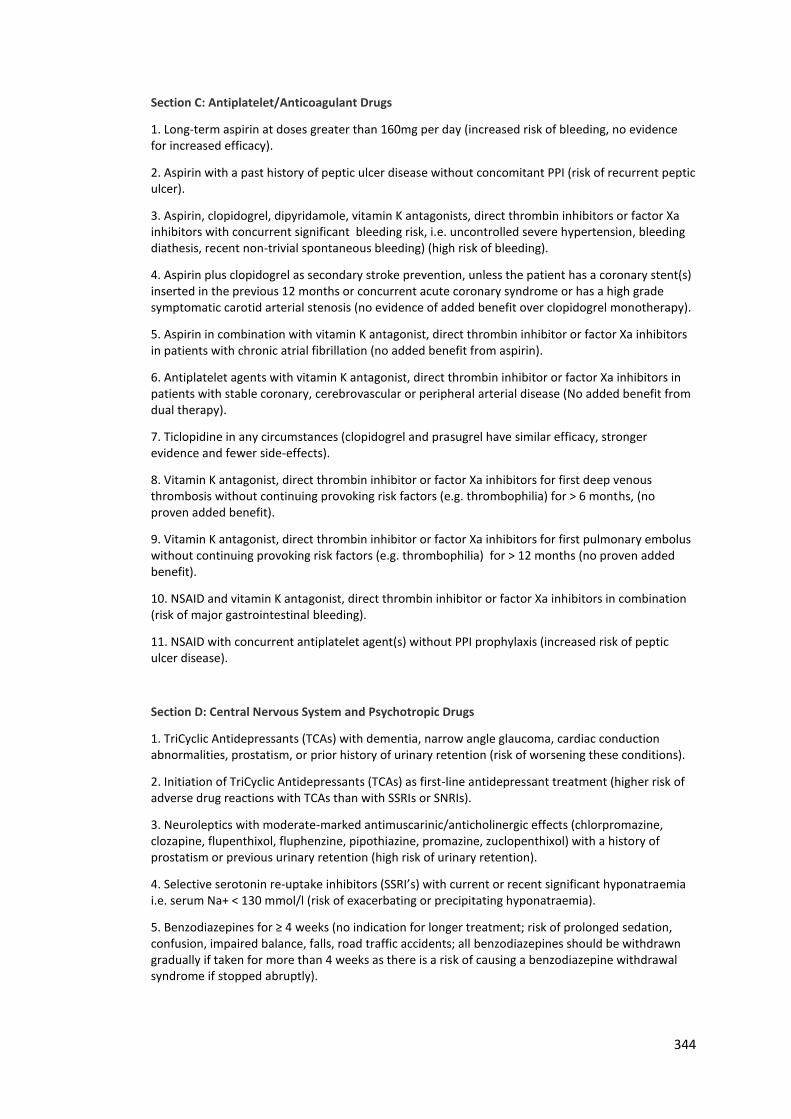
344
Section C: Antiplatelet/Anticoagulant Drugs
1. Long-term aspirin at doses greater than 160mg per day (increased risk of bleeding, no evidence for increased efficacy).
2. Aspirin with a past history of peptic ulcer disease without concomitant PPI (risk of recurrent peptic ulcer).
3. Aspirin, clopidogrel, dipyridamole, vitamin K antagonists, direct thrombin inhibitors or factor Xa inhibitors with concurrent significant bleeding risk, i.e. uncontrolled severe hypertension, bleeding diathesis, recent non-trivial spontaneous bleeding) (high risk of bleeding).
4. Aspirin plus clopidogrel as secondary stroke prevention, unless the patient has a coronary stent(s) inserted in the previous 12 months or concurrent acute coronary syndrome or has a high grade symptomatic carotid arterial stenosis (no evidence of added benefit over clopidogrel monotherapy).
5. Aspirin in combination with vitamin K antagonist, direct thrombin inhibitor or factor Xa inhibitors in patients with chronic atrial fibrillation (no added benefit from aspirin).
6. Antiplatelet agents with vitamin K antagonist, direct thrombin inhibitor or factor Xa inhibitors in patients with stable coronary, cerebrovascular or peripheral arterial disease (No added benefit from dual therapy).
7. Ticlopidine in any circumstances (clopidogrel and prasugrel have similar efficacy, stronger evidence and fewer side-effects).
8. Vitamin K antagonist, direct thrombin inhibitor or factor Xa inhibitors for first deep venous thrombosis without continuing provoking risk factors (e.g. thrombophilia) for > 6 months, (no proven added benefit).
9. Vitamin K antagonist, direct thrombin inhibitor or factor Xa inhibitors for first pulmonary embolus without continuing provoking risk factors (e.g. thrombophilia) for > 12 months (no proven added benefit).
10. NSAID and vitamin K antagonist, direct thrombin inhibitor or factor Xa inhibitors in combination (risk of major gastrointestinal bleeding).
11. NSAID with concurrent antiplatelet agent(s) without PPI prophylaxis (increased risk of peptic ulcer disease).
Section D: Central Nervous System and Psychotropic Drugs
1. TriCyclic Antidepressants (TCAs) with dementia, narrow angle glaucoma, cardiac conduction abnormalities, prostatism, or prior history of urinary retention (risk of worsening these conditions).
2. Initiation of TriCyclic Antidepressants (TCAs) as first-line antidepressant treatment (higher risk of adverse drug reactions with TCAs than with SSRIs or SNRIs).
3. Neuroleptics with moderate-marked antimuscarinic/anticholinergic effects (chlorpromazine, clozapine, flupenthixol, fluphenzine, pipothiazine, promazine, zuclopenthixol) with a history of prostatism or previous urinary retention (high risk of urinary retention).
4. Selective serotonin re-uptake inhibitors (SSRI’s) with current or recent significant hyponatraemia i.e. serum Na+ < 130 mmol/l (risk of exacerbating or precipitating hyponatraemia).
5. Benzodiazepines for ≥ 4 weeks (no indication for longer treatment; risk of prolonged sedation, confusion, impaired balance, falls, road traffic accidents; all benzodiazepines should be withdrawn gradually if taken for more than 4 weeks as there is a risk of causing a benzodiazepine withdrawal syndrome if stopped abruptly).
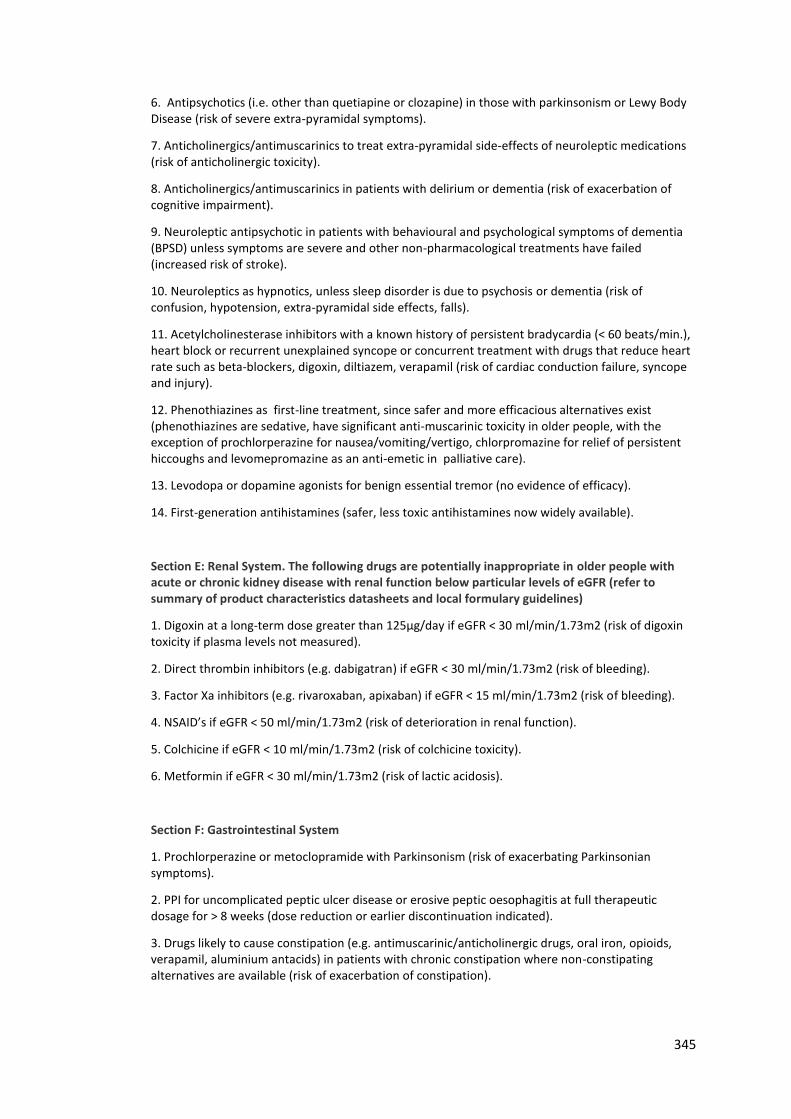
345
6. Antipsychotics (i.e. other than quetiapine or clozapine) in those with parkinsonism or Lewy Body Disease (risk of severe extra-pyramidal symptoms).
7. Anticholinergics/antimuscarinics to treat extra-pyramidal side-effects of neuroleptic medications (risk of anticholinergic toxicity).
8. Anticholinergics/antimuscarinics in patients with delirium or dementia (risk of exacerbation of cognitive impairment).
9. Neuroleptic antipsychotic in patients with behavioural and psychological symptoms of dementia (BPSD) unless symptoms are severe and other non-pharmacological treatments have failed (increased risk of stroke).
10. Neuroleptics as hypnotics, unless sleep disorder is due to psychosis or dementia (risk of confusion, hypotension, extra-pyramidal side effects, falls).
11. Acetylcholinesterase inhibitors with a known history of persistent bradycardia (< 60 beats/min.), heart block or recurrent unexplained syncope or concurrent treatment with drugs that reduce heart rate such as beta-blockers, digoxin, diltiazem, verapamil (risk of cardiac conduction failure, syncope and injury).
12. Phenothiazines as first-line treatment, since safer and more efficacious alternatives exist (phenothiazines are sedative, have significant anti-muscarinic toxicity in older people, with the exception of prochlorperazine for nausea/vomiting/vertigo, chlorpromazine for relief of persistent hiccoughs and levomepromazine as an anti-emetic in palliative care).
13. Levodopa or dopamine agonists for benign essential tremor (no evidence of efficacy).
14. First-generation antihistamines (safer, less toxic antihistamines now widely available).
Section E: Renal System. The following drugs are potentially inappropriate in older people with acute or chronic kidney disease with renal function below particular levels of eGFR (refer to summary of product characteristics datasheets and local formulary guidelines)
1. Digoxin at a long-term dose greater than 125µg/day if eGFR < 30 ml/min/1.73m2 (risk of digoxin toxicity if plasma levels not measured).
2. Direct thrombin inhibitors (e.g. dabigatran) if eGFR < 30 ml/min/1.73m2 (risk of bleeding).
3. Factor Xa inhibitors (e.g. rivaroxaban, apixaban) if eGFR < 15 ml/min/1.73m2 (risk of bleeding).
4. NSAID’s if eGFR < 50 ml/min/1.73m2 (risk of deterioration in renal function).
5. Colchicine if eGFR < 10 ml/min/1.73m2 (risk of colchicine toxicity).
6. Metformin if eGFR < 30 ml/min/1.73m2 (risk of lactic acidosis).
Section F: Gastrointestinal System
1. Prochlorperazine or metoclopramide with Parkinsonism (risk of exacerbating Parkinsonian symptoms).
2. PPI for uncomplicated peptic ulcer disease or erosive peptic oesophagitis at full therapeutic dosage for > 8 weeks (dose reduction or earlier discontinuation indicated).
3. Drugs likely to cause constipation (e.g. antimuscarinic/anticholinergic drugs, oral iron, opioids, verapamil, aluminium antacids) in patients with chronic constipation where non-constipating alternatives are available (risk of exacerbation of constipation).
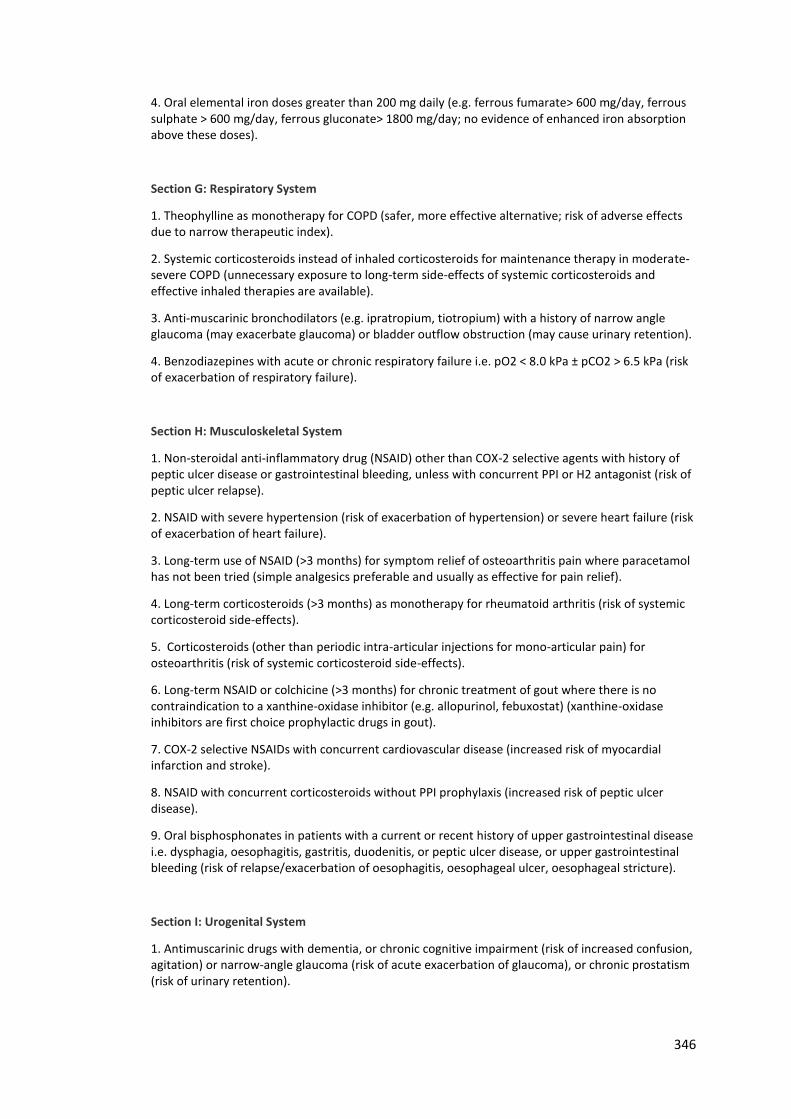
346
4. Oral elemental iron doses greater than 200 mg daily (e.g. ferrous fumarate> 600 mg/day, ferrous sulphate > 600 mg/day, ferrous gluconate> 1800 mg/day; no evidence of enhanced iron absorption above these doses).
Section G: Respiratory System
1. Theophylline as monotherapy for COPD (safer, more effective alternative; risk of adverse effects due to narrow therapeutic index).
2. Systemic corticosteroids instead of inhaled corticosteroids for maintenance therapy in moderate-severe COPD (unnecessary exposure to long-term side-effects of systemic corticosteroids and effective inhaled therapies are available).
3. Anti-muscarinic bronchodilators (e.g. ipratropium, tiotropium) with a history of narrow angle glaucoma (may exacerbate glaucoma) or bladder outflow obstruction (may cause urinary retention).
4. Benzodiazepines with acute or chronic respiratory failure i.e. pO2 < 8.0 kPa ± pCO2 > 6.5 kPa (risk of exacerbation of respiratory failure).
Section H: Musculoskeletal System
1. Non-steroidal anti-inflammatory drug (NSAID) other than COX-2 selective agents with history of peptic ulcer disease or gastrointestinal bleeding, unless with concurrent PPI or H2 antagonist (risk of peptic ulcer relapse).
2. NSAID with severe hypertension (risk of exacerbation of hypertension) or severe heart failure (risk of exacerbation of heart failure).
3. Long-term use of NSAID (>3 months) for symptom relief of osteoarthritis pain where paracetamol has not been tried (simple analgesics preferable and usually as effective for pain relief).
4. Long-term corticosteroids (>3 months) as monotherapy for rheumatoid arthritis (risk of systemic corticosteroid side-effects).
5. Corticosteroids (other than periodic intra-articular injections for mono-articular pain) for osteoarthritis (risk of systemic corticosteroid side-effects).
6. Long-term NSAID or colchicine (>3 months) for chronic treatment of gout where there is no contraindication to a xanthine-oxidase inhibitor (e.g. allopurinol, febuxostat) (xanthine-oxidase inhibitors are first choice prophylactic drugs in gout).
7. COX-2 selective NSAIDs with concurrent cardiovascular disease (increased risk of myocardial infarction and stroke).
8. NSAID with concurrent corticosteroids without PPI prophylaxis (increased risk of peptic ulcer disease).
9. Oral bisphosphonates in patients with a current or recent history of upper gastrointestinal disease i.e. dysphagia, oesophagitis, gastritis, duodenitis, or peptic ulcer disease, or upper gastrointestinal bleeding (risk of relapse/exacerbation of oesophagitis, oesophageal ulcer, oesophageal stricture).
Section I: Urogenital System
1. Antimuscarinic drugs with dementia, or chronic cognitive impairment (risk of increased confusion, agitation) or narrow-angle glaucoma (risk of acute exacerbation of glaucoma), or chronic prostatism (risk of urinary retention).
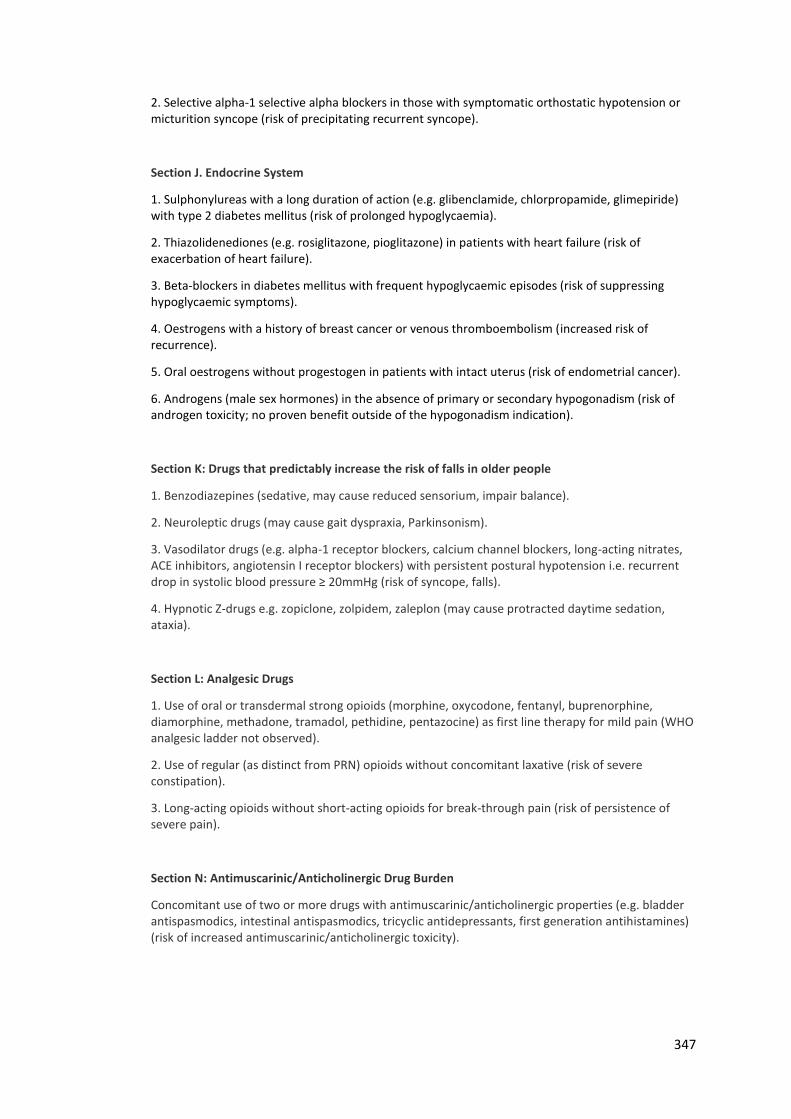
347
2. Selective alpha-1 selective alpha blockers in those with symptomatic orthostatic hypotension or micturition syncope (risk of precipitating recurrent syncope).
Section J. Endocrine System
1. Sulphonylureas with a long duration of action (e.g. glibenclamide, chlorpropamide, glimepiride) with type 2 diabetes mellitus (risk of prolonged hypoglycaemia).
2. Thiazolidenediones (e.g. rosiglitazone, pioglitazone) in patients with heart failure (risk of exacerbation of heart failure).
3. Beta-blockers in diabetes mellitus with frequent hypoglycaemic episodes (risk of suppressing hypoglycaemic symptoms).
4. Oestrogens with a history of breast cancer or venous thromboembolism (increased risk of recurrence).
5. Oral oestrogens without progestogen in patients with intact uterus (risk of endometrial cancer).
6. Androgens (male sex hormones) in the absence of primary or secondary hypogonadism (risk of androgen toxicity; no proven benefit outside of the hypogonadism indication).
Section K: Drugs that predictably increase the risk of falls in older people
1. Benzodiazepines (sedative, may cause reduced sensorium, impair balance).
2. Neuroleptic drugs (may cause gait dyspraxia, Parkinsonism).
3. Vasodilator drugs (e.g. alpha-1 receptor blockers, calcium channel blockers, long-acting nitrates, ACE inhibitors, angiotensin I receptor blockers) with persistent postural hypotension i.e. recurrent drop in systolic blood pressure ≥ 20mmHg (risk of syncope, falls).
4. Hypnotic Z-drugs e.g. zopiclone, zolpidem, zaleplon (may cause protracted daytime sedation, ataxia).
Section L: Analgesic Drugs
1. Use of oral or transdermal strong opioids (morphine, oxycodone, fentanyl, buprenorphine, diamorphine, methadone, tramadol, pethidine, pentazocine) as first line therapy for mild pain (WHO analgesic ladder not observed).
2. Use of regular (as distinct from PRN) opioids without concomitant laxative (risk of severe constipation).
3. Long-acting opioids without short-acting opioids for break-through pain (risk of persistence of severe pain).
Section N: Antimuscarinic/Anticholinergic Drug Burden
Concomitant use of two or more drugs with antimuscarinic/anticholinergic properties (e.g. bladder antispasmodics, intestinal antispasmodics, tricyclic antidepressants, first generation antihistamines) (risk of increased antimuscarinic/anticholinergic toxicity).
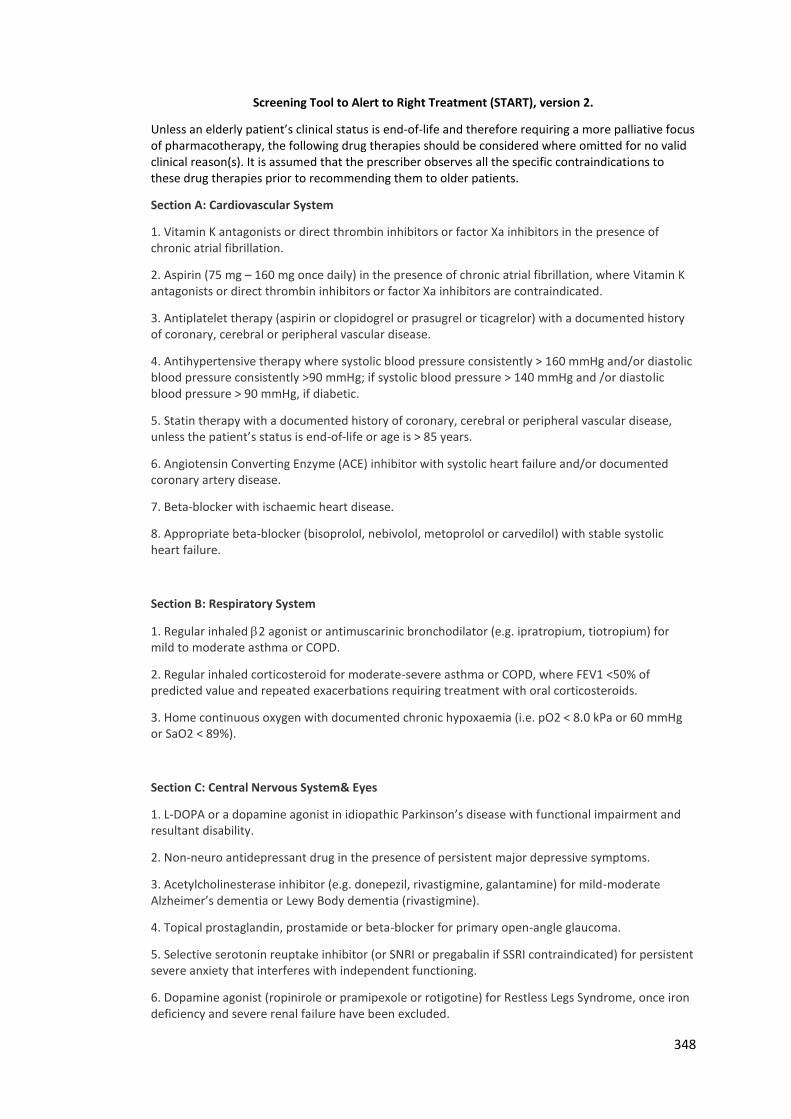
348
Screening Tool to Alert to Right Treatment (START), version 2.
Unless an elderly patient’s clinical status is end-of-life and therefore requiring a more palliative focus of pharmacotherapy, the following drug therapies should be considered where omitted for no valid clinical reason(s). It is assumed that the prescriber observes all the specific contraindications to these drug therapies prior to recommending them to older patients.
Section A: Cardiovascular System
1. Vitamin K antagonists or direct thrombin inhibitors or factor Xa inhibitors in the presence of chronic atrial fibrillation.
2. Aspirin (75 mg – 160 mg once daily) in the presence of chronic atrial fibrillation, where Vitamin K antagonists or direct thrombin inhibitors or factor Xa inhibitors are contraindicated.
3. Antiplatelet therapy (aspirin or clopidogrel or prasugrel or ticagrelor) with a documented history of coronary, cerebral or peripheral vascular disease.
4. Antihypertensive therapy where systolic blood pressure consistently > 160 mmHg and/or diastolic blood pressure consistently >90 mmHg; if systolic blood pressure > 140 mmHg and /or diastolic blood pressure > 90 mmHg, if diabetic.
5. Statin therapy with a documented history of coronary, cerebral or peripheral vascular disease, unless the patient’s status is end-of-life or age is > 85 years.
6. Angiotensin Converting Enzyme (ACE) inhibitor with systolic heart failure and/or documented coronary artery disease.
7. Beta-blocker with ischaemic heart disease.
8. Appropriate beta-blocker (bisoprolol, nebivolol, metoprolol or carvedilol) with stable systolic heart failure.
Section B: Respiratory System
1. Regular inhaled 2 agonist or antimuscarinic bronchodilator (e.g. ipratropium, tiotropium) for mild to moderate asthma or COPD.
2. Regular inhaled corticosteroid for moderate-severe asthma or COPD, where FEV1 <50% of predicted value and repeated exacerbations requiring treatment with oral corticosteroids.
3. Home continuous oxygen with documented chronic hypoxaemia (i.e. pO2 < 8.0 kPa or 60 mmHg or SaO2 < 89%).
Section C: Central Nervous System& Eyes
1. L-DOPA or a dopamine agonist in idiopathic Parkinson’s disease with functional impairment and resultant disability.
2. Non-neuro antidepressant drug in the presence of persistent major depressive symptoms.
3. Acetylcholinesterase inhibitor (e.g. donepezil, rivastigmine, galantamine) for mild-moderate Alzheimer’s dementia or Lewy Body dementia (rivastigmine).
4. Topical prostaglandin, prostamide or beta-blocker for primary open-angle glaucoma.
5. Selective serotonin reuptake inhibitor (or SNRI or pregabalin if SSRI contraindicated) for persistent severe anxiety that interferes with independent functioning.
6. Dopamine agonist (ropinirole or pramipexole or rotigotine) for Restless Legs Syndrome, once iron deficiency and severe renal failure have been excluded.
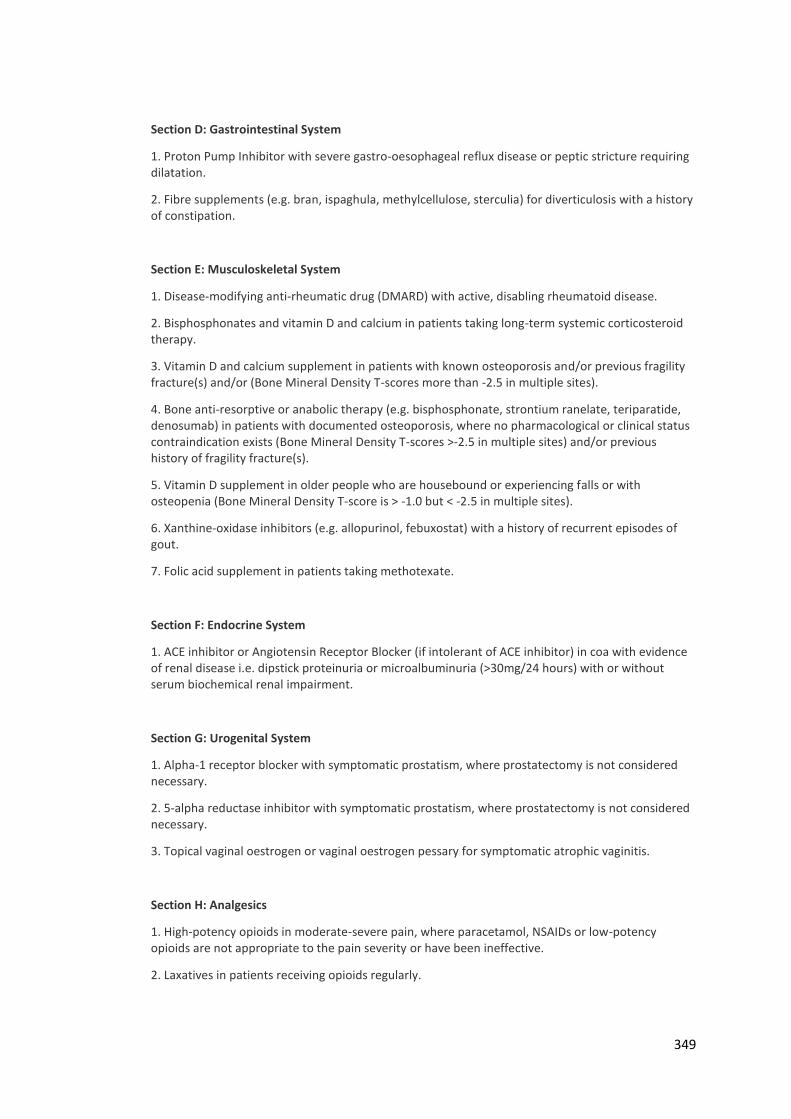
349
Section D: Gastrointestinal System
1. Proton Pump Inhibitor with severe gastro-oesophageal reflux disease or peptic stricture requiring dilatation.
2. Fibre supplements (e.g. bran, ispaghula, methylcellulose, sterculia) for diverticulosis with a history of constipation.
Section E: Musculoskeletal System
1. Disease-modifying anti-rheumatic drug (DMARD) with active, disabling rheumatoid disease.
2. Bisphosphonates and vitamin D and calcium in patients taking long-term systemic corticosteroid therapy.
3. Vitamin D and calcium supplement in patients with known osteoporosis and/or previous fragility fracture(s) and/or (Bone Mineral Density T-scores more than -2.5 in multiple sites).
4. Bone anti-resorptive or anabolic therapy (e.g. bisphosphonate, strontium ranelate, teriparatide, denosumab) in patients with documented osteoporosis, where no pharmacological or clinical status contraindication exists (Bone Mineral Density T-scores >-2.5 in multiple sites) and/or previous history of fragility fracture(s).
5. Vitamin D supplement in older people who are housebound or experiencing falls or with osteopenia (Bone Mineral Density T-score is > -1.0 but < -2.5 in multiple sites).
6. Xanthine-oxidase inhibitors (e.g. allopurinol, febuxostat) with a history of recurrent episodes of gout.
7. Folic acid supplement in patients taking methotexate.
Section F: Endocrine System
1. ACE inhibitor or Angiotensin Receptor Blocker (if intolerant of ACE inhibitor) in coa with evidence of renal disease i.e. dipstick proteinuria or microalbuminuria (>30mg/24 hours) with or without serum biochemical renal impairment.
Section G: Urogenital System
1. Alpha-1 receptor blocker with symptomatic prostatism, where prostatectomy is not considered necessary.
2. 5-alpha reductase inhibitor with symptomatic prostatism, where prostatectomy is not considered necessary.
3. Topical vaginal oestrogen or vaginal oestrogen pessary for symptomatic atrophic vaginitis.
Section H: Analgesics
1. High-potency opioids in moderate-severe pain, where paracetamol, NSAIDs or low-potency opioids are not appropriate to the pain severity or have been ineffective.
2. Laxatives in patients receiving opioids regularly.
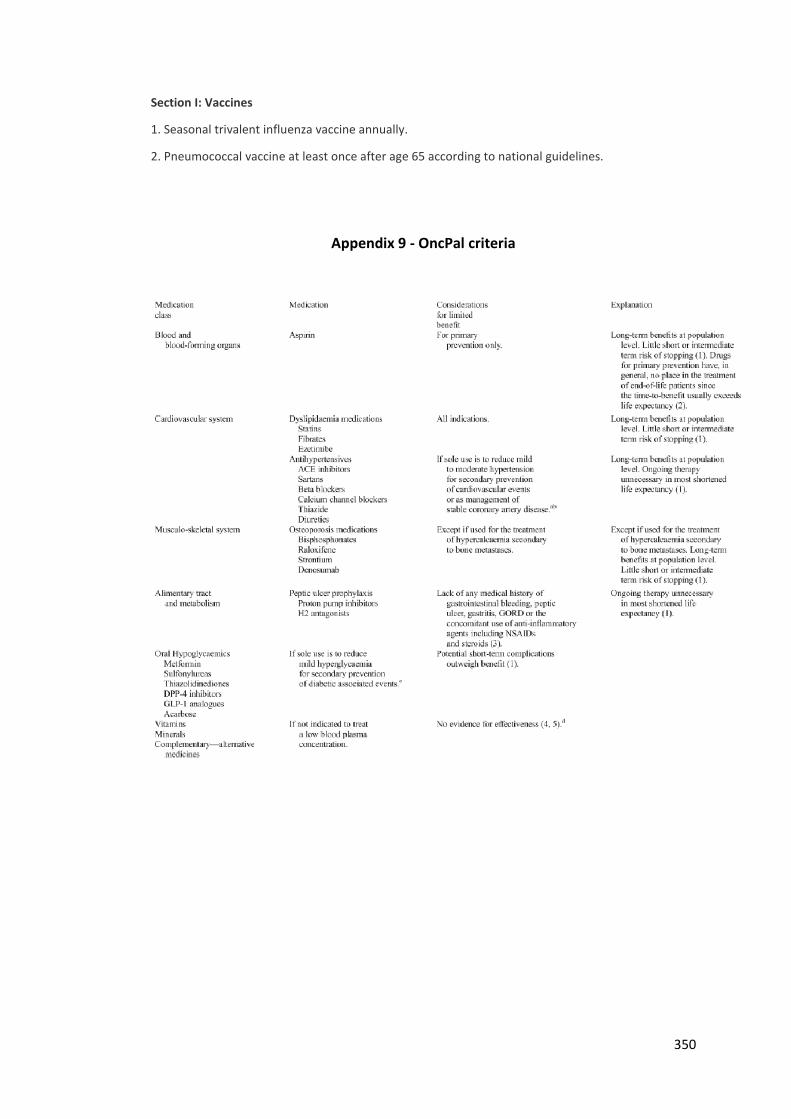
350
Section I: Vaccines
1. Seasonal trivalent influenza vaccine annually.
2. Pneumococcal vaccine at least once after age 65 according to national guidelines.
Appendix 9 - OncPal criteria
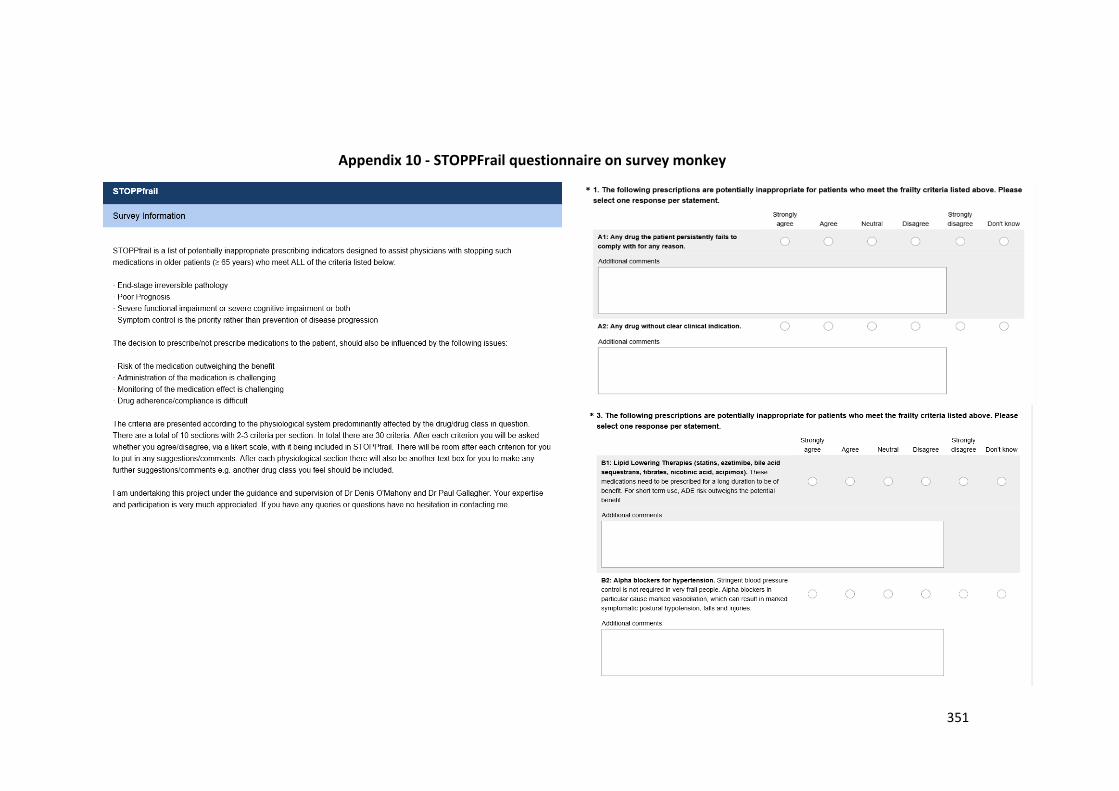
351
Appendix 10 - STOPPFrail questionnaire on survey monkey
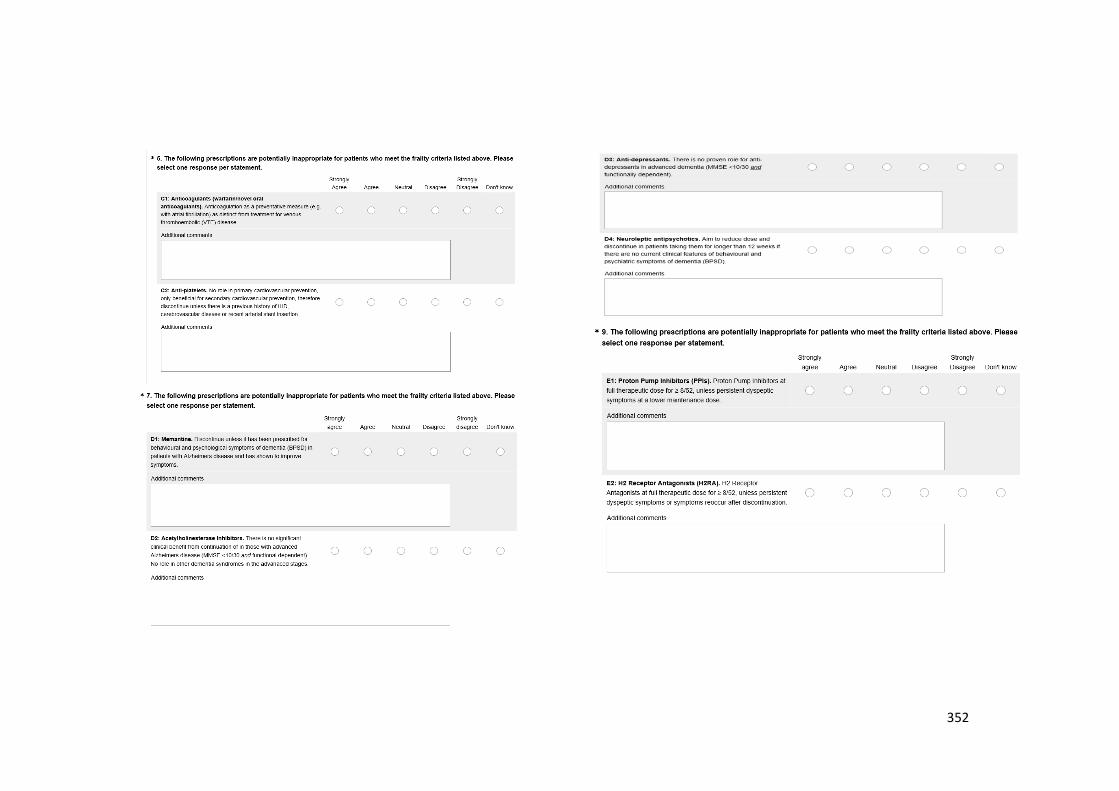
352
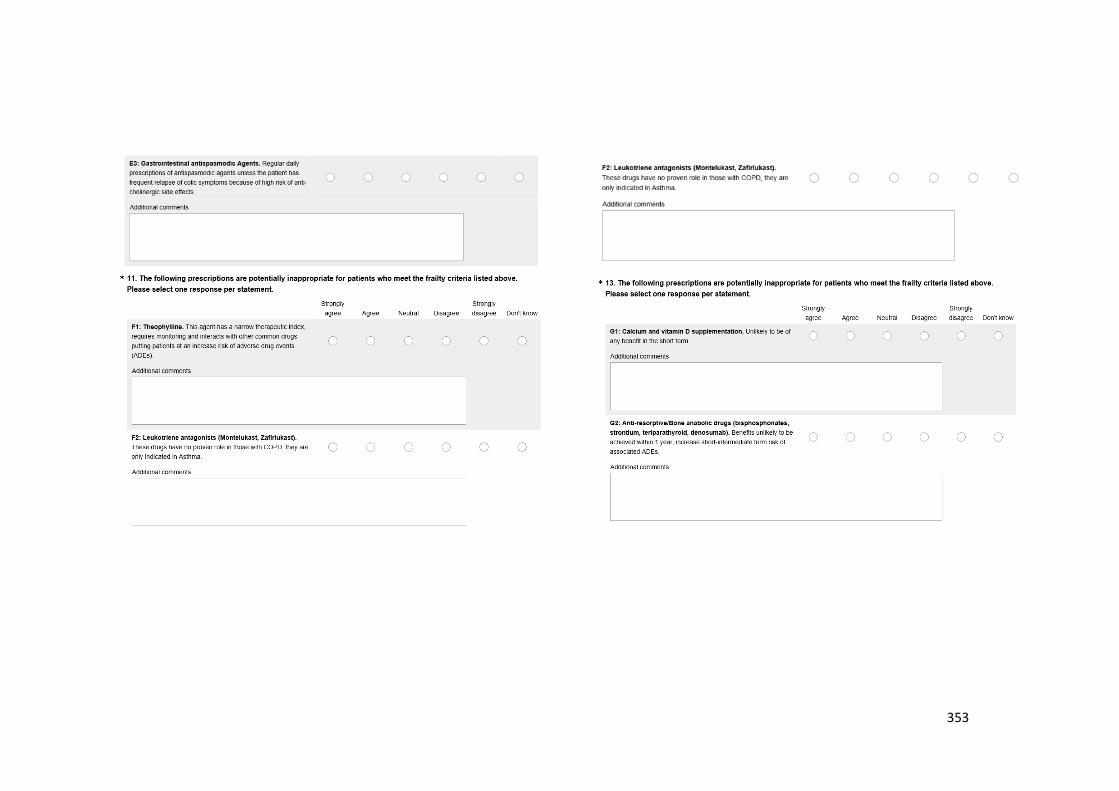
353
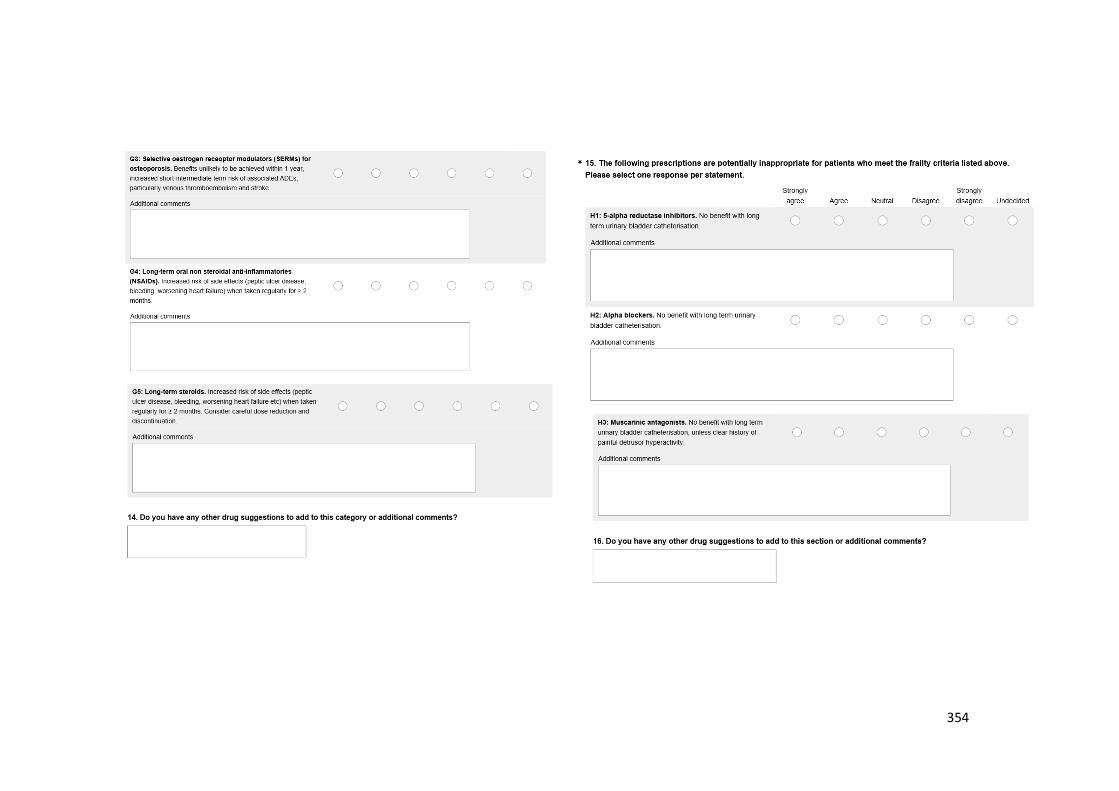
354
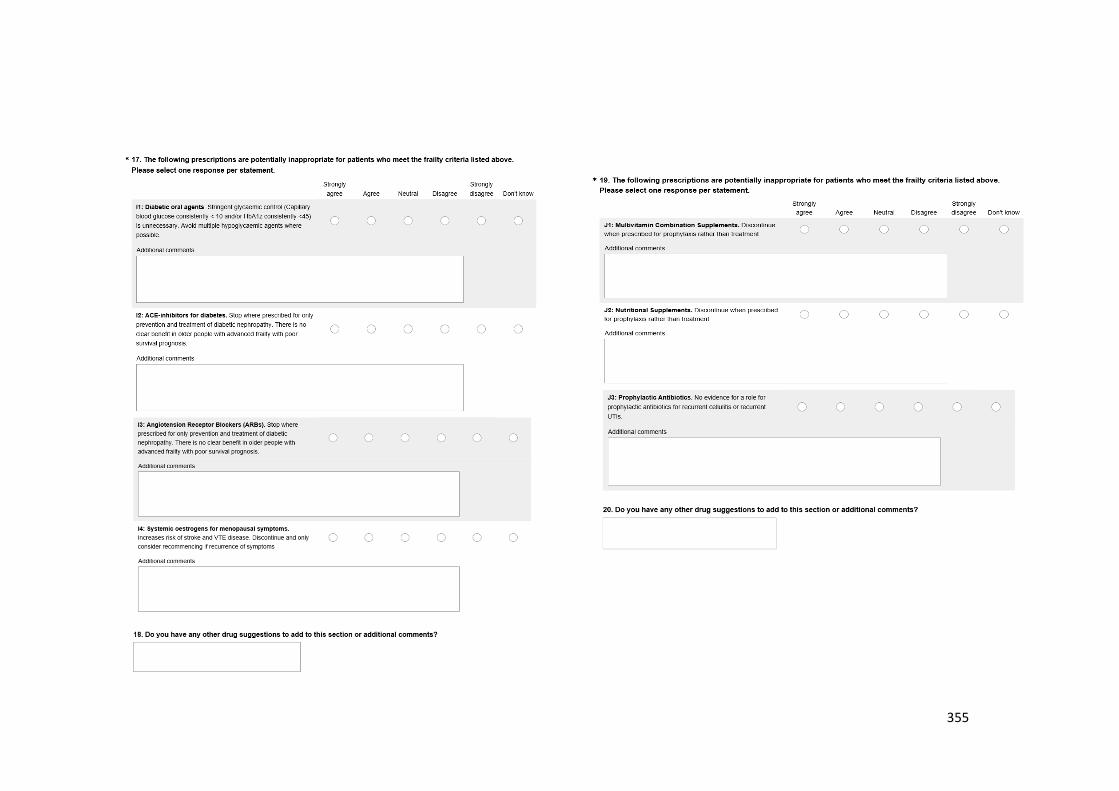
355
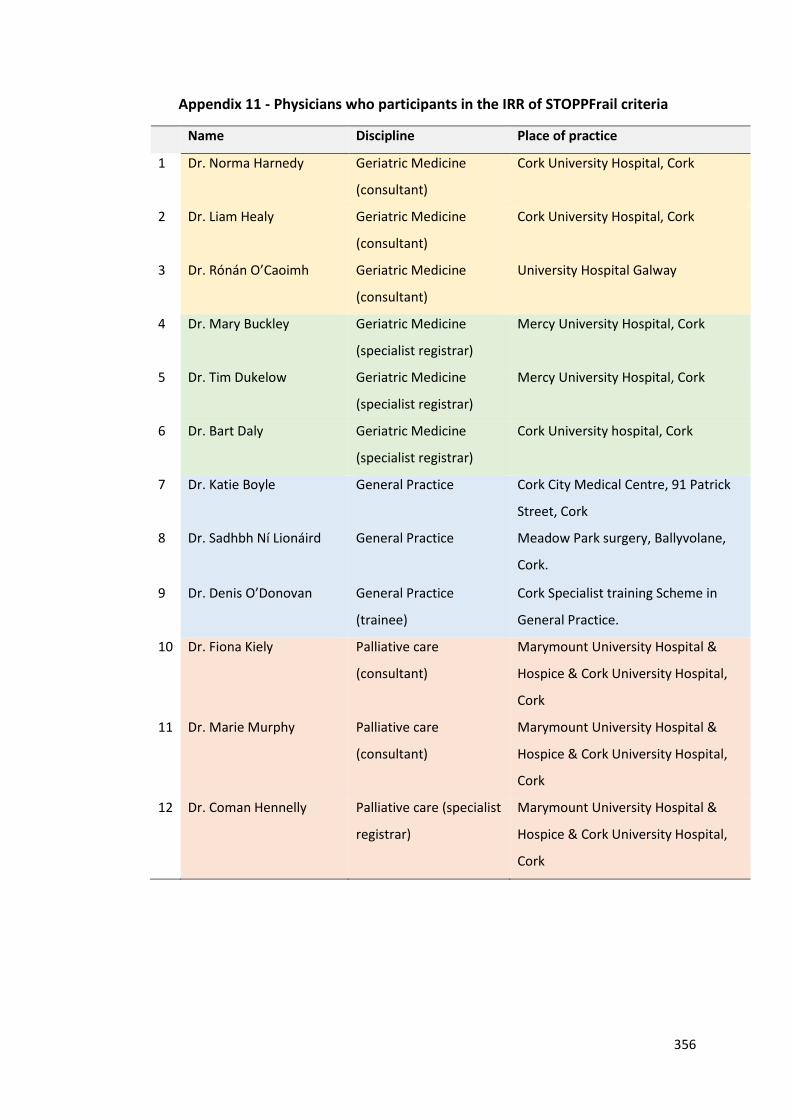
356
Appendix 11 - Physicians who participants in the IRR of STOPPFrail criteria
Name Discipline Place of practice
1 Dr. Norma Harnedy Geriatric Medicine
(consultant)
Cork University Hospital, Cork
2 Dr. Liam Healy Geriatric Medicine
(consultant)
Cork University Hospital, Cork
3 Dr. Rónán O’Caoimh Geriatric Medicine
(consultant)
University Hospital Galway
4 Dr. Mary Buckley Geriatric Medicine
(specialist registrar)
Mercy University Hospital, Cork
5 Dr. Tim Dukelow Geriatric Medicine
(specialist registrar)
Mercy University Hospital, Cork
6 Dr. Bart Daly Geriatric Medicine
(specialist registrar)
Cork University hospital, Cork
7 Dr. Katie Boyle General Practice Cork City Medical Centre, 91 Patrick
Street, Cork
8 Dr. Sadhbh Ní Lionáird
General Practice Meadow Park surgery, Ballyvolane,
Cork.
9 Dr. Denis O’Donovan General Practice
(trainee)
Cork Specialist training Scheme in
General Practice.
10 Dr. Fiona Kiely Palliative care
(consultant)
Marymount University Hospital &
Hospice & Cork University Hospital,
Cork
11 Dr. Marie Murphy Palliative care
(consultant)
Marymount University Hospital &
Hospice & Cork University Hospital,
Cork
12 Dr. Coman Hennelly Palliative care (specialist
registrar)
Marymount University Hospital &
Hospice & Cork University Hospital,
Cork
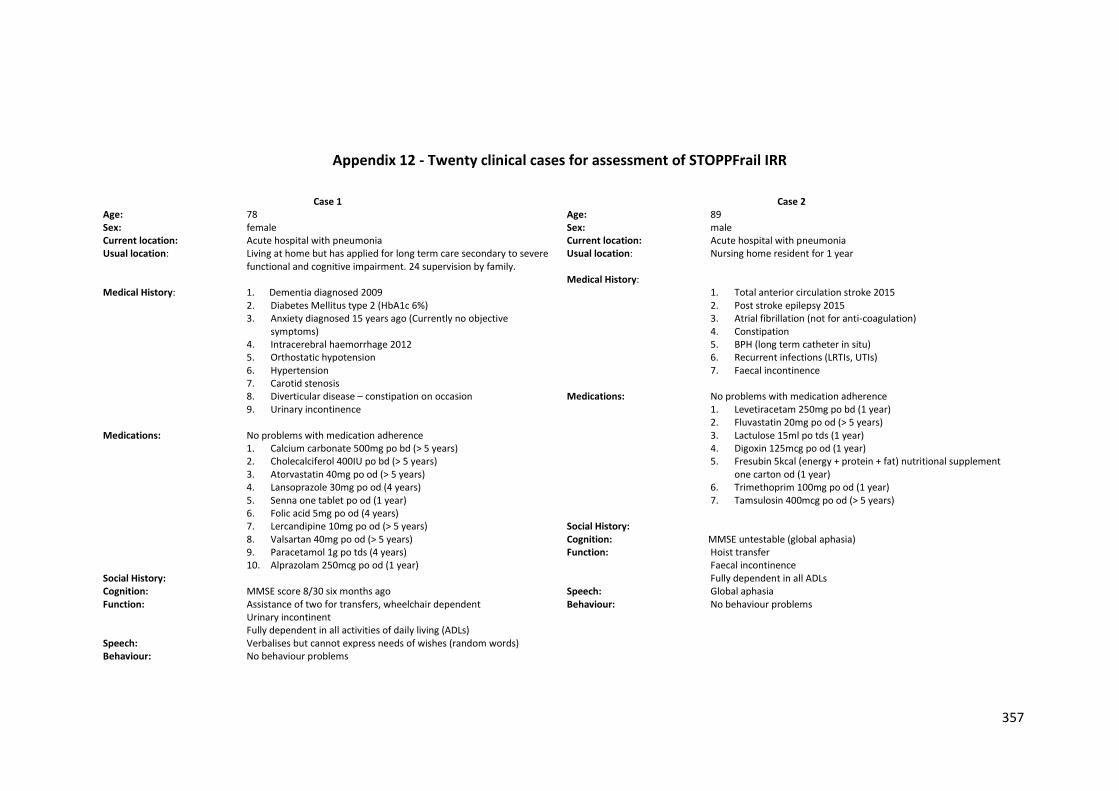
357
Appendix 12 - Twenty clinical cases for assessment of STOPPFrail IRR
Case 1
Age: 78 Sex: female Current location: Acute hospital with pneumonia Usual location: Living at home but has applied for long term care secondary to severe
functional and cognitive impairment. 24 supervision by family. Medical History: 1. Dementia diagnosed 2009
2. Diabetes Mellitus type 2 (HbA1c 6%) 3. Anxiety diagnosed 15 years ago (Currently no objective
symptoms) 4. Intracerebral haemorrhage 2012 5. Orthostatic hypotension 6. Hypertension 7. Carotid stenosis 8. Diverticular disease – constipation on occasion 9. Urinary incontinence
Medications: No problems with medication adherence
1. Calcium carbonate 500mg po bd (> 5 years) 2. Cholecalciferol 400IU po bd (> 5 years) 3. Atorvastatin 40mg po od (> 5 years) 4. Lansoprazole 30mg po od (4 years) 5. Senna one tablet po od (1 year) 6. Folic acid 5mg po od (4 years) 7. Lercandipine 10mg po od (> 5 years) 8. Valsartan 40mg po od (> 5 years) 9. Paracetamol 1g po tds (4 years) 10. Alprazolam 250mcg po od (1 year)
Social History: Cognition: MMSE score 8/30 six months ago Function: Assistance of two for transfers, wheelchair dependent Urinary incontinent Fully dependent in all activities of daily living (ADLs) Speech: Verbalises but cannot express needs of wishes (random words) Behaviour: No behaviour problems
Case 2
Age: 89 Sex: male Current location: Acute hospital with pneumonia Usual location: Nursing home resident for 1 year Medical History:
1. Total anterior circulation stroke 2015 2. Post stroke epilepsy 2015 3. Atrial fibrillation (not for anti-coagulation) 4. Constipation 5. BPH (long term catheter in situ) 6. Recurrent infections (LRTIs, UTIs) 7. Faecal incontinence
Medications: No problems with medication adherence
1. Levetiracetam 250mg po bd (1 year) 2. Fluvastatin 20mg po od (> 5 years) 3. Lactulose 15ml po tds (1 year) 4. Digoxin 125mcg po od (1 year) 5. Fresubin 5kcal (energy + protein + fat) nutritional supplement
one carton od (1 year) 6. Trimethoprim 100mg po od (1 year) 7. Tamsulosin 400mcg po od (> 5 years)
Social History: Cognition: MMSE untestable (global aphasia) Function: Hoist transfer Faecal incontinence Fully dependent in all ADLs Speech: Global aphasia Behaviour: No behaviour problems
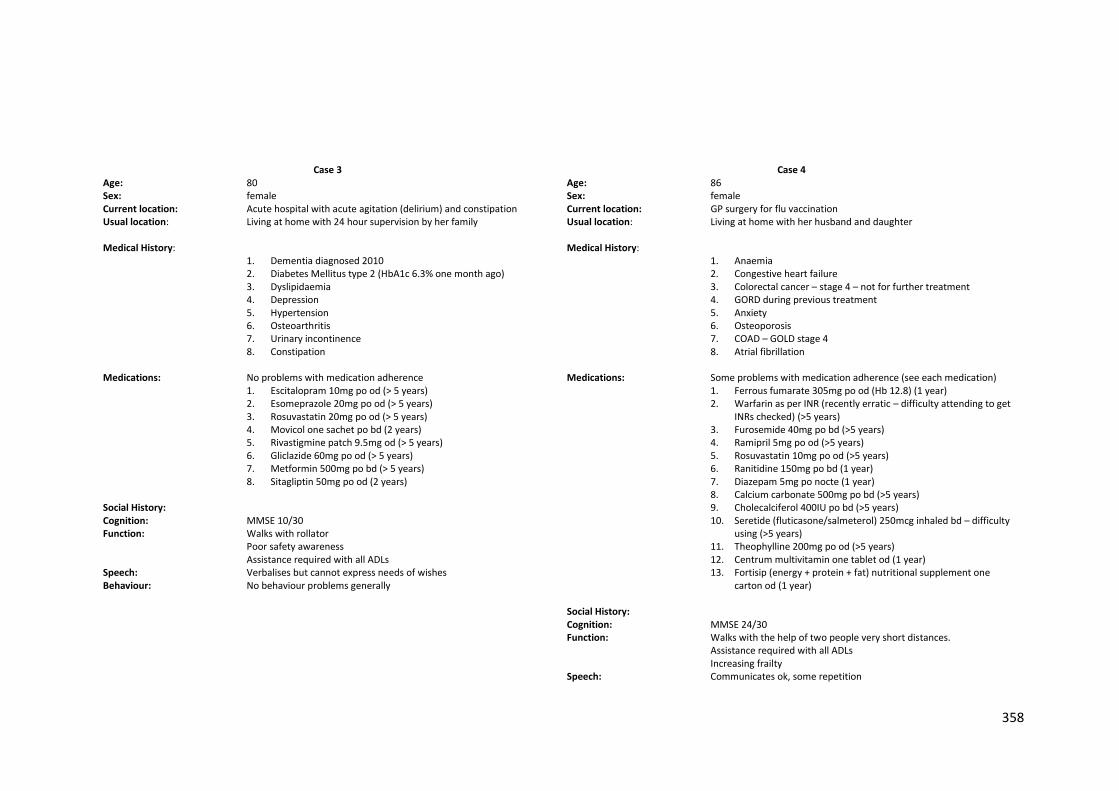
358
Case 3
Age: 80 Sex: female Current location: Acute hospital with acute agitation (delirium) and constipation Usual location: Living at home with 24 hour supervision by her family Medical History:
1. Dementia diagnosed 2010 2. Diabetes Mellitus type 2 (HbA1c 6.3% one month ago) 3. Dyslipidaemia 4. Depression 5. Hypertension 6. Osteoarthritis 7. Urinary incontinence 8. Constipation
Medications: No problems with medication adherence
1. Escitalopram 10mg po od (> 5 years) 2. Esomeprazole 20mg po od (> 5 years) 3. Rosuvastatin 20mg po od (> 5 years) 4. Movicol one sachet po bd (2 years) 5. Rivastigmine patch 9.5mg od (> 5 years) 6. Gliclazide 60mg po od (> 5 years) 7. Metformin 500mg po bd (> 5 years) 8. Sitagliptin 50mg po od (2 years)
Social History: Cognition: MMSE 10/30 Function: Walks with rollator
Poor safety awareness Assistance required with all ADLs
Speech: Verbalises but cannot express needs of wishes Behaviour: No behaviour problems generally
Case 4
Age: 86 Sex: female Current location: GP surgery for flu vaccination Usual location: Living at home with her husband and daughter Medical History:
1. Anaemia 2. Congestive heart failure 3. Colorectal cancer – stage 4 – not for further treatment 4. GORD during previous treatment 5. Anxiety 6. Osteoporosis 7. COAD – GOLD stage 4 8. Atrial fibrillation
Medications: Some problems with medication adherence (see each medication)
1. Ferrous fumarate 305mg po od (Hb 12.8) (1 year) 2. Warfarin as per INR (recently erratic – difficulty attending to get
INRs checked) (>5 years) 3. Furosemide 40mg po bd (>5 years) 4. Ramipril 5mg po od (>5 years) 5. Rosuvastatin 10mg po od (>5 years) 6. Ranitidine 150mg po bd (1 year) 7. Diazepam 5mg po nocte (1 year) 8. Calcium carbonate 500mg po bd (>5 years) 9. Cholecalciferol 400IU po bd (>5 years) 10. Seretide (fluticasone/salmeterol) 250mcg inhaled bd – difficulty
using (>5 years) 11. Theophylline 200mg po od (>5 years) 12. Centrum multivitamin one tablet od (1 year) 13. Fortisip (energy + protein + fat) nutritional supplement one
carton od (1 year) Social History: Cognition: MMSE 24/30 Function: Walks with the help of two people very short distances.
Assistance required with all ADLs Increasing frailty
Speech: Communicates ok, some repetition
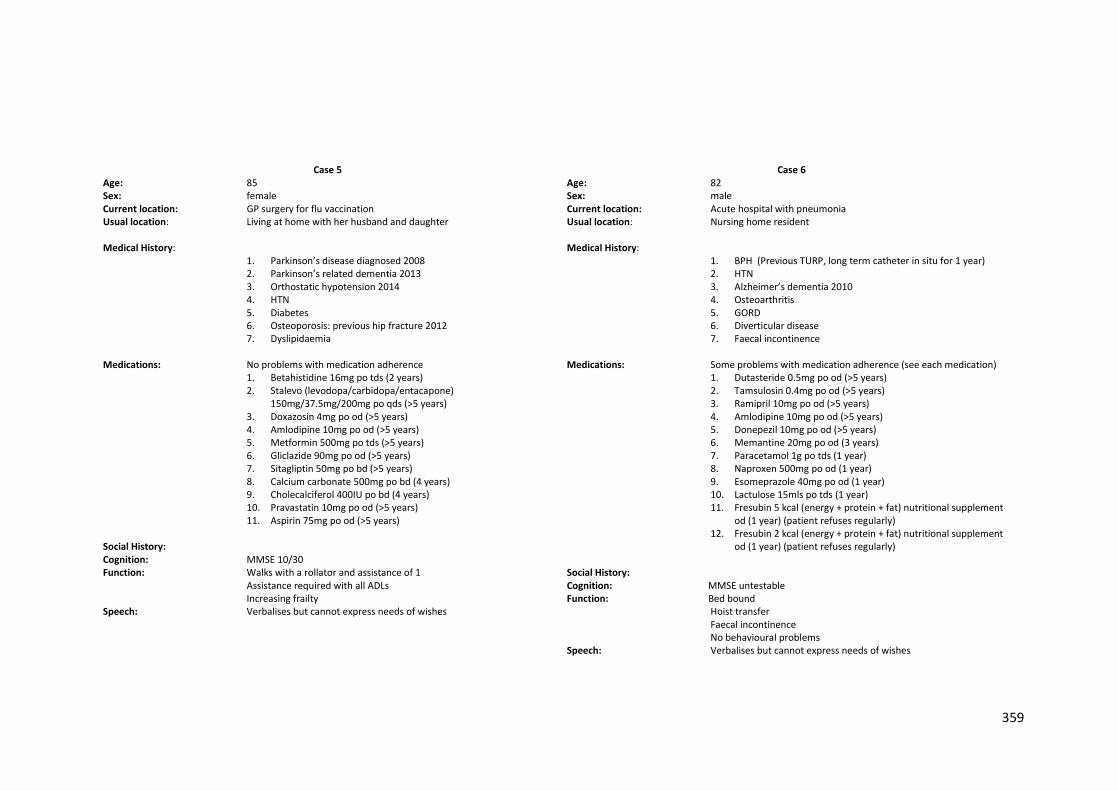
359
Case 5
Age: 85 Sex: female Current location: GP surgery for flu vaccination Usual location: Living at home with her husband and daughter Medical History:
1. Parkinson’s disease diagnosed 2008 2. Parkinson’s related dementia 2013 3. Orthostatic hypotension 2014 4. HTN 5. Diabetes 6. Osteoporosis: previous hip fracture 2012 7. Dyslipidaemia
Medications: No problems with medication adherence
1. Betahistidine 16mg po tds (2 years) 2. Stalevo (levodopa/carbidopa/entacapone)
150mg/37.5mg/200mg po qds (>5 years) 3. Doxazosin 4mg po od (>5 years) 4. Amlodipine 10mg po od (>5 years) 5. Metformin 500mg po tds (>5 years) 6. Gliclazide 90mg po od (>5 years) 7. Sitagliptin 50mg po bd (>5 years) 8. Calcium carbonate 500mg po bd (4 years) 9. Cholecalciferol 400IU po bd (4 years) 10. Pravastatin 10mg po od (>5 years) 11. Aspirin 75mg po od (>5 years)
Social History: Cognition: MMSE 10/30 Function: Walks with a rollator and assistance of 1
Assistance required with all ADLs Increasing frailty
Speech: Verbalises but cannot express needs of wishes
Case 6
Age: 82 Sex: male Current location: Acute hospital with pneumonia Usual location: Nursing home resident Medical History:
1. BPH (Previous TURP, long term catheter in situ for 1 year) 2. HTN 3. Alzheimer’s dementia 2010 4. Osteoarthritis 5. GORD 6. Diverticular disease 7. Faecal incontinence
Medications: Some problems with medication adherence (see each medication)
1. Dutasteride 0.5mg po od (>5 years) 2. Tamsulosin 0.4mg po od (>5 years) 3. Ramipril 10mg po od (>5 years) 4. Amlodipine 10mg po od (>5 years) 5. Donepezil 10mg po od (>5 years) 6. Memantine 20mg po od (3 years) 7. Paracetamol 1g po tds (1 year) 8. Naproxen 500mg po od (1 year) 9. Esomeprazole 40mg po od (1 year) 10. Lactulose 15mls po tds (1 year) 11. Fresubin 5 kcal (energy + protein + fat) nutritional supplement
od (1 year) (patient refuses regularly) 12. Fresubin 2 kcal (energy + protein + fat) nutritional supplement
od (1 year) (patient refuses regularly) Social History: Cognition: MMSE untestable Function: Bed bound Hoist transfer Faecal incontinence No behavioural problems Speech: Verbalises but cannot express needs of wishes
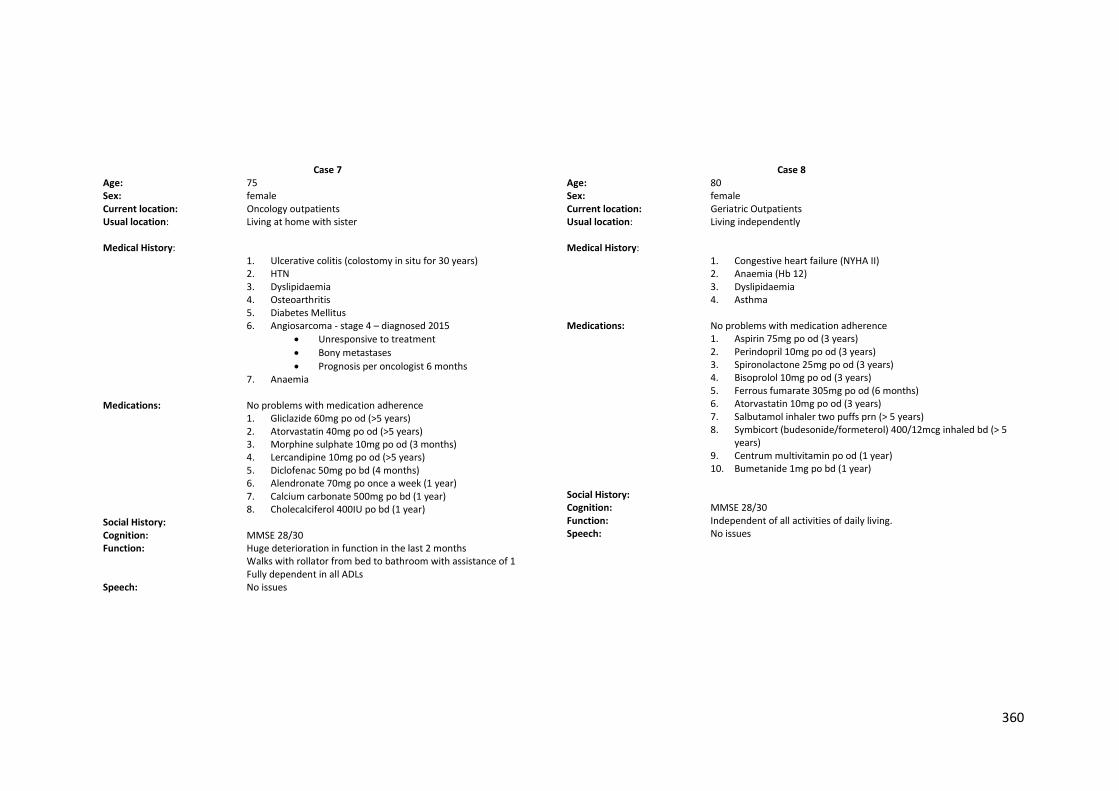
360
Case 7
Age: 75 Sex: female Current location: Oncology outpatients Usual location: Living at home with sister Medical History:
1. Ulcerative colitis (colostomy in situ for 30 years) 2. HTN 3. Dyslipidaemia 4. Osteoarthritis 5. Diabetes Mellitus 6. Angiosarcoma - stage 4 – diagnosed 2015
Unresponsive to treatment
Bony metastases
Prognosis per oncologist 6 months 7. Anaemia
Medications: No problems with medication adherence
1. Gliclazide 60mg po od (>5 years) 2. Atorvastatin 40mg po od (>5 years) 3. Morphine sulphate 10mg po od (3 months) 4. Lercandipine 10mg po od (>5 years) 5. Diclofenac 50mg po bd (4 months) 6. Alendronate 70mg po once a week (1 year) 7. Calcium carbonate 500mg po bd (1 year) 8. Cholecalciferol 400IU po bd (1 year)
Social History: Cognition: MMSE 28/30 Function: Huge deterioration in function in the last 2 months Walks with rollator from bed to bathroom with assistance of 1 Fully dependent in all ADLs Speech: No issues
Case 8
Age: 80 Sex: female Current location: Geriatric Outpatients Usual location: Living independently Medical History:
1. Congestive heart failure (NYHA II) 2. Anaemia (Hb 12) 3. Dyslipidaemia 4. Asthma
Medications: No problems with medication adherence
1. Aspirin 75mg po od (3 years) 2. Perindopril 10mg po od (3 years) 3. Spironolactone 25mg po od (3 years) 4. Bisoprolol 10mg po od (3 years) 5. Ferrous fumarate 305mg po od (6 months) 6. Atorvastatin 10mg po od (3 years) 7. Salbutamol inhaler two puffs prn (> 5 years) 8. Symbicort (budesonide/formeterol) 400/12mcg inhaled bd (> 5
years) 9. Centrum multivitamin po od (1 year) 10. Bumetanide 1mg po bd (1 year)
Social History: Cognition: MMSE 28/30 Function: Independent of all activities of daily living. Speech: No issues
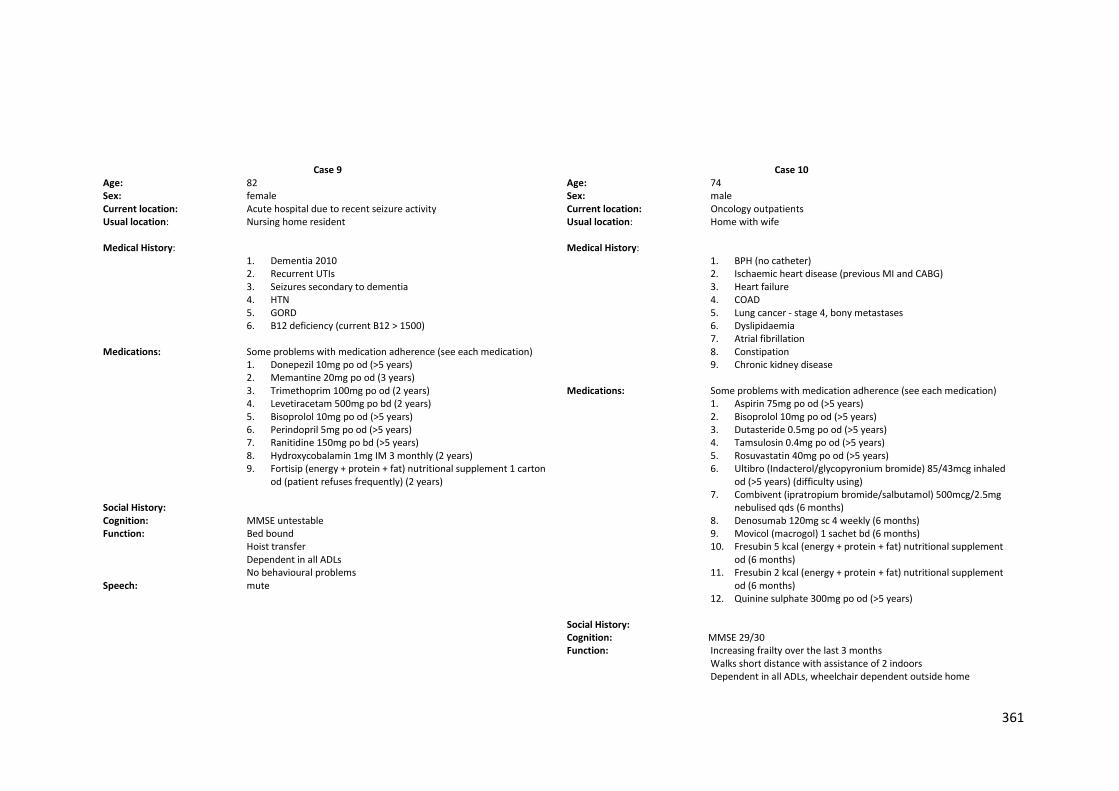
361
Case 9
Age: 82 Sex: female Current location: Acute hospital due to recent seizure activity Usual location: Nursing home resident Medical History:
1. Dementia 2010 2. Recurrent UTIs 3. Seizures secondary to dementia 4. HTN 5. GORD 6. B12 deficiency (current B12 > 1500)
Medications: Some problems with medication adherence (see each medication)
1. Donepezil 10mg po od (>5 years) 2. Memantine 20mg po od (3 years) 3. Trimethoprim 100mg po od (2 years) 4. Levetiracetam 500mg po bd (2 years) 5. Bisoprolol 10mg po od (>5 years) 6. Perindopril 5mg po od (>5 years) 7. Ranitidine 150mg po bd (>5 years) 8. Hydroxycobalamin 1mg IM 3 monthly (2 years) 9. Fortisip (energy + protein + fat) nutritional supplement 1 carton
od (patient refuses frequently) (2 years) Social History: Cognition: MMSE untestable Function: Bed bound
Hoist transfer Dependent in all ADLs No behavioural problems
Speech: mute
Case 10
Age: 74 Sex: male Current location: Oncology outpatients Usual location: Home with wife Medical History:
1. BPH (no catheter) 2. Ischaemic heart disease (previous MI and CABG) 3. Heart failure 4. COAD 5. Lung cancer - stage 4, bony metastases 6. Dyslipidaemia 7. Atrial fibrillation 8. Constipation 9. Chronic kidney disease
Medications: Some problems with medication adherence (see each medication)
1. Aspirin 75mg po od (>5 years) 2. Bisoprolol 10mg po od (>5 years) 3. Dutasteride 0.5mg po od (>5 years) 4. Tamsulosin 0.4mg po od (>5 years) 5. Rosuvastatin 40mg po od (>5 years) 6. Ultibro (Indacterol/glycopyronium bromide) 85/43mcg inhaled
od (>5 years) (difficulty using) 7. Combivent (ipratropium bromide/salbutamol) 500mcg/2.5mg
nebulised qds (6 months) 8. Denosumab 120mg sc 4 weekly (6 months) 9. Movicol (macrogol) 1 sachet bd (6 months) 10. Fresubin 5 kcal (energy + protein + fat) nutritional supplement
od (6 months) 11. Fresubin 2 kcal (energy + protein + fat) nutritional supplement
od (6 months) 12. Quinine sulphate 300mg po od (>5 years)
Social History: Cognition: MMSE 29/30 Function: Increasing frailty over the last 3 months Walks short distance with assistance of 2 indoors
Dependent in all ADLs, wheelchair dependent outside home
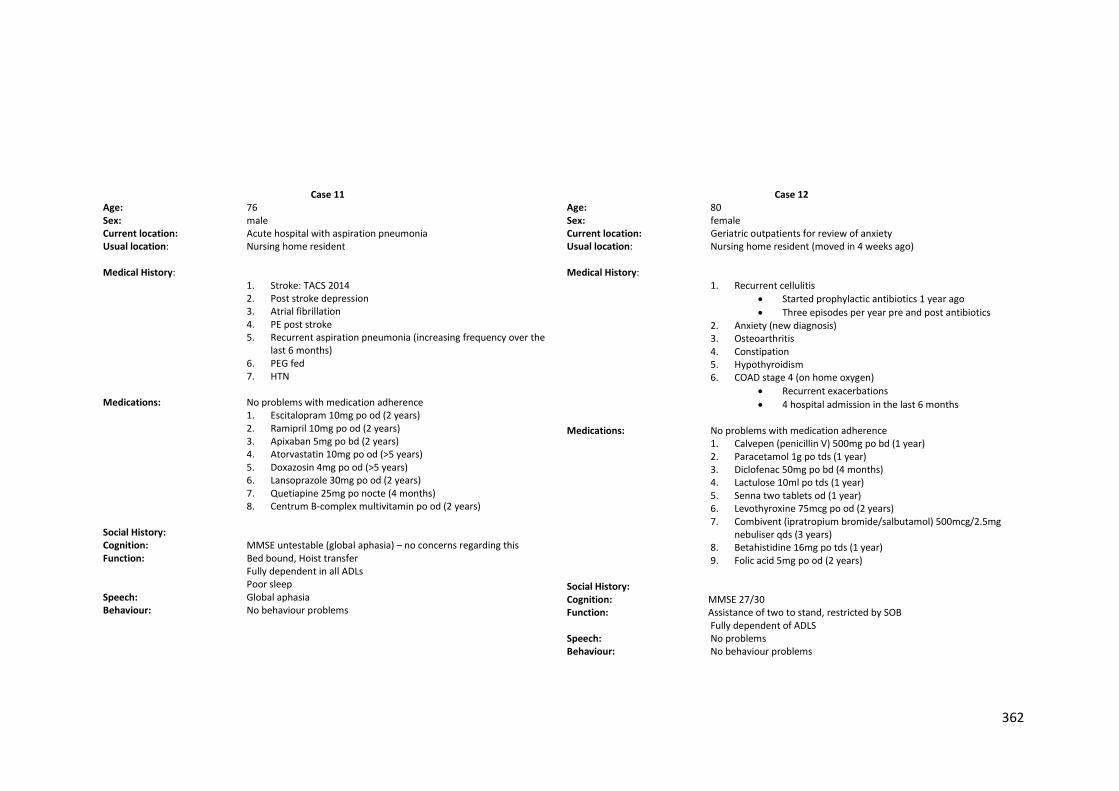
362
Case 11
Age: 76 Sex: male Current location: Acute hospital with aspiration pneumonia Usual location: Nursing home resident Medical History:
1. Stroke: TACS 2014 2. Post stroke depression 3. Atrial fibrillation 4. PE post stroke 5. Recurrent aspiration pneumonia (increasing frequency over the
last 6 months) 6. PEG fed 7. HTN
Medications: No problems with medication adherence
1. Escitalopram 10mg po od (2 years) 2. Ramipril 10mg po od (2 years) 3. Apixaban 5mg po bd (2 years) 4. Atorvastatin 10mg po od (>5 years) 5. Doxazosin 4mg po od (>5 years) 6. Lansoprazole 30mg po od (2 years) 7. Quetiapine 25mg po nocte (4 months) 8. Centrum B-complex multivitamin po od (2 years)
Social History: Cognition: MMSE untestable (global aphasia) – no concerns regarding this Function: Bed bound, Hoist transfer Fully dependent in all ADLs Poor sleep Speech: Global aphasia Behaviour: No behaviour problems
Case 12
Age: 80 Sex: female Current location: Geriatric outpatients for review of anxiety Usual location: Nursing home resident (moved in 4 weeks ago) Medical History:
1. Recurrent cellulitis
Started prophylactic antibiotics 1 year ago
Three episodes per year pre and post antibiotics 2. Anxiety (new diagnosis) 3. Osteoarthritis 4. Constipation 5. Hypothyroidism 6. COAD stage 4 (on home oxygen)
Recurrent exacerbations
4 hospital admission in the last 6 months Medications: No problems with medication adherence
1. Calvepen (penicillin V) 500mg po bd (1 year) 2. Paracetamol 1g po tds (1 year) 3. Diclofenac 50mg po bd (4 months) 4. Lactulose 10ml po tds (1 year) 5. Senna two tablets od (1 year) 6. Levothyroxine 75mcg po od (2 years) 7. Combivent (ipratropium bromide/salbutamol) 500mcg/2.5mg
nebuliser qds (3 years) 8. Betahistidine 16mg po tds (1 year) 9. Folic acid 5mg po od (2 years)
Social History: Cognition: MMSE 27/30 Function: Assistance of two to stand, restricted by SOB Fully dependent of ADLS Speech: No problems Behaviour: No behaviour problems
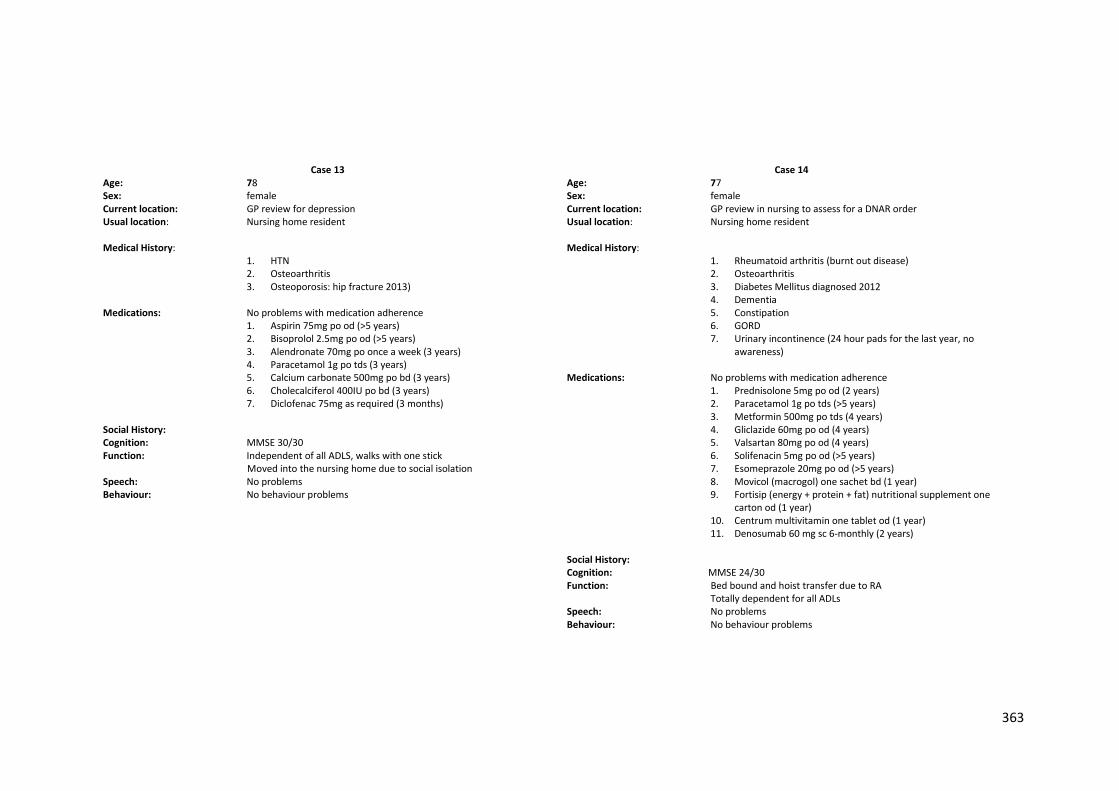
363
Case 13
Age: 78 Sex: female Current location: GP review for depression Usual location: Nursing home resident Medical History:
1. HTN 2. Osteoarthritis 3. Osteoporosis: hip fracture 2013)
Medications: No problems with medication adherence
1. Aspirin 75mg po od (>5 years) 2. Bisoprolol 2.5mg po od (>5 years) 3. Alendronate 70mg po once a week (3 years) 4. Paracetamol 1g po tds (3 years) 5. Calcium carbonate 500mg po bd (3 years) 6. Cholecalciferol 400IU po bd (3 years) 7. Diclofenac 75mg as required (3 months)
Social History: Cognition: MMSE 30/30 Function: Independent of all ADLS, walks with one stick Moved into the nursing home due to social isolation Speech: No problems Behaviour: No behaviour problems
Case 14
Age: 77 Sex: female Current location: GP review in nursing to assess for a DNAR order Usual location: Nursing home resident Medical History:
1. Rheumatoid arthritis (burnt out disease) 2. Osteoarthritis 3. Diabetes Mellitus diagnosed 2012 4. Dementia 5. Constipation 6. GORD 7. Urinary incontinence (24 hour pads for the last year, no
awareness) Medications: No problems with medication adherence
1. Prednisolone 5mg po od (2 years) 2. Paracetamol 1g po tds (>5 years) 3. Metformin 500mg po tds (4 years) 4. Gliclazide 60mg po od (4 years) 5. Valsartan 80mg po od (4 years) 6. Solifenacin 5mg po od (>5 years) 7. Esomeprazole 20mg po od (>5 years) 8. Movicol (macrogol) one sachet bd (1 year) 9. Fortisip (energy + protein + fat) nutritional supplement one
carton od (1 year) 10. Centrum multivitamin one tablet od (1 year) 11. Denosumab 60 mg sc 6-monthly (2 years)
Social History: Cognition: MMSE 24/30 Function: Bed bound and hoist transfer due to RA Totally dependent for all ADLs Speech: No problems Behaviour: No behaviour problems
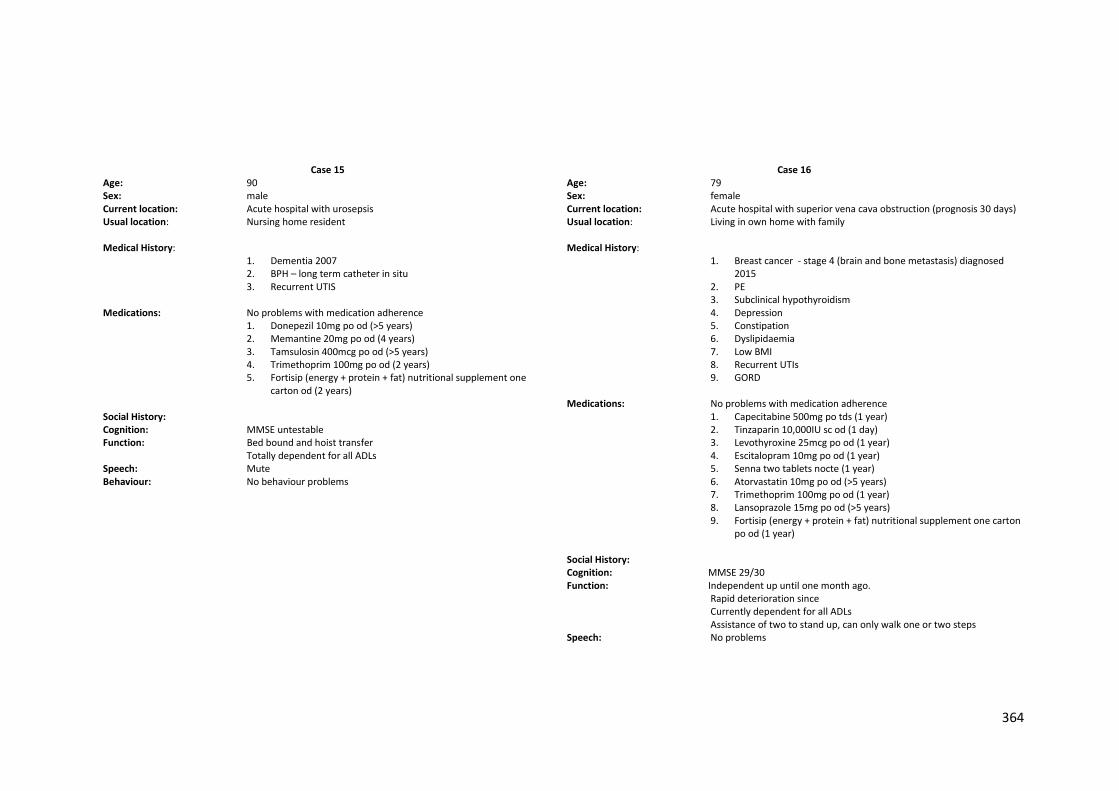
364
Case 15
Age: 90 Sex: male Current location: Acute hospital with urosepsis Usual location: Nursing home resident Medical History:
1. Dementia 2007 2. BPH – long term catheter in situ 3. Recurrent UTIS
Medications: No problems with medication adherence
1. Donepezil 10mg po od (>5 years) 2. Memantine 20mg po od (4 years) 3. Tamsulosin 400mcg po od (>5 years) 4. Trimethoprim 100mg po od (2 years) 5. Fortisip (energy + protein + fat) nutritional supplement one
carton od (2 years) Social History: Cognition: MMSE untestable Function: Bed bound and hoist transfer Totally dependent for all ADLs Speech: Mute Behaviour: No behaviour problems
Case 16
Age: 79 Sex: female Current location: Acute hospital with superior vena cava obstruction (prognosis 30 days) Usual location: Living in own home with family Medical History:
1. Breast cancer - stage 4 (brain and bone metastasis) diagnosed 2015
2. PE 3. Subclinical hypothyroidism 4. Depression 5. Constipation 6. Dyslipidaemia 7. Low BMI 8. Recurrent UTIs 9. GORD
Medications: No problems with medication adherence
1. Capecitabine 500mg po tds (1 year) 2. Tinzaparin 10,000IU sc od (1 day) 3. Levothyroxine 25mcg po od (1 year) 4. Escitalopram 10mg po od (1 year) 5. Senna two tablets nocte (1 year) 6. Atorvastatin 10mg po od (>5 years) 7. Trimethoprim 100mg po od (1 year) 8. Lansoprazole 15mg po od (>5 years) 9. Fortisip (energy + protein + fat) nutritional supplement one carton
po od (1 year) Social History: Cognition: MMSE 29/30 Function: Independent up until one month ago. Rapid deterioration since Currently dependent for all ADLs Assistance of two to stand up, can only walk one or two steps Speech: No problems
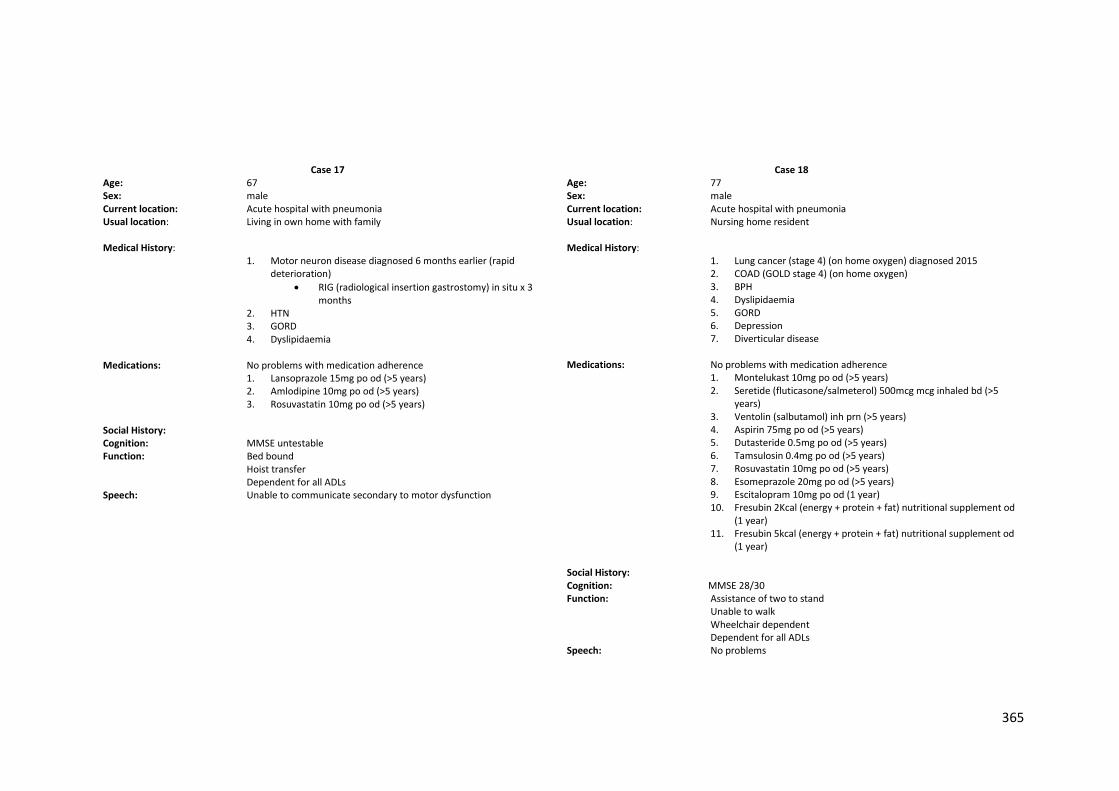
365
Case 17
Age: 67 Sex: male Current location: Acute hospital with pneumonia Usual location: Living in own home with family Medical History:
1. Motor neuron disease diagnosed 6 months earlier (rapid deterioration)
RIG (radiological insertion gastrostomy) in situ x 3 months
2. HTN 3. GORD 4. Dyslipidaemia
Medications: No problems with medication adherence
1. Lansoprazole 15mg po od (>5 years) 2. Amlodipine 10mg po od (>5 years) 3. Rosuvastatin 10mg po od (>5 years)
Social History: Cognition: MMSE untestable Function: Bed bound Hoist transfer Dependent for all ADLs Speech: Unable to communicate secondary to motor dysfunction
Case 18
Age: 77 Sex: male Current location: Acute hospital with pneumonia Usual location: Nursing home resident Medical History:
1. Lung cancer (stage 4) (on home oxygen) diagnosed 2015 2. COAD (GOLD stage 4) (on home oxygen) 3. BPH 4. Dyslipidaemia 5. GORD 6. Depression 7. Diverticular disease
Medications: No problems with medication adherence
1. Montelukast 10mg po od (>5 years) 2. Seretide (fluticasone/salmeterol) 500mcg mcg inhaled bd (>5
years) 3. Ventolin (salbutamol) inh prn (>5 years) 4. Aspirin 75mg po od (>5 years) 5. Dutasteride 0.5mg po od (>5 years) 6. Tamsulosin 0.4mg po od (>5 years) 7. Rosuvastatin 10mg po od (>5 years) 8. Esomeprazole 20mg po od (>5 years) 9. Escitalopram 10mg po od (1 year) 10. Fresubin 2Kcal (energy + protein + fat) nutritional supplement od
(1 year) 11. Fresubin 5kcal (energy + protein + fat) nutritional supplement od
(1 year) Social History: Cognition: MMSE 28/30 Function: Assistance of two to stand Unable to walk Wheelchair dependent Dependent for all ADLs Speech: No problems
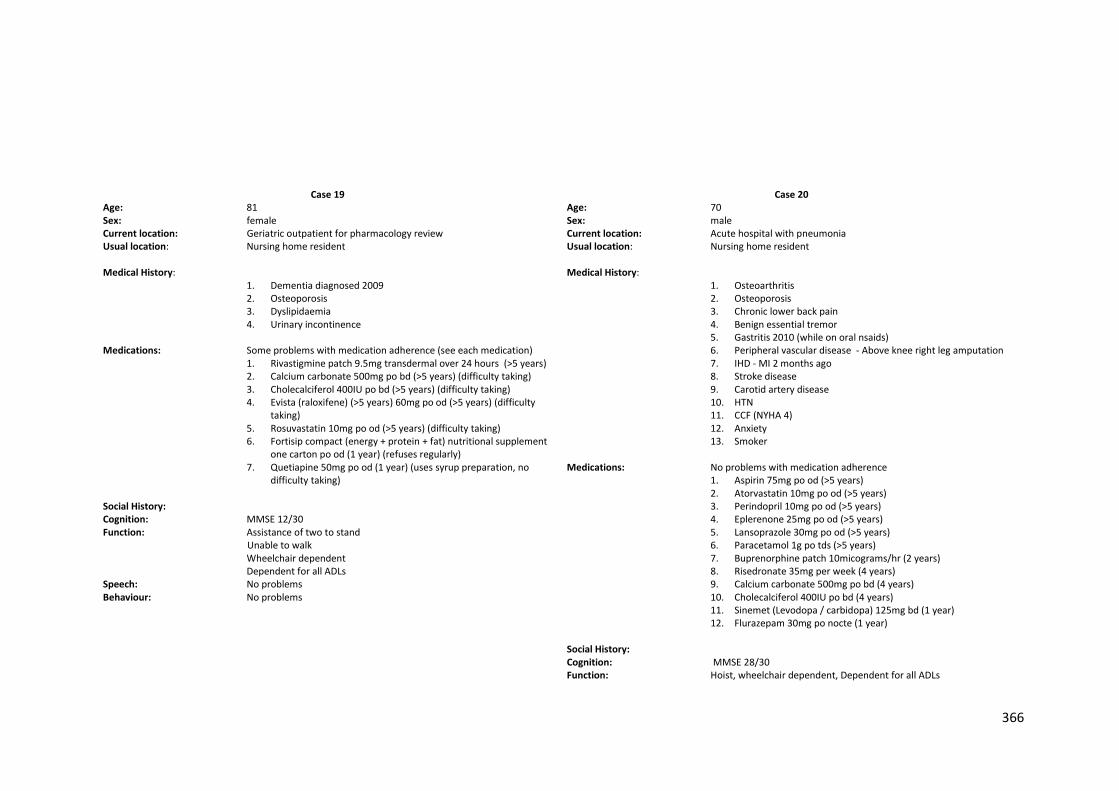
366
Case 19
Age: 81 Sex: female Current location: Geriatric outpatient for pharmacology review Usual location: Nursing home resident Medical History:
1. Dementia diagnosed 2009 2. Osteoporosis 3. Dyslipidaemia 4. Urinary incontinence
Medications: Some problems with medication adherence (see each medication)
1. Rivastigmine patch 9.5mg transdermal over 24 hours (>5 years) 2. Calcium carbonate 500mg po bd (>5 years) (difficulty taking) 3. Cholecalciferol 400IU po bd (>5 years) (difficulty taking) 4. Evista (raloxifene) (>5 years) 60mg po od (>5 years) (difficulty
taking) 5. Rosuvastatin 10mg po od (>5 years) (difficulty taking) 6. Fortisip compact (energy + protein + fat) nutritional supplement
one carton po od (1 year) (refuses regularly) 7. Quetiapine 50mg po od (1 year) (uses syrup preparation, no
difficulty taking) Social History: Cognition: MMSE 12/30 Function: Assistance of two to stand Unable to walk Wheelchair dependent Dependent for all ADLs Speech: No problems Behaviour: No problems
Case 20
Age: 70 Sex: male Current location: Acute hospital with pneumonia Usual location: Nursing home resident Medical History:
1. Osteoarthritis 2. Osteoporosis 3. Chronic lower back pain 4. Benign essential tremor 5. Gastritis 2010 (while on oral nsaids) 6. Peripheral vascular disease - Above knee right leg amputation 7. IHD - MI 2 months ago 8. Stroke disease 9. Carotid artery disease 10. HTN 11. CCF (NYHA 4) 12. Anxiety 13. Smoker
Medications: No problems with medication adherence
1. Aspirin 75mg po od (>5 years) 2. Atorvastatin 10mg po od (>5 years) 3. Perindopril 10mg po od (>5 years) 4. Eplerenone 25mg po od (>5 years) 5. Lansoprazole 30mg po od (>5 years) 6. Paracetamol 1g po tds (>5 years) 7. Buprenorphine patch 10micograms/hr (2 years) 8. Risedronate 35mg per week (4 years) 9. Calcium carbonate 500mg po bd (4 years) 10. Cholecalciferol 400IU po bd (4 years) 11. Sinemet (Levodopa / carbidopa) 125mg bd (1 year) 12. Flurazepam 30mg po nocte (1 year)
Social History: Cognition: MMSE 28/30 Function: Hoist, wheelchair dependent, Dependent for all ADLs
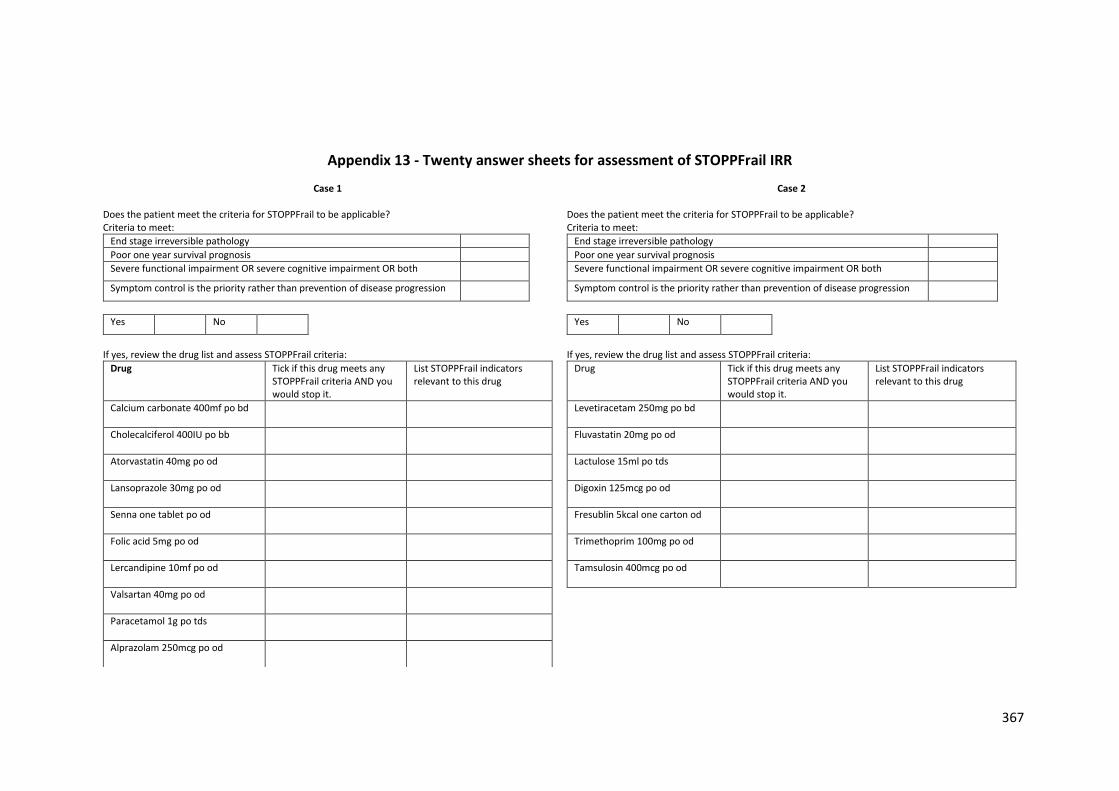
367
Appendix 13 - Twenty answer sheets for assessment of STOPPFrail IRR
Case 1
Does the patient meet the criteria for STOPPFrail to be applicable? Criteria to meet:
End stage irreversible pathology
Poor one year survival prognosis
Severe functional impairment OR severe cognitive impairment OR both
Symptom control is the priority rather than prevention of disease progression
Yes No
If yes, review the drug list and assess STOPPFrail criteria:
Drug Tick if this drug meets any STOPPFrail criteria AND you would stop it.
List STOPPFrail indicators relevant to this drug
Calcium carbonate 400mf po bd
Cholecalciferol 400IU po bb
Atorvastatin 40mg po od
Lansoprazole 30mg po od
Senna one tablet po od
Folic acid 5mg po od
Lercandipine 10mf po od
Valsartan 40mg po od
Paracetamol 1g po tds
Alprazolam 250mcg po od
Case 2 Does the patient meet the criteria for STOPPFrail to be applicable? Criteria to meet:
End stage irreversible pathology
Poor one year survival prognosis
Severe functional impairment OR severe cognitive impairment OR both
Symptom control is the priority rather than prevention of disease progression
Yes No
If yes, review the drug list and assess STOPPFrail criteria:
Drug Tick if this drug meets any STOPPFrail criteria AND you would stop it.
List STOPPFrail indicators relevant to this drug
Levetiracetam 250mg po bd
Fluvastatin 20mg po od
Lactulose 15ml po tds
Digoxin 125mcg po od
Fresublin 5kcal one carton od
Trimethoprim 100mg po od
Tamsulosin 400mcg po od
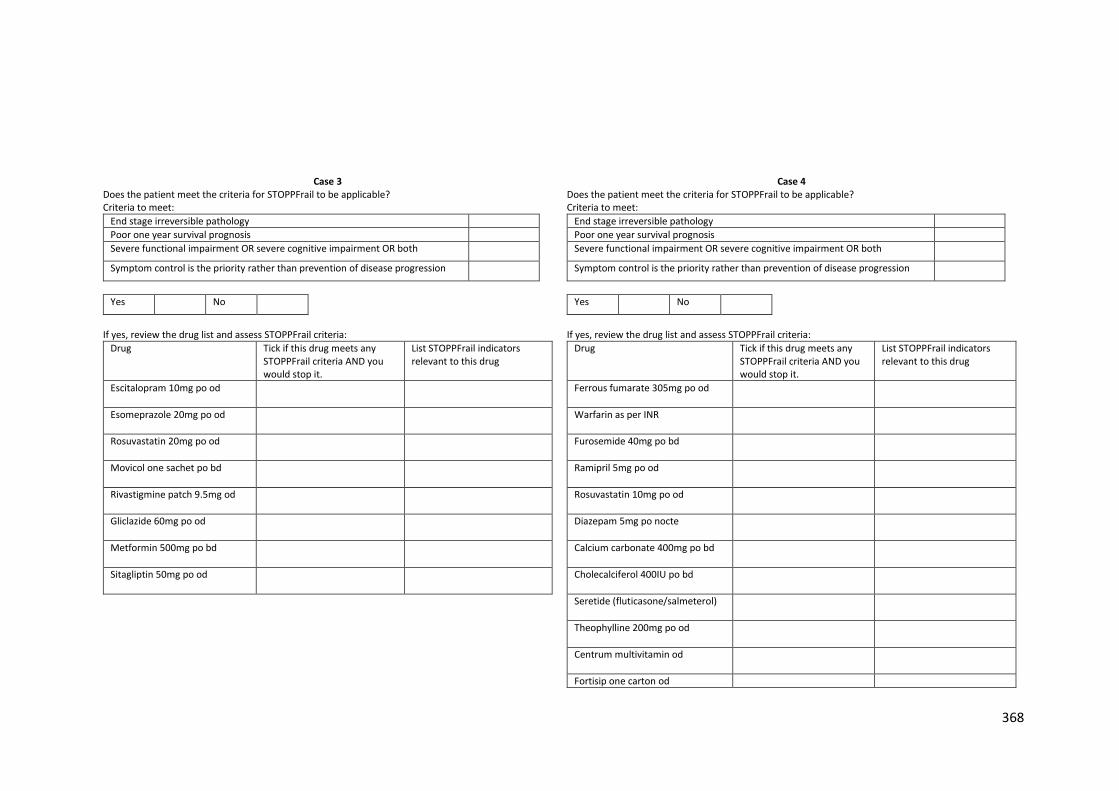
368
Case 3 Does the patient meet the criteria for STOPPFrail to be applicable? Criteria to meet:
End stage irreversible pathology
Poor one year survival prognosis
Severe functional impairment OR severe cognitive impairment OR both
Symptom control is the priority rather than prevention of disease progression
Yes No
If yes, review the drug list and assess STOPPFrail criteria:
Drug Tick if this drug meets any STOPPFrail criteria AND you would stop it.
List STOPPFrail indicators relevant to this drug
Escitalopram 10mg po od
Esomeprazole 20mg po od
Rosuvastatin 20mg po od
Movicol one sachet po bd
Rivastigmine patch 9.5mg od
Gliclazide 60mg po od
Metformin 500mg po bd
Sitagliptin 50mg po od
Case 4 Does the patient meet the criteria for STOPPFrail to be applicable? Criteria to meet:
End stage irreversible pathology
Poor one year survival prognosis
Severe functional impairment OR severe cognitive impairment OR both
Symptom control is the priority rather than prevention of disease progression
Yes No
If yes, review the drug list and assess STOPPFrail criteria:
Drug Tick if this drug meets any STOPPFrail criteria AND you would stop it.
List STOPPFrail indicators relevant to this drug
Ferrous fumarate 305mg po od
Warfarin as per INR
Furosemide 40mg po bd
Ramipril 5mg po od
Rosuvastatin 10mg po od
Diazepam 5mg po nocte
Calcium carbonate 400mg po bd
Cholecalciferol 400IU po bd
Seretide (fluticasone/salmeterol)
Theophylline 200mg po od
Centrum multivitamin od
Fortisip one carton od
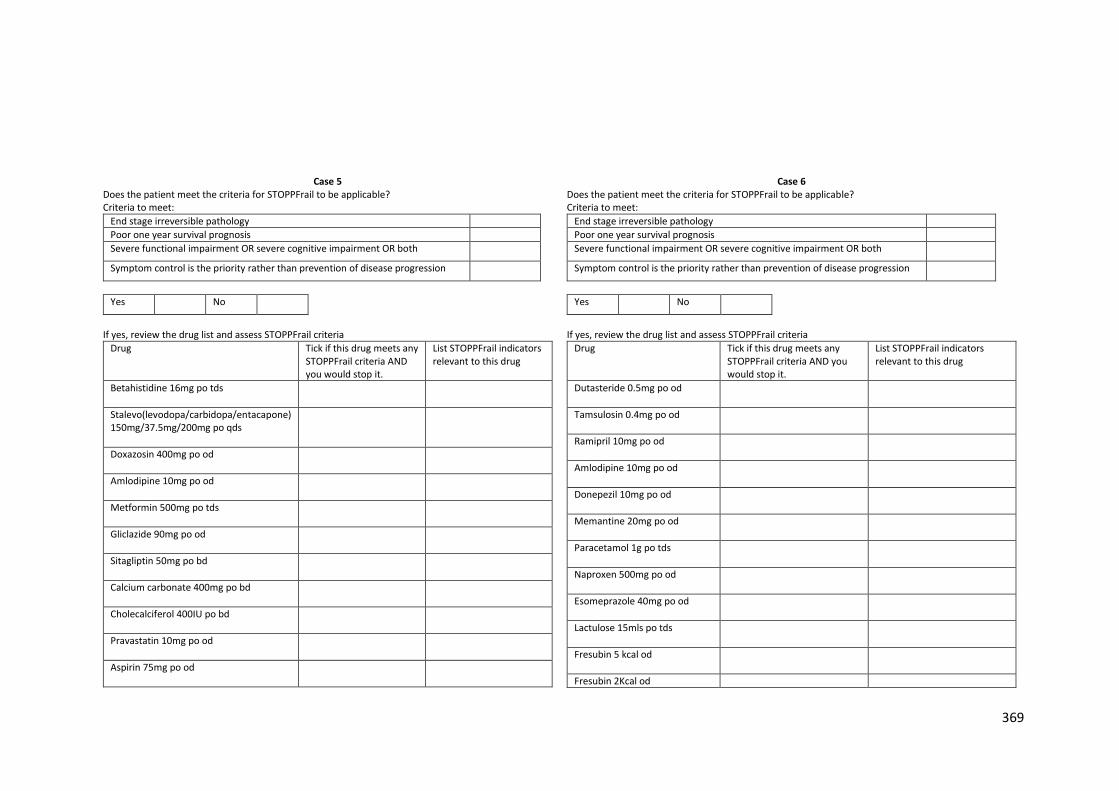
369
Case 5 Does the patient meet the criteria for STOPPFrail to be applicable? Criteria to meet:
End stage irreversible pathology
Poor one year survival prognosis
Severe functional impairment OR severe cognitive impairment OR both
Symptom control is the priority rather than prevention of disease progression
Yes No
If yes, review the drug list and assess STOPPFrail criteria
Drug Tick if this drug meets any STOPPFrail criteria AND you would stop it.
List STOPPFrail indicators relevant to this drug
Betahistidine 16mg po tds
Stalevo(levodopa/carbidopa/entacapone) 150mg/37.5mg/200mg po qds
Doxazosin 400mg po od
Amlodipine 10mg po od
Metformin 500mg po tds
Gliclazide 90mg po od
Sitagliptin 50mg po bd
Calcium carbonate 400mg po bd
Cholecalciferol 400IU po bd
Pravastatin 10mg po od
Aspirin 75mg po od
Case 6 Does the patient meet the criteria for STOPPFrail to be applicable? Criteria to meet:
End stage irreversible pathology
Poor one year survival prognosis
Severe functional impairment OR severe cognitive impairment OR both
Symptom control is the priority rather than prevention of disease progression
Yes No
If yes, review the drug list and assess STOPPFrail criteria
Drug Tick if this drug meets any STOPPFrail criteria AND you would stop it.
List STOPPFrail indicators relevant to this drug
Dutasteride 0.5mg po od
Tamsulosin 0.4mg po od
Ramipril 10mg po od
Amlodipine 10mg po od
Donepezil 10mg po od
Memantine 20mg po od
Paracetamol 1g po tds
Naproxen 500mg po od
Esomeprazole 40mg po od
Lactulose 15mls po tds
Fresubin 5 kcal od
Fresubin 2Kcal od
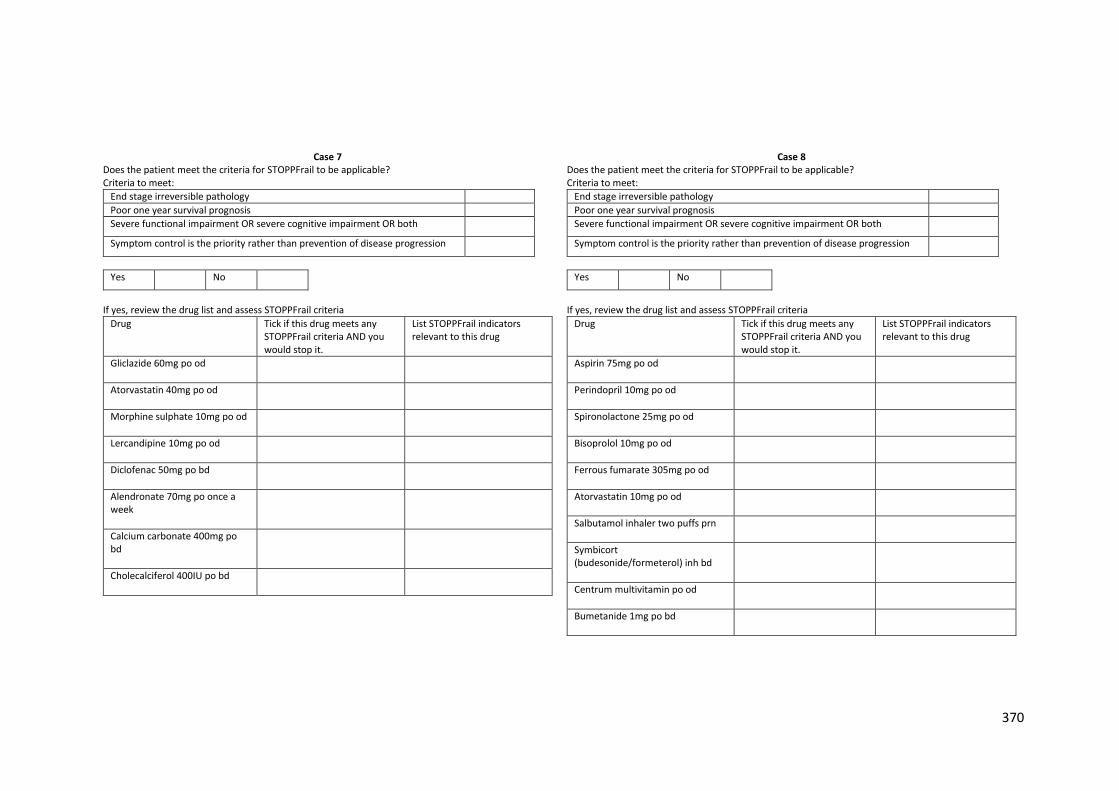
370
Case 7 Does the patient meet the criteria for STOPPFrail to be applicable? Criteria to meet:
End stage irreversible pathology
Poor one year survival prognosis
Severe functional impairment OR severe cognitive impairment OR both
Symptom control is the priority rather than prevention of disease progression
Yes No
If yes, review the drug list and assess STOPPFrail criteria
Drug Tick if this drug meets any STOPPFrail criteria AND you would stop it.
List STOPPFrail indicators relevant to this drug
Gliclazide 60mg po od
Atorvastatin 40mg po od
Morphine sulphate 10mg po od
Lercandipine 10mg po od
Diclofenac 50mg po bd
Alendronate 70mg po once a week
Calcium carbonate 400mg po bd
Cholecalciferol 400IU po bd
Case 8 Does the patient meet the criteria for STOPPFrail to be applicable? Criteria to meet:
End stage irreversible pathology
Poor one year survival prognosis
Severe functional impairment OR severe cognitive impairment OR both
Symptom control is the priority rather than prevention of disease progression
Yes No
If yes, review the drug list and assess STOPPFrail criteria
Drug Tick if this drug meets any STOPPFrail criteria AND you would stop it.
List STOPPFrail indicators relevant to this drug
Aspirin 75mg po od
Perindopril 10mg po od
Spironolactone 25mg po od
Bisoprolol 10mg po od
Ferrous fumarate 305mg po od
Atorvastatin 10mg po od
Salbutamol inhaler two puffs prn
Symbicort (budesonide/formeterol) inh bd
Centrum multivitamin po od
Bumetanide 1mg po bd
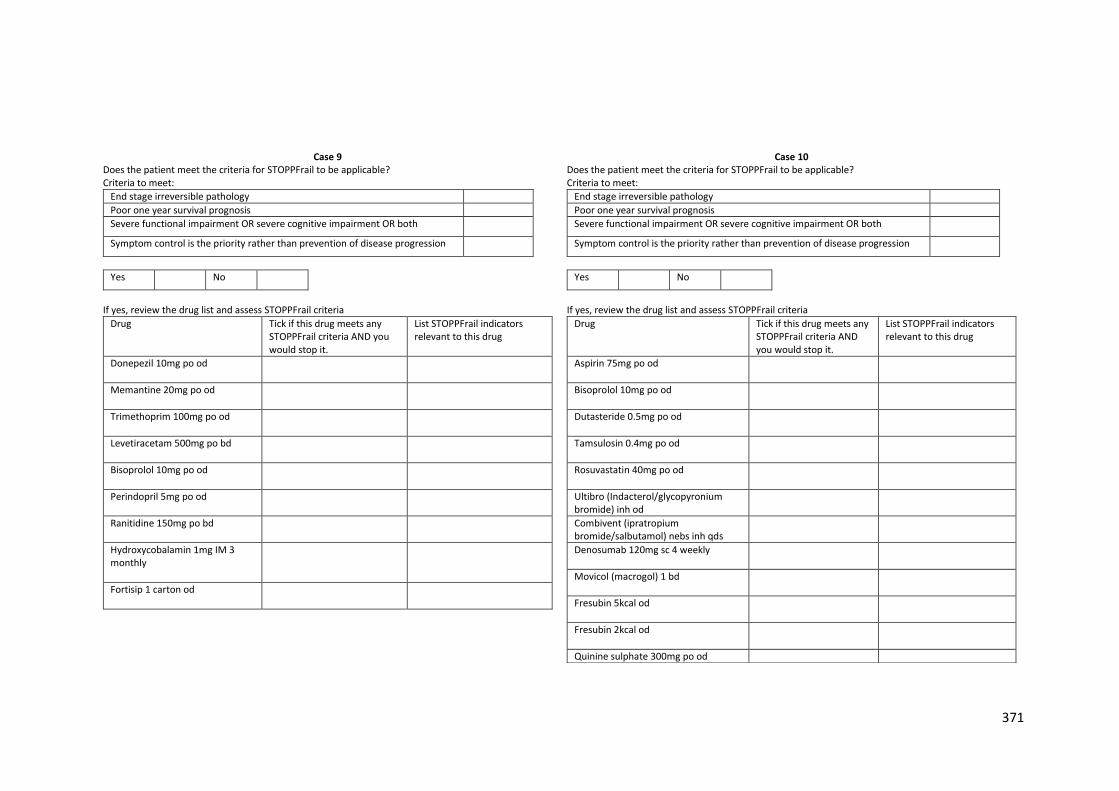
371
Case 9 Does the patient meet the criteria for STOPPFrail to be applicable? Criteria to meet:
End stage irreversible pathology
Poor one year survival prognosis
Severe functional impairment OR severe cognitive impairment OR both
Symptom control is the priority rather than prevention of disease progression
Yes No
If yes, review the drug list and assess STOPPFrail criteria
Drug Tick if this drug meets any STOPPFrail criteria AND you would stop it.
List STOPPFrail indicators relevant to this drug
Donepezil 10mg po od
Memantine 20mg po od
Trimethoprim 100mg po od
Levetiracetam 500mg po bd
Bisoprolol 10mg po od
Perindopril 5mg po od
Ranitidine 150mg po bd
Hydroxycobalamin 1mg IM 3 monthly
Fortisip 1 carton od
Case 10 Does the patient meet the criteria for STOPPFrail to be applicable? Criteria to meet:
End stage irreversible pathology
Poor one year survival prognosis
Severe functional impairment OR severe cognitive impairment OR both
Symptom control is the priority rather than prevention of disease progression
Yes No
If yes, review the drug list and assess STOPPFrail criteria
Drug Tick if this drug meets any STOPPFrail criteria AND you would stop it.
List STOPPFrail indicators relevant to this drug
Aspirin 75mg po od
Bisoprolol 10mg po od
Dutasteride 0.5mg po od
Tamsulosin 0.4mg po od
Rosuvastatin 40mg po od
Ultibro (Indacterol/glycopyronium bromide) inh od
Combivent (ipratropium bromide/salbutamol) nebs inh qds
Denosumab 120mg sc 4 weekly
Movicol (macrogol) 1 bd
Fresubin 5kcal od
Fresubin 2kcal od
Quinine sulphate 300mg po od
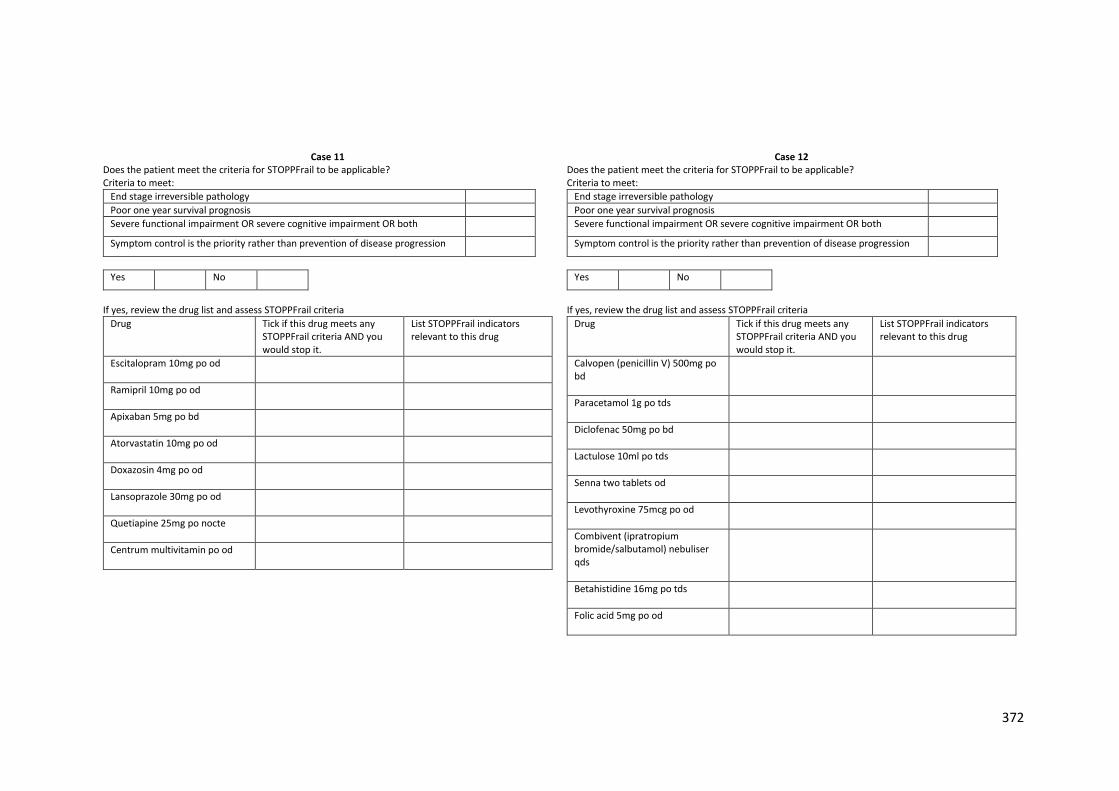
372
Case 11 Does the patient meet the criteria for STOPPFrail to be applicable? Criteria to meet:
End stage irreversible pathology
Poor one year survival prognosis
Severe functional impairment OR severe cognitive impairment OR both
Symptom control is the priority rather than prevention of disease progression
Yes No
If yes, review the drug list and assess STOPPFrail criteria
Drug Tick if this drug meets any STOPPFrail criteria AND you would stop it.
List STOPPFrail indicators relevant to this drug
Escitalopram 10mg po od
Ramipril 10mg po od
Apixaban 5mg po bd
Atorvastatin 10mg po od
Doxazosin 4mg po od
Lansoprazole 30mg po od
Quetiapine 25mg po nocte
Centrum multivitamin po od
Case 12 Does the patient meet the criteria for STOPPFrail to be applicable? Criteria to meet:
End stage irreversible pathology
Poor one year survival prognosis
Severe functional impairment OR severe cognitive impairment OR both
Symptom control is the priority rather than prevention of disease progression
Yes No
If yes, review the drug list and assess STOPPFrail criteria
Drug Tick if this drug meets any STOPPFrail criteria AND you would stop it.
List STOPPFrail indicators relevant to this drug
Calvopen (penicillin V) 500mg po bd
Paracetamol 1g po tds
Diclofenac 50mg po bd
Lactulose 10ml po tds
Senna two tablets od
Levothyroxine 75mcg po od
Combivent (ipratropium bromide/salbutamol) nebuliser qds
Betahistidine 16mg po tds
Folic acid 5mg po od
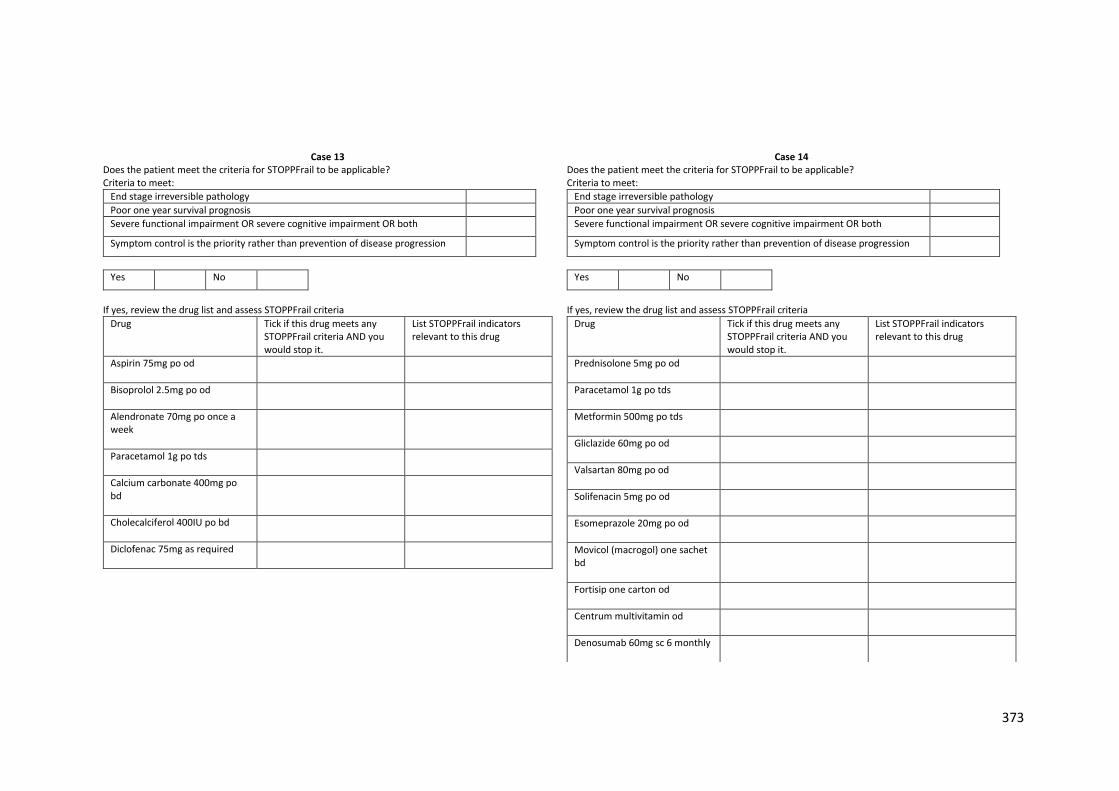
373
Case 13 Does the patient meet the criteria for STOPPFrail to be applicable? Criteria to meet:
End stage irreversible pathology
Poor one year survival prognosis
Severe functional impairment OR severe cognitive impairment OR both
Symptom control is the priority rather than prevention of disease progression
Yes No
If yes, review the drug list and assess STOPPFrail criteria
Drug Tick if this drug meets any STOPPFrail criteria AND you would stop it.
List STOPPFrail indicators relevant to this drug
Aspirin 75mg po od
Bisoprolol 2.5mg po od
Alendronate 70mg po once a week
Paracetamol 1g po tds
Calcium carbonate 400mg po bd
Cholecalciferol 400IU po bd
Diclofenac 75mg as required
Case 14 Does the patient meet the criteria for STOPPFrail to be applicable? Criteria to meet:
End stage irreversible pathology
Poor one year survival prognosis
Severe functional impairment OR severe cognitive impairment OR both
Symptom control is the priority rather than prevention of disease progression
Yes No
If yes, review the drug list and assess STOPPFrail criteria
Drug Tick if this drug meets any STOPPFrail criteria AND you would stop it.
List STOPPFrail indicators relevant to this drug
Prednisolone 5mg po od
Paracetamol 1g po tds
Metformin 500mg po tds
Gliclazide 60mg po od
Valsartan 80mg po od
Solifenacin 5mg po od
Esomeprazole 20mg po od
Movicol (macrogol) one sachet bd
Fortisip one carton od
Centrum multivitamin od
Denosumab 60mg sc 6 monthly
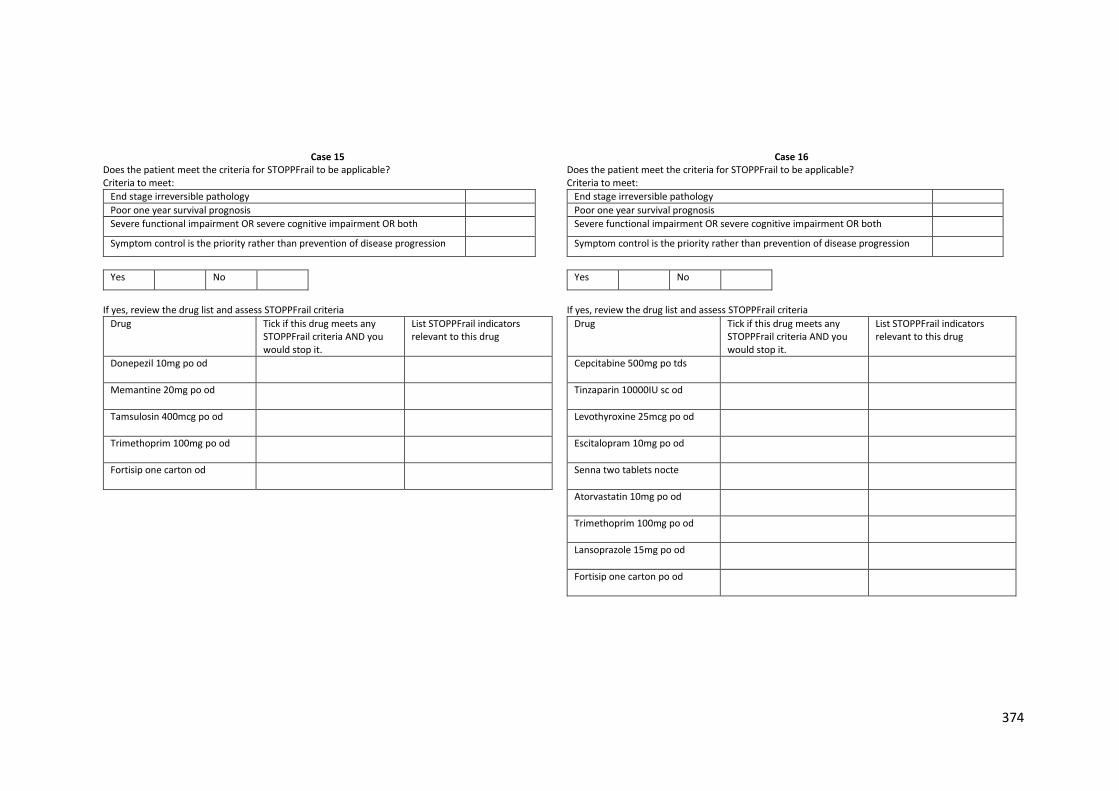
374
Case 15 Does the patient meet the criteria for STOPPFrail to be applicable? Criteria to meet:
End stage irreversible pathology
Poor one year survival prognosis
Severe functional impairment OR severe cognitive impairment OR both
Symptom control is the priority rather than prevention of disease progression
Yes No
If yes, review the drug list and assess STOPPFrail criteria
Drug Tick if this drug meets any STOPPFrail criteria AND you would stop it.
List STOPPFrail indicators relevant to this drug
Donepezil 10mg po od
Memantine 20mg po od
Tamsulosin 400mcg po od
Trimethoprim 100mg po od
Fortisip one carton od
Case 16 Does the patient meet the criteria for STOPPFrail to be applicable? Criteria to meet:
End stage irreversible pathology
Poor one year survival prognosis
Severe functional impairment OR severe cognitive impairment OR both
Symptom control is the priority rather than prevention of disease progression
Yes No
If yes, review the drug list and assess STOPPFrail criteria
Drug Tick if this drug meets any STOPPFrail criteria AND you would stop it.
List STOPPFrail indicators relevant to this drug
Cepcitabine 500mg po tds
Tinzaparin 10000IU sc od
Levothyroxine 25mcg po od
Escitalopram 10mg po od
Senna two tablets nocte
Atorvastatin 10mg po od
Trimethoprim 100mg po od
Lansoprazole 15mg po od
Fortisip one carton po od
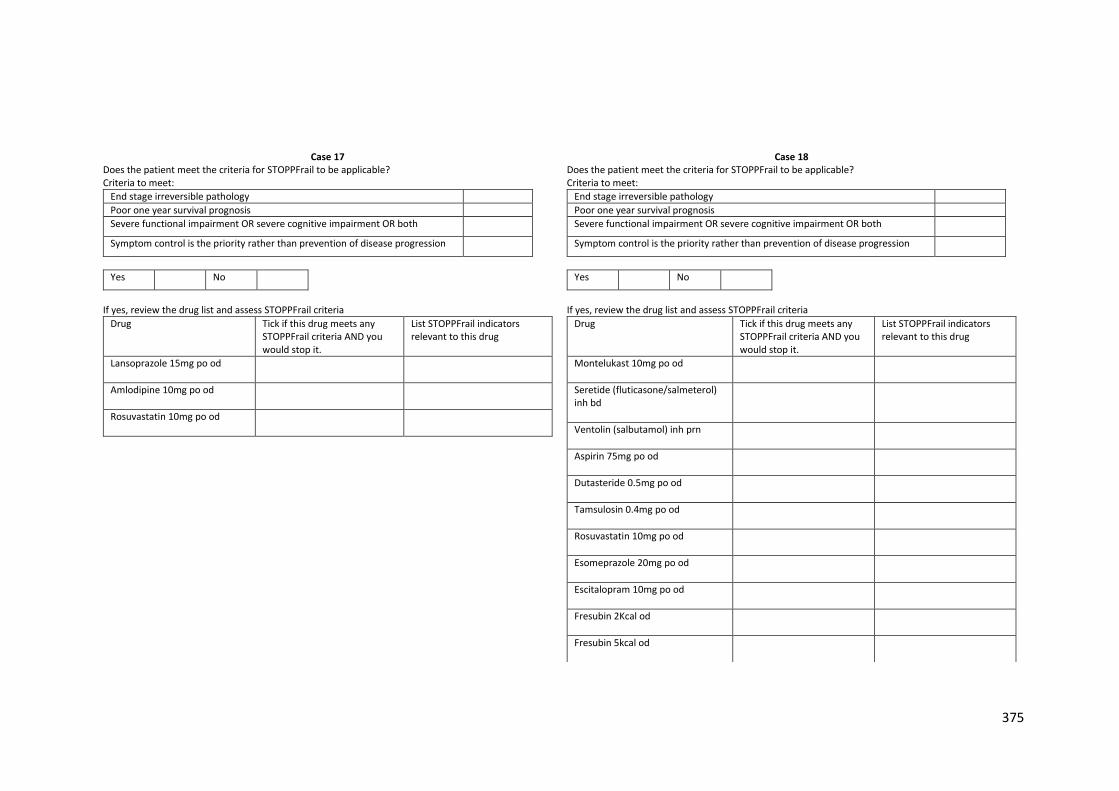
375
Case 17 Does the patient meet the criteria for STOPPFrail to be applicable? Criteria to meet:
End stage irreversible pathology
Poor one year survival prognosis
Severe functional impairment OR severe cognitive impairment OR both
Symptom control is the priority rather than prevention of disease progression
Yes No
If yes, review the drug list and assess STOPPFrail criteria
Drug Tick if this drug meets any STOPPFrail criteria AND you would stop it.
List STOPPFrail indicators relevant to this drug
Lansoprazole 15mg po od
Amlodipine 10mg po od
Rosuvastatin 10mg po od
Case 18 Does the patient meet the criteria for STOPPFrail to be applicable? Criteria to meet:
End stage irreversible pathology
Poor one year survival prognosis
Severe functional impairment OR severe cognitive impairment OR both
Symptom control is the priority rather than prevention of disease progression
Yes No
If yes, review the drug list and assess STOPPFrail criteria
Drug Tick if this drug meets any STOPPFrail criteria AND you would stop it.
List STOPPFrail indicators relevant to this drug
Montelukast 10mg po od
Seretide (fluticasone/salmeterol) inh bd
Ventolin (salbutamol) inh prn
Aspirin 75mg po od
Dutasteride 0.5mg po od
Tamsulosin 0.4mg po od
Rosuvastatin 10mg po od
Esomeprazole 20mg po od
Escitalopram 10mg po od
Fresubin 2Kcal od
Fresubin 5kcal od
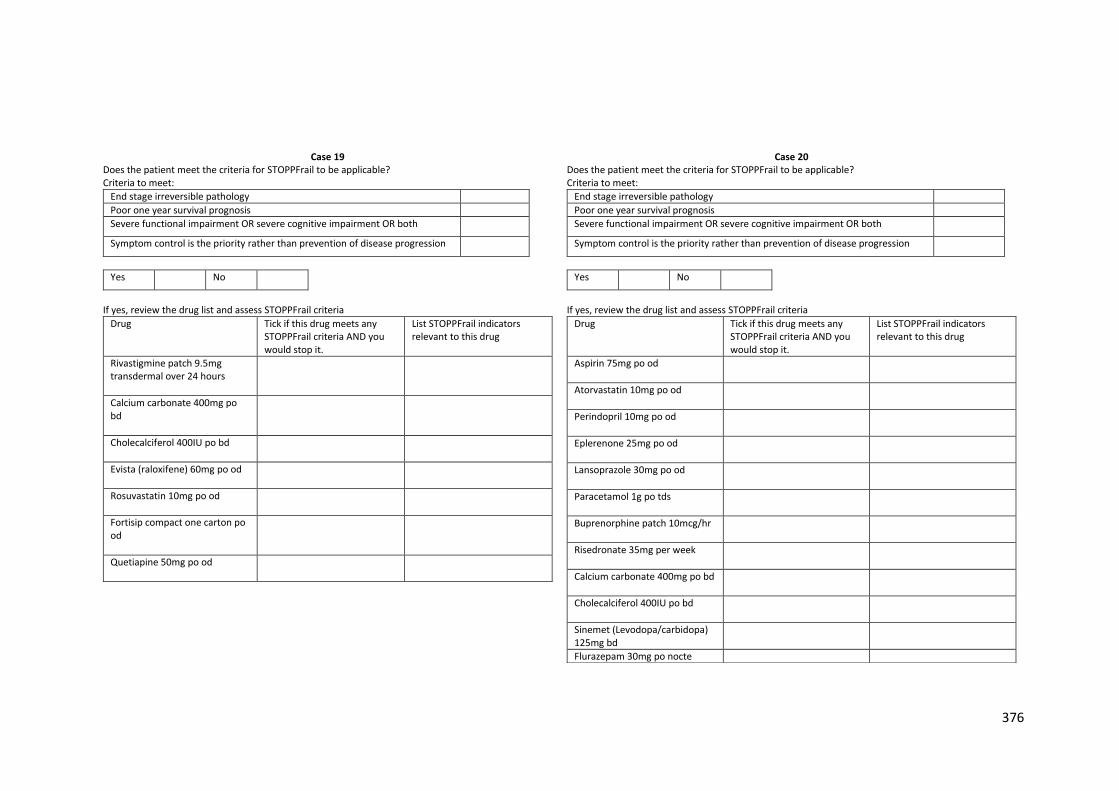
376
Case 19 Does the patient meet the criteria for STOPPFrail to be applicable? Criteria to meet:
End stage irreversible pathology
Poor one year survival prognosis
Severe functional impairment OR severe cognitive impairment OR both
Symptom control is the priority rather than prevention of disease progression
Yes No
If yes, review the drug list and assess STOPPFrail criteria
Drug Tick if this drug meets any STOPPFrail criteria AND you would stop it.
List STOPPFrail indicators relevant to this drug
Rivastigmine patch 9.5mg transdermal over 24 hours
Calcium carbonate 400mg po bd
Cholecalciferol 400IU po bd
Evista (raloxifene) 60mg po od
Rosuvastatin 10mg po od
Fortisip compact one carton po od
Quetiapine 50mg po od
Case 20 Does the patient meet the criteria for STOPPFrail to be applicable? Criteria to meet:
End stage irreversible pathology
Poor one year survival prognosis
Severe functional impairment OR severe cognitive impairment OR both
Symptom control is the priority rather than prevention of disease progression
Yes No
If yes, review the drug list and assess STOPPFrail criteria
Drug Tick if this drug meets any STOPPFrail criteria AND you would stop it.
List STOPPFrail indicators relevant to this drug
Aspirin 75mg po od
Atorvastatin 10mg po od
Perindopril 10mg po od
Eplerenone 25mg po od
Lansoprazole 30mg po od
Paracetamol 1g po tds
Buprenorphine patch 10mcg/hr
Risedronate 35mg per week
Calcium carbonate 400mg po bd
Cholecalciferol 400IU po bd
Sinemet (Levodopa/carbidopa) 125mg bd
Flurazepam 30mg po nocte
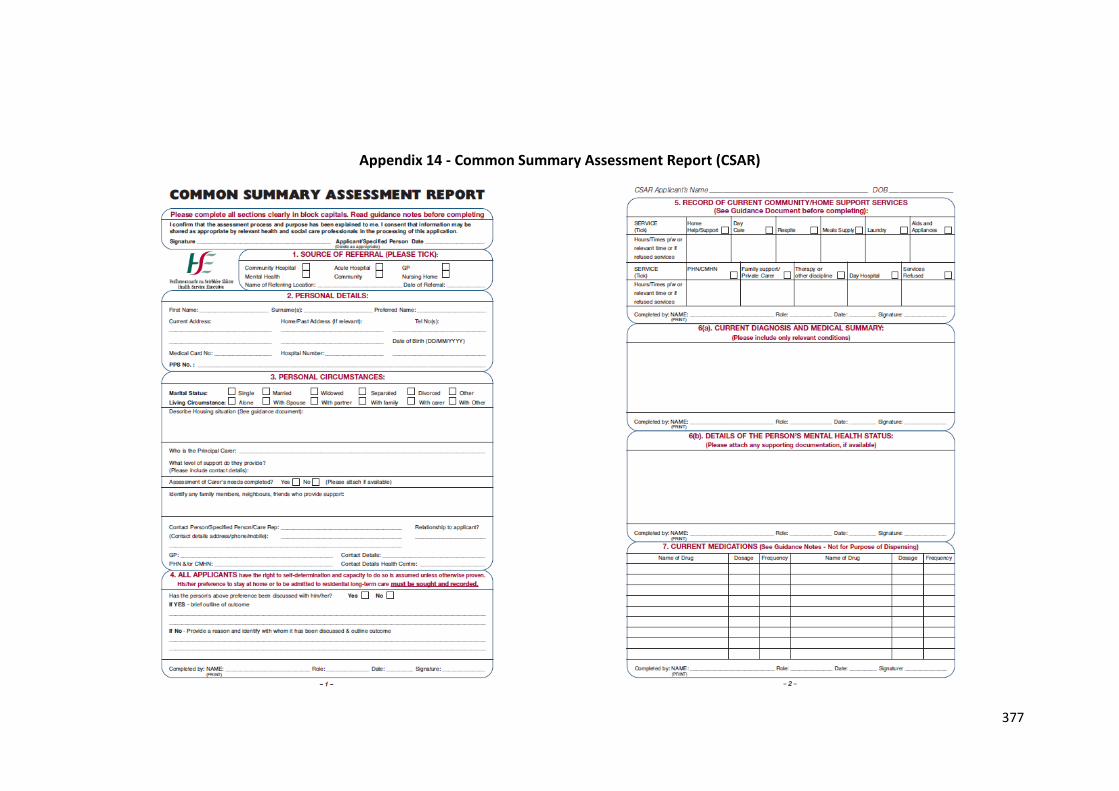
377
Appendix 14 - Common Summary Assessment Report (CSAR)
378

379
Appendix 15 - Montreal Cognitive Assessment (MoCA)
380
Appendix 16 - Ethical approval for STOPPFrail observational study

381

382