Download - VV Giri National Labour Institute
124
-
Upload
khangminh22 -
Category
Documents
-
view
1 -
download
0
Transcript of Download - VV Giri National Labour Institute


LABOUR & DEVELOPMENT
Vol. 27, No. 1, June 2020
ARTICLES
Job and Wage Losses in Informal Economy Due to the COVID-19 Lockdown Measures in India
Xavier Estupinan and Mohit Sharma
1-16
Women’s Work in India: Updates from Periodic Labour Force SurveysEllina Samantroy and Sanjib K. Pradhan
17-34
‘Cooperatisation’ of Handloom and Women’s Empowerment in Manipur Otojit Kshetrimayum
35-46
Women in Leadership and Management in Public Sector Undertakings in India
Malika Basu
47-61
World of Work and Labour in the Time of COVID-19 and Rise of Robotics Artificial Intelligence: A Critical Quest
Manoj Kumar Jena
62-69
Contractualisation in India’s Manufacturing Sector Since 1991: Trends Based on ASI Data
Bir Singh
70-83
Asset Ownership, Digital Economy and Household Finances: A Bottom-Up Perspective of the Indian Economy
Sreelakshmi R.
84-92
Labour Control, Informalisation and Policy Implications: The Case of Uber Drivers in the Platform Economy
Kanikka Sersia and Nishat K. Singh
93-108


JOB AND WAGE LOSSES IN INFORMAL ECONOMY DUE TO THE COVID-19 LOCKDOWN MEASURES IN INDIA1
Xavier Estupinan∗ and Mohit Sharma∗∗
This paper estimates the job and wage losses of workers, using the lens of informality, due to lockdown measures undertaken by the Government of India to tackle the spread of COVID-19. It focuses on the first two lockdowns when containment measures in India, one of the most stringent in the world. We estimate that 104 million and 69.4 million informally employed workers were at risk of job loss in Lockdown 1.0 and Lockdown 2.0 respectively. Informal workers lost more wages, (22.6 per cent) than the formal workers (3.6 per cent). Workers informally employed in unorganised sector suffered wage loss, amounting to Rs. 635.53 billion, which is almost equivalent to annual budget allotted for employment guarantee scheme MGNERGA in 2020-2021. The prevalence of informal labour markets calls for a larger change in the social protection framework to deal with the uncertain economic situation like the one we are facing today.
Keywords: COVID-19 Pandemic, Remote Labour Index, Informal Economy, Informality, Job Loss, Wage Loss
1 The views expressed in this paper are those of the authors and do not reflect the opinion or views of the organisations they are affiliated with.
∗ Wage Specialist, International Labour Organization (ILO), New Delhi, India, E-mail: [email protected]∗∗ Senior Researcher, Collaborative Research and Dissemination, New Delhi, India, Email: [email protected]
1. INTRODUCTION
The COVID-19 pandemic has changed the world, as we know it. The crisis has affected millions of people around the globe and governments face a two-side dilemma: controlling the spread of the virus and managing its social and economic impact. On the former, the measures taken to flatten the curve of the epidemic, providing time to strengthen health response capacity, have focused on social distancing norms, travel restrictions, and workplace closures and lockdowns. However, these lifesaving actions have had a detrimental effect on the economy, and the losses are of unprecedented magnitude. According to ILO (2020) estimates as of June 15, 2020, show that 93 per cent, of the world’s workers, face some workplace closure measures. The second quarter of 2020, has seen a 17.9 per cent drop in the estimated number of working hours in South Asia, equivalent to 135 million full-time workers (ILO, 2020a). More lockdowns or the recurrent use of containment measures to deal with the second waves of the virus is expected to further disrupt the economic activity and labour markets.
According to ILO (2018), more than 60 per cent of the global workforce are engaged in the informal economy. Informality is pervasive in many South Asian countries. Informal enterprises, usually unregistered economic units employing less than ten workers who are low skilled, account
for eight out of ten enterprises in the world (ILO, 2020b). Similarly, the self-employed (mainly own-account workers) and MSMEs account for more than 80 per cent of employment in South Asia (Kok, J. D., & Berrios, M., 2019).
Informal employment is highly concentrated in countries with lower income per capita, compared to countries with higher per capita income. Hence, informality is a more prevalent phenomenon in developing countries (Narula, 2020; Alon et al., 2020). In an economic crisis, countries with a larger share of informality face a much more challenging task with their fiscal policy. Usually, the government’s ability to collect additional taxes reduces at such times when they are expected to make transfers to those badly hit due to lockdown (Alon et al., 2020).
While informal employment is primarily concentrated in the informal sector (enterprise-based definition), there has been an increasing trend of “informalisation” of employment in the formal sector over the years. Still, the ILO has recognised the resilience and dynamism of workers and economic units in the informal economy. The 2002 International Labour Conference, under the tripartite structure of workers’ organisations, employers’ organisations and governments, developed a broad consensus on the need to address the vulnerabilities of the actors of the informal economy (ILO, 2013a) under a framework that recognises their
Labour & Development, Vol. 27, No. 1, June 2020

2 Labour & Development
diversity and heterogeneity (ILO, 2013a; ILO, 2013b). Most actors of the informal economy are often not recognised, and not registered in national statistics. Besides, even if they were registered, they may fall outside the purview of labour legislation, social protection ambit, and protective measures at the workplace (ILO, 2013b). Informal jobs often include forms of employment for which there are no clear employment relationships in place (Hussmanns, 2004).
Consequently, informal economy actors are invisible to policy formulation and may not grasp a fair share of the fruits of progress. They lack protection under the law, lack representation, and, therefore, have no voice to demand their rights. Workplaces may be unsafe and unhealthy; and work usually comprises long working hours, with productivity and incomes usually being low. Workers in the informal economy usually are not there by choice, but rather due to a lack of opportunities in the formal economy. In general, informal workers constitute a vulnerable segment of society with a rare job or income security, as we shall further analyse.
In an economic crisis, pressures on formal employment can lead to an expansion of the informal economy. Even though the informal economy is considered a natural buffer or shock absorber under adverse economic circumstances, job losses in the formal economy can exert additional pressure in the informal economy (ILO, 2020b). This is because the contraction of the global aggregate demand during financial crises in critical sectors, such as construction and textiles, has proved to affect informal jobs and business opportunities. The coupled effects increase competitive pressures in the informal economy, thus eroding job opportunities and income levels.
The COVID-19 crisis has strongly affected the informal economy. Due to the characteristics discussed above, many people in the informal economy cannot afford further shutdowns. Their livelihoods and subsistence depend on the day-to-day struggle, and staying home may mean they are not able to support their families with basic needs. Similarly, small enterprises with low productivity, with low liquidity, and negligible capital accumulation, are particularly vulnerable to this crisis. The ILO has estimated that without alternative income, lost labour income will result
in a 56-point increase in relative poverty for informal workers in low- and middle-income economies (ILO, 2020b). The estimation accounts for the disruption of rural workers that produce for the urban markets.
In India, the Government took its first measures to contain the spread of COVID-19, on 24th March 2020. A nationwide lockdown for 21 days was imposed, putting 1.3 billion people under one of the most stringent preventive and containment measures in the world. Using the OxCGRT, from the University of Oxford, a tool that tracks and compares policy responses around the world (Hale et al., 2020); India registered the highest level concerning containment and closure policies against the COVID-19 pandemic. The containment measures were most stringent during the first two lockdowns (denoted as Lockdown 1.0 and Lockdown 2.0 respectively throughout the paper). Lockdown 1.0 was imposed for 21 days, 24 March 2020 to 13 April 2020. Lockdown 2.0 was imposed for 19 days, 14 April to 3 May 2020. In comparison to Lockdown 1.0, the containment measures were eased slightly during Lockdown 2.0 and further on 4 May 2020 for workplaces in regions outside the red zones. Closure of workplaces had an immediate impact on workers who lack a job or income security, especially those in the informal economy. The resulting exodus of informal migrant workers returning to their villages made the national headline.
Some of the latest studies on the implications of COVID-19 have gauged the extent of labour supply shocks due to imposed containment measures (Dingel and Neiman, 2020; Estupinan et al., 2020; Hicks, 2020; Koren and Petö, 2020; Rio-Chanona et al. 2020). These analyses have addressed the possible consequences of the supply shock under the restriction of containment and social distancing measures while calculating the extent to which occupations can be performed from home. Most of these studies have presented findings relating to labour markets, especially using O*NET data for the U.S.; their analysis takes into consideration the industry and occupations dimension. However, there is little or no in-depth analysis concerning the supply shock on the informal economy, in particular, and the consequent labour income losses.

Job and Wage Losses in Informal Economy Due to the Covid-19 Lockdown Measures in India 3
With this background, it becomes imperative to examine the extent of the impact of the nationwide lockdown, on the Indian economy and in particular on the informal economy labour market. This paper attempts to undertake such endeavour and estimate the job and wage losses of workers, using the lens of informality, for Lockdown 1.0 and Lockdown 2.0 when containment measures to tackle COVID-19 were most stringent in the world. This paper is arranged as follows, Section 2, details the data and methodology used to estimate labour supply shocks and wage loss in the informal economy. Section 3, provides an overview of the Indian informal economy. Section 4, provides results on the labour supply shock, and wage loss estimation in the informal economy. Section 5 concludes with a discussion.
2. DATA AND METHODOLOGY
2.1 Data
All the estimates in this paper are derived using the Periodic Labour Force Survey (PLFS), 2017-18. As we are trying to estimate the job loss for the year 2020, specifically for the month of March, April and May, we have adjusted population estimates derived from PLFS 2017-18 using Census population projections for the year 2020 (Mehrotra and Parida, 2019). We have obtained final population numbers by multiplying the PLFS estimates with the Census Adjustment Multiplier (CAM). CAM is the ratio of the Census projected population and PLFS estimated population (Mehrotra and Parida, 2019). As the first lockdown was announced by the Government of India on 24th March 2020, we have used the Census projected population for March 2020 to estimate CAM (Census (2011)). We assume that there is no structural change in the employment framework between 2017-18 and March 2020.
2.2 Measurement of Informal Employment
A widespread informality characterises the Indian economy and the labour market. We may disaggregate total employment according to two dimensions: the type of production unit and type of job. The former is defined in terms of legal organisation and enterprise-related characteristics such as their number of workers. While the latter, defined in terms of status in
employment as defined by the National Sample Survey Organisation (NSSO), employers, own-account workers, unpaid family members, and regular/salaried and casual workers. Together they provide the dualistic framework of informality.
Under international Standards according to the 17th ICLS, informal employment combines all informal jobs found in the Informal Sector or Households, plus informal jobs carried out in the Formal Sector. Households employing paid domestic workers are excluded from informal sector enterprises and treated separately as part of a category named “households” (15th ICLS). While own-account workers and employers can hardly be separated from the type of enterprise they own. Thus, the informal nature of their jobs follows directly from the characteristics of the enterprise. In other words, these categories of jobs are informal if the nature of the enterprise belongs to the informal sector. Contributing family workers are considered informal employment irrespective of the sector they belong to. It is only employees that may have formal or informal jobs if the employment relationship is, in law or practice, not subject to national labour legislation, income taxation, social protection, or entitlement to certain employment benefits. Other considerations are given to members of informal producers’ cooperatives. Similar to own-account and employers their jobs follow directly from the characteristics of the cooperative they belong to. Finally, those own-account engaged in the production of goods exclusively for own final use by their households, such as subsistence farming, construction of own dwellings, manufacture of wearing apparel, furniture, water, and fuel collection, etc., if considered employed according to the 13th ICLS definition of employment (ILO, 1982).
Furthermore, the ILO definition of the informal sector suggests that the threshold number of employees in the definition should be decided as per national circumstances. Specification of the employment size limit of the enterprise in the national definition of the informal sector is left to the country’s discretion. For international reporting, however, countries should provide figures separately for enterprises with fewer than five employees.

4 Labour & Development
In India, the National Commission for Enterprises in the Unorganised Sector (NCEUS) found it appropriate to set a threshold in addition to the ownership criteria for defining the informal sector (NCEUS, 2008). It took a 10-worker threshold, noting that labour and social security legislation applies mainly to enterprises with ten or more. NCEUS defines the informal sector comprised of all unincorporated enterprises owned by individuals or households engaged in the sale and production of goods and services operated on a proprietary or partnership basis and with less ten workers (NCEUS, 2008).
NCEUS is aligned to the ICLS and ILO definitions in the following issues–
- Self-employed own-account workers in the informal sector or private households, and self-employed employers the informal sector – do not enjoy JOB security or SOCIAL security and are considered as informal employment as per the conceptual framework of the ILO.
- Unpaid family workers, whether in the informal or formal sector, are invariably regarded as informal employment.
- Paid employees can be informal or formal employment depending on the availability of both job security and social security.
- Casual based workers, irrespective of the informal or formal sector where they are employed they are considered without job security and social security.
We take a similar approach for estimating the different categories of informal employment both in the formal and informal sectors. However, in classifying economic units in the formal sector we include all Government/public sector, public/private incorporated companies; co-operatives, and trusts. We also classify the following enterprise as organised if the number of workers is 10 or above - Proprietary (male and female); and partnership with members from the same household or members from different households; and employer’s households. Other types of enterprises are classified in the formal sector if they employ ten or more workers. For those enterprises in the Agriculture sector with
no definition on the type of enterprise and number of workers, we turn to identify if they provide social benefits to its workers if this is the case we classify them in the formal sector. If there is no response on the social security benefits, by exclusion we classify them in the informal sector. We have used provident fund (PF) as the criteria for classifying worker’s employment as formal and informal following Abraham's classification (Abraham, R. 2017)). If a worker is receiving at least PF, then he/she is classified as formally employed and vice versa.
To capture the dimensions of informality at the enterprise level and worker level, we make use of the following classifications adhering to the dualistic framework of informality:
1. Formal employment in organised sector (FOS)2. Informal employment in organised sector (IOS) 3. Formal employment in unorganized sector
(FUS) 4. Informal employment in unorganised sector
(IUS)5. Formal employment in private households
(FEH) 6. Informal employment in private households
(IEH)
2.3 Estimation of Labour Supply Shock
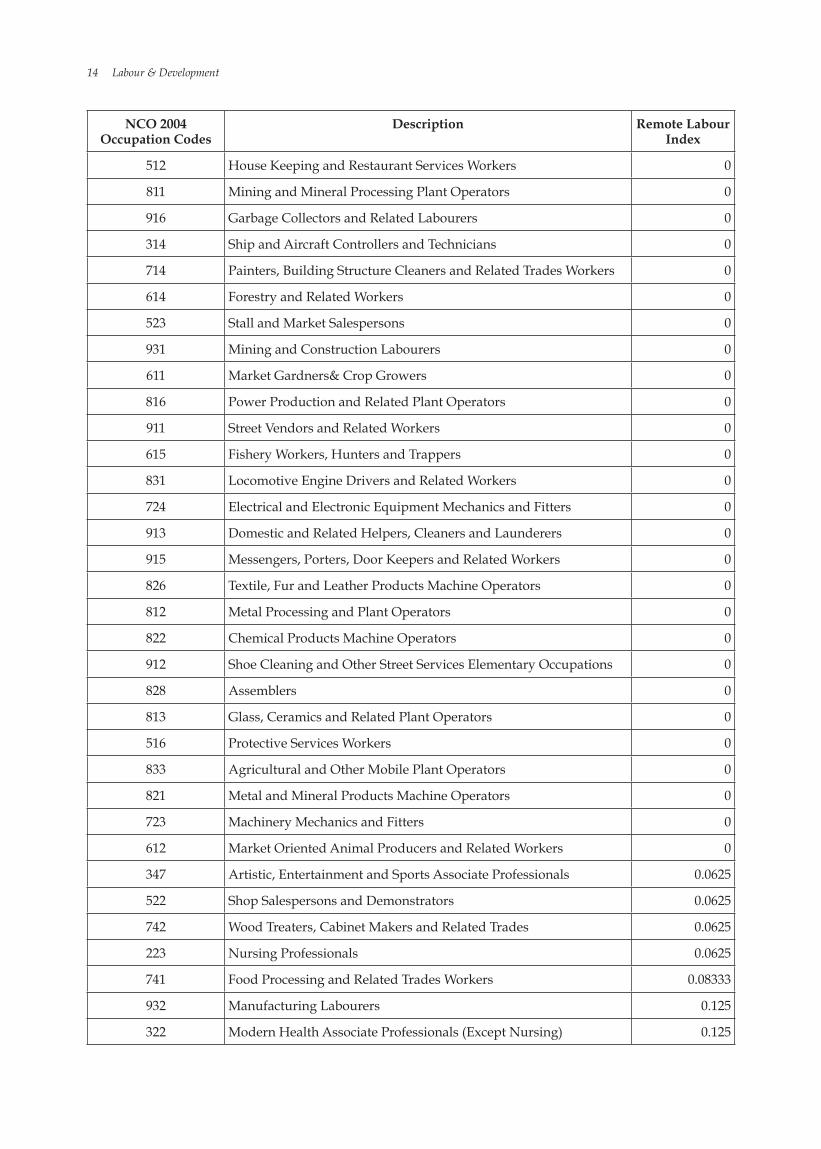
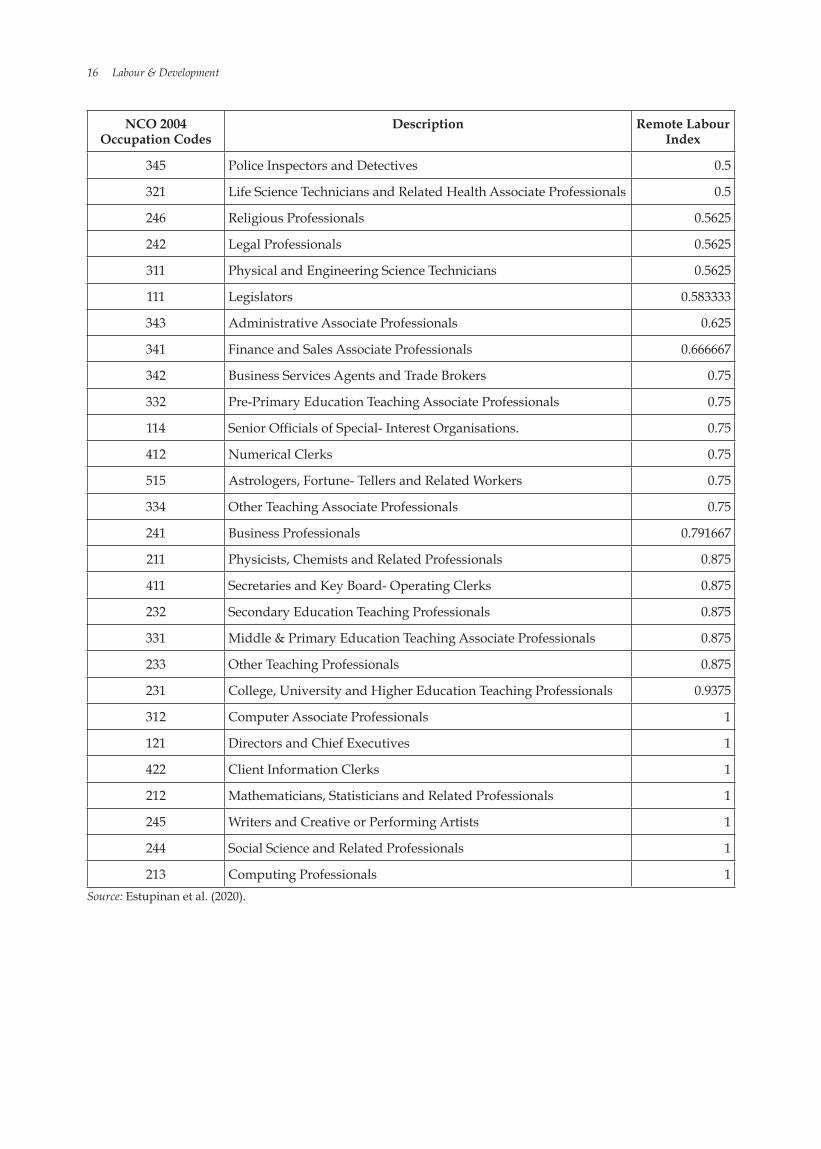
The worker is considered to be at risk of job loss (or most affected by lockdown measures) if he/she is working in a non-essential industry and unable to work from home. The framework for the analysis is borrowed from Estupinan et al. (2020). The study uses two metrics to estimate labour supply shock, first, classification of industries into essential and non-essential, and second an index to measure the extent of work which can be performed from home. The classification of industries in to essential and non-essential is done using the notifications released by the Ministry of Home Affairs (MoH) during Lockdown 1.0 and Lockdown 2.0. Further, to estimate the proportion of workers who can work from home, we make use of the recently developed Remote Labour Index (RLI) for India by Estupinan et al. (2020). The detailed occupation wise RLI score is provided in appendix A.

Job and Wage Losses in Informal Economy Due to the Covid-19 Lockdown Measures in India 5
Figure 1 Proportion of Workers Engaged in Non-essential Industries
and Workers who can Work Remotely
51.4644.22
28.00
14.61
0
10
20
30
40
50
60
Non-essential RLI
percentage
Formal Informal
occupations within these industries would be zero. On the other hand, if a worker with occupation works in a non-essential industry than the labour loss would depend on the proportion of work that cannot be done from home i.e. . If an occupation can be perfectly done from home than
would be 1 and labour shock would thus be 0. To get labour shock for an industry and a particular occupation k, , we need to aggregate labour loss for all workers within the industry adjusted by the weighted representation of a worker in the population Aggregating over all the occupations would give us industry specific labour supply shock, Aggregating over all industries q would give us economy-wide aggregate labour shock,
where industry specific labour supply shock, is the total number of
occupations within an industry and is the total number of industries within an economy.”
2.4 Estimation of Wage and Earning loss
The information on wages and income in PLFS is given at the current weekly activity status (CWS) for regular and salaried employees, casual workers, and own account workers. The information on earnings for regular and salaried employees and own account workers is available for the preceding calendar month. However,
Figure 1 shows the proportion of formal and informal workers engaged in non-essential industries and who can work remotely. Higher proportions of formal workers (51 per cent approx) are employed in non-essential industries in comparison to informal workers (28 per cent). This is because a high number of informal workers are working in the agriculture sector which was categorised predominantly as an essential activity. Moreover, 44 per cent (approximately) of the formal workers in comparison to only 15 per cent (approximately) of informal workers can work from home. This implies that in a country like India, where 91 per cent of the workers are informally employed, the impact of COVID-19 pandemic on the jobs and wages, due to lockdown measures undertaken by the Government of India, is expected to be significant.
The job loss for informal workers is estimated using the formula elucidated in Estupinan et al. (2020) and reproduced below;
“the labour supply shock for an occupation within an industry , , is calculated as follows,
For a worker working in an essential industry, labour shock would be 0, thus labour shock for all
Source: Author’s estimation using PLFS (2017-18).

6 Labour & Development
for casual worker wage earnings was recorded for each of the day of the reference week (last 7 days preceding the date of the survey) when the household member had worked as casual labour (PLFS, 2019).
To estimate the workers at risk of losing jobs due to the lockdown measures taken by the government we have made use of both usual principal and subsidiary status of an individual (usual status (ps+ss)). However, the information on earning is available at CWS. Therefore for estimating wage and earning loss we have identified those individuals whose usual status (ps+ss) matches with current weekly status for regular and salaried employees and casual workers. We assume that if for a specific individual usual activity status (ps+ss) matches with current weekly activity status, then that individual average earning approximate his/her average usual earnings.
Using this criterion for identification we find that 98.1 per cent, 86.2 per cent, and 92.4 per cent of the individuals whose usual activity status (ps + ss) is a regular and salaried employee, casual and own account workers respectively, match with their CWS. For wage and earning loss estimations we have not considered those individuals whose usual activity status (ps + ss) does not match with CWS. This implies that we have underestimated wage and income loss in comparison to the actual wage and income loss.
Moving forward, for wage and earning loss estimations we have considered ‘month’ as a unit of time. As given above the wages for regular and salaried employees and own account
workers are already available at the level of the month. However, the wages of casual worker are converted into monthly wages by using the following formula:
monthly wages of casual worker = (weekly earning of casual worker*52)/12
To estimate the wage loss we adjusted the weighted representation of the worker in the population using RLI, essential and non-essential categorisation and paid leave. Thus the new weighted sum of wages (income) provides us with the share of wages (income) after adjusting for the labour loss and the eligibility of paid leave. We assume that the workers who are eligible for paid leave would not have faced any wage or income loss.
3. OVERVIEW OF THE INFORMAL SECTOR IN INDIA
The dualistic picture from the enterprise-dimension goes beyond the organised and unorganised sector, as it also includes households as economic units that produce for their own use. Table 1 and Table 2 provide this dualistic view of informality in India. About 79.4 per cent of workers in all economic activities in India are found in the informal/unorganised sector, with only 0.5 per cent under formal employment contract within them. Even in the formal/organised sector, the share of workers with informal employment is about 52 per cent, which constitutes the ‘informalisation’ of the formal sector. Overall, India holds about 90 per cent of informal workers in the labour market.
Table 1 Percentage of Workers in the Organised/Unorganised
Sector with Informal/ Formal EmploymentJOBS BY STATUS IN EMPLOYMENT
PRODUCTION UNITS BY TYPE
Own Account Employer Contributing Family
Workers
Employees Total
Informal Formal Informal Formal Informal Informal Formal Formal/Organised Sector 0.4% 0.2% 0.1% 9.9% 8.8% 19.4%Informal/Unorganised Sector
35.8% 1.9% 12.9% 28.4% 0.5% 79.4%
Households 0.0% 0.0% 1.2% 0.0% 1.2%Total 35.8% 0.4% 1.9% 0.2% 13.0% 39.5% 9.3% 100.0%Source: Author’s estimation using PLFS (2017-18).

Job and Wage Losses in Informal Economy Due to the Covid-19 Lockdown Measures in India 7
The nature of the ‘jobs’ of employers and own-account workers follows from the characteristics of the enterprise they own. Contributing family members are informal in nature as they do not hold explicit contracts or receive compensation for their work. Employees, both regular/salaries and casual workers, are considered to have informal jobs if their employment relationship is, in law or practice, not subject to national labour legislation, income taxation, social protection or entitlement to certain employment benefits such as advance notice of dismissal, severance pay, paid annual or sick leave, etc. (Hausmann, 2013).
India’s informal employment is concentrated in the rural sector with 63.4 per cent of total employment, and urban sector holds another 26.7 per cent (Table 2). The ‘informalisation’ of the formal or organised sector exists both in rural (4.8%) and urban (5.2%) areas. Households only have informal employment which accounts for 1.2% of total employment, and more prevalent in the urban sector (Table 2).
Table 2 Category wise Proportion of Employed
Workers
Employment Categories
Rural Urban All India
FOS 2.8% 6.5% 9.4%
FUS 0.2% 0.3% 0.5%
FEH 0.0% 0.0% 0.0%
Formal (Total) 3.0% 6.8% 9.9%IOS 4.8% 5.2% 10.0%
IUS 58.3% 20.6% 78.9%
IEH 0.3% 0.9% 1.2%
Informal (Total) 63.4% 26.7% 90.1%Source: Author’s estimation using PLFS (2017-18).
Different employment categories found in the Indian labour market, respond to different levels of job and income security. Regular/salaried worker supposes better job security and higher pay. Similarly, a salaried worker employed by an enterprise with ten or more workers (organised/formal sector) is also entitled to social security
and retirement benefits by law. Others may register voluntarily for social provident funds. Hence, employment in the organised sector (enterprises with more than ten workers) should automatically grant the worker social security benefits and probably better-working conditions. However, there has been a worrying trend of informalisation of organised sector as well (EPW Engage, 2018). This trend has even manifested in wage loss figures. As covered in detail in the upcoming section it is informally employed workers in the organised sector (IOS) that have suffered proportionally higher wage loss than even the most vulnerable category of informally employed workers in unorganised sector (IUS).
4. RESULTS
4.1 Job Loss: Informality and Employment Status
An Indian economy is characterised by widespread informality in economic activities and the labour market. Workers with informal employment contract have no job security, income security, health or pension benefits and they are likely to be most affected by an aggregate economic shock like the one we are facing (see ILO (2020), Dev and Sengupta (2020), Mehrotra and Parida (2019)).
As has already been pointed out in the methodology section, the workers who were at risk of job loss, during Lockdown 1.0 and Lockdown 2.0, were the ones who were employed in non-essential activities and cannot work from home. Before delving into job loss numbers it would be interesting to know the proportion of workers who can work from home and employed in non-essential activities. Figure 2 helps to find out the same within the paradigm of the dualistic framework of informality where we account for the possibility and intersection of formal/informal employment and organised/unorganised sector. According to the dualistic framework of informality, there is a possibility of a worker employed in the organised sector and informally employed and vice versa.

8 Labour & Development
As can be seen in Figure 2 above, a higher proportion of formally employed workers in organised sector (FOS) can work from home (44.5 per cent) in comparison to 21.7 per cent informally employed workers in organised sector (IOS). The latter is more probable to lose their jobs in the present scenario. Moreover, the difference of 22 per cent between FOS and IOS in terms of worker’s probability to perform activities from home is significant implying that formality of employment matters rather than the nature of enterprise (organised and unorganised). As informal workers have no job security even in normal circumstances, low RLI further aggravates their job insecurity in times of pandemic like COVID-19. Therefore, they might end up losing their jobs despite working in the organised sector. Similarly, a higher proportion of formally employed workers in unorganised sector (FUS) (40 per cent) can work from home, in comparison to 13.9 per cent of informally employed workers in the unorganised sector. Among all categories, apart from FEH and IEH, it is IUS i.e. workers who are informally employed in unorganised sector have the lowest RLI.
Table 3 provides an absolute number of workers as well as the proportion of workers who are at risk of job loss across the employment status
category and belong to one of the informality groupings. Among the six grouping IOS, IUS and IEH together constitute informal employment, and FUS and IUS constitute employment in the unorganised sector. Workers employed in the IUS category form the most vulnerable group. We find that, among the workers who are at risk of losing jobs during Lockdown 1.0, 68 per cent belong to the IUS category. Among all the workers who are at risk of losing jobs during Lockdown 1.0, we find that 89.5 per cent (approx.) workers are informally employed and 72 per cent belong to the unorganised sector.
In absolute numbers, out of 116 million workers who are at risk of losing jobs, 104 million workers are informally employed in Lockdown 1.0. Around 79 million workers belong to the vulnerable IUS category and thus have a higher risk of losing their jobs in Lockdown 1.0 (Table 3). Moreover, within the IUS category, around 20.59 million are regular and salaried employees whose jobs are considered to be relatively stable in comparison to casual and own account workers (Rani and Belser, 2012). In fact, among all the regular and salaried employees who were at risk of losing their jobs in Lockdown 1.0, 41.37 per cent belong to the IUS category in Lockdown 1.0. This implies
Figure 2Proportion of Workers Employed in Non-essential Activities and who can Work From Home
Across Formal-informal Categories
44.521.7
40.1
13.9 1.2 1.8
51.0
49.5
58.2
24.3
95.6 96.1
0102030405060708090100
FOS IOS FUS IUS FEH IEH
percentage
RLI Non-essential
Source: Author’s estimation using PLFS (2017-18).

Job and Wage Losses in Informal Economy Due to the Covid-19 Lockdown Measures in India 9
Table 3 Employment Status and Informal Category wise
Proportion of Workers at Risk of Job Loss
Employment Status Lockdown 1: Job Loss in Millions
(percentage loss)
FOS FUS FEH Total (formal)
IOS IUS IEH Total (informal)
Total
Own-account Worker
0.33(0.9)
0.33(0.9)
33.91(99.1)
33.91(99.1)
34.24(100.0)
Employer 0.07(4.9)
0.07(4.9)
1.37(95.0)
1.37(95.0)
1.44(100.0)
Contributing Family Member
0.00(0.0)
0.00(0.0)
0.00(0.0)
0.12(2.1)
5.52(97.9)
5.64(100.0)
5.64(100.0)
Regular and Salaried Employee
10.71(21.5)
0.78(1.6)
0.10(0.2)
11.60(23.3)
13.24(26.6)
20.59(41.4)
4.35(8.8)
38.19(76.7)
49.78(100.0)
Casual Worker 0.13(0.5)
0.03(0.1)
0.00(0.0)
0.16(0.6)
6.47(25.8)
17.71(70.6)
0.74(3.0)
24.92(99.4)
25.08(100.0)
Total 11.24(9.7)
0.81(0.7)
0.10(0.1)
12.2(10.5)
19.82(17.1)
79.10(68.1)
5.10(4.4)
104.02(89.5)
116.18(100.0)
Employment StatusLockdown 2: Job Loss in Millions
(percentage loss)
FOS FUS FEH Total (formal)
IOS IUS IEH Total (informal)
Total
Own-account Worker
0.26(1.1)
0.26(1.1)
24.35(98.9)
24.35(98.9)
24.61(100.0)
Employer 0.04(5.1)
0.04(5.1)
0.83(94.9)
0.83(94.9)
0.87(100.0)
Contributing Family Member
0.00(0.0)
0.00(0.0)
0.00(0.0)
0.09(2.4)
3.62(97.6)
3.71(100.0)
3.71(100.0)
Regular and Salaried Employee
8.37(22.6)
0.57(1.5)
0.10(0.3)
9.04(24.4)
9.96(27.0)
13.61(36.8)
4.35(11.8)
27.93(77.6)
36.97(100.0)
Casual Worker 0.08(0.6)
0.03(0.2)
0.00(0.0)
0.11(0.8)
2.20(17.2)
9.72(76.2)
0.74(5.8)
12.67(99.2)
12.78(100.0)
Total 8.76(11.1)
0.60(0.8)
0.10(0.1)
9.46(12.0)
12.25(15.5)
52.13(66.0)
5.10(6.5)
69.48(88.0)
78.93(100.0)
Source: Author’s estimation using PLFS (2017-18).
that a significant proportion of regular and salaried employees, whose jobs are otherwise considered safe, are also vulnerable in times of pandemic like COVID-19. According to CMIE (July 2020), 18.9 million salaried jobs have been lost since the lockdown began. As regular and salaried jobs are hard to recover it shows the vulnerability of Indian labour markets
which is predominantly informal. Similarly in Lockdown 2.0, out of 78.9 million workers who were at risk of losing jobs, 69.4 million workers are informally employed. Around 52.13 million belong to the IUS category and within IUS 13.61 million are regular and salaried employees, 24.35 million are own-account workers and 9.72 million are casual workers.

10 Labour & Development
4.2 Wage and Earning Loss
In this section, we provide the findings for wage and earning loss of workers using the paradigm of the dualistic framework of informality. The findings pertain to a period of Lockdown 1.0 and Lockdown 2.0. The duration of the two lockdowns was 40 days (24th March to 3rd May 2020). As already explained in the methodology section, for carrying out wage loss estimations we have considered only those workers who are not eligible for paid leave. We assume that the workers who are eligible for paid leave have received regular wages and income during lockdown period. Although the Government of India on March 29, 2020, ordered the mandatory payment of wages to alleviate the suffering of those impacted by the Lockdown measures (MHA, 2020a.7), later, the Supreme Court overruled this order and said that the employers who are unable to pay full wages will not be prosecuted (Rautray, 2020 as cited in Estupinan et al., 2020). Given the above context, in conjunction with the informal nature of the labour market in India, we argue that the workers who are not eligible for paid leave would not have received wages in Lockdown 1.0 and Lockdown 2.0. This view is further corroborated by the large scale migrant crises which ensued after Lockdown1.0 and Lockdown 2.0.
Table 4 Wage and Income Loss for 40 days - from
24th March 2020 to 3rd May 2020 (at 2017-18 Prices)
Category Wage/Earning Loss for Lockdown1.0 and Lockdown 2.0
Rs. (billions) Per centFOS 49.01 3.66
FUS 3.88 8.03
FEH 0.38 18.22
Formal 53.26 3.83IOS 146.83 27.66
IUS 635.53 21.04
IEH 28.87 80.58
Informal 811.22 22.62Total 864.48 17.37
Note: Wage loss corresponds to Rs. 333.3 billion and Rs. 184.1 billion for regular/salaried worker and casual worker, respectively. Earning loss for own-account workers sums up to Rs. 347 billion.
Source: Author’s estimation using PLFS (2017-18).
Table 4 shows the wage loss estimates for all informal groupings. The total wage and earning loss, for all workers, in the period between 24th March 2020 and 3rd May 2020 (at 2017-18 prices) is Rs. 864.48 billion. The labour income loss of formal workers is 53.26 billion and for informal workers is 811.22 billion. In proportional terms, informal workers suffered more losses than formal workers i.e. 22.62 per cent of the labour income lost for Informal workers in comparison to 3.66 per cent of the wages and earnings were lost for the formal workers.
Seeing the results from the prism of the dualistic framework of informality, we find that in absolute terms the highest labour income loss is sustained by the IUS category (635.53 billion) followed by IOS (146.83 million). However, in proportional terms, there are 80.5 per cent labour income lost for workers belonging to the IEH category followed by IOS (27.6 per cent) and IUS (21 per cent). It is interesting to note that informal workers in organised sector have lost more wages and earnings in proportional terms than informal workers in unorganised sector. This again shows the vulnerability of the workers who are informally employed and it does not matter if they work in organised or unorganised sector.
To understand the gravity of wage loss it suffices to say that the labour income loss of IUS workers in Lockdown 1.0 and 2.0 is almost equivalent to the annual union budget allotted for employment guarantee scheme MGNERGA in 2020-2021 (Union Budget, 2020). On the other hand, the total labour income loss is 1.4 times the annual union MGNERGA budget. The enhancement of the NREGA budget by 400 billion to a total of 1000 billion in May 2020 barely covers the total wage and earning loss of the first two lockdowns.
5. CONCLUSION
The stringent lockdown measures undertaken by the Government of India to mitigate the spread of COVID-19 have significantly impacted the economic activities which in turn has affected the labourers engaged in carrying out those economic activities to earn their livelihood. Informality is pervasive in the Indian labour market. The workers in the informal sector hardly receive any social security benefits and are extremely vulnerable to economic shocks than workers in the formal sector (Unni and Rani

Job and Wage Losses in Informal Economy Due to the Covid-19 Lockdown Measures in India 11
2002). Therefore it becomes important to study the effect of COVID-19 on the informal labour market.
This paper attempts to estimate the job and wage losses of informal workers in the first two lockdowns. The worker is considered to be at risk of job loss (or most affected by lockdown measures) if he/she is working in non-essential industry and unable to work from home. The framework for analysis is borrowed from Estupinan et al. (2020).
We find that 44 per cent (approximately) of the formal workers in comparison to only 15 per cent (approximately) of informal workers can work from home. Further, we estimate 104 million and 69.4 million informally employed workers were at risk of job loss in Lockdown 1.0 and Lockdown 2.0 respectively. Using the dualistic framework of informality we find that in Lockdown 1.0 out of 104 million workers, 79 million workers belong to a vulnerable group - informally employed in unorganised sector (IUS).
The total wage and earning loss, for all workers, in the period between 24th March 2020 and 3rd May 2020 (at 2017-18 prices) is Rs. 864.48 billion. The wage and earning loss of formal workers is 53.26 billion and for informal workers is 811.22 billion. In proportional terms, informal workers suffered more losses than formal workers i.e. 22.6 per cent of the labour income was lost for Informal workers in comparison to 3.6 per cent of the wages and earnings were lost for the formal workers. Moreover, Workers informally employed in unorganised sector suffered a wage and earning loss, amounting to Rs. 635.53 billion, which is almost equivalent to annual union budget allotted for employment guarantee scheme MGNERGA in 2020-2021.
This calls for a larger change in the social security framework and shows the need for switching to social protection framework to deal with uncertain economic situations (Drèze, J and A Sen 1991, Unni and Rani 2002, Unni and Rani 2003, Pandey. S, 2020). This is aptly argued by Pandey. S, (2020) “Growing income insecurity and vulnerability in the informal sector necessitates expanding the scope of social protection by including economic security besides basic security.” Most of the informally employed workers are vulnerable to health shocks or food shock due to drought or any
other natural calamity. Therefore social security framework needs to be further strengthened. Additionally, to guarantee the social protection of informal workers in present times it is extremely important to ensure the greater coverage and efficient functioning of the public welfare programmes such as MGNREGA.
Finally, effective minimum wage policy coupled by the above measures may be a key strategy in developing economies towards reviving the economy from the demand side in the aftermath on the COVID-19 pandemic, thus contributing in reducing fiscal pressures on state budgets and by progressively increasing domestic consumption by lower-and middle-income groups in the economy.
DECLARATION
There are no known conflicts of interest associated with this publication among the authors and there has been no significant financial support for this work that could have influenced its outcome.
REFERENCESAbraham, R. (2017), ‘Informality in the Indian
Labour Market: An Analysis of Forms and Determinants’, The Indian Journal of Labour Economics, 60(2): 191-215.
Abraham, R. (2018), Informal Workers in Formal and Informal Enterprises in India: A Comparative Analysis, accessed January, 20.
Alon, T.M., Kim, M., Lagakos, D., and Van Vuren, M. (2020), How Should Policy Responses to the COVID-19 Pandemic Differ in the Developing World?, Working Paper No. 27273, Cambridge: National Bureau of Economic Research.
Census (2011), Population Projections for India and States 2011-2036, Report of the Technical Group on Population Projections, November 2019.
Dev, S. M. and Sengupta, R. (2020), Covid-19: Impact on the Indian Economy, IGIDR Working Paper, WP-2020-013.
Dingel, J.I. and Neiman, B. (2020), How Many Jobs Can be Done at Home?, Becker Friedman Institute, White Paper.
Drèze, J and Sen, A. (1991), Public Action for Social Security: Foundations and Strategy, Social Security in Developing Countries, E Ahmad et al (Eds),

12 Labour & Development
Oxford: Clarendon Press, viewed on 20 June 2020, https://www.oxfordscholarship.com/view/10.1093/acprof:oso/9780198233008.001.0001/acprof-9780198233008-chapter-1.
EPW Engage (2018), ‘The Unemployment Paradox: Looking at Growth Without Jobs’, Economic and Political Weekly (EPW), 30 October 2018.
Estupinan, X., Sharma, M., Gupta, S., and Birla, B. (2020), Impact of COVID-19 Pandemic on Labor Supply and Gross Value Added in India, Available at SSRN 3628761:https://papers.ssrn.com/sol3/papers.cfm?abstract_id=3628761
Hale, T., Petherick, A., Phillips, T. and Webster, S. (2020), Variation in Government Responses to COVID-19,Blavatnik School of Government Working Paper, 31.
Hausmann, R. (2013), The Logic of the Informal Economy, Available online at http://www.projectsyndicate.org/commentary/the-logic-of-the-informal-economy-by-ricardo-hausmann (accessed 16 August 2020).
Hicks, M.J, Faulk, D and Devaraj, S. (2020), Occupational Exposure to Social Distancing: A Preliminary Analysis using O*NET Data, Mimeo: Ball State University.
Hussmanns, R. (2004), ‘Defining and Measuring Informal Employment’, Geneva: International Labour Office.
International Labour Conference (2013b), Transitioning from the Informal to the Formal Economy, International Labour Office.
International Labour Conference (2020a), ILO Brief Impact of lockdown measures on the informal economy, International Labour Office https://www.ilo.org/global/topics/employment-promotion/informal-economy/publications/WCMS_743523/lang--en/index.htm
International Labour Conference (2020b), ILO Brief COVID-19 crisis and the informal economy Immediate responses and policy challenges, International Labour Office May 2020 https://www.ilo.org/global/topics/employment-promotion/informal-economy/publications/WCMS_743623/lang--en/index.htm
International Labour Organization (1982), Resolution Concerning Statistics of the Economically Active Population, Employment, Unemployment and Underemployment, The Thirteenth International Conference of Labour Statisticians.
International Labour Organization (2013a), Measuring Informality: A Statistical Manual on the Informal Sector and Informal Employment, International Labour Office.
International Labour Organization (2018), India Wage Report: Wage Policies for Decent Work and Inclusive Growth, India: International Labour Organization.
International Labour Organization (2020), Short-term Policy Responses to COVID-19 in the World of Work, India: International Labour Organization. https://www.ilo.org/newdelhi/whatwedo/publications/WCMS_739454/lang--en/index.htm
Kok, J.D. and Berrios, M. (2019), Small Matters: Global Evidence on the Contribution to Employment by the self-employed, Micro-enterprises and SMEs, International Labour Organization, Report, 10 October 2019.
Koren, M. and Pető, R. (2020), Business Disruptions from Social Distancing,arXiv:2003. 13983.
Mehrotra, S. and Parida, J.K. (2019), India’s Employment Crisis: Rising Education Levels and Falling Non-agricultural Job Growth, Working Paper, Bengaluru: Azim Premji University.
Ministry of Home Affairs (MHA) (2020a), Ministry of Home Affairs announcement of Nationwide Lockdown dated 24th March 2020, Order No.40-3/2020-DM-I(A), Ministry of Home Affairs, Government of India. - MHA (2020a.1), Annexure dated 24.03.2020. - MHA (2020a.2), First Addendum dated
25.03.2020. - MHA (2020a.3), Second Addendum dated
27.03.2020. - MHA (2020a.4), Third Addendum dated
02.04.2020. - MHA (2020a.5), Fourth Addendum dated
03.04.2020. - MHA (2020a.6), Fifth Addendum dated
10.04.2020. - MHA (2020a.7), MHA Order restricting
Movement of Migrants and Strict Enforement of Lockdown Measures - dated 29.03.2020.
MHA (2020b), Revised Consolidated Guidelines MHA order dated 15th April, 2020, No. 40-3/2020-DM-I(A), Ministry of Home Affairs, Government of India.
- MHA (2020b.1), First addendum dated 15th
April, 2020.- MHA (2020b.2), Second addendum order
dated 15th April, 2020.- MHA (2020b.3), Third addendum order dated
15thApril, 2020.

Job and Wage Losses in Informal Economy Due to the Covid-19 Lockdown Measures in India 13
Appendix ARLI for Occupations – At NCO 3- Digit level
NCO 2004 Occupation Codes
Description Remote Labour Index
815 Chemical- Processing- Plant Operators 0
712 Building Frame and Related Trades Workers 0
514 Other Personal Services Workers 0
814 Wood Processing and Paper Making Plant Operators 0
711 Miners, Shot -Firers, Stone Cutters and Carvers 0
722 Blacksmiths, Tool Makers and Related Trades Workers 0
933 Transport Labourers and Freight Handlers 0
827 Food and Related Products Machine Operators 0
713 Building Finishers and Related Trades Workers 0
832 Motor Vehicle Drivers 0
513 Personal Care and Related Workers 0
323 Nursing and Midwifery Associate Professionals 0
817 Automated Assembly Line and Industrial Robot Operators 0
613 Market- Oriented Crop and Animal Producers 0
744 Pelt, Leather and Shoe Making Trades Workers 0
824 Wood Products Machine Operators 0
823 Rubber and Plastic Products Machine Operators 0
- MHA (2020b.4), Clarification dated 15th April, 2020.
- MHA (2020b.5), Fourth addendum dated 24th April, 2020.
Narula, R. (2020), ‘Policy Opportunities and Challenges from the COVID-19 Pandemic for Economies with Large Informal Sectors’, Journal of International Business Policy, 1-9.
National Commission for Enterprises in the Unorganised Sector (NCEUS) (2008), Report on definItional and Statistical issues related to Informal Economy, New Delhi: NCEUS.
Pandey, S. (2020), ‘Social Security for Migrant Workers during COVID-19’, Economic and Political Weekly, 55(26 & 27), June 27, 2020.
Periodic Labour Force Survey (PLFS) (2019), Annual Report - Periodic Labour Force Survey (July 2017 - June 2018), Ministry of Statistics and Programme Implementation, National Statistical Office.
Rani, U. and Belser, P. (2012), ‘Low Pay Among Wage Earners and the Self‐employed in India’, International Labour Review, 151(3): 221-242.
Rautray, S. (2020), ‘SC Says No Acion for Now Against Employers who do not pay full Wages During Lockdown’, Economic Times, 16 May.
Rio-Chanona, R.M., Mealy, P., Pichler, A., Lafond, F. and Farmer, J. (2020), Supply and Demand Shocks in the COVID-19 Pandemic: An Industry and Occuptaion Perspective, INET Oxford Working Paper No. 2020-05.
Union Budget (2020), Union Budget 2020-2021, Ministry of Finance, Government of India.
Unni, J and Rani, U. (2002), Insecurities of Informal Workers in Gujarat, India, Geneva: International Labour Organization, viewed on 20 June 2020, https://www.ilo.org/public/english/protection/ ses/download/docs/india_informal.pdf.
----------(2003), ‘Social Protection for Informal Workers in India: Insecurities, Instruments and Institutional Mechanisms’, Development and Change, 34(1): 127–61.
14 Labour & Development
NCO 2004 Occupation Codes
Description Remote Labour Index
512 House Keeping and Restaurant Services Workers 0
811 Mining and Mineral Processing Plant Operators 0
916 Garbage Collectors and Related Labourers 0
314 Ship and Aircraft Controllers and Technicians 0
714 Painters, Building Structure Cleaners and Related Trades Workers 0
614 Forestry and Related Workers 0
523 Stall and Market Salespersons 0
931 Mining and Construction Labourers 0
611 Market Gardners& Crop Growers 0
816 Power Production and Related Plant Operators 0
911 Street Vendors and Related Workers 0
615 Fishery Workers, Hunters and Trappers 0
831 Locomotive Engine Drivers and Related Workers 0
724 Electrical and Electronic Equipment Mechanics and Fitters 0
913 Domestic and Related Helpers, Cleaners and Launderers 0
915 Messengers, Porters, Door Keepers and Related Workers 0
826 Textile, Fur and Leather Products Machine Operators 0
812 Metal Processing and Plant Operators 0
822 Chemical Products Machine Operators 0
912 Shoe Cleaning and Other Street Services Elementary Occupations 0
828 Assemblers 0
813 Glass, Ceramics and Related Plant Operators 0
516 Protective Services Workers 0
833 Agricultural and Other Mobile Plant Operators 0
821 Metal and Mineral Products Machine Operators 0
723 Machinery Mechanics and Fitters 0
612 Market Oriented Animal Producers and Related Workers 0
347 Artistic, Entertainment and Sports Associate Professionals 0.0625
522 Shop Salespersons and Demonstrators 0.0625
742 Wood Treaters, Cabinet Makers and Related Trades 0.0625
223 Nursing Professionals 0.0625
741 Food Processing and Related Trades Workers 0.08333
932 Manufacturing Labourers 0.125
322 Modern Health Associate Professionals (Except Nursing) 0.125

Job and Wage Losses in Informal Economy Due to the Covid-19 Lockdown Measures in India 15
NCO 2004 Occupation Codes
Description Remote Labour Index
920 Agricultural, Fishery and Related Labourers 0.125
346 Social Work Associate Professionals 0.125
829 Other Machine Operators and Assemblers 0.125
721 Metal Moulders, Welders, Sheet Metal Workers, Structural Metal Preparers and Related
0.125
914 Building Caretakers, Window and Related Cleaners 0.125
825 Printing, Binding and Paper Products Machine Operators 0.125
743 Textile, Garment and Related Trades Workers 0.125
734 Printing and Related Trades Workers 0.125
511 Travel Attendants, Guides and Related Workers 0.25
731 Precision Workers in Metal and Related Materials 0.25
834 Ships Deck Crews and Related Workers 0.25
243 Archivists, Librarians and Related Information Professionals 0.25
732 Potters, Glass Makers and Related Trades Workers 0.25
344 Customs, Tax and Related Govt. Associate Professionals 0.25
315 Safety and Quality Inspectors 0.25
521 Fashion and Other Models 0.25
620 Subsistence Agricultural and Fishery Workers 0.25
421 Cashiers, Tellers and Related Clerks 0.25
221 Life Science Professionals 0.25
733 Handicraft Workers in Wood, Textile, Leather and Related Materials 0.375
222 Health Professionals (except nursing) 0.375
313 Optical and Electronic Equipment Operators 0.4375
123 Other Department Managers 0.4375
122 Production and Operations Department Managers 0.4375
214 Architects, Engineers and Related Professionals 0.4375
112 Administrative & Executive Officials 0.5
130 General Managers 0.5
348 Religious Associate Professionals 0.5
419 Other Office Clerks 0.5
414 Library, Mail and Related Clerks 0.5
333 Special Education Teaching Associate Professionals 0.5
413 Material Recording and Transport Clerks 0.5
324 Traditional Medicine Practitioners and Faith Healers 0.5
113 Traditional Chiefs and Heads of Villages 0.5
16 Labour & Development
NCO 2004 Occupation Codes
Description Remote Labour Index
345 Police Inspectors and Detectives 0.5
321 Life Science Technicians and Related Health Associate Professionals 0.5
246 Religious Professionals 0.5625
242 Legal Professionals 0.5625
311 Physical and Engineering Science Technicians 0.5625
111 Legislators 0.583333
343 Administrative Associate Professionals 0.625
341 Finance and Sales Associate Professionals 0.666667
342 Business Services Agents and Trade Brokers 0.75
332 Pre-Primary Education Teaching Associate Professionals 0.75
114 Senior Officials of Special- Interest Organisations. 0.75
412 Numerical Clerks 0.75
515 Astrologers, Fortune- Tellers and Related Workers 0.75
334 Other Teaching Associate Professionals 0.75
241 Business Professionals 0.791667
211 Physicists, Chemists and Related Professionals 0.875
411 Secretaries and Key Board- Operating Clerks 0.875
232 Secondary Education Teaching Professionals 0.875
331 Middle & Primary Education Teaching Associate Professionals 0.875
233 Other Teaching Professionals 0.875
231 College, University and Higher Education Teaching Professionals 0.9375
312 Computer Associate Professionals 1
121 Directors and Chief Executives 1
422 Client Information Clerks 1
212 Mathematicians, Statisticians and Related Professionals 1
245 Writers and Creative or Performing Artists 1
244 Social Science and Related Professionals 1
213 Computing Professionals 1
Source: Estupinan et al. (2020).

WOMEN’S WORK IN INDIA: UPDATES FROM PERIODIC LABOUR FORCE SURVEYS
Ellina Samantroy∗ and Sanjib K Pradhan∗∗
The paper is contextualized within the ongoing debates on declining female labour market participation. There has been a continuous decline in female work force participation in India though marginal increase has been recorded in 2018-19. This paper uses data from the Periodic Labour Force Surveys (PLFS) and Employment and Unemployment Surveys (EUS) to understand the gender differentials in women’s employment in India and its rural and urban segments. The paper tries to understand women’s employment across sectors with an analysis on employment contracts and social security. It explores the inter-relationship between education and labour market with an insight into women’s access to vocational training and occupational segregation. The link between paid and unpaid work is also explored through an analysis of participation of women in domestic duties. At the end, the paper tries to reflect on policy perspectives for improving women’s participation in the labour market and capturing women’s work adequately in national statistics.
Keywords: Women’s Work; Female Labour Force Participation; Paid and Unpaid Work; Periodic Labour Force Surveys
1. THE CONTEXT
Women’s participation in the labour market has been lower than that of men globally and is characterized by high inequality. There was 27 percentage point gap in labour force participation rate between men and women in 2019 across all countries in the World. While 74 per cent of males had participated in the labour force, only 47 per cent of females could participate in the labour force in 2019 as reported by the World Employment and Social Outlook 2020 of the International labour Organisation (ILO, 2020). The gender gaps in labour market participation is more than 40 per cent in ‘low and middle income’ countries. It is also true that majority of workers worldwide are in informal employment - mostly self-employed or engaged in own account work or are contributing family workers. Hence, they are denied access to effective social protection. More than 2 billion workers are engaged in economic activities that are either insufficiently covered, or not covered at all by social protection, by formal arrangements in law or in practice (ILO, 2020). In South Asia, gender gap in labour market participation and low labour market participation has been widely prevalent. Within South Asia, India portrays a complex and challenging labour market scenario with a persistent decline in female labour force participation. There has
been plethora of debates on this decline and it has been a major policy concern to address this issue in the country.
Apart from the decline in female labour force participation rate, Indian labour market is characterised by large chunk of informal workers. More than 90 per cent of the workers in the informal economy have limited access to social protection and decent working conditions. Women in the informal sector are mostly into low paying jobs and spend a considerable amount of time in unpaid and care work which often interferes with their choices of paid employment. The global Sustainable Development Goals (Goal 5: Gender Equality) reiterates the commitment of government for providing decent working conditions and promoting gender equality and empowerment of women. This would not be possible without an assessment of women’s additional work burdens, their constant engagement in unpaid and care work that constraints them to sustain in the labour market for a longer period of time.
There has been a plethora of debates on the reasons for a declining female labour force participation. Some of the discussion are around education - with rising education, labour force participation declines (Chowdhury 2011; Rangarajan et al.
∗ Fellow, V.V. Giri National Labour Institute. Email: [email protected]∗∗ Assistant Director of Census Operations (T), Office of the Registrar General, India. Email: [email protected]. Views
expressed are of the authors and not necessarily that of the organizations that they belong.
Labour & Development, Vol. 27, No. 1, June 2020

18 Labour & Development
2011; Thomas 2012; Neff et al. 2012) Combined with a negative effect of rising income of male family members, female participation also declines (Pieters and Klasen 2011). A large majority of Indian women who spend most of their time in unpaid work within the household (that falls outside the market economy) are compelled by economic necessity, particularly in urban areas to combine domestic work with remunerative jobs in the informal sector (Mitra 2005). Women perform a large number of economic activities but most of their contributions remain underestimated with massive underreporting of women’s work. Further, the non-market economic activities performed within households are usually not recorded and the contribution of women within the household is undercounted in National Accounting Statistics (Samantroy, 2020).
From a broader theoretical premise, feminist perspectives on class and work and feminist Marxist perspective on housework provide a basis for understanding women’s invisible contribution to the economy. Engels argues that the source of the oppression of women came from the exclusion of women from social production and the conversion of household tasks into a private service (Engels, 1884). Feminist economists have insisted on re-examination of existing structures that are detrimental to women and economic analysis need to consider the social, cultural and political dimensions of women’s work (Folbre et al 1992). One of the prominent questions in feminist Marxist analysis has been the relationship of the domestic economy to the oppression of women (Mies, 1998; Barret, 1980). Chistine Delphy’s work very clearly highlights on the exploitation of women in an economic mode of production like agriculture where women produce goods which are appropriated by their husbands for direct exchange in the market. Similarly unpaid domestic work of women is extracted by men and mens’ control over their wives participation in wage labour (Barret and Mcintosh, 1979). Also, Delphy stated that housework is not accounted and not remunerated and since it is not paid it is free work is a gross error. Since it profits others it needs to be accounted and defined as a certain work relationship, a particular relationship of production (Delphy, 1984). Feminist economists have taken this premise forward in explaining
the inter relationship between paid and unpaid work and also to make visible women’s unpaid work by counting it in National accounts (Elson, 2000).
For proper assessment of women’s work and improving women’s participation in the labour market, there is a need for capturing women’s work in National accounts. The 19th International Conference on Labour Statisticians 2013 clearly stated the need to shift focus from purely economic production to measuring also livelihoods, social cohesion and well-being to measure economic performance and social progress and also emphasized on the comprehensive measurement of participation in all work activities, including paid and unpaid work, among other dimensions of well-being (ILO 2013). The present paper is contextualised within the ongoing debates on the declining female labour force participation and is an addition to the existing debates. It tries to understand the gender differentials in women’s employment with an analysis on their engagement in sectoral employment, status in employment, employment contracts and access to social security. The paper also engages to understand the linkage between access to education and labour market participation while exploring the gender differentials in access to skill/vocational training. Women’s paid and unpaid connection are explored through an analysis of domestic duties participation. At the end, the paper tries to engage with policy perspectives on improving women’s participation in the labour market with a focus on capturing women’s work. The analysis is based on estimates, primarily from the Periodic Labour Force Surveys (PLFS) of the National Statistics Office (NSO). Data from the erstwhile Employment-Unemployment Surveys of NSO has also been used for comparison. The usual activity status (principal and subsidiary status) has been taken into consideration, and unit level data are also used to generate information on a more disaggregated level. The paper focuses on the work participation of women in the productive age group between 15 and 59 years. This paper uses the term WPR to mean Work Participation Rate which is defined as Workers as a percentage of Population. The paper has also relied on secondary literature from articles

Women’s Work in India: Updates from Periodic Labour Force Surveys 19
in journals, other secondary sources like published governmental reports and reports of international organizations.
The paper is divided into six sections. The first section discusses about the gender differentials in employment trends. The following sections focus on the relationship of education with labour market with reference to women’s access to vocational training, technical education etc. and the gender differentials. Employment conditions, access to social security and women’s constraints to participate in the labour market, particularly invisible work (domestic and unpaid work), policy concerns for improving labour market participation of women are some of the other aspects which are analysed in this paper.
2. TRENDS IN WORK PARTICIPATIONa) Gender Differentials: Women’s participa-
tion in the work force in India has been very low as compared to that of men (Table 1). While 75.1 per cent of men aged between 15 and 59 years were in workforce in 2018-19, only 25.0 per cent women in the same age group could participate in the workforce in the same year – a 50.1 percentage point gap in WPR between men and women. This gap was little worse at 51.1 percentage points a year before in 2017-18. The problem is even more acute in urban areas compared to that
in rural areas. While there was a 48.5 per-centage point gap between men WPR and female WPR in rural areas for persons aged between 15 and 59 years, the same gap was at 53.5 percentage points in urban areas in 2018-19. Between 2004-05 and 2018-19, WPR for women aged between 15 and 59 years has declined by 19.2 percentage points while for men in the same age brack-et the decline is much lower at 10.0 percent-age points, given the different base points. In fact, the decline in female WPR for fe-males aged between 15 and 59 years has been much worse for rural women at 24.2 percentage points during the same period compared to urban areas where the female WPR for females aged between 15 and 59 year has declined by 4.0 percentage points. Table 1 shows the WPR for men and women aged between 15 and 59 years by usual sta-tus taking into account both principal sta-tus and subsidiary status as defined by Na-tional Statistical Organization (NSO) and is noted by ‘Usual Status (ps+ss)’.It is to be noted that the data pertaining to the years 2004-05 to 2011-12 has been calculated from the erstwhile Employment-Unemployment Survey of NSO and the data pertaining to the years 2017-18 and 2018-19 has been calculated from the newly introduced and comparable Periodic Labour Force Survey (PLFS) of NSO.
The gap in WPR is more discernable in Figure 1 which depicts the percentage point gap between female WPR and male WPR for persons aged between 15 and 59 years in different years. This has been calculated by subtracting the
Table 1 Work Participation Rate (in per cent) for persons aged 15-59 Years,
Usual Status (ps+ss), India
Year Rural Urban Rural + UrbanMale Female Total Male Female Total Male Female Total
2004-2005 87.1 51.5 69.4 80.2 24.2 53.6 85.1 44.2 65.02009-2010 83.4 39.2 61.5 78.5 19.8 50.5 81.9 33.6 58.32011-2012 82.0 37.2 59.8 78.4 21.0 50.8 80.9 32.3 57.02017-2018 75.2 25.5 50.5 74.2 19.8 47.3 74.9 23.8 49.52018-2019 75.8 27.2 51.5 73.7 20.2 47.5 75.1 25.0 50.2
Source: Calculated from Employment-Unemployment Survey & Periodic Labour Force Survey, NSO.
male WPR from that of female WPR for the corresponding age group for different years. A negative gap pertains to female WPR being lower than male WPR.

20 Labour & Development
b) Nature of Employment: After a prolonged period of decline in women’s WPR until 2017-18, marginal increase has been observed in 2018-19. Data shows that there has been a marginal increase in WPR for both male and female between 2017-18 and 2018-19. WPR for females aged between 15 and 59 years has increased by 1.2 percentage points from 23.8 per cent in 2017-18 to 25.0 per cent in 2018-19. This increase has also resulted in change in the composition of nature of employment for females. While
the share of female casual labourers has decreased in both rural and urban areas, the share of regular wage or salaried female workers has followed the pattern of previous years and has increased between 2017-18 and 2018-19. And the share of self-employed females though has increased in rural areas, it remained at the same level in urban areas for both the years 2017-18 and 2018-19. Figure 2 shows the share of each type of employment of females aged between 15 and 59 years.
Figure 1 Gender Gap in Work Participation Rate (Female WPR - Male WPR) in India for persons aged
15-59 Years, Usual Status (ps+ss) (in Percentage Points)
Source: Calculated from Employment-Unemployment Survey & Periodic Labour Force Survey, NSO
Figure 2 Share of each type of Employment by Female, 15-59 Age group,
Usual Status (ps+ss), India
0% 10% 20% 30% 40% 50% 60% 70% 80% 90% 100%
2018-19
2017-18
2011-12
2009-10
2004-05
2018-19
2017-18
2011-12
2009-10
2004-05
Urb
anRu
ral
Self Employed Regular Wage/Salaried Casual Labour
Source: Calculated from Employment-Unemployment Survey & Periodic Labour Force Survey, NSO.
Source: Calculated from Employment-Unemployment Survey & Periodic Labour Force Survey, NSO.
-35.7
-44.2 -44.8 -49.7 -48.5
-56.0 -58.7 -57.5
-54.4 -53.5
-41.0
-48.3 -48.6 -51.1 -50.1
-70.0
-60.0
-50.0
-40.0
-30.0
-20.0
-10.0
- 2004-2005 2009-2010 2011-2012 2017-2018 2018-2019
(Per
cent
age
Poin
ts)
Rural Urban Rural+Urban
Figure 1 Gender Gap in Work Participation Rate (Female WPR - Male WPR) in India for
persons aged 15-59 Years, Usual Status (ps+ss) (in Percentage Points)

Women’s Work in India: Updates from Periodic Labour Force Surveys 21
c) Sectoral Employment: With the transition of economy from primary to tertiary sector, the sectoral shifts in employment for women from agriculture to other sectors opens up new challenges to be addressed. The prevalence of massive informality permeating to various occupation often raises questions on the quality of employment and its sustainability. Though agriculture still occupies a predominant place in the rural economy, the urban areas have much diversified occupations to choose from. Between 2011-12 and 2018-19, the share of female workers aged between 15 & 59 years in agriculture in rural areas has reduced from 74.7 per cent to 70.7 per cent. The share of rural female workers in
Manufacturing, Mining & Quarrying and Construction sector has also gone down marginally, while sectors such as Electricity, Gas & Water Supply, Trade, Hotels, Transport & Communication, Financing, Insurance, Real Estate & Business Services and Community, Social & Personal Services has attracted more women in 2018-19. Similar trends have also been noticed for female workers in urban areas, except Electricity, Gas & Water Supply works where the share of female workers has also gone down in 2018-19 as compared to 2011-12. Figure 2 & 3 show sex wise distribution in broad 8 sectors of economy for 2011-12 and 2018-19 respectively.
With these sectoral shifts followed by a decline in agricultural employment, question arises on the nature and quality of employment. Though women in urban areas are moving to certain sectors in search of paid employment, do they have access to decent working conditions and access to adequate social security? Women’s status as marginal workers and greater participation in domestic duties raises important questions on the quality of employment in urban areas. Figure 4 shows the composition of female workers, aged between
15 and 59 years, by the nature of employment in broad 8 sectors of the economy. Female construction workers, both in rural and urban areas were mostly engaged as casual labourers and so are rural female workers in Mining & quarrying. Moreover, there are a variety of sectors where female workers are engaged as self-employed. These are important data points highlighting the need to understand their quality of employment and social security mechanisms that are in place for covering such kind of employment.
Figure 3 Share of each Gender in board 8 Sectors of Economy, 15-59 Age Group,
Usual Status (ps+ss), 2011-12, India
Source: Calculated from EUS 2011-12, NSO.
Figure 3
Share of each Gender in board 8 Sectors of Economy, 15-59 Age Group, Usual Status (ps+ss), 2011-12, India
Source: Calculated from EUS 2011-12, NSO.
57.3
%
0.6%
8.4%
0.3%
13.8
%
12.8
%
0.6% 6.
2%
74.7
%
0.3%
9.8%
0.1%
6.6%
3.0%
0.1% 5.
3%
5.0%
0.9%
22.3
%
1.4%
10.8
%
37.8
%
3.3%
18.4
%
10.3
%
0.3%
28.7
%
1.0% 4.
1%
15.3
%
2.5%
37.9
%0.0%
10.0%
20.0%
30.0%
40.0%
50.0%
60.0%
70.0%
80.0%
Agriculture,Forestry &
Fishing
Mining &Quarrying
Manufacturing Elect, Gas &Water Supply
Construction Trade, Hotels,Transport &
Communication
Financing,Insurance, Real
Estate &BusinessServices
Community,Social &PersonalServices
Rural Male Rural Female Urban Male Urban Female

22 Labour & Development
Abbreviation Used: AFF: Agriculture, Forestry & Fishing; M&Q: Mining & Quarrying; MANF: Manufacturing; EGWS: Electricity, Gas & Water Supply; CON: Construction, THTC: Trade, Hotels, Transport & Communication; FIRB: Financing, Insurance, Real Estate & Business Services; CSP: Community, Social & Personal Services
Figure 4
Composition of Female Workers by Type of Employment across Broad 8 Sectors, 15-59 Age Group, Usual Status (ps+ss), 2018-19, India
0% 10% 20% 30% 40% 50% 60% 70% 80% 90% 100%
Urban
Rural
Urban
Rural
Urban
Rural
Urban
Rural
Urban
Rural
Urban
Rural
Urban
Rural
Urban
Rural
Urban
Rural
Tota
lCS
PFI
RBTH
TCCO
NEG
WS
MA
NF
M&
QA
FF
Self Employed Regular Wage/Salaried Casual Labour
Source: Calculated from PLFS 2018-19, NSO.
When one looks at the share of female workers in two-digit groups of National Industrial Classification (NIC 2008), 92.7 per cent of such workers were found to be engaged in 10 sectors only in rural areas. Apart from agricultural activities (Crop and animal production, hunting and related service activities, to be precise) where 70.4 per cent of female workers were engaged in 2018-19, education, retail trade (except of motor vehicles and motorcycles) & civil engineering were other notable fields where female workers were engaged. Table 2 shows the share of top 10 sectors where female workers were engaged in 2018-19 in rural areas.
The sectoral employment in urban areas were more diversified with only 70.8 per cent of women workers engaged in top 10 sectors. While education was the most sought after field where female workers were engaged in urban areas in 2018-19, manufacturing of wearing apparels, retail trade (except of motor vehicles
Table 2 Share of Rural Women Workers aged 15-59 Years in Top 10 Sectors (in per cent) Usual
Status (ps+ss), 2018-19, India
Sector (NIC 2008 Two-Digit Code)
Share of Rural Female
WorkersCrop and animal production, hunting and related service activities (01)
70.4
Education (85) 5.2Retail trade, except of motor vehicles and motorcycles (47)
3.2
Civil engineering (42) 3.1Manufacture of wearing apparel (14) 2.8Construction of buildings (41) 2.5Manufacture of tobacco products (12) 2.4Manufacture of textiles (13) 1.5Human health activities (86) 0.9Public administration and defence; compulsory social security (84)
0.8
Source: Calculated from PLFS 2018-19, NSO.

Women’s Work in India: Updates from Periodic Labour Force Surveys 23
and motorcycles) were other notable fields where women were working. Surprisingly, Crop and animal production, hunting and related service activities were also among the top 10 sectors in urban areas where female workers were engaged (7.2 per cent). Table 3 shows the share of top 10 sectors where female workers were engaged in 2018-19 in urban areas.
Table 3 Share of Urban Women Workers aged 15-59 Years in Top 10 Sectors (in per cent) Usual
Status (ps+ss), 2018-19, IndiaSector (NIC 2008 Two-Digit Code)
Share of Urban Female
WorkersEducation (85) 16.4Activities of households as employers of domestic personnel (97)
10.0
Manufacture of wearing apparel (14) 9.8Retail trade, except of motor vehicles and motorcycles (47)
8.7
Crop and animal production, hunting and related service activities (01)
7.2
Human health activities (86) 4.5Manufacture of textiles (13) 4.3Other personal service activities (96) 4.2Construction of buildings (41) 3.0Manufacture of tobacco products (12)
2.7
Source: Calculated from PLFS 2018-19, NSO.
Some of the studies on women’s participation in the urban economy have pointed out that women’s increased participation was driven by necessity rather than improved opportunities (Pieters and Klasen, 2011).The informal nature of women’s work in urban areas have been reported by a number of studies (Sudarshan and Bhattacharya, 2009). Further certain kinds
of informal urban employment in which women participate to a greater extent has been home based in nature which has not been adequately captured in large scale labour force surveys due to conceptual and definitional issues. The National Accounts Statistics in India mostly include activities which are purely ‘economic in nature’ in the definition of ‘work’ and leaves behind most of the subsistence work which is generally carried out by women. However, the 19th ICLS has clearly recommended that true estimates of women’s employment can be achieved by capturing both market and non-market activities (ILO, 2013)1.
3. EDUCATION, TRAINING AND WORK FORCE PARTICIPATION
There has been a discouraging relationship between women’s education and labour market participation in spite of a significant progress in the field of education in India. Some of the debates around this issue point towards a clear U-shaped association between education and work, with highest levels of participation among illiterate and university educated women (Sudarshan, 2014). Some others opine that with lower levels of education women face the dilemma in choosing between the necessity to work if their household incomes are very low and at the same time face the stigma attached to working in low end menial jobs. Low levels of education are associated with low household income and poverty acts as a driver of high work participation by women (Bhaduri and Pastore, 2017). It is also true that women’s access to employment remains limited due to skill mismatches due to lack of industry oriented skills and training to cope with current labour market needs (Samantroy, 2013).
Table 4 Work Participation Rate (in per cent) at Different Levels of Education, Age Group 15-59, 2018-19,
Usual Status (ps+ss), IndiaEducation Level/ Segment Rural Urban Rural + Urban
Male Female Male Female Male Female
Not Literate 92.1 36.9 84.8 27.5 90.8 35.3Literate upto Primary 91.0 31.3 88.6 23.8 90.4 29.5Middle 76.1 21.1 76.9 16.9 76.3 19.8Secondary 61.0 17.4 64.8 10.7 62.2 15.0Higher Secondary 56.1 13.6 54.0 9.8 55.4 12.1

24 Labour & Development
Education Level/ Segment Rural Urban Rural + Urban
Male Female Male Female Male Female
Diploma/Certificate Course 67.7 35.4 77.3 37.1 72.9 36.3Graduate 70.7 18.5 75.8 24.4 73.4 22.1Post Graduate & Above 78.1 31.4 87.5 38.3 84.1 36.5Total 75.8 27.2 73.7 20.2 75.1 25.0Secondary & Above 62.0 17.1 68.1 18.3 64.5 17.7
higher work participation and middle level education ends up with lower work participation rate (Figure 5). This is quite contrary to the theories of human capital which explains that better educational access leads to better incomes. The U-shaped relationship is often explained in terms of cultural factors such as social norms often restricting upward mobility of women and structural factors like lack of job opportunities for educated women (Chatterjee et al, 2018). Moreover, the gender gaps in WPR in case of secondary (a gap of 47 percentage points) and higher secondary education (43.3 percentage points) were quite prominent. It is also found that the unemployment rates for women with secondary and above education was quite high in both rural (16.8%) and urban areas (17.8%) in the 15-59 age group as reported by the PLFS 2018-19 (see appendix table 1).
Source: Calculated from PLFS 2018-19, NSO.
Table 4 shows that WPR for females was the lowest among those who had received higher secondary education (12.1 per cent) while it was the highest for female who were post graduates and above (36.5 per cent), followed by those who had a diploma or a certificate course (36.3 per cent). The gender gap is also quite prominent where more males across all categories of education were in workforce in comparison to females. There were rural-urban variations with a greater percentage of female workers (36.9 per cent) in rural areas being illiterate. On the higher side of education, 38.3 per cent of female workers had a post graduate or higher degree. This also explains the established U shaped relationship where both lower (or no education) and higher education leads to
Figure 5 Education Level & WPR, 2018-19, 15-59 Age Group, Usual Status (ps+ss), India
0.0
10.0
20.0
30.0
40.0
50.0
60.0
70.0
80.0
90.0
100.0
Not Literate Literate upto Primary
Middle Secondary Higher Secondary Diploma/Certificate Course
Graduate Post Graduate & Above
Lite
racy
Rat
e (in
per
cent
)
Education Level
Male Female
Source: Calculated from PLFS 2018-19, NSO.
However, for a better understanding of women’s position in the labour market, it is imperative to have an in-depth analysis of women’s access to education and vocational training. Also, the gender differentials in access to vocational
and technical training would provide fresh impetus for analysing women’s social location and cultural realities. While the lack of proper technical skills may be perceived as a hindrance to enter into the workforce, data from PLFS
Education Level

Women’s Work in India: Updates from Periodic Labour Force Surveys 25
Technical Education Rural Urban TotalDiploma/Cert (Below Grad) in Other fields
47.8 38.3 42.6
Diploma/Cert (Grad & above) in Agriculture
- 0.6 0.4
Diploma/Cert (Grad & above) in Engineering/technology
40.9 50.5 48.5
Diploma/Cert (Grad & above) in Medicine
5.7 70.0 52.9
Diploma/Cert (Grad & above) in Crafts
80.6 41.3 64.6
Diploma/Cert (Grad & above) in Other fields
50.3 53.0 52.1
Total 27.2 20.2 25.0
Source: Calculated from PLFS 2018-19, NSO.
The female work participation rate in India is low in the backdrop of lower labour force participation rate. The reason for lower labour force participation is also, among other factors, perceived to be lack of skill. However, data from PLFS 2018-19 reveals that, even with vocational training less than half of such trained women enter into labour force. The situation has worsened since 2011-12. While 52.5 per cent of females who were trained in vocational education were in labour force in 2011-12, only 46.9 per cent of females trained in vocational education were in labour force in 2018-19. Table 6 shows the proportion of females who had taken vocational training in different fields but were not in labour force.
2018-19 shows that the WPR for females aged between 15 and 59 years who had technical education in different fields is still on the lower side, though on average it leads to better WPR compared to general level of education. Table 5 shows the work participation rate of those who had acquired technical education.
Table 5 Work Participation Rate (in per cent) for
Females with Different Fields of Technical Education, 15-59 Age Group, 2018-19, Usual
Status (ps+ss), IndiaTechnical Education Rural Urban TotalNo Tech Education 27.1 19.2 24.7
Technical Degree in Agriculture
22.7 9.5 14.6
Technical Degree in Engineering/technology
12.1 34.7 29.9
Technical Degree in Medicine 31.9 60.6 51.7
Technical Degree in Crafts - 21.2 21.2
Technical Degree in other Fields
45.0 42.2 43.2
Diploma/Cert (Below Grad) in Agriculture
- 33.3 29.5
Diploma/Cert (Below Grad) in Engineering/technology
17.2 37.3 30.0
Diploma/Cert (Below Grad) in Medicine
36.2 53.7 44.7
Diploma/Cert (Below Grad) in Crafts
57.0 27.0 43.9
Table 6 Proportion of Females who had taken Vocational Training but not Available in
Labour Force, Age Group 15-59, 2018-19, Usual Status (ps+ss), IndiaVocational Training Acquired by Females 2011-12 2018-19
Rural Urban Total Rural Urban TotalAerospace and Aviation 88.9 53.5 60.1 - 42.2 42.2Agriculture, Non-Crop Based Agriculture, Food Processing
42.6 63.2 55.3 70.6 52.5 64.3
Allied Manufacturing - Gems and Jewellery, Leather, Rubber, Furniture
64.6 65.2 65.0 95.1 88.8 91.2
Artisan/Craftsman/Handicraft/Creative Arts and Cottage Based Production
74.3 39.7 55.1 23.3 40.5 30.8
Automotive 64.4 0.0 16.9 44.6 31.4 39.1Beauty and Wellness - - - 67.0 50.2 55.3Chemical Engineering, Hydrocarbons, Chemicals and Petrochemicals
49.7 55.9 52.8 - 19.2 19.2
Civil Engineering- Construction, Plumbing, Paints and Coatings
21.3 25.1 24.9 55.9 22.7 29.2
Electrical, Power and Electronics 32.0 61.7 45.3 38.5 40.2 39.6

26 Labour & Development
A greater proportion of women who had obtained training in fields like allied manufacturing (91.2%), mass communication, media (80 %), telecom (65.7%), agriculture, non-crop based agriculture and food processing (64.3 %), beauty and wellness (55.3%), IT-ITes (53.3%), logistics (52.4%), textile and handlooms (48.0%) etc during the PLFS 2018-19 were in the workforce in both rural and urban areas. Though there was a shift in WPR by different field of training during 2011-12 where a greater proportion of women were in the workforce who had obtained training in hospitality and tourism (94.7%) and work related to childcare, nutrition, pre-school and creche (80.0%) both in rural and urban areas.
The gender stereotypical nature of training is quite evident from the field of vocational training where men had mostly obtained training in the fields of ‘Electrical, Power and Electronics (15.7% male, 2.2% female)’, ‘Mechanical Engineering, Capital Goods, Strategic Manufacturing (8.9% male, 0.4% female)’, Automotive (4.0% male, 0.2% female) and women had mostly obtained vocational training in the fields like ‘Textiles and Handlooms, Apparels (21.1 % female, 1.7% male)’, ‘Beauty and Wellness’(7.0 % female, 0.2% male), ‘Office and Business related Work’ (7.9 % female, 4.0% male) and work related to ‘Childcare, Nutrition, Pre-School and Crèche (4.3 % female, 1.3% male)’. Appendix Table 1.3 shows the distribution of Population by
Fields of Vocational Training for persons aged between 15 & 59 years for the year 2018-19 in India.
This phenomenon can also be explained in the context of sectoral participation of women where women are overcrowded in the service sector. Also, as per women’s concentration in industries it is evident women have been engaged in low paying jobs in the service economy. Further, the sex-typing of training often leads to high level of occupational segregation which is also explained by some scholars who have reflected on characteristics of labour market which have developed within traditional sex roles. These scholars have witnessed that economies with large service sectors often tend to incorporate ‘ female’ tasks like child care and food service into the formal economy and the affinity of many new service sector jobs to women’s traditional domestic jobs may result in a greater penetration of sexual division of labour into the occupational sphere (Charles,1992).This is also evident in feminist Marxist literature which have shown that women are often treated as ‘reserve army’ and where division of labour in the family is paralleled by sexual division of labour in employment where women habitually occupy the ‘secondary sector’ of the labour market with its characteristic features of low pay, little training and ease of dispensability (Barret,1980).
Vocational Training Acquired by Females 2011-12 2018-19Rural Urban Total Rural Urban Total
Healthcare and Life Sciences 45.4 21.4 27.6 23.5 29.8 27.5Hospitality and Tourism 94.3 95.5 94.7 30.4 48.2 45.9Iron and Steel, Mining, Earthmoving and Infra Building 40.0 80.4 76.0 0.0 0.0 0.0IT-ITes 39.4 36.8 37.8 61.5 49.3 53.2Logistics 53.6 50.7 51.6 - 52.4 52.4Mechanical Engineering, Capital Goods, Strategic Manufacturing
67.4 50.4 54.0 3.3 2.7 2.9
Media-Journalism, Mass Communication and Entertainment
54.2 49.4 50.4 0.0 84.4 80.0
Office and Business Related Work - - - 62.3 37.6 42.2Security 0.0 15.2 12.0 - 0.0 0.0Telecom 16.3 27.0 21.4 80.9 59.2 65.7Textiles and Handlooms, Apparels 96.7 41.0 59.0 36.9 59.1 48.0Work Related to Childcare, Nutrition, Pre-School and Crèche
59.6 90.0 80.0 23.2 46.1 34.4
Other 36.7 49.6 44.7 45.8 49.6 47.9Total 50.1 54.0 52.5 45.2 47.9 46.9
Source: Calculated from EUS 2011-12 & PLFS 2018-19, NSO.

Women’s Work in India: Updates from Periodic Labour Force Surveys 27
Table 7 Availability Job Contracts (in per cent) for Workers, 15-59
Age Group, 2018-19, Usual Status (ps+ss), India
Job Contract Type Year Rural Urban Rural + UrbanMale Female Male Female Male Female
No written job contract
2011-12 85.9 81.4 72.1 71.7 79.3 76.92017-18 86.8 72.6 78.9 76.0 83.3 74.42018-19 86.5 73.4 76.8 75.2 82.0 74.3
With any written job contract
2011-12 14.1 18.6 27.9 28.3 20.7 23.12017-18 13.2 27.4 21.1 24.0 16.7 25.62018-19 13.5 26.6 23.2 24.8 18.0 25.7
Source: Calculated from PLFS & EUS, NSO.
Table 8 shows availability of job contracts for regular wage/salaried workers aged between 15 and 59 years for different years. Though it shows that proportion of workers with any written job contract is higher than when combined with
casual workers (Table 7), still only one-third of women regular wage/salaried workers had any form of written job contract in 2018-19, with 41.6 per cent in rural and 28.0 per cent in urban areas.
4. EMPLOYMENT CONDITIONS AND SOCIAL SECURITY
As discussed in the previous sections, women’s engagement in certain sectors and a higher level of self- employment often reflects on lack of employment regulation and access to social security provisions. The decline in the share of casual employment coupled with a rise in self-employment among women in the 15-59 age group has further led to a decline in the aggregate share of wage employment. Such a situation leads to a difficulty among workers to get paid jobs in the form of either regular or casual contracts (Chandrasekhar and Ghosh 2007).
When it comes to formal job agreements, both male and female workers are at a disadvantage and females are at a better position than men. Given that there is a large chunk of casual workers, it aggravates the situation of having hardly any job contract. Still, just a little more than a quarter of female workers aged between 15 and 59 years had any form of job contract in India in 2018-19 (up from 23.1 per cent in 2011-12). If we look at longer term contracts (written job contract more than 3 years), only 17 per cent of women workers in the 15-59 age group could manage to get such a contract. Table 7 shows the availability of job contracts for working persons aged between 15 and 59 years for different years.
Table 8 Availability Job Contracts for (in per cent) for Regular Wage/Salaried
Workers, 15-59 Age Group, 2018-19, Usual Status (ps+ss), India
Job Contract Type Year Rural Urban Rural + UrbanMale Female Male Female Male Female
No written job contract 2011-12 65.5 61.4 63.9 65.6 64.4 64.22017-18 71.8 57.9 72.7 72.0 72.4 67.02018-19 70.4 58.4 70.6 72.0 70.5 67.0
With any job contract 2011-12 34.5 38.6 36.1 34.4 35.6 35.82017-18 28.2 42.1 27.3 28.0 27.6 33.02018-19 29.6 41.6 29.4 28.0 29.5 33.0
Source: Calculated from PLFS & EUS, NSO.
Availability of social security benefits (such as provident fund, pension, gratuity, health care & maternity benefits etc.) to female regular wage earners/salaried and casual laborers in the age group 15-59 years was also low at 28.3 per cent –
19.9 per cent in rural and 35.9 per cent in urban areas in 2018-19. While 39.2 per cent regular Wage/Salaried women in the age group 15-59 were eligible for any form of social security, only a meagre 1.1 per cent of casual labourers

28 Labour & Development
were eligible for the same. Table 9 & 10 shows the availability of social security benefits to female and male regular wage earners & casual labourers (in per cent) respectively.
The Ministry of Labour and Employment (MoLE) has taken a significant step towards labour reform which would have a positive impact on the employment contracts of workers by making it regularized. The MoLE, vide notification 16th March 2018 has amended the Industrial Employment (Standing orders) central rules to include fixed term employment across all sectors which was earlier confined to only apparel manufacturing. Here, fixed-term employment workers include those workers who have a written contract of employment for a fixed period (GoI, 2018). This change in the labour legislation
may contribute in increasing the job security of the workers as under the new rules, those workers who have an employment contract shall be entitled to statutory social security provisions at par with permanent employees. This might facilitate in having better access to social security for workers. In contrast, the Payment of Gratuity Act 1972 applies only to workers who have completed five years of job. A study conducted by the V.V. Giri National Labour Institute recommended that there need to be a provision for extending proportionate gratuity benefit to fixed term employees with less than five years of service with subsequent amendment in the Payment of Gratuity Act (Upadhyaya, 2019). With regard to women workers, the new rules would help in better access to maternity benefit with the regularization of their contracts.
Table 9 Availability of Social Security Benefits to Female Regular Wage Earners & Casual Labourers (in
per cent), 15-59 Age Group, 2018-19, Usual Status (ps+ss), IndiaType of Social Security Benefits Rural Urban Rural + Urban
Regular Wage/
Salaried
Casual Labourers
Regular Wage/
Salaried
Casual Labourers
Regular Wage/
Salaried
Casual Labourers
Eligible for any of the social security benefits
35.8 1.2 41.4 1 39.2 1.1
Not eligible for any of the social security benefits
58.9 94.8 54 93.7 55.8 94.5
Not known 5.3 4.1 4.7 5.2 4.9 4.4Total 100 100 100 100 100 100
Source: Calculated from PLFS 2018-19, NSO.
Table 10 Availability of Social Security Benefits to Male Regular Wage Earners & Casual Labourers (in
per cent), 15-59 Age Group, 2018-19, Usual Status (ps+ss), IndiaType of Social Security Benefits
Rural Urban Rural+UrbanRegular Wage/
Salaried
Casual Labourers
Regular Wage/
Salaried
Casual Labourers
Regular Wage/
Salaried
Casual Labourers
Eligible for any of the social security benefits
35.9 0.7 45.6 0.8 41.7 0.7
Not eligible for any of the social security benefits
55.8 88.4 48.9 90.6 51.6 89
Not known 8.2 10.8 5.6 8.7 6.6 10.3Total 100 100 100 100 100 100
Source: Calculated from PLFS 2018-19, NSO.
5. PARTICIPATION OF WOMEN IN DOMESTIC DUTIES
The foregoing discussion has tried to analyze women’s position in the labour market particularly drawing insights from the PLFS and trying to explore the nature of employment.
However, it is also true that there is a close inter-relationship between women’s engagement in paid activities and unpaid work. A recent report of the ILO stated that the principal reason for women of working age being outside the labour force is unpaid care work and 606 million women of working age declared

Women’s Work in India: Updates from Periodic Labour Force Surveys 29
themselves to be unavailable for employment or were not seeking a job due to unpaid care work, while only 41 million men are inactive for the same reason (ILO, 2018). Women’s over engagement in unpaid work discourages them to participate in paid work. Target 5.4 of the SDGs clearly indicates that, for achieving gender equality it is important to recognize unpaid care and domestic work through the provision of public services, infrastructure and social protection policies and the promotion of shared responsibility between the household and the family as nationally appropriate.2 In the Indian context, women spend a considerable amount of time in unpaid work and are in own account work or work as helpers in household. Women spend around 297 minutes in domestic service for own final use within the household as compared to women who spend only 31 minutes (ILO, 2018). Such information can be obtained from the time use surveys3 which are quantitative details on time spent in different activities in a 24 hour time period. Though India had conducted a pilot time use survey only in 1998-99, the surveys were not regularized. After a long gap, the National Time Use Survey was conducted during January-December
2019 but the results are awaited. However, a closer examination of women’s participation in domestic duties obtained by the EUS and the PLFS would enable in understanding the linkages between paid work and unpaid work.
The labour force surveys conducted by the National Statistics Office have captured domestic duties under two codes 92 (attended to domestic duties only) and 93 (attended to domestic duties and was also engaged in free collection of goods (like vegetable, roots, firewood, cattle feed), sewing, tailoring, weaving for household use. Between 2011-12 and 2017-18, the proportion of females in domestic duties in the age group 15-59 years declined marginally from 62.7 per cent to 62.1 per cent. This has further declined by 1.2 percentage points to 60.9 per cent in 2018-19. While those engaged in domestic duties along with engagement in other activities for household use has increased between 2017-18 and 2018-19 in both rural and urban areas, the same had increased by an astonishing 8.7 percentage points in rural India between 2009-10 and 2011-12. Table 11 gives the proportion of females in domestic duties in 15-59 age group using Usual Principal status approach.
Table 11 Proportion of Female in Domestic Duties, 15-59 Age Group, Usual Principal Status, India
Year Attended Domestic Duties Only
Attended Domestic Duties & Engaged in Free Collection of Good
Domestic Duties (Total)
Rural Urban Total Rural Urban Total Rural Urban Total2004-05 25.7 49.2 32.0 27.6 15.8 24.4 53.3 65.0 56.52009-10 32.2 54.0 38.4 26.7 11.8 22.5 59.0 65.9 60.92011-12 26.1 48.6 32.9 35.5 16.6 29.8 61.6 65.2 62.72017-18 43.1 56.6 47.2 19.3 5.0 14.9 62.4 61.6 62.12018-19 39.5 55.2 44.4 21.3 5.8 16.5 60.8 61.0 60.9
Source: Calculated from Employment-Unemployment Survey & Periodic Labour Force Survey, NSO.
Figures 6A and 6B show the trend in domestic duties for both the codes 92 and 93 separately and figure 6C shows the trend trend in domestic duties for both the codes 92 and 93 together.
0.0%
10.0%
20.0%
30.0%
40.0%
50.0%
60.0%
2004-05 2009-10 2011-12 2017-18 2018-19
Figure 6A Proportion of Female that attended Domestic Duties only, 15-59 Age group, Usual Principal Status, India
Rural Urban Total
Source: Employment-Unemployment Survey & Periodic Labour Force Survey, NSO.

30 Labour & Development
0.0%
10.0%
20.0%
30.0%
40.0%
2004-05 2009-10 2011-12 2017-18 2018-19
Figure 6B Proportion of Female that attended Domestic Duties and also were engaged in free collection of goods, 15-59 Age group, Usual Principal
Status, India
Rural Urban Total
0.0%
10.0%
20.0%
30.0%
40.0%
50.0%
60.0%
70.0%
2004-05 2009-10 2011-12 2017-18 2018-19
Figure 6C Proportion of Female that attended Domestic Duties (Total), 15-59 Age group, Usual Principal Status, India
Rural Urban Total
The decline in domestic duties in both rural and urban areas during the PLFS is quite surprising and needs a deeper investigation. Also, the increase in domestic duties by 2 percentage points for women who were engaged in domestic duties and also in free collection of goods & other related activities (code 93) during 2017-18 and 2018-19 demands a more systematic investigation in terms of access to public polices like the Pradhan Mantri Ujjwala Yojana (PMUY) which is aimed at providing clean cooking fuel (Liquified Petroleum Gas, LPG) to poor women and also save them from the drudgery of collecting firewood.4
Further, a greater participation of women in domestic duties often pushes them out of employment and constraints them to choose self-employment, part time work or other low paid jobs. It is evident that the coverage of
domestic duties by the National Statistics Office does not cover other non-market activities like cooking, cleaning, washing, care work and other related activities in which women tend to spend most of their time and such activities remain largely non-remunerated and unrecognized in national accounts statistics (Samantroy, 2020). In addition, detailed data on domestic duties participation like the previous Employment & Unemployment Survey of NSO where the reasons for participation in domestic duties, availability of assistance (availability of finance, raw materials, assured market, training, accommodation, others etc.) are not available in the PLFS. This makes it difficult to have a detailed analysis on domestic duties and also comparing with EUS as these questions are missing in the PLFS survey limiting the scope to understand the reason for an increase in domestic duties.
Source: Employment-Unemployment Survey & Periodic Labour Force Survey, NSO.
Source: Employment-Unemployment Survey & Periodic Labour Force Survey, NSO.

Women’s Work in India: Updates from Periodic Labour Force Surveys 31
Therefore, detailed information on domestic duties participation through adequate probing questions in PLFS is extremely important to assess women’s limitations for participating in paid employment.
6. CONCLUDING OBSERVATIONS
In view of the above discussion, it can be said that the female work participation has been low and declining over the years. The debates on the reasons for decline are still relevant as the increase during the PLFS 2018-19 has been a marginal increase and gender gaps in WPR is quite significant in spite of progress in education. The increase in self of employment for women in rural areas with greater participation of women in domestic duties raises many questions on the nature of employment and employment protection and social security. The sectoral shifts in employment, for example the manufacturing sector, has showed women’s concentration in low end manufacturing which deprives them of regular social security coverage. From a policy perspective, the diversified sectoral employment of women in urban areas need to be examined carefully with regard to their access to social security as mostly women tend to be engaged as self-employed in most sectors with limited or no access to social security. It is also evident that the low participation of women in the labour market is due to skill mismatches and the vocational education system also has concentration of women in certain gender stereotypical trades leading to occupational segregation often pushing women to low paying jobs. There is a need to shift policy focus to secondary education/middle level education as WPR for women was lowest for those who had secondary education. In addition, greater unemployment rate for women in secondary education and gender gaps in WPR in secondary education being higher reiterates the need to revisit the vocational training programmes with regard to industry specific requirements. It is quite surprising that there has been increase in proportion of females who had taken vocational training but were not available in the labour force.
Also, evident even in the regular wage employed category, a greater percentage of women did not have a written job contracts reflecting on informality and the need to regularize employment contracts. In this regard, the labour reforms carried out in the country like the introduction of fixed term employment, if implemented effectively, may lead to regularization of contracts for having access to social security. Since a large share of women workers did not have access to social security as evident in the PLFS data, there is a need to introduce subsequent amendments in labour legislations related to social security in line with any changes in the rules for extending greater coverage to women workers. There is no denying the fact that more emphasis on sectoral employment with greater investment in creating employment opportunities and vocational training along with addressing skill mismatches in those sectors is required.
Apart from this, women’s excessive participation in domestic duties and unpaid care work calls for an urgent need to improve labour force statistics by providing full visibility to women’s work. The 19th ICLS 2013 had introduced the first international definition of work that recognized that all productive activities contribute to economic output and to the livelihood of household and well-being, regardless of whether the production is carried out for market or for own use by producer or members of his or her household (ILO, 2013). Keeping in view the targets for achieving gender equality of the global SDGs, it is important to address issues of well-being of women as a larger part of it is the invisible constraints (burden of domestic and unpaid work) which women face due to rigid socio-cultural norms that restrict women to participate in the labour market. These constraints can be highlighted by the time use surveys which are the best tools for capturing unpaid work and have the potential for exploring the reasons for spending more time in domestic and unpaid work for informing policy in this direction. The Time Use Survey conducted in 2019 by NSO may throw fresh light on women’s invisible constraints to participate in paid employment.

32 Labour & Development
APPENDIXTable 1.1
Distribution of Type of Employment for Persons Aged 15-59 Years (in per cent), Usual Status (ps+ss), India
Year and Nature of Employment Rural Urban Rural + UrbanMale Female Male Female Male Female
2004-05Self Employed 55.9 63.0 43.4 46.5 52.5 60.5Regular Wage/Salaried 9.7 3.9 41.8 36.8 18.4 8.7Casual Labour 34.4 33.1 14.7 16.7 29.1 30.7Total 100.0 100.0 100.0 100.0 100.0 100.02009-10Self Employed 51.2 54.8 39.7 40.1 47.9 52.4Regular Wage/Salaried 9.3 4.7 43.2 40.6 19.0 10.7Casual Labour 39.5 40.5 17.1 19.3 33.1 36.9Total 100.0 100.0 100.0 100.0 100.0 100.02011-12Self Employed 52.4 58.9 40.4 42.1 48.7 55.6Regular Wage/Salaried 11.0 5.9 44.8 44.1 21.2 13.4Casual Labour 36.7 35.2 14.8 13.8 30.0 31.0Total 100.0 100.0 100.0 100.0 100.0 100.02017-18Self Employed 55.6 57.4 37.4 33.7 50.1 51.4Regular Wage/Salaried 15.2 11.0 47.4 53.6 25.0 21.8Casual Labour 29.2 31.6 15.2 12.7 24.9 26.8Total 100.0 100.0 100.0 100.0 100.0 100.02018-19Self Employed 55.1 59.4 36.9 33.7 49.3 52.9Regular Wage/Salaried 15.5 11.6 48.9 56.0 26.1 22.9Casual Labour 29.5 28.9 14.2 10.3 24.6 24.2Total 100.0 100.0 100.0 100.0 100.0 100.0
Source: Calculated from Employment-Unemployment Survey & Periodic Labour Force Survey, NSO.
Appendix Table 1.2 Unemployment Rates (in per cent) for the Persons with Different Education Level, Age Group 15
- 59 Years – Usual Status (ps+ss), India
Education Level 2017-18 2018-19Rural Urban Rural Urban
Male Female Male Female Male Female Male FemaleNot literate 2.1 0.1 2.3 1.0 1.7 0.0 3.8 1.1
Literate upto primary 3.4 0.7 3.8 1.3 3.0 0.6 3.7 1.6
Middle 6.0 3.7 6.2 5.3 5.6 1.8 5.7 4.5
Secondary and above 10.9 17.4 9.5 19.9 10.6 16.8 9.6 17.8
All 6.3 4.0 7.3 11.3 6.0 3.8 7.4 10.3Source: Calculated from PLFS 2017-18 & 2018-19, NSO.

Women’s Work in India: Updates from Periodic Labour Force Surveys 33
Appendix Table 1.3 Distribution of Population by Fields of Vocational Training,
Age Group 15-59, 2018-19, Usual Status (ps+ss), India
Field of Vocational Training Rural Urban Rural + UrbanMale Female Male Female Male Female
Aerospace and Aviation 0.00 - 0.04 0.18 0.02 0.11Agriculture, Non-Crop Based Agriculture, Food Processing
1.77 0.72 0.28 0.24 0.93 0.43
Allied Manufacturing - Gems and Jewellery, Leather, Rubber, Furniture
0.28 0.78 1.01 0.80 0.69 0.79
Artisan/Craftsman/Handicraft/Creative Arts and Cottage Based Production
0.62 3.30 0.67 1.61 0.65 2.26
Automotive 4.65 0.25 3.54 0.11 4.03 0.17Beauty and Wellness 0.32 5.51 0.03 7.93 0.16 7.00Chemical Engineering, Hydrocarbons, Chemicals and Petrochemicals
0.10 - 1.83 0.37 1.08 0.23
Civil Engineering- Construction, Plumbing, Paints and Coatings
4.96 0.58 4.95 1.50 4.95 1.15
Electrical, Power and Electronics 17.54 2.27 14.29 2.11 15.70 2.17Healthcare and Life Sciences 2.87 5.61 4.37 6.00 3.72 5.85Hospitality and Tourism 1.18 0.41 1.80 1.80 1.53 1.26Iron and Steel, Mining, Earthmoving and Infra Building
1.21 0.01 1.39 0.19 1.31 0.12
IT-ITes 20.87 19.06 27.43 25.15 24.58 22.80Logistics 0.34 - 0.49 0.26 0.43 0.16Mechanical Engineering, Capital Goods, Strategic Manufacturing
7.91 0.24 9.64 0.44 8.88 0.37
Media-Journalism, Mass Communication and Entertainment
0.51 0.04 2.07 0.41 1.39 0.26
Office and Business-related Work 2.62 3.83 4.99 10.40 3.96 7.87Security 0.54 - 0.44 0.03 0.48 0.02Telecom 0.28 0.24 0.65 0.36 0.49 0.31Textiles and Handlooms, Apparels 1.42 27.21 1.88 17.25 1.68 21.10Work Related to Childcare, Nutrition, Pre-School and Crèche
1.63 5.72 1.09 3.43 1.33 4.31
Others 28.37 24.20 17.12 19.44 22.01 21.28Total 100.00 100.00 100.00 100.00 100.00 100.00
Source: Calculated from PLFS 2018-19, NSO.
REFERENCESBarret M and Mc Intosh, Mary (1979), ‘Christine
Delphy: Towards a Materialist Feminism?’, Feminist Review, 1:95-106.
Barret, Michele. (1980), Women’s Oppression Today, London: Verso.
Bhaduri, Sanghamitra Kanjilal and Pastore, Fransesco (2017), ‘Returns to Education and Female Participation Nexus: Evidence from India’, IZA
Discussion Paper No 11209, Germany: Institute of Labour Economics.
Chandrasekhar, C.P. and Ghosh, J. (2007), Recent Employment Trends in India and China: An Unfortunate Convergence? Social Scientist, 35(3/4): 19-46.
Charles, Maria (1992), ‘Cross National Variation in Occupational Sex Segregation’, American Sociological Review, 57(4): 483-502.

34 Labour & Development
Chatterjee, Esha, Desai, Sonalde and Vanneman, Reeve (2018), ‘Indian Paradox: Rising Education Declining Women’s Employment’, Demographic Research, 38(31): 855-878.
Chowdhury, Subhanil (2011), ‘Employment in India: What Does the Latest Data Show?’, Economic and Political Weekly, 46(32): 23–26.
Daniel, Neff, Sen, Kunal and King, Veronika (2012), ‘The Puzzling Decline in Rural Women’s Labour Force Participation in India: A Re-examination’, Working Paper, GIGA Research Unit: Institute of Asian Studies, 196: 1–29.
Delphy, C. (2016), Close to Home: A Materialist Analysis of Women’s Oppression, Translated by Diana Leonard, London and New York: Verso.
Elson, D. (2000), ‘Progress of World’s Women 2000’, UNIFEM Biennial Report, New York: UNDP.
Engels, F. (1884), The Origin of the Family, Private Property and the State, Zurich: Hottingen.
Folbre, Nancy, Bergmann, Barbara, Agarwal, Bina and Floro, Maria (eds.) (1992), Women’s Work in the World Economy, London: The Macmillan Press.
Government of India (GoI) (2018), https://labour.gov.in/sites/default/files/FTE%20Final%20Notification.pdf accessed on 21 August, 2020.
Government of India (GoI) (2020), ‘Periodic Labour Force Survey (PLFS) July 2018-June 2019’, Ministry of Statistics and Programme Implementation, New Delhi: National Statistics Office.
International Labour Organization (ILO) (2013), 19th International Conference of Labour Statisticians, Geneva 2-11 October, 2013, Report II, Statistics on Work, Employment and Labour Utilization, Geneva: International Labour Office.
International Labour Organization (ILO) (2018), Care Work and Care Jobs for the Future of Decent Work, Geneva: International Labour Office.
International Labour Organization (ILO) (2020), World Employment and Social Outlook, Trends, Geneva: International Labour Office.
Mies, Maria (1998), Patriarchy and Accumulation on a World Scale: Women in the International Division of Labour, London: Zed Books.
Mitra, Arup (2005), ‘Women in the Urban Informal Sector: Perpetuation of Meagre Earnings’, Development and Change, 36(2): 291–316.
Pieters, Janneke, Stephan Klasen (2011), ‘Drivers of female labour force participation in urban India
during India’s Economic Boom’, In Proceedings of the German Development Economics Conference (Vol. 65), Berlin.
Rangarajan, C., Padma Iyer Kaul, and Seema (2011), ‘Where is the Missing Labour Force?’, Economic & Political Weekly, 46: 39.
Samantroy, E. (2013), ‘ILO Convention 181: Issues and Challenges in the Context of Private Placement Agencies in India’, NLI Research Studies Series No. 109, Noida: V.V. Giri National Labour Institute.
Samantroy, E. (2020), ‘Women’s Participation in Domestic Duties and Paid Employment in India: The Missing Links’, The Indian Journal of Labour Economics, 63(2): 437-457.
Sudarshan, Ratna M. (2014), Enabling women’s work, International Labour Organization, DWT for South Asia and Country Office for India, New Delhi: ILO.
Sudarshan, Ratna and Bhattacharya, Shrayana (2009), ‘Through the Magnifying Glass: Women’s Work and Labour Force Participation in Urban Delhi’, Economic and Political Weekly, 44(48): 28.
Thomas, Jayan Jose (2012), ‘India’s Labour Market During 2000s’, Economic and Political Weekly, 47(51): 29–31.
Upadhyaya, S. (2019), ‘Regulation of Fixed Term Employment: An Inter-country Perspective’, NLI Research Studies Series No. 133, Noida: V.V. Giri National Labour Institute.
NOTES
(Endnotes)1 For details see ILO, International Labour
Organisation (2013), 19th International Conference of Labour Statisticians, Geneva 2-11 October, 2013, Report II, Statistics on Work, Employment and Labour Utilization, International Labour Office: Geneva.
2 For details please visit https://unstats.un.org/sdgs/metadata?Text=&Goal=5&Target=5.4
3 Time use surveys are quantitative summaries of time spent by people in different activities over a specified time, particularly 24 hours in a day on weekly average basis or seven days a week. The time allocated to each of these activities is taken into account.
4 Pradhan Mantri Ujjwala Yojana (PMUY) https://pmuy.gov.in/about.html

‘COOPERATISATION’ OF HANDLOOM AND WOMEN’S EMPOWERMENT IN MANIPUR
Dr. Otojit Kshetrimayum*
The handloom weaving industry in Manipur is a household activity based on age-old tradition. It is the torchbearer of Manipur culture and heritage. It is also the largest cottage industry in the state. Weaving is not just an economic activity, which needs only economic explanation. Manipuri society has an inbuilt system of socio-economic cooperation known as shinglup and marup, which continues even today. There has been a move toward the process of ‘cooperatisation’ of handloom with the introduction of cooperative movement in Manipur initiated by the state since the mid-twentieth century. This paper analyses the role of cooperatives as an enterprise and investigates whether the cooperatisation of handloom has led to its expansion both as an economic and social enterprise empowering the handloom cooperative members in Manipur who are exclusively women.
Keywords: Handloom Weaving; Women’s Empowerment; Cooperatisation; Manipur
1. INTRODUCTION
In its Congress held in Manchester in 1995, the International Cooperative Alliance (ICA) defined a cooperative society as “an autonomous association of persons united voluntarily to meet their common economic, social and cultural needs and aspirations through a jointly owned and democratically controlled enterprise” (International Cooperative Alliance 1995). There has been a move toward the process of ‘cooperatisation’ of handloom in Manipur initiated by the state since the mid-twentieth century. ‘Cooperatisation’ here refers to that process where the state has introduced cooperatives as a new economic system leading to commercialisation of handloom industry. The entry of Manipuri women in organised business is a fairly recent phenomenon although they have been associated with the craft and other economic activities since ages. Women significantly contribute to the growth of both the organized and unorganized sectors of the economy. Though there are no popular industries in Manipur, women have played an important part in the production process by working in cottage industries such as handloom, pottery, handicrafts, etc. While such economic participation by the women went largely unacknowledged because it was carried on basically within the environs of the home, it taught them the vital art of entrepreneurship.
This paper analyses the role of cooperatives as an enterprise and investigates whether
the cooperatisation of handloom has led to its expansion both as an economic and social enterprise empowering the handloom cooperative members in Manipur who are exclusively women. Selected handloom cooperatives and handloom cooperative members were examined for this study.
2. COOPERATIVES AS A CONCEPT AND ENTERPRISE
Cooperation has two elements. It may be identified as an association of persons as well as an economic enterprise. P.H. Casselman explains this dual aspect of cooperation in the following words: “Cooperation is an economic system with a social content. Its idealism has both economic and social elements. The economic ideals affect the business enterprise, its methods, and operations. The social ideals have a direct bearing on the association of persons comprising the society, particularly, as they affect membership and personal relations- the ideas concerning human relations and those of universality, democracy, liberty, fraternity, unity and of self-help” (Saksena, 1974, p. 60). The predominance of either of the two depends upon whether we treat cooperatives as instruments of social uplift or economic change. According to Fauquet (Fauquet, 1951, p. 21), “Cooperation is an association of persons who have recognized and continue to recognize the similarity of certain of their needs and possibility of satisfying such needs by common undertaking.” Thus, he
* Fellow & Coordinator, Centre for North East India, V.V. Giri National Labour Institute, Noida (UP). E-mail: [email protected]
Labour & Development, Vol. 27, No. 1, June 2020

36 Labour & Development
of cooperatives is measured by the benefits rendered to the member-users (Krishnaswami & Kulandaiswamy 2000).
In general, the cooperative movement grew out of a need to change the existing society through an ideology based on egalitarianism. The early cooperators such as the Rochdale Pioneers and Robert Owen in England, Herr Schultz and F.W. Raiffeinsen in Germany propagated the cooperative movement as an alternative to the exploitative nature of capitalist society in nineteenth century Europe. Cooperation for them was a vehicle through which capitalist exploitation could be replaced by an egalitarian and just society. They envisioned cooperatives as instruments for transforming their societies. In this way, the objectives of cooperatives differ not only from those of private enterprise but also from traditional forms of exchange and reciprocal relations.
Cooperatives are thus not expected to function merely as mutual benefit societies. They have in addition certain social obligations which are spelt out in the principles of cooperation. While elaborating on this aspect the Commission on Co-operative Principles noted: “Co-operation at its best aims at something beyond promotion of the interests of the individual members who compose a co-operative at any time. Its object is rather to promote the progress and welfare of humanity. It is this aim that makes a co-operative society something different from an ordinary economic enterprise and justifies its being tested, not simply from the stand point of its business efficiency, but also from the standpoint of its contribution to the moral and social values which elevate human life above the merely material and animal.”1
3. COOPERATIVES IN MANIPUR: AN APPRAISAL
Manipuri society has an inbuilt system of socio-economic cooperation known as shinglup and marup, which continues even today. Marup system is one of the most important and effective forms of traditional socio-economic organization for mutual help, including reciprocal gift giving, mutual exchange of labour, assistance in death, illness, marriage and other personal crisis. It is, 1 Report of International Cooperative Alliance Commission
on Co-operative Principles in the Report of the 23rd ICA Congress at Vienna, 5-8 September 1966.
opined that the associative aspect of cooperation comes first before the enterprise is created. The associative nature of cooperation is a system of social relationship built around values like participation, self-regulation, leadership development and member prosperity and growth.
The enterprise aspect gives primacy to the economic and business function of cooperation. A cooperative enterprise comes into being, when the participating member units decide to establish a joint enterprise or undertaking which is collectively operated. A cooperative business enterprise is interposed between the member units and market and links the former with the latter. It is for this reason that it is called ‘market-linkage cooperative’. According to Kenneth H. Parsons (quoted in Krishnaswami, O.R. & V. Kulandaiswamy, 2000 p. 80), the cooperative enterprise is “an organisation of coordinated activity; it is a collective behaviour with a common purpose and a collective will governed by common working rules.” Digby (quoted in Krishnaswami, O.R. & V. Kulandaiswamy, 2000 p. 80) considered cooperation as an “economic enterprise, the structure and objective of which are somewhat between those of a private enterprise and public undertaking”. The following principles were formulated by the ICA in its definition of cooperatives:
1. Voluntary and Open Membership 2. Democratic Member Control 3. Member Economic Participation 4. Autonomy and Independence 5. Education, Training and Information 6. Cooperation among Cooperatives 7. Concern for Community
A cooperative may succeed as an enterprise, unmindful of members’ welfare; but in that case it would cease to be a cooperative. A cooperative may succeed as an association, but its economic viability may be lost. Without a viable enterprise the associative character cannot be fostered (Seetharaman & Mohanan 1986). A cooperative is said to be a success only when it achieves success in both enterprise as well as associative aspects. It must therefore synthesise the associative and enterprise characteristics. While other enterprises are primarily meant to achieve higher rates of profits for their owners, efficiency

‘Cooperatisation’ of Handloom and Women’s Empowerment in Manipur 37
thus, much more than a simple modern economic organization. It provides both economic and social security of an individual in every sphere of social and economic life. It not only promotes economic development but also acts as a means for strengthening the overall solidarity of the society. The emergence of the worldwide cooperative movement, which reached Manipur during the British regime, has strengthened the traditional system of marup by expanding its operation to productive activities.
Modern cooperative movement started in Manipur in the year 1939 with the extension of Indian Cooperative Societies Act, 1912 under an order passed by Churachand Maharaj, the then king of Manipur. One of the demands in the charter was to establish consumer cooperatives in the state and allotment of fair price shops to these consumer cooperatives. In 1947, the Indian Cooperative Societies Act, 1912 was adopted as the Manipur Cooperative Societies Act, 1947. A number of consumer cooperatives were established with the objective of equitable distribution of essential commodities.2 But the consumer cooperatives did not last long. These societies stopped functioning as soon as the controlled commodities were decontrolled after the Second World War. Later, some cooperatives on transport, handloom weavers, carpentry etc., were established gradually.
During the year 1955-56, with the introduction of planned economy in the country and launching of the Second Five Year Plan, the cooperative movement in Manipur took a massive spurt with the adoption of the Assam Cooperative Societies Act 1949. Apex level societies including the Manipur State Cooperative Bank Ltd., the Manipur Apex Cooperative Society Ltd. etc., were established. Thus, the real cooperative movement in Manipur started in the field of agricultural credit as a bulwark against the malpractices of village money lenders and for improvement in the people’s standard of living. As done in other parts of India, in Manipur also agricultural credit societies started in the form of
2 A consumers’ cooperative is a cooperative business owned by its customers for their mutual benefit. It is a form of free enterprise that is oriented toward service rather than pecuniary profit. It is a retail outlet owned and operated by consumer. The customers or consumers of the goods and/or services the business provides are often also the individuals who have provided the capital required to launch or purchase that enterprise.
multipurpose credit societies. Then there came the large sized agricultural credit cooperative societies and service societies during the year 1954-55 and 1959-60 respectively. Cooperative movement in Manipur started with 350 societies and a membership of 21,000 in the year 1950-51.
4. THE CRAFT OF WEAVING IN MANIPUR
The art of weaving of the Meiteis of Manipur is based on a mythical foundation. The Meiteis are the predominant community in Manipur. According to the manuscript on mythology called Leinunglon, the supreme goddess of the traditional pantheon, Leimarel is said to have had introduced the work of weaving as a necessary item of work in the whole course of creation of the universe. It is also stated that the goddess Panthoibi was the first primeval celestial ancestress of the Meiteis and it was she who introduced the art of weaving by imitating the pattern of weave that a spider applies when it is weaving its cobweb. The Leinunglon mentions that the first cloth made by Panthoibi was of material obtained from the soft membrane of wood and bamboo. It is recorded in the same source that Ta-mitnu, one of the seven primeval celestial ancestresses of the Meiteis, produced cotton for manufacturing cloth for the first time. For this, she is known as the goddess of cotton. The manuscript also states that Leimarel, the chief of those seven primeval ancestresses, invented the art of making thread yarn from raw cotton for use in weaving. To commemorate this achievement, the office of Sinkhombi was instituted, and maintained throughout the history of the people, to look after the craft of weaving. The place where the weaving is done was called Sinsang. The word Sinsang also refers to the institution that functions as the administrative machinery to deal with the production of royal cloths.According to the Meitei mythological traditions, the most ancient female dress is the Chinphi Phanek and the Laiphi (muslin) and the first male style of dressing the loin is the Khwangli Laikhal. The creation myth of the Meiteis holds it that the seven goddesses and the nine gods who performed the creation works were clad in the respective dress mentioned above.
Since the yore, the Meiteis have been observing the ritualistic festival of Umanglai Haraoba (or Lai Haraoba). One of the important rituals of Lai Haraoba is the performance of the dance of Pam

38 Labour & Development
Yanba. In this ritual dance, the hand movements of the maibis (priestess) accompanied with songs depict cultivation of land and sowing of cotton seeds, plucking of cotton, ginning, carding, then spinning and weaving of clothes, cutting it and finally dedicating it to Lainingthou (male deity) and Lairembi (female deity) for the prosperity and well-being of the people and the land. From this ritual dance depiction, it can be asserted that from early times people dedicated their hand-woven clothes before using to Liningthou and Lairembi. Moreover, amongst the Meiteis, use of hand spun and hand-woven cotton fabric is part of their traditional ritual. For instance, not only the traditional priests and priestesses (maibas and maibis) use hand spun and hand-woven fabrics in the performance of Lai Haraoba but also those who participate in the procession.
A framework of evolution of weaving in Manipur from mythological, royal, and colonial to state patronage can be developed. Under the royal patronage the craft of weaving was lineage based and feudalistic. While there was modernisation and institutionalisation during the colonial rule, the process of ‘cooperatisation’ and entrepreneurship started under the modern democratic state. The framework can be represented as follows:Under royal patronage Lineage based, Feudalistic
Under Colonial rule Modernisation, Institutionalisation
Under the State ‘Cooperatisation’, Entrepreneurisation
The handloom weaving industry in Manipur is a household activity based on age-old tradition. It is the torchbearer of Manipur culture and heritage. It is also the largest cottage industry in the state. Weaving is not just an economic activity, which needs only economic explanation. It may be said that there is concomitant relationship between its origin as an industry and the cultural demand of society. The industry is sustained, as there is need of the costumes of different clans and for various secular and religious occasions. So, it is a medium, which serves as a repository and transmitter of culture and civilization. The costumes serve as narratives of a different kind, which is neither oral nor written but one, which inheres and tells
the history, cultural identity, social structure, gender roles etc. This means that there is a deeper structure cloistered in the handloom works apart from its economic understanding. Owing to these cultural connotations, weaving was a very popular household industry in the traditional Meitei world.
One of the special features of this industry is that women are the only weavers. Majority of the weavers are self-employed artisans who are carrying on their profession in their own homes with the assistance of their family members in pre-loom and post-loom process. The industry which started to meet limited demands developed as a profession for certain groups of people and the ideas of commercialization and marketing of the products as a means of economy entered the field. The introduction of cooperatives has added a new dimension in the process of ‘industrialisation’ or entrepreneurisation of the handloom sector in Manipur.
The weaving cooperatives were organized and established with a view to help the weavers particularly in the supply of raw materials, such as yarn and marketing of the products. The Manipur State Handloom Weaver’s Cooperative Society was established in 1955 as an apex institution to play a pivotal role to procure and supply the required raw materials and equipments to the weavers and to market finished products of the societies affiliated to the State Society. The first handloom cooperative was registered in the year 1955-56.
5. EMPOWERING WOMEN THROUGH ‘COOPERATISATION’ OF HANDLOOM
Empowering women has been the central agenda for most government driven sectoral intervention. Empowerment of women as a goal of development projects and programmes has gained wider acceptance since 1990s (Karl. 1995). Empowerment means not only greater self-confidence, and an inner transformation of one’s consciousness that enables one to overcome external barriers to accessing resources or changing traditional ideology. The key elements of empowerment are: decision-making power, autonomy and self-reliance, entitlement, participation, and process of building awareness and capacity (Panda 2000).

‘Cooperatisation’ of Handloom and Women’s Empowerment in Manipur 39
A hallmark of women’s empowerment in development is a social transformation of poor women through collective action upon their consciousness of the dominance of patriarchy that underlines the day-to-day subordination of those women both in the home and the work place (Hill 2001). India offers interesting examples of women’s empowerment through the efforts of social movements, which mostly blossomed in the 1970s with radical ideologies, issues at stake and goals. Following such success, much empirical literature seems to have been engaged with analyzing poor women’s empowerment in terms of their participation in organizational-level activities or organizational structure of women’s movements that would increase women’s autonomy and economic independence (Everett 1989).
Based on her analysis of gendered poverty in South Asia, Naila Kabeer elaborates power relations over the creation of (dis) empowerment at three levels: (1) access to power in decision-making agendas; (2) the power over the process of policy-making; (3) the power within the ideological domination that conceals the reality and pervasiveness of male dominance (Kabeer 1994). In the case of participatory development, we can add a further level, viz. ‘participation as beneficiaries’ to the above three levels. This dimension of empowerment typifies social relations in development projects, as women organized in accordance with the ‘participatory’ method may not have much incentive for being active if the way of their participation were ‘passive’. In such a case, the argument of women’s power over their own roles is missing. Moreover, three different approaches in the context of women’s empowerment have been identified by Batliwala, namely: (a) the integrated development approach; (b) the economic approach and; (c) consciousness raising cum awareness approach. The approaches are not mutually exclusive and have the potential to be linked with each other. Whereas (a) and (b) address the practical needs or material condition of women, (c) addresses the strategic needs or socio-political position of women (Batliwala, 1994).
Consciousness and awareness raising approach has the potential to bring about long-lasting change in the position of women and has deeper implications. This approach is significant for this study as the main objective of the study is
to examine the implications of the introduction of handloom cooperatives on the status of the women weavers. With this theoretical framework in the setting, women’s empowerment through handloom cooperatives in Manipur will be examined.
According to the ‘Bye-Laws of the Handloom Weavers Cooperative Society Ltd.’ published by Manipur State Cooperative Union, the main objective of the society is the improvement of handloom and allied industries and of the economic condition of the weavers residing in the area of operation of the society. For the purpose of attainment of this object, it shall be competent:
1. to raise money required for the society from the members and others by issue of shares and by borrowing by way of deposits or otherwise;
2. to purchase such raw materials and appliances as may be required for the industry and retail the same either cash or credit to the weaver members;
3. to purchase yarn and other raw materials and advance the same to weaver members who shall convert them into finished goods and deliver them to the society, to pay wages for such conversion and to arrange for the marketing of finished goods to the best advantage of the society;
4. to purchase and hold on common or let or hire improved appliances connected with the industries;
5. to act as agent for joint purchase of the domestic and other requirement of its members and for the sale of their finished products; and
6. to do such other acts as may be conducive to the attainment of the general objects of the society.
In order to examine the empowerment of women through cooperatives, 35 handloom weavers’ cooperative societies that are run by women cooperators and 250 handloom cooperative weavers from Imphal East district of Manipur were selected. The field study was conducted during the year 2007, 2011 and 2014. Over half (18 out of 35) of the selected handloom cooperatives were established between the year 1981 and 1990 (Table 1).
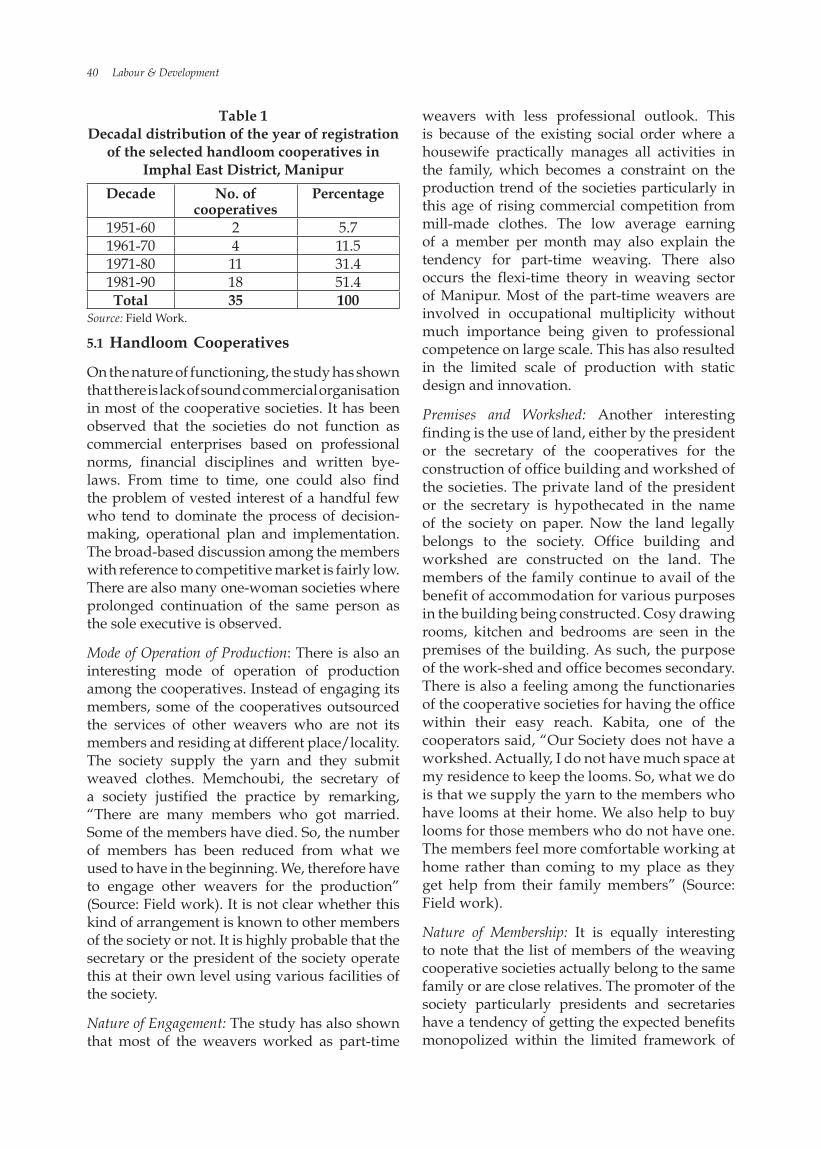
40 Labour & Development
Table 1 Decadal distribution of the year of registration
of the selected handloom cooperatives in Imphal East District, Manipur
Decade No. of cooperatives
Percentage
1951-60 2 5.71961-70 4 11.51971-80 11 31.41981-90 18 51.4Total 35 100
Source: Field Work.
5.1 Handloom Cooperatives
On the nature of functioning, the study has shown that there is lack of sound commercial organisation in most of the cooperative societies. It has been observed that the societies do not function as commercial enterprises based on professional norms, financial disciplines and written bye-laws. From time to time, one could also find the problem of vested interest of a handful few who tend to dominate the process of decision-making, operational plan and implementation. The broad-based discussion among the members with reference to competitive market is fairly low. There are also many one-woman societies where prolonged continuation of the same person as the sole executive is observed.
Mode of Operation of Production: There is also an interesting mode of operation of production among the cooperatives. Instead of engaging its members, some of the cooperatives outsourced the services of other weavers who are not its members and residing at different place/locality. The society supply the yarn and they submit weaved clothes. Memchoubi, the secretary of a society justified the practice by remarking, “There are many members who got married. Some of the members have died. So, the number of members has been reduced from what we used to have in the beginning. We, therefore have to engage other weavers for the production” (Source: Field work). It is not clear whether this kind of arrangement is known to other members of the society or not. It is highly probable that the secretary or the president of the society operate this at their own level using various facilities of the society.
Nature of Engagement: The study has also shown that most of the weavers worked as part-time
weavers with less professional outlook. This is because of the existing social order where a housewife practically manages all activities in the family, which becomes a constraint on the production trend of the societies particularly in this age of rising commercial competition from mill-made clothes. The low average earning of a member per month may also explain the tendency for part-time weaving. There also occurs the flexi-time theory in weaving sector of Manipur. Most of the part-time weavers are involved in occupational multiplicity without much importance being given to professional competence on large scale. This has also resulted in the limited scale of production with static design and innovation.
Premises and Workshed: Another interesting finding is the use of land, either by the president or the secretary of the cooperatives for the construction of office building and workshed of the societies. The private land of the president or the secretary is hypothecated in the name of the society on paper. Now the land legally belongs to the society. Office building and workshed are constructed on the land. The members of the family continue to avail of the benefit of accommodation for various purposes in the building being constructed. Cosy drawing rooms, kitchen and bedrooms are seen in the premises of the building. As such, the purpose of the work-shed and office becomes secondary. There is also a feeling among the functionaries of the cooperative societies for having the office within their easy reach. Kabita, one of the cooperators said, “Our Society does not have a workshed. Actually, I do not have much space at my residence to keep the looms. So, what we do is that we supply the yarn to the members who have looms at their home. We also help to buy looms for those members who do not have one. The members feel more comfortable working at home rather than coming to my place as they get help from their family members” (Source: Field work).
Nature of Membership: It is equally interesting to note that the list of members of the weaving cooperative societies actually belong to the same family or are close relatives. The promoter of the society particularly presidents and secretaries have a tendency of getting the expected benefits monopolized within the limited framework of

‘Cooperatisation’ of Handloom and Women’s Empowerment in Manipur 41
family members and relatives. In some cases, the societies have become a new form of individual property and a mere family enterprise. Thus, the consideration of competitive production becomes secondary while the primary consideration is to get full advantage of loans, grants and subsidies. Subadini, one of the secretaries of a society mentioned that, “This society was started by my mother-in-law. It was two years after my marriage that the society was established. And I joined to help her. The term of service for the post of secretary is three years. But, I have been holding this post since 1988 as I am performing my duty well. One of my sisters-in-law is the president. We also have a treasurer and five executive members” (Source: Field work).
Supply of Yarn: The weaving cooperative societies in Manipur have been experiencing the problem of fluctuating supply of yarn. The yarns of various kinds come from different states like West Bengal, Assam, Tamil Nadu and Maharashtra. The yarn supply in Imphal market is controlled by a few businessmen. This has created serious constraints for the diversification of production. While some of the weavers have commendable skills in diversified production of competitive designs, production remains impossible with limited availability of yarns.
Types of Loom: The study reveals that there has not been any change in the type of technology used in the weaving industry of Manipur. The weavers still use the traditional loin looms, throw-shuttle looms and fly-shuttle looms for their production. With rising demand, this has increased the burden on the workforce and also increases the cost of production in the long run.
Marketing: It has also been observed that the cooperative societies mainly concentrated on production with negligible attention paid to the marketing side. There are no marketing cooperatives based on set principles of large-scale marketing. This has been one of the major hurdles on the expansion or diversification of production of weavers’ cooperative societies in Manipur.
Financial Support: The research reveals that there has been very low percentage of cooperatives and also members who received credit or financial assistance from the government. This shows that the societies in Manipur cannot avail of the
benefit of economies of scale because of lack of sufficient credit support. Another factor, which affects the proper functioning of cooperatives, is the inefficiency and unaccountability of the government departments. The economic atmosphere has been largely disturbed by the unabated practice of corruption and compounded by nepotism and favouritism. Renuka, one of the cooperators remarked, “There are so many schemes for the cooperative weavers. Those people who have approach or link with the authority could only avail of them whether the society exists or not. This is really discouraging and we cannot have much progress. I think it is really a very painful thing for somebody who is really diligent and works all day. The department will claim that they have distributed this much of amount to so and so society. But it is very doubtful whether it has been done in practice. If investigation is done, we will come to know that there are some societies which exist only on paper. There are some societies which display items in the fair/expo by buying/hiring from handloom traders in the Ima Market. It’s so corrupt. The only aim and motivation that we have with us is simply to work hard and earn something” (Source: Field work).
Group Solidarity: There is another interesting aspect of handloom cooperatives regarding group solidarity. Notwithstanding the lack of professionalism in the functioning of the cooperatives as noted above, these cooperatives have provided a sense of comradeship among the members by extending help to each other in times of need. Romita, a cooperator said, “We also have a get-together of all the members sometimes. We attend each member’s family function. Whenever there is any problem to one of our members or anyone in their families, we try to help them both morally and financially” (Source: Field work). Memcha, another cooperator remarked, “If there is any member who needs money urgently, we all contribute some money and let her pay back from the profit that she gets later in installment form” (Source: Field work).
5.2 Handloom Cooperative Members
Age distribution of members: It is generally observed that age and socio-economic activities are inter-related. The study shows that majority of the members belong to the 36-45 age group followed by the 46-55 and 26-35 age groups,

42 Labour & Development
respectively (Table 2). Only 5.6 per cent and 6.4 per cent of the total respondents belong to 18-25 and above 55 age groups respectively, which may imply that there is less involvement of younger generations in the cooperative activities. This is attributed to the following reasons: the general presumption among the younger women weavers that cooperatives are for the older women, and the fact that the women in the age group of 36 to 55 years are generally the people who take the responsibility of running the family.
Table 2 Age Distribution of Members of Cooperatives
Age group No. of respondents
Percentage
18-25 14 5.626-35 46 18.436-45 114 45.646-55 60 24
Above 55 16 6.4Total 250 100
Source: Field work.
Educational qualification of members: Education is an important determining factor of one’s social consciousness. It is observed from this study that majority of the respondents i.e., 57.6 per cent are under-matric, which may generally affect their level of awareness on various issues and decision making (Table 3). However, it would be wrong to generalise because some of the successful cooperators are illiterate. Chandrika, a cooperative member said, “I am a post- graduate in History from Manipur University. I teach in a private school. I do not know much about matters related to cooperative. Weaving is my passion. I became a member through one of my friends’ influence as her mother is the secretary of the society” (Source: Field work).
Table 3 Educational Qualification of Members
Educational status
No. of respondents
Percentage
Illiterate 24 9.6Under-matric 144 57.6
Matric 46 18.4Undergraduate 18 7.2
Graduate 14 5.6Post Graduate 4 1.6
Total 250 100Source: Field work.
Annual family income of the members: The data shows that about half of the total respondents have an annual family income of less than ten thousand rupees (Table 4). This indicates that most of the weavers belong to very poor families. It was observed that most of the parents and husbands of these weavers were engaging in petty jobs, farming, small business etc. Therefore, these weavers do not have sufficient capital to invest in their enterprise. It is therefore the role of effective cooperative is very paramount to give assistance to these weavers.
Table 4 Annual Family Income of the Members
Income in Rs. No. of respondents
Percentage
0-5,000 58 23.2
5,000-10,000 68 27.2
10,000-15,000 20 8.0
15,000-20,000 12 4.8
20,000-25,000 18 7.2
25,000-30,000 4 1.6
30,000-35,000 10 4.0
35,000-40,000 30 12.0
40,000-45,000 16 6.4
45,000-50,000 6 2.4
50,000-55,000 8 3.2
Total 250 100Source: Field work.
Modes of joining the cooperative: Decision-making is an important facet of empowerment. Therefore, it is vital to examine under which circumstances the members join cooperative. It is observed that the least per cent i.e., 25.6 per cent of the total respondents became cooperative members only through meeting and consensus among the prospective members (Table 5). However, majority of the respondents became members either through relatives, friends, or neighbours’ initiative or enrolment through persuasion made by the president or the chairman of the cooperative society. This very nature of forming a cooperative is contrary to the basic principles of cooperative i.e., voluntary and open membership.

‘Cooperatisation’ of Handloom and Women’s Empowerment in Manipur 43
Table 5 Modes of Joining the Cooperative
Nature of Joining No. of Respondents
Percentage
Enrolment through meeting and consensus among the prospective members
64 25.6
Enrolment through relatives/friends/neighbours’ initiative
94 37.6
Enrolment through persuasion by the President/Chairman of the society
92 36.8
Total 250 100Source: Field work
Reasons for joining the cooperative: One of the significant findings of the study is that nearly 50 per cent of the total respondents join cooperatives as members because they feel that it is part of their traditional occupation or passion (Table 6). While 29.6 per cent join cooperatives in the hope of getting loan, 12 per cent for employment and 8.8 per cent for training as the reasons. It is clear from this finding that most members are not aware of the main thrust of cooperative, which is providing employment, credit and training.
Table 6 Reasons for Joining the Cooperative
Reasons No. of respondents
Percentage
For getting loan 64 29.6For employment and income
30 12
To avail training 22 8.8Traditional occupation/Passion
124 49.6
Total 250 100Source: Field work.
Employment status of the members: The character of employment remains discouraging with part-time weavers accounting for nearly 70 per cent. This indicates the marginal importance given to weaving as a basic and competitive source of employment. One of the factors for this kind of condition may be due to occupational multiplicity based on flexi-time. With this kind of prevailing nature of work-culture the weavers are not going to improve their status by just being a member of the society.
Types of assistance received by the members: As already highlighted above, the main objectives of cooperative societies are to provide assistance in terms of credit, training, infrastructure and marketing to their members. A perusal of the data, however, shows that more than one-third of the respondents have not received any assistance from the society (Table 7). Among the assistance received, raw material stands the highest followed by credit. However, marketing facility, which is considered to be one of the important instruments for ensuring better returns on the investment made by the weavers, is found to be dismal. Therefore the link between the weavers and the market, which the cooperatives are expected to provide, is extremely weak.
Table 7 Types of Assistance Received by the Members
Types of Assistance (Code)
No. of Respondents
Percentage
0 86 34.41 34 13.62 82 32.83 16 6.4
2,3 10 4.02,4 14 5.6
1,2,3 4 1.61,2,4 2 0.82,3,4 2 0.8Total 250 100
Code: 0- No assistant; 1- Financial; 2- Raw material; 3- Training; 4- Marketing;
Source: Field work.
Income earned before and after joining cooperative: It is observed that 66.4 per cent of the respondents earn less than Rs. 500/- a month both before and after joining the society (Table 8). This implies that there is hardly any increase in the income of the weavers even after they join the society. A major reason is because most of the weavers are part-timers and are generally engaged with weaving ordinary handloom products. Secondly, the lack of market networks put them at a disadvantage in the marketing of their products. However, the significance of being a member of a society is that they need not worry about the investment. Ibetombi, a cooperative member said, “It was difficult for me to manage the money for buying yarn. I had to borrow money from moneylenders with interest. But after joining the society, that problem has gone because the society now provides me the yarn” (Source: Field

44 Labour & Development
work). Memchoubi, another cooperative weaver mentioned, “The fly shuttle loom I used to weave before was in a very bad condition. However, I got a new one from the society” (Source: Field work).
There is slight increase in income among the high-income earners. This is basically due to their involvement in the production of highly intricate designed products, which are in great demand both in the domestic and national markets. Therefore, this disparity in income clearly shows that cooperative does not enhance the economic status of its members equally as a whole.
Table 8 Income Earned before and after Joining
CooperativeBefore Joining
Coop.After Joining
Coop.Monthly
Income in Rs.
No. of Respon-
dents
Per-centage
No. of Respon-
dents
Per-centage
Below 500 166 66.4 166 66.4500-1000 34 13.6 14 5.61000-1500 10 4.0 12 4.81500-2000 26 10.4 40 162000 and
above14 5.6 18 7.2
Total 250 100 250 100Source: Field work.
Ways of utilising the income: Despite their meager income, it is remarkable to note that nearly half of the respondents have put the income they earned in some form of savings (Table 9). While most of them joined marup, the traditional credit association, some deposit their money in the bank to support family and investment in the business. While 33 per cent of the respondents said that they made use of the money in running the daily household requirements, another 18 per cent said they used it for purchase of personal items like jewellery, clothes, etc.
Table 9 Ways of Utilising the Income
Ways No. of Respondents
Percentage
Saving to invest in the business
43 17.2
Saving to support family
79 31.6
Support family 83 33.2Personal use 45 18.0Total 250 100
Source: Field work
Awareness of objectives and bye-laws of cooperative: It is a general understanding that a member of an organization should have an awareness of its objectives and other matters related to it. However, this study found out that nearly two-thirds of the members of the societies were not aware of these issues. This lack of consciousness among the members clearly implies that they are passive participants, which restricts their ability to get the best out of the cooperative enterprise.
Members working for middle(wo)men: One of the objectives of cooperative is to safeguard the interests of the weavers from the exploitation of and clutches of the middlemen. However, the findings of this study show that almost two-thirds of the respondents still work for the middlemen. This shows that the poor weavers have little alternative but to rely on the middlemen for their survival. This is because they do not get adequate assistance from the society in terms of fund and raw materials. Devala, a cooperative member said, “Although I am a member of the society, I do not get regular supply of yarn and I do not have money to invest. I also do not want to borrow from the moneylenders as they charge high rate of interest. I, therefore have to depend on these women (middle[wo]men) who provide me work. It is not easy to work for them either. They have their own priorities but we have to follow them” (Source: Field work). Many of the cooperative weavers remarked that even if they knew that they were paid much less wage as compared to the market rate, they were helpless and had no alternative. Thus, this has a highly negative implication on the weavers’ socio-economic empowerment as they are paid less wages and always under the whims of the middlemen.
Awareness of government schemes for the weavers: Some of the handloom schemes implemented by the government are Project Package Scheme, Deen Dayal Hathkargha Protsahan Yojana, Integrated Handloom Village Development Project, Workshed-cum-Housing, Health Package Scheme and other miscellaneous handloom schemes. However, nearly 85 per cent of the respondents are not fully aware of any of these schemes. There are various reasons for this state of affairs. One could be the nature of joining the cooperative because the data shows that nearly 75 per cent of the respondents enrolled as a member of cooperatives through relatives or

‘Cooperatisation’ of Handloom and Women’s Empowerment in Manipur 45
friends or neighbours’ initiative and persuasion by the president/secretary of the society. The second is the reason for joining the cooperative. Nearly 50 per cent joined because weaving was their traditional occupation or passion. The third is the incompetence of the management of the society to get hold of the information of these schemes and share it with its members. The fourth is the self-centeredness of the management of the society by not divulging the information properly. The fifth is the indifferent attitude of the members.
Associative role of cooperatives: One of the significant aspects of cooperatives is its associative function. Nearly one-third of the respondents have attended annual get together/feast organised by their respective societies and also organised marup (credit association based on lottery) of various denominations as a means of savings (Table 10). Over half of the respondents have either extended or received financial or material help during the life cycle events like birth, marriage, death or other critical period in any of the member’s family. Participation in fair or mela is also one of the major components of cooperatives. About one-fifth of the respondents have participated in such activity representing their respective societies.
Table 10 Associative Role of Cooperatives
Nature of Associative Activities
No. of Respondents
Percentage*
Annual get together/feast
79 31.6
Financial/material help during ceremony/crisis
132 52.8
Organisation of marup
81 32.4
Participation in fair/mela
47 18.8
*The total percentage is more than 100 because of multiple answers.Source: Field work.
6. CONCLUSION
In the course of our investigation, we have found that cooperatives have played a more significant role for the promoters/cooperators. The promoters are usually the frontrunners or the one who spearheads the activity. They are
the one who gets recognition and fame while the ‘ordinary’ members who are the real producers are alienated.
It can be argued that women who are the focal point of the handloom weavers’ cooperative societies cannot be considered as empowered by just being members of these societies. This has been shown by the findings of the study on various aspects, such as, nature of joining the cooperative, reasons for joining the cooperative, employment status of the members, types of assistance received by the members, income earned before and after joining cooperative, awareness of objectives and bye-laws of cooperative, relation with middlemen, and awareness of government schemes for the weavers. The study has revealed that there are various factors that reduce the effectiveness of cooperatives as an agent of women’s empowerment. These include: incompetence and self-centeredness of the management, erratic supply and rising cost of raw materials, unorganised marketing mechanism, lack of credit facilities, indifference of the members, and poor accountability of the government departments. Thus, elements of equality and democracy in the functioning of the cooperatives are clearly missing in the case of handloom weavers’ cooperatives of Manipur.
The data raises strong doubts about the efficacy of the paradigm in an era of participatory approach to development. It argues that one of the agencies for realising women’s empowerment may be through institutions like cooperatives. Nevertheless, these institutions are seen simply as ‘targets’ to meet programme/plan requirements of the government. The members who are mostly the poor like the weavers in this study still suffer isolation, subordination and discrimination.
At the same time, it is important to note that since most of the weavers belong to the poorer sections of the society and they do not have enough money to sustain their business. Therefore, rural institutes like cooperatives are their only hope for assistance in terms of financial, raw materials, marketing and other benefits. In order to make cooperatives effective instruments of women’s empowerment there is an urgent need for revitalization and re-organisation of handloom weavers’ cooperative societies. The

46 Labour & Development
level of members’ participation needs to be improved by sensitizing and motivating them before enrolment as members and guiding them to develop a professional outlook in their activities. This should be accompanied by efficiency, transparency and accountability of the concerned government agencies.
Because the cooperative movement was a state driven movement it was inevitable that the state machinery would be involved in promoting it. However, the relationship between state and cooperatives should be based on complementary model i.e., the state and cooperatives develop a symbiotic and mutually complementary relationship rather than administrative model in which the state has a domineering role in the cooperative development. By examining the various definitions/provisions of the Manipur Co-operative Societies Act, 1976, it can be concluded that the kind of relationship exists between the state and cooperative in Manipur is that of the administrative model. This may be one of the factors for cooperatives being not able to provide the benefit effectively to the needy weavers.
While cooperatives do help in maximising the benefits for weavers in the entire chain of production, their present condition is a cause of concern. The handloom cooperative system is riddled with corruption and political interference. Many handloom weavers are not members of these cooperatives. Government departments have to stop using them as primary sources for routing government funds and schemes. Cooperatives have to become independent of district-level government officers in terms of management and decision-making. Big cooperative model of production is likely to see a steady decline. However, there is a growing trend to establish self-help groups, a smaller version of cooperative model. Government is also increasingly becoming inclined to promote such groups. Moreover, the Government of India, Ministry of Textiles, Office of the Development Commissioner for Handlooms started handloom cluster development programme since 2006. The Integrated Handlooms Cluster Development Programme (IHCDP) is an attempt to facilitate the sustainable development of handloom
weavers located in identified clusters into a cohesive, self-managing and competitive socio-economic unit. Under the North Eastern Region (NER) Textile Promotion Scheme, there are three schemes i) Cluster Development Project in NER, ii) Technological Upgradation of Handlooms in NER and iii) Market Promotion of Textiles and Handloom Products in NER. This is another area, which one can take up a comprehensive impact assessment of these schemes to the women weavers.
REFERENCESBatliwala, S. (1994), ‘The Meaning of Women’s
Empowerment: New Concepts from Action’, in Gita Sen et al. (ed.) Population Policies Reconsidered: Health, Empowerment and Rights, Harvard: Harvard Center for Population and Development Studies.
Everett, J. (1989), ‘Incorporation Versus Conflict: Lower Class Women, Collective Action and the State of India’, in S.E.M. Charton, et al. (eds.). Women, the State and Development, New York: State University of New York Press.
Fauquet, G. (1951), The Cooperative Sector. Manchester: Cooperative Union.
Government of Manipur, (Year not cited) Bye Laws of the Handloom Weavers Cooperative Society Ltd. Imphal: Manipur State Cooperative Union.
Hill, E. (2001), ‘Women in the Indian Informal Economy: Collective Strategies for Work Life Improvement and Development’, Work, Employment and Society, 15 (3), pp. 443-464.
Kabeer, N. (1994), Reversed Realities: Gender Hierarchies in Development Thought, London-New York: Verso.
Kabeer, N. (1999), ‘Resources, Agency, Achievements: Reflections on the Measurement of Women’s Empowerment’, Development and Change, 30 (3), pp. 435-464.
Karl, M. (1995), Women and Empowerment: Participation and Decision Making. London: Zed Books.
Krishnaswami, O. R. and V. Kulandaiswamy (2000), Cooperation: Concept and Theory, Coimbatore: Aruda Academy.
Panda, S. Mishra (2000), ‘Women’s Empowerment through NGO interventions: A framework for assessment’, Social Change, Vol. 30. Nos. 3and 4.
Saksena, K. K. (1974), Evaluation of Cooperative Thought. Bombay: Somaiya Publications.
Seetharaman, S.P. and Mohanan, N. (1986), Framework for Studying Organisations: A Case of NAFED, New Delhi: Oxford and IBH Publishing Co.

1. INTRODUCTION
In August 2017, the Bureau for Employers’ Activities (ACT/EMP) of the International Labour Organization (ILO), in collaboration with Standing Conference of Public Enterprises (SCOPE) initiated a study on “women in leadership and management in PSUs in India”. SCOPE is an apex professional organization representing central public sector enterprises (CPSEs), State enterprises, banks and other institutions.
The intent for the collaborative study was to contribute to the development of tangible impact whereby PSUs adopt innovative gender focused policies that a) help women to overcome difficulties in their career path; and b) encourage them to take on senior and leadership positions. The objective was to encourage and promote more women to take on leadership roles and aspire to be in leadership and senior management positions within PSUs
WOMEN IN LEADERSHIP AND MANAGEMENT IN PUBLIC SECTOR UNDERTAKINGS IN INDIA
Malika Basu∗
In 2017, The Bureau for Employers’ Activities (ACTEMP) of the ILO in collaboration with SCOPE an apex body representing largely the Central Public Sector Enterprises (CPSEs) in India, initiated a study to bring to light the influential factors that hold women back in advancing their careers to top leadership and management positions in PSUs in India. The findings from the study resulted in 19 recommendations clubbed under i) improving organizational work structure; ii) strengthening basic necessities and facilities; iii) sensitization efforts at all levels; and iv) other supporting factors. The study pointed out, it is not sufficient to underline organisations as being gender neutral; also, organisations have to show their intent in recognizing women as a talent pool.
Keywords: Public Sector; Women; Career Advancement; Influential Factors; Affirmative Actions
in India.1 The broad findings of the study are presented here.
Women in Public Sector Undertakings in India2
The Public Enterprises Survey 2018-19 of the Government of India found there were 348 CPSEs3, the single largest organized sector, out of which 249 were in operation, 86 were under construction and rest 13 CPSEs, were under closure/liquidation.
As on 31.3.2019, the operational CPSEs employed over 10.33 lakh people (excluding contract and casual workers). Of these 87667 are women, constituting 8.50 per cent. In 2016-17, it was 10.2%. It fell to 8.89% in 2017-18, and subsequently to 8.50% in 2018-19 (Table 1).
This decline is significant because women already comprise an underrepresented share of CPSE employees, especially when compared to the national average of 26.9% for female labour force participation. The world average stands at 48.47%.1 PSUs are companies are owned by the Government
of India, or one of the many State governments, or both. PSUs may be classified as central public sector enterprises (CPSEs), public sector banks or State-level public enterprises. This study focused on CPSE members of Standing Conference of Public Enterprises (SCOPE). In the context of this study therefore, references to PSUs are primarily references to CPSEs.
2 Information on data in this section has been updated. In the original study, Public Enterprises Survey, 2015-2016 was referred. Since then, the figures have further declined.
3 CPSEs are classified into six categories/sectors: agriculture, mining, manufacturing, electricity, services and enterprises under construction.
∗ Gender analyst and knowledge management specialist. Founder-Proprietor, Development Initiatives for Change (Di4C) - MB Knowledge Management and Consultancy Services (www.di4c.org). ILO Consultant, External Collaborator for the SCOPE-ILO Study on “Women in Leadership and Management in Public Sector Undertakings (PSUs) in India”. The author would like to express gratitude and acknowledge the guidance, support and active involvement of Mr. Ravi Peiris, Senior Specialist, Employers’ Activities ILO DWT for South Asia, in conducting this study; also of SCOPE. Email: [email protected]
Labour & Development, Vol. 27, No. 1, June 2020

48 Labour & Development
The falling percentage of women employed by CPSEs in middle level positions (supervisors) from 9.87% in 2016-17 to 7.09% in 2017-18 and further to 6.33% in 2018-19 (Figure 1) may suggest systemic issues causing women to leave the labour force, known as a “leaking
pipeline”. This is an important issue given that the Government prefers to fill top posts in public sector enterprises with internal candidates. The percentage share of women in managerial or executive posts also shows a decline.
Table 1 Break-up of the Female Employees in Different Groups/levels in the Operational CPSEs
Total Employees(Number)
Total Female Employees(Number)
Female Employees as % of Total
2016-17 2017-18 2018-19 2016-17 2017-18 2018-19 2016-17 2017-18 2018-19Managerial/Executives
264648 265543 269135 28631 25931 27026 10.82 9.77 10.04
Supervisors 104404 108622 106123 10308 7706 6720 9.87 7.09 6.33Workers 760209 712563 655791 76299 62968 53921 10.04 8.84 8.22Total 1129261 1086728 1031049 115238 96605 87667 10.2 8.89 8.50
Source: Public Enterprises Survey, 2018-2019, Vol I, Government of India.
Figure 1 Number of Female Employees in CPSEs, 2016-2019
0
10000
20000
30000
40000
50000
60000
70000
80000
90000
2016-17 2017-18 2018-19
Managers/ Executives Supervisors Workers
It is evident that women employment in CPSEs during the last three years has remained stagnant between 8.5-10% approximately. It must therefore become a concern for PSUs.
2. SCOPE-ILO MULTI-LEVEL STUDY
Multiple studies duly acknowledge the persistent gender gap – globally, at all levels for women participating in the job market (World Bank, 2017;
McKinsey, 2008, 2016; OECD, 2016; CIPD, 2016; ILO, 2015; Catalyst, 2007). In India, such studies have been conducted in Indian and multinational private companies, including banks, IT firms and hospitality sector enterprises. Drawing from the existing literature, including the ILO global report (2015) on “Women in Business and Management - Gaining Momentum”, the SCOPE-ILO study employed a multi-level approach to data collection on women in leadership and management in

Women in Leadership and Management in Public Sector Undertakings in India 49
PSUs in India.4 The multi-level approach of the study included an online survey, Focus Group Discussions (FGDs), and Key Informant Interviews (KIIs). The methodology of each level of the study is briefly described in turn below.
Online Survey of Women Employees
The employment grades E1–E9 indicate or correspond to positions in the organizational hierarchies of PSUs. If a person is recruited in E2, advancement to E3 grade (with salary increase, perks and other benefits) takes place after a specified period of time. The employee’s job title is also likely to change (for example, from senior manager to deputy manager). At level E4–E5 and above, promotion is not time bound but based on merit, track record and available vacancies. The gender balance at levels from E4 and above are comparatively skewed towards men.5
For the online survey, the E4–E9 level was particularly chosen because most PSUs have a pyramid structure with lower representation of women in higher-lever positions. The online survey was available to E4–E9 level women employees in 201 SCOPE member PSUs.
The online survey was initiated through Survey Monkey. It was open for a period of three months (mid-August–mid-November 2017). 1,665 women employees in E4–E9 level from 46 SCOPE member PSUs participated in the survey.6
4 A consultative meeting was held with SCOPE and representatives of its member PSUs, including CPSEs and representatives of Women in Public Sector (WIPS). During the consultation, it was decided that the study would cover SCOPE member organisations.
5 There is no evidence-based study as to why the percentage of men is higher than percentage of women in higher levels. Discussions during the study indicated the perception of some respondents that since the number of women recruited at the entry level is less, it is likely that fewer women make it to the top. Besides, even when women compete with men at higher levels, organisational and other biases may cause them to be overlooked while men are accommodated. Some such cases were cited during the course of this study by women employees, requesting anonymity.
6 A key limitation of the study was the lack of data on the exact number of women employed at the E4–E9 level in the 201 SCOPE member organisations. Since the data were not available, it is not possible to know what share of all women employees were represented by the 1,665 women who participated in the survey. Going by the limited data available, however, it is a fair estimate that 1,665 constitutes approximately 10-15% of all E4–E9 women employees in the 201 member organisations. In the near future, SCOPE aims to create a robust database of all its member organisations.
To make the survey as explicit as possible, the online survey included 14 closed multiple choice questions and two open-ended questions that provided space for respondents to highlight particular incidents where they felt dissatisfied or disillusioned with their career advancement. Of 1,665 women who completed the survey, 813 provided an answer in that space.
Focus Group Discussions (FGDs)
SCOPE selected 14 CPSEs7 for the FGDs based on the following selection parameters:
• Organisations representing Maharatna, Navratna, Miniratna (I and II) categories. CPSEs are ranked into these categories on the basis of their financial performance, net worth, revenue and profit. Guidelines for the criteria are issued by the Department of Public Enterprises, a nodal department for all CPSEs;
• Organisations representing different sectors(such as agriculture; mining; manufacturing; electricity; services; others);
• Organisations having effective gender andHR policy;
• Organisations with a large number ofemployees but a low ratio of women employees; and
• SCOPEmembershipandactiveparticipationin SCOPE activities.
A maximum number of participants for the FGD was stipulated at 30. It included both male and female employees of E4–E9 level in the ratio of 6 male: 1 female. It was not possible for all organisations to maintain the ratio but the total number of male employees in all FGDs was 7 List of CPSEs selected for FGDs: MAHARATNA: 1.
Bharat Heavy Electricals Limited (BHEL) 2. GAIL (India) Limited 3. Indian Oil Corporation Limited (IOCL) 4. NTPC Limited 5. Oil and Natural Gas Corporation (ONGC) Limited 6. Steel Authority of India Limited (SAIL). NAVRATNA: 7. Container Corporation of India Ltd (CONCOR) 8. Hindustan Petroleum Corporation Limited (HPCL) 9. Power Grid Corporation of India Limited (POWERGRID) 10. NBCC (India) Limited. MINIRATNA: 11. Airports Authority of India (AAI) 12. Metals and Minerals Trading Corporation of India (MMTC Ltd.) 13. NHPC Limited 14. RailTel Corporation of India Ltd. (RAILTEL). A nodal person was nominated by each of the selected CPSE to facilitate the FGD process and KIIs. The nodal persons also encouraged the E4–E9 women employees in their organisation to participate in the online survey.

50 Labour & Development
always greater than the total number of female employees.
The FGD was an interactive session involving group and team exercise. Participants were divided into six groups with at least one woman participant wherever possible. Each group worked on a single topic (decided by picking a quote card). All the six topics were inter-related and inter-linked and needed to be discussed with reference to one’s organisation only.
The six questions under each topic were as follows:
1. Biases and cultural assumptions: In your organisation, what biases and assumptions present challenges for women and men as they move up in their careers?
2. Women as leaders and managers: How differently and critically do or will women leadership styles impact company’s outcomes or business results (such as meeting targets, generative revenues, initiating innovations and developing talent pools) than male leaders?
3. Engaging men: How your organisation can engage or is engaging men in advancing women’s leadership and management?
4. Women talent pool: How can the women talent pool be expanded in your company?
5. Gender diversity: How in your view gender diversity can promote organisational performance?
6. Company policy and strategy - What could be or are your company policy or strategy to promote women in leadership and management?
The final take away of the FGD process was the group collectively, drawing from the six presentations on topics above, coming up and agreeing to one to five strategies or ways forward, which they considered as feasible for their organisation to adopt to facilitate women’s career advancement in their organisation. The take-away points were later discussed with top management especially with CMDs and Heads of HR during KIIs.
Key Informant Interviews (KIIs)
The third level of the study comprised interviewing top managers or decision makers of
the 14 selected PSUs. There were five preferred informants for the interviews:
• CMD of the company;
• Head of HR;
• A woman director in the board of directors (if applicable);8
• A senior management representative (male) who is part of company’s decision-making process; and
• A representative of WIPS or any other woman representative who actively participates or is in the forefront of organizational activities.
A total number of 53 KIIs were conducted of which 9 were CMDs and 14 were Heads of HR.
While there have been surveys conducted previously in CPSEs or with SCOPE members, no study has been conducted in this multi-level format. The 14 PSUs covered under the study appreciated the multi-level approach. A prime reason, as cited, was the FGD conducted with focus on male employees.9 What was further appreciated was that the survey trends and the FGD take-away points formed the basis of KIIs. It helped to capture management’s viewpoint on the outcomes of the FGDs, specifically the proposals for flexible organisational policies and a gender sensitive approach in facilitating women’s advancement to leadership and management positions.
3. FINDINGS FROM THE STUDYA. Survey results and analysis
The online survey touched upon seven core areas, highlighted below:
(i) What are women looking for in terms of their career growth? (Figure 2)
It was interesting to note that more women (19.78% of women respondents) want to be recognised for their contribution in achieving 8 Directors are either functional (from within the
company), independent (by the company from within its own network) or government nominated (generally by the concerned ministry). Only one of 14 PSUs reported having a female functional director. In the rest, it was either an independent or a government nominated director or they were awaiting the appointment of a woman director.
9 The approach of involving men added a holistic dimension to the study from an organisational point of view as opposed focusing only on the views of women employees.

Women in Leadership and Management in Public Sector Undertakings in India 51
organisational goals rather than wish to reach top management positions in their organisation
(18.62%). Only a marginal 1.10% women have no aspirations to grow in their career.10
What emerges more significantly is, in terms of their career growth, 30.43% women respondents want to upgrade their skills and move into roles of greater responsibility; and 30.07% want to take up new challenges and opportunities to broaden their experience at work.
(ii) Which is the most influential factor in women’s career advancement? (Figure 3)
10 Of the 1,665 respondents, 32 did not respond to this question. The percentage figure is of the total number of respondents to the question. It does not include those who did not respond to the question.
11 Of the 1,665 respondents, 30 did not respond to this question.
Figure 2 Women’s Career Goals
Source: SCOPE-ILO Online Survey, 2017.
Going by what women respondents11 cited, two most influential factors that stand out in women’s career advancement include: women’s own confidence and self-belief (43.79%); and organizational opportunities supporting women in their professional development and career growth (26.85%).
Figure 3 Influential Factor in Women’s Career Advancement
Source: SCOPE-ILO Online Survey, 2017.

52 Labour & Development
In all, 14.13% women cited family and spousal support for combining work and family to be the influential factor. Fewer women respondents (8.81%) cite tackling biases, perceptions and stereotypes against women to be the most influential factor. Flexible work arrangements took the last spot as an influential factor (6.42%). Flexible working schedules however featured later under what organisations could do to help more women move into leadership positions.
(iii) Which factors hinder most women’s career advancement? (Table 2)
Respondents were asked to rate on a scale of 1 (lowest hindrance) to 5 (greatest hindrance), factors they thought hinder most women’s career advancement.12
Echoing their responses to the most influential factor in women’s career advancement, women’s ratings of “biases and stereotypes against women”; and “family responsibilities including coping with child-care issues”, scored 2.65 and 2.68 respectively - making them the bottom most hindering factors.
What women actually considered “greatest hindrances” in their career advancement includes: having a skill gap or a knowledge gap in their specialized area (score 3.42); returning to work after a career break or maternity leave (3.19); lack of internal motivation or a desire to move up the career ladder (3.09).
Table 2 Factors Hindering Women’s Career
AdvancementSl. No
Factors hindering most women’s career advancement
Score rating
(out of 5)1 Having a skill gap or a knowledge
gap in their specialized area3.42
2 Returning to work after a career break or maternity leave
3.19
3 Lack of internal motivation or a desire to move up the career ladder
3.09
4 Family responsibilities including coping with child-care issues
2.68
5 Biases and stereotypes against women 2.65Source: SCOPE-ILO Online Survey, 2017.
(iv) What are the reasons for women being underrepresented in senior management or leadership positions in your organisation? (Figure 4)
Of the 1,665 respondents, 66 did not respond to this question. Rest attributed multiple reasons for women’s under representation in senior management or leadership positions.
However, what is articulated the most number of times as a reason for under representation is the lack of organisational strategies to identifying, promoting and retaining skilled women at higher levels (50%). Another significant reason cited is the “organisational culture” that seems to view top management jobs more as a “man’s job” (39.21%).
Figure 4 Reasons for Women Being Underrepresented in Senior Management or Leadership Positions
Source: SCOPE-ILO Online Survey, 2017.12 Of the 1,665 respondents, 78 did not respond to this question. It is difficult to provide any significant analysis of why
respondents skipped this question.

Women in Leadership and Management in Public Sector Undertakings in India 53
Other reasons include: Lack of positive role models or mentors (31.64%); Lack of leadership training for women (26.45%). Relatively less percentage of respondents viewed differential recruitment of men and women to be the reason for under representation of women.
(v) What steps are necessary to help more women move into leadership positions? (Figure 5)
Women do not view implementing targets and quotas for women as necessary to help more women move into leadership positions.13 Instead what women highlight as necessary steps for organizations to take if women are to move into leadership positions include:
A. A non-biased and consistent process to identify, develop and advance women within the organization (75.47%).
B. Investing resources by organizations in career development of women. For example, investing on programmes on confidence-building; nurturing women as leaders through mentors; other leadership programmes (63.23%).
C. Seeing more women in senior management or leadership positions (60.75%)
D. Flexible Working Schedules (55.34%).
E. Access to and Networking with Female Leaders (38.63%).
13 Of the 1,665 respondents, 55 did not respond to this question.
Figure 5 Steps Necessary to Help Women Move into Leadership Positions
Source: SCOPE-ILO Online Survey, 2017.
(vi) What benefits having female leaders bring to organizations?
While a meagre (9.05%) women respondents feel it makes no difference having female leaders in an organisation, rest attributed multiple benefits which female leaders bring to organisations. These include:
A. Leads to diversity that brings different perspectives, experiences and insights into the organization (73.04%)
B, Breaks the culture of negative perceptions and stereotypes against women (61.93%)
C. Women are better communicators and better listeners (56.91%)
D. Women have enhanced ability to understand consumers and organizational clients (56.48%)
E. Women advocate for different issues than men do (such as clean WASH facilities, crèche facilities, zero tolerance over harassment and flexible work hours) (46.19%) Women respondents also felt that contrary to common perceptions, women leaders are able to undertake risk-adverse decision

54 Labour & Development
making (34.72%). 52 respondents did not respond to this question.
(vii) What personal actions and behaviours can drive women in their careers forward?
It is not a single action or behaviour that can drive women in their careers forward. Rather, a number of actions and changing behaviours can drive them. In so saying, women identified the following actions and behaviours:
Besides balancing work and family (81.62%), making use of opportunities to improve skills and knowledge that exceeds current capabilities (79.70%), having complete trust or confidence in oneself and doing what one feels one should do (78.96%), networking or interacting with people who encourage, support and mentor women leaders in the organization (69.43%), and setting clear career path goals (57.43%).
Drawing from the survey results a number of inferences could be made.
i. It may appear dichotomous that while on one hand 69.62% women respondents credit their organisations as offering the same promotional opportunities, and 51.60% view their organisations having a “gender equal policy” towards employees; on the other hand, women (66.91%) also note that women are underrepresented in senior management or leadership positions in their organisations; further, 73.11% regard their organisations as supporting - to a very small or moderate extent - the making and development of women leaders. This dichotomy can be explained by the fact that all 14 PSUs where the study’s FGDs and KIIs took place unequivocally cited their organisation as “being gender neutral”. Nevertheless, gender-neutral policies do not necessarily promote substantive gender equality. This is also evident from other inferences drawn below.
ii. A very positive trend that emerged out of the survey is the perception women have of themselves. Acknowledging that they have family responsibilities, women do not see it as a stumbling block in their career advancement. In fact, 76.66% of women employees see themselves in a higher position or in a position with more responsibilities in the next five years. It must be reiterated
that in no uncertain terms, women today see themselves as a “talent pool” – with a set of skills – that needs recognition. But the question is, do organisations also perceive women in a similar manner as women do, or organisations’ perception get concealed under the garb of promoting a “gender neutral policy”?
iii. As a corollary to the above point, it is noteworthy that women no longer see “tackling biases and stereotypes” and dispensing family responsibilities as either influencing or hindering women’s career advancement. Instead, what is clearly called for by women is a change in organisational strategies that recognises women as a talent pool and accordingly provides opportunities supporting them – through specific measures - in their professional development and career growth. Such a measure may include “protection of previous years rating during maternity leave of a woman employee, so as not to affect her promotion upon resuming duty”; or “provision for a hand-holding so that any knowledge gap that may have occurred during the maternity leave period can be easily overcome”. A number of women have cited their performance rating being affected negatively in the year they were on maternity or child-care leave.
iv. For bringing about a change in organisational strategies, a paradigm shift in organisational approach – and thought process - is required. This may require recurrent sensitisation process at all levels. As per many women respondents, work or projects that are critical or require high level reporting are not generally assigned to women employees. Women tend to land up doing routine type jobs. Also, while women do advance in certain streams like the human resource, finance, administration, and IT, but may not do so in core streams like project management, marketing, sales or operations. However, some organisations are consciously taking innovative steps (often viewed as radical steps) in recruiting women in newer fields which traditionally were considered as male bastions (such as fire-fighting teams; posting in a far-off location to manage an organisational unit). The point is also that such innovative steps needs to be highlighted within the organisation

Women in Leadership and Management in Public Sector Undertakings in India 55
and women recognised for their exemplary performances. Such recognition can help to address issues such as lack of positive women role models or mentors, as cited by women (31.64%).
v. Equally importantly, is the need to support or facilitate women in identifying their strengths and weaknesses through leadership training programmes. Organisations do send women for leadership training, however (26.45%) of women respondents feel that leadership trainings since not matched with existing skill analysis of employees does not so much contribute towards career development. At times, such trainings – especially the ones with the subject line – “women empowerment” – are perfunctory assigned to women. Women strongly advocate as part of a “non-biased and consistent process to identify, develop, and advance women within the organisation” - that organisations need to encourage men to be the participants of such programmes. It will enable men to become better aware and sensitive, also better allies for women’s empowerment.
vi. It is interesting to note that while suggesting steps to facilitate career advancement of women in leadership and management positions, women did not necessarily seek to make all organisational policies gender-specific. However, definitely, their suggestions are oriented towards making organisations become more gender sensitive. For instance, women have noted that time spent after office hours; or women employees ability to network; or her joining a get-together predominantly comprising male colleagues are often perceptions used to judge someone’s productivity at work. Such instances can easily come under “improper evaluation of work contribution”, which is also in line with weak management of people using irrelevant criteria. There are also situations where despite visibly prioritising work demands over family commitments in the interest of work requirement, the actions and work of the woman employee is not acknowledged by (male) superiors. However, for a similar actions and work, male counterparts may be glorified.
A sharing from a woman employee in the Survey perhaps aptly says it all.
“I once superseded my husband, also my batch mate in promotion. The reaction was more of sympathy for my husband, and less congratulations for me! A few years later, my husband superseded me. At that time, the general reaction was to congratulate me for his promotion, but there were very few sympathies for my professional setback. This, in spite of the fact that both of us have equally excellent track records and professional standing.”
Despite organizations being gender neutral or pursuing so-called gender equal policies, women employees participating in the survey indicated that women are required to render higher performances than male colleagues in order to even be recognized as ‘somewhat equal’. In this regard, a respondent quoted from Charlotte Whitton, a Canadian feminist, who was the first woman mayor of Ottawa. She said: “Whatever women do, they must do twice as well as men, to be thought half as good.”
B. Focus Group Discussions (FGDs) Irrespective of which PSU it was, the FGDs entailed open and friendly deliberations among male employees and their female counterparts. The following points emerged from the FGD discussions.
i. There was a universal agreement among men employees participating in the FGD that “women are home makers; the care givers”. Men were generous in recognising and commending women’s natural care giving roles vi-a-vis family. A natural corollary followed. Women were thus perceived as being less enthusiastic – primarily due to family responsibilities – about their careers that entails taking up transfer postings (a criteria for promotion) or serve long at field site locations. Also, it was mentioned that women were likely to have more career breaks owing to their maternity or child-care leave. In this respect, it was indicated that men in the unit have to manage the additional work created by shortage of women staff going for their maternity or child-care leave.14 Further, when women return from their maternity or child-care leave, they are likely to lag behind in knowledge or skill development that may have taken place during their absence.
14 This is an inference drawn from the discussions, and is not evidence based.

56 Labour & Development
ii. While acknowledging that women in their career advancement are likely to face barriers – related more to their lifecycle choices than company policies – there ensued considerable arguments when the group collectively sat to suggest feasible organisational strategies or measures. Men employees were found to be very cautious in suggesting and agreeing to strategies lest – if accepted, it becomes counter-productive in the long run. Thus, while the agreement reached was to have some “affirmative actions” but a clear disagreement was not to translate such actions into any form of “rigid preferential treatment” (such as quota systems for women, especially at the senior management and top leadership level).
iii. There was time and again a reassertion that since not many women are seen joining the organisations’ at the entry level - so obviously, the proportion of them reaching top positions are likely to be skewed in terms of proportion of men reaching top management positions. Therefore, it was not found justifiable to say women employees are skewed at the top because company polices were not favourable. Simply put, the argument for existing skewed ratio at the top was, there were not enough women to choose from or competing against relatively larger group of men, for the higher level promotions.
iv. Another aspect highlighted was, the organisations operate with targeted outcomes. Irrespective of their gender, leaders have to drive their companies’ towards achieving the targets set. Hence, leadership does not depend on gender. Leaders must possess certain core competencies such as decision making capabilities, attitude and integrity, discipline and commitment towards organizational goals and targets – and those must be present in a company leader – whether a man or woman. In essence, men employees did not see a sea change in leadership style, if a woman was to lead a unit or the company towards achieving its target goals.
v. The FGDs drew attention to a fundamental point. PSUs can internally deliberate on women’s career advancement, however,
without specific guidelines issued by the Department of Public Enterprises under the Ministry of Heavy Industries and Public Enterprises, any structural changes in line with gender parity are unlikely to be introduced in any PSU. That is, if any of the strategies proposed under FDGs are to get translated into guidelines, then it must come as a recommendation from the Department of Public Enterprises. Then alone such guidelines are likely to be incorporated by the PSUs. The implementation of the Department of Public Enterprises instructions vests with the respective Board of Directors of PSUs and its concerned Ministry or Department.
vi. Overall, the men employees highly appreciated the FGD process noting that this was the first time ever that a FGD focusing on men along with women was conducted to discuss “women’s employees” issues. It was agreed that there was a need for men employees at all levels to become better aware and sensitive, to be able to become better allies for women’s empowerment. In this respect, the employees hoped that such FGDs would recur.
The take away points from FGDs included the plausible measures the group collectively agreed to or proposed, so as to facilitate women’s career advancement to management and leadership positions. It was felt that the measures suggested are feasible for companies to review and adopt. Broadly, the measures suggested across the 14 PSUs focused on four key aspects:
i. Improving Organizational Work Structure
The focus was primarily on developing a proper succession plan starting from the induction level, and identifying the pool of future women executives to groom them in their career advancement. While suggesting a succession plan, men employees felt that such a planning would hold well for both men and women employees of the company. It was further emphasised that alongside the succession planning, a competency mapping for all functions and for all levels will strengthen and build the talent pool of women and men for leadership roles. Flexi-hour work arrangements

Women in Leadership and Management in Public Sector Undertakings in India 57
were another pertinent issue highlighted in the discussions. However, there were reservations that such arrangements cannot be permitted on a long-term basis. Also, such arrangements must be considered for both male and female employees – preferably on a need basis.15
ii. Strengthening Basic Necessities and Facilities
The need for adequate and proper water and sanitation (WASH) facilities in field sites or locations, even if such sites currently have no women employees, was highlighted. It was noted that such sites may have women employees visiting the site on work or other women as visitors. Introducing child-care leave and paternity leave at par with Central Government regulations was also suggested. Similarly, making available crèche facilities was seen to be beneficial not just for women employees but also their male counterparts, who may have a working wife or could be a single parent. In addition, transport facilities for any long after office engagement was recommended.
iii. Sensitization at All Levels
The FGD process was seen as a positive experience by men employees wherein they could freely interact with their women counterparts on gender issues. Drawing from their FGD experience, the group suggested making provisions for mandatory, rather than one-off, gender sensitisation trainings cutting across all levels – going up to the top management. In addition, promoting structured trainings for skill upgrading was suggested at various levels for all employees. Another aspect highlighted was the guidelines of the Department of Public Enterprises. There is a provision for considering same location posting for husband and wife working in the same organisation. It was suggested that there could be guidelines to ensure or facilitate same-
location postings for spouses, irrespective of the organisation they work in.
iv. Other Supporting Factors
Trends are changing, nevertheless, there are still relatively fewer women than men joining the companies at the entry level especially in the technical fields. To encourage more women at the time of induction, it was suggested that companies give more publicity to their recruitment process and make prospective candidates aware of the organization’s commitment to gender diversity and its “women friendly work environment”. This may attract more women to the company and enable it to expand the base of the pipeline. It was also suggested that to influence other women to aspire for career advancement, the company should recognise the exemplary performance of women employees.
C. Key Informant Interviews (KIIs)
During KIIs, the FGD take-away points were shared with the respective top and senior management in 14 PSUs. Unequivocally, the leadership and the senior management interviewed as part of KIIs while acknowledging women as having the talent and potential to career development, reiterated that their organizations and its policies are “gender neutral”, where merit overrides gender to achieve organizational goals and targets. The following 10 core points emerged from the KIIs.
i. Without ambiguity, those interviewed, especially CMDs and Heads of HR, stated that their respective companies are highly supportive organisations. In no manner, whatsoever, are women deprived of any opportunity. Rather, there is equal opportunity for women as far as training, job opportunities, assigning different tasks and promotions were concerned. Women employees are treated at par with men employees in every field. Women are also part of various committees constituted within the company.16
15 In some PSUs, there was a contention that by focusing on what hinders women’s career and what ought to be done to advance their careers, there is a tendency to overlook those male employees who may be facing similar hurdles as women do, owing to their family situations (such as having aged parents to care for; being a single parent or a wife posted elsewhere).
16 In some companies, such as Oil and Natural Gas Corporation (ONGC) Limited, women are also part of all selection boards and committees.

58 Labour & Development
ii. Further, companies have well defined promotional policies,17 also, all positions at higher levels are well-defined. Hence, it leaves no scope for discrimination.
iii. There was a clear cut emphasis that leadership does not depend on gender. As clearly stated by a CMD of one of the PSUs, “Definitely, for a company to succeed and retain its competitive edge, it should cut across all demographics when considering people for leadership positions. To drive organizational performance, efficiency, excellence and competence should precede gender, as well as other demographic categories in the company.”
iv. It was noted that though women continue to be more visible or prefer office or desk jobs (such as HR, corporate communication, finance, IT/information systems) – more so because they often find it harder to adjust to shift duties or odd timings; the trend nevertheless is changing – though slow. It was shared by multiple senior management staff that nowadays women are recruited in all disciplines including geology, electronics, electrical and construction; they are working in remote and offshore locations as well.18 This is a positive change.
v. All PSUs promote training and skill upgrading opportunities to all levels of
employees. Some PSUs have a “systematic talent management schemes”. Over and above specialised training programmes for all employees, certain special programmes for developing women managers are organized to enhance their managerial effectiveness and contribution towards the organization. 19 Apart from training, women are also provided with various opportunities for growth and development like challenging assignments, projects or postings within the company and experiential learnings through collaborator site visits. 20
vi. It was also contended by top management that though everything need not necessarily translate itself into a written policy document, companies are sensitive towards their women employees. They are not averse to career hindrances that are likely to emanate from women’s life cycle choices. Hence, they are considerate and try to accommodate as far as possible need based requests of women employees. However, nothing can be done by keeping organisational needs at a disadvantage.21
vii. Women respondents under the KIIs in particular said a lot depends on women themselves to maintain a healthy work-life balance. They felt that the onus also lay on women how they wish to change perceived notions by men: “women think more emotionally and cannot make
17 At NHPC, the CMD articulated a key point about promotions. In a company like NHPC, policy requires staff to have served at field locations to gain eligibility for higher level promotions. Field postings are mandatory for personnel to understand the core work of the company and on-the-ground challenges. Field postings are located in remote or dense, hilly areas. NHPC has had instances where a woman employee declined a posting to a field site, thereby foregoing a promotion. The management can dialogue with the candidate to reason out the matter, but, as the CMD shared, it is difficult to dialogue over a field posting because it is a pre-requisite. Women employees do not deny importance of field postings, but they say that woman usually decline a posting because of family responsibilities. They requested that management consider giving them a timeline within which to take up the posting so that their promotions are not affected. This means, if a woman is offered a field posting when she is at E6 but she declines it; her promotion to E7 must not be withheld, but the company can give her a time period within which she must take the mandatory field postings. Women also requested that the required postings be divided into shorter phases rather than requiring a posting for two years or so.
18 In Airports Authority of India, women are now part of fire-cadres. Earlier, this job was not open to women candidates.
19 In PSUs like BHEL, since Subordinate Development is a key BHEL competency, women employees are also assigned as mentors to hone their coaching skills and develop them as leaders.
20 In addition, in almost all PSUs it was noted that PSUs promote equal opportunities during recruitment; also they have policies in place like child-care leave policy and fully paid maternity leave. That furthers the interest of women employees. Besides, there are Internal Complaints Committees to prevent sexual harassment at workplace.
21 For instance, flexible work arrangements came up as an enabling factor in the FGDs and the online survey. However, it was suggested by top management that not all kind of jobs – especially the technical ones or onsite jobs – also the ones which may complement such jobs - can promote such flexible arrangements. However, in some other instance, considerations are possible and have been shown. For instance, in PSUs such as the Airports Authority of India, if a female staff is posted to a remote location (which is rare as Airports are typically easily accessible cities/outskirts of cities) - from a city, where she resides with her family, she can keep her accommodation for the duration of her posting.

Women in Leadership and Management in Public Sector Undertakings in India 59
hard choices”; or “women do not keep themselves updated and tend to lag behind.” They opined, men may be more career oriented than women but it is not right to say that women cannot make hard choices. Rather, they not only can make hard choices but also make transformative choices. What facilitates women’s upward mobility depends much on women’s self-confidence and determination. However, this is not to imply that companies negate their responsibilities to create conducive environment for women’s talent pool to get recognized, grow and expand.
viii. Gender diversity definitely speaks a lot about the organisational culture. Many also believed that it is a key driver of growth as women bring with them a unique set of personality traits which helps in creating balanced leadership. But presently, there was a difference of opinion among various interviewees, whether measuring organizational performance must include gender diversity as one of the parameters. The main reason cited was when company’s targets are being well met, just because of less number of women employees, the company must not score low on any evaluation chart.
ix. It was also suggested during the KIIs that ‘mind-set issues’ are not just at the company level. The lower participation of women in the workforce has social rooting. The point is, at the social level too, a lot needs to be done and changed. The entire onus of changing mind-sets cannot be put on companies and their management.
x. Finally, all the CMDs interviewed agreed that considerable headway has been made, though it may take some time to reach a scenario where we have almost equal representation of women in various disciplines at different levels. So, what can be said aptly is, “the cracks might be bigger – as the speed of change has increased - but the glass ceiling is still not shattered”. It may take some time before the ceiling is non-existent.
The male employees through the FGDs, and the senior management and key decision makers in the company through the KIIs unambiguously
reiterate that no company policy is discriminatory. Rather, all are gender neutral.
No gender pay gaps in PSUs is definitely indicative of a gender neutral policy; also the fact that all PSUs follow open recruitment; promotions at higher levels are merit based with everyone eligible having equal opportunities. Appreciating the positives, it is necessary to nevertheless note that gender-neutral policies do not necessarily promote substantive gender equality as indicated by the skewed percentage of women in the leadership ladder.
Deliberations and interactions during FGDs and KIIs reaffirm that organisations must show their intention to recognise women as a talent pool and effectively use this talent pool.
This is possible by creating a robust system that nurtures their potential, and focuses on their competency building. This further calls for proper succession planning of women employees starting from the entry level and identifying the talent pool to groom them in their career advancement. At the entry level, organisations may need to make a conscious effort to draw more women into the organisation so that there is adequate number of women who can be groomed for board level or higher level posts.
4. RECOMMENDATIONS
The study pointed out that it is not sufficient to underline organisations as being gender neutral. Organisations have to show their intention to recognize women as a talent pool and effectively use this talent pool by creating a system that nurtures their potential, and focuses on their competency building.
The 19 recommendations that the study put forth can be divided into four broad categories.
22 These include:
22 In October 2000, following a roundtable between ILO and SCOPE, a “Model Guidelines for Company Policy on Gender Equality” was drafted. A few of the recommendations mentioned herein were part of the model guidelines. SCOPE circulated the guidelines to its members. However, as participants in this study noted, without specific guidelines issued by the Department of Public Enterprises in the Ministry of Heavy Industries and Public Enterprises, any structural changes in line with gender parity are unlikely to be introduced in any PSU.
60 Labour & Development
I. Improving Organisational Work Structure
1. Use a competency mapping system for all functions and for all levels. It will help in developing a talent pool of women and men for leadership roles.
2. Conduct proper succession planning starting from the induction level and identify the talent pool of women future executives to groom in their career advancement.
3. Implement a job rotation policy for all employees. Job rotation ensures that women and men have exposure to all the functions of the organization including exposure to mainstream functions such as project management, site postings and marketing.
4. Ensure a critical mass at the entry level so that there are adequate numbers of women who can be groomed for board level or higher level posts.
5. Ensure the participation of female representative in all committees of the organization.
6. Ensure the previous year’s rating is protected so as not to affect promotion upon resuming duty, after a career break (such as maternity leave; child-care leave).
7. Make provisions for flexible working hours or work from home arrangements not on a continual but on a need basis; or during specific life cycle periods.
II. Strengthening Basic Necessities and Facilities
8. Introduce child-care leave and paternity leave at par with Central Government regulations.
9. Provide facilities such as a crèche; also, late hour transportation for all employees, wherever necessary.
10. Introduce aged parents care leave.
11. Ensure proper water, sanitation and hygiene facilities in field sites and locations. Even if such sites currently have no women employees; women employees may have to visit the site for work.
12. Give preference to women employees posted or transferred to different stations or sites in terms of allotment of official residential accommodation.
III. Sensitization at All Levels
13. Make provisions for mandatory rather than one-off gender sensitization trainings cutting across all levels.
14. Create a task-force to identify all functions and locations where women employees’ skill sets can be optimally used within the existing set-up.
15. Promote structured trainings for skill upgrading at various levels, for all employees.
16. Ensure or facilitate same-location postings for spouses, irrespective of the organization.
IV. Other Supporting Factors
17. Give more publicity to the recruitment process to make prospective candidates aware of the organization’s policy on gender diversity and its “women friendly work environment”. This purpose is primarily to attract more women to the organization - to expand the base of the pipeline.
18. Recognize the exemplary performance of women within the organization.
19. Provide for mid-career interventions in the form of coaching, mentoring, also counselling if needed, for motivating future women leaders.
Promoting women in management and leadership positions in PSUs require a shift towards explicitly putting policy into practice – that harnesses the collective intelligence, creativity, and imagination of employees – both women and men, at all levels. The findings of the study revealed the need for positive initiatives, besides facilitating continued dialogues and discussions within PSUs.
5. POST-STUDY INITIATIVE
As a follow up to the study, and as an immediate initiative, SCOPE created a body of champions, both women and men from within its member

Women in Leadership and Management in Public Sector Undertakings in India 61
organizations, who have been successful in overcoming some barriers, or are known for their exemplary performance. The ILO trained these champions. Following their training, the champions became a task force that conducts gender training and sensitization sessions focusing on equal opportunities for career advancement in different PSUs.
In August 2020, a new study initiative has been undertaken by SCOPE-ILO. Exploring the possibilities of Working from Home (WfH) arrangement was one of the key recommendations of the SCOPE-ILO study which received a fair share of arguments and counter-arguments. In the wake of COVID-19 declared pandemic, the option of WfH became inevitable bringing out a new dimension to the workplace culture of organisations. During the lockdown period, PSUs too in India like all other big or small companies in India or globally adopted the “WfH” work arrangement. SCOPE-ILO has signed a new MoU to undertake a further study to investigate this new work arrangement: how effective was it? What are the experiences of the PSUs? What are the challenges women in leadership and management in PSUs faced working from home? Has it exposed issues of work life balance? Can WfH option now become a long term sustainable option? etc.
REFERENCESCatalyst (2007), The Double-Bind Dilemma for Women
in Leadership: Damned if You Do, Doomed if You Don’t, http://www.catalyst.org/system/files/The_Double_Bind_Dilemma_for_Women_ in_Leadership_Damned_if_You_Do_Doomed_if_You_Dont.pdf
Chartered Institute of Personnel and Development (CIPD) (2016), Why are there so Few Women at
the Top?, Chartered Institute of Personnel and Development Submission to the Women and Equalities Select Committee, UK. https://www.cipd.co.uk/Images/why-are-there-so-many-women-at-the-top_2016-april_tcm18-14006.pdf
Government of India (2019), The Public Enterprises Survey 2018-19, Vol I, New Delhi.
International Labour Organization (ILO) (2015), Women in Business and Management: Gaining Momentum, Global Report, http://www.ilo.org/wcmsp5/groups/public/---dgreports/---dcomm/---publ/documents/publication/wcms_316450.pdf
McKinsey (2008), Women Matter: Women Leadership, A Competitive Edger for the Future, https://www.mckinsey.com/~/media/McKinsey/Business%20Functions/Organization/Our%20Insights/Women%20matter/Women_matter_oct2008_english.ashx
McKinsey (2016), Women Matter 2016: Reinventing the Workplace to Unlock the Potential of Gender Diversity, https://www.mckinsey.com/~/media/mckinsey/global%20themes/women%20matter/reinventing%20the%20workplace%20for%20greater%20gender%20diversity/women-matter-2016-reinventing-the-workplace-to-unlock-the-potential-of-gender-diversity.ashx
Organisation for Economic Co-operation and Development (OECD) (2016), Improving women’s access to leadership: What works? Background Report for a Conference on improving women’s access to leadership, 08 March, 2016, Paris, https://www.oecd.org/daf/ca/OECD-Women-Leadership-2016-Report.pdf
World Bank (2017), Precarious Drop: Reassessing Patterns of Female Labor Force Participation in India, Policy Research Working Paper No. WPS8024, Washington D.C.: World Bank Group, http://documents.worldbank.org/curated/en/559511491319990632/Precarious-drop-reassessing-patterns-of-female-labor-force-participation-in-India

WORLD OF WORK AND LABOUR IN THE TIME OF COVID-19 AND RISE OF ROBOTICS ARTIFICIAL INTELLIGENCE: A CRITICAL QUEST
Manoj Kumar Jena∗
“In anatomical perception, death was the point of view from the height of which disease opened up onto truth; the life/ disease/death trinity was articulated in a triangle whose summit culminated in death; perception could grasp life and disease in a single unity only insofar as it invested death in its own gaze”.
Michel Foucault (1976:159)
In the time of unprecedented crisis we all are standing in a new juncture of human history and looking towards tomorrow with fear and anxiety. It seems suddenly the unstoppable civilization has put its emergency break. The sky is calm and clean, the roads are sleeping, and there is uncertainty and risk in every sphere of our life because of COVID-19 which is popularly known as the corona virus. It was originated in the Wuhan city of China and has spread to the entire world population. In this context of fear and anxiety of disease and rise of robotic artificial machine, this paper critically tries to study the change through two factors; disease and technology. This paper is divided into three segments; the first segment of the paper tries to understand the impact of COVID-19 on work and labour. The second part of the paper tries to explore the rise of the artificial intelligence robot and the question of technology and work since the industrial revolution. The third part of the paper tries to understand how disease and technology together are impacting the world of work and labour. This is a theoretical paper based on secondary data drawn from different sources.
Keywords: COVID-19 and Labour; Technology and Work; Robotics; Artificial Intelligence
1. INTRODUCTION
The contemporary uncertainty and risk has opened up new questions in our social imagination. Not only Sociologists but to a large extent, all Social and Natural Scientists are engaged to unravel the crisis emerging because of COVID-19 i.e. Corona virus. This is an important and pertinent question that needs to be understood and addressed. Here, in this paper, my quest is to know how our life world is fast changing because of the fear and spread of Corona virus. One can visualise a sudden shock caused due to the disease and the rise of machine Intelligence with the “surveillance capitalism” which would be a critical turning point in human history precisely the world of work and labour. “Due to its global character, the ongoing coronavirus epidemic often provokes the comment that we are now all in the same boat” (Z iz ek, 2020:31). The birth and the spread of the disease created shock waves around the world with every one looking towards various alternatives to survive. During the Corona
time, dependencies on technology has become multifold. The information communication technology/internet have had massive supporting force for socio economic activities. Dependency on Information Communication Technology (ITES) has gone to the next level in the society during the lockdown period. Though cyber technology is generally considered as a ‘healer’ yet it has a grey side as well. Over dependencies on technology has a double-edged implication; as liberator and controller.
It is argued that, since the very beginning of scientific and industrial revolution, human being has been confronting various questions of change for better and worst. They have been negotiating with the conditions of change since long. Similarly, today we are visualizing a reality which is fragile and fluid on the basis of disease and new technology. Zygman Bauman rightly argues “It would be imprudent to deny, or even to play down, the pro found change which the advent of ‘fluid modernity’ has brought to the human condition. The remoteness
∗ Associate Professor, Centre for the study of Social Systems, School of Social Sciences, Jawaharlal Nehru University, New Delhi. E-mail: [email protected]
Labour & Development, Vol. 27, No. 1, June 2020

World of Work and Labour in the Time of COVID-19 and Rise of Robotics Artificial Intelligence: A Critical Quest 63
and unreachability of systemic structure, coupled with the unstructured, fluid state of the immediate setting of life-politics, change that condition in a radical way and call for a rethinking of old concepts that used to frame its narratives”(Bauman, 2000:9). Now, a new wave of risk tendencies is emanating in work activities and labour relations due to the disease and the rise of Robotics Artificial Intelligence.
Many commentators argue, modernity and late modernity have brought many changes in society including ambivalence. It is true that we all have entered in to a new juncture of our life history, the future is fragile; uncertain disease and technologies have encompassed us, truly we are in a threshold of our socio-economic life. This is indeed a critical time for human history, human species struggling with absolute chaos. In the phase of Corona crisis as result of lock down we all are confined inside the four walls of the house in a stand still situation. The livelihood crisis of informal workers pushes them to move here and there in search of employment opportunities. COVID-19 has impacted the very existence of life; health of human life and the health of the economy unprecedentedly. Both micro and macro economic activities have been affected thereby altering industrial relations and production activities. Informal workers are forced to leave urban centers due to compete shut down of economic activities. Primary, Secondary and Tertiary sector of the economy have been directly and indirectly affected by COVID-19. The crisis has intrinsically impacted each and every one from top to bottom of our social structure.
2. DISEASE AND WE: CASE OF COVID-19
As Slavoj Zizek says “The only thing that is clear is that the virus will shatter the very foundations of our lives, causing not only an immense amount of suffering but also economic havoc conceivably worse than the Great Recession. There is no return to normal, the new “normal” will have to be constructed on the ruins of our old lives, or we will find ourselves in a new barbarism whose signs are already clearly discernible” (Zizek,2020:3). Zizek’s concern can be conceivable with current situation; it is visible in the initial global trends in terms of loss of livelihood. There is an apprehension that major
economic slowdown is coming soon. The global economic indicators are showing some worry and some drifts. There is an anticipation that the global industrial output and global trade as well as Gross Domestic Product will decrease. According to the World Trade Organisation’s (WTO) press relese on 8th April, 2020 “World trade is expected to fall between 13% and 32% in 2020 as the COVID-19 pandemic disrupts normal economic activity and life around the world”1. As per News published in Indian Express on 30th April, 2020, “the ongoing economic disruption due to Covid-19 is likely to result in a permanent loss of 4% of gross domestic product for India”2.
Each and every one around the globe is passing through severe turning point to survive. The labour have been affected badly, loss of employment and lack of demand in the job in market are witnessed. It is an unquestionable fact that Covid-19 pandemic has created challenges to the livelihood protection of not only the marginal migrants workers but also of the larger segments of both formal and informal sectors. The International Labour Organisation (ILO) has also raised concern about the impact of virus on informal labour force, and reported that “Not working and staying home means losing their jobs and their livelihoods. To die from hunger or from the virus is the all-too-real dilemma faced by many informal economy workers”3. ILO also further highlighted on informal sector and loss of work activities. The vulnerability is rising because of the spread of disease as well as lack of social security provision for broader line workers. The disease has also opened up a pandora box of critical questions about social security and health security in the informal economy.
This is loud and clear that the COVID-19 will revamp the world of work and labour. On the basis of initial economic indicators, one can argue that it will directly affect the livelihood of larger workers around the world. ILO Monitor: COVID-19 and the World of work: Fourth Edition published on 27 May, 2020, highlights “Lost working hours in the first half of 2020 continue to reflect a severe impact on employment. Young people are facing multiple shocks from the COVID-19 crisis, which could lead to the emergence of a “lockdown generation”. Unprecedented

64 Labour & Development
losses in working hours in the first half of 2020. Youth unemployment is rising faster and by a greater amount during the COVID-19 crisis”4. “There is widespread agreement among economists that it will have severe negative impact on the global economy. Early estimates predicated that, should the virus become a global pandemic, most major economies will lose at least 2.4 per cent of the value their gross domestic product (GDP) over 2020, leading economists to already reduce their 2020 forecasts of global economic growth down from around 3.0 per cent to 2.4 per cent” (Mishra, 2020). This is indeed a problematic situation as risk and inequality are inevitable.
2.1 Negotiating with Alternatives
One basic question which is bothering all of us is that, What would be the alternative? Now, at the time of Corona crisis the world is exploring alternatives to boost productivity by subsiding the disease and continuing production activities. The Capital/transnational-capital is exploring options to minimize the human interferences in the production activities. Hence, the alternative is Robotic Artificial enabled tools.
As per MIT Technology Review, 2020 ,following three important key points about how the industry is appropriating Artificial Intelligence (AI) enabled tools to increase productivity in the time of Covid-19, 5.
Firstly “the growth of AI-enabled tools and processes is already having tremendous impact augmenting jobs and automating tasks across jobs and industries. Secondly Work will change, and faster—Directly related to the Covid-19 pandemic, between 32 and 50 million US jobs could be increasingly assisted by technology to reduce health risks posed by human interaction and safeguard productivity in a time of crisis. Thirdly New technology maps—Rarely, if ever before, have business managers navigated such a confluence of events as the Covid-19 outbreak is triggering today, which combines immediate social and economic shocks with potentially repositioning the technology roadmap for their business around AI, automation, and the future of work” (MIT Technology Review Insight, 2020).
This is an important sign of paradigm shift of work and labour activities around the world.
These initial trends more and less will diffuse all around the world to all sectors of the economy. No doubt, this will increase the uncertainty in employment relations, labour problems and inequality to a large extent.
It is a fact that, whenever there is any technological change in industrial relations, it has directly impacted labour relations. Hence, it is essential to understand whether introduction of Robotics Artificial intelligence will accelerate crisis and risk or it will mitigate the problems? Many social scientists have also opined that a wave of change is coming soon. Kalleberg & Berg argue “it is widely agreed that technology and automation have and will continue to alter the conditions and nature of occupational activities in fundamental ways, though there are disagreements over how fast these alterations take place and about the potency (or impotence) of forces targeted on softening their effects. The question is whether these changes have created skilled “knowledge” workers, “deskilled” servants of machines, or a combination of the two” (Kalleberg & Berg, 1987:85). This is not at all a new debate, in fact, since the very beginning of industrial revolution, the machine and technology has brought vast changes in socio-economic as well as the geo-political structure. “Industrial Revolution’ was a total break with all past human history, for instance inanimate sources of power, rapid transportation, media of instant communication, the separation of work from leisure, are revolutionary innovations”( Brown &Harrison, 1978:14). That changed the way in which we work and live. This event and various occurrences had changed the labour conditions, intense division of labour and rise of capital and control was materialized, specialization and occupational segregation has happened. Emile Durkheim, Karl Marx and Max Weber all have minutely analyzed the changing reality during the 18th and the 19th century. Various model and theories were put forth on questions of work, labour and capital like scientific management to human relations, occupational order to bureaucratic principles, structural contradiction to new technological power etc. which were vibrant issues in our disciplinary boundary. Since the very beginning of industrial capitalist society, work, labour, occupation, organization, technology and employment have been a topical issue.

World of Work and Labour in the Time of COVID-19 and Rise of Robotics Artificial Intelligence: A Critical Quest 65
3. MACHINE TECHNOLOGY AND WORLD OF WORK: INDUSTRIALISM, POST INDUSTRIALISM AND ROBOTICS ARTIFICIAL INTELLIGENCE
Before discussing about Robotics Artificial intelligence it is essential to understand the social historical genesis of machine technology and its associated problems. It is largely accepted fact that science and technology has played a significant role to reshape the industrial relations and production process including labour relations. There are always contestations and contradictions within the technological paradigms and its impact on the industry, work and labour. This is also evident since very beginning of industrial revolution, the application of technology have impacted the labour relations and employability. For instance in the 1820s and 1830s, there was a rapid and large-scale shift as the power loom was adopted for weaving, with the result that hand- loom weavers experienced extreme pressure on wage levels, such that for many, the occupation became economically hopeless. Their numbers fell from around 250,000 in 1820 to 40,000 in 1850. (More, 2000:53). In a sense, this is a classic example that how the introduction of technology creates technological unemployment.
Many theorists have predominantly argued that technology has brought metamorphosis in different layers of our social structures and functions. In the Grundrisse’s “Fragment on Machines” (Marx 1857/1858b, 690–712), Marx argues that the development of capitalism’s productive forces results in an increased role of technology (fixed constant capital) and thereby historically increases the importance of science and knowledge work in the economy and society (Fuchs, 2014:38). Robert C Allen (2009), in his work “The British Industrial Revolution in Global Perspective” argues that how Britain’s high wages and cheap energy increased the demand for technology by giving British businesses an exceptional incentive to invent techniques that substituted capital and energy for labour. He does not ignore supply-side developments like the growth of scientific knowledge or the spread of scientific culture. However, he emphasize other factors increasing the supply of technology that have not received their due, in particular the high real wage
(Allen, 2009:15). Though he is not nullifying the importance of demand for product but nevertheless argues, how high wage compels to innovate machine technology is an example in case of initial stage of industrialization in Britain. Further Berg argues “The mechanization that came with industrialization was supposed to have destroyed many of the widespread family-based women’s trades” (Berg, 1994:131). The wage and labour was very much a contested question at the time of industrialization process.
In this context, Sabel argues “the evidence is that the discovery of basic principles of machine design, their application to large- or small-scale industrial production, and the creation of efficient managerial techniques were all independent of the creation of the factory system by nineteenth-century capitalists” (Sabel, 1984:39). These developments were the turning point in work culture and dawn machine innovation that has brought massive transformation in every sphere of industrial activities. Similarly Karr and others have also argued in the case of “logic of industrialism that industrial society is associated with level of technology and science and technology of industrialism, axiomatic frontier of knowledge and investment in equipment, machinery as well as accumulation of capital in massive scale” (Karr. C et al, 1960:3-4). All these technological developments and rise of capitalism have changed the socio- technological systems.
3.1 Post Industrial Society and Beyond
Daniel Bell (1973) in his work “The Coming of Post-Industrial Society: A Venture in Social Forecasting argues “the spread of computer-aided design in manufacture, as well as the merging of communications systems, what comes to the fore is “intellectual technology” (based on mathematics and linguistics), which uses algorithms (decision rules), programming (software), models and simulations, in the running of the new “high technology.” (Daniel, 1973: 30-31). Post Industrial society is more about service, information and technology mobilization and networks. Post Industrial development wide spread application of informatics gave birth to new kind of class of workers particularly knowledge worker/information workers. What

66 Labour & Development
Manuel Castells argues about “Informational Capitalism”.
Since the emergence of networks and interconnected nods we have been experiencing risk and uncertainty in all sectors of our economy. Our social life and employment relationship and occupational structure have become more and more complex and fluid. As Bauman argues “The present-day ‘liquefied’, ‘flowing’, dispersed, scattered and deregulated version of modernity may not portend divorce and the final break of communication, but it does augur the advent of light, free-floating capitalism, marked by the disengagement and loosening of ties linking capital and labour” (Bauman, 2000:149).
Fuchs also argues that “The rise of computer technology and computer networks (such as the Internet) has enabled the convergence of media and machines—the computer supports cognition, communication and cooperative labour (production); it is a classical medium and a classical machine at the same time. Furthermore, it has enabled the convergence of production, distribution (communication) and consumption of information—you use only one tool, the networked computer, for these three processes” (Fuchs, 2014:336).
In a phase of transnational flow of everything including knowledge, labour, advance contemporary technology to “Surveillance Capitalism”, what Shoshana Zuboff, argues under surveillance capitalism the “means of production” serves the means of “behavioral modification”. Machine processes replace human relationships so that certainty can replace trust. This new assembly relies upon a vast digital apparatus, world-historic concentrations of advanced computational knowledge and skill, and immense wealth (Zuboff, 2019).
In the question of modernity and work and labour, Bauman argues
“The disembodied labour of the software era no longer ties down capital: it allows capital to be exterritorial, volatile and fickle. Disembodiment of labour augurs weightlessness of capital. Their mutual dependency has been broken unilaterally; while the capacity to labour is as before incomplete and unfulfillable if left alone, and
dependent on the presence of capital for its fulfillment, the reverse does not apply any more. Capital travels hopefully, counting on brief profitable adventures and confident that there will be no shortage of them or of partners to share them with. Capital can travel fast and travel light and its lightness and motility have turned into the paramount source of uncertainty for all the rest. This has become the present-day basis of domination and the principal factor of social divisions”(Bauman, 2000:121).
One can easily perceive that unanticipated change is happening in every sphere of industry, work and labour. Now, we will specifically deliberate more on the question of robotic artificial intelligence. Since Artificial intelligence will be a predominant phenomena for tomorrow and for future of the world of work, here, I am using tomorrow’s work because we have already entered into to new kind of work culture which was termed as future of work. John Danaher rightly argues “Machines are being created to anticipate our wants and needs and provide us with all the entertainment, food, and distraction we could ever desire. Soon, there will be little left for us to do except sit back and enjoy the ride. We are moving from the anthropocene to what might be called the robocene” (Danaher, 2019:2). Now, we have entered in to a another technological age that is rise new machine.
4. ROBOTICS ARTIFICIAL INTELLEGENE AND FRIGHTENED TOMORROW
New techo-culture particularly advent of Artificial intelligence, particularly the introduction of Artificial Intelligent Robot will augment a new battle field in the world of work soon. This is an undeniable fact that COVID-19 will intensify the velocity of the application Robotic AI in various sectors of the economy. There is a unprecedented, intended and unintended consequence coming soon in terms of work and labour.
It is a futurist anticipation that Artificial Intelligence Robot will replace human labour and there have been signs of it in the manufacturing and service sector. In an interesting reading by Kartik Hosanagar “A Human’s Gudide to

World of Work and Labour in the Time of COVID-19 and Rise of Robotics Artificial Intelligence: A Critical Quest 67
Machine Intelligence, its about How algorithms are shaping our lives and how we can stay in control”
“ As modern algorithms have incorporated more Artificial Learning and machine learning , their capabilities and their footprint have expanded. They now touch our lives every day, from how we choose products to purchage (Amazon’s “People who bought this also bought”) and movies to watch (Netflix’s recommendations) to whom we date or marry (Match.com or Tinder matches). They are also advancing beyond their original decision support role of offering suggestions to become autonomous systems that make decision on our behalf. For example they can invest our savings and even drive our cars. They have also became fundamental part of the workplace, advising insurance agents on how to set premiums, helping recruiters shortlist job applicants, and providing doctors with Artificial Intelligence based diagnostic guidance. Algorithms are irrevocably upending old ways of decision making, transforming how we live and work”(Hosanagar, 2019:6-7)
Similarly, the rise of machine particularly Al: Robot revolution. John Hudson (2019) “The Robot Revolution: Understanding the Social and Economic Impact argues “artificial intelligence, offer tremendous hope for humankind…. And yet people are concerned that in the end robots will not lead to this vision of nirvana, but create inequality and unemployment; that they will help to destroy democracy and open the way to a surveillance state, increased criminality and lead to robot wars” (Hudson, 2019: xv). It is a pertinent question raised by Hudson about what would be the future of mankind in terms of employment and situation of war? Though we have already entered into a new phase of cyber war.
Similarly Darrell M. West (2018) argues “Robots, autonomous vehicles, virtual reality, artificial intelligence (AI), machine learning, drones, and the Internet of Things are moving ahead rapidly and transforming the way businesses operate and how people earn their livelihoods. For millions who work in occupations such as food service, retail sales, and truck driving,
machines are replacing their jobs. There already is evidence of this happening with blue-collar jobs, but the impact is starting to be felt by the white-collar workforce as well.” (West, 2018: 23). One can see there is a direct relationship and impact on world of work and labour.
Furthermore John Hudson (2019) goes on to substantiate his argument that in 2016, the majority of new industrial robots were in just two industries: automotive industries (35 per cent) and electrical/ electronics (31 per cent). But there are also a growing number of service robots and this might well be where the future growth potential lies. (Hudson, 2019:29). In the automobile industry, they are dominant and have replaced large numbers of human workers (Hudson 2019:33). Roughly half of all the robots in the world are in Asia, 32 per cent in Europe, 16 per cent in North America, 1 per cent in Australasia and 1 per cent in Africa – 40 per cent of the world’s robots are in Japan (Hudson, 2019:28) Firstly, the possibility that robots are causing unemployment and, secondly, that they are adversely affecting the living standards of at least some people in society, possibly widening inequality (Hudson, 2019:64).
He further highlighted and categorized about Robot for instance industrial robot, ware house robot, agricultural robot, caring robot (service robot), Medical robot, robots in education, robot security, robot soldier. He argues Robots will increasingly replace humans in their activities, but more than that they will increasingly do jobs humans just cannot do” (Hudson, 2019:45).
In fact what Mokyr argues and Berg cited, the debate about “technological inertia” the “anti-technological ideology and state incentive to protection technological creativity” (Mokyr, 1992 cited in Berg, 1994:156) in the context about resistance to technology. Berg (1994) argues that “Resistance to technology was an aspect of the very structure of industrialization; in the industrial sector, above all, this was marked by unevenness and division. Divisions in experience and reception at the regional and local level were not just about factors of environment and local economy—they were also about the social and

68 Labour & Development
economic structure of industry in different places and, equally significantly, about the differences in community structures and traditions” (Berg, 1994:156). Now, whether the same old debate will regenerate or disappear, it’s an issue for further exploration about unemployment, right to work and the question of inequality
5. DECONSTRUCTION OF DISEASE AND TECHNOLOGY: CONCLUDING REMARKS
In Salvoj Z iz ek’s word, “Today, however, in the midst of the coronavirus epidemic, we are all bombarded precisely by calls not to touch others but to isolate ourselves, to maintain a proper corporeal distance. What does this mean for the injunction “touch me not?” (Zizek, 2020:1). If we will deconstruct the disease (COVID-19) and technology (Robotics AI), one can visualize sort of new trends is emerging in the frontiers of world of work, a negotiation and negation process is on by the capital to continue its empire. Here it is important to read the implication of convergence as well as negotiation of disease and technology for work and labour. What would be the future of labour force. It seems that disease and technology have joined together to conquer and annihilate the human species. If it is so it will create havoc in our world order. As Heidegger recognized various dangers that are associated with the growth of modern technology especially the ‘thingification’ and uprooting of man as well as dislocation of nature, among other things (Okoro, 2016: 410). The new post pandemic world would be different, it will change how we live and work. It is quite clear that Artificial intelligence and automation will encompass the economic structure. The disease has compelled and pushed industry to navigate from the crises through less human interference hence Robotic AI is the alternative for productivity. The capital never tolerates the loss, hence it will look for alternative to reboot productivity and profit. Further, the question of capital, work and labour will occupy a dominant position in our disciplinary boundary.
The global social order is in a phase of continuous negation for bringing equilibrium, but the task is not easy at all. The Covid-19 and new technological machine will transform the global economic activities and alter bio-politics. Further, new unpredictability will emerge because of global
dependencies for which adequate preparedness is required.
REFERENCESAllen R.C. (2009), The British Industrial Revolution in
Global Perspective, UK: Cambridge University Press.
Bauman, Zygmunt (2000), Liquid Modernity, UK: Polity Press.
Bell, Daniel (1973), The Coming of Post-Industrial Society: A Venture in Social Forecasting, Harmondsworth: Penguin.
Berg, M. (1994), The Age of Manufactures, 1700-1820: Industry, Innovation and Work in Britain, London: Routledge.
Brown, D Harrison, Michael J. (1978), A Sociology of Industrialisation: An introduction, UK: Macmillan Education.
Danaher, J. (2019), Automation and Utopia: Human Flourishing in a World Without Work, Cambridge: Harvard University Press.
Foucault, Michel (1976), The Birth of the Clinic: An Archaeology of Medical Perception: UK: Routledge.
Fuchs, C. (2014), Digital Labour and Karl Marx, UK: Routledge
Hosanagar, Katik (2019), A Human’s Guide to Machine Intelligence, India: Penguin.
Hudson, J. (2019), The Robot Revolution: Understanding The Social And Economic Impact, UK: Edward Elgar Publishing.
International Labour Organization (ILO) (2020), ILO Monitor: COVID-19 and the World of Work, Fourth Edition.
Kalleberg, Arne. L and Berg, I. (1987), Work and Industry Structures, Markets, and Processes, USA: Springer.
Kerr, C., Dunlop, J. T., Harbison, F., and Myers, C. A. (1960), Industrialism and Industrial Man, International Labour review, 82(3), September.
Marx, Karl (1857/1858b), Grundrisse, London: Penguin.
Mishra, Mukesh Kumar (2020) , The World after COVID-19 and its impact on Global Economy, ZBW – Leibniz Information Centre for Economics, Kiel, Hamburg
Mokyr, J. (1992), ‘Technological Inertia in Economic History’, Journal of Economic History, 52(2):325-338.
More, C. (2000), Understanding the Industrial Revolution, London: Routledge.
Okoro, T. D (2016), Modernity and Destining of

World of Work and Labour in the Time of COVID-19 and Rise of Robotics Artificial Intelligence: A Critical Quest 69
Technological Being: Beyond Heidegger’s Critique of Technology to Responsible and Reflexive Technology, New York: Peter Lang Edition.
Sabel, Charles F. (1984), Work and Politics: The Division of Labour in Industry, Cambridge: Cambridge University Press.
West, Darrell M. (2018) “The Future of Work, Washington, D.C.: Brookings Institution Press.
Ziz ek, Slavoj (2020), Pandemic: COVID-19 Shakes the World, New York: OR Books.
Zuboff, Shoshana (2019), The Age of Surveillance Capitalism: The Fight for a Human Future at the New froNtier of Power, New York: Public Affairs Books.
___________________
1. ht tps ://www.wto.org/engl ish/news_e/pres20_e/pr855_e.htm
2. https://indianexpress.com/article/business/economy/covid-19-india-gdp-loss-crisil-rating-6386222/
3. https-//www.ilo.org/wcmsp5/groups/public/---ed_protect/---protrav/---travail/documents/briefingnote/wcms_743623.pdf.
4. h t tps ://www.i lo .org/wcmsp5/groups/public/---dgreports/---dcomm/documents/briefingnote/wcms_745963.pdf
5. Please see MIT Technology Review Insights, “Covid-19 and the workforce: Critical workers, productivity, and the future of AI” is an executive briefing paper by MIT Technology Review Insights published as part of The global AI agenda series. https://mittrinsights.s3.amazonaws.com/AIagenda2020/Covid19workforce.pdf

CONTRACTUALISATION IN INDIA’S MANUFACTURING SECTOR SINCE 1991: TRENDS BASED ON ASI DATA
Bir Singh∗
With the introduction of the economic reforms in the decade of 1990s, there were many changes that dotted India’s economic landscape. Among them employment growth of the manufacturing sector is very significant. It was observed that contractualisation intensified in the manufacturing sector. This paper attempts to look into the dynamics of contractualisation in India’s manufacturing sector since early 1990s by using the Unit level data of Annual Survey of Industries. Whether it was due to policies that were pursued in the pre-reform period (1950-1990) or was it an outcome of the New Economic Policy of 1991?
Keywords: Contractualisation, Manufacturing growth, Labour legislations, Economic Reforms
1. INTRODUCTION
Casualisation and contractualisation of the workforce in the manufacturing industry has become a global phenomenon with surge of market economy since the early 1980s. India also embraced market economy model since the early 1990s which is reflected by the new economic policy (NEP) of 1991. However, even though economic growth increased relative to pre-reform period (1950-90), performance of the manufacturing sector has not improved even in the post reform period. On the contrary, informality of labour increased further in the post-reform period (after 1991).
Contractualisation across industries and states (See Table 1). The share of contract workers was about 14 per cent before the economic reforms in the early 1990s (Goldar and Sadhukhan, 2015). It grew from 16 per cent to 34 per over 1998-99/ 2013-14. This trend was fast in some industries1 and so contract workers grew very fast. However, while the post-reform policies2 continued to promote the market economy, the labour remained unprotected against instabilities of global production system.
The growth and expansion of the organised manufacturing sector is very critical for realising inclusive growth as it generates decent jobs3.
* Assistant Professor, Delhi College of Arts & Commerce, University of Delhi. E-mail: [email protected]
1 The industries such as non-metallic, coke & refined petro, other transport equipments, electrical equipments, motor vehicles, basic metals and chemicals products.
2 Privatisation, trade liberalisation, foreign investment, and financial liberalisation.
3 The United Nations Development Programme (UNDP) has defined it under Sustainable Development Goal No 8.
However, developments like declining wage share, rising capital and technology intensity, and stagnation of the manufacturing sector are not encouraging signs for improving employment quality in the sector. In absence of adequate and effective protection for contract labour, contractualisation in India’s manufacturing industry will perpetuate systemic exploitation of such workers.
Given peculiar characteristics of India’s labour market4, bulk of job growth must come from low value-added and the labour intensive manufacturing industries as happened in China in the early 1980s (Nagaraj, 2008). However, such eventuality doesn’t seem feasible since share of the labour intensive industries 5 in total firms has declined in the post reform period and share of the unorganised sector in these industries is very high. This along-with rising contractualisation and declining wage share in the organised sector do not auger well for the labour absorbing industrialisation in India (See Table 1).
The growing use of contract workers and increasing capital intensity in the manufacturing sector do not give encouraging signals for improving quality of employment growth and accomplishing inclusive growth. Even though contractualisation has increased across industry groups over the years, it was very intense in medium and high tech industries. Against this backdrop, stagnation of the manufacturing sector is worrisome for generating regular employment. We argue that labour market
4 The low content of skill and education in profile of majority of India’s workforce.
5 For instance, industries such as food processing, leather, textiles, and footwear etc.
Labour & Development, Vol. 27, No. 1, June 2020

Contractualisation in India’s Manufacturing Sector Since 1991: Trends Based on ASI Data 71
rigidity alone did not constrain the industrial growth. Rather inappropriate industrial policies since independence were instrumental in this.
This paper is organised as follows: Section 2 dwells on different labour laws that apply to the organised manufacturing sector and their undesirable impact on employment growth.
Section 3 highlights the structural weaknesses of labour in India which keep labour off the organised sector. Section 4 presents a detailed account of trends in contractualisation and their implications for inclusive growth. Section 5 carries a discussion on labour market reforms. The last section 6 concludes the chapter.
Table 1 Contract Workers Out of Total Workers (%)
Industry 1999 2004 2009 2014Low tech industriesFood products & Beverages 20 24 29 32Tobacco products 13 61 71 23Textiles 10 12 15 17Apparels, Dressing & Dyeing of fur 5 8 13 13Tanning and dressing leather 11 17 14 21Wood & products 6 15 24 29Paper & paper products 18 26 29 30Publishing, Printing & recorded 3 9 14 21Furniture & Mfg. 17 17 22 27Medium tech industriesCoke & refined petro products 20 35 56 51Basic Metals 23 28 40 45Rubber & plastics 11 20 28 37Other non-metallic products 36 40 53 61Fabricated metal products except machinery equipments 17 34 41 42High tech industriesChemicals & Chemical products 17 26 35 44Office, accounting, and computer machinery 5 18 31 34Machinery equipments 8 17 31 34Electrical equipments 11 18 34 41Medical, precision and optical instruments, clock & watches 4 10 34 33Motor Vehicles, trailers, semi-trailers 12 23 38 43Other Transport Equipments 27 23 42 48All Org Mfg. Sector 16 25 32 34
2. LABOUR LEGISLATIONS
Though the labour laws6 were enacted to protect the labour interests de jure, the growing casualisation and contractualisation indicates that they have worked contrary to their mandate de facto. The structure of these laws was created in the decade of 1940s and1950s which not only had served interests of the British, but 6 Labour laws are broadly divided into six categories
depending on their purpose: regulation of labour, protection of labour interests, related to wages, social security, welfare of labour, and work conditions. The laws with objective of labour regulation and work conditions are important from perspective of this research. The Contract Labour (Abolition and Regulations) Act, 1970 is crucial in the miscellaneous category.
also promoted notions of the Gandhian social harmony (Kennedy, 1965; Sundar, 2010).
The Constitution of India, under article 246(4) empowers the central and state governments to legislate laws to protect the labour interests. The constitutional status given to these laws has a deep meaning. Firstly, these laws are embodiment of the labour rights vis- à-vis employers. Secondly, they reflect that role of labour in nation building is very vital. Thirdly, the labour is not just a commodity but a living entity and integral part of the republic of India. Fourthly, they also show legacy of the labour movement in struggle for Indian independence. In all, these laws were

72 Labour & Development
framed to shape the labour market institutions7. We argue that their applicability to the organised manufacturing sector only led to expansion of size of the unorganised manufacturing sector.
2.1 Labour Laws and Organised Manufacturing Sector
The organised manufacturing sector couldn’t grow due to heavy burden of the labour laws apart from several other constraints. The labour market institutions in India are governed by four principal legislations (Table 2)8. In addition, the Contract Labour (Regulation) Act, 1970 governs employment and work conditions of the contract labour. Given large number of the labour legislations9 and non-uniformity in state legislations, it is difficult to protect interests of labour and ensure expansion of the organised manufacturing.
Despite large number and complexity with their overlapping jurisdictions and interpretations of these laws, contractualisation has flourished. As regards contract labour, many other industrial laws10 have provisions for contract labour in addition to the CLRA, 1970.
Table 2 Main Labour Legislations in India
Related to Industrial Relations
The Trade Union Act, 1926
The Trade Union Amendment Act, 2011
The Industrial Disputes, 1947 The Industrial Employment
(Standing Orders) Act, 1946Related to work conditions
The Factories Act, 1948
7 Trade unions, and labour legislations.8 They include: The Factory Act, 1948, the Industrial
Employment (Standing Order) Act, 1946, the Industrial Dispute Act, 1947, and the Trade Union Act, 1926.
9 In addition, there are as many as 165 labour legislations which include 35 Central Acts also.
10 They include the Factory Act, 1948; the Plantation Labour Act, 1951; the Motor Transport Workers Act, 1961; the Mines Act, 1952; the Beedi and Cigar Workers Act, 1966; the Cine Workers Act, 1981; and the Employees State Insurance Act, 1948.
The Building/& Other Construction Workers (Regulation of Employment/& Conditions of Service) Act, 1996
The Contract Labour ( Regulation and Abolition) Act, 1970
The Shops and Establishment Act, Related to wages
The Payment of wages Act, 1936
The Payment of wages (Amendment) Act, 2005
The Minimum Wages Act, 1948 The Payment of Bonus Act, 1965 The Equal Remuneration Act, 1976 The Dock Workers (Regulation of
Employment) Act, 1948 The Plantation Labour Act, 1951 The Mines Act, 1952 The Merchant Shipping Act, 1958Related to Social Security
The Workmen’s Compensation Act, 1923
The Workmen’s Compensation (Amendment) Act, 2000
The Employees’ State Insurance Act, 1948
The Payment of Gratuity Act, 1972 The Unorganised Workers Social
Security Act, 2008Related to Women and Children
The Maternity Benefit Act, 1961
The Child Labour (Prohibition/& Regulation) Act, 1986
Source: www.labour.gov.in.
However, what did lead to expansion and complexity of such laws? Partly this may be attributed to the federal nature of the country as the labour legislation is matter of both centre and states. But the larger issue is related to heterogeneity of terminologies which were often incomparable with one another.
With rapid changes that have marked global economic scenario since 1990s, these labour laws look incompatible to handle the labour market concerns that India now faces. For instance, very nature of the manufacturing production has transited in favour of contractualisation

Contractualisation in India’s Manufacturing Sector Since 1991: Trends Based on ASI Data 73
and this has rendered mandate of the Contract Labour (Regulations and Abolition) 1970 dated in many ways. Looking at global trends, the government of India has shown commitment to streamline complexity of existing labour laws11.
The policies of globalisation have caused growth of informal labour and put pressure on the labour market globally. So, many countries have amended their labour laws accordingly. The countries of the East Asia have done substantial amendments to laws relating to contract workers have been done in countries such as China, Philippines, Thailand, Indonesia, Korea, and Malaysia. These amendments were done to take care of labour interests in post globalisation era. However, with opening up of the economy, structure of Indian economy in terms of sectoral contribution of gross domestic product (GDP) has changed substantially after the reforms (1991-2019).
A limited progress has happened regarding this In India to enable labour market keep pace with changing global economic scenario. The growing share of services sector, trade volume, and increasing influence of global value chains have rendered labour laws incompatible to the reality (Krueger, 2003). Therefore, the fixed term employment has been allowed. Similar kind of dynamism is essential for other industrial laws to improve industrial relations. The Factories Act, 1948 is one of these laws.
The Industrial Employment (Standing Orders) Act, 1946 and the Industrial Disputes Act, 1947 are other such laws which provide for employment security of workers. The provisions of this Act apply to the Contract labour as well if regular workmen raises an industrial dispute in connection with contract labour provided contract between principal employer and contractor is sham12. However, the compliance of these laws has been complex and unfriendly to industrial expansion.
The compliance hassles of industrial laws prevented employers from expanding their
11 The government has introduced three of four labour codes namely The code on Wage Bill, 2017; Labour code on Industrial Relations Bill, 2015; Social Security Code in the Parliament.
12 Supreme Court judgements on International Airport Authority of India vs. International Air Cargo Workers’ Union, (2009) 13SCC 374 & M/s Indian Iron and Steel company Ltd. vs. State of West Bengal, 2011 LLR 771(Calcutta).
establishments. So, size of manufacturing sector remained small which added to labour market informality. Therefore, they must be amended so that the manufacturing performance can be enhanced to achieve inclusive growth. However, it can’t be improved just by opening the economy to foreign trade and investment. The simplification of labour laws and adopting a comprehensive policy on skill formation would have boosted growth of employment in the manufacturing sector. However, the content and orientation of policy paradigm of 1991 did not reflect such concern. On the contrary, it has got de-linked from dynamics of labour market and thus constrained shifting of surplus labour from low to high productivity sectors. China did a commendable work in this respect.
Han et al. (2011) informs that Chinese economic growth for two decades till 2010 was financed by low labour costs and labour intensive industries growth. However, violation of labour laws is common in China such as physical violence against workers, use of forced and bonded labour, lack of safety measures for labour, wages below subsistence level. Therefore, lot of labour conflicts and strikes happened. The New Labour Contract Law13, 2008 came into effect which led to lot of speculations among employers. The empirical findings confirmed that the new legislation, the new labour contract law, did not increase labour cost significantly and fears among employers were misplaced.
The move towards simplification of labour laws shows government commitment to re-solve complexity of India’s labour market. The draft four labour codes14 might become a turning point in revitalising labour market and boosting industrial growth.
According to the government these codes will benefit about 500 million workers, trade unions
13 The law comprises of provisions for fixed term labour contracts, employee compensations after expiry of labour contract, salary of probationer employees, and penalties on enterprises for any violations thereof.
14 Bills on proposed Four Labour Codes relate to Wages, Industrial Relations, Social Security, and Occupational Safety, Health and Working Conditions. The code on wages has been passed in parliament and waiting President’s approval. Other two Bills have also been introduced in the Parliament. The fourth bill, Occupational Safety, Health, and Working Conditions is yet to be introduced in the Parliament.

74 Labour & Development
and labour rights activists, such as SEWA15 have flagged their concerns regarding exclusion of informal workers as it would require their registration and defining employer-worker relations. Babu and Chirayu (2016) argues that provisions of the Industrial Relations Bill 2015 will virtually empower employers as their compliance requirements are substantially trivial. The amount of fine and penalty for violations is also very less and employers’ possibility of imprisonment has been removed. By contrast, workers would lose their right to strike and many other restrictions. It will virtually foist flexibility on India’s labour market.
On the contrary, Srivastava (2020) argues that labour reforms are essential for expansion of industrial sector provided intended amendments are done in labour codes to meet expectations India’s employers and change perceptions of foreign investors about labour rigidity in India. These amendments must not be done in haste. In addition, fiscal policy interventions must improve growth of employment in the sector. Similarly, Papola (2013) argued that labour reforms will remove sharp divide of duality in the labour market provided wage gap between regular and contract workers is removed. So, simplification and rationalisation of labour laws should lead to expansion of formal sector
and employment growth. We argue that it will enhance efficacy of laws that exist for contract workers.
2.2 Law and Policy on Contract Labour
Even as the explicit objective of the Contract Labour (Regulation and Abolition) Act, 1970 was to abolish use of contract labour, it has become a judicial apparatus to regulate contract labour. Sec.2 (1)(b) of the Contract Labour (Regulation and Abolition) Act, defines that a workman is considered as ‘contract labour’ in or in connection with such work or through a contractor, with or without the knowledge of the principal employer. The Act is an outcome of judicial intervention relating to industrial disputes. In the post-reform period, contract labour has become preferable to permanent as well as temporary worker.
There are several landmark judgements of the Supreme Court16 which have condemned the use of contract labour. The judgement of the Standard Vacuum Refining Company Ltd. held that contract labour should not be employed in works of perennial nature which can be done by employing regular workmen. The judgement provided benchmark for continuation of contract labour in an establishment, and it also laid down circumstances under which workmen of an establishment could raise industrial dispute for contract labour.
Table 3 Size Distribution of Firms by Number of Workers, 1999-2013
1999-00 2004-05 2009-10 2013-14Average Persons Worked
Number of Firms
% Number of Firms
% Number of Firms
% Number of Firms
%
Below10 32315 36.70 10,927 18.20 12,980 16.3 14,356 14.9710-20 15624 17.74 7,887 13.14 8,727 10.9 9,771 10.1920-50 14340 16.29 13,064 21.76 14,638 18.3 17,226 17.9650-100 7414 8.42 11,179 18.62 14,377 18.0 17,837 18.60Below 100 69693 79.15 43,057 71.73 50,722 63.6 59,190 61.73100-300 9,920 11.25 12,265 20.00 19,619 25.0 24,034 25.00Below 300 79,613 90.33 55,322 92.00 70,341 88.0 83,224 86.79300-500 4,030 4.57 2,763 5.00 4,725 6.0 6,144 6.41500-1000 2853 3.24 1,366 2.28 3,242 4.1 4,380 4.571000-5000 1509 1.71 524 0.87 1,362 1.7 2,036 2.125000 and above 127 0.14 54 0.09 113 0.1 108 0.11Total 88,132 100 60,029 100 79,783 100 95,892 100Source: Author’s estimates based on ASI data.15 Self Employed Women’s Association (SEWA) is a trade union having 1.5 million women workers. It was founded in
1972.16 Standard Vacuum Refining Company Ltd. v. Their Workers, (1960) AIR SC948; National Iron and Steel company Ltd.
and Others v. State of West Bengal and Another, (1967) II LLJ23 (Supreme Court); Shiba Metal Works v. Their Workmen, (1960) I LLJ 717 (Supreme Court); BHEL Worker’s Association, Haridwar v. Union of India, (1985) SCC(I)630 etc.

Contractualisation in India’s Manufacturing Sector Since 1991: Trends Based on ASI Data 75
As revealed by Table 3, share of such firms although declined from as high as 79 to 61 per cent over period (1999-00/2013-14) is still very high. There is maximum concentration of firms below threshold of 300 workers. This threshold was raised in 1982 amendment to the IDA Chapter VB from 100 to 300 workers. This shows that concentration of such firms is still very high which has become a constraint on growth and expansion of the manufacturing sector. These firms had to hire contract workers for production activities to avoid provisions of the IDA, 1947. Secondly, the Second National Labour Commission has recommended compensation amount from 2 weeks to 6 weeks for every year for laid-off workers as provided for in the IDA, 1947. On this matter, both trade unions and employers have agreed. Therefore, amending the IDA, 1947 to this effect by removing threshold of 100 workers should not be a problem to all stakeholders.
A cross-country analysis reveals that the labour rights are not very secure in many emerging economies. Caraway (2009) reveals that track record of the labour rights is not good in the East Asian region even though it has earned title of ’economic miracle region’ (Table 4). The labour laws got pruned during the financial crisis of late 1990s which led to weakening of collective (union formation, collective bargaining, and right to strike) and individual labour bargaining. Even though de jure labour rights exist, weak enforcement of the labour laws has rendered them ineffective de facto. Cotton et al. (2000) argue that South Korea has lowest the labour protection in the post Asian financial crisis period.
Table 4 Share of Employees in the East Asia having
Union Membership (%) in 2016Country Unionisation RateChina 44.9Taiwan 39.3Singapore 21.2Vietnam 14.6India 12.8South Korea 10.1Cambodia 9.6Malaysia 8.8Philippines 8.7Indonesia 7Thailand 3.5
Source: https://ilostat.ilo.org/topics/union-membership
However, in India’s context, even though multiple the labour laws give virtual impression of enough protection to labour in the organised manufacturing sector, they could easily be bypassed in many ways (Shyam Sundar and Ratnam, 2007). The effectiveness of these provisions rather hinges upon existence of pre-conditions17. The issue of contractualisation in India is largely connected with these pre-conditions. The contribution of the manufacturing sector has not improved over past four decades (1980-2019). In the pre-reform period (1950-90) the constraints of financial resources and technological backwardness accounted for industrial backwardness. Besides, red-tapism and the license raj were blamed. However, after reforms, factors like import competition, lack of indigenous technology, and lack of skilled manpower etc. have emerged even more regressive for growth of the manufacturing sector.
Exposing domestic firms to undue import competition by import liberalisation has been responsible for creating pressure on India’s labour market to a large extent (Chaudhuri, 2002). Had there been a large base of skilled manpower meeting needs of modern industries, labour would have benefited more from trade liberalisation. Against this backdrop we argue that supply side factors18 of labour market are also responsible for declining quality of employment.
3. INDIA’S LABOUR MARKET
Even as there are multiple labour regulations for workers of the organised manufacturing sector, India’s labour market is quite flexible for a huge size of the unorganised sector. Many factors shape the labour market of a country19. However, there 17 The growth of the organised manufacturing and
strengthening the synergy in terms of ‘backward and forward linkages’ between the manufacturing and agriculture sectors as both sectors are complementary to each other in terms of supply of inputs and generating demand and essential for economic growth.
18 The duality of labour market, skill deficit in labour, and huge proportions and absolute number of youth population in total labour force.
19 The key variables that shape the labour market are: status of employment, employment by sector, informal employment, unemployment, youth unemployment, educational attainment and illiteracy, skill mismatch, wages and compensation costs these indicators refer to important labour market indicators as mentioned in KILM(ILOSTAT) framed by International Labour Organisation.

76 Labour & Development
are some concerns since a very large number of youth (25 million) falls in category of open employment. Mehrotra and Parida (2019) have shown that rise in number of open unemployed youth was very high which increased by 16 million over period (2011-12/2017-18).
The dualistic20 structure of India’s labour market is a matter of great concern for achieving inclusive growth. The foremost concern relates to high and rising informality of jobs and low skill formation in labour. This challenge gets multiplied every year with addition of 5 million people to the workforce annually in India. The labour force participation rate (LFPR) is very less (56 per cent) in India compared to world average. So, both labour force participation rate (LFPR) and the share of the organised sector in employment growth must increase.
With rising labour informality status of labour has become unclear in terms of regular or contractual labour and thus calls for setting up institutions to enforce labour regulations protecting labour. Thus, labour inspection21 is crucial for protecting labour interests. Recently, the government of India also announced a Labour Inspection Scheme22 to bring transparency in industrial regulations. We argue that while transparency in industrial regulation will boost industrial growth, skill formation among labour will enable them to mitigate harshness of contractualisation.
3.1 Skill Gap and Contractualisation
The shortage of skilled labour and intense import competition induced capital and technology intensity in India’s manufacturing sector in the post-reform era. With booming economy, demand for skilled manpower grew. However, there was a shortage of skilled manpower23
and skill mismatch at industry level (Mehrotra, 2014). This highlights the extent of skill deficit and thereby rising demand for contractual and casual workers.
Contractual jobs for unskilled labour are less rewarding than for skilled24 workforce. Low productivity level is a reflection of low skill content and education profile. As large as 30 per cent labour force is absolutely not useful for modern industries for being illiterate. Another 41 per cent comprises labour having education below primary, primary, and middle level. It means 71 per cent of total labour force is not fit for industrial employment as they do not have requisite education and skill.
In this respect, India ranks lowest25 as share of labour with vocational education is below 2 per cent. This is an outcome of lack of adequate policy on skill formation and network of technical institutions. Mehrotra (2020a) has argued that low levels of education and skills of the workforce are one of the key supply side factors behind informalisation of jobs26.
As mentioned earlier, the manufacturing production has become capital and skill intensive in the post 1990s. This is true for the world manufacturing production. Barring industries such as leather, apparels, wood products, processed foods, beverage and tobacco, the labour content has gone down since 1995. All these industries have low growth in the value-added. Therefore, it is skill level and policies that promote job growth will enable youth to get jobs in the organised manufacturing sector, not just battery of the
20 The majority (92%) of its total workforce is engaged in informal employment which is not covered by the existing labour laws (Sen Gupta, 2009).
21 ILO Recommendation No.198, 2006 is the first institutional approach to locate vitality of labour administration and labour inspectorates for improving employment relationship. These inspectorates are perceived to become very significant to evolve modern labour administration system.
22 The government has adopted a “risk-based” algorithm will now pick manufacturing units for inspection. The inspector has to upload his report within 72 hours of the inspection on a portal.
23 Out of total labour force, about 89 per cent in the age group of 15-59 did not have vocational training.
24 NSSO 50th Round defines skill is any marketable expertise however acquired.
25 Compared to countries of the East Asia particularly China which has a network of five lac (500000) vocational schools, there are about 12000 such institution inclusive of Industrial Training Institutes(ITIs) and vocational schools.
26 In addition, he makes three arguments in regard to the demand for labour that underly the high level of informalisation of the workforce. They include: a) India’s growth strategy did not promote large corporation in industrialisation and it followed state-led capitalism which concentrated on capital goods industries only, b) Product Reservation Policy of consumer non-durable goods for small industries constrained growth and expansion of the manufacturing sector, c) Large number of the labour laws enacted by the central and state governments also constrained growth of the organised manufacturing sector (Malhotra, 2020b).

Contractualisation in India’s Manufacturing Sector Since 1991: Trends Based on ASI Data 77
labour laws will ensure employment growth. The demand for skilled labour hinges on performance of the manufacturing sector. We argue that skill shortage on supply side and excessive regulation of the organised manufacturing on demand side lead to rising informal jobs in India.
3.2 Labour Informality and Social Protection
The informalisation of labour is an outcome of inappropriate industrial policies that were implemented in the pre-reform period (1950-90). Islam and Lapeyre (2020) argue that presence of informal sector is a huge stumbling block to achieve structural transformation in low income developing economies. In this context, the ILO27 underlines its concern for such economies to make a transition to the formal economy and suggests that development strategy must incorporate tools to realise this goal.
The industrial policy interventions were responsible for the expansion of the unorganised manufacturing sector which comprised factors on both supply and demand sides28. Besides, low level of education and skill among labour made them capable of finding work in the unorganised sector only. Consequently, labour productivity
remains very low in the sector.
While it is essential to reduce size of informal sector, policy interventions in the post-reform period have not been concrete on this except for introducing the GST. However, we have a chronic shortage of data on informality before 2004-05. We may say that informality has increased in the organised non-agriculture employment. The unprecedented import liberalisation led to mounting pressure on India’s labour market (Babu, 2009). The global capital has successively become powerful in production relations, vis-a-vis labour due to changes in the policy framework after 1991. The use of technology has increased over the years in the post-reform period (Das and Kalita, 2009; Goldar and Aggarwal, 2010; Kapoor, 2016).
The industrial policies concentrated on either heavy industrialisation or restrained its natural expansion by erecting complex industrial regulations. In the context of ’demographic dividend’, it is essential to expand the size of the organised manufacturing sector. We argue that bureaucratic hurdles of the pre-reform period rather than economic reforms were the key determinants of contractualisation.
4. ECONOMIC REFORMS AND CONTRACTUALISATION
The sharp growth of contract workers in the manufacturing industry owes to inappropriate industrial policies, complex and ambiguous labour laws and their judicial interpretation.
Figure 1 Distribution of Skilled Labour Force in Select Countries
Source: UNESCO-UNEVOC Database.
27 The ILO Recommendation number 204 and (Sustainable Development Goal (Target 8.3).
28 Excessive focus on industrial policies during the second five year plan (1956-60) and afterwards on heavy industrialisation, industrial reservation of consumer goods for small scale industries, and plethora of the labour laws for the organised manufacturing sector.

78 Labour & Development
Srivastava (2015) argues that this growth has its roots in the loopholes in provisions of the Contract Labour (Regulation and Abolition) Act, 197029. Since in case of legally sound contracts contract workers can’t be treated inferior to permanent workers, strict enforcement of provisions of the Act will check exploitation of contract labour. The proportion of the contract labour is very high in many countries of the East Asia30. These economies had moved to capital intensive industrialisation after achieving industrial and demographic transitions. India began with heavy industrialisation and drained a huge resources into heavy industries. Hence, the labour intensive industrialisation didn’t happen. The challenges of employment growth are also linked to orientation of industrial policy towards capital intensive industrialisation in the early stages of economic planning.
Table 5: Informal Employment (PS+SS) by Sector (in Million)
Year Sector In-for-mal
For-mal
Total Work-force
% of Informal Workers
2004-05
Informal Sector
400.8 1.3 402.1 99.7
Formal Sector 27.9 29.9 57.8 48.3 Total 428.7 31.3 459.9 93.2 % of Informal
Sector93.5 4.3 87.4 106.9
2011-12
Informal Sector
374 1.5 375.5 99.6
Formal Sector 58.5 40.2 98.7 59.2 Total 432.5 41.7 474.2 91.2 % of Informal
Sector86.5 3.5 79.2 109.2
2017-18
Informal Sector
369.3 2.5 371.8 99.3
Formal Sector 51.6 46.2 97.8 52.8 Total 420.9 48.7 469.6 89.6 % of Informal
Sector87.7 5.1 79.2 110.8
Source: Unit level NSSO data.
Overall, the organised manufacturing sector shows signs of dismal performance in terms of overall employment and emoluments to workers during period of 1991-92 to 2013-14. There was a phenomenal rise in contractualisation in the organised manufacturing after 2005. As revealed by Table 5, the large share of informal employment shows the growing vulnerability of the labour force in post reform period also reflects brewing agriculture distress. The decline in share of informal workers in the year 2017-18 has happened due to coverage of contractual jobs and fixed-term employment under the EPFO and ESIC.
Table 6 Capital Intensity Sector Wise (KL Ratio)
1999-00 2004-05 2009-10 2013-14Low Tech IndustriesFood and Beverages$
1.16 1.27 2.76 6.32
Tobacco products 0.25 0.47 1.00 1.74
Textiles 1.39 1.64 3.63 4.66
Apparels, Dressing & Dyeing of fur
0.61 0.67 1.19 1.74
Leather & related products
0.86 0.82 1.24 1.75
Wood & products 0.46 0.64 1.35 2.38
Paper & paper products
1.59 1.52 3.76 6.70
Printing & recorded media
1.06 1.37 3.36 4.55
Furniture 0.94 0.83 1.64 1.88
Medium Tech IndustriesCoke & refined petro
3.23 2.47 4.07 6.27
Basic Metals 1.38 1.05 5.57 12.47
Rubber & plastics 1.36 1.60 6.71 5.56
other non-metallic products
0.93 1.05 2.75 5.34
Fabricated metal products except machinery products
0.88 1.96 2.13 3.07
High Tech IndustriesChemicals& Chemical products
1.47 1.75 4.67 16.88
Computer, electronic, optical products
0.69 1.20 2.78 3.26
29 The Act applies to all contractors employing twenty or more workers barring states of Gujarat, West Bengal, and Rajasthan, the very nature of labour contracts are mostly sham contracts and thus contract workers get legal protection under several other legislations.
30 For instance, in China, the state labour laws permitted the contract labour after 1995 and half the labour force is contractual now with one-year contract being the standard norm. Similarly, in South Korea, temporary or daily workers which is about 54% of total workforce.

Contractualisation in India’s Manufacturing Sector Since 1991: Trends Based on ASI Data 79
Machinery Equipments
0.81 0.87 2.51 3.95
Electrical equipts 0.99 1.27 2.58 4.03other manufacturing
1.66 0.99 1.63 3.01
Motor Vehicles, trailers, semi-trailers
1.21 1.12 4.15 5.11
Other Transport Equipts
0.82 1.64 2.61 4.90
All Org Mfg. Sector
1.16 1.31 3.20 5.94
Source: Author’s calculations based on ASI data.Note: $ We have considered food industry only from Food
& Beverages K L Ratio refers to the ratio of Plan & Machinery and Total Persons Engaged
Table 6, reveals that industries in medium to high tech segment have higher level of capital intensity and growth of contract workers has been very high in these industries. In the high tech segment, all industries have had very high share of contract workers in total workforce. As these industries are capital intensive, regular labour was replaced by capital. It also reveals that eight industries31 namely are the major employers of contract workers. However, contractualisation has increased in those industries which faced import competition relatively more. We argue that incidence of contractualisation has increased proportionate to intensity of import penetration in Indian economy.
4.1 Contractualisation Across Industries
The industries having greater dependence on imported inputs for production have experienced relatively greater contractualisation. Chang (2009) argues that policies of globalisation induced informalisation of labour across Asian countries. Agarwal and Goldar (1995) also empirically supported his argument by inferring that import penetration causes informalisation of jobs in India’s manufacturing sector.
Table 7, reveals that there was big jump from 2004-05 onwards in contractualisation as use of contract workers in total workers increased to very high levels in many industry groups32 as
noticed at two-digit level. In terms of industry average, tobacco industry recorded highest increase since 2000-01 unlike these industries. The extent of contractualisation was more than forty per cent (40%) in these industries. It was much higher than the average level (35 per cent) across entire manufacturing sector in 2013-14.
There was a contrasting trend in contractualisation between both medium & high tech industries vis-a-vis low tech segment of industries during 2004-09. In this phase, all industries in medium-tech segment and all but two industries recorded a very higher growth in contract workers. This phase was really a ’golden phase’ for contractualisation. However, in phase three (2009-2014), there was a huge decline relatively in growth of contract workers. This was largely a result of recession in world economy due to the sub-prime lending crisis33.
Table 6, reveals that capital intensity was low as capital labour ratio was below 2 between 1999-2004 for all industries in low tech segment. However, it grew fast in the labour intensive industries such as leather, food and beverages, textiles, and printing industries during period 2004-2014. The contractualisation may be related to growth of high tech industries as these industries experienced very high growth in first two phases: 1999-2004 and 2004-2009. However, this does not show any causality.
Table 7 Annual Average Growth of Contract Workers (%)Industry 1999-
20042004-2009
2009-2014
Low tech industriesFood products/& Beverages 5 9 2
Tobacco products 82 2 -14
Textiles 2 11 3
Apparels, Dressing/& Dyeing of fur
29 46 3
Tanning and dressing leather 17 9 18
Wood/& products 37 24 7
Paper/& paper products 14 10 231 Industries such as tobacco, coke & refined petroleum products, chemicals, rubber & plastics, basic metals, fabricated metals, motor vehicles, and other transport equipments.
32 Other industries having very high level of contractualisation include coke & refined petro products, other non-metallic products, and other transport equipments.
33 The financial crisis of 2008 which was caused due to imprudent lending by two big banks in the United States of America (USA).

80 Labour & Development
Publishing, Printing/& recorded
32 18 15
Furniture/& Mfg. 8 17 9
Medium tech industriesCoke/& refined petro products 21 34 -4
Basic Metals 2 29 5
Rubber/& plastics 24 23 17
Other non-metallic products 5 27 8
Fabricated metal products except machinery equipments
25 24 8
High tech industriesChemicals/& Chemical products
12 15 14
Office, accounting, and computer machinery
34 41 4
Machinery Equipments 11 36 4
Electrical equipments 11 47 12
Medical, precision and optical instruments, clock/& watches
29 17 1
Motor Vehicles, trailers, semi-trailers
27 40 15
Other Transport Equipments -9 28 10
All Org Mfg. Industries 12 17 5
Source: Author’s calculation based on ASI data. $: NIC 30 industry group includes industry group 32 also.
In the preceding analysis, we found that capital intensive industries have experienced greater contractualisation of jobs. Another thing we have noticed is that, India’s industrial structure
34 Labour cost includes total emoluments here for all employees: production and non-production workers. The production workers refer to workers and the non-production employees include all supervisory and managerial staff.
35 See tables in Appendix for detail. Real wages of regular workers was higher than that of contract workers.36 Industries like food, wood, other non-metallic, leather, electronic, and fabricated metals.
has changed in favour of large capital intensive industries. Since industrial and demographic transition were not integrated, capital intensive industrialisation alone may not ensure labour absorbing manufacturing growth in near future. We argue that level of contractualisation has been enhanced by growing wage gap between regular and contract workers.
4.2 Labour Cost and Contractualisation
The substantial gap in wages of contract workers compared to regular workers prompted industries to adjust labour cost by hiring contract workers. There has been a substantial decline in labour cost34 and labour share in the value-added (Figure2). All components of labour cost have recorded a huge downfall over since then.
Bhandari and Heshmati (2005) argued that wage gap between regular and contract workers in determined by factors such as education level, skills, union membership, and migration. The contract workers earn 45 per cent less than regular workers. They argue that this may be due to factors like difference in labour productivity and weak bargaining power of contract workers. Table 8 reveals that wage gap35 for regular and contract workers is huge. The regular workers earn three fourth of total wage bill across industries barring a few36 industries. In addition, differences in the value-added growth also causes wage gap.
Figure 2 Trends in Labour Cost in Manufacturing Sector, 1990-2004
Source: Author’s calculation based on ASI data.

Contractualisation in India’s Manufacturing Sector Since 1991: Trends Based on ASI Data 81
The high wage gap between regular and contract workers impacts economic security of contract workers adversely. The formalisation of the unorganised manufacturing sector and universal application of the Contract Labour (Regulation and Abolition) Act, 1970 is essential to remove duality of the labour market. We argue that simplification of the labour laws will promote formalisation of manufacturing sector.
5. LABOUR MARKET REFORMS: THEORY AND REALITY
The rigidity of the labour market is not just about multiplicity of the labour laws, but also about arbitrariness of their implementation. This will also reduce informal part of the manufacturing sector by integrating it into the organised sector. Various existing empirical studies have inferred
that rising contractualisation in manufacturing sector is due to rigidity of the labour laws. However, there are many studies which contradict such claims.
The current union government has approved five new bills to reduce multiplicity of definitions and legal interpretations of various dimensions for labour market issues. In addition, all existing labour laws are proposed to be replaced by just four labour codes (See Sec 2). Some states have also carried out labour reforms. Moreover, these governments have endorsed the pattern of labour market flexibility like OECD countries for improving manufacturing sector performance.
As mentioned earlier, labour regulation is a part of structural reforms. In past three decades (1991-2018), the policy attention has focused on
Table 8 Wage Gap between Regular and Contract Workers (at 1991 prices) (fraction)
Industry 1999-00 2005-06 2009-10 2013-14Low Tech IndustriesFood products & Beverages 46.33 39.75 52.96 75.81Tobacco products -263.35 -203.00 -90.76 35.99Textiles 80.73 76.48 76.21 84.97Apparels, Dressing & Dyeing of fur 80.86 65.53 71.15 84.74Tanning and dressing leather 62.09 50.70 61.95 77.03wood & products 62.76 24.15 41.51 64.96Paper & paper products 68.94 66.67 71.41 78.89publishing, Printing & recorded 93.76 88.53 84.68 87.71Furniture & mfg. 62.57 78.04 76.41 83.76Medium Tech IndustriesCoke & refined petro products 89.03 85.08 84.89 94.43Rubber & plastics 79.98 66.84 73.33 73.25other non-metallic products 31.61 9.97 25.79 40.69Basic Metals 83.77 80.92 76.06 84.92Fabricated metal products except machinery equipments
62.39 42.06 58.06 71.50
High Tech IndustriesChemicals& Chemical products 80.37 71.05 70.28 76.65Machinery Equipments 55.98 24.45 22.47 65.19Office, accounting, computer 97.90 95.73 80.94 84.32Electrical equipts 90.51 78.25 73.53 80.29Medical, precision and optical instruments, clock & watches
94.75 86.75 79.39 92.70
Motor Vehicles, trailers, semi-trailers 92.55 82.16 78.64 82.60Other Transport Equipts 88.73 71.08 69.28 75.77All Manufacturing Sector 72.92 64.58 66.09 77.52
Source: Author’s calculations based on ASI data.

82 Labour & Development
mainly two dimensions only, that is, investment climate and labour market flexibility. Some economists claim that manufacturing growth is restrained by labour laws and hence they must be removed. This does not hold across countries. Instead, retardation of manufacturing sector is actually owed to lack of business environment, technological readiness, physical infrastructure, and a few other factors (Maira, 2014).
Contractualisation of jobs is a symptom of deep-rooted problem that has gripped the manufacturing sector. Essentially, low productive efficiency and rising trade integration seem to be responsible for informalisation of labour. Export competitiveness requires productivity of domestic manufacturing sector to increase. However, raising productivity is a long-term characteristic of an economy and involves multiple factors and processes37. The role of industrial relations is also very crucial. The arguments justifying further contractualisation must have overlooked contribution of regular workers to productivity growth.
The rising contractualisation is a big challenge given a huge size of India’s labour force and skill deficit. The employability of this chunk of manpower poses a great challenge for policy makers. In the post reform period, this has got worsened due to low total factor productivity growth and India’s low export share. There is a limit to enhance cost competitiveness by compressing wage share. In the long run, excessive use of contractual labour will not only reduce total factor productivity, but also lead to demand deficiency in the economy. We argue that productivity, expansion, and diversification of manufacturing sector will correct adverse implications of contractualisation and concerns of labour market.
6. CONCLUDING REMARKS
The rise of contractualisation in India’s manufacturing sector is an outcome of not just policies of economic reforms. Rather, it is a reflection of deep-rooted structural weaknesses of the economy which had stemmed from political economy of industrialisation. The re-
forms had merely aggravated and brought it to the centre of growth discourse. The share of contract workers was about 14 per cent before 1991 which picked up from 1999-00 and grew very fast from 2005 onwards.
The complexity of industrial regulations including labour laws constrained growth of the organised manufacturing sector. In addition, inability of industrial policies to address other aspects of labour market such as duality, skill formation, and harnessing demographic dividend in pre-reform period (1950-90) was also responsible. Even though decision of the government to introduce economic reforms was well- planned, domestic manufacturing sector and labour market were not equipped to face competitive demands of market economy.
Against this backdrop, labour reforms agenda of policy makers must address heterogeneity of labour market in order to simplify the existing labour laws. This will require a thorough understanding of concerns of all stakeholders of such laws. Even as labour laws need simplification for harmonising industrial relations, increasing size of organised manufacturing sector is essential. Therefore, the overarching issue of inclusive growth must not lose attention in the pursuit of labour reforms.
REFERENCESAgarwal, R. and Goldar, B. (1995), Economic Reforms and
Employment in India Projections for the Year 2001-02, Indian Journal of Labour Economics, 38(4):577–95.
Athukorala, P.C. (2009), The Rise of China and East Asian Export Performance: Is the Crowding out Fear Warranted? World Economy, 32(2):234–266.
Babu, M. and Chirayu, J. (2016), Labour Code on Industrial Relations Bill 2015-An Appraisal.
Babu, M. S. (2009), Losing Out in a Growing Economy: Labour in the Organized Manufacturing Sector in the Era of Globalization, The Indian Journal of Labour Economics, 52(2).
Bhandari, A. K. and Heshmati, A. (2005), Labour Use and Its Adjustment in Indian Manufacturing Industries, Global Economic Review, 34(3):261–290.
Caraway, T. L. (2009), Labor Rights in East Asia: Progress or Regress? Journal of East Asian Studies, 9(2):153–186.
Chakrabarti, A. and Dasgupta, B. (2007), Disinterring the Report of National Commission on Labour: A Marxist Perspective, Economic and Political Weekly, pp. 1958–1965.
37 It depends on interplay of institutions, infrastructure, macroeconomic environment, human development, product market, input market, asset market, technology, innovation, and policy framework etc.

Contractualisation in India’s Manufacturing Sector Since 1991: Trends Based on ASI Data 83
Chang, D. (2009), Informalising Labour in Asia’s Global Factory, Journal of Contemporary Asia, 39(2):161–179.
Chaudhuri, S. (2002), Economic Reforms and Industrial Structure in India, Economic and Political Weekly, pages 155–162.
Cotton, J., Elvin, M., Hill, H., Low, A., May, R., Milner, A., Morris-Suzuki, T., et al. (2000), Korea’s Globalization, Cambridge University Press.
Das, D. K. and Kalita, G. (2009), Do Labor Intensive Industries Generate Employment? Evidence from Firm Level Survey in India, Technical Report, Working Paper.
Das, D. K., Choudhury, H., and Singh, J. (2015), Contract Labour (Regulation and Abolition) Act 1970 and Labour Market Flexibility: An Exploratory Assessment of Contract Labour Use in India’s Formal Manufacturing, Technical Report, Working Paper.
Dougherty, S. M. (2008), Labour Regulation and Employment Dynamics at the State Level in India.
Goldar, B. and Aggarwal, S. C. (2010), Informalisation of Industrial Labour in India: Are Labour Market Rigidities and Growing Import Competition to Blame? Institute for Economic Growth, New Delhi, Manuscript.
Goldar, B. and Sadhukhan, A. (2015), Employment and Wages in Indian Manufacturing: Post-reform Performance.
Han, Z., Mok, V., Kong, L., and An, K. (2011), China’s Labour Contract Law and Labour Costs of Production, China Perspectives, 2011(2011/3):59–66.
Islam and Lapeyre (2020), Transition to Formality and Structural Transformation.
Kapoor, R. (2016), Technology, Jobs and Inequality Evidence from India’s Manufacturing Sector.
Kennedy, V. D. (1965), The Sources and Evolution of Indian Labour Relations Policy, Indian Journal of Industrial Relations, 1(1):15–40.
Krueger, A. O. (2003), Political Economy of Policy Reform in Developing Countries, Cambridge: MIT Press.
Maira, A. (2014), Rethinking Labor Law Reforms, Indian Journal of Industrial Relations, 50(1): 24–32.
Mehrotra, S. and Parida, J. (2019), India’s Employment Crisis: Rising Education Levels and Falling Non-agricultural Job Growth.
Mehrotra, S. (2014), India’s Skills Challenge: Reforming Vocational Education and Training
to Harness the Demographic Dividend, Oxford University Press.
Mehrotra, S. (2018), Manufacturing: The Cornerstone of a Planning Strategy for the 21st Century.
Mehrotra, S. (2020a), Informal Employment Trends in the Indian Economy: Persistent Informality, But Growing Positive Development.
Mehrotra, S. (2020b), ‘Make in India’: The Components of a Manufacturing Strategy for India, The Indian Journal of Labour Economics, pp. 1–16.
Mehrotra, S. (2020c), The National Skills Qualification Framework in India: The Promise and the Reality.
Mehrotra, S., Parida, J., Sinha, S., and Gandhi, A. (2014). Explaining Employment Trends in the Indian Economy: 1993-94 to 2011-12. Economic and Political Weekly, 49(32):49–57.
Moon, V. (1991). Dr Babasaheb Ambedkar: Writings and Speeches, vol. 10.
Nagaraj, R. (2008). India’s Recent Economic Growth: A Closer Look, Economic and Political Weekly, pages 55–61.
Papola, T. S. (2013). Role of Labour Regulation and Reforms in India: Country Case Study on Labour Market Segmentation.
Sen Gupta, A. (2009). The Challenge of Employment in India: An Informal Economy Perspective.
Shyam Sundar, K. and Ratnam, V. (2007). Labour Reforms in China and India: Reform Aggression (China) versus Reform Allergy (India), Indian Journal of Labour Economics, 50(3):497–512.
Srivastava, S. C. (2015). Contract Labour: A Review of the Contract Labour (Regulation and aboloition) Act and other Application Labour Laws, The Book Line.
Srivastava, S. C. (2020). Tackling Job Growth: Labour Policy and Labour Codes in Mehrotra, S., editor, Reviving Jobs: An Agenda for Growth. Penguin Random House India Private Limited.
Standing, G. (2008). Economic Insecurity and Global Casualisation: Threat or promise? pp 15–30.
Sundar, K. S. (2005). Labour Flexibility Debate in India: A Comprehensive Review and Some Suggestions, Economic and Political Weekly, pp. 2274–2285.
Sundar, K. S. (2010). Emerging Trends in Employment Relations in India, Indian Journal of Industrial Relations, pp. 585–595.

ASSET OWNERSHIP, DIGITAL ECONOMY AND HOUSEHOLD FINANCES: A BOTTOM-UP PERSPECTIVE OF THE INDIAN ECONOMY
Sreelakshmi R.∗
Many conversations about India’s growth trajectory have been replaced with rebound strategies to cope with the effects of the pandemic. The booming digital economy has a strong role to play in this recovery as it combines many elements of precautionary protocols in its daily activities. However, it is necessary to examine just how widespread and fair this new consumption economy is, given the fact that India is still regarded as a middle-income country at best. This article investigates the trends attributed to the largest demographic, referred to as millennials, and their consumption behaviour and ownership patterns, and contextualises it in the larger economic reality of India. The concept of “asset ownership” and its role in wealth creation is also probed, and the article points to the dangers of mis-generalising strategies of household finance. It also looks at the cultural and social factors that perpetuate certain habits and calls for conscious efforts from the political-economy to address the fallout. Lastly, the article identifies the gaps in the research that informs asset ownership and demographic spending power and recommends a grounded approach in the quest for a Digital India.
Keywords: Asset Ownership, Household Wealth, Consumption, Digital Economy, Millennials
1. INTRODUCTION
Well before the COVID-19 pandemic hit India’s shores and growth plans, the economy had witnessed a pattern of degrowth and slowdown in consumption across sectors, from tiny packets of biscuits to compact cars. While analyses have been many, a widely held suspicion pointed at changing consumer preferences, especially given how India is witnessing a demographic shift with millennials1 dominating the scene. Regardless of these justifications, a commonly acknowledged reality remains that investment in the economy has taken a hit.
This comes on the back of a relatively long growth spurt, which involved the strengthening of the digital economy, with many online services springing up, while mobile devices and internet became more rampant and accessible. New investments in technology and an enterprising workforce gave us a look into the future of a Digital India. Much urban transformation was mediated through these developments and the associated employment opportunities fuelled the growth story of the last decade in India. There is a strong connection between the worker’s job profile and their relative affluence, and the pivot to digital has had an impact on incomes across the board (MeitY & McKinsey,
∗ Research Associate, Ola Mobility Institute. E-mail: [email protected]
1 Millennials are those born after 1982, currently 24-38 years of age.
2019). However, who are the participants in this economy and how do they earn through technology-mediated jobs, largely in the online world? We will address that in the next section, but suffice to say that such larger economic and technological trends do not impact the population uniformly.
At this juncture, it is imperative to really understand what hedges the lowest income groups against the shocks of a contracting economy at the household level. The most common way in which households create value for the future is in the form of assets, such as a house, land, gold, vehicle(s), or monetary investments. This type of holding allows for securing liquidity and also protects against inflation, in most cases. Such a trend has to be viewed in the specific context under which we operate.
2. WHAT NUMBERS DON’T TELL
Economic class is determined by social standing and wealth. As of 2018, the ICE 360° Survey estimates that 24% of India’s 293 million households could be considered upper-middle and high class, with the 2030 projections at 51% of 386 million (WEF, 2019). The affordability of assets such as household appliances and cars, still lie with this Richest 20% income group, according to the same survey (Mint & ICE 360°, 2016). This means that asset creation in consumer terms is occurring only at a minor level. This is different from long-term investment or risk hedging practices.
Labour & Development, Vol. 27, No. 1, June 2020

Asset Ownership, Digital Economy and Household Finances: A Bottom-Up Perspective of the Indian Economy 85
The question, therefore, becomes about the income class one is encountering, while making generalisations about shifting consumer preferences, about behaviours of “new classes” of consumers. This is especially relevant in a context where millennials are regularly being treated as a homogenous group of 440 million, with a different life perspective and endless upward mobility. This also reflects in certain attitudes relating to ownership of assets, lifestyles or experiences. Ergo, while making sense of trends and observing economic activity at a micro level, there are some nuances to be considered, even if it applies only to the Top 20% of the population.
The aim of this article is to outline the so-called shifts in consumer preferences from the perspective of ownership, and to examine how it plays out in real terms such as asset ownership and wealth creation in the economy at large. There are many divergences to account for in this endeavour, and the role of asset ownership in expanding financial inclusion and social security needs to be highlighted. This article offers a view into the need to study this relationship further.
3. CHANGING NOTIONS SURROUNDING “OWNERSHIP”: A CONCEPTUAL JOURNEY
The journey to India’s digital futures, as mentioned in the beginning of this article, is paved with the innovations in tech, such as voice-input & natural language processing, vernacular language capabilities and availability of cheap smartphones and mobile internet. There is a strong relationship to be explored between asset creation among the masses and these technological changes, which is best seen in the pervasion of platform work in Indian cities.
What does “platform-work” entail? Simply put, it involves the matching of service providers with requesters through a mobile app-mediated online marketplace. The unique combination of younger skew in the workforce distribution, access to mobile phones and revolutionary interventions in fintech which enabled secure cashless transactions has enabled the scaling up of demand and supply for these services. Needless to say, this is one positive step in the direction of digital-first future skills, contributing to true modernisation of our workforce. This is again, well connected to the fact that our 440 million-
strong millennial population is diverse and cuts across income classes, dividing these users to service providers and consumers.
Additionally, it was found that more households had a mobile phone than a toilet, bringing the contrast to sharp relief even in the bottom income quintiles; overall 88% of households had a mobile phone (Mint & ICE 360°, 2016). Mobile phones are less a luxury and increasingly a medium for livelihood opportunities in the evolving context. Foregrounded on that reality, it is important to highlight that the platform business model has evolved differently across geographies. While in countries such as the US, the goal was to bring efficiency to the system by platform-companies designing mobile apps which would match the requesters with the providers in true side-hustle fashion, it took on a different turn in the developing world. This had much to do with the relationship between income levels and asset ownership rates. For instance, India has 22 cars per 1000 population according to the NITI Aayog Chairman, while in the US and the UK, the corresponding figures are 980 and 850 respectively. Simply put, while the demand for the services remained, those ready to provide the services either lacked the asset or the requisite skills for the task, leaving a very different model to be desired.
The proliferation of “platforms”, digital marketplaces created by buyers and sellers of a variety of services, in all imaginable kinds of work, does not suggest uniformity across jobs or geographies. Accordingly, non-location specific platforms, which emerged as the first instance of such disaggregated work, are asset-light, in that they require little beyond a stable internet connection, a mid-sized device and the skill/ expertise of the worker. An Amazon Mechanical Turk (AMT) worker or a Freelancer member, would fit this description. On the other hand, location-dependent platforms, more recent and much more visible than remote workers in their homes behind laptop screens, require that workers possess a certain level of skill and costly assets for the carrying out of tasks. Drivers associated with services like Uber or Ola, or beauticians and repairmen found on Urban Company are such location-dependent workers, using their own vehicle and skills, to deliver the service. This changes the dynamic between platform and worker, as asset ownership has a

86 Labour & Development
direct relationship with earnings, risk and legal liability of business. Therefore, delineating this relationship by situating ownership at the centre of the debate, provides descriptive insights into the nature of platform work.
This article unpacks the various relationships that play out in the context of a “platform economy”, a segment of the digital economy which evaluates the businesses and effects of digital platforms such as Airbnb or Swiggy, under the broad ambit of “ownership”. By breaking these relationships down to their constituent parts, especially with the “asset”- be it a vehicle, a set of skills, or specific tools, the platform economy allows for a broad scope of participants to create value. There are four dominant aspects of ownership under the proposed model- that of experience, asset, labour, and job. This is arrived at following a classification based on the actor in the system who owns the aspect:
(a) Ownership of experience rests typically with the customer availing of the service. By breaking down the entire lifestyle of experiences- like a car ride or residing in a home- down to its constituent parts, the end user is left with only the need for and the economic access to experiences, rather than the bulky assets that are often required to realise it.
(b) Ownership of asset forms the backbone of the business, as the on-demand service requires the massive onboarding of (spare) assets to maximise resource utilisation, given explicit consent for asset-sharing.
(c) Ownership of labour is ordained on the person/ corporeal entity putting in the work required for the service delivery.
(d) Ownership of the job is retained by the enterprise/ business, which takes the risk and invests the capital in an online platform, mediated by the digital infrastructure of a mobile app, effectively creating a virtual, real-time marketplace.
This can be visualised better when we identify that these four aspects are disjointed and can be unified in the marketplace, acknowledging the various moving parts of the entire system. The acknowledgement that such varied ownership is possible is key to understanding the model of the platform economy, and how it operates
differently in context of varying resource levels. For instance, the digital platform economy in India and other developing countries does replicate many models prevalent in the conventional, non-platform economy. It is important to pause here and acknowledge that these trends are not unique to platform work, rather it simply throws light on them. Consider for instance, an auto rickshaw driver in any Indian city who may or may not own the vehicle- the dynamics described above can be said of her as well, and have always existed. Therefore, the digital economy has simply taken a regular experience and digitalised2 it in order to scale up the efficiency of service delivery. This means that it is entirely possible to meet an Ola Auto driver who does not own his vehicle, but rather rents it on a daily basis, or even an UberX driver who is simply “employed” by the owner of the cab.
These relationships seem counterintuitive to the self-employment model espoused by the digital economy, but it is necessary to note that in low-resource settings with deep human capital proliferation, many such combinations are possible, or even necessary, to provide high value services. In teasing out this nuance and juxtaposing it against the demographic of blue-collar workers who also possess some suave with technology and basic communication skills, it is plain that a disproportionate number of “millennial” workers take up jobs in the digital economy.
4. MILLENNIALS - WHO ARE THEY AND WHAT DO THEY DO?
When it comes to understanding our workforce, many are quick to describe the predominantly millennial population as “digital natives” and other analogous terms, in a vague erasure of diverse income classes and experiences that define this age group (Deloitte, 2018). To be entirely honest, the economic and popular discourse around millennials stops short of a systematic critique of the inequality across a host of indicators, which affects growth prospects in a young country such as ours. While education outcomes and digital skills may have improved, especially in the younger cohort of the workforce,
2 Digitalisation is distinct from digitisation (where data is merely converted from analog to binary format); digitalisation is leveraging the digitised, digital data to improve business processes and economic outcomes.

Asset Ownership, Digital Economy and Household Finances: A Bottom-Up Perspective of the Indian Economy 87
it would be misguided to assume that the awesome power of the internet has impacted the group uniformly. To take a simple guesstimate, as of 2018, household income in India can be visualised as in Table 1.
Table 1 Estimate of Number of Households and
Individuals by Annual Household Income Level in India
Annual HH Income Level
Proportion in Total
Households
Number of Households
High ( > INR 27.5 lakhs) 3% 8 mn (40 mn
individuals)Upper Mid (INR 5.5-27.5 lakhs) 21% 61 mn (305 mn
individuals)Lower Mid (INR 2.5-5.5 lakhs) 33% 97 mn (485 mn
individuals)
Low (<INR 2.5 lakhs) 43%
127 mn (635 mn
individuals)Source: Based on data reported by the WEF and the ICE 360° survey (author’s own calculations).
Millennials form 34% of the Indian population at 440 million, according to some estimates (Mint, 2018). According to the above table, there are 293 million households, who can each be assumed to have 5 members, taking India’s population to 1.465 billion, which is close enough to India’s widely stated population of 1.3 billion (UN, 2017; Census, 2011). Therefore, applying the logic from the above Table 1 to the millennial population, we get an estimate of number of millennials by annual household income groups in India (Table 2)
Table 2 Estimate of Number of Millennials by Annual
Household Income Groups in IndiaAnnual HH Income Level
Proportion in Total
Households
Number of Millennials
High ( > INR 27.5 lakhs) 3% 13.2 mn
Upper Mid (INR 5.5-27.5 lakhs)
21% 92.4 mn
Lower Mid (INR 2.5-5.5 lakhs)
33% 145.2 mn
Low (<INR 2.5 lakhs) 43% 189.2 mn
Source: Based on data reported by the Mint and Table 1 (author’s own calculations).
The simplistic analysis above shows that 76% of the millennial group is susceptible to exclusion from India’s digital-enabled growth story unless deliberate measures are taken. The upper-mid group also consists of a rather wide income range, therefore, necessitating caution in the treatment of millennials as a homogeneous demographic. While united by exposure to and ownership of the digital, millennials are also segmented by income categories which also have a strong influence on access.
This context is crucial to understand the role of asset ownership in creating wealth, both among lower income groups, as well as the largest age demographic. Once such facts are examined, it might come to light that many of these youngsters do not practice divergent behaviours in terms of asset acquisition or ownership from their parents’ generation. Since the story of India’s economic recovery is often tied to the fortunes of the millennial group, the “trends” attributed to their consumption behaviour warrants further investigation. In a small way, this article hopes to begin this enquiry by examining the evidence emerging from empirical studies about asset ownership among India’s population.
5. LET THE RUPEE CIRCULATE
The Household Finance Committee of the Reserve Bank of India in its 2017 report highlights the general risk-averse nature of Indian households when they are younger, which leads to positive debt balances as they advance in age. This is a counterintuitive trend, given the high penetration of assets such as land, house or gold in terms of holdings with the average Indian household, even in the bottom 40% of the population (RBI, 2017). The risk mitigation strategy here seems to be the social relationships and sanctions dictating that children take care of their parents both emotionally and financially, but this leaves the majority of the population with illiquid assets in the wake of changing demographics and increase in the number of non-productive old people.
As the report notes, this is somewhat a reverse mortgage relationship where the possibility of inheriting the house and other illiquid assets functions as the interest. “This locks up a significant part of the country’s wealth, depriving the young of opportunities to education and productivity” (ibid). This, along with the abject

88 Labour & Development
lack of planning for retirement, and little interest in a pension fund, contributes to a co-dependency between the younger and older generations, perpetuating the lack of wealth creation that is typically associated with asset ownership. In addition, the human capital value of different professions also allocates different values and risk profiles to the members of the household, and the difficult cash flow structures make it harder to lend to these enterprises (Sharma et al., 2020).
The report also finds that “the average Indian household holds 84% of its wealth in real estate and other physical goods, 11% in gold and the residual 5% in financial assets… Indian households continue to accumulate debt as they approach retirement age, and most debt is unsecured (56%), reflecting an unusually high reliance on non-institutional sources such moneylenders” (ibid). These trends call to question many of the efforts directed to expand coverage of formal banking and financial institutions, as credit access in these places still seems to be far from sufficient. A related statistic can perhaps explain this curious conundrum: “the average value of the main residence in the bottom quintile group of Indian households is equal to INR 22,000 [which is much lower than the lowest values in many countries]” (ibid). This means that credit access contingent on collateral submissions might not be suitable for a large number of households, because of the sheer value loss, forcing the turn to informal setups, such as a moneylender.
Conscious efforts in the direction of families, especially poor families, building assets need to be taken, because buffer savings serve as precautionary measures. These could be modest, but built over a small period of time and should be more liquid than the holdings of today. This is important because, “[Asset building] in poor countries — with large populations earning less than US$1.00 or US$2.00 a day per capita — is important, as governments do not have extensive social-support programmes and cannot afford them. In richer countries with more advanced social-support systems, income transfers and more or less universal health benefits (in most but not all countries) help to reduce but almost certainly not eliminate the importance of precautionary saving. This form of saving also lies closest to the standard economic definition
of saving as “deferred consumption”.... Many microfinance programmes in developing countries, for example, focus on saving (and credit, often based on proven capacity to save) to finance modest entrepreneurial activities” in a bid to improve (self-) employment (OECD, 2003).
This is closely linked to the argument in the context of India, that having a job itself acts as social security, and that half of India’s population being self-employed is because they cannot afford to be unemployed (Sabharwal & Chakraborty, 2019). Therefore, even while incomes may be low or marginal, the fact of a steady income is still prized, and those who cannot secure that get “pushed” into self-employment. This is marked out in the observations made elsewhere by Sabina Dewan of the Just Jobs Network: “There is a stacking of preferences in the jobs that the majority of the youth in this country aspire to, according to what they perceive as the perks or the downsides. The highest in the order is a secure and life-long government job (sarkari naukri), and then come roles in the private sector prone to layoffs and furloughs, to self-employment (khud ka kaam) where risk, earnings and security are all conferred on the individual. The construction of choice here is almost specious.”
6. THE SHEEN OF GOLD: A YELLOWING TREND?
The microfinance movement in India also accounts for the tendency to “save in gold”, given that many cultural and social factors dictate this behaviour. Overall, data shows that “a disproportionately high share of wealth [is] allocated to physical (i.e. non-financial) assets, such as gold” (RBI, 2017) and this is a distinct trend, even seen against comparable economies. The average Chinese household, for example, holds only 0.4% of its wealth in gold and a higher share in durable assets at 28%. This is also relevant considering that wealthy countries hold just a third of their household wealth in real estate, as evidenced in the cases of US (44%) or Germany (37%) (ibid). This is still, to say nothing of the near absence of financial assets in Indian households, leaving people ill-prepared for a self-reliant or dignified retirement.
This behaviour, when moving across generations, has the capacity to influence wealth creation

Asset Ownership, Digital Economy and Household Finances: A Bottom-Up Perspective of the Indian Economy 89
potential among the young, bringing the discussion back to the aspirations of the whole crop of millennials, and the behaviours ascribed to them. We have already seen that in many ways, millennials do not exhibit vastly divergent financial behaviour from their predecessors, and the collective experience of their household can also determine their asset acquisition and utilisation patterns (Kwatra & Bhattacharya, 2019).
To illustrate how gold as a financing asset is steeped deeply in the cultural milieu, let us consider a brief detour into the charming world of Malayalam cinema. A slice-of-life story set in the backdrop of the Northern Kerala district of Malappuram and coloured by rural football fandom, Sudani from Nigeria packs a lot of heart and shrewd social commentary. At a particular juncture in the movie, we see the young protagonists discussing money which was borrowed against the gold ornaments from one of their wives. In frustration, the lead exclaims, “Oh women, and their obsession with gold”; but is swiftly chided that the same “obsession” allowed him to access ready liquidity against pawned ornaments. This is a striking observation in popular culture, as gold still serves the dual purposes of claiming social standing for the woman in possession of it, while also acting as a reliable collateral for quick cash. The movie, from 2018, is one contemporary instance of the value Indians attach to the yellow metal, regardless of age, gender or income class.
Some data-based observations regarding the household importance attached to saving in gold can be found in the research institution, Dvara’s analysis of their Smart Gold initiative. The report compiles evidence that across income and expenditure quintiles, investing in gold keeps with growth in income, and is consistent with job profiles and gendered expectations (Ponnathpur & Dasgupta, 2020). This research, conducted among low-income households, shows a granular and more contemporary picture of asset holding patterns of the largest majority of Indian families and illustrates why these loans are sought after- they are usually for consumption such as in the case of medical emergencies (ibid). In the pandemic-stricken market, the rallying of gold prices also proves that as an asset, it is considered durable and dependable at a global level as well (Jain, 2020).
7. NO COUNTRY FOR THE YOUNG: NUANCING GENERATIONAL DISADVANTAGES
The observations thus far show us that encouragement for liquid asset creation is very less, both due to reasons of culture as well as income. “Structural theories [of poverty and social class] suggest that circumstances of poverty cause behaviours; that is, apparently dysfunctional behaviours are adaptations to poverty.” (OECD, 2003). This acknowledgement offers us a path forward for welfare. Admittedly, there is no one clear way or one asset to endorse- but what we can do is understand the stratifications within the fastest growing demographic in India better.
In many ways, millennials have been handed a raw end of the deal- this is acknowledged all over the world. However, prevailing patterns of asset ownership and wealth creation doubly restrict the wealth potential of young people in India. Through a combination of social norms that saddle households with bulky assets in real estate and maintain investments in gold, many households, and their younger members, are bereft of financial assets or a secured retirement.
From this vantage point, interrogating the roots of inequality and problems in income distribution is necessary to understand why this discussion is relevant in a conversation about changing patterns of ownership, especially durables and vehicles, in an economy. While asset ownership has changed at the Top 20% level, the fact that all value creation occurs only there still remains. Although digital on-demand economies of goods and services have struck a chord with a certain class of young, unattached, unbridled consumers, it would be a mistake to assume that endless growth can be achieved off the back of this demographic alone.
Macroeconomic theory does not account for who consumes what and by how much, as long as there is net, increasing consumption in the economy- this is why a nation where the richest 1% holding more than 4 times the wealth held by the bottom 70% is still afloat, in what is regarded as a highly competitive emerging market (Oxfam & The Economic Times, 2020). While this trend is not confined to India alone- the world’s 2153 billionaires have more wealth than 60% of the world’s population- it does merit

90 Labour & Development
further examination that gaping inequality has seeped into many spheres of life (ibid). We need to further investigate the need for wealth creation at the bottom in light of such facts.
8. INDIA’S MISSING MIDDLE: OF DIGITAL DREAMS AND ASPIRATIONS
It has to be remembered that the consumption at the Top 10% alone cannot sustain economic growth, much less a bounce back from a pandemic-induced lockdown; the vast majority of consumers fall out of that income tier. This opinion is supported by studies that show that distribution of dividends of growth among the wealthy alone, suffices to enrich them further, by being absorbed into their wealth, rather than create value among more people, with no sign of a trickle-down effect (Piketty, 2020; Koukoulas, 2015). Piketty also notes that India has emerged as the most unequal country between 1980 and 2018, measured by the income share of the Top 10% of highest earners, beating the US and China in his analysis. A second relevant figure, reported by Oxfam, notes shareholder capitalism as another leading cause of inequality, where the priority is to maximise profits in the short term, and paying out as much as possible back to the shareholders, who tend to be richer members of society already. Such increased returns can exacerbate inequality and in India, more than 50% of profits are returned to shareholders already (Oxfam, 2017).
Therefore, the moment to create money at the bottom is now, and the need for a stepping plank for the vast “middle” income group in India cannot be overstated. The 60% of the population in this group can create an unprecedented economic expansion only if the chokehold on credit in the economy is eased. Greater liquidity and enabling policies to that effect can help, and increased cash flow-based lending, as opposed to capital-based lending can also ameliorate the credit crunch. This is all the more important in the largely informal economy that characterises India’s job market, where incomes are available but wealth creation is hard. The financial assets story of Indian households, illustrated in another recent study by Dvara shows the counterintuitive trends that have come to characterise our country- a nation of the youth, but with financial wealth peaking only in middle age, investments
overwhelmingly in low-risk and informal products, and distinct asset differences between white collar, blue collar and self-employed individuals (Kumar & Sharma, 2020).
There is a common quip that everyone in India considers themselves “middle class”. This is backed by data even; A majority of the richest 1% and most of the Top 20% in India call themselves middle class, while the true middle class, consider themselves lower-middle class or poor (ICE 360°, 2016). This perception is important and reveals many things about the consumers in the economy; a “middle class” life is one with household durable goods, varied consumable preferences, and most of all, a car. There is also, as we saw earlier, a dire need to expand asset creation beyond real estate or gold.
While the so-called change in asset ownership patterns is confined only to a top few, the impact it can have on the wider ecosystem is noteworthy. From better asset management through shared or deferred ownership to value creation through continued consumption even as rented assets, there is a real benefit to be acknowledged here, besides a market being served. New forms of asset ownership endorsed through these models can also help its deep penetration in the middle income groups. This also has an ecological impact- increased circulation of goods among users fuels circularity in the economy, which is an important step in the quest for sustainable consumption (Sposato et al., 2017). Therefore, these analyses of new models of asset ownership are valid.
However, it is important to keep in mind that a new economy that works for all, and that resolves to undo the injustices of the pre-pandemic world order, can only be achieved by acknowledging visceral differences that exist due to systemic and systematic reasons. The political economy at large needs to act with gumption and fervour in order to recognise and right these trends (Persaud, 2019). This involves a thorough examination of what can be offered to the more than half of Indian millennials who fall in the lower middle to low income groups. The first step would be to put money in people’s hands, so that their spending power becomes their contribution to the economy. Many initiatives at the central and state government

Asset Ownership, Digital Economy and Household Finances: A Bottom-Up Perspective of the Indian Economy 91
levels exist, and their reach is limited by the sheer size of the undertaking.
This fastest growing demographic of the young and the poor, can enormously benefit from income transfers and social services that develop their human resources potential. Digital platforms can prove to be a great ally and effective outreach mechanism to this effect. For these up-and-comers, born into the possibilities offered by mobile internet, intuitive computing and financial literacy should not be mutually exclusive, and forging meaningful partnerships between digital platforms and government schemes can boost the latter’s reach. Monetisation potential in the future is a key tenet of asset building, and education and talent building are equally important assets.
Securing incomes, stabilising cash flows, skill attainment for upward mobility and better job creation are the need of the hour for the bottom-up agenda. India’s second stint of unabated growth has to be fuelled from the majority and academic and policymaking efforts should be guided by this North Star. To that end, different “asset classes” have to be studied differently, given the highly fragmented nature of income in India, and economic actors must stay cognisant and grounded in these market realities.
REFERENCESAbbas, Muntazir (2018), ‘India has 22 cars per
1000 individuals: Amitabh Kant’, 12 December 2018, ET Auto https://auto.economictimes.indiatimes.com/news/passenger-vehicle/cars/india-has-22-cars-per-1000-individuals-amitabh-kant/67059021
Ahluwalia, Harveen (2018), ‘Millennial to redefine India’s Consumption Story: Report’, 20 February 2018, LiveMint, https://www.livemint.com/Consumer/vj5e3v3uGyQR9KRwcvNBvN/Millennials-to-redefine-Indias-consumption-story-report.html
C., Vishwanath, Dasgupta, Monami and Sharma, Misha (2020), ‘Household Finance in India: Approach and Challenges’, Dvara Research Working Paper Series No. WP-2020-02 May 2020, https://www.dvara.com/research/wp-content/uploads/2020/05/Household-Finance-in-India-Approaches-and-Challenges.pdf
Damodaran, Harish (2019), ‘In Economic Slowdown, A Backstory of Falling Investor Confidence’, 27 August 2019, The Indian Express. https://
i n d i a n e x p re s s . c o m / a r t i c l e / e x p l a i n e d /explained-in-economic-slowdown-a-back-story-about-falling-investor-confidence-5936308/
Deloitte Insights (2018), ‘The Untethered Workforce: Empowering the 100% Mobile Worker’, Interview of Mike Brinker by Jeff Schwartz, 07 December 2018, https://www2.deloitte.com/us/en/insights/focus/technology-and-the-future-of-work/untethered-workforce-mobile-workers.html
ICE 360° (2016), ‘Middle India is Still some way off from being Middle Class’, Survey results by PRICE, 2016, http://www.ice360.in/en/projects/homepageservey/middle-india-is-still-some-way-off-from-being
Jain, Surbhi (2020), ‘Gold Prices Continue to Rally, Near INR 51,000 per 10 gms’, Financial Express, 24 July 2020, https://www.financialexpress.com/market/commodities/gold-prices-continue-to-rally-near-51000-per-10-gms-should-you-buy-or-sell-the-yellow-metal/2033661/
Koukoulas, Stephen (2015), ‘Economic growth more likely when wealth distributed to poor than to the rich’, 04 June 2015, Guardian, https://www.theguardian.com/business/2015/jun/04/better-economic-growth-when-wealth-distributed-to-poor-instead-of-rich
Kumar, Shailesh and Sharma, Misha (2020), ‘Picturising the Portfolios of Indian Households, Dvara Research, Research Brief, July 2020, https://www.dvara .com/research/wp-content/uploads/2020/07/Picturising-the-Portfolios-of-Indian-Households.pdf
Kwatra, Nikita and Bhattacharya, Pramit (2019), ‘Saving Like an Indian Millennial’, 08 December 2019, Mint, https://www.livemint.com/news/india/saving-like-an-indian-millennial-11575801972030.html
Livemint (2019), ‘Wheels and Millennials’, 12 September 2019, https://www.livemint.com/opinion/quick-edit/opinion-wheels-and-millennials-1568285220594.html
MeitY and McKinsey (2019), ‘India’s Trillion Dollar Digital Opportunity’, New Delhi, https://www.meity.gov.in/writereaddata/files/india_trillion-dollar_digital_opportunity.pdf
Mint (2016), ‘88% of Households in India have a Mobile Phone’, 06 December 2016, New Delhi,
Mint (2016), ‘Middle India is Still Some Way off from being Middle Class’, 22 December 2016, New Delhi.
Morgan Stanley (2017), ‘India’s Millennials to Drive Growth in Four Key Sectors’, 21 April, 2017, https://www.morganstanley.com/ideas/India-millennials-growth-sectors

92 Labour & Development
OECD (2003), ‘Asset Building and the Escape from Poverty: A New Welfare Policy debate’, OECD LEED Programme, Paris, http://www.ecosocdoc.be/static/module/bibliographyDocument/document/003/2398.pdf
Oxfam (2017), ‘An Economy for the 99%’, Briefing Paper, January 2017, https://www-cdn.oxfam.org/s3fs-public/file_attachments/bp-economy-for-99-per cent-160117-en.pdf
Oxfam and The Economic Times (2020), ‘Wealth of India’s Richest More than 4 Times of Total 70% for Poorest: Oxfam’, 20 January 2020, ET, https://economictimes.indiatimes.com/news/economy/indicators/wealth-of-indias-richest-1-more-than-4-times-of-total-for-70-poorest-oxfam/articleshow/73416122.cms
Persaud, Avinash (2019), ‘A New Development Model for the New Economy’, EPW 54(28): July 13, 2019, https://www.epw.in/journal/2019/28/h-t-parekh-finance-column/new-development-model-new-economy.html
Piketty, Thomas (2020), ‘How Political Ideas Keep Economic Inequality Going’. Interview given on Capital in the 21st Century for The Harvard Gazette, 03 March 2020, https://news.harvard.edu/gazette/story/2020/03/pikettys-new-book-explores-how-economic-inequality-is-perpetuated/
Ponnathpur, Rakshit S. and Dasgupta, Monami (2020), ‘Savings in Gold by Low-Income Households’, Dvara Research Brief, May 2020, https://www.dvara.com/research/wp-content/
uploads/2020/05/Savings-in-Gold-by-Low-Income-Households.pdf
RBI (2017), “Indian Household Finance”, Report of the Household Finance Committee, July 2017, https://rbidocs.rbi.org.in/rdocs/PublicationReport/Pdfs/HFCRA28D0415E2144A009112DD314ECF5C07.PDF
Sabharwal, Manish and Chakraborty, Rituparna (2019), ‘In Search of an Effective Way to Blunt Self- Exploitation’, 26 March 2019, LiveMint, https://www.livemint.com/opinion/online-views/opinion-in-search-of-an-effective-way-to-blunt-self-exploitation-1553543107853.html
Sposato et al. (2017), ‘Sharing Economy and Circular Economy: How Technology and Collaborative Consumption Innovations Boost Closing the Loop Strategies’, Environmental and Engineering Management Journal, 16(8): 1797-1806, http://omicron.ch.tuiasi.ro/EEMJ/.
United Nations, Department of Economic and Social Affairs, Population Division (2017), ‘Household Size and Composition Around the World 2017’ – Data Booklet (ST/ESA/ SER.A/405), New York, https://www.un.org/en/development/desa/population/publications/pdf/ageing/household_size_and_composition_around_the_world_2017_data_booklet.pdf
World Economic Forum (2019), ‘Future of Consumption in Fast Growth Consumer Markets: India’, Insight Report, January 2019, http://www3.weforum.org/docs/WEF_Future_of_Consumption_Fast-Growth_Consumers_markets_India_report_2019.pdf

LABOUR CONTROL, INFORMALISATION AND POLICY IMPLICATIONS: THE CASE OF UBER DRIVERS IN THE PLATFORM ECONOMY1
Kanikka Sersia* and Nishat K. Singh**
The Uber business model has not only disrupted the labour-economy by technological intervention, but also raised apprehensions about the new framework within which the platform economy governs the relationship between Uber and its drivers. Through an in-depth survey2 of fifty Uber drivers, this research paper attempts to discuss: the forms of labour control on Uber driver-partners by the Uber company, customers and the government within the broader framework of neoliberal platform economy; the challenge of increasing flexibility at the cost of rising informalisation of work in the platform economy; and policy implications and a way forward.
Keywords: Platform Economy, Flexibility, Panopticon, Labour Control, Informalisation
* Junior Research Fellow, Delhi School of Economics. Email: [email protected]** MPhil Sociology, CSSS, JNU. Email: [email protected] 1 This paper was selected under thematic presentations at the 3rd Edition of Global Knowledge Sharing Forum: Transition
to Formal Economy at the International Training Centre of the International Labour Organisation (ITC-ILO) in Turin, Italy.
2 The fieldwork was conducted during MA programme as a part of the Course, Research and Methods under the kind supervision of Prof. Sudha Vasan; by a group of six, Arshjot Kaur, Gangotri Kashyap, Ipshita Soni, Mohika Sharma, Nishat K. Singh and Kanikka Sersia of the Department of Sociology, Delhi School of Economics.
1. INTRODUCTION
Free market has been the ultimate mantra of neo-liberalists. Neoliberalism advocates free trade without tariffs and duties across borders. One neoliberal claim popularised in the 1980s was that countries needed to pursue labour market flexibility. With globalisation, both government and private corporations chased each other to foster more flexibility into the labour market. Amidst the rise in competitive pressures of neoliberal economy, digital technologies enabled a form of “platform economy”. The digital platforms such as Uber allows the workers to avail the flexibility of time and work. Therefore, the platform workers are often celebrated as micro-entrepreneurs, self-employed, independent contractors, and so on. While it is true that the platform economy promotes flexibility, it also induces new forms of control mechanisms, and exploits the vulnerabilities of the flexible labour through increased contractualisation and informalisation. Interestingly, technology plays a pivotal role in determining the relationship between the platforms and the labour. This paper specifically attempts to look into three major axes—labour control, informalisation and policy implications of Uber drivers in particular, and platform labour in general.
2. LITERATURE REVIEW
Uber is a digital application-based model that functions as an aggregator mediating market demand and supply with bulk investment and predatory pricing. Uber’s success rests on the concepts of free market and freedom of individuals in the neoliberal economy. Founded in March 2009, in San Francisco by Travis Kalanick and Garrett Camp, Uber meaning “above” has grown immensely popular all across the globe. Uber came to India in 2013 and today, it operates in approximately 900 cities worldwide (Uber, 2020).
The Uber cab system is an appropriate model that demonstrates the concept of sharing economy. Sharing economy is based on the idea of making personal space accessible to strangers. It is quite different from the industrial economy, not just in terms of the techniques of control over labour, but also in terms of who has control over whom. In industrial capitalism, the one who controls is the owner of the means of production and the one who is controlled is the worker. On the contrary, in the sharing economy, the one who has control over labour is not the owner of the means of production (Standing, 2016:151), they rather thrive on the rent collected for the services provided by those labourers who own their means of production (in this case, the car). Sharing
Labour & Development, Vol. 27, No. 1, June 2020

94 Labour & Development
economy today is powered by technologies that extend our economic “community” far beyond family or friends, to a digitally vetted subset of the population at large (Sundararajan, 2016). Sharing economy works on platforms that provide on-demand services to consumers. This platform economy enables drivers to get associated with a platform like Uber.
Uber drivers are treated as micro-entrepreneurs, where they are held accountable for their own working time and earnings. “Drivers are now businessmen attached to the platform, rather than drivers who work for a transport company” (Aditi Surie, 2017:12). Contract, information, formal registration with a firm, etc. are indicators that make Uber drivers look like formal sector employees. However, Uber drivers remain unprotected from untimely dismissals and deprived of the long term payment and retirement safety net. Uber drivers hence, lie at the threshold of formal and informal economy reflecting the features of both.
The nature of work carried out by Uber and their driver-partners is our first and foremost concern. Guy Standing (2000) lays down seven aspects of control, namely control over self; labour (time); means of production; raw materials; skill reproduction; output; and the proceeds of output or income. Taking his idea of control further, we look into the forms and techniques of control Uber drivers are subjected to by the company, customers and the state. This control mechanism is facilitated by the Uber application installed in the driver’s smartphone, where technology masks the true source of power.
Further, in the platform economy, individual’s consumption goods can turn into capital goods, i.e. the private car becomes a capital asset whilst being used for Uber driving. This spreads the concentration of capital ownership more widely, which is instrumental in creating a consciousness of micro-entrepreneurship amongst the workers by providing them the flexibility to work on their own terms. However, the techniques of control employed by a platform capitalist like Uber, ensures that they are invariably subjected to exploitative work. It is thereby difficult to
assess the driver’s own perception of self-employment.
Moreover, this flexibility is accompanied by the “disciplinary power” which is exercised on Uber drivers (Foucault, 1977). Drawing from Foucault’s contribution to understanding how the imprisoned body is subjected to domination and power, a parallel can be drawn with that of control over Uber drivers. The power exercised on the body of the Uber driver can be deciphered in a triadic relationship amongst the customers, the driver and the company, mediated by the Uber application. The drivers are individuated according to their tasks, observation, and control which enables them to perform their duty. It is enforced with the help of surveillance systems. Thus, power relations in Uber are facilitated by the Uber application that acts like a panopticon in the Foucauldian sense. In a digitally governed world, this functions similar to an “Information Panopticon”, which does not require physical arrangements like building structures and the direct human supervision (Zuboff, 1988). Rather, the digital application performs the function of a disciplinary device where the driver (body) is subject to the constant field of visibility.
Power and control are also exercised over the emotions and behaviour of the drivers. The work of hunting for fares is being replaced by an additional demand for soft skills, alongside the responsibility of driving safely and efficiently (Glöss et al, 2016). This means, apart from the performance of physical work, drivers also perform “emotional labour” (Hochschild, 1983). Hochschild in her study of the flight attendants explains that, “Emotional labour refers to the process by which workers are expected to manage their feelings in accordance with organisationally defined rules and guidelines” (Wharton 2009:147). Here, Uber drivers are expected to be “calm, patient and polite with riders in order to receive the best ratings” (Stark, 2016). Emotional labour here is taken for granted which works as a latent but significant requirement.
Further, even though the customers and drivers are engaged in a short-lived social interaction, a

Labour Control, Informalisation and Policy Implications: The Case of Uber Drivers in the Platform Economy 95
power relation is persistently active. Their social interaction is governed by precision, time and money related calculations. This kind of attitude also stems from what Simmel (1903) calls “Metropolitan Mentalities”. Uber cabs exemplify this typical urban phenomenon, which symbolises the existence of a city as a way of illustrating urban mentalities. There exists an occupational culture, which constitutes interaction between the drivers and the customers making sociability nothing but an end in itself. When the ride is over, the passenger is dropped off and the sociability also comes to an end.
At the structural level, there has been an increased risk of informalisation of work. It was Hans Singer (1970) who predicted a persistent “dangerous” dualism in labour markets with high levels of casual and intermittent employment, as well as disguised or overt unemployment. During the 1990s, globalisation of the economy contributed to the informalisation of the workforce in many industries and countries (Standing, 1999). While technocrats largely remain optimistic that platform aggregation will lead to the formalisation of the economy, others are sceptical. The former Infosys CEO, Nandan Nilekani, for instance, said, “Once a taxi driver becomes part” of the cab service, he then “becomes part of the formal economy... he is able to use data, get a loan, buy a car and start paying taxes”. In this way, formalisation follows consequently. However, while the platform economy companies have been able to create efficiency in an unorganised transport market, so far no empirical investigation has been done to analyse the impact of the platform economy on labour practices or work experiences that suggest a transition from informal to formal economy in the Indian labour market (Surie and Koduganti, 2016).
In fact, flexible specialisation in the digital age, according to a report by WIEGO, is leading towards informalisation of employment relations where standard jobs are turned into non-standard or atypical jobs with hourly wages but few benefits, or into piece-rate jobs with no benefits; production of goods and services is subcontracted to small-scale informal units and industrial workers. Pierre Calmard, CEO of the digital agency Prospect, also argues that salaried
employees in the traditional sense of the word might be gradually dying and the future of work probably lies in doing real work but without drawing a fixed salary. This line of thought, therefore, suggests that an increase in the flexible nature of work in the platform economy has paved the way for contractual and informal3 employment relationships.
However, the concern of this paper goes beyond the dichotomy of formal and informal. Rather, this paper is an attempt to understand the nature of flexibility enjoyed by Uber drivers specifically, and platform labour in general.
3. METHODOLOGY
In our first pilot survey, a driver stated, “Earlier we were slaves, now we are our own boss”. Prima facie, the above statement creates an impression of flexibility and freedom among the drivers. But it was also ironical when the Uber cab drivers went on a nationwide strike on the streets of metropolitan cities of India. It was enticing that the platform company with the catchy tagline, “Be Your Own Boss” worked contrary to the expectations of their driver-partners.
This study was aimed to understand how Uber drivers define their freedom; what different techniques of control Uber employs over these drivers; and whether drivers are even aware of these techniques of control. With a target to interview 50 drivers, the entire process led us to interact with approximately 70 drivers out of which 20 turned out to be non-respondents. The second pilot survey was conducted to test the applicability of our interview schedule by booking an Uber XL ride from Delhi School of Economics to Kashmiri Gate.
3 For statistical convenience, the standard definition of informal employment has been established by the International Labour Organisation (ILO). Informal employment includes all remunerative work (i.e. both self-employment and wage employment) that is not registered, regulated or protected by existing legal or regulatory frameworks, as well as non-remunerative work undertaken in an income-producing enterprise. Informal workers do not have secure employment contracts, worker’s benefits, social protection or workers’ representation.
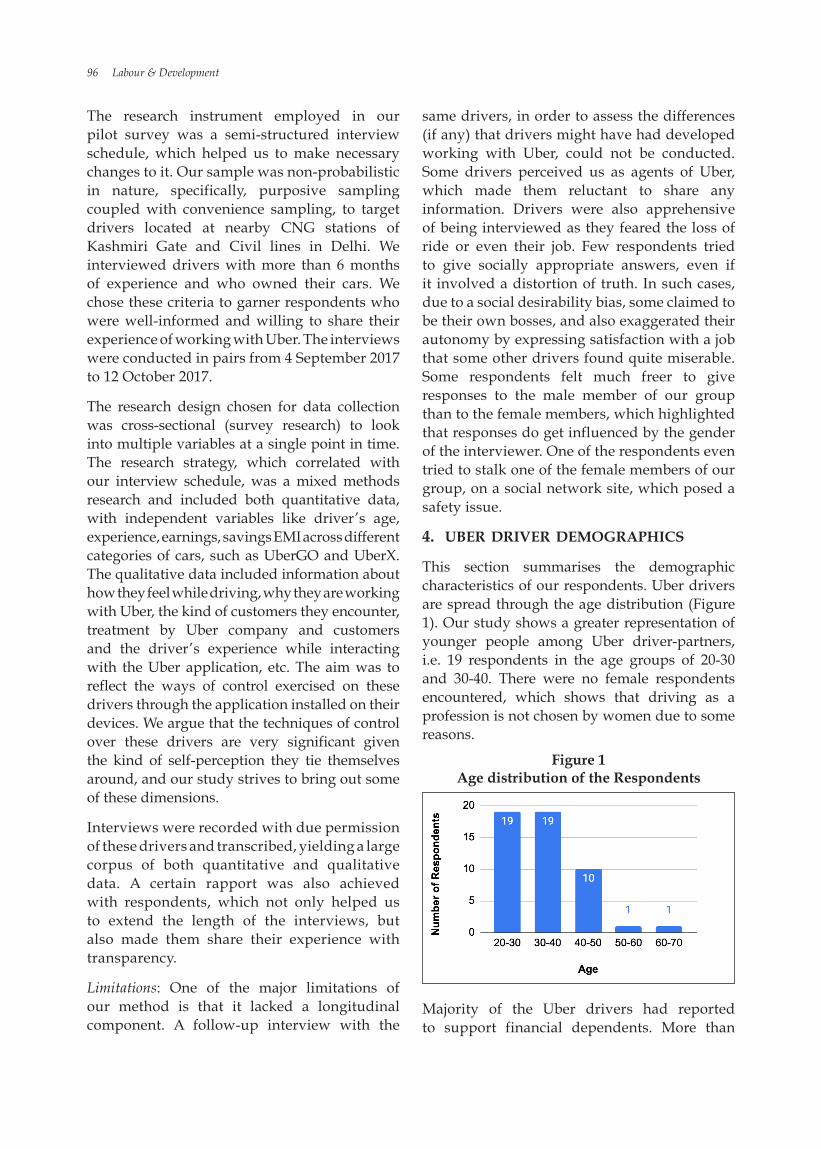
96 Labour & Development
The research instrument employed in our pilot survey was a semi-structured interview schedule, which helped us to make necessary changes to it. Our sample was non-probabilistic in nature, specifically, purposive sampling coupled with convenience sampling, to target drivers located at nearby CNG stations of Kashmiri Gate and Civil lines in Delhi. We interviewed drivers with more than 6 months of experience and who owned their cars. We chose these criteria to garner respondents who were well-informed and willing to share their experience of working with Uber. The interviews were conducted in pairs from 4 September 2017 to 12 October 2017.
The research design chosen for data collection was cross-sectional (survey research) to look into multiple variables at a single point in time. The research strategy, which correlated with our interview schedule, was a mixed methods research and included both quantitative data, with independent variables like driver’s age, experience, earnings, savings EMI across different categories of cars, such as UberGO and UberX. The qualitative data included information about how they feel while driving, why they are working with Uber, the kind of customers they encounter, treatment by Uber company and customers and the driver’s experience while interacting with the Uber application, etc. The aim was to reflect the ways of control exercised on these drivers through the application installed on their devices. We argue that the techniques of control over these drivers are very significant given the kind of self-perception they tie themselves around, and our study strives to bring out some of these dimensions.
Interviews were recorded with due permission of these drivers and transcribed, yielding a large corpus of both quantitative and qualitative data. A certain rapport was also achieved with respondents, which not only helped us to extend the length of the interviews, but also made them share their experience with transparency.
Limitations: One of the major limitations of our method is that it lacked a longitudinal component. A follow-up interview with the
same drivers, in order to assess the differences (if any) that drivers might have had developed working with Uber, could not be conducted. Some drivers perceived us as agents of Uber, which made them reluctant to share any information. Drivers were also apprehensive of being interviewed as they feared the loss of ride or even their job. Few respondents tried to give socially appropriate answers, even if it involved a distortion of truth. In such cases, due to a social desirability bias, some claimed to be their own bosses, and also exaggerated their autonomy by expressing satisfaction with a job that some other drivers found quite miserable. Some respondents felt much freer to give responses to the male member of our group than to the female members, which highlighted that responses do get influenced by the gender of the interviewer. One of the respondents even tried to stalk one of the female members of our group, on a social network site, which posed a safety issue.
4. UBER DRIVER DEMOGRAPHICS
This section summarises the demographic characteristics of our respondents. Uber drivers are spread through the age distribution (Figure 1). Our study shows a greater representation of younger people among Uber driver-partners, i.e. 19 respondents in the age groups of 20-30 and 30-40. There were no female respondents encountered, which shows that driving as a profession is not chosen by women due to some reasons.
Figure 1 Age distribution of the Respondents
Majority of the Uber drivers had reported to support financial dependents. More than

Labour Control, Informalisation and Policy Implications: The Case of Uber Drivers in the Platform Economy 97
half of the respondents were matriculated or below (Figure 2). This implies that ride-sharing platforms need not hire well-educated people. Nearly 12 per cent of Uber drivers had graduate degrees, and only one respondent was a post-graduate. It is interesting to note that the sole postgraduate respondent had a combined savings of Rs 50,000 from his two cars deployed under Uber.
Figure 2 Educational Qualification of the Respondents
5. DATA ANALYSIS
5. 1 The Body Under Control
Flexible number of working hours is what makes Uber driving one of the most lucrative jobs these days. “There are no minimum-hours requirements, so drivers can work a relatively small number of hours per week” (Hicks, 2017:1). The more they work, the more they gain. But what makes it exhausting for our respondents is the long driving hours. Almost 94 per cent of the Uber drivers have responded that they drive more than 10 hours a day on average (Figure 3). As one of the respondents said, “We have to drive all night even with our eyes red”, it is when one realises, such rigorously driving hours comes at the cost of their health in the long run.
Figure 3 Average Working Hours Per Day
The body of an Uber driver is seen to be vested with relations of power and domination, subjected to the technologies of power. The power is exercised rather than possessed (Foucault, 1977:26). So even when the Uber driver is flexible enough to schedule his daily activities, take a day off at his own will or just avoid working by logging off the Uber application, it is no guarantee that the body gets freedom from control. In order to keep drivers on the road, “the company exploits some people’s tendency to set earnings goals by alerting them that they are ever so close to hitting a target when they try to log off” (Scheiber and Huang, 2017). Our respondents had reported similar experiences. Uber offers rides 30-40 km away from their home whenever they put their home as their final destination. Sometimes Uber strategically sends these drivers their next fare opportunity just before their current ride is about to get over.
Another pattern visible in the analysis is that of migration. Amongst the respondents, 25 came from the bordering states of Uttar Pradesh, Haryana and Rajasthan. 44 per cent of our respondents reported that they had been previously working as chauffeurs or independent drivers but earned comparatively lesser than being associated with Uber. Other respondents previously worked as an electrician, farmer, embroidery worker and similar low paid jobs. Our eldest respondent who was 61 years old, was previously employed in Radisson Hotel at an executive post. Uber driving was preferred by him after retirement as a means to drive away boredom. Majority of men were initially drawn into Uber driving because of the minimum requirements, the flexibility of working hours and Uber’s promise to “Be your own Boss”. Hence, in Delhi 74,000 cabs were registered from April 2013 to March 2017, with the highest numbers recorded in 2016-17 (Anand, 2017). But, instead of a well-paying, satisfactory career option, Uber has also left many cab drivers disappointed over the years due to the company’s budgeting mechanism.

98 Labour & Development
This creates a psychological dupe which keeps cab drivers driving without much rest.
Another way of exerting control over an Uber driver’s body is by exercising control over his emotions. Uber drivers are expected to please the customers by talking nicely and behaving decently. Our respondents have ensured controlled behaviour even towards a rude customer in order to score high on customer ratings, since each customer rating adds up to a higher rating, which in turn determines the number of future rides offered. When enquired about whether the drivers ask the customers to rate them well, the majority of them denied it. Ironically, most of them do ask for high ratings at the end of the ride. This reflects a contradiction in the responses. Uber drivers are expected to be “calm, patient and polite with riders in order to receive the best ratings and that the driver should “never ask” for a five-star review” (Stark, 2016). Yet, the company never instructs clearly on how to perform emotional labour. In fact, “Uber doesn’t acknowledge the personal and financial cost of this emotional labour to its drivers and doesn’t adequately explain how these forms of work factor into drivers’ performance ratings.” (Ibid). And hence, the emotional labour performed by the cab drivers is neither recognised by the company nor the customers.
5.2 Money Matters
Uber’s business model with competitive pricing provides drivers with the ultimate access to the network of customers. Our respondents claimed to have earned handsomely in the initial days of joining Uber. But a sense of control arises from an economic perspective as the driver feels handcuffed at the same time being flexible. According to our data, 82 per cent of our respondents had taken a loan to buy their cars. Drivers have been reported to experience a constant pressure of EMIs which varies from Rs. 10,000 to Rs. 22,000 per month (Figure 4).
While most of the drivers were short on budget to pay these monthly instalments, some of them went as far as considering to commit suicide. CNG, maintenance and accidental costs make up for most of the expenditures. While weekly earnings are irregular ranging from 5,000 to
10,000 on an average, savings denote that some drivers were able to save as high as Rs. 50,000 a month and some as low as nothing. Sarah Kessler puts forward a similar account of an Uber driver’s poorly paid cab drive in her book, Gigged (2018):
Uber drivers buy gas and spend money on insurance and car payments, and the company doesn’t reimburse them—everything, the gas, air fresheners, they just add up really fast… it’s literally less than minimum wage, after expenses…. In some cases, Uber charged customers 80 cents per mile. Then it took a commission that generally ranged between 20% and 30% and charged the passenger a booking fee that effectively made its commission higher. (Kessler, 2018)
Ceteris paribus, supply-side factors also have a crucial role to play in disrupting the transport market. The increase in the number of cab drivers on Delhi roads on account of (1) an unrestricted entry of All India Permit Cabs; (2) launch of Uber owned cars, and; (3) increase in the number of Uber drivers itself increased competition among drivers to fetch rides. On the demand side, sometimes the overall customer demand for rides is low seasonally. Accruing to all these demand and supply factors, two-thirds of our respondents were unable to complete their targets in time (Figure 4).
Figure 4 Completion of the Last and
Second-last Ride Target
Moreover, Uber drivers are enticed by the incentive-based scheme. That is to say, the precise target assigned to each driver is established on an individual basis, varying with rides, category of the car (UberGo, UberX, UberXL, etc.) and the experience of the driver with Uber (Figure 5).
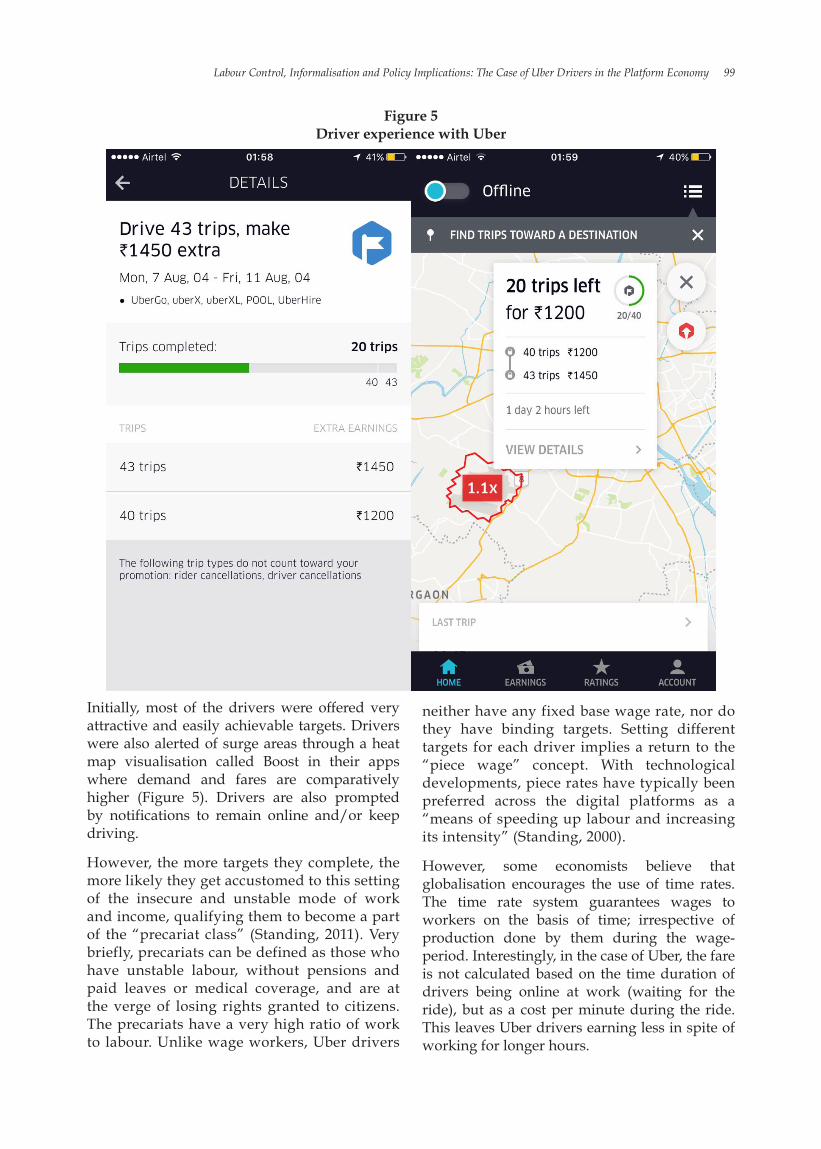
Labour Control, Informalisation and Policy Implications: The Case of Uber Drivers in the Platform Economy 99
Initially, most of the drivers were offered very attractive and easily achievable targets. Drivers were also alerted of surge areas through a heat map visualisation called Boost in their apps where demand and fares are comparatively higher (Figure 5). Drivers are also prompted by notifications to remain online and/or keep driving.
However, the more targets they complete, the more likely they get accustomed to this setting of the insecure and unstable mode of work and income, qualifying them to become a part of the “precariat class” (Standing, 2011). Very briefly, precariats can be defined as those who have unstable labour, without pensions and paid leaves or medical coverage, and are at the verge of losing rights granted to citizens. The precariats have a very high ratio of work to labour. Unlike wage workers, Uber drivers
neither have any fixed base wage rate, nor do they have binding targets. Setting different targets for each driver implies a return to the “piece wage” concept. With technological developments, piece rates have typically been preferred across the digital platforms as a “means of speeding up labour and increasing its intensity” (Standing, 2000).
However, some economists believe that globalisation encourages the use of time rates. The time rate system guarantees wages to workers on the basis of time; irrespective of production done by them during the wage-period. Interestingly, in the case of Uber, the fare is not calculated based on the time duration of drivers being online at work (waiting for the ride), but as a cost per minute during the ride. This leaves Uber drivers earning less in spite of working for longer hours.
Figure 5 Driver experience with Uber

100 Labour & Development
5.3 Disciplinary Gaze
Ten seconds to accept the ride or the call is forwarded to another driver—then technology enabled real-time tracking begins. The driver, by the virtue of customer’s gaze facilitated through Uber application, is subjected to what Foucault (1977) calls “power relations”. Customer’s gaze can be explained through a short-lived power-relation between the driver and the customer. Firstly, customers through their smartphones can keep a track of the driver’s location, and look into his other credentials like ratings, profile, etc. Secondly, drivers make sure to reach the pick-up point in time, because they know they are being watched. Thirdly, a customer sitting in the backseat forces the driver to act in a desired manner, i.e. to behave politely, follow the GPS route, etc. The majority of our respondents tend to drive according to the customer’s preference in spite of knowing better alternate routes. In addition, our respondents feel more conscious when it comes to female passengers because of concerns regarding women’s safety in an Uber cab. To address this, Uber has tied up with Delhi Police’s ‘Himmat’ application, adding another layer of surveillance.
However, what if drivers are subject to indecency by a drunk or abusive customer? Our survey shows that customers rarely refuse to pay; but if they do, Uber seldom reimburses the driver. Uber’s redressal mechanism seems quite inactive to most of the respondents. There was one such instance of physical abuse where the customer pointed a gun on our respondent when asked about payment. Yet, the company does not offer any mechanism for drivers’ safety and security, which forces the cab drivers to resort to relatively submissive and passive behaviour when faced with such indecency. However, an accident policy was recently introduced by Uber in association with ICICI Lombard, where insurance indemnity will be paid to drivers in case of damage to the car or personal injury to themselves, but due to unclear execution of this policy, most of the drivers are unaware of it.
Another technique by which disciplinary gaze is maintained is the rating system. Platform business model is based on rating system, also understood as a ‘reputational score’ (Gandini, 2018). This is fundamental in platform work as
this reputational score is used by consumers as forms of evaluation of platform worker and proxies for trustworthiness.These ratings generate performance evaluations that allow Uber to track drivers’ performance (Rosenblat, 2016). In fact, respondents claimed higher ratings provide a steady supply of rides; and lower ratings can lead to deactivation of Uber driver’s account. Our respondents also believe that cancellation results in lower ratings, which further leads to less rides. But it is the customers who possess the knowledge to define a ‘good driver’ which empowers him/her to rate driver’s services. There is a similar mechanism for drivers to rate the customers, but it is quite asymmetrical, because customer ratings have serious repercussions on the driver. One of the respondents stated, “if you as a driver get rated low by a customer, your account can be deactivated. Imagine you’re stuck in a traffic jam and the customer is annoyed because you are late, you suddenly get a two-star rating. This is just completely open to abuse. We are in a ridiculous position.” Essentially, the drivers are left at the mercy of the customer’s mood. Drawing from Foucauldian understanding, customer’s gaze makes drivers regulate their own behaviour, both in order to obtain high ratings and for fear of being terminated.
Furthermore, drivers are also under the constant gaze of the state. The proposed City Taxi Scheme, 2017, mandates the installation of GPS devices on board every vehicle applying for a permit to operate as a cab. This scheme would function like Zuboff’s Information Panopticon. Information Panopticons do not need physical arrangements, like building structures, and direct human supervision (Zuboff 1988:322). As reported by The Hindu, 24x7 Central Control Room (CCR) is to be set up at the Delhi Transport Department headquarters for real-time monitoring and tracking of all cabs operating in the capital. Cabs will be monitored and are required to be in constant communication with CCR through GPRS/GPS chips. It will enable authorities to identify the exact geographical location of a cab. It is intended to ensure that passengers who use a cab feel safe in the capital. All the data related to identities and background of cab drivers will be compiled and maintained

Labour Control, Informalisation and Policy Implications: The Case of Uber Drivers in the Platform Economy 101
by the Department, which was otherwise not being performed or not being performed as effectively as required by cab aggregators. The scheme also proposes to prohibit UberPool (ride-sharing) since The Motor Vehicles Act, 1988, has no provision to allow shared rides by cabs operating under contract carriage permits. The Uber drivers are also prescribed to wear the uniform of kaali-peeli (black-yellow) taxis. While some refuse to wear it for fear of being caught by the traffic police, others do because it makes them feel independent and self-employed. Alas, the locus of burden befalls on the drivers barring them from operating the cab and making them liable to penal action.
Uber also keeps a constant gaze on the driver’s actions via the application installed on his smartphone. Such digital application entails “algorithmic management” which is crucial aspect of the platform economy to control labour in the digitalised sphere of workplace (Wood et al., 2019:62). For instance, a pop-up notification beyond the speed of 60 kmph prevents drivers from speeding. The drivers cannot cancel more than two or three rides. As accounted, drivers can explain cancelling the rides on the basis of vehicle breakdown, queue at CNG stations and previously scheduled duties. But drivers also reported to have cancelled rides towards Gurgaon and Noida to avoid toll-tax. This was noted as misconduct by Uber.
When enquired about falling short of the last few rides before completing the target, two-thirds of the respondents agreed to this (Figure 6). The respondents expressed their mistrust over technology since they believed that it is Uber itself, not an encrypted software, which determines the allocation of rides. In this context, a driver remarked that most of the time the drivers who get maximum rides are those who have leased the car from Uber itself. Another respondent expressed that sometimes, when he is on his way back to home and tries to log off the application, he gets a ride out of nowhere. This makes him feel that Uber intentionally discourages drivers from logging off. The closer one gets to the target, the tougher the conditions become to achieve it. It undoubtedly sounds like levelling up in a video game! Regrettably, this is no video game, but real life with real people who have real problems.
Figure 6 Ever Deprived of a Ride When Close to the
Target?
Moreover, Uber has been modifying its policies unilaterally. As per our respondents, Uber gave high incentives in the initial phase to encourage drivers with their own cars. A respondent stated, “We were initially bated”. Gradually, incentives were decreased and Uber’s commission was increased. In fact, in the second phase, Uber launched its own vehicles with the promise to hand over the ownership of cars to the drivers after 3 years. However, the contract details were not explicitly explained. A respondent stated, “No one is even aware of the first line of the contract, let alone the contract is shown to us”. In the third and the last phase, the company had clearly refused to hand over the ownership of the vehicle to the drivers, which had outrightly defied the initial idea of “Be your own boss”. This indicates that the actual command and control lies in the hands of Uber company. Facilitated by the digital system of Uber application, Uber exercises control on the drivers and also makes it look like they are autonomous. All these tensions got out in the form of a demonstration against Ola and Uber during a strike in January 2017.
When enquired upon, only 15 out of the 50 respondents had taken part in the strike (Figure 7). But, the figures almost flipped when they were asked the need for government intervention (Figure 8). This indicates that some of those drivers who did not resort to strike as a means of resistance against Uber had a change of mind. Most of them now seek some kind of government intervention. This stands in stark contrast to the ideals and the enchanters of neoliberalism and free-market economy. Our respondents specifically suggested policy interventions such as increase and standardise the rates per kilometre, improve incentives and decrease the company’s unjustifiably high commission of

102 Labour & Development
20 per cent plus 5 per cent taxes. Drivers, who neither opted to participate in strike nor seek government intervention, felt helpless because they could see no avenues for unionisation. Conventional cab and auto drivers have a strong union and lobbying capacity to the extent of becoming a considerable vote bank. But in this scenario, Uber drivers are left individualised in two ways. Firstly, in legal terms, they are referred to as ‘independent contractors’ and not ‘employees’ per se, which deprives them of legal rights to unionise. Secondly, in terms of socialisation, platform workers lack social integration and a sense of belonging (Graham, 2017). They work on their own, are widely dispersed and have little opportunity to come into contact with one another. In our field itself, i.e. CNG station, autowallahs were spotted standing and squatting in long queues, unlike the Uber drivers who were enclosed within cars with their eyes riveted on smartphones.
Figure 7 Participation rate in the strike
Figure 8 Is government intervention required?
5. 4 Control Over Wheels
It was interesting how the majority of our respondents did not recognise themselves as independent-contractors. Rather, they felt
that working with an organisation like Uber, by default, bestows them with the status of an employee. An independent contractor is defined as someone who controls the result of the work, rather than what will be done and how. But Uber not only dictates the results of the work, but also what will be done and how it will be done. In 2015, Edward Chen, Judge of California’s Labour commission cited Foucault in one of his rulings and remarked that ratings gave Uber a ‘tremendous amount of control over the “manner and means” of its drivers’ performance’, he noted that a ‘state of conscious and permanent visibility assures the automatic functioning of power’ (Standing, 2016:157). The platform economy is built at the interface of technology and networking. In the digital era, technology has manipulated the social relations and scope for interaction, such that the platform not only manages the allocation of work but is also involved in changing the labour conditions at work. For instance, with Uber, the app manages not just allocation of rides at work, but it also engages in processing payments, tracking distance, fare rates and mediating the relationship between the Uber company and its drivers (Glöss, 2016).
Moreover, in the platform economy, the one who has control over labour is not the owner of the means of production; it is rather the one who collects rent from the services provided by those who own their means of production. Platform economy in that case has managed to “convert personal property of billions of people into a source of profits” for the capitalists (Booth, 2015). Moreover, it allows individuals to turn their consumption goods into capital goods, as the car once used for leisure or transportation purposes has now become commodified into a capital asset whilst being used for rides by Uber customers.
Despite the ability of a worker to turn these cars into capital goods, Uber, under the guise of boosting efficiencies and incomes through increased utilisation of underused assets, is expanding the scope of commodified labour and the amount of unpaid work-for-labour (Standing, 2016:150). We can say that Uber drivers have been reduced to a status of on-demand servants for the elites. Uber drivers own the car, but at the same time, they are subject

Labour Control, Informalisation and Policy Implications: The Case of Uber Drivers in the Platform Economy 103
to directions, discipline and deactivation. Uber does provide the crucial online system that supports and drives ride-sharing, but the drivers provide and maintain their own cars (Ritzer, 2014). Therefore, in the platform economy, control lies in the hands of those who own the ‘technological apparatus’ and not of those who own the means of production.
The control, though not overtly experienced by the Uber drivers, is reflected in their responses to our last question (Figure 9). With growing dissatisfaction amongst drivers, very few responses were affirmative when the drivers were asked if they would continue to drive with Uber in the next five years. Isn’t it ironic for a company who promises its driver-partners to “Be Your Own Boss”?
Figure 9 Do You See Yourself Being an UBER-driver in
the Coming Five Years?
Foucault (1977) made it quite explicit that the existence of capitalism is not possible without discipline, a form of control. Here, the customers, state and Uber, utilise the technological apparatus like a panopticon, to discipline the driver, track driver’s mobility and subject him to constant technological gaze. We thereby refer Uber application as a panopticon in motion. In other words, the Uber application serves as an instrument of the disciplinary mechanism through which the body (driver) is subjected to the constant field of visibility.
6. TOWARDS INFORMALISATION
There exists a high degree of fiction in the wordings of the standard agreement between Uber and its driver. The employer-employee relationship between Uber and its drivers is not just a matter of statutory debate, but
sometimes, the driver’s own perception as being ‘self-employed’ or an ‘Uber employee’ is also significant. But this distinction is not merely rhetorical, as employment by a firm implies certain rights such as paid holidays, minimum wage, etc. Some categories of wage workers have found themselves to be, in effect, without legal recognition or protection, because their employment relationship is either disguised, ambiguous, or not clearly defined (Chen, 2012). In order to become more flexible, specialized, competitive, or simply to cut down labour costs, many formal firms hire workers under informal employment relationships. The wave of globalisation demands greater attention and protection to informal workers as the process of globalisation has eroded employment relations. This has encouraged formal sector employers to hire workers at low wages with no social security benefits, or to subcontract the production of goods and services, which has helped them maintain cost efficiency (Dhas and Helen, 2008; Rodrik, 1997). In most such cases, it is the formal firm, not the informal worker, that chooses or “volunteers” to operate informally and enjoys the “benefits” of informality. The platform business models are built on large workforces competing over relatively low skilled tasks, controlled by powerful intermediaries. Contract, information, formal registration with a firm, etc. are indicators that make Uber drivers look like formal sector employees. But these drivers remain unprotected from untimely dismissals and deprived of the security of long-term payment and retirement safety net.
In theory, the International Labour Office (ILO), the international Expert Group on Informal Sector Statistics (called the Delhi Group), and the global network Women in Informal Employment: Globalizing and Organizing (WIEGO) have together made an attempt to broaden the concept and definition of the informal sector (Figure 10). They split the large heterogeneous informal sector into two categories: self-employment and wage employment; and then further into sub-categories. This includes the whole of work-related informality, as it is manifested in industrialized, transition and developing economies and the real world dynamics in labour markets today.

104 Labour & Development
to their social security. In the case of Uber, the drivers are freelancers and not employees per se, which means that Uber itself is not an employer. This saves the company from paying employer contribution for various employment benefits of social security as categorised by the ILO convention 102: Medical care, Cash sickness benefits, Disability, Old age, Survivors, Maternity, Family/children, Unemployment, Employment injury, and Protection against poverty and social exclusion through social assistance. Whether the digital platforms have led to the formalisation of informal labour or informalisation of formal labour is difficult to claim due to lack of empirical data. But clearly, the absence of such social protection provisions highlight the vulnerability of Uber drivers, and also reflect upon the nature of informality persisting in the platform economy, in general.
But how have negotiations surfaced in this new form of employment initiative? Conceptualizing the industrial relations of the platform economy, anecdotal evidence from Kilhoffer et al (2017) suggests that there is no framework for social dialogue between the different parties
involved in the platform economy. There are certain instances where the platform economy is incorporated into the broader system of industrial relations and social dialogue (Kilhoffer, 2017). But even if such a framework exists, it offers a poor fit due to differences among platform workers and employees, and platforms and employers. This is quite evident from the recent strike by Uber driver-partners across metropolitans like Delhi, Bangalore and Mumbai in a bid to press demands against low fares and long working hours. The most notorious misconception is that driver-partners are legally understood as “independent contractors” and not “employees”. This enables the companies to save around 30 per cent on labour costs by cutting benefits, overtime, sick days, and other costs (Srnicek, 2017). It is important to point out that recognised trade unions and associations, like Sarvodaya Driver Association of Delhi (SDAD) and Maharashtra Navnirman Sena (MNS), tried bargaining for their rights. But in a recent verdict by the Delhi High Court, these taxi driver unions have been refrained from staging any strike.
Figure 10 Informal Employment
Source: Chen, WIEGO Working Paper.
Formalisation means obtaining a formal wage job—or formalizing their current job status—with a secure contract, worker benefits, membership in a formal trade union, and employer contributions

Labour Control, Informalisation and Policy Implications: The Case of Uber Drivers in the Platform Economy 105
7. TECHNIQUES OF RESISTANCE
Despite different agencies of control and discipline, these drivers find innovative ways to make “the routinisation of work less routinized”, and “enjoy the luxury of self-determination” (Burawoy, 1982). Firstly, in our study, we came across some drivers who have registered their cars with both Ola and Uber. For instance, when they feel that Uber’s policy or targets are not lucrative enough, they switch to Ola. This way drivers toggle between different platforms. The act of switching between these two platforms with such an ease manifests a form of resistance against the working conditions of either. When the driver feel that they don’t want to be seen online as available, they log out of their devices to take some time off. In this manner, they resist the gaze which regulates them. Secondly, one of the respondents told us, “Customers often use abusive language when we get late by a few minutes”. In such cases, these drivers tend to cancel the ride as they can afford two cancellations per day. Mostly, they avoid driving through congested streets because that consumes more time and fuel. The ability to toggle between alternate platforms and switch within the same platform—online and offline mode, is their way of expressing resistance against the forces of control. This shows that if technology and its gaze can objectify a
worker, the same technology can be used as a tool of resistance to escape that objectification. There is also a possibility that a new form of digital trade unions will empower tomorrow’s platform economy workers.
8. COMPREHENSIVE POLICY APPROACH
It is important that policymakers should recognize various dimensions of formalisation and the fact that formalisation is not just about registration and payment of taxes by the platform workers, but also an on-going process of extending benefits of formalisation incrementally, including labour rights and decent work. What is required is a formalisation of the informal economy which is comprehensive in approach but context-specific in design and practice (Figure 11).
8.1 Legal Contract
Well defined terms and conditions of a legal contract between Uber and its drivers is a pre-condition. The platform company should also be held responsible for ensuring that drivers are also fully aware of the contract technicalities like service conditions, rate cuts, termination clause, and so on. Moreover, the disguised designation of ‘freelancers’ or ‘micro-entrepreneurs’ is not only misleading but also unfair. Therefore, there is a need to re-conceptualise the legal definition of Uber drivers in particular, and platform workers in general (Berg et al., 2018).
8.2 Platform Cooperatives
Lack of unionised representation and collective bargaining puts platform labour at a disadvantaged position. Recently, building on the almost 200-year-old history of cooperatives, and the digital platform model, platform co-ops have combined and reconfigured the best features of these two models to create a distinctive, innovative approach in recent times. Based on the principle of broad-based ownership of the platform and democratic decision making, platform co-ops provide collective solidarity to the platform labour. Platform co-op can play an instrumental role in the empowerment of the platform labour as they can organise and collectively bargain for
Figure 11 Comprehensive Policy Approach

106 Labour & Development
their rights, base price, incentives, gain access to institutional credit and so on. Through the use of technology, digital unions instead of traditional trade unions are also becoming a real thing due to the scattered nature of the virtual workforce.
8.3 Social Dialogue
Our survey respondents were mostly concerned by the absence of any mechanism of grievance redressal on part of both the Uber company and the government. Most of the Uber drivers sought some kind of government intervention. It is, in fact, necessary to bring the platform labour, platform company and the government on board for a multi-stakeholder dialogue (Graham and Woodcock, 2018). Fair negotiations are necessary for ensuring both long term economic returns for businesses, as well as inclusive development and sustainability. However, one needs to understand the limits of the process. Given the Fourth Industrial Revolution’s extraordinarily fast technological and social change, government legislation and incentives are likely to be out-of-date or redundant by the time they are implemented (WEF, 2016). Hence, the idea is to initiate ‘digital’ social dialogue through e-governance measures which require the bureaucracy, policymakers and regulators to keep pace with the digital transformations.
8.4 Social Protection
Extending social protection to informal workers is one way to support the transition from the
informal to the formal economy as highlighted in ILO Recommendation 204. Social protection for platform workers should be part of the broader regulatory strategy for the platform economy (Graham et al., 2017). At present, platform workers are not covered under the social security schemes. A year after our survey period, Uber announced the launch of Uber Care in November 2018; a novel step which facilitates driver-partners across the country with access to a life insurance programmes with an insured sum ranging from INR 200,000 to 1,000,000 from HDFC Life. Uber Care aims to extend its support not just to driver-partners but their families as well, providing them with financial security and stability. It is still a baby step. Road accidents and disability should be the part of the insurance cover as they are included in the occupational hazards. While a lot of drivers fell into a debt trap because of the car loan, a basic income security must be ensured for the drivers spending a minimum number of hours on the road. The financial security should also be extended to medical illness. Platforms, in general, should collaborate with the government and contribute to the National Pension Scheme for universal coverage for old-age pensions, which can continue even if platform workers toggle between different platforms. Building an innovative portable benefits system for the platform economy is required to deal with the flexible and precarious nature of work.
9. CONCLUSION
The digital world we are penetrating into is not a world where freedom is ensured. Forms of control are already embedded in the codes that govern our interactions in cyberspace. The platform labour unwittingly submit to the invisible constraints entailed to digital associations and transactions associated with the digital platforms that have never been publicly debated. Despite ownership of their means of production, drivers lack control over it because they are unable to control the technology. The Uber application installed in the driver’s smartphone indeed acts as a panopticon in motion—disciplining, controlling and monitoring the drivers at all times. Unless we understand these gaming strategies, we are likely to sleep through the transition from freedom into control. Further,

Labour Control, Informalisation and Policy Implications: The Case of Uber Drivers in the Platform Economy 107
the growth of independent contractual work is undoubtedly leading to insecure working conditions. So it is important to question what this condition brings to the future of work. The mere flexibility to enter, work or leave the job does not make it flexible, but rather more uncertain, insecure and precarious. Growing dissatisfaction among the workers amidst technological transformations is not just an economic but also an ethical, social and political issue, which is bound to have policy implications on the future of work.
REFERENCESAnand, J. (2017), ‘Transport Dept. to Monitor, Track
All Cabs Plying in Capital’, The Hindu, August 23, 2017.
Berg, J., Furrer, M., Harmon, E., Rani, U. and Silberman, M.S. (2018), Digital Labour Platforms and the Future of Work. Towards Decent Work in the Online World. International Labour Organization.
Booth, A. (2015), The Sharing Economy, the Future of Jobs, and “Post Capitalism”, https://www.marxist.com/the-sharing-economy-the-future-of-jobs-and-postcapitalism-part-one.htm
Bryman, A. (2015), Social Research Methods, New York: Oxford University Press.
Burawoy, M. (1982), Manufacturing Consent: Changes in the Labor Process under Monopoly, University of Chicago Press.
Chen, Martha A. (2012), ‘The Informal Economy: Definitions, Theories and Policies’, WIEGO Working Paper No 1, August 2012, Cambridge, MA: WIEGO.
Dhas, A C and M. Helen. (2008), ‘Social Security for Unorganised Workers in India’, Munich Personal RePEc, Archive Paper No 9247.
Foucault, M. (1977), Discipline and Punishment: The Birth of the Prison, New York: Pantheon Books.
Gandini, A. (2018), “Labour Process Theory and the Gig Economy”, Human Relations, 72(6):1039-1056. doi:10.1177/00187267187900021–18.
Glöss, M., McGregor, M. and Brown, B. (2016), ‘Designing for Labour: Uber and the On-Demand Mobile Workforce’, DOI: http://dx.doi.org/10.1145/2858036.2858476
Graham, M. (2017), “Your Role in Creating a Fairer World of Work”, in M. Graham & J. Shaw (eds.)
Towards a Fairer Gig Economy, Meatspace Press, 28-31
Graham, M. and Woodcock, J. (2018), “Towards a Fairer Platform Economy: Introducing the Fairwork Foundation,” Alternate Routes, 29 pp. 242–253.
Graham, M., Hjorth, I. and Lehdonvirta, V. (2017), “Digital Labour and Development: Impacts of Global Digital Labour Platforms and the Gig Economy on Worker Livelihoods,” Transfer: European Review of Labour and Research 23(2): 135–62.
Hicks, Maureen S. (2017), ‘Flexible jobs give workers choice’, Monthly Labour Review, US Bureau of Labour Statistics, pp. 1-2.
Hochschild, A.R. (1983), The Managed Heart: The Commercialization of Human Feeling, Berkeley: University of California Press.
Howritz, S. (2015), The Sharing Economy and the Ownership of the Means of Production, Bleeding Heart Libertarians.
ILO Conventions and Recommendations are available at https://www.ilo.org/dyn/normlex/en/f?p=NORMLEXPUB:1:
Kessler, S. (2018), Gigged: The Gig Economy, the End of the Job and the Future of Work, St. Martin’s Press.
Kilhoffer, Z., Lenaerts, K. and Beblavý, M. (2017), ‘The Platform Economy and Industrial Relations: Applying the old Framework to the New Reality’, European Commission or CEPS Report No. 2017/12, August 2017.
Ritzer, G. (2014), “The “Sharing” Economy, Uber, and the Triumph of Neo-Liberalism.” George Ritzer, 05 November. https://georgeritzer.wordpress.com/2014/11/05/the-sharing-economy-uber-and-the-triumph-of-neo-liberalism/
Rodrik, D. (1997), Has Globalisation Gone Too Far? Washington, DC. Institute for International Economics.
Rosenblat, A. (2016), ‘The Truth About How Uber’s App Manages Drivers’, Harvard Business Review.
Scheiber, N. and Huang, J. (2017), ‘How Uber Uses Psychological Tricks to Push Its Drivers’ Buttons’, New York Times, April 2, 2017, stable URL: https://www.nytimes.com/interactive/2017/04/02/technology/uber-drivers-psychological-tricks.html

108 Labour & Development
Simmel, G. (2002), ‘The Metropolis and Mental Life’, (1903), in Gary Bridge and Sophie Watson, eds. The Blackwell City Reader, Oxford and Maiden, MA: Wiley – Blackwell, Stable URL: http://www.blackwellpublishing.com/content/BPL_Images/Content_store/Sample_chapter/0631225137/Bridge.pdf
Srnicek, N. (2017), Platform Capitalism, Polity Press.
Standing, G. (1999), Global Labour Flexibility: Seeking Distributive Justice, New York: St. Martin’s Press.
Standing, G. (2000), ‘Modes of Control: A Labour-Status Approach to Decent Work’, International Labour Office, Geneva.
Standing, G. (2016), The Corruption of Capitalism: Why Rentiers Thrive and Work does not Pay, Biteback Publishing.
Standing, G. (2011), The Precariat: The New Dangerous Class, Bloomsbury Publishing.
Stark, L. (2016), ‘Recognizing the Role of Emotional Labour in the On-Demand Economy’, Harvard Business Review.
Sundararajan, A. (2016) ‘The Sharing Economy: The End of Employment and the Rise of Crowd-Based Capitalism’, pp. 256, MIT Press, Cambridge, Massachusetts.
Surie, A. (2017), ‘Tech in Work: Organising Informal Work in India’, Economic and Political Weekly, Vol. 52 No. 20.
Surie, A. and Koduganti J. (2016), ‘The Emerging Nature of Work in Platform Economy Companies
in Bengaluru, India: The Case of Uber and Ola Cab Drivers’, E-Journal of International and Comparative Labour Studies, Volume 5, No. 3.
Toiskallio, K. (2000), ‘Simmel Hails a Cab: Fleeting Sociability in the Urban Taxi’, Space and Culture, 1(1):4-20.
Uber (2020), Uber Website URL: https://www.uber.com/global/en/cities/
Uber Technologies Inc: Managing Opportunities and Challenges. Daniels Fund Ethics Initiative, University of Mexico, https://danielsethics.mgt.unm.edu/pdf/uber.pdf
Wharton, Amy S. (2009), ‘The Sociology of Emotional Labour’, Annual Review of Sociology, Vol.35:147-65.
Women in Informal Employment: Globalizing and Organizing (WEIGO) (2019), Extending Social Protection to Informal Workers, March 2019.
Wood, A., Graham, M., Lehdonvirta, V. and Hjorth, I. (2019), “Good Gig, Bad Gig: Autonomy and Algorithmic Control in the Global Gig Economy,” Work, Employment and Society 33(1): 56–75. doi: 10.1177/0950017018785616.
World Economic Forum (WEF) (2016), ‘Values and the Fourth Industrial Revolution: Connecting the Dots Between Value, Values, Profit and Purpose’, September 2016.
Zuboff, S. (1988), In the Age of the Smart Machine: The Future of Work and Power, Oxford: Heinemann.

V.V. Giri National Labour Institute
NLI RESEARCH STUDIES SERIES
No.
001/2000 Labour Market Institutions in Globalized Economy: Some Issues in the Indian Context — C.S.K. Singh
002/2000 Dynamics of Labour Market in Kerala — S.K. Sasikumar &S. Raju
003/2000 Women and Labour Market: A Macro Economic Study— Neetha N.
004/2000 Mode of Payment of Minimum Wages in Bihar —Navin Chandra & Nikhil Raj
005/2000 Payment of Minimum Wages in Kind and Perceptions Regarding the Mode of Payment — S.S. Suryanarayanan & Rajan K.E. Varghese
006/2000 Minimum Wages and Mode of Payment : The Case of Punjab — Ruma Ghosh
007/2000 Rural Wages: On Developing an Analytical Framework— Babu P. Remesh
008/2000 Employment in Food Processing Industries — S.S. Suryanarayanan & B. V.L.N. Rao
009/2000 Determinants of Rural Wages: An Inquiry Across Occupations — Babu P. Remesh, J. Jeyaranjan & A.C.K. Nambiar
010/2000 Adverse Sex Ratio and Labour Market Participation of Women: Trends, Patterns and Linkages — Neetha N.
011/2000 Children of Carpet Looms: A Study of Home-based Productions of Carpet in Uttar Pradesh — Nikhil Raj and Ravi Srivastava
012/2000 Child Labour in Slate Industry of Markapur in the Wake of Legislation — K. Suman Chandra, R. Vidyasagar and Y. Gangi Reddy
013/2000 Child Labour in Moradabad Home-Based Industries in the wake of Legislation — Ashish Ghosh, Helen R. Sekar
014/2000 Child Labour in Bulandshahar District of Uttar Pradesh— Tapan Kumar Pachal
015/2001 Outline of a History of Labour in Traditional Small-Scale Industry in India — Tirthankar Roy
016/2001 Gender and Class: Women in Indian Industry, 1920-1990 — Samita Sen
017/2001 The Politics of the Labour Movement: An Essay on Differential Aspirations — Dilip Simeon
018/2001 Child Labour in Home Based Lock Industries of Aligarh— Helen R. Sekar, Noor Mohammad
019/2001 Child Labour in Diamond Industry of Surat — Kiran Desai, Nikhil Raj
020/2001 Gender and Technology: Impact of Flexible Organisation and Production on Female Labour in the Tiruppur Knitwear Industry — Neetha N.
021/2001 Organisational Structure, Labour Relations and Employment in Kancheepuram Silk Weaving — Babu P. Remesh
022/2001 International Labour Migration from Independent India — S.K. Sasikumar
023/2001 Cine Workers Welfare Fund in India — M.M. Rehman
024/2001 Child Labour in Knitwear Industry of Tiruppur — J. Jayaranjan
025/2001 Child Labour in the Home Based Gem Polishing Industry of Jaipur — Kanchan Mathur & Ruma Ghosh
026/2001 Unorganised Workers of Delhi and the Seven Day Strike of 1988 — Indrani Mazumdar
Labour & Development, Vol. 26, No. 1, June 2019

110 Labour & Development
027/2001 Death of an Industrial City: Testimonies of Life Around Bombay Textile Strike of 1982 — Hemant Babu
028/2001 Child Labour in the Home Based Match Industries of Sivakasi — R. Vidyasagar
029/2001 Migration in the North-Eastern Region during 1901-1991 and Emerging Environmental Distress: A Case Study of Deforestation in Assam — Suresh Chand Aggarwal & Pushpam Kumar
030/2001 Women Weavers of Sualkuchi, The Silk Town of Assam — OKD Institute
031/2002 Cash and in-kind Modes of Wage Payment in Maharashtra — C.S.K. Singh
032/2002 Child Labour in the Knife Industry of Rampur — Ashish Ghosh & Helen R. Sekar
033/2002 Labour Contracts and Work Agreements in Tea Plantations of Assam — Kalyan Das
034/2002 Organising and Empowering Rural Labour: Lessons from Kancheepuram in Tamil Nadu — Babu P. Remesh
035/2002 Child Labour in Chrompet Leather Manufacturing Units of Tamil Nadu — J. Jayaranjan
036/2002 Trade Unionism in South Indian Film Industry — S. Theodore Baskaran
037/2002 Migration, Social Networking and Employment: A Study of Domestic Workers in Delhi — Neetha N.
038/2002 Study of Child Labour in the Zardosi and Hathari Units of Varanasi — J. John & Ruma Ghosh
039/2003 Organising Rural Labour for Effective Participation in Development — M.M. Rehman & Surinder Pratap
040/2003 Study of Child Labour in Glass Bangle Industry of Firozabad — Ruma Ghosh Singh & Rajeev Sharma
041/2003 Organising Rural Labour for Effective Participation in Development in Khurja — Poonam S. Chauhan
042/2003 Labour Market and Employment Assessment: A District Level Analysis — Uday Kumar Varma & S.K. Sasikumar
043/2003 Wage Structure and Labour: Assam Valley Tea Plantations, 1900-1947 — Rana Partap Behal
044/2003 Oral History Documentation of Indian Labour Movement — Anil Rajimwale, Krishna Jha, Bobby Poulose
045/2003 Status of Labour Welfare Measures in the Factories of NOIDA: A Case Study of Garment & Hosiery Industry — Sanjay Upadhyaya
046/2003 Labour History and the Question of Culture — Chitra Joshi
047/2003 Child Labour in Hazardous Industries: A Case of Slaughter House and Allied Occupations — Helen R. Sekar
048/2003 The Politics of Representation in the Indian Labour Diaspora — Prabhu Mohapatra
049/2003 Labour Histories: Agrarian Labour and Colonialism — Neeladri Bhattacharya
050/2004 Labour Laws, Contractual Parameters and Conditions of Construction Workers: A Study in Chennai — S.S. Suryanarayanan
051/2004 Labour in Business Process Outsourcing: A Case Study of Call Centre Agents — Babu P. Remesh

NLI Research Studies Series 111
052/2004 Labour, Employment and Gender Issues in EPZs: The Case of NEPZ — Neetha N. & Uday Kumar Varma
053/2004 Labour Relations in Small Holding Plantations: The Case of Rubber Tappers in Kerala — Babu P. Remesh
054/2004 Contractual Arrangements in the Tea Plantations of Tamil Nadu — K. Nagraj & L. Vedavalli
055/2004 Child Labour in Urban Informal Sector: A Study of Ragpickers in NOIDA — Helen R. Sekar
056/2004 Size, Composition and Characteristics of Informal Sector in India — Anoop Satpathy
057/2004 Brick Kiln Workers: A Study of Labour Process and Migration — Ruma Ghosh
058/2004 Impact of Anti-Tobacco-Legislation on the Livelihoods of the Beedi Rollers, Tobacco Cultivators and Tendu Leaf Collectors — Uday Kumar Varma & S.K. Sasikumar
059/2004 Skills Development System: A Micro Level Evidence — Shashi Bala
060/2004 Immobilising Labour: Regulation of Indentured Labour in Assam and the British West Indies, 1830-1926 — Prabhu P. Mohapatra
061/2004 Labour Forms and International Labour Flows in the Context of North-South Relationship: An Overview — Sabyasachi Bhattacharya
062/2005 Migration and Vulnerability to HIV/AIDS: Towards Evolving Viable Intervention Strategies — Uday Kumar Varma & S.K. Sasikumar
063/2005 Vocational Training for Rehabilitation of Labour: A Case Study of NCLP Schools and MAYA — Shashi Bala
064/2005 Organising Rural Labour: Case of Chittorgarh, Rajasthan—Sanjay Upadhyaya
065/2005 Trade Liberalization and Indian Agriculture: A Discussion on Food Security Concerns in the WTO Regime — Ashutosh Kumar Tripathi
066/2005 Labour, Employment and Social Security Issues in Education Industry: A Case Study of Private Schools of NOIDA — Sanjay Upadhyaya
067/2005 Opportunities and Challenges before the Construction Workers in the Globalized Era: The Indian Case — Priyadarsan Amitav Khuntia
068/2005 Workers’ Association in the New Service Sector with Special Reference to Labour Standards — Jyoti Sinha
069/2005 Gender Implications of Trade Expansion in the Context of WTO: The Case of Textile and Clothing Industries — Laimayum Basanti Devi
070/2005 Work and Workers in the New Economy: A Study of Work Organisation and Labour Process in the Context of General Agreement on Trade in Services — Sajikumar S.
071/2006 From Leather Artisans to Brick-Kiln Workers Narratives of Weary Travellers — Subodh Varma & Mahesh Kumar
072/2006 Impact of Privatisation on Labour: A Study of BALCO Disinvestment - Babu P. Remesh
073/2007 Migrant Women and Wage Employment: Exploring Issues of Work and Identity Among Health Care Professionals – Sumangala Damodaran, Krishna Menon
074/2007 Impact of Technological Change on the Demand for Child Labour in Brassware Industry of Moradabad – Helen R. Sekar
075/2007 Rural Non-Farm Employment in Arunachal Pradesh – Growth, Composition and Determinants – Deepak K. Mishra

112 Labour & Development
076/2007 Employment and Earnings in Urban Informal Sector: A Study on Arunachal Pradesh – Vandana Upadhyay
077/2007 Operation of Welfare Fund for Beedi Workers in Madhya Pradesh – M.M. Rehman
078/2007 A Study of Janshree Bima Yojana – M.M. Rehman
079/2007 Changing Rural Landscape: A Study of Village Bujhawar – Poonam S. Chauhan, Shashi Tomar
080/2007 Fishery Sector and Fish Workers in India: An Overview – K. Manjit Singh, M.M. Rehman, Poonam S. Chauhan
081/2007 Construction Workers of Guwahati City: Employment, Employability and Social Security – Kalyan Das
082/2007 Operation of the Limestone and Dolomite Mines Labour Welfare Fund in Madhya Pradesh: A Study – M.M. Rehman, Shashi Tomer
083/2007 Migration, Remittances and Development: Lessons from India – S.K. Sasikumar & Zakir Hussain
084/2008 Hkkstiqjh izoklh Jfedksa dh laLd`fr vkSj fHk[kkjh Bkdqj dk lkfgR; & /uat; flag
085/2009 Contract Labour and Judicial Interventions – Sanjay Upadhyaya
086/2009 Working Women in Urban India: Concerns and Challenges – Shashi Bala & Seema Khanna
087/2010 Agrarian Structure, Social Relations and Agricultural Development: Case Study of Ganganagar District, Rajasthan – Poonam S. Chauhan
088/2010 The Employment and Condition of Domestic Help in India: Issues and Concerns – Shashi Bala
089/2010 Social Security for Unorganised Sector Workers in India: A Critical Appraisal – Babu P. Remesh and Anoop K. Satpathy
090/2010 Linkages between HIV/AIDS and Child Labour: Developing an Integrated Approach towards Effective Policy Formulation – Helen R. Sekar
091/2010 Health Insecurities of Workers in Informal Employment: A Study of Existing and Possible Interventions – Ruma Ghosh
092/2010 Insecurities and Vulnerabilities of Informal Sector Workers: A Study of Street Vendors of Delhi – Ruma Ghosh
093/2011 Labour, Employment and Social Security Issues of Security Guards of Okhla and NOIDA – Sanjay Upadhyaya
094/2012 Migration from North-East to Urban Centres: A Study of Delhi Region - Babu P. Remesh
095/2012 Valuing Life in a Regulated Labour Market: A Study on Tea Plantations in Assam, India - Kalyan Das
096/2012 Employment Situation in North Eastern Region of India: Recent Trends and Emerging Challenges – Partha Pratim Sahu
097/2012 Growth, Composition and Determinants of Rural Non-Farm Employment in North East India –Bhagirathi Panda
098/2012 Labour Market Participation of Working Women Post Maternity: A Case of Private Sector - Shashi Bala
099/2012 Implementation of Maternity Benefit Act - Shashi Bala

NLI Research Studies Series 113
100/2012 Minimum Wage Policy and Regulatory Framework: An Inter Country Perspective - Sanjay Upadhyaya
101/2012 Engendering Gender Statistics: An Analysis of Gender Differentiated Statistics in India - Ellina Samantroy & Dhanya M.B
102/2013 MGNREGS in Tripura: A Study on Efficiency & Equity - Indraneel Bhowmik
103/2013 Migrant and Trafficked Children in Hazardous Employment: The Case of Nagaland - T. Chubayanger
104/2013 Social Security for International Labour Migrants: Issues and Policy Options – Rakkee Thimothy
105/2013 Fundamental Principles and Rights at Work and Informal Economy in India: Trends, Initiatives and Challenges - Dhanya M.B.
106/2013 The Anti-Khoti Movement in the Konkan, C. 1920-1949 - Santosh Pandhari Suradkar
107/2013 Expansion of Natural Rubber Cultivation in Tripura Impact on Landholding, Employment and, Income - S. Mohanakumar
108/2013 Work Participation and Time-Use Pattern of Women in Rural Arunachal Pradesh - Vandana Upadhyay
109/2013 ILO Convention 181: Issues and Challenges in the Context of Private Placement Agencies in India – Ellina Samantroy
110/2014 A Study of Welfare Measures for Beedi Workers in Bangalore and Hyderabad Regions - Poonam S. Chauhan, Shashi Tomer & M.M. Rehman
111/2014 Marine Fishery Industry and Marine Fish Workers in India: A Study with Special Reference to Exploring Employment Potentials in the Sector - Poonam S. Chauhan & Shashi Tomer
112/2014 Conditions of Employment, Work and Service of Faculty in Private Engineering Colleges in India – Sanjay Upadhyaya
113/2015 Reconciling Work and Family Life: A Study of Women’s Time Use Patterns, Unpaid Work and Workplace Policies - Ellina Samantroy
114/2015 Performance of Labour Administration : A Critical Analysis of Cases Filed under Child Labour (Prohibition and Regulation) Act, 1986 - Helen R. Sekar, S. C. Srivastava, Pankaj Kumar
115/2016 Gender Dimensions at Work and Employment: A Case of Sexual Harassment – Shashi Bala
116/2016 Women and Entrepreneurship in North East India: Handloom as an Enterprise in Manipur - Otojit Kshetrimayum
117/2016 Skilling India: Evaluation of Multi Skills Development Centres - Otojit Kshetrimayum
118/2016 Enhancing Labour Administration’s Performance in India - Kingshuk Sarkar
119/2017 Gender Parity in Education and Employment: A Global Perspective - Shashi Bala
120/2017 Gaps in Education & the World of Work: A Gender Perspective - Shashi Bala
121/2017 Industrial Relations in India: A Study of Central Industrial Relations Machinery - Otojit Kshetrimayum
122/2017 Amendments in Labour Laws and Other Labour Reform Initiatives Undertaken by State Governments of Rajasthan, Andhra Pradesh, Haryana and U.P.: An Analytical Impact Assessment - Sanjay Upadhyaya, Pankaj Kumar

114 Labour & Development
123/2017 Understanding Women’s Work: Gendered Analysis of Women’s Participation in Domestic Duties in North East India - Ellina Samantroy
124/2017 Skill Development of Youth in North East India: Way Forward - Priyadarsan Amitav Khuntia
125/2017 Global Labour History: Two Essays - Marcel van der Linden
126/2017 Strike-breaking or the Refusal of Subalternity? Ethnicity, Class and Gender in Chota Nagpur - Dilip Simeon
127/2017 Indian Migrant Labourers in South-east Asian and Assam Plantations under the British Imperial System - Rana P. Behal
128/2017 Workplace Health and Safety: A Study of Select Small Scale Manufacturing Units in Delhi - Rinju Rasaily
129/2017 ICT Imperatives to Bridge the Digital Divide: Gender Perspective - Shashi Bala
130/2018 Quality Employment Generation in Micro and Small Enterprises (MSEs) in India: Strategies and Way forward - Dhanya M.B
131/2018 Prospects for Youth Employment in Agriculture: Issues and Challenges - Ellina Samantroy
132/2019 Impact of the Maternity Benefit (Amendment) Act, 2017 In the IT /ITES Industry - Shashi Bala
133/2019 Regulation of Fixed-Term Employment: An Inter-Country Perspective - Sanjay Upadhyaya
134/2019 Family Labour in Small Holding Plantation Sector: A Study with Special Focus on Women and Children in Selected Areas of South India - Kingshuk Sarkar & Rinju Rasaily
135/2019 A Tale of Three States: Labour Reforms in the States of Gujarat, Madhya Pradesh and West Bengal - Kingshuk Sarkar
136/2019 Low Wages and Gender Discrimination: The Case of Plantation Workers in West Bengal - Kingshuk Sarkar
137/2019 Complexity in the Determination of Minimum Wages for Domestic Workers in India - Kingshuk Sarkar
138/2019 Unpaid Work and Time Use Patterns of Women Workers in North East India: Special Reference to Tripura - Ellina Samantroy
139/2019 Rural Industrialisation and Options for Self Employment in Rural Areas - Poonam S. Chauhan & Shashi Bala
140/2019 Youth and the Labour Market Landscape in India: Issues and Perspectives - S.K. Sasikumar
141/2020 Promoting Youth Employment & Entrepreneurship: A Study with Special focus on ‘Startups’ - Dhanya M.B
142/2020 Implementation of The Equal Remuneration Act, 1976 - Shashi Bala

Note to Contributors• Articles submitted to Labour & Development should be original
contributions and generally should not be under consideration for any other publication at the same time. However, if a paper/article is under consideration by another publication, the author should clearly indicate this at the time of submission.
• Articles should not be more than 9,000 words. This word limit should be inclusive of all notes, references, tables, annexures and appendices.
• Articles should be prepared in text format (e.g. MS Word) following British spelling. PDF versions are not accepted by the Journal.
• All articles should be accompanied by an abstract (120-150 words) along with five keywords.
• All pages of manuscript should be properly numbered and position of figures and tables should be clearly indicated in the paper.
• A brief note about the contributors should be enclosed on a separate sheet.
• References should be given in the text in parenthesis, with the name of the author, year of publication and page numbers in the following manner: (Cohen, 1996:220).
• References with comments should appear as endnote denoted by superscript in the text and be put together at the end but before references of the paper.
• All articles submitted for consideration for publication in the Journal would be subjected to the Journal’s refereeing system.
• Only a paper fulfilling all the stylistic content requirements of Labour & Development shall be referred for peer review. Non-formatted papers shall not be considered.
• After receiving referee’s comments, revised version may be sent in duplicate, one hard copy and the other on MS Word format on CD or through e-mail.
• The authors are entitled to a hard copy of the journal and electronic version of their published article.
• All references should be alphabetically arranged at the end of the text.
Labour & Development, Vol. 26, No. 1, June 2019

116 Labour & Development
Styling Format for the ReferencesSen, Amartya (1981), Poverty and Famine, Oxford: Clarendon Press.
Jain, R. K. (2003), ‘Culture and Economy: Tamils on the Plantation Frontier in Malaysia Revisited: 1998-1999’, in Bhikhu Parekh et.al (eds) Culture and Economy in the Indian Diaspora, 51-80, London and New York: Routledge.
Agarwal, Bina (1998), ‘Disinherited Peasants, Disadvantaged Workers’, Economic and Political Weekly, 33(13):2-14.
Book Reviews
Labour & Development generally does not accept unsolicited reviews. Those willing to do reviews should write to the Editor.
Notes
We encourage short notes on research in progress or short contributions on the topics of current social, political, and economic developments. The comments or rejoinders on the articles published in the journal are also welcome. These should not be more than 1000-1500 words.
Reports
Labour & Development serves as a platform for dissemination of information among social scientists. You are requested to send announcements and short reports on events like workshops, conferences organised on issues related to labour and employment.
All the correspondence should be addressed to:
EditorLabour & DevelopmentV.V. Giri National Labour InstituteSector-24, Noida–201 301, U.P., IndiaE-mail: [email protected]

AWARDS DIGESTA Quarterly Journal of Labour Legislation
Awards Digest: Journal of Labour Legislation is a quarterly journal of the V.V. Giri National Labour Institute dedicated to the dissemination of information concerning labour laws. These laws are continuously being amended. Courts keep on interpreting the provisions of these laws. It is our endeavour to present these changes and also gists of the court decisions for executives from industries, labour administrators, trade union cadres, legal practitioners, researchers and students of labour laws etc. However, our primary concern is to present the digest of judicial decisions of the various courts, concerning labour and industrial relations.
Contents of the Journal= Articles on labour laws and related matters the eminent writers
in the field of labour= Gists of the Supreme Court Decisions on personnel matters= Gists of the High Courts Decisions on personnel matters= Amendments or proposed amendments in labour laws
Important recommendations of the committees/commission set up by the Government of India concerning labour issues
How to get it?
Annual subscription of the journal is Rs. 240/- for individuals and Rs. 300 for institutions (including postage) which can be sent through bank draft/pay orders in favour of V.V. Giri National Labour Institute, payable at NOIDA/DELHI and can be mailed to:
Publication In-chargeV.V. Giri National Labour Institute
Sector-24, NOIDA- 201 301, (U.P)E-mail: [email protected]