Don't you think we're giving up enough already?’ Attitudes of patients and staff on an...
48
A Major Project Report on INTEGRATED APPROACH BASED FAULTY SECTION IDENTIFICATION USING SYNCHROPHASOR DATA Submitted as a partial fulfillment of the requirements for The Bachelor’s Degree in Electrical Engineering Submitted by: Suryakant Raycha (10117081) Syed Zeeshan Ahmad (10117082) Vinay Kumar Singh (10117084) Vivek Kumar (10117085) Vivek Kumar Verma (10117086) Vivek Kumar Singh (10117088) Approved by- Project Guided by- Dr. A S Thoke Dr. (Mrs.) Monalisa Biswal HOD Assistant Professor Department of Electrical Engg. Department of Electrical Engg. NIT RAIPUR NIT RAIPUR DEPARTMENT OF ELECTRICAL ENGINEERING NATIONAL INSTITUTE OF TECHNOLOGY, RAIPUR 2014
-
Upload
independent -
Category
Documents
-
view
4 -
download
0
Transcript of Don't you think we're giving up enough already?’ Attitudes of patients and staff on an...
A
Major Project Report on
INTEGRATED APPROACH BASED
FAULTY SECTION IDENTIFICATION USING
SYNCHROPHASOR DATA
Submitted as a partial fulfillment of the requirements for
The Bachelor’s Degree
in
Electrical Engineering
Submitted by:
Suryakant Raycha (10117081)
Syed Zeeshan Ahmad (10117082)
Vinay Kumar Singh (10117084)
Vivek Kumar (10117085)
Vivek Kumar Verma (10117086)
Vivek Kumar Singh (10117088)
Approved by- Project Guided by-
Dr. A S Thoke Dr. (Mrs.) Monalisa Biswal
HOD Assistant Professor
Department of Electrical Engg. Department of Electrical Engg.
NIT RAIPUR NIT RAIPUR
DEPARTMENT OF ELECTRICAL ENGINEERING
NATIONAL INSTITUTE OF TECHNOLOGY, RAIPUR
2014
2
CERTIFICATE
This is to certify that the project work entitled “Integrated Approach Based Faulty
Section Identification using Synchrophasor Data” submitted by Suryakant Raycha,
Syed Zeeshan Ahmad, Vinay Kumar Singh, Vivek Kumar, Vivek Verma, Vivek
Kumar Singh students of B.Tech final year of ELECTRICAL ENGINEERING
during the academic year of 2013-2014 in a partial fulfillment of the requirements for
the award of Degree of Bachelor of Technology in Electrical Engineering by
National Institute of Technology, Raipur is a bonafide presentation of work done
by them. This certificate does not necessarily endorse or accept any statement made
opinion expressed or conclusion drawn as recorded in the report however it only
signifies the acceptance of the report for the purpose for which it is submitted.
Approved by: Under the guidance of:
Dr. A.S. Thoke Dr. (Mrs.) Monalisa Biswal
HOD Assistant Professor
Department of Electrical Engg. Department of Electrical Engg.
NIT RAIPUR NIT RAIPUR
3
ACKNOWLEDGEMENT
We are grateful to the Department of Electrical Engineering, for giving us the
opportunity to execute this project, which is an integral part of the curriculum in B.
Tech programme at the National Institute of Technology, Raipur.
We would also like to take this opportunity to express heartfelt gratitude for our
project guide Dr. (Mrs.) Monalisa Biswal who provided us with valuable inputs at the
critical stages of this project execution.
We would like to thank Dr. A. S. Thoke, H.O.D Electrical Dept. for his guidance,
support and direction without which project would not have taken shape.
We are also thankful to the staff of Electrical Engineering Department for
cooperating with us during the course of our project.
We would like to acknowledge the support of every individual who assisted using
making this project a success and
We are also very thankful to our parents for providing continuous guidance and
whole hearted support throughout the project.
4
ABSTRACT
Long transmission system is an effective and economical solution for handling
more power through a network. With the ever increasing load demand, stress on
power network increases day by day. In a large interconnected network localization
of fault and faulty section is a major challenge for many protection algorithms. In this
work a new algorithm is proposed for faulty section identification based on
synchrophasor data.
The major problem in power network is to diagnosis the fault quickly and
pinpointing the faulty section. Furthermore, communicating the information within
limited time period to other protective devices so as to avoid relay mal-operation in
that zone is a crucial task. With the inception of fault, the positive sequence voltage at
a particular bus is significantly varied. Again the cosine angle between positive
sequence voltage and current is a reliable parameter for fault direction discrimination.
A protection algorithm is developed using these two features for faulty section
identification. With the optimal placement of phasor measurement units the
information is further communicated to other protective devices using binary logic for
avoiding relay mal-operation. Such a technique is advantageous for different fault
cases. The method is tested for WSCC 3-Machine, 9 Bus System simulated using
EMTDC/PSCAD. Within 60 ms time period the information regarding faulty section
is easily communicated to other protective devices.
5
CONTENTS
1. INTRODUCTION 11
1.1 Literature Review…….…………………………..………………….. 12
1.2 Faults in Power System ……………………………………………. .… 13
1.2.1 Symmetrical fault …………………………………....…..… 13
1.2.2 Unsymmetrical fault………………………….....………….. 14
1.3 Sequence components………………………………..……………... 14
1.4 Fault Analysis using Sequence Components …………………..….…. 17
1.4.1 Three Phase fault……………………...…………………… 17
1.4.2 Line to Ground Fault………….…………………..…..…… 19
1.4.3 Line-to-Line Fault……………………………………………. 21
1.4.4 Double-Line-to-Ground Fault……………………………… 22
TITLE PAGE 1
CERTIFICATE 2
ACKNOWLEDGEMENT 3
ABSTRACT 4
CONTENTS 5
LIST OF FIGURES 8
LIST OF TABLES 10
6
2. WIDE AREA MEASUREMENT SYSTEM 24
2.1 Phasor Measurement Unit…………………………………………... 24
2.1.1 Fundamentals of PMU…………………………………….. 24
2.1.2 PMU Concept………………………………………………. 25
2.1.3 Techniques Used in PMU…………………………………… 28
3. INTEGRATED APPROACH BASED FAULTY SECTION
IDENTIFICATION………………………………………………………….
29
3.1 Fault Detection using Positive Sequence Voltage Change………… 29
3.2 Directional Estimation using Cosine Algorithm……………………... 31
3.3
Proposed Method…………………………………….……………….
3.3.1 3.3.1 Relay Binary Logic For Sectional Identification………………
32
34
4. SIMULATION RESULTS……………………….…………………….......
4.1 WSCC 3-Machine, 9-Bus System…………………………………….
37
37
4.2 Cosine Angle And Voltage Dip Plots For Three Phase Fault……
4.2.1 Cosine Angle Plots………………………………………
4.2.2 Voltage Dip Plots……………………………………………
39
39
40
4.3 Cosine Angle And Voltage Dips Plots For Double Line To Ground
Fault …………………………………………………………………….
4.3.1 Cosine Angle Plots…………………………………………
4.3.2 Voltage Dip Plots………………………………………………
41
41
42
7
4.4 Cosine Angle And Voltage Dip Plots For Phase To Phase
Fault……………………………………………………………………
4.4.1 Cosine Angle Plots………………………………………..
4.4.2 Voltage Dip Plots………………………………………………
43
43
44
4.5 Cosine Angle And Voltage Dip Plots For Single Phase To Ground
Fault..........................................................................................................
4.5.1 Cosine Angle Plots…………………………………………
4.5.2 Voltage Dip Plots………………………………………………..
45
45
46
5. CONCLUSION AND FUTURE SCOPE………………………………… 47
REFERENCES……………………………………………………………. 48
8
LIST OF FIGURES
1.1 Unbalance system (a), positive sequence (b), negative sequence(c), 15
zero sequence (d), phasors
1.2 General representation of balance three phase fault 17
1.3 Sequence network diagram of a balance three phase fault 17
1.4 Representation of a single line-to-ground fault 19
1.5 Sequence network diagram of single line-to-ground fault 19
1.6 Representation of line-to-line fault 21
1.7 Sequence network diagram of line-to-line fault 21
1.8 Representation of double line-to-ground fault 22
1.9 Sequence network diagram of double line-to-ground fault 22
2.1 Sinusoidal signal (a), phasor representation(b) 25
2.2 Communication using PMUS 25
2.3 The PMUs arrangement with phasor data concentration system 27
protection center
2.4 Block diagram of PMU 28
3.1 Positive sequence voltage during voltage dip 30
3.2 Flow chart is given for relay logic 33
Table
No.
Title of the Table Page
No.
9
3.3 Flow chart is given for sectional identification 35
4.1 Single line diagram of WSCC 3-machine 9-bus system 37
4.2 Cosine angle plot for relay at bus B2 39
4.3 Cosine angle plot for relay bus B5 39
4.4 Voltage dip plot for relay at bus B2 40
4.5 Voltage dip plot for relay at bus B5 40
4.6 Cosine angle plot for relay at bus B2 41
4.7 Cosine angle plot for relay at bus B5 41
4.8 Voltage dip plot for relay at B2 42
4.9 Voltage dip plot for relay at B5 42
4.10 Cosine angle plot for relay at bus B2 43
4.11 Cosine angle plot for relay at bus B5 43
4.12 Voltage dip plot for relay at B2 44
4.13 Voltage dip plot for relay at B5 44
4.14 Cosine angle plot for relay at bus B2 45
4.15 Cosine angle plot for relay at bus B5 45
4.16 Voltage dip plot for relay at B2 46
4.17 Voltage dip plot for relay at B5 46

10
LIST OF TABLES
3.1 Binary logic for relay at different buses 34
3.2 Binary logic for section identification 36
4.1 Generator’s parameters 38
4.2 Transmission line parameters 38
4.3 Parameters of transmission line between B8-B2, B3-B9 and B1-B7 38
Table
No.
Title of the Table Page
No.
11
CHAPTER-1
INTRODUCTION
An electrical power system consists of generators, transformers, transmission and
distribution lines, etc. Short circuits and other abnormal conditions often occur on a
power system. The heavy current associated with short circuits is likely to cause
damage to equipment if suitable protective relays and circuit breakers are not
provided for the protection of each section of the power system. If a fault occurs in an
element of a power system, an automatic protective device is needed to isolate the
faulty element as quickly as possible to keep the healthy sections of the system in
normal operation. Conventionally, faults are diagnosed through the status of
protective relays and circuit breakers which are activated following a fault. However,
hidden failures of the protection system has itself often been among the main suspects
of partial or widespread blackout. The fault must be cleared within a fraction of a
second.
A protective system includes circuit breakers, transducers (CTs and VTs), and
protective relays to isolate the faulty section of the power system from the healthy
sections. Until recently it was not able to measure the phase angle of the bus voltage
in real time due to technical difficulties in synchronizing measurements from
different locations. The advent of PMUs (Phasor measurement units) all obviated this
problem by synchronizing the voltage and current waveforms at widely dispersed
locations.
This project is based on power system protection using PMUs and its optimal no. of
placement at respective positions for sectional identification of faulty part and also
fault detection. The circuit model is simulated and analyzed by PSCAD, and values
are fetched to MATLAB for further processing using programming techniques. The
project is implemented on 9 bus system.
12
1.1 LITERATURE REVIEW
In recent years different protection algorithm are given by using PMU, wide area
protection, voltage dip[1-8] for fault detection and location calculation. Some
techniques uses synchrophasor measurement, other uses voltage sag technique to
differentiate between balanced and unbalanced condition.
Voltage dip occurs at the bus adjacent to faulty section. This technique is widely used
for fault detection in power system[6-8].another techniques like wide area protection
using PMU and MHO relays are used for power system protection.
MP Thakre[9] presented MHO characteristics and frequency dependent model type
transmission line and simulated using PSCAD/EMTDC software. To study the
performance of relay characteristics single line to ground fault with or without fault
resistance is considered. A fast fourier transform(FFT) block is used to determine
sequence components.
Phasor based voltage sag monitoring proposed by Bollen, Math H.J.[6] uses voltage
sag characteristics. It is drawn including sag magnitude phase angle jump and voltage
jump. A signal processing algorithm is given to obtain voltage sag characteristics of
phase voltages and positive sequence voltages. The proposed technique is applied to a
set of actual measurement obtained from power quality monitor (PQ) and a
synchrophasor measurement unit (PMU).
After reviewing the above techniques and their limitations an integrated technique
based on combination of voltage dip and cosine algorithm is proposed for a WSCC 9
bus system. The proposed approach effectively determines the faulty section with
optimum number of PMU and with minimum fault detecting time. The following
section deal with the objectives and outline of proposed technique.

13
1.2 Faults in Power System
FAULT: The operation of power system under normal operating condition is
balanced steady state three phase. This condition can be temporarily disturbed due to
sudden external or internal change in system a short circuit or fault occur when the
insulation of system fails at any location or conducting object comes in contact with
the lines. The occurrence of short circuit in power system is termed as fault at that
point.
Electrical power systems have a dynamic and complex behavior. Different types of
faults can interrupt the healthy operation of the power system. Some of the major
Electrical faults are phase faults include phase to phase faults and phase to ground
faults and three phase faults. Other Electrical faults are not of major significance but
still are considered, Open circuit faults occurs due to the parting of the overhead line
or failure operation of the circuit breaker, Interturn fault occurs due to the overvoltage
or insulation breakdown. Electrical Faults results in the overloads is due to the
passing the current through the conductor which is above the permissible value and
faults due to real power deficit occurs due to mismatch in the power generated and
consumed and results in the frequency deviation and collapse of grid.
Faults on power system are broadly classified into following two types:
1.2.1 Symmetrical Fault:
A fault involving all the three phases i.e. a three phase fault is called symmetrical
fault in this type of fault all the three phases are simultaneously short circuited. There
may be two situations:
All the three phases may be short circuited to the ground.
All the three phases are short circuited without involving the ground.
Since the network remains electrically balanced during this type of fault it is known
as balanced fault.
14
1.2.2 Unsymmetrical Fault:
An unsymmetrical fault is any fault other than a 3 phase symmetrical fault e.g.
Single line to ground fault(L-G faults),line to line faults(L-L),double line to ground
faults(2L-G).The path of the fault may or may not contain impedance.
Since any unsymmetrical fault causes unbalanced currents to flow in the system this
type of fault is also known as unbalanced faults.
1.3 Sequence Components:
An unbalanced three-phase system can be resolved into three balanced systems in the
sinusoidal steady state. This method of resolving an unbalanced system into three
balanced phasor system has been proposed by C. L. Fortescue. This method is called
resolving symmetrical components of the original phasors or simply symmetrical
components. In this chapter we shall discuss symmetrical components transformation
and then will present how unbalanced components like Y- or -connected loads,
transformers, generators and transmission lines can be resolved into symmetrical
components. We can then combine all these components together to form what are
called sequence networks.
A system of three unbalanced phasors can be resolved in the following three
symmetrical components:
Positive Sequence: A balanced three-phase system with the same phase
sequence as the original sequence.
Negative sequence: A balanced three-phase system with the opposite phase
sequence as the original sequence.
Zero Sequence: Three phasors that are equal in magnitude and phase.
15
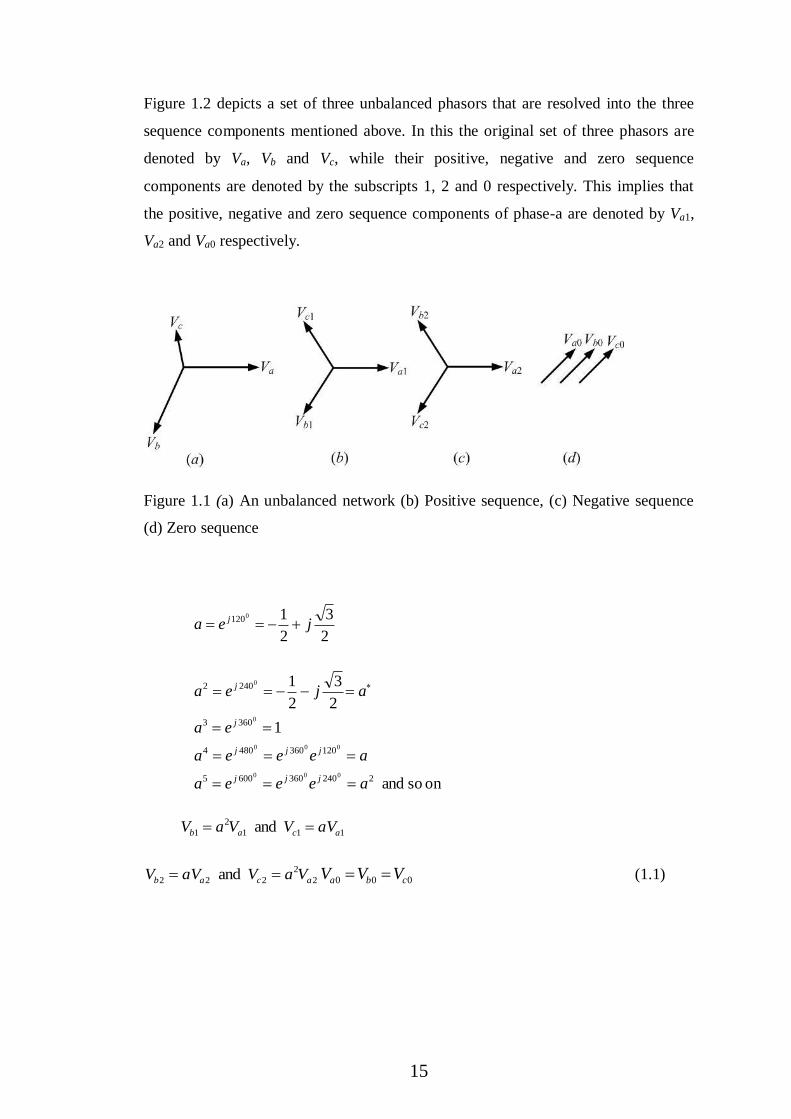
Figure 1.2 depicts a set of three unbalanced phasors that are resolved into the three
sequence components mentioned above. In this the original set of three phasors are
denoted by Va, Vb and Vc, while their positive, negative and zero sequence
components are denoted by the subscripts 1, 2 and 0 respectively. This implies that
the positive, negative and zero sequence components of phase-a are denoted by Va1,
Va2 and Va0 respectively.
Figure 1.1 (a) An unbalanced network (b) Positive sequence, (c) Negative sequence
(d) Zero sequence
2
3
2
10120 jea j
on so and
1
2
3
2
1
22403606005
1203604804
3603
2402
000
000
0
0
aeeea
aeeea
ea
ajea
jjj
jjj
j
j
111
2
1 and acab aVVVaV
2
2
222 and acab VaVaVV 000 cba VVV (1.1)
16
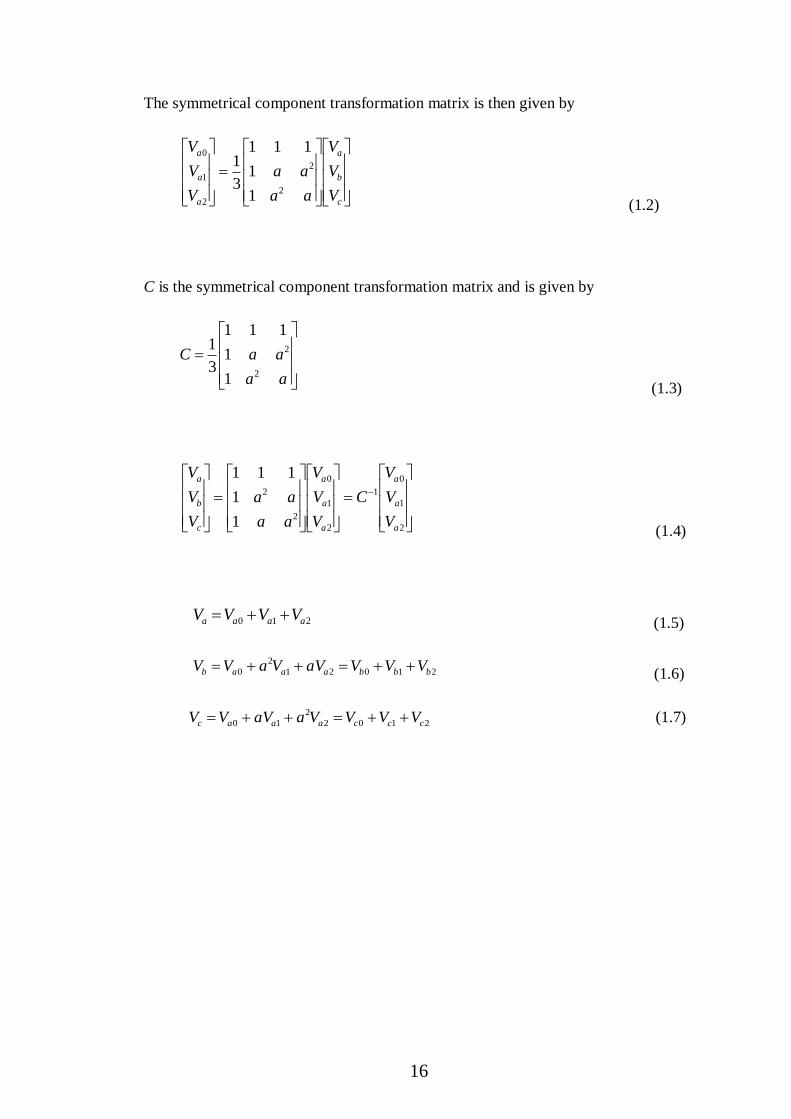
The symmetrical component transformation matrix is then given by
c
b
a
a
a
a
V
V
V
aa
aa
V
V
V
2
2
2
1
0
1
1
111
3
1
(1.2)
C is the symmetrical component transformation matrix and is given by
aa
aaC2
2
1
1
111
3
1
(1.3)
2
1
0
1
2
1
0
2
2
1
1
111
a
a
a
a
a
a
c
b
a
V
V
V
C
V
V
V
aa
aa
V
V
V
(1.4)
210 aaaa VVVV (1.5)
21021
2
0 bbbaaab VVVaVVaVV (1.6)
2102
2
10 cccaaac VVVVaaVVV (1.7)
17
1.4 Fault Analysis using Sequence Components
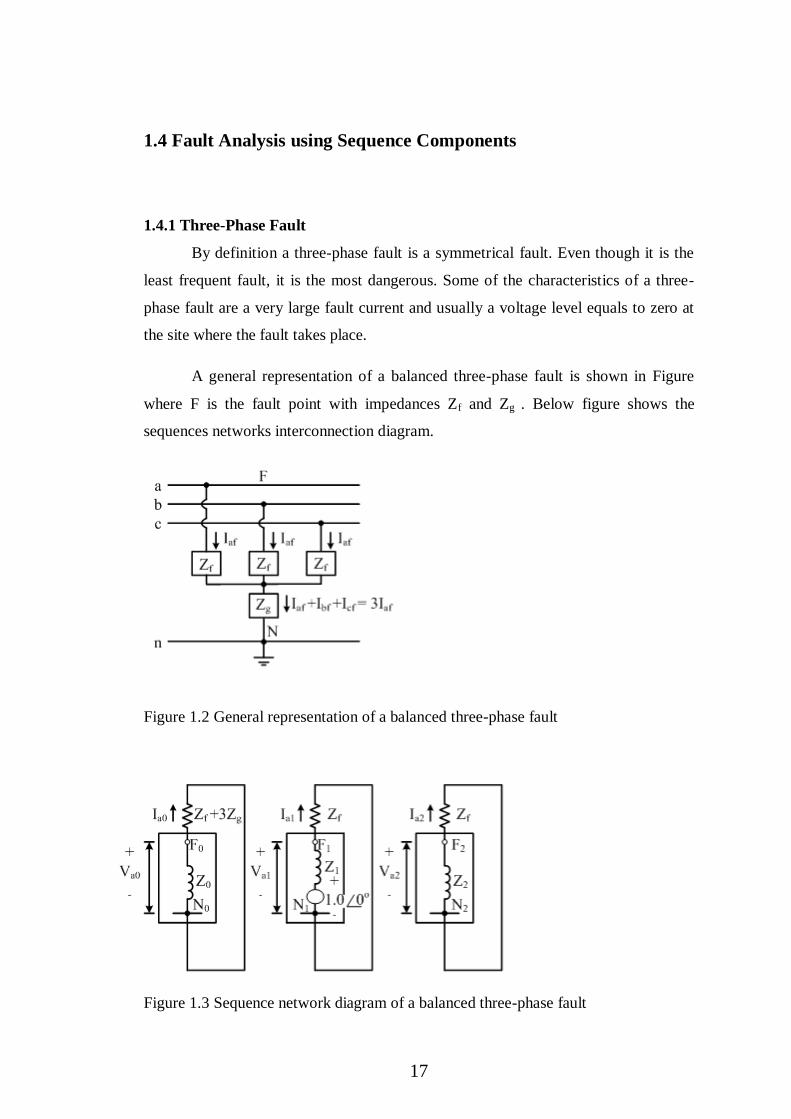
1.4.1 Three-Phase Fault
By definition a three-phase fault is a symmetrical fault. Even though it is the
least frequent fault, it is the most dangerous. Some of the characteristics of a three-
phase fault are a very large fault current and usually a voltage level equals to zero at
the site where the fault takes place.
A general representation of a balanced three-phase fault is shown in Figure
where F is the fault point with impedances Zf and Zg . Below figure shows the
sequences networks interconnection diagram.
Figure 1.2 General representation of a balanced three-phase fault
Figure 1.3 Sequence network diagram of a balanced three-phase fault
18
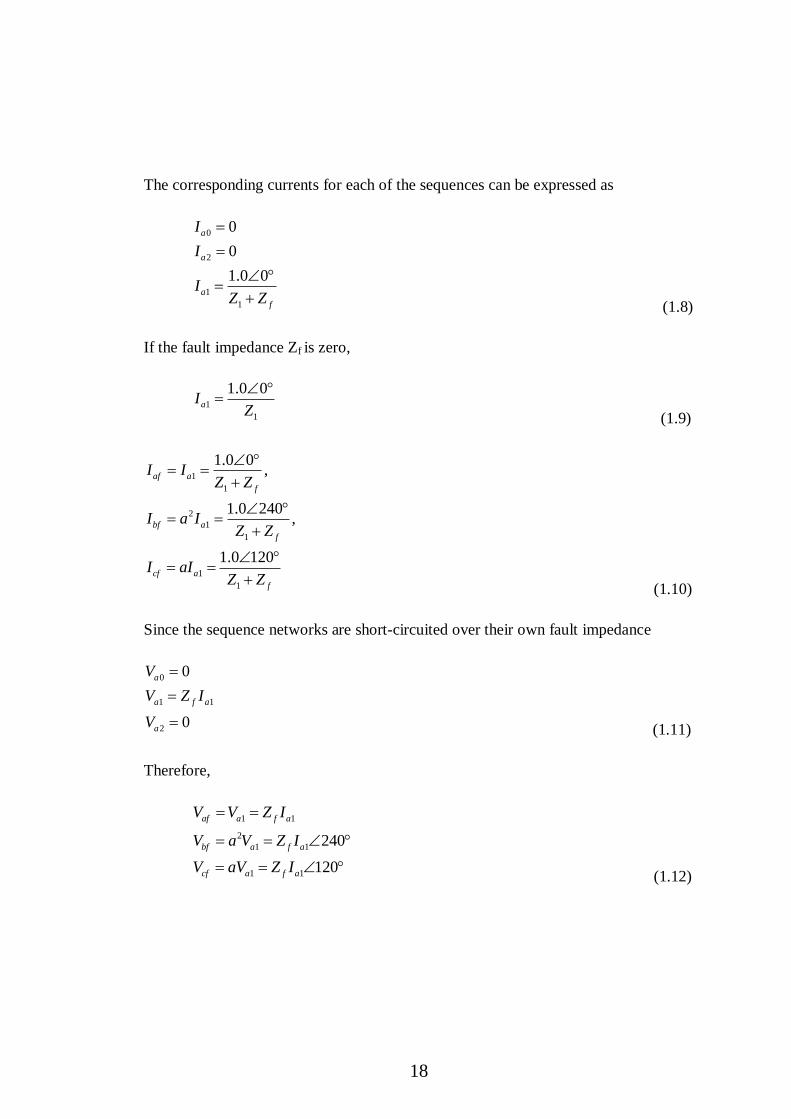
The corresponding currents for each of the sequences can be expressed as
0
2
1
1
0
0
1.0 0
a
a
a
f
I
I
IZ Z
(1.8)
If the fault impedance Zf is zero,
1
1
1.0 0aI
Z
(1.9)
1
1
2
1
1
1
1
1.0 0,
1.0 240,
1.0 120
af a
f
bf a
f
cf a
f
I IZ Z
I a IZ Z
I aIZ Z
(1.10)
Since the sequence networks are short-circuited over their own fault impedance
0
1 1
2
0
0
a
a f a
a
V
V Z I
V
(1.11)
Therefore,
1 1
2
1 1
1 1
240
120
af a f a
bf a f a
cf a f a
V V Z I
V a V Z I
V aV Z I
(1.12)
19
The line-to-line voltages are
2
1 1
2
1 1
1 1
1 3 30
3 90
1 3 150
ab af bf a f a
bc bf cf a f a
ca cf af a f a
V V V V a Z I
V V V V a a Z I
V V V V a Z I
(1.13)
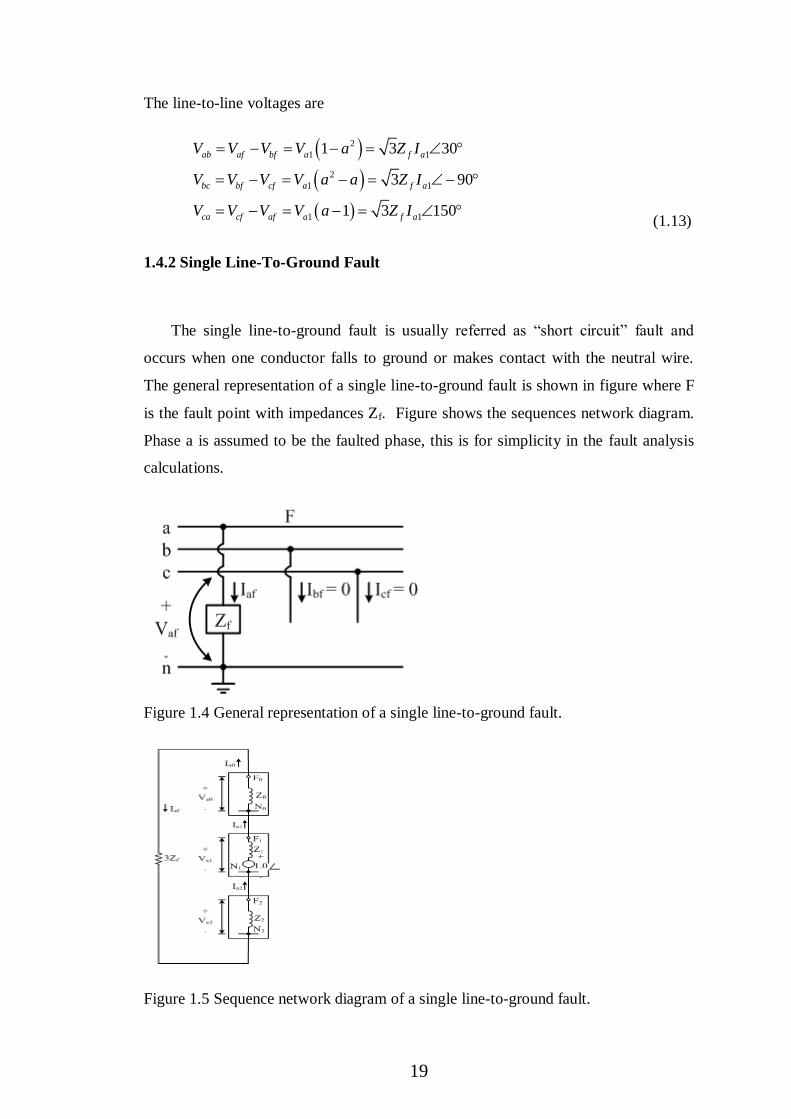
1.4.2 Single Line-To-Ground Fault
The single line-to-ground fault is usually referred as “short circuit” fault and
occurs when one conductor falls to ground or makes contact with the neutral wire.
The general representation of a single line-to-ground fault is shown in figure where F
is the fault point with impedances Zf. Figure shows the sequences network diagram.
Phase a is assumed to be the faulted phase, this is for simplicity in the fault analysis
calculations.
Figure 1.4 General representation of a single line-to-ground fault.
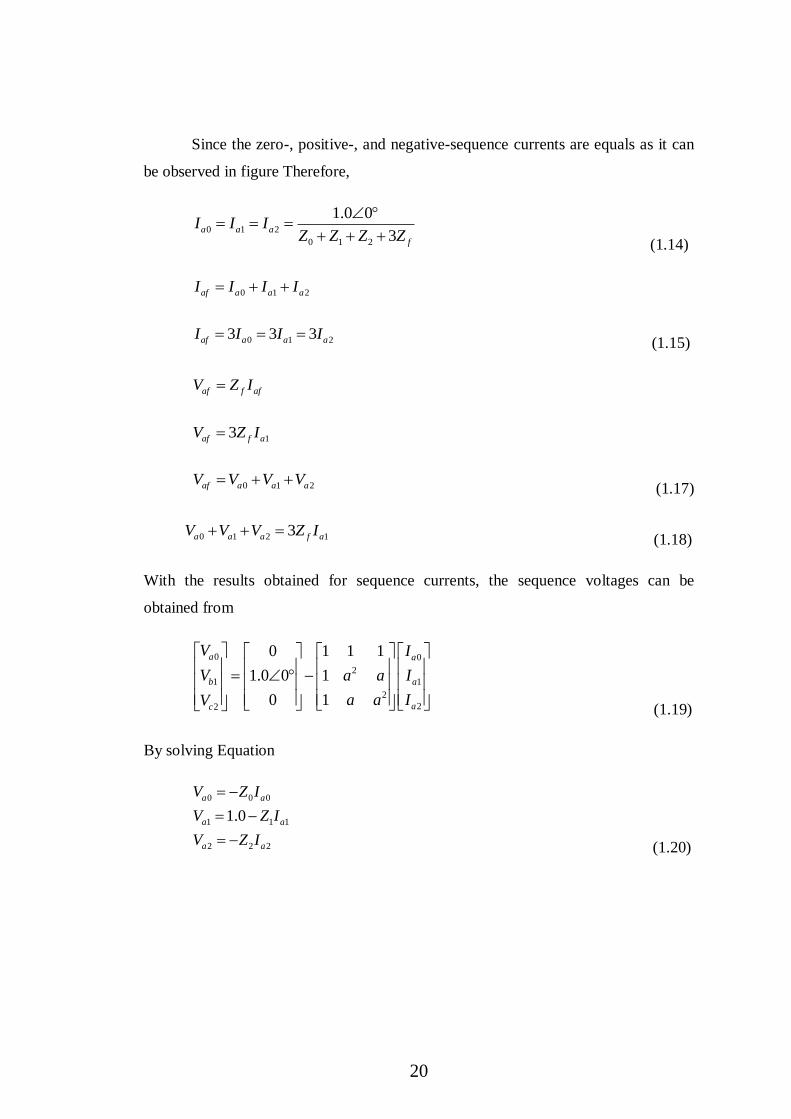
Figure 1.5 Sequence network diagram of a single line-to-ground fault.
20
Since the zero-, positive-, and negative-sequence currents are equals as it can
be observed in figure Therefore,
0 1 2
0 1 2
1.0 0
3a a a
f
I I IZ Z Z Z
(1.14)
0 1 2af a a aI I I I
0 1 23 3 3af a a aI I I I (1.15)
af f afV Z I
13af f aV Z I
0 1 2af a a aV V V V (1.17)
0 1 2 13a a a f aV V V Z I (1.18)
With the results obtained for sequence currents, the sequence voltages can be
obtained from
0 0
2
1 1
2
22
0 1 1 1
1.0 0 1
0 1
a a
b a
ac
V I
V a a I
a a IV
(1.19)
By solving Equation
0 0 0
1 1 1
2 2 2
1.0
a a
a a
a a
V Z I
V Z I
V Z I
(1.20)
21
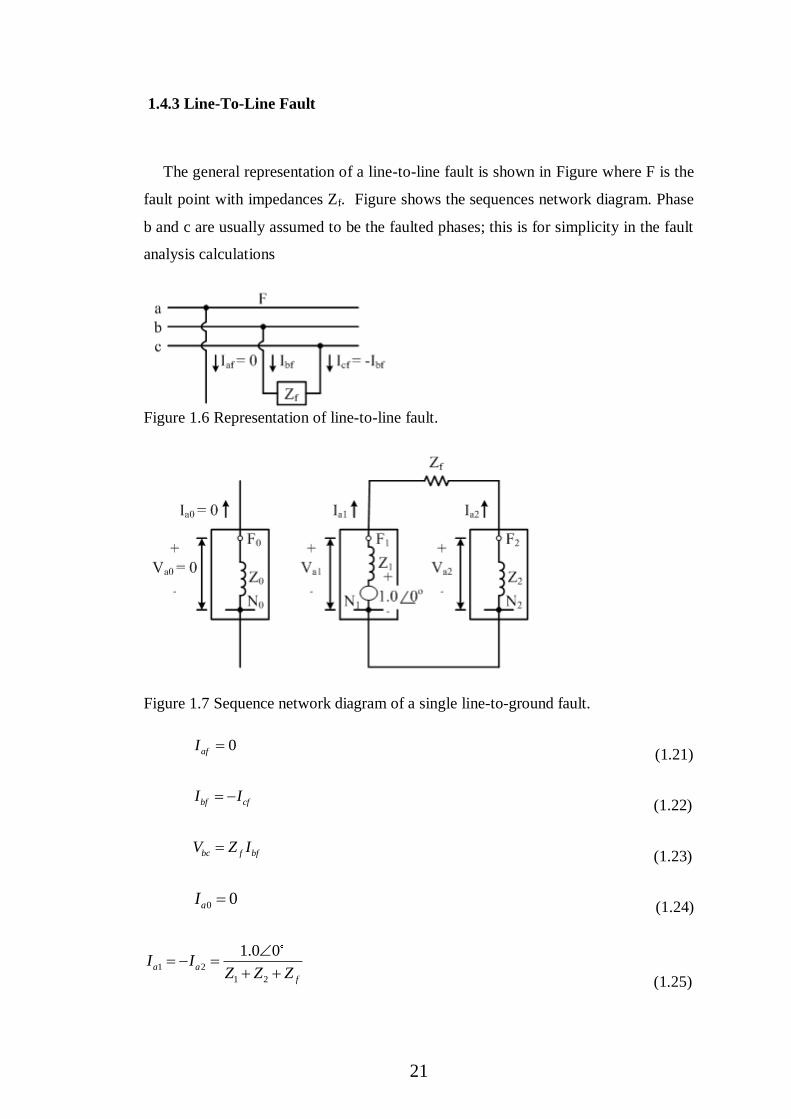
1.4.3 Line-To-Line Fault
The general representation of a line-to-line fault is shown in Figure where F is the
fault point with impedances Zf. Figure shows the sequences network diagram. Phase
b and c are usually assumed to be the faulted phases; this is for simplicity in the fault
analysis calculations
Figure 1.6 Representation of line-to-line fault.
Figure 1.7 Sequence network diagram of a single line-to-ground fault.
0afI
(1.21)
bf cfI I (1.22)
bc f bfV Z I (1.23)
0 0aI (1.24)
1 2
1 2
1.0 0a a
f
I IZ Z Z
(1.25)
22
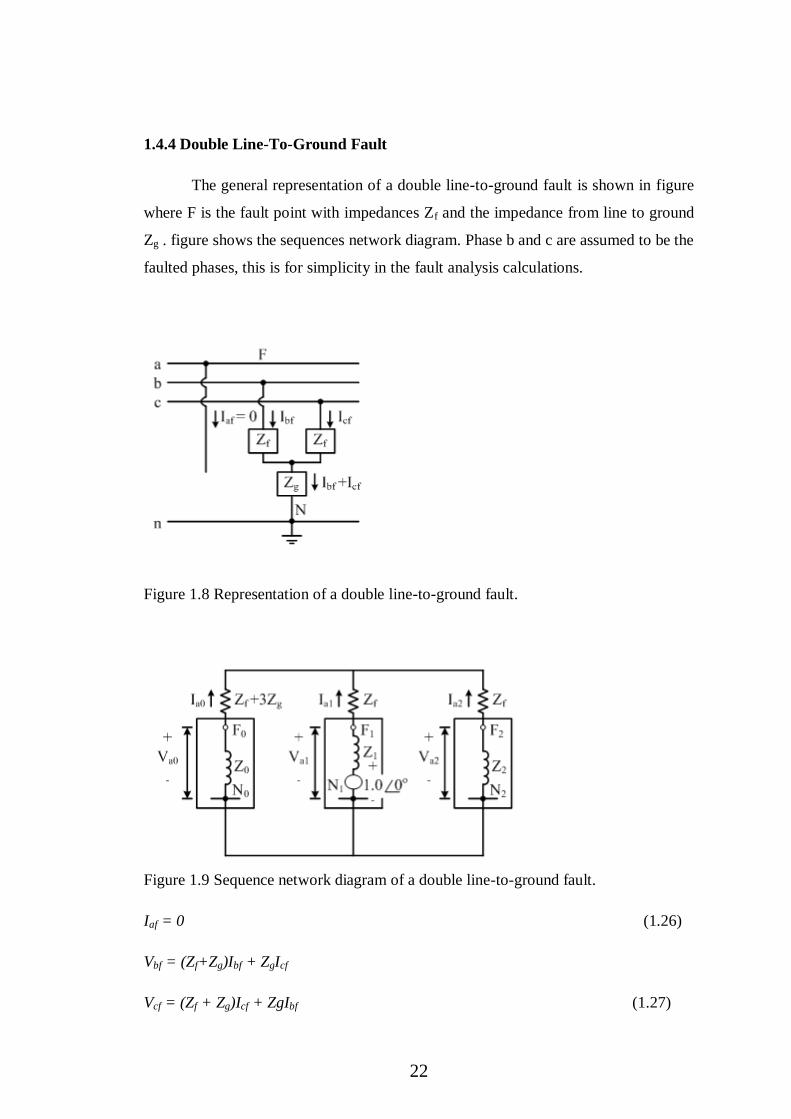
1.4.4 Double Line-To-Ground Fault
The general representation of a double line-to-ground fault is shown in figure
where F is the fault point with impedances Zf and the impedance from line to ground
Zg . figure shows the sequences network diagram. Phase b and c are assumed to be the
faulted phases, this is for simplicity in the fault analysis calculations.
Figure 1.8 Representation of a double line-to-ground fault.
Figure 1.9 Sequence network diagram of a double line-to-ground fault.
Iaf = 0 (1.26)
Vbf = (Zf+Zg)Ibf + ZgIcf
Vcf = (Zf + Zg)Icf + ZgIbf (1.27)
23
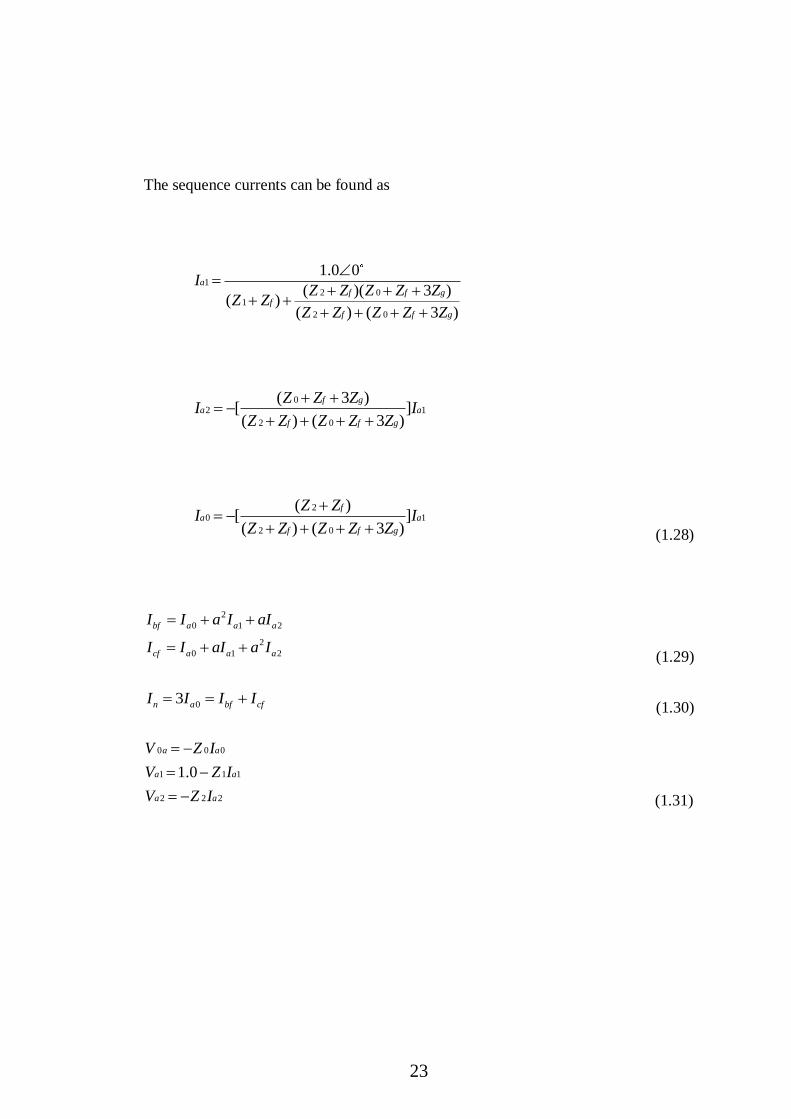
The sequence currents can be found as
12 0
1
2 0
1.0 0
( )( 3 )( )
( ) ( 3 )
af f g
f
f f g
IZ Z Z Z Z
Z ZZ Z Z Z Z
02 1
2 0
( 3 )[ ]( ) ( 3 )
f ga a
f f g
Z Z ZI I
Z Z Z Z Z
20 1
2 0
( )[ ]( ) ( 3 )
fa a
f f g
Z ZI I
Z Z Z Z Z
(1.28)
2
0 1 2
2
0 1 2
bf a a a
cf a a a
I I a I aI
I I aI a I
(1.29)
03n a bf cfI I I I (1.30)
0 0 0
1 1 1
2 2 2
1.0
a a
a a
a a
V Z I
V Z I
V Z I
(1.31)
24
CHAPTER 2
WIDE AREA MEASUREMENT SYSTEM
2.1 PHASOR MEASUREMENT UNIT:
Synchronized phasor measurements are becoming an important element of wide area
measurement systems used in advanced power system monitoring, protection, and
control applications. Phasor measurement units (PMUs) are power system devices
that provide synchronized measurements of real-time phasors of voltages and
currents. Synchronization is achieved by same-time sampling of voltage and current
waveforms using timing signals from the Global Positioning System Satellite (GPS).
2.1.1. FUNDAMENTALS OF PMU’S
PMUs technology provides phasor information (both magnitude and phase angle) in
real time. The advantage of referring phase angle to a global reference time is helpful
in capturing the wide area snap shot of the power system. With the advancement in
technology, the microprocessor based instrumentation such as protection Relays and
Disturbance Fault Recorders (DFRs) incorporate the PMU module along with other
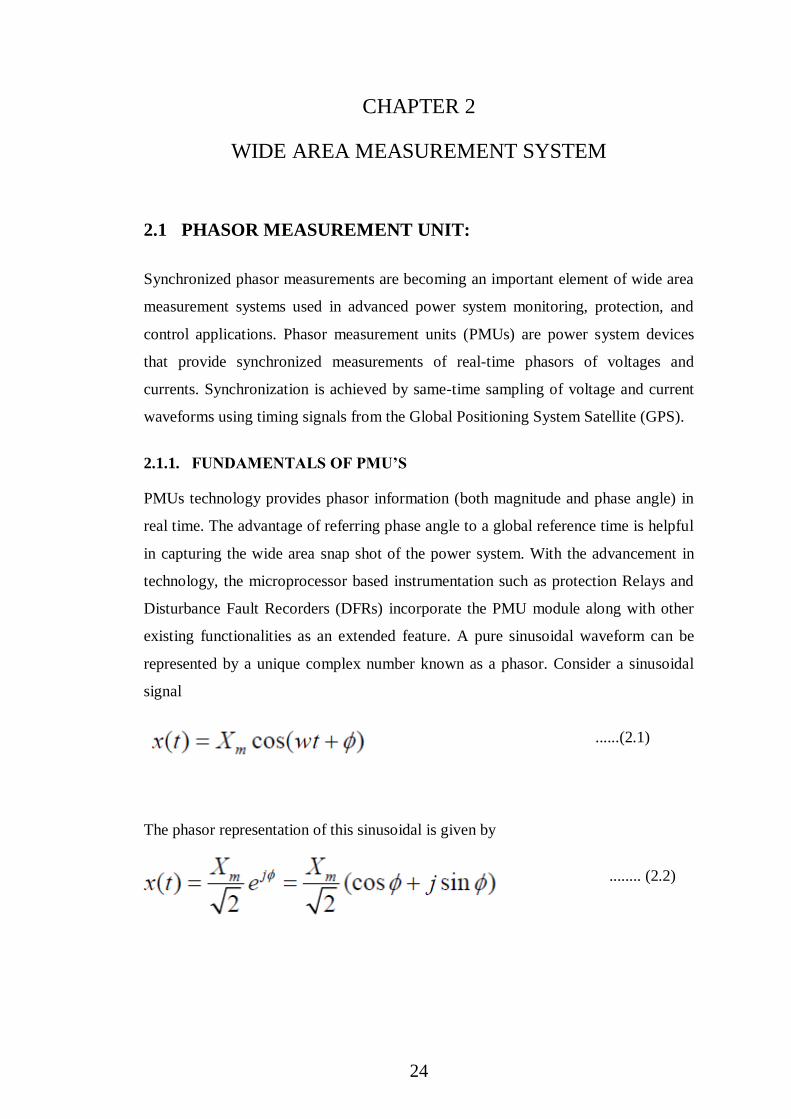
existing functionalities as an extended feature. A pure sinusoidal waveform can be
represented by a unique complex number known as a phasor. Consider a sinusoidal
signal
......(2.1)
The phasor representation of this sinusoidal is given by
........ (2.2)
25
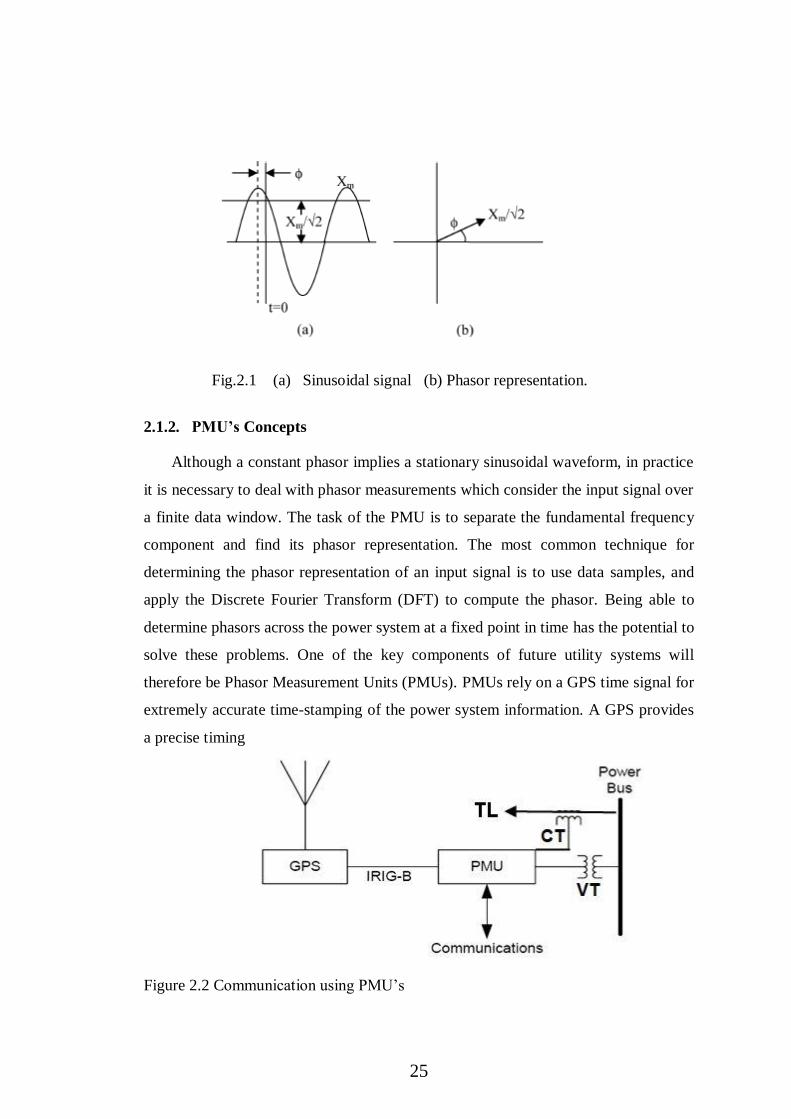
Fig.2.1 (a) Sinusoidal signal (b) Phasor representation.
2.1.2. PMU’s Concepts
Although a constant phasor implies a stationary sinusoidal waveform, in practice
it is necessary to deal with phasor measurements which consider the input signal over
a finite data window. The task of the PMU is to separate the fundamental frequency
component and find its phasor representation. The most common technique for
determining the phasor representation of an input signal is to use data samples, and
apply the Discrete Fourier Transform (DFT) to compute the phasor. Being able to
determine phasors across the power system at a fixed point in time has the potential to
solve these problems. One of the key components of future utility systems will
therefore be Phasor Measurement Units (PMUs). PMUs rely on a GPS time signal for
extremely accurate time-stamping of the power system information. A GPS provides
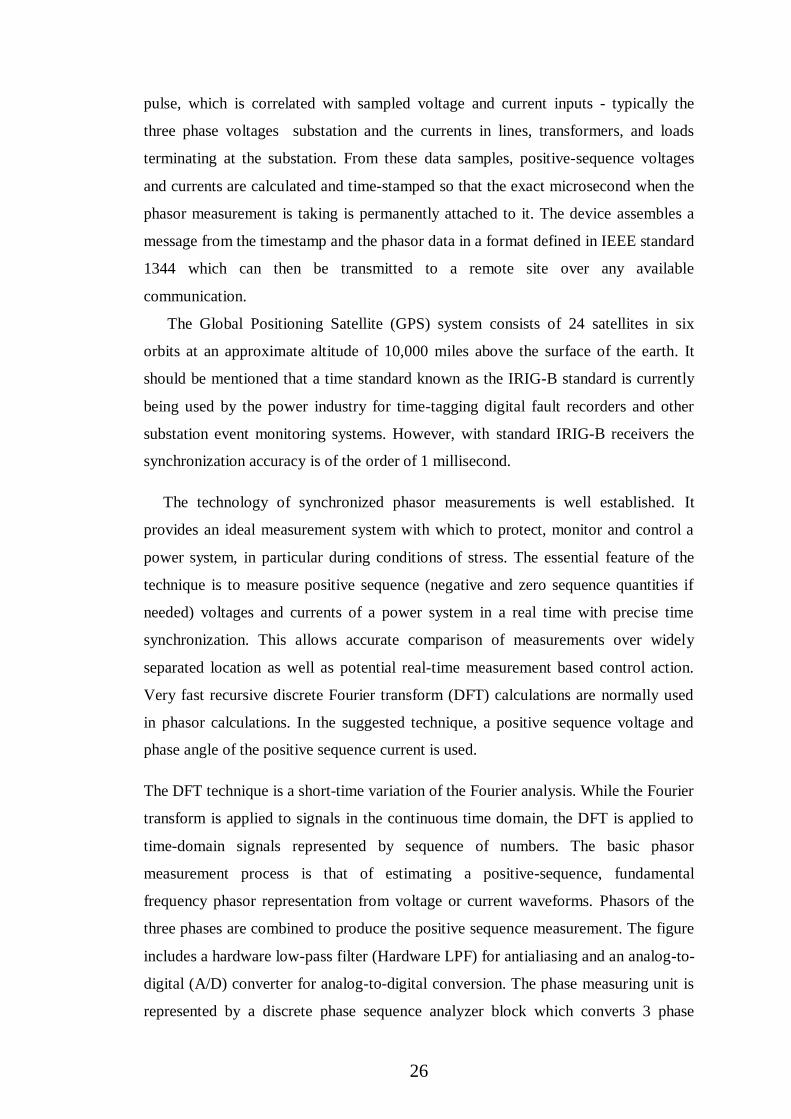
a precise timing
Figure 2.2 Communication using PMU’s
26
pulse, which is correlated with sampled voltage and current inputs - typically the
three phase voltages substation and the currents in lines, transformers, and loads
terminating at the substation. From these data samples, positive-sequence voltages
and currents are calculated and time-stamped so that the exact microsecond when the
phasor measurement is taking is permanently attached to it. The device assembles a
message from the timestamp and the phasor data in a format defined in IEEE standard
1344 which can then be transmitted to a remote site over any available
communication.
The Global Positioning Satellite (GPS) system consists of 24 satellites in six
orbits at an approximate altitude of 10,000 miles above the surface of the earth. It
should be mentioned that a time standard known as the IRIG-B standard is currently
being used by the power industry for time-tagging digital fault recorders and other
substation event monitoring systems. However, with standard IRIG-B receivers the
synchronization accuracy is of the order of 1 millisecond.
The technology of synchronized phasor measurements is well established. It
provides an ideal measurement system with which to protect, monitor and control a
power system, in particular during conditions of stress. The essential feature of the
technique is to measure positive sequence (negative and zero sequence quantities if
needed) voltages and currents of a power system in a real time with precise time
synchronization. This allows accurate comparison of measurements over widely
separated location as well as potential real-time measurement based control action.
Very fast recursive discrete Fourier transform (DFT) calculations are normally used
in phasor calculations. In the suggested technique, a positive sequence voltage and
phase angle of the positive sequence current is used.
The DFT technique is a short-time variation of the Fourier analysis. While the Fourier
transform is applied to signals in the continuous time domain, the DFT is applied to
time-domain signals represented by sequence of numbers. The basic phasor
measurement process is that of estimating a positive-sequence, fundamental
frequency phasor representation from voltage or current waveforms. Phasors of the
three phases are combined to produce the positive sequence measurement. The figure
includes a hardware low-pass filter (Hardware LPF) for antialiasing and an analog-to-
digital (A/D) converter for analog-to-digital conversion. The phase measuring unit is
represented by a discrete phase sequence analyzer block which converts 3 phase
27
signals (Vabc or Iabc) to a positive, negative and zero sequence component magnitude
and angle. Each phase signal (Va, Vb and Vc) is converted to real and imaginary
component using discrete fourier transform.
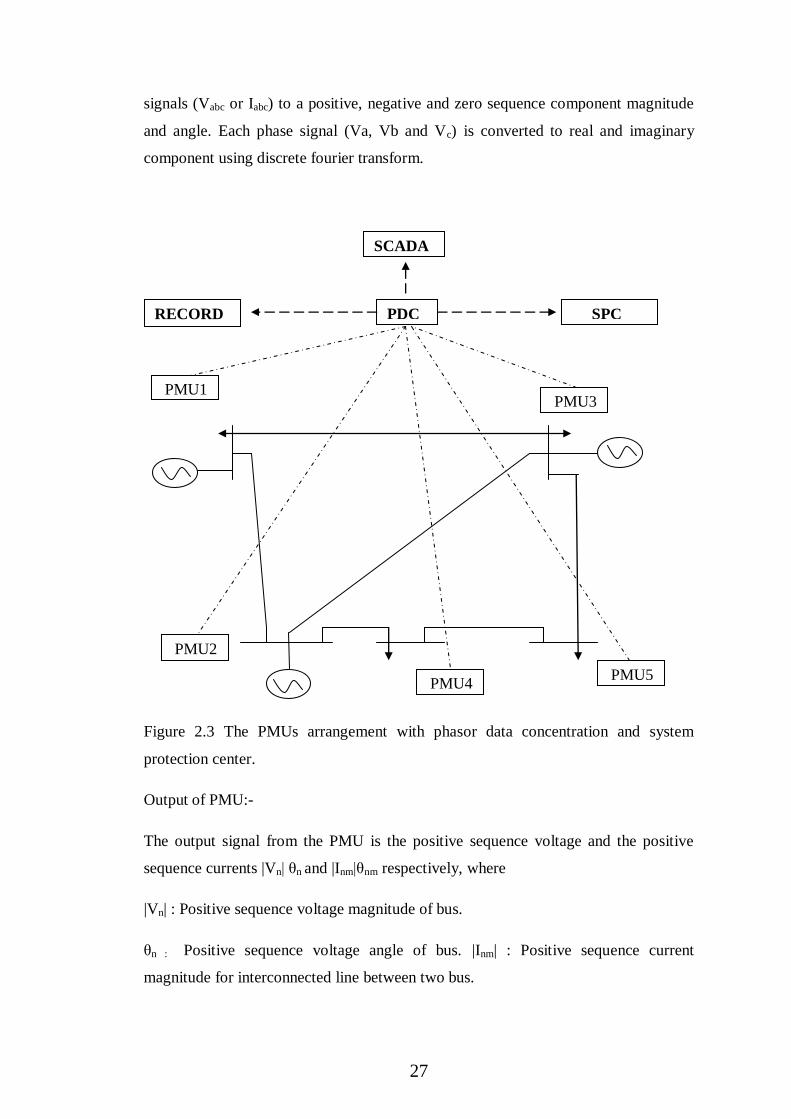
Figure 2.3 The PMUs arrangement with phasor data concentration and system
protection center.
Output of PMU:-
The output signal from the PMU is the positive sequence voltage and the positive
sequence currents |Vn| θn and |Inm|θnm respectively, where
|Vn| : Positive sequence voltage magnitude of bus.
θn : Positive sequence voltage angle of bus. |Inm| : Positive sequence current
magnitude for interconnected line between two bus.
SCADA
RECORD PDC SPC
PMU1
PMU2
PMU3
PMU4
PMU5
28
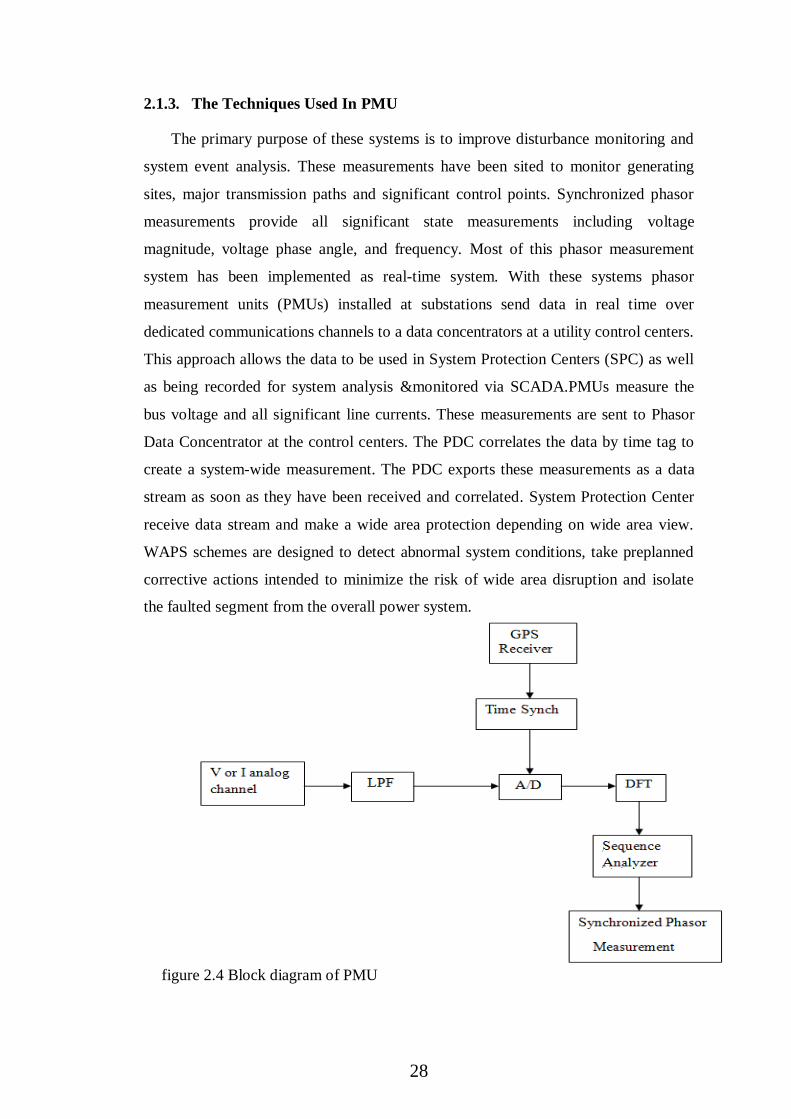
2.1.3. The Techniques Used In PMU
The primary purpose of these systems is to improve disturbance monitoring and
system event analysis. These measurements have been sited to monitor generating
sites, major transmission paths and significant control points. Synchronized phasor
measurements provide all significant state measurements including voltage
magnitude, voltage phase angle, and frequency. Most of this phasor measurement
system has been implemented as real-time system. With these systems phasor
measurement units (PMUs) installed at substations send data in real time over
dedicated communications channels to a data concentrators at a utility control centers.
This approach allows the data to be used in System Protection Centers (SPC) as well
as being recorded for system analysis &monitored via SCADA.PMUs measure the
bus voltage and all significant line currents. These measurements are sent to Phasor
Data Concentrator at the control centers. The PDC correlates the data by time tag to
create a system-wide measurement. The PDC exports these measurements as a data
stream as soon as they have been received and correlated. System Protection Center
receive data stream and make a wide area protection depending on wide area view.
WAPS schemes are designed to detect abnormal system conditions, take preplanned
corrective actions intended to minimize the risk of wide area disruption and isolate
the faulted segment from the overall power system.
figure 2.4 Block diagram of PMU
29
CHAPTER 3
INTEGRATED APPROACH BASED FAULTY SECTION
IDENTIFICATION
3.1. FAULT DETECTION USING POSITIVE SEQUENCE
VOLTAGE CHANGE
Voltage dips are the short-duration reductions in r.m.s. voltage caused by faults in the
electric supply system and the starting of large loads, such as motors. Voltage dips are
widely recognized as one of the most important aspects of power quality.
A voltage dip is normally characterized by a magnitude and a duration. In reality,
however, a specific dip can be far more complicated than this characterization can
show. First, besides the voltage drop during a dip, there is also a phase angle shift
associated with it, which is not included in the normal characterization. Second, this
characterization assumes a balanced voltage dip, whereas most voltage dips are due to
unbalanced faults. Both unbalance and phase angle shift are likely to have an
important influence on nuisance tripping of equipment
Voltage dips are regarded as one of the most relevant issues in power quality due
to their high-cost impact in sensitive industrial loads such as adjustable speed drives,
frequency converters, and contactors. A voltage event is considered as sag when the
r.m.s. voltage remains between 0.1 and 0.9 p.u. (per-unit) of nominal voltage and the
event duration does not exceed one minute. However, short interruptions where r.m.s.
voltage is below 0.1 p.u. of nominal voltage can also be considered as voltage dip
events.
Actual data, recorded by a synchrophasor measurement unit (PMU), are used to
evaluate the proposed methodology. PMU data is the positive sequence voltage,
estimated once each cycle. PMU data allows only positive voltage component
characterization through magnitude and phase angle estimated once per cycle.
Although, some drawbacks of PMU voltage dip assessment can be stated, it is a novel
application of this measurement device.

30
The PMU is connected to the substation voltage and current transformers. The
quantities recorded are positive sequence phasors (magnitude and phase angle) of the
measured voltages and currents, frequency and rate of change of frequency.
Positive sequence voltage estimated by a PMU needs to be analyzed. For
instance, phase-angle is measured using the GPS signal as time reference. As actual
frequency is not exactly nominal the phasor recorded seems to be rotating with a
relative frequency given by the difference between actual frequency and nominal one.
In order to obtain a static phasor the recorded phasor is decomposed in a new
coordinate system that is rotating at the pre-event relative frequency. Thus, a new
positive sequence voltage is obtained keeping the former phasor magnitude but with a
new angle which is zero for pre-event situation. So far, positive sequence voltage are
shown in Fig.1. where the star points show the estimated phasor values once per
cycle.
Figure 3.1 Positive sequence voltage during voltage dip
This can be achieved by comparing the measured values of the positive sequence
voltage magnitudes at the main bus for each area. This can result in the minimum
voltage value that indicates the nearest area to the fault.
The above two keys of operation can be mathematically described as follows:
Minimum {|V1|,|V2|,|V3|,|V4|,|V5|,|V6|,……|Vn|} (3.1)

31
Where |Vn| is the positive sequence voltage magnitude measured by PMU and located
at bus 1,2,…..n.
3.2. DIRECTIONAL ESTIMATION USING COSINE
ALGORITHM
By the voltage dip observed by the PMU the exact faulty section of power system
cannot be determined ,only the particular bus can be detected with whom the faulty
section is attached not the exact faulty section. Hence an integrated technique based
on combination of voltage dip measurement and cosine algorithm is used to
determine the faulty section of the system.
The cosine phase angle is used to determine the direction of fault. The ability to
differentiate between a fault in one direction or another is obtained by comparing the
phase angle of the operating voltage and current. The voltage is usually used as the
reference polarizing quantity. The fault current phasor lies within two distinct forward
and backward regions with respect to the reference phasor, depending on the power
system and fault conditions. The normal power flow in a given direction will result in
the phase angle between the voltage and the current varying around its power factor
angle ± Ø. When power flows in the opposite direction, this angle will become
180±Ø. For a fault in the reverse direction, the phase angle of the current with respect
to the voltage will be 180±Ø.
Hence the cosine of phase angle difference between the positive sequence
voltage and positive sequence current in transmission lines connecting to that bus,
also at the receiving end of all the lines where they are connected to another bus,
cosine of the phase angle difference between the positive sequence voltage of
receiving end bus and positive sequence component of current in the transmission
line is calculated via backup relay current transformer(CT).This operation is done for
all transmission lines connected to fault area.
Since for faulted transmission line, the receiving end will have opposite cosine as
observed by PMU of the faulted zone (forward fault and reverse fault). This line can
be identified by following logic-
Cos (α) = -Cos (180-α), α = phase angle (3.2)
32
If Cos (α) is positive then the output provided by relay is ‘0 ’
If Cos (α) is negative then the output provided by relay is ‘1’
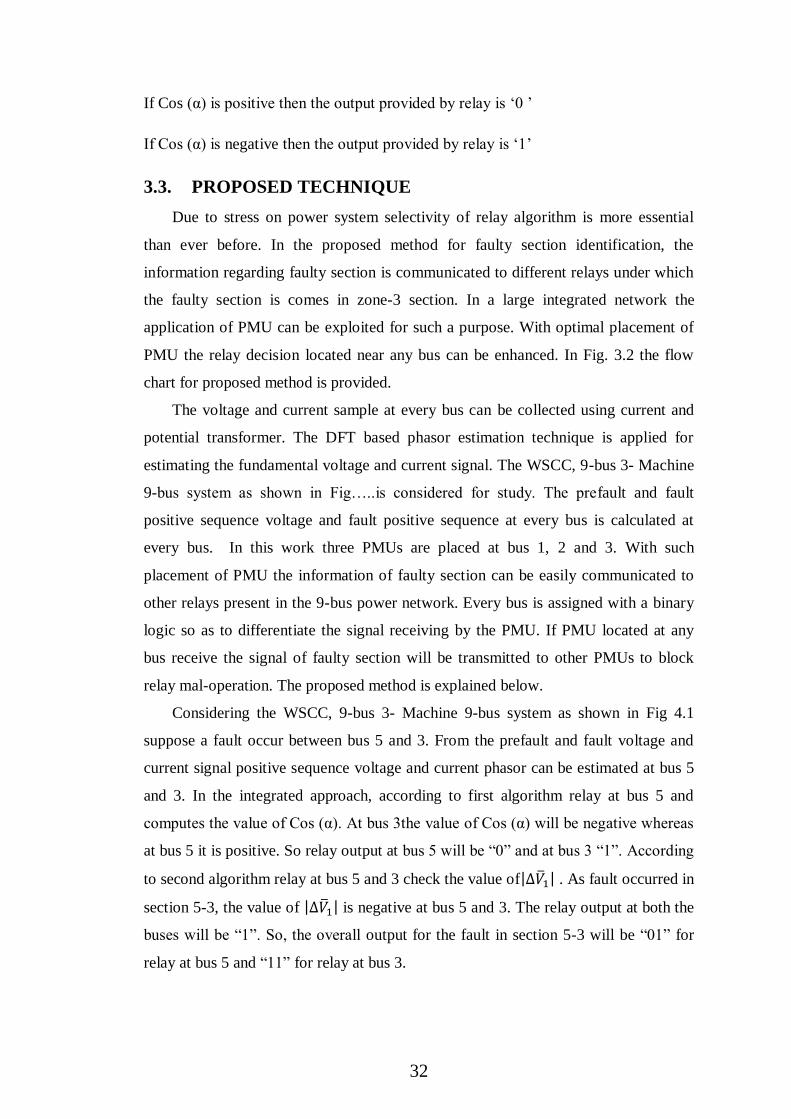
3.3. PROPOSED TECHNIQUE
Due to stress on power system selectivity of relay algorithm is more essential
than ever before. In the proposed method for faulty section identification, the
information regarding faulty section is communicated to different relays under which
the faulty section is comes in zone-3 section. In a large integrated network the
application of PMU can be exploited for such a purpose. With optimal placement of
PMU the relay decision located near any bus can be enhanced. In Fig. 3.2 the flow
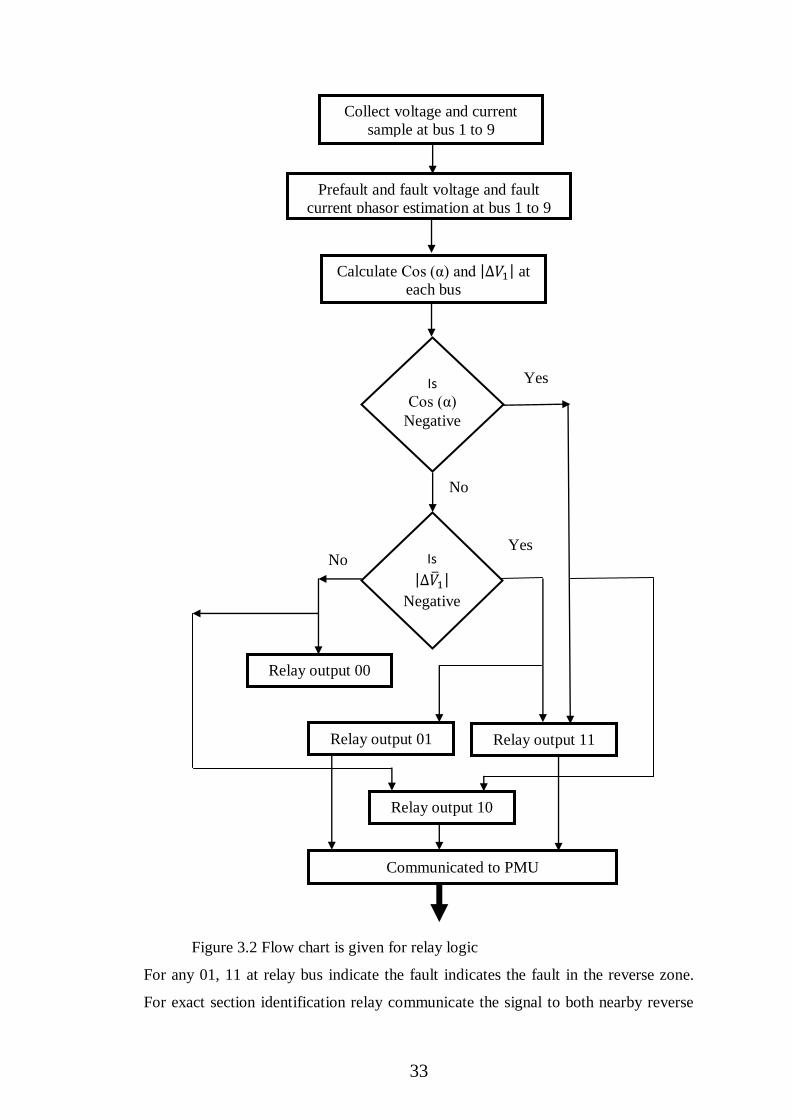
chart for proposed method is provided.
The voltage and current sample at every bus can be collected using current and
potential transformer. The DFT based phasor estimation technique is applied for
estimating the fundamental voltage and current signal. The WSCC, 9-bus 3- Machine
9-bus system as shown in Fig…..is considered for study. The prefault and fault
positive sequence voltage and fault positive sequence at every bus is calculated at
every bus. In this work three PMUs are placed at bus 1, 2 and 3. With such
placement of PMU the information of faulty section can be easily communicated to
other relays present in the 9-bus power network. Every bus is assigned with a binary
logic so as to differentiate the signal receiving by the PMU. If PMU located at any
bus receive the signal of faulty section will be transmitted to other PMUs to block
relay mal-operation. The proposed method is explained below.
Considering the WSCC, 9-bus 3- Machine 9-bus system as shown in Fig 4.1
suppose a fault occur between bus 5 and 3. From the prefault and fault voltage and
current signal positive sequence voltage and current phasor can be estimated at bus 5
and 3. In the integrated approach, according to first algorithm relay at bus 5 and
computes the value of Cos (α). At bus 3the value of Cos (α) will be negative whereas
at bus 5 it is positive. So relay output at bus 5 will be “0” and at bus 3 “1”. According
to second algorithm relay at bus 5 and 3 check the value of . As fault occurred in
section 5-3, the value of is negative at bus 5 and 3. The relay output at both the
buses will be “1”. So, the overall output for the fault in section 5-3 will be “01” for
relay at bus 5 and “11” for relay at bus 3.
33
Figure 3.2 Flow chart is given for relay logic
For any 01, 11 at relay bus indicate the fault indicates the fault in the reverse zone.
For exact section identification relay communicate the signal to both nearby reverse
Collect voltage and current
sample at bus 1 to 9
Prefault and fault voltage and fault
current phasor estimation at bus 1 to 9
Calculate Cos (α) and at
each bus
Is
Cos (α)
Negative
Yes
No
Is
Negative
No Yes
Relay output 11
Relay output 00
Relay output 01
Relay output 10
Communicated to PMU
34
and forward zone relays. Considering the communication delay the signal can be send
within 10 ms to the nearby relays. If at any bus relay receives any two signal from 01,
10, 11, it immediately transfer this signal to nearby PMU with its relay code for
further operation. The binary logic for all buses is shown in Table 3.1. The relay at
bus 5 has binary signal “01” due to its own measurement and “11” due to relay at bus
3 measurements. So it communicates its own binary signal “0101” to nearest PMU at
bus 2. Similarly the relay bus 3 sends its binary signal “0010” to PMU at the same
bus. In any network, two interconnected buses will exchange simultaneously binary
information then that section will declared as a faulty section. In a case, if any relay
receives “00” signal then it will be silent for that fault case. Further the relay at bus 2
and 3 communicate this signal to other PMU so as to circulate the decision among
other relays to avoid relay mal-operation.
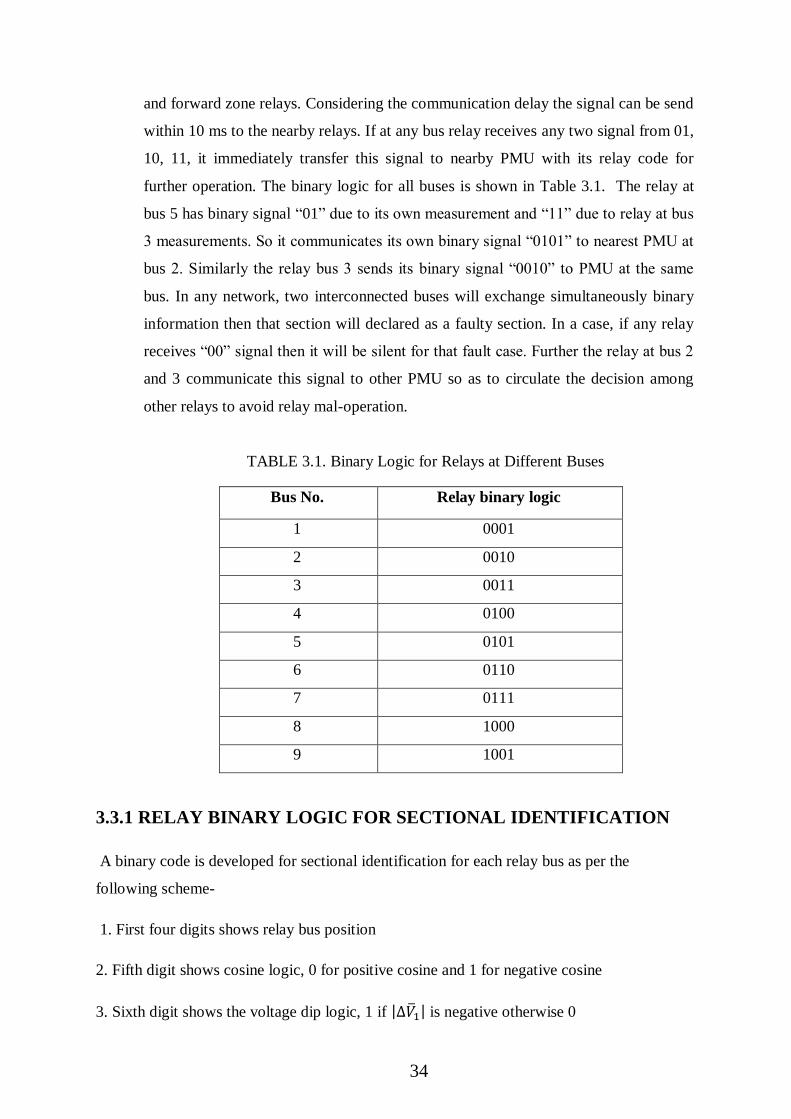
3.3.1 RELAY BINARY LOGIC FOR SECTIONAL IDENTIFICATION
A binary code is developed for sectional identification for each relay bus as per the
following scheme-
1. First four digits shows relay bus position
2. Fifth digit shows cosine logic, 0 for positive cosine and 1 for negative cosine
3. Sixth digit shows the voltage dip logic, 1 if is negative otherwise 0
TABLE 3.1. Binary Logic for Relays at Different Buses
Bus No. Relay binary logic
1 0001
2 0010
3 0011
4 0100
5 0101
6 0110
7 0111
8 1000
9 1001
35
START
SELECT BINARY
CODE RELAY
BUS N
IF LAST TWO DIGITS
ARE 01 OR 10
CONVERT FIRST FOUR
DIGITS TO HEX
DECIMAL EQUIVALENT
N=N+1
COMBINE TWO HEX
DIGITS SO OBTAINED
(abH)
FAULT IS IN SECTION
BETWEEN BUS a AND
b
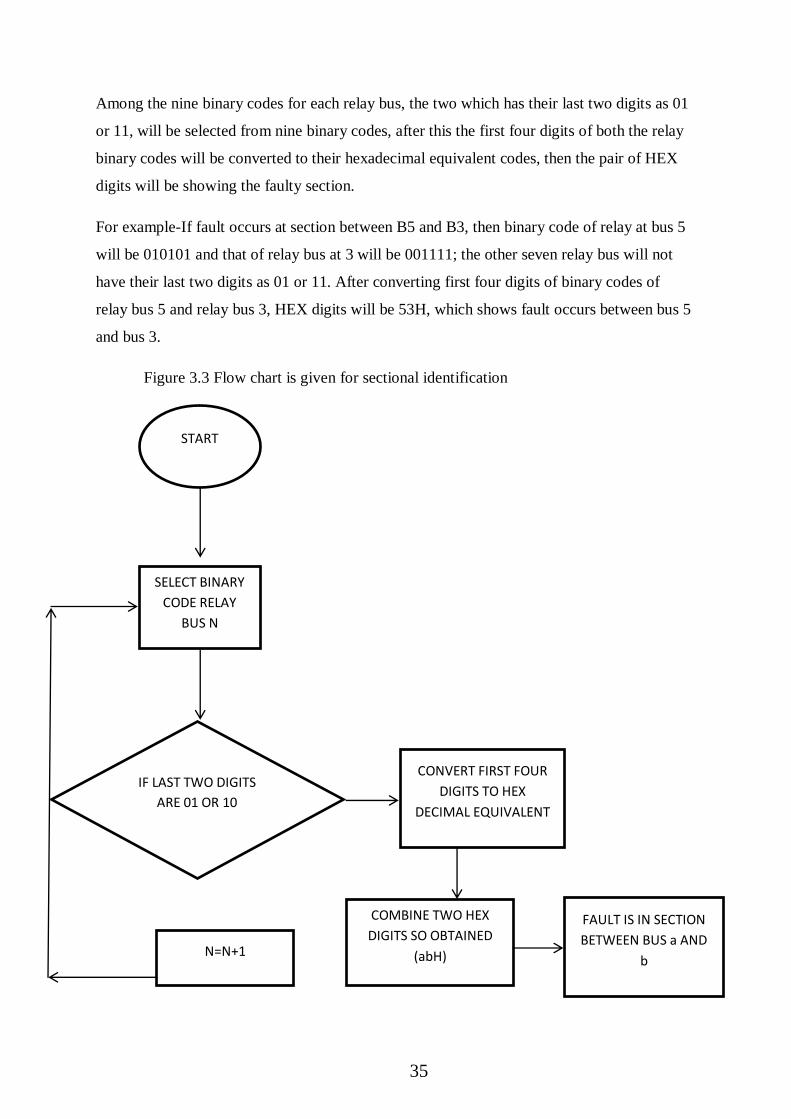
Among the nine binary codes for each relay bus, the two which has their last two digits as 01
or 11, will be selected from nine binary codes, after this the first four digits of both the relay
binary codes will be converted to their hexadecimal equivalent codes, then the pair of HEX
digits will be showing the faulty section.
For example-If fault occurs at section between B5 and B3, then binary code of relay at bus 5
will be 010101 and that of relay bus at 3 will be 001111; the other seven relay bus will not
have their last two digits as 01 or 11. After converting first four digits of binary codes of
relay bus 5 and relay bus 3, HEX digits will be 53H, which shows fault occurs between bus 5
and bus 3.
Figure 3.3 Flow chart is given for sectional identification
36
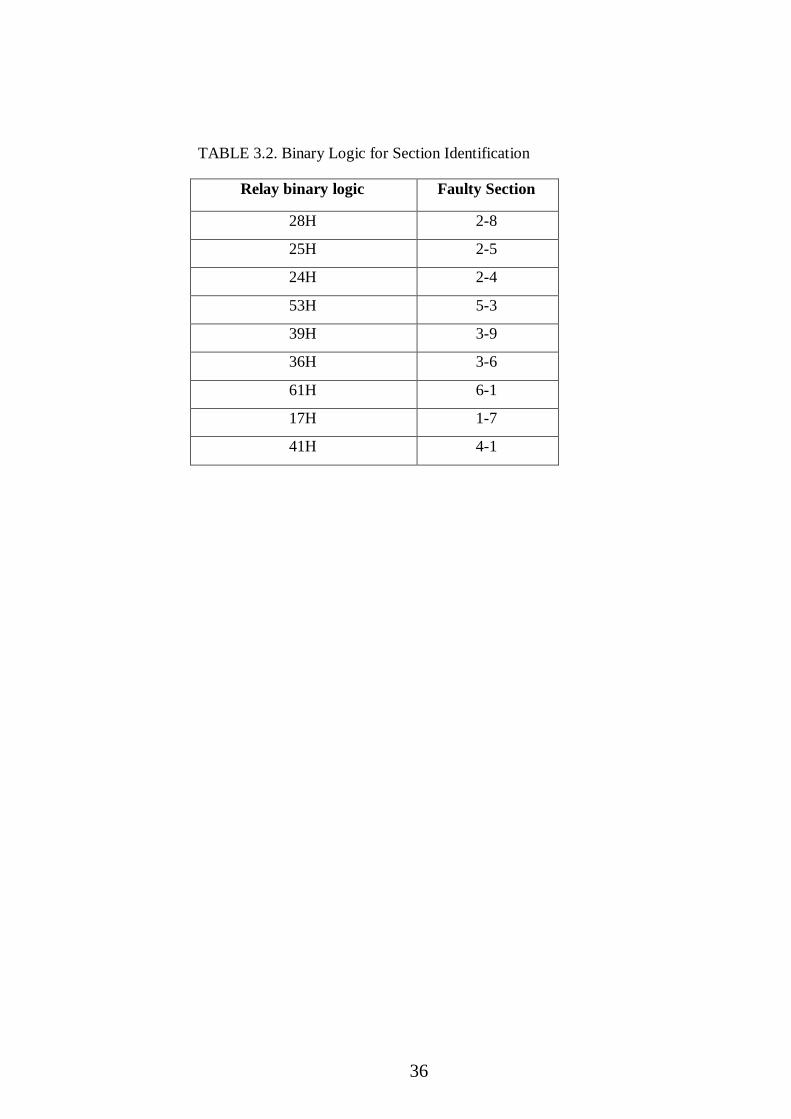
TABLE 3.2. Binary Logic for Section Identification
Relay binary logic Faulty Section
28H 2-8
25H 2-5
24H 2-4
53H 5-3
39H 3-9
36H 3-6
61H 6-1
17H 1-7
41H 4-1
37
CHAPTER 4
SIMULATION RESULT
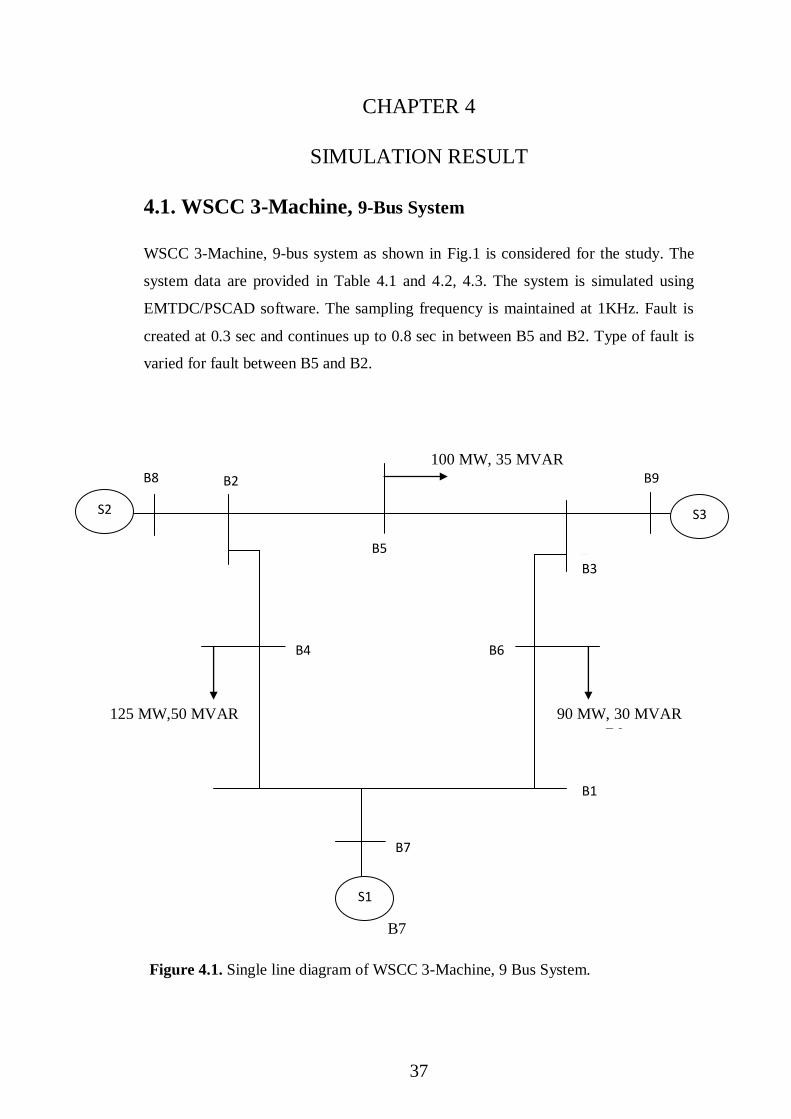
4.1. WSCC 3-Machine, 9-Bus System
WSCC 3-Machine, 9-bus system as shown in Fig.1 is considered for the study. The
system data are provided in Table 4.1 and 4.2, 4.3. The system is simulated using
EMTDC/PSCAD software. The sampling frequency is maintained at 1KHz. Fault is
created at 0.3 sec and continues up to 0.8 sec in between B5 and B2. Type of fault is
varied for fault between B5 and B2.
100 MW, 35 MVAR
Bz B5 B3 B9
B4 B6
B1
B7
Figure 4.1. Single line diagram of WSCC 3-Machine, 9 Bus System.
S2 S3
S1
B8 B2
B5
B3
B9
B1
B4 B6
125 MW,50 MVAR 90 MW, 30 MVAR
B7
38
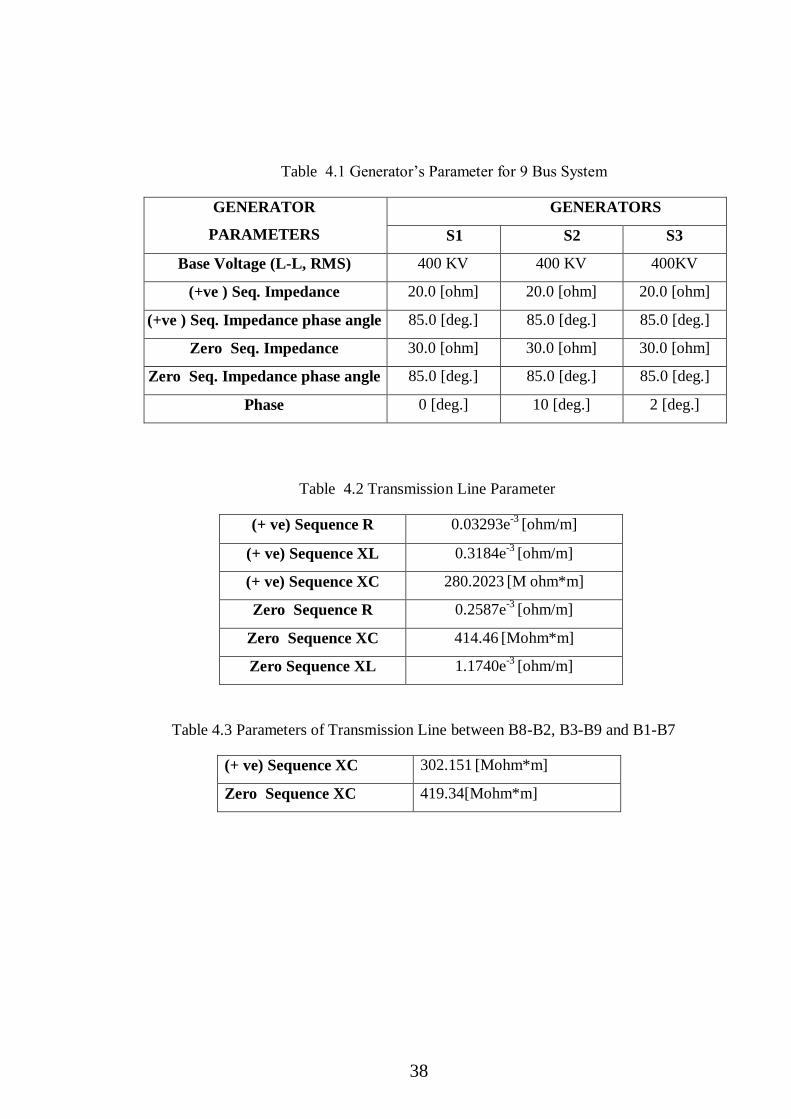
Table 4.3 Parameters of Transmission Line between B8-B2, B3-B9 and B1-B7
(+ ve) Sequence XC 302.151 [Mohm*m]
Zero Sequence XC 419.34[Mohm*m]
Table 4.2 Transmission Line Parameter
(+ ve) Sequence R 0.03293e-3
[ohm/m]
(+ ve) Sequence XL 0.3184e-3
[ohm/m]
(+ ve) Sequence XC 280.2023 [M ohm*m]
Zero Sequence R 0.2587e-3
[ohm/m]
Zero Sequence XC 414.46 [Mohm*m]
Zero Sequence XL 1.1740e-3
[ohm/m]
Table 4.1 Generator’s Parameter for 9 Bus System
GENERATOR
PARAMETERS
GENERATORS
S1 S2 S3
Base Voltage (L-L, RMS) 400 KV 400 KV 400KV
(+ve ) Seq. Impedance 20.0 [ohm] 20.0 [ohm] 20.0 [ohm]
(+ve ) Seq. Impedance phase angle 85.0 [deg.] 85.0 [deg.] 85.0 [deg.]
Zero Seq. Impedance 30.0 [ohm] 30.0 [ohm] 30.0 [ohm]
Zero Seq. Impedance phase angle 85.0 [deg.] 85.0 [deg.] 85.0 [deg.]
Phase 0 [deg.] 10 [deg.] 2 [deg.]
39
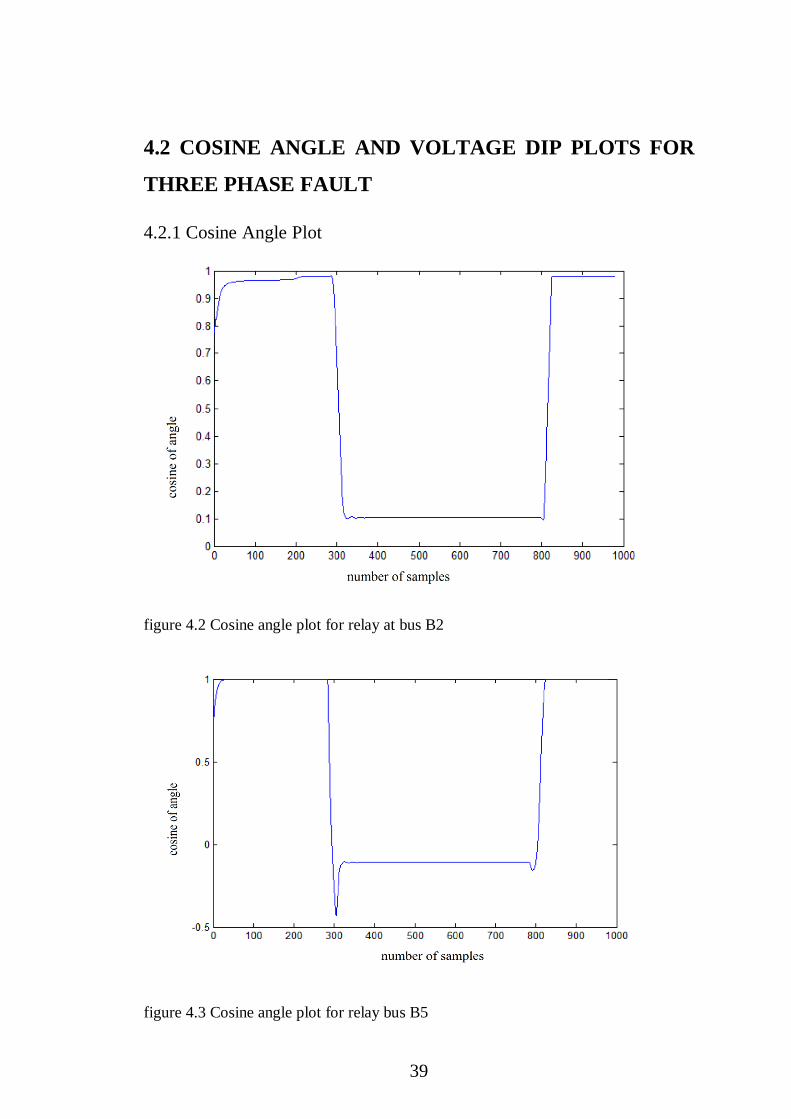
4.2 COSINE ANGLE AND VOLTAGE DIP PLOTS FOR
THREE PHASE FAULT
4.2.1 Cosine Angle Plot
figure 4.2 Cosine angle plot for relay at bus B2
figure 4.3 Cosine angle plot for relay bus B5
40
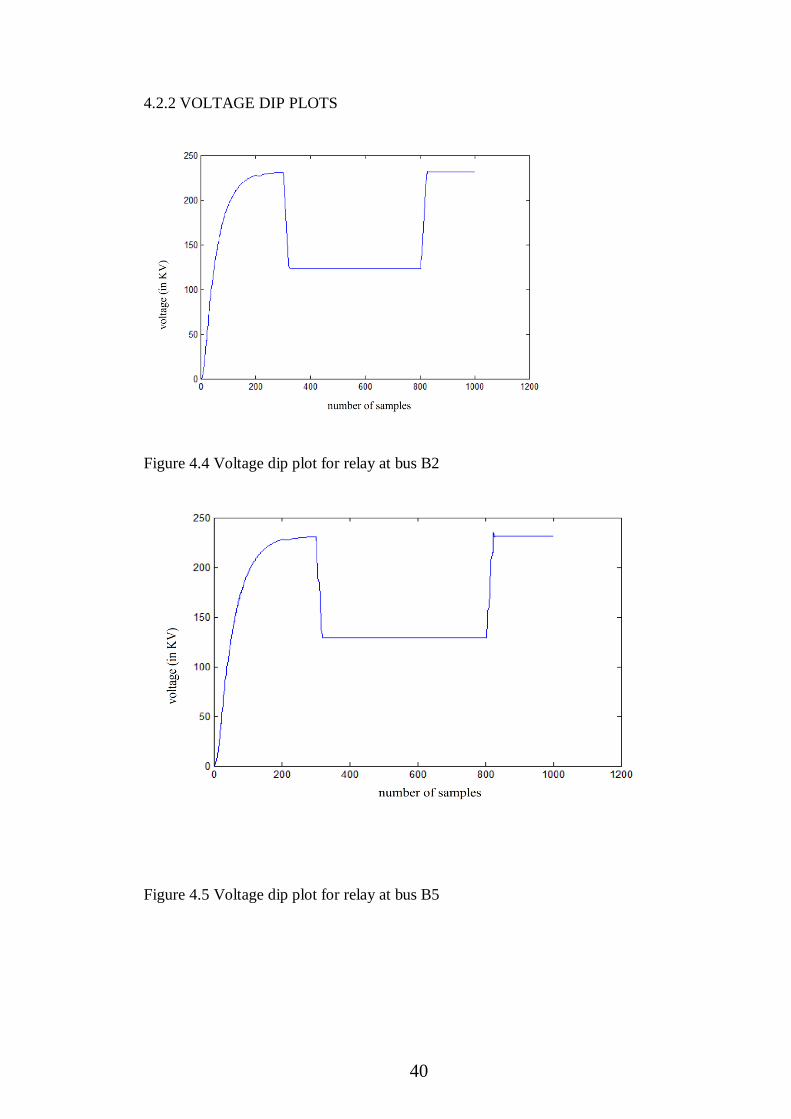
4.2.2 VOLTAGE DIP PLOTS
Figure 4.4 Voltage dip plot for relay at bus B2
Figure 4.5 Voltage dip plot for relay at bus B5
41
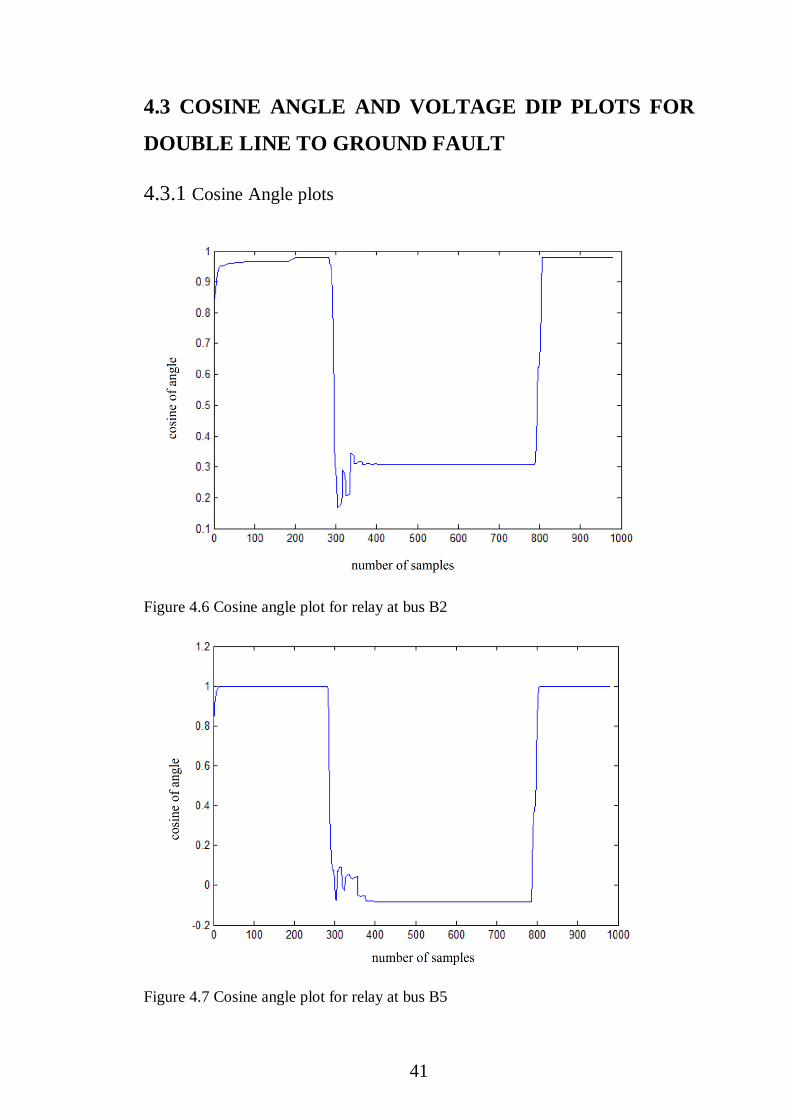
4.3 COSINE ANGLE AND VOLTAGE DIP PLOTS FOR
DOUBLE LINE TO GROUND FAULT
4.3.1 Cosine Angle plots
Figure 4.6 Cosine angle plot for relay at bus B2
Figure 4.7 Cosine angle plot for relay at bus B5
42
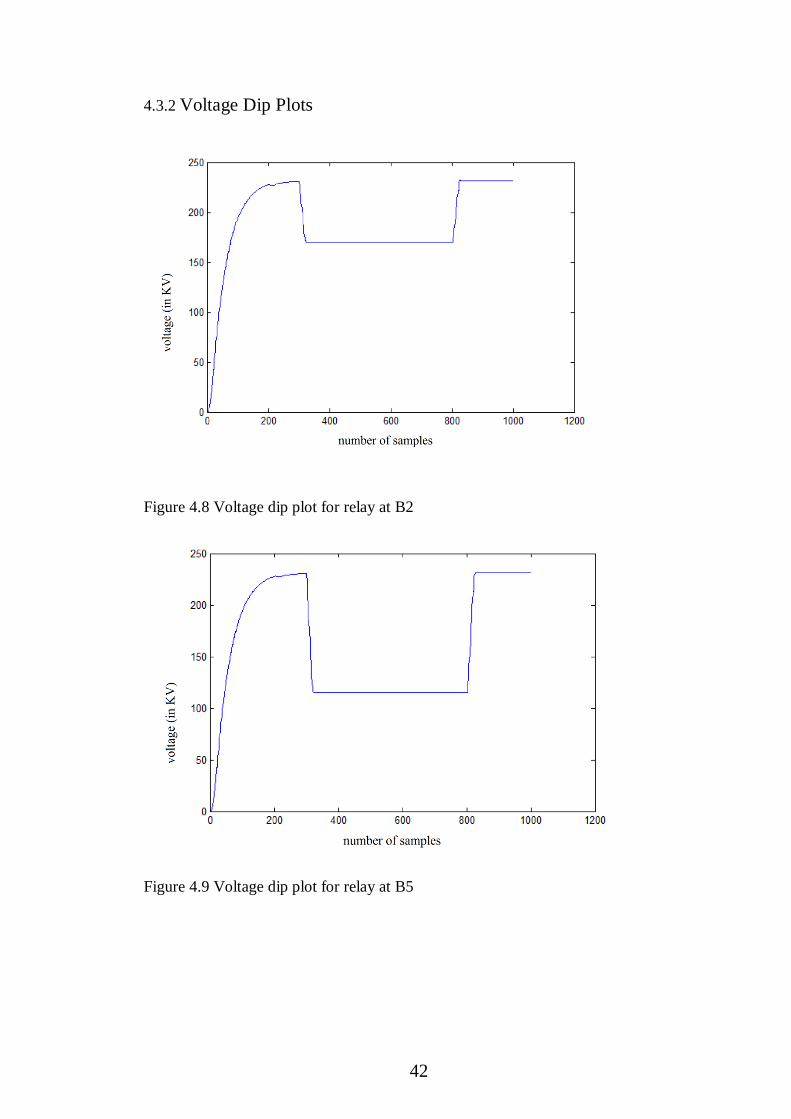
4.3.2 Voltage Dip Plots
Figure 4.8 Voltage dip plot for relay at B2
Figure 4.9 Voltage dip plot for relay at B5

43
4.4 COSINE ANGLE AND VOLTAGE DIP PLOTS FOR
PHASE TO PHASE FAULT
4.4.1 Cosine Angle plots
Figure 4.10 Cosine angle plot for relay at bus B2
Figure 4.11 Cosine angle plot for relay at bus B5

44
4.4.2 Voltage Dip Plots
Figure 4.12 Voltage dip plot for relay at B2
Figure 4.13 Voltage dip plot for relay at B5
45
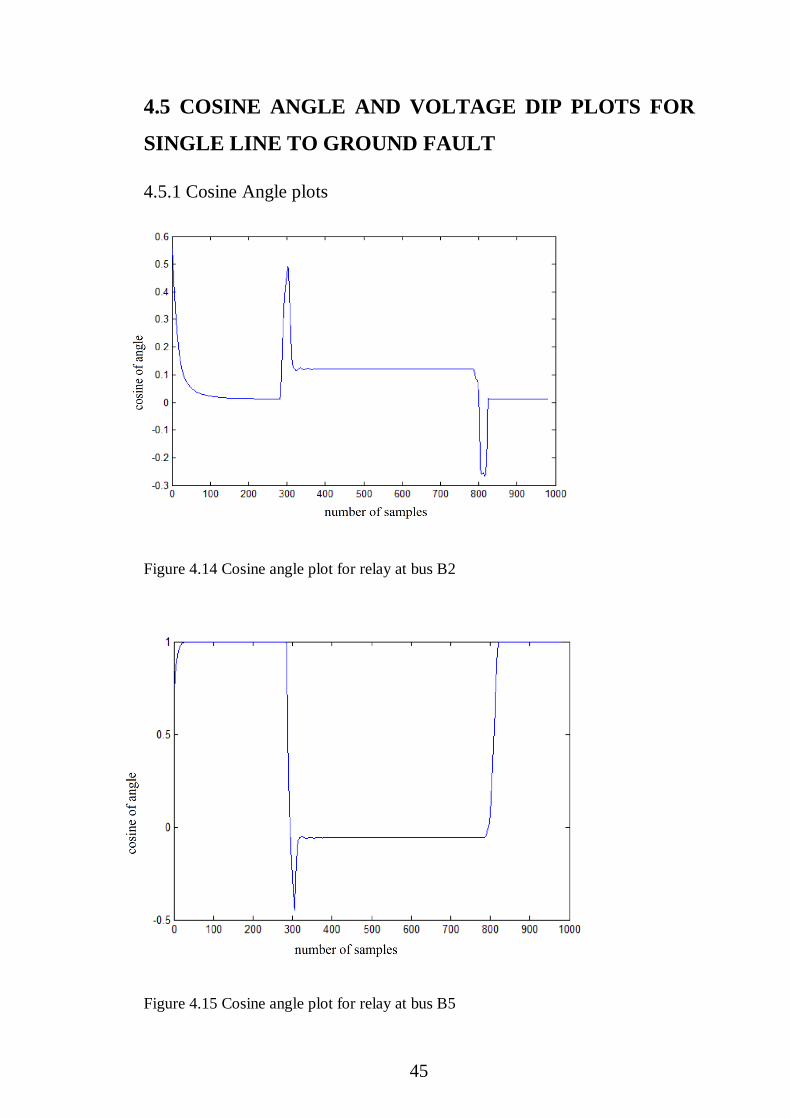
4.5 COSINE ANGLE AND VOLTAGE DIP PLOTS FOR
SINGLE LINE TO GROUND FAULT
4.5.1 Cosine Angle plots
Figure 4.14 Cosine angle plot for relay at bus B2
Figure 4.15 Cosine angle plot for relay at bus B5
46
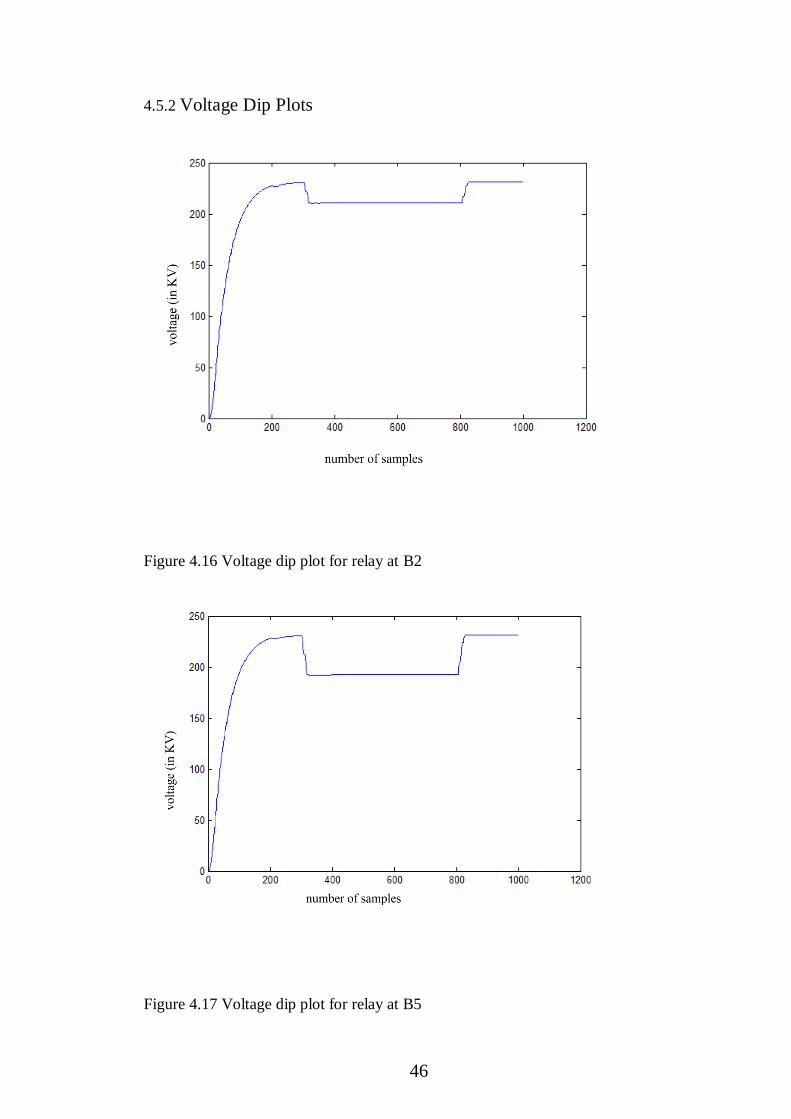
4.5.2 Voltage Dip Plots
Figure 4.16 Voltage dip plot for relay at B2
Figure 4.17 Voltage dip plot for relay at B5
47
CHAPTER 5
CONCLUSIONS AND SCOPE FOR WORK FUTURE
Large power demand and excess utilization of transmission system leads to stress
on power system. Localization of fault and faulty section is a major challenge for
protection algorithm. In this work a new integrated approach is proposed for faulty
section identification. Fault detection with the change in positive sequence voltage is
a reliable parameter. The cosine of angle between voltage and current is also a
reliable parameter for exact fault direction discrimination. These two features are
applied in the proposed algorithm for exact faulty section identification. With the
application of PMU device the information can be further transmitted to other related
zones to avoid relay mal-operation. The proposed technique has successfully
identified the faulted line and also types of fault in a large interconnected system. The
PMU descried in this paper represents a new state-of-art in the field of interconnected
grid protection for many reasons such as;
The PMU is based on sharing data from all areas.
One PMU is used instead of many standalone relays with different complexity
coordination.
The PMU has the feature of unit protection in identifying the faulted zone.
One and only one trip decision is issued from the protection Center.
The PMU has a very fast detection time for all fault cases. In the near future and
with a very fast communication links, the PMU can be considered as a main
protection unit on the interconnected grids. The proposed technique is a step forward
in achieving the full potential of a smart grid by using various measurements and data
across the grid. It is expected to be a new application of wide area measurement
system in the transmission grid with the development of communication
infrastructure in smart transmission grids. Exciting yet challenging times lie ahead.
The electrical power industry is undergoing rapid change. The rising cost of energy,
the mass electrification of everyday life, and climate change are the major drivers that
will determine the speed at which such transformations will occur.
48
References
1. Wide Area protection and Emergency control, 2002, IEEE members, Working
Group C-6.
2. Eissa ,M.M., Masoud ,M.E. Elenwar ,M.M.M. ‘A Novel back up wide area
protection technique for power transmission grid using phasor measurement unit’,
IEEE Trans, Power Deliv, 2010 , 25, (1), pp. 270-278
3. Dobakhshari , A.S, Ranjbar, A. M., ‘A circuit approach to fault diagnosis in power
system by wide area measurement system’, Accepted to be published in Eur. Trans.
Electr., power 2012
4. Phadke, A.G., Thorp, J.S., “Synchronized phasor measurements and their
application”, (Springer, 2008 1st Edition.)
5. Azizi ,S., Dobakhshari ,A.S., Sarmadi, S.A.N., Ranjbar, A.M., “Optimal PMU
Placement By An Equivalent Linear Formulation For Exhaustive search”, IEEE
Trans., Smart Grid ,2012.
6. Bollen, Math H.J. (1999). Solving power quality problems: voltage sags and
interruptions. New York: IEEE Press. p. 139.
7. Characteristic of voltage dips (sags) in power systems Lidong Zhan ; Bollen,
M.H.J. Page(s):827 – 832
8. A new definition of voltage sag duration considering the voltage tolerance
curve Seon-Ju Ahn ; Il-Yop Chung ; Joong-Moon Kim.
9. MATLAB-based fault analysis of Power Systems with Graphical User Interface
Jamahbozorg, A. ; Radman, G. Southeastcon, 2011
10. Detection of Symmetrical Faults by Distance Relays During Power Swings
Lotfifard, S. Faiz, J. ; Kezunovic, M.