
Does the Net Present Value as a Financial Metric Fit ... - MDPI
16
Citation: Dobrowolski, Z.; Drozdowski, G. Does the Net Present Value as a Financial Metric Fit Investment in Green Energy Security? Energies 2022, 15, 353. https://doi.org/10.3390/ en15010353 Academic Editors: Mirela Panait, Daniel Balsalobre-Lorente, Umer Shahzad, Abdul Rehman and Magdalena Radulescu Received: 17 November 2021 Accepted: 7 December 2021 Published: 4 January 2022 Publisher’s Note: MDPI stays neutral with regard to jurisdictional claims in published maps and institutional affil- iations. Copyright: © 2022 by the authors. Licensee MDPI, Basel, Switzerland. This article is an open access article distributed under the terms and conditions of the Creative Commons Attribution (CC BY) license (https:// creativecommons.org/licenses/by/ 4.0/). energies Article Does the Net Present Value as a Financial Metric Fit Investment in Green Energy Security? Zbyslaw Dobrowolski 1, * and Grzegorz Drozdowski 2 1 Institute of Public Affairs, Jagiellonian University, 30-348 Krakow, Poland 2 Department of Economics and Finance, Jan Kochanowski University in Kielce, 25-369 Kielce, Poland; [email protected] * Correspondence: [email protected] Abstract: Surprisingly, little is known whether the net present value (NPV) used as a financial metric in budgeting and investment planning to analyse a projects’ profitability is universal. Meanwhile, the epochal green energy revolution ensuring carbon neutrality through green innovations requires enormous investments, and projects realised must ensure energy security. Therefore, there is a need to reanalyse financial metrics used in financial planning, including NPV. We eliminate this research gap and, based on data from Poland, Romania, Hungary, Croatia, the USA, the United Kingdom, Japan, Israel, and Euro Zone, explain why one may not perceive the currently used NPV formula as a universal financial metric. We show that the variable discount rate influences the time value of money. Therefore, there is a need to redefine the NPV formula. This study makes two main contributions. First, it creates new ground by revisiting the NPV formula in the emerging market context compared to stable economies and contributes to developing business and management theory. Second, we propose and empirically verify the modified NPV formula as a financial metric that considers the situation of energy firms in emerging markets. Thus, this research helps the capital budgeting process, and the modified NPV formula can help provide optimal outcomes in firms, helping to reduce financial risks. Our study contributes to a further contextual diagnosis of business projects and can, in turn, be relevant for other energy sector analyses. Keywords: carbon neutrality; green innovations; energy efficiency improvements; energy security; net present value; financial indicators 1. Introduction No doubt, one of the critical industries in today’s economy is the energy industry, and there is a connection between energy consumption and economic growth, c.f. [1–3]. All projects in the energy sector must be well planned and implemented. It results from management rationality and the influence of the energy sector on other branches of the economy. Energy firms are obliged by law to ensure energy security, which we understand from Dobrowolski’s definition: “the state of the economy that allows covering the current and future fuel and energy supplies in a technically and economically justified manner while maintaining environmental protection requirements. Energy security can also be understood as the diversification of energy supply sources and ensuring the certainty of their supply at a price acceptable to society and the economy. It is also the optimal use of domestic energy resources, with the simultaneous use of new technology and active participation in international environmental and energy initiatives. In the local sense, energy safety can be understood as a process aiming to meet the energy needs of local communities.” [4–6]. The implemented green revolution, also known as the 5G revolution, aimed at carbon neutrality through green innovations, requires enormous financial outlays and excellent financial planning of investments. In addition, there is one more aspect, which is the obligation imposed by the States on energy companies in terms of ensuring energy Energies 2022, 15, 353. https://doi.org/10.3390/en15010353 https://www.mdpi.com/journal/energies
-
Upload
khangminh22 -
Category
Documents
-
view
0 -
download
0
Transcript of Does the Net Present Value as a Financial Metric Fit ... - MDPI

�����������������
Citation: Dobrowolski, Z.; Drozdowski,
G. Does the Net Present Value as a
Financial Metric Fit Investment in
Green Energy Security? Energies 2022,
15, 353. https://doi.org/10.3390/
en15010353
Academic Editors: Mirela Panait,
Daniel Balsalobre-Lorente,
Umer Shahzad, Abdul Rehman and
Magdalena Radulescu
Received: 17 November 2021
Accepted: 7 December 2021
Published: 4 January 2022
Publisher’s Note: MDPI stays neutral
with regard to jurisdictional claims in
published maps and institutional affil-
iations.
Copyright: © 2022 by the authors.
Licensee MDPI, Basel, Switzerland.
This article is an open access article
distributed under the terms and
conditions of the Creative Commons
Attribution (CC BY) license (https://
creativecommons.org/licenses/by/
4.0/).
energies
Article
Does the Net Present Value as a Financial Metric Fit Investmentin Green Energy Security?Zbysław Dobrowolski 1,* and Grzegorz Drozdowski 2
1 Institute of Public Affairs, Jagiellonian University, 30-348 Krakow, Poland2 Department of Economics and Finance, Jan Kochanowski University in Kielce, 25-369 Kielce, Poland;
[email protected]* Correspondence: [email protected]
Abstract: Surprisingly, little is known whether the net present value (NPV) used as a financial metricin budgeting and investment planning to analyse a projects’ profitability is universal. Meanwhile,the epochal green energy revolution ensuring carbon neutrality through green innovations requiresenormous investments, and projects realised must ensure energy security. Therefore, there is a needto reanalyse financial metrics used in financial planning, including NPV. We eliminate this researchgap and, based on data from Poland, Romania, Hungary, Croatia, the USA, the United Kingdom,Japan, Israel, and Euro Zone, explain why one may not perceive the currently used NPV formulaas a universal financial metric. We show that the variable discount rate influences the time valueof money. Therefore, there is a need to redefine the NPV formula. This study makes two maincontributions. First, it creates new ground by revisiting the NPV formula in the emerging marketcontext compared to stable economies and contributes to developing business and managementtheory. Second, we propose and empirically verify the modified NPV formula as a financial metricthat considers the situation of energy firms in emerging markets. Thus, this research helps the capitalbudgeting process, and the modified NPV formula can help provide optimal outcomes in firms,helping to reduce financial risks. Our study contributes to a further contextual diagnosis of businessprojects and can, in turn, be relevant for other energy sector analyses.
Keywords: carbon neutrality; green innovations; energy efficiency improvements; energy security;net present value; financial indicators
1. Introduction
No doubt, one of the critical industries in today’s economy is the energy industry,and there is a connection between energy consumption and economic growth, c.f. [1–3].All projects in the energy sector must be well planned and implemented. It results frommanagement rationality and the influence of the energy sector on other branches of theeconomy. Energy firms are obliged by law to ensure energy security, which we understandfrom Dobrowolski’s definition: “the state of the economy that allows covering the currentand future fuel and energy supplies in a technically and economically justified mannerwhile maintaining environmental protection requirements. Energy security can also beunderstood as the diversification of energy supply sources and ensuring the certainty oftheir supply at a price acceptable to society and the economy. It is also the optimal useof domestic energy resources, with the simultaneous use of new technology and activeparticipation in international environmental and energy initiatives. In the local sense,energy safety can be understood as a process aiming to meet the energy needs of localcommunities.” [4–6]. The implemented green revolution, also known as the 5G revolution,aimed at carbon neutrality through green innovations, requires enormous financial outlaysand excellent financial planning of investments. In addition, there is one more aspect, whichis the obligation imposed by the States on energy companies in terms of ensuring energy
Energies 2022, 15, 353. https://doi.org/10.3390/en15010353 https://www.mdpi.com/journal/energies
Energies 2022, 15, 353 2 of 16
security. We define green energy security as generating energy from environmentallyneutral sources and ensuring the certainty of their supply at a price acceptable to societyand the economy.
Mismanagement in the energy sector reduces the competitiveness of energy firms andother economic entities. Despite many studies, there is a research gap regarding whetherthe NPV metric is universal—whether one may use the NPV in different countries withdifferent economic stability? Therefore, the research problem needs to be solved: Doesthe currently applicable NPV metric fit emerging markets? Our research aims to verifythe following hypothesis: the variable discount rate influences the time value of money,requiring redefining the NPV formula as a financial metric.
This article presents a theory that explains why NPV cannot be perceived as a universalmetric used in the budgeting decisions of firms worldwide. The rules governing the projectselection process depend upon the economic environment, and therefore they may havemany restrictions and detailed guidance. Our findings are rooted in corporate finance’smainstream literature and the previous studies on NPV limitations, e.g., [7]. To proveour assumption, we develop a new NPV metric that considers the situation of firms inemerging markets. Next, we empirically verify this model.
Our findings are based on the capital budgeting literature, c.f. [7–9], and they haveseveral implications for both researchers and firms. They help modify the NPV and recon-cile the theory with actual firm capital budgeting practices from an academic standpoint.Our research shows that current NPV is an ineffective metric. However, in oppositionto the previous studies mentioned above, we prove that NPV is not the universal metricbecause of information constraints between the firms’ headquarters and their branches.There is another more serious argument. The NPV is not considering the differences infirms’ situation resulting from their location in stable and emerging markets, and thereforeit cannot be a universal metric.
We believe this research is related to the UN Sustainable Development Goals andEuropean Green Deal. It is because we aim to reduce the investment risk through theimprovement of the NPV formula. Ensuring in a better way the financial reality in energyinvestment reduces the risk of losing financial and other resources and helps achieve theplanned goals wisely. In addition, transformations in the energy sector from traditionalenergy sources into green energy need the support of decision-makers. Any failures in thisprocess can question efforts taken and create unnecessary uncertainty on financial markets.
To present our findings in the best way, we first discuss the NPV used contemporarilyin the context of interest rates and business risk. Next, we provide evidence that the currentNPV metric is not universal and formulate the new NPV formula. Finally, we formulate aconclusion and point out opportunities for further research.
2. Literature Review
Under uncertainty, the economic reliability of project financing requires solid economicmetrics [10]. One of these metrics is the net present value (NPV), understood as thedifference between the present values of cash inflows and cash outflows analysed over sometime. This understanding of NPV is used in capital budgeting and investment planning,enabling analysis of a projected investment or project [11]. The application of NPV incapital budgeting and investments is widely presented in the literature, e.g., [7,12–27]. Theresearchers emphasise the importance of NPV for investment planning. Net Present Valueenables the comparison between the money that must be paid to complete the plannedinvestment with all the cash flows that the undertaking will generate in the future [7,12–27].
One may measure economic profitability with absolute metrics in capital asset projects,including the net present value. This metric expresses a value increase in monetary units.One may also use relative metrics, showing rates of return or profitability indices to identifya project’s financial efficiency. Many factors are influencing the preference for absolutemetrics or relative metrics in practice. They may depend on the company’s policy, bankrequirements, and shareholders’ requirements [7,27–32]. We do not develop the topic of

Energies 2022, 15, 353 3 of 16
factors that influence decision-makers choice between absolute and relative metrics. How-ever, we notice ongoing discussion based on the literature presented above. We also noticediscussion on factors influencing NPV [13–21,24,31–33]. Percoco and Borgonovo [34] andothers [35–38] analyse the dependencies between the NPV and the internal rate of return(IRR). Finally, we notice that Magni and Marchioni proposed using NPV to project rank-ing [10]. However, based on the literature review, we note that little is known about usingthe NPV metric in an unstable market with unstable interest rates during the investment inenergy security.
Based on the literature review [5,39–49], one may formulate a generalisation thatenergy security is a multifaceted issue, including but not limited to “reducing emissions,reducing dependence on fossil sources, diversifying energy supplies, securing energyroutes, building liquefied gas tanks, modernising transmission lines” [5] together withreducing the energy consumption. In some countries, especially developing countries,energy security is also understood as access to energy services by the poorest, or it isunderstood as a mechanism that limits the dominance of a single energy system. Energysecurity fits sustainable development, including the energy supply chain [5]. It mayultimately be an essential component of human-environmental security and influence foodproduction and the distribution and treatment of drinking water [5,40,41,47–49]. Energysecurity understood as constant energy availability can be required by law. It has to beunderlined that the European Member States must comply with Directive 2005/89/ECof the European Parliament and of the Council of 18 January 2006 on measures to ensurethe safety of electricity supply and infrastructure investments [5,50]. This Directive statesthat “the European Union Member States must require transmission system operators tomaintain an adequate level of operational network safety, which is to be understood asthe uninterrupted operation of the energy transmission network” [5]. One may generalisethose energy companies operate in different legal conditions than other firms. They needto ensure energy security and realise the public task of being under government oversight.It constitutes that they are hybrid, linking business operations with public interest [6,51].
The influence of energy security on sustainability is evident. Researchers (e.g., Holm-berg, Reed, and Harris) underline that the concept of sustainability includes three keyaspects of development: social, economic, and environmental. One may generalise that aneconomic aspect means that the constant production of goods and services should not leadto unmanageable government and external debt levels. It also means the need to avoidextreme business cycle fluctuations. An environmental aspect means that economic andsocial development is based on renewable energy resources and ensures energy security. Asocial aspect means fairness in realising public tasks, and it is linked with accountability,transparency, and integrity. From an ecological perspective, any human activity mustconsider the natural environment [52–55]. This postulate may be achievable if green energyproduction, distribution, and consumption are well designed and realised. Furthermore,green energy will reduce the demand for nonrenewable resources.
We analyse energy availability through the prism of its production and delivery. Itmeans that any investments in energy security must be well planned, including the capitalbudgeting point of view. This statement emphasises the role of financial planning ofinvestments in energy firms, regardless of whether they are private or public entities.Any financial turbulence during the investment phase may affect future prices of energyproduction and delivery.
The payback period, or “payback method”, can be perceived as an alternative methodto NPV, showing how long the investment will be repaid. Such information is crucial forany investor and critical stakeholders. However, this method fails to account for the timevalue of money, which is its drawback. Meanwhile, one must assume that one cannotcompare the money used today with money used tomorrow, and it is not only due toinflation. The amount of money used today is worth more than the same amount of moneyin the future because of its potential profit through investment. This weakness of thepayback method is noticeable the longer investments take place.
Energies 2022, 15, 353 4 of 16
The “internal rate of return” (IRR) method is similar to NPV in general assumption.However, in the IRR method, the discount rate is stable in an assumed time. In reality,such a situation is rare, especially in unstable markets. Furthermore, although the IRR ishelpful, it has some limitations. For example, in projects with unconventional net cashflows (e.g., in the mining industry, when negative net cash flows appear not only at thebeginning of the investment but also in the final phase after depletion of deposits), one canobtain several values of internal rates of return, none of which does take into account actualfarming conditions. As mentioned earlier, NPV uses discounted cash flows following thetime value of money (TMV).
The NPV relies on assumptions and estimates. One assumption is that investmentprojects will be realised in a certain period. However, a project may require unforeseenexpenditures to get off the ground or additional expenditures to finish it. Additionally,NPV may ignore future tax credits. There is also a need to account for inflation, which maybe volatile. In addition, the correct calculation of depreciation must be used to calculatethe cost correctly, which influences the revenue. Therefore, the NPV method should not beconsidered the only investment profitability assessment source. The decision to undertakeor reject a given investment project should be based on more than one method. In thisarticle, however, we investigate the NPV to show that the premise of the current NPVmethod is not universal.
3. Materials and Methods
We used literature studies, taking into account the methodology of systematic literaturereview, including bibliometric analysis. Based on this review, we revealed that little isknown whether NPV as an economic metric can be used during investment planningrelated to energy security in any energy market. Next, we analysed information on changesin interest rates during a ten year period in randomly selected countries divided into twogroups: first, in stable economies characterised by stable interest rates; second, in less stableeconomies where interest rate fluctuations have occurred. We used data about interest ratesfrom central bank databases from Poland, Romania, Hungary, Croatia, the USA, the UnitedKingdom, Japan, Israel, and Euro Zone [56–64]. Comparative analysis allowed us to verifythe following hypothesis: the variable discount rate influences the time value of money,requiring redefining the NPV formula.
When conducting literature studies, we shared the view of Nordqvist, Gardner, Short,and Payne’s view that it can inspire research and serve as a platform for comparing our find-ings with other results [65,66]. When planning the study, we recognised that managementunderstood as an academic discipline develops in conjunction with practice, particularly inthe Anglo–Saxon context. However, regardless of the level of formulated generalisations,the concepts created must be based on some commonly shared cognitive assumptionsdefined after Kuhn as a paradigm [67]. We also assumed that we use the classification ofparadigms by Burrell and Morgan [68] for further considerations on the adopted paradigms,reflected in the researcher’s attitude and the methodology used. The analysis of episte-mological assumptions leads to the next issue, which is strategy-making in our research.Following Babbie [69], one could distinguish between inductive and deductive strategiesor mixed inductive–deductive strategies. It was also possible to analyse the strategy issue,considering the dominant or alternative paradigm theories division. We used the strategyof epistemological pluralism, allowing for the combination of approaches drawn fromdifferent paradigms. It means the possibility of using typically functionalist concepts, suchas hypotheses, verification, falsification, and experiment, but also interpretative concepts,such as meaning and interpretation. Thus, we based our methodology on the assumptionof complementarity, exemplified by the adopted methodological triangulation, which helps,as noted by Campbell, Fiske, Webb, et al., Greene et al. [70–72], in obtaining a broadercontext of the studied phenomenon and limiting measurement errors.
Energies 2022, 15, 353 5 of 16
4. Results and Discussion4.1. Current NPV as a Financial Metric and Interest Rates
The NPV as a financial metric, commonly used in capital budgeting, expresses thedifference between current cash inflows and current cash outflows. Since money has atime value, cash flows must follow the same denominator to be compared. Owing to theNPV, it is possible to assess the cash flows related to the project (they require comparingthe updated value of future revenues with the capital expenditures made today). In otherwords, the NPV metric is based on discounting future cash flows to their present values.Therefore, one may assume that NPV helps make the right decision from the shareholdersand other decision-makers points of view.
NPV enables selecting an action option that is acceptable in terms of financial ob-jectives [73]. Is it like that every time? Or are there situations where the current NPVmetric fails? We think calculating an investment’s economic efficiency without applyingthe inflationary factors, and the exchange rate is a mistake because it considers inputsand outputs equally valuable. An increase or decrease in the time value of money ischaracteristic of all economies but more affected in unstable markets (e.g., eastern andcentral European countries). The time value of money is influenced by macroeconomicfactors such as inflationary processes and changes in exchange rates [74–78]. Additionally,microeconomic factors need to be considered, including investor preference for the distri-bution of consumption over time, the risk of asset impairment, and the risk of lost profits.Without going into a broader description of the time value of money, it can be stated thatthe value of money is an essential issue from the standpoint of valuation of economic eventsand directly affects the objectivity and usefulness of the calculations obtained using theeconomic calculus. This issue concerns the financial analysis of investments because there isa long time horizon between incurring the outlay and the moment of obtaining subsequenteffects from operating the investment. What does it mean for practitioners? It means thatthere is a need to draw attention to a discount technique to assess the efficiency of tangibleinvestments. Determining the value of the parameter “r” (discount rate) allows choosingthe value of expected future effects when incurring the expenditure. One may concludethat the constant discount rate used in the presented dynamic method of investment projectappraisal does not consider its construction the actual management conditions becausethe discount rate may change. It is a severe problem in terms of the rationality of businessdecisions. Meanwhile, Simon revealed that the concept of bounded rationality might leadto serious business mistakes [79–81].
Much attention is devoted to capital structure theory, c.f. [82–89]. For example, Myersdetermines the capital structure to maximise its value [82]. Broadly cited, Rayan analysesfinancial leverage issues to increase the return on equity [88]. Others analyse how toestimate equity and debt value [89]. However, none of the presented concepts describingthe investment process develop a dynamic approach to the cost of capital. Such an approachmanifests itself in the constant discount rate assumption throughout the entire investmentimplementation period. It distorts the conditions of management that can be observed,for example, when considering the level of base interest rates over time. Because thevolatility of base interest rates occurs both in the short term and in the long period, such asituation does not allow for an upbeat assessment of the usefulness of the NPV methodrecommended in the literature, assuming the constancy of interest rates. This issue is one ofthe main factors limiting the reliability of the investment’s economic calculus, particularlyin unstable economic conditions.
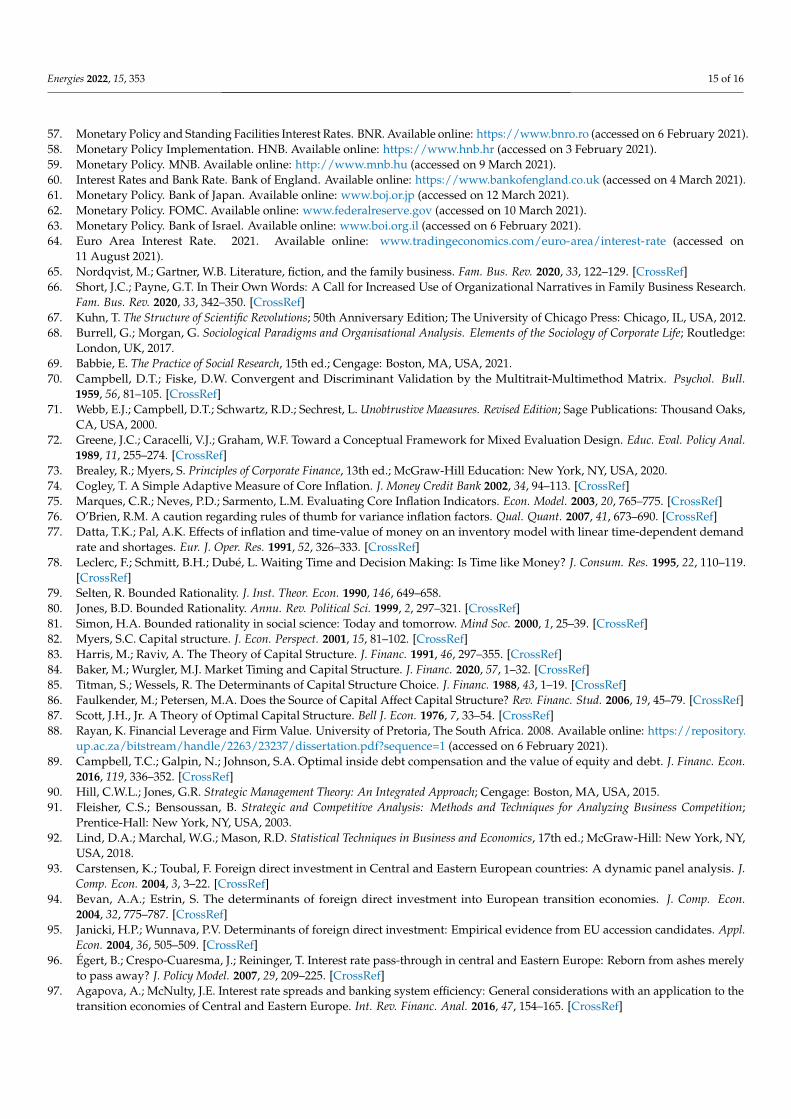
This problem can be illustrated by presenting interest rates in central Europe (fromJanuary 2010 to December 2020) (Figure 1) in comparison to interest rates in the USA, Israel,United Kingdom, Japan, and Euro Zone (Figure 2).
Energies 2022, 15, 353 6 of 16Energies 2022, 15, x FOR PEER REVIEW 6 of 17
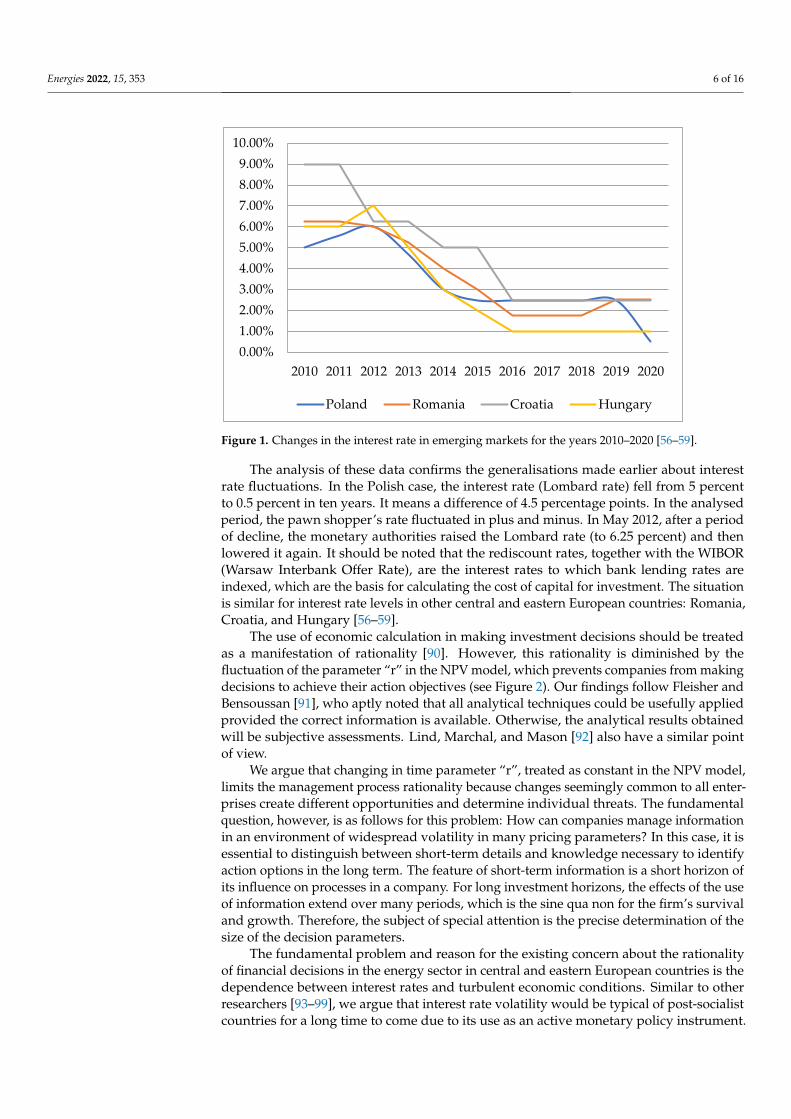
Figure 1. Changes in the interest rate in emerging markets for the years 2010–2020 [56–59].
The analysis of these data confirms the generalisations made earlier about interest rate fluctuations. In the Polish case, the interest rate (Lombard rate) fell from 5 percent to 0.5 percent in ten years. It means a difference of 4.5 percentage points. In the analysed period, the pawn shopper’s rate fluctuated in plus and minus. In May 2012, after a period of decline, the monetary authorities raised the Lombard rate (to 6.25 percent) and then lowered it again. It should be noted that the rediscount rates, together with the WIBOR (Warsaw Interbank Offer Rate), are the interest rates to which bank lending rates are in-dexed, which are the basis for calculating the cost of capital for investment. The situation is similar for interest rate levels in other central and eastern European countries: Roma-nia, Croatia, and Hungary [56–59].
The use of economic calculation in making investment decisions should be treated as a manifestation of rationality [90]. However, this rationality is diminished by the fluctu-ation of the parameter “r” in the NPV model, which prevents companies from making decisions to achieve their action objectives (see Figure 2). Our findings follow Fleisher and Bensoussan [91], who aptly noted that all analytical techniques could be usefully applied provided the correct information is available. Otherwise, the analytical results obtained will be subjective assessments. Lind, Marchal, and Mason [92] also have a sim-ilar point of view.
We argue that changing in time parameter ”r”, treated as constant in the NPV mod-el, limits the management process rationality because changes seemingly common to all enterprises create different opportunities and determine individual threats. The funda-mental question, however, is as follows for this problem: How can companies manage information in an environment of widespread volatility in many pricing parameters? In this case, it is essential to distinguish between short-term details and knowledge neces-sary to identify action options in the long term. The feature of short-term information is a short horizon of its influence on processes in a company. For long investment horizons, the effects of the use of information extend over many periods, which is the sine qua non for the firm’s survival and growth. Therefore, the subject of special attention is the precise determination of the size of the decision parameters.
The fundamental problem and reason for the existing concern about the rationality of financial decisions in the energy sector in central and eastern European countries is the dependence between interest rates and turbulent economic conditions. Similar to other researchers [93–99], we argue that interest rate volatility would be typical of post-socialist countries for a long time to come due to its use as an active monetary policy instrument.
0.00%1.00%2.00%3.00%4.00%5.00%6.00%7.00%8.00%9.00%
10.00%
2010 2011 2012 2013 2014 2015 2016 2017 2018 2019 2020
Poland Romania Croatia Hungary
Figure 1. Changes in the interest rate in emerging markets for the years 2010–2020 [56–59].
The analysis of these data confirms the generalisations made earlier about interestrate fluctuations. In the Polish case, the interest rate (Lombard rate) fell from 5 percentto 0.5 percent in ten years. It means a difference of 4.5 percentage points. In the analysedperiod, the pawn shopper’s rate fluctuated in plus and minus. In May 2012, after a periodof decline, the monetary authorities raised the Lombard rate (to 6.25 percent) and thenlowered it again. It should be noted that the rediscount rates, together with the WIBOR(Warsaw Interbank Offer Rate), are the interest rates to which bank lending rates areindexed, which are the basis for calculating the cost of capital for investment. The situationis similar for interest rate levels in other central and eastern European countries: Romania,Croatia, and Hungary [56–59].
The use of economic calculation in making investment decisions should be treatedas a manifestation of rationality [90]. However, this rationality is diminished by thefluctuation of the parameter “r” in the NPV model, which prevents companies from makingdecisions to achieve their action objectives (see Figure 2). Our findings follow Fleisher andBensoussan [91], who aptly noted that all analytical techniques could be usefully appliedprovided the correct information is available. Otherwise, the analytical results obtainedwill be subjective assessments. Lind, Marchal, and Mason [92] also have a similar pointof view.
We argue that changing in time parameter “r”, treated as constant in the NPV model,limits the management process rationality because changes seemingly common to all enter-prises create different opportunities and determine individual threats. The fundamentalquestion, however, is as follows for this problem: How can companies manage informationin an environment of widespread volatility in many pricing parameters? In this case, it isessential to distinguish between short-term details and knowledge necessary to identifyaction options in the long term. The feature of short-term information is a short horizon ofits influence on processes in a company. For long investment horizons, the effects of the useof information extend over many periods, which is the sine qua non for the firm’s survivaland growth. Therefore, the subject of special attention is the precise determination of thesize of the decision parameters.
The fundamental problem and reason for the existing concern about the rationalityof financial decisions in the energy sector in central and eastern European countries is thedependence between interest rates and turbulent economic conditions. Similar to otherresearchers [93–99], we argue that interest rate volatility would be typical of post-socialistcountries for a long time to come due to its use as an active monetary policy instrument.
Energies 2022, 15, 353 7 of 16
Such a situation creates completely different conditions for firms responsible for energysecurity than in stable economies.
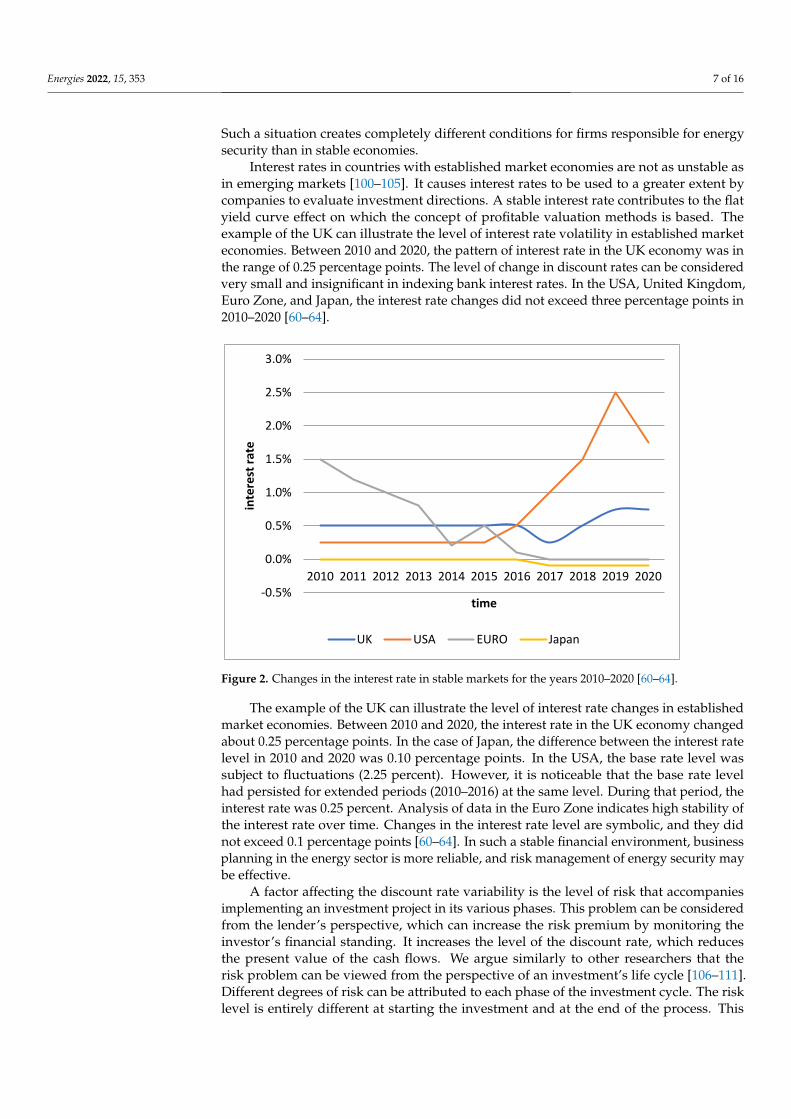
Interest rates in countries with established market economies are not as unstable asin emerging markets [100–105]. It causes interest rates to be used to a greater extent bycompanies to evaluate investment directions. A stable interest rate contributes to the flatyield curve effect on which the concept of profitable valuation methods is based. Theexample of the UK can illustrate the level of interest rate volatility in established marketeconomies. Between 2010 and 2020, the pattern of interest rate in the UK economy was inthe range of 0.25 percentage points. The level of change in discount rates can be consideredvery small and insignificant in indexing bank interest rates. In the USA, United Kingdom,Euro Zone, and Japan, the interest rate changes did not exceed three percentage points in2010–2020 [60–64].
Energies 2022, 15, x FOR PEER REVIEW 7 of 17
Such a situation creates completely different conditions for firms responsible for energy security than in stable economies.
Interest rates in countries with established market economies are not as unstable as in emerging markets [100–105]. It causes interest rates to be used to a greater extent by companies to evaluate investment directions. A stable interest rate contributes to the flat yield curve effect on which the concept of profitable valuation methods is based. The example of the UK can illustrate the level of interest rate volatility in established market economies. Between 2010 and 2020, the pattern of interest rate in the UK economy was in the range of 0.25 percentage points. The level of change in discount rates can be consid-ered very small and insignificant in indexing bank interest rates. In the USA, United Kingdom, Euro Zone, and Japan, the interest rate changes did not exceed three percent-age points in 2010–2020 [60–64].
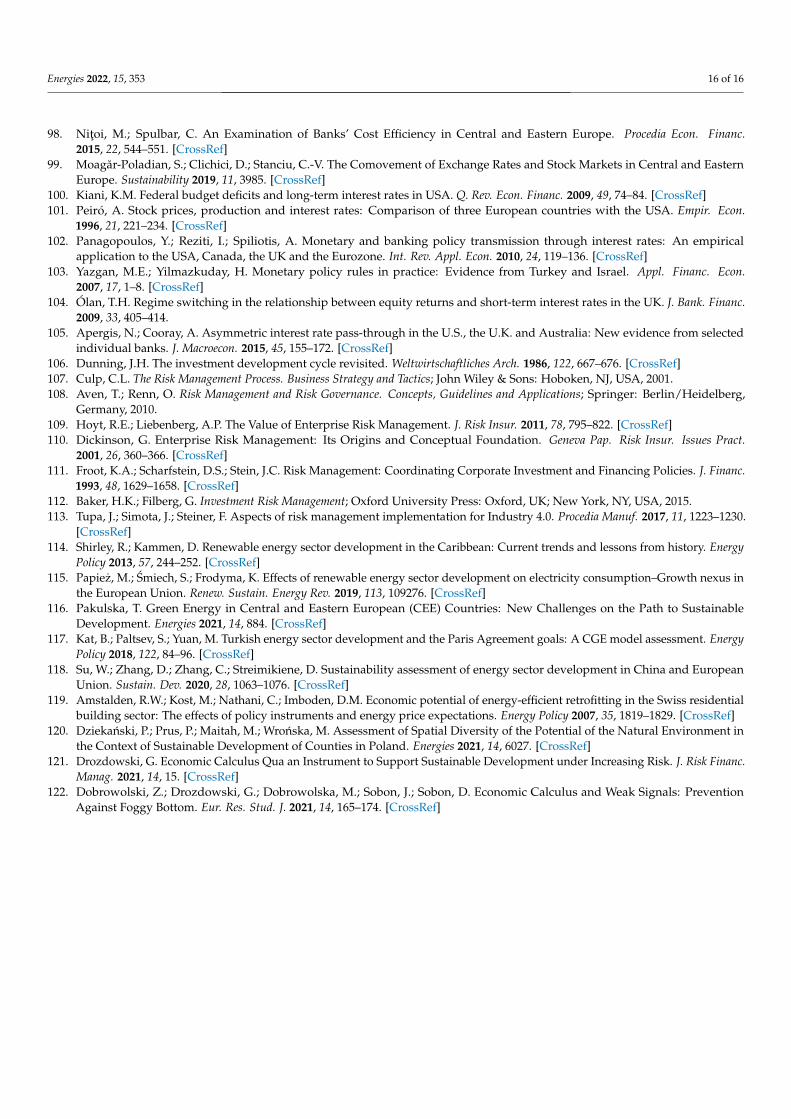
Figure 2. Changes in the interest rate in stable markets for the years 2010–2020 [60–64].
The example of the UK can illustrate the level of interest rate changes in established market economies. Between 2010 and 2020, the interest rate in the UK economy changed about 0.25 percentage points. In the case of Japan, the difference between the interest rate level in 2010 and 2020 was 0.10 percentage points. In the USA, the base rate level was subject to fluctuations (2.25 percent). However, it is noticeable that the base rate level had persisted for extended periods (2010–2016) at the same level. During that period, the in-terest rate was 0.25 percent. Analysis of data in the Euro Zone indicates high stability of the interest rate over time. Changes in the interest rate level are symbolic, and they did not exceed 0.1 percentage points [60–64]. In such a stable financial environment, business planning in the energy sector is more reliable, and risk management of energy security may be effective.
A factor affecting the discount rate variability is the level of risk that accompanies implementing an investment project in its various phases. This problem can be consid-ered from the lender’s perspective, which can increase the risk premium by monitoring the investor’s financial standing. It increases the level of the discount rate, which reduces the present value of the cash flows. We argue similarly to other researchers that the risk problem can be viewed from the perspective of an investment’s life cycle [106–111]. Dif-ferent degrees of risk can be attributed to each phase of the investment cycle. The risk level is entirely different at starting the investment and at the end of the process. This
-0.5%
0.0%
0.5%
1.0%
1.5%
2.0%
2.5%
3.0%
2010 2011 2012 2013 2014 2015 2016 2017 2018 2019 2020
inte
rest
rate
time
UK USA EURO Japan
Figure 2. Changes in the interest rate in stable markets for the years 2010–2020 [60–64].
The example of the UK can illustrate the level of interest rate changes in establishedmarket economies. Between 2010 and 2020, the interest rate in the UK economy changedabout 0.25 percentage points. In the case of Japan, the difference between the interest ratelevel in 2010 and 2020 was 0.10 percentage points. In the USA, the base rate level wassubject to fluctuations (2.25 percent). However, it is noticeable that the base rate levelhad persisted for extended periods (2010–2016) at the same level. During that period, theinterest rate was 0.25 percent. Analysis of data in the Euro Zone indicates high stability ofthe interest rate over time. Changes in the interest rate level are symbolic, and they didnot exceed 0.1 percentage points [60–64]. In such a stable financial environment, businessplanning in the energy sector is more reliable, and risk management of energy security maybe effective.
A factor affecting the discount rate variability is the level of risk that accompaniesimplementing an investment project in its various phases. This problem can be consideredfrom the lender’s perspective, which can increase the risk premium by monitoring theinvestor’s financial standing. It increases the level of the discount rate, which reducesthe present value of the cash flows. We argue similarly to other researchers that therisk problem can be viewed from the perspective of an investment’s life cycle [106–111].Different degrees of risk can be attributed to each phase of the investment cycle. The risklevel is entirely different at starting the investment and at the end of the process. This
Energies 2022, 15, 353 8 of 16
assumption should also be taken into account in determining the level of the discount rateover time.
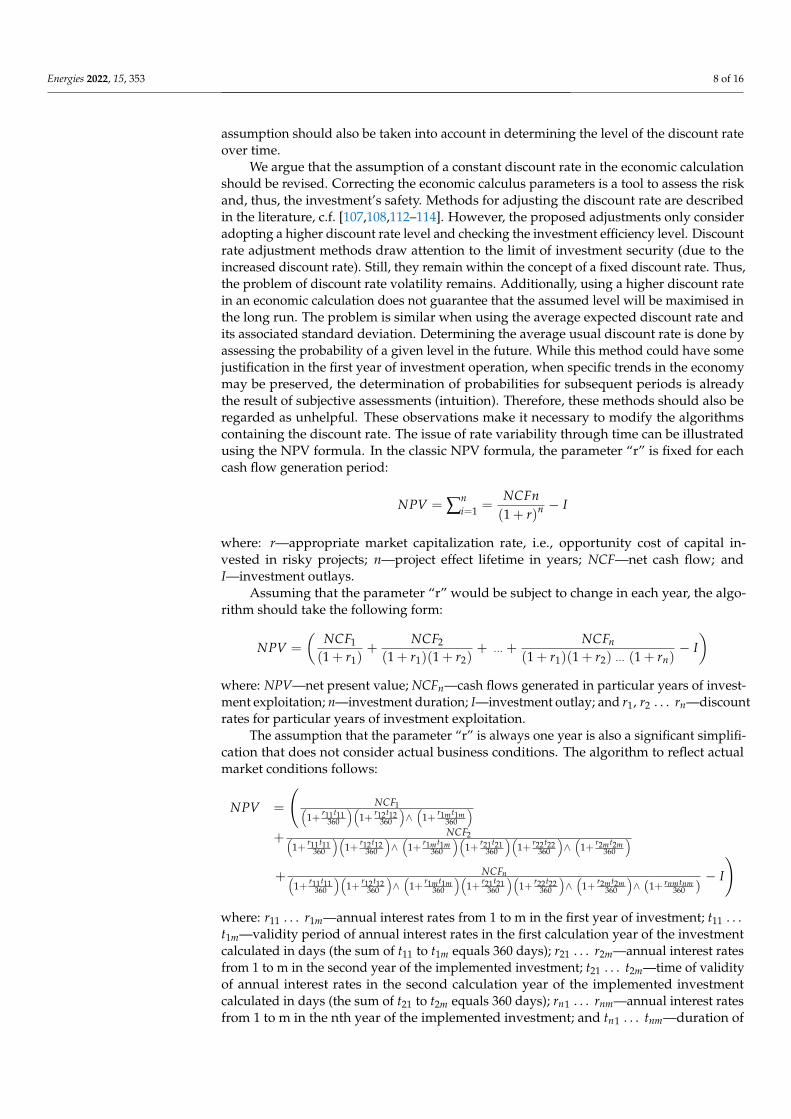
We argue that the assumption of a constant discount rate in the economic calculationshould be revised. Correcting the economic calculus parameters is a tool to assess the riskand, thus, the investment’s safety. Methods for adjusting the discount rate are describedin the literature, c.f. [107,108,112–114]. However, the proposed adjustments only consideradopting a higher discount rate level and checking the investment efficiency level. Discountrate adjustment methods draw attention to the limit of investment security (due to theincreased discount rate). Still, they remain within the concept of a fixed discount rate. Thus,the problem of discount rate volatility remains. Additionally, using a higher discount ratein an economic calculation does not guarantee that the assumed level will be maximised inthe long run. The problem is similar when using the average expected discount rate andits associated standard deviation. Determining the average usual discount rate is done byassessing the probability of a given level in the future. While this method could have somejustification in the first year of investment operation, when specific trends in the economymay be preserved, the determination of probabilities for subsequent periods is alreadythe result of subjective assessments (intuition). Therefore, these methods should also beregarded as unhelpful. These observations make it necessary to modify the algorithmscontaining the discount rate. The issue of rate variability through time can be illustratedusing the NPV formula. In the classic NPV formula, the parameter “r” is fixed for eachcash flow generation period:
NPV = ∑ni=1 =
NCFn(1 + r)n − I
where: r—appropriate market capitalization rate, i.e., opportunity cost of capital in-vested in risky projects; n—project effect lifetime in years; NCF—net cash flow; andI—investment outlays.
Assuming that the parameter “r” would be subject to change in each year, the algo-rithm should take the following form:
NPV =
(NCF1
(1 + r1)+
NCF2
(1 + r1)(1 + r2)+ ··· +
NCFn
(1 + r1)(1 + r2) ··· (1 + rn)− I)
where: NPV—net present value; NCFn—cash flows generated in particular years of invest-ment exploitation; n—investment duration; I—investment outlay; and r1, r2 . . . rn—discountrates for particular years of investment exploitation.
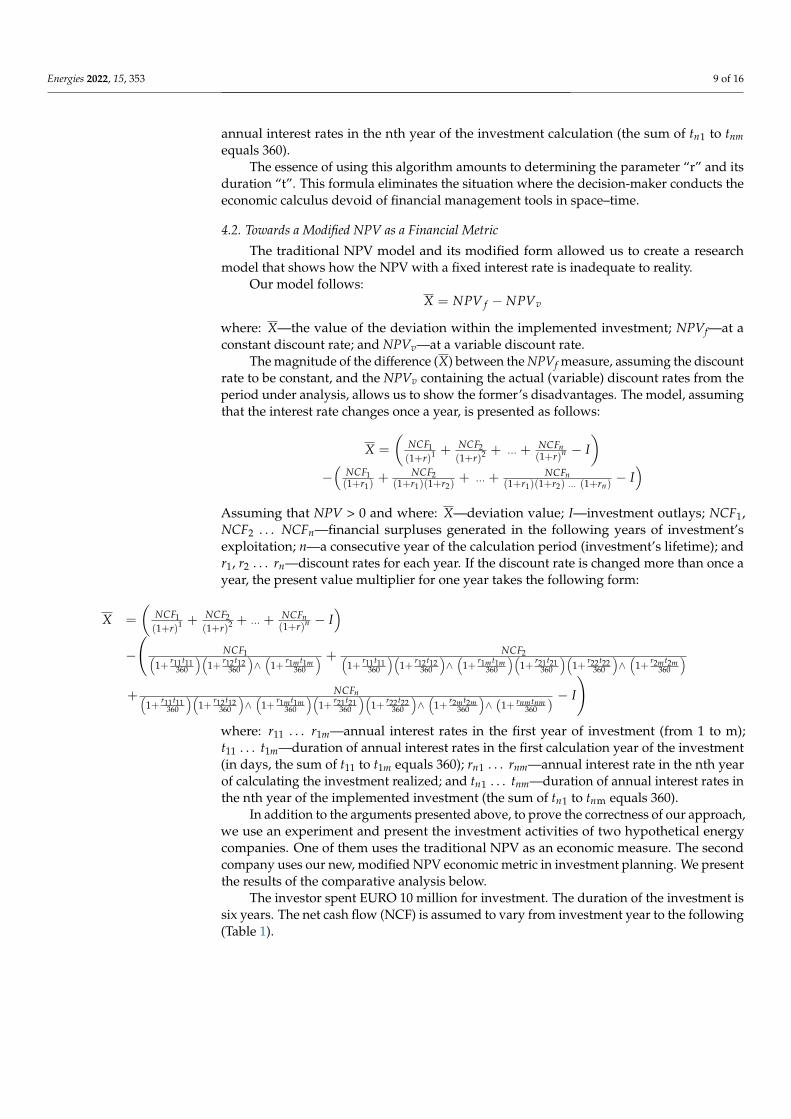
The assumption that the parameter “r” is always one year is also a significant simplifi-cation that does not consider actual business conditions. The algorithm to reflect actualmarket conditions follows:
NPV =
(NCF1(
1+ r11t11360
)(1+ r12t12
360
)∧(
1+ r1mt1m360
)+ NCF2(
1+ r11t11360
)(1+ r12t12
360
)∧(
1+ r1mt1m360
)(1+ r21t21
360
)(1+ r22t22
360
)∧(
1+ r2mt2m360
)+ NCFn(
1+ r11t11360
)(1+ r12t12
360
)∧(
1+ r1mt1m360
)(1+ r21t21
360
)(1+ r22t22
360
)∧(
1+ r2mt2m360
)∧ (1+ rnmtnm
360 )− I
)
where: r11 . . . r1m—annual interest rates from 1 to m in the first year of investment; t11 . . .t1m—validity period of annual interest rates in the first calculation year of the investmentcalculated in days (the sum of t11 to t1m equals 360 days); r21 . . . r2m—annual interest ratesfrom 1 to m in the second year of the implemented investment; t21 . . . t2m—time of validityof annual interest rates in the second calculation year of the implemented investmentcalculated in days (the sum of t21 to t2m equals 360 days); rn1 . . . rnm—annual interest ratesfrom 1 to m in the nth year of the implemented investment; and tn1 . . . tnm—duration of
Energies 2022, 15, 353 9 of 16
annual interest rates in the nth year of the investment calculation (the sum of tn1 to tnmequals 360).
The essence of using this algorithm amounts to determining the parameter “r” and itsduration “t”. This formula eliminates the situation where the decision-maker conducts theeconomic calculus devoid of financial management tools in space–time.
4.2. Towards a Modified NPV as a Financial Metric
The traditional NPV model and its modified form allowed us to create a researchmodel that shows how the NPV with a fixed interest rate is inadequate to reality.
Our model follows:X = NPV f − NPVv
where: X—the value of the deviation within the implemented investment; NPVf—at aconstant discount rate; and NPVv—at a variable discount rate.
The magnitude of the difference (X) between the NPVf measure, assuming the discountrate to be constant, and the NPVv containing the actual (variable) discount rates from theperiod under analysis, allows us to show the former’s disadvantages. The model, assumingthat the interest rate changes once a year, is presented as follows:
X =
(NCF1(1+r)1 +
NCF2(1+r)2 + ··· +
NCFn(1+r)n − I
)−(
NCF1(1+r1)
+ NCF2(1+r1)(1+r2)
+ ··· +NCFn
(1+r1)(1+r2) ··· (1+rn)− I)
Assuming that NPV > 0 and where: X—deviation value; I—investment outlays; NCF1,NCF2 . . . NCFn—financial surpluses generated in the following years of investment’sexploitation; n—a consecutive year of the calculation period (investment’s lifetime); andr1, r2 . . . rn—discount rates for each year. If the discount rate is changed more than once ayear, the present value multiplier for one year takes the following form:
X =
(NCF1(1+r)1 +
NCF2(1+r)2 + ··· +
NCFn(1+r)n − I
)−(
NCF1(1+ r11t11
360
)(1+ r12t12
360
)∧(
1+ r1mt1m360
) + NCF2(1+ r11t11
360
)(1+ r12t12
360
)∧(
1+ r1mt1m360
)(1+ r21t21
360
)(1+ r22t22
360
)∧(
1+ r2mt2m360
)+ NCFn(
1+ r11t11360
)(1+ r12t12
360
)∧(
1+ r1mt1m360
)(1+ r21t21
360
)(1+ r22t22
360
)∧(
1+ r2mt2m360
)∧ (1+ rnmtnm
360 )− I
)where: r11 . . . r1m—annual interest rates in the first year of investment (from 1 to m);t11 . . . t1m—duration of annual interest rates in the first calculation year of the investment(in days, the sum of t11 to t1m equals 360); rn1 . . . rnm—annual interest rate in the nth yearof calculating the investment realized; and tn1 . . . tnm—duration of annual interest rates inthe nth year of the implemented investment (the sum of tn1 to tnm equals 360).
In addition to the arguments presented above, to prove the correctness of our approach,we use an experiment and present the investment activities of two hypothetical energycompanies. One of them uses the traditional NPV as an economic measure. The secondcompany uses our new, modified NPV economic metric in investment planning. We presentthe results of the comparative analysis below.
The investor spent EURO 10 million for investment. The duration of the investment issix years. The net cash flow (NCF) is assumed to vary from investment year to the following(Table 1).
Energies 2022, 15, 353 10 of 16
Table 1. Financial surplus over six years of investment (in EURO).
Values
Years1 2 3 4 5 6
NCF 2,565,500 4,378,300 6,254,630 6,547,300 6,525,720 5,973,420NCF—net cash flow.
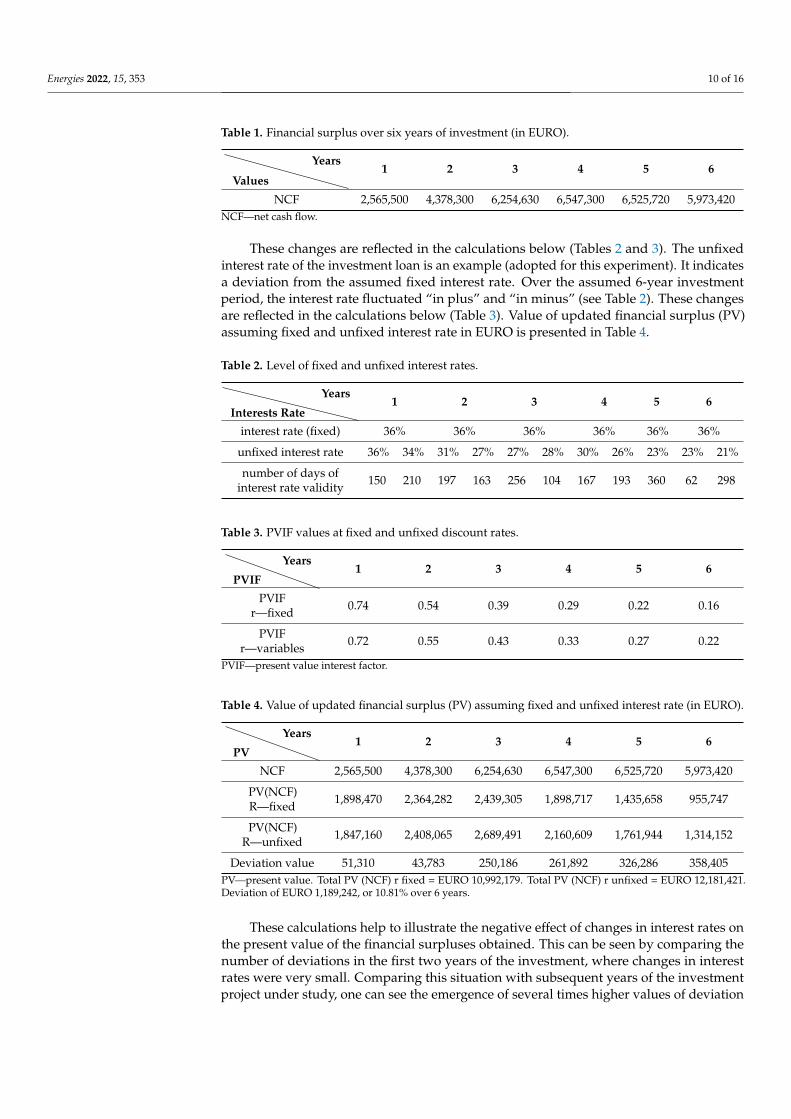
These changes are reflected in the calculations below (Tables 2 and 3). The unfixedinterest rate of the investment loan is an example (adopted for this experiment). It indicatesa deviation from the assumed fixed interest rate. Over the assumed 6-year investmentperiod, the interest rate fluctuated “in plus” and “in minus” (see Table 2). These changesare reflected in the calculations below (Table 3). Value of updated financial surplus (PV)assuming fixed and unfixed interest rate in EURO is presented in Table 4.
Table 2. Level of fixed and unfixed interest rates.
Interests Rate
Years1 2 3 4 5 6
interest rate (fixed) 36% 36% 36% 36% 36% 36%
unfixed interest rate 36% 34% 31% 27% 27% 28% 30% 26% 23% 23% 21%
number of days ofinterest rate validity 150 210 197 163 256 104 167 193 360 62 298
Table 3. PVIF values at fixed and unfixed discount rates.
PVIF
Years1 2 3 4 5 6
PVIFr—fixed 0.74 0.54 0.39 0.29 0.22 0.16
PVIFr—variables 0.72 0.55 0.43 0.33 0.27 0.22
PVIF—present value interest factor.
Table 4. Value of updated financial surplus (PV) assuming fixed and unfixed interest rate (in EURO).
PV
Years1 2 3 4 5 6
NCF 2,565,500 4,378,300 6,254,630 6,547,300 6,525,720 5,973,420
PV(NCF)R—fixed 1,898,470 2,364,282 2,439,305 1,898,717 1,435,658 955,747
PV(NCF)R—unfixed 1,847,160 2,408,065 2,689,491 2,160,609 1,761,944 1,314,152
Deviation value 51,310 43,783 250,186 261,892 326,286 358,405PV—present value. Total PV (NCF) r fixed = EURO 10,992,179. Total PV (NCF) r unfixed = EURO 12,181,421.Deviation of EURO 1,189,242, or 10.81% over 6 years.
These calculations help to illustrate the negative effect of changes in interest rates onthe present value of the financial surpluses obtained. This can be seen by comparing thenumber of deviations in the first two years of the investment, where changes in interestrates were very small. Comparing this situation with subsequent years of the investmentproject under study, one can see the emergence of several times higher values of deviation
Energies 2022, 15, 353 11 of 16
(43,783 in the second year of the investment and 358,405 in the last year of the investmentrealised) (Table 4).
NPV(r fixed) = PV − I = EURO 10,992,179 − EURO 10,000,000 = EURO 992,179
NPV(r unfixed) = PV − I = EURO 12,181,421 − EURO 10,000,000 = EURO 2,181,421
Deviation (x) = NPV(r fixed) − NPV(r unfixed)
X = EURO 992,179 − EURO 2,181,421
X = EURO 1,189,242, which gives 119.86 percent difference to NPV (r fixed)
The difference in the results obtained is 119.86 percent. This value illustrates themagnitude of the error that occurs when a constant interest rate is assumed over 6 years.
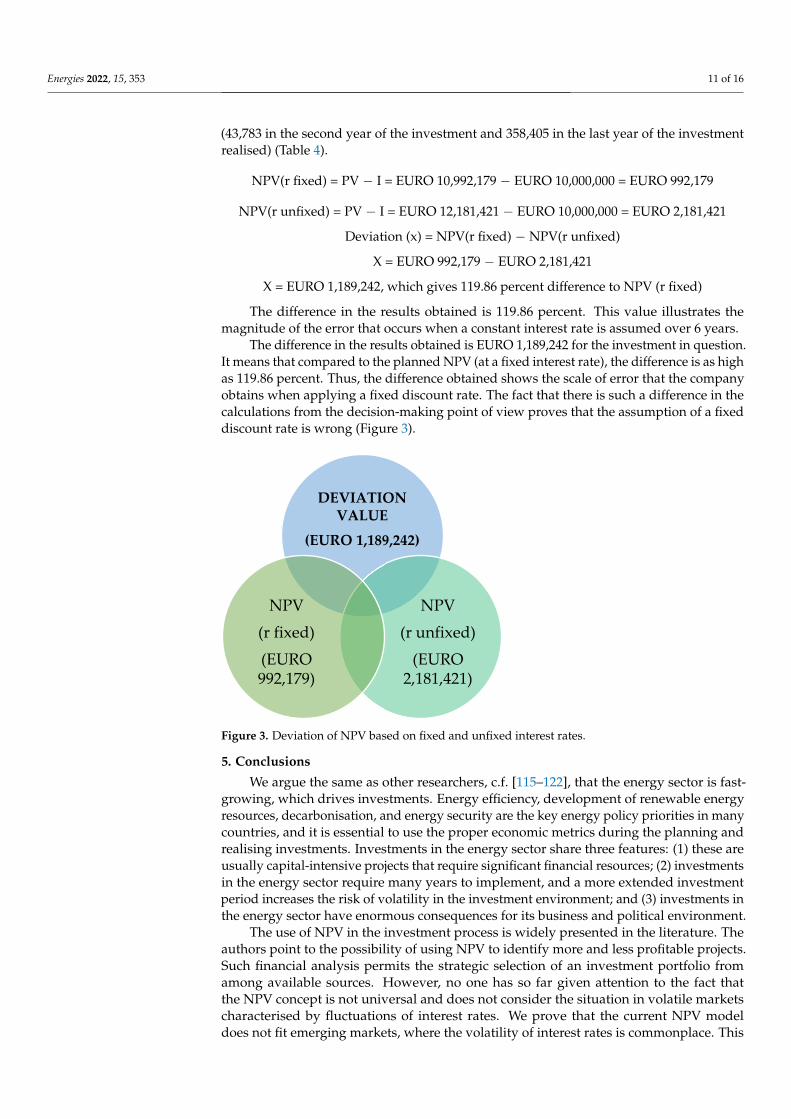
The difference in the results obtained is EURO 1,189,242 for the investment in question.It means that compared to the planned NPV (at a fixed interest rate), the difference is as highas 119.86 percent. Thus, the difference obtained shows the scale of error that the companyobtains when applying a fixed discount rate. The fact that there is such a difference in thecalculations from the decision-making point of view proves that the assumption of a fixeddiscount rate is wrong (Figure 3).
Energies 2022, 15, x FOR PEER REVIEW 12 of 17
Figure 3. Deviation of NPV based on fixed and unfixed interest rates.
5. Conclusions We argue the same as other researchers, c.f. [115–122], that the energy sector is
fast-growing, which drives investments. Energy efficiency, development of renewable energy resources, decarbonisation, and energy security are the key energy policy priori-ties in many countries, and it is essential to use the proper economic metrics during the planning and realising investments. Investments in the energy sector share three fea-tures: (1) these are usually capital-intensive projects that require significant financial re-sources; (2) investments in the energy sector require many years to implement, and a more extended investment period increases the risk of volatility in the investment envi-ronment; and (3) investments in the energy sector have enormous consequences for its business and political environment.
The use of NPV in the investment process is widely presented in the literature. The authors point to the possibility of using NPV to identify more and less profitable projects. Such financial analysis permits the strategic selection of an investment portfolio from among available sources. However, no one has so far given attention to the fact that the NPV concept is not universal and does not consider the situation in volatile markets characterised by fluctuations of interest rates. We prove that the current NPV model does not fit emerging markets, where the volatility of interest rates is commonplace. This original study and the all-new NPV model, created during this research, apply to all emerging markets globally, although we selected several European economies to prove our hypothesis.
We compared the volatility of interest rates in the United States, United Kingdom, Japan, Israel, Euro Zone, and emerging markets in central European countries: Poland, Hungary, Croatia, and Romania. Analysing the methodological side of the investment process, we drew attention to the incompatibility of corporate finance theory’s recom-mendations in evaluating long-term investment projects with the economy’s actual con-ditions (typical for the period of institutional changes). We showed that the dynamic methods of investment project evaluation recommended in the literature are based on a parameter’s constancy, a component of the present (updated) value multiplier. This methodology contradicts actual business conditions in emerging markets characterised by interest rate volatility. We assumed that the volatility of these parameters, especially the interest rate, leads to a situation where companies are already making decisions re-lying on data whose usefulness and reliability over longer time horizons are questiona-ble. It is known that the parameters of investment projects are subject to change as a re-sult of market conditions. However, their volatility must be reflected in the financial pa-
DEVIATION VALUE
(EURO 1,189,242)
NPV
(r unfixed)
(EURO2,181,421)
NPV
(r fixed)
(EURO992,179)
Figure 3. Deviation of NPV based on fixed and unfixed interest rates.
5. Conclusions
We argue the same as other researchers, c.f. [115–122], that the energy sector is fast-growing, which drives investments. Energy efficiency, development of renewable energyresources, decarbonisation, and energy security are the key energy policy priorities in manycountries, and it is essential to use the proper economic metrics during the planning andrealising investments. Investments in the energy sector share three features: (1) these areusually capital-intensive projects that require significant financial resources; (2) investmentsin the energy sector require many years to implement, and a more extended investmentperiod increases the risk of volatility in the investment environment; and (3) investments inthe energy sector have enormous consequences for its business and political environment.
The use of NPV in the investment process is widely presented in the literature. Theauthors point to the possibility of using NPV to identify more and less profitable projects.Such financial analysis permits the strategic selection of an investment portfolio fromamong available sources. However, no one has so far given attention to the fact thatthe NPV concept is not universal and does not consider the situation in volatile marketscharacterised by fluctuations of interest rates. We prove that the current NPV modeldoes not fit emerging markets, where the volatility of interest rates is commonplace. This
Energies 2022, 15, 353 12 of 16
original study and the all-new NPV model, created during this research, apply to allemerging markets globally, although we selected several European economies to proveour hypothesis.
We compared the volatility of interest rates in the United States, United Kingdom,Japan, Israel, Euro Zone, and emerging markets in central European countries: Poland, Hun-gary, Croatia, and Romania. Analysing the methodological side of the investment process,we drew attention to the incompatibility of corporate finance theory’s recommendations inevaluating long-term investment projects with the economy’s actual conditions (typical forthe period of institutional changes). We showed that the dynamic methods of investmentproject evaluation recommended in the literature are based on a parameter’s constancy,a component of the present (updated) value multiplier. This methodology contradictsactual business conditions in emerging markets characterised by interest rate volatility.We assumed that the volatility of these parameters, especially the interest rate, leads to asituation where companies are already making decisions relying on data whose usefulnessand reliability over longer time horizons are questionable. It is known that the parametersof investment projects are subject to change as a result of market conditions. However,their volatility must be reflected in the financial parameters. Otherwise, such a situationsignificantly hinders decision-making in the framework of ongoing green investments.
Our findings showed the need to determine the interest (discount) rate during a long-term period, including any changes, if any decision-maker does not want to reduce thereliability of evaluating the benefits and costs of activity and decrease the rationality of deci-sions. Modification of the classical NPV formula to a new form assuming different interestrates and variable time of their occurrence allows us to draw the following conclusions:
• When deciding to carry out a given investment based on the traditional NPV model,which assumes a fixed interest rate, the investor is exposed to the lack of credibilityof the calculations obtained; usage of the traditional NPV model creates a possibilityof rejecting investment projects that may become profitable in the case of favourablechanges in the price of money in later periods. Such a situation may lead to loss offuture profit or even to the reduction of future market position.
• There is a risk of choosing a wrong project, which may lead to the company’s bankruptcy.• Frequent changes of interest rates shaped by monetary institutions make it difficult
to estimate their level in the medium and long term, which significantly reduces thefinancial rationality of investments; investors’ financial problems may be exacerbatedby the negative interaction between interest rates and the level of cash flows. Realisingthe method of expressing the difference between the current cash inflows and theircurrent outflows will allow for a better assessment of the investment effectiveness inthe event of the volatility of interest rates.
The finding helps the capital budgeting process by illustrating how modified NPVcan provide optimal outcomes. The proposed modification of the NPV formula reducesthe risk of financing the investment, making the economic environment of the investmentmore realistic. Nevertheless, even in investments financed from sources other than bankcredit, the investor should assume the profitability of the investment by taking into accountalternative concepts of investing capital.
Analysing research limitations may lead anyone to the question, whether the proposedmodified NPV was verified in the investment process. Our answer to this question isthe following statement. We proved that arguing that the NVP is a universal metric ispremature. We showed that in some countries, the interest rates were not stable and thatthis situation needs to be reflected in the NPV formula. We provided the modified NPVformula, and then using data of two firms, we showed whether financial outcomes of bothfirms are the same if we use traditional and modified NPV formulas. Further researchshould provide evidence on how the investment processes are conducted using the newNPV formula. Furthermore, future research should also establish whether the internal rateof return or other methods of assessing the economic efficiency of a tangible investment are
Energies 2022, 15, 353 13 of 16
universal or should be modified in the case of markets characterised by a variable interestrate, such as in the NPV case.
This study can form a source for an inquiry process at any energy firm and country,thus contributing to a better contextual diagnosis of the stage where the firm builds itsbusiness future.
Author Contributions: Conceptualization: Z.D. and G.D.; research: Z.D. and G.D.; wrote and finalediting: Z.D. and G.D. All authors have read and agreed to the published version of the manuscript.
Funding: Jagiellonian University: funding program no: FS.1.2.2021. Open access license of thepublication was funded by the Priority Research Area Society of the Future under the program“Excellence Initiative—Research University” at the Jagiellonian University in Kraków.
Institutional Review Board Statement: Not applicable.
Informed Consent Statement: Not applicable.
Data Availability Statement: Not applicable.
Conflicts of Interest: The author declares no conflict of interest.
References1. Al-Mulali, U. GDP growth—Energy consumption relationship: Revisited. Int. J. Energy Sect. Manag. 2014, 8, 356–379. [CrossRef]2. Simionescu, M.; Bilan, Y.; Krajnáková, E.; Streimikiene, D.; Gedek, S. Renewable energy in the electricity sector and GDP per
capita in the European Union. Energies 2019, 12, 2520. [CrossRef]3. Hannesson, R. Energy and GDP growth. Int. J. Energy Sect. Manag. 2009, 3, 157–170. [CrossRef]4. Dobrowolski, Z. Internet of Things and Other E-Solutions in Supply Chain Management May Generate Threats in the Energy
Sector—The Quest for Preventive Measures. Energies 2021, 14, 5381. [CrossRef]5. Dobrowolski, Z. Energy and Local Safety: How the Administration Limits Energy Security. Energies 2021, 14, 4841. [CrossRef]6. Najwyzsza Izba Kontroli. Lokalne Bezpieczenstwo Energetyczne. Warszawa. 2020. Available online: https://www.nik.gov.pl/
kontrole/P/19/014/ (accessed on 17 May 2021).7. Berkovitch, E.; Israel, R. Why the NPV Criterion does not Maximize NPV. Rev. Financ. Stud. 2004, 17, 239–255. [CrossRef]8. Antle, R.; Eppen, G.D. Capital Rationing and Organizational Slack in Capital Budgeting. Manag. Sci. 1985, 31, 163–174. [CrossRef]9. Harris, M.; Raviv, A. The Capital Budgeting Process, Incentives and Information. J. Financ. 1996, 51, 1139–1174. [CrossRef]10. Magni, C.A.; Marchioni, A. Average rates of return, working capital, and NPV-consistency in project appraisal: A sensitivity
analysis approach. Int. J. Prod. Econ. 2020, 229, 107769. [CrossRef]11. Investopedia. Net Present Value (NPV). Available online: https://www.investopedia.com/terms/n/npv.asp (accessed on 23
March 2021).12. Goldenberg, J.; Libai, B.; Moldovan, S.; Muller, E. The NPV of bad news. Int. J. Res. Mark. 2007, 24, 186–200. [CrossRef]13. Shank, J.K. Analysing technology investments—From NPV to Strategic Cost Management (SCM). Manag. Account. Res.
1996, 7, 185–197. [CrossRef]14. Osborne, M.J. A resolution to the NPV–IRR debate? Q. Rev. Econ. Financ. 2010, 50, 234–239. [CrossRef]15. Stein, J.C. Internal Capital Markets and the Competition for Corporate Resources. J. Financ. 1997, 52, 111–133. [CrossRef]16. Gardiner, P.D.; Stewart, K. Revisiting the golden triangle of cost, time and quality: The role of NPV in project control, success and
failure. Int. J. Proj. Manag. 2000, 18, 251–256. [CrossRef]17. Ramezanalizadeh, T.; Monjezi, M.; Sayadi, A.R.; Mousavi, A. Development of a MIP model to maximize NPV and minimize
adverse environmental impact—A heuristic approach. Env. Monit. Assess. 2020, 192, 605. [CrossRef]18. Cigola, M.; Peccati, L. On the comparison between the APV and the NPV computer via the WACC. Eur. J. Oper. Res.
2005, 161, 377–385. [CrossRef]19. Chiang, Y.; Cheng, E.; Lam, P. Employing the Net Present Value-Consistent IRR Methods for PFI Contracts. J. Constr. Eng. Manag.
2010, 136, 811–814. [CrossRef]20. Hajdasinski, M.M. NPV-compatibility, project ranking, and related issues. Eng. Econ. 1997, 42, 325–339. [CrossRef]21. Hartman, J.C. On the equivalence of net present value and market value added as measures of a project’s economic worth. Eng.
Econ. 2000, 45, 158–165. [CrossRef]22. Chrysafis, K.A.; Papadopoulos, B.K. Decision Making for Project Appraisal in Uncertain Environments: A Fuzzy-Possibilistic
Approach of the Expanded NPV Method. Symmetry 2021, 13, 27. [CrossRef]23. Castagneto, G.; Zakeri, G.B.; Dodds, P.E.; Subkhankulova, D. Evaluating consumer investments in distributed energy technologies.
Energy Policy 2021, 149, 112008. [CrossRef]24. Pfeiffer, T. Net Present Value-consistent investment criteria based on accruals: A generalisation of the residual income-identity. J.
Bus. Financ. Account. 2004, 31, 905–926. [CrossRef]
Energies 2022, 15, 353 14 of 16
25. Quaranta, E.; Dorati, C.; Pistocchi, A. Water, energy and climate benefits of urban greening throughout Europe under differentclimatic scenarios. Sci. Rep. 2021, 11, 12163. [CrossRef]
26. Wyrobek, J.; Popławski, Ł.; Dzikuc, M. Analysis of Financial Problems of Wind Farms in Poland. Energies 2021, 14, 1239. [CrossRef]27. Mukhtar, M.; Ameyaw, B.; Yimen, N.; Zhang, Q.; Bamisile, O.; Adun, H.; Dagbasi, M. Building Retrofit and Energy Conserva-
tion/Efficiency Review: A Techno-Environ-Economic Assessment of Heat Pump System Retrofit in Housing Stock. Sustainability2021, 13, 983. [CrossRef]
28. Pike, R.H.; Ooi, T.S. The impact of corporate investment objectives and constraints on capital budgeting practices. Br. Account.Rev. 1988, 20, 159–173. [CrossRef]
29. Evans, D.A.; Forbes, S.M. Decision making and display methods: The case of prescription and practice in capital budgeting. Eng.Econ. 1993, 39, 87–92. [CrossRef]
30. Graham, J.R.; Harvey, C.R. The theory and practice of corporate finance: Evidence from the field. J. Financ. Econ. 2001, 60, 187–243.[CrossRef]
31. Lindblom, T.; Sjögren, S. Increasing goal congruence in project evaluation by introducing a strict market depreciation schedule.Int. J. Prod. Econ. 2009, 121, 519–532. [CrossRef]
32. Sandahl, G.; Sjögren, S. Capital budgeting methods among Sweden’s largest groups of companies. The state of the art and acomparison with earlier studies. Int. J. Prod. Econ. 2003, 84, 51–69. [CrossRef]
33. Pasqual, J.; Padilla, E.; Jadotte, E. Technical note: Equivalence of different profitability criteria with the net present value. Int. J.Prod. Econ. 2013, 142, 205–210. [CrossRef]
34. Percoco, M.; Borgonovo, E. A note on the sensitivity analysis of the internal rate of return. Int. J. Prod. Econ. 2012, 135, 526–529.[CrossRef]
35. Borgonovo, E.; Peccati, L. Sensitivity analysis in investment project evaluation. Int. J. Prod. Econ. 2004, 90, 17–25. [CrossRef]36. Borgonovo, E.; Peccati, L. Uncertainty and global sensitivity analysis in the evaluation of investment projects. Int. J. Prod. Econ.
2006, 104, 62–73. [CrossRef]37. Magni, C.A. Average Internal Rate of Return and investment decisions: A new perspective. Eng. Econ. 2010, 55, 150–180.
[CrossRef]38. Marchioni, A.; Magni, C. AInvestment decisions and sensitivity analysis: NPV consistency of rates of return. Eur. J. Oper. Res.
2018, 268, 361–372. [CrossRef]39. Li, X. Diversification and localization of energy systems for sustainable development and energy security. Energy Policy
2005, 33, 2237–2243. [CrossRef]40. Sovacool, B.K.; Mukherjee, I. Conceptualizing and measuring energy security: A synthesized approach. Energy 2011, 36, 5343–5355.
[CrossRef]41. Hossain, Y.; Loring, P.A.; Marsik, T. Defining energy security in the rural North—Historical and contemporary perspectives from
Alaska. Energy Res. Soc. Sci. 2016, 16, 89–97. [CrossRef]42. Sovacool, B.K.; Brown, M.A. Competing dimensions of energy security: An international perspective. Annu. Rev. Environ. Resour.
2010, 35, 77–108. [CrossRef]43. Kruyt, B.; van Vuuren, D.P.; de Vries, H.J.M.; Groenenberg, H. Indicators for energy security. Energy Policy 2009, 37, 2166–2181.
[CrossRef]44. Yergin, D. Ensuring Energy Security. Foreign Aff. 2006, 85, 69–82. [CrossRef]45. Unruh, G.C. Understanding carbon lock-in. Energy Policy 2000, 28, 817–830. [CrossRef]46. Bottomly, J.M. Energy assistance programs: Keeping older adults housed and warm. Top. Geriatr. Rehabil. 2001, 17, 71–81.
[CrossRef]47. Kuik, O.J.; Lima, M.B.; Gupta, J. Energy security in a developing world. Wiley Interdiscip. Rev. 2011, 2, 627–634. [CrossRef]48. Simpson, A. The environment–Energy security nexus: Critical analysis of an energy ‘love triangle’ in Southeast Asia. Third World
Q. 2007, 28, 539–554. [CrossRef]49. Muller-Kraenner, S. Energy Security, 1st ed.; Routledge: London, UK, 2007.50. Vukadinovic, R.D. Directive 2005/89/EC of the European Parliament and of the Council of 18 January 2006 concerning measures
to safeguard security supply and infrastructure investment. Rev. Eur. L. 2007, 9, 109.51. Dobrowolski, Z.; Sułkowski, Ł. Business Model Canvas and Energy Enterprises. Energies 2021, 14, 7198. [CrossRef]52. Harris, J.M. Sustainability and Sustainable Development, Internet Encyclopaedia of Ecological Economics, International Society
for Ecological Economics. 2003. Available online: https://www.researchgate.net/publication/237398200_Sustainability_and_Sustainable_Development (accessed on 16 October 2019).
53. Boyer, R.H.; Peterson, N.D.; Arora, P.; Caldwell, K. Five approaches to social sustainability and an integrated way forward.Sustainability 2016, 8, 878. [CrossRef]
54. Chohaney, M.L.; Yeager, C.D.; Gatrell, J.D.; Nemeth, D.J. Poverty, Sustainability, & Metal Recycling: Geovisualizing the Caseof Scrapping as a Sustainable Urban Industry in Detroit. In Urban Sustainability: Policy and Praxis; Gatrell, J.D., Jensen, R.R.,Patterson, M.W., Hoalst-Pullen, N., Eds.; Springer International Publishing: Cham, Switzerland, 2016; pp. 99–133.
55. Herremans, I.M.; Nazari, J.A.; Mahmoudian, F. Stakeholder relationships, engagement, and sustainability reporting. J. Bus. Ethics2016, 138, 417–435. [CrossRef]
56. Basic NBP Interest Rates in 1998–2020. NBP. Available online: https://www.nbp.pl (accessed on 23 February 2021).
Energies 2022, 15, 353 15 of 16
57. Monetary Policy and Standing Facilities Interest Rates. BNR. Available online: https://www.bnro.ro (accessed on 6 February 2021).58. Monetary Policy Implementation. HNB. Available online: https://www.hnb.hr (accessed on 3 February 2021).59. Monetary Policy. MNB. Available online: http://www.mnb.hu (accessed on 9 March 2021).60. Interest Rates and Bank Rate. Bank of England. Available online: https://www.bankofengland.co.uk (accessed on 4 March 2021).61. Monetary Policy. Bank of Japan. Available online: www.boj.or.jp (accessed on 12 March 2021).62. Monetary Policy. FOMC. Available online: www.federalreserve.gov (accessed on 10 March 2021).63. Monetary Policy. Bank of Israel. Available online: www.boi.org.il (accessed on 6 February 2021).64. Euro Area Interest Rate. 2021. Available online: www.tradingeconomics.com/euro-area/interest-rate (accessed on
11 August 2021).65. Nordqvist, M.; Gartner, W.B. Literature, fiction, and the family business. Fam. Bus. Rev. 2020, 33, 122–129. [CrossRef]66. Short, J.C.; Payne, G.T. In Their Own Words: A Call for Increased Use of Organizational Narratives in Family Business Research.
Fam. Bus. Rev. 2020, 33, 342–350. [CrossRef]67. Kuhn, T. The Structure of Scientific Revolutions; 50th Anniversary Edition; The University of Chicago Press: Chicago, IL, USA, 2012.68. Burrell, G.; Morgan, G. Sociological Paradigms and Organisational Analysis. Elements of the Sociology of Corporate Life; Routledge:
London, UK, 2017.69. Babbie, E. The Practice of Social Research, 15th ed.; Cengage: Boston, MA, USA, 2021.70. Campbell, D.T.; Fiske, D.W. Convergent and Discriminant Validation by the Multitrait-Multimethod Matrix. Psychol. Bull.
1959, 56, 81–105. [CrossRef]71. Webb, E.J.; Campbell, D.T.; Schwartz, R.D.; Sechrest, L. Unobtrustive Maeasures. Revised Edition; Sage Publications: Thousand Oaks,
CA, USA, 2000.72. Greene, J.C.; Caracelli, V.J.; Graham, W.F. Toward a Conceptual Framework for Mixed Evaluation Design. Educ. Eval. Policy Anal.
1989, 11, 255–274. [CrossRef]73. Brealey, R.; Myers, S. Principles of Corporate Finance, 13th ed.; McGraw-Hill Education: New York, NY, USA, 2020.74. Cogley, T. A Simple Adaptive Measure of Core Inflation. J. Money Credit Bank 2002, 34, 94–113. [CrossRef]75. Marques, C.R.; Neves, P.D.; Sarmento, L.M. Evaluating Core Inflation Indicators. Econ. Model. 2003, 20, 765–775. [CrossRef]76. O’Brien, R.M. A caution regarding rules of thumb for variance inflation factors. Qual. Quant. 2007, 41, 673–690. [CrossRef]77. Datta, T.K.; Pal, A.K. Effects of inflation and time-value of money on an inventory model with linear time-dependent demand
rate and shortages. Eur. J. Oper. Res. 1991, 52, 326–333. [CrossRef]78. Leclerc, F.; Schmitt, B.H.; Dubé, L. Waiting Time and Decision Making: Is Time like Money? J. Consum. Res. 1995, 22, 110–119.
[CrossRef]79. Selten, R. Bounded Rationality. J. Inst. Theor. Econ. 1990, 146, 649–658.80. Jones, B.D. Bounded Rationality. Annu. Rev. Political Sci. 1999, 2, 297–321. [CrossRef]81. Simon, H.A. Bounded rationality in social science: Today and tomorrow. Mind Soc. 2000, 1, 25–39. [CrossRef]82. Myers, S.C. Capital structure. J. Econ. Perspect. 2001, 15, 81–102. [CrossRef]83. Harris, M.; Raviv, A. The Theory of Capital Structure. J. Financ. 1991, 46, 297–355. [CrossRef]84. Baker, M.; Wurgler, M.J. Market Timing and Capital Structure. J. Financ. 2020, 57, 1–32. [CrossRef]85. Titman, S.; Wessels, R. The Determinants of Capital Structure Choice. J. Financ. 1988, 43, 1–19. [CrossRef]86. Faulkender, M.; Petersen, M.A. Does the Source of Capital Affect Capital Structure? Rev. Financ. Stud. 2006, 19, 45–79. [CrossRef]87. Scott, J.H., Jr. A Theory of Optimal Capital Structure. Bell J. Econ. 1976, 7, 33–54. [CrossRef]88. Rayan, K. Financial Leverage and Firm Value. University of Pretoria, The South Africa. 2008. Available online: https://repository.
up.ac.za/bitstream/handle/2263/23237/dissertation.pdf?sequence=1 (accessed on 6 February 2021).89. Campbell, T.C.; Galpin, N.; Johnson, S.A. Optimal inside debt compensation and the value of equity and debt. J. Financ. Econ.
2016, 119, 336–352. [CrossRef]90. Hill, C.W.L.; Jones, G.R. Strategic Management Theory: An Integrated Approach; Cengage: Boston, MA, USA, 2015.91. Fleisher, C.S.; Bensoussan, B. Strategic and Competitive Analysis: Methods and Techniques for Analyzing Business Competition;
Prentice-Hall: New York, NY, USA, 2003.92. Lind, D.A.; Marchal, W.G.; Mason, R.D. Statistical Techniques in Business and Economics, 17th ed.; McGraw-Hill: New York, NY,
USA, 2018.93. Carstensen, K.; Toubal, F. Foreign direct investment in Central and Eastern European countries: A dynamic panel analysis. J.
Comp. Econ. 2004, 3, 3–22. [CrossRef]94. Bevan, A.A.; Estrin, S. The determinants of foreign direct investment into European transition economies. J. Comp. Econ.
2004, 32, 775–787. [CrossRef]95. Janicki, H.P.; Wunnava, P.V. Determinants of foreign direct investment: Empirical evidence from EU accession candidates. Appl.
Econ. 2004, 36, 505–509. [CrossRef]96. Égert, B.; Crespo-Cuaresma, J.; Reininger, T. Interest rate pass-through in central and Eastern Europe: Reborn from ashes merely
to pass away? J. Policy Model. 2007, 29, 209–225. [CrossRef]97. Agapova, A.; McNulty, J.E. Interest rate spreads and banking system efficiency: General considerations with an application to the
transition economies of Central and Eastern Europe. Int. Rev. Financ. Anal. 2016, 47, 154–165. [CrossRef]
Energies 2022, 15, 353 16 of 16
98. Nitoi, M.; Spulbar, C. An Examination of Banks’ Cost Efficiency in Central and Eastern Europe. Procedia Econ. Financ.2015, 22, 544–551. [CrossRef]
99. Moagăr-Poladian, S.; Clichici, D.; Stanciu, C.-V. The Comovement of Exchange Rates and Stock Markets in Central and EasternEurope. Sustainability 2019, 11, 3985. [CrossRef]
100. Kiani, K.M. Federal budget deficits and long-term interest rates in USA. Q. Rev. Econ. Financ. 2009, 49, 74–84. [CrossRef]101. Peiró, A. Stock prices, production and interest rates: Comparison of three European countries with the USA. Empir. Econ.
1996, 21, 221–234. [CrossRef]102. Panagopoulos, Y.; Reziti, I.; Spiliotis, A. Monetary and banking policy transmission through interest rates: An empirical
application to the USA, Canada, the UK and the Eurozone. Int. Rev. Appl. Econ. 2010, 24, 119–136. [CrossRef]103. Yazgan, M.E.; Yilmazkuday, H. Monetary policy rules in practice: Evidence from Turkey and Israel. Appl. Financ. Econ.
2007, 17, 1–8. [CrossRef]104. Ólan, T.H. Regime switching in the relationship between equity returns and short-term interest rates in the UK. J. Bank. Financ.
2009, 33, 405–414.105. Apergis, N.; Cooray, A. Asymmetric interest rate pass-through in the U.S., the U.K. and Australia: New evidence from selected
individual banks. J. Macroecon. 2015, 45, 155–172. [CrossRef]106. Dunning, J.H. The investment development cycle revisited. Weltwirtschaftliches Arch. 1986, 122, 667–676. [CrossRef]107. Culp, C.L. The Risk Management Process. Business Strategy and Tactics; John Wiley & Sons: Hoboken, NJ, USA, 2001.108. Aven, T.; Renn, O. Risk Management and Risk Governance. Concepts, Guidelines and Applications; Springer: Berlin/Heidelberg,
Germany, 2010.109. Hoyt, R.E.; Liebenberg, A.P. The Value of Enterprise Risk Management. J. Risk Insur. 2011, 78, 795–822. [CrossRef]110. Dickinson, G. Enterprise Risk Management: Its Origins and Conceptual Foundation. Geneva Pap. Risk Insur. Issues Pract.
2001, 26, 360–366. [CrossRef]111. Froot, K.A.; Scharfstein, D.S.; Stein, J.C. Risk Management: Coordinating Corporate Investment and Financing Policies. J. Financ.
1993, 48, 1629–1658. [CrossRef]112. Baker, H.K.; Filberg, G. Investment Risk Management; Oxford University Press: Oxford, UK; New York, NY, USA, 2015.113. Tupa, J.; Simota, J.; Steiner, F. Aspects of risk management implementation for Industry 4.0. Procedia Manuf. 2017, 11, 1223–1230.
[CrossRef]114. Shirley, R.; Kammen, D. Renewable energy sector development in the Caribbean: Current trends and lessons from history. Energy
Policy 2013, 57, 244–252. [CrossRef]115. Papiez, M.; Smiech, S.; Frodyma, K. Effects of renewable energy sector development on electricity consumption–Growth nexus in
the European Union. Renew. Sustain. Energy Rev. 2019, 113, 109276. [CrossRef]116. Pakulska, T. Green Energy in Central and Eastern European (CEE) Countries: New Challenges on the Path to Sustainable
Development. Energies 2021, 14, 884. [CrossRef]117. Kat, B.; Paltsev, S.; Yuan, M. Turkish energy sector development and the Paris Agreement goals: A CGE model assessment. Energy
Policy 2018, 122, 84–96. [CrossRef]118. Su, W.; Zhang, D.; Zhang, C.; Streimikiene, D. Sustainability assessment of energy sector development in China and European
Union. Sustain. Dev. 2020, 28, 1063–1076. [CrossRef]119. Amstalden, R.W.; Kost, M.; Nathani, C.; Imboden, D.M. Economic potential of energy-efficient retrofitting in the Swiss residential
building sector: The effects of policy instruments and energy price expectations. Energy Policy 2007, 35, 1819–1829. [CrossRef]120. Dziekanski, P.; Prus, P.; Maitah, M.; Wronska, M. Assessment of Spatial Diversity of the Potential of the Natural Environment in
the Context of Sustainable Development of Counties in Poland. Energies 2021, 14, 6027. [CrossRef]121. Drozdowski, G. Economic Calculus Qua an Instrument to Support Sustainable Development under Increasing Risk. J. Risk Financ.
Manag. 2021, 14, 15. [CrossRef]122. Dobrowolski, Z.; Drozdowski, G.; Dobrowolska, M.; Sobon, J.; Sobon, D. Economic Calculus and Weak Signals: Prevention
Against Foggy Bottom. Eur. Res. Stud. J. 2021, 14, 165–174. [CrossRef]