
Does Parental Leave Affect Fertility and Return-to-Work? Evidence from a "True Natural Experiment
44
IZA DP No. 1613 Does Parental Leave Affect Fertility and Return-to-Work? Evidence from a "True Natural Experiment" Rafael Lalive Josef Zweimüller DISCUSSION PAPER SERIES Forschungsinstitut zur Zukunft der Arbeit Institute for the Study of Labor May 2005
Transcript of Does Parental Leave Affect Fertility and Return-to-Work? Evidence from a "True Natural Experiment
IZA DP No. 1613
Does Parental Leave Affect Fertility andReturn-to-Work? Evidence from a"True Natural Experiment"
Rafael LaliveJosef Zweimüller
DI
SC
US
SI
ON
P
AP
ER
S
ER
IE
S
Forschungsinstitut
zur Zukunft der Arbeit
Institute for the Study
of Labor
May 2005
Does Parental Leave Affect Fertility and
Return-to-Work? Evidence from a “True Natural Experiment”
Rafael Lalive University of Zurich, CESifo
and IZA Bonn
Josef Zweimüller University of Zurich, CEPR, CESifo
and IZA Bonn
Discussion Paper No. 1613 May 2005
IZA
P.O. Box 7240 53072 Bonn
Germany
Phone: +49-228-3894-0 Fax: +49-228-3894-180
Email: [email protected]
Any opinions expressed here are those of the author(s) and not those of the institute. Research disseminated by IZA may include views on policy, but the institute itself takes no institutional policy positions. The Institute for the Study of Labor (IZA) in Bonn is a local and virtual international research center and a place of communication between science, politics and business. IZA is an independent nonprofit company supported by Deutsche Post World Net. The center is associated with the University of Bonn and offers a stimulating research environment through its research networks, research support, and visitors and doctoral programs. IZA engages in (i) original and internationally competitive research in all fields of labor economics, (ii) development of policy concepts, and (iii) dissemination of research results and concepts to the interested public. IZA Discussion Papers often represent preliminary work and are circulated to encourage discussion. Citation of such a paper should account for its provisional character. A revised version may be available directly from the author.
IZA Discussion Paper No. 1613 May 2005
ABSTRACT
Does Parental Leave Affect Fertility and Return-to-Work? Evidence from a “True Natural Experiment”∗
We study the causal effects of changes in parental leave provisions on fertility and return-to-work behavior. We exploit a policy change that took place in 1990 in Austria which extended the maximum duration of parental leave from the child’s first to the child’s second birthday. As parental leave benefits can be automatically renewed when a new mother is still on leave from a previous child, this created a strong incentive to ”bunch” the time off work in case of multiple planned children and/or to increase fertility. We study the quantitative effect of this incentive using an empirical strategy which resembles a true experimental set-up very closely. In particular, assignment to treatment is random and treated and controls face (almost) identical environmental conditions. We find that treated mothers have a 4.9 percentage points (or 15 percent) higher probability to get an additional child within the following three years; and a 3.9 percentage points higher probability in the following ten years. This suggests that not only the timing but also the number of children were affected by the policy change. We also find that parental leave rules have a strong effect on mothers’ return-to-work behavior. Per additional months of maximum parental leave duration, mothers’ time off work is reduced by 0.4 to 0.5 months. The effects of a subsequent policy change in 1996 when maximum parental leave duration was reduced from the child’s second birthday to the date when the child became 18 months old brought about no change in fertility behavior, but a labor supply effect that is comparable in magnitude to the one generated by the 1990 policy change. This can be rationalized by the incentives created through automatic benefit renewal. JEL Classification: J13, J18, J22 Keywords: parental leave, fertility, pro-natalist policy, family and work obligations,
return to work, labor supply Corresponding author: Rafael Lalive Bluemlisalpstr. 10 CH-8006 Zuerich Switzerland Email: [email protected]
∗ Thanks to Sandra Hanslin for excellent research assistance and to Johann K.Brunner, Regina Riphahn and Rainer Winkelmann for comments. Financial support by the Swiss National Science Foundation (No. 8210-67640), the Austrian FWF (No. P15422-G05), and the Forschungs-Stiftung of the University of Zurich (project ”Does Parental Leave Affect Fertility Outcomes?”) is gratefully acknowledged.
1 Introduction
Can parental leave policies stimulate fertility? Total fertility rates have been strongly decreasing since
the 1960s and have reached levels below replacement in almost all OECD countries. In times of aging
societies the implications of declining births for the population structure are dramatic and policies to
turn around this trend are high on the agenda. Hence precise estimates on how and to which extent
parental leave and other family polices can affect fertility behavior are of enormous interest for economic
policy.
The present paper exploits a parental leave policy change that allows us to estimate its causal ef-
fects rather precisely. The policy change was implemented on July 1, 1990 in Austria and extended the
maximum duration of parental leave from the child’s first to the child’s second birthday. This change
created a strong incentive for new mothers to plan additional children or to get planned children more
quickly. The reason why this incentive was particularly strong, is a special feature of the Austrian
parental leave system: eligibility to parental leave is tied to previous work experience but this require-
ment is abandoned and parental leave is automatically renewed provided the new birth occurs when the
mother is still on parental leave from a previous child. Before the policy change, automatic renewal was
of minor significance, simply because it is biologically difficult to give birth to a further child within
a year’s time. After the policy change, automatic renewal became not only biologically easily possible
but also highly attractive. This is because automatic renewal implies that the work requirement is
abandoned during times when a mother’s disutility of work is particularly high, i.e. when the children
are still very small. This creates not only an incentive to ”bunch” planned births and the associated
time off work but may also induce women to get more children.
To assess how increased parental leave duration affected fertility and return-to-work choices we rely
on a comparison of two interesting groups of young mothers: ”treated” young mothers who delivered
their baby in July 1990 and ”control” young mothers who delivered their baby in June 1990. Such
a comparison has two attractive features which imply that our empirical strategy resembles a true
experimental set-up very closely. First, assignment of a mother to one of the two groups is purely
random and endogenous selection does not play a role. This is because parents could not anticipate the
parental leave reform when they made their fertility choices. The political discussion about the reform
started in mid November 1989. At that time, however, the babies born in June/July 1990 were already
conceived. Hence selectivity on the basis of parents’ deliberate choices can be ruled out.1 Furthermore,
selectivity on the basis of fine-tuning the due date cannot be a problem either. This is because the 1990
parental leave reform created an incentive to postpone the date. While bringing the date forward is
possible (by inducing a birth or by a cesarean section), postponing it is impossible on biological grounds.
A second attractive feature of this empirical strategy is that the environments in which members
of the two groups are making their fertility and return-to-work choices are almost identical. Much of
our empirical analysis will focus on the probability of getting an additional child and the probability1One could argue that assignment to treatment is non-random as the political discussion might have affected the
decision to abort an already started pregnancy. Notice, however, that until early April 1990 it was neither clear when the
parental leave reform will take place nor under which conditions the reform would be implemented. Hence, even if the
political discussion had an impact on abortions, it is not clear why the two groups should have been affected differently.
2
of returning to work during the 36 months following the June/July 1990 birth. This implies that any
observed differences between treated and controls cannot be attributed to differences in environmental
conditions between the two groups. In fact, during the 36 months over which we follow the mothers’
behavior, treated and controls have identical conditions in 35 out of the 36 months following the birth.
This allows us to adopt a (sharp-design) regression discontinuity approach (Hahn, Todd, and Van der
Klaauw, 2001) in which the required assumptions are satisfied in an almost ideal way. In sum, our
study is one of the rare cases in a socio-economic context where a policy change created a ”true natural
experiment”.
We note that the effect estimated from a comparison of these two groups captures the causal effect
of incentives created by automatic renewal of parental leave. The overall effect of the policy change,
however, is likely to be larger. Our estimated effect is based on a situation where, for any subsequent
birth, the more generous post-reform rules apply not only to treated but also to control young mothers.
This implies that our estimate does not take account of the direct effect of the more generous parental
leave rules resulting from longer job protection and longer benefit duration. To the extent that these
more generous rules have a direct effect on fertility, the overall effect of the policy change will be larger
than the automatic renewal effect we estimate here.
There are two further respects in which the present study contributes to the literature. First, the
1990 policy change was followed by a further reform in 1996 that reduced maximum parental leave
duration from 24 to 18 months. This yields further informative variation in parental leave duration. In
particular, the 1996 reform allows us to study whether the effects of parental leave duration are linear (in
the sense that the six-month decrease of the 1996 reform lead to responses of half the size as the twelve-
months increase of the 1990 reform) or whether such changes involve important non-linearities. We
note further that studying such big variation in parental leave durations is potentially highly relevant
as previous studies have found that short parental leave mandates do not change behavior whereas
longer mandates do (Baker and Milligan, 2005). If parental leave policies are an effective family policy
instrument, the Austrian policy change should produce substantial changes in mothers’ fertility and
work behavior.
A second respect in which the present study contributes to the literature is a unique and very
informative data set, the Austrian Social Security Database (ASSD). This database registers not only
the births but also the take-up of parental leave benefits and the work history of individuals. This is
particularly favorable in the present context, as our goal is to study the joint fertility and work decisions
of mothers. Furthermore, the ASSD covers the universe of all Austrian employees which allows us to
draw very specific samples. In sum, the ASSD provides more detailed information on the effects of
parental leave policies than most data sets used in previous studies.
Our findings are as follows. First, the twelve-months extension of parental leave enacted with the
1990 policy reform had a strong impact on the probability of having a further child. The percentage
women who got an additional child within the next 36 months is about 5 percentage points (or 15
percent) higher when parental leave lasts until the child’s second birthday as opposed to the child’s
first birthday. However, the six-months reduction in maximum parental leave duration enacted with
the 1996 policy reform, did not change the share of women with additional children. These seem-
3
ingly contradictory results can be rationalized by the incentives of automatic renewal of parental leave
benefits.
Second, we find that both policy changes had a significant impact on mothers’ return-to-work be-
havior. It turns out that, per additional month of maximum parental leave duration, the time off work
increases by 0.4 to 0.5 months. The return-to-work patterns are strongly determined by parental leave
rules – with particularly strong increases in the percentage women back at work when the maximum
parental leave ends. We do not observe any asymmetries between the extension and the reduction of
parental leave effects.
Third, for the 1990 policy change, we find that fertility behavior is not only affected in the short
run but we also see long-term effects of the policy change. Among women eligible to the more generous
parental leave rules, a substantially higher percentage had an additional child even ten years after
the birth of the first child. Hence, not only the spacing between planned births, but most likely also
the number of additional birth was affected. (Obvious data constraints do not allow a corresponding
analysis for the 1996 policy change).
The paper is organized as follows. In the next section, we briefly discuss related previous literature.
Section 3 discusses fertility related family-policies in Austria and describes in detail the 1990 and 1996
parental leave policy changes. Section 4 presents and discusses our empirical strategy. The empirical
results of the extension and shortening of parental leave are presented in sections 5 and 6. Section 7
concludes.
2 Previous literature
Our paper relates to various strands of the existing literature. We briefly review (i) studies that look
at the effect of parental leave (and other family policies) on fertility behavior, (ii) studies that analyze
the implications of parental leave for labor supply and return-to-work behavior, and (iii) studies that
analyze the joint determination of labor supply and fertility choices.
There is a small literature that studies the role of parental leave policies for fertility outcomes.
A study closely related to the present analysis is Hoem (1993) who looks at the effects of a ”speed
premium” introduced in Sweden during the late 1970s and early 1980s. Similar to the present paper,
these rules let parents retain their parental leave benefits provided an additional child came in time.
Hoem (1993) find that this speed premium lead to substantial increases in Swedish fertility rates. Unlike
the present paper, which relies on longitudinal individual data, Hoem’s (1993) analysis is based on vital
statistics disaggregated by cohort, parity, and age of previous child. Hoem’s analysis relies on a pre-post
comparison (where many other things may change), so the precise quantitative effect of the successive
policy changes is hard to deduce. In contrast, the present paper takes particular care in estimating a
causal effect of the policy change.
A further closely related paper is Piketty (2003). Similar to the present analysis, he uses a policy
change, the 1994 extension of the French Parental Education Benefit, to study the implications for both
fertility and labor supply behavior. The reform allowed women to claim benefits at the birth of their
second child (rather than at the birth of their third child as under previous legislation). This policy
4
change induced a large fall in participation but only a small increase in fertility.
Averett and Whittington (2001) study whether the adoption federal Family and Medical Leave Act
in 1993 did affect fertility rates in the U.S. The Act guaranteed 12 weeks of unpaid parental leave to
workers in larger firms (more than 50 employees). They find that maternity leave provisions significantly
increase the probability of birth, an effect which is larger for higher birth parities. Obviously, this study
suffers from potential selection bias as women with desired fertility may look for jobs providing parental
leave. However, Averett and Whittington (2001) find that a woman’s desire for children does not seem
to be an important mechanism by which women are sorted into jobs with parental leave provisions.
Buttner and Lutz (1990) analyze the impact of a similar policy change that took place in 1976 in
East Germany (the former German Democratic Republic) where paid parental leave was increased from
originally 18 weeks to 26 weeks (52 weeks for mothers with two or more children) which lead to a
remarkable increase in fertility rates in the following years.
To our knowledge, the only study that has looked at the effect of the 1990 change in Austrian
parental leave legislation is the study of Hoem, Prskawetz, and Neyer (2001). They show that the
1990 reform has had an impact on the likelihood of third births. The paper by Hoem et al. (2001)
differs from our study in various respects. First, their study is to understand the relative importance of
fertility determinants in Austria, including educational attainment and women’s labor force status, in
addition to the role of family policy. In contrast, our focus are the detailed incentives and effects of the
1990 parental leave reform. Second, they use survey data whereas our study is based on social security
register data. The advantage of our data set is that it provides us with a larger number of observations
and lets us focus on much more informative samples. Third, we do not only study the implications
of the 1990 extension, but also study the effects of the subsequent 1996 reduction in parental leave
duration. Finally, and most importantly, we take particular care to precisely estimate the causal effect
of the policy changes that result from the possibility of automatic parental leave renewal.
Further related studies have looked at the impact of other pronatalist family policies on fertility.
Milligan (2005) studies the introduction of the Allowance for Newborn Children in Quebec, Canada,
which pays up to C$8,000 to parents in the time following the birth of a child. He finds a significant
impact on fertility and also heterogenous effects across subgroups. Hardoy and Schøne (2005) analyze
the fertility implications of the Norwegian cash-for-care subsidy which reduces the cost of children for
mothers with limited access to public child care. It turns out that the introduction of the subsidy lead
to delays in subsequent births.
Another related literature has studied the impact of the U.S. welfare reform on fertility rates, with
mixed evidence. Surveys of Hoynes (1997) and Moffitt (1998) either see no or only a weak and little
robust impact of welfare reform on fertility. This appraisal is supported by more recent evidence of
Kearney (2004) who studies the consequences of the implementation of family cap policies. These rules
were implemented as part of the U.S. welfare reform and deny or reduce transfer payments to welfare
recipients with additional births. No significant reduction of fertility rates of women aged 15-34 could
be detected. This evidence is supported by Joyce, Kaestner, Korenman, and Henshaw (2004) who find
that women with a high risk of recipiency showed a similar fertility behavior in family cap states and
in states that did not introduce the cap. Joyce, Kaestner, and Korenman (2002) find little effect of
5
the Personal Responsibility Work Opportunity Reconciliation Act which strongly altered the financial
incentives to bear children out-of-wedlock. They find no systematic impact of the Act on out-of-wedlock
fertility. However, Rosenzweig (1999) finds that high welfare benefit levels and low marital prospects
induce young women to bear children out of wedlock.
Also other studies have found significant impacts of financial incentives on fertility behavior. Whit-
tington, Alm, and Peters (1990) and Whittington (1992) study the impact on fertility rates of the U.S.
personal tax exemption of dependants which provides an implicit subsidy for each child of. It turns out
that the personal exemption has a positive and significant effect on the US national birth rate. Similar
evidence is found by Zhang, Quan, and Van Merrbergen (1994) for Canada and by Ermisch (1988)
for the U.K. Gauthier and Hatzius (1997), using panel data for 22 OECD countries, show that family
benefits have a significant (albeit not very large) effect on fertility rates. The study by Boyer (1989)
looks at the effects of the Old Poor Laws of 19th century Great Britain and finds that child allowances
caused the birth rates to increase.
A more extensive literature has assessed the role of parental leave policies for labor supply and
return-to-work decisions of young mothers. Studies focusing on the U.S. have either used state variation
in parental leave provisions or have analyzed the impact of the 1993 U.S. Family and Medical Leave
Act. Klerman and Leibowitz (1997) find that changes in maximum parental leave durations across U.S.
states does affect the duration of leaves but does not signficantly affect female employment. Klerman
and Leibowith (1999) find that the introduction of the U.S. Family and Medical Leave Act in 1993 did
not have any major impact on the return-to-work behavior of young mothers. A more recent study by
Baum (2003) confirms this result. The 12 week duration granted by the 1993 Leave Act appears to be
too short, parental leave is unpaid, and other rules (minimum employer size) excludes many woman
from the rules. In contrast, Berger and Waldfogel (2004) find that there is closer relationship between
maternity leave coverage and mothers’ labor force participation.
Parental leave rules in other countries are more generous and hence more likely to have an impact
on the labor supply behavior of mothers. Baker and Milligan (2005) exploit the substantial variation
in parental leave provisions over time and across Canadian provinces (ranging from 17 and 70 weeks)
to study how such policies affect the amount of time that mothers spend with their children. They find
both short and long mandates increase job continuity (i.e. the fraction of women returning to their
pre-birth employer). However, only long (but not short) leaves the time off work. This is important, as
most welfare-enhancing effects of parental leave legislation work via its effects on the amount of time
that mothers spend with their very small children.
Ruhm (1998) as well as Ruhm and Teague (1997) show, using panel data on parental leave provisions
across European countries, that womens’ attachment to the labor force increases as with the duration
of parental leave mandates. Pylkkanen and Smith (2004) find that the impact of parental leave and
other family policies has a strong impact on mothers’ career interruptions in Denmark and Sweden.
Furthermore, the more flexible Swedish system – where parents can split parental leave and times on
partenal leave can be saved now and used up later – lets women adopt more strongly to policy changes
as opposed to Denmark where the parental leave system does not allow for such flexibility. Ondrich,
Spiess, Yang, and Wagner (1999) show that changes in maximum leave durations in Germany in the
6
1980s had a significant impact on the time that mothers spend with their children.
A final related strand of literature aims at understanding the role of financial incentives for women’s
joint labor supply and fertility decisions. These studies have typically relied on the estimation and/or
simulation of structural models. Early approaches include Moffitt (1984), Rosenzweig and Schultz
(1985), Hotz and Miller (1988), Heckman and Walker (1990), see also the survey of Hotz, Klerman, and
Willis (1997). More recent ones are Francesconi (2002), Del Bocca (2002) and Del Boca, Pasqua, and
Pronzato (2004). Keane and Wolpin (2002a,b) estimate and simulate a dynamic model of fertility and
welfare take up. A recent paper by Laroque and Salanie (2005), also based on the structural approach,
models in much detail the French tax-benefit system and its implications for female participation and
fertility. Their results and simulations suggest that financial incentives play a sizable role in determining
fertility decisions in France.
3 The institutional environment
3.1 The Austrian parental leave system
The Austrian system was introduced in 1957 when mothers were protected from dismissal of the previous
job for a period of 6 months. Two major reforms took place in 1961 when the maximum duration of
parental leave was extended up until the child’s first birthday and a means-tested transfer payment
proportional to the unemployment benefit was introduced; and in 1974 when the transfer became flat
rate and independent of household income.
The rules that were in place during the 1990s required a minimum employment experience prior to
birth. Women taking up parental leave for the first time, had to have worked (and paid social security
contributions) for at least 52 weeks during the two years prior to birth. For mothers with at least one
previous take-up of parental leave the employment requirements is reduced to 20 weeks of employment
during the last year prior to the subsequent birth. Parental leave comes with two major advantages.
First, mothers are eligible to a flat rate transfer amounting to about 340 Euros per month (in 1990) or
about 31 % of gross median earnings of female workers. Benefits are not means tested and not taxed
implying a median net income replacement ratio of more than 40 %. Women without a partner or with
a low-income partner are eligible to higher benefit levels (Sonderunterstutzung). Second, parental leave
provides protection of a mother’s previous job. A mother can return to her previous employer and is
protected from dismissal during the first 4 weeks after returning to work.2
Parental leave is preceded by a period of maternity protection intended to protect the health of
mother and child around the period of confinement. This period of maternity protection lasts for 16
weeks (usually 8 weeks before and 8 weeks after the actual birth). During this period women are not
only insured against the risk of dismissal but get an associated transfer equal to the average wage rate
over the last quarter prior to the birth. Formally, the parental leave period starts when the maternity
protection period ends (see Figure 1).
A specific feature of the Austrian parental leave system is the possibility of automatic parental leave2The effective duration of job protection is much longer than these four weeks. In Austria, layoffs are suject to advance
notice regulations implying that a mother’s job is protected for several months after returning from parental leave.
7
renewal in case the mother is still on leave from a previous child. In that case, the parental leave benefits
(that is, job protection and parental leave transfer) are extended without any further work requirement.
The work requirement is even abandoned if the new birth follows closely after a previous birth. Provided
that a new maternity protection period starts within 6 weeks after the formal termination of a previous
leave, take-up of a new parental leave is possible without any further employment requirement. As
maternity protection starts 8 weeks before the due date, the rules effectively imply that automatic
renewal possible until 14 weeks after the formal termination of a previous parental leave period (see
Figure 1). If a new birth occurs after this date, the new mother is required to have worked for at least
20 weeks to requalify for a new parental leave period.
Figure 1
Prior to July 1, 1990, the maximum duration of parental leave ended with the child’s first birthday.
Automatic benefit renewal played only a minor role, simply because it is biologically difficult to get
a further child within the required period (= one year plus 14 weeks). Planning an additional child
very quickly after the expiration of the previous parental leave involves the risk of not qualifying for
automatic renewal and of being forced to work for 20 weeks to requalify. As the disutility of work is
very high when children are very small, mothers planning a further child had an incentive to postpone
childbearing under the parental leave rules prior to July 1990.
After July 1, 1990, the maximum duration of parental leave was extended until the child’s second
birthday. Just like before, parental leave may end earlier for mothers taking up the old job or for
mothers getting an additional child. Clearly, the rules after July 1990 give quite different incentives.
Having a second child within a period of two year plus 14 weeks is easily possible from a biological point
of view. In other words, parental leave rules after July 1990 provide an incentive to chronologically
”bunch” a given number of planned children and the associated time off work. Moreover, the change
in parental leave duration creates an incentive to increase the number of births.3
A further policy change took place after July 1, 1996. After that date, the maximum duration of
parental leave still lasted until the child’s second birthday. However, the new rules required that at least
6 months of the leave had to be taken by the father. As fathers’ take-up of parental leave is negligible,
the 1996-reform effectively implied a reduction in maximum parental duration from the child’s second
birthday to the date when the child became 18 months old. Notice that automatic benefit renewal
is still a relevant option under these new conditions. Having a further baby within 18 months plus
14 weeks after the previous birth is still biologically easily possible. To take advantage of automatic
renewal, the spacing between two subsequent births has to become shorter. As a result, the 1996 policy3The 1990 policy reform came with several additional changes. The system was changed from a ”maternity” to a
”parental” leave system. Not only the child’s mother but also the father could go on parental leave. However, this is
of no practical consequence. In 1990 less than 1 % of fathers took advantage of that possibility. A second change was
that women in farm households and family businesses as well as women who did not meet the employment requirements
became eligible to a transfer equal to 50 % of regular parental leave benefits up until the child’s second birthday. This is
of no importance in the present analysis because we confine ourselves to study behavior of female dependent employees.
Furthermore, the reform made it possible to take part-time parental leave, either between child’s first and second birthday
(by both parents at the same time) or between child’s first and third birthday (only one parent or both parents alternating).
8
change may even further enhance the ”bunching” incentive.4 The 1996 reform brought also a slight
increase in previous employment requirements for second and subsequent birth. Instead of originally
20 weeks within the last year, women had to spend 26 weeks within the last year in employment. This
further enhances the incentive to take advantage of automatic renewal of parental leave benefits.
3.2 Other fertility related family policies
Besides parental leave benefits, fertility-related family policies in Austria consist of a broad set of
measures that we only briefly discuss here. Parents are eligible are child benefits (Familienbeihilfe).
There is universal eligibility to these benefits (meaning that all parents with sufficiently long residence
in Austria are eligible). These benefits amounted to about 95 Euros per month for each child below
age 10, and to 110 Euros per month for each child between ages 10 and 19). The tax system has tax
deductions for children (Kinderabsetzbetrage), that increase with the number of children. Furthermore
there is a birth benefit (Geburtenbeihilfe) of Euro 1090 paid to mothers in several steps upon medical
inspections between the child’s birth and its fourth birthday. The supply of child care facilities for small
children is rather low. According to OECD (Employment Outlook 2001) the proportion of children
under age 3 enrolled in formal child-care arrangements was only about 4 % in 1998 which is very low
be international standards. 5
While the most significant changes in fertility-related family policies during the 1990s concerned
changes in parental leave legislation, several other minor changes were made with respect to other
family policies. In 1997 the birth benefit was abolished. In 1998 there was a major effort by the central
government to improve the supply of childcare facilities in public kindergardens (Kindergartenmilliarde).
However, this increase in government spending was targeted towards the age group 4-6 rather than the
very small children.
Figure 2 clearly shows that times when average parental leave duration is high are times when
total fertility is high. However, the picture does not tell a very clear story. First, the correlation
between average duration of parental leave and the number of births is far from clear. In the late 1980s
parental leave was still low, but the number of births was close to the 90,000 threshold. In the late
1990s, when both maximum and average parental leave duration was more 50 % higher, the number
of births was considerably lower. Second, parental leave is clearly not the only determinant of fertility
behavior. Other things were changing as well. Most importantly, labor force participation rates (women
ages 15-64) rose from less than 50 % in the mid 1980s to more than 60 % by the year 2000 (OECD
4A further major policy change took place in 2002. There were two major changes. First, transfer payments (Kinder-
betreuungsgeld) was increased and granted for a period of 3 years (rather than at most two years as under previous rules).
Furthermore, transfer payments become became independent of previous work requirements (so also other previously
non-covered group became eligible). Third, mothers could go on leave for two years again and, during the leave period,
earn labor income up to 14,500 Euros during the period when benefits are drawn. We do not discuss these changes in
more detail, as our data do not allow us to study this most recent change.5For instance, the comparable number for the U.S. is 54 %, for Denmark, Norway and Sweden 64 %, 40 %, and
48 %, respectively. Germany, and southern European countries have similarly low levels of child care facilities for kids
under age 3 (These number include both public and private child care provision such as group care in child-care centres,
residential care, childminders based in their own home, care provided by person who are not a family-member; see OECD
Employment Outlook 2001).
9
Employment Outlook, 1993, 2004) and were monotonically increasing throughout the 1990s. Third, and
most obviously, the evolution of births is not only the effect of fertility behavior (that is, the propensity
to become a child by the typical woman in the relevant age group) but also the result of demographics
(that is, the number of potential mothers at a particular date). This suggests that a closer look at the
data is necessary to shed light on the role of parental leave legislation on fertility behavior.
Figure 2
4 Data
In order to assess the effect of parental leave legislation on fertility behavior and labor supply we use
information from the Austrian social security dataset (ASSD). The ASSD consists of administrative
individual register data collecting information relevant for old-age social security benefits. As these
benefits depend on individuals’ earnings and employment histories, the data set reports these histories
for the universe of Austrian private sector workers. Furthermore, not only employment histories, but
also times with childbearing and -rearing (”Kinderersatzzeiten”) are relevant for old-age social security
benefits. In other words, the data set reports high-quality information on the number of births and the
take-up of parental leave benefits by female employees.
The ASSD has several obvious advantages which will be of particular importance for the empirical
strategy developed below. First, the data set covers the universe of the private sector employees in
Austria implying we can rely on large samples, even when very specific groups are considered. Second,
the data reports, on a daily basis, the occurrence of a birth and take-up (and durations) of maternity
protection and parental leaves since the year 1972. This allows us to determine precisely both the
parental leave eligibility status as well as the maximum duration of parental leave of mothers. Third,
as all employment and earnings over an individual’s life cycle are reported in the data, we can look
in a very detailed way at the joint distribution of fertility and labor supply behavior of mothers over
extended time periods.
A disadvantage of the ASSD is incomplete recording of previous births. The condition for a birth
being registered in the ASSD is that a woman had to be employed at least once prior to this birth. If
no such previous employment spell exists, it is random whether or not a birth is recorded in the data.
However, once a birth has been registered in the data, all further births are also registered. This means
for all mothers in our data, we can precisely determine the subsequent fertility life cycle. However, the
randomness in birth reporting of previously never-employed women implies that we cannot precisely
determine the parity of a birth. To make things precise, consider a woman who gets a child at age 30 and
who was employed prior to birth. In that case the current birth and all subsequent births are registered
in the data. Assume this women has entered the ASSD at age 25 (because she was never employed
before that age) was continuously employed until age 30. While the birth at age 30 is observed in the
data for sure, we cannot be certain that this is the woman’s actual first birth. This woman could have
given birth to children before entering the ASSD at age 25. More generally, if we observe x previous
births in the data, we know that any subsequent birth is of parity x or higher.
As a result, we cannot condition the likelihood of a subsequent birth in an exact way on the number
10
of previous births. This is important, since demographic research has typically found then number of
previous children as one of the most important determinants of the likelihood of an additional child.
While this is a drawback of our analysis, we can still precisely determine the likelihood of an additional
child unconditional on the number of previous birth. As we will see below these indicators are quite
informative on the causal effect of changes in parental leave legislation.
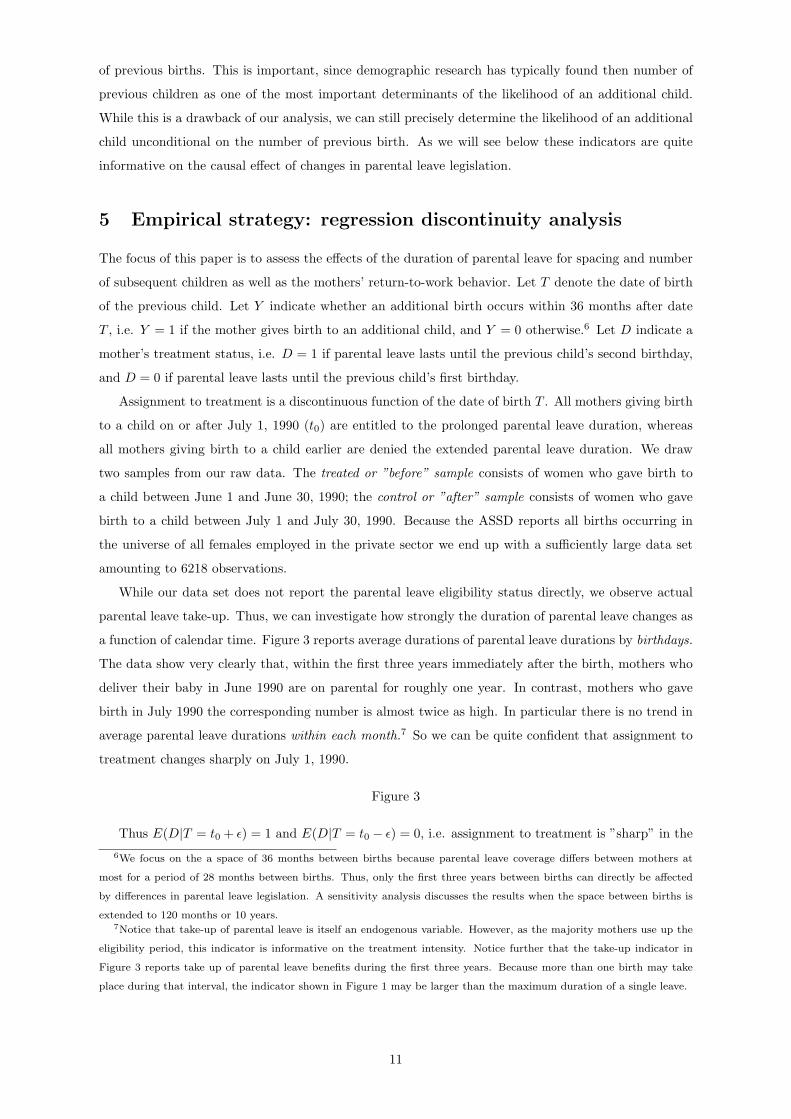
5 Empirical strategy: regression discontinuity analysis
The focus of this paper is to assess the effects of the duration of parental leave for spacing and number
of subsequent children as well as the mothers’ return-to-work behavior. Let T denote the date of birth
of the previous child. Let Y indicate whether an additional birth occurs within 36 months after date
T , i.e. Y = 1 if the mother gives birth to an additional child, and Y = 0 otherwise.6 Let D indicate a
mother’s treatment status, i.e. D = 1 if parental leave lasts until the previous child’s second birthday,
and D = 0 if parental leave lasts until the previous child’s first birthday.
Assignment to treatment is a discontinuous function of the date of birth T . All mothers giving birth
to a child on or after July 1, 1990 (t0) are entitled to the prolonged parental leave duration, whereas
all mothers giving birth to a child earlier are denied the extended parental leave duration. We draw
two samples from our raw data. The treated or ”before” sample consists of women who gave birth to
a child between June 1 and June 30, 1990; the control or ”after” sample consists of women who gave
birth to a child between July 1 and July 30, 1990. Because the ASSD reports all births occurring in
the universe of all females employed in the private sector we end up with a sufficiently large data set
amounting to 6218 observations.
While our data set does not report the parental leave eligibility status directly, we observe actual
parental leave take-up. Thus, we can investigate how strongly the duration of parental leave changes as
a function of calendar time. Figure 3 reports average durations of parental leave durations by birthdays.
The data show very clearly that, within the first three years immediately after the birth, mothers who
deliver their baby in June 1990 are on parental for roughly one year. In contrast, mothers who gave
birth in July 1990 the corresponding number is almost twice as high. In particular there is no trend in
average parental leave durations within each month.7 So we can be quite confident that assignment to
treatment changes sharply on July 1, 1990.
Figure 3
Thus E(D|T = t0 + ε) = 1 and E(D|T = t0 − ε) = 0, i.e. assignment to treatment is ”sharp” in the
6We focus on the a space of 36 months between births because parental leave coverage differs between mothers at
most for a period of 28 months between births. Thus, only the first three years between births can directly be affected
by differences in parental leave legislation. A sensitivity analysis discusses the results when the space between births is
extended to 120 months or 10 years.7Notice that take-up of parental leave is itself an endogenous variable. However, as the majority mothers use up the
eligibility period, this indicator is informative on the treatment intensity. Notice further that the take-up indicator in
Figure 3 reports take up of parental leave benefits during the first three years. Because more than one birth may take
place during that interval, the indicator shown in Figure 1 may be larger than the maximum duration of a single leave.
11
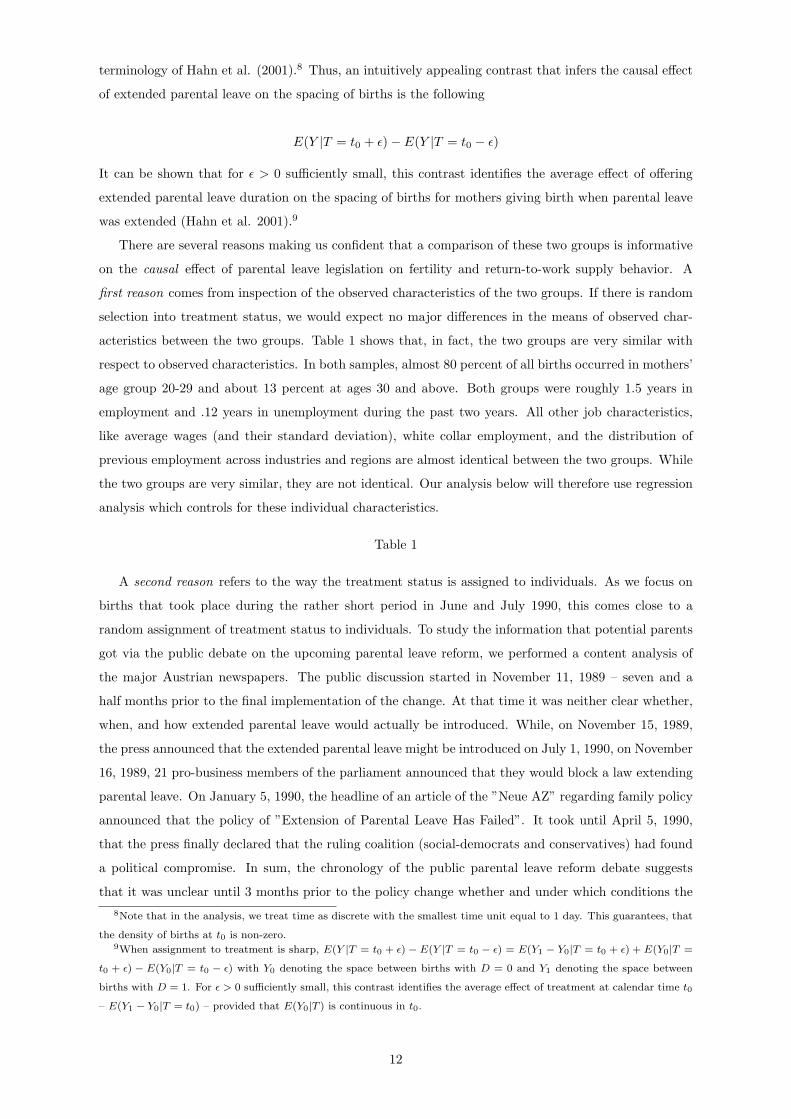
terminology of Hahn et al. (2001).8 Thus, an intuitively appealing contrast that infers the causal effect
of extended parental leave on the spacing of births is the following
E(Y |T = t0 + ε) − E(Y |T = t0 − ε)
It can be shown that for ε > 0 sufficiently small, this contrast identifies the average effect of offering
extended parental leave duration on the spacing of births for mothers giving birth when parental leave
was extended (Hahn et al. 2001).9
There are several reasons making us confident that a comparison of these two groups is informative
on the causal effect of parental leave legislation on fertility and return-to-work supply behavior. A
first reason comes from inspection of the observed characteristics of the two groups. If there is random
selection into treatment status, we would expect no major differences in the means of observed char-
acteristics between the two groups. Table 1 shows that, in fact, the two groups are very similar with
respect to observed characteristics. In both samples, almost 80 percent of all births occurred in mothers’
age group 20-29 and about 13 percent at ages 30 and above. Both groups were roughly 1.5 years in
employment and .12 years in unemployment during the past two years. All other job characteristics,
like average wages (and their standard deviation), white collar employment, and the distribution of
previous employment across industries and regions are almost identical between the two groups. While
the two groups are very similar, they are not identical. Our analysis below will therefore use regression
analysis which controls for these individual characteristics.
Table 1
A second reason refers to the way the treatment status is assigned to individuals. As we focus on
births that took place during the rather short period in June and July 1990, this comes close to a
random assignment of treatment status to individuals. To study the information that potential parents
got via the public debate on the upcoming parental leave reform, we performed a content analysis of
the major Austrian newspapers. The public discussion started in November 11, 1989 – seven and a
half months prior to the final implementation of the change. At that time it was neither clear whether,
when, and how extended parental leave would actually be introduced. While, on November 15, 1989,
the press announced that the extended parental leave might be introduced on July 1, 1990, on November
16, 1989, 21 pro-business members of the parliament announced that they would block a law extending
parental leave. On January 5, 1990, the headline of an article of the ”Neue AZ” regarding family policy
announced that the policy of ”Extension of Parental Leave Has Failed”. It took until April 5, 1990,
that the press finally declared that the ruling coalition (social-democrats and conservatives) had found
a political compromise. In sum, the chronology of the public parental leave reform debate suggests
that it was unclear until 3 months prior to the policy change whether and under which conditions the8Note that in the analysis, we treat time as discrete with the smallest time unit equal to 1 day. This guarantees, that
the density of births at t0 is non-zero.9When assignment to treatment is sharp, E(Y |T = t0 + ε) − E(Y |T = t0 − ε) = E(Y1 − Y0|T = t0 + ε) + E(Y0|T =
t0 + ε) − E(Y0|T = t0 − ε) with Y0 denoting the space between births with D = 0 and Y1 denoting the space between
births with D = 1. For ε > 0 sufficiently small, this contrast identifies the average effect of treatment at calendar time t0
– E(Y1 − Y0|T = t0) – provided that E(Y0|T ) is continuous in t0.
12
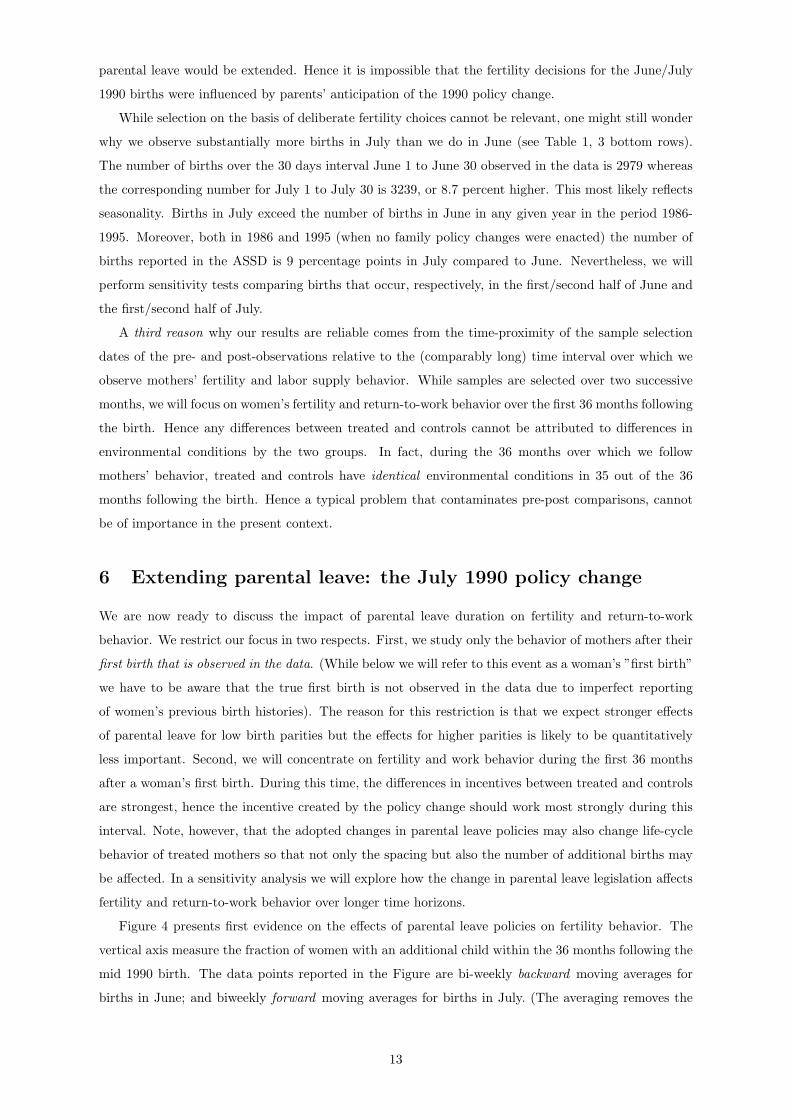
parental leave would be extended. Hence it is impossible that the fertility decisions for the June/July
1990 births were influenced by parents’ anticipation of the 1990 policy change.
While selection on the basis of deliberate fertility choices cannot be relevant, one might still wonder
why we observe substantially more births in July than we do in June (see Table 1, 3 bottom rows).
The number of births over the 30 days interval June 1 to June 30 observed in the data is 2979 whereas
the corresponding number for July 1 to July 30 is 3239, or 8.7 percent higher. This most likely reflects
seasonality. Births in July exceed the number of births in June in any given year in the period 1986-
1995. Moreover, both in 1986 and 1995 (when no family policy changes were enacted) the number of
births reported in the ASSD is 9 percentage points in July compared to June. Nevertheless, we will
perform sensitivity tests comparing births that occur, respectively, in the first/second half of June and
the first/second half of July.
A third reason why our results are reliable comes from the time-proximity of the sample selection
dates of the pre- and post-observations relative to the (comparably long) time interval over which we
observe mothers’ fertility and labor supply behavior. While samples are selected over two successive
months, we will focus on women’s fertility and return-to-work behavior over the first 36 months following
the birth. Hence any differences between treated and controls cannot be attributed to differences in
environmental conditions by the two groups. In fact, during the 36 months over which we follow
mothers’ behavior, treated and controls have identical environmental conditions in 35 out of the 36
months following the birth. Hence a typical problem that contaminates pre-post comparisons, cannot
be of importance in the present context.
6 Extending parental leave: the July 1990 policy change
We are now ready to discuss the impact of parental leave duration on fertility and return-to-work
behavior. We restrict our focus in two respects. First, we study only the behavior of mothers after their
first birth that is observed in the data. (While below we will refer to this event as a woman’s ”first birth”
we have to be aware that the true first birth is not observed in the data due to imperfect reporting
of women’s previous birth histories). The reason for this restriction is that we expect stronger effects
of parental leave for low birth parities but the effects for higher parities is likely to be quantitatively
less important. Second, we will concentrate on fertility and work behavior during the first 36 months
after a woman’s first birth. During this time, the differences in incentives between treated and controls
are strongest, hence the incentive created by the policy change should work most strongly during this
interval. Note, however, that the adopted changes in parental leave policies may also change life-cycle
behavior of treated mothers so that not only the spacing but also the number of additional births may
be affected. In a sensitivity analysis we will explore how the change in parental leave legislation affects
fertility and return-to-work behavior over longer time horizons.
Figure 4 presents first evidence on the effects of parental leave policies on fertility behavior. The
vertical axis measure the fraction of women with an additional child within the 36 months following the
mid 1990 birth. The data points reported in the Figure are bi-weekly backward moving averages for
births in June; and biweekly forward moving averages for births in July. (The averaging removes the
13
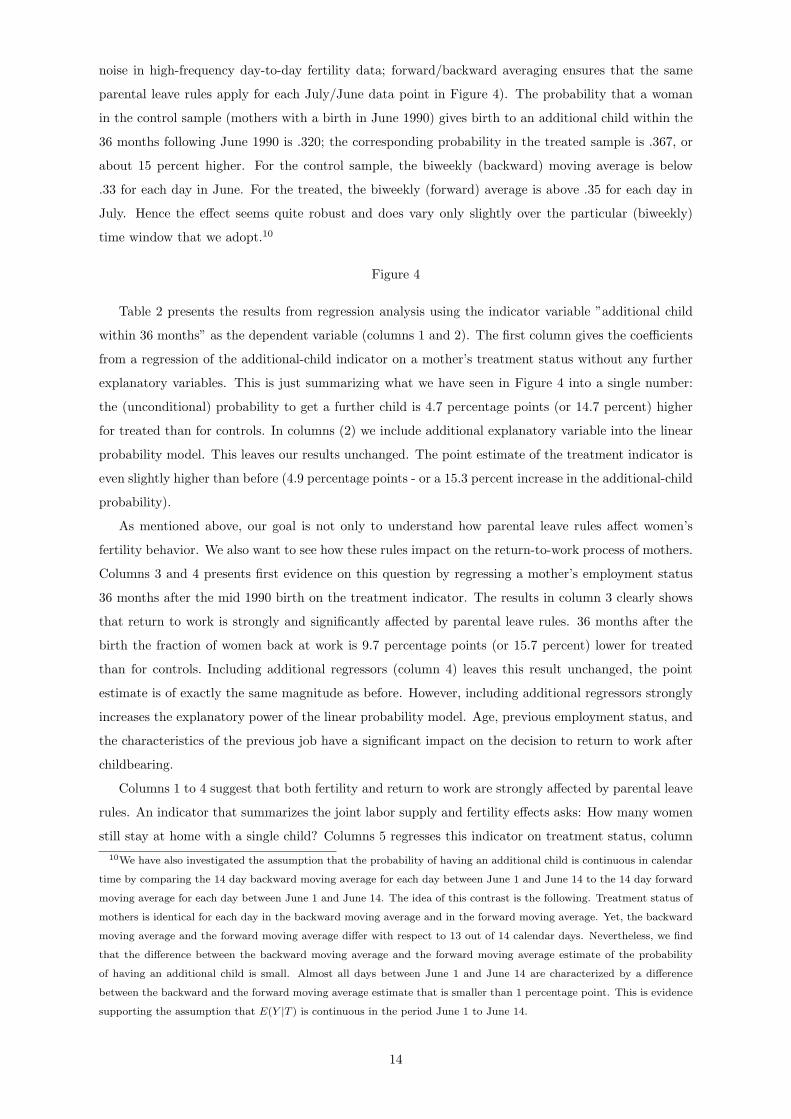
noise in high-frequency day-to-day fertility data; forward/backward averaging ensures that the same
parental leave rules apply for each July/June data point in Figure 4). The probability that a woman
in the control sample (mothers with a birth in June 1990) gives birth to an additional child within the
36 months following June 1990 is .320; the corresponding probability in the treated sample is .367, or
about 15 percent higher. For the control sample, the biweekly (backward) moving average is below
.33 for each day in June. For the treated, the biweekly (forward) average is above .35 for each day in
July. Hence the effect seems quite robust and does vary only slightly over the particular (biweekly)
time window that we adopt.10
Figure 4
Table 2 presents the results from regression analysis using the indicator variable ”additional child
within 36 months” as the dependent variable (columns 1 and 2). The first column gives the coefficients
from a regression of the additional-child indicator on a mother’s treatment status without any further
explanatory variables. This is just summarizing what we have seen in Figure 4 into a single number:
the (unconditional) probability to get a further child is 4.7 percentage points (or 14.7 percent) higher
for treated than for controls. In columns (2) we include additional explanatory variable into the linear
probability model. This leaves our results unchanged. The point estimate of the treatment indicator is
even slightly higher than before (4.9 percentage points - or a 15.3 percent increase in the additional-child
probability).
As mentioned above, our goal is not only to understand how parental leave rules affect women’s
fertility behavior. We also want to see how these rules impact on the return-to-work process of mothers.
Columns 3 and 4 presents first evidence on this question by regressing a mother’s employment status
36 months after the mid 1990 birth on the treatment indicator. The results in column 3 clearly shows
that return to work is strongly and significantly affected by parental leave rules. 36 months after the
birth the fraction of women back at work is 9.7 percentage points (or 15.7 percent) lower for treated
than for controls. Including additional regressors (column 4) leaves this result unchanged, the point
estimate is of exactly the same magnitude as before. However, including additional regressors strongly
increases the explanatory power of the linear probability model. Age, previous employment status, and
the characteristics of the previous job have a significant impact on the decision to return to work after
childbearing.
Columns 1 to 4 suggest that both fertility and return to work are strongly affected by parental leave
rules. An indicator that summarizes the joint labor supply and fertility effects asks: How many women
still stay at home with a single child? Columns 5 regresses this indicator on treatment status, column10We have also investigated the assumption that the probability of having an additional child is continuous in calendar
time by comparing the 14 day backward moving average for each day between June 1 and June 14 to the 14 day forward
moving average for each day between June 1 and June 14. The idea of this contrast is the following. Treatment status of
mothers is identical for each day in the backward moving average and in the forward moving average. Yet, the backward
moving average and the forward moving average differ with respect to 13 out of 14 calendar days. Nevertheless, we find
that the difference between the backward moving average and the forward moving average estimate of the probability
of having an additional child is small. Almost all days between June 1 and June 14 are characterized by a difference
between the backward and the forward moving average estimate that is smaller than 1 percentage point. This is evidence
supporting the assumption that E(Y |T ) is continuous in the period June 1 to June 14.
14
6 includes additional control variables. Extending parental leave from the child’s first to its second
birthday reduces the fraction of women without an additional child that are still out of labor force
after 36 months. Quantitatively, the effect is strong: the fraction being 3.5 percentage points (or 12.4
percent) lower for the treated than for the controls. Just like before, including additional regressors
leaves the picture unchanged but improves the goodness of fit of the linear probability model.
Table 2
How robust are these estimates? In order to check this, Table 3 reports results from variations of
models in columns 2, 4, and 6 of Table 2. (The row A in Table 3 simply reproduces the previous results
for ease of comparison). One possible objection is that the effects measured here are, in fact, not (or not
only) the result of changes in legislation but also the results of ”seasonality” (mothers who give birth
in July are of a different type than mothers who give birth in June). This objection may be relevant
as we observe a much higher number of births in July as compared to June. To check whether such
seasonality affects our results we reran all regression for the year for births in June versus July 1989.
During the year 1989 no policy change took place and any difference between June and July births is
purely seasonal. Row B in Table 3 shows that the birth month in 1989 does not have any significant
impact on fertility and return-to-work behavior over the following 36 months.
Table 3
A further interesting issue relates to the life-cycle effects of changes in parental leave rules. In row
C of Table 3 we present evidence on regressions when the dependent variables are measured ten years
(rather than three years) after the mid 1990 birth. With respect to fertility, the estimated coefficient is
still highly significant and quantitatively important. Ten years after the mid 1990 birth, the fraction of
women with an additional child is still 3.9 percentage points higher in the treated group. This suggests
that the effects of the 1990 parental leave reform were highly persistent. In other words, changes in
parental leave rules did not only affect the spacing between a given number of planned births but also
the number of subsequent births. Interestingly, the differences in labor supply are much lower after
ten years. However, the fraction of women that are kept off the labor market as a result of the more
generous parental leave rules are still almost 2 percentage points. Finally, and in line with the fertility
results, the fraction of women with either an additional child or with a job ten years after the mid 1990
birth is significantly higher for the treated groups again suggesting highly persistent effects of changes
in parental leave rules.
A final interesting sensitivity analysis conducted in Table 3 concerns the magnitude of the estimated
effects. Is a 5 percentage point increase in the fraction of additional children small or large? To get a
sense for the order of magnitude we compare in row D the estimated effect with the estimated effect
that we get when we compare the two birth cohorts July 1990 and July 1993. If we see differences
in behavior (over the following 36 months) between these cohorts, this most likely reflects a trend –
there was no major change in parental leave rules and fertility-related family policies between July 1990
and June 1996. The results indicate that, among the July 1993 cohort, the fraction if women with
an additional child within the next three years is 2.9 percentage points lower than in the July 1990
cohort. Neither the percentage women back to work nor the percentage women still off work without
15
an additional child changes during this three-years time interval (see columns 2 and 3). Suppose our
fertility estimate in column 1 reflects the true fertility trend in the 1990s. This implies would imply that
the fraction of mothers giving birth to an additional child within the next 36 months was decreasing
by roughly 1 percentage point per year. In other words, the increase in the generosity of parental leave
rules in 1990 has neutralized between 4 and 5 years of this downward trend (depending on whether we
rely on the the 120-months estimate of row C or the 36-months estimate of row A).
In Table 4 we investigate the issue of possible unequal birth behavior in June and July in more
detail. We have already seen in Table 3 that, for the year 1989, the additional-child probability does
not change between months June and July. Still, one might wonder why there are more births in July
1990 than in June 1990. In Table 1, we have seen that the difference in the number of births is minor
when the second half of June is compared to the first half of July. However, there is a big difference
in the number of births between the first half of June and the second half of July. If the reason is
seasonality, mothers who give birth in early June may be of a different type than mothers who give
birth in late July. In order to test the robustness of our estimates with respect to such seasonality we
check whether treatment effects depend on the within-month timing of births. We divide the samples
according to whether the birthday occurred in the first (between 1st and 15th) or the second (between
16th and 30th) day of the respective month and rerun the same linear probability model we ran in
column 2, Table 2 for the whole sample. Results in Table 4 suggest that the within-month timing
of births does not drive the results. Irrespective of the particular subperiods on which our treatment
and control samples are based, the coefficient is of the same magnitude, between .047 and .050. Hence
heterogeneous treatment effects based on seasonality can be ruled out.
Table 4
So far, our above analysis has analyzed fertility and labor supply behavior by looking a fertility
and work status at a certain point in time after the mid 1990 birth. Our focus was 36 months after
that date, because during the first three years after the birth, parental leave rules provide the most
significant difference in incentives between treated and controls. However, we have not yet looked at
the dynamics within this period. The hypothesis we put forward above is the extension of parental
leave that took effect on July 1, 1990 gives an incentive to bunch childbearing. Automatic renewal
together with the longer duration of parental leave under the new rules make it easily possible to time
an additional child such that there is no necessity to return to work between two subsequent births.
This implies we should observe most of the additional births that we see under the new rules (Figure 4
above) between the child’s first and second birthday.
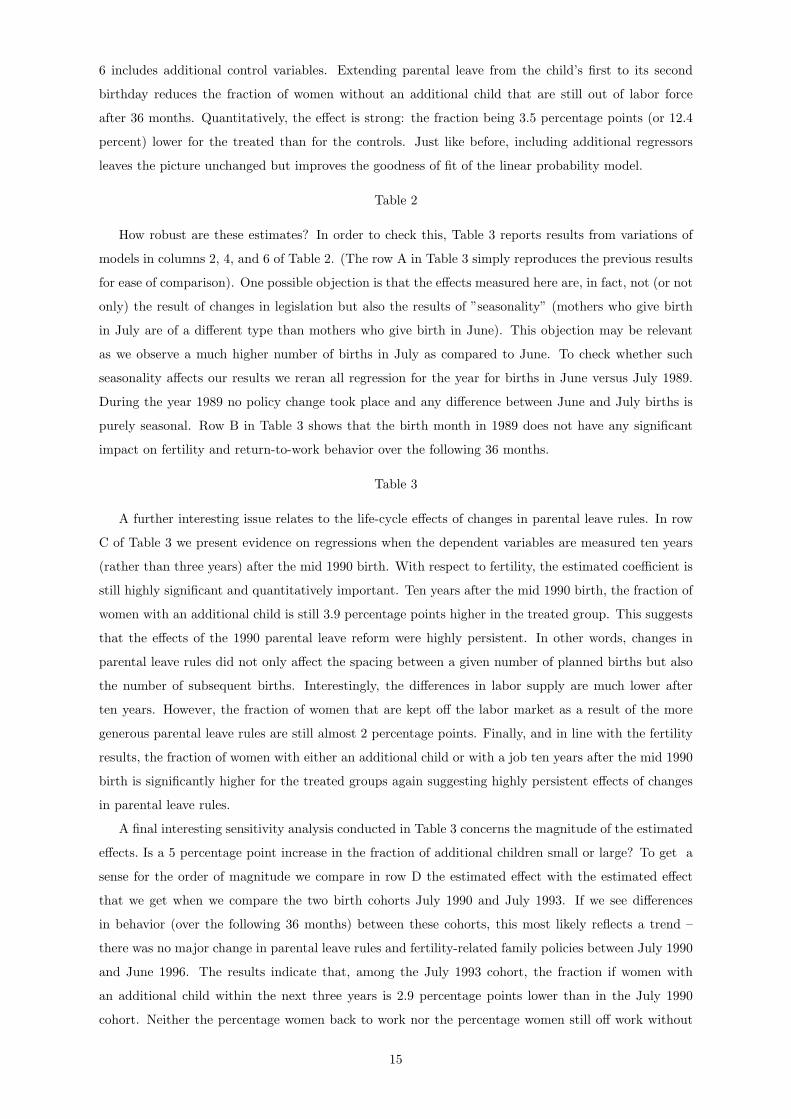
To shed light on this timing issue we draw in Figure 5 the additional-child ”hazard” rate. This is
the likelihood that, conditional upon having no child up to month t − 1, a woman gets a further child
during month t. For obviously reasons, the hazard rate is very small, before month 12, both for the
treated and the control sample. After that date, the two graphs start to diverge. The control group
has a somewhat higher hazard value between months 12 and 16, whereas the treated group takes over
after month 18 up until month 28. The difference between the two groups is highest during months 22
to 25, when the additional birth hazard is almost twice as large for the treated. After month 28 no
further differences between the two groups are observed.
16
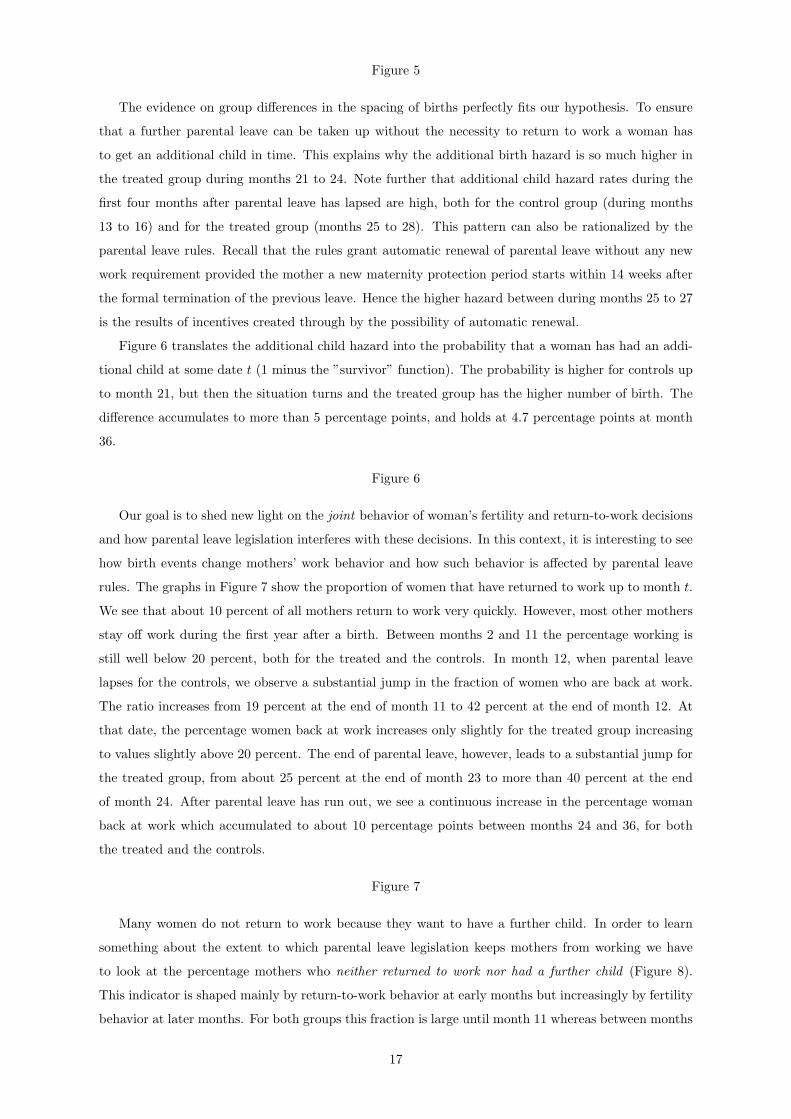
Figure 5
The evidence on group differences in the spacing of births perfectly fits our hypothesis. To ensure
that a further parental leave can be taken up without the necessity to return to work a woman has
to get an additional child in time. This explains why the additional birth hazard is so much higher in
the treated group during months 21 to 24. Note further that additional child hazard rates during the
first four months after parental leave has lapsed are high, both for the control group (during months
13 to 16) and for the treated group (months 25 to 28). This pattern can also be rationalized by the
parental leave rules. Recall that the rules grant automatic renewal of parental leave without any new
work requirement provided the mother a new maternity protection period starts within 14 weeks after
the formal termination of the previous leave. Hence the higher hazard between during months 25 to 27
is the results of incentives created through by the possibility of automatic renewal.
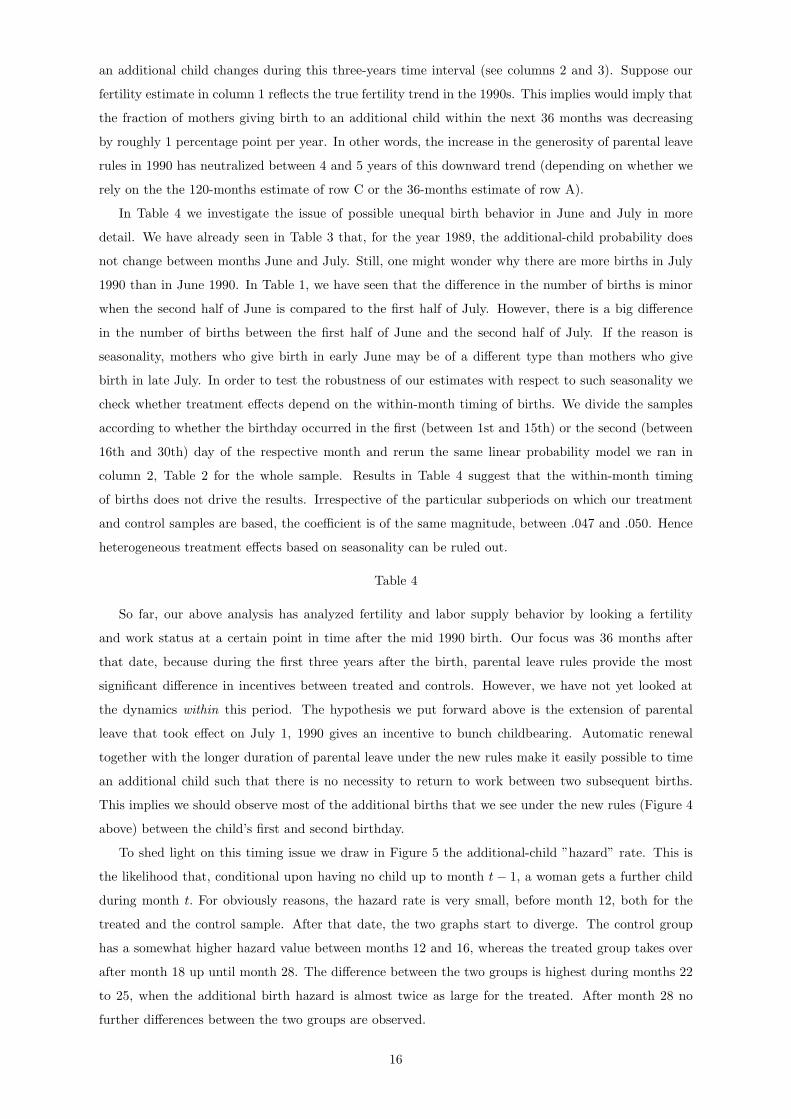
Figure 6 translates the additional child hazard into the probability that a woman has had an addi-
tional child at some date t (1 minus the ”survivor” function). The probability is higher for controls up
to month 21, but then the situation turns and the treated group has the higher number of birth. The
difference accumulates to more than 5 percentage points, and holds at 4.7 percentage points at month
36.
Figure 6
Our goal is to shed new light on the joint behavior of woman’s fertility and return-to-work decisions
and how parental leave legislation interferes with these decisions. In this context, it is interesting to see
how birth events change mothers’ work behavior and how such behavior is affected by parental leave
rules. The graphs in Figure 7 show the proportion of women that have returned to work up to month t.
We see that about 10 percent of all mothers return to work very quickly. However, most other mothers
stay off work during the first year after a birth. Between months 2 and 11 the percentage working is
still well below 20 percent, both for the treated and the controls. In month 12, when parental leave
lapses for the controls, we observe a substantial jump in the fraction of women who are back at work.
The ratio increases from 19 percent at the end of month 11 to 42 percent at the end of month 12. At
that date, the percentage women back at work increases only slightly for the treated group increasing
to values slightly above 20 percent. The end of parental leave, however, leads to a substantial jump for
the treated group, from about 25 percent at the end of month 23 to more than 40 percent at the end
of month 24. After parental leave has run out, we see a continuous increase in the percentage woman
back at work which accumulated to about 10 percentage points between months 24 and 36, for both
the treated and the controls.
Figure 7
Many women do not return to work because they want to have a further child. In order to learn
something about the extent to which parental leave legislation keeps mothers from working we have
to look at the percentage mothers who neither returned to work nor had a further child (Figure 8).
This indicator is shaped mainly by return-to-work behavior at early months but increasingly by fertility
behavior at later months. For both groups this fraction is large until month 11 whereas between months
17
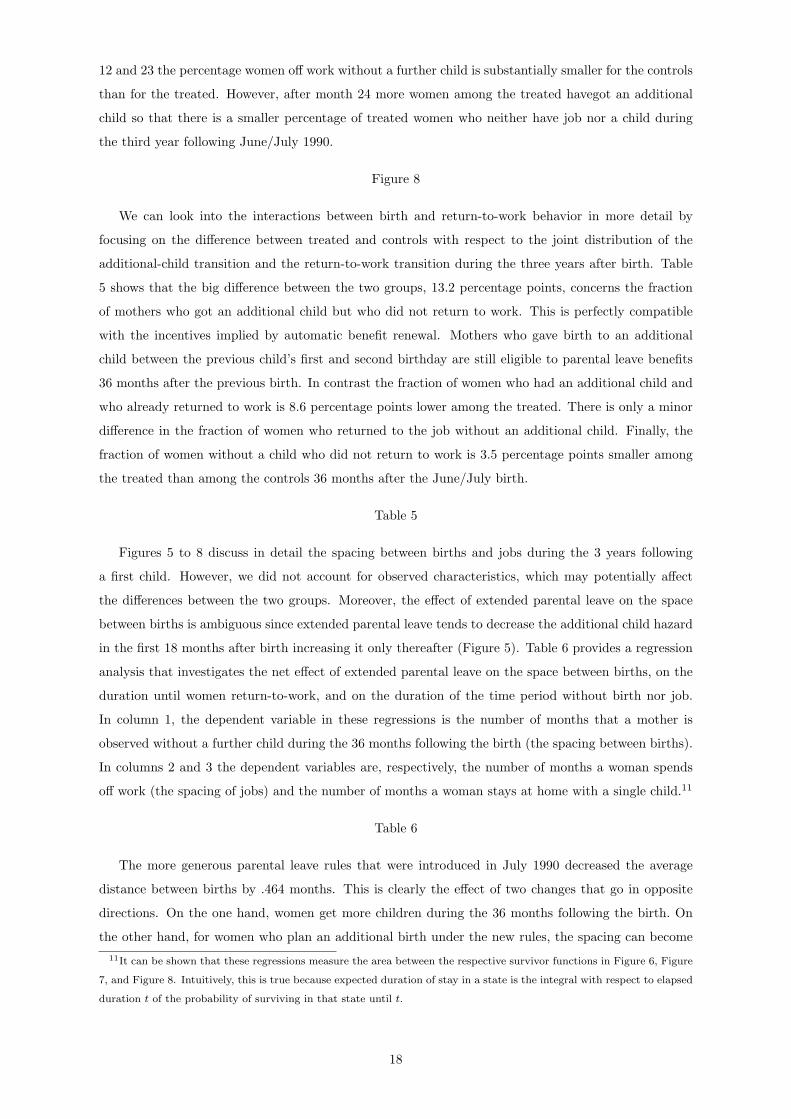
12 and 23 the percentage women off work without a further child is substantially smaller for the controls
than for the treated. However, after month 24 more women among the treated havegot an additional
child so that there is a smaller percentage of treated women who neither have job nor a child during
the third year following June/July 1990.
Figure 8
We can look into the interactions between birth and return-to-work behavior in more detail by
focusing on the difference between treated and controls with respect to the joint distribution of the
additional-child transition and the return-to-work transition during the three years after birth. Table
5 shows that the big difference between the two groups, 13.2 percentage points, concerns the fraction
of mothers who got an additional child but who did not return to work. This is perfectly compatible
with the incentives implied by automatic benefit renewal. Mothers who gave birth to an additional
child between the previous child’s first and second birthday are still eligible to parental leave benefits
36 months after the previous birth. In contrast the fraction of women who had an additional child and
who already returned to work is 8.6 percentage points lower among the treated. There is only a minor
difference in the fraction of women who returned to the job without an additional child. Finally, the
fraction of women without a child who did not return to work is 3.5 percentage points smaller among
the treated than among the controls 36 months after the June/July birth.
Table 5
Figures 5 to 8 discuss in detail the spacing between births and jobs during the 3 years following
a first child. However, we did not account for observed characteristics, which may potentially affect
the differences between the two groups. Moreover, the effect of extended parental leave on the space
between births is ambiguous since extended parental leave tends to decrease the additional child hazard
in the first 18 months after birth increasing it only thereafter (Figure 5). Table 6 provides a regression
analysis that investigates the net effect of extended parental leave on the space between births, on the
duration until women return-to-work, and on the duration of the time period without birth nor job.
In column 1, the dependent variable in these regressions is the number of months that a mother is
observed without a further child during the 36 months following the birth (the spacing between births).
In columns 2 and 3 the dependent variables are, respectively, the number of months a woman spends
off work (the spacing of jobs) and the number of months a woman stays at home with a single child.11
Table 6
The more generous parental leave rules that were introduced in July 1990 decreased the average
distance between births by .464 months. This is clearly the effect of two changes that go in opposite
directions. On the one hand, women get more children during the 36 months following the birth. On
the other hand, for women who plan an additional birth under the new rules, the spacing can become11It can be shown that these regressions measure the area between the respective survivor functions in Figure 6, Figure
7, and Figure 8. Intuitively, this is true because expected duration of stay in a state is the integral with respect to elapsed
duration t of the probability of surviving in that state until t.
18
bigger without loosing continuous access to parental leave benefits. The net effect is a slight decrease
in the spacing between subsequent birth during the first 36 months after the first birth.
In contrast to the spacing between birth, the spacing between jobs is the result of two effects that
go in the same direction. On the one hand, under the new rules there is smaller fraction of women
returning to work within 36 months following the first birth. This increases the average length of time
off work. On the other hand, to get continuous access to parental leave benefits the spacing between
jobs for women who are giving birth to a child can be longer under the new rules. In sum, the spacing
between jobs is much larger under the new rules. The coefficient in column 2 of Table 6 suggests that
treated mothers stay almost 4.7 months longer off work than control mothers (with identical observable
characteristics).
Similarly, the number of months a woman spends off work without having a further child is 2.9
months higher under the new rules (see column 3 in Table 6). While a smaller fraction women with no
additional child is still out of labor force after 36 months, the average duration in such circumstances
is much smaller under the old rules during the 36 months after birth. The point estimates are rather
robust. Just like in previous regressions, excluding control variables does neither change the point
estimates not levels of significance.
7 Shortening maximum parental leave: the 1996 reform
We have seen that the 1990 parental leave reform had substantial effects on women’s fertility and labor
supply behavior after their first birth. It is interesting to check whether we see effects of comparable
magnitude once the maximum duration of parental leave is again reduced. The 1996 policy reform
brought such a reduction by six months. (Recall that the maximum duration of parental leave continued
to terminate with the child’s second birthday, but now at least six months had to be take by either
parent. As almost no fathers take up parental leave, the effective maximum duration to be taken up by
the mother typically ended when the child’s became 1 1/2 years old).
We now study the impact of this effective reduction in maximum parental leave on women’s fertility
and work behavior. In in Panel A of Table 7, we present the coefficients estimated from the linear
probability model using the additional-child indicator (row 1), the return-to-work indicator (row 2),
and the either-child-or-work indicator (row 3) as the dependent variable. Panel B of Table 7 reports the
corresponding estimates for the corresponding durations until these events. For ease of comparison the
first column in Table 7 reproduces the results from the effects of the twelve-months extension of parental
leave presented above. The second column in Table 7 present the coefficients of our main interest.
Table 7
Interestingly, our results show that shortening maximum parental leave duration by six months
has no impact on the probability of having an additional child. 36 months after a previous birth, the
probability of having an additional child is the same for treated and controls (conditional on observed
characteristics). Furthermore, the spacing between subsequent birth occurs .271 months earlier - al-
though the coefficient is not statistically significant (see the coefficient in panel B, first row, second
column).
19
We note that these two results can be rationalized by the new rules introduced with the 1996 policy
change. Parents who plan an additional child and who want to take advantage of continuous take-up
of parental leave have to make sure that the additional birth occurs before the first child becomes 18
months plus 14 weeks old. Under the 1990 rules this had to occur before the first child become 24
months plus 14 weeks old. In other words, the 1996 rules introduced a tighter time constraint for
parents planning to combine an additional child with continuous take-up of parental leave benefits.
While the time constraint is tighter under the 1996 rules, it is still biologically feasible to meet this
constraint (and different from for the pre-1990 rules where continuous take-up was biologically almost
impossible). Figure 9 shows that, in fact, the share of mothers with an additional child is higher under
the 1996 rules as compared to the 1990 rules between months 14 and 28. Furthermore from inspection
of the hazard rates (not shown here) it is obvious that this difference is due to substantially higher
additional birth hazards during months 14 to 18, the months immediately before maximum parental
leave terminate under the 1996 rules.
Figure 9
It is further interesting to analyze how the policy change affected the return-to-work process. Table
5 (panel A row 2 column 2) it is shown that the percentage mothers back at work after 36 months is 5.4
percentage points higher under the 1996 rules as compared to the 1990 rules. Interestingly, our estimate
of the six months reduction in maximum parental leave duration is about half the size as the estimate
we got for the twelve months increase in maximum duration (see column 1). This near-linearity between
maximum parental leave duration and labor supply is further confirmed by our job-spacing regressions
(panel B, row 2). The 1996 lead to a reduction in the average time out of labor force (spacing between
jobs) of about 2.5 months. This compares to an increase in time distance between jobs of 4.7 months –
as a result of the 12 months extension of maximum parental leave duration with the 1990 rules. In sum
our estimates suggest that, per additional month of maximum parental leave duration, the percentage
mothers back to work within 36 months decreases by about 0.8 to 0.9 percentage points; and the average
duration off work increases by 0.4 to 0.5 months.
The share of women still off work without a further child after 36 months is not significantly different
under the 1996 rules as compared to the 1990 rules. While more mothers get back to work, no change
in fertility is observed. However, as shown in panel B, the new rules significantly reduce the time that
mothers spend at home without an additional child is reduced by 2.35 months.
8 Conclusions
This paper presents new evidence on the effect of parental leave policies on fertility and return-to-work
behavior. To estimate the causal impact of parental leave rules we exploit a policy change in Austria,
enacted on July 1, 1990 which increased the maximum duration of parental leave from the child’s first
to the child’s second birthday. An important feature of the Austrian parental leave system – which
plays a central role in our empirical strategy – is the possibility of automatic renewal of parental leave
benefits as long as the mother is still on parental leave from a previous child. The policy change created
a strong incentive for women planning two or more children to chronologically ”bunch” births and the
20
associated time off work. Moreover, by strongly reducing the costs of additional children, the policy
change did not only create an incentive to decrease the space between births, but also to increase the
number of birth.
To assess the causal effect created by the policy change through automatic parental leave renewal,
we adopt a regression discontinuity approach. The assumptions needed for this approach are satisfied
in an almost ideal way in the present context. First, the policy change was enacted on July 1, 1990,
at 0:00 am, so that the regression discontinuity design is ”sharp” (in the sense of Hahn et al., 2001).
Our estimates rely on a comparison of subsequent fertility and return-to-work behavior of mothers
with a birth in June 1990 to those with a birth in July 1990 so that our comparison is in the close
”neighborhood” of the treatment cut-off. Second, assignment to treatment is purely random, as parents
with children born in June/July 1990 could not anticipate the parental leave policy change. Exact
date and details of the change were not clear until early April 1990 – but at that date the June/July
1990 children were already conceived. Third, while our control/treatment samples is based on pre-post
policy births, the conditions under which all mothers in our sample made their subsequent fertility and
return-to-work decisions are almost identical. Most of our analysis focuses on behavior during the 36
months following the June/July 1990 birth. Hence treated and control mothers face identical conditions
during 35 out of 36 months.
Our findings indicate that the Austrian 1990 parental leave reform had a strong impact on the
probability of having an additional child. The additional-child probability is significantly higher for
the treated than for the controls, both in the short- and in the long-run. During the first three years
following the 1990 birth, this probability is about 5 percentage points (or 15 percent) higher for the
treated; and during the first 10 years the probability is still about 4 percentage points higher for the
treated. This suggests that the parental leave reform did not only decrease the spacing but did also
increase the number of births.
Our estimates of the effects of the parental leave reform on fertility decisions are a lower bound. Our
estimated effect is informative on the causal effect of incentives created by automatic parental leave
renewal. The overall effect of the policy change, however, is likely to be larger. The only difference is that
the maximum parental leave duration for the 1990 birth ends with the child’s second treated mothers
whereas it already ends with the child’s first birthday for control mothers. In the present context, the
more generous post-reform rules apply to both treated and control mothers for any subsequent birth.
However, the overall effect should also include the direct effect of job protection and longer benefit
duration. To the extent that these have a direct effect on fertility, the overall effect of the policy change
will be larger.
Our analysis also evaluates a subsequent policy change that took place in 1996 which effectively
reduced the maximum duration of parental leave from 24 months to 18 months. We find that this
policy change did not lead to a change in the additional-child probability of the treated mothers. This
suggests that the main effect of the policy change works via the automatic-renewal meachanism built in
the Austrian parental leave system. Getting an additional child within 18 months is biologically possible
and mothers took advantage of this possibility after the 1996 reduction in parental leave. However, this
effect refers to the short-run. It may well be that the reduction had long-run effects on fertility choices.
21
(As our data end in 2001 the long-run fertility effect cannot be estimated).
Finally, both policy changes had a significant impact on return-to-work behavior. Per additional
month of maximum parental leave duration, the time off work increases by 0.4 to 0.5 months. No major
difference between the effects of the 1990 increase and the 1996 decrease in maximum parental leave
can be detected.
Suppose the policy objective is to maximize the number of births and to minimize the amount of time
that women spend off work. Under such objectives, our results suggest that the rules introduced in 1996
optimize on this objective. Clearly, policy objectives are not as simplistic and many more dimensions
play a role. On the one hand, the amount of time mothers spend with their children might have a
significant impact on child development – which would call for a longer duration of parental leaves
(for evidence along these lines see Berger, Hill, and Waldfogel, 2005, Gregg, Washbrook, Propper,
and Burgess, 2005, and Tanaka 2005). On the other hand, a long duration of parental leave might
significantly weaken the labor market position of mother or mothers to be (either because after returning
back to work mothers are more likely to be fired by their employers as soon as the job protection period
has expired; or because employers may anticipate the higher costs of longer parental leaves and may
become more reluctant in the first place to hire women with high probabilities of childbearing).
Furthermore, it is als important to note that parental leave legislation is just one of a broad set of
fertility-related family policies. We have studied two successive policy changes during a period where
no significant changes in other fertility-related family policies took place. While this is a nice set-up
for policy evaluation we have to be cautious in extrapolating our results to other environments. There
may be important interaction effects with other policies, in particular supply of child care facilities for
very small children (or lack thereof, as in the case of Austria); or other financial incentives (such child
benefits, tax deductions for children, and social transfers directly related to a birth – where Austrian
family policies are comparably generous). How an isolated variation in parental leave policies affect
women’s behavior will depend on a country’s particular family-policy mix. Our analysis shows, however,
that parental leave provisions are a potentially very important element in the family policy / fertility
nexus.
22
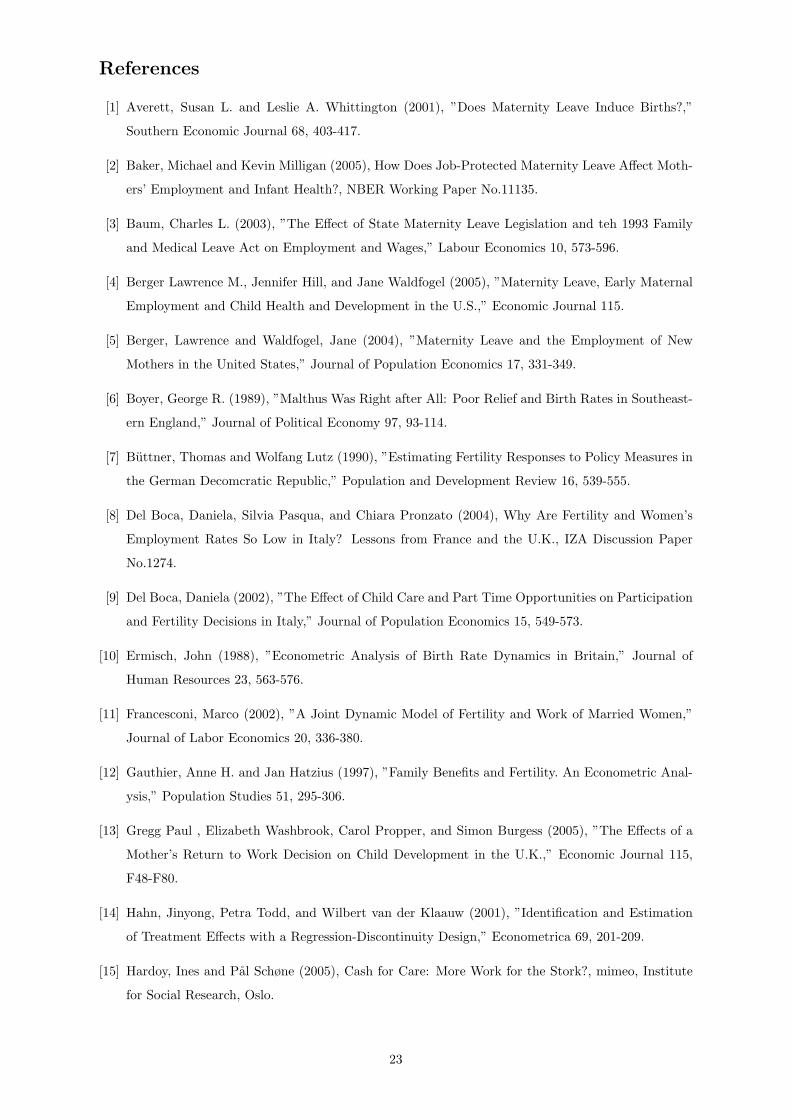
References
[1] Averett, Susan L. and Leslie A. Whittington (2001), ”Does Maternity Leave Induce Births?,”
Southern Economic Journal 68, 403-417.
[2] Baker, Michael and Kevin Milligan (2005), How Does Job-Protected Maternity Leave Affect Moth-
ers’ Employment and Infant Health?, NBER Working Paper No.11135.
[3] Baum, Charles L. (2003), ”The Effect of State Maternity Leave Legislation and teh 1993 Family
and Medical Leave Act on Employment and Wages,” Labour Economics 10, 573-596.
[4] Berger Lawrence M., Jennifer Hill, and Jane Waldfogel (2005), ”Maternity Leave, Early Maternal
Employment and Child Health and Development in the U.S.,” Economic Journal 115.
[5] Berger, Lawrence and Waldfogel, Jane (2004), ”Maternity Leave and the Employment of New
Mothers in the United States,” Journal of Population Economics 17, 331-349.
[6] Boyer, George R. (1989), ”Malthus Was Right after All: Poor Relief and Birth Rates in Southeast-
ern England,” Journal of Political Economy 97, 93-114.
[7] Buttner, Thomas and Wolfang Lutz (1990), ”Estimating Fertility Responses to Policy Measures in
the German Decomcratic Republic,” Population and Development Review 16, 539-555.
[8] Del Boca, Daniela, Silvia Pasqua, and Chiara Pronzato (2004), Why Are Fertility and Women’s
Employment Rates So Low in Italy? Lessons from France and the U.K., IZA Discussion Paper
No.1274.
[9] Del Boca, Daniela (2002), ”The Effect of Child Care and Part Time Opportunities on Participation
and Fertility Decisions in Italy,” Journal of Population Economics 15, 549-573.
[10] Ermisch, John (1988), ”Econometric Analysis of Birth Rate Dynamics in Britain,” Journal of
Human Resources 23, 563-576.
[11] Francesconi, Marco (2002), ”A Joint Dynamic Model of Fertility and Work of Married Women,”
Journal of Labor Economics 20, 336-380.
[12] Gauthier, Anne H. and Jan Hatzius (1997), ”Family Benefits and Fertility. An Econometric Anal-
ysis,” Population Studies 51, 295-306.
[13] Gregg Paul , Elizabeth Washbrook, Carol Propper, and Simon Burgess (2005), ”The Effects of a
Mother’s Return to Work Decision on Child Development in the U.K.,” Economic Journal 115,
F48-F80.
[14] Hahn, Jinyong, Petra Todd, and Wilbert van der Klaauw (2001), ”Identification and Estimation
of Treatment Effects with a Regression-Discontinuity Design,” Econometrica 69, 201-209.
[15] Hardoy, Ines and Pal Schøne (2005), Cash for Care: More Work for the Stork?, mimeo, Institute
for Social Research, Oslo.
23
[16] Heckman, James J. and J. Walker (1990), ”The Relationship between Wages and Income and
the Timing and Spacing of Births: Evidence from Swedish Longitudinal Data,” Econometrica 58,
1411-1441.
[17] Hoem, Jan M. (1993), ”Public Policy as the Fuel of Fertility: Effects of a Policy Reform on the
Pace of Childbearing in Sweden in the 1980s,” Acta Sociologica 36, 19-31.
[18] Hoem, Jan M., Alexia Prskawetz, and Gerda Neyer (2001), Autonomy or Conservative Adjustment?
The Effect of Public Policies and Educational Attainment on Third Births in Austria, Working
Paper Series of the Max Planck Institute for Demographic Research, WP2001-016.
[19] Hotz, Joseph, Jacob A. Klerman, and Robert J. Willis (1997), ”The Economics of Fertility in
Developed Countries,” in: Mark R. Rosenzweig and Oded Stark (eds.), Handbook of Population
Economics, Amsterdam: North Holland.
[20] Hotz, Joseph and Robert A. Miller (1988), ”An Empirical Analysis of Life-Cycle Fertility and
Female Labor Supply,” Econometrica 56, 91-118.
[21] Hoynes, Hillary M. (1997), ”Work, Welfare, and Family Structure,” in: Alan B. Auerbach (ed.),
Fiscal Policy: Lessons From Economic Research, Cambridge MA: MIT Press.
[22] Joyce, Theodore, Robert Kaestner, and Sanders Korenman (2002), Welfare Reform andNon-
Marital Fertility in the 1990s: Evidence from Birth Records, NBER Working Paper No.9046.
[23] Joyce, Theodore, Robert Kaestner, Sanders Korenman, and Stanley Henshaw (2004), Family Cap
Provisions and Changes in Births and Abortions, NBER Working Paper No.10214.
[24] Keane, Michael P. and Kenneth I. Wolpin (2002a), ”Estimating Welfare Effects Consistent with
Forward-Looking Behavior. Part I: Lessons from a Simulation Exercise,” Journal of Human Re-
sources 37, 570-599.
[25] Keane, Michael P. and Kenneth I. Wolpin (2002b), ”Estimating Welfare Effects Consistent with
Forward-Looking Behavior. Part II: Empirical Results,” Journal of Human Resources 37, 600-622.
[26] Kearney, Melissa Schettini (2004), ”Is There an Effect of Incremental Welfare Benefits on Fertility
Behavior? A Look at the Family Cap,” Journal of Human Resources 39, 295-325.
[27] Klerman Jacob and Arleen Leibowitz (1997), ”Labor Supply Effects of State Maternity Leave
Legislation,” in: Blau, Francine and Ron Ehrenberg (eds.), Gender and Family Issues in the
Workplace, New York: Russell Sage Press.
[28] Klerman, J. A. und A. Leibowitz (1999), ”Job Continuity Among New Mothers,” Demography 36,
145-155.
[29] Laroque, Guy and Bernard Salanie (2005), Fertility and Financial Incentives in France, CEPR
Discussion Paper No. 5007.
[30] Milligan, Kevin (2005), ”Subsidizing the Stork: New Evidence on Tax Incentives and Fertility,”
Review of Economics and Statistics, forthcoming.
24
[31] Moffitt Robert (1984), ”Profiles of Fertility, Labour Supply and Wages of Married Women: A
Complete Life-Cycle Model”, Review of Economic Studies, 51, 263-78
[32] Moffitt, Robert A. (1998), ”The Effect of Welfare on Marriage and Fertility,” in Robert A. Moffitt
(ed.), Welfare, the Family and Reproductive Behavior, Washington DC: National Academy Press.
[33] OECD (1993), Employment Outlook, Paris.
[34] OECD (2001), Employment Outlook, Paris.
[35] OECD (2004), Employment Outlook, Paris.
[36] Ondrich, Jan, C. Katharina Spiess, Qing Yang und Gert G. Wagner (1998), ”Full Time or Part
Time? German Parental Leave Policy and the Return to Work after Childbirth in Germany,”
in: Polachek, Solomon and John Robst (eds.), Research in Labor Economics, Vol 18. pp. 41-74,
Amsterdam: JAI-Press.
[37] Piketty, Thomas, (2003), L’Impact de l’Allocation Parentale d’Education sur l’Activite Feminine
et la Fecondite, 1982-2002, mimeo, CEPREMAP, Paris.
[38] Pylkkanen, Elina and Nina Smith (2004), The Impact of Family-Friendly Policies in Denmark and
Sweden on Mothers’ Career Interruptions Due to Childbirth, IZA Discussion Paper No.1050.
[39] Rosenzweig, Mark R. (1999), ”Welfare, Marital Prospects, and Nonmarital Childbearing,” Journal
of Political Economy 107, S3-S32.
[40] Rosenzweig, Mark R. and T. Paul Schultz (1985), ”The Demand for and Supply of Births: Fertility
and its Lifecylce Consequences,” American Economic Review 75, 992-1015.
[41] Ruhm, Christopher (1998), The Economic Consequences of Parental Leave Mandates: Lessons
From Europe, Quarterly Journal of Economics, 113: 285-317.
[42] Ruhm, Christopher and Jackqueline L. Teague (1997) ”Parental Leave Policies in Europe and
North America” (with ) in Francine D. Blau and Ronald Ehrenberg (eds.) Gender and Family
Issues in the Workplace, The Russell Sage Foundation Press, pp. 133-156.
[43] Tanaka, Sakiko (2005), Parental leave and child health across OECD countries, Economic Journal
115.
[44] Whittington, Leslie A. (1992), ”Taxes and the Family: The impact of the Tax Exemption for
Dependents on Marital Fertility,” Demography 29, 215-226.
[45] Whittington, Leslie A., James Alm, and H.Elizabeth Peters (1990), ”Fertility and the Personal
Exemption: Implicit Pronatalist Policy in the United States,” American Economic Review 80,
545-556.
[46] Zhang, Junsen, Jason Quan and Peter van Meerbergen (1994), ”The Effect of Tax-Transfer Policies
on Fertility in Canada, 1921-88,” Journal of Human Resources 29, 181-201.
25
The Timing of Maternity Protection (MP) and Parental Leave (PL) in AustriaFigure 1:
child is born
MP starts MP ends
PL ends
MP starts
16 weeks
Duration of PLBefore July 1990: 12 monthsJuly 1990-June 1996: 24 monthsAfter July 1996: 18 months
if gap <6 weeks:PL extended
PL starts
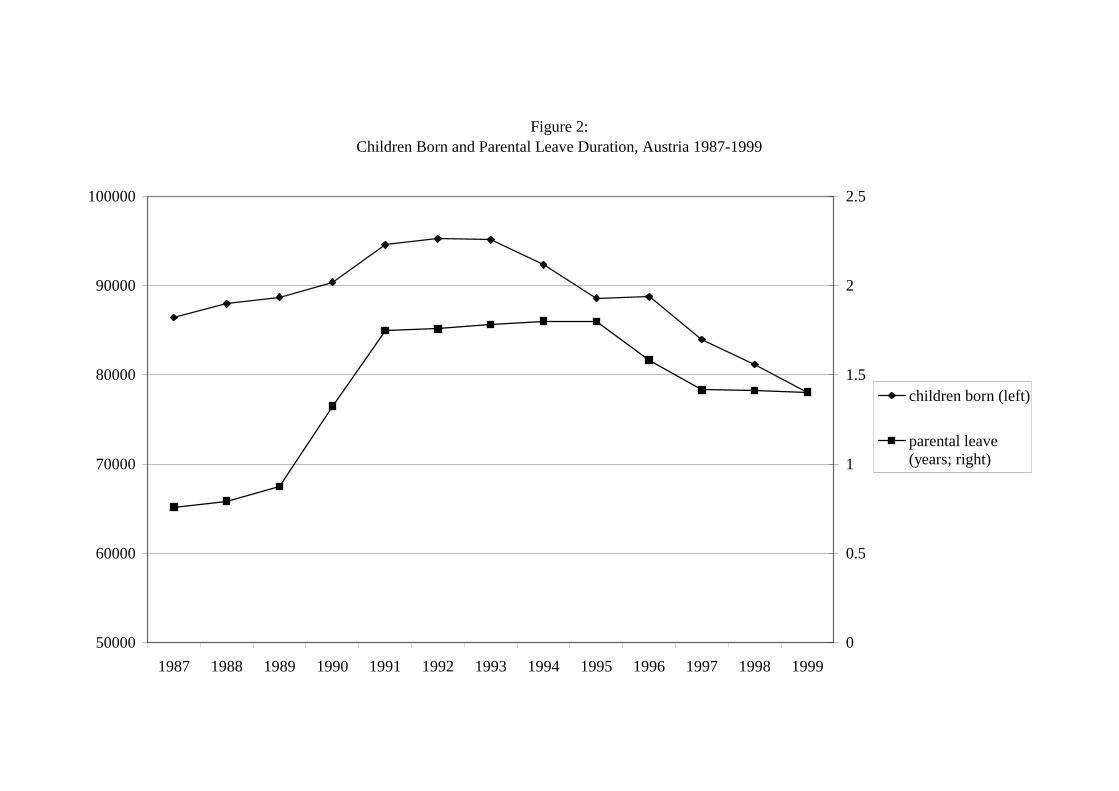
Figure 2:Children Born and Parental Leave Duration, Austria 1987-1999
50000
60000
70000
80000
90000
100000
1987 1988 1989 1990 1991 1992 1993 1994 1995 1996 1997 1998 1999
0
0.5
1
1.5
2
2.5
children born (left)
parental leave(years; right)
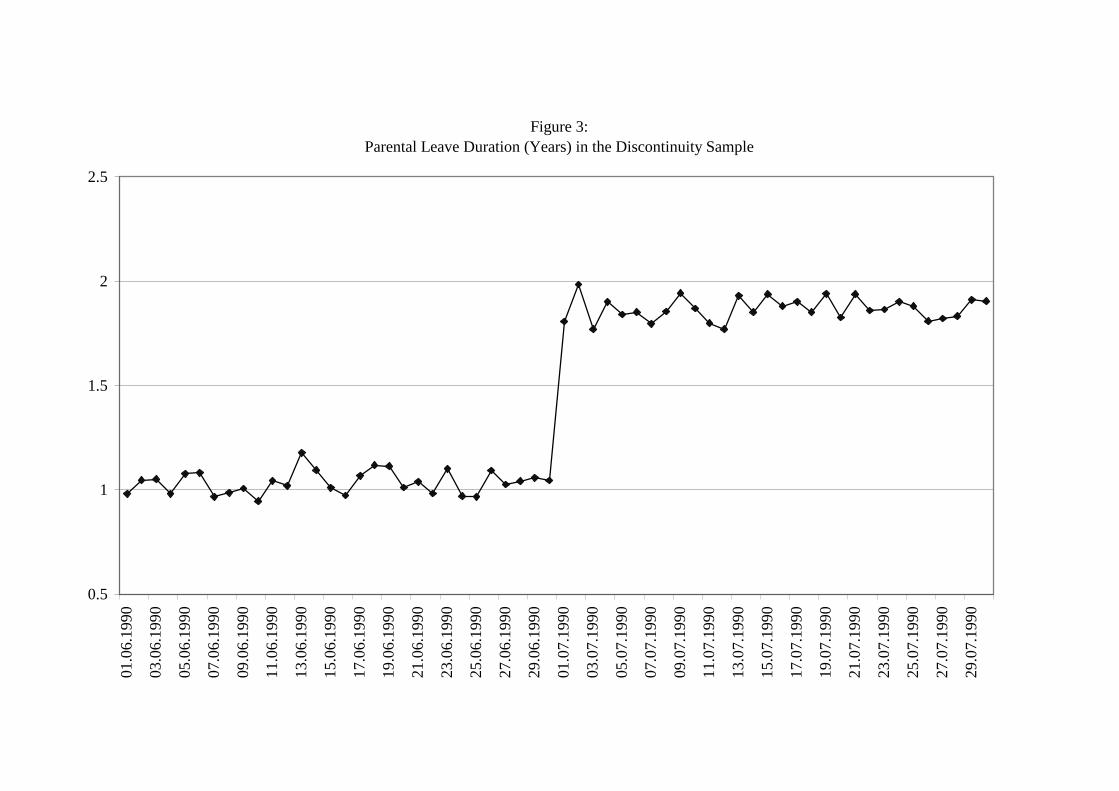
Figure 3: Parental Leave Duration (Years) in the Discontinuity Sample
0.5
1
1.5
2
2.5
01.0
6.19
90
03.0
6.19
90
05.0
6.19
90
07.0
6.19
90
09.0
6.19
90
11.0
6.19
90
13.0
6.19
90
15.0
6.19
90
17.0
6.19
90
19.0
6.19
90
21.0
6.19
90
23.0
6.19
90
25.0
6.19
90
27.0
6.19
90
29.0
6.19
90
01.0
7.19
90
03.0
7.19
90
05.0
7.19
90
07.0
7.19
90
09.0
7.19
90
11.0
7.19
90
13.0
7.19
90
15.0
7.19
90
17.0
7.19
90
19.0
7.19
90
21.0
7.19
90
23.0
7.19
90
25.0
7.19
90
27.0
7.19
90
29.0
7.19
90
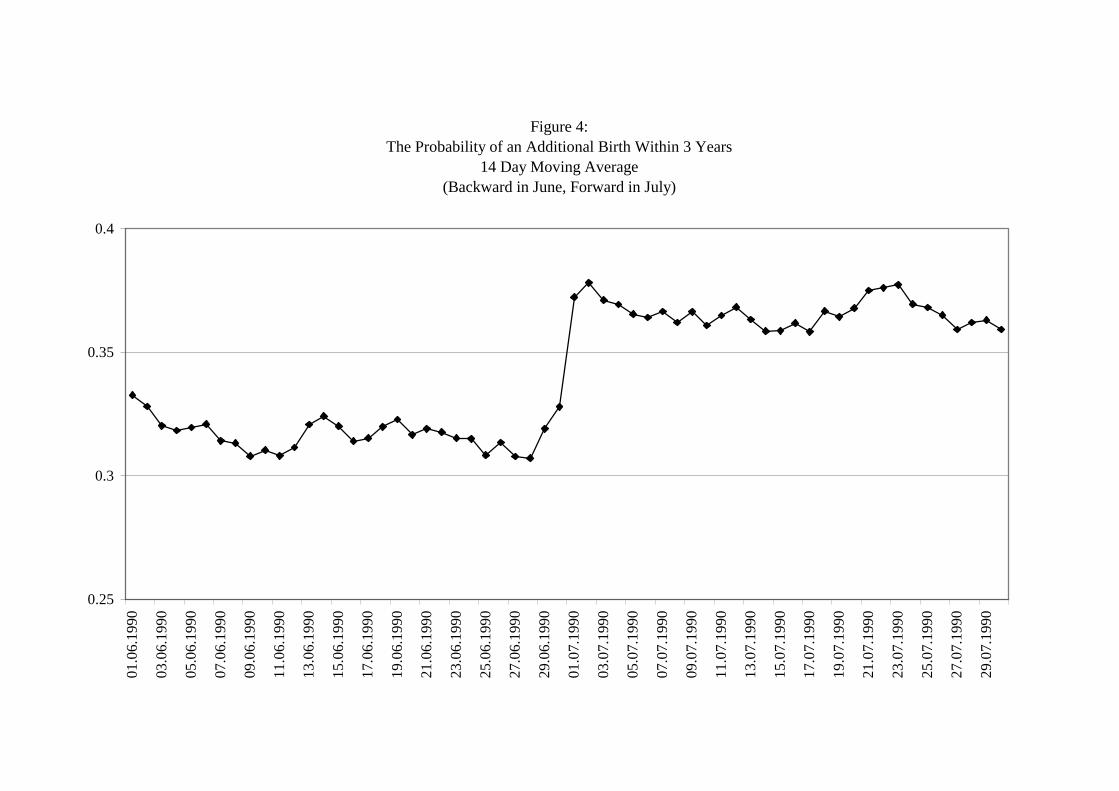
Figure 4:The Probability of an Additional Birth Within 3 Years
14 Day Moving Average(Backward in June, Forward in July)
0.25
0.3
0.35
0.4
01.0
6.19
90
03.0
6.19
90
05.0
6.19
90
07.0
6.19
90
09.0
6.19
90
11.0
6.19
90
13.0
6.19
90
15.0
6.19
90
17.0
6.19
90
19.0
6.19
90
21.0
6.19
90
23.0
6.19
90
25.0
6.19
90
27.0
6.19
90
29.0
6.19
90
01.0
7.19
90
03.0
7.19
90
05.0
7.19
90
07.0
7.19
90
09.0
7.19
90
11.0
7.19
90
13.0
7.19
90
15.0
7.19
90
17.0
7.19
90
19.0
7.19
90
21.0
7.19
90
23.0
7.19
90
25.0
7.19
90
27.0
7.19
90
29.0
7.19
90
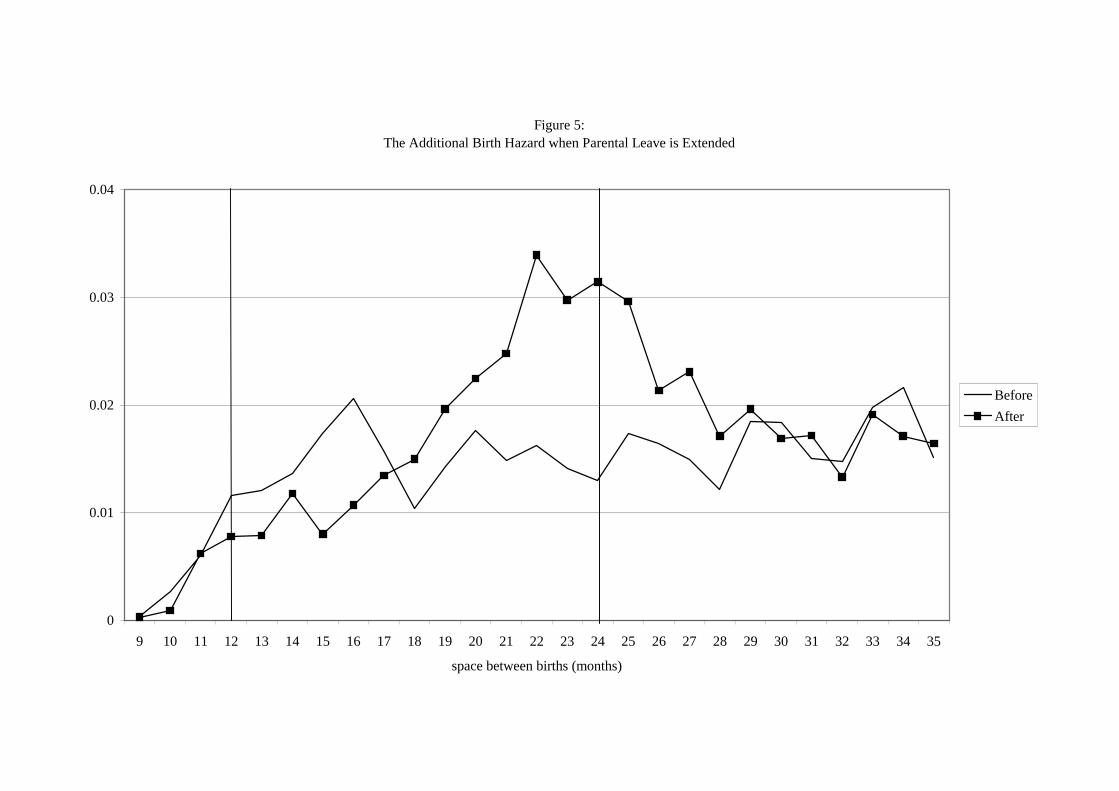
Figure 5:The Additional Birth Hazard when Parental Leave is Extended
0
0.01
0.02
0.03
0.04
9 10 11 12 13 14 15 16 17 18 19 20 21 22 23 24 25 26 27 28 29 30 31 32 33 34 35
space between births (months)
Before
After
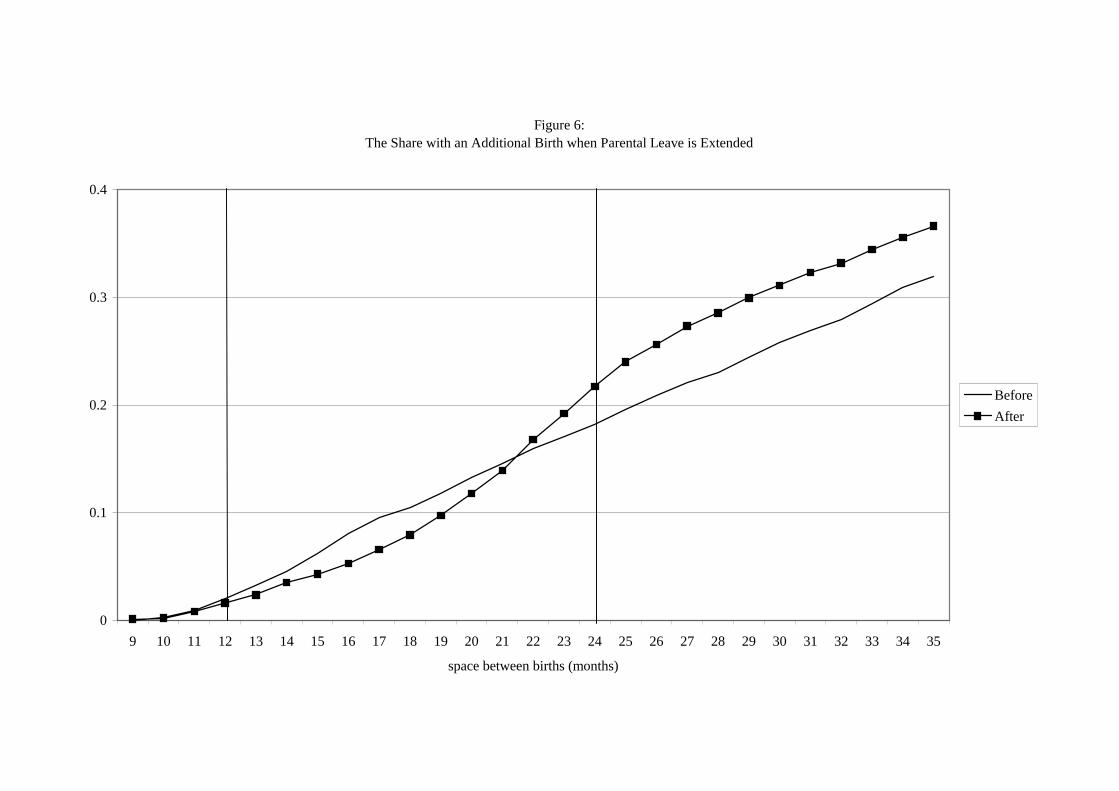
Figure 6:The Share with an Additional Birth when Parental Leave is Extended
0
0.1
0.2
0.3
0.4
9 10 11 12 13 14 15 16 17 18 19 20 21 22 23 24 25 26 27 28 29 30 31 32 33 34 35
space between births (months)
Before
After
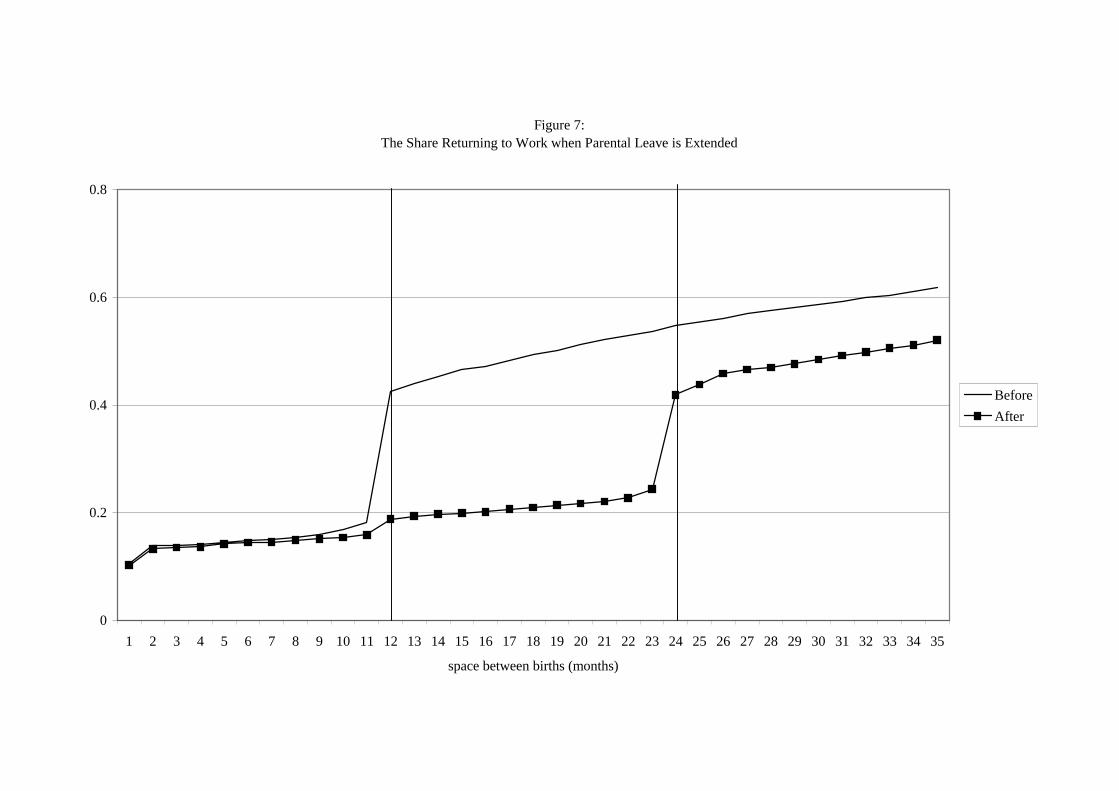
Figure 7:The Share Returning to Work when Parental Leave is Extended
0
0.2
0.4
0.6
0.8
1 2 3 4 5 6 7 8 9 10 11 12 13 14 15 16 17 18 19 20 21 22 23 24 25 26 27 28 29 30 31 32 33 34 35
space between births (months)
Before
After
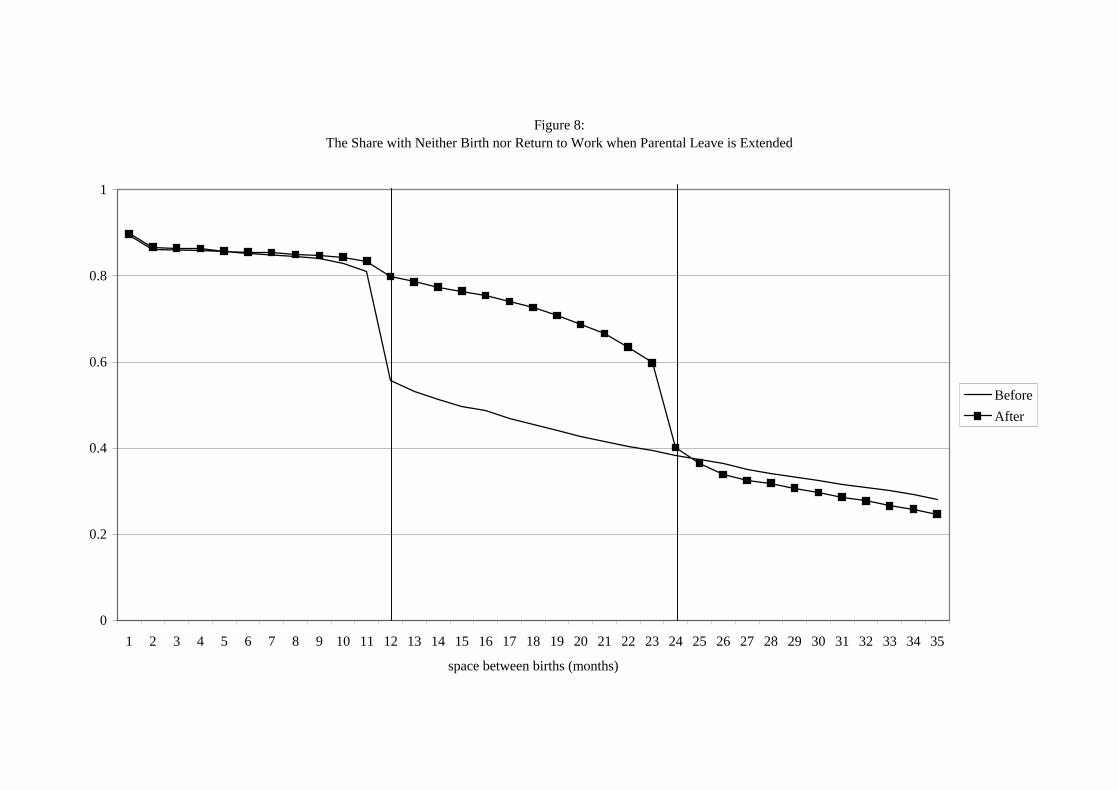
Figure 8:The Share with Neither Birth nor Return to Work when Parental Leave is Extended
0
0.2
0.4
0.6
0.8
1
1 2 3 4 5 6 7 8 9 10 11 12 13 14 15 16 17 18 19 20 21 22 23 24 25 26 27 28 29 30 31 32 33 34 35
space between births (months)
Before
After
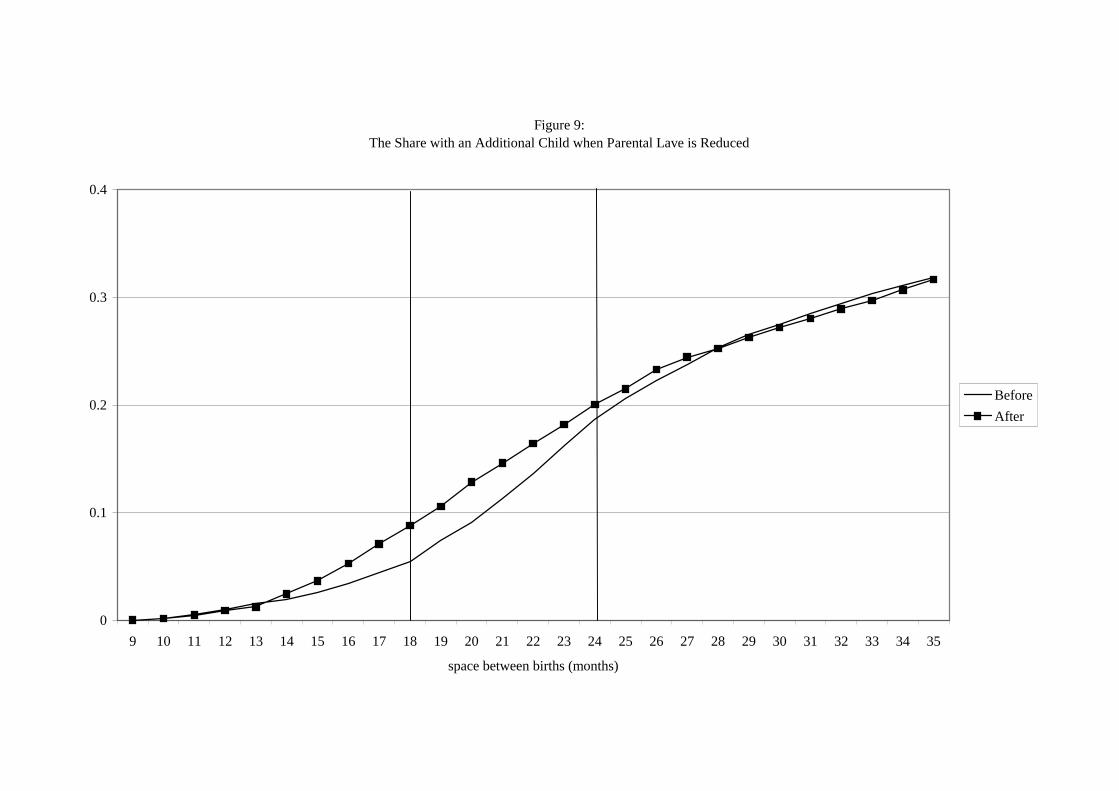
Figure 9:The Share with an Additional Child when Parental Lave is Reduced
0
0.1
0.2
0.3
0.4
9 10 11 12 13 14 15 16 17 18 19 20 21 22 23 24 25 26 27 28 29 30 31 32 33 34 35
space between births (months)
Before
After
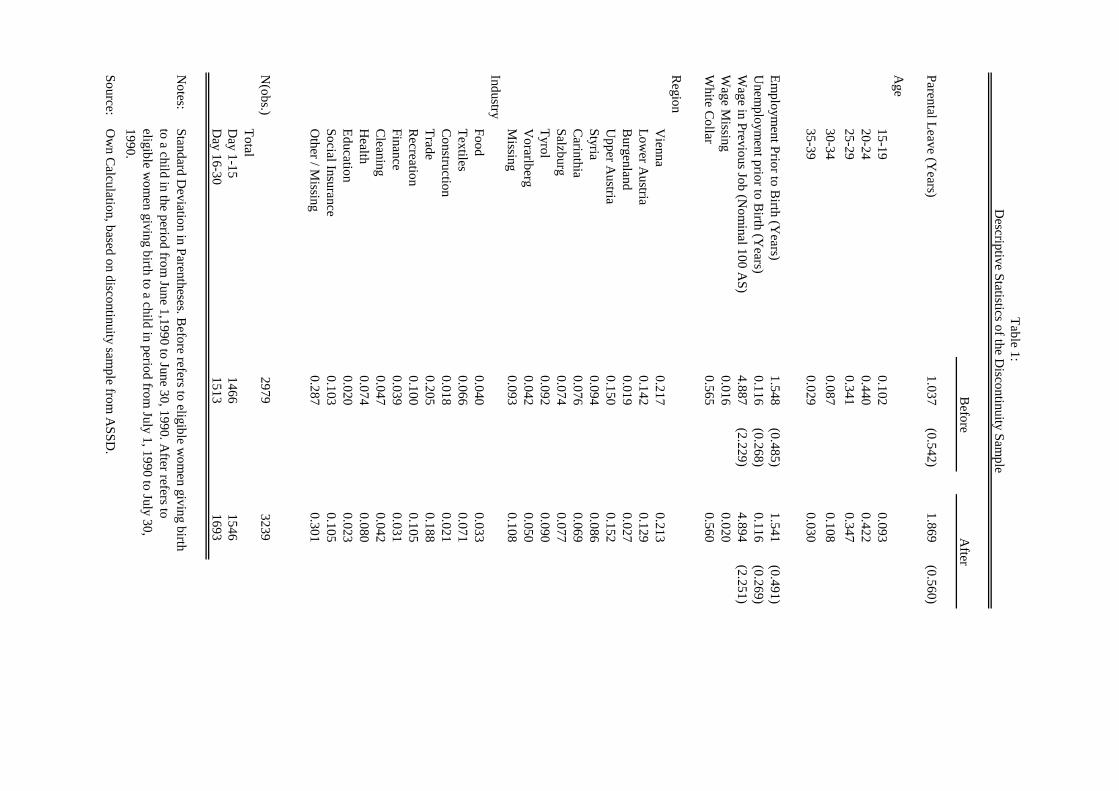
Parental L
eave (Years)
1.037(0.542)
1.869(0.560)
Age
15-190.102
0.09320-24
0.4400.422
25-290.341
0.347
30-340.087
0.108
35-390.029
0.030
Em
ployment P
rior to Birth (Y
ears)1.548
(0.485)1.541
(0.491)U
nemploym
ent prior to Birth (Y
ears)0.116
(0.268)0.116
(0.269)W
age in Previous Job (N
ominal 100 A
S)4.887
(2.229)4.894
(2.251)W
age Missing
0.0160.020
White C
ollar0.565
0.560
Region
Vienna
0.2170.213
Low
er Austria
0.1420.129
Burgenland
0.0190.027
Upper A
ustria0.150
0.152Styria
0.0940.086
Carinthia
0.0760.069
Salzburg0.074
0.077T
yrol0.092
0.090V
orarlberg0.042
0.050M
issing0.093
0.108Industry
Food0.040
0.033T
extiles0.066
0.071C
onstruction0.018
0.021T
rade0.205
0.188R
ecreation0.100
0.105Finance
0.0390.031
Cleaning
0.0470.042
Health
0.0740.080
Education
0.0200.023
Social Insurance0.103
0.105O
ther / Missing
0.2870.301
N(obs.)
29793239
Total
Day 1-15
14661546
Day 16-30
15131693
Notes:
Source: O
wn C
alculation, based on discontinuity sample from
ASSD
.
Descriptive Statistics of the D
iscontinuity Sample
Table 1:
Standard Deviation in P
arentheses. Before refers to eligible w
omen giving birth
to a child in the period from June 1,1990 to June 30, 1990. A
fter refers to eligible w
omen giving birth to a child in period from
July 1, 1990 to July 30, 1990.
Before
After
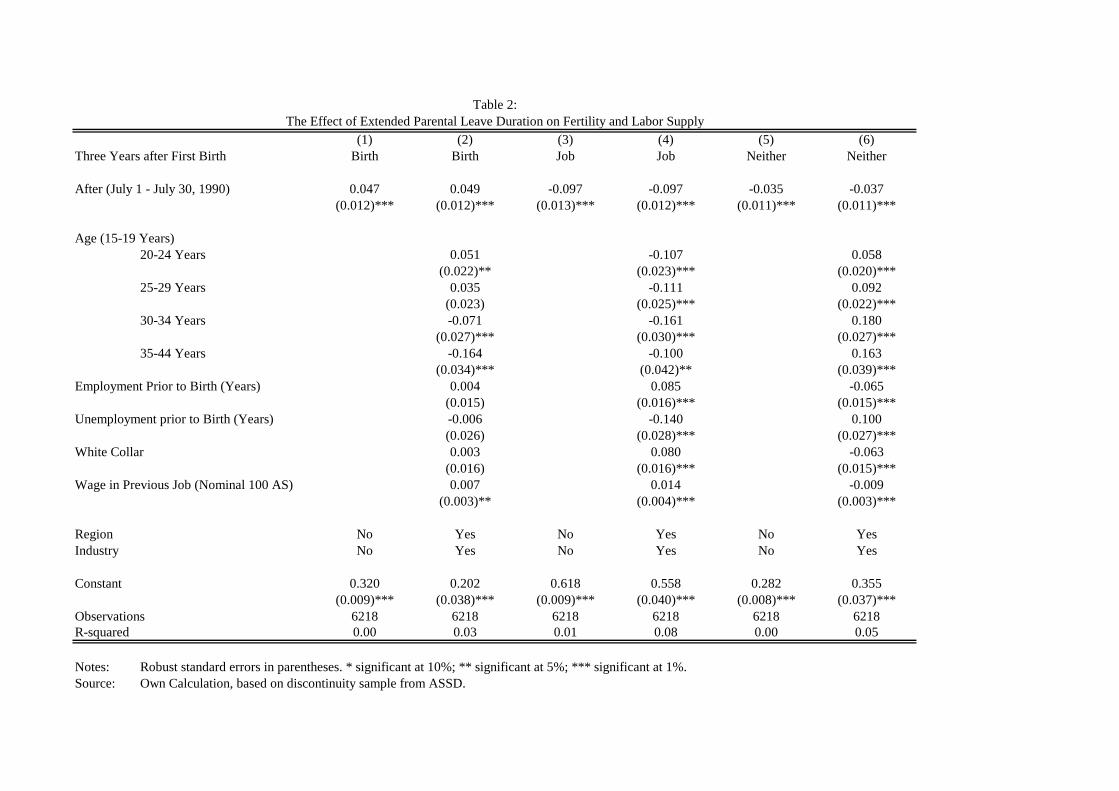
(1) (2) (3) (4) (5) (6)Three Years after First Birth Birth Birth Job Job Neither Neither
After (July 1 - July 30, 1990) 0.047 0.049 -0.097 -0.097 -0.035 -0.037(0.012)*** (0.012)*** (0.013)*** (0.012)*** (0.011)*** (0.011)***
Age (15-19 Years)20-24 Years 0.051 -0.107 0.058
(0.022)** (0.023)*** (0.020)***25-29 Years 0.035 -0.111 0.092
(0.023) (0.025)*** (0.022)***30-34 Years -0.071 -0.161 0.180
(0.027)*** (0.030)*** (0.027)***35-44 Years -0.164 -0.100 0.163
(0.034)*** (0.042)** (0.039)***Employment Prior to Birth (Years) 0.004 0.085 -0.065
(0.015) (0.016)*** (0.015)***Unemployment prior to Birth (Years) -0.006 -0.140 0.100
(0.026) (0.028)*** (0.027)***White Collar 0.003 0.080 -0.063
(0.016) (0.016)*** (0.015)***Wage in Previous Job (Nominal 100 AS) 0.007 0.014 -0.009
(0.003)** (0.004)*** (0.003)***
Region No Yes No Yes No YesIndustry No Yes No Yes No Yes
Constant 0.320 0.202 0.618 0.558 0.282 0.355(0.009)*** (0.038)*** (0.009)*** (0.040)*** (0.008)*** (0.037)***
Observations 6218 6218 6218 6218 6218 6218R-squared 0.00 0.03 0.01 0.08 0.00 0.05
Notes: Robust standard errors in parentheses. * significant at 10%; ** significant at 5%; *** significant at 1%. Source: Own Calculation, based on discontinuity sample from ASSD.
The Effect of Extended Parental Leave Duration on Fertility and Labor SupplyTable 2:
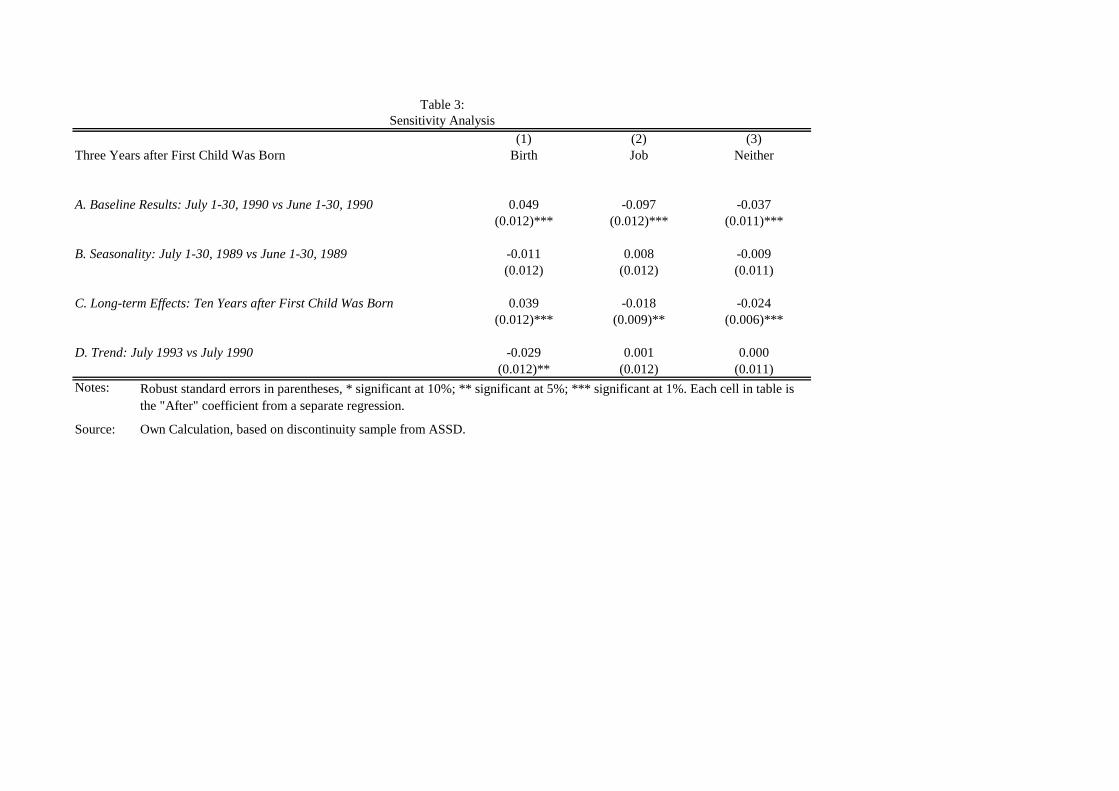
(1) (2) (3)Three Years after First Child Was Born Birth Job Neither
A. Baseline Results: July 1-30, 1990 vs June 1-30, 1990 0.049 -0.097 -0.037(0.012)*** (0.012)*** (0.011)***
B. Seasonality: July 1-30, 1989 vs June 1-30, 1989 -0.011 0.008 -0.009(0.012) (0.012) (0.011)
C. Long-term Effects: Ten Years after First Child Was Born 0.039 -0.018 -0.024(0.012)*** (0.009)** (0.006)***
D. Trend: July 1993 vs July 1990 -0.029 0.001 0.000(0.012)** (0.012) (0.011)
Notes:
Source: Own Calculation, based on discontinuity sample from ASSD.
Table 3:Sensitivity Analysis
Robust standard errors in parentheses, * significant at 10%; ** significant at 5%; *** significant at 1%. Each cell in table is the "After" coefficient from a separate regression.

July 1 - July 15July 16 - July 30
Before P
eriodJune 1 - June 15
0.0500.047
(0.017)(0.017)
June 16 - June 300.050
0.047(0.017)
(0.017)
Notes:
Source: O
wn C
alculation, based on discontinuity sample from
ASSD
.
Robust standard errors in parentheses, * significant at 10%
; ** significant at 5%
; *** significant at 1%.
Table 4:
Sensitivity Analysis: B
irths in first / second half of month
After P
eriod
Table reports the coefficient that m
easures the change in the probability of an additional child w
hen comparing the "A
fter Period" to the "B
efore P
eriod" in a regression controlling for control variables listed in Table 2.

Before
After
Difference
Three Y
ears after First Child W
as Born
Neither additional birth nor return-to-w
ork28.16
24.67-3.49
No additional birth and return-to-w
ork39.88
38.72-1.16
Additional birth but no return-to-w
ork10.00
23.2513.25
Additional birth and return-to-w
ork21.95
13.37-8.58
Total
100.00100.00
0.00
Notes:
Source: O
wn C
alculation, based on discontinuity sample from
ASSD
.
Table 5:
Interactions between birth and return-to-w
ork behavior
Table reports the joint distribution betw
een the first birth and first return-to-work transition during
the three year period after first child was born. Independence rejected at all conventional levels of
significance (p<.001). M
NL
analysis indicates that log odds of "Additional birth no return-to-w
ork" are singificantly higher and "additional birth and return-to-w
ork" are significantly lower than the
baseline "neither additional birth nor return-to-work" after extending parental leave.
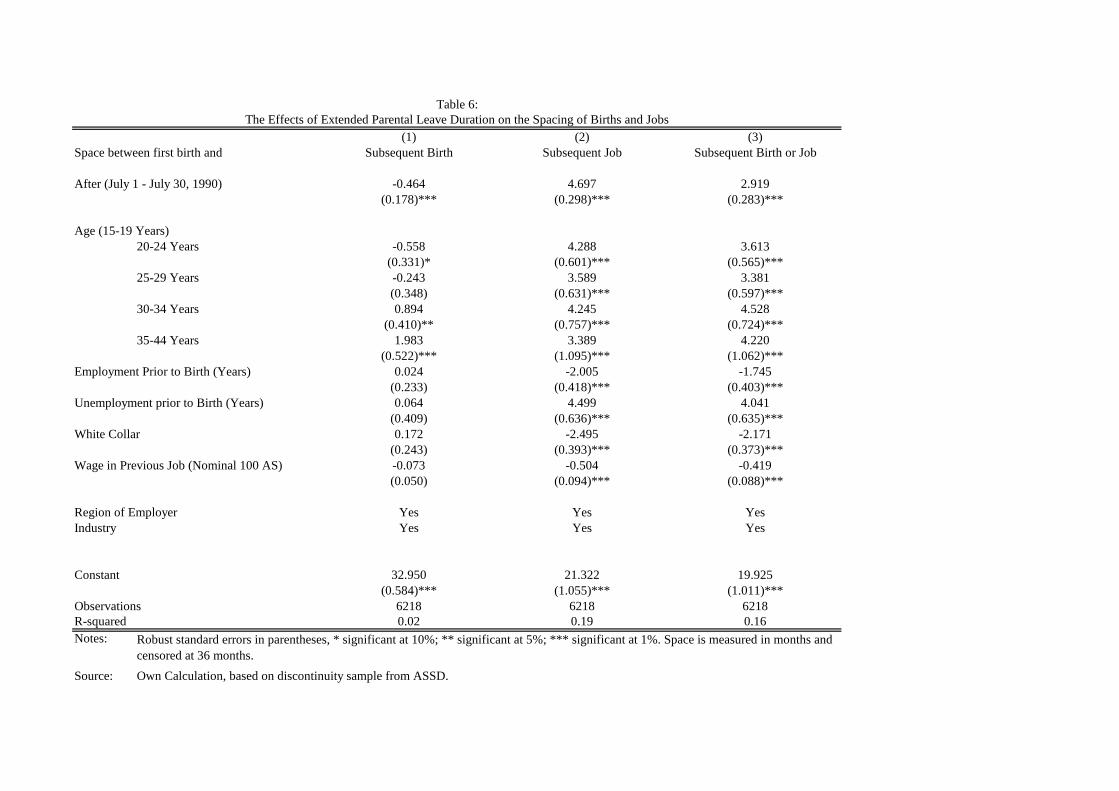
(1) (2) (3)Space between first birth and Subsequent Birth Subsequent Job Subsequent Birth or Job
After (July 1 - July 30, 1990) -0.464 4.697 2.919(0.178)*** (0.298)*** (0.283)***
Age (15-19 Years)20-24 Years -0.558 4.288 3.613
(0.331)* (0.601)*** (0.565)***25-29 Years -0.243 3.589 3.381
(0.348) (0.631)*** (0.597)***30-34 Years 0.894 4.245 4.528
(0.410)** (0.757)*** (0.724)***35-44 Years 1.983 3.389 4.220
(0.522)*** (1.095)*** (1.062)***Employment Prior to Birth (Years) 0.024 -2.005 -1.745
(0.233) (0.418)*** (0.403)***Unemployment prior to Birth (Years) 0.064 4.499 4.041
(0.409) (0.636)*** (0.635)***White Collar 0.172 -2.495 -2.171
(0.243) (0.393)*** (0.373)***Wage in Previous Job (Nominal 100 AS) -0.073 -0.504 -0.419
(0.050) (0.094)*** (0.088)***
Region of Employer Yes Yes YesIndustry Yes Yes Yes
Constant 32.950 21.322 19.925(0.584)*** (1.055)*** (1.011)***
Observations 6218 6218 6218R-squared 0.02 0.19 0.16Notes:
Source: Own Calculation, based on discontinuity sample from ASSD.
Table 6:The Effects of Extended Parental Leave Duration on the Spacing of Births and Jobs
Robust standard errors in parentheses, * significant at 10%; ** significant at 5%; *** significant at 1%. Space is measured in months and censored at 36 months.
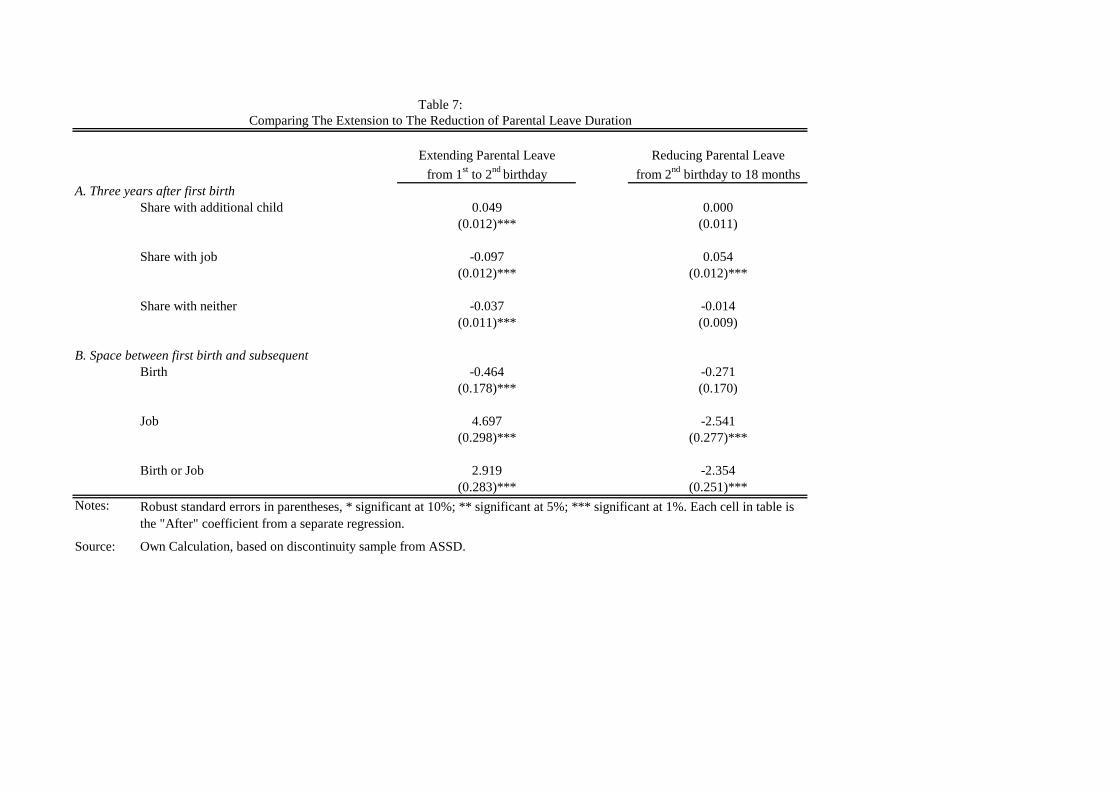
Extending Parental Leave Reducing Parental Leave
from 1st to 2nd birthday from 2nd birthday to 18 monthsA. Three years after first birth
Share with additional child 0.049 0.000(0.012)*** (0.011)
Share with job -0.097 0.054(0.012)*** (0.012)***
Share with neither -0.037 -0.014(0.011)*** (0.009)
B. Space between first birth and subsequentBirth -0.464 -0.271
(0.178)*** (0.170)
Job 4.697 -2.541(0.298)*** (0.277)***
Birth or Job 2.919 -2.354(0.283)*** (0.251)***
Notes:
Source: Own Calculation, based on discontinuity sample from ASSD.
Robust standard errors in parentheses, * significant at 10%; ** significant at 5%; *** significant at 1%. Each cell in table is the "After" coefficient from a separate regression.
Table 7:Comparing The Extension to The Reduction of Parental Leave Duration
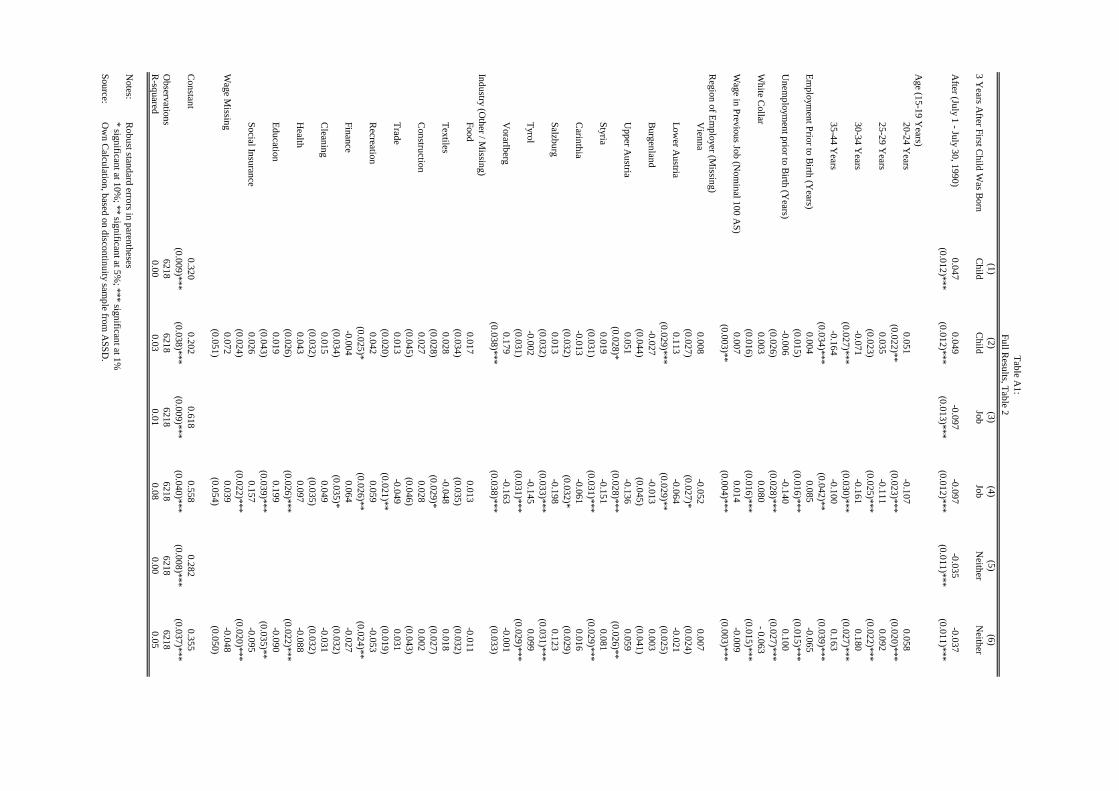
(1)(2)
(3)(4)
(5)(6)
3 Years A
fter First Child W
as Born
Child
Child
JobJob
Neither
Neither
After (July 1 - July 30, 1990)
0.0470.049
-0.097-0.097
-0.035-0.037
(0.012)***(0.012)***
(0.013)***(0.012)***
(0.011)***(0.011)***
Age (15-19 Y
ears)20-24 Y
ears0.051
-0.1070.058
(0.022)**(0.023)***
(0.020)***25-29 Y
ears0.035
-0.1110.092
(0.023)(0.025)***
(0.022)***30-34 Y
ears-0.071
-0.1610.180
(0.027)***(0.030)***
(0.027)***35-44 Y
ears-0.164
-0.1000.163
(0.034)***(0.042)**
(0.039)***E
mploym
ent Prior to B
irth (Years)
0.0040.085
-0.065(0.015)
(0.016)***(0.015)***
Unem
ployment prior to B
irth (Years)
-0.006-0.140
0.100(0.026)
(0.028)***(0.027)***
White C
ollar0.003
0.080- 0.063
(0.016)(0.016)***
(0.015)***W
age in Previous Job (N
ominal 100 A
S)0.007
0.014-0.009
(0.003)**(0.004)***
(0.003)***R
egion of Em
ployer (Missing)
Vienna
0.008-0.052
0.007(0.027)
(0.027)*(0.024)
Low
er Austria
0.113-0.064
-0.021(0.029)***
(0.029)**(0.025)
Burgenland
-0.027-0.013
0.003(0.044)
(0.045)(0.041)
Upper A
ustria0.051
-0.1360.059
(0.028)*(0.028)***
(0.026)**Styria
0.019-0.151
0.081(0.031)
(0.031)***(0.029)***
Carinthia
-0.013-0.061
0.016(0.032)
(0.032)*(0.029)
Salzburg0.013
-0.1980.123
(0.032)(0.033)***
(0.031)***T
yrol-0.002
-0.1450.099
(0.031)(0.031)***
(0.029)***V
orarlberg0.179
-0.163-0.001
(0.038)***(0.038)***
(0.033)Industry (O
ther / Missing)
Food0.017
0.013-0.011
(0.034)(0.035)
(0.032)T
extiles0.028
-0.0480.018
(0.028)(0.029)*
(0.027)C
onstruction0.027
0.0280.002
(0.045)(0.046)
(0.043)T
rade0.013
-0.0490.031
(0.020)(0.021)**
(0.019)R
ecreation0.042
0.059-0.053
(0.025)*(0.026)**
(0.024)**Finance
-0.0040.064
-0.027(0.034)
(0.035)*(0.032)
Cleaning
0.0150.049
-0.031(0.032)
(0.035)(0.032)
Health
0.0430.097
-0.088(0.026)
(0.026)***(0.022)***
Education
0.0190.199
-0.090(0.043)
(0.039)***(0.035)**
Social Insurance0.026
0.157-0.095
(0.024)(0.022)***
(0.020)***W
age Missing
0.0720.039
-0.048(0.051)
(0.054)(0.050)
Constant
0.3200.202
0.6180.558
0.2820.355
(0.009)***(0.038)***
(0.009)***(0.040)***
(0.008)***(0.037)***
Observations
62186218
62186218
62186218
R-squared
0.000.03
0.010.08
0.000.05
Notes:
Robust standard errors in parentheses
* significant at 10%; ** significant at 5%
; *** significant at 1%Source:
Ow
n Calculation, based on discontinuity sam
ple from A
SSD.
Full Results, T
able 2T
able A1: