Interdependent happiness: Cultural happiness under the East Asian cultural mandate
Upload
independentCategory
view
0download
0
1 23
Social Indicators ResearchAn International and InterdisciplinaryJournal for Quality-of-Life Measurement ISSN 0303-8300 Soc Indic ResDOI 10.1007/s11205-013-0275-1
Does Good Governance EnhanceHappiness: A Cross Nation Study
Roma Mitra Debnath & Ravi Shankar

1 23
Your article is protected by copyright and all
rights are held exclusively by Springer Science
+Business Media Dordrecht. This e-offprint
is for personal use only and shall not be self-
archived in electronic repositories. If you
wish to self-archive your work, please use the
accepted author’s version for posting to your
own website or your institution’s repository.
You may further deposit the accepted author’s
version on a funder’s repository at a funder’s
request, provided it is not made publicly
available until 12 months after publication.
Does Good Governance Enhance Happiness:A Cross Nation Study
Roma Mitra Debnath • Ravi Shankar
Accepted: 18 February 2013� Springer Science+Business Media Dordrecht 2013
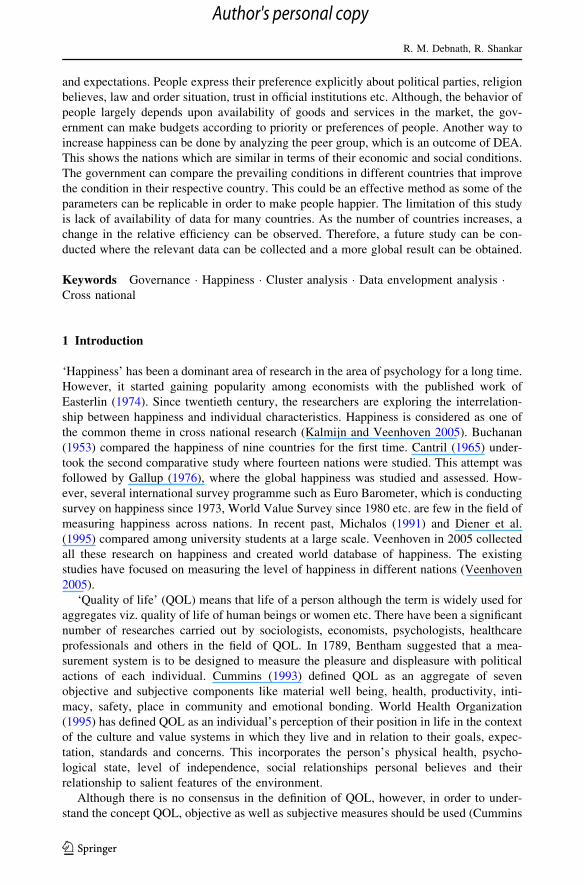
Abstract The purpose of this paper is to analyze the efficiency of the countries over the
period of 10 years by applying data envelopment analysis (DEA). Based on rational and
factual parameters such as freedom of press, freedom of religion, percentage of export in
Gross Domestic Product (GDP), index of globalization, life expectancy at birth, gender
ratio etc., this paper attempts to measure the efficiency of happiness. A combination of
social and economic factors has been used to measure technical efficiency. The contri-
bution of this paper is twofold. First, it measures the relative efficiency of all the countries
included in the study. The nations have been ranked as per their relative efficiency and the
peer group has been formed. Second a comparison between the rich and the poor countries
have been done to test empirically whether the economic growth enhances the happiness
among people. Presently, more than 3,000 studies have been published on happiness and
Veenhoven in 2004 created a database called World Database of Happiness. The World
Database of Happiness has attempted to present the available research findings on hap-
piness. Part of the findings on happiness in nations is available in ‘States of nations’. For
the research purpose, States of Nations and the data published by have been considered.
Although happiness has been quantified and the existing literature has sufficient empirical
evidences of the same, in the present context, the relative efficiency has been calculated for
the countries on basis of objective and subjective happiness parameters. As per the liter-
ature, happiness has two aspects (1) objective and (2) subjective. Objective parameters are
external to the individuals and covers material living parameters viz. GDP growth, income,
nutrition, mortality rate, literacy etc. However, Subjective indicators measure the quality of
life of the individuals. These are summarized as ‘‘subjective well-being’’. The various
parameters considered in the study capture different aspects of happiness. The result shows
how the government can increase the happiness of the people by analyzing the behavior
R. M. Debnath (&)Indian Institute of Public Administration, I.P.Estate, Ring Road, New Delhi 110 002, Indiae-mail: [email protected]
R. ShankarDepartment of Management Studies, Indian Institute of Technology Delhi,Hauz Khas, New Delhi, Indiae-mail: [email protected]
123
Soc Indic ResDOI 10.1007/s11205-013-0275-1
Author's personal copy
and expectations. People express their preference explicitly about political parties, religion
believes, law and order situation, trust in official institutions etc. Although, the behavior of
people largely depends upon availability of goods and services in the market, the gov-
ernment can make budgets according to priority or preferences of people. Another way to
increase happiness can be done by analyzing the peer group, which is an outcome of DEA.
This shows the nations which are similar in terms of their economic and social conditions.
The government can compare the prevailing conditions in different countries that improve
the condition in their respective country. This could be an effective method as some of the
parameters can be replicable in order to make people happier. The limitation of this study
is lack of availability of data for many countries. As the number of countries increases, a
change in the relative efficiency can be observed. Therefore, a future study can be con-
ducted where the relevant data can be collected and a more global result can be obtained.
Keywords Governance � Happiness � Cluster analysis � Data envelopment analysis �Cross national
1 Introduction
‘Happiness’ has been a dominant area of research in the area of psychology for a long time.
However, it started gaining popularity among economists with the published work of
Easterlin (1974). Since twentieth century, the researchers are exploring the interrelation-
ship between happiness and individual characteristics. Happiness is considered as one of
the common theme in cross national research (Kalmijn and Veenhoven 2005). Buchanan
(1953) compared the happiness of nine countries for the first time. Cantril (1965) under-
took the second comparative study where fourteen nations were studied. This attempt was
followed by Gallup (1976), where the global happiness was studied and assessed. How-
ever, several international survey programme such as Euro Barometer, which is conducting
survey on happiness since 1973, World Value Survey since 1980 etc. are few in the field of
measuring happiness across nations. In recent past, Michalos (1991) and Diener et al.
(1995) compared among university students at a large scale. Veenhoven in 2005 collected
all these research on happiness and created world database of happiness. The existing
studies have focused on measuring the level of happiness in different nations (Veenhoven
2005).
‘Quality of life’ (QOL) means that life of a person although the term is widely used for
aggregates viz. quality of life of human beings or women etc. There have been a significant
number of researches carried out by sociologists, economists, psychologists, healthcare
professionals and others in the field of QOL. In 1789, Bentham suggested that a mea-
surement system is to be designed to measure the pleasure and displeasure with political
actions of each individual. Cummins (1993) defined QOL as an aggregate of seven
objective and subjective components like material well being, health, productivity, inti-
macy, safety, place in community and emotional bonding. World Health Organization
(1995) has defined QOL as an individual’s perception of their position in life in the context
of the culture and value systems in which they live and in relation to their goals, expec-
tation, standards and concerns. This incorporates the person’s physical health, psycho-
logical state, level of independence, social relationships personal believes and their
relationship to salient features of the environment.
Although there is no consensus in the definition of QOL, however, in order to under-
stand the concept QOL, objective as well as subjective measures should be used (Cummins
R. M. Debnath, R. Shankar
123
Author's personal copy

2000; Diener and Suh 1997; Felce and Perry 1995; Turksever and Atalik 2001). Gomes
et al. (2008) concluded that QOL corresponds to an individual perception that brings
together several dimensions such as quantitative, qualitative and social which comprise
objective, subjective and relational aspects. Ramırez and Tovar (2002) were in opinion that
perception reflects perspectives and social values. These perceptions which are either
subjective or objective, takes a shape of a global character.
However, in the twenty-first century, different quantitative and qualitative measurement
scales were developed, which included different scales of satisfaction concerning various
areas of life (Ferriss 2006). The word ‘Happiness’ has been used in the existing literature as
a generic term for all worth and is in this sense; it is synonymous with QOL or ‘well-being’
(Veenhoven 1999). McCall (1975) defined QOL as a necessary condition for happiness.
Frey and Stutzer (2002a, b) explored that happiness has a significant role in economic
outcomes. For instance, if a person is happy, he would be more productive and efficient in
his life, which would increase his personal income and health (Graham et al. 2004). Myers
(2004) defined happiness as a ratio of positive to negative feelings whereas; Layard (2005a,
b) defined happiness as a good and nice feeling about enjoying life and to maintain the
same feeling. Duncan (2010) found that Happiness has three independent but correlated
factors like subjective well-being, life satisfaction, and absence of depression or anxiety.
Subjective well-being is the feelings that people have of joy; life satisfaction caters to
qualities or circumstances of life and, finally, the absence of insecurity (Argyle 2001a, b).
The purpose of this paper is to assess the performance of various countries in achieving
happiness, that is, to find the relative efficiency of the initiatives taken by the different
government. The initiatives which have been considered for the present study are
parameters from the existing literature review.
The next section discusses the relation between happiness and governance. Section 3
contains a brief discussion on methodology used in the research. Section 4 reports the
result and a discussion of the same is included. The conclusion is presented in Sect. 5.
2 Happiness and Governance
According to World Bank (1992), governance is the manner in which power is exercised in
the management of a country’s economic and resources for development’’. Governance as
defined by Kaufmann et al. (1999, 2008) is the traditions and institutions by which
authority in a country is exercised. This includes the process by which governments are
selected, inspected and replaced. According to the authors, the governments should have
properties of accountability, political stability and absence of violence, effectiveness,
regulatory quality, rule of law, and control of corruption. Although there are many defi-
nitions of governance, most of the definitions have agreed on the importance of capable
state operating under the rule of law. Helliwell and Huang (2008a, b) used the terms
governance and government as equivalents as both terms are broad and includes admin-
istration by the governments and their legislation and jurisdiction.
It has been established in the extant literature that objective economic circumstances
have only a small though statistically significant effect on happiness (Andrews and Withey
1976; Argyle 2001a, b; Diener and Biswas-Diener 2002). This conclusion was reiterated by
various other researchers like (Frey and Stutzer 2002a, b; Layard 2005a, b by referring to
Easterlin’s paper, ‘Does economic growth improve the human lot?’ The Paradox states that
money, and by extension economic growth, have little effect on happiness.
Does Good Governance Enhance Happiness
123
Author's personal copy

Easterlin (1974) studied US economy during 1946–1970 and concluded that higher does
not guarantee greater happiness. This study was compatible with other recent studies on
happiness (Diener et al. 1999; Veenhoven 1993; Ravallion and Lokshin 2000). A similar
study by Kenny (1999), happiness level in Japan between the year 1958 and 1988 was
almost the same even though the GDP per capita increased five times. In few Asian
countries like Chile, China and South Korea have double income per capita within 20 years
but over that period data shows a decline in life satisfaction, especially in South Korea with
a statistically significant decline from four surveys between the period of 1990 and 2005,
(Easterlin et al. 2010; Hilke et al. 2009).
Although a good financial state allows people to buy goods which provides material
well-being and other several opportunities, however, the happiness we receive from
material well-being also depends on several factors such as our past and present socio-
economical conditions and our future goals (D’Acci 2011). Researchers like Winkelmann
and Winkelmann (1998), Clark and Oswald (1994) and Veenhoven (1996) concluded that
unemployment and poor health as key reasons of reducing happiness and satisfaction.
On the contrary, Inglehart (1990) and Blanchflower and Oswald (2000) believe that on
average higher income makes people happier. In addition, Bolle et al. (2009) with an
empirical research concludes if income is up by $1,000, then happiness increases by 0.06
units.
Ott (2010) studied that as per utilitarian believes, the governments should aim to create
the greatest happiness for the greatest number by legislation, jurisdiction and adminis-
tration. The author studied two fundamental questions in his research. Firstly, can gov-
ernments can increase the happiness and secondly, if they can, should they do so. The
authors also found that happiness affects the quality of government rather than vice versa.
Headey and Wearing (1992) established the fact that people tend to disbelief that gov-
ernments contribute less to happiness. Majority of the citizens are doubtful about the
governments as they link it with inefficiency, bureaucracy, high taxes, corruption etc.
However, Veenhoven (2004) opined that a number of social factors over which govern-
ments have some authority and control such as respect for the rule of law and civil rights,
economic freedom and tolerance of minorities have a positive impact on happiness levels.
The author defines happiness as the overall enjoyment of your life as a whole. The author
also concluded that happiness can be raised by incorporating appropriate policy actions.
Diener and Seligman (2004) showed in their research that democratic societies that respect
universal human rights tend to have happier people. Helliwell and Huang (2008a, b) found
that quality of government has a substantial impact on average happiness. Though there is
no consensus among the governments whether to evaluate the public policies to achieve the
goal to increase the happiness (Duncan 2010)
Easterlin (2003) opined that good health and social connectedness contributes to peo-
ple’s happiness than the pursuit of wealth mad material goods. Therefore, it becomes a
primary responsibility of the government to focus more on subjective well being and not on
economic growth. No relations have been found between a country’s GDP and happiness
levels of citizens. Oswald (1997) concluded that in a developed nation, economic progress
buys only a small amount of extra happiness. Ott (2010) found that the quality of gov-
ernance is more important for happiness than the size of governments. The relation
between quality and happiness is independent of size, while the relation between size and
happiness fully depends on quality. The author also concluded that government can pro-
mote happiness and reduce inequality by enhancing their quality of governance.
R. M. Debnath, R. Shankar
123
Author's personal copy

There is no unanimous decision among the researchers about the statement that a good
economy contributes positively towards the happiness of the people as compared to non-
economic factors.
The Gross National Happiness (GNH) is an official measure of happiness in Bhutan.
The concept of GNH is based on four pillars such as sustainable socio-economic devel-
opment, preservation and promotion of cultural values, conservation of the natural envi-
ronment and establishment of good governance (Lepage 2009). Since Bhutan is a Buddhist
state, it advocates Buddhist concept of happiness which promotes detachment from
worldliness to overcome suffering and achieve salvation. As a contrast, the western con-
cept of happiness is oriented towards achieving life-satisfaction in the world as empirically
found in the existing literature.
Happiness is subjective and it refers to feelings of one person at a time, therefore,
aggregate scores from national surveys of happiness may not be best way to estimate the
happiness of the nation (Duncan 2010).
There is very little empirical research on to measure the effectiveness of governance to
promote happiness. Kacapyr (2008) used regression analysis to study satisfaction across
countries. Veenhoven (2007) reported that Denmark and Italy have a higher trend in
happiness whereas, UK has a stagnated happiness and Belgium is experiencing a gradual
downward shift in happiness. Although these statistics were reported, there were no further
explanation what the governments of Denmark and Italy are doing to make its citizens
happy or the governments of UK and Belgium are not doing to contribute towards
happiness.
To conclude whether good governance can increase the happiness is still under ambi-
guity. Not many contributions are there in the existing literature. This paper builds a cross-
national study, which attempts to measure the efficiency of the various countries. The
different initiatives taken by the countries have been considered as parameters to assess the
efficiency of the governments. This paper aims to measure the effectiveness of nations in
promoting happiness.
The objectives of the paper are to
1. Cluster the nations under study on basis of economy
2. To determine the efficiency of the governance of the clustered (similar) nations
3. To compare the efficient governance among the nations.
3 Methodology
3.1 Cluster Analysis
Cluster analysis involves the identification of groups (nations in the present context)
among a set of different objects (113 nations under study) as described by Kaufman and
Rousseeuw (1990).
The analysis is done by measuring distance between the different objects which dis-
tinguishes the objects which are most similar than those which are not. Clustering has been
used for a variety of applications in economics. Grouping of some cases have been reported
as individuals, industries, nations, or time periods (Hirschberg and Aigner 1987; Hirsch-
berg and Slottje 1994; Hirschberg and Dayton 1996; Borland et al. 2001, Hirschberg et al.
1991, 2000a, b). In the present study, all the countries were clustered into three categories
according to economy as depicted in Table 1 indicating the countries within groups are
Does Good Governance Enhance Happiness
123
Author's personal copy
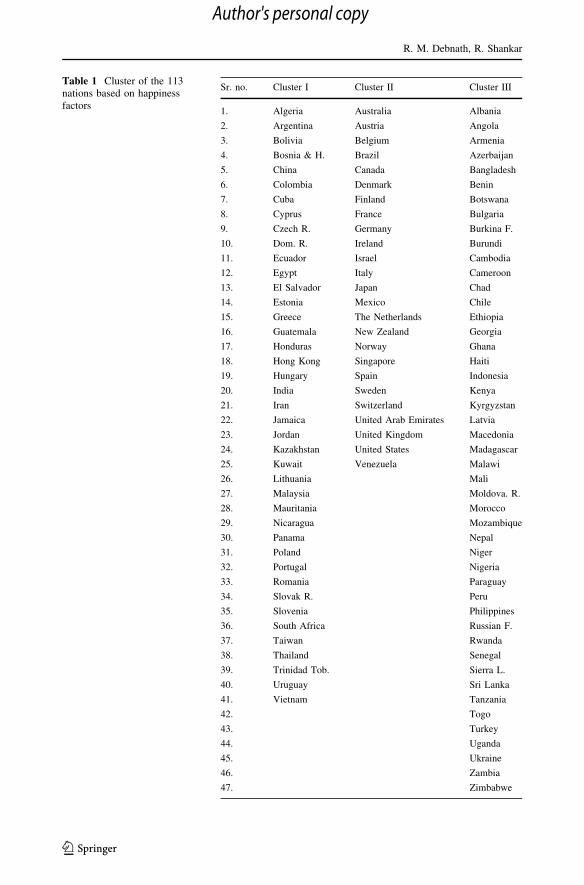
Table 1 Cluster of the 113nations based on happinessfactors
Sr. no. Cluster I Cluster II Cluster III
1. Algeria Australia Albania
2. Argentina Austria Angola
3. Bolivia Belgium Armenia
4. Bosnia & H. Brazil Azerbaijan
5. China Canada Bangladesh
6. Colombia Denmark Benin
7. Cuba Finland Botswana
8. Cyprus France Bulgaria
9. Czech R. Germany Burkina F.
10. Dom. R. Ireland Burundi
11. Ecuador Israel Cambodia
12. Egypt Italy Cameroon
13. El Salvador Japan Chad
14. Estonia Mexico Chile
15. Greece The Netherlands Ethiopia
16. Guatemala New Zealand Georgia
17. Honduras Norway Ghana
18. Hong Kong Singapore Haiti
19. Hungary Spain Indonesia
20. India Sweden Kenya
21. Iran Switzerland Kyrgyzstan
22. Jamaica United Arab Emirates Latvia
23. Jordan United Kingdom Macedonia
24. Kazakhstan United States Madagascar
25. Kuwait Venezuela Malawi
26. Lithuania Mali
27. Malaysia Moldova. R.
28. Mauritania Morocco
29. Nicaragua Mozambique
30. Panama Nepal
31. Poland Niger
32. Portugal Nigeria
33. Romania Paraguay
34. Slovak R. Peru
35. Slovenia Philippines
36. South Africa Russian F.
37. Taiwan Rwanda
38. Thailand Senegal
39. Trinidad Tob. Sierra L.
40. Uruguay Sri Lanka
41. Vietnam Tanzania
42. Togo
43. Turkey
44. Uganda
45. Ukraine
46. Zambia
47. Zimbabwe
R. M. Debnath, R. Shankar
123
Author's personal copy
having similar economy. This grouping gives a group of homogenous countries for which
the relative happiness was analyzed by using DEA as explained in the next section.
3.2 Data Envelopment Analysis
Data envelopment analysis (DEA) is a popular method in the area of efficiency mea-
surement. Efficiency measurement is a commonly used tool to measure the performance of
any decision making unit (DMU) and to estimate the relative efficiency of the DMUs.
Generally simple efficiency can be calculated using a ratio of output and input as given in
Eq. 1.
Efficiency ¼ Output=Inputs ð1Þ
However, in DEA, multiple inputs and outputs are linearly aggregated using weights.
Therefore, the efficiency is measured as a ratio of
Efficiency ¼Weighted Sum of Outputs=Weighted Sum of Inputs ð2Þ
Efficiency ¼P j
j¼1 vjyjP j
j¼1 uixi
ð3Þ
where ui is the weight assigned to input xi and vj the weight assigned to output yj as given
in Eq. 3.
Data Envelopment Analysis (DEA) is a non-parametric approach, initiated by Farrell
(1957). Later on, Charnes, Cooper and Rhodes (CCR) in 1978 made a major breakthrough
in the same field. DEA has received widespread acceptability particularly in its application
to public sector operations, such as education and health care where the policy objectives
are vaguely defined as a functional form of the inputs-outputs relationships. DEA has been
applied in a number of different areas like hospitality, health care (hospitals, doctors),
education (schools, universities), banks, manufacturing, benchmarking, management
evaluation, energy efficiency, fast food restaurants, retail stores etc. (Cooper et al. 2000;
Fare et al. 1994; Thanassoulis and Dustan 1994; Tomkins and Green 1988; Sinauny-Stern
et al. 1994; Rhode and Southwick 1993; Cooper et al. 1996). Tim Anderson (available at
www.emp.pdx.edu) in 1995 compiled over 360 papers on application of DEA and there has
been a constant increase in the number of DEA applications. DEA is used to compute a
score which defines the relative efficiency of a particular decision making unit (DMU)
versus all other DMUs observed in the sample. The various inputs and outputs are assigned
optimal weights by which the output can be maximized.
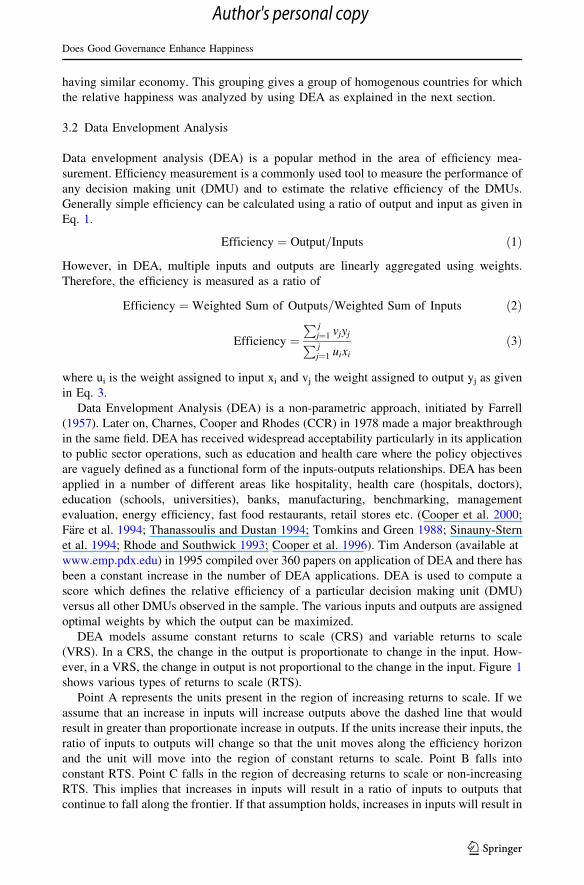
DEA models assume constant returns to scale (CRS) and variable returns to scale
(VRS). In a CRS, the change in the output is proportionate to change in the input. How-
ever, in a VRS, the change in output is not proportional to the change in the input. Figure 1
shows various types of returns to scale (RTS).
Point A represents the units present in the region of increasing returns to scale. If we
assume that an increase in inputs will increase outputs above the dashed line that would
result in greater than proportionate increase in outputs. If the units increase their inputs, the
ratio of inputs to outputs will change so that the unit moves along the efficiency horizon
and the unit will move into the region of constant returns to scale. Point B falls into
constant RTS. Point C falls in the region of decreasing returns to scale or non-increasing
RTS. This implies that increases in inputs will result in a ratio of inputs to outputs that
continue to fall along the frontier. If that assumption holds, increases in inputs will result in
Does Good Governance Enhance Happiness
123
Author's personal copy
proportionately smaller increases in output. The only point which is not identified by any
region is an inefficient unit (Fig. 2).
4 Analysis and Discussion
The DEA model which is used in this research is a BCC-output oriented model as the
objective is to maximize the output, which is happiness in the present context. In the
present context, happiness is being considered as an output variable and various indicators
of governance have been considered as input variables in DEA-output oriented model.
Helliwell and Huang (2008a, b), Kaufmann et al. (2008) and Ott (2010) segregated the
indicators of good governance into two parts (1) political quality and (2) democratic and
technical quality. The first quality includes freedom of expression, freedom of association
and a free media or accountability. It also includes political stability and absence of
violence. The latter one combines effectiveness of governance (quality of policy formu-
lation), regulatory quality (promotes private sector development), rule of law (prevention
of crime and violence) and control of corruption.
For the present study, the various outputs and inputs were considered from the study
conducted by Ott (2010). There are two outputs viz. (1) Average happiness which repre-
sents worst/best possible life and (2) Inequality in happiness in terms of dispersion of
happiness in nations under study. The four inputs considered in this study are (1) Technical
quality of governments: this includes government effectiveness, regulatory quality, rule of
law and control of corruption (2) Democratic quality of governments: this includes voice
and accountability, political stability and absence of violence, (3) Government consump-
tion as a percentage of government consumption in total national consumption and (4)
Government expenditures as a percentage of government expenditures in Gross Domestic
Product (GDP) .
The study is a cross national, in which 130 nations were studies. The data on various
inputs and outputs were collected for these nations and the data set represents both rich and
poor countries. The data has been collected from world database of happiness (Veenhoven
2010). A descriptive statistics of the data is provided in Table 1A. The descriptive statistics
reveals a huge disparity among the indicators across the nations that are similar in terms of
their economy. With cluster I, II and III categories of countries, the maximum and min-
imum values varies from negative to positive or sometimes between zeros to positive
Decreasing returns to scale (C)
Constant returns to scale (B)
Increasing returns to scale (A)
Input
Ou t pu t
Fig. 1 Various returns to scale in DEA
R. M. Debnath, R. Shankar
123
Author's personal copy

Rescaled Distance Cluster Combine
C A S E 0 5 10 15 20 25Label Num
Mauritania 75Uzbekistan 125Slovak R. 105Hungary 50Iran 53Bosnia & H. 14Ecuador 35Montenegro 78Romania 97Colombia 27Trinidad Tob. 117Cuba 30Portugal 95South Africa 107Croatia 29Korea. R. 62El Salvador 37Uruguay 124Lebanon 68Burma/My. 19Vietnam 127Belarus 10Hong Kong 49Bolivia 13Estonia 38Kazakhstan 60Czech R. 32greece 45Pakistan 88Panama 90Jamaica 57Taiwan 112Argentina 4Jordan 59Chile 25Cyprus 31Kuwait 64Malaysia 73Thailand 115Algeria 2Slovenia 106guatemala 46India 51Poland 94Lithuania 69Egypt 36Honduras 48Nicaragua 84Dom. R. 34Benin 12Cambodia 21Chad 24Togo 116Ethiopia 39Sierra L. 103Cameroon 22Bulgaria 17Zimbabwe 130haiti 47georgia 42Burkina F. 18Niger 85Mali 74Tanzania 114Uganda 119Madagascar 71Azerbaijan 8Latvia 67Albania 1Nigeria 86Kyrgyzstan 65Mozambique 80Kosovo 63RussianF. 98Moldova. R. 77Zambia 129ghana 44Paraguay 91Ukraine 120China 26Indonesia 52Botswana 15Serbia 102Morocco 79Yemen 128Macedonia 70Palestina 89Philippines 93Turkey 118Peru 92Armenia 5Malawi 72Bangladesh 9Sri Lanka 109Kenya 61Angola 3Nepal 81Tajikistan 113Senegal 101Burundi 20Rwanda 99Laos 66Brazil 16Puerto Rico 96Venezuela 126Denmark 33The Netherlands 82france 41United Kingdom 122Italy 56Ireland 54United States 123Austria 7Spain 108Israel 55Saudi Arabia 100Australia 6Belgium 11New Zealand 83Switzerland 111Canada 23Norway 87Sweden 110finland 40germany 43Japan 58United Arab Emirates 121CostaRica 28Mexico 76
Singapore 104
Fig. 2 Dendogram of nationsunder study
Does Good Governance Enhance Happiness
123
Author's personal copy

quantity. For instance, the indicator Technical Quality, the indicator ranges from negative
value to positive value showing the performance of the similar countries on this parameter
(Table 2).
It is a generally claimed that happiness is a political goal and the goal of giving
happiness to all people is of prime importance of the government. The findings presented
indicate governments to shift their priorities away from technical and democratic char-
acteristics to other social values. A very interesting pattern can be observed from the three
clusters which were formed on basis of economic position in the world. Cluster II repre-
sents developed countries whereas, cluster I and Cluster III represent developing and least
developed countries respectively.
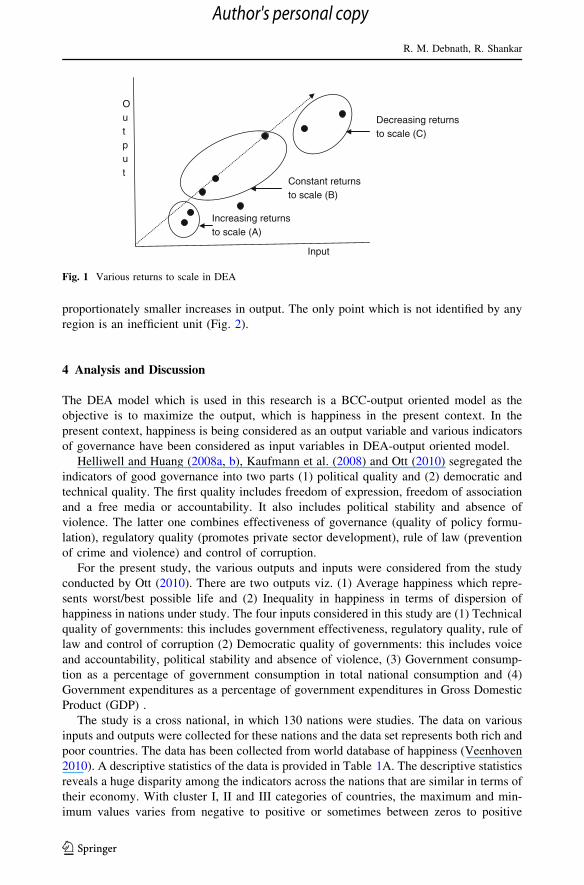
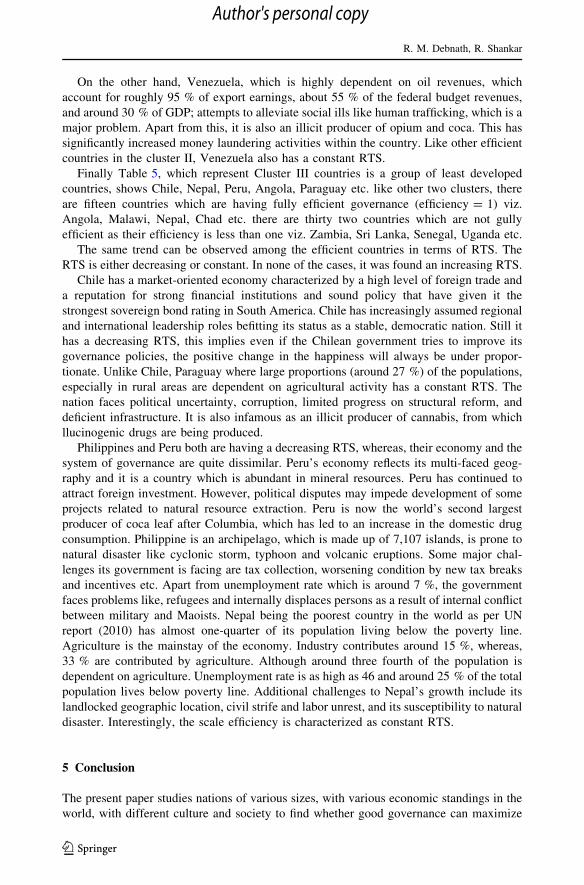
Table 3 represents the efficiency of the governance of nations along with their return to
scale. As it can be observed that countries like Algeria, Argentina, China, Cuba, Egypt etc.
are having efficiency = 1. The efficiency has been calculated by using Eq. 3. This implies
that in these countries, the efficiency of the government is 100 %. The last column shows
the returns to scale (RTS). It can be also observed that the RTS of efficient governments
are either constant viz. Algerira, Cuba etc. or decreasing viz. Argentina, Egypt etc. Sim-
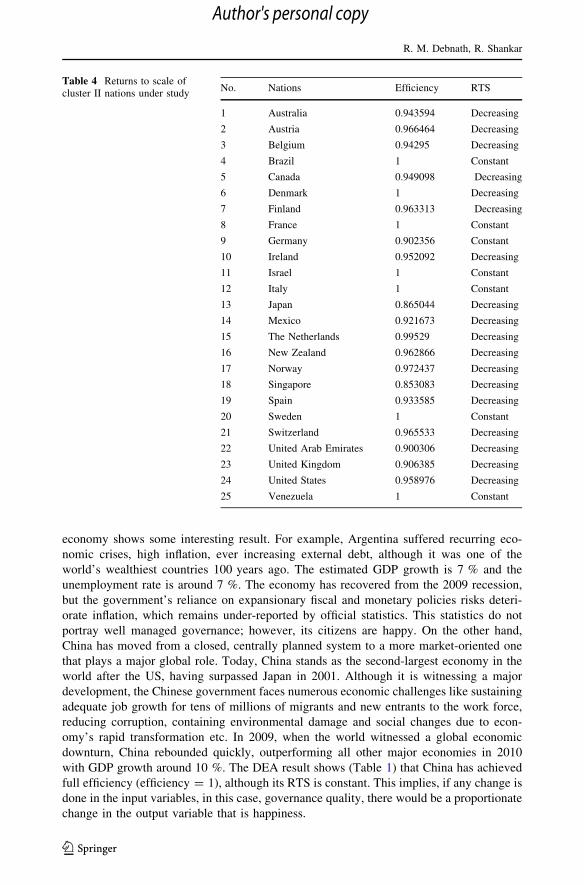
ilarly, Table 4 represents developed nations along with their efficiency and RTS. The same
trend can be seen as for the efficient government like Brazil, Denmark etc. are having
different RTS.
Table 5, which represents least developed countries like Angola, Cambodia, Chad,
Malawi, Nepal etc. the returns to scale also differ for efficient governments like Angola is
having a constant RTS whereas, Chile is witnessing a decreasing RTS. Most of the gov-
ernments are inefficient viz. Bangladesh is having 90 % efficiency; Georgia is having 86 %
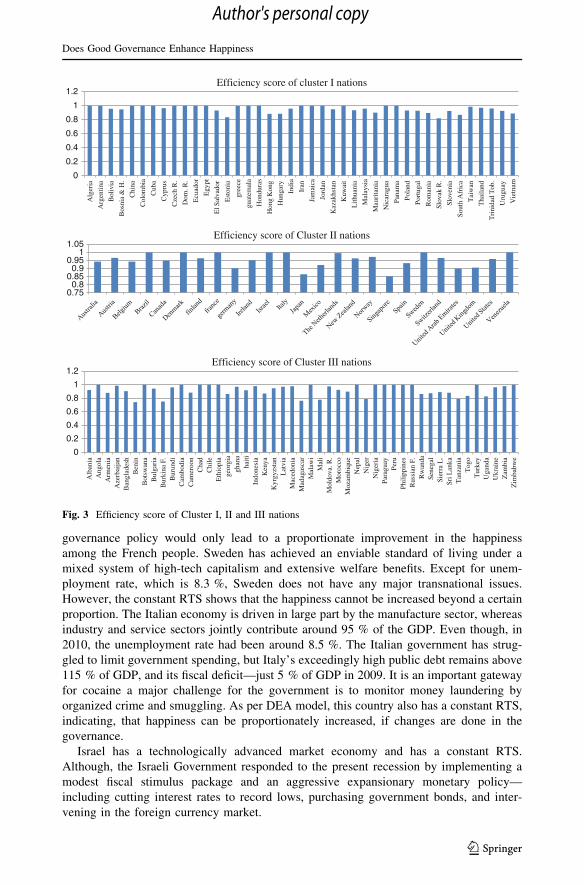
etc. Figure 3 gives a more compact picture of efficiency of nations clustered as I, II and III.
The cluster I nations, which have been exhibited in Table 3 shows few governments like
Argentina, China, Egypt, Greece, Poland, Panama etc., are fully efficient. All these
countries can be classified as developing nations. However, a close examination of the
Table 2 Descriptive statistics of the indicators used in the study
Technicalquality
Democraticquality
Governmentconsumption
Governmentexpenditure
Averagehappiness
Inequalityhappiness
Cluster I
Max 1.73 1.08 9.82 94.6 6.42 3.2
Min -0.99 -1.5 1.98 0 4.77 1.36
Average 0.035952381 -0.012380952 6.176904762 67.11428571 5.666904762 2.104761905
SD 0.66839559 0.734661599 1.796116827 20.83535881 0.449917919 0.337908399
Cluster II
Max 2.13 1.51 7.42 89.6 8 2.62
Min -1.08 -0.83 1.12 2.2 6.49 1.15
Average 1.3688 0.8292 4.2416 46.244 7.1496 1.728
SD 0.800841 0.610442 1.692619 23.78199 0.379257 0.331433
ClusterIII
Max 1.27 0.9 9.72 94.4 6.24 2.34
Min -1.59 -1.64 0 40.1 3.24 1.4
Average -0.55596 -0.47894 6.624894 77.56383 4.354255 1.815532
SD 0.520146 0.617067 2.329196 13.64996 0.54724 0.216744
R. M. Debnath, R. Shankar
123
Author's personal copy
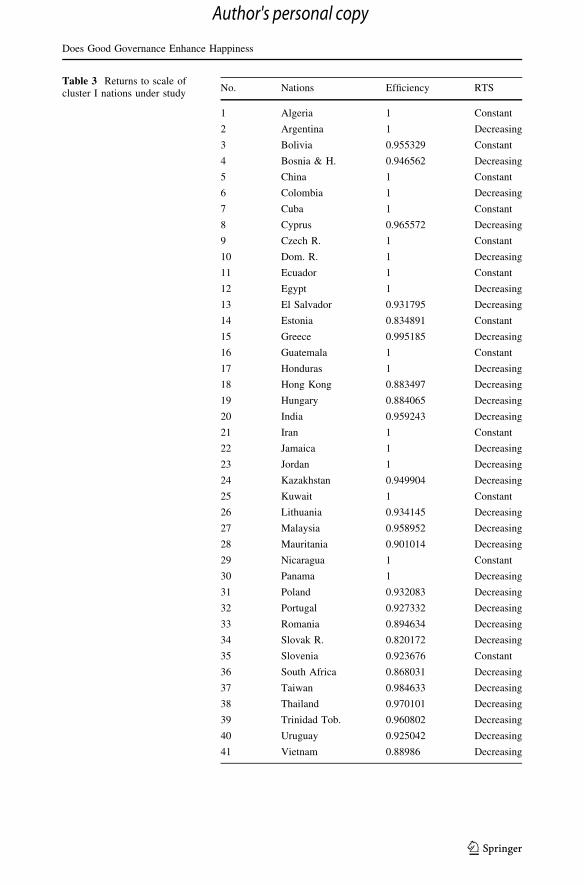
Table 3 Returns to scale ofcluster I nations under study
No. Nations Efficiency RTS
1 Algeria 1 Constant
2 Argentina 1 Decreasing
3 Bolivia 0.955329 Constant
4 Bosnia & H. 0.946562 Decreasing
5 China 1 Constant
6 Colombia 1 Decreasing
7 Cuba 1 Constant
8 Cyprus 0.965572 Decreasing
9 Czech R. 1 Constant
10 Dom. R. 1 Decreasing
11 Ecuador 1 Constant
12 Egypt 1 Decreasing
13 El Salvador 0.931795 Decreasing
14 Estonia 0.834891 Constant
15 Greece 0.995185 Decreasing
16 Guatemala 1 Constant
17 Honduras 1 Decreasing
18 Hong Kong 0.883497 Decreasing
19 Hungary 0.884065 Decreasing
20 India 0.959243 Decreasing
21 Iran 1 Constant
22 Jamaica 1 Decreasing
23 Jordan 1 Decreasing
24 Kazakhstan 0.949904 Decreasing
25 Kuwait 1 Constant
26 Lithuania 0.934145 Decreasing
27 Malaysia 0.958952 Decreasing
28 Mauritania 0.901014 Decreasing
29 Nicaragua 1 Constant
30 Panama 1 Decreasing
31 Poland 0.932083 Decreasing
32 Portugal 0.927332 Decreasing
33 Romania 0.894634 Decreasing
34 Slovak R. 0.820172 Decreasing
35 Slovenia 0.923676 Constant
36 South Africa 0.868031 Decreasing
37 Taiwan 0.984633 Decreasing
38 Thailand 0.970101 Decreasing
39 Trinidad Tob. 0.960802 Decreasing
40 Uruguay 0.925042 Decreasing
41 Vietnam 0.88986 Decreasing
Does Good Governance Enhance Happiness
123
Author's personal copy
economy shows some interesting result. For example, Argentina suffered recurring eco-
nomic crises, high inflation, ever increasing external debt, although it was one of the
world’s wealthiest countries 100 years ago. The estimated GDP growth is 7 % and the
unemployment rate is around 7 %. The economy has recovered from the 2009 recession,
but the government’s reliance on expansionary fiscal and monetary policies risks deteri-
orate inflation, which remains under-reported by official statistics. This statistics do not
portray well managed governance; however, its citizens are happy. On the other hand,
China has moved from a closed, centrally planned system to a more market-oriented one
that plays a major global role. Today, China stands as the second-largest economy in the
world after the US, having surpassed Japan in 2001. Although it is witnessing a major
development, the Chinese government faces numerous economic challenges like sustaining
adequate job growth for tens of millions of migrants and new entrants to the work force,
reducing corruption, containing environmental damage and social changes due to econ-
omy’s rapid transformation etc. In 2009, when the world witnessed a global economic
downturn, China rebounded quickly, outperforming all other major economies in 2010
with GDP growth around 10 %. The DEA result shows (Table 1) that China has achieved
full efficiency (efficiency = 1), although its RTS is constant. This implies, if any change is
done in the input variables, in this case, governance quality, there would be a proportionate
change in the output variable that is happiness.
Table 4 Returns to scale ofcluster II nations under study
No. Nations Efficiency RTS
1 Australia 0.943594 Decreasing
2 Austria 0.966464 Decreasing
3 Belgium 0.94295 Decreasing
4 Brazil 1 Constant
5 Canada 0.949098 Decreasing
6 Denmark 1 Decreasing
7 Finland 0.963313 Decreasing
8 France 1 Constant
9 Germany 0.902356 Constant
10 Ireland 0.952092 Decreasing
11 Israel 1 Constant
12 Italy 1 Constant
13 Japan 0.865044 Decreasing
14 Mexico 0.921673 Decreasing
15 The Netherlands 0.99529 Decreasing
16 New Zealand 0.962866 Decreasing
17 Norway 0.972437 Decreasing
18 Singapore 0.853083 Decreasing
19 Spain 0.933585 Decreasing
20 Sweden 1 Constant
21 Switzerland 0.965533 Decreasing
22 United Arab Emirates 0.900306 Decreasing
23 United Kingdom 0.906385 Decreasing
24 United States 0.958976 Decreasing
25 Venezuela 1 Constant
R. M. Debnath, R. Shankar
123
Author's personal copy
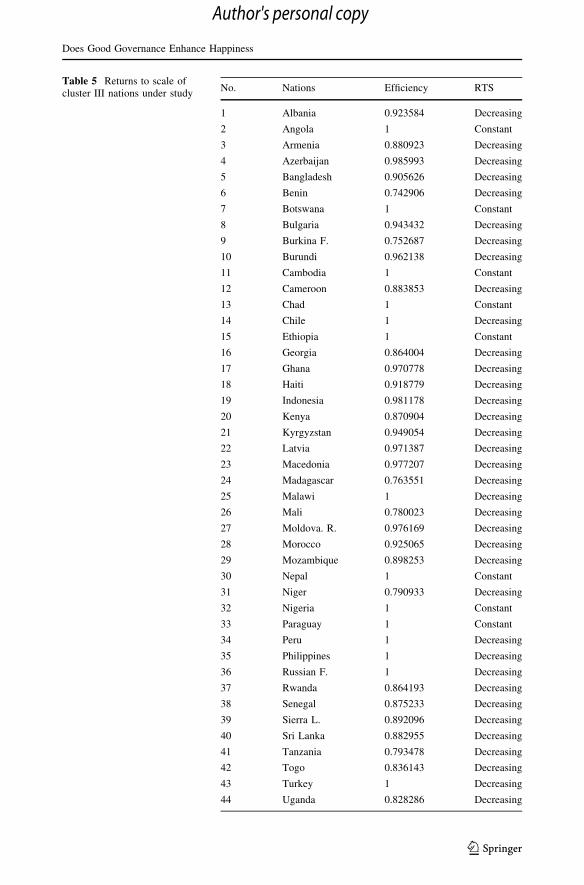
Table 5 Returns to scale ofcluster III nations under study
No. Nations Efficiency RTS
1 Albania 0.923584 Decreasing
2 Angola 1 Constant
3 Armenia 0.880923 Decreasing
4 Azerbaijan 0.985993 Decreasing
5 Bangladesh 0.905626 Decreasing
6 Benin 0.742906 Decreasing
7 Botswana 1 Constant
8 Bulgaria 0.943432 Decreasing
9 Burkina F. 0.752687 Decreasing
10 Burundi 0.962138 Decreasing
11 Cambodia 1 Constant
12 Cameroon 0.883853 Decreasing
13 Chad 1 Constant
14 Chile 1 Decreasing
15 Ethiopia 1 Constant
16 Georgia 0.864004 Decreasing
17 Ghana 0.970778 Decreasing
18 Haiti 0.918779 Decreasing
19 Indonesia 0.981178 Decreasing
20 Kenya 0.870904 Decreasing
21 Kyrgyzstan 0.949054 Decreasing
22 Latvia 0.971387 Decreasing
23 Macedonia 0.977207 Decreasing
24 Madagascar 0.763551 Decreasing
25 Malawi 1 Decreasing
26 Mali 0.780023 Decreasing
27 Moldova. R. 0.976169 Decreasing
28 Morocco 0.925065 Decreasing
29 Mozambique 0.898253 Decreasing
30 Nepal 1 Constant
31 Niger 0.790933 Decreasing
32 Nigeria 1 Constant
33 Paraguay 1 Constant
34 Peru 1 Decreasing
35 Philippines 1 Decreasing
36 Russian F. 1 Decreasing
37 Rwanda 0.864193 Decreasing
38 Senegal 0.875233 Decreasing
39 Sierra L. 0.892096 Decreasing
40 Sri Lanka 0.882955 Decreasing
41 Tanzania 0.793478 Decreasing
42 Togo 0.836143 Decreasing
43 Turkey 1 Decreasing
44 Uganda 0.828286 Decreasing
Does Good Governance Enhance Happiness
123
Author's personal copy

Panama is another country lists in Table 3 having efficient governance. Its dollar-based
economy rests primarily on a well-developed services sector that accounts for three-
quarters of GDP. As far as economic condition is concerned, about 30 % of the population
lives in poverty, around 7 % of the population is unemployed. Also official corruption
remains a major problem for the government. Surprisingly, the scale efficiency is
decreasing RTS. A unit is said to operate at decreasing returns to scale (DRS) if a pro-
portionate increase in all of its inputs results in a less than proportionate increase in its
outputs. This implies that, even if the Panama Government tries to improve its governance
policies, the happiness among its citizen would be increasing at a decreasing rate.
Cuba and Czech Republic are two countries which are fully efficient (efficiency = 1).
Both the countries are having a constant return to scale, which indicates that any changes in
the governance would bring a proportionate change in the happiness. A quick observation
to their respective governance, it can be observed that the government of Cuba heavily
depends on service sector, whereas, Czech government is dependent on export. With an
unemployment rate of 2 %, the Cuban government announced it would eliminate 500,000
state jobs by March 2011 and has expanded opportunities for self-employment. The Czech
government is having 7 % unemployment rate. Some of the challenges faced by the Czech
government are rapidly aging population, funding of the unsustainable health care system
etc.
The second cluster (Table 4) has countries like Australia, Brazil, Denmark, Germany,
Spain, UK, US etc., which are developed countries as per the definition of UN. Some of the
countries have achieved 100 % efficient viz. Brazil, Israel, Italy, Sweden etc. indicating
fully efficient governance, whereas, countries like Australia (0.9435), Austria (0.9664),
Belgium (0.9429), Japan (0.8650), Mexico (0.9214) etc. do not have fully efficient gov-
ernments, as their efficiency ratio are less than 1. A close look at their RTS reveals that
among the efficient nations, the scale varies. For example, Brazil, France, Italy, Israel,
Sweden are having a constant returns to scale, whereas, Denmark has a decreasing scale.
Denmark being a modern market economy is having a high-tech agricultural sector
along with world leading industry highly dependent on foreign trade. Danish economy is
characterized by extensive government welfare measures and an equitable distribution of
income. Within the European Union (EU), Denmark is among the strongest supporters of
trade liberalization. Brazilian government, being a fully efficient government, outweighs
all other South American countries and is expanding its presence in world markets. Over
the years, the government has steadily improved economic stability by building up foreign
reserves and reducing its debt. However, a constant RTS implies that an increase in the
governance quality, would lead to a proportionate change in the happiness among its
citizens.
France is also having a constant RTS although its GDP mainly depends on industry and
services and around 90 % of the populations is dependent on industry and services too. It is
the most visited country in the world and maintains the third largest income in the world
from tourism. The French government has tried to recover its economic policy by giving
stimulus as a remedial measure to the economic crisis. However, an improvement in the
Table 5 continuedNo. Nations Efficiency RTS
45 Ukraine 0.963866 Decreasing
46 Zambia 0.980298 Decreasing
47 Zimbabwe 1 Decreasing
R. M. Debnath, R. Shankar
123
Author's personal copy
governance policy would only lead to a proportionate improvement in the happiness
among the French people. Sweden has achieved an enviable standard of living under a
mixed system of high-tech capitalism and extensive welfare benefits. Except for unem-
ployment rate, which is 8.3 %, Sweden does not have any major transnational issues.
However, the constant RTS shows that the happiness cannot be increased beyond a certain
proportion. The Italian economy is driven in large part by the manufacture sector, whereas
industry and service sectors jointly contribute around 95 % of the GDP. Even though, in
2010, the unemployment rate had been around 8.5 %. The Italian government has strug-
gled to limit government spending, but Italy’s exceedingly high public debt remains above
115 % of GDP, and its fiscal deficit—just 5 % of GDP in 2009. It is an important gateway
for cocaine a major challenge for the government is to monitor money laundering by
organized crime and smuggling. As per DEA model, this country also has a constant RTS,
indicating, that happiness can be proportionately increased, if changes are done in the
governance.
Israel has a technologically advanced market economy and has a constant RTS.
Although, the Israeli Government responded to the present recession by implementing a
modest fiscal stimulus package and an aggressive expansionary monetary policy—
including cutting interest rates to record lows, purchasing government bonds, and inter-
vening in the foreign currency market.
0
0.2
0.4
0.6
0.8
1
1.2A
lger
ia
Arg
entin
a
Bol
ivia
Bos
nia
& H
.
Chi
na
Col
ombi
a
Cub
a
Cyp
rus
Cze
ch R
.
Dom
. R.
Ecu
ador
Egy
pt
El S
alva
dor
Est
onia
gree
ce
guat
emal
a
Hon
dura
s
Hon
g K
ong
Hun
gary
Indi
a
Iran
Jam
aica
Jord
an
Kaz
akhs
tan
Kuw
ait
Lith
uani
a
Mal
aysi
a
Mau
rita
nia
Nic
arag
ua
Pana
ma
Pola
nd
Port
ugal
Rom
ania
Slov
ak R
.
Slov
enia
Sout
h A
fric
a
Tai
wan
Tha
iland
Tri
nida
d T
ob.
Uru
guay
Vie
tnam
Efficiency score of cluster I nations
0.750.8
0.850.9
0.951
1.05Efficiency score of Cluster II nations
0
0.2
0.4
0.6
0.8
1
1.2
Alb
ania
A
ngol
a A
rmen
ia
Aze
rbai
jan
Ban
glad
esh
Ben
in
Bot
swan
a B
ulga
ria
Bur
kina
F.
Bur
undi
C
ambo
dia
Cam
eroo
n C
had
Chi
le
Eth
iopi
a ge
orgi
agh
ana
haiti
Indo
nesi
a K
enya
K
yrgy
zsta
n L
atvi
a M
aced
onia
M
adag
asca
r M
alaw
i M
ali
Mol
dova
. R.
Mor
occo
M
ozam
biqu
e N
epal
N
iger
N
iger
ia
Para
guay
Pe
ru
Phili
ppin
es
Rus
sian
F.
Rw
anda
Sene
gal
Sier
ra L
. Sr
i Lan
ka
Tan
zani
a T
ogo
Tur
key
Uga
nda
Ukr
aine
Z
ambi
a Z
imba
bwe
Efficiency score of Cluster III nations
Fig. 3 Efficiency score of Cluster I, II and III nations
Does Good Governance Enhance Happiness
123
Author's personal copy
On the other hand, Venezuela, which is highly dependent on oil revenues, which
account for roughly 95 % of export earnings, about 55 % of the federal budget revenues,
and around 30 % of GDP; attempts to alleviate social ills like human trafficking, which is a
major problem. Apart from this, it is also an illicit producer of opium and coca. This has
significantly increased money laundering activities within the country. Like other efficient
countries in the cluster II, Venezuela also has a constant RTS.
Finally Table 5, which represent Cluster III countries is a group of least developed
countries, shows Chile, Nepal, Peru, Angola, Paraguay etc. like other two clusters, there
are fifteen countries which are having fully efficient governance (efficiency = 1) viz.
Angola, Malawi, Nepal, Chad etc. there are thirty two countries which are not gully
efficient as their efficiency is less than one viz. Zambia, Sri Lanka, Senegal, Uganda etc.
The same trend can be observed among the efficient countries in terms of RTS. The
RTS is either decreasing or constant. In none of the cases, it was found an increasing RTS.
Chile has a market-oriented economy characterized by a high level of foreign trade and
a reputation for strong financial institutions and sound policy that have given it the
strongest sovereign bond rating in South America. Chile has increasingly assumed regional
and international leadership roles befitting its status as a stable, democratic nation. Still it
has a decreasing RTS, this implies even if the Chilean government tries to improve its
governance policies, the positive change in the happiness will always be under propor-
tionate. Unlike Chile, Paraguay where large proportions (around 27 %) of the populations,
especially in rural areas are dependent on agricultural activity has a constant RTS. The
nation faces political uncertainty, corruption, limited progress on structural reform, and
deficient infrastructure. It is also infamous as an illicit producer of cannabis, from which
llucinogenic drugs are being produced.
Philippines and Peru both are having a decreasing RTS, whereas, their economy and the
system of governance are quite dissimilar. Peru’s economy reflects its multi-faced geog-
raphy and it is a country which is abundant in mineral resources. Peru has continued to
attract foreign investment. However, political disputes may impede development of some
projects related to natural resource extraction. Peru is now the world’s second largest
producer of coca leaf after Columbia, which has led to an increase in the domestic drug
consumption. Philippine is an archipelago, which is made up of 7,107 islands, is prone to
natural disaster like cyclonic storm, typhoon and volcanic eruptions. Some major chal-
lenges its government is facing are tax collection, worsening condition by new tax breaks
and incentives etc. Apart from unemployment rate which is around 7 %, the government
faces problems like, refugees and internally displaces persons as a result of internal conflict
between military and Maoists. Nepal being the poorest country in the world as per UN
report (2010) has almost one-quarter of its population living below the poverty line.
Agriculture is the mainstay of the economy. Industry contributes around 15 %, whereas,
33 % are contributed by agriculture. Although around three fourth of the population is
dependent on agriculture. Unemployment rate is as high as 46 and around 25 % of the total
population lives below poverty line. Additional challenges to Nepal’s growth include its
landlocked geographic location, civil strife and labor unrest, and its susceptibility to natural
disaster. Interestingly, the scale efficiency is characterized as constant RTS.
5 Conclusion
The present paper studies nations of various sizes, with various economic standings in the
world, with different culture and society to find whether good governance can maximize
R. M. Debnath, R. Shankar
123
Author's personal copy

the happiness or not. As it has been discussed in the existing literature that happiness is
measurable and it is widely appreciable in different forms in various cultures. However,
here are few social and economic factors over which government can influence to maxi-
mize the happiness levels of the nation. Except Bhutan’s policy of Gross National Hap-
piness (GNH) and US’s Declaration of Independence to ‘the pursuit of happiness’, not
much has been firmly established by the other governments in terms of public policy. The
complexities of the research findings indicate that social and economic reforms to maxi-
mize the happiness are quite indistinct. Even though the governments adopt various pol-
icies to maximize the happiness, the change in the degree of happiness differs. For
instance, in the case of developed countries, the social and economic issues are rare. For
instance, unemployment, infant mortality rate, crime, corruption etc. are rare to be seen in
developed nations. However, the effective public policies are ineffective to increase the
happiness of the people. For example, a decreasing trend can be observed in Denmark. In
other countries happiness is constant. The unemployment rate is under control. However,
As a contrast, in some of the developing nations, like China, even though the government
is trying to deal with economic issues like unemployment, corruption migration, and health
problems etc., the happiness is increasing proportionately. Quite astonishingly, in Nepal,
where one quarter people live in below poverty line, is able to increase happiness pro-
portionately along with changes done in governance.
The inexistence of a clear classification of policies and regulations, it can be proposed
that only good governance cannot maximize the happiness. There are subjective indicators/
parameters, which could be important to measure the happiness. Therefore, the definition
of good governance must change from its existing characterization.
References
Andrews, F. M., & Withey, S. B. (1976). Social indicators of well-being: Americans’ perceptions of qualityof life. New York: Plenum Press.
Argyle, M. (2001a). The psychology of happiness (2nd ed.). Hove: Routledge.Argyle, M. (2001b). The psychology of happiness (2nd ed.). London: Routledge.Blanchflower, D. G., & Oswald A. J. (2000). Well-being over time in Britain and the USA. Mimeo.
Available at:http://www.dartmouth.edu/blnchr/papers/Wellbeingnew.pdf.Bolle, F., Okhrin, Y., & Vogel, C. (2009). A note on interdependent happiness. The Journal of Socio-
Economics, 38, 713–721.Borland, J., Hirschberg, J. G., & Lye, J. N. (2001). Data reduction of discrete responses: An application of
cluster analysis. Applied Economics Letters, 8, 149–153.Buchanan, W. (1953). How nations see each other. A study in public opinion. Urbana, USA: University of
Illinois Press.Cantril, H. (1965). The pattern of human concern. New Brunswick, New Jersey, USA: Rutgers University
Press.Clark, A. E., & Oswald, A. J. (1994). Unhappiness and unemployment. Economic Journal, 104, 648–659.Cooper, W. W., Seiford, L. M., & Tone, K. (2000). Data envelopment analysis. New York: Kluwer
Academic Publishers.Cooper, W. W., Thompson, R. G., & Thrall, R. M. (1996). Extensions and new developments.Cummins, R. A. (1993). Comprehensive quality of life scale for adults. Manual ComQol-A4. Australia:
Deakin University, School of Psychology.Cummins, R. (2000). ‘Objective and subjective quality of life: An interactive model’. Social Indicators
Research, 52(1), 55–72.D’Acci, L. (2011). Measuring well-being and progress. Social Indicator Research, 104, 47–65.Diener, E., & Biswas-Diener, R. (2002). Will money increase subjective well-being? A literature review and
guide to needed research. Social Indicators Research, 57, 119–169.
Does Good Governance Enhance Happiness
123
Author's personal copy
Diener, E., & Seligman, M. E. P. (2004). Beyond money: Toward an economy of well-being. PsychologicalScience in the Public Interest, 5(1), 1–31.
Diener, E., Shao, L., Smith, H. L., & Suh, E. M. (1995). National differences in reported subjectivewellbeing: Why do they occur? Social Indicators Research, 34, 7–32.
Diener, E., & Suh, E. (1997). Measuring quality of life: Economic, social and subjective indicators. SocialIndicators Research, 40, 189–216.
Diener, E., Suh, E. M., Lucas, R. E., & Smith, H. L. (1999). Subjective well-being: Three decades ofprogress. Psychological Bulletin, 125, 276–303.
Duncan, G. (2010). Should happiness-maximization be the goal of government? Journal of HappinessStudies, 11, 163–178.
Easterlin et al. (2010). The happiness-income paradox revisited. In Proceedings of the National Academy ofSciences, December 13, 2010.
Easterlin, R. A. (1974). Does economic growth improve the human lot? Some empirical evidence. In I. P. A.David & M. W. Reder (Eds.), Nations and households in economic growth: Essays in honor of MosesAbramovitz (pp. 89–125). New York: Academic Press.
Easterlin, R. A. (2003). Explaining happiness. Proceedings of the National Academy of Sciences of theUnited States of America, 100(19), 11176–11183.
Fare, R., Grosskopf, S., & Lovell, C. A. K. (1994). Production frontiers. Cambridge: Cambridge UniversityPress.
Farrell, M. J. (1957). The measurement of productive efficiency. Journal of the Royal Statistical Society.Series A, 120(3), 253–290.
Felce, D., & Perry, J. (1995). Quality of life: Its definition and measurement. Research in DevelopmentalDisabilities, 16(1), 51–74.
Ferriss, A. (2006), History of QOL studies from a sociological perspective. Social Indicators Research,76(53) ‘‘The quality-of-life (QOL) research movement: Past, present, and future’’, pp. 163–187.
Frey, B. S., & Stutzer, A. (2002a). Happiness and economics: How the economy and institutions affecthuman well-being. Princeton: Princeton University Press.
Frey, B. S., & Stutzer, A. (2002b). What can economists learn from happiness research. Journal of Eco-nomic Literature, 40, 402–435.
Gallup, G. P. (1976). Human needs and satisfactions: A global survey. Public Opinion Quarterly, 40,459–467.
Gomes, C. S., Marques, J., Pinto, M. L., Castro, E. A., Gomes, P. S., Gomes, G., et al. (2008). A multi-dimensionalidade do conceito de qualidade de vida. Sociedade e Territo0rio, 42, 137–146.
Graham, C., Eggers, A., & Sukhtankar, S. (2004). Does happiness pay? An exploration based on panel datafrom Russia. Journal of Economic Behavior & Organization, 55, 319–342.
Headey, B., & Wearing, A. (1992). Understanding happiness: A theory of subjective well-being. Melbourne,Australia: Longman Cheshire Pty Limited.
Helliwell, J., & Huang, H. (2008a). How’s your government? International evidence linking good gov-ernment and well-being. British Journal of Political Science, 38, 595–619.
Helliwell, J., & Huang, H. (2008). How’s your government? International evidence linking good govern-ment and well-being. British Journal of Political Science, 38, 595–619. Cambridge University Press.
Hilke, B., Jan, D., Christian, W., & Hao, Y. (2009). The China puzzle: Falling happiness in a risingeconomy. Journal of Happiness Studies, 10, 387–405.
Hirschberg, J. G., & D. J. Aigner (1987) A classification for medium and small firms by time-of-dayelectricity usage. In Papers and proceedings of the eight annual north american conference of theInternational Association of Energy Economists, Cambridge, MA, November 19–21, 1986,pp. 253–257.
Hirschberg, J. G., & Dayton, J. R. (1996). Detailed patterns of intra-industry trade in processed food. In: I M.Sheldon & P. C. Abbott (Eds.), Industrial organization and trade in the food industries (pp. 141–159).Boulder, Colorado: Westview Press.
Hirschberg, J. G., Maasoumi, E., & Slottje, D. J. (1991). Cluster analysis for measuring welfare and qualityof life across countries. Journal of Econometrics, 50, 131–150.
Hirschberg, J. G., Maasoumi, E., & Slottje, D. J. (2000a). Clusters of attributes and well-being in the US.Journal of Applied Econometrics. Wiley.
Hirschberg, J. G., Maasoumi, E., & Slottje, D. J. (2000b). The environment and the quality of life in theUnited States over time. Environmental Modelling and Software, 16(6), 525–532(8).
Hirschberg, J. G., & Slottje, D. J. (1994). An empirical Bayes approach to analyzing earnings differentialsfor various occupations and industries. Journal of Econometrics, 61, 65–79.
Inglehart, R. F. (1990). Culture shift in advanced industrial society. Princeton, NJ: Princeton UniversityPress.
R. M. Debnath, R. Shankar
123
Author's personal copy
Kacapyr, E. (2008). Cross country determinants of satisfaction with life. International Journal of SocialEconomics, 35(6), 400–416.
Kalmijn, W., & Veenhoven, R. (2005). Measuring inequality of happiness in nations: In search for properstatistics. Journal of Happiness Studies, 6, 357–396.
Kaufman, L., & Rousseeuw, P. J. (1990). Finding groups in data: An introduction to cluster analysis.New York: Wiley.
Kaufmann, D., Aart, K., & Massimo, M.(1999). Governance matters. World Bank Policy Research WorkingPaper 2196.
Kaufmann, D., Kraay, A., & Mastruzzi, M. (2008). Governance Matters VII: Aggregate and IndividualGovernance Indicators, 1996–2007. World Bank Policy Research Working Paper No. 4654, WorldBank 2008. Data available at: www.govindicators.org.
Kenny, C. (1999). Does growth cause happiness or does happiness cause growth? Kyklos, 52(1), 3–26.Layard, R. (2005a). Happiness: Lessons from a new science. London: Allen Lane.Layard, R. (2005b). Happiness: Lessons from a new science. New York: Penguin.Lepage, A. (2009). The quality of life as attribute of sustainability. The TQM Journal, 21(2), 105–115.McCall, S. (1975). Quality of life. Social Indicators Research, 2(2), 229–248.Michalos, A. C. (1991). Global report on student wellbeing, volume I: Life satisfaction and happiness.
New York, USA: Springer.Myers, D. G. (2004). Psychology. New York: Worth.Oswald, A. J. (1997). Happiness and economic performance. The Economics Journal, 107, 1815–1831.Ott, J. C. (2010). Good governance and happiness in nations: Technical quality precedes democracy and
quality beats size. Journal of Happiness Studies, 11, 353–368.Ramırez, J. C. de. P., & Tovar, L. S. (2002). ‘Significacion de la Calidade de Vida y Revitalizacion del
Espacio Urbano. Un Estudio de Caso. Fermentum, 34, 415–446.Ravallion, M., & Lokshin, M. (2000). Identifying welfare effects from subjective questions. Economica, 68,
335–357.Rhode, E., & Southwick, L., Jr. (1993). Variations in public and private university performance. Applica-
tions of Management Science, 7, 145–170.Sinauny-Stern, S., Mehrez, A., & Barboy, A. (1994). Academic departments efficiency via DEA. Computers
& Operations Research, 21(5), 543–556.Thanassoulis, E., & Dustan, P. (1994). Guiding schools to improved performance using data envelopment
analysis: An illustration with data from a local education authority. Journal of the OperationalResearch Society, 45(11), 1247–1262.
Tomkins, C., & Green, R. (1988). An experiment in the use of data envelopment analysis.Turksever, A. N. E., & Atalik, G. (2001). Possibilities and limitations for the measurement of the quality of
life in urban areas. Social Indicators Research, 53(2), 163–187.Veenhoven, R. (1993). Happiness in nations: Subjective appreciation of life in 56 nations. 1946–1992.
Rotterdam: Erasmus University Press.Veenhoven, R. (1996). Developments in satisfaction research. Social Indicators Research, 37, 1–46.Veenhoven, R. (1999). The four qualities of life. Journal of Happiness Studies, 1, 1–39.Veenhoven, R. (2004). Happiness as a public policy aim: The greatest happiness principle. In P. A. Linley &
S. Joseph (Eds.), Positive psychology in practice (pp. 658–678). Hoboken: Wiley.Veenhoven, R. (2005). Inequality of happiness in nations: Introduction. Journal of Happiness Studies, 6,
351–355.Veenhoven, R. (2007). Trend average happiness in nations 1946–2006: How much people like the life they
live. World Database of Happiness, Trend Report 2007-1. http://www.worlddatabaseofhappiness.Veenhoven, R. (2010). World database of happiness, item bank. Erasmus University Rotterdam.WHOQOL Group. (1995). Measuring quality of life. Available at: www.socialsciencegesis.de/en/social_
monitoring/social_indicators/EU_Reporting/index.htm.Winkelmann, L., & Winkelmann, R. (1998). Why are the unemployed so unhappy? Evidence from panel
data. Economica, 65, 1–15.World Bank. (1992). Governance and development. DC: Washington.
Does Good Governance Enhance Happiness
123
Author's personal copy
Copyright © 2022 FDOKUMEN