University planning, decentralization and resource allocation

NBER WORKING PAPER SERIES
DOES DECENTRALIZATION FACILITATE ACCESS TO POVERTY-RELATEDSERVICES? EVIDENCE FROM BENIN
Emilie CaldeiraMartial Foucault
Grégoire Rota-Graziosi
Working Paper 18118http://www.nber.org/papers/w18118
NATIONAL BUREAU OF ECONOMIC RESEARCH1050 Massachusetts Avenue
Cambridge, MA 02138June 2012
We thank the National Bureau of Economic Research (NBER), which has funded this project since2009. We are grateful to the Municipal Development Partnership (MDP) in Cotonou, with specialthanks to Hervé Agossou, for their warm welcome, and valuable assistance in collecting data, as wellas for their fruitful comments and discussions. We also thank the Benin National Institute of Statisticsand Economic Analysis, especially Cosmé Vodounou and Damien Mededji, for allowing us accessto EMICoV surveys. We thank Elias Potek (University of Montreal, Geography Dept.) for his outstandingwork in creating geographical maps in record time. We thank Simon Johnson (MIT) who acted notonly as a scientific mentor throughout this research e¤ort, but also as a valuable advisor. We warmlythank Michael Hiscox (Harvard University) for the valuable comments that helped make the paper'sfinal version stronger and Antoinette Sayeh (IMF) for handling the paper's policy concerns when itwas presented at the NBER conference in Zanzibar. We thank Odd-Helge FjeldStad (InternationalCentre for Tax and Development) and François Vaillancourt (University of Montreal) for all of theirconstructive suggestions. We are grateful to Leonard Wantchekon (Princeton University) and the participantsat the IREEP (Institut de Recherche Empirique en Economic Politique) conference, the CERDI (Centred'Etudes et de Recherche sur le Developpement International) seminar and the CIRANO workshop,where a preliminary draft of this paper was presented in November 2011. Finally, we acknowledgefinancial support from the NBER Program on African Successes, especially Elisa Pepe for her amazingsupport throughout this project. Any remaining errors are ours. The views expressed herein are thoseof the authors and do not necessarily reflect the views of the National Bureau of Economic Research.
NBER working papers are circulated for discussion and comment purposes. They have not been peer-reviewed or been subject to the review by the NBER Board of Directors that accompanies officialNBER publications.
© 2012 by Emilie Caldeira, Martial Foucault, and Grégoire Rota-Graziosi. All rights reserved. Shortsections of text, not to exceed two paragraphs, may be quoted without explicit permission providedthat full credit, including © notice, is given to the source.
Does Decentralization Facilitate Access to Poverty-Related Services? Evidence from BeninEmilie Caldeira, Martial Foucault, and Grégoire Rota-GraziosiNBER Working Paper No. 18118June 2012JEL No. D73,H41,H42,H52,H77,I38,O17
ABSTRACT
We study the effect of decentralization on the access to some poverty-related public services in Benin.Compiling panel data from local governments' accounts and from surveys on 18,000 Beninese householdsperformed in 2006 and 2007, our study suggests that decentralization has a positive overall effect onaccess to basic services. However, this effect appears to be nonmonotone following an inverted U-shapedcurve. It varies according to local jurisdictions' wealth and to the nature of basic services. Decentralizationin Benin contributes positively to the reduction of poverty by improving the average access to poverty-relatedservices. However, the devil is in the details, as decentralization seems to increase inequality amonglocal governments in terms of access. Another result relying on the success of decentralization in Beninis the prioritization of basic services, which differs among local governments according to their wealth.While the poorest jurisdictions neglect primary education, focusing more on access to drinking water,the richest ones get less attention to sewage services, since these are already provided at a sufficientlyhigh level.
Emilie CaldeiraCERDI-CNRS, Auvergne University65 bd François Mitterrand63000 [email protected]
Martial FoucaultPolitical Science DepartmentUniversity of MontrealCP 6128, succ. Centre-villeMontréal, QC, [email protected]
Grégoire Rota-GraziosiFiscal Affairs DepartmentInternational Monetary Fund700 19th Street, NWWashington, DC 20431and CERDI-CNRS, Auvergne [email protected]

1 Introduction
Over the past two decades, decentralization has been implemented by many developing coun-
tries, becoming a key element of the public sector reform. By bringing decision makers closer
to citizens, decentralization should alleviate information asymmetries, improve accountability,
and increase the efficiency of public goods provision. In developing countries, decentralization
is one of the main institutional reforms on international organizations’ and donors’ agendas to
enhance public governance and ultimately reduce poverty. This strategy has been in place for
a number of years, but has not undergone a systematic evaluation of its impact on well-being
and local governance. Therefore, now that several years have elapsed, it seems an appropriate
time to examine the success of decentralization in the struggle against poverty in sub-Saharan
Africa.
With this objective in mind, we analyze the effect of decentralization in Benin on access to
some poverty-related services, namely water, sanitation, refuse and sewage disposal, and pri-
mary education. Poverty is a multidimensional issue and basic health and education services
are fundamental human rights.1 Decentralization is, by definition, a transfer of competencies
to local governments, especially in the education and health sectors. These services do not
exactly correspond to the Samuelsonian definition of pure public good (nonexcludability and
nonrivalry). However, local and central governments share the responsibility for meeting funda-
mental rights in education and health. Whatever the means of producing such basic services, or
nature of relationships with providers, local decision-makers remain, in the last analysis, polit-
ically responsible (World-Bank, 2004) for achieving improvements in access to drinking water,
sanitation, and primary education. In a sense, our argument rests on how decentralization
facilitates access to high-quality services rather than on an investigation of how well publicly
provided local goods are delivered.
In regard to its democratization and decentralization processes, Benin is representative
of the African French-speaking countries. An ethnically fragmented country that has been
politically stable only since 2001, Benin began a transfer of competencies or authority to 77
local governments, called communes, in 1998. The decentralization process definitively took off
with local elections in 2002. Our analysis focuses on the 2006—2007 period, which corresponds
to a crucial time for democracy in Benin, with the 2006 national elections bringing Yayi Boni
1 Articles 25 and 26 of the Universal Declaration of Human Rights.
1

to power in place of Mathieu Kerekou, who had ruled the country for 29 years.2
By analyzing panel data from 77 Beninese communes for 2006 and 2007, we aim to shed
light on the following issues: (1) To what extent does decentralization, measured as the share
of local own-revenue in total local revenue for each commune modify access to basic public
services? Is this effect monotone with the degree of decentralization? (2) Does the decentral-
ization effect vary between communes according to their wealth? To answer these questions,
we compiled several databases: original public finance panel data, which concerns all Beninese
local governments, and the 2006 and 2007 Integrated Modular Survey on Household Living
Conditions (EMICoV), which covers a sample of 18,000 Beninese households throughout the
entire national territory and is representative at the commune level. We develop a consistent
econometric method, taking into account the potential endogeneity in the degree of decentral-
ization, heterogeneity of local governments, and inefficiency in estimating the effects of variables
having little within variance.
Our analysis suggests that, on average, decentralization increases access to basic public ser-
vices. However, this effect is not only nonmonotone, following an inverted U-shaped curve, but
its impact is also heterogeneous between poor and nonpoor communes. Decentralization’s effect
on access to poverty-related services is positive for sufficiently wealthy communes (measured
by higher quintiles of an asset-based measure of wealth), and becomes negative for the poorest
ones. Therefore, although decentralization succeeds in reducing nonmonetary poverty in Benin
by improving access to some basic services, the danger of higher inequalities between communes
remains.
A second important result is that communes seem to prioritize basic services. Distinguishing
local jurisdictions by their wealth allows us to shed light on significant differences in local
governments’ behaviors. While the poorest jurisdictions neglect primary education, focusing
more on access to drinking water, the richest ones get less attention to sewage services, since
they are already provided at a sufficiently high level. If the latter is not an issue, the former
casts some doubt on the efficiency of decentralization. A policy recommendation would be either
to recentralize primary education, or to provide additional conditional grants dedicated to this
specific sector.
The paper is structured as follows: Section 2 presents a review of the literature on the
impact of decentralization on service delivery and human development indicators in developing
2 In the spring of 2011, President Yayi Boni was reelected for his second and last mandate.
2

countries. Section 3 portrays the process of decentralization in Benin. Section 4 describes our
econometric framework. Section 5 presents our results. Section 6 concludes.
2 The impact of decentralization on services delivery and hu-
man development indicators: A review of the literature
A huge portion of economic literature focuses on decentralization in developing countries. A
brief review of this literature addresses the strengths and weaknesses of decentralization to
reduce poverty, or at least to increase the efficiency of public goods provision. Many benefits of
decentralization are claimed in the fiscal federalism literature, most of them related to the fact
that decentralization brings decisions closer to citizens, alleviating information asymmetries, and
improving local governments’ accountability. The fiscal federalism literature has largely stressed
the economic efficiency of intergovernmental competition in providing local public goods. If
such a normative prescription seems to fit well with developed countries, this issue remains
more complex for developing countries where the “voting by feet” mechanism is not so relevant.
Thus, the logic of decentralization raises some intriguing issues in developing countries that we
can summarize around two perspectives: (a) Why does decentralization entail a better provision
of local public goods? (b) What are the limits of decentralization in such countries, given their
institutional and geographical constraints?3
A demand-side argument in favor of decentralization is derived from the existence of infor-
mation asymmetries. Indeed, the seminal idea that decentralization may improve the provision
of public services when local governments have an informational advantage goes back at least
as far as Hayek (1948) and Oates (1972). Since local decision-makers have a better knowledge
of local preferences, decentralization is expected to improve the level and quality of public ser-
vices. This informational gain may induce a better targeting of the poorest populations in a
country, as indicated by the research conducted by Alderman (2002) in Albania, Bardhan and
Mookherjee (2005) in West Bengal, and Galasso and Ravallion (2005) in Bangladesh.
On the supply side, decentralization should enhance the accountability of policymakers. De-
centralization allows for a better provision of public goods and a better matching between public
policies and local needs. Several authors have established such a link: Bird and Rodriguez (1999)
3 Important literature has been devoted to analyzing the benefits of decentralization on human development
indicators in the context of the Millennium Objectives. The final impact of decentralization on growth has been
studied, for instance, by Zhang and Zou (1998), Wollera and Phillips (1998), Xie, Zou, and Davoodi (1999), Lin
and Liu (2000), Akai and Sakata (2002), and Martinez-Vazquez and McNab (2003).
3
in the Philippines (health, primary education, housing, and infrastructure); Faguet (2004) in
Bolivia (education and social services); Galiani, Gertler, and Schargrodsky (2008) in Argentina
(education); Robalino, Picazo, and Voetberg (2001) on a panel discussing low- and high-income
countries from 1970 to 1995 (mortality rate); and Enikolopov and Zhuravskaya (2007) on 75
developing and transition countries for 25 years (DPT immunization,4 infant mortality, illiter-
acy rate, and pupil-to-teacher ratio). Other studies mitigated the impact of decentralization.
For instance, Azfar and Livingston (2010) find little evidence of better provisions in govern-
ment services by local governments in Uganda; For Winkler and Rounds (1996), the transfer of
education competencies in Chile reduced the scores of cognitive tests.
Beyond improving the matching of public policies with local preferences, decentralization
is also considered as an essential support of democratization. Thus, the governance of local
public goods is expected to strengthen accountability under the strong assumption of well-
informed voters, mobility of citizens, and participation into the political market. Seabright
(1996) considers allocations of power within local and central governments as alternative means
of motivating governments to act in the interests of citizens. This author shows that although
centralization entails benefits from policy coordination, it also induces some costs in terms of
diminishing accountability. Moreover, interjurisdictional competition may enhance accountabil-
ity: local citizens encourage incumbents to increase the efficiency of public spending through a
“vote with feet” (Tiebout, 1956) or a “yardstick competition” (Salmon, 1987, Besley and Case,
1995).5 Few studies have examined the relevance of this phenomenon in developing countries:
Arze, Martinez-Vasquez, and Puwanti (2008) suggest a process of yardstick competition be-
tween local governments in Indonesia; Caldeira, Foucault, and Rota-Graziosi (2008) establish
the existence of strategic complementarities of local public goods among Beninese communes.
However, by expanding the decision space of local governments, decentralization may in-
crease corruption. Bardhan and Mookherjee (2000) point out the theoretical ambiguity of the
importance of relative capture at the local and national levels. Huther and Shah (1998), Baren-
stein and de Mello (2001), and Fisman and Gatti (2002) find a negative relationship between
4 Diphtheria, Pertussis and Tetanus.5 Citizens can “vote with their feet,” that is, move to a nearby jurisdiction to obtain the public service-tax
package they prefer so that local governments compete to attract people and increase their tax bases. Even in the
absence of population mobility, in the context of informational asymmetries between voters and politicians, voters
can use the performance cues of other governments as benchmarks for judging whether or not their representative
wastes resources and, consequently, whether or not he/she deserves to remain in office. Thus, an action chosen by
a politician in one jurisdiction affects the informational set of imperfectly informed voters in other jurisdictions,
forcing neighboring politicians to compete in order to avoid being signaled as bad incumbents, so that they might
remain in office.
4
fiscal decentralization and corruption for several panels of countries.6 In contrast, Reinikka
and Svensson (2004) highlight the capture of school grants by local officials in Uganda. At
the macroeconomic level, Treisman (2000) and Fan, Lin, and Treisman (2009) conclude that
federal states are more corrupt. Using data on 154 countries, Treisman (2000) also suggests
that more tiers of government induce higher perceived corruption, less effective provision of
public health services, and lower adult literacy, especially in developing countries. Prud’homme
(1995) stresses several additional pitfalls of decentralization in developing countries, namely
the increase in interjurisdictional disparities, the jeopardizing of macroeconomic stability, the
ethnic bias of local elections, and low capacities of local bureaucracies.
Another supply-side argument against decentralization concerns the risk of diseconomies
of scale, or at least a loss of scale economies. However, many of the public goods in ques-
tion are community- and site-specific, and it is often possible to exclude nonresidents. Rural
communities of poor countries, in particular, are often face-to-face, and social norms sharply
distinguish “outsiders” from ”insiders,” especially with respect to entitlement to community
services (Bardhan, 2002).
Finally, decentralization is generally viewed as a trade-off between autonomy and ac-countability,
between costs of coordination and better provision of public goods, and be-tween preference
matching and externalities. Besley and Coate (2003) and Lockwood (2002) confirm Oates’
insights by showing that the relative performance of centralized and decentralized provisions
of public goods depends upon spillovers and differences in tastes for public spending between
jurisdictions.7
To our knowledge, no attention has been paid to the consequences of decentralization on
well-being conditions in French-speaking African countries. Our paper fills this gap by focusing
on Benin where microdata (household survey) and macrodata (local public finance) have been
combined for the first time.
6 Fisman and Gatti (2002) use legal origin as an instrument for decentralization.7 Competition among jurisdictions to attract mobile capital is a way to discipline governments, motivating
them to invest more in infrastructure, reduce waste and corruption, and spend less on nonproductive public
goods. But, Cai and Treisman (2005) emphasize that the required assumptions (perfect mobility, perfect local
autonomy, etc.) are often unrealistic, and capital mobility may even weaken the discipline of the poorly-endowed
units.
5

3 An overview of Benin
3.1 The democratization process
In regard to its democratization and decentralization processes, Benin belongs to the group of
French-speaking African countries, which count 20 countries and around 243 million inhabitants
in 2009. Benin is also a lower income country with an estimated per capita income of US$740
in 2011 and a ranking of 134 out of 169 countries in the Human Development Index (2010). Its
population (8.93 million inhabitants in 2009) is fragmented into 42 different ethnic groups, the
most prominent being the Fon and the Adjas in the South, the Baribas and the Sombas in the
North, and the Yorubas in the Southeast.
Since its independence on August 1, 1960, the political history of Benin has been chaotic. A
succession of military governments ended in 1972, with the last military coup–led by Mathieu
Kerekou–and the establishment of a government based on Marxist-Leninist principles. A move
to democracy began in 1989. Two years later, as a result of free elections, the former Prime
Minister, Nicephore Soglo, became president. Kerekou regained power in 1996 with some elec-
toral fraud. With the political support of the North of the country (Alibori, Atacora, Borgou,
and Donga), he won subsequent elections in 2001. Having served two terms, and being over
70 years old, he was ineligible to run in the presidential elections of 2006. He was succeeded
by Thomas Yayi Boni, an independent political outsider. In March 2007, President Yayi Boni
strengthened his position after the legislative elections in which his coalition, “Force Cauris pour
un Benin Emergent” (FCBE), won the largest number of seats (35 out of 83) and negotiated a
progovernment majoritarian coalition in Parliament with seven minor parties. With a strong
electoral basis from the northern communes he was reelected in 2011 with the pivotal support
of the southern part of the country (Atlantique, Collines, and Mono).
3.2 The decentralization process
The decentralization process in Benin began in 1998 through the transfer of several com-
petencies to local Beninese jurisdictions, called communes. While an elected local govern-ment
manages each commune, a representative of the central government is in charge of the départ-
ments to which the communes belong. Local elections were held in 2002 and 2007. Benin has 77
6

communes in 12 départements.8 As in many French-speaking African countries,9 the territorial
shape of Beninese communes results from colonial history and not from any economic consider-
ation with regard to efficiency in public goods provision. For instance, Tanguieta stretches out
across more than 5,460 square kilometers for a population of 62,321 inhabitants in 2008 (11.4
inhabitants per square kilometer), while Akro-Misserete contains 98,961 inhabitants on only 79
square kilometers (1,252 inhabitants per square kilometer).
In January 1999, Law 97-029 has defined the competencies transferred from the central
government to the 77 communes. Their scope was large, ranging from elementary schooling to
economic development, and including transport infrastructure, environmental programs, health
services, social goods, tourism, security, and cultural activities. We may distinguish four kinds of
competencies: exclusive local competencies, shared competencies, delegated competencies, and
specific competencies. For delegated competencies, local jurisdictions act as representatives of
the central state. Specific competencies concern some communes that have particular statuses
(Cotonou, Porto-Novo, and Parakou). Table 1 summarizes these competencies.
Table 1: Beninese communes ’ competencies
Type of competencies
Exclusive local competencies
Transport infrastructure: maintenance of local roads, public lightings.
Shared competencies
Hygiene conditions: sewage and refuse disposal (latrines, septic tanks...), drinking water.
Education: construction and maintenance of public primary schools, adult literacy, cul-
tural public infrastructures, sports, and leisure.
Delegated competencies
Public records office, security, publication and application of laws.
Specific competencies
Secondary schools, security, communication.
Source: Law ◦97− 029 of Benin Republic, January 15th, 1999.
The distinction between shared and exclusive local competencies is largely subjective, linked
8 Communes are themselves divided into 546 districts.9 Burkina Faso counts 351 communes for 16.2 million inhabitants, while Mali has 703 communes for 15 million
inhabitants.
7
to our interpretation of the relevant law and of observed practices in this country. First, the
transfer of competencies is obviously progressive and may take some time. For instance, the
effective role of communes in water and sanitation is limited. The SONEB (Societé Nationale
des Eaux du Benin) is a public enterprise still in charge of drinking water supply and sewage
disposal in urban areas. A deconcentrated service, the General Direction of Water, remains
essential in rural areas. Secondly, some competencies, such as primary education, require some
technical and financial support from the central government.
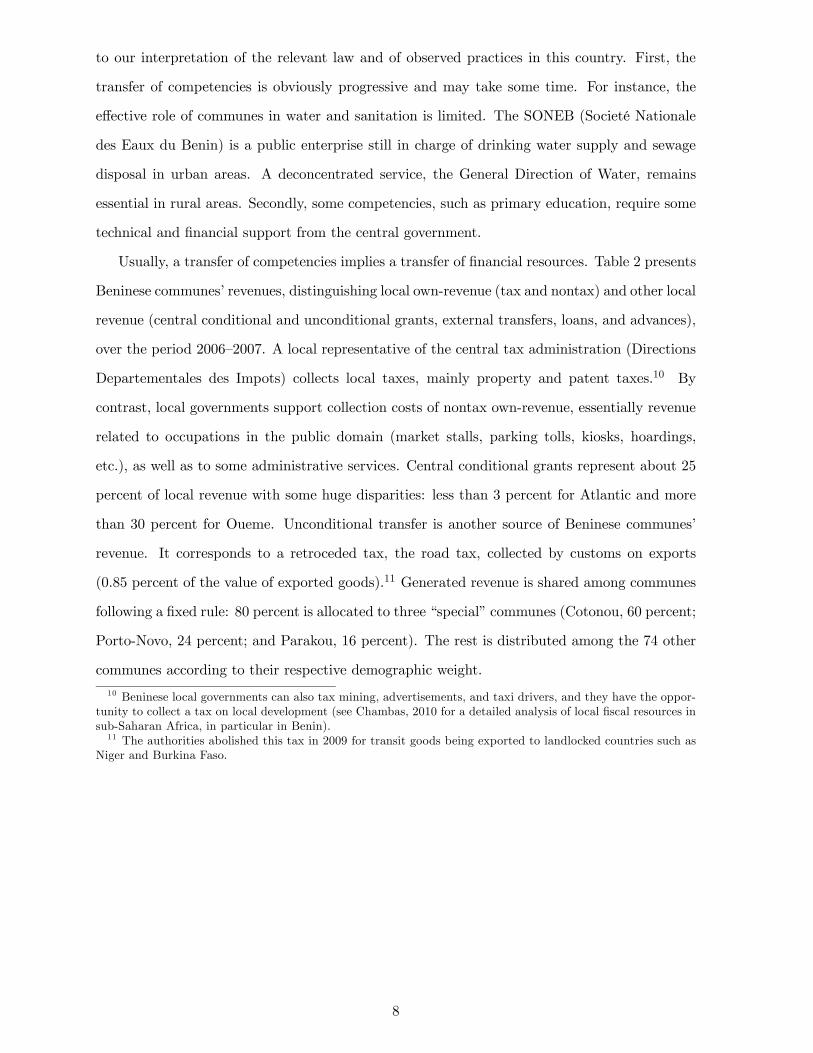
Usually, a transfer of competencies implies a transfer of financial resources. Table 2 presents
Beninese communes’ revenues, distinguishing local own-revenue (tax and nontax) and other local
revenue (central conditional and unconditional grants, external transfers, loans, and advances),
over the period 2006—2007. A local representative of the central tax administration (Directions
Departementales des Impots) collects local taxes, mainly property and patent taxes.10 By
contrast, local governments support collection costs of nontax own-revenue, essentially revenue
related to occupations in the public domain (market stalls, parking tolls, kiosks, hoardings,
etc.), as well as to some administrative services. Central conditional grants represent about 25
percent of local revenue with some huge disparities: less than 3 percent for Atlantic and more
than 30 percent for Oueme. Unconditional transfer is another source of Beninese communes’
revenue. It corresponds to a retroceded tax, the road tax, collected by customs on exports
(0.85 percent of the value of exported goods).11 Generated revenue is shared among communes
following a fixed rule: 80 percent is allocated to three “special” communes (Cotonou, 60 percent;
Porto-Novo, 24 percent; and Parakou, 16 percent). The rest is distributed among the 74 other
communes according to their respective demographic weight.
10 Beninese local governments can also tax mining, advertisements, and taxi drivers, and they have the oppor-
tunity to collect a tax on local development (see Chambas, 2010 for a detailed analysis of local fiscal resources in
sub-Saharan Africa, in particular in Benin).11 The authorities abolished this tax in 2009 for transit goods being exported to landlocked countries such as
Niger and Burkina Faso.
8
Table 2: Average composition of Beninese communes per capita revenue (CFAF)
Average level Percentage of total resources
Total local revenue 2,175 100
Own-revenue 1,137 52
Local non-tax own-revenue 623 29
Local tax own-revenue 514 23
Other local revenue 1,038 48
Unconditional central grants 225 11
Conditional central grants 571 26
External transfers 225 10
Loans and advances 17 1
Source: Beninese Ministry of Finance and Economy.
Beninese communes are characterized by a low average level of per capita revenue with
about 2,200 CFAF (US$4.7). Moreover, important inequalities exist among communes: the
revenue per capita of the 20 poorest communes represents only 50 per cent of the revenue of
the five richest ones. Local governments’ revenues also differ in their composition. For instance,
Parakou and Porto-Novo, despite having similar per capita revenues (around 6,500 CFAF), have
50 and 35 percent of local own-revenue, respectively.
9

Alibori
Borgou
Atakora
Collines
Donga
Zou
Mono
Kouffo
Plateau
AtlantiqueOuémé
Littoral
8
4
2
1
6
3
9
7
5
24
22
2610
17
11
18
66
67
63
68
13
14
73
21
64
65
19
61
2015
23
37
16
25
77
35
27
32
76
12
58
62
60
75
29
54
74
31
72
28
41
40
44
33
48 5039
47
3046
38
70
43
59
7169
5551
57
5349
Littoral
OuéméAtlantique
Plateau
Kouffo
Mono
Zou
Donga
Collines
Atakora
Borgou
Alibori
8
4
2
1
6
3
9
7
5
24
22
2610
17
11
18
66
67
63
68
13
14
73
21
64
65
19
61
2015
23
37
16
25
77
35
27
32
76
12
41 58
62
60
44
75
29
54
74
72
28
40
33
48 5039
47
3046
38
70
43
59
7169
5551
57
525349 0 50 10025 Kilometers
2006 2007
Source: http://www.gadm.org/country; Author's calculations
73 61
37
77
35
32
76
28
41
58
72
62
6040
44
75
29
33
54
4850
39
74
47
3031
38
70
34
43
45
7169
55
51
42
53
46
59
57
52
4956
36
64
No data
0.06 - 0.25
0.25 - 0.40
0.40 - 0.55
0.55 - 0.75
0.75 - 0.99
73 61
37
77
35
32
76
28
72
41
58
62
6040
44
75
29
33
54
4850
39
74
47
3031
38
70
34
43
45
7169
55
51
42
46
59
57
52 53
49
64
56
36
Map 1: Share of local own-revenue by commune
Regarding our criteria of financial autonomy, Benin is characterized by strong geographical
disparities (see Map 1) where South and North-East communes are able to collect more own-
revenue.
3.3 Local public goods provision and poverty
Since 1999, Benin is involved in a national strategy aimed at reducing poverty for a human sus-
tainable development through its successive Growth and Poverty Reduction Strategy (GPRS).
The main objective of the latest GPRS for the 2011—2015 period is the improvement of the
living conditions of the population with specific attention to water, basic sanitation, primary
education, and primary health care sectors in line with the Millennium Development Goals
(MDGs). Poverty, which is a general state of deprivation, is multidimensional. It is usually
associated with conditions under which people live. Poverty may be viewed in either absolute
or relative terms. Absolute poverty is a situation in which a person or group of persons is
unable to satisfy the most basic and elementary requirements of human survival in terms of
good nutrition, sanitation, transport, health, education, and recreation.
10

Several approaches exist which enable us to appreciate the level of poverty in Benin. Based
on the monetary approach, the proportion of poor people in Benin in 2009 is estimated at 35.21
percent, which means that more than one of every three persons is living below the subsistence
level (2011—2015 GPRS). An alternative approach involves looking at the nonmonetary poverty,
based on a composite index including variables of household living conditions and property or
assets. This measure stated that 30.84 percent of the Beninese population is poor in terms of
subsistence and property in 2009. A geographical cleavage between rural and urban communes
seems to matter. Indeed, urban communes located in the Littoral, Collines, and Oueme de-
partments display a rate of poverty of 13, 17, and 19 percent respectively, namely two times
less that the Beninese average. A final and crucial dimension of poverty in developing countries
concerns the dynamic trend of poverty mobility. Availability of data does not allow for a robust
discussion regarding the extent to which the implementation of national and local public policies
has positively affected the reduction of poverty. The current situation remains ambiguous. For
instance, between 2006 and 2007, income poverty fell by roughly 4 percentage points, versus
2.4 points in the case of nonincome poverty. On the other hand, between 2007 and 2009, in-
come poverty rose by 1.9 percentage points. This increase in income poverty between 2007 and
2009 is the result of the effects of the economic and financial crises, which caused household
consumer spending to fall. Nonincome poverty registered a substantial decline of 9 percentage
points, falling from 39.6 percent in 2007 to 30.85 percent in 2009. This decline is the result of
various actions taken by the government, during the period 2007–2009, to improve access to
basic social services. In particular, these actions involved the construction of water points and
school infrastructure. Such policies have not only been implemented at the central level, but
are also the responsibility of local governments when they have legal competencies for providing
local poverty-related goods.
In order to tackle the methodological problems resulting from an overly broad definition
of poverty, we have chosen an approach that confines poverty-related issues to five main basic
services: toilet facilities, drinking water, sewage, garbage, and primary education. In this way,
we are able to assess the impact of decentralization on major dimensions of poverty issues.
11
4 Econometric framework
In this section, we present our empirical strategy. We first test the average effect of de-
centralization on access to poverty-related services. We then assess its distributional effect
between jurisdictions by distinguishing communes according to their wealth.
4.1 Data
We use several sources of information. The Beninese Ministry of Finances and Economy pro-
vided us with the communes’ accounts. The 2006 and 2007 Integrated Modular Surveys on
Household Living Conditions (EMICoV) contain information concerning individual education
level, household consumption and wealth, and access to several local public goods. They cover a
sample of 18,000 Beninese households across the entire national territory. The sample includes
7,440 urban households and 10,560 rural households.12 The major uniqueness of these surveys
lies in their representative character at the commune level, allowing us to measure aggregated
and distributional indicators at the study level as described below. Data concerning population,
urbanization rate, and ethnic fragmentation are drawn from the General Population and Hous-
ing Census in Benin (1992 and 2002) and 77 communes’ monographs provided by the European
Union (Programme d’Appui au Démarrage des Communes).
4.1.1 Testing the average effect of decentralization on access to basic services
Our empirical analysis focuses on universal basic needs, setting aside any normative consider-
ations in terms of welfare. It appears more relevant to study actual access to public services
than ultimate effects on individual well-being, which may depend on many factors outside lo-
cal governments’ control. We consider several basic services which have been assessed through
the EMICoV surveys: toilet facilities, water access, refuse and sewage disposal, and primary
education. Table 3 gives the detailed list of indicators, denoted by , for each kind of service.
12 This sample is a stratified one, selected in two stages: stratification was achieved by separating every
commune into urban and rural areas.
12

Table 3: Indicators of basic services access
Basic services, Indicators
Toilet facilities
- Share of households having access to a toilet or latrine facility,
- Type of toilet facility (no facility, bucket/pan, latrine with composting, suspension
latrine, non-flagged pit latrine, non-ventilated pit latrine, ventilated pit latrine, own
flush toilet, flush toilet),
Water access
- Share of households having access to drinking water,
- Source of drinking water (rainwater, rainwater in tanker truck, river, pond, protected
spring, non-protected well, protected well, borehole with manual pump, borehole with
automatic pump, public tap, piped somewhere, piped into residence),
Refuse disposal
- Share of households having access to refuse disposal facilities,
-Type of refuse disposal (nature, courtyard, burning, burying, rubbish dump, collec-
tion truck (NGO), collection truck (public)),
Sewage disposal
- Share of households having access to sewage disposal facilities,
- Type of sewage disposal (nature, courtyard, well, grid/downstream, open pipe waste,
covered pipe waste, draining),
Primary education
- Primary school enrollment for children aged 6 to 11, .
Source: EMICoV surveys, 2006 and 2007.
These indicators are all measured at the household level except for education indicators,
which require individual data (level of education of the respondent). To assess public services
access we use two indicators: the first measures the share of households or individuals having
access to the service (quantity) and the second reflects the qualitative scale of the provided
service (quality). By using these two measures, we are able to capture, in a comprehensive way,
how the decentralization has or has not facilitated access to poverty-related services. Reasoning
only on the quantity will be fallacious, as such a measure does not reveal to what extent local
citizens have benefited from an improvement of the quality of local public goods.
To better understand how quantitative and qualitative variables have been computed, let us
describe the first indicator, namely toilet facilities. The EMICoV survey provides the share of
households having access to a toilet. On average, 23.7 percent of Beninese households claim to
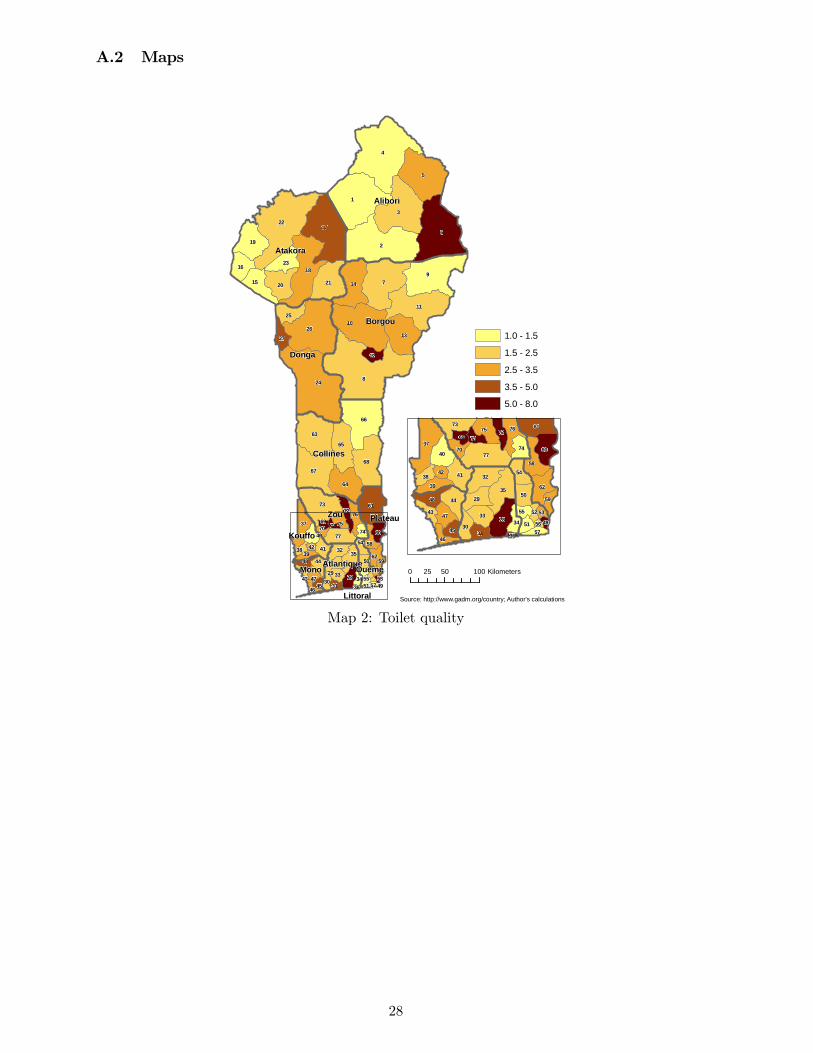
have a toilet facility (Table 4). The quality of the toilet measured by the scale in Table 3 takes
the value 1 for no facility to 9 for a flush toilet. Using responses from EMICoV respondents, we
13
compute an average index at the commune level which indicates that households in only one
commune (Toucountouna) have no toilet facilities, and 10 percent of the population has at least
nonflagged pit latrines. As depicted on Map 2, only 6 communes out of 77 converge towards the
best quality of toilets with a score superior to 6, i.e., those including either nonventilated pit
latrines, ventilated pit latrines, or flush toilets. As local governments are in charge of sanitation
facilities, decentralization should produce more efficient and equitable service delivery by making
better use of knowledge of local needs. The same coding procedure applies for the four other
indicators. Sewage and garbage facilities are respectively depicted on Maps 3 and 4. We observe
a small variance for every basic service among jurisdictions, with the exception of Segbana,
which displays the highest level of sewage and garbage disposal and drinking water in the
region (Alibori). One explanation for this discrepancy is linked to the development of hydraulic
plans (DED and PADEAR-DANIDA projects). There exist 67 drillings and 54 modern shafts
that allow the center to be served by the water supply network (SONEB). Map 5 illustrates
the diversity of quality for sources of drinking water. Surprisingly, communes located on the
littoral with easy access to seawater are not necessarily those which benefit from high-quality
access to drinking water.
[Insert Map 2, 3, 4, 5]
In sum, combining consolidated household data on access to services, and the nature of
locally provided public good quality to local public finance offers a new avenue for evaluating
the impact of decentralization in both dimensions.
4.2 Empirical models
The degree of decentralization, denoted by , is the share of local own-revenue in a given
commune’s total revenue. This measure is used in the literature as an indicator of financial
autonomy, and also allows us to approximate the accountability of local governments. Indeed,
while central transfers are often opaque to taxpayers, who are then unable to judge the efficiency
of local policies, the link between local taxes and local public services provided is more immediate
and may provide an incentive for local officials to improve their efficiency.
We add several control variables. Time dummies, denoted by , serve as controls for omitted
explanatory variables that vary over time, but remain constant between communes, and can
14

influence the share of local governments’ own-revenue. We also control for explanatory variables
that may be correlated with the degree of decentralization, and that vary across both communes
and time. Since we consider the effect of local revenues’ composition, and not the impact of
local public spending itself, we introduce communes’ per capita public spending, denoted by
. We then are able to see if a higher degree of decentralization affects the efficiency of
local policies, given the level of local public spending. This control variable is essential because
the communes’ public spending affects the level of received transfers, the measured degree of
decentralization, and access to basic services.13 For similar reasons, we introduce per capita
consumption, (measured by an index of about 1,200 commodities and services).14 Studying
jurisdiction population size () and population density () allow us to capture respectively,
overrepresentation of smaller jurisdictions and some scale economies in the provision of studied
public goods. We also consider urbanization rate, denoted by , since urban areas generally
offer better access to basic services and have higher fiscal capacities, especially in terms of
property tax base. Finally, ethnic fragmentation, denoted by ,15 may be correlated with
the degree of decentralization and affects the provision of public goods in quantity and quality
(Alesina and Ferrara, 2005).
Table 4 provides some descriptive statistics. The main independent variable (degree of
decentralization, ) is quite normally distributed with a median value and a mean of 0.48.
Nevertheless, the mode of the distribution indicates that most communes (around 22 percent)
have collected about 15 to 22 percent of own-revenue. Conversely, only eight communes located
in the southern part of the country perform very well in taxes, having raised more than 85
percent of own-revenue. Among control variables, the average value of is 142,598 CFCA;
the median is 123,042 CFCA; the ninety-fifth percentile is 299,798 CFCA. To put these numbers
in perspective, note that in strongly urbanized communes, the average per capita consumption
(197,645 CFCA) is higher than the national average due to the better situation of the first
quintile, which entails a higher median value (223,688 CFCA). Another wealth measure is
provided by , a score based on the Demographic and Health Survey ’s (DHS) wealth index,
which provides each household’s position on an index of asset wealth at the national level
13 Although the pursuit of an equitable allocation of resources would lead one to expect a propoor allocation
of transfers across jurisdictions, most empirical studies (Wallis, 1998, Meyer and Naka, 1999 or Alm and Boex,
2002) find that wealthier local governments receive greater intergovernmental transfers, indicating that political
considerations outweigh those of equity.14 Provided by the EMICoV surveys.15 Ethnic fragmentation in commune on year is defined as the probability that two individuals randomly
drawn from one commune are from different ethnic groups.
15

using Principal Components Analysis (PCA) weights.16 This variable fluctuates between -
1.72 (poorest households) and 4.54 (wealthier households). Despite a significant correlation
between and , the latter is a good proxy for the permanent wealth, whereas the former
is more sensitive to the economic conjuncture. Finally, the ethnic fragmentation, measured by
the probability that two randomly selected individuals belong to the same ethnicity, indicates
that the Beninese are strongly fragmented with an average value of 0.36. Such a cultural
pattern is expected to affect preferences for public goods provision in the sense that ethnically
heterogeneous communities may express contrasted needs or define different priorities for basic
services delivery.
We start with the following simplest regression, which assesses the average impact of decen-
tralization on access to basic services:17
= + + + + + + + + (1)
We also consider a nonmonotone effect of the degree of decentralization by introducing its
quadratic term¡2
¢:
= 1 + 22 + + + + + + + + (2)
4.2.1 A heterogeneous effect between communes
In addition to the average impact of decentralization on access to public services, we study its
effect by distinguishing communes by their respective wealth. This analysis allows us to assess
the overall impact of decentralization on inter-commune inequalities in terms of access to basic
services. We obtain the following regression:
= 1( ∗) + 2( ∗ (1−))
+ + + + + + + + + (3)
where is a dummy variable taking the value 1 if the commune belongs to the first quintile
of poor communes and zero otherwise. Following Filmer and Pritchett (2001) we define an asset-
16 The general methodology used to calculate the wealth index is given in Filmer and Pritchett (2001). The
specific approach used in the DHS is described in Rutstein and Johnson (2004).17 Population, per capita public spending, and per capita consumption are given in logarithmic terms.
16

based measure of wealth, denoted by for each commune using the EMICoV.18 However, the
DHS index underestimates the wealth of rural areas since urban populations own many valuable
assets. Following Rutstein (2008), we compute a national-level composite index from wealth
indexes that have been separately constructed for urban and rural areas. We then consider the
average score by communes, and divide the latter into quintiles to distinguish the poor from
the nonpoor. The same procedure applies for the first quintile of wealthier communes in order
to control how decentralization may lead local governments to define priorities in delivering
poverty-related services. In so doing, we assume that all local public goods are not provided
according to the same economic and political determinants, i.e., poor communes are expected
to make greater efforts in facilitating access to drinking water than in organizing high-quality
systems of waste disposal or sewage facilities.
4.2.2 Econometric issues and identification strategy
Given the small number of time series with respect to cross-sectional observations and the fact
that some variables have little within variance, we first estimate pooled OLS regressions with
year dummies. This estimation method increases the degree of freedom and allows for inquiring
into variables that have low variability. However, it assumes that control variables capture all
relevant communes’ characteristics.
This estimate may be biased by unobserved heterogeneity between communes. Our panel
data allows for controlling a large number of unobserved explanatory variables by using the
fixed-effects (FE) estimator. However, the traditional FE method fails in estimating the effects
of variables that have little within variance, a problem worth considering when analyzing two
successive years of observations. To assess coefficients of time-invariant variables and to control
for commune-specific effects, we use the Fixed Effects Vector Decomposition estimator (FEVD)
developed by Plümper and Troeger (2007).19 Through a three-step procedure, this estimator
18 Due to the abundance of household survey data on asset ownership and the considerable bias measurement
error associated with reported income or consumption, a substantial body of literature has developed an asset-
based measure of wealth. Filmer and Pritchett (2001) conclude that the DHS wealth index actually performed
better than the traditional consumption or expenditure index in explaining differences in economic statuses. From
the EMICoV, we built such a DHS measure based on a myriad of assets (cars, canoes, hi-fi systems, refrigerators,
, iron, beds, phones, motorcycles/scooters, radios, VCRs, DVD players, ovens/stoves, washing machines, chairs,
sewing machines, cell phones, bicycles, televisions, video recorders/VCRs, fans, foam mattresses, computers,
internet access, land, home ownership, types of fuel, building materials, etc.).19 Based on Monte Carlo simulations, Plümper and Troeger (2007) compare the vector decomposition model
with the FE model, the random effects (RE) model, pooled OLS, and the Hausman-Taylor procedure and find
that, while the FE model does not compute coefficients for the time-invariant variables, the vector decomposition
model performs far better than other procedures.
17

allows for a decomposition of the unit fixed effect into two parts: an explained part by time-
invariant variables and an unexplained part.20
To correct for other potential endogeneity biases in the estimation of the causal effect of
decentralization on access to basic services, we instrument the degree of decentralization through
a dummy variable, denoted by , taking the value 1 if the commune has the same political
affiliation as the president in office. This dummy variable differs between 2006 and 2007 since
Yayi Boni was elected in April 2006, succeeding Mathieu Kerekou. Partisan affiliation is a good
instrument of decentralization in a regression involving access to public services. In the relevant
literature, a jurisdiction which has greater political support from the central government receives
more transfers from the latter (see, Cox, 1986, for a theoretical argument, Case, 2001, for the
Albanian case, Miguel and Zaidi, 2003, for the Ghanaian case).
5 Estimation results
This section presents our empirical results using panel data from 77 Beninese communes for
2006 and 2007.
5.1 The average effect of decentralization on access to basic services
Figures 1 to 5 confirm our expectations that a higher degree of decentralization is positively
correlated to better access to poverty-related services.21 However, the most decentralized com-
munes are the richest, most populated, and most urbanized (Table 5). These variables are also
associated with easier access to basic public services (Table 6). This confirms the important
role of our control variables in avoiding endogeneity bias.
To test the average effect of decentralization on access to basic services (equation 1), we first
run the pooled OLS regressions with year dummies, introducing our control variables progres-
sively (columns 1 to 7). Considering potential unobserved heterogeneity between communes,
we then use the FEVD estimator (column 8). Finally, we instrument for the degree of decen-
tralization with the partisan affiliation () in column 9. Table 7 reports the relevance of
20 First, the unit fixed effect is estimated by running a fixed-effect estimate of the model. Second, the latter
is split into its two parts by regressing it on the time-invariant variables of the model. The unexplained part
corresponds to the residuals of this equation, . Third, the estimation of the full model is implemented byincluding the time-invariant variables and the unexplained part of the fixed-effect vector estimated in the second
step.21 The relation is relatively weak for primary school enrollment (Figure 5).
18

our instrument.22 Moreover, the Sargan over-identifying restriction test 23 indicates that we
cannot reject the hypothesis that there is no correlation between the instrument and the error
term in the regression stating that the partisan affiliation variable is a valid instrument. In
Tables 8 to 11, we highlight the fact that a higher degree of decentralization is consistently
associated with improved access to water sources and sanitation systems. Table 8 indicates
that the coefficient associated with the degree of decentralization is significantly different from
zero and could be interpreted as follows: the impact of a 10 percentage point increase in de-
centralization represents an extra 3.7 percent in people’s having access to toilets or latrines. In
other words, the standard deviation of the degree of decentralization (23.5 percent) implies an
8.69 percentage point increase for one-standard-deviation change. When we turn our attention
to the quality of basic services, for instance, we find, that once controlled for endogeneity bias,
such services undergo a 10 percent point increase in the share of own-revenue, entailing an extra
0.236 point on the quality index of water access in communes (Table 11). However, while the
effect of decentralization on access to refuse disposal facilities is less robust (Tables 12 and 13),
decentralization is not found to have a significant average effect on access to sewage disposal
facilities and communes’ primary school enrollment (Tables 14 to 16).
In Table 17, we consider the nonmonotone effect of the degree of decentralization by intro-
ducing its quadratic term (equation 2). We find a positive coefficient associated with the degree
of decentralization and a negative sign for its squared value. The impact of decentralization is
then nonmonotone: the relationship between decentralization and access to basic services may
be described by an inverted U-shaped curve. Even if we cannot calculate the average optimal
decentralization degree due to a combination of different scaled criteria for basic services, we are
able to determine it individually. Defined as the ratio of local own-revenue over total revenue
(given by −122, equation 2), the optimal degree of decentralization reaches a 55 percentvalue for the access to toilet facility, 65 percent for refuse disposal facilities (columns 1 to 3),
and a lower value for sewage disposal facilities (49 percent) and primary school enrollment
(52 percent, columns 4 and 5). We observe that the effect of decentralization is monotone for
drinking water access since the optimal level is above 1 (exactly 103 percent).
22 As in most empirical studies, political considerations outweigh those of equity: wealthier, smaller, or ethni-
cally fragmented jurisdictions receive more intergovernmental transfers and are less autonomous.23 We use the dummy variable indicating whether a commune has the same dominant ethnic affiliation as the
president in office, as another instrument to compute the Sargan test.
19

5.2 The non-linear effect of decentralization between communes
We now consider the heterogeneous effects of decentralization across communes according to
their wealth (equation 3). Table 18 reports that this effect is generally lower for 20 percent
of the poorest communes. While toilet, garbage, and drinking water facilities are increasing
in quality with decentralization, there is no impact on average on sewage and primary school
enrollment. For the latter, it actually has a positive effect on wealthier communes and a negative
one on the poorest communes.24 As a robustness check, we interact a continuous variable, the
DHS wealth index scores (), with the degree of decentralization (see Table 19). Estimated
results confirm that the positive effect of decentralization is contingent on a minimum wealth
in communes. Only the effect of decentralization on access to drinking water does not seem
to depend on wealth. The coefficient associated with the degree of decentralization measures
the impact of decentralization in the absence of any wealth. Its negative sign indicates that a
commune with zero wealth would suffer from decentralization.
Finally, we highlight the point that communes may prioritize basic services despite a uni-
form decentralization process. Such a hierarchy results from their autonomy, and should also
be considered by the central government and donors in the struggle against poverty. The ab-
sence of a normalized scale for every basic service prevents to conclude immediately on such
a prioritization. However, through Tables 18 and 19, we pinpoint some significant differences
among local governments’ behaviors in relation to their wealth. The poorest communes are
characterized by the negative impact of decentralization on access to primary education. This
suggests that these governments pay less attention to education than they do to both drinking
water access and toilet facilities (Table 18). Table 20 focuses on the top 20 percent wealthier
communes. For these communes the effect of decentralization on sewage access is negative and
significant. In accordance with the reading of the 77 detailed communes’ monographs,25 we
may deduce that the richest local governments, having already reached a certain level of quality
in sanitation, choose to redirect their financial resources to other public facilities.
The following table sums up our empirical results considering the effect of decentralization
on the qualitative indicators:
24 We complete our analysis with Wald tests to ascertain that coefficients for poor communes are significantly
different from those in other communes.25 Provided by the European Union through the Programme d’Appui au Démarrage des Communes.
20
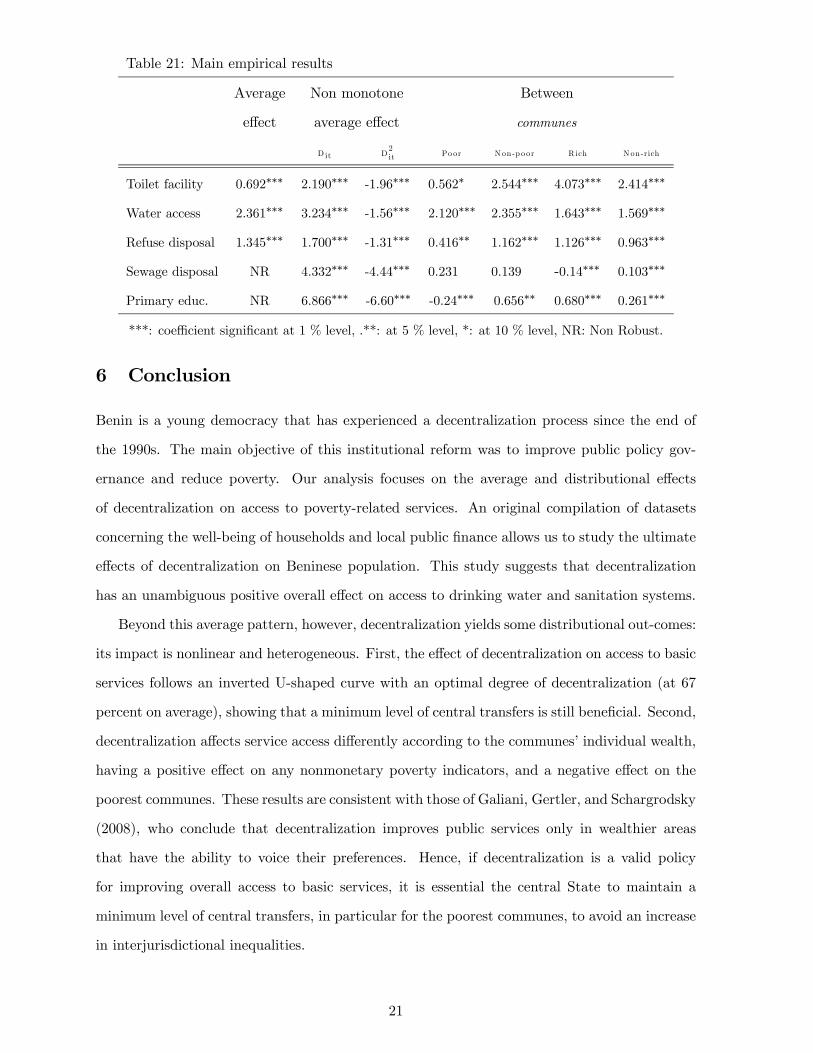
Table 21: Main empirical results
Average Non monotone Between
effect average effect communes
Dit D2it Poor Non-p oor R ich Non-rich
Toilet facility 0.692∗∗∗ 2.190∗∗∗ -1.96∗∗∗ 0.562∗ 2.544∗∗∗ 4.073∗∗∗ 2.414∗∗∗
Water access 2.361∗∗∗ 3.234∗∗∗ -1.56∗∗∗ 2.120∗∗∗ 2.355∗∗∗ 1.643∗∗∗ 1.569∗∗∗
Refuse disposal 1.345∗∗∗ 1.700∗∗∗ -1.31∗∗∗ 0.416∗∗ 1.162∗∗∗ 1.126∗∗∗ 0.963∗∗∗
Sewage disposal NR 4.332∗∗∗ -4.44∗∗∗ 0.231 0.139 -0.14∗∗∗ 0.103∗∗∗
Primary educ. NR 6.866∗∗∗ -6.60∗∗∗ -0.24∗∗∗ 0.656∗∗ 0.680∗∗∗ 0.261∗∗∗
***: coefficient significant at 1 % level, .**: at 5 % level, *: at 10 % level, NR: Non Robust.
6 Conclusion
Benin is a young democracy that has experienced a decentralization process since the end of
the 1990s. The main objective of this institutional reform was to improve public policy gov-
ernance and reduce poverty. Our analysis focuses on the average and distributional effects
of decentralization on access to poverty-related services. An original compilation of datasets
concerning the well-being of households and local public finance allows us to study the ultimate
effects of decentralization on Beninese population. This study suggests that decentralization
has an unambiguous positive overall effect on access to drinking water and sanitation systems.
Beyond this average pattern, however, decentralization yields some distributional out-comes:
its impact is nonlinear and heterogeneous. First, the effect of decentralization on access to basic
services follows an inverted U-shaped curve with an optimal degree of decentralization (at 67
percent on average), showing that a minimum level of central transfers is still beneficial. Second,
decentralization affects service access differently according to the communes’ individual wealth,
having a positive effect on any nonmonetary poverty indicators, and a negative effect on the
poorest communes. These results are consistent with those of Galiani, Gertler, and Schargrodsky
(2008), who conclude that decentralization improves public services only in wealthier areas
that have the ability to voice their preferences. Hence, if decentralization is a valid policy
for improving overall access to basic services, it is essential the central State to maintain a
minimum level of central transfers, in particular for the poorest communes, to avoid an increase
in interjurisdictional inequalities.
21
The decentralization process in Benin was successful in reducing poverty by improving ac-
cess to some basic services. But this success remains threatened by an increase in inequalities
between communes. Decentralization gives control over decisions and resources to local govern-
ments, whose aim is to target the poorest households better. In so doing, the central government
treats the poor and local democratic institutions as assets and partners in the development
process. Our results suggest that the patterns of decentralization in Benin describe a better
access to primary services, but raise some issues about the design of transfers in both financial
resources and competences. Indeed, certain basic services, mostly in education, have not been
delivered to the expected degree. Controlling for different geographical and socioeconomic vari-
ables, poor communes do not succeed in improving primary education. A potential explanation
rests on the idea that these local governments allocate available resources for other basic services
rather than education, which are considered more urgent, such as drinking water access and, to
a lesser extent, toilet facilities. If the promotion of primary education is a priority national goal,
then a re-centralization of this competence may be necessary to internalize inter-jurisdictions’
spillovers and insure the delivery of this basic public good at a minimum level in the poorest
communes.
22

References
Akai, N., and M. Sakata (2002): “Fiscal decentralization contributes to economic growth:
Evidence from state-level cross-section data for the United States,” Journal of Urban
Economics, 52(1), 93—108.
Alderman, H. (2002): “Do local officials know something we don’t? Decentralization of targeted
transfers in Albania,” Journal of Public Economics, 83(3), 375—404.
Alesina, A., and E. L. Ferrara (2005): “Ethnic diversity and economic performance,” Jour-
nal of Economic Literature, 43(3), 762—800.
Alm, J., and J. Boex (2002): “An overview of intergovernmental fiscal relations and subna-
tional public finance in Nigeria,” Discussion Paper 0201, International Studies Program,
Andrew Young School of Policy Studies, Georgia State University.
Arze, J., J. Martinez-Vasquez, and R. Puwanti (2008): “Local government fiscal compe-
tition in developing countries: The case of Indonesia,” Urban Public Economics Review,
(8).
Azfar, O., and J. A. Livingston (2010): “Federalist disciplines or local capture? An empir-
ical analysis of decentralization in Uganda,” Discussion Paper 00/12, IRIS, University of
Maryand.
Bardhan, P. (2002): “Decentralization of governance and development,” Journal of Economic
Perspectives, 16(4), 185—205.
Bardhan, P., and D. Mookherjee (2005): “Decentralizing antipoverty program delivery in
developing countries,” Journal of Public Economics, 89(4), 675—704.
Bardhan, P. K., and D. Mookherjee (2000): “Capture and governance at local and national
levels,” American Economic Review, 90(2), 135—139.
Barenstein, M., and L. de Mello (2001): “Fiscal decentralization and governance: A cross-
country analysis,” IMF Working Papers 01/71, International Monetary Fund.
Besley, T., and A. Case (1995): “Incumbent behavior: Vote-seeking, tax-setting, and yard-
stick competition,” American Economic Review, 85(1), 25—45.
Besley, T., and S. Coate (2003): “Centralized versus decentralized provision of local public
goods: A political economy approach,” Journal of Public Economics, 87(12), 2611—2637.
Bird, R. M., and E. Rodriguez (1999): “Decentralization and poverty alleviation. Interna-
tional experience and the case of the Philippines,” Public Administration and Develop-
ment, 19, 299—319.
Cai, H., and D. Treisman (2005): “Does competition for capital discipline governments?
Decentralization, globalization, and public policy,” American Economic Review, 95(3),
817—830.
Caldeira, E., M. Foucault, and G. Rota-Graziosi (2008): “Decentralization in Africa
and the nature of local governments’ competition: Evidence from Benin,” Working Paper
1018, CERDI.
Case, A. (2001): “Election goals and income redistribution: Recent evidence from Albania,”
European Economic Review, 45(3), 405—423.
23

Chambas, G. (2010): Mobiliser des ressources locales en Afrique subsaharienne. Economica,
Paris.
Cox, G., M. M. (1986): “Electoral politics as a redistributive game,” Journal of Politics, 48(2),
370—389.
Enikolopov, R., and E. Zhuravskaya (2007): “Decentralization and political institutions,”
Journal of Public Economics, 91(11-12), 2261—2290.
Faguet, J.-P. (2004): “Does decentralization increase government responsiveness to local needs?
Evidence from Bolivia,” Journal of Public Economics, 88(3-4), 867—893.
Fan, C. S., C. Lin, and D. Treisman (2009): “Political decentralization and corruption:
Evidence from around the world,” Journal of Public Economics, 93(1-2), 14—34.
Filmer, D., and L. H. Pritchett (2001): “Estimating wealth effects without expenditure
data or tears: An application to educational enrollments in states of India,” Demography,
38(1), 115—132.
Fisman, R., and R. Gatti (2002): “Decentralization and corruption: Evidence across coun-
tries,” Journal of Public Economics, 83(3), 325—345.
Galasso, E., and M. Ravallion (2005): “Decentralized targeting of an antipoverty program,”
Journal of Public Economics, 89(4), 705—727.
Galiani, S., P. Gertler, and E. Schargrodsky (2008): “School decentralization: Helping
the good get better, but leaving the poor behind,” Journal of Public Economics, 92(10-11),
2106—2120.
Hayek, F. A. v. (1948): Individualism and economic order. Chicago: Chicago University Press.
Huther, J., and A. Shah (1998): “Applying a simple measure of good governance to the
debate on fiscal decentralization,” Policy research working paper series, The World Bank.
Lin, J. Y., and Z. Liu (2000): “Fiscal decentralization and economic growth in China,” Eco-
nomic Development and Cultural Change, 49(1), 1—21.
Lockwood, B. (2002): “Distributive politics and the costs of centralization,” Review of Eco-
nomic Studies, 69(2), 313—37.
Martinez-Vazquez, J., and R. M. McNab (2003): “Fiscal decentralization and economic
growth,” World Development, 31(9), 1597—1616.
Meyer, S. A., and S. Naka (1999): “The determinants of Japanese local-benefit seeking,”
Contemporary Economic Policy, 17(1), 87—96.
Miguel, E., and F. Zaidi (2003): “Do politicians reward their supporters? Regression discon-
tinuity evidence from Ghana,” Discussion paper, University of California, Berkeley.
Oates, W. E. (1972): “Fiscal federalism,” New York: Harcourt Brace Jovanovich.
Plümper, T., and V. E. Troeger (2007): “Efficient estimation of time-invariant and rarely
changing variables in finite sample panel analyses with unit fixed effects,” Political Analy-
sis, 15(2), 124—139.
Prud’homme, R. (1995): “The dangers of decentralization,” World Bank Research Observer,
10(2), 201—20.
24

Reinikka, R., and J. Svensson (2004): “Local capture: Evidence from a central government
transfer program in Uganda,” The Quarterly Journal of Economics, 119(2), 678—704.
Robalino, D. A., O. F. Picazo, and A. Voetberg (2001): “Does fiscal decentralization im-
prove health outcomes? Evidence from a cross-country analysis,” Policy ResearchWorking
Paper Series 2565, The World Bank.
Rutstein, S. O. (2008): “The DHS wealth index: Approaches for rural and urban areas,” DHS
Comparative Reports 60, Macro International Inc., Calverton, Maryland.
Rutstein, S. O., and K. Johnson (2004): “The DHS wealth index,” DHS Comparative
Reports 6, Macro International Inc., Calverton, Maryland.
Salmon, P. (1987): “Decentralisation as an incentive scheme,” Oxford Review of Economic
Policy, 3(2), 24—43.
Seabright, P. (1996): “Accountability and decentralisation in government: An incomplete
contracts model,” European Economic Review, 40(1), 61—89.
Tiebout, C. M. (1956): “A pure theory of local expenditures,” Journal of Political Economy,
64, 416.
Treisman, D. (2000): “The causes of corruption: A cross-national study,” Journal of Public
Economics, 76(3), 399—457.
Wallis, J. J. (1998): “The political economy of New Deal spending revisited, again: With and
without Nevada,” Explorations in Economic History, 35(2), 140—170.
Winkler, D. R., and T. Rounds (1996): “Municipal and private sector response to decen-
tralization and school choice,” Economics of Education Review, 15(4), 365—376.
Wollera, G. M., and K. Phillips (1998): “Fiscal decentralisation and IDC economic growth:
An empirical investigation,” Journal of Development Studies, 34(4), 139—148.
World-Bank (2004): World development report: Making services work for poor people. New
York: Oxford University Press.
Xie, D., H.-f. Zou, and H. Davoodi (1999): “Fiscal decentralization and economic growth in
the United States,” Journal of Urban Economics, 45(2), 228—239.
Zhang, T., and H.-F. Zou (1998): “Fiscal decentralization, public spending, and economic
growth in China,” Journal of Public Economics, 67, 221—240.
25

A Appendix
A.1 Figures0
24
68
0 .2 .4 .6 .8 1Share of local own−resources
95% CI Fitted valuesType of toilet facility
Type of toilet facility
Figure 1: Share of lo cal own-resources and access to toilet facility
46
810
12
0 .2 .4 .6 .8 1Share of local own−resources
95% CI Fitted valuesSource of drinking water
Source of drinking water
Figure 2: Share of lo cal own-resources and access to water
11.
21.
41.
61.
8
0 .2 .4 .6 .8 1Share of local own−resources
95% CI Fitted valuesType of sewage disposal
Type of sewage disposal
Figure 3: Share of lo cal own-resources and access to sewage d isp osal
12
34
0 .2 .4 .6 .8 1Share of local own−resources
95% CI Fitted valuesType of garbage and refuse disposal
Type of garbage and refuse disposal
Figure 4: Share of lo cal own-resources and access to refuse disp osal
26

.2.4
.6.8
10 .2 .4 .6 .8 1
Share of local own−resources
95% CI Fitted valuesPrimary school enrollment
Primary school enrollment for the 6−11 years olds
Figure 5: Share of lo cal own-resources and access to prim ary school
enrollm ent
27
A.2 Maps
Alibori
Borgou
Atakora
Collines
Donga
Zou
Mono
Plateau
Kouffo
AtlantiqueOuémé
Littoral
8
4
2
1
6
3
9
7
5
24
22
2610
17
11
18
66
67
63
68
13
14
73
21
64
65
19
61
2015
23
37
16
25
77
35
27
32
76
28
12
4158
62
60
33
54
74
31
72
40
44
75
29
48 5039
47 30
46
38
70
344345
59
7169
5551 57
42
534936
0 50 10025 Kilometers
1.0 - 1.5
1.5 - 2.5
2.5 - 3.5
3.5 - 5.0
5.0 - 8.0
77
37
35
32
28
61
41
58
62
60
73
40
44 29
75
33
76
54
4850
39
74
47
3031
72
38
70
34
43
45
59
7169
55
51
42
53
4657
52
4956
36
Source: http://www.gadm.org/country; Author's calculations
Map 2: Toilet quality
28

Alibori
Borgou
Atakora
Collines
Donga
Zou
Mono
Plateau
Kouffo
AtlantiqueOuémé
Littoral
8
4
2
1
6
3
9
7
5
24
22
2610
17
11
18
66
67
63
68
13
14
73
21
64
65
19
61
2015
23
37
16
25
77
35
27
32
76
72
28
12
4158
62
60
33
54
74
31
42
40
44
75
29
48 5039
4730
46
38
70
344345
59
7169
5551 57
52 534936
56
0 50 10025 Kilometers
1.00 - 1.05
1.05 - 1.11
1.11 - 1.25
1.25 - 1.50
1.50 - 1.79
Source: http://www.gadm.org/country; Author's calculations
Map 3: Sewage quality
29

Alibori
Borgou
Atakora
Collines
Donga
Zou
Mono
Plateau
Kouffo
AtlantiqueOuémé
Littoral
8
4
2
1
6
3
9
7
5
24
22
2610
17
11
18
66
67
63
68
13
14
73
21
64
65
19
61
2015
23
37
16
25
77
35
27
32
76
72
28
12
4158
62
60
33
54
74
31
42
40
44
75
29
48 5039
4730
46
38
70
344345
59
7169
5551 57
52 534936
56
0 50 10025 Kilometers
1.00 - 1.10
1.10 - 1.25
1.25 - 1.50
1.50 - 2.50
2.50 - 3.79
Source: http://www.gadm.org/country; Author's calculations
Map 4: Garbage quality
30

Alibori
Borgou
Atakora
Collines
Donga
Zou
Mono
Plateau
Kouffo
AtlantiqueOuémé
Littoral
8
4
2
1
6
3
9
7
5
24
22
2610
17
11
18
66
67
63
68
13
14
73
21
64
65
19
61
2015
23
37
16
25
77
35
27
32
76
28
12
4158
62
60
33
54
74
31
72
40
44
75
29
48 5039
47 30
46
38
70
344345
59
7169
5551 57
42
534936
0 50 10025 Kilometers
5.05 - 6.00
6.00 - 7.00
7.00 - 8.00
8.00 - 9.00
9.00 - 10.56
73 61
37
77
35
32
76
28
41
58
62
6040
72
44
75
29
33
54
4850
39
74
47
3031
38
70
3445
55
51
42
46
43
59
7169
57
52 53
4956
36
64
Source: http://www.gadm.org/country; Author's calculations
Map 5: Drinking water quality
31

Alibori
Borgou
Atakora
Collines
Donga
Zou
Mono
Plateau
Kouffo
AtlantiqueOuémé
Littoral
8
4
2
1
6
3
9
7
5
24
22
2610
17
11
18
66
67
63
68
13
14
73
21
64
65
19
61
2015
23
37
16
25
77
35
27
32
76
72
28
12
4158
62
60
33
54
74
31
42
40
44
75
29
48 5039
4730
46
38
70
344345
59
7169
5551 57
52 534936
56
0 50 10025 Kilometers
0.24 - 0.50
0.50 - 0.70
0.70 - 0.80
0.80 - 0.90
0.90 - 0.99
Source: http://www.gadm.org/country; Author's calculations
Map 6: School enrollment
32
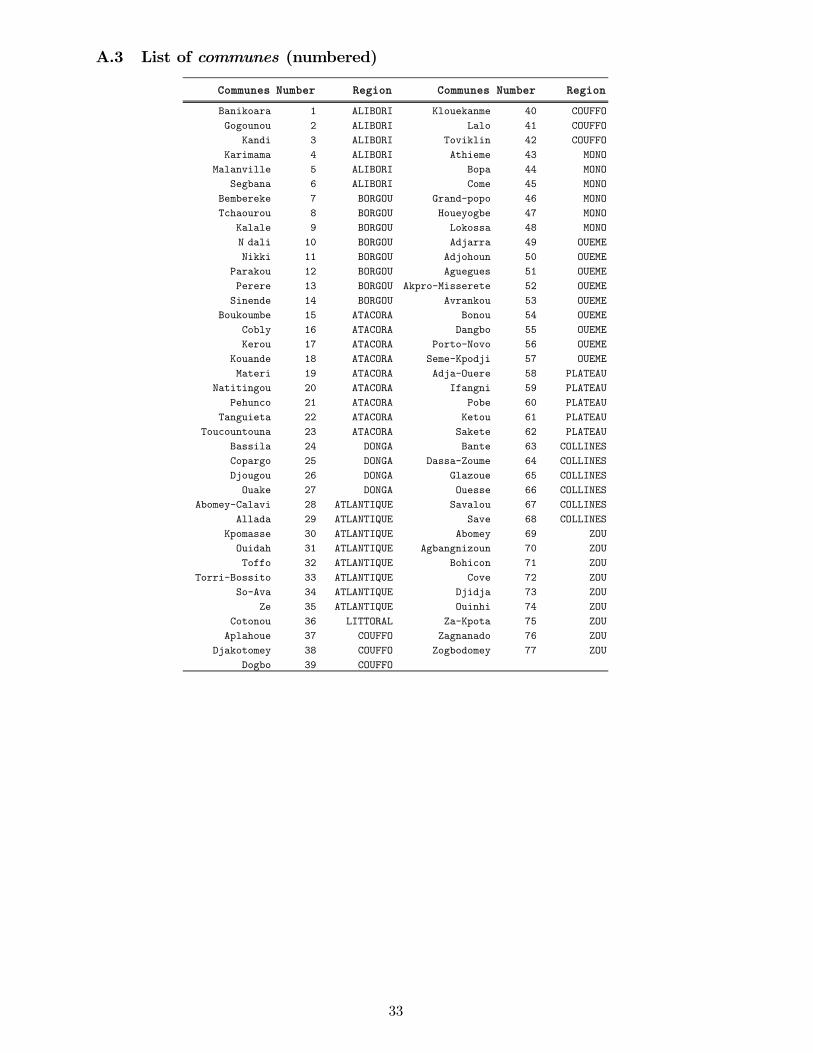
A.3 List of communes (numbered)
Communes Number Region Communes Number Region
Banikoara 1 ALIBORI Klouekanme 40 COUFFO
Gogounou 2 ALIBORI Lalo 41 COUFFO
Kandi 3 ALIBORI Toviklin 42 COUFFO
Karimama 4 ALIBORI Athieme 43 MONO
Malanville 5 ALIBORI Bopa 44 MONO
Segbana 6 ALIBORI Come 45 MONO
Bembereke 7 BORGOU Grand-popo 46 MONO
Tchaourou 8 BORGOU Houeyogbe 47 MONO
Kalale 9 BORGOU Lokossa 48 MONO
N'dali 10 BORGOU Adjarra 49 OUEME
Nikki 11 BORGOU Adjohoun 50 OUEME
Parakou 12 BORGOU Aguegues 51 OUEME
Perere 13 BORGOU Akpro-Misserete 52 OUEME
Sinende 14 BORGOU Avrankou 53 OUEME
Boukoumbe 15 ATACORA Bonou 54 OUEME
Cobly 16 ATACORA Dangbo 55 OUEME
Kerou 17 ATACORA Porto-Novo 56 OUEME
Kouande 18 ATACORA Seme-Kpodji 57 OUEME
Materi 19 ATACORA Adja-Ouere 58 PLATEAU
Natitingou 20 ATACORA Ifangni 59 PLATEAU
Pehunco 21 ATACORA Pobe 60 PLATEAU
Tanguieta 22 ATACORA Ketou 61 PLATEAU
Toucountouna 23 ATACORA Sakete 62 PLATEAU
Bassila 24 DONGA Bante 63 COLLINES
Copargo 25 DONGA Dassa-Zoume 64 COLLINES
Djougou 26 DONGA Glazoue 65 COLLINES
Ouake 27 DONGA Ouesse 66 COLLINES
Abomey-Calavi 28 ATLANTIQUE Savalou 67 COLLINES
Allada 29 ATLANTIQUE Save 68 COLLINES
Kpomasse 30 ATLANTIQUE Abomey 69 ZOU
Ouidah 31 ATLANTIQUE Agbangnizoun 70 ZOU
Toffo 32 ATLANTIQUE Bohicon 71 ZOU
Torri-Bossito 33 ATLANTIQUE Cove 72 ZOU
So-Ava 34 ATLANTIQUE Djidja 73 ZOU
Ze 35 ATLANTIQUE Ouinhi 74 ZOU
Cotonou 36 LITTORAL Za-Kpota 75 ZOU
Aplahoue 37 COUFFO Zagnanado 76 ZOU
Djakotomey 38 COUFFO Zogbodomey 77 ZOU
Dogbo 39 COUFFO
33

A.4 Tables
Table 4: Descriptive statistics
Basic services, Mean Std dev. Min Max
Degree of decentralization, 0.484 0.235 0.066 0.986
Public spending per capita, 7.218 0.778 4.521 9.436
Per capita consumption, 11.754 0.464 10.513 12.970
Population size, 11.356 0.529 10.250 13.500
Population density, 338.084 1050.57 7.382 9235.63
Urbanization rate, 0.278 0.232 0 1
Ethnic fragmentation, 0.357 0.232 0.013 0.822
Partisan affiliation, 0.305 0.461 0 1
Toilet facility
0.237 0.208 0 0.969
2.836 1.541 1 7.958
Water access
0.306 0.249 0 0.994
7.214 1.060 4.748 10.559
Refuse disposal
0.033 0.102 0 0.684
1.255 0.466 1 3.785
Sewage disposal
0.009 0.026 0 0.184
1.138 0.156 1 1.785
Primary education 0.876 0.149 0.236 1
34
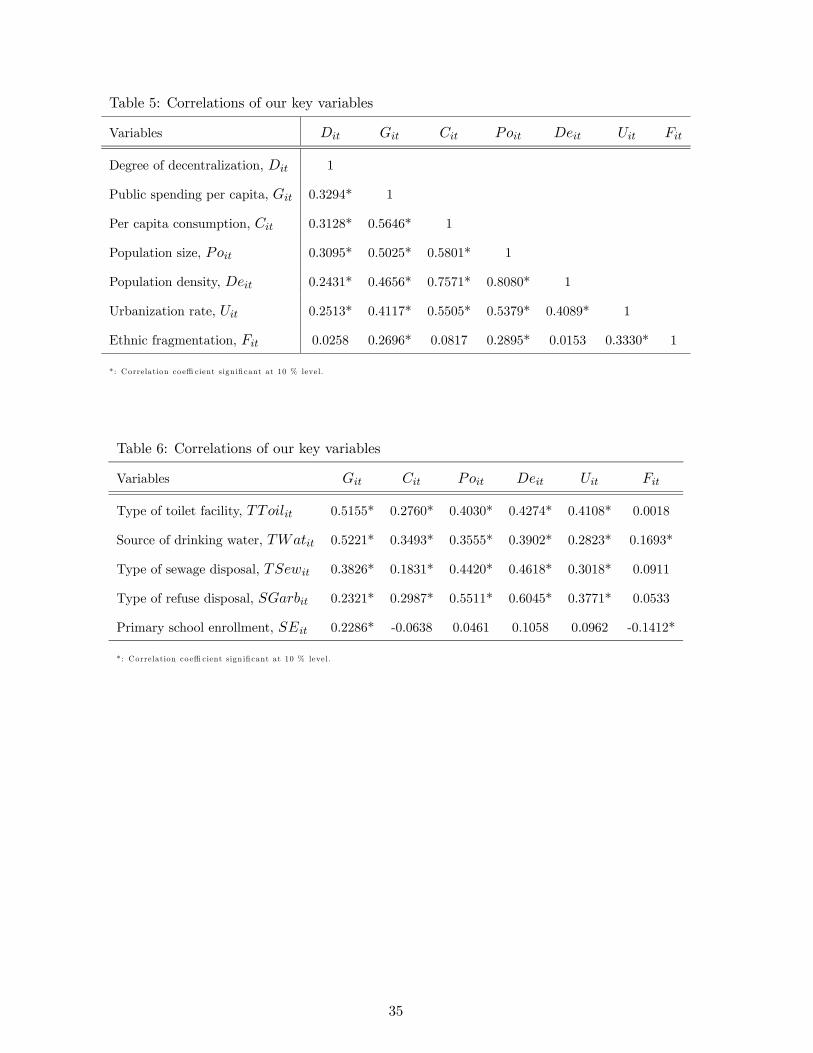
Table 5: Correlations of our key variables
Variables
Degree of decentralization, 1
Public spending per capita, 0.3294* 1
Per capita consumption, 0.3128* 0.5646* 1
Population size, 0.3095* 0.5025* 0.5801* 1
Population density, 0.2431* 0.4656* 0.7571* 0.8080* 1
Urbanization rate, 0.2513* 0.4117* 0.5505* 0.5379* 0.4089* 1
Ethnic fragmentation, 0.0258 0.2696* 0.0817 0.2895* 0.0153 0.3330* 1
*: Correlation co effi cient sign ifi cant at 10 % level.
Table 6: Correlations of our key variables
Variables
Type of toilet facility, 0.5155* 0.2760* 0.4030* 0.4274* 0.4108* 0.0018
Source of drinking water, 0.5221* 0.3493* 0.3555* 0.3902* 0.2823* 0.1693*
Type of sewage disposal, 0.3826* 0.1831* 0.4420* 0.4618* 0.3018* 0.0911
Type of refuse disposal, 0.2321* 0.2987* 0.5511* 0.6045* 0.3771* 0.0533
Primary school enrollment, 0.2286* -0.0638 0.0461 0.1058 0.0962 -0.1412*
*: Correlation co effi cient sign ifi cant at 10 % level.
35
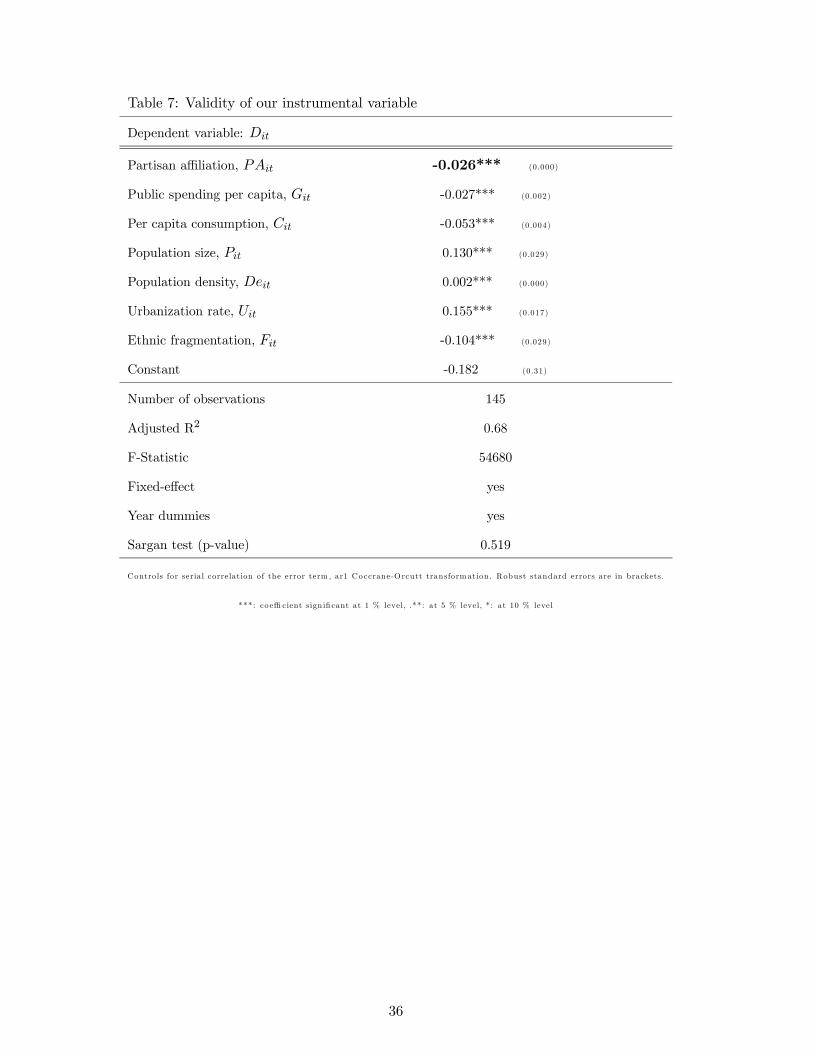
Table 7: Validity of our instrumental variable
Dependent variable:
Partisan affiliation, -0.026*** (0.000)
Public spending per capita, -0.027*** (0.002)
Per capita consumption, -0.053*** (0.004)
Population size, 0.130*** (0.029)
Population density, 0.002*** (0.000)
Urbanization rate, 0.155*** (0.017)
Ethnic fragmentation, -0.104*** (0.029)
Constant -0.182 (0.31)
Number of observations 145
Adjusted R2 0.68
F-Statistic 54680
Fixed-effect yes
Year dummies yes
Sargan test (p-value) 0.519
Controls for seria l corre lation of the error term , ar1 Coccrane-O rcutt transformation. Robust standard errors are in brackets.
***: co effi cient sign ifi cant at 1 % level, .**: at 5 % level, * : at 10 % level
36

Table8:Estimationresults-Theaveragee¤ectofdecentralizationontheaccesstotoiletfacility(quantity)
Dep.var.:
(1)
(2)
(3)
(4)
(5)
(6)
(7)
(8)
(9)
Degreeofdecentralization,
0.370***
(0.06)
0.249***
(0.06)
0.184***
(0.06)
0.116**
(0.05)
0.129**
(0.05)
0.140**
(0.05)
0.092*
(0.08)
0.171***
(0.025)
0.715***
(0.01)
Publicspendingpercapita,
0.126***
(0.03)
0.101***
(0.03)
0.109***
(0.03)
0.090***
(0.03)
0.066*
(0.03)
0.071**
(0.03)
0.030***
(0.004)
0.009
(0.01)
Percapitaconsumption,
0.133**
(0.04)
0.094***
(0.03)
0.086**
(0.03)
0.086**
(0.03)
0.099***
(0.03)
-0.001
(0.01)
-0.314*
(0.21)
Populationsize,
0.102***
(0.02)
0.064*
(0.03)
0.021
(0.03)
0.049
(0.03)
0.021
(0.01)
-0.057***
(0.01)
Populationdensity,
0.003**
(0.001)
0.003**
(0.01)
0.002**
(0.001)
0.005***
(0.00)
0.004***
(0.001)
Urbanizationrate,
0.191***
(0.08)
0.234***
(0.08)
0.301***
(0.02)
0.242***
(0.02)
Ethnicfragmentation,
-0.188***
(0.05)
-0.131***
(0.04)
-0.052*
(0.04)
Constant
0.049
(0.03)
-0.779***
(0.22)
-2.165***
(0.46)
-2.893***
(0.52)
-2.253***
(0.71)
-1.641***
(0.58)
-2.090***
(0.65)
-0.397*
(0.20)
-11.72***
(1.06)
Numberofobservations
150
149
149
149
149
149
145
145
145
AdjustedR2
0.17
0.35
0.41
0.46
0.49
0.96
0.54
0.92
0.96
F-Statistic
20.55
21.86
20.71
25.54
34.43
30.62
46.74
715.01
622.75
Fixed-e¤ect
nono
nono
nono
noyes
yes
Yeardummies
yes
yes
yes
yes
yes
yes
yes
yes
yes
Controlsforserialcorrelationoftheerrorterm,ar1
Coccrane-Orcutttransformation.Robuststandard
errorsareinbrackets.***:coe¢
cientsigni�cantat1%level,.**:at5%level,*:at10%level
37
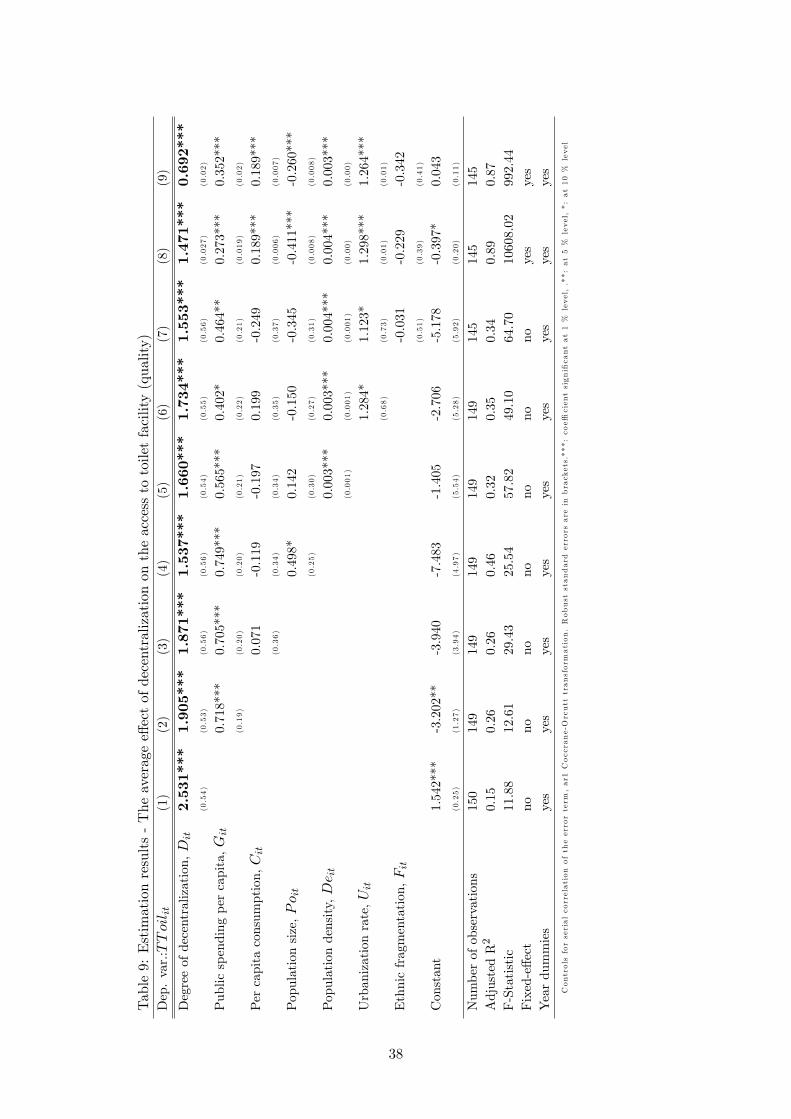
Table9:Estimationresults-Theaveragee¤ectofdecentralizationontheaccesstotoiletfacility(quality)
Dep.var.:
(1)
(2)
(3)
(4)
(5)
(6)
(7)
(8)
(9)
Degreeofdecentralization,
2.531***
(0.54)
1.905***
(0.53)
1.871***
(0.56)
1.537***
(0.56)
1.660***
(0.54)
1.734***
(0.55)
1.553***
(0.56)
1.471***
(0.027)
0.692***
(0.02)
Publicspendingpercapita,
0.718***
(0.19)
0.705***
(0.20)
0.749***
(0.20)
0.565***
(0.21)
0.402*
(0.22)
0.464**
(0.21)
0.273***
(0.019)
0.352***
(0.02)
Percapitaconsumption,
0.071
(0.36)
-0.119
(0.34)
-0.197
(0.34)
0.199
(0.35)
-0.249
(0.37)
0.189***
(0.006)
0.189***
(0.007)
Populationsize,
0.498*
(0.25)
0.142
(0.30)
-0.150
(0.27)
-0.345
(0.31)
-0.411***
(0.008)
-0.260***
(0.008)
Populationdensity,
0.003***
(0.001)
0.003***
(0.001)
0.004***
(0.001)
0.004***
(0.00)
0.003***
(0.00)
Urbanizationrate,
1.284*
(0.68)
1.123*
(0.73)
1.298***
(0.01)
1.264***
(0.01)
Ethnicfragmentation,
-0.031
(0.51)
-0.229
(0.39)
-0.342
(0.41)
Constant
1.542***
(0.25)
-3.202**
(1.27)
-3.940
(3.94)
-7.483
(4.97)
-1.405
(5.54)
-2.706
(5.28)
-5.178
(5.92)
-0.397*
(0.20)
0.043
(0.11)
Numberofobservations
150
149
149
149
149
149
145
145
145
AdjustedR2
0.15
0.26
0.26
0.46
0.32
0.35
0.34
0.89
0.87
F-Statistic
11.88
12.61
29.43
25.54
57.82
49.10
64.70
10608.02
992.44
Fixed-e¤ect
nono
nono
nono
noyes
yes
Yeardummies
yes
yes
yes
yes
yes
yes
yes
yes
yes
Controlsforserialcorrelationoftheerrorterm,ar1
Coccrane-Orcutttransformation.Robuststandard
errorsareinbrackets.***:coe¢
cientsigni�cantat1%level,.**:at5%level,*:at10%level
38

Table10:Estimationresults-Theaveragee¤ectofdecentralizationonwateraccess(quantity)
Dep.var.:
(1)
(2)
(3)
(4)
(5)
(6)
(7)
(8)
(9)
Degreeofdecentralization,
0.365***
(0.07)
0.260***
(0.07)
0.220***
(0.08)
0.192***
(0.07)
0.212***
(0.07)
0.207**
(0.08)
0.173**
(0.08)
0.230***
(0.028)
0.654***
(0.01)
Publicspendingpercapita,
0.116***
(0.02)
0.101***
(0.02)
0.105***
(0.02)
0.076***
(0.03)
0.085***
(0.03)
0.087***
(0.03)
0.047***
(0.003)
0.047***
(0.003)
Percapitaconsumption,
0.081**
(0.04)
0.065
(0.04)
0.053
(0.04)
0.053
(0.04)
0.072
(0.04)
0.021
(0.014)
0.021
(0.15)
Populationsize,
0.041
(0.04)
-0.148
(0.04)
0.002
(0.04)
0.022
(0.05)
-0.032
(0.019)
-0.064**
(0.018)
Populationdensity,
0.005***
(0.001)
0.005***
(0.001)
0.004***
(0.001)
0.006***
(0.00)
0.006***
(0.00)
Urbanizationrate,
-0.076
(0.10)
0.058
(0.11)
0.002
(0.003)
1.264***
(0.01)
Ethnicfragmentation,
-0.145*
(0.08)
-0.115***
(0.01)
-0.053***
(0.012)
Constant
0.110***
(0.04)
-0.660**
(0.19)
-1.505***
(0.47)
-1.801***
(0.51)
-0.836
(0.62)
-1.080*
(0.65)
-1.480
**(0.71)
-0.378*
(0.21)
0.110
(0.20)
Numberofobservations
150
149
149
149
149
149
145
145
145
AdjustedR2
0.12
0.24
0.25
0.26
0.29
0.30
0.34
0.88
0.87
F-Statistic
13.51
15.49
13.44
12.62
30.13
25.31
64.70
1537.87
992.44
Fixed-e¤ect
nono
nono
nono
noyes
yes
Yeardummies
yes
yes
yes
yes
yes
yes
yes
yes
yes
Controlsforserialcorrelationoftheerrorterm,ar1
Coccrane-Orcutttransformation.Robuststandard
errorsareinbrackets.***:coe¢
cientsigni�cantat1%level,.**:at5%level,*:at10%level
39
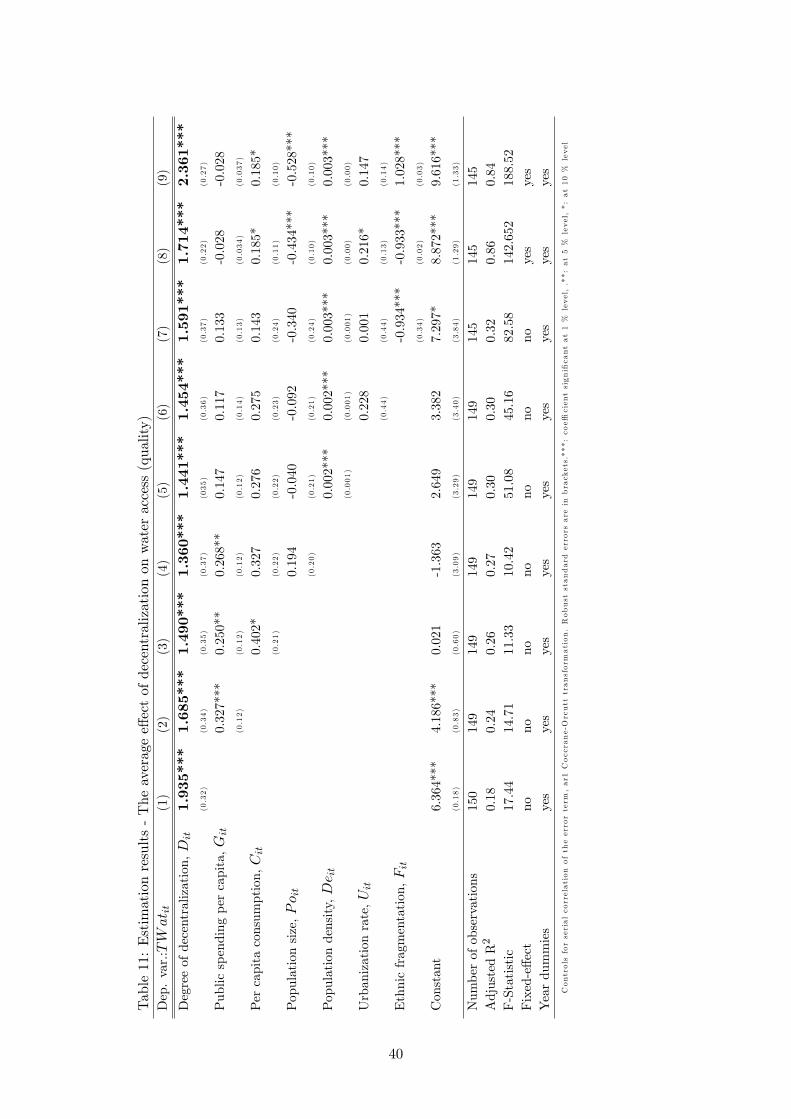
Table11:Estimationresults-Theaveragee¤ectofdecentralizationonwateraccess(quality)
Dep.var.:
(1)
(2)
(3)
(4)
(5)
(6)
(7)
(8)
(9)
Degreeofdecentralization,
1.935***
(0.32)
1.685***
(0.34)
1.490***
(0.35)
1.360***
(0.37)
1.441***
(035)
1.454***
(0.36)
1.591***
(0.37)
1.714***
(0.22)
2.361***
(0.27)
Publicspendingpercapita,
0.327***
(0.12)
0.250**
(0.12)
0.268**
(0.12)
0.147
(0.12)
0.117
(0.14)
0.133
(0.13)
-0.028
(0.034)
-0.028
(0.037)
Percapitaconsumption,
0.402*
(0.21)
0.327
(0.22)
0.276
(0.22)
0.275
(0.23)
0.143
(0.24)
0.185*
(0.11)
0.185*
(0.10)
Populationsize,
0.194
(0.20)
-0.040
(0.21)
-0.092
(0.21)
-0.340
(0.24)
-0.434***
(0.10)
-0.528***
(0.10)
Populationdensity,
0.002***
(0.001)
0.002***
(0.001)
0.003***
(0.001)
0.003***
(0.00)
0.003***
(0.00)
Urbanizationrate,
0.228
(0.44)
0.001
(0.44)
0.216*
(0.13)
0.147
(0.14)
Ethnicfragmentation,
-0.934***
(0.34)
-0.933***
(0.02)
1.028***
(0.03)
Constant
6.364***
(0.18)
4.186***
(0.83)
0.021
(0.60)
-1.363
(3.09)
2.649
(3.29)
3.382
(3.40)
7.297*
(3.84)
8.872***
(1.29)
9.616***
(1.33)
Numberofobservations
150
149
149
149
149
149
145
145
145
AdjustedR2
0.18
0.24
0.26
0.27
0.30
0.30
0.32
0.86
0.84
F-Statistic
17.44
14.71
11.33
10.42
51.08
45.16
82.58
142.652
188.52
Fixed-e¤ect
nono
nono
nono
noyes
yes
Yeardummies
yes
yes
yes
yes
yes
yes
yes
yes
yes
Controlsforserialcorrelationoftheerrorterm,ar1
Coccrane-Orcutttransformation.Robuststandard
errorsareinbrackets.***:coe¢
cientsigni�cantat1%level,.**:at5%level,*:at10%level
40

Table12:Estimationresults-Theaveragee¤ectofdecentralizationontheaccesstorefusedisposalfacility(quantity)
Dep.var.:
(1)
(2)
(3)
(4)
(5)
(6)
(7)
(8)
(9)
Degreeofdecentralization,
0.137***
(0.04)
0.092***
(0.03)
0.081**
(0.03)
0.018
(0.04)
0.035
(0.03)
0.040
(0.03)
0.048
(0.03)
0.038***
(0.007)
0.077***
(0.01)
Publicspendingpercapita,
0.049**
(0.02)
0.044**
(0.01)
0.053***
(0.01)
0.027**
(0.01)
0.017*
(0.01)
0.019*
(0.01)
0.013***
(0.001)
-0.024***
(0.001)
Percapitaconsumption,
0.022
(0.02)
-0.012
(0.02)
-0.023
(0.02)
-0.023
(0.02)
-0.036
(0.02)
-0.006*
(0.003)
-0.006
(0.004)
Populationsize,
0.019***
(0.02)
0.044**
(0.01)
0.025**
(0.01)
0.002
(0.01)
0.001
(0.003)
-0.012**
(0.005)
Populationdensity,
0.005***
(0.001)
0.005***
(0.001)
0.005***
(0.001)
0.005***
(0.000)
0.005***
(0.000)
Urbanizationrate,
0.084**
(0.03)
0.065*
(0.03)
0.069***
(0.06)
0.089***
(0.009)
Ethnicfragmentation,
0.074***
(0.02)
0.060***
(0.006)
0.065***
(0.001)
Constant
-0.033**
(0.01)
-0.357**
(0.14)
-0.595*
(0.37)
-1.258***
(0.007)
-0.424
(0.36)
-0.424
(0.36)
0.205
(0.29)
-0.081**
(0.03)
0.161***
(0.05)
Numberofobservations
150
149
149
149
149
149
145
145
145
AdjustedR2
0.10
0.21
0.22
0.40
0.55
0.57
0.58
0.96
0.95
F-Statistic
4.26
4.26
3.30
4.50
67.65
56.65
79.65
89.10
79.30
Fixed-e¤ect
nono
nono
nono
noyes
yes
Yeardummies
yes
yes
yes
yes
yes
yes
yes
yes
yes
Controlsforserialcorrelationoftheerrorterm,ar1
Coccrane-Orcutttransformation.Robuststandard
errorsareinbrackets.***:coe¢
cientsigni�cantat1%level,.**:at5%level,*:at10%level
41

Table13:Estimationresults-Theaveragee¤ectofdecentralizationontheaccesstorefusedisposalfacility(quality)
Dep.var.:
(1)
(2)
(3)
(4)
(5)
(6)
(7)
(8)
(9)
Degreeofdecentralization,
0.510***
(0.18)
0.313**
(0.15)
0.260
(0.17)
0.098
(0.19)
0.176
(0.17)
0.189
(0.17)
0.176
(0.17)
0.225***
(0.05)
1.345***
(0.12)
Publicspendingpercapita,
0.218***
(0.08)
0.198***
(0.01)
0.219***
(0.07)
0.104*
(0.06)
0.074*
(0.05)
0.089*
(0.05)
0.044**
(0.02)
-0.078***
(0.008)
Percapitaconsumption,
0.108*
(0.09)
0.016
(0.11)
-0.032
(0.11)
-0.033
(0.11)
-0.067
(0.11)
-0.122***
(0.03)
-0.122**
(0.05)
Populationsize,
0.241*
(0.12)
0.018
(0.10)
-0.034
(0.08)
-0.122
(0.08)
-0.144*
(0.08)
-0.365***
(0.11)
Populationdensity,
0.002***
(0.000)
0.002***
(0.000)
0.002***
(0.000)
0.002***
(0.000)
0.003***
(0.000)
Urbanizationrate,
0.023**
(0.21)
0.154
(0.21)
0.213***
(0.03)
0.276***
(0.02)
Ethnicfragmentation,
0.163
(0.11)
0.196***
(0.01)
0.359***
(0.01)
Constant
0.973***
(0.07)
-0.466
(0.56)
-1.590
(1.58)
-3.308*
(2.05)
0.509
(1.72)
1.249
(1..30)
2.499*
(1.37)
3.568***
(0.92)
6.354***
(1.30)
Numberofobservations
150
149
149
149
149
149
145
145
145
AdjustedR2
0.07
0.18
0.19
0.25
0.41
0.41
0.42
0.83
0.81
F-Statistic
4.83
4.41
3.40
3.90
68.32
56.66
58.22
119.60
1317.32
Fixed-e¤ect
nono
nono
nono
noyes
yes
Yeardummies
yes
yes
yes
yes
yes
yes
yes
yes
yes
Controlsforserialcorrelationoftheerrorterm,ar1
Coccrane-Orcutttransformation.Robuststandard
errorsareinbrackets.***:coe¢
cientsigni�cantat1%level,.**:at5%level,*:at10%level
42

Table14:Estimationresults-Theaveragee¤ectofdecentralizationontheaccesstosewagedisposal(quantity)
Dep.var.:
(1)
(2)
(3)
(4)
(5)
(6)
(7)
(8)
(9)
Degreeofdecentralization,
0.258***
(0.09)
0.143**
(0.06)
0.105
(0.07)
-0.061
(0.10)
-0.018
(0.09)
-0.005
(0.09)
0.037
(0.08)
0.013
(0.009)
0.024***
(0.002)
Publicspendingpercapita,
0.125**
(0.05)
0.110**
(0.04)
0.132***
(0.04)
0.068*
(0.04)
0.038*
(0.002)
0.034
(0.02)
0.020***
(0.002)
0.009***
(0.001)
Percapitaconsumption,
0.078
(0.06)
-0.016
(0.05)
-0.043
(0.05)
-0.044
(0.05)
-0.061
(0.05)
0.006
(0.008)
-0.001
(0.001)
Populationsize,
0.248***
(0.07)
0.125**
(0.05)
0.072*
(0.03)
0.054
(0.04)
0.051***
(0.01)
0.004***
(0.000)
Populationdensity,
0.001***
(0.000)
0.001***
(0.000)
0.001***
(0.000)
0.001***
(0.000)
0.001***
(0.000)
Urbanizationrate,
0.235*
(0.13)
0.218*
(0.13)
0.226***
(0.05)
0.034***
(0.01)
Ethnicfragmentation,
0.157**
(0.07)
0.124**
(0.05)
0.012
(0.008)
Constant
-0.038
(0.03)
-0.852**
(0.38)
-1.675*
(0.001)
-3.444***
(1.29)
-1.34
(1.21)
-0.587
(0.85)
-0.221
(0.98)
-0.897***
(0.17)
-0.069***
(0.003)
Numberofobservations
150
149
149
149
149
149
145
145
145
AdjustedR2
0.05
0.17
0.18
0.37
0.52
0.55
0.57
0.91
0.91
F-Statistic
4.00
3.17
3.38
3.25
21.06
18.75
19.07
235.90
350.65
Fixed-e¤ect
nono
nono
nono
noyes
yes
Yeardummies
yes
yes
yes
yes
yes
yes
yes
yes
yes
Controlsforserialcorrelationoftheerrorterm,ar1
Coccrane-Orcutttransformation.Robuststandard
errorsareinbrackets.***:coe¢
cientsigni�cantat1%level,.**:at5%level,*:at10%level
43

Table15:Estimationresults-Theaveragee¤ectofdecentralizationontheaccesstosewagedisposal(quality)
Dep.var.:
(1)
(2)
(3)
(4)
(5)
(6)
(7)
(8)
(9)
Degreeofdecentralization,
1.412**
(0.57)
1.101**
(0.51)
1.008*
(0.61)
0.390
(0.69)
0.578
(0.66)
0.613
(0.65)
0.680
(0.67)
0.142
(0.35)
-2.81***
(0.306)
Publicspendingpercapita,
0.388
(0.26)
0.352
(0.25)
0.433*
(0.24)
0.152
(0.25)
0.074
(0.22)
0.079
(0.22)
0.049**
(0.02)
0.049***
(0.01)
Percapitaconsumption,
0.190
(0.41)
-0.163
(0.38)
-0.282
(0.38)
-0.283
(0.39)
-0.357
(0.40)
0.595**
(0.06)
0.595***
(0.06)
Populationsize,
0.924**
(0.36)
0.378
(0.34)
0.238
(0.30)
0.254
(0.34)
0.348
(0.36)
0.778**
(0.38)
Populationdensity,
0.005***
(0.000)
0.005***
(0.000)
0.005***
(0.000)
0.004***
(0.000)
0.004***
(0.000)
Urbanizationrate,
0.312*
(0.79)
0.656
(0.79)
0.503*
(0.29)
0.819***
(0.30)
Ethnicfragmentation,
0.274
(0.55)
-0.204
(0.33)
-0.637*
(0.37)
Constant
-1.48***
(0.23)
7.909***
(1.83)
5.93
(5.07)
-0.634
(6.16)
8.682
(6.19)
10.643**
(4.92
11.138*
(5.66)
-1.089
(4.13)
-4.494
(0.003)
Numberofobservations
150
149
149
149
149
149
145
145
145
AdjustedR2
0.06
0.10
0.10
0.18
0.26
0.26
0.28
0.64
0.84
F-Statistic
6.22
4.61
3.47
3.68
47.77
40.32
49.20
35.87
140.55
Fixed-e¤ect
nono
nono
nono
noyes
yes
Yeardummies
yes
yes
yes
yes
yes
yes
yes
yes
yes
Controlsforserialcorrelationoftheerrorterm,ar1
Coccrane-Orcutttransformation.Robuststandard
errorsareinbrackets.***:coe¢
cientsigni�cantat1%level,.**:at5%level,*:at10%level
44
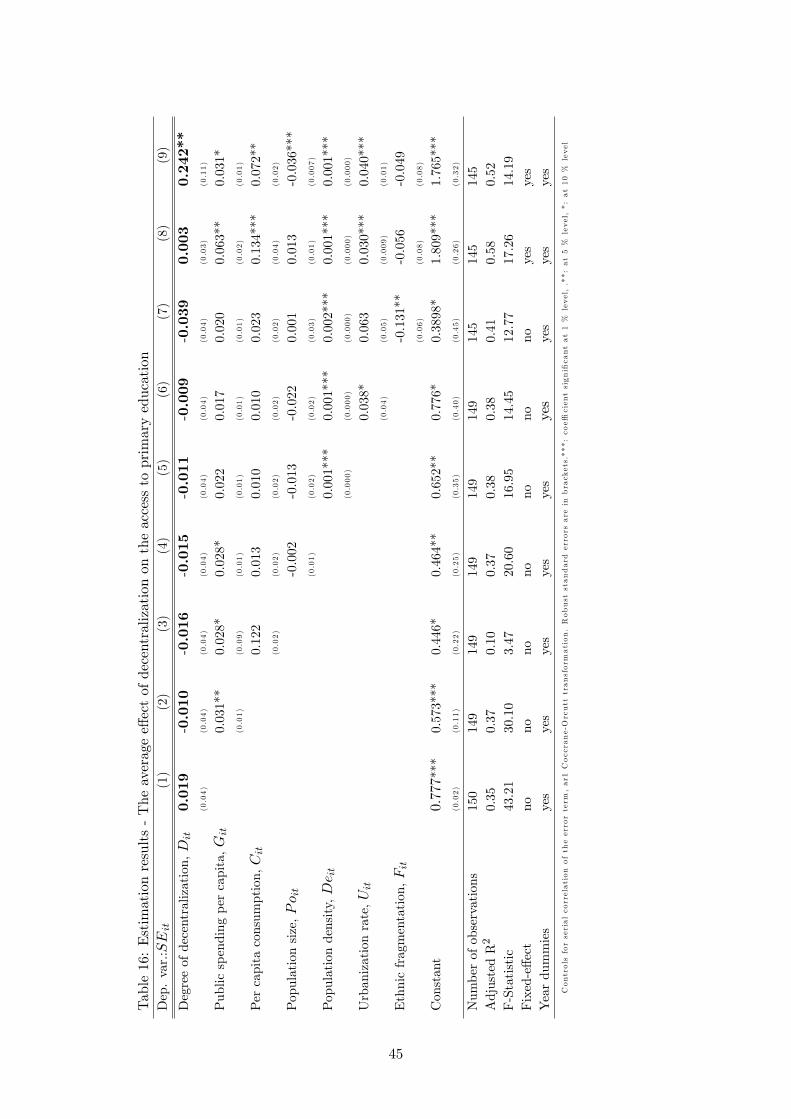
Table16:Estimationresults-Theaveragee¤ectofdecentralizationontheaccesstoprimaryeducation
Dep.var.:
(1)
(2)
(3)
(4)
(5)
(6)
(7)
(8)
(9)
Degreeofdecentralization,
0.019
(0.04)
-0.010
(0.04)
-0.016
(0.04)
-0.015
(0.04)
-0.011
(0.04)
-0.009
(0.04)
-0.039
(0.04)
0.003
(0.03)
0.242**
(0.11)
Publicspendingpercapita,
0.031**
(0.01)
0.028*
(0.09)
0.028*
(0.01)
0.022
(0.01)
0.017
(0.01)
0.020
(0.01)
0.063**
(0.02)
0.031*
(0.01)
Percapitaconsumption,
0.122
(0.02)
0.013
(0.02)
0.010
(0.02)
0.010
(0.02)
0.023
(0.02)
0.134***
(0.04)
0.072**
(0.02)
Populationsize,
-0.002
(0.01)
-0.013
(0.02)
-0.022
(0.02)
0.001
(0.03)
0.013
(0.01)
-0.036***
(0.007)
Populationdensity,
0.001***
(0.000)
0.001***
(0.000)
0.002***
(0.000)
0.001***
(0.000)
0.001***
(0.000)
Urbanizationrate,
0.038*
(0.04)
0.063
(0.05)
0.030***
(0.009)
0.040***
(0.01)
Ethnicfragmentation,
-0.131**
(0.06)
-0.056
(0.08)
-0.049
(0.08)
Constant
0.777***
(0.02)
0.573***
(0.11)
0.446*
(0.22)
0.464**
(0.25)
0.652**
(0.35)
0.776*
(0.40)
0.3898*
(0.45)
1.809***
(0.26)
1.765***
(0.32)
Numberofobservations
150
149
149
149
149
149
145
145
145
AdjustedR2
0.35
0.37
0.10
0.37
0.38
0.38
0.41
0.58
0.52
F-Statistic
43.21
30.10
3.47
20.60
16.95
14.45
12.77
17.26
14.19
Fixed-e¤ect
nono
nono
nono
noyes
yes
Yeardummies
yes
yes
yes
yes
yes
yes
yes
yes
yes
Controlsforserialcorrelationoftheerrorterm,ar1
Coccrane-Orcutttransformation.Robuststandard
errorsareinbrackets.***:coe¢
cientsigni�cantat1%level,.**:at5%level,*:at10%level
45
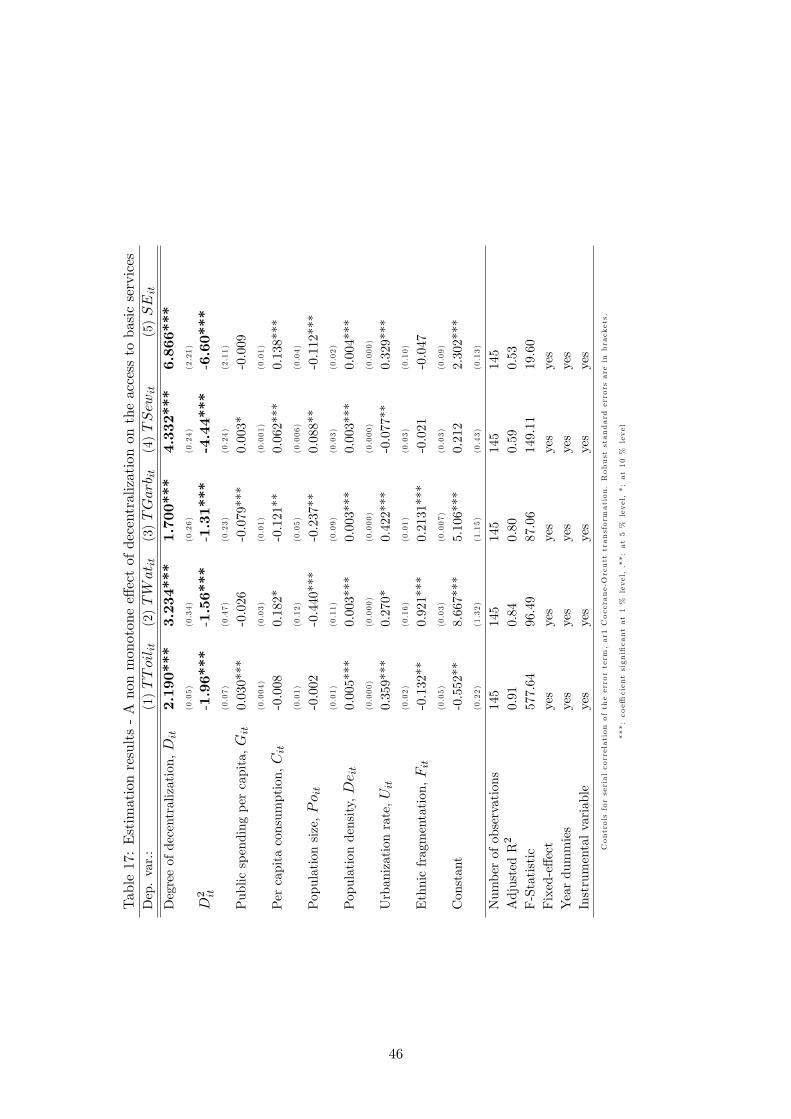
Table17:Estimationresults-Anonmonotonee¤ectofdecentralizationontheaccesstobasicservices
Dep.var.:
(1)
(2)
(3)
(4)
(5)
Degreeofdecentralization,
2.190***
(0.05)
3.234***
(0.34)
1.700***
(0.26)
4.332***
(0.24)
6.866***
(2.21)
2
-1.96***
(0.07)
-1.56***
(0.47)
-1.31***
(0.23)
-4.44***
(0.24)
-6.60***
(2.11)
Publicspendingpercapita,
0.030***
(0.004)
-0.026
(0.03)
-0.079***
(0.01)
0.003*
(0.001)
-0.009
(0.01)
Percapitaconsumption,
-0.008
(0.01)
0.182*
(0.12)
-0.121**
(0.05)
0.062***
(0.006)
0.138***
(0.04)
Populationsize,
-0.002
(0.01)
-0.440***
(0.11)
-0.237**
(0.09)
0.088**
(0.03)
-0.112***
(0.02)
Populationdensity,
0.005***
(0.000)
0.003***
(0.000)
0.003***
(0.000)
0.003***
(0.000)
0.004***
(0.000)
Urbanizationrate,
0.359***
(0.02)
0.270*
(0.16)
0.422***
(0.01)
-0.077**
(0.03)
0.329***
(0.10)
Ethnicfragmentation,
-0.132**
(0.05)
0.921***
(0.03)
0.2131***
(0.007)
-0.021
(0.03)
-0.047
(0.09)
Constant
-0.552**
(0.22)
8.667***
(1.32)
5.106***
(1.15)
0.212
(0.43)
2.302***
(0.13)
Numberofobservations
145
145
145
145
145
AdjustedR2
0.91
0.84
0.80
0.59
0.53
F-Statistic
577.64
96.49
87.06
149.11
19.60
Fixed-e¤ect
yes
yes
yes
yes
yes
Yeardummies
yes
yes
yes
yes
yes
Instrumentalvariable
yes
yes
yes
yes
yes
Controlsforserialcorrelationoftheerrorterm,ar1
Coccrane-Orcutttransformation.Robuststandard
errorsareinbrackets.
***:coe¢
cientsigni�cantat1%level,.**:at5%level,*:at10%level
46

Table18:Estimationresults-Adi¤erentiatede¤ectofdecentralizationbetweencommunes(quintiles)
Dep.var.:
(1)
(2)
(3)
(4)
(5)
�
0.562*
(0.28)
2.120***
(0.29)
0.416**
(0.19)
0.231
(1.24)
-0.24***
(0.03)
�(1¬)
2.544***
(0.03)
2.355***
(0.27)
1.162***
(0.08)
0.139
(0.41)
0.656**
(0.21)
Publicspendingpercapita,
-0.006
(0.005)
-0.063
(0.03)
0.088***
(0.01)
0.013
(0.14)
-0.010
(0.01)
Percapitaconsumption,
0.190***
(0.02)
0.189*
(0.10)
-0.121**
(0.05)
0.598**
(0.24)
-0.13***
(0.04)
Belongtothe�rstquintile,
-0.233**
(0.10)
-0.278***
(0.08)
-0.126***
(0.01)
-0.124
(0.53)
0.133***
(0.10)
Populationsize,
-0.755***
(0.01)
-0.587***
(0.10)
-0.369***
(0.12)
0.313
(0.25)
-0.106***
(0.03)
Populationdensity,
0.004***
(0.000)
0.003***
(0.000)
0.003***
(0.000)
0.004***
(0.000)
0.002***
(0.000)
Urbanizationrate,
1.400***
(0.01)
0.147
(0.13)
0.231***
(0.03)
0.551*
(0.46)
0.009**
(0.004)
Ethnicfragmentation,
-0.602
(0.48)
0.843***
(0.04)
0.115**
(0.04)
-0.247
(0.44)
-0.088
(0.11)
Constant
7.575***
(0.35)
10.64***
(1.23)
6.719***
(1.39)
-0.434
(4.03)
3.465***
(0.31)
Numberofobservations
145
145
145
145
145
AdjustedR2
0.88
0.84
0.80
0.63
0.50
Fixed-e¤ect
yes
yes
yes
yes
yes
Yeardummies
yes
yes
yes
yes
yes
Instrumentalvariable
yes
yes
yes
yes
yes
Waldtest:p-value
0.000
0.494
0.011
-0.000
Controlsforserialcorrelationoftheerrorterm,ar1
Coccrane-Orcutttransformation.Robuststandard
errorsareinbrackets.
***:coe¢
cientsigni�cantat1%level,.**:at5%level,*:at10%level
47
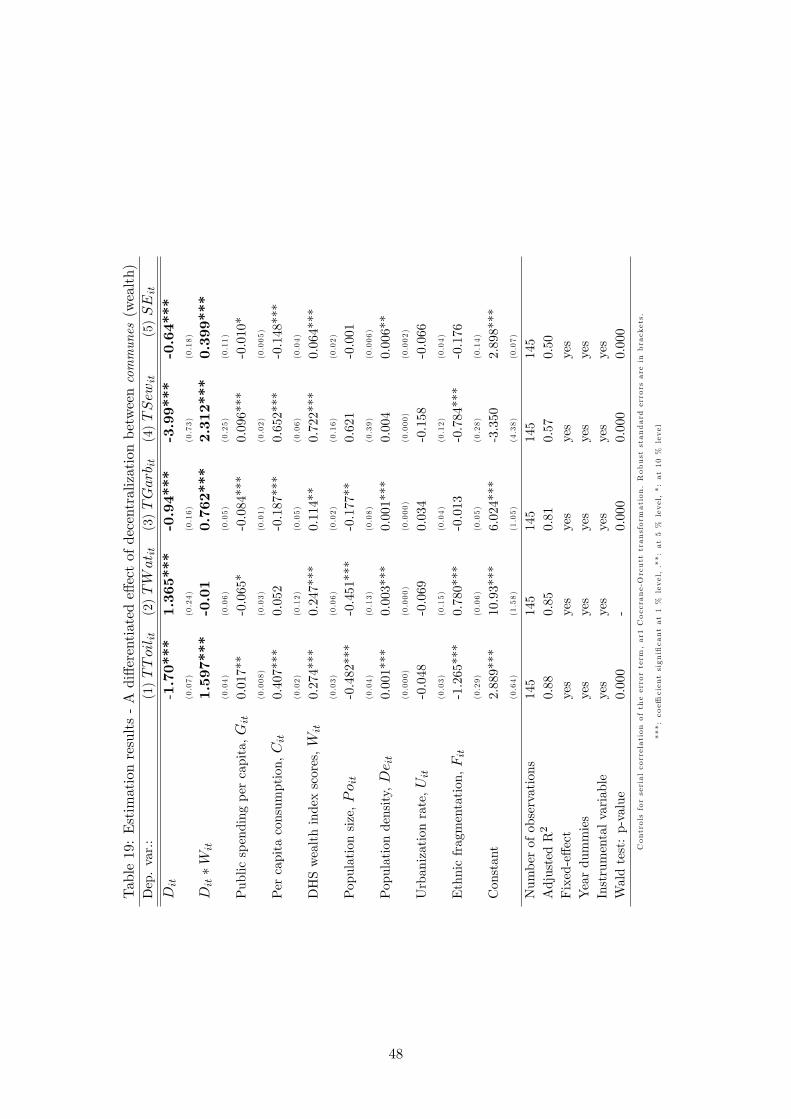
Table19:Estimationresults-Adi¤erentiatede¤ectofdecentralizationbetweencommunes(wealth)
Dep.var.:
(1)
(2)
(3)
(4)
(5)
-1.70***
(0.07)
1.365***
(0.24)
-0.94***
(0.16)
-3.99***
(0.73)
-0.64***
(0.18)
�
1.597***
(0.04)
-0.01
(0.06)
0.762***
(0.05)
2.312***
(0.25)
0.399***
(0.11)
Publicspendingpercapita,
0.017**
(0.008)
-0.065*
(0.03)
-0.084***
(0.01)
0.096***
(0.02)
-0.010*
(0.005)
Percapitaconsumption,
0.407***
(0.02)
0.052
(0.12)
-0.187***
(0.05)
0.652***
(0.06)
-0.148***
(0.04)
DHSwealthindexscores,
0.274***
(0.03)
0.247***
(0.06)
0.114**
(0.02)
0.722***
(0.16)
0.064***
(0.02)
Populationsize,
-0.482***
(0.04)
-0.451***
(0.13)
-0.177**
(0.08)
0.621
(0.39)
-0.001
(0.006)
Populationdensity,
0.001***
(0.000)
0.003***
(0.000)
0.001***
(0.000)
0.004
(0.000)
0.006**
(0.002)
Urbanizationrate,
-0.048
(0.03)
-0.069
(0.15)
0.034
(0.04)
-0.158
(0.12)
-0.066
(0.04)
Ethnicfragmentation,
-1.265***
(0.29)
0.780***
(0.06)
-0.013
(0.05)
-0.784***
(0.28)
-0.176
(0.14)
Constant
2.889***
(0.64)
10.93***
(1.58)
6.024***
(1.05)
-3.350
(4.38)
2.898***
(0.07)
Numberofobservations
145
145
145
145
145
AdjustedR2
0.88
0.85
0.81
0.57
0.50
Fixed-e¤ect
yes
yes
yes
yes
yes
Yeardummies
yes
yes
yes
yes
yes
Instrumentalvariable
yes
yes
yes
yes
yes
Waldtest:p-value
0.000
-0.000
0.000
0.000
Controlsforserialcorrelationoftheerrorterm,ar1
Coccrane-Orcutttransformation.Robuststandard
errorsareinbrackets.
***:coe¢
cientsigni�cantat1%level,.**:at5%level,*:at10%level
48
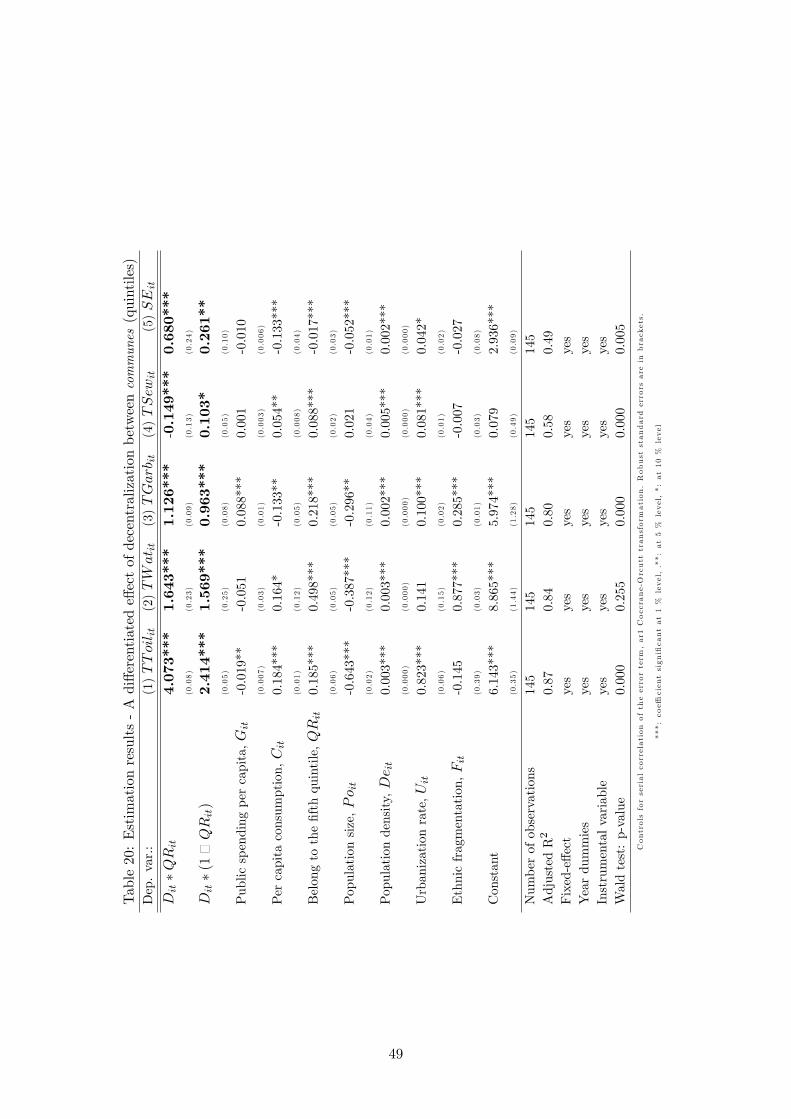
Table20:Estimationresults-Adi¤erentiatede¤ectofdecentralizationbetweencommunes(quintiles)
Dep.var.:
(1)
(2)
(3)
(4)
(5)
�
4.073***
(0.08)
1.643***
(0.23)
1.126***
(0.09)
-0.149***
(0.13)
0.680***
(0.24)
�(1¬)
2.414***
(0.05)
1.569***
(0.25)
0.963***
(0.08)
0.103*
(0.05)
0.261**
(0.10)
Publicspendingpercapita,
-0.019**
(0.007)
-0.051
(0.03)
0.088***
(0.01)
0.001
(0.003)
-0.010
(0.006)
Percapitaconsumption,
0.184***
(0.01)
0.164*
(0.12)
-0.133**
(0.05)
0.054**
(0.008)
-0.133***
(0.04)
Belongtothe�fthquintile,
0.185***
(0.06)
0.498***
(0.05)
0.218***
(0.05)
0.088***
(0.02)
-0.017***
(0.03)
Populationsize,
-0.643***
(0.02)
-0.387***
(0.12)
-0.296**
(0.11)
0.021
(0.04)
-0.052***
(0.01)
Populationdensity,
0.003***
(0.000)
0.003***
(0.000)
0.002***
(0.000)
0.005***
(0.000)
0.002***
(0.000)
Urbanizationrate,
0.823***
(0.06)
0.141
(0.15)
0.100***
(0.02)
0.081***
(0.01)
0.042*
(0.02)
Ethnicfragmentation,
-0.145
(0.39)
0.877***
(0.03)
0.285***
(0.01)
-0.007
(0.03)
-0.027
(0.08)
Constant
6.143***
(0.35)
8.865***
(1.44)
5.974***
(1.28)
0.079
(0.49)
2.936***
(0.09)
Numberofobservations
145
145
145
145
145
AdjustedR2
0.87
0.84
0.80
0.58
0.49
Fixed-e¤ect
yes
yes
yes
yes
yes
Yeardummies
yes
yes
yes
yes
yes
Instrumentalvariable
yes
yes
yes
yes
yes
Waldtest:p-value
0.000
0.255
0.000
0.000
0.005
Controlsforserialcorrelationoftheerrorterm,ar1
Coccrane-Orcutttransformation.Robuststandard
errorsareinbrackets.
***:coe¢
cientsigni�cantat1%level,.**:at5%level,*:at10%level
49
Copyright © 2022 FDOKUMEN