Does boardroom gender diversity matter? Evidence from a transitional economy
48
1 DOES BOARDROOM GENDER DIVERSITY MATTER? EVIDENCE FROM A TRANSITIONAL ECONOMY Tuan Nguyen *+ , Stuart Locke * , and Krishna Reddy * *Department of Finance | Waikato Management School | The University of Waikato Gate 1 Knighton Road, Private Bag 3105, Hamilton 3240, New Zealand + Faculty of Economics and Business Administration | Dalat University No 01 Phu-Dong-Thien-Vuong Street, Dalat, Lamdong, Vietnam + Corresponding author Email: [email protected] Tel: +64 7 838 4466 | Ext: 6383 ABSTRACT This research investigates the relationship between board gender diversity and firm financial performance in the context of a transitional economy characterised by an underdeveloped corporate governance system. Using a sample of 120 publicly listed companies in Vietnam covering a 4-year period from 2008 to 2011, we examine this relationship in a dynamic modelling framework, which controls for potential sources of endogeneity. We find that board gender diversity appears to have an effect on firm performance. This finding remains robust when alternative proxies for gender diversity are employed and is consistent with the perspectives of agency theory and resource dependence theory. The number of female directors in the boardroom also matters, supporting the view that if female board representation affects firm outcomes, this effect is more pronounced when the number of female directors increases. It is observed, furthermore, that the marginal positive performance effect of board gender diversity ceases when the percentage of female directors reaches a breakpoint of about 20%. This finding suggests that there is perhaps a potential trade-off between the costs and benefits of board gender diversification. Our findings significantly contribute to the growing literature of non-US based studies, by providing robust empirical evidence from a transitional economy in East Asia. Keywords: Corporate Governance; Financial Performance; Board Gender Diversity; Vietnam. JEL classification: C23, G30, G32, G34 NOTICE: This is the author’s version of a work that was accepted for publication in International Review of Economics and Finance. Changes resulting from the publishing process, such as peer review, editing, corrections, structural formatting, and other quality control mechanisms may not be reflected in this document. The final publication is available at: Please cite this article as: Nguyen, T., Locke, S., & Reddy, K. (2015). Does boardroom gender diversity matter? Evidence from a transitional economy. International Review of Economics and Finance, (forthcoming).
Transcript of Does boardroom gender diversity matter? Evidence from a transitional economy

1
DOES BOARDROOM GENDER DIVERSITY MATTER?
EVIDENCE FROM A TRANSITIONAL ECONOMY
Tuan Nguyen*+
, Stuart Locke*, and Krishna Reddy
*
*Department of Finance | Waikato Management School | The University of Waikato
Gate 1 Knighton Road, Private Bag 3105, Hamilton 3240, New Zealand
+ Faculty
of Economics and Business Administration | Dalat University
No 01 Phu-Dong-Thien-Vuong Street, Dalat, Lamdong, Vietnam
+Corresponding author
Email: [email protected]
Tel: +64 7 838 4466 | Ext: 6383
ABSTRACT
This research investigates the relationship between board gender diversity and firm financial
performance in the context of a transitional economy characterised by an underdeveloped
corporate governance system. Using a sample of 120 publicly listed companies in Vietnam
covering a 4-year period from 2008 to 2011, we examine this relationship in a dynamic
modelling framework, which controls for potential sources of endogeneity. We find that board
gender diversity appears to have an effect on firm performance. This finding remains robust
when alternative proxies for gender diversity are employed and is consistent with the
perspectives of agency theory and resource dependence theory. The number of female
directors in the boardroom also matters, supporting the view that if female board
representation affects firm outcomes, this effect is more pronounced when the number of
female directors increases. It is observed, furthermore, that the marginal positive
performance effect of board gender diversity ceases when the percentage of female directors
reaches a breakpoint of about 20%. This finding suggests that there is perhaps a potential
trade-off between the costs and benefits of board gender diversification. Our findings
significantly contribute to the growing literature of non-US based studies, by providing robust
empirical evidence from a transitional economy in East Asia.
Keywords: Corporate Governance; Financial Performance; Board Gender Diversity; Vietnam.
JEL classification: C23, G30, G32, G34
NOTICE: This is the author’s version of a work that was accepted for publication in International Review
of Economics and Finance. Changes resulting from the publishing process, such as peer review, editing,
corrections, structural formatting, and other quality control mechanisms may not be reflected in this
document. The final publication is available at:
Please cite this article as: Nguyen, T., Locke, S., & Reddy, K. (2015). Does boardroom gender diversity
matter? Evidence from a transitional economy. International Review of Economics and Finance,
(forthcoming).

2
1. Introduction
Using empirical data from the Vietnamese context, this research contributes to understanding
how female representation on boards of directors (BOD) affects a company’s financial
performance. The topic has become a central focus of corporate governance (CG)
rejuvenation efforts around the world, with companies being encouraged to appoint female
directors to their boards1 (Adams & Ferreira, 2009). This raises an important research
question as to whether there is a causal relationship between gender diversity on the BOD and
firm performance (FP). There has been an increase in the literature on this topic but it relates
predominantly to studies in mature markets characterised by well-established CG systems
(Adams & Funk, 2012). Several have reported inconclusive results (Campbell & Mínguez-
Vera, 2008; and Rose, 2007). Moreover, they have not fully addressed potential endogeneity
concerns, making inferences about the causal relationship between gender diversity and FP
problematic (Terjesen, Sealy, & Singh, 2009). Consequently, the causal effect of board gender
diversity on FP, especially in markets characterised by underdeveloped CG systems, remains
unclear. The current research, applying a well-structured dynamic modelling approach to
control for potential endogeneity concerns, makes an important contribution to understanding
how such diversity works in the Vietnamese market and suggests an approach for similar
economies.
The issue tends to be more complicated since, as Adams and Ferreira (2009) suggested, the
nature of the relationship between board gender diversity and FP is contingent upon whether
the firms are well governed. Using a sample of US firms, they contended that because female
directors bring tougher monitoring to boardrooms, adding more women directors is likely to
provide excessive and unnecessary monitoring for well-governed firms, which may ultimately
have a detrimental impact on FP. If so, the subsequent question is whether more gender-
diverse boards will improve FP in markets where the companies, which are generally poorly
governed, benefit from additional monitoring. Our study addresses this question, contributing
1 For example, in 2004 Norway adopted a mandatory gender quota law requiring 40% of positions on the boards
of listed companies to be reserved for women (HKEC, 2012). This initiative has motivated many countries in
Europe to follow suit, including Belgium (2011), Finland (2005), and Spain (2007). In the Australasian region,
Australia (2009), Hong Kong (2012) Malaysia (2011), New Zealand (2012) and others have revised their CG
codes to include new “comply or explain” provisions. The new provisions require listed companies to report
measurable goals for diversity in their boardrooms, as well as progress in attaining those goals (see e.g., Catalyst,
2012b; HKEC, 2012 for detail).

3
to the growing literature of non-US based studies by focusing on Vietnam, a market
characterised by an underdeveloped CG system, where the benefits of board diversity may be
more pronounced.
It is argued by Carter, Simkins, and Simpson (2003) that the link between board gender
diversity and FP is not predicted directly by any single extant theory. Therefore, examining
this causal relationship becomes an empirical issue (Carter et al., 2003). As pointed out by
Mohan (2014) in a recent comprehensive review paper, however, there are several reasons
why we might expect such a causal relationship to exist. Prior research suggests that the
presence of women in boardrooms may matter for risk-taking and leadership style, both of
which eventually result in effects on FP2. If the gender of directors matters for firm outcomes,
then female directors may fundamentally differ from their male counterparts in terms of
behaviour and personality characteristics.
A recent survey by the United Nations Industrial Development Organization (UNIDO, 2010)
confirmed that Vietnamese female entrepreneurs are distinguishable from their male
counterparts in regard to both human values and attitudes to risk3. These findings are relevant
to our current study since Vietnamese female directors are typically appointed from the pool
of female entrepreneurs. This being the case, it is plausible that female and male directors in
Vietnam will differ in terms of their human values and attitudes to risk. This suggests a causal
effect of board female representation on FP in Vietnamese companies. We argue that the
UNIDO (2010) findings strengthen the context for the current study and help establish not
only the rationale but also the significance of our results for policy implications.
Our study is noteworthy for the following four key reasons. First, it is both relevant and
timely due to the board gender diversification policy initiatives currently undertaken by
2 For example, Adams and Funk (2012) documented that female and male directors are systematically different
in their core values and attitudes to risk. The subsequent question is how financial markets evaluate these
differences. Adams, Nowland, and Grey (2011) found that market reaction to the appointment of female
directors is –on average– significantly positive, and consistently greater than it is to the appointment of their
male counterparts. Mohan and Chen (2004), however, documented that the initial public offering (IPO) markets
do not appear to distinguish between female- and male-led IPOs when evaluating them.
3 For instance, while Vietnamese male entrepreneurs are risk-taking investors and tend to make decisions by
themselves, their female counterparts –due to cultural tradition and their social role– tend to consult their family
members on important business decisions (UNIDO, 2010). Furthermore, the perseverance and determination to
succeed of Vietnamese female entrepreneurs appear to be greater than those of their male counterparts. As goal-
oriented entrepreneurs, Vietnamese women also take their businesses seriously, participate in entrepreneurial
organisations, and readily grasp how to use informal means to promote their own businesses (UNIDO, 2010).

4
several countries, including the European Union and Australasian countries. Board gender
diversity has also emerged as a contemporary policy debate in Vietnam. Accordingly, the
significance of the market-based consequences of such policy initiatives is an important
policy concern in many countries in the region.
Secondly, our study employs the system generalised method of moments (System GMM)
approach, which is considered to be the most appropriate method for exploring the CG–FP
relationship in a dynamic framework (Flannery & Hankins, 2013). This estimation technique
allows us to control for potential sources of endogeneity which have plagued many earlier
studies. Thirdly, the CG–FP relationship and, specifically, the relationship between board
gender diversity and FP in the Vietnamese market, are virtually unknown to international
scholars4. Finally, because the Vietnamese market is characterised simultaneously by a weak
CG system and an advanced gender-related institutional context5, it provides a unique
environment for examining the nexus of board gender diversity and FP.
The rest of this paper is organised as follows. First, we discuss the gender-related institutional
environment and the CG context in Vietnam to help readers grasp the significance and
background of the research. We then briefly review the relevant literature to develop our main
research hypothesis. Data, data sources, and method are described next. Finally, we present
the empirical results and conclude the paper with a discussion of the contributions and
limitations of the study.
2. Background
Corporate governance is a new concept for Vietnam and there is also no equivalent
Vietnamese terminology that fully explains CG. The term ‘corporate governance’ is translated
as ‘quản-trị-công-ty’, similar in meaning to ‘company administration’ (OECD, 2006). The CG
4 The latest review paper on the theme of CG in emerging markets conducted by Claessens and Yurtoglu (2013)
does not include any information about Vietnam. Another recent meta-analysis paper concerning corporate
board-FP relationship in the Asian region conducted by Van Essen, Oosterhout, and Carney (2012) similarly
provides no information about Vietnam. In the most recent comprehensive review paper by Terjesen et al. (2009)
dealing with the topic of female directors in the boardroom, there is no research using Vietnamese company data
among more than 400 relevant publications. We also conducted a simple ‘survey’ at the end of 2012 to look for
publications of the CG and FP relationship in Vietnam. We followed Love (2011) and used the key words
‘corporate governance’ + ‘performance’ + ‘Vietnam’ to search www.GoogleScholar.com, www.SSRN.com, and
the Proquest5000 database. Generally speaking, the search results showed that there was no empirical research
considering the case of Vietnam.
5 See section Background for more detail.

5
system in Vietnam is in the initial stages of development (World Bank, 2006a) and the current
situation can be characterised as follows: (i) CG regulations are less developed and enforced
(World Bank, 2006a); (ii) public awareness regarding CG is poor (Freeman & Nguyen, 2006);
(iii) the role of the state sector is predominant; (iv) the protection of private property rights is
weak; and (v) both internal and external governance mechanisms are limited (Le & Walker,
2008; Nguyen, 2008; World Bank, 2006a).
To establish an effective CG system and improve public awareness regarding CG, the
Vietnamese government has adopted the legal principles of Anglo-American jurisdictions in
order to establish a regulatory system for the CG practices of Vietnamese companies (Le &
Walker, 2008). Specifically, the Law on Enterprises was enacted in 2005 and became
officially binding as of July 2006 (hereafter the LOE 2005), marking a turning point in the
development of business freedom and the legal framework of CG practices in Vietnam (Bui &
Nunoi, 2008).
Under the LOE 2005, the Vietnamese Ministry of Finance promulgated the Code of Corporate
Governance for Listed Companies (the Code) in March 2007, updated in July 2012, reflecting
most of the OECD Principles of CG (the OECD Principles)6. However, it is noteworthy that
while the OECD Principles are a flexible, principle-based approach to governance (also
referred to as the ‘comply or explain’ approach), the Code is mandatory for all publicly listed
companies in Vietnam (Le & Walker, 2008). The Code also provides guidance on board
diversity in terms of professional background, management experience, and industry
knowledge. Nevertheless, it is interesting to note that the Code does not make any reference to
either gender or racial diversity.
In complying with the LOE 2005 (National Assembly, 2005) and the Code (MOF, 2007), the
typical governance structure of a Vietnamese listed company follows a two-tier model and
consists of four governance bodies: (i) a general meeting of shareholders (GMS); (ii) a board
of directors (BOD); (iii) a chief executive officer (CEO); and (iv) a board of supervisors
(BOS). The GMS, the most powerful body of a publicly listed company, establishes the
company’s constitution and elects the members of both the BOD and BOS. In accordance
6 The OECD Principles of CG were approved by Organisation for Economic Co-operation and Development
Ministers in 2004 and have since become an international benchmark of CG practices for policy makers
worldwide.

6
with the company’s constitution, the BOD chairperson may be elected by either BOD
members or the GMS. As stipulated by the LOE 2005, the BOD—consisting of three to
eleven members—is responsible for guiding and establishing the company’s business
strategies as well as monitoring managerial decisions. Specifically, the LOE 2005 clearly
stipulates four major duties of the BOD, including: (i) making decisions regarding
management strategies; (ii) nominating the CEO and approving senior executive positions;
(iii) monitoring daily managerial operations; and (iv) proposing matters for the consideration
of the GMS. In comparison with the German internal CG model, the BOD of Vietnamese
companies has a more direct role in monitoring daily management (Le & Walker, 2008).
The LOE 2005 provides that a BOS must be established in companies which have more than
eleven individual shareholders or at least one institutional shareholder holding more than 50%
of the company’s equity. The membership of a BOS must range from three to five members
who need not be shareholders or employees of the company. Unlike the one-tier board
structure in Anglo-American jurisdictions where a supervisory committee is composed and
nominated by the BOD, the members of a Vietnamese BOS are elected by the GMS and
function independently from the BOD (Bui & Nunoi, 2008). According to the LOE 2005,
more than half of the BOS’s membership must reside permanently in Vietnam and at least one
member must be an accountant or auditor.
The major role of the BOS is to make an internal assessment of the annual financial
statements and supervise the performance of both BOD and CEO. However, the LOE 2005
does not stipulate what specific form of supervision is required and how the BOS should
implement its decisions (Bui & Nunoi, 2008). The absence of clear legal guidance for the
BOS on what and how to supervise the BOD has had the result that the BOS’s supervisory
role in Vietnamese companies is ineffective (World Bank, 2006a). In consequence, the BOS
in Vietnamese companies, in reality, appears to exist in form rather than in substance (Bui &
Nunoi, 2008).
Despite the efforts made by the government to improve the standard of governance practised
by publicly listed companies, the CG system in Vietnam still remains underdeveloped. Indeed,
Vietnam is ranked 166th
out of 183 economies for the strength of investor protection (World
Bank, 2012). The most recent CG scorecard for 2011, conducted by the IFC (2012), reported

7
that the average CG score in Vietnam is only 42.5%, which is much less than those of other
markets across the Asian region7.
Regarding the gender-related institutional environment in Vietnam, UNIDO (2010) argues
that the country has been strongly influenced by Confucian gender ideologies in which
women are subordinated to men. However, Vietnamese companies nowadays enjoy an
advanced gender-related institutional environment in which women’s rights and gender
equality are constantly promoted. As a Marxist-Leninist one-party state, Vietnam has pursued
‘a socialist-oriented market economy’ in which the state sector rather than market forces plays
the decisive role in controlling the economy. In such an economic structure, the government
intervenes strongly and directly in the economy in order to achieve the socialist ideals of
citizens’ equality and, to a lesser extent, gender equality.
Gender equality, therefore, is considered to be one of the central goals of this communist
state’s socio-economic development strategies (Knodel, Vu, Jayakody, & Vu, 2004). Since
1945, the Vietnam Communist Party has been strongly committed to achieving this goal by
adopting gender-based interventions. In 2002, for example, the Vietnamese government
proclaimed a National Strategy for the Advancement of Women to 2010 that identifies high
priorities for achieving equal rights for women in labour, employment, education, health, and
economic participation (Asian Development Bank, 2005). The National Strategy on Gender
Equality 2011-2020, adopted in 2010, also specifies objectives for the participation of women
in leadership and management (World Bank, 2011).
Through concerted efforts for gender equality, Vietnam has achieved key gender equality
indicators extremely well in comparison with other East Asian countries at a similar, or even
higher, level of GDP per capita (World Bank, 2011). For instance, the World Bank (2006b)
assessed Vietnam as one of the countries in the world that had achieved the highest rate of
economic participation by women and the highest participation of women in state power
structures, such as parliament, in the East-Asian region. More recently, the World Bank (2011)
reported that the participation rate of Vietnamese women in the labour force ranked among
7 For example, the average scores of Thailand (in 2011), Hong Kong (in 2009), and the Philippines (in 2008) are
77%, 73% and 72%, respectively (IFC, 2012).

8
the highest for countries in the region and that the gender gap in earnings was lower in
Vietnam than in many other East Asian countries.
Vietnam has also made considerable progress in reducing gender-related hindrances in the
business environment for female entrepreneurs (UNIDO, 2010). More specifically, UNIDO
(2010, p. 12) reported that this organisation “did not find any significant difference in
perceived gender-based bias of male and female entrepreneurs in getting collateral, entering
networks, acquiring new contracts, employing workers and dealing with authorities.” This
situation may facilitate economic participation and promotion opportunities for Vietnamese
women, which in turn may help to extend the pool of qualified women from which the most
suitable candidates for director will be chosen.
According to Grosvold and Brammer (2011); and Terjesen and Singh (2008), national
institutional systems, such as the socio-economic and political structure, legal background,
governance system, and cultural foundation, among others, constitute important antecedents
for female representation in boardrooms as well as opportunities for women to advance in
their careers. For this reason, Grosvold and Brammer (2011) recommend that the national
institutional environment should be completely incorporated in studies on boardroom
diversity. The institutional environment in Vietnam, on the one hand, is remarkable for its
underdeveloped CG system and on the other hand, is characterised by advanced gender-
related institutions. Together, these distinctive institutional features make Vietnam an
interesting case to study.
3. Literature Review and Hypothesis Development
Theoretically, the link between board gender diversity and FP is not predicted directly by any
single theory, including agency theory and resource dependence theory8 (Carter et al., 2010).
However, both these theories do provide insight into the link and imply the possibility that
board gender diversity affects firm value (Carter et al., 2010). In fact, there is a small but
developing literature documenting that female board representation matters for firm outcomes
(Adams & Funk, 2012).
8 Therefore, “until a theoretical framework that predicts the nature of the relationship is developed”, examining
the board gender diversity–FP nexus is an empirical issue (Carter et al., 2003, p. 38). Nevertheless, among

9
According to agency theory, the monitoring function of the BOD plays an extremely
important role in mitigating principal-agent conflicts, which ultimately affect FP (Fama &
Jensen, 1983; Jensen & Meckling, 1976). Recent empirical studies suggest that greater gender
diversity on boards has the potential to strengthen this monitoring function. For example,
Adams and Ferreira (2009) and Adams et al. (2011) reported that female directors tend to
have better monitoring ability because they are able to think independently and are not
affected by the so-called old-boys’ club syndrome. Greater gender diversity on boards may
also provide better monitoring since female director representation helps to improve
managerial accountability, such as improving board meeting attendance and CEO
responsibility (Adams & Ferreira, 2009). As a result, female directors may act as additional
independent directors who help to improve the monitoring function of the BOD (Adams &
Ferreira, 2009).
However, it is worth noting that even if boards with more gender diversity do improve the
monitoring function of the BOD, it does not necessarily follow that this improvement will
result in better FP. This is because the potential effect of gender diversity on FP is contingent
upon the quality of firm governance. Adams and Ferreira (2009) suggested that weakly
governed companies may benefit from including more women on their boards, enhancing
additional monitoring and improving firm value. In support, Gul, Srinidhi, and Ng (2011, p.
314) argue that greater gender diversity on boards acts as a “substitute mechanism for
corporate governance that would be otherwise weak”, and this in turn may lead to improved
performance. Conversely, board gender diversity seems to have a harmful effect on the FP of
well-governed firms because of unnecessary, excessive monitoring (Adams & Ferreira, 2009).
Resource dependence theory suggests that the security of firms’ vital resources as well as the
linkage between firms and their external environment can be improved by an increase in the
size and diversity of the BOD (Goodstein, Gautam, & Boeker, 1994; Pfeffer, 1973). In other
words, firms with larger and/or more diverse boards may have advantages in obtaining and
maintaining their important resources, including: (i) the human capital of board members
(knowledge, skills, and talent); (ii) advice and counsel; (iii) channels of communication; and
(iv) legitimacy (Hillman & Dalziel, 2003; Pfeffer & Salancik, 2003). In fact, it is documented
several theories from various fields, resource dependence theory provides “the most convincing theoretical
arguments for a business case for board diversity” (Carter, D'Souza, Simkins, & Simpson, 2010, p. 398).

10
in the CG literature that more gender-diverse boards may help to extend these firms’ vital
resources (Liu, Wei, & Xie, 2014). Hillman, Cannella, and Harris (2002) argued that
diversifying the BOD by adding more women would help companies to gain legitimacy as
gender equality becomes increasingly one of the widely accepted social norms.
In a similar vein, female directors may broaden the human capital and channels of
communication of the BOD by offering additional insight into firms’ strategic issues,
especially those that relate to female employees, consumers, and business partners (Daily,
Certo, & Dalton, 1999). It follows that female representation in boardrooms should improve
information processing, leading to higher quality decisions and ultimately better FP (Dezsö &
Ross, 2012; Rose, 2007). However, greater boardroom gender diversity may not necessarily
result in more effective boards (Carter et al., 2003). More specifically, greater board gender
diversity may lead to several difficulties in reaching a consensus on strategy decisions and in
implementing monitoring functions effectively, since the greater the diversity of the BOD, the
greater the potential that conflict of interests may occur (Goodstein et al., 1994).
In summary, although both theories suggest that the link between board gender diversity and
FP appears to be a real possibility (Carter et al., 2010), the nature of the link remains unclear
(Carter et al., 2010; Erhardt, Werbel, & Shrader, 2003; Rose, 2007). The empirical question
that needs to be answered is, if the link between board gender diversity and FP does exist,
does female director representation make the difference? Prior empirical studies on this topic,
predominantly conducted in developed markets, provide us with inconclusive evidence
(Campbell & Mínguez-Vera, 2008; Mohan, 2014; Rose, 2007).
Some argue that the relationship between gender diversity and performance is positive
(Campbell & Mínguez-Vera, 2008; Carter et al., 2003; Dezsö & Ross, 2012; Erhardt et al.,
2003), or negative (Adams & Ferreira, 2009; Ahern & Dittmar, 2012), while others see
evidence of no significant relationship at all (Carter et al., 2010; Rose, 2007). We argue that
such mixed empirical evidence reflects the differences in research contexts and econometric
techniques used. For instance, given that women tend to work for better performing
companies (Farrell & Hersch, 2005), studies that link gender diversity to FP should treat
gender diversity as an endogenous variable (Adams & Ferreira, 2009; Carter et al., 2010;
Dezsö & Ross, 2012). This implies that ignoring the endogenous nature of the gender
diversity-FP connection makes empirical estimations problematic.
11
Given that the extant theoretical framework and prior empirical findings do not suggest a
clear outcome for the board gender diversity–performance nexus, our theory-based analysis
will be adjusted by the Vietnamese CG context. Accordingly, if the performance effect of
greater gender diversity on boards appears to be more pronounced in firms with weak
governance (Adams & Ferreira, 2009; Gul et al., 2011), we can plausibly infer that
Vietnamese firms, characterised by underdeveloped governance practices, may greatly benefit
from adding female directors to their boards. In other words, we argue that if female directors
provide greater monitoring expertise, which is more valuable in a weak CG environment
(Adams & Ferreira, 2009; Adams et al., 2011; Gul et al., 2011), it may be expected that
Vietnamese listed companies with more gender-diverse boards will enjoy better financial
performance. Therefore, we propose our main research hypothesis as follows:
Hypothesis: Board gender diversity has a significantly positive effect on the financial
performance of Vietnamese listed companies.
4. Data and Method
4.1. Sample and Data Sources
The Ho-Chi-Minh Stock Exchange (HOSE) and the Hanoi Stock Exchange (HNX) are two
stock markets in southern and northern Vietnam, respectively. Of 275 non-financial
companies listed on these two bourses at the end of 2008, 122 companies have relatively
complete data on key variables during the 4-year period from 2008 to 20119. Hence, a panel
dataset comprising 488 firm-year observations is used as the initial dataset. However, to
ensure that our findings are not driven by the outliers of Tobin’s Q, we drop firm-year
observations within the first and beyond the 99th
percentiles, as suggested by Balatbat, Taylor,
and Walter (2004), Giroud and Mueller (2010); Kuo, Lin, Lien, Wang, and Yeh (2014),
9 Consistent with the previous literature, financial firms and banks are excluded from the sample because they
function under strict regulations that may have various influences on their CG mechanisms. It should be noted
that the number of non-financial listed companies in Vietnam has increased by 317 companies over a 4-year
period, from 275 in 2008 to 592 in 2011. Because we examine a 4 consecutive year dataset from 2008-2011,
these 317 companies listed after 2008 are not included in our sample, leaving an available population of 275
companies listed in 2008. The reason for considering data from 2008 is that these Vietnamese listed companies,
in compliance with the Code, have consistently provided CG information in their annual reports from fiscal year
2008 onward. In relation to the whole population of 275 non-financial companies listed in 2008, the beginning
year in the 4 consecutive year dataset, our final sample accounts for approximately 44% and is the largest
possible dataset we can obtain.

12
among many others. Consequently, our final sample includes 479 firm-year observations.
Company financial data are sourced from Thomson One Banker (Worldscope database).
Block-holder ownership data are extracted from Thomson One Banker (Ownership module).
We also collate block-holder ownership information from the companies’ annual reports. Data
for board structures are hand-collected from the firms’ annual reports downloaded from FPT-
Ez-search Online Information Gateway and Vietstock. The list of publicly listed companies,
classified according to the Industry Classification Benchmark (ICB), is provided by StoxPlus
Corporation.
4.2. Variables
Dependent Variable
Following prior studies (e.g., Mohan & Ruggiero, 2007; Reddy, Locke, Scrimgeour, &
Gunasekarage, 2008), we employ the Tobin’s Q ratio as the FP measure. As a market-based
measure of financial performance, a Tobin’s Q ratio higher than one reflects investors’
expectation that the company has powerful comparative advantages or good growth
opportunities (Campbell & Mínguez-Vera, 2008; Rose, 2007). In contrast, a Tobin’s Q ratio
smaller than one indicates poor utilisation of company resources (Campbell & Mínguez-Vera,
2008; Rose, 2007). We follow prior studies (Chen, Guo, & Mande, 2006; Nguyen, Locke, &
Reddy, 2014) and compute the Tobin’s Q ratio as the sum of the market value of a firm’s
stock and the book value of debt divided by the book value of total assets. To mitigate the
potential effects of outliers, we transform Tobin’s Q into natural logarithmic form.
Explanatory and Control Variables
Our independent variable of interest is gender diversity. We first use the percentage of female
directors on boards (female) as a proxy for gender diversity. In order to check the robustness
of the estimations, we follow Campbell and Mínguez-Vera (2008) and employ two alternative
proxies for gender diversity: (i) a gender diversity dummy variable (d1women); and (ii) the
Blau index for gender (blau). The variable d1women, which distinguishes companies with at
least one female director on their boards from those without, allows us to answer the question
whether the presence of women in boardrooms in itself has an impact on FP.
Meanwhile, the variable female enables us to examine the effect that board gender balance has
on FP. The Blau index for gender combines both of the above aspects of diversity, including

13
the variety (measured by d1women) and the balance (measured by female) (Campbell &
Mínguez-Vera, 2008). Following Blau (1977), as cited in Harrison and Klein (2007), we also
calculate the Blau index for gender as (1-∑ 𝑃𝑖22
𝑖=1 ), where i = (1, 2) is the number of gender
categories (two); Pi is the proportion of board members in each category. The minimum and
maximum values of the Blau index for gender are zero (perfectly homogeneous boards) and
0.5 (perfectly heterogeneous boards), respectively.
Moreover, in order to capture the potential effect of the number of female directors, we follow
Liu et al. (2014) and employ a dummy variable (denoted as d2women) that takes a value of
one if there are at least two female directors and zero otherwise. We also control for other
board and firm characteristics that may have effects on FP, such as the percentage of non-
executive directors on board, duality, board size, and block-holder ownership. In line with
prior studies, we treat firm size, leverage (e.g., Chen, Guo, & Mande, 2003), firm age (e.g.,
Reddy et al., 2008), industry dummies, and year dummies as control variables. In addition, we
use the 1-year lagged dependent variable, recommended by Wintoki, Linck, and Netter (2012)
and others, as an explanatory variable to control for the dynamic nature of the CG–FP
relationship. The detailed definitions and acronyms of the variables used in this study are
summarised in Table 1.
---------------------------------
Insert Table 1 about here
---------------------------------
4.3. Method
Model Specification
As suggested by Wintoki et al. (2012), the model specification for estimating the CG–FP
relationship in a dynamic framework10
is described as follows:
10 The theoretical arguments of Harris and Raviv (2008); Hermalin and Weisbach (1998); and Raheja (2005)
imply that the relationship between CG and FP is dynamic in nature; that is, current CG characteristics and
performance are affected by firms’ past performance. This is confirmed by Schultz, Tan, and Walsh (2010);
Wintoki et al. (2012), who suggest that the appropriate empirical model for the CG–FP association should be a
dynamic one, in which lagged performance is used as one of the explanatory variables, rather than the static
model applied by many prior studies. In the context of CG literature, this dynamic approach has been recently
applied in studies of the board structure–performance nexus (e.g., Wintoki et al., 2012), the determinants of
board structure (e.g., Chen, 2014) , or the CG–FP nexus (e.g., Nguyen et al., 2014).

14
1
k
it s it s it it i it
s
y y X Z year dummies industry dummies
(1)
Where: i indexes observational firms and t indexes time; , , and are vectors of
coefficients on lagged dependent variables (yit-s), CG variables (Xit) and control variables (Zit),
respectively; 𝜂𝑖 represents unobserved time-invariant firm effects; εit is a random error term; k
is the number of dependent variable lags. Pham, Suchard, and Zein (2011); and Wintoki et al.
(2012) suggested that two lags of the dependent variable (k = 2) are sufficient to capture all
information from the past.
In order to check this argument empirically, we follow Wintoki et al. (2012) and run an OLS
regression of current performance on two lags of past performance (i.e., yit-1 and yit-2),
controlling for Xit and Zit. We find that the coefficient on yit-2 is not statistically significant at
the 5% level, suggesting that one lag is enough to capture the dynamic nature of the CG–FP
relationship. Thus, the 1-year lag of Tobin’s Q will be employed as an explanatory variable in
our official regression models. This is in line with the studies of Adams and Ferreira (2009);
Dezsö and Ross (2012); and Nguyen et al. (2014). When k = 1, equation (1) can be
specifically written as follows:
1 1 2 3 4 5
1 2 3
it it it it it it it
it it it i it
lnq lnq female nonexe dual lnbsize block
lnfage fsize lev year dummies industry dummies
(2)
Equation (2) is the base-line model in our study. In order to compare with previous studies
and emphasise the dynamic nature of the CG–FP association, we estimate equation (2) by
using alternative estimation models, including: (i) a static OLS model; (ii) a fixed-effects
model; (iii) a dynamic OLS model; and (iv) a two-step System GMM model. In these models,
, 𝛽𝑖 (i =1, 2, 3, 4, 5), and 𝛿𝑗 (j = 1, 2, 3) are estimated coefficients of explanatory variables
and control variables, respectively. For the static OLS model and fixed-effects model, it is
assumed that = 0. It should be noted that the industry dummies, by construction, are not
included in estimations with fixed effects, including models (ii) and (iv). In an unreported
additional analysis, we find that all coefficients on industry dummy variables in model (iii)
are statistically insignificant at the 5% level. The null hypothesis of the Wald test that the
coefficients on all industry dummies are simultaneously equal to zero cannot be rejected at
any conventional levels of significance. For this reason, we exclude industry dummies from
the official OLS estimations and rerun models (i) and (iii) without industry dummies.

15
Following Schultz et al. (2010); and Wintoki et al. (2012), we assume that firm age (lnfage)
and year dummies are exogenous.
Estimation Approach
Most prior studies on the CG–FP nexus commonly employed the fixed-effects (FE) approach
and/or the traditional instrumental variable (IV) approach to mitigate potential endogeneity
concerns arising from unobserved time-invariant heterogeneity and/or simultaneity. However,
these techniques are not designed to deal with dynamic endogeneity, which very likely arises
in the board structure to performance relationship in general (Wintoki et al., 2012) and in the
gender diversity to performance relationship in particular (Adams & Ferreira, 2009; Dezsö &
Ross, 2012). In addition, applying the traditional IV approach, which requires identifying
reliable external instruments, is no easy task (Flannery & Hankins, 2013). It is therefore
extremely difficult, if not impossible, to look for a set of multiple external instruments for the
current study in which almost all explanatory variables are considered to be endogenously
determined.
Given the unavailability of appropriate external instruments for CG research, the two-step
System GMM estimator—proposed by Blundell and Bond (1998)—constitutes the most
feasible solution for dealing with endogeneity issues arising from a dynamic panel setting
(Antoniou, Guney, & Paudyal, 2008; Nakano & Nguyen, 2012). This technique, on the one
hand, allows us to employ internal instruments available within the panel itself (Blundell &
Bond, 1998), facilitating our empirical estimation process. On the other hand, it allows us to
cope with “the combination of a short panel, a dynamic dependent variable, fixed effects and
a lack of good external instruments” (Roodman, 2009b, p. 156). Indeed, simulation analyses
recently undertaken by Flannery and Hankins (2013); and Zhou, Faff, and Alpert (2014),
documented that the System GMM emerges as the best-performing estimator across common
data features encountered in our dataset, including: (i) short panel; (ii) endogenous
explanatory variables; and (iii) dynamic panel bias. More importantly, by construction the
System GMM estimator allows for mitigating the problem of the slow-changing
characteristics of independent variables, which renders the FE estimator powerless (Antoniou
et al., 2008).

16
5. Empirical Results and Discussion
5.1. Descriptive Statistics
Table 2 reports the descriptive statistics of the key dependent and independent variables used.
Tobin’s Q values range from 0.20 to 2.96, with an average value of 0.85. The median Tobin’s
Q of 0.78 means that for half the observations, the Tobin’s Q is less than or equal to 0.78.
Furthermore, the median Tobin’s Q of 0.78 is very close to the mean Tobin’s Q of 0.85, both
of which are less than one. This suggests that in terms of central tendency, the market value of
the listed companies during the sampling period is lower than the book value. On the one
hand, this result may reflect the negative expectation of investors in response to the
ineffective use of scarce company resources. On the other hand, it may also reflect the
variations of the Vietnamese stock exchange during the crisis period of 2008–2011.
Figure 2 (appendices) demonstrates that the mean and median values of Tobin’s Q closely
follow the fluctuations of the Vietnamese Stock Index (VNIndex) across the years from 2008
to 2011. It is evident from Figure 2 that the mean and median of Tobin’s Q—on a year-by-
year basis—are also smaller than one when the VNIndex annual growth rates are negative.
Consequently, we believe that the negative trend of the market during this crisis period is a
possible explanation why Vietnamese listed companies were undervalued by investors.
The mean percentage of female directors is 12.06%, which is twice as many as that reported
by Sussmuth-Dyckerhoff, Wang, and Chen (2012) for the Asian region (6%). Furthermore, as
reported by Catalyst (2012a), the mean percentage of female directors in Vietnam is far larger
than that of other countries in the region, such as China (8.50%), Hong Kong (9%), Indonesia
(4.50%), Japan (0.90%), Malaysia (7.80%), Singapore (6.90%), South Korea (1.90%), and
Thailand (8.70%). Given that the institutional environment has an important influence on the
social role and boardroom representation of women (Grosvold & Brammer, 2011), the higher
ratio of female directors in Vietnamese companies appears to be the direct outcome of a better,
more gender-diverse institutional context, mentioned earlier in Section 2.
---------------------------------
Insert Table 2 about here
---------------------------------
The mean of the variable d1women is approximately 0.51 suggesting that 51% of companies
in the sample (equivalent to 239 out of 472 observations, as reported in Table 3) have at least

17
one female director on their board. Arguably, this proportion is much higher than that
reported by Campbell and Mínguez-Vera (2008) for Spain (23.70%) and by CGIO (2011) for
Singapore (40%). This result is a reflection of the high proportion of women in the labour
force in Vietnam (World Bank, 2011), which may contribute to higher gender diversity in the
boardroom than would otherwise be the case.
Nevertheless, female representation in Vietnamese boardrooms is still low. As reported in
Table 3, of 239 cases with at least one female director, only 75 (≈ 31%) have two or more
women on the board. The number of cases with at least three female directors is negligible (20
cases). Table 3 also provides detailed information about the frequency of female directors by
board size. It can be observed from Table 3 that cases with one or two female directors on the
board tend to be those which have a board membership ranging from five to seven.
On an average basis, non-executive directors account for about 49% of total directors, similar
to the ratio found by the IFC (2011) for the Vietnamese market. The minimum percentage of
non-executives is zero, although to ensure board independence (MOF, 2007), the Code
requires that at least one-third of Vietnamese listed company directors must be non-executives.
This situation reflects the fact that while one or more companies in the sample have failed to
comply with the minimum level of non-executives on the BOD, the others have achieved well
above the threshold. Among companies in the sample, only 32% of the board chairpersons are
also the CEOs, indicating that dual roles are less common in Vietnam. This ratio is in
agreement with that reported by the IFC (2011) in its survey of the Vietnamese market.
The average number of board directors is approximately six, similar to the ratio reported by
the IFC (2011) and, as reported by The Korn/Ferry Institute (2012), much smaller than the
average board size of other countries in the Asian region, such as China (11.60), Hong Kong
(11.50), India (10.80), Malaysia (9.00), and Singapore (8.60). Table 3 shows that there are
from five to seven members on the boards of most companies in our sample. It can be seen
that the board size of companies in Vietnam is: (i) in compliance with the requirement of the
Code that the boards should have from three to eleven members; and (ii) within the optimal
threshold of board size—no more than eight members—recommended by Jensen (1993) for
board effectiveness.
---------------------------------
Insert Table 3 about here
---------------------------------

18
The mean value of firm age (the period of time from the initial public offering) is 3.34,
reflecting the fact that listed companies in the sample are very young. This can partly explain
their lack of experience in dealing with CG issues pointed out in recent IFC reports (IFC,
2011, 2012). Notably, about 44% is the average percentage of ordinary shares held by
shareholders who own at least 5% of the total number of a company’s common stocks.
Although this number is lower than that of Singapore (60%) and Malaysia (47%) (see, Mak &
Kusnadi, 2005), it is still much higher than that of western developed markets, such as the US
and UK markets. This finding is in line with Chen and Huang (2014), who documented that
many emerging markets are characterised by highly concentrated ownership structures. While
this may indicate that the ownership structure of listed companies in Vietnam is highly
concentrated, it should be noted that this ratio varies considerably from zero to approximately
87%.
Table 4 reports that the variation in the ratio of female directors within firms (5.34%) is lower
than that across firms (12.85%). This result suggests that the percentage of female directors
does not vary greatly over time. In other words, female is a slow-changing variable, given that
if a variable does not vary across time, the within-standard deviation will be zero. The
remaining CG variables, including nonexe, dual, lnbsize, and block, share a similar
characteristic. These findings are consistent with Brown, Beekes, and Verhoeven (2011), who
reported that most CG variables do not change over time, which leads to a reduction in the
statistical power of CG research. Taking into account the slow-changing feature of these
variables, we employ the two-step System GMM as the main approach. The reason for this is
that the two-step System GMM, by construction, is superior to other estimators (e.g., OLS
with fixed-effects or Standard Difference GMM) in dealing with the highly persistent
characteristic of the explanatory variables (Antoniou et al., 2008; Hoechle, Schmid, Walter, &
Yermack, 2012).
However, using the lagged values of these slow-changing variables as instruments in the
System GMM estimation procedure may be questionable. More specifically, if slow-changing
explanatory variables are endogenous, then the lagged values of these variables used as
instruments will suffer as much from the endogeneity issue as do the current ones (Brown et
al., 2011). This raises doubts about the validity of the instrumental variables employed in our
model. For this reason, we follow the suggestion of Roodman (2009a, 2009b) and carefully

19
test not only the joint validity of the instruments but also the validity of the subsets of System
GMM-type instruments as well as standard instruments for the levels equation.
---------------------------------
Insert Table 4 about here
---------------------------------
5.2. Preliminary Evidence
Table 5 reports the Pearson’s correlation matrix for key dependent and independent variables.
The correlation coefficient of 0.15 shows that the Tobin’s Q is positively related to the
percentage of female directors. Although this is only a weak positive linear relationship, it
tentatively supports the main hypothesis of our study. The significantly positive relationship
between Tobin’s Q and the 1-year lagged Tobin’s Q is described by the correlation coefficient
of 0.58. This supports the proposition that the proper empirical model for the relationship
between CG and FP should be considered in a dynamic framework rather than a static one
(Wintoki et al., 2012).
With the exception of the variables nonexe and lev, the other explanatory variables are
significantly correlated with the regressant. From Table 5, the highest significant correlation
coefficient among independent variables is 0.36. As suggested by Damodar (2004), unless
correlation coefficients among regressors exceed 0.80, multi-collinearity will not be a serious
problem for multivariate analysis. Thus, there may be no problem with multi-collinearity
among the regressors included in our regression models. In an additional (un-tabulated)
analysis, we conduct a multi-collinearity diagnostic for variables in the model by using
variance inflation factors (VIFs). The results show that the highest VIF is 1.73 and the
average of VIFs is 1.30, suggesting that multi-collinearity may not be the problem in this
study.
---------------------------------
Insert Table 5 about here
---------------------------------
The differences in the mean values of Tobin’s Q between firms with and without women on
their boards are presented in Figure 1. Intuitively, companies with female directors very likely
performed better than those without women on their boards for all years from 2008 to 2011.
The clearest evidence was from 2010 when, on average, the Tobin’s Q of companies with

20
female directors was 20.40% higher than that of their counterparts. Overall, the graph
demonstrates that gender diversity in the boardroom might have a positive relation to firm
financial performance, which is consistent with the correlation coefficient between the two
variables as reported in Table 5.
---------------------------------
Insert Figure 1 about here
---------------------------------
Across the full sample, the average value of the Tobin’s Q ratio of companies with female
board directors was 15.30% higher than that of those without and the difference was
statistically significant at the 1% level (see Table 6 for the t-test results). The results reported
in Table 6 indicate that the null hypothesis of equal population means11
should be rejected in
the years 2009, 2010, 2011, and across the full sample. It is plausible that in the years when
they have female directors on their boards, companies tend to achieve better financial
performance measured by Tobin’s Q. This finding tentatively supports our main hypothesis
that board gender diversity will have a positive impact on firm financial performance. Since
the t-test procedure does not account for other factors that may interact with the gender
diversity–FP relationship, it is difficult to draw causal inferences. The next section presents a
further exploration of this relationship through multivariate regression analysis.
---------------------------------
Insert Table 6 about here
---------------------------------
5.3. Multivariate Regression Analysis
Initial multivariate regression results, conducted by using the OLS approach for pooled data,
are reported in column 2 of Table 7. It is evident that the percentage of female directors in
boardrooms (female) is positively related statistically to Tobin’s Q at the 1% level (p = 0.00),
thus providing strong support for our main hypothesis. The coefficient on female (𝛽 = 0.005)
11 The t-test procedure is conducted initially to investigate whether there is a significant difference in the
performance between companies with and without female directors. To capture both cross-sectional and time
variances, we follow Adams and Ferreira (2009) in comparing the means of Tobin’s Q not only within the cross
section but also across firm-year observations. In order to check the robustness of the results, we follow prior
studies (e.g., Chen, Guo, & Tay, 2010) and conduct the Wilcoxon rank-sum test for differences in medians of
Tobin’s Q. The (unreported) results obtained from this non-parametric test show that the conclusions obtained
from the t-test procedure are robust, even after taking the non-normality of the data into consideration.
21
means that if the percentage of female directors in boardrooms increases by one percentage
point, the predicted Tobin’s Q will increase, on average, by approximately 0.50%, holding all
other factors fixed.
It should be noted that such a percentage change is economically large, given that the size of
boards in Vietnamese listed companies ranges between three and eleven members. For
example, a change from a board with one woman and seven men to a board with three women
and five men leads to a 25 percentage point change. Consequently, the predicted Tobin’s Q
will increase by approximately 25×0.50% = 12.50% or, more exactly, by 100×[exp(0.005×25)
– 1] ≈ 13.31%. This finding is consistent with that reported by prior studies including Reddy
et al. (2008) in the New Zealand market, Carter et al. (2003) and Adams and Ferreira (2009, p.
305, column 1 of table 9) in the US market, but contrasts with the findings of Rose (2007) in
the Danish market. Such mixed results suggest that further exploration is necessary because
the OLS estimator cannot control for potential omitted-variable bias caused by the effects of
unobserved features of firms which are invariant over time and/or across firms.
As shown in column 3 of Table 7, when we add firm fixed-effects12
to address the concern of
unobserved heterogeneity, the positive relation between female and Tobin’s Q is no longer
significant (𝛽 = 0.002, p = 0.47), which is consistent with the result obtained by Carter et al.
(2010) in the US market. This indicates that the significantly positive relation uncovered by
the static OLS model may be driven by omitted variable biases. However, it is noteworthy
that the fixed-effects approach is implemented under the assumption of strict exogeneity
which implies that the CG and control variables are not correlated with the error term in the
model. This assumption is criticised for its unreliability when the other sources of
endogeneity, namely simultaneity and dynamic endogeneity, very likely arise in the board
structure–performance relation in general (Wintoki et al., 2012) and in the gender diversity–
performance relation in particular (Adams & Ferreira, 2009). This suggests that while the
fixed-effects method in our study produces better estimations, it cannot take into account
other potential sources of endogeneity. For this reason, we cannot make reliable causal
12 The Hausman test for a comparison between the fixed-effects and random-effects models was performed. The
null hypothesis that the preferred model is random-effects is rejected, (χ2(9) = 624.10, p = 0.00), suggesting that
the fixed-effects estimator should be employed.

22
inferences from the results of model (ii), thus suggesting that the fixed-effects model (within-
groups estimators) appears to be undesirable, at least in our study.
In another attempt to capture unobserved heterogeneity, we include a lagged performance
variable as an explanatory variable; that is, we move from the static OLS estimator to the
dynamic one. As shown in column 4 of Table 7, the estimated coefficient on female is
statistically different from zero (𝛽 = 0.003, p = 0.01), thus providing support for our research
hypothesis. Notably, we report that past performance can significantly explain the variation in
current performance (𝛽 = 0.698, p = 0.00). This is consistent with Wintoki et al. (2012), who
showed the importance of using lagged performance variables to control for the dynamic
nature of the CG–FP association.
However, the coefficients of CG variables in the dynamic OLS model are considerably
smaller than those of the static OLS model. According to Wintoki et al. (2012), such a
substantial reduction in the magnitude of the estimated parameters of key CG variables in the
dynamic model suggests that the current CG variables are correlated with past FP. This again
confirms the dynamic relation between CG and FP. It should be noted that the R2 in the
dynamic model (0.69) is over twice as great as the R2 in the static model (0.30), indicating
that the past performance variable considerably improves the model’s power to explain the
variation in current performance. Although the dynamic OLS estimator is an improvement
over the static models and although our findings are consistent with that of previous studies,
they appear to be driven by endogenous biases, such as simultaneity, which cannot be
controlled by the pooled OLS method. In addition, the presence of the lagged dependent
variable among the regressors makes the OLS estimated parameters biased and inconsistent
(Wooldridge, 2002).
Taking into account the concern of the dynamic nature of the board structure–FP relationship,
we follow Wintoki et al. (2012) in employing the two-step System GMM estimator. The
results reported in the last column of Table 7 show that the percentage of female directors is
positively and statistically significantly related to Tobin’s Q at the 5% level (p = 0.04)13
. The
coefficient on female (𝛽 = 0.021) means that a ten percentage point increase in the ratio of
13 Based on small-sample corrections, we have reported t-test instead of z-test statistics for the estimated
coefficients, and F test statistics instead of Wald Chi-squared test statistics for overall fit of the System GMM
models.

23
female directors will, on average, increase the predicted Tobin’s Q by approximately 21%,
holding all other factors fixed. As mentioned above, this is a strong effect given that the board
size of listed companies in Vietnam is small. This result of the System GMM model is
consistent with those obtained by using the pooled OLS model and the dynamic OLS model,
thereby suggesting that our findings are robust to alternative econometric approaches. This
result is also consistent with the findings of several prior studies that confirm the positive
relationship between gender diversity and FP (e.g. Campbell & Mínguez-Vera, 2008; Dezsö
& Ross, 2012). Our results imply that board gender seems to affect firm value, a point which
is in general agreement with Adams et al. (2011, p. 31), who suggest that “shareholders may
value female directors because they are better monitors and because they may alleviate value-
decreasing stakeholder conflicts”.
In the System GMM model, the coefficient on 1-year lagged Tobin’s Q is statistically positive
at the 1% level (𝛽 = 0.633, p = 0.00), thus suggesting that past performance can help control
for unobserved historical factors in the relationship between CG and FP. This empirical
evidence strongly supports the arguments of Wintoki et al. (2012), among others, that the link
between CG and FP should be examined in a dynamic framework.
Regarding the variable nonexe, the results obtained from the pooled OLS, fixed-effects, and
dynamic OLS models show that the presence of non-executive directors has no significant
impact on FP. However, when moving to the System GMM model, we find that this
relationship is significantly negative at the 5% level (𝛽 = -.019, p = 0.02). This conclusion is
in line with Nowland (2008), which challenged the agency theory’s viewpoint regarding the
vital role of non-executive directors in monitoring managerial behaviours and in improving
FP. Regarding the other CG variables, we find that there is statistical evidence of a
significantly positive link between concentrated ownership and FP (𝛽 = 0.014, p = 0.03). This
result is consistent in all four models applied in our study and similar to that obtained by
Victoria (2006), among others. The positive relationship between block-holder ownership and
performance is in agreement with the agency theory perspective that ownership concentration
helps to reduce agency problems arising from the separation of ownership and control
(Shleifer & Vishny, 1986). This, in turn, is expected to improve performance.
It is obvious from column 5 of Table 7 that the significantly positive relationship between
board size and FP, revealed by the static OLS, fixed-effects, and dynamic OLS models,
disappears when we control for dynamic endogeneity and simultaneity by using the System

24
GMM model (𝛽 = -1.429, p = 0.17). This result accords with the findings of Pham et al.
(2011); Schultz et al. (2010); and Wintoki et al. (2012), who argued that such significant
links, estimated by the pooled OLS and fixed-effects models, may be the result of spurious
correlations. Similarly, the relation between CEO duality and FP changes from significantly
positive to insignificantly negative when we move from the static OLS and fixed-effects
models to the System GMM model. This result, once again, supports the argument of Schultz
et al. (2010); and Wintoki et al. (2012), among others, that taking the dynamic nature of the
relationship between CG and FP into consideration is essential to ensure the reliability of
causal inferences.
With regards to the control variable leverage, we find that the positive relationship between
financial leverage and FP uncovered by the fixed-effects model and the dynamic pooled OLS
model disappears when the potential sources of endogeneity are taken into consideration
(column 5 of Table 7). Several robust-checking models reported in Table 9 and Table 10 also
confirm that the estimated coefficient on leverage is not statistically different from zero at any
conventional levels of significance, suggesting that financial leverage has no impact on FP.
Although this finding is consistent with that of Nguyen et al. (2014); Schultz et al. (2010),
among others, the relationship between financial leverage and FP is not really clear in
practice. The discussion below provides some possible explanations for our finding.
A recent study undertaken by Jiraporn, Kim, Kim, and Kitsabunnarat (2012) suggested that
debt financing and CG mechanisms may substitute for each other to alleviate agency cost
whereby FP is improved. If that is the case, it is plausible to argue that the potential
performance effect of financial leverage in Vietnamese companies is likely to be replaced by
the stronger effects of other CG mechanisms, including ownership concentration (measured
by block) and board diversity (measured by female). In consequence, the estimated coefficient
on leverage should not be statistically different from zero.
In a similar vein, González (2013) argued that the association between financial leverage and
FP is likely to be contingent upon two contradictory antecedents: (i) the cost of financial
distress; and (ii) the benefits of the disciplinary role of debt financing. A firm with higher
financial leverage may suffer from higher costs of financial distress but may also benefit from
the disciplinary role of debt financing, by which managers are forced to take value-
maximising decisions (González, 2013). Therefore, the net effect of financial leverage on FP
can be neutralised if neither of these two antecedents is predominant.

25
---------------------------------
Insert Table 7 about here
---------------------------------
As reported in the last row of Table 7, the Hansen-J test14
yields the p-value of 0.22,
suggesting that the null hypothesis that our instruments are valid cannot be rejected at any
conventional levels of significance. We also follow the recommendation of Roodman (2009b)
about good practices in implementing System GMM estimation and apply the difference-in-
Hansen test to the subsets of System GMM-type instruments, as well as standard instrumental
variables for the levels equation. Table 8 presents difference-in-Hansen tests of the exogeneity
of instrument subsets, under the null hypothesis of joint validity of a given instrument subset.
We find no statistical evidence to reject the null hypothesis, suggesting that the subsets of
instruments are econometrically exogenous.
---------------------------------
Insert Table 8 about here
---------------------------------
5.4. Robustness Checks
The impact of macroeconomic environment on firm performance15
Macroeconomic variables, such as GDP growth, may have potential impacts on firm value.
Koller, Goedhart, and Wessels (2010) posited that the value of firms may reflect the
expectations of investors about overall macroeconomic activities since firm valuation is
14 Because the validity of System GMM estimation is strongly influenced by the validity of instrumental
variables, it is very important to diagnose whether or not the instruments are exogenous. According to Arellano
and Bond (1991), there are three alternative tests for the validity of instrumental variables, namely: (i) the
Arellano-Bond test for second-order serial correlation [the AB AR(2)] in the first differences of residual series;
(ii) the Hansen-J test of over-identifying restrictions; and (iii) the Hausman specification test. Among them, we
use the Hansen-J test in this study for the two following reasons. First, since the AB AR(2) test statistic is only
defined if min T 5 (Arellano & Bond, 1991), this test cannot be used in our circumstance in which T = 4 years.
Second, while the power of the Hausman specification test is questionable, especially in the presence of outliers
(Arellano & Bond, 1991), the Hansen-J test is considered a standard test for the joint validity of the instrumental
variables after GMM estimation (Baum, 2006; Roodman, 2009a).
15 It is worth noting that we employ year dummy variables in our base-line model to account for time-specific
effects (e.g., inflation rate, demand shocks, and other macroeconomic conditions) which are common to all
companies and can change through time. The impact of macroeconomic variables on performance (if any),
therefore, is already included in these year dummies. This subsection aims to examine in more detail the
potential effect of GDP growth, one of the most important macroeconomic variables, on FP. This helps to check
the robustness of our key findings when the potential impact of the macroeconomic environment on FP is
explicitly taken into consideration.

26
directly influenced by the assumptions of major macroeconomic variables. More specifically,
the changes in Tobin’s Q ratio over time may partly reflect the variations in the valuation of
future growth opportunities which arise from exogenous economic conditions (Pham et al.,
2011). Following Jiang, Feng, and Zhang (2012), we use GDP growth measured by the annual
percentage growth rate of GDP calculated at market prices as a proxy for the macroeconomic
environment in which firms operate. In line with the result of Jiang et al. (2012), we find that
GDP growth is positively associated with Tobin’s Q at the 1% level of significance (𝛽 = 0.45,
p = 0.00). The results reported in column 2 of Table 9 show that the estimated coefficients on
the variable of interest (female) and on the other CG variables are generally unchanged.
Therefore, our findings remain robust even after controlling for the potential impact of
macroeconomic environment on FP.
---------------------------------
Insert Table 9 about here
---------------------------------
The impact of alternative proxies for gender diversity on firm performance
In order to check the robustness of the estimations reported in column 5 of Table 7, we follow
Campbell and Mínguez-Vera (2008) and employ two alternative proxies for gender diversity,
including a gender diversity dummy variable (d1women) and the Blau index for gender (blau).
The finding reported in columns 3 of Table 9 shows that the presence of female directors in
the boardroom (measured by d1women) is positively related to firm value at the 10% level (p
= 0.08). The coefficient on d1women (𝛽 = 0.379) implies that the difference in the predicted
Tobin’s Q between companies with at least one female director on their boards and those
without is about 37.90% or, more exactly, 100×[exp(0.379) – 1] ≈ 46%. Similarly, the result
from column 4 of Table 9 indicates that heterogeneous boards (measured by blau) have a
statistically positive impact on FP at the 5% level (𝛽 = 1.461, p = 0.02). Thus the positive
relationship between board gender diversity and FP remains robust when alternative proxies
for gender diversity are employed.
To capture the potential effect of the number of female directors, we include in equation (2)
one dummy variable that takes a value of one if there are at least two female directors and
zero otherwise (denoted as d2women). As reported in column 2 of Table 10, we find that the
estimated coefficient on d2women (𝛽 = 0.610) is statistically significant at the 5% level and
considerably larger than that on d1women reported in column 3 of Table 9 (𝛽 = 0.379). This

27
finding suggests that boards with at least two female directors appear to have a stronger effect
on FP than those with at least one. This empirical result generally supports the perspective of
‘critical mass theory’ proposed by Kanter (1977) that women may have a more significant
effect on a group when they increase from a token number to form a significant minority of
the group. In other words, if female board representation increases board effectiveness and FP,
then that effect should be more pronounced when the number of female directors increases
(Liu et al., 2014). However, given the significantly positive coefficient on both d1women and
d2women, we also support the view suggested by Zaichkowsky (2014), that although two or
more women on boards appear to have a stronger effect on firm outcomes, even one woman
can make a difference.
It is noteworthy that although the relationship between board gender diversity and FP appears
to be significantly positive, it is not necessarily a linear relationship. To check empirically for
possible non-linearity in the board gender diversity–performance relationship, a quadratic
term of the variable female (denoted as female_squared) is included in equation (2). In an un-
tabulated analysis, we apply the pooled OLS approach to the modified equation (2) and find
that: (i) the estimated coefficient on female_squared is statistically insignificant (𝛽 = – 0.0001;
p-value = 0.142); and (ii) the estimated coefficient on female is still significantly positive (𝛽 =
0.0060; p-value = 0.021).
To further challenge these results, we apply the two-step System GMM estimation approach
on the modified equation (2) and achieve similar results. Specifically, as reported in column 3
of Table 10, the estimated coefficient on female_squared is statistically insignificant (𝛽 = –
0.001; p-value = 0.14), whereas the coefficient on the variable of interest (female) is still
significantly positive (𝛽 = 0.033; p-value = 0.04). The results obtained from the OLS and
System GMM methods allow us to conclude that there is not enough statistical evidence to
support a non-linear association between board gender diversity and the performance of
Vietnamese companies.
---------------------------------
Insert Table 10 about here
---------------------------------
Nevertheless, one concern is that over-diversification will wipe out the variety and/or the
balance of board composition, so that gender diversification leading to an all-female BOD
may be counterproductive. The empirical question here is: what is the breakpoint at which an
28
undesired effect of gender diversification occurs? To provide a quick look at the relationship
between FP and board gender diversity which may help to find a possible answer to this
question, we perform a median-band plot16
together with a scatter-plot for Tobin’s Q against
the Blau index. The Blau index for gender is employed since, as mentioned earlier in
Subsection 4.2, it allows us to capture both aspects of diversity, including gender variety and
gender balance. As shown by the median spline on Figure 3 (appendices), the medians of
Tobin’s Q increase with the medians of the Blau index until the latter reaches about 0.30 and
then seem to remain unchanged when the Blau index goes beyond 0.30. This suggests that
0.30 is likely to be the breakpoint at which the undesired effect of gender diversification may
occur.
To check this result empirically, we carry out a segmented regression analysis in which the
sample is divided into two separate datasets on the basis of the Blau index. Accordingly, we
rerun equation (2) on the sub-dataset with a Blau index smaller than 0.30, and on the other
with a Blau index equal to or larger than 0.30. The results reported in Table 11 show that the
relationship between Tobin’s Q and the Blau index appears to change over different intervals
of the Blau index. More specifically, for firms with a Blau index smaller than 0.30, the Blau
index is significantly positively related to financial performance (columns 2 and 3 of Table
11). By contrast, for firms with a Blau index equal to or larger than 0.30, the relationship
becomes insignificant (columns 4 and 5 of Table 11). These results remain robust when
alternative econometric techniques are applied and consistent with what we can observe from
the median-band plot, that there is likely to be an upward trend in Tobin’s Q as the Blau index
increases to 0.30. After this point, there is no further significant trend in the Tobin’s Q.
---------------------------------
Insert Table 11 about here
---------------------------------
The critical Blau index of 0.30 can be approximately translated into two critical percentages
of female directors: ether 20% or 80%. However, it is impractical to consider the critical
percentage of 80%, given that the maximum proportion of female directors on boards in our
sample is just about 67%. Consequently, it is evident from our empirical analysis that a Blau
index of about 0.30, corresponding to a ratio of about 20% of women on the BOD, is the
16 A related two-way median spline providing a smoother version of the median-band plot is included in Figure 3.

29
breakpoint at which the potential performance effect of female board representation may
change17
. Although we are unable to answer explicitly, for the purposes of the current study,
what the mechanism behind the scene is, we suggest one possible explanation for our finding
that greater gender diversity on boards will add value as long as the benefits obtained from the
diversification are not outweighed by its costs. We believe that the trade-off between the costs
and benefits of board gender diversification may offer insight into developing a theoretical
framework that can provide a clear-cut prediction about the nature of the board gender
diversity–FP association.
6. Conclusion and Limitations
Over the last decade, the relationship between board gender diversity and FP has received
considerable attention from scholars and the mass media worldwide. However, this topic has
not been explored in Vietnam. To the best of our knowledge, this research makes the first
effort to discover the relationship between gender diversity and FP of the publicly listed
companies in this country. After controlling for firm size, firm age, time (year), leverage,
ownership structure, unobserved historical factors, and other CG characteristics, we report
that gender diversity in the boardrooms of the publicly listed companies in Vietnam tends to
have a positive effect on financial performance measured by Tobin’s Q.
In addition, we find that the number of female directors in the boardroom also makes a
difference. Boards with at least one female director seem to outperform those with none and
boards with at least two female directors appear to have a stronger effect on FP than those
with at least one. We further document that the nature of the relationship between board
gender diversity and FP may change when the percentage of women reaches the breakpoint of
20%. Theoretically, our findings are in agreement with the perspectives of agency theory and
resources dependence theory regarding the positive influences of board diversity on board
effectiveness, which in turn will result in improved FP. Empirically, our findings hold even
after taking into account dynamic endogeneity, simultaneity, and unobserved time-invariant
heterogeneity inherent in the CG–FP relationship.
17 In order to check for robustness, we repeat the segmented regression procedure in which the sample is divided
into two datasets on the basis of female. Accordingly, we rerun equation (2) on the sub-dataset with female less
than 20%, and on the other with female equal to or greater than 20%. We find that the results (unreported due to
space limitations) are not qualitatively different from those reported in Table 11.

30
The contribution of this paper to the extant literature is twofold. First, by providing robust
evidence from a transitional economy characterised by poor CG practices, our study supports
the view proposed by Adams and Ferreira (2009); and Gul et al. (2011) that boards with
greater gender-diversity provide additional monitoring and act as a substitute governance
mechanism from which weak-governed companies may benefit. Although our findings are in
no way intended to support mandating a gender quota system for the BOD, they do offer an
important implication for policy formulation. We suggest that efforts to rejuvenate CG by
increasing the number of women on Vietnamese boards of directors (and perhaps BODs in
other Asian markets sharing similar CG characteristics) should take the existing conditions of
the CG system into consideration.
Based on the research context, furthermore, our findings may also imply that in Asian
developing countries where women are traditionally subordinate to men, female directors
have the potential to add value if they enjoy a supportive institutional environment and if the
advancement of women is consistently promoted. Therefore, we suggest that a better
institutional environment for women plays an important role in board gender diversification,
which may have a positive effect on FP. Second, this study contributes to the international
debate on the gender diversity–performance relationship by adopting a well-structured
dynamic modelling approach to address the potential endogeneity concerns inherent in the
CG–FP association, thus helping to confirm and strengthen prior research findings.
Despite the above-mentioned contributions, this study does have some limitations, many of
which may indicate fruitful avenues for future research. First, given that the variables relating
to board structure change slowly over time, potentially vitiating panel data estimations, this
study’s 4-year dataset may render comprehensive explanations of governance–performance
dynamics ineffective. Following Wintoki et al. (2012), we suggest that datasets covering a
longer period of time may enable future research to overcome the highly persistent feature of
board structure variables by using data at 2-year intervals rather than annually.
Secondly, this research considers only the relationship between gender diversity on the BOD
and FP. Given the two-tier board structure of listed companies in Vietnam, it might be useful
for future research to treat gender diversity on the BOS as a factor driving the firms’
profitability. Moreover, like most previous empirical studies on CG, our sample selection
process relies primarily on the availability of data, including firm annual reports and
corresponding financial reports. It is likely that the selected firms are the more transparent

31
ones and, therefore, could actually be well governed and/or better performing firms. If that is
the case, our research will suffer from selection bias which hinders interpretation and
generalisation.
Finally, although this study does find a significant link between board gender diversity and
the performance of Vietnamese listed companies, the channels through which female directors
positively affect financial performance remain unclear. It is argued that if the presence of
women on the BOD matters for firm outcomes, then there may be gender-based differences in
behaviour and characteristics between female and male directors (Mohan, 2014). We believe
that understanding the personality traits of female directors, such as consensus-building
ability, management style, or attitude to risk, is essential to shed light on the potential
channels through which director gender matters for FP.
Additionally, there is empirical evidence that greater gender diversity on boards may promote
better opportunities for women to be appointed to top management positions. Female
representation on top management teams, in turn provides a feminine managerial expertise
and helps to improve managerial task performance (Dezsö & Ross, 2012). If this evidence is
considered, female directors may also add value through their contribution in choosing the
CEO and motivating women in senior management positions. For this reason, we believe that
investigating the role of women at top management levels in interaction with the role of
women on boards offers potential for understanding another channel through which female
directors add value.
--------------------------------------------

32
Acknowledgments
We would especially like to thank StoxPlus Corporation (www.stoxplus.com) for providing
ownership structure data and the list of publicly listed companies in Vietnam, classified
according to the Industry Classification Benchmark. We thank Nhue Q.T. Nguyen and
Azilawati Banchit for their assistance in collecting data. We thank an anonymous referee and
participants at the 16th ASR conference held at the Waikato Management School, the
University of Waikato, New Zealand (October 2012) and discussants of the Symposium on
New Challenges for Directors held at the AUT Corporate Governance Centre, Auckland
University of Technology, New Zealand (December 2013) for numerous helpful comments on
earlier drafts. We also gratefully acknowledge two anonymous referees of the International
Review of Economics and Finance for their valuable suggestions. Any remaining errors are
our own.
Article History
First draft: September 2012 | Second draft: June 2013 | Third draft: November 2013 | Fourth
draft: May 2014 | Final version (accepted for publication): November 2014.

33
Table 1: Variables and definitions
Variables Acronym Definition
Dependent variable
Tobin's Q ratio lnq Tobin's Q is the sum of the market value of firm's stock and the book value of debt divided by the
book value of its total assets. The natural logarithm of Tobin's Q (lnq) is used as the regressant.
Gender diversity (variable of interest)
Percentage of female directors (%) female The ratio of female directors to total number of directors.
Blau index for gender blau Blau index for gender = 1-∑ 𝑃𝑖
22𝑖=1 , where i = (1, 2) is the number of gender categories (two), Pi is the
proportion of board members in each category.
Dummy variable for gender diversity (1) d1women Dummy variable that takes a value of one if there is at least one female director, and zero otherwise.
Dummy variable for gender diversity (2) d2women Dummy variable that takes a value of one if there are at least two female directors, and zero otherwise
Board structure variables
Percentage of non-executive directors (%) nonexe The ratio of non-executive directors to total number of directors.
Duality dual Dummy variable that takes a value of one if the chairperson is also the CEO, and zero otherwise.
Board size lnbsize Board size is the total number of directors. The natural logarithm of board size (lnbsize) is used in our
models.
Other control variables
Block-holder ownership (%) block The ratio of ordinary shares held by shareholders who own at least 5% of the total number of a
company’s common stocks.
Firm age lnfage The natural logarithm of the number of years from the time the company first appears on the HOSE or
the HNX.
Firm size fsize The natural logarithm of the book value of total assets.
Leverage (%) lev The ratio of the company's total debt to its total assets.
Lagged dependent variable laglnq One year lagged Tobin's Q ratio (in natural logarithmic form).
GDP growth gdpgrow GDP growth is measured by the annual percentage growth rate of GDP calculated at market prices.
Year dummy variables year A dummy variable for each year from 2008 to 2011. One year dummy is treated as the benchmark
category to avoid dummy variable trap.
Industry dummy variables industry
A dummy variable for each of the eight industries, including: Basic Materials; Consumer Goods;
Consumer Services; Health Care; Industrials; Oil & Gas; Technology; and Utilities. One industry
dummy is treated as the benchmark category to avoid dummy variable trap.

34
Table 2: Descriptive statistics of the trimmed sample
Obs Mean Median Sd Min Max
Tobin's Q ratio 479 0.85 0.78 0.39 0.20 2.96
Female directors (%) 472 12.06 9.09 13.76 0.00 66.67
Dummy variable for gender diversity 472 0.51 1.00 0.50 0.00 1.00
Non-executive directors (%) 479 48.91 42.86 20.76 0.00 100.00
CEO duality 479 0.32 0.00 0.47 0.00 1.00
Board size 479 5.81 5.00 1.29 4.00 11.00
Block ownership (%) 478 43.92 49.28 20.86 0.00 86.89
Firm age (year) 479 3.34 3.00 2.04 0.00 11.00
Firm size [Ln(Total assets)] 479 27.24 27.22 1.20 24.11 30.55
Leverage (%) 479 29.22 28.00 20.27 0.00 75.69
Note: For descriptive purposes, Firm age and Board size are reported in levels. The variables are as defined in Table 1.
Table 3: The frequency of female directors by board size
Board size
(persons)
Number of female directors in boardroom (persons) Total
0 1 2 3 6
4 1 5 0 0 0 6
5 163 111 19 0 0 293
6 14 8 17 5 0 44
7 43 25 15 6 0 89
8 3 3 1 5 0 12
9 8 8 1 0 1 18
10 1 0 2 3 0 6
11 0 4 0 0 0 4
Total 233 164 55 19 1 472
Note: Board size is as defined in Table 1.
Table 4: Between and within standard deviation of corporate governance variables
Variables Standard Deviations
overall between within
female 13.76 12.85 5.34
nonexe 20.76 18.93 8.46
dual 0.47 0.42 0.21
lnbsize 0.20 0.18 0.08
block 20.86 18.71 9.11
Note: The notation is as defined in Table 1.

35
Figure 1: The average values of Tobin’s Q of companies with and without female directors
0.77
0.97
0.80
0.60
0.79 0.84
1.15
0.97
0.69
0.91
0.00
0.20
0.40
0.60
0.80
1.00
1.20
2008 2009 2010 2011 Full sample
Without female directors With female directors
+9.3
%
+19
.5%
+20
.4%
+14
.1%
+15
.3%
The
aver
age
of
Tob
in’s
Q

36
Table 5: Correlation matrix for variables
lnq female nonexe dual lnbsize block lnfage fsize lev laglnq
lnq 1.00
female 0.15*** 1.00
nonexe -0.07 -0.05 1.00
dual 0.11** 0.12*** -0.30*** 1.00
lnbsize 0.13*** 0.09* -0.13*** 0.10** 1.00
block 0.13*** -0.07 0.10** -0.14*** -0.26*** 1.00
lnfage -0.19*** -0.04 0.14*** -0.04 0.05 -0.04 1.00
fsize 0.21*** 0.04 -0.08* 0.01 0.23*** 0.11** -0.00 1.00
lev 0.07 -0.09** -0.11** -0.10** 0.04 0.10** -0.14*** 0.36*** 1.00
laglnq 0.58*** 0.13** -0.03 0.07 0.12** 0.12** 0.08 0.25*** -0.04 1.00
Note: Asterisks indicate significance at 10% (*), 5% (**), and 1% (***). The notation is as defined in Table 1.
Table 6: t-test for equal population means with unequal variances
Year Observations The average values of Tobin's Q
Without female directors With female directors Difference
2008 119 0.77 0.84 -0.07
2009 118 0.97 1.15 -0.19**
2010 119 0.80 0.97 -0.16***
2011 116 0.60 0.69 -0.09*
Full sample 472 0.79 0.91 -0.12***
Note: Asterisks indicate significance at 10% (*), 5% (**), and 1% (***).
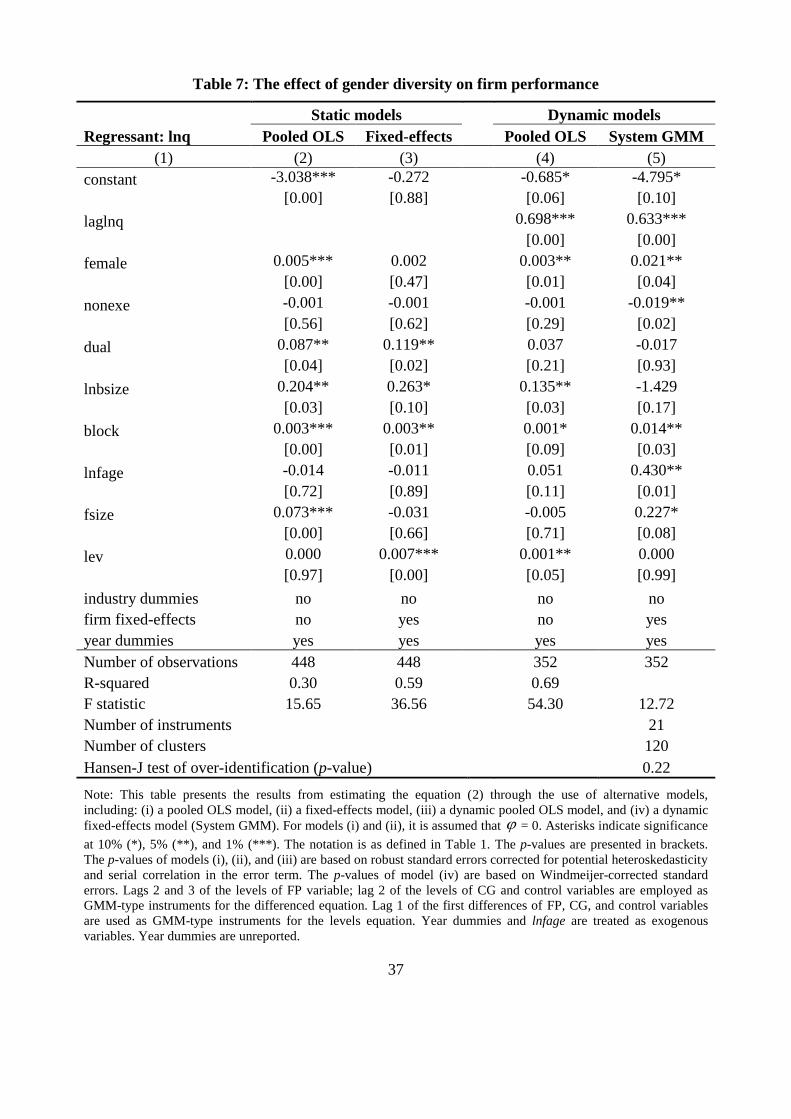
37
Table 7: The effect of gender diversity on firm performance
Static models Dynamic models
Regressant: lnq Pooled OLS Fixed-effects Pooled OLS System GMM
(1) (2) (3) (4) (5)
constant -3.038*** -0.272 -0.685* -4.795*
[0.00] [0.88] [0.06] [0.10]
laglnq 0.698*** 0.633***
[0.00] [0.00]
female 0.005*** 0.002 0.003** 0.021**
[0.00] [0.47] [0.01] [0.04]
nonexe -0.001 -0.001 -0.001 -0.019**
[0.56] [0.62] [0.29] [0.02]
dual 0.087** 0.119** 0.037 -0.017
[0.04] [0.02] [0.21] [0.93]
lnbsize 0.204** 0.263* 0.135** -1.429
[0.03] [0.10] [0.03] [0.17]
block 0.003*** 0.003** 0.001* 0.014**
[0.00] [0.01] [0.09] [0.03]
lnfage -0.014 -0.011 0.051 0.430**
[0.72] [0.89] [0.11] [0.01]
fsize 0.073*** -0.031 -0.005 0.227*
[0.00] [0.66] [0.71] [0.08]
lev 0.000 0.007*** 0.001** 0.000
[0.97] [0.00] [0.05] [0.99]
industry dummies no no no no
firm fixed-effects no yes no yes
year dummies yes yes
yes yes
Number of observations 448 448 352 352
R-squared 0.30 0.59 0.69
F statistic 15.65 36.56 54.30 12.72
Number of instruments 21
Number of clusters 120
Hansen-J test of over-identification (p-value) 0.22
Note: This table presents the results from estimating the equation (2) through the use of alternative models,
including: (i) a pooled OLS model, (ii) a fixed-effects model, (iii) a dynamic pooled OLS model, and (iv) a dynamic
fixed-effects model (System GMM). For models (i) and (ii), it is assumed that = 0. Asterisks indicate significance
at 10% (*), 5% (**), and 1% (***). The notation is as defined in Table 1. The p-values are presented in brackets.
The p-values of models (i), (ii), and (iii) are based on robust standard errors corrected for potential heteroskedasticity
and serial correlation in the error term. The p-values of model (iv) are based on Windmeijer-corrected standard
errors. Lags 2 and 3 of the levels of FP variable; lag 2 of the levels of CG and control variables are employed as
GMM-type instruments for the differenced equation. Lag 1 of the first differences of FP, CG, and control variables
are used as GMM-type instruments for the levels equation. Year dummies and lnfage are treated as exogenous
variables. Year dummies are unreported.

38
Table 8: Difference-in-Hansen tests of exogeneity of instrument subsets
Tested instrument subsets
Test statistics
(Chi-squared)
Degrees of
freedom P-value
Panel A: System GMM-type instruments
Instruments for the levels equation as a group 10.82 8 0.21
lnqit-2 and lnqit-3 (for the transformed equation) 1.36 2 0.51
Δlnqit-1 (for the levels equation) 1.55 1 0.21
Instruments for board structure variables 11.60 8 0.17
Instruments for control variables 10.56 6 0.10
Panel B: Standard instruments
2009 and 2010 year dummies, and lnfage 6.25 3 0.10
Note: This table presents difference-in-Hansen tests of the exogeneity of instrument subsets, under the null hypothesis
of joint validity of a specific instrument subset. The test statistics are asymptotically chi-squared distribution with
degrees of freedom equal to the number of questionable instrumental variables (Roodman, 2009a). GMM instrument
subset used for the levels equation includes one-year lagged differences of FP, board structure, and control variables
(Δlnqit-1 ; Δfemaleit-1 ; Δnonexeit-1 ; Δdualit-1 ; Δlnbsizeit-1 ; Δblockit-1 ; Δfsizeit-1 ; and Δlevit-1). GMM instrument subset
used for board structure variables includes lag 1 of the first difference and lag 2 in levels of board structure variables
(femaleit-2 and Δfemaleit-1 ; nonexeit-2 and Δnonexeit-1 ; dualit-2 and Δdualit-1 ; lnbsizeit-2 and Δlnbsizeit-1). GMM
instrument subset used for control variables includes lag 1 of the first differences and lag 2 in levels of control variables
(blockit-2 and Δblockit-1 ; fsizeit-2 and Δfsizeit-1 ; levit-2 and Δlevit-1). 2008 and 2011 year dummies are dropped due to
collinearity.

39
Table 9: Robustness checks with gdpgrow and alternative proxies for gender diversity
System GMM
Regressant: lnq with gdpgrow with d1women with blau
(1) (2) (3) (4)
constant -7.560** -4.867 -4.560
[0.02] [0.13] [0.10]
laglnq 0.610*** 0.629*** 0.607***
[0.00] [0.00] [0.00]
female 0.022**
[0.03]
d1women 0.379*
[0.08]
blau 1.461**
[0.02]
nonexe -0.020*** -0.016*** -0.018***
[0.01] [0.01] [0.01]
dual 0.004 -0.117 -0.078
[0.98] [0.48] [0.66]
lnbsize -1.345 -1.051 -1.368
[0.14] [0.22] [0.15]
block 0.013** 0.009** 0.012**
[0.02] [0.05] [0.02]
lnfage 0.435*** 0.275** 0.378**
[0.01] [0.03] [0.01]
fsize 0.228* 0.228 0.222*
[0.08] [0.15] [0.10]
lev 0.000 -0.007 -0.003
[0.96] [0.43] [0.74]
gdpgrow 0.450***
[0.00]
Number of observations 352 352 352
F statistic 14.27 14.56 14.23
Number of instruments 20 27 20
Number of clusters 120 120 120
Hansen-J test of over-identification (p-value) 0.23 0.30 0.23 Note: This table presents the robust results from estimating modified equation (2) through the use of an additional
control variable (gdpgrow), and two alternative proxies for gender diversity, including: (i) d1women, and (ii) blau.
The definitions of the variables are provided in Table 1. Asterisks indicate significance at 10% (*), 5% (**), and 1%
(***). The p-values are based on Windmeijer-corrected standard errors and presented in brackets. Lag 2 of the levels
of FP, CG and control variables are employed as GMM-type instruments for the differenced equations of the models
in columns (2) and (4). Lag 2 of the levels of FP variable, lags 2 and 3 of CG and control variables are employed as
GMM-type instruments for the differenced equations of the model in column (3). Lag 1 of the first differences of FP,
CG, and control variables are used as GMM-type instruments for the levels equations in all of the models. Year
dummies, gdpgrow, and lnfage are treated as exogenous variables. Year dummies are not reported.

40
Table 10: Robustness checks with alternative proxies for gender diversity (cont.)
System GMM
Regressant: lnq With d2women With female_squared
(1) (2) (3)
constant -5.261** -4.120**
[0.03] [0.02]
laglnq 0.602*** 0.545***
[0.00] [0.00]
d2women 0.610**
[0.05]
female 0.033**
[0.04]
female_squared -0.001
[0.14]
nonexe -0.018** -0.012*
[0.04] [0.06]
dual 0.009 -0.127
[0.96] [0.46]
lnbsize -0.973 -0.588
[0.30] [0.37]
block 0.012** 0.008*
[0.03] [0.06]
lnfage 0.374** 0.229*
[0.02] [0.10]
fsize 0.224* 0.166*
[0.05] [0.05]
lev -0.000 -0.003
[0.97] [0.51]
firm fixed-effects yes yes
year dummies yes yes
Number of observations 352 352
F statistic 15.76 14.84
Number of instruments 22 30
Number of clusters 120 120
Hansen-J test of over-identification (p-value) 0.15 0.16
Note: This table presents the robust results from estimating modified equation (2) using the two-step System GMM
approach. Column (2) presents the robust results when we add one new dummy variable (denoted as d2women) to
equation (2) to capture the potential effect of the number of female directors. Column (3) presents the robust results
when we add a quadratic term of female (denoted as female_squared) to equation (2) to empirically check for the
possible non-linearity in the board gender diversity–performance relationship. The definitions of the variables are
provided in Table 1. Asterisks indicate significance at 10% (*), 5% (**), and 1% (***). The p-values are based on
Windmeijer-corrected standard errors and presented in brackets. Year dummies are not reported.

41
Table 11: Robustness checks using segmented regression analysis
Regressant: lnq Blau Index < 0.3 Blau Index 0.3
OLS System GMM OLS System GMM
(1) (2) (3) (4) (5)
... ... ... ... ...
blau 0.550*** 1.493** 0.215 0.265
[0.00] [0.04] [0.58] [0.53]
... ... ... ... ...
Number of observations 209 209 143 143
R-squared 0.70 0.70
F statistic 31.90 10.80 26.46 14.10
Hansen-J test (p-value) 0.43 0.47
Note: This table presents the estimated coefficient on blau obtained from segmented regression analysis in which the
sample is divided into two separate datasets on the basis of the Blau index. Accordingly, equation (2) is estimated on
the sub-dataset in which the Blau index is smaller than 0.30, and on the other sub-dataset in which the Blau index is
equal to or larger than 0.30. Columns (2) and (4) present the results obtained from the pooled OLS approach.
Columns (3) and (5) present the results obtained from the two-step System GMM approach. The definitions of the
variables are provided in Table 1. Asterisks indicate significance at 10% (*), 5% (**), and 1% (***). The p-values
are presented in brackets. The p-values reported in columns (2) and (4) are based on robust standard errors corrected
for potential heteroskedasticity and serial correlation in the error term. The p-values reported in columns (3) and (5)
are based on Windmeijer-corrected standard errors. To save space, the estimated coefficients on other variables are
not reported.

42
References
Adams, R., & Ferreira, D. (2009). Women in the boardroom and their impact on governance and
performance. Journal of Financial Economics, 94(2), 291-309.
Adams, R., & Funk, P. (2012). Beyond the glass ceiling: Does gender matter? Management
Science, 58(2), 219-235.
Adams, R., Nowland, J., & Grey, S. (2011). Does gender matter in the boardroom? Evidence from
the market reaction to mandatory new director announcements. Working paper. Retrieved
from http://www.calpers-governance.org/docs-sof/marketinitiatives/resources/does-gender-
matter-in-boardroom.pdf
Ahern, K. R., & Dittmar, A. (2012). The changing of the boards: The impact on firm valuation of
mandated female board representation. The Quarterly Journal of Economics, 127(1), 137-
197.
Antoniou, A., Guney, Y., & Paudyal, K. (2008). The determinants of capital structure: Capital
market-oriented versus bank-oriented institutions. Journal of Financial and Quantitative
Analysis, 43(1), 59-92.
Arellano, M., & Bond, S. (1991). Some tests of specification for panel data: Monte Carlo evidence
and an application to employment equations. The Review of Economic Studies, 58(2), 277-
297.
Asian Development Bank. (2005). Viet Nam: Gender situation analysis. Hanoi, Vietnam: Asian
Development Bank. Retrieved from http://www2.adb.org/Documents/Reports/Country-
Gender-Assessments/cga-vie.pdf
Balatbat, M. C. A., Taylor, S. L., & Walter, T. S. (2004). Corporate governance, insider ownership
and operating performance of Australian initial public offerings. Accounting & Finance,
44(3), 299-328.
Baum, C. F. (2006). An introduction to modern econometrics using Stata. Texas, USA: Stata Press.
Blundell, R., & Bond, S. (1998). Initial conditions and moment restrictions in dynamic panel data
models. Journal of Econometrics, 87(1), 115-143.
Brown, P., Beekes, W., & Verhoeven, P. (2011). Corporate governance, accounting and finance: A
review. Accounting & Finance, 51(1), 96-172.
Bui, X. H., & Nunoi, C. (2008). Corporate governance in Vietnam: A system in transition.
Hitotsubashi Journal of Commerce and Management, 42(1), 45-66.
Campbell, K., & Mínguez-Vera, A. (2008). Gender diversity in the boardroom and firm financial
performance. Journal of Business Ethics, 83(3), 435-451.

43
Carter, D. A., D'Souza, F., Simkins, B. J., & Simpson, W. G. (2010). The gender and ethnic
diversity of US boards and board committees and firm financial performance. Corporate
Governance: An International Review, 18(5), 396-414.
Carter, D. A., Simkins, B. J., & Simpson, W. G. (2003). Corporate governance, board diversity, and
firm value. Financial Review, 38(1), 33-53.
Catalyst. (2012a). Global women on board. Retrieved from
http://www.catalyst.org/knowledge/women-boards
Catalyst. (2012b). Increasing gender diversity on boards: Current index of formal approaches.
Retrieved from http://www.catalyst.org/knowledge/increasing-gender-diversity-boards-
current-index-formal-approaches
CGIO. (2011). Singapore board diversity report. Singapore: The Centre for Governance,
Institutions and Organisations, Business School, National University of Singapore.
Chen, C. R., Guo, W., & Mande, V. (2003). Managerial ownership and firm valuation: Evidence
from Japanese firms. Pacific-Basin Finance Journal, 11(3), 267-283.
Chen, C. R., Guo, W., & Mande, V. (2006). Corporate value, managerial stockholdings and
investments of Japanese firms. Journal of International Financial Management &
Accounting, 17(1), 29-51.
Chen, C. R., Guo, W., & Tay, N. S. P. (2010). Are member firms of corporate groups less risky?
Financial management, 39(1), 59-82.
Chen, M. Y. (2014). Determinants of corporate board structure in Taiwan. International Review of
Economics & Finance, 32(0), 62-78.
Chen, S. S., & Huang, Y. S. (2014). Corporate governance in emerging markets: An introduction.
International Review of Economics & Finance, 32, 1-2.
Claessens, S., & Yurtoglu, B. B. (2013). Corporate governance in emerging markets: A survey.
Emerging Markets Review, 15, 1-33.
Daily, C. M., Certo, S. T., & Dalton, D. R. (1999). A decade of corporate women: Some progress in
the boardroom, none in the executive suite. Strategic Management Journal, 20(1), 93-99.
Damodar, G. (2004). Basic econometrics (4ed.). New York, USA: The McGraw-Hill Companies.
Dezsö, C. L., & Ross, D. G. (2012). Does female representation in top management improve firm
performance? A panel data investigation. Strategic Management Journal, 33(9), 1072-1089.
Erhardt, N. L., Werbel, J. D., & Shrader, C. B. (2003). Board of director diversity and firm financial
performance. Corporate Governance: An International Review, 11(2), 102-111.
Fama, E. F., & Jensen, M. (1983). Separation of ownership and control. Journal of Law and
Economics, 26(2), 301-325.

44
Farrell, K. A., & Hersch, P. L. (2005). Additions to corporate boards: the effect of gender. Journal
of Corporate Finance, 11(1–2), 85-106.
Flannery, M. J., & Hankins, K. W. (2013). Estimating dynamic panel models in corporate finance.
Journal of Corporate Finance, 19, 1-19.
Freeman, N. J., & Nguyen, V. L. (2006). Corporate governance in Vietnam: the beginning of a long
journey. Hanoi, Vietnam: International Finance Corporation, and Mekong Private Sector
Development Facility.
Giroud, X., & Mueller, H. M. (2010). Does corporate governance matter in competitive industries?
Journal of Financial Economics, 95(3), 312-331.
González, V. M. (2013). Leverage and corporate performance: International evidence. International
Review of Economics & Finance, 25, 169-184.
Goodstein, J., Gautam, K., & Boeker, W. (1994). The effects of board size and diversity on strategic
change. Strategic Management Journal, 15(3), 241-250.
Grosvold, J., & Brammer, S. (2011). National institutional systems as antecedents of female board
representation: An empirical study. Corporate Governance: An International Review, 19(2),
116-135.
Gul, F. A., Srinidhi, B., & Ng, A. C. (2011). Does board gender diversity improve the
informativeness of stock prices? Journal of Accounting & Economics, 51(3), 314-338.
Harris, M., & Raviv, A. (2008). A theory of board control and size. Review of Financial Studies,
21(4), 1797-1832.
Harrison, D. A., & Klein, K. J. (2007). What's the difference? Diversity constructs as separation,
variety, or disparity in organizations. Academy of Management Review, 32(4), 1199-1228.
Hermalin, B. E., & Weisbach, M. S. (1998). Endogenously chosen boards of directors and their
monitoring of the CEO. American Economic Review, 88(1), 96-118.
Hillman, A. J., Cannella, A. A., & Harris, I. C. (2002). Women and racial minorities in the
boardroom: how do directors differ? Journal of Management, 28(6), 747-763.
Hillman, A. J., & Dalziel, T. (2003). Boards of directors and firm performance: Integrating agency
and resource dependence perspectives. Academy of Management Review, 28(3), 383-396.
HKEC. (2012). Consultation paper: Board diversity. Hong Kong, China: Hong Kong Exchanges
and Clearing Limited.
Hoechle, D., Schmid, M., Walter, I., & Yermack, D. (2012). How much of the diversification
discount can be explained by poor corporate governance? Journal of Financial Economics,
103(1), 41-60.
IFC. (2011). The 2010 corporate governance scorecard for Vietnam. Washington, DC., USA:
International Finance Corporation.

45
IFC. (2012). The 2011 corporate governance scorecard for Vietnam. Washington, DC., USA:
International Finance Corporation.
Jensen, M. (1993). Modern industrial revolution, exit, and the failure of internal control systems.
The Journal of Finance, 48, 831-880.
Jensen, M., & Meckling, W. (1976). Theory of the firm: Managerial behaviour, agency cost, and
ownership structure. Journal of Financial Economics, 3(5), 305-360.
Jiang, C., Feng, G., & Zhang, J. (2012). Corporate governance and bank performance in China.
Journal of Chinese Economic and Business Studies, 10(2), 131-146.
Jiraporn, P., Kim, J.-C., Kim, Y. S., & Kitsabunnarat, P. (2012). Capital structure and corporate
governance quality: Evidence from the Institutional Shareholder Services (ISS).
International Review of Economics & Finance, 22(1), 208-221.
Kanter, R. M. (1977). Some effects of proportions on group life: Skewed sex ratios and responses to
token women. American Journal of Sociology, 82(5), 965-990.
Knodel, J., Vu, M. L., Jayakody, R., & Vu, T. H. (2004). Gender roles in the family: Change and
stability in Vietnam. Michigan, USA: Population Studies Centre at The Institute for Social
Research, University of Michigan.
Koller, T., Goedhart, M., & Wessels, D. (2010). Valuation: measuring and managing the value of
companies. New Jersey, USA: John Wiley & Sons.
Kuo, H. C., Lin, D., Lien, D., Wang, L. H., & Yeh, L. J. (2014). Is there an inverse U-shaped
relationship between pay and performance? The North American Journal of Economics and
Finance, 28, 347-357.
Le, T. M., & Walker, G. (2008). Corporate governance of listed companies in vietnam. Bond Law
Review, 20(2), 1-80.
Liu, Y., Wei, Z., & Xie, F. (2014). Do women directors improve firm performance in China?
Journal of Corporate Finance, (In press) http://dx.doi.org/10.1016/j.jcorpfin.2013.11.016
Love, I. (2011). Corporate governance and performance around the world: What we know and what
we don't. The World Bank Research Observer, 26(1), 42-70.
Mak, Y. T., & Kusnadi, Y. (2005). Size really matters: Further evidence on the negative
relationship between board size and firm value. Pacific-Basin Finance Journal, 13(3), 301-
318.
MOF. (2007). The Code of corporate governance 2007 (Vol. 12/2007/QĐ-BTC). Hanoi, Vietnam:
Socialst Republic of Vietnam Government Web Portal.
Mohan, N. (2014). A review of the gender effect on pay, corporate performance and entry into top
management. International Review of Economics & Finance, 34, 41-51.
46
Mohan, N., & Chen, C. R. (2004). Are IPOs priced differently based upon gender. Journal of
Behavioral Finance, 5(1), 57-65.
Mohan, N., & Ruggiero, J. (2007). Influence of firm performance and gender on CEO
compensation. Applied Economics, 39(9), 1107-1113.
Nakano, M., & Nguyen, P. (2012). Foreign ownership and firm performance: evidence from Japan's
electronics industry. Applied Financial Economics, 23(1), 41-50.
National Assembly. (2005). Law on enterprises. Hanoi, Vietnam: Socialst Republic of Vietnam
Government Web Portal.
Nguyen, D. C. (2008). Corporate governance in Vietnam: Regulations, practices and problems.
Hanoi, Vietnam: CIEM-GTZ.
Nguyen, T., Locke, S., & Reddy, K. (2014). A dynamic estimation of governance structures and
financial performance for Singaporean companies. Economic Modelling, 40(C), 1-11.
Nowland, J. (2008). Are East Asian companies benefiting from Western board practices? Journal of
Business Ethics, 79(1), 133-150.
OECD. (2006). Implementing the White Paper on corporate governance in Asia. Paris, France:
OECD Publishing.
Pfeffer, J. (1973). Size, composition, and function of hospital boards of directors: A study of
organization-environment linkage. Administrative Science Quarterly, 18(3), 349-364.
Pfeffer, J., & Salancik, G. R. (2003). The external control of organizations: A resource dependence
perspective. Stanford, California: Stanford University Press.
Pham, P. K., Suchard, J. A., & Zein, J. (2011). Corporate governance and alternative performance
measures: Evidence from Australian firms. Australian Journal of Management, 36(3), 371-
386.
Raheja, C. G. (2005). Determinants of board size and composition: A theory of corporate boards.
Journal of Financial and Quantitative Analysis, 40(2), 283-306.
Reddy, K., Locke, S., Scrimgeour, F., & Gunasekarage, A. (2008). Corporate governance practices
of small cap companies and their financial performance: An empirical study in New
Zealand. International Journal of Business Governance and Ethics, 4(1), 51-78.
Roodman, D. (2009a). How to do xtabond2: An introduction to difference and system GMM in
Stata. Stata Journal, 9(1), 86-136.
Roodman, D. (2009b). A note on the theme of too many instruments. Oxford Bulletin of Economics
& Statistics, 71(1), 135-158.
Rose, C. (2007). Does female board representation influence firm performance? The Danish
evidence. Corporate Governance: An International Review, 15(2), 404-413.
47
Schultz, E. L., Tan, D. T., & Walsh, K. D. (2010). Endogeneity and the corporate governance -
performance relation. Australian Journal of Management, 35(2), 145-163.
Shleifer, A., & Vishny, R. W. (1986). Large shareholders and corporate control. The Journal of
Political Economy, 94(3), 461-488.
Sussmuth-Dyckerhoff, C., Wang, J., & Chen, J. (2012). Women matter: An Asian perspective.
Washington DC., USA: McKinsey & Co.
Terjesen, S., Sealy, R., & Singh, V. (2009). Women directors on corporate boards: A review and
research agenda. Corporate Governance: An International Review, 17(3), 320-337.
Terjesen, S., & Singh, V. (2008). Female presence on corporate boards: A multi-country study of
environmental context. Journal of Business Ethics, 83(1), 55-63.
The Korn/Ferry Institute. (2012). The diversity scorecard measuring board composition in Asia
Pacific. Singapore: The Korn/Ferry Institute.
UNIDO. (2010). Gender related obstacles to Vietnamese women entrepreneurs. Vienna, Austria:
United Nations Industrial Development Organization.
Van Essen, M., Oosterhout, J. H. v., & Carney, M. (2012). Corporate boards and the performance of
Asian firms: A meta-analysis. Asia Pacific Journal of Management, 29(4), 873-905.
Victoria, K. (2006). Ownership, board structure, and performance in continental Europe. The
International Journal of Accounting, 41(2), 176-197.
Wintoki, M. B., Linck, J. S., & Netter, J. M. (2012). Endogeneity and the dynamics of internal
corporate governance. Journal of Financial Economics, 105(3), 581-606.
Wooldridge, J. M. (2002). Econometric analysis of cross section and panel data. Cambridge, MA:
The MIT press.
World Bank. (2006a). Report on the observance of standards and codes - Corporate governance
country assessment: Vietnam. Hanoi, Vietnam: The World Bank.
World Bank. (2006b). Vietnam - Country gender assessment. Washington DC., USA: The
Worldbank.
World Bank. (2011). Vietnam - Country gender assessment. Washington DC., USA: The
Worldbank.
World Bank. (2012). Doing Business 2012: Doing business in a more transparent world - Economy
profile: Vietnam. Washington DC., USA: The World Bank.
Zaichkowsky, J. L. (2014). Women in the board room: one can make a difference. International
Journal of Business Governance and Ethics, 9(1), 91-113.
Zhou, Q., Faff, R., & Alpert, K. (2014). Bias correction in the estimation of dynamic panel models
in corporate finance. Journal of Corporate Finance, 25, 494-513.

48
Appendices
Figure 2: Changes in the Vietnamese stock index (%) vs. Tobin’s Q, 2008–2011 Source: %ΔVN-index and the mean and median values of Tobin’s Q are based on data collected from the HOSE
website and Thomson One Banker (Worldscope database)
Figure 3: The median-spline plot and scatter-plot for Tobin’s Q against the Blau index
-70%
57%
-2% -27%
0.81
1.06
0.89
0.64
0.73
0.91
0.83
0.64
0.00
0.20
0.40
0.60
0.80
1.00
1.20
-80%
-60%
-40%
-20%
0%
20%
40%
60%
80%
2008 2009 2010 2011
%ΔVNIndex
Mean_Tobin's Q
Median_Tobin's Q
01
23
To
bin
's Q
ratio
.76
.77
.78
.79
.8
Med
ian s
plin
e
0 .1 .2 .3 .4 .5blau
Median spline Tobin's Q ratio