Docket No. 18-____ ComEd Ex. 2.03 Page 1 of 334
334
Schedule A-2 RY Page 1 of 1 Commonwealth Edison Company Overall Financial Summary Test Year 2017 Recon Year (1) (In Thousands) Witness: Tracy Line No. Schedule Amount (B) (C) 1 Jurisdictional Original Cost Rate Base B-1 9,512,615 $ 2 Jurisdictional Operating Income at Present Rates C-1 545,719 $ 3 Jurisdictional Rate of Return - Present Rates A-4 5.74% 4 Cost of Capital (Weighted Average) - Proposed Rates D-1 6.52% 5 Jurisdictional Operating Income at Proposed Rates C-1 620,223 $ 6 Jurisdictional Operating Income Difference (Line 5 less Line 2) A-4 74,504 $ 7 Jurisdictional Gross Revenue Conversion Factor A-2.1 1.6838 8 Jurisdictional Revenue Increase/(Decrease) Requested - excluding Add-on Revenue Taxes C-1 125,448 $ 9 Jurisdictional Revenue Increase/(Decrease) Requested - including Add-on Revenue Taxes 125,448 $ (2) Notes: (1) With identified adjustments. (2) None of the add-on taxes, as shown on Schedule C-25, are revenue based. Description (A) Docket No. 18-____ ComEd Ex. 2.03 Page 1 of 334
-
Upload
khangminh22 -
Category
Documents
-
view
0 -
download
0
Transcript of Docket No. 18-____ ComEd Ex. 2.03 Page 1 of 334

Schedule A-2 RYPage 1 of 1
Commonwealth Edison CompanyOverall Financial Summary
Test Year 2017 Recon Year (1)(In Thousands)
Witness: Tracy
LineNo. Schedule Amount
(B) (C)
1 Jurisdictional Original Cost Rate Base B-1 9,512,615$
2 Jurisdictional Operating Income at Present Rates C-1 545,719$
3 Jurisdictional Rate of Return - Present Rates A-4 5.74%
4 Cost of Capital (Weighted Average) - Proposed Rates D-1 6.52%
5 Jurisdictional Operating Income at Proposed Rates C-1 620,223$
6 Jurisdictional Operating Income Difference (Line 5 less Line 2) A-4 74,504$
7 Jurisdictional Gross Revenue Conversion Factor A-2.1 1.6838
8 Jurisdictional Revenue Increase/(Decrease) Requested - excluding Add-on Revenue Taxes C-1 125,448$
9 Jurisdictional Revenue Increase/(Decrease) Requested - including Add-on Revenue Taxes 125,448$ (2)
Notes:(1) With identified adjustments.(2) None of the add-on taxes, as shown on Schedule C-25, are revenue based.
Description(A)
Docket No. 18-____ ComEd Ex. 2.03
Page 1 of 334

Schedule A-2.1Page 1 of 1
Commonwealth Edison CompanyComputation of Jurisdictional Gross Revenue Conversion Factor
Year 2017
Witness: Tracy
Line % of IncrementalNo. Description Gross Revenue
(A) (B)
1 Operating Revenue 100.00%2 Uncollectible Expense 0.00% (1)3 State Taxable Income 100.00%
4 State Income Taxes 8.63% (2)5 Income Before Federal Income Taxes 91.37%
6 Federal Income Taxes (35% * Line 5) 31.979%
7 Operating Income Percentage (Line 5 - Line 6) 59.389%
8 Gross Revenue Conversion Factor:9 Including Incremental Uncollectible expense and Add-On 10 Revenue Taxes (100.00% / Operating Income Percentage (Line 7)) 1.6838
Note:
(1) The uncollectable expense factor is set to zero. Under the formula, Account 904
uncollectible expenses have been removed and are recovered through Rider UF.
(2) Illinois State Income Taxes changed in 2017 requiring a calculated value:(7.75%*(181/365)+(9.5%*(184/365))))
Docket No. 18-____ ComEd Ex. 2.03
Page 2 of 334

Schedule A-4 RYPage 1 of 1
Commonwealth Edison CompanyComparison to Prior Rate Order - 2017 Recon Year
(In Thousands)Witness: Tracy
ICC Order-Line DocketNo. Description 2017 (1) 17-0196 (2) Source (2)
(A) (B) (C) (D)
1 Original Cost Rate Base 9,512,615$ 8,807,023$ Sch 1 RY, Line 24
2 Operating Income at Present Rates 545,719$ 568,053$ Sch 1 RY, Line 23
3 Rate of Return (Line 2 / Line 1) 5.74% 6.45%
4 Cost of Capital 6.52% 6.45% Sch 1 RY, Line 25
5 Operating Income at Proposed / Approved Rates 620,223$ 568,053$ Sch 1 RY, Line 23
6 Income Deficiency / (Excess) (Line 2 - Line 5) 74,504$ -$
7 Gross Revenue Conversion Factor 1.6838 1.6677 Sch 7 RY
8 Revenue Increase Requested / Approved 125,448$ -$ Sch 5 RY
Notes:(1) Without identified projected adjustments.(2) Final Order: December 2017 Appendix B.
Docket No. 18-____ ComEd Ex. 2.03
Page 3 of 334

Schedule A-5 RYPage 1 of 4
Commonwealth Edison CompanyJurisdictional Allocation Summary for Balance Sheet Items - 2017 Recon Year (1)
December 31, 2017(In Thousands)
Witness: Tracy
LineNo. Description
ICCAccount
TotalCompany
UnadjustedLess:
Transmission
Less:Other
Non-DST
Plus:Projected Plant Additions and Adjustments
(Schedule B-2)
Illinois -Jurisdictional
Delivery ServicesRate Base (2)
(A) (B) (C) (D) (E) (F) (G)
1 Plant-in-Service 101, 106 & 1142 Distribution Plant 18,916,918$ -$ -$ (35,747)$ 18,881,171$ 3 General and Intangible Plant 2,894,041 565,114 (17,423) 2,311,504 4 Subtotal 21,810,959$ 565,114$ -$ (53,170)$ 21,192,675$
5 Accumulated Depreciation & Amortization 108, 111 & 1156 Distribution Plant (6,007,704)$ - - 5,434$ (6,002,270) 7 General and Intangible Plant (1,332,505) (271,563) 17,423 (1,043,519) 8 Subtotal (7,340,209)$ (271,563)$ -$ 22,857$ (7,045,789)$
9 Construction Work in Progress 107 517,229$ 44,970$ 449,817$ -$ 22,442$ 10 Cash Working Capital - - (17,193) - 17,193 11 Materials & Supplies Inventories 154, 155 & 163 151,996 57,906 19,346 - 74,744 12 Accumulated Deferred Income Taxes 190, 281-283 (3,507,259) (1,089,957) 1,939,233 3,303 (4,353,232) 13 Regulatory Assets 182.3 1,250,596 - 1,089,163 58,319 219,752 14 Deferred Debits 186 3,955,828 - 3,932,046 - 23,782 15 Operating Reserves 228 (608,667) - (328,706) - (279,961) 16 Asset Retirement Obligation 230 (113,065) - (94,206) - (18,859) 17 Other Deferred Credits 253 (270,584) - (265,762) (91,190) (96,012) 18 Customer Deposits 235 (112,460) - - (112,460) 19 Customer Advances 252 (133,090) - (1,430) - (131,660)
20 Total 15,601,274$ (693,530)$ 6,722,308$ (59,881)$ 9,512,615$
Notes:(1) If no portion of a balance sheet item on a functional basis is reflected in jurisdictional rate base, then information for that
balance sheet item is not provided.(2) See Page 2 for allocation or assignment descriptions.
Docket No. 18-____ ComEd Ex. 2.03
Page 4 of 334

Schedule A-5 RYPage 2 of 4
Witness: Tracy
LineNo. Description
Illinois -Jurisdictional
Delivery ServicesRate Base Allocation Methodology (1)
(A) (B) (C)
1 Plant-in-Service2 Transmission Plant -$ Transmission plant is not assigned to delivery services.3 Distribution Plant 18,881,171 Distribution plant is 100% directly assigned to delivery services.4 General and Intangible Plant 2,311,504 Allocated using the methodology shown in WPB-1.5 Subtotal 21,192,675$
6 Accumulated Depreciation & Amortization7 Transmission Plant -$ Transmission plant is not assigned to delivery services.8 Distribution Plant (6,002,270) Distribution plant is 100% directly assigned to delivery services.9 General and Intangible Plant (1,043,519) Allocated using the methodology shown in WPB-1.
10 Subtotal (7,045,789)$
11 Construction Work in Progress 22,442$ Directly assigned: distribution CWIP not earning AFUDC; see WPB-7 for list of projects.12 Cash Working Captial 17,193 For methodology / study, see Schedule B-8.13 Materials & Supplies Inventories 74,744 Based on ratio of jurisdictional material and supplies to total company. See Schedule B-8.1.14 Accumulated Deferred Income Taxes (4,353,232) Components both directly assigned and allocated as shown in Schedule B-9.15 Regulatory Assets 219,752 Directly assigned. See Schedule B-10, Page 1.16 Deferred Debits 23,782 Directly assigned. See Schedule B-10, Page 1.17 Operating Reserves (279,961) Directly assigned. See Schedule B-10, Page 2.18 Asset Retirement Obligation (18,859) Directly assigned. See Schedule B-10, Page 2.19 Other Deferred Credits (96,012) Directly assigned. See Schedule B-10, Page 2 and Sch B-2.20 Customer Deposits (112,460) Average balance. See schedule B-13.21 Customer Advances (131,660) Line extension deposits directly assigned to delivery services. See Schedule B-15.
22 Total 9,512,615
Note:(1) Primary allocation factors are derived in WPA-5, Pages 1-5.
Commonwealth Edison CompanyJurisdictional Allocation Summary for Balance Sheet Items - 2017 Recon Year
December 31, 2017(In Thousands)
Docket No. 18-____ ComEd Ex. 2.03
Page 5 of 334

Schedule A-5 RYPage 3 of 4
Commonwealth Edison CompanyJurisdictional Allocation Summary for Operating Income Items - 2017 Recon Year
For the Year 2017(In Thousands)
Witness: Tracy
LineNo. Description
ICCAccount
Total CompanyUnadjusted
Less:Transmission (1)
Less:Other
Non-DST
Plus:Operating Expense
Adj (Sch C-2) Effect of
Proposed Rates
JurisdictionalOperating
Income
(A) (B) (C) (D) (E) (F) (G) (H)1 Operating Revenues 400 4,655,548$ -$ 2,149,463$ -$ 125,448$ 2,631,533$ 2 Other Revenues 450-456 883,912 771,851 (23,898) - - 135,959 3 Total Operating Revenues 5,539,460$ 771,851$ 2,125,565$ -$ 125,448$ 2,767,492$
4 Operating Expenses5 Production 500-557 1,351,795$ -$ 1,351,795$ -$ -$ -$ 6 Transmission 560-573 427,803 427,803 - - - - 7 Regional Market Expenses 575.1-576.5 4,848 4,848 - - - - 8 Distribution 580-598 465,285 - 906 (4,207) - 460,172 9 Customer Accounts Expenses 901-905 229,443 - 49,603 - - 179,840 10 Customer Service and Informational Exp 907-910 132,730 - 99,141 - - 33,589 11 Sales Expenses 911-916 - - - - - - 12 Administrative and General Expenses 920-935 465,278 59,610 27,425 (1,922) - 376,321 13 Depreciation & Amortization Expense 403-406 775,573 148,998 (1,573) - - 628,148 14 Taxes Other Than Income 408.1 294,918 10,304 140,583 - - 144,031 15 Regulatory Debits 407.3 34,712 - (16,328) (33,444) - 17,596 16 Pension Asset Funding Costs - - - 32,714 - 32,714 17 Accretion Expense 411.10 (38) - (38) - - - 18 Total Operating Expenses 4,182,347$ 651,563$ 1,651,514$ (6,859)$ -$ 1,872,411$ 19 Income Taxes20 State Income Taxes (2) (47,070)$ -$ (12,689)$ (1,592)$ 10,826$ (25,147)$ 21 Federal Income Taxes (2) (184,121) - (56,718) (5,898) 40,118 (93,183)$ 22 Deferred Taxes (2) 658,387 - 274,458 10,865 - 394,794$ 23 ITC's Net (2) (1,916) - (310) - - (1,606)$ 24 Total Income Taxes 425,280$ -$ 204,741$ 3,375$ 50,944$ 274,858$
25 Net Utility Operating Income 931,833$ 120,288$ 269,310$ 3,484$ 74,504$ 620,223$
Notes:(1) Transmission amounts from the following sources: Other Revenues - WPC-23, Page 1; A&G Depreciation and TOTI from ComEd's Transmission Formula Rate Filing
Depreciation & Amortization - FERC Form 1 plus allocation of General & Intangible Plant; Taxes Other Than Income - WPC-18 Taxes allocated to Transmission(2) Income tax amounts shown in Column E are not separated into Transmission and Non-DST components
Docket No. 18-____ ComEd Ex. 2.03
Page 6 of 334

Schedule A-5 RYPage 4 of 4
Witness: Tracy
LineNo.
JurisdictionalOperating
Income Allocation Methodology (1)
(A) (B) (C)
1 Operating Revenues 2,631,533$ Operating revenues are 100% directly assigned to delivery services2 Other Revenues 135,959 Components both directly assigned and allocated as shown in WPC-23.
3 Total Operating Revenues 2,767,492$
4 Operating Expenses5 Production -$ Production costs are not assigned to delivery services.6 Transmission - Transmission costs are not assigned to delivery services.7 Regional Market Expenses - Transmission costs are not assigned to delivery services.8 Distribution 460,172 Distribution costs are directly assigned as shown on WPC-1a.9 Customer Accounts Expenses 179,840 Customer accounts expenses are directly assigned as shown on WPC-1a, Page 1 and 2.
10 Customer Service and Informational Exp 33,589 Customer Service costs are directly assigned as shown on WPC-1a, Page 1.11 Sales Expenses - 12 Administrative and General Expenses 376,321 Adjusted A&G are allocated using wages and salaries allocator. See WPC-1a and WPA-5.13 Depreciation & Amortization Expense 628,148 Distribution 100% directly assigned to delivery services, general and intangible plant depreciation14 and amortization allocated based on WPB-1, Page 1. See Schedule C-12 for details.15 Taxes Other Than Income 144,031 Components both directly assigned and allocated as shown in WPC-18.16 Regulatory Debits 17,596 Components assigned to delivery services as shown on Schedule C-26.17 Pension Asset Funding Cost 32,714 As assigned to distribution on schedule C-2.318 Accretion Expense -
19 Total Operating Expenses 1,872,411$
20 Income Taxes21 State Income Taxes (25,147)$ Income tax additions and deductions both directly assigned and allocated per Schedule C-5.22 Federal Income Taxes (93,183) Income tax additions and deductions both directly assigned and allocated per Schedule C-5.23 Deferred Taxes 394,794 Components both directly assigned and allocated as shown in Schedule C-5.2.24 ITC's Net (1,606) Includes Amortization of post-1971 ITC. Allocated as shown on Schedule C-5.
25 Total Income Taxes 274,858$
26 Net Utility Operating Income 620,223$
Note:
(1) Primary allocation factors are derived in WPA-5, Pages 1-5.
Description
(In Thousands)
Commonwealth Edison CompanyJurisdictional Allocation Summary for Operating Income Items - 2017 Recon Year
For the Year 2017
Docket No. 18-____ ComEd Ex. 2.03
Page 7 of 334

Schedule B-1 RYPage 1 of 2
Witness: Tracy
Line No. Description
Unadjusted Delivery Services
Rate Base (from Page 2)
Adjustments (B-2)
Illinois Jurisdictional
Delivery ServicesRate Base
(A) (B) (C) (D)
1 Plant-in-Service2 Distribution Plant 18,916,918$ (35,747)$ 18,881,171$ 3 General and Intangible Plant 2,328,927 (17,423) 2,311,504 4 Subtotal 21,245,845$ (53,170)$ 21,192,675$
5 Accumulated Depreciation & Amortization6 Distribution Plant (6,007,704)$ 5,434$ (6,002,270)$ 7 General and Intangible Plant (1,060,942) 17,423 (1,043,519) 8 Subtotal (7,068,646)$ 22,857$ (7,045,789)$
9 Construction Work in Progress 22,442$ -$ 22,442$ 10 Cash Working Capital 17,193 - 17,193 11 Materials & Supplies Inventories 74,744 - 74,744 12 Accumulated Deferred Income Taxes (4,356,535) 3,303 (4,353,232) 13 Regulatory Assets & Liabilities, Net 161,433 58,319 219,752 14 Deferred Costs 23,782 - 23,782 15 Operating Reserves (279,961) - (279,961) 16 Asset Retirement Obligation (18,859) - (18,859) 17 Deferred Liabilities (4,822) (91,190) (96,012) 18 Customer Deposits (112,460) - (112,460) 19 Customer Advances (131,660) - (131,660)
20 Total 9,572,496$ (59,881)$ 9,512,615$
Commonwealth Edison CompanyJurisdictional Rate Base Summary - 2017 Recon Year
December 31, 2017(In Thousands)
Docket No. 18-____ ComEd Ex. 2.03
Page 8 of 334
Schedule B-1 RYPage 2 of 2
Witness: Tracy
Line No. Description ICC Account
Total Company Unadjusted (2)
Adjustments And Non-Jurisdictional
Unadjusted Delivery
Services Rate Base
Supporting Schedule / Workpaper
(A) (B) (C) (D) (E) (F)
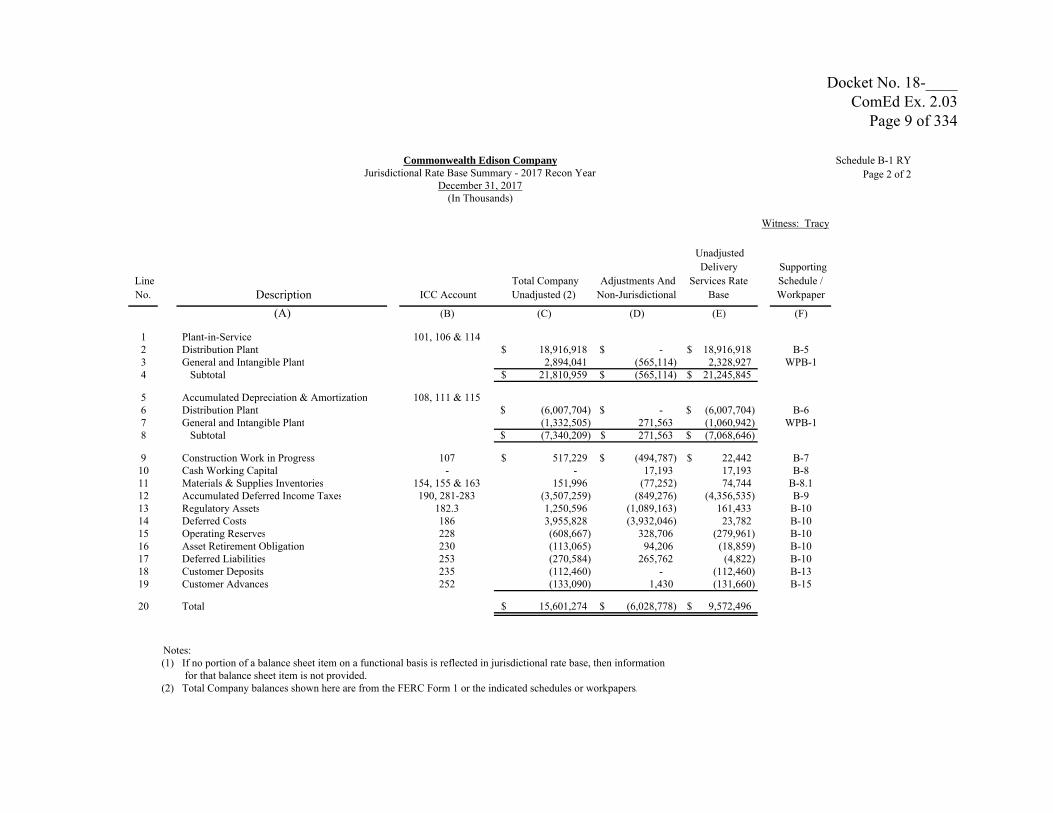
1 Plant-in-Service 101, 106 & 1142 Distribution Plant 18,916,918$ -$ 18,916,918$ B-53 General and Intangible Plant 2,894,041 (565,114) 2,328,927 WPB-14 Subtotal 21,810,959$ (565,114)$ 21,245,845$
5 Accumulated Depreciation & Amortization 108, 111 & 1156 Distribution Plant (6,007,704)$ -$ (6,007,704)$ B-67 General and Intangible Plant (1,332,505) 271,563 (1,060,942) WPB-18 Subtotal (7,340,209)$ 271,563$ (7,068,646)$
9 Construction Work in Progress 107 517,229$ (494,787)$ 22,442$ B-710 Cash Working Capital - - 17,193 17,193 B-811 Materials & Supplies Inventories 154, 155 & 163 151,996 (77,252) 74,744 B-8.112 Accumulated Deferred Income Taxes 190, 281-283 (3,507,259) (849,276) (4,356,535) B-913 Regulatory Assets 182.3 1,250,596 (1,089,163) 161,433 B-1014 Deferred Costs 186 3,955,828 (3,932,046) 23,782 B-1015 Operating Reserves 228 (608,667) 328,706 (279,961) B-1016 Asset Retirement Obligation 230 (113,065) 94,206 (18,859) B-1017 Deferred Liabilities 253 (270,584) 265,762 (4,822) B-1018 Customer Deposits 235 (112,460) - (112,460) B-1319 Customer Advances 252 (133,090) 1,430 (131,660) B-15
20 Total 15,601,274$ (6,028,778)$ 9,572,496$
Notes: (1) If no portion of a balance sheet item on a functional basis is reflected in jurisdictional rate base, then information
for that balance sheet item is not provided.(2) Total Company balances shown here are from the FERC Form 1 or the indicated schedules or workpapers.
Commonwealth Edison CompanyJurisdictional Rate Base Summary - 2017 Recon Year
December 31, 2017(In Thousands)
Docket No. 18-____ ComEd Ex. 2.03
Page 9 of 334

Schedule B-2 RYPage 1 of 2
Witness: Tracy
Removal of Capitalized Switches Remove Software
Costs Recovered for PORCB Projected AccumulatedDisallowed Under Recovered Under Plant Reserve
Line from Prior Cases Rider EEPP Rider Additions AdjustmentNo. Description (Schedule B-2.1) (Schedule B-2.2) (Schedule B-2.3) (Sch B-2.4) (1) (Sch B-2.5) (1)
(A) (B) (C) (D) (E) (F)
1 Plant-in-Service2 Distribution Plant (30,350)$ (4,995)$ -$ -$ -$ 3 General and Intangible Plant - - (14,184) - - 4 Subtotal (30,350)$ (4,995)$ (14,184)$ -$ -$
5 Accumulated Depreciation & Amortization6 Distribution Plant 4,806$ 618$ -$ -$ -$ 7 General and Intangible Plant - - 14,184 - - 8 Subtotal 4,806$ 618$ 14,184$ -$ -$
9 Construction Work in Progress -$ -$ -$ -$ -$ 10 Cash Working Capital - - - - - 11 Accumulated Deferred Income Taxes 2,506 795 - - - 12 Regulatory Assets - - - - - 13 Deferred Assets - - - - - 14 Operating Reserves - - - - - 15 Asset Retirement Obligation - - - - - 16 Deferred Liabilities - - - - - 17 Other Deferred Charges - - - - - 18 Customer Advances - - - - - 19 Accumulated Investment Tax Credits - - - - -
20 Total (23,038)$ (3,582)$ -$ -$ -$
(1) For calculation of the annual reconciliation, projected plant additions and the accumulated reserve adjustment are excluded.
Commonwealth Edison CompanySummary of Utility Adjustments To Test Year Rate Base - 2017 Recon Year
(In Thousands)
Docket No. 18-____ ComEd Ex. 2.03
Page 10 of 334

Schedule B-2 RYPage 2 of 2
LineNo. Description
(A)
1 Plant-in-Service2 Distribution Plant3 General and Intangible Plant4 Subtotal
5 Accumulated Depreciation & Amortization6 Distribution Plant7 General and Intangible Plant8 Subtotal
9 Construction Work in Progress10 Cash Working Capital11 Accumulated Deferred Income Taxes12 Regulatory Assets13 Deferred Assets14 Operating Reserves15 Asset Retirement Obligation16 Deferred Liabilities17 Other Deferred Charges18 Customer Advances19 Accumulated Investment Tax Credits
20 Total
Witness: Tracy
Adjustments Remove Adjustment to Net Adjustment to Adjustment toto Unusual Long Term Plant to Remove Operating Operating Removal ofOperating Incentive Supply Admin Reserve for Reserve for Capitalized TotalExpenses Related to Net Software Recovered Accrued Accrued Pcards & Recognition Jurisdictional> $10M Income Goals Under Rider PE Vacation Pay Incentive Pay Costs Rate Base
(WPC-2.2) (Schedule B-2.6) (Schedule B-2.7) (Schedule B-2.8) (Schedule B-2.9) (Schedule B-2.10) Adjustments(G) (H) (I) (J) (K) (L) (M)
-$ (338)$ -$ -$ -$ (64)$ (35,747)$ - - (3,239) - - - (17,423) -$ (338)$ (3,239)$ -$ -$ (64)$ (53,170)$
-$ 8 -$ -$ -$ 2$ 5,434$ - - 3,239 - - - 17,423 -$ 8$ 3,239$ -$ -$ 2$ 22,857$
-$ -$ -$ -$ -$ -$ -$ - - - - - - - - 2 - - - - 3,303
58,319 - - - - - 58,319 - - - - - - - - - - - - - - - - - - - - - - - - - - - - - - - (33,284) (57,906) - (91,190) - - - - - - - - - - - - - -
58,319$ (328)$ -$ (33,284)$ (57,906)$ (62)$ (59,881)$
Commonwealth Edison CompanySummary of Utility Adjustments To Test Year Rate Base - 2017 Recon Year
(In Thousands)
Docket No. 18-____ ComEd Ex. 2.03
Page 11 of 334

Schedule B-2.1Page 1 of 11
Witness: Tracy
Line Docket No. Docket No. Docket No. Docket No. Docket No. Docket No. Docket No. Docket No. Docket No. Docket No. Total ICCNo. 05-0597 (2) 07-0566 (3) 10-0467 (4) 11-0721 (5) 12-0321 (6) 13-0318 (7) 14-0312 (8) 15-0287 (9) 16-0259 (10) 17-0196 (11) Col (B) thru (K) Acct
(B) (C) (D) (E) (F) (G) (H) (I) (J) (K) (L) (K)
1 Adjustments to Rate Base
2 Gross Plant (5,975)$ (1,355)$ (967)$ (1,305)$ (2,675)$ (3,354)$ (4,505)$ (1,360)$ (8,645)$ (209)$ (30,350)$ 107
3 Accumulated Depreciation 1,859 355 184 218 386 482 544 132 636 10 4,806 108
4 Deferred Income Taxes 851 173 99 122 223 279 319 77 358 5 2,506 283
5 Adjustments to Rate Base (3,265)$ (827)$ (684)$ (965)$ (2,066)$ (2,593)$ (3,642)$ (1,151)$ (7,651)$ (194)$ (23,038)$
6 Depreciation 2017 (146)$ (33)$ (24)$ (32)$ (66)$ (82)$ (110)$ (33)$ (212)$ (5)$ (743)$ 403
Notes:(1) This adjustment removes from rate base the net book value and from
test year depreciation expense the effect of disallowancesin ICC Dkt. Nos. 05-0597, 07-0566, 10-0467, 11-0721, 12-0321, 13-0318, 14-0312, 15-0287, 16-0259 and 17-0196
(2) See Page 2 for details.(3) See Page 3 for details.(4) See Page 4 for details.(5) See Page 5 for details.(6) See Page 6 for details.(7) See Page 7 for details.(8) See Page 8 for details.(9) See Page 9 for details.(10) See Page 10 for details.(11) See Page 11 for details.
(A)Description
Commonwealth Edison CompanyRemoval of Capitalized Costs Disallowed in Previous ICC Orders - 2017 Actual (1)
(In Thousands)
Docket No. 18-____ ComEd Ex. 2.03
Page 12 of 334

Schedule B-2.1Page 2 of 11
Commonwealth Edison CompanyRemoval of Capitalized Costs Disallowed in ICC Dkt. No. 05-0597 - 2017 Actual
Witness: Tracy
Line TotalNo. Amount 2005 2006 2007 2008 2009 2010 2011 2012 2013 2014 2015 2016 2017 Amount
(B) (C) (D) (E) (F) (G) (H) (I) (J) (K) (L) (M) (N) (O) (P)
1 Gross Plant (5,975)$ (5,975)$
2 Tax Rate 39.75% 39.75% 39.75% 39.75% 39.75% 39.75% 41.18% 41.18% 41.18% 41.18% 40.04% 40.04% 40.61%
3 Book Depreciation Rate 2.44% 2.44% 2.44% 2.44% 2.31% 2.31% 2.31% 2.31% 2.31% 2.45% 2.45% 2.45% 2.45%
4 Annual Book Depreciation 146$ 146$ 146$ 146$ 138$ 138$ 138$ 138$ 138$ 146$ 146$ 146$ 146$ 1,859$
5 Net Book Value at 12-31-17 (4,116)$
6 Tax Depreciation Rate 3.75% 7.22% 6.68% 6.18% 5.71% 5.29% 4.89% 4.52% 4.46% 4.46% 4.46% 4.46% 4.46%
7 Annual Tax Depr (Ln 1 * Ln 6) 224$ 431$ 399$ 369$ 341$ 316$ 292$ 270$ 266$ 266$ 266$ 266$ 266$
8 Deferred Taxes ((Ln 7 - Ln 4)*Ln 2) 31$ 114$ 101$ 89$ 81$ 71$ 63$ 54$ 53$ 49$ 48$ 48$ 49$ 851$
9 Amount to be Excluded from Rate Base (3,265)$
(In Thousands)
Description(A)
Docket No. 18-____ ComEd Ex. 2.03
Page 13 of 334

Schedule B-2.1Page 3 of 11
Commonwealth Edison CompanyRemoval of Capitalized Costs Disallowed in ICC Dkt. No. 07-0566 - 2017 Actual
Witness: Tracy
Line TotalNo. Amount 2007 2008 2009 2010 2011 2012 2013 2014 2015 2016 2017 Amount
(B) (C) (D) (E) (F) (G) (H) (I) (J) (K) (L) (M) (N)
1 Gross Plant (1,355)$ (1,355)$
2 Tax Rate 39.75% 39.75% 39.75% 39.75% 41.18% 41.18% 41.18% 41.18% 40.04% 40.04% 40.61%
3 Total Book Accumulated Depreciation 2.44% 2.44% 2.31% 2.31% 2.31% 2.31% 2.31% 2.45% 2.45% 2.45% 2.45%
4 Annual Book Depreciation 33$ 33$ 31$ 31$ 31$ 31$ 31$ 33$ 33$ 33$ 33$ 355
5 Net Book Value at 12-31-17 (1,000)$
6 Tax Depreciation Rate 3.75% 7.22% 6.68% 6.18% 5.71% 5.29% 4.89% 4.52% 4.46% 4.46% 4.46%
7 Annual Tax Depreciation (Ln 1 * Ln 6) 51$ 98$ 90$ 84$ 77$ 72$ 66$ 61$ 60$ 60$ 60$
8 Deferred Taxes ((Ln 7 - Ln 4)*Ln 2) 7$ 26$ 24$ 21$ 19$ 17$ 14$ 12$ 11$ 11$ 11$ 173$
9 Amount to be Excluded from Rate Base (827)$
(In Thousands)
Description(A)
Docket No. 18-____ ComEd Ex. 2.03
Page 14 of 334

Schedule B-2.1Page 4 of 11
Commonwealth Edison CompanyRemoval of Capitalized Costs Disallowed in ICC Dkt. No. 10-0467 - 2017 Actual
(In Thousands)
Witness: Tracy
Line TotalNo. Amount 2010 2011 2012 2013 2014 2015 2016 2017 Amount
(B) (C) (D) (E) (F) (G) (H) (I) (J) (K)
1 Gross Plant (1) (967)$ (967)$
2 Tax Rate 39.75% 41.18% 41.18% 41.18% 41.18% 40.04% 40.04% 40.61%3 Total Book Accumulated Depreciation4 Book Depreciation Rate 2.31% 2.31% 2.31% 2.31% 2.45% 2.45% 2.45% 2.45%
5 Annual Book Depreciation 22$ 22$ 22$ 22$ 24$ 24$ 24$ 24$ 184$
6 Net Book Value at 12-31-17 (783)$
7 Tax Depreciation Rate 3.75% 7.22% 6.68% 6.18% 5.71% 5.29% 4.89% 4.52%
8 Annual Tax Depr (Ln 1 * Ln 6) 36$ 70$ 65$ 60$ 55$ 51$ 47$ 44$
9 Deferred Taxes ((Ln 7 - Ln 4)*Ln 2) 6$ 20$ 17$ 15$ 13$ 11$ 9$ 8$ 99$
10 Amount to be Excluded from Rate Base (684)$
Note:(1) 10-0467 Incentive Comp Final Order Appendix A Page 8, Column K (896)$
10-0467 LTIP Perqs & Awards Final Order Appendix A Page 8, Column L (62) 10-0467 Sporting Activity Final Order Appendix A Page 8, Column M (9)
Total (967)$
Description(A)
Docket No. 18-____ ComEd Ex. 2.03
Page 15 of 334

Schedule B-2.1Page 5 of 11
Witness: Tracy
Line TotalNo. Amount 2011 2012 2013 2014 2015 2016 2017 Amount
(B) (C) (D) (E) (F) (G) (H) (I) (J)
1 Gross Plant (1) (1,305)$ (1,305)$
2 Tax Rate 41.18% 41.18% 41.18% 41.18% 40.04% 40.04% 40.61%
3 Total Book Accumulated Depreciation 2.31% 2.31% 2.31% 2.45% 2.45% 2.45% 2.45%
4 Annual Book Depreciation 30$ 30$ 30$ 32$ 32$ 32$ 32$ 218
5 Net Book Value at 12-31-17 (1,087)$
6 Tax Depreciation Rate 3.75% 7.22% 6.68% 6.18% 5.71% 5.29% 4.89%
7 Annual Tax Depr (Ln 1 * Ln 6) 49$ 94$ 87$ 81$ 75$ 69$ 64$
8 Deferred Taxes ((Ln 7 - Ln 4)*Ln 2) 8$ 26$ 23$ 20$ 17$ 15$ 13$ 122$
9 Amount to be Excluded from Rate Base (965)$
Note:(1) 11-0721 LTIP Perqs & Awards Final Order Appendix A (477)$
11-0721 LTIP (ComEd Ex 4.5, Schedule B-2.7) (41) 11-0721 LTIP Restricted Stock Final Order Appendix A (787)
Total (1,305)$
Description(A)
Removal of Capitalized Costs Disallowed in ICC Dkt. No. 11-0721 - 2017 ActualCommonwealth Edison Company
(In Thousands)
Docket No. 18-____ ComEd Ex. 2.03
Page 16 of 334

Schedule B-2.1Page 6 of 11
Witness: Tracy
Line TotalNo. Amount 2012 2013 2014 2015 2016 2017 Amount
(B) (C) (D) (E) (F) (G) (G) (H)
1 Gross Plant (1) (2,675)$ (2,675)$
2 Tax Rate 41.18% 41.18% 41.18% 40.04% 40.04% 40.61%
3 Total Book Accumulated Depreciation 2.31% 2.31% 2.45% 2.45% 2.45% 2.45%
4 Annual Book Depreciation 62$ 62$ 66$ 66$ 66$ 66$ 386
5 Net Book Value at 12-31-17 (2,289)$
6 Tax Depreciation Rate 3.75% 7.22% 6.68% 6.18% 5.71% 5.29%
7 Annual Tax Depr (Ln 1 * Ln 6) 100$ 193$ 179$ 165$ 153$ 142$
8 Deferred Taxes ((Ln 7 - Ln 4)*Ln 2) 16$ 54$ 47$ 40$ 35$ 31$ 223$
9 Amount to be Excluded from Rate Base (2,066)$
Note:(1) 12-0321 BSC AIP (1,900)$
12-0321 Perqs (14) 12-0321 LTIP (86) 12-0321 Restricted Stock (675)
Total (2,675)$
Commonwealth Edison CompanyRemoval of Capitalized Costs Disallowed in ICC Dkt. No. 12-0321 - 2017 Actual
(In Thousands)
Description(A)
Docket No. 18-____ ComEd Ex. 2.03
Page 17 of 334

Schedule B-2.1Page 7 of 11
Witness: Tracy
Line TotalNo. Amount 2012 2013 2014 2015 2016 2017 Amount
(B) (C) (D) (E) (F) (G) (H) (I)
1 Gross Plant (1) (3,354)$ (3,354)$
2 Tax Rate 41.18% 41.18% 41.18% 40.04% 40.04% 40.61%
3 Total Book Accumulated Depreciation 2.31% 2.31% 2.45% 2.45% 2.45% 2.45%
4 Annual Book Depreciation 77$ 77$ 82$ 82$ 82$ 82$ 482
5 Net Book Value at 12-31-17 (2,872)$
6 Tax Depreciation Rate 3.75% 7.22% 6.68% 6.18% 5.71% 5.29%
7 Annual Tax Depr (Ln 1 * Ln 6) 126$ 242$ 224$ 207$ 192$ 177$
8 Deferred Taxes ((Ln 7 - Ln 4)*Ln 2) 20$ 68$ 58$ 50$ 44$ 39$ 279$
9 Amount to be Excluded from Rate Base (2,593)$
Note:(1) BSC AIP Related to Net Income (1,343)$
ComEd AIP Related to Net Income (52) Perqs and Awards 272 ComEd AIP Greater than 102.9% (1,972) Pension Assoc with Disallowed Incentive Costs (2) (29) Payroll Taxes Assoc with Disallowed Incentive Costs (2) (230)
Total (3,354)$
(2) Per Final Order in ICC Docket 13-0318, Appendix A
Description(A)
Commonwealth Edison CompanyRemoval of Capitalized Costs Disallowed in ICC Dkt. No. 13-0318 - 2017 Actual
(In Thousands)
Docket No. 18-____ ComEd Ex. 2.03
Page 18 of 334

Schedule B-2.1Page 8 of 11
Witness: Tracy
Line TotalNo. Amount 2013 2014 2015 2016 2017 Amount
(B) (C) (D) (E) (F) (G) (H)
1 Gross Plant (1) (4,505)$ (4,505)$
2 Tax Rate 41.18% 41.18% 40.04% 40.04% 40.61%
3 Total Book Accumulated Depreciation 2.31% 2.45% 2.45% 2.45% 2.45%
4 Annual Book Depreciation 104$ 110$ 110$ 110$ 110$ 544
5 Net Book Value at 12-31-17 (3,961)$
6 Tax Depreciation Rate 3.75% 7.22% 6.68% 6.18% 5.71%
7 Annual Tax Depr (Ln 1 * Ln 6) 169$ 325$ 301$ 278$ 257$
8 Deferred Taxes ((Ln 7 - Ln 4)*Ln 2) 27$ 89$ 76$ 67$ 60$ 319$
9 Amount to be Excluded from Rate Base (3,642)$
Note:(1) BSC AIP Related to Net Income (131)$
Perqs and Awards (132) ComEd AIP Greater than 102.9% (3,833) Pension Assoc with Disallowed Incentive Costs (2) (97) Payroll Taxes Assoc with Disallowed Incentive Costs (2) (312)
Total (4,505)$
(2) Per Final Order in 14-0312, Appendix A
Commonwealth Edison CompanyRemoval of Capitalized Costs Disallowed in ICC Dkt. No. 14-0312 2017 Actual
(In Thousands)
Description(A)
Docket No. 18-____ ComEd Ex. 2.03
Page 19 of 334

Schedule B-2.1Page 9 of 11
Witness: Tracy
Line TotalNo. Amount 2014 2015 2016 2017 Amount
(B) (C) (D) (E) (F) (G)
1 Gross Plant (1) (1,360)$ (1,360)$
2 Tax Rate 41.18% 40.04% 40.04% 40.61%
3 Total Book Accumulated Depreciation 2.45% 2.45% 2.45% 2.45%
4 Annual Book Depreciation 33$ 33$ 33$ 33$ 132
5 Net Book Value at 12-31-17 (1,228)$
6 Tax Depreciation Rate 3.75% 7.22% 6.68% 6.18%
7 Annual Tax Depr (Ln 1 * Ln 6) 51$ 98$ 91$ 84$
8 Deferred Taxes ((Ln 7 - Ln 4)*Ln 2) 7$ 26$ 23$ 21$ 77$
9 Amount to be Excluded from Rate Base (1,151)$
Note:(1) Perqs and Awards (2) (361)$
Payroll Taxes Assoc with Perqs and Awards (2) (28) Pcard Adjustments (2) (14) Pension Assoc with Previously Disallowed Incentive Costs (2) (178) Credit Card Expenditures (ICC Staff Ex. 6.0, Sch 6.03, Pg.2) (23) ComEd 401k Profit Sharing (See Final Order Appendix A) (756) Total
(1,360)$ (2) See Compliance Filing ICC Docket 15-0287, Work Paper 1
Commonwealth Edison CompanyRemoval of Capitalized Costs Disallowed in ICC Dkt. No. 15-0287 - 2017 Actual
(In Thousands)
Description(A)
Docket No. 18-____ ComEd Ex. 2.03
Page 20 of 334

Schedule B-2.1Page 10 of 11
Witness: Tracy
Line TotalNo. Amount 2015 2016 2017 Amount
(B) (C) (D) (E) (F)
1 Gross Plant (1) (8,645)$ (8,645)$
2 Tax Rate 40.04% 40.04% 40.61%
3 Total Book Accumulated Depreciation 2.45% 2.45% 2.45%
4 Annual Book Depreciation 212 212 212 636
5 Net Book Value at 12-31-17 (8,009)$
6 Tax Depreciation Rate 3.75% 7.22% 6.68%
7 Annual Tax Depr (Ln 1 * Ln 6) 324$ 624$ 577$
8 Deferred Taxes ((Ln 7 - Ln 4)*Ln 2) 45$ 165$ 148$ 358
9 Amount to be Excluded from Rate Base (7,651)$
Note:(1) Perqs and Awards 12$
Pcard Adjustments (37) Pension Assoc with Previously Disallowed Incentive Costs (90) OSHA AIP removal on Rehearing (5,777) DR RWB 8.01 agreed adjustments for Recognition (3) Removal of 2016 401K Profit Sharing Match (2,750)
Total (8,645)$
Commonwealth Edison CompanyRemoval of Capitalized Costs Disallowed in ICC Dkt. No. 16-0259 - 2017 Actual
(In Thousands)
Description(A)
Docket No. 18-____ ComEd Ex. 2.03
Page 21 of 334

Schedule B-2.1Page 11 of 11
Witness: Tracy
Line TotalNo. Amount 2016 2017 Amount
(B) (D) (E) (F)
1 Gross Plant (1) (209)$ (209)$
2 Tax Rate 40.04% 40.61%
3 Total Book Accumulated Depreciation 2.45% 2.45%
4 Annual Book Depreciation 5 5 10
5 Net Book Value at 12-31-17 (199)$
6 Tax Depreciation Rate 3.75% 7.22%
7 Annual Tax Depr (Ln 1 * Ln 6) 8$ 15$
8 Deferred Taxes ((Ln 7 - Ln 4)*Ln 2) 1$ 4$ 5
9 Amount to be Excluded from Rate Base (194)$
Note:(1) Perqs and Awards (24)$
Payroll Taxes Assoc with Perqs and Awards (1) Pcard Adjustments (67) Pension Assoc with Previously Disallowed Incentive Costs (103) Recognition Adjustments (14)
Total (209)$
Commonwealth Edison CompanyRemoval of Capitalized Costs Disallowed in ICC Dkt. No. 17-0196 - 2017 Actual
(In Thousands)
Description(A)
Docket No. 18-____ ComEd Ex. 2.03
Page 22 of 334

Schedule B-2.2Page 1 of 1
Commonwealth Edison CompanyRider EEPP Assets - 2017 Actual
(In Thousands)
Witness: Tracy
Line Switches Street LightNo. Amount (1) Amount Total ICC Acct
(B) (C) (D) (E)
1 Rider EEPP Assets2 Gross Cost (3,269)$ (1,726)$ (4,995)$ 1013 Accumulated Reserve 614 4 618 1084 Accumulated Deferred Income Taxes (ADIT) 771 24 795
5 Net Plant for Rider EEPP Assets 12/31/17 (1,884)$ (1,698)$ (3,582)$
6 Depreciation Expense (78)$ (4)$ (82)$ 403
Note:(1) Represents switches placed in service since June 2008 that were formally recovered through Rider EDA
and are now recovered through Rider EEPP.
Description(A)
Docket No. 18-____ ComEd Ex. 2.03
Page 23 of 334

Schedule B-2.3Page 1 of 2
Commonwealth Edison CompanyRemoval of Capitalized Purchase of Receivable Combined Billing Software (PORCB) - 2017 Actual
Witness: Tracy
Line JurisdictionalNo. Total (1) ICC Acct
(B) (C)
1 Removal of PORCB
2 Gross Plant (14,184)$ 101/106
3 Accumulated Depreciation 14,184 108
4 Deferred Income Taxes - 283
5 Reduction to Rate Base -$
6 Amortization Expense Reduction -$ 403
Note:(1) Details on page 2.
(In Thousands)
Description(A)
Docket No. 18-____ ComEd Ex. 2.03
Page 24 of 334

Schedule B-2.3Page 2 of 2
Commonwealth Edison CompanyRemoval of Purchase of Receivables - Combined Billing (PORCB) Software from Rate Base - 2017 Actual
(In Thousands)
Witness: Tracy
JurisdictionalLine Rate Base No. Calculation Adjustment
(B) (C)
1 Total In Service (16,505)$
2 Jurisdictional Allocator (1) 85.94%
3 Gross Plant (14,184)$ (14,184)$
4 Total Book Amortization 16,505$
5 Jurisdictional Allocator (1) 85.94%
6 Jurisdictional Amortization 12-31-2015 14,184$ 14,184$
7 Tax Depreciation Rate 100.00%
8 Tax Rate 40.61%
9 Annual Tax Depreciation (Line 3 * Line 7) 14,184$
10 Deferred Taxes ((Line 9 - Line 6) * Line 8) -$ -$
11 Reduction to Rate Base -$
12 Test Year Book Depreciation -$
(1) 100% of Jurisdictional PORCB costs are removed from the Distribution filing, per ICC Docket #14-0313.
Description(A)
Docket No. 18-____ ComEd Ex. 2.03
Page 25 of 334

LineNo. Description
FERCAccount
2017Actual Allocator (1) Jurisdictional
Payroll Tax % (2)
Payroll Tax Removed (2)
Total Removed
(A) (B) (C) (D) (E) (F) (G) (H) (I)
1 Normalization of Retention Awards (3):Inc/(Dec) to
Award Capital Portion2 Plant (See Schedule C-2.6) 107/108 (442)$ (133)$ 75.67% (101)$ 7.26% (7)$ (108)$
3 50% Reduction to Performance Awards (4):2017 Capital
Portion 50% Reduction4 Plant (See Schedule C-2.6) 107/108 477$ (239)$ 75.67% (181)$ 7.26% (13)$ (194)$
5 Cash Balance Pension Plan (CPBB) (5) Capital Portion6 Plant (See Schedule C-2.5) 107/108 (18)$ 75.67% (14)$ (14)$
7 Exelon Corporation Retirement Plan (ECRP) (6) Capital Portion8 Plant (See Schedule C-2.5) 107/108 (29)$ 75.67% (22)$ (22)$
9 Total Jurisdictional Rate Base Removed (338)$
10 Book Deprecation Rate 2.45%11 Change to Accum Depreciation in Rate Base (Line 11 * Line 12 * -1) 8$ 12 Tax Depreciation Rate (20 Years MACRS, Year 1 Rate) 3.75%13 Tax Depreciation (Line 11 * Line 14 * -1) 13$ 14 Change to Deferred Taxes in Rate Base ((Line 15 - Line 13) * 40.610%) 2
15 Change to Depreciation Expense (Line 13 * -1) (8)$
Notes:(1)(2) In compliance with the ICC's final Order in Docket 13-0318, ComEd has excluded recovery of payroll tax related to disallowed incentive
compensation. Calculation takes total jurisdictional incentive excluded multiplied by ComEd's payroll tax rate of 7.26%. No payroll taxes are associated with the Pension adjustment.
(3)(4)(5) Represents 2017 CBPP pension costs derived from previously excluded AIP in compliance with the ICC's final order in Docket 13-0318.(6) Represents 2017 ECRP pension costs derived from previously excluded AIP in compliance with the ICC's final order in Docket 13-0318.
Witness: Tracy
Allocation to jurisdictional based on 2017 Net Plant allocation factor (see WPA-5, Page 2).
Retention Awards are normalized over 4 years. Current year is increased/(decreased) based on 4 year average.Performance rewards are reduced to 50%. See Final Order in Docket 10-0467.
Schedule B-2.6Page 1 of 1
Commonwealth Edison CompanyRemoval of Incentive Compensation - Capital
2017 Actual(In Thousands)
Docket No. 18-____ ComEd Ex. 2.03
Page 26 of 334

Schedule B-2.7Page 1 of 1
Commonwealth Edison CompanySupply Administration Intangible Assets - 2017 Actual
(In Thousands)
Witness: Tracy
Line No. Amount Jurisdictional (2)
ICC Acct
(B) (C) (D)1 Adjustment to Intangible Plant (1)2 Plant in Service as of 12-31-2017 (3,769)$ (3,239)$ 1013 Accumulated Reserve as of 12-31-2017 3,769 3,239 1084 Accumulated Deferred Income Taxes (ADIT) - -
5 Net Plant Reduction -$ -$
6 2017 Amortization Expense Adjustment -$ -$
Notes:(1) Represents software assets recovered through Rider PE.(2) Unadjusted amount multiplied by the Wages and Salaries allocator 85.94%.
Description(A)
Docket No. 18-____ ComEd Ex. 2.03
Page 27 of 334

B-2.8Page 1 of 1
Commonwealth Edison CompanyAdjustment to Operating Reserve for Accrued Vacation Pay
2017 Actual(In Thousands)
Witness: Tracy
Line No. Description
Deferred Credit Amount
Deferred Debit Amount
(B) (C)
1 Year End Balance2 December Balance (38,729) 21,087
3 Wages & Salaries Allocator 85.94% 85.94%
4 DS Jurisdictional Reserve for Accrued Vacation (33,284)$ 18,122$
(A)
Docket No. 18-____ ComEd Ex. 2.03
Page 28 of 334

B-2.9Page 1 of 1
Commonwealth Edison CompanyAdjustment to Operating Reserve for Accrued Incentive Pay
2017 Actual(In Thousands)
Witness: Tracy
Line No. Description Amount
(B)
1 Year End Balance2 December Balance (95,473)$
3 Wages & Salaries Allocator 85.94%
4 DS Jurisdictional Reserve for Accrued Incentive Pay (82,049)$ 5 Less: Accrued Incentive in CWC Calculation (App 3) (24,143)
6 DS Jurisdictional Reserve for Accrued Incentive Pay - Adjustment (57,906)$
(A)
Docket No. 18-____ ComEd Ex. 2.03
Page 29 of 334

Schedule B-2.10Page 1 of 1
Witness: Tracy
Line 2017No. Amount Amount
(B) (C) (D)
1 Gross Plant (a) (64)$ (64)$
2 Tax Rate 40.61%
3 Total Book Accumulated Depreciation 2.45%
4 Annual Book Depreciation 2$ 2
5 Net Book Value at 12/31/17 (62)$
6 Tax Depreciation Rate 3.75%
7 Annual Tax Depr (Ln 1 * Ln 6) 2$
8 Deferred Taxes ((Ln 7 - Ln 4) * Ln 2) -$ -$
9 Amount to be Excluded from Rate Base (62)$
(a) Total amount of reduction :P Card (See WPC-1o) 83$ Recognition (See WPC-1o) 2Total Adjustment 85$ Net Plant Allocator 75.67%Net Adjustment 64$
Commonwealth Edison CompanyRemoval of Capitalized Pcard and Recognition Costs - 2017 Actual
(In Thousands)
Description(A)
Docket No. 18-____ ComEd Ex. 2.03
Page 30 of 334

Schedule B-3Page 1 of 2
Witness: Tracy
LineNo. Description 2017 2016 2015 2014
(A) (B) (C) (D) (E)
1 UTILITY PLANT:2 Utility Plant 30,071,793$ 28,371,338$ 26,394,810$ 24,755,142$ 3 Construction Work in Progress 517,229 566,896 571,693 275,9724 Total Utility Plant 30,589,022$ 28,938,234$ 26,966,503$ 25,031,114$ 5 Less: Accumulated Provision for Depreciation6 and Amortization 8,655,901 8,375,849 8,236,215 8,016,391 7 Net Utility Plant 21,933,121$ 20,562,385$ 18,730,288$ 17,014,723$
8 OTHER PROPERTY AND INVESTMENTS:9 Nonutility Property (net) 11,877$ 9,523$ 9,613$ 10,508$
10 Investments in Associated or Subsidiary Companies 68,768 64,991 62,002 58,899 11 Special Funds and Other Investments 77 62 79 149 12 Total Other Property and Investments 80,722$ 74,576$ 71,694$ 69,556$
13 CURRENT AND ACCRUED ASSETS:14 Cash and Temporary Cash Investments 67,372$ 48,927$ 54,858$ 57,650$ 15 Receivables (net) 587,510 871,104 1,037,005 904,458 16 Accounts and Notes Receivable from Associated Companies - - - 14,746 17 Materials and Supplies 151,996 158,158 163,510 125,239 18 Prepayments 12,101 15,494 20,685 23,803 19 Accrued Utility Revenues 242,232 219,167 218,272 203,661 20 Miscellaneous Current and Accrued Assets 55,085 29,002 41,671 16,237 21 Derivative Instrument Assets - Hedges - - - - 22 Total Current and Accrued Assets 1,116,296$ 1,341,852$ 1,536,001$ 1,345,794$
23 DEFERRED DEBITS:24 Unamortized Debt Expenses 53,160$ 47,187$ 39,660$ 33,726$ 25 Regulatory Assets 1,250,596 1,134,613 1,075,222 1,158,466 26 Miscellaneous Deferred Debits 3,955,828 3,838,987 3,987,633 4,360,695 27 Unamortized Loss on Reacquired Debt 27,765 31,574 36,022 41,438 28 Accumulated Deferred Income Taxes 262,462 557,637 442,246 457,034 29 Total Deferred Debits 5,549,811$ 5,609,998$ 5,580,783$ 6,051,359$
30 TOTAL ASSETS 28,679,950$ 27,588,811$ 25,918,766$ 24,481,432$
Note:(1) From FERC Form 1, Pages 110-113
Commonwealth Edison CompanyComparative Balance Sheets as of December 31, 2014 - 2017 (1)
(In Thousands)Assets
Docket No. 18-____ ComEd Ex. 2.03
Page 31 of 334

Schedule B-3Page 2 of 2
Witness: Tracy
LineNo. Description 2017 2016 2015 2014
(A) (B) (C) (D) (E)
1 PROPRIETARY CAPITAL:2 Common Stock 8,429,560$ 7,754,734$ 7,278,199$ 7,067,522$ 3 Retained Earnings 1,109,340 967,764 961,954 838,198 4 Subtotal 9,538,900$ 8,722,498$ 8,240,153$ 7,905,720$
5 Cumulative Preferred Stock - - - - 6 Total Proprietary Capital 9,538,900$ 8,722,498$ 8,240,153$ 7,905,720$
7 LONG-TERM DEBT:8 Bonds 7,528,600$ 6,953,600$ 6,418,600$ 5,828,600$ 9 Advances From Associated Companies 206,186 206,186 206,186 206,186
10 Other Long-Term Debt 140,000 140,000 140,000 140,000 11 Unamortized Premium/(Discount) On Long-Term Debt (22,933) (22,474) (19,886) (18,138) 12 Total Long-Term Debt 7,851,853$ 7,277,312$ 6,744,900$ 6,156,648$
13 OTHER NONCURRENT LIABILITIES:14 Obligations Under Capital Leases - Noncurrent 7,783$ 7,803$ 7,819$ 7,833$ 15 Accumulated Provision for Injuries and Damages 61,954 61,839 51,552 53,660 16 Accumulated Provision for Pensions and Benefits 262,016 282,305 302,418 307,099 17 Accumulated Misc. Operating Provisions 284,697 292,372 265,574 240,950 18 Asset Retirement Obligations 113,065 121,498 112,592 104,368 19 Total Other Noncurrent Liabilities 729,515$ 765,817$ 739,955$ 713,910$
20 CURRENT AND ACCRUED LIABILITIES:21 Notes Payables -$ -$ 294,415$ 304,000$ 22 Accounts Payable 532,946 609,484 627,803 565,778 23 Payables to Associated Companies 62,206 53,410 51,334 87,171 24 Customer Deposits 112,460 120,724 131,133 127,836 25 Accrued Interest & Taxes 164,400 674,572 505,225 160,028 26 Tax Collections Payable 33,546 34,378 30,640 32,307 27 Miscellaneous Current & Accrued Liabilities 235,070 355,589 252,175 223,906 28 Derivative Instrument Liabilities - - - - 29 Derivative Instrument Liabilities - Hedging - - - - 30 Total Current and Accrued Liabilities 1,140,628$ 1,848,157$ 1,892,725$ 1,501,026$
31 DEFERRED CREDITS:32 Customer Advances for Construction 133,091$ 117,007$ 111,191$ 92,822$ 33 Accumulated Deferred Investment Tax Credits 13,483 15,399 17,456 19,634 34 Other Deferred Credits 270,584 255,372 244,855 504,429 35 Other Regulatory Liabilities 5,232,176 2,374,092 2,279,502 2,432,992 36 Unamortized Gain on Reacquired Debt - - - - 37 Accumulated Deferred Income Taxes 3,769,720 6,213,157 5,648,029 5,154,251 38 Total Deferred Credits 9,419,054$ 8,975,027$ 8,301,033$ 8,204,128$
39 TOTAL LIABILITIES AND OTHER CREDITS 28,679,950$ 27,588,811$ 25,918,766$ 24,481,432$
Note:(1) From FERC Form 1, Pages 110-113
Commonwealth Edison CompanyComparative Balance Sheets as of December 31, 2014 - 2017 (1)
(In Thousands)Capital and Liabilities
Docket No. 18-____ ComEd Ex. 2.03
Page 32 of 334

Schedule B-4 Page 1 of 2
Witness: Tracy
Unadjusted Adjusted JurisdictionalLine Account Balance at Balance at Non- Balance atNo. Account Description Number Dec. 31, 2017 (1) Adjustments Dec. 31, 2017 Jurisdictional Dec. 31, 2017
(A) (B) (C) (D) (E) (F) (G)1 Intangible Plant2 Organization 301 80$ -$ 80$ (11)$ (2) 69$ 3 Miscellaneous Intangible Plant 303 714,363 - 714,363 (68,402) (2) 645,961 4 Total Intangible Plant 714,444$ -$ 714,443$ (68,413)$ 646,030$
5 Transmission Plant6 Land and Land Rights 350 181,859$ -$ 181,859$ (181,859)$ -$ 7 Structures and Improvements 352 487,133 - 487,133 (487,133) - 8 Station Equipment 353 2,402,302 - 2,402,302 (2,402,302) - 9 Towers and Fixtures 354 263,301 - 263,301 (263,301) -
10 Poles and Fixtures 355 748,559 - 748,559 (748,559) - 11 Overhead Conductors and Devices 356 581,042 - 581,042 (581,042) - 12 Underground Conduit 357 222,135 - 222,135 (222,135) - 13 Underground Conductors and Devices 358 530,913 - 530,913 (530,913) - 14 Roads & Trails 359 587 - 587 (587) - 15 Asset Retirement Costs for Transmission Plant 359.1 1,821 (1,821) (3) - - - 16 Total Transmission Plant 5,419,652$ (1,821)$ 5,417,831$ (5,417,831)$ -$
17 Distribution Plant18 Land and Land Rights 360 74,932$ -$ 74,932$ -$ 74,932$ 19 Structures and Improvements 361 542,581 - 542,581 - 542,581 20 Station Equipment 362 2,968,844 - 2,968,844 - 2,968,844 21 Storage Battery Equipment 363 2 - 2 - 2 22 Poles, Towers and Fixtures 364 1,912,168 - 1,912,168 - 1,912,168 23 Overhead Conductors and Devices 365 2,873,144 - 2,873,144 - 2,873,144 24 Underground Conduit 366 919,937 - 919,937 - 919,937 25 Underground Conductors and Devices 367 5,991,856 - 5,991,856 - 5,991,856 26 Line Transformers 368 1,395,740 - 1,395,740 - 1,395,740 27 Services 369 1,314,362 - 1,314,362 - 1,314,362 28 Meters 370 711,325 - 711,325 - 711,325 29 Installations on Customer Premises 371 64,687 - 64,687 - 64,687 30 Leased Property on Customer Premises 372 1,301 - 1,301 - 1,301 31 Street Lighting and Signal Systems 373 146,039 - 146,039 - 146,039 32 Asset Retirement Costs for Distribution Plant 374 22,424 (22,424) (3) - - - 33 Total Distribution Plant 18,939,342$ (22,424)$ 18,916,918$ -$ 18,916,918$
Commonwealth Edison CompanyElectric Plant in Service
Summary of Adjustments for 2017(In Thousands)
Docket No. 18-____ ComEd Ex. 2.03
Page 33 of 334

Schedule B-4 Page 2 of 2
Witness: Tracy
Unadjusted Adjusted JurisdictionalLine Account Balance at Balance at Non- Balance atNo. Account Description Number Dec. 31, 2017 (1) Adjustments Dec. 31, 2017 Jurisdictional Dec. 31, 2017
(A) (B) (C) (D) (E) (F) (G)34 General Plant35 Land and Land Rights 389 37,083$ -$ 37,083$ (4,902)$ (4) 32,181$ 36 Structures and Improvements 390 554,885 - 554,885 (73,612) (5) 481,273 37 Office Furniture and Equipment 391 116,073 - 116,073 (16,320) (4) 99,753 38 Transportation Equipment 392 347,687 - 347,687 (28,857) (4) 318,829 39 Stores Equipment 393 6,653 - 6,653 (935) (4) 5,718 40 Tools, Shop and Garage Equipment 394 201,359 - 201,359 (44,822) (4) 156,537 41 Laboratory Equipment 395 2,791 - 2,791 (621) (4) 2,170 42 Power Operated Equipment 396 10,789 - 10,789 (2,402) (4) 8,387 43 Communication Equipment 397 891,053 - 891,053 (322,650) (4) 568,403 44 Miscellaneous Equipment 398 11,224 - 11,224 (1,578) (4) 9,646 45 Other Tangible Property 399 - - - - - 46 Asset Retirement Costs for General Plant 399.1 6,803 (6,803) (3) - - - 47 Total General Plant 2,186,399$ (6,803)$ 2,179,597$ (496,699)$ 1,682,897$
48 Total Electric Plant in Service 27,259,835$ (31,048)$ 27,228,789$ (5,982,943)$ 21,245,845$ (6)
Notes:(1) From 2017 FERC Form 1, Pages 204-207.(2) WPB-1 allocates General and Intangible Plant to the functional classes Transmission, Distribution, and Customer. (3) To exclude Asset Retirement Costs.(4) WPB-1, Page 3 allocates Depreciable General Plant to functional classes.(5) Account 390 includes Depreciable General Plant (WPB-1, Page 3) and Amortizable General Plant (WPB-1, Page 5).
Non-jurisdictional Account 390 Plant is the sum of WPB-1, Page 3, Line 2, Column C ($72,034) plus Page 5, Line 5, Column B ($1,578).(6) Schedule B-1 RY, Page 1, Line 4, Column B.
(In Thousands)
Commonwealth Edison CompanyElectric Plant in Service
Summary of Adjustments for 2017
Docket No. 18-____ ComEd Ex. 2.03
Page 34 of 334

Schedule B-5Page 1 of 1
Commonwealth Edison CompanyElectric Plant in Service
Gross Additions, Retirements and Transfers(In Thousands)
LineNo. Description Transmission Distribution General Intangible
(A) (B) (C) (D) (E)
1 2014 (1)2 Beginning Balance - 1/01/2014 3,618,232$ 14,749,680$ 1,619,757$ 447,436$ 3 Gross Additions in Year 592,902 967,798 179,126 77,289 4 Retirements in Year (19,716) (212,440) (90,299) (4,413) 5 Transfers & Adjustments in Year (2) 45 3,538 (34) (214) 6 Ending Balance - 12/31/2014 4,191,463$ 15,508,576$ 1,708,550$ 520,098$ 7 Asset Retirement Costs (ARC) (2,043) (12,331) (4,280) - 8 Ending Balance (net ARC&SAC) - 12/31/2014 4,189,420$ 15,496,245$ 1,704,270$ 520,098$
9 2015 (1)10 Beginning Balance - 1/01/2015 4,191,463$ 15,508,576$ 1,708,550$ 520,098$ 11 Gross Additions in Year 353,477 1,304,735 206,999 86,129 12 Retirements in Year (7,405) (244,634) (48,157) (31,011) 13 Transfers & Adjustments in Year (3) (1,070) 10,927 9,434 - 14 Ending Balance - 12/31/2015 4,536,465$ 16,579,604$ 1,876,826$ 575,216$ 15 Asset Retirement Costs (ARC) (1,761) (21,090) (3,940) - 16 Ending Balance (net ARC&SAC) - 12/31/2015 4,534,704$ 16,558,514$ 1,872,886$ 575,216$
17 2016 (1)18 Beginning Balance - 1/01/2016 4,536,465$ 16,579,604$ 1,876,826$ 575,216$ 19 Gross Additions in Year 532,117 1,551,281 238,045 103,283 20 Retirements in Year (57,186) (288,385) (62,904) (48,629) 21 Transfers & Adjustments in Year (4) (5,521) 1,960 9,296 (195) 22 Ending Balance - 12/31/2016 5,005,875$ 17,844,460$ 2,061,263$ 629,675$ 23 Asset Retirement Costs (ARC) (1,368) (22,884) (7,142) - 24 Ending Balance (net ARC&SAC) - 12/31/2016 5,004,507$ 17,821,576$ 2,054,121$ 629,675$
25 2017 (1)26 Beginning Balance - 1/01/2017 5,005,875$ 17,844,460$ 2,061,263$ 629,675$ 27 Gross Additions in Year 411,459 1,369,475 200,118 86,503 28 Retirements in Year (26,240) (270,128) (72,557) (1,734) 29 Transfers & Adjustments in Year (5) 28,558 (4,465) (2,424) - 30 Ending Balance - 12/31/2017 5,419,652$ 18,939,342$ 2,186,400$ 714,444$ 31 Asset Retirement Costs (ARC) (1,821) (22,424) (6,803) - 32 Ending Balance (net ARC&SAC) - 12/31/2017 5,417,831$ 18,916,918$ 2,179,597$ 714,444$
Notes:(1) Source: Annual FERC Form 1, Pages 204-207.(2) 2014 Transfers & Adjustments Includes the plant in-service adjustments resulting from periodic review of, and changes to, the Company's asset retirement obligations for $2,524, intercompany transfer for ($214), transfer from account 105 for $2,338, and transfers to account 121 for ($1,313).(3) 2015 Transfers & Adjustments Includes the plant in-service adjustments resulting from periodic review of, and changes to, the Company's asset retirement obligations for $8,839, intercompany transfer for ($101), transfer from account 105 for $9,984, and transfers from account 121 for $568.(4) 2016 Transfers & Adjustments Includes the plant in-service adjustments resulting from periodic review of, and changes to, the Company's asset retirement obligations for $5,339, intercompany transfer for ($227), transfer from account 105 for $642, and transfers from account 121 for ($213).(5) 2017 Transfers & Adjustments Includes the plant in-service adjustments resulting from periodic review of, and changes to, the Company's asset retirement obligations for $203, transfers from account 105 for $24,342, and transfers from account 121 for ($2,876).
Witness: Tracy
Docket No. 18-____ ComEd Ex. 2.03
Page 35 of 334

Schedule B-5.1Page 1 of 1
Commonwealth Edison CompanyGains and Losses On Sales of Property
2017 Actuals
Witness: Tracy
LineNo.
1 There was no real property sold in 2017 where the original cost of the property
2 sold exceeded 0.1% of total Gross Plant in Service as shown for the test year
3 on Schedule B-1, Jurisdictional Rate Base Summary.
Note:Gross Plant in Service per FERC Form 1, Page 204-207 27,259,836,807
0.10%27,259,837
Description(A)
Docket No. 18-____ ComEd Ex. 2.03
Page 36 of 334

Schedule B-5.2Page 1 of 1
Witness: Tracy
LineNo.
1 There was no property either merged or acquired from other utilities by ComEd in 2017.
Description(A)
Commonwealth Edison CompanyProperty Merged Or Acquired From Other Utilities
2017 Actual
Docket No. 18-____ ComEd Ex. 2.03
Page 37 of 334

Schedule B-5.3Page 1 of 1
Commonwealth Edison CompanyLeased Property Included in Jurisdictional Rate Base
Witness: Tracy
LineNo.
1 In 2017 ComEd did have the Willis Tower capital lease however it
2 was not included in jurisdictional rate base.
Description(A)
Docket No. 18-____ ComEd Ex. 2.03
Page 38 of 334

Schedule B-6Page 1 of 1
Commonwealth Edison CompanyDepreciation Reserve By Plant Function
(In Thousands)
Witness: Tracy
LineNo. Description Transmission Distribution General
(A) (B) (C) (D)
1 2014 (1)2 Beginning Balance - 1/1/2014 (1,026,310)$ (5,583,155)$ (647,356)$ 3 Depreciation Expense (82,443) (373,904) (85,503) 4 Retirements 19,716 212,440 85,858 5 Other Transfers & Adjustments (2) 24,389 8,515 (15,537)6 Ending Balance - 12/31/2014 (1,064,648)$ (5,736,104)$ (662,538)$ 7 ARC Depreciation Reserve 1,454 11,259 3,047 8 Ending Balance (net ARC) - 12/31/2014 (1,063,194) (5,724,845) (659,491)
9 2015 (1)10 Beginning Balance - 1/1/2015 (1,064,648)$ (5,736,104)$ (662,538)$ 11 Depreciation Expense (89,685) (398,921) (90,371) 12 Retirements 7,405 244,634 48,157 13 Other Transfers & Adjustments (3) 40,789 53,198 (15,631)14 Ending Balance - 12/31/2015 (1,106,139)$ (5,837,193)$ (720,383)$ 15 ARC Depreciation Reserve 1,309 6,759 2,782 16 Ending Balance (net ARC) - 12/31/2015 (1,104,830) (5,830,434) (717,601)
9 2016 (1)10 Beginning Balance - 1/1/2016 (1,106,139)$ (5,837,193)$ (720,383)$ 11 Depreciation Expense (98,364) (444,270) (100,819) 12 Retirements 57,186 288,385 61,393 13 Other Transfers & Adjustments (4) 43,871 86,276 (22,863)14 Ending Balance - 12/31/2016 (1,103,446)$ (5,906,802)$ (782,672)$ 15 ARC Depreciation Reserve 945 7,832 4,341 16 Ending Balance (net ARC) - 12/31/2016 (1,102,501) (5,898,970) (778,331)
17 2017 (1)18 Beginning Balance - 1/1/2017 (1,103,446)$ (5,906,802)$ (782,672)$ 19 Depreciation Expense (110,489) (484,673) (107,530) 20 Retirements 26,239 270,129 72,557 21 Other Transfers & Adjustments (5) 34,831 105,209 (23,240)22 Ending Balance - 12/31/2017 (1,152,865)$ (6,016,137)$ (840,885)$ 23 ARC Depreciation Reserve 607 8,433 5,019 24 Ending Balance (net ARC) - 12/31/2017 (1,152,258) (6,007,704) (835,866)
Notes:(1) Ending Balances from Current Year FERC Form 1, Page 219, Lines 25-28. Beginning Balances from Previous Year Ending Balances.(2) 2014 B-6 Page 1- Other Transfers & Adjustments Total Represents removal reserve of $113,370, salvage proceeds of ($16,500), transportation expense of ($15,514), asset retirement cost activity of ($3,861), an adjustment for accelerated depreciation on the non-AMI meters as a result of the deployment plan approved in the ICC Docket 12-0298 as amended in ICC Dockets 13-0285 and 14-0212 of ($59,820), reserve transfers into G of ($289), and loss on the charitable donation of vehicles of ($19).(3) 2015 B-6 Page 1- Other Transfers & Adjustments Total Represents removal reserve of $172,623, salvage proceeds of ($17,316), transportation expense of ($17,043), asset retirement cost activity of $2,947, an adjustment for accelerated depreciation on the non-AMI meters as a result of the deployment plan approved in the ICC Docket 12-0298 as amended in ICC Dockets 13-0285 and 14-0212 of ($62,373), reserve transfers into General Plant of ($561), and reserve transfers due to fleet sales to an affiliate of $79(4) 2016 B-6 Page 1- Other Transfers & Adjustments Total Represents removal reserve of $187,324, salvage proceeds of ($12,870), transportation expense of ($18,310), asset retirement cost activity of ($1,468), an adjustment for accelerated depreciation on the non-AMI meters as a result of the deployment plan approved in the ICC Docket 12-0298 as amended in ICC Dockets 13-0285 and 14-0212 of ($42,790), AMI Meter A-Abase adjustment of $1,228, reserve transfers due to fleet sales to an affiliate of $33, and the transfer of reserve due to the purchase of a leased building of ($5,863) (5) 2017 B-6 Page 1- Other Transfers & Adjustments Total Represents removal reserve of $172,296, salvage proceeds of ($12,649), transportation expense of ($19,376), asset retirement cost activity of ($966), an adjustment for accelerated depreciation on the non-AMI meters as a result of the deployment plan approved in the ICC Docket 12-0298 as amended in ICC Dockets 13-0285 and 14-0212 of ($12,983), the transfer of reserve due to the purchase of a leased building of of ($9,297), and refunctionalization transfers and depreciation expense adjustments of ($225).
Docket No. 18-____ ComEd Ex. 2.03
Page 39 of 334

Schedule B-7Page 1 of 1
Commonwealth Edison CompanyConstruction Work in Progress
As of December 31, 2017(In Thousands)
Witness: Tracy
Line Jurisdictional No. CWIP Balance
(B)
1 Actual balance of Distribution Plant-Related2 Construction Work in Progress (CWIP) upon3 which AFUDC has not been capitalized 22,442$
Description(A)
Docket No. 18-____ ComEd Ex. 2.03
Page 40 of 334

Schedule B-7.1Page 1 of 1
Witness: Tracy
LineNo.
1 There were no distribution construction projects on Schedule B-7 that
2 exceeded 5% of the total construction work in progress balance at
3 December 31, 2017. See WPB-7, Page 10.
Description(A)
Commonwealth Edison CompanyConstruction Work in Progress Percent Complete
Docket No. 18-____ ComEd Ex. 2.03
Page 41 of 334

Schedule B-7.2Page 1 of 1
Witness: Tracy
LineNo. Description Jan - March April - June July - Sept Oct - Dec 2017 2016 2015 2014
(A) (B) (C) (D) (E) (F) (G) (H) (I)
1 AFUDC Generated (1)2 Borrowed Funds 1,567$ 1,597$ 1,838$ 2,707$ 7,709$ 8,243$ 4,050$ 2,274$ 3 Other Funds 2,328$ 1,600$ 2,124$ 6,078$ 12,130$ 13,718$ 5,171$ 2,461$
4 AFUDC Transferred To Plant In Service5 Borrowed Funds 1,035$ 1,703$ 898$ 2,807$ 6,443$ 7,628$ 2,549$ 5,043$ 6 Other Funds 1,858$ 2,592$ 1,251$ 4,544$ 10,244$ 11,525$ 2,896$ 8,773$
7 AFUDC Rate (2)8 Borrowed Funds 1.65% 1.60% 1.80% 2.10% 2.10% (3) 2.04% (3) 1.26% (3) 0.42% (3)9 Other Funds 2.46% 1.61% 2.08% 4.69% 4.69% (3) 4.42% (3) 2.08% (3) 0.00% (3)
10 AFUDC Policy:11 Starting in May 2006, the ComEd AFUDC rate is computed quarterly with the new AFUDC rate12 being applied the first month of each quarter (e.g., July, October, etc.). In determining the AFUDC rate for the new/current13 quarter, the balances reflect the long-term debt, preferred stock and common equity at the end of the prior quarter, the 14 estimated short-term debt and construction work in progress reflect the estimated average balance for the new/current quarter.15 The common equity cost rate is the rate granted in the most recent proceeding before the ICC.
Notes:(1) From ICC Form 21, Page 7b.(2) From ICC Form 21, Pages 44b and 44c.(3) The percentages for the year are the fourth quarter rates, not an annual weighted average.
2017
Commonwealth Edison CompanyAllowance For Funds Used During Construction
(In Thousands)
Docket No. 18-____ ComEd Ex. 2.03
Page 42 of 334

Schedule B-8 RYPage 1 of 1
Witness: Tracy
CWCLine CWC Factor RequirementNo. Item Amount Lag (Lead) (C) / 365 (B) x (D) Column (B) Source
(A) (B) (C) (D) (E) (F)
1 Receipts 1,280,025$ 51.33 0.14063 180,010$ WPB-8, Line 9, Column B2 Collection of Pass-Through Taxes:3 Energy Assistance/Renewable Energy 47,624 0.00 0.00000 - Schedule C-18, Page 1, Lines 3 and 4, Column B4 Gross Receipts/Municipal Utility Tax 256,528 0.00 0.00000 - Schedule C-18, Page 1, Line 19, Column B5 Illinois Excise Tax 249,578 36.12 0.09896 24,698 Schedule C-18, Page 1, Line 20, Column B6 Infrastructure Maintenance Fee 88,065 36.12 0.09896 8,715 Schedule C-18, Page 1, Line 2, Column B7 Total Receipts 1,921,820$ 213,423$
8 Base Payroll and Withholdings 267,616$ (15.17) (0.04156) (11,123)$ WPB-8, Line 31, Column B9 Vacation Pay Expense - (15.17) (0.04156) -
10 Incentive Compensation Expense 37,419 (235.50) (0.64521) (24,143) WPB-8, Line 32, Column B11 Employee Benefits - Pension and OPEB 73,047 0.00 0.00000 - WPB-8, Line 17, Column B12 Employee Benefits - Other 55,497 (4.20) (0.01151) (639) WPB-8, Line 18, Column B13 Inter Company Billings - Less Pass Thrus 190,913 (45.16) (0.12373) (23,621) WPB-8, Line 15, Column B14 Inter Company Billings - Pass Thrus 32,558 (45.16) (0.12373) (4,028) WPB-8, Line 16, Column B15 Property Leases 24,976 (23.74) (0.06504) (1,624) WPB-8, Line 24, Column B16 Other O&M Expense 341,141 (75.05) (0.20562) (70,144) WPB-8, Line 25, Column B17 Property/Real Estate Taxes 16,480 (336.74) (0.92258) (15,204) Schedule C-18, Page 1, Line 5, Column D18 FICA Contributions 20,743 (15.17) (0.04156) (862) Schedule C-18, Page 1, Line 8 and 16, Column D19 Federal Unemployment Tax 186 (76.50) (0.20959) (39) "20 State Unemployment Tax 388 (76.50) (0.20959) (81) "21 Electricity Distribution Tax 104,419 (30.25) (0.08288) (8,654) Schedule C-18, Page 1, Line 6, Column D22 State Franchise Tax 1,991 (193.01) (0.52879) (1,053) Schedule C-18, Page 1, Line 11, Column D23 State Public Utility Fund - 0.00 0.00000 - Schedule C-18, Page 1, Line 7, Column D24 Illinois Sales and Use Tax 580 (3.28) (0.00899) (5) Schedule C-18, Page 1, Line 9, Column D25 Chicago Sales and Use Tax (91) (229.00) (0.62740) 57 Schedule C-18, Page 1, Lines 10, 12 Column D26 Interest Expense 231,157 (91.25) (0.25000) (57,789) Schedule C-5.427 Current State Income Tax (25,146) (38.00) (0.10411) 2,618 WP 3, Page 528 Current Federal Income Tax (93,184) (38.00) (0.10411) 9,701 WP 3, Page 529 Payment of Pass-Through Taxes:30 Energy Assistance/Renewable Energy 47,624 12.62 0.03458 1,647 From line 3 above31 Gross Receipts/Municipal Utility Tax 256,528 2.23 0.00611 1,567 From line 4 above32 Illinois Excise Tax 249,578 14.27 0.03910 9,757 From line 5 above33 Infrastructure Maintenance Fee 88,065 (11.00) (0.03014) (2,654) From line 6 above34 Other Outlays (666) (46.96) (0.12866) 86 Formula WP 3 Page 435 Total Outlays 1,921,819$ (196,230)$
36 Receipts Less Outlays 1$
37 Total Cash Working Capital Requirement to Schedule B-1 17,193$
Commonwealth Edison CompanyCash Working CapitalCalendar Year 2017
(In Thousands)
Docket No. 18-____ ComEd Ex. 2.03
Page 43 of 334

Schedule B-8.1Page 1 of 2
Commonwealth Edison CompanyJurisdictional Materials & Supplies Inventory Balance
and associated Accounts Payable as of December 31, 2017(In Thousands)
Witness: Tracy
LineNo. Description Total Company
(A) (B)
Calculation of Estimated Jurisdictional Accounts Payable Balance Related to Materials And Supplies Inventory
1 Year End Material and Supplies Inventory Balance - From 2017 FERC Form 1, page 2272 Transmission Plant (Estimated) 57,906$ 3 Distribution Plant (Estimated) 94,090
4 Total Account 154 151,996$
5 Distribution Plant Inventory as a Percent of Total Inventory 61.90%
6 Accounts Payable associated with materials and supplies at December 31 (31,253)$ (1)
7 Jurisdictional Accounts Payable associated with materials and supplies8 at December 31 (Line 5 * Line 6) (19,346)$
9 Jurisdictional Materials Balance Less Accounts Payable (Line 3 plus Line 8) 74,744$
Note:(1) Calculated by taking the O&M expense lead from CWC study, divided by 365, and multiplied by
the year end inventory balance. For 2017: (75.05/365) * $151,996 = $(31,253)
Docket No. 18-____ ComEd Ex. 2.03
Page 44 of 334

Schedule B-8.1Page 2 of 2
Witness: Tracy
Line No. Month Ended 2017 2016 2015 2014
(A) (B) (C) (D) (E)
1 January 159,353$ 158,212$ 128,699$ 108,374$ 2 February 156,668 159,628 128,429 106,331 3 March 153,850 157,674 136,625 107,517 4 April 152,899 152,372 135,708 109,189 5 May 152,602 146,453 137,716 108,479 6 June 159,230 154,276 145,142 112,605 7 July 160,524 149,955 146,439 113,480 8 August 154,293 143,072 145,115 113,961 9 September 152,212 153,843 149,035 119,053
10 October 147,667 156,946 151,533 119,257 11 November 145,650 152,499 154,720 113,664 12 December 151,996 158,158 163,510 125,239
13 Accounts payable associated with materials and supplies at December 31
$ (31,253) (1) $ (32,520) (1) $ (39,121) (1) $ (29,965) (1)
Notes: (1) Calculated by taking the O&M expense lead from CWC study, divided by 365, and multiplied by the year end inventory balance. For 2017: (75.05/365) * $151,996 = $(31,253) For 2016: (75.05/365) * $158,158 = $(32,520) For 2015: (87.33/365) * $163,510 = $(39,121) For 2014: (87.33/365) * $125,239 = $(29,965)
Commonwealth Edison Company Materials and Supplies
Balances at Month End for 2014 - 2017(In Thousands)
Docket No. 18-____ ComEd Ex. 2.03
Page 45 of 334

Sch B-9Page 1 of 2
Commonwealth Edison CompanyAccumulated Deferred Income Taxes
Actual 2017(In Thousands)
LineNo. Account / Item - Debit / (Credit) Balance Federal State Total Allocator Percentage
Total= (D) * (F)
(A) (B) (C) (D) (E) (F) (G)
Summary
1 Total ADIT - Jurisdictional Excluding the Pension Asset (Page 3, Line 110) (4,356,536)$ 2 ADIT Associated with Pension Asset (353,664)$
3 Account 190 - (EPS Accts. 283150 & 283250 & 283350 & 283450) --
4 Accrued Holiday (714)$ (174)$ (888)$ Wages & Salaries 85.94% (763)$ 5 Accrued Vacation 10,378 2,121 12,499 Wages & Salaries 85.94% 10,742 6 Accrued Legal 16 1 17 Wages & Salaries 85.94% 15 7 Charitable Contributions 2,963 1,481 4,444 Non-DST 0.00% - 8 Obsolete Materials 1,865 484 2,349 Net Plant 75.67% 1,777 9 Provision for Bad Debt 18,663 5,997 24,660 Revenue Alloc 58.20% 14,352 10 Damage to Company Property 980 237 1,217 Net Plant 75.67% 921 11 Taxes Other than Income Taxes 66 20 86 Net Plant 75.67% 65 12 Incentive Compensation Plan 34,895 8,527 43,422 Wages & Salaries 85.94% 37,317 13 Liability for Severance Plans 728 179 907 Wages & Salaries 85.94% 779 14 CPS Energy Efficiency Fund 529 264 793 Non-DST 0.00% - 15 Other Accrued Expenses 118 59 177 Non-DST 0.00% - 16 Other Current 4,709 1,213 5,922 Wages & Salaries 85.94% 5,089 17 Partnerships 482 241 723 Non-DST 0.00% - 18 Deferred Rental Expense 568 108 676 Wages & Salaries 85.94% 581 19 Environmental Cleanup Costs - Non-MGP (Mfg Gas Plants) 502 108 610 DST 100.00% 610 20 Executive Uninsured Death Benefits after Retirement 818 192 1,010 Wages & Salaries 85.94% 868 21 Deferred on Unamoritzed ITC 7,260 2,186 9,446 Non-DST 0.00% - 22 Federal NOL-Depreciation 43,643 - 43,643 Net Plant 75.67% 33,025 23 Federal NOL DTA-Exclusion 6,416 - 6,416 Non-DST 0.00% - 24 Incentive Compensation Deferred Stock Bonus Plan 204 88 292 Non-DST 0.00% - 25 Stock Options; Other Equity Based Compensation 3,232 1,365 4,597 Non-DST 0.00% - 26 Workers Compensation and Public Claims Reserve 19,985 4,754 24,739 Wages & Salaries 85.94% 21,261 27 Long-Term Debt - Revaluation of Discount (78) (34) (112) Non-DST 0.00% - 28 Management Deferred Compensation Plan 10,965 2,565 13,530 Wages & Salaries 85.94% 11,628 29 Manufactured Gas Plants - Provision 54,215 25,752 79,967 Non-DST 0.00% - 30 Merger Costs (400) (194) (594) Non-DST 0.00% - 31 Post Retirement Health Care Liability 68,395 14,994 83,389 Wages & Salaries 85.94% 71,665 32 Revenue Subject to Refund - - - Non-DST 0.00% - 33 Supplemental Employee Retirement Plan 2,361 657 3,018 Non-DST 0.00% - 34 Long-Term Incentive - Cash (2,558) (846) (3,404) Wages & Salaries 85.94% (2,925) 35 Midwest Generation Settlement Asset 1,020 510 1,530 Non-DST 0.00% - 36 Interest on Projected Tax Settlements (715) (357) (1,072) Non-DST 0.00% - 37 Use Tax Adjustment (116) (29) (145) Net Plant 75.67% (110) 38 Regulatory (Asset)/Liab: Docket No 07-0566 (3) 10 7 DST 100.00% 7 39 Regulatory (Asset)/ Liab: Transmission (1,138) (569) (1,707) Non-DST 0.00% - 40 Regulatory (Asset)/Liab: 2011 IL State Tax Rate Change (1,987) 4,197 2,210 Non-DST 0.00% - 41 Alt Fuels Tax Credit CF 303 - 303 Net Plant 75.67% 229 42 R&D Credit CF 579 - 579 Wages & Salaries 85.94% 498 43 2017 IL Rate Change - 190 (3,051) 8,716 5,665 Non-DST 0.00% - 44 2017 IL Rate Change - 190 Gross Up 3,049 915 3,964 Non-DST 0.00% - 45 2017 Fed Rate Change - 190 (80,377) - (80,377) Non-DST 0.00% - 46 2017 Fed Rate Change - 190 Gross Up (25,187) (6,859) (32,046) Non-DST 0.00% -
47 Total Account 190 (FERC Form 1, Page 111, Line 82) 183,583$ 78,879$ 262,462$ 207,630$
48 Account 282 - Liberalized Deprec. - Plant & Equip. Accts 282000 & 282200
49 Total Account 282 - Liberalized Depreciation (3,661,634)$ (494,668)$ (4,156,302)$ Net Plant 75.67% (3,145,074)$
50 Account 282 - Other Property (Accts. 282100 & 282300) --
51 Competitive Transition Charge (CTC) (39,995)$ (8,046)$ (48,041)$ Non-DST 0.00% -$ 52 AFUDC Plant & Equip Borrowed (21,749) (5,284) (27,033) Net Plant 75.67% (20,456) 53 Deferred Gain - Like Kind Exchange - (60,499) (60,499) Non-DST 0.00% - 54 FIN 47 287 38 325 Net Plant 75.67% 246 55 Section 263A - Capitalized Interest 79,252 18,422 97,674 Net Plant 75.67% 73,910 56 Software Costs Capitalized - Rev Bk (90,549) (21,733) (112,282) Net Plant 75.67% (84,964) 57 Capitalized Interest / Overhead Capitalized (209,268) (47,585) (256,853) Net Plant 75.67% (194,361) 58 Pension Cost Capitalized on Books 106,847 23,481 130,328 Net Plant 75.67% 98,619 59 CIAC 123,859 25,995 149,854 Net Plant 75.67% 113,395 60 CIAC with Tax Gross Up 46,486 13,468 59,954 Non-DST 0.00% - 61 Revaluation of Property 999 547 1,546 Non-DST 0.00% - 62 Real Estate Taxes Capitalized 8 2 10 Net Plant 75.67% 8 63 Repair Allowance (32,144) (6,643) (38,787) Net Plant 75.67% (29,350) 64 Repairs - Distribution (938,474) (227,960) (1,166,434) DST 100.00% (1,166,434) 65 Repairs - Transmission (91,196) (21,837) (113,033) Non-DST 0.00% - 66 Transmission Upgrade - East/West (1,085) 1,378 293 Non-DST 0.00% - 67 Regulatory (Asset)/Liab: ASC 740 - Tax Rate Changes 40,509 (115,740) (75,231) Non-DST 0.00% - 68 2017 IL Rate Change - 282 76,896 (219,703) (142,807) Non-DST 0.00% - 69 2017 IL Rate Change - 282 Gross Up (76,850) (23,069) (99,919) Non-DST 0.00% -
Witness: Tracy
Docket No. 18-____ ComEd Ex. 2.03
Page 46 of 334

Sch B-9Page 2 of 2
Commonwealth Edison CompanyAccumulated Deferred Income Taxes
Actual 2017(In Thousands)
LineNo. Account / Item - Debit / (Credit) Balance Federal State Total Allocator Percentage
Total= (D) * (F)
(A) (B) (C) (D) (E) (F) (G)
Witness: Tracy
70 2017 Fed Rate Change - 282 1,840,936 - 1,840,936 Non-DST 0.00% - 71 2017 Fed Rate Change - 282 Gross Up 499,028 250,551 749,579 Non-DST 0.00% - 72 Total Account 282 - Other Property 1,313,797$ (424,217)$ 889,580$ (1,209,387)$
73 Total Account 282 (FERC Form 1, Page 113, Line 63) (2,347,837)$ (918,885)$ (3,266,722)$ (4,354,461)$
74 Account 283 - Other - (Accts. 283100 & 283200 & 283300 & 283400) --
75 Chicago Arbitration Settlement (1,966)$ (983)$ (2,949)$ Non-DST 0.00% -$ 76 Accrued Benefits 1,831 382 2,213 Wages & Salaries 85.94% 1,90277 Deferred Gain - Sale of Easement (3,867) (921) (4,788) Net Plant 75.67% (3,623)78 Incentive Compensation Capitalized (Global Settlement) (2,166) (503) (2,669) DST 100.00% (2,669)79 Loss on Reacquired Debt (8,284) (1,652) (9,936) Net Plant 75.67% (7,519)80 Midwest Generation Settlement Liab (2,098) (1,049) (3,147) Non-DST 0.00% 081 Other Comprehensive Income (EPS 284000 & 284100) 8 2 10 Net Plant 75.67% 882 Pension Contribution - Net of Book Provision 9.5% (106,847) (23,481) (130,328) Wages & Salaries 85.94% (112,004)83 Prepaid Pension contribution (shareholder-funded) (292,792) (63,890) (356,682) Non-DST 0.00% 084 PJM Start-up Costs (5) 14 9 Non-DST 0.00% 085 Swap and Hedging Transactions (2,529) (582) (3,111) Net Plant 75.67% (2,354)86 State Income Taxes - Temporary 8,865 - 8,865 Non-DST 0.00% 087 Regulatory (Asset)/Liab: MGP-Environmental Remediation (52,208) (24,804) (77,012) Non-DST 0.00% 088 Regulatory (Asset)/Liab: Severance Cost (FAS 112) (58) 166 108 Wages & Salaries 85.94% 9389 Regulatory (Asset)/Liab: Rider UF (11,643) (5,784) (17,427) Non-DST 0.00% 090 Regulatory (Asset)/Liab: Distribution Rate Case Matters (8) 23 15 Non-DST 0.00% 091 Regulatory (Asset)/Liab: AMP - retired meters and AMI costs (402) (87) (489) DST 100.00% (489)92 Regulatory (Asset)/Liab: AMP - other costs (4) (2) (6) Non-DST 0.00% 093 Regulatory (Asset)/Liab: Distribution Formula Rate (33,982) (17,674) (51,656) Non-DST 0.00% 094 Regulatory (Asset)/Liab: Distribution - Other Deferred (Merger) (2,796) (622) (3,418) DST 100.00% (3,418)95 Regulatory (Asset)/Liab: Distribution - Other Deferred (Storm) (1,859) (259) (2,118) DST 100.00% (2,118)96 Regulatory (Asset)/Liab: Distribution - Other Deferred (A-Base) (11,162) (2,847) (14,009) DST 100.00% (14,009)97 Regulatory (Asset)/Liab: Distribution - Other Deferred (Ash Borer) (3,071) (828) (3,899) DST 100.00% (3,899)98 Regulatory (Asset)/Liab: Energy Efficiency (52,934) (14,510) (67,444) Non-DST 0.00% 099 Regulatory (Asset)/Liab: Solar Rebate - - - Non-DST 0.00% 0
100 Regulatory (Asset)/Liab: ASC 740_2011 IL State Tax Rate Change 3,445 (9,842) (6,397) Non-DST 0.00% 0101 Accelerated Depr AMI - Related to Reg Assets (49,522) (11,994) (61,516) DST 100.00% (61,516)102 Equity In Earnings Uncon Sub 75 37 112 Non-DST 0.00% 0103 Deferred Revenue - Fiber Optics Lease 2,293 703 2,996 Comm Equip 63.79% 1,911104 REG ASSET - CAPITAL LEASES (159) (79) (238) Non-DST 0.00% 0105 2017 IL Rate Change - 283 9,497 (27,134) (17,637) Non-DST 0.00% 0106 2017 IL Rate Change - 283 Gross Up (9,406) (2,822) (12,228) Non-DST 0.00% 0107 2017 Fed Rate Change - 283 206,709 - 206,709 Non-DST 0.00% 0108 2017 Fed Rate Change - 283 Gross Up 101,928 23,140 125,068 Non-DST 0.00% 0
109 Total Account 283 (FERC Form 1, Page 113, Line 64) (315,117)$ (187,882)$ (502,999)$ (209,704)$
110 Total ADIT (2,479,371)$ (1,027,888)$ (3,507,259)$ (4,356,536)$
Docket No. 18-____ ComEd Ex. 2.03
Page 47 of 334

Schedule B-9.1Page 1 of 2
Commonwealth Edison CompanyDetailed Listing of Balance Sheet Assets and Liabilities
2017 Actual
Witness: Tracy
Line No.
Category of Accumulated Deferred Income Taxes Listed on Schedule B-9
ICC Acct # for Balance Sheet Asset or Liab. Associated w/ Component of Accum. Def.
Income Taxes
Utility Acct # for Balance Sheet Asset or Liab. Associated w/
Component of Accum. Def. Income Taxes
Balance as of 1/1/2017
Asset/(Liability)
Balance as of 12/31/2017
Asset/(Liability)
Asset or Liability
Included in Rate Base Notes
(A) (B) (C) (D) (E) (F) (G)
1 Depreciation and Property Items 101 through 115 101000 through 115000 20,562,385$ 21,933,121$ YesJurisdictional portion - see Schedule B-
1
2 Other Property and Investments 123.1 and 124 123100 and 124000 65,053$ 68,845$ NoDeferred tax related to financing
subsidiaries
3 Provision for Uncollectible Accounts 144 144000 (70,276)$ (72,939)$ No Deferred tax related to expense
accrual
4 Plant Materials and Operating Supplies 154 154000 158,158$ 151,996$ Yes Deferred tax related to obsolete
materials reserve
5 Other Regulatory Assets 182 182300 1,134,613$ 1,250,596$ Components
Reflects certain adjustments and jurisdictional assignment - see
Schedule B-10
6 Miscellaneous Deferred Debits 186 186XXX and 254225 3,838,987$ 3,955,828$ Components
Reflects certain adjustments and jurisdictional assignment - see
Schedule B-10
7 Accumulated Other Comprehensive Income 219 219000 15$ 14$ No Deferred tax related to gains/losses on
Rabbi Trust investments
8 Accrued and Other Liabilities 227 through 242228XXX; 232230; 236000;
237000; 242000 (2,613,973)$ (1,870,144)$ Components
Reflects certain adjustments and jurisdictional assignment - see
Schedule B-10; Deferred taxes related to timing differences between expense
accruals and payments
9 Deferred Credits 252 through 257 252500 through 257000 (2,761,870)$ 5,649,333$ Components
Reflects certain adjustments and jurisdictional assignment - see
Schedule B-10
Note:Source: 2017 FERC Form 1, Pages 110-113
(In Thousands)
Docket No. 18-____ ComEd Ex. 2.03
Page 48 of 334

Schedule B-9.1Page 2 of 2
Commonwealth Edison CompanyDeferred Income Taxes Related To Balance Sheet Assets and Liabilities
2017 Actual
Witness: Tracy
Line No.
Category of Accumulated Deferred Income Taxes Listed on Schedule B-9
FederalDeferred Taxes
StateDeferred Taxes
TotalDeferred Taxes
(A) (B) (C) (D)
1 Depreciation and Property Items (4,792,832)$ (766,149)$ (5,558,981)$ 2 Provision for Uncollectible Accounts 19,642 6,234 25,876 3 Plant Materials and Operating Supplies 1,865 484 2,349 4 Other Regulatory Assets 2,425,884 (182,470) 2,243,414 5 Miscellaneous Deferred Debits (412,423) (90,574) (502,997) 6 Accumulated Other Comprehensive Income 8 2 10 7 Other Property and Investments 50,062 - 50,062 8 Accrued and Other Liabilities 218,393 61,928 280,321 9 Deferred Credits 7,278 2,018 9,296
10 Total (2,482,123)$ (968,527)$ (3,450,650)$
11 Other Deferred Income Taxes Not Directly12 Related To Balance Sheet Accounts 2,754 (59,364) (56,610)
13 Total Accumulated Deferred Income Taxes14 As of December 31, 2017 (2,479,369)$ (1,027,891)$ (3,507,260)$
Accumulated Deferred Income Taxes At December 31, 2017
Docket No. 18-____ ComEd Ex. 2.03
Page 49 of 334

Schedule B-10Page 1 of 9
Witness: TracyICC
Docket Balance at Balance at JurisdictionalLine Amortization Number Beginning Amortization / Other End RateNo. Description From To Period (if any) of 2017 Accretion Changes (1) of 2017 Base (2)
(A) (B) (C) (D) (E) (F) (G) (H) (I) (J)
1 Regulatory Assets (182.3)2 Capitalized incentive costs 1/1/2000 12/31/2017 41 Years 01-0423 (3) 6,946$ (256)$ -$ 6,690$ 6,690$ 3 AMI Pilot- Retired Meters 1/1/2009 12/31/2017 10 Years 1,862 (604) - 1,258 1,258 4 AMI Pilot- Pre-2010 Costs 1/1/2009 12/31/2009 3 Years - - - - - 5 Accel. Depreciation AMI 1/1/2012 12/31/2017 10 Years 161,706 (21,204) 12,983 153,485 153,485
6 Total Regulatory Assets 170,514$ (22,064)$ 12,983$ 161,433$ 161,433$
7 Deferred Debits (186)
8 Cook/Dupage County Forest Preserve District Fees 1/1/2007 12/31/2017 10 Years (4) 3,271$ (540)$ 401$ 3,132$ 3,132$
9 Long-Term Receivable from MBA Plan 1/1/2007 12/31/2017 Varies (5) 1,447 - (628) 819 704
10 Insurance Recoveries Related to Third-Party Claims 1/1/2011 12/31/2017 Varies 1,282 - 329 1,611 1,384
11 Vacation Pay Pending Accounting Distribution pre-2001 12/31/2017 Varies 33,137 - (12,050) 21,087 18,122
12 ICC Fees for new money authority (6) 1/1/2013 12/31/2017 Varies 1,962 (1,380) - 582 440
13 Total Deferred Debits 41,099$ (1,920)$ (11,948)$ 27,231$ 23,782$
Notes:(1) See WPB-10, Page 2. (2) From Page 4, Column G.(3) The initial amount set up in this account was $10,857,000 representing the capitalization of
incentive costs as part of the March 2003 agreement. See ICC Final Order, Docket No. 01-0423, dated March 28, 2003.(4) Fees paid in accordance with Cook/Dupage County Forest Preserve District Ordinance No. 205-12-07-03.(5) Represents amounts recoverable from Voluntary Employment Benefit Association trust for disability payments made to union employees(6) Represents payments to ICC for fees related to future long-term debt issuances in order to have the right to issue debt (new money issuances)
Time Period CostsWere Accreted
2017 Activity
Commonwealth Edison CompanyDeferred Assets in Rate Base
2017 Actual(In Thousands)
Docket No. 18-____ ComEd Ex. 2.03
Page 50 of 334

Schedule B-10Page 2 of 9
Witness: TracyICC
Docket Balance at Balance at JurisdictionalLine Amortization Number Beginning Amort. / Other End RateNo. Description From To Period (if any) of 2017 Accretion (1) Changes (1) of 2017 Base (2)
(A) (B) (C) (D) (E) (F) (G) (H) (I) (J)
1 Operating Reserves (228)
2 Accumulated Provision for Injuries & Damages Pre 1990 12/31/2017 Not
applicable 99-0117 (61,839)$ -$ (115)$ (61,954)$ (53,243)$
3 Accumulated Provision for Pensions & Benefits Pre 1990 12/31/2017 Varies by
acct. 99-0117 (282,305) - 20,289 (262,016) (225,176)
4 Accumulated Miscellaneous Operating Provisions (3) Pre 1990 12/31/2017 Varies by
acct. 99-0117 (292,372) - 7,675 (284,697) (1,542)
5 Total Operating Reserves (636,516)$ -$ 27,849$ (608,667)$ (279,961)$
6 Asset Retirement Obligations (230)
7 Asset Retirement Obligations (ARO) (4) 1/1/2003 12/31/2017 Varies by asset (5) (121,497)$ (3,817)$ 12,249$ (113,065)$ (18,859)$
8 Deferred Credits (253)9 Deferred Rents (6) 6/30/2001 12/31/2017 Varies (2,057)$ 323$ -$ (1,734)$ (1,490)$
10 Deferred Revenues (7) 12/1/1998 12/31/2017 30 Years (4,731) 408 - (4,323) (2,758) 11 Other Deferred Credits 1/1/2015 12/31/2017 Varies (406) - (262) (668) (574) 12 Total Deferred Credits (7,194)$ 731$ (262)$ (6,725)$ (4,822)$
Time Period CreditsWere Accreted
2017 Activity
Commonwealth Edison CompanyDeferred Liabilities in Rate Base
2017 Actual(In Thousands)
Docket No. 18-____ ComEd Ex. 2.03
Page 51 of 334
Schedule B-10Page 3 of 9
Witness: Tracy
Notes:(1) See WPB-10, Page 4 for additional detail. (2) From Page 5, Column G.(3) Consists of various environmental liabilities. (4) Asset Retirement Obligations (ARO) are covered by FAS 143, adopted by ComEd in 2003
and FIN 47, adopted by ComEd in 2005. The ARO covers ComEd's obligation to remove long-lived assets whose timing and / or method of settlement are conditional on a future event. ComEd's significant conditional AROs cover the abatement and disposal of equipand buildings contaminated with asbestos and Polychlorinated Biphenyls (PCBs).
(5) In accordance with FERC Docket No. RM02-7-000, Order 631, issued April 9, 2003.(6) This liability is the result of the FAS 13 (straight line lease) calculation.
Rent expense is charged on a straight line basis over the term of the leases. (7) This balance is the unamortized balance of upfront payments for the rental of fiber optic cable.
Deferred Liabilities in Rate Base2017 Actual
(In Thousands)
Commonwealth Edison Company
Docket No. 18-____ ComEd Ex. 2.03
Page 52 of 334

Schedule B-10Page 4 of 9
Witness: Tracy
Line FERC 12/31/2017 JurisdictionalNo. Account Description Balance Adjustment (1) Allocator Rate 2017
(A) (B) (C) (D) (E) (F) (G)
1 Regulatory Assets (182.3)2 182.3 Capitalized incentive costs 6,690$ -$ (2) 100% 6,690$ 3 182.3 AMI Pilot- Retired Meters 1,258 - 100% 1,258 4 182.3 Accel. Depreciation AMI 153,485 - 100% 153,485
5 Total Regulatory Asset 161,433$ -$ 161,433$
6 Deferred Debits (186)
7 186Cook/Dupage County Forest Preserve District Fees 3,132$ -$ 100% 3,132$
8 186 Long-Term Receivable from MBA Plan 819 - Wages & Salaries 85.94% 704
9 186 Insurance Recoveries Related to Third-Party Claims 1,611 - Wages & Salaries 85.94% 1,384
10 186 Vacation Pay Pending Accounting Distribution 21,087 - Wages & Salaries 85.94% 18,122
11 186 ICC Fees for new money authority 582 - Net Plant 75.67% 440
12 Total Deferred Debits 27,231$ -$ 23,782$
Notes: (1) Adjustments to FERC balances prior to applying jurisdictional allocators.(2) Distribution only - Authorized in ICC Docket No. 01-0423.
Jurisdictional Allocation
2017 Actual
Commonwealth Edison CompanyAdjustments of Deferred Assets in Rate Base
(In Thousands)
Docket No. 18-____ ComEd Ex. 2.03
Page 53 of 334

Schedule B-10Page 5 of 9
Witness: Tracy
Line FERC 12/31/2017 JurisdictionalNo. Account Description Actual Adjustment (1) Allocator Rate 2017
(A) (B) (C) (D) (E) (F) (G)
1 Operating Reserves (228)2 228.2 Accumulated Provision for Injuries & Damages (61,954)$ -$ Wages & Salaries 85.94% (53,243)$ 3 228.3 Accumulated Provision for Pensions & Benefits (262,016) - Wages & Salaries 85.94% (225,176) 4 228.4 Accumulated Miscellaneous Operating Provisions (284,697) 283,155 (2) 100.00% (3) (1,542)
5 Total Operating Reserves (608,667)$ 283,155$ (279,961)$
6 Asset Retirement Obligations (230)7 230000 Asset Retirement Obligations (ARO) (113,065)$ 92,406$ (4) (5) (18,859)$
8 Deferred Credits (253)9 253900 Deferred Rents (1,734)$ -$ Wages & Salaries 85.94% (1,490)$
10 253700 Deferred Revenues (4,323) - (6) Commun. Equip 63.79% (2,758) 11 253000 Other Deferred Credits (668) - Wages & Salaries 85.94% (574)
12 Total Deferred Credits (6,725)$ -$ (4,822)$
Notes:(1) Adjustments to FERC balances prior to applying jurisdictional allocators.(2) Adjustment consists of environmental liabilities relating to manufactured gas plants (MGP). MGP costs are recovered through Rider ECR.(3) Consists of environmental liabilities relating to superfund sites not recovered through Rider ECR.(4) Adjustment removes the portion of the ARO liability not attributable to the removal reserve.(5) The portion of the ARO balance atttributable to items in the Distribution removal reserve. See WPB-10, page 3, line 6, col (E).(6) The balance in Deferred Revenues is the unamortized balance of upfront payments for the lease of fiber optic cable. Fiber optic cable is
included in Plant Account 397, Communications Equipment. Per WP 16, Plant Account 397 is allocated via the communications equipment allocator.
Jurisdictional Allocation
2017 Actual
Commonwealth Edison CompanyAdjustments of Deferred Liabilities in Rate Base
(In Thousands)
Docket No. 18-____ ComEd Ex. 2.03
Page 54 of 334

Schedule B-10Page 6 of 9
Witness: TracyICC
Docket Actual ActualLine Amort. Number Balance at Amort./ Balance at No. Description From To Period (if any) 12/31/2013 Accretion Other 12/31/2014
(A) (B) (C) (D) (E) (F) (G) (H) (I)
1 Regulatory Assets (182.3)2 Capitalized Incentive Costs (1) 1/1/2000 12/31/2016 41 Years 01-0423 7,715$ (256)$ -$ 7,459$ 3 AMI Pilot- Retired Meters 1/1/2009 12/31/2016 10 Years 3,674 (604) - 3,070 4 AMI Pilot- Pre-2010 Costs 1/1/2009 12/31/2014 3 Years 247 (247) - - 5 Accel. Depreciation AMI 1/1/2012 12/31/2016 10 Years 35,241 (6,774) 59,820 88,287 6 Total Regulatory Assets 46,877$ (7,881)$ 59,820$ 98,816$
7 Deferred Debits (186)8 Cook/Dupage County Forest Preserve District Fees 1/1/2007 12/31/2016 10 Years (2) 2,403$ -$ 274$ 2,677$
9 Long-term Receivable from MBA Plan 1/1/2007 12/31/2016 Varies (3) 2,718 - (534) 2,184 10 Insurance Recoveries Related to Third Party Claims 1/1/2011 12/31/2016 Varies 3,645 - (705) 2,940
11 Vacation Pay Pending Accounting Distribution pre-2001 12/31/2016 Varies 25,458 - 2,583 28,041 12 ICC Fees for New Money 1/1/2013 12/31/2016 Varies 2,941 (600) (79) 2,262 13 Total Deferred Debits 37,165$ (600)$ 1,539$ 38,104$
Notes:(1) The initial amount set up in this account was $10,857,000 representing the capitalization
of incentive costs as part of the 2003 agreement. See ICC Order in Dkt. No. 01-0423dated March 28, 2003.
(2) Fees paid in accordance with Cook/Dupage County Forest Preserve District Ordinance No. 205-12-07-03.
(3) Represents amounts recoverable from Voluntary Employment Benefit Association trust for disability payments made to union employees.
Time Period CostsWere Accreted
2014 Net Change
Commonwealth Edison CompanyDeferred Assets in Rate Base
2014 - 2016(In Thousands)
Docket No. 18-____ ComEd Ex. 2.03
Page 55 of 334

LineNo.
123456
78
910
111213
Schedule B-10Page 7 of 9
Witness: Tracy
Actual ActualAmort./ Balance at Amort./ Balance at
Description Accretion Other 12/31/2015 Accretion Other 12/31/2016(A) (B) (C) (D) (E) (F) (G)
Regulatory Assets (182.3)Capitalized Incentive Costs (256)$ -$ 7,203$ (257)$ -$ 6,946$ AMI Pilot- Retired Meters (604) - 2,466 (604) - 1,862 AMI Pilot- Pre-2010 Costs - - - - - - Accel. Depreciation AMI (13,239) 62,372 137,420 (18,504) 42,790 161,706 Total Regulatory Assets (14,099)$ 62,372$ 147,089$ (19,365)$ 42,790$ 170,514$
Deferred Debits (186)Cook/Dupage County Forest Preserve District Fees (456)$ 954$ 3,175$ (870)$ 966$ 3,271$
Long-term Receivable from MBA Plan - (171) 2,013 - (566) 1,447 Insurance Recoveries Related to Third Party Claims - (1,775) 1,165 - 117 1,282
Vacation Pay Pending Accounting Distribution - 3,324 31,365 - 1,772 33,137 ICC Fees for New Money (1,416) - 846 (1,284) 2,400 1,962 Total Deferred Debits (1,872)$ 2,332$ 38,564$ (2,154)$ 4,689$ 41,099$
Notes:(1) The initial amount set up in this account was $10,857,000 representing the capitalization
of incentive costs as part of the 2003 agreement. See ICC Order in Dkt. No. 01-0423dated March 28, 2003.
(2) Fees paid in accordance with Cook/Dupage County Forest Preserve District Ordinance No. 205-12-07-03.
(3) Represents amounts recoverable from Voluntary Employment Benefit Association trust for disability payments made to union employees.
2016 Net Change2015 Net Change
Commonwealth Edison CompanyDeferred Assets in Rate Base
2014 - 2016(In Thousands)
Docket No. 18-____ ComEd Ex. 2.03
Page 56 of 334

Schedule B-10Page 8 of 9
Witness: Tracy
ICC Actual ActualLine Amortization Docket Balance at Amortization/ Balance at No. Description From To Period Number (if any) 12/31/2013 Accretion Other 12/31/2014
(A) (B) (C) (D) (E) (F) (G) (H) (I)
1 Operating Reserves (228)
2 Accum Provision for Injuries & Damages Pre 1990 12/31/2016Not
Applicable 99-0117 (56,043)$ -$ 2,383$ (53,660)$
3 Accum Provision for Pensions & Benefits Pre 1990 12/31/2016Varies by account 99-0117 (424,725) - 117,626 (307,099)
4 Accum Miscellaneous Operating Provisions
(1) Pre 1990 12/31/2016Varies by account 99-0117 (234,209) - (3,459) (237,668)
5 Total Operating Reserves (714,977)$ -$ 116,550$ (598,427)$
6 Asset Retirement Obligations (ARO) (230)7 Asset Retirement Oblig (2) 1/1/2003 12/31/2016 Varies by asset RM02-7-000 (3) (100,602)$ (6,190)$ 2,424$ (104,368)$
8 Deferred Credits (253)9 Deferred rents (4) 6/30/2001 12/31/2016 Varies 05-0597 (4,829)$ 1,263$ (1,367)$ (4,933)$
10 Deferred Revenues (5) 12/1/1998 12/31/2016 30 Years (5,854) 383 - (5,471) 11 Other Deferred Credits 1/1/2015 12/31/2016 Varies - - - - 12 Total Deferred Credits (10,683)$ 1,646$ (1,367)$ (10,404)$
Notes:(1) Consists of various environmental liabilities. (2) Asset Retirement Obligations (ARO) are covered by FAS 143, adopted by ComEd in 2003 and FIN 47,
adopted by ComEd in 2005. The ARO covers ComEd's obligation to remove long-lived assets whose timing and / or method of settlement are conditional on a future event. ComEd's significant conditional AROs cover the abatement and disposal of equipment and buildings contaminated with asbestos and Polychlorinated Biphenyls (PCBs).
(3) In accordance with the guidelines of FERC Docket No. RM02-7-000, Order 631, issued April 9, 2003.(4) This liability is the result of the FAS 13 (straight line lease) calculation. Rent expense is charged on a
straight line basis over the term of the lease. (5) The balance in Deferred Revenues is the unamortized balance of upfront payments for the rental of fiber optic cable.
Time Period CreditsWere Accreted
2014 Net Change
Commonwealth Edison CompanyDeferred Liabilities in Rate Base
2014 - 2016(In Thousands)
Docket No. 18-____ ComEd Ex. 2.03
Page 57 of 334

LineNo.
1
2
3
4
5
67
89
101112
Schedule B-10Page 9 of 9
Witness: Tracy
Actual ActualAmortization/ Balance at Amortization/ Balance at
Description Accretion Other 12/31/2015 Accretion Other 12/31/2016(A) (B) (C) (D) (E) (F) (G)
Operating Reserves (228)
Accum Provision for Injuries & Damages -$ 2,108$ (51,552)$ -$ (10,287)$ (61,839)$
Accum Provision for Pensions & Benefits - 4,681 (302,418) - 20,113 (282,305)
Accum Miscellaneous Operating Provisions
- (27,906) (265,574) - (26,798) (292,372)
Total Operating Reserves -$ (21,117)$ (619,544)$ -$ (16,972)$ (636,516)$
Asset Retirement Obligations (ARO) (230)Asset Retirement Oblig (10,657)$ 2,433$ (112,592)$ (11,144)$ 2,239$ (121,497)$
Deferred Credits (253)Deferred rents 1,341$ (581)$ (4,173)$ 2,116$ -$ (2,057)$ Deferred Revenues 383 - (5,088) 357 - (4,731) Other Deferred Credits - (162) (162) - (244) (406) Total Deferred Credits 1,724$ (743)$ (9,423)$ 2,473$ (244)$ (7,194)$
Notes:(1) Consists of various environmental liabilities. (2) Asset Retirement Obligations (ARO) are covered by FAS 143, adopted by ComEd in 2003 and FIN 47,
adopted by ComEd in 2005. The ARO covers ComEd's obligation to remove long-lived assets whose timing and / or method of settlement are conditional on a future event. ComEd's significant conditional AROs cover the abatement and disposal of equipment and buildings contaminated with asbestos and Polychlorinated Biphenyls (PCBs).
(3) In accordance with the guidelines of FERC Docket No. RM02-7-000, Order 631, issued April 9, 2003.(4) This liability is the result of the FAS 13 (straight line lease) calculation. Rent expense is charged on a
straight line basis over the term of the lease. (5) The balance in Deferred Revenues is the unamortized balance of upfront payments for the rental of fiber optic cable.
2016 Net Change2015 Net Change
Commonwealth Edison CompanyDeferred Liabilities in Rate Base
2014 - 2016(In Thousands)
Docket No. 18-____ ComEd Ex. 2.03
Page 58 of 334

Schedule B-11Page 1 of 1
Commonwealth Edison CompanyProperty Held for Future Use Included in Rate Base - 2017 Actual
Witness: Tracy
LineNo.
1 ComEd did not include any property held for future use2 in the jurisdictional rate base reflected on Schedule B-1, 3 Jurisdictional Rate Base Summary.
Description(A)
Docket No. 18-____ ComEd Ex. 2.03
Page 59 of 334

Schedule B-12Page 1 of 1
Commonwealth Edison CompanyAnalysis of Activity in Property Held For Future Use - 2017 Actual
Witness: Tracy
LineNo.
1 ComEd did not include any property held for future use in the2 jurisdictional rate base reflected on Schedule B-1, Jurisdictional3 Rate Base Summary. Therefore, no analysis of activity in the4 account Property Held For Future Use is provided.
Description(A)
Docket No. 18-____ ComEd Ex. 2.03
Page 60 of 334

Schedule B-13Page 1 of 1
Witness: Tracy
LineNo. Month Ended 2017 2016 2015 2014
(A) (B) (B) (C) (D)
1 January (119,008)$ (130,814)$ (127,387)$ (133,299)$ 2 February (117,348) (130,821) (127,735) (133,180) 3 March (116,728) (129,552) (128,375) (132,725) 4 April (115,700) (128,761) (128,631) (131,651) 5 May (114,948) (128,941) (129,386) (131,071) 6 June (114,696) (128,072) (128,245) (130,450) 7 July (114,323) (127,962) (128,495) (129,473) 8 August (114,197) (126,957) (128,847) (128,755) 9 September (114,009) (126,156) (129,964) (128,472) 10 October (113,535) (124,228) (129,937) (128,309) 11 November (113,189) (122,778) (131,172) (128,231) 12 December (112,460) (120,724) (131,133) (127,836)
Note:(1) FERC Account 235, Customer Deposits.
Commonwealth Edison CompanyCustomer Deposits (1)
(In Thousands)
Docket No. 18-____ ComEd Ex. 2.03
Page 61 of 334

Schedule B-14Page 1 of 2
Witness: Tracy
Line TotalNo. Month Ended ComEd (1) Jurisdictional (2) (3)
(A) (B) (C)
1 2016 December (1,657)$ (964)$ 2 January 1,025 5973 February (230) (134)4 March (3,099) (1,804)5 April (7,354) (4,280)6 May (12,206) (7,104)7 June (11,580) (6,740)8 July (5,642) (3,284)9 August (424) (247)10 September (17) (10)11 October (2,785) (1,621)12 November (5,251) (3,056)13 December (4,220) (2,456)
14 13 month average (4,111)$ (2,393)$
Notes:(1) Credit balances denote actual bills less than budget plan payments,
therefore a liability balance. No interest was accruedon budget payment plan balances in 2017.
(2) Balances under the budget payment plan are reflected in CustomerAccounts Receivable. For ratemaking purposes, CustomerAccounts Receivable are considered a component of cash workingcapital. ComEd has requested cash working capitalin jurisdictional rate base.
(3) The jurisdictional balance is based upon the Delivery ServiceRevenue allocator. See WPA-5, Page 5.
Commonwealth Edison CompanyBudget Payment Plan Balances
Actual 2017(In Thousands)
Docket No. 18-____ ComEd Ex. 2.03
Page 62 of 334

Schedule B-14Page 2 of 2
Witness: Tracy
Line Actual BalancesNo. Month Ended 2016 2015 2014
(A) (B) (C) (D)
1 January 2,942$ 6,380$ (10,434)$ 2 February 2,136 8,806 (6,432) 3 March (710) 9,622 (4,761) 4 April (4,907) 7,591 (5,703) 5 May (9,623) 4,725 (7,734) 6 June (9,282) 3,458 (6,033) 7 July (4,504) 4,171 (1,393) 8 August 2,160 8,544 1,542 9 September 6,328 10,866 4,713 10 October 3,712 7,625 3,064 11 November (984) 3,162 (124) 12 December (1,657) 1,842 2,147
Note:(1) Credit balances denote actual bills less than budget plan payments,
therefore a liability balance. There was no interest accrued onbudget payment plan balances in 2014 through 2016.
Commonwealth Edison CompanyBudget Payment Plan Balances (1)
(In Thousands)
Docket No. 18-____ ComEd Ex. 2.03
Page 63 of 334

Schedule B-15Page 1 of 2
Witness: Tracy
Line TotalNo. Description ComEd Other Jurisdictional
(A) (B) (C) (D)
1 Line Extension Deposits (2) (101,125)$ -$ (101,125)$
2 Contributions in Aid of Construction3 Facility Relocations (557) (18) (3) (539) 4 New Business (30,499) (1,127) (3) (29,372) 5 Other (31) - (3) (31) 6 Customer Advances - IPPs (4) (878) (285) (593) 7 Total Customer Advances for Construction (133,090)$ (1,430)$ (131,660)$
Notes:(1) FERC Account 252.(2) Refundable deposits for line extensions are collected under Rider DE, Distribution
System Extensions.(3) Deposits relate to non-jurisdictional projects.(4) Cash advances from IPPs primarily for engineering studies and transmission
construction projects.
Commonwealth Edison CompanyCustomer Advances For Construction (1)
(In Thousands)
As of December 31, 2017
Docket No. 18-____ ComEd Ex. 2.03
Page 64 of 334

Schedule B-15Page 2 of 2
Witness: Tracy
LineNo. Description 2017 2016 2015 2014
(A) (B) (C) (D) (E)
1 Beginning Balance - 1/1 (117,006)$ (111,191)$ (92,822)$ (69,694)$
2 Additions during the year (33,679) (35,319) (47,245) (27,199)
3 Refunds during the year 6,173 7,732 6,171 5,804
4 Transfers during the year 11,422 21,772 22,705 (1,733)
5 Ending Balance - 12/31 (133,090)$ (117,006)$ (111,191)$ (92,822)$
Note:(1) FERC Account 252.
Additions To and Transfers From Customer Advances For Construction (1)(In Thousands)
Commonwealth Edison Company
Docket No. 18-____ ComEd Ex. 2.03
Page 65 of 334

Schedule C-1 RYPage 1 of 2
Commonwealth Edison CompanyJurisdictional Operating Statement - 2017 Recon Year
For the Year 2017(In Thousands)
Witness: Tracy
Line No. Description
Unadjusted Delivery Services Operating
Income (from Page 2) Adjustments
(Schedule C-2) Jurisdictional
Operating Income Effect of
Proposed Rates Jurisdictional
Operating Income (A) (B) (C) (D) (E) (F)
1 Operating Revenues 2,506,085$ (1) -$ 2,506,085$ 125,448$ 2,631,533$ 2 Other Revenues 135,959 - 135,959 - 135,959
3 Total Operating Revenues 2,642,044$ -$ 2,642,044$ 125,448$ 2,767,492$
4 Operating Expenses5 Production -$ -$ -$ -$ -$ 6 Transmission - - - - - 7 Regional Market Expense - - - - - 8 Distribution 464,379 (4,207) 460,172 - 460,172 9 Customer Accounts Expenses 179,840 - 179,840 - 179,840
10 Customer Service and Informational Exp. 33,589 - 33,589 - 33,589 11 Sales Expenses - - - - - 12 Administrative and General Expenses 378,243 (1,922) 376,321 - 376,321 13 Depreciation & Amortization Expense 628,148 - 628,148 - 628,148 14 Taxes Other Than Income 144,031 - 144,031 - 144,031 15 Reg Asset and Other Expense Adjustments 51,040 (33,444) 17,596 - 17,596 16 Pension Asset Funding Cost - 32,714 32,714 - 32,714 17 Accretion Expense - - - - - 18 Total Operating Expenses 1,879,270$ (6,859)$ 1,872,411$ -$ 1,872,411$
19 Income Taxes20 State Income Taxes (34,381)$ (1,591)$ (35,972)$ 10,826$ (25,146)$ 21 Federal Income Taxes (127,405) (5,897) (133,302) 40,118 (93,184) 22 Deferred Taxes 383,929 10,865 394,794 - 394,794 23 ITC's Net\One time Adjustments (1,606) - (1,606) - (1,606) 24 Total Income Taxes 220,537$ 3,377$ 223,914$ 50,944$ 274,858$
25 Net Utility Operating Income 542,237$ 3,482$ 545,719$ 74,504$ 620,223$
Note:(1) Revenues based upon Docket 17-0196, Final Order Appendix B, Page 1, Line 1.
Docket No. 18-____ ComEd Ex. 2.03
Page 66 of 334

Schedule C-1 RYPage 2 of 2
Witness: Tracy
Unadjusted Delivery Services Supporting
Line ICC Total Company Operating Schedule / No. Description Account Unadjusted (1) Income Workpaper
(A) (B) (C) (D) (E)
1 Operating Revenues 400 4,655,548$ 2,506,085$ (2)2 Other Revenues 450-456 883,912 135,959 Schedule C-23
3 Total Operating Revenues 5,539,460$ 2,642,044$
4 Operating Expenses5 Production 500-557 1,351,795$ -$ FERC Form 16 Transmission 560-573 427,803 - FERC Form 17 Regional Market Expenses 575.1-576.5 4,848 - FERC Form 18 Distribution 580-598 465,285 464,379 WPC-1a, Page 19 Customer Accounts Expenses 901-905 229,443 179,840 WPC-1a, Page 2
10 Customer Service and Informational Exp. 907-910 132,730 33,589 WPC-1a, Page 111 Sales Expenses 911-916 - - FERC Form 112 Administrative and General Expenses 920-935 465,278 378,243 WPC-1a, Page 113 Depreciation & Amortization Expense 403-406 775,573 628,148 Schedule C-1214 Taxes Other Than Income 408.1 294,918 144,031 Schedule C-18 15 Reg Asset and Other Expense Adj 407.3 34,712 51,040 Schedule C-2616 Pension Asset Funding Cost - - 17 Accretion Expense - Disp of Property 411.10/411.6 (38) - FERC Form 118 Total Operating Expenses 4,182,347$ 1,879,270$
19 Income Taxes20 State Income Taxes 409.2 (47,070)$ (34,381)$ Sch. C-5, Page 421 Federal Income Taxes 409.2 (184,121) (127,405) Sch. C-5, Page 422 Deferred Taxes 410/411 658,387 383,929 Schedule C-5.223 ITC's Net\One time Adjustments 411 (1,916) (1,606) Sch. C-5, Page 424 Total Income Taxes 425,280$ 220,537$
25 Net Utility Operating Income 931,833$ 542,237$
Notes:(1) From 2017 Form 21 ILCC, Page 7. See Schedule C-4 for further details by account.(2) Revenues based upon Docket 17-0196, Final Order Appendix B, Page 1, Line 1.
(In Thousands)
Commonwealth Edison CompanyJurisdictional Operating Statement by ICC Account - 2017 Recon Year
For the Year 2017
Docket No. 18-____ ComEd Ex. 2.03
Page 67 of 334

Schedule C-2 RYPage 1 of 1
Commonwealth Edison CompanySummary of Utility Proposed Adjustments to Operating Income - 2017 Rate Year
(In Thousands)Witness: Tracy
Unusual Operating 2017 Pension Interest2018 Projected Expenses Pension Remove Long Costs Related Synchronization Subtotal
Depreciation Greather than Funding Term Incentive to Previously Perqs and Effect of Rate JurisdictionalLine Expense $10 Million Costs Compensation Excluded Incentive Awards Base Adjustments ProposedNo. Schedule C-2.1 Schedule C-2.2 Schedule C-2.3 Schedule C-2.4 Schedule C-2.5 Schedule C-2.6 Schedule C-5.4 Adjustments
(B) (C) (D) (E) (F) (G) (I) (J)
1 Operating Revenues -$ -$ -$ -$ -$ -$ -$ -$ 2 Other Revenues - - - - - - - - 3 Total Operating Revenues -$ -$ -$ -$ -$ -$ -$ -$
4 Operating Expenses5 Production -$ -$ -$ -$ -$ -$ -$ -$ 6 Transmission - - - - - - - - 7 Regional Market Expense - - - - - - - - 8 Distribution - - - (4,019) (29) (159) - (4,207) 9 Customer Accounts Expenses - - - - - - - -
10Customer Service and Informational Exp. - - - - - - - -
11 Sales Expenses - - - - - - - - 12 A&G Expenses - - - (942) (8) (972) - (1,922) 13 Depr & Amort Expenses - - - - - - - - 14 Taxes Other Than Income - - - - - - - -
15Reg Asset and Other Expense Adjustments - (33,444) - - - - - (33,444)
16 Pension Asset Funding Costs - - 32,714 - - - - 32,714 17 Accretion Expense - - - - - - - - 18 Total Operating Expenses -$ (33,444)$ 32,714$ (4,961)$ (37)$ (1,131)$ -$ (6,859)
19 Income Taxes20 State Income Taxes -$ 577$ (2,823)$ 428$ 3$ 98$ 126$ (1,591) 21 Federal Income Taxes - 2,139 (10,462) 1,587 12 362 465 (5,897) 22 Deferred Taxes - 10,865 - - - - - 10,865 23 ITC's Net - - - - - - - - 24 Total Income Taxes -$ 13,581$ (13,285)$ 2,015$ 15$ 460$ 591$ 3,377 25 Net Utility Operating Income -$ 19,863$ (19,429)$ 2,946$ 22$ 671$ (591)$ 3,482
Description(A)
Docket No. 18-____ ComEd Ex. 2.03
Page 68 of 334

Schedule C-2.2Page 1 of 1
Commonwealth Edison Company2017 Adjustments to Unusual Operating Expenses Greater than $10M (1)
(In Thousands)
Witness: Tracy
Line ICCNo. Description Amount Source Account
(A) (B) (C) (D)
1 2017 Abase Meter Expense (21,441)$ WPC 2.2 Various2 2017 Ash Borer (12,003) WPC 2.2 Various3 Sub Total Expense Adj on C-2 (33,444)
4Reg Asset and Other Expense Adjustments 6,689 WPC 2.2 407.3
5 Total Balance Sheet (2) (26,755)$
6 Income Tax Effects of Above Adjustments: 7 State Income Taxes 577$ 409.28 Federal Income Taxes 2,139 409.29 Deferred Income Taxes 10,865 410/41110 13,581$
Note:(1) Amortization of unusual operating expense adjustments greater than $10M
for 2017.(2) No qualifying 2017 Storms
Docket No. 18-____ ComEd Ex. 2.03
Page 69 of 334

Schedule C-2.3Page 1 of 1
Commonwealth Edison Company2017 Pension Funding Costs
(In Thousands)
Witness: Tracy
Line TotalNo. Description Source Company
(A) (B) (C)
1 Pension Asset FERC Form 1 (1) 1,188,437$
2 Associated Accumulated Deferred Income Tax B-9 (2) (353,664)$
3 Pension Asset Funding net of ADIT Line 1 + Line 2 834,773$
4 Wages and Salaries Allocator WPA-5 (3) 85.94%
5 Jurisdictional Pension Asset net of ADIT Line 3 x Line 4 717,404$
6 Cost of Long-term Debt Schedule D-1 (4) 4.56%
7 Pension Funding Cost Line 5 x Line 6 32,714$
Notes:(1) 2017 FERC Form 1, Page 233.(2) B-9, Page 1, Line 2.(3) WPA-5, Page 1, Line 9, Column E.(4) Schedule D-1 RY, Page 1, Line 2, Column D.
Docket No. 18-____ ComEd Ex. 2.03
Page 70 of 334
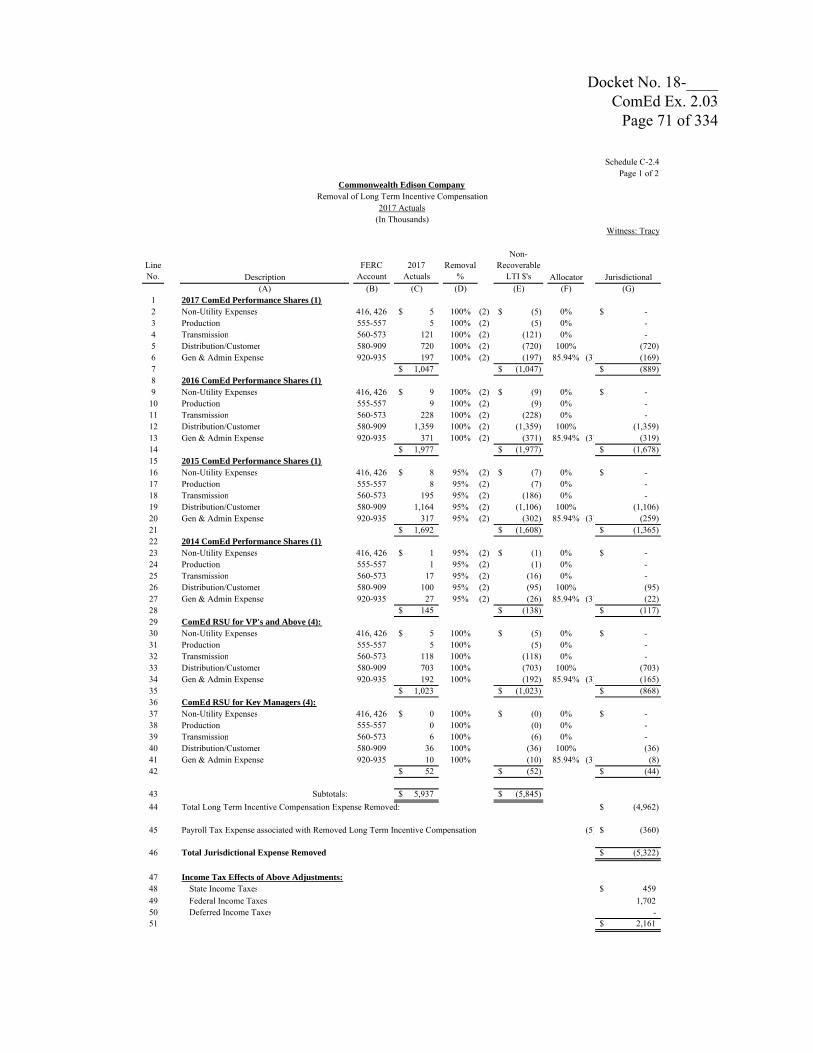
LineNo. Description
FERCAccount
2017 Actuals
Removal %
Non-Recoverable
LTI $'s Allocator Jurisdictional(A) (B) (C) (D) (E) (F) (G)
1 2017 ComEd Performance Shares (1)2 Non-Utility Expenses 416, 426 5$ 100% (2) (5)$ 0% -$ 3 Production 555-557 5 100% (2) (5) 0% - 4 Transmission 560-573 121 100% (2) (121) 0% - 5 Distribution/Customer 580-909 720 100% (2) (720) 100% (720) 6 Gen & Admin Expense 920-935 197 100% (2) (197) 85.94% (3) (169) 7 1,047$ (1,047)$ (889)$ 8 2016 ComEd Performance Shares (1)9 Non-Utility Expenses 416, 426 9$ 100% (2) (9)$ 0% -$
10 Production 555-557 9 100% (2) (9) 0% - 11 Transmission 560-573 228 100% (2) (228) 0% - 12 Distribution/Customer 580-909 1,359 100% (2) (1,359) 100% (1,359) 13 Gen & Admin Expense 920-935 371 100% (2) (371) 85.94% (3) (319) 14 1,977$ (1,977)$ (1,678)$ 15 2015 ComEd Performance Shares (1)16 Non-Utility Expenses 416, 426 8$ 95% (2) (7)$ 0% -$ 17 Production 555-557 8 95% (2) (7) 0% - 18 Transmission 560-573 195 95% (2) (186) 0% - 19 Distribution/Customer 580-909 1,164 95% (2) (1,106) 100% (1,106) 20 Gen & Admin Expense 920-935 317 95% (2) (302) 85.94% (3) (259) 21 1,692$ (1,608)$ (1,365)$ 22 2014 ComEd Performance Shares (1)23 Non-Utility Expenses 416, 426 1$ 95% (2) (1)$ 0% -$ 24 Production 555-557 1 95% (2) (1) 0% - 25 Transmission 560-573 17 95% (2) (16) 0% - 26 Distribution/Customer 580-909 100 95% (2) (95) 100% (95) 27 Gen & Admin Expense 920-935 27 95% (2) (26) 85.94% (3) (22) 28 145$ (138)$ (117)$ 29 ComEd RSU for VP's and Above (4):30 Non-Utility Expenses 416, 426 5$ 100% (5)$ 0% -$ 31 Production 555-557 5 100% (5) 0% - 32 Transmission 560-573 118 100% (118) 0% - 33 Distribution/Customer 580-909 703 100% (703) 100% (703) 34 Gen & Admin Expense 920-935 192 100% (192) 85.94% (3) (165) 35 1,023$ (1,023)$ (868)$ 36 ComEd RSU for Key Managers (4):37 Non-Utility Expenses 416, 426 0$ 100% (0)$ 0% -$ 38 Production 555-557 0 100% (0) 0% - 39 Transmission 560-573 6 100% (6) 0% - 40 Distribution/Customer 580-909 36 100% (36) 100% (36) 41 Gen & Admin Expense 920-935 10 100% (10) 85.94% (3) (8) 42 52$ (52)$ (44)$
43 Subtotals: 5,937$ (5,845)$ 44 Total Long Term Incentive Compensation Expense Removed: (4,962)$
45 Payroll Tax Expense associated with Removed Long Term Incentive Compensation (5) (360)$
46 Total Jurisdictional Expense Removed (5,322)$
47 Income Tax Effects of Above Adjustments:48 State Income Taxes 459$ 49 Federal Income Taxes 1,702 50 Deferred Income Taxes - 51 2,161$
Schedule C-2.4Page 1 of 2
Commonwealth Edison CompanyRemoval of Long Term Incentive Compensation
2017 Actuals(In Thousands)
Witness: Tracy
Docket No. 18-____ ComEd Ex. 2.03
Page 71 of 334

(1)
(2)
(3)(4)
(5) In compliance with the ICC's final Order in Docket 13-0318, ComEd has excluded recovery of payroll tax related to removed incentive compensation. The ComEd payroll tax rate is 7.26%. This amount is grossed up by the wages and salaries allocator to include on App 7.
2017 Actuals
Schedule C-2.4Page 2 of 2
Commonwealth Edison CompanyRemoval of Long Term Incentive Compensation
performance for CAIDI and SAIFI related to 2014 and 2015 LTPSAP was 5%. As such, ComEd has removed the remaining 95% ofcosts for these plans. There were no CAIDI and SAIFI performance goals for 2016 and 2017Allocation to jurisdictional based on 2017 Wages & Salaries allocation factor (see WPA-5, Page 1).100% of the Stock Options and Restricted Stock plans are now Exelon Plans and not ComEd specific. ComEd has removed 100% of those plans from the revenue requirement. The RSU plan was not offered to ComEd Executives below SVP in 2017.
(In Thousands)
Witness: Tracy
Notes:Long Term Performance Share Awards (LTPSA) were awarded in 2014 through 2017 and paid out 50% in stock and 50% in cash to Exelon Executives.Per Docket 14-0312, ComEd's weighted performance related to CAIDI and SAIFI are recoverable. In 2017 ComEd's weighted
Docket No. 18-____ ComEd Ex. 2.03
Page 72 of 334

LineNo.
(B)
1 Cash Balance Pension Plan (CBPP)
2 -$ (1)
3 CBPP Service Cost 7.00% (2)
4 Discount Rate 4.04% (3)
5 Investment Credit Rating 4.78% (3)
6 Average Years of Expected Future Service 13.52 (3)
7 Cost of pension related to 2016 excluded AIP - Line 2 * Line 3 * ((1+Line 5)/(1 + Line 4)) ^ Line 6 * (1+Line 4)
8 34 (4)
9 Total 2017 Cost of Pension Removed 34 Line 7 + Line 8
FERC Acct Allocation (5) Removal Allocator Jurisdictional(B) (C) (D) (E) (F)
10 Plant 107/108 51.66% 18$ See B-2.611 Handling/Clearing/Misc Various 0.69% 0$ 75.67% (6) 0$ 12 Non-Utility Expenses 416/426 0.66% 0$ 0% -$ 13 Production 500-557 0.21% 0$ 0% -$ 14 Transmission 560-573 5.20% 2$ 0% -$ 15 Distribution/Customer 580-908 31.45% 11$ 100% 11$ 16 Gen & Admin Expense 920-935 10.13% 3$ 85.94% (7) 3$
34$ 17 2017 CBPP Pension Expense Related to Previously Excluded AIP 14$
18 Exelon Corporation Retirement Plan (ECRP - Service Annuity System)
19 57$ (8)2021 Plant 107/108 51.66% 29$ See B-2.622 Handling/Clearing/Misc Various 0.69% 0$ 75.67% (6) 0$ 23 Non-Utility Expenses 416/426 0.66% 0$ 0% -$ 24 Production 500-557 0.21% 0$ 0% -$ 25 Transmission 560-573 5.20% 3$ 0% -$ 26 Distribution/Customer 580-908 31.45% 18$ 100% 18$ 27 Gen & Admin Expense 920-935 10.13% 6$ 85.94% (7) 5$
57$ 28 2017 ECRP Pension Expense Related to Previously Excluded AIP 23$
29 Total Jurisdictional Expense Removed 37$
30 Income Tax Effects of Above Adjustments:31 State Income Taxes (3)$ 32 Federal Income Taxes (12) 33 Deferred Income Taxes -
(15)$
(1)(2) Cash Balance Pension Plan service cost is equal to 7% of pensionable pay (base pay + incentive pay) per CBPP Summary document.(3) Actuarial assumptions(4) Carrying costs of previously excluded pension expense is equal to previously removed pension expense adjusted for discount rate
increase/decrease and gain/loss.(5) Allocation percentages based on 2017 balances.(6) Allocation to jurisdictional based on 2017 Net Plant allocation factor (see WPA-5, Page 2).(7) Allocation to jurisdictional based on 2017 Wages & Salaries allocation factor (see WPA-5, Page 2).(8) Balance based on actuarial analysis and assumptions.
Witness: Tracy
Schedule C-2.5Page 1 of 1
Commonwealth Edison CompanyRemoval of 2017 Pension Costs related to Previously Excluded Incentive Payments
2017 Actual(In Thousands)
Notes:Balance includes 2016 excluded AIP for ComEd employees participating in the CBPP.
Description(A)
Excluded 2016 AIP applicable to ComEd non-Local 15 CBPP participants
Carrying costs of previously excluded pension
2017 ECRP Pension Expense Related to Previously Excluded AIP
Docket No. 18-____ ComEd Ex. 2.03
Page 73 of 334

LineNo. Description
FERCAccount Total Expense Capital Allocator Jurisdictional
(A) (B) (C) (D) (E) (F) (G)
1 Normalization of Retention Awards:2 2014 Awards 2,789 1,276$ 1,513$ 3 2015 Awards 1,270 873 397 4 2016 Awards 1,137 836 301 5 2017 Awards 2,321 1,623 698 6 4 Year Average 1,879$
7 Total Increase/(Decrease) to 2017 Retention Awards (Col C, Line 6 - Line 5):
8Plant(Col C, Line 10 * (Col E, Line 5 / Col C, Line 5)) 107/108 (133)$ 75.67% (1) See B-2.6
9Gen & Admin Expense(Col C, Line 10 * (Col D, Line 5 / Col C, Line 5)) 920-935 (309)$ 85.94% (2) (266)
10 Total (442)$ (309)$ (133)$ (266)$
11 50% Reduction to Performance Awards (4): 201750%
Reduction50%
Reduction12 Plant 107/108 477$ (239)$ 75.67% (1) See B-2.613 Distribution/Customer 580-908 318 (159) 100% (159)$ 14 Gen & Admin Expense 920-935 1,645 (822) 85.94% (2) (706) 15 Total 2,440$ (981)$ (239)$ (865)$
16 Total Jursidictional Perqs and Awards Expense Removed: (1,290)$ (372)$ (1,131)$
17 Payroll Expense associate with Disallowed Perqs and Awards: (94)$ (3) (82)$
18 Total Jurisdictional Expense Removed (1,213)$
19 Income Tax Effects of Above Adjustments:20 State Income Taxes 105$ 21 Federal Income Taxes 388 22 Deferred Income Taxes - 23 493$
(1)(2)(3) In compliance with the ICC's final Order in Docket 13-0318, ComEd has excluded recovery of payroll tax related to removed
incentive compensation. Calculation takes total jurisdictional incentive removed (Line 16, Column G) multiplied by the payroll tax rate of 7.26%. This amount is grossed up by the wages and salaries allocator and included on App 7.
(4) Performance rewards are reduced 50%. See Final Order in Docket 10-0467.
Witness: Tracy
Notes:Allocation to jurisdictional based on 2017 Net Plant allocation factor (see WPA-5, Page 2).Allocation to jurisdictional based on 2017 Wages & Salaries allocation factor (see WPA-5, Page 1).
Schedule C-2.6Page 1 of 1
Commonwealth Edison CompanyAdjustments to Perquisites and Awards
2017 Actuals(In Thousands)
Docket No. 18-____ ComEd Ex. 2.03
Page 74 of 334

Schedule C-3Page 1 of 1
Line No. Customer Class
Total Company Revenues (2)
Megawatt Hours Sold
Total Company Revenues (2)
Megawatt Hours Sold
Total Company Revenues (2)
Megawatt Hours Sold
Total Company Revenues (2)
Megawatt Hours Sold
(A) (B) (C) (D) (E) (F) (G) (H) (I)
1 Residential 2,746,121$ 26,292 2,597,227$ 27,790 2,359,492$ 26,496 2,079,285$ 27,230
2 Small Commercial & Industrial 1,375,487 31,332 1,315,566 31,974 1,336,867 31,717 1,337,188 32,146
3 Large Commercial & Industrial 460,999 27,467 461,768 27,842 443,308 27,210 435,250 27,847
4 Public Authorities 37,721 785 38,343 797 36,915 804 38,899 796
5 Railroads 6,875 502 7,149 500 6,813 504 6,877 562
6 Total ICC Jurisdictional - Sales to Ultimate Consumers 4,627,203$ 86,378 4,420,054$ 88,903 4,183,395$ 86,732 3,897,499$ 88,581
7 Sales For Resale 28,345 1,191 17,266 705 14,263 566 88,666 1,998
8 Total Sales of Electricity 4,655,548$ 87,569 4,437,320$ 89,608 4,197,658$ 87,298 3,986,165$ 90,579
Notes:(1) From FERC Form 1, Pages 300-301.(2) Reflects delivery revenues and volumes from customers purchasing electricity directly from ComEd and customers purchasing electricity from a competitive electric generation supplier as all customers are assessed delivery charges. For customers purchasing electricity from ComEd, revenue also reflects the cost of energy.
Commonwealth Edison CompanySales Statistics (1)2014 - 2017 Actual
(In Thousands)
Witness: Tracy
2017 2016 2015 2014
Docket No. 18-____ ComEd Ex. 2.03
Page 75 of 334
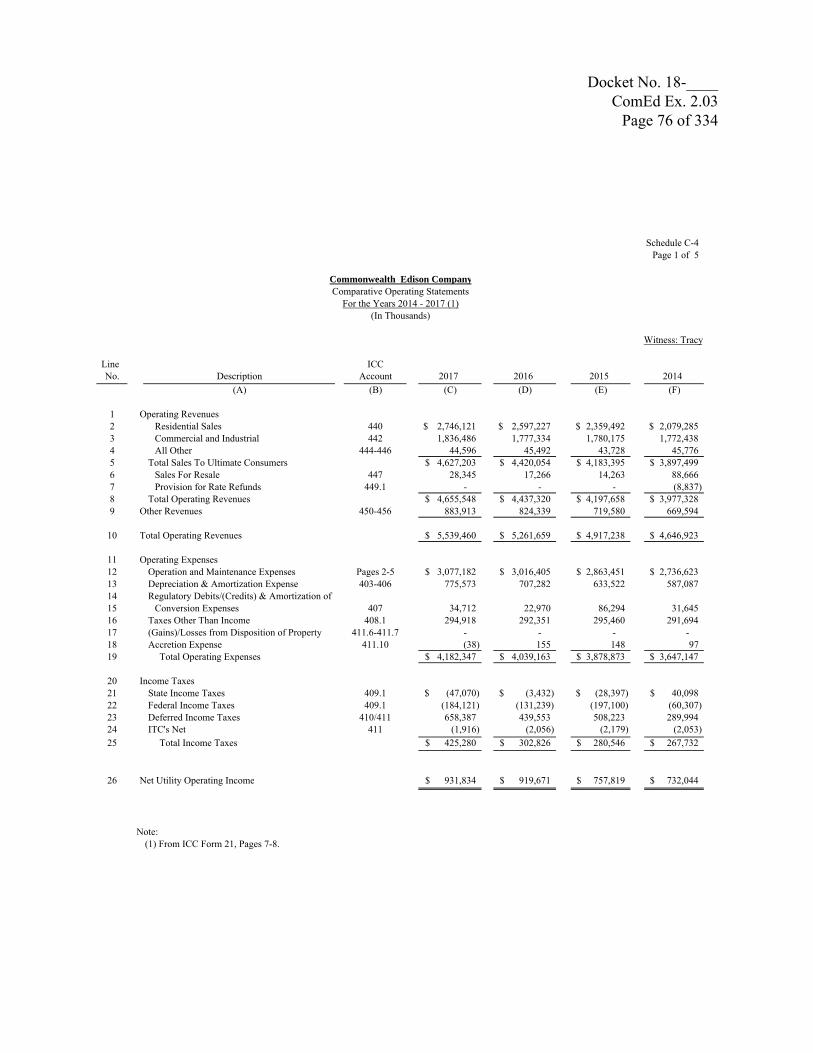
Schedule C-4Page 1 of 5
Commonwealth Edison CompanyComparative Operating Statements
For the Years 2014 - 2017 (1)(In Thousands)
Witness: Tracy
Line ICCNo. Description Account 2017 2016 2015 2014
(A) (B) (C) (D) (E) (F)
1 Operating Revenues2 Residential Sales 440 2,746,121$ 2,597,227$ 2,359,492$ 2,079,285$ 3 Commercial and Industrial 442 1,836,486 1,777,334 1,780,175 1,772,438 4 All Other 444-446 44,596 45,492 43,728 45,776 5 Total Sales To Ultimate Consumers 4,627,203$ 4,420,054$ 4,183,395$ 3,897,499$ 6 Sales For Resale 447 28,345 17,266 14,263 88,666 7 Provision for Rate Refunds 449.1 - - - (8,837) 8 Total Operating Revenues 4,655,548$ 4,437,320$ 4,197,658$ 3,977,328$ 9 Other Revenues 450-456 883,913 824,339 719,580 669,594
10 Total Operating Revenues 5,539,460$ 5,261,659$ 4,917,238$ 4,646,923$
11 Operating Expenses12 Operation and Maintenance Expenses Pages 2-5 3,077,182$ 3,016,405$ 2,863,451$ 2,736,623$ 13 Depreciation & Amortization Expense 403-406 775,573 707,282 633,522 587,087 14 Regulatory Debits/(Credits) & Amortization of15 Conversion Expenses 407 34,712 22,970 86,294 31,645 16 Taxes Other Than Income 408.1 294,918 292,351 295,460 291,694 17 (Gains)/Losses from Disposition of Property 411.6-411.7 - - - - 18 Accretion Expense 411.10 (38) 155 148 97 19 Total Operating Expenses 4,182,347$ 4,039,163$ 3,878,873$ 3,647,147$
20 Income Taxes21 State Income Taxes 409.1 (47,070)$ (3,432)$ (28,397)$ 40,098$ 22 Federal Income Taxes 409.1 (184,121) (131,239) (197,100) (60,307) 23 Deferred Income Taxes 410/411 658,387 439,553 508,223 289,994 24 ITC's Net 411 (1,916) (2,056) (2,179) (2,053) 25 Total Income Taxes 425,280$ 302,826$ 280,546$ 267,732$
26 Net Utility Operating Income 931,834$ 919,671$ 757,819$ 732,044$
Note:(1) From ICC Form 21, Pages 7-8.
Docket No. 18-____ ComEd Ex. 2.03
Page 76 of 334

Schedule C-4Page 2 of 5
Commonwealth Edison CompanyElectric Operation and Maintenance Expenses
For the Years 2014 - 2017 (1)(In Thousands)
Witness: Tracy
Line ICCNo. Description Account 2017 2016 2015 2014
(A) (B) (C) (D) (E) (F)
1 Power Production Expenses --2 Other Power Supply Expense3 Purchased Power 555000 1,293,644$ 1,189,278$ 1,123,373$ 1,082,153$ 4 System Control & Load Dispatch 556000 - - - - 5 Other Expenses 557000 58,152 29,430 25,377 23,726 5 Total Production Expenses 1,351,795$ 1,218,708$ 1,148,750$ 1,105,880$
6 Transmission Expenses --7 Operation8 Oper Supervision & Engineering 560000 20,589$ 19,495$ 18,359$ 17,711$ 9 Load Dispatching 561000 - - - -
10 Scheduling, System Control & Dispatch 561400 278,928 229,780 159,645 133,060 11 Transmission Service Studies 561600 (16) 478 28 33 12 Generation Interconnection Studies 561700 92 193 315 83 13 Reliability, Planning & Standards Dev. 561800 31,640 26,640 22,810 20,455 14 Station Expenses 562000 1,693 1,756 1,390 2,161 15 Overhead Line Expenses 563000 730 915 4,094 2,239 16 Underground Line Expenses 564000 - 2 16 21 17 Transmission of Electricity by Others 565000 8,948 7,092 7,173 6,590 18 Misc. Transmission Expenses 566000 31,139 28,881 32,359 15,069 19 Rents 567000 1,166 1,319 857 662 20 Total Operation 374,909$ 316,550$ 247,046$ 198,085$
21 Maintenance22 Maint Supervision & Engineering 568000 1,319$ 1,430$ 848$ 420$ 23 Maintenance of Structures 569000 4,905 4,609 4,362 5,647 24 Maintenance of Station equip 570000 15,487 15,024 16,365 16,362 25 Maintenance of Overhead Lines 571000 22,228 23,537 18,970 17,819 26 Maintenance of Underground Lines 572000 3,047 3,554 3,953 3,896 27 Maint. of Misc. Transmission. Plant 573000 5,908 5,495 2,089 1,639 28 Total Maintenance 52,895$ 53,649$ 46,586$ 45,782$
29 Total Transmission Expenses 427,803$ 370,199$ 293,633$ 243,867$
30 Regional Transmission and Market Operation Expenses --31 Operation32 Operation Supervision 575100 -$ -$ -$ -$ 33 Day-Ahead & Real-Time Market Facil. 575200 - - - - 34 Transmission Rights Market Facilitation 575300 - - - - 35 Capacity Market Facilitation 575400 - - - - 36 Ancillary Services Market Facilitation 575500 - - - - 37 Market Monitoring & Compliance 575600 - - - - 38 Market Facilitation, Monitoring &39 Compliance Services 575700 4,848 4,288 3,521 2,909 40 Rents 575800 - - - - 41 Total Operation 4,848$ 4,288$ 3,521$ 2,909$
Note:(1) From FERC Form 1, Pages 320 - 323.
Docket No. 18-____ ComEd Ex. 2.03
Page 77 of 334

Schedule C-4Page 3 of 5
Commonwealth Edison CompanyElectric Operation and Maintenance Expenses
For the Years 2014 - 2017 (1)(In Thousands)
Witness: Tracy
Line ICCNo. Description Account 2017 2016 2015 2014
(A) (B) (C) (D) (E) (F)
1 Regional Transmission and Market Operation Expenses (cont'd)--2 Maintenance3 Maintenance of Structures & Improve. 576100 -$ -$ -$ -$ 4 Maintenance of Computer Hardware 576200 - - - - 5 Maintenance of Computer Software 576300 - - - - 6 Maintenance of Communication Equip. 576400 - - - - 7 Maintenance of Miscellaneous8 Market Operation Plant 576500 - - - - 9 Total Maintenance -$ -$ -$ -$
10 Total Regional Transmission & Mkt. Op. Expenses 4,848$ 4,288$ 3,521$ 2,909$
11 Distribution Expenses --12 Operation13 Oper Supervision & Engineering 580000 24,029$ 23,514$ 22,785$ 17,806$ 14 Load Dispatching 581000 61 60 62 53 15 Station Expenses 582000 1,253 3,420 1,618 1,102 16 Overhead Line Expenses 583000 4,931 4,633 5,225 4,888 17 Underground Line Expenses 584000 18,113 17,572 16,793 14,285 18 Street Light & Signal System Exp 585000 1,533 1,170 1,150 1,271 19 Meter Expenses 586000 13,887 30,666 16,744 16,424 20 Customer Installations Expenses. 587000 26,482 27,944 26,246 22,772 21 Misc Distribution Expenses 588000 80,221 58,205 49,544 46,343 22 Rents 589000 2,351 2,069 2,200 2,360 23 Total Operation 172,861$ 169,252$ 142,367$ 127,304$
24 Maintenance25 Maint Supervision & Engineering 590000 3,407$ 3,002$ 229$ 196$ 26 Maintenance of Structures 591000 1,294 1,766 1,563 941 27 Maintenance of Station equip 592000 49,983 56,321 45,848 49,607 28 Maintenance of Overhead Lines 593000 154,085 138,151 166,861 173,511 29 Maintenance of Underground Lines 594000 66,922 84,443 82,506 89,791 30 Maint of Line Transformers 595000 6,045 5,984 6,675 6,561 31 Maint of Street Light & Signal Sys 596000 3,381 3,302 2,747 2,265 32 Maintenance of Meters 597000 531 538 648 384 33 Maint. of Misc. Distribution Plant 598000 6,777 6,993 16,210 16,136 34 Total Maintenance 292,424$ 300,501$ 323,285$ 339,395$
35 Total Distribution Expenses 465,285$ 469,753$ 465,651$ 466,699$
Note:(1) From FERC Form 1, Pages 320 - 323.
Docket No. 18-____ ComEd Ex. 2.03
Page 78 of 334

Schedule C-4Page 4 of 5
Commonwealth Edison CompanyElectric Operation and Maintenance Expenses
For the Years 2014 - 2017 (1)(In Thousands)
Witness: Tracy
Line ICCNo. Description Account 2017 2016 2015 2014
(A) (B) (C) (D) (E) (F)
1 Customer Accounts Expenses --2 Supervision 901000 1,075$ 1,053$ 928$ 890$ 3 Meter Reading Expenses 902000 38,987 48,012 55,624 54,818 4 Customer Records & Collect Expenses 903000 150,278 149,635 153,073 151,178 5 Uncollectible Accounts 904000 39,102 44,595 38,762 45,131 6 Misc. Customer Accounts Expenses 905000 - - - 6
7 Total Customer Accounts Expenses 229,443$ 243,296$ 248,386$ 252,022$
8 Customer Service & Informational Expenses --9 Supervision 907000 -$ -$ -$ -$ 10 Customer Assistance Expenses 908000 123,595 215,829 244,605 239,688 11 Informational and Instructional Expenses. 909000 9,135 11,688 5,874 4,824 12 Misc. Customer Service & Inform. 910000 - 741.01 - -
13 Total Customer Service & Inform. Expenses 132,730$ 228,258$ 250,478$ 244,512$
14 Sales Expenses --15 Supervision 911000 -$ -$ -$ -$ 16 Demonstrating and Selling Expenses. 912000 - - - - 17 Advertising Expenses 913000 - - - - 18 Miscellaneous Sales Expenses 916000 - - - -
19 Total Sales Expenses -$ -$ -$ -$
Note:(1) From FERC Form 1, Pages 320 - 323.
Docket No. 18-____ ComEd Ex. 2.03
Page 79 of 334

Schedule C-4Page 5 of 5
Commonwealth Edison CompanyElectric Operation and Maintenance Expenses
For the Years 2014 - 2017 (1)(In Thousands)
Witness: Tracy
Line ICCNo. Description Account 2017 2016 2015 2014
(A) (B) (C) (D) (E) (F)
1 Administrative and General Expenses --2 Operation3 Administrative & General Salaries 920000 54,996$ 50,472$ 43,933$ 44,199$ 4 Office Supplies & Expenses 921000 23,022 22,837 19,459 13,285 5 Admin Expenses Transferred -Credit 922000 (32,889) (29,345) (30,122) (26,645) 6 Outside Services Employed 923000 220,114 216,359 174,961 160,166 7 Property Insurance 924000 763 421 764 1,043 8 Injuries & Damages 925000 15,039 16,794 10,985 9,789 9 Employee Pensions & Benefits 926000 136,897 140,785 163,518 145,776
10 Franchise Requirements 927000 33,633 34,386 37,364 38,903 11 Regulatory Commission Expenses 928000 3,106 2,390 2,469 4,468 12 Duplicate Charges-Credit 929000 (33,633) (34,386) (37,364) (38,903) 13 General Advertising Expenses 930100 4,276 4,327 4,445 3,566 14 Miscellaneous General Expenses 930200 (2) 1,231 7,805 9,803 7,878 15 Rents 931000 3,522 9,073 7,481 10,820 16 Total Operation 430,076$ 441,917$ 407,696$ 374,346$
17 Maintenance18 Maintenance of General Plant 935000 35,202$ 39,986$ 45,335$ 46,388$
19 Total Administrative & General Expenses 465,278$ 481,903$ 453,031$ 420,734$
20 Total Operation & Maintenance Expenses 3,077,182$ 3,016,405$ 2,863,451$ 2,736,623$
Notes:(1) From FERC Form 1, Pages 320-323.(2) Account 930200 adjusted to reflect ICC reporting differences for each year as shown in the ICC Form 21, Page 13.1.
Docket No. 18-____ ComEd Ex. 2.03
Page 80 of 334

Schedule C-5 RYPage 1 of 4
Commonwealth Edison CompanyJurisdictional Income Taxes
2017 Actual - 2017 Rate Year(In Thousands)
Witness: Tracy
Line JurisdictionalNo. Description Present Rates
(A) (B)
1 (a) Calculation of Federal and State Income Tax Expense:
2 Delivery Services Tariff Base Revenues (Schedule C-1, Page 2, Line 1) 2,506,085$
3 Miscellaneous Revenues (Schedule C-1, Page 2, Line 2) 135,959
4 Total Revenues (Lines 2 + 3) 2,642,044$
5 O&M Expense (Schedule C-1, Page 2, Lines 8-12, Column D) (1,056,051)$
6 Depreciation and Amortization Expense (Schedule C-1, Page 2, Line 13) (628,148)
7 Taxes Other Than Income (Schedule C-1, Page 2, Line 14) (144,031)
8 Regulatory Debits (Schedule C-1, Page 2, Line 15) (51,040)
9 Total Electric Operating Expenses (Lines 5 through 8) (1,879,270)$
10 Interest Synchronization (from Schedule C-5.4 RY, Page 1, Line 3) (232,612)
11 Electric Operating Income Before Income Taxes (Lines 4 + 9 + 10) 530,162$
Docket No. 18-____ ComEd Ex. 2.03
Page 81 of 334

Schedule C-5 RYPage 2 of 4
Commonwealth Edison CompanyJurisdictional Income Taxes
2017 Actual - 2017 Rate Year(In Thousands)
Witness: TracyLine Total Utility Assignment/Allocation JurisdictionalNo. Income Tax Additions/Deductions Current Tax Method % $
(A) (B) (C) (D) (E)
1 Meals and Entertainment - 50% 785 Wages & Salaries 85.94% 6742 Sports Facilities 309 Non-DST 0.00% 03 Corporate-Owned Life Insurance Premiums (6) Wages & Salaries 85.94% (5)4 Disposition of Stock 211 Wages & Salaries 85.94% 1815 Penalties and Fines (36) Non-DST 0.00% 06 Lobbying Expenses 1,818 Non-DST 0.00% 07 Membership Dues (3) Non-DST 0.00% 08 Rite Line Minority Interest (0) Non-DST 0.00% 09 Fuel Tax Credit 49 Net Plant 75.67% 37
10 Other Equity Based Compensation - Perm (187) Non-DST 0.00% 011 Stock Options Exercised (216) Non-DST 0.00% 012 Accrued Vacation (9,609) Wages & Salaries 85.94% (8,258)13 Accrued Legal (88) Wages & Salaries 85.94% (76)14 Charitable Contributions 3,775 Non-DST 0.00% 015 Obsolete Materials 593 Net Plant 75.67% 44916 Provision for Bad Debt 1,173 Revenue Alloc 58.20% 68217 Damage to Company Property (91) Net Plant 75.67% (69)18 Taxes Other than Income Taxes 46 Net Plant 75.67% 3519 Liability for Severance Plans 107 Wages & Salaries 85.94% 9220 CPS Energy Efficiency Fund (174) Non-DST 0.00% 021 Other Accrued Expenses (2,683) Non-DST 0.00% 022 Other Current 3,765 Wages & Salaries 85.94% 3,23623 Partnerships (4) Non-DST 0.00% 024 Deferred Rental Expense (131) Wages & Salaries 85.94% (113)25 Environmental Cleanup Costs - Non-MGP (Mfg Gas Plants) (1) DST 100.00% (1)26 Executive Uninsured Death Benefits after Retirement (60) Wages & Salaries 85.94% (52)27 Federal NOL-Depreciation 14,901 Net Plant 75.67% 11,27528 Federal NOL DTA-Exclusion 10,695 Non-DST 0.00% 029 Incentive Compensation Deferred Stock Bonus Plan (54) Non-DST 0.00% 030 Stock Options; Other Equity Based Compensation (70) Non-DST 0.00% 031 Workers Compensation and Public Claims Reserve 47 Wages & Salaries 85.94% 4032 Long-Term Debt - Revaluation of Discount 313 Non-DST 0.00% 033 Management Deferred Compensation Plan (390) Wages & Salaries 85.94% (335)34 Manufactured Gas Plants - Provision (3,116) Non-DST 0.00% 035 Post Retirement Health Care Liability (7,903) Wages & Salaries 85.94% (6,792)36 Revenue Subject to Refund (339) Non-DST 0.00% 037 Supplemental Employee Retirement Plan (13) Non-DST 0.00% 038 Long-Term Incentive - Cash (4,945) Wages & Salaries 85.94% (4,250)39 Midwest Generation Settlement Asset (726) Non-DST 0.00% 040 Interest on Projected Tax Settlements (157,373) Non-DST 0.00% 041 Use Tax Adjustment (7) Net Plant 75.67% (6)42 Regulatory (Asset)/ Liab: Transmission 3,728 Non-DST 0.00% 043 Alt Fuels Tax Credit CF 303 Net Plant 75.67% 22944 R&D Credit CF 579 Wages & Salaries 85.94% 49745 Total Account 282 - Liberalized Depreciation (258,777) Net Plant 75.67% (195,817)46 Competitive Transition Charge (CTC) 7,238 Non-DST 0.00% 0
Docket No. 18-____ ComEd Ex. 2.03
Page 82 of 334

Schedule C-5 RYPage 3 of 4
Commonwealth Edison CompanyJurisdictional Income Taxes
2017 Actual - 2017 Rate Year(In Thousands)
Witness: TracyLine Total Utility Assignment/Allocation JurisdictionalNo. Income Tax Additions/Deductions Current Tax Method % $
(A) (B) (C) (D) (E)
47 AFUDC Plant & Equip Borrowed (1,297) Net Plant 75.67% (982)48 Deferred Gain - Like Kind Exchange 0 Non-DST 0.00% 049 FIN 47 (521) Net Plant 75.67% (394)50 Section 263A - Capitalized Interest 1,833 Net Plant 75.67% 1,38751 Software Costs Capitalized - Rev Bk (11,373) Net Plant 75.67% (8,606)52 Capitalized Interest / Overhead Capitalized 3,992 Net Plant 75.67% 3,02153 Pension Cost Capitalized on Books (38,999) Net Plant 75.67% (29,510)54 CIAC (6,131) Net Plant 75.67% (4,639)55 CIAC with Tax Gross Up 14,730 Non-DST 0.00% 056 Revaluation of Property (477) Non-DST 0.00% 057 Repair Allowance 5,032 Net Plant 75.67% 3,80858 Repairs - Distribution (197,502) DST 100.00% (197,502)59 Repairs - Transmission (18,447) Non-DST 0.00% 060 Transmission Upgrade - East/West (842) Non-DST 0.00% 061 AFUDC - Equity (2,561) Non-DST 0.00% 062 Chicago Arbitration Settlement 1,400 Non-DST 0.00% 063 Accrued Benefits (1,491) Wages & Salaries 85.94% (1,281)64 Incentive Compensation Capitalized (Global Settlement) 104 DST 100.00% 10465 Loss on Reacquired Debt 1,547 Net Plant 75.67% 1,17066 Midwest Generation Settlement Liab 1,494 Non-DST 0.00% 067 Pension Contribution - Net of Book Provision 9.5% 61,543 Wages & Salaries 85.94% 52,89068 Swap and Hedging Transactions 211 Net Plant 75.67% 16069 State Income Taxes - Temporary 14,887 Non-DST 0.00% 070 Regulatory (Asset)/Liab: MGP-Environmental Remediation 2,016 Non-DST 0.00% 071 Regulatory (Asset)/Liab: Rider UF (2,120) Non-DST 0.00% 072 Regulatory (Asset)/Liab: Distribution Rate Case Matters 3,129 Non-DST 0.00% 073 Regulatory (Asset)/Liab: AMP - retired meters and AMI costs 245 DST 100.00% 24574 Regulatory (Asset)/Liab: Distribution Formula Rate (20,842) Non-DST 0.00% 075 Regulatory (Asset)/Liab: Distribution - Other Deferred (Merger) 1,787 DST 100.00% 1,78776 Regulatory (Asset)/Liab: Distribution - Other Deferred (Storm) 4,883 DST 100.00% 4,88377 Regulatory (Asset)/Liab: Distribution - Other Deferred (A-Base) (4,585) DST 100.00% (4,585)78 Regulatory (Asset)/Liab: Distribution - Other Deferred (Ash Borer) (3,899) DST 100.00% (3,899)79 Regulatory (Asset)/Liab: Energy Efficiency (67,304) Non-DST 0.00% 080 Accelerated Depr AMI - Related to Reg Assets 3,338 DST 100.00% 3,33881 Equity In Earnings Uncon Sub 160 Non-DST 0.00% 082 Deferred Revenue - Fiber Optics Lease (214) Comm Equip 63.79% (137)83 REG ASSET - CAPITAL LEASES (72) Non-DST 0.00% 0
84 (652,914) (377,085)
Docket No. 18-____ ComEd Ex. 2.03
Page 83 of 334

Schedule C-5 RYPage 4 of 4
Commonwealth Edison CompanyJurisdictional Income Taxes
2017 Actual - 2017 Rate Year(In Thousands)
Witness: TracyLineNo. Description Jurisdictional
(A) (B) (C) (D)
85 Illinois Taxable Income Before Current and Deferred Tax Adjustments (Page 1, Line 11) 530,162
86 Illinois Income Tax @ 8.63% (Line 85 x 8.63%) 45,753
87 Federal Taxable Income (Line 85 - Line 86) 484,409$
88 Federal Income Tax Liability @ 35% (Line 87 x 35%) 169,546$
89 Total Current Income Tax Expense (Federal (Line 89) + Illinois (Line 86)) 215,299$
90 Total Jurisdictional Current Income Tax Adjustments (Page 3, Line 84) (377,085)
91 Deferred Amount in Line 90 Applied to Current Federal Taxes (296,951) 92 Deferred Amount in Line 90 Applied to Current State Taxes (80,134)
93 Total Jurisdictional Deferred Tax Expense (Schedule C-5.2, Page 3, Line 26, Column E) 383,929
94 Fuels Tax Credit (50) Net Plant (38) 95 Alt Fuels Credit (121) Net Plant (91) 96 R&D Credit (113) Net Plant (86) 97 ComEd IL ITC Credit (312) Net Plant (236) 98 ITC Amortization Schedule C-5.5 (1,155)
99 Total Income Tax Expense Related to Current Yr Activity (Line 86 + Line 88 + Line 91 + Line 92 + Line 93 + Line 94 through Line 98) 220,537$
Notes:(a) The most recent Illinois State income tax return and any required supporting information have been provided in Section 285.150(h). For tax years
beginning on or after January 1, 2011 through December 31, 2014, the State of Illinois imposed a 7.0% income tax on corporations earning income in Illinois.An additional personal property replacement tax of 2.5% is applicable to all corporations subject to the income tax. Resulting in a combined rate of 9.5%
For tax years beginning on or after January 1, 2015 through June 30, 2017, the State of Illinois imposed a 5.25% income tax on corporations earning income in Illinois. An additional personal property replacement tax of 2.5% is applicable to all corporations subject to the income tax. Resulting in a combined rate of 7.75%.
Effective July 1, 2017, the State of Illinois imposed a 7.0% income tax on corporations earning income in Illinois. An additional personal property replacement tax of 2.5% is applicable to all corporations subject to the income tax. Resulting in a combined rate of 9.5%
Docket No. 18-____ ComEd Ex. 2.03
Page 84 of 334

Schedule C-5.1Page 1 of 1
Commonwealth Edison CompanyConsolidated Federal Income Tax Return
Witness: TracyLineNo. Description
(A)
1 Procedure Used To Allocate Consolidated Federal Income Tax Liability:
2 The consolidated federal income tax liability is allocated based upon each member's
3 separate return tax liability. If the consolidated federal income tax liability is positive,
4 each member's liability is equal to its separate return tax liability. If the consolidated federal
5 income tax liability is negative, the members with positive separate return tax liability
6 will be allocated an amount equal to its separate return tax liability. The members with
7 negative separate return tax liability will be allocated an amount equal to the total of the
8 positive separate return taxes in the consolidated group multiplied by the ratio that the
9 negative separate return tax of the subsidiary bears to the total of the separate return tax of
10 all subsidiaries with a negative separate return.
11 The Benefits to the Utility, If Any, Expected from Filing as part of the Consolidated
12 Federal Income Tax Return:
13 Due to an expected consolidated federal tax loss, ComEd will generate a federal net operating
14 loss for the current period resulting in related deferred tax asset as a member of the federal
15 consolidated income tax return for its taxable year ending December 31, 2017.
17 The Impact of the Benefits on the Utility's Books, If Any, Expected from Filing as part of the
18 Consolidated Federal IncomeTax Return:
19 As a result of the expected consolidated federal tax loss, ComEd did record a deferred tax asset
20 related for a federal net operating loss carryforward in the financial statements for the year ended
21 December 31, 2017.
Docket No. 18-____ ComEd Ex. 2.03
Page 85 of 334

Schedule C-5.2Page 1 of 3
Commonwealth Edison Company2017 Deferred Income Tax Expense
(In Thousands)
Witness: Tracy
Line 2017 Total Assignment/AllocationNo. Description Deferred Taxes Method % $
(A) (B) (C) (D) (E)1 Acct. 190- Deferred Tax Assets2 Accrued Holiday (0)$ Wages & Salaries 85.94% (0)$ 3 Accrued Vacation 9,740 Wages & Salaries 85.94% 8,371 4 Accrued Legal 89 Wages & Salaries 85.94% 77 5 Charitable Contributions (4,081) Non-DST 0.00% - 6 Obsolete Materials (601) Net Plant 75.67% (455) 7 Provision for Bad Debt (1,189) Revenue Alloc 58.20% (692) 8 Damage to Company Property 92 Net Plant 75.67% 70 9 Taxes Other than Income Taxes (47) Net Plant 75.67% (36) 10 Incentive Compensation Plan (0) Wages & Salaries 85.94% (0) 11 Liability for Severance Plans (107) Wages & Salaries 85.94% (92) 12 CPS Energy Efficiency Fund 177 Non-DST 0.00% - 13 Other Accrued Expenses 2,721 Non-DST 0.00% - 14 Other Current (3,752) Wages & Salaries 85.94% (3,225) 15 Partnerships 4 Non-DST 0.00% - 16 Deferred Rental Expense 133 Wages & Salaries 85.94% 114 17 Environmental Cleanup Costs - Non-MGP (Mfg Gas Plants) 1 DST 100.00% 1 18 Executive Uninsured Death Benefits after Retirement 61 Wages & Salaries 85.94% 52 19 Federal NOL-Depreciation (14,901) Net Plant 75.67% (11,275) 20 Federal NOL DTA-Exclusion (10,695) Non-DST 0.00% - 21 Incentive Compensation Deferred Stock Bonus Plan 54 Non-DST 0.00% - 22 Stock Options; Other Equity Based Compensation 1,935 Non-DST 0.00% - 23 Workers Compensation and Public Claims Reserve (47) Wages & Salaries 85.94% (41) 24 Long-Term Debt - Revaluation of Discount (317) Non-DST 0.00% - 25 Management Deferred Compensation Plan 395 Wages & Salaries 85.94% 340 26 Manufactured Gas Plants - Provision 3,159 Non-DST 0.00% - 27 Post Retirement Health Care Liability 8,013 Wages & Salaries 85.94% 6,887 28 Revenue Subject to Refund 344 Non-DST 0.00% - 29 Supplemental Employee Retirement Plan 13 Non-DST 0.00% - 30 Long-Term Incentive - Cash 5,015 Wages & Salaries 85.94% 4,310 31 Midwest Generation Settlement Asset 736 Non-DST 0.00% - 32 Interest on Projected Tax Settlements 159,585 Non-DST 0.00% - 33 Use Tax Adjustment 8 Net Plant 75.67% 6 34 Regulatory (Asset)/ Liab: Transmission (3,781) Non-DST 0.00% - 35 Alt Fuels Tax Credit CF (303) Net Plant 75.67% (229) 36 R&D Credit CF (579) Wages & Salaries 85.94% (497)
37 Total Account 190 - Deferred Tax Assets 151,876$ 3,685$
Jurisdictional
Docket No. 18-____ ComEd Ex. 2.03
Page 86 of 334

Schedule C-5.2Page 2 of 3
Commonwealth Edison Company2017 Deferred Income Tax Expense
(In Thousands)
Witness: Tracy
Line 2017 Total Assignment/AllocationNo. Description Deferred Taxes Method % $
(A) (B) (C) (D) (E)
1 Acct. 282 -Property, Plant & Equip. (EPS Accts. 282000 & 282200)2 Total Account 282 - Liberalized Depreciation 260,594$ Net Plant 75.67% 197,191$ 3 Competitive Transition Charge (CTC) (7,068) Non-DST 0.00% - 4 AFUDC Plant & Equip Borrowed 1,458 Net Plant 75.67% 1,103 5 AFUDC Plant & Equip Equity - Non-DST 0.00% - 6 Deferred Gain - Like Kind Exchange (319,933) Non-DST 0.00%7 FIN 47 526 Net Plant 75.67% 398 8 Section 263A - Capitalized Interest (2,384) Net Plant 75.67% (1,804) 9 Software Costs Capitalized - Rev Bk 11,606 Net Plant 75.67% 8,783 10 Capitalized Interest / Overhead Capitalized (3,522) Net Plant 75.67% (2,665) 11 Pension Cost Capitalized on Books 38,755 Net Plant 75.67% 29,326 12 CIAC 6,059 Net Plant 75.67% 4,585 13 CIAC with Tax Gross Up (14,861) Non-DST 0.00% - 14 Revaluation of Property 463 Non-DST 0.00% - 15 Repair Allowance (5,026) Net Plant 75.67% (3,803) 16 Repairs - Distribution 198,425 DST 100.00% 198,425 17 Repairs - Transmission 18,634 Non-DST 0.00% - 18 Transmission Upgrade - East/West 825 Non-DST 0.00% -
19 Total Account 282 - Property, Plant, & Equipment 184,549$ 431,538$
Jurisdictional
Docket No. 18-____ ComEd Ex. 2.03
Page 87 of 334

Schedule C-5.2Page 3 of 3
Commonwealth Edison Company2017 Deferred Income Tax Expense
(In Thousands)
Witness: Tracy
Line 2017 Total Assignment/AllocationNo. Description Deferred Taxes Method % $
(A) (B) (C) (D) (E)
1 Account 283 - Other Deferred Tax Liabilities2 Chicago Arbitration Settlement (1,420)$ Non-DST 0.00% - 3 Accrued Benefits 1,512 Wages & Salaries 85.94% 1,299 4 Incentive Compensation Capitalized (Global Settlement) (105) DST 100.00% (105) 5 Loss on Reacquired Debt (1,568) Net Plant 75.67% (1,187) 6 Midwest Generation Settlement Liab (1,515) Non-DST 0.00% - 7 Pension Contribution - Net of Book Provision 9.5% (62,335) Wages & Salaries 85.94% (53,571) 8 Swap and Hedging Transactions (214) Net Plant 75.67% (162) 9 State Income Taxes - Temporary (14,887) Non-DST 0.00% - 10 Regulatory (Asset)/Liab: MGP-Environmental Remediation (2,045) Non-DST 0.00% - 11 Regulatory (Asset)/Liab: Rider UF 2,150 Non-DST 0.00% - 12 Regulatory (Asset)/Liab: Distribution Rate Case Matters (3,172) Non-DST 0.00% - 13 Regulatory (Asset)/Liab: AMP - retired meters and AMI costs (249) DST 100.00% (249) 14 Regulatory (Asset)/Liab: AMP - other costs 0 Non-DST 0.00% - 15 Regulatory (Asset)/Liab: Distribution Formula Rate 21,999 Non-DST 0.00% - 16 Regulatory (Asset)/Liab: Distribution - Other Deferred (Merger) (1,812) DST 100.00% (1,812) 17 Regulatory (Asset)/Liab: Distribution - Other Deferred (Storm) (4,951) DST 100.00% (4,951) 18 Regulatory (Asset)/Liab: Distribution - Other Deferred (A-Base) 4,649 DST 100.00% 4,649 19 Regulatory (Asset)/Liab: Distribution - Other Deferred (Ash Borer) 3,899 DST 100.00% 3,899 20 Regulatory (Asset)/Liab: Energy Efficiency 68,247 Non-DST 0.00% - 21 Accelerated Depr AMI - Related to Reg Assets (3,385) DST 100.00% (3,385) 22 Equity In Earnings Uncon Sub (162) Non-DST 0.00% - 23 Deferred Revenue - Fiber Optics Lease 217 Comm Equip 63.79% 139 24 Regulatory (Asset)/Liab: Capital Leases 73 Non-DST 0.00% -
25 Total Account 283 - Other Deferred Tax Liabilities 4,925$ (55,436)$
26 Tax Reg Asset Amortization & Credits27 IL Rate Change Reg Asset - Amortization 658$ Other 93.37% 615$ 28 Property Flow-Thru - AFUDC Reversal 2,356 Net Plant 75.67% 1,783 29 Property Flow-Thru - Excess Deferreds & Other Flow-thru (634) Net Plant 75.67% (480) 30 Regulatory (Asset)/Liab: FAS109 Transmission Reg Asset Write-Up/Wr 2,905 Non-DST 0.00% - 31 2017 IL Rate Change Amortization 2,224 DST 100.00% 2,224 32 2017 IL Rate Change Amortization - Transmission & Other 502 Non-DST 0.00% - 33 2017 IL Rate Change - 7/1/17-12/31/17 Reversal (10,545) Non-DST 0.00% -
34 Total Reg Asset Amortization and Credits (Line 27 through Line 33) (2,534)$ 4,142$
35 Total 2017 Deferred Tax Expense (Page 1, Line 37 + Page 2, Line 19 + Page 3, Lines 25 and 34) 338,817$ 383,929$
Jurisdictional
Docket No. 18-____ ComEd Ex. 2.03
Page 88 of 334

Schedule C-5.3Page 1 of 1
Witness: TracyLineNo. Description Jurisdictional (1)
(A) (B)
1 Book Depreciation Expense 610,617$
2 Tax Depreciation Expense - Plant & Equipment (1,107,298)
3 Liberalized Tax Depreciation - Net Add/(Deduct) (Line 1 + Line 2) (496,681)$
4 Bonus Depreciation Adjustment For State Tax 103,604
5 Tax Depreciation for State Tax - Net Add/(Deduct)6 (Line 3 + Line 4) (393,077)$
7 State Income Tax Rate 9.50%
8 State Deferred Tax Exp. - Plant & Equipment Depreciation9 (Line 6 * Line 7) * -1 37,342$
10 Federal Income Tax Rate 35.0%
11 Federal Deferred Tax Expense - Plant & Equipment Deprec.12 (Line 3 + Line 9) * Line 10 * -1 160,769$
13 Deferred Tax Expense - Plant & Equip. Depreciation14 (Line 9 + Line 12) 198,111$
15 Deferred Taxes Flow-Through -
16 Total Deferred Tax Expense - Plant & Equipment Deprec. 198,111$ (Line 14 + Line 15)
Notes: (1) Jurisdictional Plant Allocator = 75.67%.
Commonwealth Edison CompanyDifferences Between Jurisdictional 2017 Book and Tax Depreciation
(In Thousands)
Docket No. 18-____ ComEd Ex. 2.03
Page 89 of 334

Schedule C-5.4 RYPage 1 of 2
Commonwealth Edison CompanyInterest Synchronization - 2017 Recon Year
(In Thousands)
Witness: Tracy
Line Test YearNo. Description Amount
(A) (B)
1 Delivery Services Rate Base (Schedule B-1, Page 2) 9,572,496$
2 Weighted Cost of Debt (Schedule D-1, Page 1) (1) 2.43%
3 Synchronized Interest 232,612$
Note:(1) Includes cost of debt 2.41% plus an additional amount for credit facility costs of .02%.
Effect of Rate Base Adjustments
Docket No. 18-____ ComEd Ex. 2.03
Page 90 of 334

Schedule C-5.4 RYPage 2 of 2
Commonwealth Edison CompanyInterest Synchronization - 2017 Recon Year
(In Thousands)
Witness: Tracy
Line Test YearNo. Description Amount
(A) (B)
1 Illinois Jurisdictional Delivery Services Rate Base (Schedule B-1, Page 1) 9,512,615$
2 Weighted Cost of Debt (Schedule D-1, Page 1) 2.43%
3 Synchronized Interest 231,157$
4 Synchronized Interest Based on Unadjusted Delivery Services5 Rate Base (from Page 1) 232,612
6 Change in Interest-Electric for Tax Calculation (1,455)$
7 Change in Taxable Income-Electric for Tax Calculation 1,455$
8 Change in State Current Income Tax (at 8.63%) 126$
9 Change in Federal Current Income Tax (at 35%) (1) 465$
Note:(1) [Line 7 - Line 8] * 35%.
Effect of Rate Base Adjustments
Docket No. 18-____ ComEd Ex. 2.03
Page 91 of 334

Schedule C-5.5Page 1 of 2
Witness: Tracy
Balance at Deferred Adjustments Amortized Balance at Line FERC Beginning during the during the during the EndNo. Account Description of Year Year Year Year of Year
(A) (B) (C) (D) (E) (F) (G)
1 255020 Post - 1971 4% - Job Development (81)$ -$ -$ 7$ (74)$ 2 255030 Post - 1971 10% - Plant and Equipment (15,318) - - 1,909 (13,409)
3 Total Investment Tax Credits (1) (15,399)$ -$ -$ 1,916$ (13,483)$
Note:(1) Accumulated Deferred Investment Tax Credits (Account 255) - 2017 FERC Form 1, Pages 266-267.
Commonwealth Edison CompanyInvestment Tax and Job Development Credits
2017(In Thousands)
Docket No. 18-____ ComEd Ex. 2.03
Page 92 of 334
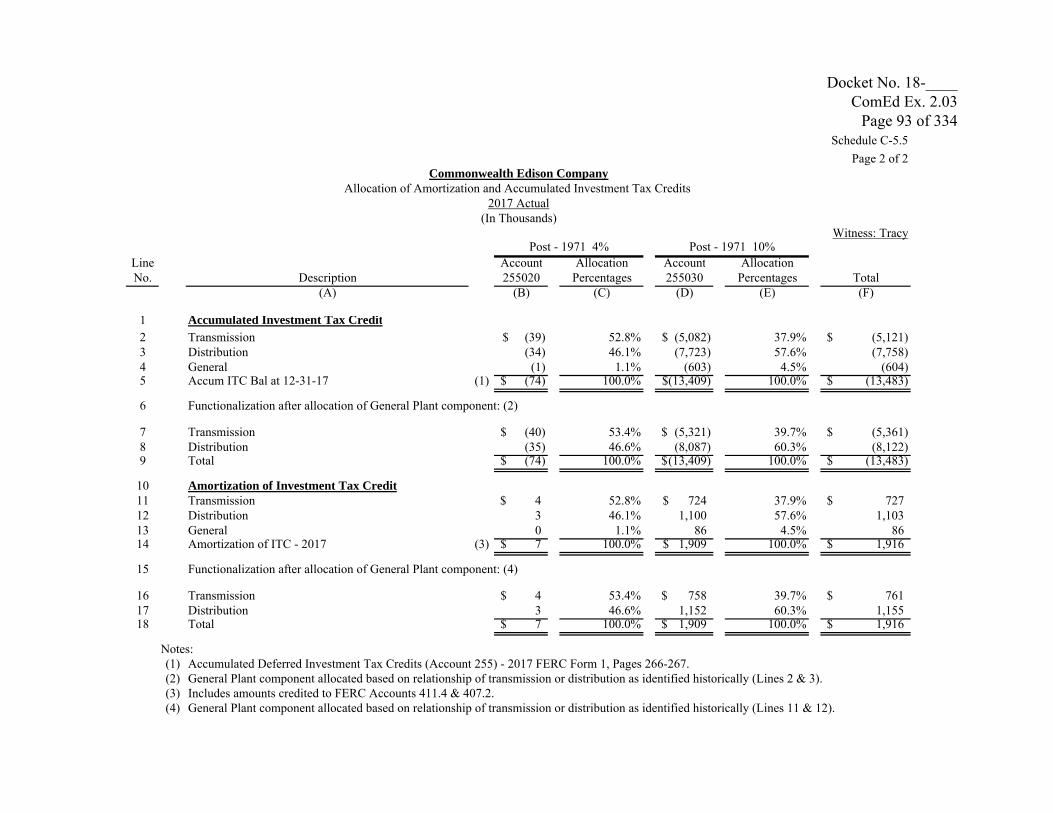
Schedule C-5.5Page 2 of 2
Witness: Tracy
Line Account Allocation Account AllocationNo. Description 255020 Percentages 255030 Percentages Total
(A) (B) (C) (D) (E) (F)
1 Accumulated Investment Tax Credit2 Transmission (39)$ 52.8% (5,082)$ 37.9% (5,121)$ 3 Distribution (34) 46.1% (7,723) 57.6% (7,758) 4 General (1) 1.1% (603) 4.5% (604) 5 Accum ITC Bal at 12-31-17 (1) (74)$ 100.0% (13,409)$ 100.0% (13,483)$
6 Functionalization after allocation of General Plant component: (2)
7 Transmission (40)$ 53.4% (5,321)$ 39.7% (5,361)$ 8 Distribution (35) 46.6% (8,087) 60.3% (8,122) 9 Total (74)$ 100.0% (13,409)$ 100.0% (13,483)$
10 Amortization of Investment Tax Credit11 Transmission 4$ 52.8% 724$ 37.9% 727$ 12 Distribution 3 46.1% 1,100 57.6% 1,103 13 General 0 1.1% 86 4.5% 86 14 Amortization of ITC - 2017 (3) 7$ 100.0% 1,909$ 100.0% 1,916$
15 Functionalization after allocation of General Plant component: (4)
16 Transmission 4$ 53.4% 758$ 39.7% 761$ 17 Distribution 3 46.6% 1,152 60.3% 1,155 18 Total 7$ 100.0% 1,909$ 100.0% 1,916$
Notes:(1) Accumulated Deferred Investment Tax Credits (Account 255) - 2017 FERC Form 1, Pages 266-267.(2) General Plant component allocated based on relationship of transmission or distribution as identified historically (Lines 2 & 3).(3) Includes amounts credited to FERC Accounts 411.4 & 407.2.(4) General Plant component allocated based on relationship of transmission or distribution as identified historically (Lines 11 & 12).
Commonwealth Edison CompanyAllocation of Amortization and Accumulated Investment Tax Credits
2017 Actual(In Thousands)
Post - 1971 4% Post - 1971 10%
Docket No. 18-____ ComEd Ex. 2.03
Page 93 of 334

Schedule C-6Page 1 of 1
Witness: Tracy
LineNo. Description 2017 2016 2015 2014
(A) (B) (C) (D) (E)
1 Total Social And Service Club Membership2 Dues Charged To Operating Expenses (1) -$ -$ -$ -$
3 Total Social And Service Club Membership4 Dues Charged To Non-Operating Expenses (8) 21 61 63
5 Total (8)$ 21$ 61$ 63$
Note:(1) Social and service club membership dues are recorded in Account 426.5, Other deductions, and excluded from operating expense.
Commonwealth Edison CompanySocial and Service Club Membership Dues
(In Thousands)
Docket No. 18-____ ComEd Ex. 2.03
Page 94 of 334

Schedule C-6.1Page 1 of 2
Witness: TracyLineNo. Description 2017 Actual Jurisdictional (1)
(A) (B) (C)
1 Industry Association Dues:2 Charged to Transmission O&M 2$ -$ 3 Charged to Distribution O&M 98 98 4 Charged to Customer Accts. O&M 4 4 5 Charged to Customer Service O&M 31 31 6 Charged to A&G Expense7 Edison Electric Institute (2)(3) 669 575 8 All other charged to A&G:
9 Memberships in other professional industry organizations 665 571
10 Memberships in transmission related industry associations - -
11 Industry Association Dues Charged to 12 To Operating Expenses In 2017 1,468$ 1,279$ 13 Total Industry Association Dues Charged14 To Other Accounts In 2017 (4) 344 -
15 Total Industry Association Dues 1,813$ 1,279$ (5)
Notes:(1) Industry dues charged to Distribution and Customer O&M accounts are allocated to delivery service at 100%. Industry dues charged to A&G O&M accounts are allocated to delivery service based on the 2017 Wages and Salaries allocation factor (85.94%,see WPA-5, Page 1 ). Industry dues are net of any expenses related to regulatory advocacy.(2) Annual EEI billing for membership dues includes an amount for annual dues, legislative and political
activities, and charitable contributions. Dues shown above are charged to account 930.2,Miscellaneous general expenses. The legislative and political portion of the invoice is charged toAccount 426.4, Expenditures for Certain Civic, Political and Related Activities, and the charitablecontribution portion of the bill is charged to 426.1, Donations.
(3) Nature and purpose of EEI: an organization that provides a forum for utilities and individuals in the electric power industry to exchange ideas and experiences and to communicate with a variety of audiences, including regulators.
(4) These expenses are recorded below the line and are not included in the revenue requirement.(5) Expense included on Schedule C-1.
Industry Association Dues(In Thousands)
Commonwealth Edison Company
Docket No. 18-____ ComEd Ex. 2.03
Page 95 of 334

Schedule C-6.1 Page 2 of 2
Witness: Tracy
LineNo. Description 2016 2015 2014
(A) (B) (C) (D)
1 Industry Association Dues --2 Edison Electric Institute (1) 648$ 673$ 679$
3 All Other 1,540 783 941
4 Total Industry Association Dues 2,188$ 1,456$ 1,620$
Note:(1) Represents EEI annual membership dues charged to Account 930.2,
excluding the portion charged to Account 426.4, Expenditures for CertainCivic, Political, and Related Activities
Industry Association Dues(In Thousands)
Commonwealth Edison Company
Docket No. 18-____ ComEd Ex. 2.03
Page 96 of 334

Schedule C-6.2Page 1 of 74
Commonwealth Edison CompanyExpenses For Outside Professional Services in 2017
2017 Payments of $50,000 Or More Charged To Operating Expense(In Thousands)
Witness: Tracy
2017Line FERC Account PaymentNo. Account Description Payee Amount Nature of Service Provided
(A) (B) (C) (D) (E)
1 557000 Other expenses BATES WHITE LLC 495$ CONSULTING SERVICES2 557000 Other expenses ILLINOIS POWER AGENCY 846 OPERATIONAL CONSULTING3 557000 Other expenses MCGUIRE WOODS LLP 234 LEGAL SERVICES4 557000 Other expenses SIDLEY & AUSTIN 74 LEGAL SERVICES5 560000 Oper supervision & engineering AVEVA INC 60 IT SERVICES6 560000 Oper supervision & engineering CATERPILLAR INC 229 TRAINING SERVICES7 560000 Oper supervision & engineering DAVEY RESOURCE GROUP 112 VEGETATION MANAGEMENT8 560000 Oper supervision & engineering M J ELECTRIC LLC 69 OPERATIONAL STAFF AUGMENTATION9 560000 Oper supervision & engineering PRIMERA ENGINEERS LTD 59 ENGINEERING
10 560000 Oper supervision & engineering QUANTA TECHNOLOGY LLC 93 CONSULTING SERVICES11 560000 Oper supervision & engineering ROONEY, RIPPIE & RATNASWAMY LLP 55 LEGAL SERVICES12 560000 Oper supervision & engineering WEST MONROE PARTNERS, LLC 246 CONSULTING SERVICES13 562000 Station expenses INTREN LLC 156 CONSTRUCTION SERVICES14 563000 Overhead line expenses ENERCON SERVICES INC 250 ENGINEERING15 566000 Misc. transmission expenses AMPJACK AMERICA LTD 155 CONSTRUCTION SERVICES16 566000 Misc. transmission expenses ARCADIS US, INC. 76 ENVIRONMENTAL SERVICES17 566000 Misc. transmission expenses AVO INTERNATIONAL 66 TRAINING SERVICES18 566000 Misc. transmission expenses BURNS & MCDONNELL ENGINEERING 582 ENGINEERING19 566000 Misc. transmission expenses D CONSTRUCTION INC 361 CONSTRUCTION SERVICES20 566000 Misc. transmission expenses ESCI INC 70 SAFETY SERVICES21 566000 Misc. transmission expenses ESPO ENGINEERING CORP 96 ENGINEERING22 566000 Misc. transmission expenses F H PASCHEN S N NIELSEN & ASSOC LLC 2,004 CONSTRUCTION SERVICES23 566000 Misc. transmission expenses INTREN LLC 100 CONSTRUCTION SERVICES24 566000 Misc. transmission expenses J F ELECTRIC INC 213 STORM ASSISTANCE25 566000 Misc. transmission expenses LINDBLAD CONSTRUCTION COMPANY 84 CONSTRUCTION SERVICES26 566000 Misc. transmission expenses M J ELECTRIC LLC 96 OPERATIONAL STAFF AUGMENTATION27 566000 Misc. transmission expenses MEADE ELECTRIC CO 91 OPERATIONAL STAFF AUGMENTATION28 566000 Misc. transmission expenses NEW SOUTH EQUIPMENT MATS LLC 133 CONSTRUCTION SERVICES
Page Sub-Total 7,105$
Docket No. 18-____ ComEd Ex. 2.03
Page 97 of 334

Schedule C-6.2Page 2 of 74
Commonwealth Edison CompanyExpenses For Outside Professional Services in 2017
2017 Payments of $50,000 Or More Charged To Operating Expense(In Thousands)
Witness: Tracy
2017Line FERC Account PaymentNo. Account Description Payee Amount Nature of Service Provided
(A) (B) (C) (D) (E)
1 566000 Misc. transmission expenses PONTOON SOLUTIONS INC 349$ PROFESSIONAL STAFF AUGMENTATION2 566000 Misc. transmission expenses RONALD G KAMINSKI 199 ENGINEERING3 566000 Misc. transmission expenses SEL ENGINEERING SERVICES INC 108 ENGINEERING4 568000 Main supervision & engineering PSC INDUSTRIAL OUTSOURCING, LP 684 OPERATIONAL STAFF AUGMENTATION5 569000 Maintenance of structures ANDERSON & SHAH ROOFING INC 213 BUILDING MAINTENANCE AND REPAIRS6 569000 Maintenance of structures BEARY LANDSCAPE MANAGEMENT INC 66 BUILDING MAINTENANCE AND REPAIRS7 569000 Maintenance of structures GARFIELD BUILDING MAINTENANCE 396 BUILDING MAINTENANCE AND REPAIRS8 569000 Maintenance of structures GREAT LAKES FIRE AND SAFETY EQUIPMENT 53 SAFETY SERVICES9 569000 Maintenance of structures OSMOSE UTILITIES SERVICES INC 53 TECHNICAL SERVICES
10 569000 Maintenance of structures PHOENIX FIRE SYSTEMS, INC. 55 SAFETY SERVICES11 569000 Maintenance of structures PUBLIC UTILITIES 691 PAINTING AND COATING12 570000 Maintenance of station equip ABB POWER T&D COMPANY INC 158 TECHNICAL SERVICES13 570000 Maintenance of station equip A-LINE E.D.S. 123 ENVIRONMENTAL SERVICES14 570000 Maintenance of station equip DELTA STAR INC 58 TECHNICAL SERVICES15 570000 Maintenance of station equip J&L COOLING TOWERS INC 140 TECHNICAL SERVICES16 570000 Maintenance of station equip LINDBLAD CONSTRUCTION COMPANY 117 CONSTRUCTION SERVICES17 570000 Maintenance of station equip MZI GROUP INC 80 TECHNICAL SERVICES18 570000 Maintenance of station equip PHOENIX FIRE SYSTEMS, INC. 62 SAFETY SERVICES19 570000 Maintenance of station equip QUALITECH ENGINEERING, LLC 80 ENGINEERING20 570000 Maintenance of station equip QUANTUM CROSSINGS LLC 271 TECHNICAL SERVICES21 570000 Maintenance of station equip SCHNEIDER ELECTRIC BUILDING AMERICAS INC 360 BUILDING MAINTENANCE AND REPAIRS22 570000 Maintenance of station equip THE BARTECH GROUP 64 TECHNICAL SERVICES23 570000 Maintenance of station equip TRACK SERVICE, INC 58 CONSTRUCTION SERVICES24 570000 Maintenance of station equip TRANSMISSION AND DISTRIBUTION SERVICES LLC 124 TECHNICAL SERVICES25 571000 Maintenance of overhead lines AMERICAN HERITAGE PROTECTION 53 SECURITY26 571000 Maintenance of overhead lines ASPLUNDH TREE EXPERT CO 3,181 TREE TRIMMING27 571000 Maintenance of overhead lines B & R REPAIR INC. 63 GENERAL MAINT AND REPAIRS28 571000 Maintenance of overhead lines BEARY LANDSCAPE MANAGEMENT INC 1,319 BUILDING MAINTENANCE AND REPAIRS
Page Sub-Total 9,178$
Docket No. 18-____ ComEd Ex. 2.03
Page 98 of 334

Schedule C-6.2Page 3 of 74
Commonwealth Edison CompanyExpenses For Outside Professional Services in 2017
2017 Payments of $50,000 Or More Charged To Operating Expense(In Thousands)
Witness: Tracy
2017Line FERC Account PaymentNo. Account Description Payee Amount Nature of Service Provided
(A) (B) (C) (D) (E)
1 571000 Maintenance of overhead lines CHEMICAL VEGETATION CONTROL LLC 128$ VEGETATION MANAGEMENT2 571000 Maintenance of overhead lines CHRISTOPHER B BURKE ENGINEERIN 102 ENGINEERING3 571000 Maintenance of overhead lines DAVEY RESOURCE GROUP 575 VEGETATION MANAGEMENT4 571000 Maintenance of overhead lines HAVERFIELD AVIATION, INC 926 AERIAL INSPECTION5 571000 Maintenance of overhead lines HOMER TREE SERVICE INC 485 VEGETATION MANAGEMENT6 571000 Maintenance of overhead lines KRUEGER TOWER INC 630 TECHNICAL SERVICES7 571000 Maintenance of overhead lines LEWIS TREE SERVICE INC 3,795 TREE TRIMMING8 571000 Maintenance of overhead lines LINDBLAD CONSTRUCTION COMPANY 520 CONSTRUCTION SERVICES9 571000 Maintenance of overhead lines M J ELECTRIC LLC 60 OPERATIONAL STAFF AUGMENTATION
10 571000 Maintenance of overhead lines MIDWEST ACCESS SOLUTIONS LLC 150 CONSTRUCTION SERVICES11 571000 Maintenance of overhead lines MOTOROLA SOLUTIONS INC 332 TELECOM SERVICES12 571000 Maintenance of overhead lines NASH BROS CONSTRUCTION CO INC 115 CONSTRUCTION SERVICES13 571000 Maintenance of overhead lines NEW SOUTH EQUIPMENT MATS LLC 177 CONSTRUCTION SERVICES14 571000 Maintenance of overhead lines OSMOSE UTILITIES SERVICES INC 150 TECHNICAL SERVICES15 571000 Maintenance of overhead lines PATTEN INDUSTRIES 137 TECHNICAL SERVICES16 571000 Maintenance of overhead lines PFT TECHNOLOGY LLC 87 TECHNICAL SERVICES17 571000 Maintenance of overhead lines PONTOON SOLUTIONS INC 102 PROFESSIONAL STAFF AUGMENTATION18 571000 Maintenance of overhead lines PSC INDUSTRIAL OUTSOURCING, LP 744 OPERATIONAL STAFF AUGMENTATION19 571000 Maintenance of overhead lines QUALITECH ENGINEERING, LLC 322 ENGINEERING20 571000 Maintenance of overhead lines STANTEC CONSULTING SERVICES INC 727 ENVIRONMENTAL SERVICES21 571000 Maintenance of overhead lines STEVENSON CRANE SERVICE 139 CONSTRUCTION SERVICES22 572000 Maintenance of undergrnd lines ALDRIDGE ELECTRIC INC 98 OPERATIONAL STAFF AUGMENTATION23 572000 Maintenance of undergrnd lines MEARS GROUP INC 121 TECHNICAL SERVICES24 572000 Maintenance of undergrnd lines MIDWEST MECHANICAL 108 TECHNICAL SERVICES25 572000 Maintenance of undergrnd lines NASH BROS CONSTRUCTION CO INC 427 CONSTRUCTION SERVICES26 572000 Maintenance of undergrnd lines PRYSMIAN CABLES & SYSTEMS USA LLC 314 TECHNICAL SERVICES27 572000 Maintenance of undergrnd lines THURSTON ELECTRICAL SPECIALTY CO 175 TECHNICAL SERVICES28 580000 Oper supervision & engineering ACCENTURE 262 CONSULTING SERVICES
Page Sub-Total 11,908$
Docket No. 18-____ ComEd Ex. 2.03
Page 99 of 334

Schedule C-6.2Page 4 of 74
Commonwealth Edison CompanyExpenses For Outside Professional Services in 2017
2017 Payments of $50,000 Or More Charged To Operating Expense(In Thousands)
Witness: Tracy
2017Line FERC Account PaymentNo. Account Description Payee Amount Nature of Service Provided
(A) (B) (C) (D) (E)
1 580000 Oper supervision & engineering AECOM TECHNICAL SERVICES, INC. 339$ TECHNICAL SERVICES2 580000 Oper supervision & engineering AECOM USA INC 216 TECHNICAL SERVICES3 580000 Oper supervision & engineering CATERPILLAR INC 225 TRAINING SERVICES4 580000 Oper supervision & engineering CUMMINS SALES AND SERVICE 129 TECHNICAL SERVICES5 580000 Oper supervision & engineering CUSTOMER LIFECYCLE LLC 57 CONSULTING SERVICES6 580000 Oper supervision & engineering CYME INTERNATIONAL INC 71 IT SERVICES7 580000 Oper supervision & engineering DAVEY RESOURCE GROUP 110 VEGETATION MANAGEMENT8 580000 Oper supervision & engineering ILLINI POWER PRODUCTS CO 174 CONSTRUCTION SERVICES9 580000 Oper supervision & engineering ILLINOIS INSTITUTE OF TECHNOLOGY 100 CONSULTING SERVICES
10 580000 Oper supervision & engineering INTREN LLC 621 CONSTRUCTION SERVICES11 580000 Oper supervision & engineering JONES LANG LASALLE AMERICAS INC 52 FACILITY SERVICES12 580000 Oper supervision & engineering KELMAR SAFETY INC 92 SAFETY SERVICES13 580000 Oper supervision & engineering MEADE ELECTRIC CO 610 OPERATIONAL STAFF AUGMENTATION14 580000 Oper supervision & engineering NUGRID POWER CORP 315 TECHNICAL SERVICES15 580000 Oper supervision & engineering PATTEN INDUSTRIES 73 TECHNICAL SERVICES16 580000 Oper supervision & engineering PONTOON SOLUTIONS INC 235 PROFESSIONAL STAFF AUGMENTATION17 580000 Oper supervision & engineering PRIMERA ENGINEERS LTD 166 ENGINEERING18 580000 Oper supervision & engineering QUANTA TECHNOLOGY LLC 1,045 CONSULTING SERVICES19 580000 Oper supervision & engineering RIGHT MANAGEMENT,INC 153 CONSULTING SERVICES20 580000 Oper supervision & engineering ROONEY, RIPPIE & RATNASWAMY LLP 361 LEGAL SERVICES21 580000 Oper supervision & engineering SHIVE-HATTERY INC 63 ENGINEERING22 580000 Oper supervision & engineering SPEC-TEC LLC 356 TECHNICAL SERVICES23 580000 Oper supervision & engineering THOR PALMER HOUSE HOTEL LLC 89 EMERGENCY LODGING24 580000 Oper supervision & engineering TRAVELLIANCE 60 EMERGENCY LODGING25 580000 Oper supervision & engineering TRICE CONSTRUCTION CO 276 CONSTRUCTION SERVICES26 580000 Oper supervision & engineering TRINIDAD CONSTRUCTION LLC 56 BUILDING MAINTENANCE AND REPAIRS27 580000 Oper supervision & engineering VANTAGE LEADERSHIP CONSULTING, LLC 152 CONSULTING SERVICES
Page Sub-Total 6,196$
Docket No. 18-____ ComEd Ex. 2.03 Page 100 of 334

Schedule C-6.2Page 5 of 74
Commonwealth Edison CompanyExpenses For Outside Professional Services in 2017
2017 Payments of $50,000 Or More Charged To Operating Expense(In Thousands)
Witness: Tracy
2017Line FERC Account PaymentNo. Account Description Payee Amount Nature of Service Provided
(A) (B) (C) (D) (E)
1 580000 Oper supervision & engineering VIRGINIA POLYTECHNIC INSTITUTE AND STATE UNIVER 90$ CONSULTING SERVICES2 580000 Oper supervision & engineering WIGHT & CO 120 BUILDING MAINTENANCE AND REPAIRS3 582000 Station expenses INTREN LLC 105 CONSTRUCTION SERVICES4 583000 Overhead line expenses MEADE ELECTRIC CO 360 OPERATIONAL STAFF AUGMENTATION5 584000 Underground line expenses CITY OF CHICAGO 421 OPERATIONAL CONSULTING6 584000 Underground line expenses MEADE ELECTRIC CO 596 OPERATIONAL STAFF AUGMENTATION7 584000 Underground line expenses USIC LOCATING SERVICES INC 13,007 OPERATIONAL CONSULTING8 586000 Meter expenses CORIX UTILITIES (US) INC 538 BUSINESS APPLICATIONS9 586000 Meter expenses MZI GROUP INC 2,623 TECHNICAL SERVICES
10 586000 Meter expenses NORTHWEST CONTRACTORS INC 60 CONSTRUCTION SERVICES11 587000 Cust installations exp CHICAGO TRANSIT AUTHORITY 120 MUNICIPALITY12 587000 Cust installations exp INTREN LLC 1,302 CONSTRUCTION SERVICES13 587000 Cust installations exp MEADE ELECTRIC CO 510 OPERATIONAL STAFF AUGMENTATION14 587000 Cust installations exp PONTOON SOLUTIONS INC 465 PROFESSIONAL STAFF AUGMENTATION15 587000 Cust installations exp RONALD G KAMINSKI 138 ENGINEERING16 588000 Misc distribution expenses ASPLUNDH TREE EXPERT CO 15,226 TREE TRIMMING17 588000 Misc distribution expenses B & R REPAIR INC. 92 GENERAL MAINT AND REPAIRS18 588000 Misc distribution expenses BEARY LANDSCAPE MANAGEMENT INC 990 BUILDING MAINTENANCE AND REPAIRS19 588000 Misc distribution expenses BURNS & MCDONNELL ENGINEERING 62 ENGINEERING20 588000 Misc distribution expenses CHICAGO TRANSIT AUTHORITY 489 MUNICIPALITY21 588000 Misc distribution expenses COLORADO SEMINARY 139 CONSULTING SERVICES22 588000 Misc distribution expenses DASHIELL CORPORATION 96 ENGINEERING23 588000 Misc distribution expenses DAVEY RESOURCE GROUP 940 VEGETATION MANAGEMENT24 588000 Misc distribution expenses FAITHFUL & GOULD INC 78 CONSULTING SERVICES25 588000 Misc distribution expenses ILLINOIS INSTITUTE OF TECHNOLOGY 399 CONSULTING SERVICES26 588000 Misc distribution expenses KELLER AND HECKMAN 104 LEGAL SERVICES27 588000 Misc distribution expenses LEWIS TREE SERVICE INC 5,189 TREE TRIMMING28 588000 Misc distribution expenses LINDBLAD CONSTRUCTION COMPANY 76 CONSTRUCTION SERVICES
Page Sub-Total 44,335$
Docket No. 18-____ ComEd Ex. 2.03 Page 101 of 334

Schedule C-6.2Page 6 of 74
Commonwealth Edison CompanyExpenses For Outside Professional Services in 2017
2017 Payments of $50,000 Or More Charged To Operating Expense(In Thousands)
Witness: Tracy
2017Line FERC Account PaymentNo. Account Description Payee Amount Nature of Service Provided
(A) (B) (C) (D) (E)
1 588000 Misc distribution expenses MEADE ELECTRIC CO 98$ OPERATIONAL STAFF AUGMENTATION2 588000 Misc distribution expenses NETWORK MAPPING INC 117 IT SERVICES3 588000 Misc distribution expenses OLENICK AND ASSOCIATES 128 CONSULTING SERVICES4 588000 Misc distribution expenses OSISOFT LLC 53 IT SERVICES5 588000 Misc distribution expenses PONTOON SOLUTIONS INC 1,916 PROFESSIONAL STAFF AUGMENTATION6 588000 Misc distribution expenses PRIMERA ENGINEERS LTD 175 ENGINEERING7 588000 Misc distribution expenses PSC INDUSTRIAL OUTSOURCING, LP 60 OPERATIONAL STAFF AUGMENTATION8 588000 Misc distribution expenses QUANTUM SPATIAL 249 CONSULTING SERVICES9 588000 Misc distribution expenses ROONEY, RIPPIE & RATNASWAMY LLP 230 LEGAL SERVICES
10 588000 Misc distribution expenses SIDLEY & AUSTIN 198 LEGAL SERVICES11 588000 Misc distribution expenses SIEMENS INDUSTRY INC 106 TECHNICAL SERVICES12 588000 Misc distribution expenses SILVER SPRING NETWORKS INC 174 TECHNICAL SERVICES13 588000 Misc distribution expenses STANTEC CONSULTING SERVICES INC 176 ENVIRONMENTAL SERVICES14 588000 Misc distribution expenses UBISENSE INC 459 PROFESSIONAL STAFF AUGMENTATION15 588000 Misc distribution expenses WEST MONROE PARTNERS, LLC 199 CONSULTING SERVICES16 590000 Main supervision & engineering KDM ENGINEERING 159 ENGINEERING17 590000 Main supervision & engineering PRIMERA ENGINEERS LTD 120 ENGINEERING18 591000 Maintenance of structures ANDERSON & SHAH ROOFING INC 51 BUILDING MAINTENANCE AND REPAIRS19 591000 Maintenance of structures BEARY LANDSCAPE MANAGEMENT INC 66 BUILDING MAINTENANCE AND REPAIRS20 591000 Maintenance of structures GARFIELD BUILDING MAINTENANCE 352 BUILDING MAINTENANCE AND REPAIRS21 591000 Maintenance of structures JONES LANG LASALLE AMERICAS INC 291 FACILITY SERVICES22 591000 Maintenance of structures MIDWEST MECHANICAL 219 TECHNICAL SERVICES23 591000 Maintenance of structures RRK ASSOCIATES LTD 215 CONSULTING SERVICES24 592000 Main of station equipment AGB INVESTIGATIVE SERVICES INC 63 SECURITY25 592000 Main of station equipment ALARM DETECTION SYSTEMS, INC. 134 BUILDING MAINTENANCE AND REPAIRS26 592000 Main of station equipment ALDRIDGE ELECTRIC INC 132 OPERATIONAL STAFF AUGMENTATION27 592000 Main of station equipment A-LINE E.D.S. 131 ENVIRONMENTAL SERVICES28 592000 Main of station equipment ANDERSON & SHAH ROOFING INC 94 BUILDING MAINTENANCE AND REPAIRS
Page Sub-Total 6,365$
Docket No. 18-____ ComEd Ex. 2.03 Page 102 of 334

Schedule C-6.2Page 7 of 74
Commonwealth Edison CompanyExpenses For Outside Professional Services in 2017
2017 Payments of $50,000 Or More Charged To Operating Expense(In Thousands)
Witness: Tracy
2017Line FERC Account PaymentNo. Account Description Payee Amount Nature of Service Provided
(A) (B) (C) (D) (E)
1 592000 Main of station equipment ARCADIS US, INC. 1,207$ ENVIRONMENTAL SERVICES2 592000 Main of station equipment BEARY LANDSCAPE MANAGEMENT INC 150 BUILDING MAINTENANCE AND REPAIRS3 592000 Main of station equipment BURLING BUILDERS INC 55 BUILDING MAINTENANCE AND REPAIRS4 592000 Main of station equipment CENTRAL PLUMBING CO., INC. 296 BUILDING MAINTENANCE AND REPAIRS5 592000 Main of station equipment CHICAGO HOLLOW METAL INC 67 BUILDING MAINTENANCE AND REPAIRS6 592000 Main of station equipment D CONSTRUCTION INC 84 CONSTRUCTION SERVICES7 592000 Main of station equipment ENVIROPLUS INC 137 ENVIRONMENTAL SERVICES8 592000 Main of station equipment GARFIELD BUILDING MAINTENANCE 167 BUILDING MAINTENANCE AND REPAIRS9 592000 Main of station equipment GREAT LAKES FIRE AND SAFETY EQUIPMENT 389 SAFETY SERVICES
10 592000 Main of station equipment GSG CONSULTANTS INC 62 ENVIRONMENTAL SERVICES11 592000 Main of station equipment JOLIET EQUIP CORP 74 REPAIR SERVICES12 592000 Main of station equipment JONES LANG LASALLE AMERICAS INC 1,491 FACILITY SERVICES13 592000 Main of station equipment KINECTRICS NORTH AMERICA INC 114 TECHNICAL SERVICES14 592000 Main of station equipment LINDBLAD CONSTRUCTION COMPANY 400 CONSTRUCTION SERVICES15 592000 Main of station equipment M J ELECTRIC LLC 133 OPERATIONAL STAFF AUGMENTATION16 592000 Main of station equipment MEADE ELECTRIC CO 132 OPERATIONAL STAFF AUGMENTATION17 592000 Main of station equipment MIDSUN GROUP 112 TECHNICAL SERVICES18 592000 Main of station equipment MIDWEST MECHANICAL 195 TECHNICAL SERVICES19 592000 Main of station equipment NASH BROS CONSTRUCTION CO INC 389 CONSTRUCTION SERVICES20 592000 Main of station equipment PEERLESS FENCE 232 BUILDING MAINTENANCE AND REPAIRS21 592000 Main of station equipment PHOENIX FIRE SYSTEMS, INC. 397 SAFETY SERVICES22 592000 Main of station equipment PRIMERA ENGINEERS LTD 90 ENGINEERING23 592000 Main of station equipment PSC INDUSTRIAL OUTSOURCING, LP 89 OPERATIONAL STAFF AUGMENTATION24 592000 Main of station equipment QP TESTING LLC 415 TECHNICAL SERVICES25 592000 Main of station equipment QUALITECH ENGINEERING, LLC 63 ENGINEERING26 592000 Main of station equipment QUANTA TECHNOLOGY LLC 167 CONSULTING SERVICES27 592000 Main of station equipment REINHAUSEN MANUFACTURING INC. 71 TECHNICAL SERVICES28 592000 Main of station equipment RUSSELL N RAYMOND DBA ORIONMAGNETIC 143 TECHNICAL SERVICES
Page Sub-Total 7,321$
Docket No. 18-____ ComEd Ex. 2.03 Page 103 of 334

Schedule C-6.2Page 8 of 74
Commonwealth Edison CompanyExpenses For Outside Professional Services in 2017
2017 Payments of $50,000 Or More Charged To Operating Expense(In Thousands)
Witness: Tracy
2017Line FERC Account PaymentNo. Account Description Payee Amount Nature of Service Provided
(A) (B) (C) (D) (E)
1 592000 Main of station equipment SARGENT & LUNDY LLC 82$ ENGINEERING2 592000 Main of station equipment SMITHEREEN PEST MANAGEMENT SERVICES 53 BUILDING MAINTENANCE AND REPAIRS3 592000 Main of station equipment STEVENSON CRANE SERVICE 131 CONSTRUCTION SERVICES4 592000 Main of station equipment THE BARTECH GROUP 458 TECHNICAL SERVICES5 592000 Main of station equipment THURSTON ELECTRICAL SPECIALTY CO 182 TECHNICAL SERVICES6 592000 Main of station equipment TRANSMISSION AND DISTRIBUTION SERVICES LLC 167 TECHNICAL SERVICES7 592000 Main of station equipment UTILITY & IND CONSTRUCTION CO 59 BUILDING MAINTENANCE AND REPAIRS8 593000 Maintenance of overhead lines ALBRECHT ENGINEERING LLC 304 ENGINEERING9 593000 Maintenance of overhead lines AMERICAN HERITAGE PROTECTION 511 SECURITY
10 593000 Maintenance of overhead lines ASPLUNDH TREE EXPERT CO 48,481 TREE TRIMMING11 593000 Maintenance of overhead lines BADGER DAYLIGHTING CORP 83 EXCAVATING SERVICES12 593000 Maintenance of overhead lines BEARY LANDSCAPE MANAGEMENT INC 95 BUILDING MAINTENANCE AND REPAIRS13 593000 Maintenance of overhead lines DAVEY RESOURCE GROUP 2,931 VEGETATION MANAGEMENT14 593000 Maintenance of overhead lines DYNAMIC UTILITY SOLUTIONS LLC 345 CONSTRUCTION SERVICES15 593000 Maintenance of overhead lines EQUALITY US 101 LANDSCAPING SERVICES16 593000 Maintenance of overhead lines HAVERFIELD AVIATION, INC 109 AERIAL INSPECTION17 593000 Maintenance of overhead lines HURLEY & ASSOCIATES INC 299 TECHNICAL SERVICES18 593000 Maintenance of overhead lines ILLINOIS INSTITUTE OF TECHNOLOGY 87 CONSULTING SERVICES19 593000 Maintenance of overhead lines INTREN LLC 4,286 CONSTRUCTION SERVICES20 593000 Maintenance of overhead lines J F ELECTRIC INC 1,261 STORM ASSISTANCE21 593000 Maintenance of overhead lines LEWIS TREE SERVICE INC 24,322 TREE TRIMMING22 593000 Maintenance of overhead lines M J ELECTRIC LLC 2,340 OPERATIONAL STAFF AUGMENTATION23 593000 Maintenance of overhead lines MEADE ELECTRIC CO 2,404 OPERATIONAL STAFF AUGMENTATION24 593000 Maintenance of overhead lines MIDWEST ACCESS SOLUTIONS LLC 55 CONSTRUCTION SERVICES25 593000 Maintenance of overhead lines NEW LOYALTY USA, INC. 76 COMMUNICATION SERVICES26 593000 Maintenance of overhead lines OSMOSE INC 5,335 TECHNICAL SERVICES27 593000 Maintenance of overhead lines PMI ENERGY SOLUTIONS LLC 1,005 OPERATIONAL STAFF AUGMENTATION28 593000 Maintenance of overhead lines PSC INDUSTRIAL OUTSOURCING, LP 274 OPERATIONAL STAFF AUGMENTATION
Page Sub-Total 95,836$
Docket No. 18-____ ComEd Ex. 2.03 Page 104 of 334

Schedule C-6.2Page 9 of 74
Commonwealth Edison CompanyExpenses For Outside Professional Services in 2017
2017 Payments of $50,000 Or More Charged To Operating Expense(In Thousands)
Witness: Tracy
2017Line FERC Account PaymentNo. Account Description Payee Amount Nature of Service Provided
(A) (B) (C) (D) (E)
1 593000 Maintenance of overhead lines RAM CONSTRUCTION & LANDSCAPING LLC 108$ LANDSCAPING SERVICES2 593000 Maintenance of overhead lines THREE PHASE LINE CONSTRUCTION INC 942 CONSTRUCTION SERVICES3 593000 Maintenance of overhead lines TRAFFIC CONTROL & PROTECTION INC 95 SAFETY SERVICES4 594000 Main of underground lines ALDRIDGE ELECTRIC INC 4,151 OPERATIONAL STAFF AUGMENTATION5 594000 Main of underground lines BADGER DAYLIGHTING CORP 179 EXCAVATING SERVICES6 594000 Main of underground lines DYNAMIC UTILITY SOLUTIONS LLC 54 CONSTRUCTION SERVICES7 594000 Main of underground lines EQUALITY US 359 LANDSCAPING SERVICES8 594000 Main of underground lines INDEPENDENT PAVING CO INC 300 CONSTRUCTION SERVICES9 594000 Main of underground lines INTREN LLC 9,322 CONSTRUCTION SERVICES
10 594000 Main of underground lines MEADE ELECTRIC CO 5,658 OPERATIONAL STAFF AUGMENTATION11 594000 Main of underground lines PSC INDUSTRIAL OUTSOURCING, LP 1,586 OPERATIONAL STAFF AUGMENTATION12 594000 Main of underground lines RAM CONSTRUCTION & LANDSCAPING LLC 265 LANDSCAPING SERVICES13 594000 Main of underground lines RONALD G KAMINSKI 1,517 ENGINEERING14 594000 Main of underground lines THURSTON ELECTRICAL SPECIALTY CO 74 TECHNICAL SERVICES15 594000 Main of underground lines TRICE CONSTRUCTION CO 1,385 CONSTRUCTION SERVICES16 595000 Main of line transformers PSC INDUSTRIAL OUTSOURCING, LP 2,162 OPERATIONAL STAFF AUGMENTATION17 598000 Main of misc distrib plant FIRE & RISK ALLIANCE LLC 96 ENGINEERING18 902000 Meter reading expenses ACCENTURE 75 CONSULTING SERVICES19 902000 Meter reading expenses AMERICAN HERITAGE PROTECTION 176 SECURITY20 902000 Meter reading expenses CLEVEST SOLUTIONS INC 339 IT SERVICES21 902000 Meter reading expenses ITRON, INC. 178 BUSINESS APPLICATIONS22 902000 Meter reading expenses MAD DASH INC 79 TECHNICAL SERVICES23 902000 Meter reading expenses PMI ENERGY SOLUTIONS LLC 1,030 OPERATIONAL STAFF AUGMENTATION24 902000 Meter reading expenses RR DONNELLEY & SONS COMPANY 74 PRINTING SERVICES25 902000 Meter reading expenses SILVER SPRING NETWORKS INC 647 TECHNICAL SERVICES26 902000 Meter reading expenses THE BLACKSTONE GROUP INC 97 CONSULTING SERVICES27 903000 Customer records & collect exp AARGON AGENCY INC 75 COLLECTION SERVICES28 903000 Customer records & collect exp ALORICA INC 130 CUSTOMER SERVICES
Page Sub-Total 31,153$
Docket No. 18-____ ComEd Ex. 2.03 Page 105 of 334

Schedule C-6.2Page 10 of 74
Commonwealth Edison CompanyExpenses For Outside Professional Services in 2017
2017 Payments of $50,000 Or More Charged To Operating Expense(In Thousands)
Witness: Tracy
2017Line FERC Account PaymentNo. Account Description Payee Amount Nature of Service Provided
(A) (B) (C) (D) (E)
1 903000 Customer records & collect exp AMERICAN HERITAGE PROTECTION 290$ SECURITY2 903000 Customer records & collect exp B & F CONSTRUCTION CODE SERVICES INC 183 INSPECTION SERVICES3 903000 Customer records & collect exp CONTRACT CALLERS INC 243 OPERATIONAL STAFF AUGMENTATION4 903000 Customer records & collect exp CORIX UTILITIES (US) INC 82 BUSINESS APPLICATIONS5 903000 Customer records & collect exp CORPORATE EXECUTIVE BOARD 130 CONSULTING SERVICES6 903000 Customer records & collect exp CREDIT BUREAU COLLECTION SERVICES, INC. 64 COLLECTION SERVICES7 903000 Customer records & collect exp CREDIT CONTROL SERVICES INC 128 CUSTOMER SERVICES8 903000 Customer records & collect exp CREDIT PROTECTION ASSOCIATION LP 152 COLLECTION SERVICES9 903000 Customer records & collect exp DEBTNEXT SOLUTIONS, LLC 59 OPERATIONAL STAFF AUGMENTATION
10 903000 Customer records & collect exp DISTRIBUTED ENERGY FINANCIAL GROUP 55 CONSULTING SERVICES11 903000 Customer records & collect exp DURKIN ELECTRIC COMPANY INC 3,689 REPAIR SERVICES12 903000 Customer records & collect exp E SOURCE COMPANIES LLC 122 CONSULTING SERVICES13 903000 Customer records & collect exp EIRE DIRECT MARKETING LLC 96 MARKETING14 903000 Customer records & collect exp ENGHOUSE KNOWLEDGE MANAGEMENT SOLUTIONS LL 131 CONSULTING SERVICES15 903000 Customer records & collect exp EXPERIAN INFORMATION SOLUTIONS INC 790 CONSULTING SERVICES16 903000 Customer records & collect exp FIRSTECH 125 PAYMENT PROCESSING SERVICES17 903000 Customer records & collect exp FISERV 1,183 FINANCIAL SERVICES18 903000 Customer records & collect exp FORRESTER RESEARCH INC 118 CUSTOMER SERVICES19 903000 Customer records & collect exp HYPERQUALITY, INC. 298 CUSTOMER SERVICES20 903000 Customer records & collect exp INCONTACT INC 222 CUSTOMER SERVICES21 903000 Customer records & collect exp INTREN LLC 212 CONSTRUCTION SERVICES22 903000 Customer records & collect exp L.J. ROSS 69 COLLECTION SERVICES23 903000 Customer records & collect exp LANGUAGE LINE SERVICES INC 90 LANGUAGE TRANSLATION SERVICES24 903000 Customer records & collect exp LEXISNEXIS A DIVISION OF REED ELSEVIER INC 165 LEGAL SERVICES25 903000 Customer records & collect exp LIVEWIRE ELECTRICAL SYSTEMS INC 2,823 REPAIR SERVICES26 903000 Customer records & collect exp LOESCHER HEATING & AIR CONDITIONING 2,051 BUILDING MAINTENANCE AND REPAIRS27 903000 Customer records & collect exp MCCARTHY BURGESS & WOLFF 136 COLLECTION SERVICES28 903000 Customer records & collect exp MCKINSEY & COMPANY, INC. 1,044 CONSULTING SERVICES
Page Sub-Total 14,750$
Docket No. 18-____ ComEd Ex. 2.03 Page 106 of 334

Schedule C-6.2Page 11 of 74
Commonwealth Edison CompanyExpenses For Outside Professional Services in 2017
2017 Payments of $50,000 Or More Charged To Operating Expense(In Thousands)
Witness: Tracy
2017Line FERC Account PaymentNo. Account Description Payee Amount Nature of Service Provided
(A) (B) (C) (D) (E)
1 903000 Customer records & collect exp MEDIUS & ASSOCIATES INC 94$ PRINTING SERVICES2 903000 Customer records & collect exp MZI GROUP INC 5,537 TECHNICAL SERVICES3 903000 Customer records & collect exp NEXIDIA INC 54 BUSINESS APPLICATIONS4 903000 Customer records & collect exp PACO COMMUNICATIONS INC 77 ADVERTISING SERVICES5 903000 Customer records & collect exp PONTOON SOLUTIONS INC 1,905 PROFESSIONAL STAFF AUGMENTATION6 903000 Customer records & collect exp QUANTUM CROSSINGS LLC 3,019 TECHNICAL SERVICES7 903000 Customer records & collect exp ROONEY, RIPPIE & RATNASWAMY LLP 945 LEGAL SERVICES8 903000 Customer records & collect exp SOUTHWEST CREDIT SYSTEMS, LP 116 COLLECTION SERVICES9 903000 Customer records & collect exp THE BRATTLE GROUP INC 65 CONSULTING SERVICES
10 903000 Customer records & collect exp THE CARA GROUP INC 51 TRAINING SERVICES11 903000 Customer records & collect exp TORRES CREDIT SERVICES, INC. 94 COLLECTION SERVICES12 903000 Customer records & collect exp VANTAGE LEADERSHIP CONSULTING, LLC 112 CONSULTING SERVICES13 903000 Customer records & collect exp WEST INTERACTIVE SERVICES CORP 92 CUSTOMER SERVICES14 903000 Customer records & collect exp WEST MONROE PARTNERS, LLC 103 CONSULTING SERVICES15 908000 Customer assistance expenses ACCENTURE 1,048 CONSULTING SERVICES16 908000 Customer assistance expenses AFTER SCHOOL MATTERS INC 230 COMMUNITY RELATIONS17 908000 Customer assistance expenses AJENDA INTERACTIVE MEDIA, LLC 194 CONSULTING SERVICES18 908000 Customer assistance expenses CALICO ENERGY INC 958 CUSTOMER SERVICES19 908000 Customer assistance expenses CAMBRIDGE PARTNERS & ASSOCIATES INC. 83 CONSULTING SERVICES20 908000 Customer assistance expenses EIRE DIRECT MARKETING LLC 407 MARKETING21 908000 Customer assistance expenses EVGC LLC 101 COMMUNICATION SERVICES22 908000 Customer assistance expenses FORESEE RESULTS, INC. 165 CONSULTING SERVICES23 908000 Customer assistance expenses GOODCENTS SOLUTIONS 1,758 CONSULTING SERVICES24 908000 Customer assistance expenses IGNITION HOLDINGS LLC 1,699 MARKETING25 908000 Customer assistance expenses ILLINOIS ASSOCIATION OF COMMUNITY ACTION AGENCIES 770 CUSTOMER SERVICES26 908000 Customer assistance expenses KONY SERVICES INC 353 IT SERVICES27 908000 Customer assistance expenses KUBRA ARIZONA INC 218 CONSULTING SERVICES28 908000 Customer assistance expenses LOYALTYONE US INC 56 CONSULTING SERVICES
Page Sub-Total 20,304$
Docket No. 18-____ ComEd Ex. 2.03 Page 107 of 334

Schedule C-6.2Page 12 of 74
Commonwealth Edison CompanyExpenses For Outside Professional Services in 2017
2017 Payments of $50,000 Or More Charged To Operating Expense(In Thousands)
Witness: Tracy
2017Line FERC Account PaymentNo. Account Description Payee Amount Nature of Service Provided
(A) (B) (C) (D) (E)
1 908000 Customer assistance expenses MAD DASH INC 67$ TECHNICAL SERVICES2 908000 Customer assistance expenses MARKET STRATEGIES INC 979 MARKETING3 908000 Customer assistance expenses MINDSEYE RESEARCH GROUP INC 126 MARKETING4 908000 Customer assistance expenses NEST LABS INC 239 TECHNICAL SERVICES5 908000 Customer assistance expenses NEXANT INC 109 TECHNICAL SERVICES6 908000 Customer assistance expenses NIELSEN LLC, CLARITAS 155 CONSULTING SERVICES7 908000 Customer assistance expenses OPINION DYNAMICS CORPORATION 65 MARKETING8 908000 Customer assistance expenses ORACLE AMERICA INC 221 CONSULTING SERVICES9 908000 Customer assistance expenses PACO COMMUNICATIONS INC 255 ADVERTISING SERVICES
10 908000 Customer assistance expenses PONTOON SOLUTIONS INC 836 PROFESSIONAL STAFF AUGMENTATION11 908000 Customer assistance expenses PRIMERA ENGINEERS LTD 409 ENGINEERING12 908000 Customer assistance expenses RF DEMAND SOLUTIONS, LLC 183 PAGING SERVICES13 908000 Customer assistance expenses RR DONNELLEY & SONS COMPANY 50 PRINTING SERVICES14 908000 Customer assistance expenses SOFBANG LLC 152 IT SERVICES15 908000 Customer assistance expenses STRIVR LABS INC 139 TRAINING SERVICES16 908000 Customer assistance expenses THE BLACKSTONE GROUP INC 355 CONSULTING SERVICES17 908000 Customer assistance expenses WEST MONROE PARTNERS, LLC 174 CONSULTING SERVICES18 909000 Inform and Instruct advert exp BULLY PULPIT INTERACTIVE LLC 72 ADVERTISING SERVICES19 909000 Inform and Instruct advert exp CAROL H WILLIAMS ADVERTISING INC 625 MEDIA20 909000 Inform and Instruct advert exp EDUCATIONAL DIVIDENDS INC 138 COMMUNITY RELATIONS21 909000 Inform and Instruct advert exp EIRE DIRECT MARKETING LLC 731 MARKETING22 909000 Inform and Instruct advert exp LEO BURNETT USA INC 347 ADVERTISING SERVICES23 909000 Inform and Instruct advert exp MEDIUS & ASSOCIATES INC 429 PRINTING SERVICES24 909000 Inform and Instruct advert exp PACO COMMUNICATIONS INC 5,154 ADVERTISING SERVICES25 909000 Inform and Instruct advert exp PONTOON SOLUTIONS INC 132 PROFESSIONAL STAFF AUGMENTATION26 923000 Outside services employed ABSO 110 SECURITY27 923000 Outside services employed ACCENTURE 971 CONSULTING SERVICES28 923000 Outside services employed ADVANTAGE GOVERNMENT STRATEGIES LLC 55 PUBLIC AFFAIRS CONSULTING
Page Sub-Total 13,278$
Docket No. 18-____ ComEd Ex. 2.03 Page 108 of 334

Schedule C-6.2Page 13 of 74
Commonwealth Edison CompanyExpenses For Outside Professional Services in 2017
2017 Payments of $50,000 Or More Charged To Operating Expense(In Thousands)
Witness: Tracy
2017Line FERC Account PaymentNo. Account Description Payee Amount Nature of Service Provided
(A) (B) (C) (D) (E)
1 923000 Outside services employed AECOM TECHNICAL SERVICES, INC. 116$ TECHNICAL SERVICES2 923000 Outside services employed ALLIED 100 LLC 86 SAFETY SERVICES3 923000 Outside services employed ALVAREZ AND ASSOCIATES 60 PUBLIC AFFAIRS CONSULTING4 923000 Outside services employed AMERICAN HERITAGE PROTECTION 1,055 SECURITY5 923000 Outside services employed ARCADIS US, INC. 175 ENVIRONMENTAL SERVICES6 923000 Outside services employed ARCHITECTURAL DETAILS 63 BUILDING MAINTENANCE AND REPAIRS7 923000 Outside services employed ARCOS, INC. 433 CONSULTING SERVICES8 923000 Outside services employed ASGK PUBLIC STRATEGIES LLC 354 COMMUNICATION SERVICES9 923000 Outside services employed BALLARD SPAHR ANDREWS & INGERSOLL LLP 185 LEGAL SERVICES
10 923000 Outside services employed BERGLUND CONSTRUCTION COMPANY 837 BUILDING MAINTENANCE AND REPAIRS11 923000 Outside services employed BIG SHOULDERS DIGITAL VIDEO PRODUCTIONS 95 MEDIA12 923000 Outside services employed BURLING BUILDERS INC 358 BUILDING MAINTENANCE AND REPAIRS13 923000 Outside services employed BURNS & MCDONNELL ENGINEERING 348 ENGINEERING14 923000 Outside services employed CATERPILLAR INC 95 TRAINING SERVICES15 923000 Outside services employed CHEMSTAFF INC 93 TECHNICAL SERVICES16 923000 Outside services employed CHRISTOPHER B BURKE ENGINEERIN 87 ENGINEERING17 923000 Outside services employed COMPREHENSIVE INJURY 1,353 CONSULTING SERVICES18 923000 Outside services employed CORNERSTONE GOVERNMENT AFFAIRS INC 70 PUBLIC AFFAIRS CONSULTING19 923000 Outside services employed CULVER COMPANY INC 85 CONSULTING SERVICES20 923000 Outside services employed DENNIS J. GANNON 102 CONSULTING SERVICES21 923000 Outside services employed DOBLE ENGINEERING CO 106 CONSULTING SERVICES22 923000 Outside services employed DOT TO DOT MANAGEMENT CONSULTING INC 82 CONSULTING SERVICES23 923000 Outside services employed DRIVER IMPROVEMENT 58 TRAINING SERVICES24 923000 Outside services employed DUFF & PHELPS 59 FINANCIAL SERVICES25 923000 Outside services employed DXE MEDICAL INC 129 SAFETY SERVICES26 923000 Outside services employed EDWARD C HURLEY 120 CONSULTING SERVICES27 923000 Outside services employed EIMER STAHL, LLP 341 LEGAL SERVICES28 923000 Outside services employed ELEVATE ENERGY 2,037 CONSULTING SERVICES
Page Sub-Total 8,982$
Docket No. 18-____ ComEd Ex. 2.03 Page 109 of 334

Schedule C-6.2Page 14 of 74
Commonwealth Edison CompanyExpenses For Outside Professional Services in 2017
2017 Payments of $50,000 Or More Charged To Operating Expense(In Thousands)
Witness: Tracy
2017Line FERC Account PaymentNo. Account Description Payee Amount Nature of Service Provided
(A) (B) (C) (D) (E)
1 923000 Outside services employed FTI CONSULTING (SC) INC 173$ COMMUNICATION SERVICES2 923000 Outside services employed G&R PUBLIC LAW AND STRATEGIES LLC 72 LEGAL SERVICES3 923000 Outside services employed GREGORY K BUSCH 69 CONSULTING SERVICES4 923000 Outside services employed GRISKO LLC 67 COMMUNICATION SERVICES5 923000 Outside services employed HARTMANN ELECTRIC COMPANY INC. 59 CONSTRUCTION SERVICES6 923000 Outside services employed HYGIENEERING INC 195 CONSULTING SERVICES7 923000 Outside services employed ILLINOIS INSTITUTE OF TECHNOLOGY 70 CONSULTING SERVICES8 923000 Outside services employed IRON MOUNTAIN INFORMATION 148 RECORDS RETENTION9 923000 Outside services employed J C ANDERSON INC 128 CONSTRUCTION SERVICES
10 923000 Outside services employed JACKSON LEWIS PC 202 LEGAL SERVICES11 923000 Outside services employed JAMES O. HAMILTON & CO INC 97 CONSULTING SERVICES12 923000 Outside services employed JILL KERRIGAN 134 CONSULTING SERVICES13 923000 Outside services employed JOHNSON AND BELL LTD 128 LEGAL SERVICES14 923000 Outside services employed JONES LANG LASALLE AMERICAS INC 967 FACILITY SERVICES15 923000 Outside services employed KIRKLAND & ELLIS LLP 192 LEGAL SERVICES16 923000 Outside services employed KLAFTER AND BURKE 218 LEGAL SERVICES17 923000 Outside services employed KPMG LLP 86 CONSULTING SERVICES18 923000 Outside services employed LEO BURNETT USA INC 154 ADVERTISING SERVICES19 923000 Outside services employed LINJEN PROMOTIONS INC 59 MARKETING20 923000 Outside services employed LOPEZ MARTIN & ASSOC INC 64 ADVERTISING SERVICES21 923000 Outside services employed MAYER BROWN, LLP 90 LEGAL SERVICES22 923000 Outside services employed MCGUIRE WOODS LLP 160 LEGAL SERVICES23 923000 Outside services employed MCKINSEY & COMPANY, INC. 1,300 CONSULTING SERVICES24 923000 Outside services employed MCKISSACK & MCKISSACK OF WASHINGTON INC 322 BUILDING MAINTENANCE AND REPAIRS25 923000 Outside services employed MCLEAN ENGINEER COMPANY INC 53 ENGINEERING26 923000 Outside services employed MEADE ELECTRIC CO 76 OPERATIONAL STAFF AUGMENTATION27 923000 Outside services employed MEDIUS & ASSOCIATES INC 592 PRINTING SERVICES28 923000 Outside services employed MICHAEL F MCCLAIN 150 LEGAL SERVICES
Page Sub-Total 6,025$
Docket No. 18-____ ComEd Ex. 2.03 Page 110 of 334

Schedule C-6.2Page 15 of 74
Commonwealth Edison CompanyExpenses For Outside Professional Services in 2017
2017 Payments of $50,000 Or More Charged To Operating Expense(In Thousands)
Witness: Tracy
2017Line FERC Account PaymentNo. Account Description Payee Amount Nature of Service Provided
(A) (B) (C) (D) (E)
1 923000 Outside services employed MORGAN, LEWIS & BOCKIUS,LLP 66$ LEGAL SERVICES2 923000 Outside services employed NAVIGANT CONSULTING INC 85 CONSULTING SERVICES3 923000 Outside services employed NEAL MURDOCK AND LEROY, LLC 171 LEGAL SERVICES4 923000 Outside services employed NORTHWEST CONTRACTORS INC 527 CONSTRUCTION SERVICES5 923000 Outside services employed OLENICK AND ASSOCIATES 66 CONSULTING SERVICES6 923000 Outside services employed PATTEN INDUSTRIES 78 TECHNICAL SERVICES7 923000 Outside services employed PETROLEUM TRADERS CORP 232 TECHNICAL SERVICES8 923000 Outside services employed PLANETRISK INC 75 CONSULTING SERVICES9 923000 Outside services employed PONTOON SOLUTIONS INC 8,180 PROFESSIONAL STAFF AUGMENTATION
10 923000 Outside services employed PRIMERA ENGINEERS LTD 402 ENGINEERING11 923000 Outside services employed PSC INDUSTRIAL OUTSOURCING, LP 92 OPERATIONAL STAFF AUGMENTATION12 923000 Outside services employed PUBLIC RELAY 72 COMMUNICATION SERVICES13 923000 Outside services employed QUANTA TECHNOLOGY LLC 555 CONSULTING SERVICES14 923000 Outside services employed REYES KURSON 122 LEGAL SERVICES15 923000 Outside services employed RICHARD M. HANSEN & ASSOCIATES 241 ENGINEERING16 923000 Outside services employed RIGHT MANAGEMENT,INC 126 CONSULTING SERVICES17 923000 Outside services employed ROADSAFE TRAFFIC SYSTEMS INC 60 SAFETY SERVICES18 923000 Outside services employed RONALD G KAMINSKI 418 ENGINEERING19 923000 Outside services employed ROONEY, RIPPIE & RATNASWAMY LLP 2,126 LEGAL SERVICES20 923000 Outside services employed RR DONNELLEY & SONS COMPANY 2,670 PRINTING SERVICES21 923000 Outside services employed RUIZ CONSTRUCTION SYSTEMS INC 347 BUILDING MAINTENANCE AND REPAIRS22 923000 Outside services employed SARGENT & LUNDY LLC 326 ENGINEERING23 923000 Outside services employed SIDLEY & AUSTIN 1,142 LEGAL SERVICES24 923000 Outside services employed SMITH,HEMMESCH,BURKE&BRANNIGAN 169 LEGAL SERVICES25 923000 Outside services employed STANTEC CONSULTING SERVICES INC 342 ENVIRONMENTAL SERVICES26 923000 Outside services employed SWANSON MARTIN & BELL 308 LEGAL SERVICES27 923000 Outside services employed THE BRATTLE GROUP INC 150 CONSULTING SERVICES28 923000 Outside services employed THE NORTHBRIDGE GROUP 67 CONSULTING SERVICES
Page Sub-Total 19,215$
Docket No. 18-____ ComEd Ex. 2.03 Page 111 of 334

Schedule C-6.2Page 16 of 74
Commonwealth Edison CompanyExpenses For Outside Professional Services in 2017
2017 Payments of $50,000 Or More Charged To Operating Expense(In Thousands)
Witness: Tracy
2017Line FERC Account PaymentNo. Account Description Payee Amount Nature of Service Provided
(A) (B) (C) (D) (E)
1 923000 Outside services employed THE ROOSEVELT GROUP INC 97$ CONSULTING SERVICES2 923000 Outside services employed THOMAS M TULLY LTD 216 LEGAL SERVICES3 923000 Outside services employed THURSTON ELECTRICAL SPECIALTY CO 61 TECHNICAL SERVICES4 923000 Outside services employed TRAFFIC CONTROL & PROTECTION INC 105 SAFETY SERVICES5 923000 Outside services employed TRICE CONSTRUCTION CO 53 CONSTRUCTION SERVICES6 923000 Outside services employed TRINIDAD CONSTRUCTION LLC 160 BUILDING MAINTENANCE AND REPAIRS7 923000 Outside services employed TRUE PARTNERS CONSULTING, LLC 339 CONSULTING SERVICES8 923000 Outside services employed TTK PARTNERS LLC 263 FINANCIAL SERVICES9 923000 Outside services employed TYNDALE COMPANY, INC. 83 SAFETY SERVICES
10 923000 Outside services employed VANTAGE LEADERSHIP CONSULTING, LLC 131 CONSULTING SERVICES11 923000 Outside services employed WIGHT & CO 71 BUILDING MAINTENANCE AND REPAIRS12 925000 Injuries & damages DLA PIPER US LLP 574 LEGAL SERVICES13 925000 Injuries & damages JOHNSON AND BELL LTD 460 LEGAL SERVICES14 925000 Injuries & damages KELLY & KING PC 347 LEGAL SERVICES15 925000 Injuries & damages LOCKE LORD LLP 413 LEGAL SERVICES16 925000 Injuries & damages SANCHEZ, DANIELS & HOFFMAN 213 LEGAL SERVICES17 925000 Injuries & damages SIDLEY & AUSTIN 449 LEGAL SERVICES18 925000 Injuries & damages SWANSON MARTIN & BELL 660 LEGAL SERVICES19 928000 Regulatory commission exp CHICO & NUNES, P.C. 73 LEGAL SERVICES20 928000 Regulatory commission exp EIMER STAHL, LLP 323 LEGAL SERVICES21 928000 Regulatory commission exp GRAHAM & GRAHAM LLP 128 LEGAL SERVICES22 928000 Regulatory commission exp JENNER & BLOCK 100 LEGAL SERVICES23 928000 Regulatory commission exp MCGUIRE WOODS LLP 192 LEGAL SERVICES24 928000 Regulatory commission exp PONTOON SOLUTIONS INC 72 PROFESSIONAL STAFF AUGMENTATION25 928000 Regulatory commission exp ROONEY, RIPPIE & RATNASWAMY LLP 1,605 LEGAL SERVICES26 928000 Regulatory commission exp UNIVERSITY OF ILLINOIS 71 CONSULTING SERVICES27 930100 General advertising expenses APCO WORLDWIDE INC 106 PUBLIC AFFAIRS CONSULTING28 930100 General advertising expenses ASGK PUBLIC STRATEGIES LLC 50 COMMUNICATION SERVICES29 930100 General advertising expenses BULLY PULPIT INTERACTIVE LLC 241 ADVERTISING SERVICES
Page Sub-Total 7,656$
Docket No. 18-____ ComEd Ex. 2.03 Page 112 of 334

Schedule C-6.2Page 17 of 74
Commonwealth Edison CompanyExpenses For Outside Professional Services in 2017
2017 Payments of $50,000 Or More Charged To Operating Expense(In Thousands)
Witness: Tracy
2017Line FERC Account PaymentNo. Account Description Payee Amount Nature of Service Provided
(A) (B) (C) (D) (E)
1 930100 General advertising expenses CAROL H WILLIAMS ADVERTISING INC 229$ MEDIA2 930100 General advertising expenses JILL KERRIGAN 52 CONSULTING SERVICES3 930100 General advertising expenses LEO BURNETT USA INC 2,180 ADVERTISING SERVICES4 930100 General advertising expenses MEDIUS & ASSOCIATES INC 93 PRINTING SERVICES5 930100 General advertising expenses PACO COMMUNICATIONS INC 241 ADVERTISING SERVICES6 930100 General advertising expenses WTTW CHANNEL 11 80 ADVERTISING SERVICES7 930200 Misc general expenses ACCENTURE 106 CONSULTING SERVICES8 930200 Misc general expenses HBK ENGINEERING LLC 59 ENGINEERING9 930200 Misc general expenses M2 CONSULTING INC 113 CONSULTING SERVICES
10 930200 Misc general expenses SARGENT & LUNDY LLC 294 ENGINEERING11 935000 Maint of general plant - Elec 4A CONSULTING LLC 90 IT SERVICES12 935000 Maint of general plant - Elec AGB INVESTIGATIVE SERVICES INC 433 SECURITY13 935000 Maint of general plant - Elec AMERICAN HERITAGE PROTECTION 523 SECURITY14 935000 Maint of general plant - Elec ARCADIS US, INC. 73 ENVIRONMENTAL SERVICES15 935000 Maint of general plant - Elec BEARY LANDSCAPE MANAGEMENT INC 2,501 BUILDING MAINTENANCE AND REPAIRS16 935000 Maint of general plant - Elec BURLING BUILDERS INC 53 BUILDING MAINTENANCE AND REPAIRS17 935000 Maint of general plant - Elec COMPREHENSIVE CONSTRUCTION CONSULTING, INC. 55 CONSULTING SERVICES18 935000 Maint of general plant - Elec COVENANT SECURITY 827 SECURITY19 935000 Maint of general plant - Elec J C ANDERSON INC 80 CONSTRUCTION SERVICES20 935000 Maint of general plant - Elec JONES LANG LASALLE AMERICAS INC 14,681 FACILITY SERVICES21 935000 Maint of general plant - Elec NORTHWEST CONTRACTORS INC 51 CONSTRUCTION SERVICES22 935000 Maint of general plant - Elec OLENICK AND ASSOCIATES 181 CONSULTING SERVICES23 935000 Maint of general plant - Elec PONTOON SOLUTIONS INC 87 PROFESSIONAL STAFF AUGMENTATION24 935000 Maint of general plant - Elec PSC INDUSTRIAL OUTSOURCING, LP 412 OPERATIONAL STAFF AUGMENTATION25 935000 Maint of general plant - Elec QUANTUM CROSSINGS LLC 634 TECHNICAL SERVICES26 935000 Maint of general plant - Elec RT BEVERAGE 294 BUILDING MAINTENANCE AND REPAIRS27 935000 Maint of general plant - Elec SCHNEIDER ELECTRIC BUILDING AMERICAS INC 750 BUILDING MAINTENANCE AND REPAIRS28 935000 Maint of general plant - Elec SPEC-TEC LLC 91 TECHNICAL SERVICES
Page Sub-Total 25,263$
Docket No. 18-____ ComEd Ex. 2.03 Page 113 of 334

Schedule C-6.2Page 18 of 74
Commonwealth Edison CompanyExpenses For Outside Professional Services in 2017
2017 Payments of $50,000 Or More Charged To Operating Expense(In Thousands)
Witness: Tracy
2017Line FERC Account PaymentNo. Account Description Payee Amount Nature of Service Provided
(A) (B) (C) (D) (E)
1 935000 Maint of general plant - Elec THOMAS INTERIOR SYSTEMS INC 99$ BUILDING MAINTENANCE AND REPAIRS2 935000 Maint of general plant - Elec WIGHT & CO 161 BUILDING MAINTENANCE AND REPAIRS
Page Sub-Total 260$
Total 2017 Payments $50,000 and Above Charged To Operating Expense (p. 1-18 detail) 335,130$
Total 2017 Payments Under $50,000 Charged To Operating Expenses 11,287$
Docket No. 18-____ ComEd Ex. 2.03 Page 114 of 334

Schedule C-6.2Page 19 of 74
Commonwealth Edison CompanyExpenses For Outside Professional Services in 2016
2016 Payments of $50,000 Or More Charged To Operating Expense(In Thousands)
Witness: Tracy
2016Line FERC Account PaymentNo. Account Description Payee Amount Nature of Service Provided
(A) (B) (C) (D) (E)
1 560000 Oper supervision & engineering BEELINE.COM, INC. 116$ PROFESSIONAL STAFF AUGMENTATION2 560000 Oper supervision & engineering DAVID MASON & ASSOCIATES OF ILLINOIS LTD 57 FACILITY SERVICES3 560000 Oper supervision & engineering NEAL MURDOCK AND LEROY, LLC 162 LEGAL SERVICES4 560000 Oper supervision & engineering OLENICK AND ASSOCIATES 60 CONSULTING SERVICES5 561700 Generation Interconnect Study QUALITECH ENGINEERING, LLC 57 ENGINEERING6 563000 Overhead line expenses AMPJACK AMERICA LTD 255 CONSTRUCTION SERVICES7 563000 Overhead line expenses J F ELECTRIC INC 192 STORM ASSISTANCE8 563000 Overhead line expenses MIDWEST ACCESS SOLUTIONS LLC 65 CONSTRUCTION SERVICES9 566000 Misc. transmission expenses AVO INTERNATIONAL 122 TRAINING SERVICES
10 566000 Misc. transmission expenses BEELINE.COM, INC. 267 PROFESSIONAL STAFF AUGMENTATION11 566000 Misc. transmission expenses BURNS & MCDONNELL ENGINEERING 85 ENGINEERING12 566000 Misc. transmission expenses ENVIRONMENTAL RESOURCES 74 CONSULTING SERVICES13 566000 Misc. transmission expenses F H PASCHEN S N NIELSEN & ASSOC LLC 1,402 CONSTRUCTION SERVICES14 566000 Misc. transmission expenses OLENICK AND ASSOCIATES 196 CONSULTING SERVICES15 566000 Misc. transmission expenses RONALD G KAMINSKI DBA HBK ENGINEERING LLC 299 ENGINEERING16 566000 Misc. transmission expenses SARGENT & LUNDY LLC 288 ENGINEERING17 566000 Misc. transmission expenses SCHWEITZER ENGINEERING LABORATORIES INC 70 TRAINING SERVICES18 566000 Misc. transmission expenses SYNERGRID SOLUTIONS INC 78 CONSULTING SERVICES19 566000 Misc. transmission expenses SYSTEM ONE LLC 59 CONSTRUCTION SERVICES20 566000 Misc. transmission expenses TRC ENGINEERS 938 ENGINEERING21 566000 Misc. transmission expenses UBISENSE INC 78 PROFESSIONAL STAFF AUGMENTATION22 568000 Main supervision & engineering PSC INDUSTRIAL OUTSOURCING, LP 485 OPERATIONAL STAFF AUGMENTATION23 569000 Maintenance of structures BEARY LANDSCAPE MANAGEMENT INC 89 BUILDING MAINTENANCE AND REPAIRS24 569000 Maintenance of structures GREAT LAKES FIRE AND SAFETY EQUIPMENT 217 SAFETY SERVICES25 569000 Maintenance of structures OSMOSE UTILITIES SERVICES INC 72 TECHNICAL SERVICES26 569000 Maintenance of structures PUBLIC UTILITIES 532 PAINTING AND COATING27 569300 Maint of Communication Equip ABB ENTERPRISE SOFTWARE INC 242 IT SERVICES28 569300 Maint of Communication Equip OLENICK AND ASSOCIATES 182 CONSULTING SERVICES
Page Sub-Total 6,739$
Docket No. 18-____ ComEd Ex. 2.03 Page 115 of 334

Schedule C-6.2Page 20 of 74
Commonwealth Edison CompanyExpenses For Outside Professional Services in 2016
2016 Payments of $50,000 Or More Charged To Operating Expense(In Thousands)
Witness: Tracy
2016Line FERC Account PaymentNo. Account Description Payee Amount Nature of Service Provided
(A) (B) (C) (D) (E)
1 570000 Maintenance of station equip ABB POWER T&D COMPANY INC 56$ TECHNICAL SERVICES2 570000 Maintenance of station equip A-LINE E.D.S. 180 ENVIRONMENTAL SERVICES3 570000 Maintenance of station equip ALSTOM GRID, INC C/O KW ASSOCIATES 158 TECHNICAL SERVICES4 570000 Maintenance of station equip BEARY LANDSCAPE MANAGEMENT INC 82 BUILDING MAINTENANCE AND REPAIRS5 570000 Maintenance of station equip D CONSTRUCTION INC 134 CONSTRUCTION SERVICES6 570000 Maintenance of station equip DELTA STAR INC 53 TECHNICAL SERVICES7 570000 Maintenance of station equip ENVIROPLUS 545 ENVIRONMENTAL SERVICES8 570000 Maintenance of station equip LINDBLAD CONSTRUCTION COMPANY 71 CONSTRUCTION SERVICES9 570000 Maintenance of station equip M J ELECTRIC LLC 115 OPERATIONAL STAFF AUGMENTATION
10 570000 Maintenance of station equip MIDWEST MECHANICAL 55 TECHNICAL SERVICES11 570000 Maintenance of station equip PRIMERA ENGINEERS LTD 109 ENGINEERING12 570000 Maintenance of station equip QUALITECH ENGINEERING, LLC 82 ENGINEERING13 570000 Maintenance of station equip QUANTUM CROSSINGS LLC 441 TECHNICAL SERVICES14 570000 Maintenance of station equip SCHNEIDER ELECTRIC BUILDING AMERICAS INC 438 BUILDING MAINTENANCE AND REPAIRS15 570000 Maintenance of station equip TRANSMISSION AND DISTRIBUTION SERVICES LLC 94 TECHNICAL SERVICES16 571000 Maintenance of overhead lines ABC PROFESSIONAL TREE SERVICES INC 57 TREE TRIMMING17 571000 Maintenance of overhead lines AMPJACK AMERICA LTD 80 CONSTRUCTION SERVICES18 571000 Maintenance of overhead lines ARCADIS US, INC. 290 ENVIRONMENTAL SERVICES19 571000 Maintenance of overhead lines ASPLUNDH TREE EXPERT CO 505 TREE TRIMMING20 571000 Maintenance of overhead lines BARRICADE LITES INC. 63 CONSTRUCTION SERVICES21 571000 Maintenance of overhead lines BEARY LANDSCAPE MANAGEMENT INC 1,103 BUILDING MAINTENANCE AND REPAIRS22 571000 Maintenance of overhead lines CHEMICAL VEGETATION CONTROL LLC 129 VEGETATION MANAGEMENT23 571000 Maintenance of overhead lines CHRISTOPHER B BURKE ENGINEERIN 94 ENGINEERING24 571000 Maintenance of overhead lines CJ DRILLING, INC. 111 EXCAVATING SERVICES25 571000 Maintenance of overhead lines DAVEY RESOURCE GROUP 602 VEGETATION MANAGEMENT26 571000 Maintenance of overhead lines HAVERFIELD AVIATION, INC 1,184 AERIAL INSPECTION27 571000 Maintenance of overhead lines HOMER TREE SERVICE INC 450 VEGETATION MANAGEMENT28 571000 Maintenance of overhead lines JONES LANG LASALLE AMERICAS INC 153 FACILITY SERVICES
Page Sub-Total 7,434$
Docket No. 18-____ ComEd Ex. 2.03 Page 116 of 334

Schedule C-6.2Page 21 of 74
Commonwealth Edison CompanyExpenses For Outside Professional Services in 2016
2016 Payments of $50,000 Or More Charged To Operating Expense(In Thousands)
Witness: Tracy
2016Line FERC Account PaymentNo. Account Description Payee Amount Nature of Service Provided
(A) (B) (C) (D) (E)
1 571000 Maintenance of overhead lines KRUEGER TOWER INC 655$ TECHNICAL SERVICES2 571000 Maintenance of overhead lines LEWIS TREE SERVICE INC 7,356 TREE TRIMMING3 571000 Maintenance of overhead lines M J ELECTRIC LLC 298 OPERATIONAL STAFF AUGMENTATION4 571000 Maintenance of overhead lines MIDWEST ACCESS SOLUTIONS LLC 217 CONSTRUCTION SERVICES5 571000 Maintenance of overhead lines MOTOROLA SOLUTIONS INC 445 TELECOM SERVICES6 571000 Maintenance of overhead lines NEW SOUTH EQUIPMENT MATS LLC 128 CONSTRUCTION SERVICES7 571000 Maintenance of overhead lines PATTEN INDUSTRIES 91 TECHNICAL SERVICES8 571000 Maintenance of overhead lines PSC INDUSTRIAL OUTSOURCING, LP 90 OPERATIONAL STAFF AUGMENTATION9 571000 Maintenance of overhead lines QUALITECH ENGINEERING, LLC 245 ENGINEERING
10 571000 Maintenance of overhead lines STANTEC CONSULTING SERVICES INC. 199 ENVIRONMENTAL SERVICES11 571000 Maintenance of overhead lines STEVENSON CRANE SERVICE 247 CONSTRUCTION SERVICES12 571000 Maintenance of overhead lines UNITED BUILDING MAINTENANCE INC 177 BUILDING MAINTENANCE AND REPAIRS13 571000 Maintenance of overhead lines UNITED SCRAP METAL INC 53 SALVAGE14 572000 Maintenance of undergrnd lines CATHODIC PROTECTION MANAGEMENT 123 TECHNICAL SERVICES15 572000 Maintenance of undergrnd lines NASH BROS CONSTRUCTION CO INC 569 CONSTRUCTION SERVICES16 572000 Maintenance of undergrnd lines PRYSMIAN CABLES & SYSTEMS USA LLC 482 TECHNICAL SERVICES17 572000 Maintenance of undergrnd lines TESCO 206 TECHNICAL SERVICES18 573000 Maint of Misc Transm Plant D CONSTRUCTION INC 565 CONSTRUCTION SERVICES19 573000 Maint of Misc Transm Plant ENVIRONMENTAL DESIGN INTERNATIONAL INC 381 ENVIRONMENTAL SERVICES20 580000 Oper supervision & engineering AECOM TECHNICAL SERVICES, INC. 164 ENVIRONMENTAL SERVICES21 580000 Oper supervision & engineering AECOM USA INC 105 TECHNICAL SERVICES22 580000 Oper supervision & engineering BEELINE.COM, INC. 1,106 PROFESSIONAL STAFF AUGMENTATION23 580000 Oper supervision & engineering CYME INTERNATIONAL INC 55 IT SERVICES24 580000 Oper supervision & engineering ELEVATE ENERGY 150 CONSULTING SERVICES25 580000 Oper supervision & engineering ELECTRIC POWER RESEARCH INSTITUTE INC 77 CONSULTING SERVICES26 580000 Oper supervision & engineering ILLINI POWER PRODUCTS CO 122 CONSTRUCTION SERVICES27 580000 Oper supervision & engineering INTREN INC 653 CONSTRUCTION SERVICES28 580000 Oper supervision & engineering JONES LANG LASALLE AMERICAS INC 75 FACILITY SERVICES
Page Sub-Total 15,034$
Docket No. 18-____ ComEd Ex. 2.03 Page 117 of 334

Schedule C-6.2Page 22 of 74
Commonwealth Edison CompanyExpenses For Outside Professional Services in 2016
2016 Payments of $50,000 Or More Charged To Operating Expense(In Thousands)
Witness: Tracy
2016Line FERC Account PaymentNo. Account Description Payee Amount Nature of Service Provided
(A) (B) (C) (D) (E)
1 580000 Oper supervision & engineering MEADE ELECTRIC CO 462$ OPERATIONAL STAFF AUGMENTATION2 580000 Oper supervision & engineering OLENICK AND ASSOCIATES 57 CONSULTING SERVICES3 580000 Oper supervision & engineering PATTEN INDUSTRIES 123 TECHNICAL SERVICES4 580000 Oper supervision & engineering PRIMERA ENGINEERS LTD 287 ENGINEERING5 580000 Oper supervision & engineering PSC INDUSTRIAL OUTSOURCING, LP 89 OPERATIONAL STAFF AUGMENTATION6 580000 Oper supervision & engineering QUANTA TECHNOLOGY LLC 556 CONSULTING SERVICES7 580000 Oper supervision & engineering RIGHT MANAGEMENT,INC 121 CONSULTING SERVICES8 580000 Oper supervision & engineering RONALD G KAMINSKI DBA HBK ENGINEERING LLC 60 ENGINEERING9 580000 Oper supervision & engineering SI ADVERTISING INC 98 COMMUNITY RELATIONS
10 580000 Oper supervision & engineering SPEC-TEC LLC 301 TECHNICAL SERVICES11 580000 Oper supervision & engineering SYSTEM ONE LLC 84 CONSTRUCTION SERVICES12 580000 Oper supervision & engineering THE BARTECH GROUP 214 TECHNICAL SERVICES13 580000 Oper supervision & engineering THE SOMOGYI GROUP 62 BUILDING MAINTENANCE AND REPAIRS14 580000 Oper supervision & engineering TRAVELLIANCE 72 EMERGENCY LODGING15 580000 Oper supervision & engineering TRICE CONSTRUCTION COMPANY 631 CONSTRUCTION SERVICES16 580000 Oper supervision & engineering VANTAGE LEADERSHIP CONSULTING, LLC 95 CONSULTING SERVICES17 580000 Oper supervision & engineering WIGHT & CO 73 BUILDING MAINTENANCE AND REPAIRS18 582000 Station expenses AMERICAN HERITAGE PROTECTION 109 SECURITY19 582000 Station expenses FIRE & RISK ALLIANCE LLC 64 ENGINEERING20 582000 Station expenses INTREN INC 130 CONSTRUCTION SERVICES21 582000 Station expenses MEADE ELECTRIC CO 81 OPERATIONAL STAFF AUGMENTATION22 582000 Station expenses PHOENIX FIRE SYSTEMS, INC. 288 SAFETY SERVICES23 582000 Station expenses STEVENSON CRANE SERVICE 202 CONSTRUCTION SERVICES24 583000 Overhead line expenses G4S SECURE INTEGRATION 184 CONSTRUCTION SERVICES25 583000 Overhead line expenses ILLINOIS DEPT OF TRANSPORTATION 52 CONSTRUCTION SERVICES26 584000 Underground line expenses CITY OF CHICAGO DEPT OF TRANS 107 EXCAVATING SERVICES27 584000 Underground line expenses JULIE INC 1,127 OPERATIONAL CONSULTING28 584000 Underground line expenses MEADE ELECTRIC CO 227 OPERATIONAL STAFF AUGMENTATION
Page Sub-Total 5,956$
Docket No. 18-____ ComEd Ex. 2.03 Page 118 of 334

Schedule C-6.2Page 23 of 74
Commonwealth Edison CompanyExpenses For Outside Professional Services in 2016
2016 Payments of $50,000 Or More Charged To Operating Expense(In Thousands)
Witness: Tracy
2016Line FERC Account PaymentNo. Account Description Payee Amount Nature of Service Provided
(A) (B) (C) (D) (E)
1 584000 Underground line expenses USIC LOCATING SERVICES INC 11,886$ OPERATIONAL CONSULTING2 585000 Street light & sign sys exp WEST MONROE PARTNERS, LLC 51 CONSULTING SERVICES3 586000 Meter expenses AMERICAN HERITAGE PROTECTION 61 SECURITY4 586000 Meter expenses CORIX UTILITIES (US) INC 1,111 BUSINESS APPLICATIONS5 586000 Meter expenses DELOITTE 85 CONSULTING SERVICES6 586000 Meter expenses MZI GROUP INC 2,420 TECHNICAL SERVICES7 586000 Meter expenses WEST MONROE PARTNERS, LLC 80 CONSULTING SERVICES8 587000 Cust installations exp ALDRIDGE ELECTRIC INC 156 OPERATIONAL STAFF AUGMENTATION9 587000 Cust installations exp AMPED 1 LLC 150 CONSULTING SERVICES
10 587000 Cust installations exp BEELINE.COM, INC. 450 PROFESSIONAL STAFF AUGMENTATION11 587000 Cust installations exp CHICAGO TRANSIT AUTHORITY 191 MUNICIPALITY12 587000 Cust installations exp INTELLIGRID POWER & CONTROL CO 193 CONSULTING SERVICES13 587000 Cust installations exp INTREN INC 1,109 CONSTRUCTION SERVICES14 587000 Cust installations exp MEADE ELECTRIC CO 606 OPERATIONAL STAFF AUGMENTATION15 587000 Cust installations exp PMI ENERGY SOLUTIONS LLC 269 STORM ASSISTANCE16 587000 Cust installations exp RONALD G KAMINSKI DBA HBK ENGINEERING LLC 138 ENGINEERING17 587000 Cust installations exp SILVER SPRING NETWORKS INC 172 TECHNICAL SERVICES18 588000 Misc distribution expenses ACCENTURE 138 CONSULTING SERVICES19 588000 Misc distribution expenses AECOM TECHNICAL SERVICES INC 65 TECHNICAL SERVICES20 588000 Misc distribution expenses AECOM USA INC 115 TECHNICAL SERVICES21 588000 Misc distribution expenses ASPLUNDH TREE EXPERT CO 9,419 TREE TRIMMING22 588000 Misc distribution expenses BEARY LANDSCAPE MANAGEMENT INC 638 BUILDING MAINTENANCE AND REPAIRS23 588000 Misc distribution expenses BEELINE.COM, INC. 582 PROFESSIONAL STAFF AUGMENTATION24 588000 Misc distribution expenses BURNS & MCDONNELL ENGINEERING 58 ENGINEERING25 588000 Misc distribution expenses DAVEY RESOURCE GROUP 507 VEGETATION MANAGEMENT26 588000 Misc distribution expenses DELOITTE CONSULTING LLP 143 CONSULTING SERVICES27 588000 Misc distribution expenses LINDBLAD CONSTRUCTION COMPANY 130 CONSTRUCTION SERVICES28 588000 Misc distribution expenses MEADE ELECTRIC CO 64 OPERATIONAL STAFF AUGMENTATION
Page Sub-Total 30,987$
Docket No. 18-____ ComEd Ex. 2.03 Page 119 of 334

Schedule C-6.2Page 24 of 74
Commonwealth Edison CompanyExpenses For Outside Professional Services in 2016
2016 Payments of $50,000 Or More Charged To Operating Expense(In Thousands)
Witness: Tracy
2016Line FERC Account PaymentNo. Account Description Payee Amount Nature of Service Provided
(A) (B) (C) (D) (E)
1 588000 Misc distribution expenses OLENICK AND ASSOCIATES 900$ CONSULTING SERVICES2 588000 Misc distribution expenses PRIMERA ENGINEERS LTD 300 ENGINEERING3 588000 Misc distribution expenses PSC INDUSTRIAL OUTSOURCING, LP 73 OPERATIONAL STAFF AUGMENTATION4 588000 Misc distribution expenses QUANTA TECHNOLOGY LLC 110 CONSULTING SERVICES5 588000 Misc distribution expenses RONALD G KAMINSKI DBA HBK ENGINEERING LLC 153 ENGINEERING6 588000 Misc distribution expenses SIDLEY & AUSTIN 197 LEGAL SERVICES7 588000 Misc distribution expenses SILVER SPRING NETWORKS INC 352 TECHNICAL SERVICES8 588000 Misc distribution expenses THREE PHASE LINE CONSTRUCTION INC 89 CONSTRUCTION SERVICES9 588000 Misc distribution expenses UBISENSE INC 1,255 PROFESSIONAL STAFF AUGMENTATION
10 588000 Misc distribution expenses UNITED BUILDING MAINTENANCE INC 117 BUILDING MAINTENANCE AND REPAIRS11 588000 Misc distribution expenses URS CORPORATION 85 ENVIRONMENTAL SERVICES12 588000 Misc distribution expenses WEST MONROE PARTNERS, LLC 403 CONSULTING SERVICES13 590000 Main supervision & engineering KDM ENGINEERING 94 ENGINEERING14 591000 Maintenance of structures BEARY LANDSCAPE MANAGEMENT INC 89 BUILDING MAINTENANCE AND REPAIRS15 591000 Maintenance of structures BERGLUND CONSTRUCTION COMPANY 444 BUILDING MAINTENANCE AND REPAIRS16 591000 Maintenance of structures CENTRAL PLUMBING CO., INC. 106 OPERATIONAL STAFF AUGMENTATION17 591000 Maintenance of structures ENVIROPLUS INC 72 ENVIRONMENTAL SERVICES18 591000 Maintenance of structures GARFIELD BUILDING MAINTENANCE 410 BUILDING MAINTENANCE AND REPAIRS19 591000 Maintenance of structures JONES LANG LASALLE AMERICAS INC 448 FACILITY SERVICES20 591000 Maintenance of structures MIDWEST MECHANICAL 123 TECHNICAL SERVICES21 592000 Main of station equipment ABB POWER T&D COMPANY INC 71 TECHNICAL SERVICES22 592000 Main of station equipment ALARM DETECTION SYSTEMS, INC. 127 BUILDING MAINTENANCE AND REPAIRS23 592000 Main of station equipment ALDRIDGE ELECTRIC INC 106 OPERATIONAL STAFF AUGMENTATION24 592000 Main of station equipment A-LINE E.D.S. 212 ENVIRONMENTAL SERVICES25 592000 Main of station equipment AMERICAN HERITAGE PROTECTION 57 SECURITY26 592000 Main of station equipment ANDERSON & SHAH ROOFING INC 61 BUILDING MAINTENANCE AND REPAIRS27 592000 Main of station equipment ARCADIS US, INC. 1,273 ENVIRONMENTAL SERVICES28 592000 Main of station equipment B & R REPAIR INC. 156 GENERAL MAINT AND REPAIRS
Page Sub-Total 7,883$
Docket No. 18-____ ComEd Ex. 2.03 Page 120 of 334

Schedule C-6.2Page 25 of 74
Commonwealth Edison CompanyExpenses For Outside Professional Services in 2016
2016 Payments of $50,000 Or More Charged To Operating Expense(In Thousands)
Witness: Tracy
2016Line FERC Account PaymentNo. Account Description Payee Amount Nature of Service Provided
(A) (B) (C) (D) (E)
1 592000 Main of station equipment BEARY LANDSCAPE MANAGEMENT INC 220$ BUILDING MAINTENANCE AND REPAIRS2 592000 Main of station equipment BURLING BUILDERS INC 90 BUILDING MAINTENANCE AND REPAIRS3 592000 Main of station equipment CENTRAL PLUMBING CO., INC. 115 OPERATIONAL STAFF AUGMENTATION4 592000 Main of station equipment D CONSTRUCTION INC 126 CONSTRUCTION SERVICES5 592000 Main of station equipment DELTA STAR INC 290 TECHNICAL SERVICES6 592000 Main of station equipment ENVIROPLUS INC 97 ENVIRONMENTAL SERVICES7 592000 Main of station equipment G RABINE PAVING 92 CONSTRUCTION SERVICES8 592000 Main of station equipment GARFIELD BUILDING MAINTENANCE 176 BUILDING MAINTENANCE AND REPAIRS9 592000 Main of station equipment GREAT LAKES FIRE AND SAFETY EQUIPMENT 162 SAFETY SERVICES
10 592000 Main of station equipment INDUSTRIAL FENCE INC 53 BUILDING MAINTENANCE AND REPAIRS11 592000 Main of station equipment INTREN INC 416 CONSTRUCTION SERVICES12 592000 Main of station equipment JOLIET EQUIP CORP 79 REPAIR SERVICES13 592000 Main of station equipment JONES LANG LASALLE AMERICAS INC 1,340 FACILITY SERVICES14 592000 Main of station equipment LINDBLAD CONSTRUCTION COMPANY 265 CONSTRUCTION SERVICES15 592000 Main of station equipment M J ELECTRIC LLC 467 OPERATIONAL STAFF AUGMENTATION16 592000 Main of station equipment MEADE ELECTRIC CO 143 OPERATIONAL STAFF AUGMENTATION17 592000 Main of station equipment MIDSUN GROUP 225 TECHNICAL SERVICES18 592000 Main of station equipment MIDWEST MECHANICAL 173 TECHNICAL SERVICES19 592000 Main of station equipment NASH BROS CONSTRUCTION CO INC 803 CONSTRUCTION SERVICES20 592000 Main of station equipment NORTHWEST CONTRACTORS 212 CONSTRUCTION SERVICES21 592000 Main of station equipment PEERLESS FENCE 305 BUILDING MAINTENANCE AND REPAIRS22 592000 Main of station equipment PHOENIX FIRE SYSTEMS, INC. 353 SAFETY SERVICES23 592000 Main of station equipment PSC INDUSTRIAL OUTSOURCING, LP 96 OPERATIONAL STAFF AUGMENTATION24 592000 Main of station equipment QUAD PLUS, LLC 704 CONSTRUCTION SERVICES25 592000 Main of station equipment SHERMCO INDUSTRIES INC 62 TECHNICAL SERVICES26 592000 Main of station equipment SMITHEREEN PEST MANAGEMENT SERVICES 76 BUILDING MAINTENANCE AND REPAIRS27 592000 Main of station equipment SPX TRANSFORMER SOLUTIONS INC 77 TECHNICAL SERVICES28 592000 Main of station equipment STEVENSON CRANE SERVICE 114 CONSTRUCTION SERVICES
Page Sub-Total 7,331$
Docket No. 18-____ ComEd Ex. 2.03 Page 121 of 334

Schedule C-6.2Page 26 of 74
Commonwealth Edison CompanyExpenses For Outside Professional Services in 2016
2016 Payments of $50,000 Or More Charged To Operating Expense(In Thousands)
Witness: Tracy
2016Line FERC Account PaymentNo. Account Description Payee Amount Nature of Service Provided
(A) (B) (C) (D) (E)
1 592000 Main of station equipment TESCO 231$ TECHNICAL SERVICES2 592000 Main of station equipment THE BARTECH GROUP 55 TECHNICAL SERVICES3 592000 Main of station equipment THOMAS INTERIOR SYSTEMS INC 73 BUILDING MAINTENANCE AND REPAIRS4 592000 Main of station equipment THREE PHASE LINE CONSTRUCTION INC 70 CONSTRUCTION SERVICES5 592000 Main of station equipment TRANSMISSION AND DISTRIBUTION SERVICES LLC 196 TECHNICAL SERVICES6 592000 Main of station equipment UTILITY & IND CONSTRUCTION CO 91 BUILDING MAINTENANCE AND REPAIRS7 593000 Maintenance of overhead lines AMEREN ILINOIS CO 251 CONSTRUCTION SERVICES8 593000 Maintenance of overhead lines AMERICAN HERITAGE PROTECTION 692 SECURITY9 593000 Maintenance of overhead lines ARC AMERICAN INC 88 STORM ASSISTANCE
10 593000 Maintenance of overhead lines ASPLUNDH TREE EXPERT CO 58,074 TREE TRIMMING11 593000 Maintenance of overhead lines BEARY LANDSCAPE MANAGEMENT INC 109 BUILDING MAINTENANCE AND REPAIRS12 593000 Maintenance of overhead lines BEELINE.COM, INC. 64 PROFESSIONAL STAFF AUGMENTATION13 593000 Maintenance of overhead lines DAVEY RESOURCE GROUP 3,171 VEGETATION MANAGEMENT14 593000 Maintenance of overhead lines EQUALITY US 143 LANDSCAPING SERVICES15 593000 Maintenance of overhead lines HAVERFIELD AVIATION, INC 203 AERIAL INSPECTION16 593000 Maintenance of overhead lines HOOPER CORPORATION 52 STORM ASSISTANCE17 593000 Maintenance of overhead lines HURLEY & ASSOCIATES INC 314 TECHNICAL SERVICES18 593000 Maintenance of overhead lines HYDAKER WHEATLAKE COMPANY 84 STORM ASSISTANCE19 593000 Maintenance of overhead lines INTREN INC 4,105 CONSTRUCTION SERVICES20 593000 Maintenance of overhead lines J F ELECTRIC INC 2,183 STORM ASSISTANCE21 593000 Maintenance of overhead lines LEWIS TREE SERVICE INC 2,046 TREE TRIMMING22 593000 Maintenance of overhead lines M J ELECTRIC LLC 2,518 OPERATIONAL STAFF AUGMENTATION23 593000 Maintenance of overhead lines MEADE ELECTRIC CO 2,575 OPERATIONAL STAFF AUGMENTATION24 593000 Maintenance of overhead lines MICHELS POWER 77 STORM ASSISTANCE25 593000 Maintenance of overhead lines MIDWEST ACCESS SOLUTIONS LLC 168 CONSTRUCTION SERVICES26 593000 Maintenance of overhead lines MP SYSTEMS INC 179 STORM ASSISTANCE27 593000 Maintenance of overhead lines NEW LOYALTY USA, INC. 55 COMMUNICATION SERVICES28 593000 Maintenance of overhead lines OSMOSE, INC. 4,739 TECHNICAL SERVICES
Page Sub-Total 82,606$
Docket No. 18-____ ComEd Ex. 2.03 Page 122 of 334

Schedule C-6.2Page 27 of 74
Commonwealth Edison CompanyExpenses For Outside Professional Services in 2016
2016 Payments of $50,000 Or More Charged To Operating Expense(In Thousands)
Witness: Tracy
2016Line FERC Account PaymentNo. Account Description Payee Amount Nature of Service Provided
(A) (B) (C) (D) (E)
1 593000 Maintenance of overhead lines PAR ELECTRIC CONTRACTORS INC 188$ CONSTRUCTION SERVICES2 593000 Maintenance of overhead lines PMI ENERGY SOLUTIONS LLC 843 STORM ASSISTANCE3 593000 Maintenance of overhead lines PSC INDUSTRIAL OUTSOURCING, LP 261 OPERATIONAL STAFF AUGMENTATION4 593000 Maintenance of overhead lines QUALITY LINES INC 197 STORM ASSISTANCE5 593000 Maintenance of overhead lines RAM CONSTRUCTION & LANDSCAPING LLC 100 LANDSCAPING SERVICES6 593000 Maintenance of overhead lines RIGGS DISTLER & COMPANY INC 1,290 STORM ASSISTANCE7 593000 Maintenance of overhead lines THOMPSON ELECTRIC INC 221 STORM ASSISTANCE8 593000 Maintenance of overhead lines THREE PHASE LINE CONSTRUCTION INC 1,068 CONSTRUCTION SERVICES9 594000 Main of underground lines ALDRIDGE ELECTRIC INC 8,716 OPERATIONAL STAFF AUGMENTATION
10 594000 Main of underground lines BADGER DAYLIGHTING CORP 105 EXCAVATING SERVICES11 594000 Main of underground lines BEELINE.COM, INC. 103 PROFESSIONAL STAFF AUGMENTATION12 594000 Main of underground lines EQUALITY US 306 LANDSCAPING SERVICES13 594000 Main of underground lines INDEPENDENT PAVING CO INC 327 CONSTRUCTION SERVICES14 594000 Main of underground lines INTREN INC 13,124 CONSTRUCTION SERVICES15 594000 Main of underground lines M J ELECTRIC LLC 75 OPERATIONAL STAFF AUGMENTATION16 594000 Main of underground lines MEADE ELECTRIC CO 6,566 OPERATIONAL STAFF AUGMENTATION17 594000 Main of underground lines NASH BROS CONSTRUCTION CO INC 79 CONSTRUCTION SERVICES18 594000 Main of underground lines PSC INDUSTRIAL OUTSOURCING, LP 2,646 OPERATIONAL STAFF AUGMENTATION19 594000 Main of underground lines RAM CONSTRUCTION & LANDSCAPING LLC 212 LANDSCAPING SERVICES20 594000 Main of underground lines RONALD G KAMINSKI DBA HBK ENGINEERING LLC 2,928 ENGINEERING21 594000 Main of underground lines TESCO 75 TECHNICAL SERVICES22 594000 Main of underground lines THREE PHASE LINE CONSTRUCTION INC 82 CONSTRUCTION SERVICES23 594000 Main of underground lines TRICE CONSTRUCTION COMPANY 2,340 CONSTRUCTION SERVICES24 594000 Main of underground lines UTILX CORPORATION 545 GENERAL MAINT AND REPAIRS25 595000 Main of line transformers PSC INDUSTRIAL OUTSOURCING, LP 1,993 OPERATIONAL STAFF AUGMENTATION26 598000 Main of misc distrib plant FIRE & RISK ALLIANCE LLC 96 ENGINEERING27 598000 Main of misc distrib plant MEADE ELECTRIC CO 129 OPERATIONAL STAFF AUGMENTATION28 598000 Main of misc distrib plant PRIMERA ENGINEERS LTD 232 ENGINEERING
Page Sub-Total 44,847$
Docket No. 18-____ ComEd Ex. 2.03 Page 123 of 334

Schedule C-6.2Page 28 of 74
Commonwealth Edison CompanyExpenses For Outside Professional Services in 2016
2016 Payments of $50,000 Or More Charged To Operating Expense(In Thousands)
Witness: Tracy
2016Line FERC Account PaymentNo. Account Description Payee Amount Nature of Service Provided
(A) (B) (C) (D) (E)
1 598000 Main of misc distrib plant VENCORE LABS INC 87$ OPERATIONAL CONSULTING2 598000 Main of misc distrib plant WEST MONROE PARTNERS, LLC 135 CONSULTING SERVICES3 902000 Meter reading expenses ACCENTURE 63 CONSULTING SERVICES4 902000 Meter reading expenses BEELINE.COM, INC. 119 PROFESSIONAL STAFF AUGMENTATION5 902000 Meter reading expenses CLEVEST SOLUTIONS INC 273 IT SERVICES6 902000 Meter reading expenses ITRON, INC. 425 BUSINESS APPLICATIONS7 902000 Meter reading expenses PMI ENERGY SOLUTIONS LLC 884 STORM ASSISTANCE8 902000 Meter reading expenses RR DONNELLEY & SONS COMPANY 91 PRINTING SERVICES9 902000 Meter reading expenses SILVER SPRING NETWORKS INC 665 TECHNICAL SERVICES
10 902000 Meter reading expenses THE BLACKSTONE GROUP INC 92 CONSULTING SERVICES11 902000 Meter reading expenses UTILISMART CORPORATION 91 BUSINESS APPLICATIONS12 902000 Meter reading expenses WEST INTERACTIVE SERVICES CORP 52 CUSTOMER SERVICES13 902000 Meter reading expenses WEST MONROE PARTNERS, LLC 168 CONSULTING SERVICES14 903000 Customer records & collect exp 3DINTERNET LLC 90 TRAINING SERVICES15 903000 Customer records & collect exp AARGON AGENCY INC 69 COLLECTION SERVICES16 903000 Customer records & collect exp ACCENTURE 320 CONSULTING SERVICES17 903000 Customer records & collect exp ALLMED STAFFING INC. 72 PROFESSIONAL STAFF AUGMENTATION18 903000 Customer records & collect exp ALORICA INC 229 CUSTOMER SERVICES19 903000 Customer records & collect exp AMERICAN HERITAGE PROTECTION 201 SECURITY20 903000 Customer records & collect exp B & F CONSTRUCTION CODE SERVICES INC 205 INSPECTION SERVICES21 903000 Customer records & collect exp BANCTEC INC 884 PAYMENT PROCESSING SERVICES22 903000 Customer records & collect exp BEELINE.COM, INC. 1,323 PROFESSIONAL STAFF AUGMENTATION23 903000 Customer records & collect exp CAROL H WILLIAMS ADVERTISING INC 158 MEDIA24 903000 Customer records & collect exp CONTRACT CALLERS INC 334 OPERATIONAL STAFF AUGMENTATION25 903000 Customer records & collect exp CORIX UTILITIES (US) INC 276 BUSINESS APPLICATIONS26 903000 Customer records & collect exp CRANE INSPECTION & CERTIFICATE BUREAU 56 TRAINING SERVICES27 903000 Customer records & collect exp CREDIT CONTROL SERVICES INC 151 OPERATIONAL STAFF AUGMENTATION28 903000 Customer records & collect exp CREDIT PROTECTION ASSOCIATION LP 189 COLLECTION SERVICES
Page Sub-Total 7,702$
Docket No. 18-____ ComEd Ex. 2.03 Page 124 of 334

Schedule C-6.2Page 29 of 74
Commonwealth Edison CompanyExpenses For Outside Professional Services in 2016
2016 Payments of $50,000 Or More Charged To Operating Expense(In Thousands)
Witness: Tracy
2016Line FERC Account PaymentNo. Account Description Payee Amount Nature of Service Provided
(A) (B) (C) (D) (E)
1 903000 Customer records & collect exp DEBTNEXT SOLUTIONS, LLC 59$ OPERATIONAL STAFF AUGMENTATION2 903000 Customer records & collect exp DELOITTE CONSULTING LLP 566 CONSULTING SERVICES3 903000 Customer records & collect exp DISTRIBUTED ENERGY FINANCIAL GROUP 105 CONSULTING SERVICES4 903000 Customer records & collect exp DURKIN ELECTRIC COMPANY INC 3,555 REPAIR SERVICES5 903000 Customer records & collect exp E SOURCE COMPANIES LLC 62 CONSULTING SERVICES6 903000 Customer records & collect exp EIRE DIRECT MARKETING LLC 51 CONSULTING SERVICES7 903000 Customer records & collect exp EXCELERON SOFTWARE LLC 56 IT SERVICES8 903000 Customer records & collect exp EXPERIAN INFORMATION SOLUTIONS INC. 590 CONSULTING SERVICES9 903000 Customer records & collect exp FIRSTECH 138 PAYMENT PROCESSING SERVICES
10 903000 Customer records & collect exp FISERV 1,288 FINANCIAL SERVICES11 903000 Customer records & collect exp FORRESTER RESEARCH INC 184 CUSTOMER SERVICES12 903000 Customer records & collect exp HYPERQUALITY, INC. 239 CUSTOMER SERVICES13 903000 Customer records & collect exp ILLINOIS INSTITUTE OF TECHNOLOGY 59 CONSULTING SERVICES14 903000 Customer records & collect exp INCONTACT INC 136 CUSTOMER SERVICES15 903000 Customer records & collect exp INTREN INC 776 CONSTRUCTION SERVICES16 903000 Customer records & collect exp JD POWER AND ASSOC 125 CUSTOMER SERVICES17 903000 Customer records & collect exp L.J. ROSS 102 COLLECTION SERVICES18 903000 Customer records & collect exp LEXISNEXIS A DIVISION OF REED ELSEVIER INC 158 LEGAL SERVICES19 903000 Customer records & collect exp LIVEWIRE ELECTRICAL SYSTEMS INC 304 REPAIR SERVICES20 903000 Customer records & collect exp LOESCHER HEATING & AIR CONDITIONING 356 BUILDING MAINTENANCE AND REPAIRS21 903000 Customer records & collect exp MCCARTHY BURGESS & WOLFF 51 COLLECTION SERVICES22 903000 Customer records & collect exp MZI GROUP INC 5,624 TECHNICAL SERVICES23 903000 Customer records & collect exp OLENICK AND ASSOCIATES 495 CONSULTING SERVICES24 903000 Customer records & collect exp QUANTUM CROSSINGS LLC 2,366 TECHNICAL SERVICES25 903000 Customer records & collect exp RR DONNELLEY & SONS COMPANY 136 PRINTING SERVICES26 903000 Customer records & collect exp SIMPLE ENERGY 50 MARKETING27 903000 Customer records & collect exp SOUTHWEST CREDIT SYSTEMS, LP 69 COLLECTION SERVICES28 903000 Customer records & collect exp THE BLACKSTONE GROUP INC 67 CONSULTING SERVICES
Page Sub-Total 17,767$
Docket No. 18-____ ComEd Ex. 2.03 Page 125 of 334

Schedule C-6.2Page 30 of 74
Commonwealth Edison CompanyExpenses For Outside Professional Services in 2016
2016 Payments of $50,000 Or More Charged To Operating Expense(In Thousands)
Witness: Tracy
2016Line FERC Account PaymentNo. Account Description Payee Amount Nature of Service Provided
(A) (B) (C) (D) (E)
1 903000 Customer records & collect exp THE CARA GROUP INC 66$ TRAINING SERVICES2 903000 Customer records & collect exp THE CBE GROUP, INC. 58 CUSTOMER SERVICES3 903000 Customer records & collect exp TORRES CREDIT SERVICES, INC. 125 CUSTOMER SERVICES4 903000 Customer records & collect exp VANTAGE LEADERSHIP CONSULTING, LLC 103 CONSULTING SERVICES5 903000 Customer records & collect exp VOIANCE LANGUAGE SERVICES, LLC 99 LANGUAGE TRANSLATION SERVICES6 903000 Customer records & collect exp WEST INTERACTIVE SERVICES CORP 96 CUSTOMER SERVICES7 903000 Customer records & collect exp WEST MONROE PARTNERS, LLC 84 CONSULTING SERVICES8 908000 Customer assistance expenses ACCENTURE 2,851 CONSULTING SERVICES9 908000 Customer assistance expenses AFTER SCHOOL MATTERS INC 220 COMMUNITY RELATIONS
10 908000 Customer assistance expenses AJENDA INTERACTIVE MEDIA, LLC 162 CONSULTING SERVICES11 908000 Customer assistance expenses BEELINE.COM, INC. 750 PROFESSIONAL STAFF AUGMENTATION12 908000 Customer assistance expenses CALICO ENERGY INC 761 CUSTOMER SERVICES13 908000 Customer assistance expenses E SOURCE COMPANIES LLC 208 CONSULTING SERVICES14 908000 Customer assistance expenses EIRE DIRECT MARKETING LLC 416 CONSULTING SERVICES15 908000 Customer assistance expenses ELEVATE ENERGY 59 CONSULTING SERVICES16 908000 Customer assistance expenses ENGHOUSE KNOWLEDGE MANAGEMENT SOLUTIONS LL 138 CONSULTING SERVICES17 908000 Customer assistance expenses EVGC LLC 110 COMMUNICATION SERVICES18 908000 Customer assistance expenses EXCELERON SOFTWARE LLC 130 IT SERVICES19 908000 Customer assistance expenses FORESEE RESULTS, INC. 83 CONSULTING SERVICES20 908000 Customer assistance expenses GOODCENTS SOLUTIONS 1,685 CONSULTING SERVICES21 908000 Customer assistance expenses HEART & MIND STRATEGIES LLC 111 CONSULTING SERVICES22 908000 Customer assistance expenses HOOTSUITE MEDIA INC 100 IT SERVICES23 908000 Customer assistance expenses IFACTORING CONSULTING INC 220 IT SERVICES24 908000 Customer assistance expenses IGNITION HOLDINGS LLC 1,947 ADVERTISING SERVICES25 908000 Customer assistance expenses ILLINOIS ASSOCIATION OF COMMUNITY ACTION AGENC 759 CUSTOMER SERVICES26 908000 Customer assistance expenses KONY SERVICES INC 206 IT SERVICES27 908000 Customer assistance expenses LEO BURNETT USA INC 110 ADVERTISING SERVICES28 908000 Customer assistance expenses LOYALTYONE US INC 110 CONSULTING SERVICES
Page Sub-Total 11,767$
Docket No. 18-____ ComEd Ex. 2.03 Page 126 of 334

Schedule C-6.2Page 31 of 74
Commonwealth Edison CompanyExpenses For Outside Professional Services in 2016
2016 Payments of $50,000 Or More Charged To Operating Expense(In Thousands)
Witness: Tracy
2016Line FERC Account PaymentNo. Account Description Payee Amount Nature of Service Provided
(A) (B) (C) (D) (E)
1 908000 Customer assistance expenses M1 INTERACTIVE INC 116$ COMMUNICATION SERVICES2 908000 Customer assistance expenses MAD DASH INC 89 TECHNICAL SERVICES3 908000 Customer assistance expenses MARKET STRATEGIES INC 1,209 MARKETING4 908000 Customer assistance expenses MEDIUS & ASSOCIATES INC 130 PRINTING SERVICES5 908000 Customer assistance expenses NEST LABS INC 161 TECHNICAL SERVICES6 908000 Customer assistance expenses NEXANT INC 77 TECHNICAL SERVICES7 908000 Customer assistance expenses NEXIDIA INC 54 BUSINESS APPLICATIONS8 908000 Customer assistance expenses NIELSEN LLC, CLARITAS 110 CONSULTING SERVICES9 908000 Customer assistance expenses OPOWER INC 633 TECHNICAL SERVICES
10 908000 Customer assistance expenses PACO COMMUNICATIONS INC 212 ADVERTISING SERVICES11 908000 Customer assistance expenses REGULUS INTEGRATED 119 CUSTOMER SERVICES12 908000 Customer assistance expenses RF DEMAND SOLUTIONS, LLC 187 PAGING SERVICES13 908000 Customer assistance expenses RR DONNELLEY & SONS COMPANY 82 PRINTING SERVICES14 908000 Customer assistance expenses THE BLACKSTONE GROUP INC 350 CONSULTING SERVICES15 908000 Customer assistance expenses VOCUS INC 95 MARKETING16 908000 Customer assistance expenses WEST MONROE PARTNERS, LLC 674 CONSULTING SERVICES17 908000 Customer assistance expenses WIGHT & CO 54 BUILDING MAINTENANCE AND REPAIRS18 909000 Inform and Instruct advert exp BEELINE.COM, INC. 118 PROFESSIONAL STAFF AUGMENTATION19 909000 Inform and Instruct advert exp BULLY PULPIT INTERACTIVE LLC 92 ADVERTISING SERVICES20 909000 Inform and Instruct advert exp CAROL H WILLIAMS ADVERTISING INC 577 MEDIA21 909000 Inform and Instruct advert exp EDUCATIONAL DIVIDENDS INC 99 COMMUNITY RELATIONS22 909000 Inform and Instruct advert exp EIRE DIRECT MARKETING LLC 947 CONSULTING SERVICES23 909000 Inform and Instruct advert exp KIVVIT 110 COMMUNICATION SERVICES24 909000 Inform and Instruct advert exp LEO BURNETT USA INC 2,573 ADVERTISING SERVICES25 909000 Inform and Instruct advert exp MEDIUS & ASSOCIATES INC 654 PRINTING SERVICES26 909000 Inform and Instruct advert exp PACO COMMUNICATIONS INC 4,919 ADVERTISING SERVICES27 909000 Inform and Instruct advert exp USA DISPLAYS INC 73 ADVERTISING SERVICES28 910000 Misc cust serv & info exp OPOWER INC 419 TECHNICAL SERVICES
Page Sub-Total 14,933$
Docket No. 18-____ ComEd Ex. 2.03 Page 127 of 334

Schedule C-6.2Page 32 of 74
Commonwealth Edison CompanyExpenses For Outside Professional Services in 2016
2016 Payments of $50,000 Or More Charged To Operating Expense(In Thousands)
Witness: Tracy
2016Line FERC Account PaymentNo. Account Description Payee Amount Nature of Service Provided
(A) (B) (C) (D) (E)
1 923000 Outside services employed ABSO 107$ SECURITY2 923000 Outside services employed ACCENTURE 260 CONSULTING SERVICES3 923000 Outside services employed A-LINE E.D.S. 69 ENVIRONMENTAL SERVICES4 923000 Outside services employed ALVAREZ AND ASSOCIATES 60 PUBLIC AFFAIRS CONSULTING5 923000 Outside services employed ARCADIS US, INC. 115 ENVIRONMENTAL SERVICES6 923000 Outside services employed ARCOS, INC. 291 CONSULTING SERVICES7 923000 Outside services employed AXIS GROUP LLC 161 IT SERVICES8 923000 Outside services employed BALLARD SPAHR ANDREWS & INGERSOLL LLP 319 LEGAL SERVICES9 923000 Outside services employed BEELINE.COM, INC. 6,549 PROFESSIONAL STAFF AUGMENTATION
10 923000 Outside services employed BERGLUND CONSTRUCTION COMPANY 550 BUILDING MAINTENANCE AND REPAIRS11 923000 Outside services employed BIG SHOULDERS DIGITAL VIDEO PRODUCTIONS 217 MEDIA12 923000 Outside services employed BRANDENBURGER PLUMBING, INC. 180 CONSTRUCTION SERVICES13 923000 Outside services employed BULLY PULPIT INTERACTIVE LLC 100 ADVERTISING SERVICES14 923000 Outside services employed BURLING BUILDERS INC 53 BUILDING MAINTENANCE AND REPAIRS15 923000 Outside services employed CALICO ENERGY INC 60 CUSTOMER SERVICES16 923000 Outside services employed CAPITOL F CONSULTING, LLC 132 CONSULTING SERVICES17 923000 Outside services employed CARDIO PARTNER RESOURCES LLC 99 SAFETY SERVICES18 923000 Outside services employed CATERPILLAR INC 930 TRAINING SERVICES19 923000 Outside services employed CGI TECHNOLOGIES AND SOLUTIONS 78 IT SERVICES20 923000 Outside services employed CHICAGO ZOOLOGICAL SOCIETY 275 CONSULTING SERVICES21 923000 Outside services employed CHRISTOPHER B BURKE ENGINEERIN 68 ENGINEERING22 923000 Outside services employed COMPREHENSIVE INJURY 1,167 CONSULTING SERVICES23 923000 Outside services employed CONTINENTAL PAINTING & DECORATING INC 256 PAINTING AND COATING24 923000 Outside services employed DENNIS J. GANNON 102 CONSULTING SERVICES25 923000 Outside services employed DRIVER IMPROVEMENT 113 TRAINING SERVICES26 923000 Outside services employed EDWARD C HURLEY 120 CONSULTING SERVICES27 923000 Outside services employed EIMER STAHL, LLP 459 LEGAL SERVICES28 923000 Outside services employed ELEVATE ENERGY 1,862 CONSULTING SERVICES
Page Sub-Total 14,752$
Docket No. 18-____ ComEd Ex. 2.03 Page 128 of 334

Schedule C-6.2Page 33 of 74
Commonwealth Edison CompanyExpenses For Outside Professional Services in 2016
2016 Payments of $50,000 Or More Charged To Operating Expense(In Thousands)
Witness: Tracy
2016Line FERC Account PaymentNo. Account Description Payee Amount Nature of Service Provided
(A) (B) (C) (D) (E)
1 923000 Outside services employed ENDEAVOUR EHS LLC 74$ ENVIRONMENTAL SERVICES2 923000 Outside services employed FTI CONSULTING (SC) INC 320 COMMUNICATION SERVICES3 923000 Outside services employed G&R PUBLIC LAW AND STRATEGIES LLC 78 LEGAL SERVICES4 923000 Outside services employed GARFIELD BUILDING MAINTENANCE 227 BUILDING MAINTENANCE AND REPAIRS5 923000 Outside services employed GREGORY K BUSCH 145 CONSULTING SERVICES6 923000 Outside services employed GRISKO LLC 268 COMMUNICATION SERVICES7 923000 Outside services employed HYGIENEERING INC 339 CONSULTING SERVICES8 923000 Outside services employed INSTITUTE OF HEALTH AND HUMAN PERFORMANCE 383 CONSULTING SERVICES9 923000 Outside services employed INTELLI-BUILDING CONTROL & SOLUTIONS LLC 295 BUILDING MAINTENANCE AND REPAIRS
10 923000 Outside services employed IRON MOUNTAIN INFORMATION 165 RECORDS RETENTION11 923000 Outside services employed JACKSON LEWIS PC 74 LEGAL SERVICES12 923000 Outside services employed JAMES O. HAMILTON & CO INC 62 CONSULTING SERVICES13 923000 Outside services employed JENNER & BLOCK 72 LEGAL SERVICES14 923000 Outside services employed JILL KERRIGAN 148 CONSULTING SERVICES15 923000 Outside services employed JOHNSON AND BELL LTD 142 LEGAL SERVICES16 923000 Outside services employed JOHNSON CONTROLS 121 BUILDING MAINTENANCE AND REPAIRS17 923000 Outside services employed JONES LANG LASALLE AMERICAS INC 470 FACILITY SERVICES18 923000 Outside services employed KIVVIT 68 COMMUNICATION SERVICES19 923000 Outside services employed KLAFTER AND BURKE 204 LEGAL SERVICES20 923000 Outside services employed KPMG LLP 148 CONSULTING SERVICES21 923000 Outside services employed LAFATA CONTRACTING SERVICES 206 CONSULTING SERVICES22 923000 Outside services employed LEO BURNETT USA INC 271 ADVERTISING SERVICES23 923000 Outside services employed M J ELECTRIC LLC 79 OPERATIONAL STAFF AUGMENTATION24 923000 Outside services employed MAD DASH INC 65 TECHNICAL SERVICES25 923000 Outside services employed MAYER BROWN, LLP 899 LEGAL SERVICES26 923000 Outside services employed MCGUIRE WOODS LLP 220 LEGAL SERVICES27 923000 Outside services employed MCKINSEY & COMPANY, INC. 3,300 CONSULTING SERVICES28 923000 Outside services employed MCKISSACK & MCKISSACK OF WASHINGTON INC 141 BUILDING MAINTENANCE AND REPAIRS
Page Sub-Total 8,984$
Docket No. 18-____ ComEd Ex. 2.03 Page 129 of 334

Schedule C-6.2Page 34 of 74
Commonwealth Edison CompanyExpenses For Outside Professional Services in 2016
2016 Payments of $50,000 Or More Charged To Operating Expense(In Thousands)
Witness: Tracy
2016Line FERC Account PaymentNo. Account Description Payee Amount Nature of Service Provided
(A) (B) (C) (D) (E)
1 923000 Outside services employed MEADE ELECTRIC CO 109$ OPERATIONAL STAFF AUGMENTATION2 923000 Outside services employed MEDIUS & ASSOCIATES INC 144 PRINTING SERVICES3 923000 Outside services employed MICHAEL BEST STRATEGIES LLC 110 CONSULTING SERVICES4 923000 Outside services employed MORGAN, LEWIS & BOCKIUS,LLP 70 LEGAL SERVICES5 923000 Outside services employed MR DAVIDS CARPET SERVICE LTD 211 BUILDING MAINTENANCE AND REPAIRS6 923000 Outside services employed NEAL MURDOCK AND LEROY, LLC 209 LEGAL SERVICES7 923000 Outside services employed NERA, INC. 96 CONSULTING SERVICES8 923000 Outside services employed NORTHWEST CONTRACTORS INC 175 CONSTRUCTION SERVICES9 923000 Outside services employed OLENICK AND ASSOCIATES 622 CONSULTING SERVICES
10 923000 Outside services employed POWER ENGINEERS, INC. 67 ENGINEERING11 923000 Outside services employed PSC INDUSTRIAL OUTSOURCING, LP 188 OPERATIONAL STAFF AUGMENTATION12 923000 Outside services employed PWC 87 FINANCIAL SERVICES13 923000 Outside services employed PUBLIC RELAY 60 COMMUNICATION SERVICES14 923000 Outside services employed REYES KURSON 135 LEGAL SERVICES15 923000 Outside services employed RICHARD M. HANSEN & ASSOCIATES 119 ENGINEERING16 923000 Outside services employed RIGHT MANAGEMENT,INC 77 CONSULTING SERVICES17 923000 Outside services employed RINGLAND JOHNSON, INC 160 CONSTRUCTION SERVICES18 923000 Outside services employed ROBERT A CANTONE ATTORNEY AT LAW 54 LEGAL SERVICES19 923000 Outside services employed RONALD G KAMINSKI DBA HBK ENGINEERING LLC 292 ENGINEERING20 923000 Outside services employed ROONEY, RIPPIE & RATNASWAMY LLP 1,348 LEGAL SERVICES21 923000 Outside services employed RR DONNELLEY & SONS COMPANY 3,223 PRINTING SERVICES22 923000 Outside services employed SARGENT & LUNDY LLC 67 ENGINEERING23 923000 Outside services employed SCOTT MADDEN 579 CONSULTING SERVICES24 923000 Outside services employed SIDLEY & AUSTIN 1,888 LEGAL SERVICES25 923000 Outside services employed SMITH,HEMMESCH,BURKE&BRANNIGAN 116 LEGAL SERVICES26 923000 Outside services employed STANTEC CONSULTING SERVICES INC. 360 ENVIRONMENTAL SERVICES27 923000 Outside services employed SYNERGRID SOLUTIONS INC 90 CONSULTING SERVICES28 923000 Outside services employed SYSTEM ONE LLC 651 CONSTRUCTION SERVICES
Page Sub-Total 11,307$
Docket No. 18-____ ComEd Ex. 2.03 Page 130 of 334

Schedule C-6.2Page 35 of 74
Commonwealth Edison CompanyExpenses For Outside Professional Services in 2016
2016 Payments of $50,000 Or More Charged To Operating Expense(In Thousands)
Witness: Tracy
2016Line FERC Account PaymentNo. Account Description Payee Amount Nature of Service Provided
(A) (B) (C) (D) (E)
1 923000 Outside services employed TESCO 258$ TECHNICAL SERVICES2 923000 Outside services employed THE AYCO COMPANY 83 FINANCIAL SERVICES3 923000 Outside services employed THE BARTECH GROUP 116 TECHNICAL SERVICES4 923000 Outside services employed THE BRATTLE GROUP INC 82 CONSULTING SERVICES5 923000 Outside services employed THE CARA GROUP INC 151 TRAINING SERVICES6 923000 Outside services employed THE NORTHBRIDGE GROUP 301 CONSULTING SERVICES7 923000 Outside services employed THE ROOSEVELT GROUP, INC. 168 CONSULTING SERVICES8 923000 Outside services employed THOMAS M TULLY LTD 225 LEGAL SERVICES9 923000 Outside services employed TRAFFIC CONTROL & PROTECTION INC 88 SAFETY SERVICES
10 923000 Outside services employed TRANE 96 BUILDING MAINTENANCE AND REPAIRS11 923000 Outside services employed TRC ENGINEERS 224 ENGINEERING12 923000 Outside services employed TRINIDAD CONSTRUCTION LLC 292 BUILDING MAINTENANCE AND REPAIRS13 923000 Outside services employed TRUE PARTNERS CONSULTING, LLC 137 CONSULTING SERVICES14 923000 Outside services employed TYNDALE COMPANY, INC. 68 SAFETY SERVICES15 923000 Outside services employed URS CORPORATION 339 ENVIRONMENTAL SERVICES16 923000 Outside services employed VANTAGE LEADERSHIP CONSULTING, LLC 139 CONSULTING SERVICES17 923000 Outside services employed WEST MONROE PARTNERS, LLC 388 CONSULTING SERVICES18 923000 Outside services employed WIGHT & CO 159 BUILDING MAINTENANCE AND REPAIRS19 925000 Injuries & damages JENNER & BLOCK 60 LEGAL SERVICES20 925000 Injuries & damages JOHNSON AND BELL LTD 284 LEGAL SERVICES21 925000 Injuries & damages KELLY & KING PC 256 LEGAL SERVICES22 925000 Injuries & damages KRAUSFLAMING LLC 63 LEGAL SERVICES23 925000 Injuries & damages LOCKE LORD LLP 284 LEGAL SERVICES24 925000 Injuries & damages PIPER RUDNICK 50 LEGAL SERVICES25 925000 Injuries & damages REYES KURSON 59 LEGAL SERVICES26 925000 Injuries & damages SANCHEZ, DANIELS & HOFFMAN 206 LEGAL SERVICES27 925000 Injuries & damages SIDLEY & AUSTIN 563 LEGAL SERVICES28 925000 Injuries & damages SWANSON MARTIN & BELL 865 LEGAL SERVICES
Page Sub-Total 6,004$
Docket No. 18-____ ComEd Ex. 2.03 Page 131 of 334

Schedule C-6.2Page 36 of 74
Commonwealth Edison CompanyExpenses For Outside Professional Services in 2016
2016 Payments of $50,000 Or More Charged To Operating Expense(In Thousands)
Witness: Tracy
2016Line FERC Account PaymentNo. Account Description Payee Amount Nature of Service Provided
(A) (B) (C) (D) (E)
1 928000 Regulatory commission exp BEELINE.COM, INC. 57$ PROFESSIONAL STAFF AUGMENTATION2 928000 Regulatory commission exp EIMER STAHL, LLP 584 LEGAL SERVICES3 928000 Regulatory commission exp GRAHAM & GRAHAM LLP 190 LEGAL SERVICES4 928000 Regulatory commission exp MCGUIRE WOODS LLP 93 LEGAL SERVICES5 928000 Regulatory commission exp MEDIUS & ASSOCIATES INC 52 PRINTING SERVICES6 928000 Regulatory commission exp ROONEY, RIPPIE & RATNASWAMY LLP 1,293 LEGAL SERVICES7 928000 Regulatory commission exp SIDLEY & AUSTIN 212 LEGAL SERVICES8 930100 General advertising expenses AXIOM CONSULTING PARTNERS 190 CONSULTING SERVICES9 930100 General advertising expenses BULLY PULPIT INTERACTIVE LLC 212 ADVERTISING SERVICES
10 930100 General advertising expenses CAROL H WILLIAMS ADVERTISING INC 326 MEDIA11 930100 General advertising expenses JILL KERRIGAN 80 CONSULTING SERVICES12 930100 General advertising expenses LEO BURNETT USA INC 2,285 ADVERTISING SERVICES13 930100 General advertising expenses PACO COMMUNICATIONS INC 274 ADVERTISING SERVICES14 930100 General advertising expenses WTTW CHANNEL 11 80 ADVERTISING SERVICES15 930200 Misc general expenses ELECTRIC POWER RESEARCH INSTITUTE INC 60 CONSULTING SERVICES16 930200 Misc general expenses M2 CONSULTING INC 150 CONSULTING SERVICES17 930200 Misc general expenses TRC ENGINEERS 109 ENGINEERING18 935000 Maint of general plant - Elec ACCENTURE 3,254 CONSULTING SERVICES19 935000 Maint of general plant - Elec AGB INVESTIGATIVE SERVICES INC 212 SECURITY20 935000 Maint of general plant - Elec ALLIED BARTON SECURITY SERVICE 778 SECURITY21 935000 Maint of general plant - Elec AMERICAN HERITAGE PROTECTION 530 SECURITY22 935000 Maint of general plant - Elec ANEXINET 238 IT SERVICES23 935000 Maint of general plant - Elec AXIS GROUP LLC 462 IT SERVICES24 935000 Maint of general plant - Elec BEARY LANDSCAPE MANAGEMENT INC 3,394 BUILDING MAINTENANCE AND REPAIRS25 935000 Maint of general plant - Elec BEELINE.COM, INC. 485 PROFESSIONAL STAFF AUGMENTATION26 935000 Maint of general plant - Elec BERGLUND CONSTRUCTION COMPANY 521 BUILDING MAINTENANCE AND REPAIRS27 935000 Maint of general plant - Elec BIG SHOULDERS DIGITAL VIDEO PRODUCTIONS 52 MEDIA28 935000 Maint of general plant - Elec COVENANT SECURITY 98 SECURITY
Page Sub-Total 16,271$
Docket No. 18-____ ComEd Ex. 2.03 Page 132 of 334

Schedule C-6.2Page 37 of 74
Commonwealth Edison CompanyExpenses For Outside Professional Services in 2016
2016 Payments of $50,000 Or More Charged To Operating Expense(In Thousands)
Witness: Tracy
2016Line FERC Account PaymentNo. Account Description Payee Amount Nature of Service Provided
(A) (B) (C) (D) (E)
1 935000 Maint of general plant - Elec CPMH CONSTRUCTION INC 136$ CONSTRUCTION SERVICES2 935000 Maint of general plant - Elec J C ANDERSON INC 67 CONSTRUCTION SERVICES3 935000 Maint of general plant - Elec JONES LANG LASALLE AMERICAS INC 13,301 FACILITY SERVICES4 935000 Maint of general plant - Elec LBJ CONSTRCUTION & MANAGEMENT INC 64 CONSTRUCTION SERVICES5 935000 Maint of general plant - Elec NORTHWEST CONTRACTORS INC 317 CONSTRUCTION SERVICES6 935000 Maint of general plant - Elec OLENICK AND ASSOCIATES 64 CONSULTING SERVICES7 935000 Maint of general plant - Elec PRIMERA ENGINEERS LTD 50 ENGINEERING8 935000 Maint of general plant - Elec PSC INDUSTRIAL OUTSOURCING, LP 394 OPERATIONAL STAFF AUGMENTATION9 935000 Maint of general plant - Elec QUANTUM CROSSINGS LLC 337 TECHNICAL SERVICES
10 935000 Maint of general plant - Elec RT BEVERAGE 231 BUILDING MAINTENANCE AND REPAIRS11 935000 Maint of general plant - Elec SCHNEIDER ELECTRIC BUILDING AMERICAS INC 215 BUILDING MAINTENANCE AND REPAIRS12 935000 Maint of general plant - Elec SPEC-TEC LLC 51 TECHNICAL SERVICES13 935000 Maint of general plant - Elec UNITED BUILDING MAINTENANCE INC 1,598 BUILDING MAINTENANCE AND REPAIRS14 935000 Maint of general plant - Elec V3 COMPANIES OF ILLINOIS LTD 78 ENGINEERING15 935000 Maint of general plant - Elec WEST MONROE PARTNERS, LLC 245 CONSULTING SERVICES16 935000 Maint of general plant - Elec WIGHT & CO 214 BUILDING MAINTENANCE AND REPAIRS17 935000 Maint of general plant - Elec WOLD ARCHITECTS & ENGINEERS INC 103 CONSULTING SERVICES
Page Sub-Total 17,465$
Total 2016 Payments $50,000 and Above Charged To Operating Expense (p. 1-19 detail) 335,769$
Total 2016 Payments Under $50,000 Charged To Operating Expenses 10,721$
Docket No. 18-____ ComEd Ex. 2.03 Page 133 of 334

Schedule C-6.2Page 38 of 74
Commonwealth Edison CompanyExpenses For Outside Professional Services in 2015
2015 Payments of $50,000 Or More Charged To Operating Expense(In Thousands)
Witness: Tracy
2015Line FERC Account PaymentNo. Account Description Payee Amount Nature of Service Provided
(A) (B) (C) (D) (E)
1 560000 Oper supervision & engineering ABB POWER T&D COMPANY INC 63$ TECHNICAL SERVICES2 560000 Oper supervision & engineering BEELINE.COM, INC. 208 PROFESSIONAL STAFF AUGMENTATION3 560000 Oper supervision & engineering M J ELECTRIC, LLC 198 OPERATIONAL STAFF AUGMENTATION4 560000 Oper supervision & engineering NEAL MURDOCK AND LEROY, LLC 236 LEGAL SERVICES5 560000 Oper supervision & engineering QUANTA TECHNOLOGY, LLC 104 CONSULTING SERVICES6 560000 Oper supervision & engineering SYSTEM ONE LLC 112 CONSTRUCTION SERVICES7 561700 Generation Interconnect Study DASHIELL CORPORATION 152 ENGINEERING8 562000 Station expenses ORNELAS CONSTRUCTION CO 113 CONSTRUCTION SERVICES9 563000 Overhead line expenses DASHIELL CORPORATION 81 ENGINEERING
10 563000 Overhead line expenses M J ELECTRIC, LLC 2,709 OPERATIONAL STAFF AUGMENTATION11 563000 Overhead line expenses THREE PHASE LINE CONSTRUCTION 122 CONSTRUCTION SERVICES12 565000 Transmission of elect by other AMEREN ILLINOIS 825 CONSTRUCTION SERVICES13 566000 Misc. transmission expenses BEELINE.COM, INC. 192 PROFESSIONAL STAFF AUGMENTATION14 566000 Misc. transmission expenses BRIDGE ENERGY GROUP INC 156 CONSULTING SERVICES15 566000 Misc. transmission expenses ENVIRONMENTAL RESOURCES 124 CONSULTING SERVICES16 566000 Misc. transmission expenses F H PASCHEN 431 BUILDING MAINTENANCE AND REPAIRS17 566000 Misc. transmission expenses IMPERIAL CRANE SERVICES INC 72 CONSTRUCTION SERVICES18 566000 Misc. transmission expenses KPMG LLP 59 CONSULTING SERVICES19 566000 Misc. transmission expenses LINDBLAD CONSTRUCTION COMPANY 112 CONSTRUCTION SERVICES20 566000 Misc. transmission expenses M J ELECTRIC, LLC 292 OPERATIONAL STAFF AUGMENTATION21 566000 Misc. transmission expenses OLENICK AND ASSOCIATES 112 CONSULTING SERVICES22 566000 Misc. transmission expenses PSC INDUSTRIAL OUTSOURCING, LP 58 OPERATIONAL STAFF AUGMENTATION23 566000 Misc. transmission expenses QUALITECH ENGINEERING, LLC 117 ENGINEERING24 566000 Misc. transmission expenses RONALD G KAMINSKI DBA HBK ENGINEERING LLC 127 ENGINEERING25 566000 Misc. transmission expenses SARGENT & LUNDY LLC 637 ENGINEERING26 566000 Misc. transmission expenses SCHWEITZER ENGINEERING LABS 75 PROJECT MANAGEMENT SERVICES27 566000 Misc. transmission expenses SYSTEM ONE LLC 64 CONSTRUCTION SERVICES28 566000 Misc. transmission expenses TRC ENGINEERS 1,221 ENGINEERING
Page Sub-Total 8,772$
Docket No. 18-____ ComEd Ex. 2.03 Page 134 of 334

Schedule C-6.2Page 39 of 74
Commonwealth Edison CompanyExpenses For Outside Professional Services in 2015
2015 Payments of $50,000 Or More Charged To Operating Expense(In Thousands)
Witness: Tracy
2015Line FERC Account PaymentNo. Account Description Payee Amount Nature of Service Provided
(A) (B) (C) (D) (E)
1 566000 Misc. transmission expenses UBISENSE INC 94$ PROFESSIONAL STAFF AUGMENTATION2 566000 Misc. transmission expenses WIGHT & COMPANY 95 PROFESSIONAL STAFF AUGMENTATION3 568000 Main supervision & engineering PSC INDUSTRIAL OUTSOURCING, LP 735 OPERATIONAL STAFF AUGMENTATION4 569000 Maintenance of structures BEARY LANDSCAPE MANAGEMENT INC. 114 BUILDING MAINTENANCE AND REPAIRS5 569000 Maintenance of structures GREAT LAKES FIRE AND SAFETY 54 SAFETY SERVICES6 569000 Maintenance of structures OSMOSE UTILITIES SERVICES, INC 73 TECHNICAL SERVICES7 569000 Maintenance of structures PUBLIC UTILITIES MAINTENANCE, INC 621 PAINTING AND COATING8 569200 Maint of Computer Software BEELINE.COM, INC. 98 PROFESSIONAL STAFF AUGMENTATION9 569200 Maint of Computer Software UBISENSE INC 106 PROFESSIONAL STAFF AUGMENTATION
10 570000 Maintenance of station equip A-LINE E.D.S. 69 ENVIRONMENTAL SERVICES11 570000 Maintenance of station equip CITY OF BERWYN 70 MUNICIPALITY12 570000 Maintenance of station equip DELTA-STAR INC 212 TECHNICAL SERVICES13 570000 Maintenance of station equip INTREN, INC. 70 CONSTRUCTION SERVICES14 570000 Maintenance of station equip M J ELECTRIC, LLC 124 OPERATIONAL STAFF AUGMENTATION15 570000 Maintenance of station equip QUANTUM CROSSINGS LLC 359 TECHNICAL SERVICES16 570000 Maintenance of station equip SCHNEIDER ELECTRIC BUILDINGS AMERICAS, INC. 576 CONSULTING SERVICES17 570000 Maintenance of station equip TRANSMISSION & DISTRIBUTION SERVICES LLC 59 TECHNICAL SERVICES18 570000 Maintenance of station equip WALBRIDGE EQUIPMENT INSTALLATION 207 TECHNICAL SERVICES19 571000 Maintenance of overhead lines AMPJACK AMERICA LTD 95 CONSTRUCTION SERVICES20 571000 Maintenance of overhead lines ARCADIS US, INC. 462 ENVIRONMENTAL SERVICES21 571000 Maintenance of overhead lines BEARY LANDSCAPE MANAGEMENT INC. 968 BUILDING MAINTENANCE AND REPAIRS22 571000 Maintenance of overhead lines CHEMICAL VEGETATION CONTROL LLC 115 VEGETATION MANAGEMENT23 571000 Maintenance of overhead lines CHRISTOPHER B BURKE ENGINEERIN 464 ENGINEERING24 571000 Maintenance of overhead lines DAVEY RESOURCE GROUP 721 VEGETATION MANAGEMENT25 571000 Maintenance of overhead lines HAVERFIELD AVIATION, INC 574 AERIAL INSPECTION26 571000 Maintenance of overhead lines HOMER TREE SERVICE INC 494 VEGETATION MANAGEMENT27 571000 Maintenance of overhead lines J F ELECTRIC INC 113 STORM ASSISTANCE28 571000 Maintenance of overhead lines JONES LANG LASALLE AMERICAS INC 193 FACILITY SERVICES
Page Sub-Total 7,935$
Docket No. 18-____ ComEd Ex. 2.03 Page 135 of 334

Schedule C-6.2Page 40 of 74
Commonwealth Edison CompanyExpenses For Outside Professional Services in 2015
2015 Payments of $50,000 Or More Charged To Operating Expense(In Thousands)
Witness: Tracy
2015Line FERC Account PaymentNo. Account Description Payee Amount Nature of Service Provided
(A) (B) (C) (D) (E)
1 571000 Maintenance of overhead lines KRUEGER TOWER INC. 476$ OPERATIONAL STAFF AUGMENTATION2 571000 Maintenance of overhead lines LEWIS TREE SERVICE INC 5,323 TREE TRIMMING3 571000 Maintenance of overhead lines LINDBLAD CONSTRUCTION COMPANY 75 CONSTRUCTION SERVICES4 571000 Maintenance of overhead lines M J ELECTRIC, LLC 220 OPERATIONAL STAFF AUGMENTATION5 571000 Maintenance of overhead lines MIDWEST ACCESS SOLUTIONS LLC 216 CONSTRUCTION SERVICES6 571000 Maintenance of overhead lines MOTOROLA SOLUTIONS INC 626 TELECOM SERVICES7 571000 Maintenance of overhead lines NEW SOUTH EQUIPMENT MATS LLC 199 CONSTRUCTION SERVICES8 571000 Maintenance of overhead lines PSC INDUSTRIAL OUTSOURCING, LP 173 OPERATIONAL STAFF AUGMENTATION9 571000 Maintenance of overhead lines RIGGS DISTLER & COMPANY INC 131 STORM ASSISTANCE
10 571000 Maintenance of overhead lines ROGERS HELICOPTERS, INC 210 AERIAL INSPECTION11 571000 Maintenance of overhead lines STANTEC CONSULTING SERVICES INC. 255 ENVIRONMENTAL SERVICES12 571000 Maintenance of overhead lines STEVENSON CRANE SERVICE 96 CONSTRUCTION SERVICES13 571000 Maintenance of overhead lines THREE PHASE LINE CONSTRUCTION 56 CONSTRUCTION SERVICES14 571000 Maintenance of overhead lines UNITED BUILDING MAINTENANCE INC 239 BUILDING MAINTENANCE AND REPAIRS15 571000 Maintenance of overhead lines WALBRIDGE EQUIPMENT INSTALLATION 73 TECHNICAL SERVICES16 572000 Maintenance of undergrnd lines MEADE ELECTRIC CO 101 OPERATIONAL STAFF AUGMENTATION17 572000 Maintenance of undergrnd lines NASH BROS CONSTRUCTION CO, INC 881 CONSTRUCTION SERVICES18 572000 Maintenance of undergrnd lines PRYSMIAN CABLES & SYSTEMS USA LLC 372 TECHNICAL SERVICES19 572000 Maintenance of undergrnd lines RONALD G KAMINSKI DBA HBK ENGINEERING LLC 123 ENGINEERING20 572000 Maintenance of undergrnd lines TESCO 98 TECHNICAL SERVICES21 580000 Oper supervision & engineering ACCENTURE 96 CONSULTING SERVICES22 580000 Oper supervision & engineering APPLIED ENERGY GROUP 95 CONSULTING SERVICES23 580000 Oper supervision & engineering BEELINE.COM, INC. 183 PROFESSIONAL STAFF AUGMENTATION24 580000 Oper supervision & engineering COMPREHENSIVE INJURY PREVENTION SOLUTIONS, INC. 86 SAFETY SERVICES25 580000 Oper supervision & engineering CYRUS, INC. 352 CONSULTING SERVICES26 580000 Oper supervision & engineering DELOITTE CONSULTING LLP 117 CONSULTING SERVICES27 580000 Oper supervision & engineering EIMER STAHL, LLP 818 LEGAL SERVICES28 580000 Oper supervision & engineering HYFN INC 59 IT SERVICES
Page Sub-Total 11,749$
Docket No. 18-____ ComEd Ex. 2.03 Page 136 of 334

Schedule C-6.2Page 41 of 74
Commonwealth Edison CompanyExpenses For Outside Professional Services in 2015
2015 Payments of $50,000 Or More Charged To Operating Expense(In Thousands)
Witness: Tracy
2015Line FERC Account PaymentNo. Account Description Payee Amount Nature of Service Provided
(A) (B) (C) (D) (E)
1 580000 Oper supervision & engineering ILLINI POWER PRODUCTS CO 263$ CONSTRUCTION SERVICES2 580000 Oper supervision & engineering ILLINOIS INSTITUTE OF TECHNOLOGY 50 CONSULTING SERVICES3 580000 Oper supervision & engineering INNER SPACE DPM INC 55 FACILITY SERVICES4 580000 Oper supervision & engineering INSTITUTE OF HEALTH AND HUMAN PERFORMANCE 989 CONSULTING SERVICES5 580000 Oper supervision & engineering J C ANDERSON INC 60 CONSTRUCTION SERVICES6 580000 Oper supervision & engineering JONES LANG LASALLE AMERICAS INC 96 FACILITY SERVICES7 580000 Oper supervision & engineering MEADE ELECTRIC CO 2,733 OPERATIONAL STAFF AUGMENTATION8 580000 Oper supervision & engineering PATTEN INDUSTRIES 122 TECHNICAL SERVICES9 580000 Oper supervision & engineering PMI SYSTEMS INC 1,622 CONSULTING SERVICES
10 580000 Oper supervision & engineering PRIMERA ENGINEERS LTD 526 ENGINEERING11 580000 Oper supervision & engineering PSC INDUSTRIAL OUTSOURCING, LP 253 OPERATIONAL STAFF AUGMENTATION12 580000 Oper supervision & engineering QUANTA TECHNOLOGY, LLC 239 CONSULTING SERVICES13 580000 Oper supervision & engineering QUEST TECHNOLOGY IMPLEMENTATION INC 103 MEDICAL TESTING14 580000 Oper supervision & engineering RIGHT MANAGEMENT,INC 50 CONSULTING SERVICES15 580000 Oper supervision & engineering RONALD G KAMINSKI DBA HBK ENGINEERING LLC 56 ENGINEERING16 580000 Oper supervision & engineering SPEC-TEC LLC 269 TECHNICAL SERVICES17 580000 Oper supervision & engineering SYSTEM ONE LLC 292 CONSTRUCTION SERVICES18 580000 Oper supervision & engineering TRAVELLIANCE 72 EMERGENCY LODGING19 580000 Oper supervision & engineering VANTAGE LEADERSHIP CONSULTING, LLC 98 CONSULTING SERVICES20 580000 Oper supervision & engineering WEST MONROE PARTNERS, LLC 269 CONSULTING SERVICES21 582000 Station expenses INTREN, INC. 124 CONSTRUCTION SERVICES22 584000 Underground line expenses CITY OF CHICAGO DEPT. OF TRANS 95 OPERATIONAL CONSULTING23 584000 Underground line expenses JULIE INC. 1,008 OPERATIONAL CONSULTING24 584000 Underground line expenses MEADE ELECTRIC CO 268 OPERATIONAL STAFF AUGMENTATION25 584000 Underground line expenses USIC LOCATING SERVICES, INC 11,611 OPERATIONAL CONSULTING26 585000 Street light & sign sys exp DELOITTE CONSULTING LLP 116 CONSULTING SERVICES27 585000 Street light & sign sys exp ELECTRICAL RESOURCE MANAGEMENT INC 76 OPERATIONAL CONSULTING28 585000 Street light & sign sys exp SILVER SPRING NETWORKS INC 220 TECHNICAL SERVICES
Page Sub-Total 21,735$
Docket No. 18-____ ComEd Ex. 2.03 Page 137 of 334

Schedule C-6.2Page 42 of 74
Commonwealth Edison CompanyExpenses For Outside Professional Services in 2015
2015 Payments of $50,000 Or More Charged To Operating Expense(In Thousands)
Witness: Tracy
2015Line FERC Account PaymentNo. Account Description Payee Amount Nature of Service Provided
(A) (B) (C) (D) (E)
1 585000 Street light & sign sys exp VENCORE LABS INC 101$ OPERATIONAL CONSULTING2 585000 Street light & sign sys exp WEST MONROE PARTNERS, LLC 269 CONSULTING SERVICES3 586000 Meter expenses AMERICAN HERITAGE PROTECTION 95 SECURITY4 586000 Meter expenses BEELINE.COM, INC. 87 PROFESSIONAL STAFF AUGMENTATION5 586000 Meter expenses CORIX UTILITIES (US) INC 1,410 BUSINESS APPLICATIONS6 586000 Meter expenses MZI GROUP INC 692 TECHNICAL SERVICES7 586000 Meter expenses WEST MONROE PARTNERS, LLC 161 CONSULTING SERVICES8 587000 Cust installations exp AMPED 1 LLC 169 CONSULTING SERVICES9 587000 Cust installations exp BEELINE.COM, INC. 138 PROFESSIONAL STAFF AUGMENTATION
10 587000 Cust installations exp CHICAGO TRANSIT AUTHORITY 68 MUNICIPALITY11 587000 Cust installations exp INTELLIGRID POWER & CONTROL CO 120 CONSULTING SERVICES12 587000 Cust installations exp INTREN, INC. 549 CONSTRUCTION SERVICES13 587000 Cust installations exp M J ELECTRIC, LLC 88 OPERATIONAL STAFF AUGMENTATION14 587000 Cust installations exp MEADE ELECTRIC CO 379 OPERATIONAL STAFF AUGMENTATION15 587000 Cust installations exp RONALD G KAMINSKI DBA HBK ENGINEERING LLC 50 ENGINEERING16 587000 Cust installations exp SILVER SPRING NETWORKS INC 226 TECHNICAL SERVICES17 587000 Cust installations exp SPEC-TEC LLC 69 TECHNICAL SERVICES18 588000 Misc distribution expenses AECOM TECHNICAL SERVICES, INC. 104 ENVIRONMENTAL SERVICES19 588000 Misc distribution expenses ASPLUNDH TREE EXPERT CO 7,543 TREE TRIMMING20 588000 Misc distribution expenses BEARY LANDSCAPE MANAGEMENT INC. 653 BUILDING MAINTENANCE AND REPAIRS21 588000 Misc distribution expenses BEELINE.COM, INC. 364 PROFESSIONAL STAFF AUGMENTATION22 588000 Misc distribution expenses BRIDGE ENERGY GROUP INC 101 CONSULTING SERVICES23 588000 Misc distribution expenses DAVEY RESOURCE GROUP 491 VEGETATION MANAGEMENT24 588000 Misc distribution expenses DELOITTE CONSULTING LLP 556 CONSULTING SERVICES25 588000 Misc distribution expenses ILLINOIS INSTITUTE OF TECHNOLOGY 94 CONSULTING SERVICES26 588000 Misc distribution expenses INTREN, INC. 174 CONSTRUCTION SERVICES27 588000 Misc distribution expenses OLENICK AND ASSOCIATES 403 CONSULTING SERVICES28 588000 Misc distribution expenses POWER ENGINEERS, INC. 61 ENGINEERING
Page Sub-Total 15,215$
Docket No. 18-____ ComEd Ex. 2.03 Page 138 of 334

Schedule C-6.2Page 43 of 74
Commonwealth Edison CompanyExpenses For Outside Professional Services in 2015
2015 Payments of $50,000 Or More Charged To Operating Expense(In Thousands)
Witness: Tracy
2015Line FERC Account PaymentNo. Account Description Payee Amount Nature of Service Provided
(A) (B) (C) (D) (E)
1 588000 Misc distribution expenses PRIMERA ENGINEERS LTD 205$ ENGINEERING2 588000 Misc distribution expenses QUINNOX INC 73 CONSULTING SERVICES3 588000 Misc distribution expenses RONALD G KAMINSKI DBA HBK ENGINEERING LLC 129 ENGINEERING4 588000 Misc distribution expenses STRATEGIC DECISIONS GROUP INTERNATIONAL LLC 163 CONSULTING SERVICES5 588000 Misc distribution expenses UBISENSE INC 283 PROFESSIONAL STAFF AUGMENTATION6 588000 Misc distribution expenses UNITED BUILDING MAINTENANCE INC 163 BUILDING MAINTENANCE AND REPAIRS7 588000 Misc distribution expenses WEST MONROE PARTNERS, LLC 85 CONSULTING SERVICES8 590000 Main supervision & engineering BEELINE.COM, INC. 100 PROFESSIONAL STAFF AUGMENTATION9 590000 Main supervision & engineering INSTITUTE OF HEALTH AND HUMAN PERFORMANCE 198 CONSULTING SERVICES
10 590000 Main supervision & engineering SMITH SYSTEM DRIVER IMPROVEMENT INSTITUTE INC. 51 TRAINING SERVICES11 591000 Maintenance of structures ANDERSON & SHAH ROOFING INC 95 BUILDING MAINTENANCE AND REPAIRS12 591000 Maintenance of structures BEARY LANDSCAPE MANAGEMENT INC. 114 BUILDING MAINTENANCE AND REPAIRS13 591000 Maintenance of structures BERGLUND CONSTRUCTION COMPANY 243 BUILDING MAINTENANCE AND REPAIRS14 591000 Maintenance of structures DOORS DONE RIGHT, INC. 98 REPAIR SERVICES15 591000 Maintenance of structures GARFIELD BUILDING MAINTENANCE 159 BUILDING MAINTENANCE AND REPAIRS16 591000 Maintenance of structures INNER SPACE DPM INC 66 FACILITY SERVICES17 591000 Maintenance of structures JONES LANG LASALLE AMERICAS INC 290 FACILITY SERVICES18 591000 Maintenance of structures MEADE ELECTRIC CO 108 OPERATIONAL STAFF AUGMENTATION19 591000 Maintenance of structures MIDWEST MECHANICAL 120 TECHNICAL SERVICES20 592000 Maint of station equipment ALARM DETECTION SYSTEMS, INC. 124 BUILDING MAINTENANCE AND REPAIRS21 592000 Maint of station equipment A-LINE E.D.S. 54 ENVIRONMENTAL SERVICES22 592000 Maint of station equipment AMERICAN HERITAGE PROTECTION 73 SECURITY23 592000 Maint of station equipment ARCADIS US, INC. 651 ENVIRONMENTAL SERVICES24 592000 Maint of station equipment B & R REPAIR INC. 77 GENERAL MAINT AND REPAIRS25 592000 Maint of station equipment BEARY LANDSCAPE MANAGEMENT INC. 168 BUILDING MAINTENANCE AND REPAIRS26 592000 Maint of station equipment CENTRAL PLUMBING CO., INC. 202 OPERATIONAL STAFF AUGMENTATION27 592000 Maint of station equipment DELTA-STAR INC 168 TECHNICAL SERVICES28 592000 Maint of station equipment DOORS DONE RIGHT, INC. 68 REPAIR SERVICES
Page Sub-Total 4,328$
Docket No. 18-____ ComEd Ex. 2.03 Page 139 of 334

Schedule C-6.2Page 44 of 74
Commonwealth Edison CompanyExpenses For Outside Professional Services in 2015
2015 Payments of $50,000 Or More Charged To Operating Expense(In Thousands)
Witness: Tracy
2015Line FERC Account PaymentNo. Account Description Payee Amount Nature of Service Provided
(A) (B) (C) (D) (E)
1 592000 Maint of station equipment ENVIROPLUS INC 55$ ENVIRONMENTAL SERVICES2 592000 Maint of station equipment GARFIELD BUILDING MAINTENANCE 65 BUILDING MAINTENANCE AND REPAIRS3 592000 Maint of station equipment GREAT LAKES FIRE AND SAFETY 327 SAFETY SERVICES4 592000 Maint of station equipment INNER SPACE DPM INC 86 FACILITY SERVICES5 592000 Maint of station equipment JOLIET EQUIP CORP 80 REPAIR SERVICES6 592000 Maint of station equipment JONES LANG LASALLE AMERICAS INC 862 FACILITY SERVICES7 592000 Maint of station equipment LINDBLAD CONSTRUCTION COMPANY 170 CONSTRUCTION SERVICES8 592000 Maint of station equipment M J ELECTRIC, LLC 262 OPERATIONAL STAFF AUGMENTATION9 592000 Maint of station equipment MCKISSACK & MCKISSACK 175 PROJECT MANAGEMENT SERVICES
10 592000 Maint of station equipment MIDWEST MECHANICAL 148 TECHNICAL SERVICES11 592000 Maint of station equipment PEERLESS FENCE 195 BUILDING MAINTENANCE AND REPAIRS12 592000 Maint of station equipment PHOENIX FIRE SYSTEMS, INC. 236 SAFETY SERVICES13 592000 Maint of station equipment PRIT SERVICE INC. 151 TECHNICAL SERVICES14 592000 Maint of station equipment QUAD PLUS, LLC 447 CONSTRUCTION SERVICES15 592000 Maint of station equipment SARGENT & LUNDY LLC 79 ENGINEERING16 592000 Maint of station equipment TRANSMISSION & DISTRIBUTION SERVICES LLC 121 TECHNICAL SERVICES17 593000 Maintenance of overhead lines AMERICAN HERITAGE PROTECTION 662 SECURITY18 593000 Maintenance of overhead lines AMPED 1 LLC 61 CONSULTING SERVICES19 593000 Maintenance of overhead lines ASPLUNDH TREE EXPERT CO 72,879 TREE TRIMMING20 593000 Maintenance of overhead lines BBC ELECTRICAL SERVICES INC 153 STORM ASSISTANCE21 593000 Maintenance of overhead lines BEARY LANDSCAPE MANAGEMENT INC. 149 BUILDING MAINTENANCE AND REPAIRS22 593000 Maintenance of overhead lines CHICAGO TRANSIT AUTHORITY 156 MUNICIPALITY23 593000 Maintenance of overhead lines DAVEY RESOURCE GROUP 2,985 VEGETATION MANAGEMENT24 593000 Maintenance of overhead lines EQUALITY US 84 LANDSCAPING SERVICES25 593000 Maintenance of overhead lines HAVERFIELD AVIATION, INC 819 AERIAL INSPECTION26 593000 Maintenance of overhead lines HURLEY & ASSOCIATES INC 247 TECHNICAL SERVICES27 593000 Maintenance of overhead lines INTREN, INC. 5,947 CONSTRUCTION SERVICES28 593000 Maintenance of overhead lines J F ELECTRIC INC 746 STORM ASSISTANCE
Page Sub-Total 88,347$
Docket No. 18-____ ComEd Ex. 2.03 Page 140 of 334

Schedule C-6.2Page 45 of 74
Commonwealth Edison CompanyExpenses For Outside Professional Services in 2015
2015 Payments of $50,000 Or More Charged To Operating Expense(In Thousands)
Witness: Tracy
2015Line FERC Account PaymentNo. Account Description Payee Amount Nature of Service Provided
(A) (B) (C) (D) (E)
1 593000 Maintenance of overhead lines LEWIS TREE SERVICE INC 470$ TREE TRIMMING2 593000 Maintenance of overhead lines M J ELECTRIC, LLC 4,548 OPERATIONAL STAFF AUGMENTATION3 593000 Maintenance of overhead lines MEADE ELECTRIC CO 2,838 OPERATIONAL STAFF AUGMENTATION4 593000 Maintenance of overhead lines NEW LOYALTY USA, INC. 85 COMMUNICATION SERVICES5 593000 Maintenance of overhead lines OSMOSE, INC. 4,615 TECHNICAL SERVICES6 593000 Maintenance of overhead lines PAR ELECTRIC CONTRACTORS INC 66 CONSTRUCTION SERVICES7 593000 Maintenance of overhead lines PMI ENERGY SOLUTIONS LLC 419 STORM ASSISTANCE8 593000 Maintenance of overhead lines PSC INDUSTRIAL OUTSOURCING, LP 179 OPERATIONAL STAFF AUGMENTATION9 593000 Maintenance of overhead lines RAM CONSTRUCTION & LANDSCAPING LLC 52 LANDSCAPING SERVICES
10 593000 Maintenance of overhead lines RIGGS DISTLER & COMPANY INC 1,021 STORM ASSISTANCE11 593000 Maintenance of overhead lines THREE PHASE LINE CONSTRUCTION 362 CONSTRUCTION SERVICES12 593000 Maintenance of overhead lines TRAVELLIANCE 109 EMERGENCY LODGING13 593000 Maintenance of overhead lines UNITED SCRAP METAL INC 212 SALVAGE14 594000 Maint of underground lines ALDRIDGE ELECTRIC INC 9,614 OPERATIONAL STAFF AUGMENTATION15 594000 Maint of underground lines BADGER DAYLIGHTING CORP 78 EXCAVATING SERVICES16 594000 Maint of underground lines BEELINE.COM, INC. 115 PROFESSIONAL STAFF AUGMENTATION17 594000 Maint of underground lines CATHODIC PROTECTION MANAGEMENT 154 TECHNICAL SERVICES18 594000 Maint of underground lines CYRUS, INC. 442 CONSULTING SERVICES19 594000 Maint of underground lines EQUALITY US 349 LANDSCAPING SERVICES20 594000 Maint of underground lines INDEPENDENT PAVING CO. INC. 354 BUILDING MAINTENANCE AND REPAIRS21 594000 Maint of underground lines INTREN, INC. 13,122 CONSTRUCTION SERVICES22 594000 Maint of underground lines M J ELECTRIC, LLC 88 OPERATIONAL STAFF AUGMENTATION23 594000 Maint of underground lines MEADE ELECTRIC CO 5,816 OPERATIONAL STAFF AUGMENTATION24 594000 Maint of underground lines NASH BROS CONSTRUCTION CO, INC 104 CONSTRUCTION SERVICES25 594000 Maint of underground lines PSC INDUSTRIAL OUTSOURCING, LP 2,312 OPERATIONAL STAFF AUGMENTATION26 594000 Maint of underground lines RAM CONSTRUCTION & LANDSCAPING LLC 300 LANDSCAPING SERVICES27 594000 Maint of underground lines RIGGS DISTLER & COMPANY INC 114 STORM ASSISTANCE28 594000 Maint of underground lines RONALD G KAMINSKI DBA HBK ENGINEERING LLC 2,338 ENGINEERING
Page Sub-Total 50,276$
Docket No. 18-____ ComEd Ex. 2.03 Page 141 of 334

Schedule C-6.2Page 46 of 74
Commonwealth Edison CompanyExpenses For Outside Professional Services in 2015
2015 Payments of $50,000 Or More Charged To Operating Expense(In Thousands)
Witness: Tracy
2015Line FERC Account PaymentNo. Account Description Payee Amount Nature of Service Provided
(A) (B) (C) (D) (E)
1 594000 Maint of underground lines TESCO 136$ TECHNICAL SERVICES2 594000 Maint of underground lines TRICE CONSTRUCTION COMPANY 1,571 CONSTRUCTION SERVICES3 594000 Maint of underground lines UTILX CORPORATION 599 GENERAL MAINT AND REPAIRS4 595000 Maint of line transformers PSC INDUSTRIAL OUTSOURCING, LP 2,062 OPERATIONAL STAFF AUGMENTATION5 598000 Maint of misc distrib plant BARON USA, INC. 64 TECHNICAL SERVICES6 598000 Maint of misc distrib plant BEELINE.COM, INC. 617 PROFESSIONAL STAFF AUGMENTATION7 598000 Maint of misc distrib plant OLENICK AND ASSOCIATES 227 CONSULTING SERVICES8 598000 Maint of misc distrib plant PRIMERA ENGINEERS LTD 195 ENGINEERING9 598000 Maint of misc distrib plant QUINNOX INC 179 CONSULTING SERVICES
10 598000 Maint of misc distrib plant UBISENSE INC 696 PROFESSIONAL STAFF AUGMENTATION11 598000 Maint of misc distrib plant WEST MONROE PARTNERS, LLC 211 CONSULTING SERVICES12 902000 Meter reading expenses ACCENTURE 108 CONSULTING SERVICES13 902000 Meter reading expenses BEELINE.COM, INC. 265 PROFESSIONAL STAFF AUGMENTATION14 902000 Meter reading expenses CHATHAM BUSINESS ASSOCIATION 152 OPERATIONAL STAFF AUGMENTATION15 902000 Meter reading expenses CLEVEST SOLUTIONS INC. 160 IT SERVICES16 902000 Meter reading expenses CORIX UTILITIES (US) INC 54 BUSINESS APPLICATIONS17 902000 Meter reading expenses HYFN INC 99 IT SERVICES18 902000 Meter reading expenses INTREN, INC. 517 CONSTRUCTION SERVICES19 902000 Meter reading expenses ITRON, INC. 414 BUSINESS APPLICATIONS20 902000 Meter reading expenses JUAN ALBERTO BERNAL dba INTELLIPROBE 53 REPAIR SERVICES21 902000 Meter reading expenses PMI ENERGY SOLUTIONS LLC 822 CONSTRUCTION SERVICES22 902000 Meter reading expenses SILVER SPRING NETWORKS INC 745 TECHNICAL SERVICES23 902000 Meter reading expenses THE BLACKSTONE GROUP INC. 98 CONSULTING SERVICES24 902000 Meter reading expenses TWENTY FIRST CENTURY 61 CUSTOMER SERVICES25 902000 Meter reading expenses UTILISMART CORPORATION 106 BUSINESS APPLICATIONS26 902000 Meter reading expenses WEST MONROE PARTNERS, LLC 476 CONSULTING SERVICES27 903000 Customer records & collect exp ACCENTURE 174 CONSULTING SERVICES28 903000 Customer records & collect exp ALLMED STAFFING INC. 131 PROFESSIONAL STAFF AUGMENTATION
Page Sub-Total 10,992$
Docket No. 18-____ ComEd Ex. 2.03 Page 142 of 334

Schedule C-6.2Page 47 of 74
Commonwealth Edison CompanyExpenses For Outside Professional Services in 2015
2015 Payments of $50,000 Or More Charged To Operating Expense(In Thousands)
Witness: Tracy
2015Line FERC Account PaymentNo. Account Description Payee Amount Nature of Service Provided
(A) (B) (C) (D) (E)
1 903000 Customer records & collect exp AMERICAN HERITAGE PROTECTION 264$ SECURITY2 903000 Customer records & collect exp B & F CONSTRUCTION CODE SERVICES INC 58 INSPECTION SERVICES3 903000 Customer records & collect exp BANCTEC INC 1,159 PAYMENT PROCESSING SERVICES4 903000 Customer records & collect exp BEELINE.COM, INC. 1,317 PROFESSIONAL STAFF AUGMENTATION5 903000 Customer records & collect exp CAPSTONE WORLDWIDE INC 192 CONSULTING SERVICES6 903000 Customer records & collect exp CAROL H WILLIAMS ADVERTISING INC 131 ADVERTISING SERVICES7 903000 Customer records & collect exp CIVIS 85 CONSULTING SERVICES8 903000 Customer records & collect exp CONTRACT CALLERS INC 428 OPERATIONAL STAFF AUGMENTATION9 903000 Customer records & collect exp CONVERGENT OUTSOURCING, INC. 132 OPERATIONAL STAFF AUGMENTATION
10 903000 Customer records & collect exp CORIX UTILITIES (US) INC 125 BUSINESS APPLICATIONS11 903000 Customer records & collect exp CREDIT CONTROL SERVICES, INC. 164 OPERATIONAL STAFF AUGMENTATION12 903000 Customer records & collect exp CREDIT PROTECTION ASSOCIATION LP 240 COLLECTION SERVICES13 903000 Customer records & collect exp CUSTOMER LIFECYCLE LLC 50 CONSULTING SERVICES14 903000 Customer records & collect exp DEBTNEXT SOLUTIONS, LLC 59 OPERATIONAL STAFF AUGMENTATION15 903000 Customer records & collect exp DELOITTE CONSULTING LLP 3,157 CONSULTING SERVICES16 903000 Customer records & collect exp DURKIN ELECTRIC COMPANY INC 2,527 REPAIR SERVICES17 903000 Customer records & collect exp EGS FINANCIAL CARE INC 71 CREDIT SERVICES18 903000 Customer records & collect exp EIMER STAHL, LLP 59 LEGAL SERVICES19 903000 Customer records & collect exp EXPERIAN INFORMATION SOLUTIONS INC. 657 CONSULTING SERVICES20 903000 Customer records & collect exp FIRSTECH 112 PAYMENT PROCESSING SERVICES21 903000 Customer records & collect exp FISERV 1,231 FINANCIAL SERVICES22 903000 Customer records & collect exp GRISKO LLC 203 COMMUNICATION SERVICES23 903000 Customer records & collect exp HYPERQUALITY, INC. 276 CUSTOMER SERVICES24 903000 Customer records & collect exp I.C. SYSTEM, INC. 135 COLLECTION SERVICES25 903000 Customer records & collect exp INCONTACT INC 209 CUSTOMER SERVICES26 903000 Customer records & collect exp INTREN, INC. 1,074 CONSTRUCTION SERVICES27 903000 Customer records & collect exp L.J. ROSS 142 COLLECTION SERVICES28 903000 Customer records & collect exp LEXISNEXIS A DIVISION OF REED ELSEVIER INC 165 LEGAL SERVICES
Page Sub-Total 14,422$
Docket No. 18-____ ComEd Ex. 2.03 Page 143 of 334

Schedule C-6.2Page 48 of 74
Commonwealth Edison CompanyExpenses For Outside Professional Services in 2015
2015 Payments of $50,000 Or More Charged To Operating Expense(In Thousands)
Witness: Tracy
2015Line FERC Account PaymentNo. Account Description Payee Amount Nature of Service Provided
(A) (B) (C) (D) (E)
1 903000 Customer records & collect exp MARKET STRATEGIES INC 114$ MARKETING2 903000 Customer records & collect exp MEDIUS & ASSOCIATES INC 66 PRINTING SERVICES3 903000 Customer records & collect exp MZI GROUP INC 2,242 REPAIR SERVICES4 903000 Customer records & collect exp NCO FINANCIAL SYSTEMS, INC. 190 CUSTOMER SERVICES5 903000 Customer records & collect exp NEXANT, INC. 50 CONSULTING SERVICES6 903000 Customer records & collect exp OLENICK AND ASSOCIATES 122 CONSULTING SERVICES7 903000 Customer records & collect exp QUANTUM CROSSINGS LLC 1,839 TECHNICAL SERVICES8 903000 Customer records & collect exp REGULUS INTEGRATED 125 CUSTOMER SERVICES9 903000 Customer records & collect exp THE BOSTON CONSULTING GROUP INC 1,277 CONSULTING SERVICES
10 903000 Customer records & collect exp THE CBE GROUP, INC. 186 CUSTOMER SERVICES11 903000 Customer records & collect exp TORRES CREDIT SERVICES, INC. 156 CUSTOMER SERVICES12 903000 Customer records & collect exp TWENTY FIRST CENTURY 83 CUSTOMER SERVICES13 903000 Customer records & collect exp VANTAGE LEADERSHIP CONSULTING, LLC 66 CONSULTING SERVICES14 903000 Customer records & collect exp VOIANCE LANGUAGE SERVICES, LLC 98 LANGUAGE TRANSLATION SERVICES15 903000 Customer records & collect exp WEST MONROE PARTNERS, LLC 81 CONSULTING SERVICES16 908000 Customer assistance expenses ACCENTURE 4,263 CONSULTING SERVICES17 908000 Customer assistance expenses AFTER SCHOOL MATTERS, INC. 220 COMMUNITY RELATIONS18 908000 Customer assistance expenses AJENDA INTERACTIVE MEDIA, LLC 133 CONSULTING SERVICES19 908000 Customer assistance expenses BEELINE.COM, INC. 1,167 PROFESSIONAL STAFF AUGMENTATION20 908000 Customer assistance expenses CALICO ENERGY SERVICES 855 CONSULTING SERVICES21 908000 Customer assistance expenses CAROL H WILLIAMS ADVERTISING INC 222 ADVERTISING SERVICES22 908000 Customer assistance expenses DISTRIBUTED ENERGY FINANCIAL GROUP 95 CONSULTING SERVICES23 908000 Customer assistance expenses DOBLE ENGINEERING COMPANY 58 CONSULTING SERVICES24 908000 Customer assistance expenses E SOURCE COMPANIES LLC 114 CONSULTING SERVICES25 908000 Customer assistance expenses EIRE DIRECT MARKETING LLC 818 CONSULTING SERVICES26 908000 Customer assistance expenses ELEVATE ENERGY 242 CONSULTING SERVICES27 908000 Customer assistance expenses ENGHOUSE KNOWLEDGE MANAGEMENT SOLUTIONS LLC 142 CONSULTING SERVICES28 908000 Customer assistance expenses FIELD TRIP FACTORY 135 VISITOR SERVICES
Page Sub-Total 15,159$
Docket No. 18-____ ComEd Ex. 2.03 Page 144 of 334

Schedule C-6.2Page 49 of 74
Commonwealth Edison CompanyExpenses For Outside Professional Services in 2015
2015 Payments of $50,000 Or More Charged To Operating Expense(In Thousands)
Witness: Tracy
2015Line FERC Account PaymentNo. Account Description Payee Amount Nature of Service Provided
(A) (B) (C) (D) (E)
1 908000 Customer assistance expenses FORESEE RESULTS, INC. 92$ CONSULTING SERVICES2 908000 Customer assistance expenses GOOD EGG MEDIA LLC 205 CUSTOMER COMMUNICATIONS3 908000 Customer assistance expenses GOODCENTS SOLUTIONS 1,698 CONSULTING SERVICES4 908000 Customer assistance expenses HEART & MIND STRATEGIES LLC 134 CONSULTING SERVICES5 908000 Customer assistance expenses HYFN INC 152 IT SERVICES6 908000 Customer assistance expenses IFACTORING CONSULTING, INC. 220 CONSULTING SERVICES7 908000 Customer assistance expenses IGNITION HOLDINGS LLC 1,582 MARKETING8 908000 Customer assistance expenses ILLINOIS ASSOCIATION OF COMMUNITY ACTION 678 CUSTOMER SERVICES9 908000 Customer assistance expenses KONY SERVICES INC 123 IT SERVICES
10 908000 Customer assistance expenses KONY SOLUTIONS, INC. 55 IT SERVICES11 908000 Customer assistance expenses LEO BURNETT USA, INC. 96 ADVERTISING SERVICES12 908000 Customer assistance expenses M1 INTERACTIVE INC 281 CONSULTING SERVICES13 908000 Customer assistance expenses MAD DASH INC 386 TECHNICAL SERVICES14 908000 Customer assistance expenses MARKET STRATEGIES INC 1,192 MARKETING15 908000 Customer assistance expenses MEDIUS & ASSOCIATES INC 289 PRINTING SERVICES16 908000 Customer assistance expenses NEST LABS INC 101 TECHNICAL SERVICES17 908000 Customer assistance expenses NEXANT, INC. 120 TECHNICAL SERVICES18 908000 Customer assistance expenses NEXIDIA INC 54 BUSINESS APPLICATIONS19 908000 Customer assistance expenses NIELSEN LLC, CLARITAS 107 CONSULTING SERVICES20 908000 Customer assistance expenses OPOWER INC 276 TECHNICAL SERVICES21 908000 Customer assistance expenses PACO COMMUNICATIONS INC 564 COMMUNICATION SERVICES22 908000 Customer assistance expenses REGULUS INTEGRATED 613 CUSTOMER SERVICES23 908000 Customer assistance expenses RF DEMAND SOLUTIONS, LLC 246 PAGING SERVICES24 908000 Customer assistance expenses SHTC HOLDINGS LLC 142 CONSULTING SERVICES25 908000 Customer assistance expenses THE BLACKSTONE GROUP INC. 293 CONSULTING SERVICES26 908000 Customer assistance expenses THINKECO INC 154 CONSULTING SERVICES27 908000 Customer assistance expenses USA DISPLAYS INC 83 CONSTRUCTION SERVICES28 908000 Customer assistance expenses USABLENET INC 182 IT SERVICES
Page Sub-Total 10,118$
Docket No. 18-____ ComEd Ex. 2.03 Page 145 of 334

Schedule C-6.2Page 50 of 74
Commonwealth Edison CompanyExpenses For Outside Professional Services in 2015
2015 Payments of $50,000 Or More Charged To Operating Expense(In Thousands)
Witness: Tracy
2015Line FERC Account PaymentNo. Account Description Payee Amount Nature of Service Provided
(A) (B) (C) (D) (E)
1 908000 Customer assistance expenses VOCUS INC 93$ MARKETING2 908000 Customer assistance expenses WEST MONROE PARTNERS, LLC 585 CONSULTING SERVICES3 908000 Customer assistance expenses WIGHT & COMPANY 101 PROFESSIONAL STAFF AUGMENTATION4 909000 Inform and Instruct advert exp BEELINE.COM, INC. 199 PROFESSIONAL STAFF AUGMENTATION5 909000 Inform and Instruct advert exp CAROL H WILLIAMS ADVERTISING INC 353 ADVERTISING SERVICES6 909000 Inform and Instruct advert exp EIRE DIRECT MARKETING LLC 847 CONSULTING SERVICES7 909000 Inform and Instruct advert exp IGNITION HOLDINGS LLC 84 ADVERTISING SERVICES8 909000 Inform and Instruct advert exp LEO BURNETT USA, INC. 1,049 ADVERTISING SERVICES9 909000 Inform and Instruct advert exp MEDIUS & ASSOCIATES INC 295 PRINTING SERVICES
10 909000 Inform and Instruct advert exp PACO COMMUNICATIONS INC 1,553 ADVERTISING SERVICES11 909000 Inform and Instruct advert exp WTTW CHANNEL 11 63 ADVERTISING SERVICES12 923000 Outside services employed A-LINE E.D.S. 68 ENVIRONMENTAL SERVICES13 923000 Outside services employed ARCADIS US, INC. 115 ENVIRONMENTAL SERVICES14 923000 Outside services employed ARCOS, INC. 271 CONSULTING SERVICES15 923000 Outside services employed BALLARD SPAHR ANDREWS & 205 LEGAL SERVICES16 923000 Outside services employed BEELINE.COM, INC. 5,077 PROFESSIONAL STAFF AUGMENTATION17 923000 Outside services employed BIG SHOULDERS DIGITAL VIDEO PRODUCTIONS 113 MEDIA18 923000 Outside services employed BRIDGE ENERGY GROUP INC 242 CONSULTING SERVICES19 923000 Outside services employed CALICO ENERGY SERVICES 172 CONSULTING SERVICES20 923000 Outside services employed CAPITOL F CONSULTING, LLC 101 CONSULTING SERVICES21 923000 Outside services employed CARDIO PARTNER RESOURCES LLC 60 SAFETY SERVICES22 923000 Outside services employed CHICAGO ZOOLOGICAL SOCIETY 174 CONSULTING SERVICES23 923000 Outside services employed CHICO & NUNES 50 LEGAL SERVICES24 923000 Outside services employed CHRISTOPHER B BURKE ENGINEERIN 59 ENGINEERING25 923000 Outside services employed CONCENTRIC ENERGY ADVISORS INC 71 CONSULTING SERVICES26 923000 Outside services employed CORNERSTONE RESEARCH INC 740 CONSULTING SERVICES27 923000 Outside services employed CRA INTERNATIONAL INC 422 LEGAL SERVICES28 923000 Outside services employed CYRUS, INC. 204 CONSULTING SERVICES
Page Sub-Total 13,366$
Docket No. 18-____ ComEd Ex. 2.03 Page 146 of 334

Schedule C-6.2Page 51 of 74
Commonwealth Edison CompanyExpenses For Outside Professional Services in 2015
2015 Payments of $50,000 Or More Charged To Operating Expense(In Thousands)
Witness: Tracy
2015Line FERC Account PaymentNo. Account Description Payee Amount Nature of Service Provided
(A) (B) (C) (D) (E)
1 923000 Outside services employed DAVIDOFF COMMUNICATIONS LLC 60$ ADVERTISING SERVICES2 923000 Outside services employed DELOITTE CONSULTING LLP 206 CONSULTING SERVICES3 923000 Outside services employed DENNIS J. GANNON 102 CONSULTING SERVICES4 923000 Outside services employed DRINKER BIDDLE & REATH LLP 53 LEGAL SERVICES5 923000 Outside services employed EIMER STAHL, LLP 688 LEGAL SERVICES6 923000 Outside services employed EIRE DIRECT MARKETING LLC 83 CONSULTING SERVICES7 923000 Outside services employed ELEVATE ENERGY 1,750 CONSULTING SERVICES8 923000 Outside services employed FIRST ADVANTAGE LNS SCREENING 88 CONSULTING SERVICES9 923000 Outside services employed FLOWERS COMMUNICATIONS GROUP 84 COMMUNICATION SERVICES
10 923000 Outside services employed FOLEY & LARDNER 100 LEGAL SERVICES11 923000 Outside services employed G&R PUBLIC LAW AND STRATEGIES LLC 85 LEGAL SERVICES12 923000 Outside services employed G RABINE & SONS INC 68 PAVING13 923000 Outside services employed GLOBAL HR RESEARCH LLC 196 CONSULTING SERVICES14 923000 Outside services employed GREGORY K BUSCH 144 CONSULTING SERVICES15 923000 Outside services employed GRISKO LLC 391 COMMUNICATION SERVICES16 923000 Outside services employed HEIDRICK & STRUGGLES INC 105 EXECUTIVE SEARCH17 923000 Outside services employed HYGIENEERING INC 162 CONSULTING SERVICES18 923000 Outside services employed ILLINOIS INSTITUTE OF TECHNOLOGY 50 CONSULTING SERVICES19 923000 Outside services employed INGRID L SARAPUU 251 LEGAL SERVICES20 923000 Outside services employed INNER SPACE DPM INC 101 FACILITY SERVICES21 923000 Outside services employed INSTITUTE OF HEALTH AND HUMAN PERFORMANCE 138 CONSULTING SERVICES22 923000 Outside services employed IRON MOUNTAIN INFORMATION 126 RECORDS RETENTION23 923000 Outside services employed J C ANDERSON INC 148 CONSTRUCTION SERVICES24 923000 Outside services employed JACKSON LEWIS PC 52 LEGAL SERVICES25 923000 Outside services employed JAMES O. HAMILTON & CO INC 124 CONSULTING SERVICES26 923000 Outside services employed JILL KERRIGAN 188 CONSULTING SERVICES27 923000 Outside services employed JOHNSON AND BELL LTD 59 LEGAL SERVICES28 923000 Outside services employed JONES LANG LASALLE AMERICAS INC 110 FACILITY SERVICES
Page Sub-Total 5,712$
Docket No. 18-____ ComEd Ex. 2.03 Page 147 of 334
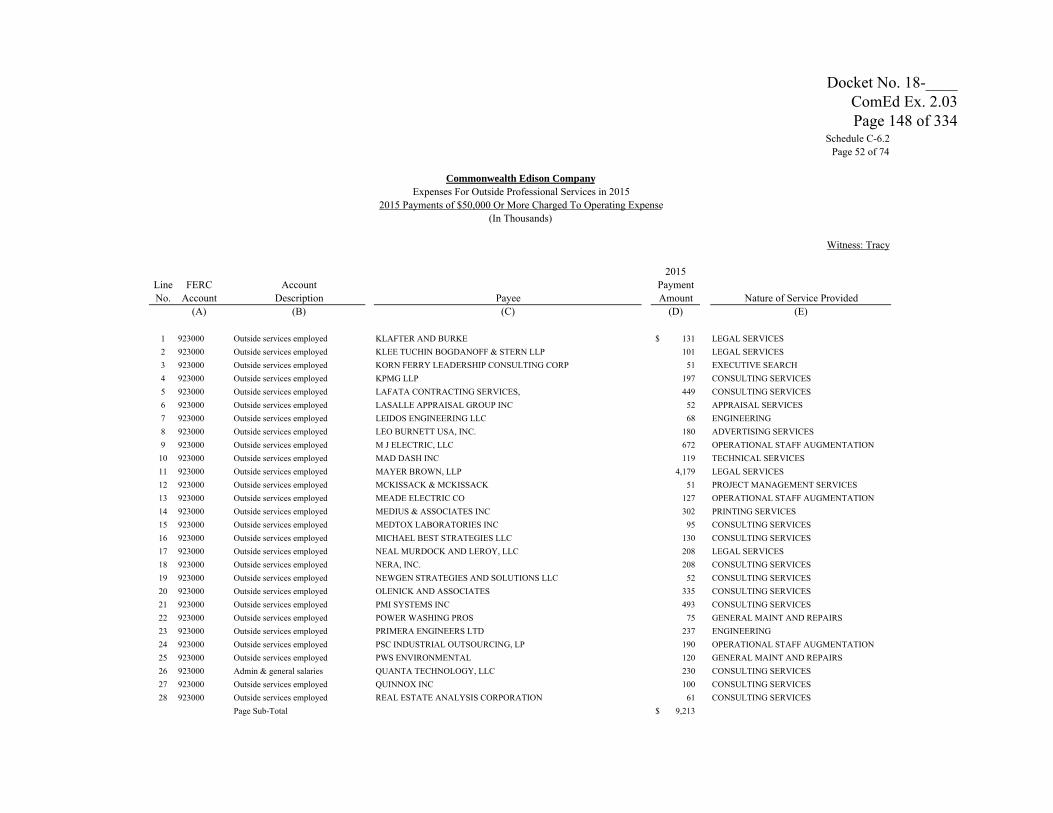
Schedule C-6.2Page 52 of 74
Commonwealth Edison CompanyExpenses For Outside Professional Services in 2015
2015 Payments of $50,000 Or More Charged To Operating Expense(In Thousands)
Witness: Tracy
2015Line FERC Account PaymentNo. Account Description Payee Amount Nature of Service Provided
(A) (B) (C) (D) (E)
1 923000 Outside services employed KLAFTER AND BURKE 131$ LEGAL SERVICES2 923000 Outside services employed KLEE TUCHIN BOGDANOFF & STERN LLP 101 LEGAL SERVICES3 923000 Outside services employed KORN FERRY LEADERSHIP CONSULTING CORP 51 EXECUTIVE SEARCH4 923000 Outside services employed KPMG LLP 197 CONSULTING SERVICES5 923000 Outside services employed LAFATA CONTRACTING SERVICES, 449 CONSULTING SERVICES6 923000 Outside services employed LASALLE APPRAISAL GROUP INC 52 APPRAISAL SERVICES7 923000 Outside services employed LEIDOS ENGINEERING LLC 68 ENGINEERING8 923000 Outside services employed LEO BURNETT USA, INC. 180 ADVERTISING SERVICES9 923000 Outside services employed M J ELECTRIC, LLC 672 OPERATIONAL STAFF AUGMENTATION
10 923000 Outside services employed MAD DASH INC 119 TECHNICAL SERVICES11 923000 Outside services employed MAYER BROWN, LLP 4,179 LEGAL SERVICES12 923000 Outside services employed MCKISSACK & MCKISSACK 51 PROJECT MANAGEMENT SERVICES13 923000 Outside services employed MEADE ELECTRIC CO 127 OPERATIONAL STAFF AUGMENTATION14 923000 Outside services employed MEDIUS & ASSOCIATES INC 302 PRINTING SERVICES15 923000 Outside services employed MEDTOX LABORATORIES INC 95 CONSULTING SERVICES16 923000 Outside services employed MICHAEL BEST STRATEGIES LLC 130 CONSULTING SERVICES17 923000 Outside services employed NEAL MURDOCK AND LEROY, LLC 208 LEGAL SERVICES18 923000 Outside services employed NERA, INC. 208 CONSULTING SERVICES19 923000 Outside services employed NEWGEN STRATEGIES AND SOLUTIONS LLC 52 CONSULTING SERVICES20 923000 Outside services employed OLENICK AND ASSOCIATES 335 CONSULTING SERVICES21 923000 Outside services employed PMI SYSTEMS INC 493 CONSULTING SERVICES22 923000 Outside services employed POWER WASHING PROS 75 GENERAL MAINT AND REPAIRS23 923000 Outside services employed PRIMERA ENGINEERS LTD 237 ENGINEERING24 923000 Outside services employed PSC INDUSTRIAL OUTSOURCING, LP 190 OPERATIONAL STAFF AUGMENTATION25 923000 Outside services employed PWS ENVIRONMENTAL 120 GENERAL MAINT AND REPAIRS26 923000 Admin & general salaries QUANTA TECHNOLOGY, LLC 230 CONSULTING SERVICES27 923000 Outside services employed QUINNOX INC 100 CONSULTING SERVICES28 923000 Outside services employed REAL ESTATE ANALYSIS CORPORATION 61 CONSULTING SERVICES
Page Sub-Total 9,213$
Docket No. 18-____ ComEd Ex. 2.03 Page 148 of 334

Schedule C-6.2Page 53 of 74
Commonwealth Edison CompanyExpenses For Outside Professional Services in 2015
2015 Payments of $50,000 Or More Charged To Operating Expense(In Thousands)
Witness: Tracy
2015Line FERC Account PaymentNo. Account Description Payee Amount Nature of Service Provided
(A) (B) (C) (D) (E)
1 923000 Outside services employed REGULUS INTEGRATED 2,797$ CUSTOMER SERVICES2 923000 Outside services employed REYES KURSON 377 LEGAL SERVICES3 923000 Outside services employed RICHARD M. HANSEN & ASSOCIATES 154 ENGINEERING4 923000 Outside services employed RIGHT MANAGEMENT,INC 105 CONSULTING SERVICES5 923000 Outside services employed ROBERT A CANTONE ATTORNEY AT LAW 91 LEGAL SERVICES6 923000 Outside services employed RONALD G KAMINSKI DBA HBK ENGINEERING LLC 615 ENGINEERING7 923000 Outside services employed ROONEY, RIPPIE & RATNASWAMY LLP 833 LEGAL SERVICES8 923000 Outside services employed RR DONNELLEY & SONS COMPANY 325 PRINTING SERVICES9 923000 Outside services employed SARGENT & LUNDY LLC 287 ENGINEERING
10 923000 Outside services employed SCOTT MADDEN 70 CONSULTING SERVICES11 923000 Outside services employed SIDLEY & AUSTIN 1,387 LEGAL SERVICES12 923000 Outside services employed SMITH,HEMMESCH,BURKE&BRANNIGAN 133 LEGAL SERVICES13 923000 Outside services employed SPEC-TEC LLC 616 TECHNICAL SERVICES14 923000 Outside services employed STANTEC CONSULTING SERVICES INC. 332 ENVIRONMENTAL SERVICES15 923000 Outside services employed SYNERGRID SOLUTIONS INC 195 CONSULTING SERVICES16 923000 Outside services employed SYSTEM ONE LLC 1,566 CONSTRUCTION SERVICES17 923000 Outside services employed THE BRATTLE GROUP INC 269 CONSULTING SERVICES18 923000 Outside services employed THE NORTHBRIDGE GROUP 670 CONSULTING SERVICES19 923000 Outside services employed THE ROOSEVELT GROUP, INC. 97 CONSULTING SERVICES20 923000 Outside services employed THE SALEM PROFESSIONAL SERVICES GROUP INC 136 PROFESSIONAL STAFF AUGMENTATION21 923000 Outside services employed THOMAS M. TULLY, LTD. 300 CONSULTING SERVICES22 923000 Outside services employed TRUE PARTNERS CONSULTING, LLC 121 CONSULTING SERVICES23 923000 Outside services employed TYNDALE COMPANY, INC. 50 SAFETY SERVICES24 923000 Outside services employed URS CORPORATION 171 ENVIRONMENTAL SERVICES25 923000 Outside services employed UTILITY BUSINESS MEDIA INC 58 CONSULTING SERVICES26 923000 Outside services employed VANTAGE LEADERSHIP CONSULTING, LLC 188 CONSULTING SERVICES27 923000 Outside services employed VR RESEARCH INC 170 CONSULTING SERVICES28 923000 Outside services employed WESTERN UTILITY LLC 66 EXCAVATING SERVICES
Page Sub-Total 12,179$
Docket No. 18-____ ComEd Ex. 2.03 Page 149 of 334

Schedule C-6.2Page 54 of 74
Commonwealth Edison CompanyExpenses For Outside Professional Services in 2015
2015 Payments of $50,000 Or More Charged To Operating Expense(In Thousands)
Witness: Tracy
2015Line FERC Account PaymentNo. Account Description Payee Amount Nature of Service Provided
(A) (B) (C) (D) (E)
1 923000 Outside services employed WIGHT & COMPANY 129$ PROFESSIONAL STAFF AUGMENTATION2 923000 Outside services employed WOLD ARCHITECTS & ENGINEERS INC 72 CONSULTING SERVICES3 925000 Injuries & damages DRINKER BIDDLE & REATH LLP 181 LEGAL SERVICES4 925000 Injuries & damages JOHNSON AND BELL LTD 527 LEGAL SERVICES5 925000 Injuries & damages KELLY & KING PC 316 LEGAL SERVICES6 925000 Injuries & damages LOCKE LORD LLP 81 LEGAL SERVICES7 925000 Injuries & damages ROONEY, RIPPIE & RATNASWAMY LLP 53 LEGAL SERVICES8 925000 Injuries & damages SANCHEZ, DANIELS & HOFFMAN 207 LEGAL SERVICES9 925000 Injuries & damages SIDLEY & AUSTIN 599 LEGAL SERVICES
10 925000 Injuries & damages SWANSON MARTIN & BELL 423 LEGAL SERVICES11 928000 Regulatory commission exp EIMER STAHL, LLP 485 LEGAL SERVICES12 928000 Regulatory commission exp GRAHAM & GRAHAM LLP 187 LEGAL SERVICES13 928000 Regulatory commission exp MCGUIRE WOODS LLP 79 LEGAL SERVICES14 928000 Regulatory commission exp MEDIUS & ASSOCIATES INC 53 PRINTING SERVICES15 928000 Regulatory commission exp ROONEY, RIPPIE & RATNASWAMY LLP 1,447 LEGAL SERVICES16 928000 Regulatory commission exp SIDLEY & AUSTIN 155 LEGAL SERVICES17 930100 General advertising expenses BULLY PULPIT INTERACTIVE LLC 50 ADVERTISING SERVICES18 930100 General advertising expenses CAROL H WILLIAMS ADVERTISING INC 289 ADVERTISING SERVICES19 930100 General advertising expenses HYFN INC 71 IT SERVICES20 930100 General advertising expenses IGNITION HOLDINGS LLC 83 ADVERTISING SERVICES21 930100 General advertising expenses JAK GRAPHIC DESIGN LLC 134 COMMUNICATION SERVICES22 930100 General advertising expenses KIVVIT 50 COMMUNICATION SERVICES23 930100 General advertising expenses LEO BURNETT USA, INC. 2,874 ADVERTISING SERVICES24 930100 General advertising expenses PACO COMMUNICATIONS INC 190 ADVERTISING SERVICES25 930100 General advertising expenses WTTW CHANNEL 11 63 ADVERTISING SERVICES26 930200 Misc general expenses ARCADIS US, INC. 2,809 ENVIRONMENTAL SERVICES27 930200 Misc general expenses BEELINE.COM, INC. 75 PROFESSIONAL STAFF AUGMENTATION28 930200 Misc general expenses BRIDGE ENERGY GROUP INC 89 CONSULTING SERVICES
Page Sub-Total 11,771$
Docket No. 18-____ ComEd Ex. 2.03 Page 150 of 334

Schedule C-6.2Page 55 of 74
Commonwealth Edison CompanyExpenses For Outside Professional Services in 2015
2015 Payments of $50,000 Or More Charged To Operating Expense(In Thousands)
Witness: Tracy
2015Line FERC Account PaymentNo. Account Description Payee Amount Nature of Service Provided
(A) (B) (C) (D) (E)
1 930200 Misc general expenses M2 CONSULTING INC 150$ CONSULTING SERVICES2 930200 Misc general expenses QUANTA TECHNOLOGY, LLC 110 CONSULTING SERVICES3 930200 Misc general expenses WOLD ARCHITECTS & ENGINEERS INC 154 CONSULTING SERVICES4 935000 Maintenance of general plant ACCENTURE 3,081 CONSULTING SERVICES5 935000 Maintenance of general plant ALLIED BARTON SECURITY SERVICE 633 SECURITY6 935000 Maintenance of general plant AMERICAN HERITAGE PROTECTION 380 SECURITY7 935000 Maintenance of general plant ANDERSON & SHAH ROOFING INC 156 BUILDING MAINTENANCE AND REPAIRS8 935000 Maintenance of general plant ARCADIS US, INC. 104 ENVIRONMENTAL SERVICES9 935000 Maintenance of general plant AXIS GROUP, LLC 676 CONSULTING SERVICES
10 935000 Maintenance of general plant BEARY LANDSCAPE MANAGEMENT INC. 4,354 BUILDING MAINTENANCE AND REPAIRS11 935000 Maintenance of general plant BEELINE.COM, INC. 715 PROFESSIONAL STAFF AUGMENTATION12 935000 Maintenance of general plant BERGLUND CONSTRUCTION COMPANY 669 BUILDING MAINTENANCE AND REPAIRS13 935000 Maintenance of general plant BRANDENBURGER PLUMBING, INC. 130 CONSTRUCTION SERVICES14 935000 Maintenance of general plant BURLING BUILDERS INC 143 BUILDING MAINTENANCE AND REPAIRS15 935000 Maintenance of general plant CONTINENTAL PAINTING & DECORATING INC 140 PAINTING AND COATING16 935000 Maintenance of general plant CPMH CONSTRUCTION INC 91 CONSTRUCTION SERVICES17 935000 Maintenance of general plant ENVIROPLUS INC 107 ENVIRONMENTAL SERVICES18 935000 Maintenance of general plant G RABINE & SONS INC 81 PAVING19 935000 Maintenance of general plant GSG CONSULTANTS INC 139 ENVIRONMENTAL SERVICES20 935000 Maintenance of general plant INLINE DESIGNS OFFICE SOUTIONS 158 FACILITY SERVICES21 935000 Maintenance of general plant INNER SPACE DPM INC 265 FACILITY SERVICES22 935000 Maintenance of general plant INTREN, INC. 88 CONSTRUCTION SERVICES23 935000 Maintenance of general plant J C ANDERSON INC 420 CONSTRUCTION SERVICES24 935000 Maintenance of general plant JONES LANG LASALLE AMERICAS INC 12,435 FACILITY SERVICES25 935000 Maintenance of general plant KLASS ELECTRIC 71 BUILDING MAINTENANCE AND REPAIRS26 935000 Maintenance of general plant LBJ CONSTRCUTION & MANAGEMENT INC 93 CONSTRUCTION SERVICES27 935000 Maintenance of general plant LINDBLAD CONSTRUCTION COMPANY 94 CONSTRUCTION SERVICES28 935000 Maintenance of general plant MCKISSACK & MCKISSACK 308 PROJECT MANAGEMENT SERVICES
Page Sub-Total 25,945$
Docket No. 18-____ ComEd Ex. 2.03 Page 151 of 334

Schedule C-6.2Page 56 of 74
Commonwealth Edison CompanyExpenses For Outside Professional Services in 2015
2015 Payments of $50,000 Or More Charged To Operating Expense(In Thousands)
Witness: Tracy
2015Line FERC Account PaymentNo. Account Description Payee Amount Nature of Service Provided
(A) (B) (C) (D) (E)
1 935000 Maintenance of general plant MEDIA RESOURCES INC. 68$ BUILDING MAINTENANCE AND REPAIRS2 935000 Maintenance of general plant MR DAVIDS CARPET SERVICE LTD 92 BUILDING MAINTENANCE AND REPAIRS3 935000 Maintenance of general plant NORTHWEST CONTRACTORS INC 332 CONSTRUCTION SERVICES4 935000 Maintenance of general plant PMI SYSTEMS INC 83 CONSULTING SERVICES5 935000 Maintenance of general plant PRESIDIO NETWORKED SOLUTIONS, INC. 90 TECHNICAL SERVICES6 935000 Maintenance of general plant PSC INDUSTRIAL OUTSOURCING, LP 348 OPERATIONAL STAFF AUGMENTATION7 935000 Maintenance of general plant QUALITECH ENGINEERING, LLC 243 ENGINEERING8 935000 Maintenance of general plant QUANTUM CROSSINGS LLC 321 TECHNICAL SERVICES9 935000 Maintenance of general plant RRK ASSOCIATES LTD 195 CONSULTING SERVICES
10 935000 Maintenance of general plant RT BEVERAGE 258 BUILDING MAINTENANCE AND REPAIRS11 935000 Maintenance of general plant SARGENT & LUNDY LLC 125 ENGINEERING12 935000 Maintenance of general plant SCB ARCHITECTS 58 BUILDING MAINTENANCE AND REPAIRS13 935000 Maintenance of general plant SCHNEIDER ELECTRIC BUILDINGS AMERICAS, INC. 171 CONSULTING SERVICES14 935000 Maintenance of general plant SCHWEITZER ENGINEERING LABS 149 PROJECT MANAGEMENT SERVICES15 935000 Maintenance of general plant SPEC-TEC LLC 86 TECHNICAL SERVICES16 935000 Maintenance of general plant TESCO 69 TECHNICAL SERVICES17 935000 Maintenance of general plant TOVAR SNOW PROFESSIONALS 810 BUILDING MAINTENANCE AND REPAIRS18 935000 Maintenance of general plant TRICE CONSTRUCTION COMPANY 52 CONSTRUCTION SERVICES19 935000 Maintenance of general plant TRINIDAD CONSTRUCTION LLC 61 BUILDING MAINTENANCE AND REPAIRS20 935000 Maintenance of general plant UNITED BUILDING MAINTENANCE INC 846 BUILDING MAINTENANCE AND REPAIRS21 935000 Maintenance of general plant VENCORE LABS INC 117 OPERATIONAL CONSULTING22 935000 Maintenance of general plant WEST MONROE PARTNERS, LLC 279 CONSULTING SERVICES23 935000 Maintenance of general plant WIGHT & COMPANY 456 PROFESSIONAL STAFF AUGMENTATION
Page Sub-Total 5,309$
Total 2015 Payments $50,000 and Above Charged To Operating Expense (p. 1-19 detail) 342,543$
Total 2015 Payments Under $50,000 Charged To Operating Expenses 11,426$
Docket No. 18-____ ComEd Ex. 2.03 Page 152 of 334

Schedule C-6.2Page 57 of 74
Commonwealth Edison CompanyExpenses For Outside Professional Services in 2014
2014 Payments of $50,000 Or More Charged To Operating Expense(In Thousands)
Witness: Tracy
2014Line FERC Account PaymentNo. Account Description Payee Amount Nature of Service Provided
(A) (B) (C) (D) (E)
1 560000 Oper supervision & engineering BEELINE.COM, INC. 193$ PROFESSIONAL STAFF AUGMENTATION2 560000 Oper supervision & engineering M J ELECTRIC, LLC 91 OPERATIONAL STAFF AUGMENTATION3 560000 Oper supervision & engineering NEAL MURDOCK AND LEROY, LLC 221 LEGAL SERVICES4 560000 Oper supervision & engineering SYSTEM ONE, INC. 179 PROFESSIONAL STAFF AUGMENTATION5 562000 Station expenses CORPORATE RISK SOLUTIONS INC 235 SECURITY SERVICES6 562000 Station expenses ORNELAS CONSTRUCTION CO 105 CONSTRUCTION SERVICES7 562000 Station expenses RED TIGER SECURITY LLC 59 SECURITY SERVICES8 563000 Overhead line expenses DASHIELL CORPORATION 67 ENGINEERING SERVICES9 563000 Overhead line expenses M J ELECTRIC, LLC 436 OPERATIONAL STAFF AUGMENTATION
10 563000 Overhead line expenses SARGENT & LUNDY LLC 58 ENGINEERING SERVICES11 563000 Overhead line expenses THREE PHASE LINE CONSTRUCTION 267 CONSTRUCTION SERVICES12 566000 Misc. transmission expenses BEELINE.COM, INC. 201 PROFESSIONAL STAFF AUGMENTATION13 566000 Misc. transmission expenses DELOITTE CONSULTING LLP 95 CONSULTING SERVICES14 566000 Misc. transmission expenses PRIMERA ENGINEERING 133 ENGINEERING15 566000 Misc. transmission expenses SARGENT & LUNDY LLC 102 ENGINEERING16 566000 Misc. transmission expenses SCHWEITZER ENGINEERING LABS 67 PROJECT MANAGEMENT SERVICES17 566000 Misc. transmission expenses THREE PHASE LINE CONSTRUCTION 341 CONSTRUCTION SERVICES18 566000 Misc. transmission expenses UBISENSE INC. 94 PROFESSIONAL STAFF AUGMENTATION19 566000 Misc. transmission expenses URS CORPORATION 185 ENVIRONMENTAL SERVICES20 568000 Main supervision & engineering PSC INDUTRIAL OUTSOURCING, LP 503 OPERATIONAL STAFF AUGMENTATION21 569000 Maintenance of structures BEARY LANDSCAPE MANAGEMENT INC. 99 BUILDING MAINTENANCE AND REPAIRS22 569000 Maintenance of structures G. RABINE & SONS, INC. 572 PAVING23 569000 Maintenance of structures M J ELECTRIC, LLC 639 OPERATIONAL STAFF AUGMENTATION24 569000 Maintenance of structures OSMOSE, INC. 67 OPERATIONAL STAFF AUGMENTATION25 569000 Maintenance of structures QSC CONTRACTING, INC. 507 CONSTRUCTION SERVICES26 569200 Maint of Computer Software BEELINE.COM, INC. 162 PROFESSIONAL STAFF AUGMENTATION27 569200 Maint of Computer Software UBISENSE INC. 106 PROFESSIONAL STAFF AUGMENTATION28 569200 Maint of Computer Software WEST MONROE PARTNERS, LLC 52 CONSULTING SERVICES
Page Sub-Total 5,836$
Docket No. 18-____ ComEd Ex. 2.03 Page 153 of 334

Schedule C-6.2Page 58 of 74
Commonwealth Edison CompanyExpenses For Outside Professional Services in 2014
2014 Payments of $50,000 Or More Charged To Operating Expense(In Thousands)
Witness: Tracy
2014Line FERC Account PaymentNo. Account Description Payee Amount Nature of Service Provided
(A) (B) (C) (D) (E)
1 570000 Maintenance of station equip A-LINE E.D.S. 57$ ENVIRONMENTAL SERVICES2 570000 Maintenance of station equip ALSTOM GRID, INC C/O KW ASSOCIATES 76 TECHNICAL SERVICES3 570000 Maintenance of station equip DELTA-STAR INC 252 TECHNICAL SERVICES4 570000 Maintenance of station equip HOOD-PATTERSON & DEWAR, INC 80 TECHNICAL SERVICES5 570000 Maintenance of station equip M J ELECTRIC, LLC 653 OPERATIONAL STAFF AUGMENTATION6 570000 Maintenance of station equip PRIT SERVICE INC. 113 TECHNICAL SERVICES7 570000 Maintenance of station equip ORNELAS CONSTRUCTION CO 127 CONSTRUCTION SERVICES8 570000 Maintenance of station equip QUANTUM CROSSINGS LLC 234 TECHNICAL SERVICES9 570000 Maintenance of station equip RUSSELL N RAYMOND DBA ORIONMAGNETIC 72 TECHNICAL SERVICES
10 570000 Maintenance of station equip SARGENT & LUNDY LLC 183 ENGINEERING11 570000 Maintenance of station equip SCHNEIDER ELECTRIC BUILDINGS AMERICAS, INC. 462 CONSULTING SERVICES12 570000 Maintenance of station equip SIEMENS INDUSTRY, INC 183 TECHNICAL SERVICES13 570000 Maintenance of station equip TRANSMISSION & DISTRIBUTION 79 TECHNICAL SERVICES14 571000 Maintenance of overhead lines ASPLUNDH TREE EXPERT CO 5,808 TREE TRIMMING15 571000 Maintenance of overhead lines BEARY LANDSCAPE MANAGEMENT INC. 1,381 BUILDING MAINTENANCE AND REPAIRS16 571000 Maintenance of overhead lines CHEMICAL VEGETATION CONTROL LLC 100 VEGETATION MANAGEMENT17 571000 Maintenance of overhead lines DAVEY RESOURCE GROUP 770 VEGETATION MANAGEMENT18 571000 Maintenance of overhead lines HAVERFIELD AVIATION, INC 321 AERIAL INSPECTION19 571000 Maintenance of overhead lines HOMER TREE SERVICE INC 661 VEGETATION MANAGEMENT20 571000 Maintenance of overhead lines JONES LANG LASALLE 133 CONSULTING SERVICES21 571000 Maintenance of overhead lines KRUEGER TOWER INC. 498 OPERATIONAL STAFF AUGMENTATION22 571000 Maintenance of overhead lines M J ELECTRIC, LLC 579 OPERATIONAL STAFF AUGMENTATION23 571000 Maintenance of overhead lines MOTOROLA SOLUTIONS, INC. 984 TELECOM SERVICES24 571000 Maintenance of overhead lines NATIVE RESTORATION SERVICES INC 59 ENVIRONMENTAL SERVICES25 571000 Maintenance of overhead lines NEW SOUTH EQUIPMENT MATS LLC 303 CONSTRUCTION SERVICES26 571000 Maintenance of overhead lines STANTEC CONSULTING SERVICES INC. 248 ENVIRONMENTAL SERVICES27 571000 Maintenance of overhead lines UNITED BUILDING MAINTENANCE INC 246 BUILDING MAINTENANCE AND REPAIRS28 572000 Maintenance of undergrnd lines CATHODIC PROTECTION MANAGEMENT 215 TECHNICAL SERVICES
Page Sub-Total 14,877$
Docket No. 18-____ ComEd Ex. 2.03 Page 154 of 334

Schedule C-6.2Page 59 of 74
Commonwealth Edison CompanyExpenses For Outside Professional Services in 2014
2014 Payments of $50,000 Or More Charged To Operating Expense(In Thousands)
Witness: Tracy
2014Line FERC Account PaymentNo. Account Description Payee Amount Nature of Service Provided
(A) (B) (C) (D) (E)
1 572000 Maintenance of undergrnd lines MIDWEST MECHANICAL 109$ TECHNICAL SERVICES2 572000 Maintenance of undergrnd lines NASH BROS CONSTRUCTION CO, INC 919 CONSTRUCTION SERVICES3 572000 Maintenance of undergrnd lines ORNELAS CONSTRUCTION CO 131 CONSTRUCTION SERVICES4 572000 Maintenance of undergrnd lines PRIMERA ENGINEERING 83 ENGINEERING5 572000 Maintenance of undergrnd lines PRYSMIAN CABLES & SYSTEMS USA LLC 320 TECHNICAL SERVICES6 572000 Maintenance of undergrnd lines PSC INDUSTRIAL OUTSOURCING, LP 196 OPERATIONAL STAFF AUGMENTATION7 572000 Maintenance of undergrnd lines TESCO 58 TECHNICAL SERVICES8 573000 Maint of Misc Transm Plant RUSSELL N RAYMOND DBA ORIONMAGNETIC 97 TECHNICAL SERVICES9 573000 Maint of Misc Transm Plant STEVENSON CRANE SERVICE 54 CONSTRUCTION SERVICES
10 573000 Maint of Misc Transm Plant WALBRIDGE EQUIPMENT INSTALLATION 66 TECHNICAL SERVICES11 580000 Oper supervision & engineering APPLIED ENERGY GROUP 385 CONSULTING SERVICES12 580000 Oper supervision & engineering BEELINE.COM, INC. 143 PROFESSIONAL STAFF AUGMENTATION13 580000 Oper supervision & engineering CB&I ENVIRONMENTAL & INFRASTRUCTURE INC 360 CONSULTING SERVICES14 580000 Oper supervision & engineering CUMMINS NPOWER, LLC 69 TECHNICAL SERVICES15 580000 Oper supervision & engineering CYRUS, INC. 561 CONSULTING SERVICES16 580000 Oper supervision & engineering EIMER STAHL, LLP 57 LEGAL SERVICES17 580000 Oper supervision & engineering GOOGLE, INC. 79 IT SERVICES18 580000 Oper supervision & engineering ILLINI POWER PRODUCTS CO 106 CONSTRUCTION SERVICES19 580000 Oper supervision & engineering INNER SPACE DPM INC 51 FACILITY SERVICES20 580000 Oper supervision & engineering INSTITUTE OF HEALTH AND HUMAN PERFORMANCE 1,113 CONSULTING SERVICES21 580000 Oper supervision & engineering INTERIOR INVESTMENTS, LLC 109 BUILDING MAINTENANCE AND REPAIRS22 580000 Oper supervision & engineering JACOBS & ASSOCIATES 124 CONSULTING SERVICES23 580000 Oper supervision & engineering J.C. ANDERSON, INC. 66 CONSTRUCTION SERVICES24 580000 Oper supervision & engineering MEADE ELECTRIC CO 2,823 OPERATIONAL STAFF AUGMENTATION25 580000 Oper supervision & engineering PACO COMMUNICATIONS, INC. 88 ADVERTISING26 580000 Oper supervision & engineering PATTEN INDUSTRIES 124 TECHNICAL SERVICES27 580000 Oper supervision & engineering PMI SYSTEMS INC 1,110 CONSULTING SERVICES28 580000 Oper supervision & engineering PRIMA COMMUNICATIONS 53 CONSULTING SERVICES
Page Sub-Total 9,454$
Docket No. 18-____ ComEd Ex. 2.03 Page 155 of 334

Schedule C-6.2Page 60 of 74
Commonwealth Edison CompanyExpenses For Outside Professional Services in 2014
2014 Payments of $50,000 Or More Charged To Operating Expense(In Thousands)
Witness: Tracy
2014Line FERC Account PaymentNo. Account Description Payee Amount Nature of Service Provided
(A) (B) (C) (D) (E)
1 580000 Oper supervision & engineering PRIMERA ENGINEERING 236$ ENGINEERING2 580000 Oper supervision & engineering PSC INDUSTRIAL OUTSOURCING, LP 172 OPERATIONAL STAFF AUGMENTATION3 580000 Oper supervision & engineering RIGHT MANAGEMENT,INC 63 CONSULTING SERVICES4 580000 Oper supervision & engineering RONALD G KAMINSKI DBA HBK ENGINEERING LLC 52 ENGINEERING5 580000 Oper supervision & engineering SPEC-TEC LLC 226 TECHNICAL SERVICES6 580000 Oper supervision & engineering SYSTEM ONE LLC 436 CONSTRUCTION SERVICES7 580000 Oper supervision & engineering TRAVELLIANCE 78 EMERGENCY LODGING8 582000 Station expenses INTREN, INC. 168 CONSTRUCTION SERVICES9 582000 Station expenses MICHELS POWER 85 OPERATIONAL STAFF AUGMENTATION
10 584000 Underground line expenses CITY OF CHICAGO DEPT. OF TRANS 77 OPERATIONAL CONSULTING11 584000 Underground line expenses IMCORP 222 TECHNICAL SERVICES12 584000 Underground line expenses INTREN, INC. 317 CONSTRUCTION SERVICES13 584000 Underground line expenses JULIE INC. 838 OPERATIONAL CONSULTING14 584000 Underground line expenses USIC LOCATING SERVICES, INC 9,775 OPERATIONAL CONSULTING15 585000 Street light & sign sys exp CITYSCAN INC 58 OPERATIONAL CONSULTING16 586000 Meter expenses BEELINE.COM, INC. 62 PROFESSIONAL STAFF AUGMENTATION17 586000 Meter expenses CORIX UTILITIES (US) INC 691 BUSINESS APPLICATIONS18 586000 Meter expenses MZI GROUP INC 357 SMART METER INSTALLATIONS19 586000 Meter expenses SILVER SPRING NETWORKS INC 332 TECHNICAL SERVICES20 586000 Meter expenses WEST MONROE PARTNERS, LLC 165 CONSULTING SERVICES21 587000 Cust installations exp ALDRIDGE ELECTRIC CO 60 OPERATIONAL STAFF AUGMENTATION22 587000 Cust installations exp DETECTENT INC. 267 CONSULTING SERVICES23 587000 Cust installations exp INTREN, INC. 432 CONSTRUCTION SERVICES24 587000 Cust installations exp M J ELECTRIC, LLC 105 OPERATIONAL STAFF AUGMENTATION25 587000 Cust installations exp MEADE ELECTRIC CO 158 OPERATIONAL STAFF AUGMENTATION26 587000 Cust installations exp SPEC-TEC LLC 147 TECHNICAL SERVICES27 587000 Cust installations exp THE CORNERSTONE ENERGY GROUP 94 CONSULTING SERVICES28 588000 Misc distribution expenses AECOM TECHNICAL SERVICES, INC. 67 ENVIRONMENTAL SERVICES29 588000 Misc distribution expenses AMERICAN HERITAGE PROTECTION 82 SECURITY
Page Sub-Total 15,822$
Docket No. 18-____ ComEd Ex. 2.03 Page 156 of 334

Schedule C-6.2Page 61 of 74
Commonwealth Edison CompanyExpenses For Outside Professional Services in 2014
2014 Payments of $50,000 Or More Charged To Operating Expense(In Thousands)
Witness: Tracy
2014Line FERC Account PaymentNo. Account Description Payee Amount Nature of Service Provided
(A) (B) (C) (D) (E)
1 588000 Misc distribution expenses ASPLUNDH TREE EXPERT CO 8,578$ TREE TRIMMING2 588000 Misc distribution expenses BEARY LANDSCAPE MANAGEMENT INC. 989 BUILDING MAINTENANCE AND REPAIRS3 588000 Misc distribution expenses BEELINE.COM, INC. 508 PROFESSIONAL STAFF AUGMENTATION4 588000 Misc distribution expenses DAVEY RESOURCE GROUP 350 VEGETATION MANAGEMENT5 588000 Misc distribution expenses DELOITTE CONSULTING LLP 1,356 CONSULTING SERVICES6 588000 Misc distribution expenses MEADE ELECTRIC CO 214 OPERATIONAL STAFF AUGMENTATION7 588000 Misc distribution expenses POWER ENGINEERS, INC. 204 ENGINEERING8 588000 Misc distribution expenses QUANTUM CROSSINGS LLC 67 CONSULTING SERVICES9 588000 Misc distribution expenses SPEC-TEC LLC 57 TECHNICAL SERVICES
10 588000 Misc distribution expenses UBISENSE INC 287 PROFESSIONAL STAFF AUGMENTATION11 588000 Misc distribution expenses UNITED BUILDING MAINTENANCE INC 167 BUILDING MAINTENANCE AND REPAIRS12 588000 Misc distribution expenses WEST MONROE PARTNERS, LLC 135 CONSULTING SERVICES13 590000 Main supervision & engineering BEELINE.COM, INC. 189 PROFESSIONAL STAFF AUGMENTATION14 590000 Main supervision & engineering INSTITUTE OF HEALTH AND HUMAN PERFORMANCE 192 CONSULTING SERVICES15 591000 Maintenance of structures BEARY LANDSCAPE MANAGEMENT INC. 99 BUILDING MAINTENANCE AND REPAIRS16 591000 Maintenance of structures G. RABINE & SONS, INC. 74 PAVING17 591000 Maintenance of structures GARFIELD BUILDING MAINTENANCE 602 BUILDING MAINTENANCE AND REPAIRS18 591000 Maintenance of structures INNER SPACE DPM INC 55 FACILITY SERVICES19 591000 Maintenance of structures MCKISSACK & MCKISSACK 68 PROJECT MANAGEMENT SERVICES20 591000 Maintenance of structures MIDWEST MECHANICAL 148 BUILDING MAINTENANCE AND REPAIRS21 591000 Maintenance of structures ORNELAS CONSTRUCTION CO 66 CONSTRUCTION SERVICES22 592000 Main of station equipment ABB POWER T&D COMPANY INC 56 TECHNICAL SERVICES23 592000 Main of station equipment ALARM DETECTION SYSTEMS, INC. 120 BUILDING MAINTENANCE AND REPAIRS24 592000 Main of station equipment A-LINE E.D.S. 57 ENVIRONMENTAL SERVICES25 592000 Main of station equipment AMERICAN HERITAGE PROTECTION 161 SECURITY26 592000 Main of station equipment ARCADIS US, INC. 86 ENVIRONMENTAL SERVICES27 592000 Main of station equipment B & R REPAIR INC. 91 GENERAL MAINT AND REPAIRS28 592000 Main of station equipment BEARY LANDSCAPE MANAGEMENT INC. 70 BUILDING MAINTENANCE AND REPAIRS29 592000 Main of station equipment BRANDENBURGER PLUMBING, INC. 53 CONSTRUCTION SERVICES
Page Sub-Total 15,099$
Docket No. 18-____ ComEd Ex. 2.03 Page 157 of 334
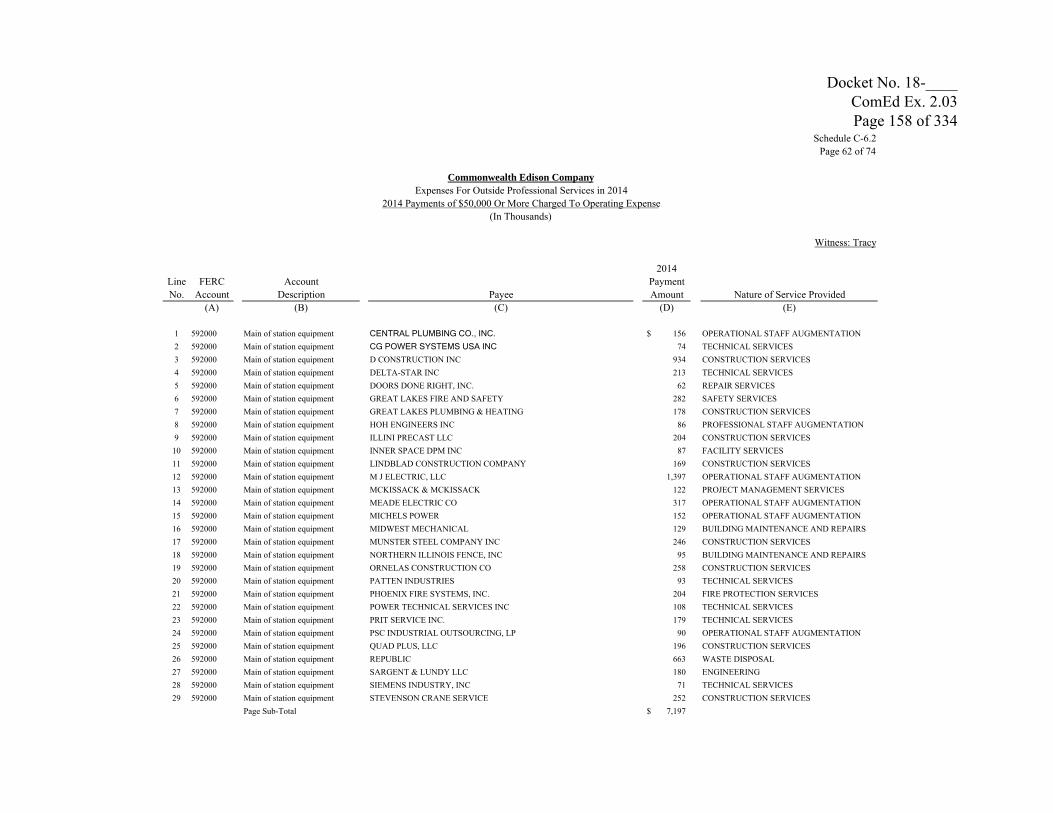
Schedule C-6.2Page 62 of 74
Commonwealth Edison CompanyExpenses For Outside Professional Services in 2014
2014 Payments of $50,000 Or More Charged To Operating Expense(In Thousands)
Witness: Tracy
2014Line FERC Account PaymentNo. Account Description Payee Amount Nature of Service Provided
(A) (B) (C) (D) (E)
1 592000 Main of station equipment CENTRAL PLUMBING CO., INC. 156$ OPERATIONAL STAFF AUGMENTATION2 592000 Main of station equipment CG POWER SYSTEMS USA INC 74 TECHNICAL SERVICES3 592000 Main of station equipment D CONSTRUCTION INC 934 CONSTRUCTION SERVICES4 592000 Main of station equipment DELTA-STAR INC 213 TECHNICAL SERVICES5 592000 Main of station equipment DOORS DONE RIGHT, INC. 62 REPAIR SERVICES6 592000 Main of station equipment GREAT LAKES FIRE AND SAFETY 282 SAFETY SERVICES7 592000 Main of station equipment GREAT LAKES PLUMBING & HEATING 178 CONSTRUCTION SERVICES8 592000 Main of station equipment HOH ENGINEERS INC 86 PROFESSIONAL STAFF AUGMENTATION9 592000 Main of station equipment ILLINI PRECAST LLC 204 CONSTRUCTION SERVICES
10 592000 Main of station equipment INNER SPACE DPM INC 87 FACILITY SERVICES11 592000 Main of station equipment LINDBLAD CONSTRUCTION COMPANY 169 CONSTRUCTION SERVICES12 592000 Main of station equipment M J ELECTRIC, LLC 1,397 OPERATIONAL STAFF AUGMENTATION13 592000 Main of station equipment MCKISSACK & MCKISSACK 122 PROJECT MANAGEMENT SERVICES14 592000 Main of station equipment MEADE ELECTRIC CO 317 OPERATIONAL STAFF AUGMENTATION15 592000 Main of station equipment MICHELS POWER 152 OPERATIONAL STAFF AUGMENTATION16 592000 Main of station equipment MIDWEST MECHANICAL 129 BUILDING MAINTENANCE AND REPAIRS17 592000 Main of station equipment MUNSTER STEEL COMPANY INC 246 CONSTRUCTION SERVICES18 592000 Main of station equipment NORTHERN ILLINOIS FENCE, INC 95 BUILDING MAINTENANCE AND REPAIRS19 592000 Main of station equipment ORNELAS CONSTRUCTION CO 258 CONSTRUCTION SERVICES20 592000 Main of station equipment PATTEN INDUSTRIES 93 TECHNICAL SERVICES21 592000 Main of station equipment PHOENIX FIRE SYSTEMS, INC. 204 FIRE PROTECTION SERVICES22 592000 Main of station equipment POWER TECHNICAL SERVICES INC 108 TECHNICAL SERVICES23 592000 Main of station equipment PRIT SERVICE INC. 179 TECHNICAL SERVICES24 592000 Main of station equipment PSC INDUSTRIAL OUTSOURCING, LP 90 OPERATIONAL STAFF AUGMENTATION25 592000 Main of station equipment QUAD PLUS, LLC 196 CONSTRUCTION SERVICES26 592000 Main of station equipment REPUBLIC 663 WASTE DISPOSAL27 592000 Main of station equipment SARGENT & LUNDY LLC 180 ENGINEERING28 592000 Main of station equipment SIEMENS INDUSTRY, INC 71 TECHNICAL SERVICES29 592000 Main of station equipment STEVENSON CRANE SERVICE 252 CONSTRUCTION SERVICES
Page Sub-Total 7,197$
Docket No. 18-____ ComEd Ex. 2.03 Page 158 of 334

Schedule C-6.2Page 63 of 74
Commonwealth Edison CompanyExpenses For Outside Professional Services in 2014
2014 Payments of $50,000 Or More Charged To Operating Expense(In Thousands)
Witness: Tracy
2014Line FERC Account PaymentNo. Account Description Payee Amount Nature of Service Provided
(A) (B) (C) (D) (E)
1 592000 Main of station equipment TANKNOLOGY INC 95$ TECHNICAL SERVICES2 592000 Main of station equipment TESCO 68 BUILDING MAINTENANCE AND REPAIRS3 592000 Main of station equipment TRANSMISSION & DISTRIBUTION 207 TECHNICAL SERVICES4 592000 Main of station equipment WALBRIDGE EQUIPMENT INSTALLATION 365 TECHNICAL SERVICES5 593000 Maintenance of overhead lines AMERICAN HERITAGE PROTECTION 561 SECURITY6 593000 Maintenance of overhead lines ARC AMERICAN INC 218 STORM ASSISTANCE7 593000 Maintenance of overhead lines ASPLUNDH TREE EXPERT CO 64,933 TREE TRIMMING8 593000 Maintenance of overhead lines BASE LOGISTICS, LLC 230 STORM ASSISTANCE9 593000 Maintenance of overhead lines BBC ELECTRICAL SERVICES INC 1,719 STORM ASSISTANCE
10 593000 Maintenance of overhead lines BSJ POWER SERVICES INC 631 STORM ASSISTANCE11 593000 Maintenance of overhead lines CAMPBELL ELECTRIC INC 193 STORM ASSISTANCE12 593000 Maintenance of overhead lines CAPITAL ELECTRIC LINE BUILDERS, INC 407 STORM ASSISTANCE13 593000 Maintenance of overhead lines CUSTOM LIGHTING SERVICES LLC 263 STORM ASSISTANCE14 593000 Maintenance of overhead lines DANELLA CONSTRUCTION COMPANY 579 STORM ASSISTANCE15 593000 Maintenance of overhead lines DAVEY RESOURCE GROUP 3,323 VEGETATION MANAGEMENT16 593000 Maintenance of overhead lines EQUALITY US 156 LANDSCAPING SERVICES17 593000 Maintenance of overhead lines FIRST ENERGY SOLUTIONS CORP 247 STORM ASSISTANCE18 593000 Maintenance of overhead lines GRAYS POWER SUPPLY LLC 515 STORM ASSISTANCE19 593000 Maintenance of overhead lines HAVERFIELD AVIATION, INC 934 AERIAL INSPECTION20 593000 Maintenance of overhead lines HENKELS AND MCCOY 771 STORM ASSISTANCE21 593000 Maintenance of overhead lines HURLEY & ASSOCIATES INC 103 TECHNICAL SERVICES22 593000 Maintenance of overhead lines HYDAKER WHEATLAKE COMPANY 141 STORM ASSISTANCE23 593000 Maintenance of overhead lines INTREN, INC. 5,760 STORM ASSISTANCE24 593000 Maintenance of overhead lines J F ELECTRIC INC 1,934 STORM ASSISTANCE25 593000 Maintenance of overhead lines J RANCK ELECTRIC INC 110 STORM ASSISTANCE26 593000 Maintenance of overhead lines KANSAS CITY POWER & LIGHT CO 279 STORM ASSISTANCE27 593000 Maintenance of overhead lines LOUISVILLE GAS AND ELECTRIC COMPANY 86 STORM ASSISTANCE28 593000 Maintenance of overhead lines M J ELECTRIC, LLC 2,195 STORM ASSISTANCE29 593000 Maintenance of overhead lines MEADE ELECTRIC CO 4,289 STORM ASSISTANCE
Page Sub-Total 91,312$
Docket No. 18-____ ComEd Ex. 2.03 Page 159 of 334

Schedule C-6.2Page 64 of 74
Commonwealth Edison CompanyExpenses For Outside Professional Services in 2014
2014 Payments of $50,000 Or More Charged To Operating Expense(In Thousands)
Witness: Tracy
2014Line FERC Account PaymentNo. Account Description Payee Amount Nature of Service Provided
(A) (B) (C) (D) (E)
1 593000 Maintenance of overhead lines MICHELS POWER 1,079$ STORM ASSISTANCE2 593000 Maintenance of overhead lines MIRARCHI BROTHERS INC 425 STORM ASSISTANCE3 593000 Maintenance of overhead lines NEW LOYALTY USA, INC. 74 COMMUNICATION SERVICES4 593000 Maintenance of overhead lines NEW SOUTH EQUIPMENT MATS LLC 107 CONSTRUCTION SERVICES5 593000 Maintenance of overhead lines OSMOSE, INC. 4,860 TECHNICAL SERVICES6 593000 Maintenance of overhead lines PAR ELECTRICAL CONTRACTORS 2,420 STORM ASSISTANCE7 593000 Maintenance of overhead lines PMI ENERGY SOLUTIONS LLC 448 STORM ASSISTANCE8 593000 Maintenance of overhead lines PSC INDUSTRIAL OUTSOURCING, LP 245 STORM ASSISTANCE9 593000 Maintenance of overhead lines QUALITY LINES INC 342 STORM ASSISTANCE
10 593000 Maintenance of overhead lines RAM CONSTRUCTION & LANDSCAPING LLC 51 LANDSCAPING SERVICES11 593000 Maintenance of overhead lines RS ELECTRIC UTILITY SERVICES CORP 377 STORM ASSISTANCE12 593000 Maintenance of overhead lines SERVICE ELECTRIC COMPANY 1,591 STORM ASSISTANCE13 593000 Maintenance of overhead lines TESCO 56 STORM ASSISTANCE14 593000 Maintenance of overhead lines THREE PHASE LINE CONSTRUCTION 455 STORM ASSISTANCE15 593000 Maintenance of overhead lines TWENTY FIRST CENTURY 104 CUSTOMER SERVICES16 593000 Maintenance of overhead lines UNION ELECTRIC COMPANY DBA AMEREN 226 STORM ASSISTANCE17 593000 Maintenance of overhead lines WISCONSIN CENTRAL LTD 59 SAFETY-FLAGGING ON RR ROW18 593000 Maintenance of overhead lines WISCONSIN ELECTRIC POWER CO 104 STORM ASSISTANCE19 594000 Main of underground lines ALDRIDGE ELECTRIC CO 13,182 OPERATIONAL STAFF AUGMENTATION20 594000 Main of underground lines CATHODIC PROTECTION MANAGEMENT 176 TECHNICAL SERVICES21 594000 Main of underground lines CYRUS, INC. 240 CONSULTING SERVICES22 594000 Main of underground lines EQUALITY US 379 BUILDING MAINTENANCE AND REPAIRS23 594000 Main of underground lines INDEPENDENT PAVING CO. INC. 458 BUILDING MAINTENANCE AND REPAIRS24 594000 Main of underground lines INTREN, INC. 13,306 CONSTRUCTION SERVICES25 594000 Main of underground lines LEIDOS ENGINEERING LLC 198 ENGINEERING26 594000 Main of underground lines MEADE ELECTRIC CO 6,880 OPERATIONAL STAFF AUGMENTATION27 594000 Main of underground lines PSC INDUSTRIAL OUTSOURCING, LP 2,299 OPERATIONAL STAFF AUGMENTATION
Page Sub-Total 50,141$
Docket No. 18-____ ComEd Ex. 2.03 Page 160 of 334

Schedule C-6.2Page 65 of 74
Commonwealth Edison CompanyExpenses For Outside Professional Services in 2014
2014 Payments of $50,000 Or More Charged To Operating Expense(In Thousands)
Witness: Tracy
2014Line FERC Account PaymentNo. Account Description Payee Amount Nature of Service Provided
(A) (B) (C) (D) (E)
1 594000 Main of underground lines RAM CONSTRUCTION & LANDSCAPING LLC 295$ LANDSCAPING SERVICES2 594000 Main of underground lines RONALD G KAMINSKI DBA HBK ENGINEERING LLC 1,322 ENGINEERING3 594000 Main of underground lines SYSTEM ONE LLC 117 CONSTRUCTION SERVICES4 594000 Main of underground lines TESCO 59 BUILDING MAINTENANCE AND REPAIRS5 594000 Main of underground lines TRICE CONSTRUCTION COMPANY 1,859 CONSTRUCTION SERVICES6 594000 Main of underground lines UTILX CORPORATION 962 GENERAL MAINT AND REPAIRS7 595000 Main of line transformers PSC INDUSTRIAL OUTSOURCING, LP 2,401 OPERATIONAL STAFF AUGMENTATION8 598000 Main of misc distrib plant ALCATEL-LUCENT USA INC. 103 TECHNICAL SERVICES9 598000 Main of misc distrib plant BEELINE.COM, INC. 1,053 PROFESSIONAL STAFF AUGMENTATION
10 598000 Main of misc distrib plant DELOITTE CONSULTING LLP 165 CONSULTING SERVICES11 598000 Main of misc distrib plant CB&I ENVIRONMENTAL & INFRASTRUCTURE INC 152 CONSULTING SERVICES12 598000 Main of misc distrib plant PRIMERA ENGINEERING 92 ENGINEERING13 598000 Main of misc distrib plant UBISENSE INC 693 PROFESSIONAL STAFF AUGMENTATION14 598000 Main of misc distrib plant WEST MONROE PARTNERS, LLC 344 CONSULTING SERVICES15 902000 Meter reading expenses AMERICAN HERITAGE PROTECTION 82 SECURITY16 902000 Meter reading expenses BEELINE.COM, INC. 188 PROFESSIONAL STAFF AUGMENTATION17 902000 Meter reading expenses CORIX UTILITIES (US) INC 53 BUSINESS APPLICATIONS18 902000 Meter reading expenses CREDIT CONTROL SERVICES, INC. 77 OPERATIONAL STAFF AUGMENTATION19 902000 Meter reading expenses DELOITTE CONSULTING LLP 58 CONSULTING SERVICES20 902000 Meter reading expenses DETECTENT INC. 613 CONSULTING SERVICES21 902000 Meter reading expenses INTREN, INC. 126 CONSTRUCTION SERVICES22 902000 Meter reading expenses ITRON, INC. 169 BUSINESS APPLICATIONS23 902000 Meter reading expenses JUAN ALBERTO BERNAL DBA INTELLIPROBE 53 TECHNICAL SERVICES24 902000 Meter reading expenses MEDIUS & ASSOCIATES INC 144 PRINTING SERVICES25 902000 Meter reading expenses PMI ENERGY SOLUTIONS LLC 74 STAFF AUGMENTATION26 902000 Meter reading expenses REGULUS INTEGRATED 54 CUSTOMER SERVICES27 902000 Meter reading expenses SILVER SPRING NETWORKS INC 527 TECHNICAL SERVICES28 902000 Meter reading expenses SMITH SYSTEM DRIVER IMPROVEMENT INSTITUTE INC. 76 TRAINING SERVICES
Page Sub-Total 11,911$
Docket No. 18-____ ComEd Ex. 2.03 Page 161 of 334

Schedule C-6.2Page 66 of 74
Commonwealth Edison CompanyExpenses For Outside Professional Services in 2014
2014 Payments of $50,000 Or More Charged To Operating Expense(In Thousands)
Witness: Tracy
2014Line FERC Account PaymentNo. Account Description Payee Amount Nature of Service Provided
(A) (B) (C) (D) (E)
1 902000 Meter reading expenses THE BLACKSTONE GROUP INC. 82$ CONSULTING SERVICES2 902000 Meter reading expenses THE STRUCTURE GROUP 154 CONSULTING SERVICES3 902000 Meter reading expenses WEST MONROE PARTNERS, LLC 663 CONSULTING SERVICES4 903000 Customer records & collect exp ACCENTURE 3,465 CONSULTING SERVICES5 903000 Customer records & collect exp ALLMED STAFFING INC. 147 PROFESSIONAL STAFF AUGMENTATION6 903000 Customer records & collect exp AMERICAN HERITAGE PROTECTION 296 SECURITY7 903000 Customer records & collect exp BANCTEC INC 1,216 PAYMENT PROCESSING SERVICES8 903000 Customer records & collect exp BEELINE.COM, INC. 2,139 PROFESSIONAL STAFF AUGMENTATION9 903000 Customer records & collect exp BOSTON CONSULTING GROUP 266 CONSULTING SERVICES
10 903000 Customer records & collect exp CAPSTONE WORLDWIDE INC 114 CONSULTING SERVICES11 903000 Customer records & collect exp CONTRACT CALLERS INC 715 OPERATIONAL STAFF AUGMENTATION12 903000 Customer records & collect exp CONVERGENT OUTSOURCING, INC. 84 OPERATIONAL STAFF AUGMENTATION13 903000 Customer records & collect exp CORIX UTILITIES (US) INC 106 BUSINESS APPLICATIONS14 903000 Customer records & collect exp CREDIT CONTROL SERVICES, INC. 209 OPERATIONAL STAFF AUGMENTATION15 903000 Customer records & collect exp CREDIT PROTECTION ASSOCIATION LP 211 COLLECTION SERVICES16 903000 Customer records & collect exp DEBTNEXT SOLUTIONS, LLC 59 OPERATIONAL STAFF AUGMENTATION17 903000 Customer records & collect exp DELOITTE CONSULTING LLP 2,928 CONSULTING SERVICES18 903000 Customer records & collect exp DISTRIBUTED ENERGY FINANCIAL GROUP 90 CONSULTING SERVICES19 903000 Customer records & collect exp DURKIN ELECTRIC COMPANY INC 1,435 REPAIR SERVICES20 903000 Customer records & collect exp EIMER STAHL, LLP 108 LEGAL SERVICES21 903000 Customer records & collect exp EXPERIAN INFORMATION SOLUTIONS INC. 568 CONSULTING SERVICES22 903000 Customer records & collect exp FIRSTECH 96 PAYMENT PROCESSING SERVICES23 903000 Customer records & collect exp HYPERQUALITY, INC. 242 CUSTOMER SERVICES24 903000 Customer records & collect exp INCOHO CONSULTING LLC 173 CONSULTING SERVICES25 903000 Customer records & collect exp INTREN, INC. 425 CONSTRUCTION SERVICES26 903000 Customer records & collect exp ITRON, INC. 265 BUSINESS APPLICATIONS27 903000 Customer records & collect exp L.J. ROSS 116 COLLECTION SERVICES28 903000 Customer records & collect exp LEXISNEXIS A DIVISION OF REED ELSEVIER INC 146 LEGAL SERVICES
Page Sub-Total 16,518$
Docket No. 18-____ ComEd Ex. 2.03 Page 162 of 334

Schedule C-6.2Page 67 of 74
Commonwealth Edison CompanyExpenses For Outside Professional Services in 2014
2014 Payments of $50,000 Or More Charged To Operating Expense(In Thousands)
Witness: Tracy
2014Line FERC Account PaymentNo. Account Description Payee Amount Nature of Service Provided
(A) (B) (C) (D) (E)
1 903000 Customer records & collect exp MEDIUS & ASSOCIATES INC 145$ PRINTING SERVICES2 903000 Customer records & collect exp MZI GROUP INC 622 TECHNICAL SERVICES3 903000 Customer records & collect exp NCO FINANCIAL SYSTEMS, INC. 267 CUSTOMER SERVICES4 903000 Customer records & collect exp NEXIDIA INC 54 BUSINESS APPLICATIONS5 903000 Customer records & collect exp PACO COMMUNICATIONS, INC. 103 ADVERTISING6 903000 Customer records & collect exp QUANTUM CROSSINGS LLC 619 CONSULTING SERVICES7 903000 Customer records & collect exp REGULUS INTEGRATED 119 CUSTOMER SERVICES8 903000 Customer records & collect exp SHTC HOLDINGS LLC 52 CONSULTING SERVICES9 903000 Customer records & collect exp THE CBE GROUP, INC. 376 CUSTOMER SERVICES
10 903000 Customer records & collect exp TORRES CREDIT SERVICES, INC. 164 CUSTOMER SERVICES11 903000 Customer records & collect exp TWENTY FIRST CENTURY 90 CUSTOMER SERVICES12 903000 Customer records & collect exp UTILISMART CORPORATION 80 BUSINESS APPLICATIONS13 903000 Customer records & collect exp VANTAGE LEADERSHIP CONSULTING, LLC 75 CONSULTING SERVICES14 903000 Customer records & collect exp VOIANCE LANGUAGE SERVICES, LLC 74 LANGUAGE TRANSLATION SERVICES15 903000 Customer records & collect exp WEST MONROE PARTNERS, LLC 178 CONSULTING SERVICES16 908000 Customer assistance expenses ACCENTURE 4,426 CONSULTING SERVICES17 908000 Customer assistance expenses AFTER SCHOOL MATTERS, INC. 172 COMMUNITY RELATIONS18 908000 Customer assistance expenses AJENDA INTERACTIVE MEDIA, LLC 128 CONSULTING SERVICES19 908000 Customer assistance expenses AMERICAN CUSTOMER 70 CONSULTING SERVICES20 908000 Customer assistance expenses BEELINE.COM, INC. 793 PROFESSIONAL STAFF AUGMENTATION21 908000 Customer assistance expenses CALICO ENERGY SERVICES 852 CONSULTING SERVICES22 908000 Customer assistance expenses CAPSTONE WORLDWIDE INC 142 CONSULTING SERVICES23 908000 Customer assistance expenses CUSTOMER INNOVATIONS INC 119 CONSULTING SERVICES24 908000 Customer assistance expenses DISTRIBUTED ENERGY FINANCIAL GROUP 60 CONSULTING SERVICES25 908000 Customer assistance expenses E SOURCE COMPANIES LLC 112 CONSULTING SERVICES26 908000 Customer assistance expenses EIRE DIRECT MARKETING LLC 519 CONSULTING SERVICES27 908000 Customer assistance expenses FORESEE RESULTS, INC. 189 CONSULTING SERVICES28 908000 Customer assistance expenses FTI CONSULTING (SC) INC 793 CONSULTING SERVICES
Page Sub-Total 11,393$
Docket No. 18-____ ComEd Ex. 2.03 Page 163 of 334
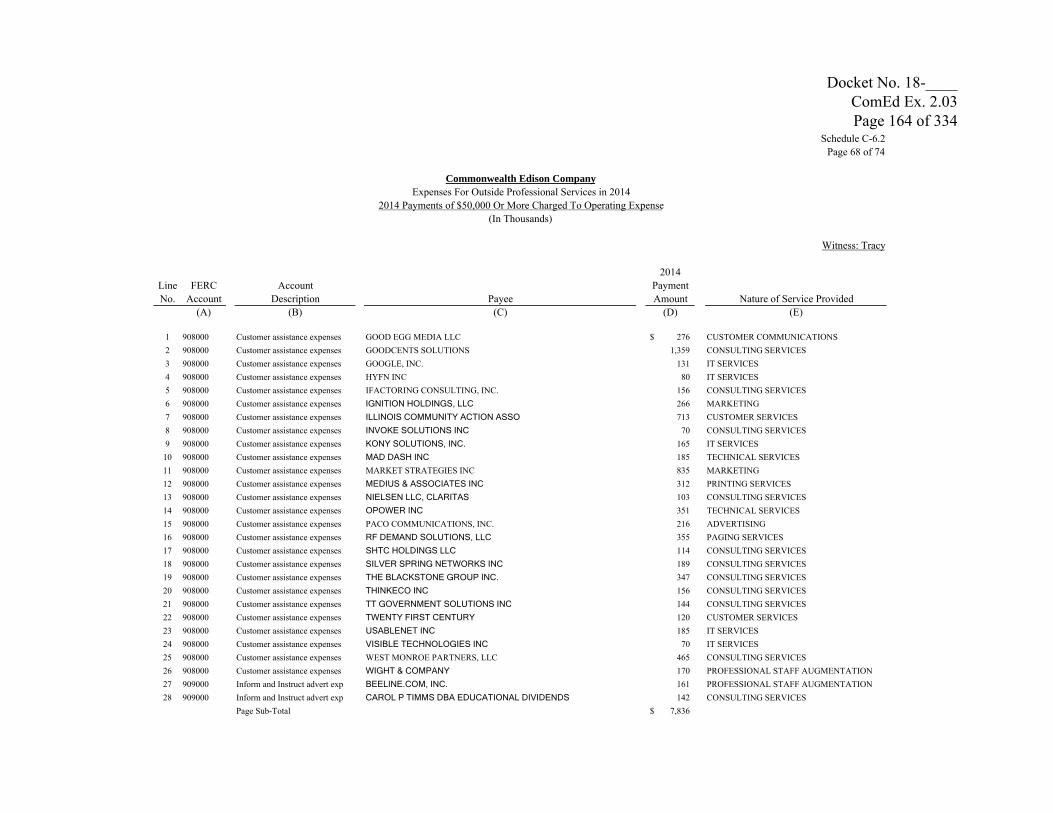
Schedule C-6.2Page 68 of 74
Commonwealth Edison CompanyExpenses For Outside Professional Services in 2014
2014 Payments of $50,000 Or More Charged To Operating Expense(In Thousands)
Witness: Tracy
2014Line FERC Account PaymentNo. Account Description Payee Amount Nature of Service Provided
(A) (B) (C) (D) (E)
1 908000 Customer assistance expenses GOOD EGG MEDIA LLC 276$ CUSTOMER COMMUNICATIONS2 908000 Customer assistance expenses GOODCENTS SOLUTIONS 1,359 CONSULTING SERVICES3 908000 Customer assistance expenses GOOGLE, INC. 131 IT SERVICES4 908000 Customer assistance expenses HYFN INC 80 IT SERVICES5 908000 Customer assistance expenses IFACTORING CONSULTING, INC. 156 CONSULTING SERVICES6 908000 Customer assistance expenses IGNITION HOLDINGS, LLC 266 MARKETING7 908000 Customer assistance expenses ILLINOIS COMMUNITY ACTION ASSO 713 CUSTOMER SERVICES8 908000 Customer assistance expenses INVOKE SOLUTIONS INC 70 CONSULTING SERVICES9 908000 Customer assistance expenses KONY SOLUTIONS, INC. 165 IT SERVICES
10 908000 Customer assistance expenses MAD DASH INC 185 TECHNICAL SERVICES11 908000 Customer assistance expenses MARKET STRATEGIES INC 835 MARKETING12 908000 Customer assistance expenses MEDIUS & ASSOCIATES INC 312 PRINTING SERVICES13 908000 Customer assistance expenses NIELSEN LLC, CLARITAS 103 CONSULTING SERVICES14 908000 Customer assistance expenses OPOWER INC 351 TECHNICAL SERVICES15 908000 Customer assistance expenses PACO COMMUNICATIONS, INC. 216 ADVERTISING16 908000 Customer assistance expenses RF DEMAND SOLUTIONS, LLC 355 PAGING SERVICES17 908000 Customer assistance expenses SHTC HOLDINGS LLC 114 CONSULTING SERVICES18 908000 Customer assistance expenses SILVER SPRING NETWORKS INC 189 CONSULTING SERVICES19 908000 Customer assistance expenses THE BLACKSTONE GROUP INC. 347 CONSULTING SERVICES20 908000 Customer assistance expenses THINKECO INC 156 CONSULTING SERVICES21 908000 Customer assistance expenses TT GOVERNMENT SOLUTIONS INC 144 CONSULTING SERVICES22 908000 Customer assistance expenses TWENTY FIRST CENTURY 120 CUSTOMER SERVICES23 908000 Customer assistance expenses USABLENET INC 185 IT SERVICES24 908000 Customer assistance expenses VISIBLE TECHNOLOGIES INC 70 IT SERVICES25 908000 Customer assistance expenses WEST MONROE PARTNERS, LLC 465 CONSULTING SERVICES26 908000 Customer assistance expenses WIGHT & COMPANY 170 PROFESSIONAL STAFF AUGMENTATION27 909000 Inform and Instruct advert exp BEELINE.COM, INC. 161 PROFESSIONAL STAFF AUGMENTATION28 909000 Inform and Instruct advert exp CAROL P TIMMS DBA EDUCATIONAL DIVIDENDS 142 CONSULTING SERVICES
Page Sub-Total 7,836$
Docket No. 18-____ ComEd Ex. 2.03 Page 164 of 334

Schedule C-6.2Page 69 of 74
Commonwealth Edison CompanyExpenses For Outside Professional Services in 2014
2014 Payments of $50,000 Or More Charged To Operating Expense(In Thousands)
Witness: Tracy
2014Line FERC Account PaymentNo. Account Description Payee Amount Nature of Service Provided
(A) (B) (C) (D) (E)
1 909000 Inform and Instruct advert exp EIRE DIRECT MARKETING LLC 435$ CONSULTING SERVICES2 909000 Inform and Instruct advert exp GOOGLE, INC. 122 IT SERVICES3 909000 Inform and Instruct advert exp HYFN INC 50 IT SERVICES4 909000 Inform and Instruct advert exp IGNITION HOLDINGS, LLC 687 MARKETING5 909000 Inform and Instruct advert exp LEO BURNETT USA, INC. 1,707 ADVERTISING SERVICES6 909000 Inform and Instruct advert exp MEDIUS & ASSOCIATES INC 366 PRIINTING SERVICES7 909000 Inform and Instruct advert exp PACO COMMUNICATIONS, INC. 659 ADVERTISING SERVICES8 909000 Inform and Instruct advert exp WTTW CHANNEL 11 75 ADVERTISING SERVICES9 923000 Outside services employed ACCENTURE 150 CONSULTING SERVICES
10 923000 Outside services employed ARCADIS US, INC. 236 ENVIRONMENTAL SERVICES11 923000 Outside services employed ARCOS, INC. 170 CONSULTING SERVICES12 923000 Outside services employed BALLARD SPAHR ANDREWS & 115 LEGAL SERVICES13 923000 Outside services employed BEARY LANDSCAPE MANAGEMENT INC. 154 BUILDING MAINTENANCE AND REPAIRS14 923000 Outside services employed BEELINE.COM, INC. 4,281 PROFESSIONAL STAFF AUGMENTATION15 923000 Outside services employed CAPITOL F CONSULTING, LLC 60 CONSULTING SERVICES16 923000 Outside services employed CARDIO PARTNER RESOURCES LLC 101 SAFETY TRAINING17 923000 Outside services employed CHICO & NUNES, P.C. 78 LEGAL SERVICES18 923000 Outside services employed CHRISTOPHER B BURKE ENGINEERIN 66 ENGINEERING19 923000 Outside services employed CORNERSTONE RESEARCH INC 330 CONSULTING SERVICES20 923000 Outside services employed CRA INTERNATIONAL INC 84 LEGAL SERVICES21 923000 Outside services employed CYRUS, INC. 233 CONSULTING SERVICES22 923000 Outside services employed DAVIDOFF COMMUNICATIONS LLC 69 ADVERTISING SERVICES23 923000 Outside services employed DEBERRY & ASSOCIATES LTD 87 CONSULTING SERVICES24 923000 Outside services employed DENNIS J. GANNON 102 CONSULTING SERVICES25 923000 Outside services employed DRINKER BIDDLE & REATH LLP 141 LEGAL SERVICES26 923000 Outside services employed EDISON ELECTRIC INSTITUTE (EEI) 57 CONSULTING SERVICES27 923000 Outside services employed EIMER STAHL, LLP 982 LEGAL SERVICES28 923000 Outside services employed EIRE DIRECT MARKETING LLC 72 CONSULTING SERVICES
Page Sub-Total 11,669$
Docket No. 18-____ ComEd Ex. 2.03 Page 165 of 334

Schedule C-6.2Page 70 of 74
Commonwealth Edison CompanyExpenses For Outside Professional Services in 2014
2014 Payments of $50,000 Or More Charged To Operating Expense(In Thousands)
Witness: Tracy
2014Line FERC Account PaymentNo. Account Description Payee Amount Nature of Service Provided
(A) (B) (C) (D) (E)
1 923000 Outside services employed ELEVATE ENERGY 1,621$ CONSULTING SERVICES2 923000 Outside services employed FIRST ADVANTAGE LNS SCREENING 60 CONSULTING SERVICES3 923000 Outside services employed FOLEY & LARDNER 110 LEGAL SERVICES4 923000 Outside services employed G&R PUBLIC LAW AND STRATEGIES LLC 78 LEGAL SERVICES5 923000 Outside services employed GLOBAL HR RESEARCH LLC 204 CONSULTING SERVICES6 923000 Outside services employed GRISKO LLC 410 COMMUNICATIONS SERVICES7 923000 Outside services employed GUNTHER POLAK 72 LEGAL SERVICES8 923000 Outside services employed HYGIENEERING INC 269 CONSULTING SERVICES9 923000 Outside services employed ILLINOIS INSTITUTE OF TECHNOLOGY 111 CONSULTING SERVICES10 923000 Outside services employed INGRID L SARAPUU 231 LEGAL SERVICES11 923000 Outside services employed INNER SPACE DPM INC 83 FACILITY SERVICES12 923000 Outside services employed INSTITUTE OF HEALTH AND HUMAN PERFORMANCE 79 CONSULTING SERVICES13 923000 Outside services employed INTEGRATED COACHING SOLUTIONS, 141 CONSULTING SERVICES14 923000 Outside services employed INTREN, INC. 53 CONSTRUCTION SERVICES15 923000 Outside services employed IRON MOUNTAIN 114 SECURITY SERVICES16 923000 Outside services employed JAK GRAPHIC DESIGN LLC 104 COMMUNICATION SERVICES17 923000 Outside services employed JAMES O. HAMILTON & CO., INC. 91 CONSULTING SERVICES18 923000 Outside services employed JAYNE THOMPSON & ASSOCIATES LTD 246 CONSULTING SERVICES19 923000 Outside services employed JENNER & BLOCK 245 LEGAL SERVICES20 923000 Outside services employed JOHNSON AND BELL LTD 69 LEGAL SERVICES21 923000 Outside services employed KENEXA TECHNOLOGY, INC. 58 CONSULTING SERVICES22 923000 Outside services employed KINECTRICS US INC 80 TECHNICAL SERVICES23 923000 Outside services employed KLAFTER AND BURKE 243 LEGAL SERVICES24 923000 Outside services employed KPMG LLP 101 CONSULTING SERVICES25 923000 Outside services employed LAFATA CONTRACTING SERVICES, 249 CONSULTING SERVICES26 923000 Outside services employed LAW FIRM OF RUSSELL R. JOHNSON 62 LEGAL SERVICES27 923000 Outside services employed LEIDOS ENGINEERING LLC 120 ENGINEERING28 923000 Outside services employed LEO BURNETT USA, INC. 193 ADVERTISING SERVICES30 923000 Outside services employed M J ELECTRIC, LLC 899 OPERATIONAL STAFF AUGMENTATION
Page Sub-Total 6,396$
Docket No. 18-____ ComEd Ex. 2.03 Page 166 of 334

Schedule C-6.2Page 71 of 74
Commonwealth Edison CompanyExpenses For Outside Professional Services in 2014
2014 Payments of $50,000 Or More Charged To Operating Expense(In Thousands)
Witness: Tracy
2014Line FERC Account PaymentNo. Account Description Payee Amount Nature of Service Provided
(A) (B) (C) (D) (E)
1 923000 Outside services employed MAD DASH INC 111$ TECHNICAL SERVICES2 923000 Outside services employed MAYER BROWN, LLP 2,848 LEGAL SERVICES3 923000 Outside services employed MEDIUS & ASSOCIATES INC 200 PRINTING SERVICES4 923000 Outside services employed MEDTOX LABORATORIES INC 94 CONSULTING SERVICES5 923000 Outside services employed MEDVEC & ASSOCIATES LLC 121 CONSULTING SERVICES6 923000 Outside services employed MOORE SYNDICATION INC. 86 SAFETY SERVICES7 923000 Outside services employed NEAL MURDOCK AND LEROY, LLC 198 LEGAL SERVICES8 923000 Outside services employed NERA, INC. 87 CONSULTING SERVICES9 923000 Outside services employed PARKER + LYNCH 60 CONSULTING SERVICES10 923000 Outside services employed PMI SYSTEMS INC 127 STAFF AUGMENTATION11 923000 Outside services employed PRIMERA ENGINEERING 166 ENGINEERING12 923000 Outside services employed PSC INDUSTRIAL OUTSOURCING, LP 100 OPERATIONAL STAFF AUGMENTATION13 923000 Outside services employed REGULUS INTEGRATED 2,960 CUSTOMER SERVICES14 923000 Outside services employed REYES KURSON 419 LEGAL SERVICES15 923000 Outside services employed RICHARD M. HANSEN & ASSOCIATES 198 ENGINEERING SERVICES16 923000 Outside services employed RIGHT MANAGEMENT,INC 107 CONSULTING SERVICES17 923000 Outside services employed RONALD G KAMINSKI DBA HBK ENGINEERING LLC 983 ENGINEERING18 923000 Outside services employed ROONEY, RIPPIE & RATNASWAMY LLP 665 LEGAL SERVICES19 923000 Outside services employed SARGENT & LUNDY LLC 554 ENGINEERING20 923000 Outside services employed SIDLEY & AUSTIN 1,353 LEGAL SERVICES21 923000 Outside services employed SMITH SYSTEM DRIVER IMPROVEMENT INSTITUTE INC. 103 TRAINING SERVICES22 923000 Outside services employed SMITH,HEMMESCH,BURKE&BRANNIGAN 139 LEGAL SERVICES23 923000 Outside services employed SPEC-TEC LLC 581 TECHNICAL SERVICES24 923000 Outside services employed STANTEC CONSULTING SERVICES INC. 293 ENVIRONMENTAL SERVICES25 923000 Outside services employed SYNERGRID SOLUTIONS INC 90 CONSULTING SERVICES26 923000 Outside services employed SYSTEM ONE LLC 1,024 CONSTRUCTION SERVICES27 923000 Outside services employed TANKNOLOGY INC 82 TECHNICAL SERVICES28 923000 Outside services employed THE AYCO COMPANY 75 CONSULTING SERVICES29 923000 Outside services employed THE BRATTLE GROUP INC 334 CONSULTING SERVICES
Page Sub-Total 14,158$
Docket No. 18-____ ComEd Ex. 2.03 Page 167 of 334

Schedule C-6.2Page 72 of 74
Commonwealth Edison CompanyExpenses For Outside Professional Services in 2014
2014 Payments of $50,000 Or More Charged To Operating Expense(In Thousands)
Witness: Tracy
2014Line FERC Account PaymentNo. Account Description Payee Amount Nature of Service Provided
(A) (B) (C) (D) (E)
1 923000 Outside services employed THE NORTHBRIDGE GROUP 791$ CONSULTING SERVICES2 923000 Outside services employed THE ROOSEVELT GROUP, INC. 105 CONSULTING SERVICES3 923000 Outside services employed THE SALEM PROFESSIONAL SERVICES GROUP INC 139 PROFESSIONAL STAFF AUGMENTATION4 923000 Outside services employed THOMAS M. TULLY, LTD. 353 CONSULTING SERVICES5 923000 Outside services employed TRUE PARTNERS CONSULTING, LLC 108 CONSULTING SERVICES6 923000 Outside services employed URS CORPORATION 174 ENVIRONMENTAL SERVICES7 923000 Outside services employed VANTAGE LEADERSHIP CONSULTING, LLC 281 CONSULTING SERVICES8 923000 Outside services employed WOLD ARCHITECTS & ENGINEERS INC 54 CONSULTING SERVICES10 925000 Injuries & damages DRINKER BIDDLE & REATH LLP 631 LEGAL SERVICES11 925000 Injuries & damages EDWARDS WILDMAN PALMER LLP 96 LEGAL SERVICES12 925000 Injuries & damages JOHNSON AND BELL LTD 832 LEGAL SERVICES13 925000 Injuries & damages KELLY & KING PC 245 LEGAL SERVICES14 925000 Injuries & damages KRAUSFLAMING LLC 72 LEGAL SERVICES15 925000 Injuries & damages ROONEY, RIPPIE & RATNASWAMY LLP 50 LEGAL SERVICES16 925000 Injuries & damages SANCHEZ, DANIELS & HOFFMAN 298 LEGAL SERVICES17 925000 Injuries & damages SIDLEY & AUSTIN 274 LEGAL SERVICES18 925000 Injuries & damages SWANSON MARTIN & BELL 419 LEGAL SERVICES19 928000 Regulatory commission exp BEELINE.COM, INC. 71 PROFESSIONAL STAFF AUGMENTATION20 928000 Regulatory commission exp EIMER STAHL, LLP 947 LEGAL SERVICES21 928000 Regulatory commission exp GRAHAM & GRAHAM LLP 76 LEGAL SERVICES22 928000 Regulatory commission exp JENNER & BLOCK 280 LEGAL SERVICES23 928000 Regulatory commission exp MARK L GOLDSTEIN 73 LEGAL SERVICES24 928000 Regulatory commission exp MCGUIRE WOODS LLP 103 LEGAL SERVICES25 928000 Regulatory commission exp MEDIUS & ASSOCIATES INC 51 PRINTING SERVICES26 928000 Regulatory commission exp PRIMERA ENGINEERING 97 ENGINEERING27 928000 Regulatory commission exp REYES KURSON - LEGAL SERVICES28 928000 Regulatory commission exp ROONEY, RIPPIE & RATNASWAMY LLP 2,125 LEGAL SERVICES
Page Sub-Total 8,745$
Docket No. 18-____ ComEd Ex. 2.03 Page 168 of 334

Schedule C-6.2Page 73 of 74
Commonwealth Edison CompanyExpenses For Outside Professional Services in 2014
2014 Payments of $50,000 Or More Charged To Operating Expense(In Thousands)
Witness: Tracy
2014Line FERC Account PaymentNo. Account Description Payee Amount Nature of Service Provided
(A) (B) (C) (D) (E)
1 928000 Regulatory commission exp SIDLEY & AUSTIN 119 LEGAL SERVICES2 930100 General advertising expenses CAROL H WILLIAMS ADVERTISING INC 245 MEDIA3 930100 General advertising expenses EIRE DIRECT MARKETING LLC 51 CONSULTING SERVICES4 930100 General advertising expenses JAK GRAPHIC DESIGN LLC 206 PRINTING SERVICES5 930100 General advertising expenses LEO BURNETT USA, INC. 2,349 ADVERTISING SERVICES6 930100 General advertising expenses PACO COMMUNICATIONS, INC. 232 COMMUNICATION SERVICES7 930200 Misc general expenses ARCADIS US, INC. 2,596 ENVIRONMENTAL SERVICES8 930200 Misc general expenses IGNITION HOLDINGS, LLC 660 MARKETING9 930200 Misc general expenses M2 CONSULTING, INC 150 BUSINESS APPLICATIONS10 930200 Misc general expenses QUANTA TECHNOLOGY, LLC 148 CONSULTING SERVICES11 930200 Misc general expenses STANTEC CONSULTING SERVICES INC. 52 ENVIRONMENTAL SERVICES12 930200 Misc general expenses THE BLACKSTONE GROUP INC. 132 CONSULTING SERVICES13 930200 Misc general expenses UNITED SECURITY SERVICES, INC. 76 SECURITY SERVICES14 935000 Maintenance of general plant ACCENTURE 2,075 CONSULTING SERVICES15 935000 Maintenance of general plant ACTION FENCE CONTRACTORS INC 156 BUILDING MAINTENANCE AND REPAIRS16 935000 Maintenance of general plant AGAE CONTRACTORS INC 67 BUILDING MAINTENANCE AND REPAIRS17 935000 Maintenance of general plant AMERICAN HERITAGE PROTECTION 743 SECURITY SERVICES18 935000 Maintenance of general plant ANDERSON & SHAH ROOFING INC 231 BUILDING MAINTENANCE AND REPAIRS19 935000 Maintenance of general plant ANDERSON BROTHERS CORP 130 CONSULTING SERVICES20 935000 Maintenance of general plant ARCADIS US, INC. 740 ENVIRONMENTAL SERVICES21 935000 Maintenance of general plant AXIS GROUP, LLC 225 CONSULTING SERVICES22 935000 Maintenance of general plant BEARY LANDSCAPE MANAGEMENT INC. 3,764 BUILDING MAINTENANCE AND REPAIRS23 935000 Maintenance of general plant BEELINE.COM, INC. 662 PROFESSIONAL STAFF AUGMENTATION24 935000 Maintenance of general plant BERGLUND CONSTRUCTION COMPANY 511 BUILDING MAINTENANCE AND REPAIRS25 935000 Maintenance of general plant BRANDENBURGER PLUMBING, INC. 169 CONSTRUCTION SERVICES26 935000 Maintenance of general plant BRIDGE ENERGY GROUP INC 250 CONSULTING SERVICES27 935000 Maintenance of general plant BURLING BUILDERS INC 389 BUILDING MAINTENANCE AND REPAIRS28 935000 Maintenance of general plant CB RICHARD ELLIS 12,791 FACILITIES MANAGEMENT/BASE LEASE29 935000 Maintenance of general plant F H PASCHEN S N NIELSEN & 620 BUILDING MAINTENANCE AND REPAIRS30 935000 Maintenance of general plant G. RABINE & SONS, INC. 62 PAVING
Page Sub-Total 30,601$
Docket No. 18-____ ComEd Ex. 2.03 Page 169 of 334

Schedule C-6.2Page 74 of 74
Commonwealth Edison CompanyExpenses For Outside Professional Services in 2014
2014 Payments of $50,000 Or More Charged To Operating Expense(In Thousands)
Witness: Tracy
2014Line FERC Account PaymentNo. Account Description Payee Amount Nature of Service Provided
(A) (B) (C) (D) (E)
1 935000 Maintenance of general plant GSG CONSULTANTS INC 391$ ENVIRONMENTAL SERVICES2 935000 Maintenance of general plant HARTMANN ELECTRIC COMPANY INC. 792 CONSTRUCTION SERVICES3 935000 Maintenance of general plant INLINE DESIGNS OFFICE SOUTIONS 54 FACILITY SERVICES4 935000 Maintenance of general plant INNER SPACE DPM INC 519 FACILITY SERVICES5 935000 Maintenance of general plant INTERIOR INVESTMENTS, LLC 50 BUILDING MAINTENANCE AND REPAIRS6 935000 Maintenance of general plant J.C. ANDERSON, INC. 1,002 CONSTRUCTION SERVICES7 935000 Maintenance of general plant JONES LANG LASALLE 681 FACILITY SERVICES8 935000 Maintenance of general plant KPMG LLP 55 CONSULTING SERVICES9 935000 Maintenance of general plant M+W U.S. INC. 156 ENGINEERING SERVICES10 935000 Maintenance of general plant MCKISSACK & MCKISSACK 290 PROJECT MANAGEMENT SERVICES11 935000 Maintenance of general plant MEDIA RESOURCES INC. 133 BUILDING MAINTENANCE AND REPAIRS12 935000 Maintenance of general plant NORTHWEST CONTRACTORS INC 132 CONSTRUCTION SERVICES13 935000 Maintenance of general plant PSC INDUSTRIAL OUTSOURCING, LP 298 OPERATIONAL STAFF AUGMENTATION14 935000 Maintenance of general plant QUANTUM CROSSINGS LLC 246 CONSULTING SERVICES15 935000 Maintenance of general plant RIDGELINE CONSULTANTS, LLC 58 ENGINEERING SERVICES16 935000 Maintenance of general plant ROBERT E. LAMB, INCORPORATED 62 ENGINEERING SERVICES17 935000 Maintenance of general plant RRK ASSOCIATES LTD 522 CONSULTING SERVICES18 935000 Maintenance of general plant RT BEVERAGE 252 BUILDING MAINTENANCE AND REPAIRS19 935000 Maintenance of general plant SCHNEIDER ELECTRIC BUILDINGS AMERICAS, INC. 892 CONSULTING SERVICES20 935000 Maintenance of general plant TESCO 161 BUILDING MAINTENANCE AND REPAIRS21 935000 Maintenance of general plant THE STRUCTURE GROUP 154 CONSULTING SERVICES22 935000 Maintenance of general plant TOVAR SNOW PROFESSIONALS 1,112 BUILDING MAINTENANCE AND REPAIRS23 935000 Maintenance of general plant TT GOVERNMENT SOLUTIONS INC 324 CONSULTING SERVICES24 935000 Maintenance of general plant UNITED BUILDING MAINTENANCE INC 391 BUILDING MAINTENANCE AND REPAIRS25 935000 Maintenance of general plant UNITED SECURITY SERVICES, INC. 155 SECURITY SERVICES26 935000 Maintenance of general plant WEST MONROE PARTNERS, LLC 365 CONSULTING SERVICES27 935000 Maintenance of general plant WIGHT & COMPANY 110 PROFESSIONAL STAFF AUGMENTATION
Page Sub-Total 9,357$
Total 2014 Payments $50,000 and Above Charged To Operating Expense (p. 1-18 detail) 338,322$
Total 2014 Payments Under $50,000 Charged To Operating Expenses 11,562$
Docket No. 18-____ ComEd Ex. 2.03 Page 170 of 334

Schedule C-7Page 1 of 23
Witness: Tracy
2017 2016 2015 2014Payments Payments Payments Payments
Line Of $1,000 Of $5,000 Of $5,000 Of $5,000No. Organization Organization Program Area Organization Mission and Purpose of 2017 Donation Or More Or More Or More Or More
(A) (B) (C) (D) (E) (F) (G)$ $ $ $
15 DE MAYO CASA PUEBLA Community & Economic Development
The Cinco 5 de Mayo Festival and Parade is celebration to observe and commemorate the Mexican army's victory over French forces at the Battle of Puebla. ComEd supported the annual Cinco de Mayo parade. 4 4 3 6
2
A PHILIP RANDOLPH PULLMAN PORTER MUSEUM INC Education
The mission is to promote, honor and celebrate the legacy of A. Philip Randolph and contributions made by African-Americans to America's labor movement; with a significant focus on the African American Railroad Employee. ComEd supported the Gentle Warriors Awards Banquet and Fundraiser. 3 - - -
3
ABRAHAM LINCOLN PRESIDENTIAL LIBRARY Culture & Arts
The Abraham Lincoln Presidential Library Foundation (ALPLF) is a private, not–for–profit organization whose primary mission is to support the exhibits and programs of the Abraham Lincoln Presidential Library and Museum (ALPLM). Funding was for the annual dinner in Chicago. - 20 35 12
4
ACADEMY FOR GLOBAL CITIZENSHIP Culture & Arts
The Academy for Global Citizenship (AGC) is a Chicago Public Charter School located on the city's industrial and under-served Southwest side. Our mission is to develop mindful leaders who take action both now and in the future to positively impact their communities and the world beyond. Our larger goal is to inspire the way society educates our future by fostering both local and global systemic change through the development and extension of AGC's model within our local and national public education systems by scaling our innovation.
AGC was founded in 2008 in with a commitment to providing a relevant, engaging and challenging educational program for all children while simultaneously fostering environmental stewardship, international mindedness, positive nutrition and whole-child wellness. At AGC, every child is held accountable for achieving rigorous academic standards. Our inquiry-based, certified International Baccalaureate program provides an opportunity for learners to construct meaning through concept-driven units of study. Students become environmentally and internationally minded by learning how their choices impact their community and the world. AGC places an emphasis on the total growth of the developing child by addressing physical, emotional and cultural needs in addition to academic development.
Funding is for the school's annual fundraiser. - 10 15 -
5
ACADEMY FOR URBAN SCHOOL LEADERSHIP Education
AUSL is a mission-driven, not-for-profit school management and teacher training organization focused on transforming the educational outcomes for students in the lowest performing schools. Founded in 2001, AUSL was established to develop a new model for the training, placement, and professional development of teachers within the Chicago Public Schools system. ComEd funded the AUSL Benefits dinner. 5 - - -
6 ADLER PLANETARIUM & ASTRONOMY Culture & Arts The mission of the Adler Planetarium is to inspire exploration and understanding of our Universe. Funding was for the Celestial Ball. 10 10 21 -
7
AFTER SCHOOL MATTERS Culture & ArtsAfter School Matter's mission is to provide Chicago public high school teens opportunities to explore and develop their talents, while gaining critical skills for work, college and beyond. Funding was for the Annual Gala. 25 25 25 25
8
ALBANY PARK THEATER PROJECT Culture & Arts
Albany Park Theater Project is a multiethnic, youth theater ensemble that inspires people to envision a more just and beautiful world. Since its founding in 1997, APTP teens have created 19 original, evening-length plays, performed for more than 50,000 people, opened their neighborhood's first performing arts space, and toured to other theaters, universities, festivals, and community organizations. Their artistry and activism have earned APTP numerous awards, most notably the Midwest Light of Human Rights Award from the National Immigrant Justice Center and the Coming Up Taller Award from the President's Committee on the Arts and Humanities, the nation's highest honor for organizations that nourish the creativity and civic engagement of young people. Funding was for season general-operating support. - 5 5 5
9
ALLIANCE FOR THE MENTALLY ILL OF GREATER CHICAGO Health & Human Services
The local Chicago affiliate of the National Alliance on Mental Illness, known as NAMI Chicago. The mission of the National Alliance on Mental Illness (NAMI)-Chicago is to provide hope and improve the quality of life for those in the greater Chicago area whose lives are affected by serious mental illness. The 2014 donation supports general-operating expenses. - - - 10
10
ALLIANCE OF POLISH CLUBS IN THE USA Community & Economic Development
The purpose of Alliance of Polish Clubs is to initiate and coordinate the activities of individual clubs and organizations affiliated within the infrastructure by encouraging their interest in assisting the people of Poland and our surrounding Polish-American community in the Chicago area. We uphold and cherish all the fundamental values of our Polish Heritage by consistently arranging and celebrating the national holidays such as the harvest fest, the May 3rd Constitution Day Parade, Wigilia (Christmas Eve), and folk festivals throughout the year so that future generations can appreciate and understand all that their Polish heritage has to offer. Plus the ethnic events reinforce the sense of community. Sponsorship was for the Polish Constitution Day Parade 4 4 4 -
11
ALMOST HOME KIDS Health & Social Services
Almost Home Kids' mission is to provide transitional care in a home-like setting to children with complicated health needs, training for their families and respite care. Funding is for their annual event. (Please note: although the organization is based in Naperville, they offer support to children throughout ComEd's service territory.) - 25 - -
12
ALZHEIMER`S ASSOCIATION - GREATER ILLINOIS CHAPTER Health & Social Services
The Alzheimer's Association is the leading voluntary health organization in Alzheimer's care, support and research. Funding was for the annual Walk to Remember. 10 5 5 -
13
AMERICAN BLUES THEATER Culture & Arts
American Blues Theater is the premier American theater producing visceral theatrical works while engaging its audience in missions of local service agencies. American Blues Theater illuminates the American ideas of freedom, equality, and opportunity in the plays we produce and communities we serve. Funding was for season general-operating support. 20 20 15 10
14
AMERICAN CANCER SOCIETY Health & Social Services
For over 100 years, the American Cancer Society (ACS) has worked relentlessly to save lives and create a world with less cancer. Together with millions of our supporters worldwide, we help people stay well and get well, find cures, and fight back against cancer. ComEd supported the Making Strides Against Breast Cancer Walk of Park Ridge. 3 5 5 -
15
AMERICAN JEWISH COMMITTEE Culture & Arts
For more than a century, AJC has been the leading global Jewish advocacy organization. With offices across the United States and around the globe, and partnerships with Jewish communities worldwide, AJC works to enhance the well-being of the Jewish people and to advance human rights and democratic values for all. Funding was for the AJC Chicago Latino Leaders Passover Seder. 3 5 2 -
16
AMERICAN LEGION - COMMONWEALTH EDISON POST 118 Community and Neighborhood Development
It is the nation’s largest wartime veterans service organization, committed to mentoring youth and sponsorship of wholesome programs in our communities, advocating patriotism and honor, promoting strong national security, and continued devotion to our fellow servicemembers and veterans. ComEd provides annual support to an American Legion Post for current and retired employees who served in the U.S. Military. - - - 16
17
AMERICAN RED CROSS OF CHICAGO Disaster Relief
The American Red Cross prevents and alleviates human suffering in the face of emergencies by mobilizing the power of volunteers and the generosity of donors. We are the leading humanitarian disaster response and recovery organization in the country. Since 1915, the American Red Cross of Chicago & Northern Illinois has been a key provider of disaster response, preparedness and health and safety services. Funding was for a new event focused on disaster preparedness and the Heroes Breakfast. 35 25 25 25
Commonwealth Edison Company Charitable Contributions of $1,000 or $5,000 and Greater
Charged To Account 426.1 Donations(In Thousands)
Docket No. 18-____ ComEd Ex. 2.03 Page 171 of 334
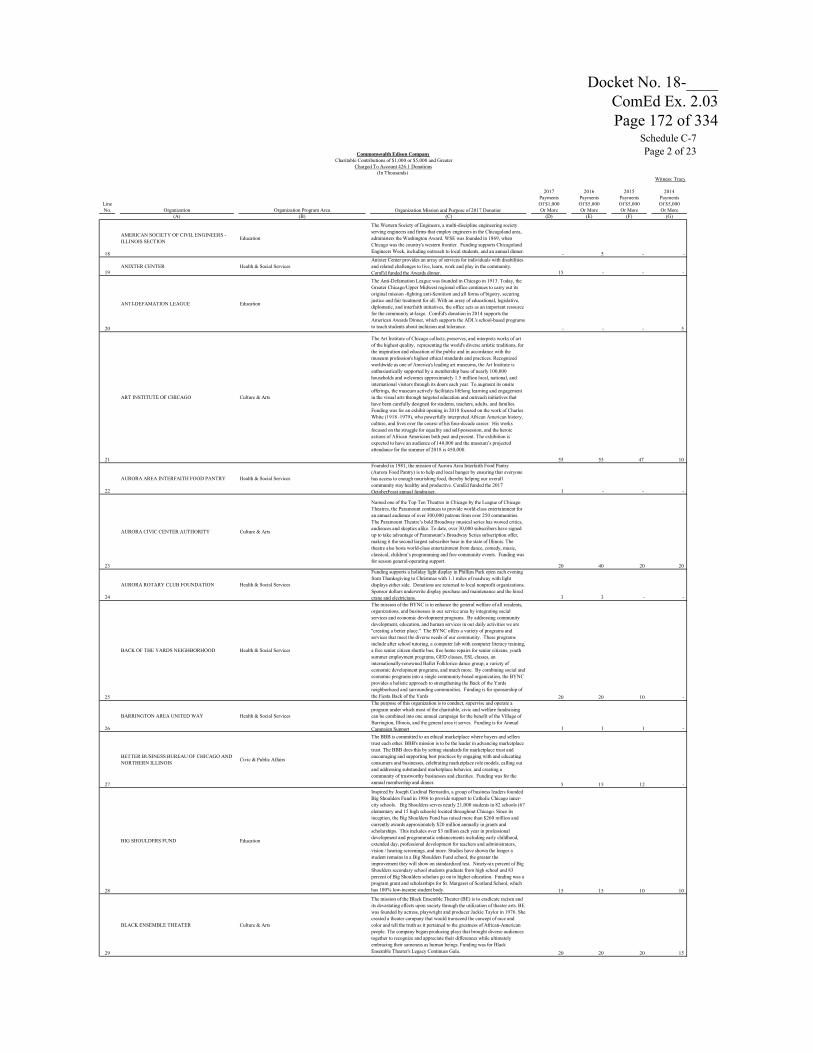
Schedule C-7Page 2 of 23
Witness: Tracy
2017 2016 2015 2014Payments Payments Payments Payments
Line Of $1,000 Of $5,000 Of $5,000 Of $5,000No. Organization Organization Program Area Organization Mission and Purpose of 2017 Donation Or More Or More Or More Or More
(A) (B) (C) (D) (E) (F) (G)
Commonwealth Edison Company Charitable Contributions of $1,000 or $5,000 and Greater
Charged To Account 426.1 Donations(In Thousands)
18
AMERICAN SOCIETY OF CIVIL ENGINEERS - ILLINOIS SECTION Education
The Western Society of Engineers, a multi-discipline engineering society serving engineers and firms that employ engineers in the Chicagoland area, administers the Washington Award. WSE was founded in 1869, when Chicago was the country's western frontier. Funding supports Chicagoland Engineers Week, including outreach to local students, and an annual dinner. - 5 - -
19ANIXTER CENTER Health & Social Services
Anixter Center provides an array of services for individuals with disabilities and related challenges to live, learn, work and play in the community. ComEd funded the Awards dinner. 15 - - -
20
ANTI-DEFAMATION LEAGUE Education
The Anti-Defamation League was founded in Chicago in 1913. Today, the Greater Chicago/Upper Midwest regional office continues to carry out its original mission -fighting anti-Semitism and all forms of bigotry, securing justice and fair treatment for all. With an array of educational, legislative, diplomatic, and interfaith initiatives, the office acts as an important resource for the community at-large. ComEd's donation in 2014 supports the American Awards Dinner, which supports the ADL's school-based programs to teach students about inclusion and tolerance. - - - 5
21
ART INSTITUTE OF CHICAGO Culture & Arts
The Art Institute of Chicago collects, preserves, and interprets works of art of the highest quality, representing the world's diverse artistic traditions, for the inspiration and education of the public and in accordance with the museum profession's highest ethical standards and practices. Recognized worldwide as one of America's leading art museums, the Art Institute is enthusiastically supported by a membership base of nearly 100,000 households and welcomes approximately 1.5 million local, national, and international visitors through its doors each year. To augment its onsite offerings, the museum actively facilitates lifelong learning and engagement in the visual arts through targeted education and outreach initiatives that have been carefully designed for students, teachers, adults, and families. Funding was for an exhibit opening in 2018 focused on the work of Charles White (1918–1979), who powerfully interpreted African American history, culture, and lives over the course of his four-decade career. His works focused on the struggle for equality and self-possession, and the heroic actions of African Americans both past and present. The exhibition is expected to have an audience of 140,000 and the museum’s projected attendance for the summer of 2018 is 450,000.
55 55 47 10
22
AURORA AREA INTERFAITH FOOD PANTRY Health & Social Services
Founded in 1981, the mission of Aurora Area Interfaith Food Pantry (Aurora Food Pantry) is to help end local hunger by ensuring that everyone has access to enough nourishing food, thereby helping our overall community stay healthy and productive. ComEd funded the 2017 OctoberFeast annual fundraiser. 1 - - -
23
AURORA CIVIC CENTER AUTHORITY Culture & Arts
Named one of the Top Ten Theatres in Chicago by the League of Chicago Theatres, the Paramount continues to provide world-class entertainment for an annual audience of over 300,000 patrons from over 250 communities.The Paramount Theatre’s bold Broadway musical series has wowed critics, audiences and skeptics alike. To date, over 30,000 subscribers have signed up to take advantage of Paramount’s Broadway Series subscription offer, making it the second largest subscriber base in the state of Illinois. The theatre also hosts world-class entertainment from dance, comedy, music, classical, children’s programming and free community events. Funding was for season general-operating support.
20 40 20 20
24
AURORA ROTARY CLUB FOUNDATION Health & Social Services
Funding supports a holiday light display in Phillips Park open each evening from Thanksgiving to Christmas with 1.1 miles of roadway with light displays either side. Donations are returned to local nonprofit organizations. Sponsor dollars underwrite display purchase and maintenance and the hired crane and electricians. 3 3 - -
25
BACK OF THE YARDS NEIGHBORHOOD Health & Social Services
The mission of the BYNC is to enhance the general welfare of all residents, organizations, and businesses in our service area by integrating social services and economic development programs. By addressing community development, education, and human services in our daily activities we are "creating a better place." The BYNC offers a variety of programs and services that meet the diverse needs of our community. These programs include after school tutoring, a computer lab with computer literacy training, a free senior citizen shuttle bus, free home repairs for senior citizens, youth summer employment programs, GED classes, ESL classes, an internationally-renowned Ballet Folklorico dance group, a variety of economic development programs, and much more. By combining social and economic programs into a single community-based organization, the BYNC provides a holistic approach to strengthening the Back of the Yards neighborhood and surrounding communities. Funding is for sponsorship of the Fiesta Back of the Yards 20 20 10 -
26
BARRINGTON AREA UNITED WAY Health & Social Services
The purpose of this organization is to conduct, supervise and operate a program under which most of the charitable, civic and welfare fundraising can be combined into one annual campaign for the benefit of the Village of Barrington, Illinois, and the general area it serves. Funding is for Annual Campaign Support 1 1 1 -
27
BETTER BUSINESS BUREAU OF CHICAGO AND NORTHERN ILLINOIS Civic & Public Affairs
The BBB is committed to an ethical marketplace where buyers and sellers trust each other. BBB's mission is to be the leader in advancing marketplace trust. The BBB does this by setting standards for marketplace trust and encouraging and supporting best practices by engaging with and educating consumers and businesses, celebrating marketplace role models, calling out and addressing substandard marketplace behavior, and creating a community of trustworthy businesses and charities. Funding was for the annual membership and dinner. 5 15 12 -
28
BIG SHOULDERS FUND Education
Inspired by Joseph Cardinal Bernardin, a group of business leaders founded Big Shoulders Fund in 1986 to provide support to Catholic Chicago inner-city schools. Big Shoulders serves nearly 21,000 students in 82 schools (67 elementary and 15 high schools) located throughout Chicago. Since its inception, the Big Shoulders Fund has raised more than $260 million and currently awards approximately $20 million annually in grants and scholarships. This includes over $3 million each year in professional development and programmatic enhancements including early childhood, extended day, professional development for teachers and administrators, vision / hearing screenings, and more. Studies have shown the longer a student remains in a Big Shoulders Fund school, the greater the improvement they will show on standardized test. Ninety-six percent of Big Shoulders secondary school students graduate from high school and 83 percent of Big Shoulders scholars go on to higher education. Funding was a program grant and scholarships for St. Margaret of Scotland School, which has 100% low-income student body. 15 15 10 10
29
BLACK ENSEMBLE THEATER Culture & Arts
The mission of the Black Ensemble Theater (BE) is to eradicate racism and its devastating effects upon society through the utilization of theater arts. BE was founded by actress, playwright and producer Jackie Taylor in 1976. She created a theater company that would transcend the concept of race and color and tell the truth as it pertained to the greatness of African-American people. The company began producing plays that brought diverse audiences together to recognize and appreciate their differences while ultimately embracing their sameness as human beings. Funding was for Black Ensemble Theater's Legacy Continues Gala. 20 20 20 15
Docket No. 18-____ ComEd Ex. 2.03 Page 172 of 334

Schedule C-7Page 3 of 23
Witness: Tracy
2017 2016 2015 2014Payments Payments Payments Payments
Line Of $1,000 Of $5,000 Of $5,000 Of $5,000No. Organization Organization Program Area Organization Mission and Purpose of 2017 Donation Or More Or More Or More Or More
(A) (B) (C) (D) (E) (F) (G)
Commonwealth Edison Company Charitable Contributions of $1,000 or $5,000 and Greater
Charged To Account 426.1 Donations(In Thousands)
30
BOOKER WASHINGTON COMMUNITY CENTER Community and Neighborhood Development
Booker Washington Community Center's mission is to provide an environment that promotes the quality of life, values and the welfare of the people of the community through education, art, recreational and cultural programs, and to promote learning and sharing within the greater multi-cultural community. ComEd's donation in 2014 provides general operating support for the Center and a sponsorship of their annual event. - - - 12
31
BOY SCOUT OF AMERICA CHICAGO COUNCIL NO 118 Community & Economic Development
The Boy Scouts of America is one of the nation's largest and most prominent values-based youth development organizations. The BSA provides a program for young people that builds character, trains them in the responsibilities of participating citizenship, and develops personal fitness. Funding was for annual dinner. - - 3 -
32
BRIGHTON PARK NEIGHBORHOOD COUNCIL Education
BPNC's mission is to create a safer community, improve the learning environment in public schools, preserve affordable housing, provide a voice for youth, protect immigrant rights, promote gender equity, and end all forms of violence. BPNC's core services and programs include the Full Service Community Schools Initiative (FSCSI), community violence prevention, community health, school-based mental health counseling, and foreclosure prevention and economic assistance. Funding was to purchase and set up 10 computers for the local school. - 10 - -
33
BUILD INC Community & Economic Development
BUILD’s mission is to engage at-risk youth in the schools and on the streets, so they can realize their educational and career potential and contribute to the stability, safety and well being of our communities. Funding was for the annual dinner. 5 5 5 5
34
BUREAU COUNTY UNITED WAY INC Health & Social Services
To provide financial support to health, welfare, and character building services. The United Way is a national system of volunteers, contributors, and local charities built on the proven effectiveness of local organizations helping people in their own communities. Funding for Annual Campaign Services 1 1 1 -
35
CALUMET AREA INDUSTRIAL COMMISSION Civic & Public Affairs
To lead industrial retention and expansion efforts in the Calumet Area of Chicago in order to create an environment in which industry will remain and grow. Our success is accomplished through advocacy, industrial retention, networks and workforce development. ComEd provided membership services and economic development to Lake Calumet Area. 3 - - -
36
CASA CENTRAL Community & Economic Development
Casa Central was founded in 1954 by a group of multi-denominational churches in an effort to address the growing needs of their community, largely Hispanic immigrants. With a budget of $26,000 and a staff of three, Casa Central set out to build strong communities, one family at a time. Since then Casa Central has become a model agency with over 500 employees and a budget of approximately $17 million. Though much has changed over the years, its mission and passion have remained the same, as they continue to transform lives and strengthen communities, with a special focus on Hispanics. A network of social services propels a diverse population of all ages toward self sufficiency and a higher quality of life." Funding was for Casa Central Annual Awards Dinner 25 25 25 25
37CATHOLIC BISHOP OF CHICAGO Education
Catholic Bishop of Chicago and the Archdiocese of Chicago hold an annual breakfast hosted by Cardinal Cupich to raise scholarship funds for low-income students. Funding was for that event. 20 35 5 25
38
CENTER FOR NEIGHBORHOOD TECHNOLOGY Community & Economic Development
CNT's mission is to build more livable and sustainable urban communities. CNT fulfills this mission by developing and applying strategies that make more efficient and effective use of the undervalued resources in and inherent advantages of the built and natural systems that together create the urban environment. - - 10 -
39
CHATHAM BUSINESS ASSOCIATION Civic & Public Affairs
The Mission of CBA, SBDI is to provide a viable and effective business association to enhance social, political, and economic growth within our community. CBA creates opportunities, inroads and programs to benefit and ensure the prosperity, economic strength and excellence of service in Chatham and its surrounding communities. Funding was for membership dues 4 - - -
40
CHICAGO ACADEMY OF SCIENCES Culture & Arts
The mission of the Chicago Academy of Sciences and its Peggy Notebaert Nature Museum is to create a positive relationship between people and nature through collaborations, education, research and collections, exhibits and public forums that foster urban connections to our region's nature and science. The vision is to be the urban connection to the world of nature and science.Funding is for the Butterfly Ball. 22 12 25 12
41
CHICAGO ARCHITECTURE FOUNDATION Culture & Arts
The Chicago Architecture Foundation (CAF) inspires people to discover why design matters. It is the leading organization devoted to celebrating and promoting Chicago as a center of architectural innovation. As Chicago's forum for the exchange of ideas on urban design, CAF inspires people to participate in the building of vibrant communities and to demand the highest standard in urban design. CAF awakens young people to achieve their potential through the discovery of architecture, engineering and design. Funding is for Open House Chicago which allows residents to visit buildings free of charge. 26 25 26 -
42
CHICAGO BOTANIC GARDEN Environment
The Chicago Botanic Garden cultivates the power of plants to sustain and enrich life. They opened more than 40 years ago as a beautiful place to visit, and it has matured into one of the world's great living museums and conservation science centers. In 2014, more than one million people visited the Garden's 26 gardens and four natural areas, uniquely situated on 385 acres on and around nine islands, with six miles of lake shoreline. Funding is for Wonderland Express event. 50 40 51 40
43
CHICAGO CARES INC Community and Neighborhood Development
ComEd's funding supports a hat-and-glove drive in northern Illinois for low-income residents. ComEd collected hats and gloves at all offices and at holiday lighting locations, such as the Chicago Botanic Garden and Brookfield Zoo. - - - 10
44
CHICAGO CHILDRENS ADVOCACY CENTER Health & Social Services
ChicagoCAC is a public-private partnership between a nonprofit agency and the public agencies that respond to reports of child abuse and assault in Chicago -- the Chicago Police Department, Illinois Department of Children and Family Services, Cook County State's Attorney's Office, and Cook County Health & Hospitals System. Professionals from all five partner agencies work together in a child-friendly facility to investigate reports of child abuse and protect suspected victims. Since opening in 2001, we have served over 30,000 children. The Center is a model for other children's advocacy centers and multidisciplinary first responder programs in urban areas throughout the country. Our unique partnership facilitates a child-focused investigative process that preserves and protects the evidence that supports child abuse allegations while providing abused children with a safe place to share their story in their own words to experts who will listen to them. The trauma-informed environment at the Center allows ChicagoCAC staff and partners to ensure that children and families get the critical support and appropriate trauma resources they need. Funding was for Luminary Awards Dinner 20 15 10 -
Docket No. 18-____ ComEd Ex. 2.03 Page 173 of 334

Schedule C-7Page 4 of 23
Witness: Tracy
2017 2016 2015 2014Payments Payments Payments Payments
Line Of $1,000 Of $5,000 Of $5,000 Of $5,000No. Organization Organization Program Area Organization Mission and Purpose of 2017 Donation Or More Or More Or More Or More
(A) (B) (C) (D) (E) (F) (G)
Commonwealth Edison Company Charitable Contributions of $1,000 or $5,000 and Greater
Charged To Account 426.1 Donations(In Thousands)
45
CHICAGO CHILDRENS CHOIR Education
Chicago Children’s Choir’s (CCC) mission is to inspire and change lives through music. Founded at the height of the Civil Rights Movement in 1956, CCC has grown from a single choir in the Hyde Park community into a network of over 130 choirs throughout Chicago, serving over 4,600 diverse singers, ages 8-18, from all 57 Chicago zip codes. Under the leadership of President and Artistic Director Josephine Lee, CCC has become a model of urban music education, promoting the values of education, expression, and excellence through the following choral programs: 1) the In-School Program, comprising 110 choirs in 85 Chicago schools, over 80% of which primarily serve singers from low-income households; 2) the Neighborhood Choir Program, comprising 10 community-based choirs in Albany Park, Austin (new in Jan. 2016), Beverly, Englewood, Garfield Park/Off the Street Club, Lincoln Park/DePaul, Humboldt Park, Hyde Park, Pilsen/Little Village, and Rogers Park; 3) DiMension, a specialized ensemble for boys with changing voices; and 4) Voice of Chicago, CCC’s premier ensemble. Funding provided for in-school and after-school programs in Pilsen and Little Village. 20 - - 15
46
CHICAGO CHILDRENS THEATRE Culture & Arts
Chicago Children's Theatre (CCT) aspires to enrich our community through diverse and significant theatrical and educational programming that engages and inspires the child in all of us. CCT achieves its mission through the creation of awe-inducing theatrical productions and programs with an emphasis on inclusion, accessibility and affordability; inspiring young people and families to lead lives of adventure, courage, and curiosity. The funding was for season general-operating support. 20 20 - 40
47
CHICAGO CHINATOWN CHAMBER OF COMMERCE Civic & Public Affairs
Our vision is to increase revenue streams for members and local business by making Chinatown a major destination point for visitors to the Midwest, City of Chicago, and the State of Illinois. The mission of the Chinatown Chamber of Commerce is to expand business opportunities and educate other on the history, culture, and diversity of the China. Funding was for membership dues and the Dragon Boat Race. 2 - - -
48
CHICAGO CHINATOWN COMMUNITY FOUNDATION Community & Economic Development
The mission of the Chicago Chinatown Community Foundation is to promote the Chinese culture. Funding supported the annual Lunar New Year parade and the Summer Fair featuring live cultural performances, taste of Chinatown's restaurants, unique gift shops, and a children's area. 19 9 9 -
49
CHICAGO COMMONS ASSOCIATION Education
Chicago Commons was founded as a settlement house in 1894. Since its founding they have operated with the mission to partner with individuals, families and communities to overcome poverty, discrimination and isolation. Chicago Commons has centered our services in communities of the highest need to provide our neighbors with the tools and skills they need to reach their greatest potential. Commons is a leading provider of high-quality early childhood education and senior services, operating four early education schools in West Humboldt Park, Pilsen and Back of the Yards. While children are being educated and cared for, their parents/families can also receive comprehensive services through our Family Hub program. For seniors, they provide in home care and adult day services, so they stay in their homes to delay, and in some cases prevent, the need for higher cost nursing home/institutional care. Funding supported the Young Professionals' event. 5 5 8 -
50
CHICAGO COMMUNITY LOAN FUND Community & Economic Development
The mission of Chicago Community Loan Fund (CCLF) is to provide flexible, affordable and responsible financing and technical assistance for community stabilization and development efforts and initiatives that benefit low- to moderate-income neighborhoods, families and individuals throughout metropolitan Chicago.
Founded in 1991, CCLF provides low-cost, flexible financing to non- and for-profit community development organizations for development projects promising high social impact that regulated financial institutions generally do not--or cannot--provide. CCLF has assets of $44 million and is a federally certified Community Development Financial Institution. As a nonprofit that operates similarly to a banking institution, without the banking industry regulations and mandate to make money for shareholders, CCLF is able to focus exclusively on distressed communities and promise our stakeholders a social return for on their investment. A grant was provided for the Gateway to Community Development Technical Assistance program and the annual luncheon.
- 18 - 12
51
CHICAGO COMMUNITY TRUST Community & Economic Development
The Chicago Community Trust is a community foundation dedicated to improving our region through strategic grant making, civic engagement and inspiring philanthropy. We are here to serve the nonprofit organizations, the generous donors and the thoughtful residents who strive to make a difference, helping their bold vision create lasting community change. Funding was for Anniversary Celebration - - 25 20
52
CHICAGO DEFENDER CHARITIES Community & Economic Development
Founded April 2, 1945, the Chicago Defender Charities' purpose then as now is to promote, hold, operate and conduct exhibitions, meets, contests, parades, concerts, shows, parties, seminars, festivals, picnics, dinners, forums and meetings; to aid the infirm, poor, needy, unfortunate and deserving individuals; to give to religious institutions, churches, schools, religious and social clubs, hospitals and sanitariums; to give away money and other property to charity and other purposes as above set forth. The Chicago Defender, for 100 years, has been the voice of the African-American Community in Chicago and across the United States. Funding supported the Bud Biliken Parade 25 24 24 26
53
CHICAGO FOOTBALL CLASSIC Education
Encouraging African American youth to achieve their personal best in school and beyond. Our initiative empowers them to not only complete high school, but also attend Historically Black Colleges and Universities (HBCUs). African American college students are known to fare better and graduate at higher rates from HBCUs, than African American students attending mainstream colleges and universities. The group achieves these goals via several initiatives, including adopt-a-school programs and most notable, scholarships for African American students planning to attend HBCU institutions. Funding is for the Classic. - - 10 -
54
CHICAGO FOUNDATION FOR WOMEN Health & Social Services
Chicago Foundation for Women (CFW) was established in 1985 by four Chicago- area women to increase opportunities and resources targeted to women and girls. Throughout its history, CFW has been the only organization in the region to take a comprehensive approach to understanding and addressing issues impacting Chicago-area women and girls through every stage of their lives. Since its inception, Chicago Foundation for Women has distributed nearly 3,000 grants totaling approximately $26 million to hundreds of organizations serving women and girls in the metropolitan Chicago area. Chicago Foundation for Women envisions a community and world in which all women and girls have the opportunity to achieve their full potential and live in safe, just, and healthy communities. Funding was for CFW's Luncheon and Symposium 25 20 30 -
Docket No. 18-____ ComEd Ex. 2.03 Page 174 of 334

Schedule C-7Page 5 of 23
Witness: Tracy
2017 2016 2015 2014Payments Payments Payments Payments
Line Of $1,000 Of $5,000 Of $5,000 Of $5,000No. Organization Organization Program Area Organization Mission and Purpose of 2017 Donation Or More Or More Or More Or More
(A) (B) (C) (D) (E) (F) (G)
Commonwealth Edison Company Charitable Contributions of $1,000 or $5,000 and Greater
Charged To Account 426.1 Donations(In Thousands)
55
CHICAGO HISTORY MUSEUM Culture & Arts
Recent exhibitions and public programs clearly demonstrate this new commitment to be inclusive: My Chinatown, South Chicago, Benito Juarez and the Making of Modern Mexico, and Out in Chicago, as well upcoming exhibitions such as Shalom Chicago and Ebony Fashion Fair. CHM serves more than 200,000 visitors and 50,000 K-12 students each year. The Museum seeks to include all the city's neighborhoods, monuments, and architectural sites as part of our continuing program through more than 200 public tours of the city, lectures, and educational symposia each year. Founded in 1856, the Chicago History Museum (CHM) is the city's oldest cultural institution. The CHM specializes in both presenting and preserving the diverse and evolving history of Chicago and Illinois, as well as selected areas of American history. The mission of the Chicago History Museum is to "Share Chicago stories, serving as a hub of scholarship and learning, inspiration and civic engagement." With the CHM's renovation and name change in 2006, more than 90% of the Museum's gallery space was remodeled and the institution re-focused its mission to tell the stories of all Chicagoans. Funding is for "The Great Chicago Adventure" exhibit.
75 40 50 -
56
CHICAGO INDO-US LIONS CLUB Civic & Public Affairs
INDO-US Lion's club is dedicated towards helping the community through the following initiatives: Helping the poor through feeding the hungry; educating kids and adults in different languages and in different communities; provide scholarship for children for higher education; engage children in community activities thereby keeping them away from trouble; and supporting the growth of local businesses through community activities and events. ComEd funded the India Day Parade in August. 2 - - -
57
CHICAGO LIGHTHOUSE Health & Social Services
Founded in 1906, The Chicago Lighthouse is one of America's most comprehensive non-profit organizations serving the visually impaired, blind, disabled and Veteran communities. The organization has evolved from providing food and clothing to people who are blind to providing a broad array of 30 programs that help its clients lead richer, more independent lives. Funding was for Seeing What's Possible Annual Dinner. 15 15 15 15
58
CHICAGO LOOP ALLIANCE Civic & Public Affairs
The Chicago Loop is a vibrant global business center and recognized world-class destination. Chicago Loop Alliance creates, manages and promotes high-performing urban experiences, attracting people and investment to downtown Chicago area known as the Loop. Funding was for membership dues. 5 - - -
59
CHICAGO METRO HISTORY EDUCATION CENTER Education
The mission of the Chicago Metro History Education Center (CMHEC) is to spark students' interest in the study of history, help them build high-level thinking skills, engage them in civic life, and foster their intellectual self-confidence.
CMHEC fulfills this mission and improves history education by providing:- yearlong student programs, such as the Chicago Metro History Fair, that employ inquiry- and project-based approaches to the study of local and community history and use students' natural curiosity to build their research and critical-thinking skills;- ongoing, long-term professional development programs for teachers that promote the use of inquiry- and project-based teaching methods; and- high-quality curriculum materials that support critical- and historical-thinking skills through the use of primary and secondary sources.
ComEd provided a program grant for the annual science fair.- 5 - 5
60
CHICAGO PARK DISTRICT Community & Economic Development
The mission of the Chicago Park District is to: enhance the quality of life in Chicago by becoming the leading provider of recreation and leisure opportunities; provide safe, inviting and beautifully maintained parks and facilities; create a customer-focused and responsive park system that prioritizes the needs of children and families. Funding was for a free event celebrating the opening of Buckingham Fountain. 45 50 50 -
61
CHICAGO POLICE FOUNDATION Health & Social Services
In partnership with the business and philanthropic communities, the CPF is committed to support the Chicago Police Department in fulfilling its mission to reduce crime and enhance public trust. Funding was for ComEd's director of security to serve on the board of directors, ensuring alignment between the two organizations for safety for customers. - 20 - -
62
CHICAGO PUBLIC LIBRARY FOUNDATION Culture & Arts
The Chicago Public Library Foundation supports collection development, programs and technology initiatives that connect library users to their community and to the world and ensure that all Chicagoans have the freedom to read, to learn and to discover at the Chicago Public Library. Funding was for the annual dinner. 10 30 25 40
63
CHICAGO PUBLIC SCHOOLS STUDENT SCIENCE FAIR INC Culture & Arts
Recognizing the need to develop a reservoir of future scientists, a group of high school physics teachers organized small gatherings of students to discuss their scientific research and experiments. In 1950, the Student Science Fair was born and was incorporated in the State of Illinois in 1955. To this date, the practice has continued. Funding support the annual fair and science clubs in high schools. 30 30 30 30
64
CHICAGO SHAKESPEARE THEATER Culture & Arts
Chicago Shakespeare Theater (CST) believes that Shakespeare speaks to everyone. A global theatrical force, CST is known for vibrant productions that reflect Shakespeare's genius for storytelling, language and empathy for the human condition. We have evolved into a dynamic company, producing award-winning plays at our home on Navy Pier, throughout Chicago's schools and neighborhoods, and on stages around the world. Funding was for general-operating support for the season. 50 45 45 45
65
CHICAGO SKY CARES Education
The Sky Cares Foundation is deeply committed to creating programs that improve the quality of life for all people with a special emphasis on promoting youth education, environmental progress, diversity and inclusion, and Veteran support. Funding supports Sky Cares Foundation STEM Enrichment Project - 50 50 -
66
CHICAGO STATE UNIVERSITY FOUNDATION Education
The Chicago State University Foundation, chartered in 1967 and incorporated in 1968, is an independent, charitable organization with the sole purpose of soliciting, receiving, and administering private gifts to the Chicago State University. ComEd's 2014 donation was made in support of the University's annual dinner and awards program--all funds from the event support the school's scholarships, programs and general-operating expenses.. - - - 20
67
CHICAGO SUNDAY EVENING CLUB Community & Economic Development
The Chicago Sunday Evening Club seeks to transform the lives of individuals, and the world at large, by turning belief into action. The purpose of the Chicago Leadership Prayer Breakfast is to gather as an interfaith community to pray for the city, and nation, and the world. Funding was for the Chicago Leadership Prayer Breakfast 5 5 5 -
68CHICAGO UNITED, INC. Community & Economic Development
Chicago United promotes multiracial leadership in business to advance parity in economic opportunity. Funding was for the Chicago United Bridge Awards Dinner and Conference and the annual membership. 45 25 25 -
69
CHICAGO URBAN LEAGUE Culture & Arts
The Chicago Urban League (CUL) works for economic, educational and social progress for African Americans and promotes strong, sustainable communities through advocacy, collaboration and innovation. Funding supported a scholarship program for local students and the Golden Fellowship Dinner. 75 75 75 92
Docket No. 18-____ ComEd Ex. 2.03 Page 175 of 334

Schedule C-7Page 6 of 23
Witness: Tracy
2017 2016 2015 2014Payments Payments Payments Payments
Line Of $1,000 Of $5,000 Of $5,000 Of $5,000No. Organization Organization Program Area Organization Mission and Purpose of 2017 Donation Or More Or More Or More Or More
(A) (B) (C) (D) (E) (F) (G)
Commonwealth Edison Company Charitable Contributions of $1,000 or $5,000 and Greater
Charged To Account 426.1 Donations(In Thousands)
70
CHICAGO WHITE SOX CHARITIES INC Education
Chicago White Sox Charities (CWSC) provides annual financial, in-kind and emotional support to hundreds of Chicago-based organizations, including those leading the fight against cancer, dedicated to improving the lives of Chicago’s youth through educational and health and wellness programs. and offering support to children and families in crisis. With the generous support of White Sox fans, friends and sponsors, CWSC has donated millions of dollars since its inception in 1990, striving to improve the quality of life for Chicagoans of all ages, races and genders. To the Chicago White Sox, winning goes beyond the baseball diamond into the community. The White Sox and CWSC want to inspire, educate and embrace Chicago to create a lasting legacy for future generations. Funding supported the Fan Force, which employs persons with disabilities to interact with fans. - 50 - -
71
CHICAGO WILDERNESS TRUST Environment
Chicago Wilderness is a regional alliance leading strategy to preserve, improve and expand nature and quality of life.
Celebrating 20 years Chicago Wilderness has been leveraging resources, sharing knowledge and tackling ecological challenges for nearby nature. While vast improvements have been made, there is still work to be done.
There are have six areas of concentration:1)Protect our oak ecosystem2) Support our 12 priority species3) improve our water4) engage private and public landowners5) streamline data for member use6) broaden our constituencyWHAT DID WE FUND?
- 10 - -
72
CHICAGO ZOOLOGICAL SOCIETY EnvironmentThe mission of the Chicago Zoological Society/Brookfield Zoo is to inspire conservation leadership by connecting people with wildlife and nature. Funding was for the annual Holiday Magic event and the annual dinner. 100 10 176 86
73
CHICAGOLAND CHAMBER OF COMMERCE FOUNDATION Community & Economic Development
The Chamber Foundation coordinates educational resources, programs, and research to advance the activities of the Chamber. Foundation initiatives allow the Chamber to collaborate with strategic partners and organizations to address key business issues, and extend the scope of our activities. These initiatives serve a diverse audience including community leaders, entrepreneurs, business executives, employees, as well as educators and students. The Chamber Foundation is currently concentrating on issues of disability inclusion in the workplace as well as youth employment and workforce development. Funding was for Annual Meeting of Membership and the Chamber Leadership Academy. 35 37 36 -
74
CHILDSERV Education
ChildServ serves more than 2,800 children and families contending with trauma, neglect and economic hardship through locations in Chicagoland's Cook, Kane, Lake and DuPage counties. ComEd supported the annual Founders' Day Celebration.
5 - - -
75
CHINESE AMERICAN SERV. LEAGUE Health & Social Services
A nurturing hub within the heart of Chinatown, the Chinese American Service League (CASL) connects families and individuals of all ages with the vital support they need to thrive and contribute to the greater Chicago community. In the fall of 1978, ten dedicated Chinese Americans came together to bridge the gap in services for Chinese American immigrants in Chicago. Their passion and commitment ignited the spark for the Chinese American Service League (CASL), which has since burgeoned into a nurturing hub in the heart of Chinatown. Funding was for the annual gala and a program to teach senior citizens about DIY Weatherization. 13 20 15 12
76
CHRISTMAS IN THE WARDS Health & Social Services
Christmas in the Wards dedicates resources to serve Chicago's underserved families and you through giving the gift of Christmas. This is accomplished by giving deserving families clothes, toys and technology gifts. We want to transform lives through the joy of giving, thanks to generous sponsors and donations. Funding supported gifts for children. 20 - - -
77
CHRISTOPHER HOUSE Education
Christopher House provides a family of schools to help low-income children and their families succeed in school, the workplace, and life. Our objective is to partner with families to provide a continuum of education for students birth through high-school as well as educational resources to help parents create and foster stable, self-sufficient families. Funding was for the Annual Benefit and Christopher House's Family of Schools - 20 20 20
78
CITY COLLEGES OF CHICAGO - DAWSON TECHNICAL INSTITUTE Education
ComEd dontated two trucks to the Dawson Tech Overhead Line program for use in their training programs. The value of the contribution reprsents the remaining, unrecovered book value of these vehicles. - - - 19
79
CITY COLLEGES OF CHICAGO FOUNDATION Education
Seven colleges in Chicago form the City Colleges of Chicago, a large community college system in Chicago, Illinois serving about 100,000 students. The goal of the City Colleges is to provide educations that can create economic value (jobs) for those graduating from the system or go on to receive an associates degree or advanced degree at another college. The Overhead Electrical Line Worker Program is a partnership between the City Colleges and ComEd to increase diversity in the skilled trades (lineworker profession) and address the aging skilled craft workforce issue. The program has been in existence for 10 years, has resulted in hundreds of job placements and is a model for other programs being developed in the City Colleges' System. 576 students have been admitted to the program, 319 have graduated. ComEd has hired more than half of them.Overhead Electrical Line Worker Program Support and 2 ComEd Scholarships for students to be admitted to the programOverhead Electrical Line Worker Program Support - 41 41 30
Docket No. 18-____ ComEd Ex. 2.03 Page 176 of 334

Schedule C-7Page 7 of 23
Witness: Tracy
2017 2016 2015 2014Payments Payments Payments Payments
Line Of $1,000 Of $5,000 Of $5,000 Of $5,000No. Organization Organization Program Area Organization Mission and Purpose of 2017 Donation Or More Or More Or More Or More
(A) (B) (C) (D) (E) (F) (G)
Commonwealth Edison Company Charitable Contributions of $1,000 or $5,000 and Greater
Charged To Account 426.1 Donations(In Thousands)
80
CLAY EVANS SCHOLARSHIP FOUNDATION Education
The mission of the Clay Evans Scholarship Foundation, Inc. (CESF) is to provide scholarships and financial assistance to young people in need, yet possessing the sincere desire to attend an institution of higher learning. Students may perhaps, be average in cumulative grade point (2.0), and therefore, lack the eligibility requirements many other scholarships offer students with higher grade point averages. Moreover, the CE$F is concerned about the holistic being (physical, mental, emotional nod spiritual) of each individual, and attempts to provide reinforcement, revenue, and resources to aid the student in his/her effort to further his/her academic education.
As the CE$F looks to the future, it seeks to equip students with the skills and tools to be competitive in their academic and professional pursuits. The CE$F has partnered with Northern Illinois University's STEM (Science, Technology, Engineering, Math) outreach program to provide an opportunity for high school students to attend their STEM Career Exploration Camp. The foundation sponsors under served and under represented students to provide exposure and access to the program's collegiate academic and professional network.
They are actively involved in their respective churches. Many of the recipients of the CESF exceed in completing their education, and accomplish their various goals. Many have become ministers, practicing attorneys in various fields, certified public accountants, teachers, social workers, business managers, optometrist, dentist, chemists, song writers, musicians, licensed electricians, realtors, nurses, and licensed labor tradesmen. Funding supports an annual scholarship.
- 1 - -
81
CLEAN ENERGY TRUST Environment
Clean Energy Trust is an impact investor that fuels innovation to create a healthier environment and more prosperous future. We launch, fund and grow early stage clean energy business in the Midwest through direct investment, venture development and advocacy. Funding was for the Clean Energy Trust Challenge. 25 15 25 16
82
COALITION FOR THE REMEMBRANCE OF ELIJAH MUHAMMAD Community & Economic Development
The official archives for the Nation of Islam. Holds general civilization classes (open to public) different speakers are featured. Funding was for CROE'S 28th Annual Founders' Day Gala 3 3 3 -
83
COMMUNITY FOUNDATION OF FOX RIVER VALLEY Education
The Foundation is an advocate for all Veterans of all generations and all conflicts. We shall ensure our citizens, our City and our Nation remember the sacrifices of those gone and those who remain. Funding supported the 2015 Community Breakfast - - 1 -
84
COMPASSIONATE COMMUNITIES FOR CHILDREN Health & Social Services
Compassionate Communities helps victims of sexual exploitation and works to prevent future cases. Funds were for the organization's annual fundraising event. 5 5 - -
85
COOK COUNTY HEALTH FOUNDATION Health & Social Services
Founded in 2011, the Cook County Health Foundation ["CCHF"] is an independent 501(c)(3) charitable nonprofit organization that advocates on behalf of the Cook County Health & Hospitals System ["CCHHS"]. The Foundation is not a branch of County government, but rather an independent philanthropic fundraising arm supporting the CCHHS and specifically the programs and services designed to improve the quality of patient care. Funds raised by the Foundation are used directly to foster continuous advancement and to help defray the rising cost of providing health care to indigent families. In this regard, an annual dinner/gala has been the Foundation's flagship fundraiser. Future investments in the Foundation will go toward the purchase of capital equipment andthe support of critical programs, allowing Cook County Health & Hospitals System to maintain its position as a renowned center for patient care, teaching and research. Sponsorship was for the annual fundraising dinner.
- 10 - -
86
CRISTO REY JESUIT HIGH SCHOOL Education
In 1994, the Chicago Province of Jesuits sought to expand ministry for the Hispanic population in Chicago. After performing a needs assessment of some of the most economically disadvantaged communities in Chicago, they chose to focus on the Pilsen and Little Village communities. These areas were the most densely populated and least formally educated neighborhoods in the city with over 10,000 high school age adolescents and limited access to educational opportunity.
The Jesuits identified education as the greatest way to help this struggling community and, in 1996, Cristo Rey Jesuit High School opened for 79 local students who would not otherwise have the financial means to pursue a challenging, private, college preparatory education. To make the school affordable and sustainable, Cristo Rey pioneered the Corporate Work Study Program (CWSP) model for inner-city education that has since inspired a national network of 30 schools serving low-income urban communities across the country. The CWSP enables all students to earn a majority of their annual tuition by working one day a week at an entry-level position for a corporation or nonprofit agency in the Chicago area.
Today, there are over 1,600 Cristo Rey Jesuit High School alumni. In the class of 2015, 100% of seniors were accepted to at least one college or university.
Sponsorship was for the annual fundraising dinner. - 15 - -
87
CRUSADER HEALTH FOUNDATION Health & Social Services
Crusader Community Health is a community based not-for-profit community health center whose mission is to serve the Rock River Valley area with quality primary healthcare for all people in need. For 44 years, Crusader Community Health has been a major part of the Rockford, Illinois community 'safety net', providing excellent medical and dental care one patient at a time. Crusader has been providing 'Care Within Reach' to one in five area residents. - 2 - -
88
CRUSADERS CENTRAL CLINIC ASSOC Health & Social Services
Crusader Community Health is a community based not-for-profit community health center whose mission is to serve the Rock River Valley area with quality primary health care for all people in need. For 45 years, Crusader has been a major part of the Rockford community 'safety net', providing 'Care Within Reach' to one in five area residents. In 2016, over 50,000 individual patients were served from six locations in northern Illinois. Crusader provides healthcare for all, regardless of their ability to pay, on an affordable discount basis. Funding was for the annual fundraiser. 2 - - -
89
CUB CONSUMER EDUCATION AND RESEARCH FUND Community & Economic Development
CUB is a consumer education and policy work on clean energy and telecom issues. Funding was for the Sky Is The Limit event, supporting CUB's clean energy and distributed energy resources policy and consumer education work. - - 5 -
90
CYSTIC FIBROSIS FOUNDATION Health & Social Services
The mission of the Cystic Fibrosis Foundation is to cure cystic fibrosis and to provide all people with the disease the opportunity to lead full, productive lives by funding research and drug development, promoting individualized treatment and ensuring access to high-quality, specialized care. Sponsorship was for the annual festival. - - 5 5
91
DEPAUL COLLEGE PREP Education
DePaul College Prep, formerly known as Gordon Technical High School, is a Roman Catholic high school located in Chicago, Illinois, United States. It is located on the north side of Chicago on Addison Street and California Avenue. It is located in the Roman Catholic Archdiocese of Chicago. Funding was a STEM scholarship program. - 80 10 20
Docket No. 18-____ ComEd Ex. 2.03 Page 177 of 334

Schedule C-7Page 8 of 23
Witness: Tracy
2017 2016 2015 2014Payments Payments Payments Payments
Line Of $1,000 Of $5,000 Of $5,000 Of $5,000No. Organization Organization Program Area Organization Mission and Purpose of 2017 Donation Or More Or More Or More Or More
(A) (B) (C) (D) (E) (F) (G)
Commonwealth Edison Company Charitable Contributions of $1,000 or $5,000 and Greater
Charged To Account 426.1 Donations(In Thousands)
92
DEPAUL UNIVERSITY Education
DePaul University is a private institution of higher education. DePaul's mission is to pursue the preservation, enrichment and transmission of knowledge and culture across a broad scope of academic disciplines. DePaul treasures its deep roots in the wisdom nourished in Catholic universities from medieval times. The principal distinguishing marks are its Catholic, Vincentian and urban character. The university currently enrolls 23,110 undergraduate, graduate, and professional students: 36 percent are people of color; 32 percent represent first-generation of the freshman class. National rankings recognize the quality of DePaul's programs and the diversity of its students. Funding is for a Technology scholarship program for DePaul College Prep students. - 200 - -
93
DISCOVERY CENTER MUSEUM Culture & Arts
Discovery Center's mission is to create opportunities for joyful learning and discovery through hands-on experiences in the sciences and arts. Discovery Center is a participatory museum created to provide hands-on learning experiences for visitors of all ages. Our exhibits and programs provide an enriching, challenging and fun environment designed to stimulate curiosity and to promote interest in science, technology, engineering, arts and mathematics. Funding was for the renovation of an exhibit designed to teach visitors about energy and energy efficiency. 20 40 - 20
94
DONORS FORUM OF CHICAGO Community & Economic Development
The mission of Forefront is to build a vibrant social impact sector for all the people of Illinois. Founded in 1974, we are the nation's only statewide membership association for nonprofits, philanthropy, public agencies, advisors, and allies. We provide education, advocacy, thought leadership, and project management to attract investment to the sector, develop top talent, improve systems and policies, and build organizational capacity. Funding was for a session for non-profit organizations to learn about energy efficiency. - - 10 5
95
DUPAGE HABITAT FOR HUMANITY Community & Economic Development
DuPage Habitat is a locally run affiliate of Habitat for Humanity International®, a nonprofit, ecumenical Christian housing organization. We work in partnership with families and the community to build affordable housing at no profit. Our vision is a world where everyone has a decent place to live. Habitat is on the front end of energy efficiency, partnering with emerging "green" technology within the construction and building industry. Funding was continued housing programs and for the DuPage Habitat for Humanity Annual Golf Tournament. 11 11 12 5
96 DUPAGE REGIONAL OFFICE OF EDUCATION Education The office oversees public education for DuPage County. Funding was for the annual Scripps Spelling Bee for all schools. 6 6 6 6
97
DUPAGE SENIOR CITIZENS COUNCIL Health & Social Services
The DuPage Senior Citizens Council initiates, delivers, monitors and coordinates services that promote the ability of older people to live their lives in dignity. Established in 1975, the DuPage Senior Citizens Council is a 501(c) (3) not-for-profit, community-based, volunteer-driven agency with a budget of nearly $3 million dollars, dedicated to providing basic needs services to seniors in DuPage County, Illinois. Programs help seniors live safely in their own homes and communities and provide them with the resources necessary to maintain their physical and mental health. By integrating a countywide network of partners as well as consultants, contractors, and volunteers, our staff is able to ensure that our organization is efficient and streamlined, providing the best possible assistance to the senior citizen population of DuPage County.
Services include a Senior Nutrition Program, that includes home delivered meals ("Meals on Wheels") and community dining opportunities with activities, a Health and Wellness Education Program, Well-Being Checks, and a comprehensive Home Maintenance Program that includes minor home repairs, contractor referrals, small task and socialization visits, and yard clean-up service. These programs promote the well-being of seniors and support the ability of older persons to live their lives with dignity.
Funding was for the annual dancing fundraiser. - 1 - -
98
DUSABLE MUSEUM OF AFRICAN AMERICAN HISTORY Culture & Arts
The mission of the DuSable Museum is to promote the understanding and inspire the appreciation of achievements, contributions and experiences of African Americans through exhibits, programs and activities that illustrate African and African American history, art and culture. The DuSable Museum is the oldest, independently owned black institution of its kind in the country and we are proud to continue providing the community with cultural and artistic experiences that meet the educational needs of families, children and visitors. ComEd funded the Museum's A Night of 100 Stars annual gala. 15 - 20 10
99
EASTER SEALS METROPOLITAN CHICAGO Environment
Easter Seals Metropolitan Chicago maximizes independence and creates opportunities for people with disabilities and other special needs to live, learn, work and play in their communities by providing a lifespan of premier services. Funding was for the annual holiday gala. 6 5 5 14
100
EIGHTEENTH STREET DEVELOPMENT CORP Community & Economic Development
Commercial development of Hispanic business leaders that are working to strike a balance between preserving the ethnic image of their communities and attracting more tourists and their dollars. Funding was for membership dues. 5 - - -
101
EL VALOR CORPORATION Health & Social Services
El Valor is a non-profit community-based organization founded in 1973 by the late Guadalupe A. Reyes. A visionary leader and mother, Mrs. Reyes dreamed of a community in which all members, including her son with special needs, could live, learn and work. She and several others took out a small bank loan and borrowed a church basement in Pilsen where they started the first bilingual, bicultural rehabilitation center in Illinois, and named it El Valor, meaning "courage." From its roots in the Latino community, El Valor has grown into a multicultural, multipurpose organization that reaches thousands of families in the Chicagoland area, and millions throughout the nation. Funding was for the annual Don Quixote dinner. 25 25 15 24
102
ELGIN SYMPHONY ORCHESTRA Culture & Arts
Founded in 1950 by Douglas Steensland of Elgin Community College, the Elgin Symphony Orchestra's (ESO) mission is to serve and engage a broad audience through the performance of powerful symphonic music and dynamic educational programs while developing strong community relationships. The orchestra's guiding principle is to remain a recognized model of artistic excellence and community engagement with structural pillars including excellent musicians, innovative educational and community-driven programs, strong leadership, and actively involved board members and volunteers. Funding is a general-operating grant.
6 6 - 12
103
ENVIRONMENTAL LAW AND POLICY CENTER Environmental/Preservation and ConservationThe Environmental Law & Policy Center is the Midwest’s leading public interest environmental legal advocacy and eco-business innovation organization. This donation supports the center's 20th anniversary gala. - - - 5
104
ERIE NEIGHBORHOOD HOUSE INC Education
Since 1870, Erie Neighborhood House has been an agent of hope and change to immigrant and low-income communities in Chicago, enabling children to develop to their fullest potential and families to meet the challenges of poverty and build a brighter future. Erie House’s mission is to promote a just and inclusive society by strengthening low-income, primarily Latino families through skill building, access to critical resources, advocacy, and collaborative action. With two sites in West Town, a site in Humboldt Park, and a community center in Little Village, Erie House provides services to over 6,500 individuals annually that help strengthen community, build leadership, and encourage civic engagement. Funding for Future of Promise Annual Dinner 11 - - -
Docket No. 18-____ ComEd Ex. 2.03 Page 178 of 334

Schedule C-7Page 9 of 23
Witness: Tracy
2017 2016 2015 2014Payments Payments Payments Payments
Line Of $1,000 Of $5,000 Of $5,000 Of $5,000No. Organization Organization Program Area Organization Mission and Purpose of 2017 Donation Or More Or More Or More Or More
(A) (B) (C) (D) (E) (F) (G)
Commonwealth Edison Company Charitable Contributions of $1,000 or $5,000 and Greater
Charged To Account 426.1 Donations(In Thousands)
105
FAITH IN PLACE Culture & Arts
Faith in Place is a fifteen-year-old nonprofit with a long history of inspiring positive environmental behavior change in partnerships with religious communities across Illinois. Faith in Place was founded in 1999 (incorporated in 2004) in Chicago, IL, where the majority of our outreach continues to happen. Faith in Place has partnered with more than 1,000 congregations of all faiths from every corner of Illinois -- Baha'i, Buddhist, Christian, Hindu, Jewish, Muslim, Sikh, and Zoroastrian -- to educate, connect, and advocate around the teachings of faith for living out practices of better Earth care. Faith in Place's mission is to inspire people of diverse faiths to care for the earth through connection, education, and advocacy. Unity of purpose emerges from an astounding diversity of beliefs and belief systems. This mission is implemented through four program areas at partner congregations: 1) energy and climate change, 2) water preservation, 3) sustainable land and food, and 4) environmental advocacy. Funding was for the Eco-Ambassadors Summer Program. 13 10 10 10
106FEDERATION OF INDIAN ASSOCIATIONS INC Community & Economic Development
The Federation builds pride among the Indian-American community in Chicago and does community outreach more broadly. Funding was for the 2016 Indian Independence Day Parade. - 2 1 -
107
FEDERATION OF WOMEN Community & Economic Development
The Federation of Women Contractors (FWC) has been in existence since 1989 and is committed to the advancement of entrepreneurial women in the construction industry. The 100-plus members of FWC include general contractors, sub-contractors, suppliers and service related firms representing every facet and component of construction. The funding is for the annual fundraiser. 8 8 7 8
108
FIELD MUSEUM OF NATURAL HISTORY Culture & Arts
The Field Museum is one of the world's leading institutions for object-based scientific research and serves as an educational resource for millions of people in the Chicago region and beyond. At its core is a collection of more than 27 million specimens that document the history of life on Earth. Our scientists--and visiting researchers from around the world--use this collection to better understand the root causes of a range of environmental and scientific issues affecting our world today, including climate change, deforestation, and disease. Funding was for general-operating support. - - 1 -
109
FOX VALLEY UNITED WAY Community & Economic Development
The mission of Fox Valley United Way is to measurably improve lives in the communities we serve. We accomplish this by focusing support in in the following areas: Health, Education and Income. Funding was Annual Campaign Support. 15 15 15 15
110
FRANK LLOYD WRIGHT PRESERVATION TRUST Education
The mission of the Trust is to engage, educate and inspire the public through interpretation of Frank Lloyd Wright's design legacy and preservation of his original sites for future generations.
Today the Frank Lloyd Wright Trust has 65 employees and 650 volunteers who serve an audience of 150,000 site visitors and 1 million virtual visitors from around the world each year. Trust activities include tours, workshops, teacher training, student internships, school outreach, family activities, multi-media programs, a restoration resource center, library/archive, a membership program, a travel program, and multi-channel merchandising operated by the Trust and the Trust in alliance with its Chicago area partner organizations. Funding supports the annual Wright Walk of homes. - 5 - -
111
FRIENDS OF BLUE ISLAND PARK DISTRICT Community & Economic Development
Raise money through grants, donations and fundraisers to assist with park projects and community and recreational events for youth and adults. Assist with programs and projects for recreation for youths and adultsGrant financial scholarships to youth for recreational activities. ComEd funded the Blue Island Park District Flash Light Easter Egg Hunt. 2 - - -
112
FRIENDS OF THE PARKS Environmental
Our mission is to preserve, protect, improve and promote the use of Chicago parks, forest preserves and recreational areas for the benefit of all neighborhoods and citizens. ComEd's 2014 donation supports Earth Day activities, volunteer events and the annual luncheon. - - - 12
113
GARFIELD PARK CONSERVATORY ALLIANCE Environment
The Garfield Park Conservatory Alliance changes lives through the power of nature. We inspire, educate and provoke exploration through innovative programs and experiences in one of the nation’s largest and finest historic conservatories. Funding for Music Under Glass and Fleurotica at Evening in Bloom. 15 - 50 -
114
GARY COMER YOUTH CENTER Education
The Gary Comer Youth Center offers positive extracurricular education in a welcoming and safe environment. Our mission is to provide the support for our students to graduate from high school prepared to pursue college and careers. Funding purchased trees for an Arbor Day volunteer event. - 1 - -
115
GET GROWING FOUNDATION Education
The Get Growing Foundation is a 501(c)3 nonprofit organization that provides year-round educational outreach to the public, with a particular focus on today’s youth. Organized in connection with the annual Chicago Flower & Garden Show, we raise awareness and funds for hands-on programs specifically designed to cultivate understanding and provide practical advice to all of our participants in the areas of horticulture, gardening and conservation. Funding for the Chicago Flower and Garden Show 25 - - -
116
GILDAS CLUB CHICAGO Health & Human ServicesThe mission of Gilda's Club Chicago is to ensure that all people impacted by cancer are empowered by knowledge, strengthened by action, and sustained by community. Funding for Gilda's Club Chicago Awards Dinner. 10 - - -
117
GILLOURY INSTITUTE Culture & Arts
Silk Road Rising's mission is to advance citizenship and cultural understandings with theatre based work created through Asian American and Middle Eastern American lenses. Silk Road Rising recognizes that different cultures are inherently linked. We seek to illuminate the intersections of cultures without denying their specificity. We strive to foster a world that values art over ideology and inquiry over dogma. We provide a space for diverse voices to express their own distinct stories and, through this shared experience, facilitate much-needed cross-cultural dialogue and awareness. Funding is for general-operating support for the season. 25 25 25 -
118
GIRL SCOUTS OF GREATER CHICAGO AND NORTHWEST INDIANA Education
We're 78,000 strong—53,000 girls and 23,000 adults who believe in the power of every G.I.R.L. (Go-getter, Innovator, Risk-taker, Leader)™ to change the world. Our extraordinary journey began more than 100 years ago with the original G.I.R.L., Juliette Gordon “Daisy” Low. On March 12, 1912, in Savannah, Georgia, she organized the very first Girl Scout troop, and every year since, we’ve honored her vision and legacy, building girls of courage, confidence, and character who make the world a better place.We’re the preeminent leadership development organization for girls. And with programs from coast to coast and across the globe, Girl Scouts offers every girl a chance to practice a lifetime of leadership, adventure, and success. Girl Scouting builds girls of courage, confidence, and character, who make the world a better place. Funding for First Lego Robotics Program and STEM camp support. 10 - - -
119GIRLS 4 SCIENCE Education
Enriching the lives of girls through science, technology, engineering and math. Funding is for the Women's History Month Reception and Volunteer Program. 10 10 20 8
120GLBT COMMITTEE Community & Economic Development
The GLBT Committee organizes activities during the year to engage the public. Funding was for the Chicago Pride Parade is the annual gay pride parade held on the last Sunday of June in Chicago. 1 1 1 -
Docket No. 18-____ ComEd Ex. 2.03 Page 179 of 334

Schedule C-7Page 10 of 23
Witness: Tracy
2017 2016 2015 2014Payments Payments Payments Payments
Line Of $1,000 Of $5,000 Of $5,000 Of $5,000No. Organization Organization Program Area Organization Mission and Purpose of 2017 Donation Or More Or More Or More Or More
(A) (B) (C) (D) (E) (F) (G)
Commonwealth Edison Company Charitable Contributions of $1,000 or $5,000 and Greater
Charged To Account 426.1 Donations(In Thousands)
121
GLENWOOD ACADEMY Education
Glenwood Academy is a 501(c)3 nonprofit, private residential education community for children in grades 2 - 8 that are academically capable but come from challenging circumstances. Glenwood educates more than 150 students on a campus located in Glenwood, Ill., about 35 miles south of Chicago. Nearly 100% of our children live below or at the poverty line and 92% of our children are from single-parent households. Glenwood Academy serves students by providing individualized instruction with small class sizes during the school day and a safe and supportive residential community to call home Sunday evening through Friday afternoon. Our students benefit from a structured and nurturing environment enabling them to focus and take advantage of academic and extracurricular opportunities to better their futures. Funding for Thanksgiving Luncheon. 10 - - -
122
GLENWOOD SCHOOL FOR BOYS AND GIRLS Culture & ArtsGlenwood Academy nurtures and educates good kids from challenging circumstances by inspiring excellence, building character and strengthening community. Funding is for the Annual Thanksgiving Luncheon - 15 15 15
123
GOODMAN THEATRE Culture & Arts
Goodman Theatre seeks to be the premier cultural institution in Chicago through the unsurpassed quality, range and diversity of its productions and programs, and through its commitment to improving the quality of life in the community. Funding was for general-operating support for the season. 50 45 45 45
124
GOVERNORS STATE UNIVERSITY FOUNDATION Education
Governors State University is committed to offering an exceptional and accessible education that imbues students with the knowledge, skills, and confidence to succeed in a global society. GSU is dedicated to creating an intellectually stimulating public square, serving as an economic catalyst for the region, and being a model of diversity and responsible citizenship. Established in 1969, the Governors State University Foundation is a 501 (c) 3 organization established as an independent, nonprofit corporation that exists to foster relationships with philanthropic individuals, GSU alums, and corporate and foundation partners on behalf of our students and the University. Funding was for Governors State University's College of Arts & Science "Success in Mathematics" STEM Program. - 10 10 10
125
GRANT PARK ORCHESTRAL ASSOCIATION Culture & Arts
The mission of the Grant Park Music Festival is to provide the highest quality, free, classical music concerts in the world. The Festival's core purpose is to enrich lives through the power of music, with emphasis on the values of openness, excellence, creativity, and service. Major goals include being essential to the vitality of the city, connecting people of all backgrounds to symphonic music; thrilling audiences with outstanding musical experiences not found anywhere else; and preserving the Festival as a unique cultural asset. Funding was for season sponsorship and the Advocate for the Arts Awards Benefit. 25 25 30 30
126
GROWING POWER INC (name changed in 2018 to Urban Growers Collective) Environment
Growing Power transforms communities by supporting people from diverse backgrounds and the environments in which they live through the development of Community Food Systems. These systems provide high-quality, safe, healthy, affordable food for all residents in the community. Growing Power develops Community Food Centers, as a key component of Community Food Systems, through training, active demonstration, outreach, and technical assistance. ComEd's funding supported a summer youth program for high-school students to learn about urban agriculture and be paid. The students designed and planted a garden adjacent to ComEd's training center in Bridgeport.
45 - - -
127
HACIA Professional Association supporting the social and economic development of the metropolitan Chicago area
HACIA (Hispanic American Construction Industry Association) works to ensure the equitable participation of its constituents in the construction industry and promotes the growth, quality of work, professionalism and integrity of these individuals and businesses. HACIA also sees the need to equip a growing Hispanic community with the tools necessary to seize and succeed at new business opportunities. HACIA believes that, like any group, Hispanics must constantly obtain training and education to remain at the cutting edge of the construction world. Thus, they offer established bilingual training programs, professional development activities and a suite of member services that assist Hispanics in growing their own construction-related businesses and developing powerful professional networks. ComEd's contribution supports a scholarship for an in-need students who is studying engineering and 10 tickets to the annual scholarhsip banquet.
- - - 25
128
HAYMARKET CENTER Health & Social Services
The mission of Haymarket Center is to aid people with chemical dependency in their recovery by providing a continuum of optimal professional care that is responsive to the identified needs of the community. Haymarket goes beyond treatment of addiction – from detoxification, to recovery, to finding a home, learning a job skill and gaining employment. Haymarket Center’s goal is to provide its clients with opportunities enabling them to lead productive and creative lifestyles without drugs. Funding was for annual luncheon. 10 10 5 -
129
HIGH JUMP Education
High Jump is tuition-free academic enrichment program for 7th and 8th graders in Chicago. We serve talented and motivated students from families of limited financial means. We provide academic enrichment, counseling and support to students of diverse backgrounds, with the goals of sending our participants to superior college preparatory schools, ensuring their success while they are there, and enhancing their ability to gain admission to highly regarded four-year colleges and universities. Funding was for the Annual Spring of Opportunity Benefit. 14 - - -
130
HISPANIC ALLIANCE FOR CAREER ENHANCEMENT Community & Economic Development
HACE is a nonprofit organization dedicated to the advancement of Latino professionals. Through education, access, and professional development, we help Latinos succeed in every phase of their careers. Funding was for Sembrando el Futuro. - - 2 -
131
HISPANIC AMERICAN CONSTRUCTION INDUSTRY ASSOCIATION Education
The Hispanic American Construction Industry Association (HACIA) works to ensure the equitable participation of its constituents in the construction industry, while also promoting the growth, quality of work, professionalism and integrity of these individuals and businesses. Funding supports scholarships for students and the annual fundraising reception and a foursome for the golf outing. 20 21 - -
132
HUNDRED CLUB OF COOK COUNTY Community & Economic Development
The 100 Club of Chicago provides for the families of first responders who have lost their lives in the line of duty. This membership based organization offers several forms of financial assistance, access to resources and moral support. All sworn federal, state, county and local first responders stationed in Cook and Lake Counties are included. Funding was for Raising Hope awards and general operating support. 5 - - -
133
IBIO INSTITUTE Health & Social Services
The mission of iBIO Institute, established in 2003 by the Illinois Biotechnology Industry Organization (iBIO), is to orchestrate business leadership in delivery of world-class educational programs and job-creating new technology ventures. Funding was for the annual fundraiser. - 4 - -
134
IEEE FOUNDATION INCORPORATED Education
As the philanthropic arm of IEEE, the IEEE Foundation inspires the generosity of donors so it may enable IEEE programs that enhance technology access, literacy and education, as well as support the IEEE professional community. The IEEE Foundation cultivates resources and relationships to advance IEEE's core purpose to foster technological innovation and excellence to benefit humanity. The IEEE Foundation relies on donations to bring the exhilaration of scientific discovery to students, foster technological innovation, preserve history, and promote awareness of the long-reaching effects of engineering and its impact on humanity. Funding was for engineering scholarships for college students who live in ComEd's service territory: IEEE Power & Energy Society Scholarship Plus Initiative 15 15 15 -
Docket No. 18-____ ComEd Ex. 2.03 Page 180 of 334

Schedule C-7Page 11 of 23
Witness: Tracy
2017 2016 2015 2014Payments Payments Payments Payments
Line Of $1,000 Of $5,000 Of $5,000 Of $5,000No. Organization Organization Program Area Organization Mission and Purpose of 2017 Donation Or More Or More Or More Or More
(A) (B) (C) (D) (E) (F) (G)
Commonwealth Edison Company Charitable Contributions of $1,000 or $5,000 and Greater
Charged To Account 426.1 Donations(In Thousands)
135
ILLINOIS BLACK CHAMBER OF COMMERCE Civic & Public Affairs
The Illinois State Black Chamber of Commerce (ILBCC) is the largest, most active voice for African American businesses in the state of Illinois. As the largest Black Trade organization in Illinois, the ILBCC is a strong advocate for entrepreneurship serving local and regional businesses in legislative advocacy, financial literacy, global entrepreneurship, and with various business resources. The ILBCC's objective is to help promote job creation and growth among African American businesses. Funding was for ILBCC Annual Convention. 60 - - -
136
ILLINOIS CITY MANAGEMENT ASSOCIATION Community & Economic Development
About ILCMA / Our PurposeThe Illinois City / County Management Association (ILCMA) was founded in 1953 for the purpose of supporting and improving municipal and county management and strengthening local government in Illinois.The ILCMA's 700 plus members are professionals who share the common interest of promoting effective local government. Members include city, village, and county managers / administrators and their assistants, persons interested in local government management, students, consultants, and other management professionals. Most hold graduate degrees and are appointed to their positions by the elected governing body.ILCMA Winter Conference
- - 3 -
137
ILLINOIS COALITION FOR IMMIGRANT AND REFUGEE RIGHTS Civic & Public Affairs
ICIRR is dedicated to promoting the rights of immigrants and refugees to full and equal participation in the civic, cultural, social, and political life of our diverse society.In partnership with our member organizations, the Coalition educates and organizes immigrant and refugee communities to assert their rights; promotes citizenship and civic participation; monitors, analyzes, and advocates on immigrant-related issues; and, informs the general public about the contributions of immigrants and refugees. Funding was for New Americans Initiative. - - 10 -
138
ILLINOIS COMMISSION ON DIVERSITY AND HUMAN RELATIONS Community & Economic Development
The mission is to provide equity and opportunities to impact communities throughout the State of Illinois. Funding is for the annual Martin Luther King, Jr. Dinner. 6 11 - 5
139
ILLINOIS HISPANIC CHAMBER OF COMMERCE Community & Economic Development
The Illinois Hispanic Chamber of Commerce (IHCC) is the leading Hispanic business, networking, advocacy and development organization in the state of Illinois. IHCC works with business owners, providing strategic one-on-one services designed to help businesses thrive and grow. Funding was for the Hispanic Business Expo. - - 25 -
140
ILLINOIS HOLOCAUST MUSEUM & EDUCATION CENTER Education
For 35 years, Illinois Holocaust Museum & Education Center has worked to preserve the legacy of the Holocaust by teaching universal lessons that combat hatred, prejudice, and indifference, and inspiring audiences to be Upstanders who speak out for what's right -- turning powerful lessons of history into positive actions today. We do this through world-class exhibitions, innovative public programming, and partnerships that bring diverse communities together to understand history and dialogue on contemporary human rights issues and how to improve our world. As the second largest Holocaust museum in the country, we welcome and touch the lives of 150,000 people of all ages, nationalities, and cultural backgrounds annually, and equip them with the knowledge, skills, and courage to take a stand for humanity. We also provide significant support to 650+ schools in Illinois and the Midwest, including Chicago Public Schools, suburban school districts, and parochial schools, teaching students the importance of character, leadership, and citizenship. We equip teachers with the curriculum and pedagogy to meet state mandates on Holocaust and genocide education, and teach approximately 80,000 students annually about the dangers of silence and intolerance through field trips, leadership programs, contests, and more. Our Law Enforcement & Democracy Initiative trains all Chicago police recruits on individual rights and civil protection.
Funding supported an event featuring women, including Attorney General Madigan and Anne Pramaggiore to educate on diversity and inclusion.
- 10 - -
141
ILLINOIS INSTITUTE OF TECHNOLOGY Education
IIT is dedicate to providing distinctive and relevant education in an environment of scientific, technological, and professional knowledge creation and innovation. Funding was for a Hispanic Heritage Month event for students and the community. 10 5 - -
142
ILLINOIS SCIENCE AND TECHNOLOGY INSTITUTE Education
The Illinois Science & Technology Institute (ISTI) is a STEM-focused nonprofit that provides programs and partnerships to connect companies with classrooms. ISTI supports schools and companies who want to impact the next generation of innovators. We are a bridge between the classroom and real world that facilitates collaboration between students and industry mentors. Funded STEM Challenges. 5 - 5 15
143
ILLINOIS STATE BLACK CHAMBER OF COMMERCE Civic & Public Affairs
The Illinois State Black Chamber of Commerce, Inc. (ISBCC) is dedicated to economically empowering and sustaining African American communities through entrepreneurship and capitalistic activity within the State of Illinois and via interaction with the National Black Chamber of Commerce, Inc. (NBCC). The ISBCC is a nonprofit organization whose purpose is to promote and develop Black economic empowerment in the State of Illinois. Funding was for the annual conference. - - 25 -
144
IMSA FUND FOR ADVANCEMENT OF EDUCATION Education
The IMSA Fund for Advancement of Education is a 501(c)(3) not-for-profit corporation organized under the Not-For-Profit Corporation Act of the State of Illinois. The Fund was established and is maintained as a separate corporate entity for the purpose of benefiting, performing the functions of, or carrying out certain charitable, educational, literary and scientific purposes of the Illinois Mathematics and Science Academy (IMSA), and to assist IMSA in achieving and furthering its education, research and service goals. The IMSA Fund receives and administers gifts and grants in support of IMSA's work to develop talent and leadership in math, science and technology.
The internationally recognized Illinois Mathematics and Science Academy (IMSA) develops creative, ethical leaders in science, technology, engineering and mathematics. As a teaching and learning laboratory created by the State of Illinois, IMSA enrolls academically talented Illinois students (grades 10-12) in its advanced, residential college preparatory program. It also serves thousands of educators and students in Illinois and beyond through innovative instructional programs that foster imagination and inquiry. Funding was for the IMSA Energy Center 25 25 25 25
145 IN SEARCH OF A CURE Health & Social Services The mission is to create awareness about autism and for research programs. Funding was general-operating support. - - 3 -
146
INDIVIDUAL ADVOCACY GROUP Health & Social Services
Individual Advocacy Group is a CARF accredited not-for-profit organization dedicated to community- based supports and personal advocacy for individuals with special needs. IAG provides training programs, behavioral and individual therapies, community- based residential programs, advocacy and case management for individuals who have intellectual or developmental disabilities, mental health disorders, brain injuries or physical/medical conditions. Funding was for their largest fundraising event/golf outing - - 1 -
147
INSPIRATION CORPORATION Health & Social Services
In an atmosphere of dignity and respect, Inspiration Corporation helps people who are affected by homelessness and poverty to improve their lives and increase self-sufficiency through the provision of social services, employment training and housing. Each year, Inspiration Corporation works with nearly Chicagoans who are characterized by chronic homelessness, unemployment or underemployment, mental illness, substance addiction, and social isolation. These individuals all share the strength to move beyond their current situation and toward self-sufficiency. Funding was for the One Inspired Evening event. 2 8 8 8
Docket No. 18-____ ComEd Ex. 2.03 Page 181 of 334

Schedule C-7Page 12 of 23
Witness: Tracy
2017 2016 2015 2014Payments Payments Payments Payments
Line Of $1,000 Of $5,000 Of $5,000 Of $5,000No. Organization Organization Program Area Organization Mission and Purpose of 2017 Donation Or More Or More Or More Or More
(A) (B) (C) (D) (E) (F) (G)
Commonwealth Edison Company Charitable Contributions of $1,000 or $5,000 and Greater
Charged To Account 426.1 Donations(In Thousands)
148
INSTITUTE FOR LATINO PROGRESS Education
Instituto's mission is to contribute to the fullest development of Latino immigrants and their families through education, training, and employment that fosters full participation in the changing United States society while preserving cultural identity and dignity. Funding is for the annual fundraising event. 5 5 - -
149
JACKSON PARK HOSPITAL AND MEDICAL CENTER Health & Social Services The hospital's mission is to provide efficient and effective quality healthcare
to meet the needs of the patients and the communities they serve. 3 - - -
150
JAPANESE AMERICAN SERVICE COMMITTEE Health & Social Services
JASC has been at the center of the Japanese American community since its founding in 1946. Originally created to assist Japanese Americans who came to Chicago following their internment during the WWII, JASC services revolved primarily around finding proper housing and jobs, as well as rehabilitating a broken community. Since then, JASC has evolved to provide services on a much broader scale. JASC has been responsible for the creation of retirement communities, an online database of archive material, and provides regular Japanese language classes and traditional Japanese arts courses -- all in pursuit of preserving and sharing the Japanese American legacy. JASC is working to archive the history of the Japanese American experience in Chicago for both scholars and the larger Chicago community. The scope of services JASC provides has grown far beyond our humble beginnings to serve a community wider than our founders could have imagined. Support is for the annual dinner 5 5 - 5
151
JOHN G. SHEDD AQUARIUM Culture & Arts
Supporting its mission, "At Shedd Aquarium, animals connect you to the living world, inspiring you to make a difference," the museum offers world-class animal exhibits; serves teens, school groups and teachers through a suite of learning programs; provides aquatic shows, dive presentations, animal encounters and tours for our guests; and conducts global conservation research projects to protect animals and their habitats. Shedd features two 15-minute 4-D Experience movies. Combining the visual drama of a 3-D film with a variety of sensory effects built into the seats and theater environment, the 4-D Experience brings on-screen images to life with added effects such as water mist, neck air blasts, bubbles, leg ticklers, enhanced floor lighting, seat vibrations and back pokes. Shedd offers assisted listening devices and closed captioning upon request. The experience is recommended for children ages four and older. In 2015, Shedd offered 8,464 4-D Experience performances. ComEd's funding is for the 4-D Experiences program.
90 60 - 60
152
JOINT CIVIC COMMITTEE OF ITALIAN AMERICANS Community & Economic Development
The Joint Civic Committee of Italian Americans (JCCIA) is an independent non-profit association dedicated to preserving Italian American heritage and providing a unified voice for metropolitan Chicago’s Italian American community. Founded in 1952, the JCCIA serves as a congress for more than 65 Italian American organizations, as well as a clearinghouse for information about the Chicago area. Funding was for the Columbus Day Parade. 5 4 5 -
153
JUNIOR ACHIEVEMENT OF CHICAGO Education
Junior Achievement of Chicago was founded locally in 1940 and sets the standard for other JA offices nationwide. JA of Chicago is the largest area office in the nation and will reach 550,000 students during the 2015-2016 school year. In fact, with such a strong presence throughout the franchise, one in five students within the twelve JA of Chicago outreach counties will receive JA programs this school year. Our partnership with Chicago Public Schools is particularly strong, as one in three students in CPS will receive JA programs. JA of Chicago has also maintained exceptional financial stability (on budget, steady cash flow, low cost per student, and funded endowment), even during these difficult economic times. ComEd's Support of JA's Educational Outreach focusing on STEM programs, the Bowl-A-Thon and the annual dinner. 25 15 20 -
154
JUVENILE DIABETES RESEARCH FOUNDATION INTERNATIONAL Health & Social Services
Juvenile Diabetes Research International is dedicated to finding a cure for diabetes as well as providing material of an educational and informational nature to people interested in and affected by juvenile diabetes and to supporting research in the field of juvenile diabetes. Funding was for the annual walk and the annual dinner. - 25 20 25
155
KANKAKEE COUNTY NAACP Community & Economic Development
The Kankakee County Branch of the NAACP has a rich history, having been chartered September 10, 1945. The NAACP's principal objective is to ensure the political, educational, social and economic equality of minority group citizens of Kankakee County and eliminate race prejudice. The NAACP seeks to remove all barriers of racial discrimination through the democratic processes. - - 2 -
156
KEEP CHICAGO BEAUTIFUL EducationCommunity & Economic Development
Keep Chicago Beautiful will continue to emphasize its mission of education and community awareness, and working together to make Chicago a more healthy, prosperous – and beautiful — place to live and work. Funding was for the annual dinner. - 5 11 -
157
KISHWAUKEE UNITED WAY Health & Social Services
United way of DeKalb and Sycamore merged and became Kishwaukee. Kishwaukee United Way is a local organization committed to unite people by making an impact through community building, fundraising, and local advocacy to address community needs, issues and concerns. Money raised through local fundraising efforts is distributed by volunteer allocation panels after assessing program and service needs in the DeKalb and Sycamore areas. Funding was for Annual Campaign Support. 3 3 2 -
158
KOHL CHILDRENS MUSEUM Education
Kohl Children's Museum of Greater Chicago is a place that provides experiences and memories to build a foundation for a lifetime of learning. We will be an essential leader in providing playful experiences that inspire every child. The City on the Move exhibit is designed to provide ample opportunities to explore STEM (science, technology, engineering, and math) concepts through open-ended play, allowing children to deepen their understanding of foundational math and science concepts. Using the City of Chicago as a backdrop, City on the Move promotes experimentation, working together, and problem solving. ComEd's funding funded the renovation of the exhibit. 15 20 - -
159
KOREAN AMERICAN COMMUNITY Health & Social Services
Korean American Community Services (KACS) is the oldest, largest, and most comprehensive social service agency dedicated to meeting the needs of Korean Americans in the greater Chicagoland area. Our mission is to celebrate Korean American ethnicity and empower all members of the community by providing educational, legal, health, and social services, so that all may fulfill their needs and lead dignified, meaningful lives. Funding was for annual dinner. - 10 5 5
160
LA CASA NORTE Health & Human Services
La Casa Norte's mission is to serve youth and families confronting homelessness. We provide access to stable housing and deliver comprehensive services that act as a catalyst to transform lives and communities. Funding for Gala Celebration 3 - - -
161
LA RABIDA CHILDRENS HOSPITAL Health & Social Services
La Rabida Children's Hospital provides specialized, family-centered health care to children with medically complex conditions, disabilities, and chronic illness. Through expertise, compassion, and advocacy we help children and their families reach their fullest potential, regardless of their ability to pay. Funding was for the Friends of La Rabida Gala/La Rabida Golf Classic and Awards Dinner. 13 15 25 15
Docket No. 18-____ ComEd Ex. 2.03 Page 182 of 334

Schedule C-7Page 13 of 23
Witness: Tracy
2017 2016 2015 2014Payments Payments Payments Payments
Line Of $1,000 Of $5,000 Of $5,000 Of $5,000No. Organization Organization Program Area Organization Mission and Purpose of 2017 Donation Or More Or More Or More Or More
(A) (B) (C) (D) (E) (F) (G)
Commonwealth Edison Company Charitable Contributions of $1,000 or $5,000 and Greater
Charged To Account 426.1 Donations(In Thousands)
162
LA VOZ LATINA Education
In 1971, a group of Rockford Hispanics formed an organization to help new arrivals adjust to the area. They intended to create a unifying voice to foster the progress of all Hispanics in the community, acknowledging their diversity in countries of origin, ethnicity, cultural preferences and beliefs. Utilizing space at various local churches, "Spanish Speaking Special Services" was a magnet for families who needed advice, help with resettlement, and English classes. After a few years, the organization found a home at 320 Kent Street, where bilingual staff taught English and basic skills to youth and adults.The organization is the largest community-based Hispanic organization serving northern Illinois, with programs in Rockford, Belvidere, Harvard, and LaSalle/Peru, and collaborations in Ogle and Whiteside Counties.La Voz Latina Annual Recognition Banquet - - 5 5
163
LATIN AMERICAN CHAMBER OF COMM Civic & Public Affairs
The Chamber's mission is to add value to our members and clients by providing professional and technical assistance as well as management education and training. To foster economic activities by facilitating business transactions between our members, private corporations, government entities and authorities. Funding was for membership dues. 2 - - -
164
LATINO LEADERS NETWORK INC Community & Economic Development
The Latino Leaders Network (LLN) is dedicated to "Bringing Leaders Together" to get better acquainted, to support each other, and help our community succeed. It is a non-profit organization founded by Mickey Ibarra in 2003 and incorporated in 2006 to provide a platform to share our personal stories of obstacles overcome to inspire, re-energize, motivate, and unify the community.Funding was for the Latino Leaders Luncheon Series. - - 5 -
165
LATINO POLICY FORUM Civic & Public Affairs
The mission and purpose of the Latino Policy Forum is to build the power, influence, and leadership of the Latino community through collective action to transform public policies that ensure the well being of our community and society as a whole. Funding was for the annual summit. 5 5 5 -
166
LATINOS PROGRESANDO Community & Economic Development
Latinos Progresando's mission is to deliver high-quality information and resources for people to build secure, healthy, and productive lives. Founded in 1998, today, Latinos Progresando: has built the largest Latino-led, family-based immigration legal services program in the State of Illinois, including an initiative focused on immigrant victims of domestic violence; runs Teatro Americano, a theater ensemble and arts education program; provides tuition assistance to deserving young students through the Dr. Angela Perez Miller Scholarship Fund; convenes The Marshall Square Resource Network, a 30-organization coalition working to transform Chicago's southwest side. Funding for One Community Breakfast. 2 - - -
167
LAWRENCE HALL YOUTH SERVICES Community & Economic Development
Lawrence Hall is a not-for-profit child welfare agency established to assist at-risk youth and their families through a seamless delivery of services designed to develop the self-worth, knowledge, and skills they need to lead independent and productive lives. Funding was for the workforce-development/job-skills program. 3 3 3 -
168 LAWYERS LEND-A-HAND TO YOUTH Education Spring Awards Dinner - Celebrating 20 Years of Lawyers Lend-A-Hand to Youth - - 10 10
169
LEADERSHIP GREATER CHICAGO Community & Economic Development
Leadership Greater Chicago (LGC) is a 31-year-old nonprofit organization that cultivates Chicago's business, public and civic leaders through a deeper understanding of the issues facing our community and each other, helping to build a better Chicago. Funding was for the Leaders Dinner - - 10 -
170
LEAGUE OF CHICAGO THEATRES Culture & Arts
The League of Chicago Theatres supports, promotes and advocates for Chicago theatre locally, nationally and internationally. We are dedicated to enhancing the art of theatre in the Chicagoland area through collaborative audience development programs, professional development events and support services for theatres and theatre professionals. Funding is for (1) a new program the company is developing to provide grants to arts organizations in our service territory that are struggling and (2) for Hot Tix, a program that provides discounted tickets to the general public. 140 - - -
171
LEWIS UNIVERSITY Education
Lewis University is a nationally recognized university serving a diverse student enrollment of 6,500. Located in the Chicago suburb of Romeoville, Lewis prepares intellectually engaged, ethically grounded, globally connected, and socially responsible graduates. The seventh largest private not-for-profit university in Illinois, Lewis has been nationally recognized by The Princeton Review and U.S. News & World Report. Lewis was recognized by the 2016 CollegeChoice.net rankings of the 75 Best Catholic Colleges and Universities as the 28th best Catholic university nationwide and second in the state of Illinois. Funding was for the Guardians of the Grid High School Cybersecurity Competition 3 - 3 -
172
LINCOLN PARK ZOO Environment
Lincoln Park Zoo is dedicated to connecting people with nature by providing a free, family-oriented wildlife experience in the heart of Chicago and by advancing the highest quality of animal care, education, science and conservation. Funding was for ZooLights and the annual dinner. 150 170 160 160
173 LITTLE VILLAGE 26TH ST. AREA CHAMBER Community & Economic Development The local chamber is the organizer of the Mexican Independence Day Parade, for which ComEd's funding was designated. 12 12 11 -
174
LITTLE VILLAGE ROTARY CLUB Community & Economic Development
The Little Village Chapter of the Rotary Club was established to change lives in an underserved Hispanic community. They are a group of volunteers that see areas of safety and basic needs in our community. Volunteers include civic leaders, business persons and citizens looking to make a difference. Funding for the Installation of Officers Dinner for LVR. 2 - - -
175
LOCAL INITIATIVES SUPPORT Community & Economic Development
LISC Chicago's mission is to connect neighborhoods to the resources they need to become stronger and healthier. Our vision is that through this work, Chicago grows stronger as all neighborhoods contribute to and benefit from the region's economic growth. LISC Chicago uses three main program structures to connect neighborhoods to funders, government agencies, technical assistance and other resources. Funding was for a program grant on Capacity Building & Technical Assistance to Community Based Organizations & the 22nd Annual Chicago Neighborhood Development Awards - - 20 -
176
LOOKINGGLASS THEATRE CO Culture & Arts
Guided by an artistic vision centered on the core values of collaboration, transformation, and invention, Lookingglass seeks to capture audiences' imaginations leaving them changed, charged and empowered. Lookingglass propels this unique mission through three core programs: the creation of new work through glassworks, the staging of world premieres on two stages, and the outreach of Education and Community Programs (E&C). E&C initiatives include in-school artist residencies, professional development programs for Chicago-area teachers, Student Matinees, a Young Ensemble, and a scholarship program for low-income youth. Funding was for season support. 25 - 80 12
177
MAKE A WISH AMERICA Health & Social Services
The Make-A-Wish Foundation arranges experiences described as "wishes" to children with life-threatening medical conditions. Funding was a general-operating grant. Please note that although Make-A-Wish is headquartered in Arizona, they support many children in ComEd's service territory. - 1 - -
178
MALDEF Community & Economic Development
Founded in 1968, MALDEF is the nation's leading Latino legal civil rights organization. Often described as the "law firm of the Latino community", MALDEF promotes social change through advocacy, communications, community education, and litigation in the areas of education, employment, immigrant rights, and political access. Funding was for the annual dinner. Please note that although MALDEF is based in Los Angeles (where payment was sent), funding supports the local office and initiatives. 10 10 10 10
Docket No. 18-____ ComEd Ex. 2.03 Page 183 of 334

Schedule C-7Page 14 of 23
Witness: Tracy
2017 2016 2015 2014Payments Payments Payments Payments
Line Of $1,000 Of $5,000 Of $5,000 Of $5,000No. Organization Organization Program Area Organization Mission and Purpose of 2017 Donation Or More Or More Or More Or More
(A) (B) (C) (D) (E) (F) (G)
Commonwealth Edison Company Charitable Contributions of $1,000 or $5,000 and Greater
Charged To Account 426.1 Donations(In Thousands)
179
MANO A MANO FAMILY RESOURCE CENTER Health & Social Services
Founded in 2000, Mano a Mano Family Resource Center is a 501(c)(3) non-profit organization supported by the generous contributions of individuals, corporations and foundations. Our vision is an integrated Lake County where everyone has access to opportunity and paths to success. Our mission is to empower immigrants and their families living in Lake County, Illinois to become full participants in American life. Funding is for general-operating support. 5 - - -
180
MARCH OF DIMES BIRTH DEFECTS Health & Social Services
The mission of the March of Dimes is to improve the health of babies by preventing birth defects and infant mortality. We carry out this mission through research, community services, education and advocacy to save babies' lives. March of Dimes researchers, volunteers, educators, outreach workers and advocates work together to give all babies a fighting chance against the threats to their health: prematurity, birth defects, low birthweight. Funding was for the annual luncheon. 10 10 15 5
181
MEALS ON WHEELS CHICAGO Community & Economic Development
Meals on Wheels Chicago envisions a community in which all basic needs are met and barriers to achieving independence are eliminated. Our mission is to therefore ensure that both homebound seniors and individuals with disabilities benefit from programs that improve quality of life and maximize independence. We achieve this by raising both awareness and private funds to support a meal delivery and home modification program. Funding was to support meals for seniors and people with disabilities and an annual fundraiser. 15 19 15 15
182
MERCY HOME FOR BOYS AND GIRLS Education
Since 1887, Mercy Home for Boys & Girls has been a port in the storm for over 27,000 abused, neglected and abandoned children. Beginning as a place of refuge for homeless children, we now serve youth in residential care at two locations: our Hay Boys Campus located in Chicago's West Loop and our Walsh Girls Campus in the Beverly community. Our mission is save young lives by providing: a safe, nurturing residential treatment home, AfterCare support for former residents and their families, community-based and site based youth mentoring; promoting therapeutic, educational, vocational, spiritual and life skill development; and raising public awareness of youth in need. Funding was for annual graduation. - 10 10 20
183
MERIT SCHOOL OF MUSIC Education
Merit School of Music was founded in 1979 in response to the elimination of music education from Chicago Public Schools. Its mission is to transform the lives of Chicago-area youth by providing the highest quality music education - with a focus on under served communities - inspiring young people to achieve their full musical and personal potential. Support is for the Annual Gala. 15 15 10 -
184
METROPOLITAN FAMILY SERVICES Civic & Public Affairs
The mission of Metropolitan Family Services is to provide and mobilize the services needed to strengthen families and communities. Metropolitan Family Services is the oldest not for profit organization in the Greater Chicago area. Since 1857, Metropolitan has recognized that strong families are the strength of communities; and has provided services to individuals and families in need. Services are designed to empower children, adults and senior citizens. Metropolitan provides positive, life-changing services that reflect the organization's objectives by helping individuals and families identify and build on their existing strengths. Funding is for the Annual Holiday Celebration. 25 25 40 25
185
METROPOLITAN MAYORS CAUCUS Civic & Public Affairs
The Metropolitan Mayors Caucus is a membership organization of mayors from Northeastern Illinois' 273 cities, towns, and villages. The Caucus pushes past geographical boundaries and local interests to work on public policy issues, providing a forum for metropolitan Chicago's chief elected officials to collaborate on common problems and work toward a common goal of improving the quality of life for nearly 9 million people who call the region home. ComEd's funding focused on the Powering Safe Communities grant program, which will provide grants up to $10,000 to municipalities for projects and initiatives that increase safety in ComEd's service territory. Metropolitan Mayors Caucus is overseeing the program and reviewing applications via a competitive grant process. 225 200 200 -
186
METROPOLITAN PLANNING COUNCIL Community & Economic Development
Founded in 1934, the Metropolitan Planning Council (MPC) is a nonprofit, nonpartisan group of business and civic leaders committed to serving the public interest through the promotion and implementation of sensible planning and development policies necessary for a world-class Chicago region. Funding was for seminar on infrastructure that was free to the public and the annual luncheon. 20 20 20 -
187
MIDTOWN EDUCATIONAL FOUNDATION Education
Midtown Educational Foundation guides low-income urban youth in Chicago along pathways of success. Our proven enrichment programs embrace the dignity of the person by focusing on academic excellence, virtue development, individual attention, and parental engagement. Funding was for the 2015 Metro Achievement Council (MAC) Luncheon in benefit of MEF's Metro Achievement Center for girls. - - 3 -
188
MIDWAY VILLAGE & MUSEUM CENTER Culture & Arts
Mission Midway Village Museum, the best institution for collecting, preserving and interpreting the history of the Rockford region, is committed to educating and enriching our community by providing state-of-the-art exhibits, programs and events. Vision Midway Village Museum will be the primary institution where Rockford's diverse citizens gather to understand their community's past and to discuss the challenges of the future. Funding was for the free Community Picnic. 4 4 4 -
189
MISERICORDIA HEART OF MERCY Health & Social Services
Misericordia is proud to support 550 children and adults with mild to profound developmental disabilities from all racial, religious and socio-economic backgrounds. Misericordia has a wide range of programs on campus and in the community at-large to meet the diverse needs of persons with developmental disabilities. These include: residential placement and day-to-day support; job training and employment opportunities; physical, occupational and speech therapy; fitness and healthy living guidance; social and recreational outings; and opportunities for spiritual growth. The Mission of Misericordia/Heart of Mercy is to support individuals with developmental disabilities in maximizing their level of independence and self-determination within an environment that fosters spirituality, dignity, respect and enhancement of quality of life. We promote development of natural family and community support, community awareness, education and advocacy. Funding supported the annual Family Fest. 10 15 5 10
190
MORAINE VALLEY COMMUNITY COLLEGE Education
The Moraine Valley Community College's mission is to promote and financially support college programs and provide scholarships and financial assistance to students while exercising prudent management and investment of donor funds.Moraine Valley ranks among the top 3 percent of the 2,839 public and private two-and four-year institutions nationwide that confer associate degrees. The college holds a strong commitment to math and science education, and is proud to rank first in the nation in associate degrees conferred in in Multi/Interdisciplinary Studies (science transfer programs). Funding was for a scholarship for in-need students. 4 2 1 -
191
MORTON ARBORETUM Culture & Arts
The Morton Arboretum's mission is to collect and study trees, shrubs, and other plants from around the world, to display them across naturally beautiful landscapes for people to study and enjoy, and to learn how to grow them in ways that enhance our environment. Our goal is to encourage the planting and conservation of trees and other plants for a greener, healthier, and more beautiful world. Funding was for Illumination. 55 30 66 55
192
MUJERES LATINAS EN ACCION Health & Social Services
Mujeres provides intervention, education, and guidance to over 8,000 families each year, most of whom reside in the southwest side neighborhoods of Pilsen, Little Village, Back of the Yards, Gage Park and Brighton Park. With the growth of the Latino population in the near western suburbs of Berwyn and Cicero, Mujeres recently relocated its suburban site to a larger, easily accessible facility in North Riverside. Funding was for Voices Unidas, an annual event. 5 15 5 5
Docket No. 18-____ ComEd Ex. 2.03 Page 184 of 334

Schedule C-7Page 15 of 23
Witness: Tracy
2017 2016 2015 2014Payments Payments Payments Payments
Line Of $1,000 Of $5,000 Of $5,000 Of $5,000No. Organization Organization Program Area Organization Mission and Purpose of 2017 Donation Or More Or More Or More Or More
(A) (B) (C) (D) (E) (F) (G)
Commonwealth Edison Company Charitable Contributions of $1,000 or $5,000 and Greater
Charged To Account 426.1 Donations(In Thousands)
193
MUSEUM OF SCIENCE AND INDUSTRY Culture & Arts
The Museum of Science and Industry opened its doors in 1933. Today the Museum is one of the largest science museums in the world and home to more than 35,000 artifacts and nearly 14 acres of hands-on exhibits designed to spark scientific inquiry and creativity. MSI has welcomed more than 176 million guests in 80+ years and the Museum's ongoing mission has been to inspire the inventive genius in all of them with world-class, permanent exhibits such as the U-505 Submarine, the only German U-boat in the United States; or world-premiere temporary exhibits such as the Robot Revolution exhibit. Our vision is to inspire and motivate our children to achieve their full potential in the fields of science, technology, engineering and medicine. In addition to our fun and interactive exhibits, the Museum's Center for the Advancement of Science Education is continually developing and facilitating student learning labs, after-school science clubs, teen volunteer programs, teacher development classes and community outreach--all ways in which the Museum seeks to make science come alive for children of all ages. Funding was for the Black Creativity Program. 26 25 28 50
194
NATIONAL ARBOR DAY FOUNDATION Environment
Our mission is to inspire people to plant, nurture and celebrate trees. Our vision is to be a leader in creating worldwide recognition and use of trees as a solution to global issues. Our foundation was founded in 1972 and since then we have planted over 250 million trees in forests and communities. These trees have resulted in improved air and water quality, carbon reduction, & energy conservation. Funding is for the Power Planting program, to provide two free saplings to customers who have trees removed due to reliability work, and also to provide trees to local communities. Please note: although the Foundation is based in Nebraska, all funds positively impact ComEd customers. 125 125 - 200
195
NATIONAL LATINO EDUCATION INSTITUTE Education
National Latino Education Institute exists to enhance the quality of life for Latinos through educational, vocational, and employment services, and through advocacy, thus enabling the achievement of economic independence. Funding was for the Hispanic Heritage Month event and annual dinner. 29 2 2 35
196
NATIONAL MUSEUM OF MEXICAN ART Culture & Arts
The National Museum of Mexican Art's mission is to stimulate and preserve knowledge and appreciation of Mexican culture by presenting events and exhibitions that exemplify the rich variety of visual and performing arts in the Mexican culture; to develop, conserve, and preserve a significant permanent collection of Mexican art; to encourage the professional development of Mexican artists; and to offer arts education programs. Funding was for the Día de los Muertos/Day of the Dead Exhibition and Cinco de Mayo Gala. 95 45 45 5
197
NATIONAL MUSEUM OF PUERTO RICAN ARTS & CULTURE Culture & Arts
The National Museum of Puerto Rican Arts and Culture (NMPRAC) is devoted to the promotion, integration and advancement of Puerto Rican arts and culture, presenting exhibitions and programming created to enhance the visibility and importance of the rich Puerto Rican arts tradition. Funding supported its annual gala. 15 5 - -
198
NATIONAL SAFETY COUNCIL Safety
The National Safety Council is a non-profit organization with the mission to save lives by preventing injuries and deaths at work, in homes and communities, and on the road through leadership, research, education and advocacy. Working to make the world measurably safer, NSC advances this mission by engaging businesses, government agencies, elected officials and the public to help prevent the fifth leading cause of death in the U.S. – unintentional injuries. This donation supports a new program that awards grants to local communities in northern Illinois for projects that improve safety with residents. It is a competitive grant process; all applications are reviewed and evaluated by the Itasca-based National Safety Council. - - - 150
199
NAVY PIER INC Culture & Arts
Navy Pier's mission is to be a year-round, world-class public place that celebrates and showcases the vitality of Chicago and provides for the enjoyment and enrichment of Chicago area residents and visitors. Funding was for Neighborhoods of the World, which offers free cultural activities every Sunday from February through April. - 25 25 -
200
NEED PROJECT Education
The mission of the NEED Project is to promote an energy conscious and educated society by creating effective networks of students, educators, business, government and community leaders to design and deliver objective, multi-sided energy education programs. NEED works with energy companies, agencies and organizations to bring balanced energy programs to the nation's schools with a focus on strong teacher professional development, timely and balanced curriculum materials, signature program capabilities and turn-key program management. Funding was for the Energizing Student Education program for 5th-8th grade teachers to receive year-round instruction on how energy works, including teacher trainings, conference calls and classroom materials. Please note: although NEED is based in Virginia, all funding supports students and teachers in ComEd's service territory. 100 100 100 -
201
NETWORK FOR EDUCATIONAL EXCELLENCE Education
The mission is to enhance the learning experiences of District 200 students.Inspire students to become enthusiastic and engaged learners. Funding was for The Midwest Modeling Institute for Science Instruction, a conference and resource for science teachers. - - 3 -
202NEUMANN FAMILY SERVICES Health & Social Services
The mission of Neumann Family Services is to integrate persons with disabilities into the community and enrich their quality of life with choice and independence. Funding was for annual Zest! Event. - - 5 5
203 NEW LIFE BAPTIST CHURCH OF CHICAGO Religious Our mission is to serve the needy, hungry, less-fortunate and people in need. Funding supported the church's meals programs. - 2 - -
204
NEW LIFE COVENANT PILSEN Health & Social Services
New Life Pilsen is partnered with Safe Haven to provide kids with strategies to eliminate bullying and provide conflict management efforts. Funding was for the Annual Safe Haven Culminating Event for students. - - 10 -
205
NIAGARA FOUNDATION Civic & Public Affairs
Niagara Foundation strives to promote social cohesion by fostering civic conversations and sustained relationships between people of different cultures and faiths.The founders of the Niagara Foundation envisioned an institution that could bring together people from all walks of life in order to celebrate diversity in a shared society. Funding was for the Niagra Peace & Dialogue Awards. - - 10 -
206
NIGHT MINISTRY Health & Social Services
The Night Ministry is a Chicago-based organization that works to offer housing, health care and human connection to members of the Chicago community struggling with poverty or homelessness. With an open heart and an open mind, we accept people as they are and work to address their immediate needs while affirming their sense of humanity. Funding was for the teen-homeless outreach program and the annual dinner. 40 30 30 30
207NIPPERSINK SCHOOL DISTRICT 2 Education
ComEd provided a one-time grant to the school for a unique program teaching children about STEM through weather balloons and other teaching moments. - 2 - -
208
NORTHERN ILLINOIS UNIVERSITY FOUNDATION Education
The Northern Illinois University Foundation provides leadership to the university community and constituents in building financial resources to support excellence at NIU. Northern Illinois University promotes excellence and engagement in teaching and learning, research and scholarship, creativity and artistry, and outreach and service. STEM Outreach is part of Northern Illinois University.NIU STEM Outreach seeks to increase literacy and enthusiasm in science, technology, engineering, and mathematics among P-12 students, their families, and educators. NIU has long been involved in public programs. NIU's STEM Outreach was established in 2008 as part of NIU's Center for P-20 Engagement. Funding was for STEMFest, free to local students, and 4 tickets for a fundraising dinner. 15 15 15 -
Docket No. 18-____ ComEd Ex. 2.03 Page 185 of 334

Schedule C-7Page 16 of 23
Witness: Tracy
2017 2016 2015 2014Payments Payments Payments Payments
Line Of $1,000 Of $5,000 Of $5,000 Of $5,000No. Organization Organization Program Area Organization Mission and Purpose of 2017 Donation Or More Or More Or More Or More
(A) (B) (C) (D) (E) (F) (G)
Commonwealth Edison Company Charitable Contributions of $1,000 or $5,000 and Greater
Charged To Account 426.1 Donations(In Thousands)
209
NORTHLIGHT THEATRE Culture & Arts
Northlight Theatre aspires to promote change of perspective and encourage compassion by exploring the depth of our humanity across a bold spectrum of theatrical experiences. We seek to entertain, enlighten, and electrify our audiences through contemporary dramas, intimate musicals and refreshed classics. We are fearless in our commitment to champion new work, and to provide a nurturing and creative home for our artists. We are relentless in our pursuit of excellence through our productions, our business practices, our outreach, and our education. Northlight Theatre reflects our community to the world and the world to our community. Funding was for general-operating season support and the annual gala. 35 30 30 30
210
OPENLANDS PROJECT Environment
Founded in 1963 as a program of the Welfare Council of Metropolitan Chicago, Openlands is one of the oldest metropolitan conservation organizations in the nation and the only such group with a regional scope in the greater Chicago region. Openlands has helped protect more than 55,000 acres of land for public parks and forest preserves, wildlife refuges, land and water corridors, urban farms, and community gardens. Openlands protects the natural and open spaces of northeastern Illinois and the surrounding region to ensure cleaner air and water, protect natural habitats and wildlife, and help balance and enrich our lives. Openlands' vision for the region is a landscape that includes a vast network of land and water trails, tree-lined streets, and intimate public gardens within easy reach of every city dweller. It also includes parks and preserves big enough to provide natural habitat and to give visitors a sense of the vast prairies, woodlands, and wetlands that were here before the cities. In sum, Openlands believes that protected open space is critical for the quality of life of our region. Funding is for the annual Green Region grant program that provides funding for open-space projects in ComEd's service territory and the annual luncheon.
250 271 252 261
211
OPERATION WARM INC Health & Social Services
Operation Warm has a simple, direct, high-impact mission: To provide brand new winter coats to children trapped in the cycle of poverty. Our vision is that every child wearing a new winter coat is warm, healthy, able to attend school regularly in cold weather, and has strong self-esteem. We hope that each child we reach believes, "I am of value." Operation Warm is based in Pennsylvania, but all of ComEd's funding benefits low-income children and families in CHA housing who need a winter coat. 10 10 10 10
212ORCHARD VILLAGE Health & Social Services
For more than 40 years, Orchard Village has supported adults with developmental disabilities in leading fulfilling lives. Funding was for the 8th Annual Orchard Village Blossom Gala Auction/Dinner/Dance - - 10 -
213 PAKISTAN UNITED PARADE COMMITTEE Community & Economic Development The mission is to promote understanding and celebration of the Pakistani community and culture. Funding was for the annual parade. 2 2 2 -
214PAWS CHICAGO Others
PAWS' mission is to build no-kill communities -- starting with a No Kill Chicago -- that respect and value the life of every cat and dog. Support is for an annual walk open to the public. 5 5 - -
215
PENEDO CHARITABLE ORGANIZATION Education
PCO's mission is to educate girls to become women of knowledge, faith and service. PCO offers sustained intervention through academic, social emotional and mentoring support to girls, beginning in 6th grade, through middle school, high school and college. Girls who remain in the program look to receiving scholarship support for college. Funding was for the Penedo Cohort of local students and the annual breakfast. 20 20 25 20
216
PEOPLE ON WHEELS Health & Social Services
ComEd funded Peoples on Wheels to support the mission of Ms. Wheelchair Illinois/America: to provide an opportunity of achievement for women who happen to be wheelchair users to successfully educate and advocate for the more than 52 million Americans living with disabilities. ComEd hosted the event at our building in Oak Brook, which was open to the public. 3 3 - -
217
PRESERVATION FOUNDATION OF THE LAKE Environment
The Preservation Foundation of the Lake County Forest Preserves was established in 2007 to allow concerned citizens, companies, and foundations to expand the impact of the Forest Preserves. A nonprofit 501(c)3 organization, the Foundation raises support for projects and programs that might otherwise go unfunded in a time of flat or shrinking budgets. Over its history, the Preservation Foundation has helped the Forest Preserves restore more than 1,000 acres of native habitat, increased public access to the preserves, supported cultural programs and exhibitions, and provided free or reduced-cost education programs to thousands of children.
Funding from ComEd will enable the Forest Preserves to expand educational capacity to deliver STEM-based education programs in 2017. A temporary position, known as the 2017 ComEd Science Educator, will deliver STEM-based programs at forest preserves and in classrooms throughout Lake County. This 40-week position began in February 2017, ending in November 2017. The 2017 ComEd Science Educator will reach thousands of additional students while also building the Forest Preserves relationship with new schools and new faculty members.
20 25 20 -
218
PROJECT ONWARD Culture & Arts
Project Onward is a nonprofit studio and gallery dedicated to supporting the career development of visual artists with mental and developmental disabilities. Project Onward supports the professional development of artists with exceptional talents and challenges, ranging from autism to mental illness, and provides these artists with workspace, materials, professional guidance, exhibition opportunities and access to markets to sell their work and advance their careers. Funding was a program grant for Project Onward's studio program to provide artwork for ComEd's training center in Bridgeport. - 27 20 -
219
PROJECT SYNCERE Education
Project SYNCERE (PS) was launched in 2009, with the mission to prepare the minds and create pathways for underrepresented and disadvantaged students to pursue careers in Science, Technology, Engineering and Mathematics (STEM). Funding is dedicated for Project SYNCERE's new program to expand to 15 elementary schools in diverse Chicago neighborhoods via an engineering-focused program and having a culminating competition in May for all participating schools and their families/friends. 100 35 - 29
220
PROVIDENCE ST MEL SCHOOL Education
Providence-St. Mel is an independent, nonsectarian, K-12 college preparatory school with 600 African-American students, located in one of the toughest neighborhoods in Chicago achieves remarkable results. For the past 27 years, 100 percent of its graduates have been accepted to four-year colleges and universities. ComEd's donation is for the school's annual fundraiser; all funds raised support scholarship, educational programs, and general-operating expenses. - - - 10
Docket No. 18-____ ComEd Ex. 2.03 Page 186 of 334

Schedule C-7Page 17 of 23
Witness: Tracy
2017 2016 2015 2014Payments Payments Payments Payments
Line Of $1,000 Of $5,000 Of $5,000 Of $5,000No. Organization Organization Program Area Organization Mission and Purpose of 2017 Donation Or More Or More Or More Or More
(A) (B) (C) (D) (E) (F) (G)
Commonwealth Edison Company Charitable Contributions of $1,000 or $5,000 and Greater
Charged To Account 426.1 Donations(In Thousands)
221
PUBLIC IMAGE PARTNERSHIP Civic & Public Affairs
Public Image Partnership is a not-for-profit organization whose mission is to serve the workforce development needs of Chicago-based businesses and the needs of adult job seekers. Services are provided through public-private partnerships and the delivery of comprehensive career preparation and development services. Over the past eleven years, PIP has implemented government supported programs focused on providing workforce development services to individuals seeking to transition from welfare to work, unemployed and underemployed adults. Public Image Partnership's primary contract is with the Illinois Department of Human Services, to provide employment, training and retentions services to IDHS benefits recipients. Similar services, funded by the city of Chicago's Department of Family and Support Services, are provided for ex-offenders and non-custodial parents. Public Image Partnership has also provided recovery support services via ATR I and II. Public Image also provided summer employment opportunities in 2014 and 2015 for 200 youth. Youth were selected for work experience assignments in 11 Department of Labor occupational categories. 90% of the young people were fully compliant, punctual and reliable, and assets to the businesses that employed them. Their involvement presented opportunities to mirror regular employment in the paid labor market, increase employability via development of job skills, knowledge and work behaviors, and become acclimated to a regular work schedule. The program encompassed work experience and 12 hours of job readiness, career awareness and life skills training. Workshops topics included time management, employer expectations, professionalism in the workplace, finances, life skills, soft-skills,etc. Funding was for the Christmas Tree Lighting event. - - 2 -
222
PUERTO RICAN ARTS ALLIANCE Culture & Arts
The Puerto Rican Arts Alliance (PRAA) is dedicated to preserving Puerto Rican culture by maintaining traditions, promoting the arts, providing educational opportunities in arts programming, and cultivating pride in Puerto Rican and Latino heritage for future generations. The organization works toward this mission through separate but interconnected program areas and activities (including: school-based programs, workshops, community outreach events, exhibitions, and more), serving 20,000 area residents each year. Funding was for the annual Cuatro Festival. 25 25 30 50
223
PUSH FOR EXCELLENCE Community & Economic Development
PUSH Excel was founded in 1975 to challenge parents and to inspire students to strive for excellence in education in spite of cultural, economic and social challenges they face. The mission of PUSH Excel is to promote educational excellence by engaging the stakeholders in education to work collaboratively to create opportunities and implement strategies and enact public policy to improve access to educational opportunities. Funding was for the PUSH Excel Tech Enrichment Academy, which Students will be enrolled in a STEM Enrichment program that meets weekly on Saturday exposing students to robotics, energy awareness and efficiency. - 20 10 10
224
QUAD COUNTY AFRICAN AMERICAN CHAMBER OF COMMERCE Civic & Public Affairs
The QCAACC began in 1993 after several African American business owners recognized the need to have a business organization that addressed issues which affect African American business success failures. Our mission is to enhance the commercial environment & improve the marketing opportunities that result in high performing profitable African American businesses in Quad counties. Our objectives are to promote a better understanding of our private enterprises system. To increase the number of sound African American business in Quad Counties. To coordinate the efforts of commerce, industry & the professions in maintaining & strengthening a sound & healthy business climate in our (4) counties of Will, Kane. Kendall & Dupage. Funding was for membership dues. 3 - 2 -
225
QUAD COUNTY URBAN LEAGUE Education
Quad County Urban League helps to secure equal opportunities for all disadvantaged persons and people of color, including African Americans, women and persons with disabilities. QCUL is dedicated to advocating and establishing programs that facilitate the social and economic growth of African Americans and similarly disadvantaged people in DuPage, Kane, Kendall and Will Counties in Illinois. Funding was for Women's Empowerment Summit - 7 15 -
226
RAINBOW PUSH COALITION Community & Economic Development
The Rainbow PUSH Coalition (RPC) is a multi-racial, multi-issue, progressive, international membership organization fighting for social change, with a mission is to protect, defend, and gain civil rights by leveling the economic and educational playing fields, and to promote peace and justice around the world. Funding was for the annual Martin Luther King breakfast and summer business-development conference. 40 25 25 50
227
RANDOM ACTS OF FLOWERS Environment
Random Acts of Flowers recycles and repurposes flowers by engaging dedicated volunteer teams to deliver beautiful bouquets and moments of kindness to individuals in healthcare facilities across the country.As a recycling "green" nonprofit organization run almost entirely by volunteers, Random Acts of Flowers is committed to nourishing the health of the environment, individuals, and the community. ComEd's funding supported the "purchase" of flowers -- company volunteers assembled them into bouquets and delivered to residents at Misericordia. - 3 - -
228
RAUE CENTER FOR THE ARTS Culture & Arts
Over the past 15 years, Raue Center has become a true arts center that engages the community in collaborative leadership to make the arts central to the lives of all citizens. The 700-seat theatre is a gathering place for northern Illinois residents and is an a central place for educational opportunities for local students. ComEd's funding provides general-operating support and a foursome at the golf outing. 15 18 15 18
229
REAL MEN CHARITES INC Community & Economic Development
The Real Men Charities, Inc. mission is to build healthy families and communities. Goals are to support the development of a safe environment and male support for children and families. Real Men Cook Father's Day events forward the mission and encourages male involvement. 15 - - -
230
REFLECTIONS FOUNDATION Education
The mission of the Polished Pebbles Girls Mentoring Program is to provide girls (7-17 years old) with the opportunity of learning the vital life skill of effective communication. Our Polished Pebbles Girls Mentoring program instills confidence in girls to face the challenges of daily life by substituting aggressive forms of communicating and problem solving with new strategies that allow them to gain a solid reputation and respect without retaliating. Funding supported the annual fundraiser. 3 2 - -
231 REFUGEEONE Health & Social Services RefugeeOne creates opportunity for refugees fleeing war, terror, and persecution to build new lives of safety, dignity, and self-reliance. 3 - 3 -
232
REGIONAL ACCESS & MOBILIZATION PROJECT Health & Social Services
RAMP empowers individuals with disabilities (all disabilities, all ages) through services and advocacy to live an independent life. This is accomplished by partnering with them to make changes in their own lives, seek peer support and remove barriers. RAMP also advocates for the implementation of current laws, promotion of needed legislation and improvement of existing systems for people with disabilities while working to diminish negative attitudes that threaten to impede equal access. Funding supported RAMP's Wheel-A-Thon events, a tradition that takes an ordinary event and introduces a disability awareness aspect to it by focusing on the abilities of people using wheelchairs. 2 2 - -
233
RIALTO SQUARE THEATRE CORP Culture & Arts
The Rialto Square Theatre Foundation's mission is to provide leadership and financial resources to support the cultural and educational programs of the Rialto Square Theatre. Through the efforts of the Foundation, the Rialto can fulfill its role as a cultural leader and to enrich the quality of life for the communities it serves. ComEd's funding supports holiday events open to the public at the theatre. 18 15 15 22
234ROCKFORD AREA CONVENTION & VISITORS BUREAU Community & Economic Development The mission is to promote tourism in the Rockford area. Funding was for
Stroll on State. 10 3 - -
Docket No. 18-____ ComEd Ex. 2.03 Page 187 of 334

Schedule C-7Page 18 of 23
Witness: Tracy
2017 2016 2015 2014Payments Payments Payments Payments
Line Of $1,000 Of $5,000 Of $5,000 Of $5,000No. Organization Organization Program Area Organization Mission and Purpose of 2017 Donation Or More Or More Or More Or More
(A) (B) (C) (D) (E) (F) (G)
Commonwealth Edison Company Charitable Contributions of $1,000 or $5,000 and Greater
Charged To Account 426.1 Donations(In Thousands)
235
ROCKFORD COLLEGE Education
Founded in 1847, Rockford College is an independent, coeducational, liberal arts institution of about 800 students located in Rockford. The college offers Bachelor's degree programs in 31 majors as well as Master's degree programs in business and teaching. ComEd's funding was for an annual fundraising luncheon.
1 - - -
236
ROCKFORD PARK DISTRICT FOUNDATION Community & Economic Development
The Rockford Park District Foundation serves the Rockford Park District by securing philanthropic support on its behalf and enhancing awareness of the District's benefits to the community. It is the mission of the Rockford Park District to "Help People Enjoy Life". The Park District was formed in 1909 to provide safe places for children to play by creating public parks and playgrounds. Its purpose today is to establish and maintain parks and recreation systems that provide for the health, well being, and entertainment of its citizens. It is the second largest municipal park system in Illinois, serving the communities of Rockford, Loves Park, Machesney Park, Cherry Valley, New Milford and adjacent unincorporated areas of Winnebago County. Funding for the HoopStars Free 3-3 Basketball Tournament. 4 - - -
237
ROCKFORD SYMPHONY ORCHESTRA Culture & Arts
The Rockford Symphony Orchestra was founded in 1934 and incorporated in 1943. The RSO's first Music Director and Manager, Arthur Zack, led the orchestra for the next 27 years, during which time the Rockford Area Youth Symphony Orchestra and the Rockford Symphony Orchestra Guild were established. Now in its 80th season, the Rockford Symphony Orchestra continues to fulfill its mission: to lead in the creation of vibrant musical experiences that enlighten, educate, and entertain. Funding was for the Independence Day Spectacular, Classics Series and gala. 25 25 26 25
238
ROSELAND COMMUNITY HOSPITAL FOUNDATION Health & Social Services
The mission of the Roseland Community Hospital Foundation is "to develop quality hospital programs that enable people living in the Greater Roseland Community to grow and lead healthy lives and lifestyles." Funding was for the Roseland Community Hospital Foundation 2015 Crystal Image Gala - - 2 -
239
SCITECH MUSEUM Education
SciTech is an educational resource that serves students and families in Aurora, IL and its surrounding areas. We provide first class informal and structured educational programs in STEM (Science, Technology, Engineering, and Mathematics) each year. SciTech's exciting educational programs encourage those who come through its doors visualize, experiment, and come to understand science through hands-on discovery. The organization of exhibits invite people to use their senses and imagination as they explore hands on science. The unique SciTech Discovery Academy draws families to the area and enhances the image of Aurora. SciTech serves underrepresented populations. SciTech facilitates efforts to increase the participation of those who are underrepresented in STM professions and educational arenas. Funding was for general operating support 10 10 10 10
240
SEARCH INC Health & Social Services
Search, Inc. (Search) was founded in 1968 in Cabrini Green to provide services to children with disabilities who, at the time, were generally excluded from the public school system. Over time, Search expanded its services to adults. Today, the organization's mission is to empower persons with intellectual and developmental disabilities (I/DD) to achieve their full potential, accept a valued role in their community, and lead rich, rewarding lives. We provide high-quality, person-centered services including supported living arrangements, adult learning programs and career services, as well as medical, behavioral, therapeutic and home-based services. Our vision is to create a world where people with intellectual and developmental disabilities can live, learn, work and play together as equals in the community. Our programs serve more than 600 individuals and their families annually at locations stretching from the southwest side of Chicago to the northern suburbs of Waukegan and Mount Prospect. ComEd's funding supports the annual reception/fundraiser. - 10 - -
241
SERENITY HOUSE COUNSELING SERVICES INC Health & Social Services
Serenity House provides a full continuum of care to many indigent individuals who do not otherwise have a place to obtain substance abuse treatment through our Adult and Adolescent Outpatient and Intensive Outpatient services, DUI and Anger Management, and Halfway House and Recovery Homes. It is the only facility in DuPage County that offers Halfway House services with a 90-day treatment program. ComEd gave general-operating support for their programs. 1 - - -
242
SILK ROAD RISING Arts & Culture
Silk Road Theatre Project showcases playwrights of Asian, Middle Eastern, and Mediterranean backgrounds whose works address themes relevant to the peoples of the Silk Road and their Diaspora communities. Through the creation and presentation of outstanding theatre, we promote discourse and dialogue among diverse audiences in Chicago. As Chicago's first theatre company dedicated to representing the experiences of such a distinct grouping of peoples and regions, we give voice to cultures and experiences long absent on the American stage, and aim to integrate these voices into the canon of American theatre. Founded in 2002, Silk Road Theatre Project (SRTP) is the theatre in residence at The Chicago Temple Building in the city's downtown theatre district. Over the last six years, we have produced five World premieres, five Midwest premieres and over 22 staged readings. We have garnered critical acclaim--including accolades from the Chicago Tribune, the Chicago Sun-Times, TimeOut Chicago, the New York Times, American Theatre Magazine, and other media. We have received eight After Dark Awards and, in our first year of eligibility, a Jeff nomination. On March 31, 2008, SRTP was honored with the 2008 Broadway in Chicago Emerging Theatre Award. Silk strives to deepen a sense of community for Chicago area residents of Silk Road backgrounds by presenting their stories honestly and creatively on the stage. We hope to demonstrate to Asian, Middle Eastern, and Mediterranean peoples that increasing their personal involvement and investiture in our city's vibrant cultural life can only enhance its depth and vitality. By putting stories on stage that depict their communities, SRTP is increasing access to the arts for Silk Road peoples in Chicago. ComEd's doination provides funding for year-long productions.
- - - 25
243
SKILLS FOR CHICAGOLANDS FUTURE Community & Economic Development
The mission of Skills for Chicagoland's Future (Skills) is to create demand-driven solutions for employers to get the unemployed and underemployed back to work. Skills' vision is to continuously meet employers' talent needs to create economic opportunity for individuals who are under and unemployed. Skills is an innovative organization, focused on building public/private partnerships to increase economic mobility for low and moderate-income individuals in diverse Chicagoland communities. ComEd's funding is part of an intensive effort to offer training and find jobs for adults in the Chatham neighborhood of Chicago. 45 45 - -
244
SKOKIE CHAMBER OF COMMERCE Civic & Public AffairsThe mission is to promote the interests of business, professional & service organizations in the Village of Skokie and the Greater Chicagoland area. Funding is for annual membership. - - 3 -
245SNOW CITY ARTS FOUNDATION Culture & Arts
The mission of Snow City Arts remains the same as it has been since it was founded: to educate and inspire children in hospitals through the arts. Funding was for a gallery event to showcase participants' art. 5 3 3 5
246
SOCIETY OF ST VINCENT DE PAUL Health & Social Services
The Society of St. Vincent de Paul has offered person-to-person services to those in need since 1857 regardless of religious, ethnic or economic background. The Society works for systematic change, helping people identify the root causes of their poverty and mentoring them on their self-directed journey out of poverty. Funding was used to support programs for low-income families. - 10 10 10
Docket No. 18-____ ComEd Ex. 2.03 Page 188 of 334

Schedule C-7Page 19 of 23
Witness: Tracy
2017 2016 2015 2014Payments Payments Payments Payments
Line Of $1,000 Of $5,000 Of $5,000 Of $5,000No. Organization Organization Program Area Organization Mission and Purpose of 2017 Donation Or More Or More Or More Or More
(A) (B) (C) (D) (E) (F) (G)
Commonwealth Edison Company Charitable Contributions of $1,000 or $5,000 and Greater
Charged To Account 426.1 Donations(In Thousands)
247
SOUTH AUSTIN COALITION Health & Social Services
South Austin Coalition Community Council (SACCC) has a history of providing human and social services in the City of Chicago for more than thirty five (35) years. The Austin community has been the primary beneficiary of the vast network of SACCC's resources and relationships. The strength of our organization is predicated on the dedication of a large volunteer base and established relationships with corporate partners, other community based organizations (CBOs), faith based organizations (FBOs), and community residents; as well as, local, state, and federal agencies. Funding was for general-operating support. - 5 - -
248
SOUTH CENTRAL COMMUNITY Health & Social Services
South Central Community Services, Inc. is a comprehensive human service agency committed to improving the quality of life for individuals and families by providing quality educational, mental health, socio-economic and recreational programs and services throughout metropolitan Chicago.Funding was for the Puttin' on the Hits event 5 - 1 -
249
SOUTH COOK INTERMEDIATE SERVICE CENTER #4 Culture & Arts
The mission of the South Cook Intermediate Service Center is to serve as an advocate for education by providing positive leadership, performing regulatory functions as directed by The School Code of Illinois and the Illinois State Board of Education, coordinating and delivering of state and local services, and disseminating information for educators, school districts and the community. Services that are provided to our 143 public school districts and stakeholders in the Suburban Cook County Region are as follows: Certification, Health & Life Safety; Bus Driver Training; Compliance; Regional Safe Schools; Homeless (McKinney-Vento); and Homeschooling. The South Cook ISC serves as the district office for the Regional Institute for Academic Excellence. Funding was for the annual Scripps Spelling Bee, which is open to all schools in the area. 11 11 11 10
250
SOUTH SIDE IRISH ST PATRICKS DAY PARADE & HERITAGE FOUNDATIO Civic & Public Affairs
The South Side Irish St. Patrick’s Day Parade is a tradition that dates back to 1979 when the creators of the parade, George Hendry and Pat Coakley, led a march of 17 neighborhood children around the block to celebrate family, community and of course, Irish heritage and culture. Since then, the South Side Irish Parade has grown to become the largest community-based Saint Patrick’s Day parade outside of Ireland, featuring 100 entries and thousands of participants and spectators. Each year the parade recognizes organizations that give back and serve the local community. Funding was for the parade. 3 - - -
251
SPECIAL CHILDREN`S CHARITIES Health & Social Services
The mission is to provide year-round sports training and athletic competition in a variety of Olympic-type sports for children and adults with intellectual disabilities, giving them continuing opportunities to develop physical fitness, demonstrate courage, experience joy and participate in a sharing of gifts, skills and friendship with their families, other Special Olympics athletes and the community. Funding was for 50th anniversary and the Polar Plunge. 130 30 30 20
252
SPECIAL OLYMPICS ILLINOIS Health & Social Services
Provide year-round sports training and athletic competition in a variety of Olympic-type sports for children and adults with intellectual disabilities, giving them continuing opportunities to develop physical fitness, demonstrate courage, experience joy and participate in a sharing of gifts, skills and friendship with their families, other Special Olympics athletes and the community. Funding was for the 2015 Inspire Greatness Gala. - - 20 20
253
SPRINGBOARD TO SUCCESS Civic & Public Affairs
Springboard to Success, established in 2014, is the Chicago Housing Authority's non-profit affiliate, focused on assisting CHA residents and youth on a pathway to academic success, economic stability and independence. S2S seeks corporate sponsorship to help underwrite the cost of large resident events such as the Senior Holiday Luncheon. Funding was for the aforementioned luncheon. - - 5 -
254
ST JUDE CHILDRENS RESEARCH HOSPITAL Health & Human Services
The mission of St. Jude Children’s Research Hospital is to advance cures, and means of prevention, for pediatric catastrophic diseases through research and treatment. No child is denied treatment based on race, religion or a family's ability to pay. ComEd's 2014 donation is for the annual Sabor Latino Gala, which is organized by local Latino professionals. - - - 12
255
ST PATRICKS DAY PARADE COMMITTEE OF CHICAGO Community & Economic Development The mission of the Committee is to plan and hold the annual downtown St.
Patrick's Day Parade, which ComEd's funding supported. 5 5 4 -
256
ST PIUS V CHURCH Community & Economic Development
St. Pius V is a Catholic parish in Chicago's Pilsen community. The mission is to accompany all people as they grow in faith, strengthen their families, and build community, promoting the Reign of God in the world. Funding was for the La Cosecha-Celebrating The Harvest event. - - 2 -
257
ST SABINA CHURCH Religious
Coming from humble beginnings more than 100 years ago as a storefront church, St. Sabina went from nearly closing its doors in 1975 to developing into a dynamic church on the Southside of Chicago that has helped to transform the community, influence state laws, and change the lives of countless people across the nation. Over the years, St. Sabina's constant outreach has stretched far beyond the four walls of the sanctuary to serve as a beacon of hope to those in need, while fighting for peace and social justice across the city of Chicago. Sponsorship was of the church's and school's annual fundraising event. 8 5 - -
258
STEP UP WOMENS NETWORK Community & Economic Development
Step Up propels girls from under-resourced communities to fulfill their potential by empowering them to become confident, college-bound, career-focused, and ready to join the next generation of professional women. - - 1 -
259
STEPPENWOLF THEATRE COMPANY Culture & Arts
Maintaining its tradition as an artist-driven theater, Steppenwolf reaches 200,000 individuals annually and produces a five-play Subscription Series devoted to the work of its ensemble that is in the majority comprised of new plays--first as well as second or third productions of recently premiered works. Steppenwolf for Young Adults produces plays coupled with comprehensive educational outreach programs for teens, teachers and families. Funding was for general-operating season support and the annual gala. 50 45 45 45
260 STREATOR AREA UNITED WAY, INC Community & Economic Development The United Way supports a variety of non-profit organizations in the Streator area. ComEd's funding focuses on the annual campaign. 3 3 3 -
261
TARGET AREA DEVELOPMENT CORP Community & Economic Development
Our Mission is to work in partnership with low-to-moderate income communities to build community power and capacity to solve stubborn urban problems using research, organizing, mobilization, and education (ROME) strategies. ComEd provided a grant for general-operating costs. 5 - - -
262
THE BLACK STAR PROJECT Education
From its beginning, The Black Star Project has worked to improve the lives of people in low-income Black and Latino communities, particularly on the south and west sides of Chicago. Often, these communities are plagued with violence, unemployment, and low-academic achievement. TBSP's work is motivated by its vision that all children, with the support of their families, neighborhoods and communities, will become 21st-century global citizens who are globally competent, globally cooperative and globally compassionate. Funding was for the Student Motivation and Mentoring Program. 20 35 23 -
263
THE BOARD OF TRUSTEES OF THE UNIVERSITY OF ILLINOIS Education
The University of Illinois at Chicago is a vital part of the educational, technological and cultural fabric of the region. It is Chicago’s only public research university with 30,000 students, 15 colleges, a hospital and a health sciences system. ComEd's funding supports UIC's Project CHANCE, which provides high-school students living in public housing an opportunity to have year-round STEM instruction and the opportunity to live on campus for part of the summer and engage in campus activities. 30 - - -
264
THE CARA PROGRAM Community & Economic Development
The Cara Program prepares and inspires motivated individuals to break the cycles of homelessness and poverty, transform their lives, strengthen our communities, and forge paths to real and lasting success. Funding was for a program called Transformations: Hope, Jobs, & Opportunity. - - 10 -
Docket No. 18-____ ComEd Ex. 2.03 Page 189 of 334

Schedule C-7Page 20 of 23
Witness: Tracy
2017 2016 2015 2014Payments Payments Payments Payments
Line Of $1,000 Of $5,000 Of $5,000 Of $5,000No. Organization Organization Program Area Organization Mission and Purpose of 2017 Donation Or More Or More Or More Or More
(A) (B) (C) (D) (E) (F) (G)
Commonwealth Edison Company Charitable Contributions of $1,000 or $5,000 and Greater
Charged To Account 426.1 Donations(In Thousands)
265
THE CONSERVATION FOUNDATION Environment
We preserve and restore natural areas and open space, protect rivers and watersheds, and promote stewardship of our environment. Although the Foundation is based in Naperville, an extensive amount of their programs are in ComEd's service territory. Funding was to support the Aurora Green Fest. - 1 - -
266
THE HISTORYMAKERS Culture & Arts
A national 501(c)(3) non-profit research and educational institution committed to preserving and making widely accessible the untold personal stories of both well-known and unsung African Americans. Through the media and a series of user-friendly products, services and events, The HistoryMakers enlightens, entertains and educates the public, helping to refashion a more inclusive record of American history. Funding was for the annual event. - - 10 -
267
THE HOUSE DEVELOPMENT CORPORATION NFP Culture & Arts
To engage Lawndale youth & young adults in the arts, empowering them to reach their full potential while equipping them with marketable skills in order to build confidence and success in all areas of life. Funding was for the North Lawndale Arts Impact and Firehouse Community Art Center to reach students in the arts. 10 10 7 -
268
THE HOUSE THEATRE OF CHICAGO Culture & Arts
It is the mission of The House to unite Chicago in the spirit of Community through amazing feats of storytelling. To this end, the company strives to create new, popular works of theatre and to brand the American theater as an inclusive gathering place where performers and audiences alike join together for the ritual of storytelling. Founded in 2001 by a group of friends and classmates, The House has become known for its imaginative, playfully spirited, and ambitious theatricality. An ensemble of multi-talented performers, writers, designers, choreographers, and musicians, the company employs its interdisciplinary strengths to augment the imagination and spectacle of their storytelling. Funding was for general-operating support for the season and the annual event. - 20 20 20
269
THE JOHN MARSHALL LAW SCHOOL ALUMNI ASSOC Education
The mission is to advance and promote the common interests of The John Marshall Law School and the alumni, students, and friends of the Law School. Funds supported the annual dinner to raise money for scholarships. - 3 - -
270
THE MISSION OF OUR LADY OF MERCY INC Education
Since 1887, Mercy Home for Boys & Girls has been a port in the storm for over 30,000 abused, neglected and abandoned children. Beginning as a place of refuge for homeless children, we now serve youth in residential care at two locations; our Boys Campus located in Chicago's West Loop and our Walsh Girls Campus in the Beverly community. The mission is to save young lives by providing: a safe, nurturing residential treatment home, AfterCare support for former residents and their families, community-based and site based youth mentoring; promoting therapeutic, educational vocational, spiritual and life skill development; and raising public awareness of youth in need. Funding was for Annual Graduates Luncheon. 10 - - -
271
THE NATIONAL CENTER FOR MISSING & EXPLOITED CHILDREN Culture & Arts
The mission of the National Center for Missing & Exploited Children® is to serve as a resource center for law enforcement, families and the public to help find missing children, reduce child sexual exploitation and prevent child victimization. 1 - - -
272
THE ROSE FOUNDATION Civic & Public AffairsThe Rose Foundation Mission is to address the underserved community needs holistically, including but not limited to youth services, education, housing, employment, etc. ComEd provided a general-operating grant. 1 - - -
273
THE SUPPORT GROUP Education
TSG offers educational, cultural and recreational programs for at-risk youth through after-school enrichment programs. The Support Group works directly with students on a daily basis throughout the year providing academic support and counseling.
The mission of The Support Group, is to execute programs which provide the best opportunities for youth to understand the importance of excelling academically and athletically. Emphasis is placed on academic success, test-taking skills, athletic conditioning, leadership, and character building. Funding was for The Support Group proposes Lunch with a Leader.
- 2 - -
274
TRAGEDY TO TRIUMPH FOUNDATION Education
The mission is to provide emotional support to burn survivors and their families., helping young burn survivors achieve a social confidence and meet their education goals. The major focus is to provide funds for those with financial need when they are accepted into an accredited post-secondary institution. Funding was for scholarships. 5 5 5 5
275
UCAN Community and Neighborhood Development
UCAN strives to build strong youth and families through compassionate healing, education and empowerment. ComEd's 2014 donation supports the Youth Leadership Awards Dinner. The dinner is UCAN’s flagship fundraiser held annually in June. This important evening is dedicated to celebrating the academic and personal achievements of UCAN’s outstanding youth and is set to raise $800,000 to directly support programming and services for more than 10,000 children, youth and families at UCAN this year. The evening’s highlights include awards given to five exceptional young people who receive scholarships for higher education. Alongside the youth honorees, UCAN also recognizes a distinguished business and civic leader with the John D. Nichols Impact award. The organization welcomes more than 500 guests each year, including corporate and foundation partners, community leaders and legislators, donors and UCAN youth.
- - - 10
276
UMOJA STUDENT DEVELOPMENT CORP Education
Umoja Student Development Corporation (Umoja) equips young people to succeed in college and confidently claim their future. Our mission is advanced by being an on-the-ground partner for schools and districts focused on ensuring every student graduates from high school ready for college and career success. We achieve this by preparing teachers, staff and school leaders with the knowledge, skills and tools essential to increasing on-track and graduation rates, decreasing disciplinary infractions and increasing college enrollment. Our core program areas include College & Career Readiness, Restorative Justice and Social & Emotional Learning. Funding was for the annual Spring Fling to raise money for the restorative-justice program. 10 10 35 5
277
UNITED NEGRO COLLEGE FUND INC Education
UNCF, United Negro College Fund, is the nation's largest and most effective minority education organization. The mission is to build a robust and nationally-recognized pipeline of under-represented students who, because of UNCF support, become highly-qualified college graduates and to ensure that our network of member institutions is a respected model of best practice in moving students to and through college. Funding was for the annual gala. 50 220 50 50
278
UNITED NEIGHBORHOOD Culture & Arts
It is the mission of UNO to lead the transformation of the Hispanic Community toward an educated, powerful, and prosperous citizenry by engaging and challenging it to redefine its potential and its legacy in metropolitan Chicago and the United States of America. Funding wa for the 9th Annual Carrera de Los Muertos - 5K Race in the Pilsen neigobrhood. - - 4 -
279UNITED WAY OF BOONE COUNTY Community & Economic Development The United Way supports a variety of non-profit organizations in the Booth
County area. ComEd's funding focuses on the annual campaign. 4 4 3 -
Docket No. 18-____ ComEd Ex. 2.03 Page 190 of 334
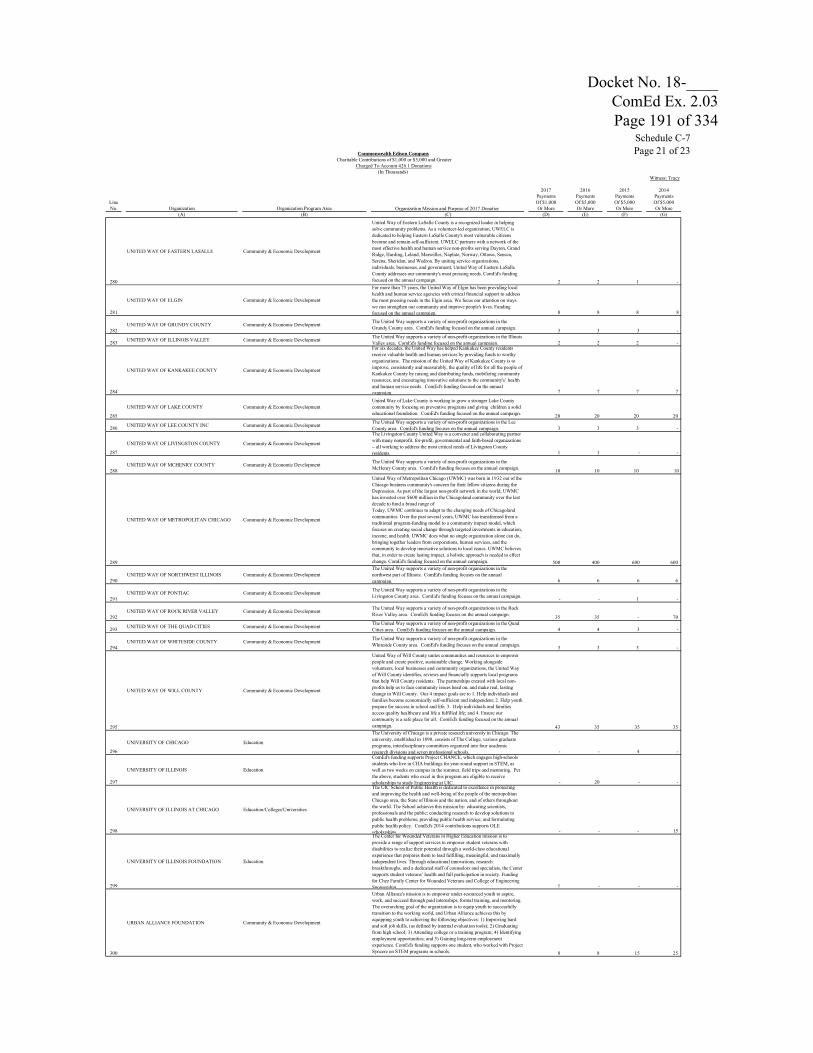
Schedule C-7Page 21 of 23
Witness: Tracy
2017 2016 2015 2014Payments Payments Payments Payments
Line Of $1,000 Of $5,000 Of $5,000 Of $5,000No. Organization Organization Program Area Organization Mission and Purpose of 2017 Donation Or More Or More Or More Or More
(A) (B) (C) (D) (E) (F) (G)
Commonwealth Edison Company Charitable Contributions of $1,000 or $5,000 and Greater
Charged To Account 426.1 Donations(In Thousands)
280
UNITED WAY OF EASTERN LASALLE Community & Economic Development
United Way of Eastern LaSalle County is a recognized leader in helping solve community problems. As a volunteer-led organization, UWELC is dedicated to helping Eastern LaSalle County's most vulnerable citizens become and remain self-sufficient. UWELC partners with a network of the most effective health and human service non-profits serving Dayton, Grand Ridge, Harding, Leland, Marseilles, Naplate, Norway, Ottawa, Seneca, Serena, Sheridan, and Wedron. By uniting service organizations, individuals, businesses, and government, United Way of Eastern LaSalle County addresses our community's most pressing needs. ComEd's funding focused on the annual campaign. 2 2 1 -
281
UNITED WAY OF ELGIN Community & Economic Development
For more than 75 years, the United Way of Elgin has been providing local health and human service agencies with critical financial support to address the most pressing needs in the Elgin area. We focus our attention on ways we can strengthen our community and improve people's lives. Funding focused on the annual campaign. 8 8 8 8
282UNITED WAY OF GRUNDY COUNTY Community & Economic Development The United Way supports a variety of non-profit organizations in the
Grundy County area. ComEd's funding focused on the annual campaign. 3 3 3 -
283 UNITED WAY OF ILLINOIS VALLEY Community & Economic Development The United Way supports a variety of non-profit organizations in the Illinois Valley area. ComEd's funding focused on the annual campaign. 2 2 2 -
284
UNITED WAY OF KANKAKEE COUNTY Community & Economic Development
For six decades, the United Way has helped Kankakee County residents receive valuable health and human services by providing funds to worthy organizations. The mission of the United Way of Kankakee County is to improve, consistently and measurably, the quality of life for all the people of Kankakee County by raising and distributing funds, mobilizing community resources, and encouraging innovative solutions to the community's’ health and human service needs. ComEd's funding focused on the annual campaign. 7 7 7 7
285
UNITED WAY OF LAKE COUNTY Community & Economic DevelopmentUnited Way of Lake County is working to grow a stronger Lake County community by focusing on preventive programs and giving children a solid educational foundation. ComEd's funding focused on the annual campaign. 20 20 20 20
286 UNITED WAY OF LEE COUNTY INC Community & Economic Development The United Way supports a variety of non-profit organizations in the Lee County area. ComEd's funding focuses on the annual campaign. 3 3 3 -
287
UNITED WAY OF LIVINGSTON COUNTY Community & Economic Development
The Livingston County United Way is a convener and collaborating partner with many nonprofit, for-profit, governmental and faith-based organizations – all working to address the most critical needs of Livingston County residents. 1 1 - -
288UNITED WAY OF MCHENRY COUNTY Community & Economic Development The United Way supports a variety of non-profit organizations in the
McHenry County area. ComEd's funding focuses on the annual campaign. 10 10 10 10
289
UNITED WAY OF METROPOLITAN CHICAGO Community & Economic Development
United Way of Metropolitan Chicago (UWMC) was born in 1932 out of the Chicago business community's concern for their fellow citizens during the Depression. As part of the largest non-profit network in the world, UWMC has invested over $600 million in the Chicagoland community over the last decade to fund a broad range of Today, UWMC continues to adapt to the changing needs of Chicagoland communities. Over the past several years, UWMC has transformed from a traditional program-funding model to a community impact model, which focuses on creating social change through targeted investments in education, income, and health. UWMC does what no single organization alone can do, bringing together leaders from corporations, human services, and the community to develop innovative solutions to local issues. UWMC believes that, in order to create lasting impact, a holistic approach is needed to effect change. ComEd's funding focused on the annual campaign. 500 400 600 600
290UNITED WAY OF NORTHWEST ILLINOIS Community & Economic Development
The United Way supports a variety of non-profit organizations in the northwest part of Illinois. ComEd's funding focuses on the annual campaign. 6 6 6 6
291UNITED WAY OF PONTIAC Community & Economic Development The United Way supports a variety of non-profit organizations in the
Livingston County area. ComEd's funding focuses on the annual campaign. - - 1 -
292UNITED WAY OF ROCK RIVER VALLEY Community & Economic Development The United Way supports a variety of non-profit organizations in the Rock
River Valley area. ComEd's funding focuses on the annual campaign. 35 35 - 70
293 UNITED WAY OF THE QUAD CITIES Community & Economic Development The United Way supports a variety of non-profit organizations in the Quad Cities area. ComEd's funding focuses on the annual campaign. 4 4 3 -
294UNITED WAY OF WHITESIDE COUNTY Community & Economic Development The United Way supports a variety of non-profit organizations in the
Whiteside County area. ComEd's funding focuses on the annual campaign. 3 3 3 -
295
UNITED WAY OF WILL COUNTY Community & Economic Development
United Way of Will County unites communities and resources to empower people and create positive, sustainable change. Working alongside volunteers, local businesses and community organizations, the United Way of Will County identifies, reviews and financially supports local programs that help Will County residents. The partnerships created with local non-profits help us to face community issues head on, and make real, lasting change in Will County. Our 4 impact goals are to 1. Help individuals and families become economically self-sufficient and independent; 2. Help youth prepare for success in school and life; 3. Help individuals and families access quality healthcare and life a fulfilled life; and 4. Ensure our community is a safe place for all. ComEd's funding focused on the annual campaign. 43 35 35 35
296
UNIVERSITY OF CHICAGO Education
The University of Chicago is a private research university in Chicago. The university, established in 1890, consists of The College, various graduate programs, interdisciplinary committees organized into four academic research divisions and seven professional schools. - - 4 -
297
UNIVERSITY OF ILLINOIS Education
ComEd's funding supports Project CHANCE, which engages high-schools students who live in CHA buildings for year-round support in STEM, as well as two weeks on campus in the summer, field trips and mentoring. Per the above, students who excel in this program are eligible to receive scholarships to study Engineering at UIC. - 20 - -
298
UNIVERSITY OF ILLINOIS AT CHICAGO Education/Colleges/Universities
The UIC School of Public Health is dedicated to excellence in protecting and improving the health and well-being of the people of the metropolitan Chicago area, the State of Illinois and the nation, and of others throughout the world. The School achieves this mission by: educating scientists, professionals and the public; conducting research to develop solutions to public health problems; providing public health service; and formulating public health policy. ComEd's 2014 contributions supports OLE scholarships. - - - 15
299
UNIVERSITY OF ILLINOIS FOUNDATION Education
The Center for Wounded Veterans in Higher Education mission is to provide a range of support services to empower student veterans with disabilities to realize their potential through a world-class educational experience that prepares them to lead fulfilling, meaningful, and maximally independent lives. Through educational innovations, research breakthroughs, and a dedicated staff of counselors and specialists, the Center supports student veterans’ health and full participation in society. Funding for Chez Family Center for Wounded Veterans and College of Engineering Sponsorship. 1 - - -
300
URBAN ALLIANCE FOUNDATION Community & Economic Development
Urban Alliance's mission is to empower under-resourced youth to aspire, work, and succeed through paid internships, formal training, and mentoring. The overarching goal of the organization is to equip youth to successfully transition to the working world, and Urban Alliance achieves this by equipping youth to achieving the following objectives: 1) Improving hard and soft job skills, (as defined by internal evaluation tools); 2) Graduating from high school; 3) Attending college or a training program; 4) Identifying employment opportunities; and 5) Gaining long-term employment experience. ComEd's funding supports one student, who worked with Project Syncere on STEM programs in schools. 8 8 15 25
Docket No. 18-____ ComEd Ex. 2.03 Page 191 of 334

Schedule C-7Page 22 of 23
Witness: Tracy
2017 2016 2015 2014Payments Payments Payments Payments
Line Of $1,000 Of $5,000 Of $5,000 Of $5,000No. Organization Organization Program Area Organization Mission and Purpose of 2017 Donation Or More Or More Or More Or More
(A) (B) (C) (D) (E) (F) (G)
Commonwealth Edison Company Charitable Contributions of $1,000 or $5,000 and Greater
Charged To Account 426.1 Donations(In Thousands)
301
WESTERN SOCIETY OF ENGINEERS Education
The Western Society of Engineer’s mission is to stimulate children of all ages to consider careers in engineering, especially through hands-on school projects, as well as highlight the contributions of engineers whose professional attainments have preeminently advanced the welfare of human kind. Funding was for the Washington Awards Dinner. 10 - 10 -
302
WESTSIDE COMMUNITY SERVICES ORGANIZATION Health & Social Services
Chicago Area Project -- a part of this organization -- is a strong network of more than 40 grassroots organizations and special projects aimed at promoting positive youth development and preventing juvenile delinquency through community-building. 1 - - -
303
WESTSIDE CULTURAL FOUNDATION Culture & Arts
The Westside Cultural Foundation was established in 2012 in an effort to create cultural and educational outlets for the youth, adults and seniors of the West Side of Chicago and to support the Chicago Westside Music Festival. - 10 - 10
304
WILL COUNTY REGIONAL OFC. OF EDUCATION Education The office oversee public education for Will County. Funding was for the
annual Scripps Spelling Bee, which is open to all schools in the area. 7 7 7 9
305
WINGS PROGRAM INC Health & Social Services
The mission of WINGS Program, Inc. is to provide housing, integrated services, education and advocacy to end domestic violence. History: WINGS was started in 1985 as a grassroots organization by members of a local church with the desire to help homeless women and children in the northwest suburbs of Chicago, an area with few resources for these families. WINGS is committed to treating each parent and child escaping domestic violence in a respectful and compassionate manner while valuing the unique qualities and needs of each family. ComEd's support was for the annual gala. 11 10 - -
306
WOMEN EMPLOYED INSTITUTE Community & Economic Development
Women Employed (WE) was founded in 1973 as a grassroots membership organization, committed to eradicating the practices that limited women’s opportunities and pay and demeaned their contributions to the workplace. WE has played a leadership role in many of the important economic advances women have made over the last four decades, opening white-collar opportunities for women, winning stronger enforcement of equal opportunity laws, calling public attention to discriminatory workplace practices and increasing women’s participation in post-secondary education and training leading to good jobs. Current work focuses on increasing opportunities and security for the millions of women who remain in low-wage jobs. Funding for the Working Lunch 65 - 20 20
307
WOMEN`S BAR ASSOCIATION OF ILLINOIS Community & Economic Development
The Women’s Bar Association of Illinois is the only statewide bar association for women in Illinois. Our members include partners and associates of large, medium, and small firms, sole practitioners, law professors, judges, political icons, public servants and in-house counsel. Funding was focused on the WBAI Joint Professional Reception - - 3 -
308
WOMENS BUSINESS DEVELOPMENT Community & Economic Development
The mission of the Women's Business Development Center (WBDC) is to provide services and programs that support and accelerate women's business ownership and strengthen their impact on the economy. ComEd's funding supported WBDConnect to deliver impactful and relevant capacity building, contracting, procurement and access to capital opportunities for women, minority and veteran suppliers. 25 25 - -
309
WORLD BUSINESS CHICAGO Community & Economic Development
World Business Chicago drives regional economic growth. We collaborate to create jobs, cultivate talent, and put Chicago at the forefront of the global economy. A unique public-private partnership, WBC engages business and community leaders to advance Chicago's Plan for Economic Growth and Jobs. Funding is for the CASE (Chicago Anchors for a Strong Economy program), fostering strategic relationships between anchor institutions (universities, cultural institutions, hospitals, government, businesses like ComEd, etc.) and small businesses who can supply their needs, to build economic vitality across Chicago's neighborhoods 50 50 - -
310
WREATHS ACROSS AMERICA Health & Social Services
Each December on National Wreaths Across America Day, our mission to Remember, Honor and Teach is carried out by coordinating wreath-laying ceremonies at Arlington National Cemetery, as well as over 1,100 additional locations in all 50 U.S. states, at sea, and abroad. ComEd's funding allows the purchase of wreaths that company volunteers bring to local cemeteries. - 2 - -
311
WRITERS THEATRE INC Culture & Arts
Writers Theatre exists to explore productions in which the word on the page and the artists that bring the word to life hold primary importance. Central to this mission are three important core values: valuing text, both classic and contemporary, as the fundamental source of inspiration; creating deliberately intimate performances where audiences are face-to-face with powerful stories; and honoring the time and commitment of our artists by remaining at the forefront of industry compensation. With a reputation for consistent artistic excellence, innovative educational programming and strong ties to our community, Writers Theatre has built an award-winning repertoire and today serves as a vital and highly-regarded company in the Chicago theatre community. ComEd's funding was used for general-operating support for the season. 25 25 25 20
312
XI LAMBDA EDUCATIONAL FOUNDATION INC Education
The Xi Lambda Educational Foundation is a non profit organization established to enhance the educational options of disadvantaged children and adults. The primary mission of the Foundation is to provide underprivileged elementary and high school-aged students with educational opportunities that transcend the traditional parameters and boundaries of public education. The Foundation also enhances educational, vocational and technological options for adults through existing literacy programs. ComEd's contribution is in support of the Spring showcase. For over a decade, the Educational Foundation has hosted an annual Spring Fashion Show and Luncheon as its major fund-raising event, a vehicle for Community and corporate involvement, and to introduce our scholarship recipients for the coming academic year. With the vigorous support of the Brothers and friends of Xi Lambda Chapter, this event can continue to generate revenue to support scholarships for deserving students in our Community.
- - - 5
313
YMCA OF METROPOLITAN CHICAGO Community & Economic Development
YWCA Metropolitan Chicago is the oldest and largest women's organization in the region, with a mission to eliminate racism and empower women. For 139 years, YWCA Metropolitan Chicago has been committed to serving the evolving needs of women and girls. Today, it helps more than 150,000 women and children annually through programs. The YWCA is the largest provider of sexual assault support services in the state of Illinois, offering crisis intervention, counseling, prevention education and medical and legal advocacy services, and also offers career, financial management and business services to help women achieve financial stability, obtain training to enter non-traditional careers and provide young women STEM education in our TechGYRLS program. Funding was for the annual luncheon.
10 - - -
314
YOUNG WOMENS LEADERSHIP CHARTER SCHOOL Education
The Young Women's Leadership Charter School of Chicago inspires urban girls to engage in rigorous college preparatory learning in a small school emphasizing on math, science and technology that nurtures their self-confidence and challenges them to achieve. At YWLCS, we believe in a “whole girl” approach to education. We meet all girls where they are academically, socially, and emotionally, and provide them with the resources and experiences to develop into contributing women in society. Funding was for the school's Mentor Program and annual luncheon. 15 - - -
Docket No. 18-____ ComEd Ex. 2.03 Page 192 of 334

Schedule C-7Page 23 of 23
Witness: Tracy
2017 2016 2015 2014Payments Payments Payments Payments
Line Of $1,000 Of $5,000 Of $5,000 Of $5,000No. Organization Organization Program Area Organization Mission and Purpose of 2017 Donation Or More Or More Or More Or More
(A) (B) (C) (D) (E) (F) (G)
Commonwealth Edison Company Charitable Contributions of $1,000 or $5,000 and Greater
Charged To Account 426.1 Donations(In Thousands)
315
YOUTH GUIDANCE Education
Youth Guidance creates and implements school-based programs that enable at-risk children to overcome obstacles, focus on their education and, ultimately, to succeed in school and in life.
Youth Guidance has served children and youth in Chicago's most under-resourced communities for 91 years. Founded in 1924 as the Church Mission of Help, the agency was originally formed to assist girls in need of shelter, clothing, medical care, financial help, legal assistance, and educational or vocational opportunities. In 1962, the Church Mission of Help merged with an agency serving boys in family court and became Youth Guidance. In 1969, through a partnership with Chicago Public Schools, Youth Guidance established its first full-time offices within public schools, laying the foundation for today's comprehensive programs that reinforce academic curricula and strengthen relationships between parents, children, and teachers.
Youth Guidance offers programs in 80 of the most challenging schools across Chicago, guiding young people through their education and setting them on the path toward a healthy and successful future. We meet kids where they are -- physically and emotionally -- to help them recognize and reach their full potential. The schools are spread throughout 40 of Chicago's 79 neighborhoods and three suburban Cook County communities. The schools and communities served by Youth Guidance are typically under-resourced and characterized by high poverty, low-academic achievement, and a high incidence of crime and violence.
Funding is for the annual gala. - 5 5 5
316
YOUTH TECHNOLOGY CORPS NFP INC Education
YTC is transforming teens, empowering them with the skills necessary for the technology of the 21st century. Enlisting teens as allies, YTC youth improve their skills while donating technology to their communities. ComEd's funding is for a new program centered in Bridgeport for teens to learn to refurbish computers, to be donated to local senior centers and other nonprofit organizations.
- 20 - -
317YWCA OF ROCKFORD Community & Economic Development
YWCA is dedicated to eliminating racism, empowering women and promoting peace, justice, freedom and dignity for all. Funding was for YWCA La Voz Latina Banquet. 5 - 3 -
318Total of Donations to Organizations Receiving Less Than $1,000 (2015-2017) 9 2 4
319Total of Donations to Organizations Receiving Less Than $5,000 (2014) 98
320ILLINOIS SCIENCE AND ENERGY INNOVATION FOUNDATION Education
The Illinois Science and Energy Innovation Foundation (ISEIF) was created to inform and engage Illinois consumers in the transformation to a digital electric grid. ISEIF accomplishes this through funding innovative education, outreach, and research projects in correspondence with smart meter deployment timelines. 2,675 2,667 2,661 2,658
321Less: FMV of consideration received (meals, tickets, admissions) (215) (199) (126) (61)
322 Amount of Charitable Contributions Included in the Revenue Requirement in this proceeding: 7,414$
323 Charitable Contributions Allowed in Prior Cases 7,250$ 6,920$ 6,456$
Docket No. 18-____ ComEd Ex. 2.03 Page 193 of 334

Schedule C-8Page 1 of 1
Witness: Tracy
Line No. Account Account Description 2017 Actual Adjustments Jurisdictional (1)
(A) (B) (C) (D) (E)
1 909 Informational and Instructional 2 Advertising Expenses 9,135$ -$ 9,135$ (2)
3 912 Demonstration and Selling Expenses - - -
4 913 Advertising Expenses - - -
5 916 Miscellaneous Sales Expenses - - -
6 930.1 General Advertising Expenses 4,276 (4,276) (3) -
7 Total 13,411$ (4,276)$ 9,135$
Notes:(1) Expense included on Schedule C-1.(2) See WPC-8 for supporting workpapers.(3) Excludes costs of program advertising which is not for informational or instructional purposes. This includes $494,000 of advertising expenses related to the EIMA Customer Assistance Programs.
Commonwealth Edison CompanyDemonstration and Selling, Advertising, and Miscellaneous Sales Expenses
Year 2017(In Thousands)
Docket No. 18-____ ComEd Ex. 2.03 Page 194 of 334

Schedule C-9Page 1 of 1
Commonwealth Edison CompanyCivic, Political and Related Activities (1)
(In Thousands)
Witness: Tracy
LineNo. Description 2017 2016 2015 2014
(A) (B) (C) (D) (E)
1 Total Expenditures Reported Under the Lobbyist Registration Act (2) 31$ 87$ 37$ 18$
2 Lobbyist Registration Fees (3) 4 3 4 9
3 Total 35$ 90$ 41$ 27$
Notes:(1) Amounts were recorded in Account 426.4, Expenditures for Certain Civic, Political and Related Activities.(2) Expenditures as reported by ComEd on the Illinois Lobbyist Expenditure Report for each year.(3) Annual registration fees for ComEd and its registered lobbyists.
Docket No. 18-____ ComEd Ex. 2.03 Page 195 of 334

Schedule C-10Page 1 of 1
Witness: Tracy
LineNo. Description
(A)
1 ComEd is not yet requesting recovery of its rate case expenses related to
2 this proceeding as none were incurred during 2017. ComEd will request
3 recovery of these expenses in future filings as costs are incurred.
Commonwealth Edison CompanyRate Case Expenses
Docket No. 18-____ ComEd Ex. 2.03 Page 196 of 334

Schedule C-10.1Page 1 of 1
Commonwealth Edison CompanyRate Case Expense Comparisons
(In Thousands)
Witness: Tracy
Estimated Incurred through Line For Current December 31, 2017No. Description Case (1) ICC Dkt. No. 17-0196
(A) (B) (C)
1 Delivery Services Formula Rate Case:2 Outside Consultants and Witnesses 155$ 3 Outside Legal Services 448
4 Total Rate Case Expense 603$
5 Percent Difference From Last Case 8%
Notes:(1) ComEd is not yet requesting recovery of its rate case expenses related to this
proceeding as none were incurred during 2017. ComEd will request recoveryof these expenses in future filings as costs are incurred.
(2) In 2017 ComEd also incurred costs related to previous delivery service rate cases,which are not included here.
Docket No. 18-____ ComEd Ex. 2.03 Page 197 of 334

Schedule C-11.1Page 1 of 1
Witness: Tracy
LineNo. Amounts Charged To: 2017 2016 2015 2014
(A) (B) (C) (D) (E)
1 Operation & Maintenance Expense:2 Power Production 1,365$ 1,393$ 1,349$ 1,414$ 3 Transmission 41,701 42,038 40,663 38,529 4 Distribution 159,509 161,664 170,830 158,359 5 Customer Accounts 103,769 114,959 122,576 127,445 6 Sales - - - - 7 Administrative & General 41,865 50,951 48,251 41,937
8 Total Charged To Expense 348,209$ 371,005$ 383,669$ 367,684$
9 Construction and Other Accounts:10 Construction 329,942$ 326,313$ 297,026$ 252,197$ 11 Plant Removal 44,535 42,804 38,318 28,608 12 Other Accounts 50,830 45,487 41,763 37,545 13 Total Charged To Construction14 and Other Accounts 425,307$ 414,604$ 377,108$ 318,350$
15 Total Direct Payroll 773,516$ 785,609$ 760,777$ 686,034$
Note:(1) From FERC Form 1, Pages 354-355.
Direct Payroll By Function (1)(In Thousands)
Commonwealth Edison Company
Docket No. 18-____ ComEd Ex. 2.03 Page 198 of 334

For the Month Ending January 31, 2017
2016 Dec Actual Actual Budget Variance Variance % Prior Month Year End
2016 Month YTD YTD Average Vacancy RateDistribution Ops - Chicago 641 632 640 8 1% 641 641 -9 -9 620 3%Distribution Ops - Suburban 1,495 1,487 1,498 11 1% 1,495 1,495 -8 -8 1,497 0%Ofc of SVP Distribution Ops 7 13 24 11 46% 7 7 6 6 21 11%Distribution Sys Operations 291 277 275 -2 -1% 291 291 -14 -14 266 3%Technical Services 415 409 414 5 1% 415 415 -6 -6 409 1%Office of EVP - Operations 3 3 3 0 0% 3 3 0 0 3 6%Strategic & Support Services 269 269 279 10 3% 269 269 0 0 268 4%Transmission and Substation 1,201 1,201 1,234 33 3% 1,201 1,201 0 0 1,217 1%Operations Admin 0 8 5 -3 -60% - 0 8 8 9 -75%TOTAL OPERATIONS 4,322 4,299 4,372 72 2% 4,322 4,322 -23 -23 4,309 1%
Automated Meter Infrastructure 277 272 280 8 3% 277 277 -5 -5 251 11%Customer Channels 480 477 469 -8 -2% 480 480 -3 -3 464 1%Customer Field Ops 466 455 468 13 3% 466 466 -11 -11 414 12%Customer Revenue Assurance 133 134 139 5 4% 133 133 1 1 130 6%SrVP Customer Operations 2 2 2 0 0% 2 2 0 0 2 0%Environmental Programs 49 49 53 4 8% 49 49 0 0 54 -2%
CED Marketing 17 17 17 0 0% 17 17 0 0 17 -2%TOTAL CUSTOMER OPERATIONS 1,424 1,406 1,428 22 2% 1,424 1,424 -18 -18 1,332 7%
Office of the Chairman/CEO 4 4 4 0 0% 4 4 0 0 5 -17%Office of the President -ComEd 2 2 2 0 0% 2 2 0 0 2 0%Utility of the Future 0 1 11 10 91% - 0 1 1 7 40%TOTAL OFFICE OF THE CEO/PRESIDENT-CED 6 7 17 10 59% 6 6 1 1 13 22%
Claims 35 30 30 0 0% 35 35 -5 -5 29 2%Legal 3 2 2 0 0% 3 3 -1 -1 2 0%Energy Acquisition - CED 27 27 27 0 0% 27 27 0 0 27 -2%
CED-Regulatory & Strategic Srv 29 28 30 2 7% 29 29 -1 -1 28 7%TOTAL REP/GENERAL COUNSEL 94 87 89 2 2% 94 94 -7 -7 86 3%
ComEd External Affairs and ESO 101 101 103 2 2% 101 101 0 0 103 0%Offce VP State & Legislative 9 9 9 0 0% 9 9 0 0 9 2%Gov Affairs Strategy & Support 5 5 6 1 17% 5 5 0 0 6 3%SVP Govt & Ext Affs 4 4 3 -1 -33% 4 4 0 0 4 -25%ComEd Corporate Relations 4 4 4 0 0% 4 4 0 0 4 6%ComEd Economic Development 5 5 5 0 0% 5 5 0 0 5 3%TOTAL OFFICE SVP GOVT & EXT AFFS-CED 128 128 130 2 2% 128 128 0 0 130 0%
CED Real Estate & Facilities 40 40 39 -1 -3% 40 40 0 0 39 1%
Ops Strategy and Bus Intellige 19 19 20 1 5% 19 19 0 0 18 12%
TOTAL OFFICE OF SVP STRATEGY & ADMIN 59 59 59 0 0% 59 59 0 0 56 5%
Finance 20 20 19 -1 -6% 20 20 0 0 21 -12%ComEd Finance 50 51 54 3 5% 50 50 1 1 53 2%Communications 12 12 12 0 -2% 12 12 0 0 11 4%Human Resources 38 38 38 0 0% 38 38 0 0 38 0%IT 34 34 39 5 13% 34 34 0 0 36 7%Legal - ComEd 12 12 12 0 -2% 12 12 0 0 11 3%Supply Services 211 207 209 2 1% 211 211 -4 -4 207 1%TOTAL FUNCTIONAL GROUPS 377 374 382 8 2% 377 377 -3 -3 378 1%
TOTAL COMED HEADS 6,410 6,360 6,477 117 2% 6,410 6,410 -50 -50 6,305 3%
ComEd Detail FTE's
Net New Hires / Attrition
Schedule C-11.2Page 1 of 48
Witness: Tracy
Docket No. 18-____ ComEd Ex. 2.03 Page 199 of 334

For the Month Ending February 28, 2017
2016 Dec Actual Actual Budget Variance Variance % Prior Month Year End
2016 Month YTD YTD Average Vacancy RateDistribution Ops - Chicago 641 621 637 16 3% 632 641 -11 -20 620 3%Distribution Ops - Suburban 1,495 1,490 1,510 20 1% 1,487 1,495 3 -5 1,497 1%Ofc of SVP Distribution Ops 7 4 12 8 67% 13 7 -9 -3 21 -78%Distribution Sys Operations 291 287 280 -7 -3% 277 291 10 -4 266 5%Technical Services 415 405 418 13 3% 409 415 -4 -10 409 2%Office of EVP - Operations 3 3 3 0 0% 3 3 0 0 3 6%Strategic & Support Services 269 270 281 11 4% 269 269 1 1 268 5%Transmission and Substation 1,201 1,222 1,244 22 2% 1,201 1,201 21 21 1,217 2%Operations Admin 0 9 10 1 10% 8 0 1 9 9 13%TOTAL OPERATIONS 4,322 4,311 4,395 83 2% 4,299 4,322 12 -11 4,309 2%
Automated Meter Infrastructure 277 278 280 2 1% 272 277 6 1 251 11%Customer Channels 480 477 467 -10 -2% 477 480 1 -2 464 1%Customer Field Ops 466 431 447 16 4% 455 466 -24 -35 414 7%Customer Revenue Assurance 133 133 139 6 4% 134 133 -1 0 130 6%SrVP Customer Operations 2 2 2 0 0% 2 2 0 0 2 0%Environmental Programs 49 48 53 5 9% 49 49 -1 -1 54 -2%
CED Marketing 17 17 17 0 0% 17 17 0 0 17 -2%TOTAL CUSTOMER OPERATIONS 1,424 1,387 1,405 19 1% 1,406 1,424 -19 -37 1,332 5%
Office of the Chairman/CEO 4 4 4 0 0% 4 4 0 0 5 -17%Office of the President -ComEd 2 2 2 0 0% 2 2 0 0 2 0%Utility of the Future 0 2 11 9 82% 1 0 1 2 7 40%TOTAL OFFICE OF THE CEO/PRESIDENT-CED 6 8 17 9 53% 7 6 1 2 13 22%
Claims 35 30 30 0 0% 30 35 0 -5 29 2%Legal 3 2 2 0 0% 2 3 0 -1 2 0%Energy Acquisition - CED 27 27 27 0 0% 27 27 0 0 27 -2%
CED-Regulatory & Strategic Srv 29 29 29 0 0% 28 29 1 0 28 4%TOTAL REP/GENERAL COUNSEL 94 88 88 0 0% 87 94 1 -6 86 1%
ComEd External Affairs and ESO 101 102 102 0 0% 101 101 1 1 103 -1%Offce VP State & Legislative 9 9 9 0 0% 9 9 0 0 9 2%Gov Affairs Strategy & Support 5 5 6 1 17% 5 5 0 0 6 3%SVP Govt & Ext Affs 4 4 3 -1 -33% 4 4 0 0 4 -25%ComEd Corporate Relations 4 4 4 0 0% 4 4 0 0 4 6%ComEd Economic Development 5 5 5 0 0% 5 5 0 0 5 3%TOTAL OFFICE SVP GOVT & EXT AFFS-CED 128 129 129 0 0% 128 128 1 1 130 -1%
CED Real Estate & Facilities 40 39 39 0 0% 40 40 -1 -1 39 1%
Ops Strategy and Bus Intellige 19 19 20 1 5% 19 19 0 0 18 12%
TOTAL OFFICE OF SVP STRATEGY & ADMIN 59 58 59 1 2% 59 59 -1 -1 56 5%
Finance 20 20 19 -1 -6% 20 20 0 0 21 -12%ComEd Finance 50 51 54 3 5% 51 50 0 1 53 2%Communications 12 12 12 0 -2% 12 12 0 0 11 4%Human Resources 38 38 38 0 0% 38 38 0 0 38 0%IT 34 34 39 5 13% 34 34 0 0 36 7%Legal - ComEd 12 12 12 0 -2% 12 12 0 0 11 3%Supply Services 211 206 209 3 1% 207 211 -1 -5 207 1%TOTAL FUNCTIONAL GROUPS 377 373 382 9 2% 374 377 -1 -4 378 1%
TOTAL COMED HEADS 6,410 6,354 6,475 121 2% 6,360 6,410 -6 -56 6,305 3%
ComEd Detail FTE's
Net New Hires / Attrition
Schedule C-11.2Page 2 of 48
Witness: Tracy
Docket No. 18-____ ComEd Ex. 2.03 Page 200 of 334

For the Month Ending March 31, 2017
2016 Dec Actual Actual Budget Variance Variance % Prior Month Year End
2016 Month YTD YTD Average Vacancy RateDistribution Ops - Chicago 641 619 636 17 3% 621 641 -2 -22 620 2%Distribution Ops - Suburban 1,495 1,484 1,505 21 1% 1,490 1,495 -6 -11 1,497 1%Ofc of SVP Distribution Ops 7 4 12 8 67% 4 7 0 -3 21 -78%Distribution Sys Operations 291 289 277 -12 -4% 287 291 2 -2 266 4%Technical Services 415 406 419 13 3% 405 415 1 -9 409 2%Office of EVP - Operations 3 3 3 0 0% 3 3 0 0 3 6%Strategic & Support Services 269 272 279 7 2% 270 269 2 3 268 4%Transmission and Substation 1,201 1,217 1,241 24 2% 1,222 1,201 -5 16 1,217 2%Operations Admin 0 9 10 1 10% 9 0 0 9 9 13%TOTAL OPERATIONS 4,322 4,303 4,382 78 2% 4,311 4,322 -8 -19 4,309 2%
Automated Meter Infrastructure 277 271 280 9 3% 278 277 -7 -6 251 11%Customer Channels 480 475 490 15 3% 477 480 -3 -5 464 5%Customer Field Ops 466 459 467 8 2% 431 466 28 -7 414 11%Customer Revenue Assurance 133 132 132 0 0% 133 133 -1 -1 130 1%SrVP Customer Operations 2 2 2 0 0% 2 2 0 0 2 0%Environmental Programs 49 49 52 3 6% 48 49 1 0 54 -4%
CED Marketing 17 16 18 2 11% 17 17 -1 -1 17 4%TOTAL CUSTOMER OPERATIONS 1,424 1,404 1,441 37 3% 1,387 1,424 17 -20 1,332 8%
Office of the Chairman/CEO 4 6 4 -2 -50% 4 4 2 2 5 -17%Office of the President -ComEd 2 2 2 0 0% 2 2 0 0 2 0%Utility of the Future 0 3 11 8 73% 2 0 1 3 7 40%TOTAL OFFICE OF THE CEO/PRESIDENT-CED 6 11 17 6 35% 8 6 3 5 13 22%
Claims 35 28 30 2 7% 30 35 -2 -7 29 2%Legal 3 2 2 0 0% 2 3 0 -1 2 0%Energy Acquisition - CED 27 28 28 0 0% 27 27 1 1 27 2%
CED-Regulatory & Strategic Srv 29 28 29 1 3% 29 29 -1 -1 28 4%TOTAL REP/GENERAL COUNSEL 94 86 89 3 3% 88 94 -2 -8 86 3%
ComEd External Affairs and ESO 101 102 100 -2 -2% 102 101 0 1 103 -3%Offce VP State & Legislative 9 9 9 0 0% 9 9 0 0 9 2%Gov Affairs Strategy & Support 5 6 6 0 0% 5 5 1 1 6 3%SVP Govt & Ext Affs 4 3 4 1 25% 4 4 -1 -1 4 6%ComEd Corporate Relations 4 4 4 0 0% 4 4 0 0 4 6%ComEd Economic Development 5 5 5 0 0% 5 5 0 0 5 3%TOTAL OFFICE SVP GOVT & EXT AFFS-CED 128 129 128 -1 -1% 129 128 0 1 130 -2%
CED Real Estate & Facilities 40 39 40 1 3% 39 40 0 -1 39 4%
Ops Strategy and Bus Intellige 19 19 19 0 0% 19 19 0 0 18 7%
TOTAL OFFICE OF SVP STRATEGY & ADMIN 59 58 59 1 2% 58 59 0 -1 56 5%
Finance 20 21 19 -2 -11% 20 20 1 1 21 -12%ComEd Finance 50 51 54 3 5% 51 50 0 1 53 2%Communications 12 11 12 1 6% 12 12 -1 -1 11 4%Human Resources 38 37 38 1 3% 38 38 -1 -1 38 0%IT 34 35 39 4 10% 34 34 1 1 36 7%Legal - ComEd 12 12 12 0 -2% 12 12 0 0 11 3%Supply Services 211 204 209 5 2% 206 211 -2 -7 207 1%TOTAL FUNCTIONAL GROUPS 377 371 382 11 3% 373 377 -2 -6 378 1%
TOTAL COMED HEADS 6,410 6,362 6,498 136 2% 6,354 6,410 8 -48 6,305 3%
ComEd Detail FTE's
Net New Hires / Attrition
Schedule C-11.2Page 3 of 48
Witness: Tracy
Docket No. 18-____ ComEd Ex. 2.03 Page 201 of 334

For the Month Ending April 30, 2017
2016 Dec Actual Actual Budget Variance Variance % Prior Month Year End
2016 Month YTD YTD Average Vacancy RateDistribution Ops - Chicago 641 613 626 13 2% 619 641 -6 -28 620 1%Distribution Ops - Suburban 1,495 1,476 1,510 34 2% 1,484 1,495 -8 -19 1,497 1%Ofc of SVP Distribution Ops 7 4 58 54 93% 4 7 0 -3 21 63%Distribution Sys Operations 291 287 278 -9 -3% 289 291 -2 -4 266 4%Technical Services 415 402 421 19 5% 406 415 -4 -13 409 3%Office of EVP - Operations 3 3 3 0 0% 3 3 0 0 3 6%Strategic & Support Services 269 271 279 8 3% 272 269 -1 2 268 4%Transmission and Substation 1,201 1,207 1,234 27 2% 1,217 1,201 -10 6 1,217 1%Operations Admin 0 9 10 1 10% 9 0 0 9 9 13%TOTAL OPERATIONS 4,322 4,272 4,419 147 3% 4,303 4,322 -31 -50 4,309 2%
Automated Meter Infrastructure 277 276 280 4 1% 271 277 5 -1 251 11%Customer Channels 480 472 486 14 3% 475 480 -2 -7 464 4%Customer Field Ops 466 465 489 24 5% 459 466 6 -1 414 15%Customer Revenue Assurance 133 132 129 -3 -2% 132 133 0 -1 130 -1%SrVP Customer Operations 2 2 2 0 0% 2 2 0 0 2 0%Environmental Programs 49 50 52 2 4% 49 49 1 1 54 -4%
CED Marketing 17 16 18 2 11% 16 17 0 -1 17 4%TOTAL CUSTOMER OPERATIONS 1,424 1,413 1,456 43 3% 1,404 1,424 10 -10 1,332 8%
Office of the Chairman/CEO 4 6 4 -2 -50% 6 4 0 2 5 -17%Office of the President -ComEd 2 2 2 0 0% 2 2 0 0 2 0%Utility of the Future 0 4 11 7 64% 3 0 1 4 7 40%TOTAL OFFICE OF THE CEO/PRESIDENT-CED 6 12 17 5 29% 11 6 1 6 13 22%
Claims 35 28 30 2 7% 28 35 0 -7 29 2%Legal 3 2 2 0 0% 2 3 0 -1 2 0%Energy Acquisition - CED 27 27 28 1 4% 28 27 -1 0 27 2%
CED-Regulatory & Strategic Srv 29 26 28 2 7% 28 29 -2 -3 28 0%TOTAL REP/GENERAL COUNSEL 94 83 88 5 6% 86 94 -3 -11 86 1%
ComEd External Affairs and ESO 101 103 101 -2 -2% 102 101 1 2 103 -2%Offce VP State & Legislative 9 9 9 0 0% 9 9 0 0 9 2%Gov Affairs Strategy & Support 5 6 6 0 0% 6 5 0 1 6 3%SVP Govt & Ext Affs 4 3 4 1 25% 3 4 0 -1 4 6%ComEd Corporate Relations 4 3 4 1 25% 4 4 -1 -1 4 6%ComEd Economic Development 5 5 5 0 0% 5 5 0 0 5 3%TOTAL OFFICE SVP GOVT & EXT AFFS-CED 128 129 129 0 0% 129 128 0 1 130 -1%
CED Real Estate & Facilities 40 39 39 0 0% 39 40 0 -1 39 1%
Ops Strategy and Bus Intellige 19 17 18 1 6% 19 19 -2 -2 18 2%
TOTAL OFFICE OF SVP STRATEGY & ADMIN 59 56 57 1 2% 58 59 -2 -3 56 1%
Finance 20 23 19 -4 -22% 21 20 2 3 21 -12%ComEd Finance 50 51 54 3 5% 51 50 0 1 53 2%Communications 12 11 12 1 6% 11 12 0 -1 11 4%Human Resources 38 37 38 1 3% 37 38 0 -1 38 0%IT 34 34 39 5 13% 35 34 -1 0 36 7%Legal - ComEd 12 12 12 0 -2% 12 12 0 0 11 3%Supply Services 211 202 209 7 3% 204 211 -2 -9 207 1%TOTAL FUNCTIONAL GROUPS 377 370 382 12 3% 371 377 -1 -7 378 1%
TOTAL COMED HEADS 6,410 6,335 6,548 212 3% 6,362 6,410 -27 -75 6,305 4%
ComEd Detail FTE's
Net New Hires / Attrition
Schedule C-11.2Page 4 of 48
Witness: Tracy
Docket No. 18-____ ComEd Ex. 2.03 Page 202 of 334

For the Month Ending May 31, 2017
2016 Dec Actual Actual Budget Variance Variance % Prior Month Year End
2016 Month YTD YTD Average Vacancy RateDistribution Ops - Chicago 641 602 611 9 2% 613 641 -11 -39 620 -1%Distribution Ops - Suburban 1,495 1,475 1,523 48 3% 1,476 1,495 -1 -20 1,497 2%Ofc of SVP Distribution Ops 7 77 93 16 17% 4 7 73 70 21 77%Distribution Sys Operations 291 282 274 -8 -3% 287 291 -5 -9 266 3%Technical Services 415 405 421 16 4% 402 415 3 -10 409 3%Office of EVP - Operations 3 3 3 0 0% 3 3 0 0 3 6%Strategic & Support Services 269 271 279 8 3% 271 269 0 2 268 4%Transmission and Substation 1,201 1,216 1,235 19 2% 1,207 1,201 9 15 1,217 1%Operations Admin 0 9 10 1 10% 9 0 0 9 9 13%TOTAL OPERATIONS 4,322 4,340 4,449 109 2% 4,272 4,322 68 18 4,309 3%
Automated Meter Infrastructure 277 256 280 24 9% 276 277 -20 -21 251 11%Customer Channels 480 468 486 18 4% 472 480 -4 -11 464 4%Customer Field Ops 466 407 429 22 5% 465 466 -58 -59 414 4%Customer Revenue Assurance 133 132 129 -3 -2% 132 133 0 -1 130 -1%SrVP Customer Operations 2 2 2 0 0% 2 2 0 0 2 0%Environmental Programs 49 52 53 1 2% 50 49 2 3 54 -2%
CED Marketing 17 16 17 1 6% 16 17 0 -1 17 -2%TOTAL CUSTOMER OPERATIONS 1,424 1,334 1,396 63 4% 1,413 1,424 -80 -90 1,332 5%
Office of the Chairman/CEO 4 5 4 -1 -25% 6 4 -1 1 5 -17%Office of the President -ComEd 2 2 2 0 0% 2 2 0 0 2 0%Utility of the Future 0 6 11 5 45% 4 0 2 6 7 40%TOTAL OFFICE OF THE CEO/PRESIDENT-CED 6 13 17 4 24% 12 6 1 7 13 22%
Claims 35 30 30 0 0% 28 35 2 -5 29 2%Legal 3 2 2 0 0% 2 3 0 -1 2 0%Energy Acquisition - CED 27 27 28 1 4% 27 27 0 0 27 2%
CED-Regulatory & Strategic Srv 29 27 28 1 4% 26 29 1 -2 28 0%TOTAL REP/GENERAL COUNSEL 94 86 88 2 2% 83 94 3 -8 86 1%
ComEd External Affairs and ESO 101 104 100 -4 -4% 103 101 1 3 103 -3%Offce VP State & Legislative 9 9 9 0 0% 9 9 0 0 9 2%Gov Affairs Strategy & Support 5 6 6 0 0% 6 5 0 1 6 3%SVP Govt & Ext Affs 4 3 4 1 25% 3 4 0 -1 4 6%ComEd Corporate Relations 4 3 4 1 25% 3 4 0 -1 4 6%ComEd Economic Development 5 5 5 0 0% 5 5 0 0 5 3%TOTAL OFFICE SVP GOVT & EXT AFFS-CED 128 130 128 -2 -2% 129 128 1 2 130 -2%
CED Real Estate & Facilities 40 39 39 0 0% 39 40 0 -1 39 1%
Ops Strategy and Bus Intellige 19 18 18 0 0% 17 19 1 -1 18 2%
TOTAL OFFICE OF SVP STRATEGY & ADMIN 59 57 57 0 0% 56 59 1 -2 56 1%
Finance 20 23 19 -4 -22% 23 20 0 3 21 -12%ComEd Finance 50 52 54 2 3% 51 50 1 2 53 2%Communications 12 11 12 1 6% 11 12 0 -1 11 4%Human Resources 38 38 38 0 0% 37 38 1 0 38 0%IT 34 36 39 3 8% 34 34 2 2 36 7%Legal - ComEd 12 12 12 0 -2% 12 12 0 0 11 3%Supply Services 211 202 209 7 3% 202 211 0 -9 207 1%TOTAL FUNCTIONAL GROUPS 377 374 382 8 2% 370 377 4 -3 378 1%
TOTAL COMED HEADS 6,410 6,334 6,517 183 3% 6,335 6,410 -2 -77 6,305 3%
ComEd Detail FTE's
Net New Hires / Attrition
Schedule C-11.2Page 5 of 48
Witness: Tracy
Docket No. 18-____ ComEd Ex. 2.03 Page 203 of 334

For the Month Ending June 30, 2017
2016 Dec Actual Actual Budget Variance Variance % Prior Month Year End
2016 Month YTD YTD Average Vacancy RateDistribution Ops - Chicago 641 619 633 14 2% 602 641 17 -22 620 2%Distribution Ops - Suburban 1,495 1,455 1,526 71 5% 1,475 1,495 -20 -40 1,497 2%Ofc of SVP Distribution Ops 7 73 68 -5 -7% 77 7 -4 66 21 69%Distribution Sys Operations 291 280 274 -6 -2% 282 291 -2 -11 266 3%Technical Services 415 408 418 10 2% 405 415 3 -7 409 2%Office of EVP - Operations 3 3 3 0 0% 3 3 0 0 3 6%Strategic & Support Services 269 267 279 12 4% 271 269 -4 -2 268 4%Transmission and Substation 1,201 1,208 1,238 30 2% 1,216 1,201 -8 7 1,217 2%Operations Admin 0 9 15 6 40% 9 0 0 9 9 42%TOTAL OPERATIONS 4,322 4,322 4,454 132 3% 4,340 4,322 -18 0 4,309 3%
Automated Meter Infrastructure 277 251 280 29 10% 256 277 -5 -26 251 11%Customer Channels 480 470 482 12 3% 468 480 1 -10 464 4%Customer Field Ops 466 405 424 19 4% 407 466 -2 -61 414 2%Customer Revenue Assurance 133 132 128 -4 -3% 132 133 0 -1 130 -2%SrVP Customer Operations 2 2 2 0 0% 2 2 0 0 2 0%Environmental Programs 49 52 53 1 2% 52 49 0 3 54 -2%
CED Marketing 17 16 17 1 6% 16 17 0 -1 17 -2%TOTAL CUSTOMER OPERATIONS 1,424 1,328 1,386 58 4% 1,334 1,424 -6 -96 1,332 4%
Office of the Chairman/CEO 4 5 4 -1 -25% 5 4 0 1 5 -17%Office of the President -ComEd 2 2 2 0 0% 2 2 0 0 2 0%Utility of the Future 0 7 11 4 36% 6 0 1 7 7 40%TOTAL OFFICE OF THE CEO/PRESIDENT-CED 6 14 17 3 18% 13 6 1 8 13 22%
Claims 35 30 30 0 0% 30 35 0 -5 29 2%Legal 3 2 2 0 0% 2 3 0 -1 2 0%Energy Acquisition - CED 27 27 28 1 4% 27 27 0 0 27 2%
CED-Regulatory & Strategic Srv 29 28 29 1 3% 27 29 1 -1 28 4%TOTAL REP/GENERAL COUNSEL 94 87 89 2 2% 86 94 1 -7 86 3%
ComEd External Affairs and ESO 101 103 101 -2 -2% 104 101 -1 2 103 -2%Offce VP State & Legislative 9 9 9 0 0% 9 9 0 0 9 2%Gov Affairs Strategy & Support 5 6 6 0 0% 6 5 0 1 6 3%SVP Govt & Ext Affs 4 4 4 0 0% 3 4 1 0 4 6%ComEd Corporate Relations 4 3 4 1 25% 3 4 0 -1 4 6%ComEd Economic Development 5 5 5 0 0% 5 5 0 0 5 3%TOTAL OFFICE SVP GOVT & EXT AFFS-CED 128 130 129 -1 -1% 130 128 0 2 130 -1%
CED Real Estate & Facilities 40 39 42 3 7% 39 40 0 -1 39 8%
Ops Strategy and Bus Intellige 19 18 18 0 0% 18 19 0 -1 18 2%
TOTAL OFFICE OF SVP STRATEGY & ADMIN 59 57 60 3 5% 57 59 0 -2 56 6%
Finance 20 22 19 -3 -16% 23 20 -1 2 21 -12%ComEd Finance 50 54 54 0 -1% 52 50 2 4 53 2%Communications 12 11 12 1 6% 11 12 0 -1 11 4%Human Resources 38 39 38 -1 -2% 38 38 1 1 38 0%IT 34 36 39 3 8% 36 34 0 2 36 7%Legal - ComEd 12 12 12 0 -2% 12 12 0 0 11 3%Supply Services 211 207 209 2 1% 202 211 5 -4 207 1%TOTAL FUNCTIONAL GROUPS 377 381 382 1 0% 374 377 7 4 378 1%
TOTAL COMED HEADS 6,410 6,319 6,517 198 3% 6,334 6,410 -15 -91 6,305 3%
Net New Hires / Attrition
ComEd Detail FTE's
Schedule C-11.2Page 6 of 48
Witness: Tracy
Docket No. 18-____ ComEd Ex. 2.03 Page 204 of 334

For the Month Ending July 31, 2017
2016 Dec Actual Actual Budget Variance Variance % Prior Month Year End
2016 Month YTD YTD Average Vacancy RateDistribution Ops - Chicago 641 616 633 18 3% 619 641 -3 -25 620 2%Distribution Ops - Suburban 1,495 1,470 1,523 53 3% 1,455 1,495 15 -25 1,497 2%Ofc of SVP Distribution Ops 7 59 53 -6 -11% 73 7 -14 52 21 60%Distribution Sys Operations 291 263 259 -4 -2% 280 291 -17 -28 266 -3%Technical Services 415 407 417 10 2% 408 415 -1 -8 409 2%Office of EVP - Operations 3 2 3 1 33% 3 3 -1 -1 3 6%Strategic & Support Services 269 266 279 13 5% 267 269 -1 -3 268 4%Transmission and Substation 1,201 1,217 1,249 33 3% 1,208 1,201 8 15 1,217 3%Operations Admin 0 10 15 5 33% 9 0 1 10 9 42%TOTAL OPERATIONS 4,322 4,310 4,431 122 3% 4,322 4,322 -13 -13 4,309 3%
Automated Meter Infrastructure 277 240 271 31 11% 251 277 -11 -37 251 8%Customer Channels 480 469 480 11 2% 470 480 -1 -11 464 3%Customer Field Ops 466 394 428 34 8% 405 466 -11 -72 414 3%Customer Revenue Assurance 133 132 127 -5 -4% 132 133 0 -1 130 -3%SrVP Customer Operations 2 2 2 0 0% 2 2 0 0 2 0%Environmental Programs 49 54 52 -2 -4% 52 49 2 5 54 -4%
CED Marketing 17 17 16 -1 -6% 16 17 1 0 17 -8%TOTAL CUSTOMER OPERATIONS 1,424 1,308 1,376 68 5% 1,328 1,424 -20 -116 1,332 3%
Office of the Chairman/CEO 4 5 4 -1 -25% 5 4 0 1 5 -17%Office of the President -ComEd 2 2 2 0 0% 2 2 0 0 2 0%Utility of the Future 0 8 11 3 27% 7 0 1 8 7 40%TOTAL OFFICE OF THE CEO/PRESIDENT-CED 6 15 17 2 12% 14 6 1 9 13 22%
Claims 35 30 30 0 0% 30 35 0 -5 29 2%Legal 3 2 2 0 0% 2 3 0 -1 2 0%Energy Acquisition - CED 27 27 27 0 0% 27 27 0 0 27 -2%
CED-Regulatory & Strategic Srv 29 27 28 1 4% 28 29 -1 -2 28 0%TOTAL REP/GENERAL COUNSEL 94 86 87 1 1% 87 94 -1 -8 86 0%
ComEd External Affairs and ESO 101 103 99 -4 -4% 103 101 0 2 103 -4%Offce VP State & Legislative 9 9 9 0 0% 9 9 0 0 9 2%Gov Affairs Strategy & Support 5 6 6 0 0% 6 5 0 1 6 3%SVP Govt & Ext Affs 4 4 4 0 0% 4 4 0 0 4 6%ComEd Corporate Relations 4 4 4 0 0% 3 4 1 0 4 6%ComEd Economic Development 5 4 5 1 20% 5 5 -1 -1 5 3%TOTAL OFFICE SVP GOVT & EXT AFFS-CED 128 130 127 -3 -2% 130 128 0 2 130 -3%
CED Real Estate & Facilities 40 37 41 4 10% 39 40 -2 -3 39 6%
Ops Strategy and Bus Intellige 19 18 18 0 0% 18 19 0 -1 18 2%
TOTAL OFFICE OF SVP STRATEGY & ADMIN 59 55 59 4 7% 57 59 -2 -4 56 5%
Finance 20 22 19 -3 -16% 22 20 0 2 21 -12%ComEd Finance 50 52 54 2 3% 54 50 -2 2 53 2%Communications 12 12 12 0 -2% 11 12 1 0 11 4%Human Resources 38 39 38 -1 -3% 39 38 0 1 38 0%IT 34 38 39 1 3% 36 34 2 4 36 7%Legal - ComEd 12 12 12 0 -2% 12 12 0 0 11 3%Supply Services 211 209 206 -3 -2% 207 211 2 -2 207 -1%TOTAL FUNCTIONAL GROUPS 377 384 379 -5 -1% 381 377 3 7 378 0%
TOTAL COMED HEADS 6,410 6,288 6,476 189 3% 6,319 6,410 -31 -123 6,305 3%
ComEd Detail FTE's
Net New Hires / Attrition
Schedule C-11.2Page 7 of 48
Witness: Tracy
Docket No. 18-____ ComEd Ex. 2.03 Page 205 of 334

For the Month Ending August 31, 2017
2016 Dec Actual Actual Budget Variance Variance % Prior Month Year End
2016 Month YTD YTD Average Vacancy RateDistribution Ops - Chicago 641 630 645 15 2% 616 641 14 -11 620 4%Distribution Ops - Suburban 1,495 1,516 1,557 41 3% 1,470 1,495 46 21 1,497 4%Ofc of SVP Distribution Ops 7 6 9 3 33% 59 7 -53 -1 21 -138%Distribution Sys Operations 291 248 259 11 4% 263 291 -15 -43 266 -3%Technical Services 415 413 430 17 4% 407 415 6 -2 409 5%Office of EVP - Operations 3 2 3 1 33% 2 3 0 -1 3 6%Strategic & Support Services 269 266 279 13 5% 266 269 0 -3 268 4%Transmission and Substation 1,201 1,221 1,248 28 2% 1,217 1,201 4 19 1,217 3%Operations Admin 0 10 10 0 0% 10 0 0 10 9 13%TOTAL OPERATIONS 4,322 4,312 4,439 128 3% 4,310 4,322 2 -11 4,309 3%
Automated Meter Infrastructure 277 237 265 28 10% 240 277 -3 -40 251 5%Customer Channels 480 460 477 17 4% 469 480 -9 -20 464 3%Customer Field Ops 466 390 431 41 10% 394 466 -4 -76 414 4%Customer Revenue Assurance 133 132 130 -2 -2% 132 133 0 -1 130 0%SrVP Customer Operations 2 2 2 0 0% 2 2 0 0 2 0%Environmental Programs 49 56 64 8 13% 54 49 2 7 54 15%
CED Marketing 17 17 16 -1 -6% 17 17 0 0 17 -8%TOTAL CUSTOMER OPERATIONS 1,424 1,294 1,385 91 7% 1,308 1,424 -14 -130 1,332 4%
Office of the Chairman/CEO 4 5 4 -1 -25% 5 4 0 1 5 -17%Office of the President -ComEd 2 2 2 0 0% 2 2 0 0 2 0%Utility of the Future 0 8 11 3 27% 8 0 0 8 7 40%TOTAL OFFICE OF THE CEO/PRESIDENT-CED 6 15 17 2 12% 15 6 0 9 13 22%
Claims 35 30 31 1 3% 30 35 0 -5 29 5%Legal 3 2 2 0 0% 2 3 0 -1 2 0%Energy Acquisition - CED 27 27 27 0 0% 27 27 0 0 27 -2%
CED-Regulatory & Strategic Srv 29 27 29 2 7% 27 29 0 -2 28 4%TOTAL REP/GENERAL COUNSEL 94 86 89 3 3% 86 94 0 -8 86 3%
ComEd External Affairs and ESO 101 102 103 1 1% 103 101 -1 1 103 0%Offce VP State & Legislative 9 9 9 0 0% 9 9 0 0 9 2%Gov Affairs Strategy & Support 5 6 6 0 0% 6 5 0 1 6 3%SVP Govt & Ext Affs 4 4 4 0 0% 4 4 0 0 4 6%ComEd Corporate Relations 4 4 4 0 0% 4 4 0 0 4 6%ComEd Economic Development 5 4 5 1 20% 4 5 0 -1 5 3%TOTAL OFFICE SVP GOVT & EXT AFFS-CED 128 129 131 2 2% 130 128 -1 1 130 1%
CED Real Estate & Facilities 40 38 41 3 7% 37 40 1 -2 39 6%
Ops Strategy and Bus Intellige 19 18 19 1 5% 18 19 0 -1 18 7%
TOTAL OFFICE OF SVP STRATEGY & ADMIN 59 56 60 4 7% 55 59 1 -3 56 6%
Finance 20 21 19 -2 -11% 22 20 -1 1 21 -12%ComEd Finance 50 53 55 2 3% 52 50 1 3 53 4%Communications 12 11 12 1 6% 12 12 -1 -1 11 4%Human Resources 38 38 38 0 0% 39 38 -1 0 38 0%IT 34 38 39 1 3% 38 34 0 4 36 7%Legal - ComEd 12 11 12 1 6% 12 12 -1 -1 11 3%Supply Services 211 209 205 -4 -2% 209 211 0 -2 207 -1%TOTAL FUNCTIONAL GROUPS 377 381 379 -2 -1% 384 377 -3 4 378 0%
TOTAL COMED HEADS 6,410 6,273 6,501 228 4% 6,288 6,410 -15 -137 6,305 3%
ComEd Detail FTE's
Net New Hires / Attrition
Schedule C-11.2Page 8 of 48
Witness: Tracy
Docket No. 18-____ ComEd Ex. 2.03 Page 206 of 334

For the Month Ending September 30, 2017
2016 Dec Actual Actual Budget Variance Variance % Prior Month Year End
2016 Month YTD YTD Average Vacancy RateDistribution Ops - Chicago 641 621 635 14 2% 630 641 -9 -20 620 2%Distribution Ops - Suburban 1,495 1,535 1,567 32 2% 1,516 1,495 19 40 1,497 4%Ofc of SVP Distribution Ops 7 5 18 13 72% 6 7 -1 -2 21 -19%Distribution Sys Operations 291 247 253 6 2% 248 291 -1 -44 266 -5%Technical Services 415 413 432 19 4% 413 415 0 -2 409 5%Office of EVP - Operations 3 3 3 0 0% 2 3 1 0 3 6%Strategic & Support Services 269 266 279 13 5% 266 269 0 -3 268 4%Transmission and Substation 1,201 1,214 1,249 36 3% 1,221 1,201 -7 12 1,217 3%Operations Admin 0 10 10 0 0% 10 0 0 10 9 13%TOTAL OPERATIONS 4,322 4,314 4,445 132 3% 4,312 4,322 2 -9 4,309 3%
Automated Meter Infrastructure 277 236 257 21 8% 237 277 -1 -41 251 3%Customer Channels 480 455 480 24 5% 460 480 -4 -24 464 3%Customer Field Ops 466 391 419 28 7% 390 466 1 -75 414 1%Customer Revenue Assurance 133 127 130 3 2% 132 133 -5 -6 130 0%SrVP Customer Operations 2 2 2 0 0% 2 2 0 0 2 0%Environmental Programs 49 57 65 8 12% 56 49 1 8 54 17%
CED Marketing 17 19 16 -3 -19% 17 17 2 2 17 -8%TOTAL CUSTOMER OPERATIONS 1,424 1,288 1,369 81 6% 1,294 1,424 -6 -136 1,332 3%
Office of the Chairman/CEO 4 4 4 0 0% 5 4 -1 0 5 -17%Office of the President -ComEd 2 2 2 0 0% 2 2 0 0 2 0%Utility of the Future 0 10 11 1 9% 8 0 2 10 7 40%TOTAL OFFICE OF THE CEO/PRESIDENT-CED 6 16 17 1 6% 15 6 1 10 13 22%
Claims 35 30 31 1 3% 30 35 0 -5 29 5%Legal 3 2 2 0 0% 2 3 0 -1 2 0%Energy Acquisition - CED 27 28 28 0 0% 27 27 1 1 27 2%
CED-Regulatory & Strategic Srv 29 28 30 2 7% 27 29 1 -1 28 7%TOTAL REP/GENERAL COUNSEL 94 88 91 3 3% 86 94 2 -6 86 5%
ComEd External Affairs and ESO 101 105 105 0 0% 102 101 3 4 103 2%Offce VP State & Legislative 9 9 9 0 0% 9 9 0 0 9 2%Gov Affairs Strategy & Support 5 6 6 0 0% 6 5 0 1 6 3%SVP Govt & Ext Affs 4 4 4 0 0% 4 4 0 0 4 6%ComEd Corporate Relations 4 4 4 0 0% 4 4 0 0 4 6%ComEd Economic Development 5 5 5 0 0% 4 5 1 0 5 3%TOTAL OFFICE SVP GOVT & EXT AFFS-CED 128 133 133 0 0% 129 128 4 5 130 2%
CED Real Estate & Facilities 40 38 41 3 7% 38 40 0 -2 39 6%
Ops Strategy and Bus Intellige 19 17 19 2 11% 18 19 -1 -2 18 7%
TOTAL OFFICE OF SVP STRATEGY & ADMIN 59 55 60 5 8% 56 59 -1 -4 56 6%
Finance 20 20 19 -1 -6% 21 20 -1 0 21 -12%ComEd Finance 50 53 55 2 3% 53 50 0 3 53 4%Communications 12 11 12 1 6% 11 12 0 -1 11 4%Human Resources 38 39 38 -1 -3% 38 38 1 1 38 0%IT 34 38 39 1 3% 38 34 0 4 36 7%Legal - ComEd 12 10 12 2 15% 11 12 -1 -2 11 3%Supply Services 211 209 204 -5 -3% 209 211 0 -2 207 -2%TOTAL FUNCTIONAL GROUPS 377 380 378 -2 -1% 381 377 -1 3 378 0%
TOTAL COMED HEADS 6,410 6,273 6,493 220 3% 6,273 6,410 1 -137 6,305 3%
ComEd Detail FTE's
Net New Hires / Attrition
Schedule C-11.2Page 9 of 48
Witness: Tracy
Docket No. 18-____ ComEd Ex. 2.03 Page 207 of 334

For the Month Ending October 31, 2017
2016 Dec Actual Actual Budget Variance Variance % Prior Month Year End
2016 Month YTD YTD Average Vacancy RateDistribution Ops - Chicago 641 621 639 18 3% 621 641 0 -20 620 3%Distribution Ops - Suburban 1,495 1,532 1,564 33 2% 1,535 1,495 -3 37 1,497 4%Ofc of SVP Distribution Ops 7 4 18 14 78% 5 7 -1 -3 21 -19%Distribution Sys Operations 291 242 252 10 4% 247 291 -5 -49 266 -5%Technical Services 415 412 435 23 5% 413 415 -1 -3 409 6%Office of EVP - Operations 3 3 3 0 0% 3 3 0 0 3 6%Strategic & Support Services 269 266 277 11 4% 266 269 0 -3 268 3%Transmission and Substation 1,201 1,218 1,267 50 4% 1,214 1,201 4 16 1,217 4%Operations Admin 0 8 10 2 20% 10 0 -2 8 9 13%TOTAL OPERATIONS 4,322 4,306 4,465 160 4% 4,314 4,322 -8 -17 4,309 4%
Automated Meter Infrastructure 277 235 249 14 6% 236 277 -1 -42 251 -1%Customer Channels 480 450 490 39 8% 455 480 -5 -29 464 5%Customer Field Ops 466 397 407 10 2% 391 466 6 -69 414 -2%Customer Revenue Assurance 133 126 131 5 4% 127 133 -1 -7 130 0%SrVP Customer Operations 2 2 2 0 0% 2 2 0 0 2 0%Environmental Programs 49 59 65 6 9% 57 49 2 10 54 17%
CED Marketing 17 19 18 -1 -6% 19 17 0 2 17 4%TOTAL CUSTOMER OPERATIONS 1,424 1,289 1,362 73 5% 1,288 1,424 1 -135 1,332 2%
Office of the Chairman/CEO 4 4 4 0 0% 4 4 0 0 5 -17%Office of the President -ComEd 2 2 2 0 0% 2 2 0 0 2 0%Utility of the Future 0 10 11 1 9% 10 0 0 10 7 40%TOTAL OFFICE OF THE CEO/PRESIDENT-CED 6 16 17 1 6% 16 6 0 10 13 22%
Claims 35 29 31 2 6% 30 35 -1 -6 29 5%Legal 3 2 2 0 0% 2 3 0 -1 2 0%Energy Acquisition - CED 27 28 28 0 0% 28 27 0 1 27 2%
CED-Regulatory & Strategic Srv 29 29 31 2 6% 28 29 1 0 28 10%TOTAL REP/GENERAL COUNSEL 94 88 92 4 4% 88 94 0 -6 86 6%
ComEd External Affairs and ESO 101 104 105 1 1% 105 101 -1 3 103 2%Offce VP State & Legislative 9 9 9 0 0% 9 9 0 0 9 2%Gov Affairs Strategy & Support 5 6 6 0 0% 6 5 0 1 6 3%SVP Govt & Ext Affs 4 4 4 0 0% 4 4 0 0 4 6%ComEd Corporate Relations 4 4 4 0 0% 4 4 0 0 4 6%ComEd Economic Development 5 5 5 0 0% 5 5 0 0 5 3%TOTAL OFFICE SVP GOVT & EXT AFFS-CED 128 132 133 1 1% 133 128 -1 4 130 2%
CED Real Estate & Facilities 40 39 41 2 5% 38 40 1 -1 39 6%
Ops Strategy and Bus Intellige 19 16 19 3 16% 17 19 -1 -3 18 7%
TOTAL OFFICE OF SVP STRATEGY & ADMIN 59 55 60 5 8% 55 59 0 -4 56 6%
Finance 20 21 19 -2 -11% 20 20 1 1 21 -12%ComEd Finance 50 54 55 1 1% 53 50 1 4 53 4%Communications 12 11 12 1 6% 11 12 0 -1 11 4%Human Resources 38 39 38 -1 -3% 39 38 0 1 38 0%IT 34 37 39 2 5% 38 34 -1 3 36 7%Legal - ComEd 12 10 12 2 15% 10 12 0 -2 11 3%Supply Services 211 210 203 -7 -4% 209 211 1 -1 207 -2%TOTAL FUNCTIONAL GROUPS 377 382 377 -5 -1% 380 377 2 5 378 0%
TOTAL COMED HEADS 6,410 6,267 6,506 239 4% 6,273 6,410 -6 -143 6,305 3%
ComEd Detail FTE's
Net New Hires / Attrition
Schedule C-11.2Page 10 of 48
Witness: Tracy
Docket No. 18-____ ComEd Ex. 2.03 Page 208 of 334

For the Month Ending November 30, 2017
2016 Dec Actual Actual Budget Variance Variance % Prior Month Year End
2016 Month YTD YTD Average Vacancy RateDistribution Ops - Chicago 641 627 645 18 3% 621 641 6 -14 620 4%Distribution Ops - Suburban 1,495 1,524 1,551 27 2% 1,532 1,495 -8 29 1,497 3%Ofc of SVP Distribution Ops 7 5 12 7 58% 4 7 1 -2 21 -78%Distribution Sys Operations 291 244 252 8 3% 242 291 2 -47 266 -5%Technical Services 415 415 438 23 5% 412 415 3 0 409 7%Office of EVP - Operations 3 3 3 0 0% 3 3 0 0 3 6%Strategic & Support Services 269 264 275 11 4% 266 269 -2 -5 268 3%Transmission and Substation 1,201 1,228 1,268 40 3% 1,218 1,201 11 27 1,217 4%Operations Admin 0 7 10 3 30% 8 0 -1 7 9 13%TOTAL OPERATIONS 4,322 4,317 4,454 136 3% 4,306 4,322 12 -5 4,309 3%
Automated Meter Infrastructure 277 228 241 13 5% 235 277 -7 -49 251 -4%Customer Channels 480 450 490 39 8% 450 480 0 -29 464 5%Customer Field Ops 466 385 409 24 6% 397 466 -12 -81 414 -1%Customer Revenue Assurance 133 127 131 4 3% 126 133 1 -6 130 0%SrVP Customer Operations 2 2 2 0 0% 2 2 0 0 2 0%Environmental Programs 49 62 65 3 5% 59 49 3 13 54 17%
CED Marketing 17 19 18 -1 -6% 19 17 0 2 17 4%TOTAL CUSTOMER OPERATIONS 1,424 1,274 1,356 82 6% 1,289 1,424 -15 -150 1,332 2%
Office of the Chairman/CEO 4 4 4 0 0% 4 4 0 0 5 -17%Office of the President -ComEd 2 2 2 0 0% 2 2 0 0 2 0%Utility of the Future 0 10 11 1 9% 10 0 0 10 7 40%TOTAL OFFICE OF THE CEO/PRESIDENT-CED 6 16 17 1 6% 16 6 0 10 13 22%
Claims 35 29 31 2 6% 29 35 0 -6 29 5%Legal 3 2 2 0 0% 2 3 0 -1 2 0%Energy Acquisition - CED 27 28 28 0 0% 28 27 0 1 27 2%
CED-Regulatory & Strategic Srv 29 29 31 2 6% 29 29 0 0 28 10%TOTAL REP/GENERAL COUNSEL 94 88 92 4 4% 88 94 0 -6 86 6%
ComEd External Affairs and ESO 101 106 105 -1 -1% 104 101 2 5 103 2%Offce VP State & Legislative 9 8 9 1 11% 9 9 -1 -1 9 2%Gov Affairs Strategy & Support 5 6 6 0 0% 6 5 0 1 6 3%SVP Govt & Ext Affs 4 4 4 0 0% 4 4 0 0 4 6%ComEd Corporate Relations 4 4 4 0 0% 4 4 0 0 4 6%ComEd Economic Development 5 5 5 0 0% 5 5 0 0 5 3%TOTAL OFFICE SVP GOVT & EXT AFFS-CED 128 133 133 0 0% 132 128 1 5 130 2%
CED Real Estate & Facilities 40 38 42 4 10% 39 40 -1 -2 39 8%
Ops Strategy and Bus Intellige 19 16 19 3 16% 16 19 0 -3 18 7%
TOTAL OFFICE OF SVP STRATEGY & ADMIN 59 54 61 7 11% 55 59 -1 -5 56 8%
Finance 20 20 19 -1 -6% 21 20 -1 0 21 -12%ComEd Finance 50 54 55 1 1% 54 50 0 4 53 4%Communications 12 11 12 1 6% 11 12 0 -1 11 4%Human Resources 38 38 38 0 0% 39 38 -1 0 38 0%IT 34 38 39 1 3% 37 34 1 4 36 7%Legal - ComEd 12 11 12 1 6% 10 12 1 -1 11 3%Supply Services 211 209 202 -7 -4% 210 211 -1 -2 207 -3%TOTAL FUNCTIONAL GROUPS 377 381 376 -5 -1% 382 377 -1 4 378 0%
TOTAL COMED HEADS 6,410 6,263 6,488 225 3% 6,267 6,410 -4 -147 6,305 3%
ComEd Detail FTE's
Net New Hires / Attrition
Schedule C-11.2Page 11 of 48
Witness: Tracy
Docket No. 18-____ ComEd Ex. 2.03 Page 209 of 334

For the Month Ending December 31, 2017
2016 Dec Actual Actual Budget Variance Variance % Prior Month Year End
2016 Month YTD YTD Average Vacancy RateDistribution Ops - Chicago 641 622 643 21 3% 627 641 -5 -19 620 4%Distribution Ops - Suburban 1,495 1,518 1,555 37 2% 1,524 1,495 -6 23 1,497 4%Ofc of SVP Distribution Ops 7 3 3 0 0% 5 7 -2 -4 21 -614%Distribution Sys Operations 291 243 251 8 3% 244 291 -1 -48 266 -6%Technical Services 415 414 439 25 6% 415 415 -1 -1 409 7%Office of EVP - Operations 3 3 3 0 0% 3 3 0 0 3 6%Strategic & Support Services 269 261 273 12 4% 264 269 -3 -8 268 2%Transmission and Substation 1,201 1,231 1,275 44 3% 1,228 1,201 3 30 1,217 5%Operations Admin 0 7 5 -2 -40% 7 0 0 7 9 -75%TOTAL OPERATIONS 4,322 4,302 4,447 144 3% 4,317 4,322 -15 -20 4,309 3%
Automated Meter Infrastructure 277 224 234 10 4% 228 277 -4 -53 251 -7%Customer Channels 480 450 472 22 5% 450 480 -1 -30 464 2%Customer Field Ops 466 384 412 28 7% 385 466 -1 -82 414 0%Customer Revenue Assurance 133 126 132 6 5% 127 133 -1 -7 130 1%SrVP Customer Operations 2 2 2 0 0% 2 2 0 0 2 0%Environmental Programs 49 61 65 4 6% 62 49 -1 12 54 17%
CED Marketing 17 19 18 -1 -6% 19 17 0 2 17 4%TOTAL CUSTOMER OPERATIONS 1,424 1,266 1,335 69 5% 1,274 1,424 -8 -158 1,332 0%
Office of the Chairman/CEO 4 4 4 0 0% 4 4 0 0 5 -17%Office of the President -ComEd 2 2 2 0 0% 2 2 0 0 2 0%Utility of the Future 0 10 11 1 9% 10 0 0 10 7 40%TOTAL OFFICE OF THE CEO/PRESIDENT-CED 6 16 17 1 6% 16 6 0 10 13 22%
Claims 35 29 31 2 6% 29 35 0 -6 29 5%Legal 3 2 2 0 0% 2 3 0 -1 2 0%Energy Acquisition - CED 27 28 28 0 0% 28 27 0 1 27 2%
CED-Regulatory & Strategic Srv 29 29 31 2 6% 29 29 0 0 28 10%TOTAL REP/GENERAL COUNSEL 94 88 92 4 4% 88 94 0 -6 86 6%
ComEd External Affairs and ESO 101 104 107 3 3% 106 101 -2 3 103 4%Offce VP State & Legislative 9 8 9 1 11% 8 9 0 -1 9 2%Gov Affairs Strategy & Support 5 6 6 0 0% 6 5 0 1 6 3%SVP Govt & Ext Affs 4 4 4 0 0% 4 4 0 0 4 6%ComEd Corporate Relations 4 4 4 0 0% 4 4 0 0 4 6%ComEd Economic Development 5 5 4 -1 -25% 5 5 0 0 5 -21%TOTAL OFFICE SVP GOVT & EXT AFFS-CED 128 131 134 3 2% 133 128 -2 3 130 3%
CED Real Estate & Facilities 40 38 42 4 10% 38 40 0 -2 39 8%
Ops Strategy and Bus Intellige 19 16 19 3 16% 16 19 0 -3 18 7%
TOTAL OFFICE OF SVP STRATEGY & ADMIN 59 54 61 7 11% 54 59 0 -5 56 8%
Finance 20 20 19 -1 -6% 20 20 0 0 21 -12%ComEd Finance 50 54 55 1 1% 54 50 0 4 53 4%Communications 12 11 12 1 6% 11 12 0 -1 11 4%Human Resources 38 38 38 0 0% 38 38 0 0 38 0%IT 34 37 39 2 5% 38 34 -1 3 36 7%Legal - ComEd 12 11 12 1 6% 11 12 0 -1 11 3%Supply Services 211 208 201 -7 -4% 209 211 -1 -3 207 -3%TOTAL FUNCTIONAL GROUPS 377 379 375 -4 -1% 381 377 -2 2 378 -1%
TOTAL COMED HEADS 6,410 6,236 6,461 224 3% 6,263 6,410 -27 -174 6,305 2%
Net New Hires / Attrition
ComEd Detail FTE's
Schedule C-11.2Page 12 of 48
Witness: Tracy
Docket No. 18-____ ComEd Ex. 2.03 Page 210 of 334

ComEd Detail FTE's
For the Month Ending January 31, 2016 Net New Hires / Attrition 2015 Dec
Actual Actual Budget Variance Variance % Prior Month Year End
2015 Month YTD YTD Average Vacancy Rate
Distribution Ops - Chicago 625 613 641 28 4% 625 625 -12 -12 629 2%Distribution Ops - Suburban 1,508 1,489 1,472 -17 -1% 1,508 1,508 -19 -19 1,462 1%Ofc of SVP Distribution Ops 3 15 24 9 37% 3 3 12 12 31 -28%Distribution Sys Operations 304 316 304 -12 -4% 304 304 12 12 300 1%Technical Services 365 359 420 62 15% 365 365 -6 -6 393 6%Office of EVP - Operations 3 3 3 0 -3% 3 3 0 0 3 5%Strategic & Support Services 267 266 267 1 1% 267 267 -1 -1 259 3%Transmission and Substation 1,154 1,140 1,167 26 2% 1,154 1,154 -14 -14 1,163 0%Operations Admin 0 10 10 0 0% - 0 10 10 12 -17%TOTAL OPERATIONS 4,228 4,210 4,308 97 2% 4,228 4,228 -18 -18 4,252 1%
Automated Meter Infrastructure 278 275 283 8 3% 278 278 -3 -3 271 4%Customer Channels 457 483 480 -3 -1% 457 457 26 26 482 0%Customer Field Ops 668 656 672 16 2% 668 668 -12 -12 557 17%Customer Revenue Assurance 142 140 139 -1 -1% 142 142 -2 -2 134 3%SrVP Customer Operations 2 2 2 0 0% 2 2 0 0 2 0%Environmental Programs 44 44 45 1 2% 44 44 0 0 46 -3%TOTAL CUSTOMER OPERATIONS 1,592 1,601 1,621 21 1% 1,592 1,592 9 9 1,493 8%
Office of the Chairman/CEO 3 3 3 0 -5% 3 3 0 0 4 -29%Office of the President -ComEd 2 2 2 0 0% 2 2 0 0 2 0%TOTAL OFFICE OF THE CEO/PRESIDENT-CED 5 5 5 0 -3% 5 5 0 0 6 -17%
Claims 35 35 35 0 1% 35 35 0 0 35 1%Legal 2 2 2 0 -3% 2 2 0 0 2 -7%Energy Acquisition - CED 27 27 27 0 1% 27 27 0 0 26 2%CED-Regulatory & Strategic Srv 29 28 39 11 28% 29 29 -1 -1 28 28%TOTAL REP/GENERAL COUNSEL 93 92 103 11 11% 93 93 -1 -1 91 11%
ComEd External Affairs and ESO 101 100 103 3 3% 101 101 -1 -1 99 4%Offce VP State & Legislative 9 9 9 0 -4% 9 9 0 0 9 -4%Gov Affairs Strategy & Support 5 5 5 0 -3% 5 5 0 0 5 -3%SVP Govt & Ext Affs 5 5 5 0 -4% 5 5 0 0 5 6%ComEd Corporate Relations 4 4 4 0 -3% 4 4 0 0 4 -3%ComEd Economic Development 5 5 5 0 -4% 5 5 0 0 5 -4%TOTAL OFFICE SVP GOVT & EXT AFFS-CED 129 128 130 2 2% 129 129 -1 -1 126 3%
CED Real Estate & Facilities 40 39 42 3 7% 40 40 -1 -1 39 6%CED Marketing 17 17 17 0 3% 17 17 0 0 17 1%Ops Strategy and Bus Intellige 19 19 19 0 2% 19 19 0 0 19 2%Security Services 13 13 12 -1 -12% 13 13 0 0 13 -12%TOTAL OFFICE OF SVP STRATEGY & ADMIN 89 88 91 3 3% 89 89 -1 -1 89 2%
Finance 19 20 22 2 7% 19 19 1 1 20 7%ComEd Finance 51 51 53 2 3% 51 51 0 0 51 4%Communications 10 9 13 4 29% 10 10 -1 -1 10 20%Human Resources 37 37 38 1 3% 37 37 0 0 36 5%IT 70 68 71 3 5% 70 70 -2 -2 58 18%Legal - ComEd 12 12 12 0 -2% 12 12 0 0 12 -2%Supply Services 210 206 209 3 1% 210 210 -4 -4 209 0%TOTAL FUNCTIONAL GROUPS 409 403 417 14 3% 409 409 -6 -6 397 5%
TOTAL COMED HEADS 6,545 6,527 6,675 148 2% 6,545 6,545 -18 -18 6,453 3%
Schedule C-11.2Page 13 of 48
Witness: Tracy
Docket No. 18-____ ComEd Ex. 2.03 Page 211 of 334

ComEd Detail FTE's
For the Month Ending February 28, 2016 Net New Hires / Attrition
2015 Dec Actual Actual Budget Variance Variance % Prior Month
Year End 2015 Month YTD YTD Average Vacancy Rate
Distribution Ops - Chicago 625 613 650 37 6% 613 625 0 -12 629 3%Distribution Ops - Suburban 1,508 1,485 1,468 -17 -1% 1,489 1,508 -4 -23 1,462 0%Ofc of SVP Distribution Ops 3 15 23 8 35% 15 3 0 12 31 -33%Distribution Sys Operations 304 311 300 -11 -4% 316 304 -5 7 300 0%Technical Services 365 361 420 60 14% 359 365 2 -4 393 6%Office of EVP - Operations 3 3 3 0 -3% 3 3 0 0 3 5%Strategic & Support Services 267 265 267 2 1% 266 267 -1 -2 259 3%Transmission and Substation 1,154 1,130 1,183 53 4% 1,140 1,154 -10 -24 1,163 2%Operations Admin 0 10 20 10 50% 10 0 0 10 12 42%TOTAL OPERATIONS 4,228 4,192 4,334 141 3% 4,210 4,228 -18 -36 4,252 2%
Automated Meter Infrastructure 278 269 283 14 5% 275 278 -6 -9 271 4%Customer Channels 457 483 455 -29 -6% 483 457 0 26 482 -6%Customer Field Ops 668 654 655 1 0% 656 668 -2 -14 557 15%Customer Revenue Assurance 142 137 138 1 1% 140 142 -3 -5 134 3%SrVP Customer Operations 2 2 2 0 0% 2 2 0 0 2 0%Environmental Programs 44 44 45 1 2% 44 44 0 0 46 -3%TOTAL CUSTOMER OPERATIONS 1,592 1,590 1,577 -12 -1% 1,601 1,592 -11 -2 1,493 5%
Office of the Chairman/CEO 3 3 3 0 -5% 3 3 0 0 4 -29%Office of the President -ComEd 2 2 2 0 0% 2 2 0 0 2 0%TOTAL OFFICE OF THE CEO/PRESIDENT-CED 5 5 5 0 -3% 5 5 0 0 6 -17%
Claims 35 35 35 0 1% 35 35 0 0 35 1%Legal 2 2 2 0 -3% 2 2 0 0 2 -7%Energy Acquisition - CED 27 27 27 0 1% 27 27 0 0 26 2%CED-Regulatory & Strategic Srv 29 27 39 12 30% 28 29 -1 -2 28 28%TOTAL REP/GENERAL COUNSEL 93 91 103 12 12% 92 93 -1 -2 91 11%
ComEd External Affairs and ESO 101 98 103 5 5% 100 101 -2 -3 99 4%Offce VP State & Legislative 9 9 9 0 -3% 9 9 0 0 9 -3%Gov Affairs Strategy & Support 5 5 5 0 -2% 5 5 0 0 5 -2%SVP Govt & Ext Affs 5 5 5 0 -3% 5 5 0 0 5 7%ComEd Corporate Relations 4 4 4 0 -2% 4 4 0 0 4 -2%ComEd Economic Development 5 5 5 0 -3% 5 5 0 0 5 -3%TOTAL OFFICE SVP GOVT & EXT AFFS-CED 129 126 130 4 3% 128 129 -2 -3 126 3%
CED Real Estate & Facilities 40 40 42 2 5% 39 40 1 0 39 6%CED Marketing 17 17 17 0 3% 17 17 0 0 17 1%Ops Strategy and Bus Intellige 19 19 19 0 2% 19 19 0 0 19 2%Security Services 13 13 12 -1 -12% 13 13 0 0 13 -12%TOTAL OFFICE OF SVP STRATEGY & ADMIN 89 89 91 2 2% 88 89 1 0 89 2%
Finance 19 21 22 1 3% 20 19 1 2 20 7%ComEd Finance 51 50 53 3 5% 51 51 -1 -1 51 4%Communications 10 9 13 4 29% 9 10 0 -1 10 20%Human Resources 37 35 38 3 8% 37 37 -2 -2 36 5%IT 70 66 71 5 8% 68 70 -2 -4 58 18%Legal - ComEd 12 12 12 0 -2% 12 12 0 0 12 -2%Supply Services 210 207 209 2 1% 206 210 1 -3 209 0%TOTAL FUNCTIONAL GROUPS 409 400 417 17 4% 403 409 -3 -9 397 5%
TOTAL COMED HEADS 6,545 6,493 6,657 164 2% 6,527 6,545 -34 -52 6,453 3%
Schedule C-11.2Page 14 of 48
Witness: Tracy
Docket No. 18-____ ComEd Ex. 2.03 Page 212 of 334

ComEd Detail FTE's
For the Month Ending March 31, 2016 Net New Hires / Attrition
2015 Dec Actual Actual Budget Variance Variance % Prior Month
Year End 2015 Month YTD YTD Average Vacancy Rate
Distribution Ops - Chicago 625 623 650 27 4% 613 625 10 -2 629 3%Distribution Ops - Suburban 1,508 1,466 1,465 -1 0% 1,485 1,508 -19 -42 1,462 0%Ofc of SVP Distribution Ops 3 3 12 9 75% 15 3 -12 0 31 -156%Distribution Sys Operations 304 309 299 -10 -3% 311 304 -2 5 300 0%Technical Services 365 373 420 48 11% 361 365 12 8 393 6%Office of EVP - Operations 3 3 3 0 -3% 3 3 0 0 3 5%Strategic & Support Services 267 264 267 3 1% 265 267 -1 -3 259 3%Transmission and Substation 1,154 1,154 1,187 32 3% 1,130 1,154 24 0 1,163 2%Operations Admin 0 10 20 10 50% 10 0 0 10 12 42%TOTAL OPERATIONS 4,228 4,204 4,323 119 3% 4,192 4,228 12 -24 4,252 2%
Automated Meter Infrastructure 278 265 283 18 6% 269 278 -4 -13 271 4%Customer Channels 457 488 467 -20 -4% 483 457 4 30 482 -3%Customer Field Ops 668 632 656 24 4% 654 668 -22 -36 557 15%Customer Revenue Assurance 142 137 135 -2 -1% 137 142 0 -5 134 0%SrVP Customer Operations 2 2 2 0 0% 2 2 0 0 2 0%Environmental Programs 44 43 46 3 7% 44 44 -1 -1 46 0%TOTAL CUSTOMER OPERATIONS 1,592 1,567 1,589 23 1% 1,590 1,592 -23 -25 1,493 6%
Office of the Chairman/CEO 3 3 3 0 -5% 3 3 0 0 4 -29%Office of the President -ComEd 2 2 2 0 0% 2 2 0 0 2 0%TOTAL OFFICE OF THE CEO/PRESIDENT-CED 5 5 5 0 -3% 5 5 0 0 6 -17%
Claims 35 35 35 0 1% 35 35 0 0 35 1%Legal 2 2 2 0 -3% 2 2 0 0 2 -7%Energy Acquisition - CED 27 27 27 0 1% 27 27 0 0 26 2%CED-Regulatory & Strategic Srv 29 27 39 12 30% 27 29 0 -2 28 28%TOTAL REP/GENERAL COUNSEL 93 91 103 12 12% 91 93 0 -2 91 11%
ComEd External Affairs and ESO 101 96 103 7 7% 98 101 -2 -5 99 4%Offce VP State & Legislative 9 9 9 0 -3% 9 9 0 0 9 -3%Gov Affairs Strategy & Support 5 5 5 0 -2% 5 5 0 0 5 -2%SVP Govt & Ext Affs 5 5 5 0 -3% 5 5 0 0 5 7%ComEd Corporate Relations 4 4 4 0 -2% 4 4 0 0 4 -2%ComEd Economic Development 5 5 5 0 -3% 5 5 0 0 5 -3%TOTAL OFFICE SVP GOVT & EXT AFFS-CED 129 124 130 6 5% 126 129 -2 -5 126 3%
CED Real Estate & Facilities 40 41 42 1 3% 40 40 1 1 39 6%CED Marketing 17 18 17 -1 -3% 17 17 1 1 17 1%Ops Strategy and Bus Intellige 19 19 19 0 2% 19 19 0 0 19 2%Security Services 13 13 12 -1 -12% 13 13 0 0 13 -12%TOTAL OFFICE OF SVP STRATEGY & ADMIN 89 91 91 0 0% 89 89 2 2 89 2%
Finance 19 20 22 2 7% 21 19 -1 1 20 7%ComEd Finance 51 49 53 4 7% 50 51 -1 -2 51 4%Communications 10 9 13 4 29% 9 10 0 -1 10 20%Human Resources 37 35 38 3 8% 35 37 0 -2 36 5%IT 70 63 71 8 12% 66 70 -3 -7 58 18%Legal - ComEd 12 12 12 0 -2% 12 12 0 0 12 -2%Supply Services 210 208 209 1 0% 207 210 1 -2 209 0%TOTAL FUNCTIONAL GROUPS 409 396 417 21 5% 400 409 -4 -13 397 5%
TOTAL COMED HEADS 6,545 6,478 6,658 180 3% 6,493 6,545 -15 -67 6,453 3%
Schedule C-11.2Page 15 of 48
Witness: Tracy
Docket No. 18-____ ComEd Ex. 2.03 Page 213 of 334

ComEd Detail FTE's
For the Month Ending April 30, 2016 Net New Hires / Attrition
2015 Dec Actual Actual Budget Variance Variance % Prior Month
Year End 2015 Month YTD YTD Average Vacancy Rate
Distribution Ops - Chicago 625 624 649 25 4% 623 625 1 -1 629 3%Distribution Ops - Suburban 1,508 1,462 1,460 -2 0% 1,466 1,508 -4 -46 1,462 0%Ofc of SVP Distribution Ops 3 3 24 21 87% 3 3 0 0 31 -28%Distribution Sys Operations 304 306 299 -7 -2% 309 304 -3 2 300 0%Technical Services 365 393 420 28 7% 373 365 20 28 393 6%Office of EVP - Operations 3 3 3 0 -3% 3 3 0 0 3 5%Strategic & Support Services 267 263 267 4 2% 264 267 -1 -4 259 3%Transmission and Substation 1,154 1,147 1,177 30 3% 1,154 1,154 -7 -7 1,163 1%Operations Admin 0 10 20 10 50% 10 0 0 10 12 42%TOTAL OPERATIONS 4,228 4,210 4,318 108 3% 4,204 4,228 6 -18 4,252 2%
Automated Meter Infrastructure 278 271 283 12 4% 265 278 6 -7 271 4%Customer Channels 457 485 460 -25 -5% 488 457 -3 27 482 -5%Customer Field Ops 668 620 651 31 5% 632 668 -12 -48 557 14%Customer Revenue Assurance 142 134 132 -2 -2% 137 142 -3 -8 134 -2%SrVP Customer Operations 2 2 2 0 0% 2 2 0 0 2 0%Environmental Programs 44 43 45 2 4% 43 44 0 -1 46 -3%TOTAL CUSTOMER OPERATIONS 1,592 1,555 1,573 18 1% 1,567 1,592 -12 -37 1,493 5%
Office of the Chairman/CEO 3 3 3 0 -5% 3 3 0 0 4 -29%Office of the President -ComEd 2 2 2 0 0% 2 2 0 0 2 0%TOTAL OFFICE OF THE CEO/PRESIDENT-CED 5 5 5 0 -3% 5 5 0 0 6 -17%
Claims 35 35 35 0 1% 35 35 0 0 35 1%Legal 2 2 2 0 -3% 2 2 0 0 2 -7%Energy Acquisition - CED 27 27 27 0 1% 27 27 0 0 26 2%CED-Regulatory & Strategic Srv 29 27 39 12 30% 27 29 0 -2 28 28%TOTAL REP/GENERAL COUNSEL 93 91 103 12 12% 91 93 0 -2 91 11%
ComEd External Affairs and ESO 101 97 103 6 6% 96 101 1 -4 99 4%Offce VP State & Legislative 9 9 9 0 -3% 9 9 0 0 9 -3%Gov Affairs Strategy & Support 5 5 5 0 -2% 5 5 0 0 5 -2%SVP Govt & Ext Affs 5 5 5 0 -3% 5 5 0 0 5 7%ComEd Corporate Relations 4 4 4 0 -2% 4 4 0 0 4 -2%ComEd Economic Development 5 5 5 0 -3% 5 5 0 0 5 -3%TOTAL OFFICE SVP GOVT & EXT AFFS-CED 129 125 130 5 4% 124 129 1 -4 126 3%
CED Real Estate & Facilities 40 39 42 3 7% 41 40 -2 -1 39 6%CED Marketing 17 18 17 -1 -3% 18 17 0 1 17 1%Ops Strategy and Bus Intellige 19 18 19 1 7% 19 19 -1 -1 19 2%Security Services 13 13 12 -1 -12% 13 13 0 0 13 -12%TOTAL OFFICE OF SVP STRATEGY & ADMIN 89 88 91 3 3% 91 89 -3 -1 89 2%
Finance 19 21 22 1 3% 20 19 1 2 20 7%ComEd Finance 51 49 53 4 7% 49 51 0 -2 51 4%Communications 10 8 13 5 37% 9 10 -1 -2 10 20%Human Resources 37 35 38 3 8% 35 37 0 -2 36 5%IT 70 65 71 6 9% 63 70 2 -5 58 18%Legal - ComEd 12 12 12 0 -2% 12 12 0 0 12 -2%Supply Services 210 205 209 4 2% 208 210 -3 -5 209 0%TOTAL FUNCTIONAL GROUPS 409 395 417 22 5% 396 409 -1 -14 397 5%
TOTAL COMED HEADS 6,545 6,469 6,637 168 3% 6,478 6,545 -9 -76 6,453 3%
Schedule C-11.2Page 16 of 48
Witness: Tracy
Docket No. 18-____ ComEd Ex. 2.03 Page 214 of 334

ComEd Detail FTE's
For the Month Ending May 31, 2016 Net New Hires / Attrition
2015 Dec Actual Actual Budget Variance Variance % Prior Month
Year End 2015 Month YTD YTD Average Vacancy Rate
Distribution Ops - Chicago 625 621 645 24 4% 624 625 -3 -4 629 2%Distribution Ops - Suburban 1,508 1,456 1,446 -10 -1% 1,462 1,508 -6 -52 1,462 -1%Ofc of SVP Distribution Ops 3 28 24 -4 -17% 3 3 25 25 31 -28%Distribution Sys Operations 304 301 299 -2 -1% 306 304 -5 -3 300 0%Technical Services 365 397 420 24 6% 393 365 4 32 393 6%Office of EVP - Operations 3 2 3 1 31% 3 3 -1 -1 3 5%Strategic & Support Services 267 262 267 5 2% 263 267 -1 -5 259 3%Transmission and Substation 1,154 1,145 1,191 46 4% 1,147 1,154 -2 -9 1,163 2%Operations Admin 0 10 20 10 50% 10 0 0 10 12 42%TOTAL OPERATIONS 4,228 4,221 4,314 93 2% 4,210 4,228 11 -7 4,252 1%
Automated Meter Infrastructure 278 263 283 20 7% 271 278 -8 -15 271 4%Customer Channels 457 483 446 -37 -8% 485 457 -2 25 482 -8%Customer Field Ops 668 596 632 36 6% 620 668 -24 -72 557 12%Customer Revenue Assurance 142 133 128 -5 -4% 134 142 -1 -9 134 -5%SrVP Customer Operations 2 2 2 0 0% 2 2 0 0 2 0%Environmental Programs 44 44 46 2 4% 43 44 1 0 46 0%TOTAL CUSTOMER OPERATIONS 1,592 1,521 1,537 16 1% 1,555 1,592 -34 -71 1,493 3%
Office of the Chairman/CEO 3 4 3 -1 -40% 3 3 1 1 4 -29%Office of the President -ComEd 2 2 2 0 0% 2 2 0 0 2 0%TOTAL OFFICE OF THE CEO/PRESIDENT-CED 5 6 5 -1 -24% 5 5 1 1 6 -17%
Claims 35 35 35 0 1% 35 35 0 0 35 1%Legal 2 2 2 0 -3% 2 2 0 0 2 -7%Energy Acquisition - CED 27 26 27 1 4% 27 27 -1 -1 26 2%CED-Regulatory & Strategic Srv 29 28 39 11 28% 27 29 1 -1 28 28%TOTAL REP/GENERAL COUNSEL 93 91 103 12 12% 91 93 0 -2 91 11%
ComEd External Affairs and ESO 101 98 103 5 5% 97 101 1 -3 99 4%Offce VP State & Legislative 9 9 9 0 -2% 9 9 0 0 9 -2%Gov Affairs Strategy & Support 5 5 5 0 -2% 5 5 0 0 5 -2%SVP Govt & Ext Affs 5 5 5 0 -2% 5 5 0 0 5 8%ComEd Corporate Relations 4 4 4 0 -2% 4 4 0 0 4 -2%ComEd Economic Development 5 5 5 0 -2% 5 5 0 0 5 -2%TOTAL OFFICE SVP GOVT & EXT AFFS-CED 129 126 130 4 3% 125 129 1 -3 126 3%
CED Real Estate & Facilities 40 38 42 4 10% 39 40 -1 -2 39 6%CED Marketing 17 18 17 -1 -3% 18 17 0 1 17 1%Ops Strategy and Bus Intellige 19 19 19 0 2% 18 19 1 0 19 2%Security Services 13 13 12 -1 -12% 13 13 0 0 13 -12%TOTAL OFFICE OF SVP STRATEGY & ADMIN 89 88 91 3 3% 88 89 0 -1 89 2%
Finance 19 21 22 1 3% 21 19 0 2 20 7%ComEd Finance 51 51 53 2 3% 49 51 2 0 51 4%Communications 10 10 13 3 22% 8 10 2 0 10 20%Human Resources 37 35 38 3 8% 35 37 0 -2 36 5%IT 70 65 71 6 9% 65 70 0 -5 58 18%Legal - ComEd 12 12 12 0 -2% 12 12 0 0 12 -2%Supply Services 210 210 209 -1 -1% 205 210 5 0 209 0%TOTAL FUNCTIONAL GROUPS 409 404 417 13 3% 395 409 9 -5 397 5%
TOTAL COMED HEADS 6,545 6,456 6,597 140 2% 6,469 6,545 -12 -88 6,453 2%
Schedule C-11.2Page 17 of 48
Witness: Tracy
Docket No. 18-____ ComEd Ex. 2.03 Page 215 of 334

ComEd Detail FTE's
For the Month Ending June 30, 2016 Net New Hires / Attrition
2015 Dec Actual Actual Budget Variance Variance % Prior Month
Year End 2015 Month YTD YTD Average Vacancy Rate
Distribution Ops - Chicago 625 637 664 27 4% 621 625 16 12 629 5%Distribution Ops - Suburban 1,508 1,433 1,420 -13 -1% 1,456 1,508 -23 -75 1,462 -3%Ofc of SVP Distribution Ops 3 30 24 -6 -25% 28 3 2 27 31 -28%Distribution Sys Operations 304 299 308 9 3% 301 304 -2 -5 300 2%Technical Services 365 399 420 21 5% 397 365 3 35 393 6%Office of EVP - Operations 3 2 3 1 31% 2 3 0 -1 3 5%Strategic & Support Services 267 258 267 9 4% 262 267 -4 -9 259 3%Transmission and Substation 1,154 1,155 1,202 47 4% 1,145 1,154 10 1 1,163 3%Operations Admin 0 18 30 12 40% 10 0 8 18 12 61%TOTAL OPERATIONS 4,228 4,230 4,338 108 2% 4,221 4,228 10 2 4,252 2%
Automated Meter Infrastructure 278 268 283 15 5% 263 278 5 -10 271 4%Customer Channels 457 482 437 -45 -10% 483 457 -1 24 482 -10%Customer Field Ops 668 579 631 52 8% 596 668 -17 -89 557 12%Customer Revenue Assurance 142 133 131 -2 -2% 133 142 0 -9 134 -3%SrVP Customer Operations 2 2 2 0 0% 2 2 0 0 2 0%Environmental Programs 44 45 45 0 0% 44 44 1 1 46 -3%TOTAL CUSTOMER OPERATIONS 1,592 1,509 1,529 20 1% 1,521 1,592 -12 -83 1,493 2%
Office of the Chairman/CEO 3 4 3 -1 -40% 4 3 0 1 4 -29%Office of the President -ComEd 2 2 2 0 0% 2 2 0 0 2 0%TOTAL OFFICE OF THE CEO/PRESIDENT-CED 5 6 5 -1 -24% 6 5 0 1 6 -17%
Claims 35 35 34 -1 -2% 35 35 0 0 35 -2%Legal 2 2 2 0 -3% 2 2 0 0 2 -7%Energy Acquisition - CED 27 26 27 1 4% 26 27 0 -1 26 2%CED-Regulatory & Strategic Srv 29 27 39 12 30% 28 29 -1 -2 28 28%TOTAL REP/GENERAL COUNSEL 93 90 102 12 12% 91 93 -1 -3 91 11%
ComEd External Affairs and ESO 101 99 103 4 4% 98 101 1 -2 99 4%Offce VP State & Legislative 9 9 9 0 -2% 9 9 0 0 9 -2%Gov Affairs Strategy & Support 5 5 5 0 -2% 5 5 0 0 5 -2%SVP Govt & Ext Affs 5 5 5 0 -2% 5 5 0 0 5 8%ComEd Corporate Relations 4 4 4 0 -2% 4 4 0 0 4 -2%ComEd Economic Development 5 5 5 0 -2% 5 5 0 0 5 -2%TOTAL OFFICE SVP GOVT & EXT AFFS-CED 129 127 130 3 2% 126 129 1 -2 126 3%
CED Real Estate & Facilities 40 38 42 4 10% 38 40 0 -2 39 6%CED Marketing 17 17 17 0 3% 18 17 -1 0 17 1%Ops Strategy and Bus Intellige 19 19 19 0 2% 19 19 0 0 19 2%Security Services 13 13 12 -1 -12% 13 13 0 0 13 -12%TOTAL OFFICE OF SVP STRATEGY & ADMIN 89 87 91 4 4% 88 89 -1 -2 89 2%
Finance 19 21 22 1 3% 21 19 0 2 20 7%ComEd Finance 51 51 53 2 3% 51 51 0 0 51 4%Communications 10 10 13 3 22% 10 10 0 0 10 20%Human Resources 37 36 38 2 5% 35 37 1 -1 36 5%IT 70 63 71 8 12% 65 70 -2 -7 58 18%Legal - ComEd 12 12 12 0 -2% 12 12 0 0 12 -2%Supply Services 210 208 209 1 0% 210 210 -2 -2 209 0%TOTAL FUNCTIONAL GROUPS 409 401 417 16 4% 404 409 -3 -8 397 5%
TOTAL COMED HEADS 6,545 6,450 6,612 162 2% 6,456 6,545 -6 -95 6,453 2%
Schedule C-11.2Page 18 of 48
Witness: Tracy
Docket No. 18-____ ComEd Ex. 2.03 Page 216 of 334

ComEd Detail FTE's
For the Month Ending July 31, 2016 Net New Hires / Attrition
2015 Dec Actual Actual Budget Variance Variance % Prior Month
Year End 2015 Month YTD YTD Average Vacancy Rate
Distribution Ops - Chicago 625 653 662 10 1% 637 625 16 28 629 5%Distribution Ops - Suburban 1,508 1,447 1,418 -29 -2% 1,433 1,508 14 -61 1,462 -3%Ofc of SVP Distribution Ops 3 4 14 10 71% 30 3 -26 1 31 -119%Distribution Sys Operations 304 298 309 11 4% 299 304 -1 -6 300 3%Technical Services 365 401 417 16 4% 399 365 2 37 393 6%Office of EVP - Operations 3 2 3 1 31% 2 3 0 -1 3 5%Strategic & Support Services 267 255 267 12 5% 258 267 -3 -12 259 3%Transmission and Substation 1,154 1,158 1,194 36 3% 1,155 1,154 3 4 1,163 3%Operations Admin 0 18 30 12 40% 18 0 0 18 12 61%TOTAL OPERATIONS 4,228 4,235 4,314 79 2% 4,230 4,228 5 7 4,252 1%
Automated Meter Infrastructure 278 265 285 20 7% 268 278 -3 -13 271 5%Customer Channels 457 481 437 -44 -10% 482 457 -1 24 482 -10%Customer Field Ops 668 574 626 52 8% 579 668 -5 -94 557 11%Customer Revenue Assurance 142 133 133 0 0% 133 142 0 -9 134 -1%SrVP Customer Operations 2 2 2 0 0% 2 2 0 0 2 0%Environmental Programs 44 47 44 -3 -7% 45 44 2 3 46 -5%TOTAL CUSTOMER OPERATIONS 1,592 1,502 1,527 25 2% 1,509 1,592 -7 -89 1,493 2%
Office of the Chairman/CEO 3 4 3 -1 -40% 4 3 0 1 4 -29%Office of the President -ComEd 2 2 2 0 0% 2 2 0 0 2 0%TOTAL OFFICE OF THE CEO/PRESIDENT-CED 5 6 5 -1 -24% 6 5 0 1 6 -17%
Claims 35 35 34 -1 -2% 35 35 0 0 35 -2%Legal 2 2 2 0 -3% 2 2 0 0 2 -7%Energy Acquisition - CED 27 26 27 1 4% 26 27 0 -1 26 2%CED-Regulatory & Strategic Srv 29 27 39 12 30% 27 29 0 -2 28 28%TOTAL REP/GENERAL COUNSEL 93 90 102 12 12% 90 93 0 -3 91 11%
ComEd External Affairs and ESO 101 99 103 4 3% 99 101 0 -2 99 4%Offce VP State & Legislative 9 9 9 0 -1% 9 9 0 0 9 -1%Gov Affairs Strategy & Support 5 5 5 0 -1% 5 5 0 0 5 -1%SVP Govt & Ext Affs 5 5 5 0 -1% 5 5 0 0 5 9%ComEd Corporate Relations 4 4 4 0 -1% 4 4 0 0 4 -1%ComEd Economic Development 5 5 5 0 -1% 5 5 0 0 5 -1%TOTAL OFFICE SVP GOVT & EXT AFFS-CED 129 127 130 3 2% 127 129 0 -2 126 3%
CED Real Estate & Facilities 40 38 42 4 10% 38 40 0 -2 39 6%CED Marketing 17 17 17 0 3% 17 17 0 0 17 1%Ops Strategy and Bus Intellige 19 19 19 0 2% 19 19 0 0 19 2%Security Services 13 13 12 -1 -12% 13 13 0 0 13 -12%TOTAL OFFICE OF SVP STRATEGY & ADMIN 89 87 91 4 4% 87 89 0 -2 89 2%
Finance 19 21 22 1 3% 21 19 0 2 20 7%ComEd Finance 51 51 53 2 3% 51 51 0 0 51 4%Communications 10 11 13 2 14% 10 10 1 1 10 20%Human Resources 37 36 38 2 5% 36 37 0 -1 36 5%IT 70 57 71 14 20% 63 70 -6 -13 58 18%Legal - ComEd 12 12 12 0 -2% 12 12 0 0 12 -2%Supply Services 210 208 209 1 0% 208 210 0 -2 209 0%TOTAL FUNCTIONAL GROUPS 409 396 417 21 5% 401 409 -5 -13 397 5%
TOTAL COMED HEADS 6,545 6,444 6,586 143 2% 6,450 6,545 -7 -101 6,453 2%
Schedule C-11.2Page 19 of 48
Witness: Tracy
Docket No. 18-____ ComEd Ex. 2.03 Page 217 of 334

ComEd Detail FTE's
For the Month Ending August 31, 2016 Net New Hires / Attrition 2015 Dec
Actual Actual Budget Variance Variance % Prior Month Year End
2015 Month YTD YTD Average Vacancy Rate
Distribution Ops - Chicago 625 648 662 14 2% 653 625 -5 23 629 5%Distribution Ops - Suburban 1,508 1,438 1,417 -21 -2% 1,447 1,508 -9 -70 1,462 -3%Ofc of SVP Distribution Ops 3 65 3 -62 -2111% 4 3 61 62 31 -940%Distribution Sys Operations 304 296 309 13 4% 298 304 -2 -8 300 3%Technical Services 365 402 417 15 4% 401 365 1 38 393 6%Office of EVP - Operations 3 3 3 0 -3% 2 3 1 0 3 5%Strategic & Support Services 267 253 267 14 5% 255 267 -2 -14 259 3%Transmission and Substation 1,154 1,168 1,194 26 2% 1,158 1,154 10 14 1,163 3%Operations Admin 0 18 20 2 10% 18 0 0 18 12 42%TOTAL OPERATIONS 4,228 4,290 4,292 2 0% 4,235 4,228 55 62 4,252 1%
Automated Meter Infrastructure 278 277 285 8 3% 265 278 12 -1 271 5%Customer Channels 457 479 443 -36 -8% 481 457 -2 22 482 -9%Customer Field Ops 668 485 610 125 20% 574 668 -89 -183 557 9%Customer Revenue Assurance 142 134 130 -4 -3% 133 142 1 -8 134 -3%SrVP Customer Operations 2 2 2 0 0% 2 2 0 0 2 0%Environmental Programs 44 49 45 -4 -9% 47 44 2 5 46 -3%TOTAL CUSTOMER OPERATIONS 1,592 1,427 1,516 89 6% 1,502 1,592 -76 -165 1,493 2%
Office of the Chairman/CEO 3 4 3 -1 -40% 4 3 0 1 4 -29%Office of the President -ComEd 2 2 2 0 0% 2 2 0 0 2 0%TOTAL OFFICE OF THE CEO/PRESIDENT-CED 5 6 5 -1 -24% 6 5 0 1 6 -17%
Claims 35 35 34 -1 -2% 35 35 0 0 35 -2%Legal 2 2 2 0 -3% 2 2 0 0 2 -7%Energy Acquisition - CED 27 26 27 1 4% 26 27 0 -1 26 2%CED-Regulatory & Strategic Srv 29 27 39 12 30% 27 29 0 -2 28 28%TOTAL REP/GENERAL COUNSEL 93 90 102 12 12% 90 93 0 -3 91 11%
ComEd External Affairs and ESO 101 101 103 2 1% 99 101 2 0 99 4%Offce VP State & Legislative 9 9 9 0 -1% 9 9 0 0 9 -1%Gov Affairs Strategy & Support 5 5 5 0 -1% 5 5 0 0 5 -1%SVP Govt & Ext Affs 5 4 5 1 19% 5 5 -1 -1 5 9%ComEd Corporate Relations 4 4 4 0 -1% 4 4 0 0 4 -1%ComEd Economic Development 5 5 5 0 -1% 5 5 0 0 5 -1%TOTAL OFFICE SVP GOVT & EXT AFFS-CED 129 128 130 2 2% 127 129 1 -1 126 3%
CED Real Estate & Facilities 40 40 42 2 5% 38 40 2 0 39 6%CED Marketing 17 17 17 0 3% 17 17 0 0 17 1%Ops Strategy and Bus Intellige 19 19 19 0 2% 19 19 0 0 19 2%Security Services 13 13 12 -1 -12% 13 13 0 0 13 -12%TOTAL OFFICE OF SVP STRATEGY & ADMIN 89 89 91 2 2% 87 89 2 0 89 2%
Finance 19 19 21 2 8% 21 19 -2 0 20 3%ComEd Finance 51 51 53 2 3% 51 51 0 0 51 4%Communications 10 11 13 2 14% 11 10 0 1 10 20%Human Resources 37 36 38 2 5% 36 37 0 -1 36 5%IT 70 57 71 14 20% 57 70 0 -13 58 18%Legal - ComEd 12 12 12 0 -2% 12 12 0 0 12 -2%Supply Services 210 209 209 0 0% 208 210 1 -1 209 0%TOTAL FUNCTIONAL GROUPS 409 395 416 21 5% 396 409 -1 -14 397 5%
TOTAL COMED HEADS 6,545 6,425 6,552 127 2% 6,444 6,545 -19 -120 6,453 2%
Schedule C-11.2Page 20 of 48
Witness: Tracy
Docket No. 18-____ ComEd Ex. 2.03 Page 218 of 334

ComEd Detail FTE's
For the Month Ending September 30, 2016 Net New Hires / Attrition 2015 Dec
Actual Actual Budget Variance Variance % Prior Month Year End
2015 Month YTD YTD Average Vacancy Rate
Distribution Ops - Chicago 625 624 660 36 6% 648 625 -24 -1 629 5%Distribution Ops - Suburban 1,508 1,464 1,414 -50 -4% 1,438 1,508 26 -44 1,462 -3%Ofc of SVP Distribution Ops 3 67 48 -19 -40% 65 3 2 64 31 36%Distribution Sys Operations 304 294 299 5 2% 296 304 -2 -10 300 0%Technical Services 365 404 417 13 3% 402 365 2 40 393 6%Office of EVP - Operations 3 3 3 0 -3% 3 3 0 0 3 5%Strategic & Support Services 267 257 267 10 4% 253 267 4 -10 259 3%Transmission and Substation 1,154 1,163 1,200 37 3% 1,168 1,154 -5 9 1,163 3%Operations Admin 0 18 20 2 10% 18 0 0 18 12 42%TOTAL OPERATIONS 4,228 4,294 4,329 35 1% 4,290 4,228 3 65 4,252 2%
Automated Meter Infrastructure 278 278 285 7 2% 277 278 1 0 271 5%Customer Channels 457 481 455 -26 -6% 479 457 1 23 482 -6%Customer Field Ops 668 482 578 96 17% 485 668 -3 -186 557 4%Customer Revenue Assurance 142 133 133 0 0% 134 142 -1 -9 134 -1%SrVP Customer Operations 2 2 2 0 0% 2 2 0 0 2 0%Environmental Programs 44 48 45 -3 -7% 49 44 -1 4 46 -3%TOTAL CUSTOMER OPERATIONS 1,592 1,424 1,498 74 5% 1,427 1,592 -3 -168 1,493 0%
Office of the Chairman/CEO 3 4 3 -1 -40% 4 3 0 1 4 -29%Office of the President -ComEd 2 2 2 0 0% 2 2 0 0 2 0%TOTAL OFFICE OF THE CEO/PRESIDENT-CED 5 6 5 -1 -24% 6 5 0 1 6 -17%
Claims 35 35 35 0 1% 35 35 0 0 35 1%Legal 2 2 2 0 -3% 2 2 0 0 2 -7%Energy Acquisition - CED 27 27 27 0 1% 26 27 1 0 26 2%CED-Regulatory & Strategic Srv 29 29 39 10 25% 27 29 2 0 28 28%TOTAL REP/GENERAL COUNSEL 93 93 103 10 10% 90 93 3 0 91 11%
ComEd External Affairs and ESO 101 100 103 3 3% 101 101 -1 -1 99 4%Offce VP State & Legislative 9 9 9 0 -2% 9 9 0 0 9 -2%Gov Affairs Strategy & Support 5 5 5 0 -2% 5 5 0 0 5 -2%SVP Govt & Ext Affs 5 3 5 2 39% 4 5 -1 -2 5 8%ComEd Corporate Relations 4 4 4 0 -2% 4 4 0 0 4 -2%ComEd Economic Development 5 5 5 0 -2% 5 5 0 0 5 -2%TOTAL OFFICE SVP GOVT & EXT AFFS-CED 129 126 130 4 3% 128 129 -2 -3 126 3%
CED Real Estate & Facilities 40 40 42 2 5% 40 40 0 0 39 6%CED Marketing 17 17 17 0 3% 17 17 0 0 17 1%Ops Strategy and Bus Intellige 19 19 19 0 2% 19 19 0 0 19 2%Security Services 13 13 12 -1 -12% 13 13 0 0 13 -12%TOTAL OFFICE OF SVP STRATEGY & ADMIN 89 89 91 2 2% 89 89 0 0 89 2%
Finance 19 18 21 3 13% 19 19 -1 -1 20 3%ComEd Finance 51 51 53 2 3% 51 51 0 0 51 4%Communications 10 11 13 2 14% 11 10 0 1 10 20%Human Resources 37 36 38 2 5% 36 37 0 -1 36 5%IT 70 58 71 13 19% 57 70 1 -12 58 18%Legal - ComEd 12 12 12 0 -2% 12 12 0 0 12 -2%Supply Services 210 211 209 -2 -1% 209 210 2 1 209 0%TOTAL FUNCTIONAL GROUPS 409 397 416 19 5% 395 409 2 -12 397 5%
TOTAL COMED HEADS 6,545 6,428 6,572 143 2% 6,425 6,545 4 -116 6,453 2%
Schedule C-11.2Page 21 of 48
Witness: Tracy
Docket No. 18-____ ComEd Ex. 2.03 Page 219 of 334

ComEd Detail FTE's
For the Month Ending October 31, 2016 Net New Hires / Attrition 2015 Dec
Actual Actual Budget Variance Variance % Prior Month Year End
2015 Month YTD YTD Average Vacancy Rate
Distribution Ops - Chicago 625 624 636 12 2% 624 625 0 -1 629 1%Distribution Ops - Suburban 1,508 1,455 1,436 -19 -1% 1,464 1,508 -9 -53 1,462 -2%Ofc of SVP Distribution Ops 3 65 48 -17 -36% 67 3 -2 62 31 36%Distribution Sys Operations 304 294 294 0 0% 294 304 0 -10 300 -2%Technical Services 365 406 417 11 3% 404 365 2 42 393 6%Office of EVP - Operations 3 3 3 0 -3% 3 3 0 0 3 5%Strategic & Support Services 267 257 266 9 3% 257 267 1 -9 259 3%Transmission and Substation 1,154 1,190 1,201 11 1% 1,163 1,154 27 36 1,163 3%Operations Admin 0 18 20 2 10% 18 0 0 18 12 42%TOTAL OPERATIONS 4,228 4,312 4,321 9 0% 4,294 4,228 19 84 4,252 2%
Automated Meter Infrastructure 278 265 285 20 7% 278 278 -13 -13 271 5%Customer Channels 457 481 474 -7 -2% 481 457 1 24 482 -2%Customer Field Ops 668 479 570 91 16% 482 668 -3 -189 557 2%Customer Revenue Assurance 142 132 133 1 1% 133 142 -1 -10 134 -1%SrVP Customer Operations 2 2 2 0 0% 2 2 0 0 2 0%Environmental Programs 44 49 45 -4 -9% 48 44 1 5 46 -3%TOTAL CUSTOMER OPERATIONS 1,592 1,409 1,509 101 7% 1,424 1,592 -15 -183 1,493 1%
Office of the Chairman/CEO 3 4 3 -1 -40% 4 3 0 1 4 -29%Office of the President -ComEd 2 2 2 0 0% 2 2 0 0 2 0%TOTAL OFFICE OF THE CEO/PRESIDENT-CED 5 6 5 -1 -24% 6 5 0 1 6 -17%
Claims 35 35 35 0 1% 35 35 0 0 35 1%Legal 2 2 2 0 -3% 2 2 0 0 2 -7%Energy Acquisition - CED 27 27 27 0 1% 27 27 0 0 26 2%CED-Regulatory & Strategic Srv 29 29 39 10 25% 29 29 0 0 28 28%TOTAL REP/GENERAL COUNSEL 93 93 103 10 10% 93 93 0 0 91 11%
ComEd External Affairs and ESO 101 96 103 7 7% 100 101 -4 -5 99 4%Offce VP State & Legislative 9 9 9 0 -3% 9 9 0 0 9 -3%Gov Affairs Strategy & Support 5 5 5 0 -2% 5 5 0 0 5 -2%SVP Govt & Ext Affs 5 4 5 1 18% 3 5 1 -1 5 7%ComEd Corporate Relations 4 4 4 0 -2% 4 4 0 0 4 -2%ComEd Economic Development 5 5 5 0 -3% 5 5 0 0 5 -3%TOTAL OFFICE SVP GOVT & EXT AFFS-CED 129 123 130 7 5% 126 129 -3 -6 126 3%
CED Real Estate & Facilities 40 40 42 2 5% 40 40 0 0 39 6%CED Marketing 17 17 17 0 3% 17 17 0 0 17 1%Ops Strategy and Bus Intellige 19 19 19 0 2% 19 19 0 0 19 2%Security Services 13 13 12 -1 -12% 13 13 0 0 13 -12%TOTAL OFFICE OF SVP STRATEGY & ADMIN 89 89 91 2 2% 89 89 0 0 89 2%
Finance 19 20 21 1 3% 18 19 2 1 20 3%ComEd Finance 51 51 53 2 3% 51 51 0 0 51 4%Communications 10 11 13 2 14% 11 10 0 1 10 20%Human Resources 37 38 38 0 0% 36 37 2 1 36 5%IT 70 54 71 17 24% 58 70 -4 -16 58 18%Legal - ComEd 12 12 12 0 -2% 12 12 0 0 12 -2%Supply Services 210 211 209 -2 -1% 211 210 0 1 209 0%TOTAL FUNCTIONAL GROUPS 409 397 416 19 5% 397 409 0 -12 397 5%
TOTAL COMED HEADS 6,545 6,429 6,576 147 2% 6,428 6,545 0 -116 6,453 2%
Schedule C-11.2Page 22 of 48
Witness: Tracy
Docket No. 18-____ ComEd Ex. 2.03 Page 220 of 334

ComEd Detail FTE's
For the Month Ending November 30, 2016 Net New Hires / Attrition
2015 Dec Actual Actual Budget Variance Variance % Prior Month
Year End 2015 Month YTD YTD Average Vacancy Rate
Distribution Ops - Chicago 625 628 636 8 1% 624 625 4 3 629 1%Distribution Ops - Suburban 1,508 1,458 1,423 -35 -2% 1,455 1,508 3 -50 1,462 -3%Ofc of SVP Distribution Ops 3 65 46 -19 -41% 65 3 0 62 31 33%Distribution Sys Operations 304 291 294 3 1% 294 304 -3 -13 300 -2%Technical Services 365 412 417 5 1% 406 365 6 48 393 6%Office of EVP - Operations 3 3 3 0 -3% 3 3 0 0 3 5%Strategic & Support Services 267 256 266 10 4% 257 267 -1 -10 259 3%Transmission and Substation 1,154 1,199 1,210 11 1% 1,190 1,154 9 45 1,163 4%Operations Admin 0 - 20 20 100% 18 0 -18 0 12 42%TOTAL OPERATIONS 4,228 4,312 4,316 3 0% 4,312 4,228 0 84 4,252 1%
Automated Meter Infrastructure 278 278 285 7 2% 265 278 13 0 271 5%Customer Channels 457 477 483 7 1% 481 457 -5 19 482 0%Customer Field Ops 668 465 540 75 14% 479 668 -14 -203 557 -3%Customer Revenue Assurance 142 133 132 -1 -1% 132 142 1 -9 134 -2%SrVP Customer Operations 2 2 2 0 0% 2 2 0 0 2 0%Environmental Programs 44 49 46 -3 -7% 49 44 0 5 46 0%TOTAL CUSTOMER OPERATIONS 1,592 1,404 1,488 85 6% 1,409 1,592 -5 -188 1,493 0%
Office of the Chairman/CEO 3 4 3 -1 -40% 4 3 0 1 4 -29%Office of the President -ComEd 2 2 2 0 0% 2 2 0 0 2 0%TOTAL OFFICE OF THE CEO/PRESIDENT-CED 5 6 5 -1 -24% 6 5 0 1 6 -17%
Claims 35 35 35 0 1% 35 35 0 0 35 1%Legal 2 2 2 0 -3% 2 2 0 0 2 -7%Energy Acquisition - CED 27 27 27 0 1% 27 27 0 0 26 2%CED-Regulatory & Strategic Srv 29 29 39 10 25% 29 29 0 0 28 28%TOTAL REP/GENERAL COUNSEL 93 93 103 10 10% 93 93 0 0 91 11%
ComEd External Affairs and ESO 101 99 103 4 3% 96 101 3 -2 99 4%Offce VP State & Legislative 9 9 9 0 -1% 9 9 0 0 9 -1%Gov Affairs Strategy & Support 5 5 5 0 -1% 5 5 0 0 5 -1%SVP Govt & Ext Affs 5 4 5 1 19% 4 5 0 -1 5 9%ComEd Corporate Relations 4 4 4 0 -1% 4 4 0 0 4 -1%ComEd Economic Development 5 5 5 0 -1% 5 5 0 0 5 -1%TOTAL OFFICE SVP GOVT & EXT AFFS-CED 129 126 130 4 3% 123 129 3 -3 126 3%
CED Real Estate & Facilities 40 40 42 2 5% 40 40 0 0 39 6%CED Marketing 17 17 17 0 3% 17 17 0 0 17 1%Ops Strategy and Bus Intellige 19 19 19 0 2% 19 19 0 0 19 2%Security Services 13 13 12 -1 -12% 13 13 0 0 13 -12%TOTAL OFFICE OF SVP STRATEGY & ADMIN 89 89 91 2 2% 89 89 0 0 89 2%
Finance 19 20 21 1 3% 20 19 0 1 20 3%ComEd Finance 51 51 53 2 3% 51 51 0 0 51 4%Communications 10 12 13 1 6% 11 10 1 2 10 20%Human Resources 37 38 38 0 0% 38 37 0 1 36 5%IT 70 54 71 17 24% 54 70 0 -16 58 18%Legal - ComEd 12 12 12 0 -2% 12 12 0 0 12 -2%Supply Services 210 211 209 -2 -1% 211 210 0 1 209 0%TOTAL FUNCTIONAL GROUPS 409 398 416 18 4% 397 409 1 -11 397 5%
TOTAL COMED HEADS 6,545 6,428 6,549 121 2% 6,429 6,545 -1 -117 6,453 1%
Schedule C-11.2Page 23 of 48
Witness: Tracy
Docket No. 18-____ ComEd Ex. 2.03 Page 221 of 334

ComEd Detail FTE's
For the Month Ending December 31, 2016 Net New Hires / Attrition 2015 Dec
Actual Actual Budget Variance Variance % Prior Month Year End
2015 Month YTD YTD Average Vacancy Rate
Distribution Ops - Chicago 625 641 639 -2 0% 628 625 13 16 629 2%Distribution Ops - Suburban 1,508 1,495 1,432 -63 -4% 1,458 1,508 37 -13 1,462 -2%Ofc of SVP Distribution Ops 3 7 20 13 65% 65 3 -58 4 31 -53%Distribution Sys Operations 304 291 293 2 1% 291 304 0 -13 300 -3%Technical Services 365 415 417 2 0% 412 365 3 51 393 6%Office of EVP - Operations 3 3 3 0 -3% 3 3 0 0 3 5%Strategic & Support Services 267 256 265 9 3% 256 267 0 -10 259 2%Transmission and Substation 1,154 1,201 1,207 6 0% 1,199 1,154 2 47 1,163 4%Operations Admin 0 - 10 10 100% - 0 0 0 12 -17%TOTAL OPERATIONS 4,228 4,309 4,286 -23 -1% 4,312 4,228 -3 81 4,252 1%
Automated Meter Infrastructure 278 277 285 8 3% 278 278 -1 -1 271 5%Customer Channels 457 480 436 -44 -10% 477 457 3 22 482 -11%Customer Field Ops 668 466 544 78 14% 465 668 1 -202 557 -2%Customer Revenue Assurance 142 133 132 -1 -1% 133 142 0 -9 134 -2%SrVP Customer Operations 2 2 2 0 0% 2 2 0 0 2 0%Environmental Programs 44 49 45 -4 -9% 49 44 0 5 46 -2%TOTAL CUSTOMER OPERATIONS 1,592 1,407 1,444 37 3% 1,404 1,592 3 -185 1,493 -3%
Office of the Chairman/CEO 3 4 3 -1 -40% 4 3 0 1 4 -29%Office of the President -ComEd 2 2 2 0 0% 2 2 0 0 2 0%TOTAL OFFICE OF THE CEO/PRESIDENT-CED 5 6 5 -1 -24% 6 5 0 1 6 -17%
Claims 35 35 35 0 1% 35 35 0 0 35 1%Legal 2 3 2 -1 -55% 2 2 1 1 2 -7%Energy Acquisition - CED 27 27 27 0 1% 27 27 0 0 26 2%CED-Regulatory & Strategic Srv 29 29 39 10 25% 29 29 0 0 28 28%TOTAL REP/GENERAL COUNSEL 93 94 103 9 9% 93 93 1 1 91 11%
ComEd External Affairs and ESO 101 101 103 2 2% 99 101 2 0 99 4%Offce VP State & Legislative 9 9 8 -1 -12% 9 9 0 0 9 -12%Gov Affairs Strategy & Support 5 5 5 0 0% 5 5 0 0 5 0%SVP Govt & Ext Affs 5 4 5 1 20% 4 5 0 -1 5 10%ComEd Corporate Relations 4 4 4 0 0% 4 4 0 0 4 0%ComEd Economic Development 5 5 5 0 0% 5 5 0 0 5 0%TOTAL OFFICE SVP GOVT & EXT AFFS-CED 129 128 130 2 2% 126 129 2 -1 126 3%
CED Real Estate & Facilities 40 40 42 2 5% 40 40 0 0 39 6%CED Marketing 17 17 17 0 3% 17 17 0 0 17 1%Ops Strategy and Bus Intellige 19 19 19 0 2% 19 19 0 0 19 2%Security Services 13 13 12 -1 -12% 13 13 0 0 13 -12%TOTAL OFFICE OF SVP STRATEGY & ADMIN 89 89 91 2 2% 89 89 0 0 89 2%
Finance 19 20 21 1 3% 20 19 0 1 20 3%ComEd Finance 51 50 53 3 5% 51 51 -1 -1 51 4%Communications 10 12 13 1 6% 12 10 0 2 10 20%Human Resources 37 38 38 0 0% 38 37 0 1 36 5%IT 70 34 71 37 52% 54 70 -20 -36 58 18%Legal - ComEd 12 12 12 0 -2% 12 12 0 0 12 -2%Supply Services 210 211 209 -2 -1% 211 210 0 1 209 0%TOTAL FUNCTIONAL GROUPS 409 377 416 39 9% 398 409 -21 -32 397 5%
TOTAL COMED HEADS 6,545 6,410 6,475 65 1% 6,428 6,545 -18 -135 6,453 0%
Schedule C-11.2Page 24 of 48
Witness: Tracy
Docket No. 18-____ ComEd Ex. 2.03 Page 222 of 334

For the Month Ending December 31, 2015
Dec Actual Actual Budget Variance Variance % Prior Month Year End 2014 Month YTD YTD Average Vacancy Rate
Distribution Ops - Chicago 615 625 619 -6 -1% 620 615 5 10 617 0%Distribution Ops - Suburban 1,359 1,508 1,438 -70 -5% 1,511 1,359 -3 149 1,442 0%Ofc of SVP Distribution Ops 11 3 3 0 -3% 5 11 -2 -8 43 -1366%Distribution Sys Operations 305 304 297 -7 -2% 304 305 0 -1 308 -4%Technical Services 343 365 351 -14 -4% 368 343 -3 22 350 0%Office of EVP - Operations 3 3 3 0 -3% 3 3 0 0 3 11%Strategic & Support Services 251 267 266 -1 0% 267 251 0 16 263 1%Transmission and Substation 1,122 1,154 1,159 5 0% 1,155 1,122 -1 32 1,135 2%Operations Admin 2 - 10 10 100% - 2 0 -2 16 -56%TOTAL OPERATIONS 4,011 4,228 4,146 -82 -2% 4,232 4,011 -4 218 4,175 -1%
Automated Meter Infrastructure 217 278 285 6 2% 280 217 -2 61 273 4%Customer Channels 470 457 425 -32 -8% 456 470 1 -12 457 -7%Customer Field Ops 773 668 702 34 5% 667 773 1 -105 671 4%Customer Revenue Assurance 130 142 139 -3 -2% 142 130 0 12 139 1%SrVP Customer Operations 2 2 2 0 0% 2 2 0 0 2 0%Environmental Programs 45 44 45 1 2% 44 45 0 -1 45 1%TOTAL CUSTOMER OPERATIONS 1,637 1,592 1,598 7 0% 1,591 1,637 0 -45 1,586 1%
Office of the Chairman/CEO 3 3 3 0 -3% 3 3 0 0 3 -9%Office of the President -ComEd 2 2 2 0 -3% 2 2 0 0 2 -3%TOTAL OFFICE OF THE CEO/PRESIDENT-CED 5 5 5 0 -3% 5 5 0 0 5 -7%
Claims 33 35 35 0 0% 35 33 0 2 34 4%Legal 2 2 2 0 -3% 2 2 0 0 2 -3%Energy Acquisition - CED 28 27 27 0 1% 27 28 0 -1 27 1%CED-Regulatory & Strategic Srv 31 29 31 2 7% 30 31 -1 -2 29 5%TOTAL REP/GENERAL COUNSEL 94 93 95 2 2% 94 94 -1 -1 92 3%
ComEd External Affairs and ESO 106 101 104 3 3% 102 106 -1 -5 104 0%Offce VP State & Legislative 9 9 9 0 -3% 9 9 0 0 9 -3%Gov Affairs Strategy & Support 5 5 6 1 14% 5 5 0 0 5 13%SVP Govt & Ext Affs 2 5 4 -1 -29% 5 2 0 3 4 -10%ComEd Corporate Relations 3 4 4 0 -3% 4 3 0 1 4 1%ComEd Economic Development 5 5 5 0 -3% 5 5 0 0 5 -1%TOTAL OFFICE SVP GOVT & EXT AFFS-CED 130 129 131 2 2% 130 130 -1 -1 131 0%
CED Real Estate & Facilities 42 40 43 3 7% 41 42 -1 -2 41 4%CED Marketing 17 17 17 0 3% 16 17 1 0 17 2%Ops Strategy and Bus Intellige 19 19 19 0 2% 19 19 0 0 19 0%Security Services 12 13 12 -1 -12% 13 12 0 1 13 -9%TOTAL OFFICE OF SVP STRATEGY & ADMIN 90 89 91 2 3% 89 90 0 -1 90 1%
Finance 23 19 24 5 21% 19 23 0 -4 21 15%ComEd Finance 51 51 53 2 4% 51 51 0 1 51 4%Communications 9 10 13 3 22% 10 9 0 1 10 22%Human Resources 33 37 37 0 0% 37 33 0 4 36 4%IT 67 70 71 1 2% 70 67 0 3 68 4%Legal - ComEd 0 12 12 0 0% 12 0 0 12 12 0%Supply Services 198 210 207 -3 -2% 211 198 -1 12 204 1%TOTAL FUNCTIONAL GROUPS 380 409 417 8 2% 410 380 -1 29 402 4%
TOTAL COMED HEADS 6,346 6,545 6,484 -61 -1% 6,551 6,346 -7 198 6,481 0%
Net New Hires / Attrition
ComEd Detail FTE's
Schedule C-11.2Page 25 of 48
Witness: Tracy
Docket No. 18-____ ComEd Ex. 2.03 Page 223 of 334

For the Month Ending November 30, 2015
Dec Actual Actual Budget Variance Variance % Prior Month Year End 2014 Month YTD YTD Average Vacancy Rate
Distribution Ops - Chicago 615 620 621 1 0% 601 615 19 5 617 1%Distribution Ops - Suburban 1,359 1,511 1,444 -67 -5% 1,469 1,359 42 152 1,442 0%Ofc of SVP Distribution Ops 11 5 22 17 78% 70 11 -65 -6 43 -91%Distribution Sys Operations 305 304 299 -5 -2% 305 305 -1 -1 308 -3%Technical Services 343 368 350 -18 -5% 361 343 7 25 350 0%Office of EVP - Operations 3 3 3 0 -3% 3 3 0 0 3 11%Strategic & Support Services 251 267 265 -2 -1% 266 251 1 16 263 1%Transmission and Substation 1,122 1,155 1,161 6 1% 1,131 1,122 24 33 1,135 2%Operations Admin 2 - 20 20 100% 19 2 -19 -2 16 22%TOTAL OPERATIONS 4,011 4,232 4,186 -46 -1% 4,225 4,011 8 222 4,175 0%
Automated Meter Infrastructure 217 280 285 5 2% 293 217 -13 63 273 4%Customer Channels 470 456 463 6 1% 459 470 -3 -13 457 1%Customer Field Ops 773 667 683 16 2% 667 773 0 -106 671 2%Customer Revenue Assurance 130 142 140 -2 -2% 145 130 -3 12 139 1%SrVP Customer Operations 2 2 2 0 0% 2 2 0 0 2 0%Environmental Programs 45 44 45 1 3% 44 45 0 -1 45 1%TOTAL CUSTOMER OPERATIONS 1,637 1,591 1,617 25 2% 1,610 1,637 -19 -45 1,586 2%
Office of the Chairman/CEO 3 3 3 0 -3% 3 3 0 0 3 -9%Office of the President -ComEd 2 2 2 0 -3% 2 2 0 0 2 -3%TOTAL OFFICE OF THE CEO/PRESIDENT-CED 5 5 5 0 -3% 5 5 0 0 5 -7%
Claims 33 35 35 0 0% 34 33 1 2 34 4%Legal 2 2 2 0 -3% 2 2 0 0 2 -3%Energy Acquisition - CED 28 27 27 0 1% 26 28 1 -1 27 1%CED-Regulatory & Strategic Srv 31 30 31 1 3% 30 31 0 -1 29 5%TOTAL REP/GENERAL COUNSEL 94 94 95 1 1% 92 94 2 0 92 3%
ComEd External Affairs and ESO 106 102 104 2 2% 103 106 -1 -4 104 0%Offce VP State & Legislative 9 9 9 0 -3% 9 9 0 0 9 -3%Gov Affairs Strategy & Support 5 5 6 1 14% 5 5 0 0 5 13%SVP Govt & Ext Affs 2 5 4 -1 -29% 5 2 0 3 4 -10%ComEd Corporate Relations 3 4 4 0 -3% 4 3 0 1 4 1%ComEd Economic Development 5 5 5 0 -3% 5 5 0 0 5 -1%TOTAL OFFICE SVP GOVT & EXT AFFS-CED 130 130 131 1 1% 131 130 -1 0 131 0%
CED Real Estate & Facilities 42 41 43 2 4% 42 42 -1 -1 41 4%CED Marketing 17 16 17 1 8% 17 17 -1 -1 17 2%Ops Strategy and Bus Intellige 19 19 19 0 2% 18 19 1 0 19 0%Security Services 12 13 12 -1 -12% 13 12 0 1 13 -9%TOTAL OFFICE OF SVP STRATEGY & ADMIN 90 89 91 2 3% 90 90 -1 -1 90 1%
Finance 23 19 24 5 21% 21 23 -2 -4 21 15%ComEd Finance 51 51 54 3 5% 52 51 -1 1 51 5%Communications 9 10 13 3 22% 10 9 0 1 10 22%Human Resources 33 37 37 0 0% 37 33 0 4 36 4%IT 67 70 71 1 2% 70 67 0 3 68 4%Legal - ComEd 0 12 12 0 0% 12 0 0 12 12 0%Supply Services 198 211 205 -6 -3% 208 198 3 13 204 0%TOTAL FUNCTIONAL GROUPS 380 410 416 6 1% 410 380 0 30 402 3%
TOTAL COMED HEADS 6,346 6,551 6,541 -11 0% 6,563 6,346 -11 205 6,481 1%
ComEd Detail FTE's
Net New Hires / Attrition
Schedule C-11.2Page 26 of 48
Witness: Tracy
Docket No. 18-____ ComEd Ex. 2.03 Page 224 of 334

For the Month Ending October 31, 2015
Dec Actual Actual Budget Variance Variance % Prior Month Year End 2014 Month YTD YTD Average Vacancy Rate
Distribution Ops - Chicago 615 601 589 -12 -2% 604 615 -3 -14 617 -5%Distribution Ops - Suburban 1,359 1,469 1,428 -41 -3% 1,455 1,359 14 110 1,442 -1%Ofc of SVP Distribution Ops 11 70 74 4 5% 80 11 -10 59 43 42%Distribution Sys Operations 305 305 301 -4 -1% 309 305 -4 0 308 -2%Technical Services 343 361 349 -12 -3% 359 343 2 18 350 0%Office of EVP - Operations 3 3 3 0 -3% 3 3 0 0 3 11%Strategic & Support Services 251 266 267 1 1% 267 251 -1 15 263 2%Transmission and Substation 1,122 1,131 1,144 12 1% 1,131 1,122 0 9 1,135 1%Operations Admin 2 19 20 1 5% 19 2 0 17 16 22%TOTAL OPERATIONS 4,011 4,225 4,174 -50 -1% 4,227 4,011 -2 214 4,175 0%
Automated Meter Infrastructure 217 293 285 -8 -3% 288 217 5 76 273 4%Customer Channels 470 459 467 8 2% 452 470 7 -11 457 2%Customer Field Ops 773 667 695 28 4% 677 773 -10 -106 671 3%Customer Revenue Assurance 130 145 139 -6 -4% 146 130 -1 15 139 0%SrVP Customer Operations 2 2 2 0 0% 2 2 0 0 2 0%Environmental Programs 45 44 45 1 3% 45 45 -1 -1 45 1%TOTAL CUSTOMER OPERATIONS 1,637 1,610 1,633 23 1% 1,610 1,637 0 -26 1,586 3%
Office of the Chairman/CEO 3 3 3 0 -3% 4 3 -1 0 3 -9%Office of the President -ComEd 2 2 2 0 -3% 2 2 0 0 2 -3%TOTAL OFFICE OF THE CEO/PRESIDENT-CED 5 5 5 0 -3% 6 5 -1 0 5 -7%
Claims 33 34 35 1 3% 35 33 -1 1 34 4%Legal 2 2 2 0 -3% 2 2 0 0 2 -3%Energy Acquisition - CED 28 26 27 1 4% 27 28 -1 -2 27 1%CED-Regulatory & Strategic Srv 31 30 31 1 3% 29 31 1 -1 29 5%TOTAL REP/GENERAL COUNSEL 94 92 95 3 3% 93 94 -1 -2 92 3%
ComEd External Affairs and ESO 106 103 104 1 1% 105 106 -2 -3 104 0%Offce VP State & Legislative 9 9 9 0 -3% 9 9 0 0 9 -3%Gov Affairs Strategy & Support 5 5 6 1 14% 5 5 0 0 5 13%SVP Govt & Ext Affs 2 5 4 -1 -29% 5 2 0 3 4 -10%ComEd Corporate Relations 3 4 4 0 -3% 4 3 0 1 4 1%ComEd Economic Development 5 5 5 0 -3% 5 5 0 0 5 -1%TOTAL OFFICE SVP GOVT & EXT AFFS-CED 130 131 131 0 0% 133 130 -2 1 131 0%
CED Real Estate & Facilities 42 42 43 1 2% 42 42 0 0 41 4%CED Marketing 17 17 17 0 3% 17 17 0 0 17 2%Ops Strategy and Bus Intellige 19 18 19 1 7% 18 19 0 -1 19 0%Security Services 12 13 12 -1 -12% 12 12 1 1 13 -9%TOTAL OFFICE OF SVP STRATEGY & ADMIN 90 90 91 1 1% 89 90 1 0 90 1%
Finance 23 21 24 3 13% 20 23 1 -2 21 15%ComEd Finance 51 52 54 2 3% 52 51 0 2 51 5%Communications 9 10 13 3 22% 10 9 0 1 10 22%Human Resources 33 37 37 0 0% 37 33 0 4 36 4%IT 67 70 71 1 2% 71 67 -1 3 68 4%Legal - ComEd 0 12 12 0 0% 12 0 0 12 12 0%Supply Services 198 208 205 -3 -2% 208 198 0 10 204 0%TOTAL FUNCTIONAL GROUPS 380 410 416 6 1% 410 380 0 30 402 3%
TOTAL COMED HEADS 6,346 6,563 6,545 -18 0% 6,568 6,346 -5 216 6,481 1%
ComEd Detail FTE's
Net New Hires / Attrition
Schedule C-11.2Page 27 of 48
Witness: Tracy
Docket No. 18-____ ComEd Ex. 2.03 Page 225 of 334

For the Month Ending September 30, 2015
Dec Actual Actual Budget Variance Variance % Prior Month Year End 2014 Month YTD YTD Average Vacancy Rate
Distribution Ops - Chicago 615 604 605 1 0% 632 615 -28 -11 617 -2%Distribution Ops - Suburban 1,359 1,455 1,433 -22 -2% 1,436 1,359 19 96 1,442 -1%Ofc of SVP Distribution Ops 11 80 78 -2 -2% 80 11 0 69 43 46%Distribution Sys Operations 305 309 302 -7 -2% 314 305 -5 4 308 -2%Technical Services 343 359 348 -11 -3% 354 343 5 16 350 0%Office of EVP - Operations 3 3 3 0 -3% 3 3 0 0 3 11%Strategic & Support Services 251 267 266 -1 0% 267 251 0 16 263 1%Transmission and Substation 1,122 1,131 1,142 10 1% 1,125 1,122 6 9 1,135 1%Operations Admin 2 19 20 1 5% 19 2 0 17 16 22%TOTAL OPERATIONS 4,011 4,227 4,197 -29 -1% 4,230 4,011 -3 216 4,175 1%
Automated Meter Infrastructure 217 288 285 -3 -1% 281 217 7 71 273 4%Customer Channels 470 452 460 8 2% 446 470 6 -17 457 1%Customer Field Ops 773 677 680 3 0% 693 773 -16 -96 671 1%Customer Revenue Assurance 130 146 137 -9 -7% 146 130 0 16 139 -1%SrVP Customer Operations 2 2 2 0 0% 2 2 0 0 2 0%Environmental Programs 45 45 45 0 1% 45 45 0 0 45 2%TOTAL CUSTOMER OPERATIONS 1,637 1,610 1,609 -1 0% 1,613 1,637 -3 -26 1,586 1%
Office of the Chairman/CEO 3 4 3 -1 -37% 4 3 0 1 3 -9%Office of the President -ComEd 2 2 2 0 -3% 2 2 0 0 2 -3%TOTAL OFFICE OF THE CEO/PRESIDENT-CED 5 6 5 -1 -24% 6 5 0 1 5 -7%
Claims 33 35 35 0 0% 35 33 0 2 34 4%Legal 2 2 2 0 -3% 2 2 0 0 2 -3%Energy Acquisition - CED 28 27 27 0 1% 27 28 0 -1 27 1%CED-Regulatory & Strategic Srv 31 29 31 2 7% 30 31 -1 -2 29 5%TOTAL REP/GENERAL COUNSEL 94 93 95 2 2% 94 94 -1 -1 92 3%
ComEd External Affairs and ESO 106 105 104 -1 -1% 104 106 1 -1 104 0%Offce VP State & Legislative 9 9 9 0 -3% 9 9 0 0 9 -3%Gov Affairs Strategy & Support 5 5 6 1 14% 5 5 0 0 5 13%SVP Govt & Ext Affs 2 5 4 -1 -29% 5 2 0 3 4 -10%ComEd Corporate Relations 3 4 4 0 -3% 4 3 0 1 4 1%ComEd Economic Development 5 5 5 0 -3% 5 5 0 0 5 -1%TOTAL OFFICE SVP GOVT & EXT AFFS-CED 130 133 131 -2 -2% 132 130 1 3 131 0%
CED Real Estate & Facilities 42 42 43 1 2% 42 42 0 0 41 4%CED Marketing 17 17 17 0 3% 17 17 0 0 17 2%Ops Strategy and Bus Intellige 19 18 19 1 7% 18 19 0 -1 19 0%Security Services 12 12 12 0 -3% 12 12 0 0 13 -9%TOTAL OFFICE OF SVP STRATEGY & ADMIN 90 89 91 2 3% 89 90 0 -1 90 1%
Finance 23 20 24 4 17% 21 23 -1 -3 21 15%ComEd Finance 51 52 54 2 3% 53 51 -1 2 51 5%Communications 9 10 13 3 22% 10 9 0 1 10 22%Human Resources 33 37 37 0 0% 37 33 0 4 36 4%IT 67 71 71 0 1% 70 67 1 4 68 4%Legal - ComEd 0 12 12 0 0% 12 0 0 12 12 0%Supply Services 198 208 205 -3 -2% 207 198 1 10 204 0%TOTAL FUNCTIONAL GROUPS 380 410 416 6 1% 410 380 0 30 402 3%
TOTAL COMED HEADS 6,346 6,568 6,545 -23 0% 6,573 6,346 -6 221 6,481 1%
ComEd Detail FTE's
Net New Hires / Attrition
Schedule C-11.2Page 28 of 48
Witness: Tracy
Docket No. 18-____ ComEd Ex. 2.03 Page 226 of 334

For the Month Ending August 31, 2015
Dec Actual Actual Budget Variance Variance % Prior Month Year End 2014 Month YTD YTD Average Vacancy Rate
Distribution Ops - Chicago 615 632 619 -13 -2% 635 615 -3 17 617 0%Distribution Ops - Suburban 1,359 1,436 1,413 -23 -2% 1,443 1,359 -7 77 1,442 -2%Ofc of SVP Distribution Ops 11 80 78 -2 -2% 78 11 2 69 43 45%Distribution Sys Operations 305 314 305 -9 -3% 314 305 0 9 308 -1%Technical Services 343 354 348 -6 -2% 346 343 8 11 350 0%Office of EVP - Operations 3 3 3 0 -3% 2 3 1 0 3 11%Strategic & Support Services 251 267 266 -1 0% 269 251 -2 16 263 1%Transmission and Substation 1,122 1,125 1,144 18 2% 1,130 1,122 -5 3 1,135 1%Operations Admin 2 19 20 1 5% 20 2 -1 17 16 22%TOTAL OPERATIONS 4,011 4,230 4,196 -34 -1% 4,237 4,011 -7 219 4,175 0%
Automated Meter Infrastructure 217 281 285 4 1% 282 217 -1 64 273 4%Customer Channels 470 446 453 8 2% 447 470 -2 -24 457 -1%Customer Field Ops 773 693 646 -47 -7% 695 773 -2 -80 671 -4%Customer Revenue Assurance 130 146 137 -9 -6% 144 130 2 16 139 -1%SrVP Customer Operations 2 2 2 0 0% 2 2 0 0 2 0%Environmental Programs 45 45 45 0 1% 46 45 -1 0 45 2%TOTAL CUSTOMER OPERATIONS 1,637 1,613 1,569 -44 -3% 1,617 1,637 -4 -24 1,586 -1%
Office of the Chairman/CEO 3 4 3 -1 -37% 3 3 1 1 3 -9%Office of the President -ComEd 2 2 2 0 -3% 2 2 0 0 2 -3%TOTAL OFFICE OF THE CEO/PRESIDENT-CED 5 6 5 -1 -24% 5 5 1 1 5 -7%
Claims 33 35 35 0 0% 34 33 1 2 34 4%Legal 2 2 2 0 -3% 2 2 0 0 2 -3%Energy Acquisition - CED 28 27 27 0 1% 26 28 1 -1 27 1%CED-Regulatory & Strategic Srv 31 30 31 1 3% 29 31 1 -1 29 5%TOTAL REP/GENERAL COUNSEL 94 94 95 1 1% 91 94 3 0 92 3%
ComEd External Affairs and ESO 106 104 104 0 0% 105 106 -1 -2 104 0%Offce VP State & Legislative 9 9 9 0 -3% 9 9 0 0 9 -3%Gov Affairs Strategy & Support 5 5 6 1 14% 5 5 0 0 5 13%SVP Govt & Ext Affs 2 5 4 -1 -29% 5 2 0 3 4 -10%ComEd Corporate Relations 3 4 4 0 -3% 4 3 0 1 4 1%ComEd Economic Development 5 5 5 0 -3% 5 5 0 0 5 -1%TOTAL OFFICE SVP GOVT & EXT AFFS-CED 130 132 131 -1 -1% 133 130 -1 2 131 0%
CED Real Estate & Facilities 42 42 43 1 2% 42 42 0 0 41 4%CED Marketing 17 17 17 0 3% 17 17 0 0 17 2%Ops Strategy and Bus Intellige 19 18 19 1 7% 19 19 -1 -1 19 0%Security Services 12 12 12 0 -3% 13 12 -1 0 13 -9%TOTAL OFFICE OF SVP STRATEGY & ADMIN 90 89 91 2 3% 91 90 -2 -1 90 1%
Finance 23 21 24 3 13% 21 23 0 -2 21 15%ComEd Finance 51 53 54 1 2% 54 51 -1 3 51 5%Communications 9 10 13 3 22% 10 9 0 1 10 22%Human Resources 33 37 37 0 0% 37 33 0 4 36 4%IT 67 70 71 1 2% 68 67 2 3 68 4%Legal - ComEd 0 12 12 0 0% 12 0 0 12 12 0%Supply Services 198 207 203 -4 -2% 208 198 -1 9 204 -1%TOTAL FUNCTIONAL GROUPS 380 410 414 4 1% 410 380 0 30 402 3%
TOTAL COMED HEADS 6,346 6,573 6,501 -72 -1% 6,583 6,346 -10 227 6,481 0%
ComEd Detail FTE's
Net New Hires / Attrition
Schedule C-11.2Page 29 of 48
Witness: Tracy
Docket No. 18-____ ComEd Ex. 2.03 Page 227 of 334

For the Month Ending July 31, 2015
Dec Actual Actual Budget Variance Variance % Prior Month Year End 2014 Month YTD YTD Average Vacancy Rate
Distribution Ops - Chicago 615 635 621 -14 -2% 628 615 7 20 617 1%Distribution Ops - Suburban 1,359 1,443 1,420 -23 -2% 1,446 1,359 -3 84 1,442 -2%Ofc of SVP Distribution Ops 11 78 24 -54 -225% 5 11 73 67 43 -78%Distribution Sys Operations 305 314 305 -9 -3% 316 305 -2 9 308 -1%Technical Services 343 346 348 2 1% 345 343 1 3 350 0%Office of EVP - Operations 3 2 3 1 31% 2 3 0 -1 3 11%Strategic & Support Services 251 269 260 -9 -3% 268 251 1 18 263 -1%Transmission and Substation 1,122 1,130 1,147 16 1% 1,135 1,122 -5 8 1,135 1%Operations Admin 2 20 30 10 33% 25 2 -5 18 16 48%TOTAL OPERATIONS 4,011 4,237 4,158 -79 -2% 4,170 4,011 67 226 4,175 0%
Automated Meter Infrastructure 217 282 286 3 1% 282 217 0 65 273 4%Customer Channels 470 447 447 0 0% 454 470 -7 -22 457 -2%Customer Field Ops 773 695 654 -41 -6% 635 773 60 -78 671 -3%Customer Revenue Assurance 130 144 137 -7 -5% 136 130 8 14 139 -1%SrVP Customer Operations 2 2 2 0 0% 2 2 0 0 2 0%Environmental Programs 45 46 44 -2 -3% 45 45 1 1 45 0%TOTAL CUSTOMER OPERATIONS 1,637 1,617 1,571 -46 -3% 1,554 1,637 62 -20 1,586 -1%
Office of the Chairman/CEO 3 3 3 0 -3% 3 3 0 0 3 -9%Office of the President -ComEd 2 2 2 0 -3% 2 2 0 0 2 -3%TOTAL OFFICE OF THE CEO/PRESIDENT-CED 5 5 5 0 -3% 5 5 0 0 5 -7%
Claims 33 34 35 1 3% 34 33 0 1 34 4%Legal 2 2 2 0 -3% 2 2 0 0 2 -3%Energy Acquisition - CED 28 26 27 1 4% 26 28 0 -2 27 1%CED-Regulatory & Strategic Srv 31 29 31 2 7% 28 31 1 -2 29 5%TOTAL REP/GENERAL COUNSEL 94 91 95 4 4% 90 94 1 -3 92 3%
ComEd External Affairs and ESO 106 105 104 -1 -1% 105 106 0 -1 104 0%Offce VP State & Legislative 9 9 9 0 -3% 9 9 0 0 9 -3%Gov Affairs Strategy & Support 5 5 6 1 14% 5 5 0 0 5 13%SVP Govt & Ext Affs 2 5 4 -1 -29% 5 2 0 3 4 -10%ComEd Corporate Relations 3 4 4 0 -3% 4 3 0 1 4 1%ComEd Economic Development 5 5 5 0 -3% 5 5 0 0 5 -1%TOTAL OFFICE SVP GOVT & EXT AFFS-CED 130 133 131 -2 -2% 133 130 0 3 131 0%
CED Real Estate & Facilities 42 42 43 1 2% 41 42 1 0 41 4%CED Marketing 17 17 17 0 3% 18 17 -1 0 17 2%Ops Strategy and Bus Intellige 19 19 19 0 2% 19 19 0 0 19 0%Security Services 12 13 12 -1 -12% 13 12 0 1 13 -9%TOTAL OFFICE OF SVP STRATEGY & ADMIN 90 91 91 0 0% 91 90 0 1 90 1%
Finance 23 21 24 3 13% 20 23 1 -2 21 15%ComEd Finance 51 54 54 0 0% 54 51 0 4 51 5%Communications 9 10 13 3 22% 10 9 0 1 10 22%Human Resources 33 37 37 0 0% 37 33 0 4 36 4%IT 67 68 71 3 5% 68 67 0 1 68 4%Legal - ComEd 0 12 12 0 0% 12 0 0 12 12 0%Supply Services 198 208 201 -7 -4% 207 198 1 10 204 -2%TOTAL FUNCTIONAL GROUPS 380 410 412 2 0% 408 380 2 30 402 2%
TOTAL COMED HEADS 6,346 6,583 6,463 -120 -2% 6,451 6,346 132 237 6,481 0%
ComEd Detail FTE's
Net New Hires / Attrition
Schedule C-11.2Page 30 of 48
Witness: Tracy
Docket No. 18-____ ComEd Ex. 2.03 Page 228 of 334
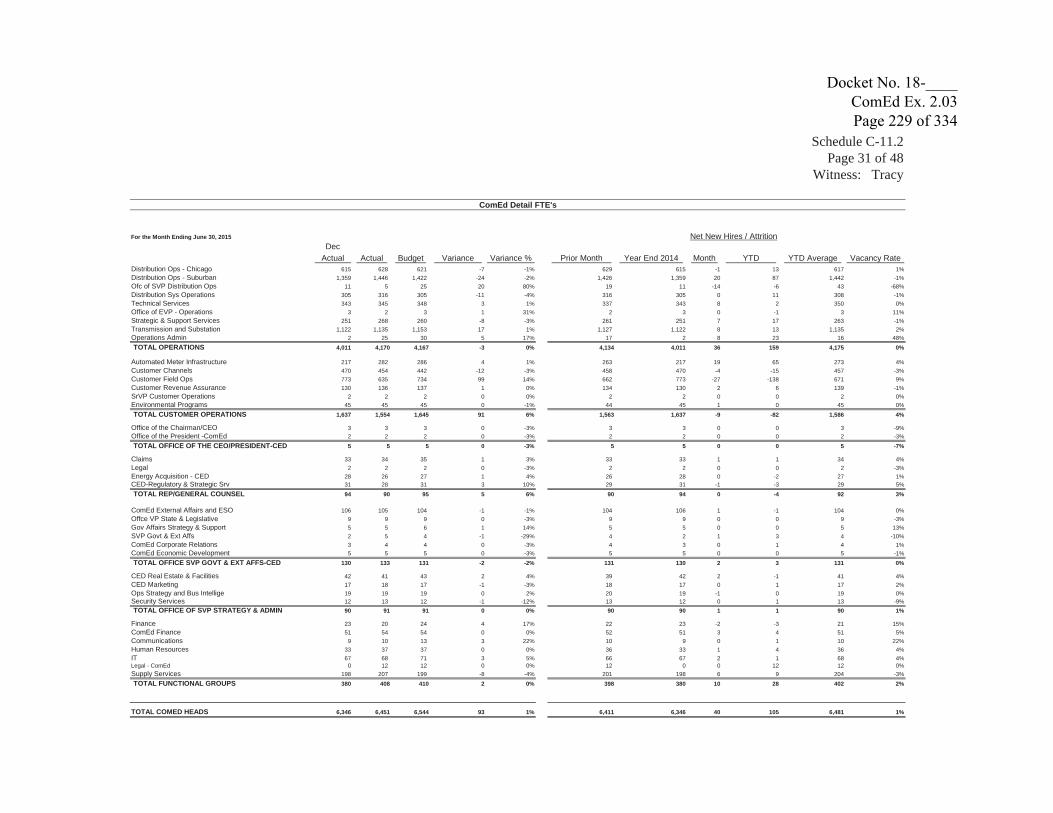
For the Month Ending June 30, 2015
Dec Actual Actual Budget Variance Variance % Prior Month Year End 2014 Month YTD YTD Average Vacancy Rate
Distribution Ops - Chicago 615 628 621 -7 -1% 629 615 -1 13 617 1%Distribution Ops - Suburban 1,359 1,446 1,422 -24 -2% 1,426 1,359 20 87 1,442 -1%Ofc of SVP Distribution Ops 11 5 25 20 80% 19 11 -14 -6 43 -68%Distribution Sys Operations 305 316 305 -11 -4% 316 305 0 11 308 -1%Technical Services 343 345 348 3 1% 337 343 8 2 350 0%Office of EVP - Operations 3 2 3 1 31% 2 3 0 -1 3 11%Strategic & Support Services 251 268 260 -8 -3% 261 251 7 17 263 -1%Transmission and Substation 1,122 1,135 1,153 17 1% 1,127 1,122 8 13 1,135 2%Operations Admin 2 25 30 5 17% 17 2 8 23 16 48%TOTAL OPERATIONS 4,011 4,170 4,167 -3 0% 4,134 4,011 36 159 4,175 0%
Automated Meter Infrastructure 217 282 286 4 1% 263 217 19 65 273 4%Customer Channels 470 454 442 -12 -3% 458 470 -4 -15 457 -3%Customer Field Ops 773 635 734 99 14% 662 773 -27 -138 671 9%Customer Revenue Assurance 130 136 137 1 0% 134 130 2 6 139 -1%SrVP Customer Operations 2 2 2 0 0% 2 2 0 0 2 0%Environmental Programs 45 45 45 0 -1% 44 45 1 0 45 0%TOTAL CUSTOMER OPERATIONS 1,637 1,554 1,645 91 6% 1,563 1,637 -9 -82 1,586 4%
Office of the Chairman/CEO 3 3 3 0 -3% 3 3 0 0 3 -9%Office of the President -ComEd 2 2 2 0 -3% 2 2 0 0 2 -3%TOTAL OFFICE OF THE CEO/PRESIDENT-CED 5 5 5 0 -3% 5 5 0 0 5 -7%
Claims 33 34 35 1 3% 33 33 1 1 34 4%Legal 2 2 2 0 -3% 2 2 0 0 2 -3%Energy Acquisition - CED 28 26 27 1 4% 26 28 0 -2 27 1%CED-Regulatory & Strategic Srv 31 28 31 3 10% 29 31 -1 -3 29 5%TOTAL REP/GENERAL COUNSEL 94 90 95 5 6% 90 94 0 -4 92 3%
ComEd External Affairs and ESO 106 105 104 -1 -1% 104 106 1 -1 104 0%Offce VP State & Legislative 9 9 9 0 -3% 9 9 0 0 9 -3%Gov Affairs Strategy & Support 5 5 6 1 14% 5 5 0 0 5 13%SVP Govt & Ext Affs 2 5 4 -1 -29% 4 2 1 3 4 -10%ComEd Corporate Relations 3 4 4 0 -3% 4 3 0 1 4 1%ComEd Economic Development 5 5 5 0 -3% 5 5 0 0 5 -1%TOTAL OFFICE SVP GOVT & EXT AFFS-CED 130 133 131 -2 -2% 131 130 2 3 131 0%
CED Real Estate & Facilities 42 41 43 2 4% 39 42 2 -1 41 4%CED Marketing 17 18 17 -1 -3% 18 17 0 1 17 2%Ops Strategy and Bus Intellige 19 19 19 0 2% 20 19 -1 0 19 0%Security Services 12 13 12 -1 -12% 13 12 0 1 13 -9%TOTAL OFFICE OF SVP STRATEGY & ADMIN 90 91 91 0 0% 90 90 1 1 90 1%
Finance 23 20 24 4 17% 22 23 -2 -3 21 15%ComEd Finance 51 54 54 0 0% 52 51 3 4 51 5%Communications 9 10 13 3 22% 10 9 0 1 10 22%Human Resources 33 37 37 0 0% 36 33 1 4 36 4%IT 67 68 71 3 5% 66 67 2 1 68 4%Legal - ComEd 0 12 12 0 0% 12 0 0 12 12 0%Supply Services 198 207 199 -8 -4% 201 198 6 9 204 -3%TOTAL FUNCTIONAL GROUPS 380 408 410 2 0% 398 380 10 28 402 2%
TOTAL COMED HEADS 6,346 6,451 6,544 93 1% 6,411 6,346 40 105 6,481 1%
ComEd Detail FTE's
Net New Hires / Attrition
Schedule C-11.2Page 31 of 48
Witness: Tracy
Docket No. 18-____ ComEd Ex. 2.03 Page 229 of 334

For the Month Ending May 31, 2015
Dec Actual Actual Budget Variance Variance % Prior Month Year End 2014 Month YTD YTD Average Vacancy Rate
Distribution Ops - Chicago 615 629 630 1 0% 617 615 12 14 617 2%Distribution Ops - Suburban 1,359 1,426 1,419 -7 0% 1,433 1,359 -7 67 1,442 -2%Ofc of SVP Distribution Ops 11 19 37 18 49% 15 11 4 8 43 -15%Distribution Sys Operations 305 316 305 -11 -4% 304 305 12 11 308 -1%Technical Services 343 337 349 12 3% 339 343 -2 -6 350 0%Office of EVP - Operations 3 2 3 1 31% 2 3 0 -1 3 11%Strategic & Support Services 251 261 263 2 1% 256 251 5 10 263 0%Transmission and Substation 1,122 1,127 1,158 30 3% 1,129 1,122 -2 5 1,135 2%Operations Admin 2 17 20 3 15% 17 2 0 15 16 22%TOTAL OPERATIONS 4,011 4,134 4,184 50 1% 4,112 4,011 22 123 4,175 0%
Automated Meter Infrastructure 217 263 286 23 8% 259 217 4 46 273 5%Customer Channels 470 458 454 -4 -1% 461 470 -3 -12 457 -1%Customer Field Ops 773 662 698 36 5% 684 773 -22 -111 671 4%Customer Revenue Assurance 130 134 136 2 1% 136 130 -2 4 139 -2%SrVP Customer Operations 2 2 2 0 0% 2 2 0 0 2 0%Environmental Programs 45 44 45 1 1% 44 45 0 -1 45 0%TOTAL CUSTOMER OPERATIONS 1,637 1,563 1,620 57 4% 1,586 1,637 -23 -73 1,586 2%
Office of the Chairman/CEO 3 3 3 0 -3% 3 3 0 0 3 -9%Office of the President -ComEd 2 2 2 0 -3% 2 2 0 0 2 -3%TOTAL OFFICE OF THE CEO/PRESIDENT-CED 5 5 5 0 -3% 5 5 0 0 5 -7%
Claims 33 33 35 2 6% 32 33 1 0 34 4%Legal 2 2 2 0 -3% 2 2 0 0 2 -3%Energy Acquisition - CED 28 26 27 1 4% 27 28 -1 -2 27 1%CED-Regulatory & Strategic Srv 31 29 31 2 7% 30 31 -1 -2 29 5%TOTAL REP/GENERAL COUNSEL 94 90 95 5 6% 91 94 -1 -4 92 3%
ComEd External Affairs and ESO 106 104 104 0 0% 105 106 -1 -2 104 0%Offce VP State & Legislative 9 9 9 0 -3% 9 9 0 0 9 -3%Gov Affairs Strategy & Support 5 5 6 1 14% 5 5 0 0 5 13%SVP Govt & Ext Affs 2 4 4 0 -3% 3 2 1 2 4 -10%ComEd Corporate Relations 3 4 4 0 -3% 4 3 0 1 4 1%ComEd Economic Development 5 5 5 0 -3% 5 5 0 0 5 -1%TOTAL OFFICE SVP GOVT & EXT AFFS-CED 130 131 131 0 0% 131 130 0 1 131 0%
CED Real Estate & Facilities 42 39 43 4 9% 40 42 -1 -3 41 4%CED Marketing 17 18 17 -1 -3% 18 17 0 1 17 2%Ops Strategy and Bus Intellige 19 20 19 -1 -3% 21 19 -1 1 19 0%Security Services 12 13 12 -1 -12% 13 12 0 1 13 -9%TOTAL OFFICE OF SVP STRATEGY & ADMIN 90 90 91 1 1% 92 90 -2 0 90 1%
Finance 23 22 24 2 8% 20 23 2 -1 21 15%ComEd Finance 51 52 54 3 5% 50 51 2 1 51 5%Communications 9 10 13 3 22% 11 9 -1 1 10 22%Human Resources 33 36 37 1 3% 34 33 2 3 36 4%IT 67 66 71 5 8% 69 67 -3 -1 68 4%Legal - ComEd 0 12 12 0 0% 12 0 0 12 12 0%Supply Services 198 201 197 -4 -2% 204 198 -3 3 204 -4%TOTAL FUNCTIONAL GROUPS 380 398 408 10 2% 399 380 -1 18 402 2%
TOTAL COMED HEADS 6,346 6,411 6,534 123 2% 6,416 6,346 -5 65 6,481 1%
ComEd Detail FTE's
Net New Hires / Attrition
Schedule C-11.2Page 32 of 48
Witness: Tracy
Docket No. 18-____ ComEd Ex. 2.03 Page 230 of 334

For the Month Ending April 30, 2015
Dec Actual Actual Budget Variance Variance % Prior Month Year End 2014 Month YTD YTD Average Vacancy Rate
Distribution Ops - Chicago 615 617 616 -1 0% 606 615 11 2 617 0%Distribution Ops - Suburban 1,359 1,433 1,420 -13 -1% 1,433 1,359 0 74 1,442 -2%Ofc of SVP Distribution Ops 11 15 24 9 37% 14 11 1 4 43 -79%Distribution Sys Operations 305 304 307 3 1% 302 305 2 -1 308 0%Technical Services 343 339 350 11 3% 339 343 0 -4 350 0%Office of EVP - Operations 3 2 3 1 31% 2 3 0 -1 3 11%Strategic & Support Services 251 256 264 8 3% 261 251 -5 5 263 0%Transmission and Substation 1,122 1,129 1,167 38 3% 1,132 1,122 -3 7 1,135 3%Operations Admin 2 17 20 3 15% 17 2 0 15 16 22%TOTAL OPERATIONS 4,011 4,112 4,171 59 1% 4,106 4,011 6 101 4,175 0%
Automated Meter Infrastructure 217 259 282 23 8% 259 217 0 42 273 3%Customer Channels 470 461 472 11 2% 460 470 1 -9 457 3%Customer Field Ops 773 684 679 -5 -1% 701 773 -17 -89 671 1%Customer Revenue Assurance 130 136 136 0 0% 130 130 6 6 139 -2%SrVP Customer Operations 2 2 2 0 0% 2 2 0 0 2 0%Environmental Programs 45 44 45 1 2% 45 45 -1 -1 45 0%TOTAL CUSTOMER OPERATIONS 1,637 1,586 1,616 30 2% 1,597 1,637 -11 -51 1,586 2%
Office of the Chairman/CEO 3 3 3 0 -3% 3 3 0 0 3 -9%Office of the President -ComEd 2 2 2 0 -3% 2 2 0 0 2 -3%TOTAL OFFICE OF THE CEO/PRESIDENT-CED 5 5 5 0 -3% 5 5 0 0 5 -7%
Claims 33 32 35 3 9% 31 33 1 -1 34 4%Legal 2 2 2 0 -3% 2 2 0 0 2 -3%Energy Acquisition - CED 28 27 27 0 1% 28 28 -1 -1 27 1%CED-Regulatory & Strategic Srv 31 30 31 1 3% 30 31 0 -1 29 5%TOTAL REP/GENERAL COUNSEL 94 91 95 4 4% 91 94 0 -3 92 3%
ComEd External Affairs and ESO 106 105 104 -1 -1% 101 106 4 -1 104 0%Offce VP State & Legislative 9 9 9 0 -3% 9 9 0 0 9 -3%Gov Affairs Strategy & Support 5 5 6 1 14% 5 5 0 0 5 13%SVP Govt & Ext Affs 2 3 4 1 23% 3 2 0 1 4 -10%ComEd Corporate Relations 3 4 4 0 -3% 4 3 0 1 4 1%ComEd Economic Development 5 5 5 0 -3% 5 5 0 0 5 -1%TOTAL OFFICE SVP GOVT & EXT AFFS-CED 130 131 131 0 0% 127 130 4 1 131 0%
CED Real Estate & Facilities 42 40 43 3 7% 41 42 -1 -2 41 4%CED Marketing 17 18 17 -1 -3% 16 17 2 1 17 2%Ops Strategy and Bus Intellige 19 21 19 -2 -8% 21 19 0 2 19 0%Security Services 12 13 12 -1 -12% 13 12 0 1 13 -9%TOTAL OFFICE OF SVP STRATEGY & ADMIN 90 92 91 -1 -1% 91 90 1 2 90 1%
Finance 23 20 24 4 17% 20 23 0 -3 21 15%ComEd Finance 51 50 54 5 8% 50 51 0 -1 51 5%Communications 9 11 13 2 14% 10 9 1 2 10 22%Human Resources 33 34 37 3 8% 33 33 1 1 36 4%IT 67 69 71 2 3% 67 67 2 2 68 4%Legal - ComEd 0 12 12 0 0% 12 0 0 12 12 0%Supply Services 198 204 196 -8 -4% 200 198 4 6 204 -4%TOTAL FUNCTIONAL GROUPS 380 399 407 8 2% 391 380 8 19 402 1%
TOTAL COMED HEADS 6,346 6,416 6,516 100 2% 6,407 6,346 8 69 6,481 1%
ComEd Detail FTE's
Net New Hires / Attrition
Schedule C-11.2Page 33 of 48
Witness: Tracy
Docket No. 18-____ ComEd Ex. 2.03 Page 231 of 334

For the Month Ending March 31, 2015
Dec Actual Actual Budget Variance Variance % Prior Month Year End 2014 Month YTD YTD Average Vacancy Rate
Distribution Ops - Chicago 615 606 605 -1 0% 592 615 14 -9 617 -2%Distribution Ops - Suburban 1,359 1,433 1,378 -55 -4% 1,385 1,359 48 74 1,442 -5%Ofc of SVP Distribution Ops 11 14 64 50 78% 78 11 -64 3 43 33%Distribution Sys Operations 305 302 302 0 0% 305 305 -3 -3 308 -2%Technical Services 343 339 351 12 3% 340 343 -1 -4 350 0%Office of EVP - Operations 3 2 3 1 31% 3 3 -1 -1 3 11%Strategic & Support Services 251 261 262 1 1% 255 251 6 10 263 0%Transmission and Substation 1,122 1,132 1,158 26 2% 1,139 1,122 -7 10 1,135 2%Operations Admin 2 17 20 3 15% 17 2 0 15 16 22%TOTAL OPERATIONS 4,011 4,106 4,143 37 1% 4,114 4,011 -8 95 4,175 -1%
Automated Meter Infrastructure 217 259 277 19 7% 257 217 2 42 273 2%Customer Channels 470 460 465 6 1% 464 470 -5 -10 457 2%Customer Field Ops 773 701 657 -44 -7% 634 773 67 -72 671 -2%Customer Revenue Assurance 130 130 136 6 5% 130 130 0 0 139 -2%SrVP Customer Operations 2 2 2 0 0% 2 2 0 0 2 0%Environmental Programs 45 45 45 0 -1% 45 45 0 0 45 0%TOTAL CUSTOMER OPERATIONS 1,637 1,597 1,583 -14 -1% 1,532 1,637 64 -40 1,586 0%
Office of the Chairman/CEO 3 3 3 0 -3% 3 3 0 0 3 -9%Office of the President -ComEd 2 2 2 0 -3% 2 2 0 0 2 -3%TOTAL OFFICE OF THE CEO/PRESIDENT-CED 5 5 5 0 -3% 5 5 0 0 5 -7%
Claims 33 31 35 4 12% 34 33 -3 -2 34 4%Legal 2 2 2 0 -3% 2 2 0 0 2 -3%Energy Acquisition - CED 28 28 27 -1 -3% 28 28 0 0 27 1%CED-Regulatory & Strategic Srv 31 30 31 1 3% 30 31 0 -1 29 5%TOTAL REP/GENERAL COUNSEL 94 91 95 4 4% 94 94 -3 -3 92 3%
ComEd External Affairs and ESO 106 101 104 3 3% 103 106 -2 -5 104 0%Offce VP State & Legislative 9 9 9 0 -3% 8 9 1 0 9 -3%Gov Affairs Strategy & Support 5 5 6 1 14% 6 5 -1 0 5 13%SVP Govt & Ext Affs 2 3 4 1 23% 4 2 -1 1 4 -10%ComEd Corporate Relations 3 4 4 0 -3% 3 3 1 1 4 1%ComEd Economic Development 5 5 5 0 -3% 4 5 1 0 5 -1%TOTAL OFFICE SVP GOVT & EXT AFFS-CED 130 127 131 4 3% 128 130 -1 -3 131 0%
CED Real Estate & Facilities 42 41 43 2 4% 42 42 -1 -1 41 4%CED Marketing 17 16 17 1 8% 17 17 -1 -1 17 2%Ops Strategy and Bus Intellige 19 21 19 -2 -8% 21 19 0 2 19 0%Security Services 12 13 12 -1 -12% 12 12 1 1 13 -9%TOTAL OFFICE OF SVP STRATEGY & ADMIN 90 91 91 0 0% 92 90 -1 1 90 1%
Finance 23 20 24 4 17% 22 23 -2 -3 21 15%ComEd Finance 51 50 54 5 8% 48 51 2 -1 51 5%Communications 9 10 13 3 22% 9 9 1 1 10 22%Human Resources 33 33 37 4 11% 34 33 -1 0 36 4%IT 67 67 71 4 6% 67 67 0 0 68 4%Legal - ComEd 0 12 12 0 0% 12 0 0 12 12 0%Supply Services 198 200 196 -4 -2% 187 198 13 2 204 -4%TOTAL FUNCTIONAL GROUPS 380 391 407 16 4% 378 380 13 11 402 1%
TOTAL COMED HEADS 6,346 6,407 6,455 48 1% 6,343 6,346 64 61 6,481 0%
ComEd Detail FTE's
Net New Hires / Attrition
Schedule C-11.2Page 34 of 48
Witness: Tracy
Docket No. 18-____ ComEd Ex. 2.03 Page 232 of 334

For the Month Ending February 28, 2015
Dec Actual Actual Budget Variance Variance % Prior Month Year End 2014 Month YTD YTD Average Vacancy Rate
Distribution Ops - Chicago 615 592 590 -2 0% 613 615 -21 -23 617 -4%Distribution Ops - Suburban 1,359 1,385 1,380 -5 0% 1,358 1,359 27 26 1,442 -4%Ofc of SVP Distribution Ops 11 78 81 3 4% 65 11 13 67 43 47%Distribution Sys Operations 305 305 304 -1 0% 305 305 0 0 308 -1%Technical Services 343 340 347 7 2% 345 343 -5 -3 350 -1%Office of EVP - Operations 3 3 3 0 -3% 3 3 0 0 3 11%Strategic & Support Services 251 255 259 4 2% 254 251 1 4 263 -1%Transmission and Substation 1,122 1,139 1,157 18 2% 1,129 1,122 10 17 1,135 2%Operations Admin 2 17 20 3 15% 17 2 0 15 16 22%TOTAL OPERATIONS 4,011 4,114 4,142 28 1% 4,089 4,011 25 103 4,175 -1%
Automated Meter Infrastructure 217 257 273 16 6% 252 217 5 40 273 0%Customer Channels 470 464 448 -16 -4% 469 470 -5 -5 457 -2%Customer Field Ops 773 634 627 -7 -1% 668 773 -34 -139 671 -7%Customer Revenue Assurance 130 130 136 6 4% 132 130 -2 0 139 -2%SrVP Customer Operations 2 2 2 0 0% 2 2 0 0 2 0%Environmental Programs 45 45 45 0 0% 44 45 1 0 45 1%TOTAL CUSTOMER OPERATIONS 1,637 1,532 1,530 -2 0% 1,567 1,637 -35 -104 1,586 -4%
Office of the Chairman/CEO 3 3 3 0 -3% 3 3 0 0 3 -9%Office of the President -ComEd 2 2 2 0 -3% 2 2 0 0 2 -3%TOTAL OFFICE OF THE CEO/PRESIDENT-CED 5 5 5 0 -3% 5 5 0 0 5 -7%
Claims 33 34 35 1 3% 34 33 0 1 34 4%Legal 2 2 2 0 -3% 2 2 0 0 2 -3%Energy Acquisition - CED 28 28 27 -1 -3% 28 28 0 0 27 1%CED-Regulatory & Strategic Srv 31 30 31 1 3% 29 31 1 -1 29 5%TOTAL REP/GENERAL COUNSEL 94 94 95 1 1% 93 94 1 0 92 3%
ComEd External Affairs and ESO 106 103 104 1 1% 104 106 -1 -3 104 0%Offce VP State & Legislative 9 8 9 1 8% 10 9 -2 -1 9 -3%Gov Affairs Strategy & Support 5 6 6 0 -3% 5 5 1 1 5 13%SVP Govt & Ext Affs 2 4 4 0 -3% 2 2 2 2 4 -10%ComEd Corporate Relations 3 3 4 1 23% 3 3 0 0 4 1%ComEd Economic Development 5 4 5 1 18% 5 5 -1 -1 5 -1%TOTAL OFFICE SVP GOVT & EXT AFFS-CED 130 128 131 3 2% 129 130 -1 -2 131 0%
CED Real Estate & Facilities 42 42 43 1 2% 42 42 0 0 41 4%CED Marketing 17 17 17 0 3% 17 17 0 0 17 2%Ops Strategy and Bus Intellige 19 21 19 -2 -8% 19 19 2 2 19 0%Security Services 12 12 12 0 -3% 12 12 0 0 13 -9%TOTAL OFFICE OF SVP STRATEGY & ADMIN 90 92 91 -1 -1% 90 90 2 2 90 1%
Finance 23 22 24 2 8% 21 23 1 -1 21 15%ComEd Finance 51 48 54 7 12% 48 51 0 -3 51 5%Communications 9 9 13 4 29% 9 9 0 0 10 22%Human Resources 33 34 37 3 8% 33 33 1 1 36 4%IT 67 67 71 4 6% 67 67 0 0 68 4%Legal - ComEd 0 12 12 0 0% 12 0 0 12 12 0%Supply Services 198 187 196 9 5% 199 198 -12 -11 204 -4%TOTAL FUNCTIONAL GROUPS 380 378 407 29 7% 388 380 -10 -2 402 1%
TOTAL COMED HEADS 6,346 6,343 6,401 58 1% 6,361 6,346 -18 -3 6,481 -1%
ComEd Detail FTE's
Net New Hires / Attrition
Schedule C-11.2Page 35 of 48
Witness: Tracy
Docket No. 18-____ ComEd Ex. 2.03 Page 233 of 334

For the Month Ending January 31, 2015
Dec Actual Actual Budget Variance Variance % Prior Month Year End 2014 Month YTD YTD Average Vacancy Rate
Distribution Ops - Chicago 615 613 614 1 0% 615 615 -2 -2 617 0%Distribution Ops - Suburban 1,359 1,358 1,357 -1 0% 1,359 1,359 -1 -1 1,442 -6%Ofc of SVP Distribution Ops 11 65 87 22 26% 11 11 54 54 43 51%Distribution Sys Operations 305 305 305 0 0% 305 305 0 0 308 -1%Technical Services 343 345 341 -4 -1% 343 343 2 2 350 -3%Office of EVP - Operations 3 3 3 0 -3% 3 3 0 0 3 11%Strategic & Support Services 251 254 258 4 2% 251 251 3 3 263 -2%Transmission and Substation 1,122 1,129 1,135 6 1% 1,122 1,122 7 7 1,135 0%Operations Admin 2 17 10 -7 -70% 2 2 15 15 16 -56%TOTAL OPERATIONS 4,011 4,089 4,111 22 1% 4,011 4,011 78 78 4,175 -2%
Automated Meter Infrastructure 217 252 255 3 1% 217 217 35 35 273 -7%Customer Channels 470 469 431 -38 -9% 470 470 0 0 457 -6%Customer Field Ops 773 668 671 3 0% 773 773 -105 -105 671 0%Customer Revenue Assurance 130 132 134 2 1% 130 130 2 2 139 -4%SrVP Customer Operations 2 2 2 0 0% 2 2 0 0 2 0%Environmental Programs 45 44 45 1 2% 45 45 -1 -1 45 1%TOTAL CUSTOMER OPERATIONS 1,637 1,567 1,538 -30 -2% 1,637 1,637 -69 -69 1,586 -3%
Office of the Chairman/CEO 3 3 3 0 -3% 3 3 0 0 3 -9%Office of the President -ComEd 2 2 2 0 -3% 2 2 0 0 2 -3%TOTAL OFFICE OF THE CEO/PRESIDENT-CED 5 5 5 0 -3% 5 5 0 0 5 -7%
Claims 33 34 35 1 3% 33 33 1 1 34 4%Legal 2 2 2 0 -3% 2 2 0 0 2 -3%Energy Acquisition - CED 28 28 27 -1 -3% 28 28 0 0 27 1%CED-Regulatory & Strategic Srv 31 29 31 2 7% 31 31 -2 -2 29 5%TOTAL REP/GENERAL COUNSEL 94 93 95 2 2% 94 94 -1 -1 92 3%
ComEd External Affairs and ESO 106 104 104 0 0% 106 106 -2 -2 104 0%Offce VP State & Legislative 9 10 9 -1 -15% 9 9 1 1 9 -3%Gov Affairs Strategy & Support 5 5 6 1 14% 5 5 0 0 5 13%SVP Govt & Ext Affs 2 2 4 2 48% 2 2 0 0 4 -10%ComEd Corporate Relations 3 3 4 1 23% 3 3 0 0 4 1%ComEd Economic Development 5 5 5 0 -3% 5 5 0 0 5 -1%TOTAL OFFICE SVP GOVT & EXT AFFS-CED 130 129 131 2 2% 130 130 -1 -1 131 0%
CED Real Estate & Facilities 42 42 43 1 2% 42 42 0 0 41 4%CED Marketing 17 17 17 0 3% 17 17 0 0 17 2%Ops Strategy and Bus Intellige 19 19 19 0 2% 19 19 0 0 19 0%Security Services 12 12 12 0 -3% 12 12 0 0 13 -9%TOTAL OFFICE OF SVP STRATEGY & ADMIN 90 90 91 1 1% 90 90 0 0 90 1%
Finance 23 21 24 3 13% 23 23 -2 -2 21 15%ComEd Finance 51 48 54 7 12% 51 51 -3 -3 51 5%Communications 9 9 13 4 29% 9 9 0 0 10 22%Human Resources 33 33 37 4 11% 33 33 0 0 36 4%IT 67 67 71 4 6% 67 67 0 0 68 4%Legal - ComEd 0 12 12 0 0% - 0 12 12 12 0%Supply Services 198 199 196 -3 -2% 198 198 1 1 204 -4%TOTAL FUNCTIONAL GROUPS 380 388 407 19 5% 380 380 8 8 402 1%
TOTAL COMED HEADS 6,346 6,361 6,378 17 0% 6,346 6,346 15 15 6,481 -2%
ComEd Detail FTE's
Net New Hires / Attrition
Schedule C-11.2Page 36 of 48
Witness: Tracy
Docket No. 18-____ ComEd Ex. 2.03 Page 234 of 334

For the Month Ending December 31, 2014 2013 Dec Actual Budget Variance Variance % Prior Month Year End 2013 Month YTD YTD Average Vacancy Rate
Distribution Ops - Chicago 568 615 614 -1 0% 609 568 6 47 601 2%Distribution Ops - Suburban 1,352 1,359 1,381 22 2% 1,360 1,352 -1 7 1,353 2%Ofc of SVP Distribution Ops 10 11 39 28 72% 10 10 1 1 12 69%Distribution Sys Operations 284 305 300 -5 -2% 291 284 14 21 290 3%Technical Services 255 343 335 -8 -2% 334 255 9 89 311 7%Office of EVP - Operations 8 3 8 5 63% 4 8 -1 -5 5 39%Strategic & Support Services 266 251 271 20 8% 248 266 3 -15 243 10%Transmission and Substation 1,009 1,122 1,145 23 2% 1,082 1,009 40 113 1,057 8%Operations Admin 5 2 13 11 85% 21 5 -19 -3 15 -13%TOTAL OPERATIONS 3,756 4,011 4,106 95 2% 3,959 3,756 52 255 3,887 5%
Automated Meter Infrastructure 92 217 215 -2 -1% 207 92 10 125 140 35%Customer Channels 470 470 442 -27 -6% 430 470 39 0 440 1%Customer Field Ops 693 773 781 8 1% 662 693 111 80 726 7%Customer Revenue Assurance 120 130 129 -1 -1% 131 120 -1 10 127 2%SrVP Customer Operations 2 2 2 0 0% 2 2 0 0 2 0%Environmental Programs 43 45 48 3 6% 45 43 0 2 43 10%TOTAL CUSTOMER OPERATIONS 1,420 1,637 1,617 -19 -1% 1,478 1,420 159 217 1,479 9%
ComEd Corporate Relations 3 3 3 0 -2% 3 3 0 0 3 -2%Office of the Chairman/CEO 3 3 2 -1 -53% 3 3 0 0 3 -45%Office of the President -ComEd 2 2 3 1 32% 2 2 0 0 2 32%TOTAL OFFICE OF THE CEO/PRESIDENT-CED 8 8 8 0 -2% 8 8 0 0 8 0%
Claims 35 33 35 2 6% 33 35 0 -2 35 2%Legal 2 2 2 0 0% 2 2 0 0 2 0%Energy Acquisition - CED 28 28 28 0 2% 27 28 1 0 27 3%CED-Regulatory & Strategic Srv 27 31 29 -2 -5% 31 27 0 4 29 0%TOTAL REP/GENERAL COUNSEL 92 94 95 1 1% 93 92 1 2 93 2%
ComEd External Affairs and ESO 104 111 112 1 1% 110 104 1 7 108 4%Offce VP State & Legislative 2 9 9 0 -2% 8 2 1 7 8 9%Ofc Dist Srvs, Comm Rel&Adm VP 9 2 3 1 32% 2 9 0 -7 2 32%ComEd Economic Development 5 5 6 1 15% 4 5 1 0 5 9%TOTAL OFFICE SVP GOVT & EXT AFFS-CED 120 127 129 2 2% 124 120 3 7 123 5%
CED Real Estate & Facilities 40 42 43 1 3% 42 40 0 2 39 10%CED Marketing 14 17 18 1 4% 16 14 1 3 17 5%Ops Strategy and Bus Intellige 20 19 21 2 8% 19 20 0 -1 19 8%Security Services 9 12 11 -1 -11% 11 9 1 3 10 5%TOTAL OFFICE OF SVP STRATEGY & ADMIN 83 90 92 2 2% 88 83 2 7 85 8%
Finance 16 23 14 -9 -62% 24 16 -1 7 24 -66%ComEd Finance 51 51 53 3 5% 49 51 1 0 50 5%Communications 10 9 13 4 29% 9 10 0 -1 9 26%Human Resources 32 33 34 1 3% 34 32 -1 1 32 5%IT 63 67 68 2 2% 68 63 -1 4 65 4%Supply Services 192 198 195 -3 -1% 197 192 1 6 195 0%TOTAL FUNCTIONAL GROUPS 363 380 378 -3 -1% 381 363 -1 17 376 0%
TOTAL COMED HEADS 5,842 6,346 6,425 79 1% 6,131 5,842 216 504 6,050 6%
ComEd Detail FTE's
Net New Hires / Attrition
Schedule C-11.2Page 37 of 48
Witness: Tracy
Docket No. 18-____ ComEd Ex. 2.03 Page 235 of 334
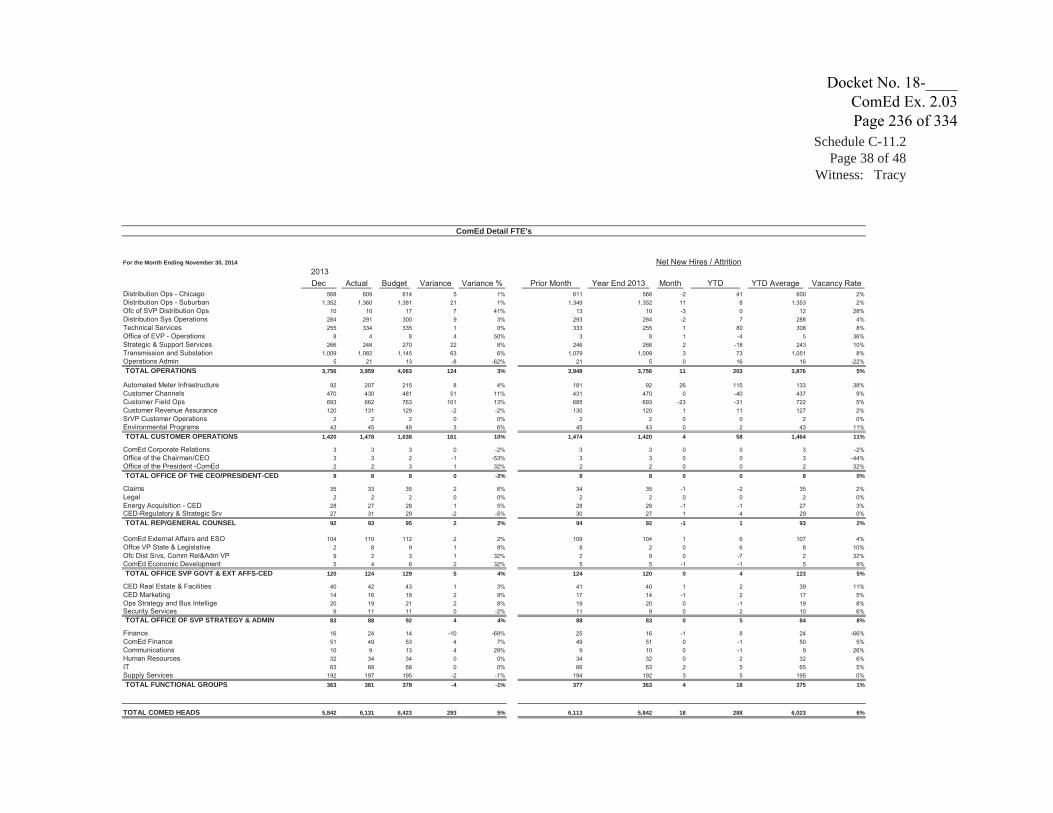
For the Month Ending November 30, 2014 2013 Dec Actual Budget Variance Variance % Prior Month Year End 2013 Month YTD YTD Average Vacancy Rate
Distribution Ops - Chicago 568 609 614 5 1% 611 568 -2 41 600 2%Distribution Ops - Suburban 1,352 1,360 1,381 21 1% 1,349 1,352 11 8 1,353 2%Ofc of SVP Distribution Ops 10 10 17 7 41% 13 10 -3 0 12 28%Distribution Sys Operations 284 291 300 9 3% 293 284 -2 7 288 4%Technical Services 255 334 335 1 0% 333 255 1 80 308 8%Office of EVP - Operations 8 4 8 4 50% 3 8 1 -4 5 36%Strategic & Support Services 266 248 270 22 8% 246 266 2 -18 243 10%Transmission and Substation 1,009 1,082 1,145 63 6% 1,079 1,009 3 73 1,051 8%Operations Admin 5 21 13 -8 -62% 21 5 0 16 16 -22%TOTAL OPERATIONS 3,756 3,959 4,083 124 3% 3,948 3,756 11 203 3,876 5%
Automated Meter Infrastructure 92 207 215 8 4% 181 92 26 115 133 38%Customer Channels 470 430 481 51 11% 431 470 0 -40 437 9%Customer Field Ops 693 662 763 101 13% 685 693 -23 -31 722 5%Customer Revenue Assurance 120 131 129 -2 -2% 130 120 1 11 127 2%SrVP Customer Operations 2 2 2 0 0% 2 2 0 0 2 0%Environmental Programs 43 45 48 3 6% 45 43 0 2 43 11%TOTAL CUSTOMER OPERATIONS 1,420 1,478 1,638 161 10% 1,474 1,420 4 58 1,464 11%
ComEd Corporate Relations 3 3 3 0 -2% 3 3 0 0 3 -2%Office of the Chairman/CEO 3 3 2 -1 -53% 3 3 0 0 3 -44%Office of the President -ComEd 2 2 3 1 32% 2 2 0 0 2 32%TOTAL OFFICE OF THE CEO/PRESIDENT-CED 8 8 8 0 -2% 8 8 0 0 8 0%
Claims 35 33 35 2 6% 34 35 -1 -2 35 2%Legal 2 2 2 0 0% 2 2 0 0 2 0%Energy Acquisition - CED 28 27 28 1 5% 28 28 -1 -1 27 3%CED-Regulatory & Strategic Srv 27 31 29 -2 -5% 30 27 1 4 29 0%TOTAL REP/GENERAL COUNSEL 92 93 95 2 2% 94 92 -1 1 93 2%
ComEd External Affairs and ESO 104 110 112 2 2% 109 104 1 6 107 4%Offce VP State & Legislative 2 8 9 1 9% 8 2 0 6 8 10%Ofc Dist Srvs, Comm Rel&Adm VP 9 2 3 1 32% 2 9 0 -7 2 32%ComEd Economic Development 5 4 6 2 32% 5 5 -1 -1 5 9%TOTAL OFFICE SVP GOVT & EXT AFFS-CED 120 124 129 5 4% 124 120 0 4 123 5%
CED Real Estate & Facilities 40 42 43 1 3% 41 40 1 2 39 11%CED Marketing 14 16 18 2 9% 17 14 -1 2 17 5%Ops Strategy and Bus Intellige 20 19 21 2 8% 19 20 0 -1 19 8%Security Services 9 11 11 0 -2% 11 9 0 2 10 6%TOTAL OFFICE OF SVP STRATEGY & ADMIN 83 88 92 4 4% 88 83 0 5 84 8%
Finance 16 24 14 -10 -69% 25 16 -1 8 24 -66%ComEd Finance 51 49 53 4 7% 49 51 0 -1 50 5%Communications 10 9 13 4 29% 9 10 0 -1 9 26%Human Resources 32 34 34 0 0% 34 32 0 2 32 6%IT 63 68 68 0 0% 66 63 2 5 65 5%Supply Services 192 197 195 -2 -1% 194 192 3 5 195 0%TOTAL FUNCTIONAL GROUPS 363 381 378 -4 -1% 377 363 4 18 375 1%
TOTAL COMED HEADS 5,842 6,131 6,423 293 5% 6,113 5,842 18 288 6,023 6%
ComEd Detail FTE's
Net New Hires / Attrition
Schedule C-11.2Page 38 of 48
Witness: Tracy
Docket No. 18-____ ComEd Ex. 2.03 Page 236 of 334

For the Month Ending October 31, 2014 2013 Dec Actual Budget Variance Variance % Prior Month Year End 2013 Month YTD YTD Average Vacancy Rate
Distribution Ops - Chicago 568 611 611 0 0% 607 568 4 43 599 2%Distribution Ops - Suburban 1,352 1,349 1,382 33 2% 1,343 1,352 6 -3 1,352 2%Ofc of SVP Distribution Ops 10 13 13 -1 -4% 12 10 1 3 12 1%Distribution Sys Operations 284 293 292 -1 0% 293 284 0 9 288 1%Technical Services 255 333 326 -7 -2% 330 255 3 79 305 6%Office of EVP - Operations 8 3 8 5 63% 3 8 0 -5 5 35%Strategic & Support Services 266 246 269 23 9% 247 266 -1 -20 242 10%Transmission and Substation 1,009 1,079 1,146 67 6% 1,076 1,009 3 70 1,048 9%Operations Admin 5 21 13 -8 -62% 21 5 0 16 15 -18%TOTAL OPERATIONS 3,756 3,948 4,060 112 3% 3,932 3,756 16 192 3,867 5%
Automated Meter Infrastructure 92 181 215 34 16% 158 92 24 89 126 41%Customer Channels 470 431 469 38 8% 433 470 -2 -39 438 6%Customer Field Ops 693 685 768 83 11% 710 693 -25 -8 728 5%Customer Revenue Assurance 120 130 129 -1 -1% 129 120 1 10 126 2%SrVP Customer Operations 2 2 2 0 0% 2 2 0 0 2 0%Environmental Programs 43 45 48 3 6% 43 43 2 2 43 11%TOTAL CUSTOMER OPERATIONS 1,420 1,474 1,630 156 10% 1,475 1,420 -1 54 1,463 10%
ComEd Corporate Relations 3 3 3 0 -2% 3 3 0 0 3 -2%Office of the Chairman/CEO 3 3 2 -1 -53% 2 3 1 0 3 -43%Office of the President -ComEd 2 2 3 1 32% 2 2 0 0 2 32%TOTAL OFFICE OF THE CEO/PRESIDENT-CED 8 8 8 0 -2% 7 8 1 0 8 1%
Claims 35 34 35 1 4% 34 35 0 -1 35 1%Legal 2 2 2 0 0% 2 2 0 0 2 0%Energy Acquisition - CED 28 28 28 0 2% 28 28 0 0 27 3%CED-Regulatory & Strategic Srv 27 30 29 -1 -2% 31 27 -1 3 29 1%TOTAL REP/GENERAL COUNSEL 92 94 95 1 1% 95 92 -1 2 93 2%
ComEd External Affairs and ESO 104 109 112 3 2% 109 104 0 5 107 4%Offce VP State & Legislative 2 8 9 1 9% 8 2 0 6 8 10%Ofc Dist Srvs, Comm Rel&Adm VP 9 2 3 1 32% 2 9 0 -7 2 32%ComEd Economic Development 5 5 6 1 15% 5 5 0 0 6 6%TOTAL OFFICE SVP GOVT & EXT AFFS-CED 120 124 129 5 4% 124 120 0 4 122 5%
CED Real Estate & Facilities 40 41 43 2 5% 38 40 3 1 38 11%CED Marketing 14 17 18 1 4% 17 14 0 3 17 4%Ops Strategy and Bus Intellige 20 19 21 2 8% 19 20 0 -1 19 8%Security Services 9 11 11 0 -2% 10 9 1 2 10 7%TOTAL OFFICE OF SVP STRATEGY & ADMIN 83 88 92 4 4% 84 83 4 5 84 9%
Finance 16 25 14 -11 -76% 25 16 0 9 24 -66%ComEd Finance 51 49 53 4 7% 50 51 -1 -1 51 5%Communications 10 9 13 4 29% 9 10 0 -1 10 24%Human Resources 32 34 34 0 0% 32 32 2 2 32 7%IT 63 66 68 2 3% 66 63 0 3 65 5%Supply Services 192 194 195 1 1% 195 192 -1 2 194 0%TOTAL FUNCTIONAL GROUPS 363 377 378 0 0% 377 363 0 14 374 1%
TOTAL COMED HEADS 5,842 6,113 6,392 279 4% 6,094 5,842 19 271 6,012 6%
ComEd Detail FTE's
Net New Hires / Attrition
Schedule C-11.2Page 39 of 48
Witness: Tracy
Docket No. 18-____ ComEd Ex. 2.03 Page 237 of 334

For the Month Ending September 30, 2014 2013 Dec Actual Budget Variance Variance % Prior Month Year End 2013 Month YTD YTD Average Vacancy Rate
Distribution Ops - Chicago 568 607 619 12 2% 611 568 -4 39 597 4%Distribution Ops - Suburban 1,352 1,343 1,411 68 5% 1,350 1,352 -7 -9 1,353 4%Ofc of SVP Distribution Ops 10 12 17 5 29% 12 10 0 2 12 27%Distribution Sys Operations 284 293 284 -9 -3% 292 284 1 9 287 -1%Technical Services 255 330 326 -4 -1% 320 255 10 76 302 7%Office of EVP - Operations 8 3 8 5 63% 3 8 0 -5 5 32%Strategic & Support Services 266 247 260 13 5% 243 266 4 -19 242 7%Transmission and Substation 1,009 1,076 1,145 69 6% 1,070 1,009 6 67 1,045 9%Operations Admin 5 21 13 -8 -62% 21 5 0 16 15 -13%TOTAL OPERATIONS 3,756 3,932 4,083 151 4% 3,922 3,756 10 176 3,858 6%
Automated Meter Infrastructure 92 158 204 46 23% 136 92 22 66 120 41%Customer Channels 470 433 450 17 4% 438 470 -5 -37 439 3%Customer Field Ops 693 710 769 59 8% 732 693 -22 17 733 5%Customer Revenue Assurance 120 129 128 -1 -1% 129 120 0 9 126 2%SrVP Customer Operations 2 2 2 0 0% 2 2 0 0 2 0%Environmental Programs 43 43 48 5 10% 43 43 0 0 42 12%TOTAL CUSTOMER OPERATIONS 1,420 1,475 1,602 127 8% 1,479 1,420 -5 55 1,462 9%
ComEd Corporate Relations 3 3 3 0 -2% 3 3 0 0 3 -2%Office of the Chairman/CEO 3 2 2 0 -2% 2 3 0 -1 3 -42%Office of the President -ComEd 2 2 3 1 32% 2 2 0 0 2 32%TOTAL OFFICE OF THE CEO/PRESIDENT-CED 8 7 8 1 11% 7 8 0 -1 8 1%
Claims 35 34 35 1 4% 34 35 0 -1 35 1%Legal 2 2 2 0 0% 2 2 0 0 2 0%Energy Acquisition - CED 28 28 28 0 2% 28 28 0 0 27 3%CED-Regulatory & Strategic Srv 27 31 29 -2 -5% 31 27 0 4 29 1%TOTAL REP/GENERAL COUNSEL 92 95 95 0 0% 95 92 0 3 93 2%
ComEd External Affairs and ESO 104 109 112 3 2% 108 104 1 5 107 4%Offce VP State & Legislative 2 8 9 1 9% 8 2 0 6 8 11%Ofc Dist Srvs, Comm Rel&Adm VP 9 2 3 1 32% 2 9 0 -7 2 32%ComEd Economic Development 5 5 6 1 15% 5 5 0 0 6 6%TOTAL OFFICE SVP GOVT & EXT AFFS-CED 120 124 129 5 4% 123 120 1 4 122 6%
CED Real Estate & Facilities 40 38 43 5 12% 38 40 0 -2 38 12%CED Marketing 14 17 18 1 4% 17 14 0 3 17 4%Ops Strategy and Bus Intellige 20 19 21 2 8% 17 20 2 -1 19 8%Security Services 9 10 11 1 7% 10 9 0 1 10 8%TOTAL OFFICE OF SVP STRATEGY & ADMIN 83 84 92 8 9% 82 83 2 1 84 9%
Finance 16 25 14 -11 -76% 25 16 0 9 24 -66%ComEd Finance 51 50 53 3 5% 48 51 2 0 51 5%Communications 10 9 13 4 29% 9 10 0 -1 10 24%Human Resources 32 32 34 2 6% 31 32 1 0 32 7%IT 63 66 68 2 3% 66 63 0 3 65 5%Supply Services 192 195 195 0 0% 196 192 -1 3 194 0%TOTAL FUNCTIONAL GROUPS 363 377 378 0 0% 375 363 2 14 374 1%
TOTAL COMED HEADS 5,842 6,094 6,387 293 5% 6,083 5,842 10 251 6,001 6%
ComEd Detail FTE's
Net New Hires / Attrition
Schedule C-11.2Page 40 of 48
Witness: Tracy
Docket No. 18-____ ComEd Ex. 2.03 Page 238 of 334

For the Month Ending August 31, 2014 2013 Dec Actual Budget Variance Variance % Prior Month Year End 2013 Month YTD YTD Average Vacancy Rate
Distribution Ops - Chicago 568 611 612 1 0% 606 568 5 43 596 3%Distribution Ops - Suburban 1,352 1,350 1,402 52 4% 1,346 1,352 4 -2 1,354 3%Ofc of SVP Distribution Ops 10 12 18 6 33% 12 10 0 2 12 31%Distribution Sys Operations 284 292 285 -7 -2% 291 284 1 8 287 -1%Technical Services 255 320 327 7 2% 311 255 9 66 298 9%Office of EVP - Operations 8 3 8 5 63% 3 8 0 -5 6 28%Strategic & Support Services 266 243 259 16 6% 241 266 2 -23 241 7%Transmission and Substation 1,009 1,070 1,145 75 7% 1,067 1,009 3 61 1,041 9%Operations Admin 5 21 13 -8 -62% 21 5 0 16 14 -7%TOTAL OPERATIONS 3,756 3,922 4,069 147 4% 3,898 3,756 24 166 3,849 5%
Automated Meter Infrastructure 92 136 179 43 24% 122 92 14 44 115 36%Customer Channels 470 438 438 0 0% 422 470 16 -32 440 0%Customer Field Ops 693 732 771 39 5% 710 693 22 39 736 5%Customer Revenue Assurance 120 129 128 -1 -1% 126 120 3 9 125 2%SrVP Customer Operations 2 2 2 0 0% 2 2 0 0 2 0%Environmental Programs 43 43 48 5 10% 44 43 -1 0 42 12%TOTAL CUSTOMER OPERATIONS 1,420 1,479 1,566 87 6% 1,426 1,420 54 59 1,460 7%
ComEd Corporate Relations 3 3 3 0 -2% 3 3 0 0 3 -2%Office of the Chairman/CEO 3 2 2 0 -2% 3 3 -1 -1 3 -47%Office of the President -ComEd 2 2 3 1 32% 2 2 0 0 2 32%TOTAL OFFICE OF THE CEO/PRESIDENT-CED 8 7 8 1 11% 8 8 -1 -1 8 0%
Claims 35 34 35 1 4% 34 35 0 -1 35 1%Legal 2 2 2 0 0% 2 2 0 0 2 0%Energy Acquisition - CED 28 28 28 0 2% 28 28 0 0 27 3%CED-Regulatory & Strategic Srv 27 31 29 -2 -5% 30 27 1 4 29 2%TOTAL REP/GENERAL COUNSEL 92 95 95 0 0% 94 92 1 3 93 2%
ComEd External Affairs and ESO 104 108 112 4 3% 108 104 0 4 107 5%Offce VP State & Legislative 2 8 9 1 9% 8 2 0 6 8 11%Ofc Dist Srvs, Comm Rel&Adm VP 9 2 3 1 32% 2 9 0 -7 2 32%ComEd Economic Development 5 5 6 1 15% 5 5 0 0 6 4%TOTAL OFFICE SVP GOVT & EXT AFFS-CED 120 123 129 6 5% 123 120 0 3 122 6%
CED Real Estate & Facilities 40 38 43 5 12% 38 40 0 -2 38 12%CED Marketing 14 17 18 1 4% 17 14 0 3 17 4%Ops Strategy and Bus Intellige 20 17 21 4 17% 18 20 -1 -3 19 8%Security Services 9 10 11 1 7% 10 9 0 1 10 8%TOTAL OFFICE OF SVP STRATEGY & ADMIN 83 82 92 10 11% 83 83 -1 -1 84 9%
Finance 16 25 14 -11 -76% 25 16 0 9 23 -64%ComEd Finance 51 48 53 5 9% 49 51 -1 -2 51 5%Communications 10 9 13 4 29% 9 10 0 -1 10 24%Human Resources 32 31 34 3 9% 32 32 -1 -1 32 7%IT 63 66 68 2 3% 66 63 0 3 65 5%Supply Services 192 196 195 -1 0% 197 192 -1 4 194 0%TOTAL FUNCTIONAL GROUPS 363 375 378 2 1% 378 363 -3 12 374 1%
TOTAL COMED HEADS 5,842 6,083 6,337 254 4% 6,010 5,842 74 241 5,990 5%
ComEd Detail FTE's
Net New Hires / Attrition
Schedule C-11.2Page 41 of 48
Witness: Tracy
Docket No. 18-____ ComEd Ex. 2.03 Page 239 of 334

For the Month Ending July 31, 2014 2013 Dec Actual Budget Variance Variance % Prior Month Year End 2013 Month YTD YTD Average Vacancy Rate
Distribution Ops - Chicago 568 606 616 10 2% 608 568 -2 38 594 4%Distribution Ops - Suburban 1,352 1,346 1,400 54 4% 1,341 1,352 5 -6 1,354 3%Ofc of SVP Distribution Ops 10 12 26 14 54% 12 10 0 2 12 52%Distribution Sys Operations 284 291 283 -8 -3% 295 284 -4 7 286 -1%Technical Services 255 311 319 8 3% 309 255 2 57 295 7%Office of EVP - Operations 8 3 8 5 63% 3 8 0 -5 6 23%Strategic & Support Services 266 241 258 17 7% 245 266 -4 -25 241 7%Transmission and Substation 1,009 1,067 1,144 77 7% 1,060 1,009 7 58 1,037 9%Operations Admin 5 21 13 -8 -62% 29 5 -8 16 13 1%TOTAL OPERATIONS 3,756 3,898 4,067 169 4% 3,902 3,756 -4 142 3,839 6%
Automated Meter Infrastructure 92 122 152 30 20% 112 92 10 30 112 26%Customer Channels 470 422 435 13 3% 418 470 4 -48 440 -1%Customer Field Ops 693 710 774 64 8% 718 693 -8 17 736 5%Customer Revenue Assurance 120 126 128 2 2% 130 120 -4 6 125 2%SrVP Customer Operations 2 2 2 0 0% 2 2 0 0 2 0%Environmental Programs 43 44 48 4 8% 44 43 0 1 42 12%TOTAL CUSTOMER OPERATIONS 1,420 1,426 1,539 113 7% 1,424 1,420 2 6 1,457 5%
ComEd Corporate Relations 3 3 3 0 -2% 3 3 0 0 3 -2%Office of the Chairman/CEO 3 3 2 -1 -53% 3 3 0 0 3 -53%Office of the President -ComEd 2 2 3 1 32% 2 2 0 0 2 32%TOTAL OFFICE OF THE CEO/PRESIDENT-CED 8 8 8 0 -2% 8 8 0 0 8 -2%
Claims 35 34 35 1 4% 33 35 1 -1 35 0%Legal 2 2 2 0 0% 2 2 0 0 2 0%Energy Acquisition - CED 28 28 28 0 2% 28 28 0 0 27 3%CED-Regulatory & Strategic Srv 27 30 29 -1 -2% 29 27 1 3 28 3%TOTAL REP/GENERAL COUNSEL 92 94 95 1 1% 92 92 2 2 93 2%
ComEd External Affairs and ESO 104 108 112 4 3% 108 104 0 4 106 5%Offce VP State & Legislative 2 8 9 1 9% 8 2 0 6 8 11%Ofc Dist Srvs, Comm Rel&Adm VP 9 2 3 1 32% 2 9 0 -7 2 32%ComEd Economic Development 5 5 6 1 15% 5 5 0 0 6 3%TOTAL OFFICE SVP GOVT & EXT AFFS-CED 120 123 129 6 5% 123 120 0 3 122 6%
CED Real Estate & Facilities 40 38 43 5 12% 38 40 0 -2 38 12%CED Marketing 14 17 18 1 4% 17 14 0 3 17 4%Ops Strategy and Bus Intellige 20 18 21 3 13% 19 20 -1 -2 19 7%Security Services 9 10 11 1 7% 10 9 0 1 10 9%TOTAL OFFICE OF SVP STRATEGY & ADMIN 83 83 92 9 10% 84 83 -1 0 84 9%
Finance 16 25 14 -11 -76% 25 16 0 9 23 -60%ComEd Finance 51 49 53 4 7% 52 51 -3 -1 51 4%Communications 10 9 13 4 29% 9 10 0 -1 10 24%Human Resources 32 32 34 2 6% 32 32 0 0 32 7%IT 63 66 68 2 3% 65 63 1 3 64 6%Supply Services 192 197 195 -2 -1% 199 192 -2 5 194 1%TOTAL FUNCTIONAL GROUPS 363 378 378 -1 0% 382 363 -3 15 374 1%
TOTAL COMED HEADS 5,842 6,010 6,307 298 5% 6,014 5,842 -5 167 5,976 5%
ComEd Detail FTE's
Net New Hires / Attrition
Schedule C-11.2Page 42 of 48
Witness: Tracy
Docket No. 18-____ ComEd Ex. 2.03 Page 240 of 334

For the Month Ending June 30, 2014 2013 Dec Actual Budget Variance Variance % Prior Month Year End 2013 Month YTD YTD Average Vacancy Rate
Distribution Ops - Chicago 568 608 619 11 2% 596 568 12 40 592 4%Distribution Ops - Suburban 1,352 1,341 1,418 77 5% 1,351 1,352 -10 -11 1,356 4%Ofc of SVP Distribution Ops 10 12 25 13 52% 22 10 -10 2 13 50%Distribution Sys Operations 284 295 284 -11 -4% 290 284 5 11 285 0%Technical Services 255 309 319 10 3% 296 255 13 55 293 8%Office of EVP - Operations 8 3 8 5 63% 9 8 -6 -5 7 17%Strategic & Support Services 266 245 260 15 6% 245 266 0 -21 241 7%Transmission and Substation 1,009 1,060 1,138 78 7% 1,041 1,009 19 51 1,032 9%Operations Admin 5 29 15 -14 -90% 8 5 21 24 12 25%TOTAL OPERATIONS 3,756 3,902 4,086 184 5% 3,858 3,756 44 146 3,829 6%
Automated Meter Infrastructure 92 112 144 32 22% 141 92 -29 20 111 23%Customer Channels 470 418 444 26 6% 422 470 -4 -52 443 0%Customer Field Ops 693 718 775 57 7% 699 693 19 25 741 4%Customer Revenue Assurance 120 130 128 -2 -2% 123 120 7 10 125 3%SrVP Customer Operations 2 2 2 0 0% 2 2 0 0 2 0%Environmental Programs 43 44 48 4 8% 42 43 2 1 42 13%TOTAL CUSTOMER OPERATIONS 1,420 1,424 1,541 117 8% 1,429 1,420 -5 4 1,463 5%
ComEd Corporate Relations 3 3 3 0 -2% 3 3 0 0 3 -2%Office of the Chairman/CEO 3 3 2 -1 -53% 3 3 0 0 3 -53%Office of the President -ComEd 2 2 3 1 32% 2 2 0 0 2 32%TOTAL OFFICE OF THE CEO/PRESIDENT-CED 8 8 8 0 -2% 8 8 0 0 8 -2%
Claims 35 33 35 2 6% 36 35 -3 -2 35 0%Legal 2 2 2 0 0% 2 2 0 0 2 0%Energy Acquisition - CED 28 28 28 0 2% 27 28 1 0 27 3%CED-Regulatory & Strategic Srv 27 29 29 0 1% 29 27 0 2 28 4%TOTAL REP/GENERAL COUNSEL 92 92 95 3 3% 94 92 -2 0 93 2%
ComEd External Affairs and ESO 104 108 112 4 3% 107 104 1 4 106 5%Offce VP State & Legislative 2 8 9 1 9% 8 2 0 6 8 11%Ofc Dist Srvs, Comm Rel&Adm VP 9 2 3 1 32% 2 9 0 -7 2 32%ComEd Economic Development 5 5 6 1 15% 6 5 -1 0 6 1%TOTAL OFFICE SVP GOVT & EXT AFFS-CED 120 123 129 6 5% 123 120 0 3 122 6%
CED Real Estate & Facilities 40 38 43 5 12% 36 40 2 -2 38 12%CED Marketing 14 17 18 1 4% 18 14 -1 3 17 5%Ops Strategy and Bus Intellige 20 19 21 2 8% 18 20 1 -1 19 6%Security Services 9 10 11 1 7% 11 9 -1 1 10 9%TOTAL OFFICE OF SVP STRATEGY & ADMIN 83 84 92 8 9% 83 83 1 1 84 9%
Finance 16 25 14 -10 -73% 24 16 0 9 23 -60%ComEd Finance 51 52 53 1 1% 51 51 1 2 51 4%Communications 10 9 13 4 29% 10 10 -1 -1 10 23%Human Resources 32 32 34 2 6% 33 32 -1 0 32 7%IT 63 65 68 3 5% 64 63 1 2 64 6%Supply Services 192 199 195 -4 -2% 193 192 6 7 194 1%TOTAL FUNCTIONAL GROUPS 363 382 378 -4 -1% 376 363 6 19 373 1%
TOTAL COMED HEADS 5,842 6,014 6,329 314 5% 5,970 5,842 44 172 5,971 6%
ComEd Detail FTE's
Net New Hires / Attrition
Schedule C-11.2Page 43 of 48
Witness: Tracy
Docket No. 18-____ ComEd Ex. 2.03 Page 241 of 334

For the Month Ending May 31, 2014 2013 Dec Actual Budget Variance Variance % Prior Month Year End 2013 Month YTD YTD Average Vacancy Rate
Distribution Ops - Chicago 568 596 620 24 4% 603 568 -7 28 589 5%Distribution Ops - Suburban 1,352 1,351 1,416 65 5% 1,357 1,352 -6 -1 1,359 4%Ofc of SVP Distribution Ops 10 22 25 3 12% 11 10 11 12 13 50%Distribution Sys Operations 284 290 285 -5 -2% 279 284 11 6 283 1%Technical Services 255 296 321 25 8% 294 255 2 42 289 10%Office of EVP - Operations 8 9 8 -1 -13% 7 8 2 1 7 8%Strategic & Support Services 266 245 260 15 6% 243 266 2 -21 240 8%Transmission and Substation 1,009 1,041 1,138 97 9% 1,035 1,009 6 32 1,026 10%Operations Admin 5 8 9 1 11% 8 5 0 3 8 11%TOTAL OPERATIONS 3,756 3,858 4,082 224 5% 3,837 3,756 21 102 3,814 7%
Automated Meter Infrastructure 92 141 137 -4 -3% 132 92 9 49 110 20%Customer Channels 470 422 456 33 7% 428 470 -5 -48 448 2%Customer Field Ops 693 699 777 78 10% 714 693 -15 6 745 4%Customer Revenue Assurance 120 123 128 5 4% 125 120 -2 3 124 3%SrVP Customer Operations 2 2 2 0 0% 2 2 0 0 2 0%Environmental Programs 43 42 48 6 13% 42 43 0 -1 42 13%TOTAL CUSTOMER OPERATIONS 1,420 1,429 1,547 118 8% 1,443 1,420 -13 9 1,470 5%
ComEd Corporate Relations 3 3 3 0 -2% 3 3 0 0 3 -2%Office of the Chairman/CEO 3 3 2 -1 -53% 3 3 0 0 3 -53%Office of the President -ComEd 2 2 3 1 32% 2 2 0 0 2 32%TOTAL OFFICE OF THE CEO/PRESIDENT-CED 8 8 8 0 -2% 8 8 0 0 8 -2%
Claims 35 36 35 -1 -2% 36 35 0 1 36 -1%Legal 2 2 2 0 0% 2 2 0 0 2 0%Energy Acquisition - CED 28 27 28 1 5% 27 28 0 -1 27 4%CED-Regulatory & Strategic Srv 27 29 29 0 1% 28 27 1 2 28 5%TOTAL REP/GENERAL COUNSEL 92 94 95 1 1% 93 92 1 2 93 2%
ComEd External Affairs and ESO 104 107 112 5 4% 108 104 -1 3 106 5%Offce VP State & Legislative 2 8 9 1 9% 7 2 1 6 8 12%Ofc Dist Srvs, Comm Rel&Adm VP 9 2 3 1 32% 2 9 0 -7 2 32%ComEd Economic Development 5 6 6 0 -2% 6 5 0 1 6 -2%TOTAL OFFICE SVP GOVT & EXT AFFS-CED 120 123 129 6 5% 123 120 0 3 121 6%
CED Real Estate & Facilities 40 36 43 7 17% 37 40 -1 -4 38 12%CED Marketing 14 18 18 0 -2% 17 14 1 4 17 5%Ops Strategy and Bus Intellige 20 18 21 3 13% 20 20 -2 -2 19 6%Security Services 9 11 11 0 -2% 10 9 1 2 10 9%TOTAL OFFICE OF SVP STRATEGY & ADMIN 83 83 92 9 10% 84 83 -1 0 84 9%
Finance 16 24 14 -10 -70% 23 16 1 9 22 -58%ComEd Finance 51 51 53 2 3% 52 51 0 1 51 4%Communications 10 10 13 3 22% 10 10 0 0 10 22%Human Resources 32 33 34 1 3% 31 32 2 1 32 7%IT 63 64 68 4 6% 64 63 0 1 64 6%Supply Services 192 193 195 2 1% 190 192 3 1 192 1%TOTAL FUNCTIONAL GROUPS 363 376 378 2 1% 370 363 6 12 371 2%
TOTAL COMED HEADS 5,842 5,970 6,331 361 6% 5,957 5,842 14 128 5,962 6%
ComEd Detail FTE's
Net New Hires / Attrition
Schedule C-11.2Page 44 of 48
Witness: Tracy
Docket No. 18-____ ComEd Ex. 2.03 Page 242 of 334

For the Month Ending April 30, 2014 2013 Dec Actual Budget Variance Variance % Prior Month Year End 2013 Month YTD YTD Average Vacancy Rate
Distribution Ops - Chicago 568 603 618 15 2% 588 568 15 35 587 5%Distribution Ops - Suburban 1,352 1,357 1,404 47 3% 1,376 1,352 -19 5 1,361 3%Ofc of SVP Distribution Ops 10 11 15 4 27% 10 10 1 1 10 32%Distribution Sys Operations 284 279 281 2 1% 284 284 -5 -5 282 0%Technical Services 255 294 310 16 5% 292 255 2 40 288 7%Office of EVP - Operations 8 7 8 1 13% 7 8 0 -1 7 13%Strategic & Support Services 266 243 259 16 6% 237 266 6 -23 239 8%Transmission and Substation 1,009 1,035 1,139 104 9% 1,035 1,009 0 26 1,022 10%Operations Admin 5 8 9 1 11% 8 5 0 3 8 11%TOTAL OPERATIONS 3,756 3,837 4,042 206 5% 3,837 3,756 0 81 3,803 6%
Automated Meter Infrastructure 92 132 164 32 20% 91 92 41 40 103 38%Customer Channels 470 428 464 36 8% 451 470 -23 -42 454 2%Customer Field Ops 693 714 777 63 8% 740 693 -26 21 757 3%Customer Revenue Assurance 120 125 128 3 2% 126 120 -1 5 124 3%SrVP Customer Operations 2 2 2 0 0% 2 2 0 0 2 0%Environmental Programs 43 42 48 6 13% 42 43 0 -1 42 14%TOTAL CUSTOMER OPERATIONS 1,420 1,443 1,583 140 9% 1,452 1,420 -9 23 1,481 6%
ComEd Corporate Relations 3 3 3 0 -2% 3 3 0 0 3 -2%Office of the Chairman/CEO 3 3 2 -1 -53% 3 3 0 0 3 -53%Office of the President -ComEd 2 2 3 1 32% 2 2 0 0 2 32%TOTAL OFFICE OF THE CEO/PRESIDENT-CED 8 8 8 0 -2% 8 8 0 0 8 -2%
Claims 35 36 35 -1 -2% 36 35 0 1 36 -1%Legal 2 2 2 0 0% 2 2 0 0 2 0%Energy Acquisition - CED 28 27 28 1 5% 27 28 0 -1 27 3%CED-Regulatory & Strategic Srv 27 28 29 1 5% 28 27 0 1 28 6%TOTAL REP/GENERAL COUNSEL 92 93 95 2 2% 93 92 0 1 93 2%
ComEd External Affairs and ESO 104 108 112 4 3% 105 104 3 4 105 6%Offce VP State & Legislative 2 7 9 2 21% 8 2 -1 5 8 12%Ofc Dist Srvs, Comm Rel&Adm VP 9 2 3 1 32% 2 9 0 -7 2 32%ComEd Economic Development 5 6 6 0 -2% 6 5 0 1 6 -2%TOTAL OFFICE SVP GOVT & EXT AFFS-CED 120 123 129 6 5% 121 120 2 3 121 6%
CED Real Estate & Facilities 40 37 43 6 14% 39 40 -2 -3 38 11%CED Marketing 14 17 18 1 4% 17 14 0 3 17 6%Ops Strategy and Bus Intellige 20 20 21 1 3% 20 20 0 0 20 4%Security Services 9 10 11 1 7% 10 9 0 1 10 12%TOTAL OFFICE OF SVP STRATEGY & ADMIN 83 84 92 8 9% 86 83 -2 1 84 9%
Finance 16 23 14 -9 -63% 23 16 0 8 23 -65%ComEd Finance 51 52 53 2 3% 51 51 1 1 52 3%Communications 10 10 13 3 22% 10 10 0 0 10 22%Human Resources 32 31 34 3 9% 31 32 0 -1 31 9%IT 63 64 68 4 6% 63 63 1 1 64 6%Supply Services 192 190 195 5 3% 191 192 -1 -2 190 3%TOTAL FUNCTIONAL GROUPS 363 370 378 8 2% 369 363 1 7 370 2%
TOTAL COMED HEADS 5,842 5,957 6,327 370 6% 5,965 5,842 -8 115 5,960 6%
ComEd Detail FTE's
Net New Hires / Attrition
Schedule C-11.2Page 45 of 48
Witness: Tracy
Docket No. 18-____ ComEd Ex. 2.03 Page 243 of 334

For the Month Ending March 31, 2014 2013 Dec Actual Budget Variance Variance % Prior Month Year End 2013 Month YTD YTD Average Vacancy Rate
Distribution Ops - Chicago 568 588 621 33 5% 587 568 1 20 582 6%Distribution Ops - Suburban 1,352 1,376 1,428 52 4% 1,361 1,352 15 24 1,362 5%Ofc of SVP Distribution Ops 10 10 17 7 39% 10 10 0 0 10 39%Distribution Sys Operations 284 284 282 -2 -1% 282 284 2 0 282 0%Technical Services 255 292 310 18 6% 285 255 7 38 286 8%Office of EVP - Operations 8 7 8 1 13% 7 8 0 -1 7 13%Strategic & Support Services 266 237 256 19 8% 238 266 -1 -29 238 7%Transmission and Substation 1,009 1,035 1,130 95 8% 1,013 1,009 22 26 1,018 10%Operations Admin 5 8 9 1 11% 8 5 0 3 8 11%TOTAL OPERATIONS 3,756 3,837 4,060 224 6% 3,791 3,756 46 81 3,792 7%
Automated Meter Infrastructure 92 91 158 67 42% 93 92 -2 -1 93 41%Customer Channels 470 451 472 21 5% 461 470 -10 -19 463 2%Customer Field Ops 693 740 748 8 1% 763 693 -23 47 771 -3%Customer Revenue Assurance 120 126 127 1 1% 124 120 2 6 123 3%SrVP Customer Operations 2 2 2 0 0% 2 2 0 0 2 0%Environmental Programs 43 42 48 6 13% 41 43 1 -1 41 14%TOTAL CUSTOMER OPERATIONS 1,420 1,452 1,555 104 7% 1,484 1,420 -32 32 1,493 4%
ComEd Corporate Relations 3 3 3 0 -2% 3 3 0 0 3 -2%Office of the Chairman/CEO 3 3 2 -1 -53% 3 3 0 0 3 -53%Office of the President -ComEd 2 2 3 1 32% 2 2 0 0 2 32%TOTAL OFFICE OF THE CEO/PRESIDENT-CED 8 8 8 0 -2% 8 8 0 0 8 -2%
Claims 35 36 35 -1 -2% 36 35 0 1 36 -1%Legal 2 2 2 0 0% 2 2 0 0 2 0%Energy Acquisition - CED 28 27 28 1 5% 28 28 -1 -1 27 3%CED-Regulatory & Strategic Srv 27 28 29 1 5% 28 27 0 1 28 6%TOTAL REP/GENERAL COUNSEL 92 93 95 2 2% 94 92 -1 1 93 2%
ComEd External Affairs and ESO 104 105 112 7 6% 105 104 0 1 104 7%Offce VP State & Legislative 2 8 9 1 9% 8 2 0 6 8 9%Ofc Dist Srvs, Comm Rel&Adm VP 9 2 3 1 32% 2 9 0 -7 2 32%ComEd Economic Development 5 6 6 0 -2% 6 5 0 1 6 -2%TOTAL OFFICE SVP GOVT & EXT AFFS-CED 120 121 129 8 6% 121 120 0 1 120 7%
CED Real Estate & Facilities 40 39 43 4 10% 38 40 1 -1 39 10%CED Marketing 14 17 18 1 4% 16 14 1 3 16 9%Ops Strategy and Bus Intellige 20 20 21 1 3% 19 20 1 0 20 3%Security Services 9 10 11 1 7% 9 9 1 1 9 17%TOTAL OFFICE OF SVP STRATEGY & ADMIN 83 86 92 6 7% 82 83 4 3 84 9%
Finance 16 23 15 -8 -53% 21 16 2 8 22 -42%ComEd Finance 51 51 53 3 5% 51 51 0 0 51 5%Communications 10 10 13 3 22% 10 10 0 0 10 22%Human Resources 32 31 34 3 9% 32 32 -1 -1 32 6%IT 63 63 68 5 8% 64 63 -1 0 64 6%Supply Services 192 191 192 1 1% 193 192 -2 -1 193 0%TOTAL FUNCTIONAL GROUPS 363 369 376 7 2% 371 363 -2 6 371 1%
TOTAL COMED HEADS 5,842 5,965 6,316 351 6% 5,950 5,842 15 123 5,961 6%
ComEd Detail FTE's
Net New Hires / Attrition
Schedule C-11.2Page 46 of 48
Witness: Tracy
Docket No. 18-____ ComEd Ex. 2.03 Page 244 of 334

For the Month Ending February 28, 2014 2013 Dec Actual Budget Variance Variance % Prior Month Year End 2013 Month YTD YTD Average Vacancy Rate
Distribution Ops - Chicago 568 587 600 13 2% 571 568 16 19 579 4%Distribution Ops - Suburban 1,352 1,361 1,439 78 5% 1,348 1,352 13 9 1,355 6%Ofc of SVP Distribution Ops 10 10 34 24 71% 10 10 0 0 10 71%Distribution Sys Operations 284 282 283 1 0% 281 284 1 -2 282 1%Technical Services 255 285 315 30 10% 280 255 5 31 283 10%Office of EVP - Operations 8 7 8 1 13% 7 8 0 -1 7 13%Strategic & Support Services 266 238 256 18 7% 239 266 -1 -28 238 7%Transmission and Substation 1,009 1,013 1,133 120 11% 1,004 1,009 9 4 1,009 11%Operations Admin 5 8 9 1 11% 8 5 0 3 8 11%TOTAL OPERATIONS 3,756 3,791 4,077 286 7% 3,748 3,756 43 35 3,769 8%
Automated Meter Infrastructure 92 93 131 38 29% 94 92 -1 1 94 29%Customer Channels 470 461 445 -16 -4% 478 470 -18 -9 470 -5%Customer Field Ops 693 763 750 -13 -2% 809 693 -46 70 786 -5%Customer Revenue Assurance 120 124 127 3 2% 120 120 4 4 122 4%SrVP Customer Operations 2 2 2 0 0% 2 2 0 0 2 0%Environmental Programs 43 41 48 7 15% 41 43 0 -2 41 15%TOTAL CUSTOMER OPERATIONS 1,420 1,484 1,503 19 1% 1,544 1,420 -61 64 1,514 -1%
ComEd Corporate Relations 3 3 3 0 -2% 3 3 0 0 3 -2%Office of the Chairman/CEO 3 3 2 -1 -53% 3 3 0 0 3 -53%Office of the President -ComEd 2 2 3 1 32% 2 2 0 0 2 32%TOTAL OFFICE OF THE CEO/PRESIDENT-CED 8 8 8 0 -2% 8 8 0 0 8 -2%
Claims 35 36 35 -1 -2% 35 35 1 1 36 -1%Legal 2 2 2 0 0% 2 2 0 0 2 0%Energy Acquisition - CED 28 28 28 0 2% 28 28 0 0 28 2%CED-Regulatory & Strategic Srv 27 28 28 0 1% 27 27 1 1 28 3%TOTAL REP/GENERAL COUNSEL 92 94 94 0 0% 92 92 2 2 93 1%
ComEd External Affairs and ESO 104 105 112 7 6% 103 104 2 1 104 7%Offce VP State & Legislative 2 8 9 1 9% 8 2 0 6 8 9%Ofc Dist Srvs, Comm Rel&Adm VP 9 2 3 1 32% 2 9 0 -7 2 32%ComEd Economic Development 5 6 6 0 -2% 6 5 0 1 6 -2%TOTAL OFFICE SVP GOVT & EXT AFFS-CED 120 121 129 8 6% 119 120 2 1 120 7%
CED Real Estate & Facilities 40 38 43 5 12% 39 40 -1 -2 39 10%CED Marketing 14 16 18 2 9% 16 14 0 2 16 9%Ops Strategy and Bus Intellige 20 19 21 2 8% 20 20 -1 -1 20 3%Security Services 9 9 11 2 17% 9 9 0 0 9 17%TOTAL OFFICE OF SVP STRATEGY & ADMIN 83 82 92 10 11% 84 83 -2 -1 84 9%
Finance 16 21 15 -6 -39% 20 16 1 6 21 -36%ComEd Finance 51 51 53 3 5% 51 51 0 0 51 5%Communications 10 10 13 3 22% 10 10 0 0 10 22%Human Resources 32 32 34 2 6% 32 32 0 0 32 6%IT 63 64 68 4 6% 65 63 -1 1 65 5%Supply Services 192 193 192 -1 0% 195 192 -2 1 195 -1%TOTAL FUNCTIONAL GROUPS 363 371 376 5 1% 373 363 -2 8 373 1%
TOTAL COMED HEADS 5,842 5,950 6,279 329 5% 5,968 5,842 -18 108 5,961 5%
ComEd Detail FTE's
Net New Hires / Attrition
Schedule C-11.2Page 47 of 48
Witness: Tracy
Docket No. 18-____ ComEd Ex. 2.03 Page 245 of 334

For the Month Ending January 31, 2014 2013 Dec Actual Budget Variance Variance % Prior Month Year End 2013 Month YTD YTD Average Vacancy Rate
Distribution Ops - Chicago 568 571 599 28 5% 568 568 3 3 571 5%Distribution Ops - Suburban 1,352 1,348 1,431 83 6% 1,352 1,352 -4 -4 1,348 6%Ofc of SVP Distribution Ops 10 10 70 60 86% 10 10 0 0 10 86%Distribution Sys Operations 284 281 288 7 2% 284 284 -3 -3 281 2%Technical Services 255 280 306 26 8% 255 255 26 26 280 8%Office of EVP - Operations 8 7 8 1 13% 8 8 -1 -1 7 13%Strategic & Support Services 266 239 257 18 7% 266 266 -27 -27 239 7%Transmission and Substation 1,009 1,004 1,133 129 11% 1,009 1,009 -5 -5 1,004 11%Operations Admin 5 8 11 3 24% 5 5 3 3 8 24%TOTAL OPERATIONS 3,756 3,748 4,102 354 9% 3,756 3,756 -9 -9 3,748 9%
Automated Meter Infrastructure 92 94 129 35 27% 92 92 2 2 94 27%Customer Channels 470 478 451 -27 -6% 470 470 8 8 478 -6%Customer Field Ops 693 809 779 -30 -4% 693 693 116 116 809 -4%Customer Revenue Assurance 120 120 127 7 6% 120 120 0 0 120 6%SrVP Customer Operations 2 2 2 0 0% 2 2 0 0 2 0%Environmental Programs 43 41 48 7 15% 43 43 -2 -2 41 15%TOTAL CUSTOMER OPERATIONS 1,420 1,544 1,537 -8 -1% 1,420 1,420 124 124 1,544 -1%
ComEd Corporate Relations 3 3 3 0 -2% 3 3 0 0 3 -2%Office of the Chairman/CEO 3 3 2 -1 -53% 3 3 0 0 3 -53%Office of the President -ComEd 2 2 3 1 32% 2 2 0 0 2 32%TOTAL OFFICE OF THE CEO/PRESIDENT-CED 8 8 8 0 -2% 8 8 0 0 8 -2%
Claims 35 35 35 0 1% 35 35 0 0 35 1%Legal 2 2 2 0 0% 2 2 0 0 2 0%Energy Acquisition - CED 28 28 28 0 2% 28 28 0 0 28 2%CED-Regulatory & Strategic Srv 27 27 28 1 5% 27 27 0 0 27 5%TOTAL REP/GENERAL COUNSEL 92 92 94 2 2% 92 92 0 0 92 2%
ComEd External Affairs and ESO 104 103 112 9 8% 104 104 -1 -1 103 8%Offce VP State & Legislative 2 8 9 1 9% 2 2 6 6 8 9%Ofc Dist Srvs, Comm Rel&Adm VP 9 2 3 1 32% 9 9 -7 -7 2 32%ComEd Economic Development 5 6 6 0 -2% 5 5 1 1 6 -2%TOTAL OFFICE SVP GOVT & EXT AFFS-CED 120 119 129 10 8% 120 120 -1 -1 119 8%
CED Real Estate & Facilities 40 39 43 4 10% 40 40 -1 -1 39 10%CED Marketing 14 16 18 2 9% 14 14 2 2 16 9%Ops Strategy and Bus Intellige 20 20 21 1 3% 20 20 0 0 20 3%Security Services 9 9 11 2 17% 9 9 0 0 9 17%TOTAL OFFICE OF SVP STRATEGY & ADMIN 83 84 92 8 9% 83 83 1 1 84 9%
Finance 16 20 15 -5 -33% 16 16 5 5 20 -33%ComEd Finance 51 51 53 3 5% 51 51 0 0 51 5%Communications 10 10 13 3 22% 10 10 0 0 10 22%Human Resources 32 32 33 1 3% 32 32 0 0 32 3%IT 63 65 68 3 5% 63 63 2 2 65 5%Supply Services 192 195 192 -3 -1% 192 192 3 3 195 -1%TOTAL FUNCTIONAL GROUPS 363 373 375 2 1% 363 363 10 10 373 1%
TOTAL COMED HEADS 5,842 5,968 6,337 369 6% 5,842 5,842 125 125 5,968 6%
ComEd Detail FTE's
Net New Hires / Attrition
Schedule C-11.2Page 48 of 48
Witness: Tracy
Docket No. 18-____ ComEd Ex. 2.03 Page 246 of 334

Schedule C-11.3Page 1 of 2
Witness: Tracy
Line Employee Total Amount Percentage Amount PercentageNo. Benefit Types Classification Benefit Cost Expensed Expensed Capitalized Capitalized
(A) (B) (C) (D) (E) (F) (G)
1 Pension Benefit Salaried, Union 192,939$ 92,430$ 47.90% 100,509$ 52.10%2 Post-Retirement Benefits Salaried, Union (15,491) (7,432) 48.00% (8,059) 52.00%3 Medical Insurance Plan Salaried, Union 85,659 41,020 47.90% 44,639 52.10%4 Dental Insurance Plan Salaried, Union 4,851 2,323 47.90% 2,528 52.10%5 Vision Insurance Plan Salaried, Union 671 322 48.00% 350 52.20%6 Other Benefit Plans Salaried, Union 6,699 3,704 55.30% 2,995 44.70%7 401 K Benefit Plan Salaried, Union 30,874 14,760 47.80% 16,114 52.20%8 Disability Benefit Plan Salaried, Union 757 362 47.80% 394 52.00%9 Severance Salaried, Union 2,086 2,086 100.00% - 0.00%
10 Total 2017 309,045$ 149,575$ 48.40% 159,470$ 51.60%
2017 Actual Employee Benefits
Commonwealth Edison Company
(In Thousands)
Docket No. 18-____ ComEd Ex. 2.03 Page 247 of 334

Schedule C-11.3Page 2 of 2
Witness: Tracy
Line EmployeeNo. Benefit Types Classification 2016 2015 2014
(A) (B) (C) (D) (E)
1 Pension Benefit Salaried, Union 181,571$ 205,204$ 156,872$ 2 Post-Retirement Benefits Salaried, Union (14,395) 3,164 7,085 3 Medical Insurance Plan Salaried, Union 87,631 79,083 71,7124 Dental Insurance Plan Salaried, Union 4,896 4,699 4,396 5 Vision Insurance Plan Salaried, Union 694 683 655 6 Other Benefit Plans Salaried, Union 6,005 4,235 7,118 7 401 K Benefit Plan Salaried, Union 32,678 31,477 25,846 8 Disability Benefit Plan Salaried, Union 756 535 536 9 Severance Salaried, Union 1,771 1,900 1,122
10 Total Benefit Cost 301,607$ 330,980$ 275,342$
11 Benefits Expensed 149,254$ 171,034$ 148,853$
12 Benefits Capitalized 152,352$ 159,943$ 126,485$
13 Percentage of Benefits Expensed 49.50% 51.70% 54.10%
14 Percentage of Benefits Capitalized 50.50% 48.30% 45.90%
Commonwealth Edison CompanyEmployee Benefits
(In Thousands)2014 - 2016
Docket No. 18-____ ComEd Ex. 2.03 Page 248 of 334

Schedule C-11.4Page 1 of 1
Commonwealth Edison Company
2017Witness: Tracy
LineNo. Description
(A)
1 ComEd's clearing account balances and overhead allocation rates are monitored monthly
2 to ensure that all costs are distributed by year-end, at which point, the balance within the
3 accounts is zero. With this process, there are no reconciliations of estimates to actuals at
4 year-end as there is no balance to reconcile.
Reconciliation of Estimated Overhead and Clearing Costs With Actual Costs
Docket No. 18-____ ComEd Ex. 2.03 Page 249 of 334

Schedule C-12Page 1 of 5
Commonwealth Edison Company2017 Jurisdictional Depreciation and Amortization Expense
Witness: Tracy
LineNo. Description Distribution
Depreciable- Other
Depreciable- Acct 397 Amortized Jurisdictional
(A) (B) (C) (D) (E) (F)
1 2017 Depreciation Expense (1) 483,057$ 43,874$ 62,632$ -$ 2 2017 Amortization Expense (2) - - - 73,825 3 Adjustments 4 Deprec Exp Related To Asset Retirement Costs (3) 1,217 163 - - 5 Deprec Exp Related To Supply Admin Costs (Sch B-2.7) - - - - 6 Costs Excluded from Previous Cases (Sch B-2.1) (743) - - - 7 Costs Excluded from Filing (Sch B-2.6) (8) - - - 8 Rider EEPP Depreciation (Sch B-2.2) (82) - - -
9 Deprec Exp Related To PCards (Sch B-2.10, Pg 1) (2) - - -
10 Sub Total 2017 Depreciation Expense 483,439$ 44,037$ 62,632$ 73,825$
11 Jurisdictional Percentage (4) 100.00% 86.50% 63.79% 90.30%
12 Jurisdictional Deprec and Amortization Expense 483,439$ 38,092$ 39,953$ 66,664$ 628,148$
Notes:(1) From Page 2.(2) Amortization expense from 2017 FERC Form 1, Page 336, Column (d) excluding Transmission.(3) Represents removal portion of depreciation exp that was charged to Account 403.1(4) For General Plant jurisdictional percentage calculation, see WPB-1, Page 1.
(In Thousands)
General and Intangible Plant
Docket No. 18-____ ComEd Ex. 2.03 Page 250 of 334

Schedule C-12Page 2 of 5
Witness: Tracy
AppliedLine Depreciable Depreciation DepreciationNo. Functional Account Description Plant Base Rate Expense (3)
(A) (B) (C) (D)
1 Total Transmission Plant 5,066,653$ 2.18% 110,453$
2 Distribution Plant:3 Excl HVD, Trans and Meters 13,331,284$ 2.45%4 High Voltage 2,786,718 2.37%5 Line Transformers 1,365,651 2.14%6 Non AMI Meters 71,344 41.88%7 AMI Meters 581,943 7.58%8 All Other 28,512 2.49%9 Total Distribution Plant 483,057$
10 General Plant (2):11 Structures & Improvements 504,866$ 2.70%12 Computer Equipment 95,398 20.74%13 Furniture & Equipment 21,751 4.61%14 Office Machines 215 9.30%15 Stores Equipment 3,030 15.00%16 Tools, Shop and Garage Equip. 198,102 3.72%17 Laboratory Equipment 2,765 4.19%18 Power Operated Equipment 11,264 6.84%19 Communication Equipment 778,023 7.18%20 MESH Communications Equip. 95,348 7.10%21 Miscellaneous Equipment 9,814 7.11%22 Total General Plant 106,506$
Notes:(1) From 2017 FERC Form 1, Pages 336 - 337.(2) Excludes transportation. Individual depreciation rates are determined for each class of transportation
equipment. Depreciation provisions are charged to the respective transportation clearing accounts.(3) Excludes depreciation expense for asset retirement costs (see Schedule C-12, Page 1).
Commonwealth Edison CompanyDepreciation Expense
2017 Actual (1)(In Thousands)
Docket No. 18-____ ComEd Ex. 2.03 Page 251 of 334

Schedule C-12Page 3 of 5
Witness: Tracy
AppliedLine Depreciable Depreciation DepreciationNo. Functional Account Description Plant Base Rate Expense (3)
(A) (B) (C) (D)
1 Total Transmission Plant 4,510,780$ 2.18% 98,335$
2 Distribution Plant:3 Excl HVD, Trans and Meters 12,426,750$ 2.45%4 High Voltage 2,611,464 2.37%5 Line Transformers 1,306,090 2.14%6 Non AMI Meters 167,747 35.97%7 AMI Meters 413,409 7.58%8 All Other 24,527 2.49%9 Total Distribution Plant 443,042$
10 General Plant (2):11 Structures & Improvements 369,101$ 2.70%12 Computer Equipment 93,800 20.74%13 Furniture & Equipment 26,237 4.61%14 Office Machines 283 9.30%15 Stores Equipment 2,137 15.00%16 Tools, Shop and Garage Equip. 188,813 3.72%17 Laboratory Equipment 2,656 4.19%18 Power Operated Equipment 11,666 6.84%19 Communication Equipment 746,221 7.18%20 MESH Communications Equip. 81,006 7.10%21 Miscellaneous Equipment 5,425 7.11%22 Total General Plant 98,638$
Notes:(1) From 2016 FERC Form 1, Pages 336 - 337.(2) Excludes transportation. Individual depreciation rates are determined for each class of transportation
equipment. Depreciation provisions are charged to the respective transportation clearing accounts.(3) Excludes depreciation expense for asset retirement costs (see Schedule C-12, Page 1).
Commonwealth Edison CompanyDepreciation Expense
2016 Actual (1)(In Thousands)
Docket No. 18-____ ComEd Ex. 2.03 Page 252 of 334
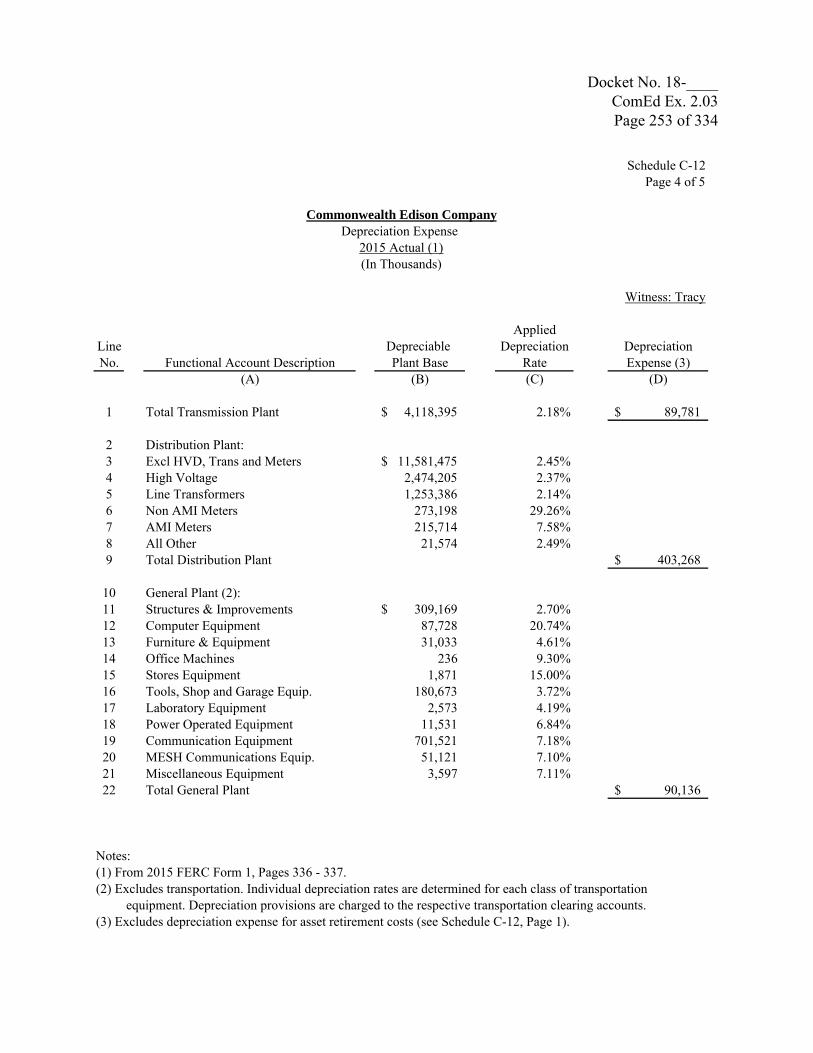
Schedule C-12Page 4 of 5
Witness: Tracy
AppliedLine Depreciable Depreciation DepreciationNo. Functional Account Description Plant Base Rate Expense (3)
(A) (B) (C) (D)
1 Total Transmission Plant 4,118,395$ 2.18% 89,781$
2 Distribution Plant:3 Excl HVD, Trans and Meters 11,581,475$ 2.45%4 High Voltage 2,474,205 2.37%5 Line Transformers 1,253,386 2.14%6 Non AMI Meters 273,198 29.26%7 AMI Meters 215,714 7.58%8 All Other 21,574 2.49%9 Total Distribution Plant 403,268$
10 General Plant (2):11 Structures & Improvements 309,169$ 2.70%12 Computer Equipment 87,728 20.74%13 Furniture & Equipment 31,033 4.61%14 Office Machines 236 9.30%15 Stores Equipment 1,871 15.00%16 Tools, Shop and Garage Equip. 180,673 3.72%17 Laboratory Equipment 2,573 4.19%18 Power Operated Equipment 11,531 6.84%19 Communication Equipment 701,521 7.18%20 MESH Communications Equip. 51,121 7.10%21 Miscellaneous Equipment 3,597 7.11%22 Total General Plant 90,136$
Notes:(1) From 2015 FERC Form 1, Pages 336 - 337.(2) Excludes transportation. Individual depreciation rates are determined for each class of transportation
equipment. Depreciation provisions are charged to the respective transportation clearing accounts.(3) Excludes depreciation expense for asset retirement costs (see Schedule C-12, Page 1).
Commonwealth Edison CompanyDepreciation Expense
2015 Actual (1)(In Thousands)
Docket No. 18-____ ComEd Ex. 2.03 Page 253 of 334

Schedule C-12Page 5 of 5
Witness: Tracy
AppliedLine Depreciable Depreciation DepreciationNo. Functional Account Description Plant Base Rate Expense (3)
(A) (B) (C) (D)
1 Total Transmission Plant 3,764,896$ 2.18% 82,075$
2 Distribution Plant:3 Excl HVD, Trans and Meters 10,887,372$ 2.45%4 High Voltage 2,403,245 2.37%5 Line Transformers 1,210,796 2.14%6 Non AMI Meters 344,270 22.45%7 AMI Meters 73,263 7.58%8 All Other 20,360 2.49% 372,955$ 9 Total Distribution Plant
10 General Plant (2):11 Structures & Improvements 295,280$ 2.70%12 Computer Equipment 79,375 20.74%13 Furniture & Equipment 30,370 4.61%14 Office Machines 481 9.30%15 Stores Equipment 2,650 15.00%16 Tools, Shop and Garage Equip. 166,862 3.72%17 Laboratory Equipment 5,930 4.19%18 Power Operated Equipment 11,438 6.84%19 Communication Equipment 693,258 7.18%20 MESH Communications Equip. 108,194 7.10%21 Miscellaneous Equipment 3,360 7.11%22 Total General Plant 85,424$
Notes:(1) From 2014 FERC Form 1, Pages 336 - 337.(2) Excludes transportation. Individual depreciation rates are determined for each class of transportation
equipment. Depreciation provisions are charged to the respective transportation clearing accounts.(3) Excludes depreciation expense for asset retirement costs (see Schedule C-12, Page 1).
Commonwealth Edison CompanyDepreciation Expense
2014 Actual (1)(In Thousands)
Docket No. 18-____ ComEd Ex. 2.03 Page 254 of 334

Schedule C-13Page 1 of 18
Witness: Tracy
Company Company Dollar Docket #Line Transaction Providing Receiving Nature of Amount of GrantingNo. Period (2) Services Services Transactions Transactions Approval
(A) (B) (C) (D) (E) (F)
1 ComEd is Recipient of Services2 1/1/2017 - 12/31/2017 PECO Energy Company Commonwealth Edison Company Information Technology 435,147$ 95-06153 1/1/2017 - 12/31/2017 PECO Energy Company Commonwealth Edison Company Other (3) 10,058 95-06154 1/1/2017 - 12/31/2017 Baltimore Gas & Electric Co Commonwealth Edison Company Information Technology 463,029 95-06155 1/1/2017 - 12/31/2017 Commonwealth Edison of Indiana Commonwealth Edison Company Transmission 8,939,452 N/A6 1/1/2017 - 12/31/2017 Exelon Business Services Company Commonwealth Edison Company Direct Bill (4) 114,203,607 00-02957 1/1/2017 - 12/31/2017 Exelon Business Services Company Commonwealth Edison Company Indirect Bill (4) 266,014,984 00-02958 1/1/2017 - 12/31/2017 Exelon Generation Company, LLC Commonwealth Edison Company Calibration and Equipment 238,520 95-06159 1/1/2017 - 12/31/2017 Exelon Generation Company, LLC Commonwealth Edison Company Construction Transmission 441,402 95-0615
10 1/1/2017 - 12/31/2017 Exelon Generation Company, LLC Commonwealth Edison Company Other 2,241 95-061511 ComEd is Recipient of Pass-Through Transactions12 1/1/2017 - 12/31/2017 Baltimore Gas & Electric Co Commonwealth Edison Company Cash Balancing 829,850$ 00-029513 1/1/2017 - 12/31/2017 Baltimore Gas & Electric Co Commonwealth Edison Company Contracting 42,280 00-029514 1/1/2017 - 12/31/2017 Baltimore Gas & Electric Co Commonwealth Edison Company Other (3) 368,356 00-029515 1/1/2017 - 12/31/2017 Exelon Business Services Company Commonwealth Edison Company Cash Balancing 1,216,947 00-029516 1/1/2017 - 12/31/2017 Exelon Business Services Company Commonwealth Edison Company Compensation 12,139,054 00-029517 1/1/2017 - 12/31/2017 Exelon Business Services Company Commonwealth Edison Company Contracting 3,987,955 00-029518 1/1/2017 - 12/31/2017 Exelon Business Services Company Commonwealth Edison Company Escheatment Related 981,921 00-029519 1/1/2017 - 12/31/2017 Exelon Business Services Company Commonwealth Edison Company Information Technology 2,632,119 00-029520 1/1/2017 - 12/31/2017 Exelon Business Services Company Commonwealth Edison Company Materials 5,494,444 00-029521 1/1/2017 - 12/31/2017 Exelon Business Services Company Commonwealth Edison Company Office Supplies 1,667,959 00-029522 1/1/2017 - 12/31/2017 Exelon Business Services Company Commonwealth Edison Company Other (3) 276,287 00-029523 1/1/2017 - 12/31/2017 Exelon Business Services Company Commonwealth Edison Company Purchase Cards 2,050,920 00-029524 1/1/2017 - 12/31/2017 Exelon Business Services Company Commonwealth Edison Company Human Resources 464,053 00-029525 1/1/2017 - 12/31/2017 Exelon Business Services Company Commonwealth Edison Company Communications 158,226 00-029526 1/1/2017 - 12/31/2017 Exelon Business Services Company Commonwealth Edison Company Telecommunication 16,637,682 00-029527 1/1/2017 - 12/31/2017 Exelon Business Services Company Commonwealth Edison Company Worker's Compensation 4,296,371 00-029528 1/1/2017 - 12/31/2017 Exelon Corporation Commonwealth Edison Company Contribution from Parent 345,621,088 00-0295
Notes: (1) Columns (A) through (E) agree with the Supplemental Schedule to ComEd's ILCC Form 21 Annual Report for the year ended December 31, 2017.The Supplemental Schedule was filed in accordance with the Illinois Commerce Commission's Order in Docket No. 07-0566.
(2) Transactions are recurring in nature.(3) Includes services under $100,000 that have been combined.(4) ComEd receives a variety of corporate support services from Exelon Business Services Company including legal, human resources, financial,
information technology and supply management services.
Commonwealth Edison CompanySummary of Affiliated Interest Transactions (1)
2017 Actual(In Dollars)
Docket No. 18-____ ComEd Ex. 2.03 Page 255 of 334
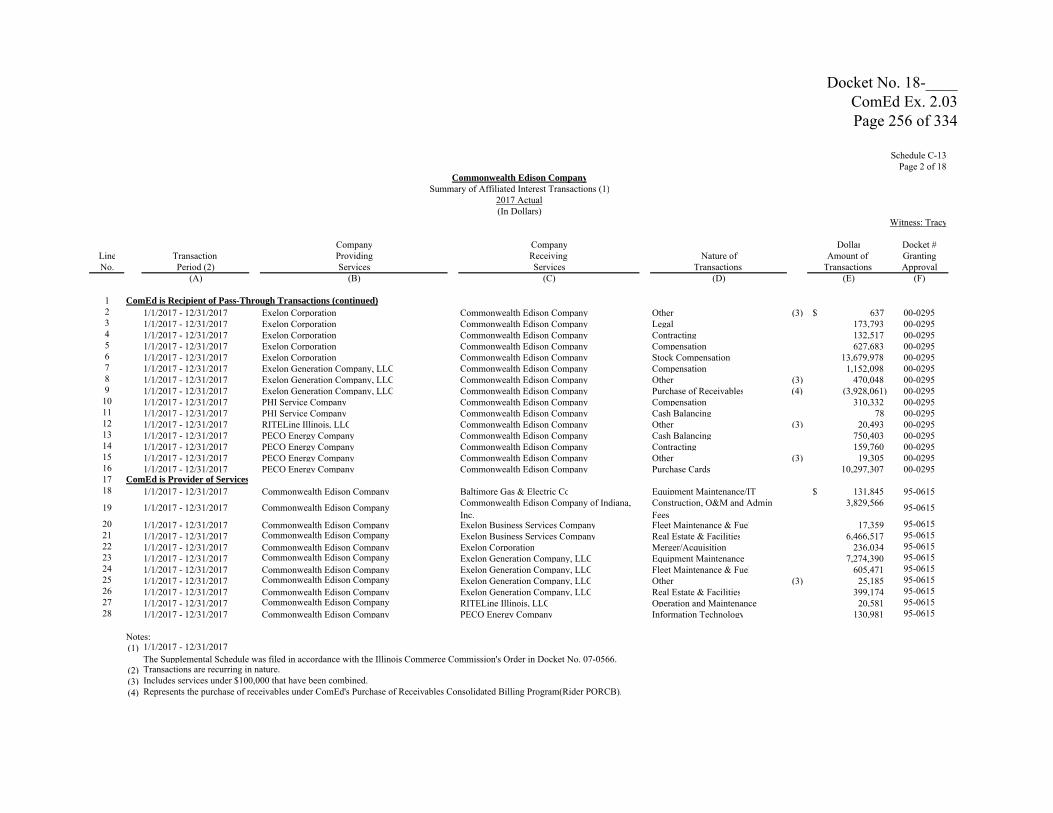
Schedule C-13Page 2 of 18
Witness: Tracy
Company Company Dollar Docket #Line Transaction Providing Receiving Nature of Amount of GrantingNo. Period (2) Services Services Transactions Transactions Approval
(A) (B) (C) (D) (E) (F)
1 ComEd is Recipient of Pass-Through Transactions (continued)2 1/1/2017 - 12/31/2017 Exelon Corporation Commonwealth Edison Company Other (3) 637$ 00-02953 1/1/2017 - 12/31/2017 Exelon Corporation Commonwealth Edison Company Legal 173,793 00-02954 1/1/2017 - 12/31/2017 Exelon Corporation Commonwealth Edison Company Contracting 132,517 00-02955 1/1/2017 - 12/31/2017 Exelon Corporation Commonwealth Edison Company Compensation 627,683 00-02956 1/1/2017 - 12/31/2017 Exelon Corporation Commonwealth Edison Company Stock Compensation 13,679,978 00-02957 1/1/2017 - 12/31/2017 Exelon Generation Company, LLC Commonwealth Edison Company Compensation 1,152,098 00-02958 1/1/2017 - 12/31/2017 Exelon Generation Company, LLC Commonwealth Edison Company Other (3) 470,048 00-02959 1/1/2017 - 12/31/2017 Exelon Generation Company, LLC Commonwealth Edison Company Purchase of Receivables (4) (3,928,061) 00-0295
10 1/1/2017 - 12/31/2017 PHI Service Company Commonwealth Edison Company Compensation 310,332 00-029511 1/1/2017 - 12/31/2017 PHI Service Company Commonwealth Edison Company Cash Balancing 78 00-029512 1/1/2017 - 12/31/2017 RITELine Illinois, LLC Commonwealth Edison Company Other (3) 20,493 00-029513 1/1/2017 - 12/31/2017 PECO Energy Company Commonwealth Edison Company Cash Balancing 750,403 00-029514 1/1/2017 - 12/31/2017 PECO Energy Company Commonwealth Edison Company Contracting 159,760 00-029515 1/1/2017 - 12/31/2017 PECO Energy Company Commonwealth Edison Company Other (3) 19,305 00-029516 1/1/2017 - 12/31/2017 PECO Energy Company Commonwealth Edison Company Purchase Cards 10,297,307 00-029517 ComEd is Provider of Services18 1/1/2017 - 12/31/2017 Commonwealth Edison Company Baltimore Gas & Electric Co Equipment Maintenance/IT 131,845$ 95-0615
19 1/1/2017 - 12/31/2017 Commonwealth Edison Company Commonwealth Edison Company of Indiana, Inc.
Construction, O&M and Admin Fees
3,829,566 95-0615
20 1/1/2017 - 12/31/2017 Commonwealth Edison Company Exelon Business Services Company Fleet Maintenance & Fuel 17,359 95-061521 1/1/2017 - 12/31/2017 Commonwealth Edison Company Exelon Business Services Company Real Estate & Facilities 6,466,517 95-061522 1/1/2017 - 12/31/2017 Commonwealth Edison Company Exelon Corporation Merger/Acquisition 236,034 95-061523 1/1/2017 - 12/31/2017 Commonwealth Edison Company Exelon Generation Company, LLC Equipment Maintenance 7,274,390 95-061524 1/1/2017 - 12/31/2017 Commonwealth Edison Company Exelon Generation Company, LLC Fleet Maintenance & Fuel 605,471 95-061525 1/1/2017 - 12/31/2017 Commonwealth Edison Company Exelon Generation Company, LLC Other (3) 25,185 95-061526 1/1/2017 - 12/31/2017 Commonwealth Edison Company Exelon Generation Company, LLC Real Estate & Facilities 399,174 95-061527 1/1/2017 - 12/31/2017 Commonwealth Edison Company RITELine Illinois, LLC Operation and Maintenance 20,581 95-061528 1/1/2017 - 12/31/2017 Commonwealth Edison Company PECO Energy Company Information Technology 130,981 95-0615
Notes:(1) 1/1/2017 - 12/31/2017
The Supplemental Schedule was filed in accordance with the Illinois Commerce Commission's Order in Docket No. 07-0566.(2) Transactions are recurring in nature.(3) Includes services under $100,000 that have been combined.(4) Represents the purchase of receivables under ComEd's Purchase of Receivables Consolidated Billing Program(Rider PORCB).
Commonwealth Edison CompanySummary of Affiliated Interest Transactions (1)
2017 Actual(In Dollars)
Docket No. 18-____ ComEd Ex. 2.03 Page 256 of 334

Schedule C-13Page 3 of 18
Witness: Tracy
Company Company Dollar Docket #Line Transaction Providing Receiving Nature of Amount of GrantingNo. Period (2) Services Services Transactions Transactions Approval
(A) (B) (C) (D) (E) (F)
1 ComEd is Provider of Pass-Through Transactions 2 1/1/2017 - 12/31/2017 Commonwealth Edison Company Baltimore Gas & Electric Co Compensation 5,779$ 95-06153 1/1/2017 - 12/31/2017 Commonwealth Edison Company Baltimore Gas & Electric Co Materials 144,051 95-06154 1/1/2017 - 12/31/2017 Commonwealth Edison Company Baltimore Gas & Electric Co Information Technology 146,218 95-06155 1/1/2017 - 12/31/2017 Commonwealth Edison Company Commonwealth Edison of Indiana Other (3) 5,720 95-06156 1/1/2017 - 12/31/2017 Commonwealth Edison Company Exelon Business Services Company Compensation 416,415 95-06157 1/1/2017 - 12/31/2017 Commonwealth Edison Company Exelon Business Services Company Finance 345,004 95-06158 1/1/2017 - 12/31/2017 Commonwealth Edison Company Exelon Business Services Company Real Estate 542,286 95-06159 1/1/2017 - 12/31/2017 Commonwealth Edison Company Exelon Business Services Company Other (3) 1,397,723 95-0615
10 1/1/2017 - 12/31/2017 Commonwealth Edison Company Exelon Business Services Company Information Technology 15,474,692 95-061511 1/1/2017 - 12/31/2017 Commonwealth Edison Company Exelon Corporation Compensation 1,988,539 95-061512 1/1/2017 - 12/31/2017 Commonwealth Edison Company Exelon Corporation Other (3) 17,364 95-061513 1/1/2017 - 12/31/2017 Commonwealth Edison Company Exelon Generation Company, LLC Cash Balancing 566,345 95-061514 1/1/2017 - 12/31/2017 Commonwealth Edison Company Exelon Generation Company, LLC Other (3) 34,387 95-061515 1/1/2017 - 12/31/2017 Commonwealth Edison Company Exelon Generation Company, LLC Contracting 35,847 95-061516 1/1/2017 - 12/31/2017 Commonwealth Edison Company Exelon Generation Company, LLC Single Bill Option (4) 4,650,453 95-061517 1/1/2017 - 12/31/2017 Commonwealth Edison Company Exelon Generation Company, LLC Stock Compensation 970 95-061518 1/1/2017 - 12/31/2017 Commonwealth Edison Company PHI Service Company Merger/Acquisition 4,104,024 95-061519 1/1/2017 - 12/31/2017 Commonwealth Edison Company PHI Service Company Other (3) 27,060 95-061520 1/1/2017 - 12/31/2017 Commonwealth Edison Company PECO Energy Company Contracting 193,336 95-061521 1/1/2017 - 12/31/2017 Commonwealth Edison Company PECO Energy Company Information Technology 184,553 95-061522 1/1/2017 - 12/31/2017 Commonwealth Edison Company PECO Energy Company Memberships 13,333 95-061523 1/1/2017 - 12/31/2017 Commonwealth Edison Company PECO Energy Company Materials 824,374 95-061524 1/1/2017 - 12/31/2018 Commonwealth Edison Company PECO Energy Company Other (3) 399,137 95-0615
Notes:(1) Columns (A) through (E) agree with the Supplemental Schedule to ComEd's ILCC Form 21 Annual Report for the year ended December 31, 2017.
The Supplemental Schedule was filed in accordance with the Illinois Commerce Commission's Order in Docket No. 07-0566.(2) Transactions are recurring in nature.(3) Includes services under $100,000 that have been combined.(4) Represents amounts under ComEd's Rider Single Bill Option (SBO). Under Rider SBO an Alternative Electric Retail Supplier (RES) is allowed to
send the RES's customer a single bill, including charges for ComEd's delivery services.
(In Dollars)2017 Actual
Commonwealth Edison CompanySummary of Affiliated Interest Transactions (1)
Docket No. 18-____ ComEd Ex. 2.03 Page 257 of 334
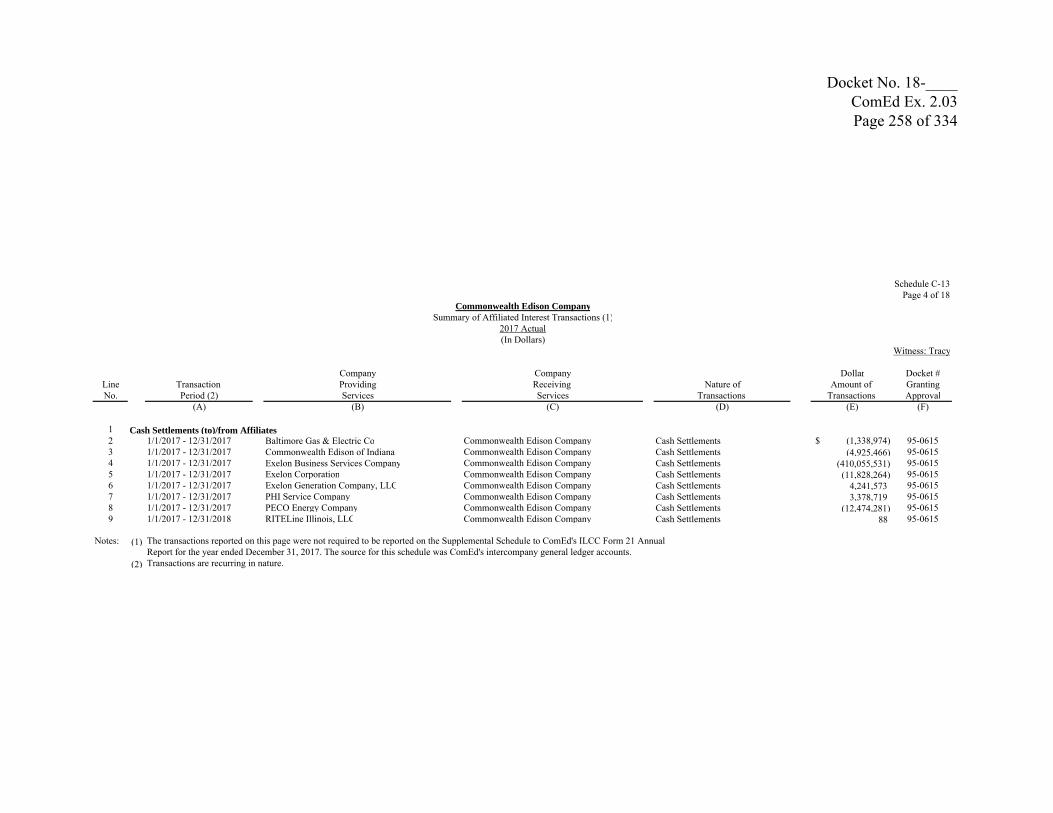
Schedule C-13Page 4 of 18
Witness: Tracy
Company Company Dollar Docket #Line Transaction Providing Receiving Nature of Amount of GrantingNo. Period (2) Services Services Transactions Transactions Approval
(A) (B) (C) (D) (E) (F)
1 Cash Settlements (to)/from Affiliates2 1/1/2017 - 12/31/2017 Baltimore Gas & Electric Co Commonwealth Edison Company Cash Settlements (1,338,974)$ 95-06153 1/1/2017 - 12/31/2017 Commonwealth Edison of Indiana Commonwealth Edison Company Cash Settlements (4,925,466) 95-06154 1/1/2017 - 12/31/2017 Exelon Business Services Company Commonwealth Edison Company Cash Settlements (410,055,531) 95-06155 1/1/2017 - 12/31/2017 Exelon Corporation Commonwealth Edison Company Cash Settlements (11,828,264) 95-06156 1/1/2017 - 12/31/2017 Exelon Generation Company, LLC Commonwealth Edison Company Cash Settlements 4,241,573 95-06157 1/1/2017 - 12/31/2017 PHI Service Company Commonwealth Edison Company Cash Settlements 3,378,719 95-06158 1/1/2017 - 12/31/2017 PECO Energy Company Commonwealth Edison Company Cash Settlements (12,474,281) 95-06159 1/1/2017 - 12/31/2018 RITELine Illinois, LLC Commonwealth Edison Company Cash Settlements 88 95-0615
Notes: (1) The transactions reported on this page were not required to be reported on the Supplemental Schedule to ComEd's ILCC Form 21 Annual Report for the year ended December 31, 2017. The source for this schedule was ComEd's intercompany general ledger accounts.
(2) Transactions are recurring in nature.
2017 Actual(In Dollars)
Commonwealth Edison CompanySummary of Affiliated Interest Transactions (1)
Docket No. 18-____ ComEd Ex. 2.03 Page 258 of 334

Schedule C-13Page 5 of 18
Witness: Tracy
Company Company Dollar Docket #Line Transaction Providing Receiving Nature of Amount of GrantingNo. Period (2) Services Services Transactions Transactions Approval
(A) (B) (C) (D) (E) (F)
1 ComEd is Recipient of Services2 1/1/2016 - 12/31/2016 Baltimore Gas & Electric Company Commonwealth Edison Company IT/Energy Services 1,259,509$ 95-06153 1/1/2016 - 12/31/2016 Peco Energy Company Commonwealth Edison Company Information Technology 503,555 95-06154 1/1/2016 - 12/31/2016 Peco Energy Company Commonwealth Edison Company Other 4,130 95-06155 1/1/2016 - 12/31/2016 Commonwealth Edison of Indiana Commonwealth Edison Company Transmission 7,091,720 N/A6 1/1/2016 - 12/31/2016 Exelon Business Services Company Commonwealth Edison Company Direct Bill (3) 106,251,438 00-02957 1/1/2016 - 12/31/2016 Exelon Business Services Company Commonwealth Edison Company Indirect Bill (3) 233,520,505 00-02958 1/1/2016 - 12/31/2016 Exelon Generation Company, LLC Commonwealth Edison Company Other 65,606 95-06159 1/1/2016 - 12/31/2016 Exelon Generation Company, LLC Commonwealth Edison Company Calibration of Equipment 270,263 95-061510 ComEd is Recipient of Pass-Through Transactions11 1/1/2016 - 12/31/2016 Baltimore Gas & Electric Company Commonwealth Edison Company Cash Balancing 1,707,192$ 00-029512 1/1/2016 - 12/31/2016 Baltimore Gas & Electric Company Commonwealth Edison Company Asset Transfer 137,181 00-029513 1/1/2016 - 12/31/2016 Baltimore Gas & Electric Company Commonwealth Edison Company Other (4) 335,578 00-029514 1/1/2016 - 12/31/2016 Baltimore Gas & Electric Company Commonwealth Edison Company Materials 3,546 00-029515 1/1/2016 - 12/31/2016 Baltimore Gas & Electric Company Commonwealth Edison Company Real Estate & Facilities 885,705 00-029516 1/1/2016 - 12/31/2016 Commonwealth Edison of Indiana Commonwealth Edison Company Other (4) 207,484 00-029517 1/1/2016 - 12/31/2016 Exelon Business Services Company Commonwealth Edison Company Cash Balancing 1,325,345 00-029518 1/1/2016 - 12/31/2016 Exelon Business Services Company Commonwealth Edison Company Compensation 8,758,232 00-029519 1/1/2016 - 12/31/2016 Exelon Business Services Company Commonwealth Edison Company Contracting 9,700,692 00-029520 1/1/2016 - 12/31/2016 Exelon Business Services Company Commonwealth Edison Company Escheatment Related 666,672 00-029521 1/1/2016 - 12/31/2016 Exelon Business Services Company Commonwealth Edison Company Fleet Maintenance & Fuel 27,039 00-029522 1/1/2016 - 12/31/2016 Exelon Business Services Company Commonwealth Edison Company Information Technology 871,366 00-029523 1/1/2016 - 12/31/2016 Exelon Business Services Company Commonwealth Edison Company Materials 4,586,243 00-029524 1/1/2016 - 12/31/2016 Exelon Business Services Company Commonwealth Edison Company Office Supplies 1,710,729 00-029525 1/1/2016 - 12/31/2016 Exelon Business Services Company Commonwealth Edison Company Other (3) 1,654,918 00-029526 1/1/2016 - 12/31/2016 Exelon Business Services Company Commonwealth Edison Company Real Estate 192,261 00-029527 1/1/2016 - 12/31/2016 Exelon Business Services Company Commonwealth Edison Company Telecommunication 18,979,046 00-0295
Notes: (1) Columns (A) through (E) agree with the Supplemental Schedule to ComEd's ILCC Form 21 Annual Report for the year ended December 31, 2016.The Supplemental Schedule was filed in accordance with the Illinois Commerce Commission's Order in Docket No. 07-0566.
(2) Transactions are recurring in nature.(3) ComEd receives a variety of corporate support services from Exelon Business Services Company including legal, human resources, financial,
information technology and supply management services.(4) Includes services under $100,000 that have been combined.
Commonwealth Edison CompanySummary of Affiliated Interest Transactions (1)
2016 Actual(In Dollars)
Docket No. 18-____ ComEd Ex. 2.03 Page 259 of 334

Schedule C-13Page 6 of 18
Witness: Tracy
Company Company Dollar Docket #Line Transaction Providing Receiving Nature of Amount of GrantingNo. Period (2) Services Services Transactions Transactions Approval
(A) (B) (C) (D) (E) (F)
1 ComEd is Recipient of Pass-Through Transactions (continued)2 1/1/2016 - 12/31/2016 Exelon Business Services Company Commonwealth Edison Company Worker's Compensation 3,514,084$ 00-02953 1/1/2016 - 12/31/2016 Exelon Corporation Commonwealth Edison Company Information Technology 280,171 00-02954 1/1/2016 - 12/31/2016 Exelon Corporation Commonwealth Edison Company Legal 821,988 00-02955 1/1/2016 - 12/31/2016 Exelon Corporation Commonwealth Edison Company Other (3) 719,039 00-02956 1/1/2016 - 12/31/2016 Exelon Corporation Commonwealth Edison Company Contracting 101,252 00-02957 1/1/2016 - 12/31/2016 Exelon Corporation Commonwealth Edison Company Stock Compensation 10,079,409 00-02958 1/1/2016 - 12/31/2016 Exelon Corporation Commonwealth Edison Company Telecommunication 52,405 00-02959 1/1/2016 - 12/31/2016 Exelon Generation Company, LLC Commonwealth Edison Company Cash Balancing 1,973,944 00-029510 1/1/2016 - 12/31/2016 Exelon Generation Company, LLC Commonwealth Edison Company Compensation 168,891 00-029511 1/1/2016 - 12/31/2016 Exelon Generation Company, LLC Commonwealth Edison Company Other (3) 2,209,275 00-029512 1/1/2016 - 12/31/2016 Exelon Generation Company, LLC Commonwealth Edison Company Purchase of Receivables (4) (3,440,434) 00-029513 1/1/2016 - 12/31/2016 Exelon Generation Company, LLC Commonwealth Edison Company Stock Compensation 1,914 00-029514 1/1/2016 - 12/31/2016 PHI Service Company Commonwealth Edison Company Compensation 17,603 00-029515 1/1/2016 - 12/31/2016 Peco Energy Company Commonwealth Edison Company Cash Balancing 1,040,327 00-029516 1/1/2016 - 12/31/2016 Peco Energy Company Commonwealth Edison Company Contracting 131,312 00-029517 1/1/2016 - 12/31/2016 Peco Energy Company Commonwealth Edison Company Information Technology 176,054 00-029518 1/1/2016 - 12/31/2016 Peco Energy Company Commonwealth Edison Company Other (3) 163,827 00-029519 1/1/2016 - 12/31/2016 Peco Energy Company Commonwealth Edison Company Purchase Cards 22,499,139 00-029520 ComEd is Provider of Services21 1/1/2016 - 12/31/2016 Commonwealth Edison Company Baltimore Gas & Electric Co IT/Equipment Maintenance 306,868$ 95-061522 1/1/2016 - 12/31/2016 Commonwealth Edison Company Baltimore Gas & Electric Co Mutual Assistance 899,393 95-0615
Notes:(1) 1/1/2016 - 12/31/2016
The Supplemental Schedule was filed in accordance with the Illinois Commerce Commission's Order in Docket No. 07-0566.(2) Transactions are recurring in nature.(3) Includes services under $100,000 that have been combined.(4) Represents the purchase of receivables under ComEd's Purchase of Receivables Consolidated Billing Program(Rider PORCB).
2016 Actual(In Dollars)
Summary of Affiliated Interest Transactions (1)Commonwealth Edison Company
Docket No. 18-____ ComEd Ex. 2.03 Page 260 of 334

Schedule C-13Page 7 of 18
Witness: Tracy
Company Company Dollar Docket #Line Transaction Providing Receiving Nature of Amount of GrantingNo. Period (2) Services Services Transactions Transactions Approval
(A) (B) (C) (D) (E) (F)
1 1/1/2016 - 12/31/2016 Commonwealth Edison Company Exelon Business Services Company Fleet Maintenance & Fuel 21,616$ 95-06152 1/1/2016 - 12/31/2016 Commonwealth Edison Company Exelon Business Services Company Real Estate & Facilities 6,465,747 95-06153 1/1/2016 - 12/31/2016 Commonwealth Edison Company Commonwealth Edison Company of Indiana,
Inc.Operation and Maintenance of Equipment & Admin Fees
11,866,854 95-0615
4 1/1/2016 - 12/31/2016 Commonwealth Edison Company Exelon Corporation Merger/Acquisition 237,086 95-06155 1/1/2016 - 12/31/2016 Commonwealth Edison Company Exelon Generation Company, LLC Equipment Maintenance 4,719,538 95-06156 1/1/2016 - 12/31/2016 Commonwealth Edison Company Exelon Generation Company, LLC Fleet Maintenance & Fuel 725,871 95-06157 1/1/2016 - 12/31/2016 Commonwealth Edison Company Exelon Generation Company, LLC Other 23,090 95-06158 1/1/2016 - 12/31/2016 Commonwealth Edison Company Exelon Generation Company, LLC Real Estate & Facilities 340,075 95-06159 1/1/2016 - 12/31/2016 Commonwealth Edison Company PECO Energy Company IT/Equipment Maintenance 357,932 95-061510 1/1/2016 - 12/31/2016 Commonwealth Edison Company PECO Energy Company Mutual Assistance 697,511 95-061511 ComEd is Provider of Pass-Through Transactions 12 1/1/2016 - 12/31/2016 Commonwealth Edison Company Baltimore Gas & Electric Company Contracting 77,569$ 95-061513 1/1/2016 - 12/31/2016 Commonwealth Edison Company Baltimore Gas & Electric Company Stock Compensation 1,601 95-061514 1/1/2016 - 12/31/2016 Commonwealth Edison Company Baltimore Gas & Electric Company Information Technology 321,442 95-0615
Notes:(1) Columns (A) through (E) agree with the Supplemental Schedule to ComEd's ILCC Form 21 Annual Report for the year ended December 31, 2016.
The Supplemental Schedule was filed in accordance with the Illinois Commerce Commission's Order in Docket No. 07-0566.(2) Transactions are recurring in nature.
Commonwealth Edison CompanySummary of Affiliated Interest Transactions (1)
2016 Actual(In Dollars)
Docket No. 18-____ ComEd Ex. 2.03 Page 261 of 334

Schedule C-13Page 8 of 18
Witness: Tracy
Company Company Dollar Docket #Line Transaction Providing Receiving Nature of Amount of GrantingNo. Period (2) Services Services Transactions Transactions Approval
(A) (B) (C) (D) (E) (F)
1 ComEd is Provider of Pass-Through Transactions (continued)2 1/1/2016 - 12/31/2016 Commonwealth Edison Company Commonwealth Edison Company of Indiana Real Estate 173,386$ 95-06153 1/1/2016 - 12/31/2016 Commonwealth Edison Company Exelon Business Services Company Merger/Acquisition 54,949 95-06154 1/1/2016 - 12/31/2016 Commonwealth Edison Company Exelon Business Services Company Purchase Cards 915,584 95-06155 1/1/2016 - 12/31/2016 Commonwealth Edison Company Exelon Business Services Company Information Technology 9,900,690 95-06156 1/1/2016 - 12/31/2016 Commonwealth Edison Company Exelon Corporation Compensation 18,879 95-06157 1/1/2016 - 12/31/2016 Commonwealth Edison Company Exelon Corporation LKE - Hold Harmless Agreement 345,650,503 95-06158 1/1/2016 - 12/31/2016 Commonwealth Edison Company Exelon Corporation Other 623 95-06159 1/1/2016 - 12/31/2016 Commonwealth Edison Company Exelon Generation Company, LLC Compensation 64,034 95-061510 1/1/2016 - 12/31/2016 Commonwealth Edison Company Exelon Generation Company, LLC Other (3) (3) 361,553 95-061511 1/1/2016 - 12/31/2016 Commonwealth Edison Company Exelon Generation Company, LLC Contracting 585,047 95-061512 1/1/2016 - 12/31/2016 Commonwealth Edison Company Exelon Generation Company, LLC Single Bill Option (4) (788,759) 95-061513 1/1/2016 - 12/31/2016 Commonwealth Edison Company Exelon Generation Company, LLC Stock Compensation 3,932 95-061514 1/1/2016 - 12/31/2016 Commonwealth Edison Company PHI Service Company Merger/Acquisition 928,762 95-061515 1/1/2016 - 12/31/2016 Commonwealth Edison Company PECO Energy Company Contracting 482,143 95-061516 1/1/2016 - 12/31/2016 Commonwealth Edison Company PECO Energy Company Information Technology 306,307 95-061517 1/1/2016 - 12/31/2016 Commonwealth Edison Company PECO Energy Company Memberships 8,799 95-061518 1/1/2016 - 12/31/2016 Commonwealth Edison Company PECO Energy Company Other (3) 196,244 95-061519 1/1/2016 - 12/31/2016 Commonwealth Edison Company PECO Energy Company Stock Compensation 141 95-0615
Notes:(1) Columns (A) through (E) agree with the Supplemental Schedule to ComEd's ILCC Form 21 Annual Report for the year ended December 31, 2016.
The Supplemental Schedule was filed in accordance with the Illinois Commerce Commission's Order in Docket No. 07-0566.(2) Transactions are recurring in nature.(3) Includes services under $100,000 that have been combined.(4) Represents amounts under ComEd's Rider Single Bill Option (SBO). Under Rider SBO an Alternative Electric Retail Supplier (RES) is allowed to
send the RES's customer a single bill, including charges for ComEd's delivery services.
Commonwealth Edison CompanySummary of Affiliated Interest Transactions (1)
2016 Actual(In Dollars)
Docket No. 18-____ ComEd Ex. 2.03 Page 262 of 334

Schedule C-13Page 9 of 18
Witness: Tracy
Company Company Dollar Docket #Line Transaction Providing Receiving Nature of Amount of GrantingNo. Period (2) Services Services Transactions Transactions Approval
(A) (B) (C) (D) (E) (F)
1 Cash Settlements (to)/from Affiliates2 1/1/2016 - 12/31/2016 Baltimore Gas & Electric Company Commonwealth Edison Company Cash Settlements (2,720,166)$ 95-06153 1/1/2016 - 12/31/2016 Commonwealth Edison of Indiana Commonwealth Edison Company Cash Settlements 4,136,948 95-06154 1/1/2016 - 12/31/2016 Exelon Business Services Company Commonwealth Edison Company Cash Settlements (370,672,777) 95-06155 1/1/2016 - 12/31/2016 Exelon Corporation Commonwealth Edison Company Cash Settlements (10,694,172) 95-06156 1/1/2016 - 12/31/2016 Exelon Generation Company, LLC Commonwealth Edison Company Cash Settlements 2,942,150 95-06157 1/1/2016 - 12/31/2016 PHI Service Company Commonwealth Edison Company Cash Settlements 816,021 95-06158 1/1/2016 - 12/31/2016 PECO Energy Company Commonwealth Edison Company Cash Settlements (21,959,751) 95-0615
Notes: (1) The transactions reported on this page were not required to be reported on the Supplemental Schedule to ComEd's ILCC Form 21 Annual Report for the year ended December 31, 2016. The source for this schedule was ComEd's intercompany general ledger accounts.
(2) Transactions are recurring in nature.
Commonwealth Edison CompanySummary of Affiliated Interest Transactions (1)
2016 Actual(In Dollars)
Docket No. 18-____ ComEd Ex. 2.03 Page 263 of 334

Schedule C-13Page 10 of 18
Witness: Tracy
Company Company Dollar Docket #Line Transaction Providing Receiving Nature of Amount of GrantingNo. Period (2) Services Services Transactions Transactions Approval
(A) (B) (C) (D) (E) (F)
1 ComEd is Recipient of Services2 1/1/2015 - 12/31/2015 Baltimore Gas & Electric Company Commonwealth Edison Company Contracting 536,226$ N/A3 1/1/2015 - 12/31/2015 Commonwealth Edison of Indiana Commonwealth Edison Company Transmission 7,173,160 N/A4 1/1/2015 - 12/31/2015 Exelon Business Services Company Commonwealth Edison Company Direct Bill (3) 103,683,057 00-02955 1/1/2015 - 12/31/2015 Exelon Business Services Company Commonwealth Edison Company Indirect Bill (3) 192,178,056 00-02956 1/1/2015 - 12/31/2015 Exelon Generation Company, LLC Commonwealth Edison Company Calibration of Equipment 312,189 00-02957 ComEd is Recipient of Pass-Through Transactions8 1/1/2015 - 12/31/2015 Baltimore Gas & Electric Company Commonwealth Edison Company Cash Balancing 2,140,195$ 00-02959 1/1/2015 - 12/31/2015 Baltimore Gas & Electric Company Commonwealth Edison Company Other (3) 164,792 00-029510 1/1/2015 - 12/31/2015 Baltimore Gas & Electric Company Commonwealth Edison Company Stock Compensation 317,820 00-029511 1/1/2015 - 12/31/2015 Exelon Business Services Company Commonwealth Edison Company Cash Balancing 4,040,663 00-029512 1/1/2015 - 12/31/2015 Exelon Business Services Company Commonwealth Edison Company Compensation (7,380,634) 00-029513 1/1/2015 - 12/31/2015 Exelon Business Services Company Commonwealth Edison Company Contracting 15,661,463 00-029514 1/1/2015 - 12/31/2015 Exelon Business Services Company Commonwealth Edison Company Escheatment Related 712,444 00-029515 1/1/2015 - 12/31/2015 Exelon Business Services Company Commonwealth Edison Company Informational Technology 671,728 00-029516 1/1/2015 - 12/31/2015 Exelon Business Services Company Commonwealth Edison Company Materials 6,386,962 00-029517 1/1/2015 - 12/31/2015 Exelon Business Services Company Commonwealth Edison Company Office Supplies 1,544,306 00-029518 1/1/2015 - 12/31/2015 Exelon Business Services Company Commonwealth Edison Company Other (4) 2,563,374 00-029519 1/1/2015 - 12/31/2015 Exelon Business Services Company Commonwealth Edison Company Purchase Cards 239,665 00-029520 1/1/2015 - 12/31/2015 Exelon Business Services Company Commonwealth Edison Company Real Estate 462,125 00-029521 1/1/2015 - 12/31/2015 Exelon Business Services Company Commonwealth Edison Company Telecommunication 21,307,890 00-029522 1/1/2015 - 12/31/2015 Exelon Business Services Company Commonwealth Edison Company Worker's Compensation 3,689,498 00-0295
(1) The Supplemental Schedule was filed in accordance with the Illinois Commerce Commission's Order in Docket No. 07-0566.(2) Transactions are recurring in nature.(3) ComEd receives a variety of corporate support services from Exelon Business Services Company including legal, human resources, financial,
information technology and supply management services.(4) Includes services under $100,000 that have been combined.
Commonwealth Edison CompanySummary of Affiliated Interest Transactions (1)
2015 Actual(In Dollars)
Docket No. 18-____ ComEd Ex. 2.03 Page 264 of 334

Schedule C-13Page 11 of 18
Witness: Tracy
Company Company Dollar Docket #Line Transaction Providing Receiving Nature of Amount of GrantingNo. Period (2) Services Services Transactions Transactions Approval
(A) (B) (C) (D) (E) (F)
1 ComEd is Recipient of Pass-Through Transactions (continued)2 1/1/2015 - 12/31/2015 Exelon Corporation Commonwealth Edison Company Information Technology 603,475$ 95-06153 1/1/2015 - 12/31/2015 Exelon Corporation Commonwealth Edison Company Legal 4,805,499 95-06154 1/1/2015 - 12/31/2015 Exelon Corporation Commonwealth Edison Company Other (3) 2,651,905 95-06155 1/1/2015 - 12/31/2015 Exelon Corporation Commonwealth Edison Company Stock Compensation 6,845,381 95-06156 1/1/2015 - 12/31/2015 Exelon Corporation Commonwealth Edison Company Telecommunications 66,741 95-06157 1/1/2015 - 12/31/2015 Exelon Generation Company, LLC Commonwealth Edison Company Cash Balancing 4,867,642 95-06158 1/1/2015 - 12/31/2015 Exelon Generation Company, LLC Commonwealth Edison Company Compensation 45,338 95-06159 1/1/2015 - 12/31/2015 Exelon Generation Company, LLC Commonwealth Edison Company Other (3) 2,241,265 95-061510 1/1/2015 - 12/31/2015 Exelon Generation Company, LLC Commonwealth Edison Company Purchase of Receivables (4) (27,698,666) 95-061511 1/1/2015 - 12/31/2015 Exelon Generation Company, LLC Commonwealth Edison Company Stock Compensation 18,264 95-061512 1/1/2015 - 12/31/2015 PECO Energy Company Commonwealth Edison Company Cash Balancing 570,655 95-061513 1/1/2015 - 12/31/2015 PECO Energy Company Commonwealth Edison Company Compensation 11,112 95-061514 1/1/2015 - 12/31/2015 PECO Energy Company Commonwealth Edison Company Contracting 16,549 95-061515 1/1/2015 - 12/31/2015 PECO Energy Company Commonwealth Edison Company Information Technology 60,371 95-061516 1/1/2015 - 12/31/2015 PECO Energy Company Commonwealth Edison Company Other (3) 285,955 95-061517 1/1/2015 - 12/31/2015 PECO Energy Company Commonwealth Edison Company Purchase Cards 20,525,151 95-061518 ComEd is Provider of Services19 1/1/2015 - 12/31/2015 Commonwealth Edison Company Baltimore Gas & Electric Co Equipment Maintenance/IT 320,702$ 95-061520 1/1/2015 - 12/31/2015 Commonwealth Edison Company Baltimore Gas & Electric Co Transmission Company Services 40,395 95-0615
211/1/2015 - 12/31/2015
Commonwealth Edison CompanyCommonwealth Edison Company of Indiana, Inc. O&M and Admin Fees
5,670,316 95-0615
Notes:(1) The Supplemental Schedule was filed in accordance with the Illinois Commerce Commission's Order in Docket No. 07-0566.(2) Transactions are recurring in nature.(3) Includes services under $100,000 that have been combined.(4) Represents the purchase of receivables under ComEd's Purchase of Receivables Consolidated Billing Program(Rider PORCB).
Commonwealth Edison CompanySummary of Affiliated Interest Transactions (1)
2015 Actual(In Dollars)
Docket No. 18-____ ComEd Ex. 2.03 Page 265 of 334

Schedule C-13Page 12 of 18
Witness: Tracy
Company Company Dollar Docket #Line Transaction Providing Receiving Nature of Amount of GrantingNo. Period (2) Services Services Transactions Transactions Approval
(A) (B) (C) (D) (E) (F)
1 1/1/2015 - 12/31/2015 Commonwealth Edison Company Exelon Business Services Company Fleet Maintenance & Fuel 89,958$ 95-06152 1/1/2015 - 12/31/2015 Commonwealth Edison Company Exelon Business Services Company Real Estate & Facilities 6,684,235 95-06153 1/1/2015 - 12/31/2015 Commonwealth Edison Company Exelon Corporation Merger/Acquisition 227,078 95-06154 1/1/2015 - 12/31/2015 Commonwealth Edison Company Exelon Corporation Other 8,348 95-06155 1/1/2015 - 12/31/2015 Commonwealth Edison Company Exelon Generation Company, LLC Equipment Maintenance 9,651,547 95-06156 1/1/2015 - 12/31/2015 Commonwealth Edison Company Exelon Generation Company, LLC Fleet Maintenance & Fuel 1,319,290 95-06157 1/1/2015 - 12/31/2015 Commonwealth Edison Company Exelon Generation Company, LLC Other (3) 27,935 95-06158 1/1/2015 - 12/31/2015 Commonwealth Edison Company Exelon Generation Company, LLC Real Estate & Facilities 280,332 95-06159 1/1/2015 - 12/31/2015 Commonwealth Edison Company PECO Energy Company Equipment Maintenance 202,803 95-061510 1/1/2015 - 12/31/2015 Commonwealth Edison Company PECO Energy Company Other (3) 357,932 95-061511 1/1/2015 - 12/31/2015 Commonwealth Edison Company RITELine Illinois, LLC O&M and Admin Fees 108 95-061512 ComEd is Provider of Pass-Through Transactions 13 1/1/2015 - 12/31/2015 Commonwealth Edison Company Baltimore Gas & Electric Company Compensation 326,071$ 95-061514 1/1/2015 - 12/31/2015 Commonwealth Edison Company Baltimore Gas & Electric Company Contracting 139,286 95-061515 1/1/2015 - 12/31/2015 Commonwealth Edison Company Baltimore Gas & Electric Company Materials 702 95-0615
Notes:(1) 1/1/2015 - 12/31/2015
The Supplemental Schedule was filed in accordance with the Illinois Commerce Commission's Order in Docket No. 07-0566.(2) Transactions are recurring in nature.(3) Includes services under $100,000 that have been combined.(4) Represents the purchase of receivables under ComEd's Purchase of Receivables Consolidated Billing Program(Rider PORCB).
(In Dollars)
Commonwealth Edison CompanySummary of Affiliated Interest Transactions (1)
2015 Actual
Docket No. 18-____ ComEd Ex. 2.03 Page 266 of 334

Schedule C-13Page 13 of 18
Witness: Tracy
Company Company Dollar Docket #Line Transaction Providing Receiving Nature of Amount of GrantingNo. Period (2) Services Services Transactions Transactions Approval
(A) (B) (C) (D) (E) (F)
1 ComEd is Provider of Pass-Through Transactions (continued)2 1/1/2015 - 12/31/2015 Commonwealth Edison Company Baltimore Gas & Electric Company Other (3) 680,497$ 95-06153 1/1/2015 - 12/31/2015 Commonwealth Edison Company Baltimore Gas & Electric Company Information Technology 57,743 95-06154 1/1/2015 - 12/31/2015 Commonwealth Edison Company Commonwealth Edison Company of Indiana Other (3) (9,993) 95-06155 1/1/2015 - 12/31/2015 Commonwealth Edison Company Exelon Business Services Company Compensation 204,052 95-06156 1/1/2015 - 12/31/2015 Commonwealth Edison Company Exelon Business Services Company Information Technology 4,478,321 95-06157 1/1/2015 - 12/31/2015 Commonwealth Edison Company Exelon Corporation Compensation 779 95-06158 1/1/2015 - 12/31/2015 Commonwealth Edison Company Exelon Corporation Other (3) (547) 95-06159 1/1/2015 - 12/31/2015 Commonwealth Edison Company Exelon Generation Company, LLC Compensation 7,259 95-061510 1/1/2015 - 12/31/2015 Commonwealth Edison Company Exelon Generation Company, LLC Fleet Maintenance & Fuel 132,762 95-061511 1/1/2015 - 12/31/2015 Commonwealth Edison Company Exelon Generation Company, LLC Other (3) 2,871,800 95-061512 1/1/2015 - 12/31/2015 Commonwealth Edison Company Exelon Generation Company, LLC Contracting 714,367 95-061513 1/1/2015 - 12/31/2015 Commonwealth Edison Company Exelon Generation Company, LLC Single Bill Options (3,111,525) 95-061514 1/1/2015 - 12/31/2015 Commonwealth Edison Company Exelon Generation Company, LLC Stock Compensation 6,040 95-061515 1/1/2015 - 12/31/2015 Commonwealth Edison Company Exelon Generation Company, LLC Transmission Credits 457,710 95-061516 1/1/2015 - 12/31/2015 Commonwealth Edison Company PECO Energy Company Contracting 1,177,856 95-061517 1/1/2015 - 12/31/2015 Commonwealth Edison Company PECO Energy Company Information Technology 17,391 95-061518 1/1/2015 - 12/31/2015 Commonwealth Edison Company PECO Energy Company Memberships 10,398 95-061519 1/1/2015 - 12/31/2015 Commonwealth Edison Company PECO Energy Company Other (3) 21,065 95-061520 1/1/2015 - 12/31/2015 Commonwealth Edison Company PECO Energy Company Stock Compensation 619 95-0615
Notes:(1) 1/1/2015 - 12/31/2015
The Supplemental Schedule was filed in accordance with the Illinois Commerce Commission's Order in Docket No. 07-0566.(2) Transactions are recurring in nature.(3) Includes services under $100,000 that have been combined.
Commonwealth Edison CompanySummary of Affiliated Interest Transactions (1)
2015 Actual(In Dollars)
Docket No. 18-____ ComEd Ex. 2.03 Page 267 of 334

Schedule C-13Page 14 of 18
Witness: Tracy
Company Company Dollar Docket #Line Transaction Providing Receiving Nature of Amount of GrantingNo. Period (2) Services Services Transactions Transactions Approval
(A) (B) (C) (D) (E) (F)
1 Cash Settlements (to)/from Affiliates2 1/1/2015 - 12/31/2015 Baltimore Gas & Electric Company Commonwealth Edison Company Cash Settlements (1,543,558)$ 95-06153 1/1/2015 - 12/31/2015 Commonwealth Edison Company of
Indiana, Inc.Commonwealth Edison Company Cash Settlements (1,239,465) 95-0615
4 1/1/2015 - 12/31/2015 Exelon Business Services Company Commonwealth Edison Company Cash Settlements (342,892,430) 95-06155 1/1/2015 - 12/31/2015 Exelon Corporation Commonwealth Edison Company Cash Settlements (15,715,218) 95-06156 1/1/2015 - 12/31/2015 Exelon Generation Company, LLC Commonwealth Edison Company Cash Settlements 8,689,699 95-06157 1/1/2015 - 12/31/2015 PECO Energy Company Commonwealth Edison Company Cash Settlements (19,558,637) 95-06158 1/1/2015 - 12/31/2015 RITELine Illinois, LLC Commonwealth Edison Company Cash Settlements 108 95-0615
Notes: (1) The transactions reported on this page were not required to be reported on the Supplemental Schedule to ComEd's ILCC Form 21 Annual Report for the year ended December 31, 2015. The source for this schedule was ComEd's intercompany general ledger accounts.
(2) Transactions are recurring in nature.
2015 Actual(In Dollars)
Commonwealth Edison CompanySummary of Affiliated Interest Transactions (1)
Docket No. 18-____ ComEd Ex. 2.03 Page 268 of 334

Schedule C-13Page 15 of 18
Witness: Tracy
Company Company Dollar Docket #Line Transaction Providing Receiving Nature of Amount of GrantingNo. Period (2) Services Services Transactions Transactions Approval
(A) (B) (C) (D) (E) (F)
1 ComEd is Recipient of Services2 1/1/14 - 12/31/14 Baltimore Gas & Electric Company Commonwealth Edison Company Contracting 352,140$ N/A3 1/1/14 - 12/31/14 Commonwealth Edison of Indiana Commonwealth Edison Company Transmission 6,589,611 N/A4 1/1/14 - 12/31/14 Exelon Business Services Company Commonwealth Edison Company Direct Bill (3) 95,590,027 00-02955 1/1/14 - 12/31/14 Exelon Business Services Company Commonwealth Edison Company Indirect Bill (3) 147,916,599 00-02956 1/1/14 - 12/31/14 Exelon Generation Company, LLC Commonwealth Edison Company Calibration of Equipment 278,919 00-02957 ComEd is Recipient of Pass-Through Transactions8 1/1/14 - 12/31/14 Baltimore Gas & Electric Company Commonwealth Edison Company Cash Balancing 1,654,111$ 00-02959 1/1/14 - 12/31/14 Exelon Business Services Company Commonwealth Edison Company Cash Balancing 3,811,962 00-029510 1/1/14 - 12/31/14 Exelon Business Services Company Commonwealth Edison Company Compensation 5,333,473 00-029511 1/1/14 - 12/31/14 Exelon Business Services Company Commonwealth Edison Company Contracting 18,615,451 00-029512 1/1/14 - 12/31/14 Exelon Business Services Company Commonwealth Edison Company Employee Benefits 151,219 00-029513 1/1/14 - 12/31/14 Exelon Business Services Company Commonwealth Edison Company Escheatment Related 701,390 00-029514 1/1/14 - 12/31/14 Exelon Business Services Company Commonwealth Edison Company Facility Lease 10,739,310 00-029515 1/1/14 - 12/31/14 Exelon Business Services Company Commonwealth Edison Company Informational Technology 664,480 00-029516 1/1/14 - 12/31/14 Exelon Business Services Company Commonwealth Edison Company Materials 6,424,292 00-029517 1/1/14 - 12/31/14 Exelon Business Services Company Commonwealth Edison Company Office Supplies 1,925,747 00-029518 1/1/14 - 12/31/14 Exelon Business Services Company Commonwealth Edison Company Other (4) 3,795,345 00-029519 1/1/14 - 12/31/14 Exelon Business Services Company Commonwealth Edison Company Purchase Cards 1,236,440 00-029520 1/1/14 - 12/31/14 Exelon Business Services Company Commonwealth Edison Company Telecommunication 16,382,493 00-029521 1/1/14 - 12/31/14 Exelon Business Services Company Commonwealth Edison Company Worker's Compensation 3,900,920 00-0295
Notes: (1) Columns (A) through (E) agree with the Supplemental Schedule to ComEd's ILCC Form 21 Annual Report for the year ended December 31, 2014The Supplemental Schedule was filed in accordance with the Illinois Commerce Commission's Order in Docket No. 07-0566.
(2) Transactions are recurring in nature.(3) ComEd receives a variety of corporate support services from Exelon Business Services Company including legal, human resources, financial,
information technology and supply management services.(4) Includes services under $100,000 that have been combined.
Commonwealth Edison CompanySummary of Affiliated Interest Transactions (1)
2014 Actual(In Dollars)
Docket No. 18-____ ComEd Ex. 2.03 Page 269 of 334

Schedule C-13Page 16 of 18
Witness: Tracy
Company Company Dollar Docket #Line Transaction Providing Receiving Nature of Amount of GrantingNo. Period (2) Services Services Transactions Transactions Approval
(A) (B) (C) (D) (E) (F)
1 ComEd is Recipient of Pass-Through Transactions (continued)2 1/1/14 - 12/31/14 Exelon Corporation Commonwealth Edison Company Cash Balancing 958,712$ 95-06153 1/1/14 - 12/31/14 Exelon Corporation Commonwealth Edison Company Information Technology 233,149 95-06154 1/1/14 - 12/31/14 Exelon Corporation Commonwealth Edison Company Legal 3,004,842 95-06155 1/1/14 - 12/31/14 Exelon Corporation Commonwealth Edison Company Other (3) 1,939,956 95-06156 1/1/14 - 12/31/14 Exelon Corporation Commonwealth Edison Company Stock Compensation 8,834,012 95-06157 1/1/14 - 12/31/14 Exelon Generation Company, LLC Commonwealth Edison Company Cash Balancing 1,134,834 95-06158 1/1/14 - 12/31/14 Exelon Generation Company, LLC Commonwealth Edison Company Other (3) 1,636,046 95-06159 1/1/14 - 12/31/14 Exelon Generation Company, LLC Commonwealth Edison Company Purchase of Receivables (4) 39,569,460 95-061510 1/1/14 - 12/31/14 PECO Energy Company Commonwealth Edison Company Cash Balancing 329,353 95-061511 1/1/14 - 12/31/14 PECO Energy Company Commonwealth Edison Company Other (3) 361,626 95-061512 1/1/14 - 12/31/14 PECO Energy Company Commonwealth Edison Company Purchase Cards 17,056,902 95-061513 ComEd is Provider of Services
14 1/1/14 - 12/31/14 Commonwealth Edison Company Commonwealth Edison Company of Indiana, Inc.
Construction, Oper. & Maint. of Equip. & Admin Fees
6,061,902$ 95-0615
15 1/1/14 - 12/31/14 Commonwealth Edison Company Exelon Business Services Company Real Estate & Facilities 6,416,452 95-061516 1/1/14 - 12/31/14 Commonwealth Edison Company Exelon Generation Company, LLC Equipment Maintenance 9,862,580 95-061517 1/1/14 - 12/31/14 Commonwealth Edison Company Exelon Generation Company, LLC Fleet Maintenance & Fuel 1,225,769 95-061518 1/1/14 - 12/31/14 Commonwealth Edison Company PECO Energy Company Mutual Assistance 599,428 95-0615
Notes:(1) Columns (A) through (E) agree with the Supplemental Schedule to ComEd's ILCC Form 21 Annual Report for the year ended December 31, 2014
The Supplemental Schedule was filed in accordance with the Illinois Commerce Commission's Order in Docket No. 07-0566.(2) Transactions are recurring in nature.(3) Includes services under $100,000 that have been combined.(4) Represents the purchase of receivables under ComEd's Purchase of Receivables Consolidated Billing Program(Rider PORCB).
Summary of Affiliated Interest Transactions (1)Commonwealth Edison Company
2014 Actual(In Dollars)
Docket No. 18-____ ComEd Ex. 2.03 Page 270 of 334

Schedule C-13Page 17 of 18
Witness: Tracy
Company Company Dollar Docket #Line Transaction Providing Receiving Nature of Amount of GrantingNo. Period (2) Services Services Transactions Transactions Approval
(A) (B) (C) (D) (E) (F)
1 ComEd is Provider of Pass-Through Transactions 2 1/1/14 - 12/31/14 Commonwealth Edison Company Baltimore Gas & Electric Company Materials 633,465$ 95-06153 1/1/14 - 12/31/14 Commonwealth Edison Company Exelon Business Services Company Information Technology 4,123,267 95-06154 1/1/14 - 12/31/14 Commonwealth Edison Company Exelon Corporation Employee Benefits 958,712 95-06155 1/1/14 - 12/31/14 Commonwealth Edison Company Exelon Generation Company, LLC Fleet 237,877 95-06156 1/1/14 - 12/31/14 Commonwealth Edison Company Exelon Generation Company, LLC Single Bill Options 10,795,221 95-06157 1/1/14 - 12/31/14 Commonwealth Edison Company Exelon Generation Company, LLC Transmission Credits 457,710 95-06158 1/1/14 - 12/31/14 Commonwealth Edison Company PECO Energy Company Contracting 446,501 95-06159 1/1/14 - 12/31/14 Commonwealth Edison Company PECO Energy Company Information Technology 219,748 95-061510 1/1/14 - 12/31/14 Commonwealth Edison Company PECO Energy Company Other (3) 250,019 95-0615
Notes:(1) Columns (A) through (E) agree with the Supplemental Schedule to ComEd's ILCC Form 21 Annual Report for the year ended December 31, 2014
The Supplemental Schedule was filed in accordance with the Illinois Commerce Commission's Order in Docket No. 07-0566.(2) Transactions are recurring in nature.(3) Includes services under $100,000 that have been combined.
Commonwealth Edison CompanySummary of Affiliated Interest Transactions (1)
(In Dollars)2014 Actual
Docket No. 18-____ ComEd Ex. 2.03 Page 271 of 334

Schedule C-13Page 18 of 18
Witness: TracyCompany Company Dollar Docket #
Transaction Providing Receiving Nature of Amount of GrantingPeriod (2) Services Services Transactions Transactions Approval
(A) (B) (C) (D) (E) (F)
1 Cash Settlements (to)/from Affiliates2 1/1/14 - 12/31/14 Baltimore Gas & Electric Company Commonwealth Edison Company Cash Settlements (1,497,231)$ 95-06153 1/1/14 - 12/31/14 Commonwealth Edison of Indiana Commonwealth Edison Company Cash Settlements (174,466) 95-06154 1/1/14 - 12/31/14 Exelon Business Services Company Commonwealth Edison Company Cash Settlements (304,035,798) 95-06155 1/1/14 - 12/31/14 Exelon Corporation Commonwealth Edison Company Cash Settlements (19,744,823) 95-06156 1/1/14 - 12/31/14 Exelon Generation Company, LLC Commonwealth Edison Company Cash Settlements 10,139,942 95-06157 1/1/14 - 12/31/14 PECO Energy Company Commonwealth Edison Company Cash Settlements (15,861,662) 95-0615
Notes: (1) The transactions reported on this page were not required to be reported on the Supplemental Schedule to ComEd's ILCC Form 21 Annual Report for the year ended December 31, 2014. The source for this schedule was ComEd's intercompany general ledger accounts.
(2) Transactions are recurring in nature.
Commonwealth Edison CompanySummary of Affiliated Interest Transactions (1)
2014 Actual(In Dollars)
Docket No. 18-____ ComEd Ex. 2.03 Page 272 of 334

Schedule C-14Page 1 of 2
Witness: Tracy
Lease Line ICC ExpenseNo. Description of Leased Property Location Account From To 2017 (1)
(A) (B) (C) (D) (E) (F)
1 Section 285.3155(a) Information on Individual Operating Leases2 Real Estate Leases3 Lincoln Center 1, 2 & 3 Oak Brook Terrace 931000 02/18/01 (2) 1,556
4 Section 285.3155(b) Total Annual Lease Expense - All Operating Leases5 Total Annual Expense - Operating Leases 7,039$
Notes:(1) Rent charged to affiliates is recorded in account 454 ( Rent from Electric Property) for FERC reporting
purposes. See WPC-23, Page 4.(2) ComEd purchased Lincoln Center 2 in December 2016 and Lincoln Center 3 in February 2017.
The lease agreement for Lincoln Center 1 ends in February 2020.
Commonwealth Edison CompanyOperating Leases
(In Thousands)
Lease AgreementPeriod of
2017 Actual
Docket No. 18-____ ComEd Ex. 2.03 Page 273 of 334

Schedule C-14Page 2 of 2
Witness: Tracy
Line ICCNo. Description of Leased Property Location Account From To 2016 2015 2014
(A) (B) (C) (D) (E) (F) (G) (H)
1 Section 285.3155(a) Information on Individual Operating Leases2 Real Estate Leases3 Lincoln Center 1, 2 & 3 Oak Brook Terrace 931000 02/18/01 (2) 7,845$ 7,183$ 7,108$ 4 Libertyville Regional Headquarters Libertyville 931000 07/01/90 01/11/13 -$ -$ 1$ 5 Oak Brook Call Center Oak Brook 931000 06/15/99 05/31/14 -$ -$ 557$
6 Section 285.3155(b) Total Annual Lease Expense - All Operating Leases7 Total Annual Expense - Operating Leases 12,461$ 10,537$ 13,842$
Notes:(1) Rent charged to affiliates is recorded in account 454 ( Rent from Electric Property) for FERC reporting
purposes. See WPC-23, Page 4.(2) ComEd purchased Lincoln Center 2 in December 2016 and Lincoln Center 3 in February 2017.
The lease agreement for Lincoln Center 1 ends in February 2020.
2014 - 2016 Actual
Commonwealth Edison CompanyOperating Leases
Lease AgreementPeriod of
(In Thousands)
Lease Expense (1)
Docket No. 18-____ ComEd Ex. 2.03 Page 274 of 334

Schedule C-15Page 1 of 3
Commonwealth Edison CompanyMajor Maintenance ProjectsYears 2014 Through 2017
(In Thousands)
Witness: Moy
Line PrimaryNo. Project Description (1) Facility Account Project Dates Total Cost (3)
(A) (B) (C) (D) (E)
1 Major ERP - 19 projects Various Distribution Facilities 593 1/6/2014 - 11/24/2014 72,315$
2 Major ERP - 15 projects Various Distribution Facilities 593 2/1/2015 - 12/28/2015 57,709$
3 Major ERP - 9 projects Various Distribution Facilities 593 2/9/2016 - 7/23/2016 39,740$
4 Major ERP - 15 projects (2) Various Distribution Facilities 593 1/10/2017 - 12/31/2017 56,714$
Notes:(1) ERP is Emergency Restoration of Power. An SRO project is issued for each ICC reportable storm. A declared
storm event is defined as one where 10,000 or more customers are interrupted for three or moreconsecutive hours. 2017 also includes costs related to the Emerald Ash Bore program.
(2) See Pages 2 and 3 for costs charged to individual storm projects.(3) In addition to ERP projects, 2017 includes one additional major maintenance project (Emerald Ash Borer program)
Docket No. 18-____ ComEd Ex. 2.03 Page 275 of 334

Schedule C-15Page 2 of 3
Commonwealth Edison CompanyMajor Maintenance Projects 2014 - 2017
(In Thousands)
Witness: Moy
Line Amounts ChargedNo. Year Project ID Date of Event To Acct. 590-593 Location
(A) (B) (C) (D) (E)
1 2014 SRO240 Storm - 1/6/2014 2,953$ Various2 SRO244 Storm - 2/20/2014 1,856 "3 SRO257 Storm - 3/12/2014 5,565 "4 SRO251 Storm - 5/11/2014 507 "5 SRO254 Storm - 5/12/2014 663 "6 SRO248 Storm - 5/20/2014 636 "7 SRO249 Storm - 6/17/2014 1,383 "8 SRO255 Storm - 6/17/2014 894 "9 SRO256 Storm - 6/21/2014 1,149 "
10 SRO250 Storm - 6/30/2014 (1) 31,252 "11 SRO252 Storm - 6/30/2014 521 "12 SRO253 Storm - 7/12/2014 605 "13 SRO267 Storm - 8/21/2014 1,005 "14 SRO260 Storm - 8/23/2014 871 "15 SRO264 Storm - 8/25/2014 5,157 "
SRO262 Storm - 9/10/2014 2,292 "SRO259 Storm - 9/5/2014 (1) 11,842 "SRO266 Storm - 10/31/2014 2,393 "
16 SRO261 Storm - 11/24/2014 771 "17 Total 2014 72,315$
18 2015 SRO258 Storm - 2/1/2015 5,510$ Various19 SRO265 Storm - 4/9/2015 5,057 "20 SRO270 Storm - 6/22/2015 8,490 "21 SRO263 Storm - 6/7/2015 530 "22 SRO268 Storm - 7/13/2015 4,835 "23 SRO271 Storm - 7/18/2015 816 "24 SRO269 Storm - 8/2/2015 6,567 "25 SRO275 Storm - 8/18/2015 900 "26 SRO276 Storm - 9/17/2015 1,115 "27 SRO273 Storm - 9/19/2015 519 "28 SRO277 Storm - 11/11/2015 6,242 "29 SRO274 Storm - 11/18/2015 1,305 "30 SRO279 Storm - 11/21/2015 4,802 "31 SRO284 Storm - 12/23/2015 1,008 "32 SRO283 Storm - 12/28/2015 (1) 10,013 "33 Total 2015 57,709$
Docket No. 18-____ ComEd Ex. 2.03 Page 276 of 334

Schedule C-15Page 3 of 3
Commonwealth Edison CompanyMajor Maintenance Projects 2014 - 2017
(In Thousands)
Witness: Moy
Line Amounts ChargedNo. Year Project ID Date of Event To Acct. 590-593 Location
(A) (B) (C) (D) (E)
1 2016 SRO278 Storm - 2/9/2016 7,701$ Various2 SRO281 Storm - 2/24/2016 4,829 "3 SRO285 Storm - 3/16/2016 4,859 "4 SRO282 Storm - 4/2/2016 906 "5 SRO289 Storm - 6/22/2016 5,334 "6 SRO288 Storm - 7/6/2016 3,405 "7 SRO286 Storm - 7/13/2016 1,037 "8 SRO290 Storm - 7/21/2016 3,326 "9 SRO294 Storm - 7/23/2016 8,343 "
10 Total 2016 39,740$
11 2017 SRO296 Storm - 3/7/2017 1,269$ Various12 SRO298 Storm - 4/29/2017 1,144 "13 SRO299 Storm - 1/10/2017 2,364 "14 SRO300 Storm - 3/8/2017 5,209 "15 SRO301 Storm - 6/14/2017 3,713 "16 SRO302 Storm - 7/12/2017 4,817 "17 SRO303 Storm - 10/15/2017 748 "18 SRO304 Storm - 5/17/2017 5,836 "19 SRO305 Storm - 7/19/2017 4,335 "20 SRO306 Storm - 7/23/2017 4,590 "21 SRO307 Storm - 6/13/2017 735 "22 SRO308 Storm - 7/21/2017 5,767 "23 SRO309 Storm - 6/17/2017 866 "24 SRO310 Storm - 6/28/2017 2,306 "25 SRO311 Storm - 12/4/2017 1,012 "26 TREEDCEAB Emerald Ash Borer Program (2) 12,003 (1) "27 Total 2017 56,714$
Note:(1) Includes both baseline and incremental costs. One-time expenses greater than $10M have been removed from jurisdictional operating expenses and amortized over a five year period, with the unamortized balance included in rate base, as required by Section 16-108.5(c)(4)(F). 2015 Storm SRO283 incremental cost was under $10M and therefore not amortized over 5 years.(2) The Emerald Ash Borer Program primarily occurred from March through December 2017
Docket No. 18-____ ComEd Ex. 2.03 Page 277 of 334

Schedule C-16Page 1 of 5
Witness: Tracy
LineNo. Description Total Jurisdictional Non- Jurisdictional
(A) (B) (C) (D)
1 Uncollectible Accounts Expense (1) 39,102$ -$ (2) 39,102$
2 Outside Collection Agency Expenses (3) 1,069$ 704$ (4) 365$
Notes:(1) As recorded in FERC Account 904, Uncollectible Accounts Expense.(2) Uncollectible expense is recovered in Rider UF. (3) See Page 4.(4) Jurisdictional Outside Collection Agency Expense is calculated as a percentage of the total of Delivery Service
Revenue (A) plus the total of discounted receivables purchased in accordance with the provisions of Rider PORCB (B) to Total Sales to Ultimate Consumers (C) plus the total of discounted receivables purchased during the year in accordance with the provisions of Rider PORCB (B).
Delivery Service Revenues (See WP 15) (A) 2,693,177$
(B) 1,048,016$
(C) 4,627,203$
(B) + (C) (D) 5,675,219$
Total Outside Collection Agency Expenses (Line 2, Column B) (E) 1,069$
(F) 507$
(G) 197$
365$ Outside collection agency fees attributable to Supply Revenue
(E) - (F) - (G)
Outside collection agency fees attributable to Delivery Service Revenue((A)/(D))*(E)
Outside collection agency fees attributable to PORCB Revenue ((B)/(D)*(E)
Sales to Ultimate Consumers (ComEd FERC Form 1, Page 300, Line 10, col. (b)
Commonwealth Edison CompanyUncollectible Expense
2017(In Thousands)
The Amount of the Discounted Receivables Purchased in Accordance with the Provisions of Rider PORCB During the Year
Docket No. 18-____ ComEd Ex. 2.03 Page 278 of 334

Schedule C-16Page 2 of 5
Commonwealth Edison CompanyUncollectible Expense (1)
2017
Witness: Tracy
LineNo. Description 2016 2015 2014
(A) (B) (C) (D)
1 Uncollectible Accounts Expense 44,595$ 38,762$ 45,131$
Note:(1) As charged to FERC Account 904, Uncollectible Accounts Expense.
Docket No. 18-____ ComEd Ex. 2.03 Page 279 of 334

Schedule C-16Page 3 of 5
Commonwealth Edison CompanyAccumulated Provisions For Uncollectible Accounts Receivable
2017
Witness: Tracy
Line Balance at Reserve Balance atNo. Year Beginning of Year Accrual (1) Write-offs Recoveries Adjustments End of Year
(A) (B) (C) (D) (E) (F) (G)
1 2014 (62,221)$ (67,658)$ 86,778$ (29,330)$ (11,414)$ (2) (83,845)$
2 2015 (83,845)$ (41,214)$ 100,384$ (33,545)$ (16,627)$ (2) (74,847)$
3 2016 (74,847)$ (55,074)$ 99,113$ (26,290)$ (13,177)$ (2) (70,275)$
4 2017 (70,275)$ (48,587)$ 81,257$ (25,631)$ (9,703)$ (2) (72,939)$
Notes:(1) Includes a reserve accrual for late payment charges that is booked as a reduction to Account 450, Forfeited Discounts.
the PORCB Regulatory Asset. (2) Adjustment relates to PORCB write-offs net of recoveries (included in columns D & E) that were reclassified to
Docket No. 18-____ ComEd Ex. 2.03 Page 280 of 334

Schedule C-16Page 4 of 5
Commonwealth Edison CompanyUncollectible Expense
2017
Witness: Tracy
LineNo. Description
(A)
1 Method of Determining Uncollectible Accounts Expense
2 Uncollectible accounts expense is comprised of two factors. The first is the actual expense from customer accounts that remain
3 uncollected 90 days after their account has moved to a final status (note that a final status indicates that they are no longer a customer).
4 The second component is the reserve for uncollectible accounts. Each month the reserve is calculated to determine the collectability
5 of the accounts receivable portfolio. This value is compared to the amount reserved in the previous month and the difference used
6 to adjust the actual account expense. This total is then recorded as the total uncollectible accounts expense.
7 Outside Collection Agency Expenses
8 Expenses for outside collection agencies for the year 2017 are $1,068,581. The jurisdictional portion of the 2017 total Company
9 amount is estimated to be $704,000 Total Company expenses for outside collection agencies were: $1,296,882; $1,583,007; and $1,964,075
10 for the years 2016, 2015, and 2014, respectively.
Docket No. 18-____ ComEd Ex. 2.03 Page 281 of 334

Schedule C-16Page 5 of 5
Commonwealth Edison CompanyUncollectible Expense
2017Witness: Tracy
LineNo. Description
(A)
1 Summary of Collection Agency Contracts:2 ComEd utilizes two forms of collection agencies in its collection process: final bill agencies and charge-off agencies. Final bill agencies receive accounts that3 have not paid their final bills from ComEd at Day 35 in the collection process stream. These agencies are given 120 days to work the accounts through their4 processes to attempt collection. If the agency is successful in retrieving money owed, they are paid a commission. If unsuccessful, the account is retrieved 5 by ComEd and charged off (written off). Charge-off agencies receive the charged-off accounts the day after they are written off. Currently these agencies work 6 the written-off accounts until ComEd retrieves them for some other type of treatment such as debt sale. These agencies differ from final bill agencies in the 7 time frame in which they are allowed to work the accounts and their overall commission incentives. In an effort to increase recoveries, both tiers have the 8 ability to report delinquent customers to credit bureaus, after following the FDPPA (Federal Debt Protection Practices Act) guidelines.
9 Collection Agency Results:10 In 2017, 155,014 accounts with a total value of $64.6 million was sent to final bill agencies. Approximately 6.5%, or $4.2 million was collected in 2017. Also,11 121,156 accounts with a total value of $61.3 million was sent to charge-off agencies and approximately $2.4 million was collected from them in 2017. This12 includes collections from accounts turned over in prior periods.13 In 2016, 161,105 accounts with a total value of $73.4 million was sent to final bill agencies. Approximately 5.71%, or $4.2 million was collected in 2016. Also,14 118,423 accounts with a total value of $71.6 million was sent to charge-off agencies and approximately $2.7 million was collected from them in 2016. This
15 includes collections from accounts turned over in prior periods. In 2015, 167,542 accounts with a total value of $89.3 million was sent to final bill agencies. 16 Approximately 4.61%, or $4.1 million was collected in 2015. Also, 130,503 accounts with a total value of $76.4 million was sent to charge-off agencies and 17 approximately $3.4 million was collected from them in 2015. This includes collections from accounts turned over in prior periods. In 2014, 130,653 accounts 18 with a total value of $64.0 million was sent to final bill agencies. Approximately 6.01%, or $3.8 million was collected in 2014. Also, 105,541 accounts with a total 19 value of $60.1 million was sent to charge-off agencies and approximately $2.4 million was collected from them in 2014. This includes collections from accounts 20 turned over in prior periods.
Docket No. 18-____ ComEd Ex. 2.03 Page 282 of 334

Schedule C-17Page 1 of 2
Witness: Tracy
LineNo. Name of Carrier (1) Type of Policy (1) Amount of Coverage Policy Coverage Period
Policy Term Premium (2)
Annual Premium (2) Deductible Claims
(A) (B) (C) (D) (E) (F) (G) (H)
2017 - Insurance on Operations1 AEGIS Primary Directors & Officers $35 Mil. layer over Col G 10/20/2017-10/20/2018 1,811$ 1,811$ $10 M None2 Various (3) Excess Directors & Officers $365 Mil. Excess layer over line 1 10/20/2017-10/20/2018 3,607 3,607 None None3 AEGIS Primary Fiduciary $15 Mil. layer over Col G 10/20/2017-10/20/2018 370 370 $5 M None4 Various (4) Excess Fiduciary $100 Mil. layer over line 3 10/20/2017-10/20/2018 435 435 None None5 AEGIS Primary Excess Liability $35 Mil. layer over Col G 05/15/2017-05/15/2018 8,314 8,314 $10 M None6 Various (5) Excess Excess Liability $270 Mil.excess layer over line 5 05/15/2017-05/15/2018 4,456 4,456 None None7 AEGIS Excess Workers' Compensation $35 Mil. layer over Col G 05/15/2017-05/15/2018 2,215 1,983 $4 M None8 Various (6) Property $800 Mil. Quota Share Program 07/01/2017-07/01/2018 3,313 3,313 $10 M None9 FM Global Excess Property $700 Mil.layer excess over line 9 07/01/2017-07/01/2018 512 512 None None
10 AIG Owned/Non-owned Aircraft $300 Mil. Liability/$65 Mil. PD 12/28/2017-12/28/2018 176 176 None None11 AIG Owned Unmanned Aircraft Aviation ('d $100 Liability/$1,200 Property
Damage 12/28/2017-12/28/2018 10 10 0.6 Property
Damage only None
12 AIG Commercial Crime $15 Mil. layer over Col G 06/01/2017-06/01/2018 80 80 $250K None13 Various (7) Excess Crime $50 Mil. layer over line 12 06/01/2017-06/01/2018 66 66 None None14 U.S. Specialty Company (HCC) Other-Special $25 Mil. 02/20/2016-02/20/2019 9 9 None None15 AEGIS Cyber-Risk- Primary $50 Mil. 11/01/2017-11 /01/2018 1,089 1,089 $10 M None16 EIM (8) Excess Cyber Risk coverage $50 Mil layer over line 15 11/01/2017-11 /01/2018 324 665 None None
17 Self insurance18 ComEd is a qualified self - insurer in the State of Illinois for up to: 19 $3,000,000 per occurrence for workers' compensation liability. When the limit is exceeded, the AEGIS excess workers' compensation coverage is utilized. 20 $10,000,000 per occurrence for bodily injury, property damage and automobile liability. When the limit is exceeded, the AEGIS excess liability coverage is utilized.
Notes:(1) All plans listed are Exelon plans in which Commonwealth Edison participates(2) Premium is for all Exelon Subsidiaries including Commonwealth Edison. Exelon Business Services Company allocates insurance expense to Commonwealth Edison.(3) Excess Directors & Officers carriers are AEGIS, EIM, Hartford, AIG, HCC, AXIS, Zurich, Ironshore, Everest, RSUI, Travelers, Chubb Westchester, Travelers, Nationwide,
AWAC, XL AWAC, Chubb BDA & Endurance(4) Excess Fiduciary carriers are AEGIS, AIG, HCC, EIM, AXIS and AWAC BDA(5) Excess Excess Liability carriers are AEGIS, EIM, ARGO RE, XL Insurance, SCOR-UK, CHUBB Bermuda, Ironsure, Hamilton RE and Lloyds Syndicate(6) Property carriers are FM Global, EIM, AEGIS, AIG , XL, SCOR & Zurich(7) Excess Crime carriers are Zurich, Great American and Berkley Regional
Commonwealth Edison CompanyInsurance Expense
2017 Actual(In Thousands)
Docket No. 18-____ ComEd Ex. 2.03 Page 283 of 334

Schedule C-17Page 2 of 2
Witness: Tracy
Line No. Name of Carrier (1) Type of Policy (1) Amount of Coverage Policy Coverage Period
Annual Premium (2) (3) Deductible Notes
(A) (B) (C) (D) (E) (F) (G)
2017 - Group Insurance
1 BlueCare Dental HMODental insurance HMO for employees (Local 15 only) Annual maximum of $1,750 per
person excluding orthodontia 01/01/2017-12/31/2017 60 None (4)
2 Aetna DMODental insurance HMO for employees and retirees (excluding Local 15)
100%, 75%, or 50% coverage with no annual or lifetime maximums 01/01/2017-12/31/2017 1,017 None (4)
3 The HartfordDisability insurance for active employees (excluding Local 15) 50% - 70% of earnings 01/01/2017-12/31/2017 15,421 None (4)
4 The Hartford
Life insurance for active employees and eligible retirees, and dependent life insurance and accidental death benefits to active employees
Life insurance: 1x - 8x pay for actives, other benefits vary 01/01/2017-12/31/2017 38,623 None (4)
5 John Hancock Long-term care insurance for employees and qualified beneficiaries (policies in place prior to 2013)
Daily benefit of $100, $200, or $300 for 3 years or 5 years (5) 01/01/2017-12/31/2017 789 None (6)
6 ARAG Group Legal insurance for employees (5) 01/01/2017-12/31/2017 856 None (7)
7 GenworthLong-term care insurance for employees and qualified beneficiaries (policies purchased as of 1/1/2013)
Up to: $3,000, $4,500, $6,000, $7,500 or $9,000 a month (5) 01/01/2017-12/31/2017 41 None (8)
8 Self insurance9 Aetna - A dental PPO plan for active employees and retirees. 10 Disability Benefit Plan (MBA) - A disability plan for certain collectively bargained employees. 11 Vision Service Plan (VSP) and HearUSA - Provides vision and hearing benefits to active employees and retirees. 12 Healthy Roads - Provides disease management services for participants with chronic diseases.13 Healthy Roads also provides health coaching, HRA and onsite biometric screenings for eligible populations at Exelon14 Blue Cross / Blue Shield of Illinois - A health plan for active employees and retirees. Also, staffs the 24/7 nurseline.15 Optum Rx - A prescription drug benefit plan for active employees and retirees. 1617 WageWorks - Health FSA, dependent care FSA, and commuter spending accounts for active employees. 18 ComEd self - insures a short-term disability / salary continuation program for non-Local 15 employees. For long-term disabilities (over 19 25 weeks), the Hartford disability insurance coverage is utilized. 20 Aetna HMO - a self-insured national HMO offered to active employees and retirees who reside in HMO network area.21 National HMO replaces regional fully insured HMOs.
Notes:(1) All plans listed are Exelon plans in which Commonwealth Edison participates. Group insurance may include Exelon Corporation, ComEd, GENCO
BSC and legacy Constellation employees and retirees.(2) Includes company and employee portions of the premiums. In general, employees pay 20% to 30% of the cost of the various plans.(3) Premium is for all Exelon Subsidiaries including Commonwealth Edison. Exelon Business Services Company allocates insurance expense to Commonwealth Edison.(4) Premiums for these policies are "pooled rates" based upon the demographic characteristics of the group being insured. ComEd does not receive ComEd specific
claim statistics since these policies are fully insured and claim experience is not segregated by operating company. (5) Premiums are paid for by the participants - Neither Commonwealth Edison nor Exelon contributes.(6) Premiums paid to John Hancock in plan year 2017 by the participants - Neither Commonwealth Edison nor Exelon contributes..(7) Premiums paid to ARAG during plan year 2017 by the participants - Neither Commonwealth Edison nor Exelon contributes.(8) Premiums paid to Genworth during plan year 2017 by the participants - Neither Commonwealth Edison nor Exelon contributes.
Commonwealth Edison CompanyInsurance Expense
2017 Actual(In Thousands)
United Behavioral Health (UBH) formerly OptumHealth - Provides the EAP for all employees.
Docket No. 18-____ ComEd Ex. 2.03 Page 284 of 334

Schedule C-18
Page 1 of 5
Witness: TracyLine Total JurisdictionalNo. Description Company Allocator Jurisdictional (1)
(A) (B) (C) (D)
1 Taxes Other Than Income Taxes - Operating Expense - Account 408.12 Infrastructure Maintenance Fee (2) 88,065$ 0% -$ 3 Rider RCA - Low Income Assistance (3) 43,133 0% - 4 Rider RCA - Renewable Energy (3) 4,491 0% - 5 Property Taxes (4) 26,967 61.11% 16,480 6 Illinois Electricity Distribution Tax 104,419 100% 104,419 7 Public Utilities Fund (5) - 100% - 8 Payroll Taxes (6) 25,446 85.94% 21,868 9 State Use Tax on Purchases (7) 767 75.67% 580 10 Chicago Sales and Use Taxes (7) (141) 75.67% (107) 11 State Franchise Tax (7) 2,630 75.67% 1,991 12 Heavy Vehicle Use Tax (7) 21 75.67% 16 13 Chicago Transaction Tax (7) (943) 75.67% (714) 14 Municipal Utility Tax (7) 63 75.67% 48
15 Total - Account 408.1 294,918$ 144,581$
16 Payroll Taxes Adjusted in Other Schedules (8) (550)
17 Total Jurisdictional Taxes Other than Income 144,031$
18 Taxes Other Than Income Taxes - Pass Through - Account 24119 Municipal Utility Tax (9) 256,528$ 20 Electricity Excise Tax (10) 249,578
21 Total - Account 241 506,106$
Notes:(1) See WPC-18, Page 1.(2) Kilowatt hour based tax is collected under the provisions of Rider FCA (Franchise Cost Additions).
Tax amounts are to recover franchise costs imposed upon ComEd by municipalities.(3) Flat charge per customer tax collected under Rider RCA. (4) Property taxes are primarily allocated to the appropriate business function based on estimated functional use of the properties.(5) The 2017 Public Utility Fund tax of $1.4 million was recorded on ComEd's books in 2018 and will be recovered
in the Company's 2019 formula rate update.(6) Payroll taxes, less amounts capitalized, are allocated based on Wages and Salaries allocator. (7) Allocated based on Net Plant allocator.(8) From Taxes Other than Income lines on WPC-1b for $108, C-2.4 for $360 and C-2.6 for $82. (9) Kilowatt hour based tax collected under the provisions of Rider TAX (Municipal and State Tax Additions).
This pass-through tax is recorded as a balance sheet item only in account 241 - Tax collections Payable.(10) Kilowatt hour based tax is imposed on electricity used by customers for consumption and not for resale.
This pass-through tax is recorded as a balance sheet item only in account 241 - Tax collections Payable.
Commonwealth Edison CompanyTaxes Other Than Income Taxes
2017 Actual(In Thousands)
Docket No. 18-____ ComEd Ex. 2.03 Page 285 of 334

Schedule C-18
Page 2 of 5
Witness: Tracy
Line No. Description Type of Tax
Total Company (1)
Operating Expense (2)
Clearing Accounts
(3)Construction
(3) Other (3)(A) (B) (C) (D) (E) (F) (G)
1 Taxes Other Than Income Taxes - Account 236
2 Infrastructure Maintenance Fee (4) kWh based 88,087$ 88,065$ -$ -$ 22$
3 Rider RCA - Low Income Assistance (5)Charge per customer 39,784 43,133 - - (3,349)
4 Rider RCA - Renewable Energy (5)Charge per customer 4,491 4,491 - - -
5 Illinois Electric Distribution Tax (6) Miscellaneous 104,419 104,419 - - -
6 Public Utility Fund (7) Miscellaneous - - - - -
7 Property Taxes Real Estate 27,362 26,967 - - 395
8 Federal Unemployment Insurance Tax (FUTA) Payroll 303 217 - 86 -
9 Federal Insurance Contributions Tax (FICA) Payroll 53,355 24,777 - 28,578 -
10 State Unemployment Insurance Tax (SUTA) Payroll 961 452 - 509 -
11 Chicago Employers' Expense Tax Payroll - - - - -
12 Federal Heavy Vehicle Use Tax Use Tax 21 21 - - -
13 State Use Tax on Purchases Use Tax 11,829 767 - - 11,062
14 Chicago Sales and Use Taxes Use Tax 228 (141) - - 369
15 Chicago Transaction Tax Miscellaneous (1,693) (943) - - (750)
16 State Franchise Tax Miscellaneous 2,630 2,630 - - -
17 Vehicle Licenses Miscellaneous 2,185 - - - 2,185
18 Municipal Utility Tax Miscellaneous 63 63 - - -
19 Total - Account 236 334,025$ 294,918$ -$ 29,173$ 9,934$
20 Taxes Other Than Income Taxes - Account 241
21 Municipal Utility Tax (8) kWh based 256,528$
22 Electricity Excise Tax (9) kWh based 249,578
23 Total - Account 241 506,106$
Notes:(1) Totals for account 236 were taken from 2017 FERC Form 1, Page 262, Column "d' (Taxes Charged During Year),
less income taxes. Totals for account 241 were taken from ComEd's general ledger.(2) Totals taken from 2017 FERC Form 1, Page 263, Column "i" (Electric) - Charged to account 408.1.(3) Totals taken from 2017 FERC Form 1, Page 263, Column "l" (Other)(4) Kilowatt hour based tax is collected under the provisions of Rider FCA (Franchise Cost Additions). Tax amounts
are to recover franchise costs imposed upon ComEd by municipalities.(5) Flat charge per customer tax collected under Rider RCA (Renewable Energy Resources and Coal Technology
Development Assistance Charge and Energy Assistance Charge for the Supplemental Low-Income Energy Assistance Fund).
(6) Tax is imposed upon utilities distributing electricity for consumption and not resale. The basis of the calculation of the tax is MWH billed to Ultimate Consumers.
(7) See Page 1, note 5(8) Kilowatt hour based tax collected under the provisions of Rider TAX (Municipal and State Tax Additions). This
pass-through tax is recorded as a balance sheet item only in account 241 - Tax collections Payable.(9) Kilowatt hour based tax is imposed on electricity used by customers for consumption and not for resale. This
Commonwealth Edison CompanyTaxes Other Than Income Taxes
2017(In Thousands)
Docket No. 18-____ ComEd Ex. 2.03 Page 286 of 334

Schedule C-18
Page 3 of 5
Witness: Tracy
Line No. Description Type of Tax
Total Company (1)
Operating Expense (2)
Clearing Accounts
(3)Construction
(3) Other (3)(A) (B) (C) (D) (E) (F) (G)
1 Taxes Other Than Income Taxes - Account 236
2 Infrastructure Maintenance Fee (4) kWh based 90,812$ 90,812$ -$ -$ -$
3 Rider RCA - Low Income Assistance (5)Charge per customer 41,515 42,614 - - (1,099)
4 Rider RCA - Renewable Energy (5)Charge per customer 4,440 4,440 - - -
5 Illinois Electric Distribution Tax (6) Miscellaneous 103,639 103,639 - - -
6 Public Utility Fund Miscellaneous (7,645) (7,645) - - -
7 Property Taxes Real Estate 27,165 26,080 - - 1,085
8 Federal Unemployment Insurance Tax (FUTA) Payroll 314 148 - 166 -
9 Federal Insurance Contributions Tax (FICA) Payroll 59,492 27,115 - 32,377 -
10 State Unemployment Insurance Tax (SUTA) Payroll 1,002 468 - 534 -
11 Chicago Employers' Expense Tax Payroll - - - - -
12 Federal Heavy Vehicle Use Tax Use Tax 21 21 - - -
13 State Use Tax on Purchases Use Tax 13,328 144 - - 13,184
14 Chicago Sales and Use Taxes Use Tax 794 305 - - 489
15 Chicago Transaction Tax Miscellaneous 3,533 1,843 - - 1,690
16 State Franchise Tax Miscellaneous 2,367 2,367 - - -
17 Vehicle Licenses Miscellaneous 2,233 - - - 2,233
18 - - - - -
19 Total - Account 236 343,010$ 292,351$ -$ 33,077$ 17,582$
20 Taxes Other Than Income Taxes - Account 241
21 Municipal Utility Tax (7) kWh based 265,651$
22 Electricity Excise Tax (8) kWh based 257,235
23 Total - Account 241 522,886$
Notes:(1) Totals for account 236 were taken from 2016 FERC Form 1, Page 262, Column "d' (Taxes Charged During Year),
less income taxes. Totals for account 241 were taken from ComEd's general ledger.(2) Totals taken from 2016 FERC Form 1, Page 263, Column "i" (Electric) - Charged to account 408.1.(3) Totals taken from 2016 FERC Form 1, Page 263, Column "l" (Other)(4) Kilowatt hour based tax is collected under the provisions of Rider FCA (Franchise Cost Additions). Tax amounts
are to recover franchise costs imposed upon ComEd by municipalities.(5) Flat charge per customer tax collected under Rider RCA (Renewable Energy Resources and Coal Technology
Development Assistance Charge and Energy Assistance Charge for the Supplemental Low-Income Energy Assistance Fund).
(6) Tax is imposed upon utilities distributing electricity for consumption and not resale. The basis of the calculation of the tax is MWH billed to Ultimate Consumers.
(7) Kilowatt hour based tax collected under the provisions of Rider TAX (Municipal and State Tax Additions). This pass-through tax is recorded as a balance sheet item only in account 241 - Tax collections Payable.
(8) Kilowatt hour based tax is imposed on electricity used by customers for consumption and not for resale. This pass-through tax is recorded as a balance sheet item only in account 241 - Tax collections Payable.
Commonwealth Edison CompanyTaxes Other Than Income Taxes
2016(In Thousands)
Docket No. 18-____ ComEd Ex. 2.03 Page 287 of 334

Schedule C-18
Page 4 of 5
Witness: Tracy
Line No. Description Type of Tax
Total Company (1)
Operating Expense (2)
Clearing Accounts
(3)Construction
(3) Other (3)(A) (B) (C) (D) (E) (F) (G)
1 Taxes Other Than Income Taxes - Account 236
2 Infrastructure Maintenance Fee (4) kWh based 88,141$ 88,141$ -$ -$ -$
3 Rider RCA - Low Income Assistance (5)Charge per customer 40,470 42,329 - - (1,859)
4 Rider RCA - Renewable Energy (5)Charge per customer 4,407 4,407 - - -
5 Illinois Electric Distribution Tax -2015 (6) Miscellaneous 100,911 100,911 - - -
6 Public Utility Fund Miscellaneous 3,819 3,819 - - -
7 Property Taxes Real Estate 27,042 26,260 - - 781
8 Federal Unemployment Insurance Tax (FUTA) Payroll 321 233 - 89 -
9 Federal Insurance Contributions Tax (FICA) Payroll 54,676 26,606 - 28,071 -
10 State Unemployment Insurance Tax (SUTA) Payroll 1,204 485 - 718 -
11 Chicago Employers' Expense Tax Payroll - - - - -
12 Federal Heavy Vehicle Use Tax Use Tax 24 24 - - -
13 State Use Tax on Purchases Use Tax 13,242 144 - - 13,098
14 Chicago Sales and Use Taxes Use Tax 506 111 - - 395
15 Chicago Transaction Tax Miscellaneous 299 202 - - 97
16 State Franchise Tax Miscellaneous 2,246 2,246 - - -
17 Cook County Use Tax Miscellaneous (457) (457) - - -
18 Vehicle Licenses Miscellaneous 2,094 - - - 2,094
19 Municipal Taxes Miscellaneous - - - - -
20 Total - Account 236 338,944$ 295,460$ -$ 28,877$ 14,607$
21 Taxes Other Than Income Taxes - Account 241
22 Municipal Utility Tax (7) kWh based 254,357$
23 Electricity Excise Tax (8) kWh based 252,710
24 Total - Account 241 507,067$
Notes:(1) Totals for account 236 were taken from 2015 FERC Form 1, Page 262, Column "d' (Taxes Charged During Year),
less income taxes. Totals for account 241 were taken from ComEd's general ledger.(2) Totals taken from 2015 FERC Form 1, Page 263, Column "i" (Electric) - Charged to account 408.1.(3) Totals taken from 2015 FERC Form 1, Page 263, Column "l" (Other)(4) Kilowatt hour based tax is collected under the provisions of Rider FCA (Franchise Cost Additions). Tax amounts
are to recover franchise costs imposed upon ComEd by municipalities.(5) Flat charge per customer tax collected under Rider RCA (Renewable Energy Resources and Coal Technology
Development Assistance Charge and Energy Assistance Charge for the Supplemental Low-Income Energy Assistance Fund).
(6) Tax is imposed upon utilities distributing electricity for consumption and not resale. The basis of the calculation of the tax is MWH billed to Ultimate Consumers.
(7) Kilowatt hour based tax collected under the provisions of Rider TAX (Municipal and State Tax Additions). This pass-through tax is recorded as a balance sheet item only in account 241 - Tax collections Payable.
(8) Kilowatt hour based tax is imposed on electricity used by customers for consumption and not for resale. This pass-through tax is recorded as a balance sheet item only in account 241 - Tax collections Payable.
Commonwealth Edison CompanyTaxes Other Than Income Taxes
2015(In Thousands)
Docket No. 18-____ ComEd Ex. 2.03 Page 288 of 334

Schedule C-18
Page 5 of 5
Witness: TracyLine No. Description Type of Tax
Total Company (1)
Operating Expense (2)
Clearing Accounts
Construction (3) Other (3)
(A) (B) (C) (D) (E) (F) (G)
1 Taxes Other Than Income Taxes - Account 236
2 Infrastructure Maintenance Fee (4) kWh based 89,716$ 89,716$ -$ -$ -$
3 Rider RCA - Low Income Assistance (5)Charge per customer 38,386 41,762 - - (3,376)
4 Rider RCA - Renewable Energy (5)Charge per customer 4,356 4,356 - - -
5 Illinois Electric Distribution Tax (6) Miscellaneous 101,883 101,883 - - -
6 Public Utility Fund Miscellaneous 3,836 3,836 - - -
7 Property Taxes Real Estate 24,176 23,959 - - 217
8 Federal Unemployment Insurance Tax (FUTA) Payroll 309 233 - 76 -
9 Federal Insurance Contributions Tax (FICA) Payroll 51,854 26,627 - 25,227 -
10 State Unemployment Insurance Tax (SUTA) Payroll 1,349 486 - 863 -
11 Chicago Employers' Expense Tax Payroll - - - - -
12 Federal Heavy Vehicle Use Tax Use Tax 19 19 - - -
13 State Use Tax on Purchases Use Tax 8,313 (3,472) - - 11,785
14 Chicago Sales and Use Taxes Use Tax 637 72 - - 565
15 Chicago Transaction Tax Miscellaneous 160 - - - 160
16 State Franchise Tax Miscellaneous 2,217 2,217 - - -
17 Vehicle Licenses Miscellaneous 2,061 - - - 2,061
18 Municipal Taxes Miscellaneous - - - - -
19 Total - Account 236 329,272$ 291,694$ -$ 26,166$ 11,412$
20 Taxes Other Than Income Taxes - Account 241
21 Municipal Utility Tax (7) kWh based 257,220$
22 Electricity Excise Tax (8) kWh based 257,883
23 Total - Account 241 515,103$
Notes:(1) Totals for account 236 were taken from 2014 FERC Form 1, Page 262, Column "d' (Taxes Charged During Year),
less income taxes. Totals for account 241 were taken from ComEd's general ledger.(2) Totals taken from 2014 FERC Form 1, Page 263, Column "i" (Electric) - Charged to account 408.1.(3) Totals taken from 2014 FERC Form 1, Page 263, Column "l" (Other)(4) Kilowatt hour based tax is collected under the provisions of Rider FCA (Franchise Cost Additions). Tax amounts
are to recover franchise costs imposed upon ComEd by municipalities.(5) Flat charge per customer tax collected under Rider RCA (Renewable Energy Resources and Coal Technology
Development Assistance Charge and Energy Assistance Charge for the Supplemental Low-Income Energy Assistance Fund).
(6) Tax is imposed upon utilities distributing electricity for consumption and not resale. The basis of the calculation of the tax is MWH billed to Ultimate Consumers.
(7) Kilowatt hour based tax collected under the provisions of Rider TAX (Municipal and State Tax Additions). This pass-through tax is recorded as a balance sheet item only in account 241 - Tax collections Payable.
(8) Kilowatt hour based tax is imposed on electricity used by customers for consumption and not for resale. This pass-through tax is recorded as a balance sheet item only in account 241 - Tax collections Payable.
Commonwealth Edison Company
Taxes Other Than Income Taxes
(In Thousands)2014
Docket No. 18-____ ComEd Ex. 2.03 Page 289 of 334

Schedule C-19Page 1 of 2
Witness: Tracy
LineNo. Description Total Company Jurisdictional (1)
(A) (B) (C)
1 Real Estate Taxes - Account 408.1 26,967$ 16,480$
Note:(1) Real estate taxes are primarily allocated to the appropriate business function based
on estimated functional use of the properties.
2017 Actual
Commonwealth Edison CompanyProperty Taxes
(In Thousands)
Docket No. 18-____ ComEd Ex. 2.03 Page 290 of 334

Schedule C-19Page 2 of 2
Commonwealth Edison CompanyProperty Taxes
2014 - 2016(In Thousands)
Witness: Tracy
Line Actual Actual ActualNo. Description 2016 2015 2014
(A) (B) (B) (B)
1 Real Estate Taxes - Account 408.1 26,080$ 26,260$ 23,959$
Docket No. 18-____ ComEd Ex. 2.03 Page 291 of 334

Schedule C-20Page 1 of 5
Witness: Tracy
AmountAmount Charged to Fees or
Line Taxing Effective Total Tax Passed to Operating ICC Foregone Explanation of fees orNo. Description Authority Rate Basis Assessed Customers Expense Account Discounts Foregone Discounts
(A) (B) (C) (D) (E) (F) (G) (H) (I) (J)
1 Local & Municipal Taxes2 Chicago Sales and Use Taxes Chicago 1.0% (1) (141) - (141) 408.1 None Not applicable3 Chicago Sales and Use Taxes Chicago 1.0% (1) 369 - 369 Various None Not applicable4 Chicago Transaction Tax Chicago 9.0% (2) (943) - (943) 408.1 None Not applicable5 Chicago Transaction Tax Chicago 9.0% (2) (750) - (750) Various None Not applicable6 Vehicle Licenses Various (3) (3) 2,185 - 2,185 Various None Not applicable7 Municipal Utility Tax Various (5) 63 - 63 408.1 None Not applicable
Franchise Taxes8 State Franchise Tax Illinois 0.1% (4) 2,630 - 2,630 408.1 None Not applicable
9 Total 3,413 - 3,413
Notes:(1) Self-imposed tax on the purchase price of tangible personal property for use in Chicago from a seller located outside Chicago.(2) Tax assessed on the value of leased personal property used in the City of Chicago. The tax is paid annually based on the lease / rental
price of the applicable personal property.(3) Fee varies by taxing authority. The fee is generally determined based on the value of the vehicle and / or the gross weight of the vehicle.
Fees are first charged to Clearing Account 184 and then to various accounts. (4) This tax is assessed on corporations doing business in the State of Illinois. The tax is filed annually, due each August 31. The tax is assessed on the
Company's capital. The maximum amount of the tax is $2 million per year plus 0.15% of the increase in the Company's capital during the year.(5) Tax imposed by a municipality and collections go through reconcilliation of recovery. Over/under recovery of collections.
Commonwealth Edison CompanyTaxes Other Than Income Taxes
(In Thousands)
Local Taxes, Municipal Taxes, and Franchise Taxes2017 Actual
Docket No. 18-____ ComEd Ex. 2.03 Page 292 of 334

Schedule C-20Page 2 of 5
Witness: Tracy
Line Sched. TotalNo. Description Ref Type of Tax Acct Company
(A) (B) (C) (D) (E)1 Federal and state taxes other than income: 2 Illinois Electric Distribution Tax (1), (2) C-18 Miscellaneous 408.1 104,419 3 Illinois Electric Distribution Tax C-18 Miscellaneous Various - 4 Federal Unemployment Insurance Tax (FUTA) C-18 Payroll 408.1 217 5 FUTA Tax Capitalized C-18 Payroll 107&108 86 6 Federal Insurance Contributions Tax (FICA) C-18 Payroll 408.1 24,777 7 FICA Tax Capitalized C-18 Payroll 107&108 28,578 8 State Unemployment Insurance Tax (SUTA) C-18 Payroll 408.1 452 9 SUTA Tax Capitalized C-18 Payroll 107&108 509
10 Federal Heavy Vehicle Use Tax C-18 Use Tax 408.1 21 11 State Use Tax on Purchases C-18 Use Tax 408.1 767 12 State Use Tax on Purchases C-18 Use Tax Various 11,062 13 Public Utility Fund Base Maintenance Contribution C-18 Miscellaneous 408.1 -
14 Subtotal 170,888$ 15 Total Property Taxes C-18 27,362 16 Total Local Taxes, Municipal Taxes, and Franchise Taxes Page 1 3,413 17 Total Add - On Taxes C-18 638,468
18 Subtotal 840,131$ 19 State of Illinois Electricity Excise Tax \ Muni Utility Tax C-18 (506,106)
20 Taxes Other Than Income - Total Company (3) 334,025$
21 Taxes not charged to Operating Expense (4) (39,107)
22 Taxes Other Than Income - Charged to Operating Expense (5) 294,918$
23 Reductions to arrive at jurisdictional amounts (6) (150,888)
24 Total Taxes Other Than Income - Jurisdictional C-1 144,030$
Notes:(1) The basis of the calculation of the tax is MWH.(2) Assessment by the State of Illinois on Illinois regulated utilities. (3) Agrees with Schedule C-18, Page 2, Line 19, Column C. (4) Schedule C-18, Page 2, Line 19, Columns F plus G.(5) Agrees with Schedule C-18, Page 2, Line 19, Column D.(6) Jurisdictional adjustments as calculated on Schedule C-18, lines 2 through 13. In addition other misc
adjustments reflected in other schedules on C-18, line 15.
(In Thousands)
Commonwealth Edison CompanyReconciliation of Taxes Other Than Income Taxes to Schedule C-1
2017 Actual
Docket No. 18-____ ComEd Ex. 2.03 Page 293 of 334

Schedule C-20Page 3 of 5
Witness: Tracy
AmountAmount Charged to Fees or
Line Taxing Effective Total Tax Passed to Operating ICC Foregone Explanation of fees orNo. Description Authority Rate Basis Assessed Customers Expense Account Discounts Foregone Discounts
(A) (B) (C) (D) (E) (F) (G) (H) (I) (J)
1 Local & Municipal Taxes2 Chicago Sales and Use Taxes Chicago 1.0% (1) 305 - 305 408.1 None Not applicable3 Chicago Sales and Use Taxes Chicago 1.0% (1) 489 - 489 Various None Not applicable4 Chicago Transaction Tax Chicago 9.0% (2) 1,843 - 1,843 408.1 None Not applicable5 Chicago Transaction Tax Chicago 9.0% (2) 1,690 - 1,690 Various None Not applicable6 Vehicle Licenses Various (3) (3) 2,233 - 2,233 Various None Not applicable
Franchise Taxes7 State Franchise Tax Illinois 0.1% (4) 2,367 - 2,367 408.1 None Not applicable
8 Total 8,927 - 8,927
Notes:(1) Self-imposed tax on the purchase price of tangible personal property for use in Chicago from a seller located outside Chicago.(2) Tax assessed on the value of leased personal property used in the City of Chicago. The tax is paid annually based on the lease / rental
price of the applicable personal property.(3) Fee varies by taxing authority. The fee is generally determined based on the value of the vehicle and / or the gross weight of the vehicle.
Fees are first charged to Clearing Account 184 and then to various accounts. (4) This tax is assessed on corporations doing business in the State of Illinois. The tax is filed annually, due each August 31. The tax is assessed on the
Company's capital. The maximum amount of the tax is $2 million per year plus 0.15% of the increase in the Company's capital during the year.
Commonwealth Edison CompanyTaxes Other Than Income Taxes
Local Taxes, Municipal Taxes, and Franchise Taxes2016 Actual
(In Thousands)
Docket No. 18-____ ComEd Ex. 2.03 Page 294 of 334

Schedule C-20Page 4 of 5
Witness: Tracy
AmountAmount Charged to Fees or
Line Taxing Effective Total Tax Passed to Operating ICC Foregone Explanation of fees orNo. Description Authority Rate Basis Assessed Customers Expense Account Discounts Foregone Discounts
(A) (B) (C) (D) (E) (F) (G) (H) (I) (J)
1 Local & Municipal Taxes2 Chicago Employers' Expense Tax Chicago (1) (1) - - - 408.1 None Not applicable3 Chicago Employers' Expense Tax Chicago (1) (1) - - - Various None Not applicable4 Chicago Sales and Use Taxes Chicago 1.0% (2) 111 - 111 408.1 None Not applicable5 Chicago Sales and Use Taxes Chicago 1.0% (2) 395 - 395 Various None Not applicable6 Chicago Transaction Tax Chicago 8.0% (3) 202 - 202 408.1 None Not applicable7 Chicago Transaction Tax Chicago 8.0% (3) 97 - 97 Various None Not applicable8 Vehicle Licenses Various (4) (4) 2,094 - 2,094 Various None Not applicable9 Municipal Tax Various (5) - - - 408.1 None Not applicable
10 Cook County Use Tax County (6) (457) (457) 408.1 None Not applicable
Franchise Taxes11 State Franchise Tax Illinois 0.1% (7) 2,246 - 2,246 408.1 None Not applicable
12 Total 4,688 - 4,688
Notes:(1) The tax is assessed as a flat $4 fee per month per taxable employee. Taxable employees are defined as employees who
perform 50% or more of their work / services in Chicago during the quarter and earn more than $900. The Employers' Expense Tax was repealed effective 1-1-2014. Final returns for the 2014 tax year were due 8-15-2014.
(2) Self-imposed tax on the purchase price of tangible personal property for use in Chicago from a seller located outside Chicago.(3) Tax assessed on the value of leased personal property used in the City of Chicago. The tax is paid annually based on the lease / rental
price of the applicable personal property.(4) Fee varies by taxing authority. The fee is generally determined based on the value of the vehicle and / or the gross weight of the vehicle.
Fees are first charged to Clearing Account 184 and then to various accounts. (5) Tax imposed by a municipality and collections go through reconcilliation of recovery. Over/under recovery of collections.(6) Represents a refund of an amount paid for county tax that was recovered in a previous case.(7) This tax is assessed on corporations doing business in the State of Illinois. The tax is filed annually, due each August 31. The tax is assessed on the
Company's capital. The maximum amount of the tax is $2 million per year plus 0.10% of the increase in the Company's capital during the year.
Commonwealth Edison CompanyTaxes Other Than Income Taxes
Local Taxes, Municipal Taxes, and Franchise Taxes2015 Actual
(In Thousands)
Docket No. 18-____ ComEd Ex. 2.03 Page 295 of 334

Schedule C-20Page 5 of 5
Witness: Tracy
AmountAmount Charged to Fees or
Line Taxing Effective Total Tax Passed to Operating ICC Foregone Explanation of fees orNo. Description Authority Rate Basis Assessed Customers Expense Account Discounts Foregone Discounts
(A) (B) (C) (D) (E) (F) (G) (H) (I) (J)
1 Local & Municipal Taxes2 Chicago Employers' Expense Tax Chicago (1) (1) - - - 408.1 None Not applicable3 Chicago Employers' Expense Tax Chicago (1) (1) - - - Various None Not applicable4 Chicago Sales and Use Taxes Chicago 1.0% (2) 72 - 72 408.1 None Not applicable5 Chicago Sales and Use Taxes Chicago 1.0% (2) 565 - 565 Various None Not applicable6 Chicago Transaction Tax Chicago 8.0% (3) - - - 408.1 None Not applicable7 Chicago Transaction Tax Chicago 8.0% (3) 160 - 160 Various None Not applicable8 Vehicle Licenses Various (4) (4) 2,061 - 2,061 Various None Not applicable9 Municipal Tax Various (5) - - - 408.1 None Not applicable
10 Franchise Taxes11 State Franchise Tax Illinois 0.1% (6) 2,217 - 2,217 408.1 None Not applicable
12 Total 5,075 - 5,075
Notes:(1) The tax is assessed as a flat $4 fee per month per taxable employee. Taxable employees are defined as employees who
perform 50% or more of their work / services in Chicago during the quarter and earn more than $900. (2) Self-imposed tax on the purchase price of tangible personal property for use in Chicago from a seller located outside Chicago.(3) Tax assessed on the value of leased personal property used in the City of Chicago. The tax is paid annually based on the lease / rental
price of the applicable personal property.(4) Fee varies by taxing authority. The fee is generally determined based on the value of the vehicle and / or the gross weight of the vehicle.
Fees are first charged to Clearing Account 184 and then to various accounts. (5) Tax imposed by a municipality and collections go through reconcilliation of recovery. Over/under recovery of collections.(6) This tax is assessed on corporations doing business in the State of Illinois. The tax is filed annually, due each August 31. The tax is assessed on the
Company's capital. The maximum amount of the tax is $2 million per year plus 0.10% of the increase in the Company's capital during the year.
Commonwealth Edison CompanyTaxes Other Than Income Taxes
Local Taxes, Municipal Taxes, and Franchise Taxes2014 Actual
(In Thousands)
Docket No. 18-____ ComEd Ex. 2.03 Page 296 of 334

Schedule C-21Page 1 of 2
Witness: Tracy
Line FERC Form 1 AdjustedNo. Description Amount (1) Adjustments Amount Jurisdictional (2)
(A) (B) (C) (D) (E)
1 Industry Association Dues 709$ -$ 709$ 609$ 2 Accrued Vacation Pay (12,141) - (12,141) (10,434) 3 Environmental Remediation Expenses 713 - 713 613 4 Other Environmental Projects 231 - 231 199 5 Illinois Energy Efficiency Program 708 - 708 608 6 Directors' Fees and Expenses 403 - 403 346 7 Write-down of Obsolete Materials 3,217 - 3,217 2,765 8 Bank Fees 2,913 (377) (3) 2,536 2,179 9 Undistributed Employee Expenses (182) - (182) (156)
10 Informational Technology Upgrades 948 - 948 815 11 Unclaimed Property Adjustment 3,330 - 3,330 2,862 12 Other 382 - 382 328
13 Total Miscellaneous General Expenses 1,231$ (377)$ 854$ 734$
Notes:(1) Reflects amounts charged to Account 930.2, Miscellaneous Gen. Expenses, per 2017 FERC Form 1, Page 335 excluding the
amortization of the deferred debits for the Chicago Arbitration Settlement and the Midwest Generation/Chicago settlement.(2) Allocated using the Wages and Salaries allocator.(3) Included in Credit Facility Fees. See Schedule D-1.
Miscellaneous General ExpensesCommonwealth Edison Company
2017(In Thousands)
Docket No. 18-____ ComEd Ex. 2.03 Page 297 of 334

Schedule C-21Page 2 of 2
Commonwealth Edison CompanyMiscellaneous General Expenses
2014 - 2016(In Thousands)
Witness: TracyLineNo. Description 2016 (1) 2015 (1) 2014 (1)
(A) (B) (C) (D)
1 Industry Association Dues 685$ 704$ 738$ 2 Other Experimental and General Research Expense - 1,156 901 3 Accrued Vacation Pay (916) 234 (524) 4 Environmental Remediation Expense 380 3,366 3,080 5 Other Environmental Projects 184 97 114 6 Illinois Energy Efficiency Program 501 490 101 7 Directors' Fees and Expense 379 399 414 8 Write-down of Obsolete Material 4,295 1,037 823 9 Bank Fees 1,421 897 1,432 10 Undistributed Employee Expense 245 57 166 11 Informational Technology Upgrades 480 951 340 12 Other 151 416 292 13 Total Miscellaneous General Expenses 7,805$ 9,804$ 7,878$
Note:(1) Reflects amounts charged to Account 930.2, Miscellaneous Gen. Expenses, per FERC Form 1, Page 33
excluding the amortization of the deferred debits for the Chicago Arbitration Settlement and the MidweGeneration/Chicago settlement
Docket No. 18-____ ComEd Ex. 2.03 Page 298 of 334

Schedule C-22Page 1 of 1
Witness: Tracy
LineNo. Description
1 (A) In April 2014 Exelon and Pepco Holdings, Inc. (PHI) announced their plans to merge the two companies.
2 1) Title of Program: Exelon/PHI Merger3 2) Description: Synergy Savings due to Merger4 3) Date of Implementation: March 20165 4) Initial Start Up Costs: $4.4 million in costs were either incurred directly by or allocated to 6 ComEd in 2014. See part 5) below for additional cost information related to merger savings.
7 5) Costs to be incurred by or allocated to ComEd (1)
89 Capital O&M10 2015 -$ 10$ 11 2016 3 13 12 2017 4 10 13 2018 - 2 14 2019 - - 15 6) Annual savings expected to be realized by ComEd (1)
1617 Capital O&M18 2015 -$ 19 2016 - 9 20 2017 - 14 21 2018 1 15 22 2019 1 16
23 Note:24 (1) Merger costs and savings are based on estimates developed for merger due diligence.
Commonwealth Edison CompanyCost Savings Programs
In Millions
In Millions
Docket No. 18-____ ComEd Ex. 2.03 Page 299 of 334

Schedule C-23 Page 1 of 2
Witness: Tracy
Line ICC Adjusted No. Account Description Account Total Company (1) Jurisdictional (1)
(A) (B) (C) (D)
1 Forfeited Discounts 450 (28,838)$ (25,686)$ 2 Miscellaneous Service Revenues 451 (10,166) (9,901) 3 Rent from Electric Property 454 (80,940) (69,341) 4 Other Electric Revenues 456 (9,499) (2,055) 5 Transmission of Electricity to Others 456.1 (754,470) (4,677) 6 Other Revenue Adjustments - (24,299)
7 Total Miscellaneous Operating Revenues (883,913)$ (135,959)$
Note:(1) See WPC-23 for additional information.
2017 Actual(In Thousands)
Commonwealth Edison CompanyMiscellaneous Operating Revenues
Docket No. 18-____ ComEd Ex. 2.03 Page 300 of 334

Schedule C-23Page 2 of 2
Witness: Tracy
Line ICCNo. Account Account 2016 2015 2014
(A) (B) (C) (D) (E)
1 Forfeited Discounts 450 (29,311)$ (29,347)$ (30,209)$ 2 Miscellaneous Service Revenues 451 (10,095) (4,945) (8,075) 3 Rent from Electric Property 454 (81,145) (83,864) (78,878) 4 Other Electric Revenues 456 (9,691) (4,101) (2,899) 5 Transmission of Electricity to Others 456.1 (694,097) (648,467) (601,551)
6 Total Miscellaneous Operating Revenues (824,339)$ (770,724)$ (721,612)$
(In Thousands)
Commonwealth Edison CompanyMiscellaneous Operating Revenues
2014 - 2016 Actual
Docket No. 18-____ ComEd Ex. 2.03 Page 301 of 334

Schedule C-24Page 1 of 4
Witness: Tracy
Line No. Account & Description
Balance at 1/1/2017 Additions
Charged To Legal Expense (1) Other
Balance at 12/31/2017
(A) (B) (C) (D) (E) (F)
1 Subaccount 228300 - Public Claims (40,728)$ (15,025)$ -$ 13,108$ (42,645)$ 2 Subaccount 228320 - Worker's Comp - Long Term (21,111) (2,630) - 4,433 (19,309)
3 Total FERC Account 228.2 (61,839)$ (17,655)$ -$ 17,541$ (61,954)$
Note:(1) Legal fees are not included in the reserve; they are charged to expense as incurred.
Commonwealth Edison CompanyLegal Expense and Reserves
Accumulated Provision For Injuries and Damages - Account 228.2(In Thousands)
Activity in 2017
Docket No. 18-____ ComEd Ex. 2.03 Page 302 of 334
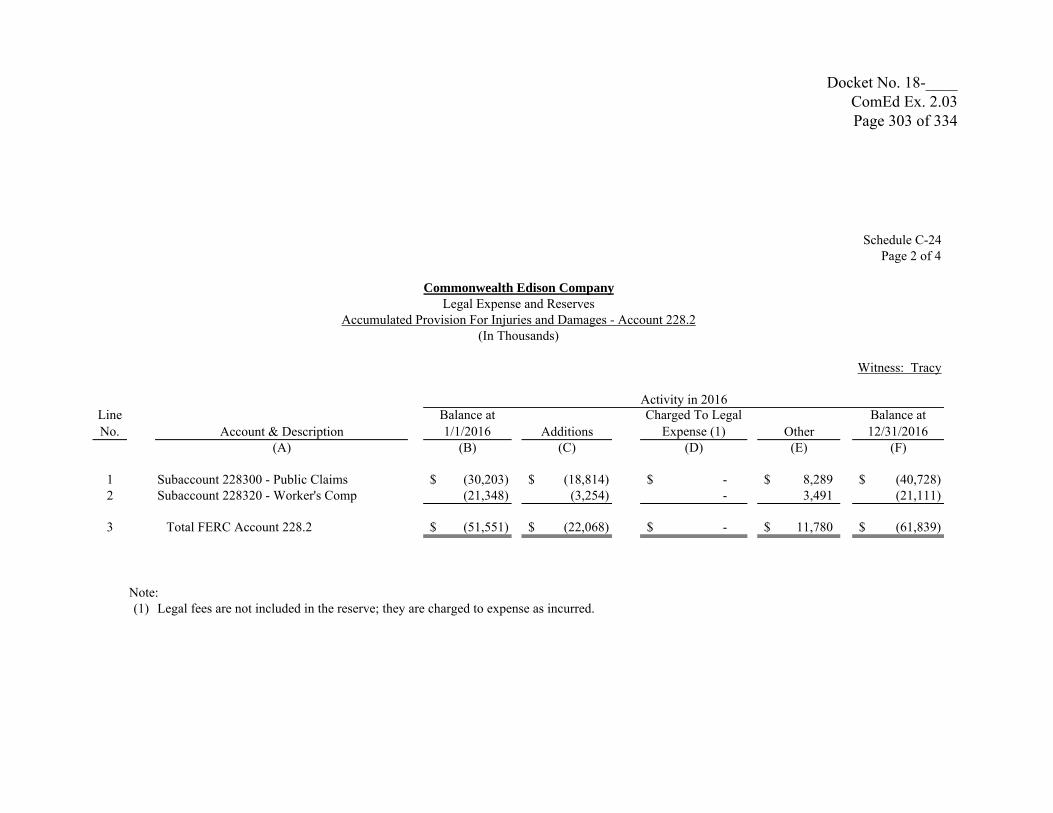
Schedule C-24Page 2 of 4
Witness: Tracy
Line No. Account & Description
Balance at 1/1/2016 Additions
Charged To Legal Expense (1) Other
Balance at 12/31/2016
(A) (B) (C) (D) (E) (F)
1 Subaccount 228300 - Public Claims (30,203)$ (18,814)$ -$ 8,289$ (40,728)$ 2 Subaccount 228320 - Worker's Comp (21,348) (3,254) - 3,491 (21,111)
3 Total FERC Account 228.2 (51,551)$ (22,068)$ -$ 11,780$ (61,839)$
Note:(1) Legal fees are not included in the reserve; they are charged to expense as incurred.
Commonwealth Edison CompanyLegal Expense and Reserves
Accumulated Provision For Injuries and Damages - Account 228.2(In Thousands)
Activity in 2016
Docket No. 18-____ ComEd Ex. 2.03 Page 303 of 334

Schedule C-24Page 3 of 4
Witness: Tracy
Line No. Account & Description
Balance at 1/1/2015 Additions
Charged To Legal Expense (1) Other
Balance at 12/31/2015
(A) (B) (C) (D) (E) (F)
1 Subaccount 228300 - Public Claims (33,039)$ (6,496)$ -$ 9,332$ (30,203)$ 2 Subaccount 228320 - Worker's Comp (20,621) (4,372) - 3,645 (21,348)
3 Total FERC Account 228.2 (53,660)$ (10,868)$ -$ 12,977$ (51,551)$
Note:(1) Legal fees are not included in the reserve; they are charged to expense as incurred.
Commonwealth Edison CompanyLegal Expense and Reserves
Accumulated Provision For Injuries and Damages - Account 228.2(In Thousands)
Activity in 2015
Docket No. 18-____ ComEd Ex. 2.03 Page 304 of 334

Schedule C-24Page 4 of 4
Witness: Tracy
Line No. Account & Description
Balance at 1/1/2014 Additions
Charged To Legal Expense (1) Other
Balance at 12/31/2014
(A) (B) (C) (D) (E) (F)
1 Subaccount 228300 - Public Claims (33,302)$ (3,904)$ -$ 4,167$ (33,039)$ 2 Subaccount 228320 - Worker's Comp (22,741) (1,874) - 3,994 (20,621)
3 Total FERC Account 228.2 (56,043)$ (5,778)$ -$ 8,161$ (53,660)$
Note:(1) Legal fees are not included in the reserve; they are charged to expense as incurred.
Commonwealth Edison CompanyLegal Expense and Reserves
Accumulated Provision For Injuries and Damages - Account 228.2(In Thousands)
Activity in 2014
Docket No. 18-____ ComEd Ex. 2.03 Page 305 of 334

Schedule C-25Page 1 of 4
Commonwealth Edison CompanyAdd-On Taxes(In Thousands)
Witness: Tracy
Line Basis ofNo. Description Assessment 2017 (1)
(A) (B) (C)
1 State of Illinois Electricity Excise Tax kilowatt hour (2) 249,578$
2 Municipal Utility Tax kilowatt hour (3) 256,528
3 Municipal Compensation / Infrastructure Maintenance Fee kilowatt-hour (4) 88,065
4 Renewable Energy Resource Charge and Low-Income Flat charge per5 Energy Assistance Fund customer (5) 47,624
6 Total 641,795$
Notes:(1) Add-on taxes are not recovered in tariffed rates. Rather, these add on taxes are
recovered in separate riders. Transactions for these add-on taxes are recorded in separategeneral ledger account for proper segregation.
(2) Tax is imposed on electricity used by customers for consumption and not for resale.This pass-through tax is recorded as a balance sheet item only. Activity is recorded in Account 241-Tax Collections Payable.
(3) Municipalities are allowed to impose taxes on ComEd's customers based on electricityconsumption. This tax is collected under the provisions of Rider TAX (Municipal and State Tax Additions). This pass-through tax is recorded as a balance sheet item only.Activity is recorded in Account 241 - Tax Collections Payable.
(4) Tax is collected under the provisions of Rider FCA (Franchise Cost Additions). Taxamounts are to recover franchise costs imposed upon ComEd by municipalities.
(5) Tax is collected under Rider RCA (Renewable Energy Resources and Coal TechnologyDeveloptment Assistance Charge and Energy Assistance Charge for the SupplementalLow-Income Energy Assistance Fund).
Docket No. 18-____ ComEd Ex. 2.03 Page 306 of 334

Schedule C-25Page 2 of 4
Commonwealth Edison CompanyAdd-On Taxes Recorded as Revenues
(In Thousands)
Witness: Tracy
Line Actual Actual Actual ActualNo. Description 2017 2016 2015 2014
(A) (B) (C) (D) (E)
1 State of Illinois Electricity Excise Tax (1) -$ -$ -$ -$
2 Municipal Utility Tax (1) - - - -
3 Municipal Compensation / Infrastructure Maint. F (2) 88,065 90,812 88,141 89,716
4 Renewable Energy Resource Charge and Low-5 Income Energy Assistance Fund (2) 47,624 47,054 46,735 46,118
6 Total 135,689$ 137,866$ 134,876$ 135,834$
Notes:(1) Pass through tax is recorded as a balance sheet item only. (2) Equal amounts are recorded as revenue and expense. See Page 3.
Amounts Recorded As Revenue
Docket No. 18-____ ComEd Ex. 2.03 Page 307 of 334

Schedule C-25Page 3 of 4
Commonwealth Edison CompanyAdd-On Taxes Recorded as Expense
(In Thousands)
Witness: Tracy
Line Actual Actual Actual ActualNo. Description 2017 2016 2015 2014
(A) (B) (C) (D) (E)
1 State of Illinois Electricity Excise Tax (1) -$ -$ -$ -$
2 Municipal Utility Tax (1) - - - -
3 Municipal Compensation / Infrastructure Maint. F(2) 88,065 90,812 88,141 89,716
4 Renewable Energy Resource Charge and Low-5 Income Energy Assistance Fund (2) 47,624 47,054 46,735 46,118
6 Total 135,689$ 137,866$ 134,876$ 135,834$
Notes:(1) Pass through tax is recorded as a balance sheet item only. (2) Equal amounts are recorded as revenue and expense. See Page 2.
Amounts Recorded As Expense
Docket No. 18-____ ComEd Ex. 2.03 Page 308 of 334

Schedule C-25Page 4 of 4
Commonwealth Edison CompanyAdd-On Taxes - Accounting Fees Collected
(In Thousands)
Witness: Tracy
Line Actual Actual Actual ActualNo. Description 2017 2016 2015 2014
(A) (B) (C) (D) (E)
1 Accounting fees collected (1) (7,716)$ (2) (8,003)$ (7,684)$ (7,762)$
Notes:(1) Under Section 9-221 of the Public Utilities Act and Section 8-11-2 subsection 4(b) of the
Illinois Municipal Code, ComEd is allowed to collect a 3% fee as reimbursement of administrative expenses incurred in accounting for the municipal taxes. The fee is based ontaxes imposed on customers by municipalities under Rider 23 (Municipal and State TaxAdditions). The fee amounts are included in revenues from ultimate consumers.
(2) The accounting fees collected were included in Miscellaneous OperatingRevenue. See WPC-23, Page 8, Line 4, Column B.
Docket No. 18-____ ComEd Ex. 2.03 Page 309 of 334

Schedule C-26Page 1 of 2
Witness: Tracy
ICC Balance at Balance at Amortization Line Amortization Docket Beginning End (Expense) orNo. Description From To Period Number (if any) of Year of Year Credit Jurisdictional
(A) (B) (C) (D) (E) (F) (G) (H) (I)
1 Amortization Charged to account 407.32 Capitalized Incentive Costs (1) 1/1/2017 12/31/2017 42 Years 01-0423 6,946$ 6,690$ (2) (256)$ (256)$ 3 AMI Pilot Program Costs 1/1/2017 12/31/2017 Varies by asset 09-0263 1,862 1,258 (3) (604) (604) 4 AMI Accelerated Depreciation 1/1/2017 12/31/2017 10 Years 12-0298 161,706 153,485 (4) (21,204) (21,204) 5 2013 Storm Costs Capitalized (5) 1/1/2017 12/31/2017 5 Years 14-0312 4,397 - (4,397) (4,397) 6 2014 Storm Costs Capitalized (5) 1/1/2017 12/31/2017 5 Years 15-0287 15,256 7,628 (7,628) (7,628) 7 2013 Merger Costs - Distribution (6) 1/1/2017 12/31/2017 5 Years 14-0312 2,283 - (2,283) (2,283) 8 2016 Merger Costs - Distribution 1/1/2017 12/31/2017 5 Years 17-0196 8,468 6,351 (2,117) (2,117) 9 A-Base Meter Costs 1/1/2017 12/31/2017 5 Years 17-0196 23,447 34,738 (10,150) (10,150)
10 Emerald Ash Borer 1/1/2017 12/31/2017 5 Years - 9,602 (2,401) (2,401) 11 MGP Remediation Costs 1/1/2017 12/31/2017 9 Years 05-0597 277,643 272,678 (7) (17,110) - 12 Conditional Asset Retirement Obligations Reg Asset Varies by asset (8) 76,892 73,452 - - 13 Rider EEPP 1/1/2017 12/31/2017 Various - 165,748 (5,027) - 14 PORCB Regulatory Asset 1/1/2017 12/31/2017 - - (9) (201) - 15 Rider UF 55,986 61,207 (12) - -
16 Total Amortization Charged to account 407.3 (10) (73,378)$ (51,040)$
17 Amortization Charged to account 407.4 (11)18 Rider UF (12) 5,222$ -$ 19 Emerald Ash Borer 12,003 - 20 A-Base Meter Costs 21,441 -
21 Total Amortization Charged to account 407.4 (13) 38,666$ -$
Notes:(1) The initial amount included in this account was $10,857,000, representing the capitalization of incentive costs as part of the March 2003 agreement.
See ICC Order No. 01-0423, dated March 28, 2003.(2) 12/31/17 Balance included in the calculation of the jurisdictional rate base (See Schedule B-10).(3) AMI Pilot Program Costs regulatory asset consists of deferred expenses and the cost of prematurely retired meters. The cost of the retired meters
and pre-2010 costs are included in rate base per docket 10-0467. See Schedule B-10.(4) AMI Accelerated Depreciation is the unrecovered undepreciated cost of meters retired prematurely as they are replaced by AMI 'Smart Meters'.
The unrecovered balance of this regulatory asset is included in rate base per docket 12-0298.(5) Significant Storm costs were credited to account 407400 and charged to account 182300. The regulatory asset is being amortized to account 407300.(6) The 2012 Merger of Exelon and Constellation Energy resulted in ComEd incurring certain costs to achieve systems integration. These costs are being recovered over five years.(7) Recovered through Rider ECR.(8) In accordance with the guidelines of FERC Docket No. RM02-7-000, Order 631, issued April 9, 2003.(9) Recovered through Rider PORCB.
(10) Ties to FERC Form 1, Page 114, Line 12(11) Certain regulatory assets were established by charging account 182300 and crediting account 407400 rather than crediting O&M. (12) Recovered through Rider UF.(13) Ties to FERC Form 1, Page 114, Line 13
Were Accreted
Commonwealth Edison CompanyAmortization of Regulatory Debits and Credits
2017 Actual(In Thousands)
Time Period Costs
Docket No. 18-____ ComEd Ex. 2.03 Page 310 of 334

Schedule C-26Page 2 of 2
Commonwealth Edison CompanyAmortization of Deferred Charges - Debits
2013 - 2016(In Thousands)
Witness: Tracy
ICC Actual Actual Actual ActualLine Amortization Docket Balance at Balance at Balance at Balance at No. Description From To Period Number (if any) 12/31/2013 Amortization Other 12/31/2014 Amortization Other 12/31/2015 Amortization Other 12/31/2016
(A) (B) (C) (D) (E) (F) (G) (H) (I) (J) (K) (L) (M) (N) (O)
1 Amortization Charged to account 407.0, 407.3, 407.4
2 Capitalized Incentive Costs (1) 1/1/2014 12/31/2016 41 Years 01-0423 7,715$ (256)$ -$ 7,459$ (256)$ -$ 7,203$ (257)$ -$ 6,946$ 3 Original Cost Audit Costs 1/1/2014 12/31/2014 3 Years 07-0566 & 10-0467 228 (228) - - - - - - - - 4 Rehearing on ICC Docket 05-0597 1/1/2014 12/31/2014 3 Years 07-0566 29 (29) - - - - - - - - 5 Lease Abandonment Costs 1/1/2014 12/31/2014 3 Years 07-0566 44 (44) - - - - - - - - 6 Rate Case Costs - ICC Docket 07-0566 & 10-0467 1/1/2014 12/31/2014 3 Years 07-0566 & 10-0467 1,234 (1,234) - - - - - - - -
7 MGP Remediation Costs 1/1/2014 12/31/2016 9 Years 05-0597 211,440 (26,330) 34,111 219,221 (17,415) 53,444 255,250 (14,504) 36,897 277,643 8 Recoverable RTO Start up Costs 1/1/2014 12/31/2015 119 Months FERC ER03-1335,
ER04-367, EL05-742,164 (2,608) 753 309 (463) 154 - - - -
9 PORCB Regulatory Asset 1/1/2014 12/31/2016 27,127 (7,348) (6,073) 13,706 176 (13,882) - (35) 35 - 10 Rider UF 1/1/2015 12/31/2016 - - - - (19,098) 71,191 52,093 - 3,893 55,986 11 AMI Pilot Program Costs 1/1/2014 12/31/2016 3 to 10 Years 09-0263 4,203 (1,133) 3,070 (604) 2,466 (604) - 1,862 12 AMI Accelerated Depreciation 1/1/2014 12/31/2016 10 Years 12-0298 35,241 (6,774) 59,820 88,287 (13,239) 62,372 137,420 (18,504) 42,790 161,706 13 2009 Severance Costs 1/1/2014 12/31/2014 3 Years 10-0467 12,315 (1,779) (10,536) - - - - - - - 14 2011 Storm Costs Capitalized 1/1/2014 12/31/2015 5 Years 12-0321 27,188 (13,594) - 13,594 (13,594) - - - - - 15 2012 Storm Costs Capitalized 1/1/2014 12/31/2016 5 Years 13-0318 12,748 (4,249) - 8,499 (4,250) - 4,249 (4,249) - - 16 2013 Storm Costs Capitalized 1/1/2014 12/31/2016 5 Years 14-0312 17,589 (4,397) - 13,192 (4,397) - 8,795 (4,397) - 4,398 17 2014 Storm Costs Capitalized 1/1/2014 12/31/2016 5 Years 15-0287 - (7,628) 38,139 30,511 (7,628) - 22,883 (7,628) - 15,255 18 2012 Merger Costs - Distribution 1/1/2014 12/31/2016 5 Years 13-0318 19,111 (6,504) (25) 12,582 (6,291) - 6,291 (6,291) - - 19 2013 Merger Costs - Distribution 1/1/2014 12/31/2016 5 Years 14-0312 9,133 (2,280) (3) 6,850 (2,284) - 4,566 (2,283) - 2,283 20 2016 Merger Costs - Distribution 1/1/2016 12/31/2016 5 Years - - - - - - - (2,117) 10,585 8,468 21 A-Base Meter Costs 1/1/2016 12/31/2016 5 Years - - - - - - - (5,862) 29,309 23,447 22 Deferred Costs of Initial Formula Rate Filing 1/1/2014 12/31/2016 3 Years 826 (787) 75 114 (90) - 24 (24) - - 23 Conditional ARO Reg Asset (2) 1/1/2014 12/31/2016 Varies by asset (3) 68,657 (1,414) 7,215 74,458 (1,416) (5,661) 67,381 - 9,511 76,892
24 Amortization Charged to Account 407.3 $ (88,616) $ (90,849) $ (66,755)
25 Amortization Charged to account 407.4 (4)26 Rider UF 18,975 4,554 3,892 27 Establishment of Reg Asset for 2014 Significant Storms 5 Years 38,139 - - 28 Establishment of Reg Asset for 2016 Distrib Merger Cost 5 Years - - 10,585 29 A-Base Meter Costs 5 Years - - 29,309 30 Other Misc. Adjustments (144) 1 - 3132 Accretions Credited to Account 407.4 56,970$ 4,555$ 43,786$
33 Deferred Credits (253)34 Deferred Benefits - ACRS deduction sold 6/30/1981 6/30/1981 31.5 years 99-0117 -$ -$ -$ -$ -$ -$ -$ 35 Deferred Benefits - investment tax credits sold 6/30/1981 6/30/1981 31.5 years 99-0117 - - - - - - - 36 Amortization of ACRS and ITC Benefits to Account 407.0 -$ -$ -$
37 Total Regulatory Asset and Other Expense Adjustments Amortized to FERC Account 407 (5) (31,646)$ (86,294)$ (22,969)$
Notes(1) The initial amount set up in this account was $10,857,000, representing the capitalization of incentive costs as part of the 2003 agreement.
See ICC Order in Docket No. 01-0423, dated March 28, 2003.(2) Asset Retirement Obligations (ARO) are covered by FAS 143, adopted by ComEd in 2003 and FIN 47, adopted by ComEd in 2005. The ARO covers ComEd's obligation to
remove long-lived assets whose timing and/or method of settlement are conditional on a future event. ComEd's significant conditional AROs cover the abatement and disposal of equipment and buildings contaminated with asbestos and Polychlorinated Biphenyls (PCBs).
(3) In accordance with the guidelines of FERC Docket No. RM02-7-000, Order 631, issued April 9, 2003.(4) Certain regulatory assets were established by charging account 182300 and crediting account 407400 rather than crediting O&M. (5) Ties to FERC Form 1, Page 114, Lines 11+12+13
Time Period CostsWere Accreted Net Change-2014 Net Change-2015 Net Change-2016
Docket No. 18-____ ComEd Ex. 2.03 Page 311 of 334

Schedule C-27Page 1 of 1
Witness: TracyLineNo.
1 ComEd does not derive any revenue from or incur any fuel costs recoverable through
2 a uniform fuel adjustment clause (UFAC). Thus, no UFAC revenue or expenses are
3 included in its operating income at proposed rates reflected on Schedule C-1,
4 Jurisdictional Operating Income Summary.
Commonwealth Edison CompanyFuel Adjustment Clause Revenue and Expenses - Electric Utilities
2017
Description(A)
Docket No. 18-____ ComEd Ex. 2.03 Page 312 of 334

Schedule C-28Page 1 of 1
Witness: TracyLineNo.
1 ComEd did not incur any fuel transportation expense for coal
2 contracts during 2017 or for any of the three preceding years.
Commonwealth Edison CompanyFuel Transportation Expense - Electric Utilities
2017
Description(A)
Docket No. 18-____ ComEd Ex. 2.03 Page 313 of 334

Schedule C-29Page 1 of 1
Commonwealth Edison CompanyDecommissioning Expenses
2017
Witness: TracyLineNo. Description
(A)
1 In 2017 there were no revenues realized from a decommissioning rider nor
2 were any decommissioning expenses incurred
Docket No. 18-____ ComEd Ex. 2.03 Page 314 of 334

Schedule C-30Page 1 of 1
Witness: Tracy
Not applicable.
Commonwealth Edison CompanyPurchased Gas Adjustment Clause Revenue and Expenses - Gas Utilities
2017
Description(A)
Docket No. 18-____ ComEd Ex. 2.03 Page 315 of 334

Schedule C-31 Page 1 of 1
Commonwealth Edison Company Competitive Services
2017
Witness: Leick Line No. 1 2 3 4 5 6 7 8 9 10 11 12 13 14 15 16 17 18 19 20 21 22 23 24 25 26 27 28 29
Section 16-102 of the Public Utilities Act (“Act”) provides that "competitive service" includes (i) any service that has been declared to be competitive pursuant to Section 16-113 of this Act, (ii) contract service, and (iii) services, other than tariffed services, that are related to, but not necessary for, the provision of electric power and energy or delivery services. For item (i) above, “any service that has been declared to be competitive pursuant to Section 16-113 of this Act”, ComEd notes that service for customers with peak demand of 100 kilowatts and above was declared competitive in accordance with the Illinois Commerce Commission’s Order in Docket No. 07-0478 issued pursuant to Section 16-113 of the Act, as amended by Public Act 095-481 which was enacted August 28, 2007. With respect to item (ii) above, “contract service”, Section 16-102 of the Act provides that “contract service” means (1) services, including the provision of electric power and energy or other services, that are provided by mutual agreement between an electric utility and a retail customer that is located in the electric utility's service area, provided that, delivery services shall not be a contract service until such services are declared competitive pursuant to Section 16-113; and also means (2) the provision of electric power and energy by an electric utility to retail customers outside the electric utility's service area pursuant to Section 16-116. Provided, however, contract service does not include electric utility services provided pursuant to (i) contracts that retail customers are required to execute as a condition of receiving tariffed services, or (ii) special or negotiated rate contracts for electric utility services that were entered into between an electric utility and a retail customer prior to the effective date of this amendatory Act of 1997 and filed with the Commission. Thus, ComEd states that no customers took “contract service” as defined above. For item (iii) above, “services, other than tariffed services, that are related to, but not necessary for, the provision of electric power and energy or delivery services”, ComEd states that no such services were provided. ComEd also notes that other non-utility services are listed in Schedule C-32.
Docket No. 18-____ ComEd Ex. 2.03 Page 316 of 334

Schedule C-32 Page 1 of 1
Commonwealth Edison Company Non-Utility Operations – 2017
Witness: Tracy Line No. 1 2 3 4 5 6 7 8 9 10 11 12 13 14 15 16 17 18 19 20 21 22 23 24
Pole Attachments (make ready activity). ComEd performs engineering and construction work to prepare poles for pole attachments. Advances are paid by the customer based on the estimated fully distributed cost of the make-ready cable work. This type of work has been performed since the early 1980s. During this period, customer advances were credited to the balance sheet and the costs ComEd incurred were recorded to FERC Account 416004. When a customer project is completed, the customer advance is transferred to non-operating revenue. Tower Attachments (make ready activity). Similar to the pole attachments activity, but this work is performed on ComEd’s transmission towers. These activities began in 2003. As described above, customer advances were credited to the balance sheet and the costs incurred by ComEd recorded to FERC Account 416004. When a customer project is completed the customer advance is transferred to non-operating revenue. Technical Consulting Services ComEd provides limited fee-based consultative services at the request of customers. These customer requested services can include energy usage analysis, energy audits, unique customer process solutions, and the development, support and management of programs for governmental and not-for-profit organizations. ComEd has offered this service since 1996; however, the frequency and scope has significantly decreased over the last couple of years. Third Party Advertising ComEd offers the sale and placement of third-party advertising in ComEd’s bills. All associated labor and insertion costs incurred by ComEd are recorded below the line in FERC Account 416. ComEd has offered this service since 1998.
Docket No. 18-____ ComEd Ex. 2.03 Page 317 of 334

Schedule C-33Page 1 of 1
Witness: LeickLineNo.
1 The mandatory transition period ended January 1, 2007
2 pursuant to Section 16-106 of the Public Utilities Act. Therefore there
3 are no billing experiments that qualify under the requirements of
4 Section 285.3700 Schedule C-33.
(A)
2017
Commonwealth Edison CompanyBilling Experiments
Description
Docket No. 18-____ ComEd Ex. 2.03 Page 318 of 334

Schedule D-1 RYPage 1 of 2
Witness: Tracy
Line Percent of December 31 WeightedNo. Class of Capital Amount Total Capital Cost Cost
(A) (B) (C) (D) (E)
Year Ending December 31, 2017
1 Short-Term Debt -$ 0.00% 1.24% 0.00%
2 Long-Term Debt 7,516,534$ 52.89% 4.56% (3) 2.41%
3 Common Equity $6,694,878 47.11% 8.69% (1) 4.09%
4 Credit Facility Costs (2) 0.02%
5 Total Capital $14,211,412 100.00% 6.52%
Notes:(1) See Schedule D-6 RY Line 16.(2) See Schedule D-2, Page 2, Line 14.(3) See Schedule D-3, Page 2, Col F, Line 6.
Commonwealth Edison CompanyCost of Capital Summary
(In Thousands)
Docket No. 18-____ ComEd Ex. 2.03 Page 319 of 334
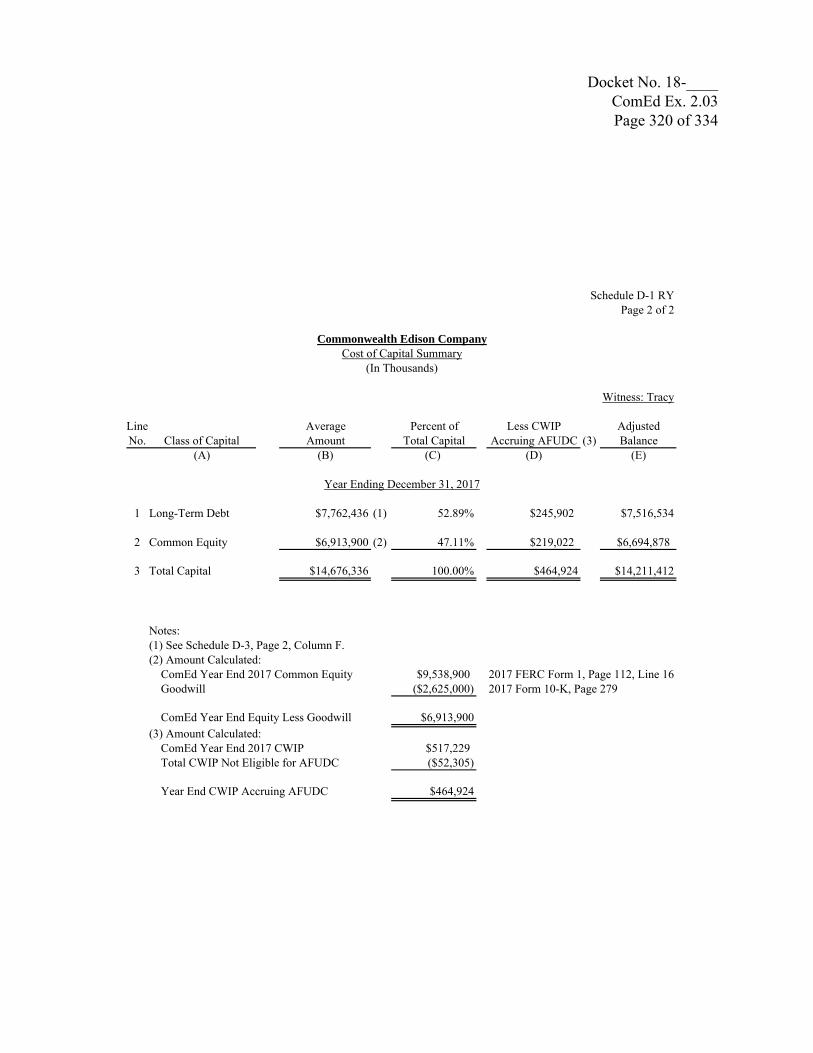
Schedule D-1 RYPage 2 of 2
Witness: Tracy
Line Average Percent of Less CWIP AdjustedNo. Class of Capital Amount Total Capital Accruing AFUDC (3) Balance
(A) (B) (C) (D) (E)
Year Ending December 31, 2017
1 Long-Term Debt $7,762,436 (1) 52.89% $245,902 $7,516,534
2 Common Equity $6,913,900 (2) 47.11% $219,022 $6,694,878
3 Total Capital $14,676,336 100.00% $464,924 $14,211,412
Notes:(1) See Schedule D-3, Page 2, Column F.(2) Amount Calculated: ComEd Year End 2017 Common Equity $9,538,900 2017 FERC Form 1, Page 112, Line 16 Goodwill ($2,625,000) 2017 Form 10-K, Page 279
ComEd Year End Equity Less Goodwill $6,913,900(3) Amount Calculated: ComEd Year End 2017 CWIP $517,229 Total CWIP Not Eligible for AFUDC ($52,305)
Year End CWIP Accruing AFUDC $464,924
Commonwealth Edison CompanyCost of Capital Summary
(In Thousands)
Docket No. 18-____ ComEd Ex. 2.03 Page 320 of 334
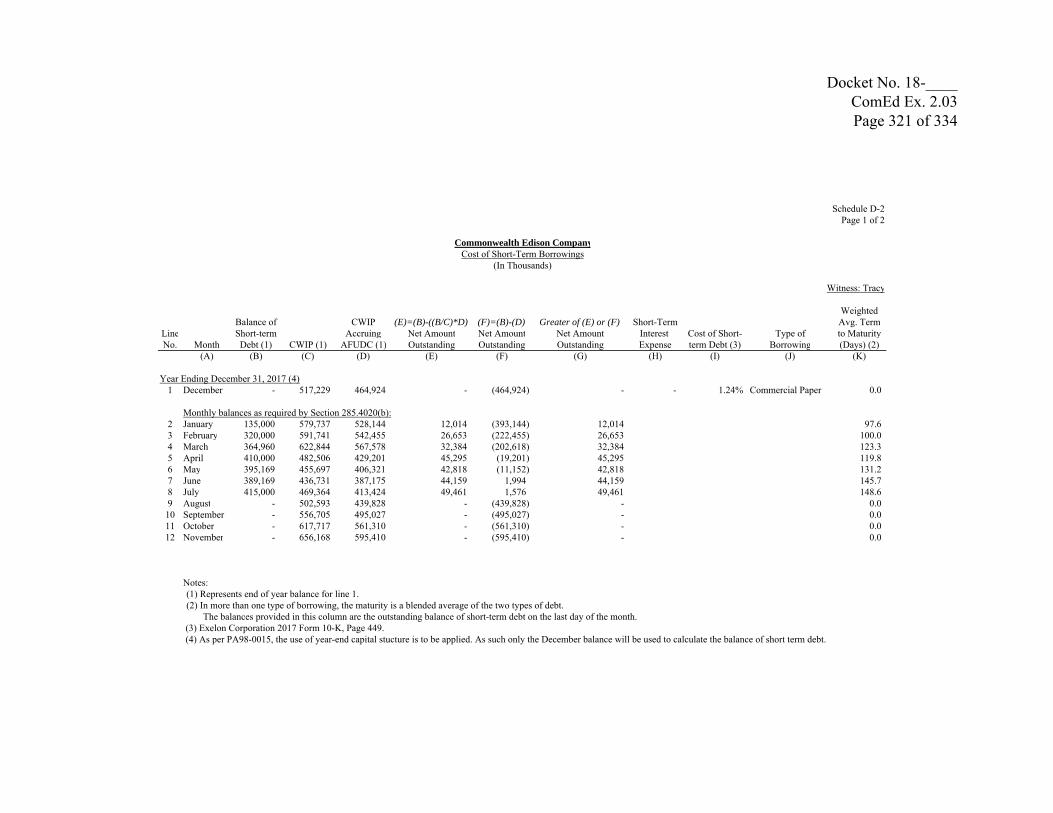
Schedule D-2Page 1 of 2
Witness: Tracy
WeightedBalance of CWIP (E)=(B)-((B/C)*D) (F)=(B)-(D) Greater of (E) or (F) Short-Term Avg. Term
Line Short-term Accruing Net Amount Net Amount Net Amount Interest Cost of Short- Type of to MaturityNo. Month Debt (1) CWIP (1) AFUDC (1) Outstanding Outstanding Outstanding Expense term Debt (3) Borrowing (Days) (2)
(A) (B) (C) (D) (E) (F) (G) (H) (I) (J) (K)
Year Ending December 31, 2017 (4)1 December - 517,229 464,924 - (464,924) - - 1.24% Commercial Paper 0.0
Monthly balances as required by Section 285.4020(b):2 January 135,000 579,737 528,144 12,014 (393,144) 12,014 97.63 February 320,000 591,741 542,455 26,653 (222,455) 26,653 100.04 March 364,960 622,844 567,578 32,384 (202,618) 32,384 123.35 April 410,000 482,506 429,201 45,295 (19,201) 45,295 119.86 May 395,169 455,697 406,321 42,818 (11,152) 42,818 131.27 June 389,169 436,731 387,175 44,159 1,994 44,159 145.78 July 415,000 469,364 413,424 49,461 1,576 49,461 148.69 August - 502,593 439,828 - (439,828) - 0.0
10 September - 556,705 495,027 - (495,027) - 0.011 October - 617,717 561,310 - (561,310) - 0.012 November - 656,168 595,410 - (595,410) - 0.0
Notes:(1) Represents end of year balance for line 1. (2) In more than one type of borrowing, the maturity is a blended average of the two types of debt. The balances provided in this column are the outstanding balance of short-term debt on the last day of the month.
(3) Exelon Corporation 2017 Form 10-K, Page 449. (4) As per PA98-0015, the use of year-end capital stucture is to be applied. As such only the December balance will be used to calculate the balance of short term debt.
Commonwealth Edison CompanyCost of Short-Term Borrowings
(In Thousands)
Docket No. 18-____ ComEd Ex. 2.03 Page 321 of 334

Schedule D-2Page 2 of 2
Commonwealth Edison CompanyCost to Maintain Credit Facilities (1)
(In Thousands)
Line December One-Time AnnualizedNo. Accrual Accrual Amount
(B) (C) (D)
1 Primary Credit Facility2 Annual amortization of upfront fees (2) 67 - 804 3 Facility commitment fees 108 - 1,296 4 Line of credit drawn fees 4 - 48 5 Subtotal - 2,148
6 Community- and Minority-Owned Bank Credit Facility7 Annually incurred upfront fees (2) - 146 146 8 Facility commitment fees 4 - 48 9 Line of credit drawn fees 21 - 252
10 Subtotal 446
11 LESS LC fees associated with PJM collateral requirements - - -
12 Total 2,594
13 Total capital (3) 14,211,412 14 Credit facility cost of capital (Line 12 / Line 13) 0.02%
Notes:(1) Does not include the cost of short term borrowings, which are shown
on Page 1.(2) Upfront fees include legal and administrative costs associated with
establishing credit facilities. ComEd's policy is to amortize these fees for the primary credit facility and to expense them once annually as incurred for the community- and minority-owned bank credit facility.
(3) From FR D-1 RY, Line 5, Column B.
Description(A)
Docket No. 18-____ ComEd Ex. 2.03 Page 322 of 334

Schedule D-3Page 1 of 2
Commonwealth Edison CompanyEmbedded Cost of Long-term DebtYear Ending December 31, 2017
Witness: Tracy
Annual AnnualDebt, Days Unamortized Carrying Coupon Annual Annual Interest
Line Issue Type Date Maturity Outstanding Principal Face Amount Discount or Unamortized Value Interest Amortization of Amortization of ExpenseNo. Coupon Rate Issued Date Factor Amount Outstanding (Premium) Debt Expense (H)=(E)-(F)-(G) (I) Discount (Prem) Debt Expense (L)=(I)+(J)+(K)
(A)1 (B)1 (C)1 (D)1 (E)1 (F)2 (G)2 (H) (I) (J)2 (K)2 (L)
First Mortgage Bonds1 5.875% Series 100 01/22/03 02/01/33 350,000,000 253,600,000 551,021 1,303,202 251,745,777 14,899,000 36,608 86,580 15,022,188 2 5.900% Series 103 03/06/06 03/15/36 325,000,000 325,000,000 1,239,002 2,121,095 321,639,903 19,175,000 68,222 116,793 19,360,015 3 5.900% Series 103B 03/22/07 03/15/36 300,000,000 300,000,000 7,807,995 658,964 291,533,041 17,700,000 429,927 36,284 18,166,211 4 6.450% Series 107 01/16/08 01/15/38 450,000,000 450,000,000 907,654 2,987,339 446,105,007 29,025,000 45,395 149,408 29,219,803 5 5.800% Series 108 03/27/08 03/15/18 700,000,000 700,000,000 26,585 125,910 699,847,505 40,600,000 135,138 640,042 41,375,180 6 4.000% Series 109 08/02/10 08/01/20 500,000,000 500,000,000 30,953 1,160,855 498,808,192 20,000,000 12,026 451,033 20,463,059 7 3.400% Series 112 09/07/11 09/01/21 350,000,000 350,000,000 42,374 996,741 348,960,885 11,900,000 11,591 272,651 12,184,242 8 3.800% Series 113 10/01/12 10/01/42 350,000,000 350,000,000 513,889 2,884,990 346,601,121 13,300,000 20,810 116,830 13,437,640 9 4.600% Series 114 08/19/13 08/15/43 350,000,000 350,000,000 675,739 3,611,349 345,712,912 16,100,000 26,432 141,258 16,267,690 10 2.150% Series 115 01/10/14 01/15/19 300,000,000 300,000,000 137,855 485,190 299,376,955 6,450,000 133,127 468,547 7,051,674 11 4.700% Series 116 01/10/14 01/15/44 350,000,000 350,000,000 100,201 3,188,316 346,711,483 16,450,000 3,856 122,705 16,576,561 12 3.100% Series 117 11/10/14 11/01/24 250,000,000 250,000,000 145,553 1,838,220 248,016,227 7,750,000 21,343 269,547 8,040,890 13 3.700% Series 118 03/02/15 03/01/45 400,000,000 400,000,000 - 4,077,951 395,922,049 14,800,000 - 150,107 14,950,107 14 4.350% Series 119 11/19/15 11/15/45 450,000,000 450,000,000 3,253,622 5,291,424 441,454,954 19,575,000 116,977 231,500 19,923,477 15 2.550% Series 120 06/27/16 06/15/26 500,000,000 500,000,000 - 3,739,433 496,260,567 12,750,000 - 396,314 13,146,314 16 3.650% Series 121 06/27/16 06/15/46 700,000,000 700,000,000 4,414,115 7,410,225 688,175,660 25,550,000 86,107 150,598 25,786,705 17 2.950% Series 122 08/15/17 08/15/27 350,000,000 350,000,000 929,320 2,993,247 346,077,433 10,325,000 77,937 239,569 10,642,506 18 3.750% Series 123 08/15/17 08/15/47 650,000,000 650,000,000 1,614,459 7,142,445 641,243,096 24,375,000 27,680 118,026 24,520,706
19 7,625,000,000 7,528,600,000 22,390,337 52,016,896 7,454,192,767 320,724,000 1,253,176 4,157,792 326,134,968
20 Notes21 6.950% 07/16/98 07/15/18 225,000,000 140,000,000 49,267 833 139,949,900 9,730,000 91,744 1,572 9,823,316
22 Subordinated Deferrable Interest Debt23 6.350% 03/17/03 03/15/33 206,186,000 206,186,000 94,226 1,142,698 204,949,076 13,092,811 6,212 75,343 13,174,366
24 8,056,186,000$ 7,874,786,000$ 22,533,830$ 53,160,427$ 7,799,091,743$ 343,546,811$ 1,351,132$ 4,234,707$ 349,132,650$
Notes:(1) Long-term debt balances taken from Form 21 ILCC, Page 22a.(2) Balances taken from Form 21 ILCC, Supplemental Pages 26a-27b.
Docket No. 18-____ ComEd Ex. 2.03 Page 323 of 334

Schedule D-3Page 2 of 2
Commonwealth Edison CompanyEmbedded Cost of Long-term DebtYear Ending December 31, 2017
Witness: Tracy
Line EMBEDDED COST OFNo. Amount Amount LONG TERM DEBT Amount
(B) (D) (E) (F)
1 Interest on long-term debt (1) 343,546,811$ Total long-term debt balance (6) 7,874,786,000$ Cost of long-term debt 353,694,106$ 2 + Amortization of discount (premium) (2) 1,351,132 Less Unamortized discount (premium) (7) 22,533,830 3 + Amortization of debt expense (3) 4,234,707 Less Unamortized debt expense (8) 53,160,427 Balance of long-term debt 7,762,435,760$ 4 + Amortization of loss on reacquired debt (4) 4,577,989 Less Unamortized loss on reacquired debt (9) 36,698,738 5 + Amortization of gain on reacquired debt (5) (16,533) Less Unamortized gain on reacquired debt (10) (42,755) 6 Cost of long-term debt 353,694,106$ Balance of long-term debt 7,762,435,760$ COST OF LONG-TERM DEBT 4.56%
Notes:(1) Schedule D-3, Page 1, Column (I).(2) Schedule D-3, Page 1, Column (J).(3) Schedule D-3, Page 1, Column (K).(4) WPD-3, Page 1, Line 33, Column (H)(5) WPD-3, Page 1, Line 37, Column (H)(6) Schedule D-3, Page 1, Column (E).(7) Schedule D-3, Page 1, Column (F).(8) Schedule D-3, Page 1, Column (G).(9) WPD-3, Page 1, Line 33, Column (G).(10) WPD-3, Page 1, Line 37, Column (G).
Adjusted Cost of Long-term Debt Adjusted Long-term Debt Balance(A) (C)
Docket No. 18-____ ComEd Ex. 2.03 Page 324 of 334

Schedule D-4Page 1 of 1
Witness: Tracy
Annualized Annualized Annualized Embedded CostLine Dividend Rate, Date Mandatory No. of Shares Par Value Premium or Issue Net Amortization of Amortization of Annualized Preferred Stock of PreferredNo. Type, Par Value Issued Redemption Date Outstanding Outstanding Discount Expense Proceeds Discount / Premium Issue Expense Dividends Expense Stock
(A) (B) (C) (D) (E) (F) (G) (H) (I) (J) (K) (L) (M)
Commonwealth Edison CompanyEmbedded Cost of Preferred StockYear Ending December 31, 2017
ComEd has no preferred stock
Docket No. 18-____ ComEd Ex. 2.03 Page 325 of 334

Schedule D-5Page 1 of 1
Witness: Tracy
Line Issue Date Gross Underwriters' Issuance Net Method of AuthorizedNo. Type Issued Proceeds Discounts Expense Proceeds Rate Treatment Amort. Period
(A) (B) (C) (D) (E) (F) (G) (H)
Commonwealth Edison CompanyUnrecovered Common Equity Issuance Costs
Year Ending December 31, 2017
ComEd has no Unrecovered Common Equity Issuance Costs
Docket No. 18-____ ComEd Ex. 2.03 Page 326 of 334

Schedule D-6 RYPage 1 of 1
Commonwealth Edison CompanyCost of Capital Equity Workpapers - 2017 Recon Year
Year Ending December 31, 2017
Witness: Tracy
Line Monthly Average Market YieldNo. Month on 30 Year US Treasury Securities
(A) (B)
1 January 3.02%2 February 3.03%3 March 3.08%4 April 2.94%5 May 2.96%6 June 2.80%7 July 2.88%8 August 2.80%9 September 2.78%10 October 2.88%11 November 2.80%12 December 2.77%
13 12 Month Average 2.89%
14 Cost of Equity Base 5.80% (1)15 Performance Metrics Penalty 0.00%
16 Total Cost of Common Equity 8.69%
Note:(1) Per 220 ILCS 5/16-108.5(c)(3)(B)
Docket No. 18-____ ComEd Ex. 2.03 Page 327 of 334

Schedule D-7Page 1 of 2
Commonwealth Edison CompanyComparative Financial Data
(In Thousands)Witness: Tracy
Line Historical Calendar YearsNo. Description Source 2017 2016 2015 2014 2013
(A) (B) (C) (D) (E) (F) (G)
1 Funds from Operations:2 Net Income FERC Form 1, P. 120 567,362$ 377,796$ 425,934$ 407,523$ 249,341$ 3 Depreciation and Amortization FERC Form 1, P. 120 848,945 774,199 705,449 685,934 667,911 4 Deferred Income Taxes - Net FERC Form 1, P. 120 658,387 439,553 508,223 289,994 179,069 5 Deferred Investment Tax Credits - Net FERC Form 1, P. 120 (1,916) (2,056) (2,179) (2,053) (2,314) 6 (Less) AFUDC - Other Funds (Acct 419.1) ICC Form 21, P. 7b Line 38 (12,130) (13,718) (5,171) (2,461) (10,144) 7 (Less) AFUDC - Borrowed Funds (Acct 432) ICC Form 21, P. 7b Line 65 (7,709) (8,243) (4,050) (2,274) (4,962) 8 Total Funds from Operations (Sum Lines 2 to 8) 2,052,939$ 1,567,531$ 1,628,206$ 1,376,663$ 1,078,901$ 9
10 Capital Structure:11 Short-term Debt (Accts 231 and 233) ICC Form 21, P. 4 Lines 34, 36 - - 294,415 304,000 184,000 12 Long-term Debt (Accts 221-226) ICC Form 21, P. 4 Line 23 7,851,853 7,277,312 6,744,900 6,156,648 5,872,857 13 Preferred and Preference Stock (Acct 204) ICC Form 21, P. 4 Line 3 - - - - -
14 Common Equity ICC Form 21, P. 415 Common Stock (Acct 201) ICC Form 21, P. 4 Line 2 1,587,766 1,587,714 1,587,712 1,587,712 1,587,711 16 Premium on Capital Stock (Acct 207) ICC Form 21, P. 4 Line 6 5,020,101 5,020,278 5,019,959 5,020,506 5,020,843 17 Other Paid in Capital (Accts 208-211) ICC Form 21, P. 4 Line 7 1,807,920 1,136,747 663,521 455,401 177,087 18 (Less) Capital Stock Expense (Acct 214) ICC Form 21, P. 4 Line 10 (6,943) (6,943) (6,943) (6,943) (6,943) 19 Retained Earnings (Accts 215-216.1) ICC Form 21, P. 4 Lines 11-12 1,130,071 984,717 975,919 849,059 748,523 20 Accumulated Other Comprehensive Income (Acct 219) ICC Form 21, P. 4 Line 14 (14) (15) (15) (14) (64) 21 Reacquired Capital Stock ICC Form 21, P. 4 Line 13 - - - - - 22 Total Common Equity Lines 15+16+17+18+19+20+21 9,538,901 8,722,498 8,240,153 7,905,721 7,527,157
23 Total Capital (including short-term debt) Lines 11+12+22 17,390,754$ 15,999,810$ 15,279,468$ 14,366,369$ 13,584,014$
24 Capital Structure Ratios:25 Short-term Debt Ratio Line 11 / Line 23 0.0% 0.0% 1.9% 2.1% 1.4%26 Long-term Debt Ratio Line 12 / Line 23 45.1% 45.5% 44.1% 42.9% 43.2%27 Preferred Stock Ratio Line 13 / Line 23 - - - - - 28 Common Equity Ratio Line 22 / Line 23 54.9% 54.5% 53.9% 55.0% 55.4%
29 Cost of Capital:30 Embedded Cost of Long-term Debt (a) From WPD-7, Page 1 4.51% 4.80% 4.83% 5.12% 5.14%31 Embedded Cost of Preferred Stock Line 57 / Line 13 - - - - -
32 Earnings Ratios:33 Earnings Available for Common Equity ("EACE") Line 2 - Line 45 567,362 377,796 425,934 407,523 249,341 34 AFUDC as a percentage of EACE Line 6 + Line 7 / Line 33 3.5% 5.8% 2.2% 1.2% 6.1%35 Estimated Net Utility Rate Base From WPD-7, Page 2 15,815,050 12,646,881 11,441,921 10,444,102 9,542,258 36 Estimated Return on Rate Base (b) (b) (b) (b) (b) (b)37 Return on Average Common Equity (NI/Avg Com Equity) Annual ICC Filing (c) 6.2% 4.5% 5.3% 5.3% 3.4% (c)
Docket No. 18-____ ComEd Ex. 2.03 Page 328 of 334

Schedule D-7Page 2 of 2
Commonwealth Edison CompanyComparative Financial Data
(In Thousands)Witness: Tracy
Line Historical Calendar YearsNo. Description Source 2017 2016 2015 2014 2013
(A) (B) (C) (D) (E) (F) (G)38 Fixed Charge Coverage:39 Total Operating Income ICC Form 21, P. 7 Line 26 931,834 919,671 757,817 732,044 827,511 40 Other Income ICC Form 21, P. 7b Line 41 26,965 31,307 23,175 17,414 26,130
41 Federal and State Income Taxes42 Income Taxes - Electric ICC Form 21, P. 7 Line 15-19 1,714,440 302,826 280,546 267,732 153,904
43 AFUDC Equity Funds Portion (Acct 419.1) ICC Form 21, P. 7b Line 38 12,130 13,718 5,171 2,461 10,144 44 Total Interest Charges ICC Form 21, P. 7b Line 66 360,729 460,803 331,010 320,014 579,018 45 Preferred Dividends FERC Form 1, P. 121 Line 80 - - - - -
46 Pre-tax Interest Coverage (Excluding AFUDC) Line (39+40+42-43)/44 7.38 2.69 3.19 3.17 1.72 47 After-tax Fixed Charge Coverage Line (39+40)/(44+45) 2.66 2.06 2.36 2.34 1.47
48 Cash Flow Ratios:49 Funds from Operations Line 8 2,052,939$ 1,567,531$ 1,628,206$ 1,376,663$ 1,078,901$ 50 Cash Interest Paid FERC Form 1, Suppl. C.F. Info. 307,000 298,000 308,000 292,000 283,000 51 Total Interest Incurred Line 44 360,729 460,803 331,010 320,014 579,018 52 Funds Flow Interest Coverage (Lines 49+50)/ Line 51 6.54 4.05 5.85 5.21 2.35
53 Average Short-term Debt Line 11 (Average) - 147,208 299,208 244,000 92,000 54 Average Long-term Debt Line 12 (Average) 7,564,583 7,011,106 6,450,774 6,014,753 5,823,158 55 Funds Flow as % of Ave. Total Debt Line 49/(Line 53+54) 27.1% 21.9% 24.1% 22.0% 18.2%
56 Common Dividends FERC Form 1, P. 121 Line 81 422,009 368,997 299,074 306,987 219,993 57 Preferred Dividends FERC Form 1, P. 121 Line 80 - - - - - 58 Cash Coverage of Common Dividends (Line 49-57) / Line 56 4.86 4.25 5.44 4.48 4.90
59 Gross Construction Expenditures FERC Form 1, P. 120 Line 26 2,257,891 2,722,151 2,402,036 1,683,357 1,420,726 60 Gross Construction Expenditures (Excluding AFUDC) Line 59 - Line 7 - Line 8 2,238,052 2,700,190 2,392,815 1,678,622 1,405,620 61 Net Cash Flow as % of Construction Exp. (Line 49-56-57) / Line 60 72.9% 44.4% 55.5% 63.7% 61.1%
62 Common Stock Related Data:63 Shares Outstanding - Year End (000) FERC Form 1, P. 251 Line 3 127,021 127,017 127,017 127,017 127,017 64 Shares Outstanding - Monthly Weighted Average (000) (d) (d) (d) (d) (d)65 Earnings Per Share - Weighted Average (d) (d) (d) (d) (d)66 Dividends Per Share - Weighted Average (d) (d) (d) (d) (d)67 Dividends Declared Per Share (d) (d) (d) (d) (d)68 Dividend Payout Ratio (Declared Basis) (d) (d) (d) (d) (d)
Notes:(a) Not used for ratemaking purposes. See Schedule D-3 for ComEd's embedded cost of long term debt with appropriate ratemaking adjustments included in the ILCC Form 21.(b) Not used for ratemaking purposes. Includes non-jurisdictional assets.(c) Not used for ratemaking purposes. Includes non-jurisdictional revenue and costs.(d) Data is not meaningful as Exelon Corporation owns 99.9% of ComEd's outstanding common stock.
Docket No. 18-____ ComEd Ex. 2.03 Page 329 of 334

Schedule D-8Page 1 of 1
Commonwealth Edison CompanySecurity Quality Ratings
Witness: TracyLineNo.
1 Filing Requirement (a) History of Changes in Ratings by Class of Security
2Senior
Secured DebtSenior
Unsecured DebtPreferred
StockCommercial
Paper3 S&P4 3/20/2013 A- BBB BB+ A25 1/30/2014 A- BBB BB+ A26 1/30/2015 A- BBB BB+ A27 2/3/2016 A- BBB BB+ A28 2/6/2017 A- BBB BB+ A29 1/29/2018 A- BBB BB+ A2
10 Moody's11 3/20/2013 A3 Baa2 Ba1 P212 1/30/2014 A2 Baa1 Baa3 P213 1/30/2015 A2 Baa1 Baa3 P214 2/3/2016 A2 Baa1 Baa2 P215 2/3/2016 A2 Baa1 Baa2 P216 2/6/2017 A2 Baa1 Baa2 P217 1/29/2018 A1 A3 Baa2 P2
18 Fitch19 3/20/2013 BBB+ BBB BB+ F320 1/30/2014 BBB+ BBB BB+ F321 2/7/2014 A- BBB+ BBB- F222 1/30/2015 BBB+ BBB BB+ F323 2/3/2016 A- BBB+ BBB- F224 2/6/2017 A A- BBB F225 1/29/2018 A A- BBB F2
26 Filing Requirement (b) and (c)27 WPD-8 contains copies of credit rating analyses and reports published during the last 12 28 months. All discussion by the rating agencies with respect to the utility's operations, financial 29 condition, and regulatory environment occurred within a report that changed, affirmed, or 30 explained the rationale for the ratings of ComEd's securities or that of its parent company.31 Preferred stock is related to a financing subsidiary of ComEd.
Docket No. 18-____ ComEd Ex. 2.03 Page 330 of 334

Schedule D-9Page 1 of 1
Witness: Tracy
LineNo.
1 See Exelon Corporation 2017 Form 10-K, Page 277.
2 The Exelon Corporation Form 10-K was filed under the provisions of 3 Section 285.305 - "General Information Applicable to All Utilities4 Subject to This Part", subparagraph "m".
(A)
Year Ending December 31, 2017
Commonwealth Edison CompanyIncome Statement
Descritpion
Docket No. 18-____ ComEd Ex. 2.03 Page 331 of 334

Schedule D-10Page 1 of 1
Witness: Tracy
LineNo.
1 See Exelon Corporation 2017 Form 10-K, Page 279-280.
2 The Exelon Corporation Form 10-K was filed under the provisions of
3 Section 285.305 - "General Information Applicable to All Utilities
4 Subject to This Part", subparagraph "m".
(A)
Year Ending December 31, 2017
Commonwealth Edison CompanyBalance Sheet
Descritpion
Docket No. 18-____ ComEd Ex. 2.03 Page 332 of 334

Schedule D-11Page 1 of 1
Witness: Tracy
LineNo.
1 See Exelon Corporation 2017 Form 10-K, Page 278.
2 The Exelon Corporation Form 10-K was filed under the provisions of 3 Section 285.305 - "General Information Applicable to All Utilities4 Subject to This Part", subparagraph "m".
(A)
Year Ending December 31, 2017
Commonwealth Edison CompanyStatement of Cash Flows
Descritpion
Docket No. 18-____ ComEd Ex. 2.03 Page 333 of 334

Schedule D-12Page 1 of 1
Witness: Tracy
LineNo.
1 See Exelon Corporation 2017 Form 10-K, Page 281.
2 The Exelon Corporation Form 10-K was filed under the provisions of
3 Section 285.305 - "General Information Applicable to All Utilities
4 Subject to This Part", subparagraph "m".
(A)
Year Ending December 31, 2017
Commonwealth Edison CompanyStatement of Retained Earnings
Descritpion
Docket No. 18-____ ComEd Ex. 2.03 Page 334 of 334