Do multivariate analyses incorporating changes in pattern across taxonomic levels reveal...
11
This article appeared in a journal published by Elsevier. The attached copy is furnished to the author for internal non-commercial research and education use, including for instruction at the authors institution and sharing with colleagues. Other uses, including reproduction and distribution, or selling or licensing copies, or posting to personal, institutional or third party websites are prohibited. In most cases authors are permitted to post their version of the article (e.g. in Word or Tex form) to their personal website or institutional repository. Authors requiring further information regarding Elsevier’s archiving and manuscript policies are encouraged to visit: http://www.elsevier.com/copyright
-
Upload
independent -
Category
Documents
-
view
1 -
download
0
Transcript of Do multivariate analyses incorporating changes in pattern across taxonomic levels reveal...
This article appeared in a journal published by Elsevier. The attachedcopy is furnished to the author for internal non-commercial researchand education use, including for instruction at the authors institution
and sharing with colleagues.
Other uses, including reproduction and distribution, or selling orlicensing copies, or posting to personal, institutional or third party
websites are prohibited.
In most cases authors are permitted to post their version of thearticle (e.g. in Word or Tex form) to their personal website orinstitutional repository. Authors requiring further information
regarding Elsevier’s archiving and manuscript policies areencouraged to visit:
http://www.elsevier.com/copyright

Author's personal copy
Do multivariate analyses incorporating changes in pattern across taxonomic levelsreveal anthropogenic stress in Mediterranean lagoons?
Christos Arvanitidis a,⁎, Paul John Somerfield b, Georgios Chatzigeorgiou c, Sofia Reizopoulou d,Theodoros Kevrekidis e, Anastasios Eleftheriou a
a Institute of Marine Biology of Crete, Hellenic Centre for Marine Research, Heraklion, 71003, Crete, Greeceb Plymouth Marine Laboratory, Prospect Place, The Hoe, Plymouth PL1 3DH, United Kingdomc Biology Department, University of Crete, Vasilika Vouton, 71409 Heraklio, Crete, Greeced Institute of Oceanography, Hellenic Centre for Marine Research, 19013, Anavyssos Attikis, Greecee Laboratory of Environmental Research and Education, Democritus University of Thrace, 68100, Alexandroupolis, Greece
a b s t r a c ta r t i c l e i n f o
Article history:Received 7 July 2006Received in revised form 29 October 2008Accepted 31 October 2008
Keywords:BiodiversityBiodiversity MDSDelta MDSLambda MDSMediterranean, lagoonsNumber of taxa MDSTaxonomic distinctness
It is accepted that observed patterns in community structure change as analyses are carried out at highertaxonomic levels. Univariate analyses which incorporate higher taxonomic structure within assemblageshave been shown to be informative. In this paper we suggest ways in which changes in multivariaterelationships at higher taxonomic levels and associated with higher taxonomic/phylogenetic structure of thecommunity may be incorporated into multivariate analyses, an aspect never occurred before in this type ofanalysis. Four approaches, namely: biodiversity MDS (bdMDS), number of taxa MDS (ntMDS), delta MDS(δMDS) and lambda MDS (λMDS), are proposed, and applied to theoretical data as well as to data collectedfrom the literature on the Mediterranean lagoonal environment. Results show that these approaches havethe capacity to distinguish severely impacted lagoons from naturally disturbed ones, although in practicethe simplest method (ntMDS) was the most successful. Analyses based on the most abundant groups(polychaetes, molluscs, crustaceans) did not always match analyses based on the entire macrofauna,mirroring the performance of taxonomic distinctness indices in the Mediterranean lagoons. The importantcharacteristics of the approaches introduced, as well as potential criticisms are provided. Application of thesetechniques on smaller scales and to other habitats, is suggested prior to their wider use in the region.
© 2008 Elsevier B.V. All rights reserved.
1. Introduction
Major global environmental concerns, such as the biodiversitycrisis (genomes-species-habitats extinction) and global change, havebrought the need to assess and conserve biodiversity to the fore inmany international fora (e.g. Gray,1997). Governmental commitmentsunder a number of European and International treaties and conven-tions, limited resources, and the rapidity with which environmentalmanagers and decision-makers need biodiversity information,have necessitated the development and application of various RapidAssessment Techniques (RATs) in the field of marine science (e.g. Féralet al., 2003).
Many techniques for measuring changes in biodiversity have beendeveloped over the years (see for example Clark, 1997; Gray, 2000;Clarke and Warwick, 2001; Magurran, 2004). Though these techniquesare generally applied to species information, several studies have shownthat information about the distribution of higher taxa may be useful in
studies of marine biodiversity and environmental issues (Warwick,1988; Warwick et al., 1990; Ferraro and Cole, 1995; Somerfield andClarke, 1995; Olsgard et al., 1997, 1998; Warwick and Clarke, 2001;Warwick and Light, 2001; Féral et al., 2003).
Two approaches employing higher taxonomic information arecommonly used in marine benthic ecology: (1) analyses performed attaxonomic levels higher than species (Warwick, 1988; Warwick et al.,1990; Ferraro and Cole,1995; Somerfield and Clarke,1995;Olsgard et al.,1997, 1998); (2) analyses using biodiversity indices which includeinformation about the phylogenetic/taxonomic relationships betweentaxa, such as average taxonomic distinctness (Δ+) and variation intaxonomic distinctness (Λ+) (Clarke and Warwick, 1998a,b; Izsak andPrice, 2001; Warwick and Clarke, 2001; Clarke et al., 2006).
It is often postulated that the taxonomic level required to meet theobjectives of an environmental monitoring study with the leastpossible cost and time spends is higher than the species level(Warwick, 1988; Kingston and Riddle, 1989; Ferraro and Cole, 1995).This is because identification of organisms to the species level may notalways be necessary to describe spatial patterns, especially whenpatterns are strong such as along established pollution gradients(Pearson and Rosenberg,1978; Boesch and Rosenberg,1981;Warwick,
Journal of Experimental Marine Biology and Ecology 369 (2009) 100–109
⁎ Corresponding author. Tel.: +30 2810 337748; Fax: +30 2810 337822.E-mail address: [email protected] (C. Arvanitidis).
0022-0981/$ – see front matter © 2008 Elsevier B.V. All rights reserved.doi:10.1016/j.jembe.2008.10.032
Contents lists available at ScienceDirect
Journal of Experimental Marine Biology and Ecology
j ourna l homepage: www.e lsev ie r.com/ locate / jembe
Author's personal copy
1988; Ferraro and Cole, 1990; Olsgard et al., 1997, 1998). Multivariateanalyses deriving from higher phylogenetic/taxonomic categories mayreflect gradients of contamination more closely than those based onspecies abundances, which are considered to be more affected bynatural variability (the “hierarchic-response-to-stress” hypothesis)and therefore the taxonomic level most highly correlated withenvironmental variables indicative of anthropogenic impacts willincrease with increasing levels of stress (Olsgard et al., 1997, 1998;Olsgard and Somerfield, 2000). Comparisons of patterns at the specieslevel and those from the higher taxonomic categories show thatpatterns are more closely related in polluted areas than in pristineones (Olsgard et al., 1998; Olsgard and Somerfield, 2000). Inanthropogenically impacted areas species abundances may bediscriminated into a smaller number of lower taxonomic categories.If pollution, in the extreme example, reduces the number of species ineach family to a single species, then patterns deriving from the genusand family level will be identical.
Recently, the efficiency and robustness of taxonomic distinctnessindices have been tested using data derived from Mediterraneanlagoons at various geographic scales (Arvanitidis et al., 2005a,b). Themain difficulty faced in the course of biodiversity/environmentalhealth assessments in such lagoons is that natural disturbance, suchas increased nutrient concentrations (fresh water resources) andhigh temperatures, as well as anthropogenic activities (e.g. intensiveresource exploitation, sewage discharges) often result in dystrophicepisodes (uncontrolled microbial activity and oxygen depletion),with identical community modifications: low species diversitywith almost complete dominance of a few tolerant species;intercrossed ABC curves, associated with near zero W-statisticvalues (e.g. Cognetti, 1992; Reizopoulou et al., 1996). Analysesusing taxonomic distinctness indices, incorporating phylogenetic/taxonomic relationships, could differentiate severely impactedlagoons from naturally disturbed ones but standard multivariateanalyses making use of information at the species level only, couldnot (Arvanitidis et al., 2005a,b).
In this study we explore multivariate techniques, which incorpo-rate higher taxonomic structure into the analysis, to see if suchanalyses match the capacity of taxonomic distinctness indices todistinguish between anthropogenic impact and natural disturbance inMediterranean coastal lagoons. The performance of these techniquesis tested by using both theoretical datasets as well as literature datafrom the Mediterranean.
2. Material and Methods
2.1. Data
An artificial dataset was constructed (http://elnet-net.hcmr.gr/data_sets/data_sets.zip), representing abundances of 48 species insamples from 4 coastal lagoons (A, B, C, D), together with taxonomicrelationships between species (Table 1). Five replicate samples fromeach of 3 sites along an environmental gradient in each of 4 seasonsfor each lagoon are simulated, giving a total of 240 samples. Speciespresences, abundances and taxonomic relationships are used torepresent different conditions. Seasonal shifting was taken intoaccount based on the general trend that species abundances areknown to produce a spatially homogenized multivariate patternduring summer and autumn and a well-defined gradient in winterand spring. This trend emerges from the Mediterranean lagoonsliterature and is well documented in the papers cited below.Accordingly, the two extremes were that the abundances values inthe artificial dataset were within the same order of magnitude alongthe sea-land axe in summer sampling period and differed severalorders of magnitude during spring period, with higher abundancevalues towards the land side. This theoretical dataset closely followsthat proposed by Pearson and Rosenberg (1978) in that it provides
less species with higher abundances towards the land side andmore species in lower abundance values towards the sea side of thelagoons included.
Lagoons A and D represent one biogeographic sector, B and Canother. Lagoons C and D represent severely impacted conditions,while A and B do not. Species abundances in the simulated datasetwere aggregated to higher taxonomic groupings, namely genera,families, orders and classes, and averaged within seasons foreach lagoon, standardised (converted to percentages) and fourth-root transformed.
Eighteen Mediterranean lagoons, sampled at least on a seasonalbasis, are considered (Fig. 1, Table 2). Macrobenthic datasets werecollected from the following Hellenic lagoons: Tsopeli, Vivari(Reizopoulou et al., 1996), Gialova (Koutsoubas et al., 2000), Papas(Reizopoulou and Nicolaidou, 2004), Monolimni, Laki, and Drana
Table 1Examples of the theoretical datasets. a: example of species presence/absence data;b: example of the aggregation matrix used for the classification of the species
a
LagoonA LagoonB LagoonC LagoonD
Sp1 1 1 1 1Sp2 1 1 1 0Sp3 1 1 0 0Sp4 1 1 0 0Sp5 1 0 1 0Sp6 1 0 1 0Sp7 1 0 0 0Sp8 1 0 0 0Sp9 1 0 0 0Sp10 1 0 0 0Sp11 1 0 0 0Sp12 1 0 0 1Sp13 1 0 0 1Sp14 1 0 0 1Sp15 1 0 0 0Sp16 1 0 0 0Sp17 1 0 0 0Sp18 1 0 0 0Sp19 0 1 1 0Sp20 0 1 1 0Sp21 0 1 1 0Sp22 0 1 1 0Sp23 0 1 0 0Sp24 0 1 0 0Sp25 0 1 0 1
b
SPECIES GENUS FAMILY ORDER CLASS PHYLUM
Sp1 genus 1 family 1 order 1 class 1 phylum 1Sp2 genus 2 family 1 order 1 class 1 phylum 1Sp3 genus 51 family 99 order 3 class 3 phylum 1Sp4 genus 52 family 100 order 3 class 3 phylum 1Sp5 genus 10 family 5 order 4 class 4 phylum 1Sp6 genus 10 family 5 order 4 class 4 phylum 1Sp7 genus 21 family 7 order 6 class 6 phylum 1Sp8 genus 22 family 7 order 6 class 6 phylum 1Sp9 genus 23 family 8 order 7 class 7 phylum 1Sp10 genus 24 family 9 order 7 class 7 phylum 1Sp11 genus 25 family 10 order 7 class 7 phylum 1Sp12 genus 18 family 6 order 5 class 5 phylum 1Sp13 genus 18 family 6 order 5 class 5 phylum 1Sp14 genus 18 family 6 order 5 class 5 phylum 1Sp15 genus 26 family 11 order 7 class 7 phylum 1Sp16 genus 27 family 12 order 7 class 7 phylum 1Sp17 genus 28 family 13 order 8 class 8 phylum 1Sp18 genus 29 family 14 order 9 class8 phylum 1Sp19 genus 12 family 2 order 2 class 2 phylum 1Sp20 genus 12 family 2 order 2 class 2 phylum 1Sp21 genus 12 family 2 order 2 class 2 phylum 1Sp22 genus 12 family 2 order 2 class 2 phylum 1Sp23 genus 30 family 15 order 10 class 9 phylum 1Sp24 genus 31 family 16 order 11 class 10 phylum 1Sp25 genus 16 family 2 order 2 class 2 phylum 1
101C. Arvanitidis et al. / Journal of Experimental Marine Biology and Ecology 369 (2009) 100–109

Author's personal copy
(Kevrekidis et al., 2000; Kevrekidis, 2004a). Datasets on lagoonalmacrobenthos elsewhere in the Mediterranean were collected from:Prevost (Guelorget and Michel, 1979a,b), Fogliano, Monaci, Caprolace,Fondi, Lungo (Gravina et al., 1989), Ghar el Melh (Romdhane andChakroun, 1986), Sacca di Goro (both polluted and dredged areas;Reizopoulou et al., 1996), Burollus (Samaan et al., 1989) and Bardawil(Aboul-Ezz, 1988). The majority are euryhaline systems experiencingregular dystrophic crises during summer and early autumn associatedwith the rapid decomposition of organic material accumulated overthe year. These crises frequently result in hypoxic or anoxic conditionsin the water column and in sediments, with hydrogen sulphidereleases into the water column. Although subjected to periodicaquaculture stress, most lagoons are naturally stressed ecosystemsthat do not experience severe anthropogenic impacts (e.g. Guelorgetand Michel, 1979a,b; Gravina et al., 1989; Reizopoulou et al., 1996;Koutsoubas et al., 2000).
Drana, Papas, Sacca di Goro and Burollus are considered to beanthropogenically stressed. Drana, Sacca di Goro, and Burollus areseverely impacted. Drana lagoon is impacted by anthropogenicactivities associated with the occlusion of its sea connection, whichled to irregular reclamation of much of the lagoon. Papas lagoon,opening to the Patraikos Gulf and the Ionian Sea, is strongly affected by
eutrophic phenomena, characterized by prolonged seasonal hypoxiaand frequent anoxic events (Reizopoulou and Nicolaidou, 2004). Saccadi Goro at the south of the Po River Delta is considered a severelyimpacted ecosystem (Reizopoulou et al., 1996; Viaroli et al., 2006;Marchini et al., 2004). Burollus is one of the most impacted lagoons inthe Nile delta, subjected to inputs from agriculture, urbanization andindustrial pollution. Dramatic alterations in fish and macrofaunalspecies diversity have been observed in recent years (Prof. M.R. Fishar,pers. comm.).
On the other hand, for those lagoons reported as not receivingsevere anthropogenic impact, sufficient information on runoffs fromagriculture, industry, sewage or from any other kind of urbanwaste, isoften not provided by the relevant publications.
Average abundance values, over seasonal samplings, data forthe most abundant macrofaunal species (polychaetes, molluscsand crustaceans combined) from the Hellenic lagoons were aggregatedto genus, family, order, class and phylum. These taxa have been selectedbecause the respective taxonomic knowledge and expertise is con-sidered to be evenly distributed in the Mediterranean. Abundances ofeach macrofaunal group were also aggregated separately. Taxonomicclassification followed the European Register of Marine Species (http://www.marbef.org/data/erms.php) and ITIS (Integrated Taxonomic
Table 2Diversity values, geomorphological and physico-chemical characteristics of the Mediterranean lagoons considered (modified from Dounas et al., 1998)
Lagoons Mean macrobenthic density1 H'2 J'2 Surface (Km2) Mean Depth (m) Salinity range Temperature range Reference
Bardawil 3,850 — — 1,440 2.5 33.1-93.56 15.6-32.7 Aboul-Ezz (1988); Siliem (1989)Burollus 440 — — 500 1 — 17-29.3 Samaan et al. (1989)Carpolace 1,239 4.23 — 2.26 1.3 — 8-30 Gravina et al. (1989)Drana 9,051 1.15 0.43 2.2 1.2 0.9-8.7 2-34 Malea et al. (2004)Fogliano 2,489 2.6 — 4.04 0.9 18-45 7.5-28.2 Gravina et al. (1989)Fondi 10,482 1.55 — 38 9.1 13-33 — Gravina et al. (1989)Ghar El Melh — — — 30 — — 9-29.5 Romdhane and Chakroun (1986);
Ben Abdallah and Maamouri (2006)Gialova 5,792 2.5 0.57 2.4 0.7 13-60 14-24 Dounas et al. (1998); present studyLaki 9,063 1.16 0.43 1 0.2 0.1-35.1 6.7-25.9 Mogias and Kevrekidis (2005)Lungo 4,516 1.36 — 47 4.5 13-33 — Gravina et al., (1989)Monaci 1,687 2.99 — 0.95 0.8 — 8.9-29.2 Gravina et al., (1989)Monolimni 27,538 1.5 0.57 1.12 0.65 0.3-5.7 1.8-28.5 Kevrekidis (2004a,b)Papas 8,633 2.33 0.61 — — 20-42.5 10-32 Reizopoulou and Nicolaidou (2004)Prevost 5,485 0.51 — 38 1 17-40 24.9-12.2 Guelorget and Michel (1979a,b)Sacca di Goro — — — 25 1.5 18.4-35.6 4.9-26.9 Reizopoulou et al. (1996)Sacca di Goro (polluted) 5,866 1.7 0.53 — — 18.4-34.7 — Reizopoulou et al. (1996)Sacca di Goro (dredged) 13,921 1.7 0.52 — — 19.9-35.6 — Reizopoulou et al. (1996)Tsopeli 1,648 2.35 0.59 1 — 21-35 8-29 Reizopoulou et al. (1996)Vivari 3,716 1.42 0.41 0.5 — 31.5-40 12-34 Reizopoulou et al. (1996)
1: Yearly averaged values; 2: Index calculated from yearly averaged abundance values.
Fig. 1.Map indicating locations of the Mediterranean lagoonal systems taken into account in the present study. Numbers on the top of columns indicate number of species belongingto the most abundant macrobenthic groups (polychaetes, molluscs, and crustaceans. Abbreviations: Pr: Prevost; Fo: Fogliano; Mo: Monaci; Ca: Caprolace; Lu: Lungo; Fn: Fondi; Gh:Ghar el Melh; Gp: Sacca di Goro polluted; Gd: Sacca di Goro dredged; Ts: Tsopeli; Pa: Papas; Gl: Gialova; Vv: Vivari; La: Laki; Dr: Drana; Mn: Monolimni; Bu: Burollus; Ba: Bardawil.
102 C. Arvanitidis et al. / Journal of Experimental Marine Biology and Ecology 369 (2009) 100–109

Author's personal copy
Information System; http://www.itis.usda.gov). Quantitative data werestandardised (converted to percentages) and fourth-root transformed.
Seasonal abundances were not available for many of the Mediter-ranean lagoons. For all lagoons data matrices were constructed withthe numbers of taxa recorded in each taxonomic level from species tophylum, average (Δ+) and variation in taxonomic distinctness (Λ+)values as calculated for taxonomic levels from species to class, both forpolychaetes, molluscs and crustaceans combined, and for each groupseparately. The original datasets are available from http://elnet-net.hcmr.gr/data_sets/data_sets.zip.
2.2. Analyses
Non-metric multidimensional scaling (MDS) was performed onresemblance matrices calculated using Steinhaus' similarity coeffi-cient (Legendre and Legendre, 1998), more commonly called the Bray-Curtis coefficient (Clarke et al., 2006), on both the quantitative data(standardised and fourth-root transformed) and qualitative data(number of taxa, Δ+ and Λ+ values, per taxonomic category andlagoon). These analyses were applied to the artificial dataset as wellas to those from the Hellenic and the Mediterranean lagoons. Stress of
Fig. 2. Schematic representation of the non-metric multivariate scaling (nMDS) technique, applied on the theoretical dataset.
Fig. 3. Schematic representation of the third-stage MDS, biodiversity MDS (bdMDS), applied on the theoretical dataset.
103C. Arvanitidis et al. / Journal of Experimental Marine Biology and Ecology 369 (2009) 100–109

Author's personal copy
2-dimensional plots was measured by Kruskal's stress formula I(Clarke and Green, 1988). Changes in pattern deriving from differenttaxonomic levels in different lagoons were assessed by means ofsecond-stage MDS (Somerfield and Clarke, 1995). This kind of analysisrequires, however, quantitative data and was, therefore, appliedonly to the artificial dataset and to those from the Hellenic lagoonsconsidered.
Lagoons in the same biogeographical sector will have morespecies in common than lagoons in different sectors. In a standardmultivariate analysis of species abundance data from the 4 lagoons inthe simulated dataset lagoons in the same sector should clustertogether. Lagoons A and D should bewell-distinguished from lagoonsB and C (Fig. 2). To strip out the effect of shared species, and to focuson changes in pattern across taxonomic levels, the key is to constructsecond-stage resemblance matrices (Fig. 3). First, matrices ofresemblances between seasonal abundances of taxa at each taxo-nomic level within each lagoon are constructed. These resemblancematrices are produced by taxa-by-season (averaged abundancevalues) matrices, at each of the taxonomic levels. These matricesare then correlated using a rank correlation between correspondingelements. Thus a second-stage resemblance matrix is constructed foreach lagoon (Fig. 3), which could be used to display interrelationshipsbetween patterns derived from different taxonomic levels, as inSomerfield and Clarke (1995). To display interrelationships betweenlagoons, in terms of how similar they are with respect how patterns
change across taxonomic levels, a second second-stage resemblancematrix (here termed a third-stage resemblance matrix) is con-structed using rank correlations between corresponding elementsin the set of second-stage matrices (Fig. 3). This third-stage matrixis further processed by MDS (a third-stage MDS) in which lagoonsshowing similar changes in pattern as species abundances areaggregated to higher taxonomic levels, regardless of whether theyhave any species in common, will group together. The anticipatedpattern in the third-stage MDS plot, henceforward termed biodiver-sity MDS (bdMDS), is that impacted lagoons (in which interrelationsof the patterns deriving from the different taxonomic levelsare expected to be similar, according to the hierarchic-response-to-stress hypothesis) should cluster separately from non-impactedones, irrespective of the species present. In such an analysis ofthe simulated dataset, therefore, lagoons C and D should clusterseparately from A and B.
The bdMDS has been explored using only the simulated datasetand those from the Hellenic sector which have been collected by usinghand-operating grabs (0.025-0.05 m2 sampling surface). At the pan-Mediterranean scale, however, there is insufficient data to assesschanges in the full multivariate pattern across taxonomic levels.Heterogeneity in sampling gears used was another reason for nottaking into account the quantitative information but only informationon the presence of species. Non-metric MDS was performed onresemblance matrices summarising similarity between lagoons in theway that the number of taxa, Δ+, and Λ+ values change acrosstaxonomic levels, which from now on are referred to as ntMDS, δMDSand λMDS, respectively.
3. Results
In the standard MDS ordination plot derived from Steinhaussimilarities calculated from yearly averaged abundance values in thesimulated dataset (Fig. 4a), as expected, lagoons A and D representingimpacted and unimpacted conditions in the same biogeographicsector, are clearly separated from lagoons B and C representingimpacted and unimpacted conditions in another sector. Usingpresence-absence data, or seasonally averaged abundance values,
Fig. 4. Ordination plots resulting from the application of: (a) the MDS technique on thespecies density values from the seasonal sampling data, in included in the model file;(b) the bdMDS technique on the same dataset.
Fig. 5. MDS plot resulting from the average macrofaunal density values at the sectoralscale (Hellenic lagoons).
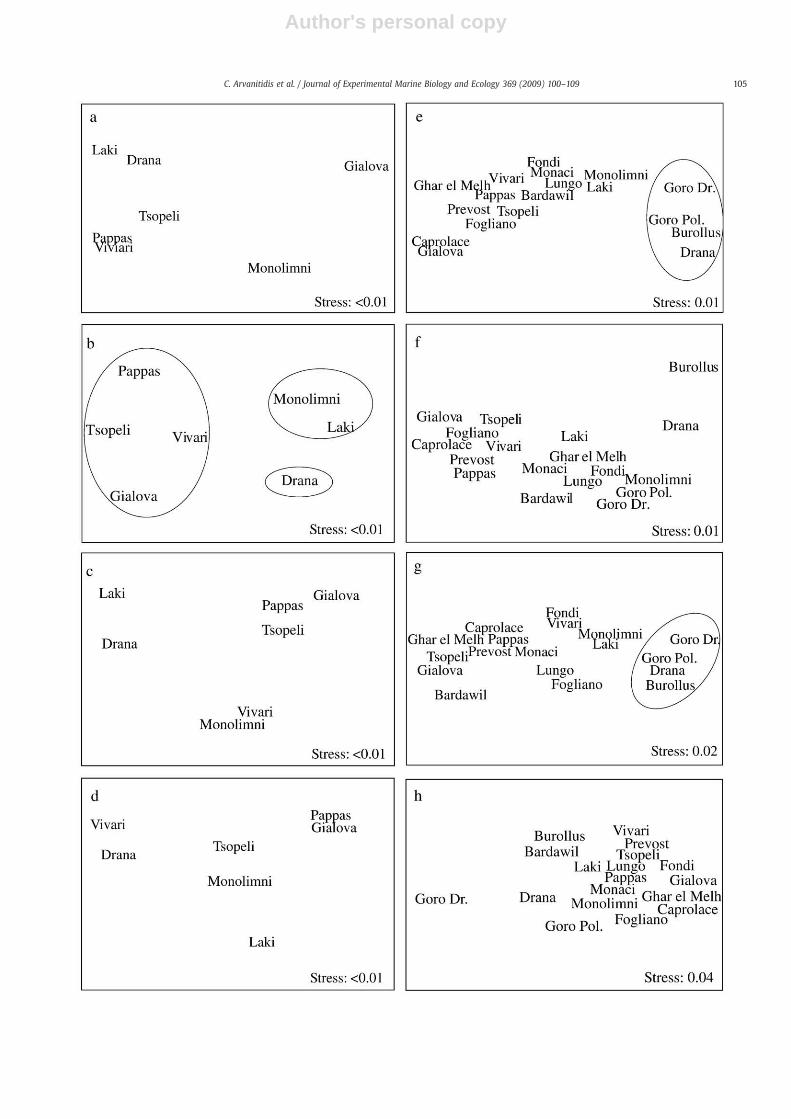
Fig. 6. Left column: ordination bdMDS plots of ranked intermatrix correlations resulted from the third-stageMDS;matrices involved, include information on changes of patterns fromthe species and higher taxonomic levels. Data include both the total of the most abundant macrofaunal groups (a), as well as each of these groups: polychaetes (b), molluscs (c) andcrustaceans (d). Right column: ordination ntMDS plots; matrices involved, include numbers of taxa identified for each lagoon. Data include both the total of the most abundantmacrofaunal groups (e), as well as each of these groups: polychaetes (f), molluscs (g) and crustaceans (h).
104 C. Arvanitidis et al. / Journal of Experimental Marine Biology and Ecology 369 (2009) 100–109
Author's personal copy
105C. Arvanitidis et al. / Journal of Experimental Marine Biology and Ecology 369 (2009) 100–109
Author's personal copy
resulted in the same lagoonal differentiation (not shown). The bdMDS(Fig. 4b) shows, as intended, a completely different grouping of thelagoons: the lagoons designated as impacted (C, D) cluster separatelyfrom those designated as non-impacted (A, B).
Application of the standard multivariate analysis to the 7 lagoonsin the Hellenic sector (Fig. 5) clearly separates lagoons biogeographi-cally, with lagoons in the vicinity of the Evros delta (Monolimni, Laki,Drana) clustering separately from lagoons on the coasts of thePeloponnese and the Ionian Sea. Again, and as expected, analysesbased on presence-absence data and averaged abundance valuesof the seasonal sampling data resulted in similar MDS ordinationplots (not shown). Applying bdMDS to the data from these lagoons,however, generally shows different patterns (Fig. 6a-d). This isexpected, as lagoons are nowordinated on the basis of their taxonomicstructure, not on the basis of the species composition and abundance.The exception, however, is the plot derived from polychaetes (Fig. 6b)where the biogeographic pattern is evident. In none of the plots(Fig. 6a-d) is there a clear separation of impacted lagoons (Drana, andto a lesser extent Papas) from non-impacted lagoons, although thereis a suggestion in Fig. 6b that Drana is separated from other lagoonsin the Evros delta.
Similar results, for lagoons in the Hellenic sector, were also derivedfrom macrobenthos and polychaetes with ntMDS, crustaceans withδMDS and polychaetes, molluscs and crustaceans with λMDS (notshown). The advantage of these techniques, however, is that they can beapplied to all theMediterranean lagoons (Figs. 6e-h and 7) and are verymuch easier to calculate. For macrobenthos in all lagoons it isimmediately apparent that ntMDS clearly discriminates the severelyimpacted lagoons (Drana, Borullus and Sacca di Goro) from the rest(Fig. 6e). The division of the severely impacted lagoons from theremainder is also clear for the plot derived from molluscs (Fig. 6g), butless so for plots derived from polychaetes (Fig. 6f) or crustaceans(Fig. 6h). Additionally, there is no evidence, from these plots, that Papasis impacted in comparison to other lagoons in the Mediterranean.
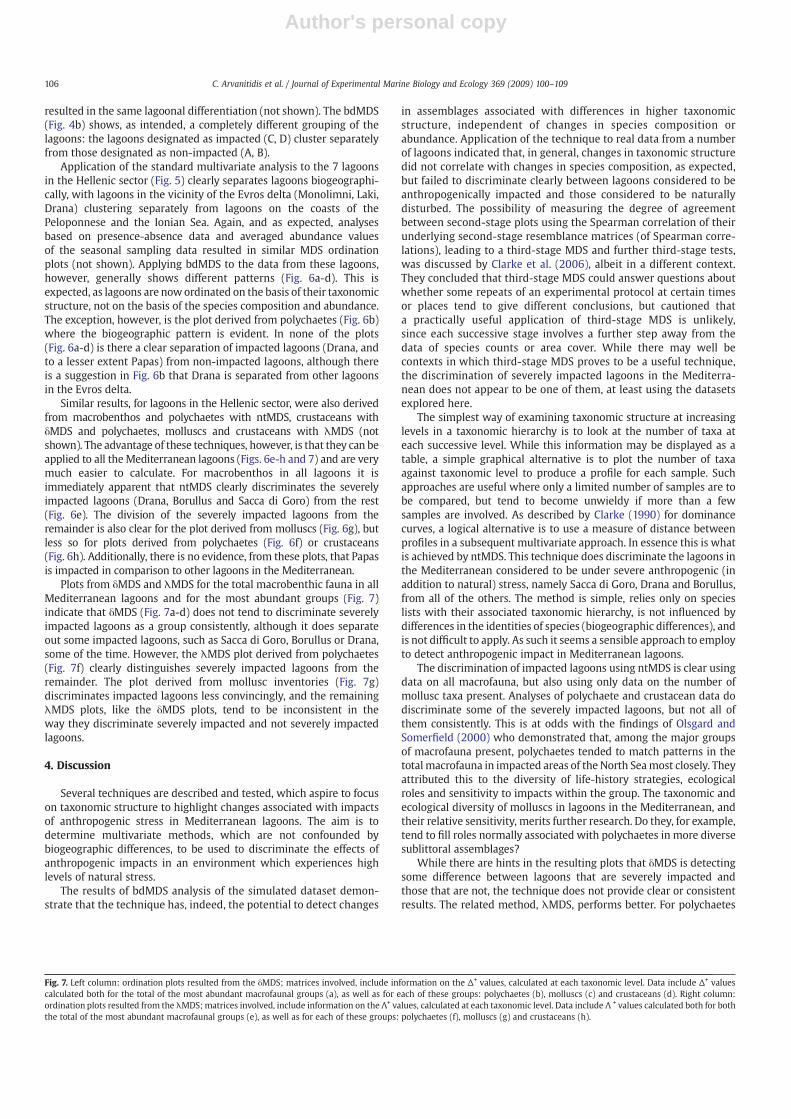
Plots from δMDS and λMDS for the total macrobenthic fauna in allMediterranean lagoons and for the most abundant groups (Fig. 7)indicate that δMDS (Fig. 7a-d) does not tend to discriminate severelyimpacted lagoons as a group consistently, although it does separateout some impacted lagoons, such as Sacca di Goro, Borullus or Drana,some of the time. However, the λMDS plot derived from polychaetes(Fig. 7f) clearly distinguishes severely impacted lagoons from theremainder. The plot derived from mollusc inventories (Fig. 7g)discriminates impacted lagoons less convincingly, and the remainingλMDS plots, like the δMDS plots, tend to be inconsistent in theway they discriminate severely impacted and not severely impactedlagoons.
4. Discussion
Several techniques are described and tested, which aspire to focuson taxonomic structure to highlight changes associated with impactsof anthropogenic stress in Mediterranean lagoons. The aim is todetermine multivariate methods, which are not confounded bybiogeographic differences, to be used to discriminate the effects ofanthropogenic impacts in an environment which experiences highlevels of natural stress.
The results of bdMDS analysis of the simulated dataset demon-strate that the technique has, indeed, the potential to detect changes
in assemblages associated with differences in higher taxonomicstructure, independent of changes in species composition orabundance. Application of the technique to real data from a numberof lagoons indicated that, in general, changes in taxonomic structuredid not correlate with changes in species composition, as expected,but failed to discriminate clearly between lagoons considered to beanthropogenically impacted and those considered to be naturallydisturbed. The possibility of measuring the degree of agreementbetween second-stage plots using the Spearman correlation of theirunderlying second-stage resemblance matrices (of Spearman corre-lations), leading to a third-stage MDS and further third-stage tests,was discussed by Clarke et al. (2006), albeit in a different context.They concluded that third-stage MDS could answer questions aboutwhether some repeats of an experimental protocol at certain timesor places tend to give different conclusions, but cautioned thata practically useful application of third-stage MDS is unlikely,since each successive stage involves a further step away from thedata of species counts or area cover. While there may well becontexts in which third-stage MDS proves to be a useful technique,the discrimination of severely impacted lagoons in the Mediterra-nean does not appear to be one of them, at least using the datasetsexplored here.
The simplest way of examining taxonomic structure at increasinglevels in a taxonomic hierarchy is to look at the number of taxa ateach successive level. While this information may be displayed as atable, a simple graphical alternative is to plot the number of taxaagainst taxonomic level to produce a profile for each sample. Suchapproaches are useful where only a limited number of samples are tobe compared, but tend to become unwieldy if more than a fewsamples are involved. As described by Clarke (1990) for dominancecurves, a logical alternative is to use a measure of distance betweenprofiles in a subsequent multivariate approach. In essence this is whatis achieved by ntMDS. This technique does discriminate the lagoons inthe Mediterranean considered to be under severe anthropogenic (inaddition to natural) stress, namely Sacca di Goro, Drana and Borullus,from all of the others. The method is simple, relies only on specieslists with their associated taxonomic hierarchy, is not influenced bydifferences in the identities of species (biogeographic differences), andis not difficult to apply. As such it seems a sensible approach to employto detect anthropogenic impact in Mediterranean lagoons.
The discrimination of impacted lagoons using ntMDS is clear usingdata on all macrofauna, but also using only data on the number ofmollusc taxa present. Analyses of polychaete and crustacean data dodiscriminate some of the severely impacted lagoons, but not all ofthem consistently. This is at odds with the findings of Olsgard andSomerfield (2000) who demonstrated that, among the major groupsof macrofauna present, polychaetes tended to match patterns in thetotal macrofauna in impacted areas of the North Seamost closely. Theyattributed this to the diversity of life-history strategies, ecologicalroles and sensitivity to impacts within the group. The taxonomic andecological diversity of molluscs in lagoons in the Mediterranean, andtheir relative sensitivity, merits further research. Do they, for example,tend to fill roles normally associated with polychaetes in more diversesublittoral assemblages?
While there are hints in the resulting plots that δMDS is detectingsome difference between lagoons that are severely impacted andthose that are not, the technique does not provide clear or consistentresults. The related method, λMDS, performs better. For polychaetes
Fig. 7. Left column: ordination plots resulted from the δMDS; matrices involved, include information on the Δ+ values, calculated at each taxonomic level. Data include Δ+ valuescalculated both for the total of the most abundant macrofaunal groups (a), as well as for each of these groups: polychaetes (b), molluscs (c) and crustaceans (d). Right column:ordination plots resulted from the λMDS; matrices involved, include information on the Λ+ values, calculated at each taxonomic level. Data include Λ + values calculated both for boththe total of the most abundant macrofaunal groups (e), as well as for each of these groups: polychaetes (f), molluscs (g) and crustaceans (h).
106 C. Arvanitidis et al. / Journal of Experimental Marine Biology and Ecology 369 (2009) 100–109

Author's personal copy
107C. Arvanitidis et al. / Journal of Experimental Marine Biology and Ecology 369 (2009) 100–109

Author's personal copy
λMDS clearly discriminates all of the anthropogenically impactedlagoons from the naturally stressed ones. It is perhaps surprising thatλMDS and ntMDS discriminate impacted lagoons most effectivelyusing data from different taxa, but it should be remembered that eachtechnique relies on very different source of information. Variation intaxonomic distinctness (Λ+) is not mechanistically correlated with thenumber of taxa involved, instead reflecting how evenly taxa aredistributed across the underlying taxonomic hierarchy. The λMDSusing mollusc data does discriminate Sacca di Goro and Drana fromthe others, but the relationships between Borullus and the impactedlagoons, and Vivari and the moderately disturbed lagoons, are not asexpected.
A potential problem with all of these techniques is that thephylogenetic/taxonomic resolution is more stable in some groupsthan in others: a family within the polychaetes does not necessarilycorrespond to amolluscan or a crustacean family. Such difficulties areunlikely ever to be resolved, at least until phylogenetic analysisreveals the entire tree-of-life (e.g. Pleijel and Rouse, 2003). However,the original observations that prompted Warwick and Clarke (1995)to develop indices based on the relatedness of organisms, such as thatin severely impacted situations large numbers of individuals fromclosely related species, such as sibling species of Capitella and Tisbe,are often found, and also that along pollution gradients differentphyla tend to show differing sensitivities to pollution, hold true. Thiscan be reflected in the polychaetes, in the case of λMDS for instance,because it is either the dominant group in terms of abundance orbiomass values, or an important contributor to the entire macro-benthic communities in the coastal lagoons (e.g. Arvanitidis et al.,2005a,b). Consequently, severely impacted lagoons imposing a highdegree of niche filtering through less and more homogenisedmicrohabitats available, host a limited number of closely relatedtaxa. Although this may be overlooked at the level of the species itcan, nevertheless, be apparent in their higher phylogenetic structure.The latter is not far from an interpretation which could derivefrom other approaches such as niche filtering and functionaltraits analysis: almost all of the feeding methods occur in thistaxon (e.g. Fauchald and Jumars, 1979; Rouse and Pleijel, 2001).Feeding methods is one of the main functional traits, closely linkedto ecosystem processes and which make the group more reliablethan other macrobenthic components in the natural representationof the communities. Therefore, species sharing feeding methods areable to survive under severe anthropogenic impact because theymost probably have similar feeding structures and feeding mechan-isms. If this is true, then these species are more likely to have manycharacters shared in common and thus common higher classification(e.g. congeners, species classified under the same family). Thelatter may explain, up to a certain degree, why polychaetes did notperform with ntMDS but they did perform with λMDS: the formermethod is an approximation through raw numbers of taxa ateach taxonomic level while the latter is a measure of their actualtaxonomic relatedness.
Many studies have looked at taxonomic structure in relation topollution and other stressors, using a range of multivariate, graphicaland univariate techniques. As discussed by Ellingsen et al. (2005),there tends to be a trade-off between the confidence one has in ataxonomic hierarchy and the number of species one is considering, butas long as one taxonomic hierarchy is consistently applied within astudy there is no reason to discard the Linnean classification in itsentireity because it is not perfect. There is valid, albeit imperfect,information to be utilized in the taxonomic structure of assemblages,and we suggest some approaches in this paper which use it and mayprove useful.
Methods based on the taxonomic relatedness are not the only onesproposed for the detection of anthropogenic impacts to macro- andmeiobenthic communities (Warwick and Clarke, 2001). Moulliot et al.(2006) have summarized an array of alternative methods, such as
those based on: (i) body size or size spectra (e.g. Holling, 1992; Robsonet al., 2005), (ii) biomass distribution among functional groups(e.g. Pearson, 2001; Gerino et al., 2003), (iii) functional diversity (e.g.Diaz and Cabido, 2001; Petchey and Gaston, 2002; Bremner et al.,2003), and (iv) biomass or productivity measures (e.g. Pearson andRosenberg, 1978). Some of the methods have also been applied tocoastal Mediterranean lagoons with a varying degree of success(e.g. Basset et al., 2006; Reizopoulou and Nicolaidou, 2007). Recently,Moulliot et al. (2007) have developed methodology for the testingof the niche filtering hypothesis, with promising results in twoMediterranean lagoons. Bremner (2008) has reviewed the biologicaltraits analysis in benthic communities and their potential use inconservation andmanagement. The fundamental principle behind themethodologies hitherto developed and tested is a presumed mechan-istic link between the shape of the assemblages and how theirmembers (species, taxa) are related to each other as competitors ormembers of a web of interactions, facing (dis)similar environmentalconstrains (Moulliot et al., 2007). All of the above methods, however,require additional information (e.g. biomass measures, functionaltraits), the collection and systematization of which may be highlydemanding in energy and time. Certainly, these data are not readilyavailable from the literature for the total of theMediterranean lagoonsconsidered here. The pros and cons of each of the previously-mentioned methodologies, including those based on taxonomicrelatedness can only be tested through inter-calibration exerciseson datasets produced under similar conditions and for the samepurposes. Finally, the incorporation of the special attributes of each ofthe methods into a broader theory, such as the metabolic theory ofecology (Brown et al., 2004) should also be attempted in order toanswer questions relevant with space, time and biological organiza-tion scales.
The novel feature in themultivariate techniques presented above isone that allows comparisons of any habitat throughout the Medi-terranean in terms of changes in multivariate patterns derived fromdata at each taxonomic level (from species to phylum). Consequently,these methods make use of information that has never been utilizedby the multivariate techniques: they do not simply use the “front-page” information (species occurrence and abundance) but also theirtaxonomic/phylogenetic relationships. The efficiency of these meth-ods to distinguish severely impacted lagoons from the remainder inthe Mediterranean, when applied to specific macrobenthic compo-nents, indicates that their capability to compare changes in pattern asthe information is aggregated into higher than species taxonomiccategories, as an intrinsic character, has a strong potential in theirwider application as rapid assessment techniques. This potential isfurther enhanced by the general acceptance of the multivariatetechniques as the more sensitive ones among those used forenvironmental assessment, and also as those techniques which givethe most reliable results compared to other standard methods such ascalculation of “classical” diversity indices and the utilization ofgraphical methods (e.g. Clarke and Warwick, 1994).
Coastal lagoons, especially those in theMediterranean, are severelyfluctuating environments. The populations within them show dra-matic seasonal, annual and inter-annual variations, ranging fromdisappearance to complete dominance during the periods of dys-trophic crises. Although the techniques described here seem to have adegree of success in detecting anthropogenic impact inMediterraneancoastal lagoons, their application in studies of lagoonal macrofaunalbiodiversity on smaller scales, or in other Mediterranean habitats,should be tested before they are proposed for wider use in the region.All of these analyses should be seen as merely providing evidencefor the existence of particular forms of, or changes in, assemblagestructuring. The contributions from individual species in establishingobserved patterns are fundamental, and understanding the ecologicalmechanisms underpinning those contributions should continue to be aprimary goal of any scientific investigation.
108 C. Arvanitidis et al. / Journal of Experimental Marine Biology and Ecology 369 (2009) 100–109

Author's personal copy
Acknowledgements
The authors are much indebted to Mrs. M. Eleftheriou for thecritical reading of the manuscript. The authors acknowledge supportby the MARBEF EU funded Network of Excellence (6th EU FP) andTWReferenceNET (INTERREG IIIB). Support was also received from theUK NERC through PML's CSRP, and Defra, Project ME3109. The threeanonymous reviewers are acknowledged for their fruitful commentsand suggestions. [RH]
References
Aboul-Ezz, S.M., 1988. Periodicity and distribution of bottom fauna of the hyper-salineBardawil lagoon (Egypt). Bull. Natl. Inst. Oceanogr. Fish ARE 14, 159–174.
Arvanitidis, C., Chatzigeorgiou, G., Koutsoubas, D., Dounas, C., Eleftheriou, A., Koulouri, P.,2005a. Mediterranean lagoons revisited: weakness and efficiency of the rapidbiodiversity assessment techniques in a severely fluctuating environment. Biodivers.Conserv. 14, 2347–2359.
Arvanitidis, C., Chatzigeorgiou, G., Koutsoubas, D., Kevrekidis, T., Dounas, C., Eleftheriou, A.,Koulouri, P.,Mogias, A., 2005b. Estimating lagoonal biodiversity inGreece: comparisonof rapid assessment techniques. Helgol. Mar. Res. 59, 177–186.
Basset, A., Galuppo, N., Sabetta, L., 2006. Environmental heterogeneity and benthicmacroinvertebrate guilds in italian lagoons. Transit. Waters Bull. 1, 48–63.
Ben Abdallah, L.G., Maamouri, F., 2006. Spatial-temporal dynamics of the nematodeAnguillicolla crassus in Northest Tunisian lagoons. C.R. Biologies 329, 785–789.
Boesch, D.F., Rosenberg, R., 1981. Response to stress in marine benthic communities.In: Barrett, G.W., Rosenberg, R. (Eds.), Stress effects on natural ecosystems. Wiley,New York, pp. 179–200.
Bremner, J., 2008. Species' traits and ecological functioning in marine conservation andmanagement. J. Exp. Mar. Biol. Ecol. 366, 37–47.
Bremner, J., Rogers, S.I., Frid, C.L.J., 2003. Assessing functional diversity in marineecosystems: a comparison of approaches. Mar. Ecol. Prog. Ser. 254, 11–25.
Brown, J.H., Gilloogy, J.F., Allen, A.P., Van Savage,M.,West, G.B., 2004. Toward ametabolictheory of ecology. Ecology 85, 1771–1789.
Clark, R.B., 1997. Marine Pollution. Clarendon Press, Oxford.Clarke, K.R.,1990. Comparisons of dominance curves. J. Exp. Mar. Biol. Ecol.138,143–157.Clarke, K.R., Green, R.H., 1988. Statistical design and analysis for a “biological effects”
study. Mar. Ecol. Prog. Ser. 46, 213–226.Clarke, K.R., Warwick, R.M., 1994. Change in marine communities: an approach to
statistical analysis and interpretation. Natural Environmental Research Council,Plymouth Marine Laboratory, Plymouth.
Clarke, K.R., Warwick, R.M., 1998a. Quantifying structural redundancy in ecologicalcommunities. Oecologia 113, 278–289.
Clarke, K.R., Warwick, R.M., 1998b. A taxonomic distinctness index and its statisticalproperties. J. Appl. Ecol. 35, 523–531.
Clarke, K.R., Warwick, R.M., 2001. A further biodiversity index applicable to species lists:variation in taxonomic distinctness. Mar. Ecol. Prog. Ser. 216, 265–278.
Clarke, K.R., Somerfield, P.J., Chapmen, M.G., 2006. On resemblance measures forecological studies, including taxonomic dissimilarities and a zero-adjusted Bray-Curtis coefficient for denuded assemblages. J. Exp. Mar. Biol. Ecol. 330, 55–80.
Cognetti,G.,1992.Colonizationof stressed coastal environments.Mar. Pollut. Bull. 24,12–14.Diaz, S., Cabido, M., 2001. Vive la difference: plant functional diversity matters to
ecosystem processes. Trends Ecol. Evol. 16, 646–655.Dounas, C., Koutsoubas, D., Arvanitidis, C., Petihakis, G., Drummond, L., Eleftheriou, A.,
1998. Biodiversity and the impact of anthropogenic activities in Mediterraneanlagoons: the case of Gialova lagoon, SW Greece. Oebalia 24, 77–91.
Ellingsen, K.E., Clarke, K.R., Somerfield, P.J., Warwick, R.M., 2005. Taxonomic distinct-ness as a measure of diversity applied over a large scale: the benthos of theNorwegian continental shelf. J. Anim. Ecol. 74, 1069–1079.
Fauchald, K., Jumars, P., 1979. The diet of worms: A study of polychaete feeding guilds.Oceanogr. Mar. Biol. Annu. Rev. 17, 193–284.
Féral, J.-P., Fourt, M., Perez, T., Warwick, R.M., Emblow, C., Heip, C., van Avesaath, P.,Hummel, H., 2003. European Marine Biodiversity Indicators. NIOO-CEME, Yerseke.
Ferraro, S.P., Cole, F.A., 1990. Taxonomic level and sample size sufficient for assessingpollution impacts on the Southern California Bight macrobenthos. Mar. Ecol. Prog.Ser. 67, 251–262.
Ferraro, S.P., Cole, F.A., 1995. Taxonomic level sufficient for assessing pollution impacts on thesouthernCalifornia bightmacrobenthos– revisited. Environ. Toxicol. Chem.1,1031–1040.
Gerino, M., Stora, G., Francois-Carcaillet, F., Gilbert, F., Poggiale, J.C., Mermillod-Blondin, F.,Desrosiers, G., Vervier, P., 2003. Macro-invertebrate functional groups in freshwaterand marine sediments: a common mechanistic classification. Vie Milieu 53, 221.
Gravina, M.F., Ardizzone, G.D., Scaletta, F., Chimenz, C., 1989. Descriptive analysis andclassification of benthic communities in some Mediterranean coastal lagoons(central Italy). PSZN Mar. Ecol. 10, 141–166.
Gray, J.S., 1997. Marine biodiversity: patterns, threats and conservation needs. Biodivers.Conserv. 6, 153–175.
Gray, J.S., 2000. The measurement of marine species diversity with an application to thebenthic fauna of the Norwegian continental shelf. J. Exp. Mar. Biol. Ecol. 250, 23–49.
Guelorget, O., Michel, P., 1979a. Les peuplements benthiques d'un étang littoralLanguedocien, l'étang du Prevost (Herault). Téthys 9, 49–64.
Guelorget, O., Michel, P., 1979b. Les peuplements benthiques d'un étang littoralLanguedocien, l'étang du Prevost (Herault). 2. Ètude quantitative de la macrofaunedes sables. Téthys 9, 65–77.
Holling, C.S., 1992. Cross-scale morphology, geometry, and dynamics of ecosystsems.Ecol. Monogr. 62, 447–502.
Izsak, C., Price, A.R.G., 2001. Measuring β-diversity using a taxonomic similarity index,and its relation to spatial scale. Mar. Ecol. Prog. Ser. 215, 69–77.
Kevrekidis, T., 2004a. Seasonal variation of the macrozoobenthic community structureat low salinities in a Mediterranean lagoon (Monolimni Lagoon, Northern Aegean)Int. Rev. Hydrobiol. 89, 407–425.
Kevrekidis, T., 2004b. Population dynamics, growth and reproduction of Corophiuminsidiosum (Crustacea: Amphipoda) at low salinities in Monolimni Lagoon (Evrosdelta, North Aegean Sea). Hydrobiologia 522, 117–132.
Kevrekidis, T., Mogias, A., Gouvis, N., 2000. Interannual changes in the composition ofthe macrobenthic fauna of Drana lagoon (Evros Delta, N. Aegean Sea): preliminarynote. Belg. J. Zool. 130, 105–111.
Kingston, P.F., Riddle, M.J., 1989. Cost effectiveness of benthic faunal monitoring. Mar.Pollut. Bull. 20, 490–496.
Koutsoubas, D., Dounas, C., Arvanitidis, C., Kornilios, S., Petihakis, G., Triantafyllou, G.,Eleftheriou, A., 2000. Macrobenthic community structure and disturbance assess-ment in Gialova lagoon, Ionian Sea. ICES J. Mar. Sci. 57, 1472–1480.
Legendre, P., Legendre, L., 1998. Numerical ecology. Developments in environmentalmodelling, vol. 20. Elsevier Scientific Publishers, Amsterdam.
Magurran, A.E., 2004. Measuring Biological Diversity. Blackwell Publishing, Madlen,Oxford, Carleton.
Malea, P., Kevrekidis, T., Mogias, A., 2004. Annual versus perennial growth cycle in Ruppiamaritime L.: temporal variation inpopulation characteristics inMediterranean lagoons(Monolimni and Drana lagoons, Northern Aegean Sea). Bot. Mar. 47, 357–366.
Marchini, A., Gauzer, K., Occhipinti-Ambrogi, A., 2004. Spatial and temporal variabilityof hard-bottom macrofauna in a disturbed coastal lagoon (Sacca di Goro, Po RiverDelta northwestern Adriatic Sea). Mar. Pollut. Bull. 48, 1084–1095.
Mogias, A., Kevrekidis, T., 2005. Macrobenthic community structure in a poikilohalineMediterranean lagoon (Laki lagoon, northern Aegean). Helgol. Mar. Res. 59,167–176.
Moulliot, D., Spatharis, S., Reizopoulou, S., Laugier, T., Sabetta, L., Basset, A., Do Chi, T.,2006. Alternatives to taxonomic-based approaches to assess changes in transitionalwater communities. Aquat. Conserv.: Mar. Freshw. Ecosyst. 16, 469–482.
Moulliot,D.,Dumay,O., Tomasini, J.A., 2007. Limitingsimilarity, nichefiltering and functionaldiversity in coastal lagoon fish communities. Estuar. Coast. Shelf Sci. 71, 443–456.
Olsgard, F., Somerfield, P.J., 2000. Surrogates in marine benthic investigations – whichtaxonomic unit to target? J. Aquat. Ecosyst. Stress Recovery 7, 25–42.
Olsgard, F., Somerfield, P.J., Carr, M.R.,1997. Relationships between taxonomic resolutionand data transformations in analyses of a macrobenthic community along anestablished pollution gradient. Mar. Ecol. Prog. Ser. 149, 173–181.
Olsgard, F., Somerfield, P.J., Carr, M.R., 1998. Relationships between taxonomic resolution,macrobenthic community patterns and disturbance. Mar. Ecol. Prog. Ser. 172, 25–36.
Pearson, T.H., 2001. Functional group ecology in soft-sediment marine benthos: the roleof bioturbation. Oceanogr. Mar. Biol. 39, 233.
Pearson, T.H., Rosenberg, R., 1978. Macrobenthic succession in relation to organicenrichment and pollution of the marine environment. Oceanogr. Mar. Biol. Annu.Rev. 16, 229–311.
Petchey, O.L., Gaston, K.J., 2002. Functional Diversity (FD), species richness andcommunity composition. Ecol. Lett. 5, 402–411.
Pleijel, F., Rouse, G.W., 2003. Ceci n'est pas une pipe: names, clades and phylogeneticnomenclature. J. Zool. Syst. Evol. Res. 41, 162–174.
Reizopoulou, S., Nicolaidou, A., 2004. Benthic diversity of coastal brackish-waterlagoons in Western Greece. Aquat. Conserv. 14, 93–102.
Reizopoulou, S., Nicolaidou, A., 2007. Index of Size Distribution (ISD): a method ofquality assessment for coastal lagoons. Hydrobiologia 577, 141–149.
Reizopoulou, S., Thessalou-Legaki, M., Nicolaidou, A., 1996. Assessment of disturbancein Mediterranean lagoons: an evaluation of methods. Mar. Biol. 12, 189–197.
Robson, B.J., Barmuta, L.A., Fairweather, P.G., 2005. Methodological and conceptualissues in the search for a relationship between animal body-size distributions andbenthic habitat architecture. Mar. Freshw. Res. 56, 1–11.
Romdhane, M.S., Chakroun, F.L., 1986. Les peuplements benthiques de la lagune de Gharel Mehl. Bull. Inst. Natl. Sci. Tech. Océanogr. Pêche Salammbô 13, 95–108.
Rouse, G.W., Pleijel, F., 2001. Polychaetes. Oxford University Press, Oxford.Samaan, A.A., Ghobashy, A.F.A., Aboul-Ezz, S.M., 1989. The benthic fauna of lake
Burollus. 1. Community composition and distribution of the total fauna. Bull. Natl.Inst. Oceanogr. Fish ARE 15, 217–224.
Siliem, T.A.E., 1989. Chemical conditions in Bardawil lagoon. III. – Some limnologicalstudies. Bull. Natl. Inst. Oceanogr. Fish ARE 15, 21–33.
Somerfield, P.J., Clarke, K.R., 1995. Taxonomic levels, in marine community studies,revisited. Mar. Ecol. Prog. Ser. 127, 113–119.
Viaroli, P., Giordani, G., Bartoli, M., Naldi, M., Azzoni, R., Nizzoli, D., Ferrari, I., Zaldívar,J.M., Bencivelli, S., Castaldelli, G., Fano, E.A., 2006. The Sacca di Goro and an arm ofthe Po river. In: Wangersky, P.J. (Ed.), The Handbook of Environmental Chemistry,pp. 197–232. Estuaries 5/H.
Warwick, R.M., 1988. The level of taxonomic discrimination required to detect pollutioneffects on marine benthic communities. Mar. Pollut. Bull. 19, 259–268.
Warwick, R.M., Clarke, K.R., 1995. New “biodiversity” measures reveal a decrease intaxonomic distinctness with increasing stress. Mar. Ecol. Prog. Ser. 129, 301–305.
Warwick, R.M., Clarke, K.R., 2001. Practical measures of marine biodiversity based onrelatedness of species. Oceanogr. Mar. Biol. Annu. Rev. 39, 207–231.
Warwick, R.M., Light, J., 2001. Death assemblages of molluscs on St. Martin's flats, Islesof Scilly: a surrogate for Mediterranean biodiversity? Biodivers. Conserv.11, 99–112.
Warwick, R.M., Platt, H.M., Clarke, K.R., Agard, J., Gobin, J., 1990. Analysis ofmacrobenthic and meiobenthic community structure in relation to pollution anddisturbance in Hamilton harbour, Bermuda. J. Exp. Mar. Biol. Ecol. 138, 119–142.
109C. Arvanitidis et al. / Journal of Experimental Marine Biology and Ecology 369 (2009) 100–109