Do federal farm policies influence surface water quality?
8
(This is a sample cover image for this issue. The actual cover is not yet available at this time.) This article appeared in a journal published by Elsevier. The attached copy is furnished to the author for internal non-commercial research and education use, including for instruction at the authors institution and sharing with colleagues. Other uses, including reproduction and distribution, or selling or licensing copies, or posting to personal, institutional or third party websites are prohibited. In most cases authors are permitted to post their version of the article (e.g. in Word or Tex form) to their personal website or institutional repository. Authors requiring further information regarding Elsevier’s archiving and manuscript policies are encouraged to visit: http://www.elsevier.com/copyright
Transcript of Do federal farm policies influence surface water quality?

(This is a sample cover image for this issue. The actual cover is not yet available at this time.)
This article appeared in a journal published by Elsevier. The attachedcopy is furnished to the author for internal non-commercial researchand education use, including for instruction at the authors institution
and sharing with colleagues.
Other uses, including reproduction and distribution, or selling orlicensing copies, or posting to personal, institutional or third party
websites are prohibited.
In most cases authors are permitted to post their version of thearticle (e.g. in Word or Tex form) to their personal website orinstitutional repository. Authors requiring further information
regarding Elsevier’s archiving and manuscript policies areencouraged to visit:
http://www.elsevier.com/copyright

Author's personal copy
Agriculture, Ecosystems and Environment 158 (2012) 103– 109
Contents lists available at SciVerse ScienceDirect
Agriculture, Ecosystems and Environment
jo ur n al homepage: www.elsev ier .com/ lo cate /agee
Do federal farm policies influence surface water quality?
Whitney P. Broussard III a,∗, R. Eugene Turnera, John V. Westrab
a Department of Oceanography and Coastal Sciences, Louisiana State University, Baton Rouge, LA 70803, USAb Department of Agricultural Economics and Agribusiness, Louisiana State University Agricultural Center, Baton Rouge, LA 70803, USA
a r t i c l e i n f o
Article history:Received 22 February 2011Received in revised form 9 May 2012Accepted 10 May 2012
Keywords:Agricultural policyLand useWater qualityNitrogenWatershed ecology
a b s t r a c t
Federal government farm payments authorized by the Farm Bill accounted for 32% of the total U.S. netfarm income in 2005. This study uses Census of Agriculture and nitrate-nitrogen (NN) data to ask whetherthere is a quantifiable relationship between the allocation of these farm payments and indicators of sur-face water quality using 29 independent watersheds covering 28% of the conterminous U.S. The analysisidentifies a significant relationship between increasing government farm payments and: (1) increas-ing riverine NN concentrations, (2) more expansive fertilizer applications, (3) commodity specialization,and (4) reductions in cropland diversity. These results suggest that federal farm policies could be animportant factor affecting water quality, and the authors present a working hypothesis that farm poli-cies influence land use decisions that, in turn, ultimately influence water quality. These farm payments,subsequently, could be used as a potent policy instrument to influence alternative environmental andeconomic outcomes that protect soil and water resources.
© 2012 Elsevier B.V. All rights reserved.
1. Introduction
The 20th century was marked by consolidation, increasing farmsize, and specialization in American agriculture (Fig. 1; Dimitri et al.,2005). Although the area of total farmland increased by 11.5% from1900 to 2002, the total number of farms fell almost 63% and theaverage farm size doubled. The average number of commoditiesproduced per farm decreased from 5.1 in 1900 to 1.3 in 2002, mini-mizing the benefits associated with diversified cropland that earlierfarmers used to mitigate some of the risks from weather, pests, andcommodity prices. In the last century, the portion of the U.S. popula-tion employed in production agriculture fell from 41% to 2%, and thenumber of farmers earning off-farm income rose from 30% to 93%(Fig. 1). The average American farm is now producing a narrowerrange of agricultural products, is more susceptible to input andcommodity price swings, is more dependent on energy intensivemachinery, and is more reliant on off-farm income.
This transformation of farming, emulating an industrial modelof agricultural production, has multiple benefits and consequenceson and off the farm. Although farm management decisions havegreatly improved the efficient production of staple commodities,this mode of operation is often in conflict with weaker incentives
∗ Corresponding author. Present address: Institute for Coastal Ecology and Engi-neering, University of Louisiana at Lafayette, P.O. Box 43688, Lafayette, LA 70504,USA. Tel.: +1 337 482 1396.
E-mail addresses: [email protected] (W.P. Broussard III),[email protected] (R.E. Turner), [email protected] (J.V. Westra).
for mitigating externalities and off-site impacts – what economistsrefer to as ‘public goods’ and ecologists refer to as ‘ecological ser-vices’. Excessive nutrient loading, for example, has become oneof the most dominant drivers of ecosystem change in the last 40years for both terrestrial and aquatic ecosystems and is projectedto increase in the 21st century (MEA, 2005). The N flux from the Mis-sissippi River Basin (MRB) increased nearly 300% from 1955–1970to 1980–1999, due almost entirely to increases in nitrate concen-tration accompanying the intensification of agricultural practices(Goolsby and Battaglin, 2001; Turner and Rabalais, 2003; Broussardand Turner, 2009). From 1980 to 2008, flow-normalized NN fluxincreased 9%, 67%, and 57% in the MRB, the upper MississippiRiver basin above Clinton, IA, and the Missouri River basin aboveHermann, MO, respectively (Sprague et al., 2011). The size of thebottom water hypoxic zone in the Northern Gulf of Mexico hasgrown to the size of New Jersey primarily because of nutrientloading from the Mississippi River, and particularly because of theincreased nitrate loading (Rabalais et al., 2007; Turner et al., 2008;SAB, 2008).
One health-related consequence of these changes is thatdrinking water supplies may also be compromised by nutrientenrichment. The Des Moines Water Works in Des Moines, IA, forexample, employs an expensive ion exchange process to reducethe nitrate concentration in their drinking water, pumped from theRaccoon and Des Moines Rivers, to meet national health standards(Des Moines Water Works, 2007).
Land use and water quality are, therefore, co-mingled ecosys-tem traits, especially in agricultural landscapes. Federal farm policy,in turn, is one of the largest federal interventions in the U.S.
0167-8809/$ – see front matter © 2012 Elsevier B.V. All rights reserved.http://dx.doi.org/10.1016/j.agee.2012.05.022

Author's personal copy
104 W.P. Broussard III et al. / Agriculture, Ecosystems and Environment 158 (2012) 103– 109
BA DC E
0
100
200
300
1900 1945 2002
A - Number of farms (million)
B - Avg. farm size (ha)
C - Avg.commodies per farm
D - U.S. workforce employed in agriculture (%)
E - Farm households with off-farm income (%)
5.7 5.9
2.1
59
79
178
5.1 4.6
1.3
41
16
1.9
30 27
93
Pro
po
rtio
n o
f 1
90
0 v
alu
es (
%)
Fig. 1. Changes in 20th century American agriculture relative to 1900 (bar withabsolute values).
Adapted from Dimitri et al. (2005).
agricultural sector, a significant contributor to land cover andecosystem change (MEA, 2005), and it is the focus of this study toexamine its interrelations with water quality indicators and landuse practices.
1.1. History of government farm programs
The central purpose of U.S. agricultural policy has beencommodity-specific price supports, supply controls, and incomesupport programs for U.S. farmers. The first Farm Bill was estab-lished in the Agricultural Adjustment Act of 1933. This legislationwas part of the New Deal implementing commodity and incomesupport programs to assist the typically small, diversified farmsof rural America in the 1930s (Dimitri et al., 2005). Subse-quent Farm Bills introduced soil conservation programs (1936),fixed-price commodity support programs (1949), flexible pricecommodity support programs (1954), rural development programs(1970), food stamp programs (1977), conservation reserve pro-grams (1985), direct payment programs for specific commodities(1997), and counter-cyclical payment programs to offset low mar-ket prices for specific commodities (2002) (Dimitri et al., 2005;Bowers et al., 1985).
Direct commodity payments accounted for the largest share(26%) of government farm payments in 2002–2005, with loandeficiency, conservation program, ad hoc and emergency, andcounter-cyclical payments collectively accounting for 54% of thetotal U.S. payments (USDA-ERS, 2008a). The direct commodity pay-ments are provided principally for barley, corn, grain sorghum, oats,peanuts, rice, soybeans, upland cotton, and wheat, with smallerpayments to dry peas and minor oilseed crops including canola,crambe varieties, flaxseed, mustard seed, rapeseed, safflower,sesame seed, sunflower seed (USDA-FSA, 2006). These paymentsare based on county-level historical yields and farm-level historicalplanting areas, also known as ‘base-acres’ hereafter referred to as‘base-units’. Once the direct payment rate is determined by theUSDA Farm Service Agency (FSA) (e.g., $11.02 per tonne of cornin 2006), then the total direct payment for an individual farm isequal to the payment rate, times the number of pre-determinedbase-units for that crop on that farm, times 85% to reduce Federal
Fig. 2. Five-year average U.S. net farm income, federal government farm pay-ments, and the proportion of net farm income derived from government payments;adjusted for inflation using the Consumer Price Index (1982–1984 price level).
budget expenditure, times the historical yield for that crop for thatfarmer (base yield). If the base yield is unavailable for the farm,then the FSA county average yield is used as a substitute. The directcommodity payments are, therefore, theoretically de-coupledfrom the actual farm production and market price. Once a farmingoperation is enrolled in a direct commodity program, it receivesthis fixed direct payment regardless of the farm’s production thatyear.
1.2. Land use and federal farm policy
Five hundred thousand farms received fixed direct commoditypayments in 2002 (Dimitri et al., 2005), equal to 25% of all farms,while corn and wheat payments accounted for over 60% of all U.S.direct commodity payments in that year (USDA-ERS, 2006). Thetotal net farm income for all U.S. farms declined over the second halfof the 20th century by 35%, from $62 billion in 1950–1955 to $40billion in 2001–2005 (real 1982–1984 $; Fig. 2; USDOC-BEA, 2007).Total U.S. government farm payments simultaneously increased 10fold – from $1 billion in 1950–1955 to $11 billion in 2001–2005(real 1982–1984 $; Fig. 2; USDA-ERS, 2001, 2007). The proportionof total net farm income in the U.S. derived from government farmpayments has subsequently increased from 9% in 1933–1937, theyears of the first Farm Bill, to 29% in 2001–2005 (Fig. 2; USDOC-BEA,2007; USDA-ERS, 2001, 2007).
Farm policies potentially influence cropping choices throughboth direct economic subsidies (financial assistance) and agro-nomic advice (technical assistance). Gardner (1987) describes thedevelopment and persistence of federal farm programs, particu-larly commodity programs, as an income re-distribution processthat producers influence to their advantage. Although commoditysupport programs were initiated to support farm income, for landowners and producers, they have evolved into mechanisms for re-distributing income towards production of select commodities thattend to remain in place, despite changes in conditions that mightno longer warrant intervention by the government into the mar-ket (Gardner, 1992). Although federal farm payments are one ofmany factors influencing the farm economy and cropping choicesincluding labor supply, infrastructure and materials costs, familyhealth and community-based factors, water supply, weather, pests,and disease, government farm payments appear to be an importantcomponent of net farm income and on-farm decisions.
Author's personal copy
W.P. Broussard III et al. / Agriculture, Ecosystems and Environment 158 (2012) 103– 109 105
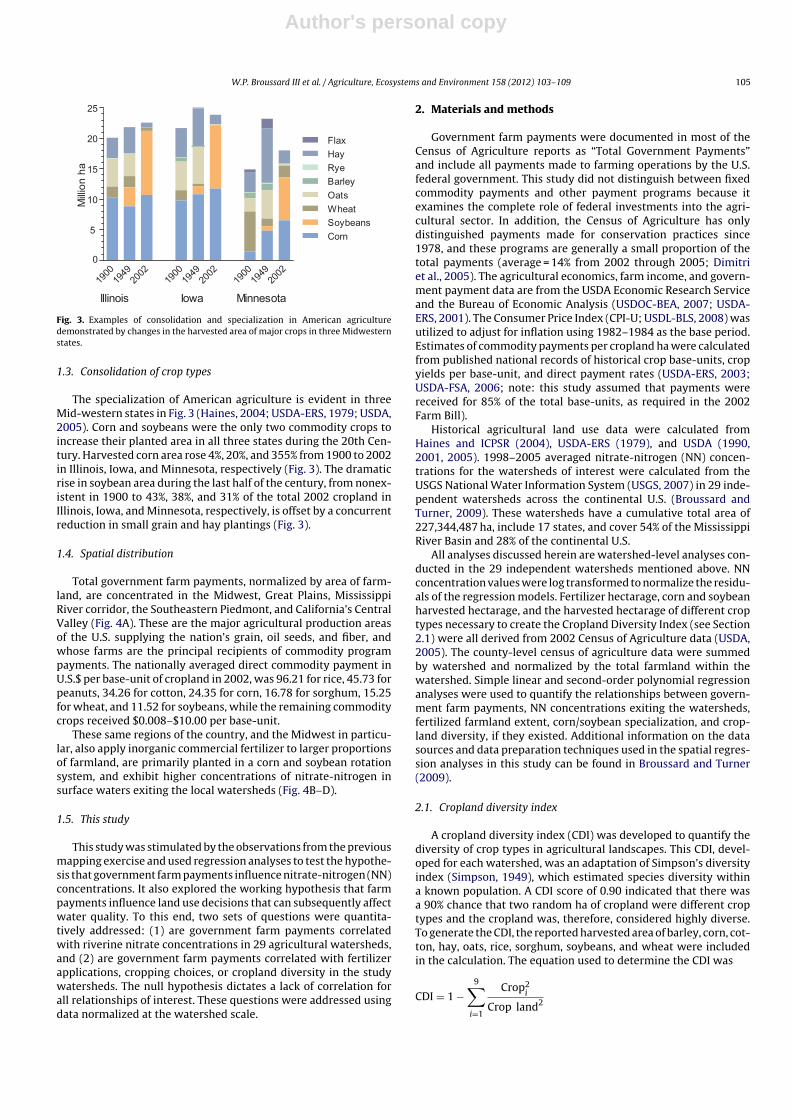
Fig. 3. Examples of consolidation and specialization in American agriculturedemonstrated by changes in the harvested area of major crops in three Midwesternstates.
1.3. Consolidation of crop types
The specialization of American agriculture is evident in threeMid-western states in Fig. 3 (Haines, 2004; USDA-ERS, 1979; USDA,2005). Corn and soybeans were the only two commodity crops toincrease their planted area in all three states during the 20th Cen-tury. Harvested corn area rose 4%, 20%, and 355% from 1900 to 2002in Illinois, Iowa, and Minnesota, respectively (Fig. 3). The dramaticrise in soybean area during the last half of the century, from nonex-istent in 1900 to 43%, 38%, and 31% of the total 2002 cropland inIllinois, Iowa, and Minnesota, respectively, is offset by a concurrentreduction in small grain and hay plantings (Fig. 3).
1.4. Spatial distribution
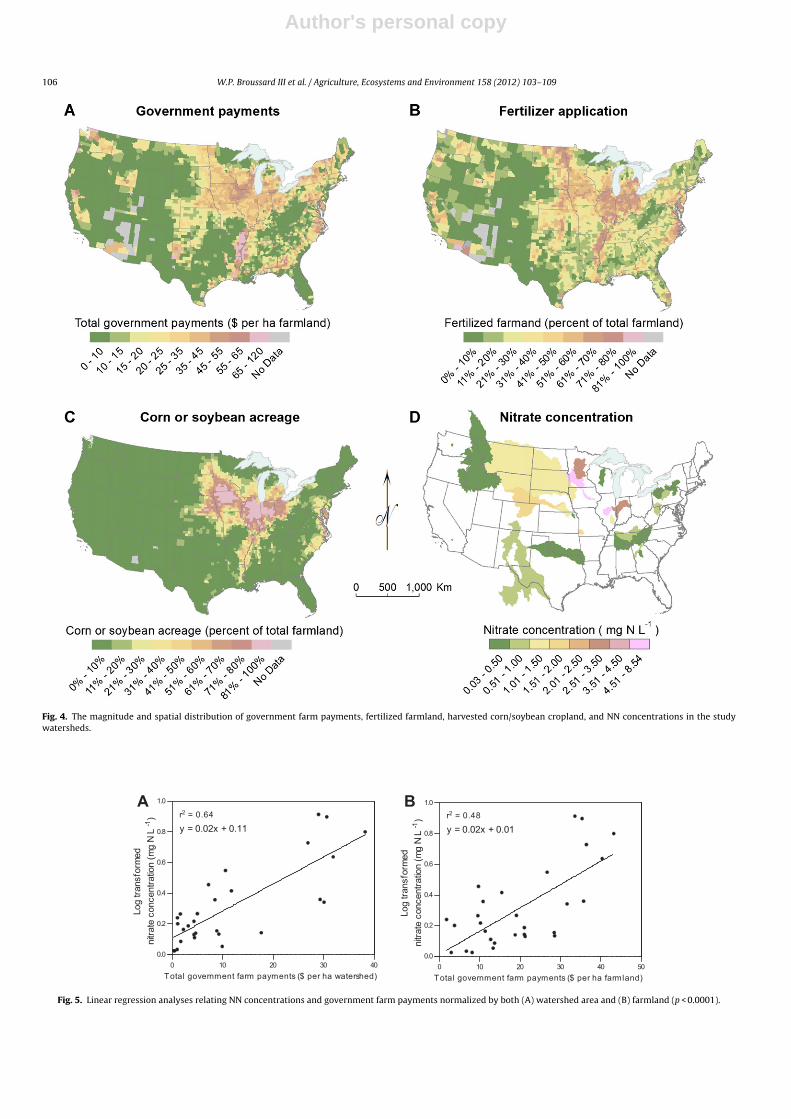
Total government farm payments, normalized by area of farm-land, are concentrated in the Midwest, Great Plains, MississippiRiver corridor, the Southeastern Piedmont, and California’s CentralValley (Fig. 4A). These are the major agricultural production areasof the U.S. supplying the nation’s grain, oil seeds, and fiber, andwhose farms are the principal recipients of commodity programpayments. The nationally averaged direct commodity payment inU.S.$ per base-unit of cropland in 2002, was 96.21 for rice, 45.73 forpeanuts, 34.26 for cotton, 24.35 for corn, 16.78 for sorghum, 15.25for wheat, and 11.52 for soybeans, while the remaining commoditycrops received $0.008–$10.00 per base-unit.
These same regions of the country, and the Midwest in particu-lar, also apply inorganic commercial fertilizer to larger proportionsof farmland, are primarily planted in a corn and soybean rotationsystem, and exhibit higher concentrations of nitrate-nitrogen insurface waters exiting the local watersheds (Fig. 4B–D).
1.5. This study
This study was stimulated by the observations from the previousmapping exercise and used regression analyses to test the hypothe-sis that government farm payments influence nitrate-nitrogen (NN)concentrations. It also explored the working hypothesis that farmpayments influence land use decisions that can subsequently affectwater quality. To this end, two sets of questions were quantita-tively addressed: (1) are government farm payments correlatedwith riverine nitrate concentrations in 29 agricultural watersheds,and (2) are government farm payments correlated with fertilizerapplications, cropping choices, or cropland diversity in the studywatersheds. The null hypothesis dictates a lack of correlation forall relationships of interest. These questions were addressed usingdata normalized at the watershed scale.
2. Materials and methods
Government farm payments were documented in most of theCensus of Agriculture reports as “Total Government Payments”and include all payments made to farming operations by the U.S.federal government. This study did not distinguish between fixedcommodity payments and other payment programs because itexamines the complete role of federal investments into the agri-cultural sector. In addition, the Census of Agriculture has onlydistinguished payments made for conservation practices since1978, and these programs are generally a small proportion of thetotal payments (average = 14% from 2002 through 2005; Dimitriet al., 2005). The agricultural economics, farm income, and govern-ment payment data are from the USDA Economic Research Serviceand the Bureau of Economic Analysis (USDOC-BEA, 2007; USDA-ERS, 2001). The Consumer Price Index (CPI-U; USDL-BLS, 2008) wasutilized to adjust for inflation using 1982–1984 as the base period.Estimates of commodity payments per cropland ha were calculatedfrom published national records of historical crop base-units, cropyields per base-unit, and direct payment rates (USDA-ERS, 2003;USDA-FSA, 2006; note: this study assumed that payments werereceived for 85% of the total base-units, as required in the 2002Farm Bill).
Historical agricultural land use data were calculated fromHaines and ICPSR (2004), USDA-ERS (1979), and USDA (1990,2001, 2005). 1998–2005 averaged nitrate-nitrogen (NN) concen-trations for the watersheds of interest were calculated from theUSGS National Water Information System (USGS, 2007) in 29 inde-pendent watersheds across the continental U.S. (Broussard andTurner, 2009). These watersheds have a cumulative total area of227,344,487 ha, include 17 states, and cover 54% of the MississippiRiver Basin and 28% of the continental U.S.
All analyses discussed herein are watershed-level analyses con-ducted in the 29 independent watersheds mentioned above. NNconcentration values were log transformed to normalize the residu-als of the regression models. Fertilizer hectarage, corn and soybeanharvested hectarage, and the harvested hectarage of different croptypes necessary to create the Cropland Diversity Index (see Section2.1) were all derived from 2002 Census of Agriculture data (USDA,2005). The county-level census of agriculture data were summedby watershed and normalized by the total farmland within thewatershed. Simple linear and second-order polynomial regressionanalyses were used to quantify the relationships between govern-ment farm payments, NN concentrations exiting the watersheds,fertilized farmland extent, corn/soybean specialization, and crop-land diversity, if they existed. Additional information on the datasources and data preparation techniques used in the spatial regres-sion analyses in this study can be found in Broussard and Turner(2009).
2.1. Cropland diversity index
A cropland diversity index (CDI) was developed to quantify thediversity of crop types in agricultural landscapes. This CDI, devel-oped for each watershed, was an adaptation of Simpson’s diversityindex (Simpson, 1949), which estimated species diversity withina known population. A CDI score of 0.90 indicated that there wasa 90% chance that two random ha of cropland were different croptypes and the cropland was, therefore, considered highly diverse.To generate the CDI, the reported harvested area of barley, corn, cot-ton, hay, oats, rice, sorghum, soybeans, and wheat were includedin the calculation. The equation used to determine the CDI was
CDI = 1 −9∑
i=1
Crop2i
Crop land2
Author's personal copy
106 W.P. Broussard III et al. / Agriculture, Ecosystems and Environment 158 (2012) 103– 109
Fig. 4. The magnitude and spatial distribution of government farm payments, fertilized farmland, harvested corn/soybean cropland, and NN concentrations in the studywatersheds.
A B
Fig. 5. Linear regression analyses relating NN concentrations and government farm payments normalized by both (A) watershed area and (B) farmland (p < 0.0001).
Author's personal copy
W.P. Broussard III et al. / Agriculture, Ecosystems and Environment 158 (2012) 103– 109 107
where CDI was the cropland diversity index for a given watershed,Crop was the number of ha of a particular crop type i within thatwatershed, and Cropland was the number of ha of all croplandwithin that watershed.
3. Results and discussion
A significant linear relationship exists in the study watershedsbetween the concentration of NN exiting the local river and (1)total government farm payments per ha of watershed (r2 = 0.64,p < 0.0001, n = 29; Fig. 5A), and (2) total government farm paymentsper ha of farmland (r2 = 0.48, p < 0.0001, n = 29; Fig. 5B). The resultsindicate a significant relationship within agricultural landscapes(Fig. 5B) that holds true on a watershed scale (Fig. 5A).
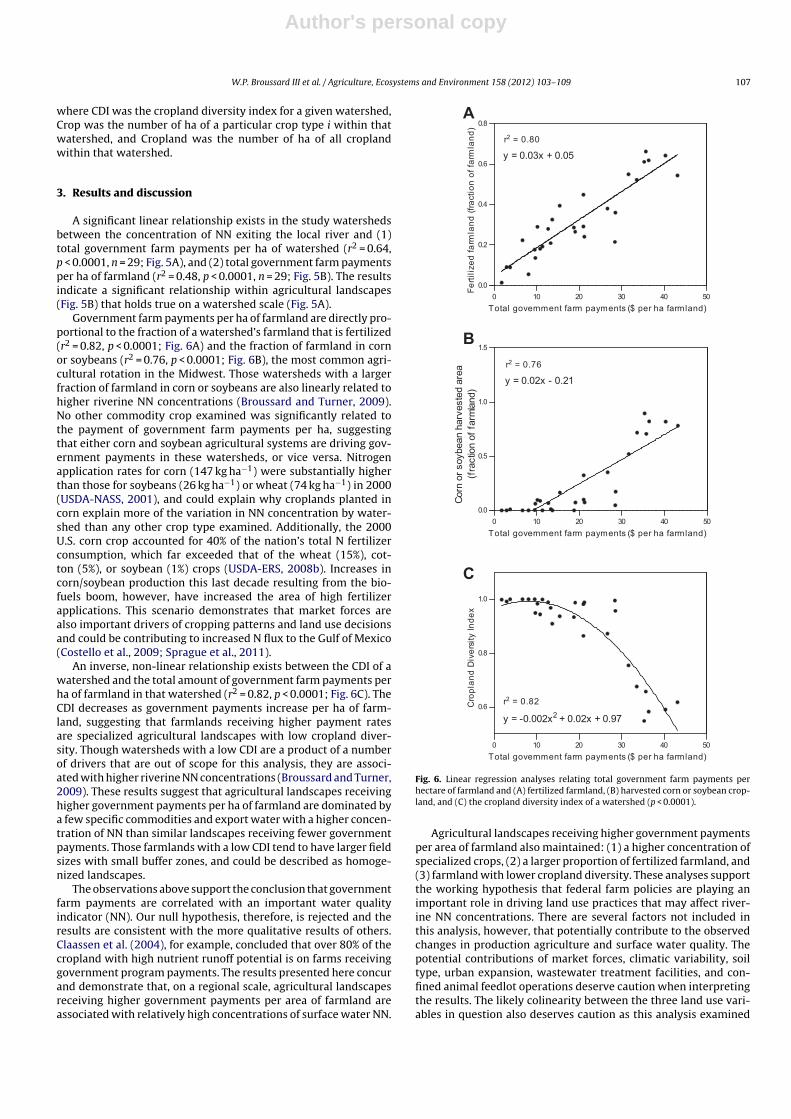
Government farm payments per ha of farmland are directly pro-portional to the fraction of a watershed’s farmland that is fertilized(r2 = 0.82, p < 0.0001; Fig. 6A) and the fraction of farmland in cornor soybeans (r2 = 0.76, p < 0.0001; Fig. 6B), the most common agri-cultural rotation in the Midwest. Those watersheds with a largerfraction of farmland in corn or soybeans are also linearly related tohigher riverine NN concentrations (Broussard and Turner, 2009).No other commodity crop examined was significantly related tothe payment of government farm payments per ha, suggestingthat either corn and soybean agricultural systems are driving gov-ernment payments in these watersheds, or vice versa. Nitrogenapplication rates for corn (147 kg ha−1) were substantially higherthan those for soybeans (26 kg ha−1) or wheat (74 kg ha−1) in 2000(USDA-NASS, 2001), and could explain why croplands planted incorn explain more of the variation in NN concentration by water-shed than any other crop type examined. Additionally, the 2000U.S. corn crop accounted for 40% of the nation’s total N fertilizerconsumption, which far exceeded that of the wheat (15%), cot-ton (5%), or soybean (1%) crops (USDA-ERS, 2008b). Increases incorn/soybean production this last decade resulting from the bio-fuels boom, however, have increased the area of high fertilizerapplications. This scenario demonstrates that market forces arealso important drivers of cropping patterns and land use decisionsand could be contributing to increased N flux to the Gulf of Mexico(Costello et al., 2009; Sprague et al., 2011).
An inverse, non-linear relationship exists between the CDI of awatershed and the total amount of government farm payments perha of farmland in that watershed (r2 = 0.82, p < 0.0001; Fig. 6C). TheCDI decreases as government payments increase per ha of farm-land, suggesting that farmlands receiving higher payment ratesare specialized agricultural landscapes with low cropland diver-sity. Though watersheds with a low CDI are a product of a numberof drivers that are out of scope for this analysis, they are associ-ated with higher riverine NN concentrations (Broussard and Turner,2009). These results suggest that agricultural landscapes receivinghigher government payments per ha of farmland are dominated bya few specific commodities and export water with a higher concen-tration of NN than similar landscapes receiving fewer governmentpayments. Those farmlands with a low CDI tend to have larger fieldsizes with small buffer zones, and could be described as homoge-nized landscapes.
The observations above support the conclusion that governmentfarm payments are correlated with an important water qualityindicator (NN). Our null hypothesis, therefore, is rejected and theresults are consistent with the more qualitative results of others.Claassen et al. (2004), for example, concluded that over 80% of thecropland with high nutrient runoff potential is on farms receivinggovernment program payments. The results presented here concurand demonstrate that, on a regional scale, agricultural landscapesreceiving higher government payments per area of farmland areassociated with relatively high concentrations of surface water NN.
A
B
C
Fig. 6. Linear regression analyses relating total government farm payments perhectare of farmland and (A) fertilized farmland, (B) harvested corn or soybean crop-land, and (C) the cropland diversity index of a watershed (p < 0.0001).
Agricultural landscapes receiving higher government paymentsper area of farmland also maintained: (1) a higher concentration ofspecialized crops, (2) a larger proportion of fertilized farmland, and(3) farmland with lower cropland diversity. These analyses supportthe working hypothesis that federal farm policies are playing animportant role in driving land use practices that may affect river-ine NN concentrations. There are several factors not included inthis analysis, however, that potentially contribute to the observedchanges in production agriculture and surface water quality. Thepotential contributions of market forces, climatic variability, soiltype, urban expansion, wastewater treatment facilities, and con-fined animal feedlot operations deserve caution when interpretingthe results. The likely colinearity between the three land use vari-ables in question also deserves caution as this analysis examined
Author's personal copy
108 W.P. Broussard III et al. / Agriculture, Ecosystems and Environment 158 (2012) 103– 109
each bivariate correlation separately and did not examine theinteractions among variables. The results of the analysis shouldbe interpreted with this caveat in mind. The transition to cur-rent agricultural practices, nevertheless, would most likely havebeen slower and more gradual without federal support becausegovernment programs are intended to reduce the risk of farmingoperations (Key and Roberts, 2007) and favor the survival of largeroperations with the resources to pursue land and capital acquisition(Roberts and Key, 2008).
4. Conclusions
Government commodity programs can be used to support awider variety of crop types, particularly on smaller farms (Robertsand Key, 2008), can decrease the risks of diversifying crop choicesin impaired agricultural landscapes (Dimitri et al., 2005), and canstimulate economic markets for other crops (Jordan et al., 2007).Additionally, increasing government farm programs for soil conser-vation could protect valuable soil resources (Claassen et al., 2007)by encouraging investment in long-term soil fertility and agricul-tural sustainability.
These goals can be accomplished while supporting workingfarms (Jordan et al., 2007; Claassen et al., 2007) and could poten-tially distribute income support benefits more broadly across theU.S. agricultural sector (Claassen et al., 2007). Conservation pro-grams and commodity programs are currently working at crosspurposes in several instances where commodity program pay-ments influence landowner’s decisions to convert grasslands tocroplands (Claassen et al., 2007). One way to encourage sustain-able conservation and the development of ecological services is, forexample, to require that conservation practices be implemented inorder to receive commodity payments. Examples of conservationmanagement practices that could reduce N leaching include adop-tion of traditional and innovative conservation practices (Nassaueret al., 2007), continuous living cover on the soil for the majority ofthe growing season (Jordan et al., 2007), reduced dependency onfield drainage systems (Nassauer et al., 2007), and increased pro-duction of perennial field crops (Glover et al., 2010; Nassauer et al.,2007) – all of which could support a market-driven economy.
The U.S. Farm Bill is one of the most expensive and far-reachingpieces of legislation in U.S. agriculture. The results from this studysupport the idea that the monies dispersed through this policyinstrument could be used as a tool to influence on-the-grounddecisions affecting land use and cropping choices (Roberts andKey, 2008), nutrient runoff (Claassen et al., 2007), stream restora-tion (Marshall et al., 2008), and national water quality issueslike hypoxia in the Northern Gulf of Mexico (Nassauer et al.,2007; Donner and Kucharik, 2008). Administrative bodies andagreements that integrate across political, economic, and socialboundaries (Roux et al., 2008) will be required to successfully applymanagement practices in ecological units stretching from smallupland watersheds to coastal waters. Demonstration watersheds ofsufficiently large temporal and spatial scale, perhaps similar to thecurrent USDA Mississippi River Basin Healthy Watersheds Initia-tive, could be used to improve economic and ecological conditionsbased on the relationships between farm policies, on-the-groundoutcomes, and environmental benefits or consequences that aresupported in the results from this study, and suggested as potentialbenefits by others (e.g., Jordan et al., 2007; Batie, 2009).
Acknowledgements
We thank Michael Haines for providing historical agriculturaldata, and Dennis Keeney, Nick Jordan, and two anonymous review-ers for comments and suggestions that have clarified and refined
the manuscript. Support was provided by a Louisiana State Univer-sity Dissertation Fellowship, a Land Institute Graduate ResearchFellowship, a Louisiana Board of Regents Fellowship, a NationalOceanic and Atmospheric Administration Coastal Ocean ProgramAward NA09N084780230, and NSF award DEB-1008184.
References
Batie, S.S., 2009. Green payments and the U.S. Farm Bill: information and policychallenges. Front. Ecol. Environ. 7, 380–388.
Bowers, D.E., Rasmussen, W.D., Baker, G.L., 1985. History of agricultural price-support and adjustment programs, 1933–84. Agri. Infor. Mull. 485, USDA,Economic Research Service, Washington, D.C.
Broussard, W., Turner, R.E., 2009. A century of changing land use and water qualityrelationships in the continental U.S. Front. Ecol. Environ. 7, 302–307.
Claassen, R., Breneman, V., Bucholtz, S., Cattaneo, A., Johansson, R., Morehart, M.,2004. Environmental Compliance in U.S. Agricultural Policy: Past Performanceand Future Potential. USDA-ERR Report 832. Washington, D.C.
Claassen, R., Aillery, M., Nickerson, C., 2007. Integrating Commodity and Con-servation Programs: Design Options and Outcomes. USDA-ERR Report 44.Washington, D.C.
Costello, C., Griffin, W.M., Landis, A.E., Matthews, H.S., 2009. Impact of biofuel cropproduction on the formation of hypoxia in the Gulf of Mexico. Environ. Sci.Technol. 43, 7985–7991.
Des Moines Water Works, 2007. Des Moines Water Works Consumer ConfidenceReport. Des Moines, IA, http://www.dmww.com/CCR/CCR2007.pdf (accessed12.10.10.).
Dimitri, C., Effland, A., Conklin, N., 2005. The 20th Century Transformation of U.S.Agriculture and Farm Policy. ERS Economic Infor. Bull. Number 3, USDA, Wash-ington, D.C.
Donner, S.D., Kucharik, C.J., 2008. The impact of cropland cover on rivernutrient levels in the Mississippi river basin. Global Ecol. Biogeogr. 12,341–355.
Gardner, B., 1987. Causes of U.S. farm commodity programs. J. Polit. Econ. 95,290–310.
Gardner, B., 1992. Changing economic perspective on the farm program. J. Econ. Lit.30, 62–101.
Glover, J.D., Culman, S.W., DuPont, T., Broussard, W., Young, L., Mangan, M.E., Mai,J.G., Crews, T.E., DeHaan, L.R., Buckley, D.H., Ferris, H., Turner, R.E., Reynolds, H.L.,Wyse, D.L., 2010. Harvested perennial grasslands provide ecological benchmarksfor agricultural sustainability. Agric. Ecosyst. Environ. 137, 3–12.
Goolsby, D.A., Battaglin, W.A., 2001. Long-term changes in concentrations andflux of nitrogen in the Mississippi River Basin USA. Hydrol. Processes 15,1209–1226.
Haines, M.R., The Inter-University Consortium for Political and Social Research.2004. Historical, demographic, economic, and social data: The UnitedStates, 1790–2000. (computer file: ICPSR 2896-V2). Ann Arbor, MI.http://dx.doi.org/10.3886/ICPSR02896.
Jordan, N., Boody, G., Broussard, W., Glover, J.D., Keeney, D., McCown, B.H., McIsaac,G., Muller, M., Murray, H., Neal, J., Pansing, C., Turner, R.E., Warner, K., Wyse, D.,2007. Sustainable development of the agricultural bio-economy. Science 316,1570–1571.
Key, N., Roberts, M.J., 2007. Commodity Payments, Farm Business Survival, and FarmSize Growth. USDA-ERS Report 51. Washington, D.C.
Marshall, D.W., Fayram, A.H., Panuska, J.C., Baumann, J., Hennessy, J., 2008. Posi-tive effects of agricultural land use changes on coldwater fish communities insouthwest Wisconsin streams. N. Am. J. Fish. Manage. 28, 944–953.
MEA (Millennium Ecosystem Assessment), 2005. Ecosystems and Human Well-being: Synthesis. Island Press, Washington, D.C.
Nassauer, J.I., Santelmann, M.V., Scavia, D. (Eds.), 2007. From the Corn Belt to the Gulf:Societal and Environmental Implications of Alternative Agricultural Futures.Johns Hopkins University Press/Resources for the Future, Baltimore, MD.
Rabalais, N.N., Turner, R.E., Sen Gupta, B.K., Boesch, D.F., Chapman, P., Murrel,M.C., 2007. Hypoxia in the Northern Gulf of Mexico: does the science sup-port the plan to reduce, mitigate, and control hypoxia? Estuaries Coasts 30,753–772.
Roberts, M.J., Key, N., 2008. Agricultural payments and land concentration: a semi-parametric spatial regression analysis. Am. J. Agric. Econ. 90, 627–643.
Roux, D.J., Ashton, P.J., Nel, J.L., MacKay, H.M., 2008. Improving cross-sector pol-icy integration and cooperation in support of freshwater conservation. Conserv.Biol. 22, 1382–1387.
Science Advisory Board, 2008. Hypoxia in the Northern Gulf of Mexico: An Updateby the EPA Science Advisory Board. EPA-SAB-08-003. U.S. EPA, Washington, D.C.
Simpson, E.H., 1949. Measurement of diversity. Nature 163, 688.Sprague, L.A., Hirsch, R.M., Aulenbach, B.T., 2011. Nitrate in the Mississippi River and
its tributaries, 1980 to 2008: are we making progress? Environ. Sci. Technol. 45,7209–7216.
Turner, R.E., Rabalais, N.N., 2003. Linking landscape and water quality in the Missis-sippi River Basin for 200 years. Bioscience 53, 563–572.
Turner, R.E., Rabalais, N.N., Justic, D., 2008. Gulf of Mexico hypoxia: alternate statesand a legacy. Environ. Sci. Technol. 42, 2323–2327.
USDA, 1990. Census of agriculture, 1987. (on CD-ROM) U.S. Bureau of the Census,Washington, D.C.

Author's personal copy
W.P. Broussard III et al. / Agriculture, Ecosystems and Environment 158 (2012) 103– 109 109
USDA, 2001. Census of agriculture 1999. (on CD-ROM) U.S. Bureau of the Census,Washington, D.C.
USDA, 2005. Census of Agriculture 2002. (on CD-ROM) U.S. Bureau of the Census,Washington, D.C.
USDA-ERS, 1979. Census of Agriculture, 1949–1974. (computer file: USDA 1-354-79-1). Washington, D.C.
USDA-ERS, 2001. Direct government payments by program, United States,1933–95. Data file: GP3395us. Washington, D.C. (http://www.ers.usda.gov/Data/farmincome/finfidmu.htm (accessed 08.05.08.).
USDA-ERS, 2003. 2002 Farm Act base acres. (Data file: 2002 Farm Actbase acres), Washington, D.C. (http://www.ers.usda.gov/Data/BaseAcres/Download.aspx) (accessed 14.05.08.).
USDA-ERS, 2006. Agricultural outlook: statistical indicators. Washington,D.C. http://www.ers.usda.gov/publications/Agoutlook/AOTables/(accessed14.05.08.).
USDA-ERS, 2007. Direct government payments by program, United States,1996–06. (Data file: GP9606us). Washington, D.C. http://www.ers.usda.gov/Data/farmincome/finfidmu.htm (accessed 23.01.08.).
USDA-ERS, 2008. Direct government payments, 2004–2008F (Data file: GP T6).Washington, D.C. http://www.ers.usda.gov/Data/farmincome/finfidmu.htm(accessed 14.05.08).
USDA-ERS, 2008. U.S. plant nutrient use by corn, soybeans, cotton, and wheatfor 1964–2006. Washington, D.C. http://www.ers.usda.gov/Data/FertilizerUse/(accessed 19.05.08).
USDA-FSA, 2006. Fact sheet: direct and counter-cyclical payment program. Wash-ington, D.C. http://www.fsa.usda.gov/pas/publications/facts/html/dcp03.htm(accessed 08.05.08.).
USDA-NASS, 2001. Agricultural chemical usage: 2000 field crops summary.http://www.usda.mannlib.cornell.edu/MannUsda/ (accessed 15.05.08.).
USDL-BLS, 2008. Consumer price index: all urban consumers (CPI-U). Washington,D.C. ftp://ftp.bls.gov/pub/special.requests/cpi/cpiai.txt (accessed 15.01.08.).
USDOC-BEA, 2007. CA45 – farm income and expenses. Washington, D.C.http://www.bea.gov/regional/reis/default.cfm#step2 (accessed 14.05.08.).
USGS, 2007. National Water Information System. http://waterdata.usgs.gov/nwis(accessed October–December 2007).