do age and generational differences exist - ScholarWorks
114
DO AGE AND GENERATIONAL DIFFERENCES EXIST IN THE FEDERAL WORKFORCE? A Thesis Presented to the faculty of the Department of Public Policy and Administration California State University, Sacramento Submitted in partial satisfaction of the requirements for the degree of MASTER OF PUBLIC POLICY AND ADMINISTRATION by Kevin Robert Holland SUMMER 2018
-
Upload
khangminh22 -
Category
Documents
-
view
4 -
download
0
Transcript of do age and generational differences exist - ScholarWorks

DO AGE AND GENERATIONAL DIFFERENCES EXIST
IN THE FEDERAL WORKFORCE?
A Thesis
Presented to the faculty of the Department of Public Policy and Administration
California State University, Sacramento
Submitted in partial satisfaction of
the requirements for the degree of
MASTER OF PUBLIC POLICY AND ADMINISTRATION
by
Kevin Robert Holland
SUMMER
2018

ii
© 2018
Kevin Robert Holland
ALL RIGHTS RESERVED
iii
DO AGE AND GENERATIONAL DIFFERENCES EXIST
IN THE FEDERAL WORKFORCE?
A Thesis
by
Kevin Robert Holland
Approved by:
__________________________________, Committee Chair Charles W. Gossett, Ph.D.
__________________________________, Second Reader
Edward L. Lascher, Ph.D.
____________________________
Date

iv
Student: Kevin Robert Holland
I certify that this student has met the requirements for format contained in the University
format manual, and that this thesis is suitable for shelving in the Library and credit is to
be awarded for the thesis.
__________________________, Graduate Coordinator ___________________
Robert W. Wassmer, Ph. D. Date
Department of Public Policy and Administration

v
Abstract
of
DO AGE AND GENERATIONAL DIFFERENCES EXIST
IN THE FEDERAL WORKFORCE?
by
Kevin Robert Holland
A major change is occurring within the American workforce. The Baby Boomers
who have been employed within the general workforce force for decades are now retiring
or becoming eligible to retire. The gap left within organizations from the retirement of
these older and skilled workers will be felt across all segments of society. As a result,
younger generations of workers will need to step in and fill the void left by the Baby
Boomers. To address these changes, organizations will need to plan for and
accommodate an age diverse workforce. This is nowhere more evident than within the
Federal government where a large proportion of workers are older Baby Boomers. As
they retire, Federal agencies will need to develop personnel plans to attract and retain
younger workers more urgently than organizations within the private sector. All this
involves understanding the values and motives from an age and generational perspective.
Little research has examined age and/or generational differences within the public

vi
sector. Fewer studies still, have examined age and/or generational differences within the
Federal workforce. I therefore contribute to the literature by using 1979 Federal
Employee Attitude Survey (FEAS) and 2008 Federal Human Capital Survey (FHCS) data
in my thesis to determine what if any age and/or generational differences exist in
values/motivations within the Federal workforce. The results from logistic regressions
and Pearson Chi2 tests revealed there are age and generational differences on
values/motives within the Federal workforce.
_______________________, Committee Chair
Charles W. Gossett, Ph.D.
_______________________
Date

vii
ACKNOWLEDGEMENTS
I am grateful for the help and guidance of Dr. Gossett and Dr. Lascher for their
help on my thesis. Thank you both for your help in developing this topic and reviewing
multiple drafts of this thesis. Without your continued support, this thesis would not have
been possible.

viii
TABLE OF CONTENTS
Page
Acknowledgements ........................................................................................................... vii
List of Tables ..................................................................................................................... xi
List of Figures ................................................................................................................... xii
1. THE AGING FEDERAL WORKFORCE CRISIS ...................................................... 1
Introduction ............................................................................................................. 1
History of Federal Workforce ................................................................................. 2
State of the Federal Workforce ............................................................................... 3
Millennials in the Federal Workforce ..................................................................... 7
Conclusion .............................................................................................................. 9
2. LITERATURE REVIEW ........................................................................................... 11
Introduction ........................................................................................................... 11
Generational Cohort and Work Values Literature ................................................ 11
Theory ................................................................................................................... 14
Work Values ......................................................................................................... 15
Generational Cohort Findings ............................................................................... 18
Age/Aging Literature ............................................................................................ 27
FEVS/FHCS and Related Studies ......................................................................... 34
Whistleblowers ..................................................................................................... 38

ix
Conclusion ............................................................................................................ 41
3. METHODS ................................................................................................................. 44
Introduction ........................................................................................................... 44
Reasons for Survey Selection ............................................................................... 44
Federal Employee Survey History ........................................................................ 44
Survey Information ............................................................................................... 46
Dependent Variables ............................................................................................. 47
Independent Variables .......................................................................................... 49
Statistical Tests Utilized ....................................................................................... 51
Limitations with Data ........................................................................................... 53
Conclusion ............................................................................................................ 54
4. RESULTS ................................................................................................................... 58
Introduction ........................................................................................................... 58
Age Differences .................................................................................................... 59
Generational Differences/Cross Tabulations ........................................................ 63
Conclusion ............................................................................................................ 65
5. CONCLUSION ........................................................................................................... 69
Introduction ........................................................................................................... 69
Age Differences .................................................................................................... 69
Generational Differences ...................................................................................... 72
Limitations ............................................................................................................ 74
Recommendations ................................................................................................. 74

x
Conclusion ............................................................................................................ 75
Appendix A: 1979 Federal Employee Attitude Survey Descriptive Statistics ................. 77
Appendix B: 2008 Federal Human Capital Survey Descriptive Statistics ....................... 78
Appendix C: 1979 FEAS VIFs ......................................................................................... 79
Appendix D: 2008 FHCS VIFs ......................................................................................... 80
Appendix E1: 1979 Questions Intrinsic Results with Standard Errors ............................. 81
Appendix E2: 1979 Administrative & Whistleblower with Standard Errors ................... 82
Appendix F1: 2008 Intrinsic & Extrinsic Results with Standard Errors .......................... 83
Appendix F2: 2008 Administrative & Whistleblower with Standard Errors ................... 84
References ......................................................................................................................... 85

xi
LIST OF TABLES
Tables Page
1. Table 1:1: Age of Federal Workforce Compared to Private Sector ............................ 4
2. Table 1:2: 1979 FEAS Number of Federal Workers by Age Group ........................... 5
3. Table 1:3: 2008 Number of Federal Workers by Age Group ...................................... 5
4. Table 1:4: Table 1:4: Racial and Gender Comparison Within Age ............................ 6
5. Table 2:1: Generational Definitions .......................................................................... 13
6. Table 2:2: Generational Differences and Work Values ............................................ 22
7. Table 2:3: Generational Differences in Public Sector ............................................... 37
8. Table 3:1: Comparative Survey Questions ................................................................ 48
9. Table 3:2: Demographic Variables ............................................................................ 50
10. Table 3:3: Explanatory Variables: Predicted Effects ................................................ 56
11. Table 3:4: Generational Predicted Effects ................................................................. 57
12. Table 4:1: 1979 and 2008 FEAS Significant Predictors ........................................... 58
13. Table 4:2: 1979 Federal Attitude Employee Survey Logistic Regression Results ... 62
14. Table 4:3: 2008 Federal Human Capital Survey Logistic Regression Results ......... 67
15. Table 4:4: 1979 FEAS and 2008 FHCS Cross Tabulations ...................................... 68

xii
LIST OF FIGURES
Figures Page
1. Figure 1:1: PEW Research: The Generations Defined ................................................ 1
2. Figure 2:1: Value Typology ...................................................................................... 17
3. Figure 4:1: Baby Boomers in 1979 & 2008 .............................................................. 65

1
THE AGING FEDERAL WORKFORCE CRISIS
Introduction
One of the great personnel challenges to confront the American workforce now,
and into the near future, is the retirement of the Baby Boomers. The PEW Research
Center (2014), shows the last four generational cohorts in the U.S, and when each was 18
to 33 years of age in Figure 1:1. For several decades, the Baby Boomers, those born
between 1946-1964, constituted the largest generational cohort in American history at 79
million people (Cohn and Taylor 2010; PEW 2015). Their impact on American society
has been felt politically and economically for decades. Though Millennials, those born
between 1981-1996, have recently surpassed the Baby Boomers as the largest
generational cohort in American history at 83.1 million (US Census 2015), the impact of
Baby Boomers will continue to be strongly felt as they enter retirement.
Figure 1:1: PEW Research: The Generations Defined
Source PEW 2014

2
January 1, 2011 was the day the oldest of the Baby Boomers reached retirement
age at 65, according to Cohn and Taylor (2010). The result, is as Cohn and Taylor (2010)
state that, “Every day for the next 19 years, about 10,000 more will cross that threshold”
(p. 1). These retirements will impact all segments of society. This will be strongly felt in
the Federal workforce as the older employees become eligible to retire and/or start to
retire. Therefore, it is crucial to understand age differences and/or generational cohort
differences between Millennials and Baby Boomers.
History of Federal Workforce
Overall, there are a variety of reasons the Federal workforce force has skewed
towards older workers. Past administrative reforms/initiatives, as well as recent political
and governmental dysfunction have resulted in an older workforce. Lewis and Cho
(2011) analyzed U.S. Census data and found Federal hiring slowed after Baby Boomers
entered the workforce between 1965 and 1989. This was followed by reductions in the
Federal workforce by President George H. W. Bush and was compounded by President
Bill Clinton’s “reinventing government” initiative (Lewis & Cho 2011). During this
period few new employees were hired, and those that were hired were older (Lewis &
Cho 2011). During the 2000 Presidential campaign, both parties made Federal workforce
reductions part of their campaign platforms (Light 1999, 2002). At which point,
according to, Light (2002) the Federal workforce had, “…endured a decade of
downsizing, two decades of bureaucrat bashing, three decades of constant reform, four
decades of increasing workloads, and five decades of pay and hiring freezes…” (p.1;
Light 1999). The end result, as Light (1999) stated was:
3
“The Federal government is not only losing the competition for talented college
graduates in general, it is not evening winning the competition among students at
the nation’s leading schools of public policy and administration who are now
choosing jobs in the private and nonprofit sectors…” (p. 1).
Unfortunately, governmental disfunction looks like it will continue into the near
future. A recent GAO (2016) report noted government dysfunction as a cause of an older
Federal workforce. For example, as Millennials entered the workforce, the Federal
government confronted, “…hiring freezes, sequestration, furloughs, and a 3-year freeze
on statutory annual pay adjustments from 2011-2013” (GAO 2016, p. 5). Recent political
developments do not bode well either. President Trump campaigned on reducing the
Federal workforce and instituting a hiring freeze; which was instituted in January 2018
and lifted a few months later (Jacobson 2018; Naylor 2017). Despite a short-lived hiring
freeze, President Trump in his 2018 State of the Union Address, reaffirmed his
commitment to reduce the size of the Federal workforce by asking Congress to give
governmental agencies more control to fire Federal workers (D’ Angelo 2018). These
proposed policy shifts, coupled with a recent, albeit brief government shutdown (New
York Times 2018) does not bode well for attracting younger employees.
State of the Federal Workforce
As shown in Table 1:1, in 2014, 23.4 percent of the U.S. civilian labor force were
employees 29 years and younger, versus 8.2 percent for the Federal civilian labor force
(GAO 2016). The 2008 Federal Human Capital Survey (FHCS) and the 1979 Federal
Employee Attitude Survey (FEAS) datasets used in this study further verified the small
percentage of workers 29 years old and younger compared to other age groups. Table 1:3
shows that the 29 and under age group consisted only 6.72% of the Federal labor force

4
in 2008. Furthermore, Table 1:3 shows that the Federal labor force in 2008 was skewed
toward the older age groups. In contrast, the Table 1:2 shows that workers 29 years old
and younger in the 1979 FEAS dataset consisted of 11.54% of the Federal labor force;
roughly twice the size than in 2008. Additionally, the age of respondents was more
evenly distributed across all age groups in the 1979 FEAS. Notably, the 60 and older age
group nearly doubled between both surveys. This means increased retirements of older
employees within the Federal workforce. Baby Boomer retirements within the Federal
workforce have increased in the last several years. The OPM (2015) noted from the fiscal
years 2005-2014 retirements increased by 10.9 percent (OPM 2015). The average age of
retirees was 60.2 years old and the average length of service was 27.8 years (OPM 2015).
A little over half of these were 60 or older and half of all retirees had 30 or more years of
Federal service (OPM 2015).
Table 1:1: Age of Federal Workforce Compared to Private Sector
Millennials (a)
Gen X, Baby Boomers, and Silent
Generation
>25 26-29 30-39 40-49 50-59 60<
% of U.S.
Employed
Civilian Labor
Force
12.6(b) 10.8(c) 21.4 21.7 21.3 12.2
% of U.S.
Federal
Workforce(d)
1.8 6.4 21.4 25.9 31.2 13.3
(a)We are defining the millennial generation to include all employees 39 and younger for purposes of
this statement. (b)As age groups do not correspond across data sets, this percent represents people ages 16
to 24 in the U.S. employed civilian labor force. ©As above, this percent represents people ages 25 to 29
in the U.S. employed civilian labor force. (d)Percent of federal workforce includes employees with non-
permanent and permanent appointments.
Source GAO 2016

5
The demographics of Federal retirements from 2005-2014 were largely
homogenous. The OPM (2015) noted that these retirees, “…were mainly men, whites,
non-veterans, non-supervisors and were largely in the cabinet-level agencies, in general
schedule and equivalent pay-plans, in Civil Service Retirement System and in
administrative occupations” (p. 8). The 2008 FEVS dataset largely mirrored the OPM
findings. Weighted cross-tabulations indicated that the 60 and older age group had the
largest percentage of males at 68.61% compared to 31.39% for females. When weighted,
the 50-59 age group comprised the largest percentage of whites at 74.16%, and the 60
and older age group was the second highest at 71.03%. Table 1.4 shows the 60 and older
age group was compromised of more males and whites compared to the 18-29 age group.
Table 1:2: 1979 FEAS Number of
Federal Workers by Age Group
Table 1:3: 2008 Number of Federal
Workers by Age Group
0
5
10
15
20
25
30
35
Per
centa
ge
of
Em
plo
yee
s
Age Group
0
5
10
15
20
25
30
35
Num
ber
of
Em
plo
yee
s
Age Group

6
Of the 60 and older age group, weighted cross tabulations revealed that 34.78% plan to
retire in 1-3 years, 28.46% in 3-5 years, 22.11% in 5 or more years, and 14.65% in less
than one year. However, the impact of the Great Recession from 2007-2009 likely
altered the plans of these workers (BLS 2012).
Those who retired between 2004-2014 were roughly the early cohort of Baby-
Boomers. A 2015 Government Accountability Office (GAO) report found that, “…of the
1.92 million permanent career employees on board in 2014, approximately 270,000 (14
percent) were eligible to retire” (p. 5). By the Fall of 2019, this number of eligible
retirees will reach 31 percent of the Federal workforce (GAO 2015). This retirement
wave will impact some agencies more than others. By September 2019, “…18 of the 24
CFO [Chief Financial Officers] Act agencies will have a higher percentage of staff
eligible to retire than the current overall average of 31 percent” (GAO 2015, p. 6). These
retirements could harm Federal agencies’ operations through the widening of a skills gap
0
10
20
30
40
50
60
70
80
18-29 30-39 40-49 50-59 60&Older
Per
centa
ge
of
Em
plo
yee
s
White Male
Table 1:4: Table 1:4: Racial and Gender Comparison Within Age

7
between older and younger workers, and changes to agency culture throughout the
Federal government. Table 1.4 also showed the 60 and older age group was comprised
largely of white males which was largely different compared to the 18-29 age group.
Fortunately, the ongoing and impending retirement of Baby-Boomers from the Federal
workforce has not gone unnoticed or unaddressed by government officials.
Concerns over the ongoing and impending retirement of Baby-Boomers are
widespread. In September of 2016, Senators on the Senate Homeland Security and
Governmental Affairs Committee (HSGAC) expressed concern over the impact on
Federal agencies and workforce due to the looming retirement of a large portion of
Federal employees (Hum 2016). The GAO (2016) noted that federal agencies will need
to revamp and/or improve their succession planning, “…to avoid a brain-drain and
mission-critical skills gaps” within the Federal workforce (p. 16). Furthermore, concerns
over the ongoing retirement wave lead President Obama and Congress to approve a
phased-retirement program in 2012 that allowed employees to work part-time after they
reached the Federal retirement age, and still receive some compensation (Hicks 2014).
The program is aimed, in part, for older workers to train their replacements to reduce
skills gaps within Federal agencies (Hicks 2014). However, as noted above, the current
political climate may change or eliminate programs established under President Obama.
Millennials in the Federal Workforce
As Baby Boomers exit the Federal workforce, Millennial workers will begin to
constitute a larger and important segment of the labor force. News reports on the wants,
desires, and intentions of Millennials in the workforce are widespread. However, when it

8
comes to Millennials and Federal service, news reports are contradictory. A headline by
Washington Post reporter Lisa Rein (2014) was entitled Millennials exit the federal
workforce as government jobs lose their allure. Rein (2014) noted that Millennials are
operating within a Federal environment that may not be accommodating them due to the
lengthy hiring processes, hiring freezes, and pay freezes due to budget cuts under
“sequestration” (p. 1). Burger (2014), wrote Why Millennials Want Government Jobs
(and then quit them), also commented on the organizational environment Millennials face
when seeking Federal employment such, as the long hiring processes and “red tape” etc.
However, Burger (2014) also noted that Millennials were frustrated with the
government’s preference to reward older workers for their longevity over more merit and
performance-based qualifications. Another journalist, Feintzeig (2014) again mentioned
many of the issues listed above. However, Feintzeig (2014) also noted a poll from a
private research firm, Universum, which indicated interest in working for the Federal
government by college students had decreased over the last four years. Feintzeig (2014)
attributed this to what Professor Paul Light of New York University, stated, “Unlike their
parents, today’s young workers don’t consider the government to be a haven of stability
and long-term job security…” (p. 1).
Just as there are news reports that highlight Millennials negativity about Federal
service or leaving Federal service, others highlight the opposite. Interestingly, The Hill
reporter Lisa Rein (2015) released another article entitled, Millennials actually like
government work, and other myths about them. In the article, Rein (2015) citied Deloitte
Consulting which found evidence that suggested Millennials do not have higher turnover

9
rates, have similar levels of morale as older workers, that they will not leave for the
private sector, and that it is not clear if it is harder to recruit Millennials into Federal
service compared to older generations. Los Angeles Times reporter, Yvonne Wenger
(2015) also reported results from Deloitte Consulting in an article entitled Federal
Workforce Is Thin on Millennials, but Study Shows How That Could Change which
challenges the views about Millennials and Federal service noted above. Related articles
from New York Daily News reporter Ann Vanderslice (2016) suggested Federal Service
jobs offer Millennials many of the things they want in a job/career. For example, the
retirement of older employees leaves opportunities for younger employees to climb the
job latter, along with good Federal benefits, and a chance to make an impact on society
(Vanderslice 2016).
Conclusion
The controversy over Millennials’ attitudes toward Federal service is widespread.
This thesis seeks to examine and compare the perceptions and attitudes of Federal
government employees between Millennials and Baby Boomers. Even as Baby Boomers
retire in droves they will still impact the Federal workforce for several years. Many Baby
Boomers are delaying their retirement (Feintzeig 2014), and not all Baby Boomers are
currently eligible to retire. As noted above, the year 2011 marks a 19-20 year period in
which the Baby Boomers will be eligible to retire (Cohn & Taylor 2010, p. 1). This
means Baby Boomers will continue to remain in Federal service for the next 12 years; at
least at the time of this study was written.
The Federal workforce will undergo substantial changes as the percentage of

10
older workers who comprise the labor force declines. Federal agencies will have to
develop human resource plans to accommodate the needs of younger and older workers.
This study seeks to examine differences in age between Millennials and Baby Boomers
on attitudes towards work. Additionally, this study seeks to determine what generational
differences, if any, exist with the Federal workforce using data from the 1979 FEAS and
2008 FEVS to answer these questions. Chapter 2 will highlight the academic research on
generational cohorts and work values. In addition, Chapter 2 will highlight some
controversies within the academic literature on generational research, such as
generational definitions and methods employed to study generational cohorts. Chapter 3
of this thesis will highlight the statistical tests used to answer the above questions and
why the 1979 FEAS and 2008 FHCS were selected. Chapter 4 will highlight the results
of the statistical tests mentioned in Chapter 3. Lastly, Chapter 5 will highlight the big
findings and highlight what and where future research can go.
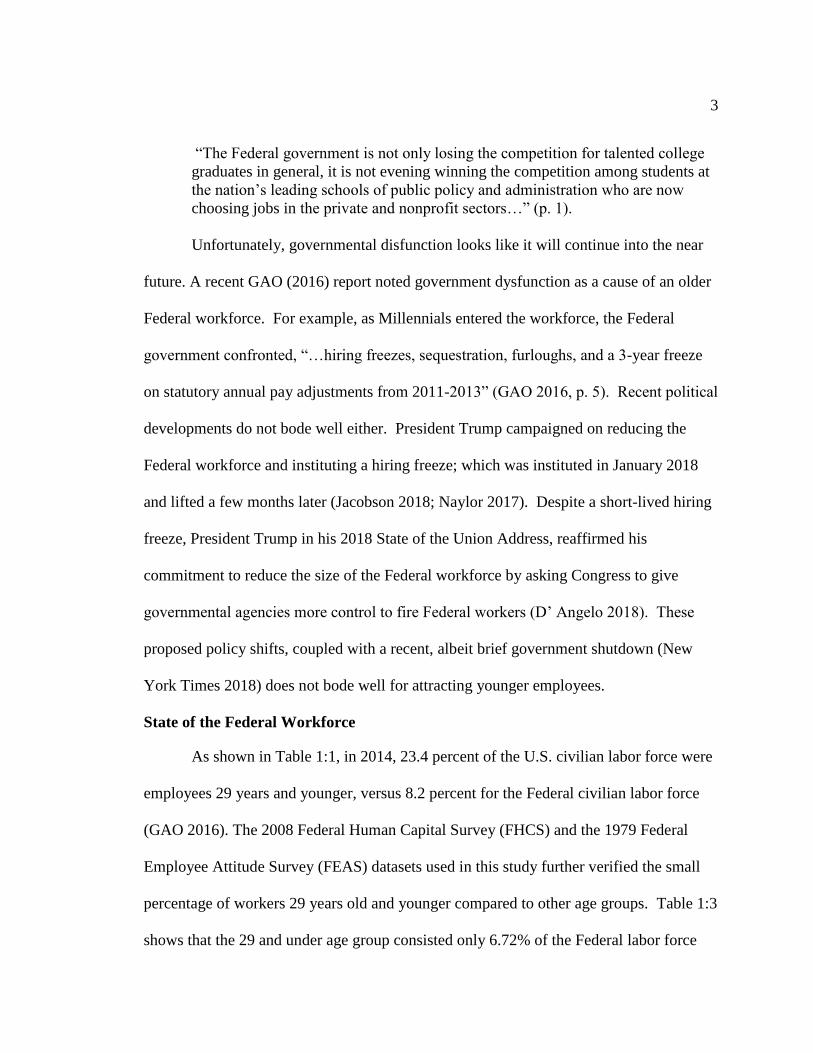
11
LITERATURE REVIEW
Introduction
Do generational or age differences in work values exist? If so, to what degree do
they exist? How have generational or age differences been studied with public sector
workers? In Chapter 1, I noted that there is confusion within mass media over these
questions. This is perhaps not surprising as the academic literature is also deeply divided
on these questions as well. Some researchers have found generational differences do
exist. However, others argue that the methodologies used to find these differences are
insufficient in teasing out age, period, and cohort effects necessary to confirm the
existence of differences between generational cohorts. Interestingly, a few researchers on
both sides of the debate have noted some results show gradual linear trends rather than
large jumps between generational cohorts, but they disagree on the significance of this
finding. In this chapter, I highlight the generational cohort literature and the work values
literature it builds off, the age/aging literature, other studies that have used FEVS/FHCS
data, and briefly note whistleblower literature. Whistleblowing was included because the
number of similar questions between the 1979 FEAS and the 2008 FHCS were limited,
and the research has identified age, among many, as a factor of whistleblowing.
However, to my knowledge the whistleblowing research has not examined any
generational effects on whistleblowing.
Generational Cohort and Work Values Literature
Generational differences in the workplace has been a popular subject among news

12
reporters, human resource managers, consultants, and academics (Parry & Urwin
2017; Costanza & Finkelstein 2017; Campbell et al 2017). This interest has also
expanded to other countries. Twenge (2010) noted that the generational cohort research
has been conducted on samples in North America, Europe, Australia, and New Zealand
(p. 202). Generally, research into generational differences has shown or suggested
differences in values, attitudes, behaviors, notions of career expectations/success, desires
etc., within the workplace (McDonald & Hite 2008; Ng & Schweitzer 2010; Twenge
2010; Kooij et al 2011; Becton et al 2014; Campbell et al 2017). The ongoing retirement
wave of Baby Boomers means younger Milllennials will take their place in a variety of
work environments. This is especially pronounced in the Federal workforce, as I noted in
Chapter 1. To avoid the potential for intergenerational conflict, office managers and
human resource specialists will need to be armed with knowledge to form appropriate
policies and practices to deal with an age diverse workforce. Failure to adequately
understand generational differences could result in intergenerational conflict (Adams
2000). The existence of intergenerational conflict, could lead to workplace tension,
declines in job satisfaction, and productivity (Kupperschmidt 2000).
While many scholars have found evidence to support the existence of generational
differences, detractors are pushing back. This has resulted in fragmentation in the
generational cohort literature into three separate categories. The first category of research
suggests that there are generational differences in the workplace (Smola & Sutton 2002;
Twenge 2010; Twenge 2014; Wray-Lake et al 2011; Twenge et al 2012; Hansen & Leuty
2012; Twenge & Kasser 2013; Lyons & Kuron 2014; Campbell et al 2017). The second
13
category of research suggests that there are no generational differences in the workplace
(Westerman & Yamamura 2007; Trzsniewski & Donnellan 2010; Costanza et al 2012;
Parry & Urwin 2011, 2017; Costanza & Finkelstein 2015, 2017). The third and last
category of research suggests that changes between generations are rather gradual
changes over time. However, researchers disagree whether this confirms or denies the
existence of generational differences (Parry & Urwin 2017; Campbell et al 2017).
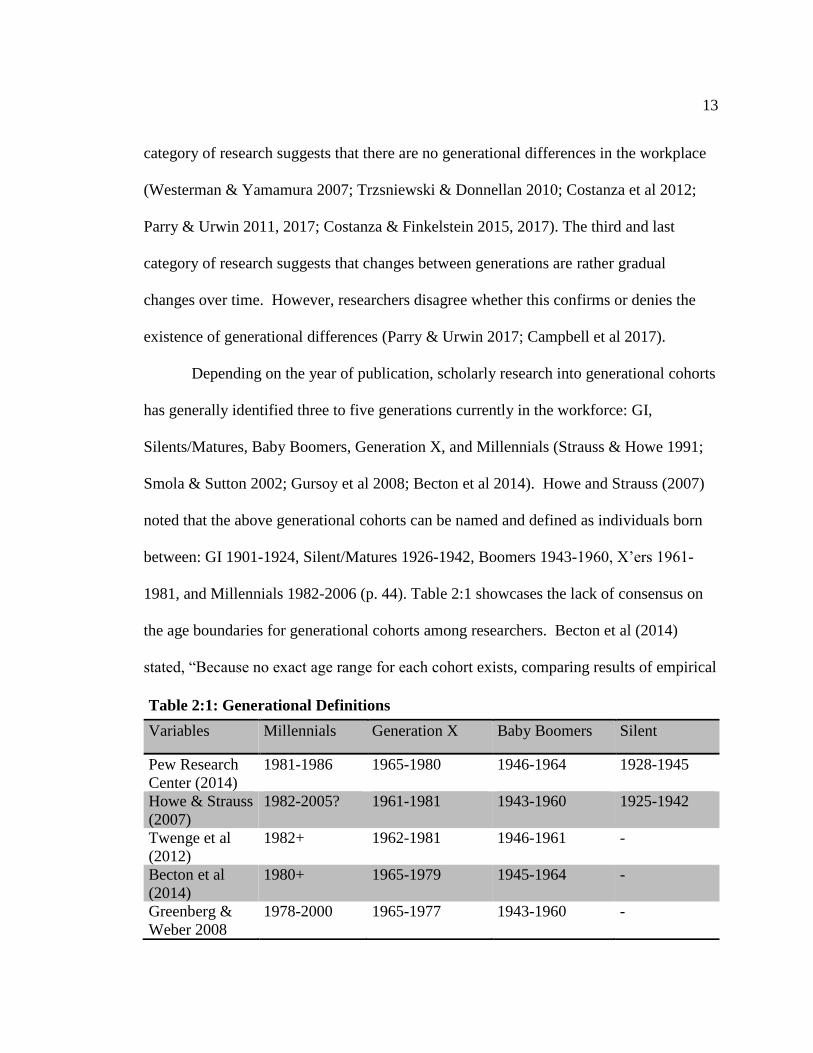
Depending on the year of publication, scholarly research into generational cohorts
has generally identified three to five generations currently in the workforce: GI,
Silents/Matures, Baby Boomers, Generation X, and Millennials (Strauss & Howe 1991;
Smola & Sutton 2002; Gursoy et al 2008; Becton et al 2014). Howe and Strauss (2007)
noted that the above generational cohorts can be named and defined as individuals born
between: GI 1901-1924, Silent/Matures 1926-1942, Boomers 1943-1960, X’ers 1961-
1981, and Millennials 1982-2006 (p. 44). Table 2:1 showcases the lack of consensus on
the age boundaries for generational cohorts among researchers. Becton et al (2014)
stated, “Because no exact age range for each cohort exists, comparing results of empirical
Table 2:1: Generational Definitions
Variables Millennials Generation X Baby Boomers Silent
Pew Research
Center (2014)
1981-1986 1965-1980 1946-1964 1928-1945
Howe & Strauss
(2007)
1982-2005? 1961-1981 1943-1960 1925-1942
Twenge et al
(2012)
1982+ 1962-1981 1946-1961 -
Becton et al
(2014)
1980+ 1965-1979 1945-1964 -
Greenberg &
Weber 2008
1978-2000 1965-1977 1943-1960 -

14
studies of generational differences is difficult” (p. 177). Therefore, this study uses the
age ranges used by PEW Research, noted in Chapter 1.
Theory
What is a generation? Karl Mannheim (1952) pioneered the idea and theory of
generations as a significant factor to consider in social science research (Parry & Urwin
2011, 2017; Campbell et al 2017; Becton et al 2014; Lyons & Kuron 2013). Mannheim
(1952) noted that an individual,
“…belonging to the same generation or age group, have this in common, that
both endow the individuals sharing in them with a common location in the social
and historical process, and thereby limit them to a specific range of potential
experience, predisposing them for a certain characteristic mode of thought and
experience, and a characteristic type of historically relevant action (p. 291).
The notion of birth year and the historical influence of events has been echoed by
other definitions of generational cohorts. Howe and Strauss (1991) stated that a
generation, “…is shaped by events or circumstances according to which phase of life its
members occupy at the time” (p. 42). Whereas, Kupperschmidt (2000) defined
generation as, “…a group of people or cohorts who share birth years and experiences as
they move through time together…” (p. 66). Other scholars have used similar
definitions and/or expanded them a little, but overall, Costanza et al (2012) noted that the
definitions of generations are generally consistent in that, “…a generation is defined as a
group of individuals, who are roughly the same age, and who experience and are
influenced by the same set of significant historical events during key developmental
periods in their lives, typically late childhood, adolescence, and early adulthood” (p.
377). Costanza et al (2012) clarifies that, “…these [generational] differences are not

15
attributable solely to an individual’s age but rather to the common influence of shared
experiences on the cohort” (p. 377). In addition to shared historical events,
Kupperschmidt (2000) noted that other “critical factors” can influence a generation,
which, “…include shifts in society-wide attitudes; changes in social, economic, and
public policy…” (p. 66).
Scholarly research has shown that those who experience major events in their
youth were remembered more than those who did not. For example, Schuman and Scott
(1989) and Schuman & Corning (2012) found that when respondents were asked to name
important events or changes, a higher proportion of Matures/Silents (“Americans born
before the mid-1930s”) cited World War II, than people of other ages/generations (p.
365; p. 10). This was the result of personal experiences by this age group in World War
II; with the same thing appearing for Baby Boomers and citations of the Vietnam War
(Schuman and Scott 1989). The result of shared experiences and memories is the
formation of “generational characteristics” which, “…include relatively enduring values,
attitudes, preferences, and behaviors that form the filter through which cohorts interpret
subsequent life experiences” (Kupperschmidt 2000, p. 66). This “generational filter”
impacts every aspect of how members of a generation live and interact with others and
events (Kupperschmidt 2000).
Work Values
The generational cohort literature borrowed from research into work values. This
is not surprising; as George and Jones (1997) stated, “…the experience of work is
multidimensional and includes work values, attitudes, and moods and their interactions”

16
(p. 394). The research on generational differences and work has largely reflected this.
However, the FEVS/FHCS questions I used, fall into the values and attitudes categories.
Therefore, I only examined the work values and generational cohort literature that studied
values and attitudes.
Rokeach’s work on values is widely known. At the time of this writing,
Rokeach’s book, The Nature of Human Values, has been cited 18,569 times according to
Google Scholar. According to Rokeach (1973), a value is an, “…enduring belief that a
specific mode of conduct or end state of existence is personal or socially preferable to an
opposite or converse mode of conduct or end state of existence” (1973, p. 5). Put
differently, Lyons et al (2006) stated “Values are goals or criteria that we use to
determine the desirability of certain actions or motives in our lives” (p. 606). The
literature on values highlights the difference between general values (or life values) a
person holds and values they have toward specific areas in their life, such as work values
(Elizur & Sagie 1999; Roe & Ester 1999; George & Jones 1997). Elizur and Sagie
(1999) noted general or life values, “…are mostly considered in the context of the home
life and family[,]” and are not work related (p. 78). Values themselves are general in
nature because they transcend specific situations and contexts (Rokeach 1973; Schwartz
1992; Ros et al 1999). In contrast, work values are considered the manifestations of
general values in the work place (Roe & Ester 1999; Ros et al 1999). More specifically,
work values are the, “…beliefs pertaining to desirable end-states (e.g. high pay) or
behavior (e.g. working with people)” (Ros et al 1999, p. 54). Values help individuals
guide their actions and behaviors in various situations and contexts (Rokeach 1973).

17
Lyons et al (2006) stated, “Like general values,
work values act as the criteria that individuals
use in selecting appropriate work-related
behaviors and goals” (p. 607).
There have been a wide variety of
different work value typologies proposed by
values scholars (Schwartz 1999; Lyons et al
2006; Lyons et al 2010). As can be seen in
Figure 2.1, researchers have generally noted the
existence of four comprehensive work value
categories: intrinsic, extrinsic, social, and status
or prestige work values (Ros et al 1999; Lyons
et al 2006, Lyons et al 2010; Jin & Rounds
2012). In general, intrinsic work values have
been noted to be “psychological satisfactions of work” (Lyons et al 2006, p. 608) and to
include elements such as: openness to change, individual interest, personal growth,
creativity, interesting/ meaningful life or work, independence, responsibility,
achievement etc. (Ros et al 1999; Schwartz 1999; Elizur 1984; Sagie & Elizur 1996;
Nord et al 1990; Elizur & Sagie 1999). Extrinsic work values include material elements
such as pay, benefits, hours of work, job security, work conditions etc., (Ros et al 1999;
Schwartz 1999; Elizur 1984; Sagie & Elizur 1996; Nord et al 1990; Elizur & Sagie 1999).
Social work motivations are the relationships and contact one has with other people and
Figure 2:1: Value Typology
Values Work Values**
Intrinsic Openness to change
Individual interest
Personal growth
Creativity
Interesting/
meaningful life or work
Independence
Responsibility
Achievement
Extrinsic Pay
Benefits
Hours of work
Job security
Work conditions
Social Interpersonal relationships
Contact with other people
Contribution to society
Esteem from colleagues
Feelings/emotions
Status* Power
Advancement
Authority
Influence
*Power and Prestige also included
**Sources: Ros et al 1999; Schwartz 1999;
Elizur 1984; Sagie & Elizur 1996; Nord et al
1990; Elizur & Sagie 1999

18
include elements such as the: contribution to society, esteem from colleagues,
feelings/emotions etc., (Schwartz 1999; Elizur 1984; Sagie & Elizur 1996; Elizur & Sagie
1999; Ros et al 1999). Lastly, status or prestige work values include elements such as:
power, advancement, authority influence, dominance etc. (Schwartz 1999; Ros et al
1999).
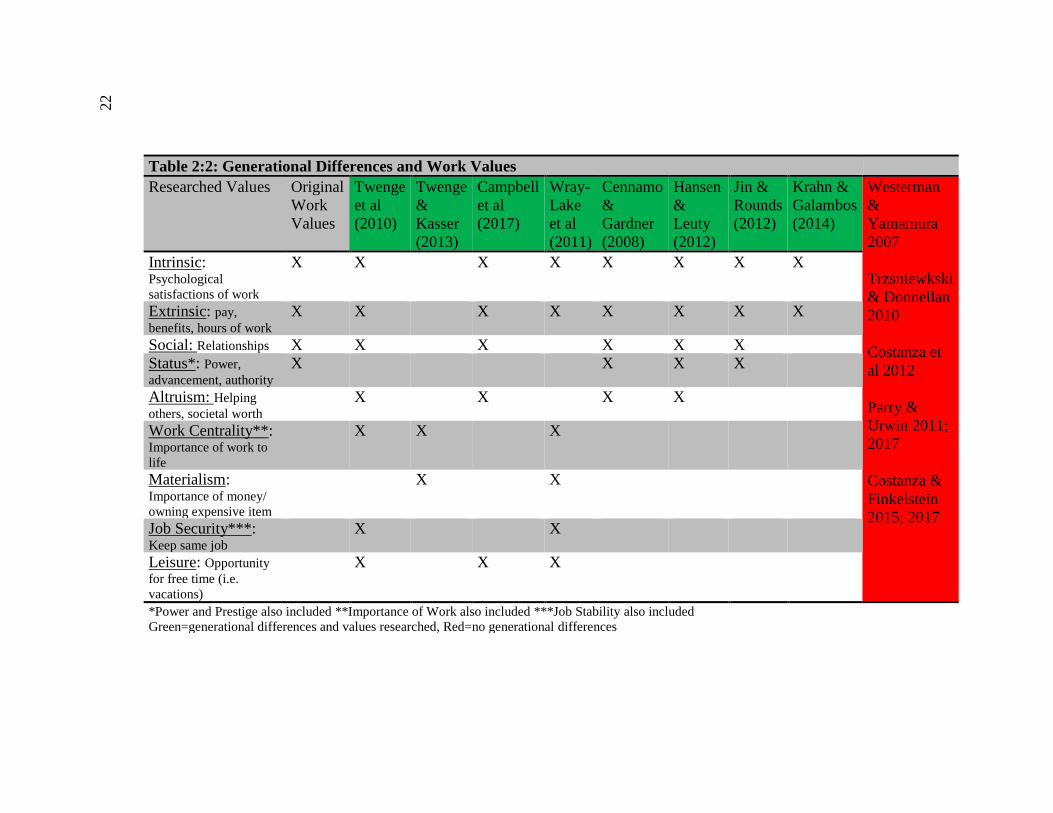
Generational Cohort Findings
The generational cohort literature that finds generational differences have
continued, added to, and/or changed the four categories in the work value typology, as
seen in Figure 2.1. Table 2:2 notes which researchers used what work values, and
identifies those that have and have not found generational differences. For example,
Twenge et al (2010) and Campbell et al (2017) added dimensions of leisure and altruism
as values, while others such as Wray-Lake et al (2011) only added leisure. However,
Twenge et al (2012), Campbell et al (2017), and Wray-Lake (2014) combined
status/power dimensions into extrinsic work values. Whereas, Cennamo and Gardner
(2008) kept status/power dimensions separate from extrinsic work values, while they
added altruism and freedom dimensions to their study. Some studies have added or
researched other items such as: work centrality, importance of work, leisure, altruism
etc., (Smola & Sutton 2002; Twenge et al 2010; Twenge & Kasser 2013; Twenge 2014;
Wray-Lake et al 2011; Hansen & Leuty 2012; Campbell et al 2017). Overall, despite
some differences in the work values typologies used, most of the items included in the
generational differences studies could be classified into intrinsic, extrinsic, social,
prestige or power dimensions. However, for the purposes of my study, I specifically

19
examine the generational differences on intrinsic and extrinsic values.
First Research Stream: Generational Differences
The first category of the generational cohort literature includes scholars that have
found generational differences on work values/motives (Smola & Sutton 2002; Twenge
2010; Wray-Lake et al 2011; Twenge et al 2012; Hansen & Leuty 2012; Twenge &
Kasser 2013; Schullery 2013; Krahn & Galambos 2014; Campbell et al 2017). The
literature has found that extrinsic values such as being very well off financially, having
lots of money, status, and other material related items were more important for
Millennials and Generation X than Baby Boomers (Twenge 2010; Wray-Lake et al 2011;
Twenge et al 2012; Twenge & Kasser 2013; Schullery 2013; Krahn & Galambos 2014;
Campbell et al 2017). This has translated into a strong generational preference among
Millennials for leisure values/motives compared to Baby Boomers (Twenge 2010;
Twenge et al 2010; Wray-Lake et al 2011; Schullery 2013; Campbell et al 2017). This is
not surprising, as related research has found the “importance of work or work centrality”
in one’s life has declined across generations (Smola & Sutton 2002; Twenge 2010;
Twenge et al 2010; Highhouse et al 2010; Wray-Lake 2011). For some studies, the data
showed curvilinear trends for the importance of extrinsic/material values, which peaked
with Generation X then declined slightly with Millennials but remained higher than the
Baby Boomers (Twenge 2010; Twenge et al 2012; Twenge & Kasser 2013; Campbell et
al 2017). On the other hand, one study found no differences in extrinsic work values
(Cennamo & Gardner 2008).
While large differences between generations were found on extrinsic/materialistic
20
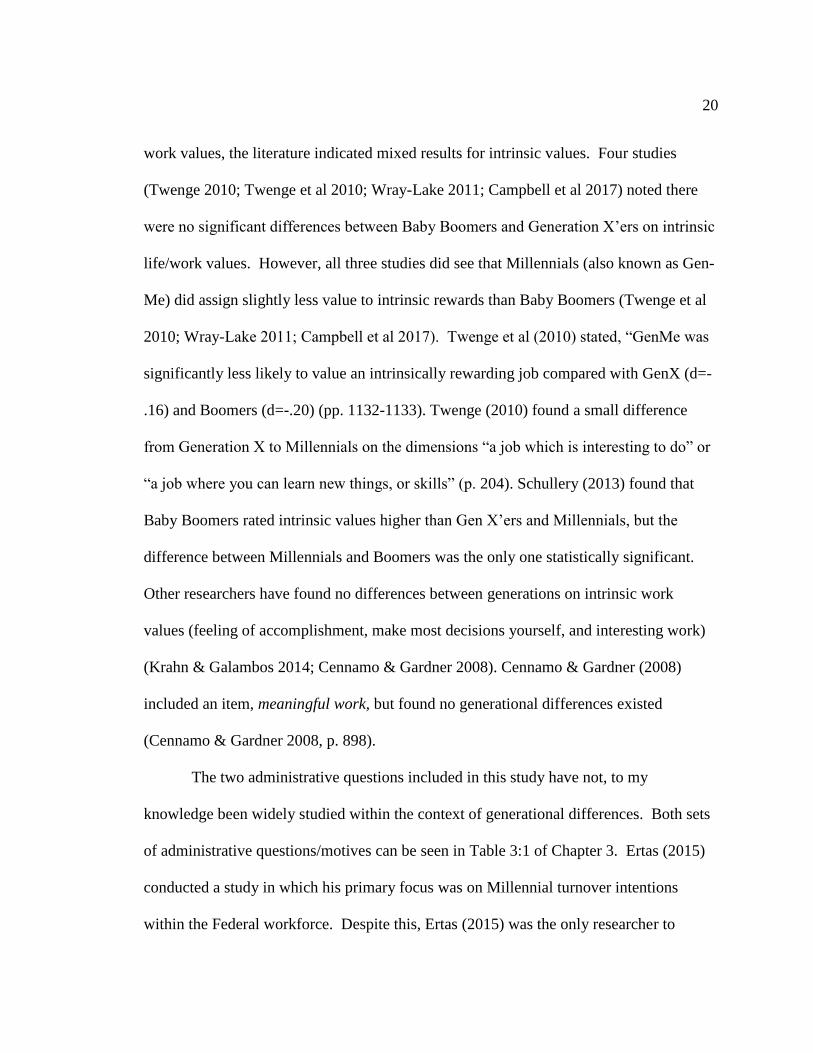
work values, the literature indicated mixed results for intrinsic values. Four studies
(Twenge 2010; Twenge et al 2010; Wray-Lake 2011; Campbell et al 2017) noted there
were no significant differences between Baby Boomers and Generation X’ers on intrinsic
life/work values. However, all three studies did see that Millennials (also known as Gen-
Me) did assign slightly less value to intrinsic rewards than Baby Boomers (Twenge et al
2010; Wray-Lake 2011; Campbell et al 2017). Twenge et al (2010) stated, “GenMe was
significantly less likely to value an intrinsically rewarding job compared with GenX (d=-
.16) and Boomers (d=-.20) (pp. 1132-1133). Twenge (2010) found a small difference
from Generation X to Millennials on the dimensions “a job which is interesting to do” or
“a job where you can learn new things, or skills” (p. 204). Schullery (2013) found that
Baby Boomers rated intrinsic values higher than Gen X’ers and Millennials, but the
difference between Millennials and Boomers was the only one statistically significant.
Other researchers have found no differences between generations on intrinsic work
values (feeling of accomplishment, make most decisions yourself, and interesting work)
(Krahn & Galambos 2014; Cennamo & Gardner 2008). Cennamo & Gardner (2008)
included an item, meaningful work, but found no generational differences existed
(Cennamo & Gardner 2008, p. 898).
The two administrative questions included in this study have not, to my
knowledge been widely studied within the context of generational differences. Both sets
of administrative questions/motives can be seen in Table 3:1 of Chapter 3. Ertas (2015)
conducted a study in which his primary focus was on Millennial turnover intentions
within the Federal workforce. Despite this, Ertas (2015) was the only researcher to

21
examine generational differences on the same or similar questions I used. Ertas (2015)
used a fairness variable which included the following two questions, “My performance
appraisal is a fair reflection of my performance,” and “Promotions in my work unit are
based on merit” (p. 411). Chi2 tests revealed that mean for Millennials (18-29) was
higher than for older workers (Ertas 2015, p. 413). However, Ertas (2015) did find that a
Millennial and fairness interaction term was not significant in his logistic regression (p.
414).
Based on the above literature, the following hypotheses are:
H1 Intrinsic motives will be less important for Millennials than Baby Boomers at the
same age.
H2 Administrative motives will be more important for Millennials than Baby Boomers at
the same age.
Second Research Stream: No Differences Research
Another stream of generational literature suggests there are little or no
generational differences in work values or attitudes (Westerman & Yamamura 2007;
Trzesniewski & Donnellan 2010; Costanza et al 2012; Parry & Urwin 2011; 2017;
Costanza & Finkelstein 2015; 2017). Most of this research attacks the generational
differences research on methodological grounds.
Of the attacks on the generational differences literature, most are on its
methodology (Trzesniewski & Donnellan 2010; Costanza et al 2012; Costanza &
Finkelstein 2015; Parry & Urwin 2017). These studies and others highlight the
importance of controlling for age, period, cohort effects when studying generational
22
Table 2:2: Generational Differences and Work Values
Researched Values Original
Work
Values
Twenge
et al
(2010)
Twenge
&
Kasser
(2013)
Campbell
et al
(2017)
Wray-
Lake
et al
(2011)
Cennamo
&
Gardner
(2008)
Hansen
&
Leuty
(2012)
Jin &
Rounds
(2012)
Krahn &
Galambos
(2014)
Westerman
&
Yamamura
2007
Trzsniewkski
& Donnellan
2010
Costanza et
al 2012
Parry &
Urwin 2011;
2017
Costanza &
Finkelstein
2015; 2017
Intrinsic: Psychological
satisfactions of work
X X X X X X X X
Extrinsic: pay,
benefits, hours of work X X X X X X X X
Social: Relationships X X X X X X
Status*: Power,
advancement, authority X X X X
Altruism: Helping
others, societal worth X X X X
Work Centrality**: Importance of work to
life
X X X
Materialism: Importance of money/
owning expensive item
X X
Job Security***: Keep same job
X X
Leisure: Opportunity
for free time (i.e.
vacations)
X X X
*Power and Prestige also included **Importance of Work also included ***Job Stability also included
Green=generational differences and values researched, Red=no generational differences

23
differences (Rhodes 1983; Lyons et al 2013; Costanza & Finkelstein 2015; Parry and
Urwin 2017). Costanza & Finkelstein (2015) noted that age referred to the “variation
associated with aging attributable to life stage and maturity,” period referred to “variation
associated with specific historical time period,” and cohort referred to “variation
associated with groups of individuals based on shared experiences” (p. 309). Many of the
studies that show generational differences use longitudinal sequence, time-lag, or cross-
sectional methods (Smola & Sutton 2002; Wray et al 2008; Cennamo & Gardner 2008;
Wong et al 2008; Twenge et al 2010; Twenge & Kasser 2013; Krahn & Galambos 2014;
Campbell et al 2017). Many of these methods have issues with separating age, period,
and cohort effects, which are necessary to truly determine if generational differences
exist (Costanza & Finkelstein 2015; Parry & Urwin 2011; 2017). However, it has been
noted that no one statistical technique can separate out age, period, and cohort effects
(Glenn 1976; Parry & Urwin 2011).
Many if not most of the studies on generational differences use cross-sectional
methods (Twenge 2010; Parry & Urwin 2011; Lyons & Kuron 2013). There is
agreement between researchers on both sides of the debate that cross-sectional designs
are, according to Lyons & Kuron (2013), “…the weakest from of evidence as they
control for neither age nor cohort effects and hold constant only the period effect…” (p.
142; Cennamo & Gardner 2008; Twenge 2010; Twenge et al 2010; Parry & Urwin 2011;
Krahn & Galambos 2014; Costanza & Finkelstein 2015; Campbell et al 2017; Parry &
Urwin 2017). Longitudinal sequence designs, and time-lag data are some of the better
methods and data to detect generational differences (Parry & Urwin 2011). Of the two,

24
longitudinal sequential design is one of the best methods (Schaie & Caskie 2008; Lyons
& Kuron 2013; Krahn & Galambos 2014). Schaie and Caskie (2008) stated that,
“…longitudinal sequences use the same sample of individuals from two (or more) cohorts
repeatedly…” which allows researchers to measure, “…interindividual age change and
interindividual differences in rate of change” (p. 23), and cohorts (Lyons & Kuron 2013,
p. 142). I found one study that used this method. Krahn and Galambos (2014) found
“cohort differences” high school seniors in 1985 and 1996 in extrinsic work values and
job entitlement beliefs, but no differences on intrinsic work values (p. 106). However,
Krahn & Galambos (2014) went on to state, “We use the concept ‘cohort’ rather than
‘generation’ in this discussion because our cohort differences in extrinsic work values
and job entitlement beliefs were statistically significant but not particularly strong” (p.
106). These results were similar to those obtained by Twenge et al (2010, p. 1133). Due
to the small cohort differences, Krahn & Galambos (2014) refrained from concluding
these differences were the result of generational differences.
A Methodological Middle Ground
Despite the methodological issues, Lyons & Kuron (2013) advocated a middle
ground on which generational differences literature should progress. In their review of
the generational literature they stated that it is, “…useful to examine the body of evidence
holistically, treating methodologies as complementary, rather than competing” (p. 143).
They further state, “The results of time-lag, cross-temporal meta-analytic and cross-
sectional studies provide sufficient “proof of concept” for generation as a workplace
variable, but further theoretical and qualitative work is needed to flesh out mediators and

25
moderators in the relationship between generation and work-related variables” (p. 139).
Therefore, Lyons and Kuron (2013) are not entirely dismissive of cross-sectional studies
on generations, and they even note cross-sectional studies can contribute to the research.
They argued that, “Despite their limitations, cross-sectional studies provide a current
snapshot of generational differences, which is desirable to practitioners grappling with
generational issues (or perceived issues). They also contribute to the “fossil record,”
providing data for meta-analysis and reviews” (Lyons & Kuron, p. 153).
Third Research Stream: Gradual Changes
The last research stream in the generational literature proposes that any detected
changes in generations are small gradual changes over time. Some notable scholars from
the generational differences stream (Campbell et al 2017), and some scholars from the no
differences stream (Parry & Urwin 2017) have made such propositions. Two things
suggest gradual linear trends over time. One, researchers have noted that generational
cohorts are fundamentally social constructions (Mannheim 1952; Campbell et al 2017;
Parry & Urwin 2017). Therefore, there has not been consistent time periods used to
differentiate when a generational cohort begins and ends (Lyons et al 2007; Campbell et
al 2017; Parry & Urwin 2017; Becton et al 2017). Two, different results from scholars
show linear rather than “…staircase pattern[s] that would imply a clear generational
boundary” (Parry & Urwin 2017; Campbell et al 2017, p. 136). In response to these
results, Campbell et al (2017) makes the argument that there likely will not be tangible
differences for people born on the front and back ends of a generational cohort.
However, Campbell et al (2017) stated that, “The difference based on birth cohort

26
between individuals born in, say, 1964 and 1965 should be irrelevant in most cases (p.
136). However, the 1955 and 1975 birth cohorts should show differences[,]” and
ultimately show that generational cohorts are “fuzzy but useful constructs” (p. 136).
The Impact of Age
No discussion on generational differences can be had without the examination of
age and its potential effects. As noted above, one of the big problems of the generational
differences research is controlling for age, period, and cohort effects (Costanza &
Finkelstein 2015; Parry and Urwin 2017). Of these age is important because the results
found in the generational differences literature could be the result of age due to
methodological issues (Rhodes 1983; Costanza & Finkelstein 2015; Parry and Urwin
2017). In fact, some studies’ results in the generational literature indicated age was an
influential factor. Two studies indicated age was responsible for some differences in
work values. In their work, Krahn and Galambos (2014) examined two classes of high
school seniors in Canada in 1985 and 1996. Then they conducted follow up surveys to
track any changes as respondents aged from 18 to 25. Follow up surveys were sent to the
1985 seniors in 1986, 1987, 1989, and 1992, while one follow-up survey for the 1996
seniors was conducted in 2003 (Krahn & Galambos 2014). Krahn and Galambos (2014)
found intrinsic work values became more important as respondents aged between 18-25
for 1985 and 1996 in both cohorts of high school seniors. For extrinsic work values,
Krahn and Galambos (2014) found extrinsic work values became more important as
respondents aged from 18-25, but only for the 1996 cohort. Due to these results Krahn
and Galambos (2014) noted that differences between cohorts could grow or shrink as

27
they aged (p. 109). In a separate study, Jin and Rounds (2012) examined age group/life
stage in more detail.
Jin and Rounds (2012) conducted a meta-analysis to determine if work values
were stable or changed across an individual’s life span. Their results indicated that work
values changed based on the age group/life stage individuals were in (Jin and Rounds
2012). For example, Jin and Rounds (2012) found that people in college (18-22) valued
intrinsic values (ability utilization, independence, creativity, and learning) more than
extrinsic values (financial success, work environment, security, and economics) (p. 336).
However, after college Jin and Rounds (2012) found that individuals in young adulthood
(22-26) placed greater importance on extrinsic values while the other values decreased (p.
336). Additionally, for respondents after adulthood (26+ years), the importance of
extrinsic values continued to increase (Jin & Rounds 2012, p. 336).
Age/Aging Literature
Apart from the generational literature, age has been studied in a variety of ways
related to work. In 1983 Rhodes conducted one of the first comprehensive literature
reviews pertaining to worker age and attitudes (Farrell & Matthew 2007, p. 140). Rhodes
(1983) noted that age and/or aging had a psychological and biological component. The
psychological component was tied to, “…changes in personality, needs, expectations, and
behavior as well as performance in a sequence of socially prescribed roles and
accumulation of experiences” (Rhodes 1983, p. 329). The biological component was tied
to the, “…physical changes that occur with age” (p. 329). The concept of age and/or
aging has expanded to include changes across the lifespan of an individual in the

28
psychological, cultural, and social realms as well (Baltes et al 1999).
Age and work values/motives has not been widely researched (Barnes-Farrell &
Matthews 2007; Ng & Feldman 2010; Inceoglu et al 2012; Rudolph et al 2013). Most of
the research has examined age and motivation on work outcomes (Farrell & Matthews
2007; Rudolph et al 2013). Rudolph et al (2013) stated, “…almost no empirical studies
have been primarily interested in how workplace motives change as a function of aging”
(p. 2). Rudolph (2013) noted that despite recent research such as Kooij et al’s (2010)
meta-analysis on age and job attitudes, “…primary research has yet to adequately address
this topic directly” (p. 2). To compensate for this, I focused on the results of a few big
and often cited studies (Ng & Feldman 2010; Kooij et al 2011), along with more recent
studies or literature synopses (Rhodes 1983; Rudolph et al 2013).
There are a variety of theoretical perspectives in the age/aging literature (Rudolph
2016). Specifically, when it comes to age/aging and work values/motives lifespan
theories of development have been the dominant lenses in which researchers have
conducted their studies. Rudolph (2016), in his assessment of the lifespan literature,
noted there were four theories within the field: (1) selection, optimization, and
compensation (SOC), (2) socioemotional selectivity (SST), (3) motivation theory of
control/lifespan development (MTC/MTLD), and (4) assimilative and accommodative
coping theories (AAC) (pp. 133-134). SOC theory predicts that as individuals advance in
age they experience more losses than gains (Baltes et al 1999). Therefore, older
individuals select alternative goals, optimize their resources, and compensate for their
age-related losses (Baltes et al 1999). As a result, Kooij et al (2011) noted that SOC

29
theory predicts, “…that growth related work motives (i.e. aimed at reaching higher levels
of functioning) will decline and motives related to maintenance and regulation of work
related losses (i.e., “security will increase”) (p. 201). SST is framed around the
perception of time. The more time someone has, SST predicts they will pursue skills and
knowledge (“acquisitive behavior geared toward learning about the social and physical
world” p. 166), but as time shrinks as individuals get older they will invest more time and
energy into emotional goals (“desire to find meaning in life, gain emotional intimacy, and
establish feelings of social embeddedness” (Carstensen et al 1999, p. 166). Lastly, Kanfer
and Ackerman (2004) built on the above theories to propose that changes in work
motivation stem from decreases in fluid intelligence and increases in crystallized
intelligence as an individual ages.
MTC theory presents the concept that individuals have primary motives and
secondary control motives; primary motives have “functional primacy” over secondary
motives (Heckhausen & Schulz 1995, p. 284). Primary control motives center around the
actions individuals take to affect their environment, whereas secondary control motives
center around individual “cognitive” development and processes that assist individuals,
“…cope with two inevitable features of any human activity: its selectivity and failure-
proneness” (Heckhausen & Schultz 1995, p. 297). MTC predicts that as an individual
ages, there is a shift in focus on primary control motives to secondary control motives
due to biological and cultural effects (Heckhausen & Schultz 1995). I do not discuss
AAC theory as it is similar to MTC theory and as Rudolph (2016) stated the, “…work
and aging research has favored MTC/MTLD” (p. 145).

30
Kanfer and Ackerman (2004) built on the previous aging theories to develop and
propose that age-related changes in cognitive abilities affect individual motivations.
Cognitive dimensions include fluid and crystallized intelligence. Fluid cognitive abilities
are, “…associated with working memory, abstract reasoning, attention, and processing of
novel information” which decrease as individuals get older (Kanfer and Ackerman 2004,
p. 443). Conversely, crystallized cognitive abilities are, “…associated with general
knowledge, extent of vocabulary, and verbal comprehension” which increase as
individuals get older (Kanfer and Ackerman 2004, p. 443). Under Kanfer and
Ackerman’s (2004) theory, the type of demands a job places on an individual will affect
their motivation. For example, a job that places high demands on someone’s fluid
intelligence will negatively affect employee motivation over time as the compensatory
efforts to maintain work performance (through various strategies such as more effort)
have negative psychological effects (Kanfer & Ackerman 2004, p 450). Conversely,
individuals employed in jobs that place high demands on crystallized intelligence could
improve with age (Kanfer & Ackerman 2004, p. 450).
The work motivation typology used in the age/aging literature is generally
different from the work values and the generational differences literature. For starters,
Kooij et al (2011) stated, “…work-related measures of needs, motives, and values tend to
be used interchangeably in the work motivation literature” (p. 199), whereas these are
treated separately in the work values and generational literature. Secondly, two big and
often cited meta-analyses for age and work motivation, Ng and Feldman (2010) and
Kooij et al (2011) used different motivation typologies. For example, Kooij et al (2011)

31
broke values/motives into intrinsic and extrinsic categories, but he also used items in
those categories and put them into growth, social, and security value/motive categories;
which he said was more consistent with the age. Ng and Feldman (2010) examined job
attitudes and broke those attitudes into task-based, people based, and organization-based
attitudes. Despite these typological differences, I examined the results from age and
value/motives studies and classified them into the intrinsic and extrinsic value topology
used in the work values literature (Ros et al 1999; Lyons et al 2006, Lyons et al 2010; Jin
& Rounds 2012), and to a lesser extent, the generational differences literature (Smola &
Sutton 2002; Twenge 2010; Lyons et al 2010; Twenge & Kasser 2013; Hansen & Leuty
2012; Wray-Lake et al 2011; Campbell et al 2017).
Kooij et al (2011) operationalized intrinsic motives as: development or challenge,
working with people, helping people, contributing to society, job security or need for
security, accomplishment/achievement, use of skills, interesting work, autonomy (p.
206). Whereas, Kooij et al (2011) operationalized extrinsic values as: advancement/
promotion, recognition/prestige/status, and compensation and benefits (p. 206). Rudolph
et al (2013) used the same typological arrangements in his review of the age/aging
literature. While Inceoglu et al (2012) used the intrinsic (interesting tasks, working with
other people, autonomy over tasks) and extrinsic (status, financial rewards, praise and
outward signs of recognition, and a pleasant working environment) motive typology and
added another – “energy” - (things/tasks that require “personal resources”) as a separate
dimension (p. 306).
The literature supports the idea that as a worker gets older they place greater value

32
on intrinsic values/motivation (Rhodes 1983; Kooij et al 2011; Inceoglu et al 2012).
Rhodes (1983) concluded after her survey of the age and work literature that age was
positively associated with the “satisfaction of the work itself, job involvement, internal
work motivation…” (p. 355). Studies since Rhodes (1983) have generally found similar
results (Ng & Feldman 2010; Kooij et al 2011; Inceoglu et al 2012). Kooij et al (2011)
found age was positively associated with “use of skills, “interesting work,” and
“autonomy” (p. 209). However, Kooij et al (2011) found age was negatively related to
“development” or “challenge” work values/motives (p. 209). Ng and Feldman (2010)
found that age positively but weakly related to intrinsic work motivation and job
involvement, and that age was negatively and weakly related to personal
accomplishment. Inceoglu et al (2012) found that achievement and personal growth
(“training, development, and new skills”) were less important for older workers (pp. 307
& 321). Inceoglu et al (2012) also found that age was positively associated with
autonomy, but not for interest (variety, interest, stimulation pp. 307-308), flexibility
(“absence of clearly defined structures and procedures for managing tasks”), and personal
principles (“uphold ideals and have high ethical standards”) (p. 322). Conversely, Calo et
al (2014) found age was not related to intrinsic motivations (challenge and task
enjoyment) (p. 103). Lastly, Inceoglu et al (2012) found ease and security (pleasant work
conditions and job security) were not related to age (p. 322).
Research into age and extrinsic work values/motivations appears a little mixed.
Rhodes (1983) in her overview of the age and work values/motivation literature, noted
that the importance of extrinsic job characteristics increased with age. Rhodes (1983)

33
stated that age and satisfaction with promotion(s), “…appears to be age related” (p. 338).
However, more recent studies have not found positive relationships between age and
extrinsic work values/motivations (Elias et al 2012; Kooij et al 2011; Inceoglu et al
2012). For example, Kooij et al (2011) found older workers did not value “compensation
and benefits” as much as younger workers. Additionally, Elias et al (2012) and Calo et al
(2014) found age was negatively associated with extrinsic motivation (my job is secure,
my income is high, my opportunities for advancement are high; compensation and
recognition) (p. 459; p. 103). Inceoglu et al (2012) found age was not associated with
material (financial) rewards. However, Inceoglu et al (2012) did find that progression
(having good promotion prospects) was negatively related to age (p. 322). Additionally,
Ng and Feldman (2010) noted that age was negatively but moderately related to
satisfaction with promotions.
Based on the aging literature, the following are my hypotheses:
H3 Older employees will agree more on the importance of intrinsic motives than younger
employees.
H4 Younger employees are more likely to report dissatisfaction with their pay than older
employees
H5 Based on Ertas’s (2015) findings noted above, I predict: younger employees are more
likely to agree than older employees on the importance administrative motives.
In general, the age/aging literature has not spent a lot of effort in examining
changes in work values/motives over time (Barnes-Farrell & Matthews 2007; Ng &
Feldman 2010; Inceoglu et al 2012). This hampered the search for articles used in this
34
study. However, the inclusion of two meta-analyses and two literature synopses help to
paint a picture of what the age/aging literature has on changes in work values and
motivation over time. Despite this, the age/aging literature and the generational literature
share the same methodological concerns. Many studies in the age and work motivation
literature used cross-sectional and/or used age as a control variable (Rhodes 1983; Ng &
Feldman 2010; Zacher 2015). This is problematic as, Rudolph et al (2013) noted,
“…most research cannot distinguish between ‘true’ developmental effects and ones that
are due to cohort preferences” (p. 2). In a slightly different vein, Kooij et al (2011) in his
meta-analysis noted that the “effects sizes [for his results] were small to medium” (p.
209) and should be considered when interpreting his results.
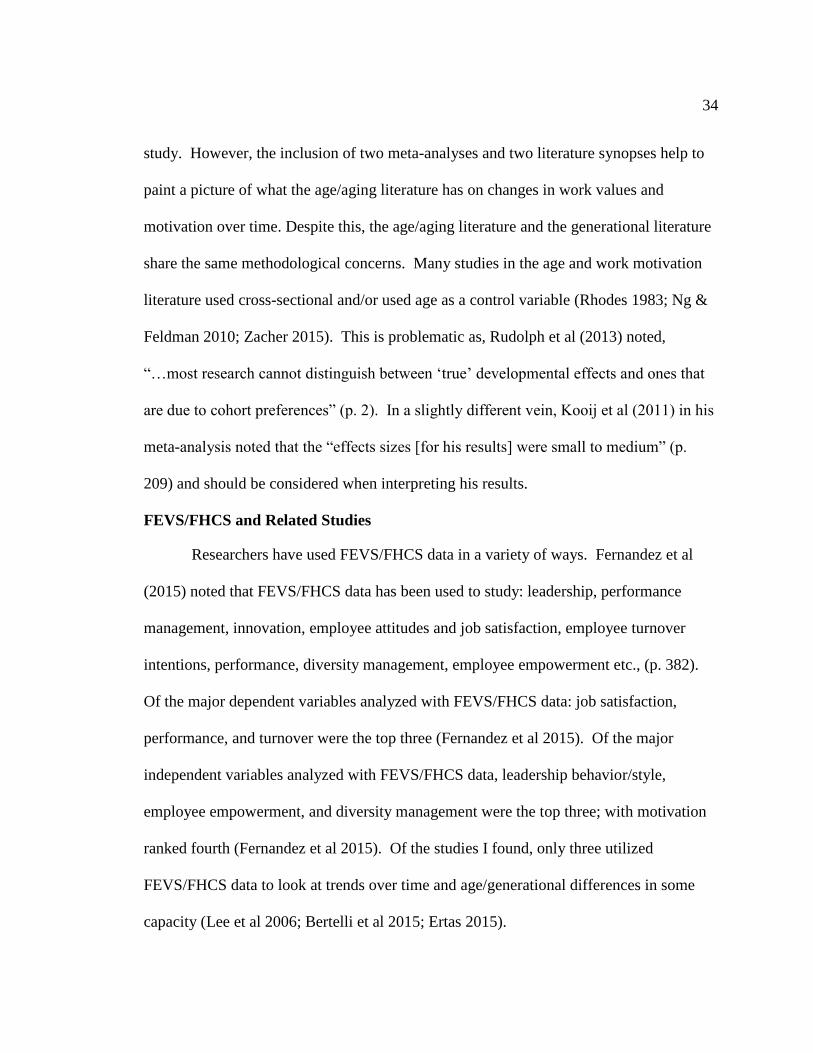
FEVS/FHCS and Related Studies
Researchers have used FEVS/FHCS data in a variety of ways. Fernandez et al
(2015) noted that FEVS/FHCS data has been used to study: leadership, performance
management, innovation, employee attitudes and job satisfaction, employee turnover
intentions, performance, diversity management, employee empowerment etc., (p. 382).
Of the major dependent variables analyzed with FEVS/FHCS data: job satisfaction,
performance, and turnover were the top three (Fernandez et al 2015). Of the major
independent variables analyzed with FEVS/FHCS data, leadership behavior/style,
employee empowerment, and diversity management were the top three; with motivation
ranked fourth (Fernandez et al 2015). Of the studies I found, only three utilized
FEVS/FHCS data to look at trends over time and age/generational differences in some
capacity (Lee et al 2006; Bertelli et al 2015; Ertas 2015).

35
The three most pertinent studies I found were of limited use. Lee et al (2006)
provided the most comprehensive study by including FHCS/FEVS data and other survey
data for 1979, 1983, 1991, 1998, 1999, 2000, and 2002 to examine Federal employee
attitudes and the variety of civil service reforms throughout the time period.
Unfortunately, Lee et al (2006) did not include age as an independent variable, so I do not
discuss his results. Bertelli et al (2015) used FHCS/FEVS and the Merit Principles
Survey (MPS) to examine changes in Federal attitudes across fourteen years. However,
Bertelli et al’s (2015) unit of analysis was of government agencies and not individual
Federal employees. Therefore, no meaningful comparisons between his study and mine
can be made. Ertas (2015) examined younger workers as part of the Millennial
generation to determine if they had higher turnover intentions and different work
motivations compared to Baby Boomers. Ertas (2015) found that Millennials were more
likely to “report an intention to leave” their jobs compared to older employees.
Additionally, he found that Millennials were more likely to indicate they would leave
governmental service altogether, or switch to a different Federal job, than older
employees. On job value/motives, older workers were reported to have scored a little
higher on the dimensions of creativity and meaningfulness than younger workers (Ertas
2015, pp. 412-415). The average score on, “…the perception of fairness of the
performance appraisal and promotions in the workplace…” was higher for younger
workers than for older workers, and no difference between Millennials and older workers
on the dimensions of job or pay satisfaction (Ertas 2015, p. 413).
Two other studies that used FHCS/FEVS data did find some age effects on job

36
satisfaction (Cho & Perry 2012; Ting 1997). Cho and Perry (2012), among other things,
found that older workers, “…had lower satisfaction than others” (p. 397). Cho and Perry
(2012) found that intrinsic motivations and managerial trustworthiness were the primary
variables associated with satisfaction among employees. Ting (1997) found that age was
partly associated with job satisfaction. She found that age had a significant and positive
effect on job satisfaction for employees at a GS rank of 6 or lower, but no effect for
employees at a higher GS rank.
Since very few studies examined age/generational differences with FEVS/FHCS
data, I opened my search to studies that used other data sets. The problem with research
into generational differences among Federal/public employees is that there are very few
scholars that have examined it (Ertas 2015). My search yielded three studies that
examined age or generational differences in the public sector (Jurkiewicz & Brown 1998;
Jurkiewicz 2000; Bright 2010). Jurkiewicz & Brown (1998) conducted a cross-sectional
study to examine age and generational differences between Matures/Silents, Baby
Boomers, and Generation X’ers on 15 different motivations, as seen in Table 2:3.
Interestingly, Jurkiewicz & Brown (1998) stated that, “Overall, the results suggest very
little difference between the cohorts” (p. 27). Further, they noted that, “…the most
pronounced outcome is that Boomers and Matures did not differ significantly on any of
the 15 attributes measured” (p. 27). The results did show that Generation X’ers did value
“chance[s] to learn new things” more than Baby Boomers and Matures, and that Baby
Boomers did want “freedom from supervision” more than Generation X (Jurkiewicz &
Brown (1998, p. 27).

37
Jurkiewicz (2000) conducted another study examining motivational differences
Baby Boomers and Generation X’ers and found similar results as the earlier study. There
appeared to be little difference between Generation X’ers and Baby Boomers (Jurkiewicz
2000). However, Baby Boomers did value “chance[s] to learn new things” and “freedom
from pressures to conform both on and off the job” more than Generation X’ers
(Jurkiewicz 2000, p. 63). While Generation X’ers valued “freedom from supervision”
more than Baby Boomers (Jurkiewicz 2000, p. 63). Both studies (Jurkiewicz & Brown
1998; Jurkiewicz 2000) surveyed “large midwestern municipalities” to comprise their
datasets (p. 26; p. 62).
A more recent study by Bright (2010) sought to determine age or generational
Table 2:3: Generational Differences in Public Sector
Researchers Generations Motivation/Values
Bright
(2011)
Generation X
Baby
Boomers
Veterans
Personal Recognition
Task Meaningfulness
Career Advancement
Leadership Responsibility
Professional Growth
Monetary Incentives
Jurkiewicz
and Brown
1998
Jurkiewicz
2000
Generation X
Baby
Boomers
Matures
Generation X
Baby
Boomers
A stable and secure future
Chance to learn new things
Chance to exercise leadership
Chance to use my special abilities
Chance to make a contribution to important decisions
Chance to benefit society
Freedom from supervision
Freedom from pressures to conform both on and off the
job
Friendly and congenial associates
High salary
High prestige and social status
Opportunity for advancement
Variety in work assignments
Working as part of a team

38
differences among public employees. Bright (2010) looked at possible differences
between Baby Boomers and Generation X’ers on a variety of motivations/values as seen
in Table 2:3. Bright’s (2010) results indicated that younger workers valued, “…personal
recognition, career advancement, professional growth, and monetary rewards
significantly more than did older employees” (p. 9). Bright (2010) did note that younger
workers also valued task meaningfulness and leadership responsibility more than older
workers, but that the results were not statistically significant. Additionally, Bright (2010)
found that, “As the age of the employees increased, their desires for personal recognition,
career advancement, professional growth, task meaningfulness, leadership responsibility,
and monetary rewards decreased” (p. 10). Bright (2010) noted that the results indicated
that the age differences he found varied in significance in relation to which of the
following items explained the results the best: generational differences, unequal access to
desirable opportunities, or socialization experiences in public sector organizations (p. 11).
For example, on the dimension of personal recognition, generational differences better
explained the results than did the other two perspectives (Bright 2010, p. 10).
Whistleblowers
I provide a brief overview of the whistleblower literature. This is done since two
questions regarding whether or not a respondent would agree to blow the whistle without
fear of reprisal were included in this thesis. As noted in Chapter 2, this was done in part
due to the lack of similarly worded questions. Near and Miceli (1985) defined whistle-
blowing as, “…the disclosure by organization members (former or current) of illegal,
immoral, or illegitimate practices under the control of their employers or organizations

39
that may be able to effect action” (p. 4). Research on whistle-blowers has included
personal characteristics of whistleblowers, such as age, and contextual factors such as
organizational climate (Mesmer-Magnus & Viswesvaran 2005).
A variety of demographic factors have been studied in relation to whistleblowing
such as age, sex, level of education etc., (Near & Miceli 1996). However, in relation to
my study, I was more interested in age and whistleblowing. The research indicated age
as a predictor of whistle-blowing is mixed (Near & Miceli 1996; Keenan & Sims 1998).
Near and Miceli (1996) in their survey of the research found at least three studies that in
which “age & service” were significant predictors, while one study found age was not a
significant predictor of whistle blowing (pp. 5111-512). Despite this, Near and Miceli
(1996) stated that,
“…whistle-blowers are older or have more service, are better educated, and are
more likely to be male than inactive observers (i.e., those observers of
wrongdoing who do not report it). Whistle-blowers are also more likely than
inactive observers to be highly paid, have high job performance, hold supervisory
or professional status, and report that they have the role responsibility to report
wrongdoing and the knowledge of channels for doing so” (p. 511).
Sims and Keenan (1998), in their study, found the, “…variables age, educational level,
number of years employed, formal policies, organizational commitment, and job
satisfaction were not found to be significant predictors of whistleblowing” (pp. 415-146).
In addition to causes of whistleblowing, age has also been examined in terms of
retaliation against whistleblowers.
Parmerlee et al (1982) found, “…that organizations are more likely to retaliate
against whistle-blowers who are more valuable to the organization, due to their age,
experience, or education…” (p. 30). However, Parmerlee et al (1982) also found that,

40
“…employers also seemed to retaliate against complainants who were less threatening in
that they lacked prestige or public support for their complaint” (p. 30). There were two
explanations for these findings. One, retaliation against older whistleblowers that were
higher in the organizational hierarchy was “more rational” as they could “do the most
damage to the organization” (Parmerlee et al 1982, p. 30). Two, for younger employees
with less power and influence, organizational retaliation could be an effort to, “…warn
potential whistle-blowers that the organization does not permit such challenges to its
authority” (Parmerlee et al 1982, pp. 30-31). However, the implications of Parmerlee et al
(1982) are limited since their study was on women who filed “unfair employment
discrimination (based on sex) with Wisconsin’s Equal Rights Division” (p. 22). Other
researchers have posited similar explanations.
Mesmer-Magnus and Viswesvaran (2005) suggested two possible reasons for
organizational retaliation against whistle-blowers. First, organizational members may
feel they were betrayed by their colleague(s); even more so if the whistleblower utilizes
avenues that are outside the organization for whistleblowing. Second, they state,
“Theories of power also suggest that whistleblowers at higher job levels, who are
expected to enforce the power structure, upon violating this mandate are more likely to
suffer retaliation” Mesmer-Magnus and Viswesvaran 2005, p. 282). However, Mesmer-
Magnus and Viswesvaran (2005) noted lower level employees have less power, and that
can make them an easier target over higher level employees.
While I focus on the demographic characteristic of age, the whistleblowing
literature also focuses on contextual factors. Mesmer-Magnus and Viswesvaran (2005)

41
noted contextual factors have included, “…supervisor and coworker support,
organizational climate, threat of retaliation, and size of organization” (p. 280). The
literature seems to indicate that contextual factors are more important than demographic
characteristics (Near & Miceli 1996; Mesmer-Magnus and Viswesvaran 2005). It must
be noted, that the 1979 FEAS and 2008 FHCS did not indicate if Federal workers were
whistle blowers. Both surveys only asked Federal employees agreed or disagreed that
they felt could disclose a violation without fear of reprisal. Furthermore, I did not find a
study that viewed whistleblowers within a generational context.
While I did not find any research that examined generational differences in
whistleblowers, recent governmental reforms suggest younger employees/generations
should be more likely to blow the whistle on their organization. Whistleblower
protections have expanded since their adoption for Federal employees by the 1979 Civil
Service Reform Act of 1979 (Shimabukuro & Whitaker 2012). Since the 1979, Congress
expanded Federal whistleblower protections through executive orders, and the passage of
the Whistleblower Protection Act of 1989 (Shimabukuro & Whitaker 2012) and
executive orders. More recently, the Whistleblower Protection Enhancement Act of
2012, continued this trend.
Therefore, based on the above literature, I make the following hypothesis:
H6 Millennials will agree more than Baby Boomers at the same age they could blow the
whistle on their organization without fear of reprisal.
Conclusion
The primary aim of this literature review is to examine if any age or generational

42
differences exist between Federal employees. To answer this question, I reviewed the
literature on work values, generational cohort, age/aging, and studies that used
FEVS/FHCS data, and briefly examined whistleblower research. The generational cohort
literature is divided on whether differences exists between different generational cohorts
as seen in Table 2:2. Simultaneously, little research has been done to examine changes in
work values/motivation across an individual’s lifetime (Barnes-Farrell & Matthews 2007;
Ng & Feldman 2010; Inceoglu et al 2012; Rudolph et al 2013).
Results found in the generational cohort and age/aging literature are limited as
both have issues with teasing out age, period, and cohort effects due to an over reliance
on cross-sectional methodology (Rhodes 1983; Lyons et al 2013; Costanza & Finkelstein
2015; Parry and Urwin 2017). However, as Lyons et al (2013) has pointed out how cross-
sectional studies, despite their limitations, can assist researchers to examine generational
cohort differences holistically. This is necessary, as no one study design can completely
tease out age, period, and cohort effects (Glenn 1976).
Very few studies have sought to examine if age and generational differences exist
among Federal/public employees (Ertas 2015). Only four studies examined age and/or
generational differences in the public sector. One study, Ting (1997) examined age’s
impact on job satisfaction, among other items, and found that age did significantly affect
job satisfaction for Federal workers at general schedule classification 6 or lower, while
higher classifications were not affected. The other three studies examined age and/or
generational differences in the public sector but consisted of small samples from local
municipalities in the Midwest and Oregon (Jurkiewicz and Brown 1998; Jurkiewicz

43
2000; Bright 2010). Lastly, no research that I found attempted to examine generational
differences on whistleblowing. Therefore, my study adds a cross-sectional sample of
Federal employees from 1979 and 2008 to bring more insight into a limited area of
inquiry.

44
METHODS
Introduction
The research design employed in this thesis utilized cross tabulations to directly
compare Baby Boomers 18-29 in 1979 to Millennials 18-29 in 2008. Additionally, Baby
Boomers 18-29 in 1979 were also compared to their 50-59 older selves in 2008. Logistic
regressions were conducted to determine the sign and strength of the relationships
between age groups while controlling for demographic characteristics in both the 1979
and 2008 datasets. This chapter outlines the methods and datasets used to answer the
above questions. Specifically, this chapter addresses the 1979 FEAS and 2008 FHCS
history, information and data collection in both datasets, the statistical tests used, data
limitations, then concludes.
Reasons for Survey Selection
The 1979 FEAS and the 2008 FEVS were chosen for several reasons. Frist, both
surveys roughly target the same population of Federal white-collar employees. Second, as
seen on Table 3:1, there were enough questions between both datasets that were
sufficiently similar to make a comparison. Third, Figure 1:1 in Chapter 1, highlights that
the time periods are far enough apart (nearly 30 years – a generation and a half) that the
comparisons between Baby Boomers 18-29-years-old in the 1979 survey can be
compared to the same age group in the 2008 FHCS survey, as well as Baby Boomers 50-
59 in 2008.
Federal Employee Survey History
The 1979 Federal FEAS was the result of government reforms in the late 1970s.

45
The Civil Service Reform Act (CSRA) of 1978 was passed due to mounting pressure to
reevaluate the role and responsibilities of the Civil Service Commission of the 1960s and
1970s, and President Jimmy Carter’s adoption of civil service reform as a center piece of
his campaign and presidency (OPM 2003). The CSRA of 1978, according to Lee et al
(2006), “…is considered the most comprehensive reform of civil service since the
Pendleton Civil Service Act of 1883” (p. 22). Two important changes of the CSRA was
the replacement of the Civil Service Commission with the Office of Personal
Management (OPM), and the requirement (5 USC 4702: Research programs) that OPM
study the impact the law had on Federal personnel. Out of this environment, the 1979
FEAS was established to evaluate employee attitudes on the reforms of the CSRA of
1978, but also on the general state of affairs throughout the workforce and Federal
agencies (OPM 1979; Fernandez et al 2015). The OPM created the 1979 FEAS, which
included 225 items to address employee backgrounds, and attitudes on a variety of issues
such as job satisfaction, employment background, employee attitudes etc., (OPM 1979-
1980; Fernandez et al 2015). The FEAS of 1979-1980 is the forerunner to the FEVS
currently used by the OPM.
The FHCS was born from President Bush’s 2002 management agenda for the
Federal workforce and the Chief Human Capital Officers Act (CHCO) that Congress
passed as part of the Homeland Security Act of 2002 (Fernandez et al 2015). CHCO
mandated the creation of the Chief Human Capital Officers Council whose purpose was
to develop, “…systems, standards, and metrics to assess efforts by federal agencies to
develop and manage human capital” (Fernandez et al 2015, p. 383). Federal agencies

46
were also required to develop their own Federal human capital plans (Fernandez et al
2015). To ensure Federal agencies were meeting human capital standards developed by
the Chief Human Capital Officers as codified in individual agency plans, the OPM used
the FHCS/FEVS (Fernandez et al 2015). The FHCS/FEVS underwent changes when
Congress passed the National Defense Authorization Act (NDAA) of 2004, which
mandated Federal agencies survey their employees on their attitudes and satisfaction with
human capital systems/plans (Fernandez et al 2015; GPO 2003). The FHCS was
conducted every two years from 2002 to 2010 (Fernandez et al 2015). In 2010 the FHCS
was renamed the FEVS and conducted every year since 2011 (Fernandez et al 2015).
Survey Information
The 1979-1980 OPM FEAS was sent to a “stratified random sample of 20,000
federal civilian employees from over 20 federal departments and agencies…” (1979-
1980b, p. iii). The 1980 survey was sent to a proportion of senior federal employees
(1979-1980b). The information gathered for both surveys in 1979 and 1980 was on,”
…personal and employment background[s], current position, job and pay rate
satisfaction, work relationships with other employees and supervisors, work group
performance, attitudes about the agency's organizational culture, and perceived
promotional opportunities” (1979-1980b, p. ii). In the dataset obtained from the Inter-
University Consortium for Political Science, there were a total of 6,381 observations,
which can be seen in the descriptive statistics in Appendix A. The 1980 survey on senior
federal employees included everyone from the 1979 survey with the addition of,
“…employees' attitudes about the Senior Executive Service (SES), labor/management

47
relations, and job performance incentives” (1979-1980b, p. ii). Since the 1980 survey was
primarily focused on senior Federal employees, only the 1979 dataset was used.
The 2008 FHCS dataset, according to the OPM, “…was directed at full-time,
permanent employees from agencies represented on the President’s Management
Council[,]” which consist[ed] of 97 percent of the “…executive branch workforce” (p.
36). The OPM (2008) also extended invites to small and independent agencies, of which
a total of 54 chose to participate. The 2008 FEVS had 212,223 employees respond from
the 417,128 employees the survey was sent to for a 51 percent response rate (OPM 2008).
The data was weighted to, “…take into account the variable probabilities of selection
across the sample domains, nonresponse, and known demographic characteristics of the
survey population[,]” within one percentage point (OPM 2008, p. 37). The 2008 FEVS
incorporated 85 questions across the following dimensions: leadership and knowledge
management, results-oriented performance culture, talent management, and job
satisfaction (OPM 2008). Descriptive statistics in Appendix B showed the number of
observations varied from a low of 23,567 to a high of 72,758. Table 15 in Chapter 4,
showed the number of observations for the logistic regressions were roughly 22,000 to
23,500.
Dependent Variables
The dependent variables used in this study are questions from the 1979 FEAS and
the 2008 FCHS and can be seen in Table 3:1. All questions have a five-ordinal response
scale, but were recoded to a binary (1,0) agree or disagree/satisfied or dissatisfied for
logistic regression. Table 3:1 also notes that all the questions, except for question 61 and

48
62 from the 2008 FHCS, responses were: strongly agree, agree, neither agree or disagree,
disagree, strongly disagree. Questions 61’s and 62’s responses were, very satisfied,
satisfied, neither satisfied or dissatisfied, dissatisfied, and strongly dissatisfied.
Comparisons between two different worded response scales is somewhat problematic, but
not insurmountable. Question 62 was added for the 2008 survey year to help show any
possible shift from extrinsic to intrinsic motives as employees got older. Unfortunately,
the 1979 FEAS did not have a similar question, to allow for a generational comparison.
Table 3:1: Comparative Survey Questions
Work
Dimensions
1979 Federal Employee
Viewpoint Survey
2008 Federal Human Capital
Survey
Intrinsic
100. I enjoy doing my work for
the personal satisfaction it gives
me*
84. My job makes good use of my
abilities*
81. In general, I am satisfied with
my job*
6. I like the kind of work I do*
18. My talents are used well in the
workplace*
61. Considering everything, how
satisfied are you with your job**
Administrative
17. Promotions or unscheduled
pay increases here usually depend
on how well a person performs on
his/her job*
27. Pay raises depend on how well
employees perform their jobs*
107. My performance rating
presents a fair and accurate picture
of my actual job performance*
30. My performance appraisal is a
fair refection of my performance*
Whistleblower 35. I am not afraid to “blow the
whistle” on things I find wrong
with my organization*
47. I can disclose a suspected
violation of any law, rule or
regulation without fear of reprisal*
Extrinsic ----- 62. Considering everything, how
satisfied are you with your pay**
*Strongly Agree, Agree, Neither Agree nor Disagree **Very Satisfied, Satisfied, Neither Satisfied or
Dissatisfied, Dissatisfied, Very Dissatisfied

49
The way the 1979 FEAS questions are worded, such as question 81, “In general, I
am satisfied with my job,” are still close enough to their 2008 FHCS counterpart,
“Considering everything, how satisfied are you with your job” to allow for some
comparison. For example, a respondent that selected strongly agree or agree for 1979
FEAS question 81, strongly agrees they are satisfied with their job, as opposed to being
satisfied with their job (very satisfied and satisfied=satisfied), as is worded in the 2008
FHCS. Other questions were a closer match. For example, both questions 17 and 27
from the 1979 FEAS and 2008 FEVS respectively, are close but not identical, as seen in
Comparative Survey Questions Table 3:1. The 1979 FEAS question specifically
mentions promotions and unscheduled pay raises as opposed to just pay raises. Overall,
these issues highlighted the difficulty in finding questions and their response scales that
were close enough for comparative examination.
Independent Variables
The primary independent variable of interest in this study was age group. The
1979 FEAS data set broke age into the following categories: Under 20, 20-29, 30-39, 40-
49, 50-59, 55-59, 60-64, and 65 and Older. However, not all the publicly available
FHCS/FEVS data had age groups, or enough age groups. For example, the 2017 FEVS
data did not include age groups, and the 2016 FEVS only had the two following age
groups: under 40, 40 and older. As a result, the 2008 FEVS was selected, as it included
the following age groups: 29 and under, 30-39, 40-49, 50-59, and 60 and older.
Therefore, I regrouped the age groups in the 1979 FEAS to match the age groups
in the 2008 FHCS. I created dummy variables for the age groups in both datasets

50
for the regressions seen in Chapter 4.
The 18-29 age group was used as the
reference category in all regressions.
The 1979 FEAS had more
demographic variables than the 2008
FHCS. Demographic variables were
chosen to ensure the variables used in
both datasets were as similar as
possible. As a result, factors such as
income or education in the 1979 FEAS
were not included in the 2008 FHCS,
and as a result were not controlled for.
The demographic variables used in this study can be seen in Table 3:2. These variables
were used to control for factors that could affect how age groups responded to the
questions in Table 3:1. Examples of control variables that have been used or noted to
have been used by scholars are tenure (organizational tenure, job tenure), education,
gender, seniority/worker level/management experience, hours worked per week, and
health (Rhodes 1983; Ng & Feldman 2010; Kooij et al 2011; Inceoglu et al 2012;
Akkermans et al 2016). Ng and Feldman (2010) encouraged scholars to include more
“sociodemographic backgrounds of older workers” (p. 708). Due to a lack of scholarly
focus, Ng and Feldman (2010) encouraged researchers to devote more attention towards
education and gender (p. 709). Appendix A and B show the descriptive statistics for the
Table 3:2: Demographic Variables
1979 Federal Employee
Viewpoint Survey
2008 Federal Human
Capital Survey
White* White*
Hispanic* Hispanic*
18-29* (reference
category)
18-29* (reference
category)
30-39* 30-39*
40-49* 40-49*
50-59* 50-59*
60 and Older* 60 and Older*
Male* Male*
Years of Federal
Service
Years of Federal
Service
Pay Category Pay Category
Years in Supervisory
/Managerial Position
Supervisory Status
*(0,1) dummy variable

51
1979 FEAS and 2008 FHCS variables used in this study.
The regression equation can be seen below:
Individual values/motives: f(demographics) + f(status) + f(service)
Only the 2008 FHCS variables were used for status due to subtle differences between
both datasets; these can be seen on the tables on previous pages. These factors were
broken down into:
Individual values/motives: 1979 FEAS and 2008 FHCS questions were used to gauge
values/motives of the respondents. For example, for question 6 of the 2008 asked
respondents “I like the kind of work I do.” 1= agree (strongly agree + agree) 0= disagree
(strongly disagree + disagree).
Demographics: White (1=white 0=nonwhite & not Hispanic), Hispanic (1=Hispanic
0=non-Hispanic), Male (dummy variable) 18-29 (dummy variable), 30-39 (dummy
variable), 40-49 (dummy variable), 50-59 (dummy variable), 60 and Older (dummy
variable)
Status: Pay category (1=general schedule 1-6, 2=general schedule 7-12, 3=general
schedule 13-15, 4=senior executive service, 5=senior level or scientific or professional),
Supervisory/Managerial status (non-supervisor, team leader, supervisor, manager,
executive)
Statistical Tests Utilized
To determine if an age group was more, or less likely to agree or disagree, or be
satisfied or dissatisfied with the questions used in this study, I chose to conduct logistic
regressions. Logistic regressions require a (0,1) binary dependent variable, as 1 represents
52
an event occurred or an “attribute” is present, and 0 if an event did not occur, or no
“attribute” was present (Gujarati 2011, p. 163). This means that if the predicted
probability of an explanatory variable is larger than 0.5 it is classified as a 1, and if lower
it is classified as a 0 (Gujarati 2011).
The interpretation of odds ratio coefficients, according to Gujarati (2011), is,
“…[as] the value of the explanatory variable(s) changes, the estimated probability always
lies in the 0-1 interval…” (p. 154). Therefore, I collapsed the ends of the ordinal
responses for each question into agree or disagree, or satisfied or dissatisfied, and
dropped the neutral/undecided category. Logistic regression results for this study can be
seen in Chapter 4 and the Appendices, and are given in odds ratios. If an odds ratio is
subtracted from one then multiplied by 100, you get the percentage of the effect a
variable has on the dependent variable. The independent variables used in both the 1979
FEAS and 2008 FHCS questions are largely similar. This was done to compare results
between age groups in both years. When it comes to goodness of fit in logistic
regressions, Gujarati (2011) stated that, “It should be emphasized that in binary
regression model’s goodness of fit measures are of secondary importance. What matters
are the expected sign of the regression coefficients and their statistical and or practical
significance (p. 159).
I used the variance inflation factor (VIF) test to test for multicollinearity.
Appendix C and D shows the VIF scores for the 1979 and the 2008 regressions,
respectively. The VIFs were for the 50-59 and 40-49 age groups in 1979 FEAS at 13.24
and 12.01 respectively. O’Brian (2007) noted that of the few difference cutoffs

53
researchers have used, one used has been ten. Both the VIFs for the 50-59 and 40-49 are
a little high. However, since age is the primary unit of interest in my study, I left them in.
I used the Pearson Chi-square test to determine if there is a statistically significant
relationship between two variables. Age groups used for the Pearson Chi-square tests
were amended to include: 18-29, 30-39, 40-49, and 50 and older. This was done to
compare and/or contrast what differences, if any, existed between Baby Boomers when
they were 18-29 in 1979 and 50-59 in 2008. Additionally, Baby Boomers 18-29 in 1979
are also compared to Millennials 18-29 in 2008 to determine what differences, if any
existed, between both generational cohorts. The Pearson Chi-square was used since it
calculates the expected and actual number of observations that should be in each cell of a
cross tabulation to get the chi2 number (Meier et al 2012). If the p-value is significant,
then there are differences between age groups. The results of the Pearson Chi-square
cross tabulations can be seen in Chapter 4.
Limitations with Data
There were a few different limitations with this study. First, the questions used to
measure federal employees’ responses in 1979 and 2008 were similar in nature but not
identical. For example, question 17 of the 1979 FEAS asked employees if, “Promotions
or unscheduled pay increases here usually depend on how well a person performs on
his/her job,” while the 2008 FHCS asked employees, “Pay raises depend on how well
employees perform their jobs.” The wording differences between the two opens the
possibility they could be interpreted differently. Second, question 61 of the 2008 FHCS
was under a different ordinal scale then the 1979 FEAS question used to compared it

54
with. For example, the equivalent 1979 FEAS question response was divided into agree
and disagree, while question 61 of the 2008 FHCS was divided into satisfied and
dissatisfied limiting the inferences that can be drawn between both questions.
Two other limitations with this study related to question congruence and dataset
limitations. Third, there were not many questions that were similar enough to be used to
provide a larger picture in the potential differences between age groups and generational
cohorts. Fourth, the 2008 FEVS data set was chosen for this thesis because it had more
of the desired demographic variables then the other publicly available FHCS data sets.
For example, the 2011 dataset had the same age categories as the 2008 FEVS but lacked
detailed racial categories the 2008 FHCS had. More current FEVS surveys such as the
2015 trend dataset and the 2014 dataset had the following age categories: under 40, 40-
49, 50-59, and 60 or older. Since the primary independent variable of interest is age
group, more current FEVS data was not used because the age groups were too broad.
Fifth, it must be noted that the 2008 FHCS publicly available data file and all previous
publicly available FEVS data files from other years were subjected to privacy
restrictions. OPM utilized a program to flag cross-tabulated variables that might present
a disclosure risk for FEVS employees (OPM 2015).
Conclusion
The primary purpose of this thesis is to explore the differences between age
groups of Federal employees. Additionally, possible generational effects are examined
with Pearson Chi2 tests for the questions seen in Table 3:1, except for the 2008 FHCS for
question 62. To examine the above research questions, I used the 1979 FEAS and the

55
2008 FHCS since they broke age down into the needed categories necessary to conduct
this thesis. Logistic regressions were conducted to determine the strength and direction
of the relationships between age groups in 1979 and 2008. Lastly, Pearson Chi2 cross
tabulations were conducted to evaluate the differences between Baby Boomers 18-29 in
1979 and Millennials 18-29 in 2008. Furthermore, Baby Boomers 18-29 and their 50-59
older selves in 2008 were compared to determine what changes, if any, occurred over
time. Chapter 4, highlights the results between age groups in the logistic regression and
Pearson Chi2 tests used in this study. Table 3:3 and Table 3:4 indicate the expected signs
of the independent variables based on the literature in Chapter 2.

56
Table 3:3: Explanatory Variables: Predicted Effects
Intrinsic
Administrative
Whistle-blower
Variables Question 6 &
100
Question 18 &
84
Question 61
& 81
Question 27 & 17 Question
30 & 107
Question 47 & 35
Male ? ? ? ? ? ?
Age 30-39 ? ? ? ? ? ?
Age 40-49 ? ? ? ? ? ?
Age 50-59 + + + - - -
Age 60 and Older + + + - - -
Age 18-29 0 0 0 0 0 0
Years of Federal
Service
? ? ? ? ? ?
Pay Category + + + + + +
Supervisory Status ? ? ? ? ? ?
White ? ? ? ? ? ?
Hispanic ? ? ? ? ? ?

57
Table 3:4: Generational Predicted Effects
Intrinsic
Administrative
Whistleblower
Variables Question 6 &
100
Question 18 &
84
Question 61 &
81
Question 27 &
17
Question 30
& 107
Question 47 &
35
Age 18-29 - - - + + +
Age 30-39 - - - ? ? +
Age 40-49 ? ? ? ? ? ?
Age 50-59 + + + - - ?
Age 60 and Older + + + - - ?

58
RESULTS
Introduction
What differences, if any, exist between younger and older Federal workers? In
this chapter I shed some light on these questions as I discuss the results from logistic
regressions and Pearson Chi2 tests. First, I discuss the differences between the older and
younger age groups and other variables on Federal worker attitudes in both survey years,
1979 and 2008. Second, I note the generational implications of the logistic regressions
across both survey years. Lastly, I discuss the differences between Baby Boomers who
were 18-29 in 1979 to their older selves (50 and older) in 2008 to determine what, if any,
shifts in values/motives occurred within the same group over time. Additionally, I note
the differences between Baby Boomers and Millennials at the same age in 1979 and 2008
respectively, to determine what if any generational effect took place.
Table 4:1: 1979 and 2008 FEAS Significant Predictors
Variables 1979: Number of
Regressions Significant in
2008: Number of Regressions
Significant in
Male 2/6 4/6
Age 30-39 1/6 3/6
Age 40-49 1/6 3/6
Age 50-59 0/6 3/6
Age 60 and Older 0/6 2/6
Age 18-29 Reference Category Reference Category
Years of Federal Service 4/6 6/6
Pay Category 3/6 6/6
Years as Supervisor/
Manager Supervisory
Status
1/6 6/6
White 2/6 2/6
Hispanic 0/6 2/6 Significant In/Total Number of Regressions

59
Age Differences
Age differences were examined using logistic regressions in both 1979 and 2008.
The logistic regression results are given in odds ratios and are given without the standard
errors. Regression results without standard errors can be seen in Tables 4.2 and 4.3 for
the 1979 FEAS and 2008 FHCS respectively. Regression results with standard errors can
be seen in Appendix E1-E2 for the 1979 FEAS results, and Appendix F1-F2 for the 2008
FHCS survey results. Overall, the logistic results showed differences between older and
younger workers were much bigger in 2008 than in 1979.
1979 FEAS Logistic Regression Results
When using the FEAS data, the 18-29 age group represents the core of the Baby
Boomer cohort born between 1950-1961 compared to the whole cohort born between
1946-1964. The older age groups represent older generations of workers. The results did
not support Hypotheses 3, 4, and 5. Table 4:1 shows older workers were largely not
significantly different from Baby Boomers 18-29-years-old in 1979. Only one older age
group was significantly different from Baby Boomers 18-29 years old for questions 81
and 84. Overall, pay category was a stronger predictor than differences between older
and younger workers across most dimensions. The higher the pay category a respondent
was in, the more likely they agreed promotions or unscheduled pay increases usually
depended on how well a person performed their job, their job made good use of their
abilities, and that their performance rating presented a fair and accurate picture of their
actual job performance.

60
2008 FHCS Logistic Regression Results
Differences between older workers and Millennials across the intrinsic,
administrative, and whistleblower dimensions in this study were greater in the 2008
FHCS than the 1979 FEAS. In terms of generational cohort, the 18-29 age group
represents Millennials, and the 50-59 age group represents the core proportion of the
Baby Boomers born between 1946-1964. Interpretations of the 2008 FHCS questions are
given below and are divided into intrinsic work values, administrative, and whistleblower
dimensions. Table 4:1 shows the explanatory variables used in this study and the number
of times they were significant in the 6 regressions conducted with the 2008 FHCS data.
Regression results without the standard errors for the 2008 FHCS can be seen in Table
4:3. Appendix F1 and F2 contains the 2008 FHCS regression results with standard
errors.
Intrinsic
As seen in Table 4:3, only two of the three intrinsic questions used in this study
showed significant differences between older age groups and Millennials. The results
partially support hypothesis 3. Millennials and older workers were not significantly
different from each other on whether they agreed or disagreed their talents were used well
in the workplace (question 18). However, older employees were much more likely to
agree they liked the kind of work they did compared to Millennials (question 6), holding
everything else constant. Only the oldest workers were significantly different from
Millennials on whether they were satisfied or dissatisfied with their job (question 61).
The oldest workers were much more likely to be satisfied with their job than Millennials,

61
holding everything else constant. Across all three intrinsic questions, the higher the pay
category and supervisory level a respondent was in, the more likely they agreed they
liked/were satisfied with the kind of work they did, their talents were used well in the
workplace, and were satisfied with their jobs after considering everything.
Extrinsic
The results did not support Hypothesis 4. As seen in Table 4:3 older workers and
Millennials were not significantly different from each other on whether or not they were
satisfied or dissatisfied with their pay. Employees that were in higher pay categories
were more likely to agree they were satisfied with their pay.
Administrative
As seen in Table 4:3, only one of the two administrative questions showed
significant differences between Millennials and older workers. The results partially
support Hypothesis 5. Millennials and older workers were not significantly different from
each other on agreeing or disagreeing that pay raises depended on how well employees
performed their jobs (question 27). However, only two groups of older workers (40-49
and 50-59) were significantly different from Millennials on agreeing or disagreeing
their performance appraisal was a fair reflection of their performance (question 30). Both
the 40-49 and 50-59 age groups were less likely to agree their performance appraisal was
a fair reflection of their actual performance compared to Millennials. This is also
loosely in line with what Ertas (2015) found when he included the same question along
with “Promotions in my work unit are based on merit” into a “fairness dimension” and
found Millennials had higher mean scores than older workers (p. 413). For both

62
Age 18-29 Used as Reference Category
*** p<0.01, ** p<0.05, * p<0.1
Table 4:2: 1979 Federal Attitude Employee Survey Logistic Regression Results
Intrinsic
Administrative
Whistleblower
Question 81
In general, I’m
satisfied with my
job
Question 84 My job makes
good use of my
abilities
Question 100 I enjoy doing my
work for the
personal
satisfaction it
gives me
Question 17 Promotions or
unscheduled pay
increases here usually
depend on how well a
person performs on
his/her job
Question 107 My performance
rating presents a
fair and accurate
picture of my
actual job
performance
Question 35 I am not afraid to
“blow the
whistle” on things
I find wrong with
my organization
Variables Odds Ratio Odds Ratio Odds Ratio Odds Ratio Odds Ratio Odds Ratio
Male 1.478** 0.963 1.064 0.966 1.057 1.337**
AGE 30-39 0.462* 1.339 0.579 0.801 1.046 0.888
AGE 40-49 0.553 1.808* 1.088 0.723 0.989 0.911
AGE 50-59 0.541 1.666 0.999 0.656 0.917 1.028
AGE 60 and Older 0.549 1.580 1.890 0.683 1.055 1.155
AGE 18-29 - - - - - -
Years of Federal
Service
1.610*** 1.468*** 1.060 1.147* 1.153* 1.060
Pay Grade 1.121 1.222*** 1.041 1.751*** 1.182*** 1.021
Years as Supervisor 0.953 0.846*** 1.000 0.970 0.951 1.051
White 1.302 1.702*** 1.613* 1.153 1.109 1.035
Hispanic 1.591 1.848 0.991 0.810 0.861 1.246
LR Chi2 (10) 43.79 55.42 17.63 194.37 24.93 19.99
Prob > Chi2 0.0000 0.0000 0.0615 0.0000 0.0055 0.0294
Pseudo R2 0.0208 0.0211 0.0160 0.0429 0.0059 0.0059
Observations 3,717 3,717 3,717 3,717 3,717 3,717

63
administrative questions, the higher the pay category and supervisory level, the more
likely a respondent agreed pay raises depended on how well employees performed their
jobs and that their performance appraisals were a fair reflection of their performance.
Whistleblower
As seen in Table 4:3, there were significant differences between older workers
and Millennials on the whistleblower question. The results support Hypothesis 6. Older
employees were less likely than Millennials to agree they could disclose any law, rule, or
regulation without fear of reprisal, holding everything else constant. The higher the pay
category and supervisory level, the more likely a respondent agreed they could disclose a
suspected violation of any law, rule, or regulation without fear of reprisal.
Generational Implications
The logistic regression results suggest a generational effect took place between
both survey years. Older age groups were generally not significantly different from Baby
Boomers (18-29) in 1979 on the intrinsic, administrative, and whistleblower dimensions
included in this study. However, older age groups became more different from
Millennials (18-29) in 2008 on all three value/motive dimensions noted above. Despite
this, there were no or minimal differences on a few questions that comprised the three
value/motive dimensions.
Generational Differences/Cross Tabulations
The differences between Baby Boomers 18-29 in 1979 and Millennials 18-29 in
2008 are compared to each other to determine what if any generational differences exist.
Additionally, Baby Boomers 18-29 in 1979 and 50-59 in 2008 were compared to each

64
other to determined changes overtime and the results can be seen in Figure 4.1 The
responses for agree and strongly agree were added together. Pearson Chi-square results
can be seen in Table 4:4. All the Pearson Chi2 test results for the 1979 FEAS indicated
that there were differences between all age groups. However, the results for the 2008
FHCS indicated there were age differences for only 2 of the 6 questions examined. As a
result, hypothesis 1 was not supported by the results in Table 4:4. Generational
differences were observed on the whistleblower and one administrative dimension.
Administrative
The results from Table 4:4 partially support hypothesis 2. Question 107 from the
1979 FEAS asked employees, “My performance rating presents a fair and accurate
picture of my actual job performance,” and question 30 from the 2008 FHCS asked
employees, “My performance appraisal is a fair reflection of my performance.”
Millennials 18-29 in 2008 experienced the largest change on question 107/30 than any
other age group. Millennials 18-29 were +25.43% more likely to believe their
performance rating presented a fair and accurate picture of their performance than Baby
Boomers 18-29 in 1979. Additionally, as seen in Table 4.1 Baby Boomers 50-59 in 2008
were +3.98% more likely to agree their performance appraisal was a fair reflection of
their actual job performance than their younger 18-29-year-old selves.
Whistleblower
The results from Table 4:4 support hypothesis 4. Question 35 from the 1979
FEAS asked employees, “I am not afraid to “blow the whistle” on things I find wrong
with my organization,” and question 47 of the 2008 FHCS asked employees, “I can

65
disclose a suspected violation of any law, rule or regulation without fear of reprisal.”
Millennials 18-29 were +10.93% more likely to agree they could disclose a suspected
violation without fear of reprisal than Baby Boomers 18-29. Additionally, as see Figure
4.1, Baby Boomers 50-59 in 2008 were +19.05% more likely to agree they could disclose
a violation without the fear of reprisal compared to their 18-29-year-olds selves in 1979.
Conclusion
The logistic regression results showed that older workers were mostly not
significantly different from Baby Boomers (18-29) in 1979 across intrinsic,
administrative, and whistleblower dimensions included in this study. This changed in
2008, as older workers were much more significantly different from Millennials (18-29)
across all the motive dimensions in 2008. However, differences between Millennials and
older workers varied among the specific items that comprised the value/motive
dimensions included in this study. The differences in age across both years suggests the
0
10
20
30
40
50
60
70
80
90
Baby Boomers Whistleblower Baby Boomers Performance
1979 2008
Figure 4:1: Baby Boomers in 1979 & 2008

66
existence of generational differences within the Federal workforce. The Pearson Chi2
tests indicated that there were generational differences between Millennials and Baby
Boomers at the same age on the whistleblower dimension and on one of the two
administrative dimensions.

67
Age 18-29 Used as Reference Category
*** p<0.01, ** p<0.05, * p<0.1
Table 4:3: 2008 Federal Human Capital Survey Logistic Regression Results
Intrinsic
Extrinsic
Administrative
Whistleblower
Question 6
I Like the kind
of work I do
Question 18 My talents are
used well in
the work place
Question 61 Considering
everything,
how satisfied
are you with
your job
Question 62 Considering
everything,
how satisfied
are you with
your pay
Question 27 Pay Raises
depend on
how well
employees do
their jobs
Question 30 My
performance
appraisal is a
fair reflection
of my
performance
Question 47 I can disclose a
suspected violation
of any law, rule, or
regulation without
fear of reprisal
Variables Odds Ratio Odds Ratio Odds Ratio Odds Ratio Odds Ratio Odds Ratio Odds Ratio
Male 0.734** 0.843* 0.726*** 0.749*** 0.864* 0.950 1.133
Age 30-39 1.635* 1.063 1.140 0.786 0.746* 0.715 0.478***
Age 40-49 2.533*** 0.890 1.279 0.807 0.749 0.586** 0.408***
Age 50-59 2.057** 0.840 1.157 0.632* 0.855 0.526** 0.352***
Age 60 and Older 3.617*** 1.150 1.700* 0.671 1.193 0.753 0.458**
Age 18-29 - - - - - - -
Years of Federal
Service
0.861*** 0.937** 0.864*** 0.960 0.916*** 0.923** 0.854***
Pay Category 1.518*** 1.470*** 1.450*** 1.922*** 1.424*** 1.676*** 1.455***
Supervisory Status 1.528*** 1.372*** 1.375*** 1.062 1.258*** 1.162*** 1.550***
White 0.700** 0.933 0.933 1.407*** 0.613*** 0.926 0.973
Hispanic 2.188** 0.997 1.006 1.404 1.132 0.635** 0.817
Wald Chi2 (10) 75.42 112.19 94.29 112.23 132.29 105.29 208.62
Prob > Chi2 0.0000 0.0000 0.0000 0.0000 0.0000 0.0000 0.0000
Pseudo R2 0.0336 0.0243 0.0245 0.0245 0.0242 0.0230 0.0557
Observations 21,323 21,150 21,324 21,323 19,942 21,048 19,420

68
Table 4:4: 1979 FEAS and 2008 FHCS Cross Tabulations
Questions 29 and Under 30-39 40-49 50-59 Pearson Chi2 Significance
Agree
1979 Question 81 77.32 83.37 89.90 91.34 (3 D.F.) 113.0376 0.000
2008 Question 61 88.65 86.42 85.90 86.19 (3 D. F.) 25.53 0.4557
Difference - - - - - -
1979 Question 17 55.18 54.96 60.94 62.04 (3 D.F.) 23.2607 0.000
2008 Question 27 57.36 51.88 51.11 52.71 (3 D.F.) 57.7162 0.2296
Difference - - - - - -
1979 Question 35 73.93 74.38 80.42 80.50 (3 D.F.) 29.8181 0.000
2008 Question 47 84.86 80.95 77.76 77.91 (3 D.F.) 145.4569 0.0249
Difference +10.93 +6.57 -2.66 -2.59
1979 Question 107 63.04 66.31 71.68 71.14 (3 D.F.) 24.5138 0.000
2008 Question 30 88.53 85.99 82.52 82.09 (3 D.F.) 184.0719 0.0010
Difference +25.49 +19.68 +10.84 +10.95
1979 Question 100 84.11 91.79 96.02 96.47 (3 D.F.) 145.5302 0.000
2008 Question 6 94.17 93.46 95.17 94.22 (3 D.F.) 47.5261 0.1835
Difference - - - - - -
1979 Question 84 65.71 78.30 85.29 86.22 (3 D.F.) 152.3320 0.000
2008 Question 18 84.81 84.27 82.97 81.25 (3 D.F.) 70.8305 0.1604
Difference - - - - - -

69
CONCLUSION
Introduction
In this Chapter, I discuss the implications of the results from the logistic
regressions and Pearson Chi2 tests. Overall, the results from Chapter 4 showed older
workers were mostly not significantly different from Baby Boomers (18-29) in 1979.
While the results for 2008 showed there were differences between older workers and
Millennials (18-29). The results from the logistic regressions also suggest the presence of
generational differences within the Federal workforce. Pearson Chi2 tests showed
generational differences exist on two questions. Overall, this study shows age and
generational differences do exist within the Federal workforce. However, more research
is needed to further explore these differences.
Age Differences
Intrinsic/Extrinsic Motivations
Older employees were more likely to agree they liked the kind of work they did
compared to Millennials (question 6). However, only the oldest employees were more
likely to agree they were satisfied with their jobs after the considered everything, than
Millennials (question 61). The results support the aging theories that predict as workers
get older they place greater value on intrinsic values/motivation than younger employees
(Rhodes 1983; Kooij et al 2011; Inceoglu et al 2012). However, a question used as an
intrinsic dimension showed older workers were not significantly different from
Millennials to agree or disagree their talents were used well in the work place (question
70
18). This is perhaps because most workers, ages 30+, agreed they liked the kind of work
they did, compared to Millennials on question 6. Additionally, this does also indicate
that there may simply be no differences between Millennials and older workers on
perceptions of how well their talents are used in the workplace.
On the extrinsic dimension of pay satisfaction (question 61) there was no
difference between older workers and Millennials on whether or not a they were satisfied
with their pay. Therefore, no shift from extrinsic to intrinsic motives could be examined.
A possible explanation for no differences between older and younger workers on pay
satisfaction, is public service motivation (PSM). PSM research has generally shown that
public sector workers are not as motivated by extrinsic rewards such as pay compared to
their private sector counterparts, and instead are more interested in the intrinsic aspects of
public service (Crewson 1997; Houston 2000).
Administrative
Of the two administrative questions used in this study, there were moderate
differences between older workers and Millennials for one, but not the other. Older
employees aged 40-49 and 50-59 were the only two age groups significantly different
from Millennials, and both were less likely to agree that that their performance appraisal
was a fair reflection of their actual performance. The results do align with Ertas (2015),
who found similar results. There were not large differences between older workers and
Millennials on whether or not they agreed or disagreed pay raises depended on how well
employees did their jobs (question 27). Only 30-39 age group was significantly different
from Millennials, and they were less likely to agree. This could be likely related to the

71
results for question 62. Additionally, PSM likely has an impact here since governmental
employees are primary motivated by intrinsic values/motives than extrinsic ones
(Crewson 1997; Houston 2000).
Whistleblower
There were strong differences between older workers and Millennials on the
whistleblower dimension included in this study. In 2008, older employees were
significantly more likely to disagree that they could disclose a suspected violation of any
law, rule, or regulation without fear of reprisal, compared to the Millennials. There are
two likely explanations for this. First, Parmerlee et al (1982) found that, “…organizations
are more likely to retaliate against whistle-blowers who are more valuable to their
organization, due to their age, experience, or education” (p. 30). Parmerlee et al (1982)
suggested that organizational retaliation against older workers was as a result of their job
level “seems to be more rational” since they can do more harm to their organization (pp.
30-31). Second, whistleblower protections have expanded since their adoption for
Federal employees by the 1979 Civil Service Reform Act of 1979 (Shimabukuro &
Whitaker 2012). Since the 1979, Congress expanded Federal whistleblower protections,
such as the passage of the Whistleblower Protection Act of 1989 (Shimabukuro &
Whitaker 2012), or through executive orders. Most recently, the passage of the
Whistleblower Protection Enhancement Act of 2012 continued this trend.
The logistic regressions suggest change in generational cohort motives among
Federal employees. There was a large growth in age differences between older between
the 1979 FEAS and the 2008 FHCS. This suggests a generational change in

72
values/motives between generations within the Federal workforce. Therefore, Pearson
Chi2 tests were used to determine what, if any, generational differences on the six sets of
questions noted in Table 3:1 of Chapter 3.
Generational Differences
Between the 1979 FEAS and the 2008 FHCS, only two sets of questions were
able to be analyzed. While all age groups were significantly different from each other in
1979, only two questions in 2008 showed significant differences between age groups, as
seen in Table 4:4 in Chapter 4. The two questions analyzed were the whistleblower
dimension, and one administrative question.
The Pearson Chi2 tests showed there were large increases in agreement between
Baby Boomers in 1979 and Millennials in 2008 on two questions. First, Millennials were
more likely to agree they could blow the whistle on their organization without fear of
reprisal than Baby Boomers at the same age (18-29). However, as noted above, this is
likely the result of increased whistleblower protections put in place by Congress.
Second, Millennials were much more likely to agree that their performance appraisal was
a fair reflection of their actual job performance. This is consistent with results found by
Ertas (2015). Ertas (2015) measured performance measures as “fairness” which
comprised “My performance appraisal is a fair reflection of my performance,” which is
the question I used from the 2008 dataset, and, “Promotions in my work unit are based on
merit” (p. 411). Ertas (2015) found, “The mean scores on the perception of the fairness
of the performance appraisal…were higher for Millennials, compared to older workers”
(p. 413). However, an interaction between Millennial and fairness was not statistically

73
significant (Ertas 2015, p. 414).
Overall, few studies have examined age and generational differences among
public employees (Ertas 2015). Three studies were conducted on small samples of local
municipalities in the Midwest and Oregon (Jurkiewicz & Brown 1998; Jurkiewicz 2000;
Bright 2010). Two studies from Ting (1997) and Ertas (2015) primarily examined job
satisfaction and turnover intentions using Federal data from 1991-1992 and 2011,
respectively. While age and generational differences were not the primary aims of their
studies, some insights were gleaned. However, Ting (1997) found that age did have a
large impact on job satisfaction, but only for employees in grade scales (GS) 6 or lower.
Ertas’s (2015) primary research question was about the turnover intentions of
Millennials. In the process of examining this question, Ertas (2015) did find some
differences between Millennials and older workers, such as learning that, “…overall job
satisfaction mattered more for Millennials than older workers” (p. 415). On Ertas’s
(2015) main research question, turnover, he found, “A Millennial federal employee seems
to be more likely than his or her older counterpart to indicate a desire to leave the public
sector or to switch to another government job” (p. 415). Additionally, Ertas (2015)
stated, “Factors such as creativity, opportunities for professional development, work-life,
balance, appreciation of the work group or meaningfulness of work were not particularly
important for Millennial workers” (p. 418). What is noteworthy is Ertas (2015)
combined a few questions that are intrinsically motivated for meaningfulness of work
such as: “My work gives me a feeling of personal accomplishment,” “I like the kind of
work I do,” is included in my study, while the other three, “I know how my work relates
74
to the agency’s goals and priorities,” and “The work I do is important” (p. 411). The
results indicated a Millennial and meaningfulness of work interaction term was not
statistically significant Ertas 2015, p. 414).
Limitations
There were two primary limitations on this study. One, the generational and aging
research has strongly shown that age, period, and aging effects need to be controlled for
to properly assess generational differences (Lyons & Kuron 2013; Twente 2010;
Cennamo & Gardner 2008; Twenge et al 2010; Parry & Urwin 2011;2017; Krahn &
Galambos 2014; Costanza & Finkelstein 2015). Two, the questions compared to each
other, while similar, were not identical. This is a problem as employees could have
considered different factors while answering each question. Despite these issues,
scholars Lyons and Kuron (2013) have noted cross sectional studies, like this one, are
“…desirable to practitioners grappling with generational issues (or perceived issues)” and
“...contribute to the “fossil record,” providing data for meta-analysis and review” (p.
153). Despite, way the way the questions were worded, this thesis has proven there are
generational and age differences among Federal workers.
Recommendations
More research is needed before actionable policy recommendations can be made.
Despite this a few recommendations can be made with regard to future research.
• A more comprehensive study using FEAS/FHCS data should be conducted with
multiple questions on intrinsic, extrinsic, administrative, whistleblower and other
dimensions to get a larger and better picture of age related differences within the

75
Federal workforce.
• To better address the major limitations of this study, I highly recommend the
OPM release a future FEVS with similarly worded questions used in the 1979
FEAS, as well as the 1983 and 1991-1992 surveys to better control for period,
cohort, and age effects, as well as allowing for more direct comparisons across
multiple dimensions.
Conclusion
Overall, few studies have attempted to examine age and generational differences
among public sector workers (Ertas 2015). Fewer still, are studies that have attempted to
examine age and generational differences with FEAS/FEVS datasets. Despite the
methodological issues, the results of this thesis have shown there are age and generational
differences among Federal employees. This study has also shown that older workers and
Baby Boomers (18-29) in 1979 were not significantly different from each other on the
intrinsic, administrative, and whistleblower dimensions included in this study. While the
2008 regressions showed there were some large differences between older workers and
Millennials on all three value/motive dimensions.
The results also indicated possible public service motivation influences. For
example, no age group was positive on the extrinsic pay satisfaction question. Therefore,
the aging theories that predict older workers value intrinsic motives over extrinsic ones
was not confirmed in this study. This is perhaps not surprising since public service
motivation research has found there are differences between public and private sector
workers (Crewson 1997; Steijn 2008; Houston 2000; Vadenabeele 2008). Specifically,

76
PSM research has found public sector workers place a greater emphasis on intrinsic over
extrinsic rewards/motivations (Crewson 1997; Houston 2000). To what extent this
influences the process of aging and generational differences within the Federal workforce
deserves more attention.
This study did show evidence of generational differences within the public sector
across a few dimensions using two large OPM datasets. However, more research is
needed before policy recommendations can be made to personnel managers. The OPM
should add questions used in past surveys or release a separate survey with the same
questions on past surveys to better examine the age and generational differences within
the Federal workforce.

77
Appendix A: 1979 Federal Employee Attitude Survey Descriptive Statistics
Variables Observations Mean Standard
Deviations Minimum Maximum
Question 17 6,381 .5955179 .49083 0 1
Question 35 6,381 .7878076 .4088924 0 1
Question 81 6,381 .8790158 .3261344 0 1
Question 84 6,381 .8246356 .3803083 0 1
Question 86 6,381 .9645824 .1848475 0 1
Question 100 6,381 .9427989 .2322446 0 1
Question 107 6,381 .6962858 .4598967 0 1
Male 6,381 .7625764 .4255373 0 1
Age 30-39 6,381 .2195581 .4139797 0 1
Age 40-49 6,381 .2993261 .4579988 0 1
Age 50-59 6,381 .3149976 .4645513 0 1
Age 60 and Older 6,381 .0783576 .2687546 0 1
Age 18-29 6,381 .0877605 .2829685 0 1
Years of Federal
Service 6,381 3.748002 .7817257 1 5
Pay Category 6,381 3.076947 1.23324 1 14
Supervisory Status 6,381 3.221125 2.087318 0 7
White 6,381 .859113 .3479322 0 1
Hispanic 6,381 .0363579 .1871938 0 1

78
Appendix B: 2008 Federal Human Capital Survey Descriptive Statistics
Variables Observations Mean Standard
Deviations
Minimum Maximum
Question 5 72,756 .8970963 .3038351 0 1
Question 6 72,758 .9464764 .2250767 0 1
Question 18 72,147 .8332555 .3727502 0 1
Question 27 67,678 .5268009 .4992849 0 1
Question 30 71,187 .8355821 .3706569 0 1
Question 47 66,419 .7932022 .4050123 0 1
Question 61 72,755 .8654787 .3412139 0 1
Question 62 72,755 .7782037 .4154576 0 1
Male 23,568 .5907525 .4917054 0 1
Age 30-39 71,529 .172008 .37739 0 1
Age 40-49 71,529 .3196982 .4663629 0 1
Age 50-59 71,529 .3299692 .4702049 0 1
Age 60 and Older 71,529 .1116201 .3149007 0 1
Age 18-29 71,529 .0667045 .2495113 0 1
Years of Federal
Service 23,567 5.676997 1.731783 1 7
Pay Category 71,521 3.528538 1.506547 1 7
Supervisory Status 71,515 1.722457 1.049727 1 5
White 69,813 .7141885 .4518033 0 1
Hispanic 53,756 .0425052 .2017405 0 1

79
Appendix C: 1979 FEAS VIFs
Variables
Questions 17-61
VIF
Age 50-59 13.24
Age 40-49 12.01
Age 30-29 7.90
Age 60+ 5.12
Years in Supervisory/
Managerial Position 1.49
Years in Federal Service 1.45
Pay Category 1.27
Male 1.15
White 1.09
Hispanic 1.03
Mean VIF 4.58

80
Appendix D: 2008 FHCS VIFs
Variables
Questions 5-62
VIF
Age 50-59 9.39
Age 40-49 7.35
Age 60 and Older 3.86
Age 30-39 3.72
Years in Federal Service 2.28
Pay Category 1.46
Supervisor Status 1.37
Male 1.20
White 1.11
Hispanic 1.06
Mean VIF 3.28

81
Age 18-29 Used as Reference Category
*** p<0.01, ** p<0.05, * p<0.1
Appendix E1: 1979 Questions Intrinsic Results with Standard Errors
Intrinsic
Question 81
Question 84
Question 100
Variables Odds Ratio Standard
Errors
Odds Ratio Standard
Errors
Odds Ratio Standard
Errors
Male 1.478** (0.232) 0.963 (0.140) 1.064 (0.265)
AGE 30-39 0.462* (0.197) 1.339 (0.405) 0.579 (0.364)
AGE 40-49 0.553 (0.239) 1.808* (0.561) 1.088 (0.707)
AGE 50-59 0.541 (0.239) 1.666 (0.534) 0.999 (0.665)
AGE 60 and Older 0.549 (0.269) 1.580 (0.576) 1.890 (1.506)
AGE 18-29 - - -
Years of Federal
Service
1.610*** (0.177) 1.468*** (0.145) 1.060 (0.185)
Pay Grade 1.121 (0.0830) 1.222*** (0.0781) 1.041 (0.118)
Years as Supervisor 0.953 (0.0573) 0.846*** (0.0459) 1.000 (0.0899)
White 1.302 (0.233) 1.702*** (0.256) 1.613* (0.411)
Hispanic 1.591 (0.692) 1.848 (0.711) 0.991 (0.527)
LR Chi2 (10) 43.79 55.42 17.63
Prob > Chi2 0.0000 0.0000 0.0615
Pseudo R2 0.0208 0.0211 0.0160
Observations 3,717 3,717 3,717

82
Age 18-29 Used as Reference Category
*** p<0.01, ** p<0.05, * p<0.1
Appendix E2: 1979 Administrative & Whistleblower with Standard Errors
Administrative
Whistleblower
Question 17
Question 107
Question 35
Variables Odds Ratio Standard
Errors
Odds Ratio Standard
Errors
Odds Ratio Standard
Errors
Male 0.966 (0.0991) 1.057 (0.114) 1.337** (0.161)
AGE 30-39 0.801 (0.204) 1.046 (0.275) 0.888 (0.264)
AGE 40-49 0.723 (0.186) 0.989 (0.262) 0.911 (0.274)
AGE 50-59 0.656 (0.173) 0.917 (0.249) 1.028 (0.319)
AGE 60 and Older 0.683 (0.199) 1.055 (0.318) 1.155 (0.402)
AGE 18-29 - - -
Years of Federal
Service
1.147* (0.0820) 1.153* (0.0845) 1.060 (0.0899)
Pay Grade 1.751*** (0.0824) 1.182*** (0.0552) 1.021 (0.0555)
Years as Supervisor 0.970 (0.0349) 0.951 (0.0358) 1.051 (0.0448)
White 1.153 (0.133) 1.109 (0.134) 1.035 (0.145)
Hispanic 0.810 (0.182) 0.861 (0.202) 1.246 (0.372)
LR Chi2 (10) 194.37 24.93 19.99
Prob > Chi2 0.0000 0.0055 0.0294
Pseudo R2 0.0429 0.0059 0.0059
Observations 3,717 3,717 3,717

83
Appendix F1: 2008 Intrinsic & Extrinsic Results with Standard Errors
Intrinsic
Extrinsic
Question 6
Question 18
Question 61
Question 62
Variables Odds Ratio Standard
Errors
Odds Ratio Standard
Errors
Odds Ratio Standard
Errors
Odds Ratio Standard
Errors
Male 0.734** (0.113) 0.843* (0.0757) 0.726*** (0.0722) 0.749*** (0.0684)
Age 30-39 1.635* (0.456) 1.063 (0.225) 1.140 (0.263) 0.786 (0.179)
Age 40-49 2.533*** (0.766) 0.890 (0.190) 1.279 (0.298) 0.807 (0.193)
Age 50-59 2.057** (0.610) 0.840 (0.193) 1.157 (0.285) 0.632* (0.157)
Age 60 and Older 3.617*** (1.299) 1.150 (0.296) 1.700* (0.483) 0.671 (0.200)
Age 18-29 - - - -
Years of Federal
Service
0.861*** (0.0407) 0.937** (0.0305) 0.864*** (0.0290) 0.960 (0.0308)
Pay Category 1.518*** (0.193) 1.470*** (0.119) 1.450*** (0.139) 1.922*** (0.192)
Supervisory Status 1.528*** (0.102) 1.372*** (0.0620) 1.375*** (0.0714) 1.062 (0.0519)
White 0.700** (0.118) 0.933 (0.121) 0.933 (0.110) 1.407*** (0.161)
Hispanic 2.188** (0.867) 0.997 (0.224) 1.006 (0.240) 1.404 (0.346)
Wald Chi2 (10) 75.42 112.19 94.29 112.23
Prob > Chi2 0.0000 0.0000 0.0000 0.0000
Pseudo R2 0.0336 0.0243 0.0245 0.0245
Observations 21,323 21,150 21,324 21,323
Age 18-29 Used as Reference Category
*** p<0.01, ** p<0.05, * p<0.1

84
Appendix F2: 2008 Administrative & Whistleblower with Standard Errors
Administrative Whistleblower
Question 27
Question 30
Question 47
Variables Odds Ratio Standard
Errors
Odds Ratio Standard
Errors
Odds Ratio Standard Errors
Male 0.864* (0.0699) 0.950 (0.0876) 1.133 (0.113)
Age 30-39 0.746* (0.129) 0.715 (0.178) 0.478*** (0.123)
Age 40-49 0.749 (0.136) 0.586** (0.146) 0.408*** (0.106)
Age 50-59 0.855 (0.164) 0.526** (0.137) 0.352*** (0.0957)
Age 60 and Older 1.193 (0.265) 0.753 (0.213) 0.458** (0.141)
Age 18-29 - - -
Years of Federal
Service
0.916*** (0.0256) 0.923** (0.0295) 0.854*** (0.0274)
Pay Category 1.424*** (0.112) 1.676*** (0.140) 1.455*** (0.141)
Supervisory Status 1.258*** (0.0495) 1.162*** (0.0514) 1.550*** (0.0779)
White 0.613*** (0.0669) 0.926 (0.102) 0.973 (0.113)
Hispanic 1.132 (0.201) 0.635** (0.130) 0.817 (0.172)
Wald Chi2 (10) 132.29 105.29 208.62
Prob > Chi2 0.0000 0.0000 0.0000
Pseudo R2 0.0242 0.0230 0.0557
Observations 19,942 21,048 19,420
Age 18-29 Used as Reference Category
*** p<0.01, ** p<0.05, * p<0.1

85
References
Adams, S. J. (2000). Generation X. Professional Safety, 45(1), 26-29.
Akkermans, J., Annet H. de Lange, Beatrice I.J.M. van der Heijden, Dorien
T.A.M. Kooij, Paul G.W. Jansen, Josje S.E. Dikkers, (2016) "What about
time? Examining chronological and subjective age and their relation to
work motivation", Career Development International, Vol. 21 Issue: 4,
pp.419-439,
Baltes, P. B., & Staudinger, U. M. (1999). Lifespan psychology: Theory and
application to intellectual functioning. Annual Review Of Psychology,
50(1), 471.
Barnes-Farrell, J. L., & Matthews R. A. (2007). Chapter 7: Age and Work
Attitudes. Aging and work in the 21st century (Series in applied
psychology) (Eds. K. Shultz & G. Adams). Mahwah, N.J.; London:
Lawrence Erlbaum Associates.
Becton, J. B., Walker, H. J., & Jones-Farmer, A. (2014). Generational differences
in workplace behavior. Journal Of Applied Social Psychology, 44(3), 175-
189.
Bertelli, A. M., Mason, D. P., Connolly, J. M., & Gastwirth, D. A. (2015).
Measuring Agency Attributes with Attitudes Across Time: A Method
and Examples Using Large-Scale Federal Surveys. Journal Of
Public Administration Research & Theory, 25(2), 513-544.

86
Bright, L. (2010). Why age matters in the work preferences of public employees:
a comparison of three age-related explanations. Public Personnel
Management, 39(1), 1-14.
Burger, Rachel. (2014). Why Millennials want Government Jobs (and then quit
them). Retrieved from:
http://thehill.com/blogs/congress-blog/labor/220696-why-millennials-
want-government-jobs-and-then-quit-them
Calo, J., T., Patterson, M. M., & Decker, H. W. (2014). Age-Related Work
Motivation Declines: Myth or Reality? Journal of Organizational
Psychology, 14(1), pp. 96-110
Campbell, S. M., Campbell, W. K., & Twenge, J. M. (2017). Fuzzy but useful
constructs: Making sense of the differences between generations. Work,
Aging, and Retirement, 3, 130-139.
Carstensen, L. L., Isaacowitz, D. M., & Charles, S. T. (1999). Taking Time
Seriously: A Theory of Socioemotional Selectivity. American
Psychologist, 54(3), 165-181.
Cennamo, L., & Gardner, D. (2008). Generational differences in work
values, outcomes and person-organization values fit. Journal Of
Managerial Psychology, 23(8), 891-906.

87
Cho, Y. J., & Perry, J. L. (2012). Intrinsic Motivation and Employee
Attitudes: Role of Managerial Trustworthiness, Goal Directedness,
and Extrinsic Reward Expectancy. Review Of Public Personnel
Administration, 32(4), 382-406.
Cohn, D’Vera and Paul Taylor (2010). Baby Boomers Approach 65---Glumly.
Retrieved from:
http://www.pewsocialtrends.org/2010/12/20/baby-boomers-approach-65-
glumly/
Costanza, D., Badger, J., Fraser, R., Severt, J., & Gade, P. (2012).
Generational Differences in Work-Related Attitudes: A Meta-
analysis. Journal Of Business & Psychology, 27(4), 375-394.
Costanza, D. P., & Finkelstein, L. M. (2015). Generationally Based
Differences in the Workplace: Is There a there there? Industrial And
Organizational Psychology: Perspectives On Science And Practice,
8(3), 308-323.
-----.(2017). Generations, Age, and the Space Between. Work, Aging and
Retirement, 3(2), 109-112
Crewson, Philip. (1997). Public-Service Motivation: Building Empirical
Evidence of Incidence Effect. Journal of Public Administration
Research and Theory, 7(4).

88
D’Angelo, Chris. (2018). Trump Calls on Congress to Empower Agencies
to Oust Federal Workers. Retrieved from:
https://www.huffingtonpost.com/entry/trump-sotu-congress-fire-federal-
workers_us_5a712923e4b0ae29f08bf88c
Elias, S. M., Smith, W. L., & Barney, C. E. (2012). Age as a moderator of
attitude towards technology in the workplace: work motivation and
overall job satisfaction. Behaviour & Information Technology, 31(5),
453-467.
Elizur, D. (1984). Facets of work values: A structural analysis of work
outcomes. Journal of Applied Psychology, 69, 379-389.
Elizur, D., & Sagie, A. (1999). Facets of Personal Values: A Structural
Analysis of Life and Work Values. Applied Psychology: An
International Review, 48(1), 73-87.
Ertas, N. (2015). Turnover Intentions and Work Motivations of Millennial
Employees in Federal Service. Public Personnel Management, 44(3),
401-423.
Feintzeig, Rachel. (2014). U.S. Struggles to Draw Young, Savvy Staff:
Percentage of Government Employees Under 30 Hit 8-Year Low in 2013.
Retrieved from:
https://www.wsj.com/articles/u-s-government-struggles-to-attract-young-
savvy-staff-members-1402445198

89
Fernandez, S., Resh, W. G., Moldogaziev, T., & Oberfield, Z. W. (2015).
Assessing the Past and Promise of the Federal Employee Viewpoint
Survey for Public Management Research: A Research Synthesis. Public
Administration Review, 75(3), 382-394.
George, J. M., & Jones, G. M. (1997). Experiencing Work: Values,
Attitudes, and Moods. Human Relations, 50(4), 363-392.
Glenn, N. D. (1976). Cohort analysts’ futile quest: Statistical attempts to separate
age, period and cohort effects. American Sociological Review, 41, 900–
904.
Greenberg, E., & Weber, K. (2008). Generation We: How Millennial Youth are
Taking Over America and Changing Our World Forever. Retrieved from:
http://www.gen-we.com/sites/default/files/GenWe_EntireBook3.pdf
Gujarati, Damodar. (2012). Econometrics by Example. Palgrace Macmillan: New
York City.
Gursoy, D., Maier, T. A., & Chi, C. G. (2008). Generational differences: An
examination of work values and generational gaps in the hospitality
workforce. International Journal Of Hospitality Management, 27(3),
448-458.
Hansen, J. C., & Leuty, M. E. (2012). Work Values across Generations.
Journal Of Career Assessment, 20(1), 34-52.

90
Heckhausen, L., & Schulz, R. (1995). A Life-span Theory of Control.
Psychological Review, 102(2), 284-304.
Hicks, Josh. (2014). Fed-Worker Retirement Eligibility to Skyrocket by 2017,
Report Says. Retrieved from:
https://www.washingtonpost.com/news/federal-eye/wp/2014/01/30/fed-
worker-retirement-eligibility-to-skyrocket-by-2017-report-
says/?utm_term=.a1d3eadec28b
Highhouse, S., Zickar, M., & Yankelevich, M. (2010). Would you work if you
won the lottery? Tracking changes in the American work ethic. Journal Of
Applied Psychology, 95(2), 349-357.
Houston, D. J. (2000). Public-Service Motivation: A Multivariate Test. Journal
Of Public Administration Research & Theory, 10(4), 713.
Howe, N., & Struass, W. (July/August 2007). The Next 20 Years: How Customer
and Workforce Attitudes will Evolve. Harvard Business Review, 41-52.
Hum, Bryan. (2016). The Might of Millennials in the Federal Workforce.
Retrieved from:
http://thehill.com/blogs/congress-blog/labor/311434-the-might-of-
millennials-in-the-federal-workforce
Inceoglu, I., Segers, J., & Bartram, D. (2012). Age-related differences in
work motivation. Journal Of Occupational & Organizational
Psychology, 85(2), 300-329.

91
Jacobson, Louis. (2018). Taking the Measure of the Federal Workforce Under
Donald Trump. Retrieved from:
http://www.politifact.com/truth-o-meter/article/2018/jan/22/taking-
measure-federal-workforce/
Jin, J., & Rounds, J. (2012). Stability and Change in Work Values: A Meta-
Analysis of Longitudinal Studies. Journal Of Vocational Behavior,
80(2), 326-339.
Jurkiewicz, C. L., & Brown, R. G. (1998). GenXers vs. Boomers vs.
Matures. Review Of Public Personnel Administration, 18(4), 18.
Jurkiewicz, C. L. (2000). Generation X and the Public Employee. Public
Personnel Management, 29(1), 55.
Kanfer, R., & Ackerman, P. L. (2004). Aging, Adult Development, and
Work Motivation. The Academy of Management Review, 29(3), 440-
458
Kooij, Dorien T.A.M., De Lange, Annet H., Jansen, Paul G.W., Kanfer,
Ruth, & Dikkers, Josje S.E. (2011). Age and work-related motives:
Results of a meta-analysis. (Report). Journal of Organizational
Behavior, 32(2), 197-225
Krahn, H. J., & Galambos, N. L. (2014). Work values and beliefs of
‘Generation X’ and Generation Y’. Journal Of Youth Studies, 17(1),
92-112.

92
Kupperschmidt, B. (2000). Multigeneration employees: strategies for
effective management. Health Care Manager, 19(1), 65-76.
Lee, H., Cayer, N. J., & Lan, G. Z. (2006). Changing Federal Government
Employee Attitudes Since the Civil Service Reform Act of 1978.
Review Of Public Personnel Administration, 26(1), 21-51.
Lewis, G. B., & Yoon Jik, C. (2011). The Aging of the State Government
Workforce: Trends and Implications. American Review of Public
Administration, 41(1), 48-60
Light, Paul C. (1999). The Public Service. Retrieved from:
https://www.brookings.edu/articles/the-public-service/
-----. (2002). What Federal Employees Want from Reform. Retrieved from:
https://www.brookings.edu/research/what-federal-employees-want-from-
reform/
Lyons, S. T., Duxbury, L. E., & Higgins, C. A. (2006). A Comparison of the
Values and Commitment of Private Sector, Public Sector, and
Parapublic Sector Employees. Public Administration Review, 66(4),
605-618.
-----. (2010). Work values: Development of a new three-dimensional
structure based on confirmatory smallest space analysis. Journal Of
Organizational Behavior, 31(7), 969-1002

93
Lyons, S., & Kuron, L. (2013). Generational differences in the workplace: A
review of the evidence and directions for future research. Journal Of
Organizational Behavior, 35S139-S157.
Mannheim, K. (1952). The problem of generations. In K. Mannheim (Ed.), Essays
on the sociology of knowledge (pp. 276–322). London: Routledge
McDonald, K. and Hite, L. (2008). The next generation of career success:
implications for HRD. Advances in Developing Human Resources, 10(1),
pp. 83–103.
Meier, Kenneth et al. (2012). Applied Statistics: For Public and Nonprofit
Administration (8th Ed.). Wadswoth, Cengage Learning: Boston
Mesmer-Magnus, J. R., & Viswesvaran, C. (2005). Whistleblowing in
Organizations: An Examination of Correlates of Whistleblowing
Intentions, Actions, and Retaliation. Journal of Business Ethics, 62, 277-
297
Naylor, Brian. (2017). Trump Lifting Federal Hiring Freeze. Retrieved from:
https://www.npr.org/2017/04/12/523473051/trump-lifting-federal-hiring-
freeze
Near, J. P., & Miceli, M.P. (1985) Organizational Dissidence: The Case of
Whistle-Blowing. Journal of Business Ethics, 4(1), 1-16.
-----. (1996). Whistle-Blowing: Myth and Reality. Journal of Management, 22(3),
507-526
94
New York Times. (2018). Stopgap Bill to End Government Shutdown Passes
Congress. Retrieved from:
https://www.nytimes.com/2018/01/22/us/politics/government-
shutdown.html
Ng, T. H., & Feldman, D. C. (2010). The Relationships of Age with Job Attitudes:
A Meta-Analysis. Personnel Psychology, 63(3), 677-718.
Ng, E., Schweitzer, S., & Lyons, W. (2010). New Generation, Great Expectations:
A Field Study of the Millennial Generation. Journal of Business and
Psychology, 25(2), 281-292.
Nord, W. R., Brief, A.P., Atieh, J. M. & Doherty, E. M. (1990). 2---Studying the
Meanings of Work: The Case of Work Values. Meanings of Occupational
Work (Eds., A.P. Brief & W.R. Nord). Lexington, MA: Lexington Books,
pp. 21-64
O'Brien, R. M. (2007). A caution regarding rules of thumb for variance inflation
factors. Quality & Quantity: International Journal Of Methodology, 41(5),
673-690. Retrieved from:
http://proxy.lib.csus.edu/login?url=http://search.ebscohost.com/login.aspx
?direct=true&db=psyh&AN=2008-08581-005
Parmerlee, M. A., Near, J. P., & Jensen, T. C. (1982). Correlates of
Whistleblowers’ Perceptions of Organizational Retaliation.
Administrative Science Quarterly, 27(1), 17-34.
95
Parry, E., & Urwin, P. (2011) Generational Differences in Work Values: A
Review of Theory and Evidence. International Journal of Management
Reviews, 13(1), 79-96.
-----. (2017). The Evidence Base for Generational Differences: Where Do We Go
from Here? Work, Aging and Retirement, 3(2), 140-148.
Pew Research Center. (2014). The Generations Defined. Retrieved from:
http://www.pewresearch.org/fact-tank/2018/03/16/how-millennials-
compare-with-their-grandparents/st_140711_ft_millennials/
-----. (2015). Comparing Millennials to Other Generations. Retrieved from:
http://www.pewsocialtrends.org/2015/03/19/comparing-millennials-to-
other-generations/
Rein, Lisa. (2014). Millennials Exit the Federal Workforce as Government Jobs
Lose their Allure. Retrieved from:
https://www.washingtonpost.com/politics/millennials-exit-the-federal-
workforce-as-government-jobs-lose-their-allure/2014/12/15/ea3d4418-
7fd4-11e4-9f38-95a187e4c1f7_story.html?utm_term=.dfaad61f61f7
-----. (2015). Millennials Actually Like Government Work, and Other Myths
About Them. Retrieved from:
https://www.washingtonpost.com/news/federal-
eye/wp/2015/11/10/millennials-actually-like-government-work-and-other-
myths-about-them/?utm_term=.e1ebfeeb9cba

96
Rhodes, S. R. (1983). Age-related differences in work attitudes and behavior:
A review and conceptual analysis. Psychological Bulletin, 93(2), 328-
367.
Roe, R. A., & Ester, P. (1999). Values and work: Empirical findings and
theoretical perspective. Applied Psychology: An International
Review, 48(1), 1-21.
Rokeach, M. (1973). The nature of human values. New York: Free Press.
Ros, M., Schwartz, S. H., & Surkiss, S. (1999). Basic Individual Values,
Work Values, and the Meaning of Work. Applied Psychology: An
International Review, 48(1), 49-71.
Rudolph, W., C., Baltes, B. B., & Zabel, K. L. (2013). Chapter 7: Age and
Work Motives The Sage Handbook of Aging, Work and Society
(Eds., Field, J., Burke, R. J., & Cooper, C.L.). London: SAGE
Publications Ltd, pp. 118-140.
Rudolph, W., C. (2016). Lifespan Developmental Perspectives on Working:
A Literature Review of Motivational Theories. Work, Aging, and
Retirement, 2(2), pp. 130-158
Sagie, A., & Elizur, D. (1996). The Structure of Personal Values: A Conical
Representation of Multiple Life Areas. Journal of Organizational
Behavior, 17, pp. 573-586

97
Schaie, K. W., & Caskie, I. L. (2008). Chapter 2: Methodological Issues in
Aging Research. Handbook of Research Methods in Developmental
Science (Ed. D. M. Teti), Blackwell Publishing Ltd, Oxford, Uk.
Schullery, N. M. (2013). Workplace Engagement and Generational
Differences in Values. Business Communication Quarterly, 76(2),
252-265.
Schuman, H., & Scott, J. (1989). Generations and Collective Memories
Generations. American Sociological Review, 54(3), 359-381
Schuman, H., & Corning, A. (2012). Generational Memory and the Critical
Period. Public Opinion Quarterly, 76(1), 1-31
Schwartz, S. H. (1992). Universals in the Context and Structure of Values:
Theoretical Advances and Empirical Tests in 20 Countries. (Ed.,
Zanna). Advances in Experimental Social Psychology (1st Edition),
Vol. 25., 1-65
-----. (1999). A Theory of Cultural Values and Some Implications for Work.
Applied Psychology: An International Review, 48(1), 23-47.
Sims, R. L., & Keenan, J. P. (1998). Predictors of External Whistleblowing:
Organizational and Intrapersonal Variables. Journal of Business
Ethics, 17(4), 411-421.

98
Smola, K. W., & Sutton, C. D. (2002). Generational Differences: Revisiting
Generational Work Values for the New Millennium. Journal Of
Organizational Behavior, 23(4), 363-382.
Shimabukuro, J. O. & Whitaker, P. L. (2012). Whistleblower Protections Under
Federal Law: An Overview. Retrieved from:
https://fas.org/sgp/crs/misc/R42727.pdf
Steijn, Bram. (2008). Person-Environment Fit and Public Service Motivation.
International Public Management Journal, 11(1). Retrieved from:
Ting, Y. (1997). Determinants of Job Satisfaction of Federal Government
Employees. Public Personnel Management, 25(3), pp. 313-334
Trzesniewski, K. H., & Donnellan, M. B. (2010). Rethinking 'Generation Me': A
study of cohort effects from 1976-2006. Perspectives On Psychological
Science, 5(1), 58-75.
Twenge, J. (2010). A Review of the Empirical Evidence on Generational
Differences in Work Attitudes. Journal Of Business & Psychology, 25(2),
201-210.
----- (2014). Generation Me: Why Today’s Young Americans Are More
Confident, Assertive, Entitled—and More Miserable Than Ever Before.
New York: Atria Paperback

99
Twenge, J., Campbell, S., Hoffman, B., & Lance, C. (2010). Generational
Differences in Work Values: Leisure and Extrinsic Values Increasing,
Social and Intrinsic Values Decreasing. Journal of Management, 36(5),
1117-1142
Twenge, J. M., & Foster, J. D. (2010). Birth cohort increases in narcissistic
personality traits among American college students, 1982-2009. Social
Psychological And Personality Science, 1(1), 99-106
Twenge, J. M. et al. (2012). Generational differences in young adults' life goals,
concern for others, and civic orientation, 1966–2009. Journal Of
Personality And Social Psychology, 102(5), 1045-1062
Twenge, J. M., & Kasser, T. (2013). Generational changes in materialism and
work centrality, 1976-2007: Associations with temporal changes in
societal insecurity and materialistic role modeling. Personality And Social
Psychology Bulletin, 39(7), 883-897.
United States Government Accountability Office. (2016). Federal Workforce:
Lessons Learned for Engaging Millennials and Other Age Groups.
Retrieved from:
http://www.gao.gov/assets/690/680107.pdf
-----. (2015). Human Capital: Update on Strategic Management Challenges for the
21st Century. Retrieved from:
http://govt.act1group.com/documents/ACT1_GAO_Human_Capital.pdf

100
United States Bureau of Labor Statistics. (2012). The Recession of 2007-2009.
Retrieved from:
https://www.bls.gov/spotlight/2012/the-recession-of-2007-
2009/home.htm
United States Census Bureau. (2015). Millennials Outnumber Baby Boomers and
Are Far More Diverse Census Bureau Reports (Release Number CB15-
113). Retrieved from:
https://www.census.gov/newsroom/press-releases/2015/cb15-113.html
United States Government Publishing Office. (2003). National Defense
Authorization Act of 2004, 5 USC 7101 § 1128. Retrieved from:
https://www.gpo.gov/fdsys/pkg/PLAW-108publ136/pdf/PLAW-
108publ136.pdf
United States Office of Personnel Management. Federal Employee Attitudes
Survey, 1979-1980. ICPSR07804-v2. Ann Arbor, MI: Inter-university
Consortium for Political and Social Research [distributor], 2013-08-29.
Retrieved from:
http://doi.org/10.3886/ICPSR07804.v2
-----. (1979-1980b). Federal Employee Attitudes Survey, 1979-1980: United
States Office of Personnel Management Codebook. Retrieved
from: http://www.icpsr.umich.edu/icpsrweb/ICPSR/studies/7804

101
-----. (2003). Biography of an Ideal: A History of the Federal Civil Service.
Retrieved from:
https://archive.opm.gov/biographyofanideal/PDF/BiographyOfAnIdeal.pd
f
-----. (2008). Federal Human Capital Survey 2008. Retrieved from:
https://www.fedview.opm.gov/2008/
------. (2015). Executive Branch Retirement Statistics: Fiscal Years 2005-2014.
Retrieved from:
https://www.opm.gov/policy-data-oversight/data-analysis-
documentation/federal-employment-reports/reports-
publications/executive-branch-retirement-statistics-fy2005- 2014.pdf
-----. (2015). Federal Employee Viewpoint Survey Results: Employee Influencing
Change Technical Report. Retrieved from:
https://www.fedview.opm.gov/2015FILES/2015_OPM_Technical_Report.
Vandenabeele, Wouter. (2008). Government Calling: Public Service Motivation
as an Element in Selecting Government as an Employer of Choice. Public
Administration, 86(4), 1089-1105.

102
Vanderslice, Ann. (2016). Job-Hunting Millennials Could Find the Right Fit with
the Federal Government. Retrieved from:
http://www.nydailynews.com/life-style/job-hunting-millennials-find-fit-
federal-gov-article-1.2873045
Wenger, Yvonne. (2015). Federal Workforce is Thin on Millennials, but Study
Shows How That Could Change. Retrieved from:
http://www.latimes.com/nation/la-na-federal-millennials-20151214-
story.html
Westerman, J. W., & Yamamura, J. H. (2007). Generational preferences for
work environment fit: effects on employee outcomes. Career
Development International, 12(2), 150-161.
Wong, M., Gardiner, E., Lang, W., & Coulon, L. (2008). Generational differences
in personality and motivation: Do they exist and what are the implications
for the workplace? Journal Of Managerial Psychology, 23(8), 878-890.
Wray-Lake, L., Syvertsen, A. K., Briddell, L., Osgood, D. W., & Flanagan, C. A.
(2011). Exploring the changing meaning of work for American high
school seniors from 1976 to 2005. Youth & Society, 43, 1110–1135.
Zacher, H. (2015). Successful Aging at Work. Work, Aging, and Retirement, 1(1),
pp. 4-25