DIVERSITY AND CONFLICT RESOLUTION LEADERSHIP PROGRAM EVALUATION
44
DIVERSITY AND CONFLICT RESOLUTION LEADERSHIP PROGRAM EVALUATION Nakeina E. Douglas, Darrell L. Hairston, Samantha G. Lowell, and Kasey J. Martin Race and Social Policy Research Center Virginia Tech 201 Wall Street Blacksburg, VA 24061-0520 (540) 231-7305 May 2003
Transcript of DIVERSITY AND CONFLICT RESOLUTION LEADERSHIP PROGRAM EVALUATION

DIVERSITY AND CONFLICT RESOLUTION LEADERSHIP PROGRAM EVALUATION
Nakeina E. Douglas, Darrell L. Hairston, Samantha G. Lowell, and Kasey J. Martin
Race and Social Policy Research Center Virginia Tech
201 Wall Street Blacksburg, VA
24061-0520 (540) 231-7305
May 2003
Diversity and Conflict Resolution Leadership Douglas et al. Program Evaluation June 2003
i
TABLE OF CONTENTS
List of Tables ii Acknowledgements iii Executive Summary ES-1 Program Overview and Purpose of the Report Conflict Resolution Skills and the Educational Curriculum Southside Virginia: Profile of an area in need The Diversity and Conflict Resolution Leadership Program: An Overview Benefit of the Program to Virginia Tech
1 1 2 3 7
Data Collection Methods Questionnaires Focus Groups Participant Observations Limitations of Research
8 8 8 8 9
Characteristics of Respondents Fall 2002 Respondents Spring 2003 Respondents
10 10 11
Report of Findings Diversity Conflict Resolution Leadership Career Community Service College Overall Program Experience
13 13 15 17 19 19 24 28
Discussion and Suggestions 31 References 33
Diversity and Conflict Resolution Leadership Douglas et al. Program Evaluation June 2003
ii
LIST OF TABLES
Table 1: Examples of Conflict Resolution Programs 1 Table 2: Student Demographics Part 1 10 Table 3: Student Demographics Part 2 12 Table 4: Diversity – Individual 14 Table 5: Diversity – General 14 Table 6: Conflict Resolution 16 Table 7: Leadership 18 Table 8: Career 20 Table 9: Community Service – Individual 21 Table 10: Community Service – General 22 Table 11: College – Individual 25 Table 12: College – General 26

Diversity and Conflict Resolution Leadership Douglas et al. Program Evaluation June 2003
iii
ACKNOWLEDGEMENTS
We are grateful for the many individuals who made significant contributions to this study. In particular, we thank Kimble Reynolds, Jr., Director, and Deborah Robison, Program Assistant with the Diversity and Conflict Resolution Leadership Program. They welcomed our evaluation efforts, hosted the focus groups, provided needed background information for the report, and provided important feedback on early drafts of the report.
Susan Gooden, Director of the Race and Social Policy Research Center, directed the project, and provided overall advice and guidance. We appreciate her review of report drafts. This study also benefited greatly from the contributions of James Price who assisted with data entry and analysis for the report. Aimee Florsch, Raquel Becerra, Javier Paula and Susan White provided valuable fact checking and editing.
The Diversity and Conflict Resolution Leadership Program was made possible through the cooperation and financial support of the Reynolds Homestead and the Diversity Incentive Grants Program at Virginia Tech. We greatly appreciate their support of this project.
The Authors

Diversity and Conflict Resolution Leadership ES- Douglas et al. Program Evaluation June 2003
1
EXECUTIVE SUMMARY The Diversity and Conflict Resolution Leadership Program is designed to provide high school students in the City of Martinsville, Henry County and Patrick County with information about diversity awareness, conflict resolution, college life, and career planning. Students in this region are considered at risk due to severe unemployment levels and lack of new industry growth. Also, the area lacks the presence of a four-year college or university to provide students with exposure to college life. With an emphasis on conflict resolution and mediation, the program attempts to expose students to diverse people and situations through student development activities and college experiences. This is achieved by the students participating in team building exercises, educational activities, and visits to college campuses. This report provides an evaluation of the Diversity and Conflict Resolution Leadership Program. This evaluation is based on a pre-test and post-test questionnaire designed to collect data on six aspects of the program: diversity education, conflict resolution, leadership, career preparation, community service, and college exposure. Also, we conducted two, one-hour focus groups with students and observed multiple sessions of the program throughout the academic year. The overall goal of this evaluation is to identify areas of program strength, as well as offer suggestions for program improvement. Findings in Brief
• Overall students developed an appreciation for culture and expanded their understanding of diversity. Male students increased their relationships with people of different cultures from 75 percent in the fall to 100 percent in the spring.
• Students acquired skills to avoid and resolve conflict, and improved public
speaking and leadership skills, particularly among black students.
• Black students reported the most dramatic increase in their identity as leaders from 18.2 percent in the fall to 100 percent in the spring.
• Sixty-five percent of students reported they were confident with public speaking
in the fall. This increased to 85.7 percent in the spring. Males experienced the most dramatic change in their confidence in public speaking from 37.5 percent in the fall to 75 percent in the spring.
• Community service projects increased students’ perception that they can
influence and share values with their community. Students also came to the

Diversity and Conflict Resolution Leadership ES- Douglas et al. Program Evaluation June 2003
2
realization that community service is beneficial to the whole community not just the disadvantaged.
• Overall student knowledge about finding financial aid information for college
increased from fall to spring. In the fall, 55.5 percent of students reported that they knew where to look for information. This increased to 71.4 percent in the spring. The largest increase was among male students.
• More students are aware of career choices, although confidence in applying and
interviewing for a job is still lower among black students.
• Students were generally uncertain of their career choices after high school in the fall, although 71.4 percent of students expressed more certainty in the spring.
• All students developed college preparation skills that enabled them to find
financial aid and become comfortable in a college environment, though black students reported less overall comfort than white students.
• College tours were valuable resources to students who were able to change their
misconceptions and feel less intimidated by college.
• Although the program was able to provide exposure to college life, many students expressed the need for more attention and assistance from school administration and guidance counselors with career preparation.
Diversity and Conflict Resolution Leadership 1 Douglas et al. Program Evaluation June 2003
PROGRAM OVERVIEW AND PURPOSE OF REPORT
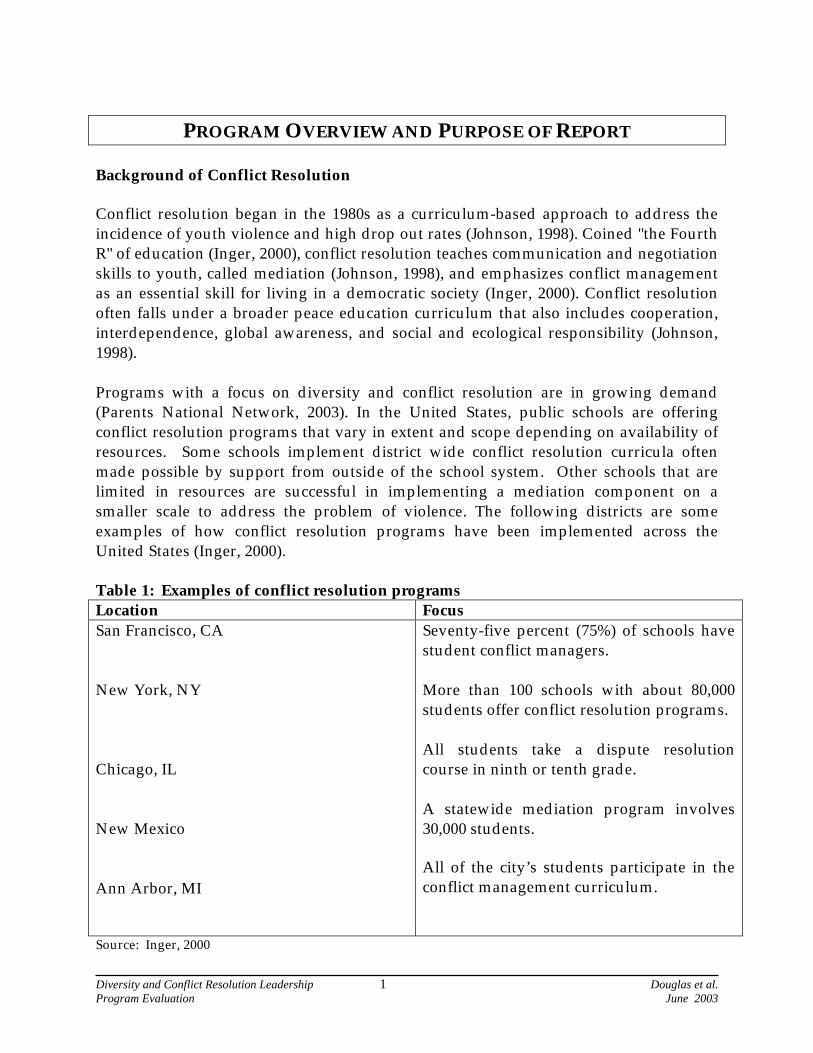
Background of Conflict Resolution Conflict resolution began in the 1980s as a curriculum-based approach to address the incidence of youth violence and high drop out rates (Johnson, 1998). Coined "the Fourth R" of education (Inger, 2000), conflict resolution teaches communication and negotiation skills to youth, called mediation (Johnson, 1998), and emphasizes conflict management as an essential skill for living in a democratic society (Inger, 2000). Conflict resolution often falls under a broader peace education curriculum that also includes cooperation, interdependence, global awareness, and social and ecological responsibility (Johnson, 1998). Programs with a focus on diversity and conflict resolution are in growing demand (Parents National Network, 2003). In the United States, public schools are offering conflict resolution programs that vary in extent and scope depending on availability of resources. Some schools implement district wide conflict resolution curricula often made possible by support from outside of the school system. Other schools that are limited in resources are successful in implementing a mediation component on a smaller scale to address the problem of violence. The following districts are some examples of how conflict resolution programs have been implemented across the United States (Inger, 2000). Table 1: Examples of conflict resolution programs Location Focus San Francisco, CA New York, NY Chicago, IL New Mexico Ann Arbor, MI
Seventy-five percent (75%) of schools have student conflict managers. More than 100 schools with about 80,000 students offer conflict resolution programs. All students take a dispute resolution course in ninth or tenth grade. A statewide mediation program involves 30,000 students.
All of the city’s students participate in the conflict management curriculum.
Source: Inger, 2000
Diversity and Conflict Resolution Leadership 2 Douglas et al. Program Evaluation June 2003
New York City offers the Resolving Conflict Creatively Program (RCCP) in which students learn better ways to deal with conflict and cultural differences. The RCCP is interactive and teaches students skills in communication, anger management, negotiation, mediation, cooperation, intercultural understanding, and standing up to bias.
Researchers at Columbia University studied the program and found that children receiving substantial RCCP instruction developed more positively than their peers (Resolving Conflict Creatively Program, 2003). Furthermore, they had a less hostile perspective of their social world, saw violence as an unacceptable option, and chose nonviolent ways to resolve conflict. The program has been so successful that it is being implemented in other school systems across the nation.
Not only have conflict resolution programs been implemented at the middle and secondary school levels, but many institutions of higher education have also made it a priority. Several colleges and universities in the United States offer degrees and/or concentrations in Conflict Resolution, including Nova Southeastern University in Fort Lauderdale, Florida, which houses the Department of Conflict Analysis and Resolution (DCAR). The DCAR emphasizes academic excellence, cultural diversity, social responsibility, and reflective practice in the fields of peacemaking and conflict resolution. The focus of DCAR is on the study, practice, and research of conflict resolution to improve social relations among individuals, groups, organizations, and nations (Nova Southeastern University, 2003). Southside Virginia: Profile of an Area in Need The City of Martinsville, Henry County and Patrick County are located in Southside, Virginia, a rural area facing severe unemployment and the lack of new industry growth. In recent years the area has suffered economically by the closings of several factories and plants. Thousands of jobs were lost when Tultex, Pluma, and VF Imagewear shut their doors (Chittum & Allen, 2002). As a result, residents in the area have experienced extremely high rates of unemployment. As of October 2002, the City of Martinsville and the Counties of Patrick and Henry ranked second, third and fourth in unemployment among the state’s 134 localities (Houff, 2002). Martinsville’s unemployment rate was 16.2 percent, followed by Patrick County with 14.8 percent, and Henry County with 14.5 percent (Houff, 2002). The total population of these three areas is 92,753. This includes a population of 15,416 in the City of Martinsville, 57,930 in Henry County and 19,407 in Patrick County (U. S. Census Bureau, 2002). Education attainment above the high school level is low among residents in these areas. Of the adult population over 25, only 9.4, 8.6, and 16.6 percent hold a bachelor’s degree or higher in the counties of Henry and Patrick, and the City of Martinsville, respectively (U.S. Census Bureau, 2002).

Diversity and Conflict Resolution Leadership 3 Douglas et al. Program Evaluation June 2003
In 2002 the racial composition of the City of Martinsville was 55.4 percent white and 42.5 percent black (U.S. Census Bureau, 2002). Hispanics account for 2.3 percent of the city’s total population, although this population is steadily increasing. In Henry County, 75 percent of the population is white, 22 percent are black, and 3.5 percent are Hispanic. In Patrick County, 92 percent are white, while 6 percent are black, and 2 percent are Hispanic. American Indians and Asian Americans account for less than 1 percent of the population in each of the areas. The Diversity and Conflict Resolution Leadership Program: An Overview The Diversity and Conflict Resolution Leadership Program was developed to promote understanding among people of diverse backgrounds. Founded in 1998, the program targets high school freshmen, sophomores, and juniors. The program also exposes the students to college and presents information regarding potential career paths. Students are expected to gain greater self-awareness, achieve an appreciation of social and cultural differences, develop conflict resolution skills, and gain exposure to college life. Kimble Reynolds, Jr., the program’s founder and director, is an attorney in Martinsville, Virginia. He and program assistant, Deborah Robison, constitute the volunteer staff. The Public Welfare Foundation provided funding for the program for two years (1999 and 2000). The program has since received funding from the Reynolds Homestead, a Continuing Education Center of Virginia Tech.
Participants are initially recruited during August and September through the six local high schools (Bassett, Fieldale-Collinsville, Laurel Park, Magna Vista, Martinsville, and Patrick County). Guidance counselors are given program information and applications to distribute to students. The application process requires students to read the program overview to determine their level of interest. Students are required to obtain parental consent before returning the completed applications. Applicants and their parents are invited to attend one of two information sessions. Meeting face-to-face with the parents is designed to ensure family commitment to their child's involvement, and the likelihood that program benefits will be long lasting through reinforcement at home. One information session is held in Henry County and the other in Patrick County. The information sessions are held on different nights and the applicant can choose which information session to attend. At each information session students and parents are given an overview of the program's objectives and what is expected of students and parents. Students and parents are also provided an opportunity to ask questions. After the question and answer period, student applicants are assembled outside of the presence of the parents. The program staff permits the applicants to introduce themselves and at a minimum explain what they expect to gain from the program and what they can contribute to the
Diversity and Conflict Resolution Leadership 4 Douglas et al. Program Evaluation June 2003
program. After both information sessions are concluded, the program staff reviews each application. The review focuses on the applicants’ background, interests, and personal statement about what they expect to gain from the Diversity and Conflict Resolution Leadership Program. After careful review of the applications, twenty students are selected for the program. This selection is based on their interest in learning about conflict resolution techniques, leadership skills, and diversity in society, as well as parental commitment to support the student’s participation in the program. Once selected, students meet twice a month. In order to ensure participant success in the program, students are required to attend at least 80 percent of the scheduled meetings. Students who do not meet this requirement are removed from the program and replaced by an alternate. Meetings are held at either the Reynolds Homestead in Patrick County or Patrick Henry Community College in Henry County, and last for two hours. The Diversity and Conflict Resolution Leadership Program is intentionally designed to serve a maximum of 20 students. This program is best viewed as an intensive program that offers a wealth of resources to an at-risk youth population. There are six primary components to the program. These components include: 1) diversity education; 2) conflict resolution; 3) leadership; 4) career preparation; 5) community service; and 6) college exposure.
1. Diversity Education Diversity is "otherness," or those human qualities that are different from one’s own and outside the groups to which one belongs, yet are present in other individuals and groups (University of Maryland, 1995). Diversity education includes enhancing one’s understanding of other racial and ethnic groups and gender awareness, and their understanding and appreciation of the value of a diverse population and work force. Students in the Diversity and Conflict Resolution Leadership Program are expected to gain greater self-awareness, achieve an appreciation of social and cultural differences, develop conflict resolution skills, and participate in a year-end community service project. The Southside region will benefit as students gain awareness of community problems and commit to seeking long-term solutions. These objectives are accomplished through education and building interpersonal relationships with a diverse group of people while working together to provide service to the community.

Diversity and Conflict Resolution Leadership 5 Douglas et al. Program Evaluation June 2003
2. Conflict Resolution Conflict resolution educates individuals about the issues and relationships surrounding conflict. Parties are empowered through ownership of the process. Conflict resolution reduces the ongoing costs and consequences of unresolved conflict (Guildford College, 2003). Students in peace and conflict studies engage in critical analysis in several key components of the field: theories of war and peace, central concepts in peace research, the interrelation between the personal, local, and global levels of conflict and possibilities of reducing conflict, and methods and practices of conflict resolution, reduction, and transformation (Conflict Resolution Information Source, 2003).
Students involved in the Diversity and Conflict Resolution Leadership Program acquire skills to solve problems of violence and conflict, listen carefully and caringly to others in the midst of conflict, and contribute to organizing groups and actions concerned with social change, conflict resolution and transformation. Specific activities include attending a meeting at the Conflict Resolution Center on the campus of Guilford College in Greensboro, North Carolina, where students have the opportunity to learn conflict resolution skills and techniques.
3. Leadership
Leadership development is particularly useful for high school students who often experience low self-confidence and difficulty expressing their own voice. Students who participate in leadership development learn the process of good decision-making which helps them recognize negative influences in their environment that have the ability to undermine their full potential. Leadership development teaches the interpersonal skills of good leadership: patience, tolerance, respect for others, self-respect, and ability to share their ideas. Student leaders tend to have higher internal locus of control and achievement motivation than non-leaders (McCullough & Ashbirdge, 1994). Helping students develop as leaders will enable them to become better problem solvers and more fluent and assertive when communicating their ideas (Myers & Slavin, 1990). Leadership development helps students identify what type of leader they can become by exposing them to different leadership styles and helping them realize their personal strengths and abilities. The leadership component of the Diversity and Conflict Resolution Leadership Program combines communication, empowerment, and decision-making. Students examine leadership styles of others while developing their own techniques, such as motivation, cooperation, and language. They come together to experience and participate in a set of leadership-focused educational programs and activities, designed to build and enhance students' leadership skills. Activities include a Ropes course, designed to challenge participants. The Ropes course involves a series of physical activities that encourage teambuilding, builds decision making skills, and increases respect for differences that exist within the
Diversity and Conflict Resolution Leadership 6 Douglas et al. Program Evaluation June 2003
group. Students benefit by building self-confidence and esteem. The Ropes course helps students build bonds, friendships, and leadership skills. Students also participate in a leadership retreat conducted by student leaders in Virginia Tech’s Residential Leadership community, where they are involved in a variety of sessions and activities pertaining to time management, goal setting, and stereotypes. Upon completion of the program, students are eligible to serve as mentors for future programs.
4. Career Preparation
An important and vital part of the high school years is career preparation. Career preparation is training for students for entry into work, continued studies, or post-secondary education in a specific career sector (Career Education Oak Bay, 2003). Students may be unaware of the options available to them and benefit from exposure to career planning and steps to identify and achieve their future goals. It is important that students understand that the decisions they make now will greatly influence their future. The consequences of not planning can be severe, such as limited choices for further education, training, or high-skill, high-wage career opportunities (South Carolina Department of Education, 2003). One focus of the Diversity and Conflict Resolution Leadership Program is to assist students in preparing for careers after high school. Those students that choose to go to college are given information and opportunities (i.e. college visits) to prepare them for college and increase their chances of success. Other students may choose to go into the military or directly into the workforce after completing high school. They are also afforded opportunities to interact with guest speakers, which expands their knowledge and networking resources for the future.
5. Community Service
Community service is a way for many people, particularly the young, to gain a sense of community. Many high school service organizations and church youth groups provide students with the opportunity to involve themselves in a variety of enriching, useful and practical experiences that serve the school and community. Through community service, students can learn new skills, assume responsibilities, become aware of the needs of others, and learn the importance of unselfish serving and giving. Community service links students to the wider community and exposes them to people and situations outside of their previous experiences (Dewitt & Joyce, 2001). These experiences help students realize the impact of their actions on their community, helping them understand the important role they play as citizens in improving their environment. Students, who are active in their community through volunteering and participating in school service projects, develop a better sense of themselves. The time students
Diversity and Conflict Resolution Leadership 7 Douglas et al. Program Evaluation June 2003
spend volunteering can build their college resume and make them more competitive for scholarships (Hefferman, 2001).
The community service component of the program involves a group project, designed by students and approved by the program director. This year’s group decided to develop a community panel to discuss controversial real-life issues facing youth today. The topics for the panel included: living in a bi-racial family, living in a single-parent family, and living in a lesbian or gay family.
6. College Exposure The importance of college exposure cannot be overstated. For many young people, particularly in economically disadvantaged areas, visiting college campuses can provide a spark and peak interest in something that may have seemed out of reach (U.S. Department of Education, 2002; Tierney & Jun, 2001). Not only can visits to campuses prove helpful, but interacting with current college students can encourage and enlighten high school students as well. The more high school students are exposed to the college life and its benefits, the more likely they will want to attend (Burd, 2002).
The college exposure component provides an opportunity for students to interact with college mentors. Many high school students in the City of Martinsville, Henry County, and Patrick County are first-generation college students who may not otherwise receive exposure to Virginia Tech. Even though Virginia Tech is the closest four-year, state university to this area, it is still two hours away. The program gives them an opportunity to experience college life during trips to the Virginia Tech campus, and through personal visits. Students meet with Virginia Tech leaders and obtain an initial orientation of the campus. They learn about campus life through panel sessions with diverse undergraduate students. Career Services provides high school students with information about course selection and academic preparation, followed by a tour of campus. Virginia Tech student leaders also learn more about the program participants so they can assess and prepare for students’ needs in the spring, when they host a weekend retreat.
Benefit of the Program to Virginia Tech In addition to providing college exposure to high school students in Southside, Virginia, the Diversity and Conflict Resolution Leadership Program directly relates to Virginia Tech’s University Diversity Plan. The university has sought to recruit more students from underrepresented backgrounds. The Southside area has been targeted primarily because of its recent economic conditions, which included severe unemployment and the lack of new industry growth.

Diversity and Conflict Resolution Leadership 8 Douglas et al. Program Evaluation June 2003
This Diversity and Conflict Resolution Leadership Program directly relates to the following goals in the University’s Diversity Plan, “The Faces of Change” (Virginia Tech Office of Multicultural Affairs, 2000).
1A: Develop a student recruitment plan that will increase the diversity of the undergraduate student population. 1B: Review and improve university-wide strategy for retaining underrepresented undergraduate students. 2B: Develop multi-year plans for long-term, sustainable collaborative projects that promote positive and supportive relationships between students and individuals from majority, underrepresented, and international groups. 5B: Strengthen ties with local communities by involving individuals and organizations from those communities in university-sponsored or supported programs and by supporting community efforts to create and sustain a welcoming environment for all.
Diversity and Conflict Resolution Leadership 9 Douglas et al. Program Evaluation June 2003
DATA COLLECTION METHODS
The findings presented in this report are primarily based on data collected during program year 2002-2003. Evaluators conducted a pre-test and post-test questionnaire designed to collect data on the six programmatic aspects. Also, we reviewed program materials, conducted two, one-hour focus groups, observed several of the student activity sessions, and interviewed the program director. The overall goal of this evaluation is to identify areas of program strength, as well as offer suggestions for program improvement. Questionnaires The questionnaires were designed to capture demographic information about who was involved in the program, their views of their involvement, and changes in students’ perceptions between the first questionnaire administration during fall 2002 and the second questionnaire administration during spring 2003. To assess change, both survey instruments included 38 questions that investigated the six areas of program content: 1) diversity; 2) conflict resolution; 3) leadership; 4) career preparation; 5) community services; and 6) college exposure. The questionnaire use Likert-scaled items to address issues from these six areas and to collect demographic data. Students were asked to respond with answers of true or false, or strongly agree/agree (SA/A), neutral (N), or Strongly Disagree/Disagree (SD/D). Twenty students completed the first survey for a response rate of 100 percent. Fourteen students completed the second survey for a response rate of 70 percent. Focus Groups Focus groups were conducted in fall 2002 and spring 2003 to provide a qualitative perspective of participants’ thoughts. The first focus group was designed to learn more about the specific knowledge and experiences of participants prior to their program involvement and the program’s influence on this knowledge and experience. Preliminary attitudes of the participants with regard to the six areas were examined. During the second focus group, we asked questions along the six dimensions. These questions were designed to assess areas of change between students’ baseline knowledge and their knowledge near program completion. The second focus group also contained general questions regarding students’ overall perception of programmatic strengths and weaknesses.
Participant Observations Throughout the 2002-2003 program year, researchers followed the progression of students’ activities. Areas that emphasized discussion, including the seminars, retreats,

Diversity and Conflict Resolution Leadership 10 Douglas et al. Program Evaluation June 2003
and collaborative projects, received particularly close attention. This provided valuable information regarding the program’s operation and provided opportunities to observe the learning process. Limitations of Research The director of the Diversity and Conflict Resolution Leadership Program established several performance goals for the program at its inception. For example, of the 20 students enrolled in the program, it is expected that 80 percent will attend at least 80 percent of the meetings and events. For those who complete the program, 70 percent of the participants will apply to Virginia Tech for undergraduate admission. For those offered admission, 55 percent are expected to attend. Although a main focus is to encourage students to attend Virginia Tech, of those students who complete the program, a goal of 60 percent has been set for college attendance at any institution. Although these outcomes would have been useful to include in our analysis, we could not do so because the program does not have this data available. Data collection in the program is not current. The program director attributes this to limited volunteer staff and financial resources. It is important to note that this program serves a small group of students. Therefore, our survey data is based on a small sample and cannot be generalized to other programs. Due to the small sample size we only report simple frequencies in our statistical section. In the focus group, some participants were very verbal, while others participated to a far lesser extent. Despite researcher efforts to promote all voices, this challenge was not completely overcome. Additionally, students may have been influenced by each other’s comments during the focus group process. The presence of the researcher in the program’s activities for participant observations posed an additional limitation. The presence of the researcher may have had an impact on the students’ willingness to engage in activities, although this was less of a limitation as the program progressed, and students became more comfortable. Like other such efforts, it is difficult to pinpoint the effects of student participation in the Diversity and Conflict Resolution Leadership Program to attitudes and behaviors along the six dimensions under study. Nevertheless, our research offers a pre-test and post-test survey evaluation of the six dimensions, and identifies several important themes that emerged from the student focus groups.
Diversity and Conflict Resolution Leadership 11 Douglas et al. Program Evaluation June 2003
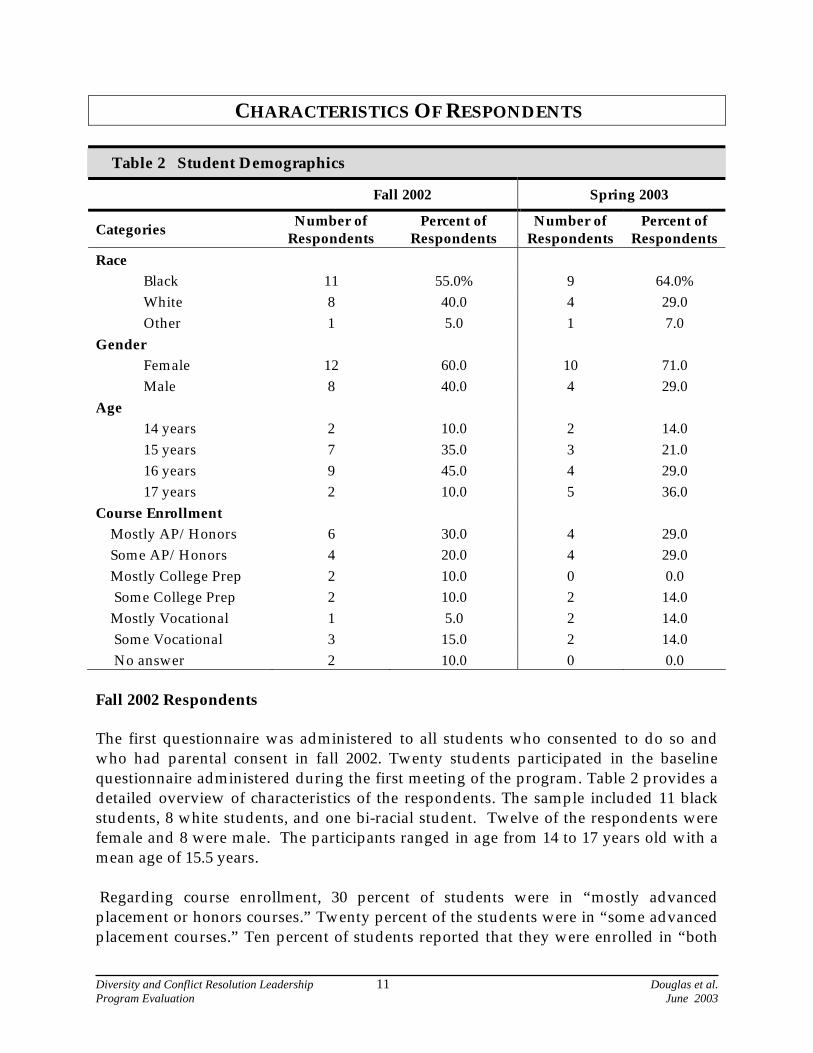
CHARACTERISTICS OF RESPONDENTS
Table 2 Student Demographics
Fall 2002 Spring 2003
Categories Number of Respondents
Percent of Respondents
Number of Respondents
Percent of Respondents
Race Black 11 55.0% 9 64.0% White 8 40.0 4 29.0 Other 1 5.0 1 7.0
Gender Female 12 60.0 10 71.0 Male 8 40.0 4 29.0
Age 14 years 2 10.0 2 14.0 15 years 7 35.0 3 21.0 16 years 9 45.0 4 29.0 17 years 2 10.0 5 36.0
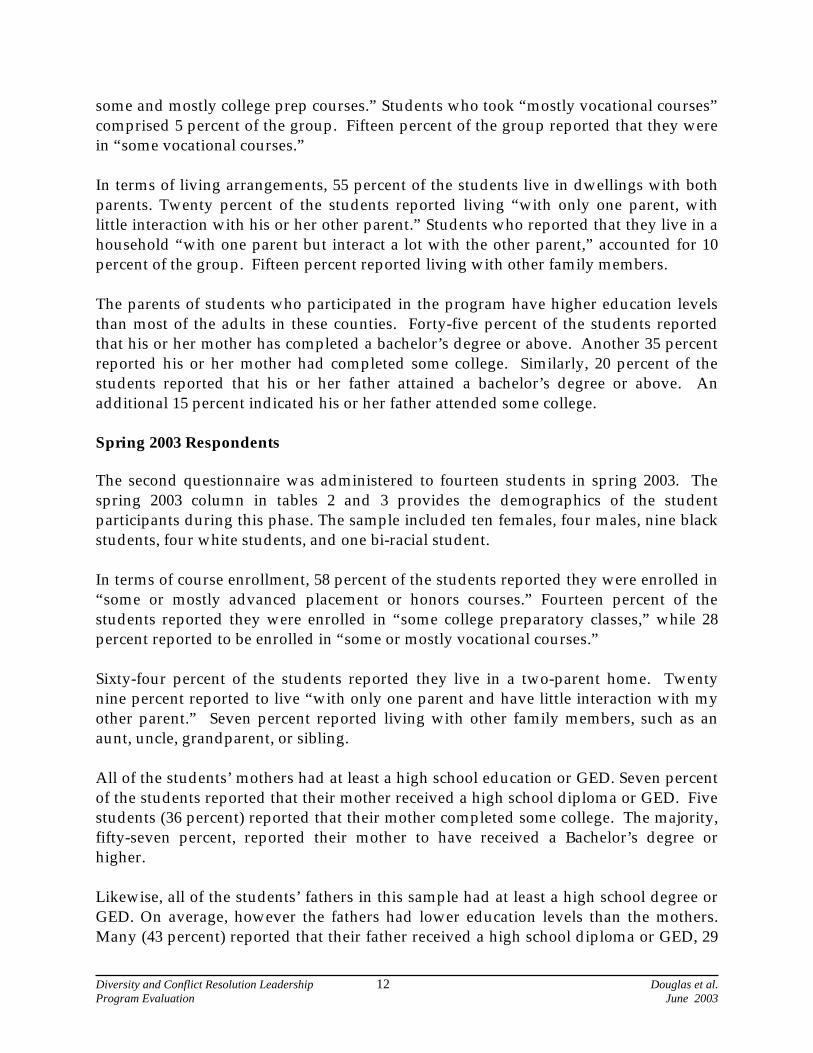
Course Enrollment Mostly AP/Honors 6 30.0 4 29.0 Some AP/Honors 4 20.0 4 29.0 Mostly College Prep 2 10.0 0 0.0 Some College Prep 2 10.0 2 14.0 Mostly Vocational 1 5.0 2 14.0 Some Vocational 3 15.0 2 14.0 No answer 2 10.0 0 0.0 Fall 2002 Respondents The first questionnaire was administered to all students who consented to do so and who had parental consent in fall 2002. Twenty students participated in the baseline questionnaire administered during the first meeting of the program. Table 2 provides a detailed overview of characteristics of the respondents. The sample included 11 black students, 8 white students, and one bi-racial student. Twelve of the respondents were female and 8 were male. The participants ranged in age from 14 to 17 years old with a mean age of 15.5 years. Regarding course enrollment, 30 percent of students were in “mostly advanced placement or honors courses.” Twenty percent of the students were in “some advanced placement courses.” Ten percent of students reported that they were enrolled in “both
Diversity and Conflict Resolution Leadership 12 Douglas et al. Program Evaluation June 2003
some and mostly college prep courses.” Students who took “mostly vocational courses” comprised 5 percent of the group. Fifteen percent of the group reported that they were in “some vocational courses.” In terms of living arrangements, 55 percent of the students live in dwellings with both parents. Twenty percent of the students reported living “with only one parent, with little interaction with his or her other parent.” Students who reported that they live in a household “with one parent but interact a lot with the other parent,” accounted for 10 percent of the group. Fifteen percent reported living with other family members. The parents of students who participated in the program have higher education levels than most of the adults in these counties. Forty-five percent of the students reported that his or her mother has completed a bachelor’s degree or above. Another 35 percent reported his or her mother had completed some college. Similarly, 20 percent of the students reported that his or her father attained a bachelor’s degree or above. An additional 15 percent indicated his or her father attended some college. Spring 2003 Respondents The second questionnaire was administered to fourteen students in spring 2003. The spring 2003 column in tables 2 and 3 provides the demographics of the student participants during this phase. The sample included ten females, four males, nine black students, four white students, and one bi-racial student. In terms of course enrollment, 58 percent of the students reported they were enrolled in “some or mostly advanced placement or honors courses.” Fourteen percent of the students reported they were enrolled in “some college preparatory classes,” while 28 percent reported to be enrolled in “some or mostly vocational courses.” Sixty-four percent of the students reported they live in a two-parent home. Twenty nine percent reported to live “with only one parent and have little interaction with my other parent.” Seven percent reported living with other family members, such as an aunt, uncle, grandparent, or sibling. All of the students’ mothers had at least a high school education or GED. Seven percent of the students reported that their mother received a high school diploma or GED. Five students (36 percent) reported that their mother completed some college. The majority, fifty-seven percent, reported their mother to have received a Bachelor’s degree or higher. Likewise, all of the students’ fathers in this sample had at least a high school degree or GED. On average, however the fathers had lower education levels than the mothers. Many (43 percent) reported that their father received a high school diploma or GED, 29
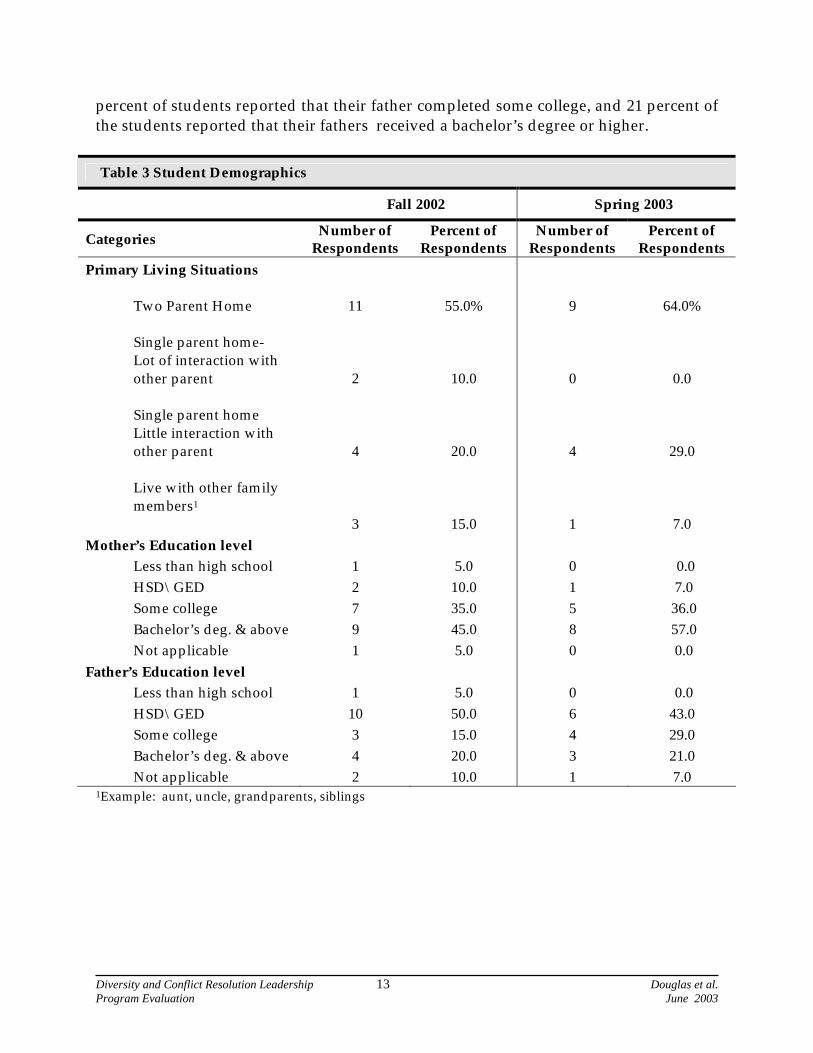
Diversity and Conflict Resolution Leadership 13 Douglas et al. Program Evaluation June 2003
percent of students reported that their father completed some college, and 21 percent of the students reported that their fathers received a bachelor’s degree or higher.
Table 3 Student Demographics
Fall 2002 Spring 2003
Categories Number of Respondents
Percent of Respondents
Number of Respondents
Percent of Respondents
Primary Living Situations
Two Parent Home
11 55.0% 9 64.0% Single parent home- Lot of interaction with other parent 2 10.0 0 0.0 Single parent home Little interaction with other parent 4 20.0 4 29.0 Live with other family members1 3 15.0 1 7.0
Mother’s Education level Less than high school 1 5.0 0 0.0 HSD\GED 2 10.0 1 7.0 Some college 7 35.0 5 36.0 Bachelor’s deg. & above 9 45.0 8 57.0 Not applicable 1 5.0 0 0.0
Father’s Education level Less than high school 1 5.0 0 0.0 HSD\GED 10 50.0 6 43.0 Some college 3 15.0 4 29.0 Bachelor’s deg. & above 4 20.0 3 21.0 Not applicable 2 10.0 1 7.0
1Example: aunt, uncle, grandparents, siblings
Diversity and Conflict Resolution Leadership 14 Douglas et al. Program Evaluation June 2003
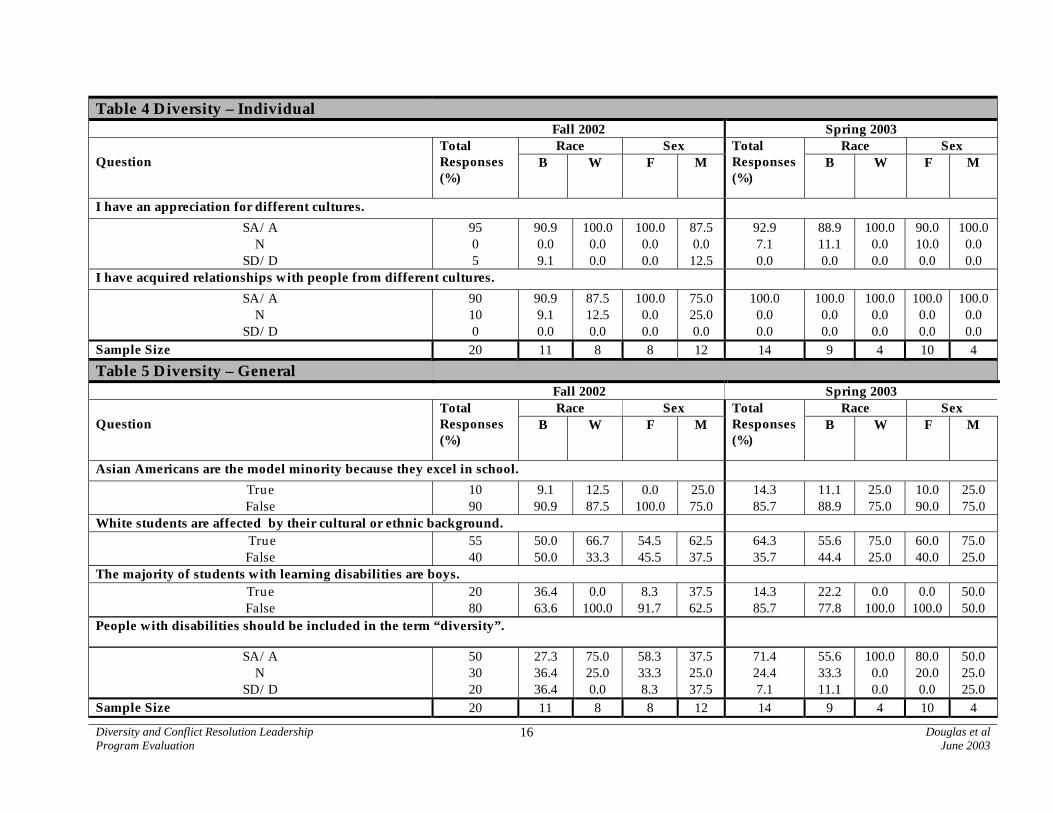
REPORT OF FINDINGS Diversity Student perceptions of culture and diversity are indicators that measure their personal development in the Diversity and Conflict Resolution Leadership Program. Tables 4 and 5 report student perspectives on diversity issues for both fall and spring surveys, including their cultural appreciation and understanding of diversity. Cultural appreciation Students responded favorably to questions regarding diversity and their own development, and reported previous exposure to diverse people saying they, “had an appreciation for them as individuals.” Females showed a stronger indication of cultural appreciation than males in the fall survey. One hundred percent of females and 75 percent of males reported having relationships with people from different cultures. By the spring both males and females reported similar levels of cultural appreciation (100 percent). Understanding of diversity The Diversity and Conflict Resolution Leadership Program assisted most students to become more accepting of others and less stereotypical. Across all students, there was more agreement that people with disabilities should be included in the term “diversity” in the spring. In the fall, 50 percent of students agreed with the statement compared to 71.4 percent in the spring. In the spring, more females (21.7 percent change) believed that persons with disabilities should be included in the term diversity. When students were asked to define diversity in the fall, they expressed that it meant paying attention to differences. Students unanimously expressed the importance of diversity and that it was not covered in their school. As one student stated, “Our school does not have diversity among its teachers. Teachers are not willing to talk about it. Most of our teachers are not diverse. They are too busy with class, [and] it is not incorporated with class material.” Students also reported that any knowledge about diversity came from their parents, community, and environment. When asked if their concept of diversity changed since the beginning of the program, students unanimously agreed, yes. “When we first started I thought it was different races, but it really is about the way people think. [My] definition of diversity has expanded.” The program also helped some students recognize their own biases. “[When I first came into this program], I did not think I had stereotypes, but I realize that I did have certain prejudices.” Another student remarked that “just because [someone is] Asian does not [necessarily] mean that they are smart.” One student, who expressed interest in individuals with disabilities remarked, “I used to think of people

Diversity and Conflict Resolution Leadership 15 Douglas et al. Program Evaluation June 2003
with disabilities as handicapped---now I think of them as diverse.” Students named multiple aspects of diversity such as individuals with disabilities, gays and lesbians, religious diversity. They began to realize that diversity included more than they had previously considered.
Diversity and Conflict Resolution Leadership Program Evaluation
Douglas et al June 2003
16
Table 4 Diversity – Individual Fall 2002 Spring 2003
Race Sex Race Sex Question
Total Responses (%)
B W F M Total Responses (%)
B W F M
I have an appreciation for different cultures. SA/A
N SD/D
95 0 5
90.9 0.0 9.1
100.0 0.0 0.0
100.0 0.0 0.0
87.5 0.0
12.5
92.9 7.1 0.0
88.9 11.1 0.0
100.0 0.0 0.0
90.0 10.0 0.0
100.0 0.0 0.0
I have acquired relationships with people from different cultures. SA/A
N SD/D
90 10 0
90.9 9.1 0.0
87.5 12.5 0.0
100.0 0.0 0.0
75.0 25.0 0.0
100.0 0.0 0.0
100.0 0.0 0.0
100.0 0.0 0.0
100.0 0.0 0.0
100.0 0.0 0.0
Sample Size 20 11 8 8 12 14 9 4 10 4 Table 5 Diversity – General Fall 2002 Spring 2003
Race Sex Race Sex Question
Total Responses (%)
B W F M Total Responses (%)
B W F M
Asian Americans are the model minority because they excel in school. True False
10 90
9.1 90.9
12.5 87.5
0.0 100.0
25.0 75.0
14.3 85.7
11.1 88.9
25.0 75.0
10.0 90.0
25.0 75.0
White students are affected by their cultural or ethnic background. True False
55 40
50.0 50.0
66.7 33.3
54.5 45.5
62.5 37.5
64.3 35.7
55.6 44.4
75.0 25.0
60.0 40.0
75.0 25.0
The majority of students with learning disabilities are boys. True False
20 80
36.4 63.6
0.0 100.0
8.3 91.7
37.5 62.5
14.3 85.7
22.2 77.8
0.0 100.0
0.0 100.0
50.0 50.0
People with disabilities should be included in the term “diversity”.
SA/A N
SD/D
50 30 20
27.3 36.4 36.4
75.0 25.0 0.0
58.3 33.3 8.3
37.5 25.0 37.5
71.4 24.4 7.1
55.6 33.3 11.1
100.0 0.0 0.0
80.0 20.0 0.0
50.0 25.0 25.0
Sample Size 20 11 8 8 12 14 9 4 10 4
Diversity and Conflict Resolution Leadership 17 Douglas et al. Program Evaluation Jiune 2003
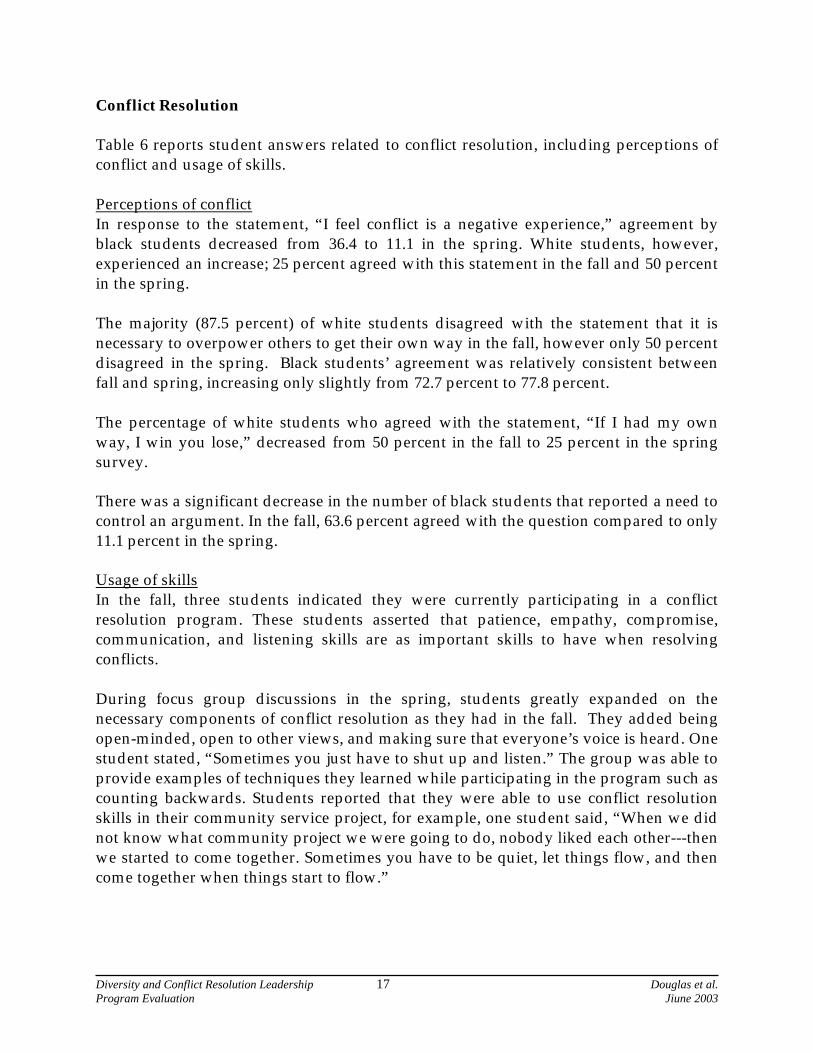
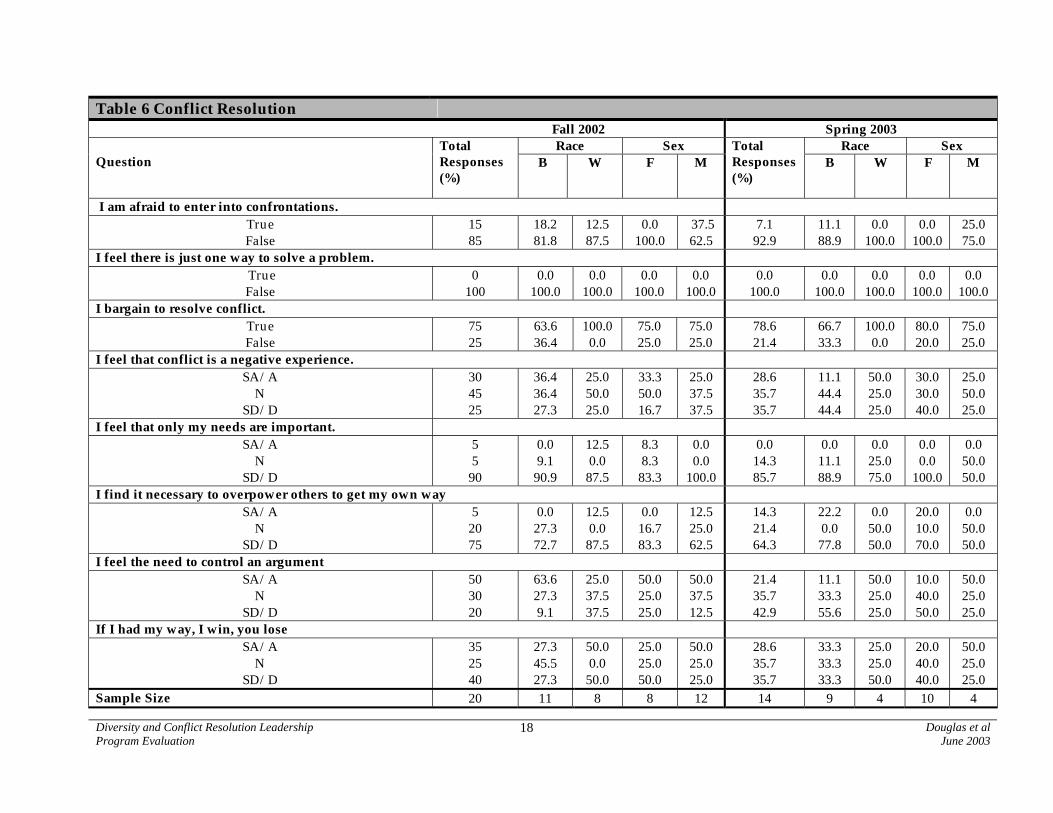
Conflict Resolution Table 6 reports student answers related to conflict resolution, including perceptions of conflict and usage of skills. Perceptions of conflict In response to the statement, “I feel conflict is a negative experience,” agreement by black students decreased from 36.4 to 11.1 in the spring. White students, however, experienced an increase; 25 percent agreed with this statement in the fall and 50 percent in the spring. The majority (87.5 percent) of white students disagreed with the statement that it is necessary to overpower others to get their own way in the fall, however only 50 percent disagreed in the spring. Black students’ agreement was relatively consistent between fall and spring, increasing only slightly from 72.7 percent to 77.8 percent. The percentage of white students who agreed with the statement, “If I had my own way, I win you lose,” decreased from 50 percent in the fall to 25 percent in the spring survey. There was a significant decrease in the number of black students that reported a need to control an argument. In the fall, 63.6 percent agreed with the question compared to only 11.1 percent in the spring. Usage of skills In the fall, three students indicated they were currently participating in a conflict resolution program. These students asserted that patience, empathy, compromise, communication, and listening skills are as important skills to have when resolving conflicts. During focus group discussions in the spring, students greatly expanded on the necessary components of conflict resolution as they had in the fall. They added being open-minded, open to other views, and making sure that everyone’s voice is heard. One student stated, “Sometimes you just have to shut up and listen.” The group was able to provide examples of techniques they learned while participating in the program such as counting backwards. Students reported that they were able to use conflict resolution skills in their community service project, for example, one student said, “When we did not know what community project we were going to do, nobody liked each other---then we started to come together. Sometimes you have to be quiet, let things flow, and then come together when things start to flow.”
Diversity and Conflict Resolution Leadership Program Evaluation
Douglas et al June 2003
18
Table 6 Conflict Resolution Fall 2002 Spring 2003
Race Sex Race Sex Question
Total Responses (%)
B W F M Total Responses (%)
B W F M
I am afraid to enter into confrontations. True False
15 85
18.2 81.8
12.5 87.5
0.0 100.0
37.5 62.5
7.1 92.9
11.1 88.9
0.0 100.0
0.0 100.0
25.0 75.0
I feel there is just one way to solve a problem. True False
0 100
0.0 100.0
0.0 100.0
0.0 100.0
0.0 100.0
0.0 100.0
0.0 100.0
0.0 100.0
0.0 100.0
0.0 100.0
I bargain to resolve conflict. True False
75 25
63.6 36.4
100.0 0.0
75.0 25.0
75.0 25.0
78.6 21.4
66.7 33.3
100.0 0.0
80.0 20.0
75.0 25.0
I feel that conflict is a negative experience. SA/A
N SD/D
30 45 25
36.4 36.4 27.3
25.0 50.0 25.0
33.3 50.0 16.7
25.0 37.5 37.5
28.6 35.7 35.7
11.1 44.4 44.4
50.0 25.0 25.0
30.0 30.0 40.0
25.0 50.0 25.0
I feel that only my needs are important. SA/A
N SD/D
5 5
90
0.0 9.1
90.9
12.5 0.0
87.5
8.3 8.3
83.3
0.0 0.0
100.0
0.0 14.3 85.7
0.0 11.1 88.9
0.0 25.0 75.0
0.0 0.0
100.0
0.0 50.0 50.0
I find it necessary to overpower others to get my own way SA/A
N SD/D
5 20 75
0.0 27.3 72.7
12.5 0.0
87.5
0.0 16.7 83.3
12.5 25.0 62.5
14.3 21.4 64.3
22.2 0.0
77.8
0.0 50.0 50.0
20.0 10.0 70.0
0.0 50.0 50.0
I feel the need to control an argument SA/A
N SD/D
50 30 20
63.6 27.3 9.1
25.0 37.5 37.5
50.0 25.0 25.0
50.0 37.5 12.5
21.4 35.7 42.9
11.1 33.3 55.6
50.0 25.0 25.0
10.0 40.0 50.0
50.0 25.0 25.0
If I had my way, I win, you lose SA/A
N SD/D
35 25 40
27.3 45.5 27.3
50.0 0.0
50.0
25.0 25.0 50.0
50.0 25.0 25.0
28.6 35.7 35.7
33.3 33.3 33.3
25.0 25.0 50.0
20.0 40.0 40.0
50.0 25.0 25.0
Sample Size 20 11 8 8 12 14 9 4 10 4
Diversity and Conflict Resolution Leadership 19 Douglas et al. Program Evaluation June 2003
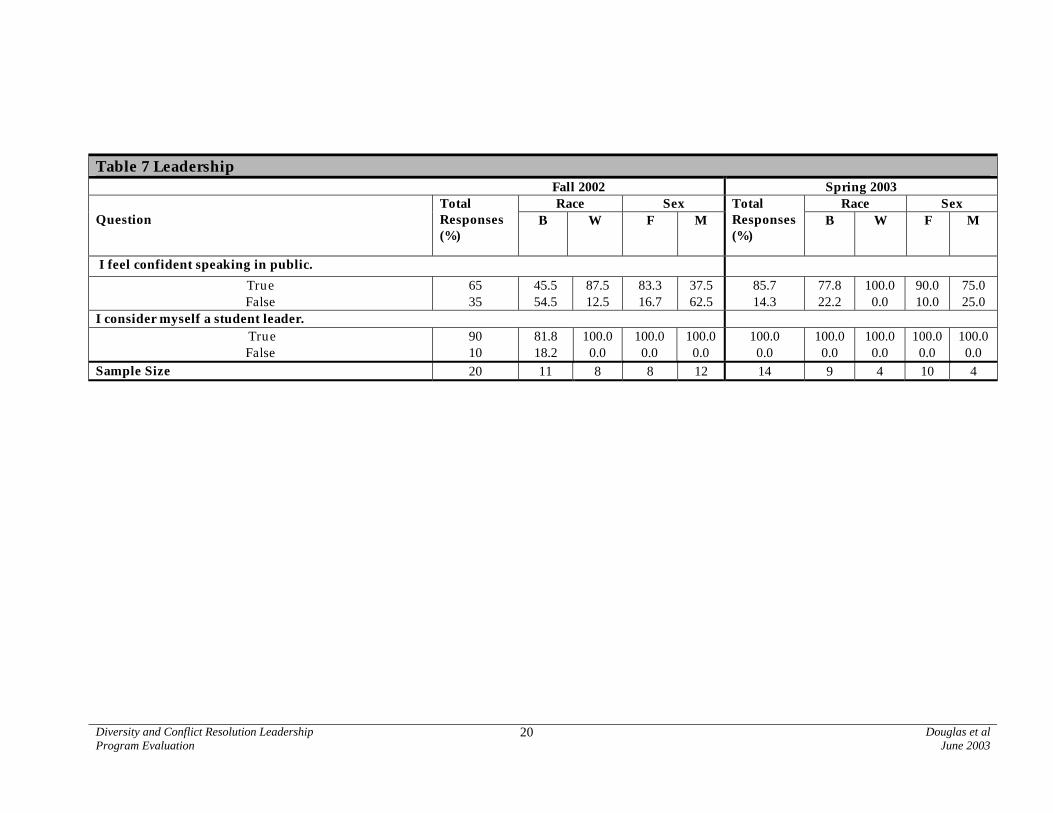
Leadership Table 7 provides the results of student responses about leadership, including public speaking and perceptions of leadership. Students reported that they were more comfortable with public speaking. They learned that in order to lead, individuals must also have good people behind them, understand techniques of compromise and be willing to work with others. Public speaking Sixty-five percent of students reported they were confident with public speaking in the fall, which increased to 85.7 percent in the spring. The largest increase was among male respondents, however more females than males felt confident speaking in public in the fall. The gender gap decreased in the spring by 15 percent. Although positive responses increased within each group from fall to spring, black students reported less confidence with public speaking than white students. In the fall 45.5 percent of black students reported confidence in public speaking compared to 87.5 percent of white students. In the spring 77.8 percent of black student reported confidence in public speaking compared to 100 percent of white students. Students’ perceptions of leadership Black students reported the most dramatic increase in their identity as leaders. This increased from 81.8 percent in the fall to 100 percent in the spring. White students experienced no change, as 100 percent identified themselves as student leaders in the fall and spring. When asked what characteristics a leader possesses, students replied that a leader is a role model with good communication skills and a positive influence in the community. “A person in a leadership role is often criticized,” said one student who further explained, “[leaders] will be second-guessed when you make a decision. Being second-guessed is a good thing. It will help you become stronger in your convictions.” To be a good leader the students insisted that he or she must also have good followers. Again, in the spring students emphasized that a good leader is someone who can follow. “A lot of us were leaders at the beginning, because we learned to shut up and listen. You have to listen when you do not want to.” One student referred to the program director, Kimble Reynolds, who stressed that a good leader can also follow.
Diversity and Conflict Resolution Leadership Program Evaluation
Douglas et al June 2003
20
Table 7 Leadership Fall 2002 Spring 2003
Race Sex Race Sex Question
Total Responses (%)
B W F M Total Responses (%)
B W F M
I feel confident speaking in public. True False
65 35
45.5 54.5
87.5 12.5
83.3 16.7
37.5 62.5
85.7 14.3
77.8 22.2
100.0 0.0
90.0 10.0
75.0 25.0
I consider myself a student leader. True False
90 10
81.8 18.2
100.0 0.0
100.0 0.0
100.0 0.0
100.0 0.0
100.0 0.0
100.0 0.0
100.0 0.0
100.0 0.0
Sample Size 20 11 8 8 12 14 9 4 10 4
Diversity and Conflict Resolution Leadership 21 Douglas et al. Program Evaluation June 2003
Career Table 8 presents student perceptions about their career choices. This area involved student knowledge about career choices available to them after high school, confidence, and understanding about career processes. Choices and confidence Student perceptions were mixed and included a wide variety of outlooks on the topic. Table 8 shows that students were generally uncertain of their career choices after high school in the fall, although 71.4 percent of students expressed more certainty in the spring, including 25 percent more white students and male students. When asked to report the processes associated with a job search, 80 percent of females expressed familiarity compared with only 25 percent of male students. In the spring, more male students (100 percent) than female students (40 percent) reported their guidance counselor was helpful in providing information about career choices. Differences are noted between black and white students’ confidence levels in applying and interviewing for a job, on the spring survey. Fewer black students (66.7 percent) than white students (100 percent) reported being confident. Understanding about career processes When students were probed further about their ideas regarding careers, they provided interesting insight. By the spring, students believed that a college degree is needed to obtain a career. “Without a degree, you can only have a low-paying job; it’s the difference between a 5 figure job and a 6 figure job.” Students commented that it is somewhat difficult to have a good job without going to college. In the spring, students expressed more critical thinking about the future. They expressed concern that they are not prepared for their future, and suggested that the school should offer career assistance courses. Students explained that enrollment in classes like college prep courses or dual enrollment in AP classes helps. Community Service Tables 9 and 10 report student responses to community service, including influence over community, community values, and barriers to performing community service. Community responsibility Most of the students disagreed that it was “the responsibility of government to provide community services” on both fall (75 percent) and spring (85.7 percent) questionnaires, including all of the white students.

Diversity and Conflict Resolution Leadership Program Evaluation
Douglas et al June 2003
22
Table 8 Career Fall 2002 Spring 2003
Race Sex Race Sex Question
Total Responses (%)
B W F M Total Responses (%)
B W F M
I am uncertain of my career choices after high school. True False
45 55
36.4 63.6
50.0 50.0
41.7 58.3
50.0 50.0
28.6 71.4
22.2 77.8
25.0 75.0
30.0 70.0
25.0 75.0
I can easily think of 10 career opportunities available to me upon completion of high school. True False
45 55
45.5 54.5
37.5 62.5
50.0 50.0
37.5 62.5
42.9 57.1
33.3 66.7
50.0 50.0
50.0 50.0
25.0 75.0
I am familiar with the process for searching for a job. SA/A
N SD/D
65 15 20
63.6 18.2 18.2
62.5 12.5 25.0
66.7 16.7 16.7
62.5 12.5 25.0
64.3 7.1
28.6
55.6 11.1 33.3
75.0 0.0
25.0
80.0 10.0 10.0
25.0 0.0
75.0 I feel confident in applying and interviewing for a job.
SA/A N
SD/D
85 15 0
81.8 18.2 0.0
87.5 12.5 0.0
91.7 8.3 0.0
75.0 25.0 0.0
78.6 14.3 7.1
66.7 22.2 11.1
100.0 0.0 0.0
80.0 10.0 10.0
75.0 25.0 0.0
My guidance counselor is helpful in providing me information on career choices. SA/A
N SD/D
65 25 10
63.6 27.3 9.1
75.0 12.5 12.5
66.7 25.0 8.3
62.5 25.0 12.5
57.1 35.7 7.1
44.4 44.4 11.1
100.0 0.0 0.0
40.0 50.0 10.0
100.0 0.0 0.0
Sample Size 20 11 8 8 12 14 9 4 10 4
Diversity and Conflict Resolution Leadership Program Evaluation
Douglas et al June 2003
23
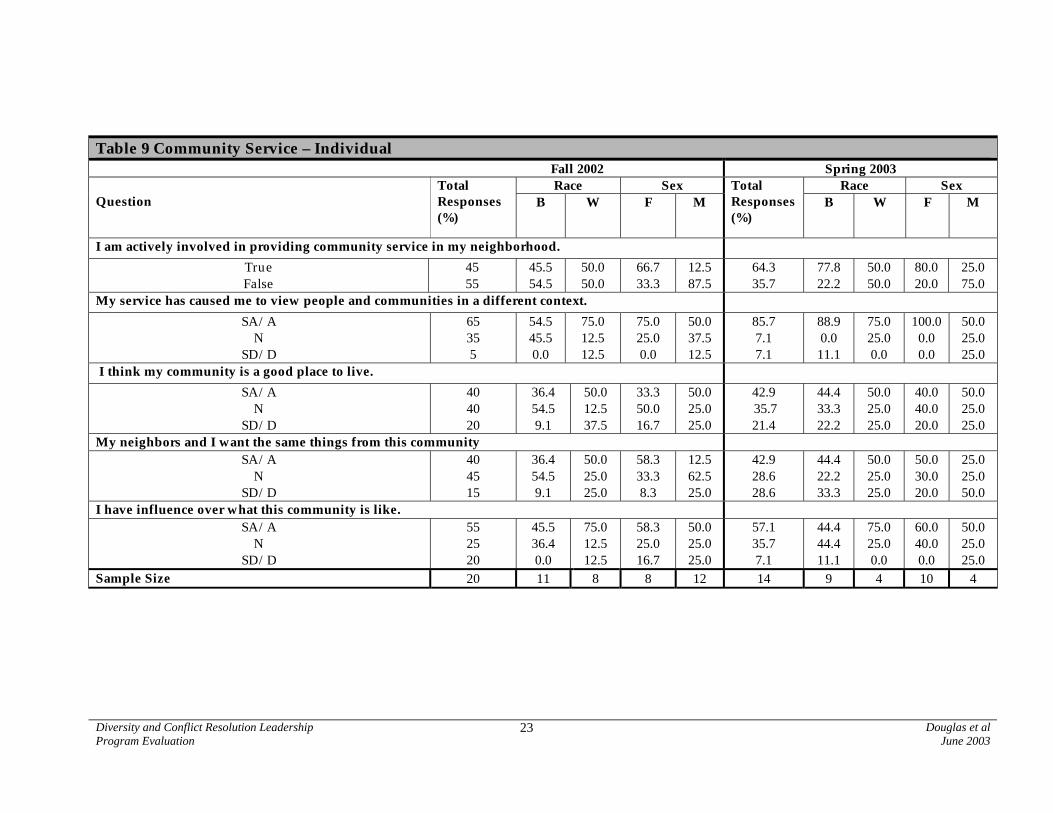
Table 9 Community Service – Individual Fall 2002 Spring 2003
Race Sex Race Sex Question
Total Responses (%)
B W F M Total Responses (%)
B W F M
I am actively involved in providing community service in my neighborhood. True False
45 55
45.5 54.5
50.0 50.0
66.7 33.3
12.5 87.5
64.3 35.7
77.8 22.2
50.0 50.0
80.0 20.0
25.0 75.0
My service has caused me to view people and communities in a different context. SA/A
N SD/D
65 35 5
54.5 45.5 0.0
75.0 12.5 12.5
75.0 25.0 0.0
50.0 37.5 12.5
85.7 7.1 7.1
88.9 0.0
11.1
75.0 25.0 0.0
100.0 0.0 0.0
50.0 25.0 25.0
I think my community is a good place to live. SA/A
N SD/D
40 40 20
36.4 54.5 9.1
50.0 12.5 37.5
33.3 50.0 16.7
50.0 25.0 25.0
42.9 35.7 21.4
44.4 33.3 22.2
50.0 25.0 25.0
40.0 40.0 20.0
50.0 25.0 25.0
My neighbors and I want the same things from this community SA/A
N SD/D
40 45 15
36.4 54.5 9.1
50.0 25.0 25.0
58.3 33.3 8.3
12.5 62.5 25.0
42.9 28.6 28.6
44.4 22.2 33.3
50.0 25.0 25.0
50.0 30.0 20.0
25.0 25.0 50.0
I have influence over what this community is like. SA/A
N SD/D
55 25 20
45.5 36.4 0.0
75.0 12.5 12.5
58.3 25.0 16.7
50.0 25.0 25.0
57.1 35.7 7.1
44.4 44.4 11.1
75.0 25.0 0.0
60.0 40.0 0.0
50.0 25.0 25.0
Sample Size 20 11 8 8 12 14 9 4 10 4

Diversity and Conflict Resolution Leadership Program Evaluation
Douglas et al June 2003
24
Table 10 Community Service – General Fall 2002 Spring 2003
Race Sex Race Sex Question
Total Responses (%)
B W F M Total Responses (%)
B W F M
Community service helps only poor people. True False
5 95
9.1 90.9
0.0 100.0
0.0 100.0
12.5 87.5
0.0 100.0
0.0 100.0
0.0 100.0
0.0 100.0
0.0 100.0
It is the responsibility of the government to provide community services. True False
25 75
45.5 54.5
0.0 100.0
8.3 91.7
50.0 50.0
14.3 85.7
22.2 77.8
0.0 100.0
10.0 90.0
25.0 75.0
People in my community share the same values. SA/A
N SD/D
25 45 30
18.2 54.5 27.3
37.5 25.0 37.5
33.3 41.7 25.0
12.5 50.0 37.5
7.1 42.9 50.0
11.1 22.2 66.7
0.0 75.0 25.0
10.0 50.0 40.0
0.0 25.0 75.0
If there is a problem in this community, people who live here can get it solved.
SA/A N
SD/D
65 30 5
63.6 27.3 9.1
75.0 25.0 0.0
58.3 41.7 0.0
75.0 12.5 12.5
71.4 28.6 0.0
66.7 33.3 0.0
75.0 25.0 0.0
70.0 30.0 0.0
75.0 25.0 0.0
Sample Size 20 11 8 8 12 14 9 4 10 4

Diversity and Conflict Resolution Leadership 25 Douglas et al. Program Evaluation June 2003
The difference between black and white students narrowed as the percentage of black students that disagreed increased in the spring (77.8 percent), compared to the fall (54.5 percent). Similarly, 25 percent more male students also disagreed with the statement in the spring than in the fall. Many students agreed that they have influence over what their community is like, however more white students (75 percent) agreed with this statement than black students in both fall (45.5 percent) and spring (44.4 percent). Community values When students were asked in the fall questionnaire whether people in their community share the same values, the results were evenly distributed among the possible answers. Among females, 33.3 percent also agreed that people in their community share the same values while another 25 percent disagreed. Among males 37.5 percent disagreed. In the spring, there was an increase in males who disagreed that their community shared the same values from 37.5 percent in the fall to 75 percent in the spring. The percent of females who agreed with this statement decreased from 33.3 percent in the fall to 10 percent in the spring. None of the white students agreed that people in their community shared the same values in the spring. The need for community service was highlighted in student responses during the fall and spring focus groups. Students said community service was good for the community, but commented that there are no opportunities for community service beyond school-related activities. Several students mentioned community projects that they are currently involved in or were involved with in the past. Students responded that they would like to get involved but that there are not many areas where they can help in a project from the beginning. They also remarked, “People [are] always talking about what needs to be done, but nobody is doing anything. Just talking!” Barriers to performing community service Demands on time were expressed as a major hindrance to performing community service during the spring discussion. “We have everything on our mind-we are not doing what we could---we will do it later on when we are not so tired.” Students indicated that their time was limited due to school work, after-school activities, and part-time jobs. One student said, “Community service is good in the abstract, but nobody really wants to do it.” When asked if they had any opportunities to perform community service since October, the students replied that they had not. Again, they emphasized that there are not many opportunities. Location was also identified as a barrier. There are a lot of people who are close-minded--resistant to change. One student objected to the other students’ rationale for lack of involvement, and explained, “We have an opportunity to do community service-you can do things for your school-go to the hospital and read to people.” Students also articulated their frustration finding

Diversity and Conflict Resolution Leadership 26 Douglas et al. Program Evaluation June 2003
community service, and said that they often have to look for it. Instead, they suggested, people should be more verbal about requesting for help. When asked if they would continue to be involved in other community service projects, some students replied that they would; other students did not seem to think that this was a realistic answer, and observed, “People always say they will do it–independently-but they probably will not.”
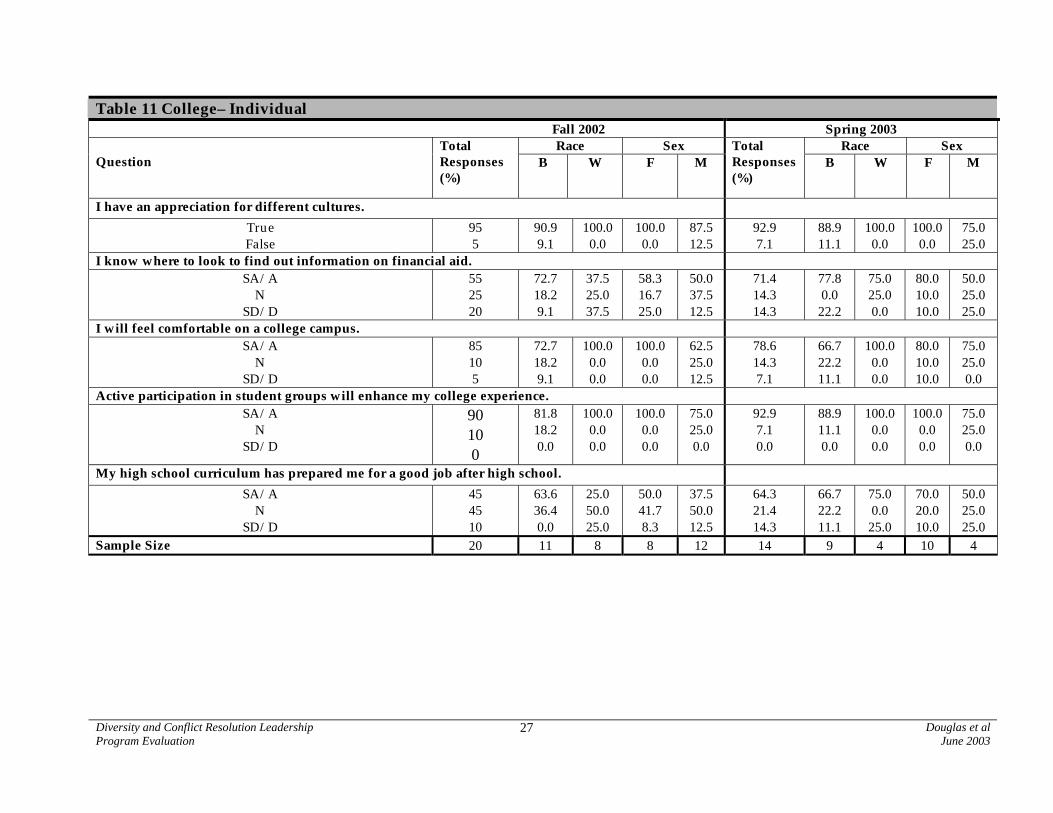
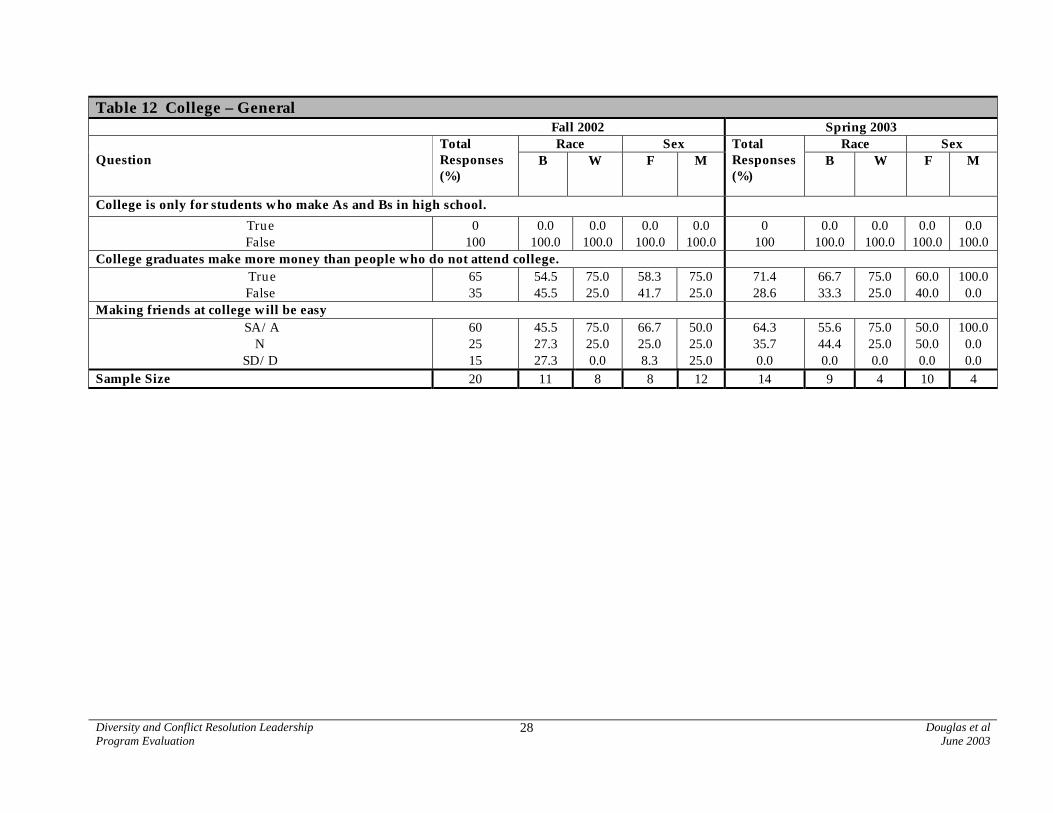
College Tables 11 and 12 report student impressions about college, including finding financial aid, comfort with the college environment, and adequacy of preparation, perception of future earnings, and perception of the necessity of higher education. Finding financial aid Overall student knowledge about finding financial aid information for college increased from fall to spring. In the fall, 55 percent of students reported that they knew where to look for information, which increased to 71.4 percent in the spring. There was an increase in knowledge by female students from 58.3 in the fall to 75 percent in the spring. Similarly only 37.5 percent of white students knew where to look for financial aid information in the fall, compared to 75 percent in the spring. More than half (72.7 percent) of black students reported being able to find financial aid in the fall, followed by 37.5 percent of white students. By spring, slightly more black students reported familiarity (77.8 percent), while the percentage of white students doubled. Comfort with the college environment In the fall, there was a much wider gap between males and females, with all females (100 percent) indicating comfort with a college environment, compared to only 62.5 percent of males. The gender gap narrowed in the spring with only a five percent difference. However, the gap between racial groups reporting level of comfort on a college campus widened in the spring survey. All white students (100%) expressed comfort on a college campus during fall and spring, however, only 72.7 percent of black students reported such comfort in the fall, and this decreased to 66.7 percent in the spring. Males convey some level of difficulty in making friends at college in the fall. Only 50 percent of the male respondents thought that it would be easy. There was a significant increase in the spring with 100 percent of the males reporting a sense of ease, while a noticeable gap existed between the races on both the fall and spring survey. The percent of whites who expressed a level of ease when considering making new friends
Diversity and Conflict Resolution Leadership Program Evaluation
Douglas et al June 2003
27
Table 11 College– Individual Fall 2002 Spring 2003
Race Sex Race Sex Question
Total Responses (%)
B W F M Total Responses (%)
B W F M
I have an appreciation for different cultures. True False
95 5
90.9 9.1
100.0 0.0
100.0 0.0
87.5 12.5
92.9 7.1
88.9 11.1
100.0 0.0
100.0 0.0
75.0 25.0
I know where to look to find out information on financial aid. SA/A
N SD/D
55 25 20
72.7 18.2 9.1
37.5 25.0 37.5
58.3 16.7 25.0
50.0 37.5 12.5
71.4 14.3 14.3
77.8 0.0
22.2
75.0 25.0 0.0
80.0 10.0 10.0
50.0 25.0 25.0
I will feel comfortable on a college campus. SA/A
N SD/D
85 10 5
72.7 18.2 9.1
100.0 0.0 0.0
100.0 0.0 0.0
62.5 25.0 12.5
78.6 14.3 7.1
66.7 22.2 11.1
100.0 0.0 0.0
80.0 10.0 10.0
75.0 25.0 0.0
Active participation in student groups will enhance my college experience. SA/A
N SD/D
90 10 0
81.8 18.2 0.0
100.0 0.0 0.0
100.0 0.0 0.0
75.0 25.0 0.0
92.9 7.1 0.0
88.9 11.1 0.0
100.0 0.0 0.0
100.0 0.0 0.0
75.0 25.0 0.0
My high school curriculum has prepared me for a good job after high school. SA/A
N SD/D
45 45 10
63.6 36.4 0.0
25.0 50.0 25.0
50.0 41.7 8.3
37.5 50.0 12.5
64.3 21.4 14.3
66.7 22.2 11.1
75.0 0.0
25.0
70.0 20.0 10.0
50.0 25.0 25.0
Sample Size 20 11 8 8 12 14 9 4 10 4
Diversity and Conflict Resolution Leadership Program Evaluation
Douglas et al June 2003
28
Table 12 College – General Fall 2002 Spring 2003
Race Sex Race Sex Question
Total Responses (%)
B W F M Total Responses (%)
B W F M
College is only for students who make As and Bs in high school. True False
0 100
0.0 100.0
0.0 100.0
0.0 100.0
0.0 100.0
0 100
0.0 100.0
0.0 100.0
0.0 100.0
0.0 100.0
College graduates make more money than people who do not attend college. True False
65 35
54.5 45.5
75.0 25.0
58.3 41.7
75.0 25.0
71.4 28.6
66.7 33.3
75.0 25.0
60.0 40.0
100.0 0.0
Making friends at college will be easy SA/A
N SD/D
60 25 15
45.5 27.3 27.3
75.0 25.0 0.0
66.7 25.0 8.3
50.0 25.0 25.0
64.3 35.7 0.0
55.6 44.4 0.0
75.0 25.0 0.0
50.0 50.0 0.0
100.0 0.0 0.0
Sample Size 20 11 8 8 12 14 9 4 10 4

Diversity and Conflict Resolution Leadership 29 Douglas et al. Program Evaluation June 2003
at college was constant from fall to spring at 75 percent. Although an increased percentage of black students reported that they would be comfortable making friends in college, overall blacks reported being less comfortable than whites. In the spring, students were asked, “Have your feelings about college changed since the program? If so, how?” One student replied, “My thoughts have changed a little, my family helps. Now I think about my future, where I am going, I am interested in college.” Another student emphasized, “It helped me to think about college. Even though I am not a straight-A student, I can still go to college.” Many felt that the program helped to further prepare them for college by providing information on how to get into college. They learned how to utilize valuable resources, such as using the internet and touring college campuses. One student expressed delight knowing the program director saying, “He has been my biggest resource.” His advice helped this student to recognize the value of using available resources, asking for help, and learning from what people have to teach you. Students were also open to different schools because of their involvement with the program. Activities at Guilford, Virginia Tech and Patrick Henry Community College provided students with valuable information. Students remarked that by attending program meetings at Patrick Henry they were introduced to something new. One student reported that her exposure to the program enabled her to consider selecting roommates from a different perspective, for example, by acknowledging and accepting differences. Students found college less intimidating because they learned about various programs at the universities they visited and explained, “This way it does not seem so big.” Students concluded that they are more comfortable now. With this comfort came the recognition that, “we have to step out of our comfort zone.” Preparation for college When asked whether participation in student groups would enhance their college experience, 25 percent more females than males agreed with this statement. Female students also reported more preparation by their high school curriculum, compared to only 37.5 percent of males. Females displayed an increase from 50 percent in the fall to 70 percent in the spring. There was a similar increase in the percent of white students who agreed that their high school curriculum prepared them for a good job after high school, from 25 percent in the fall to 75 percent in the spring, however the gap between black and white students decreased in the spring. In the fall, more black students (63.6 percent) than whites (25 percent) agreed that high school prepared them for a good job, whereas more white students believe this to be true in the spring. Perception of future earnings Students were asked to report whether college graduates make more money than people who do not attend college. For both the fall and spring surveys, males agreed with this statement more than females. Fewer females (16.7 percent) reported that they
Diversity and Conflict Resolution Leadership 30 Douglas et al. Program Evaluation June 2003
agreed with the statement than the 75 percent of males who answered the question. In the spring, 100 percent of males responded that this statement was true, compared to only 60 percent of females. Perception of necessity of higher education In the fall, many students perceived college as additional schooling, but agreed that it was necessary to provide for a better future. When asked what comes to mind when they think of college, students reported that college meant independence. They felt that college would involve a lot of studying; however it would be more fun than high school. Students expressed concerns about sexually transmitted diseases, and stated that they heard that [a nearby university] was among the top ten for students with STD’s. They expressed familiarity about sororities. Indicative of some students lack of familiarity with college life were statements such as, “I have never been on a college campus.” Students do not find high school guidance counselors helpful in providing information Many students did not view high school guidance counselors as helpful in telling them about college. “Guidance counselors are biased towards students with good grades. Guidance counselors only tell students about college if it will benefit them (the school).” Several other students agreed that school officials withhold information from them. “High school is not preparing us for college. Only certain teachers care about students.” Some expressed that their guidance counselors have not been helpful. One student noted, “Most of the time it’s difficult to talk with them, especially without an appointment. We have maybe four for the entire school and you cannot even talk to another one.” Another student indicated that at her school a student was assigned a counselor, and that if you tried to get advice from another counselor you would be ignored or told to talk to your assigned counselor. Students were asked what happens to their friends or people they know who do not want to go to college or who are not familiar with it. They replied, “They just don’t get the information.” Overall Program Experience Students were asked several questions in the spring about their overall program experience. In order to encourage students to participate in the evaluation discussion, they were each handed a blank bumper sticker and asked to describe in one or more words their experience in the Diversity and Conflict Resolution Leadership Program. Some of the adjectives used to describe the program included: “excellent, bonding, very interesting experience, crazy, conflicts, liked it, friendly environment, a marvelous experience, educative, lasting friendships, acceptance, love, friendship, community awareness, teens alike, fun, exciting, and learning experience.”

Diversity and Conflict Resolution Leadership 31 Douglas et al. Program Evaluation June 2003
Program strengths In general, students reported favorably about their experiences, viewed the program as helpful and agreed that the program helped prepare them for college. They were able to identify skills that they learned through team interaction, “I have learned how to communicate with some people. We worked together.” The program provided the opportunity to learn about different cultures. Students mentioned that they became familiar with people and how they feel about certain situations. One student said the program provided, “a chance to let other people take the lead, [and] swallow my pride. At first I thought these people were weird… everyone is different yet we are all the same. I learned to deal with different people and deal with conflict better.” Even though they reported going home mad on several occasions, one student believed that everyone made at least one friend from the program. When asked about the strengths of the program students reaffirmed some of their previous answers. Getting to know different people, learning to communicate, and college preparation were consistent responses from all of the students. Students mentioned that the program taught them how to deal with different people. They viewed this program as different from any program, saying “others are based on academic achievement. This group is a combination of students.” One student made the point that even if leadership was not one’s strong suit that they could find their niche. Another student raised an example of how Mr. Reynolds would let them dispute –then he would step in and point out a [different] view that helped them come to a resolution on their own. Many of the students expressed appreciation for Ms. Robison as well. Suggested Areas of Improvement Students also were asked to identify areas of program improvement. Their comments focused on improving the content of program activities; including a more diverse group of speakers and student participants; and modifying the point evaluation system of the program. Improving the content of program activities Some students reported a need for more structure and organization. One student commented, “The program was not always task-oriented, and they got off the subject a lot of times.” Another recommendation for the program would be to focus a great deal on the integration and overlap of material and content. Some students indicated that they spent “too much time” on the Civil War and did not understand what it had to do with the program. For some students, the connection between the Civil War and conflict resolution was not made. They also expressed interest in learning how to control their emotions and stated,“The program does not really teach you how to do that, [there is] nothing showing you what

Diversity and Conflict Resolution Leadership 32 Douglas et al. Program Evaluation June 2003
you should do.” Students also expressed interest in having additional opportunities to visit other college campuses. Several students indicated that they enjoyed their trip to Virginia Tech and welcomed more interaction. More diversity of participants and speakers Some students believed they would benefit from interaction with an even more diverse group of students. For example, students suggested that the population of the program should be more diverse, including people with different career aspirations, such as those who do not plan to go to college, and people of different racial/ethnic groups, such as Mexican students. Some students also commented that previous year’s program participants, who interacted with them during the community service project, tried to force their ideas upon them, and recommended that their participation be limited to the planning stages of the students’ community service projects. Administrative modifications There were also suggestions that were more administrative in focus. For example all students agreed that program leaders should be responsible for choosing groups when teamwork is required. “If groups were chosen for us that would be better because we typically group with our friends [or people] from our high school.” Some students also expressed the need to modify the point system upon which participation criteria are based saying, “it’s hard to make up points. We are often absent for other activities that we are involved in at school such as sports. If these things conflict with the schedule, you miss out on those points. Trips should be more points because you have to take a whole day out [of your schedule]. The point system needs to be revised.” One student interjected that maybe trips were worth fewer points than other activities because they had more fun on them. Students also stated that information regarding where the meetings are going to be held needs to be clearly communicated.

Diversity and Conflict Resolution Leadership 33 Douglas et al. Program Evaluation June 2003
DISCUSSION AND SUGGESTIONS
The Diversity and Conflict Resolution Leadership Program provides students with skills in six focus areas: 1) diversity; 2) conflict resolution; 3) leadership; 4) career preparation; 5) community services; and 6) college exposure. Overall, students expressed a high degree of satisfaction with their program involvement and there was considerable growth in student knowledge in these areas between fall 2002 and spring 2003. The results of the study suggest the program benefits students through: (a) improvement in conflict resolution skills, (b) exposure to community leaders and organizations, (c) high goals and aspirations, (d) increased access to information about careers, colleges and financial aid and (e) increased self-esteem and confidence. The following are suggestions that may be useful in fostering discussion regarding the future of the Diversity and Conflict Resolution Leadership Program. Selection of Student Participants The application process requires students to determine his or her individual level of interest. This portion of the application process lends itself to self-selection biases. This may be a limitation of the program efforts because students who seek out the program may have already been pre-disposed to seeking out the information provided in the program and achieving the program’s goals. During focus groups sessions, some students explained that they were selected to participate in the program by their guidance counselors. It appeared to students that some selection bias was in place because they were chosen from advance standing classes in most schools. Several students indicated that they were specifically identified for the program and provided with information that their other classmates did not receive based on their high academic achievement. One school only offered the program to its eleventh grade students, although the program is intended to target ninth and tenth graders as well. Some students also observed that their high school guidance counselors chose people to participate in the program who were already leaders in the school. Students expressed concern that with too many leaders, there were often not enough opportunities to participate fully, particularly during the planning phase of their community service project. The program director and school guidance counselors can offset problems associated with selection biases using a number of approaches. For example, the program director could meet collectively with guidance counselors from each school in the late summer, prior to the beginning of the program. After the director explains the Diversity and Conflict Resolution Leadership Program in depth, counselors would have the opportunity to ask questions in order to clarify the program components. Through a
Diversity and Conflict Resolution Leadership 34 Douglas et al. Program Evaluation June 2003
deeper understanding of the program’s intent, guidance counselors may be more likely to select students using diverse criteria, including not only race and gender, but also academics, personality, interests, and leadership abilities. Stigma of Participation The program’s name and how it is communicated to the students, is somewhat misleading. Some students indicated that they initially thought the program was punative. Two students commented:
“First, I thought they were singling people out. I thought our teacher submitted our names for doing something wrong.”
“I thought it was a penalty or something negative.”
By using former participants as ambassadors, the program may be able to overcome the perceived stigma associated with its title. In addition, student ambassadors could decrease the stress and apprehension that students may face as they enter the program. One of the two fall orientation meetings could serve as mentoring seminar for new participants. This is an opportunity to tell prospective participants about their experiences while in the program.
A change in the program’s name could alleviate any confusion about its purpose, mission, or target population. An acronym for Diversity and Conflict Resolution Leadership Program, such as the DCR Leadership Program, could help give the program a new identity. Alternatively, the program could be called by a different name that retains the original meaning of the title, for example, by calling it the R.E.A.L. Program (Resolution, Education, and Leadership Program).
Integration and Overlap of Program Material and Content Our research suggests there was a disconnect between some of the program components. Comments from students also support this claim. Some students indicated that they spent “too much time” on the Civil War and did not understand what it had to do with the program. For some students, the connection between the Civil War and conflict resolution was not made. The program would benefit a great deal by focusing on integration of program materials so that students continue to understand the connection between all of its components and its tasks. A debriefing at the end of each meeting could assist students in understanding the connection between topic areas and the program’s goals. Provoking students to talk about the Civil War in terms of program components will

Diversity and Conflict Resolution Leadership 35 Douglas et al. Program Evaluation June 2003
allow them to find its relevance to leadership, diversity and conflict resolution, and begin to make connections between them. Guest speakers are useful way to illustrate connections from a practical perspective. The program could request that its guest speakers integrate the program components into their lecture so students can make connections between the material presented and program themes. Student Relationships with School Administrators Students addressed several issues that could be of interest to the program. Particularly, students expressed on several occasions that they had difficulty communicating with school administrators such as guidance counselors and teachers regarding issues of diversity, college exposure and career preparation. Students’ specific concerns, although outside of the intended scope of the program, could be incorporated so that students continue to explore those areas related to the programs mission outside of its activities. The program may be improved by giving students suggestions for how to successfully communicate with their guidance counselors and other school administrators. The program can offer support for students in the classroom and with their guidance counselors. Classroom Students also commented that they do not learn about diversity in school but that it is strongly needed. The program could provide the students with a resource guide to aid their studies. This guide could 1) offer grade and course appropriate materials useful in areas of history, science, English and foreign languages, 2) offer options of magazines, newspapers and journal articles that may be of benefit too, and 3) offer guidelines on how to choose books with relevant themes. This guide could also include tips on using the library and navigating the internet to retrieve information. As a result, students will be equipped with resources to complete research projects or other independent assignments. Guidance Counselors Guidance counselors play an important role in the students’ school life and future career goals. The program could assist students in understanding the role of their high school guidance counselor. Counselors can help students to adjust to school and to plan the course of study that will best meet their future goals. The Diversity and Conflict Resolution Leadership Program could serve as a resource to the students by providing them with information that will help them interact more successfully with their guidance counselors. The program could educate the students on the significance of making appointments and punctuality. The program could also aid the student in the development of an agenda for meeting with guidance counselors so that they feel assured that their concerns have been addressed. As students learn about the role of their counselor, they will pay attention to their own communication and preparation, allowing them to recognize their own responsibility to nurture the relationship.
Diversity and Conflict Resolution Leadership 36 Douglas et al. Program Evaluation June 2003
Stressing to students the importance of knowing the normative communication styles will assist them to feel a little more at ease when contacting their guidance counselor. Increased Staff and Financial Resources The Diversity and Conflict Resolution Leadership Program is limited by few staff who work on a voluntary basis. While many of the students’ comments focused on the strengths of the program leaders and their contributions, the current level of staffing is not structured to achieve program goals, and is not sustainable over a long-term period. In addition to increased staffing, more resources are needed. In order for the program to grow and progress toward programmatic performance goals, additional resources are needed for field trips and speakers. Grant funding and donations from local businesses or civic organizations could assist in meeting this need.
Diversity and Conflict Resolution Leadership 37 Douglas et al. Program Evaluation June 2003
REFERENCES
Burd, S. (2002). Bridging the gap. Chronicle of Higher Education, 48: A22-A25. Business Consultancy. (2003). Conflict resolution Retrieved April 28, 2003, from http://www.stenhouse-nlp.com/bc_business.html. Career Education Oak Bay (2003). Work experience programs. Retrieved May 15, 2003,
from http://oakbay.sd61.bc.ca/~career/work_exp_req.html. Conflict Resolution Information Source (2003) Defining conflict resolution. Retrieved June
2, 2003 from http:// www.crinfo.org. Chittum & Allen. (2002, August 18). Textile powerhouse-gone: Lives are devastated
along with the local economy. The Roanoke Times, [Electronic version], Retrieved May 14, 2003, from http://www.roanoke.com/roatimes/henry/henry2c.html.
DeWitt, D. & Joyce, K. (2001). Merging the Community & Curriculum. Principal
Leadership, 2(1):33-35. Guildford College (2003). Conflict resolution center. Retrieved June 2, 2003 from
http://www.guilford.edu/academics. Hefferman, K.(2001).Campus Compact: Developing Partnerships for Community
Service. Community & Junior College Libraries, 10(2):55-59. Houff, D. (2002, October 2). Area unemployment rates stay ahead of state. The Winchester Star. Retrieved April 28, 2003, from http: www.winchesterstar.com. Inger, M. (2000). Conflict resolution programs in schools. Eric Clearinghouse on Urban
Education, 74. Retrieved April 28, 2003, from http://www.ericfacility.net/ericdigests/ed338791.html.
Johnson, M.L. (1998). Trends in Peace Education. ERIC Digest 073. Reston, VA: ERIC
Clearinghouse SO029303. (ERIC Document Reproduction Service No. ED 417123) Retrieved May 26, 2003, from the ERIC database.
McCullough, P. M. & Ashbridge, D. (1994). The effect of self-esteem,family structure,
locus of control, and career goals on adolescent leadership behavior. Adolescence, 29(115), 605-612.

Diversity and Conflict Resolution Leadership 38 Douglas et al. Program Evaluation June 2003
Myers, M. R. & Slavin, M. J. (1990). Emergence and maintenance of leadership among gifted students in group problem-solving. Roeper Review, 12(4), 256-262.
Nova Southeastern University (2003). Conflict analysis and resolution program overview. Retrieved May 14, 2003, from Nova Southeastern University, Graduate school of humanities and social sciences Web site: http://www.nova.edu/shss/DCAR/.
Parent’s National Network (2000). School violence: Is conflict resolution an answer or part
of the problem? Retrieved May 14, 2003, from http://education-resources.com/articles/conflict.htm.
Resolving Conflict Creatively Program (2003). About the resolving conflict creatively
program. Retrieved May 14, 2003, from RCCP Web site: http://www.esrnational.org/about-rccp.html.
South Carolina Department of Education (2003). Career preparation in high school students. Retrieved June 2, 20003, from http://www.sde.state.sc.us/reports/pathways.html Tierney, W.G.& Jun, A. (2001).A university helps prepare low-income youths for
college: Tracking school success. Journal of Higher Education, 72 (2):205-25. United States Census Bureau (2002). General population and housing characteristics .
Washington D.C. Retrieved April 28, 2003 from http://www.factfinder.census.gov.
United States Department of Education (2002). A profile of federal TRIO programs: 2002.
Washington D.C. Retrieved May 15, 2003 from http://www.ed.gov/office/OPE/OHEP/trio/index.html.
University of Maryland (1995). Diversity database: Moving towards community.
Diversity at UMCP: Moving toward community plan. College Park, MD. Retrieved April 28, 2003 from http://www.inform.umd.edu/EdRes/Topic/Diversity/search.html.
Virginia Tech Office of Multicultural Affairs (2000). University diversity plan, 2000-2005. Virginia Polytechnic Institute and State University.