Divergence or Both? 2000 : A Factor for Convergence, −− South Inequality, 1870 −−...
28
http://cos.sagepub.com/ Sociology International Journal of Comparative http://cos.sagepub.com/content/50/5-6/425 The online version of this article can be found at: DOI: 10.1177/0020715209339881 2009 50: 425 International Journal of Comparative Sociology Karen Rasler and William R. Thompson Divergence or Both? 2000 : A Factor for Convergence, -- South Inequality, 1870 -- Globalization and North Published by: http://www.sagepublications.com can be found at: International Journal of Comparative Sociology Additional services and information for http://cos.sagepub.com/cgi/alerts Email Alerts: http://cos.sagepub.com/subscriptions Subscriptions: http://www.sagepub.com/journalsReprints.nav Reprints: http://www.sagepub.com/journalsPermissions.nav Permissions: http://cos.sagepub.com/content/50/5-6/425.refs.html Citations: at Vytautas Magnus University on June 19, 2011 cos.sagepub.com Downloaded from
-
Upload
independent -
Category
Documents
-
view
1 -
download
0
Transcript of Divergence or Both? 2000 : A Factor for Convergence, −− South Inequality, 1870 −−...
http://cos.sagepub.com/Sociology
International Journal of Comparative
http://cos.sagepub.com/content/50/5-6/425The online version of this article can be found at:
DOI: 10.1177/0020715209339881
2009 50: 425International Journal of Comparative SociologyKaren Rasler and William R. Thompson
Divergence or Both?2000 : A Factor for Convergence,−−South Inequality, 1870−−Globalization and North
Published by:
http://www.sagepublications.com
can be found at:International Journal of Comparative SociologyAdditional services and information for
http://cos.sagepub.com/cgi/alertsEmail Alerts:
http://cos.sagepub.com/subscriptionsSubscriptions:
http://www.sagepub.com/journalsReprints.navReprints:
http://www.sagepub.com/journalsPermissions.navPermissions:
http://cos.sagepub.com/content/50/5-6/425.refs.htmlCitations:
at Vytautas Magnus University on June 19, 2011cos.sagepub.comDownloaded from

IJ CS
Globalization and North–South Inequality, 1870–2000A Factor for Convergence, Divergence or Both?
Karen Rasler and William R. ThompsonIndiana University, USA
AbstractAnalysts continue to debate the nature of the relationship between globalization and global inequality between states, with some arguing that globalization increases inequality, others saying that the relationship is negative, and still others suggesting that the relationship varies over time. There is actually more overlap in these positions than is apparent – an element underlined by our own argument that globalization’s effects can be both positive and negative simultaneously. We argue that globalization contributes to intra-Northern convergence while it reinforces North–South divergence. An 1870–2000 time series analysis of the relationships among trade and financial globalization and North–South inequality supports this prediction, while also finding that the effects of globalization are time dependent.
Key words: convergence • divergence • globalization • inequality • North–South gap
There are three answers to the questions of whether and how globalization is linked to global inequality: yes, no, and several variations on maybe or it depends.1 All three types of positions tend to be strongly held with ‘yes’ advo-cates who are convinced that globalization is making things worse and ‘no’ believers who argue that globalization will eventually make things better (Brune and Garrett, 2005). The ‘fence-sitters’ may not know what the ultimate outcome will be but they are quite sure that the variation they see will hold up to closer scrutiny. One of the more interesting characteristics of this debate, nevertheless, is that the relationships between globalization and inequality are rarely tested in a rigorous, dynamic fashion. People involved in this debate often point to observations on increasing/decreasing globalization and inequality relationship but unfortunately, they generally prefer to rely on an interocular method with selected data. When a test is conducted, moreover, it often is for a short period of
International Journal of Comparative Sociology© The Author(s), 2009. Reprints and permissions:
http://www.sagepub.co.uk/journalsPermissions.navhttp://cos.sagepub.com
Vol 50(5–6): 425–451DOI: 10.1177/0020715209339881
at Vytautas Magnus University on June 19, 2011cos.sagepub.comDownloaded from
426 International Journal of Comparative Sociology 50(5–6)
time leaving open the question of whether different globalization episodes might be characterized by different relationships with inequality. Visual inspections of selected data and shorter time spans are better than nothing. Nonetheless, there is also something to be said for examining these questions in a more rigorous fashion and over as long a time period as possible. Such tests may not fully resolve these debates but, without them, we are likely to persist in advo-cating our preferred analytical positions indefinitely. Accordingly, in this article we examine the 1870–2000 relationships among measures of trade and financial globalization and (between-state) global inequality with error-correction time series models.2 We find strong evidence for positive relationships between globalization and North–South inequality both prior to and after 1945, but not consistently. These systemic findings do not preclude an untested but theoretically anticipated, different relationship for globalization and greater equality within the North.
THE CONTESTED RELATIONSHIP BETWEEN GLOBALIZATION AND INEQUALITY
We have said that there are three answers (yes, no, maybe) to the question of whether globalization is responsible for more inequality. We expand on this as sertion below by elaborating the central nature of the answers, while freely admitting to there being numerous variations on the central themes. Still, there are common denominators that span the three answers – a point to which we will return once the basic arguments have been described.
Yes – Globalization Contributes to Greater Inequality
Milanovic (2003) is one of the more interesting and forceful arguments on net positive relationship between globalization and inequality. He argues that global-ization is Janus-faced. It has a benign side in the sense that some states benefit from globalization, although not as much as is claimed. But there is also a malign side in which many more states definitely do not benefit from globalization. On the contrary, they suffer to the extent that globalization makes it less likely that income convergence will come about.
Milanovic (2003) notes that the late 19th-century globalization episode is often promoted as the template for the benefits of globalization. Yet, it was principally restricted to Western Europe and the North American and Oceanic offshoots to which Europeans migrated in large numbers. Even in this best case, Milanovic disputes empirically the extent to which incomes converged within this rich subsection of the world economy. Even more clear is the extent to which the rest of the world diverged from the wealthy between 1800 and 1913. The reasons for this divergence are attributed to colonialism, Milanovic’s darker side of globalization. That is to say, in some parts of the world globalization processes emphasize increasingly freer movements of people, trade and capital.
at Vytautas Magnus University on June 19, 2011cos.sagepub.comDownloaded from
Rasler and Thompson Globalization and North–South Inequality, 1870–2000 427
In other parts of the world, predatory coercion was the primary force bringing about greater economic integration. Military force, slavery, and colonialism globalized a much larger territorial span than the more affluent neighborhood of Western Europe and its offshoots. In the process, the rest of the world was deindustrialized, underdeveloped, and subordinated. Colonies had resources expropriated asymmetrically, manufacturing competition was strongly discour-aged if not banned, and colonial markets were inundated with products imported from the metropole. Local development policies were subordinated to the preferences and interests of the metropole. Milanovic does not adopt the world-system perspective that the underdeveloping third world made the first world rich. But, he does see the richer European states precluding poorer states the opportunity to develop economically while more closely integrating them to the world economy.
Milanovic contends that imperial competition led to the First and Second World Wars, and that the joint impact of the Great Depression and external com munist threat led to social-democratic reforms in the richer world, at least until the collapse of Communism. Former colonial areas were given independ-ence and the opportunity to practice import substitution policies until they were overwhelmed by escalating petroleum prices and debt crises. Poor growth prospects and the Washington Consensus encouraged a policy switch from import substitution to structural adjustment/transition to market economy strategies from the late 1970s on. But if you compare growth rates in what is labeled the first, more recent, period of globalization, 1960–78, with an ensuing second period (1978–98) which is also a period of more strident globalization, economic growth outcomes were much better in the first globalization period than in the second. The conclusion is that the more recent globalization episode’s net effects, as in the 19th century, have without any doubt contributed to greater divergence in the world economy.
The ‘yes’ position is reinforced further by Wade’s (2007) reciprocal argu-ment that inequality becomes an even greater problem the more the world economy globalizes. Inequality constrains demand and economic growth which encourages more intense competition, overcapacity, and falling profits in the developed world. Migration from the less developed world to the more de-veloped world is encouraged while the spread of democratization in a highly inequitable setting is discouraged. The greater the inequality is, the more likely are coercive interventions into the lesser developed world in an attempt to thwart behavior that is perceived to be undesirable by the more developed. Moreover, inequality, and especially increasing inequality can be expected to hinder greatly the prospects for unified policy responses to global policy problems. In sum, a positive relationship between globalization and inequality can be expected to make things worse, not better.3
at Vytautas Magnus University on June 19, 2011cos.sagepub.comDownloaded from
428 International Journal of Comparative Sociology 50(5–6)
No – Globalization Reduces Inequality
Although Kuznets’s (1955) inverted U argument was developed to apply to national economies, it can be translated into world economy terms. Emphasizing the movement from low productivity agriculture to higher productivity manufacturing, labor should be expected to move from an initial situation of fairly low inequality to increased inequality in an industrial setting that grad-ually declines as wages improve. So, as agrarian economies move into more productive activities in the world economy, some increase in inequality may be probable but only temporary. Globalization pressures would provide the necessary access to technology, resources, and investment needed to make the agrarian-manufacturing transition. Dowrick and DeLong (2003: 194) describe the conventional perspective of economists as one of expecting that:
World trade, migration, and flows of capital should all work to take resources and consumption goods from where they are cheap to where they are dear as they travel with increasing speed and volume as transportation and communication costs decline, commodity and factor of production flows should erode differences in productivity and living standards between national economies.
Globalization, therefore, should contribute ultimately to reduced inequality as initially poor states improve their status and converge on the position of initially wealthier states.
The ‘no’ position can be stated unequivocally or in more nuanced ways. Ward and Gleditsch (2004), for instance, conclude that economic globalization has generated prosperity around the globe and therefore should be expected to dramatically reduce global inequality. Lindert and Williamson (2003) offer a more qualified approach. They begin by noting that inequality and integration have both been rising over the past 200 years and that might be thought to suggest a positive correlation when, in fact, they think a negative correlation is more appropriate for two basic reasons. Inequality began to increase (late 17th–18th century if not earlier) well in advance of increasing integration or globalization (early 19th century at best). Second, integration into the world economy has improved the income levels of states that exploited the opportunities to become more integrated. In this sense, even if only some states have embraced greater integration, globalization processes constrained the level of inequality that might otherwise have been attained. All things considered, Lindert and Williamson (2003) say, more globalization has meant less world inequality. Globalizers converge and non-globalizers diverge.
Maybe – Globalization Sometimes Increases Inequality and Sometimes Decreases It
There are several variations on the ‘maybe’ theme. Indeed, Lindert and Williamson’s (2003) argument could be placed within this rubric. A different ap-proach is taken by G. Thompson (2007). His basic position is that globalization
at Vytautas Magnus University on June 19, 2011cos.sagepub.comDownloaded from
Rasler and Thompson Globalization and North–South Inequality, 1870–2000 429
and inequality are not systematically related. That is, sometimes globalization contributes to convergence and sometimes it does not. He argues that global-ization in the 1870–1914 period contributed to the convergence of the ‘original convergence club’ which could be equated with Western Europe and the Western offshoots. Some more general convergence was attained in the interwar years even as globalization was in full retreat. When globalization was on the move once again after the 1970s, no evident movement toward convergence was discernible. Hence, more globalization does not appear to be systematically related to the ability of poorer states in the system to catch up to richer states.
Dowrick and DeLong (2003) take a very similar position but their conclusion seems closer to the idea that globalization works in contributing to income convergence for some states but certainly not for all. Greater openness cannot be expected to overcome subsistence agriculture, low savings and investment, low levels of education, and high population growth rates. Hence, globalization can reduce inequality if the conditions are right but that, in general, greater globalization need not work towards inequality reduction. This position may sound close to the Lindert and Williamson (2003) position except Dowrick and DeLong (2003) stress that even when openness is accepted, the results can be disappointing if the basic ingredients for exploiting the situation are absent.
Considering the three positions simultaneously, one cannot help but be struck by the overlap in the qualifiers associated with each position. Analysts may have intense commitments to the converging or diverging implications of globalization processes, but in advancing their various arguments, they widely accept the premise that globalization may make some states wealthier and others poorer. The crux of this conundrum is whether it is more of the former (convergence) or more of the latter (divergence). Analysts also seem to agree that different globalization episodes might have different outcomes, with one leading to greater convergent effects and another leading to greater divergent outcomes. Of course, that does not mean that there is a consensus on which episodes might have had differential outcomes or whether any in fact did have them. In sum, the outstanding questions are what is the net impact of globalization on inequality and are the impacts consistent across time.
We do not claim to have answers that will satisfy all of the contending camps. We do have, however, a theoretical position that suggests a dual outcome for globalizing processes – that is, with some states converging and some diverging. The theory also suggests a reasonably parsimonious reason for this duality that goes beyond reliance on preferred narratives. It is also testable. Once we have summarized our theoretical interpretation, we will turn to a rigorous examination of its empirical validity that involves modeling the dynamics of globalization and inequality over 130 years as opposed to other studies which have relied selectively on descriptive statistics.
at Vytautas Magnus University on June 19, 2011cos.sagepub.comDownloaded from
430 International Journal of Comparative Sociology 50(5–6)
A LEADERSHIP LONG CYCLE INTERPRETATION
Leadership long cycle theory (Modelski and Thompson, 1996) posits that the pattern of systemic leadership and long-term economic growth increasingly has assumed a double S-shaped pattern, with each consecutive growth wave encom-passing a rough 50-year duration. In the first iteration, one state achieves the lead in economic innovation. In the following iteration, the established leader’s relative position declines as competitors adopt and improve upon the initial set of innovations. As new leaders ascend, the systemic hierarchy is destabilized by uneven growth. As growth slows down in the first ascent iteration, global competition becomes more intense and has resulted in repeated instances of global warfare between 1494 and 1945. The second iteration of S-shaped growth follows the end of the global warfare which has the effect of reinforcing the new system leader’s material and political-military foundation at the apex of the global system (Rasler and Thompson, 1994).
In this perspective, one of the most important keys to ascent is the successful innovation of leading sectors in commerce and industry. Depending on whether commerce (prior to 1800) or industry (post-1800) are more significant, innov-ations can encompass, à la Schumpeter, the discovery of new markets and routes, radical reductions in transaction costs, or new industries such as mechanized textile looms, automobiles, or computers. The pioneers in these sectors benefit from monopoly profits as long as they can maintain their leads. The same profits also help finance the military forces necessary for maintaining the leader’s global concerns for protecting markets and national security. Leading sector growth benefits the system leader’s national economy but it also stimulates world economic growth by introducing new hard and soft technologies (Reuveny and Thompson, 2001, 2004b). Some, but certainly not all, other economies can learn how to make use of these new technologies and eventually catch up to the system leader.
The process is highly discontinuous. Long-term growth pulses and decays. Radical novelties are introduced but eventually become more common and less profitable. As a consequence, periods of fast growth stimulated by new tech-nologies alternates with periods of slow growth in which the old technology becomes more routine. Periods of depression demarcate situations in which new sources of growth are slow to emerge due to various obstacles to new ways of doing things that must first be overcome before economic stimulation can be optimized.
If long-term growth is driven by iterations of system leader technological innovations that create new trade routes, develop new markets, lower trans-portation and transaction costs, and invent new products, accelerations in globalization are fueled by these same iterations of S-shaped growth (Atheye and Simonetti, 2004). If all economies were equally capable of absorbing the new leading sectors, globalization or integration could conceivably be expected
at Vytautas Magnus University on June 19, 2011cos.sagepub.comDownloaded from
Rasler and Thompson Globalization and North–South Inequality, 1870–2000 431
to work towards reducing global inequality, at least between states. But the likelihood of catch-up with the leader is not widely distributed. Only some actors are in a position to absorb the latest wave of innovation. Those actors that are not in good positions to do so will tend to fall behind. With each successive iteration, then, a good number of states will fall increasingly behind the leader and its close rivals (Reuveny and Thompson, 2008).
It has been shown elsewhere (Reuveny and Thompson, 2007) that trade globalization tends to be manifested most strongly in the global North or more well developed economies. Investment also tends to be highly concentrated within the North.4 Globalization in trade and investment, therefore, should expand the gap between North and South even because Northern economies are the primary beneficiaries even while it reduces intra-Northern income dif-ferences. The debate over economic convergence tends to either overlook or mis-categorize this double effect of new technology-stimulated growth. There is no single outcome but neither are the dual outcomes entirely unpredictable or random. Instead we observe convergence in the North and divergence between the North and the South. In other words, globalization reduces inequality be-tween some states while it contributes to greater inequality between most states.5 The net effect, as a consequence, should be to increase North–South inequality as long as only a few states manage to move from the South to the North.
This argument helps explain the finding (Maddison, 1995) that the regional hierarchy of zones within the world economy has not changed a great deal in the past two hundred years. At the end of the Napoleonic Wars, the regional income hierarchy put Western Europe in first place, followed by ‘Western offshoots’ (Canada, the United States, Australia, New Zealand), Southern Europe, Eastern Europe, Latin America, Asia, and Africa. Two centuries later, the Western offshoots and Western Europe have switched their rank order positions without maintaining much of a gap between them and parts of Asia have moved up the technological gradient. Otherwise, the regional hierarchy remains reasonably similar with the important exception that while the bottom ranks have become less impoverished in some respects, the gap between the first half (basically Western offshoots and Europe)of the hierarchy and the second half (Latin American, parts of Asia, and Africa) have grown greater. This is exactly the outcome one would expect if long-term growth is characterized by uneven change and restricted diffusion.
Globalization is very much part of these processes. Accelerations in economic integration occur from time to time but the benefits are not evenly distributed. From our perspective, globalization is not the root cause of expanding between-state inequalities. Globalization is simply a derivative of the pace of long-term technological growth. At times, the pace picks up. At other times, it slows down and may work in reverse. Yet it remains the nature of the long-term techno-logical growth process that makes the unevenness pattern probable. Periods of accelerated globalization simply speed up the manifestation of uneven
at Vytautas Magnus University on June 19, 2011cos.sagepub.comDownloaded from
432 International Journal of Comparative Sociology 50(5–6)
structural propensities. Still, such an interpretation hardly absolves globalization from contributing to greater inequality among a majority of the states in the world system. It is a contributor, from our perspective, if not the root or sole cause. Assuming that we can control for tendencies toward intra-Northern convergence, we should expect to find positive relationships between indicators of globalization and North–South inequality.
TESTING THE RELATIONSHIP BETWEEN GLOBALIZATION AND INEQUALITY
To test the relationship between globalization and inequality, we need to develop serial measures of globalization processes and the amount of inequality. Globalization is, at a minimum, a systemic process of integration. The degree of inequality is a systemic attribute. Our unit of analysis is, therefore, the world system. We have or can generate comparable data on the 1870–2000 period which will allow us to examine several episodes of globalization in the late 19th and late 20th centuries. Globalization, of course, assumes many dimensions. Since we cannot examine them all, we focus here on trade and capital flows. Inasmuch as initial efforts to measure inequality as neutrally as possible proved disappointing, we cast our measure of inequality in a North–South mode.
Inequality and Actor Classification
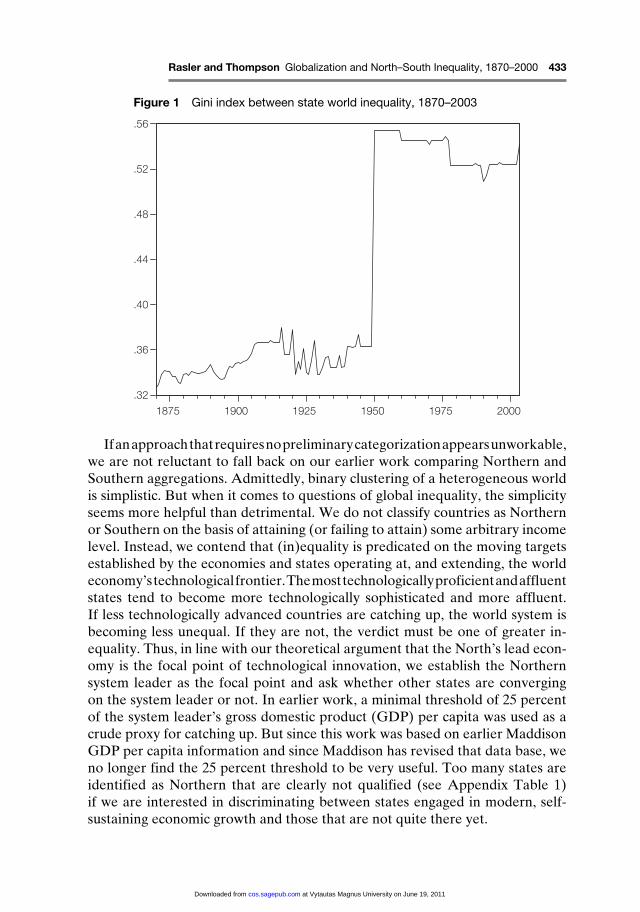
While we have worked with North–South classification schemes in the past, our initial approach in this analysis was to avoid any a priori categorization of states by utilizing Gini indexes calculated separately for the array of unweighted, national gross domestic product per capita each year in our study.6 Figure 1 reveals why we decided not to continue along this track. Gini indices are clearly sensitive to changes in N size. Maddison’s (2007) 1870–2003 GDP data introduces data on a large number of poor African states in 1950 – hence the major leap in the series at that juncture.7 Since the sudden increase in demonstrated inequality is not substantively meaningful, we assume that examining this series would yield more interpretative problems than it would produce benefits.8 The serial outcome is nonetheless interesting. Prior to 1950, our analysis indicates that the Gini index inequality fluctuated between 0.32 and 0.38 with some positive trend discernible. After 1950, Gini index inequality fluctuated between about 0.55 and 0.52 with some negative trend discernible until the movement upwards at the very end of the series. In neither case, is the trend all that impressive. No doubt, there is more than one way to look at these data but, controlling for the 1950 abrupt shift, we see them as implying that the Gini version of world inequality has remained roughly constant since 1870, with slight to moderate tendencies to trend upwards and downwards to and after 1950. If that were really the case, it would be difficult to analyze a constant. Unfortunately, there are good reasons to think that inequality has not remained roughly constant since the 19th century.9
at Vytautas Magnus University on June 19, 2011cos.sagepub.comDownloaded from
Rasler and Thompson Globalization and North–South Inequality, 1870–2000 433
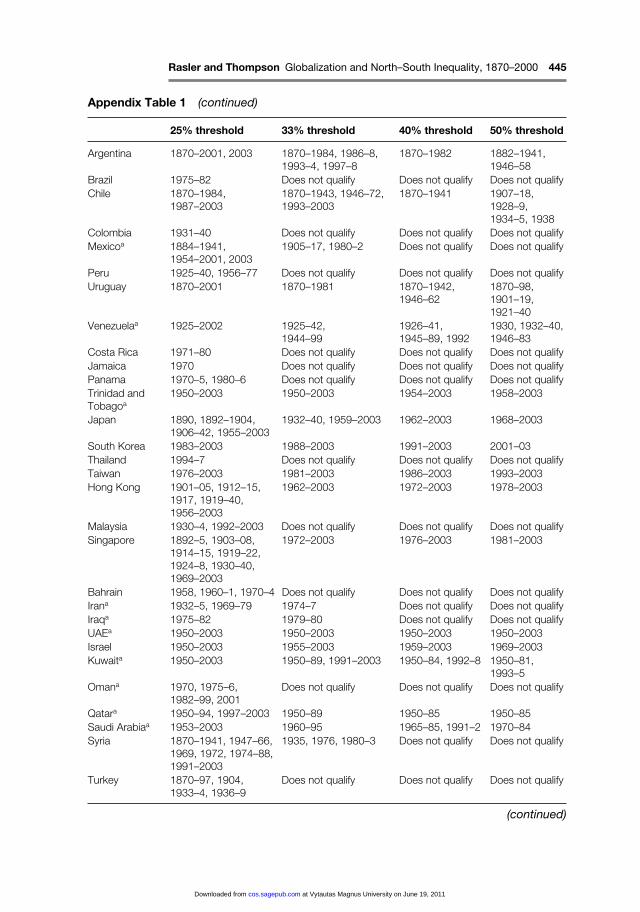
If an approach that requires no preliminary categorization appears unworkable, we are not reluctant to fall back on our earlier work comparing Northern and Southern aggregations. Admittedly, binary clustering of a heterogeneous world is simplistic. But when it comes to questions of global inequality, the simplicity seems more helpful than detrimental. We do not classify countries as Northern or Southern on the basis of attaining (or failing to attain) some arbitrary income level. Instead, we contend that (in)equality is predicated on the moving targets established by the economies and states operating at, and extending, the world economy’s technological frontier. The most technologically proficient and affluent states tend to become more technologically sophisticated and more affluent. If less technologically advanced countries are catching up, the world system is becoming less unequal. If they are not, the verdict must be one of greater in-equality. Thus, in line with our theoretical argument that the North’s lead econ-omy is the focal point of technological innovation, we establish the Northern system leader as the focal point and ask whether other states are converging on the system leader or not. In earlier work, a minimal threshold of 25 percent of the system leader’s gross domestic product (GDP) per capita was used as a crude proxy for catching up. But since this work was based on earlier Maddison GDP per capita information and since Maddison has revised that data base, we no longer find the 25 percent threshold to be very useful. Too many states are identified as Northern that are clearly not qualified (see Appendix Table 1) if we are interested in discriminating between states engaged in modern, self-sustaining economic growth and those that are not quite there yet.
Figure 1 Gini index between state world inequality, 1870–2003
.32
.36
.40
.44
.48
.52
.56
1875 1900 1925 1950 1975 2000
at Vytautas Magnus University on June 19, 2011cos.sagepub.comDownloaded from
434 International Journal of Comparative Sociology 50(5–6)
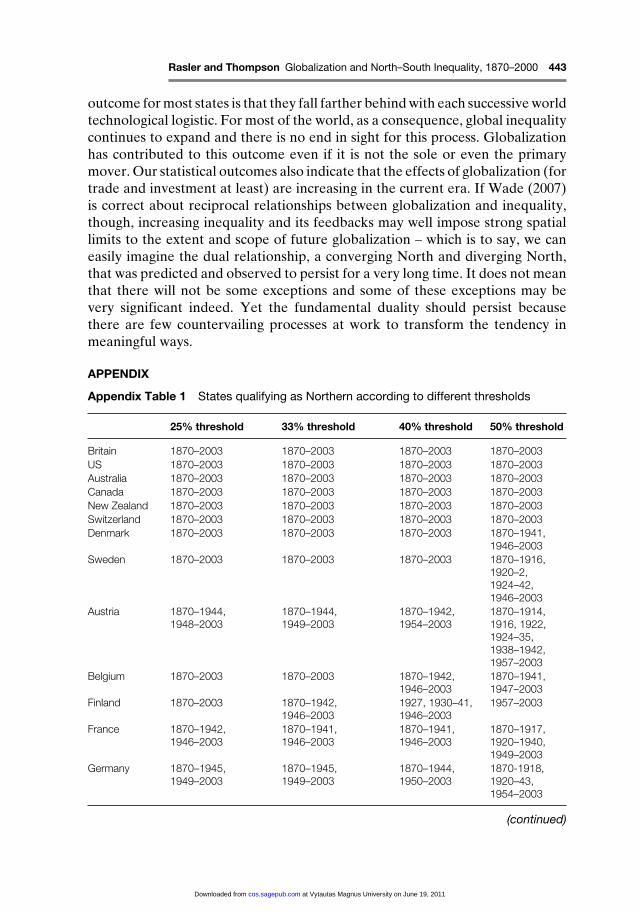
Recognizing that any threshold distinguishing between North and South is arbitrary, we have experimented with three higher thresholds: 33 percent, 40 percent, and 50 percent. Each has its advantages and perceived categorical ‘errors’.10 But the inequality outcomes associated with each threshold are very similar. Not surprisingly, the three thresholds yield series that are highly correlated (Pearson’s R = .99) and indicate very similar depictions of the direction taken by North–South inequality since 1870. Accordingly, we adopt the most liberal threshold (33%) of the three as our main empirical focus. Table 1 identifies the states considered Northern in this analysis.11
The Northern categorization revealed in Table 1 possesses some face validity. Western Europe and the Western offshoots are the core states. Only the vicis-situdes of the Second World War interfere with these identifications. A few Eastern European and Latin American states are selected intermittently but none persist across the entire 1870–2003 period. A few other states enter the list more or less as one would anticipate (e.g. Japan, Israel, Greece, Portugal, Hong Kong, Singapore, Taiwan, South Korea). That leaves a relatively small residual of a few states that seem out of place (e.g. Romania, Syria, Bulgaria, Mauritius) but they do not remain in the list for very long. Any compilation based solely on GDP per capita considerations is likely to have a few categorical errors. The 33 percent threshold generates a list that is, we believe, is acceptable for present purposes.
One threat to the validity of a North–South categorization based on a fixed relative but moving absolute threshold is that substantial movement from the South to the North would guarantee that the North–South gap would always be great and perhaps also always expanding. If, on the other hand, there is limited mobility from the South to the North (or vice versa), the interpretation threat should be minimized. Table 2 looks at this question by distinguishing among states that stay consistently in the North, move up to the North, or drop out into the South after once having been in the North. Keeping in mind that we are dealing with a total state N in the neighborhood of 150, only 16 states or about 10 percent remain consistently in the North. Another 13 states qualify intermittently between 1870 and 2003 but manage to continue qualifying by our end date. A number of these states are intermittent members only because of the damage done by military occupation or defeat in the Second World War and would otherwise be prime candidates for most observers’ Northern candidate list. Another group of 11 make the threshold but cannot maintain that status. That means at most only 40 states have qualified for Northern status at some point. More than half (23) qualified in 1870. Only nine states have moved into the North on a presumably permanent basis. We view these numbers as indicative of limited mobility and thus also a limited threat to the interpretation of our measurement procedure.12
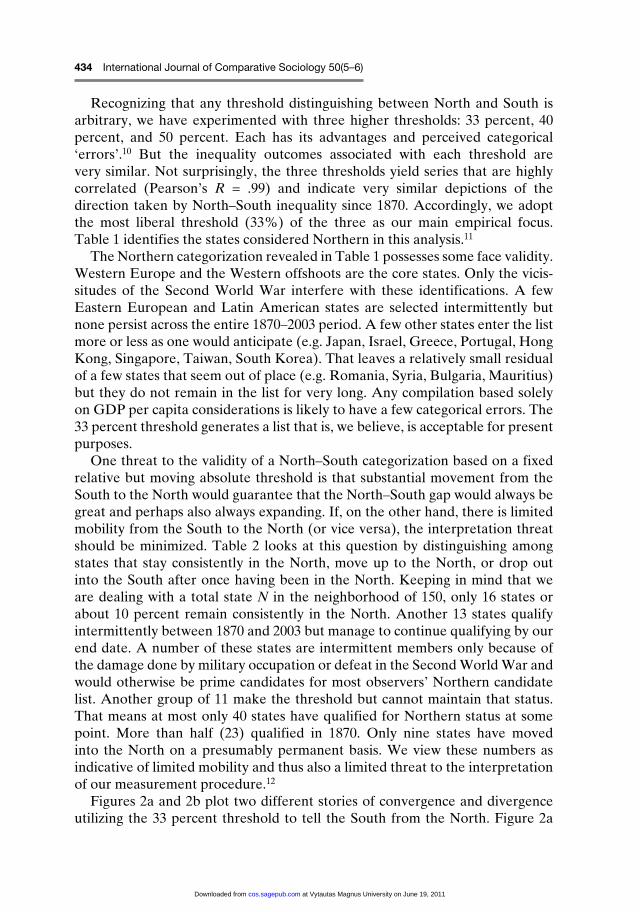
Figures 2a and 2b plot two different stories of convergence and divergence utilizing the 33 percent threshold to tell the South from the North. Figure 2a
at Vytautas Magnus University on June 19, 2011cos.sagepub.comDownloaded from

Rasler and Thompson Globalization and North–South Inequality, 1870–2000 435
focuses on intra-Northern processes by showing the gap in GDP per capita between the system leader and the rest of the North. There is a gap and it cannot be described as narrowing substantially over time. Yet it is also not diverg-ing all that much, especially in comparison to what is displayed in Figure 2b.
Table 1 The North, 1870–2003 (employing a 33% threshold)
State Years of inclusion using the 33 percent threshold
Argentina 1870–1984, 1986–8, 1993–4, 1997–8Australia 1870–Austria 1870–1944, 1949–Belgium 1870–Canada 1870–Chile 1870–1943, 1946–72, 1993–Czechoslovakia 1870–1941, 1946–89Czech Republic 1990–7, 2001–Denmark 1870–Finland 1870–1942, 1946–France 1870–1941, 1946–Germany 1870–1945, 1949–Hungary 1870–1917, 1924–40, 1967–84Ireland 1870–1941, 1946–Italy 1870–1942, 1948–New Zealand 1870–Netherlands 1870–1942, 1946–Norway 1870–1942, 1946–Spain 1870–1935, 1963–Sweden 1870–Switzerland 1870–United Kingdom 1870–United States 1870–Uruguay 1870–1981Poland 1885–1887, 1893–1922, 1974–1977Romania 1903–1905, 1908, 1910–11, 1914–15South Africa 1914–1915, 1922, 1931–9Greece 1915, 1917, 1920–22, 1964–Japan 1932–40, 1959–Portugal 1932–4, 1970–Russia 1933–8, 1960–2, 1964–83, 1990Syria 1935, 1976, 1980–3Israel 1955–Hong Kong 1963–Singapore 1972–Bulgaria 1975–82Taiwan 1981–South Korea 1988–Estonia 1990–Latvia 1990–1Slovakia 1990Mauritius 1992–
at Vytautas Magnus University on June 19, 2011cos.sagepub.comDownloaded from
436 International Journal of Comparative Sociology 50(5–6)
Keep in mind, though, that we have already established that the Northern group does take in new members, sometimes permanently and sometimes not. The new admissions are likely to hover near the threshold when they first move up. Thus, the most recent upwardly mobile states are apt to pull down the rest of the Northern average. If we looked only at the Northern states that had been Northern since 1870, according to the 33 percent threshold, greater converging propensities would be demonstrated – but that is not currently our primary concern.
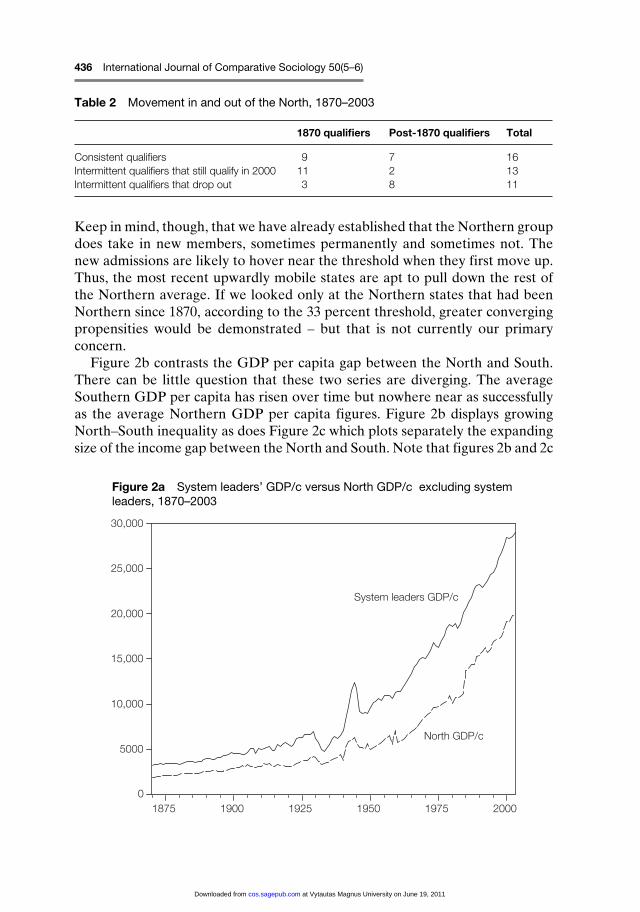
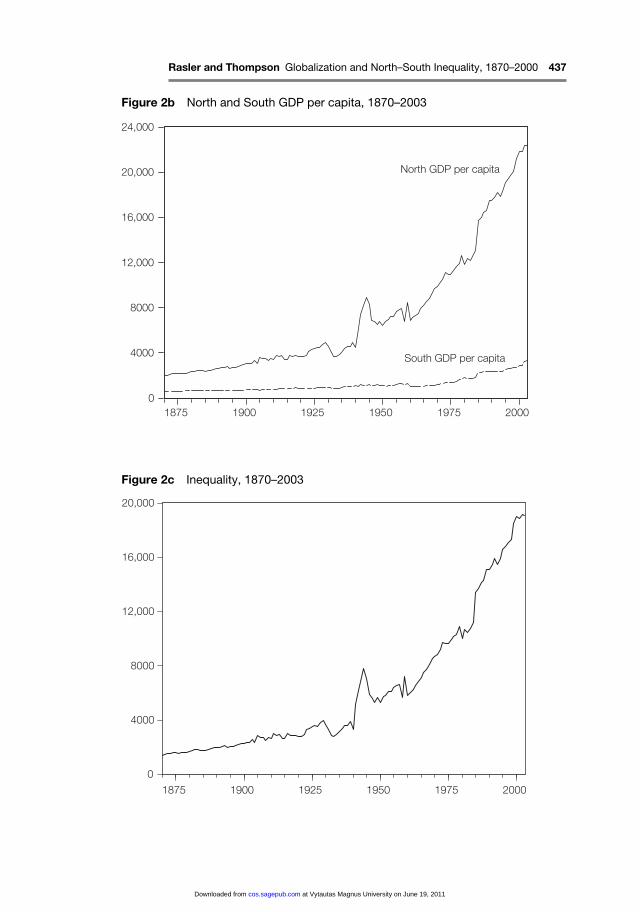
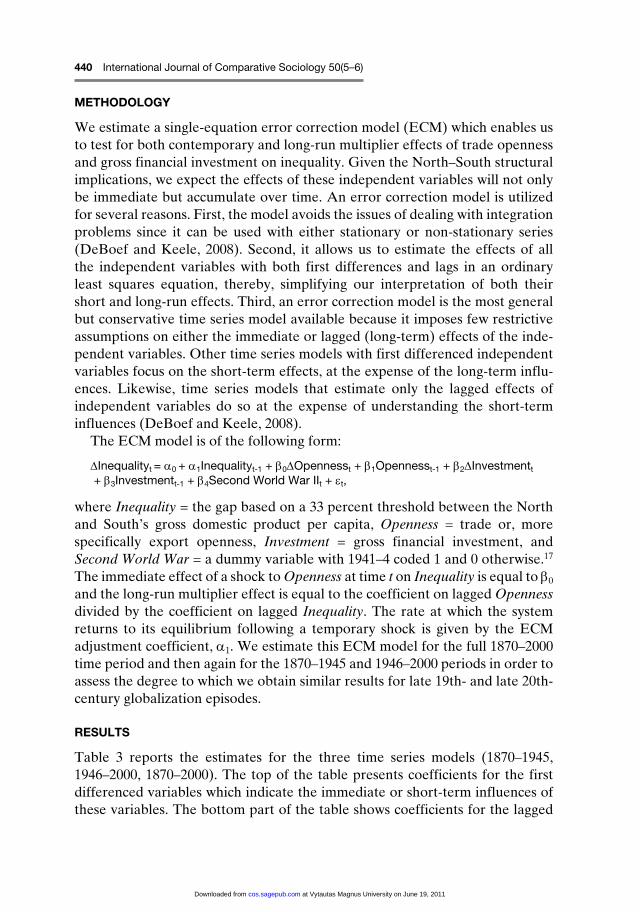
Figure 2b contrasts the GDP per capita gap between the North and South. There can be little question that these two series are diverging. The average Southern GDP per capita has risen over time but nowhere near as successfully as the average Northern GDP per capita figures. Figure 2b displays growing North–South inequality as does Figure 2c which plots separately the expanding size of the income gap between the North and South. Note that figures 2b and 2c
Table 2 Movement in and out of the North, 1870–2003
1870 qualifi ers Post-1870 qualifi ers Total
Consistent qualifiers 9 7 16Intermittent qualifiers that still qualify in 2000 11 2 13Intermittent qualifiers that drop out 3 8 11
Figure 2a System leaders’ GDP/c versus North GDP/c excluding system leaders, 1870–2003
5000
0
10,000
15,000
20,000
25,000
System leaders GDP/c
North GDP/c
30,000
1875 1900 1925 1950 1975 2000
at Vytautas Magnus University on June 19, 2011cos.sagepub.comDownloaded from
Rasler and Thompson Globalization and North–South Inequality, 1870–2000 437
Figure 2b North and South GDP per capita, 1870–2003
North GDP per capita
South GDP per capita
0
4000
8000
12,000
16,000
20,000
24,000
1875 1900 1925 1950 1975 2000
Figure 2c Inequality, 1870–2003
0
4000
8000
12,000
16,000
20,000
1875 1900 1925 1950 1975 2000
at Vytautas Magnus University on June 19, 2011cos.sagepub.comDownloaded from

438 International Journal of Comparative Sociology 50(5–6)
are characterized by precisely the opposite bias observed in Figure 2a. While the Northern averages are constrained somewhat by more recent admissions, the Southern averages incorporate India and China, the two states thought to be doing well in recent years, as well as oil producers with their high GDP and small populations, and a few states that have reverted to Southern status only recently, such as Russia. Since both types of bias work against finding a widening North–South gap, the expanding gulf between average Northern and Southern income levels is all the more impressive.
Trade and Capital Globalization
There are other types of globalization than the economic variety but it is economic globalization that figures most prominently in the debates on the relationship between globalization and inequality. Economic globalization, in turn, is often thought of as having several dimensions encompassing trade, investment, and migration activities. We develop two indicators here that are meant to capture the timing of trade and investment globalization.
For trade globalization, we have constant dollar series extending back to 1870 on exports (Maddison, 1995) that, once slightly updated, can be divided by world GDP to develop an openness measure. The higher the relative size of exports in comparison to GDP, the more open the system is to trade. That series is plotted in the upper half of Figure 3 and shows that systemic trade openness has approximately tripled over the last 130 years but not without taking some dips along the way.13 The two most prominent dips are associated with the First and Second World Wars. Interestingly, the figure suggests that the once high levels of openness attained just prior to the First World War were re-attained and definitely exceeded after the early 1970s. The high points achieved in the 1990s are nearly twice the levels attained in the late 19th-century globalization acceleration.
Investment globalization proved more challenging to operationalize. As far as we know there are no continuous series on investment that correspond to our extended time period. Therefore, we set out to construct one. We do have 13 observations on gross financial investment as a proportion of world GDP.14 To transform the observations into a series, we borrowed from Suter’s (1990, 1992) suggestions that estimated series on British and French gross financial investment in the pre-First World War period (Imlah, 1958; and Levy-Leboyer, 1977, respectively) can serve as proxies for the nature of fluctuations in that time period.15 He also provides data on the investment activity of the six most prominent national sources of foreign investment for the interwar period. Data on US and world investment in the post-Second World War period are also available.16 We used these various series as guides to what transpired (increasing or decreasing activity) for extrapolating between the points provided by Obstfeld and Taylor (2004). The outcome is portrayed in the lower half of Figure 3. The nature of its creation gives it a more smoothed appearance than the one for
at Vytautas Magnus University on June 19, 2011cos.sagepub.comDownloaded from

Rasler and Thompson Globalization and North–South Inequality, 1870–2000 439
exports but the activity displayed does not seem all that off the mark. An initial high is set just before the turn of the 20th century, followed by a contraction of activity that extends through the 1950s. The series turns dramatically upwards in the 1960s re-attaining the 19th-century high level in the later 1970s and then going considerably beyond that through the 1990s. The lower portion of Figure 3 seems in tune with the oft-stated observation that investment globalization has more than set the pace among all the various types of globalizing activities (Held et al., 1999).
Figure 3 Plots of trade openness and gross financial investment, 1870–2003
.02
.04
.06
.08
.10
.12
.14
.16
1875 1900 1925 1950 1975 2000
0.0
0.2
0.4
0.6
0.8
1.0
1875 1900 1925 1950 1975 2000
at Vytautas Magnus University on June 19, 2011cos.sagepub.comDownloaded from
440 International Journal of Comparative Sociology 50(5–6)
METHODOLOGY
We estimate a single-equation error correction model (ECM) which enables us to test for both contemporary and long-run multiplier effects of trade openness and gross financial investment on inequality. Given the North–South structural implications, we expect the effects of these independent variables will not only be immediate but accumulate over time. An error correction model is utilized for several reasons. First, the model avoids the issues of dealing with integration problems since it can be used with either stationary or non-stationary series (DeBoef and Keele, 2008). Second, it allows us to estimate the effects of all the independent variables with both first differences and lags in an ordinary least squares equation, thereby, simplifying our interpretation of both their short and long-run effects. Third, an error correction model is the most general but conservative time series model available because it imposes few restrictive assumptions on either the immediate or lagged (long-term) effects of the inde-pendent variables. Other time series models with first differenced independent variables focus on the short-term effects, at the expense of the long-term influ-ences. Likewise, time series models that estimate only the lagged effects of independent variables do so at the expense of understanding the short-term influences (DeBoef and Keele, 2008).
The ECM model is of the following form:
ΔInequalityt = α0 + α1Inequalityt-1 + β0ΔOpennesst + β1Opennesst-1 + β2ΔInvestmentt + β3Investmentt-1 + β4Second World War IIt + εt,
where Inequality = the gap based on a 33 percent threshold between the North and South’s gross domestic product per capita, Openness = trade or, more specifically export openness, Investment = gross financial investment, and Second World War = a dummy variable with 1941–4 coded 1 and 0 otherwise.17 The im mediate effect of a shock to Openness at time t on Inequality is equal to β0 and the long-run multiplier effect is equal to the coefficient on lagged Openness divided by the coefficient on lagged Inequality. The rate at which the system returns to its equilibrium following a temporary shock is given by the ECM adjustment coefficient, α1. We estimate this ECM model for the full 1870–2000 time period and then again for the 1870–1945 and 1946–2000 periods in order to assess the degree to which we obtain similar results for late 19th- and late 20th-century globalization episodes.
RESULTS
Table 3 reports the estimates for the three time series models (1870–1945, 1946–2000, 1870–2000). The top of the table presents coefficients for the first differenced variables which indicate the immediate or short-term influences of these variables. The bottom part of the table shows coefficients for the lagged
at Vytautas Magnus University on June 19, 2011cos.sagepub.comDownloaded from

Rasler and Thompson Globalization and North–South Inequality, 1870–2000 441
or long-term influences of the independent variables. Turning to the short-term influences, Table 3 shows that changes in trade openness are positively related to changes inequality in the 1870–2000 and 1946–2000 periods, but not in the 1870–1945 era. Trade openness is positively related to inequality in the pre-Second World War era, but the coefficient is statistically insignificant. Meanwhile, in contrast, short term changes in gross financial investment have a statistically significant effect in the 1870–1945 era but not in the remaining two periods. We view these results as suggesting that the short-term impact of trade openness has grown stronger over time while the short-term effect of gross financial in-vestment has waned. Neither set of outcomes suggests that globalization is unrelated to inequality but that the relationships are time dependent.
Moving to the long-term influences of these variables in Table 3, the lagged coefficients are not very informative, because they do not estimate the total lagged impact of each independent variable. Rather, these coefficients must be interpreted in conjunction with the error correction rate, which is provided by the coefficient on the lagged inequality variable. Since we are interested in the total impact that changes in trade openness and gross financial investment have on inequality (i.e. the short- and long-term effects), we must calculate the long-run multiplier (LRM) impact. The LRM is calculated by dividing the lagged coefficients by the coefficient on lagged inequality.18 We did not calculate the
Table 3 Error correction models of inequality on trade openness and gross financial investment, 1870–2000
1870–1945 1946–2000 1870–2000
Coeffi cientStandard error Coeffi cient
Standard error Coeffi cient
Standard error
Short-term (first differences) ∆ Trade Openness(t) 88.28 77.11 453.89** 174.75 254.98** 90.18 ∆ Gross Financial Investment(t)
35.34** 13.56 –17.48 79.77 33.81 21.71
Long-term (levels) Trade Openness(t-1) 70.46** 22.77 286.72** 107.62 105.11** 30.69 Gross Financial Investment(t-1)
–4.35 5.73 44.48** 16.21 2.39 3.64
Inequality(t-1) –.09** .02 –.39** .13 –.04** .02 Second World War (1941–4)
1462.59** 131.72 1491.59** 204.12
Constant –182.43** 143.27 –93.59 643.71 –640.86** 189.53N 75 54 130Adjusted R² .73 .28 .39LM test; d.f. = 2 .75 .63 .55Arch F test; d.f. = 1 .40 .78 1.62Ljung-Box Q 55.90;(d.f. = 36) 22.10(d.f. = 24) 41.10(d.f. = 24)
Notes: Dependent variable: Changes in inequality; Ordinary least squares estimates; Two-tailed tests; **p < = .05; *p < = .10.
at Vytautas Magnus University on June 19, 2011cos.sagepub.comDownloaded from
442 International Journal of Comparative Sociology 50(5–6)
LRMs for lagged gross financial investment in the 1870–1945 and the 1870–2000 periods since their coefficients were statistically insignificant and in the wrong direction in the pre-war period. For those LRMs that we did calculate, their estimates reflect the same direction as the short-term and lagged variables (at their levels). However, the LRMs are larger, because they incorporate all the immediate and long-term effects. The LRMs for trade openness are 782.88 (1870–1945 period), 735.18 (1946–2000 period) and 2627.5 (1870–2000 period), while the LRM for gross financial investment is 114.1 (1946–2000 period), and they are also statistically significant.
The results suggest that the long-run impact of trade openness increases inequality across all three time periods. The Second World War outlier variable is significant and positive in both the pre-Second World War era and the full 1870–2000 time period. The residual diagnostics of these models indicate that the modeled series are devoid of any serious autocorrelation problems.19
CONCLUSION
Overall, the estimates of the ECMs indicate that trade openness and gross financial investment do indeed increase inequality – although the impacts are not consistent across the time periods. The short-term effects of trade openness have significant influence on increasing inequality in the full period of 1870–2000 and the post-Second World War era. The short-term effects of gross fin-an cial investment are significant during the 1870–1945 era, but not so in the smaller pre- and post-Second World War periods. As for long-term influences, trade openness exerts a consistent positive long-term effect on increasing in-equality across all time periods, while gross financial investment is associated with a significant effect in the post-Second World War era only. Despite the lack of consistency in the short- and long-term estimates across the three time periods, the results indicate that there is a robust connection between increasing inequality and globalization processes in general.
Richard Cooper (2007) contends that world development is a process that follow a logistic curve. Eventually, convergence can be anticipated after a very long wait but only after considerable initial divergence, if the most developed actors stop developing, and if the technological frontier stops expanding. We have certainly experienced the considerable initial divergence (and continue experiencing it) but it seems most improbable that the most developed actors will cease developing or that the technological frontier will come to a complete halt. The problem is that world development is not one logistic but a nested series or sequence of multiple logistics curves. Each cluster of new technologies goes through its own S-curved growth pattern and then is rendered variably obsolete by the next cluster. Yet the diffusion of this technology is highly uneven leading to vastly different regional and national outcomes. Some states can keep up with the persistent if intermittent expansion of the technological gradient. Some states have even managed to catch up after being far behind. But, the net
at Vytautas Magnus University on June 19, 2011cos.sagepub.comDownloaded from
Rasler and Thompson Globalization and North–South Inequality, 1870–2000 443
outcome for most states is that they fall farther behind with each successive world technological logistic. For most of the world, as a consequence, global inequality continues to expand and there is no end in sight for this process. Globalization has contributed to this outcome even if it is not the sole or even the primary mover. Our statistical outcomes also indicate that the effects of globalization (for trade and investment at least) are increasing in the current era. If Wade (2007) is correct about reciprocal relationships between globalization and inequality, though, increasing inequality and its feedbacks may well impose strong spatial limits to the extent and scope of future globalization – which is to say, we can easily imagine the dual relationship, a converging North and diverging North, that was predicted and observed to persist for a very long time. It does not mean that there will not be some exceptions and some of these exceptions may be very signi ficant indeed. Yet the fundamental duality should persist because there are few countervailing processes at work to transform the tendency in meaningful ways.
APPENDIX
Appendix Table 1 States qualifying as Northern according to different thresholds
25% threshold 33% threshold 40% threshold 50% threshold
Britain 1870–2003 1870–2003 1870–2003 1870–2003US 1870–2003 1870–2003 1870–2003 1870–2003Australia 1870–2003 1870–2003 1870–2003 1870–2003Canada 1870–2003 1870–2003 1870–2003 1870–2003New Zealand 1870–2003 1870–2003 1870–2003 1870–2003Switzerland 1870–2003 1870–2003 1870–2003 1870–2003Denmark 1870–2003 1870–2003 1870–2003 1870–1941,
1946–2003Sweden 1870–2003 1870–2003 1870–2003 1870–1916,
1920–2, 1924–42, 1946–2003
Austria 1870–1944, 1948–2003
1870–1944, 1949–2003
1870–1942, 1954–2003
1870–1914, 1916, 1922, 1924–35, 1938–1942, 1957–2003
Belgium 1870–2003 1870–2003 1870–1942, 1946–2003
1870–1941, 1947–2003
Finland 1870–2003 1870–1942,1946–2003
1927, 1930–41, 1946–2003
1957–2003
France 1870–1942, 1946–2003
1870–1941, 1946–2003
1870–1941, 1946–2003
1870–1917, 1920–1940, 1949–2003
Germany 1870–1945, 1949–2003
1870–1945, 1949–2003
1870–1944, 1950–2003
1870-1918, 1920–43, 1954–2003
(continued)
at Vytautas Magnus University on June 19, 2011cos.sagepub.comDownloaded from

444 International Journal of Comparative Sociology 50(5–6)
25% threshold 33% threshold 40% threshold 50% threshold
Italy 1870–1943,1947–2003
1870–1942, 1948–2003
1870–87,1902–40,1954–2003
1914–1919, 1931–1940, 1958–2003
Netherlands 1870–1943,1946–2003
1870–1943, 1946–2003
1870–1942, 1946–2003
1870–1941, 1947–2003
Norway 1870–1942, 2003
1870–1942, 1945–2003
1870–1942, 1946–2003
1914–15, 1930–41, 1947–2003
Ireland 1870–1943,1945–2003
1870–1941, 1946–2003
1870–1940, 1969–2003
1870–1915, 1917, 1931–5, 1990–2003
Greece 1870–1940,1957–2003
1915, 1917, 1920–2, 1924–30, 1964–2003
1932–5, 1937–9, 1970–2003
Does not qualify
Portugal 1870–1908, 1930–9, 1958, 1960–2003
1932–4,1970–2003
1973–7,1979-2003
Does not qualify
Spain 1870–1940,1955–2003
1870–1935,1963–2003
1872–87, 1989–95, 1901, 1908, 1910, 1913–14, 1921–2, 1930–5, 1970–2003
1989-2003
Bulgaria 1870–1918, 1960–89 1975–82 Does not qualify Does not qualifyCzechoslovakia 1870–1943,
1946–901870–1941, 1946 1903–05, 1911,
1914–15, 1925–40, 1958–90
Does not qualify
Hungary 1870–1941, 1949–90, 2000–2003
1870–1917, 1924–40, 1967–84
1910–11, 1915, 1932–9
Does not qualify
Poland 1870–1941, 1950–88, 1999–2003
1885–7, 1893–1922, 1974–7
Does not qualify Does not qualify
Romania 1870–1922 1903–05, 1908, 1910–11, 1914–15
Does not qualify Does not qualify
Yugoslavia 1971–89 Does not qualify Does not qualify Does not qualifyCroatia 1990–1 Does not qualify Does not qualify Does not qualifySlovenia 1990–2003 1990–2003 1990–1,
1993–20031990
Czech Republic 1990–2003 1990–7, 2001–2003 Does not qualify Does not qualifySlovakia 1990–2003 1990 Does not qualify Does not qualifyArmenia 1990 Does not qualify Does not qualify Does not qualifyBelarus 1990–2, 2003 Does not qualify Does not qualify Does not qualifyEstonia 1990–2003 1990–2003 1990–2003 Does not qualifyGeorgia 1990–1 Does not qualify Does not qualify Does not qualifyKazakhstan 1990–2, 2003 Does not qualify Does not qualify Does not qualifyLatvia 1990–2, 1998–2003 1990–1 Does not qualify Does not qualifyLithuania 1990–2, 2002-2003 1990–1 Does not qualify Does not qualifyUkraine 1990 Does not qualify Does not qualify Does not qualifyRussian Federationa
1870–1923, 1931–42, 1948–92
1933–8, 1960–2, 1964–83, 1990
Does not qualify Does not qualify
Appendix Table 1 (continued)
(continued)
at Vytautas Magnus University on June 19, 2011cos.sagepub.comDownloaded from
Rasler and Thompson Globalization and North–South Inequality, 1870–2000 445
25% threshold 33% threshold 40% threshold 50% threshold
Argentina 1870–2001, 2003 1870–1984, 1986–8, 1993–4, 1997–8
1870–1982 1882–1941, 1946–58
Brazil 1975–82 Does not qualify Does not qualify Does not qualifyChile 1870–1984,
1987–20031870–1943, 1946–72, 1993–2003
1870–1941 1907–18, 1928–9, 1934–5, 1938
Colombia 1931–40 Does not qualify Does not qualify Does not qualifyMexicoa 1884–1941,
1954–2001, 20031905–17, 1980–2 Does not qualify Does not qualify
Peru 1925–40, 1956–77 Does not qualify Does not qualify Does not qualifyUruguay 1870–2001 1870–1981 1870–1942,
1946–621870–98, 1901–19, 1921–40
Venezuelaa 1925–2002 1925–42,1944–99
1926–41, 1945–89, 1992
1930, 1932–40, 1946–83
Costa Rica 1971–80 Does not qualify Does not qualify Does not qualifyJamaica 1970 Does not qualify Does not qualify Does not qualifyPanama 1970–5, 1980–6 Does not qualify Does not qualify Does not qualifyTrinidad and Tobagoa
1950–2003 1950–2003 1954–2003 1958–2003
Japan 1890, 1892–1904, 1906–42, 1955–2003
1932–40, 1959–2003 1962–2003 1968–2003
South Korea 1983–2003 1988–2003 1991–2003 2001–03Thailand 1994–7 Does not qualify Does not qualify Does not qualifyTaiwan 1976–2003 1981–2003 1986–2003 1993–2003Hong Kong 1901–05, 1912–15,
1917, 1919–40, 1956–2003
1962–2003 1972–2003 1978–2003
Malaysia 1930–4, 1992–2003 Does not qualify Does not qualify Does not qualifySingapore 1892–5, 1903–08,
1914–15, 1919–22, 1924–8, 1930–40, 1969–2003
1972–2003 1976–2003 1981–2003
Bahrain 1958, 1960–1, 1970–4 Does not qualify Does not qualify Does not qualifyIrana 1932–5, 1969–79 1974–7 Does not qualify Does not qualifyIraqa 1975–82 1979–80 Does not qualify Does not qualifyUAEa 1950–2003 1950–2003 1950–2003 1950–2003Israel 1950–2003 1955–2003 1959–2003 1969–2003Kuwaita 1950–2003 1950–89, 1991–2003 1950–84, 1992–8 1950–81,
1993–5Omana 1970, 1975–6,
1982–99, 2001Does not qualify Does not qualify Does not qualify
Qatara 1950–94, 1997–2003 1950–89 1950–85 1950–85Saudi Arabiaa 1953–2003 1960–95 1965–85, 1991–2 1970–84Syria 1870–1941, 1947–66,
1969, 1972, 1974–88, 1991–2003
1935, 1976, 1980–3 Does not qualify Does not qualify
Turkey 1870–97, 1904, 1933–4, 1936–9
Does not qualify Does not qualify Does not qualify
Appendix Table 1 (continued)
(continued)
at Vytautas Magnus University on June 19, 2011cos.sagepub.comDownloaded from

446 International Journal of Comparative Sociology 50(5–6)
25% threshold 33% threshold 40% threshold 50% threshold
South Africa 1870–1941, 1946–76
1914–15, 1922, 1931–9
Does not qualify Does not qualify
Gabona 1950–86 1954–82 1961–2, 1971, 1973–7
Does not qualify
Seychelles 1997–8 Does not qualify Does not qualify Does not qualifyMauritius 1950–1, 1961–4,
1976–9, 1982–20031992–2003 2002–03 Does not qualify
Libyaa 1963–83 1964–73, 1976–80 1966–73, 1976, 1979
1968–71
Eq. Guineaa 1999–2003 2001–03 2002–03 Does not qualify
aoil producer.
NOTES
1. The treatment of inequality in this paper is restricted to the systemic and between country variety. Within-country inequality is hardly irrelevant (see, for instance, Bornschier, 2002) but space precludes discussing here the similarities and differences between the between and within types. The same space constraints dictate that we ignore the equally related poverty issue.
2. One of our series is slightly shorter than the others and dictates the 2000 end point. 3. See, as well, Hurrell and Woods (1995), Payne (2005), and Phillips (2005) for discus-
sions of the reciprocal nature of the globalization and inequality relationship. 4. See, for instance, Bisley (2007), Easterly and Levine (2003), Feenstra (1999),
Nicholson (2004) and Twomey (2000). 5. In making this assertion, we feel no need to say anything about whether states choose
to globalize and therefore benefit. We imagine that there have been decision-makers that tried to open their economies with little effect, as well as decision-makers that made no choices either way and decision-makers that probably felt that they had no choice. For our purposes, there are simply some states that are able to absorb/imitate new technology and many others that cannot or do not do so. Similarly, we prefer not to specify in this article precisely why technology cannot be absorbed. The list of reasons is long and ranges from ill-equipped labor forces to technology being less freely available than economists assume. For various views on this issue, see Clark and Feenstra (2003), Dowrick and DeLong (2003), Easterly and Levine (2003), Eaton and Kortum (1996), Lall (2003) and Lewis (2004).
6. See, for instance, Reuveny and Thompson (2002, 2003, 2004a, 2007, forthcoming). 7. Earlier Maddison series focused on a 56 state sample that omitted much of Africa.
The current N is 170, although Maddison also provides information on grouped but unnamed small countries that we ignored.
8. We could of course limit the sample to a fixed N but that would vitiate the utility of the Gini index in allowing the analyst to evade any a priori decisions on which actors to include and exclude.
9. The empirical literature on global inequality is literally maddening vis-à-vis the differ-ent results that have been obtained. Sample sizes, population weights, the fortunes of China and India, and PPP measurement all seem to make some difference to the outcome. Or, as G. Thompson (2007: 182) suggests, there does not appear to
Appendix Table 1 (continued)
at Vytautas Magnus University on June 19, 2011cos.sagepub.comDownloaded from
Rasler and Thompson Globalization and North–South Inequality, 1870–2000 447
be any ‘single correct way to measure inequality’. Still, most analysts recognize that inequality has been increasing since the 19th century to the last 30–40 years, after which inequality either continued increasing, remained stable, or decreased slightly. See Berry and Serieux (2007), Bhalla (2002), Bourguignon and Morrisson (2002), Dowrick and Akmal (2005), Fischer (2003), Korzeniewicz and Moran (1997), Melchior et al. (2000), Milanovic (2003, 2005, 2007), Sala-i-Martin (2002), and Wade (2001, 2007, 2008). Another group argues that inequality has been increasing but has peaked and is now declining (Boltho and Toniolo, 1999; Dollar, 2007; Radetski and Jonsson, 2000; Schultz, 1998).
10. Appendix Table 1 provides a list of the states categorized as Northern depending on which threshold is utilized.
11. A number of preliminary procedures must be executed to obtain the results in Table 1. Maddison’s (2007) series for GDP, population, and GDP per capita (stated in constant, PPP-adjusted, Gheary-Khamis dollars) are incomplete and have different starting dates. Where possible we interpolated between observed values to make each country series complete with a start date beginning in 1870. We used the GDP per capita information on a year by year basis to determine which states were to be classified Northern and Southern for which periods of time. We then aggregated the GDP and population series separately into Northern and Southern GDP and population aggregates before dividing the appropriate sub-aggregate GDP by sub-aggregate population to create series for Northern and Southern GDP per capita. We do eliminate states that specialize in oil production from the Northern category. Finally, we should also note that Maddison’s series are not geared to dates of independence but to the availability of data. We did not alter that approach.
12. Earlier work on North-South differences also experimented with various ways to measure North and South – as in fixing the categorization from 1870 on and not allowing mobility – without finding major differences in the outcomes.
13. This outcome resembles the data developed by Chase-Dunn et al. (2000). 14. Obstfeld and Taylor (2004) provide these values for 1870, 1900, 1914, 1930, 1938,
1945, 1960, 1980, 1985, 1990, 1990, 1995, and 2000 based on data taken from Maddison (1995), Twomey (1998), and Woodruff (1967), and various years of the IMF’s International Financial Statistics. Gross financial investment is not the same thing as FDI but, presumably, the nature of gross activity can serve as a decent proxy for tapping into the pace of globalization.
15. Britain and, to a lesser extent, France were the leading sources of investment in the 19th century.
16. We used the World Bank Group’s WDI Online: World Development Indicators and relied on US foreign investment patterns in the 1950s–1960s before switching to world investment flows in the 1970s and thereafter.
17. The Second World War dummy is an attempt to control for the effects of serious outliers. Meanwhile, the values of trade openness and gross financial investment have been multiplied by 100 in light of the small values associated with the differenced values.
18. The standard errors for the LRMs are estimated by the Bewley transformation (see De Boef and Keele, 2008).
19. The 1870–2000 model in Table 3 included AR(1) and AR(2) parameters – both of which had a coefficient of .22 or less in order to eliminate serial correlation in the residuals. The 1870–2000 model was estimated with and without the autoregressive
at Vytautas Magnus University on June 19, 2011cos.sagepub.comDownloaded from
448 International Journal of Comparative Sociology 50(5–6)
parameters, and the coefficients for the independent variables in both situations were roughly identical. In the 1946–2000 model, one AR(2) parameter was included whose value was .29. Again, estimates of the model with and without the AR parameter yielded approximately the same coefficient estimates for the independent variables. No autoregressive parameters were included for the 1870–1945 model.
REFERENCES
Athreye, S. and Simonetti, R. (2004) ‘Technology, Investment and Economic Growth’, in W. Brown, S. Bromley and S. Athreye (eds) Ordering the International: History, Change and Transformation. London: Pluto Press.
Berry, A. and Serieux, J. (2007) ‘World Economic Growth and Income Distribution, 1980–2000’, in K.S. Jomo with J. Baudot (eds) Flat World, Big Gaps: Economic Liberalization, Globalization, Poverty & Inequality. London: Zed Books.
Bhalla, S.S. (2002) Imagine There’s No Country: Poverty, Inequality, and Growth in the Era of Globalization. Washington, DC: International Institute of Economics.
Bisley, N. (2007) Rethinking Globalization. New York: Palgrave Macmillan.Boltho, A. and Toniolo, G. (1999) ‘The Assessment: The Twentieth Century-
achievements, Failures, Lessons’, Oxford Review of Economic Policy 15: 1–17.Bornschier, V. (2002) ‘Changing Income Equality in the Second Half of the 20th Century:
Preliminary Findings and Propositions for Explanations’, Journal of World-System Research 8: 99–127.
Bourguignon, F. and Morrisson, C. (2002) ‘The Size Distribution of Income among World Citizens, 1820–1992’, American Economic Review 92: 727–44.
Brune, N. and Garrett, G. (2005) ‘The Globalization Rohrschach Test: International Integration, Inequality, and the Role of Government’, Annual Review of Political Science 8: 399–423.
Chase-Dunn, C., Kawano, Y. and Brewer, B.D. (2000) ‘Trade Globalization since 1795: Waves of Integration in the World-system’, American Sociological Review 65: 77–95.
Clark, G. and Feenstra, R.C. (2003) ‘Technology with Great Divergence’, in M.D. Bordo, A.M. Taylor and J.G. Williamson (eds) Globalization in Historical Perspective. Chicago, IL: University of Chicago Press.
Cooper, R.N. (2007) ‘Introduction: Growth and Poverty in the World Economy, 1950–2000’, in E. Aryeety and N. Dinello (eds) Testing Global Interdependence: Issues on Trade, Aid, Migration and Development. Cheltenham: Edward Elgar.
DeBoef, S. and Keele, L. (2008) ‘Taking Time Seriously’, American Journal of Political Science 52: 184–200.
Dollar, D. (2007) ‘Globalization, Poverty and Inequality since 1980’, in D. Held and A. Kaya (eds) Global Inequality: Patterns and Explanations. Cambridge: Polity.
Dowrick, S. and Akmal, M. (2005) ‘Contradicting Trends in Global Income Inequality: A Tale of Two Biases’, Review of Income and Wealth 51: 201–29.
Dowrick, S. and DeLong, J.B. (2003) ‘Globalization and Convergence’, in M.D. Bordo, A.M. Taylor and J.G. Williamson (eds) Globalization in Historical Perspective. Chicago, IL: University of Chicago Press.
Easterly, W. and Levine, R. (2003) ‘Its Not Factor Accumulation: Stylized Facts and Growth Models’, The World Bank Economic Review 15: 177–219.
at Vytautas Magnus University on June 19, 2011cos.sagepub.comDownloaded from
Rasler and Thompson Globalization and North–South Inequality, 1870–2000 449
Eaton, J. and Kortum, S. (1996) ‘Trade in Ideas: Patenting and Producing in the OECD’, Journal of International Economics 40: 251–78.
Feenstra, R.C. (1999) ‘Facts and Fallacies about Foreign Direct Investment’, in M. Feldstein (ed.) International Capital Flows. Chicago, IL: University of Chicago Press.
Fischer, S. (2003) ‘Globalization and its Challenges’, American Economic Review 93: 1–30.
Held, D., McGrew, A., Goldblatt, D. and Perraton, J. (1999) Global Transformations: Politics, Economics and Culture. Cambridge, MA: Polity.
Hurrell, A. and Woods, N. (1995) ‘Globalisation and Inequality’, Millennium Journal of International Studies 24: 447–70.
Imlah, A.H. (1958) Economic Elements in the Pax Britannica: Studies in British Foreign Trade in the Nineteenth Century. Cambridge, MA: Harvard University Press.
Korzeniewicz, R. and Moran, T. (1997) ‘World Economic Trends in the Distribution of Income, 1965–1992’, American Journal of Sociology 102: 1000–39.
Kuznets, S. (1955) ‘Economic Growth and Income Inequality’, American Economic Review 45: 1–28.
Lall, S. (2003) ‘Technology and Industrial Development in an Era of Globalization’, in H.-J. Chang (ed.) Rethinking Development Economics. London: Anthem Press.
Levy-Leboyer, M. (1977) La Position Internationale de la France: Aspects Economiques et Financiers, XIX–XX Siecles. Paris: Librairie Jean Touzot.
Lewis, W.W. (2004) The Power of Productivity: Wealth, Poverty, and the Threat to Global Stability. Chicago, IL: University of Chicago Press.
Lindert, P.H. and Williamson, J.G. (2003) ‘Does Globalization Make the World More Unequal?’, in M.D. Bordo, A.M. Taylor and J.G. Williamson (eds) Globalization in Historical Perspective. Chicago, IL: University of Chicago Press.
Maddison, A. (1995) Monitoring the World Economy. Paris: OECD.Maddison, A. (2007) ‘World Population, GDP, and Per Capita GDP, 1–2003 AD’,
available online at: [http://www.ggdc.net/maddison/].Melchior, A., Telle, K. and Wiig, H. (2000) ‘Globalization and Inequality: World Income
Distribution and Living Standards, 1960–1998’, Studies on Foreign Policy Issues, Report G6, Royal Norwegian Ministry of Foreign Affairs, Oslo.
Milanovic, B. (2003) ‘The Two Faces of Globalization: Against Globalization as We Know It’, World Development 31: 667–83.
Milanovic, B. (2005) Worlds Apart: Global and International Inequality 1950–2000. Princeton, NJ: Princeton University Press.
Milanovic, B. (2007) ‘Globalization and Inequality’, in D. Held and A. Kaya (eds) Global Inequality Patterns and Explanations. Cambridge: Polity.
Modelski, G. and Thompson, W.R. (1996) Leading Sectors and World Power: The Coevolution of Global Economics and Politics. Columbia: University of South Carolina Press.
Nicholson, M.W. (2004) ‘Caught Behind the Eight Ball: Impeding and Facilitating Technology Diffusion to Developing Countries’, in J. O’Loughlin, L. Staeheli and E. Greenberg (eds) Globalization and Its Outcomes. New York: Guilford Press.
Obstfeld, M. and Taylor, A.M. (2004) Global Capital Markets: Integration, Crisis, and Growth. Cambridge: Cambridge University Press.
at Vytautas Magnus University on June 19, 2011cos.sagepub.comDownloaded from

450 International Journal of Comparative Sociology 50(5–6)
Payne, A. (2005) The Global Politics of Unequal Development. Basingstoke: Palgrave Macmillan.
Philips, N.J. (2005) ‘Globalization Studies in International Political Economy’, in N.J. Philips (ed.) Globalizing International Political Economy. Basingstoke: Palgrave Macmillan.
Radetzki, M. and Jonsson, B. (2000) ‘The Twentieth Century: The Century of Increasing Income Gaps. But How Reliable Are the Numbers?’, Ekonomisk Debatt 1: 43–55.
Rasler, K. and Thompson, W.R. (1994) The Great Powers and Global Struggle: 1490–1990. Lexington: University Press of Kentucky.
Reuveny, R. and Thompson, W.R. (2001) ‘Leading Sectors, Lead Economies, and Economic Growth’, Review of International Political Economy 8: 689–719.
Reuveny, R. and Thompson, W.R. (2002) ‘World Economic Growth, Northern Antagonism, and North–South Conflict’, Journal of Conflict Resolution 46: 484–515.
Reuveny, R. and Thompson, W.R. (2003) ‘Exploring the North–South Gap Longi-tudinally’, Japanese Journal of Political Science 4: 77–102.
Reuveny, R. and Thompson, W.R. (2004a) ‘World Economic Growth, Systemic Leadership and Southern Debt Crises’, Journal of Peace Research 41: 5–24.
Reuveny, R. and Thompson, W.R. (2004b) Growth, Trade and Systemic Leadership. Ann Arbor: University of Michigan Press.
Reuveny, R. and Thompson, W.R. (2007) ‘The Limits of Economic Globalization: Still Another North–South Cleavage?’, International Journal of Comparative Sociology 48: 107–35.
Reuveny, R. and Thompson, W.R. (2008) ‘Uneven Economic Growth and the World Economy’s North–South Stratification’, International Studies Quarterly 52: 579–605.
Sala-i-Martin, X. (2002) The Disturbing ‘Rise’ of Global Income Inequality. New York: Columbia University Press.
Schultz, T.P. (1998) ‘Inequality in the Distribution of Personal Income in the World: How is it Changing and Why?’, Journal of Population Economics 11: 307–44.
Suter, C. (1990) Schuldenzyklen in der Dritten Welt. Frankfurt am Main: Anton Hain.Suter, C. (1992) Debt Cycles in the World-Economy. Boulder, CO: Westview.Thompson, G.F. (2007) ‘Global Inequality, the ‘‘Great Divergence’’ and Supranational
Regionalization’, in D. Held and A. Kaya (eds) Global Inequality: Patterns and Explanations. Cambridge: Polity.
Twomey, M.J. (1998) ‘Patterns of Foreign Investment in Latin America in the Twentieth Century’, in J.H. Coatsworth and A.M. Taylor (eds) Latin America and the World Economy since 1800. Cambridge, MA: Harvard University Press.
Twomey, M.J. (2000) A Century of Foreign Investment in the Third World. London: Routledge.
Wade, R.H. (2001) ‘The Rising Inequality of World Income Distribution’, Finance and Development 38: 37–9.
Wade, R.H. (2007) ‘Should We Worry about Income Inequality’, in D. Held and A. Kaya (eds) Global Inequality: Patterns and Explanations. Cambridge: Polity.
Wade, R.H. (2008) ‘Globalization, Growth, Poverty, Inequality, Resentment, and Imperialism’, in J. Ravenhill (ed.) Global Political Economy, 2nd edn. Oxford: Oxford University Press.
at Vytautas Magnus University on June 19, 2011cos.sagepub.comDownloaded from

Rasler and Thompson Globalization and North–South Inequality, 1870–2000 451
Ward, M.D. and Gleditsch, K.S. (2004) ‘Globalization’s Impact on Poverty, Inequality, Conflict, and Democracy’, in J. O’Loughlin, L. Staeheli and E. Greenberg (eds) Globalization and Its Outcomes. New York: Guilford Press.
Woodruff, W. (1967) Impact of Western Man: A Study of Europe’s Role in the Western Economy, 1750–1960. New York: St Martin’s Press.
Karen Rasler is Professor of Political Science at Indiana University and co-editor of International Studies Quarterly. Her most recent book is Strategic Rivalry: Space, Position and Conflict Escalation in World Politics (2007).
William R. Thompson is Donald A. Rogers Professor of Political Science at Indiana University and Managing Editor of International Studies Quarterly. Recent books include Globalization as Evolutionary Process: Modeling Global Change (2008), North and South in the World Political Economy (2009), Systemic Transitions: Past, Present, and Future (2009), and Limits to Globalization and North–South Divergence (forthcoming). Address: William R. Thompson, Department of Political Science, Indiana University, Bloomington, IN 47405, USA. [email: [email protected]]
at Vytautas Magnus University on June 19, 2011cos.sagepub.comDownloaded from