DISTRICT SURVEY REPORT FOR SAND MINING OR RIVER ...
100
Draft DSR Report for Gondia DISTRICT SURVEY REPORT FOR SAND MINING OR RIVER BED MINING Prepared by District Mining Officer Collector Office, Gondia Prepared Under A] Appendix –X Of MoEFCC, GoI. Notification S.O. 141(E) Dated 15.1.2016 B] Sustainable Sand Mining Guidelines C] MoEFCC, GoI. Notification S.O. 3611(E) Dated 25.07.2018 DISTRICT-GONDIA MAHARASHTRA
-
Upload
khangminh22 -
Category
Documents
-
view
3 -
download
0
Transcript of DISTRICT SURVEY REPORT FOR SAND MINING OR RIVER ...
Draft DSR Report for Gondia
DISTRICT SURVEY REPORT
FOR
SAND MINING OR RIVER BED MINING
Prepared by
District Mining Officer
Collector Office, Gondia
Prepared Under
A] Appendix –X Of MoEFCC, GoI. Notification S.O. 141(E) Dated 15.1.2016
B] Sustainable Sand Mining Guidelines
C] MoEFCC, GoI. Notification S.O. 3611(E) Dated 25.07.2018
DISTRICT-GONDIA
MAHARASHTRA

PREFACE
With reference to the gazette notification dated 15th January 2016, ministry of Environment, Forest
and Climate Change, the State environment Impact Assessment Authority (SEIAA) and State
Environment Assessment Committee (SEAC) are to be constituted by the divisional commissioner for
prior environmental clearance of quarry for minor minerals. The SEIAA and SEAC will scrutinize and
recommend the prior environmental clearance of ministry of minor minerals on the basis of district
survey report. The main purpose of preparation of District Survey Report is to identify the mineral
resources and mining activities along with other relevant data of district. This report contains details of
Lease, Sand mining and Revenue which comes from minerals in the district. This report is prepared on
the basis of data collected from different concern departments. A survey is carried out by the members
of DEIAA with the assistance of Geology Department or Irrigation Department or Forest Department
or Public Works Department or Ground Water Boards or Remote Sensing Department or Mining
Department etc. in the district.
Minerals are classified into two groups, namely (i) Major minerals and (ii) Minor minerals. Amongst
these two groups minor mineral have been defined under section 3(e) of Mines and Minerals
(Regulation and development) Act, 1957. The minor minerals are further governed by
―The Maharashtra Minor Minerals Rule MMME(D&R)rules2013‖.TheMinormineralsinclude building
stones, Gravel, ordinary clay, ordinary sand, limestone used for lime burning, boulders, , murrum,
brick earth, bentonite, road metal, slate, marble, stones used for making household utensils etc. and
other minerals not defined as minor minerals in the said Act are treated as major minerals. They
include coal, kyanite, sillimanite, barites, chromite, fluorite, quartz, sand used for stowing Purposes in
coal mines and many other minerals used for industrial purposes.
Based on the amendments made by the Ministry of Environment, Forests and Climate Change,
Government of India, in the Environment Impact Assessment Notification, 2006 notified or
amendment on 15 January 2016, the Survey document of the district Gondia. The district survey
document has been prepared in accordance with the Appendix-X of the said notification. The
Minerals/ rivers/streams were studied based on the following parameters excluding the hill slope
mining.
OBJECTIVES
The main objective of the preparation of District Survey Report
(as per the Sustainable Sand Mining Guideline) is to ensure the following –
� Identification of areas of aggradations or deposition where mining can be
allowed; and
� Identification of areas of erosion and proximity to infrastructural structures
and installations where mining should be prohibited and calculation of
annual rate of replenishment and allowing time for replenishment after
mining in that area.
� Identification of mineral wealth in the district.
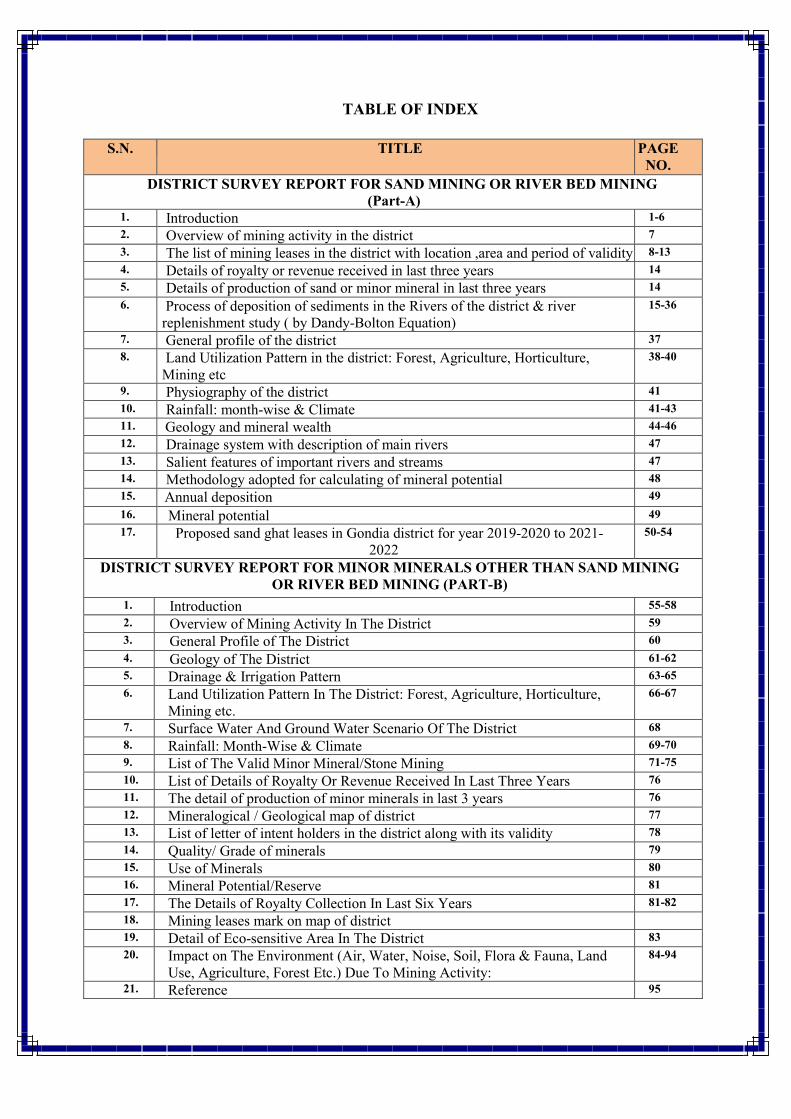
TABLE OF INDEX
S.N. TITLE PAGE
NO. DISTRICT SURVEY REPORT FOR SAND MINING OR RIVER BED MINING
(Part-A) 1. Introduction 1-6
2. Overview of mining activity in the district 7
3. The list of mining leases in the district with location ,area and period of validity 8-13
4. Details of royalty or revenue received in last three years 14
5. Details of production of sand or minor mineral in last three years 14
6. Process of deposition of sediments in the Rivers of the district & river replenishment study ( by Dandy-Bolton Equation)
15-36
7. General profile of the district 37
8. Land Utilization Pattern in the district: Forest, Agriculture, Horticulture, Mining etc
38-40
9. Physiography of the district 41
10. Rainfall: month-wise & Climate 41-43
11. Geology and mineral wealth 44-46
12. Drainage system with description of main rivers 47
13. Salient features of important rivers and streams 47
14. Methodology adopted for calculating of mineral potential 48
15. Annual deposition 49
16. Mineral potential 49
17. Proposed sand ghat leases in Gondia district for year 2019-2020 to 2021- 2022
50-54
DISTRICT SURVEY REPORT FOR MINOR MINERALS OTHER THAN SAND MINING OR RIVER BED MINING (PART-B)
1. Introduction 55-58
2. Overview of Mining Activity In The District 59
3. General Profile of The District 60
4. Geology of The District 61-62
5. Drainage & Irrigation Pattern 63-65
6. Land Utilization Pattern In The District: Forest, Agriculture, Horticulture, Mining etc.
66-67
7. Surface Water And Ground Water Scenario Of The District 68
8. Rainfall: Month-Wise & Climate 69-70
9. List of The Valid Minor Mineral/Stone Mining 71-75
10. List of Details of Royalty Or Revenue Received In Last Three Years 76
11. The detail of production of minor minerals in last 3 years 76
12. Mineralogical / Geological map of district 77
13. List of letter of intent holders in the district along with its validity 78
14. Quality/ Grade of minerals 79
15. Use of Minerals 80
16. Mineral Potential/Reserve 81
17. The Details of Royalty Collection In Last Six Years 81-82
18. Mining leases mark on map of district
19. Detail of Eco-sensitive Area In The District 83
20. Impact on The Environment (Air, Water, Noise, Soil, Flora & Fauna, Land Use, Agriculture, Forest Etc.) Due To Mining Activity:
84-94
21. Reference 95
DISTRICT SURVEY REPORT FOR GONDIA
District Survey Report Gondia 1
DISTRICT SURVEY REPORT FOR SAND MINING OR RIVER BED MINING (Part-A)
1. INTRODUCTION:
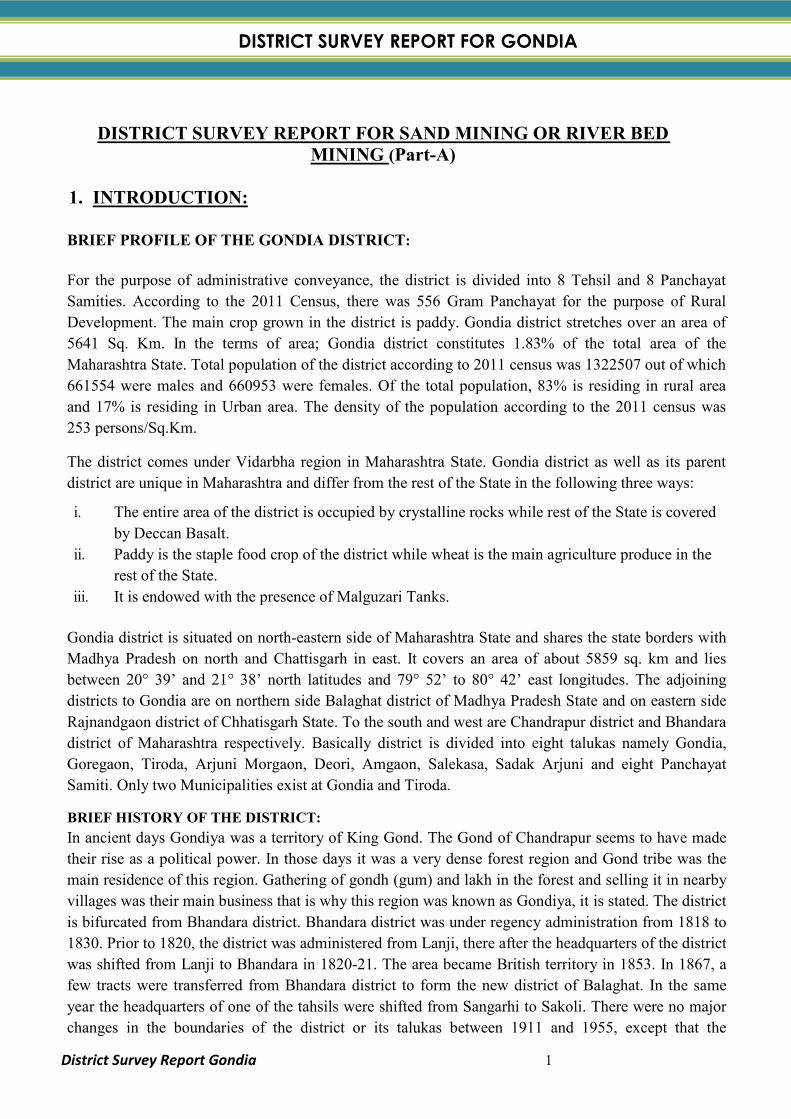
BRIEF PROFILE OF THE GONDIA DISTRICT:
For the purpose of administrative conveyance, the district is divided into 8 Tehsil and 8 Panchayat
Samities. According to the 2011 Census, there was 556 Gram Panchayat for the purpose of Rural
Development. The main crop grown in the district is paddy. Gondia district stretches over an area of
5641 Sq. Km. In the terms of area; Gondia district constitutes 1.83% of the total area of the
Maharashtra State. Total population of the district according to 2011 census was 1322507 out of which
661554 were males and 660953 were females. Of the total population, 83% is residing in rural area
and 17% is residing in Urban area. The density of the population according to the 2011 census was
253 persons/Sq.Km.
The district comes under Vidarbha region in Maharashtra State. Gondia district as well as its parent
district are unique in Maharashtra and differ from the rest of the State in the following three ways:
i. The entire area of the district is occupied by crystalline rocks while rest of the State is covered
by Deccan Basalt.
ii. Paddy is the staple food crop of the district while wheat is the main agriculture produce in the
rest of the State.
iii. It is endowed with the presence of Malguzari Tanks.
Gondia district is situated on north-eastern side of Maharashtra State and shares the state borders with
Madhya Pradesh on north and Chattisgarh in east. It covers an area of about 5859 sq. km and lies
between 20° 39’ and 21° 38’ north latitudes and 79° 52’ to 80° 42’ east longitudes. The adjoining
districts to Gondia are on northern side Balaghat district of Madhya Pradesh State and on eastern side
Rajnandgaon district of Chhatisgarh State. To the south and west are Chandrapur district and Bhandara
district of Maharashtra respectively. Basically district is divided into eight talukas namely Gondia,
Goregaon, Tiroda, Arjuni Morgaon, Deori, Amgaon, Salekasa, Sadak Arjuni and eight Panchayat
Samiti. Only two Municipalities exist at Gondia and Tiroda.
BRIEF HISTORY OF THE DISTRICT:
In ancient days Gondiya was a territory of King Gond. The Gond of Chandrapur seems to have made
their rise as a political power. In those days it was a very dense forest region and Gond tribe was the
main residence of this region. Gathering of gondh (gum) and lakh in the forest and selling it in nearby
villages was their main business that is why this region was known as Gondiya, it is stated. The district
is bifurcated from Bhandara district. Bhandara district was under regency administration from 1818 to
1830. Prior to 1820, the district was administered from Lanji, there after the headquarters of the district
was shifted from Lanji to Bhandara in 1820-21. The area became British territory in 1853. In 1867, a
few tracts were transferred from Bhandara district to form the new district of Balaghat. In the same
year the headquarters of one of the tahsils were shifted from Sangarhi to Sakoli. There were no major
changes in the boundaries of the district or its talukas between 1911 and 1955, except that the
DISTRICT SURVEY REPORT FOR GONDIA
District Survey Report Gondia 2
headquarters of Tirora tahsil was shifted to Gondiya and name of the tahsil was changed to Gondiya
Tehsil in 1914. From 1947 to 1956, the district Bhandara, along with other districts of Vidarbha region
continued to form a part of the central provinces. With the re-organisation of states in 1956, Bhandara
district was transferred from Madhya Pradesh to Bombay State, which came in to existence in the
same year. In 1960, with the formation of state of Maharashtra it formed a part of the newly created
state. With effect from 1st May 1999, Bhandara district is divided in to two-district viz. Bhandara and
Gondia for the administrative purpose and industrial/agricultural development.

DISTRICT SURVEY REPORT FOR GONDIA
District Survey Report Gondia 3
FIGURE 1. LOCATION MAP OF GONDIA DISTRICT
DISTRICT SURVEY REPORT FOR GONDIA
District Survey Report Gondia
FIGURE
DISTRICT SURVEY REPORT FOR GONDIA
4
FIGURE-2. GONDIA DISTRICT MAP
DISTRICT SURVEY REPORT FOR GONDIA
DISTRICT SURVEY REPORT FOR GONDIA
District Survey Report Gondia 5
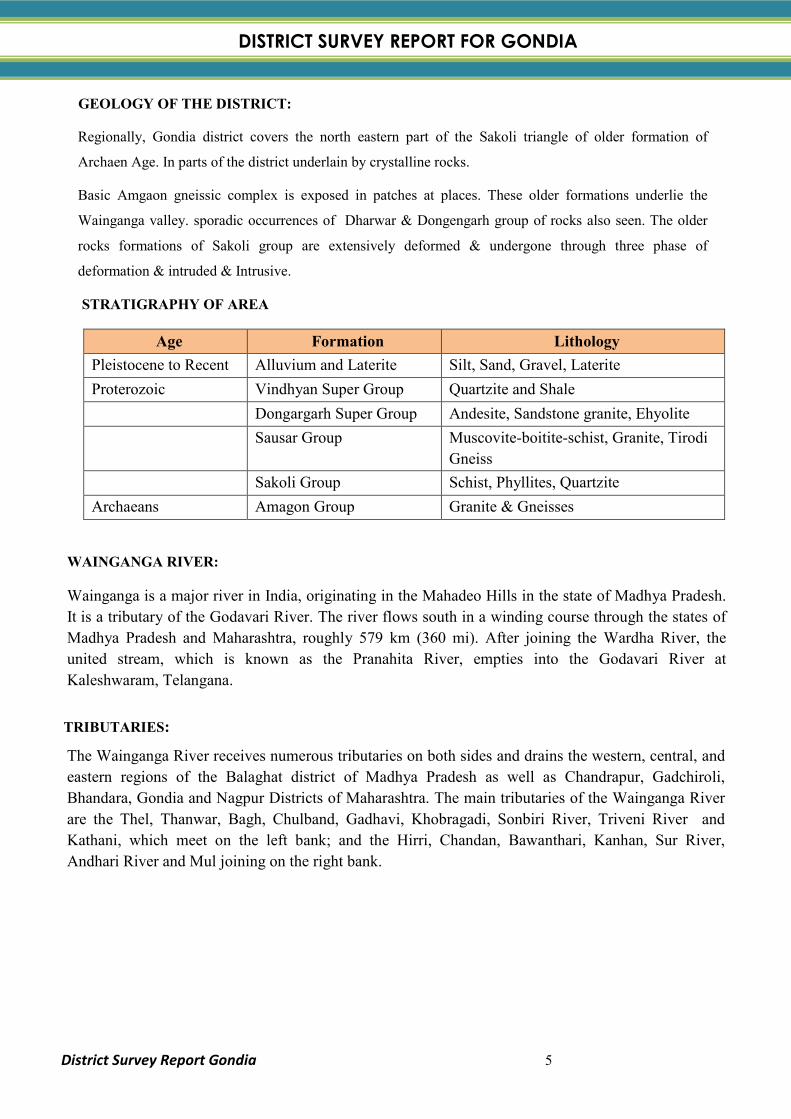
GEOLOGY OF THE DISTRICT:
Regionally, Gondia district covers the north eastern part of the Sakoli triangle of older formation of
Archaen Age. In parts of the district underlain by crystalline rocks.
Basic Amgaon gneissic complex is exposed in patches at places. These older formations underlie the
Wainganga valley. sporadic occurrences of Dharwar & Dongengarh group of rocks also seen. The older
rocks formations of Sakoli group are extensively deformed & undergone through three phase of
deformation & intruded & Intrusive.
STRATIGRAPHY OF AREA
Age Formation Lithology
Pleistocene to Recent Alluvium and Laterite Silt, Sand, Gravel, Laterite
Proterozoic Vindhyan Super Group Quartzite and Shale
Dongargarh Super Group Andesite, Sandstone granite, Ehyolite
Sausar Group Muscovite-boitite-schist, Granite, Tirodi
Gneiss
Sakoli Group Schist, Phyllites, Quartzite
Archaeans Amagon Group Granite & Gneisses
WAINGANGA RIVER:
Wainganga is a major river in India, originating in the Mahadeo Hills in the state of Madhya Pradesh.
It is a tributary of the Godavari River. The river flows south in a winding course through the states of
Madhya Pradesh and Maharashtra, roughly 579 km (360 mi). After joining the Wardha River, the
united stream, which is known as the Pranahita River, empties into the Godavari River at
Kaleshwaram, Telangana.
TRIBUTARIES:
The Wainganga River receives numerous tributaries on both sides and drains the western, central, and
eastern regions of the Balaghat district of Madhya Pradesh as well as Chandrapur, Gadchiroli,
Bhandara, Gondia and Nagpur Districts of Maharashtra. The main tributaries of the Wainganga River
are the Thel, Thanwar, Bagh, Chulband, Gadhavi, Khobragadi, Sonbiri River, Triveni River and
Kathani, which meet on the left bank; and the Hirri, Chandan, Bawanthari, Kanhan, Sur River,
Andhari River and Mul joining on the right bank.
DISTRICT SURVEY REPORT FOR GONDIA
District Survey Report Gondia 6
–
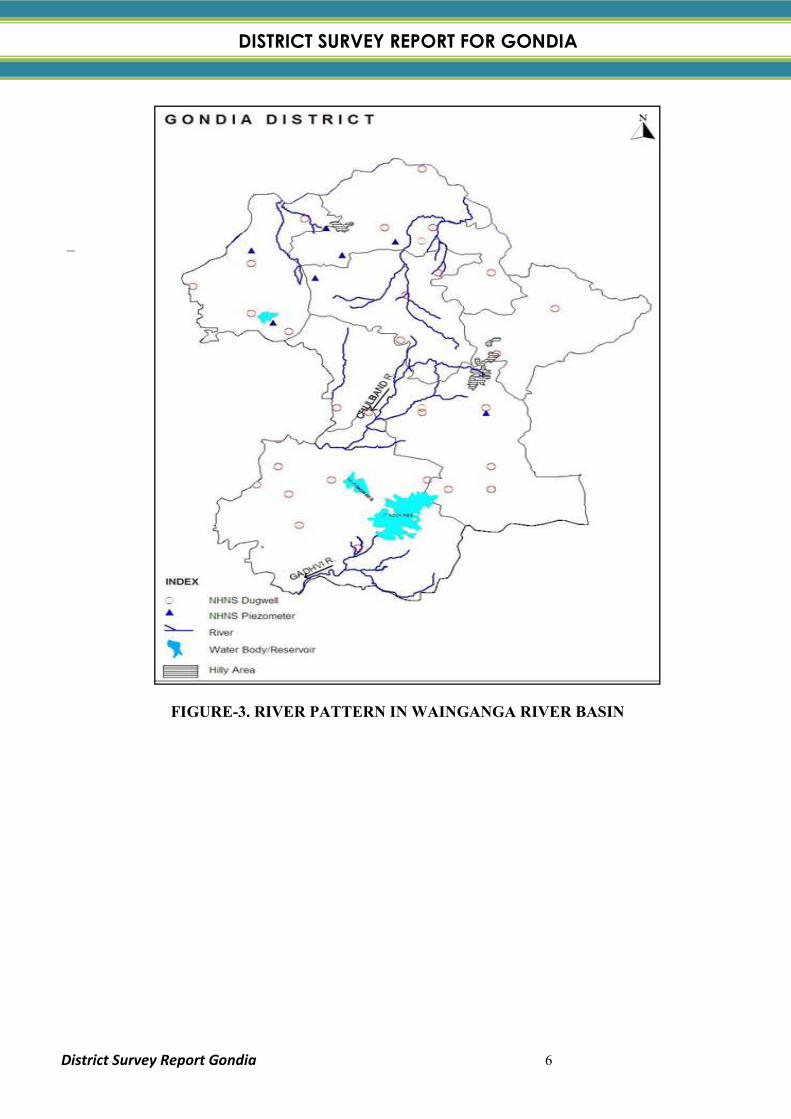
FIGURE-3. RIVER PATTERN IN WAINGANGA RIVER BASIN

DISTRICT SURVEY REPORT FOR GONDIA
District Survey Report Gondia 7
2. OVERVIEW OF MINING ACTIVITY IN THE DISTRICT:
The three types of minor mineral constituents such as sand, stone and bajri are required for any type of
construction apart from other material like cement and steel. In earlier times, the houses/ buildings
were constructed in form of small dwellings with walls made up of mud plaster, stone and
interlocking provided with wooden frames and there were negligible commercial as well as
developmental activities resulting less demand of building material. However, with the passage of time
when the District was carved out during new vistas of developmental activities were started. Mineral
Resources: Gondia district is reasonably. As such the demand of minor minerals in the District started
an increasing trend. The increase could be gauged from the fact that during year 2018-19 the total
royalty collection approximate on all mineral was Rs. 2828.28 Lakh. The quantity of minor mineral
consumption is a thermometer to assess the quantity of developmental activities being undertaken in a
particular area. In order to meet the requirement of raw material for construction, the extraction of sand
from the river bed, stone and bajri from the land mining area are being carried out exclusively. The
demand of sand is mainly met through river borne collection, whereas the demand of bajri/grits are
met through manufactured grit by stone crushers. The demand of dressed or undressed stone is met
through the broken rock material from the hill slope. The local residents used to lift sand/gravel etc.
from the river beds to meet out their bonafide requirement, however after coming into being the Mines
and Minerals (Development and Regulation) Act, 1957 (67 Act-1957) and Maharashtra Minor Mineral
Extraction (Development and Regulation)Rules, 2013. As the mining was allowed in accordance to the
rules, presently in this District, Mineral concessions are being granted through grant of mining Lease.
At present 22 nos. of mining leases for minor minerals have been granted under the rules in different
parts of the District and the detail is tabulated below. 27 Sand mine river Beds has put to auction.
Based on the amendments made by the Ministry of Environment, Forests and Climate Change,
Government of India, in the Environment Impact Assessment Notification, 2006 notified on 15
January 2015, the Survey document of the district Gondia, The district survey document has been
prepared in accordance with the Appendix-X of the said notification.
DISTRICT SURVEY REPORT FOR GONDIA
District Survey Report Gondia 8
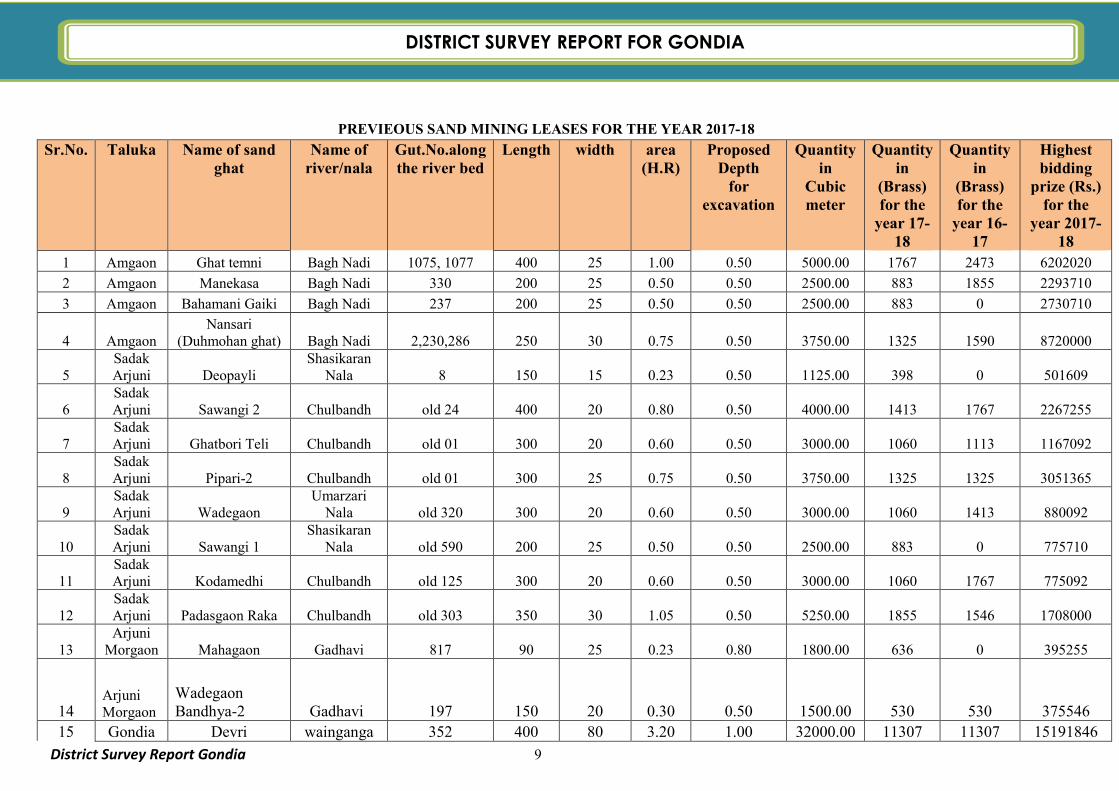
3. THE LIST OF MINING LEASES IN THE DISTRICT WITH LOCATION,
AREA AND PERIOD OF VALIDITY: The Gondia District is moderately rich in mineral and there are both major and minor mineral mines.
There are 4 Iron ore and out of 4, 1 mine is closed due to IBM suspension as well there are about 24
mines of stone quarry approved from commencement of last validity period including 2
Quartz/Quartzite Mines. Currently, out of these 24 mines, 7 mines are not in working due to ending of
validity period. About 68 Sand Ghats have been marked in all river of the Gondia district, of which
about 27 Sand Ghats are technically feasible. The details of the sand mining leases in the district are as
follows.
DISTRICT SURVEY REPORT FOR GONDIA
District Survey Report Gondia 9
PREVIEOUS SAND MINING LEASES FOR THE YEAR 2017-18
Sr.No. Taluka Name of sand ghat
Name of river/nala
Gut.No.along the river bed
Length width area (H.R)
Proposed Depth
for excavation
Quantity in
Cubic meter
Quantity in
(Brass) for the
year 17-18
Quantity in
(Brass) for the
year 16-17
Highest bidding
prize (Rs.) for the
year 2017-18
1 Amgaon Ghat temni Bagh Nadi 1075, 1077 400 25 1.00 0.50 5000.00 1767 2473 6202020
2 Amgaon Manekasa Bagh Nadi 330 200 25 0.50 0.50 2500.00 883 1855 2293710
3 Amgaon Bahamani Gaiki Bagh Nadi 237 200 25 0.50 0.50 2500.00 883 0 2730710
4 Amgaon Nansari
(Duhmohan ghat) Bagh Nadi 2,230,286 250 30 0.75 0.50 3750.00 1325 1590 8720000
5 Sadak Arjuni Deopayli
Shasikaran Nala 8 150 15 0.23 0.50 1125.00 398 0 501609
6 Sadak Arjuni Sawangi 2 Chulbandh old 24 400 20 0.80 0.50 4000.00 1413 1767 2267255
7 Sadak Arjuni Ghatbori Teli Chulbandh old 01 300 20 0.60 0.50 3000.00 1060 1113 1167092
8 Sadak Arjuni Pipari-2 Chulbandh old 01 300 25 0.75 0.50 3750.00 1325 1325 3051365
9 Sadak Arjuni Wadegaon
Umarzari Nala old 320 300 20 0.60 0.50 3000.00 1060 1413 880092
10 Sadak Arjuni Sawangi 1
Shasikaran Nala old 590 200 25 0.50 0.50 2500.00 883 0 775710
11 Sadak Arjuni Kodamedhi Chulbandh old 125 300 20 0.60 0.50 3000.00 1060 1767 775092
12 Sadak Arjuni Padasgaon Raka Chulbandh old 303 350 30 1.05 0.50 5250.00 1855 1546 1708000
13 Arjuni
Morgaon Mahagaon Gadhavi 817 90 25 0.23 0.80 1800.00 636 0 395255
14 Arjuni Morgaon
Wadegaon Bandhya-2 Gadhavi 197 150 20 0.30 0.50 1500.00 530 530 375546
15 Gondia Devri wainganga 352 400 80 3.20 1.00 32000.00 11307 11307 15191846
DISTRICT SURVEY REPORT FOR GONDIA
District Survey Report Gondia 10
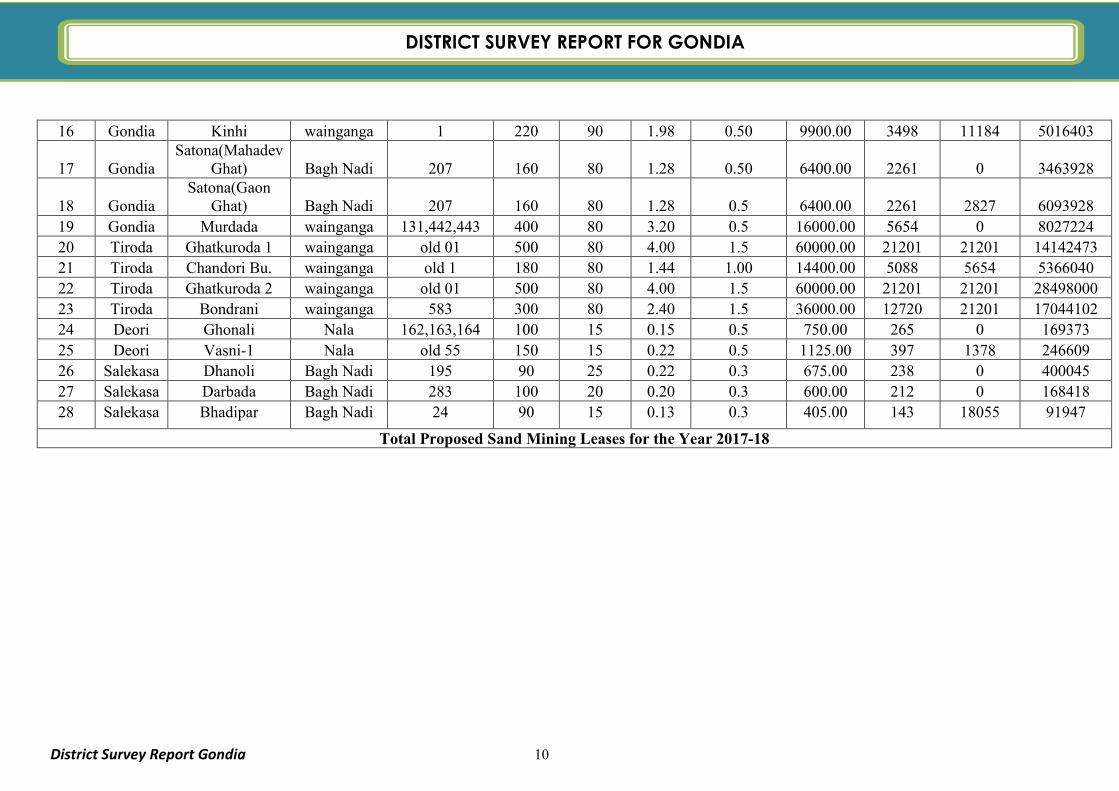
16 Gondia Kinhi wainganga 1 220 90 1.98 0.50 9900.00 3498 11184 5016403
17 Gondia Satona(Mahadev
Ghat) Bagh Nadi 207 160 80 1.28 0.50 6400.00 2261 0 3463928
18 Gondia Satona(Gaon
Ghat) Bagh Nadi 207 160 80 1.28 0.5 6400.00 2261 2827 6093928 19 Gondia Murdada wainganga 131,442,443 400 80 3.20 0.5 16000.00 5654 0 8027224 20 Tiroda Ghatkuroda 1 wainganga old 01 500 80 4.00 1.5 60000.00 21201 21201 14142473 21 Tiroda Chandori Bu. wainganga old 1 180 80 1.44 1.00 14400.00 5088 5654 5366040 22 Tiroda Ghatkuroda 2 wainganga old 01 500 80 4.00 1.5 60000.00 21201 21201 28498000 23 Tiroda Bondrani wainganga 583 300 80 2.40 1.5 36000.00 12720 21201 17044102 24 Deori Ghonali Nala 162,163,164 100 15 0.15 0.5 750.00 265 0 169373 25 Deori Vasni-1 Nala old 55 150 15 0.22 0.5 1125.00 397 1378 246609 26 Salekasa Dhanoli Bagh Nadi 195 90 25 0.22 0.3 675.00 238 0 400045 27 Salekasa Darbada Bagh Nadi 283 100 20 0.20 0.3 600.00 212 0 168418 28 Salekasa Bhadipar Bagh Nadi 24 90 15 0.13 0.3 405.00 143 18055 91947
Total Proposed Sand Mining Leases for the Year 2017-18
DISTRICT SURVEY REPORT FOR GONDIA
District Survey Report Gondia 11
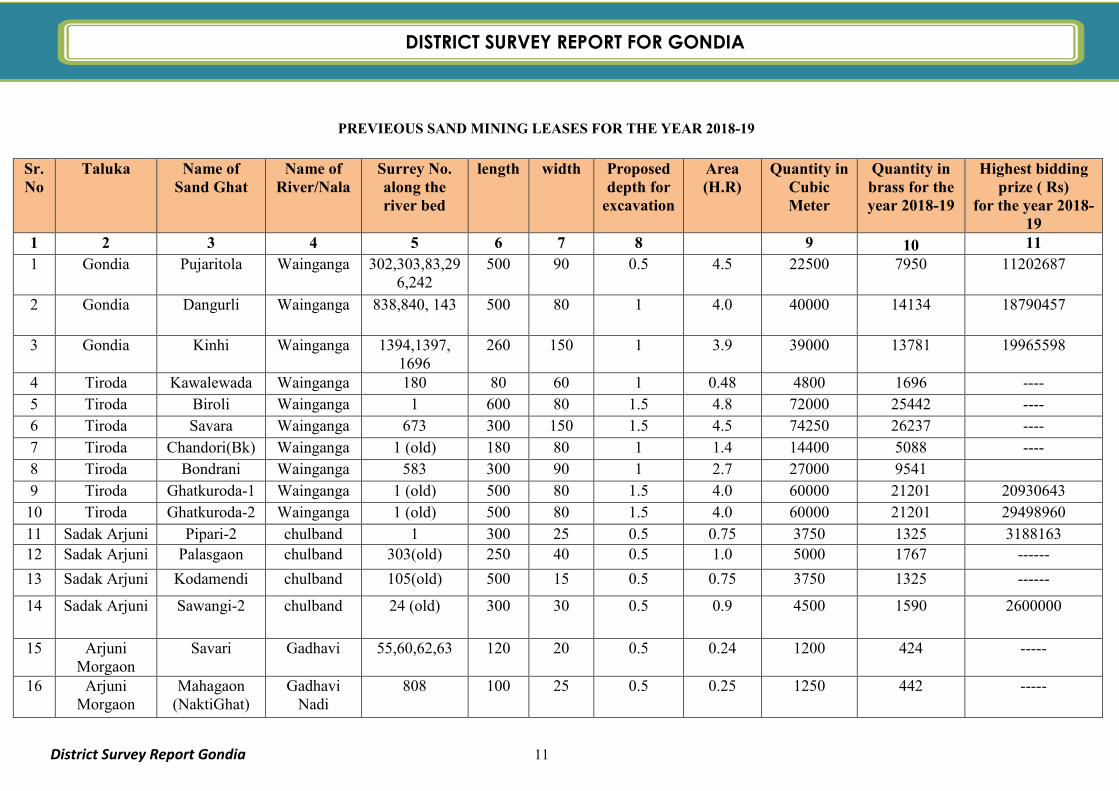
PREVIEOUS SAND MINING LEASES FOR THE YEAR 2018-19
Sr. No
Taluka Name of Sand Ghat
Name of River/Nala
Surrey No. along the river bed
length width Proposed depth for
excavation
Area (H.R)
Quantity in Cubic Meter
Quantity in brass for the year 2018-19
Highest bidding prize ( Rs)
for the year 2018-19
1 2 3 4 5 6 7 8 9 10 11
1 Gondia Pujaritola Wainganga 302,303,83,296,242
500 90 0.5 4.5 22500 7950 11202687
2 Gondia Dangurli Wainganga 838,840, 143 500 80 1 4.0 40000 14134 18790457
3 Gondia Kinhi Wainganga 1394,1397, 1696
260 150 1 3.9 39000 13781 19965598
4 Tiroda Kawalewada Wainganga 180 80 60 1 0.48 4800 1696 ----
5 Tiroda Biroli Wainganga 1 600 80 1.5 4.8 72000 25442 ----
6 Tiroda Savara Wainganga 673 300 150 1.5 4.5 74250 26237 ----
7 Tiroda Chandori(Bk) Wainganga 1 (old) 180 80 1 1.4 14400 5088 ----
8 Tiroda Bondrani Wainganga 583 300 90 1 2.7 27000 9541
9 Tiroda Ghatkuroda-1 Wainganga 1 (old) 500 80 1.5 4.0 60000 21201 20930643
10 Tiroda Ghatkuroda-2 Wainganga 1 (old) 500 80 1.5 4.0 60000 21201 29498960
11 Sadak Arjuni Pipari-2 chulband 1 300 25 0.5 0.75 3750 1325 3188163 12 Sadak Arjuni Palasgaon chulband 303(old) 250 40 0.5 1.0 5000 1767 ------
13 Sadak Arjuni Kodamendi chulband 105(old) 500 15 0.5 0.75 3750 1325 ------
14 Sadak Arjuni Sawangi-2 chulband 24 (old) 300 30 0.5 0.9 4500 1590 2600000
15 Arjuni Morgaon
Savari Gadhavi 55,60,62,63 120 20 0.5 0.24 1200 424 -----
16 Arjuni Morgaon
Mahagaon (NaktiGhat)
Gadhavi Nadi
808 100 25 0.5 0.25 1250 442 -----
DISTRICT SURVEY REPORT FOR GONDIA
District Survey Report Gondia 12
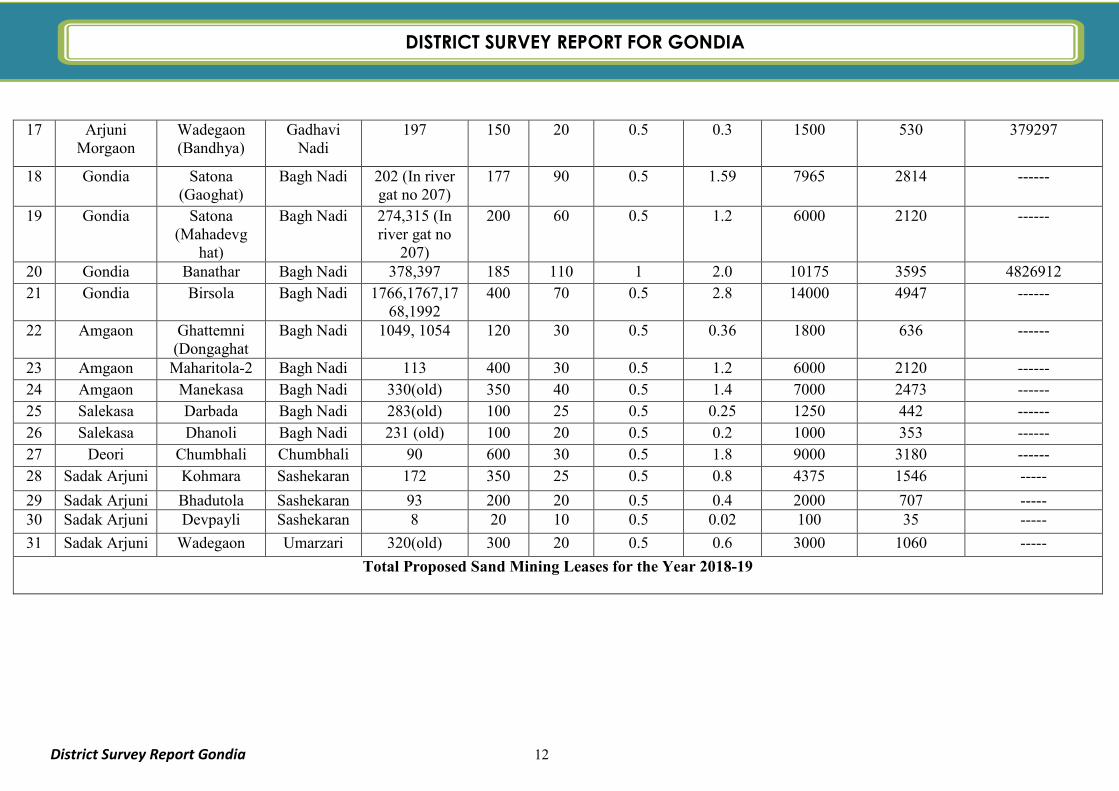
17 Arjuni Morgaon
Wadegaon (Bandhya)
Gadhavi Nadi
197 150 20 0.5 0.3 1500 530 379297
18 Gondia Satona (Gaoghat)
Bagh Nadi 202 (In river gat no 207)
177 90 0.5 1.59 7965 2814 ------
19 Gondia Satona (Mahadevg
hat)
Bagh Nadi 274,315 (In river gat no
207)
200 60 0.5 1.2 6000 2120 ------
20 Gondia Banathar Bagh Nadi 378,397 185 110 1 2.0 10175 3595 4826912
21 Gondia Birsola Bagh Nadi 1766,1767,1768,1992
400 70 0.5 2.8 14000 4947 ------
22 Amgaon Ghattemni (Dongaghat
Bagh Nadi 1049, 1054 120 30 0.5 0.36 1800 636 ------
23 Amgaon Maharitola-2 Bagh Nadi 113 400 30 0.5 1.2 6000 2120 ------
24 Amgaon Manekasa Bagh Nadi 330(old) 350 40 0.5 1.4 7000 2473 ------
25 Salekasa Darbada Bagh Nadi 283(old) 100 25 0.5 0.25 1250 442 ------
26 Salekasa Dhanoli Bagh Nadi 231 (old) 100 20 0.5 0.2 1000 353 ------
27 Deori Chumbhali Chumbhali 90 600 30 0.5 1.8 9000 3180 ------
28 Sadak Arjuni Kohmara Sashekaran 172 350 25 0.5 0.8 4375 1546 -----
29 Sadak Arjuni Bhadutola Sashekaran 93 200 20 0.5 0.4 2000 707 ----- 30 Sadak Arjuni Devpayli Sashekaran 8 20 10 0.5 0.02 100 35 -----
31 Sadak Arjuni Wadegaon Umarzari 320(old) 300 20 0.5 0.6 3000 1060 -----
Total Proposed Sand Mining Leases for the Year 2018-19

DISTRICT SURVEY REPORT FOR GONDIA
District Survey Report Gondia 13
FIGURE-4 LOCATION MAP OF SAND GHAT (PREVIOUS YEAR) GONDIA DISTRICT.
DISTRICT SURVEY REPORT FOR GONDIA
District Survey Report Gondia 14
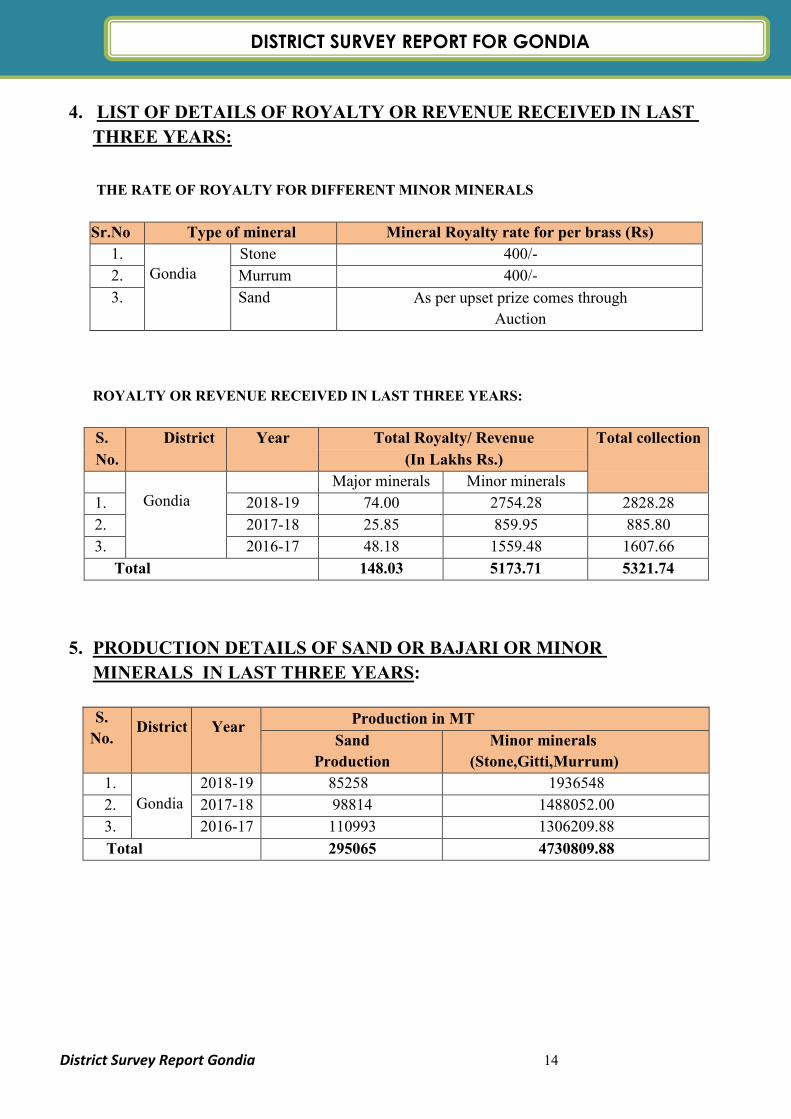
4. LIST OF DETAILS OF ROYALTY OR REVENUE RECEIVED IN LAST
THREE YEARS:
THE RATE OF ROYALTY FOR DIFFERENT MINOR MINERALS
Sr.No Type of mineral Mineral Royalty rate for per brass (Rs)
1.
Gondia Stone 400/-
2. Murrum 400/-
3. Sand As per upset prize comes through
Auction
ROYALTY OR REVENUE RECEIVED IN LAST THREE YEARS:
S. District Year Total Royalty/ Revenue Total collection
No. (In Lakhs Rs.)
Gondia
Major minerals Minor minerals
1. 2018-19 74.00 2754.28 2828.28
2. 2017-18 25.85 859.95 885.80
3. 2016-17 48.18 1559.48 1607.66
Total 148.03 5173.71 5321.74
5. PRODUCTION DETAILS OF SAND OR BAJARI OR MINOR
MINERALS IN LAST THREE YEARS:
S.
No. District Year
Production in MT
Sand
Production
Minor minerals
(Stone,Gitti,Murrum)
1.
Gondia 2018-19 85258 1936548
2. 2017-18 98814 1488052.00
3. 2016-17 110993 1306209.88
Total 295065 4730809.88
DISTRICT SURVEY REPORT FOR GONDIA
District Survey Report Gondia 15
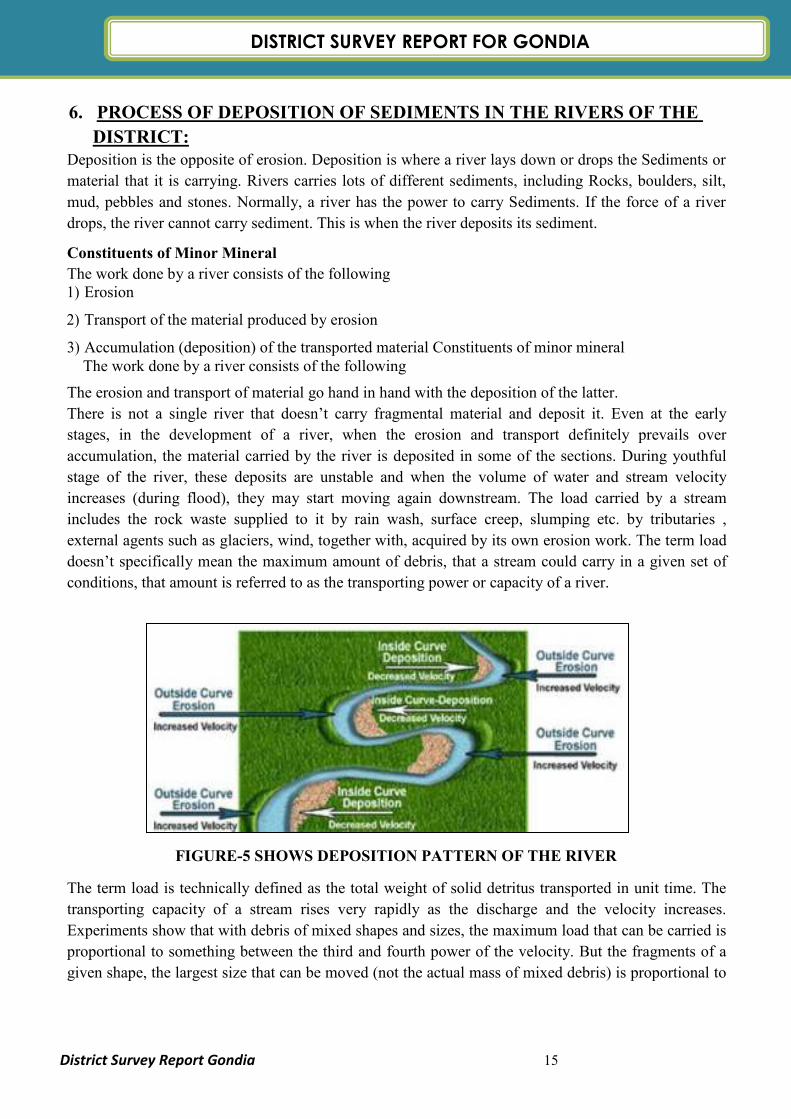
6. PROCESS OF DEPOSITION OF SEDIMENTS IN THE RIVERS OF THE
DISTRICT: Deposition is the opposite of erosion. Deposition is where a river lays down or drops the Sediments or
material that it is carrying. Rivers carries lots of different sediments, including Rocks, boulders, silt,
mud, pebbles and stones. Normally, a river has the power to carry Sediments. If the force of a river
drops, the river cannot carry sediment. This is when the river deposits its sediment.
Constituents of Minor Mineral
The work done by a river consists of the following 1) Erosion
2) Transport of the material produced by erosion
3) Accumulation (deposition) of the transported material Constituents of minor mineral The work done by a river consists of the following
The erosion and transport of material go hand in hand with the deposition of the latter.
There is not a single river that doesn’t carry fragmental material and deposit it. Even at the early
stages, in the development of a river, when the erosion and transport definitely prevails over
accumulation, the material carried by the river is deposited in some of the sections. During youthful
stage of the river, these deposits are unstable and when the volume of water and stream velocity
increases (during flood), they may start moving again downstream. The load carried by a stream
includes the rock waste supplied to it by rain wash, surface creep, slumping etc. by tributaries ,
external agents such as glaciers, wind, together with, acquired by its own erosion work. The term load
doesn’t specifically mean the maximum amount of debris, that a stream could carry in a given set of
conditions, that amount is referred to as the transporting power or capacity of a river.
FIGURE-5 SHOWS DEPOSITION PATTERN OF THE RIVER
The term load is technically defined as the total weight of solid detritus transported in unit time. The
transporting capacity of a stream rises very rapidly as the discharge and the velocity increases.
Experiments show that with debris of mixed shapes and sizes, the maximum load that can be carried is
proportional to something between the third and fourth power of the velocity. But the fragments of a
given shape, the largest size that can be moved (not the actual mass of mixed debris) is proportional to
DISTRICT SURVEY REPORT FOR GONDIA
District Survey Report Gondia 16
the sixth power of the velocity, provided of course that the depth of water is also adequate for the
purpose. As the velocity of a river is checked, the bed load is first to come to rest with continued
slackening of the flow; the larger ingredients of the suspended load are dropped, followed by finer and
finer particles. When the stream begins to flow more vigorously, the finer materials are the first to
move again. A river begins to sort out its load or burden as soon as it receives it. The proportion of
fine to coarse amongst the deposited materials tend on average to increase downstream, but there may
be interruptions of this tendency because of addition of coarse debris from tributaries or from
landslides and steepening of the banks. Both discharge and load depend on the climate and geology
(lithology, structure and relief) of the river basin concerned and both co-operate in carving out the
channels down.
RIVER REPLENISHMENT STUDY:
Sediment Transportation-
Sediment transport is the movement of organic and inorganic particles by water. In general, greater the
flow more sediment that will be conveyed. Water flow can be strong enough to suspend particles in the
water column as they move downstream, or simply push them along the bottom of a waterway.
Transported sediment may include mineral matter, chemicals and pollutants, and organic material.
Another name for sediment transport is sediment load. The total load includes all particles moving as
bed load, suspended load, and wash load.
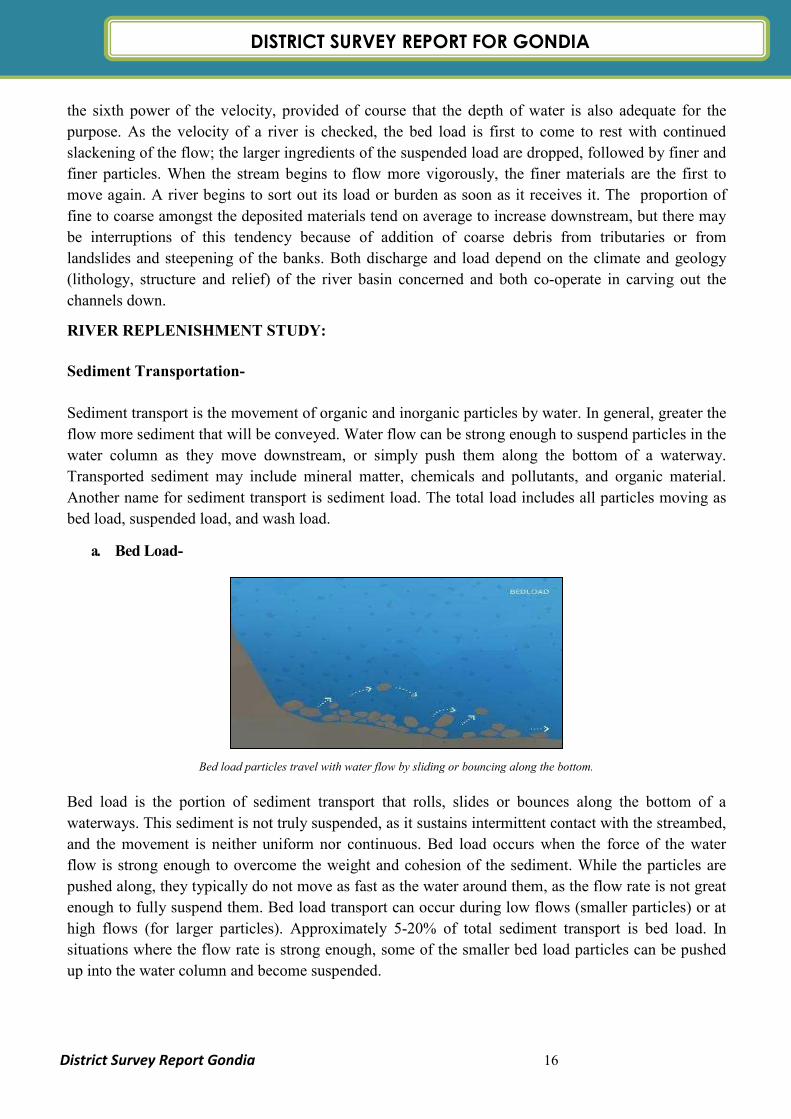
a. Bed Load-
Bed load particles travel with water flow by sliding or bouncing along the bottom.
Bed load is the portion of sediment transport that rolls, slides or bounces along the bottom of a
waterways. This sediment is not truly suspended, as it sustains intermittent contact with the streambed,
and the movement is neither uniform nor continuous. Bed load occurs when the force of the water
flow is strong enough to overcome the weight and cohesion of the sediment. While the particles are
pushed along, they typically do not move as fast as the water around them, as the flow rate is not great
enough to fully suspend them. Bed load transport can occur during low flows (smaller particles) or at
high flows (for larger particles). Approximately 5-20% of total sediment transport is bed load. In
situations where the flow rate is strong enough, some of the smaller bed load particles can be pushed
up into the water column and become suspended.

DISTRICT SURVEY REPORT FOR GONDIA
District Survey Report Gondia 17
b. Suspended Load-
While there is often overlap, the suspended load and suspended sediment are not the same thing.
Suspended sediment are any particles found in the water column, whether the water is flowing or not.
The suspended load, on the other hand, is the amount of sediment carried downstream within the water
column by the water flow. Suspended loads require moving water, as the water flow creates small
upward currents (turbulence) that keep the particles above the bed. The size of the particles that can be carried
as suspended load is dependent on the flow rate. Larger particles are more likely to fall through the
upward currents to the bottom, unless the flow rate increases, increasing the turbulence at the streambed.
In addition, suspended sediment will not necessarily remain suspended if the flow rate slows.
If the water flow is strong enough to pick up sediment particles, they will become part of the suspended load.
c. Wash Load-
The wash load is the portion of sediment that will remain suspended even when there is no water flow.

DISTRICT SURVEY REPORT FOR GONDIA
District Survey Report Gondia 18
When the flow rate changes, some sediment can settle out of the water, adding to point bars, channel bars and
beaches.
The wash load is a subset of the suspended load. This load is comprised of the finest suspended
sediment (typically less than 0.00195 mm in diameter). The wash load is differentiated from the
suspended load because it will not settle to the bottom of a waterway during a low or no flow period.
Instead, these particles remain in permanent suspension as they are small enough to bounce off water
molecules and stay afloat. However, during flow periods, the wash load and suspended load are
indistinguishable. Turbidity in lakes and slow moving rivers is typically due the wash load. When the
flow rate increases (increasing the suspended load and overall sediment transport), turbidity also
increases. While turbidity cannot be used to estimate sediment transport, it can approximate suspended
sediment concentrations at a specific location.
What is Sediment Deposition?
Sediment is necessary to the development of aquatic ecosystems through nutrient replenishment and
the creation of benthic habitat and spawning areas. These benefits occur due to sediment deposition –
when suspended particles settle down to the bottom of a body of water. This settling often occurs
when water flow slows down or stops and heavy particles can no longer be supported by the bed
turbulence. Sediment deposition can be found anywhere in a water system, from high mountain
streams, to rivers, lakes, deltas and floodplains. However, it should be noted that while sediment is
important for aquatic habitat growth, it can cause environmental issues if the deposition rates are too
high, or too low. Sediment transportation and Deposition is depends upon various factors like Slope of
the Area, Annual Rainfall, Lithology, flow intensity of River, Geomorphology, Soil, Geology and
Landuse.

DISTRICT SURVEY REPORT FOR GONDIA
District Survey Report Gondia 19
FIGURE.6 IMAGE SHOWS SLOPE PROFILE OF WAINGANGĀ RIVER
WAINGANGA RIVER:
The Waingangā rises in the Mahadeo Hills in south-central Madhya Pradesh state and flows 360
miles (580 km) south to join the Wardha River (a headwater of the Godavari), northeast of
Kagaznagar in Maharashtra state. Along the final 142 miles (229 km) of its course, the river forms
the boundary between Maharashtra and Telangana states and is known as the Pranhita. The river
receives water from numerous tributaries, notably the Bagh, Bawanthadi, Kanhan, Chulband,
Garhvi, and Thanwar rivers. During the rainy season the river is navigable for only a short distance
upstream from the confluence with the Bagh River.
Tributaries-
The Wainganga river receives numerous tributaries on both sides and drains the western, central,
and eastern regions of the Balaghat district of Madhya Pradesh, Chandrapur, Gadchiroli,
Bhandara, Gondia, and Nagpur Districts of Maharashtra. The main tributaries of the Wainganga
River are the Thel, Thanwar, Bagh, Chulband, Garhavi, Khobragadi, and Kathani, which meet on
the left bank; and the Hirri, Chandan, Bawanthari, Kanhan, and Mul joining on the right bank.

DISTRICT SURVEY REPORT FOR GONDIA
District Survey Report Gondia 20
Major Tributaries of the Waingangā River:
Bagh River-
Bagh is the main tributary of the river Wainganga. It is interesting to note that there are two
Bagh rivers and both are tributaries of Wainganga. They are known as Main Bagh and lesser
Balaghat Bagh. The main Bagh originates from the Chichgarh plateau, and flows north on
granitic landscape. Most of its tributaries join on the right bank. The river joins Wainganga on its
left bank near the village Satona (Mahadeoghat). Lesser Balaghat Bagh which rises in the hills of
Khairagarh, joins main Bagh in the east of village Sarkartola. The Kuadhas river rising in the
Darekasa hills which flows within the district, is a sub tributary of Bagh. One of the tributaries of
main Bagh viz. Pangoli river originates from Tumsar hill of Gondia district. The river Pangoli
has a perennial source of water and it floods during the rainy season. The Satbahni river rising in
Chinchewada hills and flowing through Deori, along with Pangoli river, join the main Bagh on
its left bank.
Sirpur Dam, is an earth fill and gravity dam on Bagh river near Deori, Gondia district in the state
of Maharashtra in India. The reservoir created by the dam is also known as Bagh reservoir. It is a
joint project of Maharashtra and Chhattisgarh states located in Godavari river basin.
Bawanthadi River-
Bawanthadi is another principle affluent of Wainganga river. It rises in Madhya Pradesh in Kurai
plateau of Seoni district. The River runs east for a distance of 48 km before falling into
Wainganga. Though small and seasonal in its upper course, the river after entering the Gondia
district, is fed by numerous hill torrents and nullas which make her perennial. The river has low
banks and hence, in floods, it overflows the banks. Quick sands also occur in many parts of its
bed. Comparably small Bodalkasa river drains the overflow of the Bodalkasa tank westwards to
join the Wainganga on its left bank just downstream of the confluence of the Ambagad river.
Before its confluence with the main stream, it is met by an affluent, the Chorkhambara river
which is the main supportive water flow of Bodalkasa river. Chulband another important river of
the region and a tributary of Wainganga originates from joint hill complex of Salegaon Dalli and
Palasgaon hill. The river generally flow south, parallel to Wainganga. The river has an overall
length of 114 km. It drains the overflow of the Nawegaon and Seoni tanks. The Garhvinadi, also
known as the Itiadoh nadi, rises in the granitic plateau of Chichgarh in the south-eastern part of
Sakolitahsil and flows west in a deep and narrow valley before it finally joins Wainganga river.
Another important river Son rises in Lutna village on Baihar plateau. Gold washing was carried
out in the upper reaches of the Son river due to which it derived its name (Bhandara district
gazetteer 1979).
DISTRICT SURVEY REPORT FOR GONDIA
District Survey Report Gondia 21
Thanwar River-
The Thanwar River joins the Wainganga at the Nainpur Forest Range, at the border of the Seoni
District and Mandla District, before the Dhuty Dam on the Wainganga. It originates from the
forest of Chiraidongri in the Mandla District. There is a medium-sized dam at the village of
Bejegaon on the bank of this river, which opened in 1980. River water stored in the dam is used
to irrigate the farmland of 50 villages. The Halon River and the Chakor River (catchment from
Nainpur Forest Range) are some of the well-known tributaries to this small, fully utilized river.
Geographically, this river misses a few miles due to a Satpura foothill to become the Narmada's
first major tributary. The main towns on this tributary are Nainpur and Pindrai. The river has
been in recreational use since ancient times, as it was on the route of pilgrimage from South to
North India. The village of Jhulpur, on the bank of this river, was a stoppage and temple town.
The major bridge over the river is at the town Pindrai by Indian Railway (Jabalpur-Gondia rail
track).
Kathani River-
The Kathani River originates in the Pendhri Hills at Dhanora and joins Wainganga
near Gadchiroli city.
Hirri River-
The Hirri River originates in Moondapar, Seoni District and flows through Jeonara. It joins
Wainganga near the Dhuty Dam.
Chandan River-
The Chandan River is an important river of the Balaghat District. It flows through Waraseoni.
The Nahalesara dam is built upon the Chandan River. One of the major features along the river
is the Rampayali's temple.
Kanhan river-
The Kanhan River is Wainganga's longest tributary, at 275 km (171 mi). It rises in the hills at
the southern edge of the Satpura Range in the north-western region of Chhindwara District.
Chulband River-
Chulband River is a stream which is located between Amgaon and Lakhandur, and is also
nearby to Bramhapuri and Warsa. It flows in the Bhandara district of Maharashtra. Chulband
River is one of tributaries of Godavari River. A dam named on the river, Chulband Dam is built
across the Chulband River to supply water to the nearby regions of the river.
Chulband Dam: Chulband Dam is an earthfill dam on Chulband River near Goregaon, Gondia
district in state of Maharashtra. The Chulband dam was constructed with a purpose to store
water and supply water for irrigation.
DISTRICT SURVEY REPORT FOR GONDIA
District Survey Report Gondia 22
Course-
The main stream of the Wainganga originates at Mundara, Seoni District, on the southern
slopes of the Satpura Range of Madhya Pradesh. The river has developed extensive floodplains
characterized by sweeping graceful meanders, low alluvial flats, and slip-off slopes. The river
has high banks, which measure from 10 m (33 ft) to 15 m (49 ft) on either side. The
northern part is surrounded by the Mahadeo hills and Satpura Range, with an average elevation
of 625 m (2,051 ft) above sea level. The valley of the Wainganga River is forested and sparsely
populated. Balaghat and Bhandara are the major cities located on the bank of the Wainganga
River, while Pauni and Desaiganj are smaller urban centers on the smallest of the river banks.
The Wainganga River is the water lifeline of these cities and their primary source of water.
The Government of Maharashtra is developing a protection wall for Bhandara to protect
it from heavy flooding. This flood protection wall encircles Bhandara from east to south.
Topographical Features of the Region-
The Wainganga and its major tributaries like Bagh, Bawanthadi occupies most of the area of the
district chiefly in the north-western side. Low hills are found at a few places within the district.
These hills spread in a group or in isolation at varying heights. Maikal (Darekasa) hill lies at
eastern end of the district on the border of Maharashtra and Chhattisgarh. The elevation of these
hills is higher than the western hills. These are predominantly occupied by dense forest cover.
Gondia Bagh and Balaghat Bagh rivers flow over these hills. Few natural caves of various sizes
are also found in these hills. Towards the west of Darekasa hill, Ambagad hill is situated. This is
an extreme outlier of the Satpura ranges running with W-N and E-SE trend, separating Valley of
Bawanthadi River with Wainganga. The average elevation of Ambagad hill is 200 meter with a
width of 3 km and overall length of 30 km. To the east of Chichgarh plateau a group of hills
known as Navegaon, Palasgaon and Pratapgarh hills are located. Navegaon and Pratapgarh hills
rise to the highest elevation of the region. Chichgad hills situated at southern part of the district
represent a higher elevation than Palasgaon hills. North-western part of the district is occupied by
Wainganga and its tributaries- Bagh and Chulband rivers. This area is significantly noteworthy
since long periods of circumdenudation have resulted in the river valleys being carved out over
the Archaean, gneiss and schist. The Sausar rock beds west of the Wainganga and the Sakoli
rock beds to the east and south stand up boldly in relief as resistant hill-masses (Bhandara
District Gazetteer 1979).
Soils-
The characteristics and distribution of soils in Upper Wainganga region are influenced
essentially by the nature and intensity of weathering and the mode and rapidity of fluvial
transport on the plateau. Kali, kanhar, sihar, morand, khardi and bardi are the main types of soils
that are found in this region. The area under kali is not very extensive and it occurs in form of
DISTRICT SURVEY REPORT FOR GONDIA
District Survey Report Gondia 23
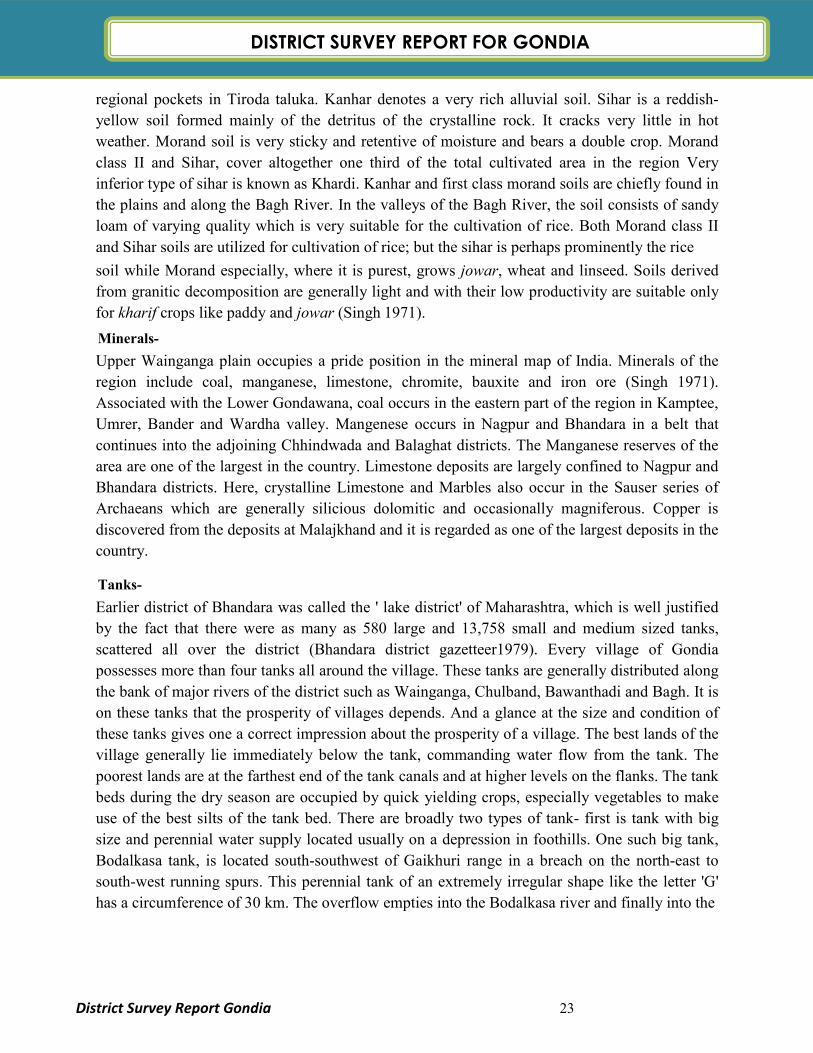
regional pockets in Tiroda taluka. Kanhar denotes a very rich alluvial soil. Sihar is a reddish-
yellow soil formed mainly of the detritus of the crystalline rock. It cracks very little in hot
weather. Morand soil is very sticky and retentive of moisture and bears a double crop. Morand
class II and Sihar, cover altogether one third of the total cultivated area in the region Very
inferior type of sihar is known as Khardi. Kanhar and first class morand soils are chiefly found in
the plains and along the Bagh River. In the valleys of the Bagh River, the soil consists of sandy
loam of varying quality which is very suitable for the cultivation of rice. Both Morand class II
and Sihar soils are utilized for cultivation of rice; but the sihar is perhaps prominently the rice
soil while Morand especially, where it is purest, grows jowar, wheat and linseed. Soils derived
from granitic decomposition are generally light and with their low productivity are suitable only
for kharif crops like paddy and jowar (Singh 1971).
Minerals-
Upper Wainganga plain occupies a pride position in the mineral map of India. Minerals of the
region include coal, manganese, limestone, chromite, bauxite and iron ore (Singh 1971).
Associated with the Lower Gondawana, coal occurs in the eastern part of the region in Kamptee,
Umrer, Bander and Wardha valley. Mangenese occurs in Nagpur and Bhandara in a belt that
continues into the adjoining Chhindwada and Balaghat districts. The Manganese reserves of the
area are one of the largest in the country. Limestone deposits are largely confined to Nagpur and
Bhandara districts. Here, crystalline Limestone and Marbles also occur in the Sauser series of
Archaeans which are generally silicious dolomitic and occasionally magniferous. Copper is
discovered from the deposits at Malajkhand and it is regarded as one of the largest deposits in the
country.
Tanks-
Earlier district of Bhandara was called the ' lake district' of Maharashtra, which is well justified
by the fact that there were as many as 580 large and 13,758 small and medium sized tanks,
scattered all over the district (Bhandara district gazetteer1979). Every village of Gondia
possesses more than four tanks all around the village. These tanks are generally distributed along
the bank of major rivers of the district such as Wainganga, Chulband, Bawanthadi and Bagh. It is
on these tanks that the prosperity of villages depends. And a glance at the size and condition of
these tanks gives one a correct impression about the prosperity of a village. The best lands of the
village generally lie immediately below the tank, commanding water flow from the tank. The
poorest lands are at the farthest end of the tank canals and at higher levels on the flanks. The tank
beds during the dry season are occupied by quick yielding crops, especially vegetables to make
use of the best silts of the tank bed. There are broadly two types of tank- first is tank with big
size and perennial water supply located usually on a depression in foothills. One such big tank,
Bodalkasa tank, is located south-southwest of Gaikhuri range in a breach on the north-east to
south-west running spurs. This perennial tank of an extremely irregular shape like the letter 'G'
has a circumference of 30 km. The overflow empties into the Bodalkasa river and finally into the
DISTRICT SURVEY REPORT FOR GONDIA
District Survey Report Gondia 24
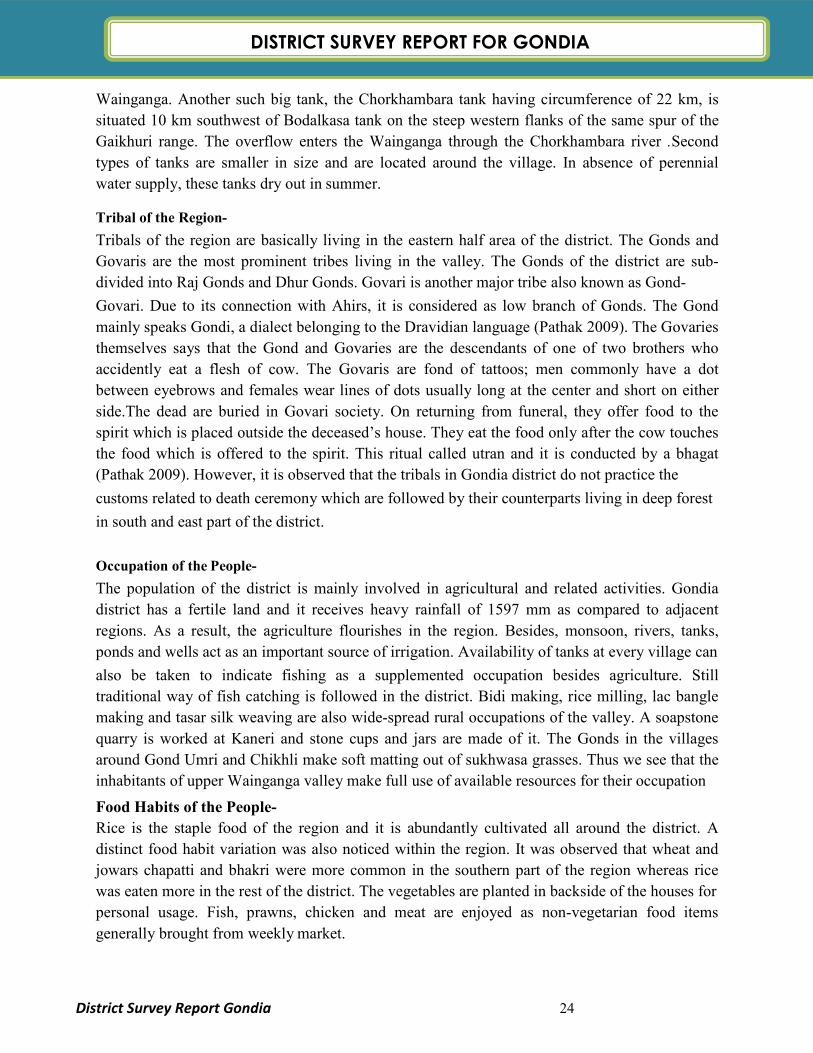
Wainganga. Another such big tank, the Chorkhambara tank having circumference of 22 km, is
situated 10 km southwest of Bodalkasa tank on the steep western flanks of the same spur of the
Gaikhuri range. The overflow enters the Wainganga through the Chorkhambara river .Second
types of tanks are smaller in size and are located around the village. In absence of perennial
water supply, these tanks dry out in summer.
Tribal of the Region-
Tribals of the region are basically living in the eastern half area of the district. The Gonds and
Govaris are the most prominent tribes living in the valley. The Gonds of the district are sub-
divided into Raj Gonds and Dhur Gonds. Govari is another major tribe also known as Gond-
Govari. Due to its connection with Ahirs, it is considered as low branch of Gonds. The Gond
mainly speaks Gondi, a dialect belonging to the Dravidian language (Pathak 2009). The Govaries
themselves says that the Gond and Govaries are the descendants of one of two brothers who
accidently eat a flesh of cow. The Govaris are fond of tattoos; men commonly have a dot
between eyebrows and females wear lines of dots usually long at the center and short on either
side.The dead are buried in Govari society. On returning from funeral, they offer food to the
spirit which is placed outside the deceased’s house. They eat the food only after the cow touches
the food which is offered to the spirit. This ritual called utran and it is conducted by a bhagat
(Pathak 2009). However, it is observed that the tribals in Gondia district do not practice the
customs related to death ceremony which are followed by their counterparts living in deep forest
in south and east part of the district.
Occupation of the People-
The population of the district is mainly involved in agricultural and related activities. Gondia
district has a fertile land and it receives heavy rainfall of 1597 mm as compared to adjacent
regions. As a result, the agriculture flourishes in the region. Besides, monsoon, rivers, tanks,
ponds and wells act as an important source of irrigation. Availability of tanks at every village can
also be taken to indicate fishing as a supplemented occupation besides agriculture. Still
traditional way of fish catching is followed in the district. Bidi making, rice milling, lac bangle
making and tasar silk weaving are also wide-spread rural occupations of the valley. A soapstone
quarry is worked at Kaneri and stone cups and jars are made of it. The Gonds in the villages
around Gond Umri and Chikhli make soft matting out of sukhwasa grasses. Thus we see that the
inhabitants of upper Wainganga valley make full use of available resources for their occupation
Food Habits of the People-
Rice is the staple food of the region and it is abundantly cultivated all around the district. A
distinct food habit variation was also noticed within the region. It was observed that wheat and
jowars chapatti and bhakri were more common in the southern part of the region whereas rice
was eaten more in the rest of the district. The vegetables are planted in backside of the houses for
personal usage. Fish, prawns, chicken and meat are enjoyed as non-vegetarian food items
generally brought from weekly market.
DISTRICT SURVEY REPORT FOR GONDIA
District Survey Report Gondia 25
The Villages and House Pattern-
The villages of the Gondia district are situated close to each other within the radius of 3 to 5 km.
The villages are generally small in size and are neat and clean. They are concentrated at a place
surrounded by agricultural land. Small settlements called Tola or Toli lie on the roadways or near
the cultivation land. They consist of few houses generally of the same cast. The houses are big in
size with a courtyard at the center surrounded by rooms with tilted and thatched walls painted
from both sides. The cattle are essential component of the house. They are tied in a room
constructed on the either side of the entrance. Storage of wood is also a necessary requirement of
the house which is arranged under a single roof. Grain is kept in round bamboo-work receptacles
called dholas, supported on wooden posts with thatched covers. Those meant for seed-grains are
often located outside the house and are only opened when sowing time comes while those for
food are kept inside the house and the requisite amount of grain is allowed to run out daily from
a hole in the side. Nowadays, the houses are using cement and brick for construction.
.

DISTRICT SURVEY REPORT FOR GONDIA
District Survey Report Gondia 26
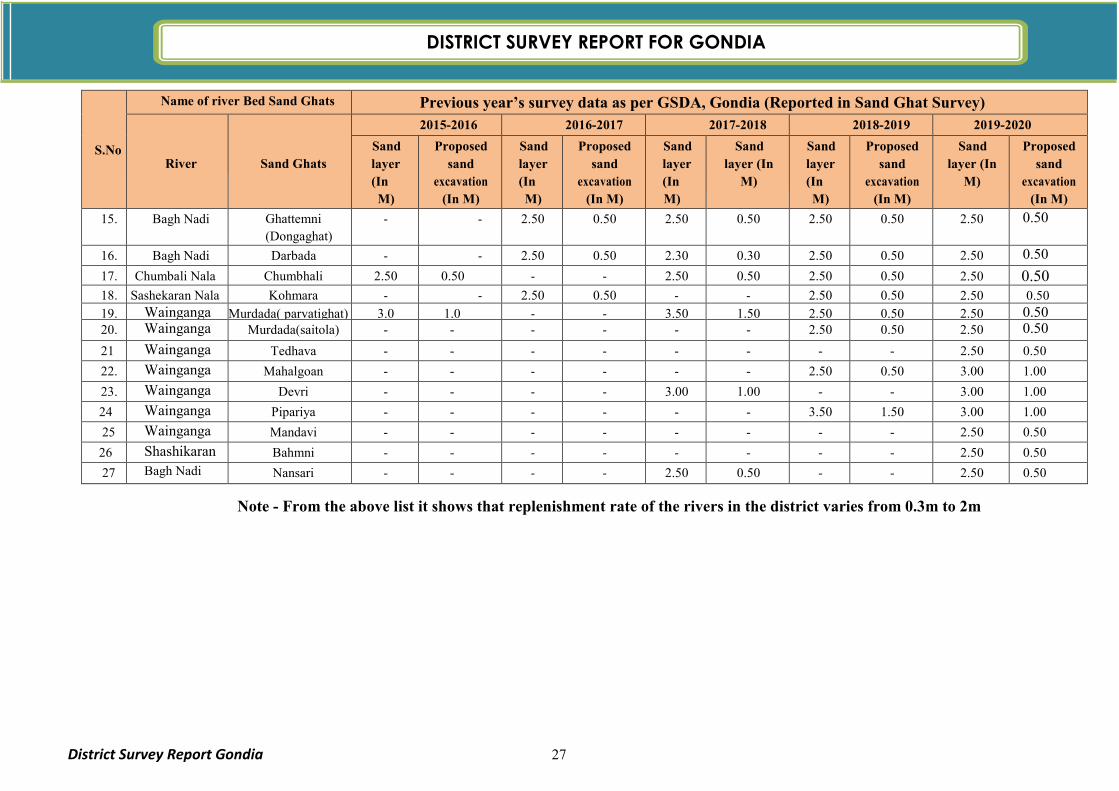
S.No
Name of river Bed Sand Ghats Previous year’s survey data as per GSDA, Gondia (Reported in Sand Ghat Survey)
River
Sand Ghats
2015-2016 2016-2017 2017-2018 2018-2019 2019-2020
Sand layer (In M)
Proposed sand
excavation (In M)
Sand layer (In M)
Proposed sand
excavation (In M)
Sand layer (In M)
Sand layer (In M)
Sand layer (In M)
Proposed sand
excavation (In M)
Sand layer (In M)
Proposed sand
excavation (In M)
1. Wainganga Pujaritola (kasa) 3.0 1.0 2.50 0.50 3.00 1.00 2.50 0.50 2.50 0.50
2. Wainganga Dangurli 3.0 1.0 3.50 1.50 - - 3.0 1.0 3.00 1.00
3. Wainganga Kinhi 3.50 1.50 3.00 1.00 2.50 0.50 3.0 1.0 3.00 1.00
4. Wainganga Kawalewada 3.00 1.0 3.50 1.50 - - 3.0 1.0 2.50 0.50
5. Wainganga Biroli 3.50 1.50 3.0 1.00 - - 3.50 1.50 3.50 1.50
6. Wainganga Chandori(Bk) 3.00 1.0 3.0 1.00 3.0 1.0 3.0 1.0 2.50 0.50
7. Wainganga Bondrani 2.50 0.50 2.50 0.50 2.50 0.50 3.0 1.0 3.50 1.50
8. Wainganga Ghatkuroda-1 3.0 0.50 2.50 0.50 3.0 1.50 3.50 1.50 3.50 1.50
9. Wainganga Ghatkuroda-2 3.50 1.50 2.50 0.50 3.5 1.50 3.50 1.50 3.50 1.50
10. Chulbandh Sawangi-2 - - 2.50 0.50 - - 2.50 0.50 2.50 0.50
11. Gadhavi Nadi Mahagaon(NaktiGhat) - - 2.50 0.50 - - 2.50 0.50 2.50 0.50 12. Gadhavi Nadi Wadegaon
(Bandhya) - - 2.50 0.50 - - 2.50 0.50 2.50 0.50
13. Bagh Nadi Banathar - - 2.50 0.50 - - 2.50 0.50 2.50 0.50
14. Bagh Nadi Birsola 2.50 0.50 2.50 0.50 - - 2.50 0.50 2.50 0.50
DISTRICT SURVEY REPORT FOR GONDIA
District Survey Report Gondia 27
S.No
Name of river Bed Sand Ghats Previous year’s survey data as per GSDA, Gondia (Reported in Sand Ghat Survey)
River
Sand Ghats
2015-2016 2016-2017 2017-2018 2018-2019 2019-2020
Sand
layer
(In
M)
Proposed
sand
excavation
(In M)
Sand
layer
(In
M)
Proposed
sand
excavation
(In M)
Sand
layer
(In
M)
Sand
layer (In
M)
Sand
layer
(In
M)
Proposed
sand
excavation
(In M)
Sand
layer (In
M)
Proposed
sand
excavation
(In M)
15. Bagh Nadi Ghattemni
(Dongaghat)
- - 2.50 0.50 2.50 0.50 2.50 0.50 2.50 0.50
16. Bagh Nadi Darbada - - 2.50 0.50 2.30 0.30 2.50 0.50 2.50 0.50
17. Chumbali Nala Chumbhali 2.50 0.50 - - 2.50 0.50 2.50 0.50 2.50 0.50 18. Sashekaran Nala Kohmara - - 2.50 0.50 - - 2.50 0.50 2.50 0.50
19. Wainganga Murdada( parvatighat) 3.0 1.0 - - 3.50 1.50 2.50 0.50 2.50 0.50 20. Wainganga Murdada(saitola) - - - - - - 2.50 0.50 2.50 0.50
21 Wainganga Tedhava - - - - - - - - 2.50 0.50
22. Wainganga Mahalgoan - - - - - - 2.50 0.50 3.00 1.00
23. Wainganga Devri - - - - 3.00 1.00 - - 3.00 1.00
24 Wainganga Pipariya - - - - - - 3.50 1.50 3.00 1.00
25 Wainganga Mandavi - - - - - - - - 2.50 0.50
26 Shashikaran Bahmni - - - - - - - - 2.50 0.50
27 Bagh Nadi Nansari - - - - 2.50 0.50 - - 2.50 0.50
Note - From the above list it shows that replenishment rate of the rivers in the district varies from 0.3m to 2m
DISTRICT SURVEY REPORT FOR GONDIA
District Survey Report Gondia 28
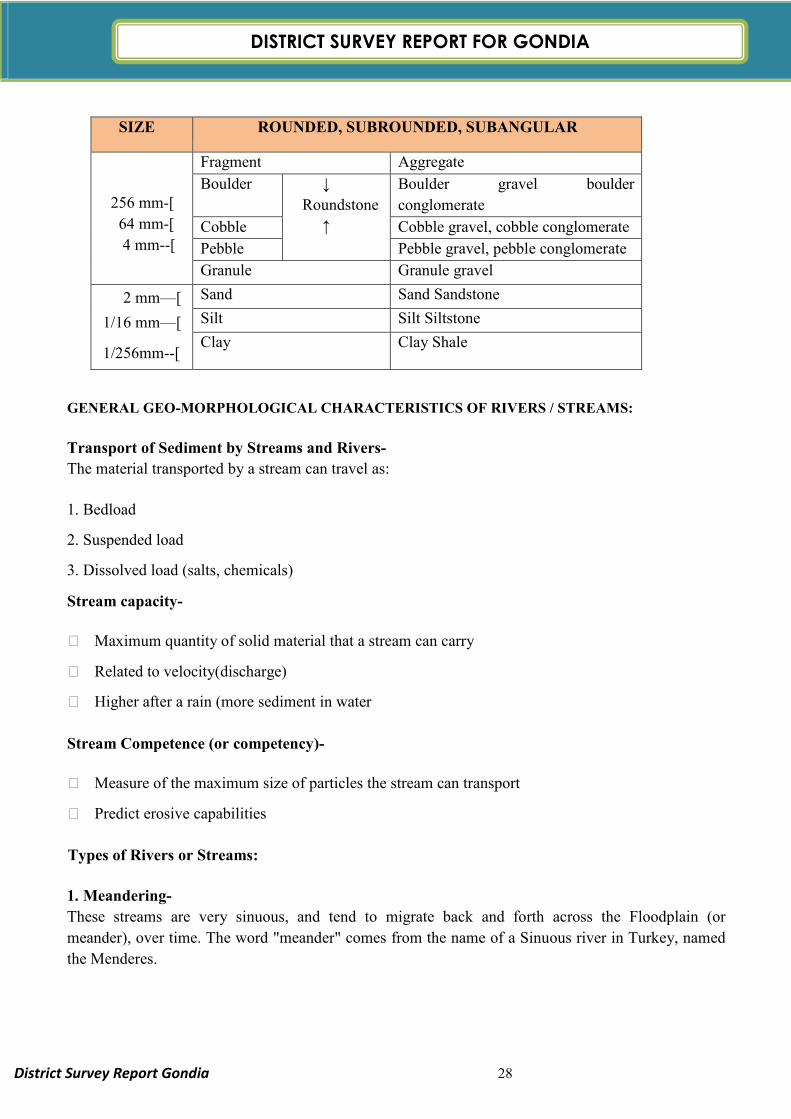
SIZE ROUNDED, SUBROUNDED, SUBANGULAR
256 mm-[
64 mm-[
4 mm--[
Fragment Aggregate
Boulder ↓
Roundstone
↑
Boulder gravel boulder
conglomerate
Cobble Cobble gravel, cobble conglomerate
Pebble Pebble gravel, pebble conglomerate
Granule Granule gravel
2 mm—[
1/16 mm—[
1/256mm--[
Sand Sand Sandstone
Silt Silt Siltstone
Clay Clay Shale
GENERAL GEO-MORPHOLOGICAL CHARACTERISTICS OF RIVERS / STREAMS:
Transport of Sediment by Streams and Rivers-
The material transported by a stream can travel as:
1. Bedload
2. Suspended load
3. Dissolved load (salts, chemicals)
Stream capacity-
Maximum quantity of solid material that a stream can carry
Related to velocity(discharge)
Higher after a rain (more sediment in water
Stream Competence (or competency)-
Measure of the maximum size of particles the stream can transport
Predict erosive capabilities
Types of Rivers or Streams:
1. Meandering-
These streams are very sinuous, and tend to migrate back and forth across the Floodplain (or
meander), over time. The word "meander" comes from the name of a Sinuous river in Turkey, named
the Menderes.
DISTRICT SURVEY REPORT FOR GONDIA
District Survey Report Gondia 29
2. Braided-
These streams have lots of lenticular-shaped in-channel bars. The stream channel bifurcates around
these bars, and follows a pattern resembling braided hair.
Fluvial Geomorphology:-
Erosion is the set of all processes by which soil and rock are loosened and moved Downhill or down
slope. The most important process of erosion is due to running water. Erosion by running water acts in
two basic forms: overland flow and channel flow.
Splash Erosion-
Most running water starts off as rain. Rain drops have diameters of between 0.5 to 7 mm and hit the
ground at between 1 - 9 m/sec. The force of the impact loosens material and throws it into the air. This
is called splash erosion. In violent thunderstorms over 200 tonnes/hectare can be disturbed. On a
sloping surface, soil is shifted downhill as grains are moved slightly greater distances downhill than
uphill. More importantly, however, it leads to a decrease in the permeability of the surface due to
openings being sealed by particles. There is therefore less infiltration and an increase in overland flow
Overland Flow-
Runoff starts as a broad sheet. The sheet exerts a drag force over the ground surface and some
weathered products may be removed. This is sheet erosion. Generally, after traveling a short distance,
small channels or rills are formed, which coalesce into gullies, concentrating the erosive action.
The amount of erosion of a slope depends on the
Length and steepness of the slope
Rainfall intensity
Permeability and structure of the surface
Amount of vegetation cover.
Channel Flow-
Stream erosion is "the progressive removal of mineral matter from the surfaces of a stream channel
which itself may consist of bedrock or regolith" (Strahler). Erosion will only occur when the stream
has an excess of energy. In mountainous streams, the rough channel walls may amount to 96% of the
potential energy of the stream. Some energy is also spent in transporting load previously acquired.
Erosion will result if the energy available > cohesion of particles. The quantity of water passing
through the channel is termed the discharge (m2/sec) and is equal to the channel cross-sectional area
(m2) times the average stream velocity (m/sec). The amount of sediment carried by the stream is called
the stream load(kg/m3) Sub-processes of Erosion.
District Survey Report Gondia 30
DISTRICT SURVEY REPORT FOR GONDIA
a. Hydraulic Action-
� The force of the running water alone. This is very important in weak alluvial deposits,
especially in times of flood, when fast flowing; turbulent water undermines the channel banks.
b. Abrasion-
� The scouring caused by the impact of rock particles that are being transported. Abrasion features
include plunge pools, potholes and chutes. Abrasion is proportional to velocity 2, so a three-fold
increase in velocity leads to nine times as much abrasion. The mutual erosion of two particles is
known as attrition
c. Solution (Corrosion)-
� Chemical reactions between ions in solution and exposed minerals. It is particularly important in
limestone areas or on beds of rock salt and gypsum, but all common minerals are soluble to
some extent.
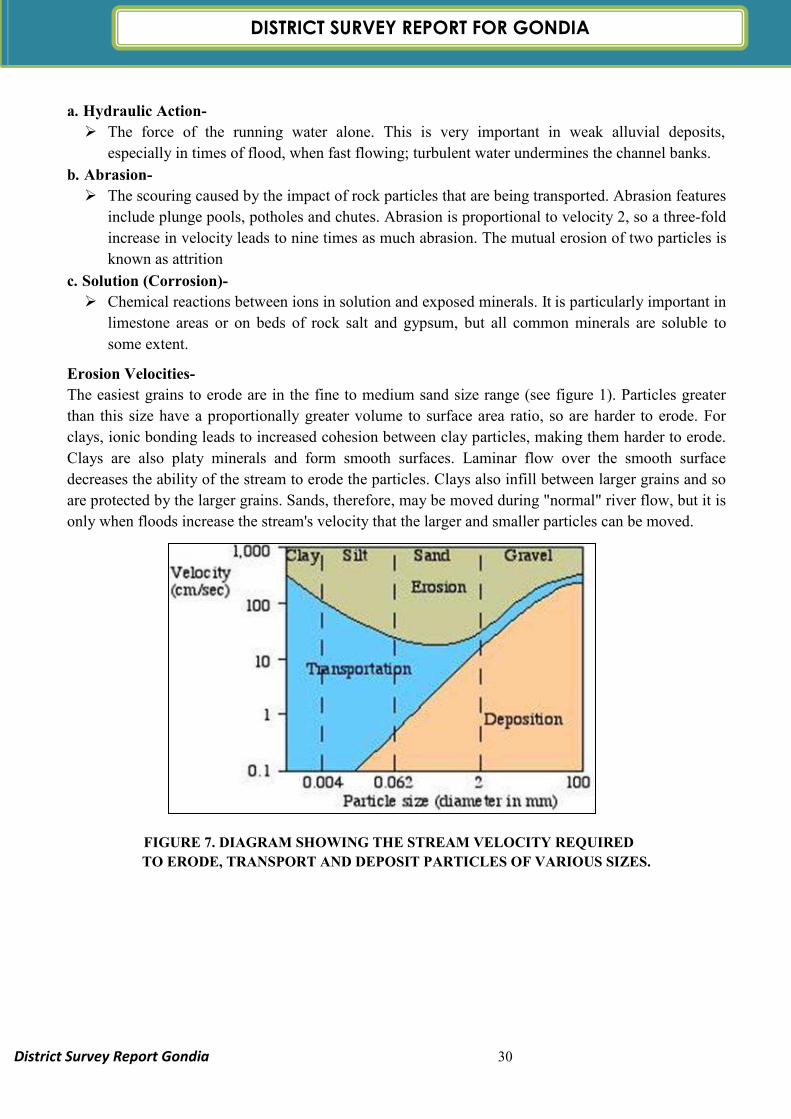
Erosion Velocities-
The easiest grains to erode are in the fine to medium sand size range (see figure 1). Particles greater
than this size have a proportionally greater volume to surface area ratio, so are harder to erode. For
clays, ionic bonding leads to increased cohesion between clay particles, making them harder to erode.
Clays are also platy minerals and form smooth surfaces. Laminar flow over the smooth surface
decreases the ability of the stream to erode the particles. Clays also infill between larger grains and so
are protected by the larger grains. Sands, therefore, may be moved during "normal" river flow, but it is
only when floods increase the stream's velocity that the larger and smaller particles can be moved.
FIGURE 7. DIAGRAM SHOWING THE STREAM VELOCITY REQUIRED
TO ERODE, TRANSPORT AND DEPOSIT PARTICLES OF VARIOUS SIZES.
DISTRICT SURVEY REPORT FOR GONDIA
District Survey Report Gondia 31
Once the particles are being transported, there is an orderly deposition of particles with the largest
being deposited first and clays being held almost indefinitely. Hence the sediment becomes sorted
downstream.
Transportation:
The particles carried by streams are known as the stream load. Particles may be carried by
Floatation of very minor significance.
Solution. -Ions of dissolved minerals that may travel downstream indefinitely. The most common
are Na, Ca, K, Mg, Cl, SO4 and HCO3. One estimate of rivers was that they carry 300 million
tones of dissolved load each year, and 250 million tonnes of solidload.
Suspension.-The temporary support of particles when turbulence is greater than the settling
velocity of the particle. Clay and silt are normally transported in suspension, but sand may be
carried this way in floods.
Saltation.-Intermittent "jumping" of grains that are lifted by turbulence, but are too heavy to
remain in suspension.
Traction.-The sliding or rolling of particles along the stream floor. Particles moved in this way
comprise the bed load. Bed load normally constitutes around 10% of the solid load, but may be
up to 50% during floods, when the major work of the stream is done.
Transportation is aided by the buoyancy of water. eg. Quartz grains are Å 2000 times the density of
air, but only two and a half times that of water. Unequal velocities at the top and bottom of boulders
also assist transportation, as doe’s steep gradients.
The total load of particles of all sizes that a stream can carry is known as its capacity. It is proportional
to discharge, which is proportional to velocity. A faster flowing stream therefore has a higher capacity.
If a stream's capacity is less than its load, the stream cannot carry its load, so deposition occurs. If
capacity exceeds load, the stream has excess energy (gravitational, potential energy), so it can erode
more sediments. Streams switch back and forth from depositional to erosional agents, depending on
load vs. capacity. A stream can erode along one stretch and deposit along another, since gradient and
channel shape/size vary along the stream's course. Streams can erode during periods of higher velocity
or discharge (floods) and deposit during periods of lower velocity or discharge. Anything that alters
the sediment load delivered to the channel or that alters the stream's capacity to carry that load will
cause the stream's gradient or channel geometry to change in response
The largest particle that a stream can transport is known as its competence. Assuming that there is
sufficient depth to cover the particles, then competence is proportional to the square of velocity.
Deposition-
Deposition will occur when a loss of energy results in a decrease in velocity. This may be due to such
things as declining gradient, a decrease in water volume, an increase in cross-sectional area
(particularly pools, lakes, and oceans), or by local obstructions. An excessive load produced by
increased erosion in the drainage basin or tributary valleys, or from glaciofluvial outwash will also
inevitably lead to deposition. The accumulations of stream deposits are called alluvium
DISTRICT SURVEY REPORT FOR GONDIA
District Survey Report Gondia 32
Note: There is a constant interaction between erosion, transportation and deposition. During a flood,
the bed of a stream at a particular point may be eroded, but as the flood subsides the bed is filled again.
Similarly, in different parts of the stream, velocity differs and hence one part of the stream may be
eroding its bank, while on the opposite bank deposition is taking place.
Downstream Adjustments:
Overall, despite some variations, effluent streams (those that receive water from the water table)
generally show the following changes downstream:
Discharge increases (due to more tributaries and a greater drainage area)
Total load increases (due to more tributaries and a greater drainage area)
Channel size increases (to cope with the increased discharge and load)
Particle size decreases (due to increased abrasion/attrition and changes in velocity)
the smoothness of the channel increases (due to decreased particle size)
Gradient decreases
Stream velocity downstream is increased by the smoother channels, but decreased by lower gradients.
Under normal conditions, velocity is proportional to discharge0.1, so there is a slight overall increase in
the average velocity of the stream - despite the appearance of faster flowing mountain streams at the
headwaters. In such streams, the amount of turbulence and associated eddies and backward flowing
portions of the streams means that the average velocity is lower than the smoother flowing waters
downstream. During floods, however, when the major work of the stream is done, velocity is
proportional to discharge0 (i.e. it is constant), so the increased velocity associated with floods allows
the erosion and transportation of a large range of particle sizes throughout the drainage system.
It can be seen from these relationships that peak discharge conditions that occur during floods are very
important in determining the form of rivers and the features associated with them, and not the
"normal" river level.
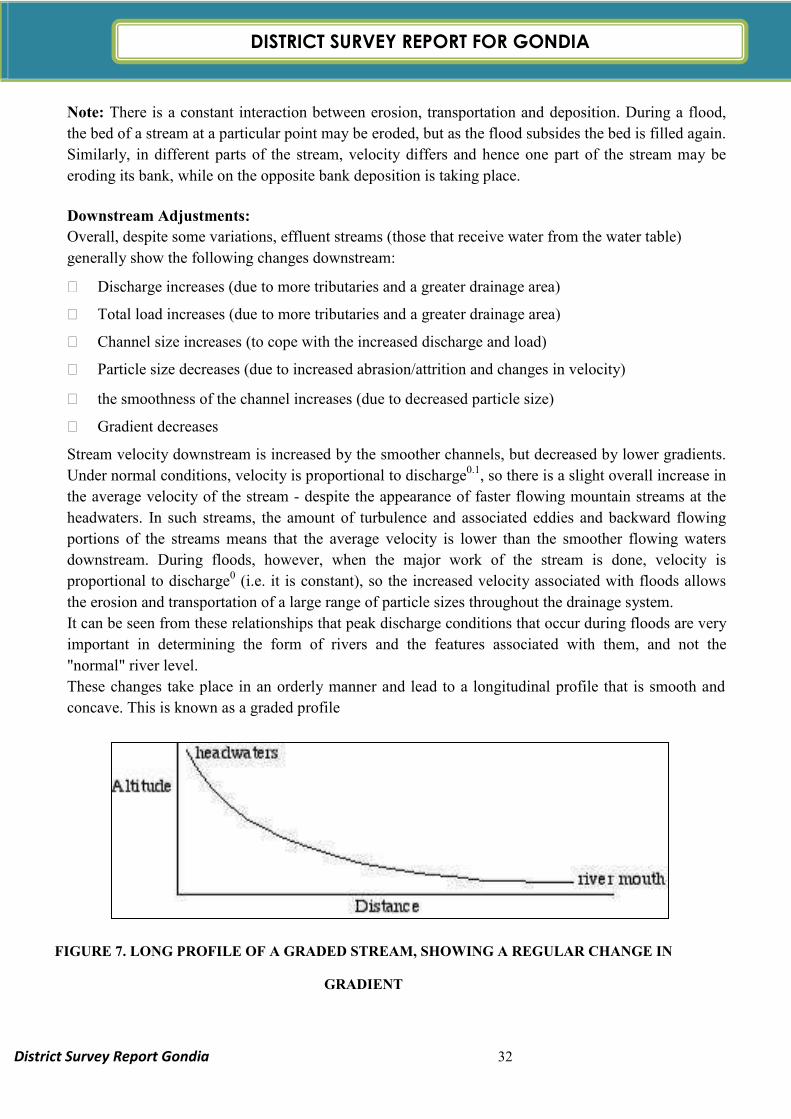
These changes take place in an orderly manner and lead to a longitudinal profile that is smooth and
concave. This is known as a graded profile
FIGURE 7. LONG PROFILE OF A GRADED STREAM, SHOWING A REGULAR CHANGE IN
GRADIENT
DISTRICT SURVEY REPORT FOR GONDIA
District Survey Report Gondia 33
For a stream with an irregular profile, erosion will be more pronounced at places of higher than normal
gradient, such as at falls and rapids, and sedimentation will occur in areas of low gradient, such as
lakes. The "bumps" are therefore ironed out until the graded profile is achieved.
Over geological time, providing that tectonic forces do not change the base level, any stream,
irrespective of length, discharge, and bedrock, will achieve such a state of "dynamic equilibrium".
It is a "dynamic" system, as there is constant re-adjustment of the channel in response to local
variations in the volume, velocity and load that leads to a local balance between the sediment being
transported and the energy available. That is, short term changes of scour and fill may occur, but in the
long term the gradient and velocity are such that the available load can be transported without erosion
or deposition dominating in any particular place. Over geological time, erosion dominates and the
whole profile is lowered until a pediplain is developed close to base level. The base level is the lowest
level that a stream can erode its channel. A temporary base level results from obstructions such as
resistant outcrops, lakes, dams etc. that lead to temporary sub-profiles An increase in base level will
lead to aggradations, the built up of sediment on valley floors and the development of thick deposits of
alluvium.
A decrease in base level will lead to such things as nick points that migrate upstream, alluvial terraces,
valley in valley topography and entrenched meanders.
The rise in sea level from 18,000 to 10,000 years ago means that most present river systems don't
demonstrate ultimate base level control by modern sea level. Estuaries (in streams with minor solid
loads) and deltas (large loads) demonstrate adaptations to the changed conditions.
DISTRICT SURVEY REPORT FOR GONDIA
District Survey Report Gondia 34
DANDY-BOLTON EQUATION:
Dandy Bolton equation is commonly used to calculate the sedimentation yield. for specific location
variability often occurs due to local factors. However this equation gives rough estimation of mean
sedimentation yield. There are two equations i.e. for runoff less 2 inches & for runoff more than 2
inches.
The average annual rainfall of Gondia district is approx 1300 mm. Total runoff which will contribute
sediment yield will be considered as 75% of total rainfall i.e. 975 mm.
The computations for total annual suspended and bed load sediment yield are given below.
Sediment Yield-
for runoff less than 2 inches,
S=1280 Q 0.26[1.43-0.26 log (A)]
For, runoff more than 2 inches,
S=1965 e-0.055Q [1.43-0.26log (A)]
DISTRICT SURVEY REPORT FOR GONDIA
District Survey Report Gondia 35
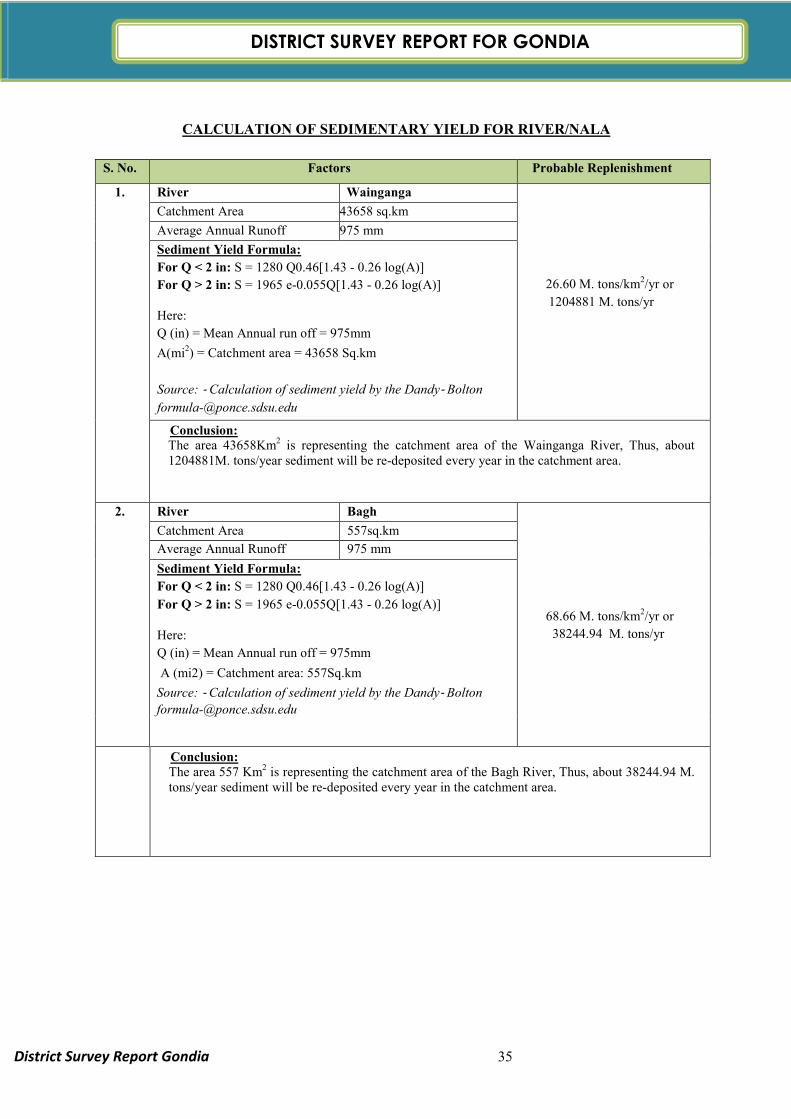
CALCULATION OF SEDIMENTARY YIELD FOR RIVER/NALA
S. No. Factors Probable Replenishment
1. River Wainganga
26.60 M. tons/km2/yr or
1204881 M. tons/yr
Catchment Area 43658 sq.km
Average Annual Runoff 975 mm
Sediment Yield Formula:
For Q < 2 in: S = 1280 Q0.46[1.43 - 0.26 log(A)]
For Q > 2 in: S = 1965 e-0.055Q[1.43 - 0.26 log(A)]
Here:
Q (in) = Mean Annual run off = 975mm
A(mi2) = Catchment area = 43658 Sq.km
Source: ‐ Calculation of sediment yield by the Dandy‐ Bolton
Conclusion: The area 43658Km2 is representing the catchment area of the Wainganga River, Thus, about 1204881M. tons/year sediment will be re-deposited every year in the catchment area.
2. River Bagh
68.66 M. tons/km2/yr or
38244.94 M. tons/yr
Catchment Area 557sq.km
Average Annual Runoff 975 mm
Sediment Yield Formula:
For Q < 2 in: S = 1280 Q0.46[1.43 - 0.26 log(A)]
For Q > 2 in: S = 1965 e-0.055Q[1.43 - 0.26 log(A)]
Here:
Q (in) = Mean Annual run off = 975mm
A (mi2) = Catchment area: 557Sq.km
Source: ‐ Calculation of sediment yield by the Dandy‐ Bolton
Conclusion: The area 557 Km2 is representing the catchment area of the Bagh River, Thus, about 38244.94 M. tons/year sediment will be re-deposited every year in the catchment area.
DISTRICT SURVEY REPORT FOR GONDIA
District Survey Report Gondia 36
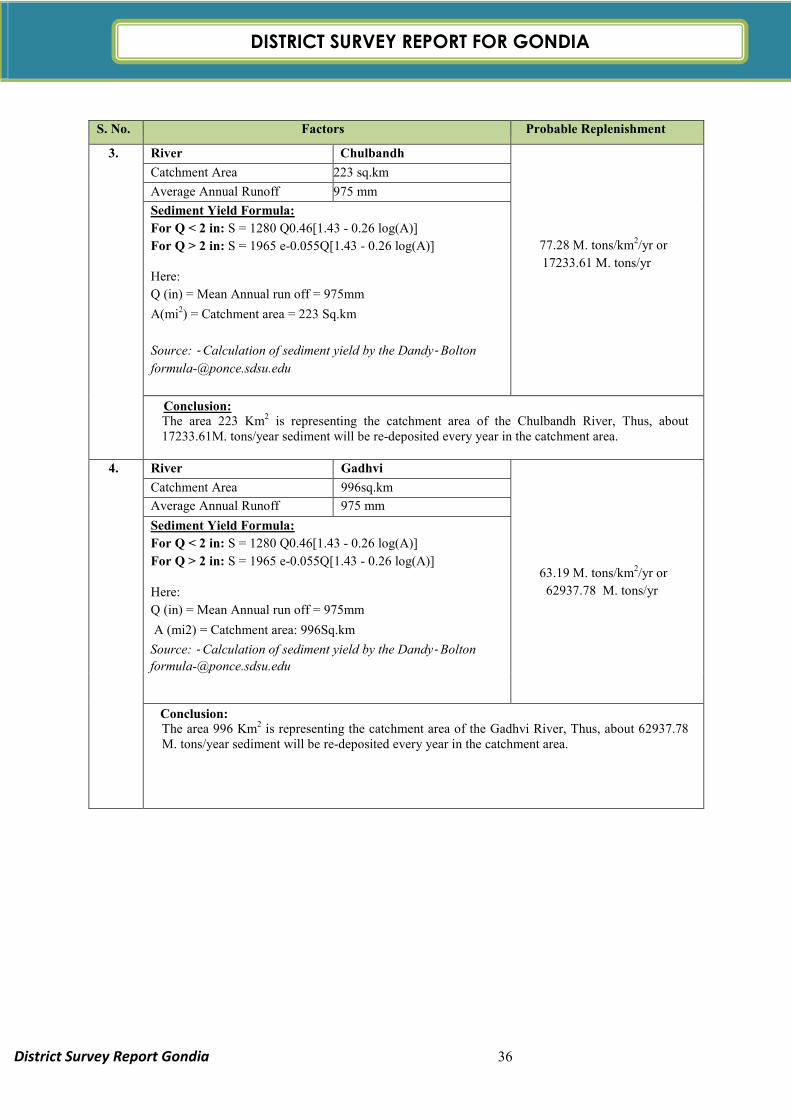
S. No. Factors Probable Replenishment
3. River Chulbandh
77.28 M. tons/km2/yr or
17233.61 M. tons/yr
Catchment Area 223 sq.km
Average Annual Runoff 975 mm
Sediment Yield Formula:
For Q < 2 in: S = 1280 Q0.46[1.43 - 0.26 log(A)]
For Q > 2 in: S = 1965 e-0.055Q[1.43 - 0.26 log(A)]
Here:
Q (in) = Mean Annual run off = 975mm
A(mi2) = Catchment area = 223 Sq.km
Source: ‐ Calculation of sediment yield by the Dandy‐ Bolton
Conclusion: The area 223 Km2 is representing the catchment area of the Chulbandh River, Thus, about 17233.61M. tons/year sediment will be re-deposited every year in the catchment area.
4. River Gadhvi
63.19 M. tons/km2/yr or
62937.78 M. tons/yr
Catchment Area 996sq.km
Average Annual Runoff 975 mm
Sediment Yield Formula:
For Q < 2 in: S = 1280 Q0.46[1.43 - 0.26 log(A)]
For Q > 2 in: S = 1965 e-0.055Q[1.43 - 0.26 log(A)]
Here:
Q (in) = Mean Annual run off = 975mm
A (mi2) = Catchment area: 996Sq.km
Source: ‐ Calculation of sediment yield by the Dandy‐ Bolton
Conclusion: The area 996 Km2 is representing the catchment area of the Gadhvi River, Thus, about 62937.78 M. tons/year sediment will be re-deposited every year in the catchment area.
DISTRICT SURVEY REPORT FOR GONDIA
District Survey Report Gondia 37
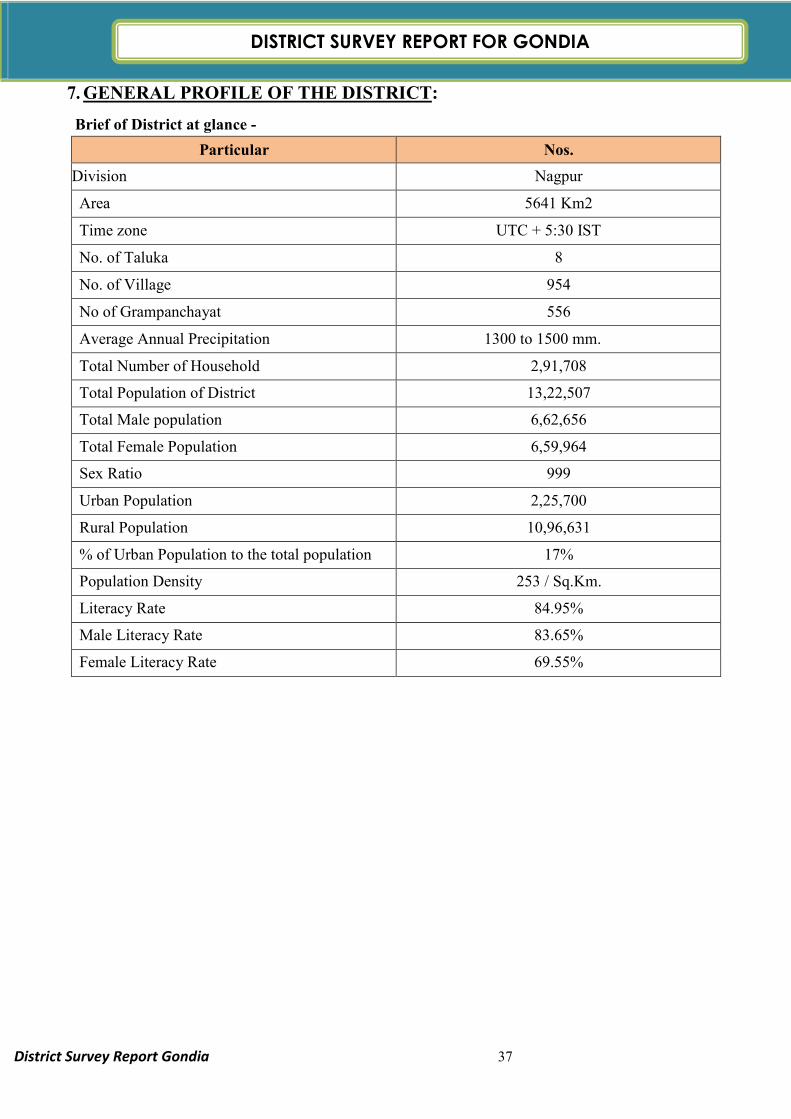
7. GENERAL PROFILE OF THE DISTRICT:
Brief of District at glance -
Particular Nos.
Division Nagpur
Area 5641 Km2
Time zone UTC + 5:30 IST
No. of Taluka 8
No. of Village 954
No of Grampanchayat 556
Average Annual Precipitation 1300 to 1500 mm.
Total Number of Household 2,91,708
Total Population of District 13,22,507
Total Male population 6,62,656
Total Female Population 6,59,964
Sex Ratio 999
Urban Population 2,25,700
Rural Population 10,96,631
% of Urban Population to the total population 17%
Population Density 253 / Sq.Km.
Literacy Rate 84.95%
Male Literacy Rate 83.65%
Female Literacy Rate 69.55%

DISTRICT SURVEY REPORT FOR GONDIA
District Survey Report Gondia 38
8. LAND UTILIZATION PATTERN IN THE DISTRICT: FOREST,
AGRICULTURE, HORTICULTURE, MINING ETC.
Particulars Area (ha)
Area under forests 215928
Cultivable area (Ha) 235476.86
Cultivated Area (Ha) 226248.37
Cultivable Waste Land 65570.75
Current Fallow Land 13492.18
Land put Under non agriculture use 21898.20
Net area under irrigation 103213
Land use under misc. Plantation 18074.27
Barren and uncultivable land (Waste) 15718.86
FOREST: Flora and Fauna:
Flora-
The Upper Wainganga valley is highly rich in terms of forest cover. Two national Tiger projects
and Sanctuary in the region itself speak about the strategic importance of forests here. The region
falls under the broad variety of the southern dry deciduous forest and incorporates two main sub
types. First type includes the teak forest and second type is mixed forest. The usual teak includes,
tinsa, shisham, mahua, roham, khair, dikamali, garahi.
The mixed forest includes three types.
i) Superior quality of mixed forests.
ii) Medium quality of mixed forests.
iii) Poor quality of mixed forests.
The mixed forest is mostly occupied as reserve forest and entire protected forest area. Tropical
deciduous forests of Wainganga valley are the main source of timber and support paper industries
of the region (Singh, 1971). Rich forest cover supports a lot of economic activities. Teek wood is
utilized for timber, tendu leaves for bidis, mahuwa for liquor, palas for propagation of lac, kadai
or dhaora for making of gum. The area of study also has semi moist mixed deciduous forest
occurring on the hill slopes and valley on the well-drained alluvium soil and dry mixed
deciduous forest occurring on stony and rocky surface. However because of thick forest cover
and rocky terrain, very little land is under cultivation producing mainly rice and jowar as cereal
crops and orange and cotton as cash crops (Singh, 1971).
DISTRICT SURVEY REPORT FOR GONDIA
District Survey Report Gondia 39
Fauna-
Well clad forests occurring almost all over the region offer adequate cover for protection for wild
life and foliage as a principal feed. Tiger (Felis tigris), (Semnopithecus entellus), panther (Felis
pardus), jungle cat (Felis Chaus), hyaena (Hyaena struatam), jackal (Canis aureus), fox (Vulpes
bengalensis), wild dog (Red dogs), bear (Ursus vel melursus ursinus), wild pig (Sus scrofa fel
cristatus), hare (Lepus ruficandants), bison (Bos vel gavaeus gaurus), sambhar (Rusa aristotelis),
chital (Axis maculatus), barking deer (Cervalus muntjac), black buck (Antelope bezoartica),
chinkara (Gazella bennettii) abound in rich forest cover of Upper Wainganga valley. The forest
offers habitat to numerous bird species like golden orioles, blue roller, king fisher, wood peckers,
little green fly catcher, jungle fowl, painted and rock sand grouses, grey partridge, green pigeon,
jungle quail and a variety of doves and snakes.
Agricultural Pattern-
The population of the Gondia district mainly depends upon agricultural activity. Well drained flat
topography and various means of irrigation in upper Wainganga valley make it a dependable
agricultural zone where the rice crop seldom fails (Dixit 1986). The south west monsoon from
June to October brings fruitful heavy rains to the Upper Wainganga Valley. Kharip and rabi are
the main agricultural seasons in the region nonetheless, more cultivation is observed in kahrip as
compared to rabi crop. Rice is generally drilled in the field by the end of June. Rice and tur are
the largest cultivated crop in kharip season. The chief rabi crops are wheat, jowar, linseed, gram
and lac. Black gram, horse gram and green gram are the important pulses grown in the district.
As many as 70 different varieties of rice are recognized here with slight difference in the method
of cultivation of each. Transplantation and broadcast sowing are the two important methods of
September to mid-October and it is harvested during February to March (Bhandara District
gazetteer 1979). In addition to rice, wheat and gram, a variety of vegetables, fruits and condiment
crops like brinjals, chillies, tomatoes, beans, cauliflowers and tamarind are planted in July and
picking starts during September to February. It is this varied but favorable geographical setting
that made upper Wainganga valley an area of attraction for the early Iron Age settlers.
PRODUCTION OF MAJOR AGRICULTURE AND HORTICULTURE PRODUCTS:
Sr.no. Name of crop Production ( ‘000 t.) Productivity ( Kg/Ha)
1 Paddy 239 1256
2 Pigeon pea 4.2 826
3 Wheat 1.6 700
4 Gram 2.6 433
5 Mango 3.8 20000
6 Papaya 12.8 64000
7 Banana 33.3 111100
8 Chilly 6.1 6100
9 Brinjl 41.9 19000
DISTRICT SURVEY REPORT FOR GONDIA
District Survey Report Gondia 40
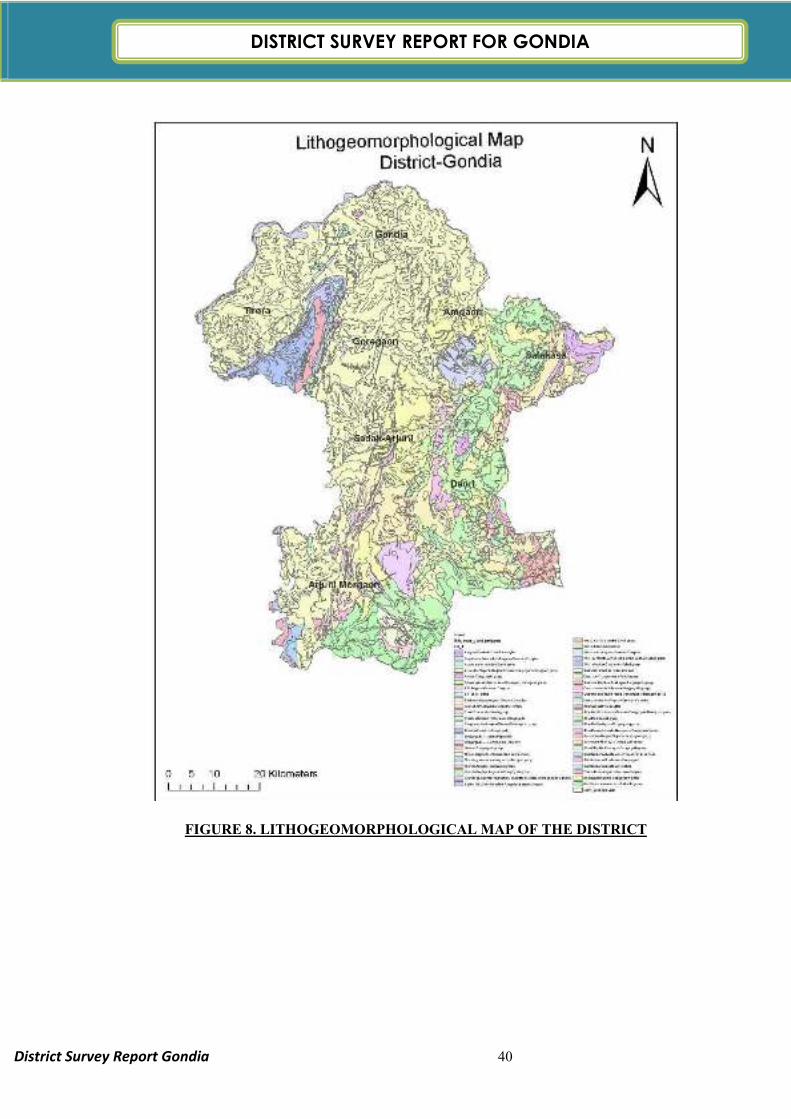
FIGURE 8. LITHOGEOMORPHOLOGICAL MAP OF THE DISTRICT
DISTRICT SURVEY REPORT FOR GONDIA
District Survey Report Gondia 41
9. PHYSIOGRAPHY OF THE DISTRICT:
Gondia district lies at latitude’s 20.39 and 21.38 North and longitudes 79.27 to 80.42 east. The
adjoining districts to Gondia are on northern side Balaghat district of Madhya Pradesh and on eastern
side Rajnandgaon district of Chattisgarh state. To the south and west are Chandrapur district and
Bhandara district of Maharashtra. From Northen to Western part of the district is drained by
wainganga river. Geomorphologically, the region can be divided into two parts one includes North
western, north eastern, south- eastern and central region which have structural units like hills and
ridges whereas, second part includes northern, north-central, west-central, south and south west
portion having undulating topography over denudational units like pediments and fluvial units The
physical milieu of region is characterized by forest cover, rugged and unhealthy terrain (Singh 1971).
more ever, rapid fluvial erosion has reduced the land leaving number of isolated hills. Rocky surfaces
are often devoid of thick soil cover and account for more than half of the forest cover of Maharashtra
state.
The district headquarter is situated at Gondia situated on Mumbai- Calcutta railway route which is
1060 Km from Mumbai, capital of state.
Important places in the district:
Navegaon Bandh : 65 Km south of Gondia in Arjuni Moregaon Taluka is a National Park.
Nagzira : 30 Km south of Gondia in Sadak Arjuni Taluka is a National Park.
Birsi Airport: 12 Km North from Gondia.
Adani Power Plant: 30 Km from Gondia at Tiroda Taluka.
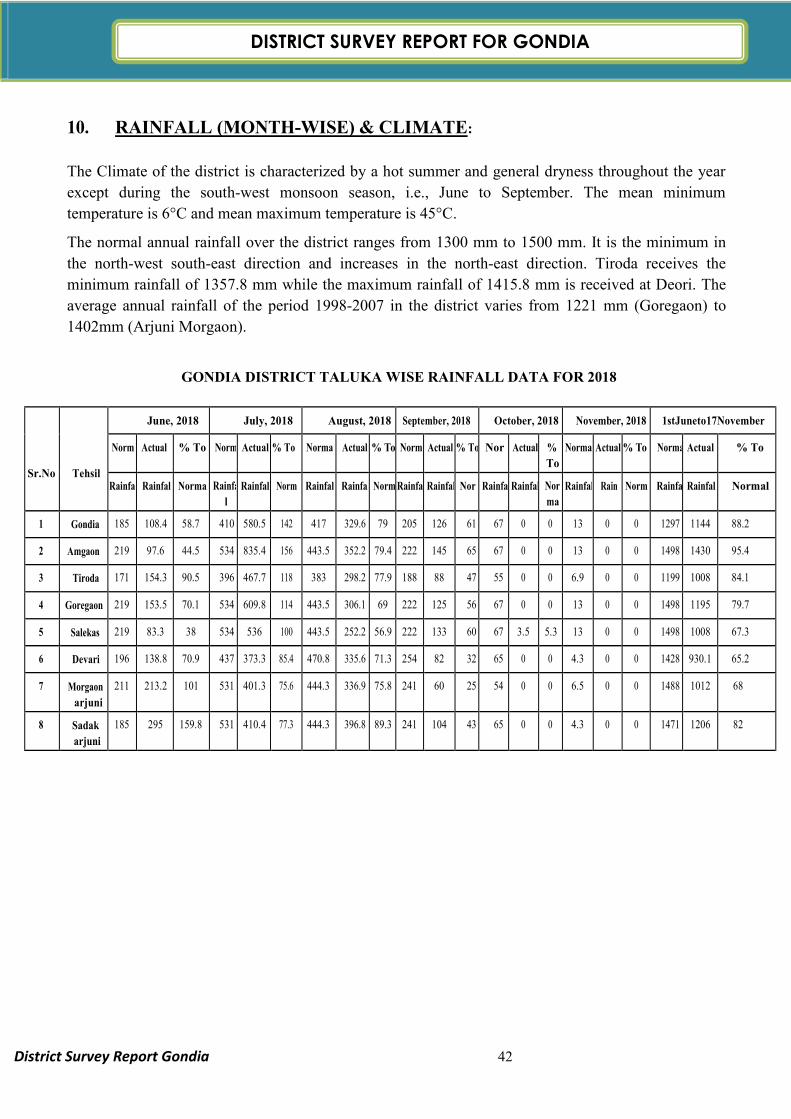
DISTRICT SURVEY REPORT FOR GONDIA
District Survey Report Gondia 42
10. RAINFALL (MONTH-WISE) & CLIMATE:
The Climate of the district is characterized by a hot summer and general dryness throughout the year
except during the south-west monsoon season, i.e., June to September. The mean minimum
temperature is 6°C and mean maximum temperature is 45°C.
The normal annual rainfall over the district ranges from 1300 mm to 1500 mm. It is the minimum in
the north-west south-east direction and increases in the north-east direction. Tiroda receives the
minimum rainfall of 1357.8 mm while the maximum rainfall of 1415.8 mm is received at Deori. The
average annual rainfall of the period 1998-2007 in the district varies from 1221 mm (Goregaon) to
1402mm (Arjuni Morgaon).
GONDIA DISTRICT TALUKA WISE RAINFALL DATA FOR 2018
Sr.No
Tehsil
June, 2018 July, 2018 August, 2018 September, 2018 October, 2018 November, 2018 1stJuneto17November
Norm Actual % To Norm Actual % To Norma Actual % To Norm Actual % To Nor Actual %
To
Norma Actual % To Norma Actual % To
Rainfa Rainfal Norma Rainfa
l
Rainfal Norm Rainfal Rainfal Norm Rainfa Rainfal Nor Rainfa Rainfal Nor
ma
Rainfal Rain Norm Rainfal Rainfal Normal
1 Gondia 185 108.4 58.7 410 580.5 142 417 329.6 79 205 126 61 67 0 0 13 0 0 1297 1144 88.2
2 Amgaon 219 97.6 44.5 534 835.4 156 443.5 352.2 79.4 222 145 65 67 0 0 13 0 0 1498 1430 95.4
3 Tiroda 171 154.3 90.5 396 467.7 118 383 298.2 77.9 188 88 47 55 0 0 6.9 0 0 1199 1008 84.1
4 Goregaon 219 153.5 70.1 534 609.8 114 443.5 306.1 69 222 125 56 67 0 0 13 0 0 1498 1195 79.7
5 Salekas 219 83.3 38 534 536 100 443.5 252.2 56.9 222 133 60 67 3.5 5.3 13 0 0 1498 1008 67.3
6 Devari 196 138.8 70.9 437 373.3 85.4 470.8 335.6 71.3 254 82 32 65 0 0 4.3 0 0 1428 930.1 65.2
7 Morgaon
arjuni
211 213.2 101 531 401.3 75.6 444.3 336.9 75.8 241 60 25 54 0 0 6.5 0 0 1488 1012 68
8 Sadak
arjuni
185 295 159.8 531 410.4 77.3 444.3 396.8 89.3 241 104 43 65 0 0 4.3 0 0 1471 1206 82

DISTRICT SURVEY REPORT FOR GONDIA
District Survey Report Gondia 43
RAINFALL DATA OF GONDIA DISTRICT FOR 2019
Month Rainfall in
mm
January 0.6
February 0.4
March 1.1
April 14
May 0
June 174.6
July 556.5
August 368.2
September 700.7
October 175.6
November 71.3
December 27.4
Total 2090.4
Note - On the basis of above Tehsil wise & total rainfall data it shows that the yearly maximum sand
Deposition may be possible for Gondia district.

DISTRICT SURVEY REPORT FOR GONDIA
District Survey Report Gondia 44
11. GEOLOGY AND MINERAL WEALTH :
Gondia district is unique in Maharashtra in the sense that the entire area of the district is occupied by
metamorphic and igneous rocks. Major part of the district is occupied by the crystalline rocks of Pre-
Cambrian formations viz; Archaean, Dharwars.
Archeans:
The Archeans are represented by Amgaon Group consisting of Augen gneisses, amphibolites,
migmatites and these formations are confined to the N & NW corner of the district around Amgaon
andBahela.
Dharwars:
The Amgaon group is followed by Dharwars (Lower Precambrian) are represented by Sakoli Group
and Dongargarh Group of rocks, the latter forms the major stratigraphic unit in the district. The Sakoli
Group consists of quartzites, schists, phyllites, metavolcanics and BIF and are confined to the N and
NW part of Nagjhira. The areas surrounding Salekasa, Wadegaon, Murdoli, Deori and Chinchgarh
rocks consisting of Rhyolites, Andesite’s, basic volcanic are present which respectively represents
Bijli, Pitepani and Sitagota formations of the Dongargarh Group.
Geomorphology and Soil Type:
The district forms part of Wainganga sub-basin and has an undulating terrain with elevations ranging
from 263 to 315 m amsl. Physiographically, the district can be broadly divided into two physiographic
units viz., the one controlled by structural features i.e., the Structural Origin and the one controlled by
differential weathering i.e., the Denudation Origin. The structural hills and ridges are more common in
the eastern and south eastern parts of the district, while the denudational features like pediments/
pediplains are seen in north-central, west central and south-west portions.
The soils of the district are highly varied and are derived from weathering of crystalline metamorphic
and igneous rocks. The main types of soils are Kali, Kankar, Morand, Khardi, Sihar and Bardi. Out of
these, Sihar soils are used for growing the Rice, which is the main crop in the district.
In the Wainganga valley, some of the earliest known rocks of the earth are exposed. The schistose
gneisses of the archaean with island of archaean granite flanked by Dharwarian schists are the
principal formations in the area of study (Singh 1971; Wadia 1957; Dixit 1986). The geneiss-granite
complex of archaeans has accumulated in their tectonic depressions the sediments that later
metamorphosed into Dharwarian rocks. There are occasional patches of Cuddappahs and Vindhyans,
the latter however are highly localized and not very significant. Lithologically, Dharwarian formations
in Madhya Pradesh and Nagpur region have been identified as Sausar series. The Sausar series
consists of granualites, calciphyres, mica sillimanite quartz, schist, hornblende schist along with highly
characteristic metalliferous deposits like the ores of magnesium and iron. It is largely of aqueous
sedimentation but subsequently it has been metamorphosed and invaded by plutonic rock masses.
DISTRICT SURVEY REPORT FOR GONDIA
District Survey Report Gondia 45
The archaeans, the dharwars and the Vindhyas exposed in this region are like a museum of a whole
sequence of rocks from the archaean to Cambrian (Dixit1986).
The rocks underlying Upper Wainganga valley form a part of above lithology. However certain
district wise variations are evident. In the greater area of Wainganga valley local representative of
Dharwars are distinguished as outcrops of Chilpi and Gondite series (Wadia 1957). These rocks
include a great thickness of highly disturbed slates and phyllites with quartzite and basic trappean
intrusions. This is different in case of Gondia district. Rare and sporadic occurrences of the Vindhyans
in parts of the region and the basic traps at the higher elevations of the Ambagad range are the only
geological horizons outcropping in the Gondia district. The Dharwars belong to two suites; the more
highly metamorphosed rocks of the Sausar series occur in the north-west, mainly in the Bawanthadi
valley and consist of calc-granulites, marbles and manganese bearing gondites, tourmaline-garnet-
biotitic. schists, gneisses and quartzite. The other, covering a larger part of Gondia district in the south
and east belongs to the Sakoli series comprising predominantly argillaceous and siliceous rocks with a
high proportion of chlorites, but lacking in lime rocks. The former rocks in the district have generally
an N-NE and S-SW strike and are often intruded by granites and quartz. The boundary between the
two belts has been drawn more or less in a north-east-south-west direction, not far from the town of
Tiroda and two km. north-west of Bhandara, the Sakoli series being to its south-east and the Sausar
series to its north-west. Parts of the region, steadily opening out into a broad valley southwards in the
west-central parts of the district are separated from tributary valley basins by intervening hill ranges
that also act as water-partings between the lesser streams of the district. The highest elevation mainly
lies in the south-eastern tracts that form an undulating plateau dotted with residual smoothly rounded
hills (Bhandara district gazetteer 1979).
Alluvium is developed all along major river courses such as Bagh, Chulbandh and Gadhvi. Laterites
are distributed all over the district. Metamorphic rocks like various granites, gneiss, schists, phylites
are also exposed throughout the district. The stratigraphic sequence based on available information on
the geology of the area is as follows.
GEOLOGY OF THE UPPER WAINGANGA VALLEY:
Age Formation Lithology
Pleistocene to Recent Alluvium and Laterite Silt, Sand, Gravel, Laterite
Proterozoic Vindhyan Super Group Quartzite and Shale
Dongargarh Super Group Andesite, Sandstone granite, Ehyolite
Sausar Group Muscovite-boitite-schist, Granite, Tirodi
Gneiss
Sakoli Group Schist, Phyllites, Quartzite
Archaeans Amagon Group Granite & Gneisses
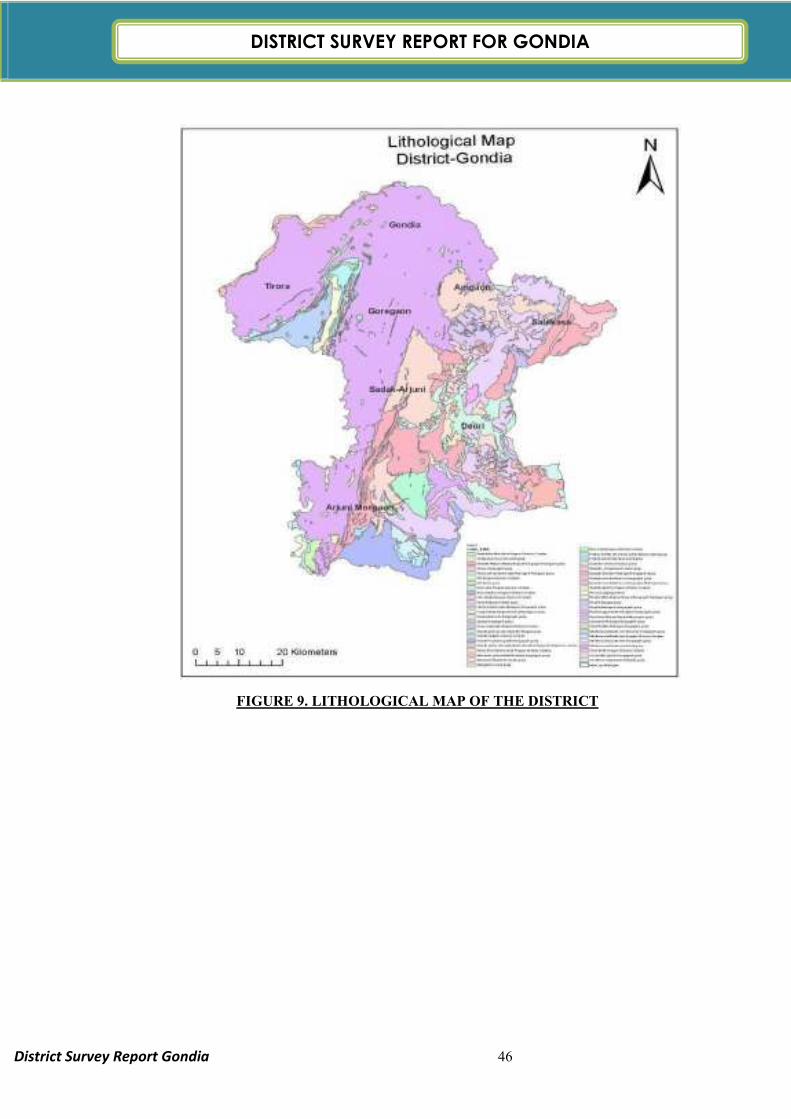
DISTRICT SURVEY REPORT FOR GONDIA
District Survey Report Gondia 46
FIGURE 9. LITHOLOGICAL MAP OF THE DISTRICT
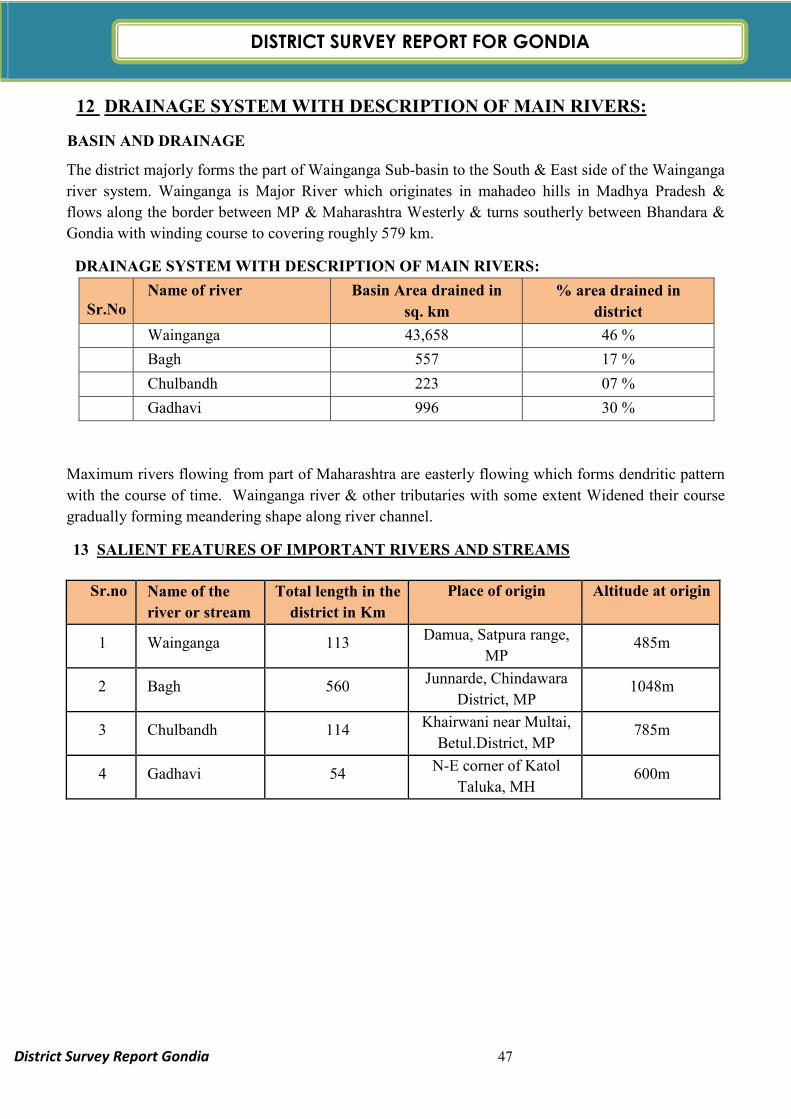
DISTRICT SURVEY REPORT FOR GONDIA
District Survey Report Gondia 47
12 DRAINAGE SYSTEM WITH DESCRIPTION OF MAIN RIVERS:
BASIN AND DRAINAGE
The district majorly forms the part of Wainganga Sub-basin to the South & East side of the Wainganga
river system. Wainganga is Major River which originates in mahadeo hills in Madhya Pradesh &
flows along the border between MP & Maharashtra Westerly & turns southerly between Bhandara &
Gondia with winding course to covering roughly 579 km.
DRAINAGE SYSTEM WITH DESCRIPTION OF MAIN RIVERS:
Sr.No Name of river Basin Area drained in
sq. km
% area drained in
district
Wainganga 43,658 46 %
Bagh 557 17 %
Chulbandh 223 07 %
Gadhavi 996 30 %
Maximum rivers flowing from part of Maharashtra are easterly flowing which forms dendritic pattern
with the course of time. Wainganga river & other tributaries with some extent Widened their course
gradually forming meandering shape along river channel.
13 SALIENT FEATURES OF IMPORTANT RIVERS AND STREAMS
Sr.no Name of the
river or stream
Total length in the
district in Km
Place of origin Altitude at origin
1 Wainganga 113 Damua, Satpura range,
MP 485m
2 Bagh 560 Junnarde, Chindawara
District, MP 1048m
3 Chulbandh 114 Khairwani near Multai,
Betul.District, MP 785m
4 Gadhavi 54 N-E corner of Katol
Taluka, MH 600m

DISTRICT SURVEY REPORT FOR GONDIA
District Survey Report Gondia 48
14. METHODOLOGY ADOPTED FOR CALCULATING OF MINERAL
POTENTIAL: The mineral potential is calculated based on field investigation and geology of the catchment area of
the river/ streams. As per the policy of the State and location, depth of minable mineral is defined. The
area for removal of mineral in a river or stream can be decided depending on geomorphology and
other factors, it can be 50% to 60% of the area of a particular river/stream. Other constituents like clay
and silt are excluded as waste while calculating the mineral potential of particular river/stream.
The specific gravity of each mineral constituent is different. While calculating the mineral potential,
the average specific gravity is taken as 2.25. The percent of mineral constituent like boulder, river
Gravel, and sand also varies for different river and streams. While calculating the mineral potential the
percentage of each mineral constituent is taken as, Sand 25- 30% and 5- 10% for silt and clay.
The quantum of deposition varies from stream to stream depending upon factors like catchment
lithology, discharge, river profile and geomorphology of the river course. There are certain geo-
morphological features developed in the river beds such as channel bar, point bar etc. where annual
deposition is more even two to three meters.
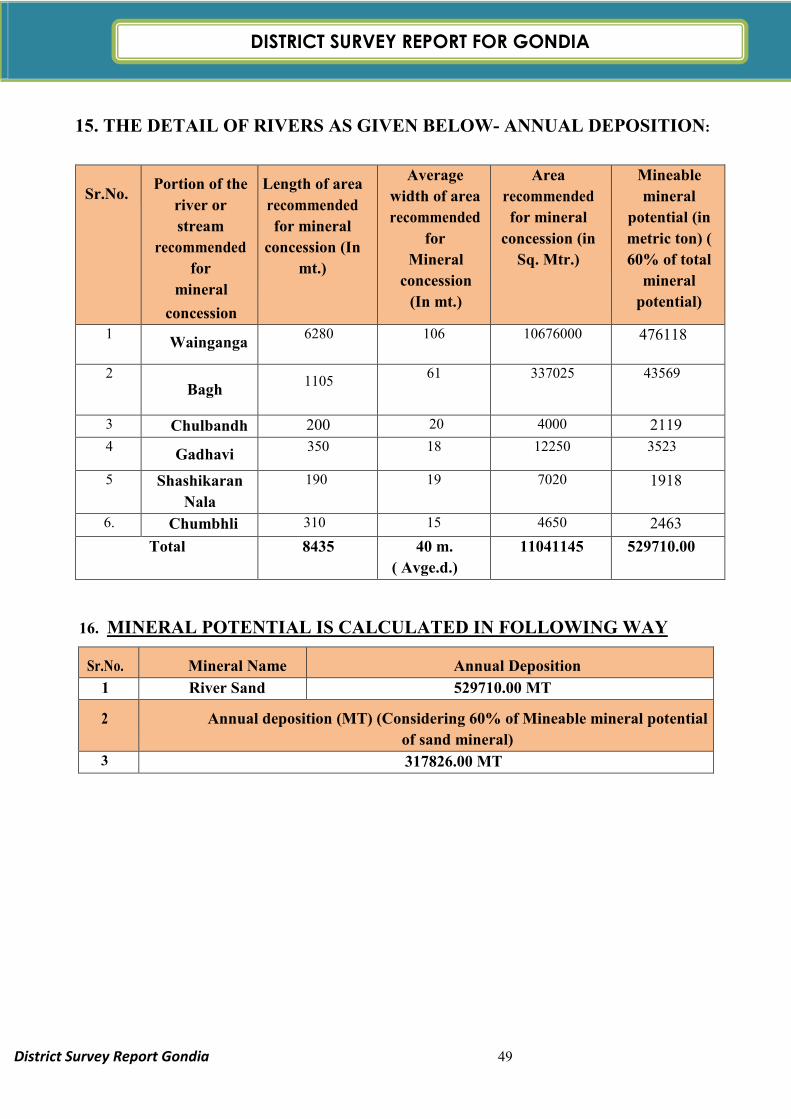
DISTRICT SURVEY REPORT FOR GONDIA
District Survey Report Gondia 49
15. THE DETAIL OF RIVERS AS GIVEN BELOW- ANNUAL DEPOSITION:
Sr.No. Portion of the
river or
stream
recommended
for
mineral
concession
Length of area
recommended
for mineral
concession (In
mt.)
Average
width of area
recommended
for
Mineral
concession
(In mt.)
Area
recommended
for mineral
concession (in
Sq. Mtr.)
Mineable
mineral
potential (in
metric ton) (
60% of total
mineral
potential)
1 Wainganga
6280
106 10676000 476118
2 Bagh
1105 61 337025 43569
3 Chulbandh 200 20 4000 2119
4 Gadhavi
350 18 12250 3523
5 Shashikaran
Nala
190 19 7020 1918
6. Chumbhli 310 15 4650 2463
Total 8435 40 m.
( Avge.d.)
11041145
529710.00
16. MINERAL POTENTIAL IS CALCULATED IN FOLLOWING WAY
Sr.No. Mineral Name Annual Deposition
1 River Sand 529710.00 MT
2 Annual deposition (MT) (Considering 60% of Mineable mineral potential
of sand mineral)
3 317826.00 MT
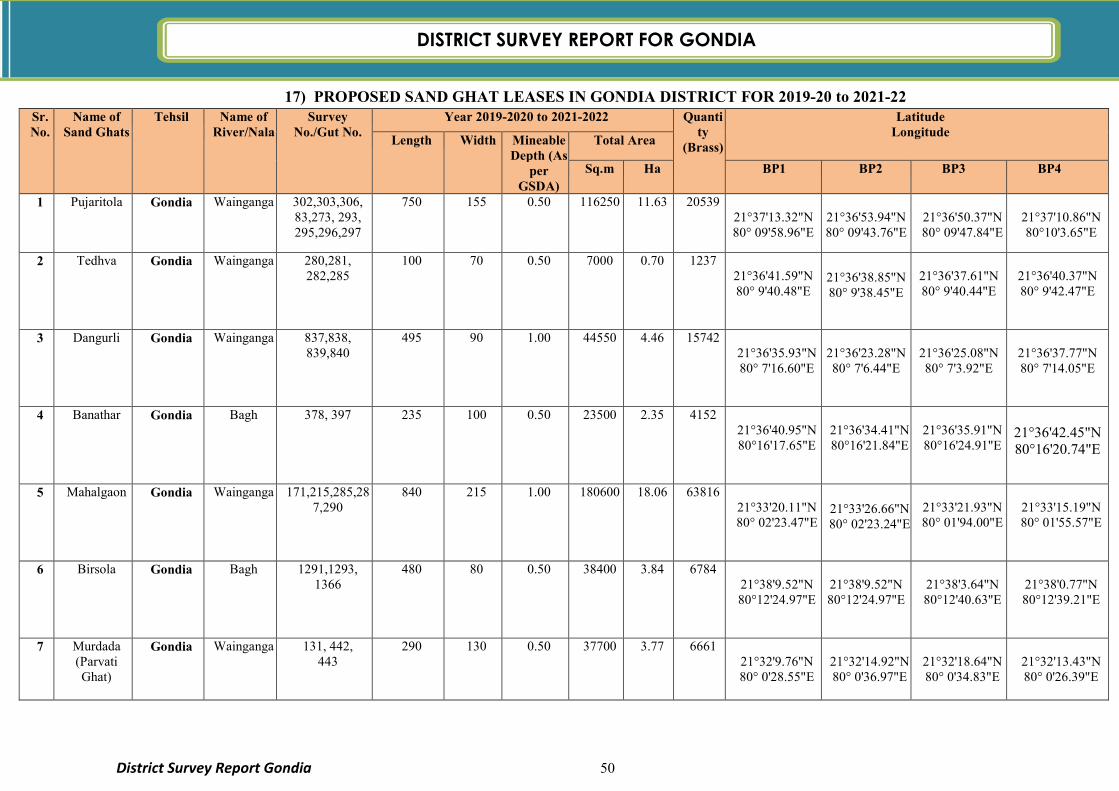
DISTRICT SURVEY REPORT FOR GONDIADISTRICT SURVEY REPORT FOR GONDIA
District Survey Report Gondia 50
17) PROPOSED SAND GHAT LEASES IN GONDIA DISTRICT FOR 2019-20 to 2021-22 Sr. No.
Name of Sand Ghats
Tehsil Name of River/Nala
Survey No./Gut No.
Year 2019-2020 to 2021-2022 Quantity
(Brass)
Latitude Longitude
Length Width Mineable Depth (As
per GSDA)
Total Area
Sq.m Ha BP1
BP2 BP3
BP4
1 Pujaritola Gondia Wainganga 302,303,306, 83,273, 293, 295,296,297
750 155 0.50 116250 11.63 20539 21°37'13.32"N 80° 09'58.96"E
21°36'53.94"N 80° 09'43.76"E
21°36'50.37"N 80° 09'47.84"E
21°37'10.86"N 80°10'3.65"E
2 Tedhva Gondia Wainganga 280,281,
282,285 100 70 0.50 7000 0.70 1237
21°36'41.59"N 80° 9'40.48"E
21°36'38.85"N 80° 9'38.45"E
21°36'37.61"N 80° 9'40.44"E
21°36'40.37"N 80° 9'42.47"E
3 Dangurli Gondia Wainganga 837,838, 839,840
495 90 1.00 44550 4.46 15742 21°36'35.93"N 80° 7'16.60"E
21°36'23.28"N 80° 7'6.44"E
21°36'25.08"N 80° 7'3.92"E
21°36'37.77"N 80° 7'14.05"E
4 Banathar Gondia Bagh 378, 397 235 100 0.50 23500 2.35 4152 21°36'40.95"N 80°16'17.65"E
21°36'34.41"N 80°16'21.84"E
21°36'35.91"N 80°16'24.91"E
21°36'42.45"N 80°16'20.74"E
5 Mahalgaon Gondia Wainganga 171,215,285,287,290
840 215 1.00 180600 18.06 63816 21°33'20.11"N 80° 02'23.47"E
21°33'26.66"N 80° 02'23.24"E
21°33'21.93"N 80° 01'94.00"E
21°33'15.19"N 80° 01'55.57"E
6 Birsola Gondia Bagh 1291,1293, 1366
480
80 0.50 38400 3.84 6784 21°38'9.52"N 80°12'24.97"E
21°38'9.52"N 80°12'24.97"E
21°38'3.64"N 80°12'40.63"E
21°38'0.77"N 80°12'39.21"E
7 Murdada (Parvati Ghat)
Gondia Wainganga 131, 442, 443
290 130 0.50 37700 3.77 6661 21°32'9.76"N 80° 0'28.55"E
21°32'14.92"N 80° 0'36.97"E
21°32'18.64"N 80° 0'34.83"E
21°32'13.43"N 80° 0'26.39"E

DISTRICT SURVEY REPORT FOR GONDIADISTRICT SURVEY REPORT FOR GONDIA
District Survey Report Gondia 51
8 Murdada (Saitola)
Gondia Wainganga 123,126, 127,128,
129
580 155 0.50 89900 8.99 15883 21°32' 0.75"N 80° 0 11.97"E
21°32'6.02"N 80° 0'11.02"E
21°31'58.89"N 79° 59'51.83"E
21°31'54.32"N 79° 59' 53.34"E
9 Kinhi Gondia Wainganga 1394,1397 , 1398,1399,
350 120 1.00 42000 4.20 14841 21°35'30.33"N 80° 6'43.56"E
21°35'27.41"N 80° 6'46.43"E
21°35'34.81"N 80° 6'55.48"E
21°35'37.71"N 80° 6'52.82"E
10 Devri Gondia Wainganga 352, 211, 215 550 70 1.00 38500 3.85 13604 21°33'38.67"N 80° 4'39.74"E
21°33'53.47"N 80° 4'50.47"E
21°33'54.87"N 80° 4'48.59"E
21°33'40.01"N 80° 4'37.80"E
11 Kawalewada Tiroda Wainganga 180 120 80 0.50 9600 0.96 1696 21°26'6.60"N 79°52'50.60"E
21°26'2.57"N 79°52'51.90"E
21°26'1.50"N 79°52'49.20"E
21°26'5.50"N 79°52'48.00"E
12 Chandori (Bu.)
Tiroda Wainganga 1 180 80 0.50 14400 1.44 2544 21°24'1.40"N 79°50'12.40"E
21°23'56.84"N 79°50'8.26"E
21°23'58.70"N 79°50'6.20"E
21°24'3.30"N 79°50'10.40"E
13 Biroli Tiroda Wainganga 1 460 105 1.50 48300 4.83 25601 21°24'23.44"N 79°50'43.21"E
21°24'26.43"N 79°50'41.08"E
21°24'36.90"N 79°50'52.60"E
21°24'34.11"N 79°50'54.75"E
14 Pipriya Tiroda Wainganga 2, 3, 13 200 90 1.00 18000 1.80 6360 21°32'50.60"N 79°55'40.10"E
21°32'52.50"N 79°55'37.50"E
21°32'58.19"N79°55'41.25"E
21°32'56.40"N 79°55'43.95"E
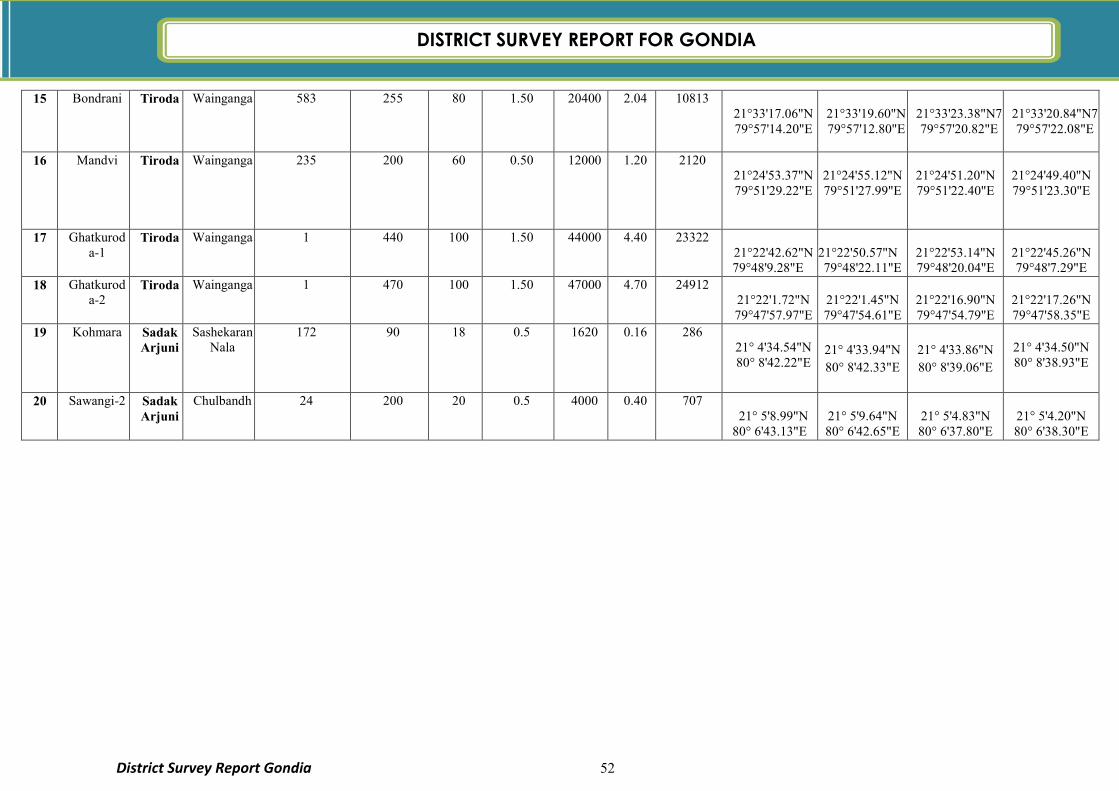
DISTRICT SURVEY REPORT FOR GONDIADISTRICT SURVEY REPORT FOR GONDIA
District Survey Report Gondia 52
15 Bondrani Tiroda Wainganga 583 255 80 1.50 20400 2.04 10813 21°33'17.06"N 79°57'14.20"E
21°33'19.60"N 79°57'12.80"E
21°33'23.38"N779°57'20.82"E
21°33'20.84"N779°57'22.08"E
16 Mandvi Tiroda Wainganga 235 200 60 0.50 12000 1.20 2120
21°24'53.37"N 79°51'29.22"E
21°24'55.12"N 79°51'27.99"E
21°24'51.20"N 79°51'22.40"E
21°24'49.40"N 79°51'23.30"E
17 Ghatkurod a-1
Tiroda Wainganga 1 440 100 1.50 44000 4.40 23322 21°22'42.62"N
79°48'9.28"E
21°22'50.57"N 79°48'22.11"E
21°22'53.14"N 79°48'20.04"E
21°22'45.26"N 79°48'7.29"E
18 Ghatkurod a-2
Tiroda Wainganga 1 470 100 1.50 47000 4.70 24912 21°22'1.72"N 79°47'57.97"E
21°22'1.45"N 79°47'54.61"E
21°22'16.90"N 79°47'54.79"E
21°22'17.26"N 79°47'58.35"E
19 Kohmara Sadak Arjuni
Sashekaran Nala
172 90 18 0.5 1620
0.16 286 21° 4'34.54"N 80° 8'42.22"E
21° 4'33.94"N
80° 8'42.33"E
21° 4'33.86"N
80° 8'39.06"E
21° 4'34.50"N 80° 8'38.93"E
20 Sawangi-2 Sadak Arjuni
Chulbandh 24 200 20 0.5 4000 0.40 707 21° 5'8.99"N
80° 6'43.13"E
21° 5'9.64"N 80° 6'42.65"E
21° 5'4.83"N 80° 6'37.80"E
21° 5'4.20"N 80° 6'38.30"E
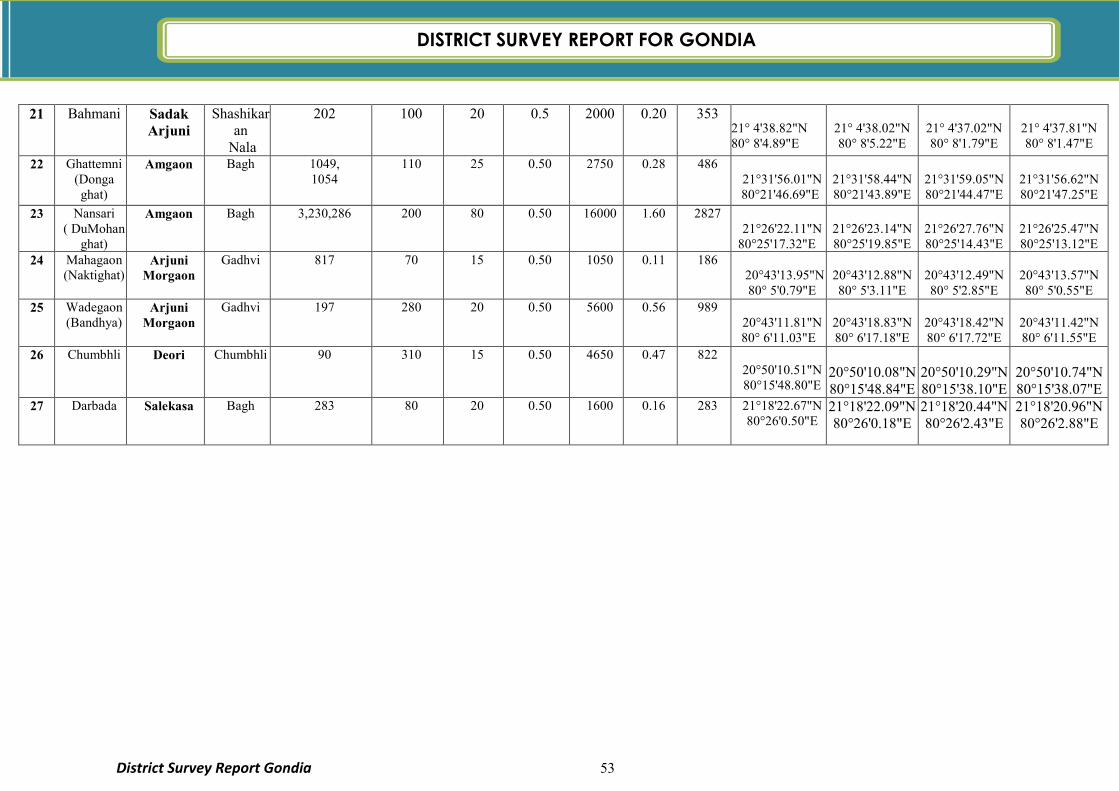
DISTRICT SURVEY REPORT FOR GONDIADISTRICT SURVEY REPORT FOR GONDIA
District Survey Report Gondia 53
21 Bahmani Sadak Arjuni
Shashikaran
Nala
202 100 20 0.5 2000
0.20 353 21° 4'38.82"N 80° 8'4.89"E
21° 4'38.02"N 80° 8'5.22"E
21° 4'37.02"N 80° 8'1.79"E
21° 4'37.81"N 80° 8'1.47"E
22 Ghattemni (Donga ghat)
Amgaon Bagh 1049, 1054
110 25 0.50 2750 0.28 486 21°31'56.01"N
80°21'46.69"E
21°31'58.44"N 80°21'43.89"E
21°31'59.05"N 80°21'44.47"E
21°31'56.62"N 80°21'47.25"E
23 Nansari ( DuMohan
ghat)
Amgaon Bagh 3,230,286 200 80 0.50 16000 1.60 2827 21°26'22.11"N
80°25'17.32"E
21°26'23.14"N 80°25'19.85"E
21°26'27.76"N 80°25'14.43"E
21°26'25.47"N 80°25'13.12"E
24 Mahagaon (Naktighat)
Arjuni Morgaon
Gadhvi 817 70 15 0.50 1050 0.11 186 20°43'13.95"N
80° 5'0.79"E
20°43'12.88"N 80° 5'3.11"E
20°43'12.49"N 80° 5'2.85"E
20°43'13.57"N 80° 5'0.55"E
25 Wadegaon (Bandhya)
Arjuni Morgaon
Gadhvi 197 280 20 0.50 5600 0.56 989 20°43'11.81"N
80° 6'11.03"E
20°43'18.83"N 80° 6'17.18"E
20°43'18.42"N 80° 6'17.72"E
20°43'11.42"N 80° 6'11.55"E
26 Chumbhli Deori Chumbhli 90 310 15 0.50 4650 0.47 822 20°50'10.51"N 80°15'48.80"E
20°50'10.08"N 80°15'48.84"E
20°50'10.29"N 80°15'38.10"E
20°50'10.74"N 80°15'38.07"E
27 Darbada Salekasa Bagh 283 80 20 0.50 1600 0.16 283 21°18'22.67"N 80°26'0.50"E
21°18'22.09"N 80°26'0.18"E
21°18'20.44"N 80°26'2.43"E
21°18'20.96"N 80°26'2.88"E
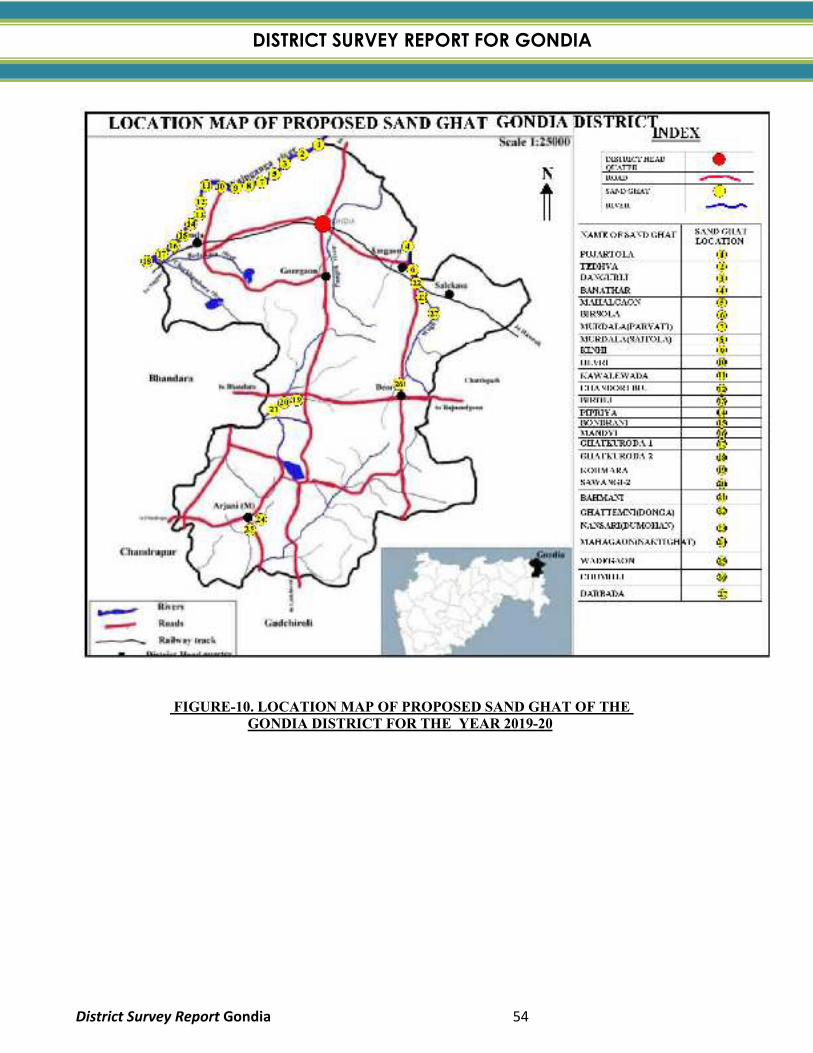
DISTRICT SURVEY REPORT FOR GONDIA DISTRICT SURVEY REPORT FOR GONDIA
District Survey Report Gondia 54
FIGURE-10. LOCATION MAP OF PROPOSED SAND GHAT OF THE
GONDIA DISTRICT FOR THE YEAR 2019-20
DISTRICT SURVEY REPORT FOR GONDIADISTRICT SURVEY REPORT FOR GONDIA
District Survey Report Gondia 55
DISTRICT SURVEY REPORT FOR MINOR MINERALS OTHER THAN SAND MINING OR RIVER BED MINING
(Part-B) 1. INTRODUCTION:
BRIEF PROFILE OF GONDIA DISTRICT:
For the purpose of administrative conveyance, the district is divided into 8 Tehsil and 8 Panchayat
Samities. According to the 2011 Census, there was 556 Gram Panchayat for the purpose of Rural
Development. The main crop grown in the district is paddy. Gondia district stretches over an area
of 5641 Sq. Km. In the terms of area, Gondia district constitutes 1.83% of the total area of the
Maharashtra State. Total population of the district according to 2011 census was 1322507 out of
which 661554 were males and 660953 were females. Of the total population, 83% is residing
in rural area and 17% is residing in Urban area. The density of the population according to the
2011 census was 253 Persons/Sq. Km.
The district comes under Vidarbha region in Maharashtra State. Gondia district as well as its parent
district are unique in Maharashtra and differ from the rest of the State in the following three ways:
i. The entire area of the district is occupied by crystalline rocks while rest of the State is covered
by Deccan Basalt.
ii. Paddy is the staple food crop of the district while wheat is the main agriculture product in the
rest of the State.
iii. It is endowed with the presence of Malguzari Tanks.
Gondia district is situated on north-eastern side of Maharashtra State and shares the state borders
with Madhya Pradesh on north and Chattisgarh in east. It covers an area of about 5859 sq. km and
lies between 20° 39’ and 21° 38’ north latitudes and 79° 52’ to 80° 42’ east longitudes. The
adjoining districts to Gondia are on northern side Balaghat district of Madhya Pradesh State and on
eastern side Rajnandgaon district of Chhatisgarh State. To the south and west are Chandrapur
district and Bhandara district of Maharashtra respectively. Basically district is divided into eight
talukas namely Gondia, Goregaon, Tiroda, Arjuni Moregaon, Deori, Amgaon, Salekasa, Sadak
Arjuni with eight Panchayat Samiti. Only two es exist at Gondia and Tiroda.
DISTRICT SURVEY REPORT FOR GONDIADISTRICT SURVEY REPORT FOR GONDIA
District Survey Report Gondia 56
BRIEF HISTORY OF THE DISTRICT:
In ancient days Gondiya was a territory of king Gond. The Gond of Chandrapur seems to have
made their rise as a political power. In those days it was a very dence forest region and Gond tribe
was the main residence of this region. Gathering of gondh (gum) and lakh in the forest and selling
it in nearby villages was their main business that is why this region was known as Gondiyait is
stated. The district is bifurcated from Bhandara district. Bhandara district was under regency
administration from 1818 to 1830. Prior to 1820, the district was administered from Lanji, there
after the headquarters of the district was shifted from Lanji to Bhandara in 1820-21. The area
became British territory in 1853. In 1867, a few tracts were transferred from Bhandara district to
form the new district of Balaghat. In the same year the headquarters of one of the tahsils were
shifted from Sangarhi to Sakoli. There were no major changes in the boundaries of the district or its
talukas between 1911 and 1955, except that the headquarters of Tiroratahsil was shifted to Gondiya
and name of the tahsil was changed to Gondiya Tehsil in 1914. From 1947 to 1956, the district
Bhandara, along with other districts of Vidarbha region continued to form a part of the central
provinces. With the re-organisation of states in 1956, Bhandara district was transferred from
Madhya Pradesh to Bombay State, which came in to existence in the same year. In 1960, with the
formation of state of Maharashtra it formed a part of the newly created state. With effect from 1st
May 1999, Bhandara district is divided in to two-district viz. Bhandara and Gondia for the
administrative purpose and industrial/agricultural development
.
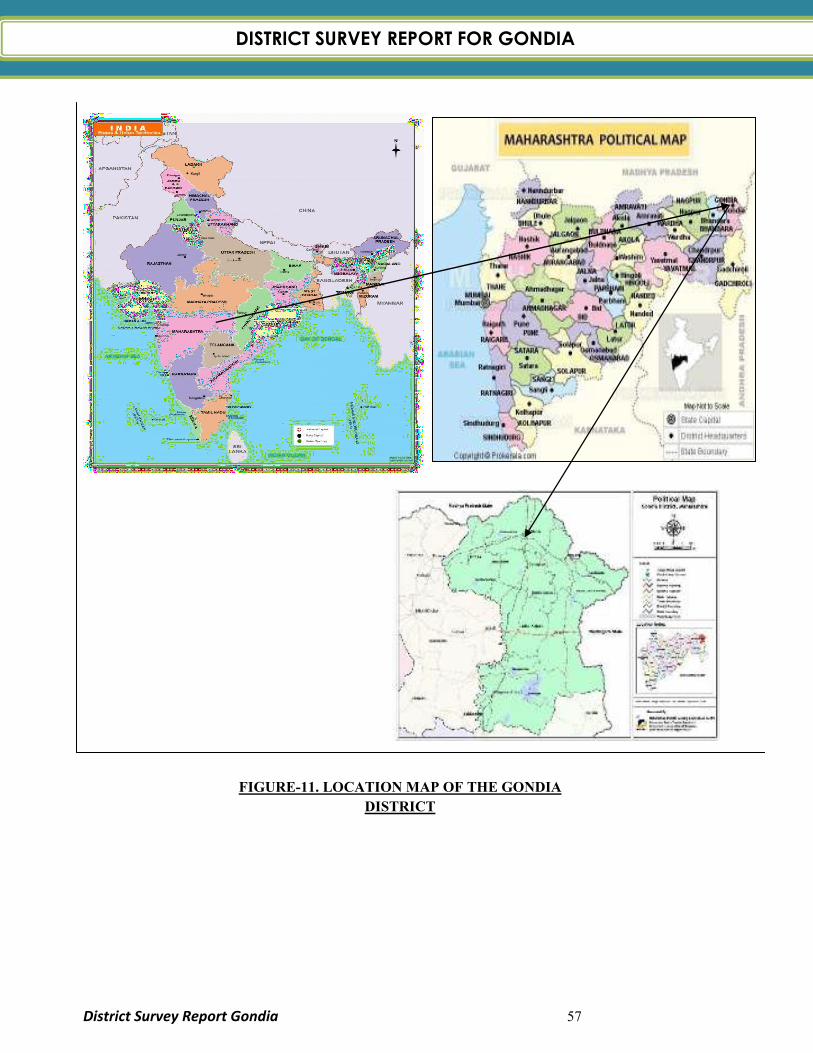
DISTRICT SURVEY REPORT FOR GONDIADISTRICT SURVEY REPORT FOR GONDIA
District Survey Report Gondia 57
FIGURE-11. LOCATION MAP OF THE GONDIA
DISTRICT

DISTRICT SURVEY REPORT FOR GONDIA
District Survey Report Gondia
FIGURE
DISTRICT SURVEY REPORT FOR GONDIADISTRICT SURVEY REPORT FOR GONDIA
58
FIGURE-12. GONDIA DISTRICT MAP
DISTRICT SURVEY REPORT FOR GONDIA
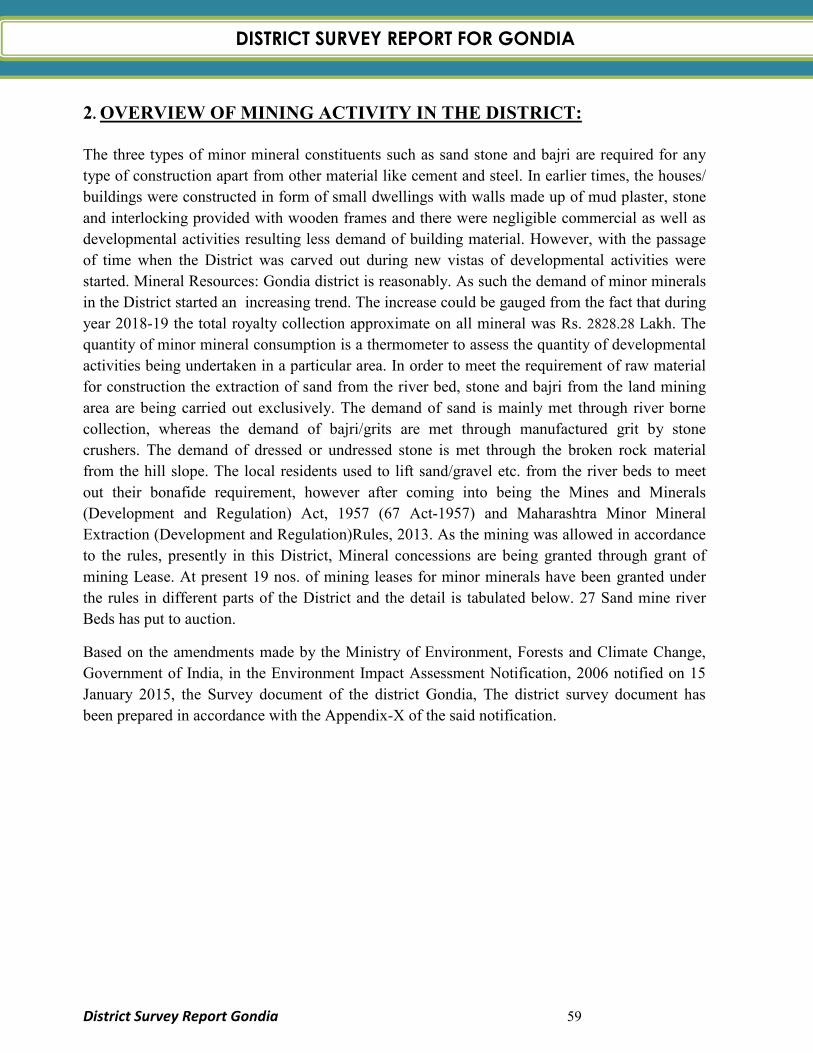
DISTRICT SURVEY REPORT FOR GONDIADISTRICT SURVEY REPORT FOR GONDIA
District Survey Report Gondia 59
2. OVERVIEW OF MINING ACTIVITY IN THE DISTRICT:
The three types of minor mineral constituents such as sand stone and bajri are required for any
type of construction apart from other material like cement and steel. In earlier times, the houses/
buildings were constructed in form of small dwellings with walls made up of mud plaster, stone
and interlocking provided with wooden frames and there were negligible commercial as well as
developmental activities resulting less demand of building material. However, with the passage
of time when the District was carved out during new vistas of developmental activities were
started. Mineral Resources: Gondia district is reasonably. As such the demand of minor minerals
in the District started an increasing trend. The increase could be gauged from the fact that during
year 2018-19 the total royalty collection approximate on all mineral was Rs. 2828.28 Lakh. The
quantity of minor mineral consumption is a thermometer to assess the quantity of developmental
activities being undertaken in a particular area. In order to meet the requirement of raw material
for construction the extraction of sand from the river bed, stone and bajri from the land mining
area are being carried out exclusively. The demand of sand is mainly met through river borne
collection, whereas the demand of bajri/grits are met through manufactured grit by stone
crushers. The demand of dressed or undressed stone is met through the broken rock material
from the hill slope. The local residents used to lift sand/gravel etc. from the river beds to meet
out their bonafide requirement, however after coming into being the Mines and Minerals
(Development and Regulation) Act, 1957 (67 Act-1957) and Maharashtra Minor Mineral
Extraction (Development and Regulation)Rules, 2013. As the mining was allowed in accordance
to the rules, presently in this District, Mineral concessions are being granted through grant of
mining Lease. At present 19 nos. of mining leases for minor minerals have been granted under
the rules in different parts of the District and the detail is tabulated below. 27 Sand mine river
Beds has put to auction.
Based on the amendments made by the Ministry of Environment, Forests and Climate Change,
Government of India, in the Environment Impact Assessment Notification, 2006 notified on 15
January 2015, the Survey document of the district Gondia, The district survey document has
been prepared in accordance with the Appendix-X of the said notification.
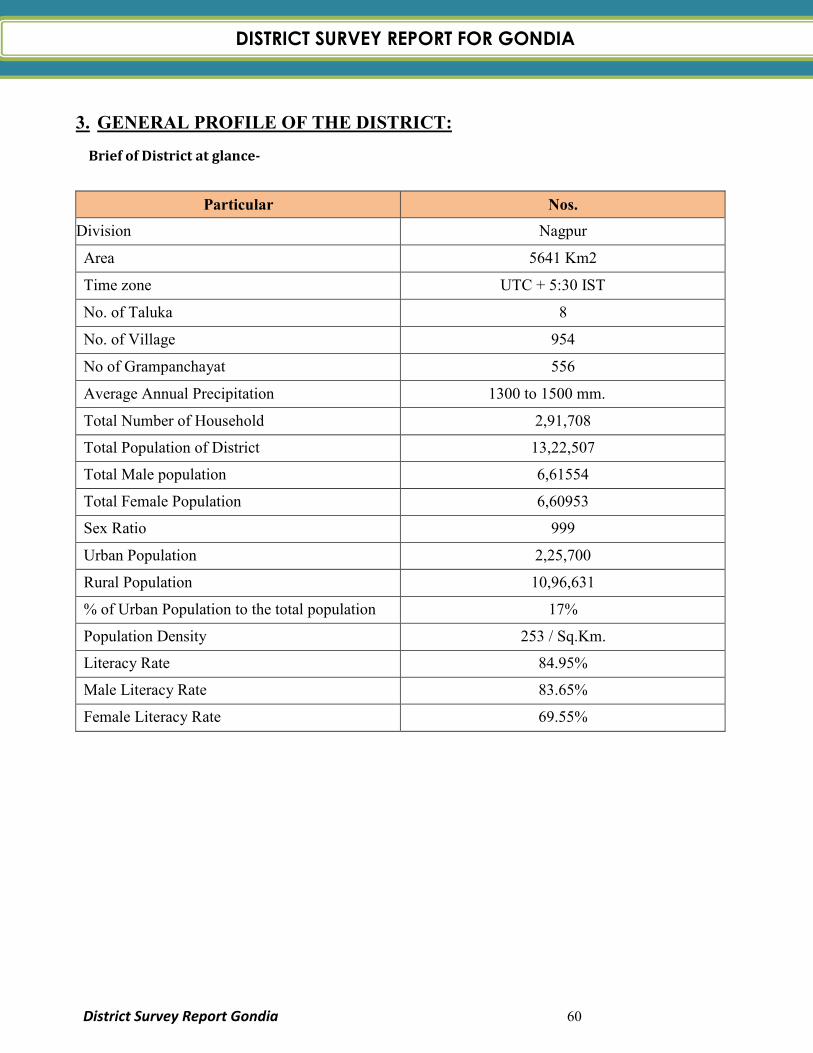
DISTRICT SURVEY REPORT FOR GONDIADISTRICT SURVEY REPORT FOR GONDIA
District Survey Report Gondia 60
3. GENERAL PROFILE OF THE DISTRICT:
Brief of District at glance-
Particular Nos.
Division Nagpur
Area 5641 Km2
Time zone UTC + 5:30 IST
No. of Taluka 8
No. of Village 954
No of Grampanchayat 556
Average Annual Precipitation 1300 to 1500 mm.
Total Number of Household 2,91,708
Total Population of District 13,22,507
Total Male population 6,61554
Total Female Population 6,60953
Sex Ratio 999
Urban Population 2,25,700
Rural Population 10,96,631
% of Urban Population to the total population 17%
Population Density 253 / Sq.Km.
Literacy Rate 84.95%
Male Literacy Rate 83.65%
Female Literacy Rate 69.55%
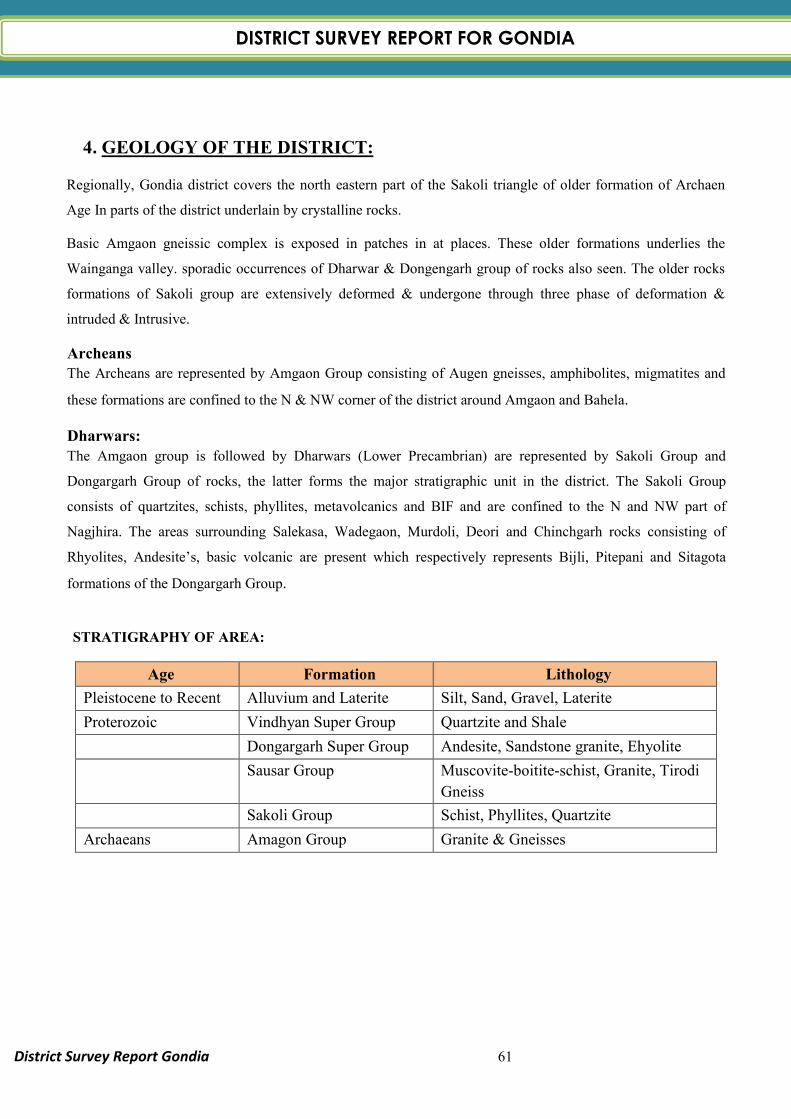
DISTRICT SURVEY REPORT FOR GONDIADISTRICT SURVEY REPORT FOR GONDIA
District Survey Report Gondia 61
4. GEOLOGY OF THE DISTRICT:
Regionally, Gondia district covers the north eastern part of the Sakoli triangle of older formation of Archaen
Age In parts of the district underlain by crystalline rocks.
Basic Amgaon gneissic complex is exposed in patches in at places. These older formations underlies the
Wainganga valley. sporadic occurrences of Dharwar & Dongengarh group of rocks also seen. The older rocks
formations of Sakoli group are extensively deformed & undergone through three phase of deformation &
intruded & Intrusive.
Archeans
The Archeans are represented by Amgaon Group consisting of Augen gneisses, amphibolites, migmatites and
these formations are confined to the N & NW corner of the district around Amgaon and Bahela.
Dharwars: The Amgaon group is followed by Dharwars (Lower Precambrian) are represented by Sakoli Group and
Dongargarh Group of rocks, the latter forms the major stratigraphic unit in the district. The Sakoli Group
consists of quartzites, schists, phyllites, metavolcanics and BIF and are confined to the N and NW part of
Nagjhira. The areas surrounding Salekasa, Wadegaon, Murdoli, Deori and Chinchgarh rocks consisting of
Rhyolites, Andesite’s, basic volcanic are present which respectively represents Bijli, Pitepani and Sitagota
formations of the Dongargarh Group.
STRATIGRAPHY OF AREA:
Age Formation Lithology
Pleistocene to Recent Alluvium and Laterite Silt, Sand, Gravel, Laterite
Proterozoic Vindhyan Super Group Quartzite and Shale
Dongargarh Super Group Andesite, Sandstone granite, Ehyolite
Sausar Group Muscovite-boitite-schist, Granite, Tirodi
Gneiss
Sakoli Group Schist, Phyllites, Quartzite
Archaeans Amagon Group Granite & Gneisses

DISTRICT SURVEY REPORT FOR GONDIADISTRICT SURVEY REPORT FOR GONDIA
District Survey Report Gondia 62
FIGURE-13 GEOLOGICAL MAP OF THE GONDIA DISTRICT
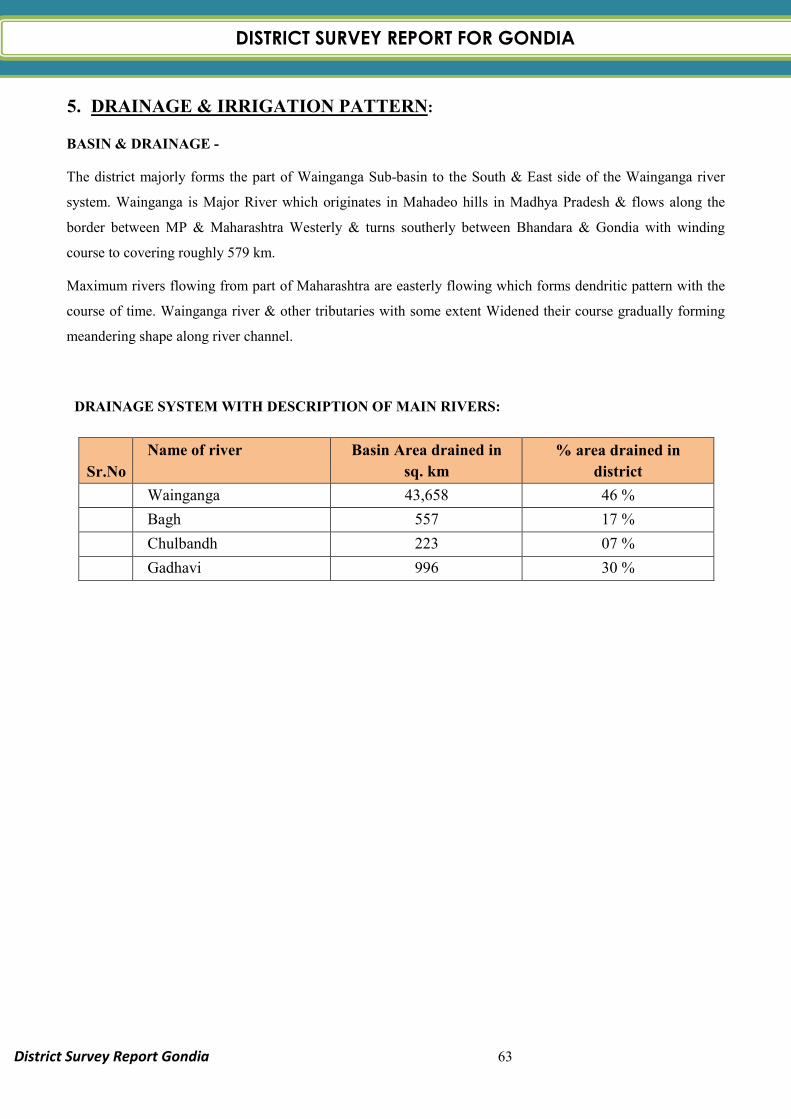
DISTRICT SURVEY REPORT FOR GONDIADISTRICT SURVEY REPORT FOR GONDIA
District Survey Report Gondia 63
5. DRAINAGE & IRRIGATION PATTERN:
BASIN & DRAINAGE -
The district majorly forms the part of Wainganga Sub-basin to the South & East side of the Wainganga river
system. Wainganga is Major River which originates in Mahadeo hills in Madhya Pradesh & flows along the
border between MP & Maharashtra Westerly & turns southerly between Bhandara & Gondia with winding
course to covering roughly 579 km.
Maximum rivers flowing from part of Maharashtra are easterly flowing which forms dendritic pattern with the
course of time. Wainganga river & other tributaries with some extent Widened their course gradually forming
meandering shape along river channel.
DRAINAGE SYSTEM WITH DESCRIPTION OF MAIN RIVERS:
Sr.No
Name of river Basin Area drained in
sq. km
% area drained in
district
Wainganga 43,658 46 %
Bagh 557 17 %
Chulbandh 223 07 %
Gadhavi 996 30 %
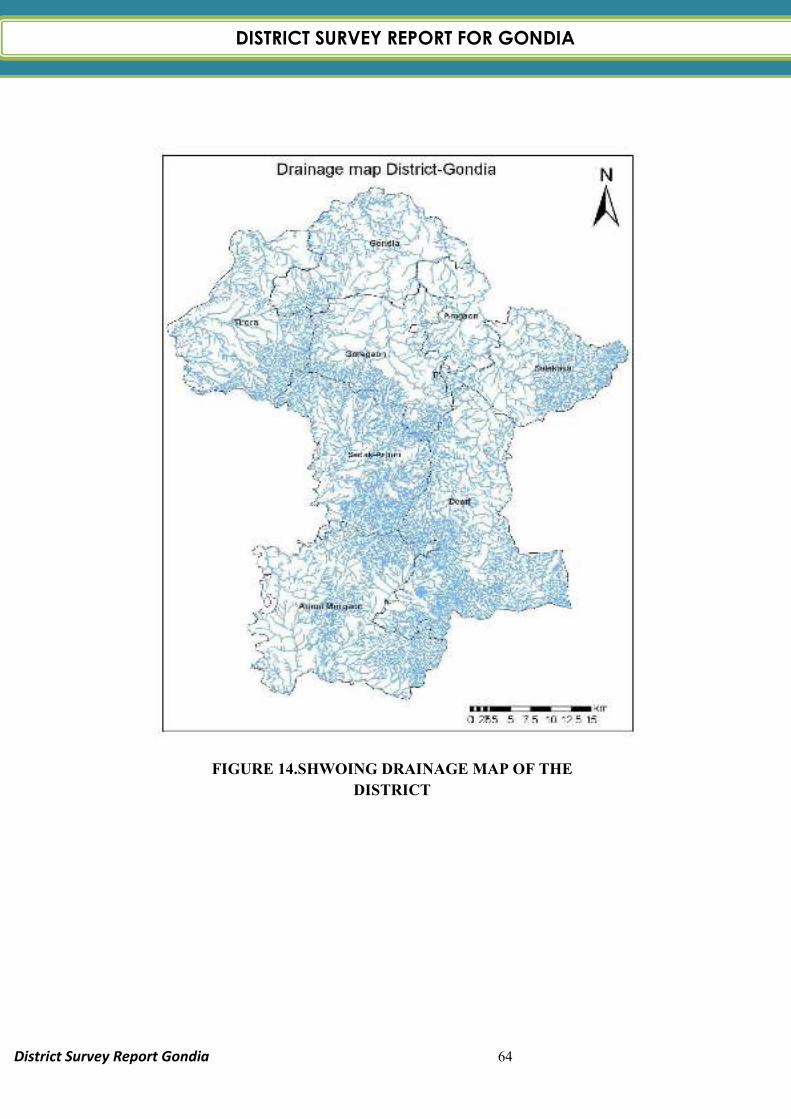
DISTRICT SURVEY REPORT FOR GONDIADISTRICT SURVEY REPORT FOR GONDIA
District Survey Report Gondia 64
FIGURE 14.SHWOING DRAINAGE MAP OF THE
DISTRICT
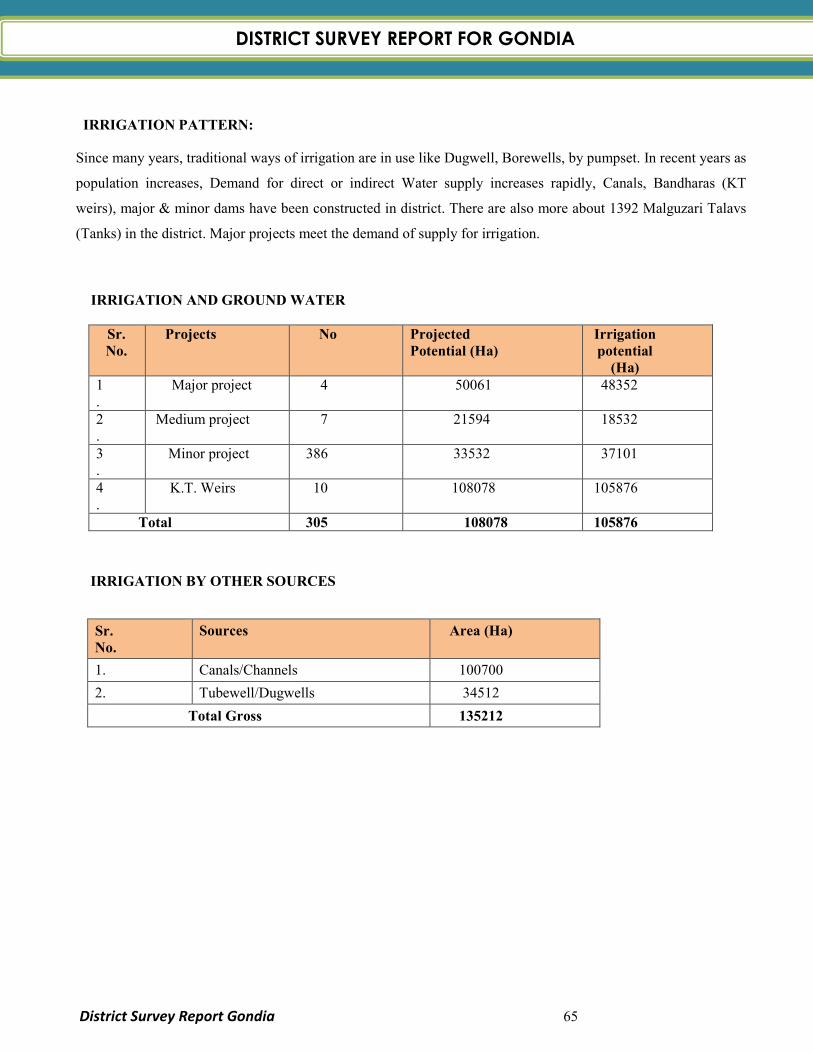
DISTRICT SURVEY REPORT FOR GONDIADISTRICT SURVEY REPORT FOR GONDIA
District Survey Report Gondia 65
IRRIGATION PATTERN:
Since many years, traditional ways of irrigation are in use like Dugwell, Borewells, by pumpset. In recent years as
population increases, Demand for direct or indirect Water supply increases rapidly, Canals, Bandharas (KT
weirs), major & minor dams have been constructed in district. There are also more about 1392 Malguzari Talavs
(Tanks) in the district. Major projects meet the demand of supply for irrigation.
IRRIGATION AND GROUND WATER
Sr. No.
Projects No Projected Potential (Ha)
Irrigation potential
(Ha) 1.
Major project 4 50061 48352
2.
Medium project 7 21594 18532
3.
Minor project 386 33532 37101
4.
K.T. Weirs 10 108078 105876
Total 305 108078 105876
IRRIGATION BY OTHER SOURCES
Sr. No.
Sources Area (Ha)
1. Canals/Channels 100700
2. Tubewell/Dugwells 34512
Total Gross 135212
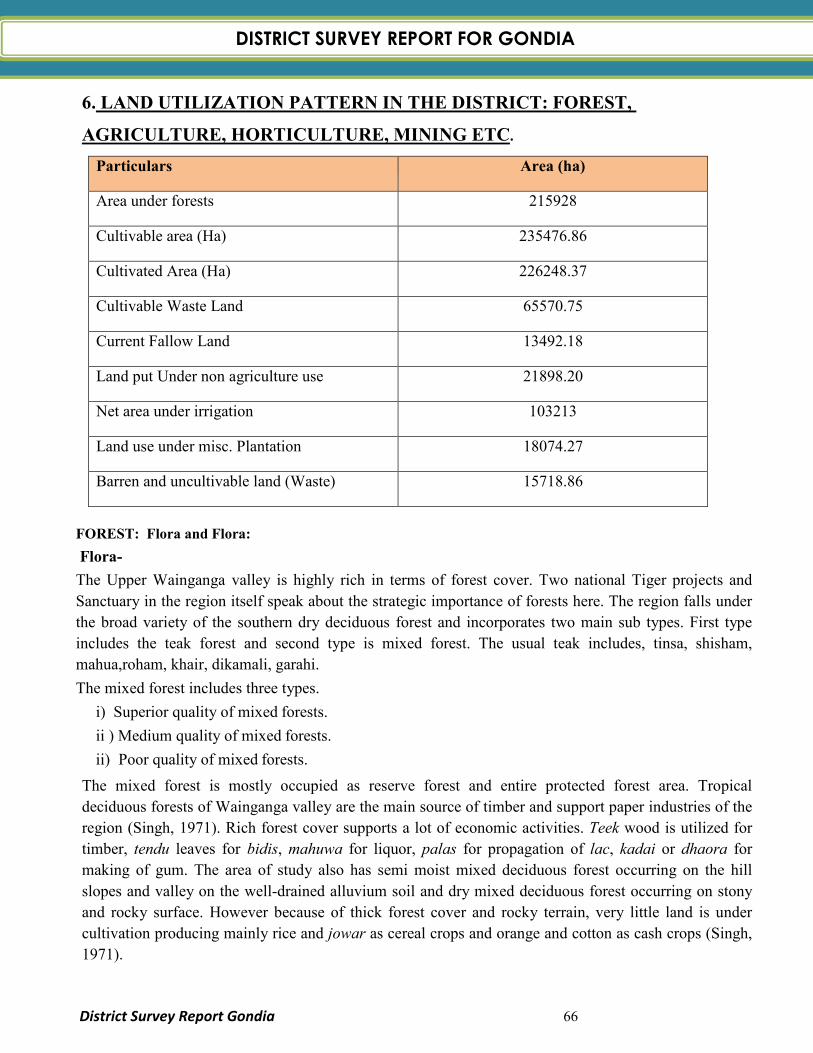
DISTRICT SURVEY REPORT FOR GONDIADISTRICT SURVEY REPORT FOR GONDIA
District Survey Report Gondia 66
6. LAND UTILIZATION PATTERN IN THE DISTRICT: FOREST,
AGRICULTURE, HORTICULTURE, MINING ETC.
Particulars Area (ha)
Area under forests 215928
Cultivable area (Ha) 235476.86
Cultivated Area (Ha) 226248.37
Cultivable Waste Land 65570.75
Current Fallow Land 13492.18
Land put Under non agriculture use 21898.20
Net area under irrigation 103213
Land use under misc. Plantation 18074.27
Barren and uncultivable land (Waste) 15718.86
FOREST: Flora and Flora:
Flora-
The Upper Wainganga valley is highly rich in terms of forest cover. Two national Tiger projects and
Sanctuary in the region itself speak about the strategic importance of forests here. The region falls under
the broad variety of the southern dry deciduous forest and incorporates two main sub types. First type
includes the teak forest and second type is mixed forest. The usual teak includes, tinsa, shisham,
mahua,roham, khair, dikamali, garahi.
The mixed forest includes three types.
i) Superior quality of mixed forests.
ii ) Medium quality of mixed forests.
ii) Poor quality of mixed forests.
The mixed forest is mostly occupied as reserve forest and entire protected forest area. Tropical
deciduous forests of Wainganga valley are the main source of timber and support paper industries of the
region (Singh, 1971). Rich forest cover supports a lot of economic activities. Teek wood is utilized for
timber, tendu leaves for bidis, mahuwa for liquor, palas for propagation of lac, kadai or dhaora for
making of gum. The area of study also has semi moist mixed deciduous forest occurring on the hill
slopes and valley on the well-drained alluvium soil and dry mixed deciduous forest occurring on stony
and rocky surface. However because of thick forest cover and rocky terrain, very little land is under
cultivation producing mainly rice and jowar as cereal crops and orange and cotton as cash crops (Singh,
1971).
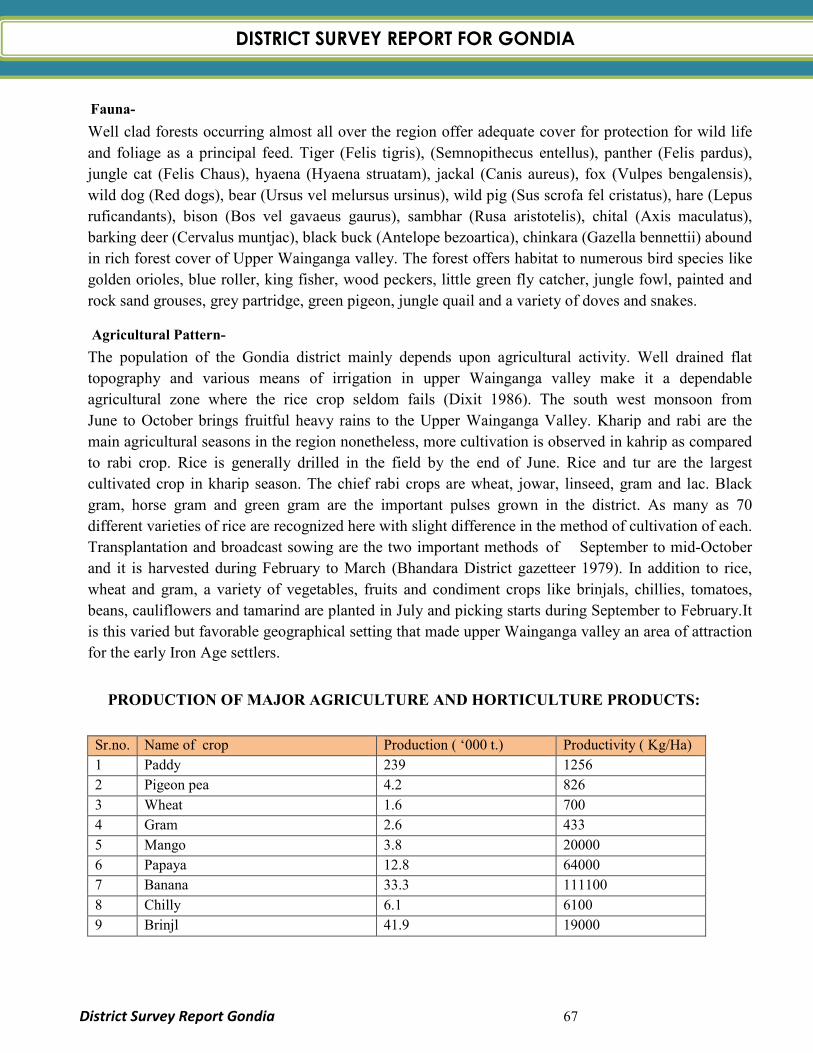
DISTRICT SURVEY REPORT FOR GONDIADISTRICT SURVEY REPORT FOR GONDIA
District Survey Report Gondia 67
Fauna-
Well clad forests occurring almost all over the region offer adequate cover for protection for wild life
and foliage as a principal feed. Tiger (Felis tigris), (Semnopithecus entellus), panther (Felis pardus),
jungle cat (Felis Chaus), hyaena (Hyaena struatam), jackal (Canis aureus), fox (Vulpes bengalensis),
wild dog (Red dogs), bear (Ursus vel melursus ursinus), wild pig (Sus scrofa fel cristatus), hare (Lepus
ruficandants), bison (Bos vel gavaeus gaurus), sambhar (Rusa aristotelis), chital (Axis maculatus),
barking deer (Cervalus muntjac), black buck (Antelope bezoartica), chinkara (Gazella bennettii) abound
in rich forest cover of Upper Wainganga valley. The forest offers habitat to numerous bird species like
golden orioles, blue roller, king fisher, wood peckers, little green fly catcher, jungle fowl, painted and
rock sand grouses, grey partridge, green pigeon, jungle quail and a variety of doves and snakes.
Agricultural Pattern-
The population of the Gondia district mainly depends upon agricultural activity. Well drained flat
topography and various means of irrigation in upper Wainganga valley make it a dependable
agricultural zone where the rice crop seldom fails (Dixit 1986). The south west monsoon from
June to October brings fruitful heavy rains to the Upper Wainganga Valley. Kharip and rabi are the
main agricultural seasons in the region nonetheless, more cultivation is observed in kahrip as compared
to rabi crop. Rice is generally drilled in the field by the end of June. Rice and tur are the largest
cultivated crop in kharip season. The chief rabi crops are wheat, jowar, linseed, gram and lac. Black
gram, horse gram and green gram are the important pulses grown in the district. As many as 70
different varieties of rice are recognized here with slight difference in the method of cultivation of each.
Transplantation and broadcast sowing are the two important methods of September to mid-October
and it is harvested during February to March (Bhandara District gazetteer 1979). In addition to rice,
wheat and gram, a variety of vegetables, fruits and condiment crops like brinjals, chillies, tomatoes,
beans, cauliflowers and tamarind are planted in July and picking starts during September to February.It
is this varied but favorable geographical setting that made upper Wainganga valley an area of attraction
for the early Iron Age settlers.
PRODUCTION OF MAJOR AGRICULTURE AND HORTICULTURE PRODUCTS:
Sr.no. Name of crop Production ( ‘000 t.) Productivity ( Kg/Ha)
1 Paddy 239 1256
2 Pigeon pea 4.2 826
3 Wheat 1.6 700
4 Gram 2.6 433
5 Mango 3.8 20000
6 Papaya 12.8 64000
7 Banana 33.3 111100
8 Chilly 6.1 6100
9 Brinjl 41.9 19000

DISTRICT SURVEY REPORT FOR GONDIADISTRICT SURVEY REPORT FOR GONDIA
District Survey Report Gondia 68
7. SURFACE WATER AND GROUND WATER SCENARIO OF THE DISTRICT:
SURFACE WATER:
Wainganga & other tributary river comes under the Wainganga basin. The entire Catchment area of the
Wainganga basin is full of ridges, valley & low hill ranges. The basin is lies in the medium rainfall zone between
900 mm to 1600 mm.
According to water quality status of Maharashtra. Wainganga basin is Sub basin to Godavari-2 with other basins
are Wardha and Pranhita.
ANNUAL AVERAGE WATER QUALITY INDEXE IN VARIOUS SUB BASINS OF GODAVARI -2 BASINS ON DIFF. PARAMETERS. (As per water quality status of Maharashtra)
Basin Name of sub-basin Number of Observations Grand total
G2E M2G B B2V DRY
Godavari-2 Wardha 11 - 1 - 12
Wainganga 10 1 2 2 15
Pranhita & others 1 - - - 1
GROUND WATER:
Entire part of Gondia district is covered by metamorphic rocks & with igneous rocks. Major part is occupied by
Precambrian formations. These pre-Cambrian rocks are major water bearing formations. Weathered portions of
these rocks-joints, cracks & fractures zones act as good aquifer. Ground water occurs below water table & in
semi-confined conditions in these formations.
As per CGWB there are 26 ground water monitoring stations to check fluctuations in ground water level as pre
monsoon & post monsoon readings.
GROUND WATER QUALITY:
Water samples from monitoring well all collect for checking the quality of ground water. The samples analyses on
various parameters including (pH), electrical conductivity (EC), total alkaline (TH), Nitrate (NOS) & Fluoride
(P).
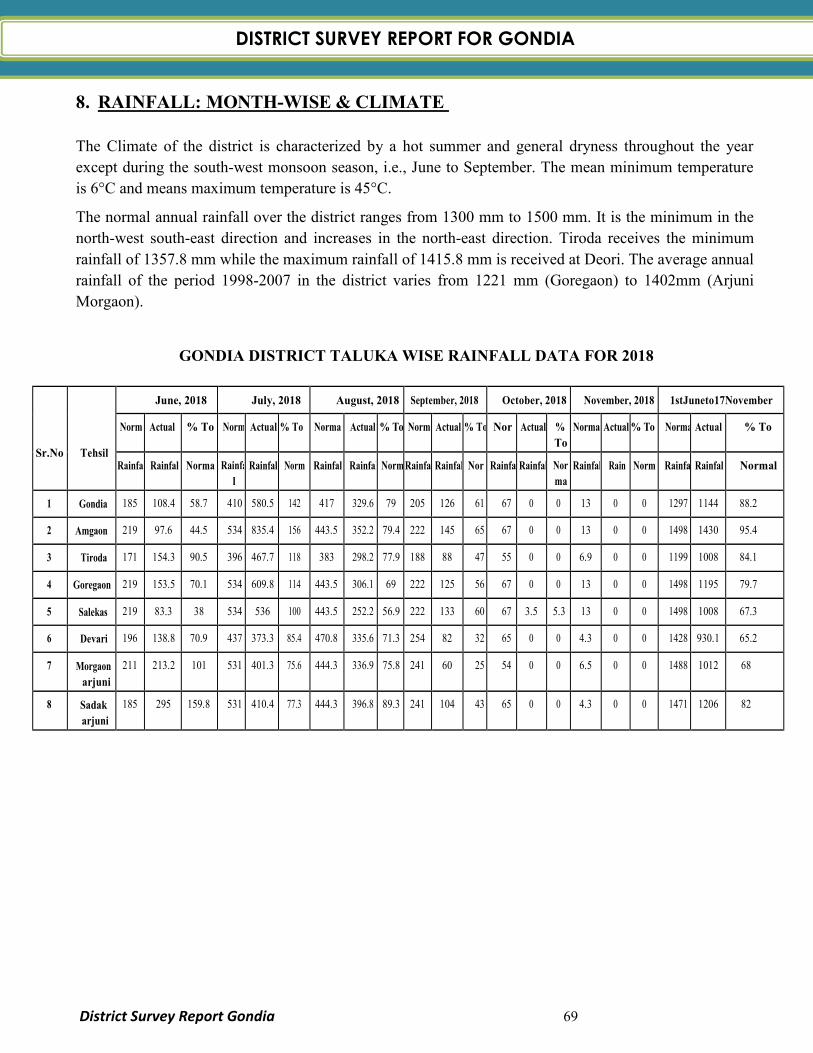
DISTRICT SURVEY REPORT FOR GONDIADISTRICT SURVEY REPORT FOR GONDIA
District Survey Report Gondia 69
8. RAINFALL: MONTH-WISE & CLIMATE
The Climate of the district is characterized by a hot summer and general dryness throughout the year
except during the south-west monsoon season, i.e., June to September. The mean minimum temperature
is 6°C and means maximum temperature is 45°C.
The normal annual rainfall over the district ranges from 1300 mm to 1500 mm. It is the minimum in the
north-west south-east direction and increases in the north-east direction. Tiroda receives the minimum
rainfall of 1357.8 mm while the maximum rainfall of 1415.8 mm is received at Deori. The average annual
rainfall of the period 1998-2007 in the district varies from 1221 mm (Goregaon) to 1402mm (Arjuni
Morgaon).
GONDIA DISTRICT TALUKA WISE RAINFALL DATA FOR 2018
Sr.No
Tehsil
June, 2018 July, 2018 August, 2018 September, 2018 October, 2018 November, 2018 1stJuneto17November
Norm Actual % To Norm Actual % To Norma Actual % To Norm Actual % To Nor Actual %
To
Norma Actual % To Norma Actual % To
Rainfa Rainfal Norma Rainfa
l
Rainfal Norm Rainfal Rainfal Norm Rainfa Rainfal Nor Rainfa Rainfal Nor
ma
Rainfal Rain Norm Rainfal Rainfal Normal
1 Gondia 185 108.4 58.7 410 580.5 142 417 329.6 79 205 126 61 67 0 0 13 0 0 1297 1144 88.2
2 Amgaon 219 97.6 44.5 534 835.4 156 443.5 352.2 79.4 222 145 65 67 0 0 13 0 0 1498 1430 95.4
3 Tiroda 171 154.3 90.5 396 467.7 118 383 298.2 77.9 188 88 47 55 0 0 6.9 0 0 1199 1008 84.1
4 Goregaon 219 153.5 70.1 534 609.8 114 443.5 306.1 69 222 125 56 67 0 0 13 0 0 1498 1195 79.7
5 Salekas 219 83.3 38 534 536 100 443.5 252.2 56.9 222 133 60 67 3.5 5.3 13 0 0 1498 1008 67.3
6 Devari 196 138.8 70.9 437 373.3 85.4 470.8 335.6 71.3 254 82 32 65 0 0 4.3 0 0 1428 930.1 65.2
7 Morgaon
arjuni
211 213.2 101 531 401.3 75.6 444.3 336.9 75.8 241 60 25 54 0 0 6.5 0 0 1488 1012 68
8 Sadak
arjuni
185 295 159.8 531 410.4 77.3 444.3 396.8 89.3 241 104 43 65 0 0 4.3 0 0 1471 1206 82
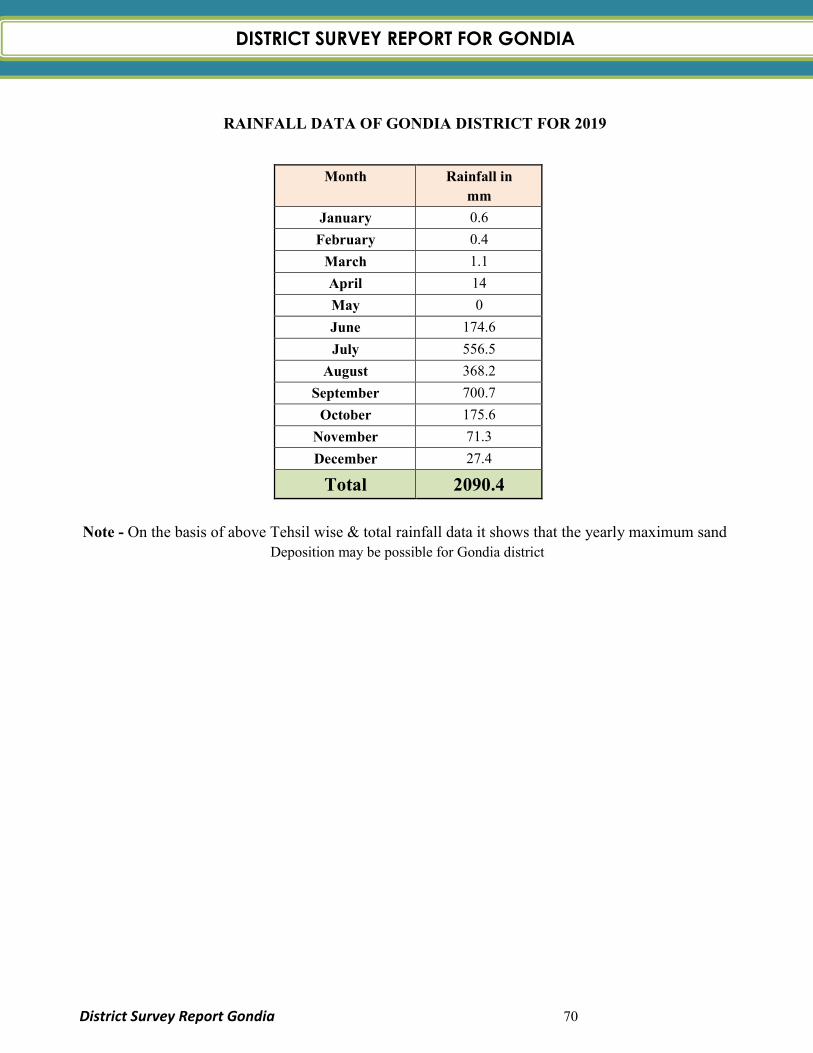
DISTRICT SURVEY REPORT FOR GONDIADISTRICT SURVEY REPORT FOR GONDIA
District Survey Report Gondia 70
RAINFALL DATA OF GONDIA DISTRICT FOR 2019
Month Rainfall in
mm
January 0.6
February 0.4
March 1.1
April 14
May 0
June 174.6
July 556.5
August 368.2
September 700.7
October 175.6
November 71.3
December 27.4
Total 2090.4
Note - On the basis of above Tehsil wise & total rainfall data it shows that the yearly maximum sand
Deposition may be possible for Gondia district
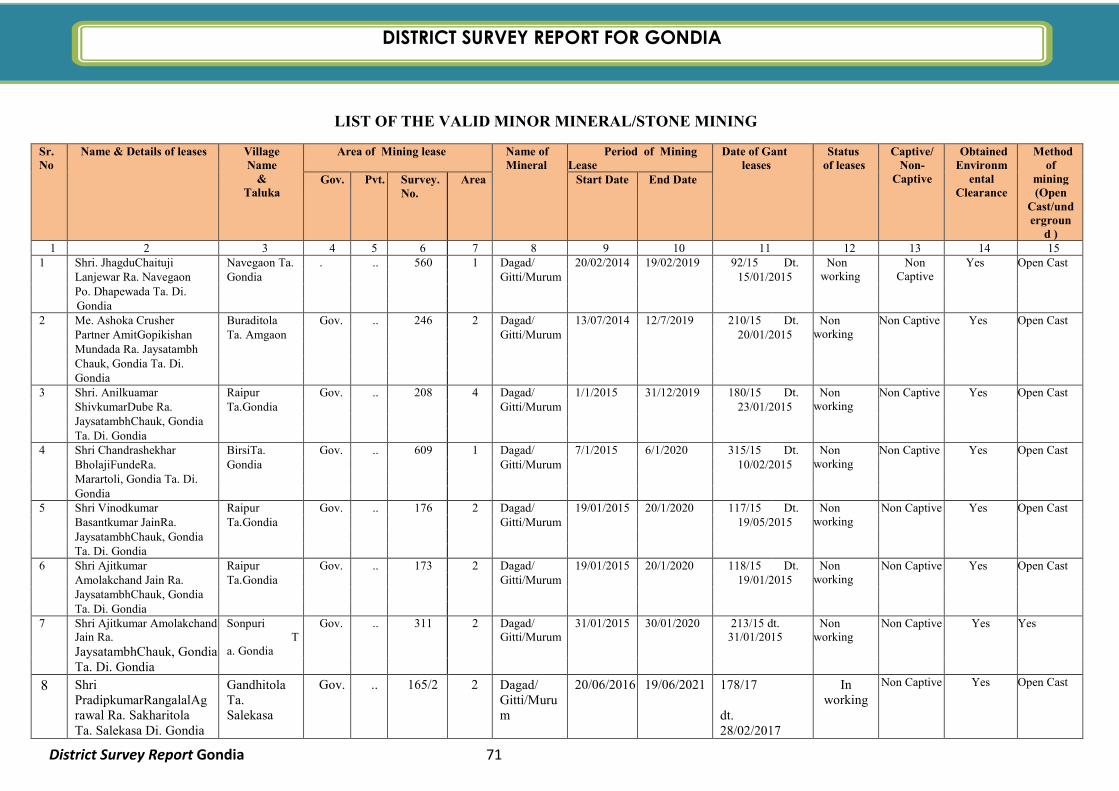
DISTRICT SURVEY REPORT FOR GONDIA
District Survey Report Gondia 71
LIST OF THE VALID MINOR MINERAL/STONE MINING
Sr. No
Name & Details of leases Village Name
& Taluka
Area of Mining lease Name of Mineral
Period of Mining Lease
Date of Gant leases
Status of leases
Captive/Non-
Captive
Obtained Environm
ental Clearance
Method of
mining (Open
Cast/undergroun
d )
Gov. Pvt. Survey. No.
Area Start Date End Date
1 2 3 4 5 6 7 8 9 10 11 12 13 14 15 1 Shri. JhagduChaituji Navegaon Ta. . .. 560 1 Dagad/ 20/02/2014 19/02/2019 92/15 Dt. Non
working Non
Captive Yes Open Cast
Lanjewar Ra. Navegaon Gondia Gitti/Murum 15/01/2015 Po. Dhapewada Ta. Di.
Gondia 2 Me. Ashoka Crusher Buraditola Gov. .. 246 2 Dagad/ 13/07/2014 12/7/2019 210/15 Dt. Non
working Non Captive Yes Open Cast
Partner AmitGopikishan Ta. Amgaon Gitti/Murum 20/01/2015 Mundada Ra. Jaysatambh Chauk, Gondia Ta. Di. Gondia
3 Shri. Anilkuamar Raipur Gov. .. 208 4 Dagad/ 1/1/2015 31/12/2019 180/15 Dt. Non working
Non Captive Yes Open Cast ShivkumarDube Ra. Ta.Gondia Gitti/Murum 23/01/2015
JaysatambhChauk, Gondia Ta. Di. Gondia
4 Shri Chandrashekhar BirsiTa. Gov. .. 609 1 Dagad/ 7/1/2015 6/1/2020 315/15 Dt. Non working
Non Captive Yes Open Cast BholajiFundeRa. Gondia Gitti/Murum 10/02/2015
Marartoli, Gondia Ta. Di. Gondia
5 Shri Vinodkumar Raipur Gov. .. 176 2 Dagad/ 19/01/2015 20/1/2020 117/15 Dt. Non working
Non Captive Yes Open Cast Basantkumar JainRa. Ta.Gondia Gitti/Murum 19/05/2015
JaysatambhChauk, Gondia Ta. Di. Gondia
6 Shri Ajitkumar Raipur Gov. .. 173 2 Dagad/ 19/01/2015 20/1/2020 118/15 Dt. Non working
Non Captive Yes Open Cast Amolakchand Jain Ra. Ta.Gondia Gitti/Murum 19/01/2015 JaysatambhChauk, Gondia Ta. Di. Gondia
7 Shri Ajitkumar Amolakchand Jain Ra. JaysatambhChauk, Gondia Ta. Di. Gondia
Sonpuri Ta. Gondia
Gov. .. 311 2 Dagad/ Gitti/Murum
31/01/2015 30/01/2020 213/15 dt. 31/01/2015
Non working
Non Captive Yes Yes
8 Shri PradipkumarRangalalAgrawal Ra. Sakharitola Ta. Salekasa Di. Gondia
Gandhitola Ta. Salekasa
Gov. .. 165/2 2 Dagad/ Gitti/Murum
20/06/2016 19/06/2021 178/17 dt. 28/02/2017
In working
Non Captive Yes Open Cast
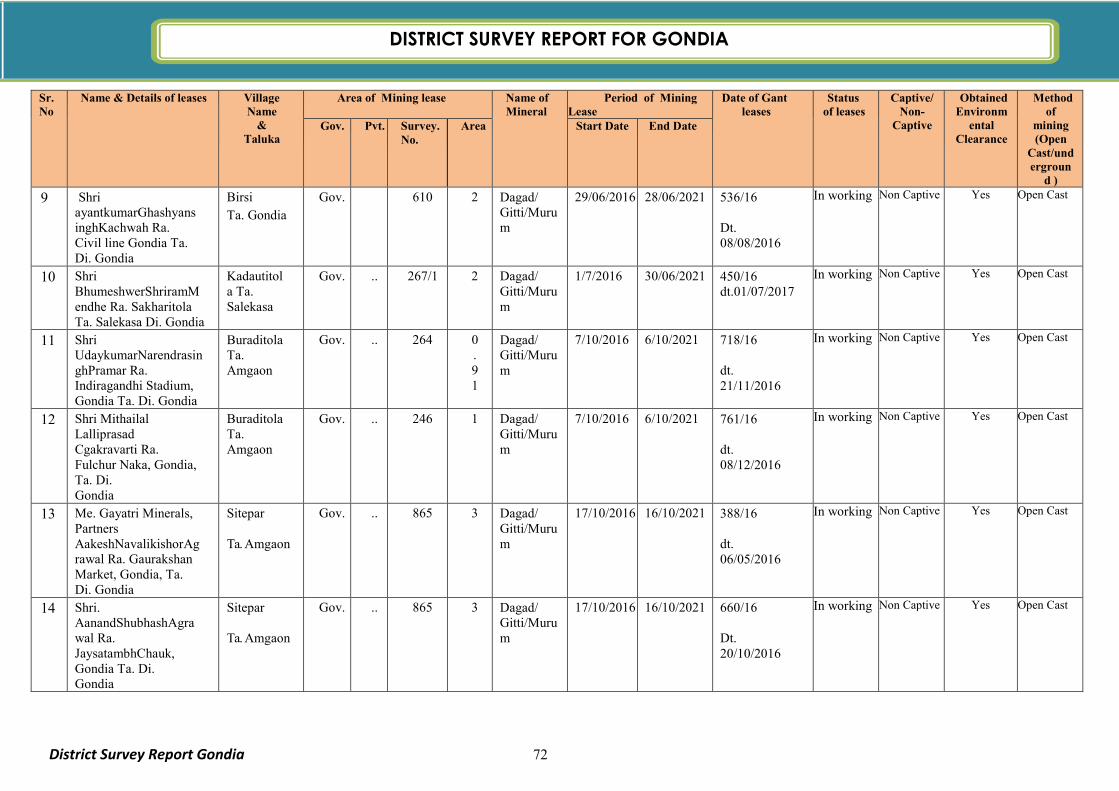
DISTRICT SURVEY REPORT FOR GONDIADISTRICT SURVEY REPORT FOR GONDIA
District Survey Report Gondia 72
Sr. No
Name & Details of leases Village Name
& Taluka
Area of Mining lease Name of Mineral
Period of Mining Lease
Date of Gant leases
Status of leases
Captive/Non-
Captive
Obtained Environm
ental Clearance
Method of
mining (Open
Cast/undergroun
d )
Gov. Pvt. Survey. No.
Area Start Date End Date
9 Shri ayantkumarGhashyansinghKachwah Ra. Civil line Gondia Ta. Di. Gondia
Birsi
Ta. Gondia
Gov. 610 2 Dagad/ Gitti/Murum
29/06/2016 28/06/2021 536/16 Dt. 08/08/2016
In working Non Captive Yes Open Cast
10 Shri BhumeshwerShriramMendhe Ra. Sakharitola Ta. Salekasa Di. Gondia
Kadautitola Ta. Salekasa
Gov. .. 267/1 2 Dagad/ Gitti/Murum
1/7/2016 30/06/2021 450/16 dt.01/07/2017
In working Non Captive Yes Open Cast
11 Shri UdaykumarNarendrasinghPramar Ra. Indiragandhi Stadium, Gondia Ta. Di. Gondia
Buraditola Ta. Amgaon
Gov. .. 264 0.91
Dagad/ Gitti/Murum
7/10/2016 6/10/2021 718/16 dt. 21/11/2016
In working Non Captive Yes Open Cast
12 Shri Mithailal Lalliprasad Cgakravarti Ra. Fulchur Naka, Gondia, Ta. Di. Gondia
Buraditola Ta. Amgaon
Gov. .. 246 1 Dagad/ Gitti/Murum
7/10/2016 6/10/2021 761/16 dt. 08/12/2016
In working Non Captive Yes Open Cast
13 Me. Gayatri Minerals, Partners AakeshNavalikishorAgrawal Ra. Gaurakshan Market, Gondia, Ta. Di. Gondia
Sitepar Ta. Amgaon
Gov. .. 865 3 Dagad/ Gitti/Murum
17/10/2016 16/10/2021 388/16 dt. 06/05/2016
In working Non Captive Yes Open Cast
14 Shri. AanandShubhashAgrawal Ra. JaysatambhChauk, Gondia Ta. Di. Gondia
Sitepar Ta. Amgaon
Gov. .. 865 3 Dagad/ Gitti/Murum
17/10/2016 16/10/2021 660/16 Dt. 20/10/2016
In working Non Captive Yes Open Cast
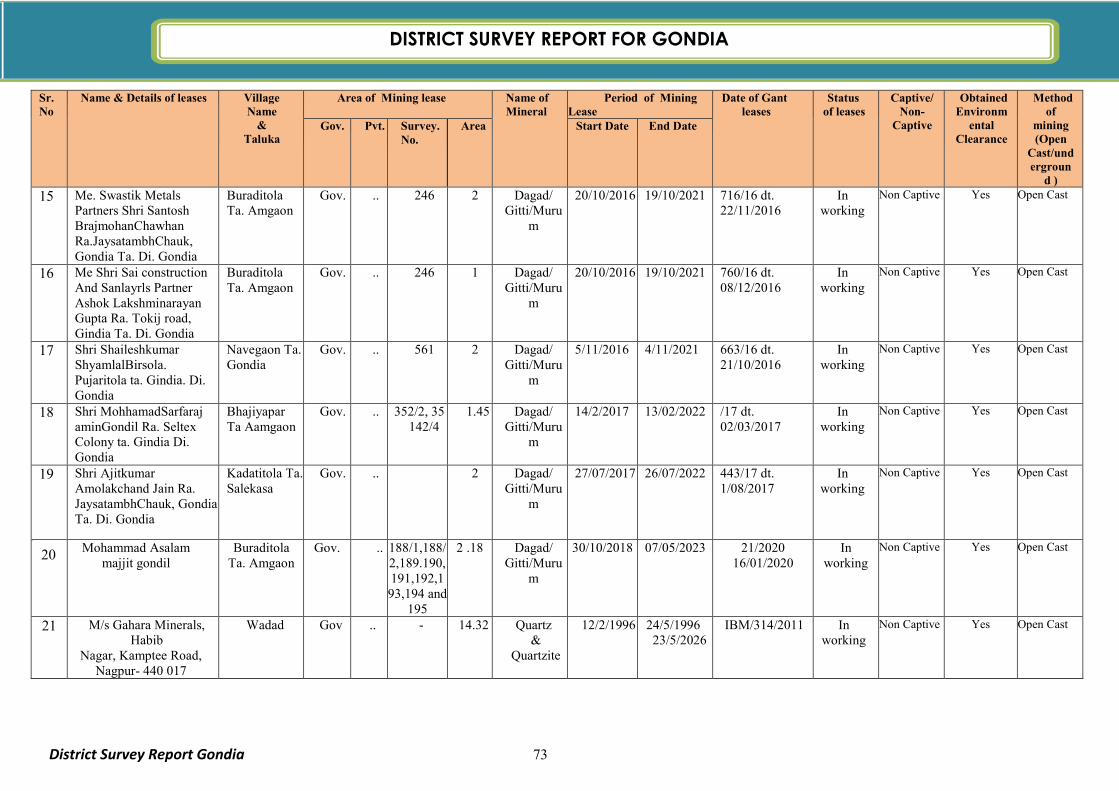
DISTRICT SURVEY REPORT FOR GONDIADISTRICT SURVEY REPORT FOR GONDIA
District Survey Report Gondia 73
Sr. No
Name & Details of leases Village Name
& Taluka
Area of Mining lease Name of Mineral
Period of Mining Lease
Date of Gant leases
Status of leases
Captive/Non-
Captive
Obtained Environm
ental Clearance
Method of
mining (Open
Cast/undergroun
d )
Gov. Pvt. Survey. No.
Area Start Date End Date
15 Me. Swastik Metals Partners Shri Santosh BrajmohanChawhan Ra.JaysatambhChauk, Gondia Ta. Di. Gondia
Buraditola Ta. Amgaon
Gov. .. 246 2 Dagad/ Gitti/Muru
m
20/10/2016 19/10/2021 716/16 dt. 22/11/2016
In working
Non Captive Yes Open Cast
16 Me Shri Sai construction And Sanlayrls Partner Ashok Lakshminarayan Gupta Ra. Tokij road, Gindia Ta. Di. Gondia
Buraditola Ta. Amgaon
Gov. .. 246 1 Dagad/ Gitti/Muru
m
20/10/2016 19/10/2021 760/16 dt. 08/12/2016
In working
Non Captive Yes Open Cast
17 Shri Shaileshkumar ShyamlalBirsola. Pujaritola ta. Gindia. Di. Gondia
Navegaon Ta. Gondia
Gov. .. 561 2 Dagad/ Gitti/Muru
m
5/11/2016 4/11/2021 663/16 dt. 21/10/2016
In working
Non Captive Yes Open Cast
18 Shri MohhamadSarfaraj aminGondil Ra. Seltex Colony ta. Gindia Di. Gondia
Bhajiyapar Ta Aamgaon
Gov. .. 352/2, 35 142/4
1.45 Dagad/ Gitti/Muru
m
14/2/2017 13/02/2022 /17 dt. 02/03/2017
In working
Non Captive Yes Open Cast
19 Shri Ajitkumar Amolakchand Jain Ra. JaysatambhChauk, Gondia Ta. Di. Gondia
Kadatitola Ta. Salekasa
Gov. .. 2 Dagad/ Gitti/Muru
m
27/07/2017 26/07/2022 443/17 dt. 1/08/2017
In working
Non Captive Yes Open Cast
20
20
Mohammad Asalam majjit gondil
Buraditola Ta. Amgaon
Gov. .. 188/1,188/2,189.190,191,192,193,194 and
195
2 .18 Dagad/ Gitti/Muru
m
30/10/2018 07/05/2023 21/2020 16/01/2020
In working
Non Captive Yes Open Cast
21 M/s Gahara Minerals,
Habib Nagar, Kamptee Road,
Nagpur- 440 017
Wadad Gov .. - 14.32 Quartz &
Quartzite
12/2/1996 24/5/1996 23/5/2026
IBM/314/2011 In working
Non Captive Yes Open Cast
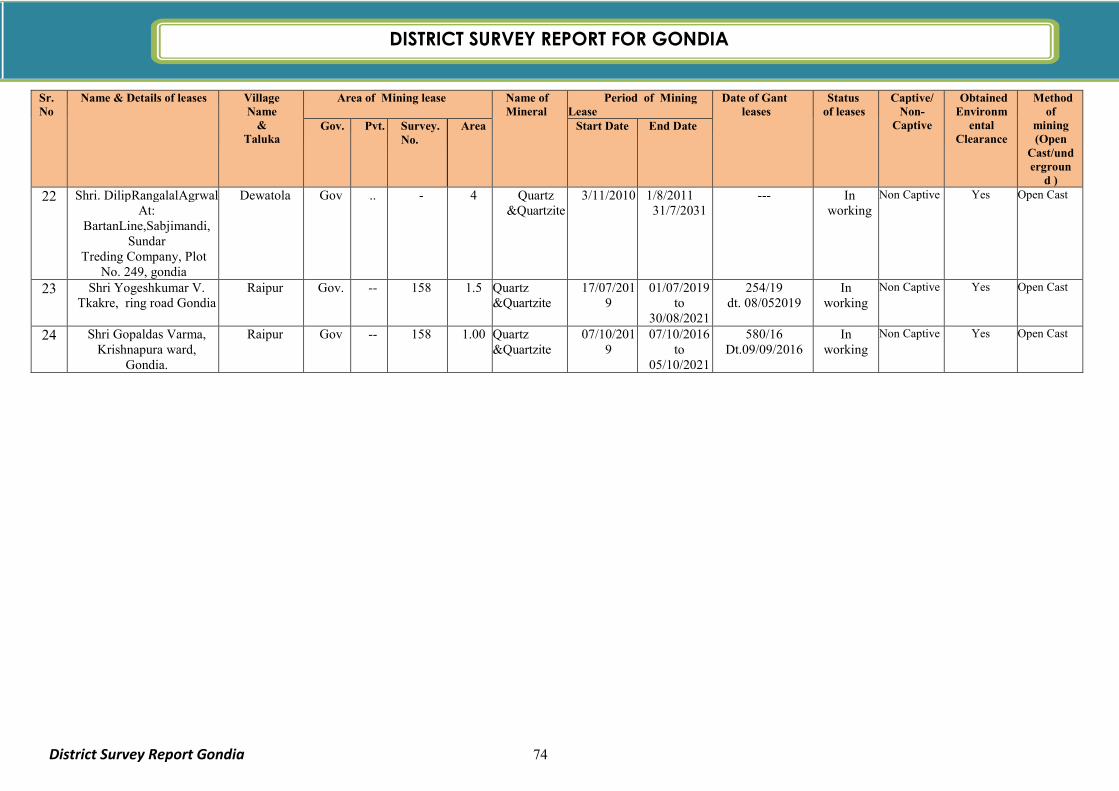
DISTRICT SURVEY REPORT FOR GONDIADISTRICT SURVEY REPORT FOR GONDIA
District Survey Report Gondia 74
Sr. No
Name & Details of leases Village Name
& Taluka
Area of Mining lease Name of Mineral
Period of Mining Lease
Date of Gant leases
Status of leases
Captive/Non-
Captive
Obtained Environm
ental Clearance
Method of
mining (Open
Cast/undergroun
d )
Gov. Pvt. Survey. No.
Area Start Date End Date
22 Shri. DilipRangalalAgrwal
At: BartanLine,Sabjimandi,
Sundar Treding Company, Plot
No. 249, gondia
Dewatola Gov .. - 4 Quartz &Quartzite
3/11/2010 1/8/2011 31/7/2031
--- In working
Non Captive Yes Open Cast
23 Shri Yogeshkumar V. Tkakre, ring road Gondia
Raipur Gov. -- 158 1.5 Quartz &Quartzite
17/07/2019
01/07/2019 to
30/08/2021
254/19 dt. 08/052019
In working
Non Captive Yes Open Cast
24 Shri Gopaldas Varma, Krishnapura ward,
Gondia.
Raipur Gov -- 158 1.00 Quartz &Quartzite
07/10/2019
07/10/2016 to
05/10/2021
580/16 Dt.09/09/2016
In working
Non Captive Yes Open Cast
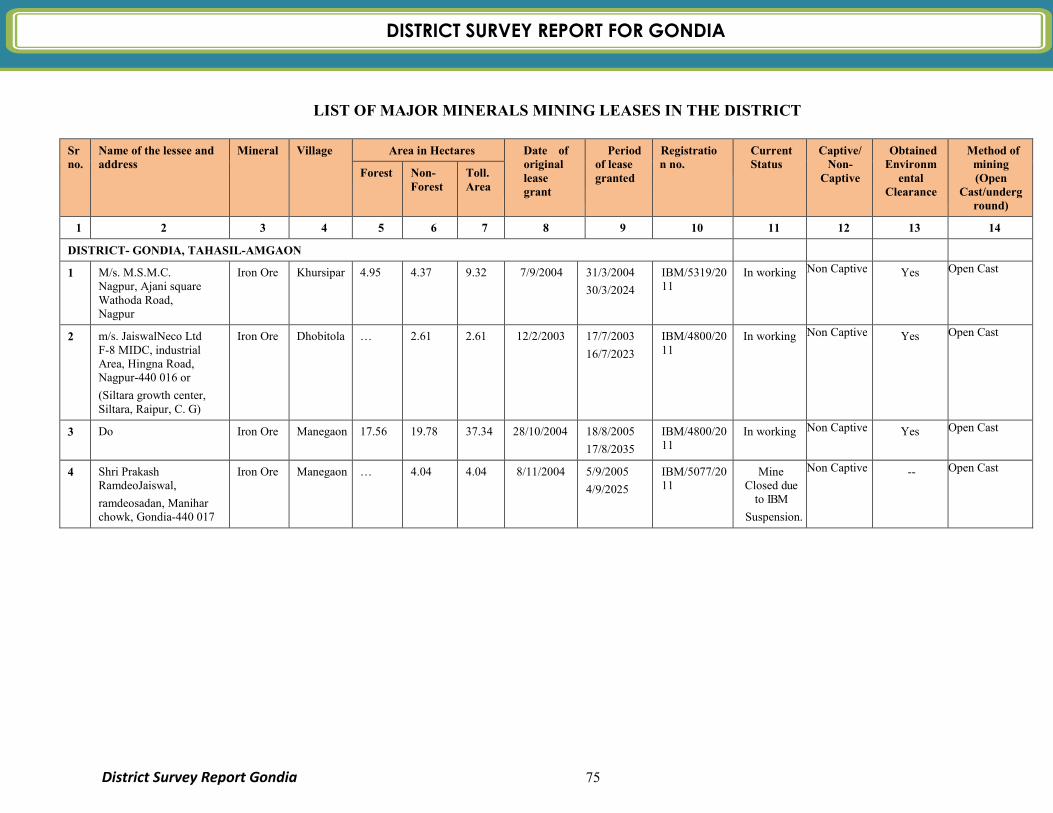
DISTRICT SURVEY REPORT FOR GONDIA
District Survey Report Gondia 75
LIST OF MAJOR MINERALS MINING LEASES IN THE DISTRICT
Sr no.
Name of the lessee and address
Mineral Village Area in Hectares Date of original lease grant
Period of lease granted
Registration no.
Current Status
Captive/Non-
Captive
Obtained Environm
ental Clearance
Method of mining (Open
Cast/underground)
Forest Non- Forest
Toll. Area
1 2 3 4 5 6 7 8 9 10 11 12 13 14
DISTRICT- GONDIA, TAHASIL-AMGAON
1 M/s. M.S.M.C. Nagpur, Ajani square Wathoda Road, Nagpur
Iron Ore Khursipar 4.95 4.37 9.32 7/9/2004 31/3/2004
30/3/2024
IBM/5319/2011
In working Non Captive Yes Open Cast
2 m/s. JaiswalNeco Ltd F-8 MIDC, industrial Area, Hingna Road, Nagpur-440 016 or
(Siltara growth center, Siltara, Raipur, C. G)
Iron Ore Dhobitola … 2.61 2.61 12/2/2003 17/7/2003
16/7/2023
IBM/4800/2011
In working Non Captive Yes Open Cast
3 Do Iron Ore Manegaon 17.56 19.78 37.34 28/10/2004 18/8/2005
17/8/2035
IBM/4800/2011
In working Non Captive Yes Open Cast
4 Shri Prakash RamdeoJaiswal,
ramdeosadan, Manihar chowk, Gondia-440 017
Iron Ore Manegaon … 4.04 4.04 8/11/2004 5/9/2005
4/9/2025
IBM/5077/2011
Mine Closed due
to IBM
Suspension.
Non Captive -- Open Cast
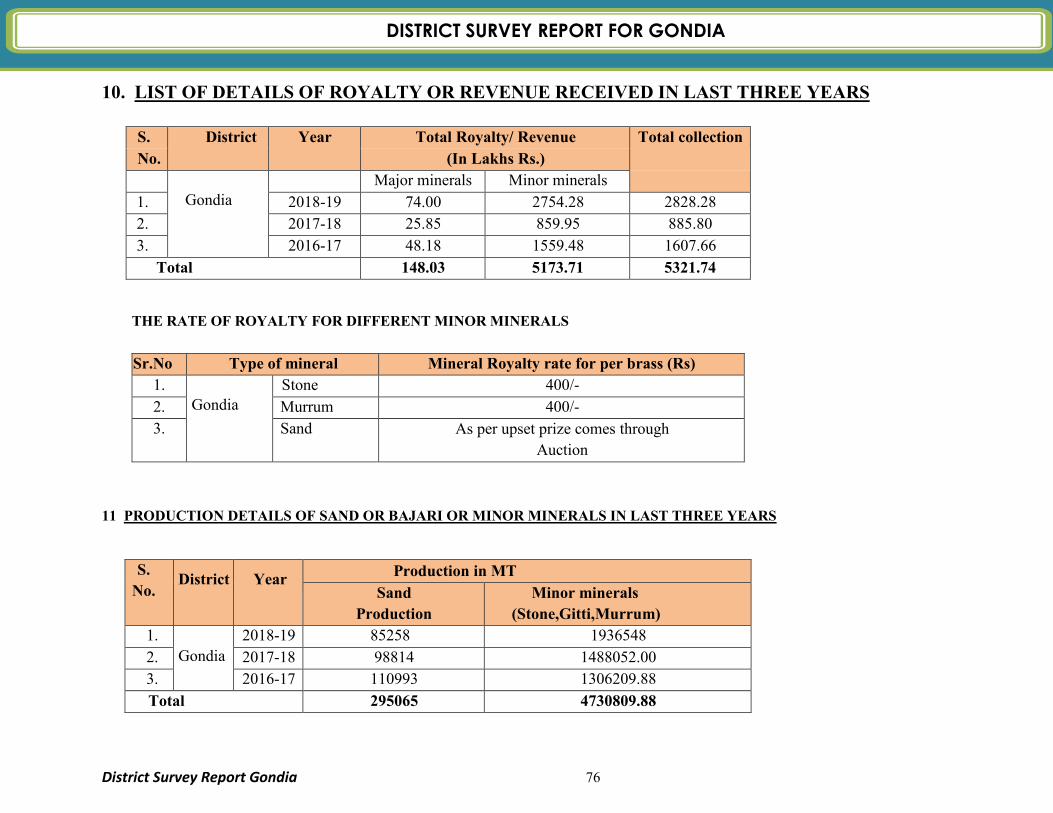
DISTRICT SURVEY REPORT FOR GONDIA
District Survey Report Gondia 76
10. LIST OF DETAILS OF ROYALTY OR REVENUE RECEIVED IN LAST THREE YEARS
S. District Year Total Royalty/ Revenue Total collection
No. (In Lakhs Rs.)
Gondia
Major minerals Minor minerals
1. 2018-19 74.00 2754.28 2828.28
2. 2017-18 25.85 859.95 885.80
3. 2016-17 48.18 1559.48 1607.66
Total 148.03 5173.71 5321.74
THE RATE OF ROYALTY FOR DIFFERENT MINOR MINERALS
Sr.No Type of mineral Mineral Royalty rate for per brass (Rs)
1.
Gondia Stone 400/-
2. Murrum 400/-
3. Sand As per upset prize comes through
Auction
11 PRODUCTION DETAILS OF SAND OR BAJARI OR MINOR MINERALS IN LAST THREE YEARS
S.
No. District Year
Production in MT
Sand
Production
Minor minerals
(Stone,Gitti,Murrum)
1.
Gondia 2018-19 85258 1936548
2. 2017-18 98814 1488052.00
3. 2016-17 110993 1306209.88
Total 295065 4730809.88
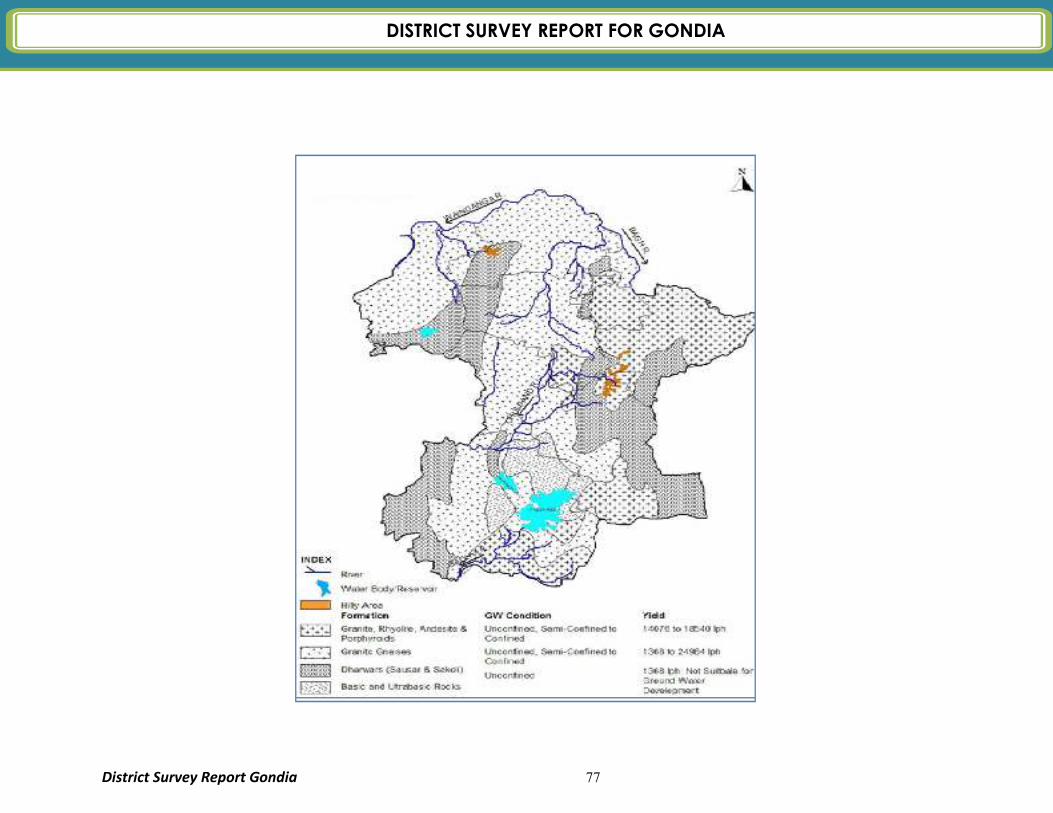
DISTRICT SURVEY REPORT FOR GONDIA
District Survey Report Gondia 77
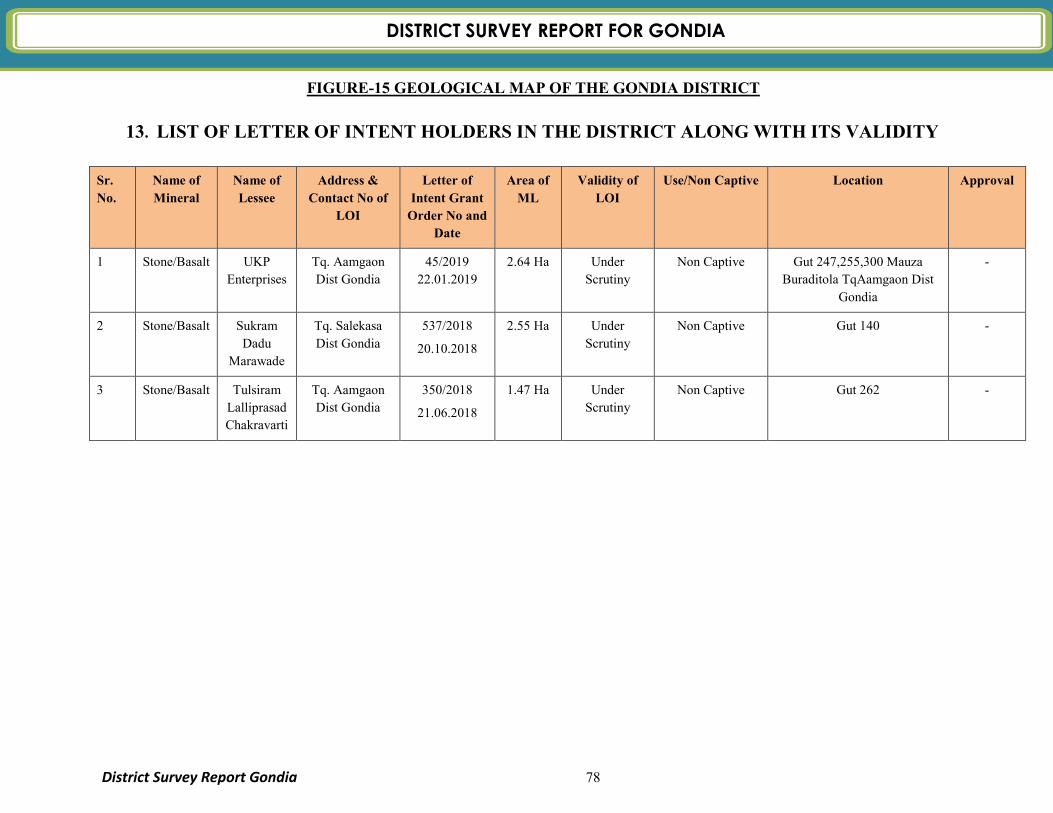
DISTRICT SURVEY REPORT FOR GONDIA
District Survey Report Gondia 78
FIGURE-15 GEOLOGICAL MAP OF THE GONDIA DISTRICT
13. LIST OF LETTER OF INTENT HOLDERS IN THE DISTRICT ALONG WITH ITS VALIDITY
Sr.
No.
Name of
Mineral
Name of
Lessee
Address &
Contact No of
LOI
Letter of
Intent Grant
Order No and
Date
Area of
ML
Validity of
LOI
Use/Non Captive Location Approval
1 Stone/Basalt UKP
Enterprises
Tq. Aamgaon
Dist Gondia
45/2019
22.01.2019
2.64 Ha Under
Scrutiny
Non Captive Gut 247,255,300 Mauza
Buraditola TqAamgaon Dist
Gondia
-
2 Stone/Basalt Sukram
Dadu
Marawade
Tq. Salekasa
Dist Gondia
537/2018
20.10.2018
2.55 Ha Under
Scrutiny
Non Captive Gut 140 -
3 Stone/Basalt Tulsiram
Lalliprasad
Chakravarti
Tq. Aamgaon
Dist Gondia
350/2018
21.06.2018
1.47 Ha Under
Scrutiny
Non Captive Gut 262 -
DISTRICT SURVEY REPORT FOR GONDIA
District Survey Report Gondia 79
14. QUALITY/GRADE OF MINERAL AVAILABLE :
Quality of the mineral is essential parameter for use. Quality of the any mineral is basically defined by its
chemical constituents, geological processes of rock/ mineral formation and physical properties. In district,
minor mineral in stone quarry is black stone. By geological time rock tend to weathered by chemical and
physical agents by which rock disintegrate to form weathered mass normally on surfacial part. Up to some
meter in upper part strength mineral is not of standard grade. In deeper part mineral is compact and harder.
In buraditola area, black stone confirming IS standards basically uses for construction purpose. Quartzite is
is siliceous rock more brittle as compare to black stone and uses for industrial purpose with less use in
construction.
River bed sand is very famous form Wainganga river. This sand is very famous as good quality as it
contains more than 90% silica which is very useful in concreting. Iron ore is basically is a magnetite which
uses in industries. Weathered material/ murrum is weathered material and uses only as filling work.
DISTRICT SURVEY REPORT FOR GONDIA
District Survey Report Gondia 80
15. USE OF MINERALS:
Minerals are use in construction, building decoration, industrial purpose and others. In district most of
mining is occupied by minor mineral. Black stone , Quartzite/Quartz, river sand and iron ore is being
mined
Gitti/building stone: Gitti / stone/ Aggregates use in construction, road and other construction projects
as it has strong physical properties. Raw rock stones can be crushed and sorted into various sizes and use
for different purpose.
Murrum: murrum is a highly weathered material which can derived from top portion of the bed rock it
does not contains any organic material and has low selling prize. It uses in plinth filling, road pavements,
and backfills in trenches. it is weathered material derived from insitue host rock.
Quartz and Quartzite: quartz and Quartzite has a high silica content it is very common mineral and has
various uses. quartz is a abrasive material as grinding media. Also use in manufacturing of rubber, paint
and putty also use as filler. Quartzite commonly use in blast furnace .it is also use as decorative stone
crushed quartzite is rarely use in road construction.
River sand: river sand is commonly use in a concrete for construction. Sometimes it is use for stowing in
opencast and underground mines. Silica sand with high % of silica usually more than 99 % use in glass
making.

DISTRICT SURVEY REPORT FOR GONDIA
District Survey Report Gondia 81
16. MINERAL POTENTIAL/RESERVE:
Sr. No
Boulder, Gitti, Murrum (MT) Sand (MT) Total Mineable Mineral Potential (MT)
1 2 3 4
1 1488052.00 529710.00 1758636.00
17. THE DETAILS OF ROYALTY COLLECTION IN LAST SIX YEARS ARE AS FOLLOWS:
Sr. no. Year Royalty in Lakh Rs. Total Collection
Major Minerals
Minor Minerals
1 2 3 4 5
1. 2018 - 19 74.00 2754.28 2828.28
2. 2017 - 18 25.85 859.95 885.8
3. 2016 - 17 48.18 1559.48 1607.66
4. 2015 - 16 27.41 1758.78 1786.19
5. 2014 - 15 49.09 1857.63 1906.72
6. 2013 - 14 25.85 3142.37 3168.22
ANNUAL DEPOSITION
Sr.No Stone, Gitti, Murum (MT) ( in situ) Sand (MT) Total (MT) 1 2 3 4 1 1488052.00 317826.00 1805878.00
Note: Annual Deposition sand (Consider 60% of Total potential minable sand mineral)

DISTRICT SURVEY REPORT FOR GONDIA
District Survey Report Gondia 82
FIGURE-16 MINING LEASES MAP OF THE GONDIA DISTRICT
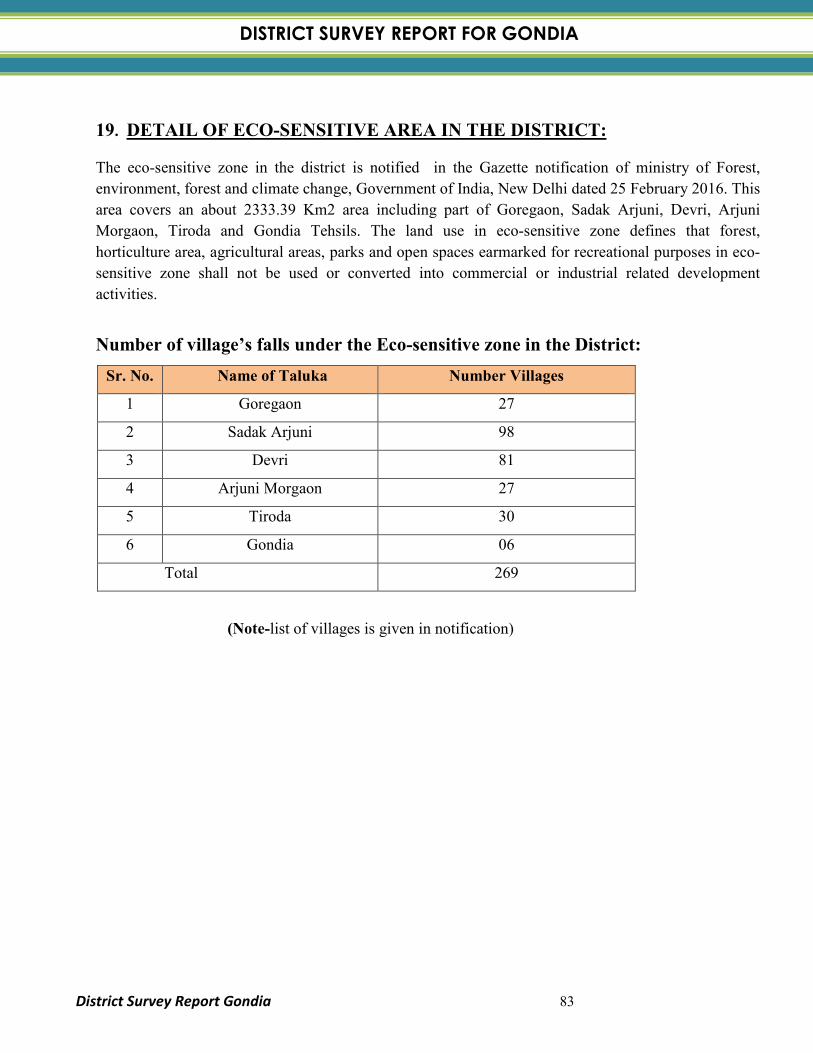
DISTRICT SURVEY REPORT FOR GONDIA
District Survey Report Gondia 83
19. DETAIL OF ECO-SENSITIVE AREA IN THE DISTRICT: The eco-sensitive zone in the district is notified in the Gazette notification of ministry of Forest,
environment, forest and climate change, Government of India, New Delhi dated 25 February 2016. This
area covers an about 2333.39 Km2 area including part of Goregaon, Sadak Arjuni, Devri, Arjuni
Morgaon, Tiroda and Gondia Tehsils. The land use in eco-sensitive zone defines that forest,
horticulture area, agricultural areas, parks and open spaces earmarked for recreational purposes in eco-
sensitive zone shall not be used or converted into commercial or industrial related development
activities.
Number of village’s falls under the Eco-sensitive zone in the District:
Sr. No. Name of Taluka Number Villages
1 Goregaon 27
2 Sadak Arjuni 98
3 Devri 81
4 Arjuni Morgaon 27
5 Tiroda 30
6 Gondia 06
Total 269
(Note-list of villages is given in notification)
DISTRICT SURVEY REPORT FOR GONDIA
District Survey Report Gondia 84
20. IMPACT ON THE ENVIRONMENT (AIR, WATER, NOISE, SOIL, FLORA
& FAUNA, LAND USE, AGRICULTURE, FOREST ETC.) DUE TO MINING
ACTIVITY:
1. Air Environment: Anticipated Impacts-
Stone/metal mining is carried out by opencast manual method. The air borne particulate matter
generated by mining and handling operations, transportation and screening of stone chips at crusher is
the main air pollutant. The emissions of Sulphur dioxide (SO2), Oxides of Nitrogen (NOX) contributed
by tractor trolley. As the number of trips of tractor trolley are less, the pollutant levels are well within
prescribed limits. Prediction of impacts on air environment has been carried out taking into
consideration proposed production and net increase in emissions. Air pollution sources in the operating
mine are classified into three categories
a. Point sources
b. Area sources
c. Line sources
• Drilling & Blasting and crusher operations of the mine are considered as point sources
• As the cumulative impacts for cluster of stone quarries are to be considered, thus the cluster of stone
mines is described as area sources
• Transportation of stone chips from mining pit to crusher is considered as line sources The other
source of air pollution is the dust generated during the movement of tractor trolley. Water tankers
with spraying arrangement will be used for regular water sprinkling on the haul roads to ensure
effective dust suppression. The tractor trolley are well maintained so that exhaust smoke does not
contribute abnormal values of noxious gases and un-burnt hydrocarbons.
2. Noise Environment: Anticipated Impacts-
The main sources of noise in the mine are classified as follows:
� Transportation Vehicles/tractor trolley
� Drilling & Blasting
� Crushing & Screening
Exposure of Noise may lead to hearing losses and may impact of mental health of Workers
Working in the vicinity.
DISTRICT SURVEY REPORT FOR GONDIA
District Survey Report Gondia 85
3. Water Environment: Anticipated Impacts-
6. Mining activities cause adverse impacts due to mine drainage and siltation due to storm
water.
� - The impact on water environment has been considered under the following heads:
� · Water consumption
� · Mine seepage and impact on ground water
� · Impact on surface water bodies
� · Storm water management
4. Soil Environment: Anticipated Impacts-
Most of the stone quarries are operated at the barren area where outcrops of basalt
are exposed having very thin layer of soil and overburden. This soil is removed and
stacked separately for plantation around peripheral area of 7.5 m.
5. Land Use:
These stone quarries are very small in area. After removal of stone these abandoned
quarries are used as water tank for irrigation purpose by lessee.
19. Remedial measures to mitigate air environment-
� Dust suppression arrangements like water tankers on haulage road and
at all dust generation points
� Dust extractors during crushing/ screening
� Grading of haul roads time to time and cleaning to remove the
accumulated dusty material
� Regular maintenance of the tractor trolley.
� Practicing wet drilling.
� Controlled blasting using delay detonators.
� Usage of sharp drill bits for drilling of holes
� Avoiding of overloading of 10T tippers and covering of loaded tippers with
tarpaulins during stone chip transportation
� Dust mask provision to workers
� Adequate barrier zone will be maintained all along the mine lease boundary
and green belt will be maintained in the barrier zone
� Periodical monitoring of air quality to take steps to control the pollutants
DISTRICT SURVEY REPORT FOR GONDIA
District Survey Report Gondia 86
20. Remedial measures to mitigate noise environment-
� The operations of the mining equipment, plying of tractor trolley and mine machinery
like drill operations are the major sources of undesirable noise in the proposed project
area.
� The following control measures are proposed for bringing down the noise levels-
� The vibration due to blasting is minimized by careful planning, supervision and
execution of each blast and using milli -second(M.S) delay detonators and proper stemming
to prevent.
� Green belt will be made around the working areas to screen the noise and also for
arresting fugitive dust
� Maintenance and tuning of machinery would be ensured to reduce undesirable noise
blow out of holes
� The vibration due to blasting is minimized by careful planning, supervision and
execution of each blast and using milli-second (M.S) delay detonators and proper stemming to
prevent.
� Green belt will be made around the working areas to screen the noise and also for
arresting fugitive dust
� Maintenance and tuning of machinery would be ensured to reduce undesirable noise
blow out of holes.
� Earplugs and earmuffs will be provided to the workmen
� Limiting the speed of haulage tractor
� Rubber lining in the chutes of Crushing/ screening plant
DISTRICT SURVEY REPORT FOR GONDIA
District Survey Report Gondia 87
21. Remedial measures to mitigate water environment-
The only pollution anticipated in the surface drainage water is the suspended solids, due to wash off.
For this purpose retaining wall with garland drain is proposed. The discharge from this drain is
diverted to a settling tank unused pit workings, which allows the sediments to settle. Further to arrest
the silted drainage entering into the area down below, check dams and gully plugs shall be erected in
the existing natural drains. These check dams also assist in the recharge of ground water system.
deliberate attempt has been made to collect this in to a garden drain. This water will be available for
uses integrated above. Percolation losses will be negligible.
22. Reclamation of Mined out Area (best practice already implemented in the district,
requirement as per rules and regulations, proposed reclamation plan):
As per Maharashtra Minor Mineral Extraction & Development Rule 2013,quarry after exhaustion of
mineral and on abandonment , the pit be used as a water tank or be used for fish culture or be used
for Municipal solid waste dump yard. As per requirement of Maharashtra Minor Mineral Extraction
& Development Rule 2013 every stone quarry after exhaustion of minerals will plan Final Mine
Closure Plan with the approval of Directorate of Geology and Mining GoM and abandon the stone
quarry as per method of approval within time frame prescribed and approved by authority.
23. Risk Assessment and Disaster Management Plan-
Risk Assessment-
The proposed project involves Stone mining through semi mechanized opencast mining. The
anticipated risks are mentioned below:
Inundation-
There is no chance of inundation of mine pits from surface waters such as rivers or nalas as it is
situated a long away from river.
The lease hold area is located in the Gondia district of Maharashtra and the area in general receives
appreciable amount of rain fall, which is in the range of 1150mm (annual average).
Pit slope & dump slope failures-
Mining is restricted to an average depth of 12 m from surface levels. No permanent dumps are
proposed.
Surface Fire-
There are no ignitable materials in Basalt deposit. Sufficient fire extinguishers of suitable type and
make will be made available at strategic locations in the mine lease area to control any fire/explosion
incident.
DISTRICT SURVEY REPORT FOR GONDIA
District Survey Report Gondia 88
Dust from the screening & crushing operations-
The hazard is the inhalation of dust which is created during the screening & crushing operations.
24. Blasting-
This may result in the various respiratory diseases to the workers. While it is not presently possible
to totally remove the hazard, properly applied control measures can substantially
reduce the risk.
The dust generated during the screening & crushing operations can be controlled by providing
proper enclosure to the plant area and by installing rain guns at transfer points inside the plant. Water
sprinkling at the crushing and screening plant units also forms an effective measure of controlling
dust generation. Provision of green belt surrounding the plant area will further suppress the spread of
airborne dust to the surrounding atmosphere. The workers engaged in these operations will be
provided with dusk masks.
25. Noise-
Loading, screening & crushing operations give rise to harmful levels of noise. Noise generated by
screening & crushing can be well controlled by providing enclosure and the green belt. The workers
engaged will be provided with ear muffs.
The noise created is harmful to anyone who is within a zone around screening & crushing machines
at which the noise level is above that considered to be safe for persons to work without having to use
control measures. Therefore wherever necessary, the workers engaged will be provided with ear
muffs.
The noise levels around screening & crushing equipment should be measured and the risk assessed.
Unless control measures are in place no-one, except those necessary for the work in hand, should be
allowed inside the designated noisy area. In most cases this will be the operators. The risk is highest
at older machines. Newer large machines are provided with sound insulated systems which control
the noise levels to acceptable levels. Other control measures will include training operators and
providing them with ear protection, although the later should only be seen as an interim precaution
until a permanent solution can be found. The risk is very high when no control measures are
provided. However if all the control measures specified as above are provided the risk will be low.
26. Loading-
The main hazard associated with loading is the Mineral falling on to the loading labour/tractor,
tractor toppling over due to uneven ground, failure of hydraulic systems. Good housekeeping
practices, regular cleaning of the haulage roads and regular maintenance of the tractors, loading
operations under supervision of competent persons, etc will be done to avoid such accidents.
27. Heavy Vehicles-
Tractor used for excavation and loading and 20 tone dumpers used for mineral and waste transport
are the major heavy vehicles in the proposed mine. The main hazards arising from the use of such
machines are incompetent drivers, brake failure, lack of all around visibility from the drivers
DISTRICT SURVEY REPORT FOR GONDIA
District Survey Report Gondia 89
Position, access to the cab, vehicle movements particularly reversing, roll over, vibration, noise, dust
and maintenance. Those most at risk are the driver and company employees likely to be struck by the
vehicle, and drivers of smaller vehicles, which cannot be seen from the cabs of large vehicles.
Visibility defects can be reduced by the use of visibility aids such rear view mirrors. Good
maintenance and regular testing are necessary to reduce the
possibility of brake failure. An area shall be set out as a testing area where regular tests are carried
out on the effectiveness of a vehicles braking system. Protection guards will be provided for moving
parts of the equipment and handling heavy components during maintenance work. Those most at risk
will be the users of the system, vehicle operators and also company employees working in such areas
may also be at risk.
23. Explosives-
No magazine is within lease hold area. Contractual blasting is proposed.
24. House keeping-
The provision and maintenance of a safe and healthy workplace is the most basic principle of health
and safety. Dirty and untidy workplaces or walkways contribute to a very large proportion of trip
and fall accidents. In the context of surface mining the provision of well defined roadways and
walkways clear of obstruction and regular cleaning up of spillage will greatly reduce the potential
risk for this type of accidents. Lack of maintenance may lead to roadways and walkways being
unsuitable for use.
25. The Work-
The application of risk assessment depends upon a full understanding of all aspects of the job being
undertaken. In carrying out a risk assessment in relation to a particular task the evaluation must
include a review of the knowledge, experience and training of those persons carrying out the work
26. Personal Competence-
It follows that the knowledge, experience and training of personnel involved in work is critical to
evaluate any risk assessment. A knowledgeable, experienced well-trained and competently
supervised workforce will be at a lower risk of accidents occurring than a poorly trained and badly
supervised workforce.
27. Co-ordination-
A competent person should be given the responsibility for overseeing and coordinating work as
required under the MMMEDR 2013. It is essential that the coordinator ensures that everyone
engaged in the work is capable and understands the role of others and their responsibility for each
other. This is particularly important when contract workers undertake part or all of the work to be
carried out.
DISTRICT SURVEY REPORT FOR GONDIA
District Survey Report Gondia 90
28. Equipments-
The prerequisite for the risk assessment is that equipments are suitable for the work being
undertaken and have been designed, manufactured and installed to at least the minimum standards
for health and safety. Failure to meet the standard will result in people being at higher risk and
remedial steps have to be implemented to compensate the shortfall. Other interim arrangements
should be implemented to protect any persons exposed to latent danger. Maintenance of plant and
equipment to agreed specification, whether original or upgraded to the latest health and safety
standards, is essential.
29. Dangerous parts of machinery-
Parts of machinery such as revolving parts, in running nips and entrapment between reciprocating
parts as defined in European and National standards should be protected meeting those standards.
30. Health hazards-
For the purposes of this document health hazards should be interpreted as being harmful dust and
noise which is emitted during surface mining operations, as well as the handling of heavy loads.
While complete elimination and often suppression at source is not practicable, in many cases, the
normal threshold values of health standards should be made applicable.
31. Personal Protective Equipment (PPE)-
The PPE should be of good construction, where ever possible ISI certified, suitable for the hazard
e.g. a dust respirator fitted with the correct filter to capture the particular hazardous dust and
maintained to recommended standards. As personal protective equipment only affords limited
protection it should only be used as a last resort and then as an interim arrangement until other steps
are taken to reduce the risk of personal injury to an acceptable level.
32. Traffic Movement-
The traffic movement should only take place within designated areas and over suitable roadways.
Adopting one way traffic movement systems are preferred to two directional traffic systems. The
risk of accidents due to traffic movement is much less with a one way traffic. Whenever mineral is
mined the first step in winning the product is the preparation of the site. The four main stages in the
site preparation are:
1. Planning
2. Surveying
3. Clearing of site
4. Laying out
33. Planning-
The risk of injuries can be significantly reduced if sufficient regard is given to health and safety at
the planning stage of a new or developing mine.
DISTRICT SURVEY REPORT FOR GONDIA
District Survey Report Gondia 91
Using trained drivers can largely eliminate the danger of being struck by large moving vehicle sand
providing the vehicles with suitable appliances, such as aids to ensure the driver has all round
visibility. Designing and implementing one-way traffic systems and ensuring that open edges of
roadways are suitably protected with parapet w a l l to regent accidental driving off the edge can
further reduce the danger. Additionally, ensuring that the vehicles are properly maintained in good
working condition, particularly the braking system will go a long way to help the driver control the
vehicle. Well- designed access and working platforms will also reduce the possibility of a fall.
34. Surveying-
Surveying has its hazards, for example surveyors are likely to be seriously injured if they fall from
heights or are thrown out of overturning vehicles. Since the hazards are created by ground formation
it is unlikely that they can be removed. Those normally at risk would be the surveying team of the
surveyor and assistants. Individuals working at the edge of vertical face or on very steep rough
terrain are more dangerous than driving over gentle slopes. It is necessary to give clear positive
instruction and ensure vehicles used to gain access to the areas to be surveyed are well Maintained
and suitable for the terrain over which access is to be gained.
35. Clearance-
Clearance covers all the activities associated with preparing a site ready for laying out primary roads
for working a face. The primary hazards are being struck by falling trees and debris from demolition
of buildings, use of power saws, equipment used in the removal of the top layers of earth and trucks
used to convey it to storage areas, and the possibility of being struck by trucks. The hazards are
created in clearing the site. While the clearing of the site cannot be avoided steep undulating ground
are at greater risk than those working on level ground. Driving over adopting the safest methods to
carry out the work can control hazards. For example, fully trained persons should be used in tree
felling operations. Well-maintained fully protected power saws should be used and the operatives
should wear full personal protection e.g. safety helmets, ear defenders, face shields, gloves, full
protection for legs (trousers) and boots.
36. Laying out-
There are many different ways of opening and development of mines but careful planning
particularly concerning the mine layout will reduce hazards. Well maintained equipment is essential
to reduce the risk of injuries.
If suitable equipment is not used, for example if poor and badly constructed scaffolding is used there
is a much higher probability of persons falling from heights or the scaffolding collapsing than if
good properly constructed scaffolding is used. To reduce the risk of injuries while using large earth
moving equipment and vehicles the equipment drivers and those giving signals should be well
trained. The lack of training and competence in the use of such equipment is the biggest cause of
such type of accidents.
DISTRICT SURVEY REPORT FOR GONDIA
District Survey Report Gondia 92
37. Disaster Management Plan-
The following natural/industrial hazards may occur during normal operation.
� Inundation of mine pit due to flood/excessive rains;
� Slope failure of pits
� Accident due to explosives;
� Accident due to heavy mining equipment; and in order to take care of above hazard/disasters, the
following control measures have been adopted.
� Checking and regular maintenance of garland drains and earthen bunds to avoid any inflow of
surface water in the pit
� Provision of suitable pumps for pumping out water from the pit during heavy rains
� Entry of unauthorized persons is prohibited.
� Fire fighting and first-aid provisions in the mines office complex and mining area
� Provisions of all the safety appliances such as safety boot, helmets, goggles etc. are made
available to the employees and regular check for their use
� Training and refresher courses for all the employees working in hazardous premises
� Working of mine, as per approved plans and regularly updating the mine plans
� Cleaning of mine faces is regularly done
� Regular maintenance and testing of all mining equipment as per manufacturer’s guidelines
� Suppression of dust on the haulage roads
� Increasing the awareness of safety and disaster through competitions, posters and other similar
drives
� The management is able to deal with the situation efficiently to reduce confusion keeping in
View of the likely sources of danger in the mine.
DISTRICT SURVEY REPORT FOR GONDIA
District Survey Report Gondia 93
38. Out Line Of Disaster Management Plan-
The purpose of disaster management plan is to restore the normalcy for early resumption of mining
operation due to an unexpected, sudden occurrence resulting to abnormalities in the course of mining
activity leading to a serious danger to workers or any machinery or the environment.
System of communication-
An internal communication system for the department head and to their line of command should be
maintained. Having the telephone nos and addresses of adjoining mines, rescue station, police
station, Fire service station, local hospital, electricity supply agency and standing consultative
committee members is another essential aspect.
Consultative committee-
A standing consultative committee of 3 persons headed by Mines Manager will be formed.
Facilities & Accommodation-
Accommodation and facilities for medical centre, rescue room and for various working groups will
be provided.
First Aid & medical facilities-
The mine management is having first aid for use in emergency situation. All casualties would be
registered and will be given first aid.
Stores and equipment-
A detailed list of equipment available its type & capacity and items reserved for emergency will be
maintained.
Transport services-
A well-defined transport control system will be provided to deal with the situation.
Functions of public relations group-
A cordial relation with government officials and other social service organization and working
groups shall be maintained. To liaise with representatives of the mine workers to ameliorate the
situation of panic, tension, sentiments, grievances and misgivings created by any disaster. To
ameliorate the injured, survivors and family members of affected persons by providing material,
moral support, finance and establishing contact with relatives of victims.
Security-
Strict manning of security posts during the disaster will be done.

DISTRICT SURVEY REPORT FOR GONDIA
District Survey Report Gondia 94
Catering & Refreshment-
Arrangements will be made for the victims, rescue teams and others for their Catering &
Refreshment services
39. Plantation and Green Belt Development in respect of leases already granted in the district:
District administration on yearly basis collects the compliance w.r.t. green clearance along with
photographic evidences of plantation and safety measures the green belt development plan along
with quarry owners individually and with their associations. District has developed a very handsome
Inventory of trees with pollution control measure implementation system.
DISTRICT SURVEY REPORT FOR GONDIA
District Survey Report Gondia 95
REFERENCE:
1. Data collected of actual sand Excavation from DMO Office, Gondia.
2. Sustainable Sand Mining Management Guidelines 2016, issued by Ministry of Environment,
Forest and Climate Change
3. Government Notification on Sand Mining Policy dated 3 rd January 2018.
4. Geology and Mineral Resource of Maharashtra by Geological Survey of India, Miscellaneous
Publication 2014.
5. Central Ground Water Board Gondia, Ministry of Water Resources, Govt. of India
6. Groundwater Surveys and Development Agency, Government of Maharashtra
7. Fluvial Geomorphology and Sediment Transport Characteristics of Wainganga River, Central
India by Domabapu B. Brahmankar, IIT Kanpur.
8. Stratigraphy of India by Ravindra Kumar Books.
9. E Book on Mineral Sector issued by Ministry of Mines, Government of India 8 February 2016
10. Census of India 2011.
11. Other references taken from the Wikipedia & Google Search.
-----------------------END-----------------------------