Reliability and Importance Discounting of Neutrosophic Masses
Upload
independentCategory
view
11download
0
ARTICLE IN PRESS
0967-0645/$ - se
doi:10.1016/j.ds
�Correspondifax: +34952 13
E-mail addre
(F. Criado-Alde
Deep-Sea Research II 53 (2006) 1144–1160
www.elsevier.com/locate/dsr2
Distribution and circulation of water masses in the Gulf of Cadizfrom in situ observations
Francisco Criado-Aldeanuevaa,�, Jesus Garcıa-Lafuentea, Juan Miguel Vargasa,Jorge Del Rıoa, A. Vazquezb, A. Reulc, A. Sancheza
aDepartamento de Fısica Aplicada II, Universidad de Malaga, Malaga, SpainbDepartamento de Fısica Aplicada, Universidad de Cadiz, Cadiz, Spain
cDepartamento de Ecologıa y Geologıa, Universidad de Malaga, Malaga, Spain
Received 1 February 2005; accepted 4 April 2006
Abstract
From data collected during GOLFO 2001 survey, a study was conducted on the circulation and distribution of water
masses in the Gulf of Cadiz in the spring of 2001. The general surface circulation in the Gulf of Cadiz is anticyclonic with
short-term, meteorologically induced variations. North Atlantic Central Water (NACW) (gt ¼ 26:6227:3 kgm�3) is a
representative water mass of the upper 1000m of the water column. To the north, the lower part of the NACW layer
(gt ¼ 27:3 kgm�3) is entrained by Mediterranean Water (MW) towards the open ocean while the upper layer
(gt ¼ 26:6 kgm�3) forms part of the anticyclonic surface circulation of the Gulf of Cadiz. NACW mainly upwells in the
vicinity of Capes St. Vincent and St. Maria. The upwelling off Cape St. Vincent is an open-sea process linked to a positive
wind curl over the area, whereas the upwelling off Cape St. Maria is a more likely coastal process with a short time
response to changes in the wind regime. The waters upwelled off Cape St. Vincent move eastwards following the main
current until reaching �7.5 1W, where they form the filament of Cape St. Maria, whose core flows at about 40–50m. Wind
changes from westerlies to easterlies produce important temporal variability in some spatial features (the upwelling off
Cape St. Maria, the surface signature of the Huelva Front or the region of warm coastal waters) in a relatively shallow
layer. Below this surface layer, the hydrological characteristics are fairly independent of meteorological forcing.
r 2006 Elsevier Ltd. All rights reserved.
Keywords: Gulf of Cadiz; Water masses; Geostrophic circulation; Upwelling processes; Cape St. Maria filament; Wind-induced variability
1. Introduction
The Gulf of Cadiz is the sub-basin of the NorthAtlantic nearest to the Strait of Gibraltar. Its
e front matter r 2006 Elsevier Ltd. All rights reserved
r2.2006.04.012
ng author. Tel.: +34 952 132849;
1450.
anueva).
northern, eastern and southern boundaries arewell-defined by the southwest coasts of the IberianPeninsula and by the Strait of Gibraltar and theAtlantic coast of Morocco, respectively. The wes-tern limit can be defined by the 9 1W meridian. Onthe Iberian coast, the most relevant geographicalfeatures are Cape St. Maria, Cape St. Vincent, andCape Trafalgar (Fig. 1). To the east of CapeSt. Maria the continental shelf is very wide (some
.

ARTICLE IN PRESS
30′
30′
30′
37°N
36°N
35°N
37°N
40′20′
36°N
40′
37°N
40′20′
36°N
40′
37°N
40′20′
36°N
40′
9°W 8°W 7°W 6°W
9°W 8°W 7°W 6°W 9°W 8°W 7°W 6°W 9°W 8°WMesoscale 1 Mesoscale 2Macroscale
7°W 6°W
Fig. 1. Upper panel: Map of the Gulf of Cadiz showing the position of locations and other geographical features mentioned in the text.
CT, CSM and CSV stand for Cape Trafalgar, Cape St. Maria and Cape St. Vincent, respectively. Grm, Orm, Trm and Gqrm stand for the
mouths of Guadiana, Odiel, Tinto and Guadalquivir rivers, respectively. The star marks the position of the Red de Aguas Profundas
(RAP) oceanographic buoy mentioned in the text. Lower panels show the station grid of the three legs (Mesoscale 1, Macroscale and
Mesoscale 2) of GOLFO 2001 survey.
F. Criado-Aldeanueva et al. / Deep-Sea Research II 53 (2006) 1144–1160 1145
30–50 km) and has a gentle slope, whereas to thewest it is narrow (o15 km) and its bottom is dottedwith submarine canyons (Faro, Lagos, Portimao,St. Vincent, etc.).
The surface circulation of the Gulf of Cadiz, lessstudied than its deep circulation, is integrated intothe general circulation of the Northeast Atlantic:the Azores current, which transports some 15 Svbetween latitudes 351N and 401N to feed the CanaryCurrent, frequently forms meanders that separatethemselves from the main flow (Alves et al., 2002).Thus, the surface circulation of the Gulf of Cadizcould be understood as the last meander of the saidAzores current. Part of this meander enters theMediterranean Sea through the Strait of Gibraltarto balance evaporation and buoyancy losses withinthis Sea.
Stevenson (1977), combining in situ and sea-surface temperature (SST) satellite observations,identified an interesting thermal feature formed by asequence of warm–cold–warm waters in NW–SE
direction in the northeast part of the Gulf of Cadiz.Specifically, this feature is found between Cadiz andHuelva; Stevenson (1977) called it the ‘HuelvaFront’. Fiuza (1983), using wind data and SSTimages corresponding to the summer of 1979,correlated the occurrence of upwelling off thesouthwest coast of Iberia (and the appearance ofthe Huelva Front) with westerlies and the develop-ment of a warm coastal countercurrent stretchingeast–west with easterlies (Fiuza et al., 1982; Fiuza,1983).
Folkard et al. (1997) analysed infrared SSTsatellite images throughout the year between July1989 and March 1990 to provide a description ofseasonal circulation patterns. An interesting out-come is the identification, at least in the summermonths, of a bimodal pattern in SST images relatedto the wind regime. One of the patterns (related towesterlies) is characterised by an extension to theeast of the upwelling off Cape St. Vincent, alongwith a signature of cold waters in the SE direction

ARTICLE IN PRESSF. Criado-Aldeanueva et al. / Deep-Sea Research II 53 (2006) 1144–11601146
from Cape St. Maria to the Strait of Gibraltar. Theother configuration (related to easterlies) restrictsthe upwelling off Cape St. Vincent to a smaller areawhile, at the same time, the continental shelf of thesouthwest coast of Spain is flooded with warmwaters and a new region of cold waters appears tothe southwest of the Strait of Gibraltar.
More recently, Relvas and Barton (2002) haveused a combined set of satellite data (1200 imagesbetween 1981 and 1995), coastal meteorological(wind, atmospheric pressure) and sea-level observa-tions at strategic points to study different areas ofinterest: the upwelling off the western Portuguesecoast, the upwelling off the south coast of theIberian peninsula (Gulf of Cadiz), the filament offCape St. Vincent, and the warm coastal counter-current, all of them in relation to meteorologicalpatterns. Sanchez and Relvas (2003) have analyseddatabases of hydrographic stations containing datafor the entire 20th century (1900–1998) correspond-ing to spring and summer on the southwest coast ofthe Iberian Peninsula. Their analysis makes itpossible, among other things, to identify theclimatic patterns of circulation in the Gulf of Cadizduring the spring and summer months. ThePortuguese Current flows southwards parallel tothe western coast of the Iberian Peninsula and,when reaching Cape St. Vincent, it moves mainlytowards the East. Once in the Gulf of Cadiz, thecirculation is predominantly anticyclonic with somemesoscale meanders. Off Cape St. Maria, the maincurrent turns to the south and then to the north andcontinues flowing parallel to the Spanish coast.Finally, the branch that separates from the Strait ofGibraltar forms an anticyclonic meander in theeasternmost region which finally meets the CanaryCurrent further southwest.
Vargas et al. (2003) have studied the evolution ofthermal features in the Gulf of Cadiz using weeklySST images between 1993 and 1999 by means ofspatial empirical orthogonal functions (EOF). TheSST’s first empirical mode (60% of variance) showsa clear north–south temperature gradient in thebasin. The most outstanding characteristic is thenearly circular shape of (above average) warmwaters in the southern part of the region understudy. Likewise, this mode describes the upwellingarea off Cape St. Vincent. The second empiricalmode (13% of variance) shows a strong temporalvariability and is chiefly responsible for the coolingand warming of the waters of the southwest Iberiancontinental shelf. Finally, the third mode (6% of
variance) is well-correlated with the wind regimeand allows to identify the areas of upwellinginduced by this agent: one region off Capes St.Maria and St. Vincent, favoured by westerlies, andanother located at the southwest extreme of theStrait of Gibraltar, favoured by easterlies.
Sub-surface in situ temperature observationscollected during historical surveys (Rubın et al.,1999; Prieto et al., 1999; Garcıa et al., 2002)correlate reasonably well with satellite surfacepatterns and indicate a certain variability. In thesurvey of 1995, the tongue of cold water constitut-ing the Huelva Front weakens and warm waters areseen to flood the shelf from the east of Cape St.Maria to the Guadalquivir river mouth, this beingmore pronounced between the latter and Cadiz.This description of the Huelva Front is compatiblewith an anticyclonic circulation. In addition, theestimate of geostrophic velocities confirms thehypothesis of anticyclonic circulation (Garcıa et al.,2002). In previous surveys (Rubın et al., 1997, 1999)this anticyclonic circulation is not evident on thesurface, but it is in the sub-surface layer, thussupporting the hypothesis that this type of circula-tion is dominant, at least during summertime.
New data sets and results concerning thisrelatively poorly known area are presented in thispaper, which is organised as follows: Section 2presents the data and outlines the data processingand methodology. In Section 3, the spatial distribu-tion and circulation of water masses, their largescale patterns and meteorologically forced varia-bility are presented and discussed. Finally, Section 4summarises the conclusions.
2. Data and methods
2.1. Data acquisition
The interdisciplinary survey GOLFO 2001 wascarried out in the Gulf of Cadiz between 14 Mayand 3 June 2001 onboard the oceanographicresearch vessel Hesperides, within the frameworkof the project MAR99-0643, ‘Distribution andDynamics of Plankton and Seston in the Gulf ofCadiz: Variability Scales and Control by Physicaland Biological Processes’. The survey was dividedinto three legs, called Mesoscale 1, Macroscale andMesoscale 2, whose characteristics and geographicalscope are shown in Table 1 and Fig. 1.
The data set includes hydrological data (Con-ductivity-Temperature-Depth, CTD Idronaut MK

ARTICLE IN PRESS
Table 1
Characteristics of the three legs of the GOLFO 2001 survey
Mesoscale 1 Macroscale Mesoscale 2
Sample dates 14/05/01–16/05/01 17/05/01–24/05/01 29/05/01–02/06/01
No. of transects 7 12 11
Longitude range 6.92–8.181W 6.27–9.281W 6.51–8.591W
Latitude range 36.58–37.081N 36.01–37.131N 36.571N–37.081N
Inclination — 151 —
Origin coordinates 8.31W–36.541N (9.21W–36.01N) (8.71W–36.541N)
Number of points 12� 15 22� 31 12� 23
Inclination refers to the angle of deviation from the meridians. The last two rows are related to the optimal interpolation technique
parameters (see Section 2.2).
F. Criado-Aldeanueva et al. / Deep-Sea Research II 53 (2006) 1144–1160 1147
137 with nephelometer and fluorometer SeaPointand thermosalinographer SEABIRD SBE 21 forcontinuous recording of surface data), AcousticDoppler Current Profiler (ADCP) velocity data (notused in this work), biological data (Rosette GeneralOceanics 1015 of 24 bottles), meteorological data(wind measurements taken with a scatterometerQuickscat, by the R/V Hesperides meteorologicalstation and by the Red de Aguas Profundas(RAP network Puertos del Estado, see http://www.puertos.es) buoy of the Gulf of Cadiz), and satellitedata (from National Oceanic and AtmosphericAdministration, NOAA series). Some small gapsin the CTD and thermosalinographer data havebeen interpolated linearly. Larger gaps in the fluoro-meter data have been obviated.
2.2. Data processing: optimal interpolation
Following UNESCO (1985) the quantities gt andgy, obtained from the temperature, salinity andpressure fields through the state equation are usedto express the density field. The interpolation of thehydrological data was carried out by means of theoptimal or statistical interpolation technique (OIhenceforth). This method, widely presented in theliterature (Gandin, 1963; Thiebaux and Pedder,1987; Ruiz Valero, 2000; Gomis et al., 2001), isbased on the condition that the differences betweenreal field values and the results of the analysis areminimised statistically. In this work, the OI packageworked out and broadcasted by the UIB-IMEDEA(Special Action CICYT, REN2000-2599-E) hasbeen used.
This OI package, which includes a previoussmoothing stage, requires the adjustment of severalparameters: for the tendency’s degree of the poly-
nomial a low value is recommended and n ¼ 2 has
been used. The spatial scale correlation, or slope ofthe Gaussian used to adjust the correlationsobtained from the survey data, has been establishedas 20 km, an appropriate value when mesoscalefeatures dominate the dynamics. The noise-signal
ratio allows us to introduce an estimate of observa-tional error of analysed data into the analysis. Thecross-validation technique provides values in theorder of 0.001 for CTD data and in the order of 0.01for ADCP data. The interpolated grid step should bea compromise between a grid dense enough to solvethe scales of the features captured by sampling andthe fact that the observational error is amplified onmaking spatial derivatives on a very dense grid. Thecondition ð1=4ÞdkioDxoð1=2Þdki, where dki is theaverage distance between sampling points, providesa reasonable value. For the sake of homogeneity,the same spatial step has been chosen for the threelegs, 0.11 in coordinate x (longitude) and 0.05481 incoordinate y (latitude). The difference lies in theorigin of the grid and, consequently, in the numberof grid points. The values of these parameters foreach leg are shown in Table 1.
2.3. Data processing: EOF analysis
EOF analysis was introduced in the Earthsciences by Obukhov (1947) and Lorenz (1956).There are many examples in the literature concern-ing EOF analysis, mainly related to SST images(Hernandez-Guerra and Nykjaer, 1997; Parada andCanton, 1998; Alvarez et al., 2000; Vargas et al.,2003). In this work, it will be applied to the profilesof hydrological variables distributed all along thesampling grid to study the filament of Cape St.Maria in Section 3.4.
Assume a set of profiles of a specific variable on adefined domain with a dimension identical to the

ARTICLE IN PRESSF. Criado-Aldeanueva et al. / Deep-Sea Research II 53 (2006) 1144–11601148
number of levels considered (this will depend on thedepth range of study). Each one of these vectors canbe decomposed as the sum of an average value andan anomaly, that is
~ji ¼ ~jþ ~j0i, (1)
where the mean ~j is defined as
~j ¼1
N
XN
k¼1
~jk, (2)
where N is the total number of profiles (stations)and i ¼ 1; 2 ; . . . ; N l indicates level i (Nl is thenumber of levels). The covariance matrix ofanomaly vectors between the different profiles isgiven by
C ¼ Cmn ¼1
N
XN l
i¼1
j0iðmÞj0iðnÞ (3)
with m, n being any two profiles. C is diagonalisedaccording to jC � lI j ¼ 0, with I the identity matrixand l a vector with the eigenvalues of C, which arereal and verify: C ~Mp ¼ lp
~Mp, where ~Mpðp ¼
1; 2; . . . ;NÞ are the eigenvectors (which constitutean orthogonal base) associated with the eigenvaluelp. Once the eigenvectors or modes have beencalculated, the information at any depth can beexpressed as a linear combination of the vectors ofthis base:
~ji ¼ ~jþXN
p¼1
aip~Mp, (4)
where ~Mp is the eigenvector corresponding to modep and aip is the amplitude of the mode at level(depth) i, defined by aip ¼ ~Mp � ~j
0i.
In this formulation, the eigenvectors (modes)represent an ‘average’ horizontal situation for allthe sampled stations in the range of depths in whichthe analysis has been performed, while the ampli-tude of the corresponding mode (which depends onthe depth) represents the importance in depth of thehorizontal features depicted by the mode. Tofacilitate interpretation, the amplitude coefficientshave been normalised to unit variance for eachmode, the units of the corresponding variableremaining in the spatial maps of each mode.
3. Results and discussion
3.1. Water masses in the Gulf of Cadiz
In this section, the water masses detected in theGulf of Cadiz will be analysed. Strictly speaking, awater mass is defined by its temperature and salinitytaken as conservative parameters only altered bymixing. Following this requirement, some of thewater classes described below are not water massesin the strict sense, although, by extension, in somecases all of them will be referred as water masses ingeneral. Fig. 2 shows the TS diagram for Macro-scale leg, which is the leg of greatest interest toidentify water masses, owing to their wider geo-graphical extension. The different waters foundin the samplings can be listed as follows (see alsoFig. 2):
(i) North Atlantic Central Water (NACW): Thelinear behaviour in the TS diagram, characteristic ofNACW, is found between 11.0 1CpTp17.0 1C;35.6pSp36.5 (although its most superficial regionwill be called SAW henceforth). Below a certaindepth (from a certain isopycne), the TS diagramdiverges from its former linear behaviour due tomixing with the underlying, salty MediterraneanWater (MW). In general, NACW shows a linearbehaviour in the TS diagram for values of26.6 kgm�3pgyp27.3 kgm�3, in good agreementwith the description of Knoll et al. (1999) andAmbar et al. (2002).
(ii) Surface Atlantic Water (SAW): This water hasits origin in shallow NACW that has been modifiedby air–sea interactions so, strictly speaking, SAW isnot a water mass. In the Gulf of Cadiz, SAW can becharacterised for practical purposes as a region ofthe TS diagram with temperatures above 16.0 1C,SE36.4 and gtp26.7 kgm�3, which is found be-tween the surface and a depth of approximately100m over the entire region except for thecontinental shelf.
(iii) Warm Shelf Waters (SW): At some of thesampled stations, mainly over the continental shelf,water warmer and fresher than SAW has beendetected at the surface. This water comes from SAWthat has been noticeably influenced by continentalshelf processes, including heating and fresh waterinputs from land. It corresponds to the points ofthe TS diagram between temperatures 14.0 1CpTp18.0 1C (in Mesoscale 2 (not shown), thetemperature is higher) and salinities 35.9pSp36.5that are placed outside the line of NACW. They

ARTICLE IN PRESS
35
4
6
8
20
18
16
14
12
10
35.5
Salinity
Tem
per
atu
re (
°°C)
36 36.5 37 37.5
Fig. 2. Temperature–Salinity (TS) diagram of all the stations of the Macroscale leg during GOLFO 2001 survey. NACW, SAW, SW, MW
and NADW are the acronyms for North Atlantic Central Water, Surface Atlantic Water, Shelf Water, Mediterranean Water and North
Atlantic Deep Water, respectively. The labels are roughly located at the theoretical positions of these water masses on the TS diagram.
F. Criado-Aldeanueva et al. / Deep-Sea Research II 53 (2006) 1144–1160 1149
have been called Shelf Waters (SW) for practicalpurposes, although they are not a water mass in thestrict sense.
(iv) Mediterranean Water (MW): The analysis ofthe thermohaline properties of MW shows two mainmaxima in the TS diagram corresponding to twocores (upper and lower) with different densities,respectively, gtE27.5 and 27.8 kgm�3 centred near800 and 1200m, in good agreement with numberreferences from previous surveys (Madelain, 1970;Zenk, 1970; Ambar and Howe, 1979a, b; Ambaret al., 2002).
(v) North Atlantic Deep Water (NADW): At areduced number of deep stations (depth41500m) inthe southwest part of the surveyed region, NADW,which is characterised by its depth-decreasingthermohaline properties (Ambar et al., 2002), hasbeen found. The study of this water does not fallwithin the scope of this work.
3.2. Geostrophic calculations
There are different choices of a reference level tocarry out geostrophic calculations in the Gulf ofCadiz in the literature: Garcıa et al. (2002) estimatethe surface currents with reference to both 100 and200m. Ambar et al. (2002) adopt 2000m as the no-motion surface. Ochoa and Bray (1991) postulatedthe interface between MW and NACW as the no-
motion surface, and Sanchez and Relvas (2003) take400m as the reference surface.
An adequate reference level, which would be an(intuitively) motionless surface, should be the inter-face separating NACW from MW, at least in thevicinity of the Strait of Gibraltar, where MW isfound at shallower depths. Since the flows haveopposite directions, in this hypothetical interface thevelocity will be near zero. Such a particularreference level has to maximise the inflow to theStrait of Gibraltar and the condition of maximisa-tion determines, in turn, the depth of the ‘‘best’’reference level. In addition, this level would gatherconditions to be considered a motionless surface.
To this aim, the geostrophic volume transporttowards the Strait of Gibraltar has been computedfor different choices of the reference level. Details ofthis procedure can be found in Criado-Aldeanueva(2004). The isolines of geostrophic transport arethen plotted starting from the zero value, which hasbeen selected as the closest-to-shore isoline thatcrosses the full domain from west to east. Fig. 3(A)shows one of the geostrophic maps produced (theone with the reference in Zref ¼ 300m). From plotslike this, the transport towards the Strait is easilycomputed. The maximum is reached when thereference level is around 300m (between 300 and325, see Fig. 3(B)). For this depth, the estimatedtransport to the Strait is 0.8 Sv (Fig. 3(B)), in good

ARTICLE IN PRESS
37°N
40′
20′
36°N
40′
9°W 8°W 7°W 6°W
1
0.9
0.8
0.7
0.6
0.5
0.4
0.3
0.2
0.1
200 225 250 275 300 325 350 375 4000
Tra
nspo
rt (
Sv)
Reference level depth (m)
0.8
(A)
(B)
Fig. 3. (A) Isolines of geostrophic volume transport (Sv) during Macroscale using Z ¼ 300m as reference level. Notice that the lines
follow two paths: one feeds the inflow to the Strait of Gibraltar and another recirculates towards the Atlantic. (B) Estimation of
geostrophic volume transport (Sv) towards the Strait of Gibraltar as a function of the reference level depth (m) fromMacroscale data. The
maximum is reached at about 300m.
F. Criado-Aldeanueva et al. / Deep-Sea Research II 53 (2006) 1144–11601150
agreement with the values of Bryden et al. (1994)and Baringer and Price (1997). The imposition ofthis additional condition on geostrophic transportis, to a certain extent, a technique comparable withinverse methods (Tarantolla, 1987; Bennett, 1992;Bennett and Chua, 1992; Parker, 1994). Never-theless, the technique has some weak points, whichmust be discussed:
The inflow through the Strait of Gibraltar hasimportant subinertial fluctuations, and there is noprecise value that can be used as a reference tocheck our computations. In other words, it is notpossible to affirm that 0.8 Sv, for instance, is thebest value. However, using a maximisation condi-tion instead of a concrete value avoids throwinguncertainty on the Zref value. The fact thatgeostrophic transport computations reproduce rea-
sonably well the magnitude of the mean inflow tothe Mediterranean supports the choice of thereference surface.
The section through which transport is computeddoes not completely cover the north–south sectionof the Strait of Gibraltar (Fig. 3(A)). But, from acertain isoline (about 0.8 Sv for Zref ¼ 300m, seeFig. 3(A) again), the trajectory curves clearly to thesouth, suggesting that flow recirculation towards theStrait is quite improbable. More likely, waterrecirculates towards the Atlantic either to feed theanticyclonic gyre suggested in Fig. 3(A) or to forman eastern boundary current that will merge down-stream with the Canary Current.
It can be argued that the criterion used to situatethe zero transport isoline ignores possible inputs tothe transport from the region to the north of it;
ARTICLE IN PRESSF. Criado-Aldeanueva et al. / Deep-Sea Research II 53 (2006) 1144–1160 1151
that is, water coming from the continental shelf(Fig. 3(A)). However, this choice is the only onewith physical meaning, since the geostrophic func-tion cannot intersect the coast. Moreover, thecirculation on the continental shelf consists in acyclonic cell in the eastern part (Garcıa Lafuenteet al., 2006), so that the ignored transport, if any,cannot be too considerable.
Another objection arises as to whether the valueof Zref obtained in the vicinity of the Strait ofGibraltar is adequate for the rest of the basin. It iswell-known that MW sinks as it moves westwards(Zenk, 1970; Ambar and Howe, 1979a, b; Ambaret al., 2002), and thus the estimated referencesurface will not coincide with a ‘‘interface’’ throughall the basin. However, in the central region of theGulf, where MW has sunk considerably, itsinfluence on the motion of the shallower referencelayer should not be that notable and the identifica-tion of the reference level with an almost motionlesssurface would still remain valid.
The possibility of using ADCP data to referencegeostrophic computations has been considered.With the configuration adopted in the ADCPsampling, the rms error of ADCP velocities isX6 cm s�1, which is greater than the backgroundvelocity in the interior, i.e. velocity in the range200–400m. Therefore, these data do not help toselect the reference level. However, geostrophicvelocity shear (thermal wind) has been satisfactorilycompared with ADCP vertical profiles.
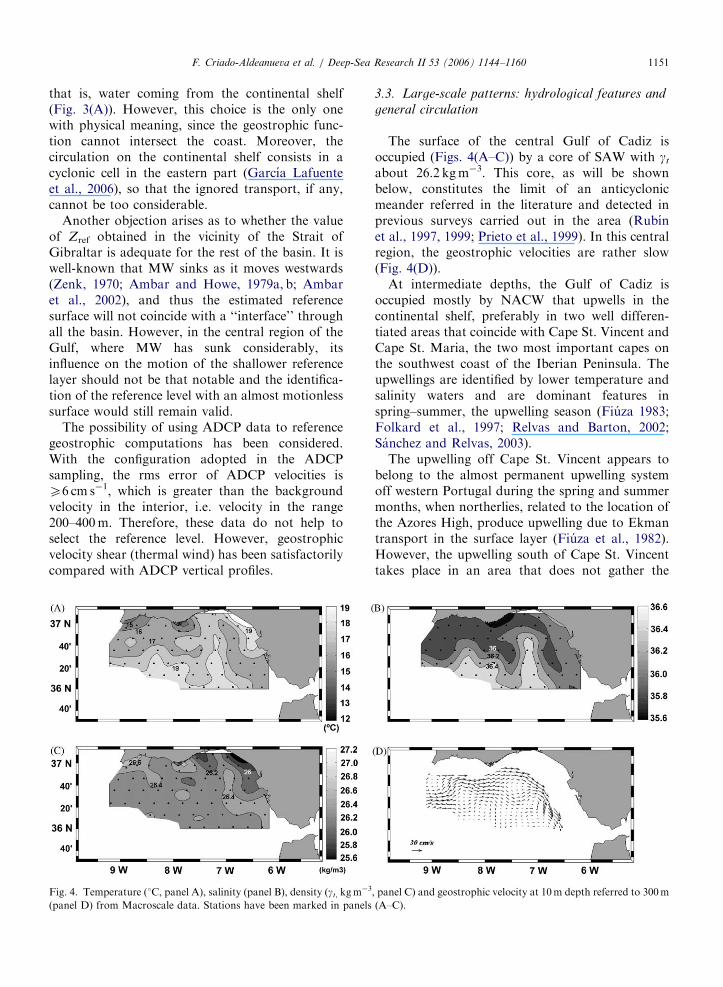
Fig. 4. Temperature (1C, panel A), salinity (panel B), density (gt, kgm�3
(panel D) from Macroscale data. Stations have been marked in panels
3.3. Large-scale patterns: hydrological features and
general circulation
The surface of the central Gulf of Cadiz isoccupied (Figs. 4(A–C)) by a core of SAW with gt
about 26.2 kgm�3. This core, as will be shownbelow, constitutes the limit of an anticyclonicmeander referred in the literature and detected inprevious surveys carried out in the area (Rubınet al., 1997, 1999; Prieto et al., 1999). In this centralregion, the geostrophic velocities are rather slow(Fig. 4(D)).
At intermediate depths, the Gulf of Cadiz isoccupied mostly by NACW that upwells in thecontinental shelf, preferably in two well differen-tiated areas that coincide with Cape St. Vincent andCape St. Maria, the two most important capes onthe southwest coast of the Iberian Peninsula. Theupwellings are identified by lower temperature andsalinity waters and are dominant features inspring–summer, the upwelling season (Fiuza 1983;Folkard et al., 1997; Relvas and Barton, 2002;Sanchez and Relvas, 2003).
The upwelling off Cape St. Vincent appears tobelong to the almost permanent upwelling systemoff western Portugal during the spring and summermonths, when northerlies, related to the location ofthe Azores High, produce upwelling due to Ekmantransport in the surface layer (Fiuza et al., 1982).However, the upwelling south of Cape St. Vincenttakes place in an area that does not gather the
, panel C) and geostrophic velocity at 10m depth referred to 300m
(A–C).

ARTICLE IN PRESSF. Criado-Aldeanueva et al. / Deep-Sea Research II 53 (2006) 1144–11601152
necessary conditions for coastal upwelling, as it isfurther south of the influence of the Portuguesecoast. It could be related to Ekman pumping in thesurface Ekman layer, an open-sea process linked toa positive wind curl over the area (Sanchez andRelvas, 2003). The positive vertical component ofwind curl produces ascending velocities at the baseof the surface Ekman layer that produce uprising ofthe isopycnes and advect dense water from theocean’s interior close to the surface. This upwellinginduces cyclonic circulation to compensate the
36°N
37°N 0.80.6
0.4
0.20
0
0
38°N
39°N
40°N
34°N
35°N
9°W10°W 8°W 7°W 6°W 5°W
Fig. 5. Monthly (May) average of the vertical component of the
wind curl (� 10�4 s�1) computed from scatterometer data.
Positive values are found in the western and southwestern Iberia.
Fig. 6. Sea surface temperature (SST) satellite images (1C) for 13 May
May, during Mesoscale 2 (panel B). Westerlies were dominant in the firs
promoting great variability of the surface thermal patterns.
baroclinic pressure field. The Ekman theory shouldnot be considered as instantaneous but rather in thesense that in a region where the vertical componentof the wind curl is positive on average, the oceanwill exhibit a cyclonic circulation and upwelling-favourable conditions. Fig. 5, which shows themonthly (May) average of the vertical component ofthe wind curl computed from scatterometer data,indicates that the region off west Portugal, andparticularly the area south of Cape St. Vincent, haspositive wind curl, supporting the hypothesis ofupwelling related to Ekman pumping. Obviously,this upwelling is enhanced under favourable windconditions, that is, westerlies, which produce addi-tional coastal upwelling.
Upwelling off Cape St. Maria seems to be anexclusively coastal process that closely follows thechange in the local wind regime. Under westerlies,upwelled waters off Cape St. Vincent are advectedto the east by the main current, reaching the vicinityof Cape St. Maria, where they join the watersupwelled there (Fig. 6(A)). If the wind is favourable,waters keep on moving from Cape St. Mariaeastwards constituting, in appearance, the HuelvaFront (see Fig. 6(A) again). In contrast, undereasterlies (Fig. 6(B)), the upwelling off Cape St.Maria disappears, and apparently this is also thecase with the Huelva Front, at least as regards itssurface thermal signature (Garcıa Lafuente et al.,2006).
Geostrophic velocities at 10m referred to 300m(Fig. 4(D)) show a general circulation pattern fromwest to east with some meanders and a bifurcationaround 8 1W in two branches that join togetherdownstream at 7 1W, and describe an anticyclonicmeander with moderate velocities (�30 cm s�1). The
, the day previous to Mesoscale 1 sampling (panel A) and for 29
t mesoscale and easterlies in the second one (see also Fig. 11), thus

ARTICLE IN PRESSF. Criado-Aldeanueva et al. / Deep-Sea Research II 53 (2006) 1144–1160 1153
overall circulation pattern is in good agreement withthe climatological results obtained by Sanchez andRelvas (2003). The surface salinity distributionshows saltier waters in the central part, whereasthe water in the northern area is less saline. Themain feature is the presence of two filaments of lowsalinity, which stretch to the south from Cape St.Maria and parallel to the coast of Huelva and Cadiz(Fig. 4(B)) (see Section 3.4). The density field showsa region of less dense water on the continental shelf,corresponding to the warm water present in thatarea, and two regions of denser water off Capes St.Vincent and St. Maria, that corresponds with theupwelled water.
Next to the Guadalquivir river mouth (Fig. 4(A))is a region of warm shelf water, which stretches toaround 7 1W and undergoes noticeable wind-in-duced variability. Separating the warm shelf watersand the central warm core is a tongue of colderwater stretching NW–SE, which has been tradition-ally denoted as the Huelva Front (Stevenson, 1977;Fiuza, 1983), which is enhanced under westerlies(Relvas and Barton, 2002).
The main characteristic of the fields at 50m(Fig. 7) is the gradient of the isolines from the coastoutwards, NACW (colder and fresher) being foundnearest to the coast and SAW (warmer and moresaline) in the central region of the Gulf. A region ofNACW off Cape St. Maria is more visible in thesalinity field, which divides into two parts thecentral SAW core. Compared with the surface
Fig. 7. Temperature (1C, panel A), salinity (panel B), density (gt, kgm�
50m depth from Macroscale data. Stations deeper than 50m have bee
description, the signature of warm water on theSpanish coastal shelf has disappeared at this depthand NACW detected off Capes St. Vincent and St.Maria now stretches along the entire continentalshelf and slope. The density field (panel c of Fig. 7)is dominated by the temperature as shown by thepresence of denser NACW in the shelf (wherewaters are colder) and lighter SAW in the centralregion (where waters are warmer). The geostrophicvelocities at 50m maintain the same circulationpattern than on the surface, with slightly lowervalues (around 20–25 cm s�1 in the northern region,where the current is strongest). The outstandingcharacteristics of the variables at 100m (not shown)are the visible presence of the central warm core ofSAW, the still noticeable signal in salinity of thefilament off Cape St. Maria, and the anticycloniccirculation parallel to the coast with lower velocitiesthan in shallower depths.
3.4. Mesoscale circulation: the filament of Cape St.
Maria
The filament of Cape St. Maria refers to thefilament of colder and fresher water that stretchessouth from about Cape St. Maria along the 7.5 1Wmeridian (Fig. 4(B)). The filament leaves a distin-guishable footprint in the T/S vertical profiles and,particularly, in the TS diagram (Fig. 8(A)): aroundS ¼ 36:0 and between 15.0 and 16.0 1C, a peak thatbreaks the linear relation characteristic of NACW is
3, panel C) and geostrophic velocity referred to 300m (panel D) at
n marked in panels (A–C).

ARTICLE IN PRESS
0
-100
-200
-300
-400
Dep
th (
m)
Dep
th (
m)
-500
-600
-700
-800
0
-100
-200
-300
-400
-500
-600
-70010 12 14
Temperature (°C) Salinity Salinity Salinity Salinity
Station 235Station 226
Temperature (°C)
Tem
pert
ure
(°C
)
Tem
pert
ure
(°C
)
16 18 35.5 36 36.5 37 35.5 36
18
17
16
15
14
13
12
11
18
19
17
16
15
14
13
12
1136.5 37 10 15 20 35.5 36 36.5 37 35.5 36 36.5 37
(A) (B)
37°N
40′
20′
36°N
40′
9°W 8°W 7°W 6°W 9°W 8°W 7°W 6°W
36.6
36.4
36.2
36.0
35.8
35.6
30 cm/s
(C) (D)
Fig. 8. (A) Temperature and salinity profiles and TS diagram of station 226 of Macroscale (see panel C for location) inside Cape St. Maria
filament. The peak marked around S ¼ 36:0 and between 15.0 and 16.0 1C in the TS diagram corresponds to the intrusion of colder and
fresher waters in the upper 100m of the water column (circled). All the stations inside the filament (see panel C) exhibit similar
characteristics. (B) The same as in panel (A) for station 235 outside the filament. No anomalous behaviour is detected in the linear TS
relation of NACW. (C) Stations inside the filament (crosses) superposed to the salinity field at 50m depth during Macroscale. Station 235,
outside the filament, is also marked with a point. (D) Geostrophic velocity at 50m depth referred to 300m superposed to the salinity field
at 50m.
F. Criado-Aldeanueva et al. / Deep-Sea Research II 53 (2006) 1144–11601154
clearly detected. The peak indicates the presence ofcolder and fresher waters in the first 100m of thewater column. All the stations that share thisspecific feature are marked by crosses in Fig. 8(C),and the resulting spatial pattern matches the low-salinity tongue of Figs. 4(B) and 7(B) quiteaccurately. In contrast, stations outside the filamentmaintain the linear T–S relation of the NACW(Fig. 8(B)).
The hypothesis is that the source of the filamentare waters upwelled off Cape St. Vincent andadvected to the east by the main current. Thiscurrent follows the salinity isolines in the westernpart of the domain (Fig. 8(D)) and bifurcatesaround 7.5 1W. The southern branch would carrythe upwelled water in a north–south direction,giving rise to the filament off Cape St. Maria.
Some further insight on the nature of the filamentis provided by an EOF analysis. Fig. 9 shows theresults of such analysis restricted to the depth rangeof 20–160m. This range has been chosen because
the filament is very clear at 50m (Fig. 8(C)) but notso clear at 100m (not shown), for which it is hopedthat this depth interval captures first the emergentfeatures of the filament and then their subsequentfading out with depth. Fig. 9(A) is the spatial mapof the first mode of the temperature and salinityanomalies (the spatial mean given in Eq. (2) hasbeen removed in the EOF analysis), and Fig. 9(B)shows the amplitude coefficients of these modes forall depths. The variance explained by the first modeis high for the two variables (62.5% for temperatureand about 67% for salinity) and the spatial patternsreveal clearly the presence of the filament. Thestations marked with a cross in Fig. 8(C) also havebeen plotted in Fig. 9(A), and all of them fall withinthe feature revealed by the first mode, both intemperature and salinity.
The first mode predicts colder and fresher watersfor the filament, in good agreement with itshydrological description. The lower salinity followsfrom the fact that the spatial map shows negative

ARTICLE IN PRESS
Dep
th (
m)
Dep
th (
m)
0
-100
-150
-50
-200
0 0.05 0.10-0.10 -0.05
0 0.2 0.4-0.4 -0.2
0
-100
-150
-50
-200
Temperature (°C)
Salinity
9°W 8°W 7°W 6°W
9°W 8°W 7°W 6°W
37°°N
40′
20′
36°N
40′
37°N
40′
20′
36°N
40′
-3 -2 -1 0 1
0 1 2 3 4
(A) (B)
Fig. 9. (A) Spatial map of the first mode of temperature (upper panel) and salinity (lower panel) anomalies of the EOF analysis performed
in the range 20–160m from Macroscale data. Stations inside the filament have been marked with X (see Fig. 7C). The first mode reveals
the presence of the filament both in temperature and salinity. (B) Amplitude coefficients of the first mode of temperature (upper panel) and
salinity (lower panel) of the EOF analysis. The maximum (absolute) value is reached at about 40–50m, where the filament is more
pronounced.
F. Criado-Aldeanueva et al. / Deep-Sea Research II 53 (2006) 1144–1160 1155
anomaly and the amplitude coefficients are positive.In contrast, the temperature anomaly is positive,but the amplitude coefficients are negative until150m, where they change sign. The EOF analysisclearly suggests that the filament is more pro-nounced between 40 and 50m, since the amplitudecoefficients reach their maximum absolute value,after which its signature progressively vanishes (thecoefficients decrease in absolute value) until itdisappears around 150m in temperature and,several metres below, in salinity. Lastly, the highvariance captured by the first mode indicates thatthe filament is likely the most relevant feature in thisdepth range.
3.5. Distribution and circulation of NACW
NACW is the most important water mass in atleast the first 1000m of the water column in thecentral part of the Gulf of Cadiz. Fig. 2 shows thatthe surface gt ¼ 27:0 kgm�3 corresponds to NACWthat has suffered very little mixing both with upperwarm surface water and with lower MW. As aresult, TS properties on the surface gt ¼ 27:0 kgm�3
are practically constant (TE13.2 1C, SE35.8).Water with gto27.0 kgm�3 may be sensitive tosurface heating making its TS signature diverge
from the line of NACW, moving vertically along thetemperature axis in the TS diagram (Fig. 2). Forgt427.0 kgm�3, in some stations the water is proneto feel the effect of MW in such a way that thedivergence from the line of NACW is along thesalinity axis towards more saline values (Fig. 2).When the Gulf of Cadiz is taken into considerationas a whole, gt ¼ 27:0 kgm�3 represents, in spatialaverage, the purest NACW. The depth of thesurface gt ¼ 27:0 kgm�3 (Fig. 10(A), contours) isgreater for stations furthest away from the coast,and the depth gradient is fairly significant in theeasternmost region of the Gulf, due to the interac-tion in this area of NACW with MW leaving theStrait of Gibraltar. In the central part of the Gulf,far from the direct influence of MW, the surfacegt ¼ 27:0 kgm�3 is located at a depth of about250–300m.
Besides this homogeneity, things are notablymore varied when we consider the surfaces gt ¼
26:6 and 27.3 kgm�3, regarded as the limits ofNACW (Fig. 10(B, D)). gt ¼ 26:6 kgm�3 is locatedat depths above 70m and the distribution of thesalinity on this surface shows saltier water to thesouth and fresher water to the north. The circu-lation at this surface is similar to the one at 50m(Fig. 7(D)). It is predominantly anticyclonic and the

ARTICLE IN PRESS
Fig. 10. (A) Depth (metres, in contours) of gt ¼ 27:0 kgm�3 and thickness (metres, in colour scale) of the NACW layer with So35.8 from
Macroscale sampling. (B) Salinity (colour scale) and depth (metres, in contours) of the gt ¼ 26:6kgm�3 isopycne regarded as the upper
limit of NACW. Stations involved in the computations have been marked. (C) Geostrophic velocity at gt ¼ 27:3kgm�3 referred to 300m.
The geostrophic velocity field depicts the vein of MW that stretches westwards in the eastern and northern part of the Gulf. (D) The same
as in panel (B) for the gt ¼ 27:3kgm�3 isopycne, regarded as the lower limit of NACW.
F. Criado-Aldeanueva et al. / Deep-Sea Research II 53 (2006) 1144–11601156
velocities are moderate, particularly in the northernarea of the domain with values around 30 cm s�1.This isopycne is of great interest in biologicalstudies in the Gulf of Cadiz, as it can be considereda nutrient tracer and an indicator of the depth of theDeep Fluorescence Maximum (Navarro et al.,2006). In contrast, gt ¼ 27:3 kgm�3 corresponds todeeper water (below 300–400m) and the distribu-tion of salinity on this surface now shows less-salinewaters to the south and traces of salty MW at theeastern stations. The circulation at this depthreflects the vein of MW stretching from east towest in the eastern and northern part of the Gulf ofCadiz (Fig. 10(C)).
The thickness of NACW could be estimated asthe difference between the depth of the surfaces gt ¼
26:6 and 27.3 kgm�3, its theoretical limits. But it isprobably more convenient to combine the proper-ties of surface gt ¼ 27:0 kgm�3 with that of mini-mum salinity to obtain the thickness of NACW withSo35.8, regarded as the purest NACW. Thesalinity minimum is on average about 35.7 andthus, due to the shape of the TS diagram, the valueof S ¼ 35:8 is reached at two different depths, theupper one coinciding with the depth of gt ¼
27:0 kgm�3 (see Fig. 2). These two depths can beconsidered acceptable as the upper and lowerboundaries of purest NACW. In the central region
of the Gulf, the thickness of this layer reaches 400 or500m, whereas at the stations nearest to the coast itis only 100 or 200m (Fig. 10(A)).
3.6. Variability of currents and geostrophic
transports
The wind regime during the three legs of GOLFO2001 survey varied significantly (Fig. 11). Mesoscale1 and Macroscale were (mainly) accomplishedunder westerlies, whereas Mesoscale 2 was sampledunder easterlies. Wind changes induced noticeablevariability in hydrological, chemical and dynamicalpatterns, whose detailed description is out of thescope of this work. However, it is worth to outlinesome of the wind-induced changes in the circulationof the Gulf of Cadiz. Although the generalcirculation keeps the same characteristic pattern,some significant differences can be detected (seeFig. 12): in Mesoscale 1, the velocity in the vicinityof Cape St. Maria at 10m depth is intense (the rmsvelocity is 20 cm s�1) and anticyclonic (Fig. 12(A)).This behaviour has been altered in Mesoscale 2,where the current is more sinuous, although theenergy, indicated by the rms velocity, is similar forthe same depth. In its route, it traces first a cyclonicmeander off the cape (�8 1W) and then recuperatesthe anticyclonic movement in a new meander more

ARTICLE IN PRESS
Fig. 11. Stick diagram of the wind regime from the RAP buoy (see Fig. 1 for location) during May–June 2001. Time period of each survey
has been indicated. Westerlies prevailed during Mesoscale 1 and the previous days; Macroscale was sampled under both regimes although
westerlies were more frequent and intense. Mesoscale 2 was influenced by the moderate to strong and rather persistent episode of easterlies.
Fig. 12. Geostrophic velocity at 10m depth referred to 300m for Mesoscale 1 (panel A) and Mesoscale 2 (panel C) and geostrophic
transport (Sv) in the upper 300m for Mesoscale 1 (panel B) and Mesoscale 2 (panel D). Stations are marked in panels (B and D). The solid
line in panels (B and D) represents the section in front of Cape St. Maria used to compare geostrophic transports.
F. Criado-Aldeanueva et al. / Deep-Sea Research II 53 (2006) 1144–1160 1157
to the east at �7.25 1W (Fig. 12(C)). An explanationfor this variability is that, in Mesoscale 1, westerlies,that favours upwelling, retain the coastal counter-current moving westwards through the northernpart of the Gulf (Fiuza, 1983; Folkard et al., 1997;Relvas and Barton, 2002; Sanchez and Relvas, 2003;Garcıa-Lafuente et al., 2006), for which reason themain current has nothing opposing its movementeastwards. In Mesoscale 2, under easterlies, theupwelling weakens, allowing the coastal counter-current to progress towards Cape St. Maria andfarther west, thereby forcing the main current awayfrom the cape and to form the characteristic featureof a double meander.
The geostrophic transports exhibit more varia-bility. In Mesoscale 1, the transport isolines are
convex and approach Cape St. Maria (Fig. 12(B)),whereas in Mesoscale 2 they remain faraway fromthe cape and have, similarly to what happened withthe currents, a double meander feature (Fig. 12(D)).The volume transports also differ: in Mesoscale 1,0.78 Sv flowed through the section marked inFig. 12(B,D) while in Mesoscale 2, it flowed only0.51. During the Macroscale (Fig. 3(A)), the flowwas 0.69 Sv, a volume transport midway betweenMesoscales 1 and 2. This variability obviouslyfollows the wind variations and is in good agree-ment with the literature on exchanges through theStrait of Gibraltar, which predicts an increase ofinflow to the Mediterranean under westerlies and adecrease under easterlies. (Garcıa-Lafuente et al.,2002a, b).

ARTICLE IN PRESSF. Criado-Aldeanueva et al. / Deep-Sea Research II 53 (2006) 1144–11601158
4. Summary
From the data collected during GOLFO 2001survey, a study has been conducted on the circula-tion and distribution of water masses in the Gulf ofCadiz in the spring of 2001, and on its meteor-ologically forced variability. Most of the experi-mental information used to conduct the studyconsisted of CTD data, with which the geostrophicanalysis in the outer region of the Gulf of Cadiz wascarried out. The meteorological conditions, studiedfrom the registers of the station of Hesperides andthe RAP buoy, as well as the scatterometer data,show that, in Mesoscale 1 and the greater part of theMacroscale, westerlies were dominant. In Mesoscale2, there was a period of strong easterlies. Thisvariability has made it possible to study theresponse of the oceanographic features to meteor-ological forcing using in situ data.
NACW (gt ¼ 26:6227:3 kgm�3) is a very repre-sentative water mass in the first 1000m of the watercolumn. In gt ¼ 27:0 kgm�3, the temperature andsalinity are practically uniform. To the northof the domain, the lower layer of NACW (gt ¼
27:3 kgm�3) is entrained by MW towards the openocean and the upper layer of NACW (gt ¼
26:6 kgm�3) already forms part of the anti-cyclonic surface circulation of the Gulf of Cadiz.In the central region, main reservoir of NACW, themovement is very limited. SAW (T416.0 1C,SE36.4 and gtp26.7 kgm�3) is found between thesurface and 100m and has its origin in shallowNACW that has been modified by air–sea interac-tions. Two main maxima were detected in the TS
diagram corresponding to the two cores (upperand lower) of MW with different densities, respec-tively, gtE27.5 and 27.8 kgm�3 centred near 800and 1200m.
NACW mainly upwells in the vicinity of CapesSt. Vincent and St. Maria. The upwelling off CapeSt. Vincent seems to be related to Ekman pumpingin the surface Ekman layer, an open-sea processlinked to a positive wind curl over the area thatproduces uprising of the isopycnes and advectsdense water from the ocean’s interior close to thesurface. The upwelling off Cape St. Maria is a morelikely coastal process with a short time response tochanges in the wind regime: it is enhanced underwesterlies, and it weakens, and even fades out,under easterlies. The waters upwelled off Cape St.Vincent move eastwards following the main currentuntil reaching �7.5 1W, where they form the
filament of Cape St. Maria, which reaches itsmaximum signature at about 40–50m.
The general surface circulation in the Gulf ofCadiz is anticyclonic with short-term variations.Under westerlies, the geostrophic current, referredto 300m so as to maximise the inflow to the Strait ofGibraltar, approaches Cape St. Maria more thanunder easterlies, possibly because, in this last case,the coastal countercurrent forces it away from thecape. The geostrophic transport in any north–southsection is 30% greater under westerlies than undereasterlies.
In the Macroscale samplings, with a greatergeographical scope, it is important to note that thecurrent bifurcates into two branches at 7.5 1W (offCape St. Maria), which then join together down-stream. Once united, the current follows two pathson approaching the Strait of Gibraltar: one ofincome to the Mediterranean Sea through the Straitand another turning south and forming a meanderthat joins the Canary Current.
Acknowledgements
We thank the UIB-IMEDEA (Special ActionCICYT, REN2000-2599-E) for the dissemination ofthe software used for the optimal interpolation.Wind data from the RAP buoy have been kindlyprovided by Puertos del Estado. Wind processing ofthe scatterometer data has been courtesy of theServicio de Teledeteccion de Color Oceanico of theICMAN-CSIC. We are also indebted to the crew ofBIO Hesperides for his work during GOLFO 2001survey. F. Criado Aldeanueva is much obliged tothe Spanish Ministry of Education and Science forawarding him a F.P.U. grant (reference No.AP2000-3951).
References
Alvarez, A., Lopez, C., Riera, M., Hernandez-Garcıa, E.,
Tintore, J., 2000. Forecasting the SST space–time variability
of the Alboran Sea with generic algorithms. Geophysical
Research Letters 27 (17), 2709–2712.
Alves, M., Gaillard, F., Sparrow, M., Knoll, M., Giraud, S.,
2002. Circulation patterns and transport of the Azores Front-
Current System. Issue Series Title: Deep-Sea Research II 49,
3983–4002.
Ambar, I., Howe, M.R., 1979a. Observations of the Mediterra-
nean outflow I: mixing in the Mediterranean outflow. Deep-
Sea Research 26A, 535–554.

ARTICLE IN PRESSF. Criado-Aldeanueva et al. / Deep-Sea Research II 53 (2006) 1144–1160 1159
Ambar, I., Howe, M.R., 1979b. Observations of the Mediterra-
nean outflow II: the deep circulation in the vicinity of the Gulf
of Cadiz. Deep-Sea Research 26A, 555–568.
Ambar, I., Serra, N., Brogueira, M.J., Cabec-adas, G., Abrantes,
F., Freitas, P., Gonc-alves, C., Gonzalez, N., 2002. Physical,
chemical and sedimentological aspects of the Mediterranean
outflow off Iberia. Deep-Sea Research II 49, 4163–4177.
Baringer, M.O., Price, J.F., 1997. Mixing and spreading of the
Mediterranean outflow. Journal of Physical Oceanography 27
(8), 1654–1677.
Bennett, A.F., 1992. Inverse Methods in Physical Oceanography.
Cambridge Monographs on Mechanics and Applied Mathe-
matics. Cambridge University Press, Cambridge, (347pp).
Bennett, A.F., Chua, B.S., 1992. Open ocean modelling as an
inverse problem: the primitive equations. Monthly Weather
Review 112, 1326–1336.
Bryden, H.L., Candela, J., Kinder, T.H., 1994. Exchange through
the Strait of Gibraltar. Progress in Oceanography 33,
201–248.
Criado-Aldeanueva, F., 2004. Distribucion y Circulacion de
Masas de Agua en el Golfo de Cadiz. Variabilidad Inducida
por el Forzamiento Meteorologico. Ph.D. Thesis, University
of Malaga. ISBN: 84-689-0245-4. Published by the Publica-
tion Service University of Malaga (in Spanish).
Fiuza, A.F.G., 1983. Upwelling patterns off Portugal. In: Suess,
E., Thiede, J. (Eds.), Coastal Upwelling. Plenum, New York,
pp. 85–98.
Fiuza, A.F.G., de Macedo, M.E., Guerreiro, M.R., 1982.
Climatological space and time variations of the Portuguese
coastal upwelling. Oceanologica Acta 5, 31–40.
Folkard, A.M., Davies, P.A., Fiuza, A.F.G., Ambar, I., 1997.
Remotely sensed sea surface thermal patterns in the Gulf of
Cadiz and Strait of Gibraltar: variability, correlations and
relationships with the surface wind field. Journal of Geophy-
sical Research 102, 5669–5683.
Gandin, L., 1963. Objective Analysis of Meteorological Fields
(Transl. from Russian by Israel Program for Scientific
Translations), 1965 (NTIS No. TT65-50007).
Garcıa, C.M., Prieto, L., Vargas, M., Echevarrıa, F., Garcıa
Lafuente, J., Ruiz, J., Rubın, P., 2002. Hydrodynamics and
the spatial distribution of Plankton and TEP in the Gulf of
Cadiz (SW Iberian Peninsula). Journal of Plankton Research
24 (8), 817–833.
Garcıa-Lafuente, J., Alvarez Fanjul, E., Vargas, J.M., Ratsiman-
dresy, A., 2002a. Subinertial variability in the flow through
the Strait of Gibraltar. Journal of Geophysical Research 107,
c10, doi:10.1029/2001JC00104.
Garcıa Lafuente, J., Delgado, J., Vargas, J.M., Vargas, M.,
Plaza, F., Sarhan, T., 2002b. Low-frequency variability of the
exchanged flows through the Strait of Gibraltar during
CANIGO. Deep-Sea Research II 49, 4051–4067.
Garcıa Lafuente, J., Delgado, J., Criado-Aldeanueva, F., Bruno,
M., Del Rıo, J., Vargas, J.M., 2006. Water mass circulation
on the Continental Shelf of the Gulf of Cadiz. Deep-Sea
Research II, this issue [doi:10.1016/j.dsr2.2006.04.011].
Gomis, D., Ruiz, S., Pedder, M.A., 2001. Diagnostic analysis of
the 3D ageostrophic circulation from a multivariate analysis
of CTD and ADCP Data. Deep-Sea Research I 48(1),
269–295.
Hernandez-Guerra, A., Nykjaer, L., 1997. Sea surface variability
off North-west Africa: 1981–1989. International Journal of
Remote Sensing 18, 2539–2558.
Knoll, M., Lenz, B., Muller, T.J., Reppin, J., Siedler, G., 1999.
Eastern Canary Basin Hidrography. Part I: Physical observa-
tions. Poster presented in CANIGO Final Conference, Las
Palmas de Gran Canaria.
Lorenz, E.N., 1956. Empirical orthogonal functions and statis-
tical weather prediction. Scientific Report No. 1, Statistical
Forecasting Project. Department of Meteorology. MIT,
Cambridge, MA, (49pp).
Madelain, F., 1970. Influence de la Topographie du Fond Sur
L’ecoulement Mediterraneen entre le Detroit de Gibraltar
et le Cap Saint -Vincent. Cahiers Oceanographiques 22, 43–61
(in French).
Navarro, G., Ruiz, J., Garcıa, C.M., Criado-Aldeanueva, F.,
Echevarrıa, F., 2006. Basin Scale Structures Governing the
Position of the Deep Fluorescence Maximum in the Gulf of
Cadiz. Deep-Sea Research II, this issue [doi:10.1016/j.dsr2.
2006.04.013].
Obukhov, A.M., 1947. Statistically homogeneous fields on a
sphere. Uspekhi Matematicheskikh Nauk 2, 196–198.
Ochoa, J., Bray, N.A., 1991. Water masses exchange in the Gulf
of Cadiz. Deep-Sea Research 38 (Suppl. 1), S465–S503.
Parada, M., Canton, M., 1998. Sea surface temperature
variability in Alboran Sea from satellite data. International
Journal of Remote Sensing 19, 2439–2450.
Parker, R.L., 1994. Geophysical Inverse Theory. Princeton
University Press, Princeton, NJ.
Prieto, L., Garcıa, C.M., Corzo, A., Ruiz Segura, J., Echevarrıa,
F., 1999. Phytoplankton, bacterioplankton and nitrate
reductase activity distribution in relation to physical structure
in the Northern Alboran Sea and Gulf of Cadiz (Southern
Iberian Peninsula). Boletin del Instituto Espanol de Oceano-
grafia 15, 401–411.
Relvas, P., Barton, E.D., 2002. Mesoscale patterns in the Cape
Sao Vicente (Iberian Peninsula) upwelling region. Journal of
Geophysical Research 107 (C10), 3164–3186.
Rubın, J.P., Cano, N., Arrate, P., Garcıa Lafuente, J., Escanez,
J., Vargas, M., Alonso Santos, J.C., Hernandez, F., 1997. El
Ictioplancton, el Mesozooplancton y la Hidrologıa en el
Golfo de Cadiz, Estrecho de Gibraltar y Sector Noroeste del
Mar de Alboran en Julio de 1994. Informe Tecnico del
Instituto Espanol de Oceanografıa 167, 44 (in Spanish).
Rubın, J.P., Cano, N., Prieto, L., Garcıa, C.M., Ruiz, J.,
Echevarrıa, F., Corzo, A., Galvez, J.A., Lozano, F., Alonso
Santos, J.C., Escanez, J., Juarez, A., Zabala, L., Hernandez,
F., Garcıa Lafuente, J., Vargas, M., 1999. La Estructura del
Ecosistema Pelagico en Relacion con las Condiciones
Oceanograficas y Topograficas en el Golfo de Cadiz, Estrecho
de Gibraltar y Mar de Alboran (Sector Noroeste) en Julio de
1995. Informe Tecnico del Instituto Espanol de Oceanografıa
175, 73 (in Spanish).
Ruiz Valero, S., 2000. Analisis Espacial Objetivo de Datos
Oceanograficos: Aplicaciones en el Mar de Alboran. Ph.D.
Thesis, University of Islas Baleares-IMEDEA (in Spanish).
Sanchez, R., Relvas, P., 2003. Spring—summer climatological circu-
lation in the upper layer in the region of Cape St. Vincent, South-
west Portugal. ICES Journal of Marine Science 60, 1232–1250.
Stevenson, R.E., 1977. Huelva front and Malaga, Spain, Eddy
chain as defined by satellite and oceanographic data.
Deutsche Hydrographische Zeitschrift 30 (2), 51–53.
Tarantolla, A., 1987. Inverse Problem Theory. Methods for Data
Fitting and Model Parameter Estimation. Elsevier Science
Publishers, Amsterdam.

ARTICLE IN PRESSF. Criado-Aldeanueva et al. / Deep-Sea Research II 53 (2006) 1144–11601160
Thiebaux, H.J., Pedder, M.A., 1987. Spatial Objective Analysis
with Applications in Atmospheric Sciences. Academic Press,
New York, (299pp).
UNESCO, 1985. The International System of Units in
Oceanography. UNESCO Technical Paper n%o. 45, Paris.
United Nations Educational, Scientific and Cultural
Organization.
Vargas, J.M., Garcıa-Lafuente, J., Delgado, J., Criado, F., 2003.
Seasonal and wind-induced variability of sea surface tem-
perature patterns in the Gulf of Cadiz. Journal of Marine
Systems 38, 205–219.
Zenk, W., 1970. On the temperature and salinity structure of the
Mediterranean water in the Northeast Atlantic. Deep-Sea
Research 17, 627–631.
Copyright © 2022 FDOKUMEN


![masos for the masses part three - []](https://static.fdokumen.com/doc/165x107/6328d98472264f12480374b5/masos-for-the-masses-part-three-.jpg)