DISTRIBUTED RELATIONAL DATABASE PERFORMANCE IN ...
31
DISTRIBUTED RELATIONAL DATABASE PERFORMANCE Journal of Information Technology Management ISSN #1042-1319 A Publication of the Association of Management DISTRIBUTED RELATIONAL DATABASE PERFORMANCE IN CLOUD COMPUTING: AN INVESTIGATIVE STUDY ALAN T LITCHFIELD AUCKLAND UNIVERSITY OF TECHNOLOGY alan.litchfi[email protected] AWADH ALTHWAB AUSTRALIAN NATIONAL UNIVERSITY [email protected] CHANDAN SHARMA AUCKLAND UNIVERSITY OF TECHNOLOGY chan [email protected] ABSTRACT This article reports on a study that demonstrates the weak points found in major relational database engines that were set up in a Cloud Computing environment, in which the nodes were geographically distant. The study undertook to establish whether running databases in the Cloud provided operational disadvantages. Findings indicate that performance measures of RDBMS’ in a Cloud Computing environment are inconsistent and that a contributing factor to poor performance is the public or shared infrastructure on the Internet. Also that RDBMS’ in a Cloud Computing environment become network-bound in addition to being I/O bound. The study concludes that Cloud Computing creates an environment that negatively impacts RDBMS performance in comparison to the n-tier architecture for which common RDBMS’ were designed. Keywords: Cloud Computing, Distributed Relational Databases, Network and I/O Latency, Query Planning INTRODUCTION There exists a concern common to organisations that are considering the transition of geographically dis- tributed operational systems to a Cloud Computing (CC) based environment. That following a period of significant hype about the promises that CC would provide an organisa- tion, the reality experienced by those that have made a naive attempt to transition to the Cloud, found the performance of systems lacking. Also that when dealing with large datasets, CC is increasingly seen as a mainstream technology [31]. This creates a significant concern for the enterprise, for ex- ample, at as January 2016, survey results indicate that of a sample size of 1060 IT professionals, 77% use private cloud Journal of Information Technology Management, Volume XXIX, Number 1, 2018 16
-
Upload
khangminh22 -
Category
Documents
-
view
8 -
download
0
Transcript of DISTRIBUTED RELATIONAL DATABASE PERFORMANCE IN ...

DISTRIBUTED RELATIONAL DATABASE PERFORMANCE
Journal of Information Technology Management ISSN #1042-1319A Publication of the Association of Management
DISTRIBUTED RELATIONAL DATABASE PERFORMANCE INCLOUD COMPUTING: AN INVESTIGATIVE STUDY
ALAN T LITCHFIELDAUCKLAND UNIVERSITY OF TECHNOLOGY
AWADH ALTHWABAUSTRALIAN NATIONAL UNIVERSITY
CHANDAN SHARMAAUCKLAND UNIVERSITY OF TECHNOLOGY
ABSTRACTThis article reports on a study that demonstrates the weak points found in major relational database engines that were
set up in a Cloud Computing environment, in which the nodes were geographically distant. The study undertook to establishwhether running databases in the Cloud provided operational disadvantages. Findings indicate that performance measuresof RDBMS’ in a Cloud Computing environment are inconsistent and that a contributing factor to poor performance is thepublic or shared infrastructure on the Internet. Also that RDBMS’ in a Cloud Computing environment become network-boundin addition to being I/O bound. The study concludes that Cloud Computing creates an environment that negatively impactsRDBMS performance in comparison to the n-tier architecture for which common RDBMS’ were designed.
Keywords: Cloud Computing, Distributed Relational Databases, Network and I/O Latency, Query Planning
INTRODUCTION
There exists a concern common to organisationsthat are considering the transition of geographically dis-tributed operational systems to a Cloud Computing (CC)based environment. That following a period of significanthype about the promises that CCwould provide an organisa-
tion, the reality experienced by those that havemade a naiveattempt to transition to the Cloud, found the performance ofsystems lacking. Also that when dealingwith large datasets,CC is increasingly seen as a mainstream technology [31].This creates a significant concern for the enterprise, for ex-ample, at as January 2016, survey results indicate that of asample size of 1060 IT professionals, 77% use private cloud
Journal of Information Technology Management, Volume XXIX, Number 1, 2018 16
DISTRIBUTED RELATIONAL DATABASE PERFORMANCE
services, 89% use public cloud services, 71% use hybrid,and perhaps more significantly enterprises are using multi-ple cloud services to satisfy their requirements [47]. More-over, this report also states that the main challenge for cloudadoption is not security but a lack of resources and exper-tise.
This paper presents the results of a study fo-cussed specifically on identifying where significant perfor-mance issues in a naively deployed database system occur.The starting point for the study is with the premise thatany distributed Relational Database Management System(RDBMS) requires a network and nodes (typically the n-tier architecture), that applications of RDBMS’ are normalin an organisational context, and that the performance ofRDBMS has been a concern for researchers for many years.The n-tier architecture operates on a client/servermodel andincludes a database system and at least one server applica-tion or middleware, through which users gain access to thedatabase system [17, 15]. However, the CC architecture dif-fers from an n-tier architecture such that CC infrastructureincludes the public Internet and typically abstracts the phys-ical architecture through virtualisation [23, 26].
In CC, the user may obtain direct access to dataor via a Service-Oriented Architecture (SOA), for exam-ple through an Application Programming Interface (API)made available by a service provider. In an n-tier architec-ture, programmatic controls exist within a data centre andamongst its networks and servers as nodes and hooks but,unlike the public network infrastructure, these have greaterand controllable bandwidth [3]. This situation, of a sharedand limited bandwidth, constrains the performance of ap-plications that run in CC [38]. Thus, for example, queryoptimisation in distributed RDBMS’ in n-tier architecturesuffer from performance issues [9, 32, 39, 43]. Therefore,whereas RDBMS’ normally operate on n-tier architecture,we investigate RDBMS performance operating on a cloud-based architecture to determine where break points exist.What we have found is that all the systems up for testingfailed at least one of the tests but that they failed them indifferent ways.
The paper is structured as follows; in the next sec-tion, related research work is presented, then themethod de-veloped for the study is described in brief, the results of ex-periments are presented and then discussed, and finally, inthe conclusion is presented an outline of the findings and in-dications of further research both planned for and currentlyunderway.
RELATEDWORKCC is abstract and encompasses various technolo-
gies and practices. Attempts to define CC typically focus onsome feature set, such as classes of technology, protocols,patterns of use, and so on. Both Geelan [18] and Buyya,Yeo, and Venugopal [7] include economies of scale in def-initions of CC, for example reduction of the overall costof cloud infrastructure consumption by service consumerscompared with the equivalent resource requirements off-cloud. The authors also focus on Service Level Agreement(SLA) provision to define the level of quality of service ex-pected from either party. Additionally, scalability and theability to optimise resource use empowers users to have fullcontrol over their spending on IT services [46]. These re-sources are typically consumed on a pay-per-use basis andservice providers are responsible for guaranteeing infras-tructure to an agreed SLA.
CC has three models of service delivery: public,private, and hybrid clouds [18]. The models differ in howthey are managed, so that a Public Cloud (PuC) involvesmany customers accessing services from different locationsand using the same infrastructure (primarily the Internet).The Private Cloud (PrC) is managed either by the organi-sation itself or it may be outsourced. The implications foran organisation with a PrC are significant, and this is espe-cially important because access to its resources is more lim-ited than a PuC. Facilitating the expansion of the PrC, usingthe resources of the PuC, creates a Hybrid Cloud (HyC).
An important feature of the Cloud-based environ-ment is a high level of availability for services, data andother IT resources [31]. However, merely moving a com-pany’s computing resources to a cloud platformwithout suf-ficient feasibility assessment for accessibility and perfor-mance may lead to bottlenecks. Technical bottlenecks ornetwork insufficiency can in turn lead to data unavailabilityespecially when data move between cloud nodes over net-works with limited bandwidth. Database locking, lack ofstorage capacity [for example, 44] and cache flushing canalso cause bottlenecks in Cloud-based systems.
This study is focussed the effect of PuCs on theperformance of relational databases in a Cloud-based envi-ronment. To review existing literature, we consider someof the wider issues associated with data base performance.Li, Yang, Kandula, and Zhang [30] conduct a comparisonbetween PuCs and conclude that considerable differencesexist between PuC providers and this makes it difficult tochoose which provider to use. Further, Iosup, Ostermann,Yigitbasi, Prodan, Fahringer, and Epema [22] suggest thatPuCs appear to suit small databases but that they demon-strate deficiencies when heavy workloads (such as scientificanalytics) are involved, but Thakar, Szalay, Church, and
Journal of Information Technology Management, Volume XXIX, Number 1, 2018 17
DISTRIBUTED RELATIONAL DATABASE PERFORMANCE
Terzis [44] and Hashem, Yaqoob, Anuar, Mokhtar, Gani,and Khan [21] disagree and state that PuCs such as AmazonElastic Cloud Computing (EC2) and Microsoft SQL Azureare suited to scientific tasks. Gunarathne, Wu, Qiu, andFox [20] add that PuCs can be used for big data tasks per-formed on high dimensional data residing on heterogeneousdatabases, where complex queries consume intensive com-putational resources. But I/O performance inconsistenciesoccur on PuCs due to the existence of shared infrastructure(the Internet) and the potential for improperly tuned VMson hypervisors.
The RDBMS is a mainstay of enterprise informa-tion systems management. Since Codd [11] established re-lational theory, the approach to the structuring of data inrelations and defining simple relationships has shown itselfto be robust and flexible. In a study considering the up-take of noSQL systems, Mc Kendrick [35] states that 77%of the study’s sample consider structured data as central totheir daily business activities, and that 92% use RDBMS’compared to 11% that have deployed NOSQL databases.The likelihood of the RDBMS being fully replaced by othertypes of database is not significant, however performanceissues still need to be resolved.
Query optimisation is an area that has been a fo-cus of research, resulting in a significant body of knowl-edge. Choosing an efficient query plan appears complexbecause many variables are computed. For instance, theRDBMS has to estimate the number of tuples that a queryselects and the number of tuples retrieved by every opera-tion in the execution plan. The RDBMS also needs to esti-mate the computational resources required for execution sothat CPU usage, I/O and memory allocation variables maybe estimated. Moreover, the RDBMS may compare plansbefore it chooses one plan [10]. While query optimisationapproaches enable multiple paths to an efficient query exe-cution [12], Shao, Liu, Li, and Liu [42] suggest that issuesexist with the performance of existing optimisation meth-ods. The authors present a new optimisation system forMS SQL Server based on a hierarchical queuing networkmodel. With this model, they achieve on average a 16.8%improvement in the performance of SQL Server comparedwith existing optimisation methods, and increases transac-tion throughput by 40%.
This study is not directed at the development ofa new algorithm or assessing specific optimisations in adistributed environment, query optimisation presents per-sistent challenges [9]. However, a factor that emerges asimportant to the study where to enable intermediate oper-ations that may be intended to optimise the local process-ing of a query and where data are moved between locations,the distributed environment adds significant complexity [8].This leads to more variables when choosing optimisation
plans [39, 27]. This is not a new problem and is not oneintroduced by CC, for example Liu and Yu [32] claim thatin deciding whether or not it is the inefficient implemen-tation or unsuitable execution plans chosen by RDBMSthat cause long processing queries, more investigation isrequired. Their findings suggest that network overhead isobserved to be a major influence. More recently, in the CCcontext, similar methods are employed for large dataset pro-cessing while noSQL databases introduce new approachesfor query optimisation that appear to improve performance[48, 9].
Traditionally, RDBMS’ have been deployed on theclient-server model, where database systems may commu-nicate directly with the server and network. Changes to datavolume, infrastructure, and platform technologies suggestthat RDBMS’ appear to cope less well [48]. Conflictingviews as to whether RDBMS can still be used in the era oflarge datasets exist. There has been a suggestion of archi-tectural issues with the relational data model that reduce theeffectiveness of RDBMS when processing large datasets inCC [31]. Supporting this view, Durham, Rosen, and Harri-son [14] report that the data model can be a significant fac-tor when handling large datasets. That is, by pulling dataacross the public network, RDBMS do not perform effi-ciently with big data and that impacts performance. Theimplication is that joins between distributed tables may beproblematic and perhaps should be avoided. An alternativeview is that it is not the architecture that is the issue but theyway in which it has been deployed in the Cloud.
Relational database performance inCCWe contend that the naive deployment of RDBMS in aCloud context has introduced additional performance chal-lenges and so we summarise research on query perfor-mance. In general, performance is done by benchmark-ing tools, for example, Transaction Processing PerformanceCouncil (TPC) tools that include SPECCpu benchmark,which works to evaluate any given computer system andrecommend the best CPU for the workload [16], and TPC-Cthat evaluates DBMS’ that suit Online Transaction Process-ing (OLTP) applications [28]. The application of TPC-C tomeasure the performance of databases is extensive but inCC, there is little attention given to domain specific charac-teristics as they relate to RDBMS performance.
RDBMS performance within the Cloud Dis-tributed Database (CDD) context has not been well de-scribed. For instance in their study, Minhas, Yadav, Aboul-naga, and Salem [37] fail to take into account the effect ofthe Internet and at 2Gb, the data size was small. Their study
Journal of Information Technology Management, Volume XXIX, Number 1, 2018 18

DISTRIBUTED RELATIONAL DATABASE PERFORMANCE
concludes that running a database over virtualised environ-ment creates I/O disk overhead but that such an overheaddoes not have a large impact during the runtime of queries.Thakar, Szalay, Church, and Terzis [44] have similar find-ings with regard to CC affecting I/O performance. Also,Ivanov, Petrov, and Buchmann [24] conclude that CC ismore suitable for read-mostly work and that for other pur-poses like OLTP applications and data-intensive workload,CC poses challenges. However, Bose, Mishra, Sethuraman,and Taheri [5] find that although RDBMS’ perform betteroff-Cloud, they achieve between 85% and 92% of native per-formance in CC and conclude that CC is capable of han-dling database-intensive workloads.
For the study, to assess RDBMS performance, anumber of approaches are considered. From these, we haveapplied the following. In a performance evaluation of PuCwith a range of benchmarking tools, Iosup, et al [22] fo-cus on CPU time, I/O, and memory hierarchy. Jackson, Ra-makrishnan, Muriki, Canon, Cholia, Shalf, andWright [25]address network latency in high performance computingapplications on PuC. Kohler and Specht [29] investigateRDBMS that are partitioned over a cloud network and usestwo performance measures; runtime and the number of tu-ples returned in a query. Thakar et al [44] investigate largedatabase query runtime performance in analytics. Lloyd,Pallickara, David, Lyon, Arabi, and Rojas [33] use a statis-tical model to examine CPU time and I/O operations in IaaSfor multi-tier applications. Baccelli and Coffman [2] alsouse runtime with the addition of throughput to analyse theperformance of a distributed database, looking at the effectof interrupted services from an update operation that had apre-emptive privilege over read operations. To avoid two-phase commit, Anderson, Breitbart, Korth, and Wool [1],among other measures, use transaction throughput to mea-sure the effect of serialisation and transaction atomicity.To examine the implementation of different strategies fordistributed lock management, Born [4] employ transactionresponse time and transaction throughput. To study theperformance of timestamp ordering concurrency control,Bouras and Spirakis [6] utilise wait time. And, to studydifferent replication models, Gray, Helland, O’Neil, andShasha [19] utilise wait time.
EXPERIMENTAL METHODTo develop the experimental method, the follow-
ing measures from literature are used:
Duration: The time taken by a query to complete and iscalculated as the sum of processing time and com-munication cost. As an indicator, this indicates if an
experiment presents issues and as a general rule, theshorter the duration, the fewer the issues. However,a longer duration indicates that further investigationis required [2, 4, 29].
CPU Time: Indicates CPU consumption for the durationof query execution and reported by the RDBMS. Itplays a central role once data arrive from disk and isused to select join operators in a query [33, 1, 22].
Disk Operation: The number of physical reads and writesthat occur during a query. Since a relational databaseis I/O bound, this measure provides observation data[1].
Average I/O Latency: The average time an I/O operationtakes to finish. It reflects the effect that disk operationhas on performance [33, 1, 45, 22].
Logical Read: Represents the number of reads that takeplace in memory. This measure may be partly asso-ciated with CPU time so that when there is high CPUconsumption, it is accompanied by a large numberof logical reads, although that is not always the case.Note, this measure is used when experiments revealspecial cases [1].
Network Traffic: The amount of data that travels a net-work for each query [4, 25].
Wait Events: The events that systems wait for operationsto finish. For example, when the system waits for acloud network to complete an I/O operation [4, 6, 19,1, 45].
To study how much the Internet infrastructurenegatively impacts RDBMS performance, the investigationemploys three database systems, SQL Server 2012, Ora-cle 11g and MySQL 6.5. However, the manner in whichMySQL determines query plans makes it impossible to runthe study’s queries without significantly more computa-tional resources for it alone. To provide distributed queries,a federated table has been determined as most suitable,however MySQL documentation states that all the recordsof remote federated tables are fetched and filtering clausesare applied locally. So for the data set used in this study,at least 18 GB of memory is needed to host Fact_Table(Fig. 1), as well as the time required for the data to traversethe network. In addition, when trying to load the data thathad previously split into smaller datasets, MySQL seemedunable to clear its memorywith each commit function, lead-ing to server crashes. Since the study uses a standardisedVM configuration with 8GB of memory (Table 1), MySQLis ruled out.
Journal of Information Technology Management, Volume XXIX, Number 1, 2018 19
DISTRIBUTED RELATIONAL DATABASE PERFORMANCE
Fact_Table
*Dim_Programme
*Dim_Paper
*Dim_ClassDim_Department*Dim_TSC_Category
Dim_Student Dim_Classicification
Dim_Intake Dim_Enrolment_StatusDim_Enrolment_Type
Dim_Date Dim_Month
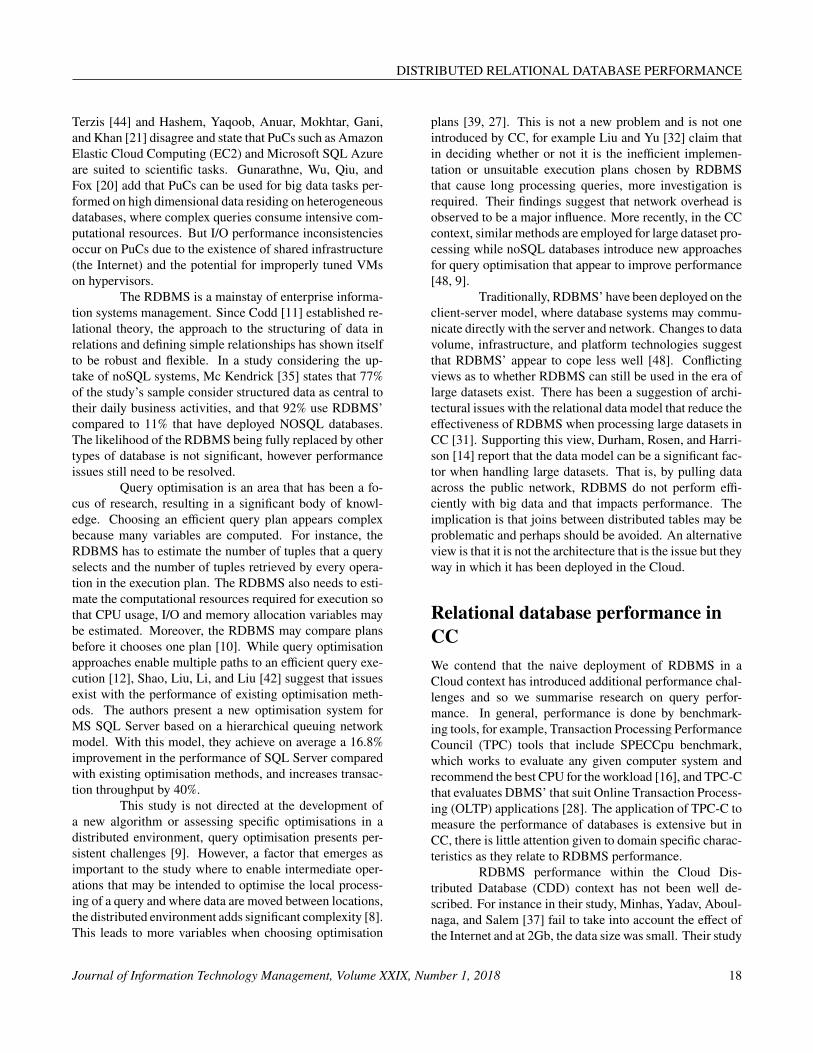
Figure 1: Star Schema
Table 1: Research environment configurations
Server Location Virtualization VM configurationAmsterdam (Local) Xenon, Quad Core x 2.13Ghz Microsoft Windows 7 x64 Operating Sys-
tem, 4 CPU cores, 8 GB RAM, 200 GB ofdisk space
Auckland (Remote) Xenon, Quad Core x 2.26Ghz Microsoft Windows 7 x64 Operating Sys-tem, 4 CPU cores, 8 GB RAM, 200 GB ofdisk space
Consequently two database systems are used, Mi-crosoft SQL Server 2012 and Oracle 11g. The CDD in-cludes a distributed database running in VMs on a PuC,via the Internet (Table 1). To create a real time distributeddatabase, two systems are set up in geographically distantlocations; Amsterdam (Netherlands), the “local instance”and Auckland (New Zealand), the “remote instance”. Eachdatabase system and geographic location has two VMs. Toobtain comparable results, all four VMs have near identicalconfigurations for memory, CPU (there is slight differencein CPU speed) and operating system. The VMs in Ams-terdam contain Fact_Table and since experiments are runfrom Amsterdam. The other two VMs in Auckland containthe remaining dimensions tables.
In the experiments, the study replicates the realworld so that the results obtained can be generalised. Tothat end a dataset from the university’s data warehouse is
used. The dataset is large at 120Gb of comma separatedvalues (CSV) files (Fact_Table alone was an 80Gb CSVfile), relational, and contains anonymised student Equiva-lent Full Time Student (EFTS) records. The database con-sists of thirteen tables in a star schema (Fig 1). Whilesmaller tables are imported directly to both databases, SQLinsert scripts are used to insert the data from the large tables(Dim_Student and Fact_Table).
Fact_Table contains 400 million tuples, with araw data size of 80 GB. The data files for the large tablesare separated using unix split into files that contain some10000 records each and then each record is concatenatedwith a record insert script. The data files are then fed intothe database systems sequentially. If too many records areinserted at once, the database systems tend to run short ofavailable memory, despite that each insert script is termi-nated with a semi-colon, ;, or commit command. From
Journal of Information Technology Management, Volume XXIX, Number 1, 2018 20

DISTRIBUTED RELATIONAL DATABASE PERFORMANCE
this problem and further limitations discovered while run-ning complex queries, the dataset is reduced to 100 milliontuples, a size of 18GB.
In the experiment, nine SQL queries are run (Ta-ble 2). Eight queries retrieve data and one (EXP9) is anupdate query. Five queries implement inner join (EXP2,EXP3, EXP4, EXP6, and EXP7) while the other threequeries implement left join (EXP5), full join (EXP8) andright outer join (EXP1). The eight data retrieval queries useat least two tables, and Fact_Table is used by every queryfor implementing joins with the dimension tables. Thus inevery experiment, data traverses the network.
Query Complexity relates to the number of joinconditions and the use of clauses, such as sorting or ag-gregating data, in a query. The complexity level in EXP1,EXP4 and EXP5 are low. In EXP1, to look for tuples that fitthe joining column in Fact_Table (two columns read) andthe WHERE clause condition, the optimiser will perform atleast one table scan. EXP4 focuses on the collection of alarge volume of data, but with less complexity in the querywhereas EXP5, assuming that the network will affect per-formance, is expected to take longer because two columnsfrom Fact_Table are involved.
EXP3 and EXP9 are of medium complexity. Theaim of EXP3 is to examine a common query that producesan aggregated result. One can expect this query to run fasterthan other experiments because it should return a smalldataset. However, EXP3 involves a considerable degreeof complexity with GROUP BY, HAVING and ORDER BY,in addition to the joining of two tables. EXP9 aims to seehow, in order to perform an update, the databases will copewhen two distributed tables are joined. It is expected thatthe query will not take long to complete because while thequery updates many tuples, two tables are joined with theWHERE condition.
The complexity of EXP2, EXP6, EXP7 and EXP8are high. In EXP2 there are more WHERE conditions andmore tables than any other experiment, therefore EXP2should take longer to run. While this experiment producesmore data from tables that traverse the network, the actualamount of data should not be large because there are twoWHERE conditions with the Fact_Table and an AND oper-ator between WHERE conditions. In EXP6, two large tablesare joined, an AND operator is used as a filtering condition,and this condition is based on a dimension table. In EXP7,three tables are joinedwith theOR operator, theFact_Tablebetween two dimension tables. It is expected that this exper-iment will take longer than the previous experiments, withfive columns and 100 million rows involved.
Details of the experiments are as follows:
EXP1 Implements a right outer join with two tables;
Dim_Student and Fact_Table. Two columns fromFact_Table, Student_Demographic_Key and TO-TAL_EFTS and one column fromDim_Student, Student_Demographic_Key areused in the query. The query contains only one con-dition in the WHERE clause.
EXP2 Implements an inner join between four tables;Dim_Enrolment_Type, Dim_Paper, Dim_Date,and Fact_Table. The query uses nine columns fromthe four tables with five columns from Fact_Tableand four columns from dimension tables. The queryuses six conditions in the WHERE clause, therefore itis expected to take longer to run.
EXP3 Implements an inner join with two tables;Dim_Paper and Fact_Table. The query uses fourcolumns, two from each table. The query usesGROUP BY, HAVING, ORDER BY, and DISTINCTclauses.
EXP4 Implements an inner join between two tables;Dim_Student and Fact_Table. The query uses twocolumns from two tables, where one column fromDim_Student and one column from Fact_Table.The expected amount of generated data is high.
EXP5 Implements a left join between two tables;Dim_Enrolment_Type and Fact_Table. The queryuses three columns from two tables with two columnsfrom Dim_Enrolment_Type and one column fromFact_Table. The query is likely to take a long timeto tun due to the volume of data moving through thenetwork.
EXP6 Implements an inner join between two tables;Dim_Student and Fact_Table. The query uses fourcolumns, with two from each of the two tables. Thequery has two WHERE clauses and large datasets.
EXP7 Implements an inner join between three tables;Dim_Programme, Fact_Table, and Dim_Intake.The query uses four columns from the dimensiontables and one from Fact_Table. The query hasjoins between three tables and two conditions in theWHERE clause. Fact_Table is used to link the di-mension tables and five columns with 100 millionrecords are involved therefore, a large volume of datawill need to travel from Auckland to Amsterdam.
EXP8 Implements a full outer join between two ta-bles Dim_Student and Fact_Table. The queryuses a column from Dim_Student and one fromFact_Table with a full join and ORDER BY clause.
Journal of Information Technology Management, Volume XXIX, Number 1, 2018 21
DISTRIBUTED RELATIONAL DATABASE PERFORMANCE
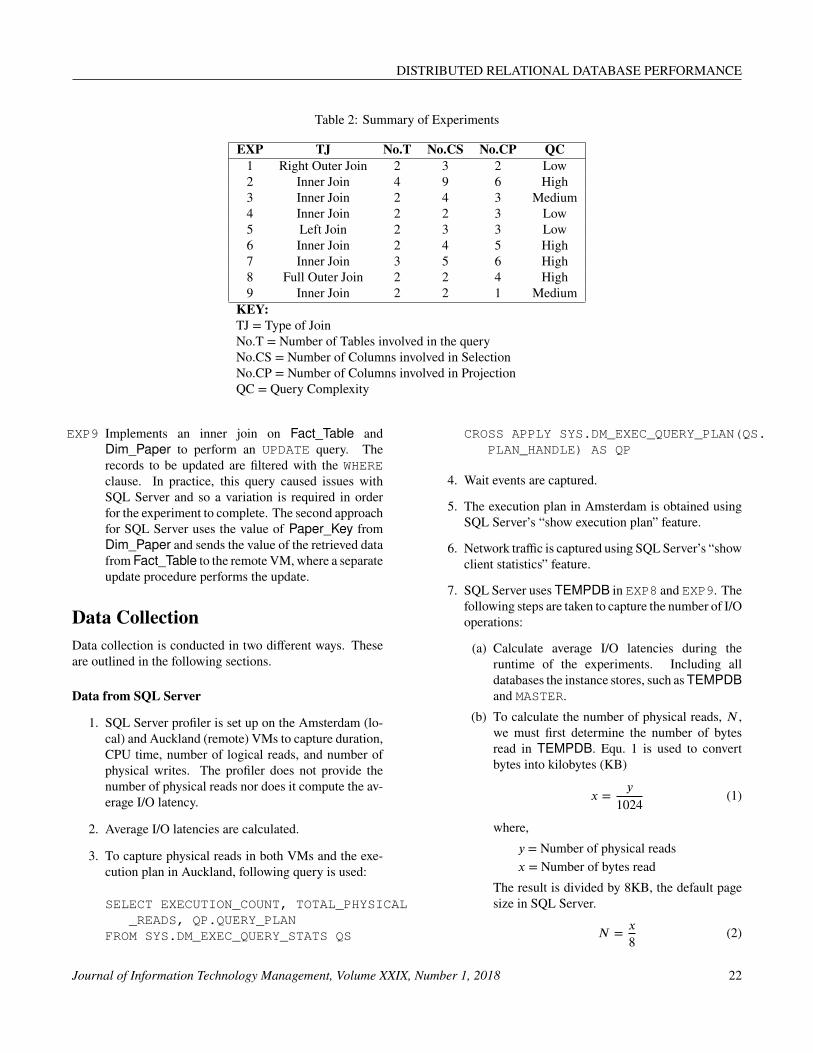
Table 2: Summary of Experiments
EXP TJ No.T No.CS No.CP QC1 Right Outer Join 2 3 2 Low2 Inner Join 4 9 6 High3 Inner Join 2 4 3 Medium4 Inner Join 2 2 3 Low5 Left Join 2 3 3 Low6 Inner Join 2 4 5 High7 Inner Join 3 5 6 High8 Full Outer Join 2 2 4 High9 Inner Join 2 2 1 Medium
KEY:TJ = Type of JoinNo.T = Number of Tables involved in the queryNo.CS = Number of Columns involved in SelectionNo.CP = Number of Columns involved in ProjectionQC = Query Complexity
EXP9 Implements an inner join on Fact_Table andDim_Paper to perform an UPDATE query. Therecords to be updated are filtered with the WHEREclause. In practice, this query caused issues withSQL Server and so a variation is required in orderfor the experiment to complete. The second approachfor SQL Server uses the value of Paper_Key fromDim_Paper and sends the value of the retrieved datafromFact_Table to the remote VM,where a separateupdate procedure performs the update.
Data CollectionData collection is conducted in two different ways. Theseare outlined in the following sections.
Data from SQL Server
1. SQL Server profiler is set up on the Amsterdam (lo-cal) and Auckland (remote) VMs to capture duration,CPU time, number of logical reads, and number ofphysical writes. The profiler does not provide thenumber of physical reads nor does it compute the av-erage I/O latency.
2. Average I/O latencies are calculated.
3. To capture physical reads in both VMs and the exe-cution plan in Auckland, following query is used:
SELECT EXECUTION_COUNT, TOTAL_PHYSICAL_READS, QP.QUERY_PLAN
FROM SYS.DM_EXEC_QUERY_STATS QS
CROSS APPLY SYS.DM_EXEC_QUERY_PLAN(QS.PLAN_HANDLE) AS QP
4. Wait events are captured.
5. The execution plan in Amsterdam is obtained usingSQL Server’s “show execution plan” feature.
6. Network traffic is captured using SQL Server’s “showclient statistics” feature.
7. SQL Server uses TEMPDB in EXP8 and EXP9. Thefollowing steps are taken to capture the number of I/Ooperations:
(a) Calculate average I/O latencies during theruntime of the experiments. Including alldatabases the instance stores, such asTEMPDBand MASTER.
(b) To calculate the number of physical reads, N ,we must first determine the number of bytesread in TEMPDB. Equ. 1 is used to convertbytes into kilobytes (KB)
x =y
1024(1)
where,y = Number of physical readsx = Number of bytes read
The result is divided by 8KB, the default pagesize in SQL Server.
N = x8
(2)
Journal of Information Technology Management, Volume XXIX, Number 1, 2018 22
DISTRIBUTED RELATIONAL DATABASE PERFORMANCE
Data collection in Oracle
1. The Snapshots section of the Automatic WorkloadRepository (AWR) feature is used to capture perfor-mance statistics. Of the large volume of performancedata collected, the following are used:
Top 5 Timed Foreground Events Provides infor-mation about wait classes, such as network anduser I/O, and the proportion (%) of each waitfrom the runtime.
Foreground Wait Class Used to get the average I/Olatency per physical read. If, however, thereare physical writes and I/O operations on TEM-PDB, then Foreground Wait Events is used.
SQL Statistics Provides runtime and CPU time.Segment Statistics Provides the number of logical
and physical reads and writes.
2. Oracle’s command, SET AUTOTRACE ON, is usedto get the execution plan from the local instance.The command also provides performance statisticsrelated to the number of I/O operations that happenin TEMPDB files and statistics similar to AWR.
3. The execution plan in Auckland is obtained by query-ing Oracle’s view V$SQL_PLAN.
4. Oracle’s error log is used to collect data from whenan experiment fails.
Data AnalysisAnalysis of the collected data is carried out using compar-isons and statistical methods. The experiments use moreless identical system configurations, making comparisonsfeasible, and the PuC providers deal with different work-loads. Comparisons are carried out as follows:
1. Compare and explain Amsterdam and Auckland ex-ecution plans.
2. Compare runtimes between systems.
3. Compare CPU time and explain its relevance to thechosen execution plans.
4. If execution plans create a large number of logicalreads, then the values are compared.
5. Number of physical operations are compared andtheir effects on runtime are quantified by measuringthe average I/O latency.
6. Wait events provide information about wait times.
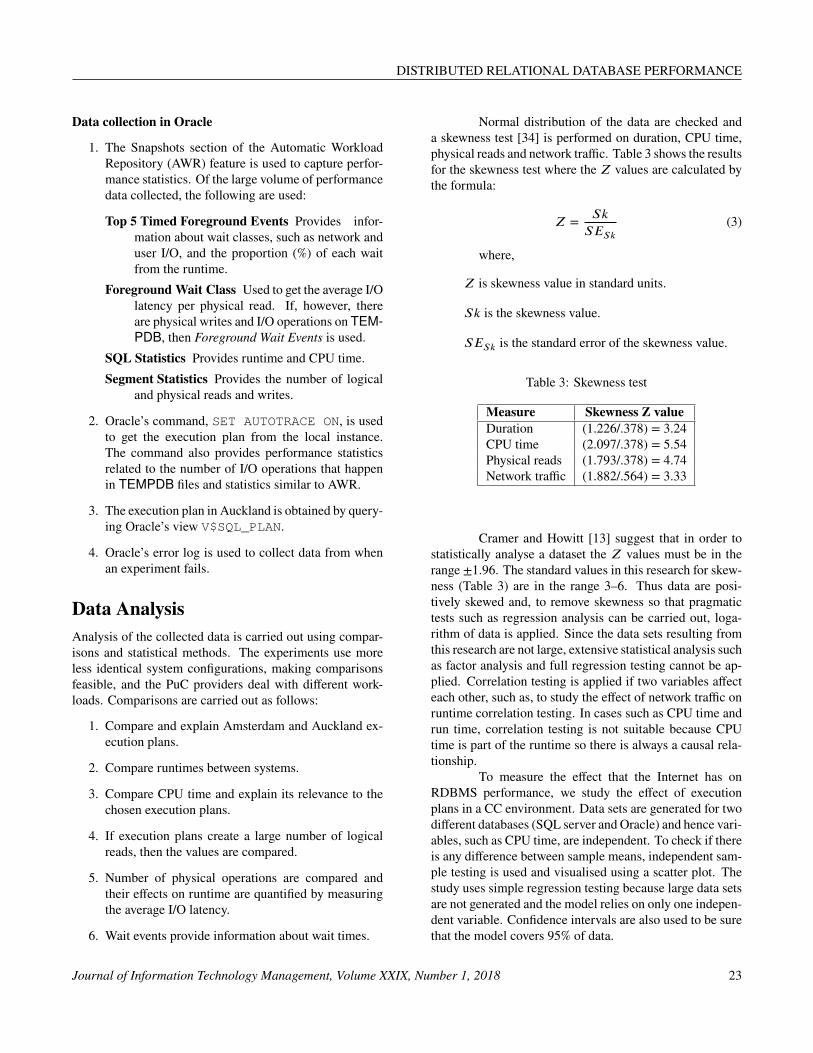
Normal distribution of the data are checked anda skewness test [34] is performed on duration, CPU time,physical reads and network traffic. Table 3 shows the resultsfor the skewness test where the Z values are calculated bythe formula:
Z = SkSESk
(3)
where,
Z is skewness value in standard units.
Sk is the skewness value.
SESk is the standard error of the skewness value.
Table 3: Skewness test
Measure Skewness Z valueDuration (1.226/.378) = 3.24CPU time (2.097/.378) = 5.54Physical reads (1.793/.378) = 4.74Network traffic (1.882/.564) = 3.33
Cramer and Howitt [13] suggest that in order tostatistically analyse a dataset the Z values must be in therange ±1.96. The standard values in this research for skew-ness (Table 3) are in the range 3–6. Thus data are posi-tively skewed and, to remove skewness so that pragmatictests such as regression analysis can be carried out, loga-rithm of data is applied. Since the data sets resulting fromthis research are not large, extensive statistical analysis suchas factor analysis and full regression testing cannot be ap-plied. Correlation testing is applied if two variables affecteach other, such as, to study the effect of network traffic onruntime correlation testing. In cases such as CPU time andrun time, correlation testing is not suitable because CPUtime is part of the runtime so there is always a causal rela-tionship.
To measure the effect that the Internet has onRDBMS performance, we study the effect of executionplans in a CC environment. Data sets are generated for twodifferent databases (SQL server and Oracle) and hence vari-ables, such as CPU time, are independent. To check if thereis any difference between sample means, independent sam-ple testing is used and visualised using a scatter plot. Thestudy uses simple regression testing because large data setsare not generated and the model relies on only one indepen-dent variable. Confidence intervals are also used to be surethat the model covers 95% of data.
Journal of Information Technology Management, Volume XXIX, Number 1, 2018 23

DISTRIBUTED RELATIONAL DATABASE PERFORMANCE
FINDINGS AND ANALYSIS
The study does not compare the two database sys-tems used in the experiments but investigates relationaldatabase performance in CDD. The reason for multipleRDBMS’ is to reduce the effect of proprietary differences.Whether one database system performs better than the otheris not relevant to the purpose of this research, and both sys-tems differ considerably in the results.
Investigating relational database performance inthe cloud involves complicating factors including but notlimited to the virtualised environment, the requirementsnecessary for RDBMS to execute queries, and the round-trip between the nodes across the network. Interactions alsooccur between nodes on the Internet that are unknown andtherefore are uncontrollable.
The following sections provide a brief discussionabout the results of EXP1–EXP7 and a detailed discussionof the results of EXP8 and EXP9. The Execution Plans arelisted in Appendix .
In EXP8, Oracle did not complete the experimentand another approach had to be considered in order to com-plete the experiment. In EXP9, SQL Server was not ableto complete the experiment and alternative approach wasrequired. The, results of EXP8 and EXP9 are explainedby considering the execution plans to investigate how eachsystem approaches the query.
Table 4 lists the measures captured for each of theexperiments. The execution plans for each experiment havebeenmapped and comparisons aremade to highlight perfor-mance issues. The performance statistics obtained are out-lined and compared. Finally, wait events are detailed andcompared.
Table 4: Performance Measures
EXP RT CT DO A I/O L LR NT WE1 ✓ ✓ ✓ ✓ ✓ ✓ ✓
2 ✓ ✓ ✓ ✓ ✓ ✓
3 ✓ ✓ ✓ ✓ ✓ ✓
4 ✓ ✓ ✓ ✓ ✓ ✓ ✓
5 ✓ ✓ ✓ ✓ ✓ ✓
6 ✓ ✓ ✓ ✓ ✓ ✓
7 ✓ ✓ ✓ ✓ ✓ ✓
8(SS) ✓ ✓ ✓ ✓ ✓ ✓ ✓
8(O) ✓ ✓ ✓ ✓ ✓ ✓
9(SS) ✓ ✓ ✓ ✓
9(O) ✓ ✓ ✓ ✓ ✓ ✓
Key:RT = Runtime CT = CPU TimeDO = Disk operation A I/O L = Average I/O latencyLR = Logical Reads NT = Network TrafficWE = Wait Event O = OracleSS = SQL Server
Experiment ResultsAs a total of runtime in EXP1 (Execution Plan 1), Oracletook more time to complete than SQL Server (Table 5). Ofthe runtime, a considerable portion of time, for example thecumulative CPU time, is consumed by the VMs in Auck-land. Oracle also performed more logical reads than SQLServer. It appears that Oracle’s NESTED LOOPS performsin a suboptimal manner in this configuration. However, the
Auckland instance of SQL Server used the SORT operatoreliminated a similar situation and led to a gain in perfor-mance. Negatively, a large number of disk operations inthe Auckland instance of SQL Server may impact perfor-mance, where SQL Server needs 10ms per read versus Or-acle’s 6ms. Compare this with the Amsterdam VM disk la-tency where the former consumes 12ms per read and latter10ms per read. These variations may be attributable to theslight difference in server configuration at each location.
Journal of Information Technology Management, Volume XXIX, Number 1, 2018 24

DISTRIBUTED RELATIONAL DATABASE PERFORMANCE
Table 5: Comparison between RDBMS for EXP1 to EXP7
EXP N S PMRT(sec) CT DO A I/O L(ms) LR
1 L SS 89 0.14 171 12 4590O 115 4 890 10 2191245
R SS 79 21 2439171 10 2439292O 97 18 2019545 6 2019840
2 L SS 359 5 2145 27O 258 5 1453 11
R SS 348 25 2325816 11O 210 25 2019474 8
3 L SS 111 0.156 7523 45O 17420 268 3786 33
R SS 100 106 2325789 10O 10685 28 2019573 14
4 L SS 21706 218 44316 56 43845O 39319 753 988 14 200200451
R SS 21695 282 2523460 15 2474516O 22352 150 2019541 15 2024368
5 L SS 14993 142 3 25O 20268 99 5 23
R SS 14983 209 2474178 18O 13406 52 2014059 15
6 L SS 22353 226 44316 54O 37166 210 38287 27
R SS 20208 235 2523554 59O 22019 125 2019573 38
7 L SS 34890 392 1246 208O 72535 365 961 13
R SS 34884 443 2622482 14O 38775 50 4629901 16
Key:N = Node S = SystemPM = Performance Measures RT = RuntimeCT = CPU time DO = Disk operationA I/O L = Average I/O latency LR = Logical readsO = Oracle SS = SQL ServerL = Local R = Remote
An examination of the I/O averages and the run-times for both systems show that as the average I/O latencyincreases the query takes longer to finish. In EXP2 (Exe-cution Plan 2), SQL Server needed 359 seconds to run theexperiment compared to 259 seconds for Oracle (Table 5).The CDD may add additional complexity to the executionplan selection process where for instance, SQL Server’s se-lection of MERGE JOIN forces the Auckland instance touse a SORT operator to order the data, which adds perfor-mance overhead. Although both databases process the samenumber of tuples, there is considerable difference in CPU
consumption. However, while the systems use different joinoperators, they consume an identical amount of CPU time,indicating that the time needed to join tables increases asthe number of joins and volume of data increases. A rela-tionship exists between disk operations (number of physicalreads) and the average I/O latency, such that the average I/Olatency in theAucklandVMsFact_Table is far less than theaverage in the Amsterdam VMs (Dimension tables).
Disk activity may be instrumental in the poor per-formance of relational databases in a cloud environment.There is a significant variation in the runtime and CPU time
Journal of Information Technology Management, Volume XXIX, Number 1, 2018 25

DISTRIBUTED RELATIONAL DATABASE PERFORMANCE
for both systems in EXP3 (Execution Plan 3). SQL Servertakes less than two minutes to finish, whereas Oracle takes4.8 hours. Oracle consumes more CPU time in the Ams-terdam VM than at Auckland. The Amsterdam Oracle VMneeds 268 seconds to execute EXP3 but the Auckland Or-acle VM needs 28 seconds to perform its part. By con-trast, SQL Server takes 106 seconds to process EXP3 in theAuckland VM and only 0.156 seconds of CPU time is spentin the Amsterdam SQL Server instance (Table 5). Further,in both database systems, the CPU time appears to be highwhich highlights the effect of processing a large dataset in arelational CDD. While EXP2 shows a correlation betweenthe average I/O latency and duration, the results of EXP3show no correlation. The Amsterdam VMs appear to sufferfrom high I/O, and that reflects the reality of operating in aPuC environment. In EXP3, SQL Server performed morephysical reads in the Auckland VM (taking 45ms) than itdid in EXP2 (taking 27ms). A similar pattern is observedin Oracle but leads to a different result where the AucklandVM average I/O latency in EXP3 (taking 14ms) is higherthan EXP2 (taking 8ms).
Disk operations (Physical reads) creates overheadon runtime and therefore is an important factor. In EXP4(Execution Plan 4), both systems execute in a nearly identi-cal manner but the runtimemeasures differ; SQL Server fin-ishes sooner than Oracle, which is 21706 seconds or 6 hoursfor SQL Server and 39319 seconds or 7.2 hours for Oracle(Table 5). Moreover, Oracle consumes 903 seconds CPUtime and SQL Server consumes 500 seconds. Oracle usesthe NESTED LOOPS join operator where one row fromDim_Student is selected, and then the operator looks forthe matching row among 100 million tuples. Accompaniedby a high CPU time, Oracle in Amsterdam produces morelogical reads than SQL Server. Further examination of SQLServer CPU time and logical reads suggests that MERGEJOIN is faster than NESTED LOOPS, creating fewer logi-cal reads. SQL Server in Amsterdam’s CPU consumption isstill relatively high (218 seconds) compared to theAucklandCPU time (282 seconds) where a SORT operator is used.Moreover, when the CPU time of both Auckland VMs arecompared, it can be seen that SQL Server consumes moreCPU time than Oracle. This is because Oracle does not usethe SORT operator.
Local network topology appears to be a factorin performance, for example the Amsterdam VMs sufferhigher average I/O latency than the Auckland VMs. Exe-cution Plan 5 shows differences in how EXP5 is executed.For instance, although SQL Server consumes a higher CPUtime in Amsterdam, it still takes less time to complete thanOracle. Table 5 illustrates how SQL Server needs 14993seconds (4 hours and 16 minutes) whereas Oracle takes20268 seconds (6 hours and 3 minutes). SQL Server’s
choice of MERGE JOIN requires a SORT operator (com-pare with EXP4 where this consumes more CPU time thanwhen aHASH JOIN operator is used). InEXP3 andEXP4,although the Auckland instances conduct high I/O traffic,their average I/O latency was not as high as in Amsterdam.
In EXP6, the collected performance data suggestssignificant variation between systems (Execution Plan 6).SQL Server runs faster than Oracle with more than 4 hoursof difference between them. CPU time in Amsterdam in-dicates that the SQL Server choice of MERGE JOIN con-sumes more CPU time than Oracle’s choice of the HASHMATCH JOIN operator. Moreover, it is clear that the useof the SORT operator leads to a 25 second difference be-tween Auckland VMs. Oracle’s consumption of CPU timeis 125 seconds, whereas SQL Server consumes 235 secondsof CPU time (Table 5). When joining tables, it matters howmany tuples are to be joined and the choice of join opera-tor. In this experiment and compared with EXP5, the SQLServer installation in Amsterdam increases CPU consump-tion by 6 seconds. This increase appears to be attributableto operations over the cloud network. That is, SQL Server’schoice of theMERGE JOIN operator appears to have addedprocessing overhead that has an effect when data needs tobe sorted at both ends (a choice that occurs in five experi-ments) compared with Oracle that uses the MERGE SORTJOIN operator only once, where there is an ORDER BYclause. EXP6 presents the effect of shared computing re-sources, causing the RDBMS to suffer. In the Amsterdaminstance of SQL Server, out of EXP1–EXP5, the highestaverage I/O read latency was recorded in EXP5 (25ms) butthis increased to 54ms per read in EXP6. Additionally, thenumber of physical reads increased to 44316 reads, com-pared with 3 reads in EXP5. The duration for EXP6 islonger time than EXP5, and EXP6 displays higher averageI/O latency. Overall, SQL Server shows higher average I/Olatency than Oracle, but Oracle runs for a longer period oftime.
Oracle needed 20 hours to run EXP7 versus 10hours for SQL Server, even though SQL Server consumedmore CPU time than Oracle in both VMs. Further, the CPUtime required by SQL Server provides evidence that MERGEJOIN is not an effective join option. By contrast, Oracleemploys HASH JOIN twice to join the data but takes 369seconds of CPU time while SQL Server takes 392 secondsof CPU time (Table 5). This does not mean that the op-timiser performs below par but that its choice of MERGEJOIN is less suitable because, on the one hand there are 100tuples coming from the Auckland instance and on the otherhand, this operator needs sorted data in order to function.So, the optimiser uses SORT in the Auckland VM. SORTcreates overhead, see the CPU time of the Auckland Ora-cle VM, which is less than the Auckland SQL Server CPU
Journal of Information Technology Management, Volume XXIX, Number 1, 2018 26
DISTRIBUTED RELATIONAL DATABASE PERFORMANCE
time. In addition, the average I/O latencies in EXP7 are thehighest where the Amsterdam SQL Server presented 208msper read. This contributes to a long running query, al-though 0ms is reported as the average I/O latency per write.The Auckland SQL Server VM experiences less averageI/O latency than in EXP6, even though it does more reads,whereas evidence suggests that the Amsterdam SQL Serveris adversely affected by the public network. Such variationsindicate inconsistencies in RDBMS performance measures,for example in all the experiments so far, Oracle in Amster-dam experienced less average I/O latency than SQL Server,suggesting that variations in performance can occur withinthe same PuC service provider. Also, the use of the HASHJOIN operator requires less time than the MERGE JOINoperator, suggesting that HASH JOIN is more time effi-cient than MERGE JOIN.
The next experiment provides more evidence that
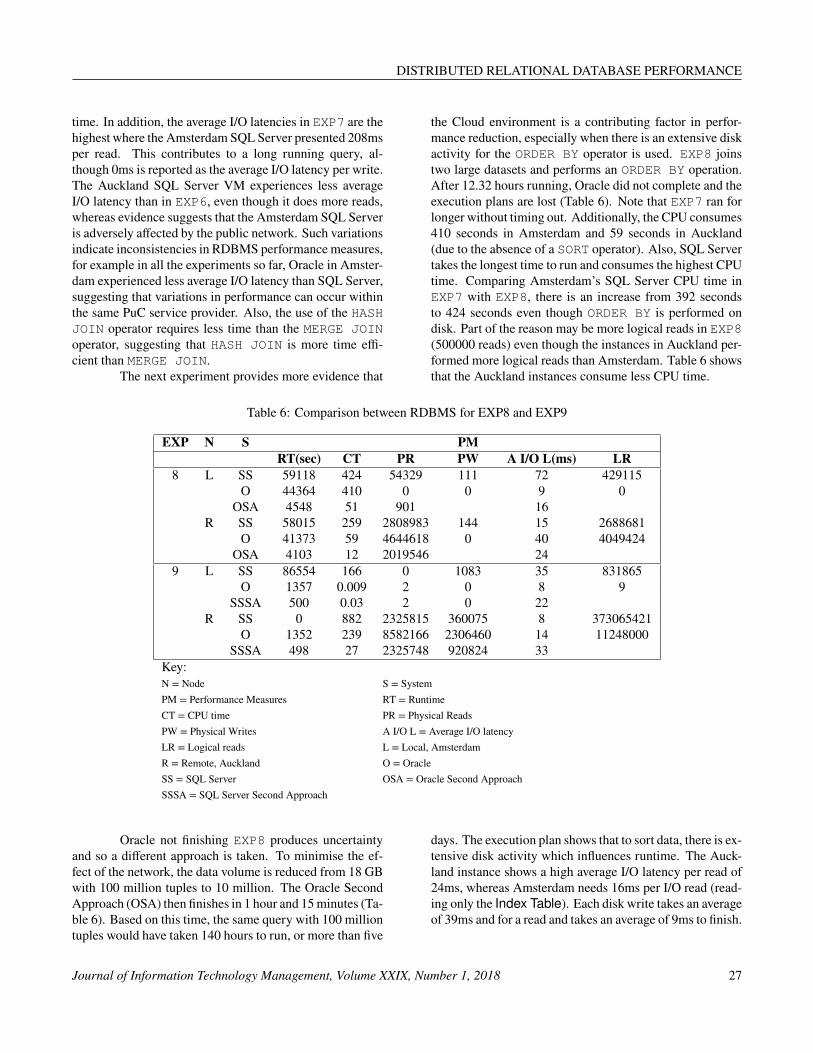
the Cloud environment is a contributing factor in perfor-mance reduction, especially when there is an extensive diskactivity for the ORDER BY operator is used. EXP8 joinstwo large datasets and performs an ORDER BY operation.After 12.32 hours running, Oracle did not complete and theexecution plans are lost (Table 6). Note that EXP7 ran forlonger without timing out. Additionally, the CPU consumes410 seconds in Amsterdam and 59 seconds in Auckland(due to the absence of a SORT operator). Also, SQL Servertakes the longest time to run and consumes the highest CPUtime. Comparing Amsterdam’s SQL Server CPU time inEXP7 with EXP8, there is an increase from 392 secondsto 424 seconds even though ORDER BY is performed ondisk. Part of the reason may be more logical reads in EXP8(500000 reads) even though the instances in Auckland per-formed more logical reads than Amsterdam. Table 6 showsthat the Auckland instances consume less CPU time.
Table 6: Comparison between RDBMS for EXP8 and EXP9
EXP N S PMRT(sec) CT PR PW A I/O L(ms) LR
8 L SS 59118 424 54329 111 72 429115O 44364 410 0 0 9 0
OSA 4548 51 901 16R SS 58015 259 2808983 144 15 2688681
O 41373 59 4644618 0 40 4049424OSA 4103 12 2019546 24
9 L SS 86554 166 0 1083 35 831865O 1357 0.009 2 0 8 9
SSSA 500 0.03 2 0 22R SS 0 882 2325815 360075 8 373065421
O 1352 239 8582166 2306460 14 11248000SSSA 498 27 2325748 920824 33
Key:N = Node S = SystemPM = Performance Measures RT = RuntimeCT = CPU time PR = Physical ReadsPW = Physical Writes A I/O L = Average I/O latencyLR = Logical reads L = Local, AmsterdamR = Remote, Auckland O = OracleSS = SQL Server OSA = Oracle Second ApproachSSSA = SQL Server Second Approach
Oracle not finishing EXP8 produces uncertaintyand so a different approach is taken. To minimise the ef-fect of the network, the data volume is reduced from 18 GBwith 100 million tuples to 10 million. The Oracle SecondApproach (OSA) then finishes in 1 hour and 15minutes (Ta-ble 6). Based on this time, the same query with 100 milliontuples would have taken 140 hours to run, or more than five
days. The execution plan shows that to sort data, there is ex-tensive disk activity which influences runtime. The Auck-land instance shows a high average I/O latency per read of24ms, whereas Amsterdam needs 16ms per I/O read (read-ing only the Index Table). Each disk write takes an averageof 39ms and for a read and takes an average of 9ms to finish.
Journal of Information Technology Management, Volume XXIX, Number 1, 2018 27

DISTRIBUTED RELATIONAL DATABASE PERFORMANCE
Table 7: Runtime wait event percentage for SQLServer
EXP 1 2 3 4 5 6 7EXP1 13.65 3.18 2.44 29.33 8.33 2.58EXP2 34.62 1.98 9.09 30.59 7.08EXP3 9 1.92 11.51 15.35 7.08EXP4 45.99 65.21 16.24EXP5 25.39 50.12 12.51EXP6 43.93 63.32 15.77EXP7 47.09 65.38 16.29EXP8 47.56 65.88 32.12EXP9 49.56 32.12
EXP9 (SSSA) 21.1 25.15 15.12 32.12Key:1 = Local OLEDB :Wait which occurs when SQL server calls the SQL server native clientOLEDB provider2 = Local LCK_M_S: Time taken when the local instance is waiting to acquire a sharedlock. This lock prevents other transactions from modifying data, but allows multiple con-current read (SELECT) operations. See https://documentation.red-gate.com/display/SM4/LCK_M_S for detailed information.3 = Local PAGEIOLATCH_SH: Time taken when the local node waits for buffer to beaccessible4 = Remote PAGEIOLATCH_SH: Time taken when the remote node waits for buffer tobe accessible5 = Remote CXPACKET: Time taken when the remote instance waits for local instance tocomplete an operation. See http://serverfault.com/questions/290526/high-cxpacket-wait-type-in-sql-server-even-with-maxdop-1
6 = Remote PAGEIOLATCH_EX: Time taken when the remote instance waits for data tobe written into the memory from the disk7 = ASYNC_NETWORK_IO: Network related wait eventSSSA = SQL Server Second Approach
Table 8: Runtime wait event percentage for Oracle
EXP 1 2 3 4 5 6 7 8 9 10EXP1 20.93 0.11 4.3 29.95 4.8 73.75EXP2 68.82 20.11 2.81 68.28 24.65EXP3 91.55 4.65 0.61 98.9 0.06 0.01EXP4 94.06 3.2 0.53 98.22 0.61 0.48EXP5 93.55 5.03 0.41 0.08 98.93 0.66 0.04EXP6 95.71 3.42 99.04EXP7 94.55 2.6 0.3 92.92 0.78 0.66 0.09EXP8 92.94 1.92 93.41 0.5 0.79 0.2
EXP8 (OSA) 89.61 3.42 98.15 0.06 1.29EXP9 46.23 4.36 4.16 17.02 25.95 1.91
Key:1 = Local SQL* Net more data from dblink 2 = Local SQL* Net message from dblink
3 = Local SQL* Net more data to client 4 = Local disk file operations I/O5 = Local db file sequential read 6 = Local db file scattered read7 = Remote SQL* Net more data to client 8 = Remote db file sequential read9 = Remote db file scattered read 10 = Remote direct path readOSA = Oracle Second Approach
Journal of Information Technology Management, Volume XXIX, Number 1, 2018 28
DISTRIBUTED RELATIONAL DATABASE PERFORMANCE
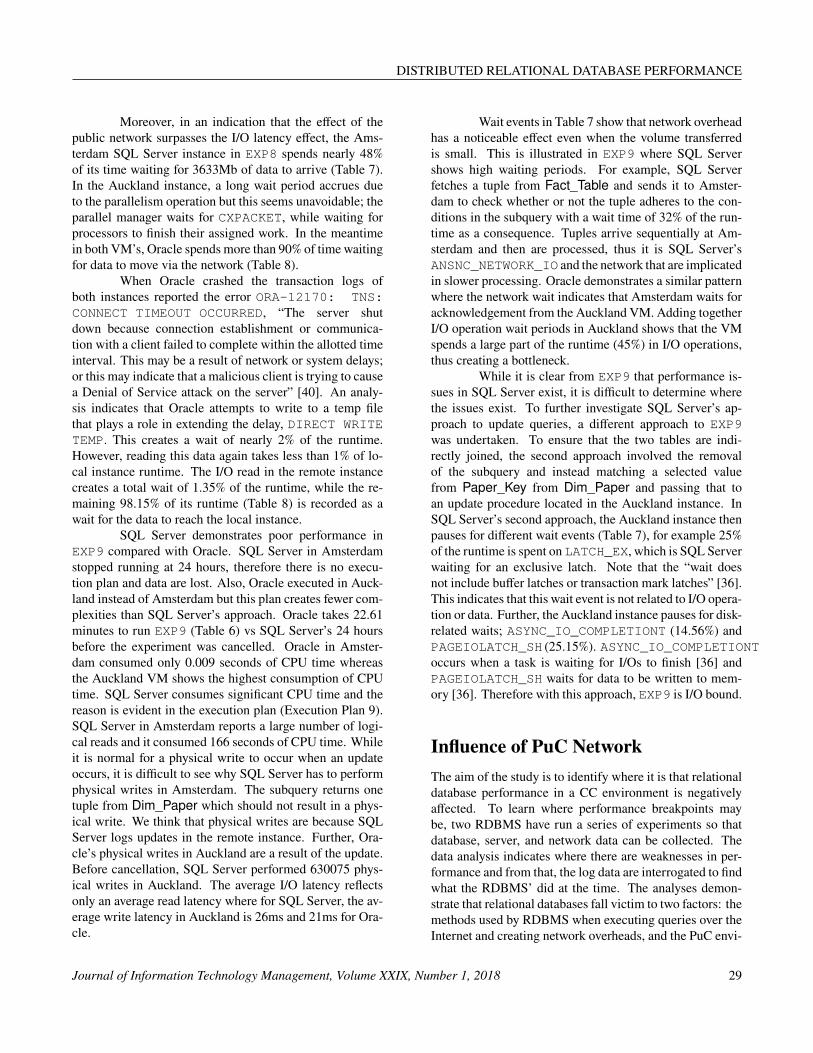
Moreover, in an indication that the effect of thepublic network surpasses the I/O latency effect, the Ams-terdam SQL Server instance in EXP8 spends nearly 48%of its time waiting for 3633Mb of data to arrive (Table 7).In the Auckland instance, a long wait period accrues dueto the parallelism operation but this seems unavoidable; theparallel manager waits for CXPACKET, while waiting forprocessors to finish their assigned work. In the meantimein both VM’s, Oracle spends more than 90% of time waitingfor data to move via the network (Table 8).
When Oracle crashed the transaction logs ofboth instances reported the error ORA-12170: TNS:CONNECT TIMEOUT OCCURRED, “The server shutdown because connection establishment or communica-tion with a client failed to complete within the allotted timeinterval. This may be a result of network or system delays;or this may indicate that a malicious client is trying to causea Denial of Service attack on the server” [40]. An analy-sis indicates that Oracle attempts to write to a temp filethat plays a role in extending the delay, DIRECT WRITETEMP. This creates a wait of nearly 2% of the runtime.However, reading this data again takes less than 1% of lo-cal instance runtime. The I/O read in the remote instancecreates a total wait of 1.35% of the runtime, while the re-maining 98.15% of its runtime (Table 8) is recorded as await for the data to reach the local instance.
SQL Server demonstrates poor performance inEXP9 compared with Oracle. SQL Server in Amsterdamstopped running at 24 hours, therefore there is no execu-tion plan and data are lost. Also, Oracle executed in Auck-land instead of Amsterdam but this plan creates fewer com-plexities than SQL Server’s approach. Oracle takes 22.61minutes to run EXP9 (Table 6) vs SQL Server’s 24 hoursbefore the experiment was cancelled. Oracle in Amster-dam consumed only 0.009 seconds of CPU time whereasthe Auckland VM shows the highest consumption of CPUtime. SQL Server consumes significant CPU time and thereason is evident in the execution plan (Execution Plan 9).SQL Server in Amsterdam reports a large number of logi-cal reads and it consumed 166 seconds of CPU time. Whileit is normal for a physical write to occur when an updateoccurs, it is difficult to see why SQL Server has to performphysical writes in Amsterdam. The subquery returns onetuple from Dim_Paper which should not result in a phys-ical write. We think that physical writes are because SQLServer logs updates in the remote instance. Further, Ora-cle’s physical writes in Auckland are a result of the update.Before cancellation, SQL Server performed 630075 phys-ical writes in Auckland. The average I/O latency reflectsonly an average read latency where for SQL Server, the av-erage write latency in Auckland is 26ms and 21ms for Ora-cle.
Wait events in Table 7 show that network overheadhas a noticeable effect even when the volume transferredis small. This is illustrated in EXP9 where SQL Servershows high waiting periods. For example, SQL Serverfetches a tuple from Fact_Table and sends it to Amster-dam to check whether or not the tuple adheres to the con-ditions in the subquery with a wait time of 32% of the run-time as a consequence. Tuples arrive sequentially at Am-sterdam and then are processed, thus it is SQL Server’sANSNC_NETWORK_IO and the network that are implicatedin slower processing. Oracle demonstrates a similar patternwhere the network wait indicates that Amsterdam waits foracknowledgement from the Auckland VM. Adding togetherI/O operation wait periods in Auckland shows that the VMspends a large part of the runtime (45%) in I/O operations,thus creating a bottleneck.
While it is clear from EXP9 that performance is-sues in SQL Server exist, it is difficult to determine wherethe issues exist. To further investigate SQL Server’s ap-proach to update queries, a different approach to EXP9was undertaken. To ensure that the two tables are indi-rectly joined, the second approach involved the removalof the subquery and instead matching a selected valuefrom Paper_Key from Dim_Paper and passing that toan update procedure located in the Auckland instance. InSQL Server’s second approach, the Auckland instance thenpauses for different wait events (Table 7), for example 25%of the runtime is spent on LATCH_EX, which is SQL Serverwaiting for an exclusive latch. Note that the “wait doesnot include buffer latches or transaction mark latches” [36].This indicates that this wait event is not related to I/O opera-tion or data. Further, the Auckland instance pauses for disk-related waits; ASYNC_IO_COMPLETIONT (14.56%) andPAGEIOLATCH_SH (25.15%). ASYNC_IO_COMPLETIONToccurs when a task is waiting for I/Os to finish [36] andPAGEIOLATCH_SH waits for data to be written to mem-ory [36]. Therefore with this approach, EXP9 is I/O bound.
Influence of PuC NetworkThe aim of the study is to identify where it is that relationaldatabase performance in a CC environment is negativelyaffected. To learn where performance breakpoints maybe, two RDBMS have run a series of experiments so thatdatabase, server, and network data can be collected. Thedata analysis indicates where there are weaknesses in per-formance and from that, the log data are interrogated to findwhat the RDBMS’ did at the time. The analyses demon-strate that relational databases fall victim to two factors: themethods used by RDBMS when executing queries over theInternet and creating network overheads, and the PuC envi-
Journal of Information Technology Management, Volume XXIX, Number 1, 2018 29
DISTRIBUTED RELATIONAL DATABASE PERFORMANCE
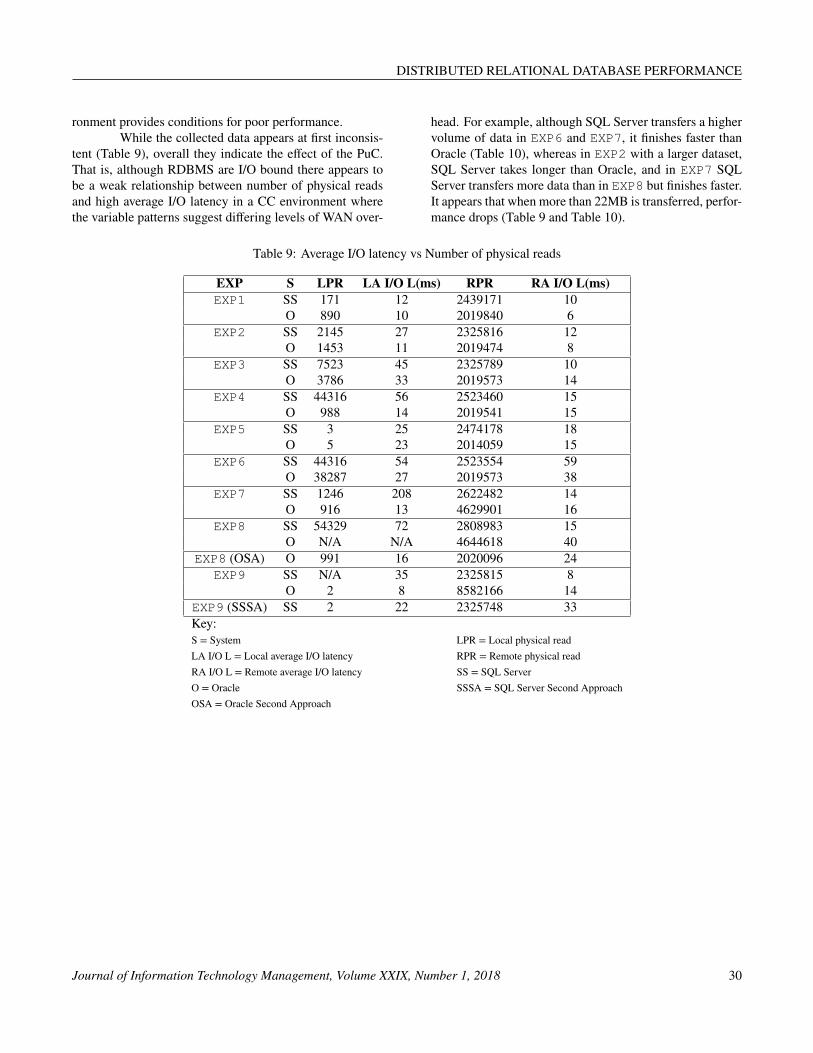
ronment provides conditions for poor performance.While the collected data appears at first inconsis-
tent (Table 9), overall they indicate the effect of the PuC.That is, although RDBMS are I/O bound there appears tobe a weak relationship between number of physical readsand high average I/O latency in a CC environment wherethe variable patterns suggest differing levels of WAN over-
head. For example, although SQL Server transfers a highervolume of data in EXP6 and EXP7, it finishes faster thanOracle (Table 10), whereas in EXP2 with a larger dataset,SQL Server takes longer than Oracle, and in EXP7 SQLServer transfers more data than in EXP8 but finishes faster.It appears that when more than 22MB is transferred, perfor-mance drops (Table 9 and Table 10).
Table 9: Average I/O latency vs Number of physical reads
EXP S LPR LA I/O L(ms) RPR RA I/O L(ms)EXP1 SS 171 12 2439171 10
O 890 10 2019840 6EXP2 SS 2145 27 2325816 12
O 1453 11 2019474 8EXP3 SS 7523 45 2325789 10
O 3786 33 2019573 14EXP4 SS 44316 56 2523460 15
O 988 14 2019541 15EXP5 SS 3 25 2474178 18
O 5 23 2014059 15EXP6 SS 44316 54 2523554 59
O 38287 27 2019573 38EXP7 SS 1246 208 2622482 14
O 916 13 4629901 16EXP8 SS 54329 72 2808983 15
O N/A N/A 4644618 40EXP8 (OSA) O 991 16 2020096 24
EXP9 SS N/A 35 2325815 8O 2 8 8582166 14
EXP9 (SSSA) SS 2 22 2325748 33Key:S = System LPR = Local physical readLA I/O L = Local average I/O latency RPR = Remote physical readRA I/O L = Remote average I/O latency SS = SQL ServerO = Oracle SSSA = SQL Server Second ApproachOSA = Oracle Second Approach
Journal of Information Technology Management, Volume XXIX, Number 1, 2018 30

DISTRIBUTED RELATIONAL DATABASE PERFORMANCE
Table 10: Network traffic vs Runtime
EXP System Network Traffic (MB) Runtime (sec)EXP1 SS 0.162 89
O 10 115EXP2 SS 125 359
O 21 258EXP3 SS 0.244 111
O 1011 17420EXP4 SS 1242 21706
O 1584 39319EXP5 SS 823 14993
O 1019 20268EXP6 SS 2864 22353
O 2572 37166EXP7 SS 8613 34890
O 8198 72535EXP8 SS 3633 59118
O N/A N/AEXP8 (OSA) O 187 4548Key:SS = SQL Server O = Oracle OSA = Oracle Second Approach
Table 11: Correlation between Duration and Network traffic
Network traffic LogDuration Pearson Correlation .928∗∗
Sig.(2-tailed) .000N 16
∗∗ = Correlation is significant at the level 0.01 level (2-tailed)
Table 12: Simple regression test
Coefficients a
Model Ustd Coeff. Std Coeff. t Sig. Conf. IntervalB Std. Error Beta LB UB
1 C -4.887 1.462 -3.344 0.005 -8.002 -1.753NTL 0.692 0.074 0.928 9.325 0.000 0.533 0.851
a = Dependent Variable: durationLogKey:Ustd Coeff. = Unstandardised Coefficients Std Coeff. = Standardised CoefficientsConf. Interval = 95% Confidence Interval for B LB = Lower BoundUB = Upper Bound C = ConstantNTL = networktrafficLog
Journal of Information Technology Management, Volume XXIX, Number 1, 2018 31

DISTRIBUTED RELATIONAL DATABASE PERFORMANCE
The study is conducted on a PuC using workloadsthat would make infrastructure effects obvious. For exam-ple, in EXP3, for SQL Server to complete, a wait of 12.43%of runtime for I/O operations is experienced (Table 9). Ad-ditionally, in EXP2 and EXP9, Oracle waits of 27.46% and45% of runtime for I/O reads to finish respectively . InEXP3, Oracle requires the data to be brought over the PuCbefore it processes the query, even though the count opera-tion could be performed on the table in Auckland. Due tothe lack of network capacity, performance issues are createdin EXP3 and Oracle takes significantly longer to run thanSQL Server (Table 10).
To summarise briefly, both systems wait for thePuC to deliver data but for Oracle, the network wait ap-pears overwhelming. Even when larger datasets are in-volved, SQL Server queries take less time and this is re-flected in wait related events that never go beyond 50% ofthe runtime, whereas Oracle never drops below 60%. Tolearn more, correlation and regression tests are carried out.A strong correlation between duration and network traffic isapparent (Table 11). A scatter plot (Figure 2) shows a trendbetween duration and network traffic which indicates thatduration increases as network traffic increases. Moreover,the plot shows the relationship is not directly linear and thatthere exists a degree of randomness with a cluster at the topof the plot. The cluster indicates a strong relationship be-tween duration and network traffic at higher volumes of datatransfer.
Figure 2: Duration vs Network traffic
To illustrate how an execution plan selection mayimpact performance, inEXP8Oracle crashes at the 44364thsecond from execution start (˜12.32 hours) because, to exe-cute each query, Oracle downloads the required tables andmore than 90% of VM time is spent waiting for data to
traverse the PuC (Table 8). Additionally, SQL Server’sexecution of EXP9 causes a long-running query and thehighest CPU time of all nine experiments. The steps thatSQL Server undertakes, which uses KEYSET CURSOR,suggests that including a sub-query in update statementsin SQL Server causes significant performance issue in PuCand when the sub-query is removed in EXP9 SSAA, per-formance improves.
An initial look at the regression test (Table 12)appears to strengthen the argument for a relationship be-tween network traffic and duration. With 95% confidence,every unit of increase in network traffic increases durationbetween 0.533 and 0.851. However, note that the curve inFigure 3 shows a more pronounced curvature than is evi-dent in Figure 2. This indicates a degree of non-linearity inthe data. The relationship may be explained by the effect ofI/O latency in the PuC environment.
Figure 3: Normality of simple regression test
CONCLUSIONThe study presents limiting factors, for example
the research originally aimed to use a larger dataset but ofthe systems that actually completed, most of the experi-ments took a long time to run and sometimes they did notfinish due to technical failures. Consequently, experimentscould not be easily compared. Also, due to time constraintsthere is no control experiment on n-tier architecture. Thiswould have provided a greater degree of surety about the
Journal of Information Technology Management, Volume XXIX, Number 1, 2018 32

DISTRIBUTED RELATIONAL DATABASE PERFORMANCE
effect of the PuC. Additionally, the experiments are con-ducted using a star schema not used in a transaction process-ing system. While joins are included in the queries, we didnot feel this would unduly affect the query results and thesignificant amount of data provided was preferred. Further,the RDBMS’s in the CDD are used in a non-optimised en-vironment compared with Amazon’s EC2 and Microsoft’sSQL Server on Azure where resources are heavily opti-mised. This was a deliberate step in order to demonstratethe effect of the Cloud on RDBMS.
Since the study includes no specific performanceenhancements, the opportunity exists to redo the experi-ments both on and off the Cloud. Architectural issues withthe relational model on the Cloud may still need to be inves-tigated. To that end, additional experiments may be done onnon-relational database systems such as NOSQL or graphdatabase environments. We have investigated opportunitiesfor replicating the experiments in a graph database (Neo4j)as a transaction processing system, where a join in a rela-tional database is somewhat equivalent to an edge traversalbetween nodes in a graph database. Elements (vertices andedges) maintain direct reference to their adjacent elements,which makes traversing a graph structure within a graphdatabase fast and efficient [41]. The issue at this time is thelack of a consistent or cross application querying languagefor graph databases. Therefore we are also investigating thedevelopment of a structured query language for graphs.
It is usual for RDBMS to be deployed on specifi-cally designed infrastructure with sufficient network band-width and consequently, RDBMS generally perform betteron n-tier architecture [17, 15, 44, 5, 29, 3]. However, sincePuC includes an unknown and heterogeneous mix of infras-tructure elements, distributed RDBMS suffer from perfor-mance issues and determining specific problem areas is dif-ficult. Thus the study identifies break points when operat-ing an RDBMS on a PuC. To identify specific problem ar-eas, RDBMS query execution plans are investigated, specif-ically noting the effect between network traffic and queryruntime. The study finds that individual product’s selec-tion of query execution plan greatly affects performance indifferent ways. For example, Oracle shows a tendency totransfer large volumes of data before undertaking a query,whereas SQL Server tends to wait for a remote event tocomplete before continuing a query. Also, sub-queries cre-ate performance issues for both of the systems. Further,when no joins are included in the query, then while theseissues are not observed, the PuC has a negative impact onperformance. This factor was emphasised with the largedataset used in the experiments.
REFERENCES
[1] Anderson, T., Breitbart, Y., Korth, H., and Wool, A.Replication, consistency, and practicality: are thesemutually exclusive? ACM SIGMOD Record, Vol-ume 27, Number 2, 1998, pp 484–495.
[2] Baccelli, F. and Coffman, E. G. A data base replica-tion analysis using an m/m/m queue with service in-terruptions. ACM SIGMETRICS Performance Eval-uation Review, Volume 11, Number 4, 1982, pp 102–107.
[3] Benson, T., Akella, A., andMaltz, D. Network trafficcharacteristics of data centers in the wild. In Pro-ceedings of the 10th ACM SIGCOMM conferenceon Internet measurement, New Delhi, India. ACM.2010, pp 267–280.
[4] Born, E. Analytical performance modelling of lockmanagement in distributed systems. Distributed Sys-tems Engineering, Volume 3, Number 1, 1996, p 68.
[5] Bose, S., Mishra, P., Sethuraman, P., and Taheri,R. Benchmarking database performance in a vir-tual environment, Springer, Berlin Heidelberg, 2009,pp 167–182.
[6] Bouras, C. and Spirakis, P. Performance modelingof distributed timestamp ordering: Perfect and im-perfect clocks. Performance evaluation, Volume 25,Number 2, 1996, pp 105–130.
[7] Buyya, R., Yeo, C., and Venugopal, S. Market-oriented cloud computing: Vision, hype, and real-ity for delivering it services as computing utilities.In 10th IEEE International Conference on High Per-formance Computing and Communications, Dalian,China. IEEE., 2008, pp 5–13
[8] Chaudhuri, S. An overview of query optimizationin relational systems. In Proceedings of the sev-enteenth ACM SIGACT-SIGMOD-SIGART sympo-sium on Principles of database systems, Seattle, WA,USA. ACM, 1998, pp 34–43.
[9] Chaudhuri, S. What next?: a half-dozen data man-agement research goals for big data and the cloud.In Proceedings of the 31st symposium on Principlesof Database Systems, Scottsdale, AZ, USA. ACM,2012, pp 1–4.
[10] Chaudhuri, S., Dayal, U., and Narasayya, V. Anoverview of business intelligence technology. Com-munications of the ACM, Volume 54, Number 8,2011, pp 88–98.
[11] Codd, E. F. A relational model of data for largeshared data banks. Communications of the ACM,Volume 13, Number 6, 1970, pp 377–387.
[12] Connolly, T. and Begg, C. Database systems: a
Journal of Information Technology Management, Volume XXIX, Number 1, 2018 33

DISTRIBUTED RELATIONAL DATABASE PERFORMANCE
practical approach to design, implementation, andmanagement. Pearson Education, Harlow, England,2005.
[13] Cramer, D. and Howitt, D. The Sage dictionary ofstatistics: a practical resource for students in the so-cial sciences. Sage, Thousand Oaks, 2004.
[14] Durham, E., Rosen, A., and Harrison, R. Opti-mization of relational database usage involving bigdata a model architecture for big data applications.In 2014 IEEE Symposium on Computational Intelli-gence and Data Mining (CIDM), Orlando, FL, USA.IEEE, 2014, pp 454–462
[15] Eriksson, P. A new approach for enterprise ap-plication architecture for financial information sys-tems: An investigation of the architectural implica-tions of adopting serialization and RPC frameworks,noSQL/hybrid data stores and heterogeneous com-puting in financial information systems. Masters the-sis, School of Computer Science and Communica-tion, KTH Royal Institute of Technology, 2015.
[16] Feuerlicht, G. and Pokorný, J. Can Relational DBMSScale Up to the Cloud?, Springer, New York, 2013,pp 317–328.
[17] Frerking, G., Blanton, P., Osburn, L., Topham, J.,DelRossi, R., and Reisdorph, K. U.S. patent appli-cation 10/935,514, 2004.
[18] Geelan, J. Twenty-one experts define cloud comput-ing. Cloud Computing Journal, Volume 1, Number4, 2009, pp 1–5.
[19] Gray, J., Helland, P., O’Neil, P., and Shasha, D. Thedangers of replication and a solution. ACMSIGMODRecord, Volume 25, Number 2, 1996, pp 173–182.
[20] Gunarathne, T., Wu, T., Qiu, J., and Fox, G. Mapre-duce in the clouds for science. In 2010 IEEE Sec-ond International Conference on Cloud ComputingTechnology and Science (CloudCom), Indianapolis,IN, USA. IEEE, 2010, pp 565–572.
[21] Hashem, I., Yaqoob, I., Anuar, N., Mokhtar, S.,Gani, A., and Khan, S. The rise of “big data” oncloud computing: review and open research issues.Information Systems, Volume 47, Jan, 2015, pp 98–115.
[22] Iosup, A., Ostermann, S., Yigitbasi, M., Prodan, R.,Fahringer, T., and Epema, D. Performance analysisof cloud computing services for many-tasks scien-tific computing. IEEE Transactions on Parallel andDistributed Systems, Volume 22, Number 6, 2011,pp 931–945.
[23] Ivanov, I. The Impact of Emerging ComputingModels on Organizational Socio technical System,Springer, Berlin Heidelberg, 2013, pp 3–19.
[24] Ivanov, T., Petrov, I., and Buchmann, A. A survey on
database performance in virtualized cloud environ-ments. International Journal of Data Warehousingand Mining, Volume 8, Number 3, 2012, pp 1–26.
[25] Jackson, K., Ramakrishnan, L., Muriki, K., Canon,S., Cholia, S., Shalf, J., and Wright, N. Performanceanalysis of high performance computing applicationson the amazon web services cloud. In IEEE SecondInternational Conference on Cloud Computing Tech-nology and Science (CloudCom), Indianapolis, IN,USA. IEEE, 2010, pp 159–168
[26] Khajeh-Hosseini, A., Greenwood, D., and Som-merville, I. Cloudmigration: A case study of migrat-ing an enterprise it system to IaaS. In IEEE 3rd In-ternational Conference on Cloud Computing, Wash-ington, DC, USA. IEEE, 2010, pp 450–457.
[27] Khan, M. and Khan, M. Exploring query optimiza-tion techniques in relational databases. InternationalJournal of Database Theory and Application, Vol-ume 6, Number 3, 2013, pp 11–20.
[28] Kiefer, T., Schlegel, B., and Lehner, W. Multe: amulti-tenancy database benchmark framework. InTechnology Conference on Performance Evaluationand Benchmarking, New Delhi, India. Springer,2012, pp 92–107
[29] Kohler, J. and Specht, T. Vertical query-join bench-mark in a cloud database environment. In SecondWorld Conference on Complex Systems, Agadir, Mo-rocco. IEEE, 2014, pp 581–586.
[30] Li, A., Yang, X., Kandula, S., and Zhang, M. Cloud-cmp: comparing public cloud providers. In Pro-ceedings of the 10th ACM SIGCOMM conference onInternet measurement, Melbourne, Australia. ACM,2010, pp 1–14.
[31] Litchfield, A. and Althouse, J. A systematic reviewof cloud computing, big data and databases on thecloud. In Twentieth Americas Conference on Infor-mation Systems, Savannah, USA.AIS, 2014, pp 1–10
[32] Liu, C. and Yu, C. Performance issues in dis-tributed query processing. IEEE Transactions onParallel and Distributed Systems, Volume 4, Num-ber 8, 1993, pp 889–905.
[33] Lloyd, W., Pallickara, S., David, O., Lyon, J., Arabi,M., and Rojas, K. Performance implications ofmulti-tier application deployments on infrastructure-as-a-service clouds:towards performance modeling.Future Generation Computer Systems, Volume 29,Number 5, 2013, pp 1254–1264.
[34] Martin, W. E. and Bridgmon, K. D. Quantitative andstatistical research methods: From hypothesis to re-sults, John Wiley & Sons, San Francisco, CA, USA,2012.
[35] McKendrick, J. Big data, big challenges, big op-
Journal of Information Technology Management, Volume XXIX, Number 1, 2018 34

DISTRIBUTED RELATIONAL DATABASE PERFORMANCE
portunities: 2012 IOUG big data strategies survey.Technical report, Unisphere Research, Murray Hill,New Providence, NJ, 2012.
[36] Microsoft Corp. Buffer management,https://technet.microsoft.com/en-us/library/aa337525%28v=sql.105%29.aspx, July, 2015.
[37] Minhas, U., Yadav, J., Aboulnaga, A., and Salem, K.Database systems on virtual machines: How muchdo you lose? In IEEE 24th International Confer-ence on Data Engineering Workshop, 2008, Cancun,Mexico. IEEE, 2008, pp 35–41.
[38] Moens, H. and De Turck, F. Shared resourcenetwork-aware impact determination algorithms forservice workflow deployment with partial cloud of-floading. Journal of Network and Computer Appli-cations, Volume 49, Number 1, 2015, pp 99–111.
[39] Mullins, C. S. Distributed query optimization. Tech-nical Support, July, 1996, pp 1–3.
[40] Oracle Corp. Database error messages,https://docs.oracle.com/cd/B19306_01/server.102/b14219/net12150.htm, July, 2015.
[41] Rodriguez, M. A. and Neubauer, P. Constructionsfrom dots and lines. Bulletin of the American Soci-ety for Information Science and Technology, Volume36, Number 6, 2010, pp 35–41.
[42] Shao, J., Liu, X., Li, Y., and Liu, J. Database perfor-mance optimization for SQL Server based on hierar-chical queuing network model. International Jour-nal of Database Theory and Application, Volume 8,Number 1, 2015, pp 187–196.
[43] Tewari, P. Query optimization strategies in dis-tributed databases. International Journal of Ad-vances in Engineering Sciences, Volume 3, Number3, 2013, pp 23–29.
[44] Thakar, A., Szalay, A., Church, K., and Terzis, A.Large science databases, are cloud services ready forthem? Scientific Programming, Volume 19, Number2—3, 2011, pp 147–159.
[45] Thanos, C., Bertino, E., and Carlesi, C. The effectsof two-phase locking on the performance of a dis-tributed database management system. PerformanceEvaluation, Volume 8, Number 2, 1988, pp 129–157.
[46] Vaquero, L. M., Rodero-Merino, L., Caceres, J., andLindner, M. A break in the clouds: towards a clouddefinition. ACM SIGCOMMComputer Communica-tion Review, Volume 39, Number 1, 2008, pp 50–55.
[47] Weins, K. Cloud Computing trends: 2016state of the cloud survey, http://www.rightscale.com/blog/cloud-industry-insights/
cloud-computing-trends-2016-state-cloud-survey,2016.
[48] Zhang, Y., Yu, L., Zhang, X., Wang, S., and Li, H.Optimizing queries with expensive video predicatesin cloud environment. Concurrency and Computa-tion: Practice and Experience, Volume 24, Number17, 2012, pp 2102–2119.
AUTHOR BIOGRAPHYAwadh Althwab completed his Master of Com-
puter and Information Sciences with First Class Honoursat AUT. For his research thesis, he was also received theDean’s List award. He is presently a research student at theAustralian National University (ANU) where he is studyingmassive graph analytics.
Dr Alan T Litchfield (corresponding author) isDirector of the Service and Cloud Computing ResearchLab (SCCRL), at the Auckland University of Technology(AUT). He is a partner in a consulting firm that providesspecialised services to corporates, government departmentsand military, is President of the Association for Informa-tion Systems (AIS) Special Interest Group on Philosophy inInformation Systems, founding Programme Leader for theMaster of Service Oriented Computing (MSOC), memberof the AUT Programmes and Academic Review Commit-tee (PARC). Dr Litchfield is member of the Institute of ITProfessionals (MIITP), Institute of Electrical and Electron-ics Engineers (IEEE), Association for Computing Machin-ery (ACM), International Institute for Information Design(IIID), TeX Users Group (TUG), and Association for Infor-mation Systems (AIS). His areas of research interest coverservice and cloud computing and the philosophy of scienceand especially in applied areas of information systems re-search. Most recently, he has been leading research intodecentralised and distributed software architectures and ap-plications of blockchains in medical records management,software licensing, utilities management, systems authen-tication and authorisation, and on the Internet of Things(IoT).
Chandan Sharma is a research student in theSchool of Engineering, Computer and Mathematical Sci-ences , Auckland University of Technology. Having com-pleted theMaster of Service Oriented Computing with FirstClass Honours in 2016, he is now a PhD student researchingDistributed Computing, Database systems, Formal Meth-ods and Theory of computation. He contributed to this pa-per in his spare time.
Journal of Information Technology Management, Volume XXIX, Number 1, 2018 35
DISTRIBUTED RELATIONAL DATABASE PERFORMANCE
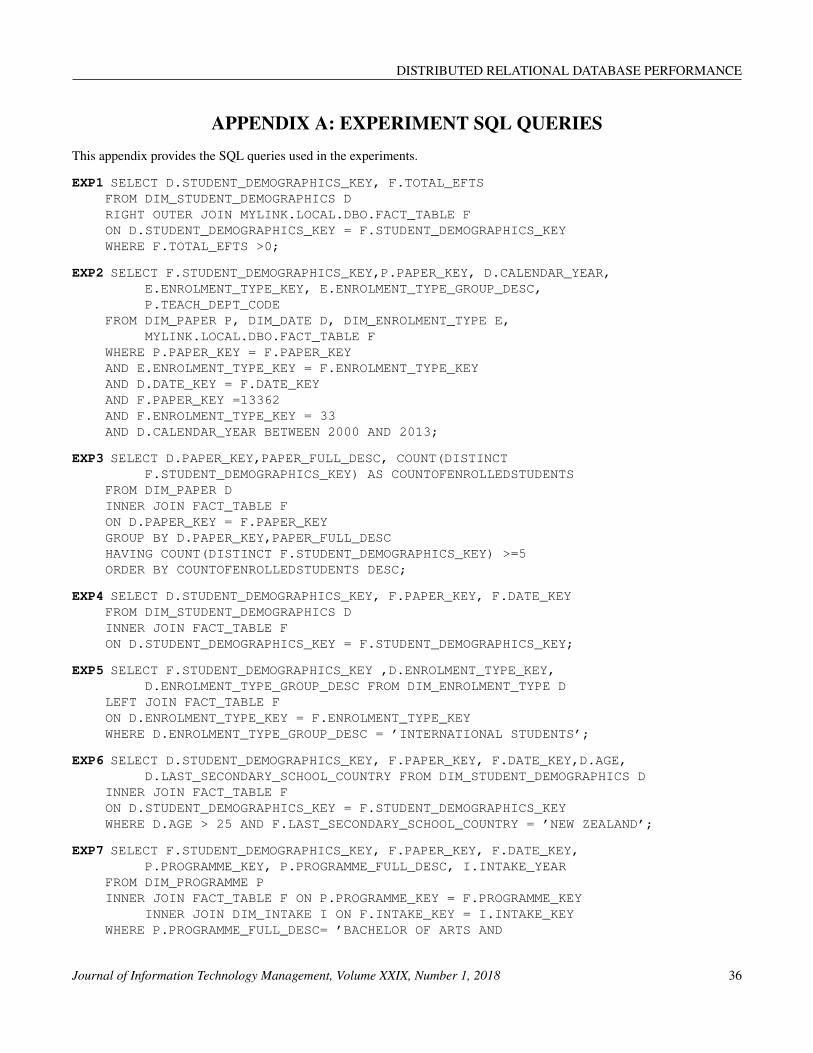
APPENDIX A: EXPERIMENT SQL QUERIESThis appendix provides the SQL queries used in the experiments.
EXP1 SELECT D.STUDENT_DEMOGRAPHICS_KEY, F.TOTAL_EFTSFROM DIM_STUDENT_DEMOGRAPHICS DRIGHT OUTER JOIN MYLINK.LOCAL.DBO.FACT_TABLE FON D.STUDENT_DEMOGRAPHICS_KEY = F.STUDENT_DEMOGRAPHICS_KEYWHERE F.TOTAL_EFTS >0;
EXP2 SELECT F.STUDENT_DEMOGRAPHICS_KEY,P.PAPER_KEY, D.CALENDAR_YEAR,E.ENROLMENT_TYPE_KEY, E.ENROLMENT_TYPE_GROUP_DESC,P.TEACH_DEPT_CODE
FROM DIM_PAPER P, DIM_DATE D, DIM_ENROLMENT_TYPE E,MYLINK.LOCAL.DBO.FACT_TABLE F
WHERE P.PAPER_KEY = F.PAPER_KEYAND E.ENROLMENT_TYPE_KEY = F.ENROLMENT_TYPE_KEYAND D.DATE_KEY = F.DATE_KEYAND F.PAPER_KEY =13362AND F.ENROLMENT_TYPE_KEY = 33AND D.CALENDAR_YEAR BETWEEN 2000 AND 2013;
EXP3 SELECT D.PAPER_KEY,PAPER_FULL_DESC, COUNT(DISTINCTF.STUDENT_DEMOGRAPHICS_KEY) AS COUNTOFENROLLEDSTUDENTS
FROM DIM_PAPER DINNER JOIN FACT_TABLE FON D.PAPER_KEY = F.PAPER_KEYGROUP BY D.PAPER_KEY,PAPER_FULL_DESCHAVING COUNT(DISTINCT F.STUDENT_DEMOGRAPHICS_KEY) >=5ORDER BY COUNTOFENROLLEDSTUDENTS DESC;
EXP4 SELECT D.STUDENT_DEMOGRAPHICS_KEY, F.PAPER_KEY, F.DATE_KEYFROM DIM_STUDENT_DEMOGRAPHICS DINNER JOIN FACT_TABLE FON D.STUDENT_DEMOGRAPHICS_KEY = F.STUDENT_DEMOGRAPHICS_KEY;
EXP5 SELECT F.STUDENT_DEMOGRAPHICS_KEY ,D.ENROLMENT_TYPE_KEY,D.ENROLMENT_TYPE_GROUP_DESC FROM DIM_ENROLMENT_TYPE D
LEFT JOIN FACT_TABLE FON D.ENROLMENT_TYPE_KEY = F.ENROLMENT_TYPE_KEYWHERE D.ENROLMENT_TYPE_GROUP_DESC = ’INTERNATIONAL STUDENTS’;
EXP6 SELECT D.STUDENT_DEMOGRAPHICS_KEY, F.PAPER_KEY, F.DATE_KEY,D.AGE,D.LAST_SECONDARY_SCHOOL_COUNTRY FROM DIM_STUDENT_DEMOGRAPHICS D
INNER JOIN FACT_TABLE FON D.STUDENT_DEMOGRAPHICS_KEY = F.STUDENT_DEMOGRAPHICS_KEYWHERE D.AGE > 25 AND F.LAST_SECONDARY_SCHOOL_COUNTRY = ’NEW ZEALAND’;
EXP7 SELECT F.STUDENT_DEMOGRAPHICS_KEY, F.PAPER_KEY, F.DATE_KEY,P.PROGRAMME_KEY, P.PROGRAMME_FULL_DESC, I.INTAKE_YEAR
FROM DIM_PROGRAMME PINNER JOIN FACT_TABLE F ON P.PROGRAMME_KEY = F.PROGRAMME_KEY
INNER JOIN DIM_INTAKE I ON F.INTAKE_KEY = I.INTAKE_KEYWHERE P.PROGRAMME_FULL_DESC= ’BACHELOR OF ARTS AND
Journal of Information Technology Management, Volume XXIX, Number 1, 2018 36
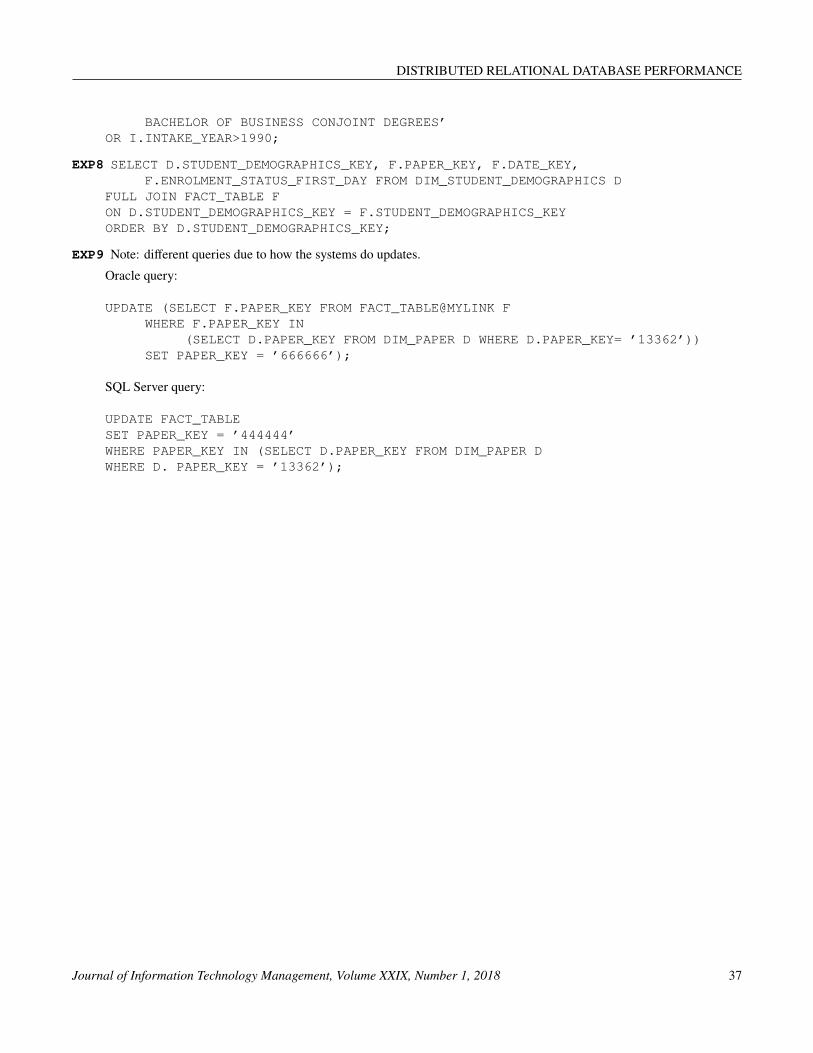
DISTRIBUTED RELATIONAL DATABASE PERFORMANCE
BACHELOR OF BUSINESS CONJOINT DEGREES’OR I.INTAKE_YEAR>1990;
EXP8 SELECT D.STUDENT_DEMOGRAPHICS_KEY, F.PAPER_KEY, F.DATE_KEY,F.ENROLMENT_STATUS_FIRST_DAY FROM DIM_STUDENT_DEMOGRAPHICS D
FULL JOIN FACT_TABLE FON D.STUDENT_DEMOGRAPHICS_KEY = F.STUDENT_DEMOGRAPHICS_KEYORDER BY D.STUDENT_DEMOGRAPHICS_KEY;
EXP9 Note: different queries due to how the systems do updates.Oracle query:
UPDATE (SELECT F.PAPER_KEY FROM FACT_TABLE@MYLINK FWHERE F.PAPER_KEY IN
(SELECT D.PAPER_KEY FROM DIM_PAPER D WHERE D.PAPER_KEY= ’13362’))SET PAPER_KEY = ’666666’);
SQL Server query:
UPDATE FACT_TABLESET PAPER_KEY = ’444444’WHERE PAPER_KEY IN (SELECT D.PAPER_KEY FROM DIM_PAPER DWHERE D. PAPER_KEY = ’13362’);
Journal of Information Technology Management, Volume XXIX, Number 1, 2018 37
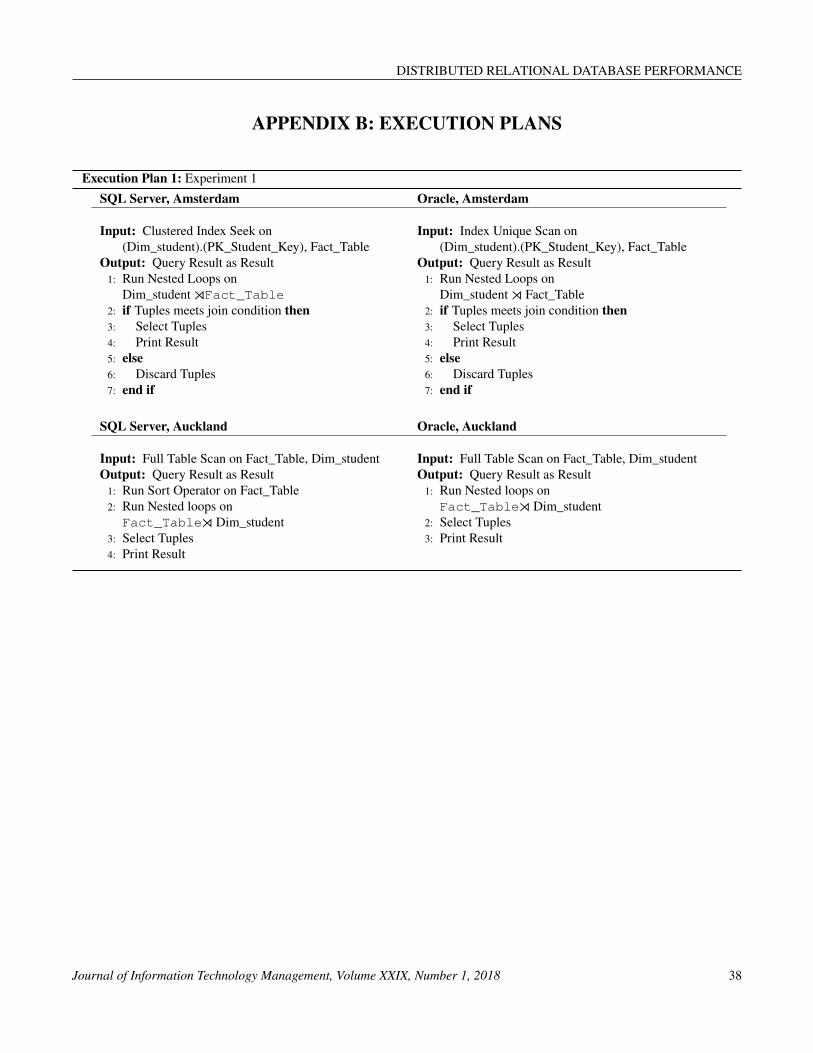
DISTRIBUTED RELATIONAL DATABASE PERFORMANCE
APPENDIX B: EXECUTION PLANS
Execution Plan 1: Experiment 1SQL Server, Amsterdam Oracle, Amsterdam
Input: Clustered Index Seek on(Dim_student).(PK_Student_Key), Fact_Table
Output: Query Result as Result1: Run Nested Loops on
Dim_student ⋊Fact_Table2: if Tuples meets join condition then3: Select Tuples4: Print Result5: else6: Discard Tuples7: end if
Input: Index Unique Scan on(Dim_student).(PK_Student_Key), Fact_Table
Output: Query Result as Result1: Run Nested Loops on
Dim_student ⋊ Fact_Table2: if Tuples meets join condition then3: Select Tuples4: Print Result5: else6: Discard Tuples7: end if
SQL Server, Auckland Oracle, Auckland
Input: Full Table Scan on Fact_Table, Dim_studentOutput: Query Result as Result1: Run Sort Operator on Fact_Table2: Run Nested loops onFact_Table⋊ Dim_student
3: Select Tuples4: Print Result
Input: Full Table Scan on Fact_Table, Dim_studentOutput: Query Result as Result1: Run Nested loops onFact_Table⋊ Dim_student
2: Select Tuples3: Print Result
Journal of Information Technology Management, Volume XXIX, Number 1, 2018 38
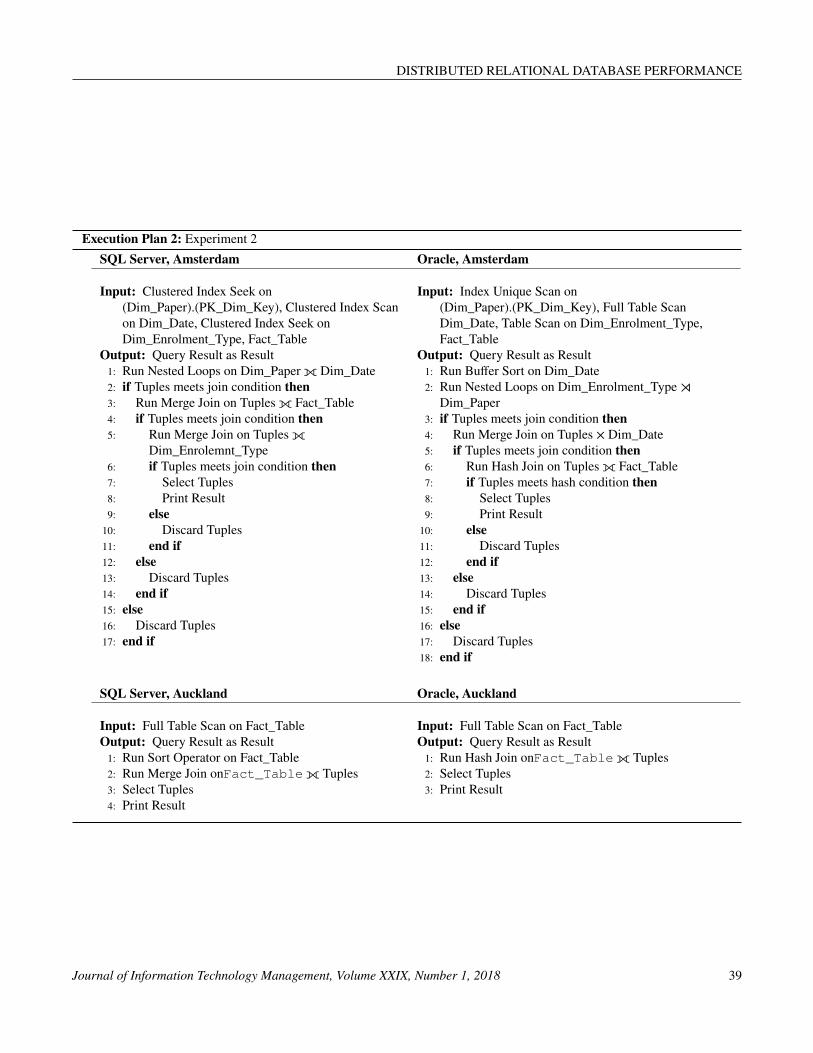
DISTRIBUTED RELATIONAL DATABASE PERFORMANCE
Execution Plan 2: Experiment 2SQL Server, Amsterdam Oracle, Amsterdam
Input: Clustered Index Seek on(Dim_Paper).(PK_Dim_Key), Clustered Index Scanon Dim_Date, Clustered Index Seek onDim_Enrolment_Type, Fact_Table
Output: Query Result as Result1: Run Nested Loops on Dim_Paper⟗ Dim_Date2: if Tuples meets join condition then3: Run Merge Join on Tuples⟗ Fact_Table4: if Tuples meets join condition then5: Run Merge Join on Tuples⟗
Dim_Enrolemnt_Type6: if Tuples meets join condition then7: Select Tuples8: Print Result9: else10: Discard Tuples11: end if12: else13: Discard Tuples14: end if15: else16: Discard Tuples17: end if
Input: Index Unique Scan on(Dim_Paper).(PK_Dim_Key), Full Table ScanDim_Date, Table Scan on Dim_Enrolment_Type,Fact_Table
Output: Query Result as Result1: Run Buffer Sort on Dim_Date2: Run Nested Loops on Dim_Enrolment_Type ⋊
Dim_Paper3: if Tuples meets join condition then4: Run Merge Join on Tuples × Dim_Date5: if Tuples meets join condition then6: Run Hash Join on Tuples⟗ Fact_Table7: if Tuples meets hash condition then8: Select Tuples9: Print Result10: else11: Discard Tuples12: end if13: else14: Discard Tuples15: end if16: else17: Discard Tuples18: end if
SQL Server, Auckland Oracle, Auckland
Input: Full Table Scan on Fact_TableOutput: Query Result as Result1: Run Sort Operator on Fact_Table2: Run Merge Join onFact_Table⟗ Tuples3: Select Tuples4: Print Result
Input: Full Table Scan on Fact_TableOutput: Query Result as Result1: Run Hash Join onFact_Table⟗ Tuples2: Select Tuples3: Print Result
Journal of Information Technology Management, Volume XXIX, Number 1, 2018 39

DISTRIBUTED RELATIONAL DATABASE PERFORMANCE
Execution Plan 3: Experiment 3SQL Server, Amsterdam Oracle, Amsterdam
Input: Clustered Index Scan on(Dim_Paper).(PK_Dim_Paper), Fact_Table
Output: Query Result as Result1: Run Merge Join Dim_Paper⟗ Fact_Table2: if Tuples meet join condition then3: Run Sort on Tuples4: Run Filter on Tuples5: if Tuples meet having condition then6: Select Tuples7: Print Result8: else9: Discard Tuples10: end if11: else12: Discard Tuples13: end if
Input: Full Table Scan on Dim_Paper, Fact_TableOutput: Query Result as Result1: Run Hash Match on Dim_Paper
ℎasℎFact_Table2: if Tuples meet hash condition then3: Run Hash Group By on Tuples4: Create View5: Run Hash Group By on Tuples6: Filter Tuples7: if Tuples meet having condition then8: Run Sort on Tuples9: Select Tuples10: Print Result11: else12: Discard Tuples13: end if14: else15: Discard Tuples16: end if
SQL Server, Auckland Oracle, Auckland
Input: Full Table Scan on Fact_Table, Dim_PaperOutput: Query Result as Results1: Run Merge Join onFact_Table⟗ Dim_Paper2: Run Hash Match(ℑ) on Tuples3: Run Hash Match(ℑ) on Tuples4: Run Sort Operator on Tuples5: Run Sort Operator on Tuples6: Run Stream Aggregate (ℑ) on Tuples7: Filter Tuples8: Select Tuples9: Print Result
Input: Full Table Scan on Fact_Table, Dim_PaperOutput: Query Result as Results1: Run Hash Match onFact_Tableℎasℎ Dim_Paper2: Select Tuples3: Print Result
Journal of Information Technology Management, Volume XXIX, Number 1, 2018 40
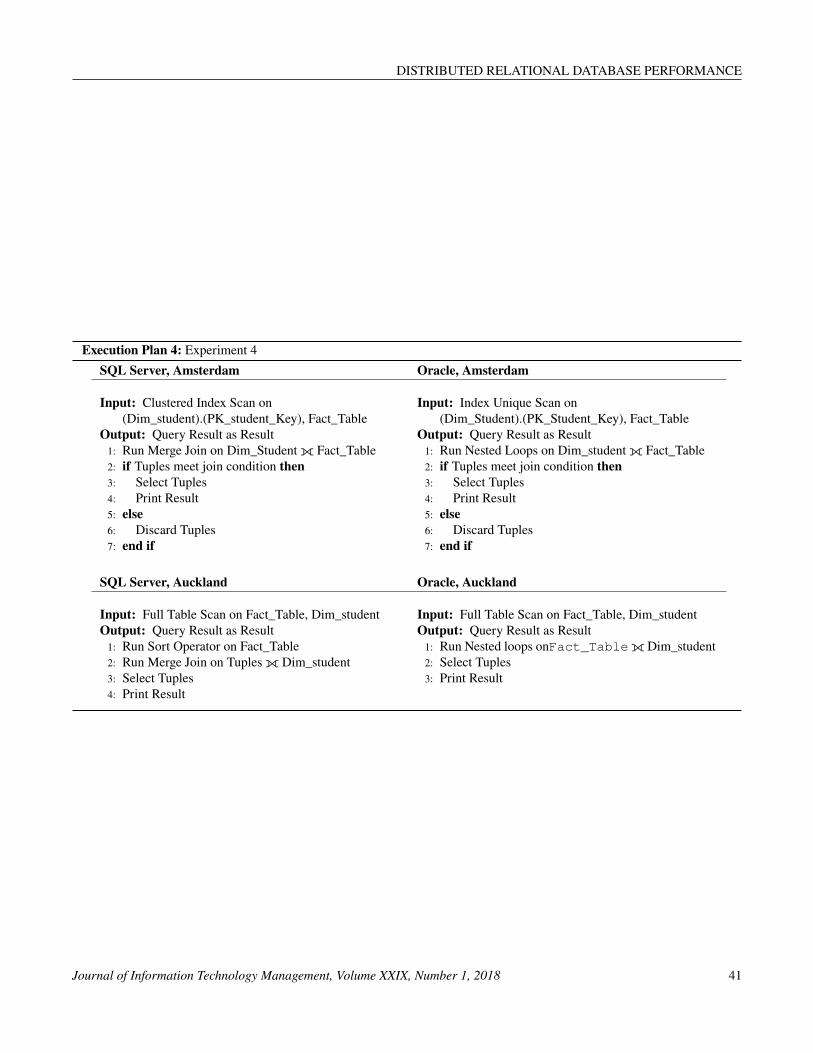
DISTRIBUTED RELATIONAL DATABASE PERFORMANCE
Execution Plan 4: Experiment 4SQL Server, Amsterdam Oracle, Amsterdam
Input: Clustered Index Scan on(Dim_student).(PK_student_Key), Fact_Table
Output: Query Result as Result1: Run Merge Join on Dim_Student⟗ Fact_Table2: if Tuples meet join condition then3: Select Tuples4: Print Result5: else6: Discard Tuples7: end if
Input: Index Unique Scan on(Dim_Student).(PK_Student_Key), Fact_Table
Output: Query Result as Result1: Run Nested Loops on Dim_student⟗ Fact_Table2: if Tuples meet join condition then3: Select Tuples4: Print Result5: else6: Discard Tuples7: end if
SQL Server, Auckland Oracle, Auckland
Input: Full Table Scan on Fact_Table, Dim_studentOutput: Query Result as Result1: Run Sort Operator on Fact_Table2: Run Merge Join on Tuples⟗ Dim_student3: Select Tuples4: Print Result
Input: Full Table Scan on Fact_Table, Dim_studentOutput: Query Result as Result1: Run Nested loops onFact_Table⟗ Dim_student2: Select Tuples3: Print Result
Journal of Information Technology Management, Volume XXIX, Number 1, 2018 41
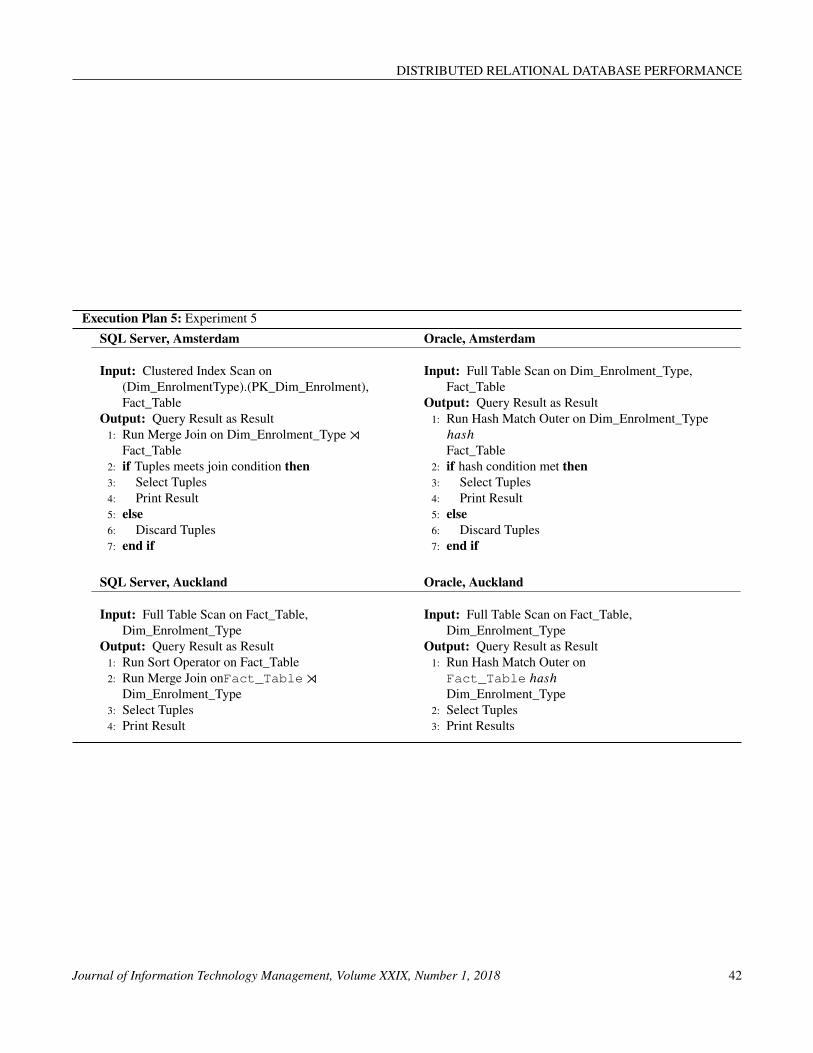
DISTRIBUTED RELATIONAL DATABASE PERFORMANCE
Execution Plan 5: Experiment 5SQL Server, Amsterdam Oracle, Amsterdam
Input: Clustered Index Scan on(Dim_EnrolmentType).(PK_Dim_Enrolment),Fact_Table
Output: Query Result as Result1: Run Merge Join on Dim_Enrolment_Type ⋊
Fact_Table2: if Tuples meets join condition then3: Select Tuples4: Print Result5: else6: Discard Tuples7: end if
Input: Full Table Scan on Dim_Enrolment_Type,Fact_Table
Output: Query Result as Result1: Run Hash Match Outer on Dim_Enrolment_Type
ℎasℎFact_Table
2: if hash condition met then3: Select Tuples4: Print Result5: else6: Discard Tuples7: end if
SQL Server, Auckland Oracle, Auckland
Input: Full Table Scan on Fact_Table,Dim_Enrolment_Type
Output: Query Result as Result1: Run Sort Operator on Fact_Table2: Run Merge Join onFact_Table ⋊
Dim_Enrolment_Type3: Select Tuples4: Print Result
Input: Full Table Scan on Fact_Table,Dim_Enrolment_Type
Output: Query Result as Result1: Run Hash Match Outer onFact_Table ℎasℎDim_Enrolment_Type
2: Select Tuples3: Print Results
Journal of Information Technology Management, Volume XXIX, Number 1, 2018 42

DISTRIBUTED RELATIONAL DATABASE PERFORMANCE
Execution Plan 6: Experiment 6SQL Server, Amsterdam Oracle, Amsterdam
Input: Clustered Index Scan on(Dim_Student).(PK_Student_Key)
Output: Query Result as Result1: Run Merge Join on
Dim_Student⟗ Fact_Table2: if Tuples meets join condition then3: Select Tuples4: Print Result5: else6: Discard Tuples7: end if
Input: Table Access Full on Dim_StudentOutput: Query Result as Result1: Run Join on
Dim_Student⟗ Fact_Table2: if Tuples meets join condition then3: Select Tuples4: Print Result5: else6: Discard Tuples7: end if
SQL Server, Auckland Oracle, Auckland
Input: Full Table Scan on Fact_Table, Dim_StudentOutput: Query Result as Result1: Run Sort Operator on Fact_Table2: Run Merge Join onFact_Table⟗ Dim_Student
3: Select Tuples4: Print Result
Input: Full Table Scan on Fact_Table,Fact_Tablease , Simple Table Scan on Fact_Table, Dim_Student
Output: Query Result as Result1: Run Join onFact_Table⟗ e2: Run Join on Tuples⟗ Fact_Table3: Run Join on Tuples⟗ Dim_Student4: Run Simple Table Scan on Fact_Table5: Run Simple Table Scan on e6: Run Simple Table Scan on Dim_Student7: Select Tuples8: Print Result
Journal of Information Technology Management, Volume XXIX, Number 1, 2018 43
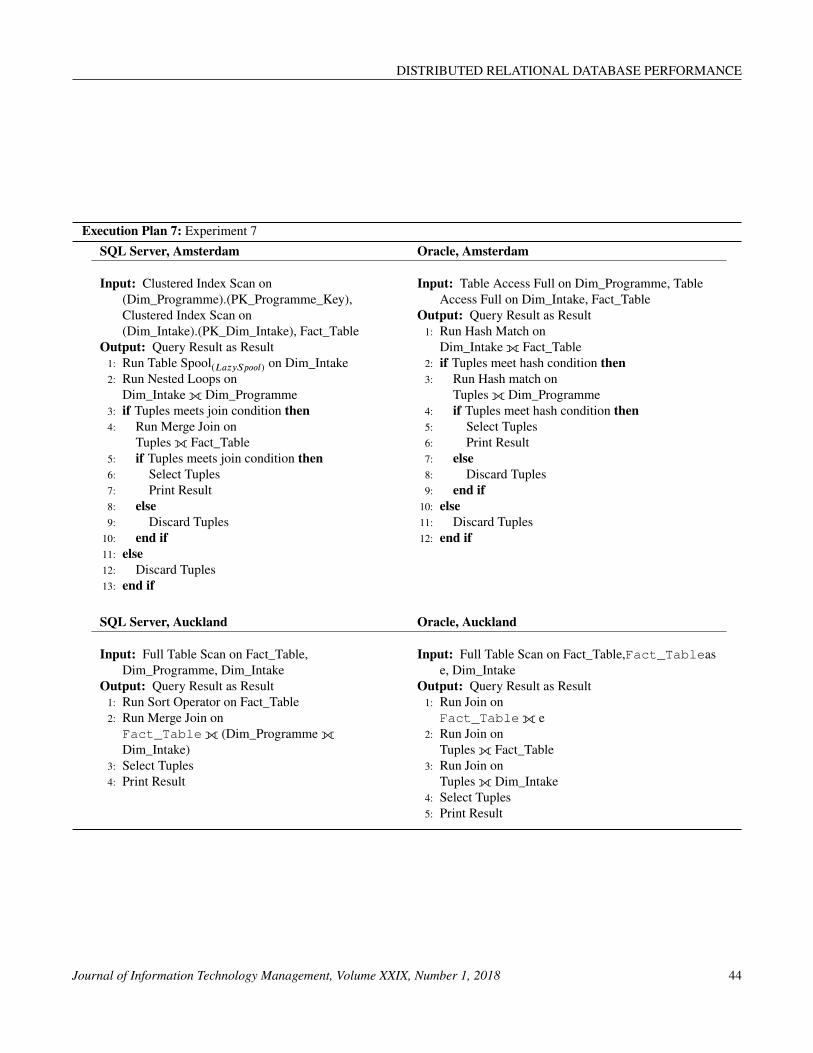
DISTRIBUTED RELATIONAL DATABASE PERFORMANCE
Execution Plan 7: Experiment 7SQL Server, Amsterdam Oracle, Amsterdam
Input: Clustered Index Scan on(Dim_Programme).(PK_Programme_Key),Clustered Index Scan on(Dim_Intake).(PK_Dim_Intake), Fact_Table
Output: Query Result as Result1: Run Table Spool(LazySpool) on Dim_Intake2: Run Nested Loops on
Dim_Intake⟗ Dim_Programme3: if Tuples meets join condition then4: Run Merge Join on
Tuples⟗ Fact_Table5: if Tuples meets join condition then6: Select Tuples7: Print Result8: else9: Discard Tuples10: end if11: else12: Discard Tuples13: end if
Input: Table Access Full on Dim_Programme, TableAccess Full on Dim_Intake, Fact_Table
Output: Query Result as Result1: Run Hash Match on
Dim_Intake⟗ Fact_Table2: if Tuples meet hash condition then3: Run Hash match on
Tuples⟗ Dim_Programme4: if Tuples meet hash condition then5: Select Tuples6: Print Result7: else8: Discard Tuples9: end if10: else11: Discard Tuples12: end if
SQL Server, Auckland Oracle, Auckland
Input: Full Table Scan on Fact_Table,Dim_Programme, Dim_Intake
Output: Query Result as Result1: Run Sort Operator on Fact_Table2: Run Merge Join onFact_Table⟗ (Dim_Programme⟗Dim_Intake)
3: Select Tuples4: Print Result
Input: Full Table Scan on Fact_Table,Fact_Tablease, Dim_Intake
Output: Query Result as Result1: Run Join onFact_Table⟗ e
2: Run Join onTuples⟗ Fact_Table
3: Run Join onTuples⟗ Dim_Intake
4: Select Tuples5: Print Result
Journal of Information Technology Management, Volume XXIX, Number 1, 2018 44
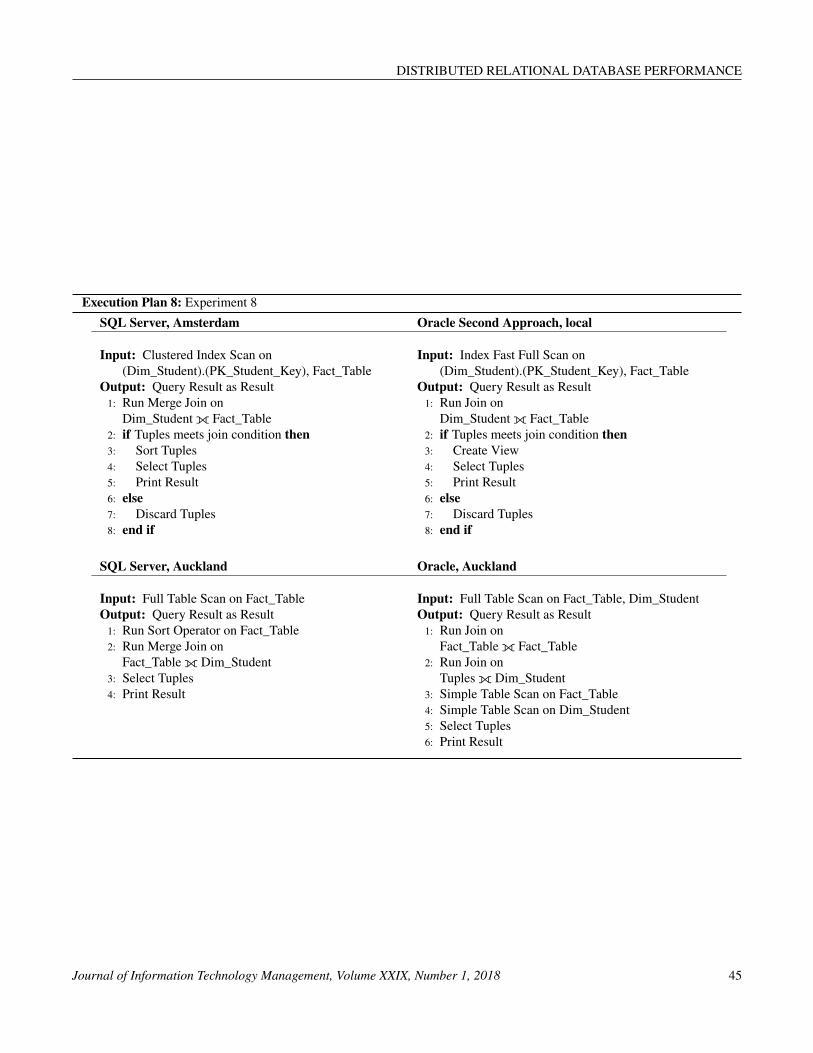
DISTRIBUTED RELATIONAL DATABASE PERFORMANCE
Execution Plan 8: Experiment 8SQL Server, Amsterdam Oracle Second Approach, local
Input: Clustered Index Scan on(Dim_Student).(PK_Student_Key), Fact_Table
Output: Query Result as Result1: Run Merge Join on
Dim_Student⟗ Fact_Table2: if Tuples meets join condition then3: Sort Tuples4: Select Tuples5: Print Result6: else7: Discard Tuples8: end if
Input: Index Fast Full Scan on(Dim_Student).(PK_Student_Key), Fact_Table
Output: Query Result as Result1: Run Join on
Dim_Student⟗ Fact_Table2: if Tuples meets join condition then3: Create View4: Select Tuples5: Print Result6: else7: Discard Tuples8: end if
SQL Server, Auckland Oracle, Auckland
Input: Full Table Scan on Fact_TableOutput: Query Result as Result1: Run Sort Operator on Fact_Table2: Run Merge Join on
Fact_Table⟗ Dim_Student3: Select Tuples4: Print Result
Input: Full Table Scan on Fact_Table, Dim_StudentOutput: Query Result as Result1: Run Join on
Fact_Table⟗ Fact_Table2: Run Join on
Tuples⟗ Dim_Student3: Simple Table Scan on Fact_Table4: Simple Table Scan on Dim_Student5: Select Tuples6: Print Result
Journal of Information Technology Management, Volume XXIX, Number 1, 2018 45
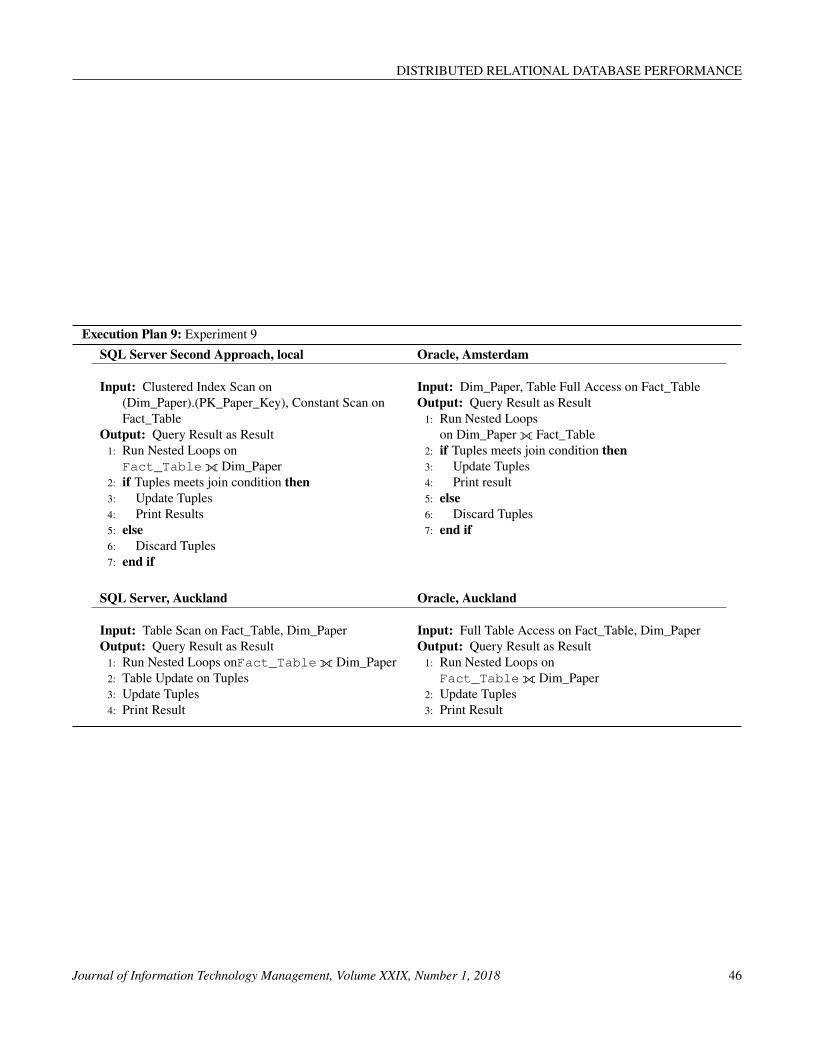
DISTRIBUTED RELATIONAL DATABASE PERFORMANCE
Execution Plan 9: Experiment 9SQL Server Second Approach, local Oracle, Amsterdam
Input: Clustered Index Scan on(Dim_Paper).(PK_Paper_Key), Constant Scan onFact_Table
Output: Query Result as Result1: Run Nested Loops onFact_Table⟗ Dim_Paper
2: if Tuples meets join condition then3: Update Tuples4: Print Results5: else6: Discard Tuples7: end if
Input: Dim_Paper, Table Full Access on Fact_TableOutput: Query Result as Result1: Run Nested Loops
on Dim_Paper⟗ Fact_Table2: if Tuples meets join condition then3: Update Tuples4: Print result5: else6: Discard Tuples7: end if
SQL Server, Auckland Oracle, Auckland
Input: Table Scan on Fact_Table, Dim_PaperOutput: Query Result as Result1: Run Nested Loops onFact_Table⟗ Dim_Paper2: Table Update on Tuples3: Update Tuples4: Print Result
Input: Full Table Access on Fact_Table, Dim_PaperOutput: Query Result as Result1: Run Nested Loops onFact_Table⟗ Dim_Paper
2: Update Tuples3: Print Result
Journal of Information Technology Management, Volume XXIX, Number 1, 2018 46