Distributed Leadership for Equity - Systemic influences on teachers’ work and professional...
22
1 Distributed Leadership for Equity - Systemic influences on teachers’ work and professional development Máté Schnellbach 1 and Nóra Révai 2 Abstract The paper explores the relationship between forms of distributed leadership (DL) and equity in the Hungarian school context by the analysis of large-sample databases. The results unfold the mechanisms that link DL and equity by confirmatory path analysis and quantitative content analysis. We found that motivated and empowered teachers mobilise more energy to decrease the differences between students’ achievements using methods in which homogeneous ability grouping prevails. Although this way equity outcomes do increase, the effectiveness of such methods remain limited. We suggest that in order that a DL approach increases equity a holistic development of teachers’ competencies is crucial. Keywords: distributed leadership, teachers’ empowerment, motivation, equity Introduction The concept of distributed leadership (DL) has been one of the central issues in research on school leadership in the last decade, literature on DL seems to be vast. On the one hand, however, a recent study conducted in the framework of the European Policy Network on School Leasership (EPNoSL) in 5 European countries (UK, Finland, Lithuania, Germany and Hungary) showed that DL was a widespread and known concept in only two of these countries: the UK and Finland, in the others there has hardly been any research done in this area. (Bolhöfer, Meyer, 2013; Risku, Tian, 2013; Sventickas, Salavejiene, 2013; Woods, Roberts, 2013; Révai, Schnellbach, 2013) On the other hand the impact of distributed leadership practices on student learning and equity has not yet been widely explored. Thus, studying this impact in the Hungarian school context has its raison d’être both because the phenomenon of DL has not been researched in this country and because of the particular challenges Hungary faces in terms of equity in education. After giving a short overview of the relevant aspects of literature on distributed leadership and equity, the article will discuss the methodology of the analysis, present the hypothetical model and the indicators used. It will then present the findings and attempt to offer explanations for some of the surprising results such as the relationship of teachers’ motivation, their teaching practice and the equity outcomes. Background and rationale Distributed leadership A recent videoscribe entitled “Leadership is distributed” (Roberts and Woods 2013) illustrates that leadership is by nature distributed inasmuch as everyone in a school reacts to 1 Hungarian Institute for Educational Research and Development ([email protected]) 2 Tempus Public Foundation, Knowledge Centre, Hungary ([email protected])
Transcript of Distributed Leadership for Equity - Systemic influences on teachers’ work and professional...

1
Distributed Leadership for Equity - Systemic influences on teachers’ work and professional development
Máté Schnellbach1 and Nóra Révai2
Abstract
The paper explores the relationship between forms of distributed leadership (DL) and equity
in the Hungarian school context by the analysis of large-sample databases. The results
unfold the mechanisms that link DL and equity by confirmatory path analysis and quantitative
content analysis. We found that motivated and empowered teachers mobilise more energy to
decrease the differences between students’ achievements using methods in which
homogeneous ability grouping prevails. Although this way equity outcomes do increase, the
effectiveness of such methods remain limited. We suggest that in order that a DL approach
increases equity a holistic development of teachers’ competencies is crucial.
Keywords: distributed leadership, teachers’ empowerment, motivation, equity
Introduction
The concept of distributed leadership (DL) has been one of the central issues in research on
school leadership in the last decade, literature on DL seems to be vast. On the one hand,
however, a recent study conducted in the framework of the European Policy Network on
School Leasership (EPNoSL) in 5 European countries (UK, Finland, Lithuania, Germany and
Hungary) showed that DL was a widespread and known concept in only two of these
countries: the UK and Finland, in the others there has hardly been any research done in this
area. (Bolhöfer, Meyer, 2013; Risku, Tian, 2013; Sventickas, Salavejiene, 2013; Woods,
Roberts, 2013; Révai, Schnellbach, 2013) On the other hand the impact of distributed
leadership practices on student learning and equity has not yet been widely explored. Thus,
studying this impact in the Hungarian school context has its raison d’être both because the
phenomenon of DL has not been researched in this country and because of the particular
challenges Hungary faces in terms of equity in education.
After giving a short overview of the relevant aspects of literature on distributed leadership
and equity, the article will discuss the methodology of the analysis, present the hypothetical
model and the indicators used. It will then present the findings and attempt to offer
explanations for some of the surprising results such as the relationship of teachers’
motivation, their teaching practice and the equity outcomes.
Background and rationale
Distributed leadership
A recent videoscribe entitled “Leadership is distributed” (Roberts and Woods 2013)
illustrates that leadership is by nature distributed inasmuch as everyone in a school reacts to
1 Hungarian Institute for Educational Research and Development ([email protected])
2 Tempus Public Foundation, Knowledge Centre, Hungary ([email protected])

2
e.g. rules/measures, many “leading” the learning process through interactions and reactions.
The question according to this videoscribe is not whether leadership is distributed or not, but
how it is distributed; what difference it makes to students and their learning. Provided that DL
does make a difference to student learning, another question is through what mechanisms
does it exercise its effects.
The definition of distributed leadership varies largely in the literature, it has been used to
label various forms of shared leadership activity and has been linked to concepts such as
empowerment, democracy or autonomy without an adequate explanation on their
relationship (Harris et al. 2007). A systemic literature review on distributed leadership
identifies three distinctive characteristics of DL: its emergent property (it does not arise from
an individual, rather it emerges from the interactions of a group); the openness of boundaries
(DL is open as to the groups and individuals to be brought in or contribute to leadership) and
leadership according to expertise (a variety of expertise distributed across the organisation is
brought together). (Woods et al. 2004) A rather complex definition of DL by Philip Woods
encompasses both the culture and the structure of the institution and includes that “this view
of leadership can be deployed in order to improve organisational effectiveness” (Woods and
Woods 2013).
Several studies suggest that distributed leadership can be a tool to improve effectiveness, in
particular to enhance learning, due to which it has also become a recommended practice in
some countries and has gained popularity in policy documents. In the UK for example, DL is
recommended by e.g. the National College for School Leadership3 (see e.g. the Distributed
Leadership Action Pack (NCSL 2004)), and is increasingly more popular in various
documents and studies aimed at improving school leadership. The OECD also promotes the
concept, the publication “Improving School Leadership” considers distributing school
leadership as a key policy strategy and recommends the encouragement and support of
distributed leadership to ultimately improve school effectiveness. (Pont et al. 2008, 94) In the
2013 OECD publication “Leadership for 21st Century Learning” distributed leadership still
appears among the concluding orientations, however the emphasis this time is more on the
social and connected nature of leadership, in which networking and professional learning
communities gain high importance and “the distribution of leadership […] must extend to a
range of different professionals, partners, and communities.” (OECD 2013)
The normative approach of DL contrary to the analytical one that simply endeavours to
understand the nature of leadership in a school, often suggests that this practice is more
inclusive, giving the power of various actors in the school to lead the processes and can lead
to more equity in schools (Lumby 2013). Lumby (2013) explores the literature on distributed
leadership from the perspective of the use of power and concludes that “opportunities to
contribute to leadership are not equal and that distributed leadership remains silent on
persistent structural barriers”. She also raises concerns about research findings emerging
from self-reports carried out in a context in which DL has been largely promoted. This
argument may suggest that there is potential in carrying out research in countries and school
systems which hasn’t yet been “corrupted” by a normative approach and implementation of
distributed leadership.
3 Called National College for Teaching and Leadership since 1
st April 2013

3
In Hungary there has been no research done on distributed leadership, nor is this concept
much used in the pedagogical context. The analysis of school legislation and of various
studies4 show the existing legal and formal frames of sharing leadership allow for school
principals to form teams flexibly and assign leading roles to teachers, and teachers on the
other hand, have power (both according to legislation and in practice) in making decisions
concerning learning and teaching. (Révai 2013) Moreover studies indicate that a positive
atmosphere in the school and co-operation between teachers are among the most important
features of a good school according to principals (Kőrösné 2006; Szekszárdi 2006), which
may suggest that principals are open to distributing leadership. There seems to be a strong
need in Hungary to protect teachers from burning out and increase their motivation (Radó
2005; Golnhofer and Szekszárdi 2003) to further facilitate professional collaboration between
the teaching staff, to better exploit the potentials of existing roles (e.g. heads of classes) in
order to increase the quality of learning for all (Szekszárdi 2006). The question is how, if at
all, distributing leadership can contribute to increasing the quality of learning.
Equity
Ben Levin notes that although we cannot precisely describe the level of equity in a school, it
is easy to show if it is too low, defining equity actually means the definition of the accepted
level of inequity. (Levin 2003, 5) From this point of view our task is to specify – besides the
highest acceptable level of inequity – the groups that could but should not be affected by
schools’ chance reduction mechanisms.
Most of the studies in the topic such as the OECD’s Equity and Quality in Education (OECD
2012) investigate the differences caused by gender, ethnic origin and social background.
“PISA defines equity in education as providing all students, regardless of gender, family
background or socio-economic status, with opportunities to benefit from education.” (OECD
2013) Equity is a key issue in the Hungarian educational system. The variance of Hungarian
students’ competence measurement results are explained by their socio-economic
background in a ratio of more than 25%. (OECD 2012, 15) The following groups of students
are more sensitive in the sense that they are more likely to have lower attainment and can
thus be considered as disadvantaged in the Hungarian educational system:
students with a low socio-economical status (OECD 2012; OECD 2013; Balázs -
Kocsis - Vágó 2011; Mihályi 2013)
boys (OECD 2012; Balázs - Kocsis - Vágó 2011, 363-367),
children of unemployed parents (OECD 2013),
students from rural areas (OECD 2013; Balázs - Kocsis - Vágó 2011, 363-367),
students with roma ethnicity. (Kertesi 2005; Balázs - Kocsis - Vágó 2011, 363-367)
The failure of the students belonging to the groups listed above – although it is not specific to
Hungary (OECD 2012; Levin 2003) – is in strong connection with the selection mechanisms
of the Hungarian school system. (Kertesi 2005, 315-376; Mihályi 2013, 9-10) Compared to
other PISA countries, in Hungary the variance of students’ social background is extremely
4 This data holds largely for the period 1990 – 2012. In September 2012 a new Educational Act
entered into force with major reforms concerning school legislation.

4
high between schools and extremely low within schools. Moreover, the level of reading
performance is mostly explained by schools’ and not by students’ social background. (PISA
2010; 85-93) A wide range of selection mechanisms within and among schools lead to
segregated vocational education (Mihályi 2013) and the system of average and elite
institutions. Roma students tend to spend less time in our educational system and are only
able to take part in training that is not needed in the labour market. (Kertesi 2005)
Roma people in Hungary suffer from many kinds of disadvantages: besides ethnic prejudice,
they often live in a rural area with bad infrastructure, low industrial capacities and dying
labour market. (Kertesi 2005) Consequently, whilst we do not have national statistics about
Roma students’ test results for legal (privacy) reasons, when considering the aspect of socio-
economic status, we in fact consider and research a huge part of Roma students’
disadvantages.
We have to note, that the expression ‘family background’ is used in different texts with two
different meanings: it refers either to the social or the ethnic background depending on the
paper. In this study we do not deal with ethnic background at all, we will use ‘family
background’ always with the meaning of students’ social background.
The influence of school leadership on student outcomes has a rich literature. The Nottingham
University’s longitudinal research (Day et al. 2009) is considered to have the most
sophisticated methodology. It found that there are many behavioural patterns of principals
which lead to a successful learning process, however there is no universal recipe for
effective leading. Nevertheless, in the 90’s it became clear that simple input-output models
were not successful in unfolding school mechanisms. (Scheerens 1997) It is especially true if
we try to understand leadership patterns behind equity, because the phenomenon of social
justice is deeply embedded into a social and societal context.
Methodology
In our research we used a hypothetical model that describes the connection between
distributed leadership and equity outcomes. This model’s validity was examined and no
further connections were searched. The analysis was purely confirmatory, exploratory
analysis was not used. The reason behind this choice is that handling the question of the
quality of the indicators and the unexpectedly emerging correlations in the databases at the
same time is highly complex. Nevertheless, in order to deepen the research, in further work
on the topic, it is recommended to carry out an exploratory analysis as well.
Our research is based on data collected from school principals reflecting their perception of
the school, which may naturally differ from what the teachers, other staff members, students,
parents and other partners can perceive in the same school. We thus decided to refer to our
indicator as “the distribution of leadership” rather than distributed leadership, thus
emphasising that it is the particular viewpoint of the person on top of the hierarchy of a
school.
Data sources
As part of this report our aim was to provide evidence about the connection between
distributed leadership and equity outcomes. We had the chance to use different data sources
that were collected on broad samples and carry out a secondary analysis. The data sources

5
we used were not originally intended to describe the phenomenon we have examined, thus
we had a limited choice when defining the indicators. Yet we chose these sources because
they contained a number of indicators that were relevant for our purposes. We used the
National Assessment of Basic Competencies – an assessment carried out annually with a full
sample – and the School Survey that is organised every three years on a sample of about
2000 schools.
National Assessment of Basic Competencies
National Assessment of Basic Competences is the main measurement tool of the Hungarian
educational system’s monitoring. It focuses on two basic competencies: mathematical and
reading literacy, and measures every student in the 6th, 8th and 10th grade of the schools.
Data are collected through two tests (mathematics and reading) and two background
questionnaires: one for the school and one for the family. School questionnaires do not
provide data about leadership practices but the test results and the family background index5
computed from the family questionnaires were key elements of our secondary data analysis.
School Survey
The School Survey is conducted every three years by the Hungarian Institute for Educational
Research and Development. The 2005 survey focused on school effectiveness, in particular
on the school’s inner world: on leadership and organisation. It was carried out with a
representative sample of about 1200 schools. Data providers were school leaders only.
The two databases use the same school ID, so the data on learning, family background and
on leadership can be matched. The merged database contains 833-977 cases depending on
the combination of indicators we used in our analysis. The data of National Assessment of
Basic Competences are from year 2005, however for certain calculations regarding the
development tendencies results of the 2008 Assessment were used as well.
Analysis of data
The model we set up to examine the relationship of distributed leadership and equity is
described in the next section. The above databases were used to define a set of indicators
on the basis of which the regression analysis was carried out on the model.
Path analysis
Path analysis is a multiple regression analysis that allows us to find the directed
dependencies among group of variables. It can be used in order to (1) create a model
(exploratory path analysis) or (2) to test and verify a hypothetical model (verifying path
analysis).
Our study uses a verifying path analysis through linear regression analysis of multiple
variables, our model is based on theoretical concepts about the phenomenon of equity and
distributed leadership.
5Similar to the PISA ESCS (economic, social and cultural status) index.

6
Quantitative content analysis
The path analysis was complemented by the quantitative content analysis of some of the
open questions of the school survey (for details see the section on the indicators). The open
questions were coded either on the full sample when it was possible or on a random sample
of approximately 20% of the full sample. Both open questions used to enhance our
information on leaders’ attitudes to equity or institutional equity aims (see the set of indicators
above) were analysed on two samples: a random one consisting of approximately 20% of the
full sample (190 items) and a selected sample of those institutions whose institutional equity
indicator was high (181 items).
The categories used through the coding process were mostly determined inductively,
although our theoretical stance also contributed to some extent to the categorical scheme.
The quantified data were analysed with quantitative statistical methods: word frequency,
correlations, cluster analysis, factor analysis and were compared with the results of the path
analysis.
The results of the content analysis were used for the following purposes:
enhancement of indicators,
collecting further evidence pertaining to our model,
identifying potential emerging evidence.
The model
Our model aims to describe the link between school leaders’ attitudes (to leading and to
equity) and equity as an outcome. It is a multilevel integrated model of school dynamics that
integrates school level characteristics only. The only indicator representing out-of-school
actors is the Pedagogical Added Value, the variable describing equity outcomes. This
variable is calculated on the basis of the family background index and the performance at the
National Assessment of Basic Competences.6
The first version of our model is based on pedagogical and leadership models, and
represents the following ideas:
The existence of equity aims and the quality of the learning environment are partly
independent. A school can have very high quality teaching without the aim of
supporting equity; however a school cannot provide equity without a high quality
learning environment.
Teachers’ empowerment and motivation have both a direct and an indirect effect on
the quality of the learning environment. They have a direct effect as both of these
leadership techniques imply quicker and more adaptive problem solving, moreover
empowerment connote training as well. They exert an indirect effect through their
influence on attitudes.
Leader’s personal attitudes might have a direct impact on institutional equity aims.
6 This indicator will be described below together with the other indicators.

7
Figure 1: First version of the model
Indicators
In the following we will shortly summarise what indicators were used to describe the
elements of the model (the actual indicators are listed in Annex 1.). In Figure 2 the colour of
the model’s elements indicates the amount of variables available to describe the given
phenomenon.
The indicator used to describe the distribution of leadership could not be as holistic and
comprehensive as are some of the definitions mentioned in the introduction. In fact, due to
the limits of our data source this analysis limits the interpretation of DL to the involvement of
various actors in the decision-making over some areas of the organisation of learning.
Since the respondents of the School Survey were school principals only, we do not have
much data on the classroom level (teaching methodology) or the shared aims or attitudes of
the schools’ staff. For the same reason we had limited data on the quality of the learning
environment. The two aspects for which we had indicators available were grouping practices
(heterogeneity – homogeneity) and methodology (whether the school as a whole uses
democratic and equity-supporting methods or not).
In accordance with the chosen definition of equity we needed an indicator that shows the
extent to which students’ achievement is determined by their social status. Pedagogical
added value (PAV) – calculated from the results of National Assessment for Basic
Competencies on the basis of students’ social background and test scores – is an acceptable
indicator for that. This choice is also in line with the OECD’s equity index. (OECD 2008)
As part of the national assessment for basic competencies a family background survey is
used in order to collect data about the social background of the children. Since 2006, the
family background index allows us to rank the students according to their social background.
This index is the weighted average of six variables found to influence student achievement.
(For more details see Annex 1.) Positive pedagogical added value means that a school helps
its students achieve better test results than anticipated by their social background while
negative added value means that the achievement of students is worse than in the case of
other schools with the same background.
Leader’s
equity
attitudes
Quality of
learning
environment
Equity as an
institutional
aim
Teachers’
attitudes and
knowledge
Distribution of
leadership Equity
Outcomes Teachers’
motivation
Teachers’
empowerment
Grouping
practices
Methodology

8
Figure 2: The amount of indicators assignable to the elements of the model
The only phenomenon that cannot be described with the given data at all is Teachers’
attitudes and knowledge, so we had to leave it out of the quantitative data analysis.
Nevertheless, we will keep indicating it in our figure as it plays an important role in the school
level processes. In our data analysis the only thing we were able to verify was whether there
was any correlation between the two elements influencing and influenced by this
phenomenon. We must note the huge restrictions of this statistical workaround: these
calculations will only show us how significantly other factors determine teachers’ attitudes
and knowledge, and through that, if equity is a main element of institutional aims.
Results of data analysis
Leaders’
equity
attitudes
Quality of
learning
environment
Equity as an
institutional
aim
Teachers’
attitudes and
knowledge
Distribution of
leadership Equity
Outcomes Teachers’
motivation
Teachers’
empowerment
Grouping
practices
Methodology
No available
indicators
available
Few
indicators
available
A couple of
indicators
available
Lot of
indicators
available
Sophisticated
indicator
available
Leaders
equity
attitudes
Quality of
learning
environment
Equity as an
institutional aim
Teachers’
attitudes and
knowledge
Distribution of
leadership
Equity
Outcomes Teachers’
motivation
Teachers’
empowerment
Grouping
practices
Methodology
,116
,005
,020
gr.: -,128; meth.: ---
--- gr.: -,179; meth.: ,228
-,150
9
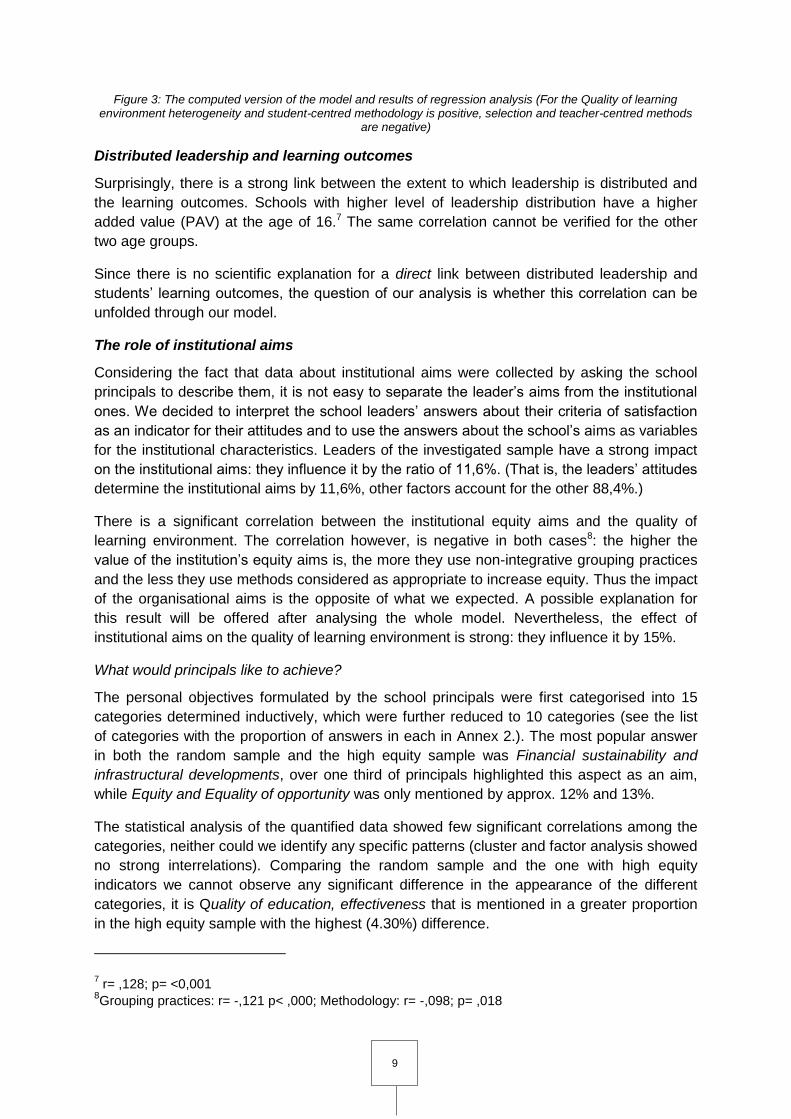
Figure 3: The computed version of the model and results of regression analysis (For the Quality of learning environment heterogeneity and student-centred methodology is positive, selection and teacher-centred methods
are negative)
Distributed leadership and learning outcomes
Surprisingly, there is a strong link between the extent to which leadership is distributed and
the learning outcomes. Schools with higher level of leadership distribution have a higher
added value (PAV) at the age of 16.7 The same correlation cannot be verified for the other
two age groups.
Since there is no scientific explanation for a direct link between distributed leadership and
students’ learning outcomes, the question of our analysis is whether this correlation can be
unfolded through our model.
The role of institutional aims
Considering the fact that data about institutional aims were collected by asking the school
principals to describe them, it is not easy to separate the leader’s aims from the institutional
ones. We decided to interpret the school leaders’ answers about their criteria of satisfaction
as an indicator for their attitudes and to use the answers about the school’s aims as variables
for the institutional characteristics. Leaders of the investigated sample have a strong impact
on the institutional aims: they influence it by the ratio of 11,6%. (That is, the leaders’ attitudes
determine the institutional aims by 11,6%, other factors account for the other 88,4%.)
There is a significant correlation between the institutional equity aims and the quality of
learning environment. The correlation however, is negative in both cases8: the higher the
value of the institution’s equity aims is, the more they use non-integrative grouping practices
and the less they use methods considered as appropriate to increase equity. Thus the impact
of the organisational aims is the opposite of what we expected. A possible explanation for
this result will be offered after analysing the whole model. Nevertheless, the effect of
institutional aims on the quality of learning environment is strong: they influence it by 15%.
What would principals like to achieve?
The personal objectives formulated by the school principals were first categorised into 15
categories determined inductively, which were further reduced to 10 categories (see the list
of categories with the proportion of answers in each in Annex 2.). The most popular answer
in both the random sample and the high equity sample was Financial sustainability and
infrastructural developments, over one third of principals highlighted this aspect as an aim,
while Equity and Equality of opportunity was only mentioned by approx. 12% and 13%.
The statistical analysis of the quantified data showed few significant correlations among the
categories, neither could we identify any specific patterns (cluster and factor analysis showed
no strong interrelations). Comparing the random sample and the one with high equity
indicators we cannot observe any significant difference in the appearance of the different
categories, it is Quality of education, effectiveness that is mentioned in a greater proportion
in the high equity sample with the highest (4.30%) difference.
7 r= ,128; p= <0,001
8Grouping practices: r= -,121 p< ,000; Methodology: r= -,098; p= ,018

10
The most significant correlation was observed between Equity and Talent development
(0.206), which can be explained with the characteristic discourse in the Hungarian
pedagogical culture, which often involves a discourse of helping the disadvantaged and
developing the talents9. This relatively strong correlation confirms the results of the path
analysis and is closely related to the pedagogical culture of ability-grouping in the Hungarian
teaching practice (see below), whereby teachers tend to deal with weaker students and
gifted students in separate settings e.g. in the framework of tutoring (to help students with
difficulties) and thematic study groups for gifted students.
For the purpose of the present paper let us have a closer look at principals’ personal
objectives with regards to equity. The support of disadvantaged, SEN learners and those
with difficulties dominated the answers (36,7%), about 16% emphasised the skills
development of each and every child. About one fifth of the equity-focused personal
objectives aimed at enhancing integration or focusing on “differential instructions”
(personalised or individual learning) and only 1 or 2 respondents formulated an objective
related to the equality of opportunities, to raising the PAV of the school, reducing early school
leaving or expanding special pedagogical support (e.g. special education teachers or other
professionals assisting learners with difficulties).
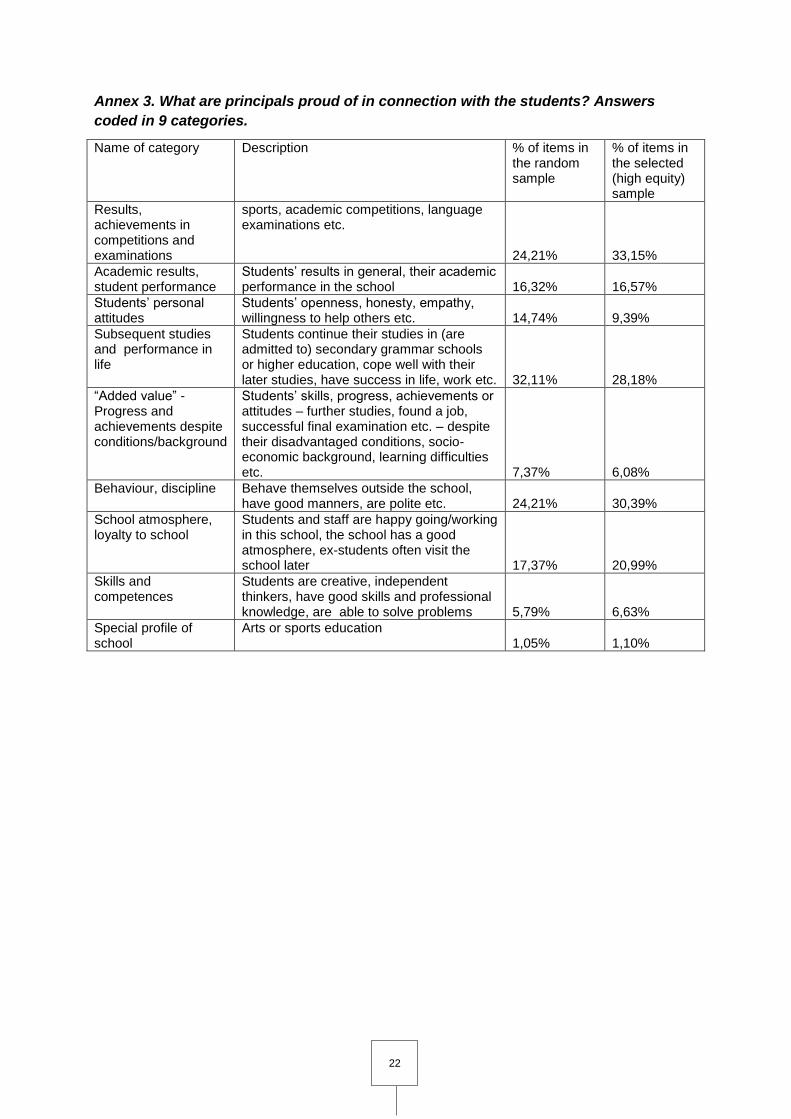
What are principals proud of?
The other open question inquired about what the leaders are proud of in connection with their
students. Among the 9 categories determined the most popular ones were: Results,
achievements in competitions and examinations, Subsequent studies and performance in life
and Behaviour, discipline. (See details in Annex 3.)
Similarly to the question on personal objectives there were no strong correlations between
the factors determined, nor could we identify any characteristic patterns of the categories. It
is interesting to observe that in the selected sample of institutions with high equity indicators
the proportion of references to the achievements of students with difficulties (“Added value”)
is somewhat lower than in the random sample contrary to the expectation that these schools,
placing a higher emphasis on equity aims, would score significantly higher in this category.
At the same time answers containing references to achievements at competitions is
considerably higher in the selected sample. The outstanding importance of competitions is
also a phenomenon rather deeply-rooted in the Hungarian school system in line with a great
emphasis on talent development (see also page 10).
Again the most important category from the perspective of equity is the one on “Added value
– Progress and achievements despite conditions/background”, that is students’ skills,
progress, achievements or attitudes – further studies, found a job, successful final
examination etc. – despite their disadvantaged conditions, socio-economic background,
learning difficulties etc. Interestingly there was no correlation at all between those principals
who indicated Equity, Equality of opportunity as a personal objective and those who referred
to “Added value” as something to be proud of. The discourse however is similar to what we
have seen with regards to the personal objectives: nearly half of the respondents who
indicated this category refer to being proud of the achievements, subsequent studies and
9 The culture of talent support is deeply-rooted in Hungarian pedagogy, talent development has a very
high significance in European comparison.

11
performance of students of disadvantaged background, with SEN. A bit more than a third of
these principals are proud that their students can achieve in life, perform well and make
progress corresponding to their skills, and a much lesser proportion mentions low early
school leaving rates or high employment rates of students after school.
Behaviour of highly motivated and empowered teachers
In our conception of distributed leadership, we assumed that teachers’ motivation and
empowerment are strongly connected to the phenomenon of DL (Révai 2013, 3). Our data
analysis seems to underpin this assumption: both motivation and empowerment are in strong
correlation with the distribution of leadership. It needs further investigation however to decide
whether empowerment and motivation are causes of DL or are inherent elements of the
distribution of leadership. This question could be answered by extensive analyses of
literature, longitudinal analyses and case studies.
Teachers’ empowerment has different influences on the different components of the learning
environment. The correlation between empowerment and grouping is strong and negative10,
while there is significant and positive correlation between empowerment and methodology11.
Teachers’ motivation has a similar correlation pattern with regards to grouping, that is, a
strong negative correlation, whereas there was no correlation found in the case of
methodology.
The partial lack of connection in case of methodology can be explained by the low quality of
our methodology indicators. The fact that the data sources are school principals encourages
a critical reading of the results, this area of our model needs further research and
investigation. We suggest as a potential hypothesis for future research that it is easier or
quicker to implement new classroom level methods than to renew the school’s grouping
practices, as this latter is more an organisational behaviour than the teachers’ choice.
A deep interpretation of the statistical results concerning the negative correlation between
empowerment or motivation and grouping practices would require further investigation. Here
we suggest that a potential reason for this correlation is that highly empowered teachers
working in a motivating environment use more techniques in order to decrease the
differences between students’ achievement, however, the techniques most widely known and
used in the Hungarian education system are mostly segregative, that is, they are based on
homogeneous groups (e.g. ability groups).
The role of pedagogical culture
Analysing the connection between the quality of the learning environment and equity
outcomes, we see the opposite of what we had expected again. The schools with selective
(or segregative) grouping practices have a higher level of pedagogical added value in the
cases where correlation is found.12The fact that correlation can be found only in the case of
grouping practices, draws the attention to the low quality and quantity of indicators for other
10 r=-,179; p=<0,001
11 r=,228; p<0,018
12Grouping practices and added value (mathematics, age 16): r= -,213; p< ,001
Grouping practices and added value (reading, age 16): r= -239; p< ,001

12
elements and characteristics of the learning environment. The pattern found in the case of
students at the age of 16 is equally true for schools with high and low test results; or for
schools with developing or deteriorating test results.13
Our first interpretation emphasises the role of pedagogical culture. In a selective pedagogical
culture like the Hungarian, empowered and motivated teachers who want to raise the level of
equity in their school only have access to selective practices. The dominance of this
methodology is described in various studies (e.g. Golnhofer and Nahalka 2001).According to
the Sutton Trust-EEF Teaching and Learning Toolkit14“ability grouping appears to benefit
higher attaining pupils and be detrimental to the learning of mid-range and lower attaining
learners”, thus on the whole it has a negative impact on the attainment of disadvantaged
pupils. According to our data the adequacy of these practices is limited but it exists: teachers
will be partly successful. As they see that they are more successful than those who do not
endeavour to achieve equity, they will conclude that their choices were right and adequate.
This might be the mechanism that leads to recognising not particularly effective choices as
adequate.
The above phenomenon can explain the fact that even the dominance of methodology-
oriented in-service training (Kocsis and Sági 2012, 38–44.) cannot change the dominant
methodology at a system level. From a cultural perspective we can say that the selective
environment of the Hungarian school system stimulates and rewards selective practices at
the school level. They simply fit better the culture in which they are embedded in.
It would seem logical that teachers’ attitudes and knowledge (the factor we do not have
indicators for in this analysis) have a direct influence on methodology and grouping practices,
since the quality of the learning environment is (to some extent) a matter of the teachers’
choices. The low level of correlation between empowerment and institutional aims and
between motivation and institutional aims however, means that there must be other and
much stronger factors determining teachers’ knowledge and attitudes. This result suggests
that our model needs to be corrected or completed. If we complete it with a direct link
between the teachers’ attitudes and knowledge and the quality of learning environment then
we have to find the main factors that have an influence on attitudes and knowledge (e.g. pre-
service and in-service training, peer-mentoring and team working, co-operation with the
schools environment, professional self-development). This is the point where we could
compensate the impact of the in-practice (or in-culture) experience of teachers and could
widen their pedagogical knowledge base with more methods that effectively increase the
level of equity.
To sum up, the distribution of leadership, motivation and empowerment seem to lead to a
more determined, more enthusiastic work of teachers, who however, seem to waste their
energy in a sense: they are successful enough to consider their selective practices as
adequate and sustain them, being unaware that it is mostly these strategies themselves that
impede a real increase of the level of equity. If we consider that a cultural change of the
above phenomenon constitutes a paradigm shift (Kuhn 1984), then we must recognise that
13Counted for the period of 2004-2008.
14Produced by the Education Endowment Foundation,
thetoolkitprovidesguidanceonhowtouseresourcestoimprovetheattainment of disadvantaged pupils. The toolkit is available here: http://educationendowmentfoundation.org.uk/toolkit/about-the-toolkit/

13
facilitating such a shift means two things. Firstly, helping the teachers “look out of their box”
and recognise that some of their practices are inappropriate, and secondly helping them find
more adequate ways in their pedagogical work.
The importance of professional development is crucial in this process, Pasi Sahlberg points
out that “The best-performing educational systems all have built their change strategies on
systemic approaches that rely on collective professional and institutional (or social capital)
development, enhanced conditions for teaching and learning for all, and more equal
educational opportunities within their education systems.” (Sahlberg 2011, in: OECD 2013b.)
Summary
We found that the distribution of leadership is strongly related to both teachers’
empowerment and motivation. In fact, the question arises whether teachers’ empowerment is
an inherent characteristics of distributed leadership or it is its strong and direct effect. Our
data suggest that the success of leadership is context-dependent: the impact of motivated
and empowered teachers working in a DL environment on the extent of equity in the school
could only be proved at the level of ISCED 3 with the secondary analysis of Hungarian data.
The main result of our data analysis is the recognition of the importance of teachers’
knowledge, attitudes and the culture their work is embedded in. The distribution of leadership
can be a powerful tool for bringing about change in a school, however in order that this tool is
targeted at increasing the quality of learning, a holistic development of the school is needed
including each and every element of our model and all other elements and influences that
has not yet been identified.
The unexpected dynamics around teachers’ motivation and their teaching practices, that is,
motivated and empowered teachers use more selective (homogeneous ability grouping)
practices, stimulate further investigation in this topic. We need to understand how these not
necessarily the most adequate choices work and how these strong beliefs of the Hungarian
schools could be changed. We assume that a paradigm shift is needed to lead Hungarian
teachers towards a pedagogical culture which is more adequate to increase the level of
equity.
Our analysis has shown that a shift of the pedagogical paradigm is not a need that emerges
from the teaching practice: teachers succeed in increasing social justice to a certain extent
by using selective practices, and thus the real benefit of comprehensive education must be
proven. This aspect needs to be considered for the design of teacher training, the definition
of its aims and the selection of its methods.
All in all, the model we used to describe a school level dynamics of distributed leadership
and equity seems to work well, further data is needed however, to explore the role of
teachers’ attitude and knowledge with regards to the impact of and on classroom
methodology. A new direct link, which we did not assume at the phase of model design, is
needed between teachers’ attitudes and knowledge and the quality of learning environment.

14
References
Balázs, É., Kocsis, M., Vágó, I., eds. 2011. Jelentés a Magyar közoktatásról 2010 [Report on
Hungarian Ppublic eEducation - 2010]. Budapest: Okatáskutató és Fejlesztő Intézet.
Bolhöfer, J., Meyer, W. 2013. Distributed Leadership for Equity and Learning. EPNoSL WP4
Final report - Germany.
Day, C et al. 2009. The Impact of School Leadership on Pupil Outcomes. London: UK
Department for Children, Schools and Families.
Golnhofer, E. and Nahalka, I. 2001. A pedagógusok pedagógiája [Teachers’ Ppedagogy].
Budapest: Nemzeti Tankönyvkiadó.
Golnhofer, E. and Szekszárdi, J. 2003. Az iskolák belső világa [The Iinner wWorld of
sSchools]. In: Jelentés a magyar közoktatásról 2003 [Report on Hungarian pPublic
eEducation - 2003], ed. Halász, G. and Lannert, J. Budapest: Országos Közoktatási
Intézet 239-271.
Harris, A. et al. 2007. Distributed Leadership and Organizational Change: Reviewing the Evidence. Journal of Educational Change, Volume 8, Issue 4: 337-347.
Kertesi, G. 2005. A társadalom peremén [On the eEdge of sSociety]. Budapest: Osiris.
Kocsis, M. and Sági, M. eds. 2012. Pedagógusok a pályán [Teachers in the fField].
Budapest: Oktatáskutató és Fejlesztő Intézet.
http://tamop311.ofi.hu/21-szazadi-kozoktatas/kiadvanyok/konyvek/pedagogusok-
palyan (accessed March 17, 2014)
Kőrösné Mikis, M. 2006. Az iskola belső világa az igazgatók szemével [The sSchool’s
iInternal wWorld from the pPoint of vView of the pPrincipals]. In: KerberZoltán ed.
Hidak a tantárgyak között [Bridges between sSchool Ssubjects]. Budapest:
Oktatáskutató és Fejlesztő Intézet.
http://www.ofi.hu/tudastar/hidak-tantargyak-kozott/iskola-belso-vilaga (accessed March
17, 2014)
Levin, B. 2003: Approaches to Equity in Policy for Lifelong Learning. Paris: OECD.
Lumby, J. 2013: Distributed Leadership: The Uses and Abuses of Power. Educational
Management Administration & Leadership. 41: 581-597.
Mihályi, K. 2013: A szakképzés szerepe az esélyteremtésben. A befogadó iskola
megteremtését szolgáló elvekről és gyakorlatokról [The rRole of vVocational
eEducation in the work for enhancing sSocial jJustice. About the principles and
preactices of buildingestablishing an inclusive school]. In. Hermándy- Berencz, J. et al.
ed. Esélyteremtés szakképzéssel [Promotion of Social Inclusion Equity through
vVocational Eeducation and Training]. Budapest: Tempus Közalapítány.
http://oktataskepzes.tka.hu/pages/content/index.php?page_id=1127 (accessed March
17, 2014)

15
OECD. 2008. Measuring Improvements in Learning Outcomes. Best practices to assess the
value-added of schools. Paris: OECD Publishing.
OECD. 2012. Equity and Quality in Education: Supporting Disadvantaged Students and
Schools. Paris: OECD Publishing.
http://dx.doi.org/10.1787/9789264130852-en (accessed March 14, 2014)
OECD. 2013a. PISA 2012 Results. Excellence Through Equity: Giving Every Student the
Chance to Succeed (Volume II), PISA. Paris: OECD Publishing.
http://dx.doi.org/10.1787/9789264201132-en (accessed March 14, 2014)
OECD. 2013b. Leadership for 21st Century Learning, Educational Research and Innovation.
Paris: OECD Publishing.
Pont, B.et al. 2008. Improving School Leadership. Volume 1.Policy and Practice. Paris:
OECD Publishing.
Radó, P. 2005. Emberi erőforrás menedzsment a közoktatásban [Human Resource
Management in School Education]. Presentation given at Corvinus University Budapest
on 29th november 2005.
Révai, N. 2013. Distributed leadership structures and cultures in Hungary. EPNoSL WP4–
Country Report.
Révai, N., Schnellbach, M. 2013. Distributed Leadership for Equity and Learning. EPNoSL
WP4 Final report – Hungary.
Risku, M., Tian, M. 2013. Distributed Leadership and Social Justice. EPNoSL WP4 Final
report – Finland.
Roberts, A., Woods, P. 2013. Leadership is Distributed. EPNoSL VIP keynote videoscribe
https://www.youtube.com/watch?v=J5F0MNrDSpY (last download: March 14, 2014)
Scheerens, J. 1997. Conceptual Models and Theory-Embedded Principles on Effective
Schooling.School Effectiveness and School Improvement. 8: 269–310.
Sventickas, A., Salavejiene, D. 2013. The Head Teachers of Educational Institutions in
Lithuania about Distributed Leadership. EPNoSL WP4 Final report – Lithuania.
Szekszárdi, J. 2006. Az iskolák belső világa [The Iinner wWorld of sSchools]. OFI. In:
Jelentés a magyarközoktatásról 2006 [Report on Hungarian Ppublic Eeducation –
2006.]. http://www.ofi.hu/tudastar/jelentes-magyar/6-iskolak-belso-vilaga-090617-1
(accessed March 17, 2014)
Woods, P. A. et al. 2004. Variabilities and Dualities in Distributed Leadership – Findings from
a Systematic Literature Review. In. Educational Management Administration &
Leadership. 32: 439–457

16
Woods, P.A., Woods, G. J. 2013. Deepening Distributed Leadership: A democratic
perspective on power, purpose and the concept of the self. In. Leadership in Education,
2: 17-40.
Woods, P.A., Roberts, A. 2013. Distributed Leadership and Social Justice. EPNoSL WP4
Final report – United Kingdom.

17
Annex
Annex 1. Questions used as indicators for specific elements of our model
Leaders’ equity attitudes
Statement: My satisfaction with my school’s teachers depends on the extent to which they
are able to teach in a differential and adaptive way.
Answer: listing 10 reasons of satisfaction (i.e. this sentence and 9 others) in order of
importance.
Statement: My satisfaction with my school’s teachers depends on whether they pay close
attention to the students’ individual problems.
Answer: listing 10 reasons of satisfaction (i.e. this sentence and 9 others) in order of
importance.
Generated variable: higher value means higher commitment for equity.
Equity as an institutional aim
Statement: The aim of our school is to help the underprivileged students’ social inclusion.
Answer: listing 11 aims (i.e. this sentence and 10 others) in order of importance.
Statement: The aim of our school is to be attractive for children with as high a social
background as it is possible.15
Answer: listing 11 aims (i.e. this sentence and 10 others) in order of importance.
Generated variable: higher value means higher commitment for equity.
Distribution of leadership
Question: Please, describe the participation of the following groups in decision making in the
following areas: a) assigning classes to teachers, b) choosing a curriculum, c) choosing
school books, d) evaluating teachers, e) evaluating students, f) handling parental complaints,
g) handling students’ major behavioural problems, h) quality management.
Answer: 1) school head, 2) deputy head, 3) the full teaching staff, 4) head of the team of
teachers teaching the same subject, 5) head of class, 6) some of the teachers, 7) someone
is responsible for this specific task.16
Let us note that this DL indicator cannot be as holistic and comprehensive as are some of
the definitions mentioned in the introduction. In fact, due to the limits of our data source this
analysis limits the interpretation of DL to the involvement of various actors in the decision-
making over some areas of the organisation of learning.
Teachers’ Empowerment
Question: Did at least one member of your schools’ teaching staff take part in the following
activities? a) pedagogical experiment, b) mentoring novice teachers, c) regular co-operation
15We used this sentence as a negative indicator of equity aims.
16 We have calculated an aggregated variable that shows how many actors are involved in the
decisions in the school.

18
between teachers teaching the same class in educational matters, d) curriculum
development, e) developing teaching staff, f) development of teaching materials or tools,
writing course books g) professional project.
Answer: Yes / No
Statement: My satisfaction with my school’s teachers depends on whether they are able to
renew themselves in a professional sense.
Answer: listing 10 reasons of satisfaction (i.e. this sentence and 9 others) in order of
importance.
Statement: My satisfaction with my school’s teachers depends on whether they are likely to
undertake additional tasks.
Answer: listing 10 reasons of satisfaction (i.e. this sentence and 9 others) in order of
importance.
Statement: My satisfaction with my school’s teachers depends on whether they are able to
manage complicated situations.
Answer: listing 10 reasons of satisfaction (i.e. this sentence and 9 others) in order of
importance.
Generated variable: higher value means more co-workers in the decision-making and the
school head’s need for this.
Teachers’ motivation
Question: Which of the following elements do you use for the teachers’ professional
evaluation? a) students’ evaluation of teachers and satisfaction with them, b) parents’
satisfaction with teachers, c) peer evaluation, d) class visits, e) professional work carried out
by the teacher out of the school.
Answer: Elements used as part of teachers’ evaluation were ticked.
Generated variable: higher value means more sophisticated form of teachers’ evaluation.
Teachers’ attitudes and knowledge
Since our data source is based on the responses of school heads, we did not have any
indicators for teachers’ knowledge and attitudes.
Quality of learning environment
For the same reason as in the case of teachers’ attitude and knowledge we had limited data
on the quality of the learning environment. The two aspects for which we had indicators
available were grouping practices (heterogeneity – homogeneity) and methodology (whether
the school as a whole uses democratic and equity-supporting methods or not).
Generated variable: the sum of the two variables below.
Grouping practices
Question: Do you use the following forms for teaching in your school? a) integrating skill-
development group, b) integrated education of children with special educational needs, c)
after-school tutoring for a group of underperforming students, d) school class for talent
management, e) school class for underperforming children.

19
Answer: Elements used in the school were ticked.
Question: How do you organise learning in your classes? Which of the following forms do
you use? a) working in the same class with student of different ages, b) creating a group for
students with the same performance level, c) exempt a student from visiting a class.
Answers: 1) We do not use it at all. 2) We use it in some cases. 3) We use it in several
cases.
Generated variable: higher value means more heterogeneous grouping.
Methodology
Question: How do you organise learning in your classes? Which of the following forms do
you use? a) teaching integrated subjects, b) teaching in epochs17, c) out of school activities
are integrated in the teaching process, d) project methods.
Answers: 1) We do not use it at all. 2) We use it in some cases. 3) We use it in several
cases.
Generated variable: higher value means using more methods considered to be appropriate
for the aim of equity.
Equity outcomes
Our only equity indicator was the so called Pedagogical Added Value (PAV), calculated from
the results of National Assessment for Basic Competencies.
The definition of equity we have chosen means that we needed an indicator that shows,to
what extent students’ achievement is determined by their social status. Pedagogical added
value – calculated based on students’ social background and test scores – is an acceptable
indicator for that. This choice fits the way the OECD works with equity. (OECD 2008)
As part of the national assessment for basic competencies a family background survey is
used in order to collect data about the social background of the children. Since 2006, the
family background index allows us to rank the students according to their social background.
This index is the weighted average of six variables found to influence student achievement.
These variables are (1) mother’s level of educational attainment, (2) father’s level of
educational attainment, (3) if the family has a computer, (4) the number of books the family
has, (5) if the student personally has books, and(6) if s/he belongs to the legal category of
multiply disadvantaged student. A school’s social background is the average of the students’
social background. The selection of variables and the weights assigned to them ensure that
on system-level a strong linear correlation can be found between students’ and schools’
social background and achievement.
The pedagogical added value is calculated through a linear regression where schools social
background is the independent variable and the average test result is the dependent one. A
schools pedagogical added value is the residual belonging to the data that represents the
school. Positive pedagogical added value means that a school helps its students achieve
better test results than anticipated by their social background while negative added value
17Teaching in epochs in pedagogy means that some themes (e.g. belonging to chemistry, physics and
biology) are treated (taught) in one longer period or block (e.g. 1-2 weeks).

20
means that the achievement of students is worse than in the case of other schools with the
same background.
Generated variable: higher value means higher level of equity outcomes.
Open questions used to enhance the above indicators and refine results of the data
analysis
Leaders’ equity attitudes / Institutional equity aims
Question: Please, indicate the most important goals you personally would like to achieve in
the school.
Question: What are you most proud of when you think of your students?
Distribution of leadership
Question: Please, describe the participation of the following groups in decision making in the
given areas: a) assigning classes to teachers, b) choosing a curriculum, c) choosing school
books, d) evaluating teachers, e) evaluating students, f) handling parental complaints, g)
handling students’ major behavioural problems, h) quality management.
Answer: 8) Other, please specify:
Generated variable: the number of extra categories specified (extra categories defined by
coding the answers) higher value means higher distribution of leadership

21
Annex 2. Personal objectives of school principals coded in 10 categories
Name of category
Description % of items in the random sample
% of items in the selected (high equity) sample
Academic results
marks, A-level results, results achieved at various competitions 11,52% 13,81%
Equity, Equality of opportunity
support and development of disadvantaged learners, SEN learners; integrated education, development of all children, supporting personalised learning 12,04% 13,26%
Innovation, change
innovative teaching staff, introduction of new teaching methods 1,57% 0,55%
Talent development
18
the support and development of talented, gifted students
2,62% 4,42%
Learner centredness
creating a positive atmosphere in the school, personality development of students, etc.) 16,75% 13,26%
Financial sustainability and infrastructural developments
sustaining or increasing the number of students, infrastructural developments, establishing specific profiles
35,60% 38,12%
Quality of education, effectiveness
raising or sustaining the quality of teaching, professional development of teaching staff, etc.) 17,80% 22,10%
Partnership development, partners’ satisfaction
establishing and maintaining good relationships with various partners: maintainer, parents, other institutions…, keeping the partners (parents, students, maintainer, local community etc.) satisfied 9,95% 9,39%
Competence development, modern skills and knowledge
development of basic and key competences such as literacy, learning to learn, foreign language skills etc., providing students with skills and knowledge useful in the world of work of the 21
st century etc. 13,61% 11,05%
Values transferring moral / religious / universal human norms, equip students with manners and good behaviour 14,66% 16,57%
22
Annex 3. What are principals proud of in connection with the students? Answers
coded in 9 categories.
Name of category Description % of items in the random sample
% of items in the selected (high equity) sample
Results, achievements in competitions and examinations
sports, academic competitions, language examinations etc.
24,21% 33,15%
Academic results, student performance
Students’ results in general, their academic performance in the school 16,32% 16,57%
Students’ personal attitudes
Students’ openness, honesty, empathy, willingness to help others etc. 14,74% 9,39%
Subsequent studies and performance in life
Students continue their studies in (are admitted to) secondary grammar schools or higher education, cope well with their later studies, have success in life, work etc. 32,11% 28,18%
“Added value” - Progress and achievements despite conditions/background
Students’ skills, progress, achievements or attitudes – further studies, found a job, successful final examination etc. – despite their disadvantaged conditions, socio-economic background, learning difficulties etc. 7,37% 6,08%
Behaviour, discipline Behave themselves outside the school, have good manners, are polite etc. 24,21% 30,39%
School atmosphere, loyalty to school
Students and staff are happy going/working in this school, the school has a good atmosphere, ex-students often visit the school later 17,37% 20,99%
Skills and competences
Students are creative, independent thinkers, have good skills and professional knowledge, are able to solve problems 5,79% 6,63%
Special profile of school
Arts or sports education 1,05% 1,10%