Distance to edges, edge contrast and landscape fragmentation: Interactions affecting farmland birds...
16
This article appeared in a journal published by Elsevier. The attached copy is furnished to the author for internal non-commercial research and education use, including for instruction at the authors institution and sharing with colleagues. Other uses, including reproduction and distribution, or selling or licensing copies, or posting to personal, institutional or third party websites are prohibited. In most cases authors are permitted to post their version of the article (e.g. in Word or Tex form) to their personal website or institutional repository. Authors requiring further information regarding Elsevier’s archiving and manuscript policies are encouraged to visit: http://www.elsevier.com/copyright
Transcript of Distance to edges, edge contrast and landscape fragmentation: Interactions affecting farmland birds...
This article appeared in a journal published by Elsevier. The attachedcopy is furnished to the author for internal non-commercial researchand education use, including for instruction at the authors institution
and sharing with colleagues.
Other uses, including reproduction and distribution, or selling orlicensing copies, or posting to personal, institutional or third party
websites are prohibited.
In most cases authors are permitted to post their version of thearticle (e.g. in Word or Tex form) to their personal website orinstitutional repository. Authors requiring further information
regarding Elsevier’s archiving and manuscript policies areencouraged to visit:
http://www.elsevier.com/copyright
Author's personal copy
Distance to edges, edge contrast and landscapefragmentation: Interactions affecting farmland birdsaround forest plantations
Luıs Reinoa,b,c,*, Pedro Bejab,d, Patrick E. Osbornec, Rui Morgadoe, Antonio Fabiaoa,John T. Rotenberryf
aCentro de Estudos Florestais, Dept. Eng. Florestal, Instituto Superior de Agronomia, Universidade Tecnica de Lisboa,
Tapada da Ajuda, 1349-017 Lisboa, PortugalbERENA – Ordenamento e Gestao de Recursos Naturais, Lda., Rua Robalo Gouveia, 1-1A, 1900-392 Lisboa, PortugalcCentre for Environmental Sciences, School of Civil Engineering and the Environment, Univ. of Southampton, Highfield,
Southampton SO17 1BJ England, United KingdomdCIBIO, Centro de Investigacao em Biodiversidade e Recursos Geneticos Campus Agrario de Vairao, Universidade do Porto,
4485-661 Vairao, PortugaleCentro de Ecologia Aplicada ‘‘Prof. Baeta Neves’’, Instituto Superior de Agronomia, Universidade. Tecnica de Lisboa,
Tapada da Ajuda, 1349-017 Lisboa, PortugalfDepartment of Biology, Univ. of California, Riverside, CA 92521, USA
A R T I C L E I N F O
Article history:
Received 8 May 2008
Received in revised form
24 November 2008
Accepted 5 December 2008
Available online 21 January 2009
Keywords:
Afforestation
Edge effects
Landscape management
Grassland
Mediterranean farmland
Steppe birds
A B S T R A C T
Afforestation often causes direct habitat losses for farmland birds of conservation concern,
but it is uncertain whether negative effects also extend significantly into adjacent open
land. Information is thus required on how these species react to wooded edges, and how
their responses are affected by edge and landscape characteristics. These issues were
examined in Mediterranean arable farmland, using bird counts at 0, 100, 200, 300 and
>300 m from oak, pine and eucalyptus edges, embedded in landscapes with variable
amounts and spatial configurations of forest plantations. Bird diversity declined away from
edges, including that of woodland, farmland and ground-nesting birds. Positive edge
responses were also found for overall and woodland bird abundances, and for five of the
nine most widespread and abundant species (Galerida larks, stonechat, linnet, goldfinch
and corn bunting). Strong negative edge effects were only recorded for steppe birds, with
reduced abundances near edges of calandra larks and short-toed larks, but not of little bus-
tards and tawny pipits. Edge contrast affected the magnitude of edge effects, with a ten-
dency for stronger responses to old and tall eucalyptus plantations (hard edges) than to
young and short oak plantations (soft edges). There were also species-specific interactions
between edge and fragmentation effects, with positive edge responses tending to be stron-
gest in less fragmented landscapes, whereas steppe birds tended to increase faster away
from edges and to reach the highest species richness and abundances in large arable
patches. Results suggest that forest plantations may increase overall bird diversity and
abundance in adjacent farmland, at the expenses of steppe birds of conservation concern.
0006-3207/$ - see front matter � 2008 Elsevier Ltd. All rights reserved.doi:10.1016/j.biocon.2008.12.011
* Corresponding author: Address: Centro de Estudos Florestais, Dept. Eng. Florestal, Instituto Superior de Agronomia, UniversidadeTecnica de Lisboa, Tapada da Ajuda, 1349-017 Lisboa, Portugal. Tel.: +351 964515213; fax: +351 219990019.
E-mail address: [email protected] (L. Reino).
B I O L O G I C A L C O N S E R V A T I O N 1 4 2 ( 2 0 0 9 ) 8 2 4 – 8 3 8
ava i lab le at www.sc iencedi rec t .com
journal homepage: www.elsevier .com/ locate /b iocon

Author's personal copy
Clustering forest plantations in a few large patches and thus reducing the density of
wooded edges at the landscape-scale might reduce such negative impacts.
� 2008 Elsevier Ltd. All rights reserved.
1. Introduction
Afforestation is a prominent conservation issue in many re-
gions worldwide, especially where forests replace open habi-
tats of conservation significance (Dıaz et al., 1998; Shochat
et al., 2001; Brennan and Kuvlesky, 2005). Forests are often
planted on grassland and shrubland to increase profits from
otherwise poorly productive soils, though there may also be
conservation objectives such as restoring forest ecosystems
in marginal or abandoned farmland (Madsen, 2002; Santos
et al., 2006; Lazdinis et al., 2005; Loyn et al., 2007). Climate
change has prompted much interest in large-scale afforesta-
tion to reduce atmospheric concentrations of carbon dioxide
(Potter et al., 2007), raising concerns about potential impacts
on biodiversity (Matthews et al., 2002; Caparros and Jacque-
mont, 2003; Garcıa-Quijano et al., 2007). Information is thus
increasingly required on the interrelationships between affor-
estation and biodiversity, to evaluate environmental costs
and benefits of afforestation policies, and to design afforesta-
tion programmes with minimal impacts on biodiversity.
The loss of open habitat is the most direct impact of affores-
tation, causing the replacement of open habitat species by for-
est species. Although this is positive where the latter are the
targets of conservation efforts (Loyn et al., 2007), plantations
are often used by generalist and widely distributed species,
occupying areas previously inhabited by grassland and shrub-
land species of conservation concern (Dıaz et al., 1998; Shochat
et al., 2001). Much less is known about the impacts of afforesta-
tion on adjacent open land, though theoretical and empirical
evidence suggests that effects may extend well beyond forest
boundaries (e.g., Ries et al., 2004; Ewers and Didham, 2006a).
These impacts arise due to habitat fragmentation, as continu-
ous patches of open habitat are broken into smaller, isolated
patches surrounded by a matrix of forested habitats, increas-
ingly influenced by the proliferation of habitat edges (Ries
et al., 2004).
Edge effects may play a critical role in determining impacts
of afforestation, mediating landscape-scale changes in species
richness, composition and abundances (Ries et al., 2004; Ewers
and Didham, 2007). Species characteristic of open habitats are
often absent or scarce near wooded boundaries (Coppedge
et al., 2004; Fletcher, 2005), and are expected to decline with
increasing edge density in smaller and more convoluted
patches (Ewers and Didham, 2007). At the same time, however,
edges are preferred by a number of other species, which tend to
increase in more fragmented landscapes (Soderstrom and Part,
2000; Coppedge et al., 2004). Indeed, habitat edges may actually
be richer in species than either of the adjacent habitats, though
increases in species richness with distance to edges have also
been reported (Ewers and Didham, 2006a). The impacts of
afforestation are thus conditional on assemblage composition
and on the conservation value of sets of species showing posi-
tive and negative responses to edge effects. The magnitude of
such impacts depends on the penetration of edge effects into
adjacent habitats, which may be greatly affected by changes
in edge and landscape features. Edge effects may penetrate
more where the contrast between edges and adjacent habitats
is high (Ries et al., 2004), and their strength may change with
landscape fragmentation, due to the cumulative effects of
multiple edges (Fletcher, 2005) and synergistic interactions be-
tween edge and patch area effects (Ewers et al., 2007). At pres-
ent, however, it is largely unknown how open habitat species
with different life histories and habitat requirements react to
forest plantation edges, and how these responses are affected
by edge and landscape characteristics.
We investigated these issues by examining the responses of
farmland birds to forest edges in Southern Portugal. In Medi-
terranean regions, afforestation of marginal agricultural land
has increased over the past decades, following a long-term
trend of rural depopulation and abandonment of poorly pro-
ductive soils (Van Doorn and Bakker, 2007). In the European
Union, this process accelerated following the implementation
of European regulation 2080/92, which provided financial sup-
port for afforestation, partly justified by the objective of restor-
ing ancient forest habitats and their associated biodiversity
(Robson, 1997). Planted forests, however, seem to be largely
inadequate for promoting rich forest bird communities (Dıaz
et al., 1998), though this depends on forest composition and
management (Lopez and Moro, 1997; Santos et al., 2006). Con-
currently, plantations have negative impacts by excluding spe-
cies of high conservation value from the habitats they replace,
particularly birds strictly associated with open pastures and
dry cereal cropland (Bota et al., 2005). At least some of these
bird species avoid or occur at low density in landscapes frag-
mented by woody habitats (Brotons et al., 2005; Moreira et al.,
2005), suggesting that afforestation effects may be far greater
than those related to the lost area of open habitat. Here we test
this hypothesis by examining how bird assemblages vary with
distance to forest edges in terms of: (i) overall species richness
and abundance, (ii) richness and abundance of birds grouped
according to habitat requirements, and (iii) abundance of the
most common species. Subsequently, we investigate how edge
and landscape features modify bird responses to edges. This
information is then used to discuss the consequences of affor-
estation for bird conservation in adjacent farmland.
2. Methods
2.1. Study area
The study was conducted in Southern Portugal, in a farmland
landscape mostly included in the Special Protection Area
(SPA) of Castro Verde, designated under European Directive
79/409/EEC to protect steppe birds. The climate is Mediterra-
nean, with hot summers (averaging 24 �C [16–32�C] in July),
mild winters (9 �C [5–14 �C] in January), and >75% of annual
B I O L O G I C A L C O N S E R V A T I O N 1 4 2 ( 2 0 0 9 ) 8 2 4 – 8 3 8 825
Author's personal copy
rainfall (500–600 mm) concentrated in October–March. The
landscape is flat or gently undulating (100–300 m a.s.l.) and
dominated by an agricultural mosaic of cereal, fallow and
ploughed fields, created by rotational dry cereal cultivation.
Until recently, tree cover was largely restricted to some euca-
lyptus (Eucalyptus sp.) plantations (40–60 years old) and open
holm oak (Quercus rotundifolia) woodlands grazed by livestock.
Afforestation with umbrella pines (Pinus pinea) and holm and
cork oaks (Quercus suber) has increased since the early 1990s
due to EU subsidies, mainly in the periphery of the SPA. De-
tails of the study area are reported elsewhere (Moreira, 1999;
Delgado and Moreira, 2000; Moreira et al., 2005).
2.2. Sampling design
Sampling was carried out on farmland along 300 m transects
perpendicular to the edge of 52 forest patches, representative
of the three most common forest plantations in the region
(eucalyptus, pine and oak stands). Only fallow fields were
sampled, to reduce variation among sites unrelated to edge
and landscape features, and because they are particularly
important for steppe birds of conservation concern (Delgado
and Moreira, 2000). Transect length was limited by the size
of fallow fields and forest spatial distribution. To account for
the possibility of edge effects penetrating more than 300 m
into farmland habitats, sampling included 28 additional fields
at >300 m from any forest edge. The selection of sampling
sites was based on 1:25,000 land cover maps from 1990
(http://www.igeo.pt/IGEO/portugues/produtos/inf_cartografi-
ca.htm), updated through systematic field checking of new
forest stands planted up to the beginning of 2005. Degraded
and abandoned forest patches with low and irregular tree cov-
er were discarded, because they were not representative of
modern forest plantations. However, young plantations (<1
year old) were included to assess eventual variation in edge
responses with forest age. Each forest plantation was visited
and selected for sampling if it was adjacent to a fallow field
at least 600 m long and 300 m wide, to allow sampling of bird
assemblages at least 300 m from any forest edge. Only one fal-
low field was sampled per forest patch, independently of its
size, to avoid pseudo-replication. All sites meeting these
selection conditions were sampled, whereas the sites far from
forest edges were randomly selected.
2.3. Bird data
Bird sampling was conducted twice (April and May) in the
breeding season of 2005. In each of the 52 transects, birds were
counted at 0, 100, 200 and 300 m from the forest edge, using 10-
minute duration point counts (Bibby et al., 2000). Conversely,
only one point was counted in each of the 28 fallow fields at >
300 m (1531 ± 1201 m, 310–5000 m) from edges. At each point,
all individual birds and flocks of each species were identified
and recorded on maps, though records at >50 m from the obser-
ver were discarded from further analyses. When birds were
flushed, care was taken to check if they landed further ahead
to minimize double counting errors. Birds flying over but not
landing were not counted, except in the case of display flights
of territorial species. Due to difficulties in reliably identifying
every individual in the field, categorisation to the genus level
was made for crested and Thekla larks (Galerida cristata and G.
theklae) and for common and Spanish sparrows (Passer domesti-
cus and P. hispaniolensis). Birds were also categorized according
to their woodland or farmland affinities. Woodland birds
encompassed speciespotentially benefiting from forest planta-
tions, as they require wooded habitats such as forests, wood-
lots, orchards and shrubland (e.g., Dıaz et al., 1998), whereas
farmland birds included species regionally associatedwith ara-
ble agriculture and pastureland (Moreira, 1999; Delgado and
Moreira, 2000). Steppe birds included a subset of the farmland
species, corresponding to open grassland species of conserva-
tion concern that may be particularly sensitive to habitat frag-
mentation (Brotons et al., 2005; Moreira et al., 2005). A group of
ground-nesting birds was also considered, because increased
nest predation is often invoked to explain edge avoidance in
open habitat birds (Vickery et al., 1992; Burger et al., 1994).
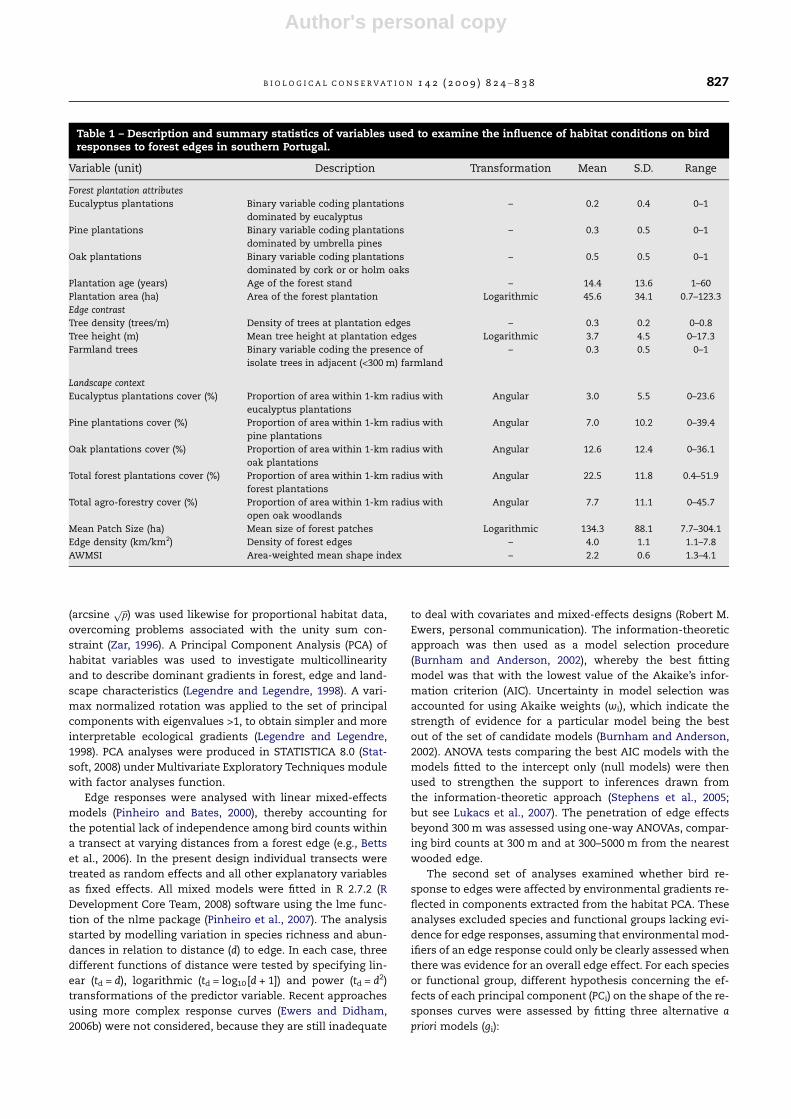
2.4. Explanatory variables
Distance to the nearest forest edge was the main variable used
to investigate bird responses to edges. In addition, 16 variables
reflecting forest plantation characteristics, edge contrast and
landscape context (Table 1) were used to examine the influ-
ence of habitat variables on edge responses. Tree species and
plantation age and area characterized forest plantations. Edge
contrast (sensu Ries et al., 2004) was estimated from the height
and density of trees at the boundary of forest plantations,
assuming that taller and denser plantations reflect a higher
contrast between edges and adjacent agricultural land. These
variables were computed from digital photographs taken at
known distances (usually 70–90 m), perpendicularly to the for-
est edge. Presence of trees in the agricultural matrix was taken
to indicate softer forest-farmland transitions. Landscape con-
text was estimated in 1-km radius circles from each sampling
point located at the forest edge. This radius was set large en-
ough to encompass different land uses despite the relative
homogeneity of the landscape, while remaining within the
range of scales to which farmland birds are responsive (e.g.,
Soderstrom and Part, 2000; Best et al., 2001; Moreira et al.,
2005). The proportion of land occupied by open oak woodlands
and by pine, oak and eucalyptus plantations was quantified in
a Geographic Information System (GIS), from maps prepared
using aerial photography and field surveys. Landscape frag-
mentation was estimated from the mean size, edge density
and the area-weighted mean shape index (AWMSI) of open
arable patches. AWMSI is a measure of shape complexity,
which is the average perimeter-to-area ratio for a given class,
weighted by the size of its patches (Rempel and Carr, 2003).
The latter variable measures the extent to which patch shapes
deviates from circularity, reflecting increases in edge-affected
habitats with increasing patch complexity. Landscape metrics
were computed using the Patch Analyst extension (version 3.1)
of Arc View� GIS (Rempel and Carr, 2003).
2.5. Statistical analysis
Prior to statistical analysis, species richness and abundance
data, and habitat variables showing skewed distributions
were log-transformed to approach normality and to reduce
the influence of extreme values. The angular transformation
826 B I O L O G I C A L C O N S E R V A T I O N 1 4 2 ( 2 0 0 9 ) 8 2 4 – 8 3 8
Author's personal copy
(arcsineffiffiffi
pp
) was used likewise for proportional habitat data,
overcoming problems associated with the unity sum con-
straint (Zar, 1996). A Principal Component Analysis (PCA) of
habitat variables was used to investigate multicollinearity
and to describe dominant gradients in forest, edge and land-
scape characteristics (Legendre and Legendre, 1998). A vari-
max normalized rotation was applied to the set of principal
components with eigenvalues >1, to obtain simpler and more
interpretable ecological gradients (Legendre and Legendre,
1998). PCA analyses were produced in STATISTICA 8.0 (Stat-
soft, 2008) under Multivariate Exploratory Techniques module
with factor analyses function.
Edge responses were analysed with linear mixed-effects
models (Pinheiro and Bates, 2000), thereby accounting for
the potential lack of independence among bird counts within
a transect at varying distances from a forest edge (e.g., Betts
et al., 2006). In the present design individual transects were
treated as random effects and all other explanatory variables
as fixed effects. All mixed models were fitted in R 2.7.2 (R
Development Core Team, 2008) software using the lme func-
tion of the nlme package (Pinheiro et al., 2007). The analysis
started by modelling variation in species richness and abun-
dances in relation to distance (d) to edge. In each case, three
different functions of distance were tested by specifying lin-
ear (td = d), logarithmic (td = log10 [d + 1]) and power (td = d2)
transformations of the predictor variable. Recent approaches
using more complex response curves (Ewers and Didham,
2006b) were not considered, because they are still inadequate
to deal with covariates and mixed-effects designs (Robert M.
Ewers, personal communication). The information-theoretic
approach was then used as a model selection procedure
(Burnham and Anderson, 2002), whereby the best fitting
model was that with the lowest value of the Akaike’s infor-
mation criterion (AIC). Uncertainty in model selection was
accounted for using Akaike weights (wi), which indicate the
strength of evidence for a particular model being the best
out of the set of candidate models (Burnham and Anderson,
2002). ANOVA tests comparing the best AIC models with the
models fitted to the intercept only (null models) were then
used to strengthen the support to inferences drawn from
the information-theoretic approach (Stephens et al., 2005;
but see Lukacs et al., 2007). The penetration of edge effects
beyond 300 m was assessed using one-way ANOVAs, compar-
ing bird counts at 300 m and at 300–5000 m from the nearest
wooded edge.
The second set of analyses examined whether bird re-
sponse to edges were affected by environmental gradients re-
flected in components extracted from the habitat PCA. These
analyses excluded species and functional groups lacking evi-
dence for edge responses, assuming that environmental mod-
ifiers of an edge response could only be clearly assessed when
there was evidence for an overall edge effect. For each species
or functional group, different hypothesis concerning the ef-
fects of each principal component (PCi) on the shape of the re-
sponses curves were assessed by fitting three alternative a
priori models (gi):
Table 1 – Description and summary statistics of variables used to examine the influence of habitat conditions on birdresponses to forest edges in southern Portugal.
Variable (unit) Description Transformation Mean S.D. Range
Forest plantation attributes
Eucalyptus plantations Binary variable coding plantations
dominated by eucalyptus
– 0.2 0.4 0–1
Pine plantations Binary variable coding plantations
dominated by umbrella pines
– 0.3 0.5 0–1
Oak plantations Binary variable coding plantations
dominated by cork or or holm oaks
– 0.5 0.5 0–1
Plantation age (years) Age of the forest stand – 14.4 13.6 1–60
Plantation area (ha) Area of the forest plantation Logarithmic 45.6 34.1 0.7–123.3
Edge contrast
Tree density (trees/m) Density of trees at plantation edges – 0.3 0.2 0–0.8
Tree height (m) Mean tree height at plantation edges Logarithmic 3.7 4.5 0–17.3
Farmland trees Binary variable coding the presence of
isolate trees in adjacent (<300 m) farmland
– 0.3 0.5 0–1
Landscape context
Eucalyptus plantations cover (%) Proportion of area within 1-km radius with
eucalyptus plantations
Angular 3.0 5.5 0–23.6
Pine plantations cover (%) Proportion of area within 1-km radius with
pine plantations
Angular 7.0 10.2 0–39.4
Oak plantations cover (%) Proportion of area within 1-km radius with
oak plantations
Angular 12.6 12.4 0–36.1
Total forest plantations cover (%) Proportion of area within 1-km radius with
forest plantations
Angular 22.5 11.8 0.4–51.9
Total agro-forestry cover (%) Proportion of area within 1-km radius with
open oak woodlands
Angular 7.7 11.1 0–45.7
Mean Patch Size (ha) Mean size of forest patches Logarithmic 134.3 88.1 7.7–304.1
Edge density (km/km2) Density of forest edges – 4.0 1.1 1.1–7.8
AWMSI Area-weighted mean shape index – 2.2 0.6 1.3–4.1
B I O L O G I C A L C O N S E R V A T I O N 1 4 2 ( 2 0 0 9 ) 8 2 4 – 8 3 8 827

Author's personal copy
where td is the transformation of distance yielding the best
AIC model in previous analysis. The strength of evidence for
each model was then estimated using Akaike weights (wi),
and the model with the highest wi was selected for each
PCi. This procedure follows the recommendation to retain
only the model with the lowest AIC from a set of nested can-
didate models (Richards, 2008). Comparison among the re-
duced subset of models, including the null model and one
model for each PCi, was then based on conditional Akaike
weights, estimated as the original wi normalized to sum to
1. The information-theoretic approach was complemented
with conventional statistical testing, using ANOVA to com-
pare the best AIC models to the models fitted only to the dis-
tance to edge variable (null models).
3. Results
3.1. Overall habitat patterns
Sampled edges represented a wide range of variability in
plantation, edge and landscape characteristics (Table 1). The
PCA extracted five axes with eigenvalues >1, together
accounting for 81% of variance in the original data (Table 2).
The varimax rotation revealed a major gradient (PC1) largely
reflecting dominant forest types, contrasting landscapes with
plantations dominated by either eucalyptus or oaks stands.
Eucalyptus plantations were generally older and taller,
whereas oak stands tended to be larger and located in land-
scapes with greater overall cover by forest plantations. The
type of forest plantation was also reflected in a secondary gra-
dient contrasting oak and pine stands (PC2), the latter show-
ing higher tree density. The third and fourth rotated PCA axes
were largely related to landscape fragmentation. PC3 repre-
sented primarily the concurrent increase of edge density
and shape complexity of open arable patches, whereas PC4
largely reflected variation in the mean size of open arable
patches, which was inversely related with eucalyptus and
overall plantation cover. PC5 represented the presence of
farmland trees, which were more prevalent in landscapes
with greater cover by agro-forestry systems.
3.2. Bird assemblage composition
Altogether, 47 bird species were recorded around (<300 m) for-
est plantations (Appendix), with an average 6.5 ± 2.5 species
and 15.8 ± 14.4 birds per transect. About half (51%) the species
were typical of arable farmland, of which 71% were ground-
nesters and 46% were steppe birds. In terms of abundance,
the assemblage was also dominated by arable farmland spe-
cies (59% of birds counted), most of which were ground-nest-
ers (87%) and about half of which were steppe birds (49%).
Only nine species were widespread (>25% of transects) and
abundant (>1 bird/10 ha), accounting for 55.7% of the birds
counted. This group was dominated by breeding species typ-
ical of arable farmland, including little bustards (Tetrax tetrax),
crested/Thekla larks (Galerida spp.), calandra larks (Melanoco-
rypha calandra), short-toed larks (Calandrella brachydactyla),
tawny pipits (Anthus campestris), stonechats (Saxicola torqua-
tus), and corn buntings (Emberiza calandra), though there were
also two species requiring woody vegetation during the
breeding season (goldfinch Carduelis carduelis) and linnets
(Carduelis cannabina).
Table 2 – Loadings of habitat variables on the first five axes extracted by a PCA, after a varimax normalized rotation, andthe proportion of variance accounted for by each axis. For clarity, only loadings >|0.40| were listed.
Habitat variables PC1 PC2 PC3 PC4 PC5
Eucalyptus plantations 0.93
Pine plantations �0.85
Oak plantations �0.68 0.65
Plantation age 0.79
Plantation area �0.77
Tree density �0.68
Tree height 0.93
Farmland trees 0.85
Eucalyptus plantations cover 0.56 0.57
Pine plantations cover �0.86
Oak plantations cover �0.69 0.53
Total forest plantations cover �0.73 0.57
Total agro-forestry cover 0.55
Mean patch size �0.83
Edge density 0.93
AWMSI 0.93
Percentage of total variance 30.6 18.5 11.9 10.7 9.4
g1 = b0 + b1.td + b2.PCi (effects on the intercept,
reflecting variation in diversity
or abundance at the edge)
g2 = b0 + b1.td + b2.td.PCi (effects on slope, reflecting
variation in the rate of change
in diversity or abundance with
distance)
g3 = b0 + b1.td + b2.PCi + b3.td.PCi (effects on both intercept and
slope)
828 B I O L O G I C A L C O N S E R V A T I O N 1 4 2 ( 2 0 0 9 ) 8 2 4 – 8 3 8
Author's personal copy
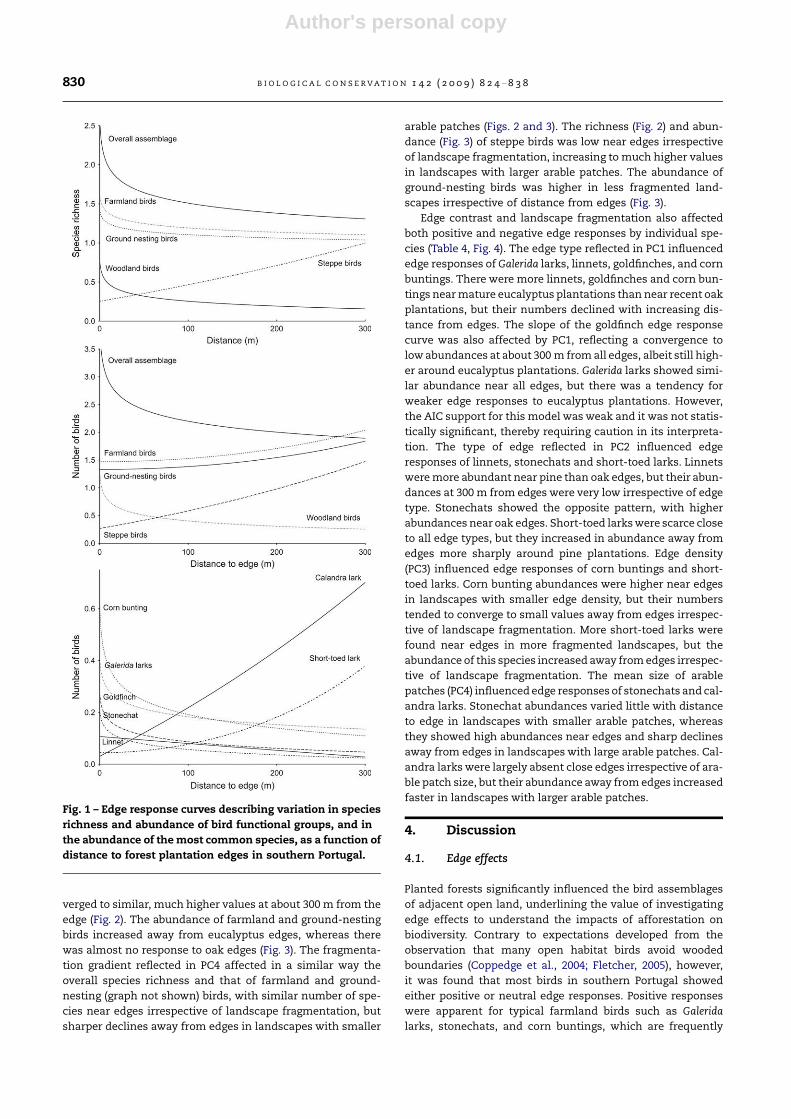
3.3. Bird responses to edges
Akaike weights provided much stronger support to models
including distance to edge as a predictor of bird species rich-
ness (1.0 >Rwi > 0.80) than to the corresponding null models
of no edge effects (Table 3). There was considerable evidence
(wi > 0.95) for exponential decays in overall and woodland
species richness with increasing distance from plantation
edges, with comparable declines, albeit not as strong, for
the richness of farmland and ground-nesting species (Fig. 1).
Only the richness of steppe birds increased along with dis-
tance to edge (Fig. 1). There was strong evidence for the total
abundance of birds and that of woodland birds to decline
exponentially away from edges, whereas linear increases
were recorded in steppe bird abundance (Fig. 1). The best
AIC models for farmland and ground-nesting bird suggested
slight increases in abundance at greater distance from edges,
but these models were only marginally significant (P < 0.10)
and not clearly superior to the alternative models (Table 3).
Seven of the nine most abundant and widespread species
were affected by plantation edges, whereas little support for
edge effects was found for little bustards and tawny pipits
(Table 3). The abundance of five species declined with increas-
ing distance to edges, with strong support for exponential de-
cays (1.00 > wi > 0.77) in the case of Galerida larks, stonechats,
goldfinches and corn buntings, and a weak support for linear
declines for the linnet (Table 3; Fig. 1). The best AIC models for
short-toed lark and calandra lark reflected strongly negative
edge effects, with abundances steadily increasing away from
edges.
Penetration of edge effects beyond the maximum length of
the sampling transect was only apparent for woodland birds,
with significantly (F1,78 = 11.068, P < 0.001) more woodland
species per point count at 300 m (0.29 ± 0.46) than at >300 m
(no species recorded). The tendency for more steppe bird spe-
cies per point count at >300 m (1.46 ± 0.84) than at 300 m
(1.13 ± 0.79) was close to statistical significance (F1,78 = 3.024,
P < 0.086).
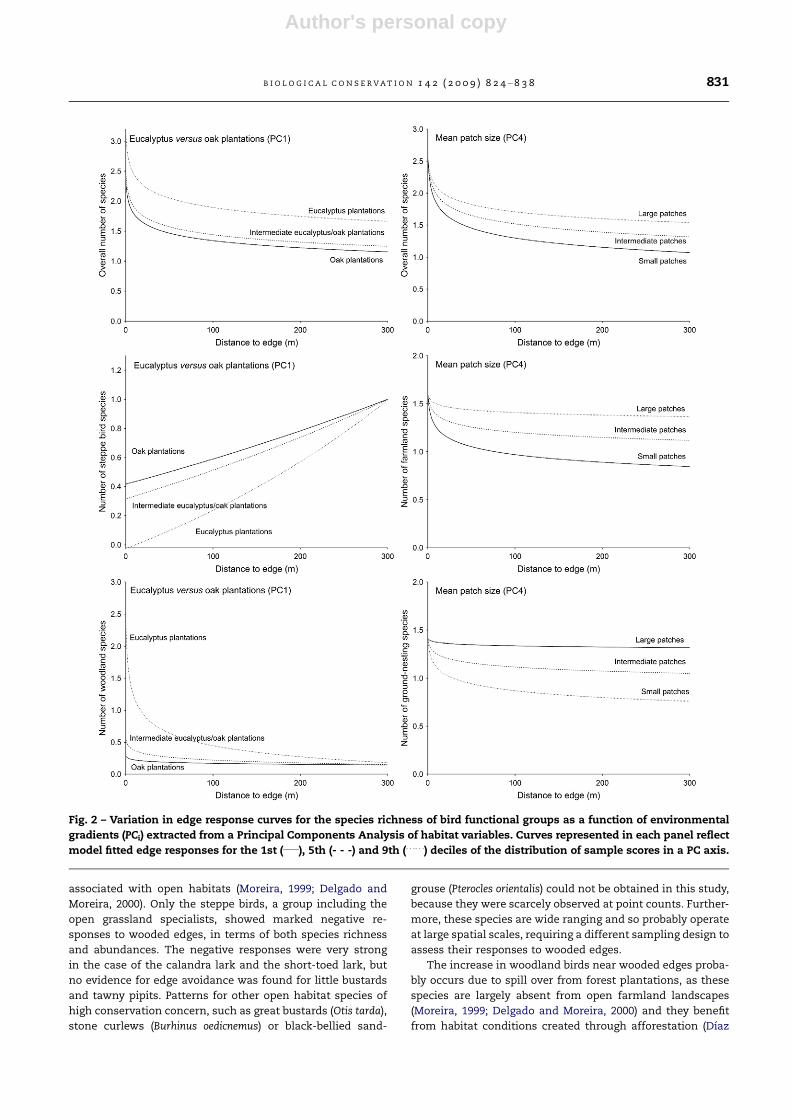
3.4. Interactions affecting edge responses
There was strong evidence for the composition of forest plan-
tations and the fragmentation of open arable habitats to af-
fect edge responses of bird functional groups (Table 4, Figs.
2 and 3). The environmental gradient represented in the first
PC axis (PC1) affected the richness (Fig. 2) and abundance
(Fig. 3) of the overall assemblage and that of woodland birds,
with more species and more birds near tall and old eucalyp-
tus plantations, than near recent oak plantations. Total spe-
cies richness remained consistently higher around
eucalyptus than oak plantations, irrespective of distance to
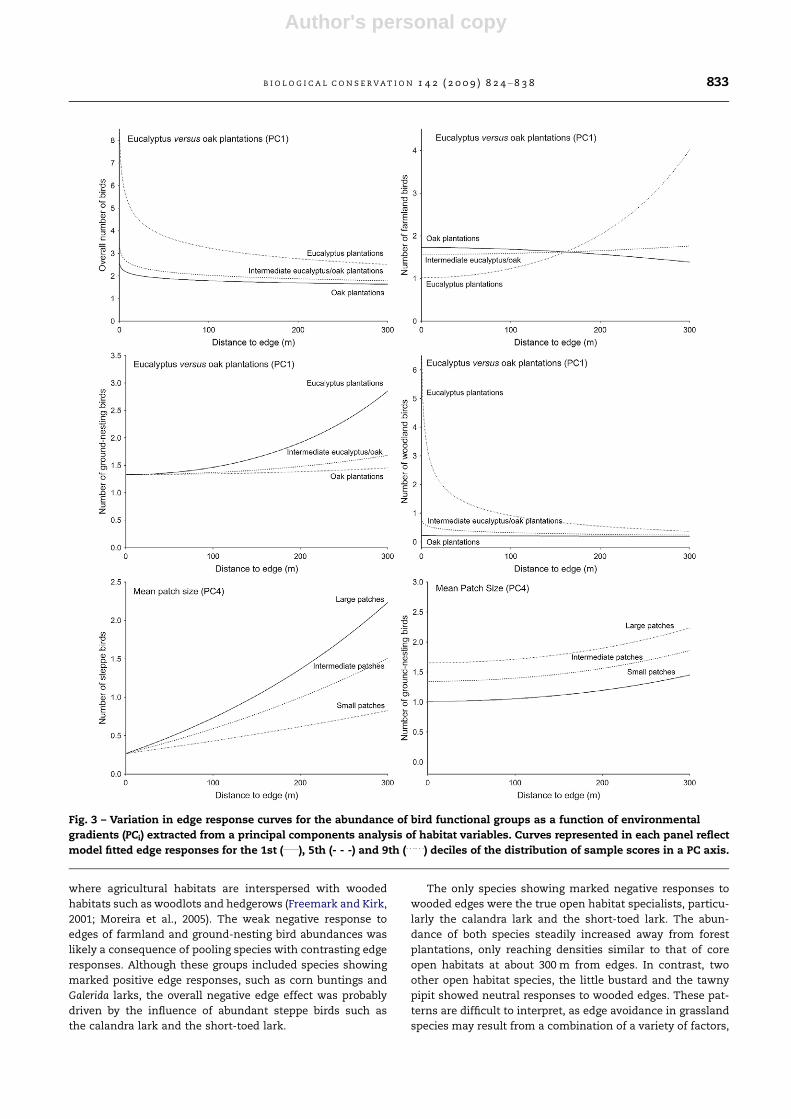
edges. Conversely, the decline in total bird abundance and
in the richness and abundance of woodland birds was sharper
away from eucalyptus edges, tending to converge to the oak
edge response curve. The number of steppe bird species was
higher near oak than near eucalyptus edges (PC1), but con-
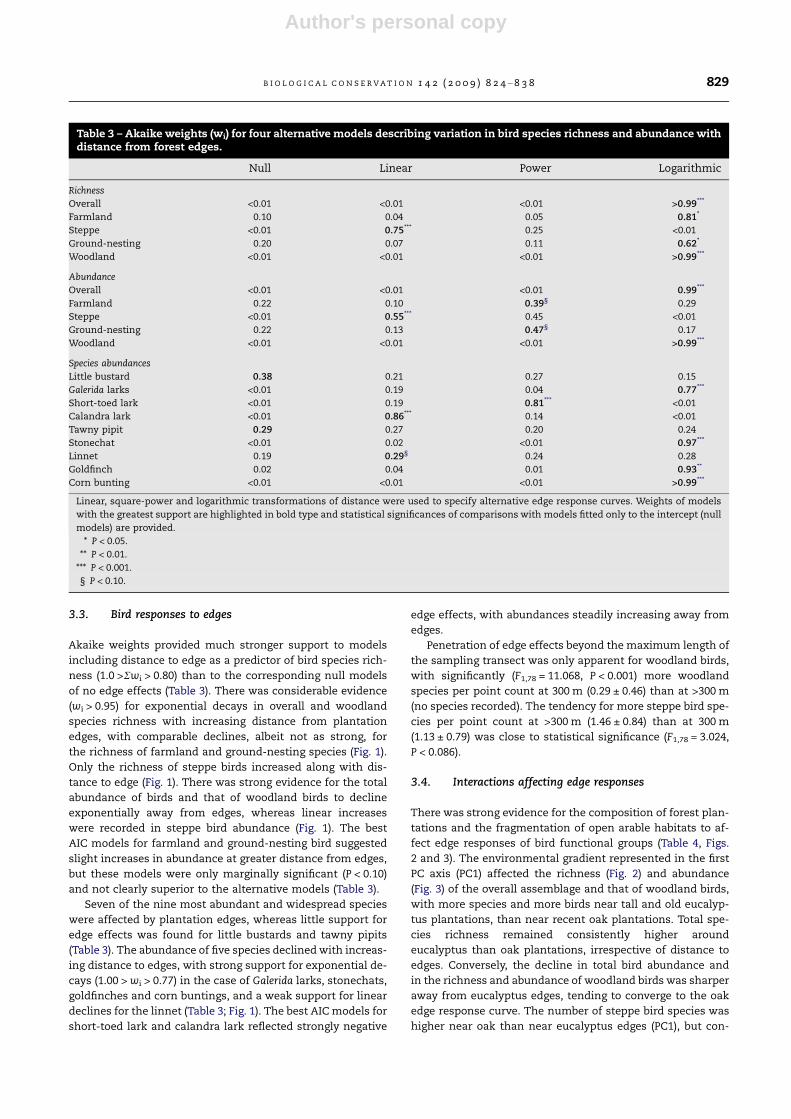
Table 3 – Akaike weights (wi) for four alternative models describing variation in bird species richness and abundance withdistance from forest edges.
Null Linear Power Logarithmic
Richness
Overall <0.01 <0.01 <0.01 >0.99***
Farmland 0.10 0.04 0.05 0.81*
Steppe <0.01 0.75*** 0.25 <0.01
Ground-nesting 0.20 0.07 0.11 0.62*
Woodland <0.01 <0.01 <0.01 >0.99***
Abundance
Overall <0.01 <0.01 <0.01 0.99***
Farmland 0.22 0.10 0.39§ 0.29
Steppe <0.01 0.55*** 0.45 <0.01
Ground-nesting 0.22 0.13 0.47§ 0.17
Woodland <0.01 <0.01 <0.01 >0.99***
Species abundances
Little bustard 0.38 0.21 0.27 0.15
Galerida larks <0.01 0.19 0.04 0.77***
Short-toed lark <0.01 0.19 0.81*** <0.01
Calandra lark <0.01 0.86*** 0.14 <0.01
Tawny pipit 0.29 0.27 0.20 0.24
Stonechat <0.01 0.02 <0.01 0.97***
Linnet 0.19 0.29§ 0.24 0.28
Goldfinch 0.02 0.04 0.01 0.93**
Corn bunting <0.01 <0.01 <0.01 >0.99***
Linear, square-power and logarithmic transformations of distance were used to specify alternative edge response curves. Weights of models
with the greatest support are highlighted in bold type and statistical significances of comparisons with models fitted only to the intercept (null
models) are provided.
* P < 0.05.
** P < 0.01.
*** P < 0.001.
§ P < 0.10.
B I O L O G I C A L C O N S E R V A T I O N 1 4 2 ( 2 0 0 9 ) 8 2 4 – 8 3 8 829
Author's personal copy
verged to similar, much higher values at about 300 m from the
edge (Fig. 2). The abundance of farmland and ground-nesting
birds increased away from eucalyptus edges, whereas there
was almost no response to oak edges (Fig. 3). The fragmenta-
tion gradient reflected in PC4 affected in a similar way the
overall species richness and that of farmland and ground-
nesting (graph not shown) birds, with similar number of spe-
cies near edges irrespective of landscape fragmentation, but
sharper declines away from edges in landscapes with smaller
arable patches (Figs. 2 and 3). The richness (Fig. 2) and abun-
dance (Fig. 3) of steppe birds was low near edges irrespective
of landscape fragmentation, increasing to much higher values
in landscapes with larger arable patches. The abundance of
ground-nesting birds was higher in less fragmented land-
scapes irrespective of distance from edges (Fig. 3).
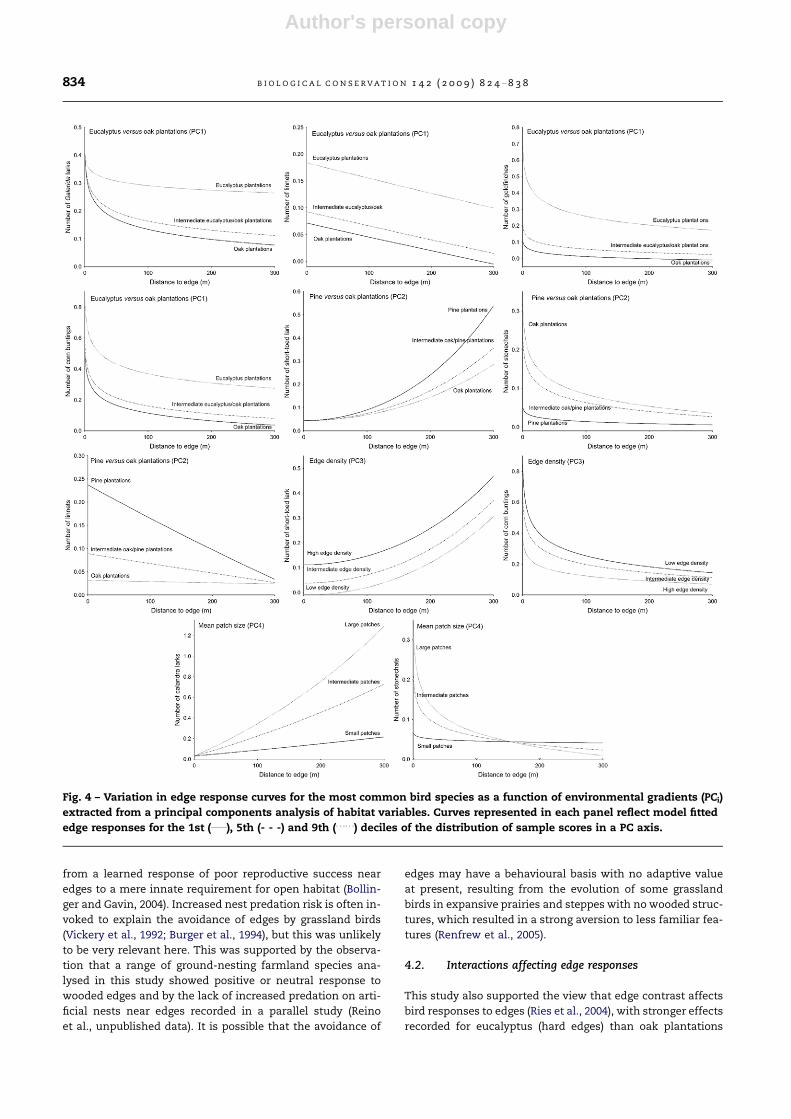
Edge contrast and landscape fragmentation also affected
both positive and negative edge responses by individual spe-
cies (Table 4, Fig. 4). The edge type reflected in PC1 influenced
edge responses of Galerida larks, linnets, goldfinches, and corn
buntings. There were more linnets, goldfinches and corn bun-
tings near mature eucalyptus plantations than near recent oak
plantations, but their numbers declined with increasing dis-
tance from edges. The slope of the goldfinch edge response
curve was also affected by PC1, reflecting a convergence to
low abundances at about 300 m from all edges, albeit still high-
er around eucalyptus plantations. Galerida larks showed simi-
lar abundance near all edges, but there was a tendency for
weaker edge responses to eucalyptus plantations. However,
the AIC support for this model was weak and it was not statis-
tically significant, thereby requiring caution in its interpreta-
tion. The type of edge reflected in PC2 influenced edge
responses of linnets, stonechats and short-toed larks. Linnets
were more abundant near pine than oak edges, but their abun-
dances at 300 m from edges were very low irrespective of edge
type. Stonechats showed the opposite pattern, with higher
abundances near oak edges. Short-toed larks were scarce close
to all edge types, but they increased in abundance away from
edges more sharply around pine plantations. Edge density
(PC3) influenced edge responses of corn buntings and short-
toed larks. Corn bunting abundances were higher near edges
in landscapes with smaller edge density, but their numbers
tended to converge to small values away from edges irrespec-
tive of landscape fragmentation. More short-toed larks were
found near edges in more fragmented landscapes, but the
abundance of this species increased away from edges irrespec-
tive of landscape fragmentation. The mean size of arable
patches (PC4) influenced edge responses of stonechats and cal-
andra larks. Stonechat abundances varied little with distance
to edge in landscapes with smaller arable patches, whereas
they showed high abundances near edges and sharp declines
away from edges in landscapes with large arable patches. Cal-
andra larks were largely absent close edges irrespective of ara-
ble patch size, but their abundance away from edges increased
faster in landscapes with larger arable patches.
4. Discussion
4.1. Edge effects
Planted forests significantly influenced the bird assemblages
of adjacent open land, underlining the value of investigating
edge effects to understand the impacts of afforestation on
biodiversity. Contrary to expectations developed from the
observation that many open habitat birds avoid wooded
boundaries (Coppedge et al., 2004; Fletcher, 2005), however,
it was found that most birds in southern Portugal showed
either positive or neutral edge responses. Positive responses
were apparent for typical farmland birds such as Galerida
larks, stonechats, and corn buntings, which are frequently
Fig. 1 – Edge response curves describing variation in species
richness and abundance of bird functional groups, and in
the abundance of the most common species, as a function of
distance to forest plantation edges in southern Portugal.
830 B I O L O G I C A L C O N S E R V A T I O N 1 4 2 ( 2 0 0 9 ) 8 2 4 – 8 3 8
Author's personal copy
associated with open habitats (Moreira, 1999; Delgado and
Moreira, 2000). Only the steppe birds, a group including the
open grassland specialists, showed marked negative re-
sponses to wooded edges, in terms of both species richness
and abundances. The negative responses were very strong
in the case of the calandra lark and the short-toed lark, but
no evidence for edge avoidance was found for little bustards
and tawny pipits. Patterns for other open habitat species of
high conservation concern, such as great bustards (Otis tarda),
stone curlews (Burhinus oedicnemus) or black-bellied sand-
grouse (Pterocles orientalis) could not be obtained in this study,
because they were scarcely observed at point counts. Further-
more, these species are wide ranging and so probably operate
at large spatial scales, requiring a different sampling design to
assess their responses to wooded edges.
The increase in woodland birds near wooded edges proba-
bly occurs due to spill over from forest plantations, as these
species are largely absent from open farmland landscapes
(Moreira, 1999; Delgado and Moreira, 2000) and they benefit
from habitat conditions created through afforestation (Dıaz
Fig. 2 – Variation in edge response curves for the species richness of bird functional groups as a function of environmental
gradients (PCi) extracted from a Principal Components Analysis of habitat variables. Curves represented in each panel reflect
model fitted edge responses for the 1st (____), 5th (- - -) and 9th (. . .. . .) deciles of the distribution of sample scores in a PC axis.
B I O L O G I C A L C O N S E R V A T I O N 1 4 2 ( 2 0 0 9 ) 8 2 4 – 8 3 8 831

Author's personal copy
et al., 1998; Lopez and Moro, 1997; Santos et al., 2006). Most
woodland birds occurred at <200 m from edges, suggesting
that they may be unable to use agricultural fields unless there
is a dense network of wooded habitats. This finding is consis-
tent with the results of gap crossing experiments which show
an increased reluctance for woodland birds to venture into
the open as the gaps between woodland fragments increase
(Creegan and Osborne, 2005). It is much less clear why farm-
land and ground-nesting bird species richness and the abun-
dance of many typical farmland species also tended to
decline away from edges. One possible reason may be the dif-
ference in the characteristics of edge and interior grassland
habitats, as forest plantations were fenced off from cattle
whereas nearby fields were regularly grazed (personal obser-
vation). Because of this, a strip of relatively tall grassland,
sometimes with small shrubs, often developed near forest
plantations, probably providing better breeding conditions
for many farmland birds than adjacent short swards (e.g.,
Yanes et al., 1996). This idea was supported by an experiment
of predation on quail (Coturnix coturnix) eggs placed in artifi-
cial nests, which showed lower predation rates in tall swards
near forest plantations (Reino et al., unpublished data). Taken
together, these results agree with the observation that the
richest bird assemblages in farmland landscapes are found
Table 4 – Akaike weights (wi) for alternative models describing factors affecting bird response curves to forest edges insouthern Portugal.
Null PC1 PC2 PC3 PC4 PC5
g0 g1 g2 g3 g1 g2 g3 g1 g2 g3 g1 g2 g3 g1 g2 g3
Richness
Overall (a) 0.06 0.29 0.06 0.17 0.02 0.02 0.01 0.05 0.07 0.03 0.04 0.09 0.04 0.02 0.02 0.01
(b) 0.10 0.52* 0.04 0.12 0.17§ 0
Farmland (a) 0.08 0.03 0.07 0.10 0.04 0.03 0.02 0.06 0.05 0.02 0.10 0.25 0.10 0.03 0.03 0.01
(b) 0.14 0.17 0.07 0.11 0.46* 0.05
Steppe (a) 0.02 0.08 0.01 0.21 0.01 0.01 0.01 0.01 0.01 0.00 0.05 0.42 0.16 0.01 0.01 0.01
(b) 0.03 0.31* 0.01 0.01 0.62* 0.02
Ground-nesting (a) 0.06 0.02 0.04 0.06 0.03 0.02 0.01 0.04 0.03 0.02 0.15 0.34 0.13 0.02 0.02 0.01
(b) 0.11 0.10 0.05 0.08 0.62* 0.04
Woodland (a) 0.00 0.00 0.00 1.00 0.00 0.00 0.00 0.00 0.00 0.00 0.00 0.00 0.00 0.00 0.00 0.00
(b) 0.00 1.00*** 0.00 0.00 0.00 0.00
Abundance
Overall (a) 0.00 0.24 0.00 0.75 0.00 0.00 0.00 0.00 0.00 0.00 0.00 0.00 0.00 0.00 0.00 0.00
(b) 0.00 0.99*** 0.00 0.00 0.01 0.00
Farmland (a) 0.01 0.00 0.36 0.56 0.00 0.00 0.00 0.01 0.01 0.00 0.02 0.02 0.01 0.00 0.00 0.00
(b) 0.01 0.93*** 0.00 0.01 0.03 0.00
Steppe (a) 0.00 0.01 0.00 0.02 0.00 0.00 0.00 0.00 0.00 0.00 0.03 0.66 0.26 0.00 0.00 0.00
(b) 0.01 0.03 0.00 0.00 0.95*** 0
Ground-nesting (a) 0.05 0.02 0.17 0.13 0.02 0.03 0.02 0.04 0.05 0.02 0.24 0.07 0.09 0.02 0.02 0.01
(b) 0.10 0.30* 0.05 0.09 0.43* 0.04
Woodland (a) 0.00 0.00 0.00 1.00 0.00 0.00 0.00 0.00 0.00 0.00 0.00 0.00 0.00 0.00 0.00 0.00
(b) 0.00 1.00*** 0.00 0.00 0.00 0.00
Species abundances
Galerida larks (a) 0.11 0.08 0.19 0.08 0.10 0.07 0.04 0.04 0.05 0.03 0.05 0.04 0.03 0.04 0.04 0.02
(b) 0.21 0.35§ 0.19 0.09 0.08 0.08
Short-toed lark (a) 0.06 0.02 0.03 0.01 0.03 0.09 0.04 0.32 0.07 0.12 0.03 0.06 0.03 0.04 0.03 0.02
(b) 0.10 0.04 0.15§ 0.53* 0.11 0.1
Calandra lark (a) 0.00 0.00 0.00 0.00 0.00 0.00 0.00 0.00 0.00 0.00 0.00 0.72 0.28 0.00 0.00 0.00
(b) 0.00 0.00 0.00 0.00 1.00*** 0
Stonechat (a) 0.04 0.02 0.02 0.01 0.15 0.02 0.37 0.01 0.01 0.02 0.03 0.01 0.25 0.01 0.01 0.01
(b) 0.05 0.03 0.52* 0.02 0.36* 0
Linnet (a) 0.04 0.22 0.03 0.13 0.20 0.02 0.26 0.01 0.01 0.01 0.01 0.01 0.01 0.02 0.01 0.01
(b) 0.06 0.39* 0.47* 0.03 0.02 0.03
Goldfinch (a) 0.00 0.42 0.01 0.55 0.00 0.00 0.00 0.00 0.00 0.00 0.01 0.00 0.01 0.00 0.00 0.00
(b) 0.00 0.98*** 0.00 0.00 0.02 0.00
Corn bunting (a) 0.02 0.29 0.15 0.12 0.01 0.01 0.01 0.11 0.01 0.22 0.01 0.02 0.01 0.01 0.01 0.00
(b) 0.03 0.51** 0.02 0.39* 0.03 0.02
Comparisons included the null model (g0) and three alternative models (g1–g3) for each of five axes (PCn) extracted by a PCA of habitat variables
(Table 2): g0 = model fit to distance only; g1 = effects on the intercept; g2 = effects on the slope; g2 = effects on both the intercept and the slope.
The table includes Akaike weights based on the entire set of models (a) and conditional Akaike weights based on the set of models including
the null model and the best AIC model for each PC (b). Conditional weights of models with the greatest support are highlighted in bold type and
statistical significances of comparisons with the null model are provided.
* P < 0.05.
** P < 0.01.
*** P < 0.001.
§ P < 0.10.
832 B I O L O G I C A L C O N S E R V A T I O N 1 4 2 ( 2 0 0 9 ) 8 2 4 – 8 3 8
Author's personal copy
where agricultural habitats are interspersed with wooded
habitats such as woodlots and hedgerows (Freemark and Kirk,
2001; Moreira et al., 2005). The weak negative response to
edges of farmland and ground-nesting bird abundances was
likely a consequence of pooling species with contrasting edge
responses. Although these groups included species showing
marked positive edge responses, such as corn buntings and
Galerida larks, the overall negative edge effect was probably
driven by the influence of abundant steppe birds such as
the calandra lark and the short-toed lark.
The only species showing marked negative responses to
wooded edges were the true open habitat specialists, particu-
larly the calandra lark and the short-toed lark. The abun-
dance of both species steadily increased away from forest
plantations, only reaching densities similar to that of core
open habitats at about 300 m from edges. In contrast, two
other open habitat species, the little bustard and the tawny
pipit showed neutral responses to wooded edges. These pat-
terns are difficult to interpret, as edge avoidance in grassland
species may result from a combination of a variety of factors,
Fig. 3 – Variation in edge response curves for the abundance of bird functional groups as a function of environmental
gradients (PCi) extracted from a principal components analysis of habitat variables. Curves represented in each panel reflect
model fitted edge responses for the 1st (____), 5th (- - -) and 9th (. . .. . .) deciles of the distribution of sample scores in a PC axis.
B I O L O G I C A L C O N S E R V A T I O N 1 4 2 ( 2 0 0 9 ) 8 2 4 – 8 3 8 833
Author's personal copy
from a learned response of poor reproductive success near
edges to a mere innate requirement for open habitat (Bollin-
ger and Gavin, 2004). Increased nest predation risk is often in-
voked to explain the avoidance of edges by grassland birds
(Vickery et al., 1992; Burger et al., 1994), but this was unlikely
to be very relevant here. This was supported by the observa-
tion that a range of ground-nesting farmland species ana-
lysed in this study showed positive or neutral response to
wooded edges and by the lack of increased predation on arti-
ficial nests near edges recorded in a parallel study (Reino
et al., unpublished data). It is possible that the avoidance of
edges may have a behavioural basis with no adaptive value
at present, resulting from the evolution of some grassland
birds in expansive prairies and steppes with no wooded struc-
tures, which resulted in a strong aversion to less familiar fea-
tures (Renfrew et al., 2005).
4.2. Interactions affecting edge responses
This study also supported the view that edge contrast affects
bird responses to edges (Ries et al., 2004), with stronger effects
recorded for eucalyptus (hard edges) than oak plantations
Fig. 4 – Variation in edge response curves for the most common bird species as a function of environmental gradients (PCi)
extracted from a principal components analysis of habitat variables. Curves represented in each panel reflect model fitted
edge responses for the 1st (____), 5th (- - -) and 9th (. . .. . .) deciles of the distribution of sample scores in a PC axis.
834 B I O L O G I C A L C O N S E R V A T I O N 1 4 2 ( 2 0 0 9 ) 8 2 4 – 8 3 8
Author's personal copy
(soft edges). In the study area, most eucalyptus plantations
are tall and old, presumably providing more colonization
opportunities for woodland birds than oak plantations, which
tended to be young and short. The spill over of woodland
birds into adjacent agricultural fields was thus stronger
around eucalyptus than oak plantations, explaining the ob-
served increase in overall species richness and abundance
near eucalyptus edges. This pattern was illustrated by the
goldfinch and the linnet, two species with woody require-
ments during the breeding season, which were relatively
abundant in agricultural fields surrounding eucalyptus plan-
tations and almost absent near young plantations. It is much
less clear why the positive responses by farmland species
such as the Galerida larks and the corn bunting were also
stronger for eucalyptus than for oak plantation edges. It is
possible that this was related to the older age of eucalyptus
edges, as edge quality may change with time and there may
be time lags in species responses (Ries et al., 2004). It is also
possible that the edges of oak plantations are perceived by
these birds as less stable, due to more frequent silvicultural
operations in recent stands. The edge avoidance response of
steppe birds was also stronger for eucalyptus than oak plan-
tation edges. This could possibly be related to the visual
obstruction effect of tall eucalyptus edges, which is likely to
elicit a much stronger aversion by open grassland birds than
the short oak plantations. The overall response of farmland
birds and ground-nesting birds, with a nearly neutral re-
sponse to oak edges and the increase with distance from
eucalyptus edges, probably reflected the cumulative effect of
contrasting responses by steppe and other farmland birds.
Difference in bird responses to pine and oak edges were rela-
tively small, though they tended to be stronger to the former.
Linnet abundance was highest near pine edges, probably be-
cause this species finds adequate breeding conditions in
young umbrella pine plantations (Khoury et al., 2009), which
may provide more concealment against predators than small
and sparse oak plantations. The reason for short-toed larks
increasing faster away from pine than oak edges was unclear.
The size of open arable patches and edge density also af-
fected edge responses by bird functional groups and individ-
ual species, underlining the presence of interactions
between edge effects and landscape fragmentation. The prev-
alence and magnitude of such interactions were relatively
unexpected, as fragmentation had the least effect on mea-
sured responses in a recent review of interactions affecting
edge effects (Ries et al., 2004). It should thus be evaluated
whether such interactions may be more widespread than pre-
viously realized, using for instance sampling designs and sta-
tistical approaches similar to those adopted herein. These
allowed the detection of complex interaction between edge
and fragmentation effects such as that of stonechats, which
showed strong positive responses to edges in landscapes
dominated by large arable patches, whereas virtually neutral
responses to smaller arable patches. This suggests that ston-
echats were largely confined to farmland fields near wooded
edges in open farmland, whereas in fragmented agricultural
landscapes they were more ubiquitous. A comparable pat-
tern, albeit not as strong, was evident for the corn bunting,
which showed the strongest edge responses in landscapes
with low edge density.
Landscape fragmentation also affected negative edge re-
sponses, with the overall richness and abundance of steppe
birds and the abundance of calandra larks increasing faster
away from edges in less fragmented landscapes. These results
agree with previous research carried out within the same
study area, showing that the calandra lark is extremely sensi-
tive to the fragmentation of grassland habitats, tending to oc-
cur at the highest densities in open grassland patches >100 ha
(Morgado et al., unpublished data). They are also akin to the
results of Fletcher (2005), who showed that negative edge ef-
fects on a North American grassland bird were intensified by
the joint influence of multiple edges. The processes that
underlie these patterns are unclear at present, but they may
be related to the exacerbated influence near multiple edges
of the mechanisms usually considered to affect bird responses
to edges, such as behavioural aversion, changes in habitat
structure, food availability and species interactions (Ries
et al., 2004; Fletcher, 2005). The overall pattern for the steppe
birds, however, was not evident for short-toed larks, which in-
creased faster away from edges in landscapes with higher
edge density, suggesting that although short-toed larks
avoided edges, they tended to be more abundant in more frag-
mented landscapes. We tentatively hypothesize that interspe-
cific competition may be involved in shaping such patterns,
with much larger calandra larks being restricted to large hab-
itat patches (Morgado et al., unpublished data; this study) and
relegating short-toed larks to more fragmented landscapes.
This hypothesis is based on the observation that competition
may be an important driving force in community assembly of
granivorous birds inhabiting simple environments (e.g., Grant
and Grant, 2006), that competition appears to be a significant
mechanism shaping the distribution patterns and habitat
selection of Calandrella larks (Suarez et al., 2002; Serrano and
Astrain, 2005), and that habitat segregation between calandra
and short-toed larks has been recorded within the study area
(Moreira, 1999; Delgado and Moreira, 2000).
4.3. Conservation
This study extends previous findings of the effects of affores-
tation in Mediterranean open farmland, showing that the
edge effects of forest plantations may contribute to increase
local bird diversity at the expense of negative effects for
steppe birds of European conservation concern (Burfield and
van Bommel, 2004). Although some farmland birds appeared
to thrive at forest plantation edges, they were generally of less
conservation concern than the open grassland specialists
(Suarez et al., 1997; Burfield and van Bommel, 2004; Bota
et al., 2005).
Recognizing the potential for significant negative edge ef-
fects has consequences for the impact assessment and plan-
ning of afforestation in Mediterranean farmland. In the first
place, it should be duly considered that the total area affected
by a forest plantation is larger than the surface actually
planted with trees. Assuming purely geometric effects, planta-
tions of, for instance 1, 10 and 100 ha, with a 200 m edge effect
and a circular shape, would cause reductions in habitat area
for steppe birds of about 21, 45 and 183 ha, respectively (e.g.,
Sisk and Haddad, 2002). The extent of such habitat reductions
may further increase with the proportion of the landscape con-
B I O L O G I C A L C O N S E R V A T I O N 1 4 2 ( 2 0 0 9 ) 8 2 4 – 8 3 8 835
Author's personal copy
verted into forest, as the strength of negative edge effects
tended to increase along with the edge density of unsuitable
habitats (Fletcher, 2005; Ewers and Didham, 2007; this study).
This implies that population declines of edge-avoiding species
should occur more rapidly than expected from simple loss of
habitat, and that such declines should be progressively faster
with increasing habitat fragmentation. This supports the rec-
ommendation that afforestation in Mediterranean farmland
should be avoided in areas occupied by steppe birds of conser-
vation concern (Dıaz et al., 1998).
Where afforestation is unavoidable due to political, social
or economic constraints, landscape planning should strive
to reduce fragmentation of adjacent agricultural habitats. A
spatial configuration of forest patches minimizing edge ef-
fects may be achieved by afforesting a small number of rela-
tively large patches, preferably those with little initial value
for species of conservation concern, instead of planting sev-
eral small forest patches scattered across the landscape
(e.g., Sisk and Haddad, 2002). This recommendation has the
double advantage of favouring the development of rich bird
assemblages within forest patches (Dıaz et al., 1998) and
reducing the impacts on edge-avoiding steppe birds. Enforc-
ing such recommendation in practice, however, has to meet
the challenges of managing multi-ownership landscapes,
where individual land-use decisions on private lands may
compromise global management goals (e.g., Spies et al.,
2002). Solving this problem probably requires a combination
of regulatory (e.g., laws and policies restricting or governing
the conversion of farmland into forest) and incentive-based
approaches (e.g., agri-environment schemes increasing the
economic return from agricultural land), aimed at reducing
the total area and promoting the aggregation of forest planta-
tions. Finding the best solution from the ecological perspec-
tive, however, calls for a better understanding of how
species-specific edge effects translate into population and
community responses at the landscape-scale, which is critical
for predicting the amount, size and spatial configuration of
suitable habitats required for the conservation of edge-sensi-
tive species (Sisk and Haddad, 2002; Ewers and Didham, 2007).
Acknowledgements
This project was funded by the Comissao de Coordenacao e
Desenvolvimento Regional do Alentejo and Associacao de De-
fesa do Patrimonio de Mertola. Luıs Reino was supported by a
PhD Grant (SFRH/BD/14085/2003) from the Portuguese Science
Foundation (FCT). We thank Robert Ewers, Pedro Leitao and
Jorge Cadima for discussions concerning the statistical analy-
sis, and three anonymous referees for helpful comments and
suggestions to improve the paper. Thanks are also due to Mig-
uel Porto for helping to process digital photographs and Joana
Santana, Luıs Gordinho and Nuno Leitao for help in preparing
the figures. We also thank Liga para a Proteccao da Natureza
for providing logistics during fieldwork.
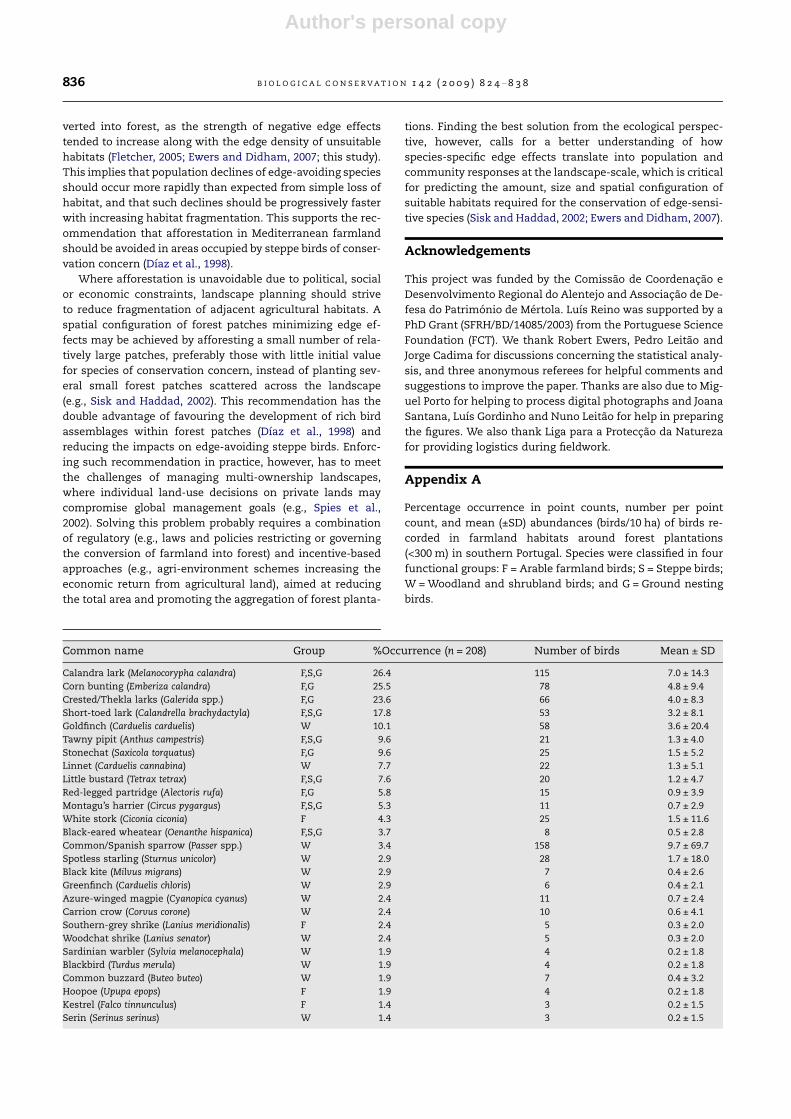
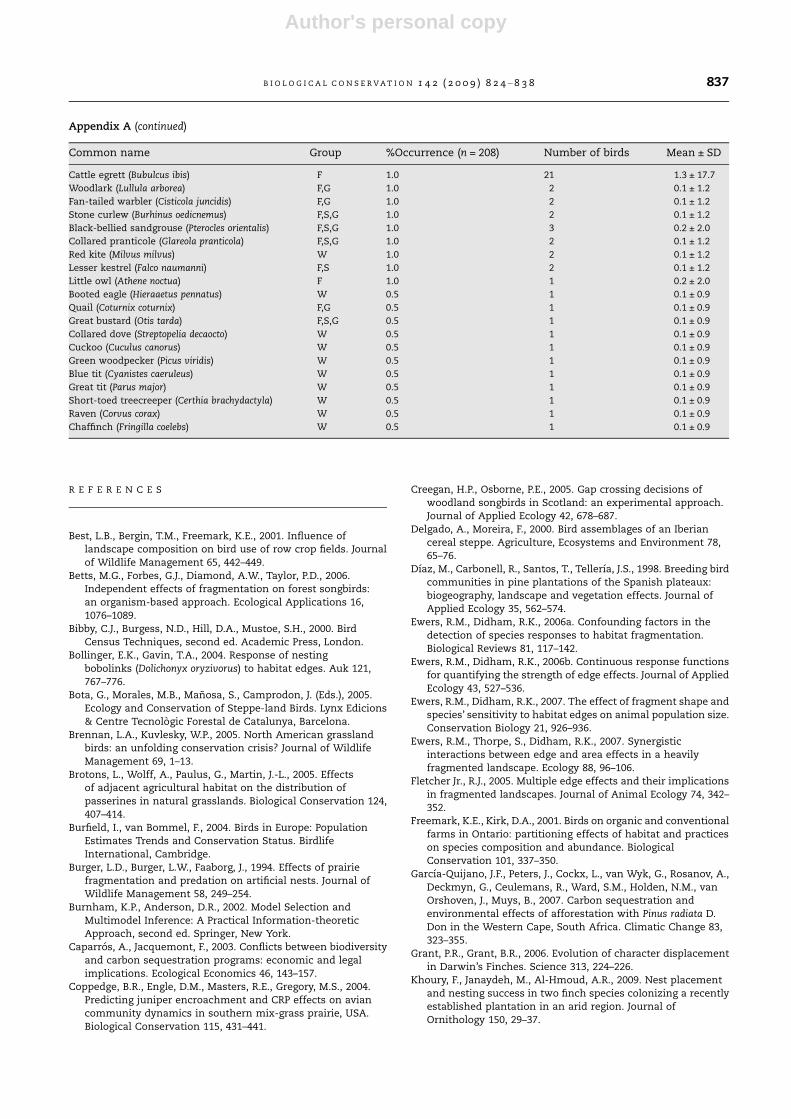
Appendix A
Percentage occurrence in point counts, number per point
count, and mean (±SD) abundances (birds/10 ha) of birds re-
corded in farmland habitats around forest plantations
(<300 m) in southern Portugal. Species were classified in four
functional groups: F = Arable farmland birds; S = Steppe birds;
W = Woodland and shrubland birds; and G = Ground nesting
birds.
Common name Group %Occurrence (n = 208) Number of birds Mean ± SD
Calandra lark (Melanocorypha calandra) F,S,G 26.4 115 7.0 ± 14.3
Corn bunting (Emberiza calandra) F,G 25.5 78 4.8 ± 9.4
Crested/Thekla larks (Galerida spp.) F,G 23.6 66 4.0 ± 8.3
Short-toed lark (Calandrella brachydactyla) F,S,G 17.8 53 3.2 ± 8.1
Goldfinch (Carduelis carduelis) W 10.1 58 3.6 ± 20.4
Tawny pipit (Anthus campestris) F,S,G 9.6 21 1.3 ± 4.0
Stonechat (Saxicola torquatus) F,G 9.6 25 1.5 ± 5.2
Linnet (Carduelis cannabina) W 7.7 22 1.3 ± 5.1
Little bustard (Tetrax tetrax) F,S,G 7.6 20 1.2 ± 4.7
Red-legged partridge (Alectoris rufa) F,G 5.8 15 0.9 ± 3.9
Montagu’s harrier (Circus pygargus) F,S,G 5.3 11 0.7 ± 2.9
White stork (Ciconia ciconia) F 4.3 25 1.5 ± 11.6
Black-eared wheatear (Oenanthe hispanica) F,S,G 3.7 8 0.5 ± 2.8
Common/Spanish sparrow (Passer spp.) W 3.4 158 9.7 ± 69.7
Spotless starling (Sturnus unicolor) W 2.9 28 1.7 ± 18.0
Black kite (Milvus migrans) W 2.9 7 0.4 ± 2.6
Greenfinch (Carduelis chloris) W 2.9 6 0.4 ± 2.1
Azure-winged magpie (Cyanopica cyanus) W 2.4 11 0.7 ± 2.4
Carrion crow (Corvus corone) W 2.4 10 0.6 ± 4.1
Southern-grey shrike (Lanius meridionalis) F 2.4 5 0.3 ± 2.0
Woodchat shrike (Lanius senator) W 2.4 5 0.3 ± 2.0
Sardinian warbler (Sylvia melanocephala) W 1.9 4 0.2 ± 1.8
Blackbird (Turdus merula) W 1.9 4 0.2 ± 1.8
Common buzzard (Buteo buteo) W 1.9 7 0.4 ± 3.2
Hoopoe (Upupa epops) F 1.9 4 0.2 ± 1.8
Kestrel (Falco tinnunculus) F 1.4 3 0.2 ± 1.5
Serin (Serinus serinus) W 1.4 3 0.2 ± 1.5
836 B I O L O G I C A L C O N S E R V A T I O N 1 4 2 ( 2 0 0 9 ) 8 2 4 – 8 3 8
Author's personal copy
R E F E R E N C E S
Best, L.B., Bergin, T.M., Freemark, K.E., 2001. Influence oflandscape composition on bird use of row crop fields. Journalof Wildlife Management 65, 442–449.
Betts, M.G., Forbes, G.J., Diamond, A.W., Taylor, P.D., 2006.Independent effects of fragmentation on forest songbirds:an organism-based approach. Ecological Applications 16,1076–1089.
Bibby, C.J., Burgess, N.D., Hill, D.A., Mustoe, S.H., 2000. BirdCensus Techniques, second ed. Academic Press, London.
Bollinger, E.K., Gavin, T.A., 2004. Response of nestingbobolinks (Dolichonyx oryzivorus) to habitat edges. Auk 121,767–776.
Bota, G., Morales, M.B., Manosa, S., Camprodon, J. (Eds.), 2005.Ecology and Conservation of Steppe-land Birds. Lynx Edicions& Centre Tecnologic Forestal de Catalunya, Barcelona.
Brennan, L.A., Kuvlesky, W.P., 2005. North American grasslandbirds: an unfolding conservation crisis? Journal of WildlifeManagement 69, 1–13.
Brotons, L., Wolff, A., Paulus, G., Martin, J.-L., 2005. Effectsof adjacent agricultural habitat on the distribution ofpasserines in natural grasslands. Biological Conservation 124,407–414.
Burfield, I., van Bommel, F., 2004. Birds in Europe: PopulationEstimates Trends and Conservation Status. BirdlifeInternational, Cambridge.
Burger, L.D., Burger, L.W., Faaborg, J., 1994. Effects of prairiefragmentation and predation on artificial nests. Journal ofWildlife Management 58, 249–254.
Burnham, K.P., Anderson, D.R., 2002. Model Selection andMultimodel Inference: A Practical Information-theoreticApproach, second ed. Springer, New York.
Caparros, A., Jacquemont, F., 2003. Conflicts between biodiversityand carbon sequestration programs: economic and legalimplications. Ecological Economics 46, 143–157.
Coppedge, B.R., Engle, D.M., Masters, R.E., Gregory, M.S., 2004.Predicting juniper encroachment and CRP effects on aviancommunity dynamics in southern mix-grass prairie, USA.Biological Conservation 115, 431–441.
Creegan, H.P., Osborne, P.E., 2005. Gap crossing decisions ofwoodland songbirds in Scotland: an experimental approach.Journal of Applied Ecology 42, 678–687.
Delgado, A., Moreira, F., 2000. Bird assemblages of an Iberiancereal steppe. Agriculture, Ecosystems and Environment 78,65–76.
Dıaz, M., Carbonell, R., Santos, T., Tellerıa, J.S., 1998. Breeding birdcommunities in pine plantations of the Spanish plateaux:biogeography, landscape and vegetation effects. Journal ofApplied Ecology 35, 562–574.
Ewers, R.M., Didham, R.K., 2006a. Confounding factors in thedetection of species responses to habitat fragmentation.Biological Reviews 81, 117–142.
Ewers, R.M., Didham, R.K., 2006b. Continuous response functionsfor quantifying the strength of edge effects. Journal of AppliedEcology 43, 527–536.
Ewers, R.M., Didham, R.K., 2007. The effect of fragment shape andspecies’ sensitivity to habitat edges on animal population size.Conservation Biology 21, 926–936.
Ewers, R.M., Thorpe, S., Didham, R.K., 2007. Synergisticinteractions between edge and area effects in a heavilyfragmented landscape. Ecology 88, 96–106.
Fletcher Jr., R.J., 2005. Multiple edge effects and their implicationsin fragmented landscapes. Journal of Animal Ecology 74, 342–352.
Freemark, K.E., Kirk, D.A., 2001. Birds on organic and conventionalfarms in Ontario: partitioning effects of habitat and practiceson species composition and abundance. BiologicalConservation 101, 337–350.
Garcıa-Quijano, J.F., Peters, J., Cockx, L., van Wyk, G., Rosanov, A.,Deckmyn, G., Ceulemans, R., Ward, S.M., Holden, N.M., vanOrshoven, J., Muys, B., 2007. Carbon sequestration andenvironmental effects of afforestation with Pinus radiata D.Don in the Western Cape, South Africa. Climatic Change 83,323–355.
Grant, P.R., Grant, B.R., 2006. Evolution of character displacementin Darwin’s Finches. Science 313, 224–226.
Khoury, F., Janaydeh, M., Al-Hmoud, A.R., 2009. Nest placementand nesting success in two finch species colonizing a recentlyestablished plantation in an arid region. Journal ofOrnithology 150, 29–37.
Common name Group %Occurrence (n = 208) Number of birds Mean ± SD
Cattle egrett (Bubulcus ibis) F 1.0 21 1.3 ± 17.7
Woodlark (Lullula arborea) F,G 1.0 2 0.1 ± 1.2
Fan-tailed warbler (Cisticola juncidis) F,G 1.0 2 0.1 ± 1.2
Stone curlew (Burhinus oedicnemus) F,S,G 1.0 2 0.1 ± 1.2
Black-bellied sandgrouse (Pterocles orientalis) F,S,G 1.0 3 0.2 ± 2.0
Collared pranticole (Glareola pranticola) F,S,G 1.0 2 0.1 ± 1.2
Red kite (Milvus milvus) W 1.0 2 0.1 ± 1.2
Lesser kestrel (Falco naumanni) F,S 1.0 2 0.1 ± 1.2
Little owl (Athene noctua) F 1.0 1 0.2 ± 2.0
Booted eagle (Hieraaetus pennatus) W 0.5 1 0.1 ± 0.9
Quail (Coturnix coturnix) F,G 0.5 1 0.1 ± 0.9
Great bustard (Otis tarda) F,S,G 0.5 1 0.1 ± 0.9
Collared dove (Streptopelia decaocto) W 0.5 1 0.1 ± 0.9
Cuckoo (Cuculus canorus) W 0.5 1 0.1 ± 0.9
Green woodpecker (Picus viridis) W 0.5 1 0.1 ± 0.9
Blue tit (Cyanistes caeruleus) W 0.5 1 0.1 ± 0.9
Great tit (Parus major) W 0.5 1 0.1 ± 0.9
Short-toed treecreeper (Certhia brachydactyla) W 0.5 1 0.1 ± 0.9
Raven (Corvus corax) W 0.5 1 0.1 ± 0.9
Chaffinch (Fringilla coelebs) W 0.5 1 0.1 ± 0.9
Appendix A (continued)
B I O L O G I C A L C O N S E R V A T I O N 1 4 2 ( 2 0 0 9 ) 8 2 4 – 8 3 8 837
Author's personal copy
Lazdinis, M., Roberge, J.-M., Kurlavicius, P., Mozgeris, G.,Angelstam, P., 2005. Afforestation planning and biodiversityconservation: predicting effects on habitat functionality inLithuania. Journal of Environmental Planning andManagement 48, 331–348.
Legendre, P., Legendre, L., 1998. Numerical Ecology, second ed.Elsevier, Amsterdam.
Lopez, G., Moro, M.J., 1997. Birds of Aleppo pine plantations insouth-east Spain in relation to vegetation composition andstructure. Journal of Applied Ecology 33, 243–262.
Loyn, R.H., McNabb, E.G., Macak, P., Noble, P., 2007. Eucalyptplantations as habitat for birds on previously cleared farmlandin south-eastern Australia. Biological Conservation 137,533–548.
Lukacs, P.M., Thompson, W.L., Kendall, W.L., Gould, W.R., DohertyJr, P.F., Burnham, K.P., Anderson, D.R., 2007. Concernsregarding a call for pluralism of information theory andhypothesis testing. Journal of Applied Ecology 44, 456–460.
Madsen, L.M., 2002. The Danish afforestation programme andspatial planning: new challenges. Landscape and UrbanPlanning 58, 241–254.
Matthews, S., O’Connor, R., Plantinga, A.J., 2002. Quantifying theimpacts on biodiversity of policies for carbon sequestration inforests. Ecological Economics 40, 71–87.
Moreira, F., 1999. Relationships between vegetation structure andbreeding bird densities in fallow cereal steppes in CastroVerde, Portugal. Bird Study 46, 309–318.
Moreira, F., Beja, P., Morgado, R., Reino, L., Gordinho, L., Delgado, A.,Borralho, R., 2005. Effects of field management and landscapecontext on grassland wintering birds in Southern Portugal.Agriculture, Ecosystems and Environment 109, 59–74.
Pinheiro, J.C., Bates, D.M., 2000. Mixed-efffects Models in S andS-Plus. Springer, New York.
Pinheiro, J.C., Bates, D.M., DebRoy, S., D. Sarkar, D., 2007. NLME:Linear and Nonlinear Mixed Effects Models. R Package Version3.1–83. <http://www.R-project.org>.
Potter, C., Klooster, S., Hiatt, S., Fladeland, M., Genovese, V., Gross,V., 2007. Satellite-derived estimates of potential carbonsequestration through afforestation of agricultural lands inthe United States. Climatic Change 80, 323–336.
R Development Core Team, 2008. R: A Language and Environmentfor Statistical Computing. R Foundation for StatisticalComputing, Vienna, Austria. URL: <http://www.R-project.org>.
Rempel, R.S., Carr., A.P., 2003. Patch Analyst extension forArcView: version 3. <http://flash.lakeheadu.ca/~rrempel/patch/index.html>.
Renfrew, R.B., Ribic, C.A., Nack, J.L., 2005. Edge avoidance bynesting grassland birds: a futile strategy in a fragmentedlandscape. Auk 122, 618–636.
Richards, S.A., 2008. Dealing with overdispersed count data inapplied ecology. Journal of Applied Ecology 45, 218–227.
Ries, L., Fletcher Jr., R.J., Battin, J., Sisk, T.D., 2004. Ecologicalresponses to habitat edges: mechanisms, models, andvariability explained. Annual Review of Ecology andSystematics 35, 491–522.
Robson, N., 1997. The evolution of the common agricultural policyand the incorporation of environmental considerations. In:
Pain, D.J., Pienkowski, M.W. (Eds.), Farming and Birds inEurope. Academic Press, London, pp. 43–78.
Santos, T., Tellerıa, J.L., Dias, M., Carbonell, R., 2006. Evaluatingthe benefits of CAP reforms: can afforestations restore birddiversity in mediterranean Spain? Basic and Applied Ecology7, 483–495.
Serrano, D., Astrain, C., 2005. Microhabitat use and segregation oftwo sibling species of Calandrella larks during the breedingseason: conservation and management strategies. BiologicalConservation 125, 391–397.
Shochat, E., Abramsky, Z., Pinshow, B., 2001. Breeding birdspecies diversity in the Negev: effects of scrubfragmentation by planted forests. Journal of Applied Ecology38, 1135–1147.
Sisk, T.D., Haddad, N.M., 2002. Incorporating the effects of habitatedges into landscape models: effective area models for cross-boundary management. In: Liu, J., Taylor, W.W. (Eds.),Integrating Landscape Ecology into Natural ResourceManagement. Cambridge University Press, Cambridge, pp.208–240.
Soderstrom, B., Part, T., 2000. Influence of landscape scale onfarmland birds breeding in semi-natural pastures.Conservation Biology 14, 522–533.
Spies, T.A., Reeves, G.H., Burnett, K.M., McComb, W.C., Johnson,K.N., Grant, G., Ohmann, J.L., Garman, S.L., Bettinger, P., 2002.Assessing the ecological consequences of forest policies in amulti-ownership province in oregon. In: Liu, J., Taylor, W.W.(Eds.), Integrating Landscape Ecology into Natural ResourceManagement. Cambridge University Press, Cambridge, pp.179–207.
Statsoft Inc., 2008. STATISTICA (data analysis software system),version 8.0. <http://www.statsoft.com>.
Stephens, P.A., Buskirk, S.W., Hayward, G.D., Martınez del Rio, C.,2005. Information theory and hypothesis testing: a call forpluralism. Journal of Applied Ecology 42, 4–12.
Suarez, F., Naveso, M.A., De Juana, E., 1997. Farming in thedrylands of Spain: birds of the pseudosteppes. In: Pain, D.J.,Pienkowsky, M.W. (Eds.), Farming and Birds in Europe: TheCommon Agricultural Policy and Its Implications for BirdConservation. Academic Press, London, pp. 297–330.
Suarez, F., Garza, V., Morales, M.B., 2002. Habitat use of two siblingspecies, the short-toed Calandrella brachydactyla and the lessershort-toed C. rufescens larks, in mainland Spain. Ardeola 49,259–272.
Van Doorn, A.M., Bakker, M.M., 2007. The destination of arableland in a marginal agricultural landscape in South Portugal: anexploration of land use change determinants. LandscapeEcology 22, 1073–1087.
Vickery, P.C., Hunter, M.L., Wells, J.V., 1992. Evidence of incidentalnest predation and its effects on nests of threatened grasslandbirds. Oikos 63, 281–288.
Yanes, M., Herranz, J., Suarez, F., 1996. Nest microhabitat selectionin larks from a European semi-arid shrub-steppe: the role ofsunlight and predation. Journal of Arid Environments 32, 469–478.
Zar, J.H., 1996. Biostatistical Analysis, 3rd ed. Prentice Hall, NewJersey.
838 B I O L O G I C A L C O N S E R V A T I O N 1 4 2 ( 2 0 0 9 ) 8 2 4 – 8 3 8