DISSERTATION Caitlin Howell (M.Sc. Botany and Plant ...
113
DISSERTATION submitted to the Faculty of Chemistry and Earth Sciences of the University of Heidelberg, Heidelberg, Germany in partial fulfillment of the requirements for the degree of Doctor of Natural Sciences (Dr. rer. nat.) sumitted by Caitlin Howell (M.Sc. Botany and Plant Pathology) born in Lewiston, Maine, USA Oral examination: October 10 th , 2011
-
Upload
khangminh22 -
Category
Documents
-
view
0 -
download
0
Transcript of DISSERTATION Caitlin Howell (M.Sc. Botany and Plant ...

DISSERTATION
submitted to the
Faculty of Chemistry and Earth Sciences
of the University of Heidelberg, Heidelberg, Germany
in partial fulfillment of the requirements for the degree of
Doctor of Natural Sciences (Dr. rer. nat.)
sumitted by
Caitlin Howell (M.Sc. Botany and Plant Pathology)born in Lewiston, Maine, USA
Oral examination: October 10th, 2011


In situ investigations of biologicalmolecules using vibrationalsum-frequency-generation
spectroscopy
The dissertation was carried out at the
Institute of Physical Chemistry
University of Heidelberg, Heidelberg, Germany
and reviewed byProf. Dr. Michael Grunze
Institute of Physical Chemistry, University of HeidelbergProf. Dr. Marcus Motzkus
Institute of Physical Chemistry, University of Heidelberg


Nothing tends so much to the advancement of knowledge as the application of a newinstrument. The native intellectual powers of men in different times are not so muchthe causes of the different success of their labours, as the peculiar nature of the means
and artificial resources in their possession.
Sir Humphrey Davy


Published works related to this thesis:
– C. Howell, H. Hamoudi, P. Koelsch, and M. Zharnikov Orientation changes insurface-bound hybridized DNA undergoing preparation for ex situ spectroscopicanalysis. Chemical Physics Letters, 513 (2011) 267–270.
– C. Howell, J. Zhao, P. Koelsch, and M. Zharnikov. Hybridization in ssDNA films:a multi-technique spectroscopy study. Physical Chemistry Chemical Physics, 13(2011) 15512-15522.
– C. Howell, R. Maul, W. Wenzel, and P. Koelsch. Interactions of hydrophobic andhydrophilic self-assembled monolayers with water as probed by sum-frequency-generation spectroscopy. Chemical Physics Letters, 494 (2010) 193–197.
– D. Verreault, V. Kurz, C. Howell and P. Koelsch. Sample cells for probing solid/liquidinterfaces with broadband sum-frequency-generation spectroscopy. Review ofScientific Instruments, 81 (2010) 06311/11–10.
– M.-O. Diesner, C. Howell, V. Kurz, D. Verreault and P. Koelsch. In vitro charac-terization of surface properties through living cell. Journal of Physical ChemistryLetters, 1 (2010) 2339–2342.
– C. Howell, R. Schmidt, V. Kurz and P. Koelsch. Sum-frequency-generation spec-troscopy of DNA films in air and aqueous environments. Biointerphases, 3 (2008)FC47–FC51
– C. Howell, M.-O. Diesner, M. Grunze, and P. Koelsch. Probing the extracellularmatrix with sum-frequency-generation spectroscopy. Langmuir, 24 (2008) 13819–13821.
Other works published as a PhD student:
– A.-C. Hastrup, C. Howell, F. Larsen, B. Goodell, and J. Jellison. Differences inmodification of crystalline cellulose due to degradation by brown and white rotfungi. FEBS Journal, (2011) submitted.
– C. Howell, A.-C. Hastrup, R. Jara, F. Larsen, B. Goodell, and J. Jellison. Changesin wood crystalline cellulose structure caused by hot-water extraction and fungaldecay. Cellulose, 18 (2011) 1179-1190.
– A.-C. Hastrup, C. Howell, B. Jensen, and F. Green. Non-enzymatic depolymer-ization of cotton cellulose by fungal mimicking metabolites. Biodeterioration andBiodegradation, 65 (2011) 553–559.
– S. Schreiner, A. Hatch, D. Shudy, C. Howell, J. Jianli, P. Koelsch, M. Zharnikov, D.Petrovykh, and A. Opdahl. Impact of DNA-surface interactions on the stabilityof DNA hybrids. Analytical Chemistry, 83 (2011) 4288–4295.

Works published as a masters student:
– C. Howell, J. Paredes, and J. Jellison. Decay resistance properties of hotwater extracted oriented strand board. Wood and Fiber Science, 41 (2009)201–208.
– C. Howell, A.-C. Hastrup, B. Goodell, and J. Jellison. Temporal changesin wood crystalline cellulose during degradation by brown rot fungi. In-ternational Biodeterioration and Biodegradation, 63 (2009) 414–419.
– J. Paredes, R. Mills, C. Howell, S. Shaler, D. Gardener, A. van Heinin-gen.Surface characterization of Red Maple strands after hot water extrac-tion. Wood and Fiber Science, 41 (2009) 38–50.
– C. Howell, A.-C. Hastrup, B. Goodell, and J. Jellison. The use of X-raydiffraction for analyzing biomodification of crystalline cellulose by wooddecay fungi. International Research Group on Wood Protection Series, (2007)IRG/WP 07-10622.
Works published as a bachelors student:
– C. Howell and J. Jellison. Biological variability in the oxalate/oxalate de-carboxylase system among five isolates of the wood-degrading fungusMeruliporia incrassata. International Research Group on Wood Protection Se-ries, (2006) IRG/WP 06-10573.
– C. Howell, L. Gott, and B. Meehan. Fun with soil block jars: teaching fun-gal wood decay in the classroom. International Research Group on WoodProtection Series, (2006) IRG/WP 06-10574.
– J. Jellison,C. Howell B. Goodell and S. Quarles. Investigations into thebiology of Meruliporia incrassata. International Research Group on Wood Pro-tection Series, (2004) IRG/WP 04-10508.
8

Acknowledgements
This work was performed at the Institute of Applied Physical Chemistry (APC) atthe University of Heidelberg and at the Institute of Toxicology and Genetics (ITG) at theKarlsruhe Institute of Technology (KIT) Campus North in Eggenstein-Leopoldshafen. Itwas funded by a US National Science Foundation Graduate Research Fellowship.
I am grateful to all the people without whom this work would not have been pos-sible:
To my advisor Prof. Dr. Michael Grunze. I am appreciative of the invitation tocome join the APC, the constant support, the multiple opportunities provided to attendscientific conferences and visit other labs, the enlightening scientific discussions that al-ways left me with more to think about, and finally for the review of this thesis. Manythanks also to Prof. Dr. Markus Motzkus, for agreeing to be the second referee of thiswork and for taking the time to come by the labs to share ideas and admire lasers.
To Priv.-Doz. Dr. Patrick Koelsch, for being a good group leader whose door wasalways open and to whom it was always exciting to come with new data and ideas, aswell as for introducing me to the field of non-linear optics.
To my lab group: Dominique Verreault, Volker Kurz, Mark-Oliver Diesner, AnnaKeese, Christoph Barth, and Markus Niermeyer, for being as fun to do science with asto party with. There is nothing quite so precious in science as a group of friendly, bril-liant, like-minded people who are always willing to listen and lend their own knowledgeand experience to a problem, and you all were it. I am particularly grateful to Volkerfor significant amounts of help with running complex SFG experiments, to Mark-Oliverfor countless great discussions and for the experimental work on living cells, and to Do-minique for his constant selflessness in sharing his knowledge, experience, and time.
To Dr. Dmitri Petrovykh, for being an excellent collaborator as well as an end-lessly patient mentor always ready and willing to provide an eye-opening point of view,a clever solution, or a much-needed reality check. Without his collaborative projects Iwould have a lot fewer interesting things to do and without his willingness to listen andprovide advice these last three years I probably would be a lot less sane.
To Dr. Michael Bruns and his group at the Institute of Material Research III: Dipl.-Ing. Vanessa Trouillet, Dip.-Ing. Florian Stemme, Vanessa Hermann and Udo Geckle,as well as Stefan Heissler at the Institute of Functional Interfaces at KIT, for help withwafer preparation and sample characterization, instrumental physics and theory lessons,interesting conversations (scientific and general), as well as in situ German lessons.
To Prof. (apl.) Dr. Michael Zharnikov for providing multiple opportunities forinteresting and extremely efficient collaborative work, as well as for performing the syn-chrotron experiments and analyzing the resulting data. To my other collaborators overthe years: Prof. Dr. Wolfgang Wenzel, Robert Maul, Hicham Hamoudi, Jianli Zhao,
i

Evgeniya Lock, Kenan Fears, Sabine Oberhansl, Asutosh Chilkoti, Vinalia Tjong, for pro-viding the opportunity to share knowledge, experience, viewpoints, and ideas.
To my Spanish family: María de la Luz and Alvaro, as well as Eduardo, Ernestoand María Ángeles for welcoming me into their family, introducing me to their culture,being so patient with my attempts to speak Spanish, and for making me feel at home sofar away from home.
To my mother Cindy for all the phone calls, care packages, and editorial help aswell as all the visits and exciting European adventures we shared. To my parents Nickyand Frank for their unconditional love, support, and cheerleading that spanned two con-tinents, as well as for always providing a happy home to come back to. To my sistersAli and Julie and my brother Justin, for being my lifelines back home and for seamlesslyrolling me back into the fray upon my annual return.
And finally to Adrián, whose emotional support, culinary prowess, sense of ad-venture, and love provided the motivation to finish this work. This is for you.
ii

Summary
In situ investigations of biological molecules using vibrational sum-frequency-generationspectroscopy
The molecular-level understanding of biological molecules on solid surfaces is critical inareas including medicine, biologically-based industry, and the development of biotechnologies.In order to gain further knowledge of the orientation and organization of biological moleculesadsorbed on surfaces, we used the label-free, interface-specific technique of sum-frequency gen-eration (SFG) spectroscopy. This technique has the distinct advantage of being able to be operatedin situ as well as ex situ, allowing for direct comparison of changes in biological molecules betweenthese two states. Films of surface-bound single-stranded DNA (ssDNA) on gold were chosen asmodel biological systems due to their numerous applications in genetic profiling, nano-assembly,and bio-computing, as well as their relative simplicity as biomolecular layers. Sensitivity andproof-of-principle tests on simple surface-bound, short alkane chains demonstrated the ability ofSFG spectroscopy to detect molecular concentrations low enough to be useful in the investigationof biological molecules and to accurately detect the interactions of water with model hydrophobicand hydrophilic self-assembled monolayers. Investigations of multilayers of thymine, adenine,and cytosine nucleobases alone revealed a high degree of order in the thymine layers, with thesignals from the methyl group unique to this base clearly visible. Films of both thiolated andnon-thiolated surface-bound DNA in air showed little and moderate orientation, respectively,with the methylene stretches of the sugar-phosphate backbone dominating the spectra. Compar-ison of the changes in signal intensity among thymine, adenine, and cytosine ssDNA films in airand in H2O revealed differences in their solubility, which agreed with current ex situ knowledgeof the manner in which these differing DNA types adsorb on gold surfaces. These experimentsalso revealed the appearance of nucleobase-specific spectra upon exposure to water, which wastied to the higher mobility of the sugar-phosphate backbone under these conditions. Investiga-tions of hybridized ssDNA films in air using SFG spectroscopy indicated that the hybridizationprocess in surface-bound DNA molecules does not necessarily correspond with an increase inmolecular order, as is known to happen with DNA molecules in solution, and furthermore thateven gentle processing of such hybridized samples for ex situ analysis can significantly disruptthe hybrid structure. These results were confirmed using near-edge absorbtion fine structurespectroscopy. Finally, the results obtained from the model DNA films were applied to a morecomplex biomolecule, fibronectin, on gold surfaces. Experiments showed that SFG spectroscopycould detect a fibronectin film even under a layer of fixed cells. Further tests on living cells overalkanethiol self-assembled monolayers confirmed this observation. These results give new infor-mation on the orientation and organization of DNA films on solid surfaces both in and ex situ,and show how this knowledge can be applied to more complex biological systems. Furthermore,this work contributes to a knowledge base for the application of SFG spectroscopy to future ques-tions in which the label-free, in situ knowledge of surface-bound biological molecules is of criticalimportance.
iii

Kurzfassung
In situ Untersuchung von biologisch relevanten Molekülen mit Summenfrequenzerzeugungs-Spektroskopie
Das Verständnis von Biomolekülen auf dem molekularen Niveau auf Oberflächen ist ins-besondere in der Medizin, der biologischen Industrie und bei der Entwicklung von Biotechnolo-gien essentiell. Die markerfreie und grenzflächenspezifische Summenfrequenzgeneration (SFG)Spektroskopie wurde angewandt um Orientierung und Konformation von Biomolekülen aufOberflächen zu bestimmen. Diese Methode kann sowohl in situ als auch ex situ verwendet wer-den. Veränderungen der Biomoleküle zwischen beiden Zuständen werden sichtbar. Auf Goldgebunden Einzelstrang DNA (single-stranded DNA: ssDNA) wurde aufgrund der zahlreicheAnwendungen bei genetischem profiling, Biocomputing und in der Nanotechnologie als biolo-gisches Modellsystem gewählt. Anhand von Messungen an selbstorganisierten Monoschichten,bestehend aus einem unterschiedlichen Verhältnis von deuterierten und undeuterierten Alkanthi-olen auf Goldoberflächen, konnte gezeigt werden, dass bei der SFG Spektroskopie geringe Ober-flächendichten, wie sie bei der Untersuchung von Biomolekülen vorkommen, ein hinreichendesSignal-Rausch-Verhältnis ergeben. Gleichermaßen wurden die Wechselwirkungen von Wassermit hydrophoben und hydrophilen selbstaggregierenden Monolagen bestimmt. Messungen anMultilagen von Thymin, Adenin und Cytosin Basen ergeben einen hochgeordneten Zustand derThyminschicht, der sich von einem starken Signal der basespecifischen Methylgruppe ableitet.Immobilizierung der ssDNA mittles Thiollinken resultierte in einem höhrer Ordgung im Vergle-ich zu nichttiolierten DNA, dabei dominierten die Methylenstreckschwingungen des Zuckers dasSpektrum. Vergleich der Veränderungen des Signals von Thymin, Adenin und Cytosin ssDNA inLuft und Wasser legten Unterschiede in ihrer Löslichkeit dar, welche mit dem aus der Literaturbekannten ex situ Adsorbtionsverhalten der verschiedenen Nukleobasen auf Goldoberflächen ko-rrelieren. Darüber hinaus zeigten die Spektren in wässriger Lösung nukleobasenspezifische Ban-den, welche sich durch eine erhöhte Mobilität des Zuckerrückgrats erklären lassen. SFG Spektrenvon hybridisierten ssDNA Filmen in Luft deuten an, dass der Hybridisierungsprozess von ober-flächengebundenen ssDNA Molekülen nicht notwendigerweise mit einem Anstieg der moleku-laren Ordnung korreliert. Dieser Zusammenhang ist anders als es für DNA in Lösung bekannt ist.Ebenso kann selbst bei vorsichtigem Umgang von derartig Proben für die ex situ Untersuchungeine signifikante Störung in der hybridisierten Struktur entstehen. Diese Ergebnisse wurden mitRöntgen-Nahkanten-Absorptions-Spektroskopie (NEXAFS) bestätigt. Schließlich wurden die zu-vor gewonnen Ergebnisse aus den DNA Studien auf das komplexere Biomolekül Fibronectionangewandt. Die Experimente zeigten, dass SFG Spektroskopie die Fibronektionfilme selbst durcheine Schicht von fixierten Zellen hindurch detektieren kann. All diese neuen Erkenntnisse überdie Orientierung und Organisation von DNA Filmen auf festen Oberflächen bilden die Grund-lage für die weiterführende Anwendung der SFG Spektroskopie, bei denen markerfreie und ober-flächengebundene Biomoleküle von großer Bedeutung sind.
iv

Table of Contents
Acknowledgements i
Summary iii
Zusammenfassung iv
Table of Contents vii
List of Figures ix
List of Tables x
1 Introduction 11.1 Biomolecules on Surfaces . . . . . . . . . . . . . . . . . . . . . . . . . . . . . . . . . 11.2 DNA and Biotechnology . . . . . . . . . . . . . . . . . . . . . . . . . . . . . . . . . 2
1.2.1 Applications . . . . . . . . . . . . . . . . . . . . . . . . . . . . . . . . . . . . 21.2.2 DNA Structure . . . . . . . . . . . . . . . . . . . . . . . . . . . . . . . . . . 41.2.3 Characterization Techniques . . . . . . . . . . . . . . . . . . . . . . . . . . . 7
1.2.3.1 In Situ Techniques . . . . . . . . . . . . . . . . . . . . . . . . . . . 71.2.3.2 Ex Situ Techniques . . . . . . . . . . . . . . . . . . . . . . . . . . 8
1.3 SFG Spectroscopy . . . . . . . . . . . . . . . . . . . . . . . . . . . . . . . . . . . . . 91.4 Aims of this work . . . . . . . . . . . . . . . . . . . . . . . . . . . . . . . . . . . . . 11
2 Materials, Methods, and Instruments 122.1 Film Preparation . . . . . . . . . . . . . . . . . . . . . . . . . . . . . . . . . . . . . . 12
2.1.1 Chemical Acquisition and Control Parameters . . . . . . . . . . . . . . . . 122.1.2 Gold wafer parameters and cleaning procedures . . . . . . . . . . . . . . . 122.1.3 Film Deposition . . . . . . . . . . . . . . . . . . . . . . . . . . . . . . . . . . 12
2.2 X-Ray Photoelectron Spectroscopy (XPS) . . . . . . . . . . . . . . . . . . . . . . . . 132.2.1 Instrument Specifications . . . . . . . . . . . . . . . . . . . . . . . . . . . . 132.2.2 Data Processing Procedures . . . . . . . . . . . . . . . . . . . . . . . . . . . 13
2.3 Infrared Reflection-Adsorption Spectroscopy (IRRAS) . . . . . . . . . . . . . . . . 142.3.1 Instrumentation . . . . . . . . . . . . . . . . . . . . . . . . . . . . . . . . . . 14
2.4 Synchrotron Measurements . . . . . . . . . . . . . . . . . . . . . . . . . . . . . . . . 142.4.1 High-Resolution X-Ray Photoelectron Spectroscopy . . . . . . . . . . . . . 142.4.2 Near-Edge X-Ray Absorption Fine Structure Spectroscopy . . . . . . . . . 14
2.5 Density Functional Theory . . . . . . . . . . . . . . . . . . . . . . . . . . . . . . . . 152.6 Sum-Frequency-Generation Spectroscopy (SFG) . . . . . . . . . . . . . . . . . . . . 15
2.6.1 Theory . . . . . . . . . . . . . . . . . . . . . . . . . . . . . . . . . . . . . . . 152.6.2 Instrument Specifications . . . . . . . . . . . . . . . . . . . . . . . . . . . . 182.6.3 Data Processing Procedures and Considerations . . . . . . . . . . . . . . . 20
3 Sensitivity and Proof-of-Principle Experiments 233.1 Summary . . . . . . . . . . . . . . . . . . . . . . . . . . . . . . . . . . . . . . . . . . 23
v

Table of Contents
3.2 Sensitivity Measurements . . . . . . . . . . . . . . . . . . . . . . . . . . . . . . . . . 233.2.1 Experimental Details . . . . . . . . . . . . . . . . . . . . . . . . . . . . . . . 233.2.2 Results and Discussion . . . . . . . . . . . . . . . . . . . . . . . . . . . . . . 24
3.3 Proof-of-Principle Experiments: Model Hydrophilic and Hydrophobic SAMs . . . 253.3.1 Background . . . . . . . . . . . . . . . . . . . . . . . . . . . . . . . . . . . . 253.3.2 Experimental Details . . . . . . . . . . . . . . . . . . . . . . . . . . . . . . . 253.3.3 Results and Discussion . . . . . . . . . . . . . . . . . . . . . . . . . . . . . . 26
3.3.3.1 Hydrophobic SAMs . . . . . . . . . . . . . . . . . . . . . . . . . . 263.3.3.2 Hydrophilic SAMs . . . . . . . . . . . . . . . . . . . . . . . . . . 27
3.4 Conclusions . . . . . . . . . . . . . . . . . . . . . . . . . . . . . . . . . . . . . . . . . 29
4 Surface-Bound DNA in Air 304.1 Summary . . . . . . . . . . . . . . . . . . . . . . . . . . . . . . . . . . . . . . . . . . 304.2 Background . . . . . . . . . . . . . . . . . . . . . . . . . . . . . . . . . . . . . . . . . 304.3 Experimental Details . . . . . . . . . . . . . . . . . . . . . . . . . . . . . . . . . . . . 314.4 Results and Discussion . . . . . . . . . . . . . . . . . . . . . . . . . . . . . . . . . . 31
4.4.1 Nucleobase Multilayers . . . . . . . . . . . . . . . . . . . . . . . . . . . . . 314.4.2 Unmodified DNA Films . . . . . . . . . . . . . . . . . . . . . . . . . . . . . 364.4.3 Thiolated DNA Films . . . . . . . . . . . . . . . . . . . . . . . . . . . . . . . 38
4.5 Conclusions . . . . . . . . . . . . . . . . . . . . . . . . . . . . . . . . . . . . . . . . . 44
5 Surface-Bound DNA in situ 455.1 Summary . . . . . . . . . . . . . . . . . . . . . . . . . . . . . . . . . . . . . . . . . . 455.2 Background . . . . . . . . . . . . . . . . . . . . . . . . . . . . . . . . . . . . . . . . . 455.3 Experimental Details . . . . . . . . . . . . . . . . . . . . . . . . . . . . . . . . . . . . 465.4 Results and Discussion . . . . . . . . . . . . . . . . . . . . . . . . . . . . . . . . . . 46
5.4.1 Structure Changes in Water . . . . . . . . . . . . . . . . . . . . . . . . . . . 465.4.2 Nucleobase-Dependent Orientation in Water . . . . . . . . . . . . . . . . . 48
5.5 Conclusions . . . . . . . . . . . . . . . . . . . . . . . . . . . . . . . . . . . . . . . . . 52
6 Surface-Bound DNA Hybridization 536.1 Summary . . . . . . . . . . . . . . . . . . . . . . . . . . . . . . . . . . . . . . . . . . 536.2 Effects of Density and Film Type . . . . . . . . . . . . . . . . . . . . . . . . . . . . . 53
6.2.1 Background . . . . . . . . . . . . . . . . . . . . . . . . . . . . . . . . . . . . 536.2.2 Experimental Details . . . . . . . . . . . . . . . . . . . . . . . . . . . . . . . 546.2.3 Results . . . . . . . . . . . . . . . . . . . . . . . . . . . . . . . . . . . . . . . 55
6.2.3.1 XPS . . . . . . . . . . . . . . . . . . . . . . . . . . . . . . . . . . . 556.2.3.2 HRXPS . . . . . . . . . . . . . . . . . . . . . . . . . . . . . . . . . 556.2.3.3 NEXAFS spectroscopy . . . . . . . . . . . . . . . . . . . . . . . . 576.2.3.4 SFG Spectroscopy . . . . . . . . . . . . . . . . . . . . . . . . . . . 60
6.2.4 Discussion . . . . . . . . . . . . . . . . . . . . . . . . . . . . . . . . . . . . . 626.3 Effects of Rinsing . . . . . . . . . . . . . . . . . . . . . . . . . . . . . . . . . . . . . . 63
6.3.1 Background . . . . . . . . . . . . . . . . . . . . . . . . . . . . . . . . . . . . 636.3.2 Materials and Methods . . . . . . . . . . . . . . . . . . . . . . . . . . . . . . 636.3.3 Results and Discussion . . . . . . . . . . . . . . . . . . . . . . . . . . . . . . 64
6.4 Conclusions . . . . . . . . . . . . . . . . . . . . . . . . . . . . . . . . . . . . . . . . . 70
7 Further Biological Applications 727.1 Summary . . . . . . . . . . . . . . . . . . . . . . . . . . . . . . . . . . . . . . . . . . 727.2 Background . . . . . . . . . . . . . . . . . . . . . . . . . . . . . . . . . . . . . . . . . 727.3 Probing the Extracellular Matrix with SFG Spectroscopy . . . . . . . . . . . . . . . 73
7.3.1 Experimental Details . . . . . . . . . . . . . . . . . . . . . . . . . . . . . . . 737.3.2 Results . . . . . . . . . . . . . . . . . . . . . . . . . . . . . . . . . . . . . . . 73
7.4 Tests on Living Erythrocytes . . . . . . . . . . . . . . . . . . . . . . . . . . . . . . . 757.4.1 Background . . . . . . . . . . . . . . . . . . . . . . . . . . . . . . . . . . . . 757.4.2 Experimental Details . . . . . . . . . . . . . . . . . . . . . . . . . . . . . . . 75
vi

Table of Contents
7.4.3 Results . . . . . . . . . . . . . . . . . . . . . . . . . . . . . . . . . . . . . . . 767.5 Conclusions . . . . . . . . . . . . . . . . . . . . . . . . . . . . . . . . . . . . . . . . . 79
8 Conclusions and Outlook 80
Bibliography 83
vii

List of Figures
1.1 Examples of areas in which biomolecule-surface interactions play an important roll. 21.2 Cartoon of hybridization in a surface-immobilized DNA film . . . . . . . . . . . . 31.3 Graphic example of an block-oligonucleotide with 2 thymine and 3 adenine subunits. 41.4 Chemical structure of a single DNA strand with the four types of nucleobases . . 51.5 Torsion angles and the atoms which form them . . . . . . . . . . . . . . . . . . . . 61.6 Definition of a torsion angle in ssDNA . . . . . . . . . . . . . . . . . . . . . . . . . 61.7 An example of the use of fluorescence in detecting DNA immobilized on surface . 81.8 DNA helices with a left-handed twist and a right-handed twist . . . . . . . . . . . 10
2.1 Graphic illustration of the oscillations of the first-, second-, and third order polar-izability with respect to time . . . . . . . . . . . . . . . . . . . . . . . . . . . . . . . 16
2.2 Energy levels associated with the generation of and SF signal . . . . . . . . . . . . 162.3 Graphic illustration of the selection rules governing the generation or suppression
of an SFG signal . . . . . . . . . . . . . . . . . . . . . . . . . . . . . . . . . . . . . . 172.4 Setup of the optical table . . . . . . . . . . . . . . . . . . . . . . . . . . . . . . . . . 182.5 3D image of the sample stage area . . . . . . . . . . . . . . . . . . . . . . . . . . . . 192.6 Beam profile of the VIS pulse at the sample stage. . . . . . . . . . . . . . . . . . . . 192.7 Measurement cell for in situ characterization of liquid/solid interfaces. . . . . . . 202.8 Comparison of the three types of presentations of SFG data used in this work . . . 22
3.1 Spectra of DDT SAMs for calculation of the lower detection level of the SFG system. 243.2 SFG spectra of a self-assembled monolayer of hydrophobic, methyl-terminated 1-
dodecanethiol SAM on gold in air and in water. . . . . . . . . . . . . . . . . . . . . 263.3 Graphic of a single DDT molecule as used for DFT calculations. . . . . . . . . . . . 273.4 SFG spectra of hydrophilic, hydroxyl-terminated 1-mercaptoundecanol in air, and
in water. . . . . . . . . . . . . . . . . . . . . . . . . . . . . . . . . . . . . . . . . . . . 283.5 Graphic of a single MCU molecule as used for DFT calculations. . . . . . . . . . . 28
4.1 Amide I IRRAS spectra of nucleobase multilayers . . . . . . . . . . . . . . . . . . . 324.2 IRRAS spectra of nucleobase multilayers in the CH region . . . . . . . . . . . . . . 334.3 SFG spectra of thymine, adenine, and cytosine nucloebase multilayers . . . . . . . 334.4 SFG spectra of a thymine nucleobase multilayer in ppp and ssp polarization com-
binations . . . . . . . . . . . . . . . . . . . . . . . . . . . . . . . . . . . . . . . . . . . 354.5 Phase-fit of a thymine multilayer . . . . . . . . . . . . . . . . . . . . . . . . . . . . . 354.6 Cartoon of a molecule of thymine adsorbed on a gold surface . . . . . . . . . . . . 364.7 XPS C 1s, N 1s, and P 2p spectra from the unmodified adenine ssDNA film. . . . . 374.8 SFG spectra of films of unmodified thymine, adenine, and cytosine ssDNA. . . . . 384.9 The chemical structure of a thiol-modified 5-mer thymine homo-oligonucleotide. 394.10 XPS C 1s, N1s, P 2p, and S 2P spectra for a 6-nucleobase thymine homo-oligonucleotide
film . . . . . . . . . . . . . . . . . . . . . . . . . . . . . . . . . . . . . . . . . . . . . . 404.11 Comparison of SFG spectra the C6 linker group alone and a thymine ssDNA film
immobilized on gold via the C6 linker group . . . . . . . . . . . . . . . . . . . . . . 414.12 SFG spectra of films of thiol-modified thymine, adenine , and cytosine ssDNA . . 41
viii

List of Figures
4.13 Raw spectra of a T6-S film, a A6-S film, and a bare gold substrate over repeatedwetting and drying . . . . . . . . . . . . . . . . . . . . . . . . . . . . . . . . . . . . . 43
5.1 SFG spectra of thymine, adenine, and cytosine ssDNA layers in air and in water . 475.2 Raw and BGS SFG spectra of thymine and adenine ssDNA layers in air and in water 485.3 Fitted SFG spectra of thymine, adenine, and cytosine ssDNA layers in air and in
water . . . . . . . . . . . . . . . . . . . . . . . . . . . . . . . . . . . . . . . . . . . . . 505.4 Raw SFG spectra of a (dT)6S/Au, (dT)25S/Au, and a (dA)6S/Au ssDNA layer in
air and in water . . . . . . . . . . . . . . . . . . . . . . . . . . . . . . . . . . . . . . . 515.5 Raw SFG spectra of a (dT)6-S/Au after two wetting and drying cycles in air and
in H2O . . . . . . . . . . . . . . . . . . . . . . . . . . . . . . . . . . . . . . . . . . . . 51
6.1 Schematical illustration of primary films of thiolated thymine homo-oligonucleotidesand thymine-adenine diblock-oligonucleotides hybridized with the suitable ade-nine homo-oligonucleotides. . . . . . . . . . . . . . . . . . . . . . . . . . . . . . . . 54
6.2 C 1s HRXPS spectra of the ssNDA templates before and after the hybridization step. 566.3 N 1s HRXPS spectra of the ssNDA templates before black) and after red) the hy-
bridization step. . . . . . . . . . . . . . . . . . . . . . . . . . . . . . . . . . . . . . . 576.4 N K-edge NEXAFS spectra of the ssNDA templates and reference A15 film before
and after the hybridization step. . . . . . . . . . . . . . . . . . . . . . . . . . . . . . 586.5 N K-edge NEXAFS difference spectra of the ssNDA templates and reference A15
film before and after the hybridization step. . . . . . . . . . . . . . . . . . . . . . . 596.6 SFG spectra of hybridized and unhybridized oligonucleotides films. . . . . . . . . 616.7 N 1s HRXPS spectra of T25S/Au before and after hybridization with poly(dA25)
and subsequent light, medium, or heavy rinsing with water. . . . . . . . . . . . . . 656.8 N K-edge NEXAFS spectra of T25S/Au before and after hybridization with A25
followed by rinsing with various volumes of water. . . . . . . . . . . . . . . . . . . 676.9 IRRAS spectra of a pristine T25S/Au film and a hybridized film after rinsing with
0.5 mL of water . . . . . . . . . . . . . . . . . . . . . . . . . . . . . . . . . . . . . . . 686.10 SFG spectra of T25S/Au before and after hybridization with A25 followed by rins-
ing with various volumes of water. . . . . . . . . . . . . . . . . . . . . . . . . . . . 696.11 Illustration of the effects of varying degrees of rinsing on the extent of residual
hybridization and orientational order in the target DNA films. . . . . . . . . . . . 70
7.1 FTIR spectra, SFG spectra, and optical microscopy image of fibronectin on goldand fibroblasts adhered on fibronectincovered gold in the CH stretching region . 74
7.2 SFG spectra of a gold wafer exposed to phosphate-buffered saline alone, cells onfibronectin-coated gold, and fibroblasts adhered directly on gold . . . . . . . . . . 75
7.3 Optical microscopy image of fibroblasts adhered on fibronectin-covered gold after30 min of irradiation with 20 µJ femtosecond light pulses . . . . . . . . . . . . . . . 76
7.4 SFG spectra of a d-DDT SAM recorded in air , sterile PBS, and media containingECs. . . . . . . . . . . . . . . . . . . . . . . . . . . . . . . . . . . . . . . . . . . . . . 77
7.5 Resonant SFG spectra of d-DDT and DDT SAMs recorded in air, sterile PBS, andPBS containing ECs . . . . . . . . . . . . . . . . . . . . . . . . . . . . . . . . . . . . 78
ix

List of Tables
2.1 Incident beam polarization combinations and the elements of χ(2)ijk which they probe 17
3.1 Peak positions and assignments for DDT and MCU monolayers in air and in water. 29
4.1 Parameters obtained from a phase-fitting of the raw SFG data of a thymine multi-layer. . . . . . . . . . . . . . . . . . . . . . . . . . . . . . . . . . . . . . . . . . . . . . 34
4.2 Parameters obtained from a phase-fitting of the raw SFG data for (dA)6. . . . . . . 384.3 Parameters obtained from a phase-fitting of the raw SFG data for thiolated thymine,
adenine, and cytosine ssDNA films. . . . . . . . . . . . . . . . . . . . . . . . . . . . 42
5.1 Parameters obtained from a phase-fitting of the raw SFG data of a thymine ssDNAfilm in H2O . . . . . . . . . . . . . . . . . . . . . . . . . . . . . . . . . . . . . . . . . 49
6.1 Thickness and percentage of adenine target strands per thymine probe strand. . . 66
x

Chapter 1
Introduction
1.1 Biomolecules on Surfaces
Nature makes extensive use of surfaces in order to control biological reactions. Interfacessuch as the cell surface/extracellular matrix (ECM), cell surface/protein, and ECM/protein are,in fact, where most biological reactions occur [1, 2]. In our effort to control and adapt biologi-cal mechanisms and processes to our own particular needs, surface science offers many uniqueadvantages.
First, employing surface functionalization techniques adapted from chemistry allows forthe fabrication of substrates for biological reactions that can be tailored to specifications suchas hydrophobicity, charge, or the presence of a particular functional group, thus enhancing (or,in some cases, diminishing) the reaction in question. This advantage has been used to preventprotein adsorption [3, 4], create simple biomolecular computers [5, 6], and control cell behavior[7, 8]. Second, the use of particular surfaces can provide a measure to control the orientationand ordering of adsorbed molecules, which can further facilitate their biological reactivity orinteraction with biological systems. This approach is currently being used in the developing fieldof tissue engineering, where for example surfaces functionalized with the temperature-switchablepolymer poly(N-isopropylacrylamide)serve as a growth substrate for cells. The cells can be grownto a confluent state on such surfaces, then removed as an intact sheet by changing the temperatureand inducing a conformational change in the polymer beneath [9, 10].
Finally, as immobilizing biomolecules generally involves fixing many molecules to a con-fined space it becomes possible to localize in 2D space a biological reaction that would perhaps innature only occur in small amount spread out over a large and undefined 3D area. This strategyis being used commercially in the case of protein [11, 12], antibody [12, 13], and DNA [14, 15]arrays, where the immobilization of a large number of molecules together makes it possible toeasily visualize the fluorescent signal when labeled target molecules are introduced to the systemand binds.
In addition, the unwanted adsorption of biomolecules on surfaces is a major issue in anumber of areas. In global shipping and other marine industries, biofouling by Ulva spores andother organisms causes significant increases in the costs associated with an increased need forfuel [16, 17], an issue which has been at the heart of a recent research efforts [18, 19, 20]. Inthe food industry, the formation of biofilms and colonization by bacteria causes problems in thediary, meat, and even grain industries [21, 17]. In medicine, the buildup of proteins on an implantsurface can trigger an inflammatory response and the formation of fibrotic capsules around thedevice, resulting in implant failure and possibly serious complications [17, 22]. A more completeunderstanding of how biomolecules bind to surfaces and how they behave once attached mayalso contribute to new technologies which are able to prevent adsorption in these situations.
Biomolecules which are intentionally immobilized on solid substrates generally fall intoone of five categories: proteins (including amino acids, polypeptides, and multi-protein aggre-gates), lipids, saccharides, nucleotides (including DNA and RNA), or composite molecules con-sisting of a combination of two or more molecules from the previously listed categories [1]. Yet
1

1.2. DNA and Biotechnology
Figure 1.1: Examples of areas in which biomolecule-surface interactions play an impor-tant role. All images used are copyright-free and in the public domain.
despite this variety and the examples given above, the field of biointerface science is still relativelynew, and a number of limitations still need to be overcome before full realization of the potentialof these systems can occur.
Among the most pressing of these is perhaps the ability to understand on the most basiclevels what exactly occurs in systems where biomolecules are bound to a solid substrate [1, 2,23, 24]. Biomolecules tend to be quite complex, and can give complex results in experiments.Of the molecules listed above, DNA and RNA are some of the most simple. Furthermore, theyoffer unique advantages due to their relative simplicity, versatility, and specific hybridizationproperties. Thus these molecules offer a good starting point for a bottom-up approach to thefurther understanding of biomolecules at interfaces.
1.2 DNA and Biotechnology
1.2.1 Applications
DNA (Deoxyriobnucleic acid) holds great promise as the basis for new nano-scale biotech-nologies due to its unique recognition and coupling abilities [25, 26]. In recent years it has becomepossible to order DNA sequences of any arbitrary sequence and of almost any length desired. Thistechnological advance has had significant effects on DNA biotechnology.
In solution, the exploitation of the sequence-specific recognition of DNA has resulted inthe creation of 3D scaffolds on which proteins can be immobilized in order to either positionthem more effectively for use in enzyme and other reactions, or as a means to crystallize themfor structure determination using X-ray crystallography [25]. Relatively recently, P. Rothemunddemonstrated that DNA can be synthesized to fold into almost any arbitrary shape [27]. These
2
Introduction
Hybridization
Probe strand
Target strand
Figure 1.2: Cartoon of hybridization in a surface-immobilized DNA film. The targetmolecules are immobilized on the surface, and the probe molecules are introduced andbind to the surface-bound moities.
technologies are based on the concept of a DNA "sticky end": a trailing DNA edge of a particularsequence that will only bind with its compliment. Through a well-considered choice of the se-quence of this end, its placement and thus the resulting shape of the overall DNA strand to whichit is attached, can be determined.
Surface-bound DNA has also begun to be more heavily used in biotechnological applica-tions. Previously, the attachment of these molecules to a solid surface was done primarily in theform of DNA microarray fabrication. DNA microarrays are detection tools which take advantageof the specific binding properties of DNA and RNA. They are currently used in applications suchas measuring expression levels, assessing genetic variability, and disease profiling [28]. DNAmicroarrays are created by attaching thousands of single strands of DNA of a known sequenceto a surface. When single stranded DNA (ssDNA) of an unknown sequence is passed over themicroarray, complimentary strands will bind (Fig. 1.2) and activate a fluorophore which can bevisually detected and quantified (Fig. 1.7) allowing for the processing of thousands of genetictests simultaneously [15, 14]. This useful technology continues to be heavily used in biologicalapplications, even as other uses for surface-bound DNA are being developed.
Mirkin and colleagues [29, 30] applied the "sticky end" concept to DNA strands immo-bilized on gold nanoparticles. They showed that through this method they could control theaggregation of the nanoparticles by controlling the length of the sequences used to decorate thesurface. The use of DNA-decorated nanoparticles for diagnostic purposes is currently a field ofactive research [31].
Other fascinating developments in the field of DNA biotechnology have been the adventof DNA computing and the use of DNA for the direction of cell settlement. DNA computing wasfirst demonstrated by Adleman, who used DNA in solution to solve a seven-point Hamiltonianpath problem [32]. Since then, this field has evolved to include using DNA immobilized on sur-faces [5]. Using DNA patterning to control where cells settle on a surface requires attaching aDNA strand with a "sticky end" to the membrane of a living cell. This was achieved by Fran-cis and colleagues [33], who then proceeded to arrange these cells in a precise way using DNAmicroarrays functionalized with the compliment strands [8, 7].
Further interesting properties unique to DNA molecules are also being discovered andexploited. For example, research into the properties of the various DNA nucleobases has shownthat adenine and adenine-containing DNA strands have a relatively high preference for gold andwill adhere to it relatively strongly [34], even to the point of out-competing DNA sequences ofcytosine, guanine, and thymine, in that order [35]. Thymine in particular has shown to have onlya very weak affinity for gold [36]. Using this knowledge, Opdahl and co-workers [37] designedDNA strands which consisted of a block of adenine followed by a block of thymine (called block
3

1.2. DNA and Biotechnology
Thymine
Adenine
Exposure to Gold
Thymine
Adenine
Figure 1.3: Graphic example of an block-oligonucleotide with 2 thymine and 3 adeninesubunits. The molecule bends into an L-shape with the adenine adsorbed to the substrateand the thymine extending away from the surface upon exposure to gold.
or di-block oligonucleotides). They demonstrated that these special strands would adsorb on agold surface in an L-shaped conformation, with the adenine block adhered to the surface andthe thymine block extending away into the ambient (Fig. 1.3). This had the effect of significantlylowering the cost of DNA needed to make arrays, as these block-oligonucleotides did not need tobe functionalized in order to adhere to a substrate. This method also allows for a certain degreeof control over the density of the DNA in the film, a parameter which is of critical importance inhybridization efficiency [38, 39, 40], through the shortening or lengthening of the adenine block.
1.2.2 DNA Structure
DNA is composed of repeating nucleotide units consisting of of a phosphoralated β-D-2’-deoxyribose sugar attached to one of four different types of nucleobase (monocyclic pyrimidinesthymine or cytosine, or bicyclic purines adenine or guanine) via a β-glycosyl C1′ -N linkage [41](Fig. 1.4). The nucleotide units making up the DNA strand are referred to as thymidine, adeno-sine, cytidine, and guanosine, and are abbreviated (dT), (dA), (dC), and (dG), respectively. Inthe case of the synthetic DNA primarily used in this work, in which the entire strand consists ofonly one type of base, the total number of nucleotide units is generally given as a subscript afterthe chain abbreviation, e.g. (dT)25. Futhermore, when modifications such as the addition of athiol group are present in the DNA molecule, they are denoted by the chemical symbol after, e.g.(dT)25-S.
A DNA nucleotide can twist itself in a number of ways. A list of the possible angles inwhich torsion can occur (Fig. 1.5) and the atoms which create these angles are listed in Table 1.6.Of the angles listed, α, β, γ, ε, ζ, which describe the rotation around the backbone, and χ, whichdescribes the rotation of the base relative to the furanose sugar, would be expected to contributemost significantly. The other angles listed (δ, v0-v4) primarily describe potential areas of twistwithin the 5-member ring, which is expected to be more constrained. However, it is known thatthis ring is generally non-planar, with the atoms transitioning between an arrangement in either atwist with two atoms displaced on opposite sides of a plane or an envelope with one of the atomsin a different plane than the other four [41].
The plane of the nucleobase is generally approximately normal to the plane of the sugar.The torsion angle describing the rotation of the nucleobase around the sugar, χ, can be describedas either syn or anti. In syn, the six-member ring in purines or the O2 group in pyrimidines arepositioned over the sugar, while in anti they are pointing away [41]. The angle γ relates theposition of the O5′ atom relative to the line of the C3′ and C4′ atoms in the sugar, and can be usedto describe the rotation of the phosphate group relative to the sugar moiety. This angle can rotate360, and so is most often described using three terms: +sc or gauche-gauche, in which γ is lessthan 90, ap or gauche-trans, in which γ is between 90 and 180, and -sc or trans-gauche, in which
4

Introduction
NH
O
ON
O
HO
HH
HH
PO
O-
O
O
N
NN
N
NH2
O
HO
HH
HH
PO
O-
O
N
NH2
ON
O
HO
HH
HH
PO
O-
O
NH
N
N
O
NH2N
O
H
HH
HHO
PO
O-
O
5’ end
3’ end
12
34
5
6
9
7
8
12
34
5
6
1
23
4
56
9
7
81
23
4
56
Thymine
Adenine
Cytosine
Guanine
1’
2’3’
4’
5’
4’
Figure 1.4: Chemical structure of a single DNA strand with a thymine, an adenine, acytosine, and a guanine nucleobase. The atom numbers for each base are shown. Thecolor scheme for the various nucleobases in this figure are used throughout the rest ofthis work.
γ is greater than 180 [41]. Previous studies have shown that some oligonucleotides in solutioncan stabilize via hydrogen bonding between the backbone and nucleobase in conformation inwhich χ is in the anti position and γ in the +sc position [42].
When adhered in an upright conformation on a surface, a single nucleotide in a DNAstrand is generally assumed to take up approximately 0.34 nm vertically and approximately 1 nmlaterally [43, 41]. Nucleobases in solution, in the solid state, and immobilized on surfaces havebeen shown to stack [41, 44], giving rise to stable, single-stranded helices, with purine-purinestacks being the most stable and pyrimidine-pyrimidine stacks the least [41]. These stacks are dy-namic in solution and can transition back and forth between a stacked and unstacked state. Thestabilization of these stacks is mainly through permanent dipoles in the C=O or C-NH2 groups ofthe nucleobases which superimpose over the π-electronic systems of the adjacent bases [41].
Given the high number of ways in which a single strand of DNA can bend, it is convenientto discuss its flexibility in terms of persistence length. Persistence length in polymers is a measureof rigidity, and is defined as the length before the molecule begins to bend away from its originaldirection at any given point. Reports on short (100-200 base pairs, bp) double-stranded DNA(dsDNA) adsorbed in mica have reported persistence lengths of 80 nm. Persistence length canalso depend on nucleobase composition, temperature, and ionic strength of the environment ofthe DNA strands. Mills et al. measured persistence lengths of 0.31 nm and 0.78 nm for 100-200bp (dT) and (dA) homo-oligonucleotides, respectively, measured at 4C. They attributed thisdifference to an improved base-stacking of adenine at these temperatures [45]. Tinland and co-workers found that the persistence length for single-stranded DNA (ssDNA) in solution appearedto increase almost exponentially with a decreasing solution ionic strength [46]. For a 3000 bpsequence at room temperature, they measured a persistence length of approximately 8 nm at0 M salt concentration. A more recent study done by Murphy and colleagues using fluorescencespectroscopy systematically investigated the persistence length of short-chain (dT) (between 10
5

1.2. DNA and Biotechnology
Angle Atoms which form Angleα O3’ -P-O 5’ -C 5’
β P-O 5’ -C 5’ -C 4’
γ O5’ -C 5’ -C 4’ -C 3’
δ C 5’ -C 4’ -C 3’ -O 3’
C 4’ -C 3’ -O 3’ -Pζ C 3’ -O 3’ -P-O 5’
χ (A and G) 4’ -C 1’ -N 1-C 2
χ (T and C) 4’ -C 1’ -N 9-C 4
v0 C 4’ -O 4’ -C 1’ -C 2’
v1 O4’ -C 1’ -C 2’ -C 3’
v2 C 1’ -C 2’ -C 3’ -C 4’
v3 C 2’ -C 3’ -C 4’ -O 4’
v4 C 3’ -C 4’ -O 4’ -C 1’
ε
OO
Figure 1.5: Torsion angles in nucleotides andthe atoms which form them. Adapted fromRef.[41].
θ
Figure 1.6: Definition of a torsion angle asdescribed in the sketch to the left. The fouratoms form three bonds, with the outer twobonds rotating relative to each other throughthe central bond.
and 70 bp) in solutions of increasing ionic strength reported a persistence length ranging from1.5 nm in 2 M NaCl to 3 nm in 25 mM NaCl [47]. For ssDNA adsorbed on solid surfaces thereis significantly less information available on the persistence length, and a length of 2 nm derivedfrom the solution data is therefore generally used [48, 49].
DNA can be attached to solid surfaces through either covalent attachment using a gold-thiol interaction or a silanization procedure, physical adsorption relying on non-covalent interac-tions such as hydrogen bonding or electrostatic effects, or through the use of other specific molec-ular interactions such as biotin-streptavidin [50]. As a result, DNA films have been reported onsuch diverse substrates as gold [51, 52], diamond [53, 54], silicon [55, 56], glass [57], platinum[58] and amorphous carbon [59]. However, of these, the immobilization of ssDNA on gold isfrequently used due to the ease of film formation when the ssDNA molecules are modified witha sulfur-terminated short-chain alkanethiol linker. Furthermore, this approach to DNA immobi-lization has been found to produce more dense and highly ordered films due to the self-assemblyeffects of thiolated molecules on gold substrates.
Assuming a cylindrical geometry with a 1 nm cross section, the theoretical upper densitylimit for a film of tightly-packed, vertically-oriented DNA strands on a solid surface is approxi-mately 1x10¹⁴ molecules/cm2. However, achievement of such high densities is nearly impossibledue to such things as the relatively high electronegativity of the sugar-phosphate backbone [41].For this reason, very high salt solutions are necessary when fabricating dense ssDNA films. Petro-vykh et al. further showed that the cation valence has a significant effect on immobilization den-sity, with buffers made with divalent cations producing significantly denser films [60]. Molecularre-organization also plays a role, as ssDNA molecules tend to initially adsorb flat on the surface,requiring time to re-arrange themselves into a more upright conformation in order to permit theadsorption of further molecules [60].
In the producing of dense ssDNA films, nucleobase composition also plays an importantrole. Experiments by Kimura-Suda and co-workers showed that adenine ssDNA would out-compete guanine, cytosine, and thymine ssDNA for adsorption sites on a gold substrate [35].In further work examining the nucleobase composition on immobilization of thiolated versusnon-thiolated ssDNA, Gorgiadis and co-workers observed that nucleobases with higher affinities
6

Introduction
for gold, such as poly(dA), tended to adsorb to the surface initially by both the thiol and the nu-cleobases and remain in that conformation, hindering the further adsorption of other poly(dA)molecules and resulting in overall lower ultimate densities. Conversely, DNA strands composedof less strongly-binding bases, such as poly(dT), tended to adsorb most strongly through the thiolbond, ultimately leading to the formation of more densely-packed films [52].
The usefulness of ssDNA adsorbed on solid surfaces comes from its ability to be hybridized.DNA hybridization occurs when cytosine bases hydrogen bond to guanine bases, and adeninebases hydrogen bond to either thymine (in DNA) or uracil (in RNA). In solution the hybridsmay adopt a number of forms, the most common of which are A-DNA with 11 nucleotides perturn and an axial rise of 2.56 , or B-DNA, with 10 nucleotides per turn and an axial rise of 3.3 to3.4 [41]. It is known that hybridization causes the DNA molecules to become stiffer and morehighly ordered, with a persistence length of around 45 nm [61, 46]. Hybridization in films ofsurface-bound oligonucleotides is less well understood and has been an area of active researchfor the past two decades. During this time it has been found that the efficient functioning of thesesystems is highly dependent on a variety of parameters including density [62], location of thenucleation site [63], length of the surface-bound DNA strands (targets) and incoming hybridizingstrands (probes) [63], target orientation [64], and degree of target mismatch [65]. Of these, packingdensity and molecular orientation of the surface-bound strands are probably the most importantfactors [38, 39, 40].
1.2.3 Characterization Techniques
In order to gain more sophisticated and detailed knowledge of systems such as DNA atinterfaces one needs efficient experimental tools which not only give specific information aboutthe composition of the molecules at the surface, but also their orientation and relationship to themolecules and environment surrounding them.
Over the years there has been a significant amount of research energy dedicated to findingways to answer these questions, involving many different techniques [1, 2]. The challenge stillremains, though, to develop techniques with high sensitivity and resolution that can be operatedin situ and provide information in real time on ordering and orientation as well as compositionand structure. This list of desired properties is long enough that no single technique can fulfillall of them, but there are several promising candidates that are currently in the process of beingrefined or developed.
1.2.3.1 In Situ Techniques
Formation, hybridization, and interaction of DNA films with different environments canbe monitored by a number of in situ techniques. Of these, fluorescence imaging is probably themost common [66, 67, 15, 68, 47], making use of fluorescent markers to track the formation ofhybrids and even DNA conformation [47]. Radiometric labeling can also be used to detect bothprobe density and hybridization efficiency [38, 69].
Label-free methods are currently favored in the scientific community due to the lack ofcomplications or artifacts stemming from the use of labels. One of the most popular methods issurface plasmon resonance (SPR) spectroscopy and imaging [70, 71, 72, 73, 39, 74], which useslight to excite plasmons which can then be detected. The plasmon is very sensitive to opticalchanges at the metal/liquid interface and can thus be used to detect adsorption or desorptionof molecules to the surface. Similarly, quartz crystal microbalance with dissipation can be usedto measure DNA attachment to surfaces [75, 76], although this process becomes difficult in thehigh salt concentrations needed for high density film formation. Electrochemical procedures suchas cyclic voltammetry and chronocoulometry have also been used to infer adsorption of DNAmolecules onto electrode surfaces [77]. In situ ellipsometry can also be used to gather informationabout the thickness of DNA films through a layer of solution [2, 1, 78]. Electrochemical in situscanning-tunneling microscopy [79] and atomic force microscopy [80] have also been used tovisualize DNA molecules immobilized on solid surfaces.
However, it can often be difficult to deduce specific, molecular-level information from thesetechniques, especially in terms of the orientation of particular parts of the molecule. For such
7

1.2. DNA and Biotechnology
Figure 1.7: An example of the use of fluorescence in detecting DNA immobilized onsurface: a DNA microarray showing a fluorescent signal at the sites of hybridization.
information, researchers generally turn to more specific ex situ techniques.
1.2.3.2 Ex Situ Techniques
Ex situ molecular spectroscopy generally does not require any labeling and probes individ-ual functional moieties and structural motifs within the DNA molecules. A number of vacuum-based techniques have been employed to investigate thin films of DNA on solid surfaces, includ-ing X-ray photoelectron spectroscopy (XPS or ESCA), near edge x-ray absorption fine structure(NEXAFS) spectroscopy , and time-of flight secondary ions mass spectrometry (ToF-SIMS). XPScan be used to quantitatively determine the elemental composition and chemical state of a sam-ple by measuring the kinetic energy of electrons ejected from the sample after irradiation with anx-ray beam. It has been used to examine the changes occurring upon the adsorption of DNA to asurface, particularly in the N 1s peak [64, 81, 39, 82]. In 2003 and 2004, Petrovykh and colleaguesdevised a way to calculate the density of DNA molecules on gold surfaces using the attenuation ofthe gold signal and the atomic percent of nitrogen calculated from the XPS spectra [60, 51]. Sincethen, XPS has proven valuable as a quality control measure for DNA films [44, 74, 40, 83, 84, 37].
NEXAFS spectroscopy samples the electronic structure of the unoccupied molecular or-bitals to provide information about the chemical identity of a thin film. A further benefit of thistechnique is that information about orientational order in the system can be obtained by examin-ing the difference between spectra obtained using different angles of incidence for the incoming x-ray beam [63]. This technique has been used to examine the overall orientation of the nucleobasesin films of ssDNA [44, 39, 85, 83]. Examining the orientation of thiol-modified DNA strands ver-sus unmodified strands, Lee et al. concluded that the thiolated strands were oriented upright withthe nucleobases stacked parallel to the surface, while the unthiolated strands were lying down onthe surface with the nucleobases adsorbed in a more or less perpendicular orientation [39]. Petro-vykh et al. compared thymine ssDNA with long ([dT]25) and short ([dT]5) chain lengths. Theyfound that the short-chain DNA had a higher degree of overall order than the long-chain, whichthey attributed to the increased flexibility of the longer strands [44].
ToF-SIMS relies on the analysis of secondary ions ejected from the surface of a film aftersputtering with a focused primary ion beam, and can give information on the composition of afilm as well as, in some situations, orientation. Lee and co-workers used ToF-SIMS to examine theeffects of impurities on the formation of thiolated ssDNA films, detecting an excess of sulfur usedas a reducing agent in the molecule preparation process which apparently had a strong tendencyto remain in the final film [86]. Other work has presented this technique as a way to verify theimmobilization of DNA onto surfaces functionalized with other polymers such as ethylene glycol
8

Introduction
[87]. Other applications for this technique include DNA sequencing [88] and imaging [89].Vibrational spectroscopic analysis of solid/liquid interfaces and thin films in situ holds
great potential for answering some of the most crucial questions in the fields of environmental,biomedical, and materials sciences [1, 2, 23, 24], in part due to the fact that it can be operatedunder ambient conditions. Of these techniques currently applied to DNA, Fourier-transform in-frared (FTIR) spectroscopy is one of the most convenient. Probing the absorption of infrared lightby molecules over a range of 400-4000 cm−1, FTIR gives distinct signatures from the four nucle-obases in the amide I region [81] due to the distinct structures of these bases. This has made ituseful for determining the composition of a surface-adsorbed DNA film after competition exper-iments between different types of homo-oligonucleotides [35], as well as determining the orien-tation of (dT) films by examining the intensities of peaks attributed to chemisorbed C=O versusnon-chemisorbed C=O [44, 37].
Raman spectroscopy, which examines changes in the inelastic scattering of laser light uniqueto particular molecules, can also be used to detect DNA on surfaces. Like FTIR spectroscopy, Ra-man spectroscopy on DNA samples gives unique peaks, primarily in the amide I region, whichare related to the composition of the nucleobases [90]. Although for the most common formsof Raman spectroscopy rather large quantities of DNA are needed in order to generate a signal,making analysis of thin films of DNA using the setups most commonly available not possible.This can be overcome, however, by using surface enhanced Raman spectroscopy [91, 92], whichmakes use of rough metal surfaces to increase the Raman signal. One particular benefit of thisapproach is that it can be used both in situ and ex situ [91]. However, the use of a rough metalsurface compromises the formation of a well-ordered films made through self-assembly mecha-nisms [93]. Recently tip-enhanced Raman spectroscopy has been proposed as a way to overcomethese limitaitions [94].
Most of methods offer a substantial understanding of the chemical composition, surfacedensity, orientation and ordering of DNA films under non-aqueous conditions. However, theability to characterize ssDNA films in aqueous environment is important because it allows for theexamination of these films in situ - the conditions under which they are actually used. Further-more, the ability to compare results obtained in situ and ex situ can provide a way to determinewhether the results obtained in air or under vacuum conditions are applicable in aqueous en-vironments. SERS can be operated in situ, however it requires the use of rough metal surfaceswhich may disrupt the natural organization of the DNA molecules in a film. In order to over-come this limitation and still retain the ability to compare in situ and ex situ states in DNA films,the technique of sum-frequency-generation (SFG) spectroscopy can be used.
1.3 SFG Spectroscopy
The technique of sum-frequency-generation (SFG) spectroscopy relies on the frequencymixing that when two pulsed laser beams achieve temporal and spacial overlap at an interface.The light emitted at the sum of the two incident frequencies can be resonantly enhanced whenthe frequency of one of the incoming beams matches a resonant frequency of vibrational modesof the molecules located at the interface [95]. SFG spectroscopy has emerged as a tool well-suitedto the investigation of liquid/solid interfaces, due to the surface sensitivity arising from the par-ticular selection rules of this technique, a molecular-level detection capability, and the ability tofunction under ambient conditions [96, 97, 98, 99]. Furthermore, this technique offers the poten-tial for probing the same sample in air and in liquid [84, 26, 10], making it possible to bridge thegap between measurements in situ and those that need to be performed under ultrahigh vacuumor other non-standard conditions. The selection rules of SFG dictate that a signal can only begenerated in a non-centrosymmetric environment, resulting in the suppression of isotropic bulksignal (see Chapter 2). This feature makes SFG spectroscopy inherently surface specific [100]with submonolayer resolution, allowing for the tracking of subtle modifications even in ultra thinfilms. Being an all optical technique, SFG is also non-invasive and non-destructive, making thistechnique useful for the characterization DNA films both in situ and ex situ.
Only a few measurements of ssDNA films by SFG spectroscopy have been reported [26].Sartenaer et al. used SFG spectroscopy to probe thiolated ssDNA immobilized on platinum in
9
1.3. SFG Spectroscopy
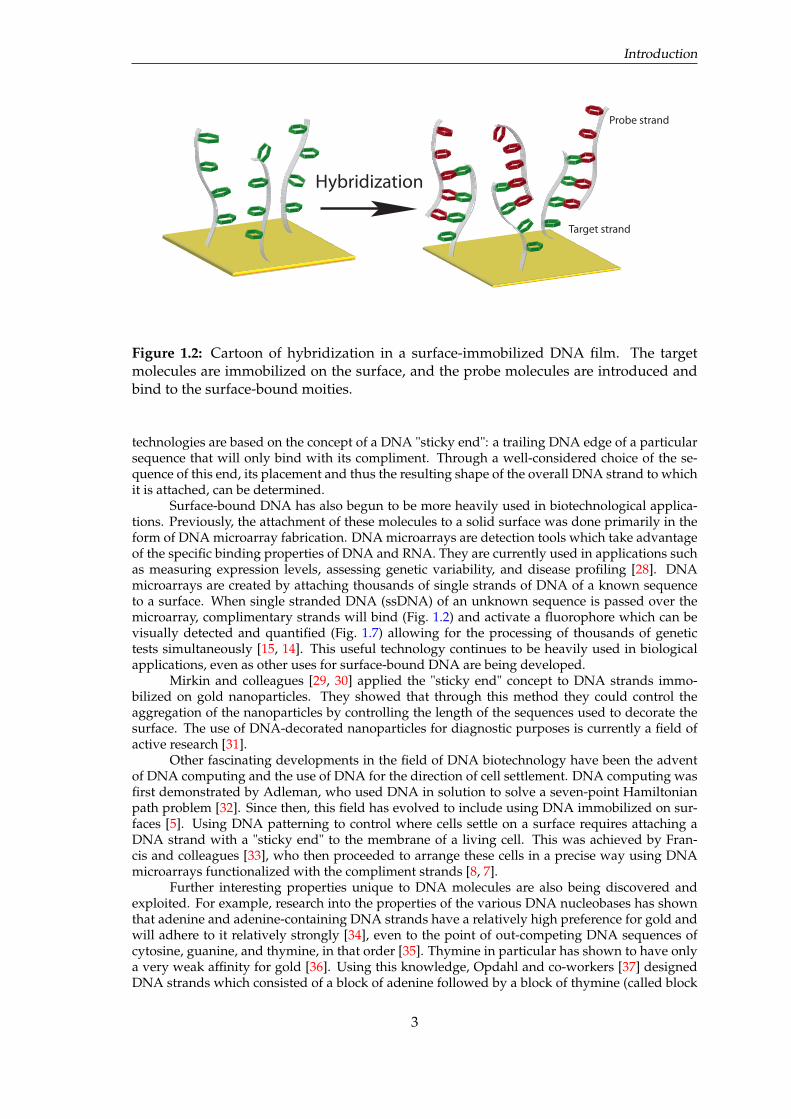
Figure 1.8: Example of DNA helices with a right-handed twist (left) and a left-handedtwist (right) such as the samples investigated by Stokes et al. in Ref. [57]
the CH stretching region. They found a strong disordering in the films with the SFG spectradominated by the linker group anchoring the ssDNA strands to the surface [58]. However, thedensities of these films were not quantified and were likely very low, given that sulfur does nothave as high an affinity for platinum as it does gold. Furthermore, that the buffer solution usedin these experiments was only 10µM, which does not completely electrostatically shield the DNAmolecules and causes them to repel each other, decreasing the film density, as discussed in Sec-tion 1.2.2.
Asanuma and co-workers used SFG spectroscopy to examine the effects of metal cations ofdifferent valencies on the overall order in a ssDNA film on silicon in air. They reported that thedivalent cations Mg2+ and Ca2+ produced a greater degree of disordering than the monovalentcations K+ and Na+, which they attributed to a greater affinity of the divalent cations for thehighly charged phosphate groups in the backbone of the DNA molecules [101]. Stokes and col-leagues used polarization-resolved SFG spectroscopy to examine the handedness of DNA helicesimmobilized on silica in air. By comparing spectra taken with light polarized ±45 relative tothe plane of incidence. They were able to see differences between dsDNA hybridized to have aright-handed rotation and those hybridized to have a left-handed rotation [57] (Fig. 1.8).
However, despite the potential of SFG to be used to compare DNA films in situ and ex situ,to date there has only been one report of such an experiment, carried out by our group in 2008[84]. In that work, (dA) and (dT) films were compared in air, D2O, and buffer in the CH and amideI regions. A more thorough analysis is needed in order to establish this technique as a viable toolfor the examination of DNA and other biological molecules in situ and to fully understand howthese systems change in different environments.
10
Introduction
1.4 Aims of this work
The overarching goal of this work was to obtain molecular-level, label-free informationabout the organization and orientation of the biological molecules immobilized on a solid sur-face, especially pertaining to how they change in situ and how this knowledge can be furtherapplied to more complex systems. This goal was achieved by using DNA as a model biomoleculeand by reaching the following smaller aims:
[i] Gaining label-free, molecular-level information in air about DNA molecules immobi-lized on solid surfaces using SFG spectroscopy
[ii] Comparing results in air to results in situ to obtain an understanding how these filmschange when exposed to liquid
[iii] Furthering the understanding of the more complex system of hybridized DNA, specif-ically gathering more information about the level of order in these systems before and after hy-bridization
[iv] Beginning to apply the knowledge obtained by the relatively simple biomolecular sys-tems of DNA to understanding more complex biological systems such as the extracellular matrixunder a layer of cells
These goals were accomplished by first testing the sensitivity of the SFG instrument toconfirm that the detection level was low enough for ssDNA films and by testing the accuracy ofthis technique when comparing model hydrophobic and hydrophilic self-assembled monolayers(Chapter 3). Then, the way in which SFG detects nucleobases alone, unmodified DNA, and mod-ified DNA in air were measured in order to gain a solid understanding of these systems ex situ(Chapter 4). Next, thiolated DNA films were measured in situ in buffer, D2O, and extensively inH2O (Chapter 5). Further tests were then done on hybridized DNA samples in air, using both SFGand NEXAFS to confirm changes seen in ordering (Chapter 6). Finally, more complex systems ofcells on surfaces were measured (Chapter 7).
11

Chapter 2
Materials, Methods, and Instruments
2.1 Film Preparation
2.1.1 Chemical Acquisition and Control Parameters
Alkanethiols used in these experiments were ordered from Sigma-Aldrich Chemie Gmbh(Munich, Germany), while deuterated 1-dodecanethiol for sensitivity determination (98.9% deuter-ation) was ordered from C/D/N Isotopes (Montreal, Canada). Thymine, adenine, and cytosinepowders were also purchased from Sigma-Aldrich.
HPLC-purified custom thymine, adenine, or cytosine homo-oligonucleotides (ssDNA) werepurchased from Operon Biotechnologies (Cologne, Germany, VBC Genomics (Vienna, Austria),or Sigma-Aldrich (Taufkirchen, Germany). Oligos modified with a C6 linker and thiol group onthe 5’ end ordered from Operon were received with a HS-(CH)6OH protective group attachedto the thiol linker, while thiol-modified oligos from Sigma were deprotected with dithiothreitol(DTT) by the vendor prior to shipping, and trace amouunts of these molecules remained presentin the final product. All DNA were used as-received with no further purification. It is possiblethat the trace DTT in the films made with the oligonucleotides purchased from Sigma disruptedthe layer formation to some extent, as previous studies have shown that this can be the case [86].However, examination of these films with XPS showed no significant amounts of excess sulfur inthese films, and comparison of the SFG spectra of these films and those made from Operon oligosshowed no significant differences between the two, and density calculations remained constant.
Upon receipt, DNA concentrations were verified using a Thermo-Fischer NanoDrop UV-vis spectrophotometer (NanoDrop, somewhere)and separated into aliquots to be frozen until use.
2.1.2 Gold wafer parameters and cleaning procedures
Gold films were fabricated at the in the lab of Dr. M. Bruns using radio frequency mag-netron sputtering. Silicon wafers (Si-Mat Silicon Materials, Kaufering, Germany) were coveredwith a chromium adhesion later, followed by a gold layer to produce a 100 nm-thick polycrys-talline gold film. The resulting metal films were polycrystalline, with a predominant (111) orien-tation. Wafers were cut into appropriate sizes and cleaned either by submersion in warm piranhasolution (70% H2SO4 / 30% H2O2) for 10 minutes or by exposure to UV/ozone (UV cleaner 42-220, Jelight) for 2.5 hrs. All wafers were rinsed thoroughly with HPLC-grade water or ethanolimmediately prior to film deposition.
2.1.3 Film Deposition
Alkanethiol SAMs were made by placing the clean gold wafers into 3 mM solutions of themolecules in ethanol and incubating them at room temperature for at least 18 hrs. Samples werethen removed from the solutions, rinsed in ethanol, dried under flowing N2.
Nucleobase multilayers were fabricated according to the procedures outlined by Ostblomet al. [102], using 50 µm solutions of adenine, thymine, and cytosine dissolved in pure ethanol. A
12

Materials, Methods, and Instruments
drop of the nucleobase solution was placed on the gold wafer and allowed to evaporate, formingthe multilayer.
For DNA film formation, gold wafers were placed in 2 mL of 1 M phosphate bufferedsaline (PBS) solution or 1 M CaCl2 solution with 10mM Tris-HCl and 1mM EDTA[74] (CaCl2-TE)at pH 7.3 and containing 3-5 µM DNA. Samples were incubated at either room temperature or37 for between 24 and 40 hours. After the incubation, all samples were rinsed with flowingHPLC-grade or Mili-Q water (resistivity > 18.2 mΩ) for 1 min to remove excess buffer salt anddried under flowing nitrogen. Using these procedures, DNA densities of between 7 × 10¹² and7× 1013 DNA molecules/cm2 were generally achievable.
Films were hybridized by placing them in 1 M NaCl-TE solution containing 10mM Tris-HCl, 1 mM EDTA, and 3 µM target solution for 6-8 hours at room temperature, followed byrinsing for 1 min with 1 M NaCl and dipping briefly in HPLC water to remove excess buffer salts.The extent of hybridization was generally confirmed using the N 1s signal.
2.2 X-Ray Photoelectron Spectroscopy (XPS)
2.2.1 Instrument Specifications
XPS measurements were performed on one of two instruments in the laboratories of Dr.Michael Bruns of the Institute for Applied Materials at the Karlsruhe Institute of Technology(KIT). The first was an ESCALAB 5 spectrometer equipped with an Alpha 110 hemisphericalelectron energy analyzer (ThermoFischer Scientific). Measurements on this instrument were per-formed at pressures of <10−9 bar using non-monochromatized MgKα radiation. A pass energy of20eV with an energy resolution of ≈ 1 eV was used. The second instrument was a K-Alpha XPSspectrometer (ThermoFisher Scientific, East Grinstead, UK). Data acquisition using the ThermoAvantage software is described elsewhere. All DNA and SAM thin films examined using this in-strument were analyzed using a microfocused, monochromated Al Kα X-ray source (400 µm spotsize).
All photoelectrons were detected at a take-off angle of 0 relative to the sample surfacenormal. In addition to survey scans to detect unexpected species, spectra of specific areas werecollected in the Au 4f, C 1s, and O1s regions. The N 1s and P 2p regions were monitored forsamples containing DNA, and the S 2p region was examined for samples made with thiolatedmolecules. All spectra were referenced to the C 1s peak at 285.0 eV binding energy and the Au4f7/2 peak assumed to be at 84.0 eV. No charge compensation was needed. The Au referencespectra used to calculate the DNA density of the layers were obtained by sputter-cleaning thefilms in situ using Ar ions.
2.2.2 Data Processing Procedures
The spectra were fitted with one or more Voigt profiles using UNIFITii [103] (BE uncer-tainty: +0.2eV) and Scofield sensitivity factors were applied for quantification. The number ofpeaks was chosen according the work published by Petrovykh and co-workers [60]. The peakswere fit simultaneously with the background, which consisted of a combination of Shirley andlinear functions.
After fitting the peaks, the surface density of the DNA molecules was determined accord-ing to the procedures of Petrovykh et al. [51] The thickness t of the DNA film relative to the Arsputter-cleaned gold was calculated by:
t = − ln
[IDNAIAu
]× L (2.1)
where IDNA is the intensity of the DNA film, IAu the intensity of the sputter-cleaned gold,and L the estimated practical effective attenuation length for electrons in Au with a DNA over-layer [51]. Once the layer thickness had been determined, the relative DNA coverage θN
NAucould
be obtained by applying the formula:
13

2.3. Infrared Reflection-Adsorption Spectroscopy (IRRAS)
θNNAu
=NN
NAu× t
100− NN
NAu
(2.2)
where NN
NAuis the atomic density relative to Au. From the relative coverage, the absolute
DNA density nDNA expressed in molecules/cm2was determined using the equation:
nDNA =θNNAu
× 5.892× 10²²
10× 10−7 × nN(2.3)
where nDNA is the number of nitrogen atoms per DNA strand in the film. The factor 5.892×10²² is the atomic density of gold and 10× 10−7 accounts for the film thickness expressed in nm[51]. It should be noted that this approach assumes that a minimal amount of signal is stemmingfrom contaminants at the surface. This assumption was further supported by examining the C1s spectra, which showed a major peak at 285 eV for samples that were heavily contaminated, asopposed to a major peak at 287 eV for samples that were composed primarily of DNA.
2.3 Infrared Reflection-Adsorption Spectroscopy (IRRAS)
2.3.1 Instrumentation
Infrared reflection-adsorption spectroscopy (IRRAS) was performed at the Institute forFunctional Interfaces (IFG) at KIT on a Vertex 80 Infrared spectrometer (Bruker Optics, Ettlin-gen, Germany) using an A518 IRRAS sampling stage with an 80 fixed-angle gracing incidence.The signal was recorded by a D313 narrow-band MCT detector cooled by liquid N2. Backgroundmeasurements were performed with 1024 scans, and suppression of the water signal in sampleswas usually achieved between 1000 and 3000 scans. Baseline correction and data evaluation wereperformed using the Opus 6.5 IR software package (Bruker Optics).
2.4 Synchrotron Measurements
2.4.1 High-Resolution X-Ray Photoelectron Spectroscopy
The high-resolution x-ray photoelectron spectroscopy (HRXPS) experiments were performedat the D1011 beamline (bending magnet) at the MAX II storage ring of the MAX-lab synchrotronradiation facility in Lund, Sweden, by Prof. (apl.) Dr. Michael Zharnikov and members of his labgroup. The spectra were acquired in normal emission geometry at photon energies (PEs) rangingfrom 350 and 580 eV. The energy resolution was better than 100 meV allowing a clear separationof individual spectral components. The energy width of the individual emissions was close to theintrinsic energy spread of the respective core-level photoemission process. The binding energy(BE) scale of every spectrum was individually calibrated using the Au 4f7/2 emission line of theunderlying Au substrate at 83.95 eV [104], which is the value given by the ISO standard. HRXPSspectra were fitted by symmetric Voigt functions and a Shirley-type background. The fits wereperformed self-consistently: identical fit parameters were used for the same spectral regions.
2.4.2 Near-Edge X-Ray Absorption Fine Structure Spectroscopy
The near-edge x-ray absorption fine structure (NEXAFS) spectroscopic experiments werealso performed by Prof. Zharnikov at the same beamline as the HRXPS measurements. Thespectra acquisition was carried out both at the carbon and nitrogen K-edges in the partial electronyield mode with retarding voltages of 150 and 300 V, respectively. Linear polarized synchrotronlight with a polarization factor of 95 percent was used. The energy resolution was better than100 meV. The incidence angle of the light was varied from 90˚ (E-vector parallel to the surfaceplane) to 20˚ (E-vector nearly normal to the surface) in steps of 10˚-20˚ in order to monitor theorientational order of the target molecules within the films.
14

Materials, Methods, and Instruments
The raw NEXAFS spectra were normalized to the incident photon flux by division throughthe spectrum of a clean, freshly sputtered gold sample. Furthermore, the spectra were reducedto the standard form by subtraction of a linear pre-edge background and normalization to theunity edge jump (as determined by a nearly horizontal plateau 40-50 eV above the respectiveabsorption edges). The energy scale was referenced to the most intense π* resonance of highlyoriented pyrolytic graphite (HOPG) at 285.38 eV [105].
2.5 Density Functional Theory
Density Functional Theory (DFT) was performed by Dr. Robert Maul in the group of Prof.Dr. Wolfgang Wenzel at the Institute for Nanotechnology at KIT and were used to provide supple-mental information on peak positions for some alkanethiol films. DFT as implemented in the Tur-bomole simulation package [106] using a localized basis set and effective core potentials to modelthe electron-ion interaction was used. The Kohn-Sham equation was solved for a given exchange-correlation (XC) functional for the valence electrons, and the well-established PBE-functional wasused [107]. To take into account van-der-Waals interactions between alkanethiols and water, theDFT+D approximation [108] was employed incorporating the long-range dispersion contribu-tion to the XC-functional. The vibrational frequencies were calculated in the framework of thefrozen-phonon method [109]. Calculations for alkanethiol molecules in H2O were made using asingle molecule of water. Simulations were performed assuming a single molecule in a vacuumand neglecting the presence of a metallic substrate, therefore a deviation between calculated andexperimental values of up to 20 cm−1 was considered acceptable.
2.6 Sum-Frequency-Generation Spectroscopy (SFG)
2.6.1 Theory
SFG spectroscopy probes vibrations of molecular groups at interfaces through a non-linearresponse. It is a relatively new technique as it requires the use of reliable high powered laserswhich first became available a few decades ago. The first reports of the detection of molecularvibrations via SFG spectroscopy were by Shen [110, 111] and Harris [112] in the late 1980s.
In general, an electric field E induces a dipole moment µ in atoms or molecules, which canbe described by:
µ = µ0 + αE (2.4)
in which µ0 is the permanent dipole of the atoms or molecules and α the polarizability [95]. Thesum of the dipole moment per unit volume or bulk polarization P induced by the E field is givenas:
P = ε0χ(1)E (2.5)
where ε0 is the vacuum permittivity (8.854×10⁻¹² C/V·m) and χ(1) is the macroscopic average ofα, also known as the first-order or linear susceptibility. When the E field is increased to the pointat which it is comparable to the E field experienced by the electrons in a molecule, as is possiblewith high-power, coherent laser beams, the polarization can be expressed as a Taylor series:
P = ε0(χ(1)E + χ(2)E2 + χ(3)E3 + ...) (2.6)
In this equation, χ(2) and χ(3) are the second- and third-order non-linear susceptibilities,respectively [95]. P can be expressed as a convolution of its first-, second-, and higher-ordercomponents (Fig. 2.1). If two incoming E fields, E1 and E2 oscillating with frequencies of ω1 andω2 are considered, the second-order term of the polarization, P(2) can be expressed as:
P(2) = ε0χ(2)(E1cosω1t+ E2cosω2t)
2 (2.7)
15

2.6. Sum-Frequency-Generation Spectroscopy (SFG)
t
t
t
P (0)
P (1)
P (2)
Figure 2.1: Graphic illustration of the oscillations of the first-, second-, and third orderpolarizability with respect to time
ω
ω ω ωSF
IR
ω VIS IR VIS
|s
|v
|g
Figure 2.2: Energy levels associated with the generation of an SF signal. |g〉 representsthe ground state, |v〉 the excited vibrational state, and |s〉 any other higher state
Equation 2.7 can be expanded to give four terms: one describing a DC field with no fre-quency dependence (optical rectification), a term in which the frequency of the emitted light isdoubled (second harmonic generation), a term in which one frequency is subtracted from theother (difference- frequency generation) and one in which one frequency of the emitted light isadded to the other (sum-frequency generation) [95]. In SFG spectroscopy we measure the latter.
When SFG light is measured from a sample on a gold substrate, its intensity can be de-scribed as:
ISFG ∝∣∣∣P(2)
∣∣∣2 ∝ ∣∣∣χ(2)∣∣∣2 IIRIV IS (2.8)
in which IIR and IV IS are the two incident beams at a tunable IR and a fixed 800 nm visible 1
wavelength. In this equation, χ(2) consists of two different contributions: one from the substrate(non-resonant) and one from the adsorbate (resonant) [113]:
χ(2) = χ(2)NR + χ
(2)R = χ
(2)NR +
∑k
∣∣∣∣ Ak(ωIR − ωv) + iΓk
∣∣∣∣ eiφk (2.9)
where the non-resonant contribution χ(2)NR is generated by electronic inter-band transitions oc-
curring within metal substrates [114]. The resonant contribution χ(2)R is generated from molecular
vibrations and modeled as a sum of Lorentzian oscillators with resonance frequency ωk, linewidthΓk, phase difference φk relative the non-resonant contribution, and strength Ak. The term Ak is a
1. Although technically in the near-IR region, this beam has historically been called "visible" to distin-guish it from the tunable IR beam.
16

Materials, Methods, and Instruments
χ(2)bulk = 0
χ(2)non res ≠ 0
χ(2)bulk = 0
Phase A(fluid medium)
Phase C(substrate medium)
Inte
rpha
ses
χ(2) = 0
χ(2)res≠ 0
Phase B(amorphouspolymer)
Figure 2.3: Graphic illustration of the selection rules governing the generation or sup-pression of an SFG signal
Table 2.1: Incident beam polarization combinations and the elements of χ(2) which theyprobe. Polarizations are listed in the order of decreasing frequency: SFG,VIS,IR. Adaptedfrom Ref. [95]
Polarization combination Probed elements of χ(2)ijk
pss χ(2)zyy
sps χ(2)yzy
ssp χ(2)yyz
ppp χ(2)zzz , χ(2)
zzx, χ(2)xzx, χ(2)
xxz
complex third-rank tensor dependent on the Fresnel factors as well as the IR and Raman transi-tion moments of the probed material [114]. The SFG signal is resonantly enhanced when (ωIR isequal to ωv (Fig. 2.2).
The second-order non-linear susceptibility χ(2)ijk (where i, j, and k has a total of 27 possible
components which can the non-linear response of of a molecule to all polarization combinations.However, in a molecule containing a C∞ rotation axis only 4 of these components contribute[95] (Table 2.1). Further information about such molecules at the surface may be gathered bychanging the polarization of the incident E field, as different polarization combinations probedifferent elements of χ(2). For instance, the E field of s-polarized light has a component solely inthe y-direction, resulting in only those elements with transition dipole moments perpendicularto the plane of incidence giving rise to an SFG signal. The E of p-polarized light, on the otherhand, has components in both the x and z directions, resulting in SFG signals from elements withtransition dipole moments both parallel and perpendicular to the plane of incidence [23]. Morecomplex molecules do not have a perfect C∞ axis of rotation; however, even for these speciesmore elements will be probed in ppp polarization than in ssp polarization.
The surface specificity of SFG spectroscopy arises from the fact that in a centrosymmetricenvironment, the elements of χ(2)
ijk must be equivalent in all directions, giving:
χ(2)ijk = χ
(2)−i−j−k = −χ(2)
−i−j−k (2.10)
17

2.6. Sum-Frequency-Generation Spectroscopy (SFG)
(2)(1)(3)
(4)
(5)
(6)
Figure 2.4: Setup of the optical table. The labels denote: (1) Millenia Pro, (2) Tsunami,(3)Empower, (4) Spitfire, (5) Topas, and (6) delay stages. The VIS and Signal/Idler beamsare represented by red and white solid lines, respectively. For clarity the beams paths areonly illustrated up to purge chamber (clear box).
This can only be true when χ(2)ijk = 0, rendering the process of SFG signal generation for-
bidden in centrosymmetric media such as air or water [23, 95]. At interfaces, however, the cen-trosymmetry is broken and SFG can occur (Fig. 2.3).
2.6.2 Instrument Specifications
SFG measurements were performed on a home-built spectrometer located in the Institute ofToxicology and Genetics (ITG) at KIT [115]. This laser consists of a fs regenerative amplifier (RGA)(Spitfire Pro 35F XP, Spectra-Physics; sub-35 fs, 1 kHz) seeded by a mode-locked Ti:sapphire os-cillator (Tsunami 3941-MS, Spectra-Physics; sub-30 fs, 80 MHz) with a tunable wavelength cen-tered at 800 nm. The regenerative amplifier and seed laser are pumped by frequency-doubledQ-switched Nd:YLF (Empower 30, Spectra-Physics; 30 W, 1 kHz, 527 nm) and Nd:YVO4 (Mil-lenia Pro 5s, Spectra-Physics; 5 W, 532 nm) solid-state lasers, respectively. The RGA generates120-fs duration pulses centered at 800 nm with a repetition rate of 1 kHz and an average powerof 4 W. The amplified output beam is then split up and the larger fraction (80%) is used to pumpan automated optical parametric amplifier (OPA) (TOPAS-C, Light Conversion) coupled to a non-collinear difference-frequency generator (NDFG) (Light Conversion). This generates broadband(FWHM∼70-200 cm−1) IR pulses which can be tuned from 2.6 to 12 µm. The signal and idlerbeams are spatially separated and spectrally filtered by a Ge plate (Crystec). The remaining frac-tion of the output beam (20%) is fed into an air-spaced Fabry-Perot etalon (SLS Optics; spacingd = 12.5 µm, free spectral range FSR = 398.29 cm−1, effective finesse Feff = 57.48 at 790 nm)which gives narrowband (FWHM∼1 nm), asymmetric ps 800 nm (VIS) pulses. A 3D graphic ofthe optical table setup is shown in Fig.2.4.
The linearly-polarized IR and VIS beams were independently directed and focused on thesample surface with incident angles (relative to the surface normal) of 60, 68 and 70, respec-tively. These beams were then spatially (through the use of mirrors) and temporally (throughthe use of delay lines) overlapped at the sample surface within a spot ∼200 µm in diameter(Fig. 2.6). The elliptical shape is due to the angle of incidence of the beams. Maximum energiesof ∼30 µJ/pulse for the IR beam and ∼40 µJ/pulse for the VIS beam can be obtained immedi-ately before the sample. However, for these experiments the incoming beams were adjusted by
18

Materials, Methods, and Instruments
(8)
(6)
(5)
(7)
(3)
(4)(2)(1)
REFIR
VIS
SFG
Figure 2.5: 3D image of the sample stage area. The labels denote: (1) input mirrors, (2)input lenses, (3) breadboard, (4) measuring cell, (5) kinematic plates, (6) 1-axis goniome-ter, (7) 3-axis rolling block, and (8) output mirrors. The IR, REF, SFG, and VIS beams arerepresented by white, purple, green, and red solid lines, respectively. The reflected IRand VIS beams are not shown for clarity.
Figure 2.6: Beam profile of the VIS pulse at the sample stage. The scale shown is in µmunits. This image was acquired using a microscope mounted above the sample stage.
pinholes to a maximum of ∼7 µJ/pulse for the IR and ∼5 µJ/pulse for the VIS to prevent bubbleformation or sample ablation.
The outgoing SFG beams is collimated by lenses, filtered through a short-pass filter (3rdMillenium 770SP, Laser Components), and dispersed in an imaging spectrograph (Shamrock SR-301i-B, Andor Technology; focal length f = 303 mm, 1200 grooves/mm grating blazed at 500 nm)equipped with both a photomultiplier (R9110, Hamamatsu) and an air-cooled, back-illuminatedhigh-resolution CCD camera (iDus DU420A-BR-DD, Andor Technology; 254 ×1024 pixels). Us-ing this setup, it was possible to obtaine SFG spectra with reasonable SNR on a time scale of ms tos. For alignment, spectra were recorded in real-time (every 0.1s) allowing more accurate intensityoptimization and frequency adjustment. Spectra were taken with either ppp, ssp, or sps polariza-tion combination for the SFG, VIS, and IR beams, respectively, acheived by the rotation of the IRand VIS beams through the use of half-wave plates and/or a periscope.
Films in liquid were probed using a liquid cell inspired by the IR spectroscopy cell of Skodaet al. [116]. The cell, designed by V. Kurz, consists of a hemicylindrical CaF2 prism with opticallypolished curved and basal surfaces (Crystec; 10×20 mm), a Teflon R© base and prism adapter, and
19

2.6. Sum-Frequency-Generation Spectroscopy (SFG)
Figure 2.7: Measurement cell for in situ characterization of liquid/solid interfaces. Thesurface is probed through a half-cylindrical CaF2 crystal located on top of the sample.The liquid is entrapped between the crystal base plate and the sample surface.
a threaded rod to hold the prism on place on top of the sample [115]. In this setup, the sample isplaced on the Teflon R© base with a drop of liquid on its surface. The prism is then placed gentlyon top of the liquid, creating an aqueous layer located between the sample and an IR-transparentprism thin enough for the beams to reach the surface and be reflected back without significantenergy loss (Fig. 2.7).
A custom-built purge chamber was used in order to collect spectra more accurately in re-gions where water absorption is a problem. This acrylic glass-enclosed, air-proof chamber coversthe optical path of the IR beam from the NDFG module to the spectrograph. The air inside thechamber is air-dried (≤ 1% RH) by an FTIR purging gas generator (75-45-12VDC, Parker-Balston;14 L/min) coupled to two additional coalescing pre-filters to remove air particulates and hydro-carbon residues. The humidity and temperature in the chamber are monitored by a thermohy-grometer (Hytelog-USB, Hygrosens) mounted on the top panel. Using this setup, near completeelimination of the signals arising from water vapor in the air is achievable.
2.6.3 Data Processing Procedures and Considerations
SFG spectra from samples on gold consist of a convolution of the signal arising from elec-tronic transitions of the gold substrate and vibrational transitions from the sample, as shown inEq. 2.9. These spectra can therefore be presented either as (i) a full, raw spectrum consisting of acombination of the non-resonant and resonant components,(ii) as background-subtracted spectrain which the non-resonant background emanating from the gold is assumed to have a Gaussianshape and is divided by the spectrum, or (iii) as a background-suppressed (BGS) spectrum inwhich a small shift in the temporal overlap of the VIS and IR beams minimize the contributionsfrom the NR background (Fig. 2.8). Very noisy data can also be smoothed with either averaging
20

Materials, Methods, and Instruments
or Savitzky-Golay routines, generally using between 5 and 15 data points.Analyzing the raw spectra (type [i]) minimizes the errors associated with data processing,
however spectra presented in this way are often difficult to understand with those not famil-iar with SFG spectroscopy, as the non-resonant background contributions are significantly moreprominent than the resonant contributions from the sample (Fig. 2.8i).
To obtain background-subtracted spectra (type [ii]), the raw SFG output can be fitted byEq. (2.8) using a Gaussian shape for the non-resonant contribution (reflecting the fs IR profile) andLorentzian oscillators for the resonant contributions (Fig. 2.8ii). The major drawback associatedwith this type of presentation, however, is the fact that the phase of the resonant contributionsrelative to the non-resonant background, φk, are unknown. This could potentially cause compli-cations in numerical analysis of such spectra, as in order to fit the SFG spectra using Eq. (2.8)thesephase values must be assumed. However, for purely qualitative comparison purposes, presenta-tion of the SFG data as type (ii) can be highly useful.
Background-suppressed (BGS) spectra (type [iii]) are generated by shifting the incidencetiming of the VIS beam slightly with respect to the IR beam. In 2007, Dlott and colleagues [117] in-troduced a method by which the non-resonant contributions coming from a metal solid substratesuch as gold could be suppressed, allowing the resonant contributions to become dominant in thespectrum. This method relies on the fact that electronic transitions that create the non-resonantbackground signal have a much shorter lifetime than the vibrational resonant contributions [117].By shaping the VIS beam through the use of a Fabry-Perot étalon, it becomes possible to createan asymmetric beam profile with a 100fs rise and a smooth 1ps ring-down [117]. When thispulse is overlapped with the IR pulse with a time delay of 300fs, a spectrum is obtained in whichthe large Gaussian peak observable in the raw spectra is nearly gone, leaving behind only theresonant contributions (Fig. 2.8iii). If theoretically modeled and plotted over time, it can be seenthat the NR background disappears slowly as the delay is increased, with the resonant contribu-tions becoming more prominent at approximately 300 fs before receding as the delay differencebetween the two beams continues to lengthen.
In a BGS spectrum, the phase of the peaks is no longer an issue. This is due to the factthat when considering a spectrum with only one resonant contribution, the SFG intensity can beexpressed as:
ISFG ∝∣∣∣χ(2)NR + χ
(2)R
∣∣∣2 =∣∣∣χ(2)NR
∣∣∣2 +∣∣∣χ(2)R
∣∣∣2 + 2∣∣∣χ(2)NRχ
(2)R eiδ
∣∣∣ (2.11)
where δ is the phase difference between the resonant and non-resonant components. Inthis picture, when the non-resonant component of the spectra is very large, the cross-term is alsolarge and the phase plays an important roll in the spectra. When the non-resonant component issmall, however,
ISFG ∝∣∣∣χ(2)NR + χ
(2)R
∣∣∣2 ∝ ∣∣∣χ(2)R
∣∣∣2 (2.12)
leading to a suppression of the cross-term as well as the non-resonant background andeffectively removing all phase contributions. This has the added benefit of facilitating the iden-tification of peak positions, especially in complex molecules such as DNA. The peak positions,used in conjunction with the raw SFG data, can then be used to determine fit phase simultane-ously with the other peak parameters such as intensity and width. In this work, a Voigt functionwas used to fit the BGS peak positions to the raw SFG spectra.
21

2.6. Sum-Frequency-Generation Spectroscopy (SFG)
2800 3000
Res
onan
t SFG
Inte
nsity
(a.u
.)
wavenumber (cm-1)
2800 3000 2800 3000
Fitte
d R
eson
ant S
FG In
tens
ity (a
.u.)
wavenumber (cm-1)
r+ rFR r-
Tota
l SFG
Inte
nsity
(a.u
.)
wavenumber (cm-1)
r+ r-rFR r+ r-rFR
(i) (ii) (iii)
Figure 2.8: The raw SFG spectrum of DDT SAM (i) consists of a large, Gaussian non-resonant contribution with smaller Lorenzian resonant contributions appearing as peakswith a 180 phase difference distorting the Gaussian shape. The Gaussian peak can befitted, divided through the spectrum, and the resonant contributions inverted to givea background-subtracted SFG spectrum (ii). When a delay between the incoming VISand IR beams is introduced, however, the non-resonant contribution can be suppressed,leaving the resonant contributions behind in a BGS spectrum (iii). The labels of r+, rFR,and r− stand for the CH3 symmetric, Fermi-resonant, and asymmetric vibrations, respec-tively.
22

Chapter 3
Sensitivity and Proof-of-PrincipleExperiments
3.1 Summary
When dealing with a new system of measurement, it is important to have a firm graspon limitations of the system in order to avoid incorrect interpretations or overstatements of theacquired data. Sensitivity tests of this system yielded a signal-to-noise ratio of 100 at a surfacecoverage of 0.2 molecules per nm2. It is also essential to have simple proof-of-principle experi-ments in which the expected outcome is known in order to confirm that the system is operatingin a predictable way. For this, hydrophilic and hydrophobic self-assembled monolayers of alka-nethiols were examined in air and in water. Hydrophilic films showed significant changes in peakintensity and position upon exposure to water, indicating extensive interaction of water moleculeswith the film, as expected. Spectra of hydrophobic films were similar in air and water, indicatingno interaction of water with the film, also as expected. Density Functional Theory (DFT) calcula-tions were also performed to identify the vibrational modes contributing most significantly to theobserved effects. These results confirm that SFG spectroscopy can be used to accurately detect theinteraction of water with molecules in thin films at interfaces.
3.2 Sensitivity Measurements
3.2.1 Experimental Details
In order to experimentally determine the lower detection limit of the SFG system, mixedSAMs consisting of increasingly deuterated molecules were fabricated via solution depositionand measured in the CH stretching region. Silicon wafers sputter-coated with 100 nm of goldwere cleaned by a UV/ozone cleaner for 2.5 hrs as described in Chapter 2 Section 2.1.2. Theclean wafers were rinsed and placed in either pure or mixed 3 mM solutions of 1-dodecanethiol(Sigma-Aldrich) and deuterated 1-dodecanethiol (98.9% deuteration) in ethanol and incubated atroom temperature for 18 hrs. Samples were then removed from the solutions, rinsed in ethanol,dried under flowing N2, and immediately measured. SFG spectra were accumulated for 1 min,smoothed with a Savitzky-Golay routine using 15 data points, analyzed according to the back-ground subtraction procedures outline in Chapter 2 Section 2.6.3 and plotted as the resonantcontributions without the non-resonant background. The resonant SFG intensity as a function ofsurface coverage of the undeuterated dodecanethiol was then calculated (Fig. 3.1). X-ray pho-toelectron and IR spectroscopy measurements were also performed as outlined in Chapter 2 toensure sample quality.
23

3.2. Sensitivity Measurements
Figure 3.1: Spectra of DDT SAMs for calculation of the lower detection level of the SFGsystem. (a) Spectra of a fully deuterated SAM (0%, bottom trace), a fully undeuteratedSAM (100%, top trace), and mixtures in between (from top: 50%, 16%, 12%, 10%, 8%, 7%,6% and 4%). (b) Magnified spectra of the four lowest surface coverages highlighting thedecrease in the CH3 symmetric stretch. (c) Unsmoothed spectrum at 4% surface coveragefor SNR determination. (d) Intensity of the symmetric CH3 vibration as a function ofsurface coverage with the corresponding quadratic fit. The peak area was quantifiedusing Lorentzian fits of the resonant SFG spectra.
3.2.2 Results and Discussion
The residual peaks present in the spectrum of the fully deuterated monolayer can be as-signed to CH2 vibrations and are related to incomplete deuteration. However, the peak at 2880 cm−1
arising from the symmetric vibrations of the terminal CH3 group could be used to accurately as-sess the SFG intensity as a function of concentration, and hence the sensitivity of the spectrometer.Note that this peak was completely absent in the fully deuterated monolayer but still present inthe mixed monolayer with the lowest undeuterated content tested (4% surface coverage, corre-sponding to 0.19 molecules per nm2 assuming 0.21 nm2 per alkanethiol molecule [118]) (Fig. 3.1b).The intensity of the SFG signal can be expressed as:
ISFG ∝ N2|〈β〉|2 (3.1)
where 〈β〉 is the average molecular hyperpolarizability and N the molecular surface coverage.This quadratic relationship was supported by the experimental data. Ultimately, the lower detec-tion limit of this system was found experimentally to be 4% with an SNR of 100. Theoretically,it should be possible to achieve a signal at 2% coverage with an SNR of 25, or even at 1% cover-age with an SNR of 6.25. This detection limit is lower than previously reported values for otherhomodyne-detected systems (10% coverage) and comparable to heterodyne-detected systems,with lower reported limits of 1% coverage [119].
In this work, DNA films with an experimentally calculated density between 7 × 10¹² and7 × 1013 DNA molecules/cm2 were used. Given that oligonucleotides consisted of at least 5nucleosides, this translates into a lower CH2 or CH3 oscillator density of 4.5 × 10¹³ and 4.5 ×
24

Sensitivity and Proof-of-Principle Experiments
1014 oscillators/cm2, above the experimentally demonstrated lower detection limit of 2 × 10¹³
oscillators/cm2 from these experiments.
3.3 Proof-of-Principle Experiments: Model Hydrophilic and Hy-drophobic SAMs
3.3.1 Background
Analyzing in situ SFG spectra of larger molecules or dynamic processes can be difficult,not only because of the inherent complexity of the molecules and processes themselves, but alsobecause the coupling of water molecules to polar groups in samples in situ can lead to conforma-tional changes which alter the resulting spectra. Due to the relatively recent appearance of SFG asan in situ spectroscopic technique, however, there is currently comparably less literature availablewhich examines these changes [120, 121, 122, 123, 124, 125]. Furthermore, there is little informa-tion on these changes in basic contrasting systems - simple hydrophobic- and hydrophilic- func-tionalized surfaces - despite the fact that this information could be highly useful in interpretingin situ spectra of more complex samples such as biomolecules and polymers.
Self-assembled monolayers (SAMs) of alkanethiols often serve as model systems due totheir relative simplicity and ability to be used to easily create hydrophilic and hydrophobic sur-faces [? 126]. To date, there have been many theoretical and experimental studies performed onSAMs with methyl-terminated hydrophobic and hydroxyl-terminated hydrophilic tail groups.The majority of these studies have focused on structural and dynamic properties of water at theinterface, and have found a substantially reduced water density in the direct vicinity of methylterminal groups for hydrophobic films and a partially solvated state for hydroxyl terminal groupsin hydrophilic films [127, 128, 129]. However these studies did not examine the effect of waterinteraction on the internal structure of the film itself. Bain and coworkers investigated the re-lationship between macroscopic contact angles and molecular-level details in methyl-terminatedSAMs in air and in increasingly polar liquids. In order to vary the water contact angle between 77
and 112, they used alkanthiols with oxygen atoms at varying distances relative to the terminalmethyl group [120, 121]. Other studies have focused on structural changes within the SAMs, al-though using more complicated molecules [125, 123, 130]. Here we examine hydroxyl-terminatedalkanethiol SAMs in air and in water using broadband SFG spectroscopy. These molecules areoften employed as a protective group in the manufacturing of a variety of thiolated biomoleculesincluding DNA [83, 84, 58, 131] and are also used as backfilling molecules to increase order infilms of biological molecules [39]. Furthermore, we compare these results to hydrophobic methylterminated SAMs and use Density Functional Theory (DFT) calculations to support peak assign-ments for both systems.
3.3.2 Experimental Details
Gold-coated wafers were placed in solutions of 1-dodecanethiol (DDT) (Fig. 3.3) to formhydrophobic surfaces or 11-mercaptoundecanol (MCU) (Fig. 3.5) to form hydrophilic surfaces(Sigma-Aldrich) in accordance with the methods outlined in Chapter 2 Section 2.1.3. Contactangles reported in literature for hydroxyl-terminated SAMs were < 10 and 112 for methyl-terminated SAMs [132]. After 36 hrs of incubation at room temperature samples were removedfrom the solutions, rinsed thoroughly in ethanol, and dried under flowing N2. Sample quality wasverified via X-ray photoelectron and infrared spectroscopy. SFG Spectra were recorded using thefemtosecond SFG spectrometer described in Chapter 2 Section 2.6. All spectra were recorded inppp polarization in the order of increasing wavelengths (SFG, visible and infrared). Each samplewas first measured in air, then in H2O. The spectra were then background corrected, smoothedusing a Savitzky-Golay fit (5 points) and normalized to the spectral profile of the broadband IRpulse as described in Section 2.6.3
Density Functional Theory (DFG) calculations were made according to the procedures de-scribed in Chapter 2 Section 2.5. In order to permit direct comparison between experiments andtheory we calibrated the calculated frequencies to match those observed for the symmetric and
25

3.3. Proof-of-Principle Experiments: Model Hydrophilic and Hydrophobic SAMs
.)ns
ity (a
.u
+ H2O
SFG
Inte
air
H2O
2800 2850 2900 2950 3000
Wavenumber (cm-1)
Figure 3.2: SFG spectra of a self-assembled monolayer of hydrophobic, methyl-terminated 1-dodecanethiol SAM on gold in air (above) and in water (below). No sig-nificant changes in relative peak intensities or positions were observed upon exposureto water, indicating that there is only a weak interaction (e.g. induced dipole, van-der-Waals) between water molecules and the film.
asymmetric CH3 vibrations of the methyl terminal group in the DDT film. This yielded a redshiftof the calculated spectra by 99.5 cm−1.
3.3.3 Results and Discussion
3.3.3.1 Hydrophobic SAMs
Fig. 3.2 shows the SFG spectra of self-assembled monolayers of methyl-terminated DDT ongold in air (orange, upper trace) and in water (blue, lower trace) in the region between 2800 and3000 cm−1. The major bands present in these spectra are attributed to vibrations of the methylterminal groups (located at 2880, 2940, and 2968 cm−1) [133, 134]. Vibrations from methylenegroups within the alkane chain can not be observed in the SFG spectra, with the exception ofminor contributions from the methylene groups adjacent to the sulfur atom (located at 2885 and2928 cm−1) (Tab. 3.1).
This is due to the selection rules for second order nonlinear optical processes which dictatethat only molecular arrangements with broken inversion symmetry can contribute to an SFGresponse. In air, the close-packed DDT film is assumed to have a highly ordered structure withan all-trans conformation of the alkane chains [135]. In this configuration a center of inversion islocated in between the methylene groups in the alkane chain, leading to the suppression of thecorresponding SFG signal. Indeed, the DFT calculation for the all-trans conformation reveals thatnone of the collective alkane chain CH2 vibrations in the observed spectral range are both Ramanand IR active. Note, that according to group theory, (SFG active) vibrations with broken inversion
26

Sensitivity and Proof-of-Principle Experiments
Figure 3.3: Graphic of a single DDT molecule as used for DFT calculations. a) moleculeas used for calculations in air and b) molecule as used for calculations in water.
symmetry must be both Raman and IR active. In addition, the absence of bands originating fromgauche defects in the alkane chain (see Tab. 3.1) confirms the presence of an ordered SAM.
Furthermore, the CH3 as vibration has both in-plane (ip, 2965 cm−1) and out-of-plane (op,2955 cm−1) contributions. In the polarization combination used in these experiments (ppp, in theorder of increasing wavelength - SFG, visible, and IR), the observed SFG intensity of the vibra-tional modes with a component of the IR transition dipole moment perpendicular to the interfaceis maximized, while this polarization combination does not sample modes with transition dipolemoments oriented parallel to the surface. The presence of the ip vibration and absence of theop vibration in these spectra indicate that the methyl groups are oriented perpendicular to thesubstrate, as is expected for a highly-ordered film of this type [135].
It was observed that placing the DDT films in water (Fig. 3.2, lower blue trace) did notsignificantly change the spectrum in either band position or relative intensity, in agreement withprevious results [120, 121]. This indicates that the water molecules have only weak interactionswith terminal methyl groups of the film and that the orientation of the methyl groups of this filmremains the same. As a high density or close proximity of water molecules near the methyl groupswould cause a change in the vibrations and thus a change in the spectra, these findings supportprevious results obtained by MD simulations [127], neutron [136], and x-ray-relfectivity [128, 129],suggesting a reduced water density near the surface of this hydrophobic film [127, 128, 129].
3.3.3.2 Hydrophilic SAMs
In Fig. 3.4, SFG spectra of the hydrophilic, OH-terminated MCU SAMs are shown. Accord-ing to our DFT calculations, the only Raman and IR active bands in this region are collective CH2
vibrations mainly located at the second CH2 group from the OH-termination (CH2(2)) and theCH2 group adjacent to the sulphur atom (CH2-S). (Tab. 3.1 and Fig. 3.5). A peak at 2964 cm−1
is also apparent in the MCU spectra in both air and water, but as this peak was not present inthe DFT calculations we refrain from assigning it here. Collective vibrations located primarilyat the first group from the OH-termination (CH2(1)) are found to be located in the region below2800 cm−1, which was not probed in these experiments. The high overall intensity of this spec-trum and presence of peaks due only to terminal or near-terminal groups indicate that this filmalso has a high degree of order, as the alkane chain methylene vibrations are suppressed (seediscussion in the previous section on symmetry arguments in an all-trans conformation).
When this film is exposed to water, however, drastic changes occur (Fig 3.4, lower bluetrace). First, the overall intensity of the peaks decreases significantly compared to the peaks in air(both spectra were normalized to the nonresonant background). Second, the relative intensities ofthese peaks are substantially changed. Third, new peaks attributed to CH2 vibrations from furtherdown the alkyl chains appear at 2909 and 2945 cm−1. These are now visible due to the appearanceof gauche defects caused by the water molecules interacting with this film and causing a changein the orientation of the hydroxyl terminal groups. This assignment is supported by the DFTcalculations showing that these vibrations are only present in CH2 groups adjacent to a kink inthe alkyl chain. It should be noted, however, that the positions of the peaks assigned to CH2-Svibrations remain unchanged. This indicates that while the interaction with water is disrupting
27

3.3. Proof-of-Principle Experiments: Model Hydrophilic and Hydrophobic SAMs
.u.)
+ H O
tens
ity (a
. + H2O
SFG
Int
H O
air
H2O
2800 2850 2900 2950 3000
Wavenumber (cm-1)
Figure 3.4: SFG spectra of hydrophilic, hydroxyl-terminated 1-mercaptoundecanol in air(upper trace), and in water (lower trace). Peak positions changed drastically upon expo-sure to water, as did both relative and overall intensities, indicating significant interactionof the water molecules with the film.
Figure 3.5: Graphic of a single MCU molecule as used for DFT calculations. a) moleculeas used for calculations in air and b) molecule as used for calculations in water.
the upper part of the film, it is not disrupting lower part of the film, as would be expected for awell-formed SAM.
In summary, hydrophobic methyl- and hydrophilic hydroxyl-terminated self-assembledmonolayers in air and in water using SFG spectroscopy were examined. Hydrophobic SAMswith methyl terminal groups showed similar spectra both in air and in water, demonstrating thatthese films do not change in either conformation or orientation upon exposure to solution, inagreement with previous results and supporting the concept of a reduced water density in closeproximity to the hydrophobic interface suggested by other techniques. Hydrophilic SAMs with
28

Sensitivity and Proof-of-Principle Experiments
DDT MCUAssignment Positions Position
Air H2O Air H2OExp. Calc. Lit.a Exp. Calc. Exp. Calc. Lit.b Exp. Calc.
CH3 as, ip 2965 2957 2968 2965 2952 - - - - -CH3 s, FR 2940 2946 2940 2939 2929 - - - - -CH3 s 2880 2864 2880 2876 2865 - - - - -CH2-S as 2928 2939 - 2928 2933 2928 2938 - 2929 2934CH2-S s 2885 2877 - 2885 2877 2885 2877 - 2882 2870CH2(2) as - - - - - 2911 2919 2910 - -CH2(2) s - - - - - 2865 2866 2956 - -CH2 gauche - - - - - - - - 2945 2955CH2 gauche - - - - - - - - 2909 2924
Table 3.1: Peak positions and assignments for DDT and MCU monolayers in air and inwater. s: symmetric, as: asymmetric, FR: Fermi resonance. The CH2(2) group in MCUindicates that this resonance is centralized 2 carbon atoms away from the OH terminalgroup as depicted in Fig. 3.5. aRef.[135] bRef.[58]
hydroxyl terminal groups revealed substantially different SFG spectra in air and H2O, attributedto a significant decrease in order and interaction of water molecules with the film. DFT calcu-lations made for these molecules substantiate the peak assignment and the presence of gauchedefects in the alkane chain when the film is exposed water.
3.4 Conclusions
Both the sensitivity measurements and the proof-of-principle results from model SAMsyield results that indicate that the technique of SFG can be used to examine and obtain accurateinformation about DNA films. The sensitivity measurements show that the current experimentalsetup can detect as few as 2 × 10¹³ oscillators/cm2, which is below the lowest calculated den-sity for DNA films used in these experiments, 4.5 × 10¹³ oscillators/cm2. The proof-of-principleexperiments have shown that SFG can give accurate and predictable information about SAMsmeasured in air versus in water, lending confidence to the analysis of the more complex systemsof DNA through similar changes in environment.
29

Chapter 4
Surface-Bound DNA in Air
4.1 Summary
Thymine, adenine, and cytosine ssDNA and nucleobases immobilized on gold were ex-amined in air in the CH stretching region using sum-frequency-generation spectroscopy. It wasexpected that the methyl group in thymine would give clues as to the changes in orientation ofthese molecules adsorbed on the surface as either ssDNA or nucleobase multilayers, with adenineand cytosine ssDNA and nucleobases acting as controls. Multilayers of the nucleobases aloneshowed clear peaks from the methyl group in thymine that were not visible in adenine and cyto-sine. Comparison of these peaks using different polarization combinations suggested an averageorientation that was not completely planar with the sample surface, in agreement with previousresults. Examination of films of unmodified short-chain DNA revealed a high degree of similarityamong the spectra of thymine, cytosine, and adenine homo-oligonucleotides, indicating that themethylene vibrations of the sugar-phosphate backbone were the primary contributors to thesespectra and suggesting that the DNA molecules on the surface were oriented in a way that wasindependent of nucleobase composition. Films of thiol-bound DNA, known for their relativelyhigh degree of ordering, also showed highly visible differences between thymine, adenine, andcytosine ssDNA. This result suggested that, as was the case for the unthiolated films, the methy-lene vibrations from the backbone as well as the methylene groups from the thiol linker attachingthe molecules to the substrate were dominating the spectra. The origin of these signals was veri-fied by inducing order in the films through continuous wetting and drying, revealing increases insimilar peaks for thymine, cytosine, and adenine ssDNA films. These results show that overall,the CH groups in films of surface-immobilized DNA are initially mostly disordered, likely due tothe flexibility of single-stranded DNA molecules.
4.2 Background
Orientation and ordering in films of ssDNA immobilized on gold are essential to the op-timal use of these systems [137]. In order to more accurately gather information on these pa-rameters, we employed a bottom-up approach in which multilayers of the nucleobases were firstexamined, followed by unmodified DNA, and finally the more highly-ordered layers of thiol-modified DNA in air. Such an approach has been used before, most notably by Stokes et al. [57]who examined both individual DNA components as well as complete DNA molecules on glassusing SFG spectroscopy. However, in those experiments the density of the DNA molecules wasrelatively low (on the order of 1012 molecules/cm2, which is usually associated with a low de-gree of order). Furthermore, only thymine and its derivatives were tested. In these experiments,adenine and cytosine nucleobases and ssDNA were also tested for comparison.
The goal of these experiments was to gain a clear understanding of which CH oscillators inthe DNA molecules gave rise to which signals, and to use that information to deduce order pa-rameters from the samples tested. Although spectra in the Amide I region were also taken, theseexperiments focused mainly on the CH stretching region, as it was hoped that the CH3 group
30

Surface-Bound DNA in Air
unique to thymine would be distinguishable and would yield clues as to the level of alignment ofthe nucleobases either alone or in a DNA strand. Previous work on the tilt angle of methyl groupsin simple CH3-terminated SAMs has shown that this information can be inferred by a comparisonof the intensities of the asymmetric (r−) to the symmetric (r+) stretch [138] in ppp polarization orby comparison of the intensities of either the symmetric stretch in ssp to ppp polarization or theasymmetric stretch in ppp to ssp polarization [139]. However, both of these systems were devel-oped assuming constraints based on alkanethiol chains, including the average degree of tilt of theentire chain (φ) relative to the surface normal, the rotation of the molecule around its axis (ψ), andthe average degree of tilt of the methyl groups (θ) relative to the surface normal which is generallyeither 27, for chains with an odd number of C atoms), or 58, for chains with an even numberof C atoms [138]. The fact that the latter dictates that the methyl groups are roughly pointingaway from the sample surface means that the phase is generally assumed to be 180 relative tothe surface normal [113, 125].
While some of these parameters may also be generally applicable to a methyl-containingthymine nucleobase in a DNA molecule, due to the flexibility of DNA strands there are also manymore parameters that may influence the methyl peaks, including the rotation of the nucleobaserelative to the pentose sugar, the rotation of the nucleobase and sugar relative to the phosphategroups, and kinks in the sugar-phosphate backbone which may result in the displacement ofone nucleobase with respect to the others [41]. Furthermore, multiple studies using NEXAFSspectroscopy to determine the average orientation of thymine nucleobases relative to the substratein films of thymine ssDNA on gold have revealed that they adopt an overall parallel orientation,although the degree of order is not extremely high [85, 44, 83]. Such an orientation would placethe methyl groups in the thymine nucleobases nearly parallel to the sample surface, a conditionwhich is generally not seen in the investigation of alkanethiol SAMs.
4.3 Experimental Details
All films were formed on 100 nm polycrystalline Au(111)-coated silicon wafers describedin Chapter 2. Films were UV-cleaned for 2.5 hours and rinsed thoroughly with either pure ethanolor Mili-Q water prior to deposition.
Nucleobase multilayers were formed by placing a 50 µm solution of adenine, thymine,or cytosine dissolved in pure ethanol on a clean gold wafer and allowing the excess solvent toevaporate as described in Ref. [102] and in Section 2.1.3. DNA films were fabricated by placing thefreshly cleaned gold wafers in 1M CaCl2-TE buffer and incubating them at 37 for approximately40 hours as described in Ref. [74] and Section 2.1.3. Following incubation, DNA films were rinsedfor 1 min under flowing Mili-Q water to remove residual salt and excess DNA, then gently driedwith flowing N2.
IRRAS measurements were performed on all films according to the procedures outlinedin Section 6.11. XPS measurements were peformed for the DNA layers using the ESCALAB 5spectrometer described in Section 2.2. SFG measurements were gathered using the broadbandSFG setup outlined in Section 2.6, using output powers of no more than 5 µJ and 7 µJ for the VISand IR beams, respectively. Data were processed according to all three of the methods detailed inSection 2.6.3.
For films that were exposed to wetting and drying cycles, a drop of HPLC-grade waterwas placed on top of the sample, then allowed to dry in the purified, filtered air of the purgebox surrounding the SFG sample stage. Measurements were taken after the drop of water hadcompletely evaporated.
4.4 Results and Discussion
4.4.1 Nucleobase Multilayers
Nucleobase multilayers were examined first, as it was expected that they would providethe simplest spectra and facilitate the assignment of the peaks stemming from the methyl groups
31

4.4. Results and Discussion
1800 1600 14000.000
0.005
0.010
0.015
0.020
0.025
0.030
1800 1600 1400 1800 1600 1400
Abs
orba
nce
(a.u
.)
wavenumber (cm-1)
Thymine
wavenumber (cm-1)
Adenine
wavenumber (cm-1)
Cytosine
Figure 4.1: IRRAS spectra of thymine, cytosine, and adenine multilayers on gold in theamide I region.
in the bases. Multilayers were chosen instead of monolayers for this purpose as they contain ahigh nucleobase density and thus provide more signal due to more contributing oscillators. Fur-thermore, multilayers of DNA nucleobaes can condense on gold substrates into highly orderedstructures [36, 140].
Multilayers were first measured with IRRAS in the amide I region in order to verify thesample quality. Results yielded peak positions in agreement with previously published resultsof different nucleobases [81, 35]. In Fig. 4.1, the spectrum of thymine shows a large peak at ≈1759cm−1, which is assigned to the vibrations of the C=O at the C2 carbon, while the peak at1678cm−1 is attributed to the C4=O and C=C vibrations. The major peak in the cytosine spectrumat 1686cm−1 is due to the C2=O vibrations, while the two adenine peaks at 1647 and 1606 cm−1
are assigned to NH2 and N3-C4/C5-C6 stretches, respectively [102]. Examination of adenine andthymine nucleobase multilayers in the CH stretching region between 2800 and 3000 cm−1 usingIRRAS revealed a sharp peak at around 2940cm−1 for the thymine film, which was assigned tothe asymmetric CH3 stretching vibration [141]. Adenine films showed no such distinguishingcharacteristics (Fig. 4.2).
In the raw SFG data in the CH region, the thymine multilayer showed a sharp peak at2935cm−1, while the adenine and cytosine multilayers showed only small, broad peaks whichdistorted the shape of the non-resonant background (Fig 4.3). Spectra for these films in the AmideI region were also collected, however it was found that peaks from these molecules in the AmideI region, although relatively strong in IR spectroscopy, appear to be only weakly present in SFGspectra. In particular, the C=O stretch at 1700 cm−1 for thymine, which is quite prominent andoften used as a marker of quality for thymine homo-oligonucleotide films [37, 51], is not sig-nificantly Raman active [102], and thus does not appear in the SFG spectra. Upon backgroundsuppression, a number of small peaks became visible that were common to all three types ofnucleobases, as well as two unique peaks for the thymine multilayer: one large contribution at2935cm−1 and one small contribution at 2905cm−1 (Fig. 4.3).
The peaks that are common to all three multilayers could be due to contamination that
32

Surface-Bound DNA in Air
3000 2950 2900 2850 2800 2750
0.0000
0.0005
0.0010
Abs
orba
nce
(a.u
.)
wavenumber (cm-1)
(a)
3000 2950 2900 2850 2800 2750
wavenumber (cm-1)
(b)
Figure 4.2: IRRAS spectra of thymine and adenine multilayers on gold in the CH region.The thymine film shows a sharp peak at approximately 2940 cm−1, which was assigned toan asymmetric CH3 stretch. The adenine nucleobase multilayers showed no such strong,sharp contributions, only broader and weaker peaks between 2750 and 3000 cm−1.
2800 3000
r+
Res
onan
t SFG
Inte
nsity
(cou
nts)
wavenumber (cm-1)
r-
2600 2800 3000 3200
Tot
al S
FG In
tens
ity (a
.u.)
wavenumber (cm-1)
Thymine multilayer Adenine multilayer Cytosine multilayer(a) (b)
Figure 4.3: SFG spectra of thymine, adenine, and cytosine nucloebase multilayers in theCH stretching region. Data are presented as (a) raw spectra (b) background-suppressedspectra
33

4.4. Results and Discussion
Table 4.1: Parameters obtained from a fitting of the raw SFG data shown in Fig. 4.5 withVoigt functions using phase as one of the variable parameters. Positions are given incm−1 and phase in degrees. Proposed peak assignments are also given.
ppp sspPosition Area Phase Position Area Phase Assignment
2895 0.26 98 2899 0.06 142 CH3 sym2928 0.10 148 2929 0.14 162 CH3 asym
was present in the deposition solution, or contaminating molecules that adsorbed onto the filmduring the process of making the films. It is also possible that these peaks are due to overtones ofvibrations in the amide region. Each of these nucleobase types shows a number of peaks between1400 and 1500 cm−1 in the IRRAS spectra (Fig. 4.1 which would give overtones in the regionbetween 2800 and 3000 cm−1. However, given that the smaller peaks look nearly identical amongthe layers, which is unlikely to be the case if these are indeed caused by overtones, as the differentstructure of the nucleobases should yield unique spectra. Therefore, contamination is the morelikely explanation for these peaks.
It is interesting to note the low intensity of the peaks above 3000 cm−1, which is typicallythe region in which strong ring vibrations are expected [141, 57]. However, other studies on filmsof nucleobases using SFG have also noted either absent or very weak peaks in this region [57].This may indicate that the ring vibrations of thymine have either a very small IR cross-section ora very small Raman cross-section, as the SFG signal is the product of both of these [95]. Hommelet al. found the major benzene ring vibration at 3070 cm−1 decreased significantly when the ringswere substituted with methyl groups [141].
The peaks for thymine at 2935 and 2905 cm−1 are assigned to the asymmetric and symmet-ric methyl stretches, respectively. This is in agreement with SFG, IR, and Raman measurementsperformed on methylated benzene rings at the air/water interface, in which major peaks in theSFG spectra were found at 2980, 2945, and 2915 cm−1 and assigned to a symmetric (at 2915 cm−1)and two asymmetric (at 2945 and 2980 cm−1) methyl stretches [141].
Stokes and co-workers [57] examined spin-coated films of thymine nucleobases on glassslides and found a peak with a negative phase at 2943 cm−1 and three peaks with positive phasesat 2908, 2880, and 2861 cm−1. They assigned these peaks to a methyl asymmetric stretch, a methylFermi resonance, a methyl symmetric stretch, and either a second methyl stretch or residualmethylene from the deposition solution, respectively. The peak observed in these experimentsat 2908 cm−1 is quite similar to the peak assigned to a Fermi resonance by Stokes et al., howeverbased on the fact that there are only two clear peaks in these spectra, we believe that an assign-ment of a symmetric stretch is more accurate. An assignment of a Fermi resonance for this peakwould suggest that the symmetric stretch for the methyl vibration in thymine is not visible ineither of the polarization combinations tested, which is unlikely.
The highly visible CH3 asymmetric stretch in the thymine multilayer suggested that thisfilm might have a relatively high degree of order. In order to test this, we examined this filmusing both ppp- and ssp-polarization combinations. A ppp-polarization combination probes ahigher number of χ(2) components, while an ssp polarization combination probes only thosecomponents which are perpendicular to the plane of the sample surface [23]. The spectra arepresented in Figure 4.4, with the raw spectra shown in the right panel and the BGS spectra shownin the left.
The large dip in the raw spectra at 2935 cm−1 is also visible in the ssp spectra, indicatingthat these molecules are not lying flat on the gold surface with the methyl group oriented parallelto the substrate. More specific information about the molecules in this film was gathered by fittingthe raw spectra using phase as a parameter as described in Section 2.6.3. The results are shownin Fig. 4.5 and the values are listed in Table 4.1. The procedure yielded relatively good fits to theexperimental data with values within the expected range.
In ssp polarization, the asymmetric methyl stretch is maximized while the symmetric methylstretch is near 0. This could be explained by a methyl angle with a preferential alignment more
34

Surface-Bound DNA in Air
2600 2800 3000
r-
Res
onan
t SFG
Inte
nsity
(cou
nts)
wavenumber (cm-1)
pppssp
r+
2600 2800 3000 3200
Tot
al S
FG In
tens
ity (a
.u.)
wavenumber (cm-1)
ppp
ssp
(a) (b)
Figure 4.4: SFG spectra of a thymine nucleobase multilayer in ppp and ssp polarizationcombinations presented as (a) raw spectra and (b) background-suppressed spectra.
ppp ssp
2600 2800 3000 3200
Tota
l SFG
Inte
nsity
(a.u
.)
wavenumber (cm-1)2600 2800 3000 3200
wavenumber (cm-1)
Figure 4.5: The raw SFG spectrum in ppp (left) and ssp (center) polarization combina-tions of a thymine nucleobase multilayer(black lines)fit using the peak locations deter-mined from the background-suppressed spectrum as fixed parameters and phase, area,and width as variable parameters (red lines).
35

4.4. Results and Discussion
Figure 4.6: Cartoon of a molecule of thymine adsorbed on a gold surface with two poten-tial orientations that would agree with the results presented in this chapter. The methylgroup is oriented neither perfectly perpendicular nor perfectly parallel to the substrate,in agreement with previous results.
parallel than perpendicular to the plane of the sample surface. Such and orientation is in agree-ment with the results of Roelfs and co-workers [36], who examined the adsorption of thymine ongold electrodes using a combination of STM and XPS, and demonstrated that thymine can adsorbon Au(111) in a condensed state in which the molecules are oriented with the plane of the ringperpendicular to the surface and bound by a deprotonated N3 nitrogen to the surface (Fig. 1.4).Other earlier studies done using STM have also suggested an end-on orientation for nucleobasesadsorbed on gold [142, 143]. This configuration would place the methyl group at an angle ofaround 60 relative to the surface plane (Fig. 4.6).
4.4.2 Unmodified DNA Films
Unmodified 6-mer homo-oligonucleotides were investigated using SFG spectroscopy inorder to determine which contributions arose from the sugar-phosphate backbone of the DNAmolecules. Prior to testing with SFG, the density and overall quality of these films were testedusing XPS and IRRAS as described in Chapter 2. Final densities were calculated to be 7×10¹², 8.2×10¹², and 7.5×10¹² molecules/cm2 for thymine, adenine, and cytosine, respectively, according theprocedures developed by Petrovykh et al. [51]. These densities are in agreement with the currentliterature, which shows the preference for binding to gold as decreasing from adenine to cytosineto thymine [35]. Adenine is known to resist being rinsed away, while thymine is more easilydislodged from the surface by streaming water. The measured densities in these experimentsconfirm this trend.
The XPS data themselves showed features typical of DNA monolayers [51]. An examplespectra set for the (dA)6 film is shown in Figure 4.7. The C 1s spectra shows two dominant peaks:1 at 285 eV stemming from carbon with C-C single bonds, and another at 287, which arises froma C=C double bond. The fact that the latter peak is nearly the same intensity as the former is anindication that this film is indeed covered with DNA molecules and not just adventitious carboncontamination, in which C-C bonds are the dominant carbon form. The N 1s signal is strong andshows 2 contributions in a 2:1 ratio which is typical of nitrogen from adenine nucleobases [37].The P 2p peak is also clearly present, although with a lower intensity due to the lower amountof phosphorous compared to nitrogen in DNA molecules (Fig. 1.4). No S 2p peak is present, asexpected for these films.
The SFG spectra generated by these films are shown in Fig. 4.8. Figure 4.8a shows the rawSFG spectra in ppp polarization consisting of the Gaussian-shaped non-resonant background con-voluted with the smaller, Lorentzian-shaped resonant contributions appearing as either dips orpeaks distorting the Gaussian shape. All three spectra appear to have broad, shallow dips at ap-proximately 2880 and 2930 cm−1, although the higher position of the Gaussian in the cytosineand adenine ssDNA films makes the lower peak appear less prominent. The BGS spectra in ppppolarization are shown in Figure 4.8b and all show two prominent peaks at 2890 and 2940 cm−1,with shoulders at 2870 and 2970 cm−1. In ssp polarization, all spectra show three peaks at 2830,2860, and 2950 cm−1. In total, all the spectra films of thymine, adenine, and cytosine ssDNA are
36

Surface-Bound DNA in Air
295 293 291 289 287 285 283 281 279Bindungsenergie / eV
96.3
94.6
92.9
91.2
89.5
87.8
Inte
nsitä
t / k
cps
R(E
) 1
-1
392 410 408 406 404 402 400 398 396 394Bindungsenergie / eV
135.00
134.26
133.52
132.78
132.04
131.30
Inte
nsitä
t / k
cps
R(E
) 1
-1
N 1s
141 140 139 138 137 136 135 134 133 132 131 130 129Bindungsenergie / eV
75.10
74.86
74.62
74.38
74.14
73.90
Inte
nsitä
t / k
cps
R(E
)
1
-1
P 2p
C 1s
172 169 166 163 160 157
Bindungsenergie / eV
154.70
153.96
153.22
152.48
151.74
151.00
Inte
nsitä
t / k
Coun
tsR(
E)
1
-1
S 2p
Figure 4.7: XPS C 1s, N 1s, and P 2p spectra from the unmodified adenine ssDNA film.The prominent peak in the C 1s spectrum at 287 eV (C=C bonds) in addition to the peakat 285 eV (C-C bonds) indicating that this film contains a significant amount of DNArather than just contaminants, which generally contain mostly C-C bonds. The N 1s peakshows a double peak typical of adenine and the clear P 2p peak confirms the amount ofDNA on the surface.
very similar, with peaks in the same locations across all the samples. This is especially interestingto note in light of the differing densities of these layers. This may be due to two reasons. First,it is possible that the combination of relatively low molecular densities and a relatively high ex-pected degree of disorder within these films is making it impossible to accurately detect the CHvibrations of these molecules. In the sensitivity experiments presented in Chapter 3, the lowerdetection limit of the system was found to be below the number of oscillators present in a sparseDNA film. However, it should be noted that the molecules probed in those experiments were in ahighly-ordered self-assembled monolayer with the majority of the oscillators pointing in the samedirection. When molecules are arranged isotropically, however, the result is a decreased overallresonant signal (see Chapter 2.6.1). In addition, it is possible that the low density of the moleculesmakes it more likely that the film contains a higher amount of contaminants, which could swampout the signal from the ssDNA molecules.
It is entirely possible that this is the case for thymine and even cytosine, as C 1s XPS dataof these films showed a relatively large peak at 285 eV attributed to contaminants, but the ade-nine film shows a reasonable density and a good C 1s peak with a large contributions at 287 eV(Fig. 4.7) that indicates that this film is primarily composed of adenine ssDNA. Castner and co-workers [85] examined non-thiolated adenine ssDNA on gold using NEXAFS and showed that
37
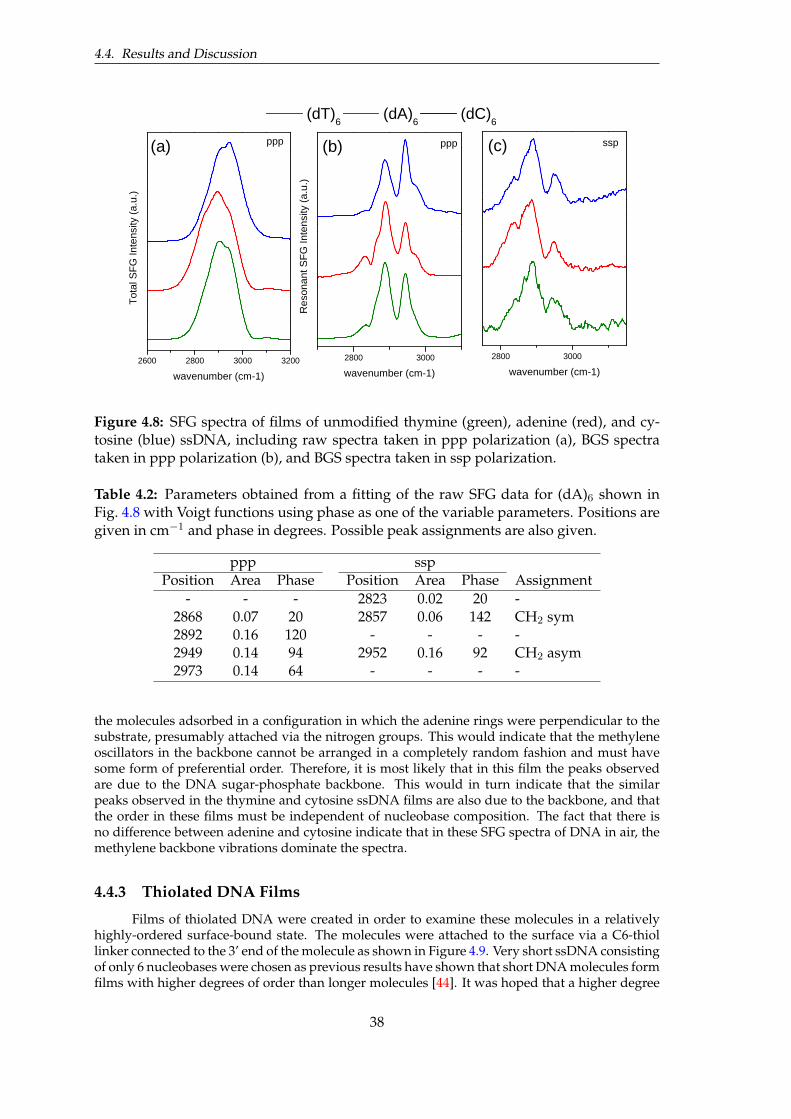
4.4. Results and Discussion
2 8 0 0 3 0 0 0
Reso
nant
SFG
Inten
sity (a
.u.)
w a v e n u m b e r ( c m - 1 )2 6 0 0 2 8 0 0 3 0 0 0 3 2 0 0
s s pp p p ( c )( b ) ( d T ) 6 ( d A ) 6 ( d C ) 6
Total
SFG
Inten
sity (a
.u.)
w a v e n u m b e r ( c m - 1 )
( a ) p p p
2 8 0 0 3 0 0 0
w a v e n u m b e r ( c m - 1 )
Figure 4.8: SFG spectra of films of unmodified thymine (green), adenine (red), and cy-tosine (blue) ssDNA, including raw spectra taken in ppp polarization (a), BGS spectrataken in ppp polarization (b), and BGS spectra taken in ssp polarization.
Table 4.2: Parameters obtained from a fitting of the raw SFG data for (dA)6 shown inFig. 4.8 with Voigt functions using phase as one of the variable parameters. Positions aregiven in cm−1 and phase in degrees. Possible peak assignments are also given.
ppp sspPosition Area Phase Position Area Phase Assignment
- - - 2823 0.02 20 -2868 0.07 20 2857 0.06 142 CH2 sym2892 0.16 120 - - - -2949 0.14 94 2952 0.16 92 CH2 asym2973 0.14 64 - - - -
the molecules adsorbed in a configuration in which the adenine rings were perpendicular to thesubstrate, presumably attached via the nitrogen groups. This would indicate that the methyleneoscillators in the backbone cannot be arranged in a completely random fashion and must havesome form of preferential order. Therefore, it is most likely that in this film the peaks observedare due to the DNA sugar-phosphate backbone. This would in turn indicate that the similarpeaks observed in the thymine and cytosine ssDNA films are also due to the backbone, and thatthe order in these films must be independent of nucleobase composition. The fact that there isno difference between adenine and cytosine indicate that in these SFG spectra of DNA in air, themethylene backbone vibrations dominate the spectra.
4.4.3 Thiolated DNA Films
Films of thiolated DNA were created in order to examine these molecules in a relativelyhighly-ordered surface-bound state. The molecules were attached to the surface via a C6-thiollinker connected to the 3’ end of the molecule as shown in Figure 4.9. Very short ssDNA consistingof only 6 nucleobases were chosen as previous results have shown that short DNA molecules formfilms with higher degrees of order than longer molecules [44]. It was hoped that a higher degree
38

Surface-Bound DNA in Air
NH
O
ON
O
H
O
H
H
H
HP
O
O-
O-
NH
O
ON
O
H
O
H
H
H
HP
O
O-
O-
NH
O
ON
O
H
O
H
H
H
HP
O
O-
O-
NH
O
ON
O
H
O
H
H
H
HP
O
O-
O-
S
NH
O
ON
O
H
O
H
H
H
HP
O
O-
O-
HO
Figure 4.9: The chemical structure of a thiol-modified 5-mer thymine homo-oligonucleotide.
of order would maximize the SFG signal and highlight the differences between DNA films ofdifferent nucleobase compositions.
Verification of film quality in the thymine ssDNA layers using XPS revealed a C 1s spec-trum typical of DNA, with a large C=C peak at 287 eV (Fig.4.10). The N 1s and P 2p peaks werealso strong and yielded a correct ratio of 2, indicating little to know nitrogen-containing contam-inants [51]. The S 2p peak showed a strong peak for bound sulfur at 163 eV, and a small peakat 168 eV, indicating that some of the thiolated molecules in this film were oxidized, which mayhave contributed to a decreased overall order. Adenine and cytosine films were also examinedusing XPS and gave similar results. The densities of these films were calculated from the fittedXPS data and found to be 6.5 × 10¹³, 3.5 × 10¹³, and 5.1 × 10¹³ molecules/cm2 for the thymine,adenine and cytosine films, respectively. As discussed in Section 1.2.1, the lower density for theadenine ssDNA films is expected, as the high affinity of these molecules for gold causes them toadsorb to the surface via both the sulfur group and the nucleobases [35]. This results in some ofthe molecules lying with an orientation more horizontal along the surface, taking up more spaceand preventing the adsorption of further DNA molecules. Thymine, on the other hand, is eas-ily displaced from the gold surface by the thiolated linkers, resulting in more of these moleculesstanding upright and an overall higher density on the surface [37, 52].
A comparison of the BGS spectra of thymine thiolated ssDNA film and a film of the linkergroup alone (HS-(C2)6-OH) is shown in Figure 4.11. The raw data (Fig. 4.11a) show a similar peakat 2930 cm−1. However, the peak at 2880 cm−1 is much more prominent in the spectrum of thelinker group alone. The BGS spectra (Fig. 4.11b) revealed that most of the peaks in these spectraare in common between the two, including the most prominent peaks at 2880 and 2940 cm−1
observed in the raw data. This is unsurprising, as both the C6 linker and the backbone vibrationsshown to be dominant in the spectra of unmodified DNA films contain exclusively methylenevibrations. The fact that some of the methylene groups in the DNA backbone are in a differentenvironment should produce small differences in the spectra unless the linker groups are domi-nating the spectra. This situation was in fact found by Sartenaer and co-workers [58] examiningDNA layers on Pt(111) with SFG spectroscopy. However, in these films of DNA on Au(111), fromwhich we expect a slightly greater degree of order, there are two peaks that stand out as distinctin the spectra of (dT)6: one at 2871cm−1 and another at 2912cm−1. The peak at 2871cm−1 is closeto the peak at 2868cm−1 was previously observed in the unmodified (dA)6 layer and assignedto a methylene symmetric stretch stemming from the backbone, while the peak at 2912 cm−1
was observed in the thymine, adenine, and cytosine thiolated ssDNA spectra and is assignedto a methylene symmetric stretch from the backbone. The other peaks present are assigned tooverlapping peaks from the backbone and the C6 linker.
It is clear to see from the data in Figure 4.12 that films of thymine, adenine, and cytosinehomo-oligonucleotides adsorbed on gold give largely similar spectra. Given the results presentedin Section 4.4.2, this is most likely due to the dominance of the methylene vibrations coming fromthe sugar-phosphate backbone, and compounded by the presence of the linker group, which arecommon to all film types and would give peaks in similar locations. It was initially assumed
39

4.4. Results and Discussion
141 139 137 135 133 131 129 127Binding Energy / eV
73.50
73.08
72.66
72.24
71.82
71.40
Inte
nsity
/ kc
psR(
E)
1
-1
P 2p
393 407 405 403 401 399 397 395Binding Energy / eV
131.40
130.52
129.64
128.76
127.88
127.00
Inte
nsity
/ kc
psR
(E)
1
-1
N 1s
279 281 295 293 291 289 287 285 283Bindungsenergie / eV
94.8
92.9
91.0
89.1
87.2
85.3
Inte
nsitä
t / k
cps
R(E
) 1
-1
C 1s
172 169 166 163 160 157
Bindungsenergie / eV
150.50
149.64
148.78
147.92
147.06
146.20
Inte
nsitä
t / k
Coun
tsR(
E)
1
-1
S 2p
Figure 4.10: XPS C 1s, N1s, P 2p, and S 2P spectra for a 6-nucleobase thymine homo-oligonucleotide film.
that adding a thiol linker, at least to the thymine ssDNA strands, would cause these layers toadopt enough order so that the distinct methyl vibrations from the thymine bases could be seen.However, this proved not to be the case.
The values from a phase fitting of the data for the three types of thiolated ssDNA in sspand ppp polarizations are given in Table 4.3. As can be seen from these data, the increase in peaksat this location in these two films is due to a combination of a phase change and an intensityincrease (in the case of (dA)6-S/Au) in the peak located at 2836 cm−1, as well as a decrease inthe intensity of the peak located at 2890 cm−1. If the former peak is assigned to a methylenesymmetric stretch coming from both the backbone and the thiol linker, its apparent change inphase in ppp polarization between the adenine and thymine ssDNA could correspond with achange in orientation of the sugar-phosphate backbone. Such a change in both intensity andorientation is also visible in the peak at 2890 cm−1 in ssp polarization. For the intensity and phaseto change so drastically it would be likely that this is either a CH2 asymmetric or symmetricstretch, and its 90 phase difference may be yet another indicator of a change in average backboneconformation between the thymine and adenine thiolated ssDNA films.
Nevertheless, the similarities in the overall spectral shapes for each of the three thiolatedfilms suggests that the backbone and linker have similar amounts of overall disordering in eachof the three film types. This may indicate that despite the differences in orientation in these filmssuggested by the XPS data, there is enough flexibility in these DNA chains that the methyl andmethylene groups are still somewhat randomly oriented, at least on the level detectable by SFGspectroscopy. Considering the structure of a single-stranded DNA molecule and all the possibleconfigurations it can adopt, this result is imaginable.
Previous work done by Lee and colleagues [39] using NEXAFS spectroscopy to probe the
40

Surface-Bound DNA in Air
2600 2800 3000 3200
C6 linker
Tota
l SFG
Inte
nsity
(a.u
.)
wavenumber (cm-1)
(dT)6-S
2800 3000
Res
onan
t SFG
Inte
nsity
(a.u
.)wavenumber (cm-1)
(a) (b)
Figure 4.11: Comparison of SFG spectra the C6 linker group alone (black) and a thyminessDNA film immobilized on gold via the C6 linker group (red) shown as (a) the rawspectra and (b) the background-suppressed spectra. The peaks at 2870 and 2912 cm−1
are assigned to methylene stretches from the sugar-phosphate backbone.
2800 3000
Res
onan
t SFG
Inte
nsity
(a.u
.)
wavenumber (cm-1)
(a)
2600 2800 3000 3200
(c)(b) ppp
Tota
l SFG
Inte
nsity
(a.u
.)
wavenumber (cm-1)
(dT)6-S (dA)6-S (dC)6
ppp
2800 3000
ssp
wavenumber (cm-1)
-S
Figure 4.12: SFG spectra of films of thiol-modified thymine (green), adenine (red), andcytosine (blue) ssDNA, including raw spectra taken in ppp polarization (a), BGS spectrataken in ppp polarization (b), and BGS spectra taken in ssp polarization. All spectra werenormalized to 1 to facilitate comparison, however all intensities were initially similar.
41

4.4. Results and Discussion
Table 4.3: Parameters obtained from a fitting of the raw SFG data for (dT)6-S, (dA)6-S,and (dC)6-S ssDNA films shown in Fig. 4.12 with Voigt functions using phase as one ofthe variable parameters. Positions are given in cm−1 and phase in degrees. Possible peakassignments are also given. *Indicates that this peak was located at a position of±5 cm−1
from the given value.
(dT)6-S/Au (dC)6-S/Au (dA)6-S/AuPolarization Position Area Phase Area Phase Area Phase Assignment
2836 0.02 136 0.06 86 0.25 962868 0.36 109 0.34 112 0.44 111 CH2 sym
ppp 2890 0.28 104 0.06 119 0.08 932901 0.05 74 0.05 110 0.05 952935* 0.17 120 0.17 105 0.24 112 CH2 asym2836 0.31 109 0.26 105 0.21 1032868 0.35 110 0.29 108 0.41 112 CH2 sym
ssp 2890 0.25 106 0.01 180 0.01 292901 0.10 100 0.45 109 0.43 1102939* 0.23 109 0.34 110 0.34 113 CH2 asym
orientation of thiolated thymine ssDNA immobilized on gold. They found a slight degree oforientation of the plane of the nucleobases along the plane of the sample. However, the overallalignment was somewhat weak, suggesting that there was not a high degree of order in thesefilms. This may also be the case in these samples, although even in a situation in which thenucleobases are stacked, it would be quite difficult to get a strong preferential alignment of themethylene groups in the backbone. An irregular orientation of the backbone would in turn affectthe orientation of the individual nucleobases in the film, resulting in a disordering of the methylgroups in the thymine nucleobases and giving rise to these results.
In order to verify the hypothesis that these signals were indeed stemming from the back-bone, we attempted to induce more order in these systems by exposing them to water and allow-ing it to evaporate. Previous research has shown that DNA molecules attached at one end to asolid surface can be straightened by exposure to a receding air/water interface [144]. However,in that work the DNA strands were unmodified and straightened along a surface rather than per-pendicular to it. It was hypothesized that a degree of ordering could also be induced in densefilms of surface-bound DNA, potentially through both the action of the receding air/water inter-face and the exposure to solution, which should allow the DNA strands to rearrange to a moreenergetically favorable ordered configuration.
The data of adenine and thymine ssDNA films through two evaporation cycles are shownin Figure 4.13. A control of the same procedure performed on a bare gold substrate is also shownfor comparison. The initial films of thymine and adenine (ladled (a) in Fig. 4.13) show the typicalshape of an ssDNA film, with a large prominent peak at 2940 cm−1 and smaller features between2860 and 2890 cm−1. The gold control shows broader, less specific peaks, although they are inpositions similar to the peaks in the DNA films. This is presumable due to the fact that the primaryoscillators in adventitious carbon contamination are also expected to be methylene.
After the first wetting and drying cycle in the ssDNA films (spectra (b) in Fig 4.13), addi-tional peaks around 2860 and 2960 cm−1 become prominent. After the second cycle (spectra (c) inFig 4.13), they are even more so. The position of the Gaussian non-resonant background changesslightly for each of the measurements due to the repositioning of the sample, however the loca-tions and overall shapes of the Lorentzian resonant contributions are highly similar between theadenine and thymine ssDNA, further confirming that the CH vibrations being measured here arefrom the sugar-phosphate backbone and C6 linker common to both of these molecules. The goldcontrol sample, however, shows perhaps a slight increase in the definition of the peaks above2900 cm−1, but not the significant increase observed in the DNA films. It is possible that theincrease in peak intensity observed is due to some interaction of the DNA strands and contami-
42

Surface-Bound DNA in Air
2600 2800 3000
(c)
(b)
Tota
l SFG
Inte
nsity
(a.u
.)
wavenumber (cm-1)
T6-S
(a)
2600 2800 3000
A6-S
wavenumber (cm-1)
(c)
(b)
(a)
2600 2800 3000
Au control
wavenumber (cm-1)
(c)
(b)
(a)
s s s s s s s s swetting, drying wetting, drying
(a) (b) (c)
Figure 4.13: Raw spectra of a T6-S film, a A6-S film, and a bare gold substrate over re-peated wetting and drying. (a) initial films (b) films after 1 wetting and drying cycle (c)films after 2 wetting and drying cycles. The cartoon below offers a graphic description ofthe hypothesized straightening of the DNA molecules occurring as a result of the wettingand drying in the ssDNA films.
nants, which would explain why it does not occur in the bare Au control. Test on the wetted anddried samples with XPS did indeed show an increase in the peak at 285 eV, indicative of con-taminants. However, it was observed through multiple repeats of these experiments with SFGspectroscopy that the positions and relative intensities of these peaks were always similar. If thiswere indeed caused by contamination, we would expect to see changes in the spectra betweensamples and between runs, as there are many different types of contaminant molecules whichwill adsorb to the surface in different ways. This observation further confirms that the changesoccurring in the ssDNA layers are due to the presence of DNA molecules and not due to contam-ination being deposited on the sample during the course of the wetting and drying.
These results show that in air, the SFG spectra of ssDNA films is dominated by the non-specific signals emanating from the sugar-phosphate backbone. However, the fact that there ap-pear to be no nucleobase-specific signals from these films of ssDNA on gold in the CH regionmay have a positive aspect, as it suggests that this technique could be used to examine overallorder in the sugar-phosphate backbone of molecules in DNA films regardless of their nucleobasecomposition.
43

4.5. Conclusions
4.5 Conclusions
Examination and comparison of films of nucleobase multilayers, unmodified short homo-oligonucleotides (ssDNA), and thiolated short homo-oligonucleotides in air were performed inan effort to track the average orientation of the methyl group among these three types underambient conditions using a label-free method. Investigation in the CH stretching region revealedclear differences between thymine and the other two the nucleobases which were minimizedupon the addition of a sugar-phosphate backbone. It was further found that the addition of alinker group to the DNA molecules in order to improve their overall ordering did not result inthe appearance of nucleobase-specific peaks, a fact that was attributed to the dominance of themethylene stretches from the sugar-phosphate backbone and linker group in the SFG spectra inthis region. This hypothesis was supported by inducing more order in the films through cyclesof wetting and drying, which increased the intensity of the peaks in the ssDNA films, but notin bare gold controls. These clearer peaks were similar in both adenine and thymine ssDNAfilms, confirming that the primary signal was stemming from the linker and backbone CH groupscommon to both.
These results demonstrate that while SFG can be used to obtain molecular-level label-freeorientation about the methyl groups in thymine, for films of DNA in air it gives information al-most exclusively about the methylene groups in the sugar-phosphate backbone and linker groups.This could make it a potentially useful complimentary technique to those such as NEXAFS, whichgive information about the orientation of the nucleobases. The SFG results presented here suggestthat the average orientation and disordering of the backbone or backbone and linker is similar inall three short-chain DNA types tested. This is a reasonable assumption given the fact that DNAmolecules are relatively flexible when in a single-strand state, and may suggest that although pre-vious studies with NEXAFS have shown a level of ordering and stacking in the nucleobases ofthymine ssDNA immobilized on gold, in the backbone of these molecules there is still a relativelylarge amount of disorder.
44

Chapter 5
Surface-Bound DNA in situ
5.1 Summary
Understanding the organization and orientation of surface-immobilized single strandedDNA (ssDNA) in aqueous environments is essential for optimizing and further developing thetechnology based on oligonucleotide binding. In this chapter, SFG spectroscopy was used tocompare the structure and orientation of ssDNA films of different nucleobase compositions in airand in water in the CH stretching region. Tests on thiolated ssDNA films of different nucleobasecompositions in air versus water revealed a differences in the degree of solvation among thesefilms types. This observation was tied to the different conformations of the DNA strands in thefilms owing to differing affinities for the gold substrate. Interestingly, the spectra of the differentfilms upon solvation in water appeared to show nucleobase-specific features for DNA contain-ing thymine. Further tests revealed that that this result occurred in both short- and long-chainthymine ssDNA. It was hypothesized that the appearance of these unique thymine peaks wasdue to a decrease of the dominant backbone and linker group methylene signals upon exposureto water, as the entire DNA chain gained more flexibility in the aqueous environment.
5.2 Background
Many of the most useful techniques for determining information about biological moleculesat interfaces on a molecular level and label-free (XPS, NEXAFS, IRRAS, etc.) are performed eitherunder ultra-high vacuum (UHV) conditions, or in air. However, the ability to characterize ssDNAfilms in aqueous environment is important because it allows for the examination of these filmsin situ —the conditions under which they are actually used. Furthermore, the ability to directlycompare results obtained in situ and ex situ can provide a way to determine whether the resultsobtained in air or under ultrahigh vacuum conditions are applicable in aqueous environments. Inthis chapter, information obtained from the proof-of-principle experiments shown in Chapter 3and the understanding of ssDNA films in air presented in Chater 4 were applied to gather knowl-edge about the changes that these films undergo when exposed to in situ conditions. The goal ofthese experiments was to determine how these films changed in water versus in air and correlatethese changes to the current understanding of these systems.
DNA is a flexible molecule with the potential to adopt multiple conformations dependingon the local microenvironment (see Chapter 1). This raised the question of how much variabilitywould be present in the spectral shapes of thymine ssDNA upon exposure to liquid. A highdegree of change among the spectra across multiple experiments would indicate a high degree ofsensitivity of these films to external conditions upon rearrangement in liquid, while a low degreeof change would indicate that the changes occurring upon exposure to liquid were largely due tomolecular properties.
Pure water was chosen as the liquid environment for these experiments, as it was expectedthat the lack of any screening charges would maximize electrostatic repulsion between the strandsand thus cause the greatest degree of order, increasing the chances of obtaining a clear SFG sig-
45

5.3. Experimental Details
nal. Furthermore, pure water has a much lower experiment-to-experiment variability than buffersolution, which must be made fresh for each experimental run and thus will be slightly differenteach time. Experiments in standard 1M NaCl-TE buffer were also performed with variable re-sults, so for clarity of presentation only those data obtained from samples in water are presentedand discussed. Adenine and thymine molecules were also tested as controls for the CH region, asthey contain all the same oscillators as the thymine ssDNA in the backbone and linker, but differin base-specific CH groups.
5.3 Experimental Details
Short-chain (6-mer), thiol-modified thymine, adenine, and cytosine homo-oligonucleotideswere chosen for these experiments. Experiments were conducted at least 6 times, although testswith background suppression were performed only twice. The films for some of these experi-ments were made in the 1 M PBS solution described in Section 2.1.3, although the larger part wasmade in the 1 M TE-CaCl2 buffer, as it was found that higher DNA densities were achievableusing this method.
Characterization and assessment of film quality was performed for all of the films usingIRRAS and XPS. Although the quality did vary to some extent, it was found that all layers haddensities of >2.0× 10¹³, which is considered good surface coverage in the literature [37, 51]. SFGmeasurements were made as described in Chapter 2 and the data were processed according tothe procedures outlined in Section 2.6.3.
5.4 Results and Discussion
5.4.1 Structure Changes in Water
The ability of a solution to penetrate or not penetrate a thin film is of importance in suchareas as protein adsorption [125, 145], molecular rearrangement upon exposure to stimuli suchas temperature [10], and the effectiveness of hybridization in DNA films [146, 38, 62]. Zolk etal. [125] examined the solubility of oligo(ethylene glycol)-terminated self-assembled monolayers(OEG SAMs) in polar and non-polar solvents. They found that they could detect solvation of onlythe upper in H2O versus the solvation of the entire layer in CCl4 by examining the appearance ofpeaks attributed to Gauche defects in the SAMs.
Fitted SFG data typical of what was observed for nearly all of the experiments is shown inFigure 5.1. The densities for these films were 1.9× 10¹³, 2.0× 10¹³, and 2.3× 10¹³ molecules/cm2
for the adenine, cytosine, and thymine layers, respectively.The somewhat drastic decrease in overall signal in the thymine ssDNA layers is in contrast
to the work by Zolk et al., who observed no such loss in overall signal [125]. This may be dueto the difference in molecular density between ssDNA and OEG layers. OEG molecules havethe ability to arrange themselves in relatively highly-ordered, densely-packed SAMs [145]. Inmolecular simulations of solvated OEG SAMs, Zhang and co-workers noted a reduced flexibilityof these molecules which they attributed to the high packing density [145]. This may explain theretention in overall signal strength in the work by Zolk and colleagues: although the films in H2Oand CCl4 were acquiring Gauche defects upon exposure to liquid, the density of the SAM wasstill high enough to restrict the mobility of these molecules, enforcing a particular conformationto some degree and resulting in a higher SFG signal.
Conversely, the formation of highly-ordered layers by DNA molecules is hindered by thestrong electrostatic charge of the sugar-phosphate backbone as well as the greater size of thesemolecules [137, 43]. The density of the molecules for the thymine ssDNA film presented in Fig-ure 5.1 translates to 0.23 molecules/nm2, which is conceivably enough space for movement con-sidering an idealized surface-bound 6-mer ssDNA strand 1 nm in diameter and 1.8 nm high atits fullest extension [137]. This relatively large amount of space surrounding the molecule couldallow the sugar-phosphate backbone enough freedom of movement in the liquid environment tobe continuously moving and changing position, resulting in a lower SFG signal due to the non-
46

Surface-Bound DNA in situ
2800 2850 2900 2950 3000
H2O
H2O
air
air
(dT)6-S
(dC)6-S
FItte
d Re
sona
nt S
FG In
tens
ity (a
.u.)
Wavenumber (cm-1)
(dA)6-S
air
H2O
s s s s s s s s
s s s s
s s s s s s s s
s s s s
Air H2O
Figure 5.1: SFG spectra of thymine, adenine, and cytosine ssDNA layers in air and inwater
alignment of the CH moieties as well as an increase in destructive interference from oscillatorspointing in opposite directions.
The fact that the adenine ssDNA does not lose intensity as drastically as the thymine ss-DNA in solution can be explained by the expected arrangement of these molecules with respectto the gold substrate. Adenine has been shown to have a significantly higher affinity for goldthan thymine, resulting in a preferential attachment of these nucleobases to the gold [35, 34]. Itis therefore likely that the adenine strands in this experiment are attached to the substrate notonly through the thiol linker groups, but also to some extent through the nucleobases themselves.This is also in agreement with the results presented in Chapter 4 from a separate experiment. Ifthis were indeed the case, it would mean that these strands have less mobility in solution thanthymine strands, and we would expect to see less change when they are exposed to solution, asis the case. The fact that the peak is broadening is likely due to a slight increase in the dispersionof the beam caused by passing through the CaF2 prism and the thin water film.
The cytosine film appears to lose more intensity than the adenine film, but less than thethymine film. This is consistent with the fact that this type of nucleobase has an affinity for goldbetween that of adenine and that of thymine [35]. It would therefore be expected that there wouldbe an intermediate number of nucleotides in the ssDNA film bound to the surface, and thus anintermediate amount of DNA strands with high mobility to result in a decreased signal intensity.This is consistent with what is observed in Figure 5.1.
These results show that the structure changes in films of ssDNA exposed to water appearto be nucleobase-dependent, and largely related to affinity of the individual nucleobases com-prising the DNA strand for the gold substrate. Films of thymine ssDNA, a nucleobase with a
47

5.4. Results and Discussion
2 8 0 0 3 0 0 0
Reso
nant
SFG
Inten
sity (a
.u.)
w a v e n u m b e r ( c m - 1 )
a i r
H 2 O
T h y m i n e s s D N A A d e n i n e s s D N A
2 8 0 0 3 0 0 0
H 2 O
Reso
nant
SFG
Inten
sity (a
.u.)
w a v e n u m b e r ( c m - 1 )
a i r
Figure 5.2: Raw (upper curves) and BGS (lower curves) SFG spectra of thymine (leftpanel) and adenine (right panel) ssDNA layers in air and in water
low affinity for gold, showed the most drastic changes, consistent with these molecules havinga higher mobility on account of being bound to the substrate primarily through the thiol linker.Films of adenine ssDNA, a nucleobase with a high affinity for gold, showed little changes, likelydue to the fact that these molecules are bound to the surface not only through the thiol groups,but also through a number of the nucleobases themselves. This would result in a lower mobil-ity of these molecules upon exposure to solution. Films of cytosine ssDNA, a nucleobase with anintermediate affinity for gold, showed changes in spectra intermediate between thymine and ade-nine ssDNA films, in agreement with previous studies showing this type of nucleobase to havean affinity for gold between that of adenine and cytosine [35].
5.4.2 Nucleobase-Dependent Orientation in Water
Despite the low overall intensity of the ssDNA layers in water, the signal stemming fromthe CH groups in the solvated chains is still above the level of noise and can be further broughtout by background suppression. The BGS data for the (dT)6 and (dA)6 thiolated films analyzedin air in Chapter 4, with corresponding densities of 9.5 × 10¹³ and 6.5 × 10¹³ molecules/cm2,respectively.
Figure 5.2 shows a comparison of BGS data for thymine and adenine ssDNA films in air andH2O. It is clear from the spectra that although these films appear quite similar when measured inair, upon exposure to solution they show distinct differences. Thymine shows two distinct peaksat 2927 and 2960 cm−1, while adenine has one particularly prominent peak at 2975 cm−1. Bothadenine and thymine ssDNA films show smaller peaks at 2870 cm−1 as well as at 3020 and3040 cm−1, although these are barely above the noise level in these spectra. This is similar to thepeaks seen above 3000 cm−1 in the spectra of the nucleobase multilayers (Fig. 4.3, although thepeaks observed here are much sharper.
Upon phase-fitting (Table 5.1), it can be seen that the two most prominent peaks in thethymine ssDNA spectra in ppp polarization are both shifted 30 cm−1 higher than the methylpeaks observed in the thymine nucleobase multilayers (Table 4.1). Previous studies using IR
48

Surface-Bound DNA in situ
Table 5.1: Parameters obtained from a fitting of the raw SFG data for a thymine ssDNAfilm in H2O with Voigt functions using phase as one of the variable parameters. Positionsare given in cm−1 and phase in degrees. Proposed peak assignments are also given.
ppp sspPosition Area Phase Position Area Phase Assignment
2927 0.28 98 2942 0.49 107 CH3 sym2960 0.05 180 2981 0.06 151 CH3 asym/CH2
spectroscopy to examine poly(vinyl methyl either) showed a blue shift of approximately 20 cm−1
in the methyl groups of these polymers as they moved from a dehydrated to a hydrated state[147]. It may be that what is visible in this BGS spectrum of thymine ssDNA in air are the methylasymmetric and symmetric stretches of the thymine bases. This would be consistent with theappearance of the peaks above 3000 cm−1, also assigned to the bases. It is conceivable that theywould appear when the dominating signals from the backbone and linker groups are decreaseddue to the flexibility afforded them by the liquid environment. The bases themselves, however,are planar molecules with significantly less flexibility, and could therefore remain in their moreenergetically favorable stacked state with less mobility than the linker and backbone, or evenarrange into a more highly ordered stacked state, as this is generally the most energetically favor-able arrangement for these nucleobases [41].
Comparison of the thymine spectrum to the adenine spectrum in H2O in Figure 5.2 showsthat unlike the thymine spectrum, the adenine spectrum consists of really only one prominentpeak. The location of the most prominent peak in this spectrum, located at 2975 cm−1, is againapproximately 30 cm−1 higher than the most prominent peak in the spectrum of the adeninenucleobase multilayer, located at 2945 cm−1. Furthermore, the shape of this spectrum is quitesimilar to the shape of the spectrum from the adenine nucleobase multilayer shown in Figure 4.3.These observations suggest that this spectrum, like the spectrum of the thymine ssDNA film inH2O, is dominated by the nucleobases.
An alternative explanation could be that a peak at approximately 2965 cm−1 is due to thebackbone and linker groups in their hydrated state. This would be a likely explanation for thespectrum of the adenine ssDNA film, given that the intensity of the SFG signal from this filmdid not decrease as drastically as that of the thymine film. To further test this, we examined a(dC)6S/Au film in a hydrated state. The background-subtracted SFG spectra for the three filmtypes in air and in H2O are shown in Figure 5.3. The spectra for the three film types in air areall similar in shape, with a main peak at approximately 2935 cm−1 and slightly differing peaksbetween 2860 and 2890 cm−1, in agreement with the spectra in air shown in Chapter 4. In water,however, differences in the spectral shapes in the thymine and adenine ssDNA layers becomeapparent, similar to what was observed in the BGS spectra shown in Figure 5.2, with the thyminefilms showing two clear peaks and the adenine just one. The cytosine spectrum in water alsoshows just one major contribution, more similar to the adenine film than to the thymine film.The positions of the peaks in these spectra are slightly different than the peak positions shownin Figure 5.2. This is likely due to the phase of these peaks, which is a contributing factor in thebackground-subtracted spectra and not in the BGS spectra (see Section 2.6.3), and thus may causean apparent shift in one spectral set versus the other.
An assignment of the single peak observed in the adenine and cytosine spectra to a hy-drated state of the methylene backbone and linker groups would explain the similarity of thespectral shape between these two films, and would further indicate that the only the peak at2927 cm−1 is due to the thymine bases, with the second expected peak at 2960 cm−1 either notpresent due to a more highly aligned conformation or present but strongly overlapping with thehydrated backbone/linker peak. However, given that the spectrum of the cytosine nucleobasemultilayer appeared very similar to the adenine nucleobase multilayer, it could still be the casethat what is observed in the cytosine spectrum is also a nucleobase-specific shape. Yet regard-less of which of the two presented peak assignments is ultimately correct, these results still showthat nucleobase-specific contributions, at least in the case of thymine homo-oligonucleotides, are
49

5.4. Results and Discussion
2800 2850 2900 2950 3000 3050
air
H2OFitte
d R
eson
ant S
FG In
tens
ity (a
.u.)
Wavenumber (cm-1)
T6-S/Au
2800 2850 2900 2950 3000 3050
air
Wavenumber (cm-1)
A6-S/Au
H2O
2800 2850 2900 2950 3000 3050
Wavenumber (cm-1)
H2O
air
C6-S/Au
x5x2
Figure 5.3: SFG spectra of thymine, adenine, and cytosine ssDNA layers in air and inwater
present in the SFG spectra of hydrated ssDNA films.In order to further test if the unique peaks observed in the thymine ssDNA layers were due
to the short length of these molecules, which would be expected to form more ordered, stackedstructures, or rather due to more to type of nucleobase, a longer thiolated thymine ssDNA film,(dT)25S/Au, was tested. A comparison of the raw spectra for the short (dT)6S/Au film, the longer(dT)25S/Au film, and the (dA)6S/Au film in both air and H2O are shown in Figure 5.4.
In air, the (dT)25S/Au film appears similar to the (dT)6 and (dA)6S/Au films, with themajor peak appearing at 2935 cm−1, although further on the right side of the Gaussian than in the(dT)6S/Au and (dA)6S/Au films due to the position of the (dT)25S/Au sample during the time ofmeasurement. When exposed to solution, however, the (dT)25S/Au film displays a spectral shapenearly identical to that of the (dT)6S/Au film, with two clear peaks: one at 2927 cm−1 and anotherat 2960 cm−1. The (dA)6S/Au film, in contrast, displays only on broad peak at 2970 cm−1. Theseresults indicate that the nucleobase composition of the thymine film is more of a factor in thedetermination of the spectral shape in solution than the length of the DNA molecule.
Since it was hypothesized that the loss of signal in these layers was due to a loss of order inthe sugar-phosphate backbone upon exposure to water, the question arose of whether the orderinduced by the repeated wetting and drying of these films presented in Chapter 4 would causethe film to retain some of its ordered structure. To test this, films of (dT)6-S/Au that had beenrepeatedly wetted and dried were placed in H2O and measured. The resulting raw spectra areshown in Figure 5.5.
The raw spectrum of the wetted and dried thymine film in air shows a spectral shape simi-lar to those observed in Figure 4.13, with four clear peaks between 2860 and 2960 cm−1, attributedto an increase in order in the sugar-phosphate backbone and linker groups. This apparent increasein order in air, however, does not seem to be retained when the film is exposed to water, as thespectrum of the wetted and dried film in water is highly similar to those of the (dT)6-S/Au and(dT)25-S/Au films in water.
50

Surface-Bound DNA in situ
2600 2800 3000
H2O
Tota
l SFG
Inte
nsity
(a.u
.)
wavenumber (cm-1)
(dT)6-S/Au
air
2600 2800 3000
(dT)25-S/Au
wavenumber (cm-1)
H2O
air
2600 2800 3000
(dA)6-S/Au
wavenumber (cm-1)
H2O
air
Figure 5.4: Raw SFG spectra of a (dT)6S/Au, (dT)25S/Au, and a (dA)6S/Au ssDNA layerin air and in water. The spectral shapes of all three films in air appear similar, however inwater the two thymine films have similar shapes while the adenine film appears different,indicating that nucleobase type is the important factor in determining the spectral shapein solution.
2600 2800 3000 3200
(b)
Tota
l SFG
Inte
nsity
(a.u
.)
wavenumber (cm-1)
T6-S
(a)
Figure 5.5: Raw SFG spectra of a (dT)6-S/Au after two wetting and drying cycles (a) inair, showing the characteristic peaks of a DNA film with induced order and (b) in H2O.In H2O, the film still loses its ordered structure and adopts the spectral shape of a typicalthiolated thymine film in water.
51

5.5. Conclusions
5.5 Conclusions
These data demonstrate the application of SFG spectroscopy to films of ssDNA immobi-lized on gold for comparison between air and aqueous environments. Tests on the solubility ofthiolated ssDNA films of different types in water showed a significant decrease in the intensityof the thymine ssDNA films, less of a decrease in the cytosine films, and the least decrease in theadenine films. This was correlated to the preference of these different nucleobases for the goldsubstrate: the adenine ssDNA molecules are known to bind to the gold through not only the thiollinker but also through the high-affinity nucleobases, making drastic orientational and conforma-tional changes in solution less likely, whereas the thymine molecule are known to adsorb to thegold primarily through the thiol linker alone, making it easier for these molecules to become morerandomized upon exposure to the solution. Such a randomization could lead to a more isotropicenvironment for the CH groups in the sugar-phosphate backbone, resulting in a reduced SFGsignal from these oscillators. A closer examination of these films in water revealed nucleobase-specific contributions from thymine ssDNA films which appeared to be independent of the lengthof the molecule, with both the (dT)6 and (dT)25 thiolated films showing similar spectra in water.
These results show that there are significant differences in the structure of ssDNA filmsin situ versus ex situ, and that SFG spectroscopy can be a useful technique for comparing thetwo. Furthermore, they show that the sugar-phosphate backbone and linker groups in the DNAstrands have a significant degree of flexibility and a much more random orientation in liquidthan in air. Such information could be useful for those seeking to connect ex situ orientationalinformation to in situ performance of systems involving DNA immobilized on surfaces.
52

Chapter 6
Surface-Bound DNA Hybridization
6.1 Summary
Understanding hybridization and the structure of hybrids formed by DNA immobilized onsolid surfaces is important for the further development of biotechnology based on these systems.In order to further this understanding, a combination of X-ray photoelectron spectroscopy (XPS),high-resolution XPS (HRXPS), near-edge X-ray absorption fine structure spectroscopy (NEXAFS),and sum-frequency-generation (SFG) spectroscopy was used to monitor two types of ssDNAfilms on Au(111) before and after hybridization. First, hybridization in films of different typeswas tested. Thiolated thymine d(T) homo-oligonucleotides and thymine-adenine d(A-T) block-oligonucleotides were chosen, as they represent two common types of ssDNA used for immo-bilization on gold substrates. In accordance with previous work, hybridization of the shorterand more densely packed thiolated ssDNA films produced fewer (if any) hybrids, whereas thelonger and less densely packed layers exhibited a larger hybridization yield. These effects wereless pronounced in the case of the d(A-T) films where the hybridization yield of the less denselypacked monolayers was significantly lower. This was presumably due to the formation of inter-and intramolecular hybrids during the immobilization step of these self-complimentary d(A-T)probe molecules, resulting in the formation of fewer additional hybrids upon exposure to the tar-get molecules. In all ssDNA films displaying a reasonable number of hybrids present, significantorientational changes were observed and could be monitored in detail. Second, films of surface-bound homo-oligonucleotides on gold were hybridized with a complementary strand and sub-jected to rinses using various volumes of water in preparation for ex situ spectroscopic analysis.It was found again through a combination of XPS, HRXPS, NEXAFS and SFG spectroscopy thatlightly rinsed films contained relatively well-ordered DNA hybrids with mostly upright orienta-tion relative to the surface, while films rinsed with a greater volume of water showed a decreasednumber of hybrids. For these films a significant disruption of their intactness and upright orderin both target and probe DNA strands was observed, with the latter adopting a preferably hori-zontal orientation relative to the substrate. These results demonstrate the significant effects thatrinsing with water can have on a hybridized DNA film and illustrate the importance of taking intoaccount preparation procedures when interpreting ex situ spectroscopic data of such systems. Fur-thermore, the work presented in this chapter demonstrates the usefulness of the combined use ofXPS, HRXPS, NEXAFS, and SFG spectroscopy for gaining information about surface-bound DNAhybrids.
6.2 Effects of Density and Film Type
6.2.1 Background
Reliable and efficient recognition of complex biomolecules is one of the major challengesof modern biology and medicine. Important in this regard are systems of surface-bound single-stranded oligonucleotides (ssDNA). Such systems can be used in multiple applications, including
53

6.2. Effects of Density and Film Type
s s s
Hybridization
s s s
d(T25)-SHord(T6)-SH on Au
(dA)15 or (dA)6 Hybridization
d(A10-T15)ord(A5-T15) on Au
(dA)15
a b
Figure 6.1: Schematical illustration of the experiments. Primary films of thiolatedthymine homo-oligonucleotides a) and thymine-adenine diblock-oligonucleotides b) hy-bridized with the suitable adenine homo-oligonucleotides. The red and green colourcodes are used for the thymine- and adenine-based oligonucleotides, respectively.
the detection of target nucleotides by hybridization [14], the functionalization of nanoparticlesfor use in specialized drug delivery systems [29], and directing the settlement of cells on surfaces[7]. As hybridization is the critical event in most applications of these systems, it is desirable tothoroughly understand this process in order to both optimize it and further its application to newareas and technologies.
In order to help achieve these goals, we examined the effects of hybridization in thiolatedthymine and d(A-T) block types of ssDNA films (see Section 1.2.2) using XPS, high-resolutionXPS (HRXPS), NEXAFS spectroscopy, and SFG spectroscopy. The goal of our study was three-fold: first, to assess the extent of hybridization using these techniques; second, to gain molecular-level information on the orientational and conformational changes that occur as the result of theformation of hybrids and third, to determine the advantages and limitations of the techniquesapplied in the present study in terms of their usefulness for detecting hybrids and the changesdue to their formation in the given types of systems.
6.2.2 Experimental Details
Two thiolated d(T) homo-oligonucleotides of different lengths (a 6-nucleobase strand, 5´-HS-(CH2)6-d(T)6-3´ abbreviated to (dT)6-SH, and a 25-nucleobase strand, and 5´-HS-(CH2)6-(dT)25-3´ abbreviated to (dT)25-SH) as well as two different d(A-T) block-oligonucleotides of differentlengths (a 20-nucleobase strand, 5´-d(A)5-d(T)15-3´ abbreviated to d(A5-T15), and a 25-nucleobasestrand, 5´-d(A)10-d(T)15-3´, abbreviated to d(A10-T15)), as well as (dA)6 and (dA)15 target se-quences, were used as received as described in Section 2.1.3. In both cases, varying the lengthsof the probes was intended to affect initial film parameters such as packing density and orienta-tion of the film constituents, as well as hybridization dynamics. The idea of the experiments isschematically shown in Figure 6.1, along with the assumed adsorption geometry of the ssDNAmolecules comprising the initial unhybridized ssDNA films.
After rinsing, samples for examination prior to hybridization were dried under flowingN2 while samples intended for treatment with the hybridization step were placed in a 3microMsolution of either (dA)6 [for (dT)6-SH films] or (dA)15 [for (dT)25-SH, d(A5-T15) and d(A10-T15)films)]. After hybridization, samples were rinsed with 1M NaCl buffer for 1 min, briefly dippedin deionized water to remove excess salts, and finally dried under flowing N2 according to previ-
54

Surface-Bound DNA Hybridization
ously described procedures [74]. It should be noted that treatments of these types of films in orderto prepare them for ex situ measurements, in particular rinsing with pure water, even though verygentle in our case, are known to affect the stability of any hybrids present [74, 37]. Therefore, thestate of these films as measured (i.e. after the hybridization step, including dipping and drying)may vary to some extent from what would be observed for these films in situ. Furthermore, theterm "hybridization" is used here to refer to any degree of base-pair association of the probe andtarget molecules which remains after the above cleaning procedure.
The unhybridized ssDNA films and those after the hybridization step were either charac-terized immediately or stored under an inert gas atmosphere in glass containers until the exper-iments at the synchrotron (see below). The films were characterized by XPS, HRXPS, NEXAFSspectroscopy, and SFG spectroscopy as described in Chapter 2. All experiments were performedat room temperature. The XPS, HRXPS, and NEXAFS measurements were carried out underUHV conditions at a base pressure better than 1.5×10⁻⁹ mbar. The spectra acquisition time wasselected in such a way that no noticeable damage by the primary X-rays occurred during themeasurements [104, 85]. The SFG experiments were performed in air using a ppp polarizationcombination.
6.2.3 Results
6.2.3.1 XPS
XPS data were only used for determination of the packing density of the unhybridizedssDNA films according to the procedure suggested by Petrovykh et al. [51]. The packing densitiesof the (dT)6-S/Au, (dT)25-S/Au, d(A5-T15)/Au and d(A10-T15)/Au films were estimated to be4.1× 1013, 2.0× 10¹³, 1.6× 10¹³, and 9.2× 10¹² molecules/cm2, respectively, based on previouslypublished procedures [60]. Note that above and in the following, the specifications (dT)6-S/Auand (dT)25-S/Au are used for the films prepared from (dT)6-SH and (dT)25-SH, respectively, inview of the abstraction of the hydrogen atom upon adsorption.
6.2.3.2 HRXPS
C 1s and N 1s HRXPS spectra of the ssDNA films before and after hybridization are pre-sented in Figures 6.2 and 6.3, with the samples after the hybridization step denoted by either:A6 or :A15 (we use the abbreviations Tn-S, AnTm, and An in the spectroscopic figures instead of(dT)n-SH, d(An-Tm)/Au, and d(A)n, respectively, in the text).
The HRXPS spectra exhibit the characteristic emissions of ssDNA films [39, 87, 74, 64, 81,44, 37, 82, 83, 51, 60]. In particular, the C 1s spectra in Figure 6.2 show a characteristic patternof at least four emissions at BEs of 285.0, 286.65, 288.0, and 289.3 eV, with the former peak beingdominant [39, 81, 82, 83]. The N 1s spectra in Figure 6.3 exhibit the characteristic features of theadenine and thymine nucleotides (see below).
The C 1s, O 1s, and P 2p spectra of all unhybridized ssDNA films are quite similar to oneanother, independent of the exact nucleotide composition and the use of either a thiol linker groupor a (dA)n anchor. This is in agreement with previous results, at least regarding the nucleotidecomposition [81, 37, 83]. However, what is probably even more important in the context of thecurrent study - these spectra, apart from the total intensity changes, do not change significantlyafter the hybridization step. This means that the acquisition of C 1s, O 1s or P 2p XPS spectra isnot suitable to measuring changes resulting from the formation of hybrids these films.
In contrast to the abovementioned data, the N 1s HRXPS spectra in Figure 6.3 are quite spe-cific with respect to the exact nucleotide composition of the unhybridized ssDNA films, which isin accordance with previous observations [81, 37, 83]. The spectra of (dT)6-S/Au and (dT)25-S/Aufilms are dominated by a strong emission at a BE of 400.5 eV accompanied by a weak shoulder at aBE of 398.5 eV. The emission is ascribed to the thymine moieties in the upright (dT)n strands whilethe shoulder is believed to be mostly related to the thymine moieties which are in direct contactwith the substrate [44]. These features have 93% and 7% of the total intensity, respectively. The N1s spectrum of the reference adenine (dA)15/Au film exhibits two emissions at BEs of 398.7 and400.5 eV with the characteristic intensity ratio of 2:1 [81, 37, 83]. These energies are slightly lower
55

6.2. Effects of Density and Film Type
292 290 288 286 284 282
hν = 350 eV
Inte
nsity
(arb
. uni
ts)
Binding Energy (eV)
T25SH
T25SH:A15
HRXPS: C1s
T6SH
A5T15
A5T15:A15
A10T15
A10T15:A15
Figure 6.2: C 1s HRXPS spectra of the ssNDA templates before and after the hybridiza-tion step.
than the analogous values for the upright adenine homo-oligonucleotides (399.0 and 400.8 eV,respectively) [83], which is probably related to the stronger screening of the photoemission holeby the electrons in the gold substrate in the case of the horizontal adsorption geometry which haspreviously been measured for similar systems [148]. Note that it is currently assumed that the N1s spectral feature of adenine is not affected by interaction with the gold surface, unlike what isapparent in the thymine spectra [37]. There are however still some debates on this subject [83].
The N 1s spectra of the d(A5-T15)/Au and d(A10-T15)/Au films are, in accordance withthe molecular composition, a superposition of the spectra of the d(A) and d(T) portions of theoligonucleotides. These spectra as well as the spectra of the hybridized films (see below) weredecomposed into the individual contributions related to the (dT)n and (dA)n fractions, taken, asdescribed in the previous paragraph, the one-peak spectrum of (dT)n and the two-peak spectrumof (dA)n as the principal components. Significantly, the relative spectral weights of the adenineand thymine components in the d(A5-T15)/Au and d(A10-T15)/Au films, which are 1:5 and 2:3.3,respectively, correspond roughly to the molecular composition, which would be not the case ifa significant part of the thymine block were in direct contact with the substrate. As mentionedabove and reported in the literature [37], this configuration would result in a higher intensity ofthe emission at 398.5 eV in the N 1s spectrum of thymine, which would coincide with the strongestpeak in the spectrum of adenine. Subsequently, a much higher spectral weight of adenine (com-pared to the molecular composition) would be recorded in the spectra of the d(A5-T15)/Au andd(A10-T15)/Au films, which is definitely not the case. On the contrary, a higher weight of thymine(compared to the molecular composition) is observed for d(A5-T15)/Au, which can be tentativelyexplained by the attenuation of the adenine-related signal by the thymine block "overlayer". Thiseffect is less pronounced for the more loosely packed d(A10-T15)/Au film.
The N 1s spectra of the (dT)25-S/Au, d(A5-T15)/Au, and d(A10-T15)/Au films change afterthe hybridization step, exhibiting an increase in the peak at 398.7 eV associated with the adeninenucleobase (the most intense peak in the characteristic doublet). This suggests an increased num-ber of the d(A) nucleotides present in the film after the hybridization step, as would be expected.
56

Surface-Bound DNA Hybridization
404 402 400 398 396
hν = 580 eV
A10T15/Au:A15A10T15/Au
Inte
nsity
(arb
. uni
ts)
Binding energy (eV)
T25S/Au T25S/Au:A15
XPS: N 1s
T6S/Au T6S/Au:A6
A5T15/AuA5T15/Au:A15
A15/Au
Figure 6.3: N 1s HRXPS spectra of the ssNDA templates before black) and after red) thehybridization step.
In contrast, almost no change was observed in the case of (dT)6-S/Au, indicating that there wereno additional adenine nucleotides present in this film after hybridization and the cleaning proce-dure.
In order to obtain an estimate of the percentage of the target (dA)6 or (dA)15 strands in thesefilms, we performed a decomposition of the N 1s HRXPS spectra of the DNA monolayers afterthe hybridization step, taking the spectra of pristine (dT)6-S/Au, (dT)25-S/Au, and (dA)15/Au asreferences, and correcting for the initial branching of the individual components and molecularcomposition. The resulting estimates for the hybridization degree are 31.5%, 4%, 26%, and 11%for (dT)25-S/Au, (dT)6-S/Au, d(T15-A5)/Au, and d(T15-A10)/Au, respectively.
6.2.3.3 NEXAFS spectroscopy
The N K-edge NEXAFS spectra of the unhybridized films are quite specific with respect tothe nucleotide composition of the DNA moieties. These spectra (55˚), along with the analogousspectra acquired after hybridization, are presented in Figure 6.4, while the respective differencespectra ("90˚" - "20˚") are depicted in Figure 6.5.
The N K-edge spectra of the primary and reference films in Figure 6.4 show the shape typi-cally obtained from ssDNA films [39, 44, 83, 148] and exhibit the characteristic π*-like resonancesof the respective nucleobases in the pre-edge region, viz. t1 and t2 for thymine and a1 and a2for adenine. The t1 and t2 resonances of thymine at 401.1 and 402.0 eV correspond to the N1sLUMO and N1s LUMO+1 transitions, respectively; these transitions involve all nitrogen atomsof this particular base [149]. Similar, the a1 and a2 resonances of adenine at 399.4 and 401.3 eVcorrespond to the N1s LUMO and N1s LUMO+2 transitions, respectively; these transitions in-volve all nitrogen atoms of adenine [149]. Both t1/t2 and a1/a2 pairs exhibit the characteristicintensity branching between the individual components [149]. Whereas the π* resonance featuresin the spectra of (dT)6-S/Au and (dA)15/Au are exclusively representative of either thymine or
57

6.2. Effects of Density and Film Type
400 410 420 430
t2
t1
a2
a1
A15/Au
A10T15/Au:A15
A10T15/Au
A5T15/Au:A15
A5T15/Au
T6S/Au:A6
T6S/Au
T25S/Au:A15
55°
T25S/Au
Photon energy (eV)
NEXAFS: N K-edge
Inte
nsity
(arb
. uni
ts)
Figure 6.4: N K-edge NEXAFS spectra of the ssNDA templates and reference A15 filmbefore and after the hybridization step. The spectra were acquired at an X-ray incidenceangle of 55˚. The positions of the most pronounced, π*-like absorption resonances ofthymine (t1 and t2) and adenine (a1 and a2) are marked by the vertical gray solid lines.
adenine, the spectra of d(T15-A5)/Au and d(T15-A10)/Au contain a superposition of the abovefeatures. In accordance with the molecular composition, the contribution of the adenine-relatedfeatures is larger in the spectrum of d(T15-A10)/Au as compared to d(T15-A5)/Au. Interestingly,the spectrum of (dT)6-S/Au does not exhibit an additional feature at 399.0 eV, which, as men-tioned above, has been previously observed for such films and attributed to the thymine baseswhich are in direct contact with the gold substrate [44, 83]. Significantly, no analogous shift inthe resonance position has so far been observed for adenine ssDNA films, as follows from theinspection of the spectra of (dA)15/Au.
Along with the conclusions mentioned above, information on the orientational order andmolecular orientation in the probe films can be derived by monitoring linear dichroism effects inX-ray absorption, as previously stated. The 90˚-20˚ difference spectra of the unhybridized ssDNAtemplates and reference (dA)15/Au film in Figure 6.5 exhibit either negative or positive peaks atthe positions of the characteristic absorption resonances of the thymine and adenine bases, whichimplies the presence of a certain orientational order in the target films. Considering that the re-spective molecular orbitals have π* character, i.e. are oriented perpendicular to the planes of thenucleobases, the negative sign of the difference peaks (indicating a higher absorption intensity atthe grazing incidence) suggests that the nucleobases are preferentially orientated parallel to the
58

Surface-Bound DNA Hybridization
400 410 420 430
t1
a1
90°-20°
Photon energy (eV)
NEXAFS: N K-edge
Inte
nsity
(arb
. uni
ts)
A15/Au
A10T15/Au:A15
A10T15/Au
A5T15/Au:A15
A5T15/Au
T6S/Au:A6
T6S/Au
T25S/Au:A15
T25S/Au
Figure 6.5: N K-edge NEXAFS difference (90˚-20˚) spectra of the ssNDA templates andreference A15 film before and after the hybridization step. The positions of the mostpronounced, π*-like absorption resonances of thymine (t1) and adenine (a1) are markedby the vertical gray solid lines. The horizontal dashed lines correspond to zero for theindividual spectra.
substrate surface, i.e. the ssDNA strands are standing upright. Vice versa, the positive sign of thedifference peaks (indicating a higher absorption intensity at the normal incidence) suggests thatthe nucleobases are preferably orientated perpendicular to the substrate surface, i.e. the ssDNAstrands are laying on the substrate. The latter is clearly the case for (dA)15/Au, where a positivepeak is observed at the position of the a1 resonance. So, the (dA)15 strands are predominantlyoriented parallel to the Au substrate, which could be expected on the basis of available literaturedata [37, 148]. In contrast, the distinct negative peak at the positions of the most intense t1 reso-nance for (dT)6-S/Au and (dT)25-S/Au suggests a predominant upright orientation of the ssDNAstrands in these films, which, again, is in accordance with the literature [39, 44, 83, 148].
Similar to the case of (dA)15/Au, the difference spectra of d(A5-T15)/Au and d(A10-T15)/Auexhibit a positive peak at the position of the a1 resonance and only a very weak (if any) negativepeak at the position of the t1 resonance. This means that the (dA)n anchor blocks of the d(A5-T15)and d(A10-T15) oligonucleotides are predominantly oriented parallel to the gold substrate, mostlikely in the direct contact with it, whereas the (dT)15 stems are mostly disordered, with proba-bly only a weak tendency toward upright orientation. The reason for such a disorder could be aweak intra- molecular hybridization between the complimentary (dA)n and (dT)15 blocks of these
59

6.2. Effects of Density and Film Type
molecules occurring after deposition, or partial inter-molecular hybridization occurring in solu-tion prior to deposition [37]. However, it can be concluded from the lack of the 399.0 eV featureassociated with the direct contact of thymine with the substrate (see above) in the 55˚ spectra, thatafter deposition only adenine is bound to the Au substrate, in agreement with the findings of pre-vious studies [35]. Presumably, at the level of the single molecule, there is a partial coordinationof the (dT)15 with the horizontally oriented (dA)n anchor block, with the remainder of the (dT)15stem existing as a loose end. As a result, on average, no pronounced upright alignment of the(dT)15 strands is observed.
Consistent with the N 1s HRXPS spectra, N K-edge NEXAFS spectra of (dT)25-S/Au, d(A5-T15)/Au, and d(A10-T15)/Au in Figure 6.4 changed significantly after the hybridization step,whereas the spectrum of (dT)6-S/Au remains unchanged, which suggested that in the latter casehybrids either did not form or were so weak that they were cleaved by the short dipping utilizingin the present study. For the other systems of this study, the formation of stable hybrids did occurto some extent. Whereas a quantitative evaluation of the hybridization degree for these systemsis questionable to the problem with normalization and lack of the necessary reference data, atleast qualitative estimate can be performed. From the N K-edge NEXAFS spectra it can be con-cluded that the changes after hybridization are most pronounced for (dT)25-S/Au suggesting, inaccordance with the XPS data, a relatively large hybridization degree for this film. In the case ofd(A5-T15)/Au and d(A10-T15)/Au, the changes are smaller but more pronounced for the formerfilm, once more in full agreement with the HRXPS results.
The hybridization step is accompanied by pronounced changes in the orientation of theindividual nucleotides in the initial ssDNA films (Figure 6.5). In particular, much smaller lineardichroism is observed at the position of the t1 resonance in the case of (dT)25-S:(dA)15 while thereis almost no dichroism at the position of the a1 resonance. This suggests a partial orientationaldisordering of the initially better ordered (dT)25-S/Au film. In the case of both d(A5-T15)/Auand d(A10-T15)/Au, the positive peak at the position of the a1 resonance in the difference spectradisappears after the hybridization step, whereas the distinct negative peaks at the position ofthe a1 and t1 resonances appear. This indicates that both the thymine and a reasonable partof the adenine portions of the d(A5-T15)/Au:d(A)15 and d(A10-T15)/Au:d(A)15 complexes arepredominantly oriented perpendicular to the substrate in these films. Whereas, in view of thegiven hybridization degree (26%), the dichroic contributions from the laying (dA)n anchor blocksand the "standing" (dA)15 hybridized targets should be comparable, a possible partial quenchingof the resonance intensity in the case of the (dA)n anchor blocks, which are in a direct contact withthe substrate, and attenuation of the respective PEY signal by the (dT)15 : (dA)15 overlayer makesthe contribution of the standing (dA)15 hybridized targets stronger, resulting in the joint negativepeak at the position of the a1 resonance.
6.2.3.4 SFG Spectroscopy
SFG spectroscopy probes vibrations of molecules at interfaces and is particularly useful forthe study of orientation and conformation of functional groups in organic monolayers, includingDNA, down to submonolayer coverages [58, 84, 101, 26, 150]. The data presented in Figure 6.6ashow the SFG signal in the spectral region where the CH-stretching vibrations are located (be-tween 2800 and 3000cm−1).
The signal is a convolution of a Gaussian-like non-resonant background emanating fromelectronic transitions in the Au substrate and vibrational resonant contributions from the ssDNAfilm. Due to the complexity of these spectra it is useful to plot the resonant contributions withoutthe non-resonant signal in order to follow the changes that occur upon hybridization. The cor-responding absolute value of the resonant signals obtained after fitting the spectra in Figure 6.6ausing Equation 2.9 are shown in Figure 6.6b. Note that all spectra are normalized to the non-resonant background and can be directly compared.
A slightly higher overall intensity of the resonant signal is observed for the unhybridizedthiolated films, of which (dT)25-S/Au shows a slightly higher intensity than (dT)6-S/Au. Assum-ing that both films have similar order and surface density, one would expect a 25-fold increase inintensity for the (dT)25-S/Au film in comparison to the (dT)6-S/Au film as the SFG intensity isproportional to the square of the total number of C H oscillators [43]. Even taking into account the
60

Surface-Bound DNA Hybridization
2400 2600 2800 3000 3200 3400
Norm
alize
d SF
G In
tens
ity (a
.u.)
wavenumber (cm-1)2800 2900 3000
Res
onan
t SFG
Con
tribu
tion
(a.u
.)
wavenumber (cm-1)
A10T15/Au:A15SFG A10T15/Au
A5T15/Au:A15 A5T15/Au
T25S/Au:A15T25S/Au
T6S/Au:A6 T6S/Au
Figure 6.6: SFG spectra of hybridized (gray lines) and unhybridized (black lines) oligonu-cleotides films. (a) Raw spectra containing both non-resonant (overall Gaussian shape)and resonant contributions. (b) Background-subtracted spectra divided by the Gaussiannon-resonant contribution showing only the resonant contributions shifted by 180˚. Thespectra appear as a sum of multiple overlapping resonant contributions with widths of30 cm−1.
50% lower surface coverage for the (dT)25-S/Au film, one would still expect more than a 4-foldsignal increase. As order and SFG intensity are closely related, the fact that the intensity is notincreased to this degree is an indicator of lower orientational order in the (dT)25-S/Au film thanin the (dT)6-S/Au one, in agreement with previous studies [44].
After the hybridization step, the overall intensity of the SFG signal decreased in the caseof (dT)25-S/Au, while for (dT)6-S/Au it remained the same. A lack of change in the resonantcontributions in the SFG spectra of (dT)6-S/Au confirms what was observed with both NEXAFSand HRXPS, i.e. that little to no bound d(A)6 target molecules are present in the final film andno significant changes in the film structure have occurred. For (dT)25-S/Au, however, there is anoticeable decrease in the intensity of the resonant contributions with respect to the non-resonantbackground, indicating, in agreement with the NEXAFS results, a decrease in overall order.
For the block-oligonucleotides, the spectral shapes of the resonant contribution are differ-ent than in the thiolated films. This difference may be related to two factors: first, the lack of a C6linker group, and second, the presence of the horizontally-oriented (dA)n block anchoring the en-tire strand to the gold substrate. The spectrum of the lower-density d(A10-T15)/Au film exhibitedlittle change upon hybridization, while that of the higher-density d(A5-T15)/Au template showeda noticeable increase in intensity. As was the case for (dT)6-S/Au, the lack of change in the spectraof d(A10-T15)/Au indicates little change in these films after the hybridization step. This wouldsuggest fewer hybrids present in this film relative to d(A5-T15)/Au, in agreement with the HRXPSand NEXAFS results.
61

6.2. Effects of Density and Film Type
6.2.4 Discussion
As reported in previous work [44] and found here, short-chain thiolated d(T) homo-oligonucleotidesform more dense and better ordered films on gold substrates than long-chain molecules of thesame type, presumably due to the specific character of the inter-molecular interaction in ssDNAmonolayers [44, 83]. In agreement with this tendency, the packing densities of (dT)6-S/Au and(dT)25-S/Au were estimated to be 4.1 × 10¹³ and 2.0 × 10¹³ molecules/cm2, respectively. In thecase of the block-oligonucleotides, the packing density was controlled by varying the length ofthe d(A) block [74, 37]. These molecules are assumed to adsorb in an L-shape geometry, withthe d(A) block serving as the anchor group oriented parallel to the substrate surface and the d(T)block protruding upright into the ambient [37]. Whereas such a bonding mode was verified in thepresent work, the L-shape geometry seems to be a course description only since no preferentialupright orientation was found for these films. This may be due to either intra-molecular coordi-nation of the d(T) blocks with the complimentary d(An) blocks, the inter-molecular associationof separate d(T15-Am) molecules, or, most likely, some combination of the above factors [74, 37].However, even with this relatively complex adsorption geometry, the packing density of the ss-DNA molecules can be altered in a controlled manner by varying the length of the d(A) block.Indeed, the packing densities in d(A5-T15)/Au and d(A10-T15)/Au in this study were estimatedat 1.6× 10¹³ and 9.2× 10¹² molecules/cm2, respectively.
The shorter (dT)6-S/Au film exhibited only a very small (4%) hybridization degree com-pared to the (dT)25-S/Au film (31.5%) and showed, accordingly, no noticeable change in the orien-tation of the ssDNA strands after the hybridization step. High packing densities and short chainlengths have been previously correlated with lower hybridization efficiencies [148, 62] tentativelyexplainable by electrostatic repulsion and steric constraints, i.e. by the lack of intermolecular freespace necessary for the entrance of the target strands into the ssDNA template [104, 151]. Therespective entrance channels are not necessarily static but can open dynamically through changesin the orientation and conformation of the film constituents, which can be both spontaneous andinduced by the interaction with the target ssDNA strands. These changes are, however, hardlypossible in the case of the dense packing observed for the (dT)6-S/Au film.
Furthermore, the shorter chain length of the (dT)6-SH species means that there are overallfewer nucleotides available for hybridization, making the binding of target molecules in this filmeven less stable [148]. In addition, the presence of fewer nucleotides to participate in hybridizationalso means that this film is more likely to be disrupted by the deionized-water dipping procedure.As mentioned previously, these procedures were necessary to remove excess salts before spectro-scopic analysis. Removing salts from ssDNA films results in a lack of screening charges [74]. Asa consequence, the negatively charged backbone of the complementary DNA strands are able torepel each other more strongly, potentially overcoming the forces holding the strands together.As there are fewer of these bonds to begin with in the short-chain (dT)6-S/Au film, this processis more likely to happen as compared to (dT)25-S/Au, resulting in some cases in a disruptionand/or dehybridization of some of the hybrids initially present. Recent work by Schreiner et al.using SPR has shown that nearly 100% of hybrids can be disrupted by rinsing even in a dilute(0.001 M) NaOH solution [74], however in those studies the samples were rinsed for 4 minuteswith no shorter rinsing times tested [103]. Although the dipping procedure used in this workis likely affecting the hybrids to some extent, the presence of increased adenine-specific spectralsignatures in both the NEXAFS and HRXPS spectra confirm that there are hybrids still present.
Multiple in situ studies systematically examining the relationship between hybridizationefficiency and density in such films have shown the optimal number of nucleotides per unit areafor hybridization to be 5 × 10¹² molecules/cm2 [74, 104, 103]. However, in the most looselypacked d(A10-T15)/Au film (9.2×10¹² molecules/cm2) used in this work, the hybridization yieldis noticeable lower (11%) than in the more densely packed (dT)25-S/Au and d(A5-T15)/Au films(2.0×10¹³ and 1.6×10¹³ molecules/cm2) with 31.5% and 26% hybridization degree, respectively.Previous experiments performed by Schreiner et al. [74]. observed a higher degree of hybridiza-tion in d(A10-T15)/Au than d(A5-T15)/Au, presumably due to the larger intermolecular spacingin these films.
As mentioned above, the self-complementary d(An-T15) probe sequences can form intra-molecular hybrids during the immobilization step. In previous work, a rinsing step with NaOH
62

Surface-Bound DNA Hybridization
(or urea) was included to destabilize any intermolecular associations, allowing for more effectivehybridization to take place [74, 37]. Note that such a NaOH rinsing step was not included in ourpreparation protocol. Therefore, in the case of d(A10-T15)/Au, the intra-molecular hybrids werelikely to be present, effectively reducing the estimated hybridization yield. The 11% estimate ofthe yield for the d(A10-T15)/Au films was reduced by the presence of such dimeric hybrids in twoways: by overestimating the density of available probes and by suppressing the ability to capturesolution targets.
Most importantly, as follows from both the NEXAFS and SFG data, the hybridization stepin all ssDNA films with a reasonable degree of hybridization was accompanied by changes in themolecular orientation. In the case of (dT)25-S/Au, the film became more disordered, although adefinite orientational order persisted. This could be explained by the fact that the (dT)25 strandcan only be partially hybridized by a (dA)15 strand, either in different positions in the (dT)25strand or by only a partial penetration of the target DNA strands into this film, with hybridizationoccurring mainly on the unbound end of the (dT)25-S molecules. In work examining the kineticsof hybridization in similar 25-mer thiol-moldified ssDNA films on Au, Peterson and co-workersfound that the rate of hybridization for the unbound ends of the probe molecules was muchgreater than for the portions of the molecules closer to the thiol linker, presumably due to electro-static effects [148]. Such partial and/or end-hybridization in these films would result in the pres-ence of either more distorted films or longer and more flexible strands, which would decrease theoverall degree of order in the film. In the case of d(A5-T15)/Au, where the number of nucleotidesin the target and probe strands matched, the NEXAFS and SFG data both showed an increase inorder upon hybridization. This would be consistent with the concept of the d(A5-T15) moleculesgaining a greater degree of upright orientation following the cleavage of the weak intra-molecularhybridization of the (dT)15 blockstem with the horizontally-oriented (dA)5 surface-binding block.This was also shown to occur in the d(A10-T15)/Au films, although to a lesser extent, presumablydue to the higher degree of intramolecular coordination between the (dT)15 and (dA)5 blocks. Itis interesting to note, however, that the changes observed for the (dT)25-S/Au film (decrease inorder) and the d(A5-T15) template (increase in order) are completely opposite despite the similardensities and hybridization yields of these films. This leads to the conclusion that observationof orientational changes in these films is important, as hybridization does not always lead to agreater degree of order.
6.3 Effects of Rinsing
6.3.1 Background
In the previous experiment, the combination of XPS, HRXPS, NEXAFS, and SFG spec-troscopy proved useful in obtaining molecular-level information on surface-bound DNA hybrids.The use of other types of spectroscopy has also proven to be advantageous in obtaining molecular-level information about surface-bound DNA systems [83, 84, 35, 87, 44, 74, 82, 26]. Among thesetechniques, those which operate under ex situ conditions have been shown to yield valuable in-formation about the composition and molecular density of DNA films [51, 60], the orientationof the molecules [83, 87, 44, 85], and changes that can occur between ex situ and in situ condi-tions [152, 84, 125]. However, for all of these techniques the question of sample preparation isessential, as the relatively high amount of salt necessary for successful DNA deposition and/orhybridization must be removed to some degree in order to be able to perform ex situ measure-ments accurately [37, 74]. It is known that such salt removal by solutions containing little to nosalt results in the destabilization of surface-bound hybrids [74]. In this work, we provide evi-dence that such treatment can have the further effect of significantly disrupting the intactness ofthe remaining hybrids and orientation of the surface-bound DNA probe molecules.
6.3.2 Materials and Methods
Thiol-modified, HPLC-purified thymine homo-oligonucleotides [oligo(dT)] were purchasedfrom Sigma-Aldrich. The thiol linkers were deprotected using DTT by the vendor and used as-
63

6.3. Effects of Rinsing
received. Films of these molecules immobilized on gold (T25S/Au) were prepared in 1M CaCl2solutions containing 10µM TRIS and 1µM EDTA (CaCl2-TE) according to previously describedprocedures [74], followed by hybridization with adenine poly(A25) for 8 hours in 1M TE-NaClbuffer (T25S/Au:A25).
After hybridization, samples first rinsed for 1 minute under flowing 1M NaCl buffer, thenwere rinsed with 0.5 mL, 1 mL, or 2 mL of Milli-Q water (resistivity > 18.2 MΩ-cm). The sampleswere held vertically and the water was directed at the surface at an angle of 45 by a pipette. Theflow rate was the same for all rinses, and thus the amount of time that the sample was in contactwith water roughly doubled from the 0.5 mL to 1 mL to 2 mL rinses. After rinsing, the sampleswere dried under flowing N2. It was not possible to measure films with no rinsing due to theheavy layer of salt encrusting such layers. The final atomic percent of Na present was found to be6.97% for the films rinsed with 0.5 mL and 3.97% for the films rinsed with 2 mL. It should be notedthat this amount is still relatively high despite the goal of the rinsing procedure to remove residualsalt, and may mean that this type of preparation technique would not be useful for spectroscopicanalysis particularly sensitive to the presence of salt, such as ToF-SIMs.
As in the previous experiment, samples were characterized with HRXPS, NEXAFS spec-troscopy, IRRAS, and SFG spectroscopy. The experimental conditions and the way the spec-tra were measured were identical to those of Ref [74]. The density of the initial unhybridizedT25S/Au film was found to be 6.3×10¹³ molecules/cm2 by a standard XPS characterization pro-cedure [51, 60].
6.3.3 Results and Discussion
The top panel of Fig. 6.7 shows the N 1s HRXPS spectra obtained for the unhybridizedfilm and the three rinsed hybridized films; the spectra are decomposed into their adenine andthymine spectral components. The spectrum of the unhybridized film exhibits only the thyminecomponent, which is a single emission at 400.8 eV. This emission is characteristic of thyminewhich is not in direct contact with the gold substrate. The emission for thymine chemisorbeddirectly on Au, located at ∼400.3 eV [44], was not observed, suggesting an upright orientation ofthe T25S moieties in this film.
The spectra of the hybridized films contain both thymine and adenine components. Thelatter consists of two peaks at 399.5 and 400.5 eV with an intensity ratio of 1:2 [83, 37, 81]. Thesepeaks are most prominent in the film rinsed with 0.5 mL of water, indicating that this layer con-tains a comparatively high amount of hybrids, as expected. The relative intensity of the adeninecomponent decreases as the volume of the rinsing water increases, contributing 38%, 32%, and23% of the total N 1s intensity for the films rinsed with 0.5 mL, 1 mL, and 2 mL, respectively(Fig. 6.7, bottom panel). This is in agreement with recent results from Opdahl et al. [74], whosystematically investigated the destabilization of surface-bound hybrids upon rinsing using SPR.Normalizing the above values for the relative intensities of the adenine and thymine componentsto the amount of the nitrogen atoms in both bases yields the percentage of adenine target strandsper thymine probe strand. These values are given in Table 6.1, along with the efficient thicknessesof the films derived from the attenuation of the Au4f signal in the HRXPS data. The overall per-centage of the adenine strands is relatively low for all the films, including the one that was onlyrinsed with 0.5 mL of water. This can be tentatively explained by the relatively high packing den-sity of the initial T25S/Au film (6.3×10¹³ molecules/cm2), which would cause a greater degree ofsteric hindrance to the incoming target molecules and impede the hybridization process to someextent [63, 87, 62]. It was, however, not the goal of the present study to maximize the hybridiza-tion degree, but rather to monitor the effects of the post-hybridization treatment on the molecularstructure of the T25S/Au:A25 films. In this regard, the tendency is clear: the overall percentageof the adenine strands decreases continuously with the increasing volume of water used for therinse, suggesting a destabilization of the hybrids and a gradual washing away of the A25 targetmoieties over the course of this procedure.
This behavior is only partly reflected in the effective thickness (Table 6.1) which, as ex-pected, increases to some extent after hybridization, but does not exhibit a continuous decreasewith increasing rinsing water volume. Possible reasons for this discrepancy may be (i) a limitedaccuracy of the absolute intensities derived from the synchrotron-based HRXPS spectra or (ii)
64

Surface-Bound DNA Hybridization
0102030405060708090
100
2mL 1mL 0.5 mL Volume of rinse
N1s
rela
tive
inte
nsity
(%) T25S/Au : A25
408 404 400 396
T25S/Au
2 mL rinse
1 mL rinse
0.5 mL rinse In
tens
ity (a
.u)
Binding energy (eV)
HRXPS N1s 580 eV
T25S/Au:A25
T25S/Au:A25
T25S/Au:A25
Figure 6.7: Top panel: N 1s HRXPS spectra of T25S/Au before and after hybridizationwith poly(dA25) and subsequent light, medium, or heavy rinsing with water. The spec-tra are decomposed into the components related to thymine (green) and adenine (red).Bottom panel: relative intensities of these components.
65

6.3. Effects of Rinsing
Sample Thickness (nm) Percentage of adenine strands (%)T25S/Au 4.10 n.a.
T25S/Au:A25 0.5 mL Rinse 4.32 24.5T25S/Au:A25 1 mL Rinse 4.20 18.8T25S/Au:A25 2 mL Rinse 4.30 12.0
Table 6.1: Thickness and percentage of adenine target strands per thymine probe strandcalculated from the HRXPS data.
drastic structural transformations occurring over the course of rinsing (see below). This is, how-ever, a good example how non-specific experimental data can result in erroneous conclusionswhen dealing with systems as complex as ssDNA and dsDNA films.
Both specific information on the chemical composition and, more importantly, structuralchanges occurring in the films over the course of rinsing were monitored using NEXAFS spec-troscopy [83, 44, 40]. In Fig. 6.8, the N K-edge NEXAFS spectra of the unhybridized and hy-bridized films are shown. The spectra obtained at the so-called magic angle (55, top panel) areonly representative of the electronic structure of the target films [153] and exhibit specific charac-teristic resonances, the most pronounced of which are two merged π*-like absorption resonancesfrom thymine at 401.1 and 402.0 eV (corresponding to the N1s→LUMO and N1s→LUMO+1 tran-sitions, respectively)[154] and a sharp π*-like resonance from adenine at 399.4 eV (correspondingto the N1s→LUMO transition) [154]. The intensities of these features indicate the amount of eachnucleobase present. Accordingly, the NEXAFS spectra confirm the HRXPS results, showing onlya thymine signal for the unhybridized film, both thymine and adenine signals for the hybridizedfilm, and a decreasing amount of adenine signal with increasing rinsing volume.
The 90-20 spectra in Fig. 6.8 (bottom panel) give information about the orientation of themolecules in the film. Qualitatively, this orientation is given by the sign and amplitude of thedifference peak at the position of a certain absorption resonance. Considering that the molecularorbitals associated with the most pronounced absorption resonances in Fig. 6.8 have π* character,i.e. are oriented perpendicular to the planes of the nucleobases, the negative or positive signs ofthe difference peaks indicates that the nucleobases are preferably orientated parallel or perpen-dicular to the substrate surface, respectively. This corresponds to the preferentially upright orhorizontal orientations of the DNA strands, respectively. Accordingly, the spectrum of the pris-tine unhybridized T25S/Au shows a reasonable (for this length)[44] degree of upright orientationfor the T25S strands, as evidenced by the pronounced downward peak at the position of the mostprominent π* resonances of thymine. The difference spectrum of the hybridized film rinsed with0.5 mL of water exhibits an even stronger downward peak at the position of the latter resonancesand the pronounced downward peak at the position of the most prominent π* resonance of ade-nine. This indicates a comparable if not slightly greater degree of upright orientation of the T25Sstrands, in addition to uprightly oriented A25 moieties: exactly what would be expected from afilm containing upright, relatively well-formed, intact hybrids as shown in Fig. 6.9.
In contrast, the spectrum of the hybridized film subjected to the 1 mL rinse shows only avery small difference peak for T25S and a small but pronounced positive difference peak for A25.The former is due to a significant loss in order of the T25S probe strands in this film in comparisonto the film rinsed with 0.5 mL. The latter observation shows that the A25 target moieties in thefilm are also disordered, but possess a slightly preferable horizontal orientation, which is onlypossible if these moieties are partly relocated to the film-ambient interface (Fig. 6.9).
Surprisingly, the spectrum of the hybridized film treated with the 2 mL rinse shows astrong downward difference peak for T25S similar to those observed in the pristine T25S/Auand 0.5 mL-rinsed T25S/Au:A25, whereas the difference peak for A25 looks very similar to thatof the film subjected to the 1 mL rinse, with an upward orientation and only a slightly smallerintensity (Fig. 6.8). The former finding indicates that the T25S probe moieties have regained theirinitial upright orientation characteristic of the molecules in the non-hybridized film (Fig. 6.9). Thelatter observation shows a low degree of order for the A25 target molecules, with a very slightpreference of the horizontal orientation. Considering that the 2 mL rinse is associated with the
66

Surface-Bound DNA Hybridization
400 410 420 430
TA
T25S/Au:A25 2 mL rinse
T25S/Au:A25 1 mL rinse
T25S/Au:A25 0.5 mL rinse
T25S/Au
55°
Photon energy (eV)
NEXAFS: N K-edge
Inte
nsity
(arb
. uni
ts)
400 410 420 430
TA
T25S/Au:A25 2 mL rinse
T25S/Au:A25 1 mL rinse
T25S/Au:A25 0.5 mL rinse
T25S/Au
90°-20°
Photon energy (eV)
NEXAFS: N K-edge
Inte
nsity
(arb
. uni
ts)
Figure 6.8: N K-edge NEXAFS spectra of T25S/Au before and after hybridization withA25 followed by rinsing with various volumes of water. The spectra in top panel wereacquired at an X-ray incidence angle of 55 while the bottom panel shows the differencebetween spectra acquired at 90 and 20. The horizontal dashed lines in the bottom panelcorrespond to zero for the individual spectra. The most pronounced π*-like absorptionresonances and difference peaks of thymine (T) and adenine (A) are highlighted by greenand red, respectively. Their positions are marked by the thin vertical solid lines.
67

6.3. Effects of Rinsing
1800 1700 1600 1500 1400 1300 1200
T25S/Au:A250.5 mL rinse
wavenumber (cm-1)
Absorbance0.001
IRRAS
T25S/Au
Figure 6.9: IRRAS spectra of a pristine T25S/Au film and a hybridized film after rinsingwith 0.5 mL of water. The pristine film shows a spectrum typical for this type of films,with a major peak at 1700 cm−1. The spectrum of the film after hybridized does not showsignificant changes, likely due to the low hybridization efficiency.
desorption of a significant part (more than 50%) of the A25 species from the hybridized film, wecan tentatively assume that the reattainment of the preferable upright orientation is related to thealmost complete removal of the A25 species from the body of the T25S/Au film and to the almostcomplete relocation of the residual A25 species to the film-ambient interface (Fig. 6.9). The ob-served improvement in the orientational order could be caused by the directionality of the appliedrinsing water, which may be causing the DNA strands to orient themselves along the direction ofthe stream. A further factor may be the more effective removal of screening charges, which wouldallow the electrostatic repulsion between the DNA strands to be more effective. This should allowthe strands to separate from each other more by gaining an upright and ordered conformation.
It should be noted that while Figure 6.9 shows one possible option for the orientation of theadenine target strands after the rinsing procedures, other orientations may also be possible. Forinstance, depending on the direction of the unzipping of the hybrids upon disruption by the rinse,some of the adenine strands may end up trapped within the bulk of the film closer to the substratethan the surface. This could also result in the horizontal orientation of the adenine componentsobserved in the NEXAFS data. However, such a configuration would be more likely for the filmrinsed with 1 mL of water, as the greater degree of order observed in the thymine bases in thesample rinsed with 2 mL would likely be difficult to achieve with adenine strands present withinthe film itself.
SFG spectroscopy was applied in the CH region in order to gain an understanding inthe amount of order present in the CH groups in the sugar-phosphate backbone of the DNAmolecules. The background-subtracted spectra are shown in Figure 6.10 The unhybridized T25S/Aufilm shows a spectral shape characteristic of a well-formed thiolated thymine ssDNA films (seeChapter 4), with a major peak at 2935 cm−1 and very minor contributions between 2860 and2890 cm−1. Upon hybridization and rinsing with 0.5 mL of water, the overall intensity of the
68

Surface-Bound DNA Hybridization
2 8 0 0 2 9 0 0 3 0 0 0
T 2 5 S / A u : A 2 5 H e a v y r i n s e
T 2 5 S / A u : A 2 5 M e d i u m r i n s e
T 2 5 S / A u : A 2 5 L i g h t r i n s e
T 2 5 S / A u
Fit Re
sona
nt SF
G sig
nal (a
.u.)
W a v e n u m b e r ( c m - 1 )
S F G
Figure 6.10: SFG spectra of T25S/Au before and after hybridization with A25 followed byrinsing with 0.5, 1, or 2 mL of water. The lightly rinsed hybridized film shows an increasein the intensity of all peaks, consistent with an increase in order observed using NEXAFSspectroscopy. This intensity decreases when the film is rinsed with 1 mL of water and isregained upon rinsing with 2 mL, again in agreement with the NEXAFS data.
peaks increases, indicating an increase in order in this film. This is in agreement with the obser-vations made upon wetting and drying presented in Chapter 4, the data presented in Figure 6.6for films undergoing hybridization, as well as the NEXAFS data shown in Figure 6.8. Upon rins-ing with 1 mL of water, this intensity is decreased, again in agreement with the NEXAFS data.The overall intensity of the resonant peaks is again increased when the film is rinsed with 2 mL ofwater, supporting the hypothesis of the molecules regaining some degree of their initial uprightorientation upon rinsing with this volume of water.
In addition to the HRXPS and NEXAFS spectroscopy, we applied IRRAS to the character-ization of the unhybridized and hybridized films (Fig. 6.11). The initial unhybridized T25S/Aushowed, in accordance with the HRXPS and NEXAFS results, an IRRAS spectrum typical of awell-formed thymine ssDNA monolayer [83, 37, 60] with a strong C=O peak at 1707 cm−1. It isinteresting to note that the hybridized film did not show a mode around 1600 cm−1 typical foradenine [37, 60]. This result has been reproduced several times, along with parallel XPS exper-iments confirming the presence of adenine in the films. In fact, besides a slight increase of theshoulders around 1670 cm−1 and 1650 cm−1 for the hybridized film, we did observe significantchanges in other frequency regions. We believe that this issue of the IR spectrum of adenine-based DNA warrants further investigation. However, such an analysis lies beyond the scope ofthe present work.
69

6.4. Conclusions
Hybridization, 0.5 mL H2ORinse
Hybridization,
1 mL H 2ORinse
Hybridization, 2 mL H2O Rinse
T25S/Au:A25
T25S/Auss s s
ss ss
s ssT25S/Au:A25
s
T25S/Au:A25
s sss
Figure 6.11: Illustration of the effects of varying degrees of rinsing on the extent of resid-ual hybridization and orientational order in the target DNA films. For simplicity, weshow all ssDNA moieties participating in the hybridization, whereas in reality only ap-proximately 25% of the DNA strands were hybridized.
6.4 Conclusions
The complementary spectroscopic techniques of XPS, HRXPS, NEXAFS spectroscopy, andSFG spectroscopy were used to monitor the effects of hybridization in ssDNA films of differ-ent types (thiolated d(T) homo-oligonucleotides and d(A-T) block-oligonucleotides) and packingdensities (from 9.2× 10¹² to 4.1× 10¹³ molecules/cm2) as well as to gather information about theeffects of preparation for ex situ analysis on surface-bound hybrids.
Whereas XPS provided information on the packing density in the films, HRXPS was used togather information on their composition. According to the experimental data, in the shorter andmost densely packed (dT)6-S/Au only very few (if any) hybrids were present after the cleaningprocedure. At comparable packing densities, the films comprised of d(An-Tn) ssDNA were foundto have hybridization yields similar to the thiolated films. However, increasing the length of theadenine block in the d(An-Tn) ssDNA led to a lower surface density and hybridization yield.The latter effect was presumably due to the creation of inter- and intramolecular hybrids duringthe immobilization step, substantially lowering the binding of the target molecules. There are,however, some indications that this intra-molecular coordination can be avoided by a rinsingstep with NaOH or urea [74]. The combination of NEXAFS and SFG spectroscopy was found tobe particular useful since it gives insight into the orientation of the ssDNA species before andafter hybridization. As mentioned above, it was found that the assumed initial L-shape bondinggeometry of d(An-Tn) species was partly distorted by the mutual coordination of the adenineand thymine blocks, which was lifted to some extent after the hybridization step, resulting in abetter upright alignment of the thymine stems. In contrast, the (dT)25-S/Au film displayed partialdisordering of the primary chains in the thiolated (dT)n ssDNA after hybridization, possibly dueto partial hybridization and/or the use of a mismatched (dA)15 target.
The process of salt removal by water rinsing to prepare DNA films for ex situ spectro-
70

Surface-Bound DNA Hybridization
scopic analysis was found to affect significantly not only the number but also the orientation ofsurface-bound DNA molecules as well as the intactness of the residual hybrids. In our modelexperiments, hybridized T25S/Au:A25 DNA films treated with a 0.5 mL rinse showed mostlywell-ordered, upright, and intact A:T hybrids, while hybridized films treated with a 1 mL, or2 mL rinse displayed a progressive disruption of the hybrids with the removal of a part of thetarget DNA strands and relocation of the remaining strands to the film-ambient interface. Theseprocesses were accompanied by initial disordering of the film and subsequent reattainment of theorientational order for the probe strands.
These results demonstrate the usefulness of NEXAFS, HRXPS, and SFG spectroscopy inthe examination of ssDNA films before and after hybridization. Furthermore, they show theimportance of correlating hybridization yields and surface densities with other film parameterssuch as orientation and conformation, as well as the effects of preparation procedures, in order toobtain a full picture of the changes that occur in these films upon hybridization.
71

Chapter 7
Further Biological Applications
7.1 Summary
The ability to probe an interface beneath a layer of living cells in situ without the need for la-beling and fixation has the potential to unlock some of the key questions in cell biology and bioin-terfacial phenomena. In order to test the usefulness of SFG spectroscopy for this purpose, fixedfibronectin-coated gold surfaces with and without adherent embryonic fibroblasts were probed.The SFG spectra were compared to infrared reflection-absorption spectroscopy (IRRAS) data inthe CH stretching region. Noticeable differences were observed in the IRRAS spectra of the sam-ples, while SFG spectra of the same samples were largely similar. These results suggest that cellswith their overall random distribution of CH groups do not contribute to the SFG spectra, result-ing in similar spectral features related to the fibronectin coating regardless of whether or not cellsare adhered on it. Furthermore, SFG spectra of cells adhered directly on gold were found to havefeatures similar to those of cells adhered on fibronectin covered gold. Additional experimentswith living cells in vitro treated with the high powered lasers used in these experiments did notresult in any visible radiation damages to the cells. These results demonstrate the feasibility ofusing SFG spectroscopy as an experimental tool to characterize the extracellular matrix (ECM)layer adjacent to a gold substrate beneath a layer of cells, and also suggest that this techniquecould be operated to examine the ECM in vitro. In order to further test this hypothesis, SFG spec-troscopy was used to probe alkanethiol self-assembled monolayers (SAMs) buried underneath alayer erythrocytes (ECs) in situ. SFG spectra with and without ECs show the spectral signaturestypical of these SAMs, indicating that the signal was being generated solely by the SAM and wasnot influenced by the presence of cells. These results could have important implications for thecharacterization of surfaces in biomedical, environmental and industrial applications.
7.2 Background
Mammalian cells and bacteria express a hydrated polymeric matrix to form biofilms. For-mation of these sessile communities -and in the case of bacteria- their inherent resistance to an-timicrobial agents is at the root of many persistent and chronic infections [155, 156]. Extracellularmatrix (ECM) components like fibronectin, laminin and collagen play a vital role in cell and tissuemorphogenesis [157]. These components provide different adhesion motifs for various cell typesas well as instructive cues for cell differentiation. ECM components can also act as storage com-partments for otherwise diffusible growth factors [158]. The ECM role in stem cell niches5-8 andthe cellular microenvironment, especially with regard to tumor development [159, 160, 161], arecurrently areas of active research. Yet despite great advances in our understanding of the ECM inrecent years, many questions remain about the interactions of ECM components with both arti-ficial and natural cell substrates, the orientation and conformation of those components, and thetemporal composition and chemical structure of the ECM during cell adhesion and differentia-tion.
72

Further Biological Applications
Techniques currently employed to investigate cell adhesion and ECM composition in vitroinclude fluorescence microscopy [161] and a combination of confocal reflectance microscopy withcoherent anti-Stokes Raman scattering (CARS) microscopy [162], both of which can be used to vi-sualize the arrangement of the ECM. Additionally, attenuated total reflectance infrared (ATR-IR)spectroscopy has been used to track conformational changes in proteins at depths of approxi-mately 1-2 µm [163, 164, 165, 166]. However, the development of more techniques capable ofcharacterizing the ECM could prove useful in investigations such as the in vitro deposition ofECM during wound healing and variations in the ECM during tumor development, especiallyif those techniques have surface specificity sufficient enough to be able to distinguish betweencellular contributions and the ECM itself.
In recent years the surface specific non-linear optical technique of sum-frequency genera-tion spectroscopy (SFG) has emerged as a complementary experimental technique to characterizebiological molecules at interfaces [167, 168, 169, 170, 171, 100, 172, 173, 174, 175]. SFG relies onthe generation of signals through a second order non-linear optical process which can only oc-cur when inversion symmetry is broken. This suppresses spectral contribution from bulk phasesmaking SFG spectroscopy inherently surface specific and suitable for the investigation of "buried"liquid-solid interfaces [176]. SFG spectroscopy has recently been applied to characterize biolog-ical samples such as model peptides [170, 171], and amino acids [100], bovine serum albumin(BSA) [172], immunoglobulin G (IgG) [169], collagen [173], fibrinogen [174], urea orientation atprotein surfaces [175], and heat-shock proteins (HSP) [169]. Here we introduce SFG as a usefulcomplementary technique to current linear spectroscopy methods for studying the ECM.
7.3 Probing the Extracellular Matrix with SFG Spectroscopy
7.3.1 Experimental Details
Fresh wafers of polycrystalline gold on silicon were UV-sterilized for 2 hours immediatelyprior to deposition. Gold was chosen because is causes a strong enhancement of the SFG signal,allowing for the specific detection of the break in symmetry between gold and another substance.Fibronectin (FN) (Sigma-Aldrich, St. Louis, MO) at 50 µg/mL was adsorbed onto the gold wafers.The thickness of the fibronectin layer, measured by ellipsometry, was 53 nm. Rat embryonicfibroblast (REF) cells (kindly provided by Prof. B. Geiger, Weizmann Institute, Israel) in DMEM(Gibco BRL, supplemented with l-glutamine and 1% FBS) media were seeded at 25,000 cellsper cm2 on the gold wafers and allowed to adhere for 3-4 hours under standard cell cultureconditions. Remaining fibronectin-covered gold wafers were incubated in media with no cells.Following the incubation period, the samples were fixed in a 1:1 mixture of acetone and methanolat -20C for 10 minutes and dried in air. Three replicates per condition were prepared.
7.3.2 Results
Figure 7.1 shows FTIR spectra, SFG spectra, and light microscopy images of gold waferscovered with fibronectin (red squares) and gold wafers covered with REF cells on fibronectin(blue circles) in the CH stretching region. The FTIR spectra (Fig. 7.1a) differ substantially betweenthe fibronectin samples and the sample containing both fibronectin and REF cells both in intensityand peak positions. This is likely due to fact that the IR light is passing through more componentsin the cells containing CH groups, resulting in an increased number of spectral contributions.
In the SFG spectra (Fig. 7.1b), however, the positions of the peaks remain the same withonly a slight difference in relative peak intensity between the fibronectin samples and the samplescontaining REF cells and fibronectin. This can only be the case when the same molecules are beingprobed in the SFG spectra, independent whether or not REF cells are present. The selection rulesof SFG dictate that a signal cannot be produced in a material in which the molecules possess anoverall random (centrosymmetric) arrangement. The similarities observed in the CH stretchingregion SFG spectra for the samples with cells and those without cells, therefore, may indicatethat the CH groups within the cells possess enough of a centrosymmetric arrangement to avoidcontributing to the SFG spectra. This then suggests that SFG is capable of directly probing the
73

7.3. Probing the Extracellular Matrix with SFG Spectroscopy
2 8 5 0 2 9 0 0 2 9 5 0 3 0 0 00 , 0 00 , 0 10 , 0 20 , 0 30 , 0 40 , 0 5
1 , 0 01 , 0 21 , 0 41 , 0 61 , 0 81 , 1 0
2 8 5 0 2 9 0 0 2 9 5 0 3 0 0 00 , 0 00 , 0 20 , 0 40 , 0 60 , 0 80 , 1 01 , 0 01 , 0 21 , 0 41 , 0 61 , 0 81 , 1 01 , 1 2 ( c )
( d )SF
G int
ensity
(a. u
.)
w a v e n u m b e r ( c m - 1 )
( b )
adso
rbanc
e (a.u
.)
w a v e n u m b e r ( c m - 1 )
( a )
Figure 7.1: FTIR spectra (a), SFG spectra (b), optical microscopy image of fibronectinon gold (red squares) (c), and fibroblasts adhered on fibronectincovered gold (blue cir-cles) (d) in the CH stretching region. Spectra are offset for clarity. The gray lines arecorresponding fits to the data, and the dotted vertical lines are guide to the eyes for thepeak positions. The FTIR spectra differ substantially between samples covered with fi-bronectin and fibroblasts on fibronectin. The SFG spectra, however, show similar peakpositions with only slight changes in relative peak intensities.
layer between solid surfaces and REF cells, and could prove a useful technique for detectingECM components through a layer of cells.
Figure 7.2 shows SFG spectra of a bare gold substrate exposed to the media used in thecell experiments (squares), of REF cells adhered on fibronectin covered gold substrates (circles)and cells on bare gold (triangles). The small features in the spectrum of bare gold are due tocontaminants in the media and bear no resemblance to the spectra of REF cells on FN or REFcells on gold. It can therefore be concluded that the SFG signals observed stem from FN or othercell related materials, rather than from contaminants in the cell media. Furthermore, the spectralcontributions for the cells on bare gold and on fibronectin covered gold differ in relative peakintensities, yet are comparable in all peak positions. The differences may be due to the fact thatthe composition of the ECM under the cells on bare gold differs from FN.
In order to test the influence of laser light treatment on the cells, in vitro experiments wereperformed. Figure 7.3 shows the light microscopy image of living cells adhered on a fibronectincoated gold wafer after 30 minutes of 20 µJ femtosecond light pulses (2900 cm−1) simultaneouslywith 7 µJ nanosecond light pulses at 800 nm both with a repetition rate of 1000 Hz. For the du-ration of the experiment the cells were kept in CO2 independent media (Gibco BRL, CatalogueNo. 1805-054 supplemented with L-glutamine and 1% FBS). After 30 minutes of light treatmentthere was no visible irradiation damage. Observations after 16 hours of incubation of the irra-diated samples under standard cell culture conditions indicated cell adhesion and proliferationattributable to a healthy population. It can therefore be concluded that the influence of SFG radi-ation on these REF cells was negligible, indicating that in vitro measurements of cells with SFGspectroscopy are possible. Further development of this technique could also include the creation
74

Further Biological Applications
Figure 7.2: SFG spectra of a gold wafer exposed to phosphate-buffered saline alone (redsquares), cells on fibronectin-coated gold (green circles), and fibroblasts adhered directlyon gold (orange triangles). The SFG spectrum of cells on gold (triangles) shows spec-tral contributions similar in location to those of the fibronectin spectra, with significantalterations in relative peak intensities.
of spectral library of relevant ECM molecules, especially in the lower wavelength region (fin-gerprint region), in order to more conclusively determine the composition, and potentially theordering of the ECM under a cellular layer.
7.4 Tests on Living Erythrocytes
7.4.1 Background
The in situ monitoring of the interphase between a substrate and the cellular layer is of greatinterest as it allows determination of changes in surface properties upon cell adhesion. Typically,this is accomplished by labeling and fixing the cell samples, which may result in their disruptionand in the loss of valuable information. In this work we show that the surface specificity of vi-brational sum-frequency-generation (SFG) spectroscopy permits the in situ characterization of aninterfacial layer through living cells, without the need for fixation or labeling. SFG spectroscopyhas proven well-suited to probing various interfaces [96, 99]. In recent years, this technique hasbeen applied to the in situ investigation of biomolecules [177], including peptides [100, 178], pro-teins [179], and DNA [84, 26]. These results will be useful for those seeking to apply this systemto investigate layers under living cells with high surface specificity.
7.4.2 Experimental Details
In order to test the ability of this technique to probe a substrate through living cells, awell-characterized self-assembled monolayer (SAM) was probed underneath a layer erythrocytes(ECs). Highly-ordered SAMs of deuterated dodecanethiol (CD3(CD2)11-SH, d-DDT) were cho-sen, as they have a distinctive spectral signature in the CD stretching vibrational region (2000 to
75

7.4. Tests on Living Erythrocytes
Figure 7.3: Optical microscopy image of fibroblasts adhered on fibronectin-covered goldafter 30 min of irradiation with 20 µJ femtosecond light pulses. No visible irradiationdamage is observable.
2300 cm−1). These deuterated layers give little to no signal in the CH stretching region (2800 to3000 cm−1), allowing us to detect any contribution from the cells or cellular debris. In addition,we investigated undeuterated dodecanethiol (CH3(CH2)11-SH, DDT) in the CH region to con-firm that the typical spectral signatures of an alkanethiol SAM remained unchanged even in thepresence of cells.
Living ECs were selected as the biological barrier since they contain the majority of moleculetypes encountered in most biological systems. These cells are known to have no direct interactionwith the surface offered to them and will lay flat on it if given enough time to settle [180]. ECsdo not deposit extracellular matrix (ECM) of their own or modify surface chemistry, allowingthem to act as biological barriers without altering surface properties [181]. Additionally, thesecells contain a large amount of hemoglobin, which make them optically dense in comparison tomost other thin biological layers. If these cells pose no obstacle to the generated SFG signal, manybiological barriers, either pro- or eukaryotic, become eligible for use with this technique.
A crudely purified solution of ECs in phosphate-buffered saline (PBS) was placed in be-tween the SAM substrate and an optically transparent prism. All samples were measured usinga femtosecond broadband SFG spectrometer in ppp polarization. Spectra were acquired in 2.5 s,background-subtracted and normalized to the non-resonant background.
7.4.3 Results
First, the presence of the d-DDT was confirmed by measurement in the CD stretching re-gion (2000-2300 cm−1) (Fig. 7.4). CD stretches of d-DDT SAMs were probed in air, sterile PBS,and PBS with ECs. In Figure 7.4A the Gaussian-like envelope reflects the spectral profile of the
76

Further Biological Applications
A B
Figure 7.4: SFG spectra of a d-DDT SAM recorded in air (black), sterile PBS (blue), andmedia containing ECs (red). (A) Spectra containing non-resonant contributions in the CD(2000–2300 cm−1) region. (B) Processed spectra showing only resonant contributions inthe CD spectral region. The CD peaks remain unchanged upon addition of ECs.
femtosecond IR pulse, whereas the resonant peaks appear as dips in the spectra with a phasedifference of π. These peaks at 2072, 2133, and 2222 cm−1 are established to be CD stretchingvibrations of the terminal deuterated methyl group (CD3) in the d-DDT SAM [182].
The lack of deuterated methylene (CD2) vibrations in the spectrum is related to the pres-ence of an inversion center in between these groups within the alkane chain and indicates theabsence of kinks or gauche defects. Figure 7.4B shows the resonant contributions after data pro-cessing of the spectra shown in Figure 7.4A. The lack of appearance of new CD2 peaks due togauche defects in the film indicates that the film quality is not significantly affected by the pres-ence of ions, cells, or cellular debris. A more thorough analysis of the ratio between the asymmet-ric and symmetric CD3 stretching vibrations yielded values of 0.55, 0.63 and 0.77 for air, PBS andPBS with ECs, respectively. This translates to a calculated tilting angle variation [138] of about 2,indicating a negligible reorientation of the terminal CD3 headgroup.
Measurements in the CD spectral region show that the d-DDT SAM can be detected througha cellular layer, however, this region does not have contributions from cellular components. Toverify whether we can detect signatures of the alkanethiol SAM even in the CH region, we furthercompared resonant SFG spectra of deuterated and undeuterated SAMs both in air, PBS, and PBSwith ECs (Fig. 7.5). The lower and upper curves correspond to the measurement of d-DDT andDDT SAMs, respectively.
The spectrum of the d-DDT SAM, taken in air is a flat line, as one would expect, whereasthe DDT spectrum in air shows the features typical of an alkanethiol SAM in the CH region. Thesame holds true for the PBS spectra with the exception of very weak features in the d-DDT SFGspectra which are attributable to a slight hydrocarbon contamination of the PBS solution.
Most interestingly, the spectrum with the ECs on top of the d-DDT SAM also does not showany significant spectral contributions other than those which are comparable in intensity with thePBS spectra. The two peaks at higher wavenumbers are related to fitting artifacts of the initial
77

7.4. Tests on Living Erythrocytes
2 8 0 0 2 9 0 0 3 0 0 0
I R f r e q u e n c y ( c m - 1 )
0 . 0
0 . 1
0 . 2
0 . 3
resona
nt SF
G sign
al (a.u
.)
E C s
P B S
a i r
Figure 7.5: Resonant SFG spectra of d-DDT (lower curve) and DDT SAMs (upper curve)recorded in air (black), sterile PBS (blue), and PBS containing ECs (red). The CH peaks ofthe DDT SAMs show the typical spectral features upon addition of ECs, and only weakCH signatures show up in the presence of PBS and ECs.
broadband spectra, as the IR frequency was at the edge of the Gaussian-like envelope. This is alsosupported by the fact that these signatures are not observed in the DDT spectra, which show onlythe typical features of the SAM. If the cellular structures were contributing to the spectra, onewould expect to see additional peaks appearing in the CH region, which are not observed. Allthe contributions from these structures cancel out since on average there is no broken inversionsymmetry thus not fulfilling the SFG selection rules.
The lack of other spectral contributions is surprising considering the fact that the crudelypurified EC solution used in these experiments contains not only whole cells, but also many smallCH-containing debris, including sugars, peptides, and membrane fragments. It could be arguedthat this debris would give rise to an SFG signal due to the build up of a locally ordered layerat the interface driven by the amphiphilic character of these molecules. This might be the sourceof the very weak signals detected in the CH region, however, the peak intensities are one to twoorders of magnitude lower than the signal generated by the SAM. These results show that SFGspectroscopy is able to probe buried interfaces even through a cellular layer.
78

Further Biological Applications
7.5 Conclusions
SFG spectroscopy has been employed to study the ECM under a layer of fibroblast cellsadhered on a solid support. No differences were observed in the SFG spectra of samples withcells and those without cells, indicating that SFG spectroscopy is capable of probing the layer inbetween a solid substrate and cells. Spectra of cells adhered on bare gold showed features similar(but not identical) to spectral features of cells adhered on fibronectin-coated gold. Tests on live fi-broblast cells irradiated with SFG laser pulses revealed that these cells were not visibly adverselyaffected by the treatment, indicating that this technique could potentially be applied to in vitromeasurements of the ECM under living cells. This was further explored by investigating inter-faces under a layer of living cells without labeling or fixation. It was found that SFG spectroscopycould accurately detect a dodecanethiol SAM through a dense layer of erythrocytes, with no ap-parent contribution from the cells themselves. Further test on deuterated SAMs showed that thesignal stemming from the erythrocytes was indeed negligible, a result which was hypothesizedto be due to the inherent internal disorder of the cells. These results demonstrate that SFG spec-troscopy is able to penetrate through biological barriers as long as they are optically transparent,and lays the groundwork for the use of this technique in diverse systems including the growthand development of biofilms in situ, the corrosive activity of bacteria and fungi on metal surfaces,or the interaction of cells with nanopatterned surfaces.
79

Chapter 8
Conclusions and Outlook
In this work, a basis for the in situ investigation of biological molecules on surfaces usingsum-frequency-generation spectroscopy was presented. This was accomplished by first verifyingthe suitability of this technique to measure under the necessary conditions. As the density of bio-logical molecules on surfaces is often relatively low, sensitivity measurements were performed toquantify the lower detection limit, which was found to be approximately 2×10¹³ oscillators/cm2.Proof-of-principle measurements on hydrophilic and hydrophobic alkanethiol SAMs in air and inwater were performed to confirm the accurate detection of the changes occurring in these filmsbetween in situ and ex situ conditions. These tests found no changes in the spectra of hydrophobiclayers upon exposure to water, as was expected due to the lack of interaction between the watermolecules and the surfaces of the film, and a significant change in the hydrophilic films upon ex-posure to water, also as was expected due to the hydrogen bonding of the water molecules withthe surface of the film.
Biological systems on solid surfaces can be highly complex, and so in order to gain the clear-est possible understanding of these systems, DNA was chosen due to its relative simplicity amongbiomolecules. In order to gain label-free, molecular-level information about DNA molecules im-mobilized on solid surfaces using SFG spectroscopy (aim [i] of this work), a bottom-up approachwas used: examination of first the nucleobases alone, followed by unmodified DNA strands, andfinally thiolated DNA strands on gold substrates. It was found that while CH3 contributionsfrom the methyl groups unique to thymine were clear in the dense nucleobase multilayers, thesedistinct signatures were not detectable in films of ssDNA. Observations that in these films thecomposition of the DNA strands (whether adenine, thymine, or cytosine) produced highly sim-ilar spectra, indicating that the methylene vibrations of the sugar-phosphate backbone and, inthe case of the thiolated ssDNA, the linker group attaching the DNA strand to thiol moiety, weredominating the spectra. The lack of differences between the ssDNA types further suggested asimilar degree of partial order in these films. It was found that this order could be improvedby repeated wetting and drying of the samples, most likely due to the temporary introductionof a liquid environment gave the DNA strands freedom to rearrange into a more energeticallyfavorable state before re-drying. The fact that SFG spectroscopy only detects signals from thesugar-phosphate backbone in films of ssDNA make make this technique useful for examiningDNA strands regardless of their nucleobase composition, as well as for use as a complimentarymethod to those which only probe the bases, such as NEXAFS.
Comparison of results from ssDNA films in air to ssDNA films in water was performedin order to obtain an understanding of how these films change when exposed to liquid (aim [ii]of this work). Results revealed that thymine films appeared to lose the most overall SFG inten-sity, followed by cytosine films, and finally adenine films. This was tied to a known increasein preference for attachment to gold from thymine to cytosine to adenine, resulting in adeninefilms in which more of the molecules are attached via both the thiol linker and some of the nucle-obases and thymine films in which the molecules are attached primarily through the thiol linkeralone. Cytosine films fall somewhere in between. In the thymine ssDNA films the molecules lostthe most order upon exposure to water due to the increased flexibility afforded them by beingattached through only the thiol linker, while in adenine ssDNA films the molecules had less flex-
80

Conclusions and Outlook
ibility due to being attached to the substrate through multiple points, and thus showed less of aloss of order when examined in water. Interestingly, closer examination of the spectra in water re-vealed unique signatures for thymine ssDNA films, suggesting that under these in situ conditionsthe increased flexibility of the backbone resulted in a suppression of the methylene signal strongenough to reveal nucleobase-specific signatures for this particular base. Such a phenomenon wasfound to occur regardless of the length of the DNA chain, with both 6- and 25-base thymine ss-DNA strands showing similar spectra in water, as well as in films that had previously undergonerepeated wetting and drying to induce order.
To further the understanding of the more complex system of hybridized DNA on surfaces,specifically about the level of order in these systems before and after hybridization (aim [iii] ofthis work), various DNA films were compared before and after hybridization using the compli-mentary techniques of high-resolution XPS and NEXAFS spectroscopy, in addition to SFG spec-troscopy. It was found that HRXPS could be used to quantify the amount of target moleculesin the film post-hybridization, while SFG and NEXAFS spectroscopy contributed information onthe overall degree of order in the film. A film of shorter, more densely-packed thiolated thyminessDNA showed nearly no hybridization, which was attributed to both the fact that the targetmolecules could not penetrate easily into this film and the fact that the smaller number of basesavailable for hybridization made any hybrids that did form inherently unstable. A significantnumber of target molecules was found in the less densely packed film made of longer ssDNAmolecules. However, through NEXAFS and SFG it was found that the degree of order in thesefilms decreased, contrary to the concept of an increasing molecular order upon hybridizationknown for DNA molecules in solution. This finding was attributed to the formation of incompleteor imperfect hybrids in this film, as well as a disruption of these hybrids due to the processingprocedures necessary for analysis via these three spectroscopic techniques. Further tests on theextent of the effects caused by these preparation procedures revealed that even light processingfor ex situ spectroscopic analysis can have a significant effect on both the ordering and number ofsurface-bound hybrids.
Finally, the knowledge obtained from the examination of these relatively simple biomolecu-lar systems of DNA was applied to the complex system of cells on surfaces (aim [iv] of this work).Tests on fibronectin-coated gold surfaces with and without an overlayer of fixed cells were per-formed with SFG spectroscopy. It was found that the SFG signal was not altered by the layer ofcells, suggesting that it was possible to "see through" this cellular layer with SFG spectroscopy,probing just the extracellular matrix beneath. The ability to probe through a layer of living cellswas tested using non-adherent erythrocytes over self-assembled monolayers. Results showed aclear signal from the surface-bound SAM with little to no signal generated by cells, demonstratingthat this technique can also be used through a living cellular layer.
Although the use of SFG spectroscopy for obtaining these insights has proven useful, thereare nevertheless some limitations which could render this technique less suitable than others forsome types of investigations. First, SFG in the CH region has been shown to be quite non-specific.This is unsurprising as many contaminants have CH oscillators similar to what can be found insamples, especially biomolecules. However, it still makes the interpretation of data in this regiondifficult. Furthermore, spectroscopic analysis in other regions such as the amide I were found tohave very low, if any, signal. This is most likely due to the fact that the IR peaks found in thisregion have a very small Raman cross sections, however it limits the use of SFG spectroscopy fordetecting these generally highly informative bands. It may also be the case that the significantdecrease signal for ssDNA films in liquid (as seen in Chapter 5) will make it difficult to obtainfurther accurate information about these types of films in situ. Although it could also be the casethat the disappearance of the dominant methylene backbone signals proves useful for researchersattempting to study such things as intercalation of drugs between nucleobases.
Future directions for this work could include further investigations of DNA in differenttypes of buffer solutions, such as those made with monovalent versus divalent cations. The find-ings presented here could also be useful for the in situ versus ex situ analysis of applied DNAfilms, such as those created by dip-pen nanolithography or microcontact printing. Such an anal-ysis may reveal differences in the solubility of films made in different ways, suggesting a greaterhybridization potential in one over another. Films of other biological molecules with distinctlydifferent CH moieties could also be measured, such as arginine, leucine, alanine, and glycine syn-
81

thetic peptides, in air and solution. This could reveal more about the differences in ordering inthese types of biomolecular systems on surfaces as researchers seek to optimize them as special-ized diagnostic tools. Such investigations would further bridge the gap between in situ and exsitu measurements, allowing for a more accurate comparison between the two.
The presentation of clear and accurate reference spectra for DNA in solution in this workcould also make possible the acquisition of dynamic measurements in solution. The fs SFG sys-tem used here has a current time resolution scale on the order of seconds, and so could be usedto monitor phenomena such as the change in order during hybridization and melting of DNAon surfaces in real time. A similar dynamic real-time approach could also be used to examinechanges in molecular ordering during the formation or breakdown of the extracellular matrix un-der a layer of cells, knowledge which could prove exceptionally valuable in the understanding ofprocesses in such areas as cancer and tissue development.
Yet no matter the future directions, the results presented here provide new knowledgeabout biological molecules, particularly DNA, on solid surfaces in situ and can help pave the wayfor future investigations of these systems using SFG spectroscopy.
82

Bibliography
[1] D. G. Castner and B. D. Ratner, “Biomedical surface science: foundations to frontiers,” Sur-face Science, vol. 500, pp. 28–60, Mar. 2002.
[2] B. Kasemo, “Biological surface science,” Surface Science, vol. 500, pp. 656–677, Mar. 2002.
[3] P. Harder, M. Grunze, R. Dahint, and D. Heidelberg, “Molecular conformation in oligo (ethylene glycol ) -terminated self-assembled monolayers on gold and silver surfaces de-termines their ability to resist protein adsorption,” Journal of Physical Chemistry B, vol. 102,no. 97, pp. 426–436, 1998.
[4] R. G. Chapman, E. Ostuni, L. Yan, and G. M. Whitesides, “Preparation of mixed self-assembled monolayers (SAMs) that resist adsorption of proteins using the reaction ofamines with a SAM that presents interchain carboxylic anhydride groups,” Langmuir,vol. 16, pp. 6927–6936, 2000.
[5] Q. Liu, L. Wang, A. G. Frutos, A. E. Condon, R. M. Corn, and L. M. Smith, “DNA computingon surfaces,” Nature, vol. 403, pp. 175–179, Jan. 2000.
[6] W. C. E. Schofield, J. McGettrick, T. J. Bradley, J. P. S. Badyal, and S. Przyborski, “RewritableDNA microarrays,” Journal of the American Chemical Society, vol. 128, pp. 2280–5, Feb. 2006.
[7] S. C. Hsiao, B. J. Shum, H. Onoe, E. S. Douglas, Z. J. Gartner, R. a. Mathies, C. R. Bertozzi,and M. B. Francis, “Direct cell surface modification with DNA for the capture of primarycells and the investigation of myotube formation on defined patterns,” Langmuir, vol. 25,pp. 6985–91, June 2009.
[8] E. S. Douglas, R. a. Chandra, C. R. Bertozzi, R. a. Mathies, and M. B. Francis, “Self-assembled cellular microarrays patterned using DNA barcodes,” Lab on a Chip, vol. 7,pp. 1442–8, Nov. 2007.
[9] M. A. Cooperstein and H. E. Canavan, “Biological cell detachment from poly(N-isopropylacrylamide) and its applications,” Langmuir, vol. 26, pp. 7695–707, June 2010.
[10] V. Kurz, M. Grunze, and P. Koelsch, “In situ characterization of thermo-responsive poly ( N-Isopropylacrylamide ) films with sum-frequency generation spectroscopy,” ChemPhysChem,vol. 11, pp. 1425 – 1429, 2010.
[11] A. Q. Emili and G. Cagney, “Large-scale functional analysis using peptide or protein ar-rays,” Nature Biotechnology, vol. 18, pp. 393–7, Apr. 2000.
[12] S. F. Kingsmore, “Multiplexed protein measurement: technologies and applications of pro-tein and antibody arrays,” Nature Reviews Drug Discovery, vol. 5, pp. 310–20, Apr. 2006.
[13] B. B. Haab, “Antibody arrays in cancer research,” Molecular & Cellular Proteomics, vol. 4,pp. 377–83, Apr. 2005.
[14] D. J. Lockhart and E. a. Winzeler, “Genomics, gene expression and DNA arrays,” Nature,vol. 405, pp. 827–836, June 2000.
83

Bibliography
[15] M. J. Heller, “DNA microarray technology: devices, systems, and applications,” AnnualReview of Biomedical Engineering, vol. 4, pp. 129–53, Jan. 2002.
[16] N. Fusetani, “Biofouling and antifouling,” Natural Product Reports, vol. 21, pp. 94–104, Feb.2004.
[17] B. Carpentier and O. Cerf, “Biofilms and their consequences, with particular reference tohygiene in the food industry,” The Journal of Applied Bacteriology, vol. 75, pp. 499–511, Dec.1993.
[18] M. Heydt, A. Rosenhahn, M. Grunze, M. Pettitt, M. E. Callow, and J. A. Callow, “Digitalin-line holography as a three-dimensional tool to study motile marine organisms duringtheir exploration of surfaces,” The Journal of Adhesion, vol. 83, pp. 417–430, May 2007.
[19] S. Schilp, A. Kueller, A. Rosenhahn, M. Grunze, M. E. Pettitt, M. E. Callow, and J. a. Callow,“Settlement and adhesion of algal cells to hexa(ethylene glycol)-containing self-assembledmonolayers with systematically changed wetting properties,” Biointerphases, vol. 2, pp. 143–50, Dec. 2007.
[20] A. Rosenhahn, S. Schilp, H. J. Kreuzer, and M. Grunze, “The role of "inert" surface chem-istry in marine biofouling prevention,” Physical chemistry chemical physics : PCCP, vol. 12,pp. 4273–4, May 2010.
[21] G. C. Kumar and S. K. Anand, “Significance of microbial biofilms in food industry: a re-view,” International Journal of Food Microbiology, vol. 42, pp. 9–27, 1998.
[22] P. Thevenot, W. Hu, and L. Tang, “Surface chemistry influences implant biocompatibility,”Current Topics in Medicinal Chemistry, vol. 8, pp. 270–280, 2008.
[23] G. L. Richmond, “Molecular bonding and interactions at aqueous surfaces as probed byvibrational sum frequency spectroscopy,” Chemical Reviews, vol. 102, pp. 2693–724, Aug.2002.
[24] F. M. Geiger, “Second harmonic generation, sum frequency generation, and chi(3): dissect-ing environmental interfaces with a nonlinear optical Swiss Army knife,” Annual Review ofPhysical Chemistry, vol. 60, pp. 61–83, Jan. 2009.
[25] N. C. Seeman, “DNA in a material world,” Nature, vol. 421, pp. 427–31, Jan. 2003.
[26] S. R. Walter and F. M. Geiger, “DNA on Stage: Showcasing Oligonucleotides at Surfaces andInterfaces with Second Harmonic and Vibrational Sum Frequency Generation,” The Journalof Physical Chemistry Letters, vol. 1, pp. 9–15, Jan. 2010.
[27] P. W. K. Rothemund, “Folding DNA to create nanoscale shapes and patterns.,” Nature,vol. 440, pp. 297–302, Mar. 2006.
[28] S. Cosnier and P. Mailley, “Recent advances in DNA sensors,” The Analyst, vol. 133, pp. 984–91, Aug. 2008.
[29] C. A. Mirkin, R. L. Letsinger, R. C. Mucic, and J. J. Storhoff, “A DNA-based method forrationally assembling nanoparticles into macroscopic materials,” Nature, vol. 382, pp. 607–609, 1996.
[30] J. J. Storhoff and C. a. Mirkin, “Programmed materials synthesis with DNA,” Chemical Re-views, vol. 99, pp. 1849–1862, July 1999.
[31] N. L. Rosi and C. a. Mirkin, “Nanostructures in biodiagnostics,” Chemical Reviews, vol. 105,pp. 1547–62, Apr. 2005.
[32] L. M. Adleman, “Molecular computation of solutions to combinatorial problems,” Science,vol. 266, pp. 1021–1024, Nov. 1994.
84

Bibliography
[33] R. a. Chandra, E. S. Douglas, R. a. Mathies, C. R. Bertozzi, and M. B. Francis, “Pro-grammable cell adhesion encoded by DNA hybridization,” Angewandte Chemie (Interna-tional ed. in English), vol. 45, pp. 896–901, Jan. 2006.
[34] J. J. Storhoff, R. Elghanian, C. a. Mirkin, and R. L. Letsinger, “Sequence-Dependent Stabilityof DNA-Modified Gold Nanoparticles,” Langmuir, vol. 18, pp. 6666–6670, Aug. 2002.
[35] H. Kimura-Suda, D. Y. Petrovykh, M. J. Tarlov, and L. J. Whitman, “Base-dependent com-petitive adsorption of single-stranded DNA on gold,” Journal of the American Chemical Soci-ety, vol. 125, pp. 9014–5, July 2003.
[36] B. Roelfs, E. Bunge, C. Schröter, T. Solomun, H. Meyer, R. J. Nichols, and H. Baumgärtel,“Adsorption of thymine on gold single-crystal electrodes,” The Journal of Physical ChemistryB, vol. 101, pp. 754–765, Jan. 1997.
[37] A. Opdahl, D. Y. Petrovykh, H. Kimura-Suda, M. J. Tarlov, and L. J. Whitman, “Independentcontrol of grafting density and conformation of single-stranded DNA brushes,” Proceedingsof the National Academy of Sciences of the United States of America, vol. 104, pp. 9–14, Jan. 2007.
[38] P. Gong, C.-y. Lee, L. J. Gamble, D. G. Castner, D. W. Grainger, L. J. A. Chem, and G. M.Harbers, “Surface coverage and structure of mixed DNA/alkylthiol monolayers on gold:characterization by XPS, NEXAFS, and fluorescence intensity measurements.,” Analyticalchemistry, vol. 78, pp. 3326–3334, May 2006.
[39] C.-Y. Lee, L. J. Gamble, D. W. Grainger, and D. G. Castner, “Mixed DNA/oligo(ethyleneglycol) functionalized gold surfaces improve DNA hybridization in complex media,” Bioin-terphases, vol. 1, pp. 82–92, June 2006.
[40] S. M. Schreiner, A. L. Hatch, D. F. Shudy, D. R. Howard, C. Howell, J. Zhao, P. Koelsch,M. Zharnikov, D. Y. Petrovykh, and A. Opdahl, “Impact of DNA-Surface Interactions onthe Stability of DNA Hybrids,” Analytical Chemistry, vol. 83, pp. 4288–95, June 2011.
[41] W. Saenger, Principles of Nucleic Acid Structure (Springer Advanced Texts in Chemistry).Springer, 1983.
[42] J. Rubin, T. Brennan, and M. Sundaralingam, “Crystal and molecular structure of a naturallyoccurring dinucleoside monophosphate. Uridylyl-(3’-5’)-adenosine hemihydrate. Confor-mational rigidity of the nucleotide unit and models for polynucleotide chain folding,” Bio-chemistry, vol. 11, pp. 3112–3128, Aug. 1972.
[43] A. Vainrub and B. M. Pettitt, “Sensitive quantitative nucleic acid detection using oligonu-cleotide microarrays.,” Journal of the American Chemical Society, vol. 125, pp. 7798–9, July2003.
[44] D. Y. Petrovykh, A. Opdahl, H. Kimura-Suda, J. M. Sullivan, M. J. Tarlov, F. J. Himpsel, L. J.Whitman, and V. Pérez-Dieste, “Nucleobase orientation and ordering in films of single-stranded DNA on gold,” Journal of the American Chemical Society, vol. 128, pp. 2–3, Jan. 2006.
[45] J. B. Mills, E. Vacano, and P. J. Hagerman, “Flexibility of single-stranded DNA: use ofgapped duplex helices to determine the persistence lengths of poly(dT) and poly(dA),”Journal of Molecular Biology, vol. 285, pp. 245–57, Jan. 1999.
[46] B. Tinland, A. Pluen, J. Sturm, and G. Weill, “Persistence Length of Single-Stranded DNA,”Macromolecules, vol. 30, pp. 5763–5765, Sept. 1997.
[47] M. Murphy, I. Rasnik, W. Cheng, T. M. Lohman, and T. Ha, “Probing single-stranded DNAconformational flexibility using fluorescence spectroscopy,” Biophysical Journal, vol. 86,pp. 2530–2537, Apr. 2004.
85

Bibliography
[48] W. J. Parak, T. Pellegrino, C. M. Micheel, D. Gerion, S. C. Williams, and a. P. Alivisatos,“Conformation of oligonucleotides attached to gold nanocrystals probed by gel elec-trophoresis,” Nano Letters, vol. 3, pp. 33–36, Jan. 2003.
[49] D. Zanchet, C. M. Micheel, W. J. Parak, D. Gerion, and a. P. Alivisatos, “ElectrophoreticIsolation of Discrete Au Nanocrystal/DNA Conjugates,” Nano Letters, vol. 1, pp. 32–35,Jan. 2001.
[50] V. Singh, M. Zharnikov, A. Gulino, and T. Gupta, “DNA immobilization, delivery and cleav-age on solid supports,” Journal of Materials Chemistry, vol. 21, pp. 10602–10618, May 2011.
[51] D. Y. Petrovykh, H. Kimura-Suda, M. J. Tarlov, and L. J. Whitman, “Quantitative character-ization of DNA films by X-ray photoelectron spectroscopy,” Langmuir, vol. 20, pp. 429–440,Jan. 2004.
[52] L. K. Wolf, Y. Gao, and R. M. Georgiadis, “Sequence-dependent DNA immobilization: spe-cific versus nonspecific contributions,” Langmuir, vol. 20, pp. 3357–61, Apr. 2004.
[53] W. Yang, O. Auciello, J. E. Butler, W. Cai, J. A. Carlisle, J. E. Gerbi, D. M. Gruen, T. Knicker-bocker, T. L. Lasseter, J. N. Russell, L. M. Smith, and R. J. Hamers, “DNA-modifiednanocrystalline diamond thin-films as stable, biologically active substrates,” Nature Ma-terials, vol. 1, pp. 253–7, Dec. 2002.
[54] T. Knickerbocker, T. Strother, M. P. Schwartz, J. N. Russell, J. Butler, L. M. Smith, and R. J.Hamers, “DNA-Modified Diamond Surfaces,” Langmuir, vol. 19, pp. 1938–1942, Mar. 2003.
[55] T. Strother, “Covalent attachment of oligodeoxyribonucleotides to amine-modified Si (001)surfaces,” Nucleic Acids Research, vol. 28, pp. 3535–3541, Sept. 2000.
[56] T. Böcking, K. A. Kilian, K. Gaus, and J. J. Gooding, “Single-step DNA immobilization onantifouling self-assembled monolayers covalently bound to silicon (111),” Langmuir, vol. 22,pp. 3494–6, Apr. 2006.
[57] G. Y. Stokes, J. M. Gibbs-davis, F. C. Boman, B. R. Stepp, A. G. Condie, S. T. Nguyen, andF. M. Geiger, “Making sense of DNA,” Journal of the American Chemical Society, vol. 129,pp. 7492–7493, 2007.
[58] Y. Sartenaer, G. Tourillon, L. Dreesen, D. Lis, A. a. Mani, P. a. Thiry, and A. Peremans,“Sum-frequency generation spectroscopy of DNA monolayers.,” Biosensors and Bioelectron-ics, vol. 22, pp. 2179–83, Apr. 2007.
[59] B. Sun, P. E. Colavita, H. Kim, M. Lockett, M. S. Marcus, L. M. Smith, and R. J. Hamers,“Covalent photochemical functionalization of amorphous carbon thin films for integratedreal-time biosensing,” Langmuir, vol. 22, pp. 9598–605, Nov. 2006.
[60] D. Y. Petrovykh, H. Kimura-Suda, L. J. Whitman, and M. J. Tarlov, “Quantitative analysisand characterization of DNA immobilized on gold,” Journal of the American Chemical Society,vol. 125, pp. 5219–26, Apr. 2003.
[61] C. Frontali, E. Dore, A. Ferrauto, E. Gratton, A. Bettini, M. R. Pozzan, and E. Valdevit,“An absolute method for the determination of the persistence length of native DNA fromelectron micrographs,” Biopolymers, vol. 18, pp. 1353–73, June 1979.
[62] A. W. Peterson, R. J. Heaton, and R. M. Georgiadis, “The effect of surface probe density onDNA hybridization,” Nucleic Acids Research, vol. 29, pp. 5163–8, Dec. 2001.
[63] M. F. Hagan and A. K. Chakraborty, “Hybridization dynamics of surface immobilizedDNA,” The Journal of Chemical Physics, vol. 120, pp. 4958–68, Mar. 2004.
[64] T. M. Herne and M. J. Tarlov, “Characterization of DNA Probes Immobilized on Gold Sur-faces,” Journal of the American Chemical Society, vol. 119, pp. 8916–8920, Sept. 1997.
86
Bibliography
[65] A. W. Peterson, L. K. Wolf, and R. M. Georgiadis, “Hybridization of mismatched or par-tially matched DNA at surfaces important in both fundamental and applied research inchemistry,” Journal of the American Chemical Society, vol. 682, no. 15, pp. 14601–14607, 2002.
[66] T. Livache, E. Maillart, N. Lassalle, P. Mailley, B. Corso, P. Guedon, A. Roget, and Y. Levy,“Polypyrrole based DNA hybridization assays: study of label free detection processes ver-sus fluorescence on microchips,” Journal of Pharmaceutical and Biomedical Analysis, vol. 32,pp. 687–696, 2003.
[67] L. Moiseev, M. S. Unlü, A. K. Swan, B. B. Goldberg, and C. R. Cantor, “DNA conformationon surfaces measured by fluorescence self-interference,” Proceedings of the National Academyof Sciences of the United States of America, vol. 103, pp. 2623–8, Feb. 2006.
[68] L. M. Demers, C. a. Mirkin, R. C. Mucic, R. a. Reynolds, R. L. Letsinger, R. Elghanian,and G. Viswanadham, “A fluorescence-based method for determining the surface coverageand hybridization efficiency of thiol-capped oligonucleotides bound to gold thin films andnanoparticles,” Analytical Chemistry, vol. 72, pp. 5535–41, Nov. 2000.
[69] L. a. Chrisey, G. U. Lee, and C. E. O’Ferrall, “Covalent attachment of synthetic DNA toself-assembled monolayer films,” Nucleic Acids Research, vol. 24, pp. 3031–9, Aug. 1996.
[70] R. Georgiadis, K. P. Peterlinz, and a. W. Peterson, “Quantitative measurements and mod-eling of kinetics in nucleic acid monolayer films using SPR spectroscopy,” Journal of theAmerican Chemical Society, vol. 122, pp. 3166–3173, Apr. 2000.
[71] J. S. Shumaker-Parry, R. Aebersold, and C. T. Campbell, “Parallel, quantitative measure-ment of protein binding to a 120-element double-stranded DNA array in real time usingsurface plasmon resonance microscopy,” Analytical Chemistry, vol. 76, pp. 2071–82, Apr.2004.
[72] L. K. Wolf, D. E. Fullenkamp, and R. M. Georgiadis, “Quantitative angle-resolved SPRimaging of DNA-DNA and DNA-drug kinetics,” Journal of the American Chemical Society,vol. 127, pp. 17453–9, Dec. 2005.
[73] A. W. Wark, H. J. Lee, and R. M. Corn, “Long-range surface plasmon resonance imaging forbioaffinity sensors,” Analytical Chemistry, vol. 77, pp. 3904–7, July 2005.
[74] S. M. Schreiner, D. F. Shudy, A. L. Hatch, A. Opdahl, L. J. Whitman, and D. Y. Petrovykh,“Controlled and efficient hybridization achieved with DNA probes immobilized solelythrough preferential DNA-substrate interactions.,” Analytical Chemistry, vol. 82, pp. 2803–10, Apr. 2010.
[75] X. Su, Y.-J. Wu, R. Robelek, and W. Knoll, “Surface plasmon resonance spectroscopy andquartz crystal microbalance study of streptavidin film structure effects on biotinylatedDNA assembly and target DNA hybridization,” Langmuir, vol. 21, pp. 348–53, Jan. 2005.
[76] M. Lazerges, H. Perrot, E. Antoine, A. Defontaine, and C. Compere, “Oligonucleotidequartz crystal microbalance sensor for the microalgae Alexandrium minutum (Dino-phyceae),” Biosensors and Bioelectronics, vol. 21, pp. 1355–1358, 2005.
[77] R. Lao, S. Song, H. Wu, L. Wang, Z. Zhang, L. He, and C. Fan, “Electrochemical interroga-tion of DNA monolayers on gold surfaces,” Analytical Chemistry, vol. 77, pp. 6475–80, Oct.2005.
[78] R. Levicky and A. Horgan, “Physicochemical perspectives on DNA microarray and biosen-sor technologies,” Trends in Biotechnology, vol. 23, pp. 143–9, Mar. 2005.
[79] Z.-L. Zhang, D.-W. Pang, R.-Y. Zhang, J.-W. Yan, B.-W. Mao, and Y.-P. Qi, “Investigationof DNA orientation on gold by EC-STM,” Bioconjugate Chemistry, vol. 13, no. 1, pp. 104–9,2002.
87

Bibliography
[80] S. O. Kelley, J. K. Barton, N. M. Jackson, L. D. McPherson, A. B. Potter, E. M. Spain, M. J.Allen, and M. G. Hill, “Orienting DNA Helices on Gold Using Applied Electric Fields,”Langmuir, vol. 14, pp. 6781–6784, Nov. 1998.
[81] A. V. Saprigin, C. W. Thomas, C. S. Dulcey, C. H. Patterson, and M. S. Spector, “Spec-troscopic quantification of covalently immobilized oligonucleotides,” Surface and InterfaceAnalysis, vol. 37, pp. 24–32, Jan. 2004.
[82] M. R. Vilar, A. M. Botelho do Rego, A. M. Ferraria, Y. Jugnet, C. Noguès, D. Peled, andR. Naaman, “Interaction of self-assembled monolayers of DNA with electrons: HREELSand XPS studies,” The Journal of Physical Chemistry B, vol. 112, pp. 6957–6964, June 2008.
[83] N. Ballav, P. Koelsch, and M. Zharnikov, “Orientation and ordering in monomolecular filmsof sulfur-modified homo-oligonucleotides on gold,” The Journal of Physical Chemistry C,vol. 113, pp. 18312–18320, Oct. 2009.
[84] C. Howell, R. Schmidt, V. Kurz, and P. Koelsch, “Sum-frequency-generation spectroscopyof DNA films in air and aqueous environments,” Biointerphases, vol. 3, pp. FC47–51, Sept.2008.
[85] N. Samuel, C. Lee, L. Gamble, D. Fischer, and D. Castner, “NEXAFS characterization ofDNA components and molecular-orientation of surface-bound DNA oligomers,” Journal ofElectron Spectroscopy and Related Phenomena, vol. 152, pp. 134–142, July 2006.
[86] C.-Y. Lee, H. E. Canavan, L. J. Gamble, and D. G. Castner, “Evidence of impurities in thi-olated single-stranded DNA oligomers and their effect on DNA self-assembly on gold,”Langmuir, vol. 21, pp. 5134–41, May 2005.
[87] C.-Y. Lee, P.-C. T. Nguyen, D. W. Grainger, L. J. Gamble, and D. G. Castner, “Structure andDNA hybridization properties of mixed nucleic acid/maleimide-ethylene glycol monolay-ers,” Analytical Chemistry, vol. 79, pp. 4390–400, June 2007.
[88] H. F. Arlinghaus, M. Ostrop, O. Friedrichs, J. Feldner, U. Gunst, and D. Lipinsky, “DNAsequencing with ToF-SIMS,” Surface and Interface Analysis, vol. 34, pp. 35–39, Aug. 2002.
[89] N. Winograd, “Prospects for imaging TOF-SIMS: from fundamentals to biotechnology,”Applied Surface Science, vol. 203-204, pp. 13–19, 2003.
[90] J. D. Gelder, K. D. Gussem, P. Vandenabeele, and L. Moens, “Reference database of Ramanspectra of biological molecules,” Journal of Raman Spectroscopy, vol. 38, pp. 1133–1147, 2007.
[91] L. Q. Dong, J. Z. Zhou, L. L. Wu, P. Dong, and Z. H. Lin, “SERS studies of self-assembledDNA monolayer - characterization of adsorption orientation of oligonucleotide probes andtheir hybridized helices on gold substrate,” Chemical Physics Letters, vol. 354, pp. 458–465,2002.
[92] A. Barhoumi and N. J. Halas, “Label-Free Detection of DNA Hybridization Using Sur-face Enhanced Raman Spectroscopy.,” Journal of the American Chemical Society, vol. 132,pp. 12792–12793, Aug. 2010.
[93] J. T. Woodward, M. L. Walker, C. W. Meuse, D. J. Vanderah, G. E. Poirier, and A. L. Plant,“Effect of an Oxidized Gold Substrate on Alkanethiol Self-Assembly,” Langmuir, vol. 16,pp. 5347–5353, June 2000.
[94] K. F. Domke, D. Zhang, and B. Pettinger, “Tip-enhanced Raman spectra of picomole quan-tities of DNA nucleobases at Au(111),” Journal of the American Chemical Society, vol. 129,pp. 6708–9, May 2007.
[95] A. G. Lambert, P. B. Davies, and D. J. Neivandt, “Implementing the theory of sum fre-quency generation vibrational spectroscopy : a tutorial review,” Applied Spectroscopy Re-views, vol. 40, pp. 103–145, 2005.
88

Bibliography
[96] Y. R. Shen and V. Ostroverkhov, “Sum-frequency vibrational spectroscopy on water in-terfaces: polar orientation of water molecules at interfaces,” Chemical Reviews, vol. 106,pp. 1140–54, Apr. 2006.
[97] Z. Chen, Y. Shen, and G. A. Somorjai, “Studies of polymer surfaces by sum frequency gen-eration spectroscopy,” Annual Review of Physical Chemistry, vol. 53, pp. 437–465, 2002.
[98] S. Roke, “Nonlinear Optical Spectroscopy of Soft Matter Interfaces,” ChemPhysChem, vol. 10,pp. 1380 – 1388, 2009.
[99] a. Hopkins, C. Mcfearin, and G. Richmond, “Investigations of the solid-aqueous interfacewith vibrational sum-frequency spectroscopy,” Current Opinion in Solid State and MaterialsScience, vol. 9, pp. 19–27, Feb. 2005.
[100] O. Mermut, D. C. Phillips, R. L. York, K. R. McCrea, R. S. Ward, and G. a. Somorjai, “In situadsorption studies of a 14-amino acid leucine-lysine peptide onto hydrophobic polystyreneand hydrophilic silica surfaces using quartz crystal microbalance, atomic force microscopy,and sum frequency generation vibrational spectroscopy,” Journal of the American ChemicalSociety, vol. 128, pp. 3598–607, Mar. 2006.
[101] H. Asanuma, H. Noguchi, K. Uosaki, and H.-Z. Yu, “Metal cation-induced deformation ofDNA self-assembled monolayers on silicon: vibrational sum frequency generation spec-troscopy,” Journal of the American Chemical Society, vol. 130, pp. 8016–22, June 2008.
[102] M. Ostblom, B. Liedberg, L. M. Demers, and C. a. Mirkin, “On the structure and desorptiondynamics of DNA bases adsorbed on gold: a temperature-programmed study.,” The Journalof Physical Chemistry B, vol. 109, pp. 15150–60, Aug. 2005.
[103] R. Hesse, P. Streubel, and R. Szargan, “Product or sum : comparative tests of Voigt, andproduct or sum of Gaussian and Lorentzian functions in the fitting of synthetic Voigt basedX ray photoelectron spectra,” Surface and Interface Analysis, vol. 39, pp. 381–391, 2007.
[104] K. Heister, M. Zharnikov, M. Grunze, and L. S. O. Johansson, “Adsorption of Alkanethi-ols and Biphenylthiols on Au and Ag Substrates : A High-Resolution X-ray PhotoelectronSpectroscopy Study,” Journal of Physical Chemistry B, vol. 105, pp. 4058–4061, May 2001.
[105] P. Batson, “Carbon 1s near-edge-absorption fine structure in graphite,” Physical Review B,vol. 48, pp. 2608–2610, July 1993.
[106] R. Ahlrichts, M. Bär, M. Häser, H. Horn, and C. Kölmel, “Electronic structure calcula-tions on worksatation computers: The program system turbomole,” Chemical Physics Letters,vol. 162, pp. 165–169, 1989.
[107] J. P. Perdew, K. Burke, and M. Ernzerhof, “Generalized gradient approximation made sim-ple,” Physical Review Letters, vol. 77, pp. 3865–3868, 1996.
[108] S. Grimme, “Semiempirical GGA-type density functional constructed with a long-rangedispersion correction,” Journal of Computational Chemistry, vol. 27, pp. 1787–99, Nov. 2006.
[109] R. Maul, F. Ortmann, M. Preuss, K. Hannewald, and F. Bechstedt, “DFT studies using su-percells and projector-augmented waves for structure, energetics, and dynamics of glycine,alanine, and cysteine,” Journal of Computational Chemistry, vol. 28, pp. 1817–33, Aug. 2007.
[110] X. D. Zhu, H. Suhr, and Y. R. Shen, “Surface vibrational spectroscopy by infrared-visiblesum frequency generation,” Physical Review B, vol. 35, pp. 3047–3050, 1987.
[111] J. Hunt, P. Guyot-Sionnest, and Y. Shen, “Observation of C-H strech vibrations of mono-layers of molecules optical sum-frequency generation,” Chemical Physics Letters, vol. 133,pp. 189–192, 1987.
89

Bibliography
[112] A. Harris, E. Chidsey, N. Levinos, and D. Loiacono, “Monolayer vibrational spectroscopyby infrared-visible sum generation at metal and semiconductor surfaces,” Chemical PhysicsLetters, vol. 141, no. 4, pp. 350–356, 1987.
[113] C. D. Bain, “Sum-frequency Vibrational Spectroscopy of the Solid/Liquid Interface,” Journalof the Chemical Society, Faraday Transactions, vol. 91, pp. 1281–1296, 1995.
[114] L. Dreesen, C. Humbert, M. Celebi, J. Lemaire, A. Mani, P. Thiry, and A. Peremans, “In-fluence of the metal electronic properties on the sum-frequency generation spectra of do-decanethiol self-assembled monolayers on Pt (111), Ag (111) and Au (111) single crystals,”Applied Physics B: Lasers and Optics, vol. 74, pp. 621–625, May 2002.
[115] D. Verreault, V. Kurz, C. Howell, and P. Koelsch, “Sample cells for probing solid/liquidinterfaces with broadband sum-frequency-generation spectroscopy,” The Review of ScientificInstruments, vol. 81, p. 063111, June 2010.
[116] M. Skoda, R. Jacobs, S. Zorn, and F. Schreiber, “Optimizing the PMIRRAS signal from amultilayer system and application to self-assembled monolayers in contact with liquids,”Journal of Electron Spectroscopy and Related Phenomena, vol. 172, no. 1-3, pp. 21–26, 2009.
[117] A. Lagutchev, S. A. Hambir, and D. D. Dlott, “Nonresonant Background Suppression inBroadband Vibrational Sum-Frequency Generation Spectroscopy,” Journal of Physical Chem-istry C Letters, vol. 111, pp. 13645–13647, 2007.
[118] R. Maoz, J. Sagiv, D. Degenhardt, H. Moehwald, and P. Quint, “Hydrogen-bonded multilay-ers of self-assembling silanes: structure elucidation by combined Fourier transform infra-red spectroscopy and X-ray scattering techniques,” Supramolecular Science, vol. 2, pp. 9–24,1995.
[119] I. V. Stiopkin, H. D. Jayathilake, A. N. Bordenyuk, and A. V. Benderskii, “Heterodyne-Detected Vibrational Sum Frequency Generation Spectroscopy,” Langmuir, vol. 130,pp. 2271–2275, 2008.
[120] T. H. Ong, P. B. Davies, and C. D. Bain, “Sum-Frequency Spectroscopy of Monolayers ofAlkoxy-Terminated Alkanethiols in Contact with Liquids,” Langmuir, vol. 9, pp. 7155– 7164,1993.
[121] T. H. Ong, R. N. Ward, P. B. Davies, and C. D. Bain, “Microscopic Basis of Wetting: An inSitu Study of the Interaction between Liquids and an Organic Monolayer,” Journal of theAmerican Chemical Society, vol. 114, pp. 6243–6245, 1992.
[122] N. Ward, B. Davies, and C. D. Bain, “Orientation of surfactants adsorbed on a hydrophobicsurface,” Journal of Physical Chemistry, vol. 97, pp. 7141–7143, 1993.
[123] M. Buck, “Ab initio calculations of vibrational spectra of 2-methoxy ethanol in the CHstretching range,” Physical Chemistry Chemical Physics, vol. 5, pp. 18–25, 2003.
[124] A. J. Pertsin and M. Grunze, “Computer Simulation of Water near the Surface ofOligo(ethylene glycol)-Terminated Alkanethiol Self-Assembled Monolayers,” Langmuir,vol. 16, pp. 8829–8841, Nov. 2000.
[125] M. Zolk, F. Eisert, J. Pipper, S. Herrwerth, W. Eck, M. Buck, and M. Grunze, “Solvation ofOligo ( ethylene glycol ) -Terminated Self-Assembled Monolayers Studied by VibrationalSum Frequency Spectroscopy,” Langmuir, vol. 16, pp. 5849–5852, 2000.
[126] C. Vericat, M. E. Vela, G. A. Benitez, J. A. M. Gago, and X. Torrelles, “Surface characteriza-tion of sulfur and alkanethiol self-assembled monolayers on Au ( 111 ),” Journal of Physics:Condensed Matter, vol. 18, pp. R867–R900, 2006.
90

Bibliography
[127] M. J. Stevens and G. S. Grest, “Simulations of water at the interface with hydrophilic self-assembled monolayers,” Biointerphases, vol. 3, no. 3, pp. 13–22, 2008.
[128] A.-c. Yang and C.-i. Weng, “Influence of alkanethiol self-assembled monolayers with vari-ous tail,” The Journal of Chemical Physics, vol. 129, p. 154710, 2008.
[129] M. Mezger, H. Reichert, S. Schöder, J. Okasinski, H. Schröder, H. Dosch, D. Palms, J. Ral-ston, and V. Honkimäki, “High-resolution in situ x-ray study of the hydrophobic gap at thewater-octadecyl-trichlorosilane interface.,” Proceedings of the National Academy of Sciences ofthe United States of America, vol. 103, pp. 18401–4, Dec. 2006.
[130] L. Dreesen, C. Humbert, P. Hollander, A. Mani, K. Ataka, P. Thiry, and A. Peremans, “Studyof the water/poly(ethylene glycol) interface by IR-visible sum-frequency generation spec-troscopy,” Chemical Physics Letters, vol. 333, pp. 327–331, 2001.
[131] L. Baugh, T. Weidner, J. E. Baio, P.-C. T. Nguyen, L. J. Gamble, P. S. Stayton, and D. G.Castner, “Probing the orientation of surface-immobilized protein G B1 using ToF-SIMS,sum frequency generation, and NEXAFS spectroscopy,” Langmuir, vol. 26, pp. 16434–41,Nov. 2010.
[132] C. D. Bain, E. B. Troughton, Y. T. Tao, J. Evall, G. M. Whitesides, and R. G. Nuzzo, “Forma-tion of monolayer films by the spontaneous assembly of organic thiols from solution ontogold,” Journal of the American Chemical Society, vol. 111, pp. 321–335, Jan. 1989.
[133] M. D. Porter, T. B. Bright, D. L. Allara, and C. E. D. Chidsey, “Spontaneously OrganizedMolecular Assemblies. 4. Structural Characterization of n-Alkyl Thiol Monolayers,” Journalof the American Chemical Society, vol. 109, pp. 3559–3568, 1987.
[134] R. G. Nuzzo, L. H. Dubois, and D. L. Allara, “Fundamental Studies of Microscopic Wettingon Organic Surfaces . 1 . Formation and Structural Characterization of a Self-ConsistentSeries of Polyfunctional Organic Monolayers,” Journal of the American Chemical Society,vol. 112, pp. 558–569, 1990.
[135] M. Himmelhaus, F. Eisert, M. Buck, and M. Grunze, “Self-Assembly of n-Alkanethiol Mono-layers. A Study by IR-Visible Sum Frequency Spectroscopy (SFG),” Journal of Physical Chem-istry B, vol. 104, pp. 576–584, 2000.
[136] M. Maccarini, R. Steitz, M. Himmelhaus, J. Fick, S. Tatur, M. Wolff, M. Grunze, J. Janec, R. R.Netz, G. Strasse, and D. Berlin, “Density Depletion at Solid-Liquid Interfaces : a NeutronReflectivity Study,” Langmuir, vol. 23, pp. 598–608, 2007.
[137] A. Vainrub and B. Pettitt, “Coulomb blockage of hybridization in two-dimensional DNAarrays,” Physical Review E, vol. 66, pp. 23–26, Oct. 2002.
[138] N. Nishi, D. Hobara, M. Yamamoto, and T. Kakiuchi, “Chain-length-dependent changein the structure of self-assembled monolayers of n-alkanethiols on Au (111) probed bybroad-bandwidth sum frequency generation spectroscopy,” Chemical Physics, vol. 118, no. 4,pp. 17–19, 2003.
[139] G. R. Bell, C. D. Bain, and R. N. Ward, “Sum-frequency vibrational spectroscopy of solublesurfactants at the air/water interface,” Journal of the Chemical Society, Faraday Transactions,vol. 92, no. 4, p. 515, 1996.
[140] W. Haiss, B. Roelfs, S. N. Port, E. Bunge, H. Baumga, and R. J. Nichols, “In-situ infraredspectroscopic studies of thymine adsorption on a Au (111) electrode,” Journal of Electroana-lytical Chemistry, vol. 454, pp. 107 – 113, 1998.
[141] E. L. Hommel and H. C. Allen, “The air/liquid interface of benzene, toluene, m-xylene,and mesitylene: a sum frequency, Raman, and infrared spectroscopic study,” The Analyst,vol. 128, no. 6, p. 750, 2003.
91

Bibliography
[142] N. J. Tao, J. a. DeRose, and S. M. Lindsay, “Self-assembly of molecular superstructures stud-ied by in situ scanning tunneling microscopy: DNA bases on gold (111),” The Journal ofPhysical Chemistry, vol. 97, pp. 910–919, Jan. 1993.
[143] T. Boland and B. D. Ratner, “Two-dimensional assembly of purines and pyrimidines onAu(111),” Langmuir, vol. 10, pp. 3845–3852, Oct. 1994.
[144] A. Bensimon, A. Simon, A. Chiffaudel, V. Croquette, F. Heslot, and D. Bensimon, “Align-ment and sensitive detection of DNA by a moving interface,” Science, vol. 265, pp. 7–9,1994.
[145] J. Zheng, L. Li, S. Chen, and S. Jiang, “Molecular Simulation Study of Water Interactionswith Oligo (Ethylene Glycol) - Terminated Alkanethiol Self-Assembled Monolayers,” Lang-muir, vol. 20, pp. 8931–8938, 2004.
[146] S. Peeters, T. Stakenborg, G. Reekmans, W. Laureyn, L. Lagae, A. Van Aerschot, andM. Van Ranst, “Impact of spacers on the hybridization efficiency of mixed self-assembledDNA/alkanethiol films,” Biosensors & Bioelectronics, vol. 24, pp. 72–7, Sept. 2008.
[147] Y. Maeda, “IR spectroscopic study on the hydration and the phase transition of poly(vinylmethyl ether) in water,” Langmuir, vol. 17, pp. 1737–1742, Mar. 2001.
[148] A. W. Peterson, R. J. Heaton, and R. Georgiadis, “Kinetic Control of Hybridization in Sur-face Immobilized DNA Monolayer Films,” Journal of the American Chemical Society, vol. 122,pp. 7837–7838, 2000.
[149] M. Wirde, U. Gelius, T. Dunbar, and D. L. Allara, “Modification of self-assembled mono-layers of alkanethiols on gold by ionizing radiation,” Nuclear Instruments and Methods inPhysics Research Section B: Beam Interactions with Materials and Atoms, vol. 131, pp. 245–251,1997.
[150] R. K. Campen, T. T. M. Ngo, M. Sovago, J.-M. Ruysschaert, and M. Bonn, “Molecular re-structuring of water and lipids upon the interaction of DNA with lipid monolayers,” Journalof the American Chemical Society, vol. 132, pp. 8037–47, June 2010.
[151] M. Zharnikov and M. Grunze, “Modification of thiol-derived self-assembling monolayersby electron and x-ray irradiation: Scientific and lithographic aspects,” Journal of VacuumScience & Technology B: Microelectronics and Nanometer Structures, vol. 20, p. 1793, Oct. 2002.
[152] C. Howell, R. Maul, W. Wenzel, and P. Koelsch, “Interactions of hydrophobic and hy-drophilic self-assembled monolayers with water as probed by sum-frequency-generationspectroscopy,” Chemical Physics Letters, vol. 494, pp. 193–197, July 2010.
[153] J. Stoehr, NEXAFS Spectroscopy, Springer Series in Surface Science 25. Berlin: SPringer-Verlag,1992.
[154] Y. Zubavichus, A. Shaporenko, M. Grunze, M. Zharnikov, and V. Korolkov, “Is X-ray ab-sorption spectroscopy sensitive to the amino acid composition of functional proteins?,” Thejournal of physical chemistry. B, vol. 112, pp. 4478–80, Apr. 2008.
[155] A. Jain, Y. Gupta, R. Agrawal, S. K. Jain, and P. Khare, “Biofilms - a microbial life perspec-tive: a critical review,” Critical Reviews in Theraputic Drug Carrier Systems, vol. 24, pp. 393–443, 2007.
[156] R. Patel, “Biofilms and antimicrobial resistance,” Clinical Orthopaedics and Related Research,vol. 437, pp. 41–47, 2005.
[157] E. D. Hay, Cell biology of the extracellular matrix. Springer, 2nd ed., 2007.
92

Bibliography
[158] I. Vlodavsky, Z. Fuks, R. Ishai-Michaeli, P. Bashkin, E. Levi, G. Korner, R. Bar-Shavit, andM. Klagsbrun, “Extracellular matrix-resident basic fibroblast growth factor: implication forthe control of angiogenesis,” Journal of Cellular Biochemistry, vol. 45, pp. 167–76, Feb. 1991.
[159] A. Cretu and P. C. Brooks, “Impact of the non-cellular tumor microenvironment on metasta-sis: potential therapeutic and imaging opportunities,” Journal of Cellular Physiology, vol. 213,pp. 391–402, Nov. 2007.
[160] S. M. Pupa, S. Ménard, S. Forti, and E. Tagliabue, “New insights into the role of extracel-lular matrix during tumor onset and progression.,” Journal of Cellular Physiology, vol. 192,pp. 259–67, Sept. 2002.
[161] P.-J. Wipff, D. B. Rifkin, J.-J. Meister, and B. Hinz, “Myofibroblast contraction activates latentTGF-beta1 from the extracellular matrix.,” The Journal of cell biology, vol. 179, pp. 1311–23,Dec. 2007.
[162] L. J. Kaufman, C. P. Brangwynne, K. E. Kasza, E. Filippidi, V. D. Gordon, T. S. Deis-boeck, and D. a. Weitz, “Glioma expansion in collagen I matrices: analyzing colla-gen concentration-dependent growth and motility patterns.,” Biophysical journal, vol. 89,pp. 635–50, July 2005.
[163] G. Bernard, M. Auger, J. Soucy, and R. Pouliot, “Physical characterization of the stratumcorneum of an in vitro psoriatic skin model by ATR-FTIR and Raman spectroscopies,”Biochimica et Biophysica Acta, vol. 1770, pp. 1317–1323, 2007.
[164] D. F. Coutinho, I. H. Pashkuleva, C. M. Alves, A. P. Marques, N. M. Neves, and R. L. Reis,“The effect of chitosan on the in vitro biological performance of chitosan-poly(butylenesuccinate) blends.,” Biomacromolecules, vol. 9, pp. 1139–45, Apr. 2008.
[165] W. He, X. Guo, and M. Zhang, “Transdermal permeation enhancement of N-trimethyl chi-tosan for testosterone,” International Journal of Pharmaceutics, vol. 356, pp. 82–87, 2008.
[166] A. Heredia, H. J. van der Strate, I. Delgadillo, V. A. Basiuk, and E. G. Vrieling, “Analysisof organo-silica interactions during valve formation in synchronously growing cells of thediatom Navicula pelliculosa.,” Chembiochem, vol. 9, pp. 573–84, Mar. 2008.
[167] J. Wang, S.-H. Lee, and Z. Chen, “Quantifying the ordering of adsorbed proteins in situ,”The Journal of Physical Chemistry B, vol. 112, pp. 2281–90, Feb. 2008.
[168] J. Wang, Z. Paszti, M. L. Clarke, X. Chen, and Z. Chen, “Deduction of structural informa-tion of interfacial proteins by combined vibrational spectroscopic methods,” The Journal ofPhysical Chemistry B, vol. 111, pp. 6088–95, May 2007.
[169] X. Chen, J. Wang, J. J. Sniadecki, M. A. Even, and Z. Chen, “Probing r-Helical and -SheetStructures of Peptides at Solid/Liquid Interfaces with SFG,” Langmuir, vol. 21, pp. 2662–2664, 2005.
[170] R. L. York, O. Mermut, D. C. Phillips, K. R. Mccrea, R. S. Ward, and G. A. Somorjai, “Influ-ence of Ionic Strength oh the Adsorption of a Model Peptide on Hydrophobic polystyrenesurfaces : insight from SFG vibrational spectroscopy,” Journal of Physical Chemistry C,vol. 111, pp. 8866–8871, 2007.
[171] D. Phillips, R. York, O. Mermut, K. McCrea, R. Ward, and G. Somorjai, “Side Chain, ChainLength, and Sequence Effects on Amphiphilic Peptide Adsorption at Hydrophobic and Hy-drophilic Surfaces Studied by Sum-Frequency Generation Vibrational Spectroscopy andQuartz Crystal Microbalance,” Journal of Physical Chemistry C, vol. 111, pp. 255–261, Jan.2007.
93

[172] J. Wang, M. a. Even, X. Chen, A. H. Schmaier, J. H. Waite, and Z. Chen, “Detection of amideI signals of interfacial proteins in situ using SFG,” Journal of the American Chemical Society,vol. 125, pp. 9914–5, Aug. 2003.
[173] I. Rocha-Mendoza, D. R. Yankelevich, M. Wang, K. M. Reiser, C. W. Frank, and A. Knoesen,“Sum frequency vibrational spectroscopy: the molecular origins of the optical second-ordernonlinearity of collagen,” Biophysical Journal, vol. 93, pp. 4433–44, Dec. 2007.
[174] S.-Y. Jung, S.-M. Lim, F. Albertorio, G. Kim, M. C. Gurau, R. D. Yang, M. a. Holden, and P. S.Cremer, “The Vroman effect: a molecular level description of fibrinogen displacement,”Journal of the American Chemical Society, vol. 125, pp. 12782–6, Oct. 2003.
[175] X. Chen, L. B. Sagle, and P. S. Cremer, “Urea orientation at protein surfaces,” Journal of theAmerican Chemical Society, vol. 129, pp. 15104–5, Dec. 2007.
[176] Y. R. Shen, “Surface probed by second-harmonic and sum-frequency generation,” Nature,vol. 337, pp. 519–525, 1989.
[177] S. Ye, K. T. Nguyen, S. V. Le Clair, and Z. Chen, “In situ molecular level studies on mem-brane related peptides and proteins in real time using sum frequency generation vibrationalspectroscopy.,” Journal of structural biology, vol. 168, pp. 61–77, Oct. 2009.
[178] T. Weidner, N. F. Breen, G. P. Drobny, and D. G. Castner, “Amide or amine: determining theorigin of the 3300 cm(-1) NH mode in protein SFG spectra using 15N isotope labels.,” TheJournal of Physical Chemistry B, vol. 113, pp. 15423–6, Nov. 2009.
[179] S. Le Clair, K. Nguyen, and Z. Chen, “Sum Frequency Generation Studies on Bioadhe-sion: Elucidating the Molecular Structure of Proteins at Interfaces.,” The Journal of Adhesion,vol. 85, pp. 484–511, Aug. 2009.
[180] M. M. Wintrobe and J. W. Landsberg, “A standardized technique for the blood sedimenta-tion test,” The American Journal of Medical Sciences, vol. 189, pp. 102–114, 1935.
[181] C. Godin and A. Caprani, “Effect of blood storage on erythrocyte/wall interactions: im-plications for surface charge and rigidity,” European Biophysics Journal, vol. 26, pp. 175–182,June 1997.
[182] P. E. Laibinis, R. G. Nuzzo, and G. M. Whitesides, “Structure of monolayers formed bycoadsorption of two n-alkanethiols of different chain lengths on gold and its relation towetting,” The Journal of Physical Chemistry, vol. 96, pp. 5097–5105, June 1992.

Eidesstattliche Erklärung
Ich erkläre hiermit, dass ich die vorgelegte Dissertation selbst verfasst und mich keiner an-deren als der von mir ausdrücklich bezeichneten Quellen und Hilfen bedient habe. Ausserdem,habe ich an keiner anderen Stelle ein Prüfungsverfahren beantragt bzw. die Dissertation in dieseroder anderer Form bereits anderweitig als Prüfungsarbeit verwendet oder einer anderen Fakultätals Dissertation vorgelegt.
Caitlin Howell
Heidelberg, den 27 Juli 2011