Dispersal responses and tolerance to temperature and salinity in two hydraenid beetles from...
11
ORIGINAL ARTICLE Dispersal ability rather than ecological tolerance drives differences in range size between lentic and lotic water beetles (Coleoptera: Hydrophilidae) Paula Arribas 1 *, Josefa Velasco 1 , Pedro Abella ´n 2 , David Sa ´nchez-Ferna ´ndez 3 , Carmelo Andu ´ jar 4 , Piero Calosi 5 , Andre ´s Milla ´n 1 , Ignacio Ribera 6 and David T. Bilton 5 1 Departamento de Ecologı ´a e Hidrologı ´a, Universidad de Murcia, Murcia 30100, Spain, 2 Department of Biological Sciences, Aarhus University, Aarhus DK-8000, Denmark, 3 Departamento de Biodiversidad y Biologı ´a Evolutiva, Museo Nacional de Ciencias Naturales (CSIC), Madrid 28006, Spain, 4 Departamento de Zoologı ´a y Antropologı ´a Fı ´sica, Universidad de Murcia, Murcia 30100, Spain, 5 Marine Biology and Ecology Research Centre, University of Plymouth, Plymouth PL4 8AA, UK, 6 Departamento de Biodiversidad Molecular y Evolucio ´n, Instituto de Biologı ´a Evolutiva (UPF-CSIC), Barcelona 08003, Spain *Correspondence: Paula Arribas Bla ´zquez, Departamento de Ecologı ´a e Hidrologı ´a, Universidad de Murcia, 30100 Espinardo, Murcia, Spain. E-mail: [email protected] ABSTRACT Aim In aquatic ecosystems, standing (lentic) and running (lotic) waters differ fundamentally in their stability and persistence, shaping the comparative population genetic structure, geographical range size and speciation rates of lentic versus lotic lineages. While the drivers of this pattern remain incompletely understood, the suite of traits making up the ability of a species to establish new populations is instrumental in determining such differences. Here we explore the degree to which the association between habitat type and geographical range size results from differences in dispersal ability or fundamental niche breadth in the members of the Enochrus bicolor complex, an aquatic beetle clade with species across the lentic–lotic divide. Location Western Mediterranean, with a special focus on North Africa, the Iberian Peninsula and Sicily. Methods DNA sequences for four loci were obtained from species of the E. bicolor complex and analysed using phylogenetic inference. Dispersal and establishment abilities were assessed in lentic–lotic species pairs of the complex, using flight wing morphometrics and thermal tolerance ranges as surrogates, respectively. Results There were clear differences in range size between the lotic and lentic taxa of the complex, which appears to have had a lotic origin with two transitions to standing waters. Only small differences were observed in temperature tolerance and acclimation ability between the two lotic–lentic sister species studied. By contrast, wing morphometrics revealed clear, consistent differences between lotic and lentic Enochrus species pairs, the latter having a higher dispersal capacity. Main conclusions We hypothesize that there have been two habitat shifts from lotic to lentic waters, which have allowed marked expansions in geographical range size in western Mediterranean species of the E. bicolor complex. Differences in dispersal rather than in establishment ability appear to underlie differences in geographical range extent, as transitions to lentic waters were associated with changes in wing morphology, but not in thermal tolerance range. In this lineage of water beetles, selection for dispersal in geologically short-lived lentic systems has driven the evolution of larger range sizes in lentic taxa compared with those of their lotic relatives. Keywords Aquatic Coleoptera, colonization capacity, Enochrus bicolor complex, funda- mental niche breadth, geographical range size, geological persistence, habitat constraints, habitat stability, western Mediterranean. Journal of Biogeography (J. Biogeogr.) (2012) 39, 984–994 984 http://wileyonlinelibrary.com/journal/jbi ª 2011 Blackwell Publishing Ltd doi:10.1111/j.1365-2699.2011.02641.x
Transcript of Dispersal responses and tolerance to temperature and salinity in two hydraenid beetles from...
ORIGINALARTICLE
Dispersal ability rather than ecologicaltolerance drives differences in range sizebetween lentic and lotic water beetles(Coleoptera: Hydrophilidae)
Paula Arribas1*, Josefa Velasco1, Pedro Abellan2, David Sanchez-Fernandez3,
Carmelo Andujar4, Piero Calosi5, Andres Millan1, Ignacio Ribera6
and David T. Bilton5
1Departamento de Ecologıa e Hidrologıa,
Universidad de Murcia, Murcia 30100, Spain,2Department of Biological Sciences, Aarhus
University, Aarhus DK-8000, Denmark,3Departamento de Biodiversidad y Biologıa
Evolutiva, Museo Nacional de Ciencias
Naturales (CSIC), Madrid 28006, Spain,4Departamento de Zoologıa y Antropologıa
Fısica, Universidad de Murcia, Murcia 30100,
Spain, 5Marine Biology and Ecology Research
Centre, University of Plymouth, Plymouth PL4
8AA, UK, 6Departamento de Biodiversidad
Molecular y Evolucion, Instituto de Biologıa
Evolutiva (UPF-CSIC), Barcelona 08003,
Spain
*Correspondence: Paula Arribas Blazquez,
Departamento de Ecologıa e Hidrologıa,
Universidad de Murcia, 30100 Espinardo,
Murcia, Spain.
E-mail: [email protected]
ABSTRACT
Aim In aquatic ecosystems, standing (lentic) and running (lotic) waters differ
fundamentally in their stability and persistence, shaping the comparative
population genetic structure, geographical range size and speciation rates of
lentic versus lotic lineages. While the drivers of this pattern remain incompletely
understood, the suite of traits making up the ability of a species to establish new
populations is instrumental in determining such differences. Here we explore the
degree to which the association between habitat type and geographical range size
results from differences in dispersal ability or fundamental niche breadth in the
members of the Enochrus bicolor complex, an aquatic beetle clade with species
across the lentic–lotic divide.
Location Western Mediterranean, with a special focus on North Africa, the
Iberian Peninsula and Sicily.
Methods DNA sequences for four loci were obtained from species of the
E. bicolor complex and analysed using phylogenetic inference. Dispersal and
establishment abilities were assessed in lentic–lotic species pairs of the complex,
using flight wing morphometrics and thermal tolerance ranges as surrogates,
respectively.
Results There were clear differences in range size between the lotic and lentic
taxa of the complex, which appears to have had a lotic origin with two transitions
to standing waters. Only small differences were observed in temperature tolerance
and acclimation ability between the two lotic–lentic sister species studied. By
contrast, wing morphometrics revealed clear, consistent differences between lotic
and lentic Enochrus species pairs, the latter having a higher dispersal capacity.
Main conclusions We hypothesize that there have been two habitat shifts from
lotic to lentic waters, which have allowed marked expansions in geographical
range size in western Mediterranean species of the E. bicolor complex. Differences
in dispersal rather than in establishment ability appear to underlie differences in
geographical range extent, as transitions to lentic waters were associated with
changes in wing morphology, but not in thermal tolerance range. In this lineage
of water beetles, selection for dispersal in geologically short-lived lentic systems
has driven the evolution of larger range sizes in lentic taxa compared with those of
their lotic relatives.
Keywords
Aquatic Coleoptera, colonization capacity, Enochrus bicolor complex, funda-
mental niche breadth, geographical range size, geological persistence, habitat
constraints, habitat stability, western Mediterranean.
Journal of Biogeography (J. Biogeogr.) (2012) 39, 984–994
984 http://wileyonlinelibrary.com/journal/jbi ª 2011 Blackwell Publishing Ltddoi:10.1111/j.1365-2699.2011.02641.x
INTRODUCTION
Despite a long history of the study of factors determining the
geographical distribution of organisms (e.g. Stevens, 1989;
Brown, 1995; Gaston, 2003; Lester et al., 2007), some funda-
mental questions remain unresolved, such as why closely
related species often have widely differing range sizes.
Although a number of ecological and evolutionary processes
may determine geographical range size (Gaston, 2003), habitat
selection has been shown to be of key importance in several
empirical studies (e.g. Duncan et al., 1999; Gregory & Gaston,
2000; Marsden & Whiffin, 2003). In aquatic ecosystems, one of
the most fundamental habitat constraints is the division
between standing (lentic) and running (lotic) waters (Ribera,
2008). The contrasting geological permanence and ecological
stability of lotic and lentic waters (Hutchinson, 1957) have
been related to the evolutionary and biogeographical differ-
ences observed between species in the two habitat types. Taxa
in the geologically shorter-lived and more ecologically unstable
lentic habitats have less population genetic structure and larger
geographical ranges than their lotic relatives, a pattern
observed across a range of taxa, regions and systems (e.g.
Ribera & Vogler, 2000; Hof et al., 2006; Abellan et al., 2009;
Damm et al., 2010). While the drivers of this pattern remain
incompletely understood, the suite of traits making up the
colonization capacity of a species will be instrumental in
shaping such differences (Ribera, 2008). In this sense, coloni-
zation capacity has two components: dispersal to and estab-
lishment at a new site (Reaka, 1980; Gaston, 2003). Despite the
assumed importance of colonization capacity, we have little
understanding of the relative contribution of differences in
dispersal ability and establishment success in shaping the
observed differences between lentic and lotic lineages (Bilton
et al., 2001; Rundle et al., 2002).
In order to understand species distributions, it is also
necessary to consider the effects of scale (Hui et al., 2010;
Kriticos & Leriche, 2010). Of the three main factors deter-
mining species distributions (i.e. environment, biotic interac-
tions and movement; Soberon, 2010), abiotic factors typically
operate at large scales, whereas biotic interactions operate
more locally (Soberon & Nakamura, 2009; Soberon, 2010). A
similar difference of scale can be seen with movement-related
factors, which at biogeographical scale have a significant effect
on the large-scale processes that determine the size and shape
of species distributional ranges, while occupancy dynamics are
relevant at smaller scales within the landscape (Hortal et al.,
2010). To understand the processes shaping relative geograph-
ical range extent, we need to focus on factors such as
fundamental niche breadth and dispersal ability, which
constrain distribution patterns over large spatial scales.
In the case of aquatic organisms, the geological instability of
lentic habitats selects for strongly dispersing individuals, while
this restriction does not act on lotic taxa. As result of this
asymmetric constraint, the dispersal ability of lentic species is
higher than that of lotic species, resulting in the more dynamic
and larger geographical ranges of lentic taxa compared with
their lotic relatives (Ribera, 2008). In aquatic insects, relative
dispersal ability is driven largely by differences in flight
capacity (Bilton et al., 2001). While comparative flight
performance and dispersal ability can be difficult to measure
directly in insects (e.g. Jonsson, 2003), wing morphometrics
are known to relate to flight performance (Brodsky, 1994;
Berwaerts et al., 2002; Gibb et al., 2006; Larsen et al., 2008);
consequently, flight wing morphology can provide a proxy of
relative dispersal ability amongst closely related, functionally
similar species.
The ability of lentic species to establish in a wider range of
localities results from broader fundamental niches (sensu
Brown, 1984) in these taxa compared with their lotic relatives.
Although niches are multidimensional, an organism’s thermal
physiology can be seen as a critical aspect of its fundamental
niche (Spicer & Gaston, 1999), and, indeed, environmental
temperatures have long been seen as critical in shaping species
distributions (e.g. Andrewartha & Birch, 1954; Merriam, 1984;
Pigot et al., 2010). In biogeographical terms, many past studies
have noted coincidences between geographical range bound-
aries and temperature isotherms (Salisbury, 1926; Caughley
et al., 1987; Iversen, 1994), and recent work has demonstrated
that thermal tolerance ranges are the best predictors of
geographical range size in a number of insect clades in
running waters (Calosi et al., 2008a,b, 2010). Relatively
shallow, small- to medium-sized lentic water bodies, which
support the majority of standing-water macroinvertebrate
biodiversity world-wide (e.g. Oertli et al., 2002; Scheffer et al.,
2006), are subjected to larger daily and seasonal temperature
fluctuations than streams or rivers (Alvarez-Cobelas et al.,
2005; Florencio et al., 2009), and selection to cope with such
local fluctuations may enable species of small lentic waters to
tolerate the thermal conditions present across a wider
geographical area. Thus, the larger geographical ranges of
lentic versus lotic macroinvertebrates (Ribera & Vogler, 2000;
Monaghan et al., 2005; Hof et al., 2006; Ribera, 2008) could be
caused by either higher dispersal ability or the higher
establishment success provided by wider thermal tolerance.
We use a clade of aquatic beetles, the Enochrus bicolor
complex (Schodl, 1998) (family Hydrophilidae), to explore
evolutionary relationships between habitat (lotic versus lentic)
and colonization capacity. Species of the E. bicolor complex are
specialists of either small lentic or lotic saline waters, living in
the margins of salt pans and saline streams. Lentic taxa have a
much wider distributions than lotic, conforming to the general
pattern in inland waters, discussed above. As a result, the
group provides an ideal comparative framework within which
to explore possible differences in dispersal and/or establish-
ment ability associated with habitat type, and how these
differences shape geographical distributions. We reconstruct
the phylogeny of the western Mediterranean taxa of the group
from mitochondrial and nuclear DNA sequence data, obtained
from multiple populations of each species, to estimate the
number and direction of habitat shifts between running and
standing waters. We examine possible differences in dispersal
and/or establishment ability in lentic and lotic sister taxa,
Dispersal ability and range size in water beetles
Journal of Biogeography 39, 984–994 985ª 2011 Blackwell Publishing Ltd
employing flight wing morphometrics and thermal physiology
as proxies of these features, respectively. In this way we test
whether habitat shifts, and associated changes in geographical
range size, are linked to differences in dispersal ability,
establishment ability, or a combination of these traits.
MATERIALS AND METHODS
Study group
Water beetles are one of the most diverse types of animal
inhabiting small inland waters world-wide (Velasco et al.,
2006; Millan et al., 2011). Amongst these, the genus Enochrus
Thomson (Coleoptera, Hydrophilidae) includes a number of
saline and hyper-saline habitat specialists, such as the Enochrus
bicolor complex, which comprises five recognized Palaearctic
species: E. falcarius (Hebauer), E. bicolor (Fabricius),
E. segmentinotatus (Kuwert), E. sinuatus D’Orchymont and
E. turanicus Schodl. Of these, three (E. falcarius, E. bicolor and
E. segmentinotatus) are found in the central and western
Mediterranean region, and form a closely related complex of
species recognized by Schodl (1998). The three species show
striking differences in ecology and distribution. Enochrus
falcarius is restricted to saline streams in the south of the
Iberian Peninsula, Tunisia, Sicily and Morocco (Hansen, 2004;
A. Millan et al., pers. obs.). In contrast, E. bicolor and
E. segmentinotatus inhabit lentic saline systems (saline ponds
and salt-pans), and are both distributed widely across much of
Europe, North Africa and Asia, east to Mongolia (Hansen,
2004).
Phylogeny of the Enochrus bicolor complex
In total, 73 specimens from the E. bicolor complex were
collected from 44 localities in the western Mediterranean (see
Tables S1.1 and S1.2 in Appendix S1 in Supporting Informa-
tion). We sampled across the entire known range of E. falcarius,
including populations from the Iberian Peninsula, Sicily,
Tunisia and Morocco (Fig. 1, Table S1.1). Sampling localities
for E. bicolor extended from North Africa to Ireland and east to
Algeria, Sicily, southern France and the Balearic Islands.
Finally, E. segmentinotatus was sampled from northern
Morocco, southern Iberia, southern France and the Balearic
Islands (Fig. 1, Table S1.1). In addition, several species of
Enochrus in the same subgenus (Lumetus Zaitzev) were
included in the analyses: E. testaceus (Fabricius), E. ater
(Kuwert) and E. salomonis (J. Sahlberg). As an outgroup we
used E. natalensis (Gemminger & Harold) from the subgenus
Methydrus Rey.
Samples were collected into absolute ethanol in the field and
stored at )20 �C in the laboratory until required. DNA was
extracted using an Invisorb Spin Tissue Mini Kit (Invitek,
Berlin, Germany), following the manufacturer’s recommenda-
tions. We sequenced three mitochondrial (3¢ end of cyto-
chrome c oxidase subunit I, COI; an internal fragment of
cytochrome b, cyt b; 3¢ end of the large ribosomal unit plus
Leucine transferase and the 5¢ end of NADH dehydrogenase
subunit 1, rrnL+trnL+ND1) and one nuclear (an internal
fragment of the large ribosomal unit, 28S rRNA, LSU) gene
(see Table S1.3 for the primers used). Sequencing was
conducted using the ABI PRISM BigDye Terminator Cycle
Sequencing Kit (Applied Biosystems, Carlsbad, CA, USA), and
sequenced products were electrophoresed on ABI 310 and 3700
automated sequencers (Applied Biosystems). Sequences were
assembled and edited with Sequencher 4.7 (GeneCodes
Corporation, Ann Arbor, MI, USA) and submitted to
GenBank (see Table S1.2 for accession numbers).
Evolutionary models were estimated prior to the analysis
with jModelTest (Posada, 2008). Bayesian analyses (BA) were
conducted on a combined data matrix with MrBayes 3.1.2
(Ronquist & Huelsenbeck, 2003), using four partitions
corresponding to the four sequenced fragments. MrBayes
ran for 10 million generations using default values, saving trees
every 100 generations. The half compact consensus tree was
calculated with the ‘sumt’ option of MrBayes. Posterior
probabilities of nodes were interpreted as Bayesian support.
MrBayes searches were carried out on the freely available
Bioportal at the University of Oslo (available at: http://
www.bioportal.uio.no). A maximum likelihood (ML) analysis
was also conducted in RAxML 7.0.3 (Stamatakis, 2006), with a
GTR + gamma model for each gene fragment partition and
100 alternative runs to select the best tree. Node support was
calculated with 1000 bootstrap replicates. RAxML analyses
were computed on CIPRES (Miller et al., 2010).
Evaluation of dispersal ability: flight wing
morphometrics
Morphometric measurements of flight wings were taken for
two pairs of lotic–lentic sister taxa: Iberian E. falcarius
(E. falcarius IP, see Results) and E. bicolor, and Sicilian
E. falcarius (E. falcarius SI) and E. segmentinotatus, respectively,
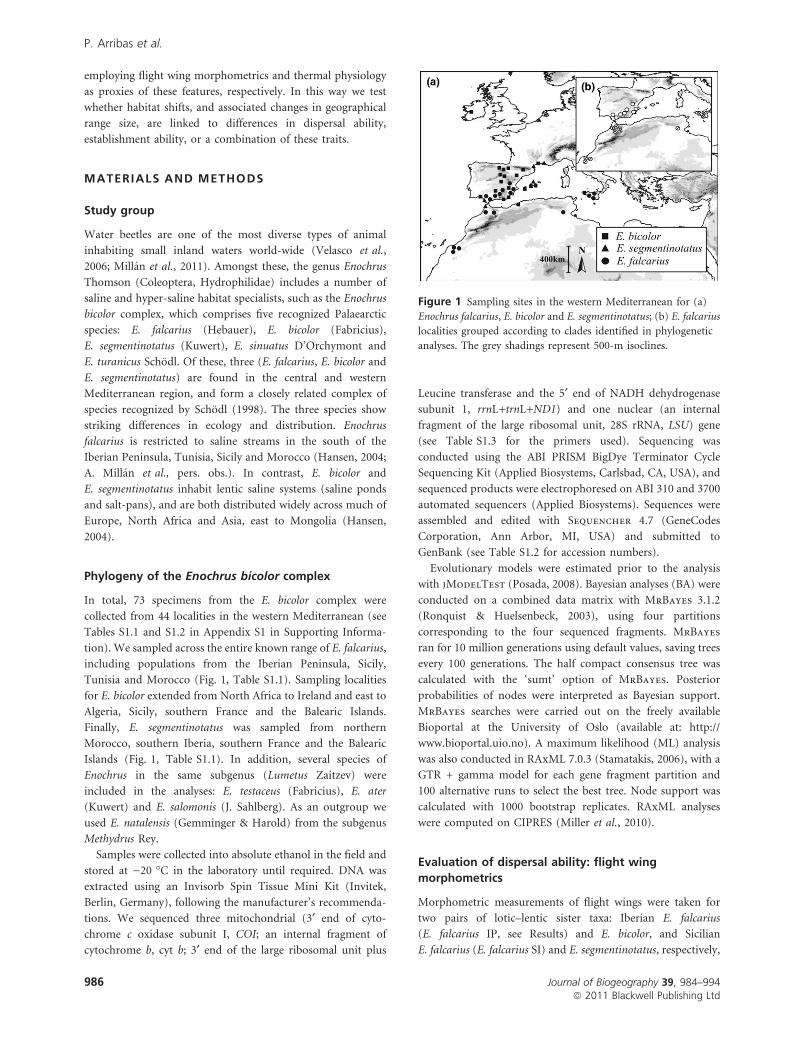
Figure 1 Sampling sites in the western Mediterranean for (a)
Enochrus falcarius, E. bicolor and E. segmentinotatus; (b) E. falcarius
localities grouped according to clades identified in phylogenetic
analyses. The grey shadings represent 500-m isoclines.
P. Arribas et al.
986 Journal of Biogeography 39, 984–994ª 2011 Blackwell Publishing Ltd
in order to evaluate comparative dispersal ability in both lotic
and lentic species. Adults of Iberian E. falcarius and E. bicolor
were collected from the same two localities as those used for
thermal tolerance experiments (see Appendix S2: Table S2.1),
and adults of Sicilian E. falcarius and E. segmentinotatus were
collected from Nicosia, Sicily (Italy) and Puerto de Santa
Marıa, Cadiz (Spain), respectively. Beetles were maintained for
24 h in filtered water from their respective localities to allow
them to empty their gut contents. Subsequently, beetles were
killed in 100% ethanol and dried at 56 �C in an oven
(Universal Precision Digitronic oven, JP Selecta, Barcelona,
Spain) for 16 h. Body mass was measured using a digital
balance (1204 MP2, Sartorius, Epsom, UK) to ± 0.001 g
precision. Measured individuals were digested in 2% protein-
ase K (Invitek, Berlin, Germany) for 8 h, in order to facilitate
manipulation of the wings.
Length, width and area of the membranous wings and elytral
length were measured for each individual. The left wing was
removed, teased open and mounted in a 50% dimethyl
hydantoin formaldehyde (DMHF) solution on a microscope
slide. Wings and individuals were photographed under a Zeiss
Stemi 2000C Trinocular Zoom Stereomicroscope (Zeiss,
Thornwood, NY, USA), and subsequently measured using a
Spot Insight Firewire digital camera (Spot Imaging Solutions,
Sterling Heights, MI, USA) and associated software. Left elytral
length was used as a proxy of body length to avoid
measurement error owing to contraction of the head and
pronotum. Elytra length and total body length are strongly
correlated in these beetles (correlation coefficient r = 0.974,
P < 0.001, n = 18).
Between 11 (E. segmentinotatus) and 16 (Iberian E. falcarius)
individuals were measured for each clade. Raw measures of
body and wing were used to derive wing loading (body mass/
wing area) and wing aspect ratio (wing length/wing width)
(Gibb et al., 2006). Preliminary results showed that body mass
was highly variable between individuals within clades, probably
resulting from differences in age and sexual development, and
cubed elytral length was therefore used as surrogate of body
mass to avoid such confounding influences. Such an approach
is justified here because maximum body mass and body length
will scale in a very similar manner across such morphologically
similar species (Benke et al., 1999). Dispersal ability estimates
were compared between four species using ANOVAs and post-
hoc tests with Bonferroni correction. Neither raw data nor
general linear model (GLM) residuals showed significant
departure from normality and homoscedasticity, so untrans-
formed values were used in all analyses, which were conducted
using spss 15.0.1 for Windows (SPSS Inc., Chicago, IL, USA).
Evaluation of establishment ability: thermal
physiology
We used thermal tolerance as a surrogate of the establishment
abilities of E. bicolor and Iberian E. falcarius (IP E. falcarius),
determining their lethal thermal limits after acclimation at
different salinities and temperatures in the laboratory. Previous
work on the Coleoptera of inland saline waters has demon-
strated that exposure to different salinities can influence the
thermal tolerance of adult beetles (Sanchez-Fernandez et al.,
2010), and we employed multiple salinity and temperature
treatments here in order to compare species thermal niches
across a range of salinities.
Adult beetles were collected from two populations at similar
latitudes (see Table S2.1). Specimens were maintained for
7 days under constant conditions (20 �C, salinity 30 g L)1) to
minimize the effects of recent thermal history on measures of
temperature tolerance (Sokolova & Portner, 2003). After this,
specimens of each species were randomly divided into three
equal-sized groups, corresponding to three acclimation tem-
peratures (15, 20 and 25 �C), and within each of these sets
individuals were re-assigned to five salinity treatments (1, 6,
12, 35 and 60 g L)1), with a total of 16 individuals per
treatment. Acclimation temperatures and salinities were cho-
sen to represent the range of environmental conditions under
which these species are usually found in Iberia (Table S2.1;
Velasco et al., 2006). Beetles were maintained under their
corresponding thermal-osmotic acclimation treatments for
6 days (Terblanche & Chown, 2006). Following this period,
individuals from each treatment were assigned randomly to
two equal-sized subgroups – one used to measure upper
thermal limits (UTLs) and the other one to measure lower
thermal limits (LTLs; Chown & Nicolson, 2004).
Thermal tolerance tests were carried out in air, using a
dynamic method (Lutterschmidt & Hutchison, 1997), ramping
temperature at ±1 �C min)1 in a computer-controlled water
bath (Grant LTC 6–30, using the Grant Coolwise software,
Grant Instruments, Cambridge, UK). Heating or cooling
commenced at the temperature at which a particular treatment
group had previously been acclimated. UTL and LTL were
estimated as lethal points following the approach of other
recent studies of aquatic beetles (see Calosi et al., 2008a,b,
2010; Sanchez-Fernandez et al., 2010).
Multifactorial ANCOVAs were used with untransformed
data to investigate the effects of temperature and salinity
acclimation and species on both UTLs and LTLs. Body mass
was included as a covariable, because species differed signifi-
cantly [ANOVA d.f. = 1, F = 411.5, P < 0.001; Iberian E.
falcarius average body mass (bm) = 6.63 mg, E. bicolor
bm = 11.31 mg]. Similar analyses were implemented separately
for each species. Homoscedasticity of raw data was met, but for
some treatments the assumption of normality was not. Despite
this, we used raw data because residuals were normally
distributed, thus ensuring a lack of bias or spurious effects in
the GLM results (see Rutherford, 2001). To employ a more
conservative approach, post-hoc tests with Bonferroni correc-
tion were used to identify significant differences amongst mean
UTLs or LTLs for different acclimation treatments. All statis-
tical analyses were conducted using spss 15.0.1 for Windows.
Thermal windows were also constructed for each species as
an integrative and synthetic index of thermal tolerance that
takes into consideration both LTLs and UTLs measured under
different acclimation conditions (see Spicer & Gaston, 1999;
Dispersal ability and range size in water beetles
Journal of Biogeography 39, 984–994 987ª 2011 Blackwell Publishing Ltd
Calosi et al., 2008b). Mean UTLs and LTLs measured at the
three acclimation temperatures (15, 20 and 25 �C) and salinity
35 g L)1 were used, since this is the modal salinity at which
E. bicolor complex species are found in the field. The width and
position of these thermal windows were then qualitatively
compared between Iberian E. falcarius and E. bicolor.
RESULTS
Phylogeny of the Enochrus bicolor complex
The aligned sequence data matrix had 2487 characters, of
which 494 were variable. There was no length variation in the
protein-coding genes, and the main variation in the ribosomal
genes was concentrated in the fragment rrnL+trnL. For
MrBayes analysis, standard deviation of the split frequencies
between the two runs reached a value of c. 0.005 at 10 million
generations, and the half compact consensus tree was calcu-
lated removing 15% of initial trees as a ‘burn-in’.
The topologies of the tree were similar for the two
reconstruction methods (Bayesian probabilities and ML), with
very similar support values for the main nodes (Fig. 2). Species
of the E. bicolor complex (E. falcarius, E. bicolor and
E. segmentinotatus) formed a clade with strong support, to
the exclusion of the remaining Enochrus species (Fig. 2, node
A). Within the E. bicolor complex, the recognized species
E. bicolor and E. segmentinotatus are each monophyletic, while
E. falcarius is paraphyletic. Thus, within the complex, two
main, well-supported clades can be recognized. One clade
(Fig. 2, node B) encompasses all populations of E. bicolor and
Iberian and northern Moroccan populations of E. falcarius
[this itself containing two independent well-supported clades
comprising Iberian (IP) and northern Moroccan (NM)
populations, respectively; Fig. 2, node C]. The other clade
(Fig. 2, node D) includes all populations of E. segmentinotatus,
and the Sicilian, Tunisian and southern Moroccan E. falcarius.
Within this second main clade, E. segmentinotatus is sister to
Sicilian E. falcarius (SI clade) (Fig. 2, node E), and these two
together are sister to a clade including populations of E.
falcarius from southern Morocco and Tunisia (SM–TU clade)
(Fig. 2, node F). Clades correlate with clear differences in range
size between the lotic and lentic species of the western
Mediterranean region. Within this area, while lotic clades were
restricted to small–medium continental areas (i.e. Sicily, south
Iberian Peninsula, north Morocco and south Morocco–Tuni-
sia), the two lentic clades included specimens from different
continental entities and extended across larger geographical
areas (from Ireland to Algeria including Sicily for E. bicolor,
and from France to north Morocco for E. segmentinotatus).
Evaluation of dispersal ability: flight wing
morphometrics
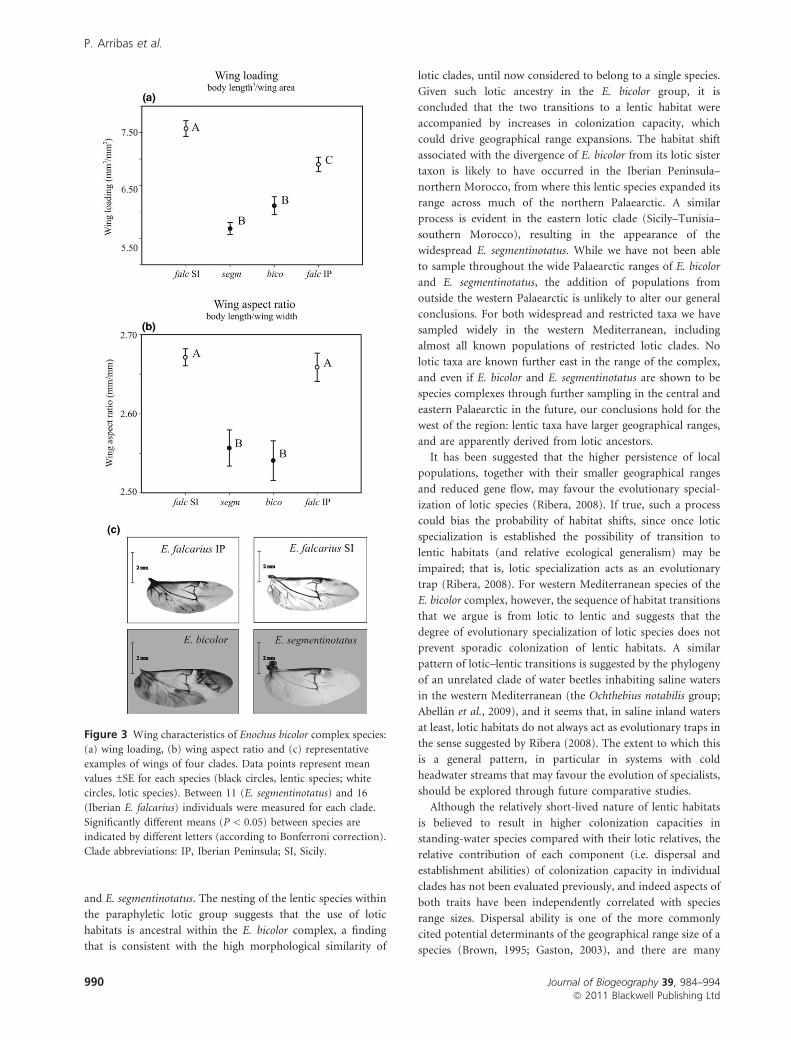
The lotic E. falcarius IP and E. falcarius SI had higher wing
loadings than the lentic E. bicolor and E. segmentinotatus
(ANOVA species, d.f. = 3, F = 26.9, P < 0.001; Fig. 3a and
Table S3.1 in Appendix S3). No differences were found within
lentic species, but lotic E. falcarius SI showed a slightly higher
wing loading than lotic E. falcarius IP (see Fig. 3a).
Wing aspect ratio was also lower in the lentic E. bicolor and
E. segmentinotatus (ANOVA species, d.f. = 3, F = 10.8,
P < 0.001; Fig. 3b and Table S3.1) than in the two lotic
E. falcarius clades, pointing to a broader, more rounded wing
shape in lentic taxa.
Evaluation of establishment ability: thermal
physiology
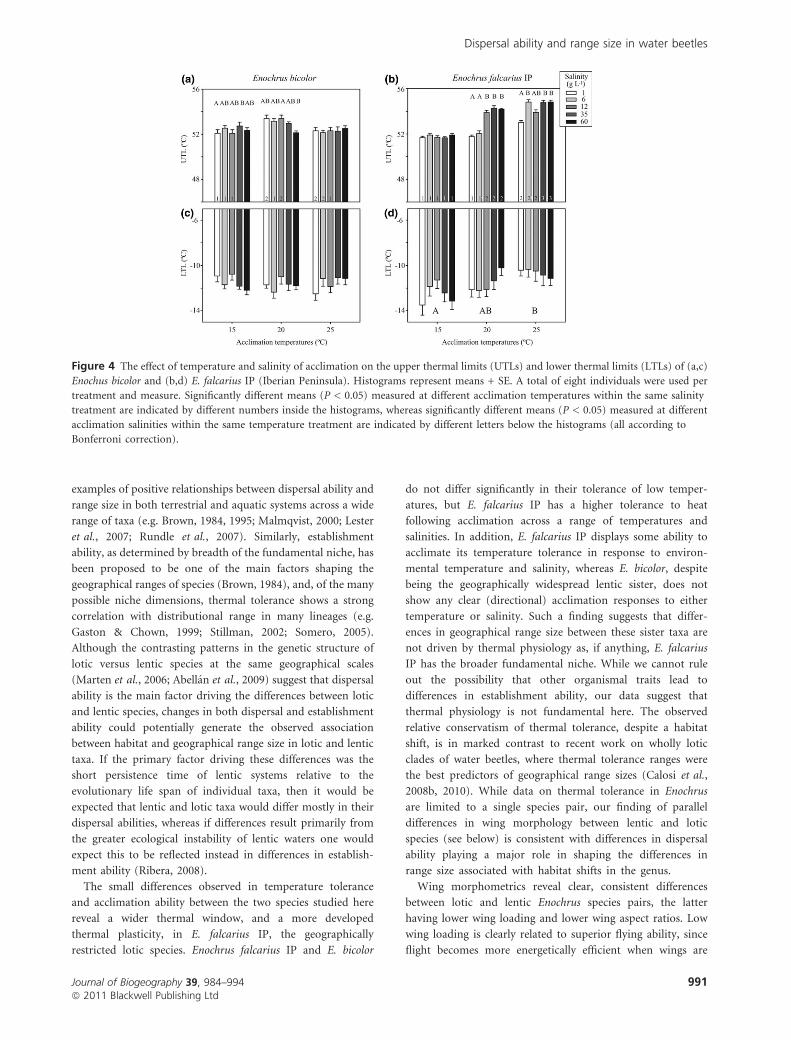
Overall tolerance of high temperatures was significantly higher
in E. falcarius IP than in E. bicolor (ANCOVA species, d.f. = 1,
F = 48.1, P < 0.001; E. falcarius IP UTL = 53.06 �C, E. bicolor
UTL = 52.45 �C) (see Table S3.2). In contrast, tolerance of
low temperatures did not differ between the two species (E.
falcarius IP LTL = )11.57 �C, E. bicolor LTL = )11.58 �C)
(see Table S3.2).
Enochrus falcarius IP showed an acclimation response for
both UTL and LTL. Mean UTLs increased with both temper-
ature and salinity of acclimation, UTLs in general being higher
following 20 or 25 �C acclimation than following 15 �C (see
Fig. 4b). Following acclimation at 20 or 25 �C, UTLs also
tended to be higher in individuals acclimated at higher
salinities (ANCOVA temperature · salinity interaction,
d.f. = 8, F = 19.2, P < 0.001; Fig. 4b and Table S3.3). In
contrast, in E. falcarius IP, mean LTLs increased with
increasing acclimation temperature only (ANCOVA temper-
ature, d.f. = 2, F = 6.0, P = 0.003; Fig. 4d and Table S3.3).
In E. bicolor, mean UTL was significantly affected by an
interaction of temperature and salinity of acclimation
(ANCOVA temperature · salinity interaction, d.f. = 8,
F = 2.5, P = 0.016; Fig. 4a and Table S3.3) and also by both
individual factors (see Table S3.3), but no clear acclimation
response was observed. LTLs did not show any significant
differences following acclimation in this species (Fig. 4c and
Table S3.3).
The thermal window of E. falcarius IP (652.43 �C2) was
greater than that of E. bicolor (642.82 �C2): although the two
thermal windows largely overlapped, the E. bicolor thermal
polygon lay within that of E. falcarius IP (see Fig. S2.1).
DISCUSSION
The differences in geographical range size and genetic structure
found between lotic and lentic macro-invertebrates have been
interpreted to result from selection for higher colonization
capacity in lentic species, owing to the fact that small–medium
standing waters are relatively short-lived on evolutionary time-
scales (Ribera, 2008). Despite the robustness of these patterns,
the sequence of ecological, biogeographical and evolutionary
changes associated with lotic–lentic habitat shifts has never
been described, and the degree to which contrasting coloni-
zation capacities of species are explained by dispersal or
establishment abilities had not been tested until now.
P. Arribas et al.
988 Journal of Biogeography 39, 984–994ª 2011 Blackwell Publishing Ltd
The phylogeny of the E. bicolor complex points to two shifts
in habitat utilization (lotic/lentic) within this clade. Enochrus
falcarius, as currently understood, actually consists of a
complex of lotic clades, which may represent morphologically
cryptic species, each with restricted, disjunct distributions
across the Mediterranean area. Within this group of narrow-
range lotic taxa, two more widely distributed, morphologically
distinct, lentic species have evolved independently: E. bicolor
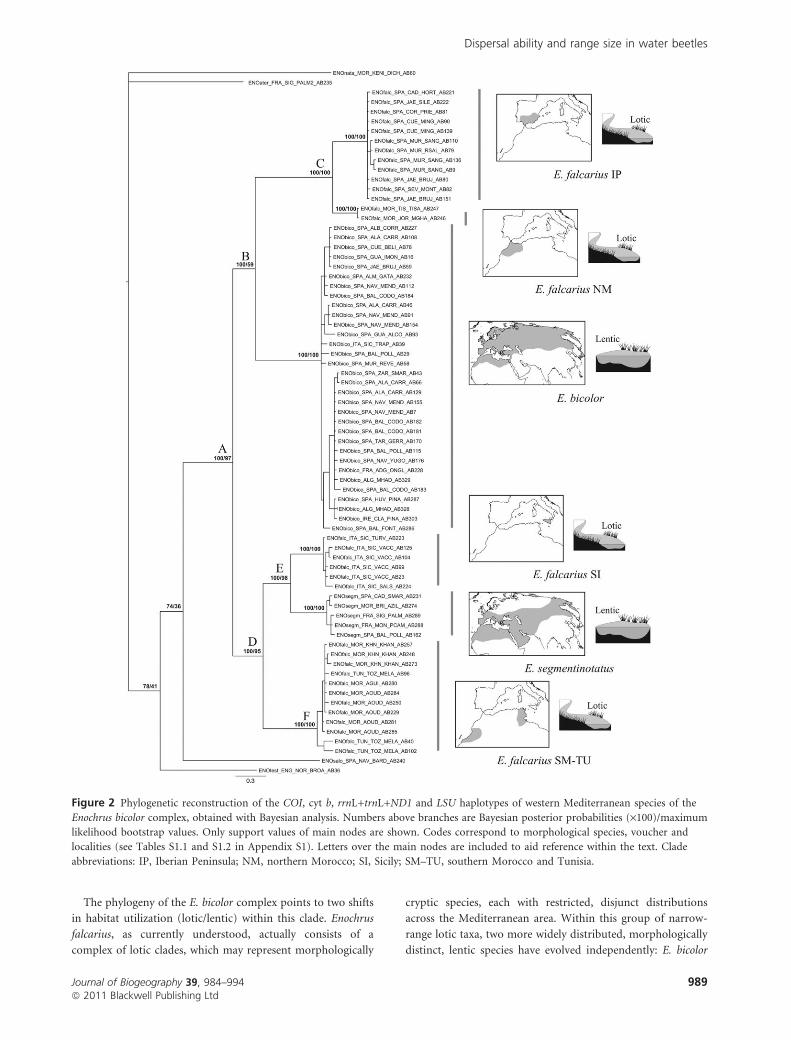
Figure 2 Phylogenetic reconstruction of the COI, cyt b, rrnL+trnL+ND1 and LSU haplotypes of western Mediterranean species of the
Enochrus bicolor complex, obtained with Bayesian analysis. Numbers above branches are Bayesian posterior probabilities (·100)/maximum
likelihood bootstrap values. Only support values of main nodes are shown. Codes correspond to morphological species, voucher and
localities (see Tables S1.1 and S1.2 in Appendix S1). Letters over the main nodes are included to aid reference within the text. Clade
abbreviations: IP, Iberian Peninsula; NM, northern Morocco; SI, Sicily; SM–TU, southern Morocco and Tunisia.
Dispersal ability and range size in water beetles
Journal of Biogeography 39, 984–994 989ª 2011 Blackwell Publishing Ltd
and E. segmentinotatus. The nesting of the lentic species within
the paraphyletic lotic group suggests that the use of lotic
habitats is ancestral within the E. bicolor complex, a finding
that is consistent with the high morphological similarity of
lotic clades, until now considered to belong to a single species.
Given such lotic ancestry in the E. bicolor group, it is
concluded that the two transitions to a lentic habitat were
accompanied by increases in colonization capacity, which
could drive geographical range expansions. The habitat shift
associated with the divergence of E. bicolor from its lotic sister
taxon is likely to have occurred in the Iberian Peninsula–
northern Morocco, from where this lentic species expanded its
range across much of the northern Palaearctic. A similar
process is evident in the eastern lotic clade (Sicily–Tunisia–
southern Morocco), resulting in the appearance of the
widespread E. segmentinotatus. While we have not been able
to sample throughout the wide Palaearctic ranges of E. bicolor
and E. segmentinotatus, the addition of populations from
outside the western Palaearctic is unlikely to alter our general
conclusions. For both widespread and restricted taxa we have
sampled widely in the western Mediterranean, including
almost all known populations of restricted lotic clades. No
lotic taxa are known further east in the range of the complex,
and even if E. bicolor and E. segmentinotatus are shown to be
species complexes through further sampling in the central and
eastern Palaearctic in the future, our conclusions hold for the
west of the region: lentic taxa have larger geographical ranges,
and are apparently derived from lotic ancestors.
It has been suggested that the higher persistence of local
populations, together with their smaller geographical ranges
and reduced gene flow, may favour the evolutionary special-
ization of lotic species (Ribera, 2008). If true, such a process
could bias the probability of habitat shifts, since once lotic
specialization is established the possibility of transition to
lentic habitats (and relative ecological generalism) may be
impaired; that is, lotic specialization acts as an evolutionary
trap (Ribera, 2008). For western Mediterranean species of the
E. bicolor complex, however, the sequence of habitat transitions
that we argue is from lotic to lentic and suggests that the
degree of evolutionary specialization of lotic species does not
prevent sporadic colonization of lentic habitats. A similar
pattern of lotic–lentic transitions is suggested by the phylogeny
of an unrelated clade of water beetles inhabiting saline waters
in the western Mediterranean (the Ochthebius notabilis group;
Abellan et al., 2009), and it seems that, in saline inland waters
at least, lotic habitats do not always act as evolutionary traps in
the sense suggested by Ribera (2008). The extent to which this
is a general pattern, in particular in systems with cold
headwater streams that may favour the evolution of specialists,
should be explored through future comparative studies.
Although the relatively short-lived nature of lentic habitats
is believed to result in higher colonization capacities in
standing-water species compared with their lotic relatives, the
relative contribution of each component (i.e. dispersal and
establishment abilities) of colonization capacity in individual
clades has not been evaluated previously, and indeed aspects of
both traits have been independently correlated with species
range sizes. Dispersal ability is one of the more commonly
cited potential determinants of the geographical range size of a
species (Brown, 1995; Gaston, 2003), and there are many
Figure 3 Wing characteristics of Enochus bicolor complex species:
(a) wing loading, (b) wing aspect ratio and (c) representative
examples of wings of four clades. Data points represent mean
values ±SE for each species (black circles, lentic species; white
circles, lotic species). Between 11 (E. segmentinotatus) and 16
(Iberian E. falcarius) individuals were measured for each clade.
Significantly different means (P < 0.05) between species are
indicated by different letters (according to Bonferroni correction).
Clade abbreviations: IP, Iberian Peninsula; SI, Sicily.
P. Arribas et al.
990 Journal of Biogeography 39, 984–994ª 2011 Blackwell Publishing Ltd
examples of positive relationships between dispersal ability and
range size in both terrestrial and aquatic systems across a wide
range of taxa (e.g. Brown, 1984, 1995; Malmqvist, 2000; Lester
et al., 2007; Rundle et al., 2007). Similarly, establishment
ability, as determined by breadth of the fundamental niche, has
been proposed to be one of the main factors shaping the
geographical ranges of species (Brown, 1984), and, of the many
possible niche dimensions, thermal tolerance shows a strong
correlation with distributional range in many lineages (e.g.
Gaston & Chown, 1999; Stillman, 2002; Somero, 2005).
Although the contrasting patterns in the genetic structure of
lotic versus lentic species at the same geographical scales
(Marten et al., 2006; Abellan et al., 2009) suggest that dispersal
ability is the main factor driving the differences between lotic
and lentic species, changes in both dispersal and establishment
ability could potentially generate the observed association
between habitat and geographical range size in lotic and lentic
taxa. If the primary factor driving these differences was the
short persistence time of lentic systems relative to the
evolutionary life span of individual taxa, then it would be
expected that lentic and lotic taxa would differ mostly in their
dispersal abilities, whereas if differences result primarily from
the greater ecological instability of lentic waters one would
expect this to be reflected instead in differences in establish-
ment ability (Ribera, 2008).
The small differences observed in temperature tolerance
and acclimation ability between the two species studied here
reveal a wider thermal window, and a more developed
thermal plasticity, in E. falcarius IP, the geographically
restricted lotic species. Enochrus falcarius IP and E. bicolor
do not differ significantly in their tolerance of low temper-
atures, but E. falcarius IP has a higher tolerance to heat
following acclimation across a range of temperatures and
salinities. In addition, E. falcarius IP displays some ability to
acclimate its temperature tolerance in response to environ-
mental temperature and salinity, whereas E. bicolor, despite
being the geographically widespread lentic sister, does not
show any clear (directional) acclimation responses to either
temperature or salinity. Such a finding suggests that differ-
ences in geographical range size between these sister taxa are
not driven by thermal physiology as, if anything, E. falcarius
IP has the broader fundamental niche. While we cannot rule
out the possibility that other organismal traits lead to
differences in establishment ability, our data suggest that
thermal physiology is not fundamental here. The observed
relative conservatism of thermal tolerance, despite a habitat
shift, is in marked contrast to recent work on wholly lotic
clades of water beetles, where thermal tolerance ranges were
the best predictors of geographical range sizes (Calosi et al.,
2008b, 2010). While data on thermal tolerance in Enochrus
are limited to a single species pair, our finding of parallel
differences in wing morphology between lentic and lotic
species (see below) is consistent with differences in dispersal
ability playing a major role in shaping the differences in
range size associated with habitat shifts in the genus.
Wing morphometrics reveal clear, consistent differences
between lotic and lentic Enochrus species pairs, the latter
having lower wing loading and lower wing aspect ratios. Low
wing loading is clearly related to superior flying ability, since
flight becomes more energetically efficient when wings are
Figure 4 The effect of temperature and salinity of acclimation on the upper thermal limits (UTLs) and lower thermal limits (LTLs) of (a,c)
Enochus bicolor and (b,d) E. falcarius IP (Iberian Peninsula). Histograms represent means + SE. A total of eight individuals were used per
treatment and measure. Significantly different means (P < 0.05) measured at different acclimation temperatures within the same salinity
treatment are indicated by different numbers inside the histograms, whereas significantly different means (P < 0.05) measured at different
acclimation salinities within the same temperature treatment are indicated by different letters below the histograms (all according to
Bonferroni correction).
Dispersal ability and range size in water beetles
Journal of Biogeography 39, 984–994 991ª 2011 Blackwell Publishing Ltd
larger relative to body size (Angelo & Slansky, 1984; Berwaerts
et al., 2002). In Enochrus, the shift from lotic to lentic habitats
has been twice accompanied by the evolution of relatively large
wings, probably as a result of selection for increased dispersal
ability in taxa occupying geologically short-lived habitats
(Ribera, 2008). Interpreting the significance of wing aspect
ratio for dispersal ability in these beetles is more difficult, as
long, narrow wings with high aspect ratios (as in our two
clades of E. falcarius) are generally associated with fast-flapping
flight, while broad wings with low aspect ratios (as in E. bicolor
and E. segmentinotatus) are associated with gliding flight
(Wootton, 1992). Although high aspect ratios are often linked
to greater flying ability (e.g. Gibb et al., 2006), the degree to
which this is the case will depend on the flight mode of
individual taxa, particularly the degree to which this is active
or reliant on air currents (Bilton et al., 2001). Moreover, wing
aspect ratios are known to influence flight performance in a
temperature-dependent manner in some insects, high aspect
ratios being advantageous at low temperatures in Drosophila
(Azevedo et al., 1998).
In short, we conclude that in the western Mediterranean
E. bicolor complex there have been two habitat shifts from
lotic to lentic waters, which have been accompanied by
marked expansions in geographical range size. Range expan-
sion has not, in the case of E. bicolor at least, been driven by
an increase in fundamental niche breadth, as estimated from
the species thermal physiology. Instead, in this species and in
the equally widespread lentic E. segmentinotatus, the coloni-
zation of standing waters has been accompanied by changes
in wing morphology that confer greater dispersal ability. In
this lineage of water beetles, selection for dispersal in
geologically short-lived lentic systems has probably driven
the evolution of larger range sizes compared with those of
their lotic relatives.
ACKNOWLEDGEMENTS
We thank all collectors listed in Table S1.2 for proving
material for study; F. Picazo, C. Gutierrez-Canovas,
J.A. Carbonell, A. Hidalgo-Galiana, J. Arribas, L. Blazquez,
N. Bennas and members of the Universite Abdelmalek Essaadi
(Tetouan, Morocco) for field assistance; J. Hemprich,
R. Haslam and R. Alonso for technical support; G. Massa-
mba-N’Siala, John Spicer, J.A. Garcıa-Charton, J. Serrano,
J. Galian and the members of the Aquatic Ecology research
group (Universidad de Murcia, Spain) for help at various
stages of this project; and Professor Pauline Ladiges and two
anonymous referees for their useful comments on an earlier
version of this paper. This work was supported by funding
from two pre-doctoral grants (FPU) from the Ministerio de
Educacion to P.Ar. and C.A., a postdoctoral grant from the
Fundacion Seneca to D.S.-F., and a postdoctoral grant from
the Ministerio de Educacion to P.Ab., and by projects CGL2006-
04159, 023/2007 (A.M.), CGL2004-00028, CGL2007-61665 (I.R.)
and CGL2010-15378 (J.V.).
REFERENCES
Abellan, P., Millan, A. & Ribera, I. (2009) Parallel habitat-
driven differences in the phylogeographical structure of two
independent lineages of Mediterranean saline water beetles.
Molecular Ecology, 18, 3885–3902.
Alvarez-Cobelas, M., Rojo, C. & Angeler, D.G. (2005) Medi-
terranean limnology: current status, gaps and the future.
Journal of Limnology, 64, 13–29.
Andrewartha, H.G. & Birch, L.C. (1954) The distribution and
abundance of animals. University of Chicago Press, Chicago.
Angelo, M.J. & Slansky, F. (1984) Body building by insects:
trade-offs in resource allocation with particular reference to
migratory species. Florida Entomologist, 67, 22–41.
Azevedo, R.B.R., James, A.C., McCabe, J. & Partridge, J. (1998)
Latitudinal variation in wing–thorax size ratio and wing
aspect ratio in Drosophila melanogaster. Evolution, 52, 1353–
1362.
Benke, A.C., Huryn, A.D., Smock, L.A. & Wallace, J.B. (1999)
Length–mass relationships for freshwater macroinverte-
brates in North America with particular reference to the
southeastern United States. Journal of the North American
Benthological Society, 18, 308–343.
Berwaerts, K., Van Dyck, H. & Aerts, P. (2002) Does flight
morphology relate to flight performance? An experimental
test with the butterfly Pararge aegeria. Functional Ecology,
16, 484–491.
Bilton, D.T., Freeland, J.R. & Okamura, B. (2001) Dispersal in
freshwater invertebrates. Annual Review of Ecology and Sys-
tematics, 32, 159–181.
Brodsky, A.K. (1994) The evolution of insect flight. Oxford
University Press, Oxford.
Brown, J.H. (1984) On the relationship between abundance
and distribution of species. The American Naturalist, 124,
255–279.
Brown, J.H. (1995) Macroecology. University of Chicago Press,
Chicago.
Calosi, P., Bilton, D.T. & Spicer, J.I. (2008a) Thermal toler-
ance, acclimatory capacity and vulnerability to global cli-
mate change. Biology Letters, 4, 99–102.
Calosi, P., Bilton, D.T., Spicer, J.I. & Atfield, A. (2008b)
Thermal tolerance and geographical range size in the Agabus
brunneus group of European diving beetles (Coleoptera:
Dytiscidae). Journal of Biogeography, 35, 295–305.
Calosi, P., Bilton, D.T., Spicer, J.I., Votier, S.C. & Atfield, A.
(2010) What determines a species’ geographical range?
Thermal biology and latitudinal range size relationships in
European diving beetles (Coleoptera: Dytiscidae). Journal of
Animal Ecology, 79, 194–204.
Caughley, G., Short, J., Grigg, G.C. & Nix, H. (1987) Kanga-
roos and climate: an analysis of distribution. Journal of
Animal Ecology, 56, 751–761.
Chown, S.L. & Nicolson, W.N. (2004) Insect physiological
ecology: mechanism and patterns. Oxford University Press,
Oxford.
P. Arribas et al.
992 Journal of Biogeography 39, 984–994ª 2011 Blackwell Publishing Ltd
Damm, S., Dijkstra, K.D.B. & Hadrys, H. (2010) Red drifters
and dark residents: the phylogeny and ecology of a Plio-
Pleistocene dragonfly radiation reflects Africa’s changing
environment (Odonata, Libellulidae, Trithemis). Molecular
Phylogenetics and Evolution, 54, 870–882.
Duncan, R.P., Blackburn, T.M. & Veltman, C.J. (1999)
Determinants of geographical range sizes: a test using
introduced New Zealand birds. Journal of Animal Ecology,
68, 963–975.
Florencio, M., Serrano, L., Gomez-Rodriguez, C., Millan, A. &
Paz-Paniagua, C. (2009) Inter- and intra-annual variations
of macroinvertebrate assemblages are related to the hydro-
period in Mediterranean temporary ponds. Hydrobiologia,
634, 167–183.
Gaston, K.J. (2003) The structure and dynamics of geographic
ranges. Oxford University Press Inc., New York.
Gaston, K.J. & Chown, S.L. (1999) Elevation and climatic
tolerance: a test using dung beetles. Oikos, 86, 584–590.
Gibb, H., Hjalten, J., Ball, J.P., Pettersson, R.B., Landin, J.,
Alvini, O. & Danell, K. (2006) Wing loading and habitat
selection in forest beetles: are red-listed species poorer dis-
persers or more habitat-specific than common congenerics?
Biological Conservation, 132, 250–260.
Gregory, R.D. & Gaston, K.J. (2000) Explanations of com-
monness and rarity in British breeding birds: separating
resource use and resource availability. Oikos, 88, 515–526.
Hansen, M. (2004) Hydrophilidae. Catalogue of Palaearctic
Coleoptera. Vol. 2: Hydrophiloidea–Histeroidea–Staphylinoi-
dea (ed. by I. Lobl and A. Smetana), pp. 44–67. Apollo
Books, Copenhagen.
Hof, C., Brandle, M. & Brandl, R. (2006) Lentic odonates have
larger and more northern ranges than lotic species. Journal
of Biogeography, 33, 63–70.
Hortal, J., Roura-Pascual, N., Sanders, N.J. & Rahbek, C.
(2010) Understanding (insect) species distributions across
spatial scales. Ecography, 33, 51–53.
Hui, C., Veldtman, R. & McGeoch, M.A. (2010) Measures,
perceptions and scaling patterns of aggregated species dis-
tributions. Ecography, 33, 95–102.
Hutchinson, G.E. (1957) A treatise on limnology. Wiley, New
York.
Iversen, J. (1994) Hedera and Ilex as climate indicators. Geo-
logiska Foreningens, 66, 463–483.
Jonsson, M. (2003) Colonisation ability of the threatened
tenebrionid beetle Oplocephala haemorrhoidalis and its
common relative Bolitophagus reticulatus. Ecological Ento-
mology, 28, 159–167.
Kriticos, D.J. & Leriche, A. (2010) The effects of climate data
precision on fitting and projecting species niche models.
Ecography, 33, 115–127.
Larsen, T.H., Lopera, A. & Forsyth, A. (2008) Understanding
trait-dependent community disassembly: dung beetles,
density functions, and forest fragmentation. Conservation
Biology, 22, 1288–1298.
Lester, S.E., Ruttenberg, B.I., Gaines, S.D. & Kinlan, B.P.
(2007) The relationship between dispersal ability and geo-
graphic range size. Ecology Letters, 10, 745–758.
Lutterschmidt, W.I. & Hutchison, V.H. (1997) The critical
thermal maximum: history and critique. Canadian Journal
of Zoology–Revue Canadienne de Zoologie, 75, 1561–1574.
Malmqvist, B. (2000) How does wing length relate to distri-
bution patterns of stoneflies (Plecoptera) and mayflies
(Ephemeroptera)? Biological Conservation, 93, 271–276.
Marsden, S.J. & Whiffin, M. (2003) The relationship between
population density, habitat position and habitat breadth
within a neotropical forest bird community. Ecography, 26,
385–392.
Marten, A., Brandle, M. & Brandl, R. (2006) Habitat type
predicts genetic population differentiation in freshwater
invertebrates. Molecular Ecology, 15, 2643–2651.
Merriam, C.H. (1984) Laws of temperature and control of the
geographic distribution of terrestrial animals and plants.
National Geographic, 6, 229–238.
Millan, A., Velasco, J., Gutierrez-Canovas, C., Arribas, P.,
Picazo, F., Sanchez-Fernandez, D. & Abellan, P. (2011)
Mediterranean saline streams in southeast Spain: what do
we know? Journal of Arid Environments, 75, 1352–1359.
Miller, M.A., Pfeiffer, W. & Schwartz, T. (2010) Creating the
CIPRES Science Gateway for inference of large phylogenetic
trees. Proceedings of the Gateway Computing Environments
Workshop (GCE), 14 November 2010, pp. 1–8. New Orleans,
LA.
Monaghan, M.T., Gattolliat, J.L., Sartori, M., Elouard, J.M.,
James, H., Derleth, P., Glaizot, O., de Moor, F. & Vogler,
A.P. (2005) Trans-oceanic and endemic origins of the small
minnow mayflies (Ephemeroptera, Baetidae) of Madagascar.
Proceedings of the Royal Society B: Biological Sciences, 272,
1829–1836.
Oertli, B., Auderset Joye, D., Castella, E., Juge, R., Cambin, D.
& Lachavanne, J.B. (2002) Does size matter? The relation-
ship between pond area and biodiversity. Biological Con-
servation, 104, 59–70.
Pigot, A.L., Owens, I.P.F. & Orme, D.L. (2010) The environ-
mental limits to geographic range expansion in birds. Ecol-
ogy Letters, 13, 705–715.
Posada, D. (2008) jModelTest: phylogenetic model averaging.
Molecular Biology and Evolution, 25, 1253–1256.
Reaka, M.L. (1980) Geographic range, life-history patterns,
and body size in a guild of coral-dwelling Mantis shrimps.
Evolution, 34, 1019–1030.
Ribera, I. (2008) Habitat constraints and the generation of
diversity in freshwater macroinvertebrates. Aquatic insects:
challenges to populations (ed. by J. Lancaster and R.A. Briers),
pp. 289–311. CAB International Publishing, Wallingford, UK.
Ribera, I. & Vogler, A.P. (2000) Habitat type as a determinant
of species range sizes: the example of lotic–lentic differences
in aquatic Coleoptera. Biological Journal of the Linnean
Society, 71, 33–52.
Dispersal ability and range size in water beetles
Journal of Biogeography 39, 984–994 993ª 2011 Blackwell Publishing Ltd
Ronquist, F. & Huelsenbeck, J.P. (2003) MrBayes 3: Bayesian
phylogenetic inference under mixed models. Bioinformatics,
19, 1572–1574.
Rundle, S.D., Foggo, A., Choiseul, V. & Bilton, D.T. (2002) Are
distribution patterns linked to dispersal mechanism? An
investigation using pond invertebrate assemblages. Fresh-
water Biology, 47, 1571–1581.
Rundle, S.D., Bilton, D.T., Abbott, J.C. & Foggo, A. (2007)
Range size in North American Enallagma damselflies cor-
relates with wing size. Freshwater Biology, 52, 471–477.
Rutherford, A. (2001) Introducing ANOVA and ANCOVA: a
GLM approach. SAGE Publications, London.
Salisbury, E.J. (1926) The geographical distribution of plants in
relation to climatic factors. Geographical Journal, 57, 312–335.
Sanchez-Fernandez, D., Calosi, P., Atfield, A., Arribas, P.,
Velasco, J., Spicer, J.I., Millan, A. & Bilton, D.T. (2010)
Reduced salinities compromise the thermal tolerance of
hypersaline specialist diving beetles. Physiological Entomol-
ogy, 35, 265–273.
Scheffer, M., van Geest, G.J., Zimmer, K., Jeppesen, E., Son-
dergaard, M., Butler, M.G., Hanson, M.A., Declerck, S. & De
Meester, L. (2006) Small habitat size and isolation can
promote species richness: second-order effects on biodi-
versity in shallow lakes and ponds. Oikos, 112, 227–231.
Schodl, S. (1998) Taxonomic revision of Enochrus (Coleoptera:
Hydrophilidae) I. The E. bicolor species complex. Entomo-
logical Problems, 29, 111–127.
Soberon, J. & Nakamura, M. (2009) Niches and distributional
areas: concepts, methods, and assumptions. Proceedings of
the National Academy of Sciences USA, 106, 19,644–19,650.
Soberon, J.M. (2010) Niche and area of distribution modeling:
a population ecology perspective. Ecography, 33, 159–167.
Sokolova, I.M. & Portner, H.O. (2003) Metabolic plasticity and
critical temperatures for aerobic scope in a eurythermal
marine invertebrate (Littorina saxatilis, Gastropoda: Litto-
rinidae) from different latitudes. Journal of Experimental
Biology, 206, 195–207.
Somero, G. (2005) Linking biogeography to physiology: evo-
lutionary and acclimatory adjustments of thermal limits.
Frontiers in Zoology, 2, 1–9.
Spicer, J.I. & Gaston, K.J. (1999) Physiological diversity and its
ecological implications. Blackwell Science, Oxford.
Stamatakis, A. (2006) RAxML-VI-HPC: maximum likelihood-
based phylogenetic analyses with thousands of taxa and
mixed models. Bioinformatics, 22, 2688–2690.
Stevens, G.C. (1989) The latitudinal gradient in geographical
range: how so many species coexist in the tropics. The
American Naturalist, 133, 240–256.
Stillman, J.H. (2002) Causes and consequences of thermal tol-
erance limits in rocky intertidal porcelain crabs, genus Petr-
olisthes. Integrative and Comparative Biology, 42, 790–796.
Terblanche, J.S. & Chown, S.L. (2006) The relative contribu-
tions of developmental plasticity and adult acclimation to
physiological variation in the tsetse fly, Glossina pallidipes
(Diptera, Glossinidae). Journal of Experimental Biology, 209,
1064–1073.
Velasco, J., Millan, A., Hernandez, J., Gutierrez, C., Abellan, P.,
Sanchez-Fernandez, D. & Ruiz, M. (2006) Response of biotic
communities to salinity changes in a Mediterranean
hypersaline stream. Saline Systems, 2, 1–15.
Wootton, R.J. (1992) Functional morphology of insect wings.
Annual Review of Entomology, 37, 113–140.
SUPPORTING INFORMATION
Additional Supporting Information may be found in the
online version of this article:
Appendix S1 Sampling localities, specimens and primers
used in phylogenetic analysis of the Enochrus bicolor complex.
Appendix S2 Thermal windows and information about
sampling localities used in dispersal and physiological mea-
surements of Enochrus falcarius IP and E. bicolor.
Appendix S3 ANCOVA results for dispersal and thermal
physiology measurements of the Enochrus bicolor complex
species.
As a service to our authors and readers, this journal provides
supporting information supplied by the authors. Such mate-
rials are peer-reviewed and may be re-organized for online
delivery, but are not copy-edited or typeset. Technical support
issues arising from supporting information (other than
missing files) should be addressed to the authors.
BIOSKETCH
Paula Arribas is an entomologist with a particular interest in
the biogeography, ecology, evolution and conservation of
beetles. Her research is currently focused on the fauna of saline
waters in the Mediterranean region.
Author contributions: A.M., D.T.B., I.R., J.V., P.Ab. and P.Ar.
conceived the ideas; A.M., J.V. and I.R. led the specimen
collection; C.A., I.R. and P.Ar. collected and analysed the
molecular data; C.A. and P.Ar. collected and analysed the
morphometric data; D.T.B, D.S.-F., P.C. and P.Ar. collected
and analysed the physiological data; all authors contributed to
the writing.
Editor: Pauline Ladiges
P. Arribas et al.
994 Journal of Biogeography 39, 984–994ª 2011 Blackwell Publishing Ltd