
DISCOPAR - Software Languages Lab
206
Jesse Zaman September 6, 2018 A Visual Reactive Flow-Based Domain-Specific Language for Constructing Participatory Sensing Platforms
-
Upload
khangminh22 -
Category
Documents
-
view
0 -
download
0
Transcript of DISCOPAR - Software Languages Lab

Jesse ZamanSeptember 6, 2018
A Visual Reactive Flow-Based Domain-Specific Language for Constructing Participatory
Sensing Platforms

© 2018 Jesse Zaman
Printed byCrazy Copy Center ProductionsVUB Pleinlaan 2, 1050 BrusselTel / fax : +32 2 629 33 [email protected]
ISBN 978 94 9231 289 1NUR 989
All rights reserved. No part of this publication may be produced in any form by print,photoprint, microfilm, electronic or any other means without permission from theauthor.

A B S T R AC T
The evolution of the smartphone as a general computing platform combined with therich sensing functionalities that it has acquired in recent years, have led to a newcollective data gathering paradigm called participatory sensing. Participatory sensingis the driving technology behind so-called citizen observatories; i.e. a set of cloud-based software tools that are used to gather, analyse and visualise data by a group ofcitizens that share some collective concern. Participatory sensing is often used in so-called campaigns. A campaign is a collective data gathering effort that is delimitedin space and/or time.
Today citizen observatories have to be developed from scratch for each applica-tion domain, meaning that deploying a new citizen observatory is nothing less than acomplex cloud-driven software engineering project that is extremely labour-intensiveprecisely because of its technical complexity. Despite an overwhelming demand forsuch platforms, they are thus beyond the reach of most societal stakeholder groups.
What is needed is a generic approach towards reusable and reconfigurable citi-zen observatories, i.e. a citizen observatory meta-platform that can be used by stake-holders to create new and adapt existing citizen observatories. Thus, apart from thetechnical design challenges, a key requirement of such a meta-platform is that it iseasily accessible by societal stakeholders and communities. Deploying a new citizenobservatory and setting up campaigns through the meta-platform should therefore bepossible without or with only very limited programming skills.
In this dissertation, we present DISCOPAR (Distributed Components for Partic-ipatory Campaigning), a new visual reactive flow-based domain-specific program-ming language created specifically to hide the non-essential complexity of citizenobservatories from the end-user, and to present only concepts that are truly relevantto their domain. DISCOPAR is used throughout the meta-platform to enable end-users to construct every part of a citizen observatory: the mobile data gathering app,server-side data processing, and web-based visualisations can all be set up using asingle visual language, thereby greatly increasing the accessibility by end-users.
i

We validate our citizen observatory meta-platform and the DISCOPAR language– in terms of expressiveness, suitability and usability – through experiments both inlaboratory as well as in real-world conditions. We demonstrate expressiveness by cre-ating three radically different citizen observatories and test the suitability and usabil-ity during real-world experiments performed by different groups of people withoutany programming knowledge.
ii

S A M E N VAT T I N G
De evolutie van de smartphone als computerplatform, gecombineerd met de rijketechnologische functies die het de afgelopen jaren heeft verworven, heeft geleid toteen nieuw paradigma voor gegevensverzameling dat participatief meten wordt ge-noemd. Participatief meten wordt vaak gebruikt in campagnes, het verzamelen vandata door een groep mensen in een specifiek gebied en/of tijdsinterval.
Participatief meten is de motor achter zogenaamde burgerobservatoria; een reeksICT-hulpmiddelen om gegevens te verzamelen, analyseren en visualiseren met alsdoel de levenskwaliteit van burgers te verbeteren. Tegenwoordig moeten burgerobser-vatoria voor elk toepassingsgebied vanaf nul worden ontwikkeld, waardoor een nieuwburgerobservatorium creëren uiterst moeilijk en arbeidsintensief blijft. Ondanks eenoverweldigende vraag naar dergelijke platforms, zijn ze dus buiten het bereik van demeeste maatschappelijke belanghebbenden.
Bijgevolg is een generieke benadering van herbruikbare en (her)configureerbareburgerobservatoria meer dan nodig. Dit proefschrift introduceert een burgerobserva-toria metaplatform, een platform dat belanghebbenden kunnen gebruiken om burg-erobservatoria te creëren. Een van de grootste uitdagingen van dit metaplatform isde toegankelijkheid verzekeren voor betrokken personen en gemeenschappen. Hetcreëren van een burgerobservatorium en het opzetten van campagnes moet daarommogelijk zijn zonder of met beperkte programmeervaardigheden.
Om dit mogelijk te maken, hebben we DISCOPAR (Distributed Componentsfor Participatory Campaigning) gecreëerd. DISCOPAR is een nieuwe visuele, reac-tive, flow-gebaseerde, domeinspecifieke programmeertaal die specifiek de ongewen-ste complexiteit van burgerobservatoria verbergt voor de eindgebruiker en alleen con-cepten presenteert die relevant zijn voor hun domein. DISCOPAR wordt overal inhet metaplatform gebruikt om eindgebruikers in staat te stellen elk deel van een burg-erobservatorium te bouwen. De mobiele app voor het verzamelen van gegevens, degegevensverwerking op de server, en ook de webgebaseerde visualisaties kunnen alle-maal worden opgezet met behulp van één visuele taal. Hierdoor vergroot de toeganke-lijkheid voor eindgebruikers aanzienlijk.
iii

Om de expressiviteit en correctheid van het herconfigureerbare platform aan tetonen, hebben we drie radicaal verschillende burgerobservatoria gecreëerd en dezegetest in zowel het laboratorium als in reële omstandigheden. De toegankelijkheidvan het metaplatform werd getest tijdens experimenten uitgevoerd door verschillendegroepen bestaande uit mensen zonder programmeerkennis.
iv

AC K N OW L E D G E M E N T S
First and foremost I would like to thank my promotor, Prof. Dr. Wolfgang de Meuter.Many thanks for your advice and encouragement throughout all these years. Myatypical research topic sometimes made me feel like a lone wolf at SOFT. Luckily,there was this other Wolf whose occasional praising made me feel part of the pack.
I would also like to thank the members of my jury: Prof. Dr. Ann Nowé, Prof.Dr. Coen De Roover, Prof. Dr. Cathy Macharis, Prof. Dr. em. Theo D’Hondt, and Dr.ir. Thomas Springer. Thank you for critically reading my dissertation and helping toimprove the quality of this text.
I would like to express my very great appreciation to Dr. Jens Nicolay for hisvaluable and constructive suggestions that helped to improve the structure of thisdissertation.
I also wish to acknowledge the excellent work environment provided by all (for-mer) members of the Software Languages Lab. My special thanks go to my col-leagues with whom I started this journey together: Simon, Janwillem, and Nathalie.
I am particularly grateful for the support of my friends and family, with an addi-tional shout-out to the “T-Time”-crew: Dries, Jonas and Caro, Dieter and Emma, andKarine and Gie. An army marches on its stomach, so special thanks to my mother forkeeping me well-provisioned during the entire Battle of the PhD.
I also want to express my gratitude to Jessica for being a great friend. Our weeklyget-togethers are always something I look forward to.
Last but not least, I would like to thank Ayla for showing me what love is allabout. In the grand scheme of things, our amazing adventure is only just beginning.I am looking forward to an equally amazing future, without doubt accompanied byour four-legged friends.
This research was funded by a PRFB grant from Innoviris, the Brussels Institute forResearch and Innovation.
v


TA B L E O F C O N T E N T S
1 Introduction 11.1 Problem Statement . . . . . . . . . . . . . . . . . . . . . . . . . . 31.2 Research Vision . . . . . . . . . . . . . . . . . . . . . . . . . . . . 41.3 Methodology . . . . . . . . . . . . . . . . . . . . . . . . . . . . . 51.4 Supporting Publications and Technical Contributions . . . . . . . . 61.5 Dissertation Outline . . . . . . . . . . . . . . . . . . . . . . . . . . 8
2 Participatory Campaigning and Citizen Observatories 112.1 Sensors Galore . . . . . . . . . . . . . . . . . . . . . . . . . . . . 122.2 Participatory Sensing . . . . . . . . . . . . . . . . . . . . . . . . . 14
2.2.1 Ad-Hoc Participatory Sensing Systems . . . . . . . . . . . 152.2.2 Reusable Participatory Sensing Systems . . . . . . . . . . . . 172.2.3 PS Research Challenges . . . . . . . . . . . . . . . . . . . 19
2.3 Participatory Campaigning . . . . . . . . . . . . . . . . . . . . . . 202.3.1 Campaign Protocol . . . . . . . . . . . . . . . . . . . . . . . 212.3.2 Campaign Definition . . . . . . . . . . . . . . . . . . . . . 232.3.3 Campaign Lifecycle . . . . . . . . . . . . . . . . . . . . . 23
2.4 Citizen Observatories . . . . . . . . . . . . . . . . . . . . . . . . . 252.4.1 Citizen Observatory Stakeholders . . . . . . . . . . . . . . . 272.4.2 Research in Citizen Observatories . . . . . . . . . . . . . . 282.4.3 Research Questions . . . . . . . . . . . . . . . . . . . . . . 29
2.5 Vision: Citizen Observatory Meta-Platform . . . . . . . . . . . . . . 312.6 Conclusion . . . . . . . . . . . . . . . . . . . . . . . . . . . . . . 33
3 Towards a Citizen Observatory Meta-Platform: Requirements 353.1 Citizen Observatory Architecture . . . . . . . . . . . . . . . . . . . 363.2 Meta-Platform Stakeholders . . . . . . . . . . . . . . . . . . . . . . 373.3 Meta-Platform Requirements . . . . . . . . . . . . . . . . . . . . . 38
vii

3.3.1 User Level Requirements . . . . . . . . . . . . . . . . . . . 383.3.2 Implementation Level Requirements . . . . . . . . . . . . . 40
3.4 The Right Tool for the Job . . . . . . . . . . . . . . . . . . . . . . 423.5 Flow-Based Programming . . . . . . . . . . . . . . . . . . . . . . 43
3.5.1 Dataflow Programming . . . . . . . . . . . . . . . . . . . . 443.5.2 Flow-Based Programming Characteristics and Classification 45
3.6 Reactive Programming . . . . . . . . . . . . . . . . . . . . . . . . . 473.7 Visual Programming Languages . . . . . . . . . . . . . . . . . . . 48
3.7.1 Visual Data Flow Programming Languages . . . . . . . . . 493.8 Domain-Specific Languages . . . . . . . . . . . . . . . . . . . . . 50
3.8.1 Domain-Specific Modelling . . . . . . . . . . . . . . . . . 503.9 Related Work . . . . . . . . . . . . . . . . . . . . . . . . . . . . . . 513.10 Conclusion . . . . . . . . . . . . . . . . . . . . . . . . . . . . . . 55
4 Language Concepts of DISCOPAR 574.1 Programming with DISCOPAR . . . . . . . . . . . . . . . . . . . . 584.2 Concepts and Terminology . . . . . . . . . . . . . . . . . . . . . . 60
4.2.1 Components . . . . . . . . . . . . . . . . . . . . . . . . . . 614.2.2 Processes . . . . . . . . . . . . . . . . . . . . . . . . . . . . 614.2.3 Connections . . . . . . . . . . . . . . . . . . . . . . . . . 624.2.4 Ports . . . . . . . . . . . . . . . . . . . . . . . . . . . . . 634.2.5 Information Packets . . . . . . . . . . . . . . . . . . . . . 644.2.6 Graphs . . . . . . . . . . . . . . . . . . . . . . . . . . . . 65
4.3 DISCOPARDE . . . . . . . . . . . . . . . . . . . . . . . . . . . . 664.3.1 Component Menu . . . . . . . . . . . . . . . . . . . . . . . 674.3.2 Canvas . . . . . . . . . . . . . . . . . . . . . . . . . . . . 684.3.3 Process Configuration . . . . . . . . . . . . . . . . . . . . 704.3.4 Graph Validation Indicator . . . . . . . . . . . . . . . . . . . 714.3.5 DISCOPARDE as Live Programming Environment . . . . . 72
4.4 Facilitating End-User Programming . . . . . . . . . . . . . . . . . 734.5 Conclusion . . . . . . . . . . . . . . . . . . . . . . . . . . . . . . 75
5 Constructing Citizen Observatories with DISCOPAR 775.1 Creating a New Citizen Observatory . . . . . . . . . . . . . . . . . 78
5.1.1 Mobile App Design Interface . . . . . . . . . . . . . . . . . 805.1.2 Data Processing Design Interface . . . . . . . . . . . . . . . 815.1.3 Mobile Data Collection App . . . . . . . . . . . . . . . . . 835.1.4 Observatory Data Analysis Interface . . . . . . . . . . . . . 84
viii
5.2 Creating a Campaign . . . . . . . . . . . . . . . . . . . . . . . . . 865.2.1 Campaign Design Interface . . . . . . . . . . . . . . . . . . 885.2.2 Campaign Analysis Interface . . . . . . . . . . . . . . . . . 90
5.3 Citizen Observatory Meta-Platform Tools . . . . . . . . . . . . . . . 915.3.1 Sensor Calibration Tool . . . . . . . . . . . . . . . . . . . 925.3.2 Community Component Creator . . . . . . . . . . . . . . . 93
5.4 Conclusion . . . . . . . . . . . . . . . . . . . . . . . . . . . . . . 94
6 Implementation 956.1 DISCOPAR: Component Layer . . . . . . . . . . . . . . . . . . . . 96
6.1.1 Components . . . . . . . . . . . . . . . . . . . . . . . . . 966.1.2 Processes . . . . . . . . . . . . . . . . . . . . . . . . . . . 1036.1.3 Ports . . . . . . . . . . . . . . . . . . . . . . . . . . . . . 1056.1.4 Observations . . . . . . . . . . . . . . . . . . . . . . . . . . 1116.1.5 Graphs . . . . . . . . . . . . . . . . . . . . . . . . . . . . 1126.1.6 Distributed Connection Manager . . . . . . . . . . . . . . . . 117
6.2 DISCOPAR: Graph Layer . . . . . . . . . . . . . . . . . . . . . . 1206.2.1 DISCOPARDE . . . . . . . . . . . . . . . . . . . . . . . . . 121
6.3 Citizen Observatory Meta-Platform Architecture . . . . . . . . . . . 1236.3.1 Mobile Data Collection App . . . . . . . . . . . . . . . . . 1236.3.2 Server-Side Data Processing and Campaigns . . . . . . . . 1266.3.3 Web-based Visualisations . . . . . . . . . . . . . . . . . . 126
6.4 Conclusion . . . . . . . . . . . . . . . . . . . . . . . . . . . . . . . 127
7 DISCOPAR at Work 1297.1 Introduction . . . . . . . . . . . . . . . . . . . . . . . . . . . . . . 1297.2 Citizen Observatory Meta-Platform Expressiveness . . . . . . . . . 130
7.2.1 NoiseTube2.0: Observatory on Noise Pollution . . . . . . . . . 1317.2.2 Trage Wegen: Observatory on Pedestrian Experience . . . . 1397.2.3 SensorDrone: Observatory on Atmospheric Conditions . . . 143
7.3 End-User Usability Tests . . . . . . . . . . . . . . . . . . . . . . . 1457.3.1 Quasi-Experiment: Mobile App Design Interface . . . . . . 1457.3.2 Quasi-Experiment: Campaign Design Interface . . . . . . . . 151
7.4 Conclusion . . . . . . . . . . . . . . . . . . . . . . . . . . . . . . 152
8 Conclusion 1558.1 Summary . . . . . . . . . . . . . . . . . . . . . . . . . . . . . . . 156
8.1.1 Contributions . . . . . . . . . . . . . . . . . . . . . . . . . . 157
ix

8.2 Future Work . . . . . . . . . . . . . . . . . . . . . . . . . . . . . . 1598.2.1 Hybrid Mobile Apps . . . . . . . . . . . . . . . . . . . . . 1598.2.2 Performance . . . . . . . . . . . . . . . . . . . . . . . . . 1608.2.3 User Experience Enhancements . . . . . . . . . . . . . . . 162
8.3 Closing Remarks . . . . . . . . . . . . . . . . . . . . . . . . . . . 164
A Component List of DISCOPAR 165A.1 Sensing Components . . . . . . . . . . . . . . . . . . . . . . . . . 166A.2 Logic Components . . . . . . . . . . . . . . . . . . . . . . . . . . . 167
A.2.1 Geographical Components . . . . . . . . . . . . . . . . . . . 167A.2.2 Temporal Components . . . . . . . . . . . . . . . . . . . . . 167A.2.3 Contextual Components . . . . . . . . . . . . . . . . . . . . 167A.2.4 Miscellaneous . . . . . . . . . . . . . . . . . . . . . . . . 168
A.3 Aggregation components . . . . . . . . . . . . . . . . . . . . . . . 169A.4 Coordination components . . . . . . . . . . . . . . . . . . . . . . . 169A.5 Visualisation components . . . . . . . . . . . . . . . . . . . . . . . 170
B Survey Questions 171
x

L I S T O F F I G U R E S
1.1 DISCOPARDE, a web-based visual programming environment forDISCOPAR. . . . . . . . . . . . . . . . . . . . . . . . . . . . . . . 6
2.1 Sensor growth in smartphones. . . . . . . . . . . . . . . . . . . . . 132.2 Architectural overview of a typical participatory sensing system. . . 152.3 Campaign lifecycle. . . . . . . . . . . . . . . . . . . . . . . . . . . 242.4 Stakeholders of a citizen observatory. . . . . . . . . . . . . . . . . . 27
3.1 Citizen observatory architecture. . . . . . . . . . . . . . . . . . . . 363.2 A simple dataflow program (a) and its directed graph representation
(b) [66]. . . . . . . . . . . . . . . . . . . . . . . . . . . . . . . . . 443.3 Sample Scratch script [110]. . . . . . . . . . . . . . . . . . . . . . 483.4 Taxonomy of visual aids for programming [119]. . . . . . . . . . . 493.5 Node-RED’s browser-based editor. . . . . . . . . . . . . . . . . . . 523.6 FlowHub IDE. . . . . . . . . . . . . . . . . . . . . . . . . . . . . . 523.7 Example of LabVIEW Block diagram. . . . . . . . . . . . . . . . . 533.8 The Reaktor environment. . . . . . . . . . . . . . . . . . . . . . . 543.9 The Blender Node Editor. . . . . . . . . . . . . . . . . . . . . . . . 54
4.1 DISCOPARDE: DISCOPAR’s web-based visual programming envi-ronment. . . . . . . . . . . . . . . . . . . . . . . . . . . . . . . . . 59
4.2 Overview of DISCOPAR. . . . . . . . . . . . . . . . . . . . . . . . 604.3 Example of DISCOPAR’s visual syntax for components. . . . . . . . 614.4 Visual syntax of connections in DISCOPAR. . . . . . . . . . . . . . 624.5 DISCOPAR’s supported data types and corresponding colours. . . . 634.6 The SensorDrone component. . . . . . . . . . . . . . . . . . . . . 654.7 A graph containing distributed components. . . . . . . . . . . . . . 664.8 DISCOPAR’s default visual programming environment. . . . . . . . . 674.9 Menu shown when right-clicking a component on the canvas. . . . . 68
xi

4.10 Highlighting of compatible ports. . . . . . . . . . . . . . . . . . . . 694.11 LineChartVisualisation component configuration window. . . . . . . 704.12 Customised component configuration window. . . . . . . . . . . . . . 714.13 Graph Validation error message example. . . . . . . . . . . . . . . 724.14 Levels of liveness in visual programming systems. . . . . . . . . . . 75
5.1 Automatically generated web pages of a citizen observatory. . . . . 795.2 The Mobile App Design Interface, featuring the component library
(left), designer canvas (middle), and a live preview of the mobile app(right). . . . . . . . . . . . . . . . . . . . . . . . . . . . . . . . . . 80
5.3 The Data Processing Design Interface, featuring the component li-brary (left), designer canvas (top-right), and the visualisations pre-view window (bottom-right). . . . . . . . . . . . . . . . . . . . . . 82
5.4 The Mobile Data Gathering App with the main tab (left) and the cam-paign tab showing intermediate results (right). . . . . . . . . . . . . 84
5.5 The Observatory Data Analysis Interface. . . . . . . . . . . . . . . 855.6 Automatically generated web pages of a campaign. . . . . . . . . . . 875.7 The Campaign Design Interface. . . . . . . . . . . . . . . . . . . . 895.8 The Campaign Analysis Interface. . . . . . . . . . . . . . . . . . . . 915.9 The Sensor Calibration Tool. . . . . . . . . . . . . . . . . . . . . . 925.10 Community Component Creator. . . . . . . . . . . . . . . . . . . . 94
6.1 Visual representation of a ObservationData process. . . . . . . . 1016.2 Configuration window of a MapVisualisation process. . . . . . . . . 1026.3 Gate ports of a community component. . . . . . . . . . . . . . . . . . 1116.4 Simple example of a graph in DISCOPAR. . . . . . . . . . . . . . . 1126.5 System architecture of a citizen observatory. . . . . . . . . . . . . . 124
7.1 Implementation of NoiseTube2.0’s mobile app in DISCOPAR. . . . 1327.2 Radisson Blue Campaign Design. . . . . . . . . . . . . . . . . . . 1337.3 Geographical constraint editor of Campaign Design Interface. . . . 1347.4 Visualisations on the ‘Radisson Blue’ campaign dashboard. . . . . . 1357.5 Visualisations on the ‘Zayed University’ campaign dashboard. . . . 1367.6 Implementation of the ‘Salaam St. and neighbourhood’ campaign. . . 1377.7 Instructing a participant to the nearest incomplete campaign objective. 1387.8 Implementation of the mobile app for the Trage Wegen observatory. 1407.9 Mobile app of the Trage Wegen observatory. . . . . . . . . . . . . . . 1417.10 Participant reporting a negative element on the walking trail. . . . . . 141
xii

7.11 Dashboard of the Trage Wegen campaign in Anderlecht. . . . . . . 1427.12 Implementation of Sensordrone mobile app. . . . . . . . . . . . . . 1447.13 Sensordrone mobile app and external SensorDrone sensor. . . . . . 1447.14 Noise measuring app implementation with redundancies. . . . . . . . 1477.15 Correct, low-level noise measuring app implementation. . . . . . . 1487.16 Survey results (part 1). . . . . . . . . . . . . . . . . . . . . . . . . 1497.17 Survey results (part 2). . . . . . . . . . . . . . . . . . . . . . . . . . 1517.18 Campaign created during the “Reclaiming the city” workshop. . . . 152
xiii

1I N T RO D U C T I O N
In 2006, Burke et al. [65] introduced the concept of participatory sensing (PS), whichtasks individuals, acting alone or in groups, along with their personal smartphones,to systematically monitor personal information (e.g. health) and environmental in-formation (e.g. noise levels, traffic conditions). Given enough people with a smart-phone, participatory sensing has the potential to collect enormous volumes of highlylocalised, person-centric data, which can support (or nudge) policy makers to assess(or adjust) societal or environmental processes in a way that was hitherto unthinkable.Especially in urban contexts with a high concentration of smartphone users, this formof sensing enables the assessment of behavioural and environmental parameters on ascale and a level of granularity that was unattainable before.
1

Chapter 1: Introduction
The emergence of the PS paradigm has resulted in a broad spectrum of systemstargeted at collecting data across various domains. These include, but are not lim-ited to, environmental monitoring, intelligent transportation, personalised medicine,and epidemiological investigations of disease vectors [126]. All these applicationsare so-called ad-hoc participatory sensing systems, which means that they can onlybe deployed to collect data about their particular domain, i.e., they are designed ona per use case basis. Developing a new PS system for a particular domain is a costlyand time-consuming operation. This inspired several research initiatives to adopt adifferent approach. Rather than developing yet another ad-hoc PS system, a new gen-eration of platforms [27, 13, 74, 123] has emerged that enable end-users to configuretheir own mobile data gathering apps. Up until now, however, these platforms havelimited expressiveness as they focus only on discrete data, i.e., single-shot observa-tions which usually take the form of a questionnaire. They provide no support forcontinuous data streams originating from smartphone sensors. This is due to the factthat uploaded surveys are much easier to handle than continuously streaming sensordata.
Despite the inferior quality of smartphone sensors when compared to profes-sional measuring equipment, participatory sensing can still produce qualitative re-sults [130, 41, 64]. This is accomplished by using the potentially enormous quantityof data PS can collect to compensate for the typically inferior quality of individualmeasurements. But this is easier said than done. To ensure that a high data quality isachieved, PS is currently mainly used on a smaller, coordinated scale where a limitednumber of people are carefully organised in order to contribute qualitative and use-ful data. This is achieved by organising a so called participatory sensing campaign,which usually focuses the combined data collection effort in both space and time.Scaling up such campaigns in order to truly get quality out of quantity is currently anopen problem.
Participatory sensing provides the enabling technology to deploy so-called citi-zen observatories. These are distributed software platforms that provide stakeholderswith the instruments to collect, process, analyse, and visualise data in order to ac-cumulate knowledge into a centralised repository. Citizen observatories have beendiscussed as an increasingly essential tool for better observing, understanding, pro-tecting, and enhancing our environment [84]. Citizen observatories may also serveas an information hub for citizens. For example, a citizen may consult (the data pro-duced and processed by) an observatory on noise pollution to get an idea of the noisepollution that he is exposed to in his daily life. Alternatively, citizen observatoriescan be a provider of publicly available data that stakeholders can use in their pol-icy making. Various citizen observatories have emerged to establish interaction and
2

1.1 Problem Statement
co-participation between citizens and authorities about various environmental issues,emergencies (e.g., flooding [81]), or the day-to-day management of fundamental re-sources (e.g., FixMyStreet [45]).
1.1 Problem Statement
One major issue of citizen observatories is that, despite the high societal demand,developing a citizen observatory remains a labour-intensive (i.e., costly) and lengthyprocess that requires substantial technical expertise. Constructing a new citizen obser-vatory for a new type of data (e.g., air pollution, mobility patterns of users of publictransportation, etc.) requires most of the software infrastructure to be rebuilt fromscratch. Source code for mobile devices, the observatory’s website, server-side dataprocessing and data storage infrastructure, participant feedback provision, and dataanalysis need to be manually programmed time and time again.
Another issue is that even though the concept of a well-orchestrated PS campaignis crucial for ensuring qualitative data, none of the existing PS systems and citizenobservatories provide technological support to make sure that the campaign is effec-tively executed in the foreseen way. Actively orchestrating campaigns is a tedioustask even for relatively small campaigns. This is mainly caused by the fact that asignificant number of tasks, such as checking the data to verify whether participantssatisfied the spatio-temporal constraints imposed by the campaign, still have to beperformed manually due to the lack of technological support [36]. The workload in-volved in manually orchestration campaigns, combined with the lack of technologicalsupport for the definition and enactment of a campaign in existing PS systems, are asignificant hindrance in the wide-scale adoption of PS campaigns that involve largenumbers of participants.
Third, the lack of a systematic, easy, and reusable method for setting up newcitizen observatories and for defining new campaigns (within a citizen observatory)poses an insurmountable hurdle for communities and organisations as these typicallylack the specific technical ICT-skills and programming knowledge that is needed tocreate the necessary server infrastructure and mobile applications. This often forcesorganisations to opt for a non-technological approach (i.e., pen and paper) or to spendlarge parts of their (often restricted) budget on external ICT-consultants.
Finally, by far the largest obstacle of current approaches is the discrepancy withrespect to software engineering efforts: stakeholders lack the strong technical back-ground required to set up their own citizen observatories, and platform engineers can-
3

Chapter 1: Introduction
not keep up with the demand for (and the number of variations in) citizen observatoryand campaigning requirements within limited budgetary constraints.
1.2 Research Vision
What is needed to tackle the aforementioned problems is a generic approach targetingreusable and reconfigurable citizen observatories that are easily accessible by societalstakeholders and communities.
In this dissertation, we focus on finding a solution toward wide-scale adoption ofcitizen observatories. We propose the notion of a citizen observatory meta-platform:
A citizen observatory meta-platform is a platform that reasons about and actsupon citizen observatory platforms. It is a platform capable of constructing citizen
observatory platforms.
Through this CO meta-platform, citizen observatories can be constructed bystakeholders in a way that appeals to ICT-agnostic end-users. These citizen obser-vatories should be scalable with respect to the amount of data, the number of users,and, most importantly, the type of data collected (i.e., the application area). Only inthis way can we move away from small-scale research-oriented deployments to thefull-fledged adoption of PS as a societally and scientifically relevant data collectionmethod. The CO meta-platform will exhibit the technical features necessary to con-cretise the following research visions:
Research Vision 1: Reconfigurable Citizen Observatory Platform The CO meta-platform has to be generic, meaning that it must be configurable to provide support forthe creation of citizen observatories for any PS scenario. Citizen observatories createdthough the meta-platform must be expressive and powerful enough to handle bothdiscrete data (e.g., people’s experience of their surroundings, such as the perceptionof local safety in cities) and continuous data (e.g., sensorial data, such as temperatureor air humidity). Additionally, the underlying technological implementation of eachcitizen observatory has to be reusable to prevent the re-implementation of each citizenobservatory from scratch.
Research Vision 2: Campaign Definition and Enactment Unlike existing PS sys-tems where the definition and enactment of campaigns is not technically supported(and thus managed manually), we envision the CO meta-platform to provide inte-grated technological support for the concept of a PS campaign. ICT-agnostic users
4

1.3 Methodology
must be able to define campaigns themselves rather than relying on PS system own-ers for insider knowledge. Campaigns will be defined by means of a set of predicates(e.g., spatio-temporal constraints) about the data collection process that have to be sat-isfied in order for the campaign to be successfully executed. Each campaign deployedwithin an observatory will be automatically enacted by the platform and provide au-tomated orchestration of participants. This orchestration can coordinate participantswhile they are collecting data and provide them with feedback on their contributionsas an incentive mechanism.
Research Vision 3: Reactive Citizen Observatories In order to guarantee suc-cessful campaigning it is essential that we embed automated orchestration to steerparticipants to optimise their data collection efforts and to provide them with imme-diate user feedback. In order to provide real-time feedback, citizen observatories andcampaigns cannot rely on the traditional mechanism such as batch processing of dataand query-based data analysis. We therefore envision each citizen observatory createdthrough the meta-platform as a massive cloud-based reactive [11] application that re-acts on data coming from mobile devices, contributes those data to the server, andpromptly pushes feedback such as intermediate campaign results back to the relevantdevices.
Research Vision 4: ICT-Agnostic Usability In order to ensure ICT-agnostic us-ability of the CO meta-platform, we envision end-user-centric tools for constructingcitizen observatories and defining campaigns. These tools offer the means to describethe type of data that is of interest, the constraints it is subject to, the mechanism of itscollection method, and the process of its storage in the citizen observatory. Throughthese tools we increase the usability of the CO meta-platform by avoiding the techno-logical complexity of setting up the necessary infrastructure.
1.3 Methodology
In order to concretise the envisioned characteristics of a citizen observatory meta-platform, this dissertation introduces DISCOPAR, a new visual reactive flow-baseddomain-specific language. DISCOPAR is designed specifically to hide the non-essential complexity of creating citizen observatories and their inherent distributednature from the end-user, and to present only concepts that are relevant to their do-main. DISCOPAR is used throughout the meta-platform to construct every part of a
5

Chapter 1: Introduction
citizen observatory, i.e., the mobile data gathering app, the server-side data process-ing, and the web-based visualisations can all be set up using a single visual language.
Furthermore, in order to enable ICT-agnostic users to construct their own citizenobservatories and define their own campaigns, we have developed DISCOPARDE, aweb-based visual programming environment for DISCOPAR. A sneak preview ofDISCOPARDE is depicted in fig. 1.1. Programs in DISCOPAR can be created byselecting components from the component menu, and visually assemble them on acanvas through drag-and-drop interactions.
Figure 1.1: DISCOPARDE, a web-based visual programming environment for DISCOPAR.
1.4 Supporting Publications and Technical Contributions
Several parts of this dissertation’s contributions have been published. This sectionlists these publications and briefly highlights their relevance to this work.
6

1.4 Supporting Publications and Technical Contributions
Published Papers
The concept of a participatory sensing campaign is formally introduced in the follow-ing papers:
• Ellie D’Hondt, Jesse Zaman, Eline Philips, Elisa Gonzalez Boix, and WolfgangDe Meuter. Orchestration support for participatory sensing campaigns. In Pro-ceedings of the 2014 ACM International Joint Conference on Pervasive andUbiquitous Computing, UbiComp ’14, pages 727-738, New York, NY, USA,2014. ACM. doi: 10.1145/2632048.2632105. URL http://doi.acm.org/10.1145/2632048.2632105
• Jesse Zaman, Ellie D’Hondt, Elisa G. Boix, Eline Philips, Kennedy Kambonaand Wolfgang De Meuter, Citizen-friendly participatory campaign support.in IEEE International Conference on Pervasive Computing and Communica-tion Workshops, pages 232-235, Budapest, Hungary, 2014. IEEE. ISBN 978-1-4799-2736-4. doi: 10.1109/PerComW.2014.6815208. URL http://ieeexplore.ieee.org/document/6815208/
The design of the mobile application builder is presented in the following work:
• Jesse Zaman, Lode Hoste, and Wolfgang De Meuter. A flow-based program-ming framework for mobile App development. In Proceedings of the 3rd Inter-national Workshop on Programming for Mobile and Touch, PROMOTO ’15,pages 9-12 , New York, NY, USA, 2015. ACM. ISBN 978-1-4503-3908-7.doi: 10.1145/2824823.2824825. URL http://doi.acm.org/10.1145/2824823.2824825
The DISCOPAR platform is discussed in the following paper:
• Jesse Zaman and Wolfgang De Meuter, DISCOPAR: Distributed compo-nents for participatory campaigning, IEEE International Conference onPervasive Computing and Communication Workshops, pages 160-165 St.Louis, MO, USA, 2015. IEEE. ISBN 978-1-4799-8425-1. doi: 10.1109/PER-COMW.2015.7134012. URL http://ieeexplore.ieee.org/document/7134012/
The underlying distribution model is the focus of the following paper:
7

Chapter 1: Introduction
• Jesse Zaman and Wolfgang De Meuter, Crowd Sensing Applications: A Dis-tributed Flow-Based Programming Approach, IEEE International Conferenceon Mobile Services, MS ’16, pages 79-86, San Francisco, CA, USA, 2016,IEEE. ISBN 978-1-4799-2736-4. doi: 10.1109/MobServ.2016.22. URL http://ieeexplore.ieee.org/document/7787058/
Technical Contribution
The DISCOPAR platform was designed as a generic citizen observatory creation tool.It is available online :
• Jesse Zaman, DISCOPAR Platform. https://discopar.net/, 2018
1.5 Dissertation Outline
The rest of this dissertation is organised as follows.
Chapter 2: Participatory Campaigning and Citizen Observatories provides agradual introduction to the core concepts of participatory sensing, participatory cam-paigning, and citizen observatories. First, an overview of the history of PS is pre-sented. Then, we introduce a definition for a PS campaign, along with a life-cyclemodel that most campaigns adhere to. Next, we present the concept of a citizen ob-servatory and its relation to participatory campaigning. We discuss a citizen observa-tory’s stakeholders and provide an overview of existing citizen observatory platforms.We highlight the problems involved in creating a citizen observatory. These motivatethe need for a citizen observatory meta-platform, i.e., a platform that can create citi-zen observatory platforms.
Chapter 3: Towards a Citizen Observatory Meta-Platform: Requirements pro-vides a more in-depth analysis of the challenges involved in creating a CO meta-platform. By analysing the “typical” citizen observatory architecture and stakehold-ers involved, we identify five key requirements that a CO meta-platform has to takeinto account. Next, we motivate our choice of programming techniques that willbe employed to implement these requirements, and we argue that a visual reactiveflow-based domain-specific language is the most suitable approach to implement acitizen observatory meta-platform. This chapter therefore introduces the concepts offlow-based programming, reactive programming, visual programming languages, anddomain-specific languages, and ends by presenting related work.
8

1.5 Dissertation Outline
Chapter 4: Language Concepts of DISCOPAR focusses on DISCOPAR’s graphlayer. More specifically, it presents the visual programming language that is built ontop of DISCOPAR’s component layer. We first describe the general idea of DISCO-PAR and introduce DISCOPARDE, our web-based visual programming environmentfor designing programs in DISCOPAR. Next, we introduce the various concepts andvisual syntax of DISCOPAR. We end the chapter by introducing four common strate-gies of visual programming languages that facilitate end-user programming, and de-scribe how these strategies are applied to DISCOPAR and DISCOPARDE.
Chapter 5: Constructing Citizen Observatories with DISCOPAR introducesthe CO meta-platform. The first part of this chapter focusses on how a citizen ob-servatory can be created through the use of DISCOPARDE. We describe how themobile data collecting app, server-side data processing, and web-based visualisationsof a citizen observatory can all be implemented in DISCOPAR. The second part ofthis chapter explains how campaigns can be created within a specific citizen obser-vatory. We conclude the chapter by describing the built-in calibration tool and thecommunity component creator provided by the CO meta-platform.
Chapter 6: Implementation gives an overview of the implementation of DISCO-PAR for the sake of reproducibility. This chapter first introduces the various abstrac-tions that together define the component layer in DISCOPAR. Next, we introduce theimplementation of DISCOPAR’s graph layer and DISCOPARDE. Finally, we providea high-level view on the underlying system architecture of the citizen observatorymeta-platform and discuss the various technologies involved in every part of a CO’sarchitecture.
Chapter 7: DISCOPAR at Work validates our reusable and reconfigurable ap-proach for ICT-agnostic users to design and deploy citizen observatories. The COmeta-platform is validated in terms of expressiveness, suitability, and usabilitythrough experiments in both laboratory as well as real-world conditions.
Chapter 8: Conclusion summarises the advantages of our CO meta-platform, pro-vides an overview of the contributions of this dissertation, and highlights some direc-tions for future work.
9


2PA RT I C I PAT O RY C A M PA I G N I N G A N D C I T I Z E NO B S E RVAT O R I E S
The evolution of the smartphone as a computing platform, combined with the richsensorial abilities it has acquired in recent years, have led to a new data gatheringparadigm called participatory sensing. Participatory sensing (PS) is often used in socalled campaigns, i.e., a collective effort focussed in an area and/or time. Partici-patory sensing is the driving technology behind so-called citizen observatories;i.e.,distributed software platforms that provide stakeholders with the instruments to col-lect, process, analyse, and visualise data in order to accumulate knowledge into acentralised repository. Today citizen observatories have to be developed from scratchfor each application area, meaning that deploying a new citizen observatory remainsextremely difficult and labour-intensive. Despite an overwhelming demand for suchplatforms, they are thus beyond the reach of most societal stakeholders. This led usto the idea of creating a reconfigurable citizen observatory platform that allows end-users to build and configure their own citizen observatory.
This chapter provides a gradual introduction into the core concepts of participa-tory sensing, participatory campaigning, and citizen observatories. First, an overviewof the history of PS is presented. Then, we introduce a definition for a PS campaign,along with a life cycle model that most campaigns adhere to. Next, we present theconcept of a citizen observatory and its relation to participatory campaigning. We dis-cuss a citizen observatory’s stakeholders and provide an overview of existing citizenobservatory platforms. We highlight the problems involved in creating a citizen obser-vatory. These motivate the need for a citizen observatory meta-platform; a platformthat can create citizen observatory platforms.
11

Chapter 2: Participatory Campaigning and Citizen Observatories
2.1 Sensors Galore
Conventional data gathering methods used by governments and authorities (i.e., usinga limited number of professional sensors placed in key locations) have some limita-tions [89, 35, 113]:
1. The number of professional sensors deployed is usually limited. Data collec-tion at sparse locations does not scale to meet a high spacial and temporalgranularity.
2. Deploying a large number of professional sensors is expensive, discouraginggovernments and authorities from applying this method due to budget limita-tions.
3. Professional sensors are usually placed in fixed locations, which means theyare inherently measuring the environmental conditions at given places and notthose surrounding actual people.
Paulos. et al [42] give a good example of this last problem: “The civic governmentmay say that the temperature is currently 23°C by taking one measurement at thecenter of the city or averaging several values from multiple sites across town. Butwhat if you are in the shade by the wind swept waterfront where it is actually 17°Cor waiting underground for the subway where it is a muggy 33°C.”.
Faced with these issues of conventional data gathering methods, scientists andstakeholders noticed the technological advances of modern mobile phones and thesheer number of them in circulation. According to a survey [19] conducted in 40nations, smartphone ownership stands at 43% of the population. The ownership ra-tio is even significantly higher among the richer economies surveyed (e.g., 88% ofSouth Koreans own a smartphone). The popularity of smartphones is not surprising asthese omnipresent devices are much more than mere cell phones that enable users tocommunicate. They can be regarded as pocket-sized computers that can be used as aphone, MP3 player, point-and-shoot digital camera, hand-held gaming system, GPS,flashlight, alarm clock, e-reader, voice recorder, etc. They have the capability to con-nect to the Internet, and utilise an operating system capable of running downloadedapps.
As smartphones matured as computing devices, they were gradually equippedwith an increasing number of sensors. For example, Figure 2.1 depicts the growthof sensors in the Samsung Galaxy S smartphone series. Nowadays, smartphones areequipped with a gyroscope, compass, accelerometer, proximity sensor, ambient light
12

2.1 Sensors Galore
BluetoothWifi RadioCellular RadioCameraProximityMicrophoneMagnetometerGPSLight MeterAccelerometer
GALAXY SGyroscopeBluetoothWifi RadioCellular RadioCameraProximityMicrophoneMagnetometerGPSLight MeterAccelerometer
GALAXY S2BarometerNFCGyroscopeBluetoothWifi RadioCellular RadioCameraProximityMicrophoneMagnetometerGPSLight MeterAccelerometer
GALAXY S3
HumidityThermometerPedometerBarometerNFCGyroscopeBluetoothWifi RadioCellular RadioCameraProximityMicrophoneMagnetometerGPSLight MeterAccelerometer
GALAXY S4 FingerprintHeart RateColor MeterPedometerBarometerNFCGyroscopeBluetoothWifi RadioCellular RadioCameraProximityMicrophoneMagnetometerGPSLight MeterAccelerometer
GALAXY S5Oxygen SaturationFingerprintHeart RateColor MeterPedometerBarometerNFCGyroscopeBluetoothWifi RadioCellular RadioCameraProximityMicrophoneMagnetometerGPSLight MeterAccelerometer
GALAXY S6
201520142013201220112010
Figure 2.1: Sensor growth in smartphones.
sensor, and other more conventional sensors such as front and back facing cameras, amicrophone, GPS, WiFi, and Bluetooth radios. Many of the newer sensors are addedto support the user interface or augment location-based services [80]. For example, alight sensor allows the phone’s software to automatically adjust the display’s bright-ness, while the GPS enables location-based applications such as maps. However, allthese sensors have additional potential: they enhance our ability to measure the realworld around us while we carry out our normal daily activities. For example, they canprovide real-time information about the current temperature, or we can use them todetermine whether noise levels fall within certain limits.
The use of smartphones as sensor nodes and location-aware data collection instru-ments led to the establishment of a new data gathering methodology, referred to asparticipatory sensing [65, 42]. This approach to data collection and interpretation re-lies on individuals, acting alone or in groups, along with their personal smartphonesto systematically monitor personal information (e.g. health) and/or environmentalinformation (e.g. noise levels, traffic conditions). Given enough people with a smart-phone, participatory sensing has the potential to collect enormous volumes of highlylocalised, person-centric data, which can support (or nudge) policy makers to assesssocietal processes in a way that was previously unthinkable.
13

Chapter 2: Participatory Campaigning and Citizen Observatories
2.2 Participatory Sensing
Participatory sensing (PS) allows people-centric environmental monitoring throughthe use of smart mobile devices. This is a well-established research field, as witnessedby the publication of recent surveys [32, 126]. The concept of PS is also sometimesreferred to as mobile crowdsensing [49], participatory urbanism [105], citizen sens-ing [65], urban sensing [15], or community sensing [76].
A concept closely related to participatory sensing is the concept of citizen science.Citizen science is defined by the European Commission as [24]:
“The engagement of the general public in scientific research activities wherecitizens actively contribute to science either with their intellectual effort orsurrounding knowledge or with their tools and resources.”
While participants in citizen science projects provide experimental data and facili-ties for researchers, they also raise new questions and co-create a new scientific cul-ture. Through citizen science activities, volunteers acquire new learning, skills, and adeeper understanding of the scientific work in an appealing way.
Strictly speaking, citizen science differs from PS in the sense that the former doesnot necessarily involve the use of technological equipment (smart mobile devices,dedicated sensors, etc.) to collect, store, and share observations from volunteers. Forexample, the earliest citizen science project is probably the Christmas Bird Count thathas been run by the National Audubon Society in the USA every year since 1900. Theproject is still ongoing, and in the most recent count, tens of thousands of observerscounted a total of over 63 million birds [117].
As the name implies, the collection of measurements is done participatively, aterm used in contrast with opportunistic sensing systems. These terms refer to whatroles people, as sensing device custodians, are willing to play in large-scale sensingsystems [78]. In the case of participatory sensing, people are incorporated into alldecision stages of the sensing system, such as deciding what data is shared or whendata is gathered. Hence, a PS system focuses on tools and mechanisms that assistpeople to share, publish, search, and interpret the information collected. With oppor-tunistic sensing, the user may not be aware of applications running in the background.These applications measure data automatically and when appropriate, and can makedecisions on their own.
Figure 2.2 presents an architectural overview of a typical PS system. A PS systemoperates in a centralised fashion, i.e., measurements collected by the mobile phonesare uploaded (using wireless data communications) to a central server for processing.On the server, the uploaded measurements are analysed and made available on a
14

2.2 Participatory Sensing
WEB-BASED CLIENT
MOBILE CLIENT
SERVER
Figure 2.2: Architectural overview of a typical participatory sensing system.
web-portal in various forms, such as graphical representations or maps showing thesensing results.
In the remainder of this section, we provide an overview of related work in thedomain of participatory sensing, dividing the research into three categories. The firstcategory consists of PS systems specifically designed for a particular use-case (e.g.measuring noise pollution, monitoring eating habits, etc.). The second category com-prises PS platforms that are more general and provide reusable tools that can beshared across various PS projects. The third category focuses on key research chal-lenges related to PS such as privacy, energy, and efficiency.
2.2.1 Ad-Hoc Participatory Sensing Systems
The emergence of the PS paradigm has resulted in a broad spectrum of systems acrossvarious domains. These include, but are not limited to, environmental monitoring,intelligent transportation, personalised medicine, and epidemiological investigationsof disease vectors [126]. Many of these applications are closed systems in the sensethat they can only be deployed in their respective domain, i.e., they are designedon a per use-case basis. We refer to such PS applications as ad-hoc participatorysensing systems. We use the term system, as participatory sensing entails more thanjust a mobile data gathering app. A PS system also includes some data managementstrategies to capture, analyse, and survey the gathered data, which is usually hostedon some back-end server infrastructure (cfr. fig. 2.2).
15

Chapter 2: Participatory Campaigning and Citizen Observatories
We present some examples of ad-hoc PS systems using a similar sub-classification as Christin et al. [32], which is based on the type of sensing involved.The first examples are people-centric sensing systems, which mainly focus on doc-umenting activities (e.g., sport experiences) and understanding the behaviour of in-dividuals (e.g., eating disorders). In contrast, environment-centric sensing systemscollect environmental parameters (e.g., air quality or noise pollution). There existmany more ad-hoc PS systems than those presented in the remainder of this section.We merely use a variety of examples to illustrate the different domains PS can beapplied to, in addition to the opportunities that it presents.
People-Centric Sensing Systems
People-centric PS systems collect data about the physiological state and health oftheir users. With the help of such applications, participants can monitor and documenthealth-related issues.
ExposureSense [106] monitors people’s daily activities to compute a reasonableestimation of air pollution exposure in their daily life. ExposureSense further enrichesair quality data by combining external sensor network data (e.g., air quality sensorsplaced on public transports like buses and trams) with data obtained from integrativeUSB pluggable sensors for smartphones (e.g., a pluggable ozone (O3) sensor). Thedaily activities are extracted using the accelerometer sensor as it is suitable for activityrecognition with minimal battery consumption.
BeWell+ [79] continuously monitors a user’s behaviour along three distinct healthdimensions, namely sleep, physical activity, and social interaction. This is done us-ing the gyroscope, accelerometer, microphone, camera, and digital compass. The apppromotes improved behavioural patterns by using an ambient display on the smart-phone’s wallpaper as a feedback mechanism.
StressSense [86] uses the microphone of smartphones to recognise stress fromhuman voice. It does this by analysing a variety of acoustic features of the capturedaudio samples, such as pitch. The classifier used by the StressSense system can ro-bustly recognise stress among multiple individuals in diverse acoustic environments.
There are many more people-centric applications dealing with health and fitnessdata such as diet behavior [4, 33, 109], physical activities [121, 57], depression [121],and sport experiences [39, 40]. However, most of these applications have been con-ceived as research prototypes and their real-world deployment still remains limited interms of either number of participants or deployment duration [20]. Nevertheless, sim-ilar commercial products for documenting running activities, such as RunKeeper [44]and Nike+ Run Club [101], are becoming increasingly popular.
16

2.2 Participatory Sensing
Environment-Centric Sensing Systems
Environment-centric PS systems handle information about a participant’s surround-ing (e.g., noise pollution, road and traffic conditions, etc.). Unlike most people-centricsensing scenarios, the collected data is mainly aggregated and exploited at a commu-nity scale [32].
NoiseTube [89], and similar projects such as NoiseSpy [70], Ear-Phone [107],and Laermometer [9], use the microphones embedded in smartphones to measurethe surrounding sound pressure level. These PS systems use their data to build rep-resentative noise pollution maps. Sound samples recorded through a mobile phone’smicrophone can also be analysed to determine the context of the sound recording(e.g., a human voice, music, etc.), as is the case in the SoundSense project [87].
Other projects focus on gathering (urban) air pollution information. Pollution-Spy [69] uses a Bluetooth personal network to connect up to seven different Blue-tooth devices (e.g., pollution sensors for CO, NO, NO2, CO2, etc.). These sensorsfeed geolocalised data to a log file and display this collected data graphically on thephone’s screen. Users also have the option to transfer the data to a remote databaseand view it in real time on GIS mapping tools, which are embedded in a dedicatedweb interface. Similarly, GasMobile[55] uses low-cost sensors connected to smart-phones to measure air pollution levels. They provide high data accuracy by exploitingsensor readings near static measurement stations to regularly keep sensor calibrationup to date. P-Sense [100] uses external sensors to monitor air pollution and assess theuser’s exposure to air pollution according to the places visited during daily activities.
Smartphones have also been exploited to document road and traffic conditions.For example, the embedded accelerometer, microphone, and positioning system canbe used to monitor traffic and road conditions such as potholes, bumps, or brakingand honking, which both are implicit indicators of traffic congestion [92]. In addi-tion, applications such as SeeClickFix [114, 90] and FixMyStreet [45] collect par-ticipant feedback about neighbourhood issues (potholes, graffiti, damaged infrastruc-ture). The reports made by users can then, for example, be submitted to the city coun-cil and made publicly available. This makes it easy to see what the common problemsare in a given area, and how quickly they are fixed.
2.2.2 Reusable Participatory Sensing Systems
Developing a new PS system for a particular domain is a costly operation, as it re-quires an enormous development effort to implement mobile apps, web interfaces,databases, data analysis, and data visualisation from scratch. This inspired a coupleof research initiatives to adopt a different approach. Rather than developing an ad-
17

Chapter 2: Participatory Campaigning and Citizen Observatories
hoc PS system, platforms were created that enables end-users to configure their ownmobile data gathering apps. However, these platforms focus only on discrete data,i.e., single-shot observations usually collected through digital questionnaires. Theyprovide no support for continuous data streams originating from smartphone sensors.This is due to the fact that surveys are much easier to handle than continuous sen-sor data streams. Examples of these platforms include Epicollect, ODK, SENR, andohmage.
EpiCollect [27] is a platform designed to provide a simple and intuitive methodto set up data collection projects. A web-based form builder enables users to definea single survey to be used for data collection, which can be deployed as both an An-droid and iOS mobile app. The survey questions can be organised using conditionalbranching. A rich set of data types is supported. Collected data can be analysed usinga web-based data visualiser. Due to the fact that many data collection projects requireconsiderably more complexity than a single form, an enhanced version of EpiCollect(EpiCollect+) has been developed that provides the ability to produce more complexforms with more features [28].
ODK [13] is a modular toolkit that helps semi-professional users to build mo-bile data collection solutions. ODK has been deployed in many countries, both inthe public health domain and environmental monitoring. It started out as a tool forcollecting surveys using mobile devices, and although integrated sensor support wasunder development, to the best of our knowledge this was never released for pro-duction. However, it does provide a modular set of tools that helps simplify sensingapplication development by creating a single interface to connect to both external andbuilt-in sensors.
SENSR [74] is an authoring tool that enables non-programmers to create, shareand manage a citizen science project. SENSR combines a visual drag-and-drop pro-gramming environment with a mobile application in which people with limited tech-nical expertise can build mobile data collection tools and manage data collectively.SENSR only supports a limited set of data types and provides no access to smart-phone sensors besides the GPS.
Ohmage [123] is a modular PS platform that gathers, analyses, and visualisesdata from both form-based surveys and continuous data streams. It has been usedprimarily for research in the education and medical fields. Although ohmage does notexplicitly have a sensor abstraction framework like ODK, it can consume collecteddata streams, such as location traces and audio samples, through its applicationprogramming interface.
18

2.2 Participatory Sensing
A different approach to reduce the workload involved in constructing participatorysensing systems is offered by AWARE [43]. Rather than providing a platform that isconfigurable by non-programmers, AWARE provides an open-source mobile instru-mentation toolkit whose aim is to reduce the development effort involved in build-ing participatory sensing systems. To do so, AWARE encapsulates implementationdetails of sensor data retrieval and exposes the sensors as higher-level abstractions.AWARE is available as a library that can be added to any Android development ap-plication or plugin using Android Studio’s Gradle mechanism.
2.2.3 PS Research Challenges
A variety of research focuses purely on key research challenges that both ad-hoc PSsystems and reusable PS systems are faced with. One key challenge in PS is ensur-ing that the collected data is representative for the monitored area. To ensure spatio-temporal density, participatory sensing systems need enough participants and/or acoordination mechanism to assist the data collection process. This can be done byusing game elements on location-based services for directly improving the qualityrather than quantity [71, 111], minimising the number of participants necessary tosatisfy a predefined coverage constraint [139], and using triggers based on spatialmodels of previously collected data [83].
A participant coordination approach generally requires that the location of eachparticipating device is known by the central coordination mechanism (i.e., a server).This poses a problem for smartphones, as sending frequent location updates to theserver consumes battery power. Energy consumption is thus another key researchchallenge, as users are not willing to use PS applications if they drain their batter-ies considerably faster [128]. For this reason, research also focusses on optimisingbattery usage of PS systems. One example is the STREET framework [73], whichis assisted by a simple localisation scheme during the data collection process thatminimises the usage of the GPS sensor.
Another key challenge is incentive mechanisms. The quality of the data gatheredby PS systems relies on the willingness of mobile users to participate in the collec-tion and reporting of data. Without adequate incentive mechanisms most users are notwilling to participate (on a longer run). Therefore, appropriate incentive mechanismsmust be designed if participants do not obtain a direct benefit from their contribution.Such mechanisms can either be monetary (e.g., micro-payments [108, 82, 99, 50])or non-monetary incentives (e.g., gamification [50, 127]). Additionally, if users feelthat their privacy might be endangered, it is likely that they will be reluctant to par-
19

Chapter 2: Participatory Campaigning and Citizen Observatories
ticipate. A number of projects therefore focus on privacy protection in participatorysensing [26, 51, 12].
2.3 Participatory Campaigning
We introduced the concept of participatory sensing as an alternative data gatheringmethodology to monitor personal and/or environmental information. One questionthat remains is whether the potentially enormous quantity of PS data can really com-pensate for the typically inferior quality of individual measurements coming fromsmartphone sensors. Several research efforts have answered that quality-quantityquestion in the affirmative [130, 41, 64]. But in order to do this, one first and foremostneeds to ensure that a high data quantity is achieved. However, participatory sensingis a relatively new paradigm, so the actual number of people that may be interestedand capable of participating is currently insufficient in order to obtain qualitative data.As a result, PS is currently mainly used on a smaller, coordinated scale where a lim-ited number of people are still capable of obtaining qualitative and useful data. Thisis achieved by organising a so called participatory sensing campaign, which usuallyfocuses the combined effort in an area and/or time. The idea of organising partici-patory sensing actions into campaigns was mentioned as early as 2006 by Burke etal. [65]:
“With the right tools, professionals and community groups alike could employparticipatory sensing campaigns to gather data about short-term concerns[...] without waiting for a formal project or grant funding— yielding bottom-up, grassroots sensing.”
The idea of a campaign also emerges naturally in the context of participatory sensingas there is high demand by communities of all sorts — grassroots, institution-led, orresearch-based — to be able to translate local concerns into actual socio-economiccampaigns for tackling them.
PS campaigns ensure data density in absence of a large crowd contributing data.This, in turn, is essential for adequate assessment of the concern at hand. Indeed,in a participatory context one has to strike the right balance between quality andquantity of data, statistically averaging over large datasets so as to minimise randomerrors while at the same time increasing representativeness of values obtained. Byfocusing measurement efforts in terms of geographical and temporal boundaries itcan be ensured that a dense enough dataset is collected.
While data density plays a significant role in the success of PS campaigns, trust-worthiness of the acquired data also plays a role. The fact that anyone is allowed to
20

2.3 Participatory Campaigning
contribute data exposes the campaigns to erroneous and malicious contributions [68].Erroneous contributions may be the result of a user unintentionally positioning thesmartphone such that incorrect measurements are recorded, e.g., placing the devicein a bag whilst recording data for a noise mapping campaign. Malicious contributionsmay originate from users that deliberately pollute sensor data for their own benefits,e.g., a real estate leasing agent may intentionally contribute fabricated low noise read-ings to promote his properties in a particular suburb. A campaign thus also needs acertain level of confidence in the contributions uploaded by volunteers, such that thecampaign outcome will be useful for the community involved.
Despite the existence of several PS systems and their application in specific cam-paigns, there is currently no formal notion of a campaign. However, Burke et al. [65]informally defined a campaign as
“geographically and temporally constrained series of systematic operationsto gather a particular type of data — using an already-deployed (but not atall static) network of mobile devices”
In the remainder of this section, we introduce the concept of a campaign protocol,which is used to define the concept of a PS campaign. We also discuss the typicallifecycle of a PS campaign. These concepts are described based on our findings fromprevious work [36, 137], where we analyse a number of participatory sensing cam-paigns to observe commonalities and detect patterns.
2.3.1 Campaign Protocol
Participatory sensing is an inherently active data gathering method; measurementsare gathered consciously by users with specific devices. It is thus possible to describethe context of the collected data, i.e., information describing the user (e.g., age, gen-der) and the particular device (e.g., brand, model) used to collect data. We denote thisset of context information by {C}. Data is gathered in a collection of measurements{M}. An individual measurement is a tuple of data points M = (s1, . . . , sn) wheresi are sensor readings. We use the liberal meaning of the word sensor here, encom-passing real sensor data, user inputs, data ingested from existing datasets, or evenhigher-order data such as that derived by activity recognition algorithms. We write{C} ⇒ {M} to indicate that the context {C} contributed dataset {M}. We thenhave the following definition.
Definition 1. A campaign protocol is a set of predicates PC + PM over context C andmeasurements M respectively.
21

Chapter 2: Participatory Campaigning and Citizen Observatories
Contextual Predicate
The contextual predicate PC captures the desired context of the data collection. Forexample, it can be used to indicate what types of users are allowed to contributeand/or what types of devices must be used to perform the data gathering. The abilityto express the former is important as our previous experiences with participatory cam-paigning indicated that there are certain campaigns that only allow trusted individualsto participate, while other campaigns allowed any participant to contribute. The abil-ity to express what types of devices must be used to perform the data gathering isimportant as restricting the data collection to certain device models, e.g., those withmore accurate sensors or a matching calibration profile, can increase data quality.
Measurement Predicate
The measurement predicate PM generally includes a temporal predicate PT specifyingwhen participants must be collecting data. For example, a temporal predicate can beused when a comparison between days (e.g., workweek vs. weekend) or hours (e.g.,peak-hours vs. off-peak hours) is desirable. Temporal predicates can also be usedwhen a limited number of participants is available.
The measurement predicate also frequently includes a geographical predicate,which we write as PA, with A for the area. Placing a geographical boundary on thearea of interest of a campaign has multiple purposes [137]. First, campaigns become‘local’, i.e., they tackle a concern in a particular area. Because, people living in thatarea would benefit from participating in that campaign, localising a campaign mayserve as an incentive to take part in it.
Focussing participant contributions to a certain time frame and instructing themto measure in a predefined area increases the density of the collected measurements,thereby enabling the generation of more accurate results.
Example: NoiseTube
NoiseTube [89] is a participatory monitoring and mapping system of ambientsound levels through mobile phones. In NoiseTube measurements are tuples ofsensor readings containing the time, sound pressure level, latitude, longitude, andzero or more tags that can be used to describe the sound source. We can thus sayuserAccount1, SamsungS8 ⇒ {timei, Leq,i, latitudei, longitudei,tags∗i }
ni=0. to indicate that that a particular user and mobile device contributed
a dataset containing NoiseTube sensor readings. Consider a campaign with thefollowing scenario: a city administrator wishes to investigate sound pressure levels
22

2.3 Participatory Campaigning
recorded by his employees, using calibrated handsets, in the centre of Brusselsbetween 8-9am during the month of May. We can thus formally represent thecampaign protocol predicates as follows:
PC = (user ∈ employees, device ∈ calibrated-devices)PM = ((latitude, longitude) ∈ polygon(Brussels),
time ∈ [2017-05-xT08:00, 2017-05-xT09:00]with x ∈ {1,...,31})
2.3.2 Campaign Definition
Using the concept of a campaign protocol, we now define a participatory sensingcampaign as follows:
Definition 2. A campaign is a collection of measurements M constrained by the cam-paign protocol consisting of predicates PC + PM over context C and measurementsM respectively, such that M is collected participatively by a set of users satisfying PC.A campaign is considered successful if M is dense enough to generate a qualitativeoutput.
It is important to notice that in addition to the constraints embodied in the protocol,we also capture the necessity of obtaining data that meets certain qualitative predi-cates. Whether or not a particular output is qualitative depends on the specific goal ofa campaign. The enormous quantity of data that is typical of PS is usually translatedinto a more qualitative condensed representation, e.g., by location-based statisticalaveraging. Therefore, the quality of a campaign is inherently related to the density ofmeasurements.
2.3.3 Campaign Lifecycle
From analysing several environmental PS campaigns [136, 36], combined with ourextensive expertise in participatory noise sensing with the NoiseTube project, we de-rived a typical campaign’s lifecycle, which is shown in fig. 2.3. A campaign’s lifecycleproceeds through a number of stages [136, 137]:
Campaign Conceptualisation
The first step in a campaign’s lifecycle is the initiative. There are many situationswhere one or more stakeholders may want to initiate a campaign around a giveninterest. Examples of campaign initiators include:
23

Chapter 2: Participatory Campaigning and Citizen Observatories
Initiative Seek Assistance
Planning
Info
Recruitment
ProtocolDefinition
Campaign Definition
ExecutionDataAggregation
ParticipatorySolution
...Institutional
Solution
Question
Answer
Campaign Conceptiualisation
Campaign Enactment
!
?
Figure 2.3: Campaign lifecycle.
• A civil society organisation setting up a campaign based on its members organ-isations’ interests.
• A research institute or governmental organisation setting up a campaign forparticipatory research or policy-making.
• Citizens setting up a campaign for a particular concern in their neighbourhood.
In second step, the initiators seek a suitable solution for their particular inter-est and compare existing data gathering methods. During this phase, initiators maydiscover the existence of a certain PS system either by themselves (media, word ofmouth) or by consulting a research institute, governmental organisation, etc. This PSsystem can then be considered as an alternative to better-known institutional solutions.Once the initiators agree to adopt a participatory solution, the campaign definitionstarts.
Campaign Definition
Defining a campaign involves several steps: The envisioned participants are recruitedand informed about the concept of a PS campaign, and each participant is briefed withthe usage instructions of the selected PS system. This is usually done by face-to-facemeetings where an expert explains the prerequisites for a campaign to be success-ful. In case the initiators underestimated the workload involved and the number ofparticipants needed, an additional recruitment phase can occur.
24

2.4 Citizen Observatories
As soon as enough motivated participants have been recruited, the planning phasebegins. The purpose of this phase is to ensure the campaign achieves its goal. Remem-ber that for participatory sensing to be a valid alternative for other data gatheringmethods, a high data quantity must be achieved. The planning ensures that each par-ticipant’s measurements have optimal use and reduces the chance for data redundan-cies. For example, a noise mapping campaign concerned about the noise pollution ina certain neighbourhood will set up a planning to prevent that every participant mea-sures in the same area at the same time. Once the planning is complete, the actualexecution of the campaign can finally begin.
Campaign Enactment
The actual execution of the campaign consists of participants collecting data usingtheir mobile devices. Ideally, the campaign is monitored and analysed during thisphase to trigger remediating action when problems arise. For example, when thereis insufficient coverage of the area of interest, or when participants are producingunusable data as a result of not measuring properly (e.g., not turning on the GPS ofthe mobile device).
During the campaign’s execution, all the data is aggregated and made availablefor analysis and visualisations. The campaign’s output can then be used by the initia-tors, participants, and decision makers to reflect upon the results. For example, whenpeople take part in a campaign that keeps track of their travel habits and providesthem with personalised recommendations for alternative routes (and benefits relatedto these alternatives), they may decide to follow up on those recommendations.
2.4 Citizen Observatories
Although many PS systems were implemented as a prototype for a single use-case,there also exist more advanced PS systems that have been used to organise multiplecampaigns. In this case, the PS system becomes a sort of data repository for variouscampaigns, where researchers/citizens — who are not necessarily actively involved— can analyse/compare the data gathered of every campaign, as well as individualcontributions.
For example, consider NoiseTube [89], a PS system enabling the monitoring andmapping of ambient sound levels by using the microphone of mobile phones. Be-tween 2008 and 2016, NoiseTube has been used in 19 noise mapping campaignsat 13 different locations. One such example is a group of 7 concerned citizens thatmapped the noise pollution in their neighbourhood due to a huge traffic-laden round-
25

Chapter 2: Participatory Campaigning and Citizen Observatories
about [36]. In some of these campaigns, the resulting noise maps where used to showthe city administrations that existing official noise maps based on simulations werenot representative of the actual noise levels. Despite their different intentions, each ofthese campaigns contributed meaningful data on sound pressure levels to NoiseTube.Combined with standalone contributions of individual users, NoiseTube has becomea data repository on noise pollution data from all over the world. End-users are al-lowed to consult this data for various purposes, such as to compare noise levels inmajor cities around the world.
To differentiate the single use-case PS systems with these more advanced PSsystems that act as a central repository of knowledge on a particular type of data, werefer to the latter as so called citizen observatories, which we define as follows:
Definition 3. A citizen observatory (CO) is a distributed software platform that pro-vides stakeholders with the instruments to collect, process, analyse, and visualisedata in order to accumulate knowledge into a centralised repository.
It is important to understand the relationship between a citizen observatory andthe previously introduced concept of participatory campaigning. Generally speaking,a CO collects, analyses, and evaluates a specific type of data (e.g. environmentalnoise, water polution, etc.). To collect this data, each observatory has one dedicatedmobile PS app. Within each CO, users can deploy campaigns to aggregate data for aparticular goal or concern. Campaigns are only interested in a subset of the observa-tory data (defined by the campaign protocol), and thus describe how the observatorydata should be filtered, processed, and aggregated. Note that a CO does not necessar-ily collect data only through campaigns. The idea of a CO is usually to obtain pub-licly available data that stakeholders can use in their policy making. It is thereforeperfectly possible that stakeholders merely use the CO to create visualisations usingthe available open data without actually running a campaign themselves. Citizen ob-servatories also serve as an information hub for citizens. For example, an individualuser might consult the CO data to get an idea of the noise pollution that he is exposedto in his daily life.
The definition of a citizen observatory does not imply that the data collection canonly be accomplished using smartphones. As stated by Liu et al. [84] a CO entails“the participation of citizens in monitoring the quality of the environment they live in,with the help of one or more of the following: (1) mobile devices of everyday utility;(2) specialized static and/or portable environmental and/or wearable health sensors,and (3) personal, subjective and/or objective observations, information, annotationand exchange routes, coming from social media technologies or other similar plat-
26

2.4 Citizen Observatories
forms”. In the scope of this dissertation, we only focus on citizen observatories wherethe data collection is performed using smartphones and specialised portable sensors.
2.4.1 Citizen Observatory Stakeholders
By analysing several PS systems, Christin et al. [32] derive a general model of a PSsystem including stakeholders and architectural components. We extend this modelto include the concept of a citizen observatory and the campaigns that it can host. Theresulting model is depicted in Fig. 2.4. We now discuss each stakeholder involved ina citizen observatory.
Query Data
Citizen Observatory Administrator
End Users
Participants
Campaign Administrator
Monitor CampaignDesign Campaign
Contribute Data
Receive Feedback
Analyse Data
Manage ICT ToolsMonitor Observatory
Figure 2.4: Stakeholders of a citizen observatory.
Citizen Observatory administrators are the creators of citizen observatories. Theyare responsible for creating and managing the set of ICT-tools that comprise a CO,usually a mobile application for data gathering, server-side back-end infrastructurefor processing and storing data, and web-based visualisation tools. It is the COadministrator’s responsibility to set up these tools either by themselves or by hiringa developer.
Campaign administrators are members of a community, an organisation, researchgroup, or simply individuals who wish to set up a participatory sensing campaignthat uses a certain CO. They design, implement, and deploy the PS campaign withinthe CO. The campaign is defined as a subset of the data collected by the observatory,so ideally the CO provides campaign administrators the means to describe whichsubset of data they want to gather and for what particular purpose or goal.
27

Chapter 2: Participatory Campaigning and Citizen Observatories
Participants install the PS application on their smartphone and voluntarily gathersensor readings to contribute to the CO and the PS campaigns of that CO. Aparticipant’s can be motivated to contribute data either through personal benefit,e.g., to monitor their impact on the environment, or through specialised incentivemechanisms (cfr. section 2.2.3).
End users access and consult the data gathered by the participants according to theirinterests and preferences. End users include the contributing participants, as theyusually want to consult their own collected data. Other end users can be campaignadministrators verifying the actual contributions and results, or specialised scientistsattempting to gain insights about the monitored phenomena.
2.4.2 Research in Citizen Observatories
Citizen observatories have been discussed as an increasingly essential tool for betterobserving, understanding, protecting, and enhancing our environment [84]. This gainin popularity is visible, for example, through the many research projects funded bythe European Union on the topic of observatories. In 2012, five projects were fundedunder the EU’s Seventh Framework Programme for Research and Technological De-velopment (FP7): CITI-SENSE [22] (air quality), COBWEB [23] (biospheres), We-SenseIt [133] (water quality), Citclops [21] (ocean monitoring), and OMNISCIEN-TIS [104] (odour monitoring). Each of these projects were aimed at developing noveltechnologies and applications in the domain of Earth Observation. Their goal was toexploit the capabilities offered by portable devices to enable an effective participationby citizens in environmental stewardship, in support of both community and policypriorities. Ever since, various citizen observatories have been emerging to stablishinteraction and co-participation between citizens and authorities about various envi-ronmental issues, emergencies (e.g., flooding [81]), or the day-to-day management offundamental resources.
Research in citizen observatories continues in ongoing projects of the EU’s Hori-zon 2020 research and innovation programme. This programme includes projectssuch as the GROW observatory [103] that generates, shares, and utilises informationon land, soil and water resource, and the SCENT [112] and LandSense [77] obser-vatories that and use and land cover. Citizen observatories such as these prove thecritical role of ICT in the evolution towards a sustainable society.
28

2.4 Citizen Observatories
2.4.3 Research Questions
Despite the existing and ongoing research, there are still many fundamental chal-lenges that citizen observatories are faced with, such as ensuring effective userparticipation, dealing with data privacy, and taking into account data standards, qual-ity and reliability [84]. One major issue of citizen observatories is that, despitethe high societal demand, developing a new citizen observatory remains a labour-intensive (i.e., costly) and lengthy process that requires substantial technical expertise.In this dissertation, we focus on finding a solution towards a wide-scale adoption ofcitizen observatories. Concretely, this dissertation addresses the following researchquestions:
Research Question 1
How can we transform the development and deployment of new citizenobservatories into a more systematic process?
There is currently no systematic, easy and reusable method for setting up new cit-izen observatories and for defining their corresponding data collection campaigns.Although there already exist several reusable and reconfigurable PS systems (cfr. sec-tion 2.2.2), they focus more on data collection (typically form-based) and neglectother roles of a citizen observatory such as advanced data processing methods, andparticipant feedback and coordination.
One key insight that can be used to make the development and deployment ofcitizen observatories a more systematic process is that each CO and their underlyingparticipatory sensing applications all share a similar structure: information is gatheredcollaboratively (implicitly or explicitly) by mobile users and uploaded to a server foraggregation, global analysis, and visualisation. Feedback is sent back to the usersso that they are made aware of the status of the observatory, ideally in a continuousmanner.
Research Question 2
How can we provide technological support for the definition and enactment of aPS campaign and enable the automated orchestration thereof?
The knowledge on how to organise campaigns properly is absent from currently ex-isting PS systems, nor do they provide any means to define and enact a PS campaign.This is problematic for stakeholders, who are therefore largely dependent on PS sys-tem owners for insider knowledge on campaign management, but also for the PS
29
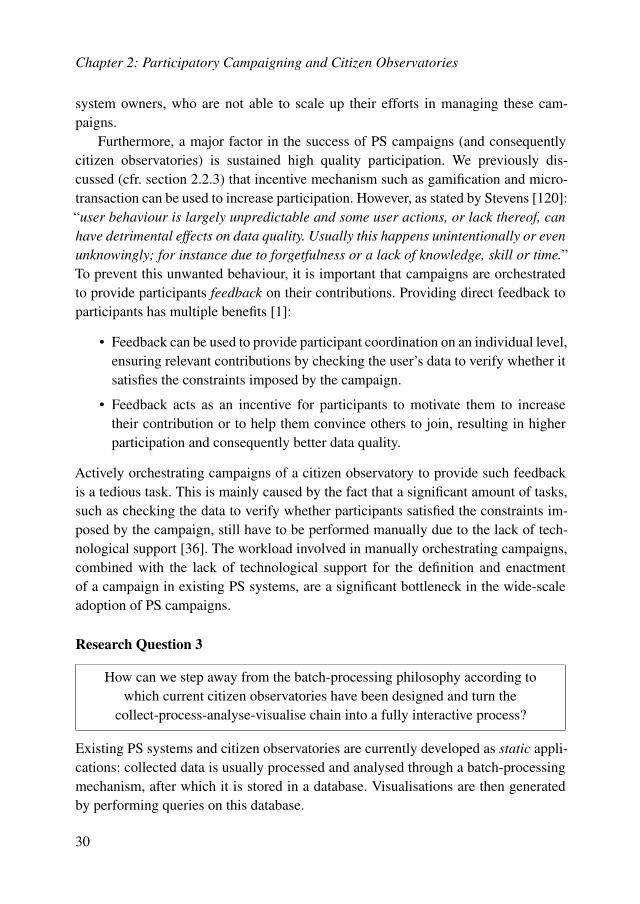
Chapter 2: Participatory Campaigning and Citizen Observatories
system owners, who are not able to scale up their efforts in managing these cam-paigns.
Furthermore, a major factor in the success of PS campaigns (and consequentlycitizen observatories) is sustained high quality participation. We previously dis-cussed (cfr. section 2.2.3) that incentive mechanism such as gamification and micro-transaction can be used to increase participation. However, as stated by Stevens [120]:“user behaviour is largely unpredictable and some user actions, or lack thereof, canhave detrimental effects on data quality. Usually this happens unintentionally or evenunknowingly; for instance due to forgetfulness or a lack of knowledge, skill or time.”To prevent this unwanted behaviour, it is important that campaigns are orchestratedto provide participants feedback on their contributions. Providing direct feedback toparticipants has multiple benefits [1]:
• Feedback can be used to provide participant coordination on an individual level,ensuring relevant contributions by checking the user’s data to verify whether itsatisfies the constraints imposed by the campaign.
• Feedback acts as an incentive for participants to motivate them to increasetheir contribution or to help them convince others to join, resulting in higherparticipation and consequently better data quality.
Actively orchestrating campaigns of a citizen observatory to provide such feedbackis a tedious task. This is mainly caused by the fact that a significant amount of tasks,such as checking the data to verify whether participants satisfied the constraints im-posed by the campaign, still have to be performed manually due to the lack of tech-nological support [36]. The workload involved in manually orchestrating campaigns,combined with the lack of technological support for the definition and enactmentof a campaign in existing PS systems, are a significant bottleneck in the wide-scaleadoption of PS campaigns.
Research Question 3
How can we step away from the batch-processing philosophy according towhich current citizen observatories have been designed and turn the
collect-process-analyse-visualise chain into a fully interactive process?
Existing PS systems and citizen observatories are currently developed as static appli-cations: collected data is usually processed and analysed through a batch-processingmechanism, after which it is stored in a database. Visualisations are then generatedby performing queries on this database.
30

2.5 Vision: Citizen Observatory Meta-Platform
This traditional approach discourages participants from contributing due to theslow or late feedback, and lack of acknowledgement of their contributions by the cit-izen observatory and/or campaigns. In contrast, immediate and specific feedback canserve as incentive mechanism for participants. Slow feedback is also problematic forthe automated orchestration of a PS campaign (cfr. Research Question 2). For exam-ple, steering the movements of individual participants requires real-time knowledgeon each participant’s whereabouts.
To solve this issue, citizen observatories and campaigns must be responsive touploads from participants. The data gathering process must be an interactive cyclewhere participants upload data to a citizen observatory and immediately receive feed-back, such as coordination instructions or intermediate campaign results, based ontheir contributions.
Research Question 4
How do we enable ICT-agnostic stakeholders to design their own citizenobservatories and campaigns?
Due to the lack of systematic, easy and reusable method for setting up new citizenobservatories, deploying a new citizen observatory remains difficult and labour inten-sive. They are thus beyond the reach of most stakeholders, who usually lack the nec-essary ICT-skills and programming knowledge to create a citizen observatory fromscratch [18]. This often forces stakeholders to opt for a non-technological approach(i.e., pen and paper) or to spend big chunks of their restricted budget on externalICT-consultants.To be accessible to societal stakeholders and communities, citizen observatories mustbe configurable and usable by ICT-agnostic stakeholders. Here, the challenge is find-ing the right balance between expressiveness and usability. Stakeholders must beallowed to design a citizen observatory and campaigns in a way that automaticallygenerates the necessary tools to collect, process, analyse, and visualise data accord-ing to their expectations.
2.5 Vision: Citizen Observatory Meta-Platform
Despite the high societal demand, citizen observatory development remains labour-intensive, lengthy, and requires technical expertise. This led us to the idea of a genericapproach towards reusable and reconfigurable citizen observatories. We refer to this
31

Chapter 2: Participatory Campaigning and Citizen Observatories
generic platform for setting up citizen observatories as a citizen observatory meta-platform. A ‘meta-platform’ is a platform that reasons about and acts upon anotherplatform [88]. Hence, a CO meta-platform reasons about and acts upon citizen obser-vatory platforms. Concretely, we envision a CO meta-platform as follows:
Research Vision 1: Reconfigurable Citizen Observatory Platform To avoid re-building all the mobile apps, web interfaces, databases, data analysis and visualisa-tion elements from scratch, we envision the CO meta-platform as a component-basedsoftware development approach that is less ad-hoc and less dependent on hardcoreprogramming technologies. Despite being constructed from reusable components, cit-izen observatories created though the meta-platform must be expressive and powerfulenough to handle both discrete data (e.g., people’s experience of their surroundings,such as the perception of local safety in cities) and continuous data (e.g., sensorialdata, such as temperature or air humidity).
Research Vision 2: Campaign Definition and Enactment Unlike existing PS sys-tems where campaigns are not explicitly supported and usually managed manually,we envision the CO meta-platform to enable the definition of a PS campaign and theenactment thereof. As a result, initiators can define campaigns themselves rather thanrelying on PS system owners for insider knowledge. Campaigns are then enacted bythe platform to provide automated orchestration to participants. This orchestrationcan coordinate participants whilst they are gathering data and provide them feedbackon their contributions as an incentive mechanism.
Research Vision 3: Reactive Citizen Observatories To guarantee successful cam-paigning it is essential that we embed automated orchestration to guide data collectionand immediate user feedback. This requires citizen observatories and campaigns to bereactive, whereas the automated orchestration must encompass the distributed archi-tecture of a citizen observatory (mobile data gathering app and server-side process-ing) transparently. We therefore envision each citizen observatory created throughthe meta-platform as a massive cloud-based reactive application that reacts on datacoming from mobile devices, contributes that data to the server, and promptly pushesfeedback, such as intermediate campaign results, back to the relevant devices.
Research Vision 4: ICT-Agnostic Usability Within this CO meta-platform,stakeholders can set up and configure the necessary ICT-tools of a citizen obser-vatory and deploy campaigns without or with very little programming skills. We
32

2.6 Conclusion
envision an interface that offers access to components to describe the type of data,the constraints it is subject to, the mechanism of its gathering and the process ofits storage in the citizen observatory. This interface also enables stakeholders toformulate a PS campaign by defining the campaign protocol (cfr. section 2.3.1) andtheir expectations for the campaign’s output (e.g., types of maps).
Furthermore, the CO meta-platform has the potential to act as a central hub for thevarious research undertakings in PS. Due to its component-based approach, problemssuch as incentive or coordination mechanisms (cfr. section 2.2.3) that are usually re-searched and solved in an isolated environment, can be implemented as a componentof the meta-platform. As a result, interoperability and synergies can be establishedbetween the various research performed in the domain of participatory sensing.
2.6 Conclusion
In this chapter, we explain how the evolution of the smartphone, combined with itsuser’s mobility, led to the establishment of a new data gathering methodology referredto as participatory sensing. After providing an overview of PS use cases and relatedresearch, we introduced the concept of participatory campaigning as a combined datagathering effort and formally described the various aspects of a campaign. In thebigger picture, such campaigns are a part of citizen observatories. We observe fromthe current state of the art that each of these observatories are developed from scratch,due to a lack of reusable and reconfigurable citizen observatory construction tools. Al-though there already exist several reusable and reconfigurable PS systems, they focusmore on the data gathering (typically form-based) and neglect other roles of a citizenobservatory such as advanced data processing methods, and participant feedback andcoordination. As a solution, we propose a more generic approach through the use ofa CO meta-platform. Through this meta-platform, ICT-agnostic stakeholders will beable to construct their own citizen observatories and design PS campaigns with littleor no help from platform owners. Only in this way can we move away from small-scale research-oriented deployments to the full-fledged adoption of PS as a societallyand scientifically relevant method. In the following chapter, we perform a require-ments analysis of the envisioned CO meta-platform and use these as a guideline tochoose the most suited technologies to implement the CO meta-platform.
33


3T OWA R D S A C I T I Z E N O B S E RVAT O RY M E TA - P L AT F O R M :R E Q U I R E M E N T S
Building a citizen observatory meta-platform is a challenging task because of threereasons. First, in order to be truly generic, the platform must cover the rich diversity incitizen observatory scenarios. Second, when applicable, campaign participants mustbe coordinated in real-time to ensure the campaign’s data quantity and/or quality. Lastbut not least, the platform must be accessible to stakeholders and communities withlimited ICT knowledge.
This chapter starts by providing a more in-depth analysis of the challenges in-volved in creating a CO meta-platform. By analysing the typical citizen observatoryarchitecture and stakeholders involved, we identify five key requirements that a COmeta-platform has to take into account. Next, we motivate our choice of program-ming techniques that will be employed to implement these requirements, where weargue that a visual reactive flow-based domain-specific language is the most suitableapproach to implement a citizen observatory meta-platform. Therefore, this chapterintroduces the concepts of flow-based programming, reactive programming, visualprogramming languages, and domain-specific languages. We end the chapter by pre-senting related work.
35

Chapter 3: Towards a Citizen Observatory Meta-Platform: Requirements
3.1 Citizen Observatory Architecture
Citizen observatories all share a similar architecture, namely a mobile app, serverwith a database, and web-based visualisation tools. Figure 3.1 depicts this typical cit-izen observatory architecture. This architecture is based on similar reference architec-tures for participatory sensing systems [138, 37]. We discuss each element in-depthto analyse the functional requirements for a CO meta-platform.
SERVER WEB-BASED CLIENTMOBILE CLIENT
Sensing
Processing
Storage
Feedback
Visualisations
Data Analysis
Data Query
Processing
Storage
Campaign Enactement
Intermittent Connection
Intermittent Connection
Figure 3.1: Citizen observatory architecture.
Mobile Apps gather the required information through on-board sensors and user-input, and upload it to the server for aggregation and analysis. Additionally, users ofthe mobile app (i.e., participants) may receive feedback in real-time (e.g., coordina-tion instructions, data visualisations). Despite the high variability of citizen observa-tory scenarios, PS apps share common technical properties. Regardless of which dataparameters are being collected, PS apps need to include logic on how to upload datato a server, handle temporal disconnections, access the device’s sensors, etc.
Servers and Databases are responsible for processing and storing the (potentiallymassive amount of) data generated by the mobile apps. Similarly to the mobile apps,many different processing steps and algorithms can be used in multiple scenarios (al-beit with slightly modified settings and input data). Storing the data also presents achallenge, as each citizen observatory can gather completely different types of data.Additionally, the server has to handle every campaign deployed within the observa-tory. Each campaign must process and filter uploaded data as specified through the
36

3.2 Meta-Platform Stakeholders
campaign protocol (cfr. section 2.3.1). Ideally, this campaign enactment occurs inreal-time to provide immediate feedback on each participant’s contributions.
Web-Based Analysis and Visualisation Tools provide participants and stakehold-ers means to reason about the collaboratively gathered data. In most cases, these aresimple graph visualisations or map-based plotting of data samples. However, moreadvanced data analysis and visualisations can be envisioned, such as cluster analysesand correlations
3.2 Meta-Platform Stakeholders
As described in section 2.4.1, there are various stakeholders involved in a citizenobservatory. The CO meta-platform must be accessible to these stakeholders andcommunities with limited ICT knowledge. In this section, we provide details onour assumptions on the background and level of ICT knowledge of the variousstakeholders that will interact with the CO meta-platform.
CO meta-platform owners are the only stakeholder category that require program-ming knowledge, as they are responsible for maintaining the CO meta-platform andthe corresponding hardware architecture. This includes the addition of new features,such as support for a new type of smartphone sensor.
Citizen Observatory administrators and Campaign administrators are expectedto be domain-experts with limited ICT knowledge, comparable to the knowledgerequired for interacting with Microsoft Excel. This means that administrators do notrequire programming knowledge to set up their own citizen observatory or deploy acampaign using traditional methods. However, administrators do need to be familiarwith the domain in the sense that they need to know how to collect, process, andvisualise data.
Participants do not need to be domain experts of the citizen observatory that theyare contributing to. We assume basic technological knowledge and experience ininteracting with a smartphone. This includes the knowledge on how to install andoperate a mobile app.
37

Chapter 3: Towards a Citizen Observatory Meta-Platform: Requirements
End-Users are divided into two categories: basic end-users and advanced end-users.Basic end-users only look at the visualisations and results made available on the webpage of the citizen observatory or campaign. Advanced end-users are those that wantto perform their own analysis and create their own visualisations. For advanced end-users, we assume an ICT knowledge-level on par with being capable of working withMicrosoft Excel.
3.3 Meta-Platform Requirements
Based on the CO architecture and stakeholder assumptions presented above, and tak-ing into account the research questions (cfr. section 2.4.3) and the concept of a COmeta-platform (cfr. section 2.5), we now introduce the five key requirements for aCO meta-platform: customisability, usability, compatibility, scalability, and reactiv-ity. A distinction is made between requirements relating to the user level and thoserelated to the implementation of the meta-platform. In the remainder of this section,we present the requirements of both categories and discuss which technologies facil-itate the development of a truly generic CO meta-platform.
3.3.1 User Level Requirements
The CO meta-platform must enable ICT-agnostic stakeholders to construct their ownobservatory and campaigns for a variety of scenarios. To enable this, the meta-platform must ensure customisability and usability. Additionally, participants con-tributing data to campaigns require real-time feedback. As a result, the CO meta-platform must include support for reactivity. We now elaborate on each of these userlevel requirements (ULR).
ULR-1: Customisability
The meta-platform must enable CO administrators and campaign administrators toset up and customise their CO and campaign respectively, in such a way that it suitstheir particular scenario. To support multiple scenarios and to be truly generic, themeta-platform must support different types of data and deal with the specific featuresinvolved. This includes both continuous data (sensorial parameters such as noise, ac-celerometer, humidity, etc.) as well as discrete data (e.g., behavioural parameters ob-tained from user input through questionnaires). In addition to providing the necessaryfeatures to collect such diverse data, the meta-platform must also enable the customi-sation of different data processing algorithms for each citizen observatory scenario.
38

3.3 Meta-Platform Requirements
Rather than forcing each CO to re-implement the same features with only some minoradjustments, we propose the use of component-based development model.
A component-based approach takes advantage of citizen observatories’ similarstructure to provide end-users with an off-the-shelf toolkit including all relevant com-ponents and tools that are needed to set up a citizen observatory. Such a toolkit would,for example, include:
• Data gathering components for collecting data either using the smartphone’ssensors, or by requesting user input.
• Data processing components for processing and aggregating data based on aparticular algorithm.
• Feedback components for handling interaction with the user (e.g., instruc-tions on how to perform the measurements, feedback coming from the server,gaming elements, etc.).
• Distribution components for handling the client-server communication (e.g.,upload of measurements to the observatory).
A CO can then be implemented through a composition of such reusable and con-figurable components, enhancing the customisability of the meta-platform. Therefore,it is desirable that the toolkit contains a component for as many features as possible,and that each component is sufficiently customisable to cope with the variety of COdata types.
ULR-2: Usability
To be accessible to societal stakeholders and communities, the meta-platform mustenable the deployment of a citizen observatory and the setup of a campaign withoutor with very little programming skills. Expecting stakeholders to program a citizenobservatory using textual source code is therefore unreasonable. A more accessibleand realistic solution is to provide stakeholders with a graphical interface in whichthey can assemble a CO and campaigns in a way similar to playing with LEGOor Scratch [110]. In fact, the aforementioned component-based development modelserves as a good foundation to create a visual programming language (VPL). Basicprogramming elements in a VPL are generally represented as blocks, i.e., structuralelements with visual cues about how they can be used and linked together. By onlyallowing the blocks to by arranged in a way that “fits”, incorrect programs can beprevented from being constructed. In contrast, there is a big risk that stakeholdersdo not manage to program their own citizen observatory textually as, in addition
39

Chapter 3: Towards a Citizen Observatory Meta-Platform: Requirements
to the syntax itself being a hindrance, there is no built-in visual cue to prevent thearrangement of components in an incorrect way.
Not any VPL will suffice. It is important that stakeholders can express themselvesusing familiar concepts without puzzling over implementation technicalities. As a re-sult, we propose to restrict the VPL to a particular domain, namely the domain ofparticipatory sensing. Using this visual domain-specific language (DSL), stakehold-ers can program a CO (and its campaigns) simply by describing the data parametersthat must be collected, which data processing and aggregation algorithms must beused, the type of feedback participants receive, etc.
ULR-3: Reactivity
Each participant is connected in real-time to the observatory and, ideally, receivesimmediate feedback about his/her contributions. This means that every time a mobiledevice uploads new information, the corresponding citizen observatory must processit immediately, keep track of the progress of the running campaigns, and inform the“interested” mobile devices about the freshly updated state of every campaign. Addi-tionally, each observatory is responsible for coordinating the behaviour of the cam-paign participants to ensure an optimal data density. Such a coordination mechanismmust be capable of operating in real-time, as it makes no sense to send participantsinstructions if they already moved to a different location or stopped contributing databy closing the app.
Orchestration of an observatory/campaigns involves more than just participantcoordination. Participants must receive feedback as incentive mechanisms, campaigncreators must be informed about the progress of their campaign, data visualisationsmust be kept up to date, etc. Ideally, each of these happen in real-time. It is thereforeimportant that the meta-platform is capable of immediately reacting to data comingfrom mobile devices, contributing those data to the server and promptly pushing in-termediate campaign analysis results back to the relevant devices.
3.3.2 Implementation Level Requirements
A CO meta-platform will host multiple citizen observatories, each hosting severalcampaigns. The high variety of data types and the different types of hardware in-volved (e.g., smartphones with different OS) requires the meta-platform to ensurecompatibility of the various elements in the CO distributed architecture. Addition-ally, the large amount of participants and end-users simultaneously interacting withthe meta-platform requires scalability. We now discuss each of these implementationlevel requirements (ILR) in more detail.
40

3.3 Meta-Platform Requirements
ILR-1: Compatibility
The architecture of a citizen observatory as depicted in fig. 3.1 engenders a distributedarchitecture: mobile apps running on smartphones communicate across a networkto upload data (in real-time) to a processing server. Feedback is sent back to thesemobile devices and to any web-based clients that are monitoring the results of theprocessing (e.g., visualisations) on dedicated webpages.
In existing citizen observatories and other PS systems, these various elementsof the architecture have been developed using a different set of technologies andprogramming languages:
• Mobile apps have to be coded for their respective operating system (i.e., Javafor Android , Objective-C or Swift for iOS).
• The data processing server requires knowledge on both web server technol-ogy (e.g., Apache Tomcat, Ruby-on-Rails, etc.) and data processing techniques(e.g., Spark, etc.).
• A database system has to be chosen (e.g., SQL or some NoSQL solution).
• Building web-based visualisation tools requires expertise in HTML, CSS, andJavaScript.
Constructing a citizen observatory involves creating each element of the architec-ture shown in fig. 3.1. When built on top of a component-based development model,it is important that all the components can be composed into a functional citizen ob-servatory. The components therefore have to be compatible with one another. Theclient-side components produce a high variety of data types that need to be compat-ible with server-side components that process and persistently store the data. Theseserver-side component must then in turn produce output data compatible with thevarious feedback and visualisations components.
ILR-2: Scalability
Scalability can be measured in various ways, depending on the context. In the caseof a CO meta-platform, we particularly focus on two types: load scalability andfunctional scalability.
Load scalability is the CO meta-platform’s ability to easily expand and contract itsresource pool to accommodate heavier or lighter loads (e.g., sudden increase or de-crease in participants). It also relates to the ease with which a component can bemodified, added, or removed to accommodate changing loads.
41

Chapter 3: Towards a Citizen Observatory Meta-Platform: Requirements
The meta-platform must be capable of specifying several citizen observatoriesthat each enact multiple campaigns simultaneously. Because a large number ofparticipants will be contributing data to these observatories, appropriate scalingmechanisms must be put in place. For example, If a certain server-side componentcannot handle the amount of data it receives from a large number of client, multipleinstances of the overloaded component can be spawned and the input load balancedamong the spawned instances. However, special care is required as additionalproblems are created when dealing with a stateful component, such as one that keepstrack of the average value of its input.
Functional scalability is the ability to enhance and extend the CO meta-platform byadding new functionality with minimal effort. Because technologies keep evolving(e.g., smartphones being equipped with additional sensors) it is required to design acitizen observatory construction tool that allows for the addition of new componentsand the maintenance of existing ones.
The functional scalability of the platform is directly influenced by the compo-nents’ granularity: fine-grained components provide very basic features and they canbe composed into larger, more complex components. Such a composition mechanismfacilitates the addition of new features. For example, if smartphones would suddenlybe equipped with a new sensor, the CO meta-platform only has to provide a new com-ponent that is capable of accessing the sensor and outputting its data. This raw datacan then be connected to various already existing data processing components.
3.4 The Right Tool for the Job
Conceptually, a citizen observatory is a distributed architecture where the data gener-ated by participants flows from their mobile apps to a server. On this server, incomingdata flows through a series of data processing components. Intermediate results of theprocessed data then flows back to the mobile apps and web-based dashboard in theform of feedback.
From this point of view on citizen observatories, combined with the aformen-tioned CO meta-platform requirements (cfr. section 3.3.1 and section 3.3.2), we pro-pose to use a visual reactive flow-based domain-specific language (VRFBDSL) thatcan handle the distributed nature of a citizen observatory’s architecture. The advan-tages of using a VRFBDSL are as follows:
• Flow-based programming is a flavour of component-oriented programming ap-proach by nature. It enables one to design a citizen observatory as a composi-
42

3.5 Flow-Based Programming
tion of reusable and configurable components, resulting in a highly customis-able platform (ULR-1). Additionally, a component-based approach increasesthe functional scalability of the CO meta-platform (ILR-2).
• Reactive Programming allows developers to express programs in terms of whatto do, and let the language automatically manage when to do it. In the context ofthe CO meta-platform, this means that the execution of each component used inin the implementation of a citizen observatory is triggered automatically basedon input data availability, resulting in reactive citizen observatories (ULR-3).
• A visual programming language greatly increases the usability of the meta-platform for societal stakeholders and communities with very little program-ming skills (ULR-2). For example, its visual cues can be used to indicate andensure compatibility of the various components used to construct the citizenobservatory (ILR-1).
• The use of a domain-specific language further enhances the usability of theplatform (ULR-2), as it ensures that stakeholders are familiar with the domainof the language, rather than forcing them to rely on a general purpose languagethat is more difficult to understand.
In the remainder of this chapter, we provide a short introduction to each of theseprogramming concepts.
3.5 Flow-Based Programming
Flow-based programming (FBP) was invented by J. Paul Morrison in the early 1970s.The FBP development approach views an application not as a single, sequential, pro-cess, which starts at a point in time, and then does one thing at a time until it isfinished. Instead, FBP views an application as a network of asynchronous processescommunicating by means of streams of structured data chunks [97]. FBP applicationsare represented as a directed graph consisting of processes as nodes and connectionsas edges. Processes access connections by means of ports. A process is an instance ofa component, and runs concurrently with other processes. Multiple instances of thesame component can be created. Morrison explains the paradigm as follows [94]: “Anapplication built using FBP may be thought of as a "data processing factory": a net-work of independent "machines", communicating by means of conveyor belts, acrosswhich travel structured chunks of data, which are modified by successive "machines"until they are output to files or discarded.”
43

Chapter 3: Towards a Citizen Observatory Meta-Platform: Requirements
FBP can be considered a particular style of dataflow programming, but consid-ering the fact that there is a sizeable body of published work related to dataflowprogramming and/or architectures, the use of the term dataflow may cause some con-fusion. Therefore, we first introduce the general concept of dataflow programming,and then provide more details on the particular type of dataflow, i.e., flow-based pro-gramming, that is used in the context of this dissertation.
3.5.1 Dataflow Programming
Dataflow Programming has been a research topic of programming languages designsince the ‘70s. Several researchers argued that conventional von Neumann processorsare inherently unsuitable for the exploitation of parallelism [34, 132]. The main issuewith von Neumann hardware is the bottleneck caused by the shared bus between theprogram memory and data memory [2, 5]. This shared bus prevents the simultaneousaccess of both program instructions and the program data. As a result, the CPU isforced to wait for data to be transferred from memory, limiting the effective process-ing speed of the CPU. As a solution, the dataflow architecture [132, 31] was proposedwhich avoids both of these bottlenecks by using only local memory and by executinginstructions as soon as their operands become available.Advances in Dataflow Programming Languages 3
Fig. 1. A simple program (a) and its dataflow equivalent (b).
2. THE DATAFLOW EXECUTION MODEL
2.1. The Pure Dataflow Model
In the dataflow execution model, a pro-gram is represented by a directed graph[Arvind and Culler 1986; Davis and Keller1982; Dennis 1974; Dennis and Misunas1975; Karp and Miller 1966]. The nodesof the graph are primitive instructionssuch as arithmetic or comparison oper-ations. Directed arcs between the nodesrepresent the data dependencies betweenthe instructions [Kosinski 1973]. Concep-tually, data flows as tokens along thearcs [Dennis 1974] which behave like un-bounded first-in, first-out (FIFO) queues[Kahn 1974]. Arcs that flow toward a nodeare said to be input arcs to that node, whilethose that flow away are said to be outputarcs from that node.
When the program begins, special acti-vation nodes place data onto certain keyinput arcs, triggering the rest of the pro-gram. Whenever a specific set of input arcsof a node (called a firing set) has data on it,the node is said to be fireable [Arvind andCuller 1986; Comte et al. 1978; Davis andKeller 1982]. A fireable node is executed atsome undefined time after it becomes fire-able. The result is that it removes a datatoken from each node in the firing set, per-forms its operation, and places a new data
token on some or all of its output arcs. Itthen ceases execution and waits to becomefireable again. By this method, instruc-tions are scheduled for execution as soonas their operands become available. Thisstands in contrast to the von Neumann ex-ecution model, in which an instruction isonly executed when the program counterreaches it, regardless of whether or not itcan be executed earlier than this.
The key advantage is that, in dataflow,more than one instruction can be executedat once. Thus, if several instructions be-come fireable at the same time, they can beexecuted in parallel. This simple principleprovides the potential for massive parallelexecution at the instruction level.
An example of dataflow versus a tra-ditional sequential program is shown inFigure 1. Figure 1(a) shows a fragment ofprogram code and Figure 1(b) shows howthis is represented as a dataflow graph.The arrows represent arcs, and the circlesrepresent instruction nodes. The squarerepresents a constant value, hard-codedinto the program. The letters representwhere data flows in or out of the rest ofthe program, which is not shown. Wheremore than one arrow emanates from agiven input, it means that the single valueis duplicated and transmitted down eachpath.
ACM Computing Surveys, Vol. 36, No. 1, March 2004.
Figure 3.2: A simple dataflow program (a) and its directed graph representation (b) [66].
In the dataflow execution model a program is represented by a directed graph,as illustrated by figure 3.2. The nodes of the graph are primitive instructions suchas arithmetic or comparison operations. Directed arcs between the nodes representthe data dependencies between the instructions [75]. Values are propagated to the
44

3.5 Flow-Based Programming
dependent nodes as soon as they are processed, triggering the computation of thedependent nodes.
There exists a large body of research devoted to dataflow programming in vari-ous application domains; Johnston et al. provide a comprehensive overview of morerecent advances in dataflow programming languages [66].
One issue with the term dataflow is that its meaning has become very broad. Theterm dataflow programming is generally used to refer to synchronous dataflow pro-gramming, while flow-based programming is used to refer to asynchronous dataflowprogramming.
Synchronous dataflow programming executes a program once by starting with thedata of all the inputs, also called sources. Each node in the graph is executed oncewhen the data of all of its input ports becomes available. When a node in the graphcompletes its execution, output data becomes available on all of its output ports. Thisdata then “flows” to the input ports of the downstream nodes allowing them to startexecuting. This process is repeated until the entire graph (representing the program)is traversed.
Asynchronous dataflow programming resembles the event-based and messagepassing programming model: the nodes in the graph are connected with asynchronousmessaging channels and all of the nodes are continuously waiting for messages to ar-rive to their inputs. Whereas in synchronous dataflow programming the nodes areexecuted only once, in flow-based programming the nodes are constantly waiting fornew asynchronous messages to arrive from other nodes.
3.5.2 Flow-Based Programming Characteristics and Classification
Flow-based programming is best understood as a coordination language, rather thana programming language [96]. A coordination language embodies a coordinationmodel, which Gelernter and Carriero define as [52] “the glue that binds separate[computational] activities into an ensemble”. A coordination model provides opera-tions to create computational activities and communication among them [52]. In thecontext of flow-based programming, these computational activities are “black box”processes that communicate among predefined connections.The strength of FBP is that different applications can be built from the same set ofcomponents by connecting them in different compositions. In 1974, Nate Edwardscoined the term “configurable modularity” [38] to denote the ability to reuse indepen-dent components by changing their interconnections. One of the important character-
45

Chapter 3: Towards a Citizen Observatory Meta-Platform: Requirements
istics of systems exhibiting configurable modularity is that they can be built using“black box” reusable components [96], as is the case in flow-based programming.FBP is therefore a component-based development approach by nature.
Component-based software engineering (CBSE), is a branch of software engi-neering that emphasises the separation of concerns with respect to the wide-rangingfunctionality available throughout a given software system [85]. It is a reuse-based ap-proach to defining, implementing and composing loosely coupled independent com-ponents into systems [134]. CBSE is primarily concerned with three functions [56]:
• Developing software from preproduced parts
• The ability to reuse those parts in other applications.
• Easily maintaining and customising those parts to produce new functions andfeatures.
There are many definitions of what a component in CBSE entails. Heineman andCouncill [56] define a software component as a “software element that conformsto a component model and can be independently deployed and composed withoutmodification according to a composition standard”. In other words, a componentmodel defines how to construct an individual component and enforces globalbehaviour on how a set of components communicate and interact with each other.A component can be composed with another component by creating assembledconnections. The general term ‘assembly’ is used, as components can be composedin many different ways. The component model can also define other aspects such asnaming conventions, meta data, interoperability, customisation, etc.
Another characteristic of FBP is that its system design is generally split into two lay-ers: the graph layer and the component layer. The graph layer usually has a visualrepresentation and is intended to be used by the graph designer, i.e., it is used to con-struct the graph by connecting the various components together to form the applica-tion’s logic. The component layer contains the actual source code of each componentas implemented by the component developer.
Classical vs. Reactive Flow-Based Programming
Flow-based programming has evolved considerably over the last 40 years, and severalnew FBP systems were recently developed that are missing some key characteristicsof true FBP, such as asynchrony, and each process running in its own thread or otherconcurrency mechanism. As a result, we make a distinction between Classical FBPand Reactive FBP:
46

3.6 Reactive Programming
Classical FBP is what we consider to be the original approach. In this case, op-erating system or virtual machine threads are used, enabling processes to executeconcurrently. Connections between processes are usually implemented as boundedbuffers or FIFO queues. Processes can choose from which port they want to readdata. Classical FBP features blocking reads and writes: a process that to reads froman empty input port blocks until input data arrives. Alternatively, a process writes to aconnection whose buffer is full, the process is suspended until the buffer is no longerfull. Examples include JavaFBP [95] and C#FBP [93].
Reactive FBP is a FBP-inspired approach designed around event-listeners. Pro-cesses operate using a publish/subscribe pattern, i.e., processes wait for data arrivingon their input ports and publish data on their output ports. Events include both datasends, as well as connects, disconnects, etc. Unlike Classical FBP, processes cannotchoose from which port they want to read data. Instead, processes in Reactive FBPsimply react to every incoming event on a port in the order of arrival. Examples in-clude NoFlo [8], Node-RED [102], and MicroFlo [91].
3.6 Reactive Programming
Reactive programming (RP) is a programming paradigm that is built around the no-tion of continuous time-varying values and propagation of change. It facilitates thedeclarative development of event-driven applications by allowing developers to ex-press programs in terms of what to do, and let the language automatically managewhen to do it [7]. In this paradigm, state changes are automatically and efficientlypropagated across the network of dependent computations by the underlying execu-tion model. RP introduces the notion of behaviors for representing continuous time-varying values and events for representing discrete values. In addition, it allows thestructure of the dataflow to be dynamic (i.e., the structure of the dataflow can changeover time at runtime).
The history of research and developments in reactive programming fall outsidethe scope of this dissertation. For more details we refer the reader to a comprehensivesurvey by Bainomugisha et al. [7]. In more recent years, reactive programming hasgained a lot of attention in the front-end developers community. As a result, several li-braries came into existence that implement RP principles. Examples of such librariesinclude Bacon.js [6], Meteor [61], React.js [60], and RxJS [125].
47

Chapter 3: Towards a Citizen Observatory Meta-Platform: Requirements
3.7 Visual Programming Languages
Visual programming languages (VPL) are languages that use some form of visualrepresentation instead of — or in addition to — textual representations used by tra-ditional programming languages [115]. One well-known example is Scratch [110],which represents programming statements graphically as colourful pieces of a jig-saw puzzle that can be composed to define the logic of a program. An example of aScratch script is illustrated in fig. 3.3.
Figure 3.3: Sample Scratch script [110].
Visual programming languages have some specific goals, which most commonlyare [14]:
• Making programming more understandable to non-technical users.
• Improving the correctness with which users perform programming tasks.
• Improving the speed with which users perform programming tasks.
It is important to distinguish visual programming from visual aids for programming.The latter is a more general term which also includes tools for program code visu-alisation (e.g., class hierarchies, state diagrams, etc.) and data visualisation, as illus-trated by the taxonomy of visual aids for programming depicted in fig. 3.4. Visualprogramming systems allow the programmer to construct programs using techniquesthat display computational functions and elements in two or more dimensions. Pro-gram code visualisation, on the other hand, helps in debugging and understandingprograms by providing visualisations of various aspects of the program. Examples ofprogram visualisation include the Unified Modeling Language (UML) or Architec-ture Description Languages.
Visual programming can be further subdivided into two key branches [119]:graphical interaction systems and visual language systems. This division is basedupon how the graphics are used to build the program. In graphical-interaction
48
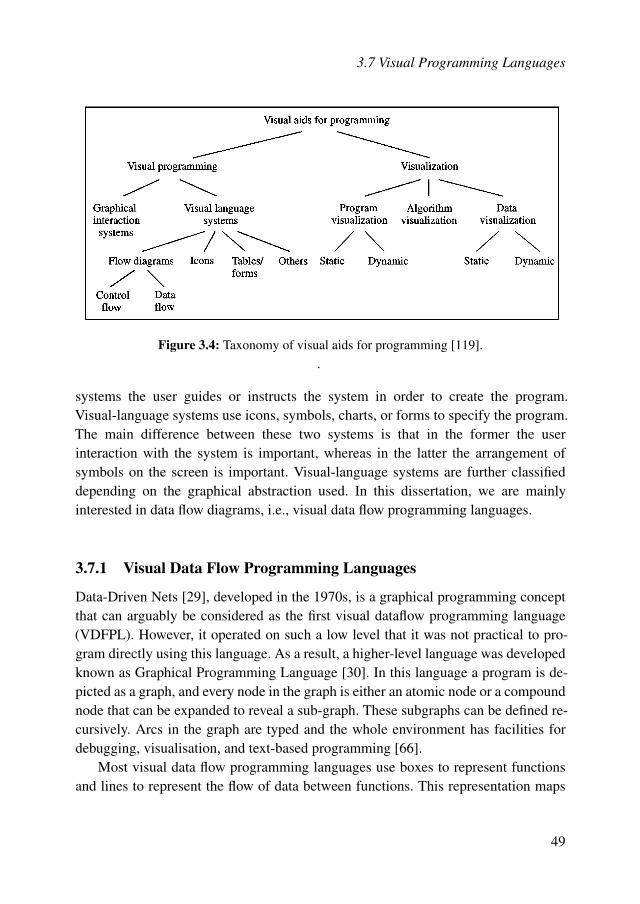
3.7 Visual Programming LanguagesFigure 1. Classification of visual computing [14]
Figure 2. Taxonomy of visual aids for programming [14]
two-dimensional since the compiler or interpreter processes it as a long, one-dimen-sional stream’ [15].Singh and Chignell [14] divide visual programming into two key branches: graphical
interaction systemsand visual languagesystems (see Figure 2). This division is based upon howthe graphics are used to build the program. Systems where the user guides or instructsthe system in order to create the program are classified as graphical interaction systems.Visual language systems consist of systems in which icons, symbols, charts or forms areused to specify the program.In graphical interaction systems, the sequence of user actions is of vital importance
since the system ‘learns’ from the user input. This category is more commonly, andperhaps,more aptlycoined programmingbyexample. In themajorityof such systems, a useris required to specify everything about the program and the system is able to rememberthe examples for later use. This type of system could be described as ‘DoWhat I Did’.Conversely, some systems attempt to infer the general program structure after the userhas provided a number of examples which work through the algorithm. These systemscould be characterized by ‘Do What I Mean’ and are often referred to as automaticprogramming, which has generally been an area of Artificial Intelligence research [15].
VISUAL PROGRAMMING LANGUAGES 177
Figure 3.4: Taxonomy of visual aids for programming [119]..
systems the user guides or instructs the system in order to create the program.Visual-language systems use icons, symbols, charts, or forms to specify the program.The main difference between these two systems is that in the former the userinteraction with the system is important, whereas in the latter the arrangement ofsymbols on the screen is important. Visual-language systems are further classifieddepending on the graphical abstraction used. In this dissertation, we are mainlyinterested in data flow diagrams, i.e., visual data flow programming languages.
3.7.1 Visual Data Flow Programming Languages
Data-Driven Nets [29], developed in the 1970s, is a graphical programming conceptthat can arguably be considered as the first visual dataflow programming language(VDFPL). However, it operated on such a low level that it was not practical to pro-gram directly using this language. As a result, a higher-level language was developedknown as Graphical Programming Language [30]. In this language a program is de-picted as a graph, and every node in the graph is either an atomic node or a compoundnode that can be expanded to reveal a sub-graph. These subgraphs can be defined re-cursively. Arcs in the graph are typed and the whole environment has facilities fordebugging, visualisation, and text-based programming [66].
Most visual data flow programming languages use boxes to represent functionsand lines to represent the flow of data between functions. This representation maps
49

Chapter 3: Towards a Citizen Observatory Meta-Platform: Requirements
directly onto the flow-based programming concepts of processes and connections. Itis therefore not surprising that many FBP frameworks have a visual representation.
3.8 Domain-Specific Languages
General-purpose languages such as C, Java, and Python enable programmers to writeinstructions for computers to solve problems in many domains. The broad applicabil-ity of these languages results in a lack of specialised features for a particular domain.Hence, when the problem is limited to a certain domain, a more specialised languageis required that provides features created specifically for that domain, i.e., a domain-specific language.
A Domain-Specific Language (DSL) is a language that is optimised for a givenclass of problems called a domain [129]. A DSL is based on abstractions that areclosely aligned with the domain for which the language is built. As such, a DSL in-cludes a syntax suitable for expressing these abstractions concisely. This syntax canbe either textual or graphical. Sometimes, representations such as graphical diagrams,matrices, and tables are used alongside text to provide the desired closer mapping tothe problem domain. There is a wide variety of DSLs, ranging from widely used lan-guages for common domains, such as HTML for web pages or SQL for for relationaldatabase queries, down to languages used by only one or a few pieces of software,such as MATLAB. DSLs have to sacrifice some of the flexibility of general-purposelanguages (GPLs) to ensure productivity and conciseness of relevant programs in aparticular domain. They can also be restricted on purpose to only allow the creationof correct programs. Unlike GPLs, there is no requirement for DSLs to be Turingcomplete [122].
Domain-specific languages can be used for a variety of purposes, such as beinga utility for developers to automate a specific aspect of software development or,in larger-scale systems, to describe the architecture of a software system. Voelter etal. [129] provide an in-depth book on the design, implementation and use of DSLs.In the context of this dissertation, we are mainly interested in the use of DSLs forDomain-Specific Modelling.
3.8.1 Domain-Specific Modelling
Domain-Specific Modelling is a software engineering methodology that involves thesystematic use of a (graphical) DSL to design and develop systems. Modelling in thiscontext refers to prescriptive modelling, where a model is created that can be used to
50

3.9 Related Work
(automatically) construct the target system. This is in contrast to a descriptive modelthat represents an existing system for discussion and analysis.
Domain-Specific Modeling mainly aims to accomplish two goals [72]: first, raisethe level of abstraction by specifying the solution in a language that directly usesconcepts and rules from a specific problem domain. Second, generate final productsin a chosen programming language or other form from these high-level specifications(i.e., automatic creation of executable source code from the domain-specific model).
There are many benefits of using DSM, such as increasing the productivity andquality of the created product through the removal of (unnecessary) degrees of free-dom for programmers, the avoidance of duplication of code, and the consistent au-tomation of repetitive work by the execution engine. Validation and verification ofthe created product are easier to implement, as the error messages can be more mean-ingful through the use of domain concepts. Using DSM, developers only need tomodel the core logic of an application system independent of the underlying tech-nology platform, making it possible to change the execution engine of the model toexecute the code on a new platform. But perhaps the most interesting benefit of DSMis domain expert involvement: if the abstractions are closely aligned with how domainexperts express themselves, the domain experts, who often are non-programmers, canbecome developers and use the DSL to write the program code by making completespecifications using familiar domain concepts. This capability to support domain ex-perts’ concepts makes DSM very applicable for end-user programming.
3.9 Related Work
Although the concept of a citizen observatory meta-platform is, to the best of ourknowledge, unprecedented, our approach is rooted in the literature of visual data flowprogramming languages.
Node-RED [102] is a reactive flow-based programming tool built on top ofNode.js. It provides a browser-based drag-and-drop editor — depicted in fig. 3.5 —for wiring together hardware devices, APIs, and online services. Node-RED providesa library where people can add new components and share existing component com-positions.
Other examples of reactive FBP include NoFlo [8], MicroFlo [91], andMsgFlo [98]. Each of these FBP implementations provide a visual editor, althoughthey adopt a slighty different approach compared to Node-RED: rather than hav-ing their own dedicated visual data flow programming language, they both rely onFlowhub [46], a technology agnostic (e.g., supports any runtimes compatible with
51

Chapter 3: Towards a Citizen Observatory Meta-Platform: Requirements
Figure 3.5: Node-RED’s browser-based editor.
the FBP protocol) web-based IDE for flow-based programming. The web-based IDEof FlowHub is depicted in fig. 3.6.
Figure 3.6: FlowHub IDE.
Despite their identical visual editor, each of these FBP implementations have adifferent domain. NoFlo is based on Node.js and is written in JavaScript and Cof-feeScript. It can be used to build server-side or client-side (browser) applications.
52

3.9 Related Work
MicroFlo is written in C++ and is intended to be used on microcontrollers and em-bedded devices. MsgFlo components can be implemented in any language (to reuseexisting code or libraries) and can be used to implement a distributed FBP systemspanning multiple computers/devices.VDFPLs have seen adoption outside of the domain of FBP as well. Perhaps one ofthe best known examples of a VDFPL is LabView [62]. First released in 1986, itallows the construction of programs for data analysis in laboratories. LabVIEW pro-grams are called virtual instruments, because their appearance and operation oftenimitate physical instruments. Creating a new virtual instrument is done by specifyingthe front panel (the user interface of the virtual instrument), and the block diagram(containing the graphical source code). An example block diagram is depicted infigure 3.7. Constructing the block diagram is done by connecting different function-nodes, displayed as boxes with icons, using wires representing the data paths. Lab-VIEW uses “G”, a dataflow programming language, meaning that the wires propagatevariables and any node can execute as soon as all its input data become available.
Figure 3.7: Example of LabVIEW Block diagram.
Another example is Reaktor [63], a graphical modular software music studio thatlets musicians and sound specialists design and build their own instruments, sam-plers, effects and sound design tools by connecting various modules. The Reaktorenvironment is depicted in figure 3.8.
Blender [47] is an open-source 3D computer graphics toolset for creating videogames, visual effects, animated films, etc. Blender allows you the creation of a mate-
53

Chapter 3: Towards a Citizen Observatory Meta-Platform: Requirements
Figure 3.8: The Reaktor environment.
rial (i.e., the artistic qualities of the substance that a 3D object is made of) by routingbasic materials through a set of nodes. Each node performs some operation on thematerial, changing how it will appear when applied to the mesh, and passes it on tothe next node. Figure 3.9 depicts this node editor environment.
Figure 3.9: The Blender Node Editor.
These, and other examples [131, 135], make it obvious that VDFPLs are applicable inmany domains. However, many of these systems did not focus directly on research indataflow programming. Instead, they were produced to solve specific problems anduse the dataflow model because it provides the best and/or most intuitive solution toa specific problem.
54

3.10 Conclusion
3.10 Conclusion
Designing a citizen observatory meta-platform that enables domain experts to cre-ate their own citizen observatory is a challenging task. This becomes apparent byanalysing various requirements of the meta-platform, i.e., customisability, usability,reactivity, compatibility, and scalability. Using these requirements as a motivation forour decision, we advocate the use of a visual flow-based domain-specific languagethat enables non-ICT stakeholders to build citizen observatories. This chapter intro-duced the programming concepts that facilitate the implementation of the CO meta-platform, i.e., flow-based programming, reactive programming, visual programminglanguages, and domain-specific languages.
Flow-based programming is particularly suited to ensure customisability of a cit-izen observatory by providing the end-user with a toolkit of relevant participatorysensing components that can be composed to provide the desired features. FBP alsoaids in the functional scalability of the meta-platform as newly designed componentscan easily be integrated in the rest of the system. Additionally, FBP ensures the reac-tivity of each citizen observatory, enabling real-time data processing and participantcoordination.
By incorporating reactive programming principles, the execution of componentsis triggered automatically based on input data availability, resulting in highly reactivecitizen observatories that can provide participants with immediate feedback.
Usability of the CO meta-platform can be facilitated through a visual program-ming language, enabling end-user programming by ICT-agnostic stakeholders. Visualcues can prevent incompatible component compositions.
However, simply providing a visual environment for the domain-expert is notsufficient. The components presented in the visual programming language have tomake sense to the domain experts. Therefore, a (visual) domain-specific languagethat only presents relevant concepts to the end users is needed.
Although this chapter discussed various existing visual data flow programminglanguages, none of these are suitable to implement a citizen observatory meta-platform for the following reasons: first, none of these languages enable the design ofa citizen observatory as the necessary domain-specific components to implement PSdata gathering and processing are not present. Second, the existing languages eitherprovide no support for distribution, or those that do only provide low-level compo-nents that are too difficult to configure for non-ICT experts. This makes the imple-mentation of citizen observatories more difficult due to their distributed architecture(i.e., mobile apps, processing server, web based visualisations).
55

Chapter 3: Towards a Citizen Observatory Meta-Platform: Requirements
In the next chapter, we introduce a novel visual reactive flow-based domain-specific language, named DISCOPAR, which is designed specifically to cope withthese issues. This language is used throughout our citizen observatory meta-platform.
56

4L A N G UAG E C O N C E P T S O F D I S C O PA R
One of the main challenges of a citizen observatory meta-platform is ensuring us-ability by (ICT-agnostic) societal stakeholders and communities (cfr. section 3.3.1- ULR-2). Deploying a citizen observatory and setting up campaigns should there-fore be possibly without or with limited programming skills. To make this possible,we propose DISCOPAR (Distributed Components for Participatory Campaigning), anew visual flow-based domain-specific programming language created specificallyto hide the non-essential complexity of citizen observatories and their distributed na-ture from the end-user, and to present only concepts that are relevant to their domain.DISCOPAR is used throughout the meta-platform to construct every part of a citi-zen observatory, i.e., the mobile data gathering app, server-side data processing, andweb-based visualisations can all be set up using a single visual language. Due to itsflow-based nature, DISCOPAR’s design is split in two layers: a graph layer enablingend-users to visually construct observatories, and a component layer containing eachcomponent’s source code and the necessary abstractions to compose them.
This chapter focusses on DISCOPAR’s graph layer. More specifically, it presentsthe visual programming language that is built on top of DISCOPAR’s componentlayer. Details on the more technical component layer are discussed in chapter 6.In this chapter, we first describe the general idea of DISCOPAR and introduceDISCOPARDE, our web-based visual programming environment for designing pro-grams in DISCOPAR. Next, we introduce the various concepts and visual syntax ofDISCOPAR. Then, we provide more details on DISCOPARDE. We end the chapter byintroducing four common strategies of visual programming languages that facilitate
57

Chapter 4: Language Concepts of DISCOPAR
end-user programming, and describe how these strategies are applied to DISCOPARand DISCOPARDE.
4.1 Programming with DISCOPAR
In section 3.4, we proposed to implement our CO meta-platform using a visual re-active flow-based domain-specific language (VRFLDSL) that can handle the dis-tributed nature of a citizen observatory’s architecture. The idea to use a VRFLDSLwas motivated through the analysis of both user level requirements (cfr. section 3.3.1)and implementation layer requirements (cfr. section 3.3.2) of the CO meta-platform.These requirements, combined with the distributed architecture of citizen observa-tories, highlight the significant challenge involved in creating a CO meta-platformcapable of constructing any type of citizen observatory.
When analysing existing flow-based languages, we noticed that most FBP lan-guages do not allow the flow to be partitioned across multiple devices. Those that doare either research prototypes [10] or only provide low-level communication compo-nents that have to be manually configured by the end user [98]. Configuring thesecomponents involves details such as specifying the IP-address and port to establish aconnection. Such details are too difficult to understand for ICT-agnostic users, whoare incapable of programming such technicalities. What is needed is a distributedflow-based language where stakeholders only need to express themselves with lan-guage concepts that come from the domain of citizen observatories and participatorycampaigning. As a result, we created DISCOPAR, a new visual reactive flow-baseddomain-specific programming language with support for distribution.
DISCOPAR ensures usability by ICT-agnostic stakeholders through the use ofdomain-specific components, which can be composed in a visual manner. Throughsuch component composition, stakeholders are capable of implementing the variouselements of a citizen observatory without having to worry about the underlying com-plexity of the CO’s distributed architecture. Due to the lack of support for distributionin existing FBP languages, we opted to design a language from the ground up. By cre-ating a new language instead of implementing additional abstractions in an existingFBP language, we facilitate the understanding and development of mechanisms thatcan handle the distributed architecture of a citizen observatory. To the best of ourknowledge, DISCOPAR is the only distributed visual flow-based language where dis-tributed connections are automatically handled by the system and do not require anyconfiguration from the programmer.
58

4.1 Programming with DISCOPAR
Programs in DISCOPAR are a directed acyclic graph (DAG) where each node ofthe graph consist of a component instance and where the edges are implemented asreal-time data streams. Programs in DISCOPAR can be visually assembled throughour web-based visual programming environment, named DISCOPARDE. Figure 4.1depicts an instance of DISCOPARDE, consisting of a component menu from whichgraph designers can select components and visually assemble them on the canvasthrough drag-and-drop interactions. More details on the features of DISCOPARDE
are deferred to section 4.3.
Figure 4.1: DISCOPARDE: DISCOPAR’s web-based visual programming environment.
Due to its flow-based nature, DISCOPAR’s design is split in two layers: a graphlayer enabling end-users to visually construct observatories, and a component layercontaining each component’s source code and the necessary abstractions to com-pose them. Figure 4.2 illustrates the interaction between DISCOPAR’s graph layerand component layer. DISCOPARDE, DISCOPAR’s integrated web-based visual pro-gramming environment, enables ICT-agnostic users to program an application usingthe visual syntax of DISCOPAR’s graph layer. To execute a program designed inDISCOPARDE, the constructed DAG is passed onto the execution engine of DIS-COPAR, named DISCOPAREE. DISCOPAREE is responsible for executing the DAG.This is done by initialising the components by loading their source code from the com-ponent layer, and establishing the real-time data streams between the newly createdprocesses. Due to its reactive flow-based nature, each process in the DISCOPAREE
activates automatically based on the availability of data on its incoming data streams.
59

Chapter 4: Language Concepts of DISCOPAR
DE EE
Graph Layer Component Layer
.json{;}
Figure 4.2: Overview of DISCOPAR.
Each element of a citizen observatory’s distributed architecture is implementedthrough DISCOPAR. This means that the CO’s mobile app, server-side data process-ing, and web-based visualisations all execute a different DAG in DISCOPAREE. Moredetails on how the CO meta-platform enables each element of a citizen observatoryto be programmed through DISCOPARDE are explained in chapter 5.
It is important to realise that DISCOPAR supports distribution and hides any tech-nological complexity associated with it. DISCOPARDE is capable of simultaneouslyprogramming client-side and server-side logic, and graph designers can create a con-nection between a component from each DAG in the same way that they create aconnection between those in the same DAG, i.e., by performing a drag-and-drop in-teraction. Connections made between components residing on a different device areautomatically handled by DISCOPAR. In other words, a DAG deployed on one par-ticular device (e.g., mobile app) transparently establishes a connection with a DAGon another device (eg server-side data processing). More details on how DISCOPARautomatically handles these distributed connections are provided in chapter 6.
4.2 Concepts and Terminology
This section provides a general introduction to various flow-based programming con-cepts and introduces their visual syntax in the graph layer of DISCOPAR.
60

4.2 Concepts and Terminology
4.2.1 Components
Components form the basic building blocks used by developers to build an applica-tion using flow-based programming. In FBP, the emphasis in implementing an appli-cation shifts from building everything from scratch to connecting pre-existing com-ponents and only creating new ones when absolutely required. Implementing compo-nents is commonly done using classes, functions or small programs in conventionalprogramming languages. Unlike components in dataflow programs, which primarilyconsist of primitive arithmetic and comparative operations (cfr. fig. 3.2), componentsin FBP are more complex. FBP uses “black-box” components, referring to the factthat the application developer does not need to understand or modify the internal im-plementation of a component. Programming in FBP is done by composing variouscomponents into a DAG to form the desired logic.
Figure 4.3: Example of DISCOPAR’s visual syntax for components.
DISCOPAR features a variety of components that all share the same visual syntax.As an example, the visual representation of some components is illustrated in fig. 4.3.Components are represented as boxes labelled with their name. Components can havemultiple input and output ports, which are represented as little squares on the side ofa component. Input ports are always shown on the left side of a component, whileoutput ports are shown on the right.
4.2.2 Processes
An instance of a component is called a process. A process is an asynchronously ex-ecuting piece of logic. Processes can be handled by the system using threads or asimilar form of concurrency, or at least provide the illusion of it to the designer. Mul-tiple processes of the same component can be simultaneously active. A process isstateful and can access its own internal state and ports, but it cannot access otherprocesses. Processes communicate by sending and receiving structured data chunkscalled information packets (IP). A process is activated when it receives an informa-tional packet on one of its input ports. Exceptions to this rule are processes that areautomatically activated on application startup.
61
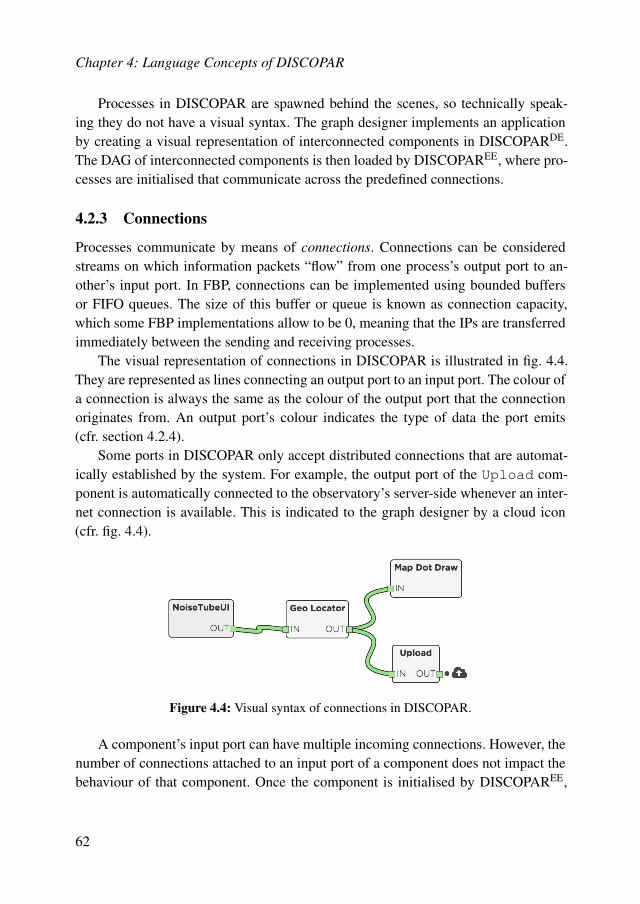
Chapter 4: Language Concepts of DISCOPAR
Processes in DISCOPAR are spawned behind the scenes, so technically speak-ing they do not have a visual syntax. The graph designer implements an applicationby creating a visual representation of interconnected components in DISCOPARDE.The DAG of interconnected components is then loaded by DISCOPAREE, where pro-cesses are initialised that communicate across the predefined connections.
4.2.3 Connections
Processes communicate by means of connections. Connections can be consideredstreams on which information packets “flow” from one process’s output port to an-other’s input port. In FBP, connections can be implemented using bounded buffersor FIFO queues. The size of this buffer or queue is known as connection capacity,which some FBP implementations allow to be 0, meaning that the IPs are transferredimmediately between the sending and receiving processes.
The visual representation of connections in DISCOPAR is illustrated in fig. 4.4.They are represented as lines connecting an output port to an input port. The colour ofa connection is always the same as the colour of the output port that the connectionoriginates from. An output port’s colour indicates the type of data the port emits(cfr. section 4.2.4).
Some ports in DISCOPAR only accept distributed connections that are automat-ically established by the system. For example, the output port of the Upload com-ponent is automatically connected to the observatory’s server-side whenever an inter-net connection is available. This is indicated to the graph designer by a cloud icon(cfr. fig. 4.4).
Figure 4.4: Visual syntax of connections in DISCOPAR.
A component’s input port can have multiple incoming connections. However, thenumber of connections attached to an input port of a component does not impact thebehaviour of that component. Once the component is initialised by DISCOPAREE,
62

4.2 Concepts and Terminology
the corresponding process will react to any IP, regardless of its origin, as soon as itarrives on the input port.
In classical FBP (cfr. section 3.5.2), an information packet is tracked from itscreation to destruction, and can only be “owned” by a single process at a time orbe in transit between processes. This means that in classical FBP a single outputport can only be connected to a single input port, as otherwise the same IP wouldbe owned by multiple processes at the same time. Classical FBP requires IPs to beexplicitly copied using a dedicated component with multiple output ports that arethen connected to multiple input ports. In order to not needlessly complicate mattersfor the graph designer, DISCOPAR adopts the reactive FBP approach where a singleoutput port can be connected to multiple input ports, thereby implying automaticreplication of data.
4.2.4 Ports
The contact points between processes and connections are called ports. Every portis named to enable FBP components to refer to them without needing to be awareof what they are connected to. A component can have multiple inputs or outputs.A process can send to or receive from any of its ports. Input ports provide receivefunctionality to dequeue IPs from a connection’s buffer. Output ports provide sendfunctionality to queue an IP into the port of a connected process.
A process reacts to the arrival of data on an input port by executing code from itsblack box implementation. This code can potentially produce output, which is thenpublished on one of its output ports. The behaviour of components with multipleinput ports depends on the implementation of the component. More details on thisare provided in section 6.1.3.
It is possible for a component to not have an input port, in which case it acts asa source of the DAG. A source is a component that automatically produces output.For example, a component generating output from a smartphone sensor. Similarly, acomponent without an output port acts as a sink of the DAG. A sink is a componentthat consumes data, such as a linechart component that draws the consumed value ona chart.
ObservationMessage
NumberText
FileAny
LocationGeoJSON
Figure 4.5: DISCOPAR’s supported data types and corresponding colours.
63

Chapter 4: Language Concepts of DISCOPAR
Ports in DISCOPAR are typed. Ports can only be connected if they “understand”each other. Components are compatible if the output of one component can serve asinput of another component. For example, it makes no sense to send a numerical valueto a component expecting JSON input. The colour of the port indicates what type ofdata the component can receive. The various types that are currently supported, alongwith their corresponding colour, are shown in fig. 4.5. The Any type is a special caseand accepts connections from any output port, regardless of its type.
4.2.5 Information Packets
An information packet (IP) is data that is sent from one process to another. An IPhas some affinities with the concept of “object” in Object-Oriented Programming.Information packets have a life cycle and are owned explicitly by one process at atime. The actual implementation and content of an IP depends on the application do-main. One special type of information packet, called initial information packets, arenot meant to be passed around between processes. They only contain configurationinformation and are given to a particular process when the program is started by theDISCOPAREE. For example, a component capable of establishing a serial connectionto external devices through USB requires that the USB protocol details are passed tothe process upon initialisation.
In DISCOPAR, IPs can be numbers, strings, or JSON objects. However, theseare often not presented to the user as-is, but use an additional layer of abstractionso that users are able to deal with domain specific data instead (cfr. port typing insection 4.2.4).
Citizen observatories can gather data on a variety of topics, such as noise pollu-tion or eating habits. Despite this diversity, there are some commonalities betweenthe data collected in every citizen observatory. Observational data typically containsthe following information [118]:
• Geographical information, indicating where the data sample was made.
• Observation time, indicating when the data sample was made.
• Observer, indicating who made the data sample.
• Observation Procedure, indicating how the data sample was made.
• Observed Data, the measured data of this sample.
DISCOPAR supports this observational data model, and provides a special typeof IP that is referred to as an observation. Observations can be considered the most
64

4.2 Concepts and Terminology
important type of information packet in a citizen observatory. Observations are al-ways created by data-producing processes on the mobile app, such as those readingout sensor values or outputting user input from questionnaires. Observations are aug-mented with relevant meta-information, such as user id, device model, so that theycan be processed and persistently stored in the citizen observatory. Observations canbe considered a summary of the captured data. Many sensor components also outputthe individual values captured in the observation on different output ports. One suchexample is the SensorDrone component, illustrated in fig. 4.6. This componentcollects sensor readings on temperature, humidity, and atmospheric pressure on a reg-ular interval from an external device that can be connected to the smartphone usingBluetooth. On each interval, these sensor readings are wrapped inside an observation,augmented with meta-data, and sent to the out output port. At the same time, eachindividual numerical value is sent to the corresponding output port.
Figure 4.6: The SensorDrone component.
4.2.6 Graphs
The structure of an application in flow-based programming is represented as a di-rected graph. The nodes of the graph are processes, while the edges are the con-nections between ports. Unlike other FBP languages that do allow the application’sdirected graph to contain cycles, DISCOPAR adopts a more strict policy where a pro-gram is implemented as a directed acyclic graph. This choice was made deliberatelyto prevent ICT-agnostic users from creating incorrect programs.
Constructing a graph in FBP can either be done graphically using a visual tool,or using a textual Domain-Specific Language. In DISCOPAR, graphs are createdthrough DISCOPARDE, our web-based visual programming environment.
A FBP application represented through a graph can be executed in the underlyingFBP language or library by initialising the processes and establishing the appropriateconnections. In the case of DISCOPAR, this is done by loading the graph constructedwith DISCOPARDE in DISCOPAREE.
65

Chapter 4: Language Concepts of DISCOPAR
Graphs in DISCOPAR do not necessarily deploy every component on the samedevice (hence the term "distributed" in the DISCOPAR acronym). However, this dis-tribution of components is hidden from the developer. For example, consider thegraph depicted in fig. 4.7. This graph filters the observations uploaded by mobiledevices based on whether those observations were made within the boundary of acertain city. Observations satisfying this constraint are then aggregated into a map,and this map is visualised to end-users.
Figure 4.7: A graph containing distributed components.
The graph designer that implemented this data processing and visualisation logicdid so only by interconnecting these four components. The data filtering and aggrega-tion processes reside on the server, as they are CPU-intensive operations that processthe uploaded data of every participant. However, visualisation components in DISCO-PAR provides real-time and interactive visualisations that are rendered on the client.Despite this distributed setting, the graph designer can simply drag connections fromone (server-side) component to a (client-side) component. Behind the scenes, DIS-COPAR will automatically establish the distributed connection between the clientand server. More details on how these distributed connections are handled are dis-cussed in section 6.1.6 .
4.3 DISCOPARDE
In addition to the visual syntax for components, ports, and connections, DISCOPARfeatures a web-based visual programming environment, named DISCOPARDE, thatprovides users with the means to visually compose components into a graph throughdrag-and-drop actions. Although already briefly introduced in section 4.1, this sectionprovides more details on the features of DISCOPARDE.
The user interface of DISCOPARDE, depicted in fig. 4.8, consists of four mainelements: the component menu, the canvas, a pop-up window granting access to pro-
66

4.3 DISCOPARDE
cess configuration, and the graph validation indicator. This default interface of theDISCOPARDE can be modified and extended for each particular use throughout theCO meta-platform, as we will discuss in chapter 5.
Figure 4.8: DISCOPAR’s default visual programming environment.
4.3.1 Component Menu
The component menu is presented as a searchable list containing the variousavailable components. Searching the available components can be done by name,(sub)category, or on any keyword in a component’s description. This description —toggleable by an information button next to each component — offers more detailsto the graph designer on the features that a certain component provides.
The set of available components is configured upon initialisation ofDISCOPARDE, meaning that every component is not always available. For example,components that only work on the client-side, such as those producing output from asmartphone sensor, are not made available when using DISCOPARDE to program theserver-side of a citizen observatory. An exhaustive list of every component availablein the current implementation of DISCOPAR is available in appendix A.
Components that provide more low-level features are hidden from the componentlibrary’s list by default. These components generally are intended to be used by moreadvanced users. They become available after switching on the advanced mode, whichcan be done through a button beneath the search bar.
67

Chapter 4: Language Concepts of DISCOPAR
Clicking on a component in the library will create an instance of that component,which immediately appears on the designer canvas. Multiple instances of the samecomponent can be created.
Dynamic Menu Population
An interesting feature of DISCOPARDE is that the component menu can be dy-namically adjusted based on other components in the graph. Graphs constructed inDISCOPARDE are analysed to extract meta-information, i.e., information about thegraph itself, such as the types of data that is produced by a mobile app. This meta-information is used as initial information packet (cfr. section 4.2.5) to configure pro-cesses. For example, the ObservationData component extracts all the data froman observation, and outputs the individual values on corresponding output ports. Thiscomponent needs the meta-information to know how many and what type of outputports it should create, which is based on the data produced by the mobile app.
Furthermore, this meta-information can result in additional components beingadded to the menu. For example, if by analysing a mobile app the system realises thatit consists of a survey containing various questions, the system will automatically addextra components to the library which can filter observations based on the input ofparticipants. If a survey asks for the participant’s gender, then a component is addedto the component menu that can sort observations by gender.
4.3.2 Canvas
The canvas contains the visual representations of the various components, and pro-vides the means to connect their various input and output ports through drag-and-drop interactions. When right-clicking a component on the canvas, a menu appears,shown in fig. 4.9, that enables the graph designer to delete the component or open itsconfiguration window (cfr. section 4.3.3).
Figure 4.9: Menu shown when right-clicking a component on the canvas.
68

4.3 DISCOPARDE
Every action performed by the designer is immediately and persistently updatedin the DISCOPAR graph. There is no need to “save" a graph, and no risk for thedesigner to lose any modifications to a potentially large graph.
Port Typing
Remember from section 4.2.4 that ports in DISCOPAR are typed, and that ports canonly be connected if the output of one component can serve as input of another com-ponent. DISCOPARDE’s canvas includes a visual feedback mechanism that helps thegraph designer by presenting this port typing constraint on connections in a visualway: when dragging a connection from an output port, only input ports with match-ing colours are highlighted and actually accept the connection. The exception to thisrule are input ports of the Any type, which are always highlighted as they acceptany type of input. DISCOPARDE thus prevents the creation of a graph in which twocomponents are connected through incompatible ports.
Figure 4.10: Highlighting of compatible ports.
Figure 4.10 demonstrates this colour matching principle. In this example, the de-signer is creating a connection from the OUT port of the Speed component. This portoutputs numerical data, namely the speed a smartphone is moving at based on GPSdata. Here, there are two compatible ports: the IN port of the Average componentthat accepts numerical data, and IN port of the Counter component that acceptsany type of data. Thus, both these ports are automatically highlighted when dragginga connection from the Speed component’s output port. The MapDotDraw inputport requires observations as input, and can therefore not be connected to the Speedcomponent.
69

Chapter 4: Language Concepts of DISCOPAR
4.3.3 Process Configuration
Components can include configurable settings that enable the designer to customisethe behaviour of the process once the component is initialised. When available, thesesettings are automatically added to the configuration window of each component.Figure 4.11 depicts the configuration window of a LineChartVisualisationcomponent. This component visualises numerical values that it receives, and can beconfigured to change the number of values that are shown simultaneously, the scaleof the Y-axis, etc.
Figure 4.11: LineChartVisualisation component configuration window.
Each component drawn on the canvas in the DISCOPARDE corresponds to oneprocess of that particular component in the DISCOPAREE once the graph is deployed.Each process has its own configuration, so it is possible for two processes of thesame component to behave differently by using other settings. For example, the graphdesigner can add two LineChartVisualisation components on the canvas butconfigure them differently. Since we are actually configuring settings that will have animpact on one particular process, we refer to this mechanism as process configurationrather than component configuration.
Components can modify the default configuration window to include a more ad-vanced editor for process customisation. One such example is the Form component,which enables the creation of questionnaires that enable data gathering through userinput. Figure 4.12 shows the modified configuration window used by the Form com-ponent to design questionnaires. This form builder consists of a drag-and-drop inter-face, along with a collection of form elements that can be dragged onto a live preview
70

4.3 DISCOPARDE
Figure 4.12: Customised component configuration window.
of the form. Upon completion, the form elements are serialised and stored inside thecorresponding Form instance. The component is then added to the canvas where itcan be assembled into the mobile app.
4.3.4 Graph Validation Indicator
DISCOPARDE supports the concept of graph validation. A graph is considered validif it satisfies every constraint that is imposed on the graph. These constraints arespecified behind the scenes, as we will describe in more detail in section 6.1.5. Oneexample is a constraint for the mobile app logic stating that there must be at leastone data connection arriving at the Upload component, as otherwise no data willbe contributed to the observatory. Another example is testing if a path exists betweenthe sensor components (i.e., the graph’s sources) and the destination.
Whenever a constraint is not satisfied, a visual cue is shown to the graph designerto indicate that there are still some unresolved issues, as illustrated in fig. 4.13. When-ever a change is made to the graph, the constraints are re-evaluated and the visual cuesupdated when necessary.
71

Chapter 4: Language Concepts of DISCOPAR
Figure 4.13: Graph Validation error message example.
4.3.5 DISCOPARDE as Live Programming Environment
The previous section introduces the various features of DISCOPARDE, the visualprogramming environment that creates DAGs that are initialised and executed by theDISCOPAREE. A previously unmentioned and optional feature of DISCOPARDE islive programming. Live programming environments, such as Smalltalk [54], allowchanges to the code of a running application in order to provide earlier feedback tothe programmer for both debugging and development.
DISCOPARDE has the option to be configured in such a way that any changesmade to the DAG, such as adding a component or changing configuration settings,are immediately, and automatically, mirrored by the DISCOPAREE responsible forexecuting that DAG. The DISCOPAREE mirroring these changes can either be de-ployed on the same device as the DISCOPARDE, or on a different device.
In case the DISCOPAREE is deployed on the same device as the DISCOPARDE,the DISCOPAREE can interact with the DISCOPARDE to provide immediate feed-back to the graph designer about the running program. For example, if theDISCOPARDE is used to create a mobile app for the citizen observatory, the live pro-gramming can be enabled to provide the graph designer a live preview of the mobileapp’s UI and test its functionality during its development.
In case the DISCOPAREE is deployed on a different device, the DISCOPARDE
acts as a distributed live programming environment, where a graph designer can mod-ify — from within its client-side browser — an application running on the server. Inthe current status, it is only possible to modify a running program on the server fromwithin the client-side browser. In the future, we plan on adding support for real-timemonitoring, such as data throughput of a process.
More use-cases of DISCOPARDE as live programming environment are discussedin chapter 5. The details on how this live programming is implemented are presentedin chapter 6.
72

4.4 Facilitating End-User Programming
4.4 Facilitating End-User Programming
Section 3.7 introduced the most common goals of visual programming languages, i.e.,making programming more understandable to some particular audience and improv-ing the speed and correctness with which people perform programming tasks. Thesegoals are directly applicable on the usability requirement of our CO meta-platform(cfr. section 3.3.1 - ULR2), as ICT-agnostic stakeholders must be able to correctlyset up a citizen observatory without too much effort through the use of DISCOPAR.To achieve these goals, visual programming languages rely on four common strate-gies [14]: Concreteness, Directness, Explicitness, Immediate Visual Feedback. In theremainder of this section, we briefly introduce each of these strategies and explainhow DISCOPAR adopts them.
Concreteness
Concreteness means expressing some aspects of a program using particular instances,i.e., using real values rather than a description of possible values [53]. Concretenesscan be used in two ways: to provide feedback or to specify part or all of the program.For example, a WYSIWYG editor (“what you see is what you get”) automaticallydisplays the effects of some portion of a program on a specific object or value.
DISCOPARDE is concrete by-design, as it enables programmers to specify whatthey want from the observatory through drag-and-drop actions where they manipulatespecific instances of components.
The process configuration (cfr. section 4.3.3) is also an example of concreteness,as each process can be further customised by specifying actual values for a variety ofconfiguration options. In case the live programming feature of DISCOPARDE is en-abled, changes to these settings are automatically applied on the running applicationin the DISCOPAREE , potentially resulting in visual feedback in the live preview ofthe running application.
Directness
Directness is described by Hutchins et al. [58] as having two aspects: distance andengagement.
The first aspect of directness is a small distance between a goal and the actionsrequired of the user to achieve this goal. A term closely related is the conceptualsimplicity of a VPL [3], meaning that the underlying concepts are represented as nat-urally as possible and simplifies abstract concepts. It only emphasises logic which isdirectly pertinent to the application and not the programming mechanics. DISCOPAR
73

Chapter 4: Language Concepts of DISCOPAR
was created specifically to hide the technological complexity of a citizen observatoryfrom the user. When creating a citizen observatory or campaign, users can createclient-side visualisations from server-side data processing components without evenrealising they are setting up a distributed connection. Creating a (distributed) connec-tion is as simple as drawing a line between an output port and an input port.
The second aspect of directness is a feeling of direct engagement, i.e., the feel-ing that one is directly manipulating the objects of interest. According to Shneider-man [116], the main principles for direct manipulation are: continuous representationof the objects of interest, physical actions or presses of labeled buttons instead ofcomplex syntax, and rapid incremental reversible operations whose effect on theobject of interest is immediately visible. Rather than relying on complex syntax,DISCOPARDE uses physical actions through its drag-and-drop interface and labelledbuttons to directly manipulate a process, e.g., to configure a process, or delete it fromthe canvas.
Explicitness
Explicitness is the direct expression of certain aspects of semantics, without requir-ing the programmer to infer it. Visual programming languages usually shows rela-tionships among objects, component, or modules in a very explicit way, for example,by drawing directed edges among related variables or statements.
Explicitness in DISCOPARDE is ensured as the connections between componentsare explicitly depicted to the graph designer. The connections indicate data flows fromone process to another in the DISCOPAREE, without requiring the graph designer toinfer it. Another example is the port typing mechanism. When dragging a connectionfrom an output port, all the compatible input ports are explicitly highlighted.
Immediate Visual Feedback
Immediate Visual Feedback refers to the automatic display of effects of programedits. A closely related term is the liveness [124] of a program, which is the degreeto which a visual programming language provides immediate feedback. Tanimotoproposed a four-level scale of liveness (see figure 4.14). The lowest level of livenessis the pure ‘informative’ level that uses the visual representation of the program asan aid to documenting or understanding the program, but not for implementing theprogram itself. The highest level is ‘informative, significant, responsive, and live’. Itis a system that automatically provides incremental semantic feedback whenever theprogrammer performs an incremental program edit, and all affected on-screen values
74

4.5 Conclusion
are automatically redisplayed. Additionally, it also reacts to other events as well suchas system clock ticks and mouse clicks over time.
Flowchart as description
Informative
Executable flowchart
Significant
Informative
Edit-triggered updates
Responsive
Significant
Informative
Live
Stream-driven updates
Responsive
Significant
Informative
4321Figure 4.14: Levels of liveness in visual programming systems.
DISCOPARDE is designed to exhibit liveness at the highest level, which meansthat it is informative, significant, responsive, and live. It is informative and significantas the visual representation of the interconnected components is used to specify theactual implementation of the citizen observatory instead of just serving as documen-tation thereof. Responsiveness is present in DISCOPARDE as it displays the effectsof changes made by the programmer automatically, that is, the programmer does notneed to press a special button or do something in order to see the effects. For exam-ple, deleting a component automatically removes it from the canvas, in addition toany connection that was connected to the component. DISCOPARDE is live as theoptional live preview (cfr. section 4.3.5) is capable of reacting to events such as thesystem clock, connection status, or microphone input, etc.
The advantage of implementing level four liveness for DISCOPARDE is that theamount and rate of feedback to the graph designers is maximised, which increasesthe correctness and speed at which they can program an observatory. Furthermore,immediately seeing the impact of incremental changes to the program makes it easierfor graph designers to understand the effect of their actions.
4.5 Conclusion
This chapter introduced DISCOPAR, a new visual reactive flow-based domain-specific programming language. More specifically, we introduced the graph layer
75

Chapter 4: Language Concepts of DISCOPAR
of DISCOPAR, i.e., the visual syntax with which graph designers can construct pro-grams. This graph layer is used by DISCOPARDE, a visual programming environ-ment for DISCOPAR that is used throughout the citizen observatory meta-platform.We introduced the main concepts of flow-based programming and their visual repre-sentation in DISCOPAR’s graph layer.
We presented DISCOPARDE, with key features including the input/output typingto ensure process compatibility, graph validation to prevent incorrect programs, pro-cess configuration to enhance customisability, and optional live programming modeto modify a running program, which may be deployed on the server. To ensure end-user usability and understanding, we adopted four common strategies into the designof DISCOPAR’s graph layer: concreteness, directness, explicitness, and immediatevisual feedback.
The concepts and visual syntax presented here serve as a guideline for the nextchapter, which introduces the CO meta-platform and discusses how stakeholders canprogram a citizen observatory using DISCOPAR.
76

5C O N S T RU C T I N G C I T I Z E N O B S E RVAT O R I E S W I T HD I S C O PA R
DISCOPAR, presented in the previous chapter, is a visual reactive flow-based domain-specific language that lies at the foundation of our citizen observatory meta-platform.This CO meta-platform enables ICT-agnostic stakeholders and communities to con-struct their own citizen observatory and set up campaigns.
This chapter introduces the CO meta-platform. The first part of this chapter fo-cusses on how a citizen observatory can be created through the use of DISCOPARDE.We describe how the mobile data collecting app, server-side data processing, and web-based visualisations of a citizen observatory are all implemented in DISCOPAR. Thesecond part of this chapter explains how campaigns can be created within a specificcitizen observatory. We conclude the chapter by describing the built-in calibrationtool and the community component creator provided by the CO meta-platform.
77

Chapter 5: Constructing Citizen Observatories with DISCOPAR
5.1 Creating a New Citizen Observatory
The citizen observatory meta-platform enables stakeholders to instantiate their ownCO on a particular topic, such as noise pollution, road conditions, etc. Creating anew citizen observatory is accomplished by specifying the name and purpose of theobservatory, along with an image that will be used as logo throughout the observatoryand as icon for the mobile app. The user who creates the CO is automatically assignedthe role of citizen observatory administrator (cfr. section 2.4.1). Upon creating a newcitizen observatory, the meta-platform automatically generates a series of dedicatedweb pages for that particular observatory, as depicted in fig. 5.1. Furthermore, thenewly created CO is added to the list of observatories on the meta-platform’s website.This website allows users to browse all currently existing citizen observatories andgrants them access to each observatory’s homepage.
The CO homepage acts as the central hub for that particular citizen observatory.The top part of the homepage consists of the observatory’s logo and description, andpresents a list of the various campaigns that have been deployed within that obser-vatory. Each campaign is listed by its name, description, and the campaign’s accesslevel (cfr. section 5.2). A button enables any visitor to create his own campaign. Thebottom part of the homepage shows a dashboard containing the visualisations speci-fied in the Data Processing Design Interface, which is described in section 5.1.2. Thisdashboard can be used to show general statistics about the observatory, such as, forexample, how many measurements have been uploaded in total, where they are made,etc.
The menu of the homepage changes depending on the user’s access rights. TheCO administator has access to the following features:
• Mobile App Design Interface (MADI) is a web application that allows theCO administrator to create a customised mobile data gathering app for theobservatory.
• Data Processing Design Interface (DPDI) is a web application that allowsthe CO administrator to specify server-side data processing and/or monitoringfeatures of the citizen observatory.
The following features are accessible to any user:
• Mobile Data Collection App to contribute data to the citizen observatory. Thisapp is created by the CO administrator through the MADI.
• Observatory Data Analysis Interface (ODAI) is a web application to analysethe citizen observatory’s data.
78

Mobile Data Gathering App
CO Administrator All Users
Data Processing Design Interface Data Analysis Interface
Mobile App Design Interface
Figure 5.1: Automatically generated web pages of a citizen observatory.

Chapter 5: Constructing Citizen Observatories with DISCOPAR
5.1.1 Mobile App Design Interface
Each citizen observatory has exactly one specific mobile app that will be used forcollecting data. This app is developed by the CO administrator using the Mobile AppDesign Interface (MADI), which is depicted in fig. 5.2.
1
Figure 5.2: The Mobile App Design Interface, featuring the component library (left), de-signer canvas (middle), and a live preview of the mobile app (right).
The MADI uses DISCOPARDE and populates the component menu with a set ofdomain-specific components that the CO administrator can compose into a graph toimplement the mobile app’s logic. The components that can be used by a mobile appcan be classified based on their functionality:
• Sensing components produce data coming from smartphone sensors or exter-nal devices, or though user input from a participant.
• Logic components offer data processing capabilities such as filtering of incom-plete data, and communication components to upload data to the observatory.
80

5.1 Creating a New Citizen Observatory
• Visualisation components provide the means to visualise the data generatedby the mobile app.
• Coordination components handle the instructions sent out by campaign or-chestration components to provide participant coordination on an individuallevel.
Within each of these categories, subcategories are used to further subdivide compo-nents into meaningful groups. For example, sensing components are further subdi-vided by the type of data they produce, such as sound levels, air pollution, etc.
The MADI enables DISCOPARDE’s feature to become a live programming en-vironment (cfr. section 4.3.5). Behind the scenes, the mobile app’s logic is executedby DISCOPAREE to provide the CO administrator with a live preview of the mobileapp 1 . As discussed in section 4.4, DISCOPAR features “level four” liveness. Asa consequence, all the affected on-screen values and dependencies are automaticallyupdated whenever the CO administrator performs an incremental program edit. Thelive preview of the mobile app also reacts to other events that the web browser pro-vides, such as geo-location information. As a result, the CO administrator can moreaccurately predict the actual behaviour of the mobile app while it is being developed.
5.1.2 Data Processing Design Interface
Each citizen observatory is responsible to process, store, and visualise all the datacollected by participants. The CO administrator specifies how this is done using theData Processing Design Interface (DPDI), which is depicted in fig. 5.3. The goal ofthe DPDI is twofold:
First, the DPDI enables the specification of how all the data gathered by partic-ipants must be pre-processed before persistently storing and passing it to the cam-paigns deployed within the observatory. This pre-processing is particularly useful toapply data cleansing and transformation to uploaded data samples. For example, fil-tering out measurements without GPS coordinates, after which reverse geocoding isperformed on the remaining data.
Second, the DPDI can be used to create visualisations for analysis and mon-itoring purposes. Visualisations can be public, in which case they are updated inreal-time on the dashboard included on the observatory’s homepage (cfr. fig. 5.1).Not every visualisation has to be made public, as the observatory administrator maywant to keep certain statistics private.
81

Chapter 5: Constructing Citizen Observatories with DISCOPAR
1
Figure 5.3: The Data Processing Design Interface, featuring the component library (left),designer canvas (top-right), and the visualisations preview window (bottom-right).
The Data Processing Design Interface is a good example of how DISCOPAR hidesthe non-essential complexity of creating distributed applications. The visualisationcomponents specified in the DPDI, which are visible on the observatory’s dashboard,are web-based visualisations that are loaded every time the observatory’s homepageis loaded. However, these visualisations expect input from components that are de-ployed on the server. Therefore, behind the scenes distributed connections are estab-lished to ensure that these visualisations remain up to date in real-time. Details on theimplementation of these distributed connections are provided in section 6.1.6.
Consider the example graph depicted in fig. 5.3. Although this graph does notperform any data pre-processing, it uses several components to produce data for twodata visualisation components: a MapVisualisation shows the locations of themost recent data contributions, and a PieChartVisualisation compares thenumber of contributions made on each day of the week. These visualisations can be
82

5.1 Creating a New Citizen Observatory
previewed from within the DPDI through a dedicated window (cfr. fig. 5.3 1 ).
Similar to the MADI (cfr. section 5.1.1), the DPDI uses DISCOPARDE as a live pro-gramming environment. When a new observatory is created, a new DISCOPAREE
is deployed on the server that executes the observatory’s server-side logic. By de-fault, new observatories only contain a component for persistently storing the data.Any change made in the DPDI to server-side logic is immediately mirrored by thisDISCOPAREE . The CO administrator’s actions on DISCOPARDE’s canvas thus mod-ify the running program. For the client-side components present in the DPDI, i.e., thevisualisation components, a separate DISCOPAREE is deployed on the client. Thisclient-side DISCOPAREE interacts with the server-side logic to provide the CO ad-ministrated with a real-time live preview of the dashboard’s visualisation during theirdevelopment.
5.1.3 Mobile Data Collection App
The mobile data collection apps created through the MADI are web-based apps thatcan run in any modern mobile web-browser. This app initialises the DAG containingthe app’s logic as designed by the CO administrator. A citizen obervatory’s mobileapp is responsible for measuring and monitoring the data, presenting the user with thenecessary feedback, and — in case of temporary disconnections from the observatory— operating autonomously by buffering results until reconnection. Behind the scenes,the mobile app automatically establishes a two-way real-time connection to the ob-servatory to upload data and receive feedback. Everyone who creates an account onthe CO meta-platform is allowed to contribute data to a CO.Each observatory’s mobile app has a default layout, depicted in fig. 5.4, consisting offour tabs:
1. The main tab contains the actual mobile app UI.
2. The feedback tab displays messages from other users and general feedbackcoming from the observatory.
3. The campaign tab shows a list of campaigns deployed within the observatorywhose intermediate results can be tracked in real-time.
4. The map tab depicts geographical information generated by the mobile app.
The campaign tab provides an overview of all the campaigns accessible to the par-ticipant. Clicking on a campaign loads their visualisations, enabling real-time mon-itoring of intermediate campaign results from within the app. Additionally, partici-
83

Chapter 5: Constructing Citizen Observatories with DISCOPAR
Figure 5.4: The Mobile Data Gathering App with the main tab (left) and the campaign tabshowing intermediate results (right).
pants can toggle a button to indicate whether or not they want to receive campaigncoordination messages by the campaigns orchestration components, if available forthat particular campaign. We deliberately chose to not turn on any campaign-relatedfeatures unless a participant explicitly chooses to do so. This way, we prevent partici-pants from being overwhelmed by unwanted campaign coordination messages, whileat the same time also reducing the bandwidth consumption of the mobile app. It alsoreduces the mobile app’s CPU usage as it does not have to perform unnecessary up-dates to all of the campaign visualisations.
5.1.4 Observatory Data Analysis Interface
In addition to providing real-time data processing and visualisation, citizen observato-ries created through the CO meta-platform also support a more traditional query-like
84

5.1 Creating a New Citizen Observatory
approach. This is achieved through the Observatory Data Analysis Interface (ODAI)which enables end-users to query the observatory’s data for analysis and visualisation.For example, the ODAI of a citizen observatory regarding noise pollution could beused to see a particular city’s noise pollution.
1
Figure 5.5: The Observatory Data Analysis Interface.
The ODAI, depicted in fig. 5.5 also uses DISCOPARDEand although very similarto the Data Processing Design Interface, it has a subtle but important difference: thegraph’s source is not the Mobile App Data component that receives observationsfrom each participant in real-time, but rather the Database component. Unlike theDPDI’s graph, which remains active during the entire citizen observatory’s lifetime,the ODAI’s graph is only executed once when the end-user decides to ‘run’ the graph(cfr. fig. 5.5 1 ). When this happens, all the observations are retrieved from the ob-servatory’s database and provided as output produced by the Database component,after which they flow through the data analysis and visualisation components. In away, end-users can thus program database queries by selecting and configuring data
85

Chapter 5: Constructing Citizen Observatories with DISCOPAR
filtering components. The raw data can also be downloaded in various formats for usein external data processing and visualisations tools.
5.2 Creating a Campaign
Each citizen observatory provides support to deploy campaigns. The goal of a cam-paign is to aggregate data for a particular goal or concern. Any user can deploy oneor more campaigns in each of the citizen observatories that are available on the COmeta-platform. Users that create a campaign automatically take on the role of cam-paign administrator for that particular campaign. A new campaign is created by click-ing the appropriate button on a CO’s homepage and specifying the name and purposeof the campaign. Additionally, the campaign’s access level has to be selected thatspecifies which users are allowed to participate in the campaign. Following accesslevels are supported:
• Open: Every user is allowed to participate. The campaign accepts observationsfrom each mobile app user. The campaign is visible and accessible to anyonefrom the observatory’s web-page.
• Request: Users request permission from the campaign administrator to con-tribute to the campaign. The campaign only accepts observations from userswho are granted permission. The campaign is visible from the observatory’sweb-page, but not accessible without permission.
• Invitation: Users are invited by the campaign administrator to contribute to thecampaign. The campaign only accepts observations from users who acceptedthe invitation. The campaign is only visible on the observatory’s web page tousers that accepted the invitation.
Creating a campaign results in the automatic generation of several web-pages, sim-ilarly to the creation of an observatory. These generated web pages are depictedin fig. 5.6. The campaign’s homepage provides the campaign administrator accessto:
• Campaign Design Interface (CDI) to specify the campaign protocol and vi-sualisations.
Furthermore, the campaign’s homepage provides every participant of the campaign(or every user in the case of a public campaign) access to:
86

Campaign Administrator All Users
Campaign Design Interface Campaign Analysis Interface
Figure 5.6: Automatically generated web pages of a campaign.

Chapter 5: Constructing Citizen Observatories with DISCOPAR
• Campaign Analysis Interface (CAI) to offer a more traditional query-likeanalysis of campaign data.
• Campaign Dashboard to examine the real-time data visualisations.
The campaign dashboard is included in the campaign’s homepage, as depictedin fig. 5.6. Visualisations defined in the CDI are shown automatically on the cam-paign’s dashboard. These visualisations can either serve as reporting tools that enablethe campaign administrator to monitor a running campaign, or as data visualisationfor end-users to analyse the data from a campaign in real-time. As mentioned in sec-tion 5.1.3, these visualisations can also be loaded from within the observatory’s mo-bile data gathering app where they serve as immediate visual feedback. These visual-isations act as an incentive mechanism promoting further involvement of participantsand end-users.
5.2.1 Campaign Design Interface
The Campaign Design Interface (CDI) enables the campaign administrator to specifythe subset of data collected by the observatory that is of interest to the campaign. Thisis done by defining the campaign’s protocol (cfr. section 2.3.1). Specifying the cam-paign protocol is done by placing constraints on the collected data (cfr. section 2.3.1)and the context in which the data collection took place (cfr. section 2.3.1). In addi-tion to defining the campaign protocol, the CDI enables the campaign administratorto describe the campaign’s desired output in terms of data collections, visualisationsand maps.
The CDI, depicted in fig. 5.7, is a live programming environment whereDISCOPARDE provides a view on the campaign’s server-side logic and client-sidedashboard visualisations simultaneously. Any changes made to the campaign’s pro-tocol are thus immediately applied on the server, and changes to the campaign’sdashboard visualisations are immediately shown on the visualisation preview win-dow (fig. 5.7 1 ), which has a similar purpose as the observatory’s Data ProcessingDesign Interface: it demonstrates what the current visualisations included in the graphlook like.
The CDI also includes a geographical constraint editor (fig. 5.7 2 ) that enablesthe campaign administrator to define what areas are of interest to the campaign. Vari-ous forms of geographical constraints are supported, such as a simple point, a trajec-tory, complex polygon, etc. Notice however that specifying geographical constraintsis not mandatory. For example, a campaign that collects data on eating habits of peo-ple from a certain age anywhere on earth does not require a geographical constraint.
88

5.2 Creating a Campaign
1 2
Figure 5.7: The Campaign Design Interface.
The geographical constraint editor is a good example of DISCOPAR’s dynamiccomponent menu population (cfr. section 4.3.1): whenever the campaign administra-tor specifies a geographical constraint, a series of specific components for that geo-graphical area are dynamically created and made available from the component menu.These include components to test whether or not an observation has been producedby an app while it is located in the specified geographical area, or a component thatoverlays the area with a grid layout and performs location-based statistical averaging.
The CDI’s component menu is categorised as follows:
• Logic Components provide various data manipulation components. as well asseveral filter components that can be used to specify the campaign protocol.These filter components are further divided into following sub-categories:
– Geographical components can be used to add a geographical predicatePA to the campaign’s protocol (cfr. section 2.3.1). In other words, theycan be used to place a geographical boundary on the area of interest of a
89

Chapter 5: Constructing Citizen Observatories with DISCOPAR
campaign. Various geographical data filtering components are available,such as testing if a measurement was made inside a specified area ortesting if the user stays on a predefined trajectory.
– Temporal components enable the campaign administrator to specify thetemporal predicate PT (cfr. section 2.3.1) to indicate when participantsshould be collecting data. These components filter data based on theirtime-stamp, which is added automatically to all observations that are pro-duced by the mobile apps.
– Contextual components describe the desired context of the data collec-tion. They define the contextual predicate PC (cfr. section 2.3.1) of thecampaign’s protocol. These components filter data based on meta-datasuch as the participant’s age or device model.
• Aggregation components collect and/or aggregate data so that it can be usedin the visualisations depicted on the campaign’s dashboard. Data collectionscan also be used by end-users in the Campaign Analysis Interface to browseand analyse the data.
• Coordination components are capable of providing real-time coordinationmessages to participants. For example, location-based triggers can be used toprompt participants to gather data when they approach a particular area, orparticipants can be requested to move to a particular area that currently has alow data density.
• Visualisation components visualise (aggregated) data on the campaign’s dash-board. These visualisations are also available from within the mobile app’scampaign tab, enabling participants to monitor campaign progress in real-time.
5.2.2 Campaign Analysis Interface
End-users who want to browse and analyse the data that was collected in the contextof an ongoing campaign can use the Campaign Analysis Interface (CAI) rather thanrelying on the visualisations depicted on the campaign dashboard. For example, con-sider a noise mapping campaign of a certain busy road during peak hours. At the endof the campaign, certain end-users may want to individually compare the differentdays of the week to see whether there is any notable difference. To this extent, theCAI provides a more traditional query-like approach, similar to the ODAI (cfr. sec-tion 5.1.4). The CAI thus enables campaign participants (or any user if the campaignis public) to run their own data analysis and visualisation.
90

5.3 Citizen Observatory Meta-Platform Tools
Figure 5.8: The Campaign Analysis Interface.
The Campaign Analysis Interface (CAI), illustrated in Figure 5.8, enables itsusers to query the data collections made by the campaign. Data in these collectionscan then be further manipulated and filtered using DISCOPARDE. Similar to theODAI, the graph constructed in the CAI is only executed once, rather than remainingactive in the system indefinitely. When the graph is initialised, the data collectionsare retrieved from the database, after which they flow through the various data anal-ysis and visualisation components. The raw data can also be downloaded in variousformats for use in external data processing and visualisations tools.
5.3 Citizen Observatory Meta-Platform Tools
The CO meta-platform has a separate web-page where various additional useful toolsfor users can be presented. At the time of writing, the page provides access to theSensor Calibration Tool and the Community Component Creator.
91

Chapter 5: Constructing Citizen Observatories with DISCOPAR
5.3.1 Sensor Calibration Tool
Sensor calibration is a comparative procedure where one smartphone’s sensor read-ings are compared with those of a trusted reference device that is considered to pro-duce correct readings. Sensor calibration can reveal systematic errors that can thenbe corrected for in the future when collecting data with those sensors. Applying thesecorrections substantially increases the accuracy of smartphone sensors [41].
A major issue with sensor calibration is the vast number of different device mod-els available. With new models being released on a regular basis, performing sensorcalibration for each device model is tedious. Luckily, we observed from our previ-ous expertise with the NoiseTube platform that there are many volunteers with thenecessary expertise (such as noise pollution scientists) who are willing to performthis calibration themselves if they know their corrections will be integrated into theNoiseTube platform. While the NoiseTube platform relies on manual effort to inte-grate the calibration profiles, our CO meta-platform includes a Sensor CalibrationTool that enables stakeholders to upload their own calibration profiles, after whichthey are automatically integrated into the platform.
Figure 5.9: The Sensor Calibration Tool.
The Sensor Calibration Tool, depicted in fig. 5.9, enables users to add their ownso-called calibration profiles. Each calibration profile is linked to a specific devicemodel and sensor. The calibration profile itself consist of a series of calibration points.A calibration point is a pair containing a reading of the smartphone sensor, combinedwith the corresponding output of the reference device. Calibration is performed bycompensating the average measurement offsets of each device model through a cor-rection term which is found by linear interpolation between calibration points for that
92

5.3 Citizen Observatory Meta-Platform Tools
sensor. Calibration can be performed both on the client and server through the use ofthe calibration component.
In the current state, only calibration profiles for sound pressure levels using anA-weighting filter are included in the CO meta-platform. Observatories dealing withsound levels can thus utilise the calibration component to automatically calibrate datawhen a profile is available. Testing whether a calibration profile is available is done byextracting the meta-information from observations, which contains information indi-cating how the data sample was made, including the device model (cfr. section 4.2.5).
5.3.2 Community Component Creator
To improve the speed at which programs can be created, the CO meta-platform sup-ports the concept of reusable and shareable end-user created components, namedCommunity Components. These components can be created using the CommunityComponent Creator (CCC), which is implemented thorugh DISCOPARDE. The CCCenables the community to add new components by re-configuring and composing anumber of existing components. Community components can be used throughout theplatform. In a sense, they allow end-users to construct their own abstractions for mo-bile apps, data processing logic, and campaigns for other people to reuse. Communitycomponents can thus be compared to procedural abstraction of other general purposelanguages. Each community component’s internal implementation consist purely outof a DAG of other reusable components (which may be community components aswell).
Figure 5.10 illustrates the Community Component Creator. A new componentcan be designed by visually programming its internal logic and defining the portsit exposes to send and receive data. The example in fig. 5.10 depicts a communitycomponent capable of filtering observations based on whether or not an observationwas produced during the daytime in weekends. To do so, the community componentrelies on two internal components: a TimeFilter configured to daytime hours,and a DayFilter that is set up to only let observations pass that were produced inthe weekend. A name and description can be specified when saving the communitycomponent, after which the component is published in the component library.
The community components mechanism ensures functional scalability of the COmeta-platform (cfr. section 3.3.2 - TR2), which is directly influenced by component’sgranularity. Community components enable the composition of fine-grained compo-nents that provide very basic features into larger, more complex components. Thiscomposition mechanism facilitates the addition of new features, as only a single fine-
93
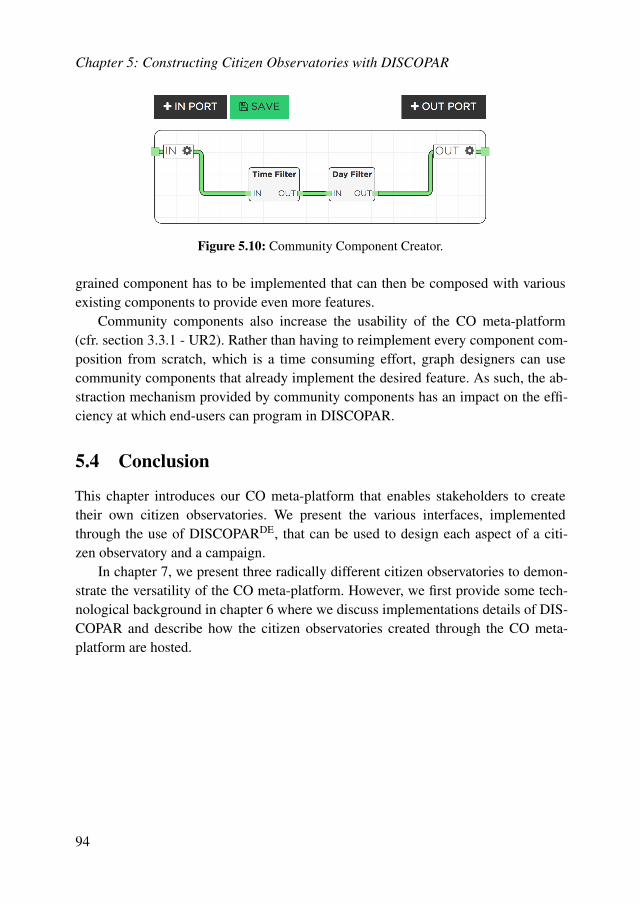
Chapter 5: Constructing Citizen Observatories with DISCOPAR
Figure 5.10: Community Component Creator.
grained component has to be implemented that can then be composed with variousexisting components to provide even more features.
Community components also increase the usability of the CO meta-platform(cfr. section 3.3.1 - UR2). Rather than having to reimplement every component com-position from scratch, which is a time consuming effort, graph designers can usecommunity components that already implement the desired feature. As such, the ab-straction mechanism provided by community components has an impact on the effi-ciency at which end-users can program in DISCOPAR.
5.4 Conclusion
This chapter introduces our CO meta-platform that enables stakeholders to createtheir own citizen observatories. We present the various interfaces, implementedthrough the use of DISCOPARDE, that can be used to design each aspect of a citi-zen observatory and a campaign.
In chapter 7, we present three radically different citizen observatories to demon-strate the versatility of the CO meta-platform. However, we first provide some tech-nological background in chapter 6 where we discuss implementations details of DIS-COPAR and describe how the citizen observatories created through the CO meta-platform are hosted.
94

6I M P L E M E N TAT I O N
For the sake of reproducibility, this chapter focuses on the implementation of DIS-COPAR, our new visual reactive flow-based domain-specific language that lies at thebasis of the citizen observatory meta-platform.
As is typical in flow-based programming (cfr. section 3.5), the design of DISCO-PAR is split into two layers: the component layer and the graph layer. The latter isused in the implementation of DISCOPARDE, a web-based visual programming en-vironment that is used throughout the CO meta-platform to design the various partsof a citizen observatory and a campaign. The visually composed programs are thenloaded by DISCOPAREE, the execution engine implemented by DISCOPAR’s com-ponent layer.
This chapter first introduces the various abstractions that together define the com-ponent layer in DISCOPAR. Next, we introduce the implementation of DISCOPAR’sgraph layer. Finally, we provide a high-level view on the underlying system archi-tecture of the citizen observatory meta-platform and discuss the various technologiesinvolved in every part of a CO’s architecture.
95

Chapter 6: Implementation
6.1 DISCOPAR: Component Layer
Remember from section 3.5 that flow-based programming applications are repre-sented as a directed graph consisting of processes as nodes and connections as edges.Processes access connections by means of ports. A process is an instance of a com-ponent, and runs concurrently with other processes.
The component layer of a flow-based programming language contains the sourcecode of each component. In DISCOPAR, this source code is divided amongst severalpackages. Each package contains components about a certain topic. For example,the ‘geolocation’ package contains components offering various geolocation features,such as components interacting with the GPS sensor to provide information aboutthe participants whereabouts or movement speed. An exhaustive list of DISCOPAR’spackages and their constituent components is presented in appendix A.
The component layer also included the necessary abstractions to create a compo-nent, spawn a process thereof, etc. Therefore, this section describes how FBP con-cepts such as components, processes, and ports are implemented in DISCOPAR’scomponent layer, which is written in JavaScript.
6.1.1 Components
Remember from section 3.5.2, which presents the characteristics of flow-basedprogramming, that FBP is a form of component-based software engineering (CBSE)by design. CBSE defines components as software elements that conform to a compo-nent model and which can be independently deployed and composed according to acomposition standard without modification [56]. The role of the component modelis to define a set of standards for component implementation, interfaces, naming,meta-data, interoperability, customisation, composition, evolution, and deployment.We now introduce the component model of DISCOPAR, i.e., the set of standardseach component in DISCOPAR must adhere to.
Component Implementation: Each component is implemented by instantiatingthe Component object, which requires two arguments: an object containing thecomponent’s meta-data, and a function that contains the component’s black box logic.
Naming: Components in DISCOPAR require a unique name, as a component’s nameis used to identify it in the component library. Within the same component, inputports must have a unique name. The same holds for output ports.
96

6.1 DISCOPAR: Component Layer
Meta-Data: The meta-data of a component contains its unique name. Optionally itcontains the component’s category, subcategory, description, and flags to indicatespecial cases such as components that can only operate on the client or server side. Ifno (sub)category is specified, it defaults to ‘miscellaneous’.
Interoperability: Components are compatible if the output of one component canserve as input of another component (cfr. port typing section 4.2.4).
Customisation: Components can be customised in two ways: by providing themwith a configuration object that acts as initial information packet (cfr. section 4.2.5),or by specifying user-customisable settings that can be configured by the graphdesigner through DISCOPARDE’s configuration window (cfr. section 4.3.3).
Composition: Components can be composed as long as their input and output portsare compatible. Client-side-only components cannot be included in a server-sideapplication, and vice versa. Components with a special flag that indicates there canonly be one instance of that component, can only be used once within the sameapplication.
Evolution Support: Replacing a component with a newer version must not breakthe component’s interface. This means that existing ports cannot be removed orrenamed, although additional ports may be added. It is only allowed to modify theinternal black-box logic of a component if it does not change the external behaviourof the component. The meta-information of a component, such as its description,can also be modified as long as it remains relevant with respect to the component’sintended behaviour.
Deployment: Components can be deployed on any system where the DISCOPAREE
is loaded. Restrictions from individual components, such as only allowing client-sidedeployment, still apply.
In the remainder of this section, we discuss how components can be implementedaccording to this model, and show how components can be initialised to create aprocess. Implementing a new component can be done in different ways: from scratchusing JavaScript, through component composition, or a combination of the two.
97

Chapter 6: Implementation
Implementing a Component from Scratch
Implementing a new component is done by creating a new Component object.Component requires two arguments upon initialisation: The first argument is an ob-ject containing meta-data about the component, as described in the component model.The second argument is a function that contains instructions on how to transform aDISCOPAR Process into a particular instance of a specific component.
An example of a component implemented from scratch is shown in listing 6.1.This code extract contains the complete source code for the Counter component,which counts the number of information packets (cfr. section 4.2.5) it has received onits input port.
1 BasicComponents.Counter = new D.Component(2 {3 name: 'Counter',4 category: D.ComponentCategory.LOGIC,5 description: 'Counts and outputs the number of incoming data.'6 },7 function (process) {89 // Register Ports
10 process.addInPort('in', {}, increment);11 process.addOutPort('out', {type: D.DataType.NUMERIC});1213 // Component Black Box Logic14 var counter = 0;1516 function increment(_) {17 process.outPorts.out.send(++counter);18 }19 }20 );
Listing 6.1: Source code of Counter component.
The Counter component is added to the package BasicComponents. As aresult, this component is automatically added to the DISCOPARDE component menuwhenever the ‘basic’ package is loaded. Note that the various abstractions provided byDISCOPAR’s component layer, such as the Component object, are made availablethrough the DISCOPAR or D global variable. The component’s meta-data is specifiedon lines 2 to 6, while lines 7 to 19 contain the component’s internal black-box logic tospawn a process of the Counter component. In case of the Counter component, aprocess must add an input port (line 10) that will execute the function increment
98

6.1 DISCOPAR: Component Layer
each time it receives an information packet. Additionally, line 11 adds an output portthat outputs the status of the counter each time it is incremented. On line 14 the valueof the counter is initialised. Lines 16 to 18 implement the increment function,which modifies the state by incrementing the process’s internal counter variable, afterwhich its new value is send to the output port.
Implementing a Component through Composition
Components can also be created through component composition [56]. Componentcomposition is the combination of two or more components yielding a new com-pound component. This composition mechanism can thus be thought of as the FBPequivalent to procedural abstraction in procedural programming languages. The char-acteristics of the new component are determined by the components being combinedand the way in which they are combined. The ability to create new components byusing other components is essential to reduce complexity and maximise code reuse.Primitive components are components that do not contain other components. Theyare the basic building blocks of the system and are equivalent to built-in proceduresin traditional programming languages.
The concept of community components, introduced in section 5.3.2, are one ex-ample of component composition (albeit on a high level of abstraction) where end-users program the internals of a new component through drag-and-drop actions inDISCOPARDE. A similar mechanism can also be used by component developers whowish to create new components on the textual source-code level by composing exist-ing ones. For example, consider the SoundLevelMeter component shown in list-ing 6.2 whose implementation consist purely of other components (lines 7 to 9) whichare interconnected (lines 11 to 12). Additionally, certain ports of the internal compo-nents are exposed (lines 14 to 16), which means that these ports act as input/outputports for the SoundLevelMeter component. The destroy function on (lines 18to 21) is the equivalent of a destructor and is called when a compound componentis deleted from the programming environment. it ensures that all the internally usedcomponents are properly disposed.
Spawning a Process from a Component
The components’ source code listed in the previous examples only describe the inter-nal black box logic of a Counter and SoundLevelMeter component. Spawningan actual process of a component is done by calling the init() function on thedesired component stored in DISCOPAR’s component library:
99

Chapter 6: Implementation
1 SoundComponents.SoundLevelMeter = new D.Component(2 {3 name: 'SoundLevelMeter',4 ...5 },6 function (process) {7 var spl = new D.Library.SoundPressureLevel.init()8 var calibration = new D.Library.CalibrateDecibel.init();9 var observationMaker = new D.Library.ObservationMaker.init();
1011 spl.outPorts.out.connect(observationCreator.inPorts.in);12 observationMaker.outPorts.out.connect(calibration.inPorts.in);1314 process.inPorts.in = spl.inPorts.in;15 process.outPorts.out = calibration.outPorts.out;16 process.outPorts.decibel = calibration.outPorts.decibel;1718 process.destroy = function () {19 spl.destroy()20 calibration.destroy()21 observationMaker.destroy()22 }23 }24 );
Listing 6.2: Source code of SoundLevelMeter component.
1 var counter = new D.Library.Counter.init(id, iip, settings)
Listing 6.3: Component initialisation.
The init() function accepts three optional arguments:
1. An identifier to be assigned to the process. If none is provided, the system willautomatically assign one to the process.
2. The initial information packet (cfr. section 4.2.5), i.e., a configuration objectcontaining extra information to properly initialise a process. Intended to beused by component developers.
3. Initial values for the configurable settings that are made available in the com-ponent’s configuration window of DISCOPARDE (cfr. section 4.3.3). Intendedto be used by the graph designers.
Section 6.1.5 provides more details on the purpose of a process’s identifier with re-spect to storing and establishes connections in a graph.
100

6.1 DISCOPAR: Component Layer
To further clarify the difference between a process’s initial information packet(IIP) and settings, consider a citizen observatory where participants can use a mobileapp to upload a geo-tagged photo combined with a rating (1-5 stars). The individualvalues of observations made for this observatory can be extracted through the use ofthe ObservationData component. This component accepts observations as inputand outputs each individual value on one of its output ports, as illustrated by fig. 6.1.
Figure 6.1: Visual representation of a ObservationData process.
The number of output ports of the ObservationData component is not de-fined in the component’s source code. Instead, the number of output ports dependson what data is gathered and uploaded by the mobile application of the citizen ob-servatory. This means that ObservationData cannot spawn a process without anIIP containing details on the data collected by the mobile app. This information isautomatically extracted by analysing the graph representing the mobile app, usingan approach similar to the graph validation presented in section 4.3.4, and stored asmeta-information of the citizen observatory. An example of this meta-information islisted in listing 6.4. This meta-information is wrapped inside an object that acts as theIIP for the ObservationData component (line 12).
1 var iip = {2 applicationmetadata : {3 sensors : {4 location: {type: "location"}5 },6 formFields : {7 photo: {type: "file"},8 rating: {type: "number"}9 }
10 }11 }12 var obsData = new D.Library.ObservationData.init(null, iip, null)
Listing 6.4: Initialisation of component requiring configuration.
Note that the type of ObservationData’s output ports is automatically setbased on the information provided by the IIP. Remember from section 4.2.4 thatDISCOPAR assigns each port a type in order to ensure that components can only be
101

Chapter 6: Implementation
connected if they ‘understand’ each other, and that port types are visually representedin DISCOPARDE through the use of different colours.
In contrast, consider the MapVisualisation component that adds a map contain-ing the individual observations to the observatory’s dashboard. The graph designercan customise processes of this component by specifying the dimensions of the vi-sualisation, providing a short description explaining its purpose, and by selecting thetile layer for the map. Sample values for these settings are explicitly shown in list-ing 6.5. Providing settings to a component upon initialisation (line 8) will overwritethe default value of each setting.
1 var settings = {2 height: "400px",3 width: "100%",4 description: "Map depicting observatory data",5 layer: "openStreetMap"6 }7 }8 var m = new D.Library.MapVisualisation.init(null,null,settings)
Listing 6.5: Initialisation of component with settings.
Unlike the initial information packet, settings are customisable by the graph de-signer, enabling them to alter the behaviour of a process during its execution. Thesesettings are displayed in the process’s configuration window (cfr. section 4.3.3) ofDISCOPARDE, as depicted in fig. 6.2
Figure 6.2: Configuration window of a MapVisualisation process.
102

6.1 DISCOPAR: Component Layer
6.1.2 Processes
Whenever a component is initialised from the library through the init() function,a new process is created (cfr.section 4.2.2). This newly created process then loads theblack box logic as defined in the component’s source code, which contains instruc-tions on how to properly initialise a process for that particular component. To do so, acomponent’s source code can utilise the Process object as illustrated in listing 6.6.Various meta-information fields, such as the process’s unique identifier, are omittedfor the sake of brevity
We now discuss each method supported by the Process object, as listed in list-ing 6.6.
1 function Process(component, iip, instanceSettings) {2 var process = this;34 process.addInPort = function (...) { ... };5 process.addOutPort = function (...) { ... };6 process.addSetting = function (...) { ... };7 process.adoptSettings = function (...) { ... }8 process.destroy = function () { ... };9
10 return process;11 }
Listing 6.6: Interface of the Process object.
The addInPort method adds an input port to a process. This method has fourparameters:
• portName: string indicating the name of the port. Each component must haveunique input port names.
• configuration: JSON object to specify various settings of the port. For exam-ple, {type: D.DataType.NUMERIC} indicates that the input port onlyaccepts numerical data.
• IPHandler: (optional) function that is executed for each information packetreceived by the input port.
• bufferHandler: (optional) function that is executed after a series of informa-tion packets are received by the input port.
103
Chapter 6: Implementation
The addOutPort method adds an output port to a Process. This method hastwo parameters, i.e., portName and configuration, which serve the identicalpurpose as in addInPort.
The addSetting method adds a configurable setting to a process (cfr. sec-tion 4.3.3). addSetting accepts a name, initial value, callback and optional con-figuration. Every time the value of a setting changes, its corresponding callback isexecuted. Settings accept any value, unless the optional configuration object speci-fies a predefined set of values that restricts the set of values from which the settingmust be chosen. For example, the Map component, which loads a map in the DOM,provides a setting to change the tile layer of the map. Rather than accepting any value,this setting must be set to one of the pre-defined supported tile layers.
The adoptSettings method enables a process that is implemented throughcomponent composition to adopt and expose the settings of internally used processes.
The destroy method is used to properly dispose processes, such as explicitlystopping underlying hardware signals used by the process. In the case of compoundcomponents, internally used processes have to be correctly destroyed as well. Forexample, the destroy function of the SoundLevelComponent (cfr. listing 6.2)disposes — amongst other — the internally used SoundPressureLevel process.Explicitly destroying the SoundPressureLevel is required to stop the mediastream which captures sound samples from the audio input.The Process object listed in listing 6.6 is used by default when initialising acomponent. However, certain components require additional features. For example,feedback components require access to the DOM, while community components(cfr. section 5.3.2) have an entire graph as their black box logic rather than built-insource code. As a result, different types of processes exist, which extend theProcess interface or which override certain aspects of the internal implementation.These different types are indicated using an additional field in a component’s meta-information, which in turn is used by a Component’s init method to decide whattype of process is required to create an instance of the component. Currently, thefollowing types of processes exist: DOM-Process, Visualisation-Processand Community-Process. We discuss each type in the remainder of this section.
DOM-Process is a process with access to the DOM. These processes are mainlyused in the Mobile App Design Interface (cfr. section 5.1.1), as the mobile app’s userinterface consists of DOM-processes, ranging from simple data visualisations, suchas displaying text on the screen, to more advanced ones, such as a line chart, pie chart,etc.
104

6.1 DISCOPAR: Component Layer
Each DOM-Process contains a field which holds the visualisation’s HTMLcode. The Process API is extended with addToDOM and removeFromDOMmethods, that add, or respectively remove, the process’s HTML to the DOM.Additionally, an addedToDOM callback function is added, which can be used byprocesses that require additional set-up once its HTML is actually added to theDOM. A resize callback enables DOM-processes to update their visualisationsin the case of a window resize, such as a participant rotating the smartphone fromportrait to landscape.
Visualisation-Process is a special case of a DOM-process, and thusfurther extends the DOM-process interface. Visualisation processes are used bythe web-based visualisation components that display observatory data or campaigndata on a dashboard. Since they are designed to be depicted on a dashboard, eachvisualisation process provides several settings that can be configured to define thedimensions of the visualisations on the dashboard. Additionally, each visualisationsupports various export options, enabling end-users to download the visualisationsin various formats. Visualisations processes can specify which export optionsthe support through the additional loadExportOptions method added to theProcess interface.
Community-Process is an instance of DISCOPAR’s community components(cfr. section 5.3.2). These user-defined processes consist of a graph describing theinternal logic of the component. This graph, combined with the user-defined inputand output ports of the community component, are persistently stored in the DIS-COPAR community component database. When creating a process of a communitycomponent, its internal graph is loaded by the loadInternalGraphmethod, afterwhich this graph is connected to the input/output ports of the community componentthrough the loadConnections method.
6.1.3 Ports
Ports are the points of contact between processes and connections. In classical FBP(cfr. section 3.5.2), input ports provide receive functionality which consists of dequeu-ing information packets from a connection’s buffer, and output ports provide sendfunctionality to queue an information packet into the port of a connected process.In contrast, DISCOPAR is a reactive FBP language, meaning that processes operateusing a publish/subscribe pattern, i.e., processes wait for data arriving on their inputports and publish data on their output ports. The actual sending of an information
105

Chapter 6: Implementation
packet is a normal JavaScript event that triggers the connected input port’s callbackfunction.
Input ports and output ports provide a different interface, although both inheritsome common properties from the Port object shown in listing 6.7.
1 function Port(name, config) {2 var port = this;3 ...4 port.connections = {};5 port.distributedConnections = {};6 port.type = config.type || Globals.DataType.ALL.;7 port.subject = new Rx.Subject();8 ...9 return port;
10 }
Listing 6.7: The Port object.
Each port must be assigned a name upon creation, and additional configurationsettings can be provided by means of an optional second parameter. DISCOPAR hasthe convention that in case there is a single input port on a component, it should benamed ‘IN’. Similarly, in case there is only a single output port, it should be named‘OUT’. In case of multiple ports, meaningful names are preferred. For example, theAccelerometer component has three output ports, named X, Y, and Z, that outputacceleration on the corresponding axis.
Each port keeps track of the connections attached to it. Each port makes a distinc-tion between local connections to another process on the same device, and distributedclient-server connections that connect to a remote process.
The type of a port (line 6) can be specified using the optional configuration pa-rameter. Recall from section 4.2.4 that DISCOPAR prevents processes with differentport types to be connected to one another, thereby ensuring that interconnected pro-cesses are always compatible. The exception to this rule is the Any datatype, which isassigned to a port by default if no type restriction is specified. Ports receive and senddata through the use of a publish/subscribe pattern implemented using RxJS Subjects.This is explained below.
RxJS Subjects
The Reactive Extensions for JavaScript (RxJS) [125] is a set of libraries for compos-ing asynchronous and event-based programs using observable sequences and fluentquery operators. RxJS represents asynchronous data streams via the Observable
106

6.1 DISCOPAR: Component Layer
abstraction. Observer objects can subscribe to an Observable, which no-tifies the subscribed Observer instance whenever an event occurs inside theObservable.
A Subject is both an Observer and an Observable: it can subscribe to adata source, and acts as an observable for its own set of subscribed observers. In thisway, the Subject can act as a proxy for a group of subscribers and a source. For ex-ample, Subject is typically used to implement a custom observable with caching,buffering, and time shifting. Additionally, it can be used to broadcast data to multi-ple subscribers. These properties make a Subject very suitable to implement FBPports: on one hand, input ports are both listening to upstream information packetsarriving from output ports, while at the same time producing a stream of that noti-fies the internal black box logic whenever new IPs arrive. This can either trigger anevent handler function within the process or (in the case of a compound component)forward the data to the required internal processes. On the other hand, output portscan subscribe to data streams coming from diverse sources, such as smartphone sen-sors and hardware signals, and publish that data immediately as output of the processupon which input ports can subscribe.
Input Ports
The additional features provided by the InPort object are shown in listing 6.8.Method subscribe (lines 4 to 13) enables a process to react upon the arrival ofnew information packets by registering a callback function. The way subscribehandles IPs depends on whether or not a bufferHandler was specified in theaddInPort call of Process (cfr. section 6.1.2). In case bufferHandler isomitted, IPHandler is registered as callback and thus executed for each IP individ-ually (line 6). In case bufferHandler is defined, IPs arriving at an input port aregrouped in a timed buffer (line 8) that collects IPs until the specified time has elapsed.The buffer time defaults to 10 milliseconds but can be overridden using the inputport’s configuration field bufferTime. Lines 9 to 12 subscribe a new callback tothis buffered stream, which execute IPHandler for each IP in the buffer (line 10),in addition to calling bufferHandler on the buffer as a whole (line 11).
We conceived the buffered stream mechanism after observing a frequentlyrecurring pattern within a component’s source code: Several components containa combination of fast operations that need to be executed for each IP individually,and slow, expensive operations that do not necessarily need to be executed for everysingle IP. Consider for example a visualisation component that displays the collecteddata from all participants on the observatory’s web page. Each newly uploaded IP is
107

Chapter 6: Implementation
1 function InPort(name, conf) {2 var inPort = new Port(name, conf);34 inPort.subscribe = function (IPHandler, bufferHandler) {5 if (!bufferHandler)6 return port.stream.subscribe(IPHandler);7 else8 return port.stream.bufferTime(port.options.bufferTime)9 .subscribe(function (buffer) {
10 buffer.forEach(IPHandler);11 bufferHandler(buffer),12 });13 };1415 inPort.connectFromDistributed = function (...) {};16 inPort.disconnectFromDistributed = function (...) {};1718 return inPort19 }
Listing 6.8: The InPort object.
individually added to this component’s state in real-time. However, actually updatingand redrawing an element in the DOM is a costly operation, especially consideringthe potentially huge amount of data arriving at the same time. Therefore, it sufficesto update the DOM only once for each buffer. Another example is a server-sidedatabase process, responsible for persistently storing each IP. Rather than inducinga write operation for each individual IP, this process only performs a write for thebuffer as a whole.
The inPort object also features methods to connect and disconnect from distributedprocesses. These are explained in more detail in section 6.1.6.
By default, each input port is associated with a specific callback function which isonly executed when IPs arrive at that particular port. However, DISCOPAR also pro-vides support for more complicated scenarios requiring so-called synchronised inputports, i.e., ports which fire a single callback only when each individual input port hasan IP in its buffer. Input ports can offer this synchronisation, in addition to a varietyof other interesting stream operators, as a result of being built on top of RxJS.
108

6.1 DISCOPAR: Component Layer
Output Ports
A connection between processes always originates at an output port. The OutPortobject (listing 6.9) provides the means to establish (and disrupt) a connection froman output port to an input port. connect (lines 4 to 7) establishes a connectionbetween an output port and an input port. Since both types of ports are implementedon top of RxJS subjects, this connection can be established by subscribing the inputport’s Subject, taking on the role of Observer, to the output port’s Subject,which takes on the role of Observable. The return value of RxJS’s subscribeis a function that, when called, will cancel the subscription. Output ports keep trackof each un-subscribe function for each of their outgoing connections (line 5). Theseoutgoing connections are distinguished based on the ID of the input port they connectto.
1 function OutPort(name, conf) {2 var outPort = new Port(name, conf);34 outPort.connect = function (inPort) {5 outPort.connections[inPort.id] = outPort.subject.subscribe(
inPort.subject);6 outPort.onConnect(inPort)7 }89 outPort.disconnect = function (inPort) {
10 outPort.connections[inPort.id].unsubscribe();11 outPort.onDisconnect(inPort)12 };1314 outPort.send = function (data) {15 outPort.subject.next(data)16 for (var connectionID in port.distributedConnections) {17 outPort.distributedConnections[connectionID].emit(connectionID
, data)18 }19 };2021 outPort.connectToDistributed = function (...){ ... }22 outPort.disconnectToDistributed = function(...){ ... }2324 return outPort25 };
Listing 6.9: The OutPort object.
109

Chapter 6: Implementation
Each time a connection is established to some process, the onConnect methodis executed, which acts as an event callback that developers can use for a variety ofpurposes. For example, when a data collection process establishes a connection to avisualisation process, it can send its entire data in bulk to that particular visualisa-tion process to bring it up-to-date. From that point on, the visualisation process willreceive incremental updates form the data collection through the established connec-tion.
The disconnect function (lines 9 to 12) cancels a particular connection bycalling the correct unsubscribe function stored in the output port’s connectionsfield. Additionally, the onDisconnect callback is executed that developers cancustomise in a component’s source code.
The send function (lines 14 to 19) enables a process to publish an IP to oneof its output ports, triggering a response from the subscribed input ports of con-nected processes. Distributed processes cannot be directly subscribed to an outputport through RxJS, as they have no Subject representing their input port on thesame device. Therefore, the output port must send the data across each distributedconnection, which are implemented in DISCOPAR through the use of web sockets.More details on how distributed connections are managed, including the use of theconnectToDistributed and disconnectToDistributed methods, areprovided in section 6.1.6.
Gate Ports
There are situations where a component’s input port acts as input and output port atthe same time. For example, consider the community component (cfr. section 5.3.2)depicted in fig. 6.3. This component’s IN input port 1 acts as output port for theinternally used components. Similarly, the community component’s output port 2acts as input port for the internally used components. As a result, these ports act as“gates” and provide the combined API of both input and output ports.
In future work (cfr. section 8.2.3), we plan on using gate ports to enable hierar-chical grouping of components, i.e., reducing a group of components into a singlecomponent representing that group. This grouped component would then use gateports to implement input ports and output ports for connections going to processesoutside the group.
110

6.1 DISCOPAR: Component Layer
1 2
Figure 6.3: Gate ports of a community component.
6.1.4 Observations
Section 4.2.5 presents the concept of information packets and introduced a standardformat for citizen observatory data, which DISCOPAR refers to as observations. List-ing 6.10 depicts the implementation details of observations. By default, each obser-vation stores the identifier of the participant that captured the data, in addition to theobservatory’s identifier for which the data is intended. Each observation automati-cally receives a timestamp on creation, in addition to the device model used by theparticipant. Location is a optional field, as not every citizen observatory needs to trackwhere data was gathered (e.g., an observatory tracking eating patterns of people).
1 function Observation(user_id, observatory_id, data) {2 var observation = this;34 observation.user_id = user_id;5 observation.observatory_id = observatory_id;6 observation.datetime = new Date();7 observation.location;8 observation.device = DISCOPAR.Globals.getDeviceModel();9 observation.data = data;
1011 observation.addData = function(...) {...};1213 return observation14 };
Listing 6.10: The Observation object.
The actual data is stored in the data field of an Observation, which is anobject containing each collected data value. The addData method requires a datatype and value.
111

Chapter 6: Implementation
6.1.5 Graphs
In section 4.2.6 we mention that the structure of an application in DISCOPAR isrepresented as a directed acyclic graph. However, cycles are often used as a means tostore state in flow-based programming [17]. A self loop, for example, is an edge thatloops back to an input port of the same process. This can be used by a process to passalong state data during subsequent activations. Because processes in DISCOPAR arestateful by design (cfr. section 4.2.2), cycles are not needed to store state, and in factnot allowed. This design choice was based on the assumption that ICT-agnostic usersinteracting with the DISCOPAR language find stateful processes more intuitive thanhaving to manually program state using cycles.
The nodes of a DISCOPAR graph are processes, while the edges are the connec-tions between ports. Before we present DISCOPAR’s Graph object, we first discussthe textual notation of graphs. This JSON representation contains all the requiredinformation to initialise a graph and execute the program’s logic. A graph in DIS-COPAR is visually created through DISCOPARDE, from where its JSON represen-tation is passed onto and loaded by DISCOPAREE. The JSON representation canalso be used to persistently store graphs. As an example, consider the graph depictedin fig. 6.4 that calculates the average speed a participant is moving at, displaying thisvalue on the screen as a simple label.
Figure 6.4: Simple example of a graph in DISCOPAR.
The JSON representation of this graph is shown in listing 6.11. Each JSON rep-resentation of a graph is comprised of five fields:
• Unique identification number of the graph.
• A collection of processes used in the graph.
• (Optional) A list of connections describing how the processes within the graphare interconnected.
• (Optional) A list of distributed connections, describing how processes connectto external processes.
• (Optional) Constraints imposed on the graph.
112

1 var graphJSON = {2 id: "af886f62-bb39-4933-c539-831de2cb0513",3 processes: {4 b0b85c47-f96b-4ea9-aef0-1a89a8ea632c: {5 name: "Speed"6 iip: {},7 settings: {},8 }9 66fd995f-c4a7-40ca-b534-a61119360346: {
10 name: "Average",11 iip: {},12 settings: {},13 },14 0d53b4a0-b577-401e-b4f2-4486a37b13ca: {15 name: "Label",16 iip: {},17 settings: {18 text: "Speed",19 unit: "km/h"20 }21 }22 },23 connections: [24 {25 sourceProcess: "b0b85c47-f96b-4ea9-aef0-1a89a8ea632c",26 sourcePort: "speed",27 sourceGraph: "af886f62-bb39-4933-c539-831de2cb0513",28 targetProcess: "66fd995f-c4a7-40ca-b534-a61119360346",29 targetPort: "in",30 targetGraph: "af886f62-bb39-4933-c539-831de2cb0513"31 },32 {33 sourceProcess: "66fd995f-c4a7-40ca-b534-a61119360346",34 sourcePort: "out",35 sourceGraph: "af886f62-bb39-4933-c539-831de2cb0513",36 targetProcess: "0d53b4a0-b577-401e-b4f2-4486a37b13ca",37 targetPort: "in",38 targetGraph: "af886f62-bb39-4933-c539-831de2cb0513"39 }40 ],41 distributedConnections: [],42 constraints: []43 }
Listing 6.11: JSON representation of a Graph object.

Chapter 6: Implementation
The JSON representation of a graph stores processes based on their ID. Each processstores the name of the component that it is an instance of, in addition to the process’sconfiguration and settings. In this example, only Label has configurable settings, asthe label’s text and optional unit can be customised.
Connections store the process ID, port name, and graph ID of both the output port(the source) and the input port (the target). This information is used to identify theports and establish a connection between them.
Distributed connections store information similar to the local connections, in ad-dition to extra information required to establish the remote connection. More detailsare provided in section 6.1.6.
Constraints can be imposed on the graph. These are used by the graph validationindicator (cfr. section 4.3.4) in order to test if the graph satisfies the imposed con-straints. Each constraint has a type, and contains information on what parts of thegraph the constraint is applicable to. An example of a constraint is shown in 6.12.This constraint forces the graph depicted in fig. 6.4 to have an incoming connection onthe in input port of the Label process. Currently, three types of constraints are sup-ported: IncomingData, OutgoingData, and pathExists. IncomingDataverifies whether a certain input port of a process receives data, i.e., whether there isat least one connection arriving on the port. Similarly, OutgoingData checks if anoutput port has any outgoing connections. pathExists takes an input port of oneprocess and an output port of another, and tests whether a path exists between theseports using the breadth-first search algorithm.
1 constraints : [2 {3 arguments: {4 port: "in",5 component: "0d53b4a0-b577-401e-b4f2-4486a37b13ca"6 },7 type: "incomingData"8 }9 ]
Listing 6.12: Example of a graph constraint.
Constraints are specified by the CO meta-platform itself, as they are included in thevarious graph templates used by the meta-platform. For example, each mobile appstarts from a graph template including an Upload component that must have atleast some incoming connections, otherwise data is never sent to the observatory.
114

1 function Graph(json) {2 var graph = this;3 ....4 graph.fromJSON = function (json) {5 graph.id = json.id6 for (var id in json.processes) {7 var jsonP = json.processes[id];8 var process = Library[jsonP.name]9 .init(id, jsonP.configuration, jsonP.settings);
10 graph.addProcess(process);11 }12 json.connections.forEach(graph.addConnection);13 json.distributedConnections14 .forEach(graph.addDistributedConnection);15 graph.constraints = json.constraints;16 return graph17 };1819 graph.addProcess = function (process) {20 graph.processes[process.id] = process21 process.graphID = graph.id;22 }2324 graph.addConnection = function (connection) {25 sourceCmp.outPorts[connection.sourcePort]26 .connect(targetCmp.inPorts[connection.targetPort]);27 graph.connections.push(connection)28 };2930 graph.addDistributedConnection = function(...){...}3132 graph.removeProcesses= function (...) {...};33 graph.removeConnection = function (...) {...};34 graph.removeDistributedConnection = function (...) {...};3536 graph.toJSON = function () {...};37 graph.loadDOM = function (...) {...};3839 graph.validate = function () {40 return graph.constraints.map(function (constraint) {41 return Globals.GraphValidation[constraint.type](graph,
constraint.arguments);42 })43 };44 ...45 return graph46 }
Listing 6.13: The Graph object.

Chapter 6: Implementation
A graph’s JSON representation can be used to initialise a Graph object. The sourcecode of the Graph object is displayed in listing 6.13. An “empty” Graph is ini-tialised when no JSON representation is provided. Loading a graph from its JSONrepresentation is accomplished by means of the fromJSON method (lines 4 to 17),which turns the JSON representation into a working program as follows: first, the pro-cesses included in the JSON representation are initialised. This is done by looking upthe correct component in the DISCOPAR component library and spawning a processof it by calling the init function with the stored identifier, initial information packet,and settings specified in the JSON representation. These newly created processes areadded to the graph object using addProcess (lines 19 to 22), which stores themby ID in the processes field. Next, addConnection (lines 24 to 28) establishesthe connections between the various processes within the graph by calling connecton the appropriate ports. Similarly, addDistributedConnection initialises thedistributed connections to processes residing on a different machine, whose detailsare described in section 6.1.6.
Certain graphs are simultaneously executed on multiple devices. For example,participants using the mobile app of a particular citizen observatory are executing thesame graph on their devices. The processes of these graphs thus share the same ID,as their IDs are used to establish the correct connections.
The toJSON method transforms a graph back into its textual representation. Anychanges made to the graph during its execution are included.
loadDOM takes a DOM container as argument and adds any process with avisual representation, such as a DOM-Process or Visualisation-Process(cfr. 6.1.2), to it. These types of processes have an additional configuration value indi-cating the order that they must be added to the DOM container, ensuring an identicallayout than the one previewed during the graph’s development.
validate (lines 39 to 43) performs the graph validation as discussed in sec-tion 4.3.4 by testing the constraints imposed on the graph and indicating whetheror not they are violated. This method is called automatically whenever a change ismade to the graph in DISCOPARDE.
DISCOPAR supports the dynamic modification of an already deployed graph, even ifthere already are information packets flowing through it. Processes and connectionscan be added, changed, and removed without stopping and restarting the graph. Asa result, Graph also offers methods to remove certain parts of a graph (lines 32to 34). More details of DISCOPAR’s live programming environment are describedin section 6.2.1
116

6.1 DISCOPAR: Component Layer
6.1.6 Distributed Connection Manager
Up until now, we have deferred the explanation on how DISCOPAR handles dis-tributed connections, i.e., connections between ports that live on a different machine.In this section, we present the Distributed Connection Manager (DCM) and describehow ports can establish a connection to a remote port. A remote port is a port belong-ing to a process that resides on a different device.
The DCM is implemented using Socket.IO [25], a JavaScript library enablingreal-time bidirectional event-based communication through webSockets. Socket.IOincludes additional features such as auto-reconnection support as well as disconnec-tion detection. It provides both server-side and client-side components with similarAPIs such that both client and server can emit events and subscribe event listeners.
Since clients, such as participants using the mobile app and end-users consultingthe web-based visualisations, can (dis)appear at any time, it is impossible for server-side processes to be aware of a new client-side process unless the latter explicitlynotifies the server-side of its existence. Therefore, distributed connections are alwaysinitiated by the clients.
The first step in establishing a distributed connections is a client-side port send-ing a message to the DCM containing a request to be connected to a certain porton the server. This is done by calling an output port’s connectToDistributedmethod, which is shown in listing 6.14. This method can only be executed on theclient-side, and works as follows: first, a new DistributedConnection is cre-ated (line 2), which requires the port names, process IDs, and graph IDs, similar to anormal connection, in addition to information whether it is an outbound or inboundconnection from the perspective of the client. Each DistributedConnectionautomatically generates an ID. More specifically, this ID is generated by concatenat-ing of the output port’s name and process ID, combined with the input port’s nameand process ID.
Next, distributedConnectionSocket is called (line 3), which either cre-ates a new socket that automatically connects to the CO meta-platform’s server, orit returns the already existing socket. This means that each client/server connectionoriginating from the same client is handled by a single underlying web socket, re-sulting in less network overhead and, as a result, less bandwidth consumption. Thisoptimisation was implemented to reduce the mobile data usage of participants.
Each output port keeps track of its outgoing distributed connections. Recallfrom listing 6.9 that an OutPort’s send method to also emits the data along eachof its distributed connections.
117

Chapter 6: Implementation
1 outPort.connectToDistributed = function (port, process, graph){2 var connection = new DistributedConnection(...)3 var socket = distributedConnectionSocket();4 outPort.distributedConnections[connection.id] = socket;56 socket.emit('connectTo', connection);7 socket.on('reconnect', function () {8 socket.emit('connectTo', connection);9 });
10 };
Listing 6.14: The ConnectToDistributed method of the OutPort object.
The output port then emits a connectTo event containing the newly createdDistributedConnection (line 6). Because the server has no means to dif-ferentiate between a temporary disconnect and a permanent one, the output portwill resend the request to establish a distributed connection whenever the socketreconnects to the server (lines 7 to 9).
On the server-side, the connectTo event is received by the DCM, thereby trigger-ing the code shown in lines 1 to 7 in listing 6.15. Here, the input port to which aconnection must be established is located by looking up the correct graph (storedon the server by ID), and then locating the correct process within that graph. Oncethe input port is found, it is subscribed to data arriving on the socket using that par-ticular connection ID as event name. Recall from section 6.1.5 that certain graphs,such as the one implementing the mobile app logic, are executed on multiple devicessimultaneously. The processes in each of these graphs share the same IDs and thuscommunicate across a distributed connection using the same connection ID. As a re-sult, the server-side input port of a distributed connection automatically receives datafrom possibly multiple instances of its client-side output port.
Since each client is connected through a single socket, we use multiplexing tosupport multiple distributed connections using the same socket.
The InPort’s callback, which is defined in the component’s source code, isautomatically triggered by setting the next value of the input port’s internally usedSubject (line 6).
Ending a distributed connection is done by removing the listener on the corre-sponding connection ID, meaning that from that point on the server-side input portwill no longer reacting to data arriving using that connection ID as event name.
118

6.1 DISCOPAR: Component Layer
1 socket.on('connectTo', function (connection) {2 var graph = getGraph(connection.targetGraph)3 var process = graph.components[connection.targetProcess]4 var inPort = process.inPorts[connection.targetPort];56 socket.on(connection.id, inPort.subject.next)7 });89 socket.on('disconnectTo', function (connection) {
10 socket.removeAllListeners(connection.id)11 });
Listing 6.15: connectTo and disconnectTo event handlers of the DCM.
The code listed in listing 6.15 only demonstrates how a connection from aclient-side output port is establised to a server-side input port. Connections goingfrom a server-side output port to a client-side input port are implemented similarly.In this case, the client-side input port send a connectFrom event to the DCM,which locates the corresponding server-side output port and requests that output portto establish a connection to the client-side input port. From that point on, the outputport will also transmit data over the specified socket to the client. On the client, theinput port is also listening for events using the connection ID as name.
By default, a process that sends data to one of its output ports results in that databeing send to every input port connected it. A previously unmentioned feature thatserver-side output ports provide is the possibility to send data to only one particu-lar client. This is particularly useful for orchestrating a campaign where individualparticipants receive personal coordination messages. Sending this personalised datais easily accomplished in DISCOPAR thanks to two reasons. First, observations, i.e.,the information packets uploaded by participants, include the user ID of the partic-ipant (cfr. section 6.1.4). Second, server-side output ports keep track of outgoingdistributed connections based on user ID. This is possible as each socket containsmeta-information such as the user ID of the client that it is associated with. Usingthis information, DISCOPAR supports a to method that can be used from withinprocesses as follows:
1 process.outPorts.out.to(observation.user_id).send(data)
Doing so overwrites the default send behaviour and only sends the provided data tothe specified client.
119

Chapter 6: Implementation
6.2 DISCOPAR: Graph Layer
In flow-based programming, the graph layer provides a higher level of abstraction andenables one to reason about an application in terms of components and their connec-tions without having to worry about the internal implementation of each component.The graph layer enables the graph designer to create a program by assembling variouscomponents in a directed acyclic graph. DISCOPAR’s graph layer has a visual rep-resentation, the syntax of which was introduced in chapter 4. This visual graph layeris used by DISCOPARDE (cfr. section 4.3) to enable ICT-agnostic users of the COmeta-platform to design their own citizen observatory and campaigns. This sectiondiscusses some of the implementation details of DISCOPAR’s graph layer as well asDISCOPARDE.
The graph layer of DISCOPAR is implemented as a standalone library, namedDISCOPAR-UI, which extends DISCOPAR with functionality to visually representprocesses. This distinction is made for efficiency reasons, as all the DISCOPAR-UIfeatures do not have to be loaded when executing a graph. DISCOPAR-UI is imple-mented using a combination of web technology, namely Javascript, HTML, and CSS.
Drawing Components
Components are drawn on the screen by adding their visual representation to the can-vas of DISCOPARDE. Creating the visual representation of a component is done byinitialising a UI-Component, which takes a regular Component and adds severalmethods and meta-information related to visually represent the process on the screen.For example, a UI-Component contains the draw method, which creates a DOMnode representing the component and applies appropriate CSS styling before addingit to the canvas.
Each component must also visualise its input and output ports. This is donein a similar fashion, i.e., by creating a UI-Port object that represents the port.UI-Port also features a draw method that creates a visual representation of a portby creating a DOM element (applying the correct colour based on the data type thatthe port accepts (cfr. section 4.2.4)), and by attaching that DOM element on the cor-rect side of the graphical representation of the component.
A UI-Component also adds extra meta-information to a component such asthe current X and Y coordinates of the component on the canvas. These are updatedwhenever the component is moved around on the canvas. Furthermore, this informa-tion is stored persistently, thereby ensuring that the component reappears in the samelocation on the canvas when re-loading DISCOPARDE.
120

6.2 DISCOPAR: Graph Layer
Connecting Components
Connections are implemented using JsPlumb [67], a JavaScript library that providesthe means to visually connect elements using Scalable Vector Graphics. JsPlumb pro-vides various customisation hooks which were used to build DISCOPARDE’s visualfeedback mechanism that highlights compatible input ports when dragging a connec-tion from a certain output port (cfr. section 4.3.2).
Connections are coloured according to the type of the output port. Once a con-nection is attached to a compatible input port in the graph layer, a correspondingconnection is made in the component layer of DISCOPAR. A connection can be re-moved either by clicking on it, or by detaching it from the input port.
6.2.1 DISCOPARDE
DISCOPARDEis the web-based visual programming environment of DISCOPAR. Itcan be integrated into any web page, as it only requires access to the DISCOPAR-UIlibrary and a DOM element in which the canvas can be initialised.
DISCOPARDE enables users to program a distributed application: multi-ple (sub)graphs, possibly deployed on different devices, can be loaded intoDISCOPARDE simultaneously. Components from each graph can freely establishconnections amongst each other, thus creating a single distributed graph. As a result,a distinction is made between local connections (i.e., between two components onthe same device) and distributed connections connecting components hosted ondifferent devices. This is done as follows: upon creation, each graph is assigned to aparticular device by the meta-platform. Since each component knows to which graphit belongs, it also (indirectly) knows on which device it will be deployed. Usingthis information, the correct type of connection is automatically created. Distributedconnections are always added to the client-side graph, as it is the client who initiatesthe connection by design (cfr. section 6.1.6).
In the current status of our work, components added to the component menuare explicitly assigned to a graph, as illustrated in listing 6.16. This code snip-pet is part of the Campaign Design Interface (cfr. section 5.2.1), where the cam-paign designer can implement the campaign protocol (server-side data filtering)and data analysis (client-side web-based visualisations) simultaneously. Here, theDISCOPAR and DISCOPAR-UI library are loaded, after which two new graphsare initialised. The processingGraph will contain all server-side logic, whilethe visualisationGraph will contain the client-side logic. Processes fromboth these graphs can be interconnected in the visual programming environment.
121

Chapter 6: Implementation
Since campaigns may contain temporal filters, all the components related to tem-poral filtering are added to the component library with the indication that eachinstance thereof will be added to the processingGraph. Similarly, visualisa-tions components added to the library will automatically add their processes to thevisualisationsGraph.
1 require(["DisCoPar", "DisCoParUI"], function (D, DUI) {2 var processingGraph = new DUI.UI-Graph(new D.Graph( ... ));3 var visualisationGraph = new DUI.UI-Graph(new D.Graph( ... ));45 D.Globals.TemporalComponents.forEach(function (cmp) {6 DUI.AddComponentToMenu(cmp, processingGraph)7 })89 D.Globals.VisualisationComponents.forEach(function (cmp) {
10 DUI.AddComponentToMenu(cmp, visualisationGraph)11 })12 ...13 })
Listing 6.16: Adding components to the component menu of DISCOPAREE.
Live Programming Environment
DISCOPARDE is synchronised in real-time, which means that users do not need toexplicitly save their changes. Each action performed by the graph designer triggersa corresponding event which is immediately sent to the CO meta-platform usingSocket.IO. For example, changing one of the settings in a component’s configura-tion window will emit a changeSetting event containing the relevant informa-tion. These changes are then persisted on the server by updating the graph’s JSONrepresentation and storing it in the database.
If DISCOPARDE’s live programming mode is enabled (cfr. section 4.3.5) thechanges are not only applied to the JSON representation of the graph, but also therunning program, i.e., the in-memory Graph object. Therefore, DISCOPARDE is alive programming environment (cfr. section 4.3.5). When this graph is running on theserver, users interacting with DISCOPARDE are performing distributed live program-ming: they are actively changing a program running on the server from within theirweb browser. The in-memory Graph is not redeployed when a change is made. Thisway, processes preserve their state when changes are made to the graph that do notaffect them.
122
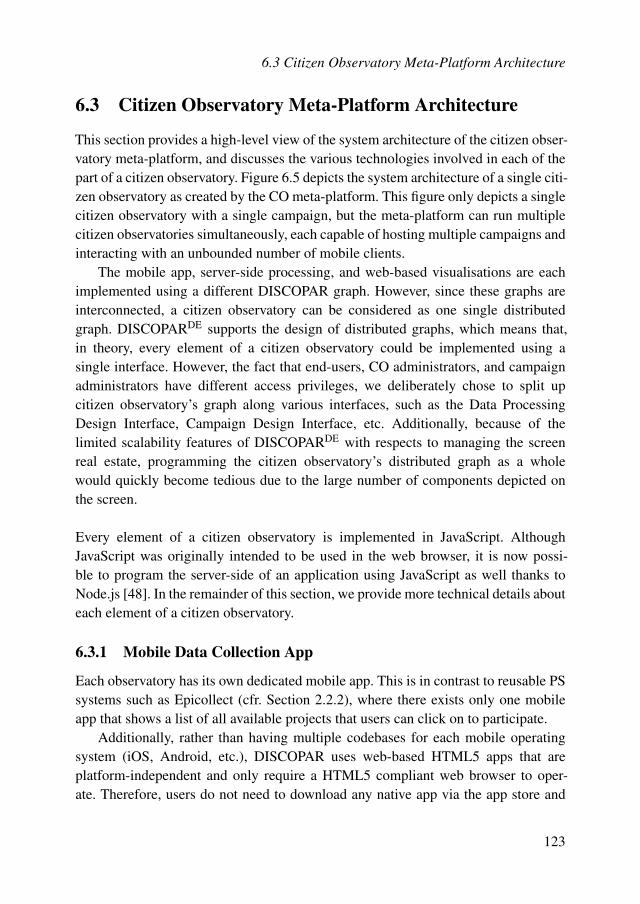
6.3 Citizen Observatory Meta-Platform Architecture
6.3 Citizen Observatory Meta-Platform Architecture
This section provides a high-level view of the system architecture of the citizen obser-vatory meta-platform, and discusses the various technologies involved in each of thepart of a citizen observatory. Figure 6.5 depicts the system architecture of a single citi-zen observatory as created by the CO meta-platform. This figure only depicts a singlecitizen observatory with a single campaign, but the meta-platform can run multiplecitizen observatories simultaneously, each capable of hosting multiple campaigns andinteracting with an unbounded number of mobile clients.
The mobile app, server-side processing, and web-based visualisations are eachimplemented using a different DISCOPAR graph. However, since these graphs areinterconnected, a citizen observatory can be considered as one single distributedgraph. DISCOPARDE supports the design of distributed graphs, which means that,in theory, every element of a citizen observatory could be implemented using asingle interface. However, the fact that end-users, CO administrators, and campaignadministrators have different access privileges, we deliberately chose to split upcitizen observatory’s graph along various interfaces, such as the Data ProcessingDesign Interface, Campaign Design Interface, etc. Additionally, because of thelimited scalability features of DISCOPARDE with respects to managing the screenreal estate, programming the citizen observatory’s distributed graph as a wholewould quickly become tedious due to the large number of components depicted onthe screen.
Every element of a citizen observatory is implemented in JavaScript. AlthoughJavaScript was originally intended to be used in the web browser, it is now possi-ble to program the server-side of an application using JavaScript as well thanks toNode.js [48]. In the remainder of this section, we provide more technical details abouteach element of a citizen observatory.
6.3.1 Mobile Data Collection App
Each observatory has its own dedicated mobile app. This is in contrast to reusable PSsystems such as Epicollect (cfr. Section 2.2.2), where there exists only one mobileapp that shows a list of all available projects that users can click on to participate.
Additionally, rather than having multiple codebases for each mobile operatingsystem (iOS, Android, etc.), DISCOPAR uses web-based HTML5 apps that areplatform-independent and only require a HTML5 compliant web browser to oper-ate. Therefore, users do not need to download any native app via the app store and
123

EE
Data P
rocessing
Cam
paig
n Pro
toco
l & A
gg
regatio
n
Mo
bile A
pp
EE
EE
EE
EE
Ob
servatory D
ashbo
ardC
amp
aign D
ashbo
ard
DE
Mo
bile A
pp
Desig
n Interface
DE
Data P
rocessing
Desig
n Interface
DE
Cam
paig
n Desig
n Interface
Client�
��
Server
Figure6.5:System
architectureofa
citizenobservatory.

6.3 Citizen Observatory Meta-Platform Architecture
they can simply add the app’s web page to their device’s homescreen. Loading theweb app automatically initialises the corresponding DISCOPAR graph representingthe mobile app’s logic. This means that users automatically use the most up to dateversion of the application. The observatory owner can modify the mobile app at anytime, and users do not have to update the app through an app store.
Web-based apps are slowly gaining popularity over native apps since they arebecoming increasingly powerful. The main advantages of web-based apps are:
• Common codebase across multiple mobile platforms.
• Developers — in our case ICT-agnostic stakeholders — do not need to submittheir app to any app store for approval.
• Users do not need to bother with downloading the app from an app store. Ad-ditionally, a web-based app is automatically up to date.
These properties make web-based apps a good solution for our meta-platform wherestakeholders want to develop and publish an app themselves. However, web-basedapps also have some disadvantages:
• Performance is generally inferior compared to native apps.
• Limited access to the mobile device’s hardware (e.g., sensors).
• Offline functionality are more difficult to support.
Although performance is less of an issue when dealing with mobile data collectionapps as they are generally not very CPU-intensive. Limited device access is a morechallenging issue for some data collection purposes. However, the gradual introduc-tion of browser APIs already provide access to various device sensors, including ac-celerometer, ambient light detector, GPS, microphone, camera, etc.
Another challenge for web-based mobile apps is offline support. By default, web-based apps do not work when network connectivity is unavailable, as they are un-able to download the app’s logic. Solutions exist, such as Service Workers, whichenable applications to take advantage of persistent background processing, includinghooks to enable bootstrapping of web applications while offline. However, these tech-nologies are not yet considered mainstream and therefore not yet supported by everybrowser.
To support more advanced features, such as offline support and additional devicehardware access, an alternative approach such as a hybrid app can be used, which wediscuss in more detail in section 8.2.
125

Chapter 6: Implementation
6.3.2 Server-Side Data Processing and Campaigns
The server-side contains both the observatory data processing graph, as well as thevarious campaign graphs. The server-side runs on a Node.js server. Since each citizenobservatory can generate completely different types of data (noise measurements, mo-bility parameters, etc.), a flexible database system is required to persistently store ob-servatory data. Therefore, we implemented the database using MongoDB, a NoSQLdatabase supporting dynamic schemas. MongoDB use JSON documents in order tostore records, just as tables and rows store records in a relational database.
Whenever a new citizen observatory is created through the CO meta-platform,a default observatory graph template containing some basic functionality, such asstoring data in the database, is automatically deployed on the server. The observatoryadministrator can modify this graph via the Data Processing Design Interface (cfr. sec-tion 5.1.2) to add additional data processing features and visualisations to the obser-vatory’s dashboard. The Store component (which stores observations uploaded byparticipants in the database) is automatically connected to the ApplicationDatacomponent of each campaign running in the observatory (which acts as source for thecampaign’s graph). As a result, every campaign receives the pre-processed data uponwhich they can apply their campaign protocol.
Newly created campaigns also start from a default campaign template, similar tothe observatory data processing graph. This graph is automatically deployed on theserver, even though it provides no functionality apart from a source component thatoutputs all processed observatory data. The campaign can be implemented thoughthe Campaign Design Interface (cfr. section 5.2.1).
Both the Observatory Data Analysis Interface (cfr. section 5.1.4) and Campaign Anal-ysis Interface (cfr. section 5.2.1) deploy temporary graphs on the server. These graphsonly remain active as long as the client is visiting the corresponding web page. Thegraph are initialised from their JSON representation, after which the observatory’sdata is retrieved from database. This data then flows through each process as definedin the Analysis Interface, after which it is automatically pushed across a distributedconnection to the visualisation components deployed on the client.
6.3.3 Web-based Visualisations
The homepage and analysis interface of both a citizen observatory and a campaigninclude a dashboard containing web-based visualisation for end-users. These web-based visualisations are rendered on the client, and are implemented in HTML5,Javascript, and CSS. When loading these web-pages, the underlying visualisation
126

6.4 Conclusion
processes automatically connect themselves to the corresponding server-side outputports (cfr. section 6.1.6). From that point on, the visualisations receive real-time sta-tus updates from the observatory or campaign. When initialising their connection, theserver-side components will first send their entire state to bring the visualisations upto date. From that point on, they will only receive incremental updates.
6.4 Conclusion
This chapter discusses the implementation of DISCOPAR’s component layer andgraph layer, and provided some technological details on the architecture of the COmeta-platform. We presented the component model that each component in DISCO-PAR must adhere to, in addition to the source code of DISCOPAR’s flow-based pro-gramming concepts such as components, processes, ports, and graphs. We presentedthe JSON representation of graphs which are the textual representation of graphsconstructed in the graph layer. We also introduced the Distributed Connection Man-ager which enables real-time client-server communication between processes. Wediscussed how implementing citizen observatories entirely in JavaScript enables DIS-COPAR’s components to be deployed on the client and server, with the exception ofsome components, such as visualisations components that can only be deployed onthe client side.
In the next chapter, we demonstrate the versatility of our CO meta-platform bycreating different citizen observatories, and evaluate the usability of DISCOPARDE
by performing two separate user studies.
127


7D I S C O PA R AT W O R K
The previous two chapters discussed the features and implementation of our citizenobservatory meta-platform, so that stakeholders can set up and configure the neces-sary ICT-tools of a citizen observatory and deploy campaigns without or with verylittle programming skills. In line with our research visions that consist of creatinga reusable and reconfigurable approach for ICT-agnostic users to design and deploycitizen observatories (cfr. section 1.2), it is essential that we validate our solution interms of expressiveness, suitability and usability through experiments in both labora-tory as well as real-world conditions. This is the goal of this chapter.
7.1 Introduction
In chapter 2 we argued that despite the high societal demand, citizen observatorydevelopment remains labour-intensive, lengthy, and requires substantial technical ex-pertise. This is mainly due to the fact that in current state of the art, each citizenobservatory is developed from scratch, due to a lack of reusable and reconfigurablecitizen observatory construction tools. As a solution, this dissertation focusses onconceiving a more generic approach. I.e., we present a CO meta-platform throughwhich ICT-agnostic stakeholders are able to construct their own citizen observatoriesand design PS campaigns. This CO meta-platform was developed with four concreteresearch visions in mind (cfr. section 1.2). We now reiterate the research visions ofthis dissertation and explain how we will validate, in the remainder of this chapter,whether the CO meta-platform lives up to these visions.
129

Chapter 7: DISCOPAR at Work
Research Vision 1: Reconfigurable Citizen Observatory Platform Establishinga generic approach for building reusable and reconfigurable citizen observatories is byfar the most complex and ambitious challenge that this dissertations tackles throughthe concept of CO meta-platform. To demonstrate the expressiveness of the CO meta-platform, we have created three radically different citizen observatories. These ob-servatories each focus on a distinct domain, namely noise pollution, the quality ofinformal walking trails, and monitoring atmospheric conditions in terms of tempera-ture, humidity, and atmospheric pressure.
Research Vision 2: Campaign Definition and Enactment Another challenge andresponsibility of the CO meta-platform is to improve the chances for successful cam-paigning by automatically orchestrating the campaigns that are deployed in the ob-servatories created on the platform. We therefore demonstrate the definition and suc-cessful enactment of several PS campaigns deploying in citizen observatories createdthrough the CO meta-platform.
Research Vision 3: Reactive Citizen Observatories As explained in section 2.4.3,it is essential that participants receive immediate feedback to guarantee successfulcampaigning. We therefore highlight DISCOPAR’s real-time campaign orchestrationmechanisms that were used in real-world campaigns deployed within the observato-ries on noise pollution and quality of informal walking trails
Research Vision 4: ICT-Agnostic Usability Citizen observatory created throughthe meta-platform have to be configurable and usable by ICT-agnostic users. Thisvision is realised through the use of DISCOPARDE, which enables stakeholders andcommunities to design a CO and campaigns only by specifying their concerns andgoals using domain-specific concepts. We validate the usability of DISCOPAR andthe CO meta-platform as a whole through two end-user usability tests involving peo-ple without any programming knowledge.
7.2 Citizen Observatory Meta-Platform Expressiveness
In section 2.2, we introduced the concept of participatory sensing (PS), and cate-gorised existing PS systems in two categories: Ad-hoc PS systems (section 2.2.1)and reusable PS systems (section 2.2.2). We discussed how most ad-hoc PS systemsare only a proof-of-concept implementation to showcase the potential of PS as an al-ternative data gathering method for both sensorial data and user input. These systems
130

7.2 Citizen Observatory Meta-Platform Expressiveness
cannot be reconfigured and only work for the particular use-case they were designedfor. Additionally, they provide no support for defining and enacting campaigns. Onthe other hand, several reusable PS systems were developed that solve the lack of re-configurability of ad-hoc PS systems. However, these reusable PS systems are limitedin terms of the type of data that can be collected, as they focus only on discrete data,i.e., single-shot observations usually collected through questionnaires. They provideno support for continuous data streams originating from smartphone sensors. As withad-hoc PS systems, campaign support is also largely missing.
The citizen observatory meta-platform presented in this dissertation provides thebest of both worlds: The highly reconfigurable citizen observatories enable the cre-ation of PS apps handling continuous data streams (e.g., sensorial data from bothinternal and external sensors), discrete data such as user input, or a combination ofboth. To showcase the CO meta-platform’s expressiveness, we now present three rad-ically different observatories that were created using the meta-platform.
7.2.1 NoiseTube2.0: Observatory on Noise Pollution
The NoiseTube2.0 observatory built using our CO meta-platform is a re-creation ofthe existing NoiseTube platform (cfr. section 2.2.1). The NoiseTube2.0 CO was al-ready demonstrated on various occasions in chapter 5, where it was used as a runningexample for the various tools that constitute the CO meta-platform. In this sectionwe provide a more in-depth look at the components that were used to implementthis citizen observatory, and we discuss various campaigns deployed in real-worldscenarios.
Mobile Data Gathering App
The NoiseTube2.0 mobile data collecting app and its implementation are depictedin fig. 7.1. The mobile app is implemented in the Mobile App Design Interface usingonly 6 components.
The implementation is straightforward thanks to the abstractions provided by thecomponent composition mechanism. If we look at the internal implementation of theNoiseTubeUI component, we notice that it is implemented using a composition of12 components, as illustrated on the lower left side of fig. 7.1. Furthermore, one ofthese internally used components, i.e., the SoundLevelMeter component, is itselfalso implemented as a composition of 3 components (cfr. listing 6.2 in section 6.1.1).This clearly illustrates how component composition greatly reduces the size and com-plexity of graphs.
131

Chapter 7: DISCOPAR at Work
Figure 7.1: Implementation of NoiseTube2.0’s mobile app in DISCOPAR.
Despite its straightforward implementation, The NoiseTube2.0 app is — with theexception of NoiseTube’s noise source tagging feature — identical to the existingNoiseTube app. Both apps provide the means to collect sound pressure levels us-ing the microphone, apply calibration when available, automatically tag observationswith GPS coordinates, and provide feedback to users through visualisations.
Campaigns on Noise Pollution
The creation of NoiseTube2.0 demonstrates that our CO meta-platform is capable ofbuilding a mobile data gathering app that provides the same data gathering and visu-alisation features an existing ad-hoc PS system for measuring noise pollution. WhereNoiseTube2.0 differentiates itself is the CO meta-platform’s integrated support fororganising campaigns, which is totally lacking from the existing NoiseTube systemwhere campaigns are orchestrated using the manual effort of a domain-specialist.
We now provide a first demonstration of the suitability and expressiveness ofthe CO meta-platform for defining (noise mapping) campaigns. All of the follow-ing campaigns were created and executed during an international cooperation with
132
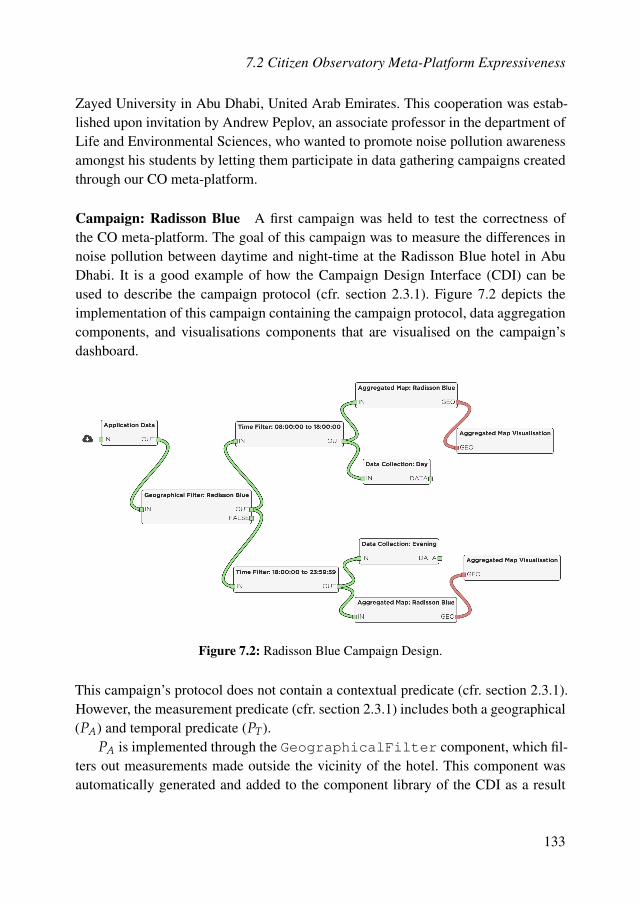
7.2 Citizen Observatory Meta-Platform Expressiveness
Zayed University in Abu Dhabi, United Arab Emirates. This cooperation was estab-lished upon invitation by Andrew Peplov, an associate professor in the department ofLife and Environmental Sciences, who wanted to promote noise pollution awarenessamongst his students by letting them participate in data gathering campaigns createdthrough our CO meta-platform.
Campaign: Radisson Blue A first campaign was held to test the correctness ofthe CO meta-platform. The goal of this campaign was to measure the differences innoise pollution between daytime and night-time at the Radisson Blue hotel in AbuDhabi. It is a good example of how the Campaign Design Interface (CDI) can beused to describe the campaign protocol (cfr. section 2.3.1). Figure 7.2 depicts theimplementation of this campaign containing the campaign protocol, data aggregationcomponents, and visualisations components that are visualised on the campaign’sdashboard.
Figure 7.2: Radisson Blue Campaign Design.
This campaign’s protocol does not contain a contextual predicate (cfr. section 2.3.1).However, the measurement predicate (cfr. section 2.3.1) includes both a geographical(PA) and temporal predicate (PT).
PA is implemented through the GeographicalFilter component, which fil-ters out measurements made outside the vicinity of the hotel. This component wasautomatically generated and added to the component library of the CDI as a result
133

Chapter 7: DISCOPAR at Work
of indicating the area of interest in the geographical constraint editor, as illustratedin fig. 7.3.
Figure 7.3: Geographical constraint editor of Campaign Design Interface.
PT is implemented by means of two TimeFilter components. This cam-paign is only interested in measurements made between eight o’clock in the morn-ing and midnight. Measurements made during this time interval are split into twogroups in order to create two separate datasets, one that includes measurements madebetween 08:00–18:00 and another one that contains measurements made between18:00–23:59. No additional temporal constraints are present, meaning that measure-ments from every month and day of the week are included in the campaign’s two datasets.
The datasets created during this campaign can be used by the CampaignAnalysis Interface (cfr. section 5.2.2), which enables end-users to create theirown visualisations to browse and analyse campaign data. However, this cam-paign already provides some data visualisations on the campaign’s dashboard: twoAggregatedMapVisualisation components show a comparison of aggre-gated noise level during the day and evening, as illustrated in fig. 7.4. These compo-nents display the data as calculated by server-side AggregatedMap components.Each individual grid cell is coloured based on the average loudness levels. Clickingon a grid cell reveals additional information, such as the minimum and maximum ofall the values recorded inside that cell.
134

7.2 Citizen Observatory Meta-Platform Expressiveness
Figure 7.4: Visualisations on the ‘Radisson Blue’ campaign dashboard.
The quality of a campaign is inherently related to measurement density (cfr. sec-tion 2.3.2), as the enormous quantity of data that is typical for particularity sensing isusually translated into a more qualitative condensed representation. In this case, thecondensed representation is obtained by location-based statistical averaging throughthe AggregatedMap component on the server. Sufficient data density, or the lackthereof, is made apparent by the AggregatedMapVisualisation componentthrough the opacity of grid cells: Translucent grid cells indicate that the specifieddata density requirement is not yet obtained. Grid cells become increasingly opaqueas density increases. Blank cells contain no data (yet). Because these visualisationsare updated in real-time, the campaign administrator and visitors of the campaignweb-page can monitor the campaign progress in real-time. Furthermore, participantscan also load the campaign visualisations in the mobile app, enabling them to trackthe progress of a campaign in real-time and move to nearby locations that are stillshort of data.
The resulting noise maps of this campaign illustrate that there is a very clear increasein noise pollution during the daytime (left map of fig. 7.4), especially in the areasurrounding the hotel’s swimming pool. Further analysis found that this was mainlycaused by the children playing and shouting near the pool. This campaign thus demon-strates that the CO meta-platform is capable of enacting campaigns and producing thedesired output.
135

Chapter 7: DISCOPAR at Work
Campaign: Zayed University A subsequent campaign using the NoiseTube2.0 cit-izen observatory was organised at the campus of Zayed University, where studentswere tasked to map the campus. In this case, the campaign was designed by profes-sor Peplov, who took on the role of campaign administrator. He then tasked severalstudents to look for loud area’s on one side of the campus, and others to look forquiet area’s. This campaign resulted in the aggregated noise map depicted in fig. 7.5.Both parking lots (north and south) are clearly identified as quiet area’s, and the high-est loudness values were measured near the university’s technical installations forclimate control.
Figure 7.5: Visualisations on the ‘Zayed University’ campaign dashboard.
When paying close attention to the aggregated map, very low sound levels can beobserved on the northern parking lot. The black grid cell indicates an unrealisticallylow value upon closer inspection. This happened due to the fact that one of the devicesused to collect data was not calibrated, resulting in inaccurate data. The campaignadministrator could have prevented this from happening by including a contextualpredicate in the campaign protocol that only accepts measurements that originatefrom devices with a calibration profile.
Situations such as these are a good example of the convenience of the CampaignAnalysis Interface (cfr. section 5.2.2). Here, the data set populated during the cam-paign’s execution can be queried and sent through a new graph that does includea contextual predicate. The result is a similar map, albeit this time only includingcalibrated data.
136

7.2 Citizen Observatory Meta-Platform Expressiveness
Other Campaigns Several additional campaigns were organised in Abu Dhabi tocreate noise maps of various public parks and highways. We do not discuss each ofthese campaigns in detail as their campaign protocol is implemented using similarcomponents as the aforementioned Radisson Blue and Zayed University campaigns.These campaigns were designed by professor Peplov himself by interacting with theCO meta-platform, without any involvement or assistance from us. For example, con-sider the campaign depicted in fig. 7.6. This rather complex graph implements a cam-paign that compares noise levels next to a busy highway during different times of theday. The successfully implementation of this campaign can be considered a testimonythat the CO meta-platform developed in this dissertation indeed enables ICT-agnosticstakeholders to create and execute their own campaigns successfully.
Figure 7.6: Implementation of the ‘Salaam St. and neighbourhood’ campaign.
Real-Time Coordination of Participants
In section 2.3.2 we defined the notion of a campaign. This definition states that acampaign is considered successful if the collection of measurements collected by thecampaign is dense enough to generate a qualitative output. In the context of the afore-mentioned noise mapping campaigns, the “qualitative output” produced by these cam-paigns are aggregated noise maps, which can be considered dense if the every gridcell has reached a certain specified measurement density. From previous experiencein organising campaigns for noise mapping, we observed that a threshold of 50 mea-surements per cell is sufficient to perform meaningful statistical averaging [41].
137

Chapter 7: DISCOPAR at Work
The noise maps generated by AggregatedMapVisualisation already pro-vide visual feedback to participants in terms of grid cell density, giving them an ideaon the campaign’s progress. However, the effectiveness of participants can be furtherimproved by coordinating their data collection effort. Doing so results in each partic-ipant receiving individual instructions about where or when data contributions mustbe made. Campaigns can therefore rely on specialised coordination components thatsteer a participant’s movement based on a specified algorithm. However, finding analgorithm that offers the most optimal participant coordination in terms of coverage,effort, etc. is not within the scope of this dissertation, as this is an entire researchtopic on its own. We focus mainly on the technical difficulties in providing real-timeindividual feedback and coordination instructions to participants. To this end, we im-plemented a basic algorithm which always instructs a participant to the nearest incom-plete campaign objective, which in this case are grid cells with insufficient data den-sity. This functionality is implemented by the FindNearestUncomplete com-ponent, whose effect is depicted in fig. 7.7. In the future, we will investigate smartercoordination algorithms that can take multiple factors into account, such as the loca-tions of other participants and their intended route.
Figure 7.7: Instructing a participant to the nearest incomplete campaign objective.
When a participant activates the coordination mode on the mobile app’s cam-paign tab, he will initialise a new process that automatically establishes a distributedconnection to the server-side FindNearestUncomplete to continuously send itlocation updates. The FindNearestUncomplete component also receives real-time updates of the campaign’s objectives, i.e., the aggregated noise map. Using thisinformation, it calculates the nearest incomplete grid cell for each individual partic-
138

7.2 Citizen Observatory Meta-Platform Expressiveness
ipant, and sends this information back using a coordination message. Participantsreceive this message and update their map by adding an arrow indicating where thecampaign instructed them to move to.
Note that the individual real-time updates on the aggregated map also take intoaccount the contributions made by the other participants. It can thus be the case thatthe algorithm suddenly instructs a user to move somewhere else, as the current gridcell may have been completed by another participant.
The main problem using this coordination algorithm is caused by the way the gridcells are created: when a campaign wishes to make an aggregated map of a particulararea, the entire area is covered using cells of a specified size. Unfortunately, many ofthese grid cells will cover inconvenient or inaccessible areas, such as areas coveredwith water, restricted areas, etc. As a result, there will always be cells that contain nodata, resulting in participant receiving instructions to move to locations they cannotaccess. These inaccessible grid cells should therefore be manually removed. In thefuture, we plan on making these maps ‘smarter’ by taking into account topographicalinformation.
7.2.2 Trage Wegen: Observatory on Pedestrian Experience
A second citizen observatory created using the CO meta-platform focusses on docu-menting the quality of informal walking trails. This citizen observatory was createdin collaboration with Trage Wegen (Eng: “Slow Roads”), a Flemish non-profit organ-isation which has conceived the notion of a so-called slow road, i.e., a road intendedfor non-motorised traffic only. After 10 years of being active in this field, the organ-isation has succeeded to anchor this notion into road development plans of manymunicipalities in Belgium, while also building up a well-thought-out approach to in-ventarise and assess future development plans for slow roads. For efficiency reasons,they want to move away from their pen-and-paper data collection approach and areexperimenting with the possibilities of mobile data collection apps. For this reason,we developed a mobile app for Trage Wegen using the CO meta-platform.
Mobile App
The implementation of the mobile data collection app is depicted in fig. 7.8. The mainlogic is provided by the Form component. Recall from section 4.3.3 that the defaultconfiguration window of a component can be modified to include a more advancededitor for component customisation. This is the case for the Form component whichincludes a drag-and-drop form builder. In the case of the Trage Wegen observatory,the Form component is configured to enable participants to evaluate the quality of
139

Chapter 7: DISCOPAR at Work
informal walking trails through the use of a photo, a rating, and an optional descrip-tion. Both positive and negative aspects of selected points situated along a walkingtrail can be evaluated in this way. Each submitted survey is automatically geo-taggedthrough the GeoLocator component, after which it is uploaded to the server. Ad-ditionally, the documented locations are drawn on a map so the participant has anoverview of the reports made.
Figure 7.8: Implementation of the mobile app for the Trage Wegen observatory.
In section 5.1.3 we described how each mobile app created in the Mobile App DesignInterface uses a default layout template. In case of the Trage Wegen observatory, themobile app layout was changed upon request by the Trage Wegen organisation to bemore in line with their own style. Using very minimal changes to the app layout’scode, a different layout was implemented, which is depicted in fig. 7.9. In this case,the main layout contained a map depicted the participant’s location. In the future, itis our goal to enable full customisation of the mobile app UI (cfr. section 8.2.3).
The Trage Wegen observatory was created specifically for use during the “Dagvan de Trage Weg”, a yearly event where multiple organisations organise walks alongvarious slow roads. Usually, these walks have a particular purpose, such as raisingawareness of slow roads amongst the public. One particular campaign organised us-ing this observatory was related to a walk organised in Anderlecht, one of the munic-ipalities of the Brussels Capital Region.
Campaign: Anderlecht
The purpose of this campaign was to get feedback about the quality of the informationdisplayed on specialised maps that are attached to various bus stops in Anderlecht.These maps illustrate the various points of interest and distance an average pedestrian
140

7.2 Citizen Observatory Meta-Platform Expressiveness
Figure 7.9: Mobile app of the Trage Wegen observatory.
can cover in 5 minutes, possibly through the use of a slow road. The goal of thesemaps is to inform commuters that walking via a slow road may be faster sometimesthan waiting for the bus. Furthermore, participants were also encouraged to makereports about their findings of other aspects of the walk. For example, recycling binsplaced in the middle of the walking trail, thereby blocking pedestrians (fig. 7.10). Sixparticipants contributed to the campaign resulting in a total of 55 reports.
Figure 7.10: Participant reporting a negative element on the walking trail.
141

Figure 7.11: Dashboard of the Trage Wegen campaign in Anderlecht.

7.2 Citizen Observatory Meta-Platform Expressiveness
All the bus stops were added to the campaign through the use of the CampaignDesign Interface’s geographical constraint editor (cfr. section 5.2.1). The geographi-cal constraint editor provides support for adding elements in bulk rather than drawingthem individually on a map. This was used to load the publicly available GeoJSONdata of bus stop locations in Anderlecht.
Although the campaign was designed to collect any feedback on both the mapsand other elements along the trail, a geographical predicate was used to create aseparate data set for feedback related to the special maps attached to the bus stops.No other predicates were used in this campaign.
The campaign’s dashboard is depicted in fig. 7.11. The top pane is implementedthrough the TableVisualisation component, which creates a table and listseach uploaded measurement. The bottom is implemented through the use of aMapMarkerVisualisation component, which is configured to use the valueof the rating for the marker’s colour.
Spatial Triggers
This campaign used spatial triggers as real-time participant coordination mechanism:whenever a participant got in the vicinity a bus stop, a notification was triggered onthe participant’s mobile app prompting the participant to make a report on the nearbymap. This mechanism prevented participants from missing a particular bus stop, andthus increased the data density and coverage of the campaign.
To do so, the app continuously uploaded each participant’s location to the cam-paign, where the NearObjective component perpetually tests whether a partici-pant is within a certain distance of an “objective”, which in this campaign are the busstops. The first time a participant is within the configured distance of an objective, anindividual message is sent to that participant’s app which triggers the notification us-ing the PushNotification component. These push notifications are an exampleof feedback being used as an incentive for participants to motivate them to increasetheir contribution.
7.2.3 SensorDrone: Observatory on Atmospheric Conditions
A third citizen observatory that was created using the CO meta-platform collectsdata of atmospheric conditions, particularly temperature, humidity, and atmosphericpressure. This observatory shows how mobile apps created through the CO meta-platform can also interact with external sensors over a Bluetooth connection.
The implementation of the mobile app is depicted in fig. 7.12. The bulk of thework is performed by the Sensordrone component, which is itself implemented
143

Chapter 7: DISCOPAR at Work
Figure 7.12: Implementation of Sensordrone mobile app.
using component composition. It relies on a component that is responsible for han-dling the Bluetooth communications, and another component that parses the dataoriginating from a Sensordrone, a sensor fabricated by Sensorcon. Individual datavalues are sent to the appropriate label component, which updates the value on themobile app’s screen. The observation containing each data value is geo-tagged usingthe GeoLocator component, after which the observation is uploaded to the server.The resulting mobile app (depicted in fig. 7.13) visualises real-time sensor readingsof temperature, pressure and humidity.
Figure 7.13: Sensordrone mobile app and external SensorDrone sensor.
144

7.3 End-User Usability Tests
Although this citizen observatory demonstrates the meta-platform’s capability ofinteracting with external sensors (i.e., sensors that are not built-in into the mobilephone), there are some technical limitations to be taken into account due to the pureweb-based implementation of mobile apps created through the CO meta-platform.More details regarding these limitations and a possible workaround are providedin section 8.2.1.
7.3 End-User Usability Tests
The CO meta-platform enables ICT-agnostic stakeholders to create their own citi-zen observatories and deploy campaigns. This is achieved by providing them withdomain-specific concepts which can be visually assembled using DISCOPARDE. Wevalidate the usability of DISCOPARDE and the CO meta-platform as a whole throughtwo end-user usability tests that involve people without any programming knowledge:
• A first experiment focusses on the Mobile App Design Interface, where wetasked users to create their own mobile app using the CO meta-platform.
• A second experiment tests the usability of the Campaign Design Interface toverify whether users can design and deploy their own campaign.
To select an appropriate empirical study for these experiments, we took into ac-count that the CO meta-platform developed in this dissertation is a new tool whichis still a prototype. Therefore, the user base is virtually non-existent. Additionally,time restrictions prevented us from studying participants over a longer period oftime. Given these restrictions, the most reliable and feasible type of experiment isa quasi-experiment [16]. A quasi-experiment is an empirical study which lacks ran-dom assignment of the groups or other factors being studied. A quasi-experiment,as opposed to a scientific experiment, does not allow us to make any founded claimregarding the usability of CO meta-platform. Nevertheless, it does provide insightsabout how the platform’s intended end-users perceive and value the features of a vi-sually programmable citizen observatory, in addition to providing anecdotal evidenceon the usability of the CO meta-platform by ICT-agnostic users.
7.3.1 Quasi-Experiment: Mobile App Design Interface
A first quasi-experiment tested the Mobile App Design Interface of the CO meta-platform in order to study the intuitiveness and practical use of its features. This
145

Chapter 7: DISCOPAR at Work
experiment was performed during the international cooperation with Zayed Univer-sity, involving 9 female bachelor students in Environmental Science, with participantages ranging between 19 and 27. The curriculum of this bachelor program does notcontain any programming courses, and we checked that none of the students had abackground in ICT. Furthermore, in order to properly test how intuitive the UI is, theydid not receive any explanation on how to use DISCOPARDE.
The students were tasked to create their own mobile app that is capable of mea-suring sound pressure levels (similar to the NoiseTube2.0 mobile app presented in sec-tion 7.2.1), using the Mobile App Design Interface (cfr. section 5.1.3). In order to beconsidered successful, the app had to provide the following functionality:
• Use the microphone to record sound samples and calculate the decibel value.
• Display the current, average, minimum, and maximum decibel value textuallyon the screen.
• Display the current decibel value graphically using a line chart.
• Add geolocalisation information to each data sample.
• Draw each data sample on the map using appropriate colour coding.
• Upload each data sample to the observatory.
There were basically two different ways in which these features could be imple-mented: either through the use of a few high-level composite components, or bymanually recreating this component composition using lower level components. Thestudents were given a total of 30 minutes to accomplish this goal. Part of this timewas spent on navigating the meta-platform’s website, creating a new account for eachstudent, creating an observatory, etc. At the end of the experiment, the students wereasked to fill in a survey to evaluate DISCOPARDE and the CO meta-platform as awhole.
Experiment Results
None of the students experienced difficulties with the meta-platform’s website nav-igation and they all managed to create an account and a novel citizen observatory1.After 12 minutes, the first student completed the task and created a functioning mo-bile app. In the end, 8 out of 9 students designed an app that satisfied the intendedfunctionality requirements within the time limit. One student forgot to ensure thateach data sample needs to be uploaded to the observatory’s server.
1Some students lost some time downloading a different browser for compatibility reasons.
146

7.3 End-User Usability Tests
Figure 7.14: Noise measuring app implementation with redundancies.
Despite the fact that 8 out of 9 students managed to implement a function-ing mobile app providing the necessary features, 5 solutions included redundant oreven unused parts in their graph. Consider for example the implementation depictedin fig. 7.14. This student’s solution utilises the high-level NoiseTubeUI which al-ready includes the required visualisations to display current decibel values and ad-ditional statistics. Each observation produced by this component is correctly taggedwith GPS coordinates using GeoLocator. However, at this point, each observationis sent to two instances of the MapDotDraw component. Having multiple instancesof this component (connected to the same output port) serves no purpose, as theyboth do exactly the same thing, namely drawing an observation on the map. There-fore, each observation is always drawn twice on the app’s map. Similar redundan-cies were implemented by two other students. For example, one student uses botha MapDotDraw and MapMarkerdraw component, meaning that the location ofevery observation was also indicated using a plain marker on the map.
Two other students made the mistake of leaving disconnected components onthe canvas. These sub-graphs contained processes expecting an input which was notprovided due to the lack of an incoming connection. As such, the entire sub-graphwill never execute. Although these have no impact on the correct functioning of therequired features, they unnecessarily consume memory and/or clog up the UI.
In order to prevent users from implementing such redundancies, we aim to im-prove DISCOPARDE’s graph validation mechanism (cfr. section 4.3.4).
Three students implemented the app as requested without any redundant compo-nents. One of these students even opted for the more difficult, low-level, implementa-tion. This student’s implementation is depicted in fig. 7.15. This low-level approachrequires the use of several low-level components, some of which are not visible un-less the advanced mode is toggled in the component menu.
147

Chapter 7: DISCOPAR at Work
Figure 7.15: Correct, low-level noise measuring app implementation.
Navigating DISCOPARDE seemed straightforward and intuitive for most students,as they realised that each component can be further configured through its corre-sponding configuration window (cfr. section 4.3.3). For example, in the low-levelimplementation, the Interval Trigger is configured to trigger the recording ofa sound sample at frequent intervals, each Label was modified to display the appro-priate text in the UI, and the Linechart’s size was updated to take up the remainingspace of the UI.
Survey Results
After the quasi-experiment, students were asked to fill in a survey. The sur-vey contained two parts: the first focussed on the participants’ experience usingDISCOPARDE, while the latter questioned their interest in the concept of a citizenobservatory meta-platform as a whole. An exhaustive list of the survey questionsused is available in appendix B.
From fig. 7.16a we can conclude that the drag-and-drop interface ofDISCOPARDE was perceived as intuitive and easy to use by the participants. Thisis further confirmed by the fact that 8 out of 9 student managed — albeit including
148

7.3 End-User Usability Tests
some redundancies — to compose a functioning mobile app that had the envisionedfeatures. Every student soon found out that connections can be made through drag-and-drop interactions. 3 students did not realise that components can be deleted (byright-clicking them), which explained the unused components left on the canvas by 2of these students. The third student simply created a new citizen observatory to startfrom scratch.
I E
12
34
5
(a) Boxplot on Intuitiveness (I) and easeof use (E) of the visual programmingenvironment of DISCOPAR.
I L P G
12
34
5
(b) Boxplot of participants’ appreciationof the features of DISCOPARDE .(I) Component Information (L) LivePreview (P) Port Typing (G) GraphValidation.
Figure 7.16: Survey results (part 1).
All students noticed that ports have different colours, and that certain compo-nents cannot be interconnected (cfr. section 4.3.2). However, only 8 out of 9 studentsnoticed the port highlighting mechanism based on matching output ports and inputports, and from those 8 only 4 students understood the meaning of this mechanismand made the link with the compatibility of components. A suggestion was made toadd a notification, explaining the highlighting mechanism, that triggers whenever thegraph designer attempts to make an illegal connection. Additionally, a large interestwas shown in a legend explaining the data type of each port colour.
Every student realised that components expect input from ports on the left side ofthe visual representation, and produce output on the right side. However, only 4 outof 9 students understood that a component will never execute if it has an input portwithout any incoming connections. They suggested to add an unused input port as awarning to the graph validation mechanism.
Only 2 students used the search function of DISCOPARDE and successfully foundthe component they were looking for. We conclude that the relative low number of
149

Chapter 7: DISCOPAR at Work
components that is currently present in the component library does not warrant theuse of the search function yet.
7 students noticed the information button of components in the component menu,which shows the component’s description when clicked. This additional informationhelped 5 students to understand the functionality of a certain component they did notknow before.
The graph validation mechanism (cfr. section 4.3.4) was discovered by 6 students,who each understood its meaning and the errors it listed. However, due to the num-ber of participants that included unused components or duplicate instances in theirimplementation, we have to conclude that additional checks must be implemented toprovide more feedback to the graph designer about the quality of their implementa-tion.
Participants also gave their opinion about the component information, livepreview, port typing, and graph validation mechanisms present in DISCOPARDE
by assigning a rating between 1 to 5 for each of these categories. At this pointin the quasi-experiment, participants received an explanation of each mechanism,as we noticed from the earlier questions that not every participants discovered orunderstood the mechanism. The summary of participant opinions is depicted infig. 7.16b. The most appreciated feature of the Mobile App Design Interface is thelive preview that immediately reflects changes made to the implementation of themobile app. Students reported that this feature greatly increased their understandingof their actions and the implementation of the mobile app as a whole.
In the second part of the survey, students answered questions regarding the very no-tion of a CO meta-platform. Figure 7.17a contains the results of these questions. Thefirst column contains the answers to the question of how likely they themselves woulduse the platform for designing environmental data collection apps in future research.The second question focussed on data analysis and visualisation, and asked how likelythey were to use a visual interface, such as the Campaign Analysis Interface, as analternative to existing software such as Microsoft Excel, SPSS, and MatLab, takinginto account that DISCOPAR would provide the same functionality. The last ques-tion asked their opinion about the usefulness of a full-fledged CO meta-platform forenvironmental scientists in general.The group of students that participated in this experiment was the same group thatwas used for the noise mapping campaign discussed in section 7.2.1. We thereforealso took the opportunity to test whether or not their experience with the CO meta-platform and data gathering for the campaigns had any impact on their view of par-ticipatory sensing in general. Figure 7.17b indicates the students’ general confidence
150

7.3 End-User Usability Tests
D A U
12
34
5
(a) Boxplot on participant opinions on theCO meta-platform as a data gather-ing methodology (D), data analysisinterface (A), and usefulness for en-vironmental scientists in general (U).
B A
12
34
5
(b) Confidence in participatory sensing asa accurate alternative for collectingenvironmental data before (B) and af-ter (A) using the CO meta-platform.
Figure 7.17: Survey results (part 2).
in participatory sensing as an accurate alternative for collecting environmental databefore (B) using the CO meta-platform and after (A) interacting with the platformand participating in the campaigns. 5 out of 9 students indicated that — as a directresult of their participation — they now also consider participatory sensing as a validalternative for collecting scientific data.
7.3.2 Quasi-Experiment: Campaign Design Interface
A second quasi-experiment was performed during the “Reclaiming the city” work-shop organised by Redelijk Eigenzinnig, an interdisciplinary elective for students atthe Vrije Universiteit Brussel. The course’s aim is to stimulate students to reflectcritically on important social issues. The topic of this particular workshop was “ac-celerated technological development in the field of ICT, app, and sensoring that aretransforming our cities”.
The idea for this workshop was to give students the opportunity to design theirown environmental noise mapping campaign in an area that was in the direct prox-imity of the workshop’s location, and to collect data with their smartphone usingthe NoiseTube2.0 mobile app. 10 students participated in the workshop, includingstudents from bachelor and master programs in History, Industrial Science, PoliticalScience, Philosophy, etc. Unlike the students from the first experiment, students par-ticipating in this workshop received a presentation explaining the concept of our CO
151

Chapter 7: DISCOPAR at Work
meta-platform and a very basic introduction on DISCOPARDE. Next, the studentswere given 30 minutes to program their own campaign and an additional 30 minutesto go out in the field and collect data for their newly created campaigns. fig. 7.18depicts the output of one such campaign entirely created by one of the students. Thiscampaign uses a PA that filters out measurements made outside the vicinity of 3 streetsegments, and aggregates the remaining measurements in a map.
Figure 7.18: Campaign created during the “Reclaiming the city” workshop.
Each participant successfully created a campaign within the foreseen time slot.Due to time restrictions, students were not asked to fill in a survey about their experi-ence with the Campaign Design Interface. However, the fact that all the students suc-cessfully created a campaign and managed to collect data for their campaign servesas anecdotal evidence that the Campaign Design Interface is indeed usable by ICT-agnostic users.
7.4 Conclusion
In this chapter, we demonstrated how the CO meta-platform developed in this disser-tation lives up to our research vision which consists of building a generic approachtowards reusable and reconfigurable citizen observatories that is accessible by ICT-agnostic users.
Through the creation of three radically different citizen observatories, we demon-strate that our citizen observatory meta-platform provides support for both continuous
152

7.4 Conclusion
data streams (e.g., sensorial data such as sound pressure levels captured through a mi-crophone) as well as discrete data (e.g., such as pedestrians’ reports on the quality ofinformal walking trails). Furthermore, mobile app created through the meta-platformcan be seamlessly augmented with external sensors as long as they can connect tothe mobile phone over a Bluetooth connection. As a result, more types of data canbe gathered than the ones that are directly available through a smartphone’s built-insensors. This wide-range support of data types means that our CO meta-platform canbe considered, to the best of our knowledge, the first of a kind in new and more pow-erful generation of reusable participatory sensing systems such as those presentedin section 2.2.2.
The CO meta-platform further distinguishes itself from existing PS systemsthrough its integrated technological support for participatory campaigning. Cam-paigns were already performed in the past with several existing PS systems, but theyalways relied on human effort to enact and monitor the campaign and guide partici-pants. In case of the CO meta-platform, the notion of a campaign, the means to designa campaign, and automated campaign orchestration are all part of the meta-platform.Furthermore, campaigns can utilise participant coordination mechanisms to increasedata quality by optimising coverage, density, etc.
In section 2.4.3 we discussed how providing real-time feedback to participantshas multiple benefits. Feedback can be used to provide participant coordination on anindividual level, but also acts as an incentive for participants when they see the effectof their contributions. Unlike other PS systems that rely on a more static approach us-ing batch-processing and queries, citizen observatories and campaign created on ourCO meta-platform process and analyse data in real-time due to the reactive nature ofDISCOPAR. This reactive approach enables real-time (individual) participants feed-back and coordination. Furthermore, data visualisations on an observatory or cam-paign’s dashboard automatically stay up to date.
Perhaps the biggest ground-breaking feature of our CO meta-platform is thatit enables people with limited technological knowledge to create their own citizenobservatory and set up PS campaigns. We observed from the two different quasi-experiments discussed in section 7.3 that non-ICT experts can indeed implementtheir own mobile data gathering app and set up a campaign with ease. These quasi-experiments only focussed on the Mobile App Design Interface and the CampaignDesign Interface, so further and more elaborate user studies are necessary to evaluatethe CO meta-platform as a whole. However, we assume that the other interfaces pro-vided by the CO meta-platform, such as the observatory’s Data Processing DesignInterface, will be equally well-received and accessible to ICT-agnostic users as theyare all built on top of DISCOPARDE.
153


8C O N C L U S I O N
This dissertation introduces the idea of a citizen observatory meta-platform,i.e., a plat-form that enables the construction of citizen observatory platforms. This final chaptersummarises the functionalities of our CO meta-platform and the visual programminglanguage that it offers, provides an overview of the contributions of this dissertation,and highlights some directions for future work.
155

Chapter 8: Conclusion
8.1 Summary
The CO meta-platform presented in this dissertation enables ICT-agnostic users toconstruct their own citizen observatories. This is achieved through the use of DIS-COPAR, a new visual flow-based domain-specific programming language designedto hide the non-essential complexity of constructing citizen observatories from theend-user, and to only confront them with concepts that are truly relevant to their do-main. The advantages of our CO meta-platform over other existing PS systems areits reconfigurability, its integrated support for automatically enacting campaigns, re-activity, and its usability by ICT-agnostic users (cfr. section 2.2.1 and section 2.2.2).
Reconfigurability The CO meta-platform enables the creation and configurationof citizen observatories for a large spectrum of PS scenarios. Citizen observatoriesare capable of collecting different types of data, including both sensorial parameters(noise, accelerometer, humidity, etc.) and behavioural parameters (e.g., user inputthrough questionnaires). In addition to providing the necessary features to collect thisdiverse data, the CO meta-platform also enables the configuration of different dataprocessing algorithms for each citizen observatory scenario. The CO meta-platformis capable of offering this high degree of reconfigurability thanks to the flow-based na-ture of DISCOPAR, which enables a wide variety of applications to be built from thesame set of components through different compositions. Thanks to the component-based nature of FBP, the CO meta-platform can avoid rebuilding all the resulting mo-bile apps, web interfaces, databases, data analysis and visualisation elements fromscratch.
Campaign Support Unlike existing PS systems where the concept of a campaignis not explicitly supported and thus usually managed manually, the CO meta-platformprovides integrated support for the definition of a PS campaign as well as for its au-tomated enactment. Within each observatory created on the meta-platform, initiatorscan define campaigns themselves. Campaigns provide automated orchestration of par-ticipants while they are collecting data and provides them with immediate feedbackon their contributions as an incentive mechanism.
Reactivity Each citizen observatory created using the CO meta-platform is a cloud-based reactive application that reacts to data coming from mobile devices that con-tribute the data to the server, and that promptly pushes feedback (e.g., intermediatecampaign results) back to the relevant devices. This reactivity enables real-time au-tomated orchestration to guide data collection and provide immediate user feedback,
156

8.1 Summary
essentials tools for successful campaigning. This also means that, unlike existing PSsystems, every form of data visualisation is always kept up to date and does not relyon batch-processing techniques a posteriori.
ICT-Agnostic Usability DISCOPARDE, the visual development environment forDISCOPAR, provides ICT-agnostic users the means to construct a citizen observatoryby visually composing components through drag-and-drop actions. DISCOPARDE
greatly increases the usability of DISCOPAR by only presenting the graph designerwith the essential domain-specific concepts, thereby hiding the irrelevant technologi-cal difficulties that normally come with deploying a cloud-based reactive application.
8.1.1 Contributions
This section gives an overview of the contributions of this dissertation.
Participatory Sensing Systems: State of the Art We gave an overview of thehistory and evolution of participatory sensing, where a distinction is made betweenad-hoc PS systems that are designed on a per use-case basis, and reusable PS sys-tems. Until now, the latter only focus only on discrete data, i.e., single-shot obser-vations usually collected through digital questionnaires (cfr. section 2.2). We definethe concept of a PS campaign (cfr. section 2.3.2) and identify the typical predicatesused in the definition of a campaign’s protocol (cfr. section 2.3.1). Furthermore, fromanalysing several environmental PS campaigns (combined with our extensive exper-tise in participatory noise sensing gained from the NoiseTube project [137, 41]), wederive and describe each step of a typical campaign’s lifecycle (cfr. section 2.3.3). Wealso introduce the concept of a citizen observatory (cfr. section 2.4).
Citizen Observatory Meta-Platform We have coined the term citizen observatorymeta-platform, which is a platform to construct citizen observatory platforms. TheCO meta-platform presented in this dissertation (cfr. chapter 5) is a contribution inthe field of participatory sensing, as it can be considered the first of its kind in a newgeneration of reusable and reconfigurable PS systems:
• The CO meta-platform provides support for a wide range of data types thatcan be collected by the apps it allows us to construct (including both sensorialparameters and behavioural parameters).
• The CO meta-platform features integrated technological support for the defini-tion and automated enactment of campaigns.
157

Chapter 8: Conclusion
• The CO meta-platform further distinguishes itself from existing work due to itsreactive nature, which enables real-time campaign orchestration and feedback.
• The CO meta-platform remains accessible for ICT-agnostic users allowing any-one to create their own citizen observatory and deploy campaigns.
DISCOPAR Citizen observatories created through the CO meta-platform are col-laborative cloud-based reactive applications. In order to support real-time commu-nication amongst the various components deployed in a citizen observatory’s dis-tributed architecture, we developed DISCOPAR, a new visual reactive flow-baseddomain-specific language, created specifically to hide the non-essential complexityof citizen observatories and their distributed nature from the end-user, and to presentonly concepts that are relevant to their domain (cfr. chapter 4). To the best of ourknowledge, this is the only flow-based programming language where componentsare automatically distributed amongst devices and their corresponding connectionsautomatically established.
DISCOPARDE In order to enable ICT-agnotic users to create their own citizen ob-servatories and define their own campaigns, we have developed DISCOPARDE, aweb-based visual programming environment for DISCOPAR (cfr. section 4.3). It fea-tures a live programming mode that allows the direct manipulation of a running DIS-COPAR program without stopping it (cfr. section 4.3.5). Moreover, DISCOPARDE
enables users to perform distributed live programming, which means that they canchange the observatory’s server-side logic from within a web-browser (i.e., remotely).To help ICT-agnostic users create correct programs in DISCOPAR, DISCOPARDE
features a graph validation mechanism that prevents them from composing incompat-ible components.
Citizen Observatory Meta-Platform Validation We have validated the citizen ob-servatory meta-platform in terms of expressiveness, suitability, and usability throughexperiments in both laboratory as well as real-world conditions. The expressivenessand suitability of DISCOPAR for constructing citizen observatories is demonstratedthrough the creation of three distinct citizen observatories and the successful enact-ment of a number of campaigns designed within those observatories (cfr section 7.2).Usability of the CO meta-platform is validated through two end-user usability tests(quasi-experiments) where we provide some evidence that people without any pro-gramming knowledge can successfully create a citizen observatory and design a cam-paign using the CO meta-platform (cfr. section 7.3). From the analysis of a partici-
158

8.2 Future Work
pant’s survey, we analysed the participants’ experience using DISCOPARDE and theirinterest in the concept of a citizen observatory meta-platform as a whole. Both werewell-received.
8.2 Future Work
This section outlines ongoing work and provides several possible avenues for futureresearch. First, we discuss the advantages of shifting the implementation of mobileapps from pure web-based apps to hybrid mobile apps. Second, we focus on optimis-ing performance by enabling components to run on different threads. Last, we presentvarious ideas towards further enhancing the CO meta-platform with regards to userexperience.
8.2.1 Hybrid Mobile Apps
In the current status, mobile apps created through the CO meta-platform are imple-mented as web-based HTML5 applications (cfr. section 6.3.1). Although web-basedapps are becoming increasingly powerful, new APIs only become mainstream veryslowly and therefore often lack support by all browser vendors. Furthermore, thereare still some limitations to hardware access, and offline availability is more difficultto implement and is also not without limitations. In ongoing work, we are switchingto a hybrid approach by using PhoneGap [59] to facilitate and enhance the implemen-tation of offline availability and hardware access.
Offline Support
Offline support can be implemented in web-based apps using to JavaScript’s ServiceWorkers. However, there are some limitations and inconsistencies involved that makethem not yet a recommended technology to implement offline-capable mobile datacollection apps. In case of citizen observatories, participants can potentially collecthuge amounts of data using their smarpthone, especially when sensorial data is beingcollected. When operating offline, all these data have to be persistently stored untilan internet connection is available. Web-based apps can therefore either rely on WebStorage (e.g., LocalStorage and SessionStorage) but this is limited in size and type(strings only). Alternatively, apps can utilise the File System API, although this APIis also not sufficiently mature or standardised to encourage widespread adoption yet.In contrast, hybrid mobile apps provide the benefits of a native app, i.e., access to thesmartphone’s internal storage. Therefore, hybrid apps provide a more straightforward
159

Chapter 8: Conclusion
and mature approach when it comes to persistently storing data on a phone. Havingno restrictions on the type of data that can be stored is also an important requirement,as certain observatories may need to store photos, videos, etc. In the future, we willfocus on increasing the mobile app’s user experience and on making it more robust,thereby particularly focussing on offline availability.
Access to Hardware
In addition to offline-capabilities, another advantage of hybrid mobile app technol-ogy is that hybrid apps do not have any restrictions regarding access to the mobiledevice’s hardware. This is advantageous for both sensor access and communicationwith external devices through Bluetooth and USB.
In section 2.1, we discussed how smartphones are becoming increasingly pow-erful and equipped with multiple sensors. Currently, many sensors (i.e., GPS, ac-celerometer, microphone, ambient-light, camera, and magnetometer) are only acces-sible through (experimental) APIs of some web browsers, as they are often still con-sidered non-standard APIs. A hybrid approach solves this issue by providing directaccess to the sensors rather than going through a web browser’s API. Additionally, ahybrid app provides access to more uncommon sensors, such as the on-board temper-ature and humidity sensors that some smartphone models provide.
Bluetooth communication is another technology that is not well-supported byweb browsers. At the time of writing, only Chrome supports the Web BluetoothAPI. Furthermore, it requires an external device featuring the Bluetooth 4.0 standard,which introduced a new “Low Energy” mode and provides most of its functionalitythrough key/value pairs provided by the Generic Attribute Profile (GATT). Hybridmobile apps do not have such limitations and are thus capable of communicating witha wider range of external devices, including any version of Bluetooth. Furthermore,having access to the device’s hardware also enables serial communication throughUSB.
In ongoing work, we successfully made two additional citizen observatories: onefocused on gathering particulate matter data by communicating with an external sen-sor through Bluetooth 2.0, and another one collecting black carbon data by establish-ing a USB serial connection to an external device.
8.2.2 Performance
In the current ongoing work, every process (cfr. section 4.2.2) runs within the samethread due to Javascript’s single-threaded execution model. Although this setupworks fine for the relatively small-scale experiments described in chapter 7, it is not
160

8.2 Future Work
capable of handling “big data” scenarios, where thousands of participants are all si-multaneously contributing data to an observatory. To prevent bottlenecks and ensurereal-time feedback of the observatory, it is important that the server-side processinggraphs can deal with the increased amount of data. Therefore, we are investigatingpossible methods to increase the scalability of observatories, such as multi-threadingand process replication.
Multi-threading
The first avenue to increase performance is to implement a thread-pool that automat-ically manages where processes are deployed based on the current workload of eachprocess. We envision various predicates that can be placed upon a process to decidewhen it should be deployed in a separate thread (e.g., based on a certain through-put indicator). When redeploying a process, only the connections from and to thatprocess have to be updated, since processes only communicate with their input andoutput ports and are not concerned with the connections attached to their ports. Thismeans that processes do not know the difference whether they are communicatingto a process in the same thread or a different one. The amount of data that a citizenobservatory must process in real-time varies greatly as the number of participantsactively contributing data to it can differ significantly throughout the observatory’slifetime. Certain processes can therefore suddenly be required to process a lot moredata. Therefore, load balancing (i.e., assigning a process to a different thread at run-time) should also be supported.
Process Replication
The second avenue is to implement a replication mechanism at the level of processes.Rather than replicating an entire observatory, the flow-based programming approachof DISCOPAR enables citizen observatories to only scale processes that are causinga bottleneck. For example, if two interconnected processes produce/consume dataat a different rate (e.g., the first process produces data faster than the second canconsume), there is a risk of buffer overflow. The goal is to automatically detect thesesituations and create multiple instances of the “slower” process. There is an additionalcomplexity to take into account for non-functional processes. Processes that maintainstate, such as an aggregated map, need to operate on the same shared object and thushave a shared state.
161

Chapter 8: Conclusion
8.2.3 User Experience Enhancements
DISCOPARDE is used in our CO meta-platform to enable ICT-agnostic users to set upa citizen observatory and deploy campaigns within a citizen observatory. Althoughthe CO meta-platform is fully functional at the time of writing, there are severalpotential improvements that can be applied with the goal of having a positive effecton the user experience. We discuss some of these in the remainder of this section.
Graph Auto-Complete
In section 4.3.4 a validation mechanism was introduced that verifies whether certainconstraints imposed on the graph are satisfied. In the current state, this mechanismis rather basic and only supports three types of constraints (cfr. section 6.1.5). In thefuture, the types of constraints supported will be increased. However, the same graphvalidation mechanism could also be used to automatically make suggestions to thegraph designer, enabling a form of “auto-complete” mechanism. For example, whenthe graph validation mechanism notices that a certain process requires input but hasno incoming connections yet on that input port, it could suggest to create a connectionfrom an unused output port from a process placed nearby on the canvas.
WYSIWYG Editor
Currently, every observatory’s mobile app uses a default layout (cfr. section 5.1.3). Al-though the active components of each observatory’s mobile app can be programmedusing DISCOPARDE, there is no means to customise the app’s UI. For example, itis not possible to include a custom logo, or use a different colour scheme. Althoughit is relative easy to modify the default app look (e.g., as demonstrated by the TrageWegen app shown in section 7.2.2), it is currently only possibly by additional cod-ing in HTML5 and CSS. A better alternative would be to include a more advancedWYSIWYG editor that enables full customisation of the mobile app’s layout. This ed-itor would enable us to modify every visualisation component, in addition to provid-ing basic layout elements such as images and different types of navigational menus.Whenever such a visualisation component is included in the layout, a correspond-ing process should be added to the graph, enabling the graph editor to connect thevisualisation to other processes.
Additionally, a WYSIWYG editor could be also be used to customise the appear-ance of the various web pages that are automatically created by the CO meta-platformfor a new citizen observatory and campaigns.
162

8.2 Future Work
Process Groups and Zoom Controls
DISCOPARDE is faced with a problem that all visual programming languages have incommon: scalability. Applications that are composed of a very large number of com-ponents can become so complex that interpreting their visual representation becomesvery difficult or even impossible. This can be solved by varying the granularity of theprogram shown at a given moment. By grouping components hierarchically, they canbe reduced into a single component representing that group. Similar to how commu-nity components are implemented (cfr. section 5.3.2), this grouped component wouldexpose input ports and output ports for connections going to processes outside thegroup. At any time a group can be expanded, enabling the user to alter its containingcomponents.
The user-friendliness can also be further increased by adding zoom controls andbetter mechanics to navigate the canvas of the visual programming environment.
Graph Templates
Newly created citizen observatories and campaigns use a default graph template fortheir various interfaces. For example, as discussed in section 6.3.2, a new citizenobservatory’s Data Processsing Design Interface (cfr. section 5.1.2) starts with a de-fault graph template containing some basic functionality, such as storing data in thedatabase.
In the future, we would like to use this graph template mechanism as a means forusers of the CO meta-platform to recycle the “code”, i.e., the component composi-tion, of an already existing citizen observatory or campaign. For example, considera user inspired by an existing campaign who wants to design a similar campaign.In the current status, this user has to manually re-create this campaign and modifyit where needed. It would be more efficient if that user could somehow copy-pastethe existing campaign’s implementation and start by modifying the copy. Therefore,we would like to enhance the graph templates, so that existing citizen observatoriesand campaigns can be reproduced and modified with ease. Furthermore, these graphtemplates could also be used to have a series of demonstrative showcases of the plat-form’s features. We envision various mobile app graph templates where users canselect one that most closely resembles their goal.
163

Chapter 8: Conclusion
8.3 Closing Remarks
Despite the evolution of participatory sensing as a data collection paradigm and theemergence of several citizen observatories, there is a lack of reusable and reconfig-urable citizen observatory construction tools. Although there already exist a couple ofreusable and reconfigurable PS systems, these primarily focus on the data gathering(typically form-based) thereby neglecting the other roles of a citizen observatory suchas advanced data processing methods, support for campaigns, and real-time partici-pant feedback and coordination. This led us to the idea of a citizen observatory meta-platform. A CO meta-platform offers a generic approach towards reusable and recon-figurable citizen observatories. Through this CO meta-platform, ICT-agnostic userscan construct their own citizen observatories and design PS campaigns autonomously.The CO meta-platform provides support for a wide range of data types, includingboth sensorial parameters and behavioural parameters, and also features integratedsupport for the definition and enactment of campaigns. These features enable a newgeneration of PS scenarios where we move away from small-scale research-orienteddeployments to the full-fledged adoption of PS as a societally and scientifically rele-vant method.
To conceive the first CO meta-platform, we designed DISCOPAR, a new vi-sual reactive flow-based domain-specific language, which automatically handles thedistributed nature of citizen observatories and that only presents essential domain-specific concepts to users. The flow-based nature of DISCOPAR means that the en-tire system is reactive and capable of processing data and providing feedback in real-time. To ensure the usability of the DISCOPAR language by ICT-agnostic users, wedeveloped DISCOPARDE, a web-based visual programming environment for DIS-COPAR. Throughout the CO meta-platform, DISCOPARDE is used to enable ICT-agnostic users to design the various parts of a citizen observatory. We demonstratedthe expressiveness and suitability of the CO meta-platform through the creation ofdifferent citizen observatories and the successful enactment of campaigns deployedwithin these observatories. We have shown the ICT-agnostic usability of the CO meta-platform through usability experiments involving people who lack any programmingknowledge.
We are confident that DISCOPAR and DISCOPARDE merely scratch the surfaceof a promising new strand of languages and systems that will form the technologicalbasis for truly democratising the citizen science approach. Our technologies not onlyallow citizens to participate in citizen science experiments that were set up by experts,but also empower them to set up their own experiments and invite their fellow citizensto participate in those experiments in an open and democratic fashion.
164

AC O M P O N E N T L I S T O F D I S C O PA R
165

Appendix A: Component List of DISCOPAR
A.1 Sensing Components
COMPONENT NAME INPUT PORT(S) OUTPUT PORT(S) DESCRIPTION SETTINGS
SensorDrone
OUT (Observation)TEMPERATURE (Numeric) HUMIDITY (Numeric) PRESSURE (Numeric) BATTERY (Numeric)
Connects to the SensorDrone Bluetooth sensor and outputs its temperature, humidity, and pressure readings.
SoundPressureLevel IN (Any) OUT (Numeric)Records a sound sample using the microphone whenever the IN port receives data and calculates the sound pressure level thereof.
SoundLevelMeter IN (Any) OUT (Observation)DECIBEL (Numeric)
Records sound samples using the microphone and calculates the dB(A) value of these samples.
NoiseTubeUI OUT (Observation)
Records sound samples using the microphone and calculates the dB(A) value of these samples and return it as data token. The dB(A) is also automatically displayed and added to a graph.
nrOfSamples (15)yAxisMax (100)yAxisMin (0)yAxisInterval (10)chartHeight (100%)colourScale (Black)
AccelerationX (Numeric)Y (Numeric)Z (Numeric)
Output the data from the smartphone's acceleration sensor.
Form OUT (Observation)Enables you to construct a form using a drag-and-drop interface. The form will be added to the mobile app to enable survey-based data collection
Camera OUT (Observation)Take photos using the camera. Alternatively, use the "Form" component to create a questionnaire which can include photos as well
GeoLocator IN (Observations) OUT (Observation) Adds GPS information to observations.
WatchGeoLocation OUT (Location) Sends out a location each time the user's location chances.
SpeedCalculator IN (Observation)OUT (Observation)SPEED (Numeric)
Calculates the speed based on two consecutive observations with GPS locations attached to them.
Speed OUT (Observation)SPEED (Numeric)
Outputs the speed a mobile app user is moving at.
166

A.2 Logic Components
A.2 Logic Components
A.2.1 Geographical Components
COMPONENT NAME INPUT PORT(S) OUTPUT PORT(S) DESCRIPTION SETTINGS
IsInsidePolygon IN (Observation) OUT (Observation)FALSE (Observation)
IsInsideMultiPolygon IN (Observation) OUT (Observation)FALSE (Observation)
IsNearLine IN (Observation) OUT (Observation)FALSE (Observation)
distance
IsInsideCircle IN (Observation) OUT (Observation)FALSE (Observation)
distance
GeographicalFilter IN (Observation)OUT (Observation)FALSE (Observation)
Filters out observations that are not made within the specified geographical area.
A.2.2 Temporal Components
COMPONENTNAME INPUTPORT(S) OUTPUTPORT(S) DESCRIPTION SETTINGS
TimeFilter IN(Observation) OUT(Observation)Filterbasedonatimewindow:Onlyobservationsmadeinsidethespecifiedtimewindowareforwarded.
from(12:00:00)to(13:00:00)
DateFilter IN(Observation) OUT(Observation)Filterbasedonadatewindow:Onlyobservationsmadeinsidethespecifieddatewindowareforwarded.
from(2018-06-01)to(2018-06-31)
DayFilter IN(Observation) OUT(Observation)Filterbasedondayoftheweek:Onlydatatokensmadeonthespecifieddayoftheweekareforwarded.
day(Monday)
DayFilterSplit IN(Observation)
MONDAY(Observation)TUESDAY(Observation)WEDNESDAY(Observation)THURSDAY(Observation)FRIDAY(Observation)SATURDAY(Observation)SUNDAY(Observation)
Filterbasedondayoftheweekandoutputsobservationsonthematchingoutputport.
A.2.3 Contextual Components
COMPONENTNAME INPUTPORT(S) OUTPUTPORT(S) DESCRIPTION SETTINGS
FilterCampaignParticipants IN(Observation) OUT(Observation)Onlyallowsobservationsmadebyparticipantsofthecampaigntopass.
167
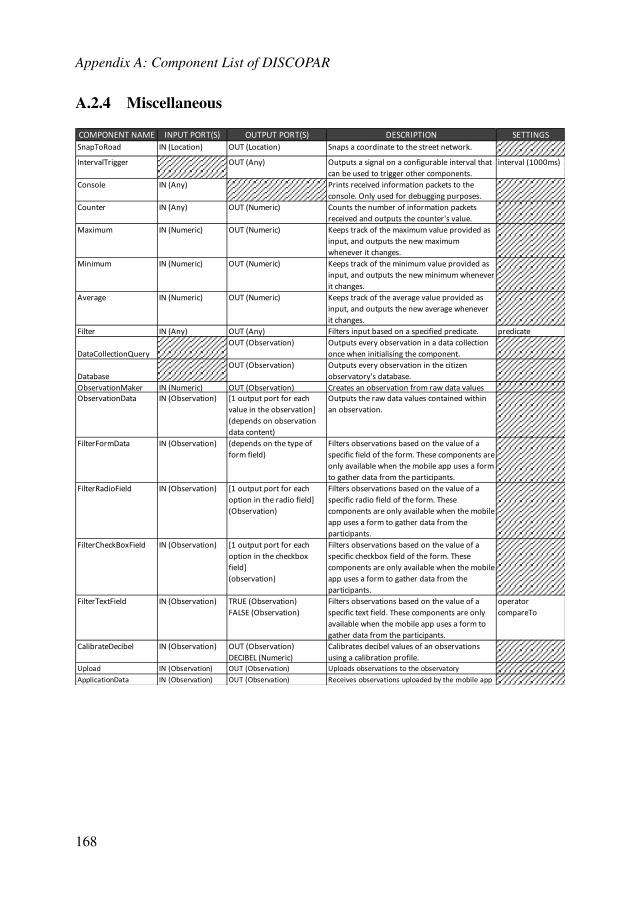
Appendix A: Component List of DISCOPAR
A.2.4 Miscellaneous
COMPONENT NAME INPUT PORT(S) OUTPUT PORT(S) DESCRIPTION SETTINGS
SnapToRoad IN (Location) OUT (Location) Snaps a coordinate to the street network.
IntervalTrigger OUT (Any) Outputs a signal on a configurable interval that
can be used to trigger other components.
interval (1000ms)
Console IN (Any) Prints received information packets to the
console. Only used for debugging purposes.
Counter IN (Any) OUT (Numeric) Counts the number of information packets
received and outputs the counter's value.
Maximum IN (Numeric) OUT (Numeric) Keeps track of the maximum value provided as
input, and outputs the new maximum
whenever it changes.
Minimum IN (Numeric) OUT (Numeric) Keeps track of the minimum value provided as
input, and outputs the new minimum whenever
it changes.
Average IN (Numeric) OUT (Numeric) Keeps track of the average value provided as
input, and outputs the new average whenever
it changes.
Filter IN (Any) OUT (Any) Filters input based on a specified predicate. predicate
DataCollectionQuery
OUT (Observation) Outputs every observation in a data collection
once when initialising the component.
Database
OUT (Observation) Outputs every observation in the citizen
observatory's database.
ObservationMaker IN (Numeric) OUT (Observation) Creates an observation from raw data values
ObservationData IN (Observation) [1 output port for each
value in the observation]
(depends on observation
data content)
Outputs the raw data values contained within
an observation.
FilterFormData IN (Observation) (depends on the type of
form field)
Filters observations based on the value of a
specific field of the form. These components are
only available when the mobile app uses a form
to gather data from the participants.
FilterRadioField IN (Observation) [1 output port for each
option in the radio field]
(Observation)
Filters observations based on the value of a
specific radio field of the form. These
components are only available when the mobile
app uses a form to gather data from the
participants.
FilterCheckBoxField IN (Observation) [1 output port for each
option in the checkbox
field]
(observation)
Filters observations based on the value of a
specific checkbox field of the form. These
components are only available when the mobile
app uses a form to gather data from the
participants.
FilterTextField IN (Observation) TRUE (Observation)
FALSE (Observation)
Filters observations based on the value of a
specific text field. These components are only
available when the mobile app uses a form to
gather data from the participants.
operator
compareTo
CalibrateDecibel IN (Observation) OUT (Observation)
DECIBEL (Numeric)
Calibrates decibel values of an observations
using a calibration profile.
Upload IN (Observation) OUT (Observation) Uploads observations to the observatory
ApplicationData IN (Observation) OUT (Observation) Receives observations uploaded by the mobile app
168

A.3 Aggregation components
A.3 Aggregation components
COMPONENTNAME INPUTPORT(S) OUTPUTPORT(S) DESCRIPTION SETTINGS
AggregatedMap IN(Observation) OUT(GeoJSON)Createsanaggregatedmapofthespecifiedarea.Output:aggregatedmap(geojson)thatcanbesendtovisualisationcomponents
field
Store IN(Observation) OUT(Observation) Persistentlystoresobservationsinthecitizenobservatory'sdatabase.
DataCollection IN(Observation) OUT(Observation) Createsapersistantdatacollectionofallthedatasamplesitreceives.
name
MapDataCollection IN(GeoJSON) PersistentlystoresmapsinGeoJSONformat name
A.4 Coordination components
COMPONENTNAME INPUTPORT(S) OUTPUTPORT(S) DESCRIPTION SETTINGS
PushNotification IN(Message)Triggersapushnoticiationonthemobileapp
uponreceivingamessage.
ArrowIndicator FROM(Location)
TO(Location)
Thiscomponentsdrawsanarrowonthemap
toguidetheusertoagivenlocation.'
ParticipantMovement OUT(Observation)
Outputsanobservationcontainingalocation
wheneverthemobileappuser'slocation
changes.Usedbycoordinationalgorithms.
ProximityNotification IN(Observation) OUT(Message)
Willinformaparticipantwhenevers/heis
withinthespecifieddistanceofacampaign's
objective.
message
title
distance(10m)
FindNearestObjectiveOBSERVATION(Observation)
OBJECTIVE(GeoJSON)OUT(Message)
Thiscomponentinstructspeopletogothe
nearestcampaignobjectivethatstillneeds
data.
FindNearestGridCellOBSERVATION(Observation)
MAP(GeoJSON)OUT(Message)
Thiscomponentinstructspeopletogothe
nearestgridcellthatstillneedsdata.
169

Appendix A: Component List of DISCOPAR
A.5 Visualisation components
COMPONENTNAME INPUTPORT(S) OUTPUTPORT(S) DESCRIPTION SETTINGS
Label IN(Any)Thiscomponentaddsalabeltothemobileapp,thatdisplaysthemostrecentvalueoftheconnectedinput.
headingunit
LineChart IN(NUmeric)Thiscomponentexpectsanumericvalue,andwildisplaythisvalueonadynamicchart.
nrOfSamples(15)yAxisMax(100)yAxisMin(0)yAxisInterval(10)chartHeight(100%)colourScale(Black)
Map Thiscomponentdisplaysamapandenablesyoutoconfigurethemaplayer.
layer(mapBox)
MapLocationTracker Thiscomponentcentersthemaponthecurrentlocationoftheuser
MapDotDraw IN(Observation)Thiscomponentcandrawcoloureddotsonthemaptovisualizeyourdatausingcolourcoding.
colourScale
MapMarkerDraw IN(Observation) Thiscomponentdrawsmarkersonthemapforthegeo-localiseddataprovided.
GeoJSONDrawer GEO(GeoJSON)Zoom(Any)
ThiscomponentdrawsanygeoJSONdataitreceivedonamap.
TableVisualisation IN(Observation)Dashboardvisualisationthatvisualisesobservationsinatable.
height(400px)width(100%)description
AggregatedMapVisualisation GEO(GeoJSON)Dashboardvisualisationthatvisualisesaggregatedmapsbydrawingtheirgeojsononamaplayer
height(400px)width(100%)description
MapMarkerVisualisation IN(Observation)Dashboardvisualisationthatvisualisesobservationssamplesbyplottingthemonamapbasedontheirgeolocation.
height(400px)width(100%)description
MapVisualisation IN(Observation)Dashboardvisualisationthatvisualisesobservationsbyplottingthemonamapbasedontheirgeolocation.
height(400px)width(100%)description
LineChartVisualisation IN(Numeric) Dashboardvisualisationthatvisualisesdatabydrawingitonalinechart.
height(400px)width(100%)descriptionnrOfSamples(15)yAxisMax(100)yAxisMin(0)yAxisInterval(10)chartHeight(100%)colourScale(Black)
PieChartVisualisation IN(Numeric) Dashboardvisualisationthatvisualisesdatabycreatingapiechart.
height(400px)width(100%)description
170

BS U RV E Y Q U E S T I O N S
171

Appendix B: Survey Questions
General Information
1. What is your name?
2. What is your age?
3. What is your gender?
DISCOPARDE
1. On a scale of 1-5, how easy did you find it to work with DISCOPARDE’s drag& drop interface?
2. On a scale of 1-5, how intuitive did you find it to work with DISCOPARDE’sdrag & drop interface?
3. Did you realise that a component accepts input from the left side, and producesoutput on the right side?
4. Did you realise that components with no connections arriving at their inputport(s) do nothing?
5. Did you notice that certain connections and input/output ports have a differentcolour?
Y.1 Did you understand their meaning?
6. Did you notice that — while dragging a connection — certain elements becomehighlighted?
Y.1 What do you think is the meaning of these highlights
7. Did you notice that certain components cannot be interconnected?
Y.1 Did you realise that it was due to the colours of their input and outputports being different?
8. How useful do you think the colour mechanism is to prevent a connectionbetween incompatible components?
9. How useful would you think a legend explaining the difference in colourswould be?
10. Did you find out by yourself that you are able to right-click a component todelete / configure it?
172

11. By right-clicking did you change the configuration of any of the components?
12. Did you use the search function provided by the component menu?
N.1 Why did you not use the search function?Y.1 Which keywords did you search for?Y.2 Did the search function help you find the components you were looking
for?
173

Appendix B: Survey Questions
13. Did you click on a component’s information button in the component menu?
Y.1 Did the provided information help you to understand the functionality ofa component that you did not initially understand?
14. On a scale of 1-5, how useful would you rate the possibility to get more infor-mation about a component?
15. Did you click on the “Graph Validation” button when building your mobileapp?
Y.1 Did you realize that it verifies whether or not the application you made isvalid?
16. On a scale of 1-5, how useful do you think this mechanism of “Graph Valida-tion”is to prevent the creation of a non-functional mobile app?
17. Did you realise the smartphone on the right was a live preview of the applica-tion you were building?
18. On a scale of 1-5, how useful do you think this live preview is?
19. In the end, did you manage to build a functional mobile app that recorded soundlevels and collected GPS location data?
20. Share any tips, feedback and/or comments you have about DISCOPARDE.
Citizen Observatory Meta-Platform
1. On a scale 1-5, If given the opportunity, how likely are you to use the platformfor environmental data capturing?
2. In case DISCOPAR would provide the same features as programs such as Mi-crosoft Excel, SPSS, Matlab, how likely are you to use DISCOPAR as an alter-native?
3. What is your opinion about the following statement: "The visual interface pro-vided by DISCOPAR enables ICT-agnostic scientists to develop Mobile Appswith ease"
4. What is your opinion about the following statement: "Seeing a program ascomponents that can be connected corresponds to how I think about data pro-cessing"
5. Taking into account that DISCOPAR is a prototype, how useful do you thinkthe finished platform will be for environmental scientists?
174

6. On a scale 1-5, BEFORE using the Mobile App (and smartphones as sensor),how confident were you that smartphones could produce accurate data?
7. On a scale 1-5, AFTER using the Mobile App (and smartphones as sensor),how confident are you that smartphones could produce accurate data?
8. Would you say that - as a result of using DISCOPAR - you now also considersmartphones as an alternative approach for gathering scientific data?
175


B I B L I O G R A P H Y
[1] Amelia Acker, Martin Lukac, and Deborah Estrin. Participatory sensing forcommunity data campaigns: A case study. Center for Embedded NetworkSensing, 2010. 30
[2] William B. Ackerman. Data flow languages. IEEE Computer, 15(2):15–25,1982. 44
[3] Rodina Ahmad. Visual languages: A new way of programming. MalaysianJournal of Computer Science, 12(1):76–81, 1999. 73
[4] Murali Annavaram, Nenad Medvidovic, Urbashi Mitra, Shrikanth Narayanan,Gaurav Sukhatme, Zhaoshi Meng, Shi Qiu, Rohit Kumar, Gautam Thatte, andDonna Spruijt-Metz. Multimodal sensing for pediatric obesity applications.UrbanSense08, page 21, 2008. 16
[5] John Backus. Can programming be liberated from the von neumann style?:a functional style and its algebra of programs. Communications of the ACM,21(8):613–641, 1978. 44
[6] Bacon.js. Bacon.js - functional reactive programming library for javascript.https://baconjs.github.io/. Accessed: 2018-03-16. 47
[7] Engineer Bainomugisha, Andoni Lombide Carreton, Tom van Cutsem, StijnMostinckx, and Wolfgang de Meuter. A survey on reactive programming.ACM Computing Surveys (CSUR), 45(4):52, 2013. 47
[8] H Bergius. Noflo–flow-based programming for javascript. Accessed: 2017-08-02. 47, 51
[9] Mark Bilandzic, Michael Banholzer, Deyan Peev, Vesko Georgiev, FlorenceBalagtas-Fernandez, and Alexander De Luca. Laermometer: A mobile noise
177

Bibliography
mapping application. In Proceedings of the 5th Nordic Conference on Human-computer Interaction: Building Bridges, NordiCHI ’08, pages 415–418, NewYork, NY, USA, 2008. ACM. 17
[10] Michael Blackstock and Rodger Lea. Toward a distributed data flow platformfor the web of things (distributed node-red). In Proceedings of the 5th Interna-tional Workshop on Web of Things, pages 34–39. ACM, 2014. 58
[11] Jonas Bonér, Dave Farley, Roland Kuhn, and Martin Thompson. The reactivemanifesto, 2014. 5
[12] I. Boutsis and V. Kalogeraki. Privacy preservation for participatory sensingdata. In Pervasive Computing and Communications (PerCom), 2013 IEEEInternational Conference on, pages 103–113, March 2013. 20
[13] Waylon Brunette, Mitchell Sundt, Nicola Dell, Rohit Chaudhri, Nathan Breit,and Gaetano Borriello. Open data kit 2.0: Expanding and refining informationservices for developing regions. In Proceedings of the 14th Workshop on Mo-bile Computing Systems and Applications, HotMobile ’13, pages 10:1–10:6,New York, NY, USA, 2013. ACM. 2, 18
[14] Margaret M Burnett. Visual programming. Wiley Encyclopedia of Electricaland Electronics Engineering, 1999. 48, 73
[15] A. T. Campbell, S. B. Eisenman, N. D. Lane, E. Miluzzo, R. A. Peterson, H. Lu,X. Zheng, M. Musolesi, K. Fodor, and G. S. Ahn. The rise of people-centricsensing. IEEE Internet Computing, 12(4):12–21, July 2008. 14
[16] Donald T Campbell and Julian C Stanley. Experimental and quasi-experimental designs for research. Handbook of research on teaching (NLGage, Ed.), pages 171–246, 1966. 145
[17] Matt Carkci. Dataflow and reactive programming systems. Create Space In-dependent Publishing Platform, 2014. 112
[18] John Carroll, Michael Horning, Blaine Hoffman, Craig Ganoe, Harold Robin-son, and Mary Beth Rosson. Visions, participation and engagement in newcommunity information infrastructures. The Journal of Community Informat-ics, 7(3), 2011. 31
[19] Pew Research Center. Smartphone ownership and internet usage continues toclimb in emerging economies, 2016. 12
178

[20] Delphine Christin. Privacy in mobile participatory sensing: Current trends andfuture challenges. Journal of Systems and Software, 116:57 – 68, 2016. 16
[21] Citclops. Citizens’ observatory for coast and ocean optical monitoring. http://www.citclops.eu/. Accessed: 2017-01-17. 28
[22] CITI-SENSE. Development of sensor-based citizens’ observatories commu-nity for improving the quality of life in cities. http://www.citi-sense.eu/. Accessed: 2017-01-17. 28
[23] COBWEB. Citizen observatory web. https://cobwebproject.eu/.Accessed: 2017-01-17. 28
[24] European Commission. Green paper on citizen science for europe: Towards asociety of empowered citizens and enhanced research, 2014. 14
[25] Socket.IO Contributors. Socket.io. https://socket.io/. Accessed:2017-10-13. 117
[26] E. De Cristofaro and C. Soriente. Participatory privacy: Enabling privacy inparticipatory sensing. IEEE Network, 27(1):32–36, January 2013. 20
[27] David M. Aanensen, Derek M. Huntley, Edward J. Feil, Fada’a al Own, andBrian G. Spratt. EpiCollect: Linking Smartphones to Web Applications forEpidemiology, Ecology and Community Data Collection. PLoS ONE, 4(9),2009. 2, 18
[28] David M. Aanensen, Derek M. Huntley, Mirko Menegazzo, Chris I. Powell,and Brian G. Spratt. Epicollect+: linking smartphones to web applications forcomplex data collection projects. F1000Research, 3:199, 2014. 18
[29] AL Davis. Data driven nets—a class of maximally parallel, output-functionalprogram schemata. Burroughs IRC Report, San Diego, 1974. 49
[30] AL Davis and SA Lowder. A sample management application program ina graphical data driven programming language. Digest of Papers CompconSpring, 81:162–167, 1981. 49
[31] Alan L Davis. The architecture and system method of ddm1: A recursivelystructured data driven machine. In Proceedings of the 5th annual symposiumon Computer architecture, pages 210–215. ACM, 1978. 44
179

Bibliography
[32] Delphine Christin, Andreas Reinhardt, Salil S. Kanhere, and Matthias Hollick.A survey on privacy in mobile participatory sensing applications. Journal ofSystems and Software, 84(11):1928–1946, 2011. 14, 16, 17, 27
[33] Tamara Denning, Adrienne Andrew, Rohit Chaudhri, Carl Hartung, JonathanLester, Gaetano Borriello, and Glen Duncan. Balance: towards a usable per-vasive wellness application with accurate activity inference. In Proceedingsof the 10th workshop on Mobile Computing Systems and Applications, page 5.ACM, 2009. 16
[34] Jack B Dennis and David P Misunas. A preliminary architecture for a basicdata-flow processor. In ACM SIGARCH Computer Architecture News, vol-ume 3, pages 126–132. ACM, 1975. 44
[35] Srinivas Devarakonda, Parveen Sevusu, Hongzhang Liu, Ruilin Liu, LiviuIftode, and Badri Nath. Real-time air quality monitoring through mobile sens-ing in metropolitan areas. In Proceedings of the 2nd ACM SIGKDD interna-tional workshop on urban computing, page 15. ACM, 2013. 12
[36] Ellie D’Hondt, Jesse Zaman, Eline Philips, Elisa Gonzalez Boix, and Wolf-gang De Meuter. Orchestration support for participatory sensing campaigns.In Proceedings of the 2014 ACM International Joint Conference on Pervasiveand Ubiquitous Computing, UbiComp ’14, pages 727–738, New York, NY,USA, 2014. ACM. 3, 21, 23, 26, 30
[37] Herbertt BM Diniz, Emanoel CGF Silva, and Kiev Santos da Gama. A refer-ence architecture for a crowdsensing platform in smart cities. In Proceedingsof the annual conference on Brazilian Symposium on Information Systems: In-formation Systems: A Computer Socio-Technical Perspective, 2015. 36
[38] NP Edwards. The effect of certain modular design principles on testability. InACM SIGPLAN Notices, volume 10, pages 401–410. ACM, 1975. 45
[39] S. B. Eisenman, E. Miluzzo, N. D. Lane, R. A. Peterson, G-S. Ahn, and A. T.Campbell. The bikenet mobile sensing system for cyclist experience mapping.In Proceedings of the 5th International Conference on Embedded NetworkedSensor Systems, SenSys ’07, pages 87–101, New York, NY, USA, 2007. ACM.16
[40] Shane B Eisenman, Nicholas D Lane, Emiliano Miluzzo, Ronald A Peterson,Gahng-Seop Ahn, and Andrew Campbell. Metrosense project: People-centric
180

sensing at scale. In Workshop on World-Sensor-Web (WSW 2006), Boulder.Citeseer, 2006. 16
[41] Ellie D’Hondt, Matthias Stevens, and An Jacobs. Participatory noise mappingworks! An evaluation of participatory sensing as an alternative to standardtechniques for environmental monitoring. Pervasive and Mobile Computing,9(5):681–694, 2013. 2, 20, 92, 137, 157
[42] Eric Paulos. Citizen Science: Enabling Participatory Urbanism. In MarcusFoth, editor, Handbook of Research on Urban Informatics: The Practice andPromise of the Real-Time City, chapter 28, pages 414–436. Information Sci-ence Reference, IGI Global, 2009. 12, 13
[43] Denzil Ferreira, Vassilis Kostakos, and Anind K Dey. Aware: mobile contextinstrumentation framework. Frontiers in ICT, 2:6, 2015. 19
[44] Inc. FitnessKeeper. Runkeeper. https://play.google.com/store/apps/details?id=com.fitnesskeeper.runkeeper.pro. Ac-cessed: 2016-09-29. 16
[45] FixMyStreet. FixMyStreet Website. https://www.fixmystreet.com/. Accessed: 2016-09-30. 3, 17
[46] Flowhub. Full-stack visual programming at your fingertips. https://flowhub.io/. Accessed: 2017-08-08. 51
[47] Blender Foundation. Blender. https://www.blender.org/. Accessed:2017-07-25. 53
[48] Node.js Foundation. Node.js. https://nodejs.org/en/. Accessed:2017-08-01. 123
[49] Raghu K Ganti, Fan Ye, and Hui Lei. Mobile crowdsensing: current state andfuture challenges. IEEE Communications Magazine, 49(11):32–39, 2011. 14
[50] Hui Gao, Chi Harold Liu, Wendong Wang, Jianxin Zhao, Zheng Song, XinSu, Jon Crowcroft, and Kin K Leung. A survey of incentive mechanisms forparticipatory sensing. IEEE Communications Surveys & Tutorials, 17(2):918–943, 2015. 19
[51] S. Gao, J. Ma, W. Shi, G. Zhan, and C. Sun. Trpf: A trajectory privacy-preserving framework for participatory sensing. IEEE Transactions on Infor-mation Forensics and Security, 8(6):874–887, June 2013. 20
181

Bibliography
[52] David Gelernter and Nicholas Carriero. Coordination languages and their sig-nificance. Commun. ACM, 35(2):97–107, February 1992. 45
[53] Adele Goldberg, Margaret Burnett, and Ted Lewis. Visual object-orientedprogramming. chapter What is Visual Object-oriented Programming?, pages3–20. Manning Publications Co., Greenwich, CT, USA, 1995. 73
[54] Adele Goldberg and David Robson. Smalltalk-80: the language and its imple-mentation. Addison-Wesley Longman Publishing Co., Inc., 1983. 72
[55] David Hasenfratz, Olga Saukh, Silvan Sturzenegger, and Lothar Thiele. Par-ticipatory air pollution monitoring using smartphones. Mobile Sensing, pages1–5, 2012. 17
[56] George T. Heineman and William T. Councill, editors. Component-based Soft-ware Engineering: Putting the Pieces Together. Addison-Wesley LongmanPublishing Co., Inc., Boston, MA, USA, 2001. 46, 96, 99
[57] John Hicks, Nithya Ramanathan, Donnie Kim, Mohamad Monibi, Joshua Sel-sky, Mark Hansen, and Deborah Estrin. Andwellness: an open mobile systemfor activity and experience sampling. In Wireless Health 2010, pages 34–43.ACM, 2010. 16
[58] Edwin L. Hutchins, James D. Hollan, and Donald A. Norman. Direct manipu-lation interfaces. Hum.-Comput. Interact., 1(4):311–338, December 1985. 73
[59] Adobe Systems Inc. Phonegap. https://phonegap.com/. Accessed:2018-02-20. 159
[60] Facebook Inc. React - a javascript library for building user interfaces. https://reactjs.org/. Accessed: 2018-03-16. 47
[61] Meteor Development Group Inc. Building apps with javascript | meteor. https://www.meteor.com/. Accessed: 2017-08-01. 47
[62] National Instruments. Labview. http://www.ni.com/en-us/shop/labview.html. Accessed: 2017-07-25. 53
[63] Native Instruments. Reaktor. https://www.native-instruments.com/en/products/komplete/synths/reaktor-6/. Accessed:2017-07-25. 53
182

[64] iSPEX. Measure aerosols with your smartphone, 2013. http://ispex.nl/en. 2, 20
[65] Jeffrey A. Burke, Deborah Estrin, Mark Hansen, Andrew Parker, Nithya Ra-manathan, Sasank Reddy, and Mani B. Srivastava. Participatory Sensing. InWSW’06: Workshop on World-Sensor-Web, held at ACM SenSys ’06, 2006. 1,13, 14, 20, 21
[66] Wesley M. Johnston, J. R. Paul Hanna, and Richard J. Millar. Advances indataflow programming languages. ACM Comput. Surv., 36(1):1–34, March2004. xi, 44, 45, 49
[67] jsPlumb Pty Ltd. Jsplumb. https://jsplumbtoolkit.com/. Ac-cessed: 2017-10-13. 121
[68] Salil S Kanhere. Participatory sensing: Crowdsourcing data from mobilesmartphones in urban spaces. In International Conference on Distributed Com-puting and Internet Technology, pages 19–26. Springer, 2013. 21
[69] E. Kanjo, J. Bacon, D. Roberts, and P. Landshoff. Mobsens: Making smartphones smarter. IEEE Pervasive Computing, 8(4):50–57, Oct 2009. 17
[70] Eiman Kanjo. Noisespy: A real-time mobile phone platform for urban noisemonitoring and mapping. Mobile Networks and Applications, 15(4):562–574,2010. 17
[71] Ryoma Kawajiri, Masamichi Shimosaka, and Hisashi Kahima. Steered crowd-sensing: Incentive design towards quality-oriented place-centric crowdsensing.In Proceedings of the 2014 ACM International Joint Conference on Pervasiveand Ubiquitous Computing, UbiComp ’14, pages 691–701, New York, NY,USA, 2014. ACM. 19
[72] Steven Kelly and Juha-Pekka Tolvanen. Domain-specific modeling: enablingfull code generation. John Wiley & Sons, 2008. 51
[73] A. Khan, S. K. A. Imon, and S. K. Das. Ensuring energy efficient coveragefor participatory sensing in urban streets. In 2014 International Conference onSmart Computing, pages 167–174, Nov 2014. 19
[74] Sunyoung Kim, Jennifer Mankoff, and Eric Paulos. Sensr: Evaluating a flexi-ble framework for authoring mobile data-collection tools for citizen science. In
183

Bibliography
Proc. Computer Supported Cooperative Work, pages 1453–1462. ACM, 2013.2, 18
[75] Paul R. Kosinski. A data flow language for operating systems programming.SIGPLAN Not., 8(9):89–94, January 1973. 44
[76] Andreas Krause, Eric Horvitz, Aman Kansal, and Feng Zhao. Toward commu-nity sensing. In Proceedings of the 7th International Conference on Informa-tion Processing in Sensor Networks, IPSN ’08, pages 481–492, Washington,DC, USA, 2008. IEEE Computer Society. 14
[77] LandSense. Landsense citizen observatory. https://landsense.eu/.Accessed: 2017-12-29. 28
[78] Nicholas D. Lane, Shane B. Eisenman, Mirco Musolesi, Emiliano Miluzzo,and Andrew T. Campbell. Urban sensing systems: Opportunistic or participa-tory? In Proceedings of the 9th Workshop on Mobile Computing Systems andApplications, HotMobile ’08, pages 11–16, New York, NY, USA, 2008. ACM.14
[79] Nicholas D Lane, Mu Lin, Mashfiqui Mohammod, Xiaochao Yang, HongLu, Giuseppe Cardone, Shahid Ali, Afsaneh Doryab, Ethan Berke, Andrew TCampbell, et al. Bewell: Sensing sleep, physical activities and social interac-tions to promote wellbeing. Mobile Networks and Applications, 19(3):345–359, 2014. 16
[80] Nicholas D. Lane, Emiliano Miluzzo, Hong Lu, Daniel Peebles, TanzeemChoudhury, and Andrew T. Campbell. A survey of mobile phone sensing.Comm. Mag., 48(9):140–150, 2010. 13
[81] Vitaveska Lanfranchi, N Ireson, U When, SN Wrigley, and C Fabio. Citi-zens’ observatories for situation awareness in flooding. In Proceedings of the11th International Conference on Information Systems for Crisis Response andManagement (ISCRAM 2014): 18-21 May 2014, pages 145–154, 2014. 3, 28
[82] Juong-Sik Lee and Baik Hoh. Dynamic pricing incentive for participatorysensing. Pervasive and Mobile Computing, 6(6):693 – 708, 2010. SpecialIssue PerCom 2010. 19
[83] Mattias Linnap and Andrew Rice. Managed participatory sensing withyousense. Journal of Urban Technology, 21(2):9–26, 2014. 19
184

[84] Hai-Ying Liu, Mike Kobernus, David Broday, and Alena Bartonova. A con-ceptual approach to a citizens’ observatory – supporting community-based en-vironmental governance. Environmental Health, 13(1):107, 2014. 2, 26, 28,29
[85] Vinit Lohan. Component based effort estimation during software development:problematic view. IJCSMS International Journal of Computer Science andManagement Studies, 11(03), 2011. 46
[86] Hong Lu, Denise Frauendorfer, Mashfiqui Rabbi, Marianne Schmid Mast,Gokul T Chittaranjan, Andrew T Campbell, Daniel Gatica-Perez, and TanzeemChoudhury. Stresssense: Detecting stress in unconstrained acoustic environ-ments using smartphones. In Proceedings of the 2012 ACM Conference onUbiquitous Computing, pages 351–360. ACM, 2012. 16
[87] Hong Lu, Wei Pan, Nicholas D Lane, Tanzeem Choudhury, and Andrew TCampbell. Soundsense: scalable sound sensing for people-centric applicationson mobile phones. In Proceedings of the 7th international conference on Mo-bile systems, applications, and services, pages 165–178. ACM, 2009. 17
[88] Pattie Maes. Computational Reflection. PhD thesis, Vrije Universiteit Brussel,1987. 32
[89] Nicolas Maisonneuve, Matthias Stevens, and Bartek Ochab. Participatorynoise pollution monitoring using mobile phones. Information Polity, 15(1,2):51–71, 2010. 12, 17, 22, 25
[90] Ines Mergel. Distributed democracy: Seeclickfix. com for crowdsourced issuereporting. Com for Crowdsourced Issue Reporting (January 27, 2012), 2012.17
[91] MicroFLo. Flow-based programming for microcontrollers (arduino++). https://github.com/microflo/microflo. Accessed: 2017-08-08. 47,51
[92] Prashanth Mohan, Venkata N. Padmanabhan, and Ramachandran Ramjee. Ner-icell: Rich monitoring of road and traffic conditions using mobile smartphones.In Proceedings of the 6th ACM Conference on Embedded Network Sensor Sys-tems, SenSys ’08, pages 323–336, New York, NY, USA, 2008. ACM. 17
[93] J Paul Morrison. C# implementation of flow-based programming (fbp). https://github.com/jpaulm/csharpfbp. Accessed: 2017-08-08. 47
185

Bibliography
[94] J Paul Morrison. Fbp vs. fbp-inspired systems. http://www.jpaulmorrison.com/fbp/noflo.html. Accessed: 2017-12-10. 43
[95] J Paul Morrison. Java implementation of flow-based programming (fbp). https://github.com/jpaulm/javafbp. Accessed: 2017-08-08. 47
[96] J Paul Morrison. Flow-based programming. In Proc. 1st International Work-shop on Software Engineering for Parallel and Distributed Systems, pages 25–29, 1994. 45, 46
[97] J. Paul Morrison. Flow-based programming. Journal of Application Develop-ers’ News, 1, 2013. 43
[98] MsgFlo. Flow-based programming with message queues. https://github.com/msgflo/msgflo. Accessed: 2017-08-08. 51, 58
[99] Mohamed Musthag, Andrew Raij, Deepak Ganesan, Santosh Kumar, and SaulShiffman. Exploring micro-incentive strategies for participant compensationin high-burden studies. In Proceedings of the 13th International Conference onUbiquitous Computing, UbiComp ’11, pages 435–444, New York, NY, USA,2011. ACM. 19
[100] D. Méndez, A. J. Pérez, M. A. Labrador, and Juan José Marrón. P-sense: Aparticipatory sensing system for air pollution monitoring and control. In Per-vasive Computing and Communications Workshops (PERCOM Workshops),2011 IEEE International Conference on, pages 344–347, March 2011. 17
[101] Inc. Nike. Nike+ run club. https://play.google.com/store/apps/details?id=com.nike.plusgps. Accessed: 2016-09-29. 16
[102] Node-RED. Flow-based programming for the internet of things. https://nodered.org/. Accessed: 2017-08-08. 47, 51
[103] GROW Observatory. Grow - build better soil through citizen science. https://growobservatory.org/. Accessed: 2017-12-29. 28
[104] Omniscientis. Odour monitoring and information system based on citizen andtechnology innovative sensors. http://www.omniscientis.eu/. Ac-cessed: 2017-01-17. 28
[105] Eric Paulos, Richard J Honicky, and Elizabeth Goodman. Sensing atmosphere.Human-Computer Interaction Institute, page 203, 2007. 14
186

[106] Bratislav Predic, Zhixian Yan, Julien Eberle, Dragan Stojanovic, and KarlAberer. Exposuresense: Integrating daily activities with air quality using mo-bile participatory sensing. In PerCom Workshops, 2013. 16
[107] Rajib Kumar Rana, Chun Tung Chou, Salil S Kanhere, Nirupama Bulusu, andWen Hu. Ear-phone: an end-to-end participatory urban noise mapping system.In Proceedings of the 9th ACM/IEEE International Conference on InformationProcessing in Sensor Networks, pages 105–116. ACM, 2010. 17
[108] Sasank Reddy, Deborah Estrin, Mark H. Hansen, and Mani B. Srivastava. Ex-amining micro-payments for participatory sensing data collections. In Ubi-Comp, 2010. 19
[109] Sasank Reddy, Andrew Parker, Josh Hyman, Jeff Burke, Deborah Estrin, andMark Hansen. Image browsing, processing, and clustering for participatorysensing: lessons from a dietsense prototype. In Proceedings of the 4th work-shop on Embedded networked sensors, pages 13–17. ACM, 2007. 16
[110] Mitchel Resnick, John Maloney, Andrés Monroy-Hernández, Natalie Rusk,Evelyn Eastmond, Karen Brennan, Amon Millner, Eric Rosenbaum, Jay Silver,Brian Silverman, and Yasmin Kafai. Scratch: Programming for all. Commun.ACM, 52(11):60–67, November 2009. xi, 39, 48
[111] John P. Rula and Fabián E. Bustamante. Crowd (soft) control: moving beyondthe opportunistic. In Gaetano Borriello and Rajesh Krishna Balan, editors,HotMobile, page 3. ACM, 2012. 19
[112] SCENT. Scent - smart toolbox for engaging citizens into a people-centricobservation web. https://scent-project.eu/. Accessed: 2017-12-29. 28
[113] Immanuel Schweizer, Roman Bärtl, Axel Schulz, Florian Probst, and MaxMühläuser. Noisemap-real-time participatory noise maps. In Proc. 2nd Int’lWorkshop on Sensing Applications on Mobile Phones (PhoneSense’11), pages1–5, 2011. 12
[114] SeeClickFix. SeeClickFix Website. http://seeclickfix.com/. Ac-cessed: 2016-09-30. 17
[115] Panos A. Ligomenides Shi-Kou Chang, Tadao Ichikawa, editor. Visual Lan-guages. Plenum Press, New York, 1986. 48
187

Bibliography
[116] B. Shneiderman. Direct manipulation: A step beyond programming languages.Computer, 16(8):57–69, Aug 1983. 74
[117] Jonathan Silvertown. A new dawn for citizen science. Trends in Ecology &Evolution, 24(9):467 – 471, 2009. 14
[118] Ingo Simonis and Rob Atkinson. Standardized Information Models to Opti-mize Exchange Reusability and Comparability of Citizen Science Data. Tech-nical report, 2016. 64
[119] Gurminder Singh and Mark H Chignell. Components of the visual computer:a review of relevant technologies. The Visual Computer, 9(3):115–142, 1992.xi, 48, 49
[120] Matthias Stevens. Community memories for sustainable societies: The case ofenvironmental noise. PhD thesis, Vrije Universiteit Brussel, 2012. 30
[121] Erich P Stuntebeck, John S Davis II, Gregory D Abowd, and Marion Blount.Healthsense: classification of health-related sensor data through user-assistedmachine learning. In Proceedings of the 9th workshop on Mobile computingsystems and applications, pages 1–5. ACM, 2008. 16
[122] Yu Sun, Zekai Demirezen, Marjan Mernik, Jeff Gray, and Barrett Bryant. Ismy dsl a modeling or programming language? In Domain-Specific ProgramDevelopment, page 4, 2008. 50
[123] H. Tangmunarunkit, C. K. Hsieh, B. Longstaff, S. Nolen, J. Jenkins,C. Ketcham, J. Selsky, F. Alquaddoomi, D. George, J. Kang, Z. Khalapyan,J. Ooms, N. Ramanathan, and D. Estrin. Ohmage: A general and extensibleend-to-end participatory sensing platform. ACM Trans. Intell. Syst. Technol.,6(3):38:1–38:21, April 2015. 2, 18
[124] Steven L. Tanimoto. Viva: A visual language for image processing. J. Vis.Lang. Comput., 1(2):127–139, June 1990. 74
[125] Microsoft Open Technologies and RxJS contributors. Reactive-extensions/rxjs: The reactive extensions for javascript. https://github.com/Reactive-Extensions/RxJS/. Accessed: 2017-09-20. 47, 106
[126] Sameer Tilak. Real-world deployments of participatory sensing applications:Current trends and future directions. ISRN Sensor Networks, 2013, 2013. 2,14, 15
188

[127] Yoshitaka Ueyama, Morihiko Tamai, Yutaka Arakawa, and Keiichi Yasumoto.Gamification-based incentive mechanism for participatory sensing. In Per-vasive Computing and Communications Workshops (PERCOM Workshops),2014 IEEE International Conference on, pages 98–103. IEEE, 2014. 19
[128] I. J. Vergara-Laurens, D. Mendez, and M. A. Labrador. Privacy, quality ofinformation, and energy consumption in participatory sensing systems. In Per-vasive Computing and Communications (PerCom), 2014 IEEE InternationalConference on, pages 199–207, March 2014. 19
[129] Markus Voelter, Sebastian Benz, Christian Dietrich, Birgit Engelmann, MatsHelander, Lennart C. L. Kats, Eelco Visser, and Guido Wachsmuth. DSL En-gineering - Designing, Implementing and Using Domain-Specific Languages.dslbook.org, 2013. 50
[130] Michael von Kaenel, Philipp Sommer, and Roger Wattenhofer. Ikarus: Large-scale participatory sensing at high altitudes. In 2th Workshop on Mobile Com-puting Systems and Applications (HotMobile), 2011. 2, 20
[131] Waylay. Waylay - where iot & apis, rules and integration meet. https://www.waylay.io/. Accessed: 2017-08-08. 54
[132] Kung Song Weng. Stream-oriented computation in recursive data flowschemas. Massachusetts Institute of Technology, Project MAC, 1975. 44
[133] WeSenseIt. The citizens’ observatory of water. http://wesenseit.eu/.Accessed: 2017-01-17. 28
[134] Wikipedia. Component-based software engineering — wikipedia, the free en-cyclopedia, 2017. 46
[135] XOD. A visual programming language for microcontrollers. https://xod.io/. Accessed: 2017-08-08. 54
[136] J. Zaman, E. D’Hondt, E. G. Boix, E. Philips, K. Kambona, and W. De Meuter.Citizen-friendly participatory campaign support. In 2014 IEEE InternationalConference on Pervasive Computing and Communication Workshops (PER-COM WORKSHOPS), pages 232–235, March 2014. 23
[137] Jesse Zaman. Orchestrating participatory sensing campaigns with workflows.Master’s thesis, Vrije Universiteit Brussel, June 2013. 21, 22, 23, 157
189

Bibliography
[138] Willian Zamora, Carlos T Calafate, Juan-Carlos Cano, and Pietro Manzoni.A survey on smartphone-based crowdsensing solutions. Mobile InformationSystems, 2016, 2016. 36
[139] Daqing Zhang, Haoyi Xiong, Leye Wang, and Guanling Chen. Crowdrecruiter:Selecting participants for piggyback crowdsensing under probabilistic cover-age constraint. In Proceedings of the 2014 ACM International Joint Confer-ence on Pervasive and Ubiquitous Computing, UbiComp ’14, pages 703–714,New York, NY, USA, 2014. ACM. 19
190


![[Lab Report] PSpice](https://static.fdokumen.com/doc/165x107/631a338ebb40f9952b01e638/lab-report-pspice.jpg)

