DISCLOSURE APPENDIX CONTAINS IMPORTANT DISCLOSURES, ANALYST CERTIFICATIONS, INFORMATION ON TRADE...
176
DISCLOSURE APPENDIX CONTAINS IMPORTANT DISCLOSURES, ANALYST CERTIFICATIONS, INFORMATION ON TRADE ALERTS, ANALYST MODEL PORTFOLIOS AND THE STATUS OF NON-U.S ANALYSTS. FOR OTHER IMPORTANT DISCLOSURES, visit www.creditsuisse.com/researchdisclosures or call +1 (877) 291-2683 for Credit Suisse Equity Research disclosures and visit https://firesearchdisclosure.credit-suisse.com or call +1 (212) 538- 7625 for Credit Suisse Fixed Income Research disclosures. US Disclosure: Credit Suisse does and seeks to do business with companies covered in its research reports. As a result, investors should be aware that the Firm may have a conflict of interest that could affect the objectivity of this report. Investors should consider this report as only a single factor in making their investment decision.. CREDIT SUISSE SECURITIES RESEARCH & ANALYTICS BEYOND INFORMATION ® Client-Driven Solutions, Insights, and Access 1 October 2013 Securities Research & Analytics http://www.credit-suisse.com/researchandanalytics The Shale Revolution II Connections Series Source: Credit Suisse In this Connections Series report, we draw on the insights of over 50 global equity analysts, economists and strategists to revisit the key investment theme of the shale revolution and chart new developments. Since our initial report The Shale Revolution (December 2012), we see shale's significance as only more compelling and, importantly, more investable. We believe the story is still in its early stages and presents end markets that display a secular growth quality. Oil and gas production in the US has continued to surpass expectations and the path to energy self-sufficiency has shortened. The global potential for shale is as yet untapped. A debate over the structural outlook for energy prices will continue: gas is our immediate focus. New themes we explore in the report include: the global consequence of LNG export approvals; cost pressures building around the shale-related capex boom; frac-safety issues; the impact on US macro numbers such as trade; and US profit margins which have leapt vs the rest of the world - can the gap close? We have built a universe of around 300 companies touched by shale, building the “effective” global supply chain at work. Credit Suisse’s PEERs supply chain tool allows us to look for lateral investment opportunities and competitiveness risks. There are plenty of both. The Credit Suisse Connections Series leverages our exceptional breadth of macro and micro research to deliver incisive cross-sector and cross-border thematic insights for our clients. SECURITIES RESEARCH & ANALYTICS Please refer to each section of this report for the specific contributors to that section
-
Upload
independent -
Category
Documents
-
view
3 -
download
0
Transcript of DISCLOSURE APPENDIX CONTAINS IMPORTANT DISCLOSURES, ANALYST CERTIFICATIONS, INFORMATION ON TRADE...

DISCLOSURE APPENDIX CONTAINS IMPORTANT DISCLOSURES, ANALYST CERTIFICATIONS, INFORMATION ON TRADE ALERTS, ANALYST MODEL PORTFOLIOS AND THE STATUS OF NON-U.S ANALYSTS. FOR OTHER
IMPORTANT DISCLOSURES, visit www.creditsuisse.com/researchdisclosures or call +1 (877) 291-2683 for Credit Suisse Equity Research disclosures and visit https://firesearchdisclosure.credit-suisse.com or call +1 (212) 538- 7625 for Credit Suisse Fixed Income Research disclosures. US Disclosure: Credit Suisse does and seeks to do business with companies covered in its research reports. As a result, investors should be aware that the Firm may have a conflict of interest that could affect the objectivity of this report. Investors should consider this report as only a single factor in making their investment decision..
CREDIT SUISSE SECURITIES RESEARCH & ANALYTICS BEYOND INFORMATION®
Client-Driven Solutions, Insights, and Access
1 October 2013
Securities Research & Analytics
http://www.credit-suisse.com/researchandanalytics
The Shale Revolution II Connections Series
Source: Credit Suisse
In this Connections Series report, we draw on the insights of over 50
global equity analysts, economists and strategists to revisit the key
investment theme of the shale revolution and chart new developments. Since
our initial report The Shale Revolution (December 2012), we see shale's
significance as only more compelling and, importantly, more investable.
We believe the story is still in its early stages and presents end markets that
display a secular growth quality. Oil and gas production in the US has
continued to surpass expectations and the path to energy self-sufficiency
has shortened. The global potential for shale is as yet untapped. A debate over
the structural outlook for energy prices will continue: gas is our immediate focus.
New themes we explore in the report include: the global consequence of
LNG export approvals; cost pressures building around the shale-related capex
boom; frac-safety issues; the impact on US macro numbers such as trade; and
US profit margins which have leapt vs the rest of the world - can the gap close?
We have built a universe of around 300 companies touched by shale,
building the “effective” global supply chain at work. Credit Suisse’s PEERs
supply chain tool allows us to look for lateral investment opportunities and
competitiveness risks. There are plenty of both.
The Credit Suisse Connections Series
leverages our exceptional breadth of
macro and micro research to deliver
incisive cross-sector and cross-border
thematic insights for our clients.
SECURITIES RESEARCH & ANALYTICS Please refer to each section of this report for the specific contributors to that section

1 October 2013
The Shale Revolution II 2
Table of contents Credit Suisse Research & Analytics 3 Key charts 4 Executive Summary 5 Global Shale Developments 18 China Shale Developments 22 Energy Markets 28 Oil, Gas & Coal 29 Developing Themes 42 Challenges ahead 43 Economic Impact 51 Corporate Profitability 56 Frac-Safety 58 Equity Research 63 Stocks & Sectors 63 Stock Selections 64
Looking for value and looking laterally 64 The Shale Supply Chain 66 Credit Suisse PEERmap 67
North American Energy 68 Exploration & Production – US 68 Exploration & Production – Canada 77 Oilfield Services 80 Oil refiners 82
Infrastructure 86 US MLPs 86 Canadian Infrastructure 93 Transport 97
Materials 101 Chemicals 101 Fertilizers 105 Steel 111
Clean Technology 119 Renewable Chemicals 122
Capital Goods and Engineering 124 US Engineering and Construction 124 Electrical Equipment/Multi-Industry 125 Japan capital goods and engineering 127 US environment and industrial services 130
Utilities 132 Appendices 137 Appendix 1 - Country impact 138 Appendix 2 – Shale Universe 156 Appendix 3 – Supplementary Reference Charts 164 Appendix 4 - Shale Acronyms 168

1 October 2013
The Shale Revolution II 3
Credit Suisse Research & Analytics Global Credit Suisse analysts contributing to this report
Thematic Research Telephone Email
Richard Kers ley +44 20 7888 0313 richard.kers [email protected]
Mujtaba Rana +44 20 7883 3773 [email protected]
Kiranjot Grewal +44 20 7883 9247 [email protected]
Ashlee Ramanathan +44 20 7883 9934 [email protected]
Product Management
Katie Iorio +1 212 538 6386 [email protected]
Brandon Vair +44 20 7888 6381 brandon.va [email protected] Research
Jan Stuart +1 212 325 1013 [email protected]
Stefan Reviel le +1 212 538 6802 stefan.reviel [email protected]
Johannes Van Der Tuin +1 212 325 4556 johannes [email protected]
Marcus Garvey +44 20 7883 4787 marcus [email protected]
Economic Research
Neal Soss +1 212 325 3335 neal [email protected]
Jay Feldman +1 212 325 7634 [email protected]
Isaac Lebwohl +1 212 538 1906 [email protected]
Equity Research
APAC
David Hewitt +65 6212 3064 [email protected]
Thomas Wong +852 2101 6738 [email protected]
Horace Tse +852 2101 7379 [email protected]
USA
Ed Westlake +1 212 325 6751 [email protected]
Arun Jayaram +1 212 538 8428 [email protected]
Jamie Cook +1 212 538 6098 [email protected]
John Edwards +1 713 890 1594 [email protected]
John McNulty +1 212 325 4385 [email protected]
Mark Lear +1 212 538 0239 [email protected]
Daniel Eggers +1 212 538 8430 [email protected]
Jul ian Mitchel l +1 212 325 6668 jul ian.mitchel [email protected]
Al l i son Landry +1 212 325 3716 al l i [email protected]
James Wicklund +1 214 979 4111 [email protected]
Hamzah Mazari +1 212 538 7983 [email protected]
Patrick Jobin +1 212 325 0843 [email protected]
Chris topher Parkinson +1 212 538 6286 chris [email protected]
Bhavesh Lodaya +1 212-325-4561 [email protected]
Maheep Mandloi +1 212 325 2345 [email protected]
Brandon Heiken +1 212 325 6608 [email protected]
Europe
Vincent Gi l les +44 20 7888 1926 vincent.gi l [email protected]
Mark Richards +44 20 7883 6484 [email protected]
Liam Fi tzpatrick +44 20 7883 8350 l iam.fi [email protected]
Jonathan Hurn +44 20 7883 4532 [email protected]
Michael Shi l laker +44 20 7888 1344 michael .shi l [email protected]
James Hanford +44 20 7883 1551 [email protected]
Lars Kjel lberg +46 8 545 07 926 lars .kjel [email protected]
Charlotte El l iott +44 20 7888 9484 charlotte.el l [email protected]
Canada
Andrew Kuske +1 416 325 4561 [email protected]
Jason Frew +1 403 476 6022 [email protected]
Robert Loebach +1 403 476 6021 [email protected]
David Phung +1 403 476 6023 [email protected]
Paul Tan +1 416 352 4593 paul [email protected]
Latin America
Vanessa Quiroga + 52 55 5283 8939 [email protected]
Vinicius Canheu +55 11 3701 6310 vinicius [email protected]
Andre Sobreira +55 11 3701 6299 [email protected]
Australia
Paul McTaggart +61 2 8205 4698 paul [email protected]
Martin Kronborg +61 2 8205 4369 [email protected]
Japan
Shinya Yamada +81 3 4550 9910 [email protected]
Shinji Kuroda +81 3 4550 9994 shinji [email protected]
Yunchao Zhao +81 3 4550 9903 [email protected]
Indonesia
Ami Tantri +62 21 2553 7976 [email protected]

1 October 2013
The Shale Revolution II 4
The story continues… Exhibit 1: The path to energy self-sufficiency is
shortening: production could exceed demand (including
sands) by around 2018E.
Exhibit 2: Estimates of shale gas resources worldwide
increase but untapped (tcf).
0
5,000
10,000
15,000
20,000
25,000
30,000
2000 2002 2004 2006 2008 2010 2012 2014 2016 2018 2020 2022
kbd
US Canada Mexico North America Consumption
Source: EIA Source: EIA
Exhibit 3: It's more about gas than oil. US gas prices
capped with plenty of cheap supply to come.
Exhibit 4: LNG export approvals gathering momentum
and will prove a source of demand for this gas.
0
1
2
3
4
5
6
7
2010 2011 2012 2013 2014 2015
yoy Fcst 2011-2012 Avg
0
2
4
6
8
10
12
2015 2016 2017 2018 2019 2020
Low Base High
Source: EIA, Credit Suisse Commodities Research estimates Source: Credit Suisse Equity Research
Exhibit 5: Strong outlook for US Chemical capex related
to shale gas (US$ in billions of 2012 dollars)….
Exhibit 6: …but unemployment rates (%) in shale hotbeds
declining. Costs are rising.
0
2
4
6
8
10
12
14
16
2013
2014
2015
2016
2017
2018
2019
2020
$ in
billions (
2012 d
ollars
)
2.0
3.0
4.0
5.0
6.0
7.0
8.0
9.0
10.0
11.0
'02 '03 '04 '05 '06 '07 '08 '09 '10 '11 '12 '13
National
Texas
North Dakota
Source: Credit Suisse Equity Research estimates Source: Bureau of Labor Statistics, Credit Suisse

1 October 2013
The Shale Revolution II 5
Executive Summary The Shale Revolution II
Since our initial report, The Shale Revolution (13 December 2012), the significance of the
theme of unconventional energy in North America and its impact on global markets has
only become more compelling, with increased evidence that the story remains in its early
stages. Technological improvements, efficiency gains and the application of capital (partly
due to high oil prices) are unlocking significant oil and gas resources from shale where
reservoir recovery factors are still low. In this report, we review developments through this
year and new themes looking forward. The theme that emerges from the collective work of
our research teams is both the connectivity (cross-sector and cross-region) of the story
and the widening areas it is touching. While becoming more investable globally, it is
equally posing increased competitive risks for those unable to benefit from this new
resource.
Industry themes
We are still in the early innings for US shale, with production growth accelerating.
Given strong activity and assuming continued technological progress, we expect
significant oil production growth still to come in the key regions such as the Permian (a
“prize” for oil shale drilling given its potential), as well as the Eagle Ford, Bakken and
Niobrara (Wattenberg). In the core of nearly every play, there is a positive story that
should propel continued volume growth. Over time, as the core gets drilled out and as the
decline of existing wells becomes a more substantial hurdle, then production growth
should slow. This appears several years off, particularly given recent geological success in
the Permian.
We see a cap on gas prices in the US. There remains an abundance of low cost gas in
the US due to enhanced productivity and cost control. The industry is increasingly
demonstrating its ability to meet bullish demand projections for gas from industry, from
power, for transportation and for LNG exports. Against the views of many commentators,
Credit Suisse's Commodities Research team believes that US gas supplies will keep on
rising, even in a relatively low (i.e. no-higher-than $5/MMbtu) price environment. It would
require a significant increase in US demand to threaten a significant upward move in
Henry Hub prices.
The impact on the oil price globally is still muted. Increased production in the US has
coincided with global supply interruptions and MENA instability. Some 2.5 million barrels
per day (Mb/d) of oil productive capacity have been put off-side from across the MENA
region through this year. This roughly equates to the entirety of the very strong crude oil
supply growth in the US of the last five years. Rather than just being a short term issue for
the supply/demand balance, our Commodities Research team, while seeing upside to their
base-case forecast for US oil production growth, see downside risk to projections for
nearly every other producing country in the immediate years ahead. A significantly weaker
oil price is not an imminent prospect. Our team see coal as the more likely structurally
challenged energy source.
Exhibit 7: Commodity Forecasts - short and long term
Commodity Forecasts 2013 2014 Long-Run Real Prices
Brent (US$/bbl) 108 110 90
WTI (US$/bbl) 97 100 82
Henry Hub (US$/MMBtu) 4 4 4.5
NBP (GBp/therm) 66 68 61
Newcastle Coal (US$/t) 86 91 100
API #2 Coal (US$/t) 81 90 100
Source: Credit Suisse Commodities Research estimates
EQUITY RESEARCH
Richard Kersley
Head of Global Product and
Thematic Research
+44 20 7888 0313
richard.kersley@credit-
suisse.com
Ed Westlake
Co-head of Global Energy
Research
+1 212 325 6751
edward.westlake@credit-
suisse.com
David Hewitt
Co-head of Global Energy
Research
+65 6212 3064
david.hewitt@credit-
suisse.com

1 October 2013
The Shale Revolution II 6
Shale outside of North America - 'fits and starts': In China, the world's largest shale
resource base (1,100 tcf vs 650 tcf in the US), 2013 has seen one foreign trial converted
into a Production Sharing Contract (Shell/PetroChina) but progress on the 21 shale blocks
awarded has been slow, with only 15% of the three-year obligatory capex likely to be
spent by year end. However, the recent regulated gas price announcement signals an on-
going desire by Chinese policymakers to support its fledgling indigenous unconventional
gas sector. In Argentina, Chevron farmed in to YPF acreage and higher gas prices are
also being signalled by the government. In Europe, Poland 'cools' as a shale postcode, but
Chevron takes a position with more than 4 million acres accumulated in Ukraine, Romania,
Lithuania and Poland in the last two years. In the UK, Prime Minister David Cameron
made a spirited call for shale developments, but public opposition appeared robust, with a
well reported anti-fracking protest in the south of England.
Infrastructure and capital spending in North America continues across the supply
chain. Connecting shale infrastructure to market via pipes, chemical crackers and LNG
exports continues to provide major opportunities across the industrial sector. Having
neared $40bn in 2013, industry estimates suggest spending amongst the MLPs will run in
the $25-30bn range for the next decade. Spending in the petro-chemicals space has
accelerated with more approvals for LNG exports being submitted. Current estimates of
incremental capex to 2017 in the chemicals sector are $40-50bn (2012 prices) due to
shale. We provide a project tracker of all LNG/GTL and cracker projects (page 49). Such
spending remains a key end market for the industrial space.
Labour costs in the US are rising amidst the capex boom. As strong a story as the
spending above portrays, our engineering and chemicals analysts examine the topic of
cost over-runs (page 43). Spending booms (eg, Australia) are littered with such examples
with cost 'blowouts' leading to cancelled projects while, in the early stages, the ability to
find skilled labour is resulting in rising costs and margin pressure on contractors. Project
cancellations have been minimal given the still attractive IRRs. However, there is a
threshold at which a competition for funds will kick in for project finance. At the same time,
contractors need to consider the pricing structure of their contracts for such projects.
Running the macro numbers. The impact of the shale revolution may only modestly
move the overall GDP arithmetic. However, its impact on the trade side is proving sizeable.
After years of expanding trade deficits, the pendulum has swung in the other direction, due
in large measure to the shale boom. The US still has a large trade deficit in total energy
goods, because of its still sizeable dependence on foreign crude oil. However, it is bringing
in fewer oil imports than at any time since the mid-1990s. Measured in real dollars, the
petroleum import bill has declined by 30% since its peak in 2006.
Company themes
Profit margin expansion. We believe the themes we explored in our initial report have
become even more relevant, with a greater impact on companies. The benefits conferred
on the US corporate sector from lower energy costs are striking. While not the only factor
at work, EBITDA margins for US companies that stood 210bp behind the rest of the world
in 2008 now sit 170bp above them, with energy intensive users clearly benefiting the most.
In this respect, it is not hard to understand the lobby against LNG exports.
The 'shale universe'. In keeping with the increasing materiality of the theme are the
sensitivities at the stock level. In this report, we have built, from the bottom up, a supply
chain showing the positioning of companies around the story. This is based on
assimilating information for nearly 300 companies related to the shale theme and detailed
on page 158. The number of companies in the universe reflects the growing and
investable nature of the theme. We have narrowed these down to reflect our top picks
across the universe and an investable shale basket on page 65. We have also assessed
relative valuation merits across the universe using the Credit Suisse HOLT ® framework.

1 October 2013
The Shale Revolution II 7
The supply chain. Exhibit 8 provides a simple 'mind map' of how the story connects and
examples of how companies fit into the theme. The E&P companies are at the core but
lateral investment sensitivities for the suppliers of equipment/services or the users of the
captive low cost feedstock are clear—as are those relatively excluded and threatened by
this resource. Their appearance in different elements of this is not necessarily reflective of
our fundamental investment rating but simply indicative of their exposure to this theme.
Exhibit 8: Shale supply chain
Equipment & Support Services Cost Beneficiaries
Regulation
Subsidies
Oil & Gas Refining & Marketing
Construction & Infrastructure
Revenue Risk
Transalta
Railroads
Environ & Facilities Services
Coal & Consumable Fuels
ABM Investama, Adaro Energy,
Alpha Natural Resources, Arch Coal,
Cloud Peak Energy, Harum Energy,
Indika Energy, Peabody Energy and
Tambang Batubara.
Tenaska
Steel
Chubu Electric Power
Oil & Gas Equipment Services Government Chemicals & Agriculture
Independent Power Producers
Industrial Machinery
Other
Electrical Equipment
Korea Gas
NextEra Energy
Phillips 66
Perusahaan Gas Negara Persero
Osaka Gas
Exploration & Production
Lyondellbasell Industries
Clean Energy Fuels
Diamondback Energy
Encana
EOG
Exxon Mobil
Gulfport Energy
Marathon Oil
Molopo Energy
Pioneer Natural Resources
TAG Oil
Trilogy Exploration
Rosetta Resources
Yara Intl
Auto's & Tech
Dominion Resources
Tokyo Gas
Agrium Inc
CF Industries
Dow Chemical
Formosa Plastics
Chemicals & Fertilizers
Eastman Chemical
Westlake Chemical
Anadarko Petroleum
Apache
ARC Resources
Athlon Energy
Aurora Oil & Gas
Carrizo Oil & Gas
Chevron
Cimarex Energy
CNOOC
Concho Resources
ConocoPhillips
Continental Resources
Devon Energy
Range Resources
Bioamber
Noble Energy
PDC Energy
Penn Virginia
Petrochina Company
Siemens, General Electric,
Honeywell, Inpex, Canadian Natural
Resources, Rolls Royce, Denso,
Keihin and Itron
Flowserve, Vallourec, Pentair,
Rotork, Weir, CIMC Enric, Energy
Recovery, Mitsubishi Heavy, KBR,
Luxfer, JGC
Anton Oilfield Services, Baker
Hughes, Cameron, Dresser-Rand,
Enbridge, Halliburton,Hilong,
Honghua, Kinder, Schlumberger,
SPT Energy, Superior Energy
Services, Transcananda
Weatherford and Yantai Jerah,
Tenaris, Vallourec
Voestalpine
Maruti, Westport Innovation,
Cummins
Tesoro Corp
Union Pacific, Canadian Pacific and
Kansas City Southern.
Dongfang Electric, Harbin Electric
and Emerson.
Nuverra, Republic Services, Waste
Mgmt and Waste Connections
Access Midstream, Caterpillar,
Crosstex, Fluor, Markwest Energy,
Plains, Targa Resources
Western Refining
Utilities
Yamato Kogyo
Nucor
Santos
Senex energy
Sinopec china
Source: Credit Suisse Equity Research

1 October 2013
The Shale Revolution II 8
Sector by sector
Alongside this broad framework, pages 68 to 136 detail new developments across the key
sectors and the most relevant stocks according to our analysts. In addition to the themes
above, we would flag the following features emerging:
■ The E&P stories in the core of the key stocks and related infrastructure themes
outlined above are clearly strong. However, we also note the strong potential in the
oilfield and environmental services side and the technologies that are getting
attention – (1) the treating and disposal of water produced in the drilling and
production of oil and gas, and (2) increasing recoveries from existing reservoirs.
■ Infrastructure is undeniably a strong story as implied above, both in terms of the
volume of spend and the derisking of projects. However, transport and rail retains a
role given pipeline capacity has not kept pace with production. Indeed, the high
flexibility that the rails have to respond to rapidly changing and unforeseeable market
conditions is a significant asset that should reinforce the industry’s long-term
sustainability in the shale revolution.
■ While benefits are numerous in the US, a more self-sufficient US gas market is forcing
Canadian producers and government officials to examine with urgency the prospect
of new LNG export markets for Canadian gas supply. Against this backdrop, several
Canadian LNG projects have been proposed in the past few years that intend to
access new export markets in Asia.
■ In keeping with the cost competitiveness theme above, the advantageous
repositioning on the cost curve of the US chemicals industry is no surprise. However,
this now extends beyond the ethylene cost curve to other chemical platforms in the US
including methanol, propylene (through the use of propane dehydro units) and
nitrogen in the fertilizer industry. Although not as wide a competitive moat as
Chemicals, US Refiners also enjoy a cost curve benefit, though they face some near-
term headwinds from demand seasonality.
■ There are opportunities on the demand and supply side for steel. Pipe suppliers have
a sizeable end market in fracking, though we are also beginning to see investments on
the supply side in DRI technology, which leverages the low feedstock cost of gas in
steel production. Equally, manufacturers of this technology have an opportunity.
■ The conviction level our analysts have that the shale gas boom will play a meaningful
role in shaping areas of the clean technology space has grown through 2013. First
the adoption of NGVs is gathering momentum. In April, the eagerly awaited 12-litre
natural gas engine was released by Cummins Westport (JV), unlocking the majority of
Class 8 trucks to the possibility of converting to natural gas fuel.
■ Second, the disruption caused by cheap shale gas, and the corresponding shift to
cracking lighter feedstocks, is leading to opportunities for bio-chemical producers
who can create chemicals from sugars at attractive prices relative to petro-based
routes. Additional capital has been secured by companies in this space, enabling
technology development and construction of first-commercial facilities.
■ The growth nature of the various end-markets stemming from the shale revolution for
the capital goods, engineering and construction space looks increasingly secular:
(1) construction of the increasing LNG, Gas-to-Liquids and pipeline facilities; (2)
equipment suppliers to the extraction industries and for the automotive industries if
compressed natural gas becomes more widespread; (3) process instrumentation/ flow
equipment/gas cleansing solution manufacturers; and (4) the market for turbines has
potential to revive with increased gas-fired generation.

1 October 2013
The Shale Revolution II 9
US Shale Developments
Since our initial report, the case for North American shale and its impacts on global
markets has become stronger and more investable (see stock ideas later in this report).
More evidence has emerged to suggest we are still in the early innings of the shale
revolution. Technological improvements, efficiency gains and the application of capital
(partly due to high oil prices) are unlocking significant oil and gas resources from shale
(where reservoir recovery factors are still low). These impacts have been felt most
particularly in gas markets, where supply is growing rapidly at the low end of the cost
curve. This low cost supply in turn transforms the cost position of US industry (notably
chemicals). Connecting shale supply to the market is leading to a boon for infrastructure,
engineering and construction players.
Evidence That We Are Still in the Early Innings
So let’s turn to the evidence since our December 2012 report.
■ Good flow rates in the Northern Midland and Delaware Basins suggest strong
production growth out of the Permian. Indeed, the Permian represents the “prize” for
oil shale drilling, given the large amount of vertical pay (productive rock) that can be
drilled horizontally using new techniques. The Permian will likely support a higher
density of wells per acre (downspacing) than any other shale play in the US.
■ Recent well results in the core of the Bakken point to the potential of improved returns
as completion technology is improved. The industry is also trying to improve well
density per acre through exploiting different zones (Middle Bakken, Three Forks).
■ In the Eagle Ford, production is growing apace. Well performance thus far suggests
the industry will be able to drill more wells per acre in the core of this play. EOG has
had some success boosting well flow rates also.
■ In the Wattenberg, where the rocks support good liquid rich economics, the industry is
testing downspacing and building infrastructure to bring this oil to market.
■ On the gas side, recovery rates from the core of the Marcellus continue to rise and the
Utica is also emerging as a strong wet-gas contender. Indeed, the industry is
increasingly demonstrating its ability to meet bullish demand projections for gas from
industry, from power, for transportation and for LNG exports. Gas substitution of oil
demand will play an important role if US policy makers want to reduce reliance on
energy imports.
■ On the cost side, well costs continue to remain under control due to well supplied
pressure pumping markets and a shift to pad drilling which increases drilling efficiency.
That said, large service providers are finding ways to add value – drill steering,
completion techniques, downhole reservoir management.
■ The large infrastructure spend to connect shales to market should continue apace.
Indeed, the industry is really just getting started on petrochemical projects, LNG export
schemes, LPG export facilities and infrastructure to connect giant gas plays like the
Marcellus/Utica to end markets.
■ From a macro perspective, the shale revolution is likely to keep a lid on US natural gas
and ethane prices due to the abundance of low cost reserves and the difficulty of
transporting these light molecules. WTI is reconnecting to global benchmarks now that
crude pipeline infrastructure is arriving. The impact of US light oil growth on global
markets has been muted due to declines in oil production outside the US and political
instability in the MENA region.
EQUITY RESEARCH
Ed Westlake
+1 212 325 6751
edward.westlake@credit-
suisse.com
Arun Jayaram
+1 212 538 8428
arun.jayaram@credit-
suisse.com
Mark Lear
+1 212 538 0239
James Wicklund
+1 214 979 4111
james.wicklund@credit-
suisse.com
John Edwards
+1 713 890 1594
john.edwards@credit-
suisse.com

1 October 2013
The Shale Revolution II 10
The US Example Feeds Into Global Shale Thinking
Drawing on the US example, we believe the following will be some of the key takeaways
from the shale revolution:
■ The shale revolution is creating the greatest resource and production growth at the
light end of the barrel (gas, NGL’s, naphtha). Unsurprisingly, light molecules flow more
easily from tight rock.
■ Given difficulties transporting light molecules, this will create pockets of cheap
stranded gas around the world, of which the North American gas market is the largest
example today. This will benefit local chemical industries in particular.
■ Returns on the best shale can be superior to available returns in deepwater projects
with lower upfront capital and less risk. In the near term, costs are still rising in the
offshore but are flat or falling in shale. This should drive increased investment flows
into shale (though we still need deepwater to meet rising demand for energy).
■ In North America, the sweet spots of the key plays are already held. This will likely
drive M&A to access the core of the best basins e.g. the core Eagle Ford, core
Niobrara, super-rich Marcellus, core Utica, Northern Midland, core Delaware, core
Bakken.
■ Connecting shale infrastructure to market via pipe, chemical cracker and LNG export
will create a large infrastructure spending opportunity.
■ Given shale oil in the core of select plays breaks even at a relatively low oil price, and
given strongly rising US gas demand, there is a positive outlook for the drilling/fracking
consumable demand outlook
Recent Liquid-Rich Play Developments in the US
Given strong activity and assuming continued technological progress, we expect
significant oil production growth still to come in the Permian, Eagle Ford, Bakken and
Niobrara (Wattenberg). In the core of nearly every play, there is a positive story that
should propel continued volume growth. Over time, as the core gets drilled out and as the
decline of existing wells becomes a more substantial hurdle, then production growth
should slow. This appears several years off, particularly given recent geological success in
the Permian.

1 October 2013
The Shale Revolution II 11
Exhibit 9: Potential Production Growth By Play (Excel Available on Request)
0
200
400
600
800
1,000
1,200
1,400
1,600
kbd
Source: Credit Suisse Equity Research
Recent Liquid-Rich Play Developments
■ Improving Eagle Ford: At the end of this year, we expect the key players to
announce the results of their downspacing tests. We believe the industry will be able
to drill more wells per acre across the core of the play. Recent well flow rates have
been improving. Together with a higher number of rigs in the core, production growth
should continue.
■ Stacked Pay Winning in the Permian: The vertical section of the Permian measures
thousands of feet compared to hundreds of feet for the Bakken or Eagle Ford. Prying
open this giant resource has been a key wildcard in US oil production estimates. With
recent wells in the play e.g. PXD’s Wolfcamp A Bench well in Northern Midland that
produced at 1,712 Boe/d over a 24-hour period with a 74% cut, a justifiable euphoria
has crept into thinking about the basin. Thus far, PXD had announced two well results
in the Northern Midland Basin approximately 28 miles apart that IP’ed at
approximately 1,633 Boe/d, with a 75% oil cut. These wells have prolific economics.
PXD cites 13 BBoe of industry resource potential from the A bench in the Midland
Basin versus 22 BBoe for the B bench and 27 BBoe for the Eagle Ford, which is the
real story of 2013 and beyond. And let’s not overlook the Delaware basin where recent
results have also been improving.
■ Better Bakken EUR’s: As some industry participants shift to longer laterals (i.e. more
frac stages per well), recoveries are increasing at a faster pace than well costs in the
core of the Bakken, boosting the economics. EUR’s as high as 940mboe (versus 650
in 2012) have been estimated in the core of the play. We have also found examples of
improving well productivity e.g. in Mountrail County e.g. a recent well with 30day IP of
1,235 boepd compared to a 4Q12 play average of 481 boepd and assumptions of circa
550boed in our production forecast models. Downspacing tests could also boost the
drillable inventory of wells in the core.
■ Rising Value in the Niobrara: The industry is focused on downspacing and stacked
pay potential, which could significantly increase the recovery factors of the play. In
2011, NBL’s testing suggested that the horizontal Niobrara would work down to 160
acres, suggesting an NPV per section ranging from $13 MM to $38 MM, depending on

1 October 2013
The Shale Revolution II 12
how many intervals could be economically developed. In 2012, further testing
suggested that the horizontal Niobrara would work down to 80 acres, given the lack of
interference on tightly spaced wells, which suggests an NPV per section ranging from
$26 MM to $77 MM, depending on how many intervals could be economically
developed. Under a blue-sky scenario, the PV per section could range from $51 MM to
$154 MM assuming 40-acre spacing.
■ Average IP Rates on a Gentle Upward Slope But Improving in the Core: With
improved completion techniques, the industry is continuing to get more oil out of the
rocks in a faster timeframe to boost IRR. At the same time the industry is working on
strategies to boost longer-term recovery rates e.g. through downspacing. Play
averages hide progress in the core, given that they are masked by operators still
investing to hold fringe acreage. Take Gonzales County in the Eagle Ford for example,
where “monster wells” are substantially higher in 2Q13 than the play average.
Exhibit 10: 30 Day Well Flow Rates in Gonzales County
0
50
100
150
200
250
300
350
400
450
0
100
200
300
400
500
600
700
800
900
We
ll C
ou
nt
BO
ED
Gonzales 30 Day IP by Vintage # Wells
Source: Company data, Credit Suisse Equity Research estimates
Exhibit 11: Eagle Ford Average IP Over Time Exhibit 12: Bakken Average IP Over Time
0
100
200
300
400
500
600
700
800
0
200
400
600
800
1000
Wel
l Co
un
t
BO
ED
Eagle Ford 30 Day IP by VintageCredit Suisse 30 Day IP Assumption# Wells
0
100
200
300
400
500
0
100
200
300
400
500
600
Wel
l Co
un
t
BO
ED
Bakken 30 Day IP by VintageCredit Suisse 30 Day IP Assumption# Wells
Source: HPDI Source: HPDI

1 October 2013
The Shale Revolution II 13
Exhibit 13: Delaware Average Horizontal IP Over Time Exhibit 14: Southern Midland IP Over Time
0
50
100
150
200
250
-
100
200
300
400
500
600
We
ll C
ou
nt
BO
ED
Delaware Basin 30 Day IP by VintageCredit Suisse 30 Day IP Assumption# Wells
0
20
40
60
80
100
-
100
200
300
400
500
600
700
We
ll C
ou
nt
BO
ED
Southern Midland 30 Day IP by VintageCredit Suisse 30 Day IP Assumption# Wells
Source: HPDI Source: HPDI
Although Oil Rig Counts Have Flattened Out, Well Counts Continue to Rise: About
9,000 wells are being drilled each quarter according to Baker Hughes. At the same time
drilling efficiency has caused the wells drilled per rig to move from 4.71 in early 2012 to
5.15 in 2Q 2013, a 10% increase in slightly over a year. Drilling efficiency gains will likely
continue to pressure rig counts while contributing to higher well additions looking forward.
Exhibit 15: The Baker Hughes Onshore Rig Count
0
200
400
600
800
1,000
1,200
1,400
1,600
1,800
Oil Gas
Source: Baker Hughes
On the Liquids-Rich Horizon
Looking ahead we believe the Permian, Eagle Ford, Bakken and Wattenberg will continue
to drive positive perceptions of liquid-rich shale in North America.
■ Zone Testing in the Permian: With 1500-2600 feet of thickness, the Permian is a
sizeable prize for the shale revolution. Thus far the Northern Midland has emerged as
one of the most economic zones but we’d expect further R&D across both the Midland
and the Delaware to test their riches.

1 October 2013
The Shale Revolution II 14
Exhibit 16: Comparison of Key Liquids Plays
Source: PXD
■ Downspacing in the Bakken and Eagle Ford: By the end of the year we should
have downspacing results from the Bakken (Three Forks, Middle Bakken) and from
the Eagle Ford. We note that the shale intervals in these two plays varies from 50-350
feet and downspacing will not be equal across play acreage. For example, in the
zones of natural fracturing in the Bakken there has been some interference. In the oily
part of the Eagle Ford, there could be more downspacing required to maximise the
hydrocarbon recovery of the rocks relative to the gas-condensate zones. In some
parts of the Eagle Ford, the Austin Chalk may be able to contribute (despite fears over
decline in this type of reservoir).
Exhibit 17: Eagle Ford Downpacing Tests Exhibit 18: Bakken Spacing Tests
Source: Aurora Oil and Gas Source: CLR
With all the “good news” it is important to remember that not all shale is created equal.
As operators delineate shale basins, they are finding well productivity trails off quickly
as they leave the "core" of the play, leading to marginal returns. The maps below

1 October 2013
The Shale Revolution II 15
visually represent where the best horizontal wells are being drilled in the Bakken,
Eagle Ford and Permian.
Figure 19: Eagle Ford Liquid IP Bubble Map Figure 20: Bakken Liquid IP Bubble Map
Source: HPDI Source: HPDI
Exhibit 21: Delaware Liquid IP Bubble Map Exhibit 22: Permian Liquid IP Bubble Map
Source: HPDI Source: HPDI
Recent Shale Gas Play Developments – The Low End of the Gas Curve Keeps
Getting Bigger
■ The Marcellus Gets Better: Since mid-2009, the industry has completed 4,217
Marcellus wells in Pennsylvania. We estimate productivity per well increased in 1H13
by 9% on a YoY basis to 1.9 MMcfe/d. This is particularly noteworthy given the weight
of natural declines from historical wells, highlighting the prolific nature of recently
completed wells. Said another way, production per well increased 9% YoY for all
4,217 wells completed since mid-2009 despite the fact that the industry placed onto
production 1,337 wells over the past 12 months. Take RRC for example—RRC
increased its EURs in its core southwest Marcellus operating area 26% in the 'Super-
Rich' window, 41% in the wet area and 63% for its dry gas projects (from early-2013
levels), as better lateral placement and the application of RCS completions continue to
drive improved well performance in the region.
■ The Utica Wet Gas Play a New Contender: Recent disclosure from core acreage
holders has suggested that the Utica is emerging as a key contender to the Marcellus.
GPOR adjusted its type curves for the wet gas window in its Utica acreage with the
'Wet Gas' type curve moving to 3.1-3.9 MMBoe (4% oil, 69% NGLs, 27% natural gas)
vs. 3.1 MMBoe prior. Another company, Antero, has disclosed some well results that
are volumetrically among the largest drilled in US shale thus far, albeit with a wet gas
bias.

1 October 2013
The Shale Revolution II 16
Exhibit 23: Wet Gas Type Curve Range Exhibit 24: Estimated Payback Sensitivities
Source: GPOR Source: GPOR
Exhibit 25: Pennsylvania Marcellus Natural Gas Production
Gross Operated PA Marcellus Production
542
1,489
2,422
3,446
4,941
6,271
7,878
0
1,000
2,000
3,000
4,000
5,000
6,000
7,000
8,000
9,000
MM
cf/d
Source: Pennsylvania DEP Oil and Gas, Credit Suisse Equity Research Estimates
On the Shale Gas Horizon
■ Infrastructure Constraints Could Emerge In the North East: With rising EUR’s in
the Marcellus and an emerging gas-rich play in the Utica, there is no shortage of low
cost gas in the US. However, infrastructure could be a temporary constraint – hooking
up these plays to the interstate pipe infrastructure. In the longer term, the
infrastructure availability to meet a rising demand pull from LNG export projects in the
Gulf is also something to consider. We think some investors are becoming nervous in
the short term that Marcellus and Utica gas well head prices could lag the US industry
benchmark, Henry Hub.
■ LNG Approvals in Focus: With abundant low cost gas, demand needs to rise
substantially in the US to drive gas prices higher (absent infrastructure bottlenecks or
Supernormal growth from
the Marcellus is supported
by great rocks

1 October 2013
The Shale Revolution II 17
a prolonged winter cold spell). LNG could provide one leg of this demand growth story
(the others are coal fired power retirements, gas transport demand and general
economic growth).
Exhibit 26: US LNG Projects – Sequential Applications to the DOE
Source: Credit Suisse Equity Research estimates
■ Unfortunately, There is Lots of Gas To Meet This Rising Demand: We show in our
analysis of energy markets that at $4.5-5/mmbtu, US shale could deliver an additional
20bcfd of supply which is surprising in a 65-70bcfd market today and supports the
robust demand growth. Indeed, the Marcellus and Utica could be more prolific than the
chart suggests.
Which Means Spending Will Continue to Rise
■ Shale Continues to Support Lots of Infrastructure Spend: It should not be a
surprise that the capital spending to connect shale oil to refineries on the coast, to
connect North East gas to demand centers, to separate natural gas liquids and ship to
the demand centers in the Gulf will require substantial spending. This excludes
additional spending on petrochemicals and LNG exports. Indeed, cost inflation is
becoming a concern, given activity (not so much in the MLPs yet, however). We look
at this in more detail in our infrastructure section (page 87)
■ And Supporting Lots of Demand For Oil Field Services: We expect expenditures
to move up through the second half of 2013 even as the drilling rig count stalls as
drilling efficiency/service intensity continues to increase, by about 9% this year based
on our estimates. Natural gas demand should start to perk up, as the longer-term
demand for the significant US chemical and North American LNG projects come on
line as well as the general move by US industry to move to more natural gas fired
“horsepower generation” takes place. So the outlook for the Oilfield Services sector
continues to be positive. The upcoming technologies that are getting the most
attention revolve around 1) the treating and disposal of water produced in the drilling
and production of oil and gas, and 2) increasing recoveries from existing reservoirs.
The first is the greater immediate issue with shale wells needing a great deal of water
required to get the well to produce and the treatment and disposal of that water. So
far, there are a number of treating technologies, but up to now, none have been able
to treat water on the scale required. The drive to increase recovery of oil and gas from
reservoirs has been a long-term goal and effort by the industry and with shales, those
technologies revolve around completion technologies; we continue to look to large cap
Service companies to accomplish that.

1 October 2013
The Shale Revolution II 18
Global Shale Developments In the appendix section of this report, we provide a more detailed analysis of shale
development around the globe. Below we summarise the momentum in the key
regions. Full details of relevant companies and their activities appear on page 157
The shale gas revolution in the US has driven interest among energy companies globally,
hoping to replicate its success. For example, according to the EIA, China has the world’s
largest shale resource base of 1,100 tcf vs. 650 tcf in the US. We have devoted a
specific chapter to China (see page 22). This is followed by Argentina with 800 tcf.
However, as our analysts lay out in this report, developing these shale resources could
take time. Property rights, mismatches between resource holder and landowner
incentives, infrastructure, access to service capacity, geology, and access to capital are all
issues that need to be overcome.
Figure 27: Comparison of 2011 and 2013 estimates of shale gas
resources worldwide (tcf)
Source: EIA
Figure 28: Global Shale is Prevalent But Untested
Source: EIA
EQUITY RESEARCH
David Hewitt
+65 6212 3064
david.hewitt@credit-
suisse.com
Charlotte Elliott
+44 20 7888 9484
charlotte.elliott@credit-
suisse.com

1 October 2013
The Shale Revolution II 19
Shale is prevalent in many countries – in this section, we focus on progress in Argentina,
Mexico, Canada, Europe, Australia and New Zealand.
Argentina
Argentina has the second largest shale resource base according to the EIA (800 tcf).
There are a number of compelling reasons to be upbeat about the unconventional
opportunity in Argentina, but a number of oil service, macro-political and environmental
challenges need to be overcome. Going forward we highlight that YPF, which is leading
the shale effort, must be able to sustain cash generation in order to keep investing. This
will be a result of increasing internally generated cash flows, as well as further
partnerships and access to the debt markets.
Figure 29: Technically recoverable shale gas resources in Argentina (tcf and % of total)
240, 31%
167, 22%50, 6%
45, 6%
272, 35%
Vaca Muerta (Neuquen) Los Molles (Neuquen)
Aguada Bandera (San Jorge) Pozo D-129 (San Jorge)
Other basins
Neuquen contains
52.6%of Argentina's
recoverable shale gas
resources, as per EIA
Source: EIA – World Shale Gas Resources: An Initial Assessment, April 2011
Over the past six months or so important developments in Argentina have been:
■ Partnerships between incumbent YPF and Chevron and Dow - with YPF
managing to sign two shale partnerships in 2013 so far, most significantly with
Chevron in an area containing Loma La Lata Norte and Loma Campana in the
Neuquen basin.
■ Argentinian government’s rejected offer to settle with Repsol - which we think will
require a number of adjustments before Repsol is willing to consider.
■ YPF successful financing in local debt markets - a surprising positive for YPF, but
we note it remains to be seen whether this appetite is sustainable.
■ Pricing news flow - a new pricing formula was announced for natural gas, a
significant win for YPF.
Mexico
Mexico has significant shale gas resources, according to the EIA, however shale
exploration activity has been very limited due to technology and investment constraints at
Pemex (Mexico’s state-run oil company). Estimated resources add up to 150-545 tcf,
representing 2.5-7 times the conventional gas reserves in Mexico; however with Pemex
having limited access to funding and tech, the shale gas potential is likely to remain locked
unless the private sector is allowed to participate.
We are positive that Mexico will get a transformational Energy Reform that will unleash the
country’s hydrocarbon potential, and that it will be approved during the Congress sessions
that started in the first week of September and will go through to December 2013. But the
solution may not be that straightforward – the reform has to find a balance between:
■ Structural changes at Pemex - currently the company has negative equity,
practically all of its net income is paid to the government in the form of taxes, it has a
pension liability that represents 8% of the country’s GDP and has a workers’ union
with significant influence on the company’s assets and business decisions.

1 October 2013
The Shale Revolution II 20
■ An independent entity to structure projects – may be set up by regulators to
choose the most suitable private sector participant.
■ Production/profit sharing contracts (PSC’s) could be set – giving the government
direct control of each project and ensuring the hydrocarbons belong to the country.
■ Booking of reserves – is a must in order to attract majors. The legal and accounting
framework has to be delivered as the majors have to be able to reflect asset potential.
Canada
A more self-sufficient US gas market is forcing Canadian producers and government
officials to examine with urgency the prospect of new LNG export markets for Canadian
gas supply. We see an increased involvement of the supermajors, as projects aim to
access Asian export markets. Infrastructure plans are being defined, with TransCanada
selected for two major pipeline projects for gas delivery to the west coast.
Exhibit 30: Canadian Gas Supply (Bcf/d) Exhibit 31: Jan-Apr Canadian Exports to the US (Bcf/d)
0.00
2.00
4.00
6.00
8.00
10.00
12.00
14.00
16.00
18.00
20.00
Jan-00 Jan-01 Jan-02 Jan-03 Jan-04 Jan-05 Jan-06 Jan-07 Jan-08 Jan-09 Jan-10 Jan-11 Jan-12 Jan-13
Bcf
/d
Alberta British Columbia Saskatchewan Nova Scotia NWT & Yukon New Brunswick Ontario
9.1
8.1
7.0
6.3
5.55.1
0.0
1.0
2.0
3.0
4.0
5.0
6.0
7.0
8.0
9.0
10.0
2008 2009 2010 2011 2012 2013
Bcf
/d
Source: NEB (Public data source) Source: GLJ
Most Canadian projects are in the feasibility stage with initial start-up envisaged around
the end of the decade. As it is still very early, we expect the list of projects and participants
to evolve further, think that the delivery timelines could lengthen, whilst the ultimate
number of projects could lessen. We see real cost risks that would be compounded if
multiple projects were to proceed in a condensed timeframe.
Australia
The geological properties of Australia are still poorly understood and most of the locations
are remote, leading to higher costs (the upside being that approvals should be easier).
The most prospective area is in the Cooper Basin (93tcf estimate) due to existing
infrastructure, with Santos drilling the most advanced.
For Santos (STO.AX), a ‘commercial success’ was announced in its Moomba 191 well in
the Cooper basin, however due to the high cost of the well, we question its economic
return. STO suggests <A$6/GJ for wells of this quality once costs are reduced through
experience and scale, but it may be higher for competitors who have to pay a tolling
charge to use STO’s infrastructure. We therefore struggle to see a positive return on the
Cooper basin at prices below $8/GJ.
Beach Energy (BPT.AX) are also in the Cooper basin and we saw Chevron farm-in in early
2013, indicating the attractive potential of the acreage. BPT has delayed its fracking
programme in the hope of improving efficiencies and reducing costs. Over the coming year
we expect four more wells to be drilled by BPT and nine wells to be fracked.
Senex Energy has now confirmed a 2C contingent gas resource of 835Bcf and we would
expect to see a farm-out to a large strategic partner in the near term to fund further

1 October 2013
The Shale Revolution II 21
appraisal drilling and the development of the field given estimated capex of ~$500m for
~100mmscf/d project.
Europe
We still agree that significant potential exists in Europe for shale gas, but our concerns
since our report in December (The Shale Revolution) have not yet been proven wrong. We
reiterate the difficulty in the operating environment, due to a far greater population density
and less land available for drilling, as well as state owned mineral rights (rather than the
land owner benefiting like in the US). Our biggest concern remains the deeper and more
fragmented geology which remains unproven commercially.
Since our last update we have observed a number of events in Europe including:
■ An exodus from Poland – from ExxonMobil, Marathon and Talisman which we
believe is predominantly down to the failure of exploration wells in the country to date.
■ Discreet entry of Chevron into Europe – building up a position of more than 4
million acres of shale gas leases in Poland, Ukraine, Romania and Lithuania.
■ Resource downgrades – in Poland and France in the latest EIA report. Norway has
also been removed as the EIA eliminated the Alum shale as a speculative area.
■ Political support strengthened in the UK – with Prime Minister David Cameron
recently urging the UK to embrace fracking and Chancellor George Osborne offering
attractive fiscal terms.
■ France closing its doors – with President Hollande announcing no shale gas
exploration will take place under his presidency.
■ Moratorium update – in Romania a shale gas exploration moratorium has not been
extended, suggesting an ease in attitudes towards fracking in the country.
Moratoriums are still in place in Bulgaria and Lithuania.
New Zealand
The East Coast basin in New Zealand could hold in excess of 250-500 billion barrels of
'original oil in place' (OOIP) in its shale oil play. If successful, it could transform the
country’s economy as oil and gas accounts for a small fraction of New Zealand’s current
GDP. Success would also further enhance the spotlight on New Zealand for onshore and
offshore oil and gas development, as the country already boasts relatively attractive fiscal
terms and a generally benign geopolitical risk environment.
Since our last update, we have seen two key events:
■ Apache pulling out of the joint venture with TAG Oil - a seemingly peculiar
decision as Apache was under no pressure to make a decision and was still obligated
to fund its portion of the capital programme (with TAG retaining all upside potential).
■ Results of TAG’s first pilot well - with positive initial indications. A forward plan may
be forthcoming in the 4Q13 timeframe once data has been evaluated and a
completion strategy formulated.
TAG has also relinquished two shale oil blocks on the East Coast after conducting a
review of its geochemical studies and geological/seismic data. Over time, we should see a
concentration of resources on the areas of greatest prospectivity.
In contrast to TAG, New Zealand Energy currently finds itself in a relatively financially
stretched position after having a number of exploration disappointments at its conventional
oil and gas assets. We currently believe New Zealand Energy will be more focused on
raising funds and repairing its near term cash flow profile, rather than focusing on its
longer term shale oil properties. However, New Zealand Energy continues to retain a
relatively large land position in the shale oil play.

1 October 2013
The Shale Revolution II 22
China Shale Developments Targets remain ambitious
Exhibit 32: Global technical recoverable shale gas resources – China vs. world
-
200
400
600
800
1,000
1,200
China Argentina Algeria US Canada Mexico Australia SouthAfrica
Russia Brazil
(Tcf)
Source: EIA, Credit Suisse Equity Research
Quick reminder #1: Why China is focusing on shale: China's recent focus on domestic
shale exploitation is driven by two factors: first, the commonly-held view is that China has
the world's largest shale resource base (32 tcm vs. 18.8 tcm in the US, according to latest
EIA estimate in June 2013); and second, without the timely development of its shale
opportunity, China could be facing a future where significantly more than 50% of gas
consumption would have to be imported.
Exhibit 33: China could be 50% import dependent on gas
by 2020E if no shale production
Exhibit 34: Effect of shale gas on China's gas balance –
60Bcm case by 2020E
-
50
100
150
200
250
300
350
400
450
2008 2009 2010 2011 2012 2013 2014 2015 2016 2017 2018 2019 2020
Conventional Gas CBM Import requirement
(Bcm)
-
50
100
150
200
250
300
350
400
450
2008 2009 2010 2011 2012 2013 2014 2015 2016 2017 2018 2019 2020
Conventional Gas CBM Import requirement Shale Gas - 60 Bcm case
(Bcm)
Source: Industry data, Credit Suisse Equity Research Source: Industry data, Credit Suisse Equity Research
EQUITY RESEARCH
David Hewitt
+65 6212 3064
david.hewitt@credit-
suisse.com
Thomas Wong
+852 2101 6738
thomas.wong@credit-
suisse.com
Horace Tse
+852 2101 7379
horace.tse@credit-
suisse.com

1 October 2013
The Shale Revolution II 23
Quick reminder #2: China shale targets bear a close resemblance to the US: China
has a target for 6.5 Bcm by 2015 and 60 to 100 Bcm by 2020. We believe the growth from
2015 to 2020 has been derived using the experience in the US from 2006 to 2012, which
recorded a 4x growth CAGR.
Exhibit 35: US actual vs China shale gas production scenarios
-
20
40
60
80
100
120
140
160
180
200
20002009
20012010
20022011
20032012
20042013
20052014
20062015
20072016
20082017
20092018
20102019
20112020
US shale gas production China - low shale China - high shale
(Bcm)
US:China:
Source: US EIA, NDRC, Credit Suisse Equity Research
China has taken a two-pronged approach so far: #1 'trial' blocks: China has
segregated the blocks targeting shale production, with the Chinese supermajors working
blocks in conjunction with foreign majors on a 'trial' basis. So far, only one of these trials
has been converted into a Production Sharing Contract, when the Chinese government
approved the PSC for the Fushan-Yonchuan block (3,500 km2) in the Sichuan basin. At
the time of the announcement, Shell announced plans to spend US$1bn per annum on
Chinese shale opportunities.
#2 - China has held two open bid rounds for shale blocks: The first round was held in
2011 and resulted in two of four blocks offered being awarded (with six bidders) – one to
Sinopec and the other to the Henan Provincial Coal Seam Gas Development & Utilization
(HPCSGDU). The second bid round in late 2012 saw 19 blocks being awarded to 16
domestic companies (foreign bidders were not permitted) – none of which has previous oil
and gas experience. Of these 19 blocks, coal and power groups won 8. From the first bid
round, HPCSGDU has subsequently farmed down a stake to Dart Energy. The logic of
awarding the blocks to 'new' domestic oil and gas players is to expand competence
beyond the traditional 'Big 3' i.e. PetroChina, Sinopec and CNOOC.
New developments: At the current pace of exploration spend, China's shale
production targets look ambitious
US$2bn obligatory capex over three years: limited seismic activity so far: The bid
rounds require U$5,000 expenditure per km2 and two exploration wells every 500 km2,
totalling a minimum spend of US$2bn over the next three years. So far, most of the
second round bidders have completed some seismic acquisitions (more than 620 km2 in
total by July 2013 – in five of the 19 blocks), and 30 exploration well locations have been
identified, but of these only two are being drilled and a further four are being contracted. If
it costs US$10,000 per km to acquire 2D seismic and US$10m per well, if the 30 wells
were drilled by the end of the year then the total spend by end 2013 would be around
US$300m, or 15% of the three-year obligatory capex requirement. The Ministry of Land

1 October 2013
The Shale Revolution II 24
and Resources (MLR) is understood to be keen to accelerate the pace of preparatory work
on the blocks, threatening licence surrender if tardy operators do not accelerate the pace
of spend.
At the current pace, the 6.5 Bcm target for 2015 looks challenged: Sinopec recently
announced it was producing and selling commercial quantities of shale gas from its Fuling
shale gas block (Jiaoye-1 well), and that it targets 1 Bcm of production by 2015.
PetroChina guides that it expects to spend Rmb8bn (US$1.3bn) on shale between 2013
and 2015 and expects to be producing around 1.5 Bcm by 2015; hence, given the current
rate of exploratory spend and targets from the major players, the 6.5 Bcm by 2015 looks
challenged, in our view.
Conclusion: China coming out of the gates slowly – but do not give up on the
theme: The decision to award shale blocks to players new to the oil and gas industry is
slowing the progress of identifying targets and crucially drilling exploratory wells in China.
However, the main driver of the Chinese shale sector is energy security; we assume China
will continue to focus on indigenous shale as a gas source – but the 'inflection point'
breakthrough for scale production is some way off.
New development: China introduces a new (and higher) regulated gas price
mechanism
Exhibit 36: PetroChina – natural gas import to reach 45%
of total gas sales by 2015
Exhibit 37: PetroChina natural gas imports schedule
(Pipeline + LNG)
0%
5%
10%
15%
20%
25%
30%
35%
40%
45%
50%
-
20
40
60
80
100
120
140
160
180
200
2009 2010 2011 2012 2013 2014 2015
PetroChina - Total gas sales (LHS) Import as % of total gas sales (RHS)
(Bcm)
-
10
20
30
40
50
60
70
80
2010 2011 2012 2013 2014 2015
W-E II pipeline W-E III pipeline Myanmar pipeline gas
Kazahkstan pipeline gas LNG
(Bcm)
Source: Credit Suisse Equity Research Source: Credit Suisse Equity Research
China: import gas cost pressures were becoming increasingly onerous: Self-
sufficient in gas as recently as 2006, China now imports 25% of its total gas consumption,
which will rise to 35% by 2015 and 50% by 2020 if the national consumption targets are
met but shale production targets are not met. The average city gate price in China before
the recent price increase was US$7.8/mcf where pipeline imports from Central Asia are
circa $13/mcf in Shanghai (at current crude prices), and LNG imports have averaged
$11.15/mmbtu in 2013 (but in a range from $3.4 from Australia, to $17.9/mmbtu from
Qatar) – with spot cargos in the $15.5 to $17.3/mmbtu range.

1 October 2013
The Shale Revolution II 25
Exhibit 38: China import gas cost vs. average city-gate price before gas price reform
-
2
4
6
8
10
12
14
16
18
20
Myanmar Kazakhstan W-E II & III LNG - Low LNG - Average LNG - High
(US$/mmbtu)
Old city-gate price
Source: Industry data, Credit Suisse Equity Research estimates
All imports were significantly loss-making under the previous prices: Using current
import prices (all shown as Shanghai city-gate), the average city-gate loss was c. $4/mcf
for supplies from Central Asia and set to be $3/mcf and $2/mcf for future supplies from
Kazakhstan and Burma respectively (it appears that first gas flows from Burma have just
been achieved). Exhibit 37 shows that imports are set to rise significantly in both 2014 and
2015, with LNG becoming an increasingly important component of the supply.
Exhibit 39: China import gas cost vs. current 'legacy' and 'incremental' city-gate price
-
2
4
6
8
10
12
14
16
18
20
Myanmar Kazakhstan W-E II & III LNG - Low LNG - Average LNG - High
(US$/mmbtu)
Old price
'Legacy' gas
'Incremental' gas
Source: Industry data, Credit Suisse Equity Research estimates
China announced a new regulated price mechanism in July 2013: The mechanism is
designed to gradually introduce a link to crude derivative products, creating a more
dynamic link to imported gas prices and the city gate. Gas prices are sensitive in China
from a residential end user perspective and an export cost competitive standpoint. For this
reason, the National Development and Reform Commission (NDRC) will continue to
regulate city-gate gas prices, and have decided to stagger the higher, crude-linked price
link. The new policy splits all gas consumed up to 2012 as ‘legacy’ gas and for this volume
(112 Bcm or 10.8 Bcf/d) prices are fixed, and were raised by a maximum of Rmb0.4/m3

1 October 2013
The Shale Revolution II 26
(US$2.2/m3) on a province by province basis. Gas volumes consumed above the legacy
volume will be priced using a formula that uses a basket of Chinese fuel oil and LPG
(60/40 weighting) with an 85% co-efficient. We estimate that 11 Bcm of gas consumed in
2013 will fall under the incremental price mechanism, rising to 31 Bcm and 66 Bcm in
2014/15E. By 2020E, without shale production, the percentage would rise to 60%.
What happens to legacy prices is unclear: The new policy is not explicit about how
legacy prices will adjust going forward. The NDRC stated it would seek to harmonise
legacy pricing with the incremental price mechanism by 2015, but the speed with which
this is implemented will be a key uncertainty.
Exhibit 40: China uncontracted gas import requirements
-80
-60
-40
-20
0
20
40
60
80
2011 2012 2013 2014 2015 2016 2017 2018 2019 2020
China uncontracted gas supply - no shale scenario
(Bcm)
Source: Credit Suisse Equity Research
Implications of the price mechanism
The new price mechanism is an important development in the China gas sector, and it
clearly indicates the government's plan to link end-user gas prices with competing fuel
price dynamics. We expect several outcomes as a result of the new mechanism:
China continues to negotiate with Russia on piped gas supply whilst it waits
for shale: Exhibit 40 shows our forecast for gas supply vs. the NDRC
consumption forecast without any shale production, where China is 'long' gas to
2017. At the same time, China is discussing with Russia on a potential gas supply
should domestic shale fail to take off. There has been continued negotiation
between China and Russia regarding a 68 Bcm gas pipeline deal over the past
five years. On the LNG side, China's strategy in LNG appears clear – take
upstream equity stakes in long-dated potential developments (example Arrow,
Poseidon, Browse, Mozambique and Yamal) to avoid developer price premiums;
hence, we think that a further pipeline purchase appears more likely.
Conventional and unconventional domestic gas developments should
accelerate: In the conventional space, higher end user price realisations should
make more resources economically viable, hence the domestic conventional
growth rate should accelerate from the middle of the decade. The economic
attractiveness of unconventional indigenous resources, including shale, also
increases, which should provide more momentum.

1 October 2013
The Shale Revolution II 27
What are the major players doing?
■ PetroChina: In the absence of further committed gas imports, PetroChina continues to
develop its domestic gas reserves – both conventionals and unconventionals. Currently,
PetroChina advertises to the market that it sees shale as the least priority within its
unconventional gas reserves (tight gas, CBM and shale). The company targets to
produce 1.5 Bcm of shale gas by 2015 – this compares with 27 Bcm for its tight gas
target and 4 Bcm for CBM by 2015.
■ CNOOC: Within the China onshore market, Coal Bed Methane is likely the main focus
for CNOOC in the near term within the unconventionals – CNOOC Parent owns 70% of
China United Coal Bed Methane (CUCBM) and CNOOC Listco has announced a
Rmb9bn exploration capex carry on CUCBM over the next three years. That said,
CNOOC is also developing its own shale reserves – the company has been exploring
shale in Anhui with Shell since 2012, but not much progress has been announced so
far.
■ COSL: Offshore (both Offshore China and international) remains the core market on
which COSL is focused, but the company is also considering the onshore
unconventionals space. COSL is developing a service base in Shanxi province to
expand its onshore CBM and Shale Gas opportunities; with CNOOC’s Rmb9bn
exploration capex carry, COSL is likely to have more opportunities on CBM vs. shale
over the next 1-2 years. COSL management is guiding that onshore services earnings
contribution are likely to be immaterial (<1% EBIT contribution) in the next 1-2 years
given the competitive onshore market and lower margins vs. its traditional offshore
business.
■ Anton Oil: Almost a year into China’s second round of shale gas block auction and
there has not been any service contract tenders awarded to the independent OFS
providers like Anton Oil. The company continues to focus on tight gas servicing in
China, while continuing to prepare for a potential shale capex boom – for example,
Anton Oil added 51,000HP of pressure pump equipment in 1H13, bringing its total
pressure pump capacity to 75,200HP. Anton Oil announced in September that it had
won a tender of 53 horizontal fracking jobs from Sinopec in Erdos Basin, with an
estimated value of US$16m (Rmb100m).
■ SPT Energy: As with Anton Oil, SPT Energy is also not receiving any tender awards
from the block winners out of the second shale gas block auction. The company
continues to focus on tight gas in China as well as partnering with CNPC in
Kazakhstan (Kazakhstan remains the highest revenue contribution country for SPT
Energy). In preparation for a potential shale capex boom in China, SPT Energy has
established a shale training school 'China Shale Gas Training and Consulting Centre'
in China along with the American Gas Technology Institute (GTI). The school ran the
first training seminar in June 2013 with 107 students participating in the programme.

1 October 2013
The Shale Revolution II 28
Energy Markets

1 October 2013
The Shale Revolution II 29
Oil, Gas & Coal Oil prices remain firm
MENA instability underscores the ‘value’ of tight oil in North America – and that oil
balances have ample room for supply growth We led off six months ago with the
observation that “the best cure for high oil prices is high oil prices – at least in the United
States.” Now consider that some 2.5 million barrels per day (Mb/d) of oil productive
capacity have been put off-side by a string of interruptions from across the Mideast and
North Africa. That’s roughly equivalent to the entirety of the very strong crude oil supply
growth in the US of the last five years.
An optimist would argue that surely these interruptions are but temporary. As the chart
below suggests, since the 'Arab Awakening' entered our lexicon, nearly three years ago,
the trend line for MENA interruptions is up, not down. Nor does the oil market fully
acknowledge that investments directed at sustaining and growing oil productive capacity
have switched away from MENA, aka the cradle of oil exports, while upstream investments
into the lower 48 states of the US continue to rise.
So three hurrahs for the US shale revolution. But let us hasten to reiterate that whilst this
revolution is helping to transform the energy landscape in North America, it is highly
unlikely to alter the global balance of power for oil, in the near to medium term (2020).
Figure 41: Tracking the Arab Awakening’s impact.
Routinely we expect some normalizing, but the trend is
up. The question is: what to add next?
Figure 42: Stretching the supply chain in 3Q-2013. The
“Call on Saudi” ran to a 30-year record high recently,
leaving less than 1.5 Mb/d (2%) spare cap
Production losses by sovereign exporter, relative to pre-crises baselines, 3mth
ma; kb/d. If history is a guide, our forecast is too optimistic, again. And this chart
does not include the lag in Iraq’s capacity build-out or issues in Nigeria.
0
500
1000
1500
2000
2500
3000
Jan-11 May-11 Sep-11 Jan-12 May-12 Sep-12 Jan-13 May-13 Sept-13E Jan-13E
Libya Iran Sudan Egypt Syria Yemen
Forecast through 1Q14
The call on Saudi Arabia’s crude oil + inventories, equals global demand; less
non-Opec’s total liquids; less other Opec’s liquids and less Saudi non-crude;
less proc.gains. The below base line and forecast takes 3 month ma of all.
8,000
8,500
9,000
9,500
10,000
10,500
11,000
11,500
12,000
J-13 M-13 M-13 J-13 S-13 N-13 J-14 M-14
Base Case
Lower Demand
Extended SupplyDisruptions
Source: Bentek Energy, Credit Suisse Commodities Research Source: Credit Suisse Commodities Research
Manageable growth and relatively high oil prices
Looking back, the last six months underscore that there is upside potential to our base-
case forecast for US oil production growth – and downside risk to our projections for very
nearly every other producing country.
We therefore reluctantly reiterate that when we put an optimistic view of US oil production
growth through this decade into a global context that that growth pales in significance
relative to the turns and roundabouts elsewhere. And therefore “…the shale revolution
FIXED INCOME RESEARCH
Jan Stuart
+1 212 325 1013
Stefan Revielle
+1 212 538 6802
stefan.revielle@credit-
suisse.com

1 October 2013
The Shale Revolution II 30
cannot, in our view, become a game-changer for global oil markets later this decade.
Maybe later, but not, we think, this decade.”
To be clear: In our view many things need to go right and/or need to “normalize” for global
supply to keep on growing at a pace that exceeds demand.
In the below “waterfall” chart the base of oil production capacity excludes bio-fuels and
processing gains. It consists of more than 6,000 oilfields and adds up to ~86 million
barrels per day in 2012.
Figure 43: Outlook for end-decade global oil supply growth (+1.4 Mb/d pa through 2019)
kb/d
40000
50000
60000
70000
80000
90000
100000
2012 Less Decline Plus Growth onExisting Fields
Plus US shale Plus New Fields(incl
Russia/Arg/CanadaShale)
Other 2019
US GoMexico 810
Saudi Arabia 896
Iraq 910
Venezuela 939
Norway 991
Russia 1160
Angola 1232
Canada 1848
Brazil 2165
Other 3700
Source: Credit Suisse Commodities Research estimates
From the base of 68 million barrels per day, we conservatively projected cumulative
declines in that portion of the existing base of oil production already in decline (based on
10-year historical performance);
And added growth from newer fields already in production;
Then comes the increment from US shale and tight oil formations, out to 2019, another ~4
Mb/d;
Then comes a stack of new field developments and a few other “optimistic” assumptions,
including the following:
large slices of growth (~1.8-2.1 Mb/d) each from Canada and Brazil;
big offshore additions also come from the US GoM, Angola and Norway;
new and large shale developments in Argentina and Russia;
a return to significant growth in Venezuela;
growth from Iraq and Saudi Arabia;
as well as a return to pre-crises production levels in Sudan, Syria, Yemen and Egypt;

1 October 2013
The Shale Revolution II 31
and lastly the plethora of ongoing industry developments.
All told, global oil capacity growth should be running at an average annual pace near
~1.4 Mb/d, or 1.5% – which is roughly equivalent to the pace of oil demand growth in EM,
but more on that latter point below.
Risks to this medium-term supply-side outlook run both ways.
The technology of shale could continue to surprise and its adaptation and scaling up
could proliferate faster;
Conversely, sovereign producers (e.g., in MENA) may find still more reasons to inhibit
investment and oil developments;
Or, something that cannot be ignored, at some point Saudi Arabia may adopt a
longer-term view and switch to a ‘low-price’ strategy to frustrate competition and
ensure market-share.
In this point-forecast, however, we simply projected a path along reasonable, higher
probability and granular estimates. The exercise serves two purposes:
One, it's a reminder that a supply shock is unlikely this decade, and prices should stay
relatively well supported unless demand collapses.
Two, this exercise also frames the broader issue: Namely that incremental and costly
private sector-driven supply growth has limitations.
Far bigger price-effects, true supply shocks if you will, are more likely to come from
key sovereign oil producers changing policy. Most critical in that regard are political
developments (and attendant changes in the investment climates) in Iraq, Venezuela,
Kuwait, and, maybe at some later point, Saudi Arabia.
Not surprisingly then, we think that the demand side, rather the supply side, is more likely
to drive oil prices out of their current comfort zone. But, again, that will take time.
The shale revolution does cap US natural gas prices
Our view of US natural gas markets is still substantially the same as in the initial Shale
Revolution report. They are capped. Indeed, and as outlined earlier, we think the ongoing
shale revolution seems about to unveil new champions in terms of well-productivity from
the Utica shale, a formation adjacent to the already surprisingly prolific Marcellus shale
(which by itself is more than compensating for the declining trend in aggregate US natural
gas production outside these two basins).
“The big picture of US natural gas markets remains one of abundant supply. The
multi-year uptrend of US dry-gas production is not turning,” we said then, and
maintain today.
Indeed, earlier this year a new batch of converts to the bullish theory (which espouses an
imminent falling away of production in older basins that will ‘inexorably’ overwhelm
whatever the new wells (and basins) can deliver, since investments are finally being
curtailed), and a well-timed and extended batch of colder than normal winter weather
periods, enabled gas prices to rise above $4/MMbtu. Within weeks, however, even these
converts were persuaded that the “data showing the beginnings of a scary fall in
production” were in fact showing nothing more than a statistical blip, a speed-bump on the
highway-like uptrend in US gas supplies.
So we reiterate: “Though consensus opinion has merrily declared a return to
normalcy and higher prices repeatedly in the last three years, we think that US
gas supplies will keep on rising, even in a relatively low (i.e. no-higher-than
$5/MMbtu) price environment. That said, we recently raised our near-term price

1 October 2013
The Shale Revolution II 32
outlook, mostly because an unusually long winter created a deep inventory deficit
versus five-year norms.
Seasonal factors vs ongoing production growth
We have highlighted how US natural gas prices remain captive to the power-generation
stack. When they rise too high, too much demand is lost to coal and gas inventories risk
over-filling; when they get too low, gas backs out so much coal that not enough is left for
pre-winter inventories. Exceptionally mild summer weather lowered the gas-trading range
to $3.40-3.80/MMbtu.
This winter’s forecast looks a little high for 4Q, but we like our target for early next year,
figuring that not only is almost all the bearish news currently priced in, but also that
infrastructure bottlenecks should limit deliverables after November and leave the door
open for “normal winter weather” to tighten the underlying s/d balance, but nothing that
will derail the theme of cheap US gas for years to come.
Exhibit 44: US natural gas price outlook ($/MMBtu)
Period
Actuals &
CS Forecast Futures
BBG
Consensus*
1Q12 (a) 2.77$
2Q12 (a) 2.26$
3Q12 (a) 2.81$
4Q12 (a) 3.36$
FY12 (a) 2.80$
1Q13 (a) 3.35$
2Q13 (a) 4.09$
3Q13 (a) 3.60$
4Q13 4.20$ 3.66$ 4.25$
FY13E 3.80$ 3.67$ 3.90$
1Q14 4.10$ 3.87$ 4.17$
2Q14 3.90$ 3.81$ 4.11$
3Q14 4.00$ 3.88$ 4.18$
4Q14 4.10$ 4.00$
FY14E 4.00$ 3.89$ 4.20$
1Q15 4.40$ 4.18$
2Q15 4.10$ 3.97$
3Q15 4.20$ 4.02$
4Q15 4.80$ 4.16$
FY15E 4.40$ 4.08$ 4.43$
FY16E 4.70$ 4.20$ 4.62$
FY17E 4.60$ 4.31$
Long-Term 4.50$
*Bloomberg forecasts from previous three months only Source: Credit Suisse Commodities Research, the BLOOMBERG PROFESSIONAL™ service
We expect US natural gas production to keep prices under wraps, mostly because supply
should continue to grow by more than 1bcf/d this year and next. Thank greater efficiencies
and better well performance for continued year-over-year growth rates in the Marcellus
and Eagle Ford shale plays that more than offset declines from higher cost shale
resources.

1 October 2013
The Shale Revolution II 33
Exhibit 45: Year-over-year growth should continue Exhibit 46: Net gas production changes in 2013
Bcf/d
0
1
2
3
4
5
6
7
2010 2011 2012 2013 2014 2015
yoy Fcst 2011-2012 Avg
Net Gas Production Changes in 2013
2.32
1.21
0.29 0.17
0.05 0.04 0.04
1.67
-0.06
-0.37
-0.99 -1.03
-2
-1
-1
0
1
1
2
2
3
Ma
rce
llu
s
Eag
le F
ord
Nio
bra
ra
Perm
ian
Fa
yett
evil
le
Gra
nit
e W
as
h
Mis
sip
pia
n
Can
a-W
oo
dfo
rd
Barn
ett
Hayn
esv
ille
Co
nve
nti
on
al
To
tal
Bcf/d
Source: EIA, Credit Suisse Commodities Research estimates Source: Company data, Credit Suisse Commodities Research
Supply potential should keep even long-term prices capped
We track carefully the impact on upstream natural gas economics, and have modelled in
great detail the reserves and productivity of the key conventional and shale basins in the
US in a series of reports (e.g., The Shale Revolution, December 2012). While it’s still
relatively early days, several key trends have emerged. These should, we think, keep a lid
on prices (near $4.50/MMbtu, annual average) through the end of the decade. Critically:
Costs keep coming down, as efficiencies rise and technology (e.g., completions
technology of late) improves; and
As exploration risk has fallen to near zero, IRR premiums enjoyed by traditional
E&P entities should come down to manufacturing and utility IRRs;
Nor do we think that we have to wait for oil and gas prices to converge before
operators target dry-gas plays again. Instead, we believe that a great many dry-
gas targets will be drilled either by operators who don’t have a portfolio of liquids-
rich targets and by entities simply looking for growth and decent returns.
In other words, we believe that the same animal spirits that scaled up the shale production
in places like the Marcellus, will continue to rule the US upstream. And consequently, as
shown by our cumulative supply cost curve in Exhibit 47, there should be enough supply at
sub $5 levels to meet our base case demand scenarios by 2020, even when including
LNG exports.

1 October 2013
The Shale Revolution II 34
Exhibit 47: Incremental 2020 low-cost supply potential is impressive (with arrows)
In $/MMbtu (y-axis) vs. cumulative incremental production by 2020 in Bcf/d
$0.00
$0.50
$1.00
$1.50
$2.00
$2.50
$3.00
$3.50
$4.00
$4.50
$5.00
-5.6 -3.6 -1.6 0.4 2.4 4.4 6.4 8.4 10.4 12.4 14.4 16.4 18.4
Mississippian Eagle Ford Fayetteville
Utica Granite Wash Barnett
Marcellus Cana Woodford Haynesville
Permian Niobrara
Needed to make up for base declines in conventional and GOM production
??
?
Source: Credit Suisse Commodities Research estimates
Exporting the shale gas revolution’s key benefit, i.e., lower natural gas prices: US
LNG exports are becoming a reality
The US natural gas market has seen three non-free trade export approvals from the
Department of Energy in 2013, sending the total number of approved projects to four with
a total export capacity of 6.37 Bcf/d. As first highlighted in US LNG export: Take-two,
recent approvals have removed doubts that had arisen around possible misgivings in
Washington about “exporting away the competitive advantage of low-cost natural gas.”
Instead, there now appears to be greater confidence about the export-approval process
and criteria under Energy Secretary Ernest Moniz. Timing of approvals for individual
projects now is the largest uncertainty, as is, of course, ultimately the question of what
overall ceiling may be imposed.
We’ve developed three scenarios with different approval time-lines and export ceilings to
frame the impact that exports would have on ‘demand’ for US gas. The range of outcomes
is 6-10 Bcf/d of exports by 2020. All three cases start with the outstanding list of projects to
be examined by the DoE (Exhibit 48). We also assume a FID is taken immediately after
approval, and allow a three year construction time (Exhibit 49).
Interestingly, the speed of the last two DoE approvals – coming just eleven and five weeks
between previous approvals – has followed (or even outpaced) our most aggressive case
and is only adding upside potential to likely US LNG export levels by the end of the
decade.
Base case: The DoE reviews applications every nine months (vs. the two years
between Sabine Pass and Freeport LNG). We have excluded the Oregon projects
(Jordan Cove and Oregon LNG) due to their environmental opposition. We also
excluded Gulf LNG and Corpus Christi as they don’t have off-take agreements. In
this scenario, 8.3 Bcf/d of exports could be possible in 2020. The total export
ceiling reaches 10.5 Bcf/d.
Fast 'n' high: Assuming an accelerated approval timeline of every three months,
and the same underlying and project assumptions as the base case, exports of
8.9 Bcf/d could be reached by 2020. Like the base case, a 10.5 Bcf/d export
ceiling is created.

1 October 2013
The Shale Revolution II 35
Slow 'n' low: Assuming approvals will occur every 12 months and the only
additional approved project is Lake Charles, we see 6 Bcf/d of exports by 2020
with an export ceiling of 6 Bcf/d.
Exhibit 48:: A laundry list of non-FTA US LNG export
projects remains
Exhibit 49: Scenarios for total annual feed gas
requirement (i.e., “demand”) of US LNG exports
0
2
4
6
8
10
12
2015 2016 2017 2018 2019 2020
Low Base High
Source: DOE, FERC, Credit Suisse Commodities Research Source: Credit Suisse Commodities Research estimates

1 October 2013
The Shale Revolution II 36
Global LNG Pricing – the Asian premium
In our recent report, Global LNG report, 'Later and longer', we analysed the dynamic of
increased US LNG exports in a broader global context. As supply becomes more global,
some observers appear tempted by the notion that global LNG prices will commoditise, but
we believe that the sheer scale of project developments will leave the majority of future
LNG in the hands of a concentrated set of like-minded players who are not driven to take
significant capex exposure without adequate returns. Hence, we conclude that, as new
supply provinces open up and new buyers enter the market, the same LNG players
develop the space, with the same drivers (namely value maximisation).
Our report provides a detailed supply-side analysis with a project-by-project update, a
review of when US projects might be sanctioned and then start supply, and a discussion of
global demand dynamics, including a scenario analysis for a nuclear return in Japan.
Among the main conclusions (a broadly balanced market through to 2017, with potential
for excess supply towards the end of the decade if projects not yet sanctioned do so in the
next 12 to 24 months), we also see the maintenance of the Asian price premium, albeit
diminished at the end of the decade versus now.
Exhibit 50: Credit Suisse Global LNG demand / supply forecast (MTpa)
150
200
250
300
350
400
450
500
2008 2009 2010 2011 2012 2013 2014 2015 2016 2017 2018 2019 2020
Existing Under construction
Possible Speculative
LNG demand (base) LNG demand (Asia bull) Source: BP Statistical Review, Credit Suisse Equity Research estimates
NB1: Asia bull demand case includes an additional 45 MTpa from China and 7 MTpa from Japan
NB2: LNG production is available capacity, not nameplate capacity.
Asian LNG pricing: Asian premium to 'calm rather than capitulate':
Exhibit 51 shows a theoretical Asian LNG price premium of US$4/mmbtu vs. supply from
the US, using a derivation of the Cheniere price formula and a US gas price of
US$4.5/mmbtu. Our base case US LNG supply scenario suggests that 70% of the total
sales that would be destined for Asia would be under the control of 'portfolio interests',
namely BG, Shell, BP, Mitsubishi and Mitsui. These groups are seeking to participate in
the US supply chain for trading rather than utility returns, and importantly have a vested
interest in maintaining the Asian price premium (as the same companies have existing
supply contracts in Asia which have price review clauses, hence price 'pollution' risk is real
and material).
For this reason, we do not believe the full HH price will be offered to Asian buyers by those
portfolio players. The recent BG/CNOOC supply contract gives direction in pricing, in our
opinion, where a blended price formula was agreed, and where 70% of the supply will be
priced using a traditional JCC (Japan Crude Cocktail) price formula and 30% on an HH
EQUITY RESEARCH
David Hewitt
+65 6212 3064
david.hewitt@credit-
suisse.com

1 October 2013
The Shale Revolution II 37
(Henry Hub) plus basis (plus being $6/mmbtu, namely $3 for liquefaction and $3 for
shipping to North Asia). We believe that the 30% supplied from the US can and will be
offered on an interruptible basis, effectively increasing flexibility as a non-price benefit in
US-based supply contracts. If JCC were $90/bbl and HH $4.5/mmbtu then the Asian LNG
premium would fall to US$2/mmbtu. Hence our forecast for Asian LNG pricing at the end
of the decade is US$13/mmbtu (real US$ 2013E).
Exhibit 51: Current (theoretical) Asian LNG premium vs.
US HH (US$/mmbtu)
Exhibit 52: 2020 Credit Suisse forecast Asian LNG
premium vs. US HH price (US$/mmbtu)
0
2
4
6
8
10
12
14
16
US H
H
sou
rcing
liqu
efaction
ship
pin
g
Asia p
remiu
m
Asian
DES p
rice
US$ / mmbtu
0
2
4
6
8
10
12
14
16
US H
H
sou
rcing
liqu
efaction
ship
pin
g
Asia p
remiu
m
Asian
DES p
rice
US$ / mmbtu
Source: Credit Suisse Equity Research estimates Source: Credit Suisse Equity Research estimates
Coal under structural pressure
Thermal coal prices have stagnated around $80/t, weighed down by a surfeit of supply. A
continued lack of producer discipline makes any material near-term recovery very unlikely
and, with many consumers also highly price sensitive, it is hard to see any immediate
catalysts for a turnaround. Over time, a slowing of supply growth should allow prices to
grind higher but thermal coal remains structurally challenged, particularly when one
considers the long-run competition from unconventional gas that should emerge more
forcefully at the back end of this decade.
In our December 2012 report, we highlighted the downside risk to coal prices and
company earnings as the regional and global thermal markets moved into visible and
growing surpluses. The shale boom had already led to severe pressure on US domestic
coal prices and a step change in US exports. US producers attempted to offset the sharp
drop in domestic demand by tapping the international markets and we felt it was only a
matter of time before international coal producers would begin to come under similar
pressure.
If anything, the price decline and margin pressure in 2013 has been more aggressive than
we anticipated. Since the start of the year international thermal coal prices have slipped
15% on average with similar declines in both Asia and Atlantic prices. Margins have come
under considerable pressure as a result and at spot prices c.30% of thermal exporters and
Chinese domestic producers are loss making at the cash cost level. At current depressed
spot prices the margin outlook for even lower cost large scale producers (in Australia,
EQUITY RESEARCH
Liam Fitzpatrick
+44 20 7883 8350
Liam.fitzpatrick@credit-
suisse.com

1 October 2013
The Shale Revolution II 38
South Africa and Colombia) appears grim, with many likely to be loss making next year as
old higher priced supply contracts roll off.
Exhibit 53: Thermal Coal NEWC prices ($/t) Exhibit 54: Average implied Australian thermal coal EBIT
margins
40
60
80
100
120
140
160
Sep-08
Mar-09
Sep-09
Mar-10
Sep-10
Mar-11
Sep-11
Mar-12
Sep-12
Mar-13
-10%
-5%
0%
5%
10%
15%
20%
25%
30%
2011 2012 2013 2014
Base case EBIT margin EBIT margin at spot
Source: Company data, Credit Suisse estimates Source: Company data, Credit Suisse estimates
Lack of supply discipline is delaying price recovery
While we have seen a number of small mine closures, a lack of market leadership and
supply discipline, caused by a relatively fragmented market, remains an issue and if
anything, production growth over the past 12 months has exceeded our estimates as
producers battle low prices by attempting to reduce costs through higher volumes
and aggressive cost cutting. This has been relatively successful with major producers in
Australia, as an example, reducing costs by $5-10/t over the past 12 months (helped of
course by a weaker currency). In Australia take or pay contracts on rail (on average $20/t)
are exacerbating the situation with producers willing to accept steeper cash losses for a
longer period due to committed tonnages. In addition, new projects, committed to in 2010-
12, will lead to continued supply growth 2013-15. All of this may merely be delaying the
inevitable. Further high cost production cuts will likely be necessary to restore market
balance and while the current state of the industry appears unsustainable (c30% of global
production is cash negative), the global thermal market is likely to remain in over-supply
for the foreseeable future and it may not be until 2015/16 when a more meaningful price
recovery is possible.
Exhibit 55: Global thermal coal cost curve
Source: Wood Mackenzie, Whitehaven company presentation
Supply growth remains strong
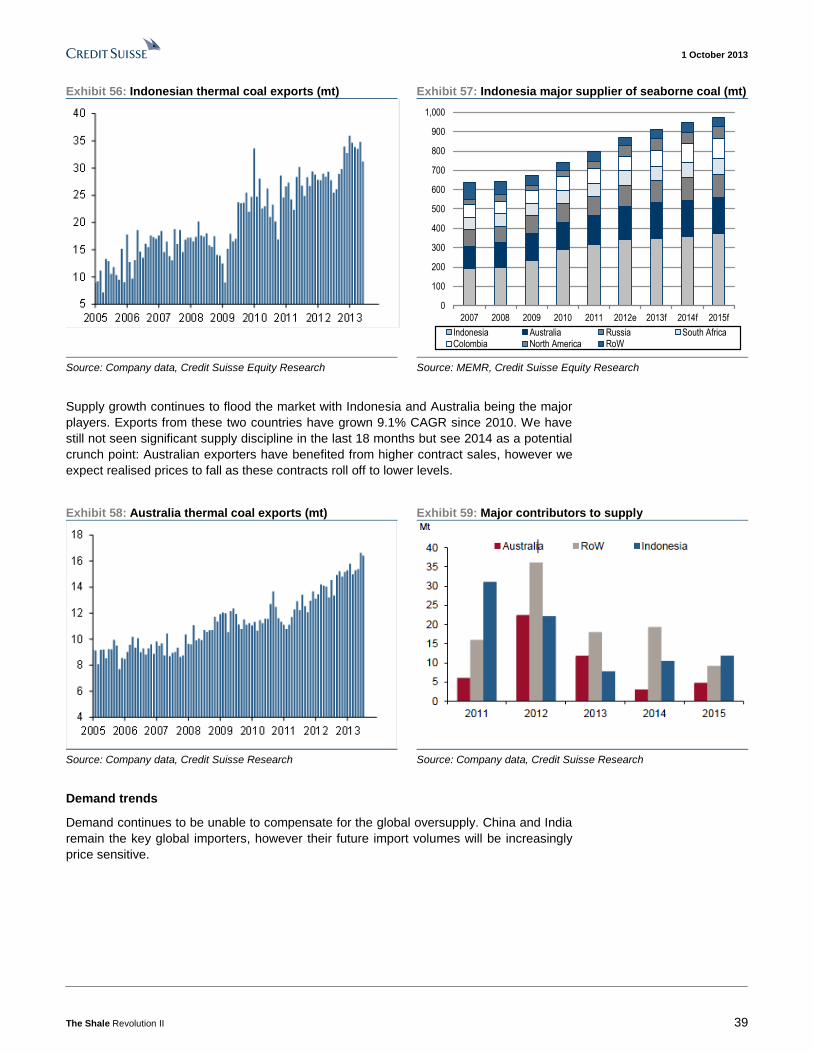
1 October 2013
The Shale Revolution II 39
Exhibit 56: Indonesian thermal coal exports (mt) Exhibit 57: Indonesia major supplier of seaborne coal (mt)
0
100
200
300
400
500
600
700
800
900
1,000
2007 2008 2009 2010 2011 2012e 2013f 2014f 2015f
Indonesia Australia Russia South AfricaColombia North America RoW
Source: Company data, Credit Suisse Equity Research Source: MEMR, Credit Suisse Equity Research
Supply growth continues to flood the market with Indonesia and Australia being the major
players. Exports from these two countries have grown 9.1% CAGR since 2010. We have
still not seen significant supply discipline in the last 18 months but see 2014 as a potential
crunch point: Australian exporters have benefited from higher contract sales, however we
expect realised prices to fall as these contracts roll off to lower levels.
Exhibit 58: Australia thermal coal exports (mt) Exhibit 59: Major contributors to supply
Source: Company data, Credit Suisse Research Source: Company data, Credit Suisse Research
Demand trends
Demand continues to be unable to compensate for the global oversupply. China and India
remain the key global importers, however their future import volumes will be increasingly
price sensitive.

1 October 2013
The Shale Revolution II 40
Exhibit 60: India's thermal coal imports Exhibit 61: China's thermal coal imports
Source: Credit Suisse, Customs Data Source: Credit Suisse, Customs Data
China
Exhibit 62: Raw coal production and prices Exhibit 63: Raw coal production and prices (seasonally adj.)
Source: the BLOOMBERG PROFESSIONAL™ service, Credit Suisse
Equity Research
Source: the BLOOMBERG PROFESSIONAL™ service, Credit Suisse
Equity Research
Similar to the global seaborne market, our China team estimates that close to 40% of
producers are below break-even at spot prices and production has fallen as a result.
However, cash costs are expected to fall $5/t in 2013, and a US$10/t price increase would
likely result in a return of domestic production growth.
Exhibit 64: Unit cost breakdown and % of supply below
cash cost
Exhibit 65: Supply growth has come to negative as price
falls
Source: FW consulting, Credit Suisse Equity Research Source: CEIC, Credit Suisse Equity Research

1 October 2013
The Shale Revolution II 41
In 2011/12, India was the largest contributor to global import growth in thermal coal,
importing 122mt in 2012 (a record year). On a structural medium-term basis, we expect
India to remain a key source of import growth in the global thermal markets; the planned
coal power station roll-out could support import growth up towards 200mt by the end of the
decade, there are no readily available energy alternatives and domestic coal production
continues to struggle to grow due to local permitting and political/regulatory issues.
However, the near-term picture is less positive for thermal markets. Indian importers have,
in recent years, tended to be extremely price sensitive - imports in late 2012/early 2013
remained strong due to the fall in international coal prices as consumers opportunistically
picked up cheaper priced coal. The weakness in the domestic economy and resultant
depreciation in the rupee is likely to put downward pressure on import growth for the
foreseeable future.
In summary, while we expect India to be a key source of import demand growth over the
medium term, we do not see this as sufficient to tighten the global markets for the next 12-
18 months given the still significant supply overhang that exists.

1 October 2013
The Shale Revolution II 42
Developing Themes

1 October 2013
The Shale Revolution II 43
Challenges ahead Cost issues amidst the capex boom
In the past, there have been numerous examples of projects being delayed and even
cancelled as a result of rising costs (both labor and material) as the economics of a project
are no longer viable versus original estimates. We see this as a potential risk to spend for
petrochemical, LNG and GTL capex driven by the exploration of the gas shale.
While in the very early stages, the ability to find skilled labor is creating concerns and
resulting in rising costs. Both KBR and MDR took charges this year as a result of labor
costs rising more quickly than expected on fixed price contracts. JEC noted terms are
slowly moving back in the contractors' favor and are starting to raise salaries in order to
retain critical talent. So far, project cancellations have been minimal. However, Yara
decided not to proceed with its planned nitrogen expansion owing to recent increases in
construction cost both in Canada and in North America. In addition, in early June, Agrium
decided to suspend engineering development on its US nitrogen greenfield project relating
to rising costs.
Labor Challenges
Labor is a critical resource in terms of successful project execution representing as much
as 65% of a project between construction and engineering. To date, constraints are most
concerning on the craft labor side. There is still plenty of engineering talent, although
contractors are concerned this resource could become constrained in 12-18 months.
Exhibit 66: EPC Project Cost Breakdown US$ in millions, unless otherwise stated
Engineering
15%
Procurement
35%
Construction
50%
Source: Credit Suisse Equity Research
Engineering Employment Approaching Prior Peak In Texas & Louisiana
The majority of the projects we are tracking across petrochemical, LNG and GTL are
expected to be built in the Gulf coast region, specifically Texas and Louisiana where
employment is already at historical highs. In nearly every city/region that borders the Gulf
within Texas and Louisiana, the number of employees working in the engineering and
construction field is exceeding the 10-year average and approaching prior peak
employment levels experienced in 2008-09.
Engineering employees in Texas and Louisiana have been at elevated levels for the past
1-2 years. In Texas, approximately 130,100 engineers are currently employed (as of July
2013), which is 13% above the 10-year average. The number of engineering employees is
EQUITY RESEARCH
Jamie Cook
+1 212 538 6098
jamie.cook@credit-
suisse.com
John McNulty
+1 212 325 4385
john.mcnulty@credit-
suisse.com
Lars Kjellberg
+46 8 545 07 926
lars.kjellberg@credit-
suisse.com
Paul McTaggart
+61 2 8205 4698 [email protected] Martin Kronborg
+61 2 8205 4369
martin.kronborg@credit-
suisse.com

1 October 2013
The Shale Revolution II 44
just 4% below the prior peak of 135,000 employees (May 2008) in Texas. In Louisiana, the
upturn in engineering employment lagged Texas by about six months but has accelerated
quickly and now stands 14% above its 10-year average, surpassing prior peak levels from
the end of 2008 and early 2009. Exhibit 67 and Exhibit 68show monthly heavy & civil
engineering employment in Texas and Louisiana, respectively, since 2003.
Exhibit 67: Texas Heavy/Civil Engineering Employment # of engineers in thousands
Exhibit 68: Louisiana Heavy/Civil Engineering
Employment # of engineers in thousands
Average = 114.8k
80
90
100
110
120
130
140
Jan
'03
Jul'0
3
Jan
'04
Jul'0
4
Jan
'05
Jul'0
5
Jan
'06
Jul'0
6
Jan
'07
Jul'0
7
Jan
'08
Jul'0
8
Jan
'09
Jul'0
9
Jan
'10
Jul'1
0
Jan
'11
Jul'1
1
Jan
'12
Jul'1
2
Jan
'13
Jul'1
3
Average
Average = 38.9k
25
30
35
40
45
50
Jan
'03
Jul'0
3
Jan
'04
Jul'0
4
Jan
'05
Jul'0
5
Jan
'06
Jul'0
6
Jan
'07
Jul'0
7
Jan
'08
Jul'0
8
Jan
'09
Jul'0
9
Jan
'10
Jul'1
0
Jan
'11
Jul'1
1
Jan
'12
Jul'1
2
Jan
'13
Average
Source: US Bureau of Labor Statistics Source: US Bureau of Labor Statistics
Within Texas, construction employment levels in Corpus Christi and Port Arthur have been
on the rise since 2011. Corpus Christi employment is 22% above its 10-year average and
has exceeded prior peak levels in 2008. Port Arthurs employment is 11% above its 10-
year average and approximately 4% below prior peak levels of late 2008.
Exhibit 69: Corpus Christi, TX Construction Employees # of workers in thousands
Exhibit 70: Port Arthur, TX Construction Employees # of workers in thousands
Average = 36.7k
25
30
35
40
45
50
Jan
'03
Jan
'04
Jan
'05
Jan
'06
Jan
'07
Jan
'08
Jan
'09
Jan
'10
Jan
'11
Jan
'12
Jan
'13
Corpus Christi, TX
Average
Average = 38.4k
25
30
35
40
45
50
Jan
'03
Jan
'04
Jan
'05
Jan
'06
Jan
'07
Jan
'08
Jan
'09
Jan
'10
Jan
'11
Jan
'12
Jan
'13
Beaumont-Port Arthur, TX
Average
Source: US Bureau of Labor Statistics Source: US Bureau of Labor Statistics
Within Louisiana, both Lake Charles and Lafayette are seeing a rebound in construction
employment levels. Lake Charles construction employment was at very low levels until
2012, spiking nearly 16% since the beginning of the year. The region is now almost 9%
above its 10-year average and just 4% below prior peak employment (May 2007).
Lafayette, LA, is nearly 10% above its 10-year average and has also exceeded prior peak
levels from 2008-09.

1 October 2013
The Shale Revolution II 45
Exhibit 71: Lake Charles, LA, Construction Employees # of employees in thousands
Exhibit 72: Lafayette, LA, Construction Employees # of employees in thousands
Average = 23.6k
1819202122232425262728
Jan
'05
Jan
'06
Jan
'07
Jan
'08
Jan
'09
Jan
'10
Jan
'11
Jan
'12
Jan
'13
Lake Charles, LA
Average
Average = 46.7k
3537394143454749515355
Jan
'05
Jan
'06
Jan
'07
Jan
'08
Jan
'09
Jan
'10
Jan
'11
Jan
'12
Jan
'13
Lafayette, LA
Average
Source: US Bureau of Labor Statistics Source: US Bureau of Labor Statistics
Please Note: "Construction" employees include workers involved in mining, logging,
manufacturing, specialty trade, building construction, oil & gas extraction, and heavy/civil
engineering.
We also look at ENR's Construction Cost Index which measures both labor and material
costs. Specifically, the Construction Cost Index is calculated using a formula made up of
fixed amounts of four components—Portland cement, 2x4 lumber, structural steel (steel
beams), and labor. Since 2003, the index has risen from 6,581 to 8,190, a 24% increase.
The Index surpassed its 10-year average in July 2008 and has seen steady year-over-year
increases each month since (on average the index has increased 3.1% y/y each month
since July '08).
Exhibit 73: ENR Construction Cost Index (2005-Present) US$ in millions, unless otherwise stated. Red line shows the average
6,000
6,500
7,000
7,500
8,000
8,500
9,000
9,500
10,000
Jan-0
3M
ay-0
3S
ep-0
3Ja
n-0
4M
ay-0
4S
ep-0
4Ja
n-0
5M
ay-0
5S
ep-0
5Ja
n-0
6M
ay-0
6S
ep-0
6Ja
n-0
7M
ay-0
7S
ep-0
7Ja
n-0
8M
ay-0
8S
ep-0
8Ja
n-0
9M
ay-0
9S
ep-0
9Ja
n-1
0M
ay-1
0S
ep-1
0Ja
n-1
1M
ay-1
1S
ep-1
1Ja
n-1
2M
ay-1
2S
ep-1
2Ja
n-1
3M
ay-1
3
Series2
Source: ENR
A look at ENR's Skilled and Common Labor Indices also provides a glimpse into how fast
the cost of labor has grown. The Skilled Labor Index has grown 3.6% y/y each month over
the past 10 years, while the Common Labor Index has grown 3.5% y/y on average. Since
January, growth has decelerated in Skilled and Common Labor, up 2.0% and 2.5%,
respectively, albeit off higher levels.
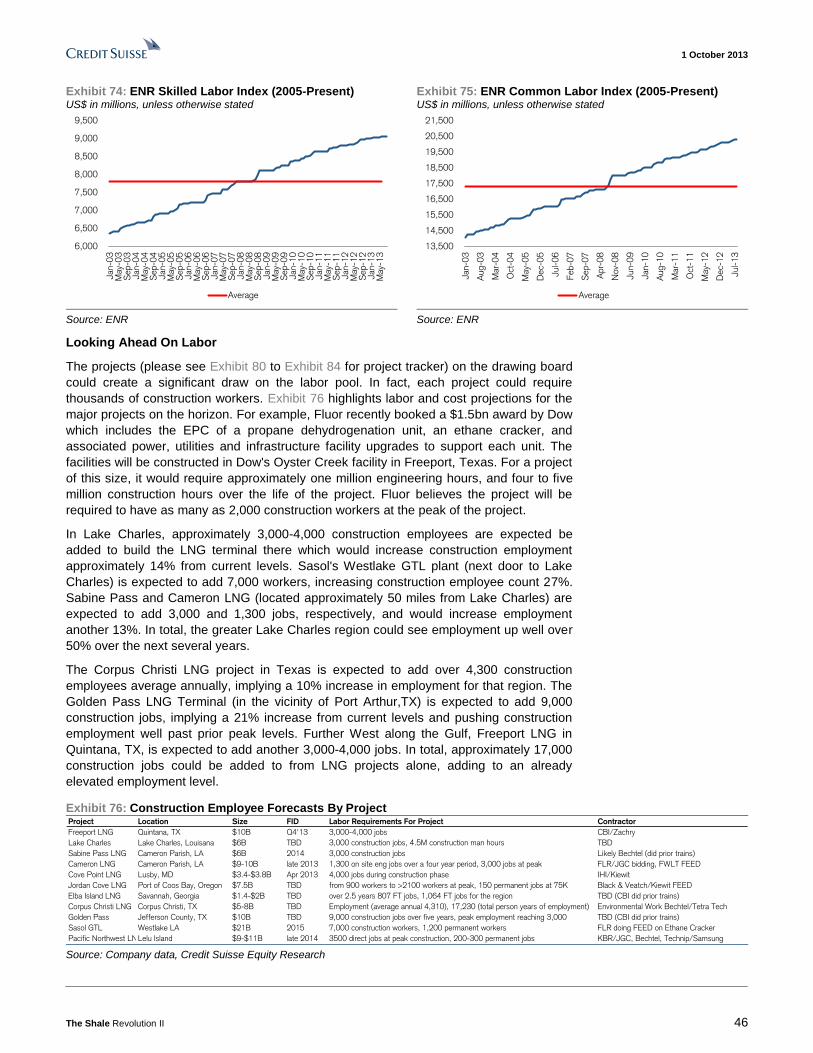
1 October 2013
The Shale Revolution II 46
Exhibit 74: ENR Skilled Labor Index (2005-Present) US$ in millions, unless otherwise stated
Exhibit 75: ENR Common Labor Index (2005-Present) US$ in millions, unless otherwise stated
6,000
6,500
7,000
7,500
8,000
8,500
9,000
9,500Jan-0
3M
ay-
03
Sep-0
3Jan-0
4M
ay-
04
Sep-0
4Jan-0
5M
ay-
05
Sep-0
5Jan-0
6M
ay-
06
Sep-0
6Jan-0
7M
ay-
07
Sep-0
7Jan-0
8M
ay-
08
Sep-0
8Jan-0
9M
ay-
09
Sep-0
9Jan-1
0M
ay-
10
Sep-1
0Jan-1
1M
ay-
11
Sep-1
1Jan-1
2M
ay-
12
Sep-1
2Jan-1
3M
ay-
13
Average
13,500
14,500
15,500
16,500
17,500
18,500
19,500
20,500
21,500
Jan-0
3
Aug-0
3
Mar-
04
Oct
-04
May-
05
Dec-
05
Jul-06
Feb-0
7
Sep-0
7
Apr-
08
Nov-
08
Jun-0
9
Jan-1
0
Aug-1
0
Mar-
11
Oct
-11
May-
12
Dec-
12
Jul-13
Average
Source: ENR Source: ENR
Looking Ahead On Labor
The projects (please see Exhibit 80 to Exhibit 84 for project tracker) on the drawing board
could create a significant draw on the labor pool. In fact, each project could require
thousands of construction workers. Exhibit 76 highlights labor and cost projections for the
major projects on the horizon. For example, Fluor recently booked a $1.5bn award by Dow
which includes the EPC of a propane dehydrogenation unit, an ethane cracker, and
associated power, utilities and infrastructure facility upgrades to support each unit. The
facilities will be constructed in Dow's Oyster Creek facility in Freeport, Texas. For a project
of this size, it would require approximately one million engineering hours, and four to five
million construction hours over the life of the project. Fluor believes the project will be
required to have as many as 2,000 construction workers at the peak of the project.
In Lake Charles, approximately 3,000-4,000 construction employees are expected be
added to build the LNG terminal there which would increase construction employment
approximately 14% from current levels. Sasol's Westlake GTL plant (next door to Lake
Charles) is expected to add 7,000 workers, increasing construction employee count 27%.
Sabine Pass and Cameron LNG (located approximately 50 miles from Lake Charles) are
expected to add 3,000 and 1,300 jobs, respectively, and would increase employment
another 13%. In total, the greater Lake Charles region could see employment up well over
50% over the next several years.
The Corpus Christi LNG project in Texas is expected to add over 4,300 construction
employees average annually, implying a 10% increase in employment for that region. The
Golden Pass LNG Terminal (in the vicinity of Port Arthur,TX) is expected to add 9,000
construction jobs, implying a 21% increase from current levels and pushing construction
employment well past prior peak levels. Further West along the Gulf, Freeport LNG in
Quintana, TX, is expected to add another 3,000-4,000 jobs. In total, approximately 17,000
construction jobs could be added to from LNG projects alone, adding to an already
elevated employment level.
Exhibit 76: Construction Employee Forecasts By Project Project Location Size FID Labor Requirements For Project Contractor
Freeport LNG Quintana, TX $10B Q4'13 3,000-4,000 jobs CBI/Zachry
Lake Charles Lake Charles, Louisana $6B TBD 3,000 construction jobs, 4.5M construction man hours TBD
Sabine Pass LNG Cameron Parish, LA $6B 2014 3,000 construction jobs Likely Bechtel (did prior trains)
Cameron LNG Cameron Parish, LA $9-10B late 2013 1,300 on site eng jobs over a four year period, 3,000 jobs at peak FLR/JGC bidding, FWLT FEED
Cove Point LNG Lusby, MD $3.4-$3.8B Apr 2013 4,000 jobs during construction phase IHI/Kiewit
Jordan Cove LNG Port of Coos Bay, Oregon $7.5B TBD from 900 workers to >2100 workers at peak, 150 permanent jobs at 75K Black & Veatch/Kiewit FEED
Elba Island LNG Savannah, Georgia $1.4-$2B TBD over 2.5 years 807 FT jobs, 1,064 FT jobs for the region TBD (CBI did prior trains)
Corpus Christi LNG Corpus Christi, TX $5-8B TBD Employment (average annual 4,310), 17,230 (total person years of employment) Environmental Work Bechtel/Tetra Tech
Golden Pass Jefferson County, TX $10B TBD 9,000 construction jobs over five years, peak employment reaching 3,000 TBD (CBI did prior trains)
Sasol GTL Westlake LA $21B 2015 7,000 construction workers, 1,200 permanent workers FLR doing FEED on Ethane Cracker
Pacific Northwest LNGLelu Island $9-$11B late 2014 3500 direct jobs at peak construction, 200-300 permanent jobs KBR/JGC, Bechtel, Technip/Samsung Source: Company data, Credit Suisse Equity Research

1 October 2013
The Shale Revolution II 47
While demand for engineering and construction labor in certain regions is expected to
reach new highs, concerns of shortages are a looming issue among the US contractors.
There are legitimate concerns that demand for welders, pipefitters, operators and
maintenance staff will exceed what the US can provide. Unlike foreign markets which can
tap into neighboring countries for workers, searching for employees internationally is not a
viable option in the US considering only there are ~66,000 US visas that can be issued
each year which include, for example, doctors and lawyers. As a result, temporary foreign
workers are not a solution. Contractors may entice employees from competitors with
expensive pay packages and/or rely on their reputation as a top contractor with a sizable
backlog of work (especially on high profile projects) to encourage craft workers to stick
around for years to come. Other important factors are reputation of safety, training and
good working conditions.
Labor Needs Often Underappreciated
In reviewing major historical E&C projects, we found that contractors typically
underestimate the labor required for the overall size of the project. For example, in March
2007, Fluor initially booked a $1.8B project for Marathon Oil's expansion of its Garyville,
Louisiana refinery. At the time of the award, FLR expected the project would require an
average of 2,000 workers with up to 4,000 workers at peak periods to complete the project.
The project ended up requiring an average workforce of 3,800 direct field craft workers
with 6,800 workers at the peak (over 9,600 total craft and staff at the peak). Another
example was Total's Port Arthur Deep Conversion project which was a $1.9B award. At
the time of the booking, FLR forecast it expected up to 2,200 craft workers to be employed
on the project. The team reached a total craft staffing level or more than 4,500. Project
costs are also underappreciated. While there are only three major GTL projects globally
(Pearl and Oryx GTL in Qatar, and Escravos in Nigeria) all have suffered from major cost
overruns. For example, Pearl GTL was estimated at $6B in 2003 and today of nearly $19B.
Escravos has had similar issues now forecast close to $8.4B versus original estimates of
$3.0B. Oryx’s original budget was $850M with the final cost coming in at more than $950M,
although this was before the days of significant cost inflation.
Business Models Shifting To Appease Labor Constraints & Rising Costs
Given increased concerns in regard to rising costs in the United States, particularly in the
Gulf Coast region, contractors are increasingly looking to expand their self-perform and
modular construction capabilities Viewed as a competitive advantage, self-perform
construction and modular construction can represent as much as 15-20% in savings on a
project and result in greater certainty of schedule (though not necessarily quicker) and
should allow contractors to better compete against growing overseas competition. In fact,
we believe this is one of the primary reasons Chicago Bridge and Iron acquired the Shaw
Group in February 2013. The two combined companies are now a powerhouse in
fabrication with CBI’s heritage steel plate structure business, along with the new pipe
fabrication business acquired from the Shaw Group. Additionally, with the Shaw Group
acquisition, CBI now has about 50,000 employees of which about two-thirds are craft labor,
the largest in the industry. Jacobs is the next largest contactor with 14.8K craft labor
workers at the end of 2012 which represents about 25% of its employee base.
Fluor is also ramping up investment in both modular and direct hire construction. With
regards to modular construction, FLR announced a partnership with Supreme Group in
Canada which supplies modules to Canadian customers. Fluor also has a joint venture
with AG&P in the Philippines that can service customers globally as the low cost of labor
more than offsets the cost of transportation. Fluor also has an existing joint venture with
Grupo ICA in Mexico for the fabrication of modules.
A Slower Shift Towards Cost Plus
Similar to the 2006-2008 period, a shift back towards cost plus contracting as market labor
markets tighten and commodities rise would be a positive catalyst for the Engineering and
Construction group. We would note customers generally prefer fixed price contracting

1 October 2013
The Shale Revolution II 48
which transfers risk on to the contractor. Recall this largely de-risked the group in a hyper
growth era driving record valuations for the group trading at 20-25X forward multiples
versus the current average of 12-13X. Labor markets, particular in the Gulf Coast, have
already begin to tighten. Still, the shift to cost plus appears further out than we would have
hoped.
At the Credit Suisse Engineering & Construction conference, Peter Oosterveer, Fluor’s Head of Energy and Chemicals, commented he would have expected more of the opportunities to be cost reimbursable in the United States given what’s ahead. Projects are still being bid lump sum, however, the hope is that as the market tightens, it transitions back to cost plus and existing lump sum contracts will be converted back to cost reimbursable. For example, the CP Chem cracker award, expected to be approved over the next couple months, bid between FLR and Technip, is expected to be a fixed price contract. There are signs of some discipline. KBR recently stated it will not take fixed price contracts in the United States on construction-only projects, reflecting concerns over rising labor costs in the gulf coast region specifically. However, KBR will bid fixed price if it is involved in the full EPC as it is better able manage costs. Still, as projects are awarded, the contract structure is important to monitor.
Exhibit 77: Contract Structure by Company (as % of backlog) US$ in millions, unless otherwise stated
Company
Cost
Reimbursable
Fixed Price or
Guaranteed Max.
Price
Other
Jacobs Engineering 85% 15% -
KBR 75% 25% -
Willbros Group 87% 13% -
Babcock & Wilcox NA NA
Fluor 88% 12% -
Foster Wheeler 54% 42% 5%*
Quanta Services 60% 40% -
URS 70% 30% -
McDermott 30% 70% -
CB&I/Shaw* 50% 50% - Source: Company data, Credit Suisse Equity Research
Australia's cautionary tale
The risk posed by simultaneous project sanctions and labor shortages have perhaps been
most evident in Australia. Australia’s LNG capacity is set to more than triple from 20mtpa
to 69mtpa in only a few years, at the same time mining investments reached a new peak.
Within a 24-month period (from September 2009 to Sep 2011) most of the $210bn of LNG
projects and $70bn of mining projects were sanctioned in a $1.5trn economy. At its peak in
early 2013, resource investments made up close to 7% of the Australian economy (closer
to 20% if accounting for indirect effects).
Capex 'blowouts' have been prevalent in both energy and mining projects (23% average
increase for LNG project) and some mines saw operating costs increase by more than
100% in less than four years. Truck drivers are being paid more than A$150k while
qualified engineers salaries easily exceed A$200k. Having priced itself out of the market,
there have been no new LNG sanctions in the past year, despite impressive untapped gas
resources.

1 October 2013
The Shale Revolution II 49
Exhibit 78: Resource Investment as share of GDP Exhibit 79: Capex 'blowouts' (so far)
0
10
20
30
40
50
60
Pre
lude
Plu
to
QC
LN
G
PN
G L
NG
GLN
G
AP
LN
G
Whea
tsto
ne
Ichth
ys
Gorg
on
Initial capex US$bn Revised capex US$bn
Source: Australian Bureau of Statistics Source: Company data, Credit Suisse Equity Research
Of course, there are many differences between the US and Australia (more remote
locations, smaller market, volatile currency) but the experiences should not be ignored.
Project Tracker
Exhibit 80 to Exhibit 84 detail the projects we are tracking across the broader
petrochemical, LNG and GTL in the United States.
Exhibit 80: Announced Ethane Steam Cracker Capacity Expansions Project Company Capacity (tonnes/yr) Cost Expected Timing FEED EPC
Announced
Lake Charles 2 expansion Westlake 108,863 NA 2H'2012 - -
St Charles ethane cracker restart Dow 390,000 NA end 2012 - -
Geismar ethane cracking capacity expansion Williams 272,158 $350-$400M Q3'2013 - CBI
Chocolate Bayou Debottlenecking capacity Ineos 115,000 NA end 2013 - KBR
Lake Charles 1 ethane conversion expansion Westlake 113,399 NA 2014 - -
La Porte expansion LyondellBasell 386,000 $350-$400M 2014 - -
Baytown new ethane cracker ExxonMobil 1,500,000 NA 2016 - -
Point Comfort ethane cracking Formosa 800,000 $1.7B 2016 - -
US Gulf Coast new ethane cracker Dow World-scale NA 2016-2017 - -
US Northeast new ethane cracker Shell 997,903 NA 2016-2017 - -
Cedar Bayou new ethane cracker CP Chem 1,500,000 NA Q1'2017 Shaw -
Westlake Ethane Cracker Sasol 1,500,000 $5-$7B 2014 FLR -
Corpus Christi expansion LyondellBasell 32,874 $430M Late 2015 - -
New Polyethylene Plant LyondellBasell 453,592 $200M/yr 2016 - -
NGL Recovery Unit LyondellBasell 68,039 $200M 2016 - -
Total Expansion 8,237,828
Considered expansions
Lake Charles new ethane cracker Sasol 1,000,000-1,400,000 $3.5-$4.5B NA - S&B
Indorama new cracker Indorama Ventures 1,300,000 NA 2018 - -
Channelview ethane cracker expansion LyondellBasell 113,398 $170M 2015 - -
US world-scale new cracker SABIC World-scale NA NA - -
US new ethane cracker Braskem NA NA NA - -
Ingleside new cracker Occidental NA NA NA - -
US Northeast new cracker Aither Chemicals NA $750M 2016 - -
New cracker PTT Global Chemical NA NA NA - - Source: Hodson, ICIS, Company data, Credit Suisse Equity Research

1 October 2013
The Shale Revolution II 50
Exhibit 81: Proposed Polypropylene & Methanol Capacity Expansions
Project Announced Company Location Capacity (tonnes/yr) CostExpected
Construction
Expected
StartupEPC
Chocolate Bayou PDH Facility Ascend Performance Materials Alvin, TX New Plant $1.2B Jan'2014 Q4'15
PDH Unit Dow Chemical Freeport, TX 750,000 2015 FLR
PDH Unit Dow Chemical n/a New Plant 2018
Mount Belvieu PDH Unit Enterprise Mount Belvieu, Texas 750,000 Q3'2015
New Enterprise PDH Plant Enterprise Texas Gulf Coast New Plant
Point Comfort PDH Unit Formosa Plastics Point Comfort, TX 600,000 $1.7B 2016
Alberta PDH unit Williams Alberta, Canada 500,000 $900M Q2'16
Petrologistics Expansion PDH Plant PetroLogistics Houston, TX
Methanol
St Charles Refinery Expansion Expansion Valero Energy St Charles, LA 1,600,000 $700M Q1'16 End
Channelview Methanol Restart LyondellBasell Channelview, TX 260M gal/yr $150M Q4'13 Source: Chemical Week, US Nitrogen, Area Development, Jamestown Sun, ICIS, CF Industries
Exhibit 82: Proposed Ammonia Greenfield & Brownfield Expansions
Project Announced Company LocationCapacity (000
tonnes/yr)Product Cost
Expected
StartupNotes
Greenfield
Greene County Ammonia to AN Upgrade US Nitrogen/Austin Powder Greene County, TN60 Ammonia, 126 AN
liquidAmmonia, AN $35-$40M 2014
Ammonia upgraded to AN
Beulah Brownfield to Synfuels Plant Dakota Gasification Beulah, ND 360 Urea Ammonia, Urea - 2016 Brownfield to Synfuels Plant
Rockport New Facility Ohio Valley Resources Rockport, IN800 Ammonia, 950 UAN
90 DEF
Ammonia, Urea,
UAN, DEF$1B 2016
Greenfield - KBR (Tech License/FEED)
North Dakota New FacilityNorthern Plains Nitrogen
(North Dakota Corn Growers)Western ND
800 Ammonia, 1M+
Various
Ammonia, Urea,
UAN, DEF$1.5B 2017
Greenfield
Texas Coal Gasification Facility Summit Power Group Texas 700 Urea Ammonia, Urea - 2017 Greenfield - Sinopec doing EPC
Spiritwood New Facility CHS Spiritwood, ND 770 AmmoniaAmmonia, Urea,
UAN$1.1-$1.4B 2018
Greenfield
Possible New Agrium Facility Agrium n/a 2M Various Ammonia, Urea - - Under Study, Greenfield
American Falls New Facility Southeast Idaho Energy American Falls, ID800 Ammonia, 380 Urea,
240 UAN
Ammonia, Urea,
UAN- -
Greenfield
Expansions
Geismar Restart/Debottleneck Facility Potash Geismar, LA 500 Ammonia $158M Online Restart/Debottleenck
Coffeeville UAN Upgrade Coffeeville Resources (CVR) Coffeeville, KS 400 UAN - Online Upgrade
Dubuque Ammonia expansion Rentech Nitrogen Dubuque, IA 67 Ammonia - 2014 Expansion/Debottleneck
Lima Debottleneck Facility Potash Lima, OH 80 Ammonia, 73 Urea Ammonia, Urea - 2015 Debottleneck
Borger Debottleneck Agrium Borger, TX 640 Ammonia, 525 Urea Ammonia, Urea $500M 2016 Debottleneck
Port Neal Brownfield CF Industries Port Neal, IA849 Ammonia, 1.35M
Urea
Ammonia, Urea,
UAN, DEF$1.7B 2016
Brownfield/Debottleneck - Probable
Donaldson Brownfield CF Industries Donaldson, LA1.25M Ammonia, 2.4M
Various
Ammonia, Urea,
UAN, DEF$2.1B 2016
Brownfield/Debottleneck - Probable
Koch New Facilities Koch Various1M+ Urea (Enid), 2M
VariousAmmonia, Urea - 2016-2018
Debottleneck
Iowa Fertilizer New Facility Iowa Fertilizer Co (OCI) Weaver, IA850 Ammonia, 1.5-2M
Various
Ammonia, Urea,
UAN, DEF$1.3B 2017
Greenfield - Probable
Waggaman Ammonia Facility Dyno Nobel (IPL) Waggaman, LA 880 Ammonia $850M 2017 Uses KBR Tech, KBR is EPC
Faustina Ammonia Facility Mosaic Faustina, LA 800 Ammonia $700M 2017 Existing Site Source: CFIndustries, Company data, Credit Suisse Equity Research
Exhibit 83: Proposed LNG Projects Project Location Size FID Labor Requirements For Project Contractor
Freeport LNG Quintana, TX $10B Q4'13 3,000-4,000 jobs CBI/Zachry
Lake Charles Lake Charles, Louisana $6B TBD 3,000 construction jobs, 4.5M construction man hours TBD
Sabine Pass LNG Cameron Parish, LA $6B 2014 3,000 construction jobs Likely Bechtel (did prior trains)
Cameron LNG Cameron Parish, LA $9-10B late 2013 1,300 on site eng jobs over a four year period, 3,000 jobs at peak FLR/JGC bidding, FWLT FEED
Cove Point LNG Lusby, MD $3.4-$3.8B Apr 2013 4,000 jobs during construction phase IHI/Kiewit
Jordan Cove LNG Port of Coos Bay, Oregon $7.5B TBD from 900 workers to >2100 workers at peak, 150 permanent jobs at 75K Black & Veatch/Kiewit FEED
Elba Island LNG Savannah, Georgia $1.4-$2B TBD over 2.5 years 807 FT jobs, 1,064 FT jobs for the region TBD (CBI did prior trains)
Corpus Christi LNG Corpus Christi, TX $5-8B TBD Employment (average annual 4,310), 17,230 (total person years of employment) Environmental Work Bechtel/Tetra Tech
Golden Pass Jefferson County, TX $10B TBD 9,000 construction jobs over five years, peak employment reaching 3,000 TBD (CBI did prior trains)
Sasol GTL Westlake LA $21B 2015 7,000 construction workers, 1,200 permanent workers FLR doing FEED on Ethane Cracker
Pacific Northwest LNGLelu Island $9-$11B late 2014 3500 direct jobs at peak construction, 200-300 permanent jobs KBR/JGC, Bechtel, Technip/Samsung Source: Company data, Credit Suisse Equity Research
Exhibit 84: Proposed GTL Projects US$ in millions, unless otherwise stated
Project Georgraphy Cost Timing Contractor
Sasol Westlake GTL Louisiana $10-15B FEED awarded/ EPC Timing 2015 FLR-FEED, Worley (support project excecution team)
Shell GTL Considering Louisiana & Texas Atleast $10B Decision on feasibility in 2015 TBD Source: Company data, Credit Suisse Equity Research

1 October 2013
The Shale Revolution II 51
Economic Impact Shale – Running the numbers
Due in large measure to the shale revolution, US crude oil production grew by more than
one million barrels a day in 2012, the largest increase in the world and the largest in US
history. The recovery in crude oil production over the last few years has taken output back
to 1992 levels, although it's still below peak levels of the 1970s. Natural gas production
has also risen very sharply over the last half decade.
Here we focus on the shale revolution’s imprint on various US macro data points, including
international trade, employment, industrial production, and business investment.
Exhibit 85: US crude oil production Exhibit 86: US natural gas production
Thousands of barrels per day Billions of cubic feet
3000
4000
5000
6000
7000
8000
9000
10000
11000
'60 '65 '70 '75 '80 '85 '90 '95 '00 '05 '10
10000
12000
14000
16000
18000
20000
22000
24000
26000
'60 '65 '70 '75 '80 '85 '90 '95 '00 '05 '10
Th
ou
sa
nd
s
Source: EIA, Credit Suisse Source: EIA, Credit Suisse
International trade
After years of expanding trade deficits, the pendulum has swung in the other
direction, due in large measure to the shale boom. The US still has a large trade deficit
in total energy goods, because of its still sizeable dependence on foreign crude oil.
However, it is bringing in fewer oil imports than at any time since the mid-1990s. Measured
in real dollars, the petroleum import bill has declined by 30% since the peak run rate in
2006. Although the starting point for exports is much lower, real exports have quadrupled
over the same period. The real petroleum deficit has shrunk by 54% since 2006.
Exhibit 87: Petroleum imports/exports Exhibit 88: Petroleum deficits
Real rate. $bn, monthly rate $bn, monthly rate
0
5000
10000
15000
20000
25000
30000
'95 '96 '97 '98 '99 '00 '01 '02 '03 '04 '05 '06 '07 '08 '09 '10 '11 '12 '13
Imports
Exports
-450000
-400000
-350000
-300000
-250000
-200000
-150000
-100000
-50000
0
'94 '95 '96 '97 '98 '99 '00 '01 '02 '03 '04 '05 '06 '07 '08 '09 '10 '11 '12
Real
Nominal
Source: Unites States Census Bureau, Credit Suisse Source: Unites States Census Bureau, Credit Suisse
ECONOMICS RESEARCH
Neal Soss
+1 212 325 3335
Jay Feldman
+1 212 325 7634
jay.feldman@credit-
suisse.com
Isaac Lebwohl
+1 212 538 1906
isaac.lebwohl@credit-
suisse.com

1 October 2013
The Shale Revolution II 52
While higher prices have kept the nominal deficit elevated by comparison, here too, the
deficit is improving. The nominal merchandise deficit has shrunk about $38bn over the 12
months ending July (annual rate). The energy deficit narrowed by $59bn over the last year
(a 23% decline). By contrast, the non-energy goods deficit deteriorated by $21bn.
Exhibit 89: Energy boom improving the US trade position
$bn, change in merchandise trade balance, annualized changes, YoY
-200
-150
-100
-50
0
50
100
'11 '12 '13
Th
ou
san
ds
Energy
Non-Energy
Total
Source: Bureau of Economic Analysis, Credit Suisse
The Energy Information Administration (EIA) provides two long-run scenarios for net
imports of “liquid supply” (petroleum-based products). The baseline “reference case”
shows continued gradual improvement for the next few years, but then a flattening out in
the net import position around 2019. A more optimistic case, which assumes larger
increases in domestic production, shows the US achieving a surplus by 2035.
EIA projections show domestic production of natural gas should exceed natural gas
consumption by 2019. At this point, demand in the US for natural gas should be
completely satisfied by domestic production.
Exhibit 90: Net imports, production, and consumption of petroleum liquid supply
Exhibit 91: Net imports, production, and consumption of natural gas
Millions of barrels per day Trillions of cubic feet
0
5
10
15
20
25
1990 2000 2010 2020 2030 2040
Net Imports
Consumption
Domestic Supply
2005 2011
Reference
Optimistic case
Net Exports
15
17
19
21
23
25
27
29
31
33
35
1990 2000 2010 2020 2030 2040
Consumption
Domestic Production
Net Imports
Source: EIA, Credit Suisse Source: EIA, Credit Suisse

1 October 2013
The Shale Revolution II 53
Employment
We focus in detail on the labour market pressures emerging in a separate chapter of the
report. However, in terms of the overall macro impact, we would highlight the following
observations.
The energy sector has relatively high labor productivity. Employment in the industry can be
locally intense (think of Houston in the 1970s or North Dakota now), but overall
employment is relatively small in the scheme of things. Energy sector employment,
including jobs in extraction and support sectors, energy machinery manufacturing, pipeline
construction, refineries, and pipeline transportation, amounts to 834K workers (June 2013).
In a workforce of about 136 million, this is isn’t particularly large (0.6%).
However, jobs over the current business expansion have been added at a rate 6½ times
the pace of national employment. Since the post-Great Recession trough in (February
2010), energy sector jobs are up 34% (+211K), while total employment is up 5.2%
(+6.55mn). In the last year, the rate of increase in job creation has tailed off somewhat
from expansion highs, but remains consistently positive.
Exhibit 92: Employment in energy sectors
Exhibit 93: Energy sector employment growth
Annual change in energy sector employment, thous.
0.0%
0.1%
0.2%
0.3%
0.4%
0.5%
0.6%
0.7%
0
100
200
300
400
500
600
700
800
900
'00 '01 '02 '03 '04 '05 '06 '07 '08 '09 '10 '11 '12 '13
Share of payroll employment(%, right)
Number of jobs (thous., left)
-100
-80
-60
-40
-20
0
20
40
60
80
100
'09 '10 '11 '12 '13
Source: Bureau of Labor Statistics, Credit Suisse Source: Bureau of Labor Statistics, Credit Suisse
The effect on the labor market is more visible at the state level as most energy rich states
have lower unemployment rates than the national aggregates. Most of the new oil and gas
production is coming from shale-rock formations such as the Bakken Shale in North
Dakota and the Eagle Ford Shale in Texas. At the cycle low in 2010, Texas and North
Dakota accounted for 8% of all US employment. But, since then, those states have
generated 15% of the increase in payrolls. Unemployment rates have declined well below
the national level (North Dakota’s 3.1% is country’s lowest).

1 October 2013
The Shale Revolution II 54
Exhibit 94: Unemployment rates in shale hotbeds (%)
2.0
3.0
4.0
5.0
6.0
7.0
8.0
9.0
10.0
11.0
'02 '03 '04 '05 '06 '07 '08 '09 '10 '11 '12 '13
National
Texas
North Dakota
Source: Bureau of Labor Statistics, Credit Suisse
Industrial production
In the large and diversified US economy, 86% of which is outside of the manufacturing and
mining sectors, natural gas and petroleum exploration are a relatively small portion of
overall GDP (about 1.6%). But the sector has a much larger impact on industrial
production. Extraction has a 10.8% weight in the IP complex (11.5% after including drilling
of oil and gas, triple what it was a decade ago). Its rapid growth has been a stabilizing
cyclical influence on overall industrial sector activity, particularly over the last 18 months,
when global headwinds slowed US output.
Exhibit 11 shows oil and gas extraction growth on a year-on-year basis. Since 2012,
extraction growth has been averaging about 9% YoY, more than double the 2009-2011
period (and well above historical averages). Over the last year, total US industrial
production has increased just 1.3%, with almost all of the growth (1 percentage point)
coming from oil and gas extraction (Exhibit 12).
Exhibit 95: Oil and gas extraction growth Exhibit 96: Contributions to IP growth
YoY% %
-10%
-5%
0%
5%
10%
15%
'91 '92 '93 '94 '95 '96 '97 '98 '99 '00 '01 '02 '03 '04 '05 '06 '07 '08 '09 '10 '11 '12 '13
-15%
-10%
-5%
0%
5%
10%
'09 '10 '11 '12 '13
Oil and gas extraction/drilling
IP Ex. Oil and GasExtraction/Drilling
Total
Source: Federal Reserve, Credit Suisse Source: Bureau of Economic Analysis, Credit Suisse

1 October 2013
The Shale Revolution II 55
Fixed investment
Oil and gas extraction and investment in related machinery are a growing presence within
business fixed investment – currently 7.5% of business capex – about four times what it
was, say, in the mid-1990s. In the latest quarter, natural gas and petroleum exploration
investment contributed 0.2 ppt to real GDP growth (following a lull in the previous few
quarters). The future of unconventional extraction growth and its impact on GDP are
uncertain. But if the 1970s' energy boom is any guide, oil and gas exploration contributed
0.3 percentage points of GDP growth on average during the headiest years, with a brief
period late in the decade surpassing 0.8 percentage points of annual growth.
Exhibit 97: Oil and gas exploration contributing more to the share of total business investment
Exhibit 98: Contribution to quarterly GDP growth
Oil and gas exploration + mining/oilfield machinery, % of total business investment
Real oil and gas exploration + mining/oilfield machinery, ppt. contribution to quarterly real GDP
1%
2%
3%
4%
5%
6%
7%
8%
'90 '91 '92 '93 '94 '95 '97 '98 '99 '00 '01 '02 '04 '05 '06 '07 '08 '09 '11 '12
-0.8%
-0.6%
-0.4%
-0.2%
0.0%
0.2%
0.4%
0.6%
'00 '02 '04 '06 '08 '10 '12
2Q13
Source: Bureau of Economic Analysis, Credit Suisse Source: Bureau of Economic Analysis, Credit Suisse

1 October 2013
The Shale Revolution II 56
Corporate Profitability Broader support for profit margins
One of the features of the equity market in recent years has been the abnormally high
level of profit margins, particularly in the US. While this has been due, in large part, to low
interest charges and low labour costs, the fall in power prices is likely to have supported
margins too.
To the extent that the US increasingly exports its cheap energy and other countries initiate
their own shale exploration, a key consideration will be whether the cost benefit is likely to
spread to other regions supporting corporate profitability.
Below, we show that EBITDA margins for US non-financials have held up well relative to
those in Europe and the rest of the world. In 2009, US non-financial EBITDA margins were
210bps below those of Europe. But they have improved to be 170bps better on the latest
reported data.
Exhibit 99: EBITDA margins for US non-financials have
held up well relative to those in Europe and the rest of the
world
Exhibit 100: The gap between US non-financials EBITDA
margins has risen from -210bps in 2009 to +170bps in
2013
12%
13%
14%
15%
16%
17%
18%
19%
20%
Q1 2005 Q1 2007 Q1 2009 Q1 2011 Q1 2013
World US Europe
EBITDA margin, equity market ex financials, %
-2.5%
-2.0%
-1.5%
-1.0%
-0.5%
0.0%
0.5%
1.0%
1.5%
2.0%
Q1 2005 Q1 2007 Q1 2009 Q1 2011 Q1 2013
US less World
US less Europe
EBITDA margin, equity market ex financials, %
Source: Thomson Reuters, Credit Suisse Equity Research Source: Thomson Reuters, Credit Suisse Equity Research
The effect can also be seen at the sector level. Here, we look at those sectors with the
majority of their production based domestically and therefore are more likely to have
benefited from lower local energy prices. Utilities and chemicals are two such sectors that
also rely on energy as a significant input cost (approximately 50% of industrial gases input
costs are energy-related). For more detail on the input cost exposure of European and US
sectors, please see Commodities: stay bearish, 29 April.
European and US utilities have EBITDA margins of 18% in 2009. While the margins of the
European sector have continued to decline (latest 12-month trailing numbers are 16.6%
according to IBES estimates), those in the US have increased sharply to 28%.
Similarly, European chemicals' margins have been on a slight downward trend in recent
years, while those for the US sector have reached their highest in at least a decade.
EQUITY RESEARCH
Mark Richards
+44 20 7883 6484
mark.richards@credit-
suisse.com

1 October 2013
The Shale Revolution II 57
Exhibit 101: US utilities' margins have risen since 2009
while those in Europe have fallen further
Exhibit 102: US chemicals' margins have risen in recent
years while those for the European sector have fallen
slightly
14%
16%
18%
20%
22%
24%
26%
28%
30%
Sep-04 Sep-06 Sep-08 Sep-10 Sep-12
European Utilities US Utilities
12m trailing EBITDA margin
13%
14%
15%
16%
17%
18%
19%
20%
21%
Sep-04 Sep-06 Sep-08 Sep-10 Sep-12
European Chemicals US Chemicals
12m trailing EBITDA margin
Source: Thomson Reuters, Credit Suisse Equity Research Source: Thomson Reuters, Credit Suisse Equity Research
This tends to underline a structural advantage for the US corporate sector. Such superior
margin performance has helped drive US valuations to high levels. The price-to-book
relative is the highest for more than a decade and the US trades on a 9% P/E premium to
global equities, 2% points above its 10-year average premium. Furthermore, net buy
recommendations on the sell side are more optimistic relative to the rest of the global
market than they have been since 2003. This limits the equity strategy team's expectations
for US equities in a global context, although it targets 1900 on the S&P 500 for the end of
2014 (for more details see Equities – stay overweight, 30 August). Within global equities,
the team prefers the recovery story in Europe (see Preference for Europe over emerging
markets, 8 August, and Upgrade Continental Europe: what to buy, 19 July).
Exhibit 103: US equities trade on a significant premium to
global equities
Exhibit 104: Net buy recommendations for US stocks are
abnormally high relative to global equities
1.1
1.15
1.2
1.25
1.3
1.35
1.4
1.45
1.5
1.55
1.6
0.95
1
1.05
1.1
1.15
1.2
Sep-03 Sep-05 Sep-07 Sep-09 Sep-11 Sep-13
US, 12m fwd PE rel
US non-financials, PB rel, rhs
0%
1%
2%
3%
4%
5%
6%
7%
8%
1995 1998 2001 2004 2007 2010 2013
US rel World: net recommendations; (+=BUY; -=SELL)
Source: Thomson Reuters, Credit Suisse Equity Research Source: Thomson Reuters, Credit Suisse Equity Research

1 October 2013
The Shale Revolution II 58
Frac-Safety Risk management
Environmental damage is one of the major concerns among opponents of fracking. In
reality, we think that many of the risks associated with fracking may occur in conventional
oil and gas exploration and in other manufacturing industries. That said, energy
companies must make considerable effort to liaise with and involve local and national
governments, local communities and environmental experts to address any problems and
concerns before, during and after activity.
What we know :
■ There are observed violations of environmental protection in the shale industry (as
there are in other industries).
■ These typically relate to surface issues and/or well failure. Though groundwater
contamination due to well failure is often cited as a top concern, surface contamination
from spills and improper disposal of waste fluids likely carries the greatest risk.
■ The key to approaching unconventional resources from a technological point of view is
(1) robust well designs and multiple layers of steel and cement specifically designed to
protect groundwater, and (2) robust surface handling and waste treatment procedures.
■ These could add costs to shale development – but not enough to derail the 'prize' of
lower cost, lower carbon fuel that natural gas represents. We do worry that Wall
Street’s focus on well costs may encourage a range of behaviors across different
industry players. Regulation and enforcement will have a role to play. We suspect that
any additional costs would be captured 100% by low cost natural gas producers i.e.
higher costs would translate into higher marginal gas prices. In oil, it may be less clear
cut – higher costs would reduce but not eliminate the cost advantage of the core of our
preferred liquid rich shale plays versus competing international oil projects.
■ The EPA and state agencies (and other countries) are spearheading research into the
environmental impacts of shale to address the issue. We believe the EPA’s Study of
the Potential Impact of Hydraulic Fracturing on Drinking Water Resources will be
closely watched given that the US is ahead of the game in terms of its experience with
the shale industry. This report will release its finding for peer review and public
comment in 2014.
■ The drilling for natural gas does release some methane, a GreenHouseGas (GHG) to
the atmosphere but no more than conventional gas drilling. Importantly, as shale gas
substitutes for oil over time, overall GHG emissions should reduce.
A run through the drilling process and solutions for
key risks
Phase one
The initial section of a shale well is drilled vertically, very much like a conventional oil and
gas well, using freshwater based fluids (and/or air cooling) that cool the drill bit and carry
mud and chippings back to the surface. This part of the well is likely to penetrate through
natural aquifers and groundwater, so when it reaches the deepest aquifer, the drill pipe
tends to be removed and replaced with steel pipe called surface casing. Cement is then
pumped down the casing and back up in order to create an impermeable layer to reduce
as far as possible the chance of contamination.
EQUITY RESEARCH
Ed Westlake
+1 212 325 6751
edward.westlake@credit-
suisse.com
Charlotte Elliott
+44 20 7888 9484
charlotte.elliott@credit-
suisse.com

1 October 2013
The Shale Revolution II 59
Figure 105: Phase 1 of an unconventional well
Source: Credit Suisse Equity Research
Phase two
The second phase of the well involves drilling vertically to a kick-off point where the well is
curved and the horizontal section is drilled into the target formation. A perforating gun is
lowered down the well, equipped with specialist charges that are fired into the reservoir to
create small fractures. High pressure fluid (a mixture of water, sand and chemicals) is then
pumped into the reservoir to open these small fractures, after which a 'proppant' (sand or
ceramic beads) is introduced to keep these wider fractures open. The bigger surface area
created by the fractures allows oil or gas to flow to the welbore.

1 October 2013
The Shale Revolution II 60
Figure 106: Phase 2 of an unconventional well
Source: Credit Suisse Equity Research
Environmental Risks
1. Contamination of groundwater
During the process of fracking, it is possible that some of the synthetic fractures in the rock
could extend beyond the target horizon, reaching shallower depths and even migrating
into drinking water supplies in aquifers. Scientists have deemed this unlikely in current
shale gas licences, as the water table lies so much deeper than the natural aquifers. For
example, in the Marcellus, the target shale formations are around 4,000-8,000ft, whilst the
deepest drinking water aquifer is at 850ft.
In addition to this type of groundwater contamination, concerns arise from any leakage
that could occur between the wellbore as it passes through the aquifer layer in the initial
part of the well. In most US states, the surface casing must be fully-cemented before
drilling operations are able to continue. Energy companies need to put sensible prevention
and detection methods into practice to avoid any sort of groundwater contamination.
The first of these prevention techniques is ensuring the quality and robustness of a
cementing/casing job in the initial part of the well. It is vital that this is completed as safely
as possible, given that the well is in direct contact with the target formation, aquifers and
the surface. If the cementing/casing fails, there is an immediate risk of leakage of natural
gas, fracking fluids or formation water that contains high concentrations of dissolved solids.
A survey by the Ground Water Protection Council (GWPC, 2009) in the USA found that 25
out of 27 states required surface casing to extend below the deepest aquifer, in some
states, surface casing is only required to extend to the deepest groundwater zone, but not
all water zones. Often groundwater at deeper depths is generally too high in salts or other

1 October 2013
The Shale Revolution II 61
solutes to be used for drinking, irrigation and most industrial processes, therefore is less of
a concern.
In order to monitor any seismicity in the area that could lead to such an event, energy
companies also need to have detection methods in place, often in the form of seismic
monitoring. It is important that the data are in real time and accurate so that effective
measures can be taken as quickly as possible.
2. Blowout prevention
Blowouts can be caused in wells, when drilling into highly pressurized zones of
hydrocarbons and introducing pressurized fluid during fracking. Although blowout
preventers are compulsory under some regulations, once the casing has been put into
place, it is possible that this is not totally efficient if higher pressure differentials than
expected are encountered.
So that blowouts can be most efficiently dealt with, it is key that energy companies gather
real-time and accurate data and ensure that they have trained and experienced personnel
onsite to deal with any surprising or unforeseen situations.
3. Chemical pollution
While over 99% of proppant is made up of water and sand, about 1% is made up of
chemical components and has to be treated with care. After the fracturing stages, water is
returned to surface through the wellbore and is either stored in pits until it can be reused or
is disposed of correctly, in line with the regulations in the region.
The initial problem that this flow-back water can present is during its storage in pits. If
there are heavy rains that cause the pits to overflow, contamination can occur in the
surface water and soil. One way energy companies have found to overcome this is by
storing the flow-back water in enclosed steel tanks.
There are a number of ways of dealing with flow-back fluids. In plays such as the Barnett,
Fayetteville, Haynesville and Woodford, the re-injection of flow-back fluids is allowed into
saline reservoirs. In the Marcellus shale, some flow-back fluid is disposed of in municipal
water treatment facilities.
There is a desire for energy companies to make greater use of the recycling of flow-back
fluids as proppant. If the flow-back fluid is treated and diluted from its heavier chemical mix,
this is possible, however greater investment needs to be made in these treatment
technologies.
4. Above ground impacts
Local communities around shale gas developments are particularly concerned with the
impact of above ground development including roads, pipelines, trucks and other
infrastructure which is needed to complete operations. As well as contributing to air
pollution, this also adds to noise pollution.
There are a number of ways to circumvent these problems, or at least reduce them. For
noise pollution, where possible, sound barriers are constructed. In order to minimize the
amount of disruption, multiple wells can also be drilled from one drill pad. On the whole,
energy companies try to liaise with local communities and governments to address
concerns and problems to minimize any impact the work has on the local community.
5. Water management
The volume of water required when drilling a shale well can be significant, totalling 2-8
million gallons per well, compared with up to 1 million in a conventional well. This can
create water shortages in some drier areas. A solution to this water shortage would be to
recycle fracking fluids. In Texas, fracking uses just 1% of available water and it is 0.3% for
the US as a whole, less than used in golf courses.

1 October 2013
The Shale Revolution II 62
Proposed Prevention
The availability of investment can ensure lower rates of well failure. The figure below
illustrates the cement and casing that should be put in place to reduce the risk of
groundwater contamination. Strength tests on cement, pressure tests before fracking to
validate well construction, inspections over the life of the asset to confirm well integrity
should form the best practice.
Exhibit 107: Prevention
Source: CVX
From the perspective of surface water handling and water use, around 60% of water used
in Marcellus fracking is freshwater. However, the use of non-potable water, higher
recycling of flowback water from the frack should reduce this over time. Proper design of
flowback tanks to prevent stormwater release and buffers between well pads and
freshwater sources can also minimize the impact of any spills.
With 1400 rigs operating in the US, drilling 14,000 wells per year, the well stock in the US
is rising rapidly. Safe design, operations, inspection and enforcement will be critical.
However, we believe the impact needs to be put in perspective. Fracking violations can
cause understandable local anger and need to be resolved. However, as the Macondo
incident showed, well designed fracking has less tail risk than other forms of offshore oil
extraction. We note that the shale revolution is predominantly a natural gas revolution
which is less polluting than oil in general.
Solving these issues will create demand for water treatment equipment, well casing and
cementing services, all fast growing areas of Oilfield Services.
PLEASE REFER TO THE MACRO RESEARCH DISCLOSURES APPENDIX AT THE
END OF THIS REPORT FOR IMPORTANT DISCLOSURES

1 October 2013
The Shale Revolution II 63
Equity Research
Stocks & Sectors
DISCLOSURE APPENDIX CONTAINS IMPORTANT DISCLOSURES, ANALYST CERTIFICATIONS, INFORMATION ON TRADE ALERTS, ANALYST MODEL PORTFOLIOS AND THE STATUS OF NON-U.S ANALYSTS. FOR OTHER
IMPORTANT DISCLOSURES, visit www.creditsuisse.com/researchdisclosures or call +1 (877) 291-2683. US Disclosure: Credit Suisse does and seeks to do business with companies covered in its research reports. As a result, investors should be aware that the Firm may have a conflict of interest that could affect the objectivity of this report. Investors should consider this report as only a single factor in making their investment decision..

1 October 2013
The Shale Revolution II 64
Stock Selections Looking for value and looking laterally
In the sector and regional sections that follow, our analysts have highlighted the key
stocks in their coverage which are impacted by the shale revolution – whether positive or
negative. This has formed the basis for our universe of stocks in Appendix 2 - though this
has been supplemented by uncovered names on the basis of factual information and
forms the basis of our 'supply chain' analysis on pages 66 to 67.
We have distilled our analyst recommendations into the shorter list in Exhibit 109, focusing
on where exposure to the theme is viewed as high and analysts have current high
conviction on the name. It is worth stressing that a keen focus on stock selection has
considerable value here. While the shale theme is a wide reaching one, we found in other
analysis that the intra-correlation of stock performance across our universe was actually
quite low. Stock selection adds considerable value.
We have also run the rule over our overall universe and key recommendations using
Credit Suisse HOLT®. Figure 108 below has analysed the valuation of the sub-groups of
our shale universe in terms of their forecast CFROI® and history and then set against the
CFROI implied in the prevailing stock price (i.e. "the green dot"). In simplistic terms,
valuation is most supportive within HOLT where the "green dot" is below the forecast
CFROI. These tend to be further to the left in the chart. We would be particularly attracted
where the CFROI is also rising – oil services for example. Further to the right, HOLT would
suggest more constraints in terms of valuation.
Valuation is only one piece of the jigsaw and might fail to pick up the full structural
potential the shale story represents. Hence, we have also assessed the relative merits of
the stocks in terms of the HOLT Scorecard which looks at valuation, momentum and
operational performance. Exhibit 109 highlights in bold those names of our analyst key
recommendations that emerge in the top two quintiles of the scorecard ranking - and
hence relatively the most attractive.
Figure 108: Shale sub-sectors: Implied CFROI versus consensus forecasts
-2
3
8
13
18
-2
3
8
13
18
Oil
& G
as R
efi
n&
Mkt
g
Inte
grat
ed
Oil
& G
as
Elec
tric
al E
qu
ipm
ent
Elec
tro
nic
Eq
uip
,In
stru
& C
om
ps
Co
nst
ruct
ion
&En
gin
eeri
ng
Oil
& G
as E
&P
Mac
hin
ery
Ind
. Co
ng.
O&
G E
qu
ip &
Serv
ices
Ener
gy E
qu
ipm
ent
& S
ervi
ces
Ae
rosp
ace
& D
efen
se
Au
tom
ob
s &
Co
mp
on
ents
Me
tals
& M
inin
g
Gas
Uti
litie
s
Ro
ad &
Rai
l
Ch
em
ical
s
Elec
tric
Uti
litie
s
Co
mm
Ser
vice
s&
Su
pp
lies
CFROI 10 yr Median CFROI Last Fiscal Year CFROI Forecast Market Implied CFROI
More demandingLess demanding
Source: Credit Suisse HOLT
EQUITY RESEARCH
Richard Kersley
+44 20 7888 0313
richard.kersley@credit-
suisse.com
Kiranjot Grewal
+44 20 7883 9247
kiranjot.grewal@credit-
suisse.com
Mujtaba Rana
+44 20 7883 3773
mujtaba.rana@credit-
suisse.com

1 O
cto
ber 2
013
Th
e S
hale
Re
volu
tion
II 6
5
Exhibit 109: Key recommendations by region (stocks in bold rank highly in the HOLT Scorecard)
Company Country Market Cap ($bn) Type Sensitivity Rating Explanation
USA
ACCESS MIDSTREAM PARNERS USA 8,481 Equip & Support Services High OUTPERFORM Active at Marcellus, Utica, Miss Lime, Granite Wash, Permian, Eagleford and Wolfberry.
AGRIUM INC USA 12,464 Cost Beneficiary High OUTPERFORM Could benefit from low cost shale at least through 2016.
ANADARKO PETROLEUM CORP USA 47,521 E&P High OUTPERFORM Exposure to core Wattenberg play.
BAKER HUGHES INC USA 21,944 Equip & Support Services High OUTPERFORM Hydraulic fracturing services.
BIOAMBER INC USA 91 Cost Beneficiary High OUTPERFORM A beneficiary of the shale boom since it supports high prices for BioAmber’s products.
CAMERON INTERNATIONAL CORP USA 14,523 Equip & Support Services High OUTPERFORM Frac stimulation trees & frac manifold rentals.
CANADIAN PACIFIC RAILWAY LTD USA 21,937 Equip & Support Services High OUTPERFORM Crude by rail; inbound drilling materials.
CROSSTEX ENERGY, INC USA 997 Equip & Support Services High OUTPERFORM Active at the Barnett, Permian, Eagleford and Utica sites.
DOW CHEMICAL USA 46,423 Cost Beneficiary High OUTPERFORM Could benefit from a cost advantage from shale gas at least until 2015.
EQT MIDSTREAM LP USA 2,344 Equip & Support Services High OUTPERFORM Active at the Marcellus site.
GENERAL ELECTRIC CO USA 244,920 Equip & Support Services High OUTPERFORM Global #1 in industrial gas turbines; strong position in compresssor technology.
GULFPORT ENERGY CORP USA 4,909 E&P High OUTPERFORM Exposure to Southern Louisiana, Permian, Niobraa and Utica shale.
HALLIBURTON CO USA 44,208 Equip & Support Services High OUTPERFORM Hydraulic fracturing services.
KANSAS CITY SOUTHERN USA 12,136 Equip & Support Services High OUTPERFORM Crude by rail; inbound drilling materials.
KBR INC USA 4,866 Equip & Support Services High OUTPERFORM Very well positioned based on the number of verticals the company can benefit from.
KINDER MORGAN ENERGY PARTNERS LP USA 34,532 Equip & Support Services High OUTPERFORM Active at Permian, Eagleford, Louisiana Coast, Alberta, Rockies, Marcellus and Utica.
LUXFER USA 431 Equip & Support Services High OUTPERFORM Leader in CNG cylinders for cars, trucks and buses.
LYONDELLBASELL INDUSTRIES NV USA 41,813 Cost Beneficiary High OUTPERFORM Could benefit from a cost advantage from shale gas at least until 2015.
MAGELLAN MIDSTREAM PARTNERS USA 12,789 Equip & Support Services High OUTPERFORM Leading refined products pipeline franchise and active at the Permian site.
MARATHON OIL CORP USA 41,813 E&P High OUTPERFORM Low cost way to play the Eagle Ford Shale, with exploration optionality on top.
MARKWEST ENERGY PARTNERS LP USA 11,232 Equip & Support Services High OUTPERFORM Operate at Marcellus, Utica, Permian, Eagleford, Woodfard, Barnett and Granite Wash.
NOBLE ENERGY INC USA 24,279 E&P High OUTPERFORM Unparalleled visibility from its five core areas, especially in the DJ Basin.
NUVERRA ENVIRONMENTAL SOLUTN USA 608 Equip & Support Services High OUTPERFORM Water pick-up, disposal and treatment and solid waste disposal in 8 shale plays.
PDC ENERGY INC USA 2,161 E&P High OUTPERFORM Offers investors some of the best leverage to the Niobrara and the Utica shale.
PHILLIPS 66 USA 36,298 Cost Beneficiary High OUTPERFORM Operate in US East Coast, Mid-Continent, Gulf Coast (in-land and coastal), Rockies.
PIONEER NATURAL RESOURCES CO USA 26,155 E&P High OUTPERFORM PXD's second Northern Midland test appears to be positive.
PLAINS ALL AMERICAN PIPELINE LP USA 18,120 Equip & Support Services High OUTPERFORM Active at Permian, Eagleford, Mid-Con, Williston, Rockies and Alberta sites.
SUPERIOR ENERGY SERVICES INC USA 4,051 Equip & Support Services High OUTPERFORM Hydraulic fracturing & coiled tubing services.
TARGA RESOURCES CORP USA 3,058 Equip & Support Services High OUTPERFORM Pipe infrastructure: active at the Permian, Barnett, Bakken and Lousiana Coast sites.
TESORO CORP USA 6,044 Cost Beneficiary High OUTPERFORM Operate in US Mid-Continent, US Rockies and US West Coast.
UNION PACIFIC CORP USA 72,633 Equip & Support Services High OUTPERFORM Crude by rail; inbound drilling materials.
WASTE CONNECTIONS INC USA 5,501 Equip & Support Services High OUTPERFORM Solid waste disposal in 8 shale plays.
WESTERN REFINING INC USA 2,425 Cost Beneficiary High OUTPERFORM Operating in US Gulf Coast (in-land).
Canada
ARC RESOURCES CAN 7,929 E&P High OUTPERFORM Canadian shale resource, potential for better extraction costs & higher future gas prices.
CANADIAN NATURAL RESOURCES CAN 34,202 E&P High OUTPERFORM Current sellers of shale/tight gas resource.
ENBRIDGE INC CAN 34,384 Equip & Support Services High OUTPERFORM Could benefit from growth in the pipeline industry in Bakken formation, North America.
TRANSCANADA CORP CAN 31,253 Equip & Support Services High OUTPERFORM Coastal GasLink Pipeline & Prince Rupert Gas transmission projects in Western Canada.
Rest of the World
CNOOC LIMITED HKG 90,865 E&P High OUTPERFORM Is commited to Shell to provide technical assistance in exploring shale gas.
DENSO CORPORATION(C) JPN 37,240 Equip & Support Services High OUTPERFORM Could benefit from increased demand in fuel injection systems for NGVs.
FORMOSA PLASTICS CORPORATION TWN 16,455 Cost Beneficiary High OUTPERFORM US subs., Formosa USA to build a 1.2mn ton/yr shale gas cracker in Texas by 2016.
INPEX CORPORATION(C) JPN 17,293 E&P High OUTPERFORM Has acquired mining concessions in Canada.
JGC CORPORATION JPN 9,128 Equip & Support Services High NEUTRAL Global top E&C players, especially in LNG area. Diversified potential project portfolio.
MARUTI SUZUKI INDIA LTD IND 6,580 Equip & Support Services High OUTPERFORM May benefit from further growth NGVs.
MITSUBISHI HEAVY INDUSTRIES JPN 22,084 Equip & Support Services High OUTPERFORM One of the global top gas turbine makers. Also provide LNG carriers.
PERUSAHAAN GAS NEGARA PERSERO IDN 10,867 Cost Beneficiary High OUTPERFORM May get more gas supply, and likely at cheaper price in the future.
ROTORK P.L.C. GBR 3,876 Equip & Support Services High OUTPERFORM Leading supplier of upstream oil & gas actuators.
VALLOUREC FRA 7,713 Equip & Support Services High OUTPERFORM Premium casing, tubing, and connections used for unconventional oil & gas wells.
WEIR GROUP PLC (THE) GBR 8,153 Equip & Support Services High NEUTRAL Could benefit from increased demand in pressure pumps, fluid ends and related services. Source: Company data, Credit Suisse Equity Research

1 October 2013
The Shale Revolution II 66
The Shale Supply Chain
Figure 110 provides an illustrative 'mind map' of how the inter-relationships come together
around the shale story, based on the analysis of the 300 stocks carried in the report. It is a
uniquely connected story. At Credit Suisse, we can look at this in an interactive way using
our PEERs Supply Chain tool which analyses the suppliers, competitors, joint ventures
and related investments of more than 3,500 companies, whilst also assessing the
materiality of the relationships (i.e. high, moderate and low). The tool carries specific value
to the shale theme, serving as a means to look for lateral plays across the network effects
that the Shale Revolution has stimulated. The data have been compiled by Credit Suisse
Equity Research analysts.
Figure 110: The shale supply chain
Equipment & Support Services Cost Beneficiaries
Regulation
Subsidies
Oil & Gas Refining & Marketing
Construction & Infrastructure
Revenue Risk
Transalta
Railroads
Environ & Facilities Services
Coal & Consumable Fuels
ABM Investama, Adaro Energy,
Alpha Natural Resources, Arch Coal,
Cloud Peak Energy, Harum Energy,
Indika Energy, Peabody Energy and
Tambang Batubara.
Tenaska
Steel
Chubu Electric Power
Oil & Gas Equipment Services Government Chemicals & Agriculture
Independent Power Producers
Industrial Machinery
Other
Electrical Equipment
Korea Gas
NextEra Energy
Phillips 66
Perusahaan Gas Negara Persero
Osaka Gas
Exploration & Production
Lyondellbasell Industries
Clean Energy Fuels
Diamondback Energy
Encana
EOG
Exxon Mobil
Gulfport Energy
Marathon Oil
Molopo Energy
Pioneer Natural Resources
TAG Oil
Trilogy Exploration
Rosetta Resources
Yara Intl
Auto's & Tech
Dominion Resources
Tokyo Gas
Agrium Inc
CF Industries
Dow Chemical
Formosa Plastics
Chemicals & Fertilizers
Eastman Chemical
Westlake Chemical
Anadarko Petroleum
Apache
ARC Resources
Athlon Energy
Aurora Oil & Gas
Carrizo Oil & Gas
Chevron
Cimarex Energy
CNOOC
Concho Resources
ConocoPhillips
Continental Resources
Devon Energy
Range Resources
Bioamber
Noble Energy
PDC Energy
Penn Virginia
Petrochina Company
Siemens, General Electric,
Honeywell, Inpex, Canadian Natural
Resources, Rolls Royce, Denso,
Keihin and Itron
Flowserve, Vallourec, Pentair,
Rotork, Weir, CIMC Enric, Energy
Recovery, Mitsubishi Heavy, KBR,
Luxfer, JGC
Anton Oilfield Services, Baker
Hughes, Cameron, Dresser-Rand,
Enbridge, Halliburton,Hilong,
Honghua, Kinder, Schlumberger,
SPT Energy, Superior Energy
Services, Transcananda
Weatherford and Yantai Jerah,
Tenaris, Vallourec
Voestalpine
Maruti, Westport Innovation,
Cummins
Tesoro Corp
Union Pacific, Canadian Pacific and
Kansas City Southern.
Dongfang Electric, Harbin Electric
and Emerson.
Nuverra, Republic Services, Waste
Mgmt and Waste Connections
Access Midstream, Caterpillar,
Crosstex, Fluor, Markwest Energy,
Plains, Targa Resources
Western Refining
Utilities
Yamato Kogyo
Nucor
Santos
Senex energy
Sinopec china
Source: Credit Suisse Equity Research

1 October 2013
The Shale Revolution II 67
Credit Suisse PEERmap
By way of example, Exhibit 111 illustrates the supply chain 'map' for Marathon Oil. We
can track Marathon’s supply chain and, via the shading in the respective circles, how the
companies listed view it in terms of significance. For example, Marathon views Conoco
as an important competitor with the latter seeing Marathon in a similar light. On the
supplier side, we can conduct the same exercise though Marathon is not heavily reliant on
any single supplier. Baker Hughes, for example, is a supplier of moderate significance
just as Marathon is of moderate significance to it. We note a key added consideration—in
previous research, we have shown that surprises across the supply chain drive related
stock price performance (see Exploiting Earnings Surprises). Hence, signals and news in
one part of the shale network can be followed through to look for investable opportunities
elsewhere. The tool is accessible through our RAVE corporate database (click here).
Exhibit 111: PEERs supply chain relationships – Marathon Oil
Source: Credit Suisse PEERs database

1 October 2013
The Shale Revolution II 68
North American Energy Exploration & Production – US
Overview
Unconventionals are driving significant increases in US oil and gas production as
illustrated in Exhibit 112 and Exhibit 113. With previous expectations being surpassed by
enhanced efficiencies, costs, capital and hence recoveries.
Exhibit 112: U.S. Oil Production Growth
Source: EIA, Credit Suisse Equity Research
Exhibit 113: US Natural Gas Supply
Total Natural Gas Supply (Bcf/d)
64.1
63.7
62.6
61.8
62.7
65.7
65.9
66.7
68.4
71.2
73.3
73.2
74.1
75.2
50
55
60
65
70
75
80
200
2
200
3
200
4
200
5
200
6
200
7
200
8
200
9
201
0
201
1
201
2
201
3
201
4
201
5
Source: EIA, Credit Suisse Equity Research
Recent Developments
EQUITY RESEARCH
Arun Jayaram
+1 212 538 8428
arun.jayaram@credit-
suisse.com
Mark Lear
+1 212 538 0239

1 October 2013
The Shale Revolution II 69
We revisit our basin economics analysis, which we have expanded to include the Utica
Wet Gas and the Cana Woodford Oil Window, as well as breaking out parts of the
Wolfcamp and the Mississippian. While natural gas prices have recovered from historical
low levels, economics continue to favor liquids-rich basins (higher % Oil), which exhibit an
average 40% rate-of-return vs. a 19% rate-of-return for gas-focused basins (excluding the
liquids-rich and super-rich areas of the Marcellus) at the current futures prices (see Exhibit
114). The highest rates of return remain in basins including the Liquids-Rich and Super-
Rich Marcellus, Liquids-Rich Utica, Liquids-Rich Eagle Ford and Core Wattenberg
Niobrara.
Exhibit 114: Basin IRRs - Current Futures Strip
Year: 1 2 3 4 5 6 7 8+
WTI Oil: $103.14 $96.74 $89.62 $85.64 $83.63 $82.19 $82.19 $82.19
NYMEX Gas: $3.64 $3.95 $4.15 $4.24 $4.35 $4.68 $4.68 $4.68
73%
73%
66%
66%
60%
56%
53%
51%
51%
49%
41%
39%
37%
35%
32%
32%
32%
28%
28%
27%
27%
26%
26%
24%
23%
23%
23%
22%
22%
18%
17%
16%
16%
16%
12%
11%
8%
5%
0%
10%
20%
30%
40%
50%
60%
70%
80%
Source: Industry data, Credit Suisse Equity Research *Futures Strip as of 9/24/13
Beyond rates-of-return, we also underscore the importance of the ability to multiply that
return profile across an asset base. We take our basin economics analysis a step further
and provide another perspective on asset valuation by taking into account spacing and
stacked resource potential to get to a value per acre estimate for the current most active
basins. While the Super-Rich Marcellus, Liquids-Rich Eagle Ford and Liquids-Rich Utica
wells provide higher project rates of return, we estimate that the Midland Permian and
Niobrara Wattenberg provide a higher undiscounted value per acre driven by the stacked
potential and spacing of the plays.
Utica Shale
Still in the early stages of delineation, there is significant room for improvement in the
Utica in terms of efficiencies, costs and recoveries. Leading companies in the play such as
Gulfport are testing wellbore density in the Utica, with early estimates that spacing can get
to ~800 feet (60-80 acre spacing) in the east and even tighter to the west. While operators
in the basin have experienced delays and constrained well performance driven by third-
party infrastructure delays, we argue this does not undercut the quality of the asset base,
and in turn, has created a compelling buying opportunity for Utica-focused companies.
On the Horizon…
MarkWest, the primary midstream and processing provider in the Utica, is rapidly building
gathering and gas processing capacity in the Utica which will allow operators in the region
to quickly ramp up development. After a slow start with the interim refrigeration plant,
Phase I of the Cadiz plant (Harrison County, OH) came online in May with 125 MMcf/d of
cryogenic capacity increasing the total processing capacity to 185 MMcf/d in the region.

1 October 2013
The Shale Revolution II 70
To the south in Noble County, start-up of MWE’s Seneca plant has slipped to early 4Q13
from 3Q13, but 400 MMcf/d of processing capacity is expected in 4Q13. In all, MWE plans
to increase gas processing capacity to 785 MMcf/d, along with an NGL interconnect
between the Majorsville and Hopesville fractionators to provide some processing flexibility
in the region. With regards to takeaway capacity, initial truck and rail loading is expected to
begin in 3Q13 with interconnects to the ATEX and TEPPCO pipelines in 1Q14.
Permian Basin (Midland Basin)
While it is still early innings for horizontal development, intriguing initial well results
suggest that the Midland Basin could serve as the largest source of incremental oil supply
in the US given the emerging Horizontal Wolfcamp play and other stacked objectives.
Industry players such as Pioneer Natural Resources (PXD) see 50 billion barrels of
industry recoverable resource potential in the Midland Basin. Since 2009, production in the
Spraberry/Wolfcamp play within the Permian has increased by approximately 450 MBoe/d,
but horizontal production only represents 40 MBoe/d or 9% of this growth. The pendulum
could shift meaningfully as the horizontal rigcount has reached 60 rigs in the Midland
Basin alone.
Well results suggest that operators have de-risked large parts of the Horizontal Wolfcamp,
with estimated ultimate recoveries (EUR) generally noted in the 450-750 MBoe range in
the Southern Midland Basin. While activity remains limited in the Northern Midland Basin,
there have been several recent positive well results released by industry in Midland county,
with peak 24-hour production rates of 651 Boe/d, 770 Boe/d and 892 Boe/d (89% oil),
respectively, at lateral well lengths of 4,351 feet, 4,451 feet and 4,830 feet. The wells were
drilled in the Western part of Midland County targeting the Wolfcamp B bench and have
estimated EURs ranging from 400 to 500 MBoe, which we view as noteworthy given the
modest lateral lengths.
In February, PXD announced results at the DL Hutt C #1H, which was completed in the
Wolfcamp B interval. This well tested at 1,693 Boepd with a 20-day rate of 1,510 Boepd
(7,380 foot lateral length). This well is performing towards a 1 MMBoe EUR, which should
generate a rate of return of ~60% with a $13m net present value (NPV) assuming an
$8.5m well cost. The company’s second attempt (Mabee K #1H), a northern extensional
test in its Northern Midland Basin acreage, is a major success, testing at 1,572 Boe/d with
a 77% oil cut. This is roughly 28 miles to the north of its initial Hutt 1H well. Note the
economics of the Hutt well as illustrated in Exhibit 115, which should give an indication as
to the future characteristics of outstanding wells.

1 October 2013
The Shale Revolution II 71
Exhibit 115: Horizontal Wolfcamp—Estimated Economics of Northern Midland Basin Ext
ended Laterals
Well Productivity
30 day rate (Boe/d) 918
Gross EUR (Boe) 578,100
Net EUR (Boe) 462,480
% oil 77%
% gas 10%
% NGL 13%
1st year decline -79%
B-factor 1.25
Cost Assumptions
Completed well cost $9.00
LOE & Gathering 9.00
Production taxes 6.0%
Tax rate % 36.0%
Royalty 20.0%
Discount rate 10.0%
Well economics
F&D cost $15.57
IRR (pre-tax) 27.9%
NPV per well ($ MM) $5.5
NPV/I 0.6x
PV-10 $14.5
PVI (x) 1.6x
Southern Midland Type Curve
0
60
120
180
240
300
360
0
100,000
200,000
300,000
400,000
500,000
600,000
700,000
1 3 5 7 9
11
13
15
17
19
21
23
25
27
29
31
33
35
37
39
Ave
rag
e A
nn
ua
l p
rod
uc
ion
(b
oe
pd
)
Cu
mu
lati
ve
Pro
du
cti
on
(b
oe
)
Year
Cumulative Production (boe)
Annual production (boepd)
Source: Industry data, HPDI, Credit Suisse Equity Research
On the Horizon…
We anticipate significant drilling results from key players in the Basin as the industry looks
to de-risk this play. Exhibit 116 illustrates horizontal permit activity in Midland County. Note
the significant amount of permitted wells; so we expect a significant level of news flow,
particularly in the back half of 2013.
Exhibit 116: Northern Midland Basin Horizontal Permit Activity CURR_OPER_NAME COUNTY LEASE_NAME WELL_NO TOTAL_DEPTH GRANTED_DATE SPUD_DATE
OXY USA WTP LP MIDLAND (TX) DORA ROBERTS RANCH UNIT4510 9500 1/29/2013 3/15/2013
PIONEER NATURAL RES. USA, INC. MIDLAND (TX) DONALD L HUTT C 3H 9920 3/20/2013 4/13/2013
PIONEER NATURAL RES. USA, INC. MIDLAND (TX) DONALD L HUTT C 3H 9920 4/4/2013 4/13/2013
PIONEER NATURAL RES. USA, INC. MIDLAND (TX) DONALD L HUTT 'C' 21H 9190 5/10/2013 5/13/2013
PIONEER NATURAL RES. USA, INC. MIDLAND (TX) E.T. O'DANIEL 2H 10598 4/29/2013 5/18/2013
PIONEER NATURAL RES. USA, INC. MIDLAND (TX) DONALD L HUTT C 4H 9920 3/20/2013 5/24/2013
PIONEER NATURAL RES. USA, INC. MIDLAND (TX) DONALD L HUTT C 4H 9920 4/2/2013 5/24/2013
CMS OIL AND GAS COMPANY MIDLAND (TX) INTERSTATE "A" 502H 12100 1/28/2000 6/6/2013
CMS OIL AND GAS COMPANY MIDLAND (TX) INTERSTATE "A 502H 12100 8/14/2000 6/6/2013
ENDEAVOR ENERGY RESOURCES L.P. MIDLAND (TX) INTERSTATE 'A' 502H 12000 4/15/2013 6/6/2013
RESOLUTE NATURAL RES. CO., LLC MIDLAND (TX) MIDKIFF 1818H 11000 5/31/2013 6/7/2013
DIAMONDBACK E&P LLC MIDLAND (TX) ST S 501H 10500 6/7/2013 6/13/2013
DIAMONDBACK E&P LLC MIDLAND (TX) ST W 706H 10300 6/11/2013 6/15/2013
PIONEER NATURAL RES. USA, INC. MIDLAND (TX) DONALD L HUTT 'C' 22H 8920 5/13/2013 6/23/2013
RSP PERMIAN, LLC MIDLAND (TX) KATIE (ALLOCATION) 1109H 12000 5/20/2013 6/25/2013
RSP PERMIAN, LLC MIDLAND (TX) KATIE 1109H 12000 5/29/2013 6/25/2013
DIAMONDBACK E&P LLC MIDLAND (TX) ST NW 3603H 10500 6/28/2013 7/5/2013
PIONEER NATURAL RES. USA, INC. MIDLAND (TX) DONALD L HUTT C 5H 10100 6/13/2013 7/10/2013
PIONEER NATURAL RES. USA, INC. MIDLAND (TX) E.T. O'DANIEL 1H 9500 4/29/2013 7/13/2013
DIAMONDBACK E&P LLC MIDLAND (TX) ST NW 3602H 10500 6/28/2013 7/18/2013
DIAMONDBACK E&P LLC MIDLAND (TX) ST W 4305H 10300 7/23/2013 7/24/2013
RESOLUTE NATURAL RES. CO., LLC MIDLAND (TX) PEARL JAM 2417H 10500 6/28/2013 7/28/2013
RESOLUTE NATURAL RES. CO., LLC MIDLAND (TX) PEARL JAM 2417H 10500 7/24/2013 7/28/2013
DIAMONDBACK E&P LLC MIDLAND (TX) ST 4106H 10500 7/30/2013 8/2/2013
DIAMONDBACK E&P LLC MIDLAND (TX) ST 4105H 10500 7/29/2013 8/4/2013
RSP PERMIAN, LLC MIDLAND (TX) SARAH ANN 3814H 12000 2/20/2013 8/6/2013
RSP PERMIAN, LLC MIDLAND (TX) KEMMER 4210H 12000 4/17/2013 8/10/2013
DIAMONDBACK E&P LLC MIDLAND (TX) ST NW 2504H 10500 7/25/2013 8/12/2013
DIAMONDBACK E&P LLC MIDLAND (TX) ST NW 2505H 10500 7/23/2013 8/15/2013
RSP PERMIAN, LLC MIDLAND (TX) KEMMER SL 4210WB 12000 6/25/2013 8/16/2013
PIONEER NATURAL RES. USA, INC. MIDLAND (TX) DONALD L HUTT C 6H 10100 6/7/2013 8/20/2013
DIAMONDBACK E&P LLC MIDLAND (TX) ST 4106H 10300 7/22/2013 8/22/2013
ATHLON ENERGY OPERATING LLC MIDLAND (TX) TXL 'N' 7-3 (ALLOC) 5H 9900 7/22/2013 8/24/2013
RSP PERMIAN, LLC MIDLAND (TX) PARKS BELL 3909H 12000 12/19/2012 9/16/2013
CALLON PETROLEUM OPERATING CO MIDLAND (TX) KENDRA-ANNIE 1481H 9900 9/6/2013 9/17/2013 Source: HPDI

1 October 2013
The Shale Revolution II 72
Niobrara
Two of the most powerful franchise assets are the Niobrara and Eagle Ford. In 2012,
companies with significant leverage to the Eagle Ford were generally stock market
winners, including EOG Resources, Marathon, ConocoPhillips and Rosetta Resources.
While we expect continued strong performance from the EF, we believe 2013 will likely be
the year for the Horizontal Niobrara play to shine. Exhibit 117 and Exhibit 118 illustrate the
strong anticipated growth from both plays based on our rig count forecasts. In particular,
note the potential increases to our base case from further drilling efficiencies (less days to
drill a well per rig), which are possible, similar to historical efficiencies seen in the
development of shale gas resources.
Exhibit 117: HZ Niobrara Forecast Model Exhibit 118: Eagle Ford Shale Forecast Model
Eagle Ford Shale Production Forecast Model
0
1,000
2,000
3,000
4,000
5,000
6,000
7,000
8,000
Jan
-09
May-0
9
Sep
-09
Jan
-10
May-1
0
Sep
-10
Jan
-11
May-1
1
Sep
-11
Jan
-12
May-1
2
Sep
-12
Jan
-13
May-1
3
Sep
-13
Jan
-14
May-1
4
Sep
-14
Jan
-15
May-1
5
Sep
-15
Jan
-16
May-1
6
Sep
-16
MM
cf/
d
Base Case CAGR: 24%10% Improvement: 27%20% Improvement : 29%
20% Efficiency Improvement
10% Efficiency Improvement
Base Case
Source: HPDI, Smith Bits, Credit Suisse Equity Research. Source: HPDI, Smith Bits, Credit Suisse Equity Research
In addition to further efficiencies, we note that franchise assets such as the Eagle Ford
and Horizontal Niobrara offer the potential to raise recovery factors over time. We illustrate
the impact on value from downspacing (more wells per section) and stacked pay
opportunities in the Niobrara. Exhibit 119 illustrates the producing intervals in the
Wattenberg, with a 300-foot section holding up to six intervals (produceable layers). NBL
estimates that there is 74 MMBoe of hydrocarbons in place per section (640 square acres).
In 2012, NBL and other companies such as APC had several pilot projects to test the
potential to increase recovery factors. If successful, these could significantly increase the
value from their acreage position.
On the Horizon…
The industry is focused on downspacing and stacked pay potential, which could
significantly increase the recovery factors of the play
Exhibit 119: Wattenberg Cross Section
Source: Noble Energy.
In 2011, Noble Energy’s testing suggested that the horizontal Niobrara would work down
to 160 acres (4 wells per section), suggesting an NPV per section ranging from $13m to
$38m, depending on how many intervals could be economically developed.

1 October 2013
The Shale Revolution II 73
Exhibit 120: Horizontal Niobrara—NPV per Section Assuming 160-Acre Spacing, $m
Horizontal Niobrara: NPV per Section 160 Acre Spacing
$12.80
$25.60
$38.40
$0
$5
$10
$15
$20
$25
$30
$35
$40
$45
160s-1 Horizon 160s-2 Horizons 160s-3 Horizons
NP
V p
er 6
40 a
cre
Sec
tio
n
Source: Credit Suisse Equity Research estimates.
In 2012, further testing suggested that the horizontal Niobrara would work down to
80 acres (8 wells per section), given the lack of interference on tightly spaced wells, which
suggests an NPV per section ranging from $26m to $77m, depending on how many
intervals could be economically developed.
Exhibit 121: Horizontal Niobrara—NPV per Section Assuming 80-Acre Spacing, $m
Horizontal Niobrara: NPV per Section 80 Acre Spacing
$25.60
$51.20
$76.80
$0
$10
$20
$30
$40
$50
$60
$70
$80
$90
80s-1 Horizon 80s-2 Horizons 80s-3 Horizons
NP
V p
er 6
40 a
cre
Sec
tio
n
Source:Credit Suisse Equity Research estimates
Exhibit 122 illustrates the pilot testing that NBL is conducting at Wells Range, which is
looking at tightly spaced wells (300 ft.) and multiple producing horizons.

1 October 2013
The Shale Revolution II 74
Exhibit 122: Wells Ranch 24 Pilot—Cross Section View of Pads
Source: Noble Energy
Under a blue-sky scenario, we could see up to 30 wells per section. Note the PV per
section could range from $51m to $154m assuming 40-acre spacing.
Exhibit 123: Horizontal Niobrara—NPV per Section Assuming 40 Acre Spacing, $m
Horizontal Niobrara: NPV per Section 40 Acre Spacing
$51.20
$102.40
$153.60
$0
$20
$40
$60
$80
$100
$120
$140
$160
$180
40s-1 Horizon 40s-2 Horizons 40s-3 Horizons
NP
V p
er 6
40 a
cre
Sec
tio
n
Source: Credit Suisse Equity Research
We believe the ‘rate of change’ for its DJ Basin asset base is improving on numerous
fronts—rising liquids mix, EURs, well counts, infrastructure availability and inventory. We
are in the very early innings of this resource play. Historical data suggest this is a much
more important driver of stock performance, particularly for companies developing large
US unconventional onshore asset bases.
Impacted Stocks
PDC Energy (PDCE) – Outperform, $65 TP
We believe PDCE offers investors some of the greatest leverage to two areas of increased
investor focus: the Niobrara and the Utica shale. The company has ~100k net acres in the
core Wattenberg Niobrara, which we think is one of the most solid projects in US E&P.
Along with its peers, the company continues to explore ways to best exploit the field and
maximise resource recovery, including tapping additional horizons horizontally (Codell,
Niobrara C and A benches), denser spacing and longer laterals, all of which should prove
to be NAV-accretive. The company has an abundance of catalysts coming down the pipe,
including its 16-well Waste Management pad, which is being drilled now.

1 October 2013
The Shale Revolution II 75
In the Utica, momentum remains strong because of an ongoing stream of positive results
from GPOR and Antero in Guernsey, Noble, Belmont and Harrison Counties, OH. PDCE
has drilled its initial Washington County, OH, well (Garvin 1H), and should have results in
3Q13 helping to derisk the southern portion of its Utica position. The company has already
reported two operated horizontal wells with the Detweiler 42-3H in G Guernsey County,
OH, that exhibited at a 24-hour IP rate of 2,039 Boe/d (49% condensate, 26% NGLs and
25% natural gas assuming full ethane recovery), and the Onega Commissioners 14-25H,
which had a peak IP rate of 1,796 Boe/d and a 24-hour rate of 1,501 Boe/d.
Trading at ~$52 per share, we estimate the company’s PD reserves (398 Bcfe) are worth
$10 per share net of debt, implying a market value of ~$1.3bn for the company’s deep,
high rate-of-return project inventory including 99k net acres in Wattenberg, 46k net acres
in the Utica and 76k net acres in the Marcellus. We argue the Wattenberg alone provides
PDCE with a project inventory with a potential undiscounted NPV of $15bn, which includes
infill drilling, Codell and Niobrara C potential.
PDCE is trading at a 17% discount to our ‘PD-Plus’ NAV at the Credit Suisse price deck vs.
the Credit Suisse SMID-cap peer group at a 13% discount. On multiples, PDCE is trading
at 13.2x 2013E and 7.0x 2014E EV/EBITDA (unhedged at the futures strip) vs. 6.3x and
4.8x for peers, respectively.
Marathon Oil (MRO) – Outperform, $45 TP
MRO is one of our top picks; it is holding an Eagle Ford analyst day in early December
where we believe management will discuss downspacing success and plans to ramp up
the rig count in the Eagle Ford, both of which would be value accretive to our Eagle Ford
NAV. This is one of the key catalysts for which the market is waiting. In the interim, the
Eagle Ford continues to improve. The pace of completions should pick up as MRO shifted
to 80% pad drilling in 2Q13. Importantly, recent IP rates are running 50% above our
conservative modeling assumptions in Karnes county. MRO does not require cash, so
execution of the remaining $0.2- $1.7bn of the disposals target could be used to buyback
up to 7% of equity.
Anadarko (APC) – Outperform, $109 TP
While the Tronox litigation remains a key overhang, we believe management is close to
unlocking significant value through a series of asset monetizations/divestitures. APC
recently sold a 10% interest in Mozambique for $2.64bn of cash, which was above our
expectations. Additionally, management plans to monetize its operations in Brazil and trim
its ~90% stake in WGP. We believe these actions will help close the gap to APC's intrinsic
value. From a long-term perspective, APC has a portfolio of high quality onshore and
international assets that provide meaningful exposure to US onshore unconventional
drilling (horizontal Wattenberg, Eagle Ford and Permian), GoM and a world-class LNG
project in Mozambique. We see the release of the final ruling in Tronox as an re-rating
opportunity for the stock, as 23% of investors in our most recent survey (July 11, 2013)
expressed interest in owning APC shares but remained on the side-lines given the
perceived tail risk.
An intriguing near-term catalyst is emerging growth from the Delaware Basin, where APC
has increased its rigcount to 10 rigs from 6. Initial wells in Ward County have registered oil
IPs of 1,000 Bopd.
APC is trading at 4.7 times 2014E EBITDA, compared to the large-cap average of 5.6
times. On a net asset valuation basis, APC trades at ~20% discount to our NAV of $117
per share, compared to the group average of 10%.

1 October 2013
The Shale Revolution II 76
Gulfport Energy (GPOR) – Outperform, $72 TP
With a series of strong well results out of the Utica, GPOR has identified the sweet spot of
the play and has quickly taken the driver’s seat in leading the exploration activity in the
basin. The infrastructure issues are getting ironed out near term with the recent start-up of
MWE’s Cadiz I processing plant, the Seneca I and II plants scheduled for 4Q13 start-up
and additional gas processing and fractionation expected in 2014. As a result of the rapid
shift from exploration to development in the southern Utica core paired with the
infrastructure build-out, we estimate GPOR is capable of delivering production growth at
a ~140% CAGR through 2015.
The company is accelerating its program in the Utica to seven rigs (from six) by the end of
1H13 and drilling 55-60 wells in 2013 (95% WI wells in 2H13) and we estimate it will drill
~120 gross wells in 2014. While the focus remains on the Utica (+128k net acres), the
company also holds a 25% equity stake in Grizzly Oil Sands ULC which holds over 800k
net acres in the Athabasca and Peace River oil sands regions in Alberta, Canada, and a
15% equity stake in Diamondback Energy (FANG) that holds over 50k net acres in the
Midland Basin in West Texas.
GPOR trades at a 30% discount to our revised ‘PD-Plus’ NAV estimate compared with a
13% discount for its peers. On EV/EBITDA, GPOR trades at 12.5x 2013E and 4.5x 2014E
vs. the peer group at 6.3x and 4.8x, respectively.
Pioneer Natural Resources (PXD) – Outperform, $209 TP
We had argued that PXD was the Range Resources (RRC) of the oil market given its
franchise asset position in the Permian Basin, with approximately 900,000 acres in the
heart of the Midland Basin. Importantly, PXD's second Northern Midland test appears to
confirm the prospectivity of one of the largest new unconventional oil plays in the US as
the well was completed approximately 28 miles north of the Hutt well. While expectations
were high, we believe the initial rate and high oil cut will be enough to push the stock
higher given the further de-risking of the play. This should also bode well for Diamondback
Energy (FANG), which is levered to the Northern Midland Basin.
PXD’s stock performance will be dictated by its northern well results. The next result
should be its Wolfcamp A test in Midland, offsetting its Hutt attempt. Four horizontal rigs
will be added this quarter, so the information flow should pick up considerably. Its five rig
programme will be split between the Wolfcamp and the Jo Mill/Spraberry. Third-party
results suggest that the additional reservoirs outside the Wolfcamp should be successful in
the north. Further success should drive upside potential to guidance that is largely
underpinned by 500 MBoe type curves for their horizontal program.
Noble Energy (NBL) – Outperform, $67.50 TP
From a longer-term perspective, we see a differentiated risk-reward opportunity at NBL
given unparalleled visibility from its five core areas, particularly in the DJ Basin. NBL's
several attempts at high-impact exploration also add to the list of catalysts to reignite
interest among investors. In 2013, NBL expects to complete 300 DJ Basin wells vs. ~200
wells in 2012. Importantly, 60 of these wells look poised to be ‘monster’ wells (extended
laterals that have more than two times the EUR as the shorter laterals) and 80 wells will be
drilled in Northern Colorado (primarily East Pony), which have the highest returns in the
play given liquids yields of 85%.
Thus far, NBL has drilled ~400 horizontal Niobrara wells, with an undrilled inventory of
9,500 wells. We are in the very early innings of this horizontal resource play. Historical
data suggest this is a much more important driver of stock performance, particularly for
companies developing large US unconventional onshore asset bases, than the modest
premium valuation on 2013 metrics (NBL shares trade at 4.7x our 2014E EBITDA vs. 4.3x

1 October 2013
The Shale Revolution II 77
for the large cap peer group).
Exhibit 124: Top shale picks
Company Ticker Sensitivity
(low, moderate,
high)
Area of activity
GULFPORT ENERGY GPOR High Has identified the sweet spot of the play and has quickly taken the driver’s seat in
leading the exploration activity in the basin
NOBLE ENERGY NBL High We see a differentiated risk-reward opportunity at NBL given unparalleled visibility from
its five core areas, particularly in the DJ Basin
PDC ENERGY PDCE High Offers investors some of the best leverage to two areas of increased investor focus: the
Niobrara and the Utica shale
MARATHON OIL MRO High Downspacing success and plans to ramp up the rig count in the Eagle Ford, both of
which would be value accretive to Marathon's NAV.
ANADARKO ADC High Management is on precipice of unlocking significant value through a series of asset
monetizations / divestitures, and has plans to monetize its operations in Brazil.
PIONEER NATURAL
RESOURCES PXD High
PXD's second Northern Midland test appears to confirm the prospectivity of one of the
largest new unconventional oil plays in the US as the well was completed approximately
28 miles north of the Hutt well
Source: Company data, Credit Suisse Equity Research
Exploration & Production – Canada
Overview
A more self-sufficient US gas market is forcing Canadian producers and Canadian
governments to examine with urgency the prospect of new LNG export markets for
Canadian gas supply.
Exhibit 125: Canadian Gas Supply (Bcf/d)
Exhibit 126: Jan-Apr Canadian Exports to the US (Bcf/d)
0.00
2.00
4.00
6.00
8.00
10.00
12.00
14.00
16.00
18.00
20.00
Jan-00 Jan-01 Jan-02 Jan-03 Jan-04 Jan-05 Jan-06 Jan-07 Jan-08 Jan-09 Jan-10 Jan-11 Jan-12 Jan-13
Bcf
/d
Alberta British Columbia Saskatchewan Nova Scotia NWT & Yukon New Brunswick Ontario
9.1
8.1
7.0
6.3
5.55.1
0.0
1.0
2.0
3.0
4.0
5.0
6.0
7.0
8.0
9.0
10.0
2008 2009 2010 2011 2012 2013
Bcf
/d
Source: NEB Source: GLJ
Against this backdrop, several Canadian LNG projects have been proposed in the past
few years that intend to access new export markets in Asia. The competitive landscape
has evolved such that the Supermajors are increasingly assuming a dominant role in
announced projects. For example, Encana and EOG have sold their respective interests in
the Kitimat LNG project to Chevron. Infrastructure needs are also being defined: currently,
TransCanada has been selected for two major pipeline projects for gas delivery to the
west coast.
EQUITY RESEARCH
Jason Frew
+1 403 476 6022

1 October 2013
The Shale Revolution II 78
Exhibit 127: Possible Canadian LNG Projects Project Operator Partners Location Licence mtpa bcf/d Trains Startup
West Coast - defined
Douglas Channel BC LNG Various Kitimat Y 2 0.2 2 2016+
Kitimat LNG Chevron (50%) Apache (50%) Kitimat Y 10 1.3 2 2018+
Pacific Northwest LNG PETRONAS (90%) Japex (10%) Prince Rupert N 20 2.6 3 2019+
LNG Canada Shell (40%) KOGAS, CNPC, Mitsu. (20% ea.) Kitimat Y 24 3.2 4 2020+
Prince Rupert LNG BG N/A Prince Rupert N 22 2.9 3 2020+
WCC Project Imperial, Exxon N/A TBD N 30 4.0 6 2021+
107 14.3
West Coast - undefined
N/A AltaGas (50%) Idemitsu Kosan (50%) N/A N N/A N/A N/A N/A
N/A CNOOC Inpex N/A N N/A N/A N/A N/A
East Coast
Goldboro LNG Pieridae Energy Contact Exploration Goldboro N 10 1.3 N/A 2020+ Source: Company data
Exhibit 128: Possible Canadian Pipelines For Projects
Company Pipe Receipt Point Delivery Point Supply Length Initial Capacity Ultimate Capacity In Service
Apache/Chevron Pacific Trail Summit Lake, B.C. Kitimat LNG facility, Kitimat B.C.Horn River, Liard,
WCSB463 km 1.0 Bcf/d 1.0 Bcf/d N/A
TransCanada Coastal GasLink Dawson Creek, B.C. LNG Canada facility, Kitimat B.C.Montney, Horn River,
Cordova, WCSB700 km 1.7 Bcf/d 5.0 Bcf/d End Decade
Spectra/BG N/A NE B.C. BG facility, Prince Rupert B.C. N/A 850 km N/A 4.2 Bcf/d 2019
TransCanada Prince Rupert G.T. Fort St. John, B.C.Pacific Northwest LNG facility,
Prince Rupert B.C.North Montney, WCSB 750 km 2.0 Bcf/d 3.6 Bcf/d End 2018
Source: Company data
LNG Project Update
Most Canadian LNG projects are in the feasibility stage with potential initial start-up
envisioned around the end of the decade. So far, three projects have received an export
license from the Canadian government (Douglas Channel, Kitimat LNG and LNG Canada).
All told, approximately 14 Bcf/d of capacity is now being contemplated for export off the
west coast from six separate projects. For reference, Canada produced a similar ~14 Bcf/d
of natural gas in 2012.
Below, we briefly summarise some recent developments on the key major projects:
■ Earlier this year, Petronas sold a 10% interest in its project to JAPEX which included a
share in the facility's production for a minimum of 20 years. The project is currently in
the FEED stage with a final investment decision expected by the end of 2014.
■ Chevron and Apache's Kitimat LNG project is also in the FEED stage but with no
explicit timeframe on final investment decision (FID). Chevron has stated it would like
60-70% of long-term sales secured before going ahead with an investment decision.
Prior to Chevron's entrance into the project, Kitimat LNG was experiencing difficulties
in securing long-term contracts from Asian buyers.
■ LNG Canada was the latest to be awarded an export licence early this year by the
NEB. An environmental assessment of the project is currently under way.
■ BG has submitted an application for a 25-year permit to ultimately export 21.6 mtpa
(~2.9 bcf/d) of LNG from three processing trains. BG has already partnered with
Spectra to construct a pipeline from the North East British Columbia producing area to
the coast. On the upstream side, BG's project is different in that a prospective supply
source has not yet been identified; however, the company has stated it would look at
some combination of acquisitions, market purchases or supply contracts to feed its
project.

1 October 2013
The Shale Revolution II 79
■ Recently (mid-June 2013), Exxon and Imperial Oil have applied for what is to be the
largest project proposal to date. The project contemplates ultimate capacity of up to
30 mtpa (~4 bcf/d) on six trains with plans for startup in the 2021+ timeframe. The
export facility location is also to be determined at this point.
As it is still very early, we expect the list of projects and participants to evolve. We also
believe that project delivery timelines could lengthen while the ultimate number of projects
that actually proceed could reduce. As yet, there is little in the way of cost estimates as no
FIDs to proceed have been made. Given the remote location of the proposed projects, we
believe there are real cost risks that would be compounded if multiple projects were to
proceed in a condensed timeframe. Cost risk has been a major issue for a number of
years for the oil sands industry in northern Alberta. The major cost issue for the oil sands
has been labour productivity, accounting for perhaps as much as ~80% of cost overruns
historically. Even following the rapid pace of construction during the oil price upcycle of
2003-08, cost risk remains an issue with Imperial and Exxon's Kearl mining project of
2009-2013 also experiencing a significant overrun versus the original budget.
Political Update – British Columbia
In May, the Liberal party won the provincial election in B.C. despite polls pointing to a
possible New Democratic Party (NDP) victory. We view this outcome as favorable for the
continued growth of gas production in the province and for the development of an LNG
export business. Since winning the election, the Liberal party has created a new ministry
dedicated to natural gas. The re-elected premier has also recently indicated her party's
plans to initiate a tax and power-supply framework for the LNG industry in the near future.
Given the Liberal party's stated desire to foster a strong LNG export business and given
the greenfield nature of the capital investment that needs to be made, we would be
surprised if the province moved forward with an overly burdensome fiscal regime.
Consolidation Update
Given the scale of unconventional gas resource emerging in western Canada and the
funding challenges that smaller Canadian producers face, we believe it is logical to expect
that acreage associated with key plays will continue to gravitate towards larger, better-
capitalized and lower cost of capital type entities. Indeed, we have already seen large
caps and Supermajors take significant positions in several of Canada's shale gas plays
(Montney, Horn River, Liard and Duvernay).
In the context of LNG supply, we think continued interest and investment in the basin will
focus on large-scale/lower-cost and liquids-rich gas plays such as the Montney and
Duvernay. We note that in some areas of the Montney, producers are now considering
development schemes of up to 20 wells per section given the thickness of pay and limited
signs of communication between intervals. Such a development plan would likely see
strong cost savings from shared infrastructure and access.
Following Exxon/Imperial's acquisition of Celtic Exploration (gaining the acquirers a
meaningful footprint in the Montney), and Chevron's more recent purchase of additional
Duvernay acreage from Alta Energy, we note that several other producers are marketing
large Montney or Duvernay positions today, namely:
■ TLM – Groundbirch/Greater Cypress Montney (~18 Tcf contingent resource)
■ TLM – North Duvernay (~158k net acres)
CNQ – Graham Kobes (North Montney ~243k net acres)

1 October 2013
The Shale Revolution II 80
Figure 129: Top Shale Picks
Company Ticker Exposure Area of activity
Encana ECA High Pure play on gas, especially shale with exposure to multiple shale gas basins in north Am
Source: Company data, Credit Suisse Equity Research
Oilfield Services
Overview
For the Oilfield Services Group, shales have become the primary driver of activity. The
capital requirements for equipment and the sophistication of the technologies required are
only resident at the larger companies. It was developments in hydraulic fracturing and
directional drilling that made shale development possible and the large capitalization
companies dominate those products and services.
The drive in the industry now is to increase the efficiency of all the processes involved in
order to improve recoveries from the shale reservoirs. Originally, the Eagle Ford shale was
expected to produce only about 3% of the gas in place but, owing to developments in
technology and methodology, the recovery factor has increased to 6% and above. For one
company alone, that translated into an additional 900,000,000 barrels of recoverable oil.
For the E&P industry, to double the recovery from reservoirs without having to find and
lease additional acreage provides a materially higher return on those incremental
recoveries.
Technical developments in using less water, treating produced water, ensuring that well
integrity protects groundwater and reducing the 'footprint' of activity by drilling numerous
wells off one location are all being rolled out to reduce the environmental impact of drilling
and production activity which is as important as increased efficiencies in drilling and
production. We are seeing increasing amounts of restrictions on 'fracking' which is as
much about the preservation of the surface, in parks and wilderness areas, as it is about
the completion technology, which is understandable. That just means that the technologies
of extended reach and directional drilling, completion techniques and drilling efficiency will
all matter more and more, a benefit to several sub-sectors of the Oilfield Services universe.
The implications for our stocks is a concentration of activity with the larger, more
technically competent companies. The high capital cost of the equipment required for this
work also limits the participation by smaller, lower-capitalized companies. Much of the
efficiencies seen have been in reduced time to drill the well but the companies involved in
that process do not capture the additional value created by that efficiency and are the net
losers in the equation.
Recent Developments
Six months ago, the E&P industry ran out of cash owing to unexpected weakness in NGLs
and the continued weakness in natural gas. As a result, drilling activity in Q4 of last year
saw a sharp unseasonal drop, penalizing the earnings of the sector since it coincided with
the continued oversupply of completion-related equipment. Coming into 2013, that low
level of activity persisted, as it seasonally does, with activity only starting to recover as we
came into Q2. Drilling efficiencies had accelerated the spending of budgets in the first half
of 2013 as work schedules and their costs got compressed. This is resulting in
international oil companies, which have set annual capital budgets, having to slow activity
to an extent in the second half of 2013. The independent E&P companies on the other
hand, whose budgets are nothing more than estimates of cash flow, have seen that cash
flow increase as oil prices have moved above $100.
EQUITY RESEARCH
James Wicklund
+1 214 979 4111
james.wicklund@credit-
suisse.com

1 October 2013
The Shale Revolution II 81
We expect expenditures to move up through the second half of 2013 even as the drilling
rig count stalls as drilling efficiency/service intensity continues to increase, by about 9%
this year based on our estimates. While the oil price is currently in backwardation, never a
good situation for forecasting increases in activity, realizations will move up as hedges at
lower prices roll off. Natural gas demand should start to perk up, as the longer-term
demand for the significant US chemical and North American LNG projects come online as
well as the general move by US industry to more natural gas-fired 'horsepower generation'.
Looking back, we believe the second half of 2012 and the first half of 2013 will be seen as
the earnings trough for the sector. So the outlook for the OIlfield Services sector continues
to be positive. The Shale Revolution has meant more manufacturing and less 'wildcatting',
lowering the volatility of activity and normalizing longer-term growth. This trend is pushing
the OFS companies into a greater focus on returns and cash flow generation rather than
on just revenue growth, which had been the compensation driver for executives in the
past. We expect to see companies increase dividends and stock buybacks, returning
capital to shareholders, and this is likely to expand valuation multiples as well.
On the Horizon…
The upcoming technologies that are getting the most attention revolve around 1) the
treating and disposal of water produced in the drilling and production of oil and gas,
and 2) increasing recoveries from existing reservoirs. The first is the greater immediate
issue with shale wells requiring a great deal of water to get the well to produce and the
treatment and disposal of that water. There are a number of treating technologies but so
far none has been able to treat water in the scale required. The drive to increase recovery
of oil and gas from reservoirs has been a long-term goal and effort by the industry and with
shales, those technologies revolve around completion technologies, for which we continue
to look to Halliburton, Baker Hughes and Schlumberger.
Impacted Stocks
The implications for our stocks is a concentration of activity with the larger, more
technically competent companies. The high capital cost of the equipment required for this
work also limits the participation by smaller, lower-capitalized companies. Much of the
efficiencies seen have been in reduced time to drill the well but the companies involved in
that process do not capture the additional value created by that efficiency and are the net
losers in the equation.
Top shale picks
Exhibit 130: Top shale picks
Company Ticker Sensitivity
(low, moderate, high)
Area of activity
BAKER HUGHES INC. BHI High Hydraulic fracturing services
CAMERON
INTERNATIONAL CORP.* CAM High
Frac stimulation trees & frac manifold rentals
HALLIBURTON HAL High Hydraulic fracturing services
SUPERIOR ENERGY
SERVICES, INC. SPN High
Hydraulic fracturing & coiled tubing services
Source: Company data, Credit Suisse Equity Research

1 October 2013
The Shale Revolution II 82
Oil refiners
US shale has improved the cost competitiveness of the US refiners by lowering their input
crude cost and energy cost (natural gas). This sets up the prospect of improved free cash
generation and higher multiples over time. Select US refiners also have large logistics
assets that can form the basis of highly valued Master Limited Partnerships (MLPs).
However, 2013 is a transition year from super normal to more normal earnings. Indeed
earnings power may undershoot the new mid-cycle in 2H13 owing to a global crude
squeeze, pipe infrastructure in excess of near-term supply and no stress yet in Gulf Coast
crude markets. However, looking into 2014/15, as crude supply grows notably from the
Permian and Eagle Ford, WTI-Brent differentials should widen out from near-term lows.
Recent Developments
Over 2013, as we outlined in the Great LLS Debate, we felt the very wide discounts for
domestic US crudes would narrow from April 2013 as infrastructure was built to bring
landlocked crude down to the Gulf (both pipes and rail). This has indeed happened,
perhaps a little faster than the market expected. As Bakken, West Texas, Canadian
crudes move down to the Gulf, the next debate is whether Gulf Coast refining capacity will
be able to process rising domestic light crude. We believe the Gulf Coast refiners will be
able to process light production by backing out imported light and medium crudes.
However, Gulf Coast crude prices (LLS) will likely fall to a small discount, say $2-3/bbl,
versus Brent, over time helping the profitability of Gulf Coast refiners such as MPC, PSX
and VLO. There could also be bottlenecks in shifting crude from Texas over to Louisiana.
The LLS-Brent and Houston-LLS discounts will be critical price spreads to gauge the
stress in the Gulf.
Exhibit 131: Domestic Onshore Crude Production Still
Rising Sharply
Exhibit 132: Sufficient Infrastructure Emerging to
Debottleneck the Mid-Continent
2,400
2,900
3,400
3,900
4,400
4,900
5,400
5,100
5,600
6,100
6,600
7,100
7,600
Jan-
10
Apr
-10
Jul-1
0
Oct
-10
Jan-
11
Apr
-11
Jul-1
1
Oct
-11
Jan-
12
Apr
-12
Jul-1
2
Oct
-12
Jan-
13
Apr
-13
KB
D
KB
D
Domestic Monthly Crude Production [LHS]
Domestic Monthly Crude Production (ex PADD V & Offshore GoM) [RHS]
-1,000
0
1,000
2,000
3,000
4,000
5,000
6,000
2010 2011 2012 2013 2014 2015 2016 2017
(KB
D)
Refining Pipeline
Rail Tanker + Barge
Mid-Con Input Growth
Source: EIA, Credit Suisse Equity Research Source: EIA, Credit Suisse Equity Research
EQUITY RESEARCH
Ed Westlake
+1 212 325 6751
edward.westlake@credit-
suisse.com

1 October 2013
The Shale Revolution II 83
Exhibit 133: LLS-Brent Differential Over Time Exhibit 134: Houston-LLS Differential Over Time
-10
-8
-6
-4
-2
0
2
4
6
8
10
1/3/2005 1/3/2007 1/3/2009 1/3/2011 1/3/2013
$/b
bl
-1.50
-1.00
-0.50
0.00
0.50
1.00
1.50
2.00
2.50
7/29/2013 8/5/2013 8/12/2013 8/19/2013 8/26/2013
LL
S -
Ho
ust
on
($/b
bl)
Source: the BLOOMBERG PROFESSIONAL™ service Source: Platts, the BLOOMBERG PROFESSIONAL™ service
On the Horizon…
■ We believe the large logistics value of select Refiners (MPC, DK, WNR, PSX and
TSO) is not fairly reflected in their share valuations. The compression of WTI-Brent
should also create an opportunity in well-positioned HFC. Once the dust settles, HFC
would still own some of the best-positioned refineries in the US. The key to the group
will likely be the performance of Permian production, the main source of incremental
upstream growth from here (albeit there is still growth from the Bakken, Eagle Ford
and Wattenberg). As Cushing-Gulf crude spreads contract, it is important for LLS-
Brent spreads to widen; otherwise earnings projections may be at risk. The second
half of 2013 could prove the low point for annualised earnings, which should then
expand into 2014E/2015E.
■ We believe RIN (renewable identification number) costs from the US RFS2 legislation
are still a headwind although the likelihood of a further RIN spike seems to be reduced
following recent EPA documentation – see our report EPA Approach May Reduce But
Not Eliminate RIN Costs.
■ Looking more globally at refining, we note that there is new capacity coming, but
demand is also growing. Our margin forecasts reflect a 20% decline in international
refining margins into 2014 (vs 2012 levels) and yet we still find value in the group.

1 October 2013
The Shale Revolution II 84
Exhibit 135: Potential Upside to Sum of the Parts, Including Higher Multiple Logistics, Retail and Accretion from
Buybacks – in $bn
MPC PSX DK WNR HFC TSO VLO ALJ
Current Net Debt/(Net Cash) 134 2,249 (219) (36) (1,786) 2,210 4,426 177
Free Cashflow 3Q13-2016 (7,687) (9,598) (403) (1,253) (1,755) (4,629) (5,657) (67)
Current Debt Less Free cash Through 2016 (7,553) (7,349) (622) (1,290) (3,540) (2,419) (1,231) 109
Shares Bought Back as % of Outstanding -25% -16% -33% -33% -31% -30% -5% 10%
EV/EBITDA Multiple, C-Corp 5.0 5.4 5.0 5.3 5.3 4.5 4.2 3.4
"See Through" EBITDA (Chemicals + Refining) 4,515 5,144 313 663 2,040 1,745 5,374 56
EV (Refining and Chemicals) 22,576 27,857 1,567 3,480 10,708 7,811 22,565 190
EV/ 2015 Share Count 93 53 39 49 77 81 43 3
(+) EV/Sh - Logistics 38 26 25 18 16 48 6 7
(+) EV/Sh - Retail 19 29 8 3 0 15 1 4
(-) Minority Stake (3) (1) (7) 0 0 (17) 0 13
(-) HEP Minority Stake 0 0 0 0 (10) 0 0 0
(-) Pension Liabilities (6) (3) 0 (0) (0) (4) (0) 0
(-) Debt in Associates 0 (6) 0 0 0 (4) 0 0
(+) WRB Cash Receipts 0 3 0 0 0 0 0 0
(+) Ethanol 2.4
Total Non-Refining/Chemical Value 48 48 26 21 6 38 10 23
% of Total 34% 47% 40% 30% 8% 32% 18% 90%
Total Value/2016 Sh 141 101 65 70 83 119 53 26
Implied EV/EBITDA, 2016 5.6 6.2 5.6 5.9 5.1 4.7 4.8 12.9
Equity 141 101 65 70 83 119 53 26
Discounted to 2013 @10% 106 76 49 53 62 89 40 20
Current Share Price 74 58 25 30 46 47 36 13
Potential Upside 42% 30% 94% 74% 37% 91% 11% 55%
Memo: Group EBITDA 2016 6,080 8,576 471 835 2,294 2,476 5,980 151 Source: the BLOOMBERG PROFESSIONAL™ service, Credit Suisse Equity Research estimates (2016 figures and upside numbers are all
estimated)

1 October 2013
The Shale Revolution II 85
Exhibit 136: Impacted Stocks
Location Ticker Sensitivity Area of activity
N/A ALJ, ALDW, DK, CVRR, High Operating cost savings: Cheap US natural gas vs Intl equivalent price
HFC, MPC, NTI, PBF,
PSX, TSO, VLO, WNR
US East Coast PBF, PSX Low - Moderate Feedstock cost savings: Water-borne barrels (i.e. Brent) set global
refined product prices. East Coast refiners largely rely on imported light,
sweet crude barrels (e.g. Brent). Shale crudes (e.g. Bakken) back out
these imports as shale barrels price at discounts (net of delivery) to
water-borne light, sweet crudes.
US Mid-Continent CVRR, HFC, PBF, PSX,
MPC, NTI, TSO, VLO High Feedstock cost savings: Water-borne barrels (i.e. Brent) set global
refined product prices – Shale crudes price at discounts (net of delivery)
to Brent barrels.
US Gulf Coast (in-land) ALJ, ALDW, DK, HFC, PSX, VLO, WNR
Moderate - High Feedstock cost savings: Water-borne barrels (i.e. Brent) set global
refined product prices – Shale crudes price at discounts (net of delivery)
to Brent barrels.
US Gulf Coast (Coastal) ALJ, MPC, PSX, VLO Low - Moderate Feedstock cost savings: Water-borne barrels (i.e. Brent) set global
refined product prices. Currently, domestic light, sweet barrels on the
US Gulf Coast (i.e. LLS) price at a premium to Brent. Once the Gulf
Coast is oversupplied with shale crude (via offtake from the Mid-Con),
LLS prices will trade at a discount to Brent.
US Rockies HFC, PSX, TSO High Feedstock cost savings: Water-borne barrels (i.e. Brent) set global refined product prices – Shale crudes price at discounts (net of delivery) to Brent barrels.
US West Coast ALJ, PSX, TSO, VLO Moderate - High Feedstock cost savings: Water-borne barrels (i.e. Brent) set global
refined product prices. The standard domestic light, sweet crude barrel
for West Coast refiners is Alaska North Slope (ANS). Shale crudes
(e.g. Bakken) replace these domestic crude barrels as shale barrels
price at a discount (net of delivery).
Source: Company data, Credit Suisse Equity Research
Exhibit 137: Top Picks
Company Ticker Sensitivity
(low, moderate, high) Area of activity
PHILLIPS 66 PSX High US East Coast, US Mid-Continent, US Gulf Coast (in-land), US
Gulf Coast (Coastal), US Rockies, US West Coast
TESORO CORP. TSO High US Mid-Continent, US Rockies, US West Coast
WESTERN REFINING INC. WNR High US Gulf Coast (in-land)
Source: Company data, Credit Suisse Equity Research

1 October 2013
The Shale Revolution II 86
Infrastructure US MLPs
Infrastructure Boom
The US shale boom, which has seen natural gas, NGL and oil production vault higher,
continues to trigger unprecedented demand for infrastructure. In this update report, we
highlight the increases in demand for infrastructure across the commodity spectrum—from
oil and natural gas to natural liquids to refined products—and across infrastructure type—
from transportation pipelines, to gathering, processing plants, fractionation facilities, and
storage as well as barges, rail, and trucks—to get product from where it is produced to
where it is consumed in the form that customers want.
The key changes from last year is that NGL and oil production has been even stronger
than expected, which in turn has resulted in capital budgets outpacing the most optimistic
scenarios. Over the past four quarters, nearly all the companies and MLPs that we cover
have rolled out higher capital budgets—not because of cost overruns but owing to
expanding opportunity. We will briefly lay out the landscape in this update.
We continue to believe that investors on the infrastructure side are too bearish regarding
the opportunity set on natural gas transport and have underestimated the ability of
companies to continue to de-risk their balance sheets and business models. The MLPs
exposed to crude logistics have performed exceptionally well as expected and we expect a
pause over the next six months followed by the opening up of additional opportunities as
the resourcefulness of crude oil refiners to adapt their existing configurations to surging
light crude oil production reaches the point of diminishing returns. This should offer further
opportunities for blending and logistics by the middle of next year.
Within the broad theme of growing demand for infrastructure, the stocks we like best are
MWE, TRGP, PAA, MMP, EQM, XTXI, KMI and ACMP.
Recent Developments
One of the more interesting developments since we wrote about this topic six months ago
(Shale Revolution - Potential Naphtha Oversupply: Impacts on Condensate, Chemicals,
Refining and LNG, 5 April 2013) is that with the installation of added pipeline capacity, the
differential has compressed sharply Exhibit 138. Key pipelines placed in service include
the Seaway Phase 1 between Cushing, OK and the Gulf Coast which went into service
with 150,000 bbl/d of capacity as well as the startup of the 225,000 bbl/d Crane pipeline
bringing barrels to the Gulf Coast which had previously gone to Cushing.
EQUITY RESEARCH
John Edwards
+1 713 890 1594
john.edwards@credit-
suisse.com
Bhavesh Lodaya
212-325-4561
bhavesh.lodaya@credit-
suisse.com
Andrew Kuske
+1 416 325 4561
andrew.kuske@credit-
suisse.com
Paul Tan
+1 416 352 4593

1 October 2013
The Shale Revolution II 87
Exhibit 138: Brent Less WTI
-$10
-$5
$0
$5
$10
$15
$20
$25
$30$
/Bb
l
Source: Company data, Credit Suisse Research estimates. NOTE: 2014 to 2016 are estimated
On the Horizon…
On the immediate horizon is the 700,000 bbl/d Keystone XL South project opening up
additional capacity between Cushing and the Gulf Coast. In Exhibit 141 there are a large
number of oil pipelines slated for the rest of this year and the next. Total spend on oil and
gas transportation is large as shown in Exhibit 140.
Exhibit 139: Capital Spending Among MLPs Has Been Concentrated on the Midstream and Has Been Rising Rapidly
$0
$10
$20
$30
$40
$50
2006 2007 2008 2009 2010 2011 2012 2013E 2014E 2015E
CapEx $Bn
Oil & Nat Gas Transportion Gathering & Processing Oil & Nat Gas Production Shipping Propane Coal Others
14% CAGR in CapEx (2007-2013E)
Source: FactSet, Credit Suisse Equity Research

1 October 2013
The Shale Revolution II 88
Exhibit 140: Over three-quarters of CAPEX To Be Concentrated in Pipelines and Gas
Processing
Oil, gas P/L transportation
55%
Gas Processing21%
Others9%
Oil, gas maritime shipping
1%
Propane0%
Oil, gas production MLPs
6%
Coal production
8%
2013-2015E MLP Cap Ex
Oil, gas P/L transportation
Gas Processing
Others
Oil, gas maritime shipping
Propane
Oil, gas production MLPs
Coal production
Source: Credit Suisse Equity Research estimates. NOTE: 2013 actual averaged with 2014 and 2015
estimates

1 October 2013
The Shale Revolution II 89
Exhibit 141: Large Number of Crude Oil Pipeline Projects
Source: Company data, Credit Suisse Equity Research estimates. NOTE: 2014-2018 numbers are
estimated

1 October 2013
The Shale Revolution II 90
Exhibit 142: Crude Oil Projects Graphically Displayed show the Back-loaded Nature of
the Backlog
Source: Credit Suisse Equity Research estimates
Exhibit 143: NGL Pipeline Expansion Projects Mostly Taking NGLs to the Gulf Coast
Project Owner In-service Capacity Description
W Gateway ETP/RGP 4Q:12 209,000 570 miles, 16", W. Tx to Mt Belvieu
Southern Hills DPM 2Q:13 150,000 800 miles, SW KS to Mt. Belvieu
Sand Hills DPM 2Q:13 200,000 720 miles W. TX via EF into Mt. Belviue. Expandable to 350,000 bpd
Texas Express EPD/EEP/APC/DPM 3Q:13 280,000 580 miles, 20" N. TX to Mt. Belvieu. Expandable to 400,000bpd, 95% costs locked in
Sterling III OKS 4Q:13 193,000 540 miles Mid-con to GC
Front Range EPD/APC/DPM 4Q:13 150,000 455 miles of 16" pipe, DJ basin to Skellytown, epxandable to 230,000 bpd, 10 yr ship or pay
MAPL Expansion EPD 2Q:14 75,000 275mbpd to 350mpd, 10 year ship or pay, 265miles, 16", 90% costs locked in
Mariner South SXL/ETP 1Q:15 200,000 Mt. Belvieu to Nederland terminal for export -- not counting on total coming to GC
Aegis Ethane Header EPD 2Q-4Q14 125,000 270 miles to serve GC steam crackers
Cajun Sibon I XTEX 4Q:13 70,000 Mt Belvieu to Louisiana
Cajoun Sibon II XTEX 2H:14 50,000 Mt Belvieu to Louisiana
1,702,000
Mariner East SXL 3Q:14 70,000 Marcellus to Marcus Hook export terminal near Philadelphia
Mariner West SXL 3Q:13 50,000 Started at 20,000 bbl/d .. Marcellus to Sarnia
ATEX Express EPD 1Q:14 190,000 1230 miles, ethane p/l, expandable, propane service could begin 1Q:15
Bluegrass WMB/BWP 2H:15 200,000 convert portion of BWPs Texas Gas p/l plus 600 miles new build, terminates in Louisiana
KMP-MWE 4Q:15 200,000 convert 900 miles of TGP plus 200 miles new build, would terminate at Mt. Belvieu
710,000
Total (1) (2) 2,412,000
Source: Company reports
(1) Not counting Mariner South in total as volumes expected to be exported.
(2) not counting MAPL as they feed into Front Range
(3) not counting Aegis Header as it is not incremental barrels coming to the Gulf Coast
Other Projects Source: Company reports

1 October 2013
The Shale Revolution II 91
Exhibit 144: Rapidly Rising Marcellus Gas Production
Source: Company data, Credit Suisse Equity Research estimates
Note that the rapidly rising gas production in the Marcellus is contributing significantly to
the rising gas processing capacity and NGLs. By 2015 we expect an incremental gas
processing capacity of 12mmcf/d and NGL production of over 1MM bbl/d. Note also the
rapid rise in fractionation capacity as well as NGL pipeline capacity to the Gulf Coast. We
expect depressed commodity prices for at least the next four years, especially in ethane
as it overwhelms the ability of the chemical industry to absorb it through reconfigurations
and additions to existing plant sites. It will take a great number of new steam crackers to
absorb the flood of ethane. Consequently, we expect ethane rejection which we currently
estimate to be running at approximately 225,000-250,000 bbl/d, consistent with our
forecast of last year, to rise further.
The reason for the rejection to arise is that extracting and transporting ethane from the
Marcellus to the Gulf Coast will cost ~15-20 c/gal netting producers about 10 cents or
~$1.50/MMBTU which is far less than just leaving it in the natural gas. This causes the
volume of natural gas to be higher than it could be as the shrink is avoided and as we are
seeing natural gas at TGP Zone 4 and Dominion south has been trading at significant
discounts to Henry Hub. However, we estimate ~600,000 bbl/d of fractionation capacity
coming online by 4Q16 in the Marcellus/Utica with over half of that ethane. This means
that the Shell steam cracker which would have 1.0-1.5m tonnes of ethylene annually of
ethylene production and demand ~80Mbl/d of ethane likely has a much better chance than
many were expecting just a year ago. However, the large increase in NGL production also
means that so much ethane will be left in the gas stream that it will exert pressure on
pipeline specs in the NE, meaning ethane likely continues to trade below natural gas
heating value for quite some time. Shell has said it has received commitments for supply
from Consol Energy, Hilcorp, Noble and Seneca Resources, although we do not know the
volumes. With such high ethane demand from Shell, there is still the issue of storage and
how to manage turnarounds that is acceptable to producers so that production does not
have to be curtailed. The Shell plant would take five years to build; so we do not expect it
to be in-service until 2019 and there is a significant amount of ethane that will be produced
in the meantime that needs to find a home.
The Mariner pipelines will help some of the surplus but they are only 110,000 bbl/d of total
volume being taken away, still leaving an excess of over 200,000 bbl/d of ethane in the NE
by 2016. The recently proposed Bluegrass NGL pipeline by Williams/Boardwalk Pipeline

1 October 2013
The Shale Revolution II 92
Partners and the MWE/KMP JV to convert TGP are also of note. Each of those projects
are Y-grade not ethane dedicated; so that still leaves a question of what to do with the
ethane. There is also not enough export capacity to handle all the propane and butane.
Exhibit 145: 10.5BCF/D of Incremental Gas Processing Capacity Additions (~12%) and 1MM
Bbl/d of NGL Production (~42% of Current Total from NGLs from processing) by Q4 15
0
200
400
600
800
1,000
1,200
0
2,000
4,000
6,000
8,000
10,000
12,000
14,000
3Q13 4Q13 1Q14 2Q14 3Q14 4Q14 1Q15 2Q15 3Q15 4Q15 TBD
MMcf/d
New Processing Capacity Addition (MMcf/d)
NGLs from Processing (Bpd)
Source: Bentek, Company data, Credit Suisse Equity Research estimates. NOTE: Q3 2013 onwards are
estimates
Exhibit 146: NGL Fractionation Capacity Additions
0
200
400
600
800
1,000
1,200
1,400
3Q13 4Q13 1Q14 2Q14 3Q14 4Q14 1Q15 2Q15 3Q15 4Q15 TBD
Mbpd
NGL Fractionation Capacity Additions (000b/d)
New NGL-Pipeline Capacity Addition To the Gulf Coast (000 b/d)
Source: Company data, Credit Suisse Equity Research estimates. NOTE: Q3 2013 onwards are estimates
Top Shale picks
Exhibit 147: US MLP Stocks Exposed to Shale Theme
Company Ticker Exposure Area of Activity
Plains All American Pipeline PAA High Permian, Eagle Ford, Mid-Con, Williston, Rockies, Alberta
Magellan Midstream Partners MMP High Permian
MarkWest Energy Partners MWE High Marcellus, Utica, Permian, Eagle Ford, Woodford, Barnett, Granite Wash, Bossier, Huron
Targa Resources Corp TRGP High Permian, Barnett, Bakken, Louisiana Coast
Crosstex Energy Inc XTXI High Barnett, Permian, Eagle Ford, Utica
Access Midstream Partners ACMP High Marcellus, Utica, Miss Lime, Granite Wash, Permian, Eagle Ford, Wolfberry, Niobrara
EQT Midstream Partners EQM High Marcellus
Kinder Morgan KMI High Permian, Eagle Ford, Louisiana Coast, Alberta, Rockies, Marcellus, Utica
Source: Company data, Credit Suisse Equity Research

1 October 2013
The Shale Revolution II 93
Canadian Infrastructure
We continue to believe shale plays not only provide clear opportunities for infrastructure
companies, but also act as a threat to some incumbent infrastructure. Connecting new
basins with pipe and other related infrastructure assets form the bulk of infrastructure
opportunities. Legacy infrastructure can be negatively affected by the changing commodity
flow patterns in light of growing shale production from non-traditional areas.
Recent Developments
Infrastructure is inherently long-dated and, therefore, relatively slow moving. For recent
developments, we divided our thoughts into two groups:
■ LNG related; and
■ Crude oil dynamics.
In terms of LNG, progress generally continues on the future movements of natural gas via
liquefaction facilities in British Columbia. More specifically, we update the project status for
a number of the west coast LNG proposals in Exhibit 148.
Exhibit 148: Possible Canadian LNG projects Project Operator Partners Location Pipeline Provider Licence mtpa bcf/d Trains Startup
West Coast - defined
Douglas Channel BC LNG Various Kitimat AtlaGas Y 2 0.2 2 2016+
Kitimat LNG Chevron (50%) Apache (50%) Kitimat Chevron/Apache Y 10 1.3 2 2018+
Pacific Northwest LNG PETRONAS (90%) Japex (10%) Prince Rupert TransCanada N 20 2.6 3 2019+
LNG Canada Shell (40%) KOGAS, CNPC, Mitsu. (20% ea.) Kitimat TransCanada Y 24 3.2 4 2020+
Prince Rupert LNG BG N/A Prince Rupert Spectra Energy N 22 2.9 3 2020+
WCC Project Imperial, Exxon N/A TBD N/A N 30 4.0 6 2021+
107 14.3
West Coast - undefined
N/A AltaGas (50%) Idemitsu Kosan (50%) N/A AtlaGas N N/A N/A N/A N/A
N/A CNOOC Inpex N/A N/A N N/A N/A N/A N/A
Discovery LNG Quicksilver N/A Campbell River N/A N 5 0.7 1 N/A
East Coast
Goldboro LNG Pieridae Energy Contact Exploration Goldboro SE/EMA/XOM N 10 1.3 N/A 2020+ Source: Company data, Credit Suisse Equity Research
On the crude oil front, we believe the major theme to watch revolves around the ongoing
challenges with obtaining regulatory approvals. These difficulties provide significant near-
term opportunities for alternative forms of transport such as rail. For some perspective on
this issue, we consider near-term growth of rail uploading capacity in Western Canada in
Exhibit 149. Exhibit 150 contains various Enbridge pipeline systems from the Bakken
along with the crude oil movements by rail. The exhibit provides an outlook from the State
of North Dakota for historical and projected pipeline and rail takeaway capacity.
Exhibit 149: Major Announced Rail Uploading Capacity (b/d)
Operator Location Q313 Q413 Q114 Q214 Q314 Q414
Tundra (Ph. 1) Cromer, MB 30,000 30,000 30,000 30,000 30,000 30,000
Tundra (Ph. 2) Cromer, MB 0 0 30,000 30,000 30,000 30,000
Keyera Cheecham, AB 30,000 30,000 30,000 30,000 30,000 30,000
Canexus Bruderheim, AB 70,000 70,000 70,000 70,000 70,000 70,000
Gibson Hardisty, AB 0 0 60,000 60,000 60,000 60,000
Ceres Global Northgate, SK 0 70,000 70,000 70,000 70,000 70,000
Total Western Canada 130,000 200,000 290,000 290,000 290,000 290,000 Source: CAPP, Credit Suisse Equity Research
EQUITY RESEARCH
Andrew Kuske
+1 416 325 4561
Paul Tan
+1 416 352 4593

1 October 2013
The Shale Revolution II 94
Exhibit 150: US Williston Basin Crude Oil Export Options Year-end system capacity, barrels per day
2007 2008 2009 2010 2011 2012 2013 2014* 2015* 2016*
Butte Pipeline 92,000 104,000 118,000 118,000 145,000 160,000 160,000 160,000 160,000 160,000
Butte Loop (Late 2014) - - - - - - - 110,000 110,000 110,000
Tesoro Mandan Refinery (June/July 2012) 58,000 58,000 58,000 58,000 58,000 68,000 68,000 68,000 68,000 68,000
Enbridge Mainline North Dakota 80,000 110,000 110,000 161,500 185,000 210,000 210,000 210,000 210,000 210,000
Enbridge Bakken Expansion Program (Q1-11/Q1-13) - - - - 25,000 25,000 145,000 145,000 145,000 145,000
Plains Bakken North (Q2 2013, Up to 75,000 BOPD) - - - - - - 50,000 50,000 50,000 50,000
High Prairie Pipeline* - - - - - - - 150,000 150,000 150,000
Enbridge Sandpiper* (Q1 2016) - - - - - - - - - 225,000
TransCanada Keystone XL* (2015) - - - - - - - - 100,000 100,000
Dakota Prairie Refinery (Q4 2014/Q1 2015) - - - - - - - - 20,000 20,000
Thunder Butte Refinery (2015) - - - - - - - - 20,000 20,000
Hiland Partners Double H Pipeline (Q3 2014, Up to 100,000 BOPD) - - - - - - - 50,000 50,000 50,000
Pipeline/Refining Total 230,000 272,000 286,000 337,500 413,000 463,000 633,000 943,000 1,083,000 1,308,000
EOG Rail, Stanley, ND (Up to 90,000 BOPD) - - 65,000 65,000 65,000 65,000 65,000 65,000 65,000 65,000
Dakota Plains, New Town, ND - - - 20,000 30,000 30,000 30,000 80,000 80,000 80,000
Various Sites in Minot, Dore, Donnybrook, Gascoyne, and Stampede (est) - 30,000 30,000 30,000 30,000 30,000 30,000 30,000 30,000 30,000
Inergy COLT Hub, Epping, ND (Q2 2012) - - - - - 120,000 120,000 120,000 120,000 120,000
Hess Rail, Tioga, ND (Up to 120,000 BOPD) - - - - - 60,000 60,000 60,000 60,000 60,000
Bakken Oil Express, Dickinson, ND - - - - 100,000 100,000 100,000 100,000 100,000 100,000
Savage Services, Trenton, ND (Q2 2012 Unit Trains) - - - - - 90,000 90,000 90,000 90,000 90,000
Enbridge, Berthold, ND (Q4 2012) - - - - - 10,000 80,000 80,000 80,000 80,000
Great Northern Midstream, Fryburg, ND (Q1 2013) - - - - - - 60,000 60,000 60,000 60,000
Musket, Dore, ND (Q2 2012) - - - - - 60,000 60,000 60,000 60,000 60,000
Plains, Ross, ND - - - - 20,000 20,000 65,000 65,000 65,000 65,000
Plains - Van Hook, New Town, ND - - - - - 35,000 65,000 65,000 65,000 65,000
Global/Basin Transload, Zap, ND (Estimate Not Confirmed) - - - - 20,000 40,000 40,000 40,000 40,000 40,000
Northstar Transloading - Fairview, MT (Q1 2014) - - - - - - - 100,000 100,000 100,000
Rail Only Total - 30,000 95,000 115,000 265,000 660,000 865,000 1,015,000 1,015,000 1,015,000
All Transportation Total 230,000 302,000 381,000 452,500 678,000 1,123,000 1,498,000 1,958,000 2,098,000 2,323,000 Note: As of May 27, 2013, *Project still in the review or proposed phase. Source: North Dakota Pipeline Authority
With more granularity, we examine the recent pipeline volume declines on two different
Enbridge systems (Exhibit 151 and Exhibit 152).
Exhibit 151: EEP’s North Dakota System volumes ‘000 of barrels a day
Exhibit 152: ENF’s Saskatchewan System volumes ‘000 of barrels a day
0
50
100
150
200
250
Q1
20
06
Q3
20
06
Q1
20
07
Q3
20
07
Q1
20
08
Q3
20
08
Q1
20
09
Q3
20
09
Q1
20
10
Q3
20
10
Q1
20
11
Q3
20
11
Q1
20
12
Q3
20
12
Q1
20
13
250
270
290
310
330
350
370
390
410
430
450
Q1
20
06
Q3
20
06
Q1
20
07
Q3
20
07
Q1
20
08
Q3
20
08
Q1
20
09
Q3
20
09
Q1
20
10
Q3
20
10
Q1
20
11
Q3
20
11
Q1
20
12
Q3
20
12
Q1
20
13
Source: Company data Note: Using FY 2010 for Q4 2010. Source: Company data
These pipeline volume declines are contrasted by the growth in Bakken production that we
show in Exhibit 153 and Exhibit 154.
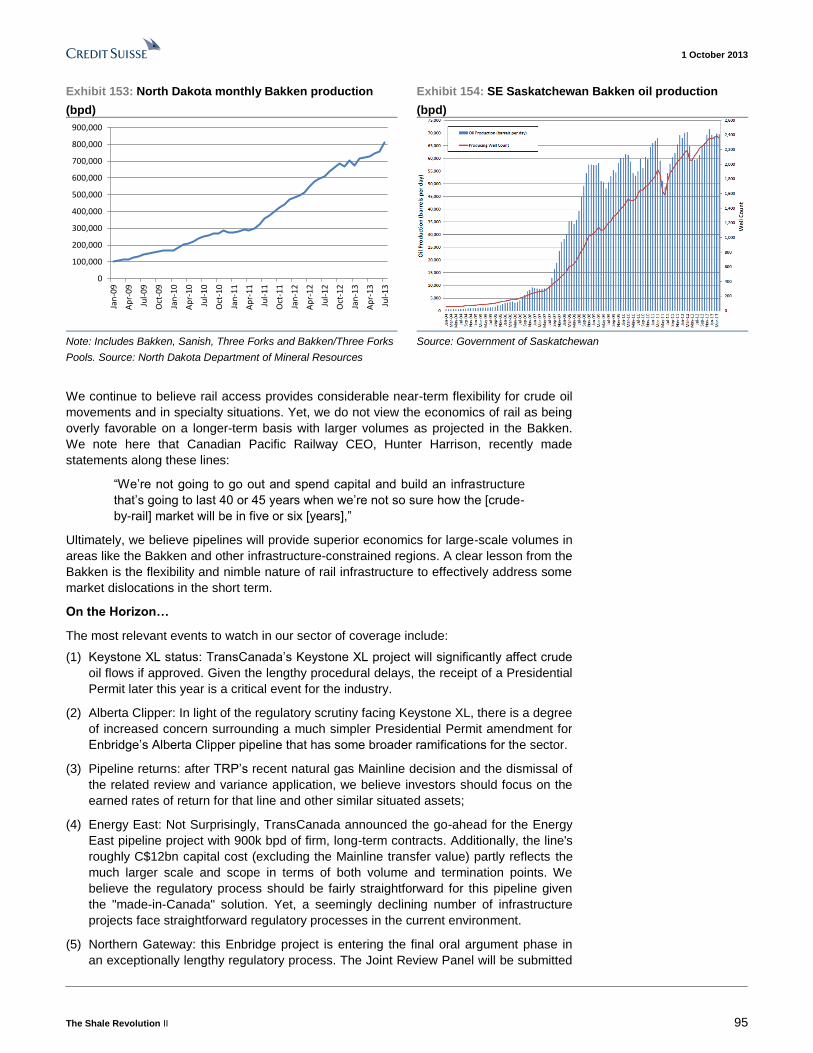
1 October 2013
The Shale Revolution II 95
Exhibit 153: North Dakota monthly Bakken production
(bpd)
Exhibit 154: SE Saskatchewan Bakken oil production
(bpd)
0
100,000
200,000
300,000
400,000
500,000
600,000
700,000
800,000
900,000
Jan
-09
Ap
r-0
9
Jul-
09
Oct
-09
Jan
-10
Ap
r-1
0
Jul-
10
Oct
-10
Jan
-11
Ap
r-1
1
Jul-
11
Oct
-11
Jan
-12
Ap
r-1
2
Jul-
12
Oct
-12
Jan
-13
Ap
r-1
3
Jul-
13
Note: Includes Bakken, Sanish, Three Forks and Bakken/Three Forks
Pools. Source: North Dakota Department of Mineral Resources
Source: Government of Saskatchewan
We continue to believe rail access provides considerable near-term flexibility for crude oil
movements and in specialty situations. Yet, we do not view the economics of rail as being
overly favorable on a longer-term basis with larger volumes as projected in the Bakken.
We note here that Canadian Pacific Railway CEO, Hunter Harrison, recently made
statements along these lines:
“We’re not going to go out and spend capital and build an infrastructure
that’s going to last 40 or 45 years when we’re not so sure how the [crude-
by-rail] market will be in five or six [years],”
Ultimately, we believe pipelines will provide superior economics for large-scale volumes in
areas like the Bakken and other infrastructure-constrained regions. A clear lesson from the
Bakken is the flexibility and nimble nature of rail infrastructure to effectively address some
market dislocations in the short term.
On the Horizon…
The most relevant events to watch in our sector of coverage include:
(1) Keystone XL status: TransCanada’s Keystone XL project will significantly affect crude
oil flows if approved. Given the lengthy procedural delays, the receipt of a Presidential
Permit later this year is a critical event for the industry.
(2) Alberta Clipper: In light of the regulatory scrutiny facing Keystone XL, there is a degree
of increased concern surrounding a much simpler Presidential Permit amendment for
Enbridge’s Alberta Clipper pipeline that has some broader ramifications for the sector.
(3) Pipeline returns: after TRP’s recent natural gas Mainline decision and the dismissal of
the related review and variance application, we believe investors should focus on the
earned rates of return for that line and other similar situated assets;
(4) Energy East: Not Surprisingly, TransCanada announced the go-ahead for the Energy
East pipeline project with 900k bpd of firm, long-term contracts. Additionally, the line's
roughly C$12bn capital cost (excluding the Mainline transfer value) partly reflects the
much larger scale and scope in terms of both volume and termination points. We
believe the regulatory process should be fairly straightforward for this pipeline given
the "made-in-Canada" solution. Yet, a seemingly declining number of infrastructure
projects face straightforward regulatory processes in the current environment.
(5) Northern Gateway: this Enbridge project is entering the final oral argument phase in
an exceptionally lengthy regulatory process. The Joint Review Panel will be submitted

1 October 2013
The Shale Revolution II 96
to the Federal government later this year and made available to the public by year-end.
Ultimately, the Federal government will make the decision to approve or reject the
project; however, the report will provide critical input to that decision process.
LNG continues to be a key area to watch, although we believe the news flow on the above
matters is more important at this time.
Impacted Stocks
As discussed briefly above, there are two broad categories of impacted stocks:
■ Increased capital allocation opportunities; and
■ Business and economic disruption from shale.
In our universe, the companies generally fall into both of these categories with a tilt toward
an increased number and dollar value of capital-allocation opportunities. In this context,
we highlight stocks in and outside our coverage universe in Exhibit 155.
Exhibit 155: Canadian infrastructure companies that have some exposure growth in shale production
Company Ticker Commentary
AltaGas Ltd. ALAALA's midstream assets in Canada could benefit from the growth of shale gas in Alberta and British Columbia. The
company's purchase of Pacific Northern Gas could also open opportunities within LNG development.
Canexus Corp. CUSCUS is involved in crude oil terminal operations in Alberta that serve primarily oil sand and conventional oil & gas. These
assets may benefit from future increased production from shale plays.
Enbridge Inc. ENB
ENB through its other public entities (EEP & ENF) are involved in Bakken shale crude oil transportation through the North
Dakota and Saskatchewan Systems. The company is also involved in crude oil rail terminals. ENB has also projects that will
give it more exposure to shale such as (light oil market access program, Cabin Gas Plant, Peace River Arch).
Enbridge Income Fund ENFExposure to the growing North Dakota & Saskatchewan Bakken crude oil production through its Saskatchewan System.
Alliance Pipeline could potentially benefit from Northeast BC shale plays.
Gibson Energy GEI
GEI is involved in truck transportation of among others crude oil. They are located in numerous oil producing regions, which
includes the North Dakota/Montana/Wyoming regions of the Bakken resource base. GEI is also involved in crude oil rail
transport.
Pembina Pipeline Corp. PPLPPL has midstream assets including crude oil terminal and oilfield hauling business that could benefit from shale growth. The
company's gas services business are situated in proximity to BC shale plays.
TransCanada Corp. TRP
Participating in the growth of shale oil in the Bakken region via Keystone XL (Bakken Market Link). TRP is also involved in the
development of the shale gas in Western Canada (such as Horn River and Montney) through the Coastal GasLink Pipeline
Project and Prince Rupert Gas Transmission Project that will transport shale gas to LNG liquefaction facilities.
Veresen Inc. VSN
Company is part-owner of the Alliance Pipeline that could benefit from the growth in natural gas shales in British Columbia.
VSN is also involved in the Jordan Cove LNG project at Coos Bay, Oregon. The LNG liquefaction & terminal will use natural
gas from Canada and US Rockies. Source: Company data, Credit Suisse Equity Research
Exhibit 156: Canadian Infrastructure Stocks Exposed to Shale Theme
Company Ticker Sensitivity
(low, moderate,
high)
Area of activity
ENBRIDGE INC. ENB High
ENB through its other public entities (EEP & ENF) are involved in Bakken shale crude oil
transportation through the North Dakota and Saskatchewan Systems. The company is
also involved in crude oil rail terminals. ENB has also projects that will give it more
exposure to shale such as (light oil market access program, Cabin Gas Plant, Peace
River Arch).
TRANSCANADA CORP. TRP High
Participating in the growth of shale oil in the Bakken region via Keystone XL (Bakken
Market Link). TRP is also involved in the development of the shale gas in Western
Canada (such as Horn River and Montney) through the Coastal GasLink Pipeline Project
and Prince Rupert Gas Transmission Project that will transport shale gas to LNG
liquefaction facilities.
Source: Company data, Credit Suisse Equity Research

1 October 2013
The Shale Revolution II 97
Transport
Crude by Rail
The rapid growth in shale production in the US and the Canadian oil sands has triggered a
fundamental change in crude logistics. Pipeline capacity has not kept pace with
production, and the rails have quickly filled the gap.
The historical logistics paradigm (whereby rails would act as a temporary stopgap while
pipelines were put in place) has fundamentally changed; if not permanently, then for a
significantly longer period of time than the market may think.
Indeed, the origin/destination pairs that we are observing today will likely evolve with
changing crude flows in the US and Canada. New shale plays are developing and crude
output will again grow faster than take-away capacity, creating a stream of new
opportunities for rail.
Although pipeline is the least expensive transport option, the benefits of rail (speed to
market, extensive geographic coverage, faster transit times and fewer
permitting/regulatory hurdles) support the likelihood that the industry will utilize both
modes in the near and longer term.
Indeed, the high flexibility that the rails have to respond to rapidly changing and
unforeseeable market conditions is a significant asset that should ensure the industry’s
long-term sustainability in the shale revolution. As such, our view is that rail is a
complement to pipeline – and not a temporary surrogate.
Please see our in-depth industry report from January 2013 for more detail (Entering a
New Era in Crude Logistics - Optionality Benefit Warrants a Lasting Position for Rail in
the Shale Revolution).
Recent Developments
As anticipated, the market has changed quite significantly since earlier this year. Crude by
rail volumes continued their steady march upward through May 2013, following which a
significant narrowing in crude differentials led to a marked deceleration in growth.
Further, juxtaposed in the middle of this was the rail disaster in Lac Megantic, Quebec, in
early July, during which a crude train operated by the Montreal, Maine and Atlantic
Railway (MM&A) derailed and exploded.
Volumes have Rolled Over, but Now Stabilized. In light of the narrowing of crude
spreads over the past few months, we have observed a clear deceleration in rail volumes
of petroleum products. In fact, we note that at the start of September, N. American rail
carloading data from the Association of American Railroads (AAR) showed that petroleum
products (the best proxy for crude, although we note that it does include other products)
have decelerated to 11% yoy growth QTD, compared with the 32% yoy growth recorded in
2Q13. For reference, carloads grew 44% yoy in 2Q12 and 45% yoy 3Q12.
However, as shown in Exhibit 157, petroleum product carloads appear to have bottomed,
and turned up slightly in recent weeks. Not coincidentally, we have seen a modest
widening in crude differentials.
EQUITY RESEARCH
Allison Landry
+1 212 325 3716
allison.landry@credit-
suisse.com

1 October 2013
The Shale Revolution II 98
Exhibit 157: Rail Petroleum Product Carloads ('000's of units; 4-wk rolling avg.)
16.0
16.5
17.0
17.5
18.0
18.5
19.0
19.5
20.0
20.5
21.0
21.5
1 3 5 7 9
11
13
15
17
19
21
23
25
27
29
31
33
35
Petroleum products carloads appear to have bottomed
Source: AAR, Company data
Rail Share in Bakken has Retreated, Although Remains a Healthy Majority
According to the most recent data from the North Dakota Pipeline Authority (for June
2013), rail continues to hold the dominant market share position (at 68%) despite having
receded from its high of 75% in April 2013. See Exhibit 158.
We were surprised that rail share continued to rise during the first four months of 2013,
given additional pipeline capacity having come online.
Exhibit 158: Bakken Market Share by Mode
500
550
600
650
700
750
800
850
0%
20%
40%
60%
80%
100%
Feb
-12
Ma
r-12
Ap
r-1
2
Ma
y-1
2
Jun
-12
Jul-
12
Au
g-1
2
Sep
-12
Oct
-12
No
v-1
2
De
c-12
Jan
-13
Feb
-13
Ma
r-13
Ap
r-1
3
Ma
y-1
3
Jun
-13
Rail Pipeline Tesoro Truck Avg. BOPD (right scale)
Source: AAR, Company data
Lingering Questions Remain in the Wake of Lac Megantic
On 7 July, a 72-car train operated by the MM&A carrying crude oil from the Bakken (which
was originated by Canadian Pacific) to the Irving Refinery in New Brunswick was derailed,
and exploded in the small town of Lac Megantic, Quebec, killing close to 50 people,
injuring hundreds, and essentially leveling the center of the town.

1 October 2013
The Shale Revolution II 99
We recognize the sensitivity of the topic, but the devastation has raised a number of safety
and regulatory concerns that will likely have consequences for the rail industry, railcar
manufacturers, and other parties involved in the crude by rail supply chain.
Most recently, the US DOT's Pipeline and Hazardous Materials Safety Administration
(PHMSA) announced that it will collect public comments for 60 days on a proposed
rulemaking (that has been delayed since October 2012) that would potentially require new
safety standards for tank cars carrying crude. This could include the retro-fit of the existing
fleet to make the car walls thicker and more resistant to puncturing—which could cost
upwards of ~$1bn.
Importantly, we point out that the railroads would not be required to foot the bill for the
retrofits—it would be the owner of the tank car asset. Having said that, it is much too early
to tell how the potential new regulations would impact the overall economics of moving
crude by rail.
Canada = Next Opportunity for Crude by Rail
Over the past several months, we have heard the rails discuss the "next big opportunity" in
crude by rail stemming from heavy Canadian crude making its way down to the US Gulf
Coast. Canadian Pacific and Kansas City Southern have each described the opportunity to
move heavy Canadian crude to the Gulf as being one of the largest growth drivers within
its respective energy businesses over the next few years.
So why have we not seen these volumes materialize? Simply stated, the issue has been the
lack of infrastructure. Rail on-loading infrastructure in Canada has been described as about
12-18 months behind the Bakken. Typically, the origination terminals are built prior to the
destination facilities. Tank car availability (particularly heated coil cars that are designed to
carry raw bitumen, i.e. heavy crude without diluent) has also been a bottleneck, although
thousands are currently on backorder for delivery in 2014 and 2015.
We have recently begun to see a number of new facilities in the Oil Sands regions in
Alberta and Saskatchewan, as illustrated in Exhibit 159. Rail capacity is expected to reach
~300kbd by the end of 2013 and more than 700kbd by the end of 2014.
In addition, announcements for additional rail offtake capacity in Western Canada are
unrelenting, in spite of the recent narrowing of spreads. Three new facilities have been
announced in the past two months alone—which have combined onloading capacity of
350kbd:
■ Keyera/Kinder Morgan: On 30 July Kinder Morgan and Keyera Corp announced a
new crude oil rail loading terminal in Edmonton, AB, will be able to load 40,000
bpd. The terminal is set to be commissioned in 2Q14 and could be expanded by
an extra 125k bpd of loading capacity if demand is sufficient.
■ Gibson Energy/US Development Group: On 6 August, Gibson Energy announced
plans to construct a new rail loading facility in Hardisty, AB. The facility will have
an initial capacity of 140,000 bpd and will be serviced by CP's North Main Line. It
is expected to begin operations in 1Q14.
■ Torq Transloading: On 14 August, TORQ transloading announced its plans to
develop a unit train crude-by-rail terminal in Kerrobert, SK. The terminal will be
able to handle up to two 120-car unit trains per day, or around 168k bpd. The
terminal is expected to commence operations in 3Q14 and will be serviced by CP.

1 October 2013
The Shale Revolution II 100
Exhibit 159: Canadian Crude Rail Loading Terminals
Rail Loading Term inals Location 2013E 2014E 2015E 2016E 2017E
Torq Transloading Kerrobert, SK 168 168 168 168
Gibson Energy/US Development Group Hardisty, AB 140 140 140 140
Canexus Edmonton-Bruderheim 70 70 70 70 70
Ceres Global Northgate, SK 70 70 70 70 70
Tundra Energy Marketing Cromer, Manitoba 30 60 60 60 60
Keyera/Kinder Morgan Edmonton, AB 40 40 40 40
Irving Oil St. John, NB 40 40 40 40 40
Keyera/Enbridge South Cheecham, AB 32 32 32 32 32
Gibson Energy Edmonton 19 19 19 19 19
Altex Falher, AB 17 17 17 17 17
Altex Lashburn, SK 15 15 15 15 15
Altex/Southern Pacific Resources Fort McMurrary, AB 12 12 12 12 12
Bulk Plus Logistics (Trimac) Estevan, SK 10 10 10 10 10
Torq Transloading Lloydminster, SK 9 9 9 9 9
Torq Transloading Tilley, AB 8 8 8 8 8 Source: Credit Suisse Equity Research estimates
The Bottom Line
Despite the recent narrowing in spreads and slow rail volume growth over the past few
months, we maintain our favorable stance on the longer-term role of rail in the crude
transportation supply chain. As outlined in our initial deep-dive analysis in January
(Transport Investing in 2013, 18 January 2013), we fully expect there to ebbs and flows in
rail crude volumes over time; as pipeline capacity comes online in 'maturing' shale plays,
new origin/destination pairs will be created via the emergence of other shales.
Supporting this view were comments recently made by Union Pacific, which noted that
origin and destination pairs to keep an eye on are Niobrara, Permian, and Eagle Ford
crude moving to the West Coast; and heavy Canadian crude moving to the Gulf Coast and
the West Coast.
Although it is unclear how quickly these volumes will materialize, we believe it is fair to say
that the rails should see an uptick from the current low double-digit growth level in the next
few months.
Impacted Stocks: The Relative Winners in Crude-by-Rail
Based on our analysis, we expect CP, KSU, and UNP to see the most incremental EPS
upside from crude by rail over the next three years (based on percentage accretion
relative to 2012 earnings).
Importantly, we note that our analysis does not include the potential incremental earnings
accretion for KSU from the proposed Port Arthur Crude Terminal deal (see our note, KSU:
Potential Crude by Rail Deal Could Spark Substantial EPS Accretion). In that scenario,
KSU would be the largest beneficiary from crude by rail relative to its peer group.
Exhibit 160: Transport Stocks Exposed to Shale Theme
Company Ticker Sensitivity (low, moderate, high) Area of activity
Canadian Pacific CP High Crude by rail; inbound drilling materials
Kansas City Southern KSU High Crude by rail; inbound drilling materials
Union Pacific UNP High Crude by rail; inbound drilling materials Source: Company data, Credit Suisse Equity Research

1 October 2013
The Shale Revolution II 101
Materials Chemicals
The shale gas revolution has materially improved the competitiveness of the American
Chemical, as the surge in natural gas liquids (NGL) production has resulted in a flood of
cheap feedstocks for the petrochemical industry. With most other regions forced to use
naphtha (based on global oil prices) and/or regional nat gas/NLGs that are higher cost, the
US has moved toward the bottom of the cost curve for many petrochemicals. This can be
seen in Exhibit 161 which demonstrates where the US has dropped to on the ethylene
cost curve, but there are other chemical platforms that are also now advantaged in the US
including methanol, propylene (through the use of propane dehydro units) and nitrogen in
the fertilizer industry.
Exhibit 161: Current Ethylene Production Cost per Ton (inc. coproduct credits) Global Ethylene Cash Cost Comparison
Source: IHS, Credit Suisse Equity Research
New developments
The enhanced competitive positioning of the US sector has resulted in significant planned
investment in the petrochemical industry with chemical capital expenditures widely expected
to cumulatively reach more than $65bn from 2013-20. While the majority of these
investments will be in the ethylene and on-purpose propylene areas, other shale-related
investments are also accounted for such as methanol, ammonia, and plastic resins. Looking
at the data, we see that the peak capital expenditure year is likely to be 2015, although we
believe there will be some noise with the exact timing of these estimates as there will be
delays that are difficult to account for.
When thinking about ethylene as an example, a rule of thumb our industry experts point to
is that every 1,000 tonnes of annual ethylene capacity costs roughly $1.3m if derived from
ethane. Naptha feedstock crackers tend to be more expensive with a cost of roughly $2m
EQUITY RESEARCH
John McNulty
+1 212 325 4385
john.mcnulty@credit-
suisse.com
Abhiram Rajendran
+1 212 538 9038
abhiram.rajendran@credit-
suisse.com

1 October 2013
The Shale Revolution II 102
per 1,000 tonnes of ethylene cracked, although this is largely useful for comparison
purposes as naphtha crackers will likely not be built in the US for the foreseeable future.
Exhibit 162: Incremental US Chemical Capex Relating to Shale Gas US$ in billions of 2012 dollars
0
2
4
6
8
10
12
14
16
2013
2014
2015
2016
2017
2018
2019
2020
$ in b
illio
ns (
2012 d
olla
rs)
Source: American Chemistry Council
Spending by US Companies in Our Chemical Coverage
Within our coverage, the most directly exposed companies to the shale revolution are Dow
Chemical, LyondellBasell and Celanese. Looking at the various investments we would
highlight the following:
■ DOW—Has significant investments planned to leverage the ethane advantage driven
by the shale revolution. Dow restarted its ethylene cracker at its St. Charles,
Louisiana, facility in 2012 to support its ethylene usage (recall in 2012 88% of Dow's
ethylene was internally consumed to produce downstream derivatives). DOW looks to
be on track to open a PDH facility at its Freeport, Texas, facility in 2015 that will shift
feedstock exposure to propane and help margin expansion (through lower-priced
feedstocks) in its Performance Materials and Coatings & Infrastructure Solutions
segments (two areas where DOW is looking to improve the return profile). Lastly,
DOW also plans to open a world-scale ethylene production plant in Freeport, Texas, in
2017 that will leverage lighter feedstocks and should further support DOW's
downstream businesses.
■ LYB—As we highlight in Exhibit 163, LyondellBasell has also leveraged the US Gulf
Coast advantage with several projects completed already and several more planned to
come online over the next few years. Starting in mid-2014, LYB expects its La Porte,
Texas, ethylene expansion to come online and support annual EBITDA of $250-
$300m with the Corpus Christi debottleneck/expansion (expected late 2015) forecast
to add 800m lbs of ethylene that will be sourced only from NGLs (ethane and
propane). The Corpus Christi expansion is expected to add $250-$300m of annual
EBITDA. In addition, LYB is on track to restart its Methanol facility in Channelview,
Texas, by 4Q13 with permitting now completed and construction under way. The
methanol restart is another way LYB is taking advantage of the attractive economics
from cheaper natural gas, which should help LYB achieve its forecast $250m in annual
EBITDA contribution from this project once fully ramped.
■ CE—Celanese is also planning to leverage lower-cost natural gas with the company
recently having announced a 50/50 joint venture agreement with Mitsui & Co to
produce 1.3m tonnes of Methanol annually. The facility is expected to begin
operations in mid-2015 and have a capital cost of $800m, of which Celanese will be

1 October 2013
The Shale Revolution II 103
responsible for $300m. This methanol stream will help CE feed its acetic acid facility
and help to reduce the risk for CE as its low-cost SCC methanol supply contract is set
to expire in 2015.
Exhibit 163: Selected LyondellBasell Projects
Project Rationale Cost Startup Segment
Channelview, TX 500m lbs of ethylene (naphtha to ethane feed) 25m 2012 O&P Americas
Midwest Debottleneck 100m lbs of polyethylene (Conway ethane cheaper than Mont Belvieu) 25m 2012 O&P Americas
La Porte, TX 800m lbs of ethylene (capacity expansion) 350m-400m 2014 O&P Americas
Gulf Coast PE Debottleneck 220m lbs of polyethyelene 20m 2014 O&P Americas
Channelview, TX Expansion 250m lbs of ethylene 170m 2015 O&P Americas
Corpus Christi Expansion 800m lbs of ethylene 420m late 2015 O&P Americas
Olefin NGL Recovery 150m lbs of ethylene/propylene (using stranded olefins) 200m 2016 O&P Americas
Potential New PE Line 1,000m lbs of polyethylene 200m 2016 O&P Americas Source: Company data, Credit Suisse Equity Research
Apart from DOW, LYB and CE in our coverage, we would highlight that several other
companies such as Williams and Westlake as well as the Chemical assets of PSX, XOM,
EMN, Shell, and Ineos (NR) have taken, or are planning to take, advantage of the shale
advantage presented in the US Gulf Coast with large-scale ethylene capacity
announcements, while other propylene expansions have been announced by Enterprise,
Formosa, as well as Williams and methanol by Valero.
Spending Makeup
Looking closer at the makeup of the spend, we note that labor is the largest component of
the typical cracker investment making up roughly ~40% of the overall spend (including
unskilled and skilled labor). The next largest component is the equipment attached to the
project that makes up roughly 35% of the spend. The remaining 25% is in the
miscellaneous category that includes piping (10%) and electrical equipment (7%) among
other costs.
Exhibit 164: Typical Cracker Spend
Labor41%
Equipment34%
Piping10%
Electrical7%
Other8%
Source: IHS, Credit Suisse Equity Research
In terms of possible limitations or impediments to crackers being built on-time or
possibilities for cost overruns on projects, we would watch the following issues: permitting,
fresh water availability, and equipment availability. For permitting, we highlight that given
the level of investment in the US Gulf Coast the price of certain permits (such as VOC
credits—which operators purchase since many plant sites are in non-attainment areas or
reduce emissions at other locations) has been on the rise. Some credits must be
purchased from an entity that has spare credits available which can sometimes delay or
push up the price of certain projects, although overall we believe that this is not much of
an issue for larger companies that are determined to add capacity and are willing to spend

1 October 2013
The Shale Revolution II 104
more on permitting to keep a project on schedule. Availability of fresh water can potentially
be a limitation or a factor that can cause delays as the increased level of investment has
reduced its availability, while Texas can be prone to drought conditions that can make
water availability more tenuous. In terms of equipment availability, there are only a limited
set of companies that can construct ethane crackers, while certain pieces of equipment
can take several months to put together, which can cause delays as the crackers are set
up.
Costs and Returns
We are already starting to hear about concerns that there are too many projects in the US
scheduled to ramp up over a relatively short time (5-6 years) resulting in labor and/or
equipment shortages leading to the potential for significant cost inflation. Therefore, we
believe it is prudent to analyze what potential capital/investment cost overruns could mean
for overall cracker economics to see what risk to returns there could be and how big they
would have to be before projects stopped making economic sense. Overall, we found that
if ethane remains relatively cheap in the US, the major US ethylene companies would see
economics/returns that would justify the projects even with significant costs overruns (30-
40%).
First, our working assumptions look at a cracker with a 30-year asset life where 1 billion
pounds of ethylene requires an investment of about $1.5bn. Based on current economics
where cash margins are close to ~32 cents per pound for a pure ethane cracker but just
barely breaking even for the naphtha producers (so roughly mid-cycle on a global basis),
we estimate that a typical 1 billion pound cracker has returns close to 25% (base case) at
current levels.
Given potential concerns over rising capital costs, we looked at scenarios that would put
upward pressure on the initial project costs and found that if costs were to rise by 30%,
then the return profile for the project would move down to ~19%, which we still view as
attractive. Furthermore, we find that if capital costs were to double, then the returns for the
projects would move to the ~13% level, which is still above the 10% chemical average
ROGIC across our coverage universe. For capital costs to approximate the 10%
threshold—verage chemical company return—we estimate capital costs would have to be
slightly less than triple for this return to be generated.
Keeping capital costs fixed at the $1.5bn level, we also look at the different return
dynamics under different operating costs scenarios. If we were to see a 30% rise in
production costs, we estimate returns would move closer to the ~21% level. Although
unlikely, if production costs were to double then returns would move down to the low teens
but would remain above the 10% threshold, which is the average chemical return across
our coverage.
While the analysis could change depending on a number of assumptions (for example,
mixed feed cracker and then the proportions of the feedstocks, normalized margin
assumptions), overall the return dynamics for ethylene crackers appear to have a good
economic moat and would likely still be worthwhile even under scenarios where costs rise
noticeably. We believe the projects would likely still go ahead at the 10% return level,
although at that point there may be other projects that could have a higher NPV and create
greater competition for company funds.

1 October 2013
The Shale Revolution II 105
Exhibit 165: Return Projection Scenarios
Change in Capital Costs Change in Operating Costs
Base @ $1.5bn per 1 bn lbs of Ethylene 25.0% Base @ 32 cents cash margin 25.0%
Capital Costs +10% 22.5% Operating Costs +10% 23.5%
Capital Costs +20% 21.0% Operating Costs +20% 22.3%
Capital Costs +30% 19.5% Operating Costs +30% 21.0%
Capital Costs 2x 13.5% Operating Costs 2x 12.5%
Capital Costs 3x 9.8% Operating Costs 2.5x 6.0%
Capital Costs 4x 7.8% Operating Costs ~2.8x 0.0% Source: Credit Suisse Equity Research estimates
Exhibit 166: Top Shale Picks
Company Ticker Sensitivity
(low, moderate,
high)
Area of activity
DOW CHEMICAL DOW High
Could benefit from a cost advantage from shale gas at least until 2015.
LYONDELLBASELL
INDUSTRIES LYB High
Could benefit from a cost advantage from shale gas at least until 2015.
WESTLAKE CHEM WLK High
Could benefit from a cost advantage from shale gas at least until 2015.
ECOLAB ECL High
Cleaning and sanitizing and water treatment and industrial chemicals. 27% of the
segment is tied to energy incl. ofs/chemicals tied to shale-frac-ing
Source: Company data, Credit Suisse Equity Research
Fertilizers
The Revolution in North America Nitrogen Continues
The shale gas revolution has been especially transformative to the global nitrogen industry
over the past several years. While a decade ago North American nitrogen producers were
the marginal cost suppliers (leading to many facilities being decommissioned), they now
reside at the bottom quartile of the global cost curve due to the shale gas revolution. As a
result during the past ~5 years the marginal cost producer has alternated between Eastern
Europe and China, with the Chinese being the primary driving force in 2013.
Exhibit 167: Credit Suisse Global Urea Cost Curve ($/MT) Exhibit 168: Nitrogen Product Overview
$0
$50
$100
$150
$200
$250
$300
$350
$400
Sub
Saharan
Africa
North
Africa
Middle
East
US Gulf Russia China Ukraine
Low Cost High Cost
$/MT
US Gulf pricing ($/MT)
Product N Content Form
Anhydrous Ammonia 82% Gaseous
Urea ~46% Liquid/Solid
Urea Ammonium Nitrate (UAN) 28% - 32% Liquid
Ammonium Nitrate 20% Liquid
Ammonium Sulfate 21% Solid
Ammonium Thiosulfate 12% Liquid
Diesel Exhaust Fluid (DEF) NA Liquid
Key Nitrogen Product Overview
Source: Credit Suisse Ag Science Team, Fertecon, CF, AGU Source: AGU, RNF, Credit Suisse Ag Science Team
EQUITY RESEARCH
Christopher S. Parkinson
212-538 6286
Christopher.parkinson@credit
-suisse.com

1 October 2013
The Shale Revolution II 106
Depending on the region, natural gas comprises roughly 50% to 80% of ammonia
production costs. Investors should note that "upgrading" to a product such as UAN or urea
from ammonia typically entails additional natural gas feedstock and conversion costs
(albeit only utilizing a percentage of a tonne of ammonia). Due to dramatic reductions in
the price of North American natural gas over the past ~5 years, the strategic position of
the region has dramatically improved which has escalated financial returns and lead to a
confluence of planned capacity projects. However, we would note that only roughly ~50%+
of planned projects have come into fruition, a trend which has been evident in 2013 with
several projects being cancelled or delayed for various reasons.
Exhibit 169: North American Key Expansion Projects
Ammonia Urea UAN Other
USA Rentech East Dubuque Illinois Expansion 2013 337 - - 1
USA Rentech Pasadena Texas Debottlenecking 2014 - - - 105
USA Coffeyville Resources (CVR Partners) Coffeyville Kansas Expansion 2014 - 20 - -
USA US Nitrogen Greene County Tennessee Greenfield 2014 - - - 133
USA BioNitrogen Holdings Pointe Coupee Parish Louisiana Greenfield 2015 - 563 - -
USA BioNitrogen Holdings Hardee County Florida Greenfield TBD - 113 - -
USA PotashCorp Lima Ohio Expansion 2015 80 - - -
USA CF Industries Donaldsonville Louisiana Brownfield 2015/2016 1,156 1,223 1,604 532
USA CF Industries Port Neal Iowa Brownfield 2015/2016 770 1,223 - -
USA Iowa Fertilizer Co (OCI) Lee County Iowa Greenfield 2015/2016 ~750 ~750 ~250 -
USA Agrium Borger Texas Debottlenecking/Brownfield 2016 120 640 - -
USA Agrium Kenai Alaska Re-Start TBD 280 640 - -
USA Mosaic Faustina Louisiana Brownfield 2016 1,000 - - -
USA Dyno Nobel (Incitec Pivot) Waggaman Louisiana Brownfield 2016 800 - - -
USA LSB Industries El Dorado Arizona Brownfield 2016 336 - - -
USA Koch Enid Oklahoma Brownfield 2016 - 1,000 - -
USA CHS Inc. Spiritwood North Dakota Greenfield 2016 699 - - -
USA Dakota Gasification Company Beulah North Dakota Brownfield 2016 - 327 - -
USA Ohio Valley Resources Rockport Indiana Greenfield 2016 726 862 - 82
CA IFFCO Canada Becancour Quebec Greenfield 2017 - 2,210 - 4
USA Northern Plains Nitrogen Grand Forks North Dakota Greenfield 2017 699 - - -
USA EuroChem Carville or St. John Parish Louisiana Greenfield 2019 - -
USA Summit Power Group Penwell Texas Greenfield TBD 635+ - - -
USA Magnolia Nitrogen Idaho (Magnida) Southeastern, ID Idaho Greenfield TBD 699 - - -
USA Southeast Idaho Energy American Falls Idaho Greenfield TBD 726 345 218 -
CA Yara* Belle Plaine Saskatchewan Brownfield 2016 - -
CA Agrium* Redwater Alberta Debottlenecking/Brownfield 2016 - 170 - -
USA Agrium* Midwest US Midwest Greenfield 2017 - -
*Suspended/Postponed
Unspecified
1,300
1,800
Incremental Capacity (MTs in 000s)
North American Nitrogen Capacity Projects
Country Company Name Facility Location TypeStart-Up
Year
Source: Credit Suisse Ag Science Team, Fertecon, CF Industries, EuroChem, Company Data
While we believe that the original supply-side concerns (most prevalent in 2012) were
overblown, we stress that the concern should not be limited to North America. In our view
developments that warrant just as much of attention at the lower end of the cost curve
include projects in the Middle East, Africa and Latin America, but for the purpose of this
report we'll keep the focus on North America. That said we believe global demand growth
(comprised of both agricultural and industrial end markets) will keep pace with global
capacity additions. We estimate that global demand growth for nitrogen will grow in the
1.5% to 2.5% range, with modest differences between products (ammonia vs. UAN, etc).

1 October 2013
The Shale Revolution II 107
Figure 170: Estimated Nitrogen Demand (mm MTs, FY) Figure 171: Estimated US Corn Farmer Expenditures
82
84
86
88
90
92
94
96
98
100
10,600
10,800
11,000
11,200
11,400
11,600
11,800
12,000
12,200
12,400
2010 2011 2012 2013E
US Planted Corn Acres N Demand N Demand Est
MTs in 000s
'13E Growth: > -1%
US Planted Corn Acres (mm)
US Corn Acres to N
Demand Correlation: 99%
0%
5%
10%
15%
20%
25%
30%
35%
$0
$100
$200
$300
$400
$500
$600
$700
United
States
Heartland Northern
Crescent
N. Great
Plains
Prairie
Gateway
Eastern
Uplands
Southern
Seaboard
Seed Fertilizer Chemicals Rental Capital Other Fert %
Fertilizer % of Total$/Planted Acre
Source: Credit Suisse Ag Science Team, AAPFCO, CF, USDA Source: USDA, Credit Suisse Ag Science Team
Capacity Additions to Displace US Imports
As the North American market still imports just under ~40% of its total nitrogen from
offshore sources (Trinidad & Tobago, etc.) we note that growth in domestic production will
simply displace imports for the foreseeable future. At present this is particularly important
to consider as US nitrogen fertilizer demand is expected to decline modestly in 2014 due
to lower corn acreage. As we have previously highlighted in our research, we believe that
the USDA estimate of ~97.4mm corn acres is too high and is more likely in the ~95.5mm
acre range, which leads us to believe that the yr/yr decline will not be as exacerbated as
many believe.
Figure 172: Credit Suisse 2013/2014 Corn Projections Figure 173: USDA 2013/2014 Corn Projections
Item 2012/13 2013/14 vs USDA
Area (mm acres)
Planted 97.2 95.5 -1.9%
Harvested 87.4 87.4 -2.0%
Yield
Bushel/Harvested Acres 123.4 154.0 -0.8%
Supply and Use (mm bushels)
Beginning Stocks 989 661 0.0%
Production 10,780 13,457 -2.8%
Imports 162 25 0.0%
Supply 11,931 14,143 -2.7%
Feed & Residual 4,475 5,200 2.0%
Ethanol and By-Products 4,665 4,900 0.0%
Other 1,395 1,450 0.0%
Food, Seed & Industrial 6,060 6,350 0.0%
Domestic Use 10,535 11,550 0.9%
Exports 735 1,300 6.1%
Total Use 11,270 12,850 7.0%
Ending Stocks 661 1,293 -30.3%
Stock/Use Ratio (%) 5.9% 10.1%
Farm Price ($/bushel) $6.90 $4.40-$5.30 1.0%
Credit Suisse Corn Projections
Item 2011/12 2012/13 2013/14
Area (mm acres)
Planted 91.9 97.2 97.4
Harvested 84.0 87.4 89.1
Yield
Bushel/Harvested Acres 147.2 123.4 155.3
Supply and Use (mm bushels)
Beginning Stocks 1,128 989 661
Production 12,360 10,780 13,843
Imports 29 162 25
Supply 13,517 11,931 14,529
Feed & Residual 4,545 4,475 5,100
Ethanol and By-Products 5,011 4,665 4,900
Other 1,428 1,395 1,450
Food, Seed & Industrial 6,439 6,060 6,350
Domestic Use 10,985 10,535 11,450
Exports 1,543 735 1,225
Total Use 12,528 11,270 12,675
Ending Stocks 989 661 1,854
Stock/Use Ratio (%) 7.9% 5.9% 14.6%
Farm Price ($/bushel) $6.22 $6.90 $4.40-$5.20
USDA Corn Projections
Source: WASDE, USDA, Credit Suisse Ag Science Team Source: WASDE, USDA
We would add that the likely regions to experience yr/yr declines in corn acreage are in the
Northern Tier of the US, where the percent of nitrogen volume which is applied to fields is
typically lower, further supporting our view (i.e. a farmer in North Dakota typically applies
less pounds of nitrogen than a farmer in Iowa). As such, we remain much more focused on
global supply side developments, particularly in China, the Middle East and Africa.

1 October 2013
The Shale Revolution II 108
Exhibit 174: Global Urea Prices Exhibit 175: Aggregate Chinese Urea Exports
$0
$200
$400
$600
$800
$1,000
$1,200
Canada
Cornbelt
US Gulf
Black
Sea
Cornbelt :
US Gulf
Spread
$/MT
0%
5%
10%
15%
20%
25%
0
1,000
2,000
3,000
4,000
5,000
6,000
7,000
8,000
9,000
10,000
China % of World Exports
MTs in 000s % of World Exports
Source: Green Markets, FMB Argus, Credit Suisse Ag Science Team Source: Fertecon, Credit Suisse Ag Science Team
International Forces Still Integral to Nitrogen Outlook
Beginning in the 4Q12, a confluence of Chinese urea exports has continued to pressure
global pricing, which we believe is now nearing its marginal cost floor. While we believe we
have reached a floor for urea prices in 2013, there are plenty of themes to monitor over
the next few years. North American producers will still inevitably benefit from higher than
historical margins, but note the magnitude of this benefit is contingent on a few variables
abroad, primarily the current cost of the marginal cost producer.
We believe the current marginal cost of a tonne of Chinese urea is in the $270/t to $290/t
range, but remind investors this is a fluid market and is not simply dependent on feedstock
prices (although it is certainly material to the equation). As the Chinese continue to
execute expansion projects to replace older facilities (to harness greater efficiencies, etc.),
it is entirely possible that there could be a reduction in the domestic cost curve which has
the potential to affect the international market. However, we note that government export
controls (export windows, tariffs, etc.) and growing domestic demand could be a material
offset to the magnitude of this theme (as well as the potential for rising Chinese gas and
coal prices). None the less we view it as one of the most important variables when
analyzing industry profitability going forward.
The other integral aspect to consider is any change to the natural gas price in Eastern
Europe, particularly the Ukraine and Romania as these countries typically act as the
marginal cost supplier during times of lower Chinese supply. We estimate producers in
these regions pay anywhere between $10.00/MMBtu to $12.50/MMBtu, so any revisiting of
the respective natural gas contracts could certainly have a material effect on the industry.
The Evolution of North American Nitrogen Supply
Despite rising demand growth in 2013, a confluence of new supply from MENA (some of
which was offline following the Arab Spring) and rising Chinese exports have been more
than enough to result in pricing pressure. In addition to record Chinese urea exports
pressuring pricing, we note that North American natural gas (although still extraordinarily
attractive to a nitrogen producer) is now well above 2012's euphoric levels.
Despite our view that 2012 represented a relative margin peak for the North American
producer, we note the longer term outlook in the region is still quite attractive. We
predicate our view on natural gas prices remaining below the ~$4.50MMBtu level (or even
$5.00MMBtu), sustainable domestic demand enabling producers to grow production by
displacing imports, as well as premium market pricing in regions such as the corn belt and
Central/Western Canada.

1 October 2013
The Shale Revolution II 109
Naturally, the favorable outlook for nitrogen project economics has attracted a plethora of
planned projects over the last several years, but we note this trend is beginning to wane.
Following an announced greenfield project by the Egyptian firm Orascom in Lee County,
Iowa and several brownfield projects in 2012, over the past ~6 months there have been
several delays and cancellations.
Beginning in June 2012, Agrium (AGU) suspended its plans for a $3bln project (~1.8mm
product tonnes) and decided to instead to focus on securing a partner for natural gas
procurement. That said, we believe the company will still go forward with its Borger, Texas
expansion and will continue to evaluate re-commissioning its Kenai, Alaska facility, which
would add an additional ~900k tonnes of product capacity to AGU's portfolio. Despite the
relatively low price tag to bring the facility back into production, we note the largest
impediment is securing a sustainable source of natural gas feedstock, which was the
primary reason for the facility's decommissioning in 2007.
Yara also decided to postpone its own Belle Plaine facility expansion, which was widely
anticipated to move forward. We believe the general reasoning behind the cancellation
was bulging construction costs in Western Canada. While several projects are still slated
to go forward including from CF Industries, Orascom, EuroChem (announced summer
2013) and Koch Fertilizers, we believe incremental project developments will be
contingent on securing natural gas contracts, reductions in construction costs (in both W.
Canada and the US Gulf Coast) and securing financing/general partnerships . Naturally all
of these variables are considered in conjunction with any change to general market forces.
Key North American Nitrogen Stocks
The key beneficiaries from low North American shale gas costs are CF Industries (CF, N,
TP: US $220) and Agrium (AGU, OP, TP: US $110). We note that while based in North
America, Potash Corp. (POT, UP, TP: US $27) has most of its nitrogen production in
Trinidad and Tobago and has its natural gas feedstock index linked to the price of
ammonia, so we exclude them in our comments for the purpose of this report .
Exhibit 176: CF Nitrogen Gross Margin vs. Natural Gas Exhibit 177: AGU Nitrogen Gross Margin vs. Natural Gas
$0
$1
$2
$3
$4
$5
$6
0%
10%
20%
30%
40%
50%
60%
70%
N Gross Margin Avg Nat Gas Cost Avg Daily H. Hub
Gross Margin % $/MMBtu
$0
$1
$2
$3
$4
$5
$6
0%
10%
20%
30%
40%
50%
60%
70%
N Gross Margin Avg Nat Gas Cost Avg Daily H. Hub
Gross Margin % $/MMBtu
Source: Credit Suisse Ag Science Team, CF, Bloomberg Source: Credit Suisse Ag Science Team, AGU, Bloomberg
While nitrogen gross margins for CF and AGU have certainly come off 2012's peak levels,
we believe they will remain quite favorable for the foreseeable future, particularly relative
to their European and Asian peers. The availability of North American shale gas should
continue to be a significant tailwind for domestic producers, but we stress that this should
not have an effect on global pricing or profitability in other producing regions. We base this
view generally on our view that lower priced nitrogen supply growth will not outpace
demand growth enough to displace China and Eastern Europe as the marginal cost
suppliers.

1 October 2013
The Shale Revolution II 110
Exhibit 178: CF Natural Gas Procurement Distribution Exhibit 179: AGU Natural Gas Procurement Distribution
Henry Hub
47%
AECO
17%
Ventura
5%
Oneok
25%
Dawn
6%
AECO
70%
Henry Hub
16%
Argentina
12%
Other
2%
Source: Credit Suisse Ag Science Team, CF Source: Credit Suisse Ag Science Team, AGU
During the next few years we view the risk of material declines of profitability for North
American producers as rather limited (i.e. feedstock prices should remain favorable).
However, we believe one issue worth monitoring is the evolution of the Chinese cost curve
and government policy. In our view further growth in lower cost, more efficient Chinese
supply has already resulted in a lower marginal cost per tonne in the region, in addition to
lower feedstock prices (note: Chinese production utilizes both coal and natural gas as
feedstock).
While we believe this theme has largely played out, we stress it is it is a variable we are
monitoring closely. That said, we estimate there remains a $120/t to $150/t profit cushion
for most North American producers, so longer term profitability should remain intact.
Exhibit 180: Top Shale Picks
Company Ticker Sensitivity
(low, moderate, high)
Area of activity
CF Industries CF.N High
North America's largest nitrogen fertilizer producer. Could benefit from low-cost shale at
least through 2016E. CF's early startup of new nitrogen capacity could prolong the
period of strong earnings
Agrium AGU.N High North America's second largest nitrogen fertilizer producer. Could benefit from low-cost
shale at least through 2016E.
Source: Company data, Credit Suisse Equity Research

1 October 2013
The Shale Revolution II 111
Steel
We think there are two key factors to consider in terms of the impact of the shale gas
revolution on steel stocks; namely, the effect on both demand and supply. The former
opportunity reflects the end market for steel products while the latter relates to the
potential to lower input costs.
On the demand side, we see the key beneficiaries as Vallourec and Tenaris, which
together account for around two-thirds of the oligopolistic market for premium casing,
tubing and connections (Oil Country Tubular Goods—OCTG). Generally speaking, as
drilling methods become less and less conventional, the demand for premium OCTG
increases.
On the supply side, we also see the potential for steel makers to benefit from lower natural
gas prices as a result of increased supply from unconventional gas production. Cheaper
natural gas can make it more economical to provide the iron input for steel via the Direct
Reduced Iron (DRI) route, which currently accounts for a very small proportion of steel
production but could start replacing the traditional BoF route more materially; and DRI will
increasingly be used as a substitute for scrap in electronic arc furnaces. Voestalpine is the
notable European steel maker directly investing in the DRI method. Elsewhere, Nucor in
the US and Yamato Kogyo in Japan are two notable companies looking to benefit from
iron produced via the DRI route.
Recent Developments
Voestalpine DRI Plant To Be Located in Texas
Voestalpine decided a few months ago to go ahead with its DRI plant in North America,
and has selected La Quinta Trade Gateway, just outside Corpus Christi, Texas, as the
location. Earlier in the year the company had outlined its year 2020 vision which included
the construction of a DRI plant in North America to produce cheap iron for its Austrian
blast furnaces. With 60% of the cost of blast furnace steel production being raw materials,
the potential cost saving is up to $150/t less the freight of $25/30/t, on our estimates. Since
the plans were announced, the location has been selected as discussed above, and it was
announced in July that the plant will be using Midrex technology.
Vallourec VM2 Mill in Ohio Ramping and Turning Profitable
Vallourec's key ramp-up of the VM2 mill in Ohio, which will focus on providing the US
domestic market with OCTG and is located close to the Marcellus basin, is going ahead as
planned and recently turned profitable in Q2. The plant should now be fully ramped by the
end of 2013, and can start producing higher-grade OCTG instead of the commodity-grade
products it has been producing during the initial ramp-up phase. The combination of
superior product mix and ramping volumes should lead to a double positive impact on
Vallourec's earnings, turning the mill from earnings dilutive to earnings accretive.
Nucor Louisiana Mill To Begin Production Imminently
Nucor should be commissioning the Louisiana DRI plant any day now (was planned to be
commissioned in September 2013). Nucor states that instead of being slowly ramped the
plant will immediately begin producing at full capacity, increasing the company's overall
DRI capacity from 2mtpa to 4.5mtpa. In November 2012, Nucor also announced a long-
term agreement with Encana to secure a 20-year supply of natural gas, which should fully
hedge the company against natural gas price fluctuations.
EQUITY RESEARCH
Michael Shillaker
+44 20 7888 1344
michael.shillaker@credit-
suisse.com
James Hanford
+44 20 7883 1551
james.hanford@credit-
suisse.com
Shinya Yamada
+81 3 4550 9910
shinya.yamada@credit-
suisse.com
Ami Tantri
+62 21 2553 7976

1 October 2013
The Shale Revolution II 112
Yamato Kogyo DRI Plant in Bahrain Begins Operation
Yamato Kogyo's new SULB plant in Bahrain began operations in July; we expect equity-
method income from the affiliate to be reflected in consolidated earnings from July-
September. SULB has annual production capacity of 1.5mt for DRI.
On the horizon…
Voestalpine Waiting On Environmental Approval and Final Go Ahead From the Board
Voestalpine does have several steps to go before construction starts on the Texas DRI
plant. Most imminently, the pellet contract is due to be agreed in Q3—key considerations
will be logistics, cost, and the quality needed to produce the DRI product. In line with
Voestalpine's overall raw materials strategy, it will likely choose a handful of suppliers
(from the US, Brazil, Canada) to diversify risk.
After this the key outstanding issue is environmental approval (concerning air pollution)
which is due to be decided in early 2014. The official board approval is due to take place in
1Q14, although we expect it is unlikely for the plans to be rejected at this stage. However,
we do note three large-scale investment projects that have been due to go ahead over the
past 12 years but were then cancelled—hence there is a possibility that Voestalpine could
turn back from its plans depending on the markets and other circumstances. Once
approval has been given, however, the plant should be ready to begin production at the
start of 2016.
Impacted Stocks
Below we outline the stocks within the steel space which we believe will be impacted by or
benefit from the shale revolution. On the demand side, we see the key beneficiaries as
Vallourec and Tenaris which provide the pipes and connections used in shale wells, and
on the supply side several steelmakers are materially investing in DRI to benefit from
lower natural gas prices.
Vallourec and Tenaris
On the demand side, we see Vallourec and Tenaris as the key direct beneficiaries of the
shale revolution as their products are used in drilling and well construction. Together the
two companies account for c.66% of the market for premium OCTG. Tenaris and
Vallourec therefore are two of the primary producers for the drill pipe used to drill shale
wells, the casing which is cemented in place once a well is drilled, and the tubing which is
used inside the casing.

1 October 2013
The Shale Revolution II 113
Exhibit 181: Worldwide premium OCTG market share 2012 Exhibit 182: Premium OCTG consumption by application
VAM (Vallourec/Sumi
tomo)32%
Tenaris Hydril30%
TMK6%
Others32%
Deep water
13%
Shallow water24%
Shales oil & gas USA23%
Shales oil and gas RoW
2%
Others gas17%
Others oil21%
Source: Tenaris Source: Tenaris
OCTG outlook differs by geography
For OCTG producers, there are several separate dynamics at play with regards demand
for premium products. In general, the drilling direction of wells (horizontal, vertical,
directional), gas vs. oil mix, and whether the drilling environment is extreme (e.g. corrosive
or high pressure) is the key determinant of OCTG intensity and the grade of OCTG used.
Casing used in horizontal wells is generally subjected to greater pressure than casing
used in vertical rigs and needs to be higher grade as a result. Horizontal wells also tend to
require higher-grade connections as they must not over-torque, and gas wells generally
require higher-grade connections than oil wells as there must always be a gas-tight seal.
In an extreme environment (e.g. high localised pressure, corrosive, or low temperature)
the grade of casing is usually higher and specialised for the environment, for example
made from a Corrosion Resistant Alloy (CRA).
Overall we think the outlook for premium producers such as Vallourec and Tenaris is
strong as oil and gas production continues to move away from conventional and into
unconventional methods, most notably shale.
Exhibit 183: Example OCTG intensities by type of well
Type of well Measured
depth
% seamless % premium
connections
OCTG tons per
well
% small OD
Horizontal
(unconventional)
13000 60% 30% 190 65%
Vertical
(conventional)
3000 35% <5% 45 25%
Source: Vallourec
The bigger growth opportunity for premium OCTG producers in our view is the
international offshore market, which generally requires much higher-grade products than
many US shale plays. Importantly, major National Oil Companies (NOCs) are significantly
ramping up investment in unconventional plays, with Petrobras for example (a key client
for Vallourec) planning to spend $72bn capex on pre-salt E&P in 2013-17, and Aramco
(NR) materially ramping investment in sour gas drilling. However, the bulk of the business
is still US based and influenced by shale.

1 October 2013
The Shale Revolution II 114
Exhibit 184: API vs. premium requirements Exhibit 185: Global offshore rigs
0
2
4
6
8
Americas International China & Russia
Premium API
North America
10%
Europe14%
Middle East12%
Africa8%Latin America
25%
Asia Pacific31%
Source: Company data, Credit Suisse Equity Research Source: Company data, Credit Suisse Equity Research
Preference for Vallourec
Of the OCTG names, we prefer Vallourec over Tenaris for several reasons. Primary
among these is what we consider to be a clear path to FCF generation as the ramp ups of
key mills VSB and VM2 near completion. VSB is an exporting mill in Brazil that will focus
on premium clients in the Middle East, whilst VM2's location near the Marcellus basin and
existing V&M operations will focus on US clients in Marcellus and other key plays.
These ramp ups should deliver material EBITDA improvement after delays last year which
significantly damaged profitability and weighed heavily on the share price. Further, capex
is coming down significantly with no more capital-intensive projects, which should make
Vallourec one of the best generators of FCF within the basic resources space in our view.
Tenaris by contrast has no additional capacity coming online until the Bay City mill near
Eagle Ford in 2016+, which will be accompanied by a material increase in capex.
Exhibit 186: Vallourec and Tenaris capex and free cash flow yield
Source: Company data, Credit Suisse Equity Research estimates
The resulting divergence in FCF generation for Vallourec versus Tenaris is striking, and if
Vallourec can deliver on capex guidance (which we think it will) there should be a material
re-rating by the market in our view, as Vallourec has been trading at a substantial discount
to Tenaris relative to the WTI price given the difficulty of the prior two years.

1 October 2013
The Shale Revolution II 115
Supply side: DRI to provide cost benefits?
As highlighted, the impact of the shale revolution is not limited to the beneficiaries on the
demand side, i.e. the producers of the OCTG used in shale wells. Steel makers such as
Voestalpine and Nucor would benefit from material cost savings as a result of low natural
gas prices if supply from unconventional production remains so elevated, as well as steel
mill manufacturers such as Danieli (not covered) which manufactures DRI plants.
Both Voest and Nucor, as well as Yamato Kogyo in Japan appear to be ahead of the curve
in investing in DRI technology as an alternative method of producing iron which could
potentially be cheaper than the traditional route if natural gas remains so cheap. DRI is
essentially a scrap substitute, where natural gas is used to reduce the iron ore to a higher-
iron content iron (i.e. similar to pig iron), instead of met coal as per the blast furnace route.
The current landscape and possible changes
At present, DRI represents around 6% of total produced iron globally (the rest being
produced via the BOF route) and EAF represents around 29% of global steel production
(heavily skewed towards the US, which produces c.55% of its steel via the EAF route).
The extent to which DRI is used varies by geography- in the Middle East for example DRI
is the main method of steel production due to the large quantities of natural gas available.
The Middle East accounts for c.20% of global DRI output.
China produces virtually all of its steel via the BF route at present and all iron units
produced are via traditional methods- however this has the potential to change over the
long term if gas prices remain low in the US and shale gas leads to lower gas prices
elsewhere in the world.
Exhibit 187: DRI/BF ‒ global iron ore production (2011) Exhibit 188: Global steel prodn by type (2011)
Source: WSA Source: WSA
Can the savings be kept?
In our view the savings for US producers (of which Nucor appears to be ahead of the
curve) look compelling, and it is hard to believe capital is not likely to be increasingly
invested in DRI capacity in regions where cheap natural gas and iron ore are plentiful.
However, note that the cost benefits of moving to DRI + EAF are only relevant if the
savings can be kept. If they cannot (i.e. the entire global cost curve falls as companies
switch to natural gas) there would be little incentive to try and cut costs and to that extent,
shale gas might not be the revolution that it could be for steel producers.

1 October 2013
The Shale Revolution II 116
The global HRC cost curve is relatively flat, with the steeper lower end dominated by
backward-integrated producers with raw materials. The change on raw material pricing
(long term contracts to quarterly to spot) had a significant effect on flattening out the curve,
as all buyers effectively moved to the same methodology for purchasing raw materials.
Exhibit 189 refers to this operating cost curve, taking into account raw material costs,
energy costs and overheads (but not depreciation or interest expense). Within the 80th-
90th percentile range lie many of the European mills, with US mills at a roughly similar
position (if not slightly lower for some mills). Those in the top decile would need to see
HRC at around 680/t and above, whereas the c.80% of mills with a lower position on the
cost curve would do so at sub-$600 levels.
Exhibit 189: Global steel cost curve HRC Q4 2012 ($/t)
0
100
200
300
400
500
600
700
800
900
1 5 9 10 16 19 27 32 39 43 46 51 55 58 61 65 68 71 73 76 81 82 85 87 88 90 94 96 99 100
90%80%
Both US and
European mills
currently operate at
this level
Source: MBR
We believe savings from using natural gas for US producers can be kept to some degree
given the US only accounts for around 6% of world steel production and therefore has little
effect on the global steel price. As a result of this and the abundance of cheap natural gas,
this could see US producers simply move down the cost curve.
Nucor
Of the US steel producers, Nucor is the most experienced and most heavily invested in
DRI technology. It currently operates a DRI plant in Trinidad with a capacity of 2 mtpa and
its 2.5 mpta DRI facility in Louisiana is expected to begin operating in September 2013,
bringing total DRI capacity to 4.5 mtpa. Furthermore, Nucor can opt to expand the
Louisiana facility, adding an additional 2.5 mtpa and bringing its total DRI production
capacity to 7 mtpa, which would account for about 35% of its required ferrous inputs.
In addition, Nucor took another step up the vertical supply chain in November 2012 when it
announced a long-term agreement with Encana which secures a 20-year supply of natural
gas. This should fully hedge the company against natural gas price fluctuations given the
company's statements that its natural gas supply is sufficient to serve two of its DRI
facilities and all its steel mills. Only minimal details have been released about the
agreement so far but the natural gas investment could potentially result in significant
savings to Nucor over the long term, particularly when taken in context with its DRI
operations.
Voestalpine
We think Voestalpine has one of the best strategies in EU steel with its specialist market
focus, although we think the shares are priced accordingly.

1 October 2013
The Shale Revolution II 117
Last year Voest outlined its 2020 vision which included, most notably given the above,
building a new DRI plant on the coast somewhere in North America (either the US or
Canada) to produce cheap iron for its blast furnace. The location was decided three
months ago as La Quinta Trade Gateway, outside Corpus Christi Texas.
With 60% of the cost of blast furnace steel production being raw materials, the potential
cost saving is up to $150/t less the freight of $25-30/t (to initially replace 10-15% of BF
pellet feed), which is significant. The DRI would be shipped to Austria and used as an
input material into Voestalpine’s existing blast furnaces (replacing 10-15% of the current
iron ore pellet feed).
Nucor suggests the cost saving from an HBI plant can be $150/tonne of crude steel
production, but for Voestalpine it would be $150/tonne less the cost of shipping the steel
US-Austria (we estimate this at $30/t tonne for an overall $120/t saving). There are likely
to be additional costs of running DRI through the blast furnace versus a minimill. Raw
material flexibility is key to the future of steel producers as this is where 60% of the total
costs lie.
We estimate a basic 2mt facility would ultimately cost €500m (say $700m or perhaps
more) to build but expect the company to start small with a modular design that can be
easily added to it if the strategy works. Starting construction in 2013 would see the plant in
production by 2016. The process would also mean less CO2 emissions in Voestalpine’s
steel production which is to become a far more serious issue for the industry as the
generous subsidies of the past look set to be reduced (carbon credits cost Voest around
€10m in FY12).
Exhibit 190: Expected pathway to DRI construction
Source: Company data, Credit Suisse Equity Research
Yamato Kogyo
In the JKT region, the two companies materially investing in DRI are Yamato Kogyo in
Japan and Dongbu Steel (NR) in Korea. Dongbu Steel has stated that it plans to increase
the DRI portion of its overall raw materials from c.20% in 1H13 to 30% in 2014. Elsewhere
in Korea, POSCO and Hyundai Steel barely use DRI and have no plans to increase its
use.

1 October 2013
The Shale Revolution II 118
The one Japanese steel company that is materially investing in DRI technology is Yamato
Kogyo, which we expect to directly benefit from its strategy of investing in DRI in the
Middle East. The new SULB plant in Bahrain began commercial operations in July, and we
expect equity-method income from the affiliate to be reflected in consolidated earnings
from July-September. SULB has annual production capacity of 1.5mnt for DRI, 970,000t
for steel, and 600,000t for rolled steel.
As mentioned above, Nucor has estimated steel made using DRI is cheaper than steel
made in a blast furnace. However, in Bahrain the cost savings could potentially be even
greater, as we estimate the cost of natural gas is c.$2/mmbtu lower than the c.$4/mmbtu
in the US. The availability of low-cost natural gas is the reason for the Middle East being
the region where DRI production is highest globally. We think SULB could potentially
achieve the highest margins in the global steel industry once the DRI facility begins
operating at normal rates, and Yamato Kogyo would stand to materially benefit from its
investments in DRI technology.
Exhibit 191: Top shale picks
Company Ticker Sensitivity Area of activity
Vallourec VLLP.PA High Premium casing, tubing, and connections used for unconventional oil & gas wells
Tenaris TENR.MI High Premium casing, tubing, and connections used for unconventional oil & gas wells
Voestalpine VOES.VI High Specialist steel producer based in Linz, Austria, to construct DRI plant in Texas
Nucor NUE.N High US largest steel producer, mainly produces steel via EAF
Source: Company data, Credit Suisse Equity Research

1 October 2013
The Shale Revolution II 119
Clean Technology The past year has increased our conviction that the shale gas boom will play a meaningful
role in shaping two important industries within the clean technology space – alternative
transport and bio-chemicals.
■ Alternative Transportation: The adoption of Natural Gas Vehicles (NGV) is occurring.
In April, the eagerly awaited 12-liter natural gas engine was released by the Cummins
Westport JV (CWI), introducing the majority of Class 8 trucks to the possibility of
converting to natural gas fuel. As of August 2013, there were more than 70 LNG natural
gas-fueling stations on highways in the US and 1,235 compressed natural gas stations.
The gradual adoption could reduce fuel demand by 30 million gallons per day by 2020 in
the US, based on our scenario model.
■ Bio-based chemicals: The disruption caused by cheap shale gas, and the
corresponding shift to cracking lighter feedstocks, is leading to opportunities for bio-
chemical producers who can create chemicals from sugars at attractive prices relative to
petro-based routes. Additional capital has been secured by companies in this space,
enabling technology development and construction of the first-commercial facilities.
Natural Gas Vehicles Have Shifted to First Gear. Perhaps the most far-reaching break-
through in terms of energy use could stem from fuel switching in transport applications.
The abundant supply of domestically-produced natural gas offers an attractive economic
and geopolitical solution to switch transportation fuels for many countries. Globally, there
are already 16.2m NGVs in use as of 2012 (according to the industry association NGVA).
Pakistan has nearly 3.1m NGVs, which represents 90%+ of the country's vehicle fleet.
We believe NGVs can be adopted in certain markets based on compelling economics.
In our view, vehicle fleets will gradually shift to NGVs in several markets, expanding
opportunities for engine technology providers and fueling infrastructure companies in the
clean technology sector. The primary driver of the adoption is based on the favorable
economics of natural gas fuels relative to diesel and, in some cases, gasoline.
Economics still favorable even following the increase in natural gas prices during
2013. We estimate a two- to four-year payback period for NGVs, based on an economic
model that varies truck class, annual mileage and incremental equipment/engine costs.
Our natural gas input cost of $4.5/mmbtu remains conservative, above the current spot
price of $3.6/mmbtu and the $3.70/mmbtu CS forecast.
Exhibit 192: Natural gas is among the least expensive
energy sources and is relatively cleaner
Exhibit 193: Compelling economics to switch with less
than three-year payback in most price environments LNG is $3/gallon less expensive than diesel….
$/MMBTU
$/Gallon
Diesel
Equivalent
Natural Gas (wellhead) $ 4.50 $ 0.58
+ Pipeline & Delivery Cost $ 2.50 $ 0.32
+ Liquefaction, Infrastructure, Margin + Tax $ 1.33 $ 0.17
Total Natural Gas Fuel Costs $ 8.33 $ 1.08
Current Retail Diesel Costs $ 3.98
LNG discount to Diesel - % (73)%
LNG discount - $/gallon $ (2.90)
And Natural Gas is relatively cleaner as a fuel….
Emission Reductions:
Carbon monoxide (CO) by 70%–90%
Non-methane organic gas (NMOG) by 50%–75%
Nitrogen oxides (NOx) by 75%–95%
Carbon dioxide (CO2) by 20%–30%
Wellhead Natural Gas: 1.65 3.15 4.65 6.15 7.65 9.15
Payback (years)
2.6 5.50 7.00 8.50 10.00 11.50 13.00
1.50 12.5 31.1 (63.5) (15.7) (9.0) (6.3)
2.00 5.3 7.1 10.8 22.5 (285.2) (19.5)
2.50 3.4 4.0 5.0 6.6 9.6 17.7
3.00 2.5 2.8 3.2 3.8 4.7 6.1
3.50 2.0 2.2 2.4 2.7 3.1 3.7
4.00 1.6 1.7 1.9 2.1 2.3 2.6
4.50 1.4 1.5 1.6 1.7 1.9 2.0
5.00 1.2 1.3 1.4 1.4 1.6 1.7
5.50 1.1 1.1 1.2 1.2 1.3 1.4
Green shading indicates payback periods of less than 3 years
Payback reflects Class 8 truck with $60k incremental truck cost, 100k miles/yr
Total Natural Gas Fuel Costs
(fully loaded, LNG)
($/MMBtu)
Die
sel P
rice a
t P
um
p (
$/g
allo
n)
Source: NGVA, Credit Suisse Equity Research, note: Emission
reductions relative to in-use vehicle
Source: Credit Suisse Equity Research
EQUITY RESEARCH
Patrick Jobin
+1 212 325 0843
patrick.jobin@credit-
suisse.com
Maheep Mandloi
+1 212 325 2345
maheep.mandloi@credit-
suisse.com
Brandon Heiken
+1 212 325 6608
brandon.heiken@credit-
suisse.com
Our interactive NGV
economic payback model
and adoption scenario
model is available upon
request.

1 October 2013
The Shale Revolution II 120
Based on our analysis, the US market could gradually adopt NGVs, adding 3.6
bcf/day of natural gas demand (over a 5% increase relative to 2012 demand) and
offsetting 27 million gallons per day in gasoline and diesel consumption by 2020, driven
primarily by only 20% adoption within the heavy-duty trucking segment and 33% adoption
in niche markets such as refuse collection. This trend is underway, with more than
110,000 NGV vehicles on US roads as of 2012 (as per DOE) and new natural gas engines
being introduced by Westport Innovations (WPRT, not covered) and Cummins (CMI,
Outperform).
Exhibit 194: Global natural gas vehicle penetration Exhibit 195: A moderate switch in the US could boost
natural gas demand by 5.3%
-
2
4
6
8
10
12
14
16
1991
1993
1995
1997
1999
2001
2003
2005
2007
2009
2011
Nat
ura
l Gas
Veh
icle
s (m
illio
ns)
Rest of World
United States
Italy
China
India
Brazil
Argentina
Pakistan
Iran
-
5.0
10.0
15.0
20.0
25.0
30.0
35.0
40.0
Natural Gas Petroluem
US
En
erg
y C
on
sum
pp
tio
n (
2011
, Qu
adri
llio
n
BT
Us)
Electric Power Residential + C&I Transportation
Moderate US NGV adoption couldshift 1.3 Quads of energy from
Petroleum to Natural Gas by 2020
Source: NGV Global, Credit Suisse Equity Research Source: EIA, Credit Suisse Equity Research
Recent Developments – US
■ Engines are available: The JV between Cummins, the engine company, and
Westport, launched the much anticipated 12-liter natural gas engine in April 2013.
Although other engine sizes were already available in the market – 9-liter by Cummins
Westport and 15-liter by Westport, a mid-range 12-liter engine was needed for the
majority of Class 8 trucks. Volvo is likely releasing a 13-liter engine in 2H2014.
Adoption will be gradual as fleet owners test engines before full-fleet conversion.
■ Fuel infrastructure build continues, albeit at a slower pace than previously
targeted: Companies are aggressively investing in both LNG and CNG, fueling
infrastructure across the country led by Clean Energy Fuels (CLNE, Not Covered) and
Shell. Clean Energy Fuels installed 70 LNG stations in 2012 and previously targeted
150 stations by end-2013, but later slowed down construction in 2013 as it awaited the
introduction of the Cummins Westport 12-liter engine. Shell announced its proposal to
build 100 LNG stations at TravelCenters of America across the country on April 15,
2013, and the first station is expected to come online in 2014. Other companies that
plan to build NGV-fueling stations in the US include: China-based ENN Group (50
stations in 2013), Encana (mobile fueling tankers), US Oil (50 stations in the next five
years) and Trillium CNG (101 stations by 2016, operates 60 today).
■ Fleets announce 'the switch': Multi-vehicle fleet owners are increasing their NGV
purchases as more vehicles and refueling stations are built. We have already seen
strong adoption in the refuse truck market and expect similar growth in fleets, which
operate on a fixed route. In June 2013, UPS announced that it would purchase only
NGVs for its small package delivery business. FedEx also announced earlier that it
plans to switch its ground fleet to NGVs and has started small pilots. Consumer major
P&G announced in June 2013 that it plans to convert 20% of its fleet operators to
NGVs within the next two years.

1 October 2013
The Shale Revolution II 121
Recent Developments – Outside the US
The US is not alone in the switch. China is actively adopting natural gas-based vehicles in
its fleets. Westport highlighted that demand in China is strong and reported strong sales in
the country. Its Chinese JV (Weichai Westport) reported natural gas engine sales of 20.9k
in 1H13, representing an annualized growth rate of 90%, compared to 22k sold in full-year
2012. Clean Energy Fuels announced in August 2013 that it would supply CNG
compressors to China Gas Holdings over the next three years to help construct 310 CNG
stations in China. We expect a strong push in big cities like Beijing to adopt NGVs in the
transit system, driven by the urge to control air pollution. Beijing plans a five-fold increase
in transit NGVs in 2013 (from 2k to 10k), later expanding to 30k vehicles by 2017 if the
pilot is successful (source: The Twelfth Five Year plan). China's central government too is
pushing for stringent air quality standards, which might result in a shift to relatively low
GHG-emitting options such as NGVs.
Among the companies that are taking advantage of these structural changes we highlight
Westport Innovations and Clean Energy Fuels.
Westport Innovations (WPRT, Not Covered): Westport is a manufacturer of natural gas
engines. It develops and manufactures engines through its own facilities along with two
JVs with Cummins (50% ownership, not consolidated) and Weichai in China (35%
ownership, not consolidated) and has partnerships with OEMs such as Volvo. The
company has a proprietary fuel injection system and has the highest number of patents in
the industry for natural gas engine technology. Westport's first commercial natural gas
engine was launched in 2006 (15-liter engine based on Cummins' platform). It sells 2-, 5-,
9- and 15-liter engines and recently launched a 12-liter engine through the Cummins
Westport JV (CWI). Westport sold 2k units in 2012 (up 218% y/y), while its Cummins JV
sold 6.8k engines in 2012 (up 25% y/y). Its JV in China sold 22k engines (up 160% y/y).
Exhibit 196: Westport Quarterly Unit Shipments
2,546 2,727
3,982
5,276 5,164
7,535 7,020
11,066
10,049
15,126
-
2,000
4,000
6,000
8,000
10,000
12,000
14,000
16,000
1Q11 2Q11 3Q11 4Q11 1Q12 2Q12 3Q12 4Q12 1Q13 2Q13*
Nat
ural
Gas
Eng
ines
Sol
d
Westport Cummins Westport JV (CWI) Weichai Westport JV (WWI)
Source: Company data *Note Westport did not disclose shipments by the parent entity in 2Q13
Clean Energy Fuels Corp (CLNE, Not Covered) is a US-based natural gas fuel supplier.
It supplied 195 million gallons (gasoline equivalent) of natural gas in 2012 (up 25% y/y) to
fleet operators and through LNG station networks owned or managed across the US. In
addition, the company builds natural gas fueling stations, manufactures compressors for
fueling stations, converts vehicles to run on natural gas and owns two biomethane landfills.
The company is aiming to build 150 LNG facilities by 2013 to accommodate highway
trucking across the US. Many of these would be co-located with Pilot-Flying J Travel

1 October 2013
The Shale Revolution II 122
Centers. Clean Energy has built 76 of these stations, 24 are in various stages of
construction and 30 others are in contracting and proposal stage. The company is raising
capital to fund the expansion of the natural gas highway, having most recently raised
$220m through a convertible debt offering on September 10, 2013 (Source:
Cleanenergyfuels.com). The company had total revenues of $334m in 2012. Outside the
US, it won a contract to supply natural gas compressors for fueling stations in China. Fuel
sales (CNG, LNG and biogas) accounted for 88% of revenues in 2012, while construction,
maintenance, vehicle conversion and other services accounted for 12% of revenues.
Renewable Chemicals
The disruption caused by cheap shale gas, and the corresponding shift to cracking lighter
feedstocks, is leading to opportunities for bio-chemical producers that can create C4 (and
other) chemicals from sugars at attractive prices relative to petro-based routes.
Exhibit 197: Rise in Ethane Production... Exhibit 198:...More Ethane Cracking Leads to Lower
Supply of C4 Chemicals
0
5000
10000
15000
20000
25000
30000
35000
Jan-07 Oct-07 Jul-08 Apr-09 Jan-10 Oct-10 Jul-11 Apr-12 Jan-13
Naphtha Production NGL Production (Ethane)
0.0
1.0
2.0
3.0
4.0
Cracking NaphthaFeedstock
Cracking EthaneFeedstock
Pro
du
ctio
n (
Mill
ion
to
ns)
Others (higher Cs)
Benzene (C6)
Butadiene (C4)
Propylene (C3)
Ethylene (C2)
Secular shift in cracking leads to lower C4 chemical production
~70% reduction in C4 production withsame ethylene production
Source: EIA. Source: Derived from IHS Presentation, Credit Suisse Equity Research estimates.
There are many companies taking advantage of these structural changes – we highlight a
few that have made progress over the past year:
■ BioAmber (BIOA, Outperform): BioAmber produces Succinic acid (C4) from renewable
sugars. Over the past year, the company has raised proceeds through an April 2013
IPO to fund the first commercial facility in Canada, which it expects to be
commissioned in 4Q2014. BioAmber is distinctive in that it has scaled the technology
to 350,000-liter fermentation.
■ Gevo (GEVO, Not Rated): Gevo produces isobutanol from converted corn ethanol
plants. It hit a few stumbling blocks scaling its technology (along with a contentious IP
dispute), but has since restarted production in June 2013.
■ Genomatica (Private): Genomatica's technology produces Butanediol (BDO, C4
compound) from renewable sugars using a single step fermentation process.
Genomatica has partnered with Novamont and Mitsubishi to manufacture and
distribute the products. The company licensed its BDO manufacturing technology to
BASF in May 2013. BASF plans to use Genomatica's process in 2H13 for sampling
and trials.
Within our coverage, we see BioAmber as a key beneficiary:

1 October 2013
The Shale Revolution II 123
BioAmber (BIOA, Outperform): BioAmber is a next-generation chemical company that
has developed a proprietary technology platform to convert renewable sugars into a high-
value building-block chemical, Succinic acid (C4H6O4), which can displace petroleum-
derived chemicals in a wide array of end markets, including plasticizers, polyurethanes,
resins, coatings, flavors and fragrances, and polymers. The company is a beneficiary of
the shale gas boom since it supports high prices for BioAmber’s products. BioAmber’s
fermentation technology can convert sugar into a C4 chemical (Succinic acid), which can
be dropped in to existing chemical industry infrastructure and acts as a building block to
produce other C4 chemicals.
Exhibit 199: BioAmber Benefits from Abundant and Inexpensive Shale Gas Ethylene
Oil Naphtha Propylene
Crude C4 (3x of ethane cracking) C4 Chemicals
Secular Feedstock shift to Shale Gas
Cracking Ethylene (same quantity as naphtha cracking)
Lower propylene & crude C4
Sugar
Fermentation of Sugar
Natural Gas Ethane
Economic Alternative Supply of C4
Chemicals (and renewable!)
Lower Supply of C4 Chemicals
BioAmber's Process
Cracking
Source: Credit Suisse Equity Research
Top shale picks
Exhibit 200:
Company Ticker Sensitivity
(low, moderate, high)
Area of activity
BIOAMBER INC. BIOA High A beneficiary of the Shale Gas boom since it supports high prices for BioAmber’s products
Source: Company data, Credit Suisse Equity Research

1 October 2013
The Shale Revolution II 124
Capital Goods and Engineering US Engineering and Construction
We reiterate our positive stance on the Engineering and Construction space as we believe
it is well positioned to benefit from the secular growth related to the build-out of the gas
shales and what that means for spend across petrochemicals, LNG, GTL and the gas
pipeline.
Recent Developments
EP/Gas Pipeline Story Remains Intact: With the recent noise in pipelines (MRC,
Freedom Pipeline), companies are not seeing any weakness and stand by their
assessment of long-term opportunities. Mastec (MTZ) noted that there are more
opportunities vs. a year ago and sees an active long-haul market even outside Keystone.
South Flanagan moved forward and while PWR bid on this project, it did not expect to win.
PWR believes the project takes ~10% of the capacity out, which is a positive. All the
pipeline players agreed that margins will improve as capacity begins to tighten. On
transmission, smaller opportunities (<$100M) are robust, growing at the same rate as
large opportunities and the 'North American Electric Reliability Corporation' standards
body is starting to enter the penalty phase (vs. just warning), which will start to drive
further demand.
Labor Still A Hot Topic: Wage Rates Increasing: Companies are seeing markets
tightening on the craft side, along the Gulf Coast in particular, and in Canada and Australia.
Wage rates are rising about 6-8%. JEC noted that it just started raising salaries over the
past 6-12 months and if market strength continues, it could get back to bi-annual price
increases. Contractors spoke about shifting their business model towards direct hire and
modular construction in order to better position themselves for the growth and labor issues
that could potentially affect North America if projects move ahead.
Market Still Competitive But Improving: One contractor noted that North American
Energy (NA Energy) is starting to become a “sellers” market and another talked about
walking away from fixed-price contracts. Another contractor noted that on a problem
project it was able to renegotiate so that the customer was meaningfully invested. Some
international competitors are already running into problems on the Gulf Coast.
On the Horizon
Award Flow Starting: Contractors are beginning to see spend on petrochemicals move
ahead. In early May, Fluor (FLR) announced that it had won an EPC contract from Dow
Chemical (DOW) for an ethylene cracker for close to $2B. FLR noted that its sees 4-6
ethylene crackers moving forward over the next several years, of which CPChem should
be awarded one in the next 3-4 months. Foster Wheeler’s (FWLT) Dow award also
appears imminent. In addition, in late May the DOE approved Freeport LNG to export gas
from the United States after Sabine Pass earlier. The DOE is widely expected by the
market to approve more LNG export facilities this year. In terms of new awards, Freeport
and Kitimat are, again, widely expected to be awarded later this year. An additional two
NA LNG awards have the potential to move forward in 2014 and beyond. The Shell GTL
FEED is expected by the market to move forward this year. Sasol’s GTL has been delayed
18-24 months, however, the petrochem section is still likely to go ahead. In total,
contractors are seeing awards move ahead and expect momentum to build into 2014 and
beyond.
Affected Stocks
We continue to favor the NA Energy plays. Our top pick remains KBR, as we believe the
market under-appreciates its gas monetization, positioned with 30-40% market share
EQUITY RESEARCH
Jamie Cook
+1 212 538 6098
jamie.cook@credit-
suisse.com
Linda Yuan
+1 212 325 6675
linda.yuan@credit-
suisse.com

1 October 2013
The Shale Revolution II 125
worldwide. We also like Fluor as a higher quality pick in global energy.
Who's Who In E&C
Exhibit 201 provides a cheat sheet of the Engineering & Construction firms by major
vertical sector in the United States that we think are best positioned for the Shale theme.
Exhibit 201: Best Positioned In The US
Petrochemical LNG GTL Gas Pipeline Gas New Gen Emissions
Fluor-
Jacobs- - - - -
KBR-
CBI/Shaw-
Foster Wheeler- -
McDermott- - - -
URS Corporation- - -
Willbros- - - -
Quanta- - - -
Babcock & Wilcox- - - - -
Power
Source: Company data, Credit Suisse Equity Research
Electrical Equipment/Multi-Industry
Shale gas is significant potentially for several types of equipment manufacturer: (i)
increased shale gas extraction will increase the demand for pressure pumping equipment;
(ii) if it can serve to lower the long-term gas price, this increases the appeal of gas-fired
power generation and could then drive up demand for industrial gas turbines, which has
been weak for the past 18 months; (iii) process instrumentation / flow equipment / gas
cleansing solution manufacturers should benefit as production of shale gas increases; (iv)
suppliers of equipment into the automotive / transportation markets if CNG becomes more
widespread.
Recent Developments
Recently, we have seen US gas turbine demand start to improve, particularly compared
with other countries, which may be indicative of the effect that the lower gas prices are
having on spurring demand, even in the face of subdued electricity consumption. The
chart below shows that although, in total, 1H13 gas turbine capacity orders (measured in
MW) were down -18% y-o-y, US orders almost doubled, according to preliminary figures.
EQUITY RESEARCH
Julian Mitchell
+1 212 325 6668
julian.mitchell@credit-
suisse.com
Jonathan Hurn
+44 20 7883 4532
Jonathan.hurn@credit-
suisse.com
Andre Kukhnin
+44 20 7888 0350
andre.kukhnin@credit-
suisse.com

1 October 2013
The Shale Revolution II 126
Exhibit 202: MW Orders YoY% in Key Geographies, 1H13 vs. 1H12 %, unless otherwise stated
112%
-2%-18%
-32%
-51% -54%
-81%-100%
-50%
0%
50%
100%
150%
UnitedStates
Other Total China SaudiArabia
Japan Russia
Source: McCoy
Exhibit 203: Geographic turbine orders by MW 1H13 %, unless otherwise stated
Exhibit 204: Geographic turbine orders by MW 1H12 %, unless otherwise stated
China, 12%
Russia, 2%
Japan, 4%
Saudi Arabia, 8%
United States, 15%
Other, 58%
China, 15%
Russia, 10%
Japan, 7%
Saudi Arabia,
14%United
States, 6%
Other, 49%
Source: McCoy, Credit Suisse Equity Research estimates
*Preliminary Estimates
Source: McCoy, Credit Suisse Equity Research estimates
*Preliminary Estimates
We have also seen the CNG market start to take off; Luxfer, which manufactures CNG
cylinders for vehicles, announced on its August Q2 conference call that it is increasing
capacity in its Alternate Fuels (AF) business given the strong demand outlook. By 2014,
the company should have, on our estimates, an annual AF sales run-rate capacity of $70-
80m, after $50m in sales this year, and $20m in 2012.
On the Horizon…
Key items to watch include:
(i) Whether gas-fired power generation in the US starts to retake share from
coal; coal has made something of a comeback in the past 12 months
(ii) Evidence of increased domestic manufacturing in the US as a result of
cheaper energy costs.
Affected Stocks
In terms of the US, the main names we would highlight with regard to the four categories
discussed in the overview section are as follows:

1 October 2013
The Shale Revolution II 127
(i) pressure pumping equipment – KMT sales have been under pressure partly
owing to weakness in pressure pumping; GDI was recently taken private by KKR;
Weir Group is the key player in this segment among European Capital Goods and
recent trends have been improving aftermarket demand (destocking now over)
while OE pumps sales have often been at lower margins. Elsewhere, Smiths
Group's John Crane business has a c50% exposure.
(ii) industrial gas turbines / components – GE is the leader here; Siemens is No 2;
suppliers into this market include WWD and Donaldson.
(iii) process instrumentation / flow equipment / gas cleansing solution manufacturers
– Honeywell, Emerson, Alfa Laval; Rotork
(iv) CNG plays – Luxfer is a leader here following its Dynetek acquisition last year.
Exhibit 205: Top US and Pan-Euro Capital Goods picks
Company Ticker Sensitivity
(low, moderate,
high)
Area of activity
KBR INC. KBR High One of the best positioned based on the number of verticals the company can benefit
from, and taking into consideration the potential for dollars to be spent
General Electric GE High Global #1 in industrial gas turbines; strong position in compressor technology
Luxfer LXFR High Leader in CNG cylinders for cars, trucks and buses
Rotork ROR.L High Leading supplier of upstream oil & gas actuators
Weir Group WEIR.L High Could benefit from increased demand in pressure pumps, fluid ends and related
services.
Source: Company data, Credit Suisse Equity Research
Japan capital goods and engineering
The shale gas revolution should, in our view, bring benefits in various areas, including both
LNG plant construction and peripheral business, which should experience a substantial
ripple effect. We anticipate growing demand for LNG tankers, storage tanks, compressors
and gas turbines. The integrated heavy machinery and plant engineering companies that
handle these products are likely to benefit substantially.
Recent developments
LNG plant projects used to be concentrated in Oceania, southeast Asia and the Middle
East, but the advent of cheap shale gas in North America is shifting the focus to the North
American market. Two major Japanese plant engineering companies, JGC and Chiyoda,
are aiming to win LNG plant orders in this market in FY3/14. The two companies are
looking to win orders jointly with local companies, as it is difficult for foreign companies to
win EPC (engineering, procurement and construction) orders in the North American
market on their own.
Falling prices for shale gas are likely to drive the closure of coal-fired thermal and nuclear
power plants in the North American market. With environmental regulations now being
tightened up in earnest, demand for gas turbines for gas-fired thermal power plants is
gradually increasing. Gas turbine orders from North America at Mitsubishi Heavy
Industries, which supplies large gas turbines to electric power companies, appear to be
higher than the company initially anticipated.
On the horizon
There are three LNG projects currently being planned in the US (Freeport, Cove Point,
and Cameron) that involve exports to Japan (with which the US does not have a free trade
EQUITY RESEARCH
Shinji Kuroda
+81 3 4550 9994
shinji.kuroda@credit-
suisse.com
Yunchao Zhao
+81 3 4550 9903
yunchao.zhao@credit-
suisse.com

1 October 2013
The Shale Revolution II 128
agreement). The US Department of Energy (DOE) has already approved the Freeport and
Cove Point projects, and we expect Cameron to be approved soon. Chiyoda is aiming to
win the EPC order for the Freeport and Cameron projects jointly with CB&I, while JGC is
looking to win the EPC order for Cameron and Kitimat in Canada jointly with Fluor. We
believe that at least in FY3/14 and FY3/15, the bulk of LNG project orders will be in North
America.
Affected stocks
We like JGC, which is one of the world's leading plant engineering companies and has
plenty of potential projects in North America, Russia, Africa, and southeast Asia. We also
have a focus on Mitsubishi Heavy Industries (7011 JP), which manufactures large gas
turbines and builds LNG tankers.
Figure 206: Top picks among Japan Cap Goods and Engineering names
Company Ticker Sensitivity
(low, moderate,
high)
Area of activity
JGC 1963.JP High One of the global top E&C players, especially in LNG area. The company has quite a
diversified potential project portfolio.
Mitsubishi Heavy Industry 7011.JP High One of the global top gas turbine makers. Also provides LNG carriers.
Source: Company data, Credit Suisse estimates

1 O
cto
ber 2
013
Th
e S
hale
Re
vo
lutio
n II
12
9
Exhibit 207: Bulk of plant and engineering projects in the spotlight are in North America
EPC
Expected
order timing Project Country Type Operator Contractor Estimate orders(bn yen)
Liquefaction
capacity
(10,000t/y) Notes
FY3/15 Arrow Australia LNG SHELL
PetroChina
Chiyoda+Saipem+CB&I(US)
JGC
A few bn for each 460×2 Grassroots, Saipem and Chiyoda got FEED. A few billion
USD investments
FY3/15 Mozambique Mozambique LNG Anadarko
Mitsui
Chiyoda+CB&I
JGC+Fluor(US)
Bechtel(US)
A few bn for each 500×4 Grassroots, start production in 2018, 15bn USD
investments(expected), triple FEED
★2013/summer Rotan Malaysia F-LNG Petronas JGC+Samsung heavy
MODEC+TOYO+CB&I+IHI
A few bn for each 150 Dual FEED
2013-2014 Yamal Russia LNG Novatek (80%)
TOTAL (20%)
Chiyoda+Saipem+CB&I
JGC+Technip
FW+Petrofac(UK)
A few bn for each 550×3 FEED implemented by Chiyoda+Saipem+CB&I group
Technip and JGC won tender to build the plants. Still
waiting for FID
2014-2015 Abadi Indonesia F-LNG INPEX(60%)
SHELL(30%)
Local names(10%)
JGC+Technip(France)
Chiyoda+Saipem
A few bn for each 250 Dual FEED
JGC+Technip, Chiyoda+Saipem
Start production in 2018
★
FY3/14 FreePort US LNG FreePort LNG
Dow Chemical
Others
CB&I+Zachry A few bn for each 440 CB&I and Zachry got FEED order. Chubu Electric and
Osaka Gas hold some interests. The project already got
DOE approval. Expect Chiyoda can Join EPC order with
CB&I.
★
2013-2014 Cameron US LNG SempraEnergy
Eni USA
Mitsubishi / Mitsui
JGC+Flour
Chiyoda+CB&I
A few bn for each 400×3 Operation may start from 2016. Tokyo Electric hold
purchase contract through Mitsubishi and Mitsui.
Competition between JGC group and Chiyoda group
2013-2014 Lake Charls US LNG Trunkline / Southrn
Union / BG
A few bn for each 1500 FW got pre-FEED order. Got approval from DOE for
exporting to non-FTA countries following SabinPass and
FreePort
2014 Lelu island Canada LNG Petronas(90%)
JAPEX(10%)
KBR+JGC
Bechtel
Techinip+Samsung
A few bn for each 600×2 Triple FEED. First project in North America for JGC.
★2013 end Kitimat Canada LNG Chevron+Apache JGC+Fluor
KBR
A few bn for each 500×2 Dual FEED
FY3/14 New+expansion Turkey Oil refinery JGC 100
FY3/14 New+expansion Saudi Arabia Oil refinery Sumitomo chemical JGC 100
FY3/14 Kuwait Oil refinery JGC 100
FY3/14 Algeria Gas processing JGC 50-100 A few projects
FEED
Expected
order timing Project Country Type Operator Contractor Estimate orders(bn yen)
Liquefaction
capacity
(10,000t/y) Notes
FY3/14 Tangguh LNG
Train3
Indonesia LNG BP Berau JGC+KBR
Chiyoda+Saipem+Locals
Technip
380 Current equipment was built by JGC
12bn USD investmens
FY3/14- Sakhalin 2, Train3 Russia LNG Shell Chiyoda Train 1,2 were built by Chiyoda
FY3/14- Vladivostok Russia LNG Gazprom Chiyoda
JGC
Itochu and JGC may possibly join the projects
2013-2014 GoldenPass US LNG ExxonMobil JGC+Flour
Chiyoda+CB&I
1,560 Pre-FEED
Source: Company data, Credit Suisse research

1 October 2013
The Shale Revolution II 130
US environment and industrial services
Overview
The shale revolution has a meaningful positive impact on revenue growth for US
environmental services companies. We classify E&P waste into three major buckets:
produced & flowback water, drilling fluids and drill cuttings.
When fracking for shale gas/oil, there is a significant amount of water on both the front end
(5.5+ mm gallons) and back end (10-50% of front end) that needs to be sourced, treated
and disposed of, which can be a significant revenue stream for some environmental
players that own trucks and disposal sites. In addition to the actual fracturing process,
water must be delivered to the well site by truck or pipeline and then stored on site (in
temporary ponds or frac tanks). During the frac process, there are two types of water
generating potential revenues, which are known as flowback and produced water.
Flowback water is 2x more saline than ocean water and has a relatively shorter life cycle
(<30 days). We believe that flowback water can be re-used in the frac process until there
are more than 2,000 wells. Produced water is approximately 5x more saline than ocean
water, is more predictable and is produced by long-life wells.
Based on our analysis, the cost for shale gas producers for produced water could be up to
~10% of the total mcf cost of producing gas. The amount of water produced per well varies
greatly, with the degree of variation driven by well depth, the method of extraction and the
geology of a particular resource basin. Water production rates are initially high (includes
flowback water) and then decline significantly. In the exhibit below, we lay out a rough
estimate of the total water used in gallons in unconventional oil and shale gas plays in the
US market. We estimate the total water usage could be ~72bn gallons annually for US oil
& gas shale plays. In addition, based on our channel checks, oil & gas E&P companies are
likely to spend ~$50bn+ annually disposing of fluids to comply with environmental
regulations and deliver fresh water for initial fracking operations.
Figure 208: Key Accounting Policies and Seasonality
1 Rig - Time to Drill a Well (days) 21
1 Rig - Annual Wells Drilled (assumes downtime) 15
Current Rig Count for Unconventional Shale Oil & Gas ~900
Total Expected Shale Wells Drilled 21,000
Average Gallons of Water Used Per Well (in mm) 5.5
Estimated Water Used (mm of gallons) 115,500
Flowback Water ~20%
Produced Water ~80% Source: Credit Suisse Equity Research estimates
Produced and flowback water is disposed in wells and tends to be lower barriers to entry
(~$0.75 to $1 per barrel disposal costs). Salt water disposal wells generally take ~90 days
to permit, while E&P landfills for solid waste can take several years. On the produced and
flowback water side, large players include Nuverra, Key Energy and Basic Energy (Not
Rated).
Drilling fluids are used to lubricate the drill bit and consist of water- and oil-based muds on
the back end. Oil and water-based muds have to be dried out, solidified and put in a
landfill (post recovering any oil). Players on the drilling fluid disposal side can be the
customer itself, while more adequate disposing services are offered by companies such as
Waste Connections (R360 acquisition), Newalta, Tervita (private) and Secure. Note that
the shift towards horizontal drilling leads to more oil-based muds, which have a higher
waste component and tend to drive a need for outsourcing. Regulation of liquid waste has
been getting tougher and driving up demand for landfills for this kind of waste as well. For
EQUITY RESEARCH
Hamzah Mazari
+1 212 538 7983
hamzah.mazari@credit-
suisse.com
Anjaneya Singh
+1 212 325 7306
anjaneya.singh@credit-
suisse.com
Flavio Campos
+1 212 325 4411
flavio.campos@credit-
suisse.com

1 October 2013
The Shale Revolution II 131
example, effective April 2012, the NDIC (North Dakota Industrial Commission) banned the
disposal of liquids in reserve pits (done by the E&P customer itself).
Drill cuttings are essentially shaved rock generated in the drilling process. They can be
disposed of in a landfill for ~$60/ton, although actual prices vary widely depending on the
shale play. Unlike some other kinds of waste that are often laid out in fields eg, drilling
fluids (which resemble a black dirt), drill cuttings have to be disposed of in landfills.
Recent Developments
■ We have seen US environmental companies move their assets towards shale plays
that are seeing higher activity levels, which are generally liquid-rich plays or where the
NYMEX breakeven price ($ per MMBtu) looks attractive. In addition, activity levels
slowed late in 2012 and have now stabilized. In our view, pricing environmental work is
also stable in most areas. The asset relocations led to some margin deterioration
earlier in the year for US environmental names, which we expect to ramp back up in
2H 2014.
On the Horizon…
■ The key developments to monitor are M&A and activity levels. We expect both these
developments to drive higher pricing for US environmental names and in turn better
margins. We view M&A as a key catalyst given that the industry is extremely
fragmented and filled with small private players serving a roster of E&P clients that has
started to be dominated by large corporations. We see the oilfield waste transport and
disposal business as a roll-up story in the future.
Impacted Stocks
■ We think the biggest beneficiaries of the shale revolution would be companies such as
Neuverra (NES) and Waste Connections (WCN) that have large businesses dedicated
to the collection and disposal of frac fluids and oily solids. Most of the environmental
companies that compete on frac fluid against Nuverra and Waste Connections are
private and do not have the safety record, disposal network, logistical experience, or
balance sheets to gain significant market share as the shale revolution develops. Clean
Harbors (CLH) tends to do equipment rental and oil & gas downhole well services
work; so it should benefit as well but its exposure is a little more commodity in nature.
CLH is currently in an effort to expand its heavily Canadian oil and gas services
business into the US and multiple shale plays, however. To a lesser extent, we view
Waste Management (WM), Republic Services (RSG), and Progressive Waste
Solutions (BIN) as beneficiaries at the margin of the shale revolution.
Figure 209: Environmental Services Companies' Exposure to the Shale Basins
Company Ticker Exposure Area of activity
Waste Connections WCN High Solid Waste Disposal in 8 Shale Plays
Nuverra NES High Water Pick-up, Disposal and Treatment and Solid Waste Disposal in 8 Shale Plays
Source: Credit Suisse Equity Research

1 October 2013
The Shale Revolution II 132
Utilities Cheap gas reshaping the US power industry
Overview
Low natural gas prices are having a significant impact on the Power and Utility
sectors, changing long-established strategies around power plant dispatch
decisions, broadly lowering the profitability of competitive power generators, and
overall creating helpful bill reductions for customers. In this section, we analyze the
potential impact of shale gas developments on power prices and stock implications
for utilities companies across the US, Europe, and Japan.
The sustained low natural gas environment – particularly in the context of the 2000s – has
had meaningful impact on the US power industry affecting both the earnings outlook for
Competitive Power generators with lower power prices and the investment / dispatch
decisions for all generators as gas plants have become a more competitive energy
resource. We expect sustained low natural gas prices, compounded by environmental
policy that disenfranchises coal plants, to lead to further reconfiguration of the US power
fleet with gas generation largely serving as the conventional electricity source of first
resort.
Recent Developments
Looking across the competitive and regulated US power markets, we see the impact of
natural gas generation most significantly on the shift in electricity resource mix with coal
generation continuing to concede share to natural gas generation in Exhibit 210, although
the bounce from 2012 lows has allowed some share recapture by coal generators. The
overall structural shift in mix reflects the more compelling economics of gas relative to coal
(Exhibit 211) that have made the dispatch decision for gas economically and
environmentally sensible.
Exhibit 210: Electricity Market Share from Different Fuel
Types
Exhibit 211: $ / MMBTU Parity: Natural Gas vs CAPP Coal
0%
10%
20%
30%
40%
50%
60%
Jan
-05
Jun
-05
No
v-0
5
Ap
r-0
6
Sep
-06
Feb
-07
Jul-
07
De
c-0
7
May
-08
Oct
-08
Mar
-09
Au
g-0
9
Jan
-10
Jun
-10
No
v-1
0
Ap
r-1
1
Sep
-11
Feb
-12
Jul-
12
De
c-1
2
May
-13
Coal Share Gas Share
$(3.00)
$(2.00)
$(1.00)
$-
$1.00
$2.00
$3.00
$4.00
$2.00
$3.00
$4.00
$5.00
$6.00
$7.00
$8.00
$9.00
3/11 5/11 7/11 9/11 11/11 1/12 3/12 5/12 7/12 9/12 11/12 1/13 3/13 5/13 7/13 9/13
Ga
s -
Co
al S
pre
ad
($
/ M
MB
tu)
Ele
ctr
icit
y C
on
ve
rte
d $
/ M
MB
tu
Diff Nat Gas CAPP Coal
Natural Gas = NYMEX + $0.50 BasisCoal = ((Coal + Rail $/ton) / (12*2) + O&M ($3/MWh / 10HR)) * HR Conversion: (10 / 7.2)
Source: EIA Source: the BLOOMBERG PROFESSIONAL™ service
We see opportunity for further share gains for gas generation as more coal plants are
retired in response to EPA emissions policy primarily around mercury (Exhibit 212) that will
increase the need for new gas generation over time.
EQUITY RESEARCH
Dan Eggers
+1 212 538 8430
dan.eggers@credit-
suisse.co m
Vincent Gilles
+44 20 7888 1926
vincent.gilles@credit-
suisse.com

1 October 2013
The Shale Revolution II 133
Exhibit 212: Planned Coal Plant Closures (MWs)
0
2,000
4,000
6,000
8,000
10,000
12,000
14,000
16,000
18,000
2013 2014 2015 2016 2017 2018 2019+
Source: SNL Financial, Company data, Credit Suisse Equity Research estimates (2013-2019 all estimated)
Challenging For Competitive Generators
The drop in natural gas prices has carried over into sharply lower power prices as the
marginal cost for electricity coming from gas-fueled power plants has come down as
shown in Exhibit 213 and Exhibit 214 where forwards are down by over 50% from the
highs and even materially down from 2011.
Exhibit 213: PJM-W Power Price Forwards (2007-Present)
in $ / MWH
Exhibit 214: PJM-W Power Price Forwards (2011-Present)
in $ / MWH
30.0
40.0
50.0
60.0
70.0
80.0
90.0
Cal 2012 Cal 2013 Cal 2014
30.0
35.0
40.0
45.0
50.0
55.0
60.0
1/5
/20
11
3/5
/20
11
5/5
/20
11
7/5
/20
11
9/5
/20
11
11
/5/2
01
1
1/5
/20
12
3/5
/20
12
5/5
/20
12
7/5
/20
12
9/5
/20
12
11
/5/2
01
2
1/5
/20
13
3/5
/20
13
5/5
/20
13
7/5
/20
13
9/5
/20
13
Cal 2012 Cal 2013 Cal 2014
Source: Credit Suisse Equity Research Source: Credit Suisse Equity Research
With this drop, we have seen conventional nuclear and coal power plants come out as the
most adversely affected as the profitability of these plants has compressed significantly.
Making things worse, coal plants have also been hurt by lower run-times as gas
generation has become more cost competitive, allowing for displacement of coal plants
when looking at the supply-dispatch curve. Exhibit 215 and Exhibit 216 illustrate the
movement in position on the supply stack for efficient gas-fired power plants (green dots)
that have become considerably more competitive with the decline in natural gas prices.

1 October 2013
The Shale Revolution II 134
Exhibit 215: 2014 PJMW Supply Curve at $3 Natural Gas Exhibit 216: 2014 PJMW Supply Curve at $6 Natural Gas
$15
$20
$25
$30
$35
$40
$45
$50
$55
$60
$65
0 20,000 40,000 60,000 80,000 100,000 120,000
Marg
inal P
ow
er
Pri
ce (
$/M
Wh
)
Capacity (MW)
PJMW
Nuclear Coal Gas Oil Renewables & Other
CCGTs
$15
$20
$25
$30
$35
$40
$45
$50
$55
$60
$65
0 20,000 40,000 60,000 80,000 100,000 120,000
Marg
inal P
ow
er
Pri
ce (
$/M
Wh
)
Capacity (MW)
PJMW
Nuclear Coal Gas Oil Renewables & Other
CCGTs
Source: Credit Suisse Equity Research Source: Credit Suisse Equity Research
This erosion in generator profitability has led to sustained stock price underperformance
and we still see further degradation as the market continues to re-rate stock valuations
lower and more toward those seen in other commodity cyclical businesses (Exhibit 217).
We think sustained lower natural gas prices facilitated by shale production will leave these
stocks structurally struggling.
Exhibit 217: 2014E and 2015E EV/EBITDA Multiples for Commodity Businesses
2015 Avg: 7.4x
2015 Avg: 7.1x
2015 Avg: 4.1x 2015 Avg: 5.2x
2015 Avg: 6.6x
2015 Avg: 9.3x
2014 Avg: 7.7x2014 Avg: 5.8x
2014 Avg: 4.1x 2014 Avg: 4.6x
2014 Avg: 6.1x
2014 Avg: 8.6x
0.0x
2.0x
4.0x
6.0x
8.0x
10.0x
12.0x
14.0x
ETR
EX
CFE
PE
G
SD
RL
RIG
DO
OR
IGA
TW NE
RD
C
XO
MH
ES
CO
PC
VX
MR
O
PS
XV
LO
MP
CTS
O
CH
KS
WN
NB
LE
OG
AP
A
PP
GA
PD
DD
DO
W
EV
/EB
ITD
A
2014 2015
Drillers Integrated Oils Refiners E&P
Chemicals
Integrateds
Source: Company data, Credit Suisse Equity Research estimates
A Help For Regulated Utilities
Regulated utilities have largely benefited from the same factors that have hurt competitive
generators as the drop in power prices through lower fuel costs has led to net reductions
in a significant component of electricity bills. Looking at spending on utilities as a
percentage of disposable income, the shale gas boom has pushed this measure to historic
lows (Exhibit 218).

1 October 2013
The Shale Revolution II 135
Exhibit 218: Utility Spending as a Percentage of Disposable Income
1.0%
1.5%
2.0%
2.5%
3.0%
3.5%
4.0%
19
78
19
80
19
82
19
84
19
87
19
89
19
91
19
93
19
95
19
97
19
99
20
01
20
03
20
05
20
07
20
09
20
12%
of
Dis
p.
Pe
rso
nal
Inco
me
Electricity & Gas Gas & Other Fuel LT Avg
Electricity & Gas LT Avg 2.3%
Source: BEA, Credit Suisse Equity Research
Further, with less inflationary pressure on bills, utilities have been in good shape to pass
along the base rate increases required to support a period of elevated investment (Exhibit
219) and therefore earnings growth. Stability in gas prices from here would be a sustaining
positive for Utilities in our view by limiting bill inflation with a latent risk being that gas
prices inflate with time – as seen in the forward curves and Credit Suisse forecasts – that
could lead to rising customer bill pressure and potential push-back from regulators which
would prospectively slow EPS growth for the industry over time.
Exhibit 219: Regulated Utility Capex ($bn)
43 4148
60
74
8378
7479
9195 92
85
0
20
40
60
80
100
120
2003 2004 2005 2006 2007 2008 2009 2010 2011 2012 2013E 2014E 2015E
Cap
ital
Exp
en
dit
ure
($
BN
)
Source: EEI, Credit Suisse Equity Research estimates
European perspective
It is still difficult to anticipate the potential impact of shale gas on the power generation
market in Europe. There are a number of reasons for this:
(a) While significant re-negotiations have taken place in the recent past, it is
reasonable to assume that a majority of gas contracts in Europe remain based on
long-term oil-derived prices which have not moved significantly down and are not
expected to.
(b) Over the past few years, the drop in coal prices and the near disappearance of
carbon as an element of pricing have largely driven gas out of the merit order in

1 October 2013
The Shale Revolution II 136
most countries. At the current stage, it costs between €30/MWh and €35/MWh to
generate power with coal (based on ARA prices) while it cost between €50/MWh
and €55/MWh to generate with natural gas while power prices are currently close to
€40/MWh on the forward curve in Central Europe.
To make gas competitive with coal, gas prices in Europe would have to drop to a range of
$6-7/mmbtu (equivalent to €16.4-19/MWh while the current TTF forward price has been
trading within €25-27/MWh recently). The above-mentioned €6-7/MWh is below the level
the Credit Suisse Commodities team forecasts for both shale gas on the European shore
and gas piped from Russia into Europe.
Stock Implications
Clearly the main stock implications lie in the US for now. We think the US market has been
effective in identifying the winners and losers so far with cheaper natural gas, penalizing
the stock prices of competitive generators as earnings power has eroded. We continue to
expect the Integrated Power stocks – EXC, FE, PEG, ETR – to lag regulated utilities until
greater stability is found in underlying supply-demand fundamentals for the power markets
(which still looks to be several years away).
Figure 220: The Price of Carbon Switching Figure 221: Cost Profitability of Gas vs Coal
0
10
20
30
40
50
60
Sep
20
08
Mar
20
09
Sep
20
09
Mar
20
10
Sep
20
10
Mar
20
11
Sep
20
11
Mar
20
12
Sep
20
12
Mar
20
13
€/
met
ric
ton
-25-20-15-10
-505
10152025
Oct
20
08
Ap
r 20
09
Oct
20
09
Ap
r 20
10
Oct
20
10
Ap
r 20
11
Oct
20
11
Ap
r 20
12
Oct
20
12
Ap
r 20
13
€/
Mw
HClean Spark Clean Dark
Source: Thomson Reuters Source: Thomson Reuters

1 October 2013
The Shale Revolution II 137
Appendices

1 October 2013
The Shale Revolution II 138
Appendix 1 - Country impact Latin America
Argentina
Overview
Argentina’s unconventional resources started to get attention at end-2010 with YPF
Repsol’s 4.5bn tcf tight gas discovery in southern Loma La Lata, followed by an April 2011
report by the EIA, which highlighted Argentina as having the third-largest recoverable
reserves globally.
Since then, YPF Repsol has announced a number of shale oil discoveries in the Vaca
Muerta formation in Neuquen and Mendoza, and Ryder Scott has certified over 14bn boe
of net resources. There seems to be a number of compelling reasons for the oil industry
(and investors) to be upbeat about the unconventional resource opportunity in Argentina.
At the same time, there are also a number of challenges that will need to be overcome,
such as oil services, macro-politics, and the environment (and in YPF’s case we would
also add financing). For further details, please refer to our more detailed note YPF: Why
Argentina should not kill Vaca Muerta, 10 April 2012.
Exhibit 222: Technically recoverable shale gas resources
globally (tcf)
Exhibit 223: Technically recoverable shale gas resources
in Argentina (tcf and % of total)
0
200
400
600
800
1,000
1,200
1,400
Ch
ina
U.S
.A
Arg
en
tin
a
Mexic
o
S.
Afr
ica
Au
str
alia
Ca
nad
a
Lib
ya
Alg
eria
Bra
zil
Po
land
Fra
nce
No
rwa
y
Ch
ile
India
01002003004005006007008009001,000
Technically recoverable resources (tcf, LHS) Reserve life (years, RHS)
240, 31%
167, 22%50, 6%
45, 6%
272, 35%
Vaca Muerta (Neuquen) Los Molles (Neuquen)
Aguada Bandera (San Jorge) Pozo D-129 (San Jorge)
Other basins
Neuquen contains
52.6%of Argentina's
recoverable shale gas
resources, as per EIA
Source: EIA – World Shale Gas Resources: An Initial Assessment, April 2011
Recent Developments
We highlight four key developments over the past six months or so in the Argentinian
shale space: (1) Partnerships between incumbent YPF and Chevron and Dow, (2) the
Argentinian Government's rejected offer to settle with Repsol, (3) Repsol successful
financing in the local debt markets, and (4) Pricing newsflow.
■ Partnerships between incumbent YPF and Chevron and Dow. YPF has signed two
shale partnerships in 2013 so far. In March, the company signed a relatively small
agreement with Dow, farming out 50% of its interest in a 41km2 (10,131 acres) area
called El Orejano. More recently in July, YPF signed a more significant partnership
with Chevron, following a preliminary agreement in December 2012 in the 395km2
(97,607 acres) area comprising Loma La Lata Norte and Loma Campana areas in the
Neuquen basin. The agreement comprises a $1.2bn spend by Chevron for the first
phase of work to develop a pilot project, corresponding to 130 wells. In the second
stage, after the pilot project is operational, Chevron and YPF will develop the entire
395km2, sharing the investments 50% each, in a 35-year concession. Chevron signing
the agreement with YPF illustrates different oil companies' perception of this theme in
the face of Repsol's vocal threats to legally dispute any agreement between oil
companies and YPF.
EQUITY RESEARCH
Vinicius Canheu
+55 11 3701 6310
vinicius.canheu@credit-
suisse.com
Andre Sobreira
+55 11 3701 6299
andre.sobreira@credit-
suisse.com

1 October 2013
The Shale Revolution II 139
Exhibit 224: Details of the YPF-Chevron agreement
Source: YPF
■ Offer to settle with Repsol. Approximately one year after the expropriation of Repsol,
the Argentine press (eg, La Nacion, May 2013) reported that the Argentine
government had approached Repsol with a first offer for compensation, comprising
$400m in cash, $600m in bonds and upstream acreage of which a $5bn valuation was
seen as too high (both by Repsol and by our Repsol analyst, Thomas Adolff). Repsol
rejected the offer. Our analyst cites the lack of a number of elements that need to be in
place before Repsol considers any offer from the government: (1) assets need to be
monetisable, (2) companies need to be able to repatriate cash/dividends, (3) both
domestic upstream and downstream prices need to be fully liberalised, (4) the export
tax regime needs to be further relaxed/removed, (5) providing incentives, and with that
the Gas Plus needs to be more flexibly applied and/or adapted, and finally (6) less
government intervention (see Argentina – Thank you… but no thank you, 7 May
2013).
■ YPF successful debt financing. Financing is crucial for YPF to finance its ambitious
capex plan. Given the arbitration between the Argentine government and the debt
hold-outs, the international markets are pragmatically closed to YPF, which means
financing has to be done only domestically. Surprisingly, the domestic market has
proved better than expected, with YPF successfully coming to the market 10 times
only in 2013. It remains uncertain how long this local appetite can be sustained.
Exhibit 225: YPF issuances in the debt markets in 2013 – better than expected
Date Notes Amount Interest rate Maturity
Q1 2013 Series XIII ARS 500m BADLAR +279bps 72 months
Q1 2013 Series XIV ARS 300m 19% 12 months
Q1 2013 Series XV USD 230m 2.50% 21 months
Q2 2013 Series XVI ARS 300 19% 12 months
Q2 2013 Series XVII ARS 2,250 BADLAR + 225bps 34 months
Q2 2013 Series XVIII USD 61m 0.10% 24 months
Q2 2013 Seies XIX USD 89m 1.29% 48 months
Q2 2013 Series XX ARS 1,265m BADLAR + 225bps 84 months
Q3 2013 Series XXI ARS 100m 19% 12 months
Q3 2013 Series XXII USD 91.5m 3.50% 84 months
Source: YPF
■ Pricing news flow. In December 2012, YPF achieved a significant win when a new
pricing formula was announced for natural gas (80% of the company's production as

1 October 2013
The Shale Revolution II 140
of that date would get a $2.3/mcf price, with that curve declining 7% p.a. Any
incremental production on the top of this curve would receive $7.5/mcf, regardless of
whether it emanated from conventional or unconventional sources). In January 2013,
the government announced an increase in the ceiling of oil-export prices from $42/bbl
to $70/bbl. In April 2013, the government decided to put a cap on gasoline and diesel
prices until October 2013 – election time.
On the Horizon
We highlight a number of events for investors to watch. Given that most of the shale effort
is being led by YPF, its cash generation is crucial for the ability of the company to keep
investing: further partnerships and further access to the debt markets are a must, and so is
YPF's ability to increase internally-generated cash flows, something which, after some
delay, management makes the case is happening now. Oil and gas production seem to be
turning (Exhibit 226 and Exhibit 227), and YPF has been able to increase its drilling rig
fleet as needed. Exhibit 228). Exhibit 229 illustrates another important factor to monitor:
the macro – the Argentine peso has been depreciating strongly, which together with a
25%+ domestic inflation, could impair YPF's ability to keep investing.
Exhibit 226: YPF crude oil production (kbd) Exhibit 227: YPF gas production (Mm3/d)
257
245241
223227 226
228
234
2008 2009 2010 2011 2012 Q1 13 Q2 13 Jul-13
47
4138
34 3331
3335
2008 2009 2010 2011 2012 Q1 13 Q2 13 Jul-13
Source: YPF Source: YPF
Exhibit 228: YPF drilling rigs under contract Exhibit 229: Argentine peso FX
25
36
4246
52
5860
Q1 12 Q2 12 Q3 12 Q4 12 Q1 13 Q2 13 Jul-13
3.00
3.50
4.00
4.50
5.00
5.50
6.00
Jan11
Mar11
May11
Jul11
Sep11
Nov11
Jan12
Mar12
May12
Jul12
Sep12
Nov12
Jan13
Mar13
May13
Jul13
Source: YPF Source: Thomson Reuters
Impacted Stocks
In LatAm, YPF (Underperform, TP $11) continues to be most relevant stock and the main
player behind Argentinian shale. We continue to see a difficult investment case, predicated
on a strong financing gap dependent on access to the international markets. In addition, a
tough Argentinian macro (inflation at 20%+/year, strongly depreciating FX, domestic
pricing controls) could have a significant impact on YPF's financial performance, even
though the resource potential in Vaca Muerta looks promising.

1 October 2013
The Shale Revolution II 141
Mexico
Positive Outlook for Shale Gas in Mexico in the Long-Run
Similar to the Argentinean case, Mexico’s shale gas story started in 2012 when the
International Energy Agency estimated that Mexico’s resources could amount to
681mmpc, which would position Mexico among the world’s top 10 countries with
recoverable shale hydrocarbon resources. However, shale exploration activity has been
limited in Mexico given technology and investment constraints at Pemex (Mexico’s state-
run oil monopoly), which has kept such potential as prospective resources only.
Exhibit 230: Mexico Among The Top 10 Countries With
Technically Recoverable Shale Oil Resources In billion barrels
Exhibit 231: Mexico Among The Top 10 Countries With
Technically Recoverable Shale Gas Resources In trillion cubic feet
75
58
3227 26
1813 13
9 9
0
10
20
30
40
50
60
70
80
1,115
802 707
665 573 545
437 390
285 245
-
200
400
600
800
1,000
1,200
Source: U.S. Energy Information Administration Source: U.S. Energy Information Administration
During the last presidential term, Pemex’s E&P investments grew from US$5bn in 2000 to
US$20bn in 2012. Pemex has identified at least 200 shale gas exploration opportunities in
Mexico. The estimated resources add up to 150-459mmmoc, which represent 2.5 to 7
times the conventional gas reserves in Mexico.
There is no clear strategy in terms of shale gas yet, however, the first steps include
investing at least US$2.4bn during Peña Nieto’s term (2013-1017). According to the
Pemex Exploration and Production investment programme, the model to be used in the
possible shale gas locations is the same used in Chicontepec (study of the underground
using mobile labs). This work would provide the basis for potential contractors to evaluate
their interest in Mexico’s shale deposits.
A possible hindrance could be that there is no certainty about the quality of the shale gas
and oil underground. Some analysts estimate that the costs in Mexico will be between 30-
40% higher than in the US. Digging and completion costs in the US are around US$3mn–
US$8mn, within a range of 800-3,400 meters. For Mexico, our best-case scenario
forecasts cost between US$3.9mn–US$11.2mn.
Currently, there is US$244.4mn available for the R&D project of assimilation and
development of technology in design, acquisition, processing and interpretation of 3D-3C
seismic data, with a focus on shale gas/oil in Mexico.
EQUITY RESEARCH
Vanessa Quiroga
+ 52 55 5283 8939
vanessa.quiroga@credit-
suisse.com

1 October 2013
The Shale Revolution II 142
Exhibit 232: Mexico and the US seem to share some shale gas provinces; map zoom shows EOG Resources’ acreage
position and its various windows
Jurassic Shale Gas
Chihuauhua
Sabinas
Burro
Picachos
Burgos
Tampico Misantia
Veracruz
Paleozoic Shale Gas
Creataceous
Shale Gas
Eagle Ford Shale
Gas Texas
Shale Gas Provinces
Eagle Ford/ Agua Nueva
Haynesville
Bone Spring/ Woodford
Arizona
New Mexico
Texas
OklahomaArkansas
Louisiana
Mississippi
Tennessee
Alabama
Crude Oil
Window
Wet Gas
Window Dry Gas
Window
San Antonio
Laredo
Source: Pemex, EOG Resources, Credit Suisse Equity Research
In September 2012, Carlos Morales, director of Pemex Exploration and Production, said
that Pemex’s natural gas imports could end by 2017, based on the high prices in the US (if
they continue to go up towards US$4 per million cubic feet, Mexico’s shale gas deposits
could be profitably extracted). Natural gas prices in the US have shown a slight trend
upwards, however, the price is still far from US$4, when Mexican production would
become profitable. Moreover, even under the unlikely scenario of having US$4 or above
natural gas prices in the US, production in Mexico cannot grow owing to the under-
developed infrastructure and lack of incentives for global E&P companies to bring their
technology and expertise to Mexico.
Recent Developments…Energy Reform is Needed to Realise Mexico’s Shale
Potential
Pemex does not have the means to fund such E&P projects nor to gain access to the
technology under the existing framework. This means that a significant part of Mexico’s
prospective resources cannot be exploited unless the private sector is allowed to
participate and be appropriately rewarded for investing and bringing its technology and
expertise.

1 October 2013
The Shale Revolution II 143
Exhibit 233: Capex Needed to Exploit Mexico’s Prospective Resources In US$ billions, unless otherwise stated
825
300
227
299
Total
Unconventionals(Prospective)
Conventionals(Prospective)
2P Reserves
Source: IMCO, Pemex Exploration and Production 2012, National Energy Strategy 2013-2017
With Mexico’s state-run oil monopoly, Pemex, capped on funding and technology, the
government wants to open the sector to private companies. At this point the main political
parties, PAN, PRI, and PRD have presented their Energy Reform proposals. PAN and PRI
agree that a constitutional change is needed to provide the right incentives for oil majors to
invest in Mexico. We expect that the votes from these two leading parties and an allied
small party will add the super majority needed for constitutional change.
On the horizon
We believe that Mexico will get a transformational Energy Reform that will realise the
country’s hydrocarbons potential, and that it will be approved during the Congress
sessions that started in the first week of September and will go through December 2013.
But the solution may not be that straightforward – the reform has to find a balance
between the following:
■ Pemex has to make some structural changes before being ready to do the job,
considering that it currently has negative equity, nearly all of its net income is paid to
the government in the form of taxes. It also has a pension liability that represents 8% of
the country's GDP and has a workers' union with significant influence on the company's
assets and business decisions.
■ We believe regulators may see the need to create an independent entity dedicated to
structuring projects, choosing the most suitable private sector participation scheme on
a case-by-case basis, and carrying out the bidding rounds to select the best partner.
■ Production/Profit sharing contracts (PSC) could be set as the most liberal type of
agreement for private sector participation, in order to address Mexicans’ conviction that
hydrocarbons belong to the nation. As the government can maintain direct control of
each project and get private sector participation via PSC, we would expect broader
political consensus.
■ Booking of reserves – expecting a pragmatic solution. Booking reserves is the
stalwart of an oil company. In order to attract majors and let the industry progress, the
legal and accounting framework has to be delivered — majors have to be able to
reflect these assets' potential. Given Mexico’s reality, we expect the feasibility to reflect
such prospects in a range of ways.
Stock picks – Alfa is the Mexican shale play
Alfa is the only Mexican listed company with exposure to the shale gas story. Its subsidiary
Newpek has partnered up with E&P companies for projects in the US shale sector and
Mexican mature oil fields.

1 October 2013
The Shale Revolution II 144
Newpek’s strategy has been to focus on the EFS play, which has greater potential for
producing a liquid-rich mix. During 2012, it started operations in 136 new wells (+89%yoy).
Drilling EFS wells is very expensive (around US$7mn–US$8mn per well), which made it
necessary for Newpek and Pioneer to bring a third party into the JV, Reliance. At present
Pioneer is the majority shareholder with 46%, followed by Reliance with 45%, and Newpek
with 8% (mostly learning and gaining experience).
In addition, in June 2012, through its 50-50 JV with Monclova Pirineos Gas in Mexico,
Newpek won two bids from Pemex to provide services in two mature oil fields located in
San Andrés and Tierra Blanca, both in the state of Veracruz, México. The operation in
these fields commenced in 1Q13. Monclova Pirineos Gas is a company formed in 2005 by
skilled professionals from Venezuela with expertise in the oil & gas sector; they created
this venture funded with both Mexican and Venezuelan capital with the purpose of
becoming an active participant in the Mexican hydrocarbons E&P sector.
Furthermore, during 2Q13, Newpek signed an agreement with UK-based oil services
company Petrofac, to create a JV for providing integrated oil & gas services in Mexico.
Petrofac provides services to customers across the entire spectrum of the oil & gas asset
lifecycle. It won its first contract in Mexico in 2011. We believe its considerable experience
in working under flexible commercial models that are tailored to a customer’s needs has
allowed it to gain relevant participation in the country.
Moreover, as part of Newpek’s business in the US, it announced in 2Q13 that it partnered
up with a highly experienced private company to explore and drill multiple shallow oil
formations in Kansas. Newpek has already invested US$17mn for a 62.5% interest in an
“area of mutual interest” that already has leases in about 70,000 acreages. Additional to
this investment, Newpek expects to spend US$10mn during 2H13, which we believe will
be used to perform seismic and geological studies in order to start drilling in early 2014.
With these agreements Newpek is moving fast to gain experience in a wide array of
segments within the hydrocarbons sector, now including exploration & production of oil &
gas in shallow and shale formations, as well as integrated services in mature oil fields. In
the Kansas project Newpek will put in use the experience it has gained from its partnership
in Texas; it will be the decision-maker in the operation and lead the strategy of the project.
We welcome this evolution in Newpek’s role in its different projects as it signals the
company’s commitment to growing its participation in the hydrocarbons sector in the US
and Mexico.
Potential investment vehicles considering Mexico as an extension to US shale
deposits increase in number
According to our research, the few wells that Pemex has been able to explore in Mexico’s
northeast shale area (10) have given early indications that characteristics vs. the Eagle
Ford Shale are similar or even better in that they could be more oil or liquid rich. However,
given the small scale of Pemex’s exploration activity it will be difficult for interested players
to rely on the existing data.
According to Credit Suisse' US Energy team, key players in the Eagle Ford Shale
(southern part of Texas) include EOG Resources, ConocoPhillips, and Marathon Oil –
companies that the team believes may have some interest in Mexico under the right terms.
Large players in the Permian Basin (western part of Texas and the southeastern part of
the state of New Mexico) include Pioneer Natural Resources, Devon Energy, Concho
Resources, Apache, Chevron, Occidental Petroleum, and ConocoPhillips.
In addition to considering the profile of Mexico’s shale, it is worth emphasising that not all
companies operating in the US need to go across the border given the large opportunity
available in the US.

1 October 2013
The Shale Revolution II 145
Australasia ex-China
Australia
Australian shale remains an uncertain quantity. The US Energy Information Administration
has released a new assessment of world shale gas and oil resources and Australia rates
highly – seventh globally for shale gas resources and sixth for shale oil. Australian
technically recoverable shale gas resources are assessed as 437Tcf and 17.4 billion
barrels of shale oil.
However, the geological properties are not yet well understood and most of the locations
are extremely remote (the upside is that approvals should be easier). The most
prospective area is in the Cooper Basin (93tcf estimate) owing to existing infrastructure,
with Santos' drilling the most advanced.
New developments
Santos (STO) in the Cooper
Santos (STO) reported ‘commercial success’ from the Moomba-191 vertical shale gas well
in the Cooper Basin. Dry gas flowed at a stabilised rate of 2.6 mmscf/d in the Roseneath,
Epilson and Murteree (REM) shale targets in December and remains above 2mmscf/d in
August. The well will be tied in to STO’s existing gas gathering infrastructure, with sales
expected to commence in October, hence the ‘commercial success’ tag. However, in
reality the high cost of the well means STO is unlikely to get an economic return on this
well.
In 2013 and 2014, Santos plans to undertake horizontal well technology trials in the
Moomba REM and the Nappamerri Trough Basin Centred Gas (BCG) and then undertake
development trials from 2015, with material commercial production and reserve bookings
by 2015 or 2016, underpinning Cooper development beyond 2020. Santos expects the
overall programme to cost $200 million gross.
Beach Energy
Beach Energy (BPT) is the most advanced of the Australian Cooper Basin shale gas
players. During the past year, BPT has drilled seven vertical wells and one horizontal well,
fracture stimulated five wells and flow tested two wells.
Below we highlight two vertical wells flow tested by BPT:
■ In January 2013, the Moonta-1 vertical well (PEL 218) flowed a maximum controlled
rate of 2.6 MMscf/d although five months later this has since declined sharply to 0.5
MMscf/d.
■ Similarly, in February 2013, the Halifax-1 vertical well (ATP 855) flowed at a
constrained rate of 2.2 MMscf/d, peaked at 4.2 MMscf/d in April and is now flowing at
a rate of 1.1 MMscf/d after 14 stimulation stages.
In early 2013, Chevron agreed to farm-in up to 30% equity interest in PEL 218 and ATP
855 for US$395m, indicating the attractive potential of this acreage.
BPT has delayed its Cooper Basin unconventional gas fracture stimulation programme
until mid-October as it is seeks to implement several measures to improve efficiencies and
reduce costs. These initiatives include higher grade production casing, stronger coil tubing,
a snubbing unit and variations in the stimulation parameters.
BPT is also waiting for specialised heat resistant micro seismic equipment to be delivered,
which it does not expect to arrive until October. The next well to be fracture stimulated will
EQUITY RESEARCH Paul McTaggart
+61 2 8205 4698 [email protected] Martin Kronborg
+61 2 8205 4369
martin.kronborg@credit-
suisse.com

1 October 2013
The Shale Revolution II 146
be Holdfast-2, the first horizontal well in the programme, followed by Dashwood-1 (vertical)
in November and Rapid-1 in December.
Over the coming year, we expect BPT to drill at least four more wells and fracture
stimulate nine wells across the two permits, which combined with three wells fracked to
date will provide BPT with data from around ~12 shale gas wells to be flow tested.
Investors seeking near-term catalysts in the form of unconventional flow rates will
therefore have to wait until late 2013. We highlight that BPT’s unconventional gas
exploration programme remains in the early, experimental phase with the company
constantly obtaining new information and incorporating new measures as it progresses.
Senex Energy
Senex Energy (SXY) holds a 100T interest in PEL 115 and PEL 516 in the South Australia
Cooper Basin. The company has drilled several vertical wells and recently confirmed a 2C
contingent gas resource of 835 Bcf (139 mmboe) at its Hornet gas field in PEL 115 and
PEL 516, allowing field appraisal and development planning to commence.
However, we believe SXY will seek to complete an equity farm-out in the near term to fund
further appraisal drilling and the eventual development of the field given estimated capex
of ~$500m for a ~100 mmscf/d project.
The Hornet-1 well in the Hornet tight gas field recently flowed at 2.2 mmscfd and benefits
from being relatively low in temperature owing to its shallow depth of 2,500m (vs 4,000-
4,500m in the shale gas formations) with low CO2 and potential for associated liquids.
A potential development plan for the Hornet gas field may consist of:
■ Drilling ~35 wells with a flowrate of ~3 mmscf/d at a cost of $7mn each ($245mn),
■ Construction of a gas processing facility with capacity of ~100 mmscf/d ($240mn), and
■ Flowlines to connect to the Moomba to Sydney pipeline 26km away ($15mn)
Capex of ~$500mn will, in our view, require SXY to farm-out an equity interest in PEL 115
and PEL 516 to a large strategic partner to provide funding, marketing and technical
knowledge. We believe potential strategic partners could include major IOCs such as Shell,
Total, Exxon and ConocoPhillips.
In our view, the booking of a 1.9Tcf 2C contingent resource has increased the
attractiveness of SXY’s Cooper Basin gas acreage and improved the probability of a farm-
out being completed during FY14.
Costs
We may see some level of commercial production by 2016, but at this stage it is difficult to
estimate if supply would make a meaningful contribution to the market. STO suggests
<A$6/GJ costs for wells of the same quality of its Moomba 191 once capital costs are
reduced (through experience and scale). Average costs for the acreage could be in the
area of A$6-9/GJ but may be even higher for competitors who have to pay a tolling charge
to use STO’s infrastructure (or build their own).
On our numbers, it is difficult to see a positive return on Cooper shale at prices below
$8/GJ, assuming US-type capex reductions (a stretch) investment might come down to $8-
10mn (from A$15mn+). But this is for 2-6bcf EUR wells without favourable tax
concessions. By comparison, Haynesville dry gas in the US has a similar capex cost, EUR
of 8BCF, 80-90% tax deduction, is located near major gas hubs and is still only profitable
at ~A$4-5/GJ.

1 October 2013
The Shale Revolution II 147
The high cost relative to US shale is primarily due to higher capital costs and the
remoteness of the location. There is no guarantee that costs will converge to US levels.
New Zealand
The East Coast basin in New Zealand could hold in excess of 250-500 billion barrels OOIP
in its shale oil play. If successful, it could potentially transform the country’s economy as oil
and gas accounts for a small fraction of New Zealand’s current GDP. Success would also
further enhance the spotlight on New Zealand for onshore and offshore oil and gas
development, as the country already boasts relatively attractive fiscal terms and a
generally benign geopolitical risk environment.
Recent Developments
Within our coverage space, TAG Oil (Neutral, TP C$4.50) and New Zealand Energy
(Underperform, TP $0.35) both operate in the East Coast basin chasing this shale play.
Since our last global shale report (The Shale Revolution, 13 December 2012), there have
been a number of notable developments, including:
Apache pulling out of the joint venture with TAG Oil
TAG has drilled its first pilot well with positive initial indications
First, Apache’s decision in January 2013 to leave the joint venture with TAG was
somewhat at odds in our view, as Apache was under no pressure to make a decision and
was still obligated to fund its portion of the capital programme. Essentially, Apache funded
the exploration expenditures while TAG retained all the upside potential. We would not be
surprised if other large companies express an interest in farming into these assets if
results are positive, despite Apache’s abrupt exit from the area.
Second, TAG has now finished drilling its first pilot well, Ngapaeruru-1, and the initial
results look promising. During drilling, oil and gas shows were not encountered until after
penetrating the seal rock, suggesting that trap integrity has not been compromised. In
addition, within the shale formation itself, there was a thick column of shows with
indications of the C3-C5 fractions, which suggests the presence of oil. Currently, the
petrophysical data is being evaluated to determine the most suitable completion technique
for production testing. A go-forward plan may be forthcoming in the Q4/13 timeframe once
the petrophysical report is complete and a completion strategy formulated.
EQUITY RESEARCH
David Phung
+1 403 476 6023
david.phung@credit-
suisse.com
Robert Loebach
+1 403 476 6021
robert.loebach@credit-
suisse.com

1 October 2013
The Shale Revolution II 148
Figure 234: TAG's East Coast Basin Acreage
Source: TAG Oil corporate presentation
On the Horizon
On a separate block from the Ngapaeruru-1 well, current plans call for a continued pilot
drilling programme at Waitangi Station-1 and Punawai-1, where we could see TAG spud
its next well in December 2013. Surface and construction consents have been submitted
for both locations.
Not All Made the Same
TAG has also relinquished two shale oil blocks on the East Coast after conducting a
review of its geochemical studies and geological/seismic data. Over time, we should see a
concentration of resources in the areas of greatest prospectivity.
In contrast to TAG, New Zealand Energy currently finds itself in a relatively financially
stretched position after having a number of exploration disappointments at its conventional
oil and gas assets. We believe New Zealand Energy will be more focused on raising funds
and repairing its near-term cash flow profile rather than focusing on its longer-term shale
oil properties. However, New Zealand Energy continues to retain a relatively large land
position in the shale oil play.
Company Ticker Sensitivity
(low, moderate, high)
Area of activity
TAG OIL LTD. TAO.TO High One of 2 biggest players of New Zealand shale oil, Operate in the East
Coast basin
NEW ZEALAND ENERGY NZ.V High Operate in the East Coast basin
Source: Credit Suisse Equity Research

1 October 2013
The Shale Revolution II 149
Europe
We still agree that significant potential exists in Europe for shale gas, but our concerns
since our last update (The Shale Revolution, 13 December 2012) have not yet been proven
wrong. We reiterate the difficulty in the operating environment, given a far greater
population density and less land available for drilling, as well as state-owned mineral rights
(rather than the land owner benefiting as in the US). Our biggest concern remains the
deeper and more fragmented geology which remains unproven commercially. We think
that once the geology is proven, more light will be shed on tax regimes and pricing to
determine whether European countries are able to become more energy independent.
Figure 235: Location of shale gas locations in Europe and company exposure
Source: Credit Suisse Equity Research
Timing still far-out – de-risking shale plays in North America has typically required about
100 wells (vs. 30 currently drilled in Poland), and achieving economies of scale requires
hundreds more. While we agree that shale gas potential does still exist in Europe, based
on US shale development, we think production will take at least eight years from the time
of aquiring a licence. This takes even the most advanced European projects out to beyond
2020, and therefore we see it unlikely that any value is attributed from present work in
progress.
EQUITY RESEARCH Charlotte Elliott
+44 20 7888 9484 [email protected]

1 October 2013
The Shale Revolution II 150
Figure 236: Timeline of unconventional resource development
Source: Credit Suisse Equity Research Chevron
Recent developments
Polish interest fades – what has been interesting to observe in Europe over the last year
or so is a drop in confidence in Poland, the former front-runner, where we have seen
ExxonMobil (in 2008), Marathon Oil (in 2013) and Talisman (in 2013) exit the country. We
attribute this to a number of reasons, but predominantly the failure of exploration in the
area to date.
Chevron increases European presence – we have also observed the discreet entry of
Chevron into Europe, taking up more than 4 million acres of shale gas leases in Poland,
Ukraine, Romania and Lithuania over the past two years.
Figure 237: Chevron's unconventional acreage in Europe
Source: Chevron
Resource downgrade in Poland and France – the latest EIA report on shale gas
resources has cut estimates in Poland and France. Norway has been removed as the EIA
decided to eliminate the speculative area for Alum Shale, while Ukraine estimates
resources increased significantly with the inclusion of a new major basin.

1 October 2013
The Shale Revolution II 151
Figure 238: Comparison of 2011 and 2013 estimates of
shale gas resources in Europe (tcf)
Figure 239: Comparison of 2011 and 2013 estimates of
shale gas resources worldwide (tcf)
0
20
40
60
80
100
120
140
160
180
200
Poland France Norway Ukraine
2011 Report 2013 Report
Source: EIA Source: EIA, Credit Suisse Equity Research
Interest wanes in Poland
Poland has Europe’s second-largest technically recoverable resources (148 tcf of shale
gas according to the EIA). The Polish drive for shale gas is founded largely on the
country's eagerness to break its dependence on Russian imports, which account for the
majority of the 14bcm imported to the country annually. We think an outcome where
Poland could reduce this dependency on Russia, even by a marginal amount, would be of
great significance to the country and as a result we see strong public support in the
country.
As of April 2013, there were 109 concessions for shale gas according to the Ministry of the
Environment, within which 43 exploration wells have been drilled and 9 of these have been
hydraulically fractured, “fracked”. Current Polish licence holders include Chevron, PGNiG,
Orlen, 3 Legs Resources, San Leon Energy, ConocoPhillips and ENI.
Recent developments
We have seen a major shift in the status of Poland in the past two years, from the country
that has been at the forefront of a European shale revolution, to one whose future is
looking progressively more gloomy as we see the departure of some major names. The
initial excitement about the Polish opportunity has cooled owing to a combination of
disappointing drilling results, changes in the fiscal terms and resource downgrade by both
the EIA, and more ominously, the Polish Geological Institute, the latter estimating the
country’s recoverable unconventional gas resources at only c.20tcf.
Unconvincing corporate landscape
■ ExxonMobil acquired four licences in Poland in late 2008, but exited in 2012, after
two disappointing gas wells, concluding that flow rates were not commercial. This
reaction by Exxon is similar to its sharp exit from Hungary in 2009, after initial testing
around the Mako Basin produced disappointing results.
■ Exxon’s departure was the beginning of an exodus from Poland. In May 2013,
Marathon Oil announced its conclusion of operations, after drilling 6 wells on its 11
licences and failing to discover commercial volumes of hydrocarbons.
■ This was closely followed by Talisman Energy, which agreed to transfer its Polish
assets to partner San Leon Energy. Talisman had drilled three wells in each of its
blocks in the Baltic Basin without success.

1 October 2013
The Shale Revolution II 152
Chevron still believes
■ One key company still present in Poland is Chevron, which employs 30 people in its
Warsaw office through its Polish subsidiary, Chevron Polska Energy Resources.
Chevron has held four exploration licences since 2009 in southeast Poland. Results of
the well drilled on the Frampol concession are unknown, however the company has
commented that no further work is planned on this well, suggesting perhaps a non-
commercial find. Continued exploration drilling is planned for 2013.
Legislative issues
A new hydrocarbon act, proposed in 2013 by the Polish government, has sparked concern
within the industry. One positive to come out of it is the assertion that the government take
will not exceed 40% of gross profit, which has been welcomed by the industry and
encourages long term investment in the country, however until the geology is proven to
yield commercial volumes, tax legislation appears premature. Other concerns still exist
including:
(1) The future role of NOKE
The Polish state-owned company NOKE, will take stakes in all future production
concessions in order to guarantee the state’s interest in future production. We think this
raises concerns in that the industry will feel uneasy about working with public
administrators that have little or no experience of working with unconventional
hydrocarbons and yet would have co-responsibility for making decisions on the pace and
scope of the operating work.
(2) Licence terms too short
Current licence awards are for five-year exploration licences, with the option to extend for
two years. We believe this is insufficient given the lengthier time-frame that it takes to
develop unconventional vs. conventional reserves. Production licences have to be applied
for through a competitive tender, or the field is handed back to the ministry. This
uncertainty may hamper investment.
(3) Too much red tape
Current permitting procedures are unduly lengthy, meaning that it can take up to a year to
apply to change concessions or carry out necessary environmental impact assessments.
This puts time burdens on companies and threatens deadlines and is something that we
believe needs to be transformed to keep investment attractive.
Ukraine still hopeful
Ukraine is also dependent on Russian imports and has recently awarded licences to
Chevron and Shell. The country has been a less attractive option to foreign investors
because of restrictions on the size of exploration areas, which led to Marathon Oil’s exit in
2008. A new government has cleaned up the regulation for foreign investment, prompting
Shell, Chevron and Eni to enter.
Corporate entries
Shell signed a profit-sharing contract (PSC) to develop the Yusivske shale gas field in the
Ukraine in January 2013. Under this agreement Shell will hand over 31-60% of extracted
gas to the Ukranian state. It has committed to shoot 2D-3D seismic and drill 15 wells in the
initial appraisal phase for a cost of ~$200m.
Chevron also entered a deal in the Ukraine through the Olesska shale, in western
Ukraine, estimated by the government to hold 1.5 trillion cubic metres. Chevron plans to
drill between 5 and 15 wells in the region.

1 October 2013
The Shale Revolution II 153
In 2012, Eni acquired a 50.01% stake and operatorship in the Ukranian company LLC
WESTGASINVEST, which holds the rights to nine blocks for exploration and development
of shale gas in the Lviv basin, in the western Ukraine near the border with Poland. The
Lviv basin is widely considered by observers to be an extension of the Lublin basin in
Poland that has attracted substantial attention. It is considered by the industry to be one of
the basins with the highest potential in Europe for shale gas.
UK momentum picks up
We have seen the slow emergence of the UK as a key player in the growing European
shale industry. EIA/ARI’s assessment of the country’s resources was increased by c.10%
in the last report, and the British Geological Survey doubled its estimate of the Bowland
shale area to 1,300tcf of gas-in-place in June 2013. The UK ban on fracking, set in 2011
(after two earthquakes were attributed to fracture stimulation), was lifted in December
2012 and the Treasury unveiled tax breaks for shale gas exploration.
Political support strengthened
In December 2012, the UK set up the Office for Unconventional Gas and Oil aiming to
streamline and simplify the process of permitting (currently an explorer needs to get
permissions from four different agencies – the Department of Energy and Climate Change,
the Environmental Agency, the Health and Safety Executive and the Local Mineral
Planning Authority).
Prime Minister David Cameron has recently urged the UK to embrace fracking for shale
gas, saying that “without it, we could lose ground in the tough global race”. Cameron
highlighted the clear economic benefits for the UK and pledged that fracking would not
damage the British countryside, in an attempt to ease the concerns of critics. George
Osborne, Chancellor of the Exchequer has offered a 30% tax rate for onshore shale gas
production, compared to rates as high as 81% for older offshore fields in the North Sea.
Focus basins
In our view, the most promising shale gas basin in the UK is the Bowland basin in the
northwest. The basin is Carboniferous in age and total organic carbons (TOCs) of the
marine shales in the basin are typically in the range of 1-3%, but can reach as much as
8% according to a UK government report. The organic rich shales are recognised to be
excellent source rocks and some hydrocarbons have migrated out into conventional oil
and gas fields in the UK Midlands area and East Irish Sea.
The Jurassic Weald basin in southern England is less mature than the Bowland basin, we
expect a government report later this year to assess its prospectivity. In the Weald basin,
the Kimmeridge Clay has been proposed as a possible target but there is considerable
doubt that it will be sufficiently mature for significant gas generation.

1 October 2013
The Shale Revolution II 154
Figure 240: Location of DECC/BGS assessment of shale gas in the UK
Source: DECC/BGS
How to invest
Gaining exposure to UK fracking as an investor is not easy, particularly as the largest UK
player is Cuadrilla Resources, a privately held company. One entry option is the AIM-listed
IGas. IGas has producing assets thanks to its acquisitions of Star Energy (bought in 2011)
and Singleton (bought in 2013). As well as this production, it holds six drilling licences for
shale gas and coal-bed methane in the Bowland shale area, in the north west of England,
but it does not have fracking permits yet. IGas will drill two appraisal wells in the region
later this year and benefits from the positive government stand point of shale exploration.
In June 2013, Centrica acquired 25% of the Bowland exploration licence PEDL 165 for
£40m. The licence is operated by Cuadrilla, and AJ Lucas is also a partner. This move
lends credibility to the emerging industry in the UK. However, even if this project is
successful in delivering large quantities of gas to market, it will be beyond 2020 and great
number of hurdles will need to be passed too (technical, legal, environmental and fiscal).
Elsewhere in Europe
Romania, Bulgaria and Lithuania
The shale gas exploration moratorium in Romania ended in December 2012 and has not
been extended, suggesting an ease in attitudes towards fracking in the country and a
willingness to explore the unconventional potential. Exploration is due to start in Vaslui in
the east and may extend to Constanta in the southeast.
Chevron owns licences in Romania through its subsidiary, Chevron Romania Exploration
and Production, and plans to start its search at its Barlad concession, with an exploration
well in 2H13, following the conclusion of a 248-mile 2D seismic survey in 2011. Chevron
also has blocks in the Dobrogea area in the southeast where it will acquire a 2D seismic
survey in 2H13.
Chevron also has shale gas acreage in Bulgaria and Lithuania. Bulgaria still has a
moratorium on shale gas drilling, that was enforced following a strong public backlash. In
Lithuania, the Environment Ministry has postponed a decision on announcing Chevron as
winner of a shale gas tender until September following a number of disputes. The timing
gives Lithuania more time to draft legislation as requested by Chevron.

1 October 2013
The Shale Revolution II 155
France
The debate has now closed in France where President Francois Hollande has
unequivocally ruled out shale gas exploration under his presidency. The discussion was
sparked by an appeal against the government ban on fracking by Schuepbach Energy, a
company that held two exploration permits that were cancelled when the law was passed
in 2011. Hollande has stated: “as long as I am president, there will be no exploration in
shale gas in France”. Supporters of shale gas in France are concerned that a ban on
unconventional exploration is hindering the growth of the French economy.
Germany
Germany has been touted by Exxon as having the most geological potential in Europe. A
survey concluded last year, ‘Shale gas reserves in Germany (as estimated in May 2012)’,
estimated that 25-80 tcf could be extracted with the application of current technologies.
The study concluded that shale gas production is economically feasible and
environmentally safe.
We think that Germany’s nuclear phase-out will have an impact on advancements in shale
gas exploration in the country, as we anticipate that a greater reliance on Russian and
Norwegian gas imports will drive Germany to look for alternative energy sources to keep
its energy independence. According to the European Commission, 12 exploration
concessions have been granted in Germany. In Lower Saxony, nine exploration licences
have been awarded to ExxonMobil. 3Leg Resources and BNK Petroleum are also licence
holders in the country.
Spain
In Spain, the most advanced of the shale concessions are located in northern region of
Cantabria, where the local government has recently introduced the country’s first fracking
ban after environmental concerns. Repsol had planned to start exploration activities in the
area, beginning with a seismic survey in July with a view to drilling, however these plans
have now been put on hold.

1 O
cto
ber 2
013
Th
e S
hale
Re
volu
tion
II 1
56
Non-US/Canadian shale plays
Figure 241: Non-US or Canadian shale-related stocks (covered by Credit Suisse analysts and having a high or moderate sensitivity to the shale theme)
Company CountryMarket
Cap ($bn)Type Sensitivity Rating Explanation
FORMOSA PLASTICS CORPORATION TWN 16,455 Cost Beneficiary High OUTPERFORM US subs., Formosa USA to build a 1.2mn ton/yr shale gas cracker in Texas by 2016.
KOREA GAS KOR 4,898 Cost Beneficiary High NEUTRAL Is buying gas from Sabine Pass so offering a new source of LNG to Asia.
PERUSAHAAN GAS NEGARA PERSERO IDN 10,971 Cost Beneficiary High OUTPERFORM May get more gas supply, and likely at cheaper price in the future.
VOESTALPINE AUT 8,222 Cost Beneficiary High NEUTRAL Specialist steel producer based in Linz, Austria, to construct DRI plant in Texas.
YAMATO KOGYO JPN 2,222 Cost Beneficiary Moderate NEUTRAL Japanese steel producer, materially investing in DRI in Bahrain.
AURORA OIL & GAS LIMITED AUS 1,396 E&P High OUTPERFORM Shale oil and gas in the Eagle Ford play, Texas.
CNOOC LIMITED HKG 92,016 E&P High OUTPERFORM Is commited to Shell to provide technical assistance in exploring shale gas.
INPEX CORPORATION(C) JPN 17,293 E&P High OUTPERFORM Has acquired mining concessions in Canada.
OMV AKTIENGESELLSCHAFT AUT 16,465 E&P High UNDERPERFORM One of few equity routes to play shale gas.
PETROCHINA CO LTD HKG 231,171 E&P High UNDERPERFORM Is working with Shell, and Conoca on shale gas exploration.
SANTOS LIMITED AUS 13,561 E&P High UNDERPERFORM Currently in the process of E&P in Australia.
SENEX ENERGY LIMITED AUS 782 E&P High OUTPERFORM Drilling exploration shale wells in the Cooper Basin.
SINOPEC CHINA PETROLEUM & CHEMHKG 86,438 E&P High NEUTRAL Has signed deals with BP, Total, Exxon and Chevron to work on shale.
YPF SOCIEDAD ANONIMA ARG 8,101 E&P Moderate UNDERPERFORM Recently struck a deal with Chevron to exploit the Vaca Muerta shale reserves.
ABB LIMITED CHE 54,995 Equip & Support Services Moderate OUTPERFORM Development of new power plants fuel demand for supporting technologies.
ALSTOM SA FRA 11,145 Equip & Support Services Moderate UNDERPERFORM Supply approximately 25% of world's power production with technology and services.
AMEC P.L.C. GBR 5,241 Equip & Support Services Moderate OUTPERFORM Are reportedly interested in participating in the development of shale block in China.
ARKEMA GROUP FRA 7,062 Equip & Support Services Moderate OUTPERFORM Elevated propylene prices in the US could support higher derivatives prices globally.
DENSO CORPORATION(C) JPN 37,240 Equip & Support Services High OUTPERFORM Could benefit from increased demand in fuel injection systems for NGVs.
DONGFANG ELECTRIC CORP HKG 3,620 Equip & Support Services High UNDERPERFORM Has formed partnership with MHI to supply gas turbine equipment.
HARBIN ELECRIC CO LTD HKG 423 Equip & Support Services High UNDERPERFORM Has formed partnership with GE to supply gas turbine equipment.
JGC CORPORATION JPN 9,128 Equip & Support Services High NEUTRAL Global top E&C players, especially in LNG area. Diversified potential project portfolio.
KEIHIN CORPORATION(C) JPN 1,191 Equip & Support Services High NEUTRAL Could benefit from increased demand in fuel injection systems for NGVs.
MARUTI SUZUKI INDIA LTD IND 6,580 Equip & Support Services High OUTPERFORM May benefit from further growth NGVs.
MELROSE GBR 6,121 Equip & Support Services Moderate NEUTRAL Leading global supplier of 20MW-130MW turbogenerators used alongside gas turbines.
MITSUBISHI HEAVY INDUSTRIES JPN 22,084 Equip & Support Services High OUTPERFORM One of the global top gas turbine makers. Also provide LNG carriers.
PRYSMIAN ITA 5,326 Equip & Support Services Moderate OUTPERFORM Cables used in upstream and downstream oil and gas. Also used for shipping industry.
ROTORK P.L.C. GBR 3,876 Equip & Support Services High OUTPERFORM Leading supplier of upstream oil & gas actuators.
SHANGHAI ELECTRIC GROUP HKG 7,003 Equip & Support Services High NEUTRAL Has formed partnership with Siemens to supply gas turbine equipment.
TENARIS S.A. LUX 27,435 Equip & Support Services High UNDERPERFORM Premium casing, tubing, and connections used for unconventional oil & gas wells .
VALLOUREC FRA 7,713 Equip & Support Services High OUTPERFORM Premium casing, tubing, and connections used for unconventional oil & gas wells.
WEIR GROUP PLC (THE) GBR 8,153 Equip & Support Services High NEUTRAL Could benefit from increased demand in pressure pumps, fluid ends and related services.
WOOD GROUP GBR 4,944 Equip & Support Services Moderate NEUTRAL Engineering, ops and maintenance services, with 110 shale projects and looking for more.
INDO TAMBANGRAYA MEGAH TBK IDN 2,679 Revenues Risk Moderate NEUTRAL Has a strong balance sheet and dividend payment.
Source: Company data, Credit Suisse Equity Research
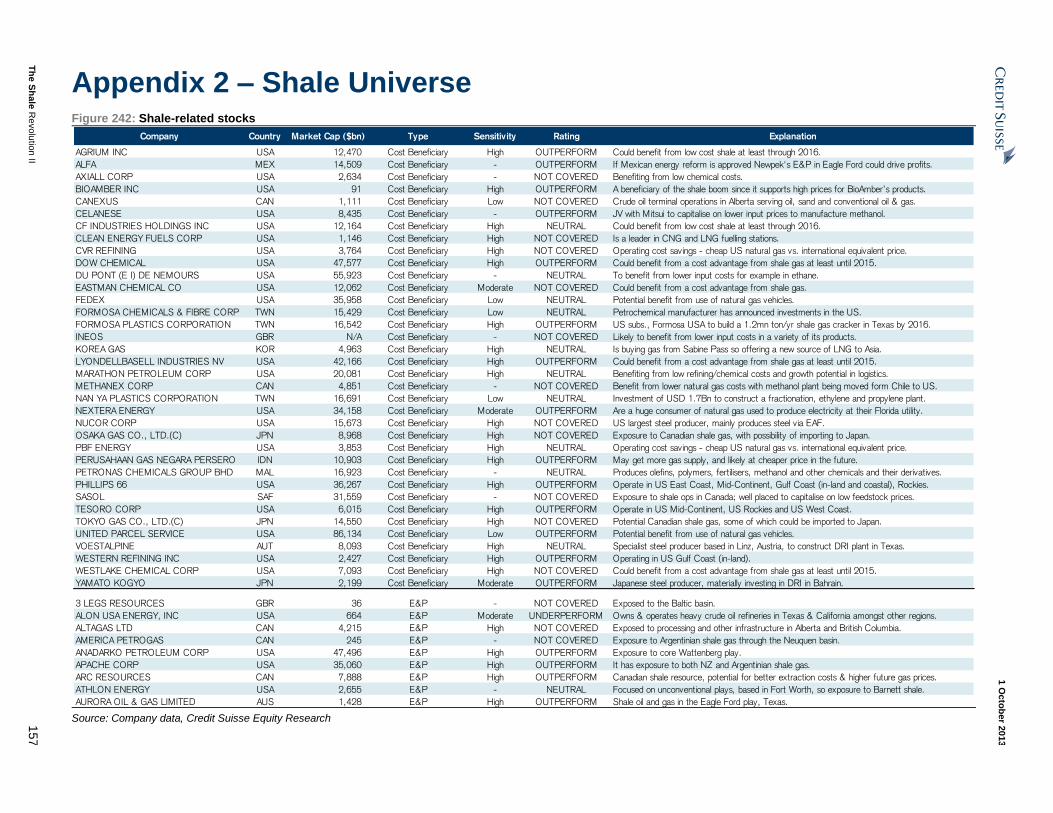
1 O
cto
ber 2
013
Th
e S
hale
Re
volu
tion
II 1
57
Appendix 2 – Shale Universe Figure 242: Shale-related stocks
Company Country Market Cap ($bn) Type Sensitivity Rating Explanation
AGRIUM INC USA 12,470 Cost Beneficiary High OUTPERFORM Could benefit from low cost shale at least through 2016.
ALFA MEX 14,509 Cost Beneficiary - OUTPERFORM If Mexican energy reform is approved Newpek's E&P in Eagle Ford could drive profits.
AXIALL CORP USA 2,634 Cost Beneficiary - NOT COVERED Benefiting from low chemical costs.
BIOAMBER INC USA 91 Cost Beneficiary High OUTPERFORM A beneficiary of the shale boom since it supports high prices for BioAmber’s products.
CANEXUS CAN 1,111 Cost Beneficiary Low NOT COVERED Crude oil terminal operations in Alberta serving oil, sand and conventional oil & gas.
CELANESE USA 8,435 Cost Beneficiary - OUTPERFORM JV with Mitsui to capitalise on lower input prices to manufacture methanol.
CF INDUSTRIES HOLDINGS INC USA 12,164 Cost Beneficiary High NEUTRAL Could benefit from low cost shale at least through 2016.
CLEAN ENERGY FUELS CORP USA 1,146 Cost Beneficiary High NOT COVERED Is a leader in CNG and LNG fuelling stations.
CVR REFINING USA 3,764 Cost Beneficiary High NOT COVERED Operating cost savings - cheap US natural gas vs. international equivalent price.
DOW CHEMICAL USA 47,577 Cost Beneficiary High OUTPERFORM Could benefit from a cost advantage from shale gas at least until 2015.
DU PONT (E I) DE NEMOURS USA 55,923 Cost Beneficiary - NEUTRAL To benefit from lower input costs for example in ethane.
EASTMAN CHEMICAL CO USA 12,062 Cost Beneficiary Moderate NOT COVERED Could benefit from a cost advantage from shale gas.
FEDEX USA 35,958 Cost Beneficiary Low NEUTRAL Potential benefit from use of natural gas vehicles.
FORMOSA CHEMICALS & FIBRE CORP TWN 15,429 Cost Beneficiary Low NEUTRAL Petrochemical manufacturer has announced investments in the US.
FORMOSA PLASTICS CORPORATION TWN 16,542 Cost Beneficiary High OUTPERFORM US subs., Formosa USA to build a 1.2mn ton/yr shale gas cracker in Texas by 2016.
INEOS GBR N/A Cost Beneficiary - NOT COVERED Likely to benefit from lower input costs in a variety of its products.
KOREA GAS KOR 4,963 Cost Beneficiary High NEUTRAL Is buying gas from Sabine Pass so offering a new source of LNG to Asia.
LYONDELLBASELL INDUSTRIES NV USA 42,166 Cost Beneficiary High OUTPERFORM Could benefit from a cost advantage from shale gas at least until 2015.
MARATHON PETROLEUM CORP USA 20,081 Cost Beneficiary High NEUTRAL Benefiting from low refining/chemical costs and growth potential in logistics.
METHANEX CORP CAN 4,851 Cost Beneficiary - NOT COVERED Benefit from lower natural gas costs with methanol plant being moved form Chile to US.
NAN YA PLASTICS CORPORATION TWN 16,691 Cost Beneficiary Low NEUTRAL Investment of USD 1.7Bn to construct a fractionation, ethylene and propylene plant.
NEXTERA ENERGY USA 34,158 Cost Beneficiary Moderate OUTPERFORM Are a huge consumer of natural gas used to produce electricity at their Florida utility.
NUCOR CORP USA 15,673 Cost Beneficiary High NOT COVERED US largest steel producer, mainly produces steel via EAF.
OSAKA GAS CO., LTD.(C) JPN 8,968 Cost Beneficiary High NOT COVERED Exposure to Canadian shale gas, with possibility of importing to Japan.
PBF ENERGY USA 3,853 Cost Beneficiary High NEUTRAL Operating cost savings - cheap US natural gas vs. international equivalent price.
PERUSAHAAN GAS NEGARA PERSERO IDN 10,903 Cost Beneficiary High OUTPERFORM May get more gas supply, and likely at cheaper price in the future.
PETRONAS CHEMICALS GROUP BHD MAL 16,923 Cost Beneficiary - NEUTRAL Produces olefins, polymers, fertilisers, methanol and other chemicals and their derivatives.
PHILLIPS 66 USA 36,267 Cost Beneficiary High OUTPERFORM Operate in US East Coast, Mid-Continent, Gulf Coast (in-land and coastal), Rockies.
SASOL SAF 31,559 Cost Beneficiary - NOT COVERED Exposure to shale ops in Canada; well placed to capitalise on low feedstock prices.
TESORO CORP USA 6,015 Cost Beneficiary High OUTPERFORM Operate in US Mid-Continent, US Rockies and US West Coast.
TOKYO GAS CO., LTD.(C) JPN 14,550 Cost Beneficiary High NOT COVERED Potential Canadian shale gas, some of which could be imported to Japan.
UNITED PARCEL SERVICE USA 86,134 Cost Beneficiary Low OUTPERFORM Potential benefit from use of natural gas vehicles.
VOESTALPINE AUT 8,093 Cost Beneficiary High NEUTRAL Specialist steel producer based in Linz, Austria, to construct DRI plant in Texas.
WESTERN REFINING INC USA 2,427 Cost Beneficiary High OUTPERFORM Operating in US Gulf Coast (in-land).
WESTLAKE CHEMICAL CORP USA 7,093 Cost Beneficiary High NOT COVERED Could benefit from a cost advantage from shale gas at least until 2015.
YAMATO KOGYO JPN 2,199 Cost Beneficiary Moderate OUTPERFORM Japanese steel producer, materially investing in DRI in Bahrain.
3 LEGS RESOURCES GBR 36 E&P - NOT COVERED Exposed to the Baltic basin.
ALON USA ENERGY, INC USA 664 E&P Moderate UNDERPERFORM Owns & operates heavy crude oil refineries in Texas & California amongst other regions.
ALTAGAS LTD CAN 4,215 E&P High NOT COVERED Exposed to processing and other infrastructure in Alberta and British Columbia.
AMERICA PETROGAS CAN 245 E&P - NOT COVERED Exposure to Argentinian shale gas through the Neuquen basin.
ANADARKO PETROLEUM CORP USA 47,496 E&P High OUTPERFORM Exposure to core Wattenberg play.
APACHE CORP USA 35,060 E&P High OUTPERFORM It has exposure to both NZ and Argentinian shale gas.
ARC RESOURCES CAN 7,888 E&P High OUTPERFORM Canadian shale resource, potential for better extraction costs & higher future gas prices.
ATHLON ENERGY USA 2,655 E&P - NEUTRAL Focused on unconventional plays, based in Fort Worth, so exposure to Barnett shale.
AURORA OIL & GAS LIMITED AUS 1,428 E&P High OUTPERFORM Shale oil and gas in the Eagle Ford play, Texas. Source: Company data, Credit Suisse Equity Research

1 O
cto
ber 2
013
Th
e S
hale
Re
volu
tion
II 1
58
Exhibit 243: Shale-related stocks
Company Country Market Cap ($bn) Type Sensitivity Rating Explanation
AWE LIMITED AUS 608 E&P High RESTRICTED Has found both oil and gas from shale.
BANKERS PETROLEUM LTD CAN 948 E&P High NOT COVERED One of few equity routes to play shale gas.
BEACH ENERGY LIMITED AUS 1,622 E&P - NEUTRAL Drilling exploratory shale wells.
BNK PETROLEUM CAN 948 E&P - NOT COVERED One of the first to pursue shale gas land acquisitions in Europe in Poland and Germany.
BP PLC GBR 134,455 E&P Moderate NOT COVERED Exposure to US shale gas but lacks liquids exposure; involved in tight gas in Oman.
BURU ENERGY LIMITED AUS 485 E&P - NOT COVERED Drilling unconventional gas exploratory wells.
CABOT OIL & GAS USA 15,647 E&P - NOT COVERED Exposure to the Marcellus, Eagle Ford and Marmaton shale.
CALLON PETROLEUM CO/DE USA 210 E&P - NOT COVERED Exposure to Permian shale.
CANADIAN NATURAL RESOURCES CAN 34,392 E&P High OUTPERFORM Current sellers of shale/tight gas resource.
CARRIZO OIL & GAS INC USA 1,522 E&P High UNDERPERFORM Exposure to Eagleford, Marcellus, Barnett and Utica shale.
CHESAPEAKE ENERGY CORP USA 17,576 E&P High NEUTRAL Exposure to Eagleford, Marcellus, Barnett, Haynesville/Bossier and Utica shale.
CHEVRON CORP USA 239,386 E&P Moderate OUTPERFORM Exposure to Pennsylvania, Ohio & Michigan shale, with acreage in CAN, ROM & MEX.
CHUBU ELECTRIC POWER CO JPN 10,335 E&P High NOT COVERED Exposure to potential Canadian shale gas, of which some could be exported to Japan.
CIMAREX ENERGY USA 8,279 E&P - NOT COVERED Exposure through mid-continent (Woodford play in Oklahoma) and Permian basin.
CNOOC LIMITED HKG 90,633 E&P High OUTPERFORM Is commited to Shell to provide technical assistance in exploring shale gas.
CONCHO RESOURCES USA 11,474 E&P High NEUTRAL Exposure to Permian shale.
CONOCOPHILLIPS USA 85,867 E&P Moderate NEUTRAL They have a license to explore and produce shale in Poland.
CONSOL ENERGY INC USA 7,728 E&P Moderate NOT COVERED May benefit from additional rail and port expansions for export growth from Appalachia.
CONTINENTAL RESOURCES USA 19,930 E&P - NOT COVERED Main exposure to bakken shale play with capex planned for development drilling in 2014.
CORRIDOR RESOURCES INC CAN 69 E&P - NOT COVERED Limited exposure to shale play through development in Sussex & Elgin sub-basins.
CRESCENT POINT CAN 14,765 E&P Moderate NEUTRAL Exposure to southern Saskatchewan, central & southern Alberta and the Bakken basin.
CUADRILLA RESOURCES GBR N/A E&P - NOT COVERED Exposure to the Bowland basin.
DENBURY RESOURCES USA 6,873 E&P Low OUTPERFORM Downsizing exposure to shale via the sale of Bakken acerage.
DEVON ENERGY CORP USA 24,805 E&P High OUTPERFORM Large US gas and NGL exposure and emerging liquids portfolio.
EMPIRE ENERGY GROUP LTD AUS 26 E&P - NOT COVERED Exploring shale possibilities in Pennsylvania and the Northern Territory in Australia.
ENCANA CORP CAN 12,770 E&P High NEUTRAL Pure play on gas, especially shale with exposure to multiple shale gas basins in north Am.
ENERPLUS CORPORATION CAN 3,432 E&P Low OUTPERFORM Upstream producer with exposure to shale oil and gas resource.
ENI - ENTE NAZIONALE IDROCARBURI ITA 10,768 E&P Low NOT COVERED They have a license to explore and produce shale in Poland.
EOG RESOURCES INC USA 46,957 E&P Moderate NEUTRAL Already present in Argentinian shale oil extraction and production.
EXCO RESOURCES INC USA 1,497 E&P - NOT COVERED Focus on shale resource plays, with acquisition of assets in Haynesville from Chesapeake.
EXXON MOBIL CORP USA 390,113 E&P High NEUTRAL Could benefit from a cost advantage from shale gas at least until 2015/16.
FALCON OIL & GAS USA 10,348 E&P - NOT COVERED Exposure to shale through Hungarian operations and possible options in Australia too.
FOREST OIL CORP USA 756 E&P High UNDERPERFORM Recently announced accelerated development program in Eagle Ford drilling program.
FORMOSA PETROCHEMICAL 25,205 E&P Low UNDERPERFORM Involved primarily in refining crude oil and producing and selling oldefins such as ethylene.
GASTAR EXPLORATION LTD USA 254 E&P - NOT COVERED Main exposure is through their exploration in the Marcellus Shale.
GOODRICH PETROLEUM CORP USA 926 E&P - NOT COVERED Involvement in Shale plays, primarily with Eagle Ford and Tuscaloosa Marine Shale.
GRIPEN GAS SWE 18 E&P - NOT COVERED Holds 12 licences to explore for shale in Sweden, including Sandon, Greby & Lundeby.
GULFPORT ENERGY CORP USA 4,936 E&P High OUTPERFORM Exposure to Southern Louisiana, Permian, Niobraa and Utica shale.
HESS CORP USA 26,912 E&P Moderate NEUTRAL Recent loss-making in Eagle Ford, but deal with PertroChina opens a new end market.
HOLLY FRONTIER CORP USA 8,339 E&P Moderate NEUTRAL Well placed for lower feedstock prices coming from the Bakken shale formation.
IGAS GBR 328 E&P - NOT COVERED Exposure to shale in southern & northwest of England, north Wales and East Midlands.
IMPERIAL OIL CAN 37,446 E&P Moderate NEUTRAL Exposure to shale via the Horn River shale gas play.
INPEX CORPORATION(C) JPN 17,051 E&P High OUTPERFORM Has acquired mining concessions in Canada.
JAPAN PETROLEUM EXPLORATION JPN 2,466 E&P Low OUTPERFORM Has an LNG regas project due to sanctioned in Japan at the end of this fiscal year.
KUNLUN ENERGY COMPANY LIMITED HKG 11,147 E&P - OUTPERFORM Planning to have 1,515 LNG filling stations open by 2015
MAGNUM HUNTER RESOURCES CORP USA 1,005 E&P - NOT COVERED Has three key production areas: Macrellus, Eagle Ford & Bakken shale.
MARATHON OIL CORP USA 25,037 E&P High OUTPERFORM Low cost way to play the Eagle Ford Shale, with exploration optionality on top.
MATADOR RESOURCES CO USA 1,082 E&P - NOT COVERED Exposure to Shale via Eagle Ford play (principal interest) as well as Haynesville etc.
MIDSTATES PETROLEUM CO USA 374 E&P - NOT COVERED Owns assets in the Anadarko Basin among other Shale plays.
MITSUI & CO., LTD.(C) JPN 24,341 E&P - NOT COVERED 30% owner of the pipeline project to export US natural gas to Mexico. Source: Company data, Credit Suisse Equity Research

1 O
cto
ber 2
013
Th
e S
hale
Re
volu
tion
II 1
59
Exhibit 244: Shale-related stocks
Company Country Market Cap ($bn) Type Sensitivity Rating Explanation
MOLOPO ENERGY LIMITED AUS 48 E&P High NOT COVERED Shale oil and gas in the Wolfcamp play, Texas.
MURPHY OIL CORPORATION USA 11,752 E&P - NOT COVERED Active in the Eagle Ford with exploration in Pearsall shale play.
NEW STANDARD ENERGY TWN 7,111 E&P - NOT COVERED Exposure to Australian shale and the US Heintschel field.
NEW ZEALAND ENERGY CORP NZL 39 E&P - UNDERPERFORM Operate in the East Coast basin.
NOBLE ENERGY INC USA 24,392 E&P High OUTPERFORM Unparalleled visibility from its five core areas, especially in the DJ Basin.
NORTHERN TIER ENERGY USA 1,785 E&P High NEUTRAL Operating cost savings - cheap US natural gas vs. international equivalent price.
OCCIDENTAL PETROLEUM USA 75,513 E&P Moderate OUTPERFORM Has a large position in Permian acreage, with a bias towards the Delaware basin.
OMV AKTIENGESELLSCHAFT AUT 16,353 E&P High UNDERPERFORM One of few equity routes to play shale gas.
PDC ENERGY INC USA 2,200 E&P High OUTPERFORM Offers investors some of the best leverage to the Niobrara and the Utica shale.
PEMEX MEX N/A E&P - NOT COVERED Only recently started a new company to work on the shale gas and oil fields in the US.
PENN VIRGINIA CORP USA 424 E&P High NEUTRAL Gaining scale in its acerage in Eagle Ford.
PENN WEST PETROLEUM LTD CAN 5,452 E&P Moderate UNDERPERFORM Limited exposure to Shale through a project shared with Mitsubishi Corp.
PETROBRAS ARGENTINA S.A. ARG 1,764 E&P - NOT COVERED Exposure to Latin American shale plays, such as the Vaca Muerta shale formation.
PETROCHINA CO LTD HKG 231,151 E&P High UNDERPERFORM Is working with Shell, and Conoca on shale gas exploration.
PGNIG POL 11,490 E&P - NOT COVERED Exposure to shale via the shale gas belt in Poland
PIONEER NATURAL RESOURCES CO USA 26,079 E&P High OUTPERFORM PXD's second Northern Midland test appears to be positive.
PKN ORLEN POL 6,146 E&P - NOT COVERED Exposure to shale via the shale gas belt in Poland.
QUESTERRE ENERGY CORP CAN 250 E&P - NOT COVERED Exposure in Utah & Wyoming through equity investment in Red Leaf Resources.
QUICKSILVER RESOURCES INC USA 341 E&P - NOT COVERED Has a large interest in the Barnett shale project, of which 25% was recently sold off.
RANGE RESOURCES CORP USA 12,760 E&P High OUTPERFORM Sold all holdings in Barnett shale and bought heavily in to the Marcellus Shale trend.
REPSOL SPN 32,729 E&P Low NEUTRAL Only has exposure to one basin in the Mississippi region, with discoveries in Argentina.
RESOLUTE ENERGY CORP USA 666 E&P - NOT COVERED Some exposure to the Bakken shale trend.
REX ENERGY CORP USA 1,191 E&P High NEUTRAL Heavy focus on the Marcellus Shale drilling projects.
ROSETTA RESOURCES INC USA 3,326 E&P High OUTPERFORM Eagleford exposure.
ROYAL DUTCH SHELL PLC - B SH GBR 214,167 E&P Moderate NOT COVERED Extensive exposure in the US. Benefits from low US gas prices as a chemicals producer.
SAN LEON ENERGY USA 3,816 E&P - OUTPERFORM Exposure to the Baltic basin in Poland, with possible opportunities in Timahdit, Morocco.
SANCHEX ENERGY CORPORATION USA 1,212 E&P - NOT COVERED Large focus on shale through Eagle Ford, continued with recent acquisitions.
SANDRIDGE ENERGY USA 3,492 E&P Moderate NEUTRAL Shunned the Shale play to focus on aged wells, so small exposure.
SANTOS LIMITED AUS 14,155 E&P High UNDERPERFORM Currently in the process of E&P in Australia.
SENEX ENERGY LIMITED AUS 828 E&P High OUTPERFORM Drilling exploration shale wells in the Cooper Basin.
SINOPEC CHINA PETROLEUM & CHEM HKG 86,432 E&P High NEUTRAL Has signed deals with BP, Total, Exxon and Chevron to work on shale.
SM ENERGY CO USA 5,200 E&P - NOT COVERED Recent results have been driven by the Eagle Ford shale play, with more to come.
SOLVAY SOCIETE ANONYME BEL 13,098 E&P Negative OUTPERFORM US oversupply of PVC due to shale cracking will put downward pressure on margins.
SOUTHWESTERN ENERGY CO USA 13,156 E&P High UNDERPERFORM Primary business is E&P of natural gas within the US, inc. the Fayetteville Shale play.
STATOIL ASA NOR 423 E&P Low NOT COVERED Exposure to US shale including 2 liquids-rich plays and low-cost dry gas.
TAG OIL CAN 256 E&P High NEUTRAL One of 2 biggest players of New Zealand shale oil, operating in East Coast basin.
TALISMAN ENERGY INC CAN 11,797 E&P Moderate OUTPERFORM Current sellers of shale/tight gas resource.
TOTAL SA FRA 138,296 E&P Low NOT COVERED Exposure to shale in Poland, Argentina and US, and tight gas in China.
TRILOGY EXPLORATION CAN 2,319 E&P - NOT COVERED Exposure to the Duvernay shale play since 2011.
ULTRA PETROLEUM CORP USA 3,145 E&P - NOT COVERED Exposure to Marcellus shale.
VALERO ENERGY CORP USA 18,601 E&P Moderate NEUTRAL Owns refineries in key areas between California and the UK; strong market position.
VERMILION CAN 5,593 E&P Moderate OUTPERFORM Part owner of Alliance Pipeline & Jordan Cove LNG project in Oregon.
W&T OFFSHORE INC. USA 1,332 E&P - NOT COVERED Exposure to Permian shale.
WPX ENERGY INC USA 3,863 E&P - NOT COVERED Well placed in North America, with successful discovery in Niobrara formation
YPF SOCIEDAD ANONIMA ARG 8,251 E&P Moderate UNDERPERFORM Recently struck a deal with Chevron to exploit the Vaca Muerta shale reserves.
ABB LIMITED CHE 55,198 Equip & Support Services Moderate OUTPERFORM Development of new power plants fuel demand for supporting technologies.
ACCESS MIDSTREAM PARNERS USA 8,457 Equip & Support Services High OUTPERFORM Active at Marcellus, Utica, Miss Lime, Granite Wash, Permian, Eagleford and Wolfberry.
ALFA LAVAL SWE 10,270 Equip & Support Services Low NEUTRAL Could benefit from increased demand from LNG plants for heat exchangers
ALON USA PARTNERS USA 794 Equip & Support Services High NEUTRAL Operating cost savings - cheap US natural gas vs. international equivalent price. Source: Company data, Credit Suisse Equity Research

1 O
cto
ber 2
013
Th
e S
hale
Re
volu
tion
II 1
60
Exhibit 245: Shale-related stocks
Company Country Market Cap ($bn) Type Sensitivity Rating Explanation
ALSTOM SA FRA 11,197 Equip & Support Services Moderate UNDERPERFORM Supply approximately 25% of world's power production with technology and services.
AMEC P.L.C. GBR 5,195 Equip & Support Services Moderate OUTPERFORM Are reportedly interested in participating in the development of shale block in China.
ANTON OILFIELD SERVICES GROUP HKG 1,453 Equip & Support Services High NOT COVERED Chinese gas services offered; so would benefit from more Chinese shale gas extraction.
ARKEMA GROUP FRA 7,068 Equip & Support Services Moderate OUTPERFORM Elevated propylene prices in the US could support higher derivatives prices globally.
BABCOCK & WILCOX USA 3,785 Equip & Support Services - NEUTRAL Should benefit from the EPA's enforcement of the CSAPR and MATS regulations
BAKER HUGHES INC USA 21,917 Equip & Support Services High OUTPERFORM Hydraulic fracturing services.
BASIC ENERGY SERVICES USA 548 Equip & Support Services - NOT COVERED Exposure via Barnett Shale, with recent relocation to Fort Worth.
BIOTEQ ENVIRONMENTAL TECH CAN 6 Equip & Support Services - NOT COVERED Treat shale gas frac water.
BURCKHARDT COMPRESSION CHE 1,356 Equip & Support Services High NOT COVERED Global leading manufacturer of turbo compressors which are highly exposed to LNG.
CAMERON INTERNATIONAL CORP USA 14,526 Equip & Support Services High OUTPERFORM Frac stimulation trees & frac manifold rentals.
CANADIAN NATIONAL RAILWAY CO USA 42,301 Equip & Support Services Moderate NEUTRAL Crude by rail; inbound drilling materials.
CANADIAN PACIFIC RAILWAY LTD USA 21,995 Equip & Support Services High OUTPERFORM Crude by rail; inbound drilling materials.
CANYON USA 6,038 Equip & Support Services - NEUTRAL Hydraulic fracturing.
CARBO CERAMICS USA 2,265 Equip & Support Services - NOT COVERED World's largest producer of ceramic proppant, used in the hydaulic fracturing process.
CATERPILLAR INC USA 54,941 Equip & Support Services High OUTPERFORM Intentions to launch LNG powered locomotives.
CGG VERITAS FRA 4,213 Equip & Support Services - NOT COVERED Provider of seismic solutions in the exploration of efficient shale formations.
CHICAGO BRIDGE & IRON CO USA 7,200 Equip & Support Services - NEUTRAL Offer natural gas infrastructure; pipes, loading and storage facilities.
CHINA OILFIELD SERVICES LTD HKG 12,224 Equip & Support Services Low OUTPERFORM Well placed to capitalise on Chinese shale gas extraction through its service offerings.
CIMC ENRIC HOLDINGS LIMITED HKG 2,529 Equip & Support Services High NOT COVERED Offer CNG and LNG transportation for Chinese shale gas.
CLEAN HARBORS USA 3,501 Equip & Support Services Moderate OUTPERFORM Downhole well services, lodging, equipment rental & solid waste disposal in 3 shale plays.
CORE LABORATORIES NV USA 7,753 Equip & Support Services - NOT COVERED Petroleum Services Business Unit provides shale oil/gas training equipment.
CROSSTEX ENERGY, INC USA 1,009 Equip & Support Services High OUTPERFORM Active at the Barnett, Permian, Eagleford and Utica sites.
CSX CORP USA 26,469 Equip & Support Services Moderate NEUTRAL Crude by rail; inbound drilling materials.
CUMMINS INC USA 25,461 Equip & Support Services High OUTPERFORM Are developing natural gas engines for truck manufacturers.
DANIELI ITA 1,156 Equip & Support Services - NOT COVERED Benefit from increased demand for their automation products such as tube & pipe mills.
DCP MIDSTREAM PARTNERS USA 4,320 Equip & Support Services High NEUTRAL Involved in gathering, processing, transporting and selling natural gas and NGLs.
DELEK US HOLDINGS USA 1,297 Equip & Support Services Moderate OUTPERFORM Specialist in energy logistics and market-leader in convenience story operations.
DENSO CORPORATION(C) JPN 38,092 Equip & Support Services High OUTPERFORM Could benefit from increased demand in fuel injection systems for NGVs.
DIAMONDBACK ENERGY, INC USA 2,030 Equip & Support Services - OUTPERFORM Exposure to the Permian Basin.
DOMINION RESOURCES USA 36,284 Equip & Support Services - OUTPERFORM Provide midstream services to companies, such as BP, in the Marcellus shale.
DONALDSON COMPANY, INC USA 5,575 Equip & Support Services - OUTPERFORM Offers filtration systems used to clean in-plant air and for air and gas purification.
DONGFANG ELECTRIC CORP HKG 3,620 Equip & Support Services High UNDERPERFORM Has formed partnership with MHI to supply gas turbine equipment.
DRESSER-RAND GROUP INC USA 4,724 Equip & Support Services High NOT COVERED Produces turbo compressors which are highly exposed to LNG.
ECOLAB USA 29,866 Equip & Support Services - OUTPERFORM Could benefit as firms look to increase the efficiency of their operations.
EMERSON ELECTRIC CO USA 46,745 Equip & Support Services High OUTPERFORM Supplier of process automation control tech for gas fired power plants.
ENBRIDGE ENERGY PARTNERS LP USA 9,518 Equip & Support Services High RESTRICTED Leading pipeline franchise for oil imports to USA from Canada; assets well positioned.
ENBRIDGE INC CAN 34,413 Equip & Support Services High OUTPERFORM Could benefit from growth in the pipeline industry in Bakken formation, North America.
ENBRIDGE INCOME FUND CAN 1,307 Equip & Support Services Moderate NEUTRAL Saskatchewan system offers exposure through North Dakota & Bakken.
ENERGY RECOVERY INC USA 374 Equip & Support Services High NEUTRAL Launching a cost reducing device for gas processing market.
ENSIGN ENERGY SERVICES CAN 2,650 Equip & Support Services - NOT COVERED Offer oilfield services, inc contract, directional, underbalanced and managed drilling.
ENTERPRISE PRODUCTS PARTNERS USA 56,606 Equip & Support Services High NEUTRAL Assets placed in virtually every natural gas, NGL, or crude growth basin.
EQT MIDSTREAM LP USA 2,406 Equip & Support Services High OUTPERFORM Active at the Marcellus site.
EVEREST KANTO CYLINDER LTD IND 14 Equip & Support Services Moderate NOT COVERED Could benefit from increased demand in CNG cyclinders.
FANUC CORPORATION(C) JPN 32,904 Equip & Support Services Low OUTPERFORM The automation system manufacturer is well placed.
FENNER GBR 1,215 Equip & Support Services Low OUTPERFORM A growing supplier of seals used within pressure pumping.
FLOTEK INDUSTRIES INC USA 1,182 Equip & Support Services - NOT COVERED The drilling and production-related manufacturer has seen higher shale-related demand.
FLOWSERVE CORP USA 8,797 Equip & Support Services High OUTPERFORM Produces centrifugal pumps which are used around the well to transport water.
FLUOR CORP USA 11,743 Equip & Support Services Moderate OUTPERFORM Are reportedly interested in participating in the development of shale block in China.
FMC TECHNOLOGIES USA 13,099 Equip & Support Services - NEUTRAL Provide services in the Marcellus shale play. Source: Company data, Credit Suisse Equity Research

1 O
cto
ber 2
013
Th
e S
hale
Re
volu
tion
II 1
61
Exhibit 246: Shale-related stocks
FOSTER WHEELER AG USA 2,600 Equip & Support Services - OUTPERFORM Engineering and construction contractor is well placed to benefit from shale boom.
GARDNER DENVER INC USA 3,739 Equip & Support Services High NOT COVERED Could benefit from increased demand in pressure pump manufacturing.
GAZPROM OAO RUS 106,839 Equip & Support Services Negative NOT COVERED Slow to react to changes in the US shale market, with revenues subsequently suffering.
GENERAL ELECTRIC CO USA 246,957 Equip & Support Services High OUTPERFORM Global #1 in industrial gas turbines; strong position in compresssor technology.
GENESEE & WYOMING USA 3,915 Equip & Support Services Moderate OUTPERFORM Crude by rail; inbound drilling materials.
GENESIS ENERGY LP USA 4,448 Equip & Support Services High NEUTRAL Assets well positioned for the large growth in oil and liquids production.
GIBSON ENERGY CAN 2,872 Equip & Support Services Moderate NOT COVERED Crude oil by rail, truck transport in Bakken.
HALLIBURTON CO USA 44,501 Equip & Support Services High OUTPERFORM Hydraulic fracturing services.
HARBIN ELECRIC CO LTD HKG 423 Equip & Support Services High UNDERPERFORM Has formed partnership with GE to supply gas turbine equipment.
HELMERICH & PAYNE USA 7,398 Equip & Support Services - NEUTRAL Contractor for drilling of oil and gas wells.
HILONG HOLDING LIMITED HKG 5 Equip & Support Services High NOT COVERED Offers oilfield services for Chinese shale gas.
HONEYWELL INTERNATIONAL INC USA 65,966 Equip & Support Services High NEUTRAL Benefits in its UOP business which is involved in helping to extract & cleanse natural gas.
HONGHUA GROUP LIMITED HKG 994 Equip & Support Services High NOT COVERED The rig maker could benefit from increased Chinese shale gas extraction.
ITRON INC USA 1,681 Equip & Support Services High NEUTRAL Benefit from higher demand in upstream metering equipment for distribution infrastructure.
JACOBS ENGINEERING USA 7,659 Equip & Support Services - OUTPERFORM Provide services to the largest oil shale processor in Estonia amongt other US ventures.
JGC CORPORATION JPN 9,337 Equip & Support Services High NEUTRAL Global top E&C players, especially in LNG area. Diversified potential project portfolio.
KANSAS CITY SOUTHERN USA 12,167 Equip & Support Services High OUTPERFORM Crude by rail; inbound drilling materials.
KBR INC USA 4,862 Equip & Support Services High OUTPERFORM Very well positioned based on the number of verticals the company can benefit from.
KEIHIN CORPORATION(C) JPN 1,208 Equip & Support Services High NEUTRAL Could benefit from increased demand in fuel injection systems for NGVs.
KENNAMETAL INC. USA 3,622 Equip & Support Services - OUTPERFORM Produces equipment for electric power plants & producer of wheels & axles for railroads.
KEY ENERGY SERVICES USA 1,137 Equip & Support Services - NOT COVERED Provides coiled tubing services in most shale plays in the US.
KINDER MORGAN ENERGY PARTNERS USA 34,679 Equip & Support Services High OUTPERFORM Active at Permian, Eagleford, Louisiana Coast, Alberta, Rockies, Marcellus and Utica.
KOMATSU JPN 23,483 Equip & Support Services Negative OUTPERFORM Less demand for excavators and dump trucks as mining companies cut spending.
LINC ENERGY USA 11,267 Equip & Support Services - UNDERPERFORM Owns 2 resources of Shale oil in south Australia which could diversify current production.
LUXFER USA 440 Equip & Support Services High OUTPERFORM Leader in CNG cylinders for cars, trucks and buses.
MAGELLAN MIDSTREAM PARTNERS USA 12,878 Equip & Support Services High OUTPERFORM Leading refined products pipeline franchise and active at the Permian site.
MARKWEST ENERGY PARTNERS LP USA 11,162 Equip & Support Services High OUTPERFORM Operate at Marcellus, Utica, Permian, Eagleford, Woodfard, Barnett and Granite Wash.
MARUTI SUZUKI INDIA LTD IND 6,744 Equip & Support Services High OUTPERFORM May benefit from further growth NGVs.
MASTEC, INC USA 2,390 Equip & Support Services - NOT COVERED Producers of natural gas pipelines.
MCDERMOTT INTERNATIONAL USA 1,770 Equip & Support Services - OUTPERFORM Create infrastructure enabling extraction of oil and gas both onshore and offshore.
MELROSE GBR 6,147 Equip & Support Services Moderate NEUTRAL Leading global supplier of 20MW-130MW turbogenerators used alongside gas turbines.
MITSUBISHI HEAVY INDUSTRIES JPN 21,850 Equip & Support Services High OUTPERFORM One of the global top gas turbine makers. Also provide LNG carriers.
MRC GLOBAL USA 2,726 Equip & Support Services - NOT COVERED Has acquired production speciality services in key shale regions such as Eagle Ford.
NATIONAL OILWELL VARCO INC USA 33,825 Equip & Support Services High RESTRICTED Beginning to produce pressure pumps used in shale gas E&P.
NATURAL GAS SERVICES GROUP USA 337 Equip & Support Services - NOT COVERED Focus on the non-conventional gas production through custom fabricated compressors.
NEXANS FRA 1,784 Equip & Support Services Low NEUTRAL Cables used in upstream and downstream oil and gas. Also used for shipping industry.
NORFOLK SOUTHERN CORP USA 24,426 Equip & Support Services Moderate OUTPERFORM Crude by rail; inbound drilling materials.
NUVERRA ENVIRONMENTAL SOLUTN USA 600 Equip & Support Services High OUTPERFORM Water pick-up, disposal and treatment and solid waste disposal in 8 shale plays.
OKUMA CORPORATION JPN 1,446 Equip & Support Services Low OUTPERFORM Increased shale interest is positively correlated with use of super allow turning applications.
ONEOK PARTNERS LP USA 12,100 Equip & Support Services High NEUTRAL One of the larger publically traded MLPs with large capacity assets.
ORION ENERGY SYSTEMS INC USA 86 Equip & Support Services High NOT COVERED Offers oilfield services for Chinese shale gas.
PARKER HANNIFIN USA 16,411 Equip & Support Services - OUTPERFORM The Complete Piping Solutions Unit has benefitted from Shale exposure.
PEMBINA CAN 10,236 Equip & Support Services Moderate NOT COVERED Midstream assets include crude oil terminal and oilfield hauling business.
PENTAIR LTD USA 13,128 Equip & Support Services High NEUTRAL Increased demand in centrifugal pumps which; used around the well to transport water.
PETROFAC GBR 7,767 Equip & Support Services Low OUTPERFORM Design and build gas infrastructure, and operate, maintain and manage assets.
PETROLEUM GEO SERVICES NOR 2,852 Equip & Support Services - NOT COVERED Offer seismic & electromagnetic services, data acquisition and reservoir analysis.
PLAINS ALL AMERICAN PIPELINE LP USA 18,247 Equip & Support Services High OUTPERFORM Active at Permian, Eagleford, Mid-Con, Williston, Rockies and Alberta sites.
Source: Company data, Credit Suisse Equity Research

1 O
cto
ber 2
013
Th
e S
ha
le R
evolu
tion
II 1
62
Exhibit 247: Shale-related stocks
Company Country Market Cap ($bn) Type Sensitivity Rating Explanation
PROGRESSIVE WASTE CAN 2,974 Equip & Support Services Low NEUTRAL Solid waste disposal in the Haynesville.
PRYSMIAN ITA 5,320 Equip & Support Services Moderate OUTPERFORM Cables used in upstream and downstream oil and gas. Also used for shipping industry.
QUANTA SERVICES INC USA 5,931 Equip & Support Services - OUTPERFORM Well placed to capitalise on pipeline opportunities.
REPUBLIC SERVICES USA 12,338 Equip & Support Services Low NEUTRAL Solid waste disposal in 8 shale plays.
ROCKWELL AUTOMATION USA 15,105 Equip & Support Services - NEUTRAL Provider of automation service which are used in shale extraction process.
ROLLS ROYCE HOLDINGS PLC GBR 34,046 Equip & Support Services Moderate NOT COVERED One of 2 major players in compressors for gas pipelines.
ROTORK P.L.C. GBR 3,872 Equip & Support Services High OUTPERFORM Leading supplier of upstream oil & gas actuators.
SAIPEM ITA 9,815 Equip & Support Services Low UNDERPERFORM Small exposure to shale through operations in Canada
SANDVIK SWE 17,616 Equip & Support Services Low UNDERPERFORM Drilling division could benefit from increased demand for shale-grade drill bits.
SAVANNA ENERGY SERVICES CAN 650 Equip & Support Services - NOT COVERED Has had exposure to most of the major shale plays through its drilling operations.
SBM OFFSHORE NET 4,263 Equip & Support Services - NOT COVERED Engaged mainly in the offshore drilling.
SCHLUMBERGER LTD USA 117,538 Equip & Support Services High NEUTRAL Fraccing crews could benefit from the growing E&P of shale gas.
SECURE ENERGY SERVICES INC CAN 1,441 Equip & Support Services - NOT COVERED Disposal division likely to benefit.
SHANGHAI ELECTRIC GROUP HKG 7,002 Equip & Support Services High NEUTRAL Has formed partnership with Siemens to supply gas turbine equipment.
SHAWCOR LTD CAN 1,282 Equip & Support Services - NOT COVERED Will benefit through increased demand for its pipeline related services.
SIEMENS AG DEU 107,184 Equip & Support Services Moderate OUTPERFORM #2 globally in industrial gas turbines and also produces compressor and pumping equip.
SMITHS GROUP GBR 8,870 Equip & Support Services Low OUTPERFORM Global leader in mechanical seals for oil and gas. Also used for shipping industry.
SPT ENERGY GROUP INC HKG 769 Equip & Support Services High NOT COVERED Chinese gas services offered; benefit from increased Chinese shale gas extraction.
STRAD ENERGY SERVICES LTD CAN 141 Equip & Support Services - NOT COVERED Provides on-site infrastructure and activation solutions.
SULZER AG CHE 5,358 Equip & Support Services High NOT COVERED Benefit from more demand in centrifugal pumps, used around the well to transport water.
SUMITOMO CORPORATION(C) JPN 16,831 Equip & Support Services - NOT COVERED Involved in pipeline procurement and sale of shale gas through US subsidiaries.
SUPERIOR ENERGY SERVICES INC USA 4,102 Equip & Support Services High OUTPERFORM Hydraulic fracturing & coiled tubing services.
TARGA RESOURCES CORP USA 3,102 Equip & Support Services High OUTPERFORM Active at the Permian, Barnett, Bakken and Lousiana Coast sites.
TECHNIP FRA 13,580 Equip & Support Services Low OUTPERFORM Recently won a FEED contract; excess shale could be exported to int'l markets.
TENARIS S.A. LUX 28,423 Equip & Support Services High UNDERPERFORM Premium casing, tubing, and connections used for unconventional oil & gas wells .
TRANSCANADA CORP CAN 31,108 Equip & Support Services High OUTPERFORM Coastal GasLink Pipeline & Prince Rupert Gas transmission projects in Western Canada.
TRINIDAD DRILLING SERVICES CAN 1,160 Equip & Support Services - NOT COVERED Building Canada's largest land-based drilling rig. Active in Duvernay region of Alberta.
TTI USA 962 Equip & Support Services - NOT COVERED Active as as a service provider in key plays as well as well testing in Eagle Ford.
U. S. SILICA HOLDINGS INC USA 1,330 Equip & Support Services - NOT COVERED Provide sand storage and rail capacity near several oil and gas shale basins.
UNION PACIFIC CORP USA 73,264 Equip & Support Services High OUTPERFORM Crude by rail; inbound drilling materials.
URS CORPORATION USA 4,149 Equip & Support Services - NEUTRAL Produces energy pipelines and offer engineering services for the extraction of oil and gas.
VALLOUREC FRA 8,402 Equip & Support Services High OUTPERFORM Premium casing, tubing, and connections used for unconventional oil & gas wells.
VERESEN CAN 2,358 Equip & Support Services Moderate NOT COVERED Part owner of Alliance Pipeline & Jordan Cove LNG project in Oregon.
WASTE CONNECTIONS INC USA 5,540 Equip & Support Services High OUTPERFORM Solid waste disposal in 8 shale plays.
WASTE MANAGEMENT USA 19,543 Equip & Support Services Low NEUTRAL Solid waste disposal (recently adding pad construction) in 11 shale plays.
WEATHERFORD INTERNATIONAL USA 11,830 Equip & Support Services High OUTPERFORM Fraccing crews could benefit from the growing E&P of shale gas.
WEICHAI POWER CO., LTD. HKG 6,751 Equip & Support Services High NOT COVERED Are developing natural gas engines.
WEIR GROUP PLC (THE) GBR 8,147 Equip & Support Services High NEUTRAL Could benefit from increased demand in pressure pumps, fluid ends and related services.
WELLSTREAM GBR 1,263 Equip & Support Services - NOT COVERED Produce specialised pipeline product for energy production.
WESTERN ENERGY SERVICES CORP CAN 400 Equip & Support Services - NOT COVERED Contract drilling services provider manufacturer could see more shale-related demand.
WESTPORT INNOVATIONS INC USA 666 Equip & Support Services High OUTPERFORM May benefit from spurred demand in natural gas engines.
WILLBROS GROUP INC USA 474 Equip & Support Services - UNDERPERFORM Energy infrastructure company focused on pipeline for oil and gas.
WILLIAMS COMPANIES, INC USA 24,820 Equip & Support Services Moderate OUTPERFORM Active at the Marcellus, Utica, Permian, Rockies and GoM sites.
WOOD GROUP GBR 4,885 Equip & Support Services Moderate NEUTRAL Engineering, ops and maintenance services, with 110 shale projects and looking for more.
WOODWARD INC USA 2,829 Equip & Support Services - NEUTRAL Producer of gas turbines and accessories.
YANTAI JEREH OILFIELD SERVICES CHN 7,014 Equip & Support Services High NOT COVERED The rig maker will benefit from increased Chinese shale gas extraction.
Source: Company data, Credit Suisse Equity Research

1 O
cto
ber 2
013
Th
e S
hale
Re
volu
tion
II 1
63
Exhibit 248: Shale-related stocks
Company Country Market Cap ($bn) Type Sensitivity Rating Explanation
ABM INVESTAMA IDN 661 Revenues Risk Negative NEUTRAL More supply coming to the market will result in weaker coal environment.
ADARO ENERGY TERBUKA IDN 2,542 Revenues Risk Negative NEUTRAL A low cost coal producer so profitability cushion, but volume growth could be constrained.
ALPHA NATURAL RESOURCES INC USA 1,385 Revenues Risk Negative NOT COVERED Downward pressures on coal demand, additional price pressures on steel production.
ARCH COAL INC USA 961 Revenues Risk Negative NOT COVERED Downward pressures on coal demand likely, so may suffer on price falls.
CHINA SHENHUA ENERGY HKG 61,692 Revenues Risk Negative OUTPERFORM Price pressures on coal from natural gas competition.
CLOUD PEAK ENERGY INC USA 925 Revenues Risk Negative NOT COVERED Downward pressures on coal demand likely, so may suffer from price falls.
ENTERGY CORPORATION USA 11,342 Revenues Risk Negative NEUTRAL Susceptible to instability of supply-demand fundamentals for power markets; lag reg. utils.
EXELON CORPORATION USA 25,744 Revenues Risk Negative NEUTRAL Susceptible to instability of supply-demand fundamentals for power markets; lag reg. utils.
FIRSTENERGY USA 15,449 Revenues Risk Negative NEUTRAL Susceptible to instability of supply-demand fundamentals for power markets; lag reg. utils.
GEA GROUP AG DEU 7,951 Revenues Risk Negative NOT COVERED Suffer from depressed demand for cooling towers required for coal fired power plants.
GREAT EASTERN ENERGY CORP IND 382 Revenues Risk Negative NOT COVERED The coal bed-bed methane producer is likely to be negatively affected by shale.
HARUM ENERGY TERBUKA IDN 673 Revenues Risk Negative NEUTRAL A low cost coal producers, so profitability cushion, but volume growth could be less.
INDIKA ENERGY TBK IDN 350 Revenues Risk Negative NEUTRAL Low cost coal producers, so profitability cusion, but volume growth could be constrained.
INDO TAMBANGRAYA MEGAH TBK IDN 2,714 Revenues Risk Moderate NEUTRAL Has a strong balance sheet and dividend payment.
PEABODY ENERGY CORP USA 4,817 Revenues Risk Negative NOT COVERED Downward pressures on coal demand likely, and so may suffer from price falls.
PT ABM INVESTAMA IDN 661 Revenues Risk Negative NEUTRAL Low cost coal producers so profitablility cushion, but volume growth could be constrained.
PUBLIC SERVICE ENTERPRISE USA 16,860 Revenues Risk Negative NEUTRAL Susceptible to instability of supply-demand fundamentals for power markets; lag reg. utils.
QINGHAI SALT LAKE POTASH CO CHN 4,769 Revenues Risk Negative NOT COVERED Plans to build CTO (Coal to Olefins) tech which is more expensive than natural gas.
SPX CORP USA 3,847 Revenues Risk Negative NEUTRAL May suffer from less demand for cooling towers required for coal fired power plants.
TAMBANG BATUBARA BUKIT ASAM IDN 2,586 Revenues Risk Negative NEUTRAL Low cost coal producers, so profitability cusion, but volume growth could be constrained.
TRANSALTA CORP CAN 3,456 Revenues Risk Negative NOT COVERED May suffer from lower power prices due to increased shift to natural gas.
YARA INTERNATIONAL ASA NOR 11,734 Revenues Risk Negative NOT COVERED European nitrogen producer; face relatively higher costs due to higher EU gas prices.
Source: Company data, Credit Suisse Equity Research

1 October 2013
The Shale Revolution II 164
Appendix 3 – Supplementary Reference Charts In this appendix, we provide a discussion on the key charts supporting our views that :
■ Shale has Most Impact on GAS and NGL Markets for Two Key Reasons
o Shale Gas is More Plentiful
o Gas and Ethane are More Difficult to Transport
■ Shale Oil Is Unlikely to Derail Global Oil Markets For Some Time
■ Shale Should Support a Significant Rise in US Gas Demand Over Time
■ The Best US Shale basins Are The Eagle Ford, Wattenberg, super-rich Marcellus,
Permian, Utica, core Bakken.
■ Stacked Pay Zones Are Important to US Shale
■ Global shale will take longer to be meaningful – but momentum is taking hold
Exhibit 249: With Higher IP Rates and Higher Activity. i.e.
If Oil Prices Remain Strong, US Oil and NGL Production
Could Get Closer to Domestic Consumption
Exhibit 250: North America Production Could Exceed
North America Demand (Including Oil Sands)
0
5,000
10,000
15,000
20,000
25,000
2000 2002 2004 2006 2008 2010 2012 2014 2016 2018 2020
Kbd
US Production US Liquids Consumption US Liquid Imports
0
5,000
10,000
15,000
20,000
25,000
30,000
2000 2002 2004 2006 2008 2010 2012 2014 2016 2018 2020 2022
kbd
US Canada Mexico North America Consumption
Source: EIA, Credit Suisse Equity Research estimates (2013-2020
estimates)
Source: EIA, Credit Suisse Equity Research estimates (2013-2020
estimates)

1 October 2013
The Shale Revolution II 165
Exhibit 251: We Argue That The World ‘Needs” Shale Oil Growth to Offset Emerging Market Demand Growth and the
Substantial Decline Rate on Existing Production (Decline Rates Shown Below by Country)
0%
2%
4%
6%
8%
10%
12%
14%
16%
18%
20%
Source: WoodMackenzie, Credit Suisse Equity Research
Exhibit 252: Shale Really is a Gas and NGL Revolution – Potentially Doubling The Resource Life of Global Gas
242
189 181160 150
11999
8268
3816
0
50
100
150
200
250
Sou
th A
fric
a
Alg
eria
Au
stra
lia
Arg
en
tin
a
Bra
zil
Ch
ina
Me
xico
Can
ada
(*)
Ve
nez
uel
a
Lib
ya
Wo
rld
Ru
ssia
Ind
on
esi
a
No
rth
Am
eri
ca US
Pak
ista
n
Gas
R/P
, ye
ars
Conventional Conventional+Shale
Source: EIA, BP Statistical Review

1 October 2013
The Shale Revolution II 166
Exhibit 253: However Shale Oil Growth Will Eventually Run Out of Steam – The Impact on Global Resource Life (R/P)
Ratio Is Not Significant Enough
91
65 61
46
32
21 19 15 14 13 11
0102030405060708090
100
Ve
nez
uel
a
Lib
ya
Ru
ssia
Arg
en
tin
a
Alg
eria
Pak
ista
n
Wo
rld
Can
ada
(*)
Me
xico
Ind
on
esi
a
No
rth
Am
eri
ca
Bra
zil
US
Ch
ina
Au
stra
lia
Oil
R/P
, ye
ars
Conventional Conventional+Shale Oil
Source: EIA, BP Statistical Review
Figure 254: Cheap Gas Should Drive a Substantial Increase in US Gas Demand (LNG,
Power Growth and Natural Gas Vehicles)
Source: EIA, Credit Suisse Equity Research estimates

1 October 2013
The Shale Revolution II 167
Exhibit 255: The US Plays That Generate the Higher NPV Per Rig Year Are the Eagle Ford, Marcellus, Wattenberg,
Northern Midland and Utica
NPV per Rig Year by Basin ($ MM) - at the Futures Strip
$188
$166
$160
$153
$138
$132
$110
$104
$90
$84
$84
$82
$79
$69
$67
$55
$51
$44
$42
$35
$34
$30
$29
$23
$23
$20
$4 $2
$0
$50
$100
$150
$200
$250
MM
per
Rig
Year
P R I C E F O R E C A S T
2013 2014 2015 2016 2017 2018 2019 2020
W T I O I l : $96.89 $100.00 $90.00 $80.00 $80.00 $80.00 $80.00 $80.00
N Y M E X G a s : $3.96 $4.03 $4.38 $4.50 $4.50 $4.50 $4.50 $4.50
Source: Credit Suisse Equity Research estimates
Exhibit 256: Taking Spacing Into Consideration (i.e. number of wells per acre) and Acreage in the Midland, Wattenberg,
Marcellus, Eagle Ford and Utica Seem Most Valuable
$97,471
$72,254$84,474
$66,522
$23,115
$34,165$72,254
$112,632
$88,696
$144,194$126,353
$114,285
$33,162
$73,103$57,803
$0
$50,000
$100,000
$150,000
$200,000
$250,000
PermianMidland
NiobraraWattenberg
Super-RichMarcellus
Liquids-RichMarcellus
Liquids-RichEagle Ford
Liquids-RichUtica
Wet Gas Utica Bakken
$203,777 $201,431 $195,931
$143,426$154,067
$55,980
$125,592
$113,235
Hz Wolfcamp
Vt Wolfberry
Hz SpraberryCodell
Niobrara C
Niobrara B
Marcellus
Upper Devonian
Marcellus
Upper Devonian Middle Bakken
Three Forks
Source: Credit Suisse Equity Research estimates

1 October 2013
The Shale Revolution II 168
Appendix 4 - Shale Acronyms The following acronyms are commonly used within this report and in the Shale industry.
AF Alternate fuels
Bcf/d Billion Cubic Feet Per Day
BCG Basin Centred Gas
boe/d Barrels of oil equivalent per day
Bopd Barrels of oil per day
CCOW Coal contract of work
CNG Compressed natural gas
CRA Corrosion resistent alloy
DRI Direct reduced iron
EAFS Electric arc furnace slag
EIA Energy Information Administration
EUR Expected ultimate recovery
GHG Greenhouse Gas
GTL Gas to liquids
GWPC Ground water protection council
IEA International energy agency
KBD Thousands of barrels per day
LLS Gulf Coast crude prices
LNG Liquified natural gas
MBoe Thousand barrels of oil equivalent
MMBTU One million BTU
Mmcfe/d One million cubic feet of natural gas equivalent
NDIC North Dakota industrial commission
NGL Natural gas liquids
NGV Natural Gas Vehicles
NOCs National oil companies
OCTG Oil country tubulas goods
OOIP Original oil in place
PSC Profit sharing contract
tcf Trillion cubic feet
TOC Total organic carbon

1 October 2013
The Shale Revolution II 169
Companies Mentioned (Price as of 27-Sep-2013)
ABB (ABBN.VX, SFr21.7) ABM Investama (ABMM.JK, Rp2,700) ALFA (ALFAA.MX, $36.84) AMEC (AMEC.L, 1089.0p) ARC Resources Ltd. (ARX.TO, C$26.03) ASX (ASX.AX, A$34.76) AWE Ltd (AWE.AX, A$1.24) Access Midstream Partners, LP (ACMP.N,
$47.82) Agrium Inc. (AGU.N, $84.96) Air Products & Chemicals, Inc. (APD.N, $109.78) Alfa Laval (ALFA.ST, Skr157.0) Alon USA Energy, Inc. (ALJ.N, $10.53) Alon USA Partners LP (ALDW.N, $12.71) Alstom (ALSO.PA, €26.9) Americas Petr (BOE.V, C$1.19) Anadarko Petroleum Corp. (APC.N, $94.48) Anritsu (6754.T, ¥1,332) Anton Oilfield Services Ltd (3337.HK,
HK$5.07) Apache Corp. (APA.N, $86.49) Arch Coal, Inc. (ACI.N, $4.53) Arch Coal, Inc. (ACI.N, $4.53) Arkema (AKE.PA, €83.46) Atwood Oceanics, Inc. (ATW.N, $55.09) Aurora Oil & Gas (AUT.AX, A$3.39) BP (BP.L, 444.35p) Babcock & Wilcox (BWC.N, $34.1) Baker Hughes Inc. (BHI.N, $49.47) Bankers Petroleum Ltd. (BNK.TO, C$3.84) Beach Energy (BPT.AX, A$1.36) BioAmber Inc. (BIOA.N, $4.92) BioteQ (BQE.TO, C$0.095) Burckhardt (BCHN.S, SFr363.0) CEMEX Latam Holdings, S.A. (CLH.CN,
peso14900.0) CF Industries Holding Inc. (CF.N, $212.35) CGG Veritas (GEPH.PA, €17.66) CIMC Enric (3899.HK, HK$10.54) CNOOC Ltd (0883.HK, HK$15.74) CONCHO RESOURCES, INC. (CXO.N, $109.29) CSX Corporation (CSX.N, $25.98) CVR Refining LP (CVRR.N, $25.5) Cabot Oil & Gas (COG.N, $37.12) Cameron International Corp. (CAM.N, $59.02) Canadian National (CNI.N, $100.94) Canadian Natural Resources Limited (CNQ.TO, C$32.6) Canadian Pacific Railways (CP.N, $125.58) Canexus (CUS.TO, C$7.6) Carbon Energy (CNX.AX, A$0.019) Carrizo Oil & Gas Inc. (CRZO.OQ, $37.24) Caterpillar Inc. (CAT.N, $84.2) Centrica (CNA.L, 367p) Chesapeake Energy Corp. (CHK.N, $26.41) Chevron Corp. (CVX.N, $123.49) Chicago Bridge & Iron (CBI.N, $67.09) China Oilfield Services Ltd (2883.HK, HK$19.38) China Petroleum & Chemical Corporation - H (0386.HK, HK$6.17) China Shenhua Energy Company Limited (1088.HK, HK$24.2) Chubu Electric Power (9502.T, ¥1,346) Clean Energy (CLNE.OQ, $12.83) Clean Harbors (CLH.N, $57.77) ConocoPhillips (COP.N, $70.23) Concho Resources, Inc (CXO.N, 107.93) Crescent Point Energy Corp (CPG.TO,
C$39.2) Crosstex Energy, Inc. (XTXI.OQ, $21.15) Cummins Inc. (CMI.N, $134.19) DCP Midstream Partners, LP (DPM.N, $49.54) Danieli & C (DANI.MI, €20.96) Delek US Holdings, Inc. (DK.N, $21.59) Denbury Resources (DNR.N, $18.43) Denso (6902.T, ¥4,735) Devon Energy Corp (DVN.N, $59.47)
Diamond Offshore Drilling, Inc (DO.N, $63.28) Diamondback Energy, Inc. (FANG.OQ, $43.98) Dillard's Inc. (DDS.N, $79.2) Dominion Resources (D.N, $62.81) Donaldson Company, Inc. (DCI.N, $38.03) Dongfang Electric Corp (1072.HK, HK$11.3) Dow Chemical Company (DOW.N, $39.99) Dresser Rand Grp (DRC.N, $61.95) E.I. du Pont de Nemours and Company (DD.N, $59.51) ENI (ENI.MI, €17.12) EOG Resources (EOG.N, $172.09) EQT Midstream Partners, LP (EQM.N, $49.55) EXCO Resources (XCO.N, $6.88) Eastman Chemical (EMN.N, $78.22) Ecolab (ECL.N, $99.12) Emerson (EMR.N, $65.42) Empire Energy (EEG.AX, A$0.091) Enbridge Energy Partners, LP (EEP.N, $30.19) Enbridge Inc. (ENB.TO, C$42.96) Enbridge Income (ENF.TO, C$23.84) Encana Corp. (ECA.N, $17.31) Energy Recovery Inc. (ERII.OQ, $7.32) Enerplus Corporation (ERF.TO, C$17.59) Ensign (ESI.TO, C$17.82) Entergy Corporation (ETR.N, $63.62) Enterprise Products Partners, LP (EPD.N, $61.41) Everest Kanto (EKCL.BO, Rs8.31) Exelon Corporation (EXC.N, $30.09) ExxonMobil Corporation (XOM.N, $87.07) FMC Technologies, Inc. (FTI.N, $55.29) Fanuc (6954.T, ¥16,790) FedEx Corporation (FDX.N, $113.56) Fenner (FENR.L, 390.9p) Ferro (FOE.N, $9.29) First Republic Bank (FRC.N, $46.65) FirstEnergy (FE.N, $36.94) Flotek Indus (FTK.N, $23.08) Flowserve Corp. (FLS.N, $62.56) Fluor (FLR.N, $72.03) Forest Oil (FST.N, $6.3) Formosa Chemical & Fibre (1326.TW, NT$77.8) Formosa Petrochemical (6505.TW, NT$78.2) Formosa Plastics (1301.TW, NT$76.8) Foster Wheeler (FWLT.OQ, $26.49) Gardner Denver, Inc. (GDI.N, $75.99) Gazprom (GAZPq.L, $9.01) General Electric (GE.N, $24.25) Genesis Energy, LP (GEL.N, $50.6) Genesse & Wyoming, Inc. (GWR.N, $94.67) Goodrich Petrol (GDP.N, $25.16) Great East (GEECq.L, 200.0p) Gulfport Energy (GPOR.OQ, $63.65) Halliburton (HAL.N, $48.71) Harbin Power Equipment (1133.HK, HK$4.84) Helmerich & Payne, Inc. (HP.N, $69.47) Hess Corporation (HES.N, $78.79) Holly Frontier Corp. (HFC.N, $42.6) Honeywell International Inc. (HON.N, $84.05) Honghua Group Ltd (0196.HK, HK$2.41) IGas Energy (IGAS.L, 105.0p) INPEX Corporation (1605.T, ¥1,154) Imperial Oil Ltd (IMO.TO, C$45.54) Itron (ITRI.OQ, $42.98) JGC Corporation (1963.T, ¥3,660) Jacobs Engineering (JEC.N, $58.26) Japan Petroleum Exploration (1662.T, ¥4,315) Jereh Group (002353.SZ, Rmb71.9) KBR Inc. (KBR.N, $32.85) Kansas City Southern (KSU.N, $110.39) Keihin (7251.T, ¥1,620) Kennametal Inc. (KMT.N, $46.23) Key Energy Serv (KEG.N, $7.46)
Kinder Morgan Energy Partners, LP (KMP.N, $80.17) Komatsu (6301.T, ¥2,480) Korea Gas Corp (036460.KS, W58,200) Kunlun Energy (0135.HK, HK$10.8) Lincoln National Corp. (LNC.N, $42.6) Luxfer (LXFR.N, $16.28) LyondellBasell Industries (LYB.N, $74.01) MRC Global (MRC.N, $26.8) Magellan Midstream Partners , LP (MMP.N, $56.81) Magnum Hunter Resources Corp. (MHR.N, $5.87) Marathon (MPC.N, $64.14) Marathon Oil Corp (MRO.N, $35.28) MarkWest Energy Partners, LP (MWE.N, $71.12) Maruti Suzuki India Ltd (MRTI.BO, Rs1385.8) MasTec, Inc. (MTZ.N, $30.99) Matador Resource (MTDR.N, $16.82) McDermott International (MDR.N, $7.48) Melrose (MRON.L, 302.6p) Methanex (MEOH.OQ, $50.74) Mitsubishi Corp (8058.T, ¥2,047) Mitsui & Co (8031.T, ¥1,492) Molopo Australia (MPO.AX, A$0.215) Mr Price Group Limited (MPCJ.J, R139.9) Murphy Oil Corp. (MUR.N, $61.54) Nan Ya Plastics (1303.TW, NT$62.2) National Oilwell Varco (NOV.N, $79.12) Natural Gas (NGS.N, $27.24) Nexen Inc. (NXY.TO, C$28.29) Noble Corporation (NE.N, $38.2) Noble Energy (NBL.N, $67.32) Norfolk Southern (NSC.N, $78.3) Northern Tier Energy, LP (NTI.N, $19.38) Nucor Corporation (NUE.N, $49.32) Nuverra Environmental Solutions (NES.N, $2.31) OMV (OMVV.VI, €37.04) ONEOK Partners, LP (OKS.N, $52.24) Occidental Petroleum (OXY.N, $93.58) Ocean Rig UDW Inc (ORIG.OQ, $18.53) Okuma Corporation (6103.T, ¥880) Orion Energy Sys (OESX.A, $4.07) Osaka Gas (9532.T, ¥425) PBF ENERGY INC (PBF.N, $22.7) PDC Energy (PDCE.OQ, $61.8) PGNIG (PGN.WA, zł6.1) PKN Orlen (PKN.WA, zł45.01) PPG Industries, Inc (PPG.N, $166.65) PT Adaro Energy Tbk (ADRO.JK, Rp920) PT Harum Energy Tbk (HRUM.JK, Rp2,900) PT Indika Energy Tbk (INDY.JK, Rp770) PT Indo Tambangraya Megah (ITMG.JK, Rp28,550) PT Tambang Batubara Bukit Asam Tbk (PTBA.JK, Rp12,800) Parker Hannifin Corporation (PH.N, $109.92) Peabody Energy Corp (BTU.N, $17.85) Pembina (PPL.TO, C$33.91) Penn Virginia Corp (PVA.N, $6.5) Penn West Petroleum Ltd. (PWT.TO, C$11.52) Pentair, Inc. (PNR.N, $65.92) Perusahaan Gas Negara (PGAS.JK, Rp5,150) PetroChina (0857.HK, HK$8.66) Petrobras Arg (PZE.N, $5.5) Petrofac (PFC.L, 1400.0p) Petroleum Geo Services (PGS.OL, Nkr78.3) Petronas Chemicals Group BHD (PCGB.KL,
RM6.78) Phillips 66 (PSX.N, $58.48) Phillips 66 Partners, LP (PSXP.N, $30.71) Pioneer Natural Resources (PXD.N, $188.23) Plains All American Pipeline, LP (PAA.N, $53.24) Progressive Waste Solutions Ltd. (BIN.N, $25.82) Public Svc Ent (PEG.N, $33.33) Qinghai Potash (000792.SZ, Rmb18.26)

1 October 2013
The Shale Revolution II 170
Quanta Services (PWR.N, $28.21) Questerre Energy (QEC.TO, C$1.07) Quicksilver Resources, Inc. (KWK.N, $1.92) Range Resources (RRC.N, $78.09) Repsol (REP.MC, €18.63) Republic Services (RSG.N, $34.08) Rex Energy Corp. (REXX.OQ, $22.22) Rockwell Automation (ROK.N, $108.15) Rolls-Royce (RR.L, 1129.0p) Rosetta Resources Inc. (ROSE.OQ, $54.43) Rotork plc (ROR.L, 2781.0p) Rowan Companies (RDC.N, $36.99) Royal Dutch Shell plc (RDSa.L, 2061.0p) SBM Offshore (SBMO.AS, €15.18) SES (SESFd.PA, €21.36) SPT Energy (1251.HK, HK$3.93) SPX (SPW.N, $84.87) Saipem (SPMI.MI, €16.49) San Leon Energy (SLEN.L, 4.87p) Sanchez Enrgy (SN.N, $26.99)
SandRidge Energy, Inc. (SD.N, $5.99) Sandvik (SAND.ST, Skr90.05) Santos Ltd (STO.AX, A$15.7) Sasol (SSL.N, $48.61) Savanna Energy (SVY.TO, C$7.67) Schlumberger (SLB.N, $88.83) Seadrill (SDRL.N, $45.97) Senex Energy Limited (SXY.AX, A$0.78)
Shanghai Electric Group Co., Ltd. (2727.HK, HK$2.76) Siemens (SIEGn.DE, €90.2) Solvay (SOLB.BR, €114.65) Southwestern Energy Co. (SWN.N, $37.25) Statoil (STL.OL, Nkr137.5) Stepan (SCL.N, $57.77) Strad Energy (SDY.TO, C$3.9) Sumitomo Corp (8053.T, ¥1,373) Superior Energy Services, Inc. (SPN.N, $25.71) TAG Oil Ltd. (TAO.TO, C$4.45) Talisman Energy Inc. (TLM.N, $11.4) Targa Resources Corp. (TRGP.N, $73.29) Technip (TECF.PA, €89.07) Tenaris (TENR.MI, €17.85) Tesoro Corp. (TSO.N, $44.53) Tetra Technologies, Inc. (TTI.N, $12.29) Tokyo Gas (9531.T, ¥547) Total (TOTF.PA, €43.14)
TransCanada Corp. (TRP.TO, C$45.35) Transocean Inc. (RIG.N, $45.05) Trinidad Drg (TDG.TO, C$9.89) U.S. Silica (SLCA.N, $25.01) URS Corporation (URS.N, $55.4) Ultra Petroleum Corp. (UPL.N, $20.56) Union Pacific (UNP.N, $157.95) United Parcel Service Inc. (UPS.N, $91.8)
Valero Energy Corporation (VLO.N, $34.31) Vallourec (VLLP.PA, €49.32) Veresen (VSN.TO, C$12.16) Vermilion Energy Inc. (VET.TO, C$56.7) Voestalpine (VOES.VI, €34.8) WPX Energy Inc. (WPX.N, $19.26) Waste Connections (WCN.N, $44.86) Waste Management (WM.N, $41.69) Weatherford International, Inc. (WFT.N, $15.41) Weichai Power Co. Ltd (2338.HK, HK$30.75) Weir Group (WEIR.L, 2383.0p) Wellstream (WSML.L^C11, 782.0p) Wellstream (WSML.L^C11, 782.0p) Wellstream (WSML.L^C11, 782.0p) Wellstream (WSML.L^C11, 782.0p) Western Gas Equity Partners, L.P. (WGP.N, $36.48) Western Refining Inc. (WNR.N, $30.19) Westlake Chem (WLK.N, $106.16)
Williams Companies, Inc (WMB.N, $36.33) Wood Group (WG.L, 812.0p) Woodward Inc (WWD.OQ, $41.58) World Point Terminals, LP (WPT.N, $20.2) XOMA Corporation (XOMA.OQ, $4.42) YPF Sociedad Anonima (YPF.N, $20.98) Yamato Kogyo (5444.T, ¥3,720) Yara International ASA (YAR.OL, Nkr251.9)

1 October 2013
The Shale Revolution II 171
Equity Research Disclosure Appendix
Important Global Disclosures
The analysts identified in this report each certify, with respect to the companies or securities that the individual analyzes, that (1) the views expressed in this report accurately reflect his or her personal views about all of the subject companies and securities and (2) no part of his or her compensation was, is or will be directly or indirectly related to the specific recommendations or views expressed in this report.
The analyst(s) responsible for preparing this research report received Compensation that is based upon various factors including Credit Suisse's total revenues, a portion of which are generated by Credit Suisse's investment banking activities
As of December 10, 2012 Analysts’ stock rating are defined as follows:
Outperform (O) : The stock’s total return is expected to outperform the relevant benchmark*over the next 12 months.
Neutral (N) : The stock’s total return is expected to be in line with the relevant benchmark* over the next 12 months.
Underperform (U) : The stock’s total return is expected to underperform the relevant benchmark* over the next 12 months.
*Relevant benchmark by region: As of 10th December 2012, Japanese ratings are based on a stock’s total return relative to the analyst's coverage uni verse which consists of all companies covered by the analyst within the relevant sector, with Outperforms representing the most att ractive, Neutrals the less attractive, and Underperforms the least attractive investment opportunities. As of 2nd October 2012, U.S. and Canadian as well as European ra tings are based on a stock’s total return relative to the analyst's coverage universe which consists of all companies covered by the analyst within the relevant sector, with Outperforms representing the most attractive, Neutrals the less attractive, and Underperforms the least attractive investment opportunities. For Latin Ame rican and non-Japan Asia stocks, ratings are based on a stock’s total return relative to the average total return of the relevant country or regional benchmark; Australia, New Zealand are, and prior to 2nd October 2012 U.S. and Canadian ratings were based on (1) a stock’s absolute total return potential to its current share price and (2) the relative attractiveness of a stock’s total return potential within an analyst’s coverage universe. For Australian and New Zealand stocks, 12 -month rolling yield is incorporated in the absolute total return calculation and a 15% and a 7.5% threshold replace the 10-15% level in the Outperform and Underperform stock rating definitions, respectively. The 15% and 7.5% thresholds replace the +10-15% and -10-15% levels in the Neutral stock rating definition, respectively. Prior to 10th December 2012, Japanese ratings were based on a stock’s total return relative to the average total return of the relevant country or regional benchmark.
Restricted (R) : In certain circumstances, Credit Suisse policy and/or applicable law and regulations preclude certain types of communications, including an investment recommendation, during the course of Credit Suisse's engagement in an investment banking transaction and in certain other circumstances.
Volatility Indicator [V] : A stock is defined as volatile if the stock price has moved up or down by 20% or more in a month in at least 8 of the past 24 months or the analyst expects significant volatility going forward.
Analysts’ sector weightings are distinct from analysts’ stock ratings and are based on the analyst’s expectations for the fundamentals and/or valuation of the sector* relative to the group’s historic fundamentals and/or valuation:
Overweight : The analyst’s expectation for the sector’s fundamentals and/or valuation is favorable over the next 12 months.
Market Weight : The analyst’s expectation for the sector’s fundamentals and/or valuation is neutral over the next 12 months.
Underweight : The analyst’s expectation for the sector’s fundamentals and/or valuation is cautious over the next 12 months.
*An analyst’s coverage sector consists of all companies covered by the analyst within the relevant sector. An analyst may cover multiple sectors.
Credit Suisse's distribution of stock ratings (and banking clients) is:
Global Ratings Distribution
Rating Versus universe (%) Of which banking clients (%)
Outperform/Buy* 42% (55% banking clients)
Neutral/Hold* 40% (49% banking clients)
Underperform/Sell* 15% (40% banking clients)
Restricted 3%
*For purposes of the NYSE and NASD ratings distribution disclosure requirements, our stock ratings of Outperform, Neutral, and Underperform most closely correspond to Buy, Hold, and Sell, respectively; however, the meanings are not the same, as our stock ratings are determined on a relative basis. (Please refer to definitions above.) An investor's decision to buy or sell a security should be based on investment objectives, current holdin gs, and other individual factors.
Credit Suisse’s policy is to update research reports as it deems appropriate, based on developments with the subject company, the sector or the market that may have a material impact on the research views or opinions stated herein.
Credit Suisse's policy is only to publish investment research that is impartial, independent, clear, fair and not misleading. For more detail please refer to Credit Suisse's Policies for Managing Conflicts of Interest in connection with Investment Research: http://www.csfb.com/research and analytics/disclaimer/managing_conflicts_disclaimer.html
Credit Suisse does not provide any tax advice. Any statement herein regarding any US federal tax is not intended or written to be used, and cannot be used, by any taxpayer for the purposes of avoiding any penalties.

1 October 2013
The Shale Revolution II 172
Please refer to the firm's disclosure website at https://rave.credit-suisse.com/disclosures for the definitions of abbreviations typically used in the target price method and risk sections.
See the Companies Mentioned section for full company names
The subject company (0883.HK, SOLB.BR, BIOA.N, PXD.N, AMEC.L, CVX.N, ERII.OQ, KWK.N, CRZO.OQ, SAND.ST, 2727.HK, CAM.N, YAR.OL, ACMP.N, 036460.KS, 0857.HK, SIEGn.DE, XTXI.OQ, SPMI.MI, DPM.N, 3337.HK, ALFAA.MX, AWE.AX, MHR.N, WG.L, UPS.N, IMO.TO, TENR.MI, ENB.TO, ALFA.ST, ALJ.N, MRON.L, AUT.AX, 1088.HK, ABBN.VX, KSU.N, OMVV.VI, WMB.N, DNR.N, VOES.VI, FDX.N, GEPH.PA, PGAS.JK, 0386.HK, WEIR.L, INDY.JK, WM.N, ABMM.JK, STO.AX, ADRO.JK, REXX.OQ, ECL.N, PTBA.JK, RSG.N, 2883.HK, CNQ.TO, TRP.TO, EQM.N, DOW.N, FST.N, URS.N, HES.N, DVN.N, FANG.OQ, APC.N, MUR.N, JEC.N, 8031.T, 8053.T, 8058.T, AGU.N, APA.N, CAT.N, CBI.N, CF.N, CHK.N, CLH.CN, COP.N, CP.N, CSX.N, CXO.N, EMR.N, ECA.N, EEP.N, EOG.N, FTI.N, FLR.N, FLS.N, FOE.N, FRC.N, GE.N, GPOR.OQ, GWR.N, HAL.N, HON.N, KBR.N, KMP.N, LNC.N, LYB.N, MMP.N, MWE.N, NBL.N, NES.N, NOV.N, NSC.N, OXY.N, PAA.N, PSX.N, PVA.N, PWR.N, ROSE.OQ, RRC.N, SD.N, SLB.N, SPN.N, SPW.N, TLM.N, TSO.N, TTI.N, UNP.N, VLO.N, WNR.N, WPT.N, WPX.N, XOM.N, ALDW.N, PBF.N, NTI.N, CVRR.N, PSXP.N, PEG.N, SDRL.N, PPG.N, ATW.N, APD.N, DD.N, DO.N, EXC.N, FE.N, ORIG.OQ, XOMA.OQ, CLH.N) currently is, or was during the 12-month period preceding the date of distribution of this report, a client of Credit Suisse.
Credit Suisse provided investment banking services to the subject company (0883.HK, BIOA.N, PXD.N, KWK.N, CRZO.OQ, SAND.ST, 2727.HK, CAM.N, YAR.OL, ACMP.N, 036460.KS, SIEGn.DE, DPM.N, ALFAA.MX, AWE.AX, MHR.N, WG.L, IMO.TO, TENR.MI, ENB.TO, ALJ.N, AUT.AX, 1088.HK, ABBN.VX, WMB.N, DNR.N, GEPH.PA, PGAS.JK, 0386.HK, STO.AX, REXX.OQ, ECL.N, PTBA.JK, RSG.N, 2883.HK, TRP.TO, EQM.N, FST.N, DVN.N, FANG.OQ, APC.N, CHK.N, COP.N, CP.N, CSX.N, CXO.N, ECA.N, EEP.N, EOG.N, FLR.N, FRC.N, GE.N, GPOR.OQ, HAL.N, KBR.N, KMP.N, LNC.N, LYB.N, NBL.N, NES.N, PSX.N, PVA.N, ROSE.OQ, RRC.N, SD.N, SLB.N, SPN.N, SPW.N, TSO.N, UNP.N, VLO.N, WNR.N, WPT.N, WPX.N, XOM.N, ALDW.N, PBF.N, NTI.N, CVRR.N, PSXP.N, PEG.N, SDRL.N, PPG.N, ATW.N, DD.N, DO.N, EXC.N, FE.N, ORIG.OQ, XOMA.OQ, CLH.N) within the past 12 months.
Credit Suisse provided non-investment banking services to the subject company (UPS.N, ABBN.VX, DOW.N, 8031.T, 8053.T, 8058.T, GE.N, NSC.N, TLM.N, XOM.N, PPG.N) within the past 12 months
Credit Suisse has managed or co-managed a public offering of securities for the subject company (0883.HK, BIOA.N, KWK.N, 2727.HK, ACMP.N, 036460.KS, SIEGn.DE, DPM.N, ALFAA.MX, MHR.N, WG.L, IMO.TO, ALJ.N, AUT.AX, WMB.N, DNR.N, GEPH.PA, 2883.HK, EQM.N, FANG.OQ, CHK.N, COP.N, CSX.N, ECA.N, FRC.N, GE.N, HAL.N, KMP.N, LNC.N, LYB.N, NES.N, PSX.N, PVA.N, ROSE.OQ, RRC.N, TSO.N, UNP.N, WNR.N, WPT.N, XOM.N, NTI.N, CVRR.N, PSXP.N, PEG.N, SDRL.N, ATW.N, DD.N, FE.N, ORIG.OQ, XOMA.OQ, CLH.N) within the past 12 months.
Credit Suisse has received investment banking related compensation from the subject company (0883.HK, BIOA.N, PXD.N, KWK.N, CRZO.OQ, SAND.ST, 2727.HK, CAM.N, YAR.OL, ACMP.N, 036460.KS, SIEGn.DE, DPM.N, ALFAA.MX, AWE.AX, MHR.N, WG.L, IMO.TO, TENR.MI, ENB.TO, ALJ.N, AUT.AX, 1088.HK, ABBN.VX, WMB.N, DNR.N, GEPH.PA, PGAS.JK, 0386.HK, STO.AX, REXX.OQ, ECL.N, PTBA.JK, RSG.N, 2883.HK, TRP.TO, EQM.N, FST.N, DVN.N, FANG.OQ, APC.N, CHK.N, COP.N, CP.N, CSX.N, CXO.N, ECA.N, EEP.N, EOG.N, FLR.N, FRC.N, GE.N, GPOR.OQ, HAL.N, KBR.N, KMP.N, LNC.N, LYB.N, NBL.N, NES.N, PSX.N, PVA.N, ROSE.OQ, RRC.N, SD.N, SLB.N, SPN.N, SPW.N, TSO.N, UNP.N, VLO.N, WNR.N, WPT.N, WPX.N, XOM.N, ALDW.N, PBF.N, NTI.N, CVRR.N, PSXP.N, PEG.N, SDRL.N, PPG.N, ATW.N, DD.N, DO.N, EXC.N, FE.N, ORIG.OQ, XOMA.OQ, CLH.N) within the past 12 months
Credit Suisse expects to receive or intends to seek investment banking related compensation from the subject company (0883.HK, 1662.T, SOLB.BR, BIOA.N, PXD.N, AMEC.L, CVX.N, ERII.OQ, KWK.N, CRZO.OQ, BPT.AX, 6505.TW, 1303.TW, SAND.ST, 2727.HK, HRUM.JK, CAM.N, YAR.OL, ACMP.N, 036460.KS, 0857.HK, SIEGn.DE, XTXI.OQ, SPMI.MI, DPM.N, 3337.HK, 1072.HK, ALFAA.MX, AWE.AX, MHR.N, WG.L, UPS.N, 1301.TW, TECF.PA, IMO.TO, TENR.MI, ENB.TO, MRTI.BO, ALFA.ST, ALJ.N, MRON.L, AUT.AX, 1088.HK, ABBN.VX, BHI.N, KSU.N, OMVV.VI, WMB.N, DNR.N, VOES.VI, FDX.N, GEPH.PA, PGAS.JK, 0386.HK, WEIR.L, INDY.JK, WM.N, ABMM.JK, STO.AX, ADRO.JK, SXY.AX, 1251.HK, 6902.T, REXX.OQ, ECL.N, PTBA.JK, RSG.N, 2883.HK, TRP.TO, EQM.N, SESFd.PA, DOW.N, FST.N, URS.N, HES.N, DVN.N, FANG.OQ, CMI.N, APC.N, 6301.T, MUR.N, JEC.N, 8031.T, 8053.T, 8058.T, AGU.N, APA.N, BWC.N, CAT.N, CBI.N, CF.N, CHK.N, CLH.CN, COP.N, CP.N, CSX.N, CXO.N, D.N, DCI.N, DDS.N, EMR.N, ECA.N, EEP.N, EOG.N, FTI.N, FLR.N, FLS.N, FOE.N, FRC.N, GE.N, GEL.N, GPOR.OQ, GWR.N, HAL.N, HON.N, HP.N, KBR.N, KMP.N, KMT.N, LNC.N, LYB.N, MDR.N, MMP.N, MPC.N, MRO.N, MWE.N, NBL.N, NES.N, NOV.N, OKS.N, OXY.N, PAA.N, PH.N, PSX.N, PVA.N, PWR.N, ROSE.OQ, RRC.N, SD.N, SLB.N, SPN.N, SPW.N, TSO.N, TTI.N, UNP.N, VLO.N, WCN.N, WNR.N, WPT.N, WPX.N, XOM.N, ALDW.N, PBF.N, NTI.N, CVRR.N, PSXP.N, ETR.N, PEG.N, SDRL.N, PPG.N, ATW.N, APD.N, DD.N, DO.N, EXC.N, FE.N, ORIG.OQ, XOMA.OQ, CLH.N) within the next 3 months.
Credit Suisse has received compensation for products and services other than investment banking services from the subject company (UPS.N, ABBN.VX, DOW.N, 8031.T, 8053.T, 8058.T, GE.N, NSC.N, TLM.N, XOM.N, PPG.N) within the past 12 months
As of the date of this report, Credit Suisse makes a market in the following subject companies (PXD.N, CVX.N, ERII.OQ, KWK.N, FWLT.OQ, CRZO.OQ, CAM.N, ACMP.N, XTXI.OQ, WWD.OQ, DPM.N, SWN.N, MHR.N, ITRI.OQ, LXFR.N, UPS.N, YPF.N, ALJ.N, BHI.N, KSU.N, WMB.N, DNR.N, FDX.N, PDCE.OQ, WM.N, REXX.OQ, ECL.N, RSG.N, DOW.N, FST.N, ROK.N, URS.N, HES.N, DVN.N, BIN.N, FANG.OQ, CMI.N, APC.N, MUR.N, JEC.N, 8058.T, AGU.N, APA.N, BWC.N, CAT.N, CBI.N, CF.N, CHK.N, CNI.N, CLH.CN, COP.N, CP.N, CSX.N, CXO.N, D.N, DCI.N, DDS.N, DK.N, EMR.N, ECA.N, EEP.N, EOG.N, EPD.N, FTI.N, FLR.N, FLS.N, FOE.N, FRC.N, GE.N, GEL.N, GPOR.OQ, GWR.N, HAL.N, HFC.N, HON.N, HP.N, KBR.N, KMP.N, KMT.N, LNC.N, LYB.N, MDR.N, MMP.N, MPC.N, MRO.N, MWE.N, NBL.N, NES.N, NOV.N, NSC.N, OKS.N, OXY.N, PAA.N, PH.N, PNR.N, PSX.N, PVA.N, PWR.N, ROSE.OQ, RRC.N, SD.N, SLB.N, SPN.N, SPW.N, TLM.N, TSO.N, TRGP.N, TTI.N, UNP.N, VLO.N, WCN.N, WFT.N, WGP.N, WNR.N, WPT.N, WPX.N, XOM.N, ALDW.N, PBF.N, NTI.N, CVRR.N, PSXP.N, ETR.N, PEG.N, SDRL.N, RIG.N, PPG.N, ATW.N, APD.N, RDC.N, DD.N, DO.N, EXC.N, FE.N, NE.N, ORIG.OQ, XOMA.OQ, CLH.N).
Credit Suisse may have interest in (PCGB.KL)

1 October 2013
The Shale Revolution II 173
As of the end of the preceding month, Credit Suisse beneficially own 1% or more of a class of common equity securities of (SBMO.AS, BIOA.N, BPT.AX, 0857.HK, SIEGn.DE, XTXI.OQ, AWE.AX, MHR.N, WG.L, TECF.PA, AKE.PA, MRTI.BO, ROR.L, AUT.AX, 1088.HK, ABBN.VX, 0386.HK, WEIR.L, EQM.N, APC.N, CF.N, CHK.N, PBF.N, RIG.N, NE.N).
Credit Suisse has a material conflict of interest with the subject company (0883.HK) . Credit Suisse is acting as financial advisor to both CNOOC Ltd. and SINOPEC on the acquisition of Marathon Oil Corporation's 20% interest in Block 32, offshore Angola.
Credit Suisse has a material conflict of interest with the subject company (2727.HK) . Credit Suisse is acting as financial advisor to Shanghai Electric Group Limited regarding an acquisition of Shanghai Electric Insurance Co Brokerage Co Ltd and Shanghai Electric Leasing Co Ltd from its parent company, Shanghai Electric (Group) Corp.
Credit Suisse has a material conflict of interest with the subject company (YAR.OL) . Credit Suisse is acting as a financial advisor to Bunge Limited in relation to its announced sale of a division to Yara International ASA.
Credit Suisse has a material conflict of interest with the subject company (0857.HK) . Any Nielsen Media Research material contained in this report represents Nielsen Media Research's estimates and does not represent facts. NMR has neither reviewed nor approved this report and/or any of the statements made herein.
Credit Suisse has a material conflict of interest with the subject company (WG.L) . Credit Suisse Securities (Europe) Limited acts as broker to WG.L.
Credit Suisse has a material conflict of interest with the subject company (GEPH.PA) . Credit Suisse is advisor to CGG Veritas in its acquisition of Fugro’s Geoscience division.
Credit Suisse has a material conflict of interest with the subject company (0386.HK) . Credit Suisse is acting as financial advisor to both CNOOC Ltd. and SINOPEC on the acquisition of Marathon Oil Corporation's 20% interest in Block 32, offshore Angola.
Credit Suisse has a material conflict of interest with the subject company (CNQ.TO) . A Credit Suisse analyst involved in the preparation of this report has a long position in the common stock of CNQ.TO.
Credit Suisse has a material conflict of interest with the subject company (URS.N) . Credit Suisse Securities (Canada), Inc provided a Fairness Opinion and acted as financial advisor to Flint Energy Services Ltd. on the announced acquisition by URS Corporation.
Credit Suisse has a material conflict of interest with the subject company (KMP.N) . Credit Suisse has a material conflict of interest with the subject company (KMP). As of the date of this report, an analyst involved in the preparation of this report has the following material conflict of interest with the subject company (KMP). An analyst or a member of the analyst's household has a long position in the common stock of Kinder Morgan Energy Partners LP (KMP).
Credit Suisse has a material conflict of interest with the subject company (SPW.N) . Credit Suisse Securities USA LLC acted as financial advisor to SPX Corp in the sale of its Service Solutions business to Robert Bosch GmbBH.
Credit Suisse has a material conflict of interest with the subject company (TLM.N) . A Credit Suisse analyst involved in the preparation of this report has a long position in the common stock of TLM.
Credit Suisse has a material conflict of interest with the subject company (VLO.N) . Credit Suisse Securities (USA) LLC is acting as financial advisor to Valero Energy Corp. on their announced decision to pursue separation of their retail business.
Credit Suisse has a material conflict of interest with the subject company (DD.N) . Credit Suisse Securities (USA) LLC is acting as financial advisor to Ei du Pont de Nemours & Co in connection with the announced sale of the DuPont Performance Coatings business to the Carlyle Group.
Credit Suisse has a material conflict of interest with the subject company (CLH.N) . Credit Suisse Securities (USA) LLC is acting as financial advisor to Safety-Kleen Inc. in connection with the announced acquisition by Clean Harbors Inc.
Important Regional Disclosures
Singapore recipients should contact Credit Suisse AG, Singapore Branch for any matters arising from this research report.
The analyst(s) involved in the preparation of this report have not visited the material operations of the subject company (0883.HK, SBMO.AS, 1662.T, SOLB.BR, ITMG.JK, BIOA.N, PXD.N, AMEC.L, CVX.N, ERII.OQ, KWK.N, FWLT.OQ, ERF.TO, CRZO.OQ, REP.MC, BPT.AX, 6505.TW, 1303.TW, SAND.ST, VLLP.PA, 2727.HK, HRUM.JK, 6103.T, CAM.N, YAR.OL, ACMP.N, 0135.HK, 036460.KS, 7251.T, 1326.TW, 0857.HK, SIEGn.DE, XTXI.OQ, SPMI.MI, WWD.OQ, PCGB.KL, DPM.N, SWN.N, 3337.HK, 1072.HK, ALFAA.MX, AWE.AX, MHR.N, WG.L, ITRI.OQ, LXFR.N, UPS.N, 1301.TW, YPF.N, TECF.PA, AKE.PA, VET.TO, TENR.MI, MRTI.BO, ROR.L, ALFA.ST, ALJ.N, MRON.L, PWT.TO, AUT.AX, 6954.T, 1088.HK, ABBN.VX, ALSO.PA, BHI.N, KSU.N, OMVV.VI, PFC.L, WMB.N, DNR.N, VOES.VI, FDX.N, GEPH.PA, PDCE.OQ, PGAS.JK, 0386.HK, WEIR.L, INDY.JK, WM.N, ABMM.JK, STO.AX, ADRO.JK, CPG.TO, SXY.AX, ARX.TO, 6902.T, REXX.OQ, TAO.TO, ECL.N, PTBA.JK, RSG.N, 1133.HK, 1963.T, 2883.HK, FENR.L, EQM.N, SESFd.PA, DOW.N, ASX.AX, FST.N, ROK.N, URS.N, HES.N, DVN.N, BIN.N, 1605.T, FANG.OQ, CMI.N, 5444.T, APC.N, 6301.T, 6754.T, MUR.N, JEC.N, 8031.T, 8053.T, 8058.T, AGU.N, APA.N, BWC.N, CAT.N, CBI.N, CF.N, CHK.N, CNI.N, CLH.CN, COP.N, CP.N, CSX.N, CXO.N, D.N, DCI.N, DDS.N, DK.N, EMR.N, ECA.N, EEP.N, EOG.N, EPD.N, FTI.N, FLR.N, FLS.N, FOE.N, GE.N, GEL.N, GPOR.OQ, GWR.N, HAL.N, HFC.N, HON.N, HP.N, KBR.N, KMP.N, KMT.N, LNC.N, LYB.N, MDR.N, MMP.N, MPC.N, MRO.N, MWE.N, NBL.N, NES.N, NOV.N, NSC.N, OKS.N, OXY.N, PAA.N, PH.N, PNR.N, PSX.N, PVA.N, PWR.N, ROSE.OQ, RRC.N, SD.N, SLB.N, SPN.N, SPW.N, TSO.N, TRGP.N, TTI.N, UNP.N, VLO.N, WCN.N, WFT.N, WGP.N, WNR.N, WPT.N, XOM.N, ALDW.N, PBF.N, NTI.N, CVRR.N, MPCJ.J, PSXP.N, ETR.N, PEG.N, SDRL.N, RIG.N, PPG.N, ATW.N, APD.N, RDC.N, DD.N, DO.N, EXC.N, FE.N, NE.N, ORIG.OQ, XOMA.OQ, CLH.N) within the past 12 months An analyst involved in the preparation of this report has visited certain material operations of the subject company (ENF.TO, IMO.TO, ENB.TO, CNQ.TO, TRP.TO, TLM.N) within the past 12 months

1 October 2013
The Shale Revolution II 174
The travel expenses of the analyst in connection with such visits were not paid or reimbursed by the subject company, other than de minimus local travel expenses.
Restrictions on certain Canadian securities are indicated by the following abbreviations: NVS--Non-Voting shares; RVS--Restricted Voting Shares; SVS--Subordinate Voting Shares.
Individuals receiving this report from a Canadian investment dealer that is not affiliated with Credit Suisse should be advised that this report may not contain regulatory disclosures the non-affiliated Canadian investment dealer would be required to make if this were its own report.
For Credit Suisse Securities (Canada), Inc.'s policies and procedures regarding the dissemination of equity research, please visit http://www.csfb.com/legal_terms/canada_research_policy.shtml.
Credit Suisse Securities (Europe) Limited (Credit Suisse) acts as broker to (WG.L, FENR.L).
The following disclosed European company/ies have estimates that comply with IFRS: (SBMO.AS, SOLB.BR, REP.MC, SAND.ST, VLLP.PA, YAR.OL, SIEGn.DE, SPMI.MI, WG.L, TECF.PA, TENR.MI, ALFA.ST, ABBN.VX, ALSO.PA, OMVV.VI, PFC.L, VOES.VI, WEIR.L, DK.N, XOM.N, SDRL.N, APD.N).
As of the date of this report, Credit Suisse acts as a market maker or liquidity provider in the equities securities that are the subject of this report.
Principal is not guaranteed in the case of equities because equity prices are variable.
Commission is the commission rate or the amount agreed with a customer when setting up an account or at any time after that.
To the extent this is a report authored in whole or in part by a non-U.S. analyst and is made available in the U.S., the following are important disclosures regarding any non-U.S. analyst contributors: The non-U.S. research analysts listed below (if any) are not registered/qualified as research analysts with FINRA. The non-U.S. research analysts listed below may not be associated persons of CSSU and therefore may not be subject to the NASD Rule 2711 and NYSE Rule 472 restrictions on communications with a subject company, public appearances and trading securities held by a research analyst account.
Credit Suisse Securities (Europe) Limited................................................................................. Richard Kersley ; Mujtaba Rana ; Kiranjot Grewal
Important MSCI Disclosures
The MSCI sourced information is the exclusive property of Morgan Stanley Capital International Inc. (MSCI). Without prior written permission of MSCI, this information and any other MSCI intellectual property may not be reproduced, re-disseminated or used to create and financial products, including any indices. This information is provided on an "as is" basis. The user assumes the entire risk of any use made of this information. MSCI, its affiliates and any third party involved in, or related to, computing or compiling the information hereby expressly disclaim all warranties of originality, accuracy, completeness, merchantability or fitness for a particular purpose with respect to any of this information. Without limiting any of the foregoing, in no event shall MSCI, any of its affiliates or any third party involved in, or related to, computing or compiling the information have any liability for any damages of any kind. MSCI, Morgan Stanley Capital International and the MSCI indexes are services marks of MSCI and its affiliates.
The Global Industry Classification Standard (GICS) was developed by and is the exclusive property of Morgan Stanley Capital International Inc. and Standard & Poor’s. GICS is a service mark of MSCI and S&P and has been licensed for use by Credit Suisse.
Important Credit Suisse HOLT Disclosures
With respect to the analysis in this report based on the Credit Suisse HOLT methodology, Credit Suisse certifies that (1) the views expressed in this report accurately reflect the Credit Suisse HOLT methodology and (2) no part of the Firm’s compensation was, is, or will be directly related to the specific views disclosed in this report.
The Credit Suisse HOLT methodology does not assign ratings to a security. It is an analytical tool that involves use of a set of proprietary quantitative algorithms and warranted value calculations, collectively called the Credit Suisse HOLT valuation model, that are consistently applied to all the companies included in its database. Third-party data (including consensus earnings estimates) are systematically translated into a number of default algorithms available in the Credit Suisse HOLT valuation model. The source financial statement, pricing, and earnings data provided by outside data vendors are subject to quality control and may also be adjusted to more closely measure the underlying economics of firm performance. The adjustments provide consistency when analyzing a single company across time, or analyzing multiple companies across industries or national borders. The default scenario that is produced by the Credit Suisse HOLT valuation model establishes the baseline valuation for a security, and a user then may adjust the default variables to produce alternative scenarios, any of which could occur.
Additional information about the Credit Suisse HOLT methodology is available on request.
The Credit Suisse HOLT methodology does not assign a price target to a security. The default scenario that is produced by the Credit Suisse HOLT valuation model establishes a warranted price for a security, and as the third-party data are updated, the warranted price may also change. The default variable may also be adjusted to produce alternative warranted prices, any of which could occur.
CFROI®, HOLT, HOLTfolio, ValueSearch, AggreGator, Signal Flag and “Powered by HOLT” are trademarks or service marks or registered trademarks or registered service marks of Credit Suisse or its affiliates in the United States and other countries. HOLT is a corporate performance and valuation advisory service of Credit Suisse.
For Credit Suisse disclosure information on other companies mentioned in this report, please visit the website at https://rave.credit-suisse.com/disclosures or call +1 (877) 291-2683.

1 October 2013
The Shale Revolution II 175
Macro Research Disclosure Appendix
Important Global Disclosures
The analysts identified in this report each certify that with respect to companies or securities that the individual analyst covers the views expressed in this report accurately reflect his or her personal views about all of the subject companies and securities and no part of his or her compensation was, is or will be directly or indirectly related to the specific recommendations or views expressed in this report.
Credit Suisse's policy is only to publish investment research that is impartial, independent, clear, fair and not misleading. For more detail, please refer to Credit Suisse's Policies for Managing Conflicts of Interest in connection with Investment Research: http://www.csfb.com/research-andanalytics/disclaimer/managing_conflicts_disclaimer.html.
Credit Suisse’s policy is to publish research reports as it deems appropriate, based on developments with the subject issuer, the sector or the market that may have a material impact on the research views or opinions stated herein.
Credit Suisse may trade as principal in the securities or derivatives of the issuers that are the subject of this report. At any point in time, Credit Suisse is likely to have significant holdings in the securities mentioned in this report.
The analyst(s) responsible for preparing this research report received compensation that is based upon various factors including Credit Suisse's total revenues, a portion of which are generated by Credit Suisse's investment banking activities.
Credit Suisse does not provide any tax advice. Any statement herein regarding any US federal tax is not intended or written to be used, and cannot be used, by any taxpayer for the purposes of avoiding any penalties.
Important Regional Disclosures
Singapore recipients should contact a Singapore financial adviser for any matters arising from this research report.
Individuals receiving this report from a Canadian investment dealer that is not affiliated with Credit Suisse should be advised that this report may not contain regulatory disclosures the non-affiliated Canadian investment dealer would be required to make if this were its own report. For Credit Suisse Securities (Canada), Inc.'s policies and procedures regarding the dissemination of equity research, please visit http://www.csfb.com/legal_terms/canada_research_policy.shtml.
Principal is not guaranteed. Commission is the commission rate or the amount agreed with a customer when setting up an account or at anytime after that.
Taiwanese Disclosures: This research report is for reference only. Investors should carefully consider their own investment risk. Investment results are the responsibility of the individual investor. Reports may not be reprinted without permission of CS. Reports written by Taiwan-based analysts on non-Taiwan listed companies are not considered recommendations to buy or sell securities under Taiwan Stock Exchange Operational Regulations Governing Securities Firms Recommending Trades in Securities to Customers.
For Credit Suisse disclosure information on other companies mentioned in this report, please visit the website at www.creditsuisse.com/researchdisclosures or call +1 (877) 291-2683 for Credit Suisse Equity Research disclosures and visit the website at https://firesearchdisclosure.credit-suisse.com or call +1 (212) 538-7625 for Credit Suisse Fixed Income Research disclosures.
Disclaimers continue on next page.

1 October 2013
The Shale Revolution II 176
References in this report to Credit Suisse include all of the subsidiaries and affiliates of Credit Suisse operating under its investment banking division. For more information on our structure, please use the following link: https://www.credit-suisse.com/who_we_are/en/This report may contain material that is not directed to, or intended for distribution to or use by, any person or entity who is a citizen or resident of or located in any locality, state, country or other jurisdiction where such distribution, publication, availability or use would be contrary to law or regulation or which would subject Credit Suisse AG or its affiliates ("CS") to any registration or licensing requirement within such jurisdiction. All material presented in this report, unless specifically indicated otherwise, is under copyright to CS. None of the material, nor its content, nor any copy of it, may be altered in any way, transmitted to, copied or distributed to any other party, without the prior express written permission of CS. All trademarks, service marks and logos used in this report are trademarks or service marks or registered trademarks or service marks of CS or its affiliates. The information, tools and material presented in this report are provided to you for information purposes only and are not to be used or considered as an offer or the solicitation of an offer to sell or to buy or subscribe for securities or other financial instruments. CS may not have taken any steps to ensure that the securities referred to in this report are suitable for any particular investor. CS will not treat recipients of this report as its customers by virtue of their receiving this report. The investments and services contained or referred to in this report may not be suitable for you and it is recommended that you consult an independent investment advisor if you are in doubt about such investments or investment services. Nothing in this report constitutes investment, legal, accounting or tax advice, or a representation that any investment or strategy is suitable or appropriate to your individual circumstances, or otherwise constitutes a personal recommendation to you. CS does not advise on the tax consequences of investments and you are advised to contact an independent tax adviser. Please note in particular that the bases and levels of taxation may change. Information and opinions presented in this report have been obtained or derived from sources believed by CS to be reliable, but CS makes no representation as to their accuracy or completeness. CS accepts no liability for loss arising from the use of the material presented in this report, except that this exclusion of liability does not apply to the extent that such liability arises under specific statutes or regulations applicable to CS. This report is not to be relied upon in substitution for the exercise of independent judgment. CS may have issued, and may in the future issue, other communications that are inconsistent with, and reach different conclusions from, the information presented in this report. Those communications reflect the different assumptions, views and analytical methods of the analysts who prepared them and CS is under no obligation to ensure that such other communications are brought to the attention of any recipient of this report. CS may, to the extent permitted by law, participate or invest in financing transactions with the issuer(s) of the securities referred to in this report, perform services for or solicit business from such issuers, and/or have a position or holding, or other material interest, or effect transactions, in such securities or options thereon, or other investments related thereto. In addition, it may make markets in the securities mentioned in the material presented in this report. CS may have, within the last three years, served as manager or co-manager of a public offering of securities for, or currently may make a primary market in issues of, any or all of the entities mentioned in this report or may be providing, or have provided within the previous 12 months, significant advice or investment services in relation to the investment concerned or a related investment. Additional information is, subject to duties of confidentiality, available on request. Some investments referred to in this report will be offered solely by a single entity and in the case of some investments solely by CS, or an associate of CS or CS may be the only market maker in such investments. Past performance should not be taken as an indication or guarantee of future performance, and no representation or warranty, express or implied, is made regarding future performance. Information, opinions and estimates contained in this report reflect a judgment at its original date of publication by CS and are subject to change without notice. The price, value of and income from any of the securities or financial instruments mentioned in this report can fall as well as rise. The value of securities and financial instruments is subject to exchange rate fluctuation that may have a positive or adverse effect on the price or income of such securities or financial instruments. Investors in securities such as ADR's, the values of which are influenced by currency volatility, effectively assume this risk. Structured securities are complex instruments, typically involve a high degree of risk and are intended for sale only to sophisticated investors who are capable of understanding and assuming the risks involved. The market value of any structured security may be affected by changes in economic, financial and political factors (including, but not limited to, spot and forward interest and exchange rates), time to maturity, market conditions and volatility, and the credit quality of any issuer or reference issuer. Any investor interested in purchasing a structured product should conduct their own investigation and analysis of the product and consult with their own professional advisers as to the risks involved in making such a purchase. Some investments discussed in this report may have a high level of volatility. High volatility investments may experience sudden and large falls in their value causing losses when that investment is realised. Those losses may equal your original investment. Indeed, in the case of some investments the potential losses may exceed the amount of initial investment and, in such circumstances, you may be required to pay more money to support those losses. Income yields from investments may fluctuate and, in consequence, initial capital paid to make the investment may be used as part of that income yield. Some investments may not be readily realisable and it may be difficult to sell or realise those investments, similarly it may prove difficult for you to obtain reliable information about the value, or risks, to which such an investment is exposed. This report may provide the addresses of, or contain hyperlinks to, websites. Except to the extent to which the report refers to website material of CS, CS has not reviewed any such site and takes no responsibility for the content contained therein. Such address or hyperlink (including addresses or hyperlinks to CS's own website material) is provided solely for your convenience and information and the content of any such website does not in any way form part of this document. Accessing such website or following such link through this report or CS's website shall be at your own risk. This report is issued and distributed in Europe (except Switzerland) by Credit Suisse Securities (Europe) Limited, One Cabot Square, London E14 4QJ, England, which is authorised by the Prudential Regulation Authority ("PRA") and regulated by the Financial Conduct Authority ("FCA") and the PRA. This report is being distributed in Germany by Credit Suisse Securities (Europe) Limited Niederlassung Frankfurt am Main regulated by the Bundesanstalt fuer Finanzdienstleistungsaufsicht ("BaFin"). This report is being distributed in the United States and Canada by Credit Suisse Securities (USA) LLC; in Switzerland by Credit Suisse AG; in Brazil by Banco de Investimentos Credit Suisse (Brasil) S.A or its affiliates; in Mexico by Banco Credit Suisse (México), S.A. (transactions related to the securities mentioned in this report will only be effected in compliance with applicable regulation); in Japan by Credit Suisse Securities (Japan) Limited, Financial Instruments Firm, Director-General of Kanto Local Finance Bureau (Kinsho) No. 66, a member of Japan Securities Dealers Association, The Financial Futures Association of Japan, Japan Investment Advisers Association, Type II Financial Instruments Firms Association; elsewhere in Asia/ Pacific by whichever of the following is the appropriately authorised entity in the relevant jurisdiction: Credit Suisse (Hong Kong) Limited, Credit Suisse Equities (Australia) Limited, Credit Suisse Securities (Thailand) Limited, having registered address at 990 Abdulrahim Place, 27 Floor, Unit 2701, Rama IV Road, Silom, Bangrak, Bangkok 10500, Thailand, Tel. +66 2614 6000, Credit Suisse Securities (Malaysia) Sdn Bhd, Credit Suisse AG, Singapore Branch, Credit Suisse Securities (India) Private Limited regulated by the Securities and Exchange Board of India (registration Nos. INB230970637; INF230970637; INB010970631; INF010970631), having registered address at 9th Floor, Ceejay House, Dr.A.B. Road, Worli, Mumbai - 18, India, T- +91-22 6777 3777, Credit Suisse Securities (Europe) Limited, Seoul Branch, Credit Suisse AG, Taipei Securities Branch, PT Credit Suisse Securities Indonesia, Credit Suisse Securities (Philippines ) Inc., and elsewhere in the world by the relevant authorised affiliate of the above. Research on Taiwanese securities produced by Credit Suisse AG, Taipei Securities Branch has been prepared by a registered Senior Business Person. Research provided to residents of Malaysia is authorised by the Head of Research for Credit Suisse Securities (Malaysia) Sdn Bhd, to whom they should direct any queries on +603 2723 2020. This report has been prepared and issued for distribution in Singapore to institutional investors, accredited investors and expert investors (each as defined under the Financial Advisers Regulations) only, and is also distributed by Credit Suisse AG, Singapore branch to overseas investors (as defined under the Financial Advisers Regulations). By virtue of your status as an institutional investor, accredited investor, expert investor or overseas investor, Credit Suisse AG, Singapore branch is exempted from complying with certain compliance requirements under the Financial Advisers Act, Chapter 110 of Singapore (the "FAA"), the Financial Advisers Regulations and the relevant Notices and Guidelines issued thereunder, in respect of any financial advisory service which Credit Suisse AG, Singapore branch may provide to you. This research may not conform to Canadian disclosure requirements. In jurisdictions where CS is not already registered or licensed to trade in securities, transactions will only be effected in accordance with applicable securities legislation, which will vary from jurisdiction to jurisdiction and may require that the trade be made in accordance with applicable exemptions from registration or licensing requirements. Non-U.S. customers wishing to effect a transaction should contact a CS entity in their local jurisdiction unless governing law permits otherwise. U.S. customers wishing to effect a transaction should do so only by contacting a representative at Credit Suisse Securities (USA) LLC in the U.S. Please note that this research was originally prepared and issued by CS for distribution to their market professional and institutional investor customers. Recipients who are not market professional or institutional investor customers of CS should seek the advice of their independent financial advisor prior to taking any investment decision based on this report or for any necessary explanation of its contents. This research may relate to investments or services of a person outside of the UK or to other matters which are not authorised by the PRA and regulated by the FCA and the PRA or in respect of which the protections of the PRA and FCA for private customers and/or the UK compensation scheme may not be available, and further details as to where this may be the case are available upon request in respect of this report. CS may provide various services to US municipal entities or obligated persons ("municipalities"), including suggesting individual transactions or trades and entering into such transactions. Any services CS provides to municipalities are not viewed as "advice" within the meaning of Section 975 of the Dodd-Frank Wall Street Reform and Consumer Protection Act. CS is providing any such services and related information solely on an arm's length basis and not as an advisor or fiduciary to the municipality. In connection with the provision of the any such services, there is no agreement, direct or indirect, between any municipality (including the officials, management, employees or agents thereof) and CS for CS to provide advice to the municipality. Municipalities should consult with their financial, accounting and legal advisors regarding any such services provided by CS. In addition, CS is not acting for direct or indirect compensation to solicit the municipality on behalf of an unaffiliated broker, dealer, municipal securities dealer, municipal advisor, or investment adviser for the purpose of obtaining or retaining an engagement by the municipality for or in connection with Municipal Financial Products, the issuance of municipal securities, or of an investment adviser to provide investment advisory services to or on behalf of the municipality. If this report is being distributed by a financial institution other than Credit Suisse AG, or its affiliates, that financial institution is solely responsible for distribution. Clients of that institution should contact that institution to effect a transaction in the securities mentioned in this report or require further information. This report does not constitute investment advice by Credit Suisse to the clients of the distributing financial institution, and neither Credit Suisse AG, its affiliates, and their respective officers, directors and employees accept any liability whatsoever for any direct or consequential loss arising from their use of this report or its content. Principal is not guaranteed. Commission is the commission rate or the amount agreed with a customer when setting up an account or at any time after that.
Copyright © 2013 CREDIT SUISSE AG and/or its affiliates. All rights reserved.
Investment principal on bonds can be eroded depending on sale price or market price. In addition, there are bonds on which investment principal can be eroded due to changes in redemption amounts. Care is required when investing in such instruments.
When you purchase non-listed Japanese fixed income securities (Japanese government bonds, Japanese municipal bonds, Japanese government guaranteed bonds, Japanese corporate bonds) from CS as a seller, you will be requested to pay the purchase price only.
XX5929EU.doc