
Dividend policy, corporate control and the tax status of the controlling shareholder
Upload
independentCategory
view
2download
0
Electronic copy available at: http://ssrn.com/abstract=945675
Direct Evidence of Dividend Tax Clienteles
Magnus Dahlquist Goran Robertsson Kristian Rydqvist∗
January 2009
Abstract
We evaluate the dividend tax clientele hypothesis using a data set of all stock portfoliosin the market. Consistent with the predictions of Tax-CAPM, we find that tax-neutralinvestors tilt their stock portfolios towards dividend-paying stocks and earn about 40basis points higher dividend yield than investment funds that prefer capital gains overdividends. We also document that private corporations, foundations, and partnershipshave deviating dividend preferences, and discuss how these portfolio behaviors relate tospecial tax or charter provisions.
Keywords: Tax-CAPM, stock ownership, institutional investors, private corporations,foundations, partnerships.JEL Classification Numbers: G11, G35.
∗We are grateful for institutional information from Ingrid Eriksson, Kerstin Nilsson, Viveca Scherman Johansson,and Per Swanstrom of the Swedish Tax Agency, Kristina Melzen and Marie Rosvall of Svenska Forsakringsforeningen,Lina Sjostrom, Krister Swaretz, and Stig Westman of Swedbank, Vigg Troedsson of Swedish Securities Dealers Asso-ciation, Jan Bjuvberg, Hakan Thorsell, and Filip Wijkstrom of Stockholm School of Economics, Svante Johansson ofCarnegie Investment Bank, Johnny Larsson of Statistics Sweden, Roger Pettersson of RPA Forsakringsmakleri, SuneRydqvist of Configura, Ingmarie Severien of Handelsbanken’s research foundations, and Bo Winnerfeldt of the NordicCentral Securities Depository. We also want to thank for comments by Michael Brennan, William Goetzmann, MichaelLemmon, Greg Nagel, Jeffrey Pontiff, and by seminar participants at the Adam Smith Asset Pricing workshop atLondon Business School, Advances in Portfolio Decision Making at the University of Notre Dame, Annual Conferenceof the Caesarea Center at IDC 2007, Binghamton University, Duke University, Financial Intermediation ResearchSociety meeting in Anchorage 2008, Frontiers of Finance meeting in Curacao 2007, Helsinki School of Economics,New University of Lisbon, Norwegian School of Economics, Norwegian School of Management, Ohio State University,Rensselaer Polytechnic Institute, Royal Institute of Technology, SIFR - Institute for Financial Research, SwedishMinistry of Finance, University of Maastricht, and University of Oxford. Financial support from the Bank of SwedenTercentenary Foundation, and Johan och Jakob Soderbergs stiftelse is gratefully acknowledged. Dahlquist: SIFR- Institute for Financial Research, Stockholm School of Economics, and CEPR; e-mail [email protected]: SIFR - Institute for Financial Research; e-mail [email protected]. Rydqvist: Binghamton Uni-versity and CEPR; e-mail: [email protected].

Electronic copy available at: http://ssrn.com/abstract=945675
1 Introduction
Corporations pay dividends and investors pay tax on those dividends. Investors also pay tax on
capital gains when they sell their shares, but they can choose when to do so. Miller and Modigliani
(1961) conjecture that investors can reduce the overall tax bill by sorting themselves into clienteles
in which low-tax investors collect dividends and high-tax investors realize capital gains. We provide
direct evidence that there are dividend tax clienteles in the Swedish stock market. Understanding
and quantifying the effects of tax clienteles has implications for the pricing of financial securities,
for corporations issuing securities, and for governments collecting taxes.
The formal analysis of tax clienteles begins with Brennan (1970), who extends the Capital
Asset Pricing Model to include investor-level taxes (Tax-CAPM).1 The model predicts a positive
relation between dividend yields and before-tax returns. Early attempts to evaluate the Tax-CAPM,
including Black and Scholes (1974), Litzenberger and Ramaswamy (1979, 1982), and Miller and
Scholes (1982), consider the model’s implications for the cross-section of returns. Some studies
find a positive association between stock return and dividend yield, but there is a disagreement on
whether this is the result of taxes, information, or time-varying risk premia.2 There is also event
study evidence. Elton and Gruber (1970) find that average stock return over the ex-dividend day is
positive and decreasing with the dividend yield. They interpret their results as indirect evidence of
tax clienteles, but the subsequent literature, notably Kalay (1982), challenges this interpretation.
The empirical literature has also investigated the portfolio implications of Tax-CAPM. A return
premium on high-yield stocks induces low-tax investors to hold high-yield stocks and high-tax
investors to hold low-yield stocks. Pettit (1977) and Lewellen, Stanley, Lease, and Schlarbaum
(1978) both study a data set of stock portfolios of 900 individuals from a retail brokerage house,
and relate portfolio dividend yields to proxies for marginal tax rates. The statistical relation is
weak, and Pettit (1977) concludes that tax rates have an important influence on portfolio decisions
only at the margin. Scholz (1992) looks at self-reported data by 4,000 individuals in the Survey
of Consumer Finances (SCF) and finds evidence consistent with dividend tax clienteles. Contrary1See also subsequent articles by Litzenberger and Ramaswamy (1979) and Allen, Bernardo, and Welch (2000).2See the survey by Allen and Michaely (2003). See also Amihud and Mendelson (1986) for a similar approach to
study liquidity clienteles in the stock market.
2

to the previous two studies, he reports a strong economic effect of marginal tax rates on portfolio
dividend yield. More recently, Graham and Kumar (2006) combines security-specific information
from a brokerage house with self-reported survey data of 30,000 individuals. They find that high-
age, low-income individuals invest more in high-yield stocks. Since income is a proxy variable for
marginal tax rate, their result can be interpreted as a tax clientele effect. There are also studies
of the portfolio behavior of institutional investors. Michaely, Thaler, and Womack (1995) find
that institutions rebalance their stock portfolios around dividend initiations and omissions,3 and
Del Guercio (1996) and Grinstein and Michaely (2005) document that institutions overweight in
dividend-paying stocks. These results are more difficult to interpret as tax effects because the tax
status of US institutional investors cannot be accurately determined.4
We are the first to study the tax clientele hypothesis using a data set of all stock portfolios in the
market. The data are obtained from the official share registry of Sweden and include the universe
of Swedish investors’ holdings of listed Swedish stocks. The data set includes the stock portfolios
of both retail and institutional investors, it is representative of the entire population, and it allows
us to make market-wide statements. The Swedish tax code offers an advantage when studying
the dividend-tax clientele hypothesis. Tax rates are proportional (flat rates) and variation across
investors arises mainly from variation in the taxation of individuals and institutional investors.
The relatively simple tax structure with proportional tax rates avoids much of the difficulties
with estimating effective marginal tax rates in a progressive tax system with multiple income-tax
brackets.
There are four domestic tax clienteles in the Swedish stock market. The first tax clientele
consists of tax-neutral investors such as pension funds, life insurance companies, and charities.
Relative to other investors, tax-neutral investors prefer dividends over capital gains. The second
tax clientele consists of businesses and individuals who prefer capital gains over dividends because
tax liability on capital gains can be deferred to the time of realization. The third tax clientele is
composed of mutual funds and closed-end funds. Their tax position is asymmetric. Dividends pass3See also subsequent work by Dhaliwal, Erickson, and Trezevant (1999) and Hotchkiss and Lawrence (2007).4See Desai and Jin (2008) for an attempt to classify US institutions that manage taxed versus tax-deferred
accounts.
3

through and are taxed by the recipient, while capital gains accrue tax free within the fund. The
asymmetric treatment of dividends and capital gains means that investment funds have a stronger
preference for capital gains over dividends than businesses and individuals. The fourth tax clientele
consists of partnerships. A partnership transforms investment income into ordinary income for the
partners. Since the tax rate on ordinary income is much higher than on investment income, stock
ownerships via a partnership is discouraged. Moreover, partnerships are particularly averse to
holding dividend-paying stocks as the value of the deferral of capital gains is particularly high due
to the higher tax rate. In addition to the four domestic tax clienteles, there are foreign investors who
hold one third of the stock market. Unfortunately, we are unable to test the dividend tax clientele
hypothesis for foreign investors because their identities, and therefore their tax preferences, are
unknown to us.
In this tax environment we find that tax-neutral investors, investment funds, and partnerships
behave according to the predictions of the dividend tax clientele hypothesis. Tax-neutral investors
earn 40 basis points higher dividend yield on their portfolios than investment funds. Partnership
portfolios are almost non-existent. Less than one percent of all registered partnerships in Sweden
hold stock portfolios, and the average dividend yield on the few partnership portfolios is much lower
than that on other stock portfolios. However, the portfolio behavior of businesses and individuals
is difficult to reconcile with the predictions of the dividend tax clientele hypothesis. In some
econometric specifications, the stock portfolios of businesses and individuals sort nicely between
tax neutral investors and investment funds, while in other specifications businesses and individuals
appear to have a stronger preference for either dividends or capital gains. We argue that the
portfolios of directly-held stocks severely misrepresent the total wealth of businesses and individuals,
and that the income from stock portfolios and its taxation is unimportant relative to other income.
Therefore, without an appropriate set of control variables, it is more difficult to evaluate the
dividend tax clientele hypothesis based on the stock portfolios of businesses and individuals.
In addition to these general results, we find that stock portfolios of private corporations are
abundant, and they are heavily concentrated to growth stocks. Special tax rules for private corpo-
rations, where the owner is also employed, create an incentive for the firm to invest excess liquidity
4

in growth stocks instead of paying dividends to the owner. In fact, many closely-held corporations
are better characterized as private investment funds than as non-financial businesses.5 We also
find that foundations earn higher dividend yield on their stock portfolios than most other investors
in the Swedish stock market. Their portfolio behavior is consistent with the common view that
foundations are constrained by charter provisions to make distributions from income and not from
principal.
The rest of the paper is organized as follows. Section 2 explains the Swedish tax rules. The data
and descriptive statistics are provided in Section 3. Section 4 presents the main empirical results.
In Section 5, we explain why private corporations invest in growth stocks. Section 6 concludes the
paper and points to directions for future research.
2 Hypothesis and Institutional Background
2.1 Tax-CAPM
Brennan (1970) extends the Capital Asset Pricing Model to include proportional investor-level taxes
on dividends and capital gains. The general expression for investors’ demand at equilibrium prices
is complicated. However, it simplifies greatly if we consider only two tax clienteles, if investors have
CARA utility, and if returns are normally distributed (see Allen, Bernardo, and Welch (2000)).
With the additional assumptions of a single dividend-paying stock, zero risk-free rate, and zero
capital gains tax, the demand functions can be written as:
X1 = γ2γ1+γ2
+[
(τ2−τ1)(γ1+γ2)σ2
]× d,
X2 = γ1γ1+γ2
−[
(τ2−τ1)(γ1+γ2)σ2
]× d,
(1)
where Xi denotes quantity demanded at the equilibrium price for tax clientele i = 1, 2, τi is investor
i’s marginal tax rate on dividends, γi is investor i’s risk aversion, σ2 is the stock’s variance, and
d is the dividend amount. The two demand equations have intercepts that represent optimal risk5Karhunen and Keloharju (2001) show that private corporations are abundant stockholders also in Finland where
private corporations are subject to similar tax rules.
5

sharing. The slope coefficients differ for tax reasons. Tax Clientele 1 has a relative tax preference for
dividends when τ1 < τ2. Tax Clientele 1 then tilts its portfolio towards the dividend-paying stock,
and Tax Clientele 2 tilts it away. The amount of tilting depends on the dividend, the difference in
marginal tax rates, the stock’s variance, and investors’ risk aversion. Investment portfolios are not
tilted if the dividend is zero (d = 0) or the marginal tax rates are equal (τ1 = τ2), and the amount
of tilting approaches zero as either the stock’s variance or investors’ risk aversion becomes large.
The main implication we take from the Tax-CAPM is that relative tax preferences affect port-
folio choices. Investors with a relative tax preference for dividends invest more in high-dividend
paying stocks, while investors with a relative tax preference for capital gains take the opposite po-
sition. Our objective is to evaluate empirically whether stock portfolios sorted by tax preferences
imply the same ordering of dividend preferences. Brennan’s assumption of proportional investor-
level taxes fits directly into our empirical setting. He also assumes that dividend policy is exogenous
and that firms do not repurchase shares. These two assumptions are maintained throughout our
empirical analysis.6
2.2 Relative Tax Preferences in the Swedish Stock Market
Tax-CAPM does not specify who the investors are. Reality is complex, most stocks are held by
institutions, and only a small fraction is held directly by individuals.7 In this section, we explain
how income from stocks are taxed in Sweden since 1991.8 We identify four dividend tax clienteles
and, for each clientele, we compute investors’ relative tax preferences for dividends over capital
gains:
θ =1 − τd1 − τg
, (2)
where τd and τg are marginal tax rates on dividends and capital gains, respectively. The relative
tax preference parameter θ is the exogenous variable used by Pettit (1977) and Scholz (1992).6We do not study how dividend tax clienteles may affect corporate payout policy. This question is studied in, for
instance, Barclay, Holderness, and Sheehan (2008) and Holmen, Knopf, and Peterson (2008).7For example, French (2008) estimates that individuals own directly 21% of listed US stocks, and we find that the
fraction of household ownership is less than 15% of listed Swedish stocks (see Table 2 below).8Swedish tax rules relating to income from stocks can be found in three legislative bodies: Inkomstskat-
telagen (SFS 1999:1229), Lagen om avkastningsskatt pa pensionsmedel (SFS 1990:661), and Kupongskattelagen(SFS 1970:624).
6

2.2.1 Tax-Neutral Investors
There are three types of tax-neutral investors in Sweden. First, government entities and charitable
organizations are exempt from tax on investment income. Second, life insurance companies, pension
funds, unit-linked insurance (defined contribution plans), and individual retirement accounts are
also exempt from taxation of investment income, but pay taxes on imputed income.9 The taxes
on imputed income do not influence the relative preference for dividends over capital gains. Third,
banks and brokerage houses calculate their income according to the mark-to-market principle.
Hence, dividends and capital gains (realized or not) are treated the same way. The tax-preference
parameter θ is equal to one for tax-neutral investors.
2.2.2 Businesses & Individuals
For businesses, investment income is taxed at the 28% rate and for individuals at the 30% rate. In
what follows, we will ignore this small difference in statutory rates and assume it is 30% for both
businesses and individuals. Business taxation applies to all businesses and non-profit organizations,
except charities, and the rules for individual’s also apply to stock clubs, sole proprietorships, and
estates. All tax obligations of a deceased individual is passes through to the estate. Taxes on
dividends are collected at the source, while the businesses and individual are responsible for paying
capital gains tax when profits are realized. Intercorporate dividends are exempt from taxation if
the ownership fraction exceeds 25% before 2003 and 10% thereafter.10
Businesses and individuals prefer capital gains over dividends because capital gains tax can
be postponed to the time of realization. The value of the tax preference parameter depends on
investors’ behavior. At one extreme, infinite deferral is equivalent to θ = 0.7. At the other
extreme, a trading strategy of realizing capital gains and losses as they accrue implies that the
tax preference parameter is θ = 1. An investor who trades occasionally for either consumption
purposes or portfolio rebalancing has a tax-preference parameter that falls somewhere between the
two extremes. Green and Hollifield (2003) model the value of deferral. They assume that free cash9Imputed income is defined as the average treasury rate during the year preceding the income year times the
market value of the stock portfolio in the beginning of the income year. The tax rate on imputed income is 15%.10Morck (2005) reports similar tax rules in most developed countries except the US where inter-corporate dividends
are taxed for the explicit reason to discourage the formation of business groups.
7

flows are either paid out as dividends or through share repurchases. In their model, investors do
not trade for any other reason than to sell back their shares to the firm in a share repurchase offer.
The repurchase price is set so high that investors become indifferent between infinite deferral and
selling back the shares to the firm and pay capital gains tax. With proportional investor-level taxes,
as in Sweden, they find that the value of deferral is approximately 60% of the statutory rate. Using
their result, the tax preference parameter for businesses and individuals is:
θ =1 − 0.3
1 − 0.6× 0.3= 0.85. (3)
This value of deferral is based on a specific model with restrictive assumptions.11 Protopapadakis
(1983) empirically estimates the value of deferral to 25% of the statutory rate, and Chay, Choi,
and Pontiff (2006) find it to be 55%. The former estimate is based on realizations of capital gains,
and the latter is derived from an event study. Although the value of the tax preference parameter
for businesses and individuals depends on the assumptions, it will fall between that of the tax-
neutral investors (above) and investment funds (below). For most of the following analysis, only
the ranking of relative tax preferences matters.
2.2.3 Investment Funds
For investment funds dividends are passed through to fund owners, while capital gains accrue
tax free.12 When investment fund shares are held in a taxed account, the fund owner must pay
investment income tax on the dividend at the 30% rate. The fund owner must also pay investment
income tax when selling shares in the fund. When fund shares are held in a retirement account,
both dividends and capital gains accrue tax free. Instead, the fund owner pays ordinary income
tax when funds are withdrawn at retirement.11A common approach in the literature on US data is to assume that the effective capital gains tax rate equals
25% of the statutory rate (e.g., Graham (2000)). This number is based on Bailey (1969), who calculates the value ofdeferral to 50% of the statutory rate and multiplies this number with the calculated value of the option to reset thecost basis to market value at death, which is also 50% of the statutory rate. We do not follow this approach as theSwedish tax code does not allow the estate of a deceased individual to reset the cost basis to market value.
12Instead of capital gains tax, an investment fund pays a 30% tax on imputed income defined as 1.5% of the marketvalue of the stock portfolio in the beginning of the income year. This tax does not influence the relative tax preferencefor dividends over capital gains.
8

We make two simplifying assumptions: (i) all investment fund shares are held in taxed accounts,
and (ii) fund owners can infinitely defer investment income tax on fund shares. These assumptions
imply that the tax preference parameter θ is 0.7 for an investment fund. It means that investment
funds have a relatively strong preference for capital gains over dividends. The value of the tax
preference parameter is an approximation because mutual fund shares are also held in (tax-neutral)
retirement accounts. Based on aggregate statistics and assumptions on the proportion of mutual
fund assets invested in Swedish stocks, we estimate the tax-neutral portion of Swedish mutual
funds to be less than 30%. The tax-neutral portion originates from unit-linked insurance (defined
contribution plans offered by life insurance companies), the mandatory pension system (PPM), and
individual retirement accounts (IRA).
That investment funds include some pension accounts makes any estimated difference between
tax-neutral investors and investment funds conservative. For simplicity we assume infinite deferral
instead of trying to quantify the effects of consumption or portfolio rebalancing by the fund owner.
We do not assume that the value of deferral is 60% of the statutory rate because portfolio rebal-
ancing by the fund manager does not trigger capital gains tax. This tax advantage of indirect stock
ownership is reflected in the tax preference parameter.13
2.2.4 Partnerships
Investment income is taxed as ordinary income by the partners. A partnership can have both
individual and institutional partners. We simplify the analysis by assuming that all partners are
individuals. Ordinary income is subject to a progressive tax schedule. The tax rate in the highest
income bracket is 67.2%.14 The transformation of investment income into ordinary income discour-
ages individuals from owning stock through a partnership because the top marginal tax rate on13Constantinides (1983) analyzes optimal tax trading when portfolio and tax decisions can be separated. Indirect
stock ownership through an investment fund is not tax-advantaged under his assumptions. Dammon, Spatt, andZhang (2001) relax these assumptions and study portfolio behavior when short sales are costly and the tax coderestricts wash sales. In their model, investors trade off diversification and capital gains tax. Then, indirect stockownership through an investment fund has an tax-advantage because it allows investors to rebalance without payingcapital gains tax. Gallmeyer, Kaniel, and Tompaidis (2006) extend the analysis to multiple risky stocks.
14The marginal tax rate on wage income is 1− (1/1.3246) (1− 0.566) = 0.672, where 32.46% is the social securitytax rate and 56.6% is the sum of the local tax rate (average of 31.6%) and the central tax rate (25%). Unlike the USand many other countries, there is no cap on the income which is subject to social security tax.
9

ordinary income (67.2%) is much higher than the marginal tax rate on investment income (30%).
The tax-preference parameter for an individual partner in the top income bracket is:
θ =1 − 0.672
1 − 0.6 × 0.672= 0.55. (4)
In Equation (4) we assume that the individual partner belongs to the top income tax bracket.
This is not a restrictive assumption as the top statutory rate applies to a modest income level of
approximately SEK 465,000.15
2.3 Summary of Relative Tax Preferences
We have identified four tax clienteles in the Swedish stock market. The tax preference parameters,
sorted from high to low, are
θ =
1.00 A. Tax-neutral investors
0.85 B. Businesses & individuals
0.70 C. Investment funds
0.55 D. Partnerships
(5)
The values for Tax Clienteles B, C, and D in Equation (5) depend on simplifying assumptions, but
for most of the analysis, only the ordering of relative tax preferences matters and not the value.
In Equation (5) we assume that investors have taxable income. If investors can offset dividends
and capital gains against capital losses, the relative tax preferences change. Loss deductions are
irrelevant for tax-neutral investors and investment funds, businesses and partnerships become tax
neutral, while individuals still prefer capital gains as a result of loss limitations.16 In the analysis
below we assume that investors make long-term investments and do not include the possibility that
businesses, individuals, and partnerships may want to rebalance their portfolios when they have15The SEK/USD exchange rate has varied between 6.5 and 10.5 during the sample period.16For businesses, capital loss is fully deductible against other business income; it can be carried forward indefinitely,
but it cannot be carried back. For individuals, capital loss on stocks is fully deductible against capital gains on otherstocks, but only 70% deductible against other investment income. Negative investment income can also offset taxliability on ordinary income. The tax reduction is 30% times the deficit up to SEK 100,000 and 21% times the deficitabove SEK 100,000. This means that capital loss saves taxes at rates 30% (gains on stock), 21% (investment income,ordinary income up to the limit), and 14.7% (ordinary income above the limit).
10

capital losses.
3 Data and Descriptive Statistics
3.1 Data
We study firms listed on the Stockholm Stock Exchange 2001–2005. Ownership of Swedish listed
stocks is registered by the Nordic Central Securities Depository (NCSD). Each investor or custodian
bank must have an account in the securities depository. Regulations require that a complete
ownership record is made available at the end of June and December each year. Furthermore,
the law requires Swedish banks to reveal the identities of the owners of all shares held in custody.
Foreign banks do not have to report the nominee identity. As we do not know the identity of the
beneficial owner, we do not consider foreign investors in the analysis. We use the ownership record
at the end of June each year. The records display the name of the shareholders and the number
of shares held. For institutional investors the name is followed by an organizational identification
number. This number is used when forming portfolios for institutional investors. The portfolios
held by individuals are formed based on investor names. Financial data are taken from Thomson
Financial. We compute betas in a three-factor regression model and idiosyncratic risk as the
standard deviation of the residuals from the same regression. The betas capture exposures to the
Swedish stock market, high-minus-low book-to-market ratios (HML), and small-minus-big market
capitalization (SMB). The return calculations are based on the Dow Jones Country Style Indexes.
These data are used to control for investors’ risk preferences. We also collect data on firm size
(market capitalization) and liquidity (bid-ask spread and turnover) to control for other factors
which may influence investors’ portfolio choices.
3.2 Identification of Investor Tax Preferences
The true tax status of an investor is privy and must be inferred from each investor’s name and orga-
nization identification number. We match the organization identification number with a two-digit
organizational code obtained from Statistics Sweden. This organizational code uniquely identifies
11

the tax status of many investors in our sample: entities of the public sector, banks, and religious
associations (A); individuals, estates, proprietorships, and corporations other than those men-
tioned elsewhere (B); investment funds (C); partnerships (D). For other important investor groups
the name uniquely identifies the organization’s tax status: life insurance, unit-linked insurance,
pension funds, and brokerage houses (A); property and casualty insurance (B). The code for or-
ganizational form also identifies foundations and associations. Foundations and associations are
non-profit organizations. Non-profits must file a tax return each year. The local tax agency decides
whether the non-profit is charitable and qualifies for tax-exempt investment income (A) or is sub-
ject to business taxation (B). We delete the non-profits from the analysis because the decision on
tax status is not available to us.17 Finally, we use intercorporate ownership data from the database
Market Manager to classify a corporation as a public firm if itself or its parent is registered in the
securities depository, or as a private firm otherwise.
3.3 Descriptive Statistics
Descriptive statistics on the sample firms and their payouts are displayed in Table 1. Average stock
market capitalization is SEK 2,290 billion. The market value of dividend-paying firms accounts
for 88.2% of total market, and share-repurchasing firms account for 25.2% of total capitalization.
Dividends are paid annually after the approval of the shareholder’s meeting. The average dividend
yield is 2.74% and the average share-repurchase yield is 0.64%. The bottom panel reports that
the average number of listed firms is 273, that 53.1% of those firms pay dividends, and that 11.3%
repurchase shares. Dividends and share repurchases are thus concentrated to the largest firms.
This is also a feature of the US stock market (see Fama and French (2001)). Table 2 presents
summary statistics for the aggregate portfolios of the four tax clienteles. The portfolios account
for 26.5%, 19.7%, 14.1%, and less than 0.1% of total market capitalization, respectively. Foreign
investors own 33.7% and unclassified domestic investors 6.0%. The number of investors exceeds two17We have elaborated with name-based classification. Non-profits with charitable-related names are classified as
tax neutral (A) and non-profits with names related to a specific group of people as businesses (B). The name methodclassifies 88% of the associations and 29% of the foundations. Foundations are harder to classify than associationsbecause they are typically named after the donor. The resulting dividend preferences are not different for non-profitsclassified as A, B, or not classified, so we do not report the results of the name-based classification.
12

million of which most are businesses and individuals. To the right, the portfolio weights invested
in dividend-paying stocks and the portfolio dividend yields are reported. The adjacent numbers to
the right of each column are deviations from the aggregate sample, 89.3% (portfolio weight) and
2.81% (dividend yield). Three results emerge.
First, the aggregate stock portfolio of tax-neutral investors (A) is tilted towards dividend-paying
stocks, while the portfolio of investment funds (C) is tilted away from those stocks. The excess
weight of the tax-neutral portfolio is 3.4%, and the yield spread between tax-neutral portfolios and
investment funds is 35 basis points. This difference between tax-neutral investors and investment
funds is a robust feature of our data. As we have some tax-neutral pension accounts in investment
funds, we view the 35 basis points as a conservative estimate. Second, the portfolio weight of busi-
nesses and individuals (B) falls below that of both tax-neutral investors and investment funds. The
ordering of businesses and individuals in Table 2 is not a robust feature of our data and depends
on the econometric specification. Third, the number of partnerships in our sample is only 936,
representing less than 1% of the about 130,000 registered partnerships in Sweden. The aggregate
portfolio of the partnerships accounts for only 0.04% of total market capitalization. This is con-
sistent with tax incentives since a partnership transforms investment income into ordinary income
for individuals. In addition, the portfolio weight in dividend-paying stocks and the dividend yield
of the few partnership portfolios are substantially below those of all other investors. Apart from
businesses and individuals, the preliminary results from Table 2 are consistent with the dividend
tax clientele hypothesis.
Table 3 presents summary statistics for the major subcategories within each clientele. Al-
though investors are heterogeneous across subcategories (see below), a common pattern is that
most tax-neutral investors (A) overweight in dividend-paying stocks, while businesses and individ-
uals (B) and investment funds (C) underweight. Life insurance and non-life insurance companies
have different tax preferences but nevertheless pick stock portfolios that reveal similar dividend
preferences. A possible explanation is that regulations provide non-life insurance companies with
tax shields that other businesses do not have. The bottom panel reports that foundations over-
weight dividend-paying stocks and earn 85 basis points higher dividend yield than our aggregate
13

sample. Foundations are sometimes restricted to make distributions from dividend income only and
not from capital gains or principal. An estimate by the supervisory authority is that 30% of the
foundations can only distribute dividends, 20% can distribute dividends and realized capital gains,
and 50% have no restriction and can therefore make payments from its principal. Such charter
provisions may explain why foundations overweight in dividend-paying stocks.
Summary statistics of portfolio characteristics are reported in Table 4. The averages are equally
weighted over investors and years. The variation in average portfolio size across investor types is
noticeable. Life insurance companies hold the largest and most diversified portfolios. Closed-end
funds are also large, but they hold on average only 10 stocks. Pension funds hold smaller and
less diversified portfolios. In general, the lack of diversification within the Swedish market may
be compensated for by holding foreign stocks in the portfolios. The smallest and least diversified
portfolios are held by individuals, private corporations, and partnerships. The small number of
directly-owned stocks in individuals’ portfolios is also a striking feature of US data according to the
Survey of Consumer Finances (see Polkovnichenko (2005)). Calvet, Campbell, and Sodini (2007)
show that Swedish individuals diversify through ownership of mutual funds. Hence, the portfolios of
directly-owned stocks provide an incomplete picture of the aggregate stock portfolios of individuals.
Individuals dominate our sample with more than two million portfolios of which approximately one
million consist of only one stock and have a market value below SEK 15,000. More than 600,000
such one-stock portfolios are invested in either Ericsson, Telia-Sonera, or Swedbank.
There is a manifested variation in the portfolio strategies across investor types. Large portfolios
held by professional investors are tilted towards value stocks (positive or small negative HML
coefficients). Small portfolios held by businesses and individuals exhibit the opposite traits. In
particular, there is a strong tendency for private corporations and partnerships to hold growth
stocks with very low HML betas. We report the frequency distribution of the HML betas, the
number of stocks, and the portfolio values in Figures 1–3. The figures exhibit that portfolios held
by businesses and individuals as well as partnerships are dominated by single-stock portfolios. Only
2% of the portfolios held by businesses and individuals are larger than SEK 1,000,000 (the x-axis
of the figure is expressed in logarithms), while only 4% of the portfolios held by investment funds
14

are smaller that SEK 1,000,000.
4 Portfolio Dividend Yield and Relative Tax Preferences
We consider a regression model with the portfolio dividend yield as the dependent variable as in
Pettit (1977), Scholz (1992), and Graham and Kumar (2006). We choose the dividend yield rather
than the portfolio weight in dividend-paying stocks as dependent variable because investor-level
stock portfolios are markedly different from the predictions of Tax-CAPM. In particular, investors
do not hold all securities in the market portfolio. Regressing the weight in dividend-paying stocks
on a set of explanatory variables is also statistically difficult, as the many single-stock portfolios
have a weight of either 0% or 100%.
For each investor i in year t, we compute the dividend yield Yit and estimate a pooled linear
regression model of the dividend yield on dummy variables Dkit for each tax clientele and a set of
control variables Zi:
Yit = β0t + γBDBit + γCDC
it + γDDDit + β′Zi + εit. (6)
The coefficient β0t captures the dividend yield on the portfolios held by tax-neutral investors in
year t over and above what is predicted by the control variables Zi. The γk coefficients capture the
additional dividend yield for investors in tax clienteles k = B,C,D. The tax clientele hypothesis
predicts that:
0 > γB > γC > γD. (7)
The vector of control variables includes estimates of systematic and idiosyncratic risk, but we have
also experimented with measures of firm size and liquidity.18
We also estimate a regression where the tax clientele dummies are replaced by the tax preference18Including the value-weighted logged market value of the firms in the portfolio, and their value-weighted turnover
rate and bid-ask spread do not change the regression results in any significant way.
15

parameter θit in Equation (5) for each investor i in year t:
Yit = β0t + γθit + β′Zi + εit. (8)
For this specification, the tax clientele hypothesis predicts that γ > 0 as a higher tax preference
parameter is associated with a higher dividend yield.
We report the regression results with and without the stock portfolios of individuals. There
are three reasons for studying the portfolio behavior of institutional investors separately. First, the
portfolios of directly-held stocks by individuals appear to provide a particularly incomplete picture
of investors’ total wealth. Many individuals with directly-held stocks also hold shares in mutual
funds. Second, we miss important background variables such as age, income, vested pension plans,
and residential real estate that influence the investment behavior of individuals. Third, adding more
than two million stock portfolios to an equally weighted regression effectively makes the coefficients
of the control variables determined by the characteristics of the individuals’ portfolios.
We report the regression results without individuals in Table 5. For brevity, we do not report
the coefficients of annual year dummies. The standard errors (reported below the coefficients)
are based on a pair-wise bootstrap (500 replications) accounting for conditional heteroscedasticity
and serial correlation.19 Specifications 1a and 2a refer to Equation (6) and Specification 3a to
Equation (8). The coefficients of the tax clientele dummies are negative. In Specification 1a, the
coefficient for businesses falls below the others, while in Specification 2a the coefficients of the tax
clientele dummies are nicely sorted according to the dividend tax clientele hypothesis (7). When
we force the regression model to chose a single tax coefficient (Equation (8)), it enters with the
predicted, positive sign. The estimated coefficient is 1.384, which implies a yield spread between tax
neutral investors (A) and investment funds (C) in the amount of 42 basis points. The magnitudes
and significance levels of the coefficients of the risk variables, as well as the regression R-squares,
are similar to those reported by Graham and Kumar (2006).
We proceed to the regressions with individuals in Table 6.20 Specifications 1b–3b replicate the19Asymptotic standard errors from a GMM estimation, also accounting for conditional heteroscedasticity and serial
correlation, are very similar to the bootstrap standard errors and are therefore not reported in the tables.20The stock portfolios of individuals cannot be tracked over time, and we cannot control for correlation over the
16

regressions without individuals above, while Specifications 4b and 5b interact the dummy variable
for businesses and individuals (B) with the four risk variables. Consistent with the dividend tax
clientele hypothesis, the coefficients of investment funds are negative across specifications, and the
coefficients of the tax preference parameter are positive. The sign of the coefficients of businesses
and individuals (B), as well as of partnerships (D) depend on the econometric model. In Specifi-
cations 1b and 4b, both coefficients are negative, while both are positive in Specification 2b. The
coefficient of the tax preference parameter is much smaller when individuals are included. This is
because the regression is now dominated by individuals and, as a consequence, the coefficient of the
tax preference parameter effectively catches the yield difference between tax-neutral investors (A)
and businesses and individuals (B). We conclude from the regressions that the yield spread between
tax-neutral investors and investment funds is a robust result, while the estimated dividend yield of
the portfolios held by businesses and individuals, as well as partnerships depend on the econometric
specification.
Many portfolios in our sample have zero dividend yield. These portfolios account for 31.7%
(12.7%) of all portfolios when individuals are excluded (included). The non-linearity at zero implies
that the linear regression model can predict negative dividend yields. We deal with this issue by
estimating the regressions in trimmed samples and by estimating a Tobit model. We focus on the
subset of our data without individuals. The left section of Table 7 excludes portfolios with less
than five stocks, the middle section excludes portfolios with a market value below SEK 250,000,
and the right section excludes portfolios of businesses, individuals, and partnerships. The number
of observations falls dramatically. More importantly, so does the fraction of portfolios with zero
dividend yield. The signs of the tax coefficients are the same as in the full sample with the
exception of the coefficient for businesses in Specification 2c. The magnitude of the tax coefficient
for investment funds is about the same. Table 8 presents results from the Tobit estimation. The top
panel reports the estimated coefficients with standard errors and the bottom panel the differences
years in standard ways. We approach this issue by bootstrapping the full sample 500 times, taking into accountconditional heteroscedasticity, but count each observation only as one fifth. This is a conservative way of dealingwith the correlations over time and is equivalent to computing the conditional heteroscedasticity-robust standarderrors without accounting for the correlation over years, and inflate them with a factor of the square root of five.
17

in dividend yields evaluated at the averages of the control variables for tax-neutral investors.21 The
resulting yield spreads are similar to those reported in Table 7.
5 Corporate Stock Portfolios
More than 28,000 portfolios are held by private corporations (see Table 3). The aggregate dividend
yield on these portfolios is low (2.56%), average portfolio size is small (SEK 2.1 million), and the
portfolios are tilted toward growth stocks as suggested by the low average HML betas (–1.03). Why
do private corporations buy growth stocks? We propose a tax-based explanation.
Special tax rules pertain to income from a private corporation, where the owner is also employed.
The purpose of these rules is to tax labor income the same way regardless of whether it is earned
directly as wages or channeled through a partnership or a corporation. The top marginal tax rate
on dividends from a private corporation is 68.8% compared to the top marginal tax rate on wages
and partnership income 67.2%.22 The taxation of capital gains from selling shares in the private
firm is more favorable. A capital gain that exceeds approximately SEK eight million is taxed as
investment income at an effective rate of 41.0%.23 A capital gain below SEK eight million is taxed
as half investment income (41.0% rate) and half ordinary income (68.8% rate). These rates are
the sum of corporate and personal taxes. The personal portion of the capital gains tax can be
postponed to the time of the realization.
Corporations may hold a liquid stock portfolio for future investments in operating assets. How-
ever, we conjecture that many corporate stock portfolios in our data serve as a supplemental
retirement accounts for the owners. A portfolio of non-dividend paying stocks does not trigger any
investor-level taxes before the owner sells the private firm. Saving for retirement through a stock
portfolio held by the firm has the advantage that the portfolio can be liquidated at any time and21Evaluating differences at the grand average or at averages of other investor clienteles give similar results.22The rules are complex and change frequently. A small dividend can be paid tax free. An additional amount, which
depends on paid-in-capital and total wages paid to employees other than the owner, is subject to 30% investmentincome tax. The excess dividend is taxed as wage income at marginal tax rate 56.6%, but is not subject to socialsecurity tax. Therefore, the marginal tax rate on dividends from a private corporation is 1− (1− 0.28)(1− 0.566) =0.688. A private firm cannot repurchase its own shares.
23The calculation of the effective rate is 1 − (1 − 0.28)(1 − 0.60 × 0.30) = 0.410, where 28% is the corporate taxrate, 30% is the tax rate on investment income, and 60% is the value of deferral.
18
used for other purposes than retirement. This benefit must be evaluated against the advantage
of a private pension plan administered by a pension fund or a life insurance company, which is
protected by the limited liability of the corporation.
Accounting data lend some support to this conjecture. Using data from Market Manager, we
compute the ratio of the market value of the stock portfolio to the book value of total assets for
financial and non-financial firms, respectively. Most financial firms are securities trading companies,
while the non-financial firms span manufacturing, construction, trade, and service. Many firms have
a significant part of their assets in stock portfolios. In more than 3,000 non-financial firms (or 13%
of the firms), the ratio exceeds 50%. These firms are better characterized as private stock funds
than operating firms.24 The result is not driven by smaller firms in the sample and the distributions
are similar across industries.
6 Concluding Remarks
We have found that tax-neutral investors, investment funds, and partnerships behave according to
the predictions of the dividend tax clientele hypothesis, while the evidence relating to businesses
and individuals is ambiguous and depends on sample and empirical specification. We conclude
that institutional investors, where the portfolios of directly-held stocks are good proxies for total
wealth, conform to the predictions of Tax-CAPM. The yield spread between tax-neutral portfolios
and investment funds in the order of 40 basis points is a robust result and economically meaningful.
The many private corporations that hold stock portfolios is curious. To the extent that corporate
stock portfolios do not merely substitute for other savings, the owners of the private corporations
suffer from too little consumption. Furthermore, the concentration of corporate stock portfolios to
growth stocks suggests that there is overinvestment in the growth sector. An immediate implication
from our interpretation of the data is that tax cuts would reduce the number of corporate stock
portfolios and increase corporate payouts. Consistent with this conjecture, Chetty and Saez (2005)
report that many listed US firms, in particular those with large inside shareholders, responded to
the dividend-tax cut of the Jobs and Growth Tax Relief Reconciliation Act of 2003 (JGTRRA) by24Investment-fund tax status does not apply to private firms.
19

increasing their dividends. Also, Frank, Singh, and Wang (2008) find that US firms with large cash
holdings responded to JGTRRA by subsequently reducing their investments. Further evaluations
of these potential tax distortions may be interesting future research.
20

References
Allen, Franklin, Antonio Bernardo, and Ivo Welch, 2000, A Theory of Dividends Based on TaxClienteles, Journal of Finance 55, 2499–2536.
Allen, Franklin, and Roni Michaely, 2003, Payout Policy, in George M. Constantinides and Mil-ton Harris and Rene M. Stulz, eds.: Handbooks of the Economics of Finance (North-Holland,Amsterdam).
Amihud, Yakov, and Haim Mendelson, 1986, Asset Pricing and the Bid-Ask Spread, Journal ofFinancial Economics 17, 2223–249.
Bailey, Martin J., 1969, Capital Gains and Income Taxation, in Arnold C. Harberger and MartinJ. Bailey, eds.: The Taxation of Income from Capital (The Brookings Institution, WashingtonD.C.).
Barclay, Michael J., Clifford G. Holderness, and Dennis P. Sheehan, 2008, Dividends and CorporateShareholders, Review of Financial Studies, forthcoming.
Black, Fisher, and Myron Scholes, 1974, The Effects of Dividend Yield and Dividend Policy onCommon Stock Prices and Returns, Journal of Financial Economics 1, 1–22.
Brennan, Michael J., 1970, Taxes, Market Valuation and Corporate Financial Policy, National TaxJournal 23, 417–427.
Calvet, Laurent E., John Y. Campbell, and Paolo Sodini, 2007, Down or Out: Assessing the WelfareCosts of Household Investment Mistakes, Journal of Political Economy 115, 707–747.
Chay, J.B., Dosoung Choi, and Jeffrey Pontiff, 2006, Market Valuation of Tax-Timing Options:Evidence from Capital Gains Distributions, Journal of Finance 61, 837–866.
Chetty, Raj, and Emmanuel Saez, 2005, Dividend Taxes and Corporate Behavior: Evidence fromthe 2003 Dividend Tax Cut, Quarterly Journal of Economics 120, 791–833.
Constantinides, George M., 1983, Capital Market Equilibrium with Personal Tax, Econometrica51, 611–636.
Dammon, Robert M., Chester S. Spatt, and Harold H. Zhang, 2001, Optimal Consumption andInvestment with Capital Gains Taxes, Review of Financial Studies 14, 583–616.
Del Guercio, Diane, 1996, The Distorting Effect of the Prudent-Man Laws on Institutional EquityInvestments, Journal of Financial Economics 40, 31–62.
Desai, Mihir A., and Li Jin, 2008, Institutional Tax Clienteles and Payout Policy, Working Paper,NBER.
Dhaliwal, Dan S., Merle Erickson, and Robert Trezevant, 1999, A Test of the Theory of TaxClienteles for Dividend Policies, National Tax Journal 52, 179–194.
Elton, Edwin J., and Martin J. Gruber, 1970, Marginal Stockholders Tax Rates and the ClienteleEffect, Review of Economics and Statistics 52, 68–74.
21

Fama, Eugene F., and Kenneth R. French, 2001, Disappearing Dividends: Changing Firm Charac-teristics or Lower Propensity to Pay?, Journal of Financial Economics 60, 3–43.
Frank, Murray Z., Rajdeep Singh, and Tracy Yue Wang, 2008, Personal Income Taxes and Corpo-rate Investment: A Tax-Overhang Effect, working paper SSRN.
French, Kenneth R., 2008, The Cost of Active Investing, Journal of Finance 63, 1537–1573.
Gallmeyer, Michael F., Ron Kaniel, and Stathis Tompaidis, 2006, Tax Management Strategies withMultiple Risky Assets, Journal of Financial Economics 80, 243–291.
Graham, John R., 2000, How Big Are the Tax Benefits of Debt?, Journal of Finance 55, 1901–1942.
Graham, John R., and Alok Kumar, 2006, Do Dividend Clienteles Exist? Dividend Preferences ofRetail Investors, Journal of Finance 61, 1305–1336.
Green, Richard C., and Burton Hollifield, 2003, The Personal-Tax Advantages of Equity, Journalof Financial Economics 67, 175–216.
Grinstein, Yaniv, and Roni Michaely, 2005, Institutional Holdings and Payout Policy, Journal ofFinance 60, 1389–1426.
Holmen, Martin, John D. Knopf, and Stefan Peterson, 2008, Inside Shareholders Effective TaxRates and Dividends, Journal of Banking and Finance 32, 1860–1869.
Hotchkiss, Edith S., and Stephen Lawrence, 2007, Empirical Evidence on the Existence of DividendClienteles, working paper SSRN.
Kalay, Avner, 1982, The Ex-dividend Day Behavior of Stock Prices: A Re-Examination of theClientele Effect, Journal of Finance 37, 1059–1070.
Karhunen, Jussi, and Matti Keloharju, 2001, Shareownership in Finland 2000, Finnish Journal ofBusiness Economics 50, 188–226.
Lewellen, Wilbur G., Kenneth L. Stanley, Ronald C. Lease, and Gary G. Schlarbaum, 1978, SomeDirect Evidence on the Dividend Clientele Phenomenon, Journal of Finance 33, 1385–1399.
Litzenberger, Robert H., and Krishna Ramaswamy, 1979, The Effects of Personal Taxes and Divi-dends on Capital Asset Prices: Theory and Empirical Evidence, Journal of Financial Economics7, 163–195.
Litzenberger, Robert H., and Krishna Ramaswamy, 1982, The Effects of Dividends on CommonStock Prices: Tax Effects or Information Effects?, Journal of Finance 37, 429–443.
Michaely, Roni, Richard H. Thaler, and Kent L. Womack, 1995, Price Reactions to DividendInitiations and Omissions: Overreaction or Drift?, Journal of Finance 50, 573–608.
Miller, Merton H., and Franco Modigliani, 1961, Dividend Policy, Growth and the Valuation ofShares, Journal of Business 4, 411–433.
Miller, Merton H., and Myron Scholes, 1982, Dividends and Taxes: Empirical Evidence, Journalof Political Economy 90, 1118–1141.
22

Morck, Randall, 2005, How to Eliminate Pyramidal Business Groups–The Double Taxation of Inter-Corporate Dividends and Other Incisive Uses of Tax Policy, in James M. Poterba, ed.: NationalBureau of Economic Research Tax Policy Annual (University of Chicago Press, Chicago).
Pettit, R. Richardson, 1977, Taxes, Transaction Costs and the Clientele Effect of Dividends, Journalof Financial Economics 5, 419–436.
Polkovnichenko, Valery, 2005, Household Portfolio Diversifcation: A Case for Rank-DependentPreferences, Review of Financial Studies 18, 1467–1502.
Protopapadakis, Aris, 1983, Some Indirect Evidence on Effective Capital Gains Tax Rates, Journalof Business 56, 127–138.
Scholz, John Karl, 1992, A Direct Examination of the Dividend Clientele Hypothesis, Journal ofPublic Economics 49, 261–285.
23

Table 1: Firms and Payouts in the Swedish Market
Average 2001 2002 2003 2004 2005
A. Values (SEK billion)
Stock market capitalization 2,290 2,650 1,909 1,760 2,331 2,802
Value of dividend-paying firms 2,033 2,465 1,674 1,511 1,851 2,663(% of total) (88.2) (93.0) (87.7) (85.8) (79.4) (95.0)
Value of repurchasing firms 578 702 483 327 753 625(% of total) (25.2) (26.5) (25.3) (18.6) (32.3) (22.3)
Dividend yield (%) 2.74 2.04 2.02 3.45 3.06 3.15
Repurchase yield (%) 0.64 0.72 0.38 0.50 0.90 0.60
B. Frequencies
Number of Listed firms 273 288 280 276 265 254
Number of Dividend-paying firms 145 159 141 138 141 146(% of total) (53.1) (55.2) (50.4) (50.0) (53.2) (57.5)
Number of Share-repurchasing firms 31 40 38 36 25 15(% of total) (11.3) (14.0) (13.4) (13.2) (9.6) (6.0)
The table presents summary statistics for the firms in the sample over the period 2001–2005. Market values arereported in SEK billion and are calculated at the end of June each year. The dividend yield include all dividendsin a year divided by the market value at the beginning of the year. The repurchase yield is defined as the value ofall repurchased shares in a year divided by the market value at the beginning of the year. The yields are reportedin percent.
24

Table 2: Aggregate Portfolios of the Tax Clienteles
Market Market Number of Weight in Dividendvalue share investors dividends yield
A. Tax neutral 604.7 26.5 1,400 92.8 +3.4 3.01 +0.20
B. Businesses & individuals 451.2 19.7 2,078,301 85.4 −3.9 2.67 −0.14
C. Investment funds 321.8 14.1 302 88.2 −1.1 2.66 −0.15
D. Partnerships 1.0 0.0 936 48.4 −40.9 1.64 −1.17
A–D 1,378.8 60.3 2,080,938 89.3 0.0 2.81 0.00
X. Unclassified domestic 136.1 6.0 25,583 93.2 3.48
X. Foreign investors 775.6 33.7 123,468 85.4 2.50
Market 2,290.5 100.0 2,229,990 88.2 2.74
The table presents statistics, averaged over 2001–2005, for the aggregate portfolios of the tax clienteles in thesample. Market values are reported in SEK billion. Market shares, portfolio weights in dividend-paying stocks,and dividend yields are reported in percent. The adjacent columns measure the deviation from the sampleaggregates 89.3% (portfolio weight) and 2.81% (dividend yield), respectively.
25

Table 3: Aggregate Portfolios of Major Subclienteles
Market Number of Weight in Dividendshare investors dividends yield
A. Tax neutral
Public sector 9.2 150 93.3 +4.0 2.42 −0.39
Life insurance 7.2 19 91.5 +2.2 2.96 +0.15
Controlling shares 5.1 81 94.3 +5.0 4.12 +1.31
Banks & brokers 2.0 115 95.2 +5.9 3.43 +0.62
Pension funds 1.9 765 90.8 +1.5 3.08 +0.27
Unit-linked insurance 1.1 63 90.0 +0.7 2.79 −0.02
Religious associations 0.1 206 88.1 −1.2 2.85 +0.04
B. Businesses & individuals
Individuals & stock clubs 14.6 2,049,541 86.0 −3.3 2.64 −0.17
Private corporations 2.7 28,511 81.0 −8.3 2.56 −0.35
Public corporations 1.3 128 81.7 −7.6 2.71 −0.10
Non-life insurance 1.3 121 91.0 +1.7 3.09 +0.28
C. Investment funds
Mutual funds 9.5 285 88.0 −1.3 2.67 −0.14
Closed-end funds 4.6 17 88.3 −1.0 2.63 −0.18
D. Partnerships 0.0 936 48.4 −40.9 1.64 −1.17
X. Unclassified domestic
Foundations 4.5 3,137 95.0 +5.7 3.66 +0.85
Associations 0.9 1,793 88.8 −0.5 3.00 +0.19
Other 0.6 20,652 86.1 −3.2 2.88 +0.07
The table presents statistics, averaged over 2001–2005, for major investor subclienteles in the sample. Marketshares, portfolio weights, and dividend yields are reported in percent. The adjacent columns measure the deviationfrom the sample aggregates 89.3% (portfolio weight) and 2.81% (dividend yield), respectively. The category“Other” refer to institutional investors that we are unable to classify.
26

Table 4: Portfolio Characteristics of Major Subclienteles
Portfoliosize
Numberof stocks
Beta(market)
Beta(HML)
Beta(SMB)
Idiosync-ratic risk
A. Tax neutral
Public sector 1,408.2 19.2 1.05 –0.14 0.10 10.6
Life insurance 8,546.5 48.2 1.05 –0.20 0.14 8.9
Controlling shares 1,508.9 1.2 0.82 –0.09 0.19 32.1
Banks & brokers 408.7 15.7 0.97 0.20 –0.16 13.4
Pension funds 56.8 7.7 1.14 –0.65 0.23 18.0
Unit-linked insurance 407.5 26.9 1.10 –0.31 0.13 9.9
Religious associations 6.8 6.9 1.07 –0.13 0.05 13.4
B. Businesses & individuals
Individuals & stock clubs 0.2 2.8 0.96 –0.44 0.14 21.5
Private corporations 2.1 3.7 1.15 –1.03 0.31 27.5
Public corporations 229.4 2.3 1.05 –0.53 0.31 20.7
Non-life insurance 239.4 15.0 1.04 –0.19 0.08 12.3
C. Investment funds
Mutual funds 762.8 24.3 1.08 –0.30 0.19 11.5
Closed-end funds 6,323.0 10.2 1.06 –0.08 0.23 20.0
D. Partnerships 1.1 2.4 1.13 –1.11 0.33 33.3
X. Unclassified domestic
Foundations 32.4 9.2 1.10 –0.28 0.15 13.1
Associations 11.4 7.1 1.08 –0.31 0.13 15.7
Other 0.6 3.9 1.08 –0.79 0.27 26.4
The table presents characteristics of portfolios for major investor subclienteles in the sample. The characteristicsare averaged over 2001–2005 as well as over all investors in a subcategory. Portfolio size is reported in SEKbillion. The betas are the factor loadings in a three-factor regression model (market; high-minus-low book-to-market ratio, HML, or value-minus-growth; small-minus-big market capitalization, SMB), and idiosyncratic riskis the (annualized) standard deviation of the residuals from the same regression. The category “Other” refer toinstitutional investors that we are unable to classify.
27

Table 5: Portfolio Dividend Yield and Relative Tax Preferences
1a 2a 3a
B. Businesses –1.198 –0.204(0.047) (0.031)
C. Investment funds –0.208 –0.472(0.069) (0.047)
D. Partnerships –0.259 –0.504(0.061) (0.039)
Tax preference θ 1.384(0.150)
Beta (Market) –0.550 –0.550(0.025) (0.023)
Beta (HML) 1.161 1.161(0.010) (0.010)
Beta (SMB) 0.287 0.286(0.026) (0.027)
Idiosyncratic risk –0.026 –0.026(0.001) (0.001)
Adjusted R2 3.4 42.9 42.9
N 152,308 152,308 152,308
N0 31.7 31.7 31.7
The table presents the results of pooled least square regressions of dividend yield on portfolio characteristicsover 2001–2005, as in Equation (6) and (8). The portfolios of individuals are excluded. B. Businesses,C. Investment funds, and D. Partnerships refer to dummy variables, which are equal to one if an investorbelongs to clientele B, C, or D, respectively, and otherwise zero. The tax preference θ is defined as inexpression (5). The betas are the factor loadings in a market model regression or in a three-factor modelregression (market; high-minus-low book-to-market ratio, HML, or value-minus-growth; small-minus-bigmarket capitalization, SMB). Idiosyncratic risk is the (annualized) standard deviation of the residualsfrom the same regressions. The regressions include dummy variables for each year, but they are notreported in the table. Standard errors based on a pairwise bootstrap (500 replications) accounting forconditional heteroscedasticity and serial correlation are reported in parentheses. The adjusted R-squaresin the regressions are reported in %. N is the total number of observations available; N0 is the number ofobservations with zero dividend yield expressed in % of total number of observations.
28

Table 6: Portfolio Dividend Yield and Relative Tax Preferences, Including Individuals
1b 2b 3b 4b 5b
B. Businesses & individuals –0.182 0.152 –0.769(0.052) (0.042) (0.225)
C. Investment funds –0.177 –0.416 –0.383(0.076) (0.059) (0.063)
D. Partnerships –1.381 0.153 –0.095(0.087) (0.072) (0.094)
Tax preference θ 0.503 0.409(0.059) (0.082)
Beta (Market) 0.455 0.455 –0.616 0.010(0.005) (0.004) (0.183) (0.040)
Beta (HML) 1.379 1.379 1.292 1.306(0.003) (0.003) (0.054 (0.052)
Beta (SMB) –0.059 –0.059 0.450 0.296(0.005) (0.005) (0.164) (0.162)
Idiosyncratic risk –0.030 –0.030 –0.022 –0.019(0.000) (0.000) (0.003) (0.003)
B × Beta (Market) 1.072 0.446(0.182) (0.040)
B × Beta (HML) 0.087 0.074(0.054) (0.052)
B × Beta (SMB) –0.509 –0.356(0.162) (0.162)
B × Idiosyncratic –0.008 –0.011(0.004) (0.003)
Adjusted R2 2.2 51.7 51.7 51.7 51.7
N 10,406,430 10,406,430 10,406,430 10,406,430 10,406,430
N0 12.7 12.7 12.7 12.7 12.7
The table presents the results of pooled least square regressions of dividend yield on portfolio characteristics over2001–2005, as in Equation (6) and (8). The portfolios of individuals are included. The variables are defined asin Table 5 with the addition of specific control variables for Clientele B. These variables are calculated as theClientele B dummy variable times the betas and the idiosyncratic risk, respectively. Standard errors based ona pairwise bootstrap (500 replications) accounting for conditional heteroscedasticity and serial correlation arereported in parentheses. The adjusted R-squares in the regressions are reported in %. N is the total number ofobservations available; N0 is the number of observations with zero dividend yield expressed in % of total numberof observations.
29

Table 7: Portfolio Dividend Yield and Relative Tax Preferences in Trimmed Samples
Number of stocks ≥ 5 Portfolio value ≥ SEK 250,000 Clienteles A and C only
1c 2c 3c 1d 2d 3d 1e 2e 3e
B. Businesses –0.519 0.024 –0.798 –0.140(0.037) (0.026) (0.047) (0.041)
C. Investment funds –0.146 –0.376 –0.450 –0.471 –0.220 –0.506(0.054) (0.040) (0.070) (0.052) (0.066) (0.050)
D. Partnerships –0.238 –0.371 –0.474 –0.513(0.048) (0.031) (0.062) (0.045)
Tax preference θ 0.811 1.251 1.688(0.110) (0.166) (0.166)
Beta (Market) –0.881 –0.890 –0.600 –0.602 –0.975 –0.975(0.051) (0.051) (0.047) (0.049) (0.207) (0.209)
Beta (HML) 1.528 1.519 1.299 1.295 1.433 1.433(0.022) (0.023) (0.027) (0.026) (0.057) (0.057)
Beta (SMB) 0.571 0.597 0.374 0.377 0.562 0.562(0.052) (0.048) (0.064) (0.058) (0.149) (0.150)
Idiosyncratic risk –0.048 –0.046 –0.029 –0.029 –0.024 –0.024(0.001) (0.001) (0.002) (0.002) (0.003) (0.003)
Adjusted R2 10.0 52.7 52.6 4.3 39.5 39.5 4.2 34.0 34.0
N 38,434 38,434 38,434 65,512 65,512 65,512 8,196 8,196 8,196
N0 2.8 2.8 2.8 8.5 8.5 8.5 8.9 8.9 8.9
The table presents the results of pooled least square regressions of dividend yield on portfolio characteristics over 2001–2005. The portfolios of individuals are excluded. The variables are defined as in Table 5. Specifications 1c, 2c, and 3c onlyconsider portfolios with five holding or more; specification 1d, 2d, and 3d only consider portfolios with a market value ofSEK 250,000 or more; specification 1e, 2e, and 5e only consider tax clienteles A and C. Standard errors based on a pairwisebootstrap (500 replications) accounting for conditional heteroscedasticity and serial correlation are reported in parentheses.The adjusted R-squares in the regressions are reported in %. N is the total number of observations available; N0 is thenumber of observations with zero dividend yield expressed in % of total number of observations.
30
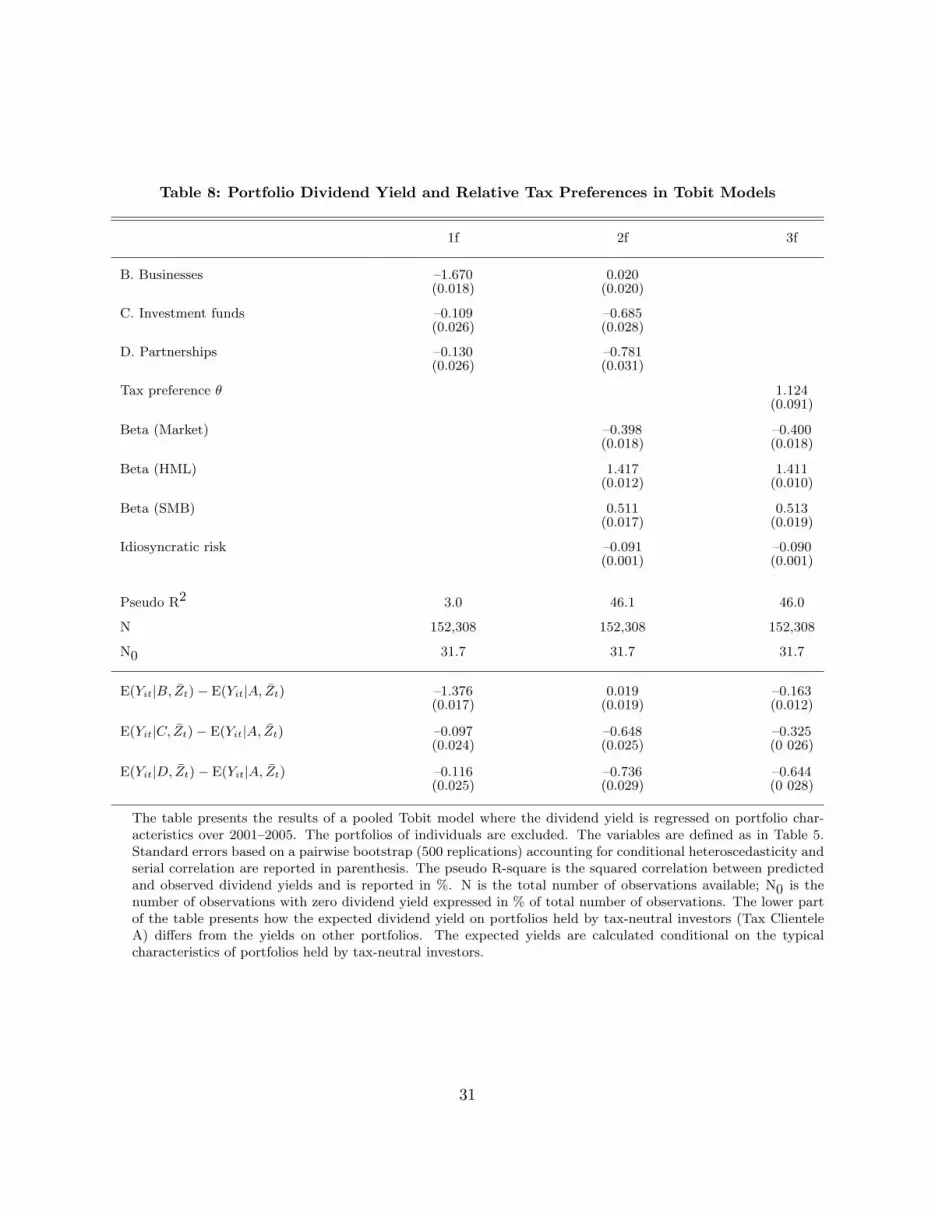
Table 8: Portfolio Dividend Yield and Relative Tax Preferences in Tobit Models
1f 2f 3f
B. Businesses –1.670 0.020(0.018) (0.020)
C. Investment funds –0.109 –0.685(0.026) (0.028)
D. Partnerships –0.130 –0.781(0.026) (0.031)
Tax preference θ 1.124(0.091)
Beta (Market) –0.398 –0.400(0.018) (0.018)
Beta (HML) 1.417 1.411(0.012) (0.010)
Beta (SMB) 0.511 0.513(0.017) (0.019)
Idiosyncratic risk –0.091 –0.090(0.001) (0.001)
Pseudo R2 3.0 46.1 46.0
N 152,308 152,308 152,308
N0 31.7 31.7 31.7
E(Yit|B, Zt)− E(Yit|A, Zt) –1.376 0.019 –0.163(0.017) (0.019) (0.012)
E(Yit|C, Zt)− E(Yit|A, Zt) –0.097 –0.648 –0.325(0.024) (0.025) (0 026)
E(Yit|D, Zt)− E(Yit|A, Zt) –0.116 –0.736 –0.644(0.025) (0.029) (0 028)
The table presents the results of a pooled Tobit model where the dividend yield is regressed on portfolio char-acteristics over 2001–2005. The portfolios of individuals are excluded. The variables are defined as in Table 5.Standard errors based on a pairwise bootstrap (500 replications) accounting for conditional heteroscedasticity andserial correlation are reported in parenthesis. The pseudo R-square is the squared correlation between predictedand observed dividend yields and is reported in %. N is the total number of observations available; N0 is thenumber of observations with zero dividend yield expressed in % of total number of observations. The lower partof the table presents how the expected dividend yield on portfolios held by tax-neutral investors (Tax ClienteleA) differs from the yields on other portfolios. The expected yields are calculated conditional on the typicalcharacteristics of portfolios held by tax-neutral investors.
31

Fig
ure
1:B
eta
(HM
L)
Loa
din
gsin
Inve
stor
s’Por
tfol
ios
The
figure
dis
pla
ys
per
cent
freq
uen
cyhis
togra
ms
of
the
bet
a(H
ML
)lo
adin
gs
of
port
folios
hel
dby
Tax
Clien
tele
A–D
.
32

Fig
ure
2:N
um
ber
ofSto
cks
inIn
vest
ors’
Por
tfol
ios
The
figure
dis
pla
ys
per
cent
freq
uen
cyhis
togra
ms
of
the
num
ber
of
stock
sin
port
folios
hel
dby
Tax
Clien
tele
A–D
.
33

Fig
ure
3:V
alue
ofIn
vest
ors’
Por
tfol
ios
The
figure
dis
pla
ys
per
cent
freq
uen
cyhis
togra
ms
of
the
log
valu
eof
the
stock
sin
port
folios
hel
dby
Tax
Clien
tele
A–D
.T
he
base
for
the
log
is10,
whic
h
mea
ns
that
3eq
uals
1,0
00,
4eq
uals
10,0
00,
etc.
34
Copyright © 2022 FDOKUMEN