Digital Pathology: Data-Intensive Frontier in Medical Imaging: Health-information sharing,...
12
Center for Comprehensive Informatics Technical Report Digital Pathology: Data Intensive Frontier in Medical Imaging Lee A. D. Cooper Alexis B. Carter Alton B. Farris Fusheng Wang Jun Kong David A. Gutman Patrick Widener Tony C. Pan Sharath R. Cholleti Ashish Sharma Tahsin Kurc Daniel J. Brat Joel H. Saltz CCI-TR-2011-5 August 31, 2011
-
Upload
independent -
Category
Documents
-
view
2 -
download
0
Transcript of Digital Pathology: Data-Intensive Frontier in Medical Imaging: Health-information sharing,...
Center for Comprehensive Informatics
Technical Report
Digital Pathology: Data Intensive Frontier in Medical Imaging
Lee A. D. Cooper Alexis B. Carter Alton B. Farris Fusheng Wang
Jun Kong David A. Gutman Patrick Widener
Tony C. Pan Sharath R. Cholleti
Ashish Sharma Tahsin Kurc
Daniel J. Brat Joel H. Saltz
CCI-TR-2011-5
August 31, 2011
1
Abstract— Pathology is a medical subspecialty that practices the diagnosis of disease. Microscopic examination of tissue reveals information enabling the pathologist to render accurate diagnoses and to guide therapy. The basic process by which anatomic pathologists render diagnoses has remained relatively unchanged over the last century, yet advances in information technology now offer significant opportunities in image-based diagnostic and research applications. Pathology has lagged behind other healthcare practices such as radiology where digital adoption is widespread. As devices that generate whole slide images become more practical and affordable, practices will increasingly adopt this technology and eventually produce an explosion of data that will quickly eclipse the already vast quantities of radiology imaging data. These advances are accompanied by significant challenges for data management and storage, but they also introduce new opportunities to improve patient care by streamlining and standardizing diagnostic approaches and uncovering disease mechanisms. Computer-based image analysis is already available in commercial diagnostic systems, but further advances in image analysis algorithms are warranted in order to fully realize the benefits of digital pathology in medical discovery and patient care. In coming decades, pathology image analysis will extend beyond the streamlining of diagnostic workflows and minimizing interobserver variability and will begin to provide diagnostic assistance, identify therapeutic targets and predict patient outcomes and therapeutic responses.
Manuscript received May 15, 2011. This work was supported in part by
SAIC/NCI Contract No. HHSN261200800001E and N01-CO-12400 from the National Cancer Institute, R24HL085343 from the National Heart Lung and Blood Institute, by Grants 1R01LM011119-01 and R01LM009239 from the National Library of Medicine, RC4MD005964 from National Institutes of Health, PHS Grant UL1RR025008 from the Clinical and Translational Science Awards program, and P20 EB000591 by the Biomedical Information Science and Technology Initiative program.
L. A. D. Cooper, F. Wang, J. Kong, D. A. Gutman, P. Widener, T. C. Pan, S. R. Cholleti, A. Sharma, T. Kurc, J. H. Saltz are with the Center for Comprehensive Informatics, Emory University, Atlanta, GA 30306 USA
(e-mails: [email protected]; [email protected]). A. B. Carter, A. B. Farris and D. J. Brat are with the Department of
Pathology & Laboratory Medicine at the Emory University School of Medicine, Atlanta, GA 30306 USA (emails: [email protected]; [email protected]; [email protected])
Index Terms— Digital Pathology, Biomedical Informatics,
Biomedical Imaging, Virtual Microscopy, Image Analysis
I. INTRODUCTION EFINED as the practice of diagnosing disease, pathology is a central subspecialty in medicine. Anatomic pathology,
a subdivision of pathology, uses microscopy to visualize and diagnose the disease process in tissue. In spite of the successful and widespread use of imaging data and computerized processes in other healthcare fields (e.g. radiology), the basic process by which diagnoses are made in anatomic pathology remains mostly devoid of computerized intervention. However, recent advances in digital pathology imaging, specifically in the arena of whole slide imaging, have initiated the transition to digital pathology practice. As digitization devices become more practical and affordable, their use in pathology laboratories is increasing. The College of American Pathologists (CAP) recently developed its Transformation Program Office in order to help accelerate adoption of technological advances in US pathology laboratories [3]. In addition, the American Board of Pathology, the organization that certifies pathologists in the United States, has progressively changed the practical examination to adopt digital images, leaving few questions dependent upon direct examination of glass slides using a microscope[4]. As this technology is implemented, pathology imaging data is growing at an exponential rate and is predicted to far exceed the already vast quantities of radiology imaging data.
A. Technological Challenges Full use of digital pathology imaging data has the promise to
improve patient care and accelerate understanding of disease and therapy, yet significant technological challenges remain that will push the limits of media and communications. Image size. A typical whole slide pathology image contains 20 billion pixels (assuming digitization at 40X objective magnification). A 24-bit color uncompressed representation of this typical image contains 56 GB. Compression with JPEG typically reduces this size to several GB or hundreds of MB. A multilayer image stack that provides a focus capability typically contains tens of such images. A single scanning
Digital Pathology: Data Intensive Frontier in Medical Imaging
Lee A. D. Cooper, Alexis B. Carter, Alton B. Farris, Fusheng Wang, Jun Kong, David A. Gutman, Patrick Widener, Tony C. Pan, Sharath R. Cholleti, Ashish Sharma, Tahsin Kurc, Daniel J. Brat,
Joel H. Saltz
D
2
system can generate hundreds of images daily which creates a significant dilemma for storage and analysis.
Low-latency access. Pathology images are typically maintained on a centralized server and viewed remotely by practitioners over network. Low-latency serving is required to maintain a fluid viewing experience that permits the panning and zooming operations required for diagnostic procedures. Most diagnoses are rendered “offline” through the examination of a biopsy but occasionally remote viewing is performed in real-time during surgical intervention.
Unique compression requirements. The content of pathology images presents unique challenges for image compression. Compression artifacts take on a new meaning when the compressed content is being used to make a diagnosis. Aggressive compression is a requirement for fluid viewing; however, the effects of existing methods developed for photography applications are still not well characterized. Additionally, compression schemes for multilayer images that exploit z-redundancy are not currently represented in commercial systems.
These challenges are compounded by the emergence of an additional layer of pathology media: quantitative data generated by computational image analysis. This derived data represents the contents of a virtual pathology slide at multiple resolutions, from individual descriptions of each of the millions of cells to regional/textural descriptions of whole tissues. The implementation, management, and delivery of this additional layer of content remain works in progress for diagnostic applications. As solutions emerge, pathology image analysis will expand beyond emulation of established diagnostic workflows and reduction of interobserver variability in diagnosis to facilitate scientific discovery. Image analysis will play a critical role in the identification of novel therapeutic targets and creation of new disease classification systems that improve prediction of treatment response. Just as whole genome sequencing provides a window into a patient’s genetic predisposition to disease and capability of treatment response, the computation of features representing millions of digitally accumulated tissue images will illuminate the interplay between molecules and biological entities. Image analysis data will provide a rich repository where patterns that predict survival and treatment response can be deduced while
further elucidating disease mechanisms and revolutionizing the care of patients with cancer and other diseases.
B. Content This paper is organized into six sections: Section II provides
the background on the practice of pathology including a brief history of microscopy and its influence on established diagnostic procedures. Section III discusses digitization in pathology imaging and provides a survey of the state of the art in digital modalities. In section IV, pathology image analysis and current trends in this research area are discussed. Section V describes the management challenges associated with digital pathology practice and image analysis results and illustrates the scale of computational and storage requirements needed. Remarks on the possible futures for digital pathology are in Section VI, followed by the conclusion.
II. PATHOLOGY – ORIGINS AND PRACTICE
A. The Practice of Anatomic Pathology Anatomic pathology is a subdivision within the field of
pathology that has traditionally used microscopes to examine the cellular and subcellular morphology of specimens, either in the form of solid tissues or fluids. When a specimen is removed from a patient, it is sent to the pathology laboratory for examination and diagnosis. Laboratory personnel first visually examine the specimen without the aid of a microscope, called gross examination, where trained personnel select tissue for microscopic examination. The selected pieces are subjected to a fixation using a formaldehyde solution to cross-link proteins and preserve tissue integrity. After fixation is complete, the tissue is further processed to replace water with organic solvents and is then embedded in a block of paraffin wax. Thin slices of the tissue (typically 4 µm in thickness) are mounted on glass slides, and these slides are taken through a series of chemical stains, each of which has an affinity for select cellular elements. After staining, a drop of optical grade mounting glue is placed on top of the tissue followed by a glass or plastic coverslip, both of which allow for clear inspection of the stained tissue section while protecting it from damage. Stains not only allow the pathologist to see the tissue under the microscope, but they also enhance detection of specific changes in the tissue that occur as a result of disease. The most commonly used stain is a combination of hematoxylin and eosin (H&E) that highlights
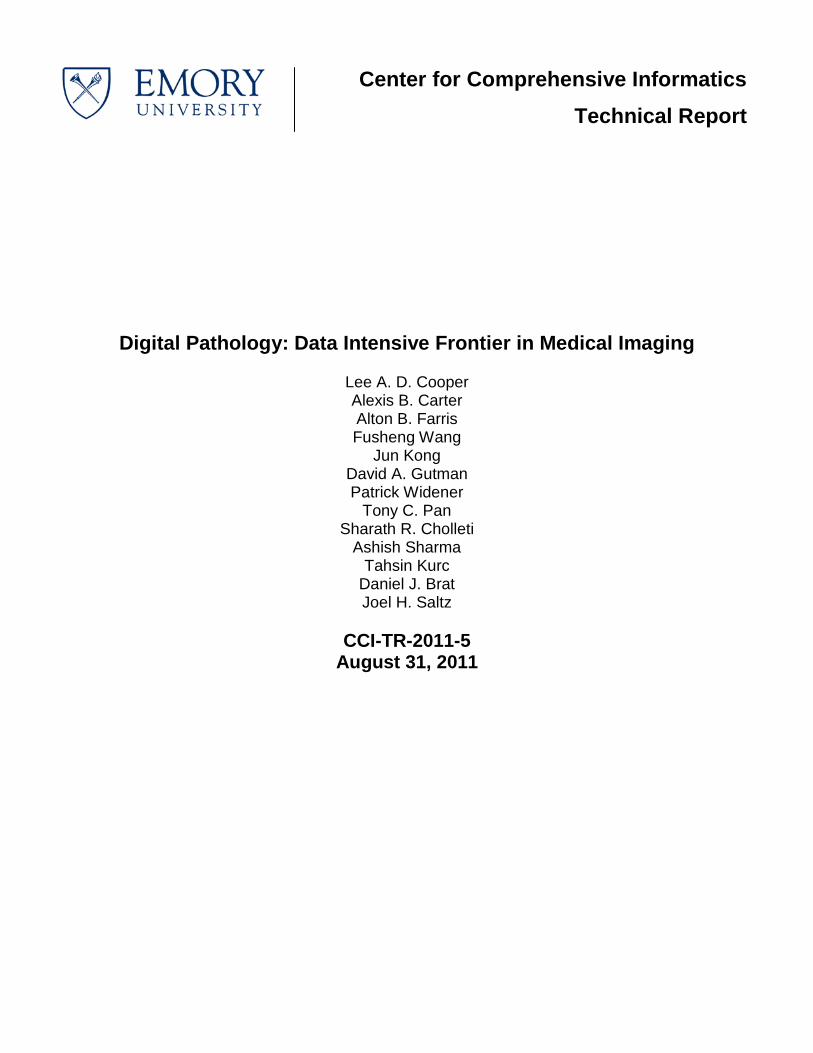
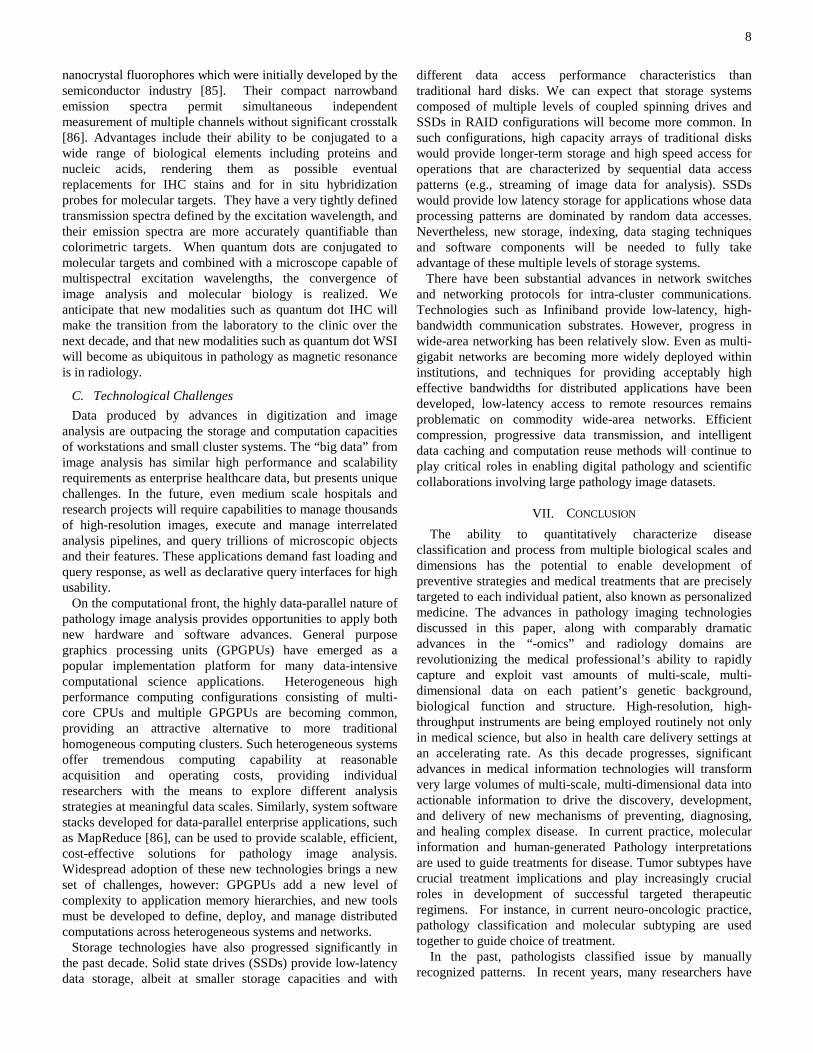
(a) (b) (c)
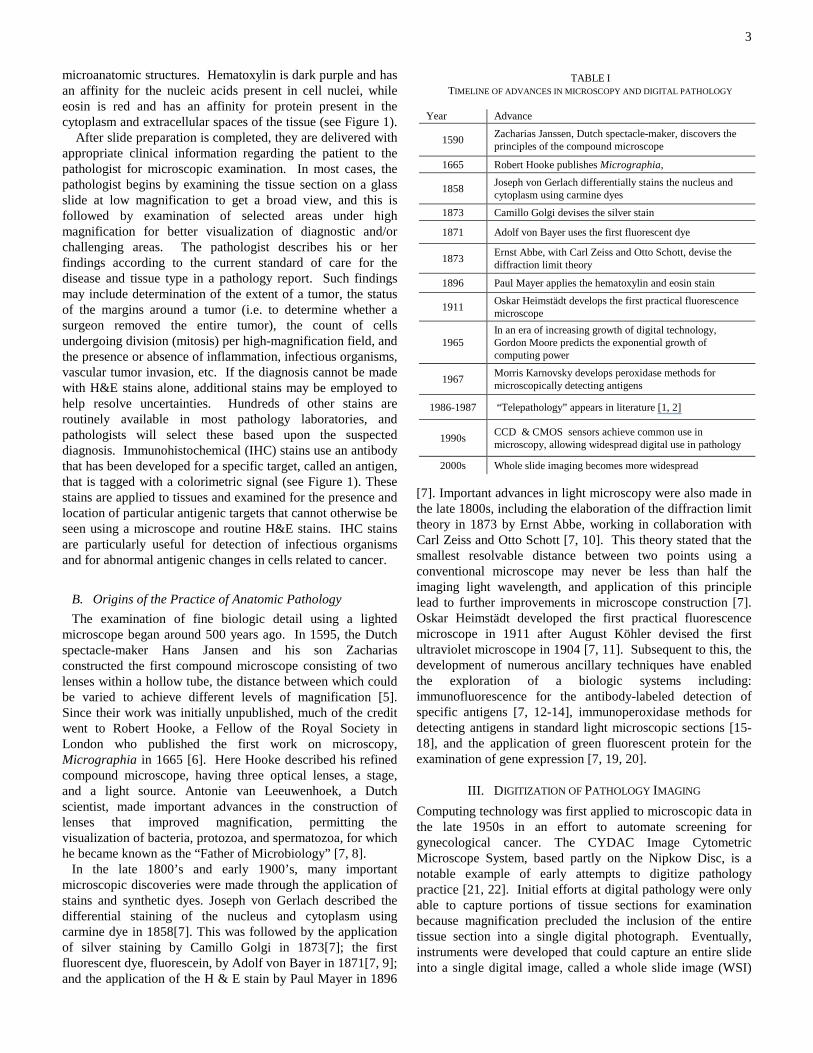
Figure 1. Whole slide imaging (WSI). (a) WSI captures the contents of an entire glass slide at high magnification, producing an image containing billions of pixels. (b) Detail view of (a). A hematoxylin and eosin (H & E) stain highlights structure. (c) Immunohistochemical staining tags specific proteins with a colorimetric signal. Here, a protein expressed by oxygen-deprived cells is marked with dark brown.
3
microanatomic structures. Hematoxylin is dark purple and has an affinity for the nucleic acids present in cell nuclei, while eosin is red and has an affinity for protein present in the cytoplasm and extracellular spaces of the tissue (see Figure 1). After slide preparation is completed, they are delivered with appropriate clinical information regarding the patient to the pathologist for microscopic examination. In most cases, the pathologist begins by examining the tissue section on a glass slide at low magnification to get a broad view, and this is followed by examination of selected areas under high magnification for better visualization of diagnostic and/or challenging areas. The pathologist describes his or her findings according to the current standard of care for the disease and tissue type in a pathology report. Such findings may include determination of the extent of a tumor, the status of the margins around a tumor (i.e. to determine whether a surgeon removed the entire tumor), the count of cells undergoing division (mitosis) per high-magnification field, and the presence or absence of inflammation, infectious organisms, vascular tumor invasion, etc. If the diagnosis cannot be made with H&E stains alone, additional stains may be employed to help resolve uncertainties. Hundreds of other stains are routinely available in most pathology laboratories, and pathologists will select these based upon the suspected diagnosis. Immunohistochemical (IHC) stains use an antibody that has been developed for a specific target, called an antigen, that is tagged with a colorimetric signal (see Figure 1). These stains are applied to tissues and examined for the presence and location of particular antigenic targets that cannot otherwise be seen using a microscope and routine H&E stains. IHC stains are particularly useful for detection of infectious organisms and for abnormal antigenic changes in cells related to cancer.
B. Origins of the Practice of Anatomic Pathology The examination of fine biologic detail using a lighted
microscope began around 500 years ago. In 1595, the Dutch spectacle-maker Hans Jansen and his son Zacharias constructed the first compound microscope consisting of two lenses within a hollow tube, the distance between which could be varied to achieve different levels of magnification [5]. Since their work was initially unpublished, much of the credit went to Robert Hooke, a Fellow of the Royal Society in London who published the first work on microscopy, Micrographia in 1665 [6]. Here Hooke described his refined compound microscope, having three optical lenses, a stage, and a light source. Antonie van Leeuwenhoek, a Dutch scientist, made important advances in the construction of lenses that improved magnification, permitting the visualization of bacteria, protozoa, and spermatozoa, for which he became known as the “Father of Microbiology” [7, 8].
In the late 1800’s and early 1900’s, many important microscopic discoveries were made through the application of stains and synthetic dyes. Joseph von Gerlach described the differential staining of the nucleus and cytoplasm using carmine dye in 1858[7]. This was followed by the application of silver staining by Camillo Golgi in 1873[7]; the first fluorescent dye, fluorescein, by Adolf von Bayer in 1871[7, 9]; and the application of the H & E stain by Paul Mayer in 1896
[7]. Important advances in light microscopy were also made in the late 1800s, including the elaboration of the diffraction limit theory in 1873 by Ernst Abbe, working in collaboration with Carl Zeiss and Otto Schott [7, 10]. This theory stated that the smallest resolvable distance between two points using a conventional microscope may never be less than half the imaging light wavelength, and application of this principle lead to further improvements in microscope construction [7]. Oskar Heimstädt developed the first practical fluorescence microscope in 1911 after August Köhler devised the first ultraviolet microscope in 1904 [7, 11]. Subsequent to this, the development of numerous ancillary techniques have enabled the exploration of a biologic systems including: immunofluorescence for the antibody-labeled detection of specific antigens [7, 12-14], immunoperoxidase methods for detecting antigens in standard light microscopic sections [15-18], and the application of green fluorescent protein for the examination of gene expression [7, 19, 20].
III. DIGITIZATION OF PATHOLOGY IMAGING Computing technology was first applied to microscopic data in the late 1950s in an effort to automate screening for gynecological cancer. The CYDAC Image Cytometric Microscope System, based partly on the Nipkow Disc, is a notable example of early attempts to digitize pathology practice [21, 22]. Initial efforts at digital pathology were only able to capture portions of tissue sections for examination because magnification precluded the inclusion of the entire tissue section into a single digital photograph. Eventually, instruments were developed that could capture an entire slide into a single digital image, called a whole slide image (WSI)
TABLE I TIMELINE OF ADVANCES IN MICROSCOPY AND DIGITAL PATHOLOGY
Year Advance
1590 Zacharias Janssen, Dutch spectacle-maker, discovers the principles of the compound microscope
1665 Robert Hooke publishes Micrographia,
1858 Joseph von Gerlach differentially stains the nucleus and cytoplasm using carmine dyes
1873 Camillo Golgi devises the silver stain
1871 Adolf von Bayer uses the first fluorescent dye
1873 Ernst Abbe, with Carl Zeiss and Otto Schott, devise the diffraction limit theory
1896 Paul Mayer applies the hematoxylin and eosin stain
1911 Oskar Heimstädt develops the first practical fluorescence microscope
1965 In an era of increasing growth of digital technology, Gordon Moore predicts the exponential growth of computing power
1967 Morris Karnovsky develops peroxidase methods for microscopically detecting antigens
1986-1987 “Telepathology” appears in literature [1, 2]
1990s CCD & CMOS sensors achieve common use in microscopy, allowing widespread digital use in pathology
2000s Whole slide imaging becomes more widespread
4
[2, 21-29]. Initial approaches to WSI were performed by acquiring multiple overlapping digital photomicrographs acquired over the course of many hours using a robotic microscope and then stitching together the images at their boundaries. A “Virtual Microscope” was created that allowed users to navigate WSI at varying levels of magnification. Performance was a challenge addressed through a parallel server and a client that carried out caching and prefetching [30, 31]. An early WSI instrument was developed by John Gilbertson and Art Wetzel, who were then at Interscope technologies [32]. Since then, a large number of systems have become commercially available [33], and the list of such systems is growing. With the availability of graphical user interfaces that allow the implementation of a “virtual microscope” [31] and increases in acquisition speeds, these devices are now being used not only in research and education but also in daily pathology practice.
Telepathology is the use of digital pathology images to make diagnoses in the absence of glass slides and a microscope, and the advent of WSI technology has spurred a sharp increase in the adoption of telepathology for clinical patient care. The first articles to use the term “telepathology” appeared in 1986, prior to the existence of WSI [2, 28]. The use of WSI systems for telepathology has resulted in a number of studies describing its effectiveness for patient care [34, 35], and a white paper on telepathology validation is expected in the last half of 2011 from the CAP Digital Pathology Working Group. An increase in informatics training in pathology residency programs will likely lead to further increases in the utilization of this technology [36-38], as will the ability for pathologists to become board-certified in clinical informatics, expected to be sometime in 2013 [39, 40].
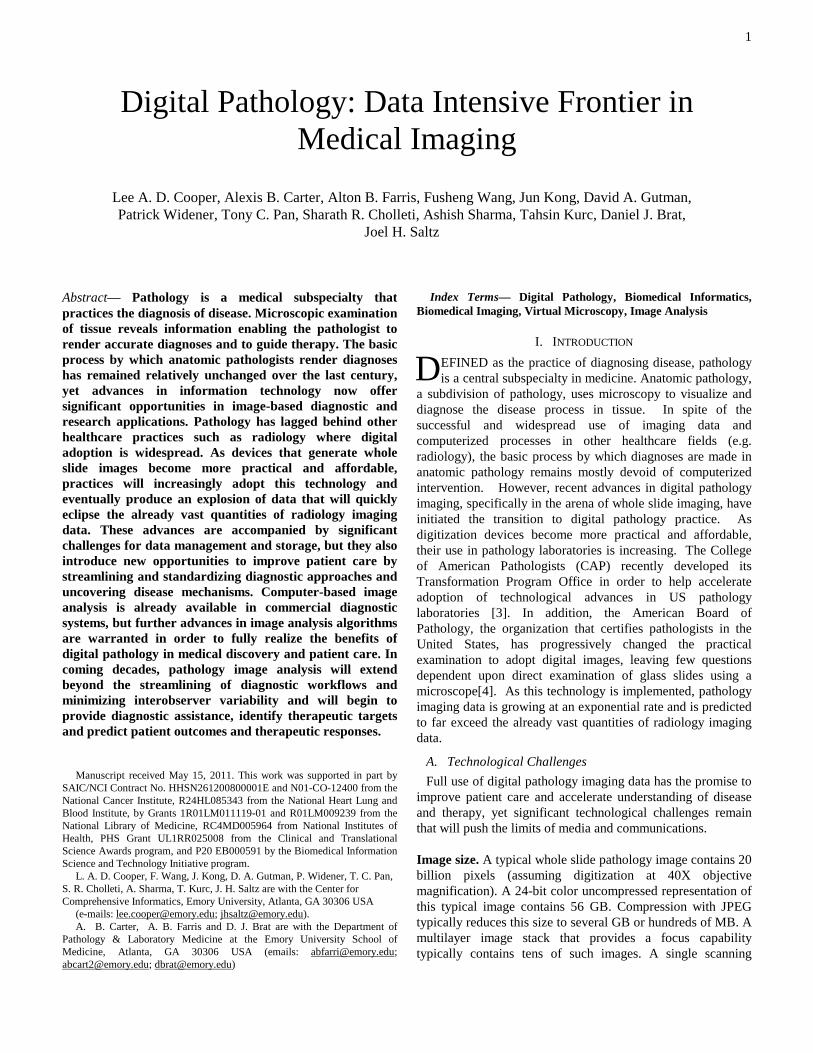
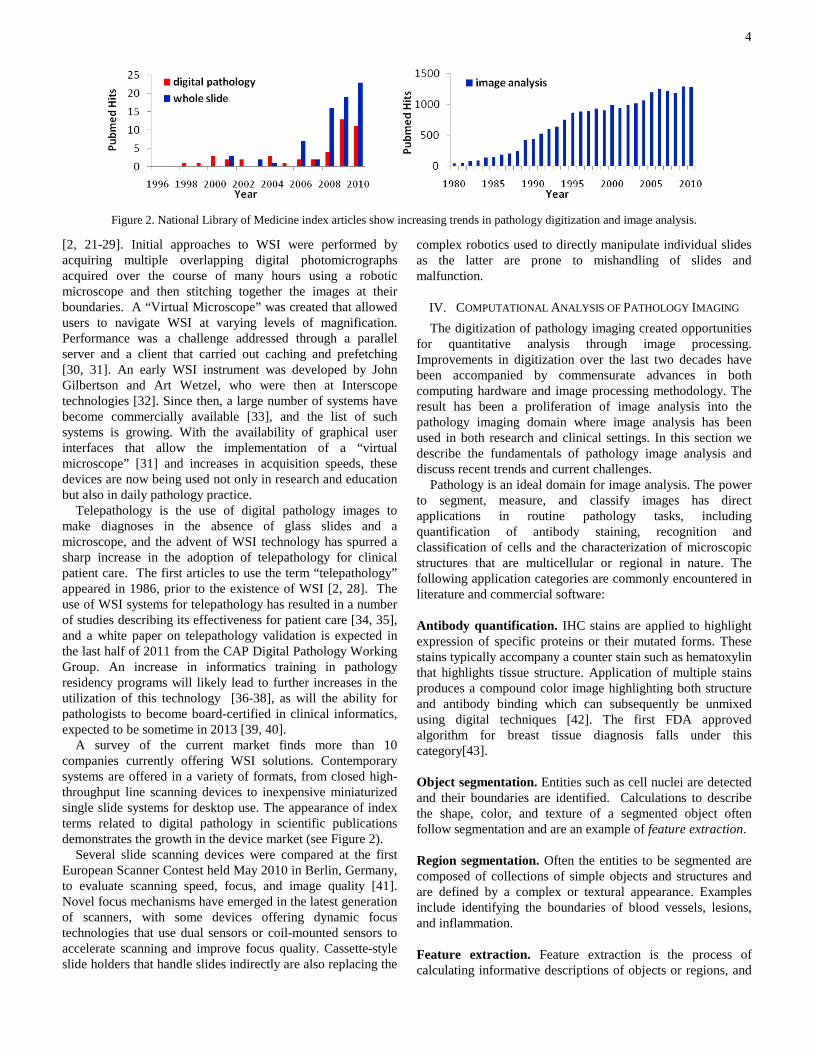
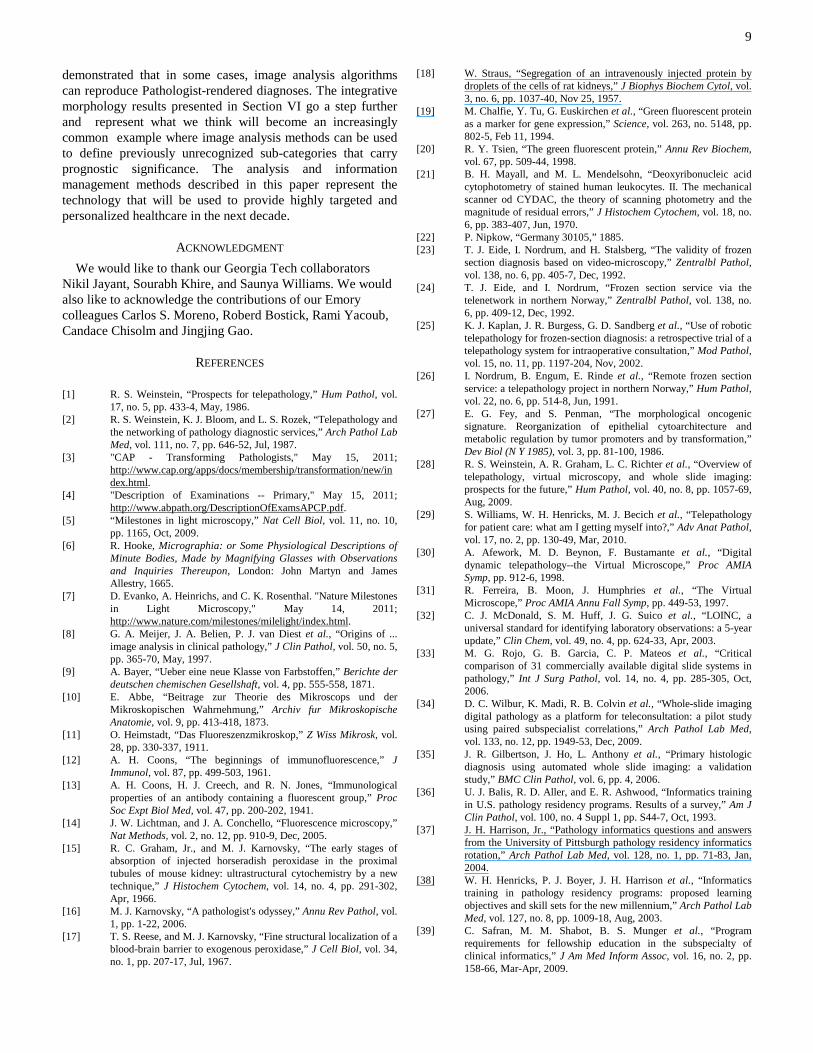
A survey of the current market finds more than 10 companies currently offering WSI solutions. Contemporary systems are offered in a variety of formats, from closed high-throughput line scanning devices to inexpensive miniaturized single slide systems for desktop use. The appearance of index terms related to digital pathology in scientific publications demonstrates the growth in the device market (see Figure 2).
Several slide scanning devices were compared at the first European Scanner Contest held May 2010 in Berlin, Germany, to evaluate scanning speed, focus, and image quality [41]. Novel focus mechanisms have emerged in the latest generation of scanners, with some devices offering dynamic focus technologies that use dual sensors or coil-mounted sensors to accelerate scanning and improve focus quality. Cassette-style slide holders that handle slides indirectly are also replacing the
complex robotics used to directly manipulate individual slides as the latter are prone to mishandling of slides and malfunction.
IV. COMPUTATIONAL ANALYSIS OF PATHOLOGY IMAGING The digitization of pathology imaging created opportunities
for quantitative analysis through image processing. Improvements in digitization over the last two decades have been accompanied by commensurate advances in both computing hardware and image processing methodology. The result has been a proliferation of image analysis into the pathology imaging domain where image analysis has been used in both research and clinical settings. In this section we describe the fundamentals of pathology image analysis and discuss recent trends and current challenges.
Pathology is an ideal domain for image analysis. The power to segment, measure, and classify images has direct applications in routine pathology tasks, including quantification of antibody staining, recognition and classification of cells and the characterization of microscopic structures that are multicellular or regional in nature. The following application categories are commonly encountered in literature and commercial software:
Antibody quantification. IHC stains are applied to highlight expression of specific proteins or their mutated forms. These stains typically accompany a counter stain such as hematoxylin that highlights tissue structure. Application of multiple stains produces a compound color image highlighting both structure and antibody binding which can subsequently be unmixed using digital techniques [42]. The first FDA approved algorithm for breast tissue diagnosis falls under this category[43]. Object segmentation. Entities such as cell nuclei are detected and their boundaries are identified. Calculations to describe the shape, color, and texture of a segmented object often follow segmentation and are an example of feature extraction. Region segmentation. Often the entities to be segmented are composed of collections of simple objects and structures and are defined by a complex or textural appearance. Examples include identifying the boundaries of blood vessels, lesions, and inflammation. Feature extraction. Feature extraction is the process of calculating informative descriptions of objects or regions, and
Figure 2. National Library of Medicine index articles show increasing trends in pathology digitization and image analysis.
5
often precedes classification or segmentation tasks. Feature extraction could be applied to raw image data to describe spatial characteristics (useful for region segmentation), a single segmented object to describe object characteristics such as shape or texture (useful for object classification), or a collection of segmented objects to describe group behavior. Classification. Segmented objects, regions, or whole slides can be classified into meaningful groups based on extracted features. Classification of cell types, antibody activation, or entire slides into pathologic categories are common classification themes. Registration. Image registration is the process of mapping two or more images into the same coordinate frame. Registration can be used to create 3D reconstructions of tissue from a sequence of tissue sections, or to map adjacent differently stained sections to each other to integrate antibody presence. A brief background of research in pathology image analysis is presented below. A more in-depth technical review is available in [44]. 1) Object Segmentation
The segmentations of cell nuclei, cell membranes, or subcellular components are the most fundamental problems in pathology image analysis. Staining can be applied to reveal these objects as uniform regions of distinct color. Color segmentation is one of the fundamental problems in image analysis, however segmentation of pathology images remains challenging due to natural biological and process-induced variations across images. Commonly used methods include forms of thresholding, active contours, Bayesian approaches, region-growing and mean-shift.
A common theme in pathology image analysis is the segmentation of cell nuclei. A Bayesian nuclear segmentation that integrates color, texture and shape was proposed for processing breast and prostate cancer images [45]. A frequent problem in nuclei segmentation is the separation of nuclei among groups of closely packed cells [46-48].
Another common problem is the separation of a structure-highlighting stain such as hematoxylin and eosin into subcellular components. In these images structures like nuclei, cytoplasm and blood are characterized by color modes that vary slightly between samples, making statistical modeling a popular approach [49]. The mean-shift algorithm combines both color and spatial locality into a robust framework that identifies these modes in a transformed color space [50]. 2) Region Segmentation
Region segmentation can assume many forms, from segmentation of simple multicellular structures to completely unsupervised segmentation of tissues. Due to the textural appearance of many tissues or regions, texture segmentation methods from the broader image analysis community are frequently adapted to pathology imaging.
Region segmentation is typically preceded by a sequence of operations including feature extraction to create an
intermediate description of image data that captures texture-discriminating information. Multiresolution methods based on filterbanks are commonly used to exploit the appearance of tissues at multiple scales [51, 52]. Other methods rely on spatial statistics and statistical geometry [53, 54]. The two-point correlation function measures the spatial distributions of tissue components such as nuclei and cytoplasm, forming a spatial-statistical signature for each tissue type. These features have the advantage that they can be computed deterministically in a computationally efficient fashion [55]. 3) Computer Aided Diagnosis
Computer aided diagnosis (CAD) is the most active research area in pathology image analysis. The aim of these systems is to reduce variability and error in diagnosis by emulating established diagnostic procedures. There are numerous systems developed for a large spectrum of diseases, including cervical cancer [56], prostate cancer [57-59], breast cancer [60-63], colon cancer [64], neurobalstoma [65-67] and follicular lymphoma [68-70]. CAD systems typically contain multiple modules implementing object segmentation, region segmentation, and feature extraction to achieve classification of disease. A brief overview of two CAD systems is presented below to illustrate fundamental CAD concepts.
Neuroblastoma CAD System Neuroblastoma (NB) is one of the most frequently occurring
tumors of the nervous system in children. The process of NB diagnosis is conducted by highly specialized pathologists, is time-consuming and is prone to variability. Heterogeneous tumors present a particular problem, since the pathologist is limited in the number of fields they can practically review during diagnosis. Two components of NB grading were automated in order to overcome challenges posed by the heterogeneity of these tumors [65, 67, 71]. Stromal classification uses a texture analysis to identify regions as either stroma-rich or stroma-poor. Degree of differentiation is evaluated by segmenting the image into nuclei and cytoplasm components and analyzing the texture created by these components. Both analyses are performed in a multiresolution manner to optimize computation and accuracy.
Lymphoma CAD System Follicular lymphoma (FL) is the second most common type
of non-Hodgkin’s lymphoma. Originating within follicle-like multicellular regions, FL is mainly comprised of centrocytes (middle-to-small sized cells) and centroblasts (large malignant cells). Grading is performed by counting malignant centroblasts in ten different and representative follicles, first using low magnification to identify follicles and then a 40x objective to search for centroblasts. In heterogeneous tumors the centroblast count can vary widely from one follicle to another, leaving grading subject to substantial variability.
A computerized system was developed to automate the centroblast counting using a hybrid registration/classification approach that integrates information from multiple stains [68-70]. Follicle regions are difficult to identify in a structure highlighting stain, and so follicles are first identified from

6
antibody stained sections using region segmentation. Centroblasts are difficult to distinguish from other cell types in the antibody stain, and so the follicle boundaries are mapped using a nonrigid registration to an adjacent piece of tissue stained with a structure highlighting stain. Cells in the mapped follicle regions are then segmented and classified.
B. Challenge of Scale Computation, storage, and networking remain significant
challenges for whole slide imaging. Modern commercial scanners, capable of producing images at 40X objective magnification images, are becoming ever faster. At 40X magnification, the digitization of a single two-centimeter square sample contains 7.5 billion pixels (21 gigabytes uncompressed). At this scale in-core analyses on a single machine are not possible. High performance computing has been employed in both research and commercial pathology image analysis applications to address the scale challenge. The emergence of repurposed commodity graphics hardware for general purpose computing has been a promising development, offering hardware acceleration of image analysis on desktop systems in environments where computing clusters are not available. Several companies currently offer some form of parallel computing as a feature in their image analysis package lineups. Beyond the challenge of raw image storage there are needs to record algorithmic results and provenance in a searchable form. This topic is discussed further in the next section.
V. MANAGEMENT INFRASTRUCTURE The infrastructure for examining, managing, querying and
sharing of WSI is essential for its use in electronic healthcare records. Design should support both basic acquisition and the management and exchange of WSI and derived analytical results.
A. WSI Acquisition, Management and Exchange The major challenges for WSI management come from the
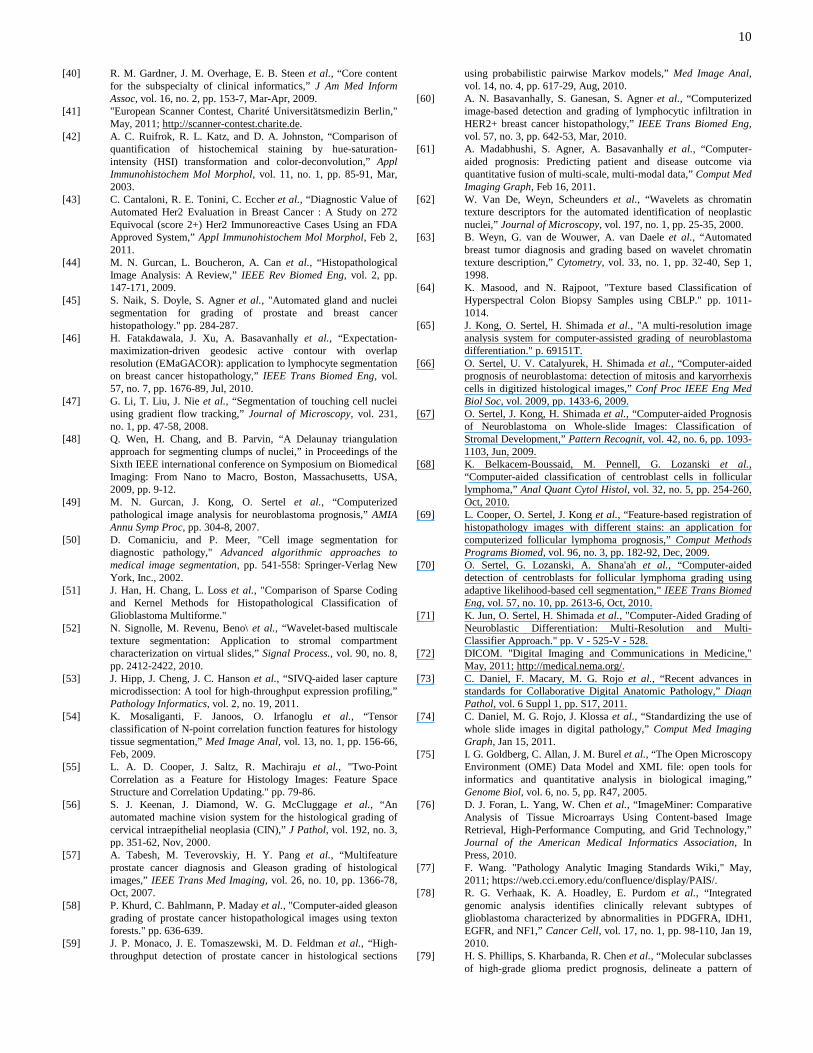
speed of acquisition, the scale of data generated, the diversity of image formats and regulations surrounding information technology used for patient care. In order for a pathology practice to digitize all slides, instruments would need to be able to scan WSI at high magnification (40X objective) at average speeds no more than those outlined in Figure 3. These average speeds must account for the variable amount of surface area covered by tissue sections: A typical section measures 15 x 15 mm (225 mm2), but sections can range anywhere from a few millimeters to a maximum of 25 x 55 mm (1375 mm2, over six times the average section’s surface area). At two minutes for a 15 x 15 mm section at 20X objective magnification, even the average pathology practice requires several full time scanners in order to achieve complete digitization. Significant increases in image acquisition speed will be needed in order to reach this goal.
Numerous protocols have been developed to manage and exchange healthcare information, including the Digital Image Communications in Medicine (DICOM)[72-74] in radiology and Health Level Seven (HL7) [18, 73, 74] for clinical data.
Nomenclature methods have also been developed to establish a
lingua franca for the terminology in data exchange, including Logical Observation Identifier Names and Codes (LOINC) [32] and Unified Medical Language System (UMLS). Pathology imaging poses unique requirements associated with managing and exchanging large images and executing complex queries over collections of images and derived data. Development of standards for WSI is a relatively new and rapidly evolving field. The Open Microscopy Environment (OME) project has developed a data model and management system that can be used to represent, exchange, and manage microscopy image data and metadata [75]. The DICOM working group for pathology, known as Working Group 26, recently developed two supplements 122 and 145 for formal representations for specimens and WSI images [72]. Supplement 145 defines a tiled multiresolution representation for rapid retrieval and viewing. A DICOM-based representation offers the advantages of a universal standard that is also compatible with existing Picture Archiving and Communication Systems (PACS) used in radiology departments.
B. Pathology Analytical Imaging Infrastructure Pathology images are often associated with rich metadata, including annotations made by humans, markups, features and classifications computed from automated image algorithms. The systematic analysis of WSI results in vast amounts of morphological information at various biological scales. The information generated by this process has tremendous potential for providing insight regarding the underlying mechanisms of disease onset and progression. One major obstacle which tends to reduce wider adoption of these new technologies throughout the clinical and scientific communities is management, query, and integration of this metadata. The Pathology Analytic Imaging Standards (PAIS) project develops a comprehensive data model for representing virtual slide related image, annotation, markup, and feature information [76, 77]. PAIS also provides a data management infrastructure – essentially a medical imaging geographical information system (GIS) to support queries for data retrieval based on analysis and image metadata, queries for comparison of results from different analyses, and spatial queries to assess relative prevalence of features and classified objects and to retrieve collections of
Figure 3. Slide production estimates. An average sized pathology practice can reasonably produce 80,000 slides per year. (*) Time available to perform WSI scanning using a single WSI scanner.
7
segmented regions and features. With the scale of data (~2GB metadata per WSI), high performance parallel database architecture is critical to support such queries and scale to large collections of WSIs. Complex queries such as algorithm result comparison across WSI are data and computation intensive. Support of rapid response of these queries requires specialized querying algorithms executing on high performance computing infrastructure.
VI. THE FUTURE OF DIGITAL PATHOLOGY Digitization and image analysis are expected to
fundamentally alter the practice of pathology, as digitization hardware and commercial image analysis tools proliferate in the clinical sphere. Most of the commercial image analysis tools are aimed at increasing throughput and reducing variability. Several analysis tools already have approval from the Federal Food and Drug Administration (FDA) for automating routine scoring of IHC-stained slides. The research community has largely followed this trend, with a focus on systems that emulate diagnostic procedures. Emulation of grading schemes is more complex than protein scoring but validation is also usually carried out on rather limited datasets. In this section we consider how image analysis may leverage the emerging abundance of digitized pathology to surpass emulation of human pathologists to improve prognosis, therapeutics, and understanding of complex diseases like cancer. The integration of patient registries, hospital information systems, and digital pathology repositories will provide a research testbed where imaging and molecular data can be interrogated to associate patient genomes with morphology. This will permit clinicians and scientists to study biological characteristics across cohorts of subjects to create new categorizations of patient populations to better drive personalization of treatment.
A. Glioblastoma: Integrative Morphology Subtypes of disease have emerged as a recent theme in
cancer research. Advances in genomics have produced a wealth of molecular information that has illuminated the molecular heterogeneity in many cancers. Diseases that have traditionally been defined by a single diagnosis are now understood to represent multiple subtypes, each with characteristic molecular foundations. Recognition of these
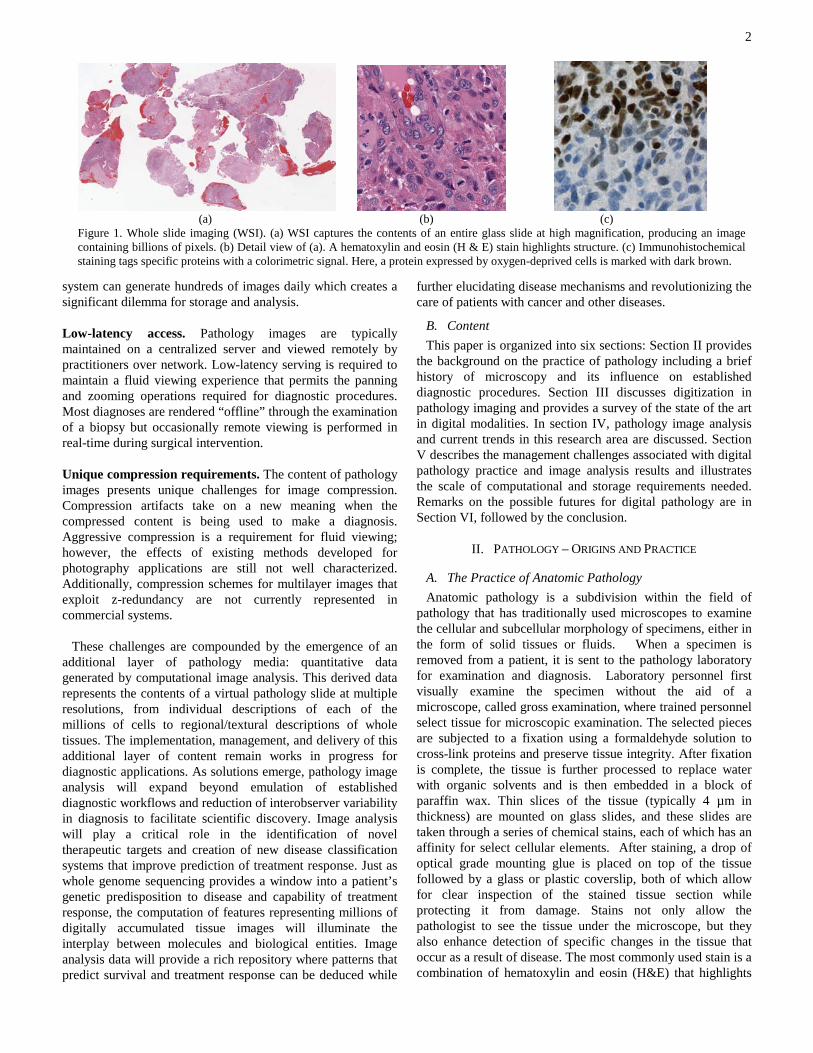
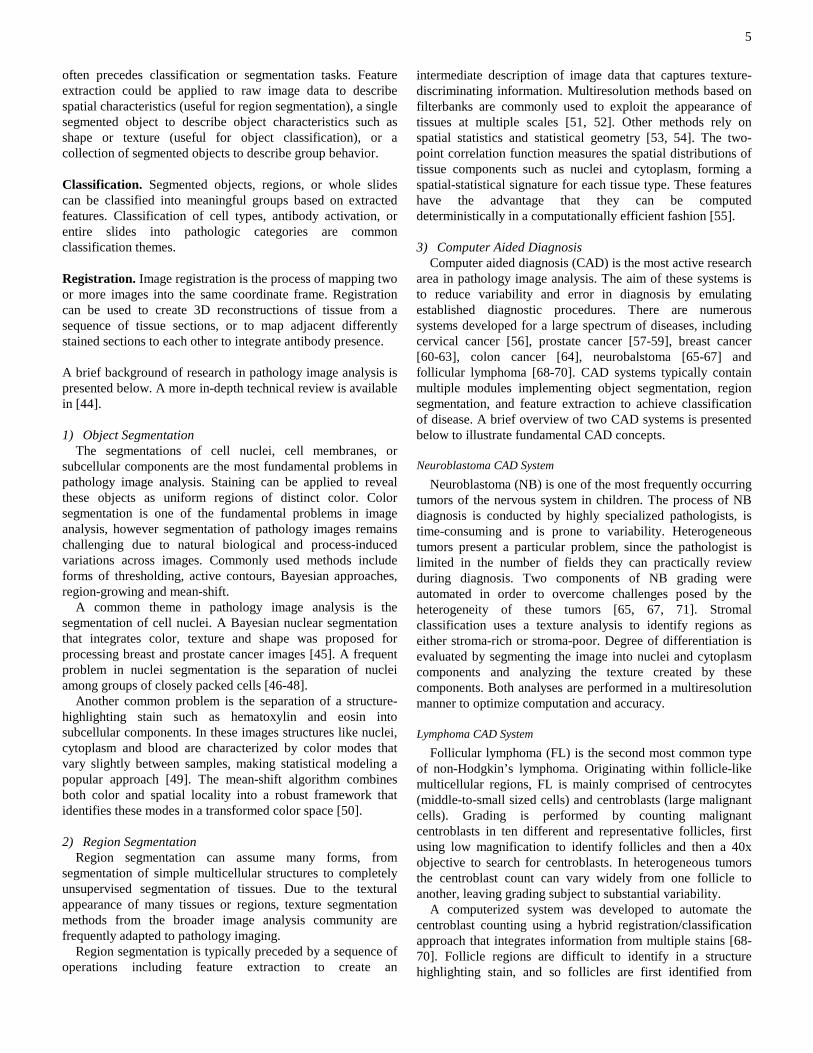
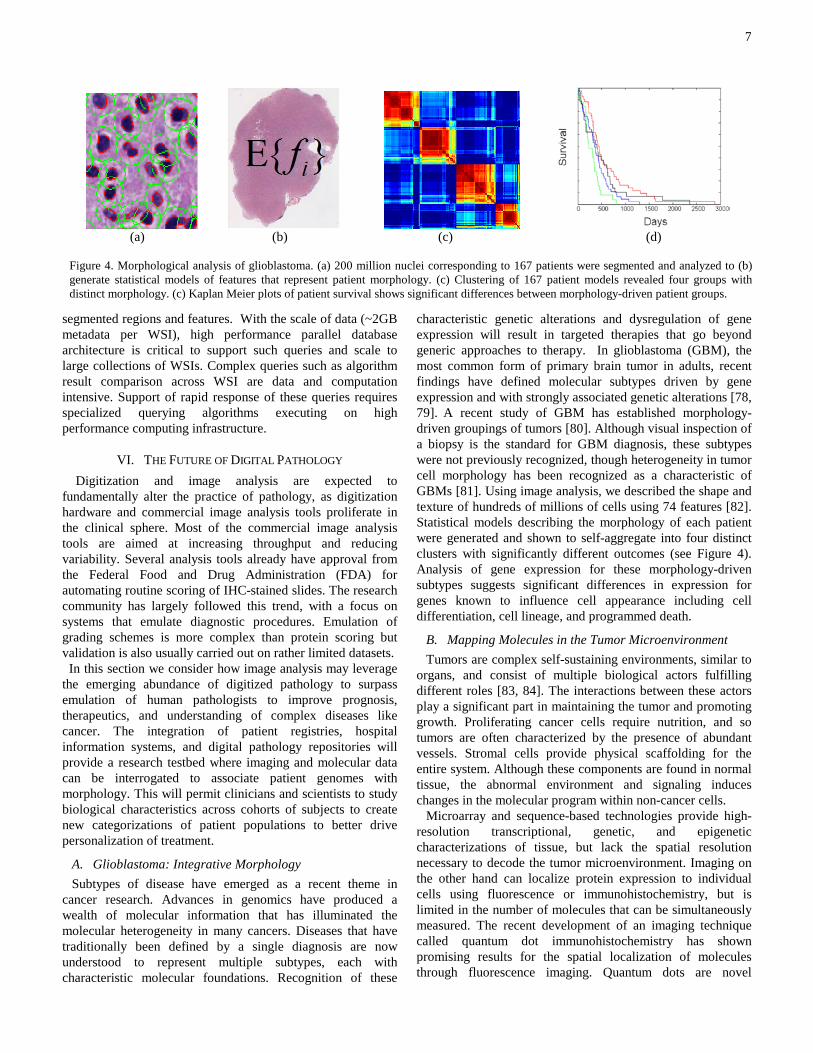
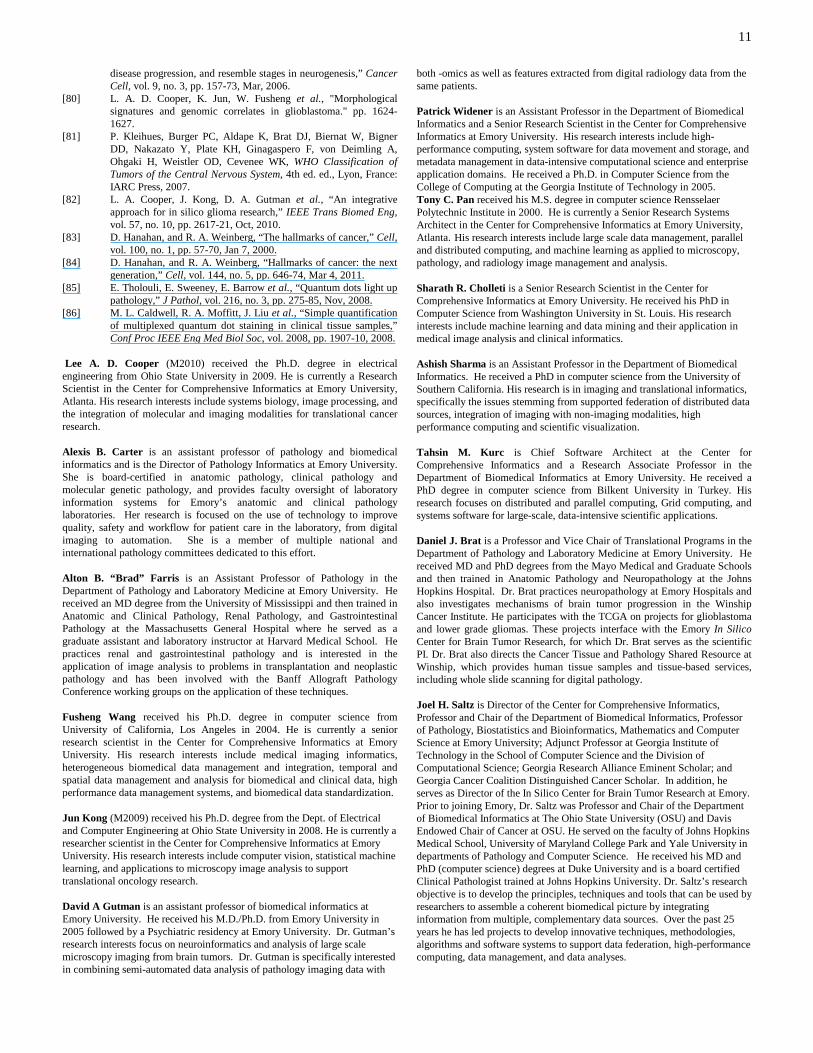
characteristic genetic alterations and dysregulation of gene expression will result in targeted therapies that go beyond generic approaches to therapy. In glioblastoma (GBM), the most common form of primary brain tumor in adults, recent findings have defined molecular subtypes driven by gene expression and with strongly associated genetic alterations [78, 79]. A recent study of GBM has established morphology-driven groupings of tumors [80]. Although visual inspection of a biopsy is the standard for GBM diagnosis, these subtypes were not previously recognized, though heterogeneity in tumor cell morphology has been recognized as a characteristic of GBMs [81]. Using image analysis, we described the shape and texture of hundreds of millions of cells using 74 features [82]. Statistical models describing the morphology of each patient were generated and shown to self-aggregate into four distinct clusters with significantly different outcomes (see Figure 4). Analysis of gene expression for these morphology-driven subtypes suggests significant differences in expression for genes known to influence cell appearance including cell differentiation, cell lineage, and programmed death.
B. Mapping Molecules in the Tumor Microenvironment Tumors are complex self-sustaining environments, similar to
organs, and consist of multiple biological actors fulfilling different roles [83, 84]. The interactions between these actors play a significant part in maintaining the tumor and promoting growth. Proliferating cancer cells require nutrition, and so tumors are often characterized by the presence of abundant vessels. Stromal cells provide physical scaffolding for the entire system. Although these components are found in normal tissue, the abnormal environment and signaling induces changes in the molecular program within non-cancer cells.
Microarray and sequence-based technologies provide high-resolution transcriptional, genetic, and epigenetic characterizations of tissue, but lack the spatial resolution necessary to decode the tumor microenvironment. Imaging on the other hand can localize protein expression to individual cells using fluorescence or immunohistochemistry, but is limited in the number of molecules that can be simultaneously measured. The recent development of an imaging technique called quantum dot immunohistochemistry has shown promising results for the spatial localization of molecules through fluorescence imaging. Quantum dots are novel
(a) (b) (c) (d)
Figure 4. Morphological analysis of glioblastoma. (a) 200 million nuclei corresponding to 167 patients were segmented and analyzed to (b) generate statistical models of features that represent patient morphology. (c) Clustering of 167 patient models revealed four groups with distinct morphology. (c) Kaplan Meier plots of patient survival shows significant differences between morphology-driven patient groups.
8
nanocrystal fluorophores which were initially developed by the semiconductor industry [85]. Their compact narrowband emission spectra permit simultaneous independent measurement of multiple channels without significant crosstalk [86]. Advantages include their ability to be conjugated to a wide range of biological elements including proteins and nucleic acids, rendering them as possible eventual replacements for IHC stains and for in situ hybridization probes for molecular targets. They have a very tightly defined transmission spectra defined by the excitation wavelength, and their emission spectra are more accurately quantifiable than colorimetric targets. When quantum dots are conjugated to molecular targets and combined with a microscope capable of multispectral excitation wavelengths, the convergence of image analysis and molecular biology is realized. We anticipate that new modalities such as quantum dot IHC will make the transition from the laboratory to the clinic over the next decade, and that new modalities such as quantum dot WSI will become as ubiquitous in pathology as magnetic resonance is in radiology.
C. Technological Challenges Data produced by advances in digitization and image
analysis are outpacing the storage and computation capacities of workstations and small cluster systems. The “big data” from image analysis has similar high performance and scalability requirements as enterprise healthcare data, but presents unique challenges. In the future, even medium scale hospitals and research projects will require capabilities to manage thousands of high-resolution images, execute and manage interrelated analysis pipelines, and query trillions of microscopic objects and their features. These applications demand fast loading and query response, as well as declarative query interfaces for high usability.
On the computational front, the highly data-parallel nature of pathology image analysis provides opportunities to apply both new hardware and software advances. General purpose graphics processing units (GPGPUs) have emerged as a popular implementation platform for many data-intensive computational science applications. Heterogeneous high performance computing configurations consisting of multi-core CPUs and multiple GPGPUs are becoming common, providing an attractive alternative to more traditional homogeneous computing clusters. Such heterogeneous systems offer tremendous computing capability at reasonable acquisition and operating costs, providing individual researchers with the means to explore different analysis strategies at meaningful data scales. Similarly, system software stacks developed for data-parallel enterprise applications, such as MapReduce [86], can be used to provide scalable, efficient, cost-effective solutions for pathology image analysis. Widespread adoption of these new technologies brings a new set of challenges, however: GPGPUs add a new level of complexity to application memory hierarchies, and new tools must be developed to define, deploy, and manage distributed computations across heterogeneous systems and networks.
Storage technologies have also progressed significantly in the past decade. Solid state drives (SSDs) provide low-latency data storage, albeit at smaller storage capacities and with
different data access performance characteristics than traditional hard disks. We can expect that storage systems composed of multiple levels of coupled spinning drives and SSDs in RAID configurations will become more common. In such configurations, high capacity arrays of traditional disks would provide longer-term storage and high speed access for operations that are characterized by sequential data access patterns (e.g., streaming of image data for analysis). SSDs would provide low latency storage for applications whose data processing patterns are dominated by random data accesses. Nevertheless, new storage, indexing, data staging techniques and software components will be needed to fully take advantage of these multiple levels of storage systems.
There have been substantial advances in network switches and networking protocols for intra-cluster communications. Technologies such as Infiniband provide low-latency, high-bandwidth communication substrates. However, progress in wide-area networking has been relatively slow. Even as multi-gigabit networks are becoming more widely deployed within institutions, and techniques for providing acceptably high effective bandwidths for distributed applications have been developed, low-latency access to remote resources remains problematic on commodity wide-area networks. Efficient compression, progressive data transmission, and intelligent data caching and computation reuse methods will continue to play critical roles in enabling digital pathology and scientific collaborations involving large pathology image datasets.
VII. CONCLUSION The ability to quantitatively characterize disease
classification and process from multiple biological scales and dimensions has the potential to enable development of preventive strategies and medical treatments that are precisely targeted to each individual patient, also known as personalized medicine. The advances in pathology imaging technologies discussed in this paper, along with comparably dramatic advances in the “-omics” and radiology domains are revolutionizing the medical professional’s ability to rapidly capture and exploit vast amounts of multi-scale, multi-dimensional data on each patient’s genetic background, biological function and structure. High-resolution, high-throughput instruments are being employed routinely not only in medical science, but also in health care delivery settings at an accelerating rate. As this decade progresses, significant advances in medical information technologies will transform very large volumes of multi-scale, multi-dimensional data into actionable information to drive the discovery, development, and delivery of new mechanisms of preventing, diagnosing, and healing complex disease. In current practice, molecular information and human-generated Pathology interpretations are used to guide treatments for disease. Tumor subtypes have crucial treatment implications and play increasingly crucial roles in development of successful targeted therapeutic regimens. For instance, in current neuro-oncologic practice, pathology classification and molecular subtyping are used together to guide choice of treatment.
In the past, pathologists classified issue by manually recognized patterns. In recent years, many researchers have
9
demonstrated that in some cases, image analysis algorithms can reproduce Pathologist-rendered diagnoses. The integrative morphology results presented in Section VI go a step further and represent what we think will become an increasingly common example where image analysis methods can be used to define previously unrecognized sub-categories that carry prognostic significance. The analysis and information management methods described in this paper represent the technology that will be used to provide highly targeted and personalized healthcare in the next decade.
ACKNOWLEDGMENT We would like to thank our Georgia Tech collaborators
Nikil Jayant, Sourabh Khire, and Saunya Williams. We would also like to acknowledge the contributions of our Emory colleagues Carlos S. Moreno, Roberd Bostick, Rami Yacoub, Candace Chisolm and Jingjing Gao.
REFERENCES [1] R. S. Weinstein, “Prospects for telepathology,” Hum Pathol, vol.
17, no. 5, pp. 433-4, May, 1986. [2] R. S. Weinstein, K. J. Bloom, and L. S. Rozek, “Telepathology and
the networking of pathology diagnostic services,” Arch Pathol Lab Med, vol. 111, no. 7, pp. 646-52, Jul, 1987.
[3] "CAP - Transforming Pathologists," May 15, 2011; http://www.cap.org/apps/docs/membership/transformation/new/index.html.
[4] "Description of Examinations -- Primary," May 15, 2011; http://www.abpath.org/DescriptionOfExamsAPCP.pdf.
[5] “Milestones in light microscopy,” Nat Cell Biol, vol. 11, no. 10, pp. 1165, Oct, 2009.
[6] R. Hooke, Micrographia: or Some Physiological Descriptions of Minute Bodies, Made by Magnifying Glasses with Observations and Inquiries Thereupon, London: John Martyn and James Allestry, 1665.
[7] D. Evanko, A. Heinrichs, and C. K. Rosenthal. "Nature Milestones in Light Microscopy," May 14, 2011; http://www.nature.com/milestones/milelight/index.html.
[8] G. A. Meijer, J. A. Belien, P. J. van Diest et al., “Origins of ... image analysis in clinical pathology,” J Clin Pathol, vol. 50, no. 5, pp. 365-70, May, 1997.
[9] A. Bayer, “Ueber eine neue Klasse von Farbstoffen,” Berichte der deutschen chemischen Gesellshaft, vol. 4, pp. 555-558, 1871.
[10] E. Abbe, “Beitrage zur Theorie des Mikroscops und der Mikroskopischen Wahrnehmung,” Archiv fur Mikroskopische Anatomie, vol. 9, pp. 413-418, 1873.
[11] O. Heimstadt, “Das Fluoreszenzmikroskop,” Z Wiss Mikrosk, vol. 28, pp. 330-337, 1911.
[12] A. H. Coons, “The beginnings of immunofluorescence,” J Immunol, vol. 87, pp. 499-503, 1961.
[13] A. H. Coons, H. J. Creech, and R. N. Jones, “Immunological properties of an antibody containing a fluorescent group,” Proc Soc Expt Biol Med, vol. 47, pp. 200-202, 1941.
[14] J. W. Lichtman, and J. A. Conchello, “Fluorescence microscopy,” Nat Methods, vol. 2, no. 12, pp. 910-9, Dec, 2005.
[15] R. C. Graham, Jr., and M. J. Karnovsky, “The early stages of absorption of injected horseradish peroxidase in the proximal tubules of mouse kidney: ultrastructural cytochemistry by a new technique,” J Histochem Cytochem, vol. 14, no. 4, pp. 291-302, Apr, 1966.
[16] M. J. Karnovsky, “A pathologist's odyssey,” Annu Rev Pathol, vol. 1, pp. 1-22, 2006.
[17] T. S. Reese, and M. J. Karnovsky, “Fine structural localization of a blood-brain barrier to exogenous peroxidase,” J Cell Biol, vol. 34, no. 1, pp. 207-17, Jul, 1967.
[18] W. Straus, “Segregation of an intravenously injected protein by droplets of the cells of rat kidneys,” J Biophys Biochem Cytol, vol. 3, no. 6, pp. 1037-40, Nov 25, 1957.
[19] M. Chalfie, Y. Tu, G. Euskirchen et al., “Green fluorescent protein as a marker for gene expression,” Science, vol. 263, no. 5148, pp. 802-5, Feb 11, 1994.
[20] R. Y. Tsien, “The green fluorescent protein,” Annu Rev Biochem, vol. 67, pp. 509-44, 1998.
[21] B. H. Mayall, and M. L. Mendelsohn, “Deoxyribonucleic acid cytophotometry of stained human leukocytes. II. The mechanical scanner od CYDAC, the theory of scanning photometry and the magnitude of residual errors,” J Histochem Cytochem, vol. 18, no. 6, pp. 383-407, Jun, 1970.
[22] P. Nipkow, “Germany 30105,” 1885. [23] T. J. Eide, I. Nordrum, and H. Stalsberg, “The validity of frozen
section diagnosis based on video-microscopy,” Zentralbl Pathol, vol. 138, no. 6, pp. 405-7, Dec, 1992.
[24] T. J. Eide, and I. Nordrum, “Frozen section service via the telenetwork in northern Norway,” Zentralbl Pathol, vol. 138, no. 6, pp. 409-12, Dec, 1992.
[25] K. J. Kaplan, J. R. Burgess, G. D. Sandberg et al., “Use of robotic telepathology for frozen-section diagnosis: a retrospective trial of a telepathology system for intraoperative consultation,” Mod Pathol, vol. 15, no. 11, pp. 1197-204, Nov, 2002.
[26] I. Nordrum, B. Engum, E. Rinde et al., “Remote frozen section service: a telepathology project in northern Norway,” Hum Pathol, vol. 22, no. 6, pp. 514-8, Jun, 1991.
[27] E. G. Fey, and S. Penman, “The morphological oncogenic signature. Reorganization of epithelial cytoarchitecture and metabolic regulation by tumor promoters and by transformation,” Dev Biol (N Y 1985), vol. 3, pp. 81-100, 1986.
[28] R. S. Weinstein, A. R. Graham, L. C. Richter et al., “Overview of telepathology, virtual microscopy, and whole slide imaging: prospects for the future,” Hum Pathol, vol. 40, no. 8, pp. 1057-69, Aug, 2009.
[29] S. Williams, W. H. Henricks, M. J. Becich et al., “Telepathology for patient care: what am I getting myself into?,” Adv Anat Pathol, vol. 17, no. 2, pp. 130-49, Mar, 2010.
[30] A. Afework, M. D. Beynon, F. Bustamante et al., “Digital dynamic telepathology--the Virtual Microscope,” Proc AMIA Symp, pp. 912-6, 1998.
[31] R. Ferreira, B. Moon, J. Humphries et al., “The Virtual Microscope,” Proc AMIA Annu Fall Symp, pp. 449-53, 1997.
[32] C. J. McDonald, S. M. Huff, J. G. Suico et al., “LOINC, a universal standard for identifying laboratory observations: a 5-year update,” Clin Chem, vol. 49, no. 4, pp. 624-33, Apr, 2003.
[33] M. G. Rojo, G. B. Garcia, C. P. Mateos et al., “Critical comparison of 31 commercially available digital slide systems in pathology,” Int J Surg Pathol, vol. 14, no. 4, pp. 285-305, Oct, 2006.
[34] D. C. Wilbur, K. Madi, R. B. Colvin et al., “Whole-slide imaging digital pathology as a platform for teleconsultation: a pilot study using paired subspecialist correlations,” Arch Pathol Lab Med, vol. 133, no. 12, pp. 1949-53, Dec, 2009.
[35] J. R. Gilbertson, J. Ho, L. Anthony et al., “Primary histologic diagnosis using automated whole slide imaging: a validation study,” BMC Clin Pathol, vol. 6, pp. 4, 2006.
[36] U. J. Balis, R. D. Aller, and E. R. Ashwood, “Informatics training in U.S. pathology residency programs. Results of a survey,” Am J Clin Pathol, vol. 100, no. 4 Suppl 1, pp. S44-7, Oct, 1993.
[37] J. H. Harrison, Jr., “Pathology informatics questions and answers from the University of Pittsburgh pathology residency informatics rotation,” Arch Pathol Lab Med, vol. 128, no. 1, pp. 71-83, Jan, 2004.
[38] W. H. Henricks, P. J. Boyer, J. H. Harrison et al., “Informatics training in pathology residency programs: proposed learning objectives and skill sets for the new millennium,” Arch Pathol Lab Med, vol. 127, no. 8, pp. 1009-18, Aug, 2003.
[39] C. Safran, M. M. Shabot, B. S. Munger et al., “Program requirements for fellowship education in the subspecialty of clinical informatics,” J Am Med Inform Assoc, vol. 16, no. 2, pp. 158-66, Mar-Apr, 2009.
10
[40] R. M. Gardner, J. M. Overhage, E. B. Steen et al., “Core content for the subspecialty of clinical informatics,” J Am Med Inform Assoc, vol. 16, no. 2, pp. 153-7, Mar-Apr, 2009.
[41] "European Scanner Contest, Charité Universitätsmedizin Berlin," May, 2011; http://scanner-contest.charite.de.
[42] A. C. Ruifrok, R. L. Katz, and D. A. Johnston, “Comparison of quantification of histochemical staining by hue-saturation-intensity (HSI) transformation and color-deconvolution,” Appl Immunohistochem Mol Morphol, vol. 11, no. 1, pp. 85-91, Mar, 2003.
[43] C. Cantaloni, R. E. Tonini, C. Eccher et al., “Diagnostic Value of Automated Her2 Evaluation in Breast Cancer : A Study on 272 Equivocal (score 2+) Her2 Immunoreactive Cases Using an FDA Approved System,” Appl Immunohistochem Mol Morphol, Feb 2, 2011.
[44] M. N. Gurcan, L. Boucheron, A. Can et al., “Histopathological Image Analysis: A Review,” IEEE Rev Biomed Eng, vol. 2, pp. 147-171, 2009.
[45] S. Naik, S. Doyle, S. Agner et al., "Automated gland and nuclei segmentation for grading of prostate and breast cancer histopathology." pp. 284-287.
[46] H. Fatakdawala, J. Xu, A. Basavanhally et al., “Expectation-maximization-driven geodesic active contour with overlap resolution (EMaGACOR): application to lymphocyte segmentation on breast cancer histopathology,” IEEE Trans Biomed Eng, vol. 57, no. 7, pp. 1676-89, Jul, 2010.
[47] G. Li, T. Liu, J. Nie et al., “Segmentation of touching cell nuclei using gradient flow tracking,” Journal of Microscopy, vol. 231, no. 1, pp. 47-58, 2008.
[48] Q. Wen, H. Chang, and B. Parvin, “A Delaunay triangulation approach for segmenting clumps of nuclei,” in Proceedings of the Sixth IEEE international conference on Symposium on Biomedical Imaging: From Nano to Macro, Boston, Massachusetts, USA, 2009, pp. 9-12.
[49] M. N. Gurcan, J. Kong, O. Sertel et al., “Computerized pathological image analysis for neuroblastoma prognosis,” AMIA Annu Symp Proc, pp. 304-8, 2007.
[50] D. Comaniciu, and P. Meer, "Cell image segmentation for diagnostic pathology," Advanced algorithmic approaches to medical image segmentation, pp. 541-558: Springer-Verlag New York, Inc., 2002.
[51] J. Han, H. Chang, L. Loss et al., "Comparison of Sparse Coding and Kernel Methods for Histopathological Classification of Glioblastoma Multiforme."
[52] N. Signolle, M. Revenu, Beno\ et al., “Wavelet-based multiscale texture segmentation: Application to stromal compartment characterization on virtual slides,” Signal Process., vol. 90, no. 8, pp. 2412-2422, 2010.
[53] J. Hipp, J. Cheng, J. C. Hanson et al., “SIVQ-aided laser capture microdissection: A tool for high-throughput expression profiling,” Pathology Informatics, vol. 2, no. 19, 2011.
[54] K. Mosaliganti, F. Janoos, O. Irfanoglu et al., “Tensor classification of N-point correlation function features for histology tissue segmentation,” Med Image Anal, vol. 13, no. 1, pp. 156-66, Feb, 2009.
[55] L. A. D. Cooper, J. Saltz, R. Machiraju et al., "Two-Point Correlation as a Feature for Histology Images: Feature Space Structure and Correlation Updating." pp. 79-86.
[56] S. J. Keenan, J. Diamond, W. G. McCluggage et al., “An automated machine vision system for the histological grading of cervical intraepithelial neoplasia (CIN),” J Pathol, vol. 192, no. 3, pp. 351-62, Nov, 2000.
[57] A. Tabesh, M. Teverovskiy, H. Y. Pang et al., “Multifeature prostate cancer diagnosis and Gleason grading of histological images,” IEEE Trans Med Imaging, vol. 26, no. 10, pp. 1366-78, Oct, 2007.
[58] P. Khurd, C. Bahlmann, P. Maday et al., "Computer-aided gleason grading of prostate cancer histopathological images using texton forests." pp. 636-639.
[59] J. P. Monaco, J. E. Tomaszewski, M. D. Feldman et al., “High-throughput detection of prostate cancer in histological sections
using probabilistic pairwise Markov models,” Med Image Anal, vol. 14, no. 4, pp. 617-29, Aug, 2010.
[60] A. N. Basavanhally, S. Ganesan, S. Agner et al., “Computerized image-based detection and grading of lymphocytic infiltration in HER2+ breast cancer histopathology,” IEEE Trans Biomed Eng, vol. 57, no. 3, pp. 642-53, Mar, 2010.
[61] A. Madabhushi, S. Agner, A. Basavanhally et al., “Computer-aided prognosis: Predicting patient and disease outcome via quantitative fusion of multi-scale, multi-modal data,” Comput Med Imaging Graph, Feb 16, 2011.
[62] W. Van De, Weyn, Scheunders et al., “Wavelets as chromatin texture descriptors for the automated identification of neoplastic nuclei,” Journal of Microscopy, vol. 197, no. 1, pp. 25-35, 2000.
[63] B. Weyn, G. van de Wouwer, A. van Daele et al., “Automated breast tumor diagnosis and grading based on wavelet chromatin texture description,” Cytometry, vol. 33, no. 1, pp. 32-40, Sep 1, 1998.
[64] K. Masood, and N. Rajpoot, "Texture based Classification of Hyperspectral Colon Biopsy Samples using CBLP." pp. 1011-1014.
[65] J. Kong, O. Sertel, H. Shimada et al., "A multi-resolution image analysis system for computer-assisted grading of neuroblastoma differentiation." p. 69151T.
[66] O. Sertel, U. V. Catalyurek, H. Shimada et al., “Computer-aided prognosis of neuroblastoma: detection of mitosis and karyorrhexis cells in digitized histological images,” Conf Proc IEEE Eng Med Biol Soc, vol. 2009, pp. 1433-6, 2009.
[67] O. Sertel, J. Kong, H. Shimada et al., “Computer-aided Prognosis of Neuroblastoma on Whole-slide Images: Classification of Stromal Development,” Pattern Recognit, vol. 42, no. 6, pp. 1093-1103, Jun, 2009.
[68] K. Belkacem-Boussaid, M. Pennell, G. Lozanski et al., “Computer-aided classification of centroblast cells in follicular lymphoma,” Anal Quant Cytol Histol, vol. 32, no. 5, pp. 254-260, Oct, 2010.
[69] L. Cooper, O. Sertel, J. Kong et al., “Feature-based registration of histopathology images with different stains: an application for computerized follicular lymphoma prognosis,” Comput Methods Programs Biomed, vol. 96, no. 3, pp. 182-92, Dec, 2009.
[70] O. Sertel, G. Lozanski, A. Shana'ah et al., “Computer-aided detection of centroblasts for follicular lymphoma grading using adaptive likelihood-based cell segmentation,” IEEE Trans Biomed Eng, vol. 57, no. 10, pp. 2613-6, Oct, 2010.
[71] K. Jun, O. Sertel, H. Shimada et al., "Computer-Aided Grading of Neuroblastic Differentiation: Multi-Resolution and Multi-Classifier Approach." pp. V - 525-V - 528.
[72] DICOM. "Digital Imaging and Communications in Medicine," May, 2011; http://medical.nema.org/.
[73] C. Daniel, F. Macary, M. G. Rojo et al., “Recent advances in standards for Collaborative Digital Anatomic Pathology,” Diagn Pathol, vol. 6 Suppl 1, pp. S17, 2011.
[74] C. Daniel, M. G. Rojo, J. Klossa et al., “Standardizing the use of whole slide images in digital pathology,” Comput Med Imaging Graph, Jan 15, 2011.
[75] I. G. Goldberg, C. Allan, J. M. Burel et al., “The Open Microscopy Environment (OME) Data Model and XML file: open tools for informatics and quantitative analysis in biological imaging,” Genome Biol, vol. 6, no. 5, pp. R47, 2005.
[76] D. J. Foran, L. Yang, W. Chen et al., “ImageMiner: Comparative Analysis of Tissue Microarrays Using Content-based Image Retrieval, High-Performance Computing, and Grid Technology,” Journal of the American Medical Informatics Association, In Press, 2010.
[77] F. Wang. "Pathology Analytic Imaging Standards Wiki," May, 2011; https://web.cci.emory.edu/confluence/display/PAIS/.
[78] R. G. Verhaak, K. A. Hoadley, E. Purdom et al., “Integrated genomic analysis identifies clinically relevant subtypes of glioblastoma characterized by abnormalities in PDGFRA, IDH1, EGFR, and NF1,” Cancer Cell, vol. 17, no. 1, pp. 98-110, Jan 19, 2010.
[79] H. S. Phillips, S. Kharbanda, R. Chen et al., “Molecular subclasses of high-grade glioma predict prognosis, delineate a pattern of
11
disease progression, and resemble stages in neurogenesis,” Cancer Cell, vol. 9, no. 3, pp. 157-73, Mar, 2006.
[80] L. A. D. Cooper, K. Jun, W. Fusheng et al., "Morphological signatures and genomic correlates in glioblastoma." pp. 1624-1627.
[81] P. Kleihues, Burger PC, Aldape K, Brat DJ, Biernat W, Bigner DD, Nakazato Y, Plate KH, Ginagaspero F, von Deimling A, Ohgaki H, Weistler OD, Cevenee WK, WHO Classification of Tumors of the Central Nervous System, 4th ed. ed., Lyon, France: IARC Press, 2007.
[82] L. A. Cooper, J. Kong, D. A. Gutman et al., “An integrative approach for in silico glioma research,” IEEE Trans Biomed Eng, vol. 57, no. 10, pp. 2617-21, Oct, 2010.
[83] D. Hanahan, and R. A. Weinberg, “The hallmarks of cancer,” Cell, vol. 100, no. 1, pp. 57-70, Jan 7, 2000.
[84] D. Hanahan, and R. A. Weinberg, “Hallmarks of cancer: the next generation,” Cell, vol. 144, no. 5, pp. 646-74, Mar 4, 2011.
[85] E. Tholouli, E. Sweeney, E. Barrow et al., “Quantum dots light up pathology,” J Pathol, vol. 216, no. 3, pp. 275-85, Nov, 2008.
[86] M. L. Caldwell, R. A. Moffitt, J. Liu et al., “Simple quantification of multiplexed quantum dot staining in clinical tissue samples,” Conf Proc IEEE Eng Med Biol Soc, vol. 2008, pp. 1907-10, 2008.
Lee A. D. Cooper (M2010) received the Ph.D. degree in electrical engineering from Ohio State University in 2009. He is currently a Research Scientist in the Center for Comprehensive Informatics at Emory University, Atlanta. His research interests include systems biology, image processing, and the integration of molecular and imaging modalities for translational cancer research. Alexis B. Carter is an assistant professor of pathology and biomedical informatics and is the Director of Pathology Informatics at Emory University. She is board-certified in anatomic pathology, clinical pathology and molecular genetic pathology, and provides faculty oversight of laboratory information systems for Emory’s anatomic and clinical pathology laboratories. Her research is focused on the use of technology to improve quality, safety and workflow for patient care in the laboratory, from digital imaging to automation. She is a member of multiple national and international pathology committees dedicated to this effort. Alton B. “Brad” Farris is an Assistant Professor of Pathology in the Department of Pathology and Laboratory Medicine at Emory University. He received an MD degree from the University of Mississippi and then trained in Anatomic and Clinical Pathology, Renal Pathology, and Gastrointestinal Pathology at the Massachusetts General Hospital where he served as a graduate assistant and laboratory instructor at Harvard Medical School. He practices renal and gastrointestinal pathology and is interested in the application of image analysis to problems in transplantation and neoplastic pathology and has been involved with the Banff Allograft Pathology Conference working groups on the application of these techniques. Fusheng Wang received his Ph.D. degree in computer science from University of California, Los Angeles in 2004. He is currently a senior research scientist in the Center for Comprehensive Informatics at Emory University. His research interests include medical imaging informatics, heterogeneous biomedical data management and integration, temporal and spatial data management and analysis for biomedical and clinical data, high performance data management systems, and biomedical data standardization. Jun Kong (M2009) received his Ph.D. degree from the Dept. of Electrical and Computer Engineering at Ohio State University in 2008. He is currently a researcher scientist in the Center for Comprehensive Informatics at Emory University. His research interests include computer vision, statistical machine learning, and applications to microscopy image analysis to support translational oncology research. David A Gutman is an assistant professor of biomedical informatics at Emory University. He received his M.D./Ph.D. from Emory University in 2005 followed by a Psychiatric residency at Emory University. Dr. Gutman’s research interests focus on neuroinformatics and analysis of large scale microscopy imaging from brain tumors. Dr. Gutman is specifically interested in combining semi-automated data analysis of pathology imaging data with
both -omics as well as features extracted from digital radiology data from the same patients. Patrick Widener is an Assistant Professor in the Department of Biomedical Informatics and a Senior Research Scientist in the Center for Comprehensive Informatics at Emory University. His research interests include high-performance computing, system software for data movement and storage, and metadata management in data-intensive computational science and enterprise application domains. He received a Ph.D. in Computer Science from the College of Computing at the Georgia Institute of Technology in 2005. Tony C. Pan received his M.S. degree in computer science Rensselaer Polytechnic Institute in 2000. He is currently a Senior Research Systems Architect in the Center for Comprehensive Informatics at Emory University, Atlanta. His research interests include large scale data management, parallel and distributed computing, and machine learning as applied to microscopy, pathology, and radiology image management and analysis. Sharath R. Cholleti is a Senior Research Scientist in the Center for Comprehensive Informatics at Emory University. He received his PhD in Computer Science from Washington University in St. Louis. His research interests include machine learning and data mining and their application in medical image analysis and clinical informatics. Ashish Sharma is an Assistant Professor in the Department of Biomedical Informatics. He received a PhD in computer science from the University of Southern California. His research is in imaging and translational informatics, specifically the issues stemming from supported federation of distributed data sources, integration of imaging with non-imaging modalities, high performance computing and scientific visualization. Tahsin M. Kurc is Chief Software Architect at the Center for Comprehensive Informatics and a Research Associate Professor in the Department of Biomedical Informatics at Emory University. He received a PhD degree in computer science from Bilkent University in Turkey. His research focuses on distributed and parallel computing, Grid computing, and systems software for large-scale, data-intensive scientific applications. Daniel J. Brat is a Professor and Vice Chair of Translational Programs in the Department of Pathology and Laboratory Medicine at Emory University. He received MD and PhD degrees from the Mayo Medical and Graduate Schools and then trained in Anatomic Pathology and Neuropathology at the Johns Hopkins Hospital. Dr. Brat practices neuropathology at Emory Hospitals and also investigates mechanisms of brain tumor progression in the Winship Cancer Institute. He participates with the TCGA on projects for glioblastoma and lower grade gliomas. These projects interface with the Emory In Silico Center for Brain Tumor Research, for which Dr. Brat serves as the scientific PI. Dr. Brat also directs the Cancer Tissue and Pathology Shared Resource at Winship, which provides human tissue samples and tissue-based services, including whole slide scanning for digital pathology. Joel H. Saltz is Director of the Center for Comprehensive Informatics, Professor and Chair of the Department of Biomedical Informatics, Professor of Pathology, Biostatistics and Bioinformatics, Mathematics and Computer Science at Emory University; Adjunct Professor at Georgia Institute of Technology in the School of Computer Science and the Division of Computational Science; Georgia Research Alliance Eminent Scholar; and Georgia Cancer Coalition Distinguished Cancer Scholar. In addition, he serves as Director of the In Silico Center for Brain Tumor Research at Emory. Prior to joining Emory, Dr. Saltz was Professor and Chair of the Department of Biomedical Informatics at The Ohio State University (OSU) and Davis Endowed Chair of Cancer at OSU. He served on the faculty of Johns Hopkins Medical School, University of Maryland College Park and Yale University in departments of Pathology and Computer Science. He received his MD and PhD (computer science) degrees at Duke University and is a board certified Clinical Pathologist trained at Johns Hopkins University. Dr. Saltz’s research objective is to develop the principles, techniques and tools that can be used by researchers to assemble a coherent biomedical picture by integrating information from multiple, complementary data sources. Over the past 25 years he has led projects to develop innovative techniques, methodologies, algorithms and software systems to support data federation, high-performance computing, data management, and data analyses.