Differences in the selection response of serially repeated color pattern characters: Standing...
13
BioMed Central Page 1 of 13 (page number not for citation purposes) BMC Evolutionary Biology Open Access Research article Differences in the selection response of serially repeated color pattern characters: Standing variation, development, and evolution Cerisse E Allen*, Patrícia Beldade, Bas J Zwaan and Paul M Brakefield Address: Institute of Biology, Leiden University, PO Box 9516 2300 RA Leiden, The Netherlands Email: Cerisse E Allen* - [email protected]; Patrícia Beldade - [email protected]; Bas J Zwaan - [email protected]; Paul M Brakefield - [email protected] * Corresponding author Abstract Background: There is spectacular morphological diversity in nature but lineages typically display a limited range of phenotypes. Because developmental processes generate the phenotypic variation that fuels natural selection, they are a likely source of evolutionary biases, facilitating some changes and limiting others. Although shifts in developmental regulation are associated with morphological differences between taxa, it is unclear how underlying mechanisms affect the rate and direction of evolutionary change within populations under selection. Here we focus on two ecologically relevant features of butterfly wing color patterns, eyespot size and color composition, which are similarly and strongly correlated across the serially repeated eyespots. Though these two characters show similar patterns of standing variation and covariation within a population, they differ in key features of their underlying development. We targeted pairs of eyespots with artificial selection for coordinated (concerted selection) versus independent (antagonistic selection) change in their color composition and size and compared evolutionary responses of the two color pattern characters. Results: The two characters respond to selection in strikingly different ways despite initially similar patterns of variation in all directions present in the starting population. Size (determined by local properties of a diffusing inductive signal) evolves flexibly in all selected directions. However, color composition (determined by a tissue-level response to the signal concentration gradient) evolves only in the direction of coordinated change. There was no independent evolutionary change in the color composition of two eyespots in response to antagonistic selection. Moreover, these differences in the directions of short-term evolutionary change in eyespot size and color composition within a single species are consistent with the observed wing pattern diversity in the genus. Conclusion: Both characters respond rapidly to selection for coordinated change, but there are striking differences in their response to selection for antagonistic, independent change across eyespots. While many additional factors may contribute to both short- and long-term evolutionary response, we argue that the compartmentalization of developmental processes can influence the diversification of serial repeats such as butterfly eyespots, even under strong selection. Published: 26 March 2008 BMC Evolutionary Biology 2008, 8:94 doi:10.1186/1471-2148-8-94 Received: 24 August 2007 Accepted: 26 March 2008 This article is available from: http://www.biomedcentral.com/1471-2148/8/94 © 2008 Allen et al; licensee BioMed Central Ltd. This is an Open Access article distributed under the terms of the Creative Commons Attribution License (http://creativecommons.org/licenses/by/2.0 ), which permits unrestricted use, distribution, and reproduction in any medium, provided the original work is properly cited.
-
Upload
independent -
Category
Documents
-
view
0 -
download
0
Transcript of Differences in the selection response of serially repeated color pattern characters: Standing...

BioMed CentralBMC Evolutionary Biology
ss
Open AcceResearch articleDifferences in the selection response of serially repeated color pattern characters: Standing variation, development, and evolutionCerisse E Allen*, Patrícia Beldade, Bas J Zwaan and Paul M BrakefieldAddress: Institute of Biology, Leiden University, PO Box 9516 2300 RA Leiden, The Netherlands
Email: Cerisse E Allen* - [email protected]; Patrícia Beldade - [email protected]; Bas J Zwaan - [email protected]; Paul M Brakefield - [email protected]
* Corresponding author
AbstractBackground: There is spectacular morphological diversity in nature but lineages typically displaya limited range of phenotypes. Because developmental processes generate the phenotypic variationthat fuels natural selection, they are a likely source of evolutionary biases, facilitating some changesand limiting others. Although shifts in developmental regulation are associated with morphologicaldifferences between taxa, it is unclear how underlying mechanisms affect the rate and direction ofevolutionary change within populations under selection.
Here we focus on two ecologically relevant features of butterfly wing color patterns, eyespot sizeand color composition, which are similarly and strongly correlated across the serially repeatedeyespots. Though these two characters show similar patterns of standing variation and covariationwithin a population, they differ in key features of their underlying development. We targeted pairsof eyespots with artificial selection for coordinated (concerted selection) versus independent(antagonistic selection) change in their color composition and size and compared evolutionaryresponses of the two color pattern characters.
Results: The two characters respond to selection in strikingly different ways despite initially similarpatterns of variation in all directions present in the starting population. Size (determined by localproperties of a diffusing inductive signal) evolves flexibly in all selected directions. However, colorcomposition (determined by a tissue-level response to the signal concentration gradient) evolvesonly in the direction of coordinated change. There was no independent evolutionary change in thecolor composition of two eyespots in response to antagonistic selection. Moreover, thesedifferences in the directions of short-term evolutionary change in eyespot size and colorcomposition within a single species are consistent with the observed wing pattern diversity in thegenus.
Conclusion: Both characters respond rapidly to selection for coordinated change, but there arestriking differences in their response to selection for antagonistic, independent change acrosseyespots. While many additional factors may contribute to both short- and long-term evolutionaryresponse, we argue that the compartmentalization of developmental processes can influence thediversification of serial repeats such as butterfly eyespots, even under strong selection.
Published: 26 March 2008
BMC Evolutionary Biology 2008, 8:94 doi:10.1186/1471-2148-8-94
Received: 24 August 2007Accepted: 26 March 2008
This article is available from: http://www.biomedcentral.com/1471-2148/8/94
© 2008 Allen et al; licensee BioMed Central Ltd. This is an Open Access article distributed under the terms of the Creative Commons Attribution License (http://creativecommons.org/licenses/by/2.0), which permits unrestricted use, distribution, and reproduction in any medium, provided the original work is properly cited.
Page 1 of 13(page number not for citation purposes)

BMC Evolutionary Biology 2008, 8:94 http://www.biomedcentral.com/1471-2148/8/94
BackgroundDespite the diversity of animal form in nature, a limitedrange of phenotypes is often observed [1-3]. Stasis, con-vergence, and limits in the direction of morphologicalevolution occur within lineages even when strong selec-tion is implicated in divergence [4-7]. The propensity forphenotypes to evolve, or evolvability [8-11], is deter-mined by the capacity of genetic and developmental sys-tems to produce heritable variation and the action ofselection on those variants [12,13]. Consequently, rates ofadaptive change and diversification are expected todepend critically on underlying developmental mecha-nisms [2,5,9,14-16]. Several different lines of evidenceprovide more understanding of the role developmentplays in determining the direction of evolutionary change,including the documented association between morpho-logical differences and changes in regulation of develop-mental-genetic pathways (reviewed in [17]), analysis ofthe variational properties of different developmentalmechanisms [18-20], and analyses of the distribution ofmorphological characters in a given phylogeny [21]. Howdevelopment affects the rate and direction of evolutionarychange in contemporary populations under selection,however, remains largely unexplored [22].
Diversification of serial repeatsThe elaboration and differentiation of serially repeatedcharacters provides clear examples of the associationbetween underlying mechanisms and morphological evo-lution. The complexity and diversity of arthropod bodysegments, tetrapod limbs, vertebrate teeth, and nym-phalid butterfly wing color patterns all result from theevolutionary differentiation of homologous serial repeats[23-26]. Individual elements often covary strongly,reflecting the effects of shared developmental pathwaysand mechanisms coordinating their development [25].This covariance can affect rates of evolutionary change[5,15,27], potentially limiting the independent evolutionof serial repeats. As a consequence, development can biasevolution (sensu [28]), as certain morphological changesmay be more readily achieved than others. However,recent empirical studies demonstrate that strong limitspredicted by patterns of covariation do not always preventthe independent evolution of morphological traits underartificial selection [29-31]. One plausible explanation forthe discrepancy between theoretical predictions andempirical results is the failure of current evolutionarygenetic models to account for the details of developmentthat determine how phenotypic variation is generated,and thereby affect the rate and direction of evolutionarychange [32-34]. Artificial selection experiments are a pow-erful tool for exploring limits on the process of morpho-logical evolution, particularly in the evolution ofcorrelated characters [35-43]. Here we focus on two char-acters with similar patterns of covariation among a set of
serial repeats. These characters, elements of the color pat-tern on butterfly wings, differ in key aspects of their devel-opment. We use artificial selection to explore effects ofthese differences on the rate and direction of evolutionarychange in this complex morphological phenotype.
Evolution of eyespot patterns on butterfly wingsWithin Bicyclus and other closely related butterfly genera,wing pattern diversification was probably driven in partby a long history of sexual and natural selection acting onthe eyespots [44,45], which are serially repeated along thewing margins. Each eyespot consists of concentric rings ofblack and gold color surrounding a white central spot[46]. Color composition (the relative dimensions of thegold and black rings) and size are two important func-tional characteristics of eyespots [47,48] that differ in crit-ical aspects of their development. Properties of aninductive signal (e.g., signal concentration) produced bycells in the eyespot organizer, the central focus [49],largely determine eyespot size [46,50,51], whereas colorcomposition is determined by the threshold response ofsurrounding tissue to the concentration gradient of thediffusing focal signal [52,53]. Each of these two aspects ofinduction (signaling and response) appears to contributedifferently to phenotypic variation in the eyespot pattern[54] and may have very different consequences for colorpattern evolution.
When selection targets either the color composition orsize of a single eyespot, all eyespots evolve in concert, eventhose on different wing surfaces [51,53]. Despite differ-ences in the underlying development of color composi-tion and size, each character is strongly and positivelycorrelated across serially repeated eyespots and their mainaxes of variation [28] in captive B. anynana populations liein the direction of concerted changes in two or more eye-spots. We used artificial selection to search for limits inthis phenotype space, and selected for concerted (alongthe main axis of variation) and antagonistic (orthogonalto the main axis) change in the color composition or sizeof two eyespots. By applying similar selection to bothcharacters and using a comparative analysis we testwhether the characters differ in their propensity to evolveindependently among serial repeats. Given initial similar-ities in patterns of standing variation for both characters,we argue in favor of the hypothesis that known differencesin the developmental determination of eyespot colorcomposition and eyespot size affect their ability torespond to antagonistic selection, and thus to evolve inde-pendently in a population under selection.
Page 2 of 13(page number not for citation purposes)
BMC Evolutionary Biology 2008, 8:94 http://www.biomedcentral.com/1471-2148/8/94
Results and DiscussionDifferences in selection response between eyespot color composition and sizeColor composition and size were similarly correlatedbetween the serially repeated eyespots in the B. anynanabase population before selection (color composition:rpearson ± SE = 0.42 ± 0.03, N = 1056, between ventral hind-wing eyespots E4 and E6; size: rpearson ± SE = 0.52 ± 0.02,N = 2254, between anterior and posterior dorsal forewingeyespots). For both characters, most phenotypic variationin the base population lay in the direction of positive cov-ariation between two eyespots but each exhibited substan-tial variation around this main axis (Fig. 1a, d). Previousexperiments demonstrated the genetic basis for these phe-notypic correlations and the presence of substantial addi-tive genetic variation for the size and color of individualeyespots [51,53,55,56]. As expected, both color composi-tion and size responded rapidly to concerted selectionimposed along the main axis of phenotypic variation (Fig.1b, e; Fig. 2a, b). After 10 generations of concerted selec-tion (see Materials and Methods), novel phenotypes welloutside the range of variation in the base population wereproduced: color composition diverged ~2–3 SD (standarddeviations, calculated from the base population) in the'Black-Black' and 'Gold-Gold' directions relative to unse-lected control lines (Fig. 2a, c), and eyespot size diverged~4–6 SD in the 'Large-Large' and 'Small-Small' directionsrelative to unselected controls (Fig. 2b, d). In contrast,responses to antagonistic selection demonstrate that theboundaries of phenotype space are very different for thetwo characters in this population (Fig. 1c, f; Fig. 2a, b).There is little potential for independent evolutionarychange in eyespot color composition, compared with thestrikingly flexible evolution of eyespot sizes.
After 10 generations of antagonistic selection, no novel'uncoupled' eyespot phenotypes appeared in the 'Black-Gold' or 'Gold-Black' directions (Fig. 1c; Fig. 2a, c). Therate of response to antagonistic selection (scaled to thecumulative selection differential; Table 1) is clearly lowerthan the rate of response to selection for concertedchanges in eyespot color composition. In some replicatesthere was no significant response to antagonistic selectionfor color composition (Table 1). Although selection canrapidly shift the mean color composition of the entire eye-spot pattern (Fig. 1b; Fig. 2a, c), there are limits on theindependent evolutionary change of individual eyespots.No comparable limits are apparent for eyespot size; antag-onistic selection ('Large-Small' and 'Small-Large' direc-tions; Fig. 1F, Fig. 2b, d) rapidly produced combinationsof large and small eyespots that were not present in thestarting population [57]. Moreover, the rate of response toantagonistic selection on eyespot size was as high (orhigher, in some replicates) as the rate of response to con-certed selection (Table 1).
Potential causes of the difference in selection responseOur results show that under similar selection regimes,there are strong limits on the independent evolution ofeyespot color composition that do not exist for eyespotsize. This difference in evolutionary response occurreddespite the fact that both characters exhibited substantialphenotypic variation in both concerted and antagonisticdirections prior to selection (Fig. 1). Genetic correlations(measured in the outbred stock population; see Materialsand Methods) across the targeted eyespots for color com-position (rG ± SE = 0.68 ± 0.15) and size (rG ± SE = 0.58 ±0.1) suggest that patterns of genetic covariation were alsosimilar for both characters. The magnitude and directionof phenotypic and genetic correlations (and the relation-ship between the two; [58]) is generally taken to indicatethe degree of limitation on the independent evolution oftwo or more characters [27,59-62]. Our experimentalapproach involved investigating the realized potential forindependent evolution among repeats of two characterswith similar patterns of standing variation known to differin important aspects of their developmental determina-tion. We expected to observe qualitatively similarresponses of color composition and size in all selecteddirections if the patterns of covariation alone were themajor internal factors governing the independent evolu-tion of eyespot characters. While we argue that the degreeof compartmentalization of the developmental mecha-nisms differs between color composition and size, we dis-cuss additional factors that may also explain the observedevolutionary responses.
Compartmentalization of focal signalingOur results demonstrate much greater flexibility in theevolutionary response of eyespot sizes compared withcolor composition, despite the fact that both are charac-teristics of the same serially repeated color pattern ele-ments on the wings of B. anynana. One explanation forthis pattern is that the developmental pathways that regu-late production of the focal signal (and determine eyespotsize; [50,51,63]) are much more flexible and more easilydecoupled across a wing surface than the pathways thatregulate the threshold level of response to signal concen-trations (and determine eyespot color composition;[52,53,64,65]). Each eyespot-competent area along thewing margin produces its own eyespot organizer [51,66].This process appears to involve independent genetic con-trol of organizer properties; single eyespots can be inde-pendently added to or eliminated from forewing orhindwing surfaces, without affecting the characteristics ofeyespots in adjacent wing cells [67,68]. Eyespots aredeleted from wing surfaces when focal establishment failsin specific wing cells [67,68], and eyespot-specific alleliceffects are associated with changes in size of individualeyespots [66]. The wing veins act to further compartmen-talize the signaling foci across a wing surface [45]. Com-
Page 3 of 13(page number not for citation purposes)

BMC Evolutionary Biology 2008, 8:94 http://www.biomedcentral.com/1471-2148/8/94
Page 4 of 13(page number not for citation purposes)
Distribution of eyespot phenotypes before and after selectionFigure 1Distribution of eyespot phenotypes before and after selection. Bivariate phenotype distributions of eyespot color composition and size before and after artificial selection. A-C, color composition of ventral hindwing eyespots E4 and E6; D-F, size of dorsal forewing anterior and posterior eyespots. In all panels, grey points illustrate phenotype distributions in the start-ing populations at Generation 0. B and E, distribution of concerted selection lines at Generation 10 relative to Generation 0 (B: 'Black-Black' selected lines in red, 'Gold-Gold' selected lines in blue; E: 'Large-Large' lines in red, 'Small-Small' lines in blue). C and F, distribution of antagonistic selection lines at Generation 10 relative to Generation 0 (C: 'Black-Gold' in blue, 'Gold-Black' in red; F: 'Small-Large' in blue, 'Large-Small' in red). Filled and solid points denote replicates in each selection direction. All data for Generation 10 are shown relative to trait values at Generation 0 (see Materials and Methods for details of trait estimation and selection). Before selection, color composition and size are both positively correlated across pairs of eyespots, but each shows substantial variation in the direction corresponding to antagonistic selection (shown in Figure 2). For Genera-tion 0, N = 1056 for color composition and N = 2254 for size; sample sizes for individual selection lines at Generation 10 ranged from N = 179 to N = 228 (color composition) and from N = 191 to N = 245 (size).

BMC Evolutionary Biology 2008, 8:94 http://www.biomedcentral.com/1471-2148/8/94
Page 5 of 13(page number not for citation purposes)
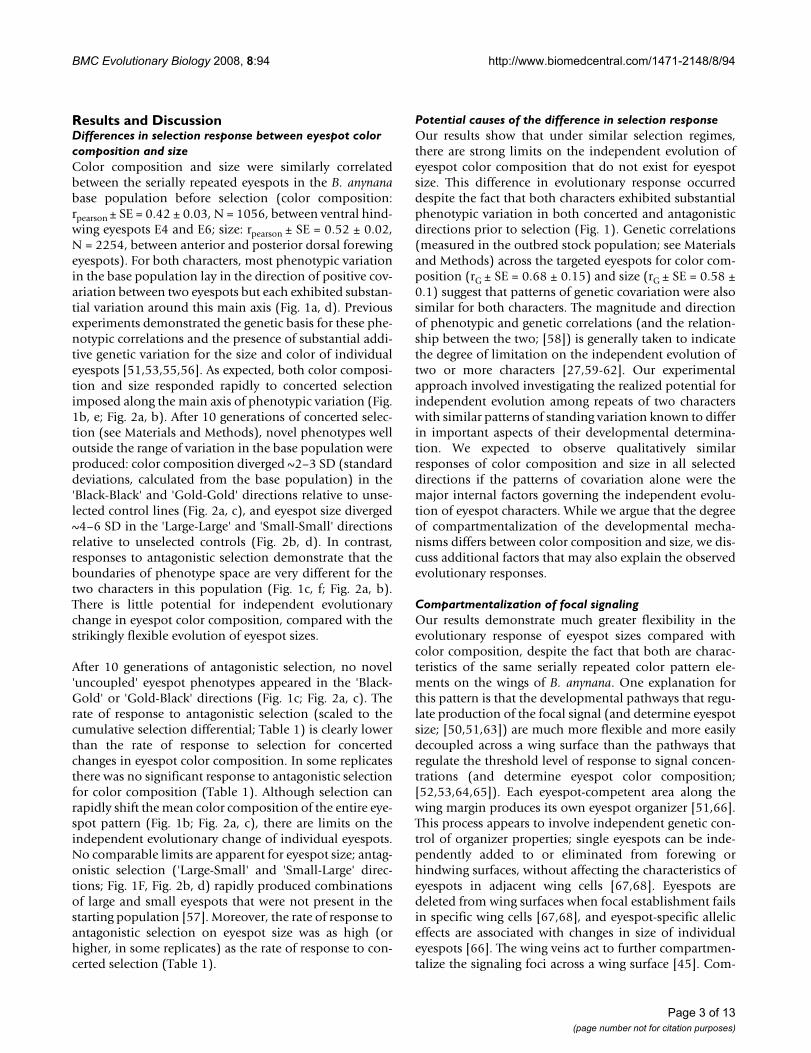
Response to artificial selection for concerted and antagonistic changes in eyespot color composition and sizeFigure 2Response to artificial selection for concerted and antagonistic changes in eyespot color composition and size. A and B, Response each generation relative to unselected control values, plotted in phenotypic standard deviations from the starting population mean. Both characters were selected for concerted (black points and lines) and antagonistic (grey) change in two eyespots, filled and solid points represent replicate populations. Lines join points in consecutive generations and mean phenotypes for the starting populations are plotted at the origin. A, Selection for color composition of the fourth and sixth ventral hindwing eyespots (E4 and E6): 'BB' ('Black-Black') and 'GG' ('Gold-Gold') are concerted directions; 'BG' ('Black-Gold') and 'GB' ('Gold-Black') are antagonistic directions. B, Selection for size (relative to wing size) of the anterior and posterior eye-spots on the dorsal forewing: 'LL' ('Large-Large') and 'SS' ('Small-Small') are concerted directions; 'LS' ('Large-Small') and 'SL' ('Small-Large') are antagonistic directions. C and D, Representative phenotypes for each selected direction in generation 10 (C, ventral hindwings shown for color composition lines; D, dorsal forewings shown for eyespot size lines; wings arranged according to axes in A and B).

BMC Evolutionary Biology 2008, 8:94 http://www.biomedcentral.com/1471-2148/8/94
partmentalization (or modular organization; [10]) in theregulation of initially identical developmental programsis considered critical to the evolutionary divergence ofserial repeats [69]. Selection acting on heritable, inde-pendent variation in developmental regulation can pro-mote evolutionary diversification, even when similaritiesin underlying developmental programs contribute to pos-itive covariation among the characters [70].
Wing-wide responses to signal thresholdsIn contrast, the observed tight coupling of color composi-tion across eyespots may result from a lack of compart-mentalization in the regulation of threshold levels ofresponse to the concentration gradient of the diffusingfocal signal. Cells in the region surrounding the eyespotfocus exhibit a threshold response to local signal concen-tration, which induces the expression of regulatory genesthat control pigment synthesis (Fig. 3a–f; [45,52,53]).Earlier experiments clearly demonstrate that the signalingand response components of eyespot determination canbe selected independently, and that selection for eyespotcolor composition affects only the level of thresholdresponse [51,53]. In our experiment, concerted selectionfor eyespot color composition altered the response prop-erties of the wing epidermis, even in regions of the wingthat do not normally produce an eyespot and were notdirectly targeted by selection. The color composition ofectopic eyespots induced on wings of butterflies from con-certed selection lines (Fig. 4) further suggest that thethreshold response is not compartmentalized across com-parable regions of a wing surface (spanning at least three
wing cells) where there is clear compartmentalization offocal signaling [67,68]. If threshold response is regulatedacross regions spanning several wing cells (or across anentire wing surface [71]), variation in the color composi-tion of two eyespots (Fig. 1a) might result from randomperturbations during the development of individual wingcompartments, not from independent heritable variationin response properties. Although the developmental-genetic architecture of the processes that regulate eyespotcolor composition requires further characterization, wesuggest that the extent to which focal signaling andresponse thresholds are compartmentalized is a criticalfactor determining the potential for evolutionary changein the wing color pattern.
Sources of covariation across wing surfacesSelection targeted pairs of eyespots on two wing surfacesthat differ in both morphology and ecological function.Eyespots on the dorsal [48] and ventral [47] wing surfacesare thought to function differently in B. anynana; how-ever, all eyespots are determined by similar spatial andtemporal patterns of gene expression [63,72] regardless oftheir location. This shared development appears to play aprimary role in shaping covariation and strongly integrat-ing eyespots among all wing surfaces in Nymphalid but-terflies [44,73-76], although functional differentiation ofsome wing characters can also affect patterns of covaria-tion [77]. Single- [51,53] and multi-trait selection on eye-spot size [55] has demonstrated that the evolutionarypotential of eyespots on all wing surfaces is strongly cou-pled and differs little among wing surfaces, despite differ-ences in morphology or function. Antagonistic selectiontargeting the size of the two dorsal forewing eyespots alsouncoupled individual eyespots on the ventral hindwing.The relative sizes of ventral hindwing eyespots E4 and E6(the targets of selection for color composition) differed by~2 SD in the antagonistic selection lines compared tounselected controls ([55]; ANOVA for effect of selectiondirection: F4,495 = 67.7, P < 0.0001; Tukey's HSD for rela-tive size of eyespots 4 and 6 in 'Large-Small' vs 'Small-Large' lines: t396 = 8.3, Padj < 0.001). Thus the ability todecouple eyespot sizes by selection is clearly not limitedto the dorsal forewing. In contrast, across a similar spatialregion of the ventral hindwing (two eyespots separated byan intervening wing cell), eyespot color composition isstrongly coupled and antagonistic selection cannot pro-duce independent evolutionary changes.
Alternative explanationsWe suggest that known differences in the developmentaldetermination of eyespot color composition and size con-tribute to qualitative differences in their responses toantagonistic selection. However, our experiments do notrule out the possibility that other factors contributed tothese differences. In addition to developmental con-
Table 1: Rates of response to concerted and antagonistic selection.
Color composition SizeLine Eyespot 4 Eyespot 6 Line Anterior Posterior
BB1 0.169 a 0.146 d LL1 0.331 h 0.308 n
BB2 0.097 b 0.095 e LL2 0.350 h 0.301 n
GG1 0.123 b 0.110 e SS1 0.300 h, i 0.370 l, m
GG2 0.191 a 0.161 d SS2 0.292 i 0.358 m
BG1 0.016 NS c 0.034f LS1 0.300 h, i 0.437 k
BG2 0.026† c 0.032f LS2 0.318 h, i 0.427 k, l
GB1 0.018 NS c 0.017‡f, g SL1 0.202 j 0.264 n
GB2 0.038 c 0.002 NS g SL2 0.290 i 0.265 n
ANCOVA 33.94** 26.33** 2.66* 10.04**
Values represent slopes from the regression of response to selection on cumulative selection differential, shown for each target eyespot in the color composition and size experiments. Rates of response were significantly different from zero with P < 0.001 except those marked by † (P < 0.005), ‡ (P < 0.01), and NS (P > 0.05). Nested analysis of covariance (ANCOVA) F-values are given for the interaction effect of cumulative selection differential by line nested within selection direction (df = 7,72); **P < 0.0001, *P < 0.01. Superscripts refer to slopes, for each eyespot within an experiment that were judged not significantly different from each other according to Tukey's pairwise multiple comparisons (α = 0.05).
Page 6 of 13(page number not for citation purposes)

BMC Evolutionary Biology 2008, 8:94 http://www.biomedcentral.com/1471-2148/8/94
straints or biases, factors that may limit the evolution ofcharacter combinations include the effects of past selec-tion, the effects of inbreeding or genetic background, theaction of maternal effects or gene-by-environment inter-actions, asymmetric gene frequencies or other differencesin patterns of allelic effects, linkage disequilibrium or
physical linkage, and correlation with other fitness-relatedcharacters (reviewed in [78,79]). Regardless of the precisemechanism, differences in selection response are unlikelyto have been caused by differences in the two experimen-tal populations. Both starting populations were derivedfrom the same outbred stock population, which was well
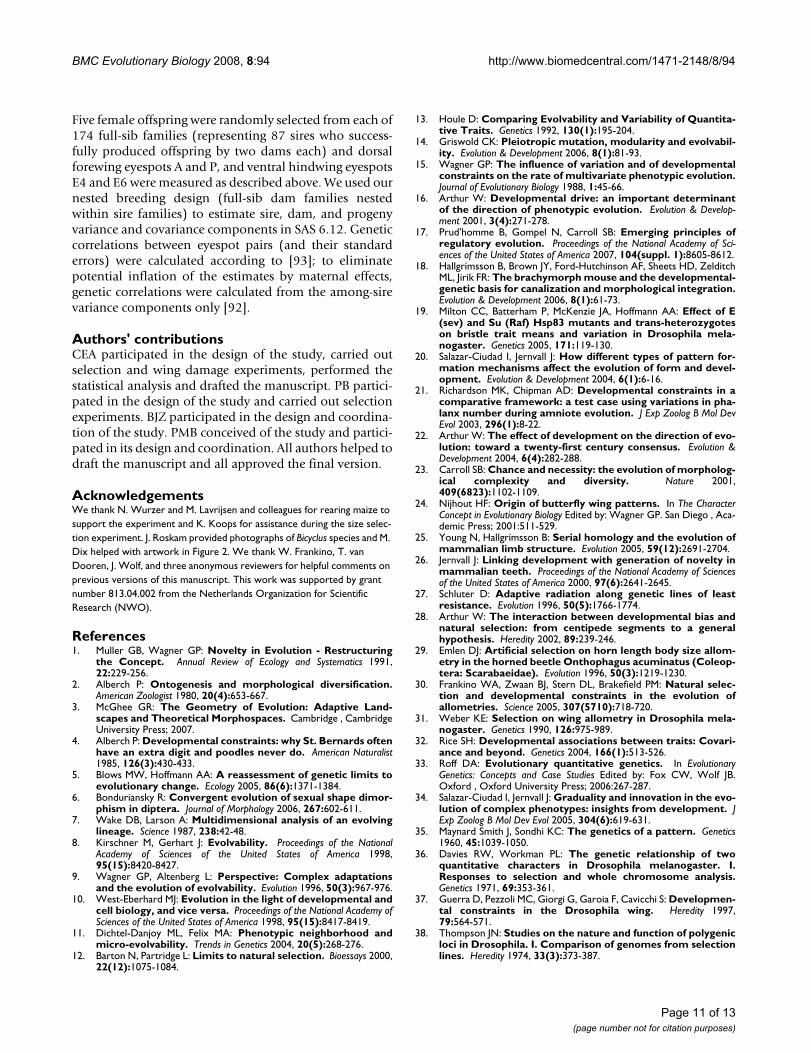
Model for the evolutionary diversification of eyespot size and color compositionFigure 3Model for the evolutionary diversification of eyespot size and color composition. A and D, phenotypes represent-ing presumed 'ancestral' and 'derived' eyespot patterns, respectively. B and E, schematics illustrating the strength of the focal signal (size of the black dot) and the level of threshold response (shading of the wing background) for the two phenotypes. In C, eyespot foci at two positions on an 'ancestral' wing surface (x-axis) produce the same amount of a diffusing morphogen (brown curve). The threshold concentration of morphogen inducing black pigment formation (black horizontal line) is higher than the gold-inducing threshold (yellow horizontal line). Size and color composition are the same for both eyespots. In F, eye-spot foci on a 'derived' wing surface produce different amounts of the morphogen signal (brown curves) and consequently dif-fer in total size. When the threshold for black pigment production is increased, both eyespots are proportionately 'golder,' since threshold concentration is a property of the whole wing surface. G-K, Bicyclus wing patterns illustrating variation in eye-spot color composition (across species, but not within a wing surface) and size (across species and individual eyespots). G, eye-spots relatively black (B. analis); H, eyespots relatively gold (B. buea); I-K, clear individualization of eyespot size but not color composition within a wing surface (left to right: B. italus, B. maesseni, B. milyas).
Page 7 of 13(page number not for citation purposes)

BMC Evolutionary Biology 2008, 8:94 http://www.biomedcentral.com/1471-2148/8/94
adapted to the laboratory and maintained at high effectivepopulation size [80] before selection began, and bothexperiments were conducted under similar environmentalconditions. Consequently, neither differences in allele fre-quencies between the starting populations, nor in theinteractions between genetic background and environ-mental conditions across experiments [81] are likely toexplain the qualitative differences in selection responsebetween the two characters.
Differences in the history (form and/or intensity) of natu-ral selection acting on eyespot color composition and eye-spot size is one possible source of differences between thecharacters that could influence their responses to antago-nistic selection. Selection favoring specific character com-binations can build or contribute to phenotypic andgenetic covariation [30,36,37,82] via linkage disequilib-rium. This type of covariation is expected to break downrapidly under antagonistic selection [83], and the break-down of linkage disequilibrium created by past naturalselection on eyespot size (for combinations of overalllarger or smaller eyespots) may have contributed to therapid independent evolution of eyespot sizes under antag-onistic selection [57]. Differences in past selection actingon color composition and size provides one possiblemechanism for differences in the underlying basis of cov-
ariation between the two characters. As comparable pat-terns of covariation may be reached through manydifferent developmental or genetic mechanisms [84,85],this does not exclude our developmental hypothesis.
Our experiment explored whether limits exist on the evo-lution of particular types of eyespot combinations givenstanding variation in a population (Fig. 1a, d). Change inpatterns of allelic interaction or allele frequency fromthose currently available in the population could affectthe trait combinations or range of morphologies that canbe reached via selection [34,79,84-86]. It is also possiblethat antagonistic selection acted on rare variants for eye-spot size that, by chance, were not present for eyespotcolor composition in the stock population. Though ourexperiment does not rule out effects of several differentunderlying mechanisms, our results are consistent withtheory suggesting that the mechanistic basis of charactercovariation is a more important predictor of evolutionarychange than the correlation estimates alone [5,32,84,85].Because developmental interactions both shape patternsof phenotypic and genetic covariation among charactersand evolve in response to selection acting on those char-acters [9,87], genetic architecture, developmental mecha-nisms, and population-genetic processes interact incomplex ways [88]. Understanding how these factors
Selection for eyespot color composition affects response properties of the wing epidermisFigure 4Selection for eyespot color composition affects response properties of the wing epidermis. Ectopic eyespots (arrows) were produced following damage to a non-focal position on the dorsal forewing 17 hours after pupation. Damage induces spatio-temporal patterns of gene expression in the surrounding tissue that mimic the response to diffusing focal signals [94] and results in an ectopic eyespot centered on the damaged site [46], located between the anterior (A) and posterior (P) eyespots. The color composition of ectopic eyespots was significantly different between 'GG' selected lines (A and B) and 'BB' selected lines (C and D; ANCOVA for effect of selection direction: F2,138 = 4.25, P < 0.01; Tukey's HSD: 'GG' vs. 'BB,' t138 = 6.7, Padj < 0.0001). The ectopic eyespots reveal evolutionary changes in the response properties of wing epidermal tissue after concerted selection for color composition. Earlier focal grafting and non-focal damage experiments [51, 53] demonstrate that selection for eyespot size mainly affects properties of the focal signal and the size of ectopic eyespots does not differ between lines selected for large and small eyespots [53, 95].
Page 8 of 13(page number not for citation purposes)

BMC Evolutionary Biology 2008, 8:94 http://www.biomedcentral.com/1471-2148/8/94
interact to shape the evolution of complex traits, such asbutterfly wing patterns, requires further detailed dissec-tion of underlying mechanisms.
Diversification within the lineagePhylogenetic patterns of morphological diversity are gen-erally consistent with the idea that development limits theability of species to occupy phenotype space (reviewed in[21]). In B. anynana, despite similar patterns of standingvariation for eyespot color composition and size in thebase population, responses to artificial antagonistic selec-tion show that these two characteristics of the eyespot pat-tern do not evolve in the same way under similarantagonistic selection regimes. Moreover, these differ-ences, found within a single B. anynana population, areconsistent with wing pattern diversity across the genus(Fig. 3g–k; see also [89]). Among Bicyclus species, eyespotcolor composition seems to have evolved along a line of'least resistance' [27,28] parallel to the main axis of varia-tion in B. anynana. In contrast, eyespot size has explored alarger area of potential phenotype space along the 'uncou-pling' axis [90].
ConclusionA number of studies suggest that natural selection plays adominant role in morphological evolution and the distri-bution of lineages in phenotype space[29,30,36,39,57,91]. However, a growing body of evi-dence shows that developmental mechanisms and indi-vidual components of developmental gene networks candiffer in their effects on phenotypic variation [19,20,54],and presumably, bias or limit adaptive morphologicalevolution. Here we compared two characters that showsimilar patterns of standing variation in a population, butdiffer in an important aspect of their developmental deter-mination. These characters evolve differently under artifi-cial antagonistic selection, in a manner consistent withthe developmental differences between them, though wecannot rule out the effects of other internal factors or proc-esses besides, or in addition to, development. Butterflycolor patterns and other complex forms we see in natureresult from novel combinations of their individual ele-ments. We suggest that compartmentalized developmentenables the production of novel phenotypes when selec-tion favors independent changes in these elements. Undersimilar selection, developmental mechanisms that are lesscompartmentalized may limit the range of likely evolu-tionary outcomes.
MethodsSelected traitsIn Bicyclus anynana, two eyespots are present on the dorsalforewing (anterior, A, and posterior, P) and seven on theventral hindwing (eyespots E1–E7). In separate experi-ments, we selected for the relative size (the ratio of total
eyespot diameter divided by the distance between thecenters of A and P; [57]) or the color composition (thesize of the black color ring relative to total eyespot diam-eter) of two eyespots simultaneously. Selection for eye-spot size targeted the two dorsal forewing eyespots [57].The results of size selection showed that selection touncouple A and P also uncoupled the relative sizes ofanterior and posterior groups of ventral hindwing eye-spots, and that the division between the two groups ofventral hindwing eyespots lay between E4 and E6 [55].Thus, we chose to select on the color composition of E4and E6 because: 1) the size experiment showed that thesetwo eyespots could be decoupled, even when they weretargeted only indirectly by selection (see Results and Dis-cussion); and 2) color composition is a function of totaleyespot diameter, so it was necessary to choose two eye-spots of initially similar size and color compositionbefore selection.
The starting population for each experiment was derivedfrom an outbred stock maintained in the laboratory for >100 generations at high Ne [80]. For each trait we estab-lished three types of lines from the stock population: 1)antagonistic selection lines where two eyespots wereselected in opposite direction (large A and small P, 'Large-Small,' or the opposite combination 'Small-Large'; E4gold and E6 black, 'Gold-Black,' or the opposite combina-tion 'Black-Gold'); 2) concerted selection lines where twoeyespots were selected in the same direction ('Gold-Gold,'or 'Black-Black'; 'Large-Large,' or 'Small-Small'); and 3)unselected control (UC) lines.
To estimate eyespot color composition, total diameterand the diameter of the inner black disc of E4 and E6 weremeasured in the proximal-distal axis, along the midline ofeach eyespot (parallel to the wing veins). Color composi-tion of an eyespot was estimated from the orthogonal(Type II) regression of black disc diameter on total eyespotdiameter. In this analysis, positive and negative residualsindicate relatively black and relatively gold eyespots,respectively. To identify individuals for selection, we per-formed an additional orthogonal regression of E4 colorcomposition on E6 color composition (from the previousregression). The regression line is similar to the axis of thefirst principal component. For concerted selection, weranked the residuals parallel to the regression line (similarto individual loadings on the first principal component);extreme positive or negative residuals indicated that botheyespots were relatively black or relatively gold, respec-tively. For antagonistic selection, we ranked the residualsperpendicular to the regression line (similar to individualloadings on the second, orthogonal, principal componentaxis); extreme positive residuals indicated individualswhere E4 was relatively black compared to E6, andextreme negative residuals indicated individuals where E6
Page 9 of 13(page number not for citation purposes)

BMC Evolutionary Biology 2008, 8:94 http://www.biomedcentral.com/1471-2148/8/94
was relatively black compared to E4. Selection for eyespotsize was made on the basis of the additive combination ofthe ranks for each individual eyespot as explained in [44].There were two replicates of each selection and each UCline, with one additional UC replicate in the size experi-ment. To estimate correlations between eyespot charactersin the base population, we calculated Pearson product-moment correlations between the target eyespots in thestarting population for each experiment.
Selection procedureFemale butterflies were selected for 10 generations. Forthe color composition experiment, 1056 females weremeasured and randomly split into two groups and 40females were randomly drawn from each group to estab-lish the UC lines. Within each group, the remainingfemales were ranked and the 40 females with the mostextreme phenotypes in each direction were selected, sothat each selection line was replicated twice in total. Forthe size experiment, 2254 females were measured andrandomly split into two groups after 40 females weredrawn to establish the first UC line [44]. All selectedfemales were placed with ~50 randomly chosen males andallowed to lay eggs. Rearing conditions for the stock pop-ulation and selected lines have been described previously[51]. We maintained similar selection intensities in bothexperiments for generations 1–10: each line, per genera-tion, we measured 140–240 females for color composi-tion (mean ± SE: 209 ± 5) and 15–200 females for size(mean ± SE: 173 ± 3). We selected 40 females per lineevery generation in the color experiment; in the size exper-iment the number decreased to 35 females between gen-erations 5–10 [44].
Selection responseEach generation, trait values for each replicate line werecalculated relative to their respective UC lines. A least-squares regression of selection response on cumulativeselection differential was used to estimate the rate ofresponse to selection for each replicate. We used nestedanalysis of covariance (ANCOVA) to test for differences inthe rate of response between selection directions, with'cumulative selection differential' as the covariate and'replicate within direction' as a random effect. Tukey'smultiple comparisons were used to compare responses ofindividual replicates when there was a significant interac-tion between the two main factors in the nested ANCOVA.Analyses were conducted using PROC GLM in SAS version6.12 (SAS Institute, 1996).
Induction of ectopic eyespotsDamage to pupal wings in the first 18 hours after pupa-tion induces formation of ectopic eyespots on the dorsalforewing [46] and can be used to assay the thresholdresponse of wing tissue to eyespot-inducing signals
[46,53]. To determine the effect of selection for eyespotcolor composition on this threshold response, we dam-aged the pupal wings of females in each of the Black-Black, Gold-Gold, and UC lines and measured the colorcomposition of the resulting ectopic eyespots. The experi-ment was conducted during generation 14 (lines weremaintained under random mating conditions after gener-ation 10, with 40 females and 55 males selected at ran-dom and ~250 offspring reared per line per generation).
To reduce the size of native eyespots (A and P) on the dor-sal forewing and increase visibility of the induced ectopic,we first pierced the foci of the anterior and posterior eye-spots on the left dorsal forewing of each individual 4.5hours after pupation with a finely sharpened tungstenneedle [46]. We then induced ectopic eyespots by piercingeach of the left forewings at a site in the fourth wing cell(immediately distal to the normal location of the eye-spots) 17 hours after pupation. We returned operatedpupae to 27°C, froze newly emerged adults (after theirwings had fully hardened), and measured the total diam-eter and inner black diameter of ectopic eyespots and theinterpupil distance between the reduced A and P eyespotson each manipulated (left) wing. We also measured thetotal diameter and black disc diameter of P on the rightdorsal forewing, and the interpupil distance on thisunmanipulated (right) wing.
We used ANCOVA to test for differences in color compo-sition of ectopic eyespots among Black-Black, Gold-Gold,and UC lines. With 'total ectopic diameter' as the covari-ate, we examined the fixed effect of 'selection direction(control, black, or gold)' and the random effect of 'repli-cate line nested within direction' on the size of the ectopicblack disc. None of the interaction terms (selection direc-tion by covariate and random effect by covariate) were sig-nificant and we used Tukey's HSD to test for differences inthe adjusted means between Black-Black, Gold-Gold, andUC lines.
Estimates of genetic covariation in the stock populationWe used a paternal half-sib breeding design [92] to esti-mate quantitative genetic parameters in our outbred stockpopulation. We randomly selected 100 virgin males fromthe stock population at adult eclosion; each male wasmated sequentially to 2 virgin females. At hatching, ~30eggs per female were transferred to mesh rearing cages andfed on young maize plants ad libitum until pupation.Full-sib offspring were reared together but densities werekept low to minimize interaction and competitionbetween individuals. Rearing cages were moved every 4days to randomize environmental effects within thegrowth chamber. Emerging adult offspring were allowedseveral hours for their wings to expand and fully hardenbefore being frozen for later analysis.
Page 10 of 13(page number not for citation purposes)
BMC Evolutionary Biology 2008, 8:94 http://www.biomedcentral.com/1471-2148/8/94
Five female offspring were randomly selected from each of174 full-sib families (representing 87 sires who success-fully produced offspring by two dams each) and dorsalforewing eyespots A and P, and ventral hindwing eyespotsE4 and E6 were measured as described above. We used ournested breeding design (full-sib dam families nestedwithin sire families) to estimate sire, dam, and progenyvariance and covariance components in SAS 6.12. Geneticcorrelations between eyespot pairs (and their standarderrors) were calculated according to [93]; to eliminatepotential inflation of the estimates by maternal effects,genetic correlations were calculated from the among-sirevariance components only [92].
Authors' contributionsCEA participated in the design of the study, carried outselection and wing damage experiments, performed thestatistical analysis and drafted the manuscript. PB partici-pated in the design of the study and carried out selectionexperiments. BJZ participated in the design and coordina-tion of the study. PMB conceived of the study and partici-pated in its design and coordination. All authors helped todraft the manuscript and all approved the final version.
AcknowledgementsWe thank N. Wurzer and M. Lavrijsen and colleagues for rearing maize to support the experiment and K. Koops for assistance during the size selec-tion experiment. J. Roskam provided photographs of Bicyclus species and M. Dix helped with artwork in Figure 2. We thank W. Frankino, T. van Dooren, J. Wolf, and three anonymous reviewers for helpful comments on previous versions of this manuscript. This work was supported by grant number 813.04.002 from the Netherlands Organization for Scientific Research (NWO).
References1. Muller GB, Wagner GP: Novelty in Evolution - Restructuring
the Concept. Annual Review of Ecology and Systematics 1991,22:229-256.
2. Alberch P: Ontogenesis and morphological diversification.American Zoologist 1980, 20(4):653-667.
3. McGhee GR: The Geometry of Evolution: Adaptive Land-scapes and Theoretical Morphospaces. Cambridge , CambridgeUniversity Press; 2007.
4. Alberch P: Developmental constraints: why St. Bernards oftenhave an extra digit and poodles never do. American Naturalist1985, 126(3):430-433.
5. Blows MW, Hoffmann AA: A reassessment of genetic limits toevolutionary change. Ecology 2005, 86(6):1371-1384.
6. Bonduriansky R: Convergent evolution of sexual shape dimor-phism in diptera. Journal of Morphology 2006, 267:602-611.
7. Wake DB, Larson A: Multidimensional analysis of an evolvinglineage. Science 1987, 238:42-48.
8. Kirschner M, Gerhart J: Evolvability. Proceedings of the NationalAcademy of Sciences of the United States of America 1998,95(15):8420-8427.
9. Wagner GP, Altenberg L: Perspective: Complex adaptationsand the evolution of evolvability. Evolution 1996, 50(3):967-976.
10. West-Eberhard MJ: Evolution in the light of developmental andcell biology, and vice versa. Proceedings of the National Academy ofSciences of the United States of America 1998, 95(15):8417-8419.
11. Dichtel-Danjoy ML, Felix MA: Phenotypic neighborhood andmicro-evolvability. Trends in Genetics 2004, 20(5):268-276.
12. Barton N, Partridge L: Limits to natural selection. Bioessays 2000,22(12):1075-1084.
13. Houle D: Comparing Evolvability and Variability of Quantita-tive Traits. Genetics 1992, 130(1):195-204.
14. Griswold CK: Pleiotropic mutation, modularity and evolvabil-ity. Evolution & Development 2006, 8(1):81-93.
15. Wagner GP: The influence of variation and of developmentalconstraints on the rate of multivariate phenotypic evolution.Journal of Evolutionary Biology 1988, 1:45-66.
16. Arthur W: Developmental drive: an important determinantof the direction of phenotypic evolution. Evolution & Develop-ment 2001, 3(4):271-278.
17. Prud'homme B, Gompel N, Carroll SB: Emerging principles ofregulatory evolution. Proceedings of the National Academy of Sci-ences of the United States of America 2007, 104(suppl. 1):8605-8612.
18. Hallgrímsson B, Brown JY, Ford-Hutchinson AF, Sheets HD, ZelditchML, Jirik FR: The brachymorph mouse and the developmental-genetic basis for canalization and morphological integration.Evolution & Development 2006, 8(1):61-73.
19. Milton CC, Batterham P, McKenzie JA, Hoffmann AA: Effect of E(sev) and Su (Raf) Hsp83 mutants and trans-heterozygoteson bristle trait means and variation in Drosophila mela-nogaster. Genetics 2005, 171:119-130.
20. Salazar-Ciudad I, Jernvall J: How different types of pattern for-mation mechanisms affect the evolution of form and devel-opment. Evolution & Development 2004, 6(1):6-16.
21. Richardson MK, Chipman AD: Developmental constraints in acomparative framework: a test case using variations in pha-lanx number during amniote evolution. J Exp Zoolog B Mol DevEvol 2003, 296(1):8-22.
22. Arthur W: The effect of development on the direction of evo-lution: toward a twenty-first century consensus. Evolution &Development 2004, 6(4):282-288.
23. Carroll SB: Chance and necessity: the evolution of morpholog-ical complexity and diversity. Nature 2001,409(6823):1102-1109.
24. Nijhout HF: Origin of butterfly wing patterns. In The CharacterConcept in Evolutionary Biology Edited by: Wagner GP. San Diego , Aca-demic Press; 2001:511-529.
25. Young N, Hallgrímsson B: Serial homology and the evolution ofmammalian limb structure. Evolution 2005, 59(12):2691-2704.
26. Jernvall J: Linking development with generation of novelty inmammalian teeth. Proceedings of the National Academy of Sciencesof the United States of America 2000, 97(6):2641-2645.
27. Schluter D: Adaptive radiation along genetic lines of leastresistance. Evolution 1996, 50(5):1766-1774.
28. Arthur W: The interaction between developmental bias andnatural selection: from centipede segments to a generalhypothesis. Heredity 2002, 89:239-246.
29. Emlen DJ: Artificial selection on horn length body size allom-etry in the horned beetle Onthophagus acuminatus (Coleop-tera: Scarabaeidae). Evolution 1996, 50(3):1219-1230.
30. Frankino WA, Zwaan BJ, Stern DL, Brakefield PM: Natural selec-tion and developmental constraints in the evolution ofallometries. Science 2005, 307(5710):718-720.
31. Weber KE: Selection on wing allometry in Drosophila mela-nogaster. Genetics 1990, 126:975-989.
32. Rice SH: Developmental associations between traits: Covari-ance and beyond. Genetics 2004, 166(1):513-526.
33. Roff DA: Evolutionary quantitative genetics. In EvolutionaryGenetics: Concepts and Case Studies Edited by: Fox CW, Wolf JB.Oxford , Oxford University Press; 2006:267-287.
34. Salazar-Ciudad I, Jernvall J: Graduality and innovation in the evo-lution of complex phenotypes: insights from development. JExp Zoolog B Mol Dev Evol 2005, 304(6):619-631.
35. Maynard Smith J, Sondhi KC: The genetics of a pattern. Genetics1960, 45:1039-1050.
36. Davies RW, Workman PL: The genetic relationship of twoquantitative characters in Drosophila melanogaster. I.Responses to selection and whole chromosome analysis.Genetics 1971, 69:353-361.
37. Guerra D, Pezzoli MC, Giorgi G, Garoia F, Cavicchi S: Developmen-tal constraints in the Drosophila wing. Heredity 1997,79:564-571.
38. Thompson JN: Studies on the nature and function of polygenicloci in Drosophila. I. Comparison of genomes from selectionlines. Heredity 1974, 33(3):373-387.
Page 11 of 13(page number not for citation purposes)
http://www.ncbi.nlm.nih.gov/entrez/query.fcgi?cmd=Retrieve&db=PubMed&dopt=Abstract&list_uids=9671692
http://www.ncbi.nlm.nih.gov/entrez/query.fcgi?cmd=Retrieve&db=PubMed&dopt=Abstract&list_uids=9671691
http://www.ncbi.nlm.nih.gov/entrez/query.fcgi?cmd=Retrieve&db=PubMed&dopt=Abstract&list_uids=9671691
http://www.ncbi.nlm.nih.gov/entrez/query.fcgi?cmd=Retrieve&db=PubMed&dopt=Abstract&list_uids=1732160
http://www.ncbi.nlm.nih.gov/entrez/query.fcgi?cmd=Retrieve&db=PubMed&dopt=Abstract&list_uids=1732160
http://www.ncbi.nlm.nih.gov/entrez/query.fcgi?cmd=Retrieve&db=PubMed&dopt=Abstract&list_uids=2127580
http://www.ncbi.nlm.nih.gov/entrez/query.fcgi?cmd=Retrieve&db=PubMed&dopt=Abstract&list_uids=2127580
http://www.ncbi.nlm.nih.gov/entrez/query.fcgi?cmd=Retrieve&db=PubMed&dopt=Abstract&list_uids=5002803
http://www.ncbi.nlm.nih.gov/entrez/query.fcgi?cmd=Retrieve&db=PubMed&dopt=Abstract&list_uids=5002803
http://www.ncbi.nlm.nih.gov/entrez/query.fcgi?cmd=Retrieve&db=PubMed&dopt=Abstract&list_uids=9418264
http://www.ncbi.nlm.nih.gov/entrez/query.fcgi?cmd=Retrieve&db=PubMed&dopt=Abstract&list_uids=9418264
http://www.ncbi.nlm.nih.gov/entrez/query.fcgi?cmd=Retrieve&db=PubMed&dopt=Abstract&list_uids=4217334

BMC Evolutionary Biology 2008, 8:94 http://www.biomedcentral.com/1471-2148/8/94
39. Weber KE: How small are the smallest selectable domains ofform? Genetics 1992, 130:345-353.
40. Delph LF, Frey FM, Steven JC, Gehring JL: Investigating the inde-pendent evolution of the size of floral organs via G-matrixestimation and artificial selection. Evolution & Development 2004,6(6):438-448.
41. Rutledge JJ, Eisen EJ, Legates JE: Correlated response in skeletaltraits and replicate variation in selected lines of mice. Theo-retical and Applied Genetics 1974, 46:26-31.
42. Atchley WR, Rutledge JJ, Cowley DE: A multivariate statisticalanalysis of direct and correlated response to selection in therat. Evolution 1982, 36:677-698.
43. Atchley WR, Cowley DE, Eisen EJ, Prasetyo H, Hawkins-Brown D:Correlated response in the developmenal choreographies ofthe mouse mandible to selection for body composition. Evo-lution 1990, 44:669-688.
44. Beldade P, Koops K, Brakefield PM: Modularity, individuality, andevo-devo in butterfly wings. Proceedings of the National Academyof Sciences of the United States of America 2002, 99(22):14262-14267.
45. Nijhout HF: Symmetry systems and compartments in lepi-dopteran wings - the evolution of a patterning mechanism.Development 1994:225-233.
46. Brakefield PM, French V: Eyespot development on butterflywings: the epidermal response to damage. Developmental Biol-ogy 1995, 168:98-111.
47. Lyytinen A, Brakefield PM, Lindstrom L, Mappes J: Does predationmaintain eyespot plasticity in Bicyclus anynana? Proc Biol Sci2004, 271(1536):279-283.
48. Robertson KA, Monteiro A: Female Bicyclus anynana butterflieschoose males on the basis of their dorsal UV-reflective eye-spot pupils. Proc Biol Sci 2005, 272(1572):1541-1546.
49. Nijhout HF: Pattern formation on lepidopteran wings: deter-mination of an eyespot. Developmental Biology 1980,80(2):267-274.
50. Beldade P, Brakefield PM: The genetics and evo-devo of butter-fly wing patterns. Nature Reviews Genetics 2002, 3(6):442-452.
51. Monteiro A, Brakefield PM, French V: The evolutionary geneticsand developmental basis of wing pattern variation in the but-terfly Bicyclus anynana. Evolution 1994, 48(4):1147-1157.
52. Brunetti CR, Selegue JE, Monteiro A, French V, Brakefield PM, CarrollSB: The generation and diversification of butterfly eyespotcolor patterns. Current Biology 2001, 11:1578-1585.
53. Monteiro A, Brakefield PM, French V: Butterfly eyespots: thegenetics and development of the color rings. Evolution 1997,51(4):1207-1216.
54. Nijhout F, Paulsen SM: Developmental models and polygeniccharacters. American Naturalist 1997, 149(2):394-405.
55. Beldade P, Brakefield PM: Concerted evolution and develop-mental integration in modular butterfly wing patterns. Evo-lution & Development 2003, 5(2):169-179.
56. Holloway GJ, Brakefield PM, Kofman S: The genetics of wing pat-tern elements in the polyphenic butterfly, Bicyclus anynana.Heredity 1993, 70:179-186.
57. Beldade P, Koops K, Brakefield PM: Developmental constraintsversus flexibility in morphological evolution. Nature 2002,416(6883):844-847.
58. Klingenberg CP, Leamy LJ: Quantitative genetics of geometricshape in the mouse mandible. Evolution 2001, 55(11):2342-2352.
59. Cheverud JM: Quantitative genetics and developmental con-straints on evolution by selection. Journal of Theoretical Biology1984, 110:155-172.
60. Cheverud JM: A comparison of genetic and phenotypic corre-lations. Evolution 1988, 42:958-968.
61. Lande R: Quantitative genetic analysis of multivariate evolui-ton, applied to brain: body allometry. Evolution 1979,33:402-416.
62. Arnold SJ: Constraints on phenotypic evolution. American Natu-ralist 1992, 140:S85-S107.
63. Nijhout HF, Rountree DB: Pattern induction across a homeoticboundary in the wings of Precis coenia (Lepidoptera: Nym-phalidae). International Journal of Insect Morphology and Embryology1995, 24:243-251.
64. French V, Brakefield PM: Eyespot development on butterflywings: the focal signal. Developmental Biology 1995, 168:112-123.
65. Nijhout HF: The Development and Evolution of ButterflyWing Patterns. Washington, D.C. , Smithsonian Institute Press;1991.
66. Beldade P, Brakefield PM, Long AD: Contribution of Distal-less toquantitative variation in butterfly eyespots. Nature 2002,415(6869):315-318.
67. Monteiro A, Prijs J, Bax M, Hakkaart T, Brakefield PM: Mutants high-light the modular control of butterfly eyespot patterns. Evo-lution & Development 2003, 5(2):180-187.
68. Reed RD, Serfas MS: Butterfly wing pattern evolution is associ-ated with changes in a notch/distal-less temporal pattern for-mation process. Current Biology 2004, 14:1159-1166.
69. Weatherbee SD, Carroll SB: Selector genes and limb identity inarthropods and vertebrates. Cell 1999, 97(April 30):283-286.
70. Klingenberg CP: Developmental constraints, modules, andevolvability. In Variation Edited by: Hallgrimsson B, Hall BK. SanDiego , Academic Press; 2005:219-247.
71. Brakefield PM: The power of evo-devo to explore evolutionaryconstraints: experiments with butterfly eyespots. Zoology2003, 106:283-290.
72. McMillan WO, Monteiro A, Kapan DD: Development and evolu-tion on the wing. Trends in Ecology & Evolution 2002, 17:125-133.
73. Allen CE: The "eyespot module" and eyespots as modules:development, evolution, and integration of a complex phe-notype. J Exp Zoolog B Mol Dev Evol 2008, 310(2):179-190.
74. Paulsen SM: Quantitative genetics of butterfly wing color pat-terns. Developmental Genetics 1994, 15(1):79-91.
75. Paulsen SM, Nijhout HF: Phenotypic correlation structureamong elements of the color pattern in Precis coenia (Lepi-doptera: Nymphalidae). Evolution 1993, 47:593-618.
76. Breuker CJ, Gibbs M, Van Dyck H, Brakefield PM, Klingenberg CP,Van Dongen S: Integration of wings and their eyespots in thespeckled wood butterfly Parage aegeria. J Exp Zoolog B Mol DevEvol 2007, 308(4):454-463.
77. Kingsolver JG, Wiernasz DC: Development, function, and thequantitative genetics of wing melanin pattern in Pieris but-terflies. Evolution 1991, 45(6):1480-1492.
78. Roff DA: A centennial celebration for quantitative genetics.Evolution 2007, 61(5):1017-1032.
79. Rose MR, Passananti HB, Chippindale AK, Phelan JP, Matos M,Teotónio H, Mueller LD: The effects of evolution are local: evi-dence from experimental evolution in Drosophila. Integrativeand Comparative Biology 2005, 45:486-491.
80. Brakefield PM, El Filali E, Van der Laan R, Breuker CJ, Saccheri IJ,Zwaan B: Effective population size, reproductive success andsperm precedence in the butterfly, Bicyclus anynana, in cap-tivity. Journal of Evolutionary Biology 2001, 14(1):148-156.
81. Teotónio H, Rose MR: Variation in the reversibility of evolu-tion. Nature 2000, 408:463-466.
82. Brodie ED III: Genetic correlations between morphology andantipredator behaviour in natural populations of the gartersnake Thamnophis ordinoides. Nature 1989,342(6249):542-543.
83. Lande R: The genetic correlation between characters main-tained by selection, linkage and inbreeding. Genetical Research1984, 44:309-320.
84. Houle D: Genetic covariance of fitness correlates - whatgenetic correlations are made of and why it matters. Evolution1991, 45(3):630-648.
85. Gromko MH: Unpredictability of Correlated Response toSelection - Pleiotropy and Sampling Interact. Evolution 1995,49(4):685-693.
86. Wolf JB, Frankino WA, Agrawal AF, Brodie ED, Moore AJ: Develop-mental interactions and the constituents of quantitative var-iation. Evolution 2001, 55:232-245.
87. Raff RA: The Shape of Life. Chicago , University of Chicago Press;1996.
88. Phillips PC, McGuigan KL: Evolution of genetic variance-covari-ance structure. In Evolutionary Genetics: Concepts and Case StudiesEdited by: Fox CW, Wolf JB. Oxford , Oxford University Press; 2006.
89. Condamin M: Monographie du genre Bicyclus (Lepidoptera:Satyridae). In Memoires de l'Institut Fondamental d'Afrique NoireDakar , IFAN; 1973.
90. Brakefield PM, Roskam JC: Exploring evolutionary constraints.American Naturalist 2006, 168:S4-S13.
Page 12 of 13(page number not for citation purposes)
http://www.ncbi.nlm.nih.gov/entrez/query.fcgi?cmd=Retrieve&db=PubMed&dopt=Abstract&list_uids=1541394
http://www.ncbi.nlm.nih.gov/entrez/query.fcgi?cmd=Retrieve&db=PubMed&dopt=Abstract&list_uids=1541394
http://www.ncbi.nlm.nih.gov/entrez/query.fcgi?cmd=Retrieve&db=PubMed&dopt=Abstract&list_uids=7883082
http://www.ncbi.nlm.nih.gov/entrez/query.fcgi?cmd=Retrieve&db=PubMed&dopt=Abstract&list_uids=7883082
http://www.ncbi.nlm.nih.gov/entrez/query.fcgi?cmd=Retrieve&db=PubMed&dopt=Abstract&list_uids=7004953
http://www.ncbi.nlm.nih.gov/entrez/query.fcgi?cmd=Retrieve&db=PubMed&dopt=Abstract&list_uids=7004953
http://www.ncbi.nlm.nih.gov/entrez/query.fcgi?cmd=Retrieve&db=PubMed&dopt=Abstract&list_uids=6492829
http://www.ncbi.nlm.nih.gov/entrez/query.fcgi?cmd=Retrieve&db=PubMed&dopt=Abstract&list_uids=6492829
http://www.ncbi.nlm.nih.gov/entrez/query.fcgi?cmd=Retrieve&db=PubMed&dopt=Abstract&list_uids=7883067
http://www.ncbi.nlm.nih.gov/entrez/query.fcgi?cmd=Retrieve&db=PubMed&dopt=Abstract&list_uids=7883067
http://www.ncbi.nlm.nih.gov/entrez/query.fcgi?cmd=Retrieve&db=PubMed&dopt=Abstract&list_uids=2586624
http://www.ncbi.nlm.nih.gov/entrez/query.fcgi?cmd=Retrieve&db=PubMed&dopt=Abstract&list_uids=2586624
http://www.ncbi.nlm.nih.gov/entrez/query.fcgi?cmd=Retrieve&db=PubMed&dopt=Abstract&list_uids=2586624
http://www.ncbi.nlm.nih.gov/entrez/query.fcgi?cmd=Retrieve&db=PubMed&dopt=Abstract&list_uids=6530140

BMC Evolutionary Biology 2008, 8:94 http://www.biomedcentral.com/1471-2148/8/94
Publish with BioMed Central and every scientist can read your work free of charge
"BioMed Central will be the most significant development for disseminating the results of biomedical research in our lifetime."
Sir Paul Nurse, Cancer Research UK
Your research papers will be:
available free of charge to the entire biomedical community
peer reviewed and published immediately upon acceptance
cited in PubMed and archived on PubMed Central
yours — you keep the copyright
Submit your manuscript here:http://www.biomedcentral.com/info/publishing_adv.asp
BioMedcentral
91. Conner JK: Artificial selection: a powerful tool for ecologists.Ecology 2003, 84(7):1650-1660.
92. Lynch M, Walsh B: Genetics and analysis of quantitative traits.Sunderland, MA , Sinauer Associates; 1998:980.
93. Becker WA: Manual of Quantitative Genetics. 5th edition. Pull-man, WA , Academic Enterprises; 1992:191.
94. Monteiro A, Glaser G, Stockslager S, Glansdorp N, Ramos D: Com-parative insights into questions of lepidopteran wing patternhomology. BMC Developmental Biology 2006, 6:52.
95. Beldade P, French V, Brakefield PM: Developmental and geneticmechanisms for evolutionary diversification of serialrepeats: eyespot size in Bicyclus anynana butterflies. J ExpZoolog B Mol Dev Evol 2008, 310(2):191-201.
Page 13 of 13(page number not for citation purposes)