Decreases in standing tree-based carbon stocks associated with repeated prescribed fires in a...
13
Full length article Decreases in standing tree-based carbon stocks associated with repeated prescribed fires in a temperate mixed-species eucalypt forest Lauren T. Bennett a,⇑ , Cristina Aponte b , Kevin G. Tolhurst a , Markus Löw a , Thomas G. Baker b a Department of Forest and Ecosystem Science, Melbourne School of Land and Environment, The University of Melbourne, 4 Water Street, Creswick, Victoria 3363, Australia b Department of Forest and Ecosystem Science, Melbourne School of Land and Environment, The University of Melbourne, 500 Yarra Boulevard, Richmond, Victoria 3121, Australia article info Article history: Received 25 March 2013 Received in revised form 3 June 2013 Accepted 16 June 2013 Keywords: Prescribed fire Planned burn Eucalypt forest Carbon Tree growth Tree mortality abstract Prescribed fire is a common management practice in fire-tolerant forests, and one that has potential car- bon costs. Previous assessments of the carbon costs of prescribed fire regimes in temperate Australia have been based on little empirical data, and have focused on direct fire effects (area burnt, fuel consumed) but have largely ignored potentially substantive indirect effects on tree mortality and growth. This study measures effects of four prescribed fire treatments on standing tree-based carbon stocks, and on individ- ual tree growth and mortality, in a fire-tolerant eucalypt forest of south-eastern Australia. Prescribed fire treatments were as a factorial combination of two seasons (autumn or spring) and two frequencies (3- yearly ‘High’, or 10-yearly ‘Low’), were replicated over five study areas, and involved 2–7 low-intensity fires over 27 years. Total standing tree-based carbon stocks (live and dead) were significantly less in prescribed fire than control treatments. However, the mean carbon difference (25 Mg ha 1 ) had a wide 95% confidence inter- val (2–48 Mg ha 1 ), indicating a high degree of uncertainty about the magnitude of prescribed fire effects in these native forests. Overall decreases were consistent with detection of both direct and indirect effects of prescribed fire treatments. Direct combustion effects on bark were minimal (c. 0.2– 0.4 Mg ha 1 ), but were also indicated by significantly less carbon in dead large stems in fire than control treatments despite evidence of marginally increased mortality of individual large stems in the former. Indirect effects of repeated prescribed fires were also detected as significantly decreased mean annual diameter increment of individual large Eucalyptus obliqua over 27 years (particularly of stems 20– 50 cm diameter). With respect to prescribed fire type, small live stem densities and associated carbon stocks were greater in autumn than spring, and in Low than High frequency treatments, and carbon stocks in large dead stems were greater in High than Low frequency treatments. This suggested that c. 10-yearly fires in autumn provided the most scope for maintaining future capacity to fix carbon. None- theless, decreases in total standing tree-based carbon stocks were not significantly different among pre- scribed fire treatments, suggesting tree-based carbon stocks were more influenced by prescribed fire per se than by fire season or frequency. Ó 2013 Elsevier B.V. All rights reserved. 1. Introduction Prescribed fire, the planned or ‘deliberate introduction of fire under specified fuel and weather conditions’ (Burrows et al., 2010), has been regularly used in forest management throughout Australia and elsewhere to maintain or restore species and habitat, to enhance post-logging recovery, and to reduce fuel loads and associated wildfire hazards (Fernandes and Botelho, 2003; Carter and Darwin Foster, 2004; Burrows et al., 2010; Penman et al., 2011). In particular, the potential for prescribed fire to reduce risks from (unplanned) wildfire is highly topical given ongoing experi- ences of large damaging wildfires (Adams, 2013; San-Miguel- Ayanz et al., 2013), and given recent predictions of more frequent, extensive and severe wildfires under climate change both in tem- perate Australia (Bradstock, 2010; Clarke et al., 2011; King et al., 2013), and globally (Flannigan et al., 2013). In south-eastern Aus- tralia, this has led to implementation of recommendations for an expanded prescribed fire program (Parliament of Victoria, 2010; DSE, 2012), potentially involving hundreds of thousands of hect- ares of State land each year, and comparable with historical peaks in annual burnt area (Attiwill and Adams, 2008). Since forest fires emit greenhouse gases, regular burning of large areas of forest by prescribed fire will likely have a carbon cost 0378-1127/$ - see front matter Ó 2013 Elsevier B.V. All rights reserved. http://dx.doi.org/10.1016/j.foreco.2013.06.036 ⇑ Corresponding author. Tel.: +61 3 5321 4300; fax: +61 3 5321 4166. E-mail addresses: [email protected] (L.T. Bennett), [email protected] (C. Aponte), [email protected] (K.G. Tolhurst), [email protected] (M. Löw), [email protected] (T.G. Baker). Forest Ecology and Management 306 (2013) 243–255 Contents lists available at SciVerse ScienceDirect Forest Ecology and Management journal homepage: www.elsevier.com/locate/foreco
Transcript of Decreases in standing tree-based carbon stocks associated with repeated prescribed fires in a...

Forest Ecology and Management 306 (2013) 243–255
Contents lists available at SciVerse ScienceDirect
Forest Ecology and Management
journal homepage: www.elsevier .com/locate / foreco
Full length article
Decreases in standing tree-based carbon stocks associated with repeatedprescribed fires in a temperate mixed-species eucalypt forest
0378-1127/$ - see front matter � 2013 Elsevier B.V. All rights reserved.http://dx.doi.org/10.1016/j.foreco.2013.06.036
⇑ Corresponding author. Tel.: +61 3 5321 4300; fax: +61 3 5321 4166.E-mail addresses: [email protected] (L.T. Bennett), [email protected]
(C. Aponte), [email protected] (K.G. Tolhurst), [email protected] (M. Löw),[email protected] (T.G. Baker).
Lauren T. Bennett a,⇑, Cristina Aponte b, Kevin G. Tolhurst a, Markus Löw a, Thomas G. Baker b
a Department of Forest and Ecosystem Science, Melbourne School of Land and Environment, The University of Melbourne, 4 Water Street, Creswick, Victoria 3363, Australiab Department of Forest and Ecosystem Science, Melbourne School of Land and Environment, The University of Melbourne, 500 Yarra Boulevard, Richmond, Victoria 3121, Australia
a r t i c l e i n f o a b s t r a c t
Article history:Received 25 March 2013Received in revised form 3 June 2013Accepted 16 June 2013
Keywords:Prescribed firePlanned burnEucalypt forestCarbonTree growthTree mortality
Prescribed fire is a common management practice in fire-tolerant forests, and one that has potential car-bon costs. Previous assessments of the carbon costs of prescribed fire regimes in temperate Australia havebeen based on little empirical data, and have focused on direct fire effects (area burnt, fuel consumed) buthave largely ignored potentially substantive indirect effects on tree mortality and growth. This studymeasures effects of four prescribed fire treatments on standing tree-based carbon stocks, and on individ-ual tree growth and mortality, in a fire-tolerant eucalypt forest of south-eastern Australia. Prescribed firetreatments were as a factorial combination of two seasons (autumn or spring) and two frequencies (3-yearly ‘High’, or 10-yearly ‘Low’), were replicated over five study areas, and involved 2–7 low-intensityfires over 27 years.
Total standing tree-based carbon stocks (live and dead) were significantly less in prescribed fire thancontrol treatments. However, the mean carbon difference (25 Mg ha�1) had a wide 95% confidence inter-val (2–48 Mg ha�1), indicating a high degree of uncertainty about the magnitude of prescribed fire effectsin these native forests. Overall decreases were consistent with detection of both direct and indirecteffects of prescribed fire treatments. Direct combustion effects on bark were minimal (c. 0.2–0.4 Mg ha�1), but were also indicated by significantly less carbon in dead large stems in fire than controltreatments despite evidence of marginally increased mortality of individual large stems in the former.Indirect effects of repeated prescribed fires were also detected as significantly decreased mean annualdiameter increment of individual large Eucalyptus obliqua over 27 years (particularly of stems 20–50 cm diameter). With respect to prescribed fire type, small live stem densities and associated carbonstocks were greater in autumn than spring, and in Low than High frequency treatments, and carbonstocks in large dead stems were greater in High than Low frequency treatments. This suggested that c.10-yearly fires in autumn provided the most scope for maintaining future capacity to fix carbon. None-theless, decreases in total standing tree-based carbon stocks were not significantly different among pre-scribed fire treatments, suggesting tree-based carbon stocks were more influenced by prescribed fire perse than by fire season or frequency.
� 2013 Elsevier B.V. All rights reserved.
1. Introduction
Prescribed fire, the planned or ‘deliberate introduction of fireunder specified fuel and weather conditions’ (Burrows et al.,2010), has been regularly used in forest management throughoutAustralia and elsewhere to maintain or restore species and habitat,to enhance post-logging recovery, and to reduce fuel loads andassociated wildfire hazards (Fernandes and Botelho, 2003; Carterand Darwin Foster, 2004; Burrows et al., 2010; Penman et al.,
2011). In particular, the potential for prescribed fire to reduce risksfrom (unplanned) wildfire is highly topical given ongoing experi-ences of large damaging wildfires (Adams, 2013; San-Miguel-Ayanz et al., 2013), and given recent predictions of more frequent,extensive and severe wildfires under climate change both in tem-perate Australia (Bradstock, 2010; Clarke et al., 2011; King et al.,2013), and globally (Flannigan et al., 2013). In south-eastern Aus-tralia, this has led to implementation of recommendations for anexpanded prescribed fire program (Parliament of Victoria, 2010;DSE, 2012), potentially involving hundreds of thousands of hect-ares of State land each year, and comparable with historical peaksin annual burnt area (Attiwill and Adams, 2008).
Since forest fires emit greenhouse gases, regular burning oflarge areas of forest by prescribed fire will likely have a carbon cost

244 L.T. Bennett et al. / Forest Ecology and Management 306 (2013) 243–255
(North and Hurteau, 2011). However, this cost might be acceptablyminor if the ‘outlay’ of carbon emissions from prescribed fires wasoffset by a ‘return on investment’ of decreased overall emissionsfrom wildfires (Bradstock and Williams, 2009). In North Americaand Europe, various studies have indicated considerable potentialfor carbon emission mitigation using prescribed fires (Narayanet al., 2007; Hurteau and North, 2009; Vilén and Fernandes,2011; Ghimire et al., 2012), while others have found this potentialto be limited (Campbell et al., 2011). Similarly, in temperate Aus-tralia, while some see considerable opportunities for prescribedfire to mitigate wildfire impacts on forest carbon (Adams, 2013),others have found minimal opportunity (Bradstock et al., 2012).
Previous assessments of the relative carbon costs of prescribedfire regimes in temperate Australia have focused on the direct ef-fects of burning (area burned, fuels consumed; e.g. Bradstocket al., 2012). However, research elsewhere suggests that the imme-diate direct effects of fire account for only a portion of actual forestcarbon losses (Hurteau and North, 2009). In particular, indirect ef-fects on stand structure and growth through scorch and death oftrees and understorey plants (Busse et al., 2000; Peterson andReich, 2001; van Mantgem et al., 2011), and associated decompo-sition of fire-killed biomass (Ghimire et al., 2012), can result in asustained ‘carbon uptake legacy’ that varies with fire severity (Ghi-mire et al., 2012). Thus, understanding the longer-term legacies ofprescribed fire on tree growth and tree-based carbons stocks is keyto assessing the full carbon ‘outlays’ of different fire regimes. In-deed, Campbell et al. (2011) argue that ‘only when [fuel-reduction]treatments change the equilibrium between growth and mortalitycan they alter long-term carbon storage’.
Data to underpin long-term assessments of prescribed fire ef-fects on forest carbon are currently lacking for temperate Australia.Few studies have examined effects of prescribed fire on forest car-bon stocks in these forests, and even fewer have considered im-pacts of multiple prescribed fires, or after fires of contrastingseason and/or frequency. In addition, research of prescribed fire ef-fects on tree mortality and growth in fire-tolerant forests of Aus-tralia has thus far been limited to small treatment plots ofminimal replication in sub-tropical (Guinto et al., 1999) or insouth-western Australia (Burrows et al., 2010).
This paper presents findings from one of the most detailed andlong-term studies of prescribed fire in Australia (Adams and Atti-
Table 1Summary of the environment, stand characteristics, and fire history of the five study area
Area
Blakeville Barkstead
Latitude/Longitude 37�310S, 144�100E 37�290S, 144�050EElevation (m, above sea level) a 590–665 635–650Slope (�) a 1–13 0–4Aspect (�) a 130–295 120–315Mean annual rainfall (mm) b 871 901Mean monthly max temp. (�) b 9–24 8–23Mean monthly min temp. (�) b 2–10 2–10Tree mean basal area (m2/ha) c 43 31Tree mean height (m) c 26 28Last thinning d 1964 1979Last wildfire d 1935 1931Total experimental area (ha) d 81 19Mean fire interval (yrs): AH e 3.0 (6, 1987–2007) 4.0 (5, 1987–2007)Mean fire interval (yrs): AL e 9.5 (3, 1987–2008) 9.0 (3, 1987–2007)Mean fire interval (yrs): SH e 3.6 (6, 1985–2008) 3.6 (6, 1985–2005)Mean fire interval (yrs): SL e 9.0 (3, 1985–2005) 9.0 (3, 1985–2005)
a Range from this study’s measurement plots.b From automated weather station within 4 km of each area (1986–1999 for Barksteac Based on measures of large stems (diameter over-bark P 20 cm at 1.3 m height) ind Tolhurst and Flinn, 1992.e Mean interval in years between successive prescribed fires during the experimental
first and last prescribed fires); treatment abbreviations: ‘AH’ autumn High frequency, ‘A
will, 2011). We use field measurements to examine effects of pre-scribed fire regimes on (standing) tree-based carbon stocks, and onlong-term tree growth and mortality, in an extensive forest type ofsouth-eastern Australia dominated by fire-tolerant eucalypts. Thestudy has a number of unique attributes, including: (1) four pre-scribed fire treatments as a factorial combination of two fire sea-sons and two fire frequencies; (2) assessment of carbon stocksafter 26 years of known prescribed fire treatment, encompassing2–7 repeat fires; and (3) repeated measures of individual treegrowth over 27 years.
Our focus is carbon in standing trees because this is the pre-dominate biomass carbon pool in Australia’s temperate eucalyptforests (Norris et al., 2010; Volkova and Weston, 2013), and islikely to be the largest carbon pool impacted by management prac-tices like prescribed fire (Moroni, 2012). Estimates of carbon poolsin forests comparable to ours have thus far been based on very fewsamples, with stocks in live standing trees expected to be in therange 120–240 Mg ha�1 (Grierson et al., 1992; Volkova and Wes-ton, 2013). We anticipate that carbon stocks in the soil (a focusof our ongoing research) will be appreciable but less than thosein aboveground components (c. 80 Mg ha�1 to 30 cm depth; Volk-ova and Weston, 2013), and that stocks in the understorey vegeta-tion of our study sites will be negligible given a non-existent shrublayer. Similarly, based on Volkova and Weston (2013), we antici-pate that stocks in dead standing trees (c. 9 Mg ha�1) and in fallentimber (‘coarse woody debris’; c. 15 Mg ha�1) will be relativelyminor, and each less than 10% of stocks in live standing trees.
The paper’s primary aim was to improve the empirical knowl-edge base for assessing and predicting effects of prescribed fire re-gimes on standing tree-based carbon stocks. The study’s nullhypotheses were: (1) no effect of prescribed fire treatments on treemortality or growth; (2) no effect of prescribed fire treatments onstanding tree-based carbon stocks; and (3) no effect of prescribedfire season or frequency on standing tree-based carbon stocks.
2. Materials and methods
2.1. Study areas
The study included five areas (known locally as the ‘Fire EffectsStudy Areas’, FESA) within a 25 km radius in the Wombat State For-
s in central Victoria, Australia.
Musk Creek Burnt Bridge Kangaroo Creek
37�280S, 144�100E 37�250S, 144�200E 37�190S, 144�180E620–720 710–760 615–6451–16 0–15 0–2140–310 30–270 0–340856 896 81410–24 7–22 8–243–11 2–11 3–1229 43 4225 26 231974 1977 19751974 1953 194478 62 1284.0 (6, 1987–2008) 5.7 (4, 1987–2007) 3.4 (6, 1987–2009)16.0 (2, 1987–2004) 16.0 (2, 1987–2004) 9.0 (3, 1987–2007)2.7 (6, 1986–2005) 2.7 (7, 1986–2008) 2.8 (7, 1985–2008)8.5 (3, 1986–2005) 8.5 (3, 1986–2005) 9.0 (3, 1985–2005)
d, 1986–2002 plus 2007–2010 for all others).this study’s three plots per control treatment; basal area is under-bark.
period (values in brackets indicate the number of prescribed fires, and the years ofL’ autumn Low frequency, ‘SH’ spring High frequency, ‘SL’ spring Low frequency.

L.T. Bennett et al. / Forest Ecology and Management 306 (2013) 243–255 245
est, about 100 km north-west of Melbourne, Victoria, south-east-ern Australia (Table 1). The areas are located on the northern (Kan-garoo Creek only) and southern sides of Victoria’s Great DividingRange, on an underlying geology of Ordovician sedimentary rock,and at elevations ranging from 590 to 760 m above sea level (Ta-ble 1). Topography of the study areas varies from mostly flat(slopes 0–4�, Barkstead) to hills of low to moderate relief (slopesup to 21�, Kangaroo Creek; Table 1), including a range of morpho-logical types from flats and depressions to ridges and crests (mor-phological types of Speight, 2009). Soils are ‘stony earths’(Blakeville only), and ‘friable earths, mottled duplex soils’ (Rowanet al., 2000), which are, respectively, Kandosols and Dermosols inthe Australian Soil Classification (ASRIS, 2011). The climate is tem-perate, with annual rainfall in the range 814–901 mm (Table 1), themajority falling in winter and spring. Frosts are common, particu-larly in winter (mean of 55 days per year; Tolhurst and Flinn,1992), and mean monthly minimum temperatures range from2 �C (July/August) to 12 �C (January/February; Table 1). Daily sum-mer temperatures often exceed 35 �C, with mean monthly maxi-mum temperatures in the range 7 �C (July) to 24 �C (January/February; Table 1).
Native vegetation of the study areas is open to tall-open forest(tree heights 10 to >30 m, projective foliage cover 30–70%; Specht,1981), with tree under-bark basal areas typically 30–40 m2 ha�1
(Table 1). Open to tall-open forests are predicted to contain themajority of Victoria’s forest carbon stocks (due to their moderateproductivity and extensive distribution; Kaye, 2009), and are likelyto be regularly burnt under ongoing commitments to extensive useof prescribed fire on Victoria’s public land (DSE, 2012). The forestsof the study areas are dominated by three co-occurring eucalyptspecies of different bark type: Eucalyptus obliqua L’Hér. (deep fi-brous ‘stringybark’), Eucalyptus radiata Sieber ex DC. (short fibrous‘peppermint’ bark), and Eucalyptus rubida H. Deane and Maiden(smooth ‘gum’ bark). The understorey is characterised by a sparseto non-existent shrub layer to 2–4 m height (e.g. Acacia spp.), and aground layer dominated by Austral bracken (Pteridium esculentum(G. Forst.) Cockayne), native perennial grasses (e.g. Tetrarrhena jun-cea R. Br., Poa sieberiana Vickery), forbs (e.g. Gonocarpus tetragynusLabill., Viola hederacea Labill.), and rushes (Lomandra spp.; Tolhurst,2003). The forest areas are un-evenaged, and the oldest trees are110–120 years old (Tolhurst and Flinn, 1992). All areas were occa-sionally thinned to remove trees of low commercial value from the1930s to 1960s/70s (Table 1). Detailed fire histories were not avail-able although these forest types are prone to regular burning bywildfire (Tolhurst and Flinn, 1992), and the last known fires inthe study areas prior to this experiment’s establishment were be-tween 1935 (Blakeville) and 1974 (Musk Creek; Table 1).
2.2. Experimental design and prescribed fire treatments
The study design was established in 1985, and used a random-ised block design involving a long-unburnt control and four pre-scribed fire treatments randomly allocated within each of thefive study areas (total of 25 treatment areas). The available exper-imental areas ranged from 19 ha (Barkstead) to 128 ha (KangarooCreek; Table 1), so individual treatments ranged from 3 to 35 hain area (Tolhurst and Flinn, 1992).
The four prescribed fire treatments involved a factorial combi-nation of two fire seasons (autumn or spring), and two fire fre-quencies (nominally every 3 or 10 years); that is, autumn Highfrequency (‘AH’), autumn Low frequency (‘AL’), spring High fre-quency (‘SH’), and spring Low frequency (‘SL’). Nominal prescribedfire intervals of three and ten years were chosen to represent,respectively, the shortest interval for sufficient recovery of surfacefuels to carry a fire in these forests, and the likely return interval ofprescribed fire based on local fire management practice. Due to
seasonal and operational constraints, mean prescribed fire inter-vals ranged from 2.7 to 5.7 years in the High frequency treatments,and 8.5–16 years in the Low frequency treatments (Table 1). Thedate of last prescribed fire ranged from March 2004 to March2009 (that is, about 7.5 to 2.5 years prior to this study’s carbon-stock measurements in late 2011; Table 1).
Prescribed fires in all treatments in this study were consideredmild (Tolhurst and Flinn, 1992) as indicated by Forest Fire DangerIndex (FFDI) means of 6 7 (low to moderate fire danger rating;Luke and McArthur, 1978). Thus, fire intensities were generally lessthan 500 kW m�1, and involved little overall canopy scorch (DSE,2003). Field observations of individual prescribed fires indicatedflame heights were in the range 0.1 to 1.3 m, and did not differ be-tween fire treatments (Table 2). However, tree scorch heights wereoften >10 m, and greater mean and maximum scorch heights indi-cated greater overall severity of Low than High frequency firetreatments (no fire season effects; Table 2). Mean area burnt(79–92%), and mean surface fuel consumed (40–53%) did not sig-nificantly differ between prescribed fire treatments (Table 2).Nonetheless, both the mean Forest Fire Danger Index (FFDI; McAr-thur, 1967) and the mean Soil Dryness Index (SDI; Mount, 1972)indicated significantly drier fire conditions for autumn versusspring fires (Table 2).
2.3. Plot-based tree measures
Trees and stumps were measured (August to November 2011)within three circular plots (18 m radius, c. 0.1 ha) per treatmentarea (total of 75 plots). ‘Trees’ were defined as upright or lean-ing, live or dead woody stems that were >1.3 m height, and wererooted in the ground (to distinguish from fallen trees that wereclassified as coarse woody debris). ‘Stumps’ were 6 1.3 m height,and were the in situ lowest part of a cut tree stem (from priorlogging), or of a naturally broken stem. Large trees were definedas P 20 cm diameter (over-bark) at breast height (‘dbh’, 1.3 mheight), and large stumps as P 20 cm diameter at 0.3 m height.Stumps were assumed dead, although any coppice/epicormic re-growth stems from stumps were assessed as individual live/deadtrees, as were multiple stems of the same tree.
All large live trees in the 0.1 ha plots were assessed for: species,dbh over-bark (mm), and bark thickness at breast height. Barkthickness was measured using a ‘Gill-type’ needle gauge (Gillet al., 1982) as the mean radial depth (mm, surface to cambium)of four points around the stem (north, south, east, west sides), tak-ing care to avoid bark furrows. Species of large dead trees were notidentifiable, and large dead trees were only assessed for dbh (over-bark or under-bark as relevant), and for remaining cross-sectionalarea at dbh (%). Large stumps, assumed to be cylindrical, were mea-sured for diameter (mm) at 0.3 m height (i.e. assuming the fullcross-sectional area was present) and total height (m), and as-sessed for the proportional volume of the full cylinder remaining(to the nearest 10%).
Small trees (live and dead; <20 cm dbh) and stumps (<20 cmdiameter at 0.3 m height) were counted in two size classes(<10 cm, 10 to < 20 cm diameter) in the north-east and south-westquadrants of each plot (total 0.05 ha). In addition, ‘seedlings’, de-fined as small live trees < 1 cm in mean diameter, and usu-ally < 2 m in height, were counted in each of these quadrants.
2.4. Estimation of tree-based biomass and carbon stocks
Biomass of large tree components (under-bark stem, bark,branch, foliage) was estimated using extant additive biomass equa-tions for open-forest eucalypts (Bi et al., 2004). The equations wereof the form:

Table 2Characteristics of prescribed fire treatments (autumn High frequency ‘AH’, autumn Low frequency ‘AL’, spring High frequency ‘SH’, spring Low frequency ‘SL’). Values are the mean(±SE) of ‘n’ observed prescribed fires (in square brackets) across the five study areas.
Treatment Significant effects a
AH AL SH SL
Flame height (m) b
Mean 0.34 ± 0.04 [20] 0.45 ± 0.07 [10] 0.43 ± 0.06 [33] 0.41 ± 0.05 [15] —Maximum 0.98 ± 0.23 [17] 1.29 ± 0.39 [10] 0.79 ± 0.09 [29] 0.97 ± 0.10 [15] —Minimum 0.11 ± 0.01 [13] 0.14 ± 0.03 [8] 0.21 ± 0.05 [22] 0.13 ± 0.02 [10] —
Scorch height (m) c
Mean 5.72 ± 1.04 [15] 7.49 ± 1.34 [9] 4.42 ± 0.61 [29] 6.79 ± 1.55 [15] Fq*
Maximum 10.71 ± 1.72 [15] 14.56 ± 2.70 [9] 7.76 ± 1.11 [28] 12.78 ± 1.86 [15] Fq**
Minimum 2.83 ± 0.69 [11] 2.69 ± 0.66 [7] 2.71 ± 0.48 [20] 4.17 ± 1.29 [10] —Area burnt (%) d 87 ± 4 [17] 92 ± 2 [10] 79 ± 5 [29] 87 ± 3 [15] —Surface fuel consumed (%) e 40 ± 5 [14] 41 ± 7 [8] 53 ± 3 [19] 53 ± 5 [10] —Forest fire danger index f 6 ± 1 [27] 7 ± 2 [12] 4 ± 1 [34] 3 ± 0 [15] S***
Soil dryness index g 111 ± 7 [27] 125 ± 12 [12] 30 ± 2 [34] 19 ± 2 [15] S***, SxFq*
a Significant effects of prescribed fire season (‘S’) and frequency (‘Fq’) and their interaction as indicated by a Linear Mixed Model (*P < 0.05; **P < 0.01; ***P < 0.001; — nosignificant effects detected).
b Visual estimation of average flame height at each of 16 posts either in a line at 2 m intervals, or on a 5 � 10 m grid (Tolhurst and Flinn, 1992).c Visual estimation of scorch height at a minimum of 20 systematically located points on a 50 � 100 m grid (or smaller as dictated by the treatment area); measured at each
point as the highest tree scorch (as measured using distance and angle) within a 10 m radius (Tolhurst and Flinn, 1992).d Proportion area burnt at a minimum of 20 systematically located points on a 50 � 100 m grid (or smaller as dictated by the treatment area); measured at each point (to
the nearest 0.10 m) as the proportion of the length of a 10 m transect that intersected with burnt patches (Tolhurst and Flinn, 1992).e Proportional decrease in oven-dry mass (105 �C) of surface fuel (<25 mm in minimum cross-sectional area) measured in 15 randomly located 0.1 m2 quadrats before and
after prescribed fire (Tolhurst and Flinn, 1992).f McArthur Forest Fire Danger Index (Luke and McArthur, 1978), based on weather data in the open (air temperature, relative humidity, rainfall, wind speed) from
automated weather stations within 4 km of each area, and, within each study area, using a Bacharach sling psychrometer (air temperature, relative humidity).g Soil Dryness Index (Mount, 1972) based on weather near and within each study area as above.
246 L.T. Bennett et al. / Forest Ecology and Management 306 (2013) 243–255
Yi ¼ ebi0Dbi1 þ �i;
where Yi is the biomass of component i, D is over-bark diameter atbreast height (‘dbhob’), bi0 and bi1 are defined coefficients, and ei isthe component error term (Bi et al., 2004). Species-specific equa-tions were available for both E. obliqua and E. radiata, but it was nec-essary to substitute Eucalyptus dalrympleana equations for E. rubida,and Acacia dealbata equations for (occasional) Acacia melanoxylon R.Br. (Bi et al., 2004).
Significant decreases in the bark thickness of E. obliqua withburning (Section 3.1), indicated probable underestimation of pre-dicted biomass components of burnt trees from equations basedon ‘dbhob’ (i.e. that smaller over-bark diameters in prescribed firethan control trees would erroneously predict less biomass). Thus,for live large E. obliqua in prescribed fire treatments only, biomassin stems (under-bark), foliage and branches was corrected for barkloss by using estimated ‘non-burnt’ dbhob (i.e. the dbhob had thetrees not been burnt), as follows: dbhub (dbh under-bark) was cal-culated for all E. obliqua as measured dbhob minus measured barkthickness; a strong linear relationship was established betweendbhob and dbhub of E. obliqua in control treatments across all areas(dbhob = 57.09 + 1.05 * dbhub; R2 0.99; n = 141); estimated ‘non-burnt’ dbhob of burnt trees was calculated using the dbhob todbhub relationship, and then used in the above-mentioned compo-nent biomass equations (Bi et al., 2004).
Bark biomass loss due to burning was estimated in two ways:(i) the cylindrical volume to breast height (1.3 m) of the estimated‘non-burnt’ tree (i.e. using the estimated ‘non-burnt’ dbhob) minusthe cylindrical volume to 1.3 m of the burnt tree (i.e. using themeasured dbhob), multiplied by an average bark density for E. obli-qua >20 cm dbhob (212 kg/m3; Attiwill, 1979); and (ii) predicted‘non-burnt’ bark biomass using the ‘non-burnt’ dbhob in theabove-mentioned bark allometric equation minus predicted barkbiomass of the burnt tree using the measured dbhob in the sameequation. Since the cylindrical method gave the lower estimatesof the two (see Section 3.1), it was used to deduce the remainingbark biomass of the burnt trees; that is, by subtracting bark loss
from the predicted bark biomass using the estimated non-burntdbhob in the bark equation.
Under-bark stem biomass of dead large trees was calculatedusing species-specific allometric equations (as above), with treespecies assigned based on the most common live species in thatplot. Dead stem biomass estimates were then adjusted for remain-ing cross-sectional area, and for minor decay using a multiplier of0.85. This multiplier was based on an average ratio of sound-deadto fresh-wood densities of over 50 pieces of coarse woody debristhat we sampled across the study areas, and was consistent withsimilar ratios in other temperate forests (e.g. Coomes et al., 2002;Grove et al., 2009). Similarly, biomass of large stumps was calcu-lated as the volume of the assumed cylinder, corrected for remain-ing volume, and multiplied by an average density of sound-deadwood (459 kg m�3, based on the above-mentioned coarse woodydebris samples).
Small trees were counted but not measured, so an estimatedbiomass of a single stem in each of the small size classes(<10 cm, 10 to < 20 cm dbhob) was used in total biomass calcula-tions. The 10 to <20 cm dbhob size class was within the range ofavailable allometric equations, so biomass of live trees in this classwas estimated as follows: above-mentioned additive biomassequations (Bi et al., 2004) for E. obliqua and E. radiata (the most fre-quent tree species) were used to predict component biomass (un-der-bark stem, bark, branch, foliage) for each 1 cm-increment from10 to 20 cm dbhob; biomass of all components was summed togive total tree biomass by diameter increment within species;and these values were averaged to give an estimated biomass of108 kg per tree. Biomass of dead trees in this size class was calcu-lated in a similar way, although only the under-bark stem compo-nent was included, and a decay multiplier of 0.85 was applied (asabove), to give an estimated biomass of 56 kg per tree. The biomassof a live tree in the smallest size class (<10 cm dbhob) was esti-mated using a generic equation for small eucalypts from Keithet al. (2000), of the form:
LnðYÞ ¼ �1:07þ ð2:89LnðHÞÞ

L.T. Bennett et al. / Forest Ecology and Management 306 (2013) 243–255 247
where Y is the biomass of a single tree, and H is the tree height(here, based on field observations, estimated as 2 m). This gave anestimate of 2.5 kg per tree, which became 2.1 kg for dead treesusing a 0.85 decay multiplier. As for large stumps, biomass of rep-resentative small stumps was estimated by multiplying a cylindri-cal volume (assuming 20 cm height for the <10 cm diameter class,and 60 cm height for the 10 to <20 cm class, and using the mid-range diameters) by an average density of sound-dead wood(459 kg m�3, as above). This gave estimates of 0.2 kg per stump inthe <10 cm diameter class, and 4.8 kg per stump in the 10 to<20 cm diameter class.
Tree (live, dead) and stump biomass by components and sizeclasses were summed for each plot (i.e. using individual largetree/stump values, and multiplying single small tree/stump esti-mates by counts), and then multiplied by 0.50 to convert mass tocarbon content. These data were then converted to carbon (C) inMg ha�1 by dividing by plot area, which was corrected for slopeusing the slope-adjusted distances of two perpendicular transectsthat ran through the plot centre.
2.5. Repeated measurements of individual trees across treatments
In addition to the above plot-based measurements, 775 individ-ual trees in selected treatments were repeatedly assessed from1985 to 2012 for stem diameter and bark thickness. These trees,mostly E. obliqua, were selected in 1985 for good form (straightstem, healthy crown), and to cover six size classes: 0–10, 10.1–20, 20.1–30 cm, 30.1–50, 50.1–70, and >70 cm dbhob (Chattoet al., 2003). That is, trees were selected to represent a range ofdominance classes rather than a random sample. Not all area-treat-ment combinations could be sampled this intensively; instead,trees were selected in all treatments at Blakeville, in control, AH,and SL treatments at Barkstead and Kangaroo Creek, and in control,SH, and AL treatments at Musk Creek and Burnt Bridge. This sam-pling design ensured that control versus prescribed fire compari-sons were based on replicated observations of a range ofprescribed fire conditions. In addition, to allow for some evaluationof fire effects on other bark types, at least five E. rubida trees ineach of the six size classes per five treatments were selected for re-peated measurement at Blakeville only.
Prior to the first prescribed fires in 1985, the selected trees wereassessed for competition using the zone count method (10 m2 ha�1
optical wedge; Opie, 1968), and were measured for dbhob and barkthickness at breast height after ‘some initial trimming to removeloose bark’ (Chatto et al., 2003). These measures were repeatedafter the first prescribed fire, on a regular basis to 1999, and in2012. Pre-fire 1985 bark thickness measures were based on twomeasures at right angles using a Swedish bark gauge, but, thereaf-ter, on four measures around the tree using a Gill-type needlegauge (Chatto et al., 2003). The initial bark trimming at breastheight was not consistent with tree measurements in the plots(Section 2.3), and could lead to underestimation of prescribed fireeffects on bark thickness of individual trees. Thus, fire effects onindividual tree growth were only examined using under-barkdbh (i.e. dbhob minus measured bark thickness). In addition, over-all effects of prescribed fire on bark thickness of individual treeswere only examined using bark thickness at 50 cm height (i.e. notrimming), which was assessed in 2012.
2.6. Statistical analyses
Effects of prescribed fire treatments on plot-based tree andstump measures (e.g. tree count ha�1, carbon stock Mg ha�1) weretested using the General Analysis of Variance models of GenStat(14th edition, VSN International Ltd, Hemel Hempstead, UK), witharea as a random factor, treatment as a fixed factor, and plot nested
within treatment by area. In addition, a ‘factorial plus added con-trol’ model (i.e. ‘season� frequency’ nested within prescribed fire;Payne, 2011) was used to assess overall effects of prescribed firetreatment (i.e. control versus prescribed fire), of fire season (au-tumn versus spring), and of fire frequency (High versus Low). REMLLinear Mixed Models (GenStat 14th edition) of a similar structurewere used if values were missing (e.g. no trees of a particular sizeclass), or if the analysis involved plot-level covariates. Assumptionsof normality and variance homogeneity were checked, and depen-dent variables transformed as necessary (ln or (Y + 0.5)^0.25 forcounts, arcsine for proportions; Quinn and Keough, 2002). In addi-tion, further checks of fire effects were made using logit transfor-mations of proportional data (Warton and Hui, 2011), and usingGenStat’s Permutation Test (4999 random permutations). To ac-count for potential pre-treatment differences in stand stocking be-tween treatment plots, all analyses of fire treatment effects oncarbon stocks were re-run using plot-level live and dead large stemdensity as a covariate.
Probability of death by 2012 of the 775 selected individual treeswas assessed using GenStat logistic regression models (logit trans-formation) with size class, competition, study area, and prescribedfire treatment as predictor variables. Here, an overwhelming effectof size class resulted from high mortality of trees 6 20 cm; as such,the 0–10 and 10.1–20 cm size classes were excluded from the anal-yses below of individual tree growth.
Repeated measures of individual live trees (>20 cm dbhub) pro-duced predominantly linear relationships between dbhub and time(1985–2012). Thus, overall effects of prescribed fire treatments onindividual tree growth were assessed using slopes of the dbhub/time relationships as a dependent variable in the above-mentionedREML Linear Mixed Models (GenStat 14th edition), with initialdbhub and initial zone-count competition as covariates, and/or sizeclass as a fixed factor. Prior to these analyses, and acknowledgingthe potential for measurement error associated with multipleassessors over the study’s 27 years, individual dbhub versus timerelationships were examined (blind to treatment), and points orwhole relationships were excluded using the following highly con-servative criteria: (1) exclude a single point if it was a clear outlierin the tree’s overall dbhub/time relationship, but only if dbhub de-creases/increases between that point and the preceding and fol-lowing points were considered improbable on the basis that theywere more than four times the mean diameter increment for thecorresponding time intervals as indicated by all relationships forthat species and size class (after Murphy et al., 2010); (2) excludea whole relationship if there were fewer than 8 points remainingafter exclusions based on the first criteria; and (3) exclude a wholerelationship if the 2012 measurement point was excluded due toan improbable decrease relative to the preceding point (i.e. includeonly those trees that had credible growth for the entire measure-ment period). Application of these criteria led to the exclusion of21 live E. obliqua >20 cm dbhub (335 remaining), and 5 live E. rub-ida >20 cm dbhub (76 remaining).
3. Results
3.1. Tree bark thickness and bark carbon loss
Burning significantly decreased mean bark thickness at breastheight of large live E. obliqua in the plots (39 mm ± 1.7 SE in con-trols, 31 mm ± 0.7 across all fire treatments, P < 0.001), but hadno effect on the mean bark thickness of either E. radiata (controls:22 mm ± 1.2, fire treatments: 21 mm ± 0.4), or E. rubida (controls:23 mm ± 1.0 controls, fire treatments: 21 mm ± 0.5; Supplemen-tary data, Fig. S1a). In addition, decreases in relative bark thickness(bark thickness/dbhub) were greater in the High than Low fre-

0
40
80
120
160
200
240
Control AH AL SH SL
C (M
g ha
-1)
C (M
g ha
-1)
C (M
g ha
-1)
Large live stemsLarge live bark, branch, foliageSmall live stems: A>S*, L>H*
a
0
4
8
12
16
20
Control AH AL SH SL
Large dead stems: Cont>F**, H>L*Small dead stemsLarge and small stumps: L>H*
b
0
40
80
120
160
200
240
280
320
Control AH AL SH SL
Treatment
Total tree live and dead: Cont>F*Total tree liveTotal tree dead: Cont>F**
c
Fig. 1. Estimated tree carbon (Mg ha�1) in plots, by large (P20 cm dbhob) and small (<20 cm dbhob) live stems, including non-stem components of large live trees (a), deadstems and stumps (b), and all live and dead tree components (c, where ‘total tree live’ is the sum of components in ‘a’; ‘total tree dead’ is the sum of components in ‘b’; and‘total tree live and dead’ is the sum of these two). Treatments were a non-burnt control, prescribed fires in autumn at High frequency (‘AH’), in autumn at Low frequency(‘AL’), in spring at High frequency (‘SH’), and in spring at Low frequency (‘SL’). Values are the means of 15 plots with 95% confidence intervals. Asterisks indicate overall effects(*P < 0.05, **P < 0.01) of prescribed fire (control versus prescribed fire, ‘F’), of fire season (‘S’ versus ‘A’), and of fire frequency (‘H’ versus ‘L’).
248 L.T. Bennett et al. / Forest Ecology and Management 306 (2013) 243–255
quency fire treatments for both E. obliqua (0.15 versus 0.17,P < 0.05) and E. rubida (0.10 versus 0.12, P < 0.05; Supplementarydata, Fig. S1b).
Consistent with the plot data, bark thickness at 50 cm height ofselected individual E. obliqua was significantly decreased by burn-ing (32 mm ± 0.5 SE across all fire treatments, 40 mm ± 1.4 in con-trols, P < 0.05), and relative bark thickness was also significantlyless in High (0.065) than Low frequency fire treatments (0.082,P < 0.05; data not shown).
Estimates of mean losses of bark carbon mass from E. obliqua infire treatment plots ranged from 0.21 Mg ha�1 (± 0.02 SE, cylindri-cal method) to 0.39 Mg ha�1 (± 0.03 SE, allometric-based method).These relatively low values were not significantly different amongfire treatments, and indicated that more accurate estimation ofthese losses was not warranted.
3.2. Live tree-based carbon stocks
Total live tree-based carbon stocks in plots ranged from 69 to318 Mg ha�1 (overall mean 174 Mg ha�1). Against this variable
background, we did not detect a significant difference in livetree-based carbon between control (191 Mg ha�1 ± 13 SE) and pre-scribed fire treatments (170 Mg ha�1 ± 4; P 0.087; Fig. 1c, Table 3).Similarly, statistical models did not detect an overall effect of pre-scribed fire on carbon in the main component of this pool, namely,live large stems (control 138 Mg ha�1; fire treatments120 Mg ha�1; P 0.057; Fig. 1a, Table 3); although we note thatthe 95% confidence interval for the difference between controland prescribed fire means did not include zero (0.3–35.6 Mg ha�1;Table 3). No significant difference in total live tree-based carbonstocks between control and prescribed fire treatments reflectedno overall significant effects of prescribed fire on plot-level largeand small live stem densities (Fig. 2).
While effects of prescribed fire per se on live tree-based carbonin plots were muted, effects of the type of prescribed fire weremore clearly significant. Mean carbon stocks in small live stemswere significantly greater in autumn (9.0 Mg ha�1) than spring firetreatments (6.4 Mg ha�1, P 0.041; Fig. 1a; Table 3), and in Low(9.3 Mg ha�1) than High frequency treatments (6.1 Mg ha�1, P0.013; Fig. 1a; Table 3). This reflected greater live stem densities

Table 3Summary of the significance of the main effects of prescribed fire treatments on carbon stocks in standing tree-based carbon pools.
Pool Effect a Difference (Mg C ha�1) b P-value c
Mean 95% CI Without covariate With covariate
Total tree live and dead Cont > Fire 25.0 2.1–47.8 0.049 0.042Total tree live Cont = Fire 21.7 -1.1–44.4 0.087 0.073Total tree dead Cont > Fire 3.3 1.0–5.7 0.011 0.009Large live stems Cont = Fire 18.0 0.3–35.6 0.057 0.059Large dead stems Cont > Fire 3.5 1.5–5.4 0.004 0.003
High > Low 2.4 0.6–4.1 0.021 0.020Small live stems Aut > Spring 2.6 0.3–4.9 0.041 0.034
Low > High 3.2 0.9–5.6 0.013 0.010Large and small stumps Low > High 1.0 0.2–1.8 0.025 0.021
a Effect from ‘Factorial plus added control’ ANOVA model without covariate. Potential effects were prescribed fire (Control versus prescribed Fire), fire season (Autumnversus Spring), and fire frequency (High versus Low).
b First listed treatment in ‘Effect’ column minus second listed (e.g. Control minus Fire treatments).c ‘Without covariate’ indicates the significance of the model effect in the ‘Effect’ column; ‘With covariate’ indicates the significance of the effect using the same model but
with the plot-level number of live and dead large stems as a covariate.
L.T. Bennett et al. / Forest Ecology and Management 306 (2013) 243–255 249
in autumn than spring and in Low than High frequency treatments(Fig. 2a), combined with significantly less small-stem mortalities inthese treatments (Fig. 3a).
3.3. Dead tree-based carbon stocks
Mean dead tree-based carbon in plots was significantly less inprescribed fire (8.7 Mg ha�1 ± 0.6 SE) than control treatments(12.0 Mg ha�1 ± 2.1; P 0.011; Fig. 1b, Table 3). Most of this decrease
0
100
200
300
400
500
600
700
Control AH
Smal
l ste
m d
ensi
ty (h
a-1)
LRGN_BackTDRGN_BackTLive: AL>SH, A>S**, L>H*
Dead: AL>SH, A>S*, L>H*
0
50
100
150
200
250
300
350
400
Control AH
Larg
e st
em d
ensi
ty (h
a-1)
Tre
LOWN_BackTLiveDead: H>L*
Fig. 2. Densities of small (a; dbhob < 20 cm) and large (b; dbhob P 20 cm) stems, bothautumn at High frequency (‘AH’), in autumn at Low frequency (‘AL’), in spring at High freqback-transformed) of 15 plots with 95% confidence intervals. Significant differences beasterisks indicate overall significant effects of fire season (‘S’ versus ‘A’), and of fire freq
was due to significant differences in carbon in large dead stems,which contained 55% of the standing dead carbon in control treat-ments, and 36% in prescribed fire treatments (Fig. 1b). In turn, ofthe total carbon stock in large live and dead stems, proportionallymore was in dead stems in control (4.9%) than fire treatments(2.6%; P 0.048). Despite differences in dead tree-based carbonmass, there were no detectable overall effects of prescribed fireon plot-level large and small dead stem densities (Fig. 2), nor onproportional numbers of small and large dead stems (Fig. 3).
AL SH SL
a
AL SH SL
atment
b
live and dead, in plots. Treatments were a non-burnt control, prescribed fires inuency (‘SH’), and in spring at Low frequency (‘SL’). Values are the means (fourth-roottween individual fire treatments are as listed (Tukey post hoc test, P < 0.05), anduency (‘H’ versus ‘L’); *P < 0.05, **P < 0.01.

250 L.T. Bennett et al. / Forest Ecology and Management 306 (2013) 243–255
In addition to overall effects of prescribed fire, carbon stocks instanding dead components were affected by the type of prescribedfire. Carbon in large dead stems was significantly greater in High(4.3 Mg ha�1 ± 1.0 SE) than Low frequency fire treatments(1.9 Mg ha�1 ± 0.5; P 0.021; Fig. 1b, Table 3), consistent with signif-icantly greater densities of large dead stems (Fig. 2), and of propor-tional numbers of large dead stems (Fig. 3). Low overall numbers ofdead large stems prevented formal analyses of fire effects by sizeclass; nonetheless, the majority of all large stem deaths were ofstems 20–50 cm dbhob, and there was a tendency for more deathsof stems >50 cm dbhob in the High than Low frequency fire treat-ments (Fig. 3b). In contrast to large dead stems, mean carbon massin stumps was significantly greater in Low (4.0 Mg ha�1 ± 0.4 SE)than High frequency fire treatments (3.0 Mg ha�1 ± 0.3, P 0.025;Fig. 1b, Table 3).
3.4. Total live and dead tree-based carbon stocks
When all standing dead and live tree components were com-bined, we detected significantly less carbon mass in prescribed fire(178 Mg ha�1 ± 4 SE) than control treatments (203 Mg ha�1 ± 13; P0.049; Fig. 1c, Table 3). This equated to a mean difference of25 Mg ha�1 (c. 12% of total tree-based carbon in control treat-ments), although the 95% confidence interval for this differencewas wide (2–48 Mg ha�1; Table 3). Including plot-level live anddead large stem density as a covariate strengthened the signifi-cance of the prescribed fire effect on total tree-based carbon (P
0
10
20
30
40
50
60
70
80
Control AH
Dea
d sm
all s
tem
s (%
)
dbhub < 10 cmdbhub 10_20
0
2
4
6
8
10
12
14
16
Dea
d la
rge
stem
s (%
)
Trea
dbhub > 70 cm
dbhub 20_30 cmdbhub 30_50 cmdbhub 50_70 cm
AHControl
Fig. 3. Percentages of small (a) and large (b) stems that were dead in plots by diametefrequency (‘AH’), in autumn at Low frequency (‘AL’), in spring at High frequency (‘SH’), aback-transformed) of 15 plots with 95% confidence intervals. Significant differences betwtest, P < 0.05), and asterisks indicate overall significant effects of fire season (‘S’ versus ‘
0.042), as was generally true for tests of stocks in other tree-basedpools (Table 3).
Despite significant effects of prescribed fire frequency and sea-son on various components of live and dead tree carbon mass, wedid not detect any effects of fire type on the total carbon stock in allthe live and dead tree components combined (Fig. 1).
3.5. Individual tree mortality and growth
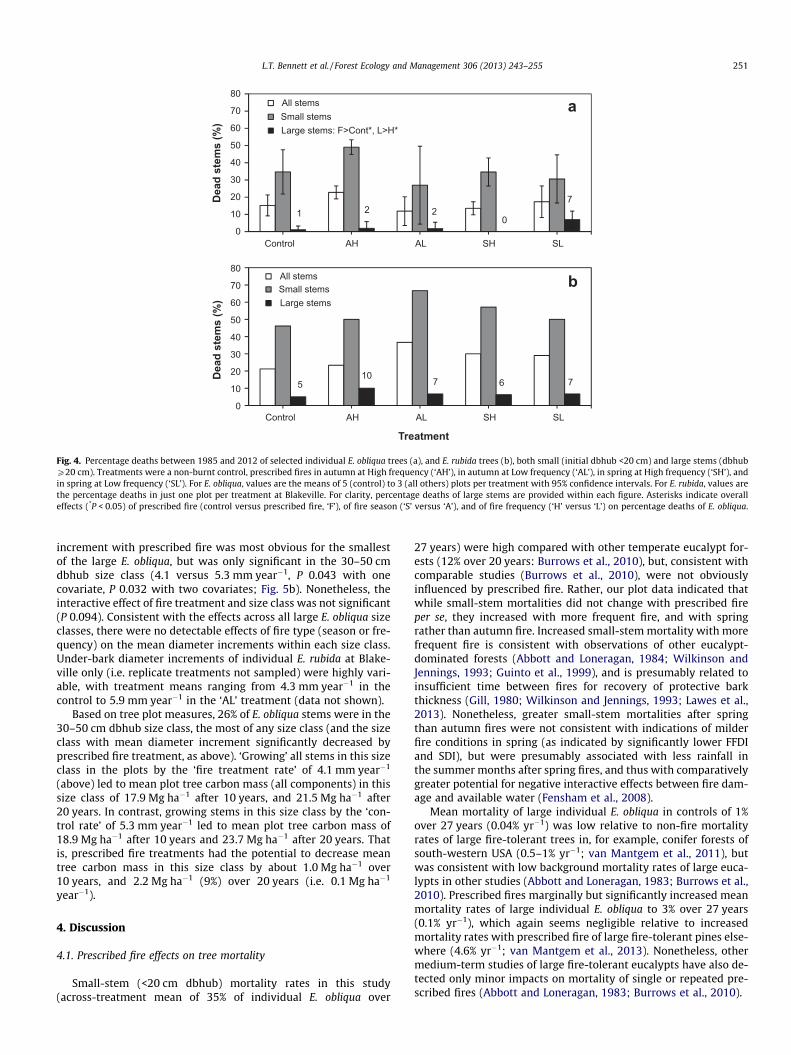
Mortality of small (<20 cm dbhub in 1985) individual E. obliquabetween 1985 and 2012 ranged from 27% to 49%, and was not sig-nificantly affected by prescribed fire (Fig. 4a). In contrast, mortalityof large individual E. obliqua was only 1% in control treatments,increasing marginally but significantly in fire treatments (3%), lar-gely due to 7% mean mortality in the SL treatments (Fig. 4a). Mor-tality of the smooth-barked E. rubida at Blakeville (only) over thesame period tended to be higher, particularly in the fire treat-ments: 46% of small stems in the control versus 56% in fire treat-ments, and 5% of large stems in the control versus 7% in firetreatments (Fig. 4b).
With initial dbhub as a covariate, mean under-bark diameterincrement from 1985 to 2012 of large individual E. obliqua was sig-nificantly less in fire treatments (4.7 mm year�1) than controltreatments (5.3 mm year�1, P 0.028), and was not obviously af-fected by type of fire treatment (Fig. 5a). The significance of theoverall effect of prescribed fire on E. obliqua diameter incrementwas increased with the inclusion of initial zone-count competitionas an additional covariate (P 0.026). Decreased mean diameter
AL SH SL
S>A*, H>L*
aSH>AL
tment
H>L*
b
AL SH SL
r classes. Treatments were a non-burnt control, prescribed fires in autumn at Highnd in spring at Low frequency (‘SL’). Total values are the mean proportion (arcsine
een individual fire treatments in total dead percentages are as listed (Tukey post hocA’), and of fire frequency (‘H’ versus ‘L’) on total dead percentages (*P < 0.05).
0
10
20
30
40
50
60
70
80
Control AH AL SH SL
Dea
d st
ems
(%)
All stemsSmall stemsLarge stems: F>Cont*, L>H*
a
1 2 20
7
0
10
20
30
40
50
60
70
80
Control AH AL SH SL
Dea
d st
ems
(%)
Treatment
bAll stemsSmall stemsLarge stems
510 7 6 7
Fig. 4. Percentage deaths between 1985 and 2012 of selected individual E. obliqua trees (a), and E. rubida trees (b), both small (initial dbhub <20 cm) and large stems (dbhubP20 cm). Treatments were a non-burnt control, prescribed fires in autumn at High frequency (‘AH’), in autumn at Low frequency (‘AL’), in spring at High frequency (‘SH’), andin spring at Low frequency (‘SL’). For E. obliqua, values are the means of 5 (control) to 3 (all others) plots per treatment with 95% confidence intervals. For E. rubida, values arethe percentage deaths in just one plot per treatment at Blakeville. For clarity, percentage deaths of large stems are provided within each figure. Asterisks indicate overalleffects (*P < 0.05) of prescribed fire (control versus prescribed fire, ‘F’), of fire season (‘S’ versus ‘A’), and of fire frequency (‘H’ versus ‘L’) on percentage deaths of E. obliqua.
L.T. Bennett et al. / Forest Ecology and Management 306 (2013) 243–255 251
increment with prescribed fire was most obvious for the smallestof the large E. obliqua, but was only significant in the 30–50 cmdbhub size class (4.1 versus 5.3 mm year�1, P 0.043 with onecovariate, P 0.032 with two covariates; Fig. 5b). Nonetheless, theinteractive effect of fire treatment and size class was not significant(P 0.094). Consistent with the effects across all large E. obliqua sizeclasses, there were no detectable effects of fire type (season or fre-quency) on the mean diameter increments within each size class.Under-bark diameter increments of individual E. rubida at Blake-ville only (i.e. replicate treatments not sampled) were highly vari-able, with treatment means ranging from 4.3 mm year�1 in thecontrol to 5.9 mm year�1 in the ‘AL’ treatment (data not shown).
Based on tree plot measures, 26% of E. obliqua stems were in the30–50 cm dbhub size class, the most of any size class (and the sizeclass with mean diameter increment significantly decreased byprescribed fire treatment, as above). ‘Growing’ all stems in this sizeclass in the plots by the ‘fire treatment rate’ of 4.1 mm year�1
(above) led to mean plot tree carbon mass (all components) in thissize class of 17.9 Mg ha�1 after 10 years, and 21.5 Mg ha�1 after20 years. In contrast, growing stems in this size class by the ‘con-trol rate’ of 5.3 mm year�1 led to mean plot tree carbon mass of18.9 Mg ha�1 after 10 years and 23.7 Mg ha�1 after 20 years. Thatis, prescribed fire treatments had the potential to decrease meantree carbon mass in this size class by about 1.0 Mg ha�1 over10 years, and 2.2 Mg ha�1 (9%) over 20 years (i.e. 0.1 Mg ha�1
year�1).
4. Discussion
4.1. Prescribed fire effects on tree mortality
Small-stem (<20 cm dbhub) mortality rates in this study(across-treatment mean of 35% of individual E. obliqua over
27 years) were high compared with other temperate eucalypt for-ests (12% over 20 years: Burrows et al., 2010), but, consistent withcomparable studies (Burrows et al., 2010), were not obviouslyinfluenced by prescribed fire. Rather, our plot data indicated thatwhile small-stem mortalities did not change with prescribed fireper se, they increased with more frequent fire, and with springrather than autumn fire. Increased small-stem mortality with morefrequent fire is consistent with observations of other eucalypt-dominated forests (Abbott and Loneragan, 1984; Wilkinson andJennings, 1993; Guinto et al., 1999), and is presumably related toinsufficient time between fires for recovery of protective barkthickness (Gill, 1980; Wilkinson and Jennings, 1993; Lawes et al.,2013). Nonetheless, greater small-stem mortalities after springthan autumn fires were not consistent with indications of milderfire conditions in spring (as indicated by significantly lower FFDIand SDI), but were presumably associated with less rainfall inthe summer months after spring fires, and thus with comparativelygreater potential for negative interactive effects between fire dam-age and available water (Fensham et al., 2008).
Mean mortality of large individual E. obliqua in controls of 1%over 27 years (0.04% yr�1) was low relative to non-fire mortalityrates of large fire-tolerant trees in, for example, conifer forests ofsouth-western USA (0.5–1% yr�1; van Mantgem et al., 2011), butwas consistent with low background mortality rates of large euca-lypts in other studies (Abbott and Loneragan, 1983; Burrows et al.,2010). Prescribed fires marginally but significantly increased meanmortality rates of large individual E. obliqua to 3% over 27 years(0.1% yr�1), which again seems negligible relative to increasedmortality rates with prescribed fire of large fire-tolerant pines else-where (4.6% yr�1; van Mantgem et al., 2013). Nonetheless, othermedium-term studies of large fire-tolerant eucalypts have also de-tected only minor impacts on mortality of single or repeated pre-scribed fires (Abbott and Loneragan, 1983; Burrows et al., 2010).

0
1
2
3
4
5
6
7
Control AH AL SH SL
Dia
m. g
row
th (m
m y
r-1)
Treatment
Control (5.3) > Fire (4.7)* a
[93] [57] [65] [62] [58]
0
1
2
3
4
5
6
7
8
9
20 to 30 30 to 50 50 to 70 70+
Dia
m. g
row
th (m
m y
r-1)
Size Class (initial dbhub; cm)
Cont mm/yrBurn mm/yr
ControlFire
b
*
[18] [48] [30] [78] [38] [89] [27][7]
Fig. 5. Mean under-bark diameter growth rate between 1985 and 2012 of large (initial dbhub P20 cm) individual E. obliqua trees, by prescribed fire treatment (a) and by sizeclass within control treatments and across all fire treatments (b). Treatments were a non-burnt control, prescribed fires in autumn at High frequency (‘AH’), in autumn at Lowfrequency (‘AL’), in spring at High frequency (‘SH’), and in spring at Low frequency (‘SL’). Values are the means with 95% confidence intervals of diameter increments of nindividuals (indicated in square brackets). Asterisks indicate an overall significant effect of fire on diameter growth (a, *P 0.028), and a significant difference between controland prescribed fire treatment trees in the 30–50 cm size class (b, *P 0.043). All statistical analyses included initial dbhub as a covariate (inclusion of initial zone-countcompetition as an additional covariate increased the significance of effects).
252 L.T. Bennett et al. / Forest Ecology and Management 306 (2013) 243–255
Despite low overall mortality rates, both our plot and individualtree data indicated significant effects of prescribed fire frequencyon large tree mortality. Percentages of dead large stems in plotswere significantly greater in High versus Low frequency treat-ments. This is consistent with (very few) other observations of in-creased large eucalypt mortality with increasing fire frequency(Collins et al., 2012). Our study indicates this could be associatedwith significant decreases in relative bark thickness of both E. obli-qua and E. rubida in High versus Low frequency treatments, whichwould increase potential (particularly for the thinner-barked E.rubida) for the cambium to be damaged by High fire temperatures(Gill and Ashton, 1968; Abbott and Loneragan, 1983). In apparentcontrast to the plot data, mortality of large individual E. obliquawas significantly greater in Low than High frequency treatments(largely due to greater mortality in the SL treatment). This couldbe an effect of greater mean fire severity, as indicated by greaterscorch height, in the Low frequency treatment (van Mantgemet al., 2013). Lack of agreement between plot- and tree-level dataon frequency effects could be attributed to greater proportionalcontributions of eucalypts other than E. obliqua to total deadcounts in the plots. In any case, our findings illustrate the needto balance the likely effects of frequency with severity on large treemortality in prescribed fire regimes.
Interpreting the significance of marginally increased large treemortality after low-intensity prescribed fires (either more or lessfrequent) requires consideration of the likely mortalities following
infrequent but higher-intensity wildfire (van Mantgem et al.,2013). Based on surprisingly few available observations, overallmortalities in comparable fire-tolerant eucalypt forests after wild-fire have been in the range 5–10% (Abbott and Loneragan, 1983;Strasser et al., 1996; Benyon and Lane, 2013), but increased to be-tween 25% and 50% following the most severe wildfire (70–100% ofoverstorey crowns burnt; Benyon and Lane, 2013). As such, thereseems little scope for prescribed fire regimes to markedly influencethe mortality rates of fire-tolerant eucalypts, unless they markedlymitigate, or indeed exacerbate (Strasser et al., 1996), the damagingeffects of severe wildfires. Such interactions between prescribedfires and wildfire on large eucalypt mortality remain un-examined.
4.2. Prescribed fire effects on tree growth
We detected significantly less mean diameter growth of E. obli-qua individuals in prescribed fire than control treatments over27 years, irrespective of fire treatment. This effect is consistentwith reduced diameter growth of large Corymbia maculata (syn.Eucalyptus maculata) after 6 years of annual burning in northernNew South Wales (Floyd, 1966), but is seemingly at odds withother studies that found no clear effect of prescribed fire on diam-eter growth of fire-tolerant eucalypts (Abbott and Loneragan,1983; Guinto et al., 1999; Burrows et al., 2010). Nonetheless, theseprevious studies had potentially less power to detect growth ef-fects for a range of reasons including less replication of fire treat-

L.T. Bennett et al. / Forest Ecology and Management 306 (2013) 243–255 253
ments, non-balanced designs and/or small experimental areas(Ab-bott and Loneragan, 1983; Guinto et al., 1999; Burrows et al.,2010). Based on broader evidence, our detected decreases in treegrowth associated with prescribed fire could be due to decreasedavailability of nutrients related to the repeated combustion of leaflitter and humus (Abbott and Loneragan, 1983), or to growth set-backs associated with either stem, root or crown damage (Kellaset al., 1984; Landsberg, 1994; Murphy et al., 2010). Assessmentof the former is the subject of our ongoing research. Evidence insupport of the latter includes significant decreases in bark thick-ness of E. obliqua in fire treatments (increasing the potential fordamage of cambial tissue; Gill and Ashton, 1968), and greatestgrowthdecreases in stems less than 50 cm dbhub, which wouldbe more proportionally affected by scorching than larger, tallerstems (Kellas et al., 1984).
Growth of individual trees in this study was potentially influ-enced by climatic conditions over the study’s 27 years, and bychanges in stand structure. Much of southern Australia was af-fected by a twelve-year drought prior to 2010 (Nicholls and Larsen,2001), so any negative effects of fire on tree growth might havebeen exacerbated by low water availability for part of the measure-ment period (Keeling and Sala, 2012). Our frequency of diametermeasures did not allow for an assessment of fire treatment bydrought interactions, but we note that climate change projectionsindicate more frequent droughts for southern Australia (CSIRO,2007) suggesting this study’s growth responses will have relevanceto prescribed fire/climate interactions in the future. High meanmortality of small trees (c. 30–60%) might also have influenceddiameter increments of some large trees by reducing competitionand thereby ‘releasing’ growth (Hurteau and North, 2009). How-ever, from both our plot-based and individual tree measures, wefound no evidence of greater mortality of small trees in prescribedfire than control treatments. Combined with the above-mentionedlow mortality of large trees, this suggested that effects of pre-scribed fire on tree growth in this eucalypt forest were not clearlymoderated by changes in stand structure as has been observed inother forest types (Hurteau and North, 2009; Blanck et al., 2013).
4.3. Prescribed fire and tree-based carbon stocks
Our study indicated mean decreases in total standing tree-based carbon stocks with repeated prescribed fire of 25 Mg ha�1,or about 12% of control tree-based stocks. However, the wide95% confidence interval for this mean difference (2–48 Mg ha�1),indicated a high degree of uncertainty around the size of the pre-scribed fire effect, which is not surprising given the level of treat-ment replication (five), and the variable structure of these nativeforests. Comparable empirical data of prescribed fire effects forAustralian temperate forests are lacking, although a 12% decreaseis comparable with decreases in tree-based carbon stocks of 11–17% after single prescribed fires in the mixed-conifer forests ofwestern USA (Meigs et al., 2009; North et al., 2009). Our findingof decreases in standing tree-based carbon stocks contradicts re-cent long-term simulation models that found no effect of pre-scribed fire regimes on carbon stocks in temperate eucalyptforests of south-eastern Australia (Norris et al., 2010; King et al.,2011), which was explained by quick recovery of stocks to pre-firelevels, and by ‘a limited impact’ of low intensity fires on tree bio-mass and growth (Norris et al., 2010).
Decreases in standing tree-based carbon stocks associated withprescribed fire in this study appeared to be due to both direct andindirect effects. Direct combustion effects were low in bark (0.2–0.4 Mg ha�1), and were not detected (as a difference between con-trol and fire treatments) in stumps; although decreased stump car-bon with more frequent combustion was indicated by significantlylower stump carbon stocks in High than Low frequency fire treat-
ments (c. 1 t ha�1). Direct combustion effects were also indicatedby significantly less carbon in large dead stems in prescribed firethan control treatments despite higher mortality of large individ-ual trees in the former. It’s also possible that repeated fire led tothe collapse of some large stems through the formation of basalscars (Collins et al., 2012). These would be more likely after thehigher severity fires in the Low than High frequency treatment(Gill, 1974), perhaps contributing to the lowest large dead stemcarbon stocks in the Low frequency treatment.
It is conceivable that decreases in standing tree-based carbonstocks in prescribed fire treatments could, through tree collapse,have been retained on site as (fallen) coarse woody debris. How-ever, while not considered explicitly here, the following suggeststhis was not the case: (1) recent measures of carbon stocks beforeand after single prescribed fires in E. obliqua forest indicate a netloss of carbon stocks in fallen timber (i.e. combustion losses greaterthan tree-fall gains; Volkova and Weston, 2013); (2) this net lossfinding is consistent with our preliminary (unpublished) assess-ments of coarse woody debris in the study plots that indicategreater losses through repeated combustion than gains throughtree collapse; and (3) low overall rates of large eucalypt stem col-lapse after low intensity prescribed fire are indicated by low ratesof collapse (6 0.2% year�1) after post-logging fires of greater inten-sity in comparable eucalypt forests (Gibbons et al., 2000).
In addition to direct combustion, indirect effects of prescribedfire treatments on tree-based carbon stocks were detected in bothmarginally increased post-fire mortality and decreased mean an-nual diameter increment of large E. obliqua. Significant decreasesin the mean diameter increment of the most prevalent large E. obli-qua size class (30 to 50 cm dbhub) represented a decrease in treecarbon mass of about 0.1 Mg ha�1 year�1. The net ecosystem ex-change (NEE) of carbon in our study’s forest is the subject of ongo-ing research, but, based on values of 7 Mg C ha�1 year�1 in wettereucalypt forests (Keith et al., 2012), might conservatively be in therange 3–5 Mg C ha�1 yr�1 (see also Beringer et al., 2007). Thus, adecrease of 0.1 Mg ha�1 year�1 might seem negligible, althoughwe note that a decrease of 0.2 Mg C ha�1 year�1 in northern Austra-lian savannas after moderate fires was considered ‘relatively large’for an NEE of 3–5 Mg C ha�1 yr�1 (Murphy et al., 2010). In addition,while the deep-barked E. obliqua was the most common eucalypt,it contained just 41% of the large live tree carbon in control plots,with the remainder comprised of two thinner-barked species (E.radiata, 33%; E. rubida, 26%; data not shown). Thus, while limited(non-replicated) data from one of our study areas indicated no neg-ative effects of prescribed fire on individual E. rubida growth, wecannot discount the possibility that repeated prescribed fire im-pacted on the growth of E. radiata and E. rubida, thereby contribut-ing to an overall finding of less tree-based carbon stocks inprescribed fire than control treatments.
While we found no significant differences among our prescribedfire treatments in total standing tree-based carbon stocks, analysesof component stocks indicated that both fire season and frequencycould influence the capacity of trees to fix carbon into the future.For example, recruitment and survival of smaller stems was great-er after autumn than spring fires suggesting that autumn fireswould better maintain future growth stocks. Similarly, small treerecruitment and overall large tree survival were greater afterLow than High frequency fires, suggesting that 10- rather than 3-yearly fires would better maintain the forest’s future capacity tofix carbon.
5. Conclusions
In a first for temperate eucalypt forests, we detected significanteffects of prescribed fire treatments on tree mortality and growth,

254 L.T. Bennett et al. / Forest Ecology and Management 306 (2013) 243–255
and on total standing tree-based carbon stocks. That such effectshave not previously been reported is evidence of the importanceof long-term studies, examining the cumulative effects of multipleprescribed fires, and of using multiple data sources that addressboth current stocks and long-term fluxes (mortality and growth).
We found evidence of both direct and indirect effects of pre-scribed fire on standing tree-based carbon stocks. That is, directcombustion effects were indicated by minor bark losses, and bysignificantly less carbon in large dead stems in prescribed fire thancontrol treatments. Indirect effects included marginally greatermortality and decreased mean diameter increment of individuallarge trees in prescribed fire than control treatments over the27 years since treatment establishment. These direct and indirecteffects were consistent with a detected mean difference in totalstanding tree-based carbon stocks of 25 Mg ha�1 between controland prescribed fire treatments. However, the wide confidenceinterval for this difference (2–48 Mg ha�1) indicated that a high de-gree of uncertainty remains about the magnitude of decreases instanding tree-based carbon stocks under prescribed fire regimesin these native eucalypt forests.
Our analyses of prescribed fire types did not detect significanteffects of fire season and frequency on total standing tree-basedcarbon stocks. However, densities of small live stems and associ-ated carbon stocks were greater in autumn than spring, and inLow than High frequency fire treatments. Combined with lowerplot-level proportions of dead stems in Low than High frequencytreatments, our study indicates that autumn fires every c. 10 yearswould offer more scope than more frequent spring fires to main-tain the capacity of these forests to fix carbon into the future.
Acknowledgements
This work was funded by the Victorian Department of Environ-ment and Primary Industries (DEPI). We thank many personnelfrom DEPI’s (then) Environmental Policy and Climate Change, Landand Fire, and Forests and Parks Divisions for supporting this FESAmeasurement. We also thank many current and past staff fromthe regional DEPI and from the University of Melbourne for main-taining, measuring, and documenting the prescribed fire treat-ments for over two decades, including J. Kellas, D. Oswin, A.Ashton, J. Najera, and N. Klaus. Two anonymous reviewers are alsothanked for providing constructive comments that improved thepaper.
Appendix A. Supplementary data
Supplementary data associated with this article can be found, inthe online version, at http://dx.doi.org/10.1016/j.foreco.2013.06.036.
References
Abbott, I., Loneragan, O., 1983. Influence of fire on growth rate, mortality, and buttdamage in Mediterranean forest of Western Australia. For. Ecol. Manage. 6,139–153.
Abbott, I., Loneragan, O., 1984. Growth rate and long-term population dynamics ofjarrah (Eucalyptus marginata Donn ex Sm.) regeneration in Western Australianforest. Aust. J. Bot. 32, 353–362.
Adams, M.A., 2013. Mega-fires, tipping points and ecosystem services: managingforests and woodlands in an uncertain future. For. Ecol. Manage. 294, 250–261.
Adams, M.A., Attiwill, P.M., 2011. Burning Issues: Sustainability and Management ofAustralia’s Southern Forests. CSIRO Publishing, Collingwood, Victoria, Australia.
ASRIS, 2011. ASRIS - Australian Soil Resource Information System. http://www.asris.csiro.au. Accessed: April 7, 2013.
Attiwill, P.M., 1979. Nutrient cycling in a Eucalyptus obliqua (L’Herit.) forest. III.Growth, biomass, and net primary production. Aust. J. Bot. 27, 439–458.
Attiwill, P.M., Adams, M.A., 2008. Harnessing forest ecological sciences in theservice of stewardship and sustainability: a perspective from ‘down-under’. For.Ecol. Manage. 256, 1636–1645.
Benyon, R.G., Lane, P.N.J., 2013. Ground and satellite-based assessments of weteucalypt forest survival and regeneration for predicting long-term hydrologicalresponses to a large wildfire. For. Ecol. Manage. 294, 197–207.
Beringer, J., Hutley, L.B., Tapper, N.J., Cernusak, L.A., 2007. Savanna fires and theirimpact on net ecosystem productivity in North Australia. Global Change Biol.13, 990–1004.
Bi, H., Turner, J., Lambert, M.J., 2004. Additive biomass equations for native eucalyptforest trees of temperate Australia. Trees – Struct. Funct. 18, 467–479.
Blanck, Y.-L., Rolstad, J., Storaunet, K.O., 2013. Low- to moderate-severity historicalfires promoted high tree growth in a boreal Scots pine forest of Norway. Scand.J. For. Res. 28, 126–135.
Bradstock, R.A., 2010. A biogeographic model of fire regimes in Australia: currentand future implications. Global Ecol. Biogeogr. 19, 145–158.
Bradstock, R.A., Williams, R.J., 2009. Can Australian fire regimes be managed forcarbon benefits? New Phytol. 183, 931–934.
Bradstock, R.A., Boer, M.M., Cary, G.J., Price, O.F., Williams, R.J., Barrett, D., Cook, G.,Gill, A.M., Hutley, L.B.W., Keith, H., Maier, S.W., Meyer, M., Roxburgh, S.H.,Russell-Smith, J., 2012. Modelling the potential for prescribed burning tomitigate carbon emissions from wildfires in fire-prone forests of Australia. Int. J.Wildland Fire 21, 629–639.
Burrows, N., Ward, B., Robinson, A., 2010. Fire regimes and tree growth inlow rainfall Jarrah forest of south-west Australia. Environ. Manage. 45, 1332–1343.
Busse, M.D., Simon, S.A., Riegel, G.M., 2000. Tree-growth and understory responsesto low-severity prescribed burning in thinned Pinus ponderosa forests of centralOregon. For. Sci. 46, 258–268.
Campbell, J.L., Harmon, M.E., Mitchell, S.R., 2011. Can fuel-reduction treatmentsreally increase forest carbon storage in the western US by reducing future fireemissions? Front. Ecol. Environ. 10, 83–90.
Carter, M.C., Darwin Foster, C., 2004. Prescribed burning and productivity insouthern pine forests: a review. For. Ecol. Manage. 191, 93–109.
Chatto, K., Bell, T.L., Kellas, J., 2003. Effects of repeated low-intensity fire on treegrowth and bark in a mixed eucalypt foothill forest in south-eastern Australia.Fire Research Report No. 66. Fire Management, Department of Sustainabilityand Environment, East Melbourne, Victoria, Australia.
Clarke, H.G., Smith, P.L., Pitman, A.J., 2011. Regional signatures of future fireweather over eastern Australia from global climate models. Int. J. Wildland Fire20, 550–562.
Collins, L., Bradstock, R.A., Tasker, E.M., Whelan, R.J., 2012. Can gullies preservecomplex forest structure in frequently burnt landscapes? Biol. Conserv. 153,177–186.
Coomes, D.A., Allen, R.B., Scott, N.A., Goulding, C., Beets, P., 2002. Designing systemsto monitor carbon stocks in forests and shrublands. For. Ecol. Manage. 164, 89–108.
CSIRO, 2007. Climate change in Australia: Technical Report 2007. CSIRO Marine andAtmospheric Research, Aspendale, Victoria, Australia.
DSE, 2003. Ecological impacts of fuel reduction burning in a mixed eucalypt foothillforest – summary report (1984–1999). Fire Research Report No. 57. Departmentof Sustainability and Environment, East Melbourne, Victoria, Australia.
DSE, 2012. Code of Practice for Bushfire Management on Public Land. Department ofSustainability and Environment, East Melbourne, Victoria, Australia.
Fensham, R.J., Fairfax, R.J., Buckley, Y.M., 2008. An experimental study of fire andmoisture stress on the survivorship of savanna eucalypt seedlings. Aust. J. Bot.56, 693–697.
Fernandes, P.M., Botelho, H.S., 2003. A review of prescribed burning effectiveness infire hazard reduction. Int. J. Wildland Fire 12, 117–128.
Flannigan, M., Cantin, A.S., de Groot, W.J., Wotton, M., Newbery, A., Gowman, L.M.,2013. Global wildland fire season severity in the 21st century. For. Ecol.Manage. 294, 54–61.
Floyd, A.G., 1966. The effects of control burning on forests. In: The effects of fire onforest conditions. Technical Paper No. 13. Forestry Commission of New SouthWales, Taree, New South Wales, Australia, pp. 3–20.
Ghimire, B., Williams, C.A., Collatz, G.J., Vanderhoof, M., 2012. Fire-induced carbonemissions and regrowth uptake in western U.S. forests: documenting variationacross forest types, fire severity, and climate regions. J. Geophys. Res.: Biogeosci.117, 1–29.
Gibbons, P., Lindenmayer, D.B., Barry, S.C., Tanton, M.T., 2000. The effects of slashburning on the mortality and collapse of trees retained on logged sites in south-eastern Australia. For. Ecol. Manage. 139, 51–61.
Gill, A.M., 1974. Towards an understanding of fire scar formation: field observationand laboratory simulation. For. Sci. 20, 198–205.
Gill, A.M., 1980. Restoration of bark thickness afer fire and mechanical injury in asmooth-barked eucalypt. Austral. For. Res. 10, 311–319.
Gill, A.M., Ashton, D.H., 1968. The role of bark type in relative tolerance to fire ofthree Central Victorian eucalypts. Aust. J. Bot. 16, 491–498.
Gill, A.M., Brack, C.L., Hall, T., 1982. Bark probe – an instrument for measuring barkthickness of eucalypts. Austral. For. 45, 206–208.
Grierson, P., Adams, M., Attiwill, P., 1992. Estimates of carbon storage in theaboveground biomass of Victoria’s forests. Aust. J. Bot. 40, 631–640.
Grove, S.J., Stamm, L., Barry, C., 2009. Log decomposition rates in TasmanianEucalyptus obliqua determined using an indirect chronosequence approach. For.Ecol. Manage. 258, 389–397.
Guinto, D.F., House, A.P.N., Xu, Z.H., Saffigna, P.G., 1999. Impacts of repeated fuelreduction burning on tree growth, mortality and recruitment in mixed specieseucalypt forests of southeast Queensland. Austral. For. Ecol. Manage. 115, 13–27.

L.T. Bennett et al. / Forest Ecology and Management 306 (2013) 243–255 255
Hurteau, M., North, M., 2009. Fuel treatment effects on tree-based forest carbonstorage and emissions under modeled wildfire scenarios. Front. Ecol. Environ. 7,409–414.
Kaye, J., 2009. Estimation of tree above-ground biomass across native forests ofVictoria. Masters by Research Thesis. Melbourne School of Land andEnvironment, The University of Melbourne, Victoria, Australia
Keeling, E.G., Sala, A., 2012. Changing growth response to wildfire in old-growthponderosa pine trees in montane forests of north central Idaho. Global ChangeBiol. 18, 1117–1126.
Keith, H., Barrett, D., Keenan, R., 2000. Review of allometric relationships forestimating woody biomass for New South Wales, the Australian CapitalTerritory, Victoria, Tasmania and South Australia. National Carbon AccountingTechnical Report, vol. 5B. Australian Greenhouse Office, Canberra, ACT,Australia.
Keith, H., van Gorsel, E., Jacobsen, K.L., Cleugh, H.A., 2012. Dynamics of carbonexchange in a Eucalyptus forest in response to interacting disturbance factors.Agric. For. Meteorol. 153, 67–81.
Kellas, J.D., Incoll, W.D., Squire, R.O., 1984. Reduction in basal area increment ofEucalyptus obliqua following crown scorch. Austral. For. 47, 179–183.
King, K.J., de Ligt, R.M., Cary, G.J., 2011. Fire and carbon dynamics under climatechange in south-eastern Australia: insights from FullCAM and FIRESCAPEmodelling. Int. J. Wildland Fire 20, 563–577.
King, K.J., Cary, G.J., Bradstock, R.A., Marsden-Smedley, J.B., 2013. Contrasting fireresponses to climate and management: insights from two Australianecosystems. Global Change Biol. 19, 1223–1235.
Landsberg, J.D., 1994. A review of prescribed fire and tree growth response in thegenus Pinus. In: Proceedings of the 12th Conference on Fire and ForestMeteorology. Society of American Foresters, Bethesda, MD, pp. 326–349.
Lawes, M.J., Midgley, J.J., Clarke, P.J., 2013. Costs and benefits of relative barkthickness in relation to fire damage: a savanna/forest contrast. J. Ecol. 101, 517–524.
Luke, R.H., McArthur, A.G., 1978. Bushfires in Australia. Australian GovernmentPublishing Service, Canberra, Australia.
McArthur, A.G., 1967. Fire behaviour in eucalypt forests. Leaflet No. 107. ForestResearch Institute, Forestry and Timber Bureau of Australia, Canberra, Australia.
Meigs, G., Donato, D., Campbell, J., Martin, J., Law, B.E., 2009. Forest fire impacts oncarbon uptake, storage, and emission: the role of burn severity in the EasternCascades, Oregon. Ecosystems 12, 1246–1267.
Moroni, M.T., 2012. Aspects of forest carbon management in Australia: a discussionpaper. For. Ecol. Manage. 275, 111–116.
Mount, A.B., 1972. The Derivation and Testing of a Soil Dryness Index using Run-offData. Tasmanian Forestry Commission Bulletin No. 4. Tasmanian ForestryCommission, Hobart, Tasmania, Australia.
Murphy, B.P., Russell-Smith, J., Prior, L.D., 2010. Frequent fires reduce tree growth innorthern Australian savannas: implications for tree demography and carbonsequestration. Global Change Biol. 16, 331–343.
Narayan, C., Fernandes, P.M., van Brusselen, J., Schuck, A., 2007. Potential for CO2
emissions mitigation in Europe through prescribed burning in the context of theKyoto Protocol. For. Ecol. Manage. 251, 164–173.
Nicholls, N., Larsen, S., 2001. Impact of drought on temperature extremes inMelbourne, Australia. Austral. Meteorol. Ocean. J. 61, 113–116.
Norris, J., Arnold, S., Fairman, T., 2010. An indicative estimate of carbon stocks onVictoria’s publicly managed land using the FullCAM carbon accounting model.Austral. For. 73, 209–219.
North, M.P., Hurteau, M.D., 2011. High-severity wildfire effects on carbon stocksand emissions in fuels treated and untreated forest. For. Ecol. Manage. 261,1115–1120.
North, M., Hurteau, M., Innes, J., 2009. Fire suppression and fuels treatment effectson mixed-conifer carbon stocks and emissions. Ecol. Appl. 19, 1385–1396.
Opie, J.E., 1968. Predictability of individual tree growth using various definitions ofcompeting basal area. For. Sci. 14, 314–323.
Parliament of Victoria, 2010. 2009 Victorian Bushfires Royal Commission: FinalReport. The Commission, Melbourne, Victoria, Australia.
Payne, R., 2011. A Guide to Anova and Design in GenStat�. VSN International, HemelHempstead, Hertfordshire, UK.
Penman, T.D., Christie, F.J., Andersen, A.N., Bradstock, R.A., Cary, G.J., Henderson,M.K., Price, O., Tran, C., Wardle, G.M., Williams, R.J., York, A., 2011. Prescribedburning: how can it work to conserve the things we value? Int. J. Wildland Fire20, 721–733.
Peterson, D.W., Reich, P.B., 2001. Prescribed fire in oak savanna: fire frequencyeffects on stand structure and dynamics. Ecol. Appl. 11, 914–927.
Quinn, G.P., Keough, M.J., 2002. Experimental Design and Data Analysis forBiologists. Cambridge University Press, Cambridge, UK.
Rowan, J.N., Russell, L.D., Ransom, S.W., Rees, D.B., 2000. Land Systems of Victoria(third ed.). Technical Report No. 56. Centre for Land Protection Research,Department of Natural Resources and Environment, Melbourne, Victoria,Australia.
San-Miguel-Ayanz, J., Moreno, J.M., Camia, A., 2013. Analysis of large fires inEuropean Mediterranean landscapes: lessons learned and perspectives. For.Ecol. Manage. 294, 11–22.
Specht, R.L., 1981. Foliage projective cover and standing biomass. In: Gillson, A.N.,Anderson, D.J. (Eds.), Vegetation Classification in Australia. CSIRO, Canberra,Australia, pp. 10–21.
Speight, J.G., 2009. Landform. In, Australian Soil and Land Survey Field Handbook(third ed.). The National Committee on Soil and Terrain, CSIRO Publishing,Collingwood, Victoria, Australia, pp. 15–72.
Strasser, M.J., Pausas, J.G., Noble, I.R., 1996. Modelling the response of eucalypts tofire, Brindabella ranges, ACT. Aust. J. Ecol. 21, 341–344.
Tolhurst, K.G., 2003. Effects of repeated low-intensity fire on the understorey of amixed eucalypt foothill forest in south-eastern Australia. Fire Research ReportNo. 58. Fire Management, Department of Sustainability and Environment, EastMelbourne, Victoria, Australia.
Tolhurst, K.G., Flinn, D., 1992. Ecological impacts of fuel reduction burning in drysclerophyll forest: first progress report. Forest Research Report No. 349. ForestResearch Section, Department of Conservation and Environment, Kew, Victoria,Australia.
van Mantgem, P.J., Stephenson, N.L., Knapp, E., Battles, J., Keeley, J.E., 2011. Long-term effects of prescribed fire on mixed conifer forest structure in the SierraNevada, California. For. Ecol. Manage. 261, 989–994.
van Mantgem, P.J., Nesmith, J.C.B., Keifer, M., Brooks, M., 2013. Tree mortalitypatterns following prescribed fire for Pinus and Abies across the southwesternUnited States. For. Ecol. Manage. 289, 463–469.
Vilén, T., Fernandes, P., 2011. Forest fires in Mediterranean countries: CO2 emissionsand mitigation possibilities through prescribed burning. Environ. Manage. 48,558–567.
Volkova, L., Weston, C., 2013. Redistribution and emission of forest carbon byplanned burning in Eucalyptus obliqua (L. Hérit.) forest of south-easternAustralia. For. Ecol. Manage., <http://dx.doi.org/10.1016/j.foreco.2013.1005.1019>.
Warton, D.I., Hui, F.K.C., 2011. The arcsine is asinine: the analysis of proportions inecology. Ecology 91, 3–10.
Wilkinson, G., Jennings, S., 1993. Survival and recovery of Eucalytpus obliquaregeneration following wildfire. TasForests 5, 1–11.